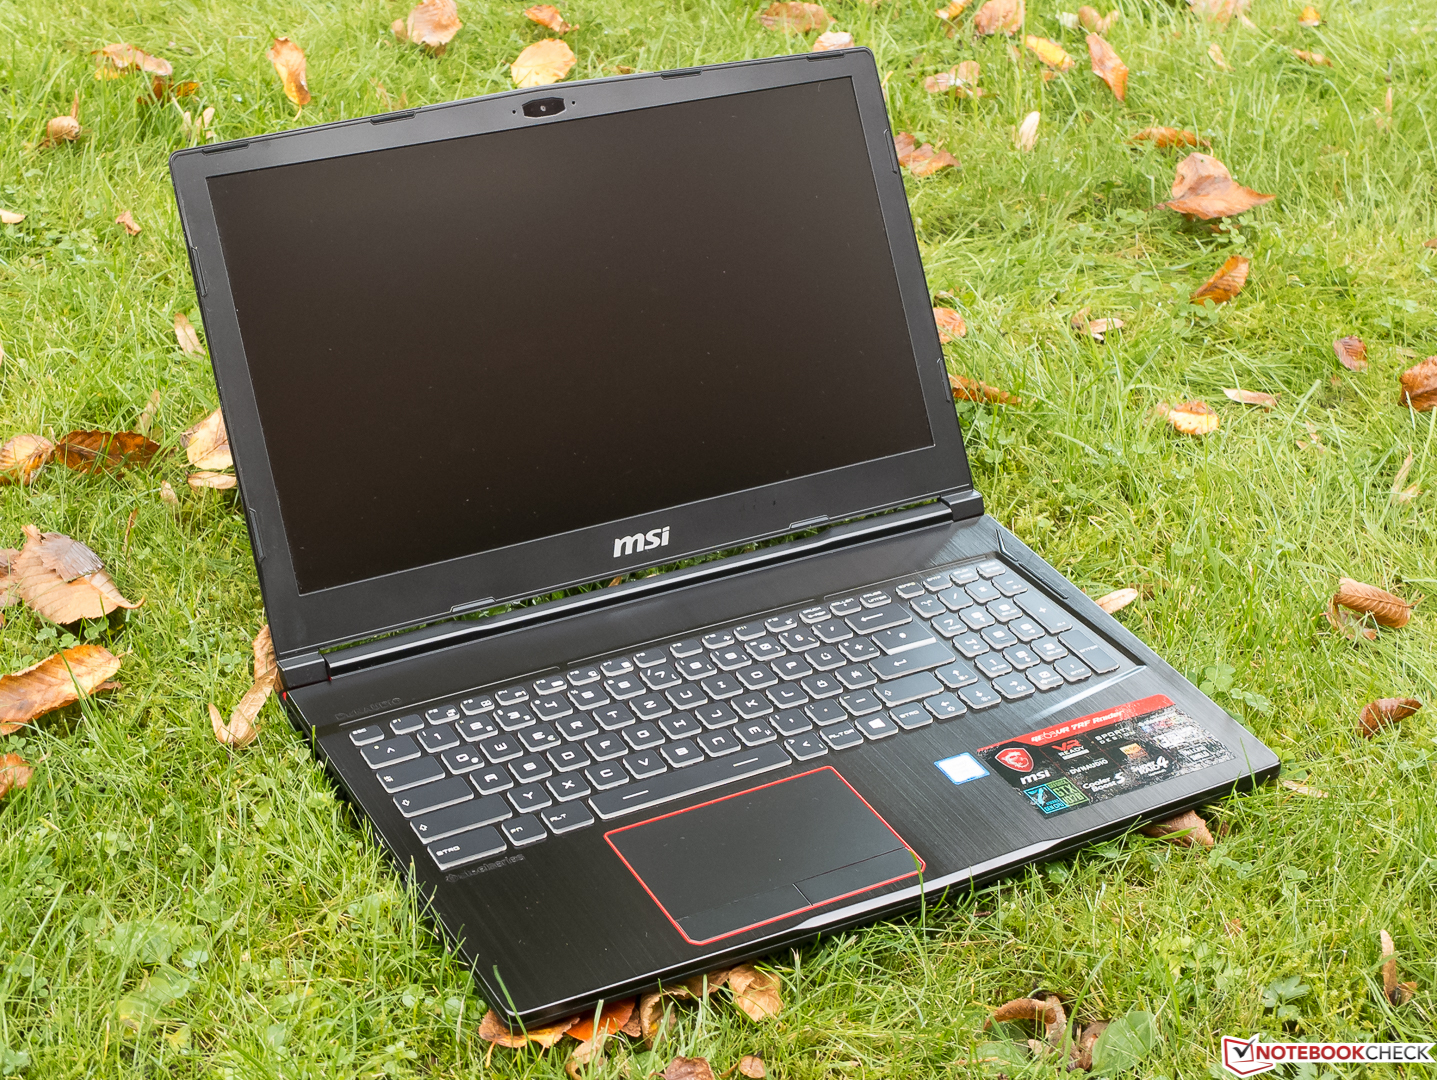
Breve análisis del portátil MSI GE63VR Raider-075 (i7-7700HQ, GTX 1070, Full-HD)


| SD Card Reader | |
| average JPG Copy Test (av. of 3 runs) | |
| MSI GE63VR 7RF Raider (Toshiba Exceria Pro SDXC 64 GB UHS-II) | |
| Acer Predator 15 G9-593-751X (Toshiba Exceria Pro SDXC 64 GB UHS-II) | |
| maximum AS SSD Seq Read Test (1GB) | |
| MSI GE63VR 7RF Raider (Toshiba Exceria Pro SDXC 64 GB UHS-II) | |
| Acer Predator 15 G9-593-751X (Toshiba Exceria Pro SDXC 64 GB UHS-II) | |
| Networking | |
| iperf3 transmit AX12 | |
| Acer Predator 15 G9-593-751X | |
| Alienware 15 R3 | |
| MSI GE63VR 7RF Raider | |
| Asus Zephyrus GX501VS | |
| iperf3 receive AX12 | |
| Acer Predator 15 G9-593-751X | |
| MSI GE63VR 7RF Raider | |
| Alienware 15 R3 | |
| Asus Zephyrus GX501VS | |
| |||||||||||||||||||||||||
iluminación: 84 %
Brillo con batería: 285 cd/m²
Contraste: 1239:1 (Negro: 0.23 cd/m²)
ΔE ColorChecker Calman: 3.52 | ∀{0.5-29.43 Ø4.73}
ΔE Greyscale Calman: 3.41 | ∀{0.09-98 Ø4.97}
100% sRGB (Argyll 1.6.3 3D)
77% AdobeRGB 1998 (Argyll 1.6.3 3D)
86.7% AdobeRGB 1998 (Argyll 3D)
100% sRGB (Argyll 3D)
91.3% Display P3 (Argyll 3D)
Gamma: 2.05
CCT: 7077 K
| MSI GE63VR 7RF Raider Chi Mei N156HHE-GA1 (CMN15F4), 1920x1080, 15.6" | Acer Predator 15 G9-593-751X LG Philips LP156WF6-SPP1 (LGD04D5), 1920x1080, 15.6" | Alienware 15 R3 HPJGK_B156HTN (AUO51ED), 1920x1080, 15.6" | Asus Zephyrus GX501VS ID: AUO42ED, Name: AU Optronics B156HAN04.2, 1920x1080, 15.6" | |
|---|---|---|---|---|
| Display | -23% | -20% | -25% | |
| Display P3 Coverage (%) | 91.3 | 65.4 -28% | 66 -28% | 62.1 -32% |
| sRGB Coverage (%) | 100 | 85.5 -14% | 90.5 -9% | 85.6 -14% |
| AdobeRGB 1998 Coverage (%) | 86.7 | 62.5 -28% | 66.2 -24% | 62.4 -28% |
| Response Times | -271% | -114% | -268% | |
| Response Time Grey 50% / Grey 80% * (ms) | 9.6 ? | 36 ? -275% | 25 ? -160% | 33.2 ? -246% |
| Response Time Black / White * (ms) | 7.2 ? | 26.4 ? -267% | 12 ? -67% | 28 ? -289% |
| PWM Frequency (Hz) | 26000 ? | 20830 ? | ||
| Screen | -26% | -66% | -10% | |
| Brightness middle (cd/m²) | 285 | 295 4% | 386 35% | 307.1 8% |
| Brightness (cd/m²) | 273 | 274 0% | 382 40% | 309 13% |
| Brightness Distribution (%) | 84 | 88 5% | 93 11% | 86 2% |
| Black Level * (cd/m²) | 0.23 | 0.32 -39% | 0.39 -70% | 0.35 -52% |
| Contrast (:1) | 1239 | 922 -26% | 990 -20% | 877 -29% |
| Colorchecker dE 2000 * | 3.52 | 4.59 -30% | 10.2 -190% | 3.4 3% |
| Colorchecker dE 2000 max. * | 5.18 | 11 -112% | 15.81 -205% | 8.2 -58% |
| Greyscale dE 2000 * | 3.41 | 4.03 -18% | 11.28 -231% | 1.4 59% |
| Gamma | 2.05 107% | 2.3 96% | 2.23 99% | 2.19 100% |
| CCT | 7077 92% | 7229 90% | 11383 57% | 6558 99% |
| Color Space (Percent of AdobeRGB 1998) (%) | 77 | 56 -27% | 59 -23% | 55.6 -28% |
| Color Space (Percent of sRGB) (%) | 100 | 85 -15% | 90 -10% | 85 -15% |
| Media total (Programa/Opciones) | -107% /
-58% | -67% /
-63% | -101% /
-47% |
* ... más pequeño es mejor
Tiempos de respuesta del display
| ↔ Tiempo de respuesta de Negro a Blanco | ||
|---|---|---|
| 7.2 ms ... subida ↗ y bajada ↘ combinada | ↗ 5 ms subida | 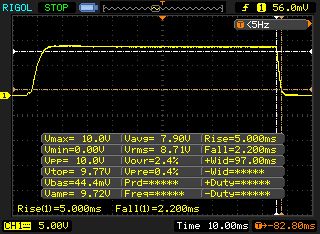 |
| ↘ 2.2 ms bajada | ||
| La pantalla mostró tiempos de respuesta muy rápidos en nuestros tests y debería ser adecuada para juegos frenéticos. En comparación, todos los dispositivos de prueba van de ##min### (mínimo) a 240 (máximo) ms. » 21 % de todos los dispositivos son mejores. Esto quiere decir que el tiempo de respuesta medido es mejor que la media (19.9 ms) de todos los dispositivos testados. | ||
| ↔ Tiempo de respuesta 50% Gris a 80% Gris | ||
| 9.6 ms ... subida ↗ y bajada ↘ combinada | ↗ 5.2 ms subida | 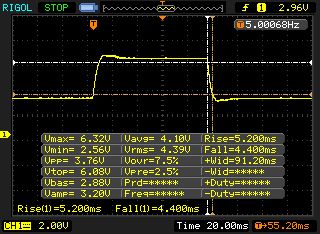 |
| ↘ 4.4 ms bajada | ||
| La pantalla mostró tiempos de respuesta rápidos en nuestros tests y debería ser adecuada para juegos. En comparación, todos los dispositivos de prueba van de ##min### (mínimo) a 636 (máximo) ms. » 23 % de todos los dispositivos son mejores. Esto quiere decir que el tiempo de respuesta medido es mejor que la media (31.1 ms) de todos los dispositivos testados. | ||
Parpadeo de Pantalla / PWM (Pulse-Width Modulation)
| Parpadeo de Pantalla / PWM detectado | 26000 Hz | ≤ 25 % de brillo | 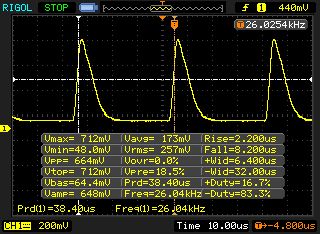 |
La retroiluminación del display parpadea a 26000 Hz (seguramente usa PWM - Pulse-Width Modulation) a un brillo del 25 % e inferior. Sobre este nivel de brillo no debería darse parpadeo / PWM. La frecuencia de 26000 Hz es bastante alta, por lo que la mayoría de gente sensible al parpadeo no debería ver parpadeo o tener fatiga visual. Comparación: 52 % de todos los dispositivos testados no usaron PWM para atenuar el display. Si se usó, medimos una media de 7794 (mínimo: 5 - máxmo: 343500) Hz. | |||
| Cinebench R15 | |
| CPU Single 64Bit | |
| Alienware 15 R3 | |
| Acer Predator 15 G9-593-751X | |
| MSI GE63VR 7RF Raider | |
| Asus Zephyrus GX501VS | |
| CPU Multi 64Bit | |
| Acer Predator 15 G9-593-751X | |
| Alienware 15 R3 | |
| Asus Zephyrus GX501VS | |
| MSI GE63VR 7RF Raider | |
| PCMark 8 | |
| Home Score Accelerated v2 | |
| Acer Predator 15 G9-593-751X | |
| Asus Zephyrus GX501VS | |
| Alienware 15 R3 | |
| MSI GE63VR 7RF Raider | |
| Work Score Accelerated v2 | |
| Acer Predator 15 G9-593-751X | |
| Asus Zephyrus GX501VS | |
| Alienware 15 R3 | |
| MSI GE63VR 7RF Raider | |
| PCMark 8 Home Score Accelerated v2 | 4406 puntos | |
| PCMark 8 Work Score Accelerated v2 | 5270 puntos | |
ayuda | ||
| MSI GE63VR 7RF Raider Toshiba HG6 THNSNJ256G8NY | Acer Predator 15 G9-593-751X Samsung SM951 MZVPV256HDGL m.2 PCI-e | Alienware 15 R3 | Asus Zephyrus GX501VS Samsung SM961 MZVPW256HEGL | |
|---|---|---|---|---|
| CrystalDiskMark 3.0 | 146% | 64% | ||
| Read Seq (MB/s) | 507 | 1939 282% | 1123 121% | |
| Write Seq (MB/s) | 441.4 | 1262 186% | 429.2 -3% | |
| Read 512 (MB/s) | 411.9 | 1078 162% | 833 102% | |
| Write 512 (MB/s) | 409.9 | 1192 191% | 428.1 4% | |
| Read 4k (MB/s) | 21.77 | 50.8 133% | 37.8 74% | |
| Write 4k (MB/s) | 88.9 | 141.9 60% | 122.9 38% | |
| Read 4k QD32 (MB/s) | 368.8 | 573 55% | 542 47% | |
| Write 4k QD32 (MB/s) | 190.3 | 375.3 97% | 429.8 126% |

| 3DMark 11 - 1280x720 Performance GPU | |
| MSI GE63VR 7RF Raider | |
| Alienware 15 R3 | |
| Acer Predator 15 G9-593-751X | |
| Asus Zephyrus GX501VS | |
| 3DMark - 1920x1080 Fire Strike Graphics | |
| MSI GE63VR 7RF Raider | |
| Alienware 15 R3 | |
| Acer Predator 15 G9-593-751X | |
| Asus Zephyrus GX501VS | |
| 3DMark 11 Performance | 16625 puntos | |
| 3DMark Cloud Gate Standard Score | 27629 puntos | |
| 3DMark Fire Strike Score | 13917 puntos | |
ayuda | ||
| The Witcher 3 - 1920x1080 Ultra Graphics & Postprocessing (HBAO+) | |
| MSI GE63VR 7RF Raider | |
| Acer Predator 15 G9-593-751X | |
| Asus Zephyrus GX501VS | |
| Rise of the Tomb Raider | |
| 1920x1080 Very High Preset AA:FX AF:16x | |
| MSI GE63VR 7RF Raider | |
| Asus Zephyrus GX501VS | |
| 1920x1080 High Preset AA:FX AF:4x | |
| MSI GE63VR 7RF Raider | |
| Battlefield 1 | |
| 1920x1080 Ultra Preset AA:T | |
| Acer Predator 15 G9-593-751X | |
| Alienware 15 R3 | |
| MSI GE63VR 7RF Raider | |
| 1920x1080 High Preset AA:T | |
| Acer Predator 15 G9-593-751X | |
| Alienware 15 R3 | |
| MSI GE63VR 7RF Raider | |
| For Honor | |
| 1920x1080 Extreme Preset AA:T AF:16x | |
| MSI GE63VR 7RF Raider | |
| Acer Predator 15 G9-593-751X | |
| 1920x1080 High Preset AA:T AF:8x | |
| MSI GE63VR 7RF Raider | |
| Acer Predator 15 G9-593-751X | |
| Ghost Recon Wildlands | |
| 1920x1080 Ultra Preset AA:T AF:16x | |
| MSI GE63VR 7RF Raider | |
| Acer Predator 15 G9-593-751X | |
| 1920x1080 High Preset AA:T AF:4x | |
| MSI GE63VR 7RF Raider | |
| Acer Predator 15 G9-593-751X | |
| bajo | medio | alto | ultra | |
|---|---|---|---|---|
| The Witcher 3 (2015) | 62.2 | |||
| Rise of the Tomb Raider (2016) | 118.8 | 102.5 | ||
| Far Cry Primal (2016) | 76 | 74 | ||
| Deus Ex Mankind Divided (2016) | 83.1 | 45.6 | ||
| Battlefield 1 (2016) | 110.5 | 103.2 | ||
| For Honor (2017) | 144.4 | 113 | ||
| Ghost Recon Wildlands (2017) | 90.8 | 52.2 |
Ruido
| Ocioso |
| 33 / 35 / 40 dB(A) |
| HDD |
| 34 dB(A) |
| Carga |
| 48 / 55 dB(A) |
 | ||
30 dB silencioso 40 dB(A) audible 50 dB(A) ruidosamente alto |
||
min: | ||
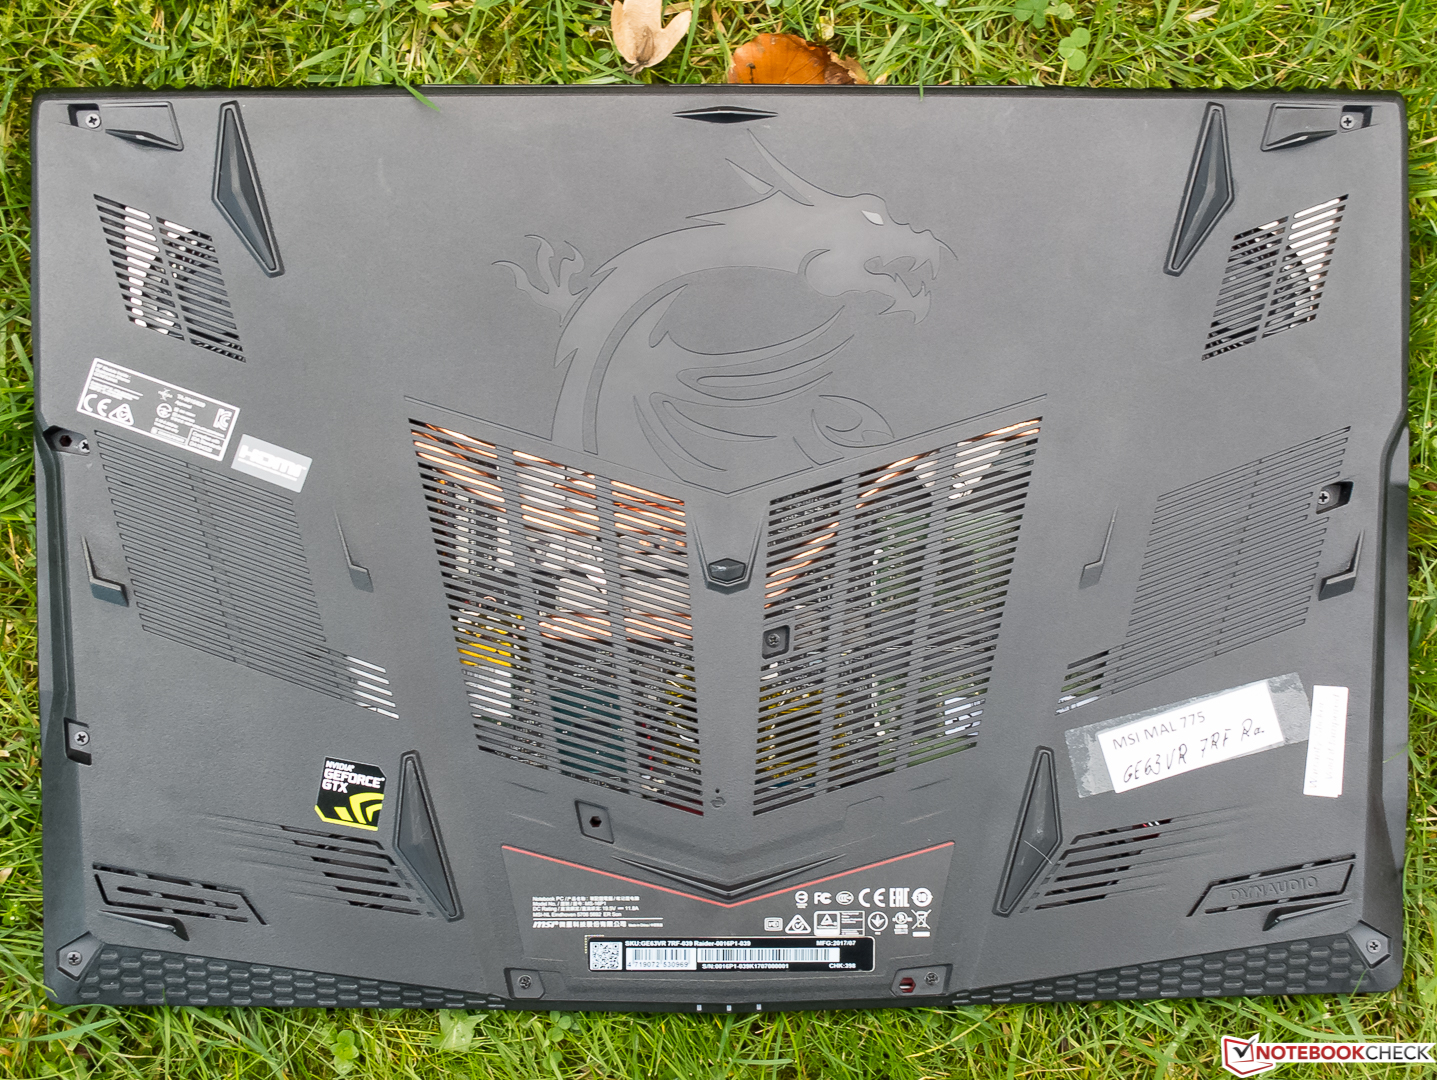
(-) La temperatura máxima en la parte superior es de 48 °C / 118 F, frente a la media de 40.4 °C / 105 F, que oscila entre 21.2 y 68.8 °C para la clase Gaming.
(-) El fondo se calienta hasta un máximo de 47 °C / 117 F, frente a la media de 43.2 °C / 110 F
(+) En reposo, la temperatura media de la parte superior es de 28.4 °C / 83# F, frente a la media del dispositivo de 33.9 °C / 93 F.
(-) Jugando a The Witcher 3, la temperatura media de la parte superior es de 42 °C / 108 F, frente a la media del dispositivo de 33.9 °C / 93 F.
(±) El reposamanos y el touchpad pueden calentarse mucho al tacto con un máximo de 39 °C / 102.2 F.
(-) La temperatura media de la zona del reposamanos de dispositivos similares fue de 28.8 °C / 83.8 F (-10.2 °C / -18.4 F).
MSI GE63VR 7RF Raider análisis de audio
(+) | los altavoces pueden reproducir a un volumen relativamente alto (#93 dB)
Graves 100 - 315 Hz
(±) | lubina reducida - en promedio 6.6% inferior a la mediana
(±) | la linealidad de los graves es media (8.2% delta a frecuencia anterior)
Medios 400 - 2000 Hz
(+) | medios equilibrados - a sólo 4.1% de la mediana
(+) | los medios son lineales (4.7% delta a la frecuencia anterior)
Altos 2 - 16 kHz
(+) | máximos equilibrados - a sólo 2.6% de la mediana
(+) | los máximos son lineales (4.6% delta a la frecuencia anterior)
Total 100 - 16.000 Hz
(+) | el sonido global es lineal (9.9% de diferencia con la mediana)
En comparación con la misma clase
» 5% de todos los dispositivos probados de esta clase eran mejores, 2% similares, 94% peores
» El mejor tuvo un delta de 6%, la media fue 18%, el peor fue ###max##%
En comparación con todos los dispositivos probados
» 4% de todos los dispositivos probados eran mejores, 1% similares, 95% peores
» El mejor tuvo un delta de 4%, la media fue 24%, el peor fue ###max##%
Alienware 15 R3 análisis de audio
(+) | los altavoces pueden reproducir a un volumen relativamente alto (#82 dB)
Graves 100 - 315 Hz
(-) | casi sin bajos - de media 19.1% inferior a la mediana
(±) | la linealidad de los graves es media (10.4% delta a frecuencia anterior)
Medios 400 - 2000 Hz
(±) | medias más altas - de media 6.7% más altas que la mediana
(±) | la linealidad de los medios es media (7.5% delta respecto a la frecuencia anterior)
Altos 2 - 16 kHz
(+) | máximos equilibrados - a sólo 3.6% de la mediana
(+) | los máximos son lineales (5.2% delta a la frecuencia anterior)
Total 100 - 16.000 Hz
(±) | la linealidad del sonido global es media (21.6% de diferencia con la mediana)
En comparación con la misma clase
» 77% de todos los dispositivos probados de esta clase eran mejores, 5% similares, 18% peores
» El mejor tuvo un delta de 6%, la media fue 18%, el peor fue ###max##%
En comparación con todos los dispositivos probados
» 61% de todos los dispositivos probados eran mejores, 7% similares, 32% peores
» El mejor tuvo un delta de 4%, la media fue 24%, el peor fue ###max##%
Acer Predator 15 G9-593-751X análisis de audio
(+) | los altavoces pueden reproducir a un volumen relativamente alto (#91 dB)
Graves 100 - 315 Hz
(±) | lubina reducida - en promedio 14.1% inferior a la mediana
(±) | la linealidad de los graves es media (10.6% delta a frecuencia anterior)
Medios 400 - 2000 Hz
(+) | medios equilibrados - a sólo 3.2% de la mediana
(+) | los medios son lineales (4.9% delta a la frecuencia anterior)
Altos 2 - 16 kHz
(+) | máximos equilibrados - a sólo 3.7% de la mediana
(+) | los máximos son lineales (5.3% delta a la frecuencia anterior)
Total 100 - 16.000 Hz
(+) | el sonido global es lineal (14.1% de diferencia con la mediana)
En comparación con la misma clase
» 24% de todos los dispositivos probados de esta clase eran mejores, 8% similares, 68% peores
» El mejor tuvo un delta de 6%, la media fue 18%, el peor fue ###max##%
En comparación con todos los dispositivos probados
» 17% de todos los dispositivos probados eran mejores, 4% similares, 80% peores
» El mejor tuvo un delta de 4%, la media fue 24%, el peor fue ###max##%
Asus Zephyrus GX501VS análisis de audio
(-) | altavoces no muy altos (#71.4 dB)
Graves 100 - 315 Hz
(-) | casi sin bajos - de media 18.8% inferior a la mediana
(±) | la linealidad de los graves es media (11.3% delta a frecuencia anterior)
Medios 400 - 2000 Hz
(+) | medios equilibrados - a sólo 1.2% de la mediana
(+) | los medios son lineales (6.3% delta a la frecuencia anterior)
Altos 2 - 16 kHz
(±) | máximos más altos - de media 6.5% más altos que la mediana
(+) | los máximos son lineales (6.3% delta a la frecuencia anterior)
Total 100 - 16.000 Hz
(±) | la linealidad del sonido global es media (23.4% de diferencia con la mediana)
En comparación con la misma clase
» 85% de todos los dispositivos probados de esta clase eran mejores, 5% similares, 11% peores
» El mejor tuvo un delta de 6%, la media fue 18%, el peor fue ###max##%
En comparación con todos los dispositivos probados
» 70% de todos los dispositivos probados eran mejores, 6% similares, 24% peores
» El mejor tuvo un delta de 4%, la media fue 24%, el peor fue ###max##%
| Off / Standby | |
| Ocioso | |
| Carga |
|
Clave:
min: | |
| MSI GE63VR 7RF Raider i7-7700HQ, GeForce GTX 1070 Mobile | Acer Predator 15 G9-593-751X i7-7700HQ, GeForce GTX 1070 Mobile | Alienware 15 R3 i7-7700HQ, GeForce GTX 1070 Mobile | Asus Zephyrus GX501VS i7-7700HQ, GeForce GTX 1070 Max-Q | |
|---|---|---|---|---|
| Power Consumption | -22% | -27% | -6% | |
| Idle Minimum * (Watt) | 11 | 18 -64% | 19 -73% | 19.1 -74% |
| Idle Average * (Watt) | 16 | 23 -44% | 23 -44% | 20.8 -30% |
| Idle Maximum * (Watt) | 21 | 30 -43% | 29 -38% | 21.8 -4% |
| Load Average * (Watt) | 92 | 89 3% | 85 8% | 73.7 20% |
| Witcher 3 ultra * (Watt) | 185 | 168 9% | 130.2 30% | |
| Load Maximum * (Watt) | 224 | 213 5% | 192 14% | 173.1 23% |
* ... más pequeño es mejor
| MSI GE63VR 7RF Raider i7-7700HQ, GeForce GTX 1070 Mobile, 51 Wh | Acer Predator 15 G9-593-751X i7-7700HQ, GeForce GTX 1070 Mobile, 90 Wh | Alienware 15 R3 i7-7700HQ, GeForce GTX 1070 Mobile, 99 Wh | Asus Zephyrus GX501VS i7-7700HQ, GeForce GTX 1070 Max-Q, 50 Wh | |
|---|---|---|---|---|
| Duración de Batería | 101% | 64% | -14% | |
| Reader / Idle (h) | 5.4 | 8.4 56% | 6.4 19% | 3.8 -30% |
| WiFi v1.3 (h) | 3.4 | 5.5 62% | 4.4 29% | 2.5 -26% |
| Load (h) | 0.7 | 2 186% | 1.7 143% | 0.8 14% |
| H.264 (h) | 4.9 | 4.4 |
Pro
Contra
MSI se ha alejado de la tendencia general de IPS y se ha atrevido a ser imperfecto. Si no requieres de mucho espacio libre alrededor de su portátil y puedes evitar mirar la pantalla desde abajo, apreciarás este portátil por sus tiempos de respuesta rápidos, color en pantalla preciso, cobertura 100% sRGB y 120 Hz, aunque esto habría tenido más sentido si MSI no hubiera quitado el G-Sync para tener un menor consumo de energía.
El MSI GE63VR Raider-075 nos dio una gran impresión durante las pruebas, solo que su decisión de renunciar a G-Sync es bastante sorprendente.
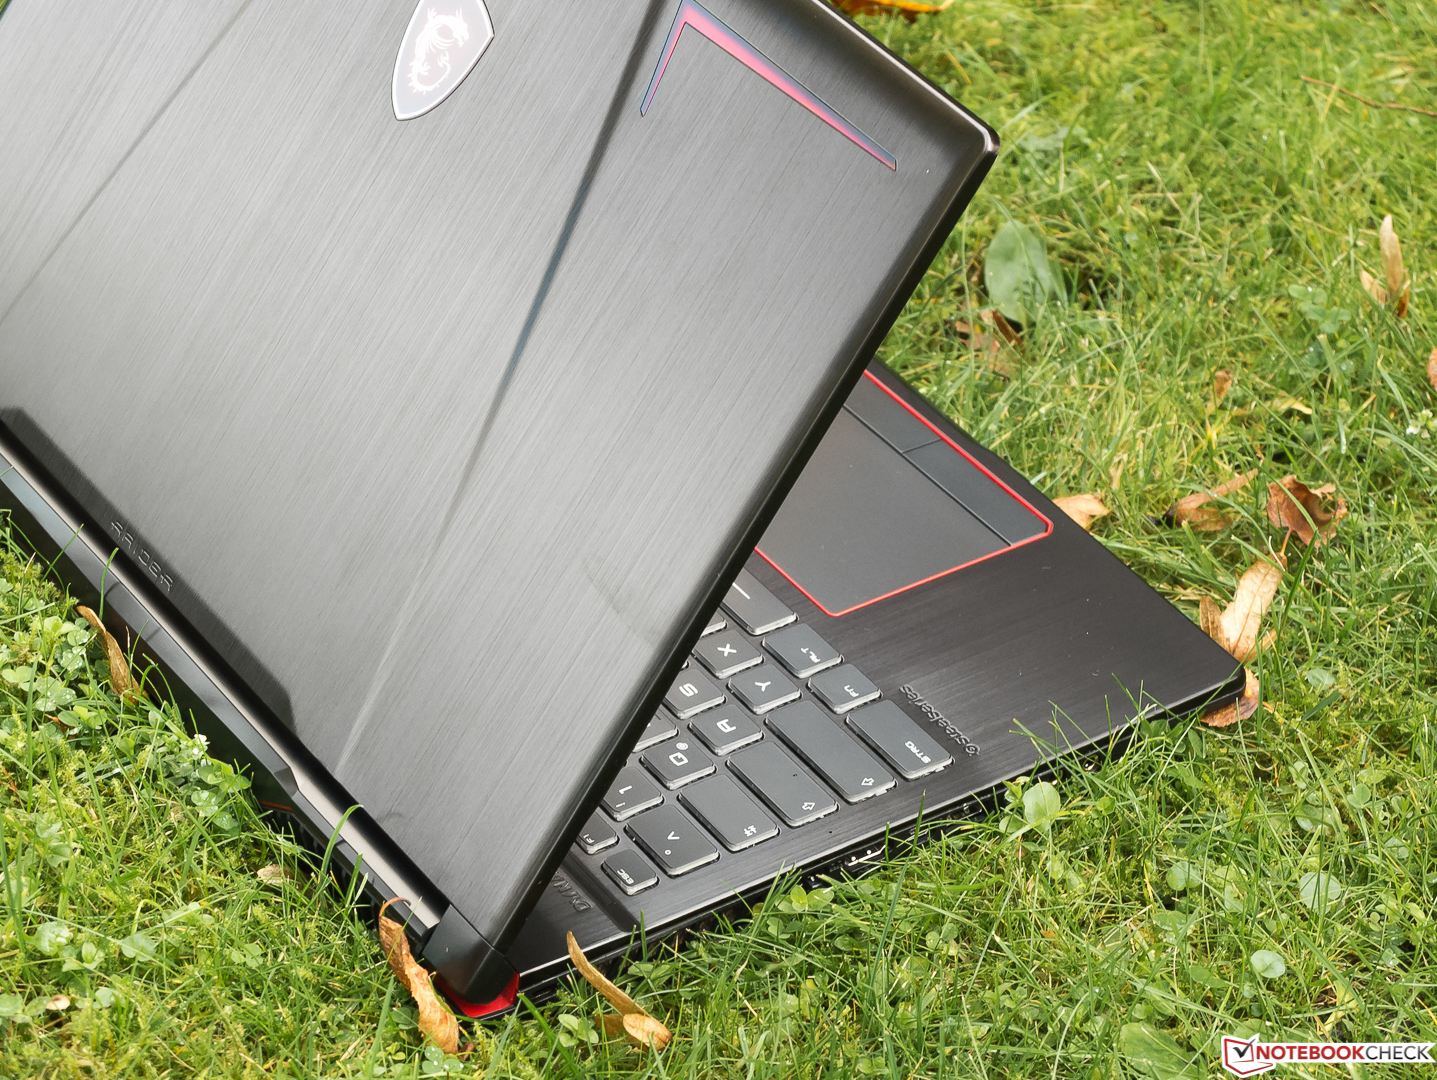
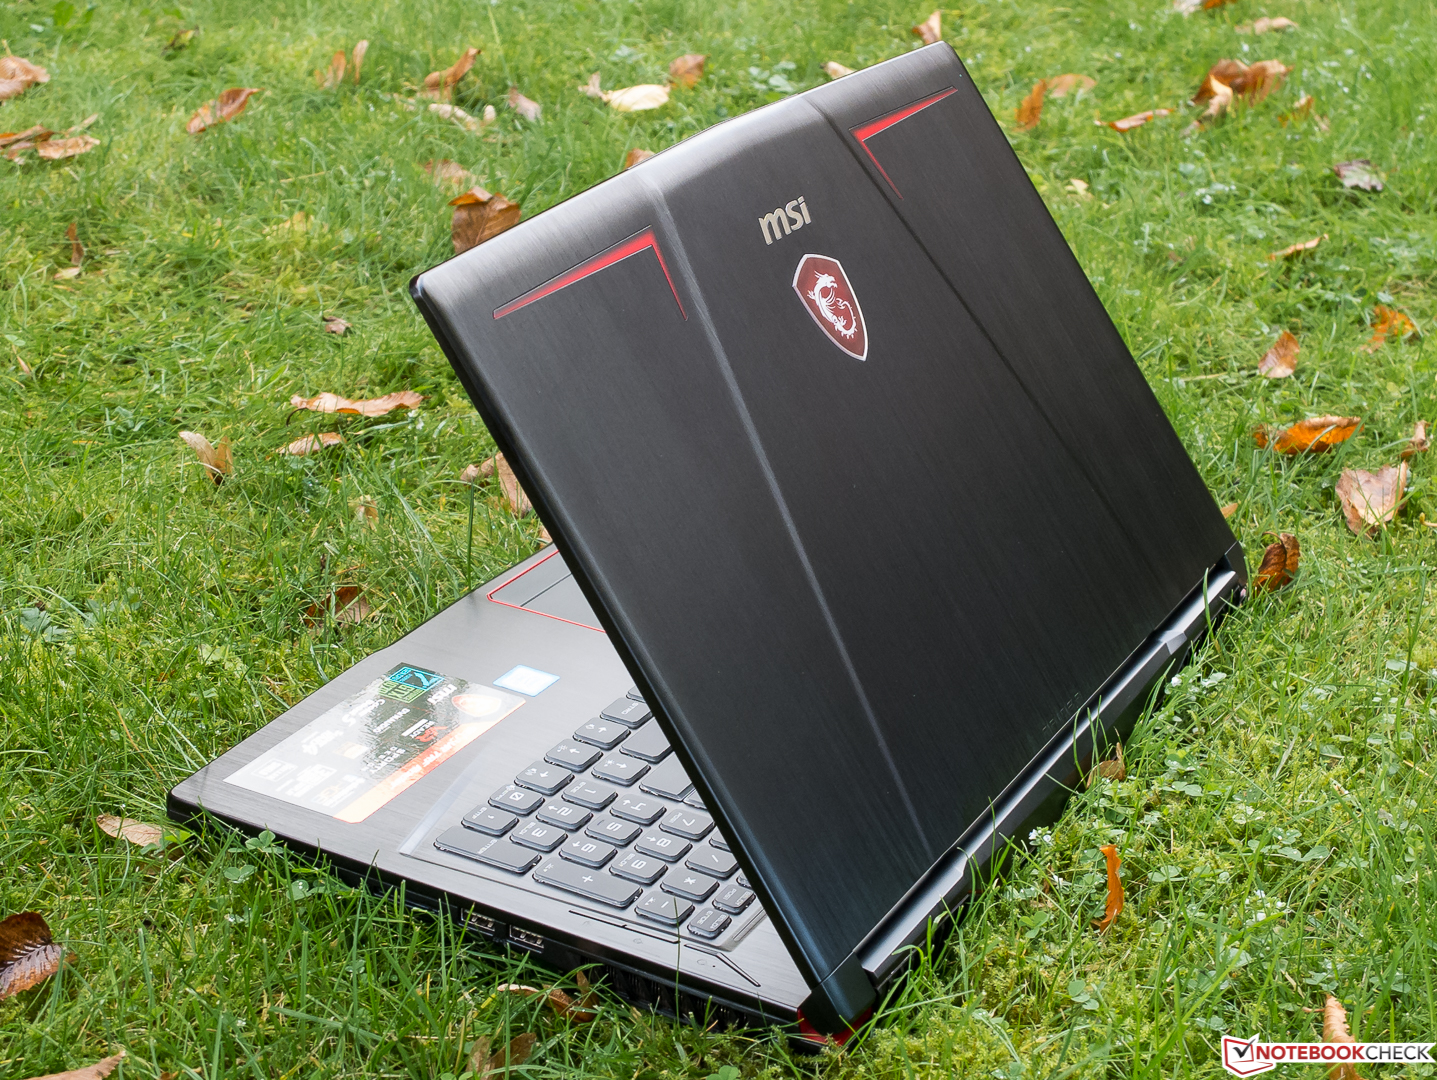
El MSI GE63VR Raider-075 está disponible desde $1700 y es un portátil gaming compacto, liviano, bien construido y de alto rendimiento con una pantalla testaruda cuyas pocas desventajas no molestarán a los jugadores ambiciosos. Podemos recomendar claramente este dispositivo.
Ésta es una versión acortada del análisis original. Puedes leer el análisis completo en inglés aquí.
MSI GE63VR 7RF Raider
- 10/28/2017 v6 (old)
Sven Kloevekorn