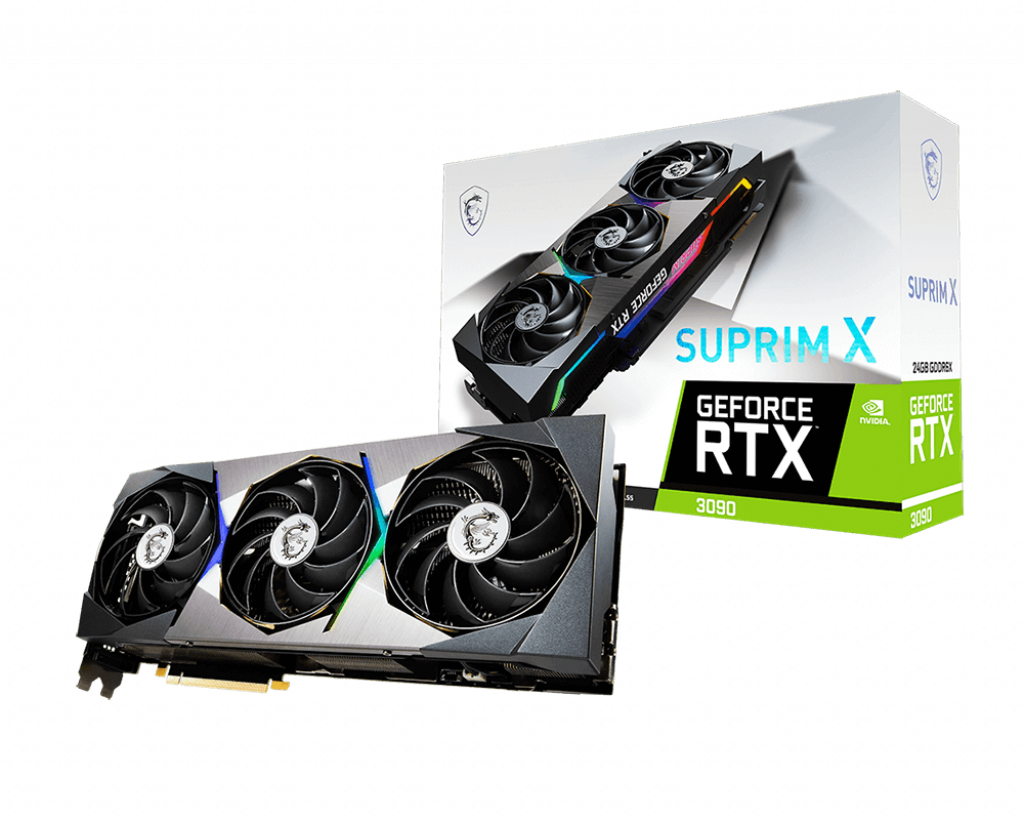
GeForce RTX 3090 Suprim X en revisión - la nueva serie de tarjetas gráficas de alta gama de MSI

Hasta ahora, el Gaming X Trio era la parte del portafolio de MSIdestinada a modelos especiales de alta gama. Lightning En los últimos años, también había modelos Z de vez en cuando, que ofrecían un rendimiento aún mayor debido a los componentes seleccionados y a los ajustes especiales. Ahora, MSI introduce una nueva división en el sector de gama alta con los modelos Suprim X. MSI ofrece bajo este nombre los modelos RTX 3070, 3080 y 3090 de las nuevas tarjetas gráficas Ampere. Al mismo tiempo, siguen existiendo los modelos Gaming X Trio, que se conforman con un rendimiento ligeramente inferior, ya que los modelos Suprim X ofrecen una BIOS con un TDP más alto
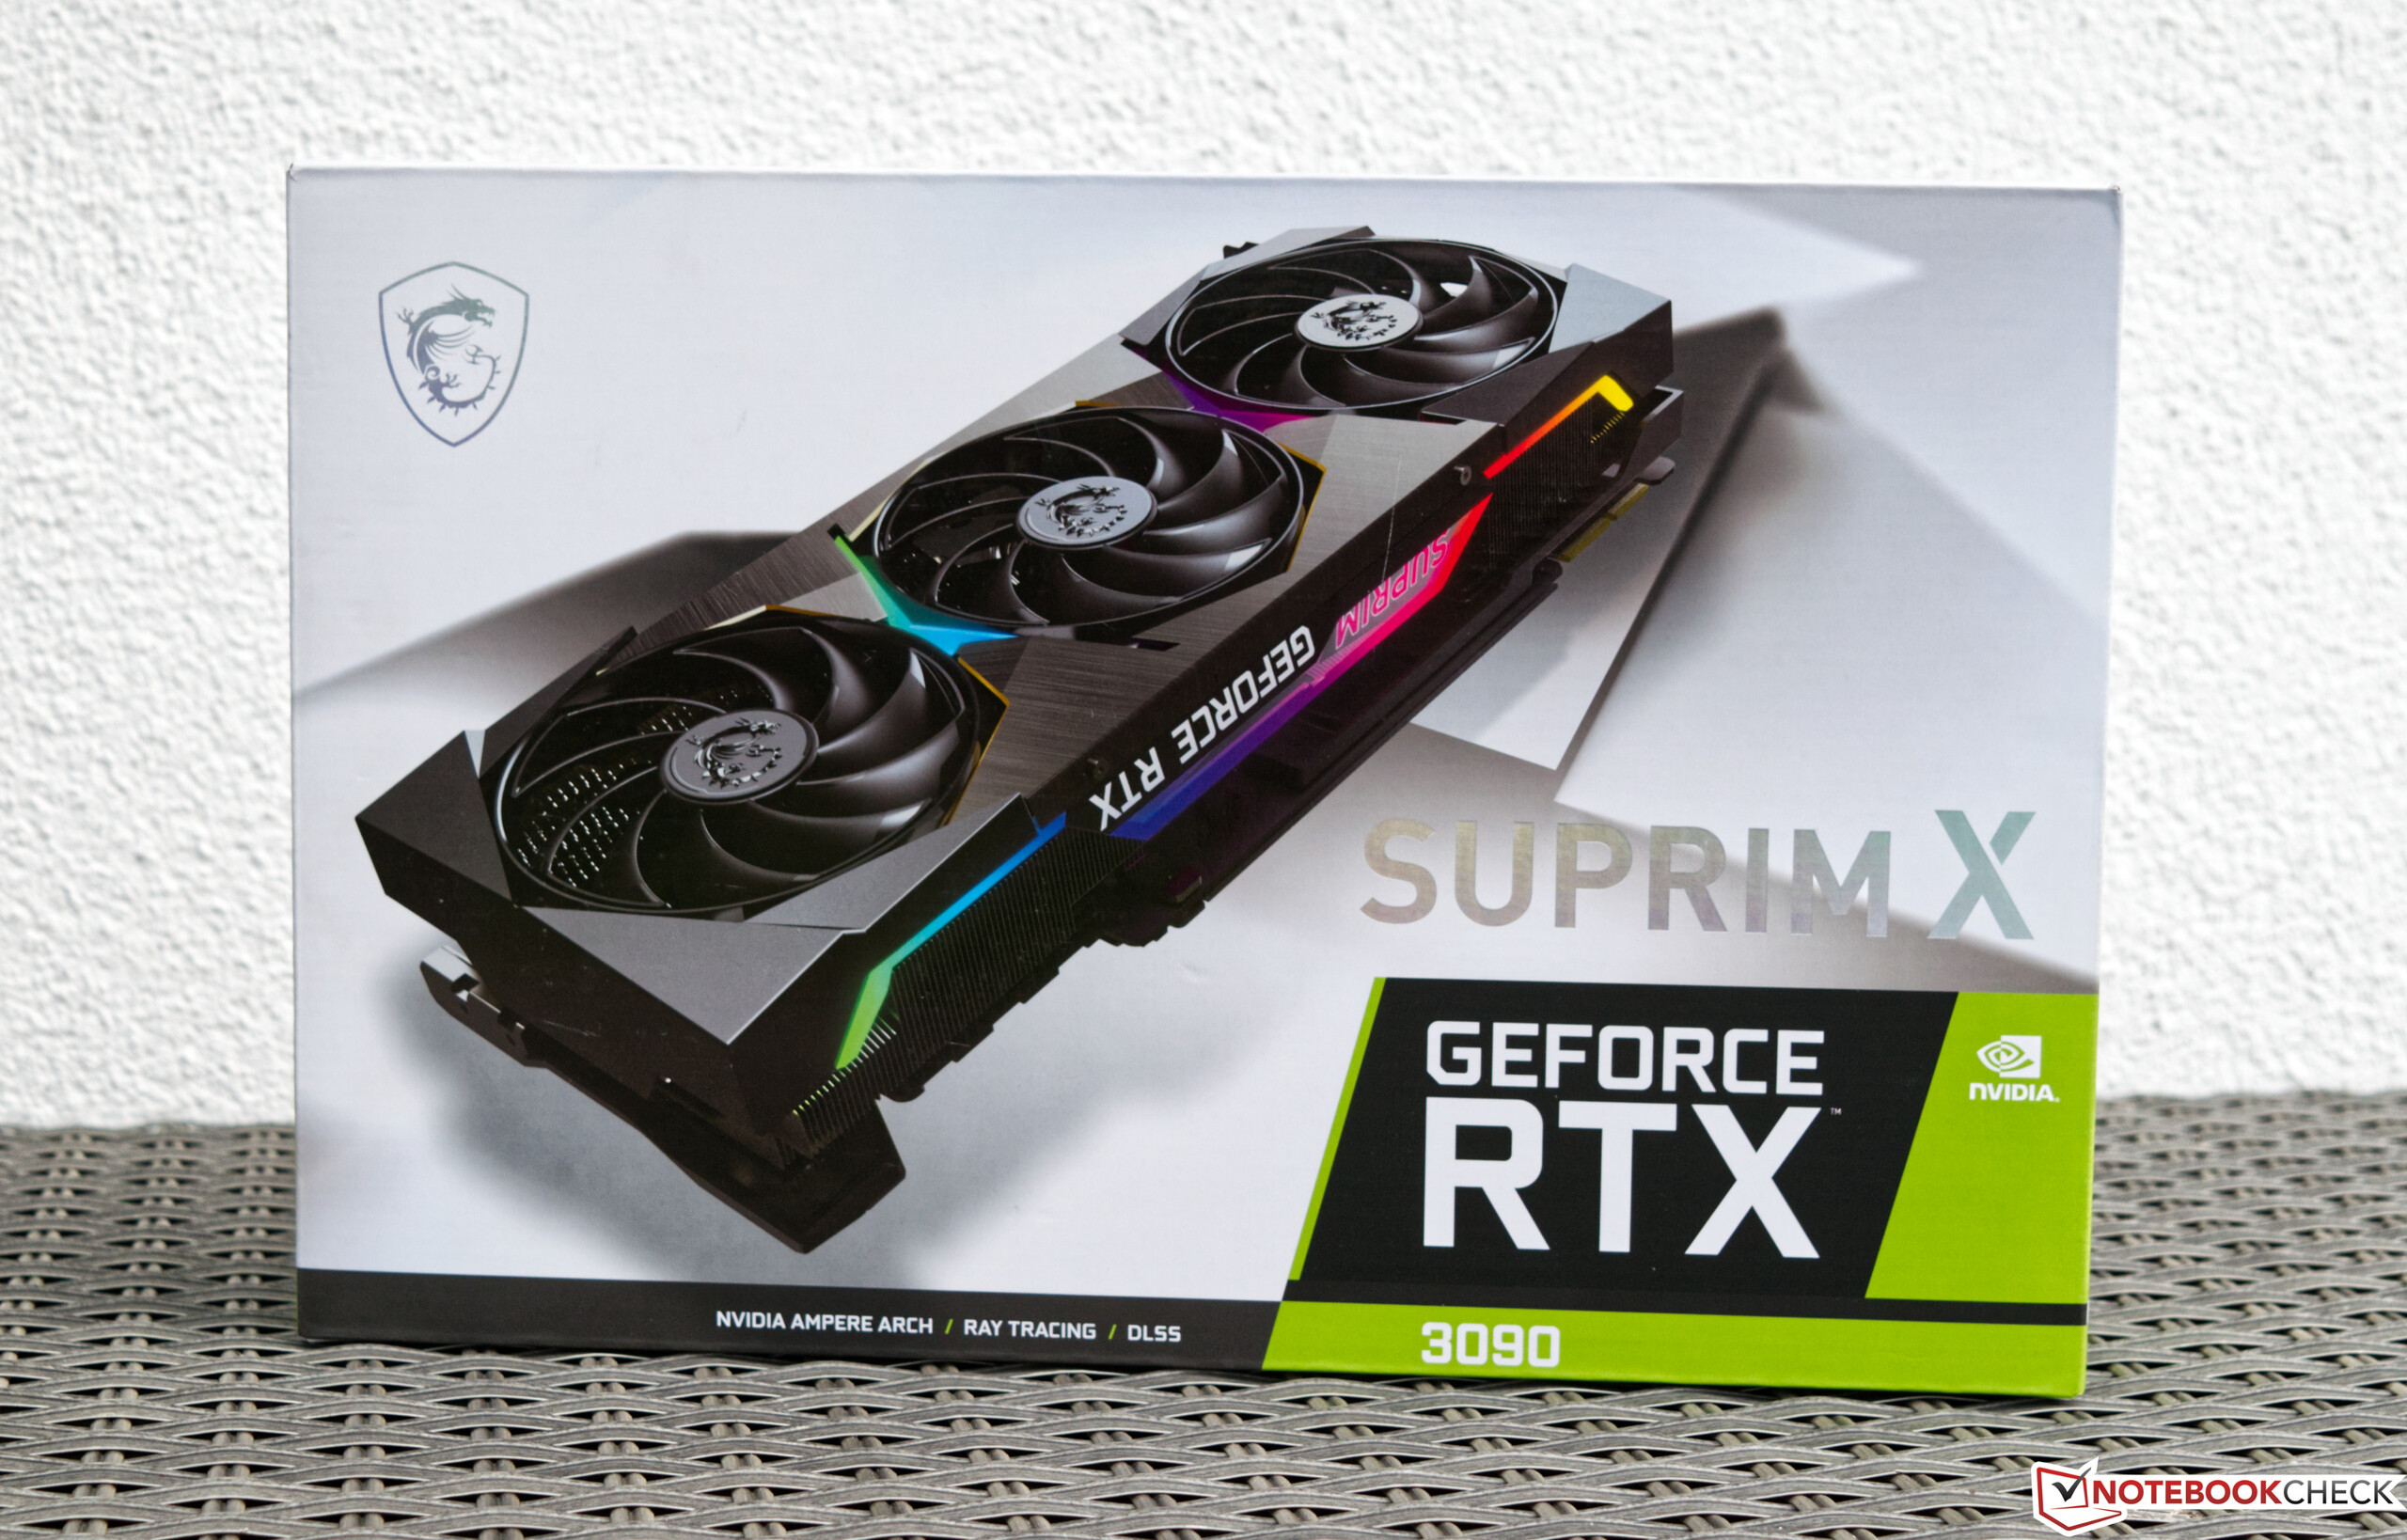
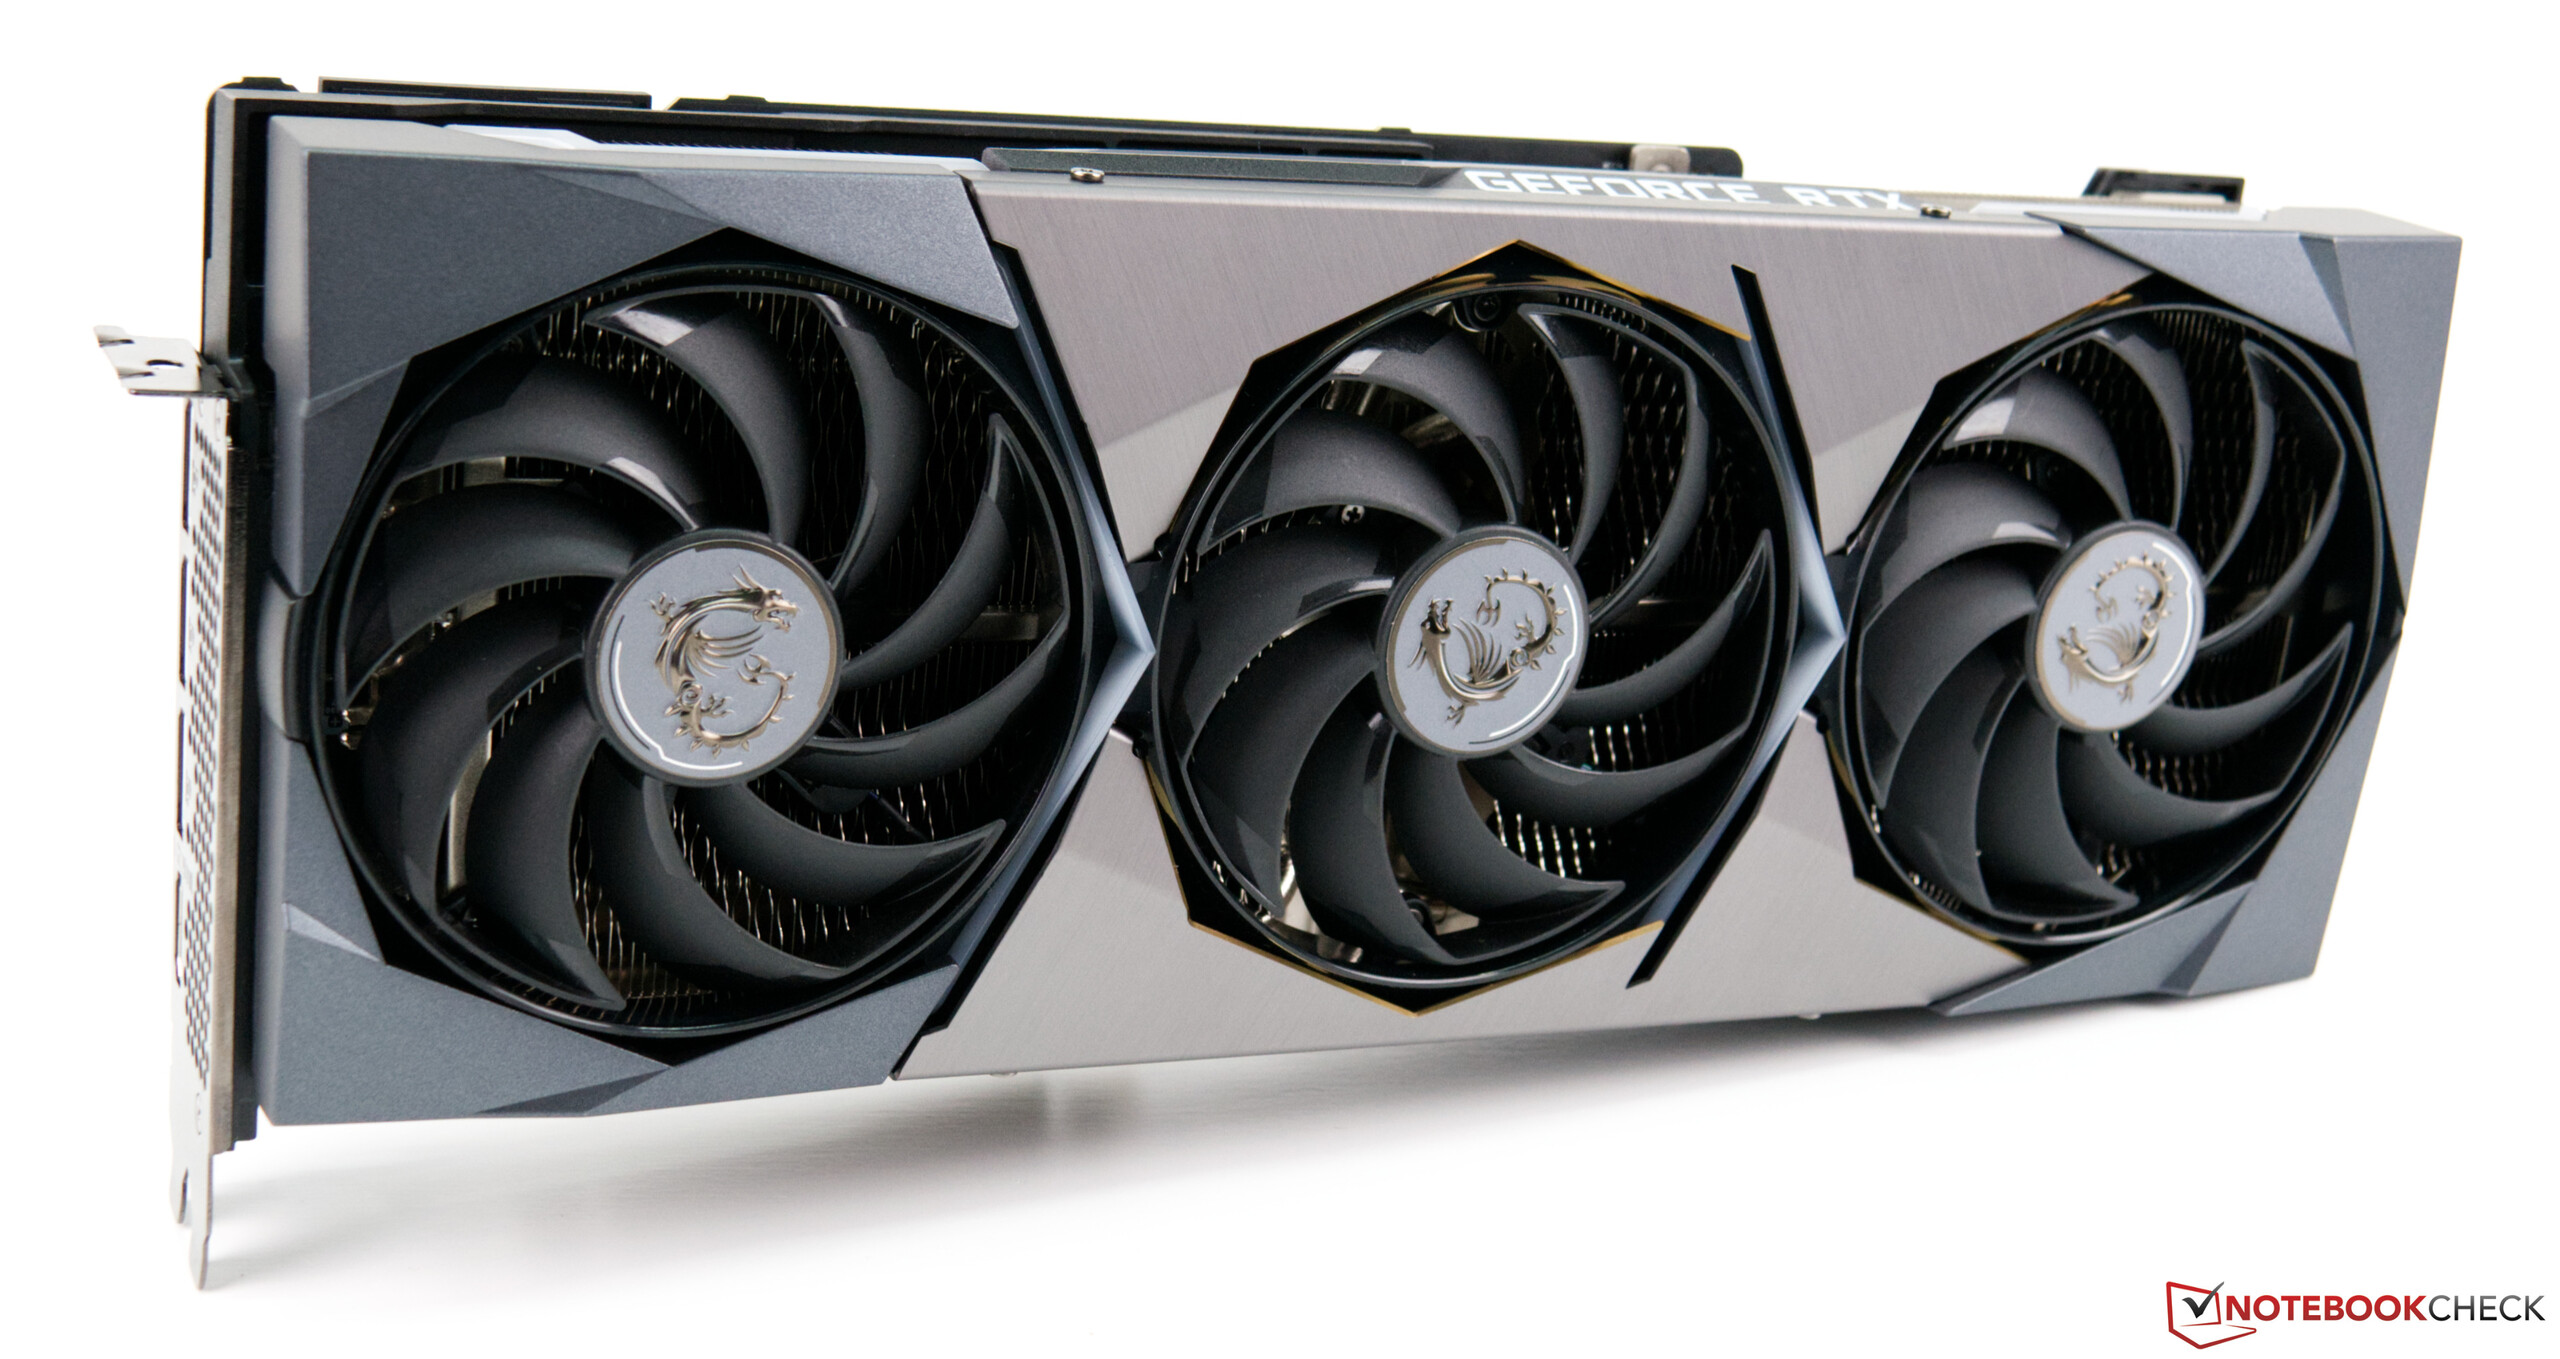
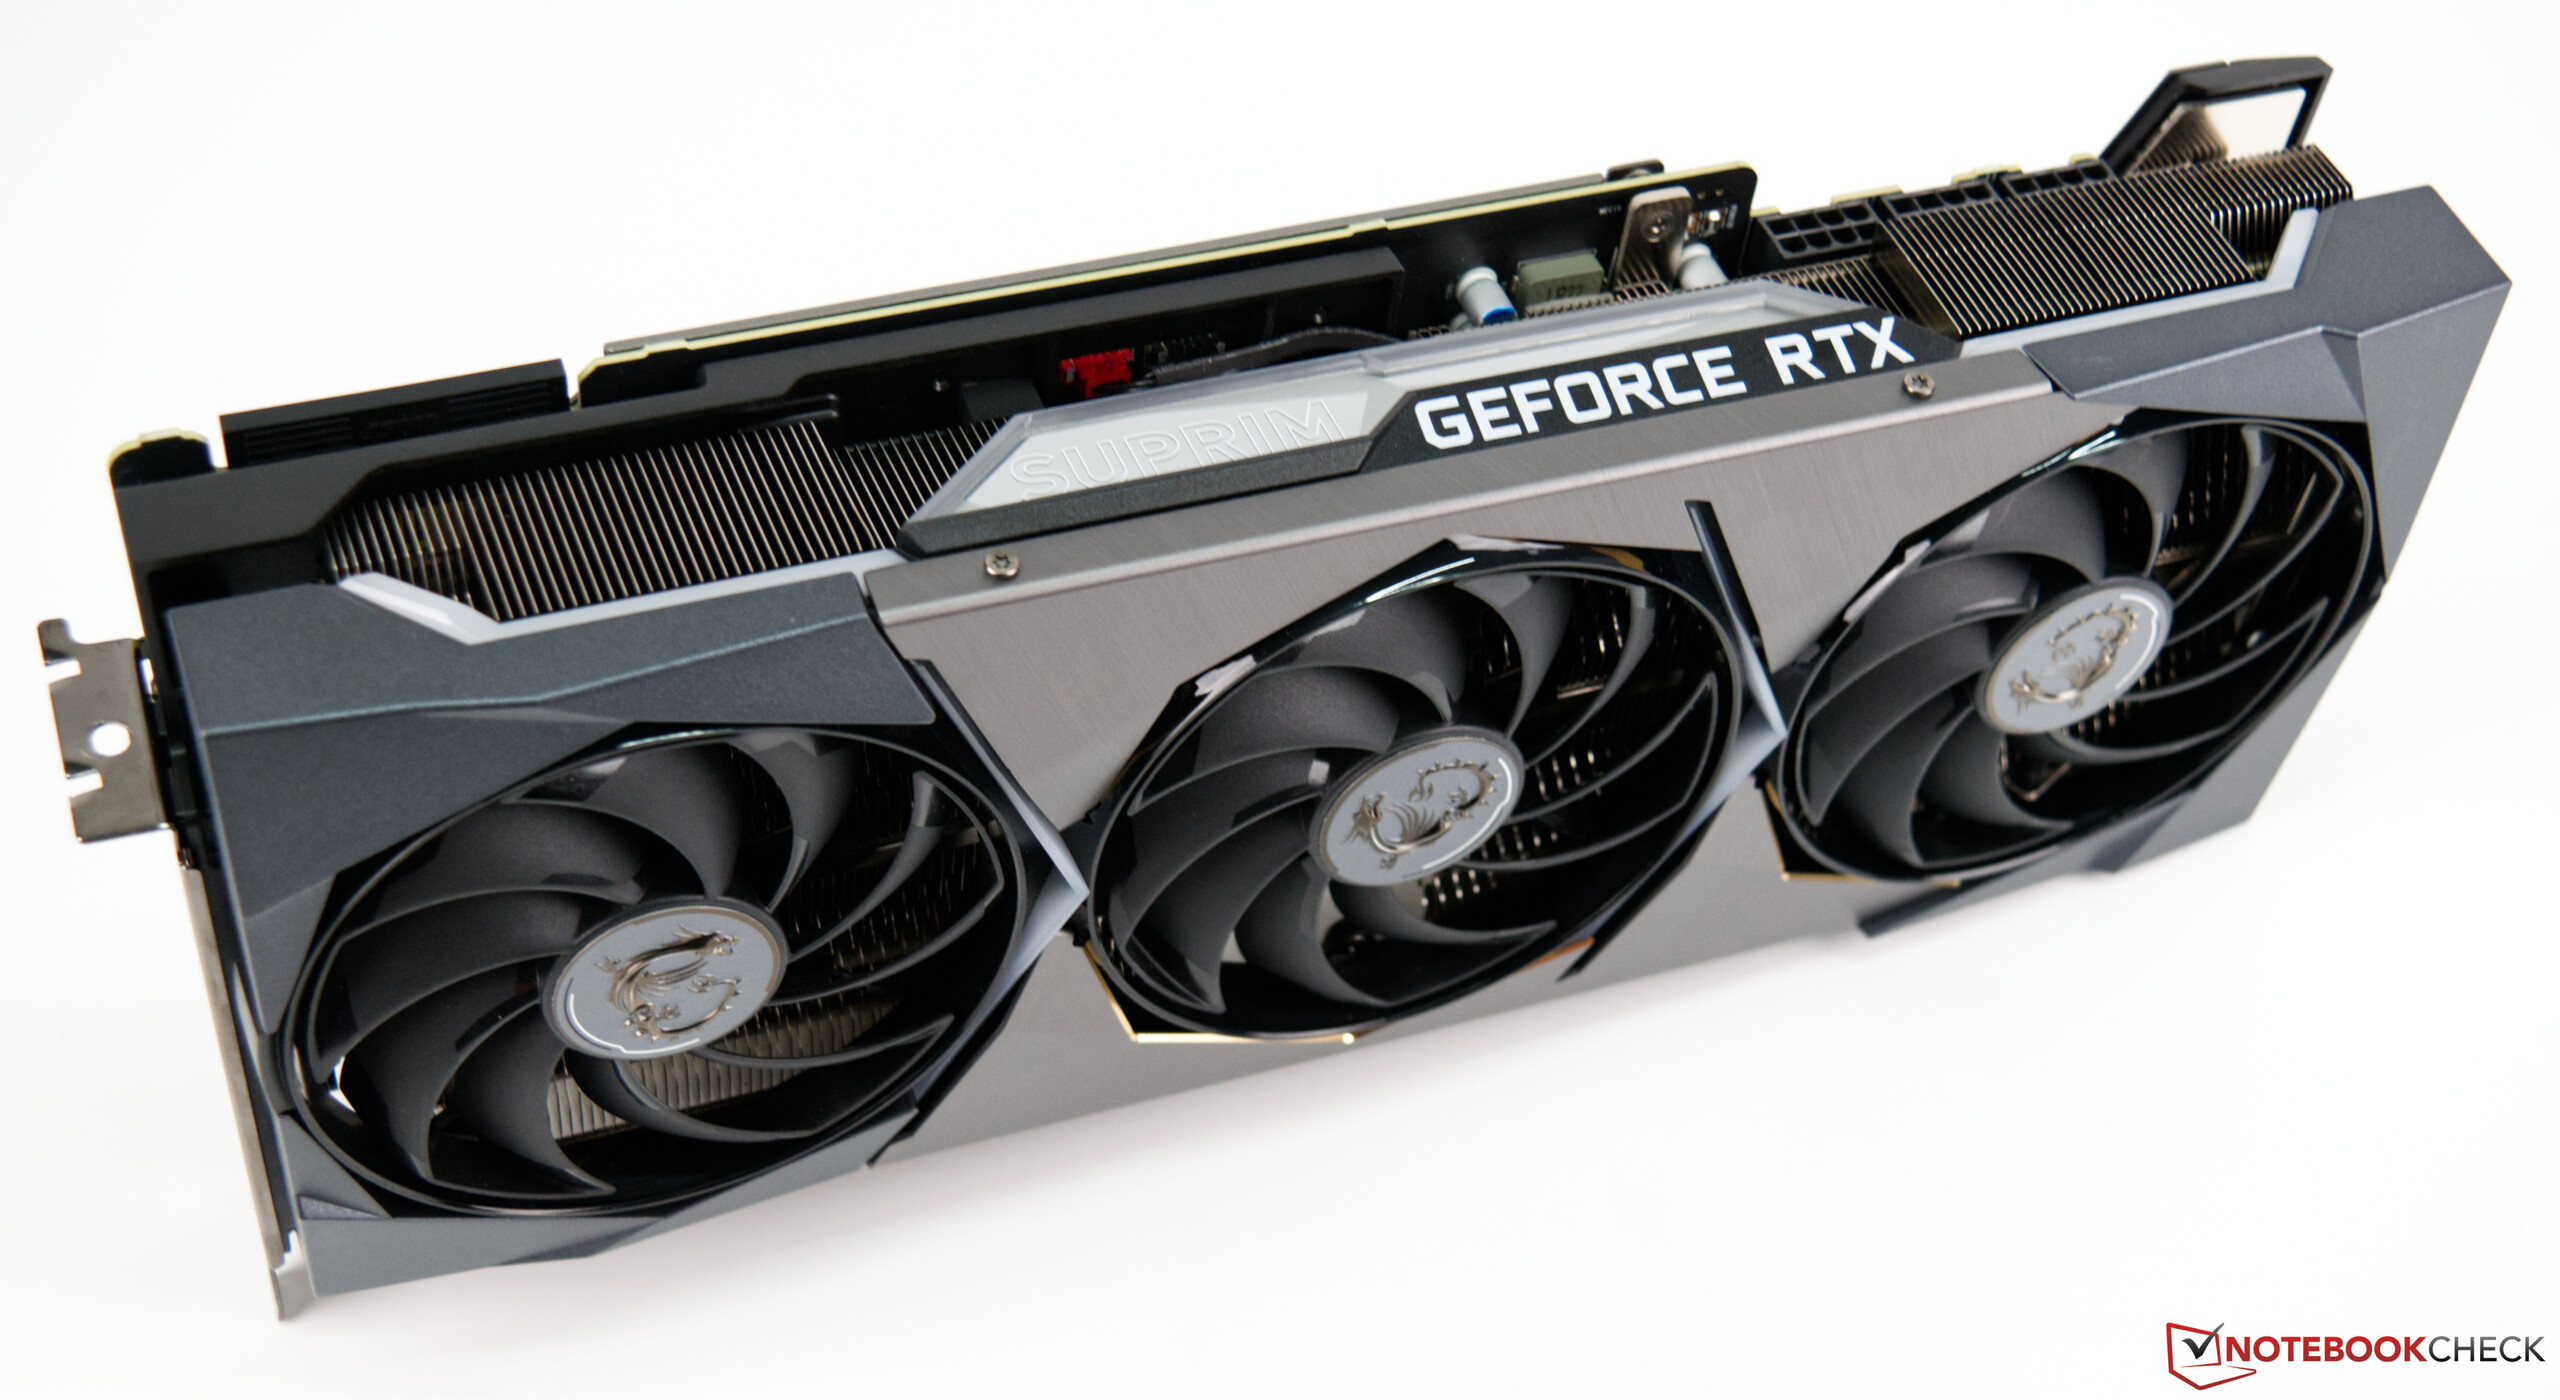
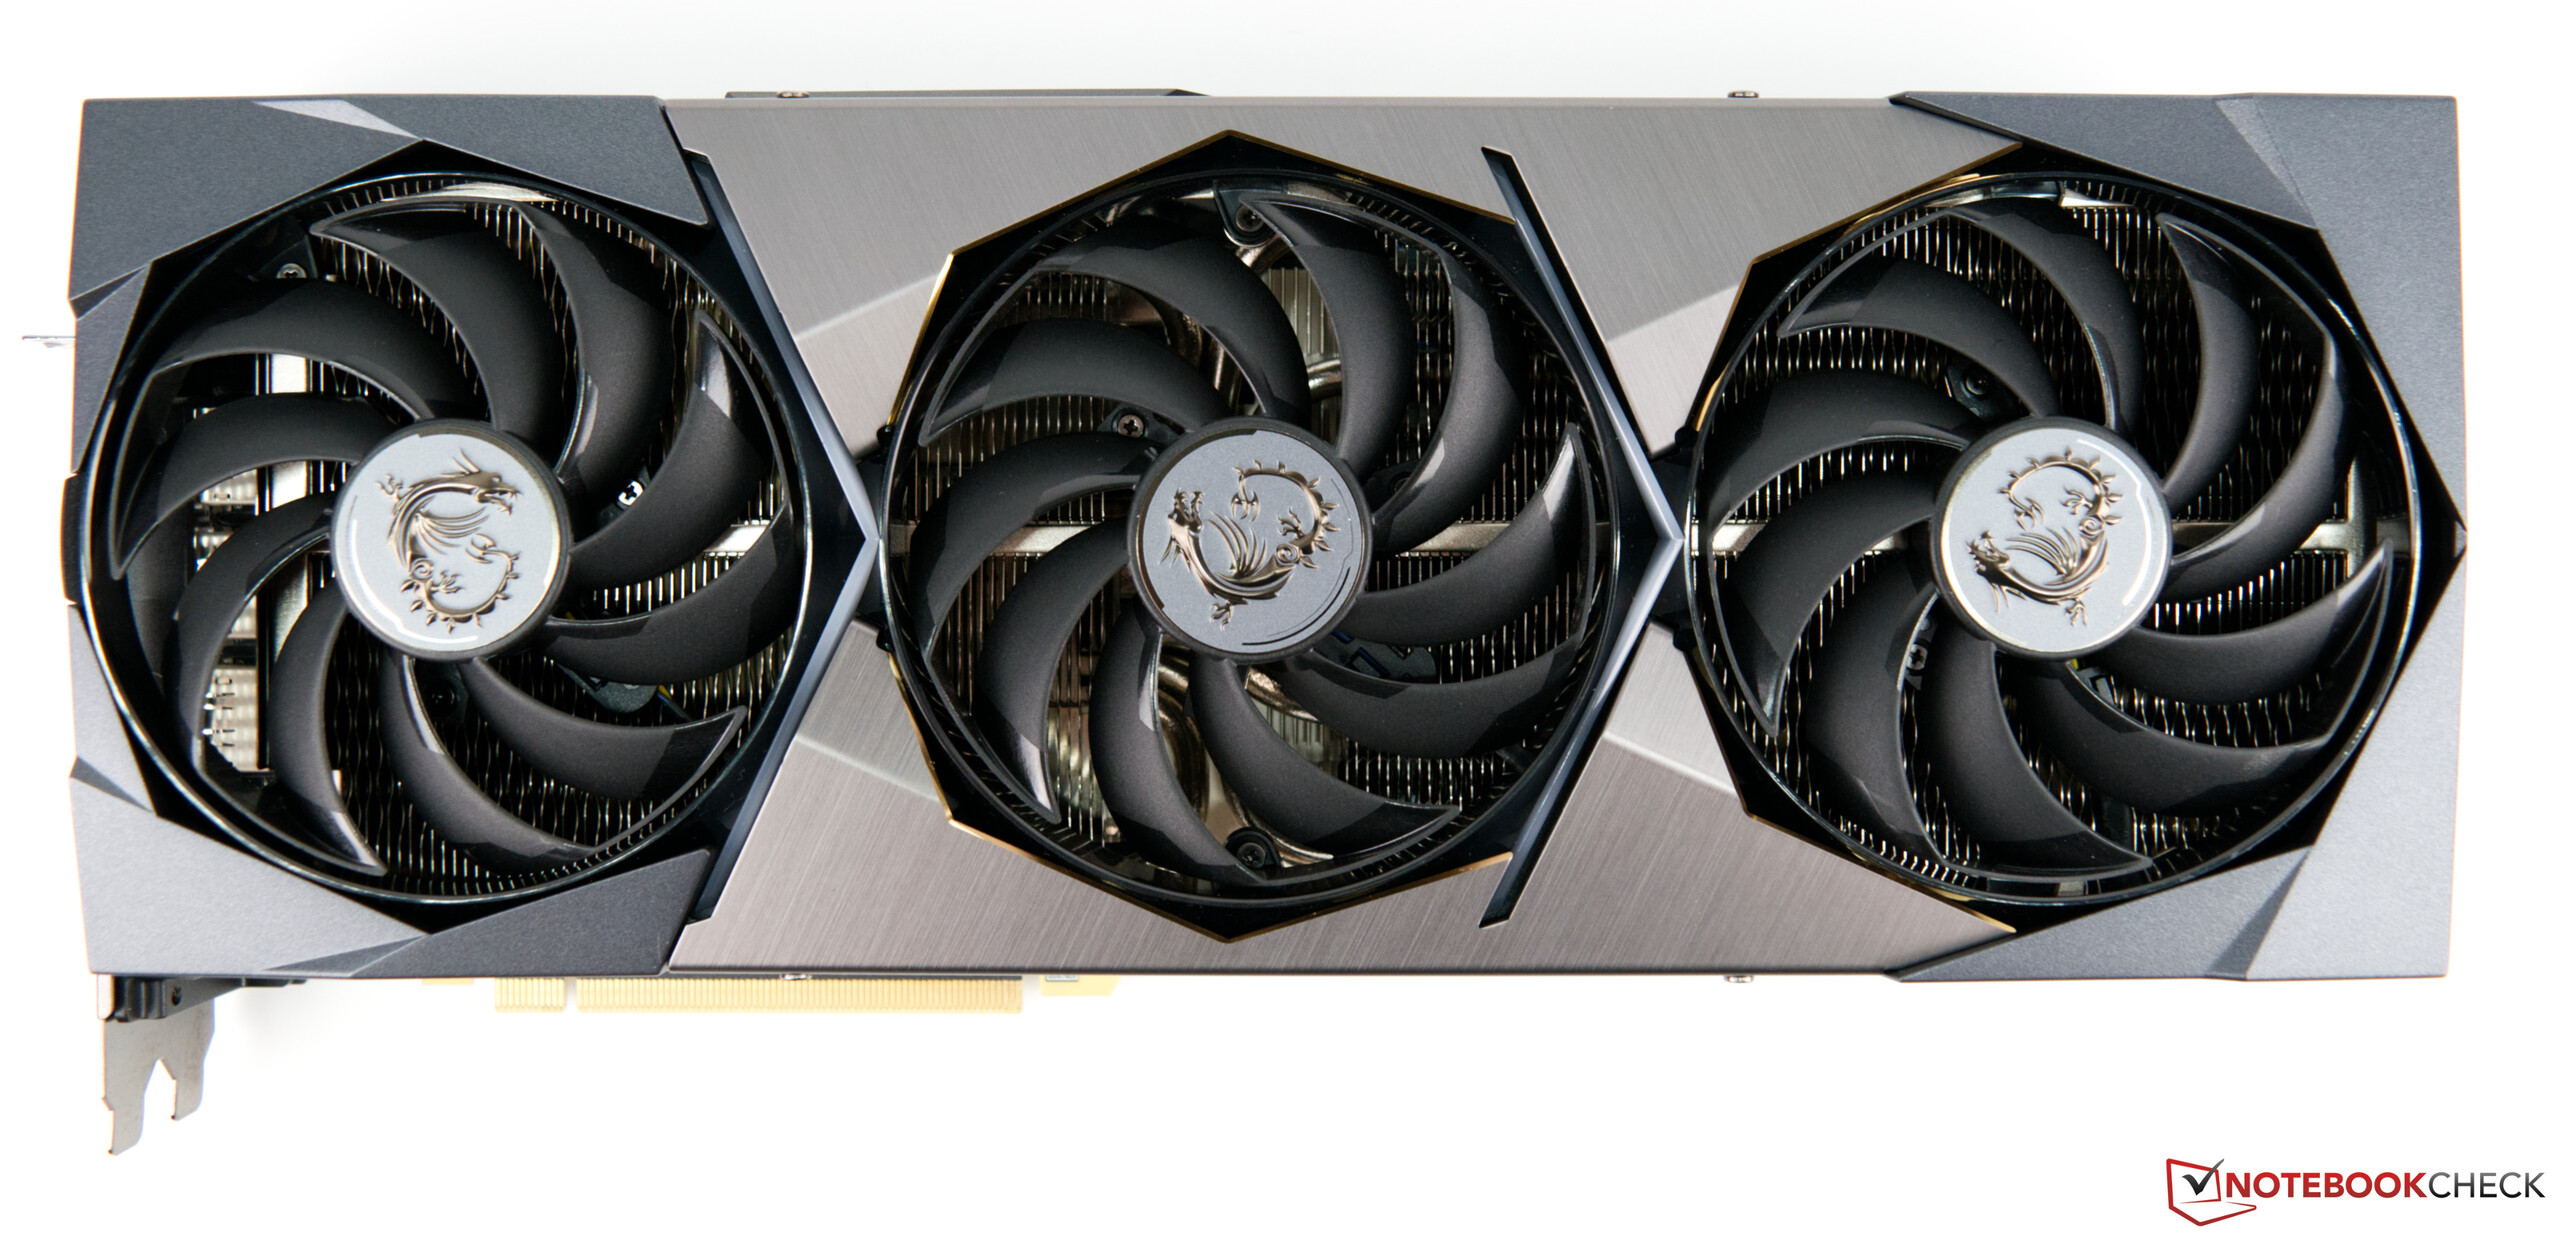
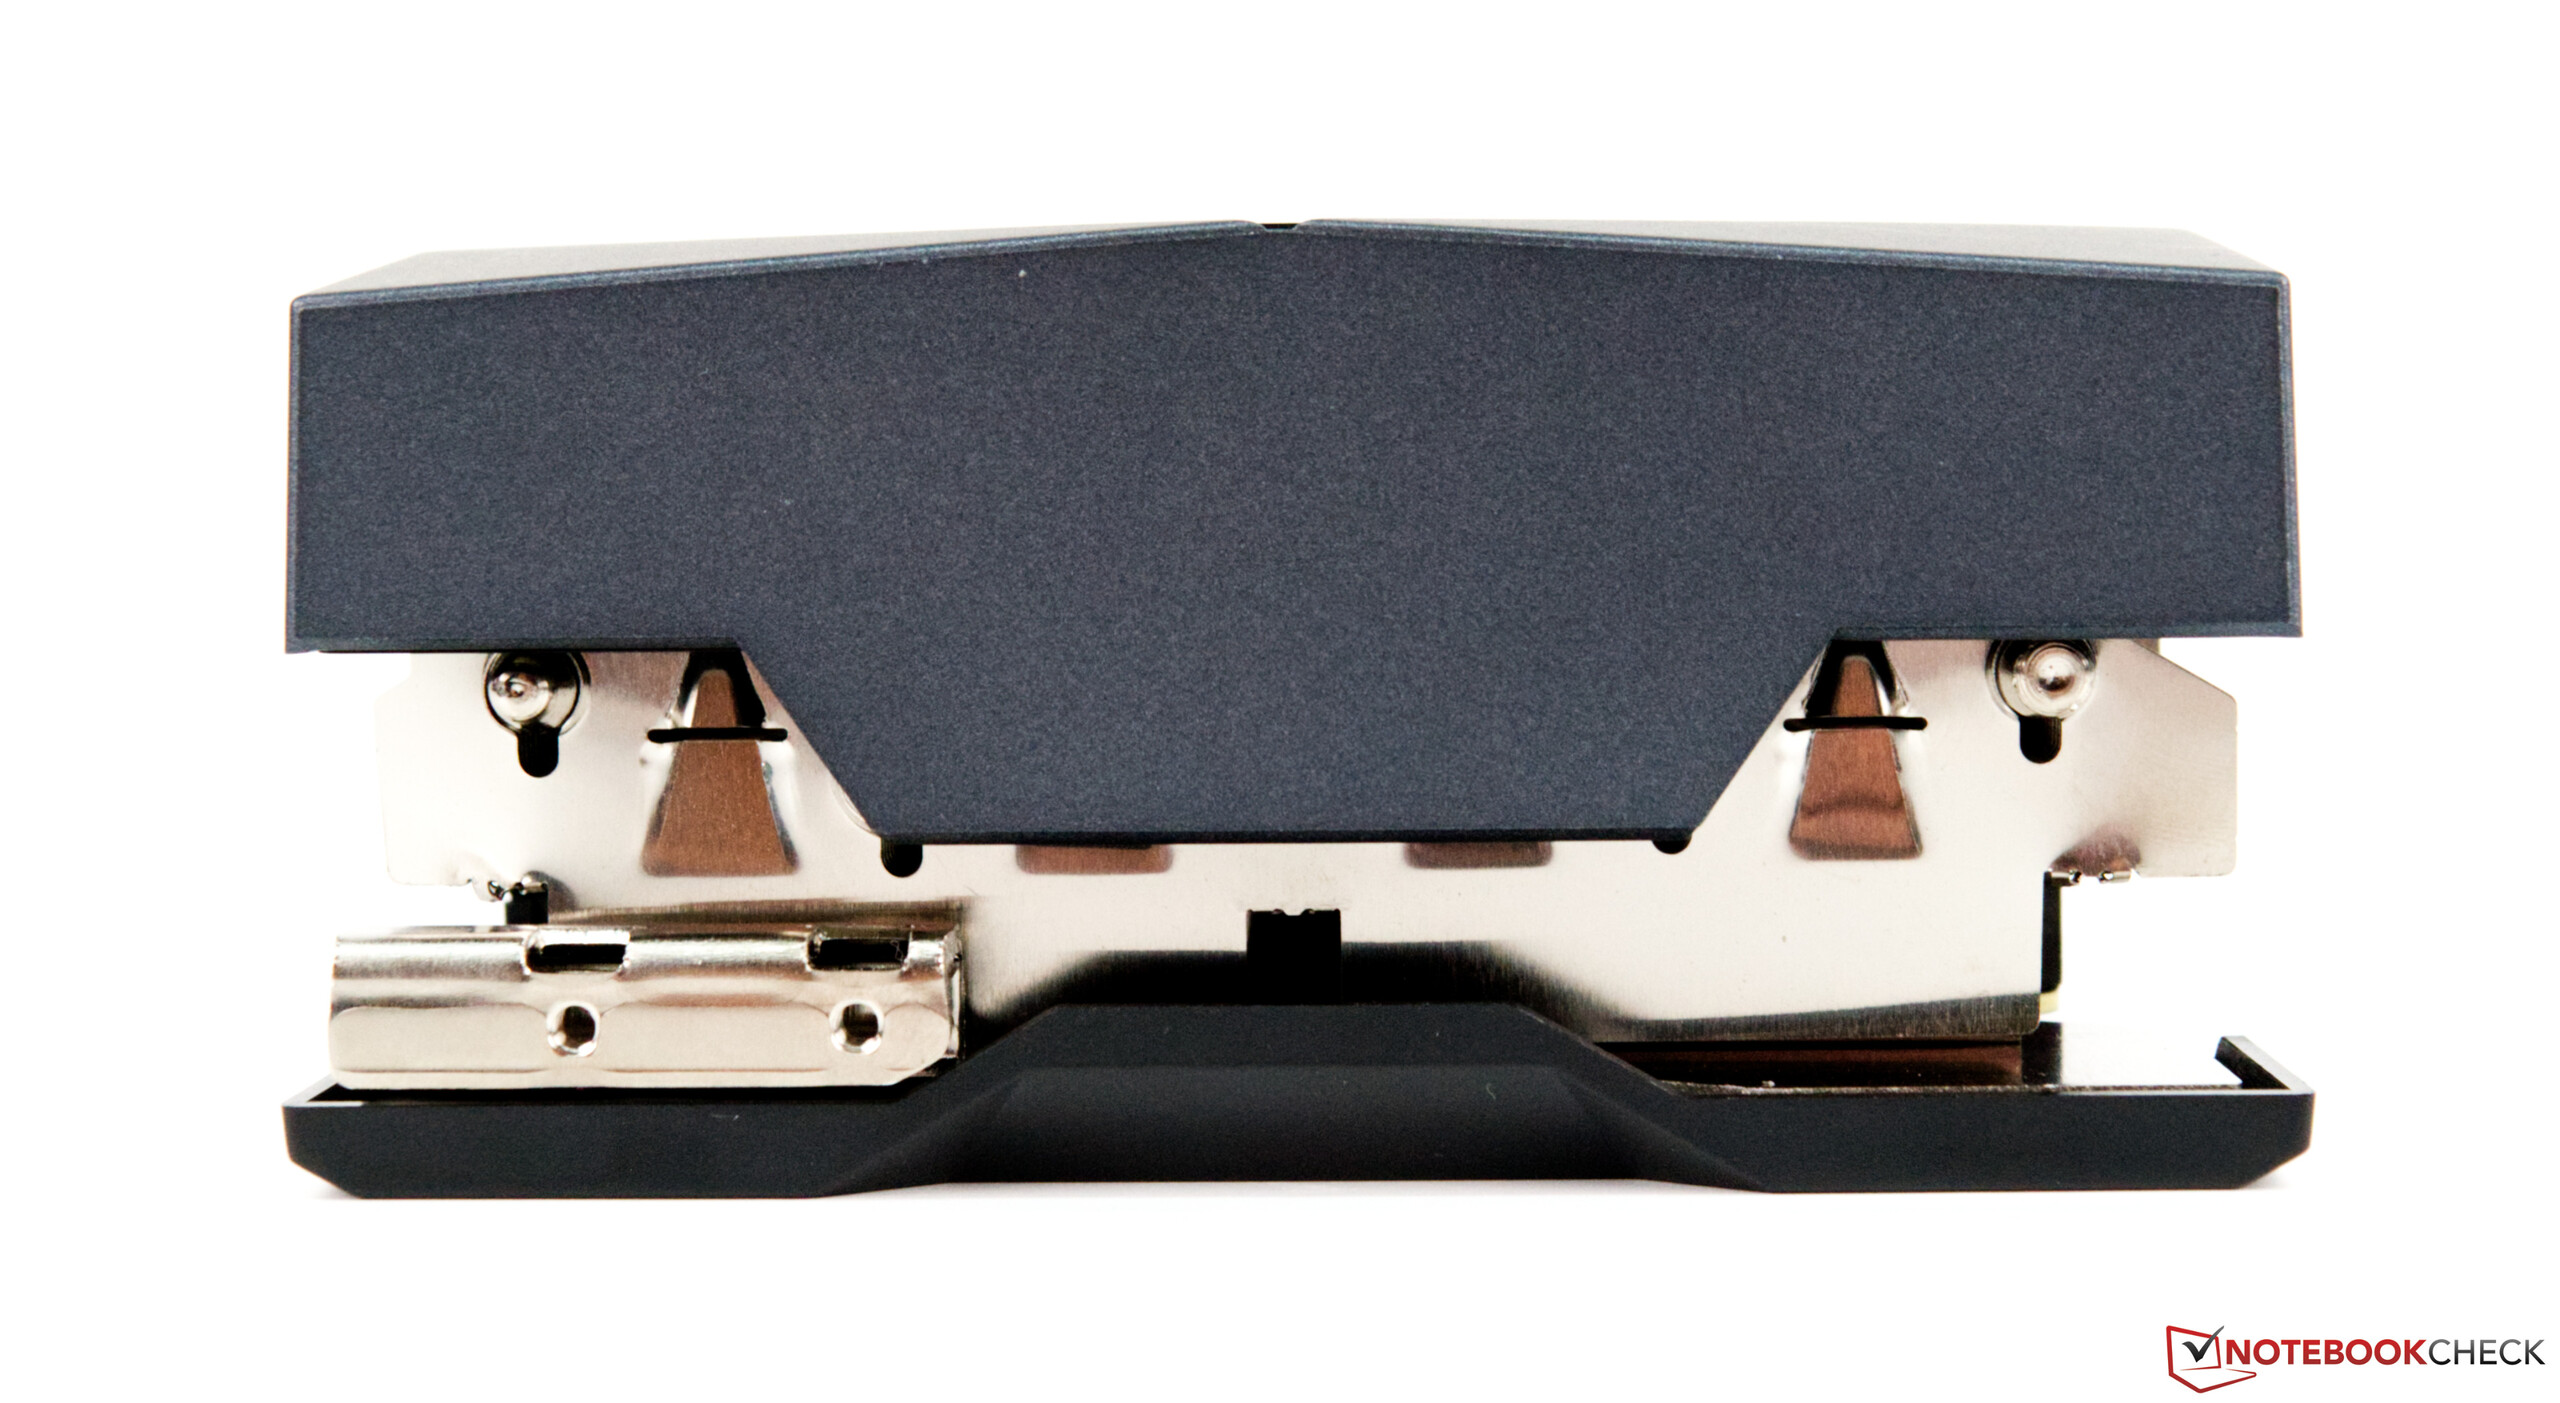
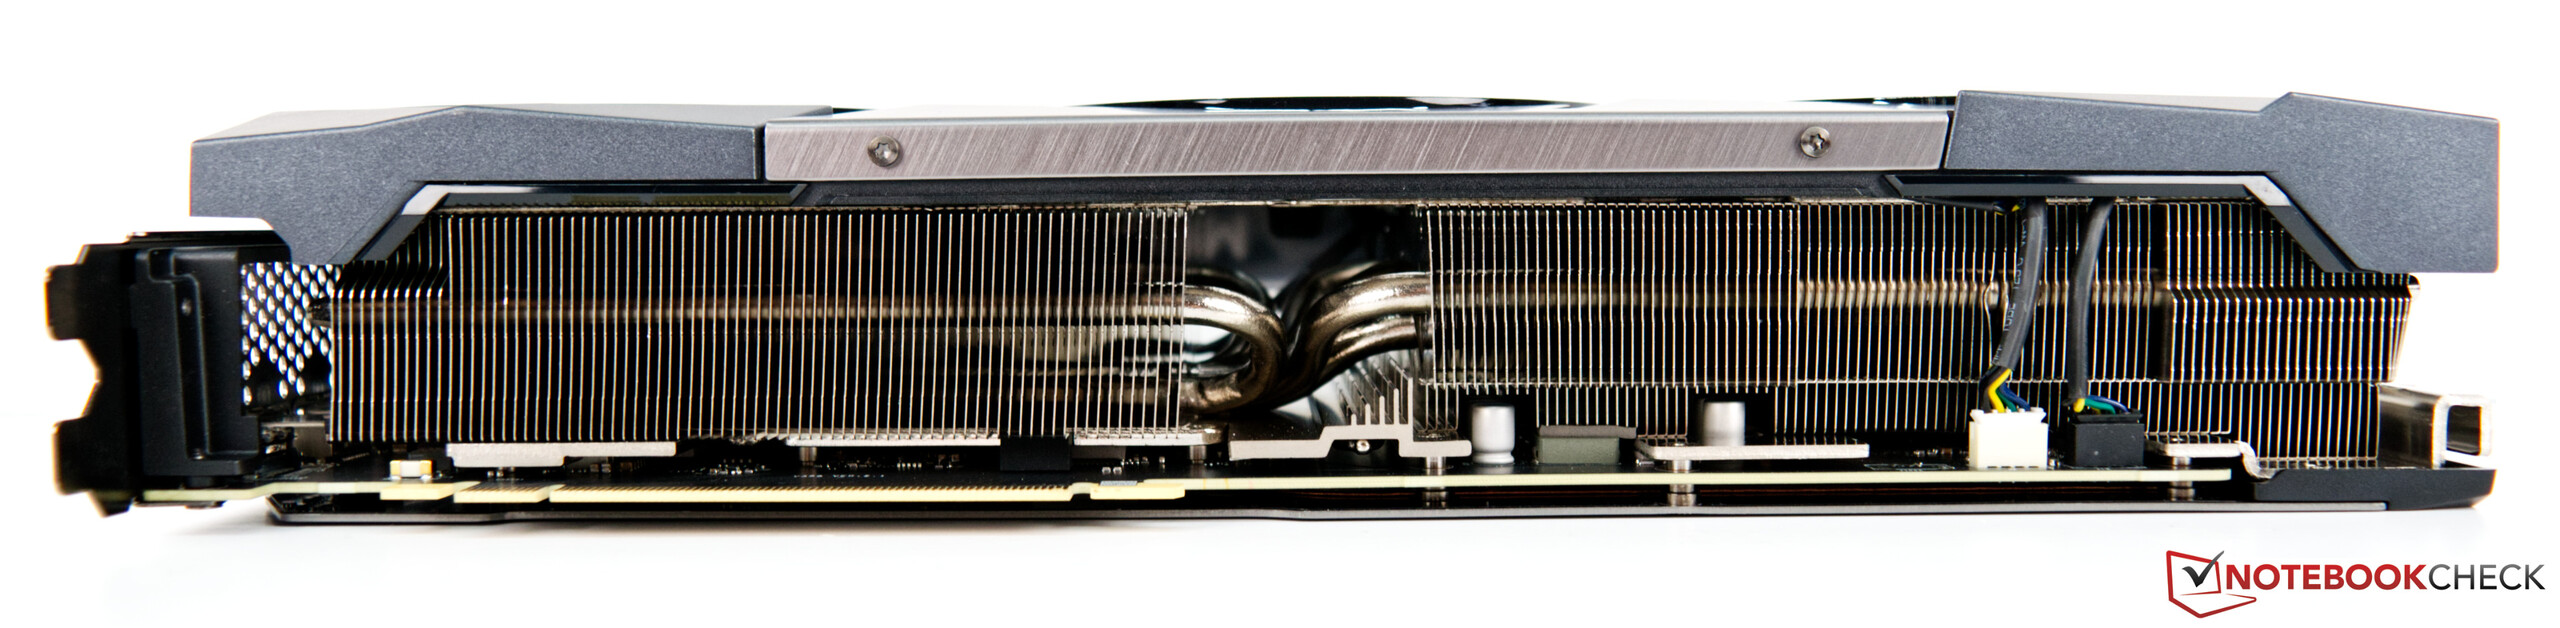
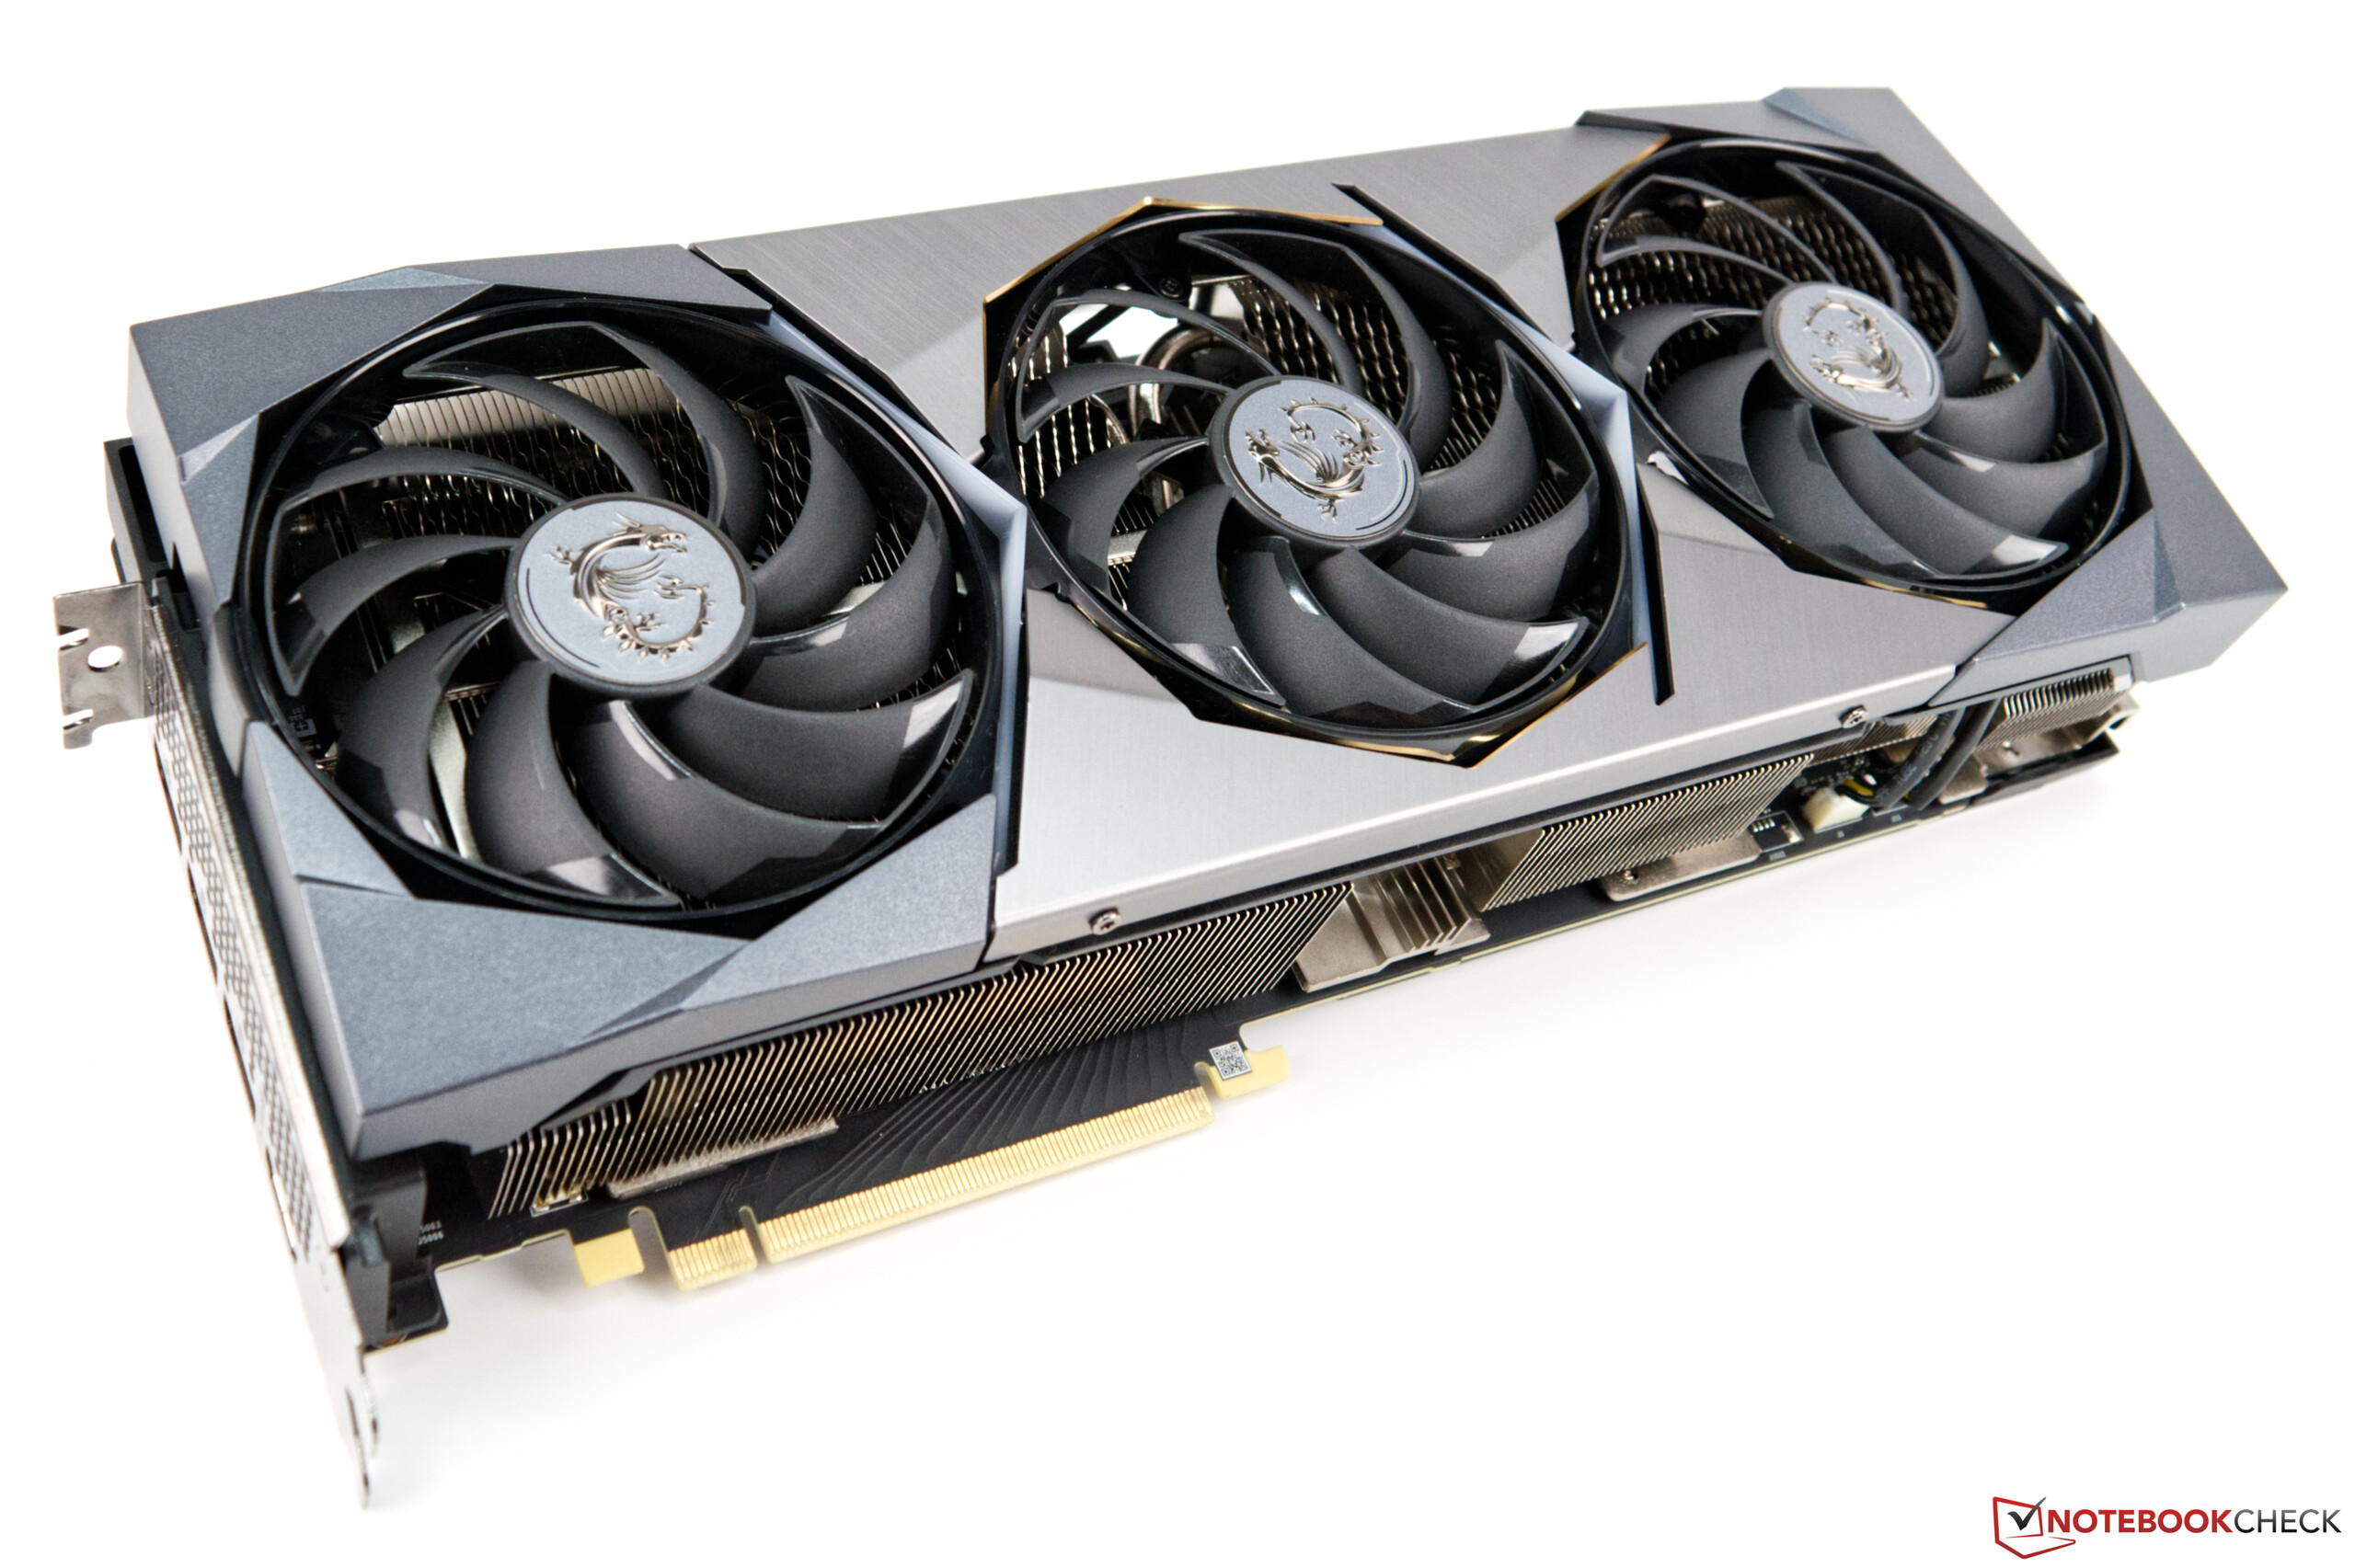
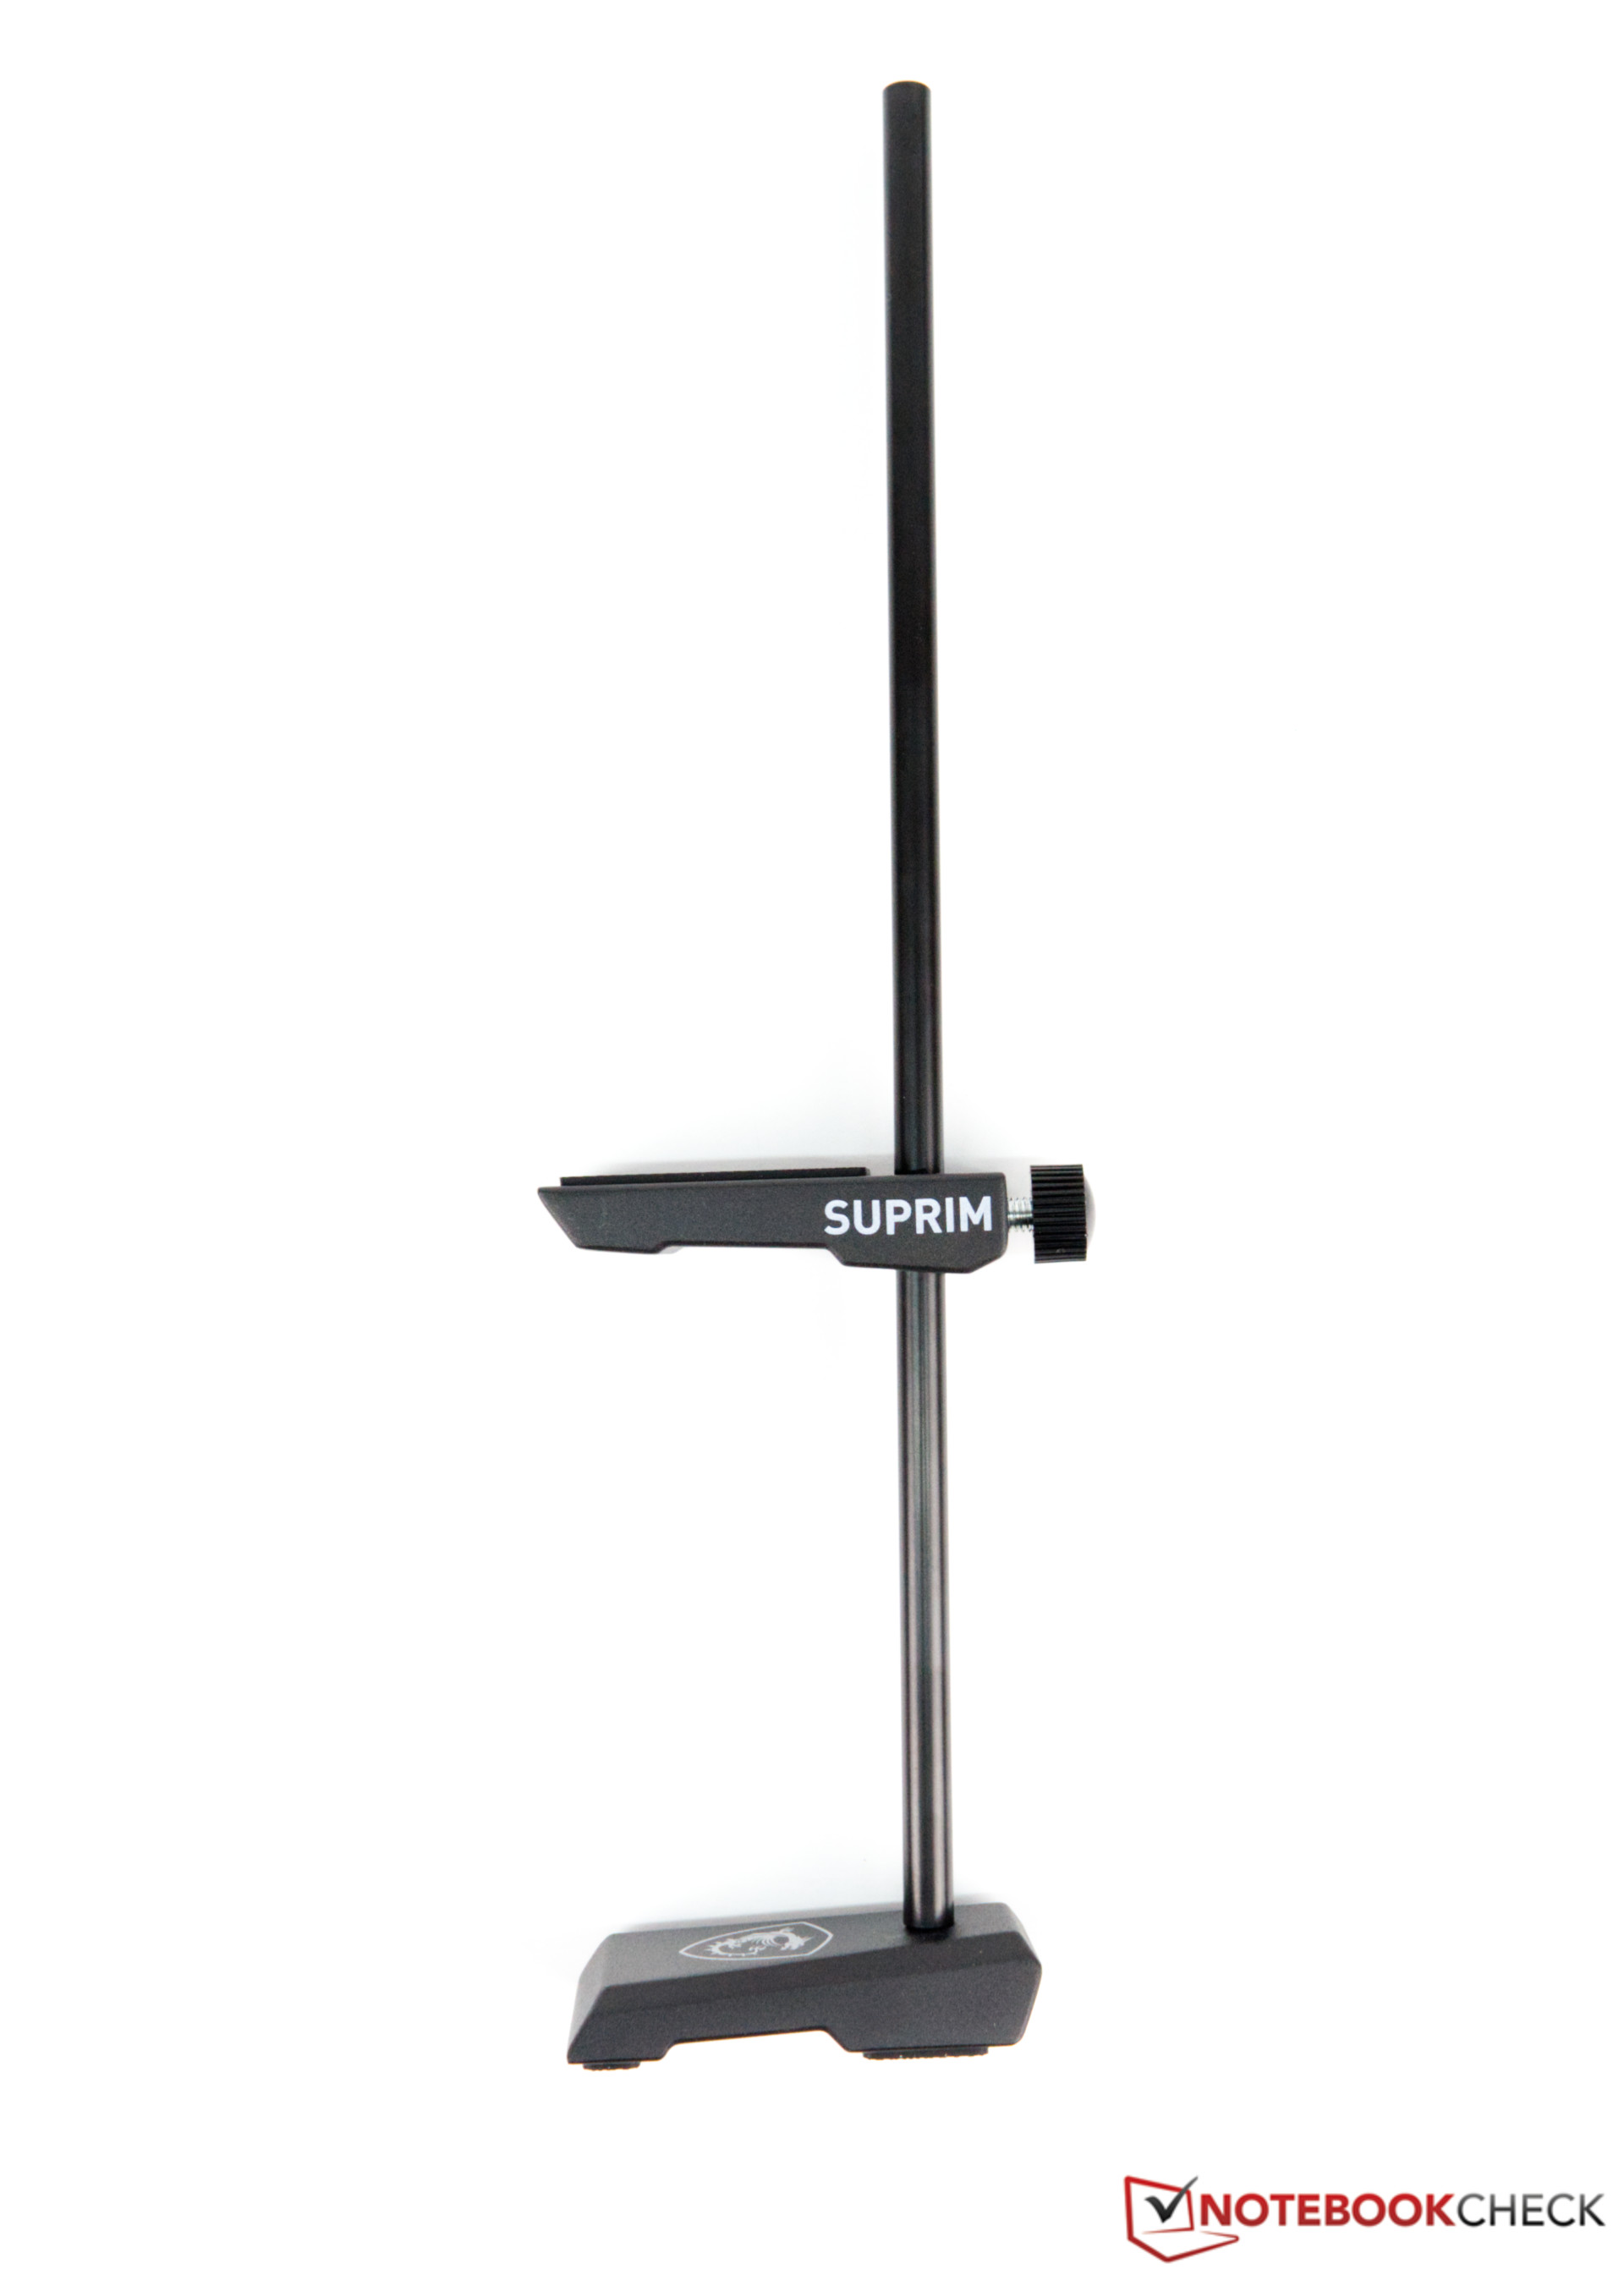
Echamos un vistazo al modelo superior basado en la RTX 3090 y nos entusiasmaron mucho los resultados después de desempacar la tarjeta gráfica. Hay que admitir que debería haber mucho espacio en la caja, porque la tarjeta gráfica mide la friolera de 34 centímetros de longitud total. El peso suma unos buenos 1,7 kilogramos, por lo que MSI también incluye un soporte separado para estabilizar la tarjeta gráfica en el extremo debido al exceso de longitud. Sin el soporte, la tarjeta gráfica se hunde mucho en la carcasa, lo que hace temer que la ranura PCIe se dañe a largo plazo. No debería haber problemas si la montas verticalmente. Además, el refrigerador es muy grueso, por lo que se necesita un total de tres ranuras
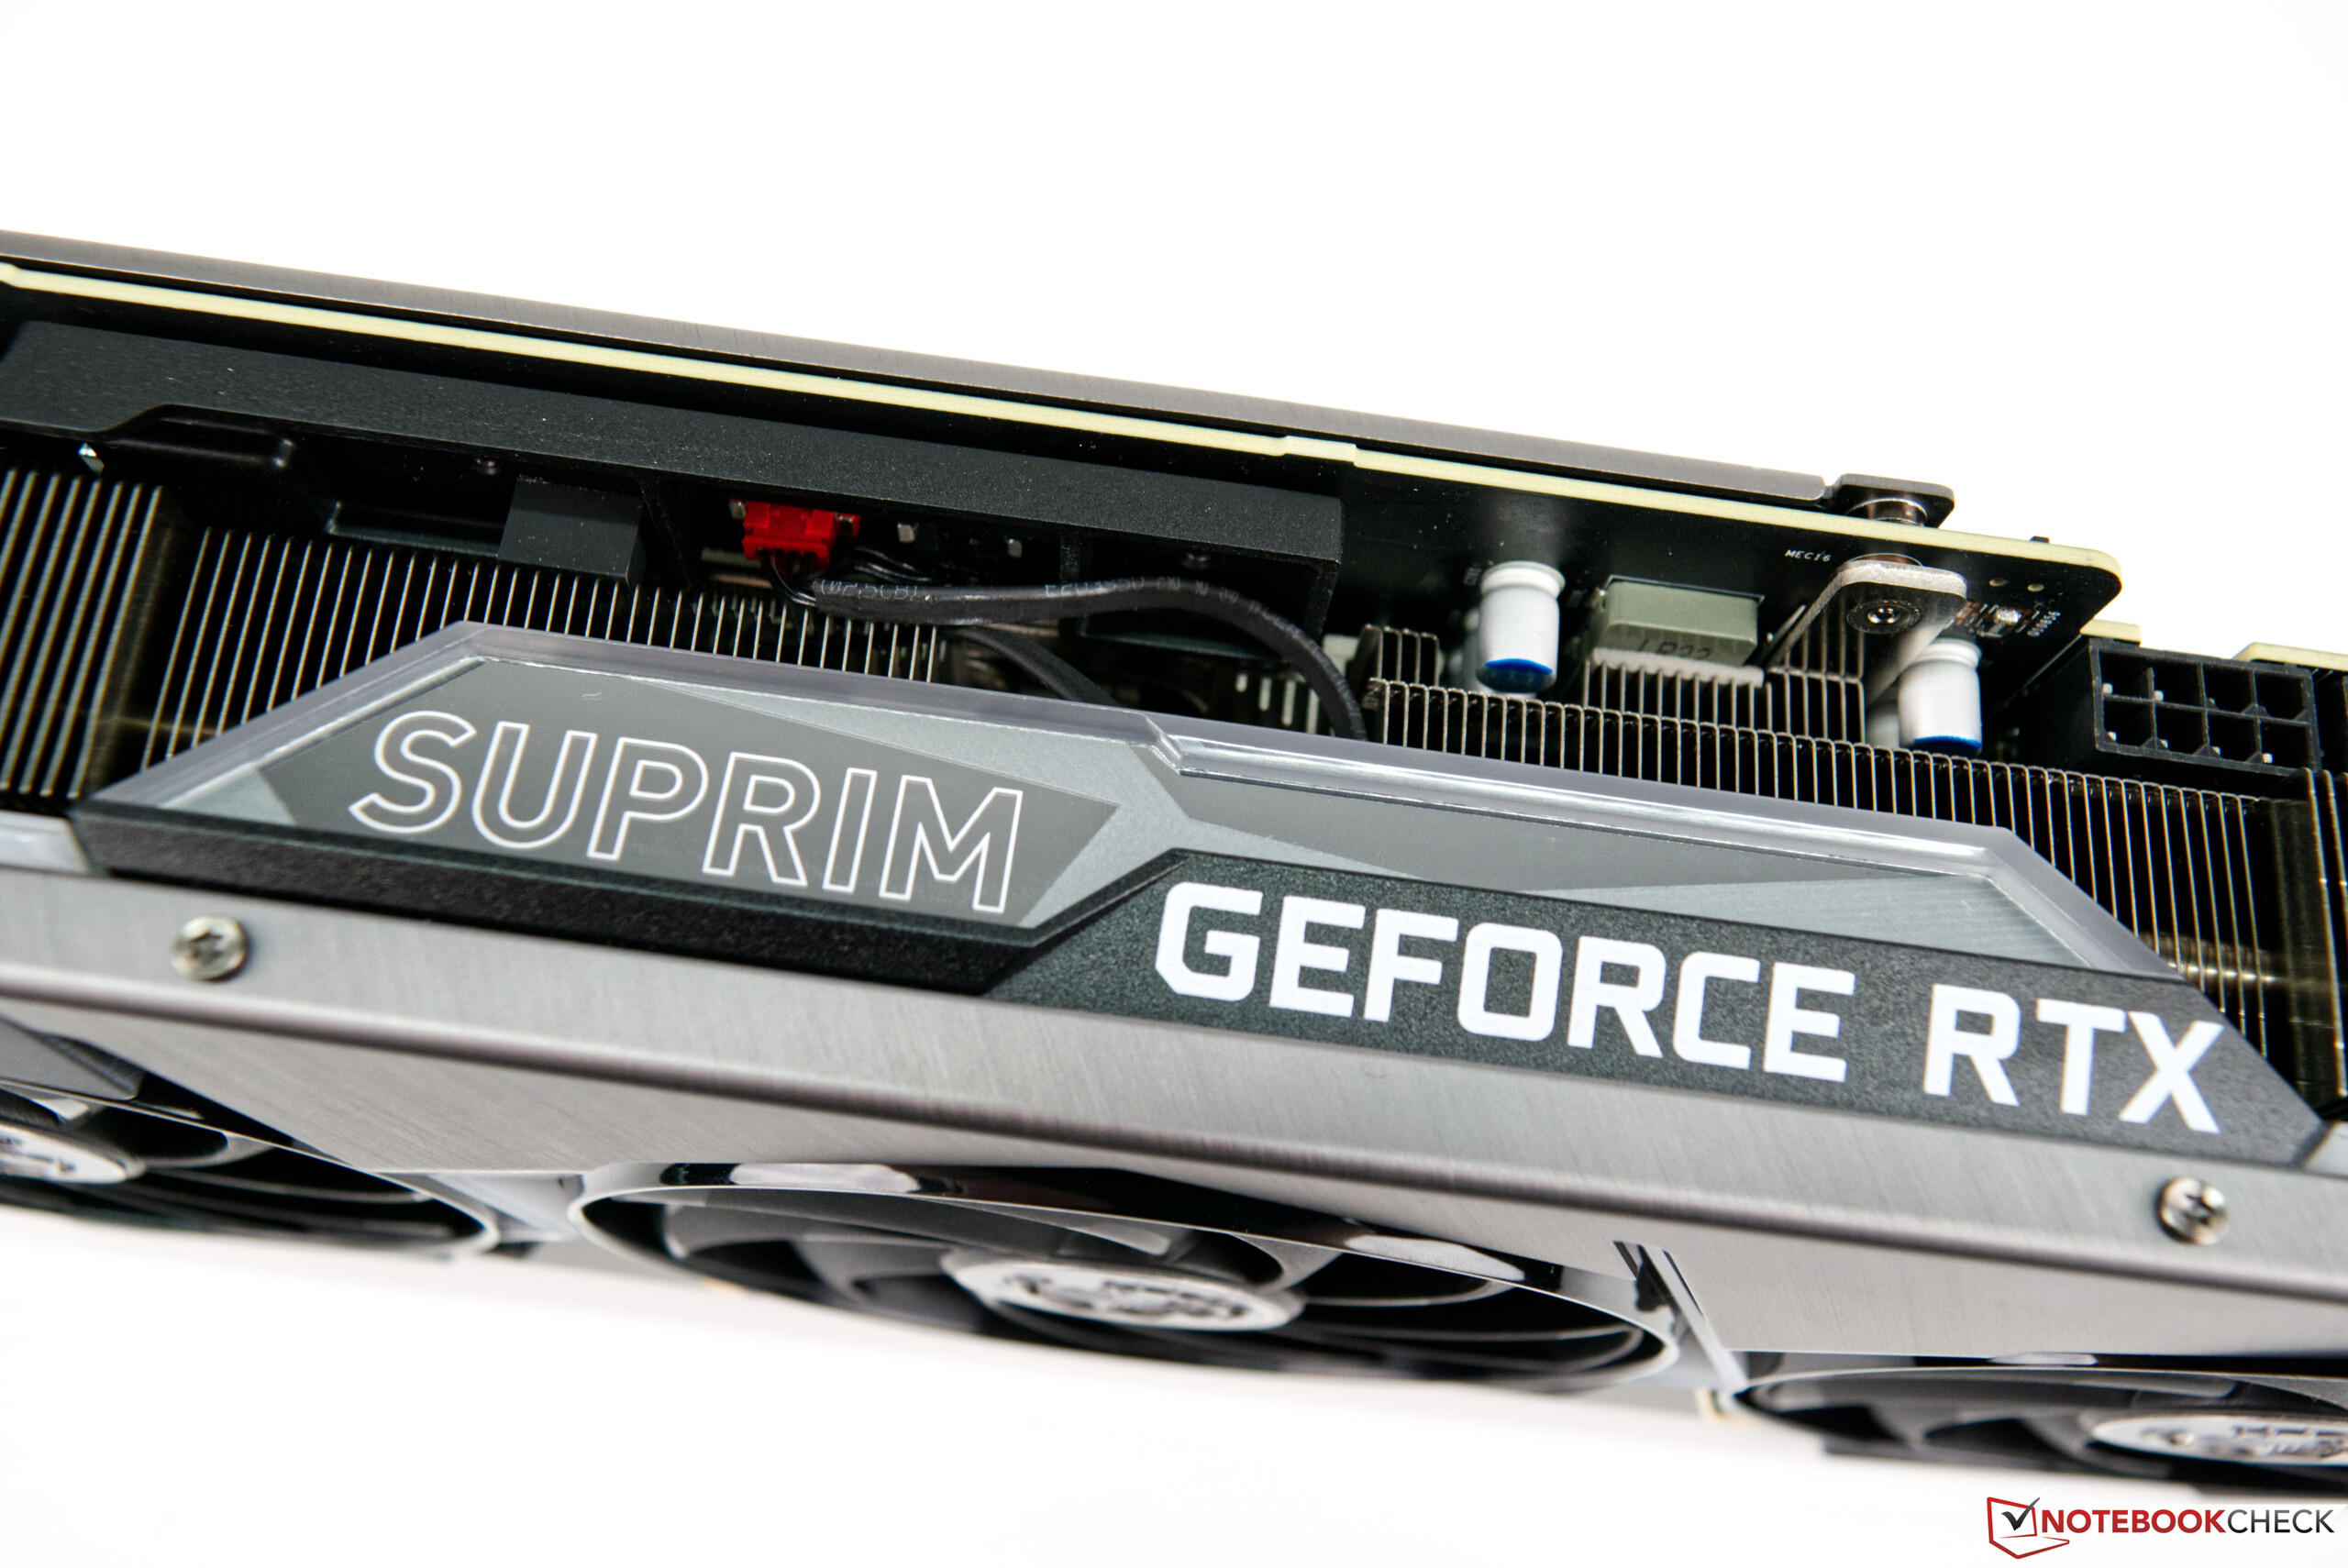
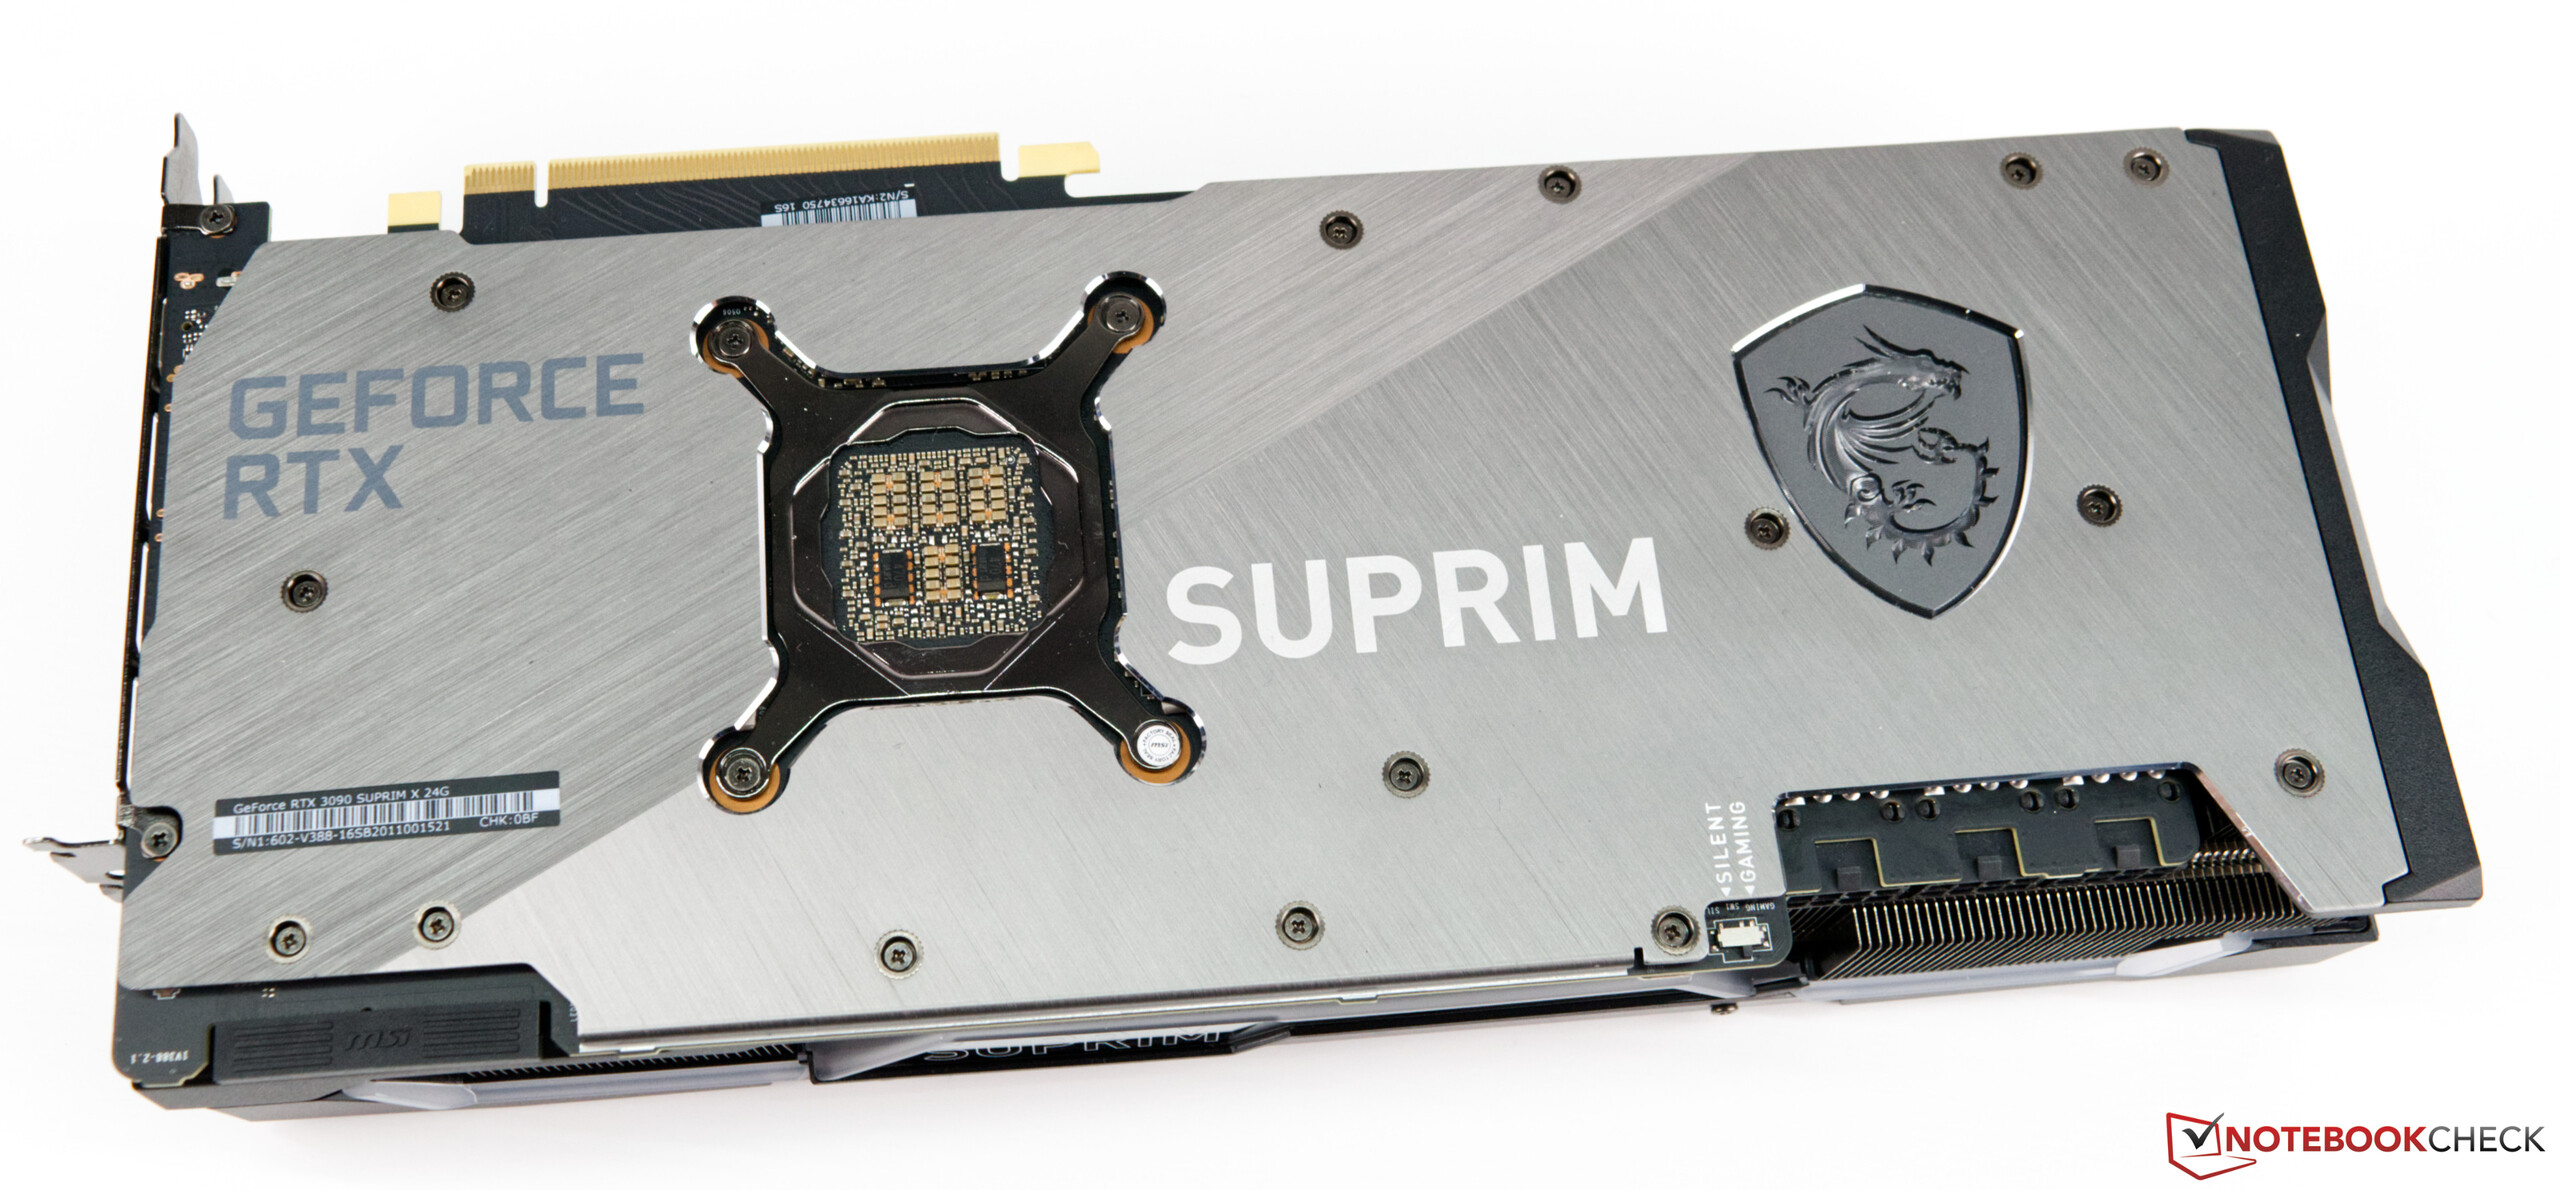
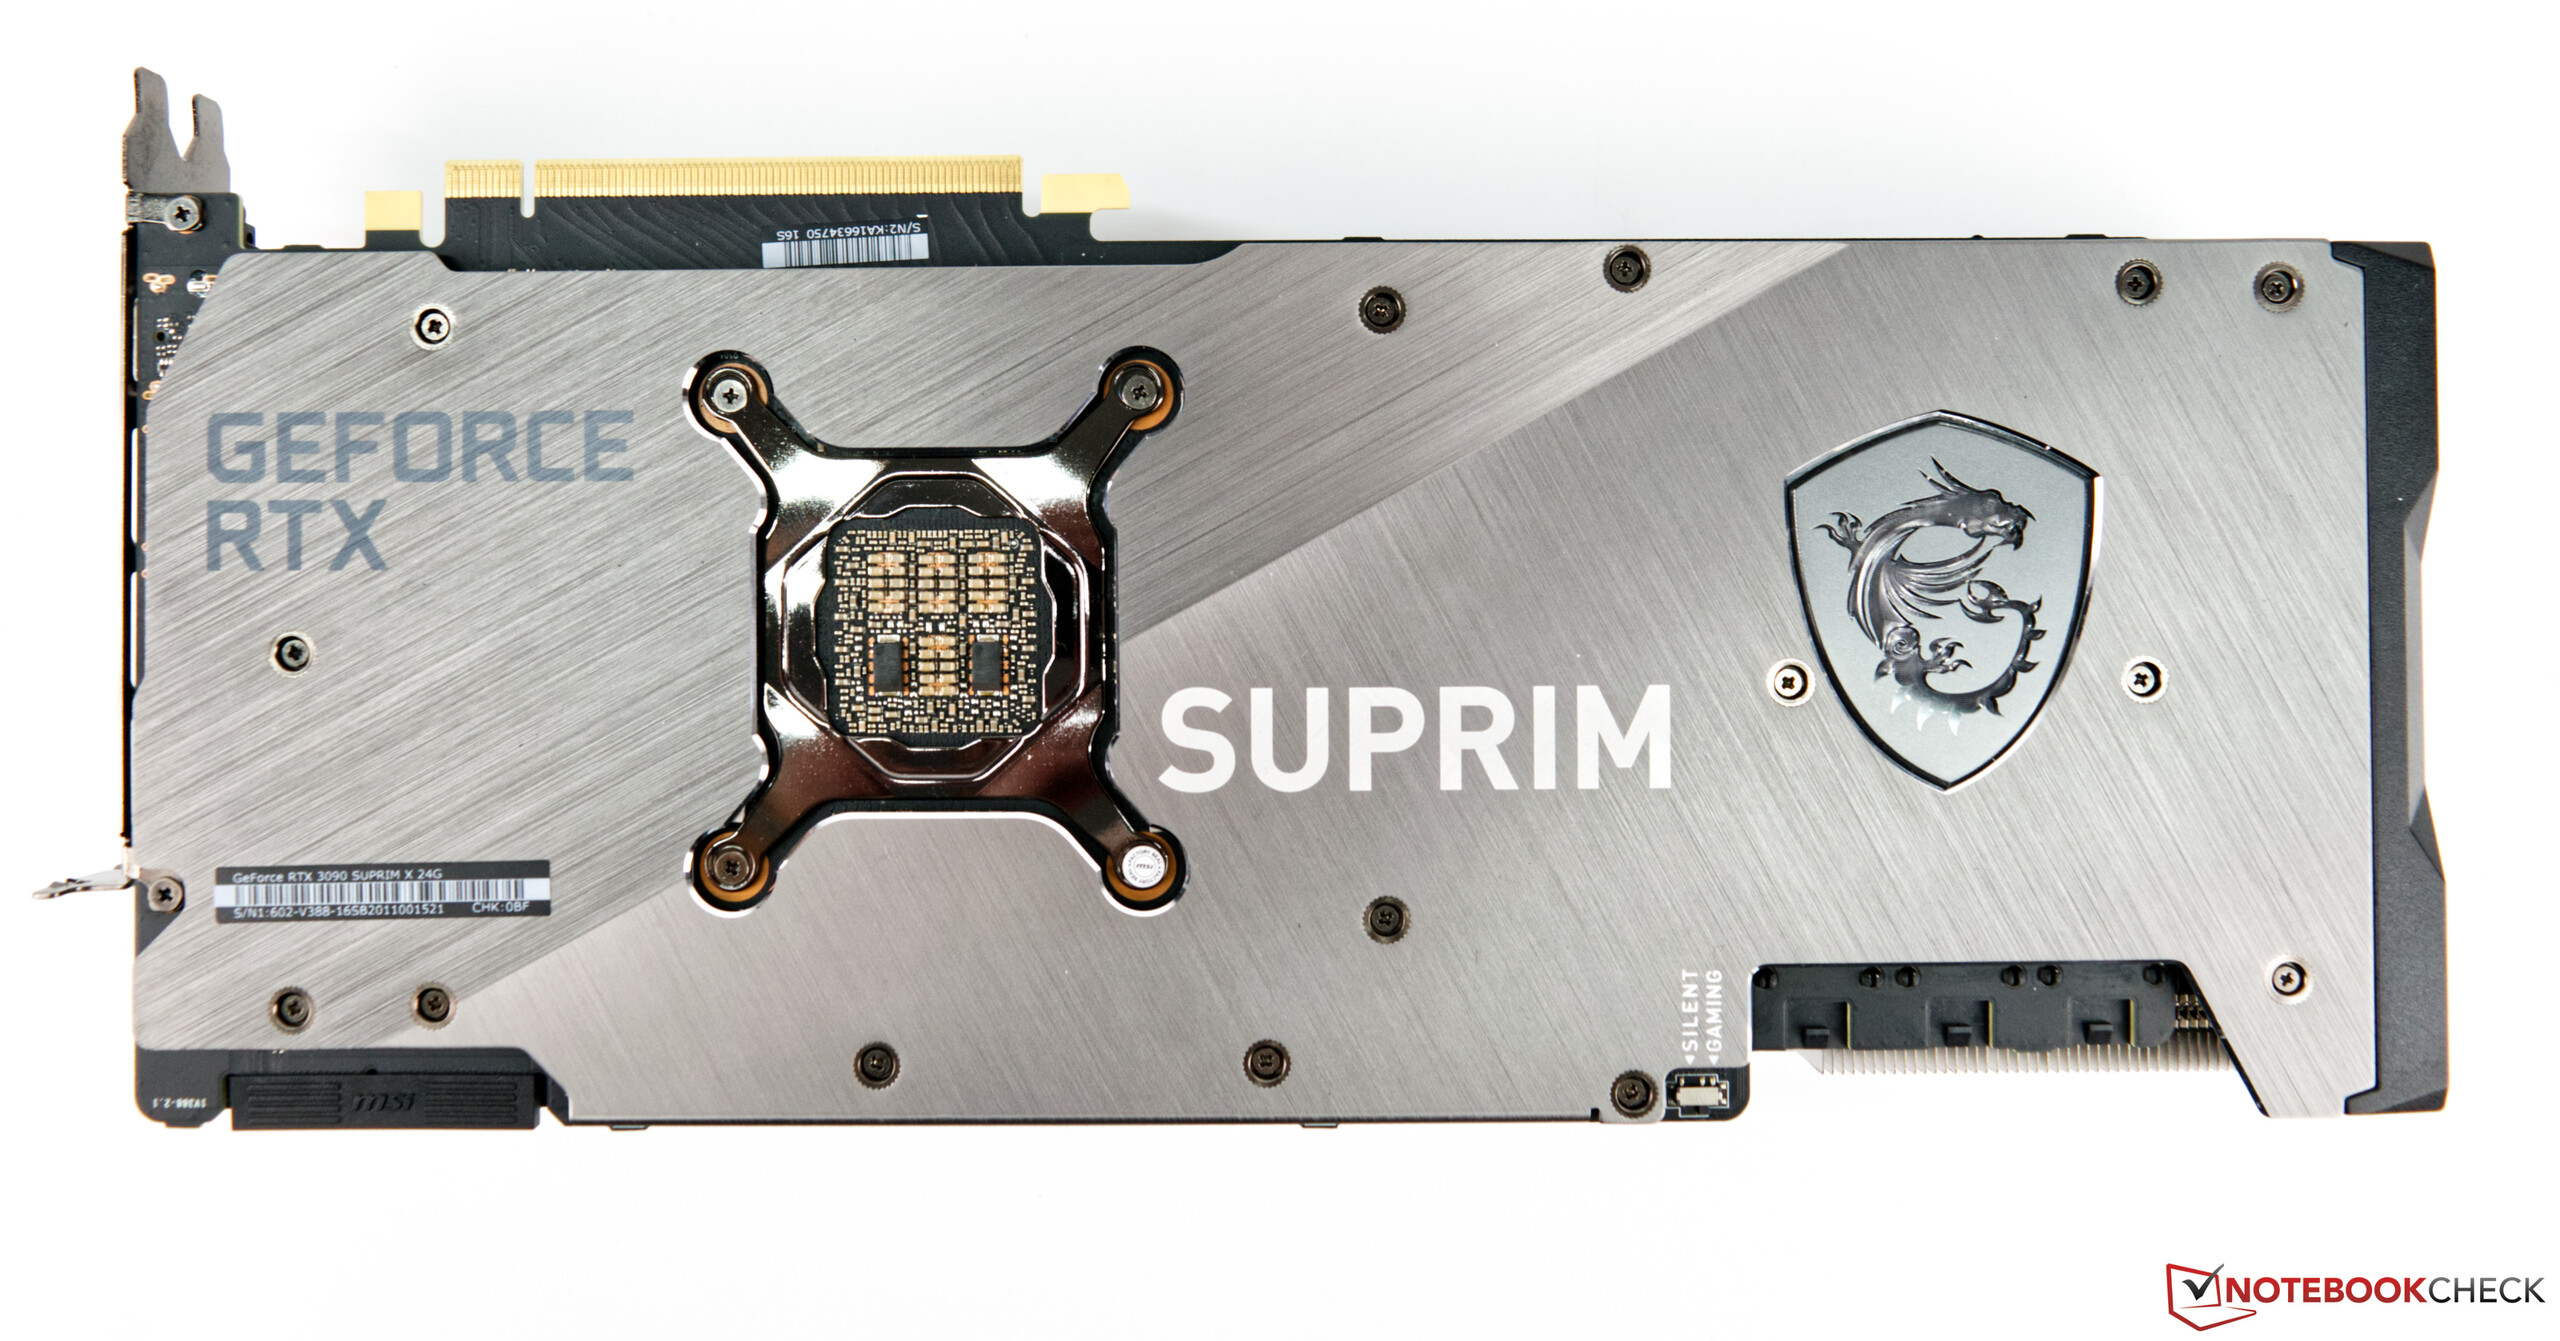
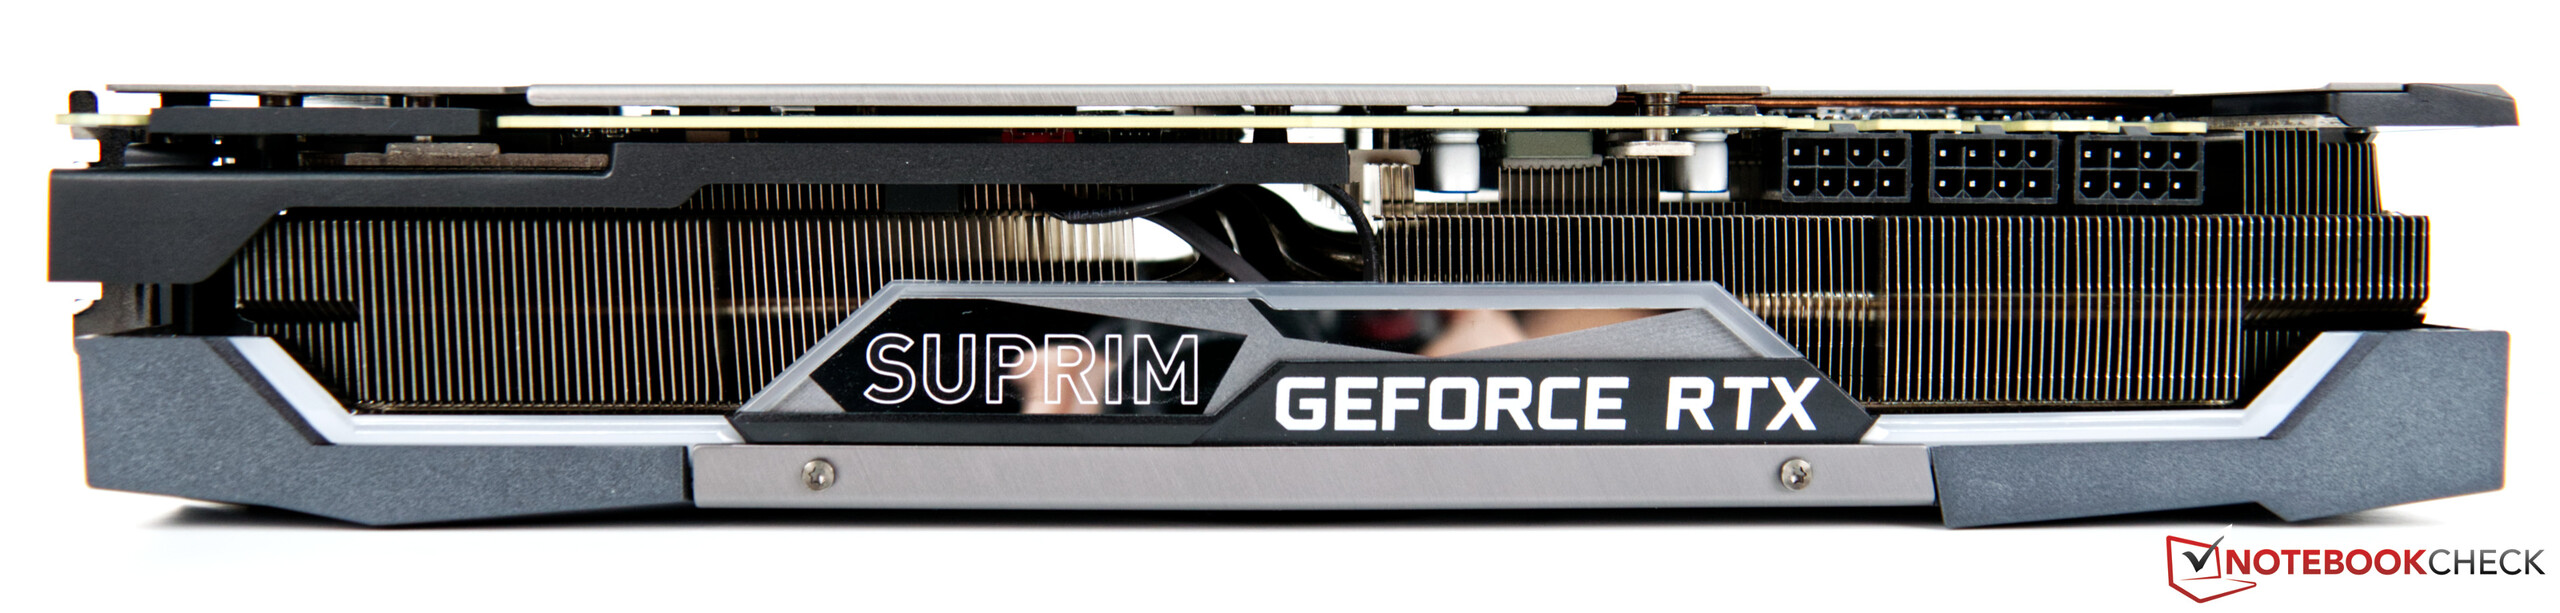
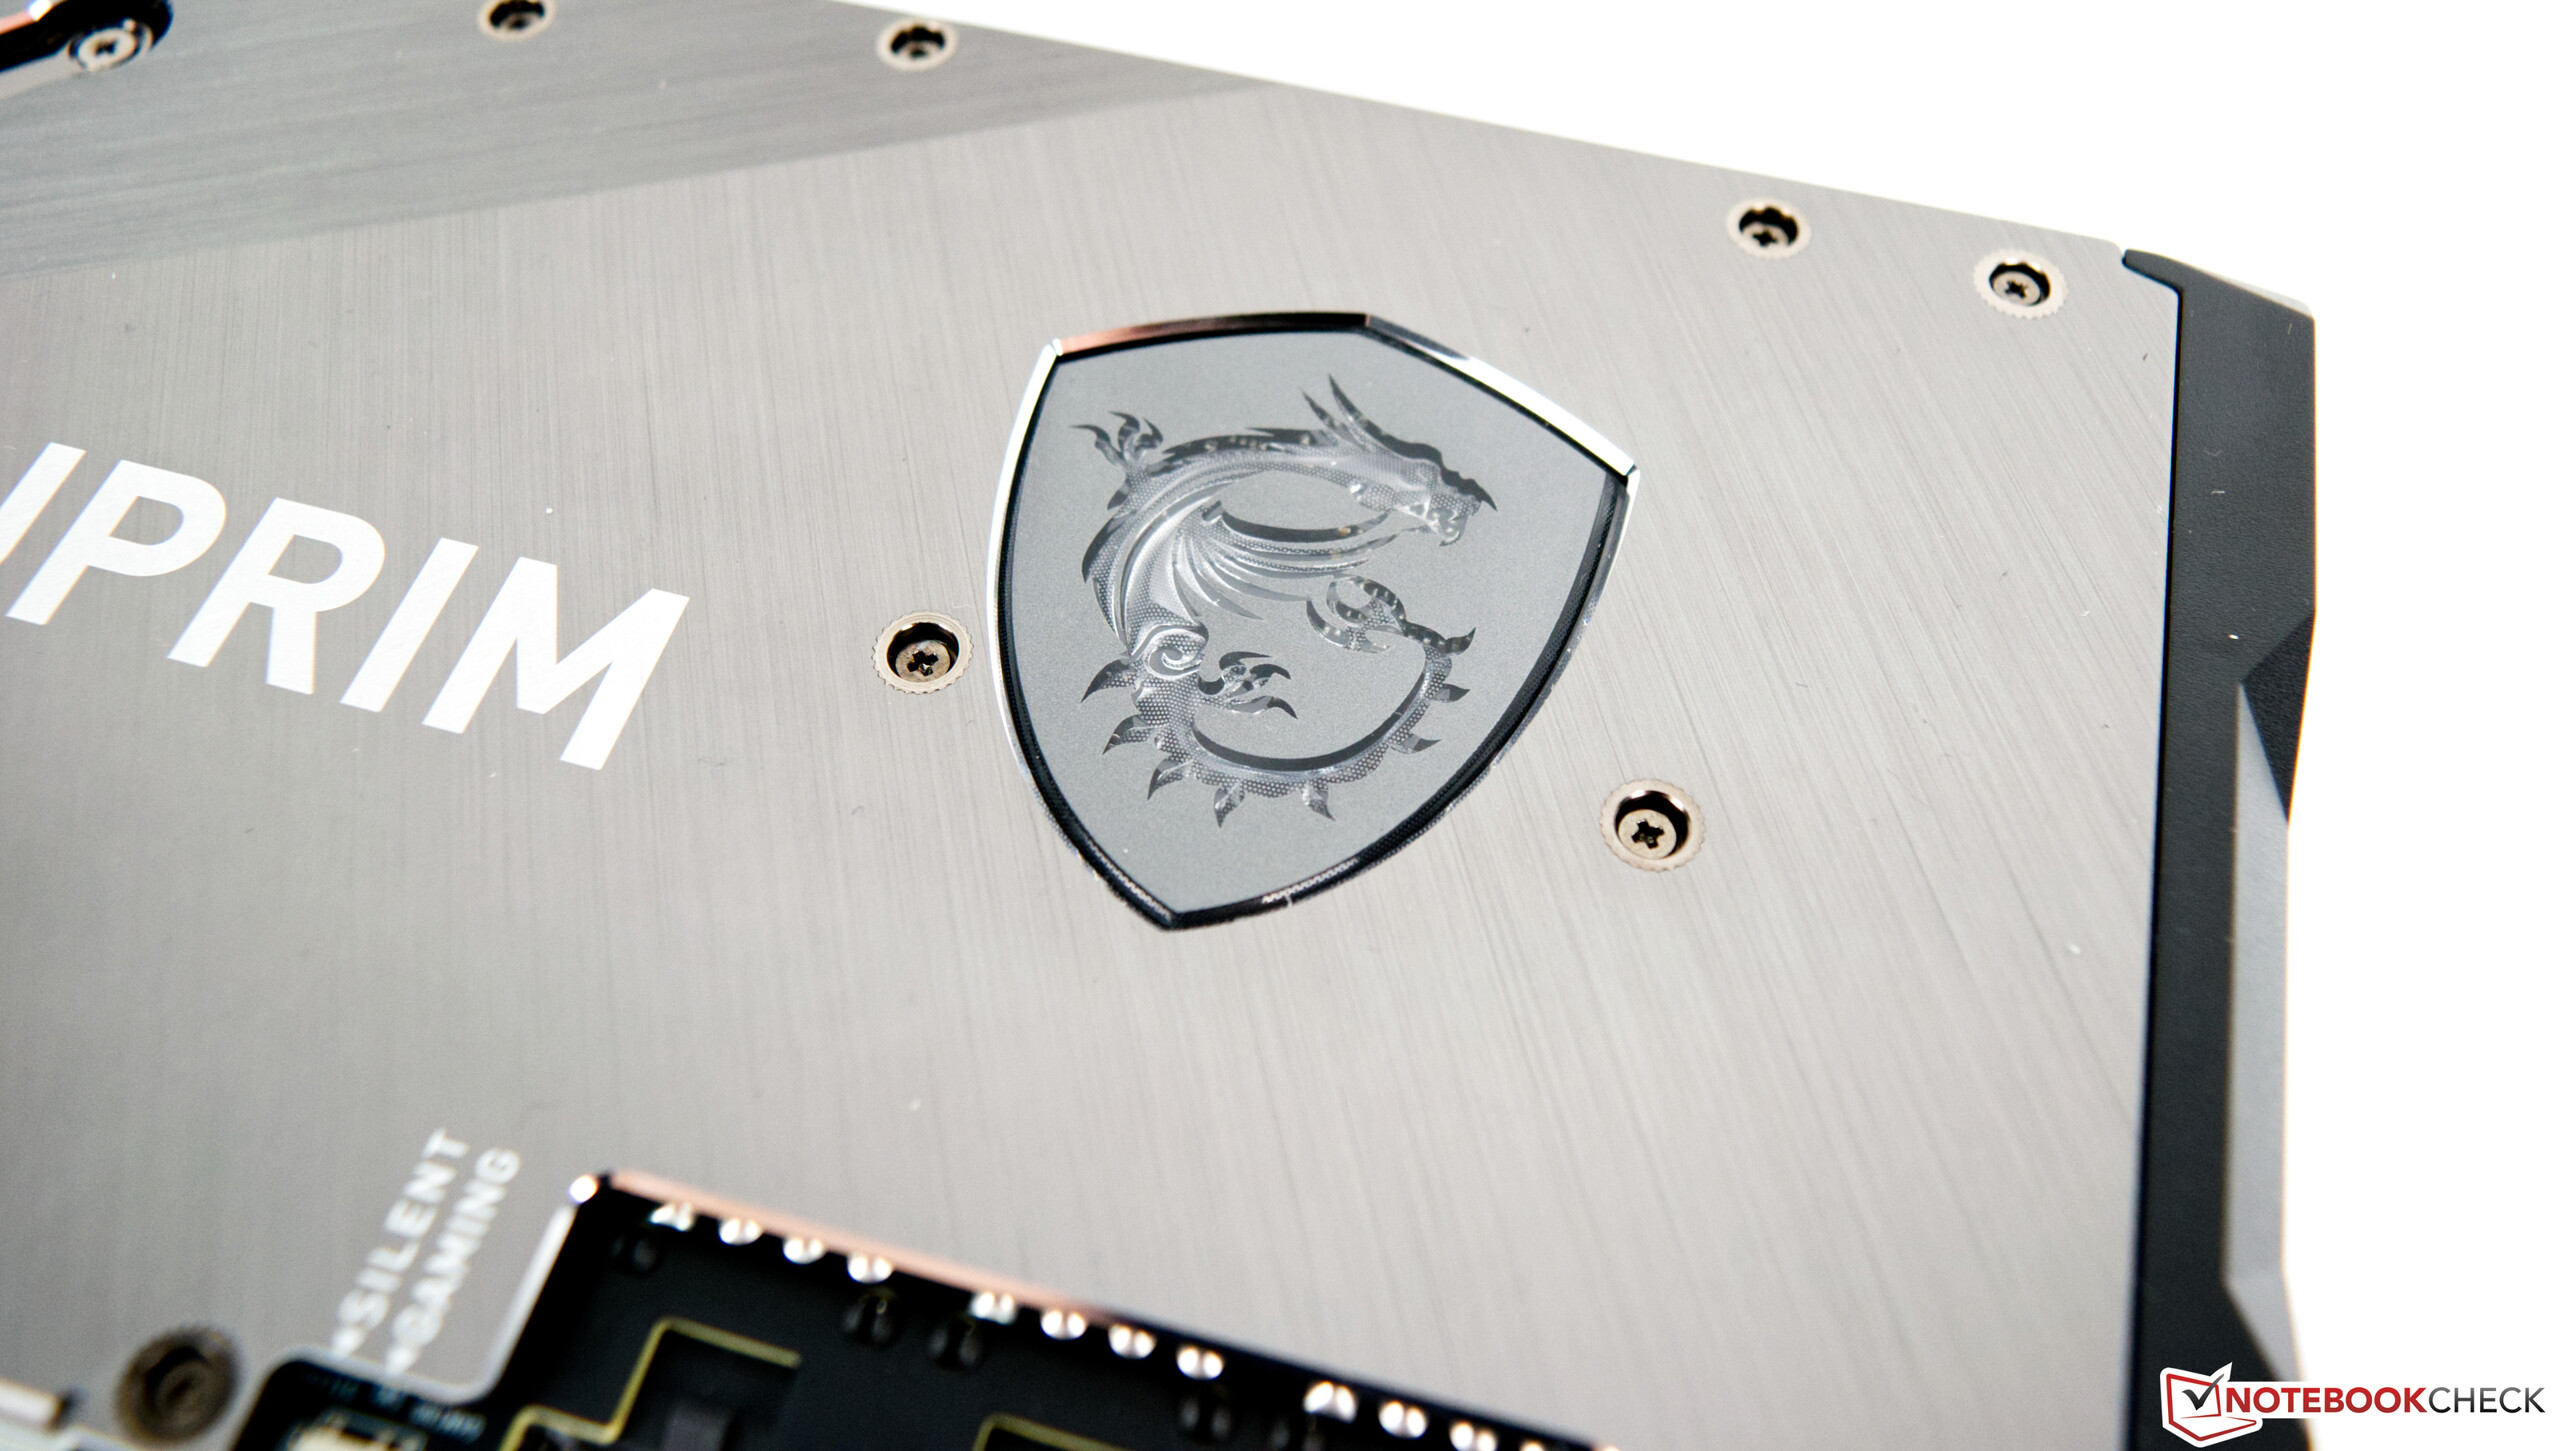
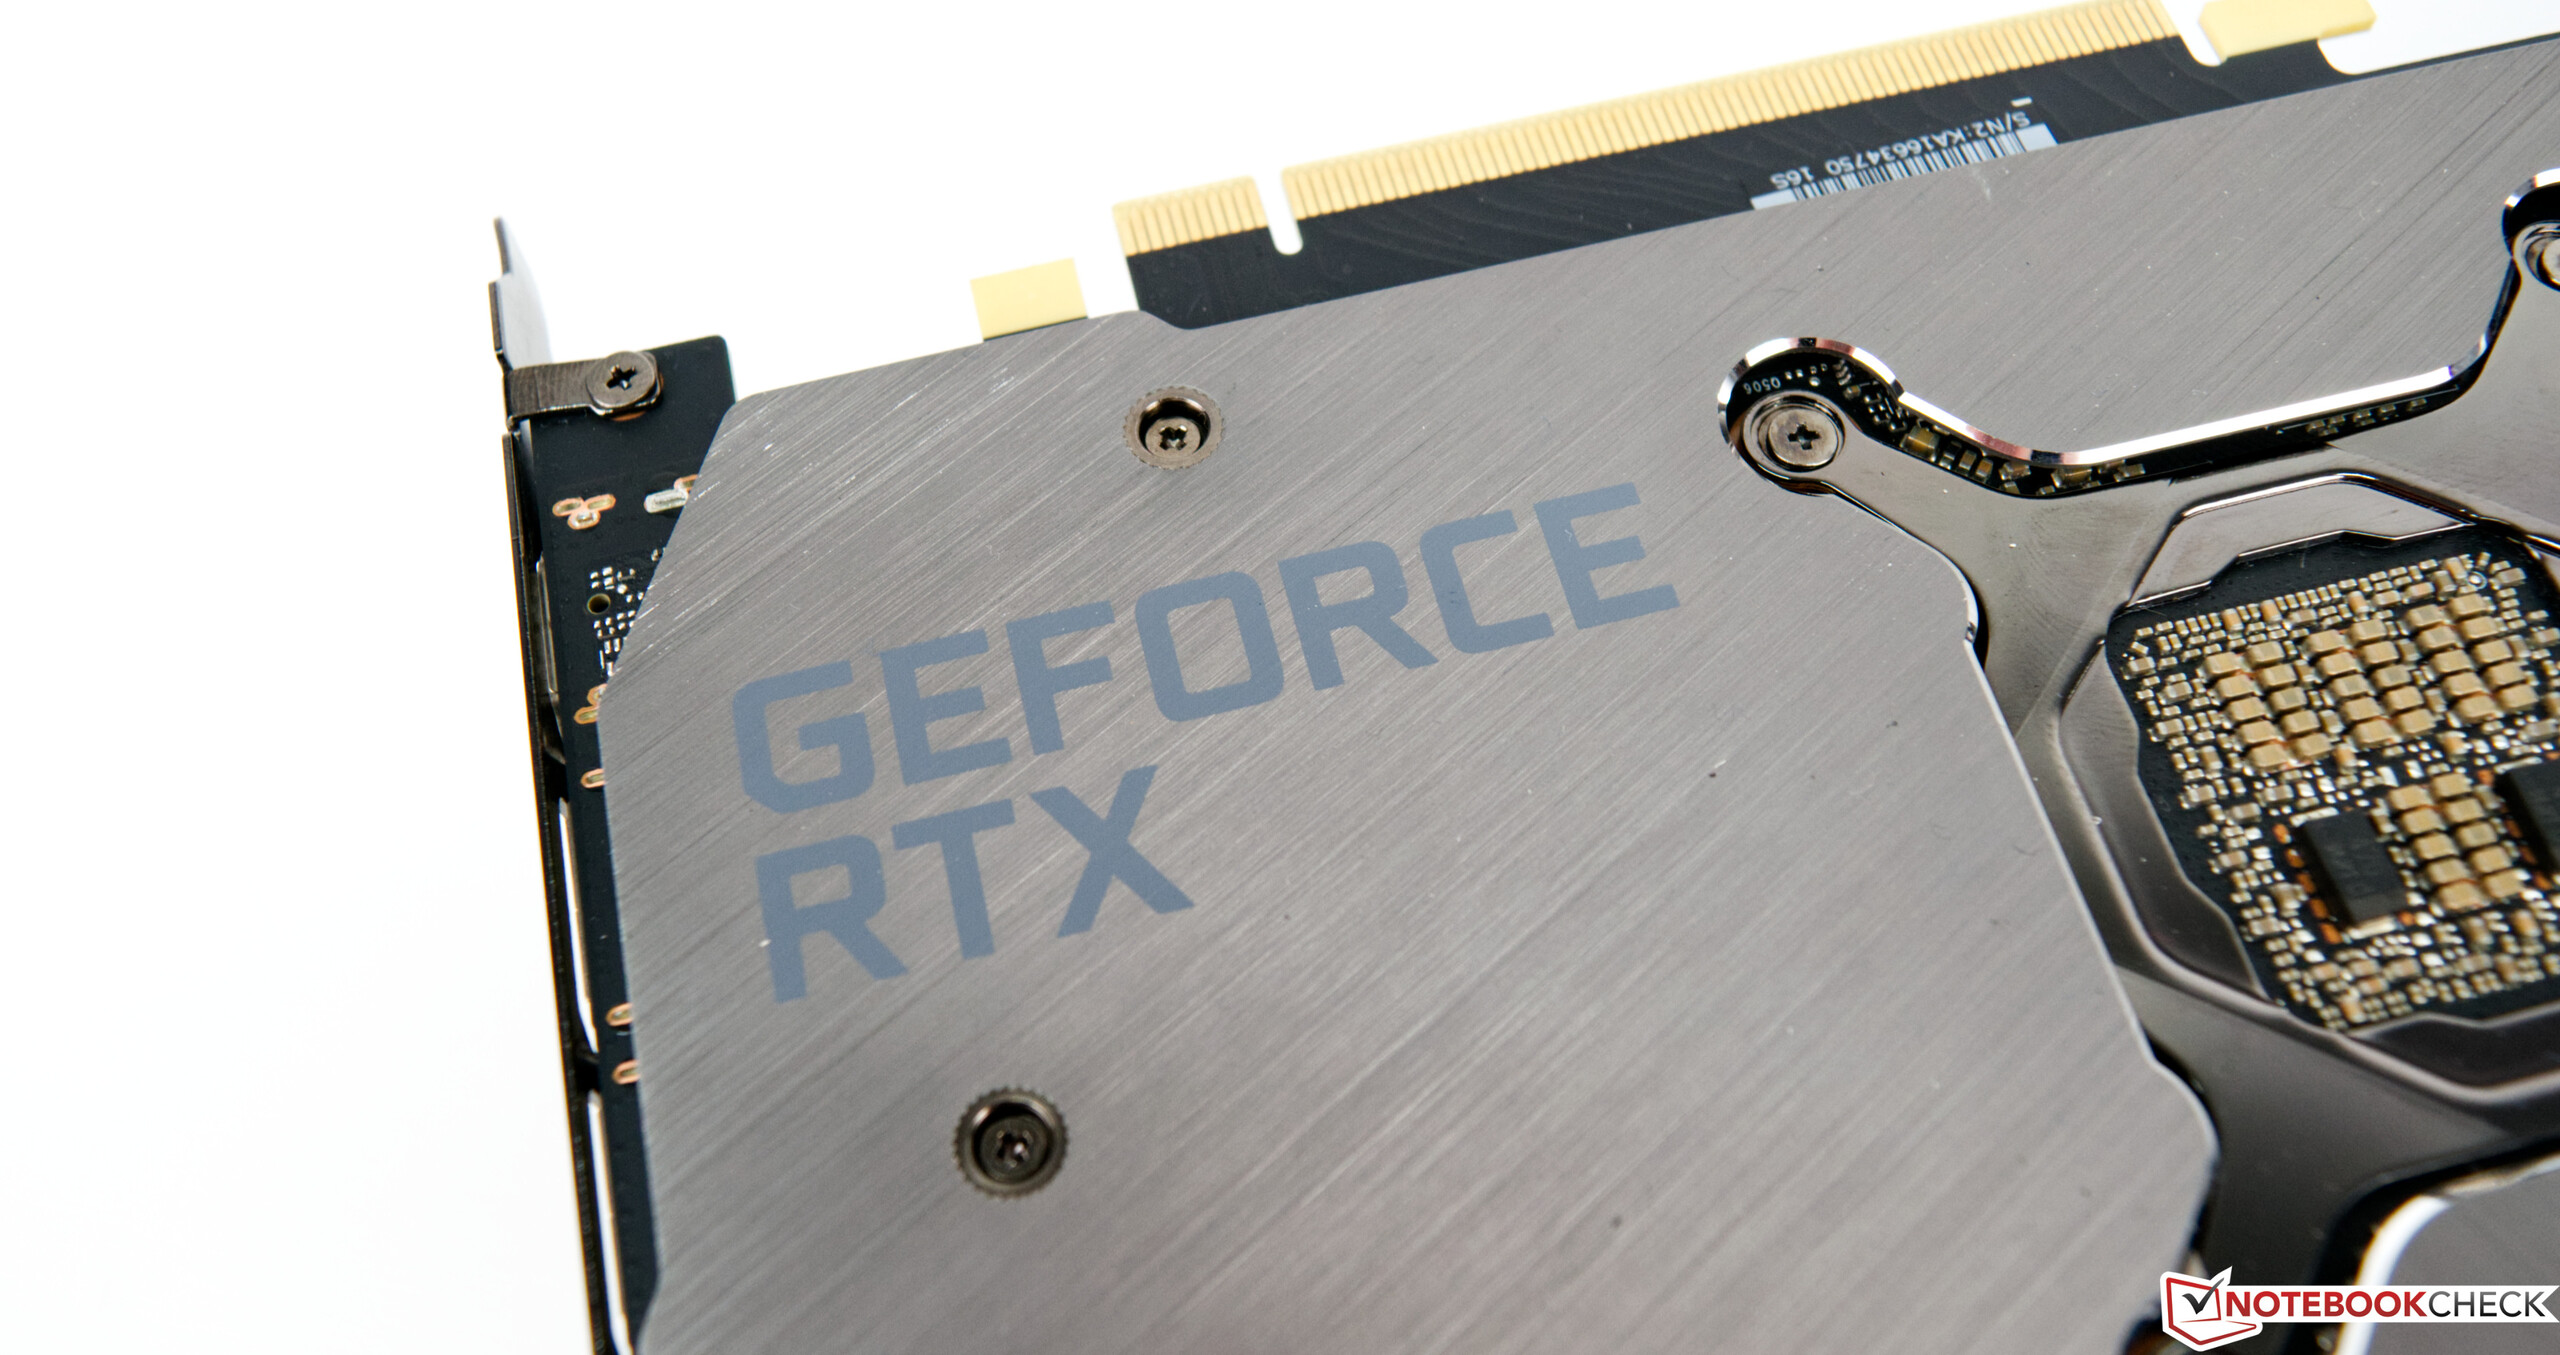
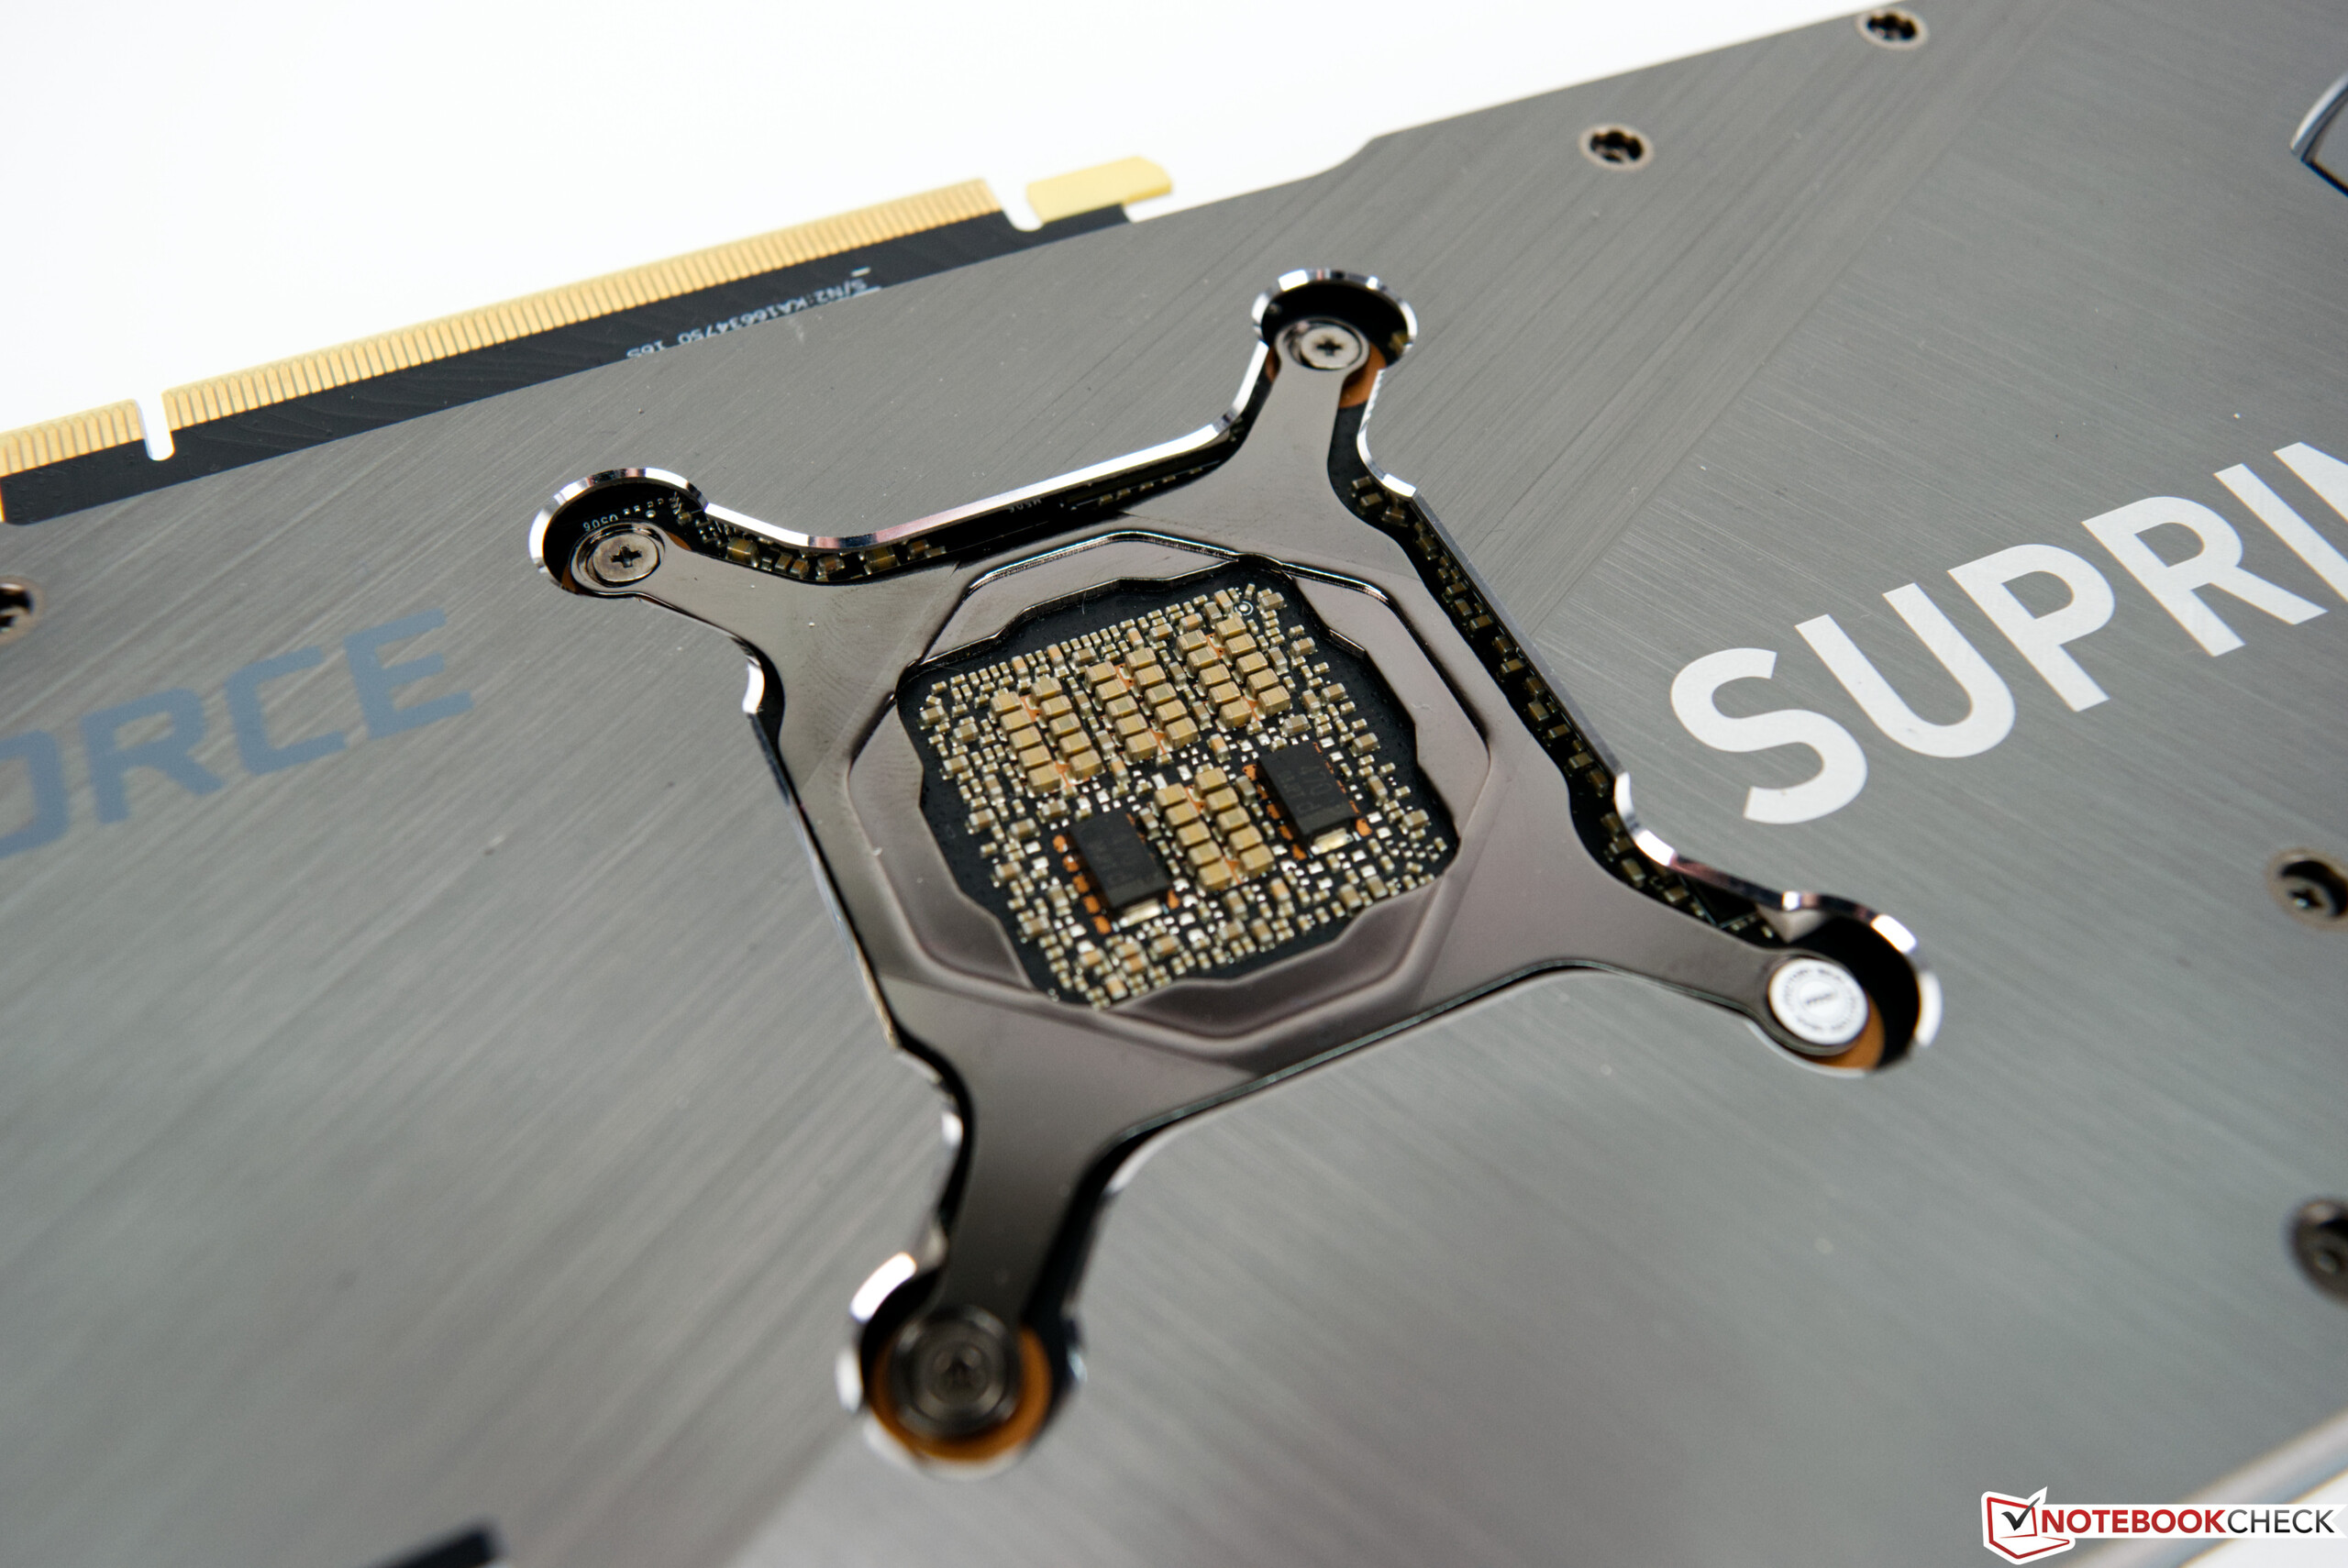
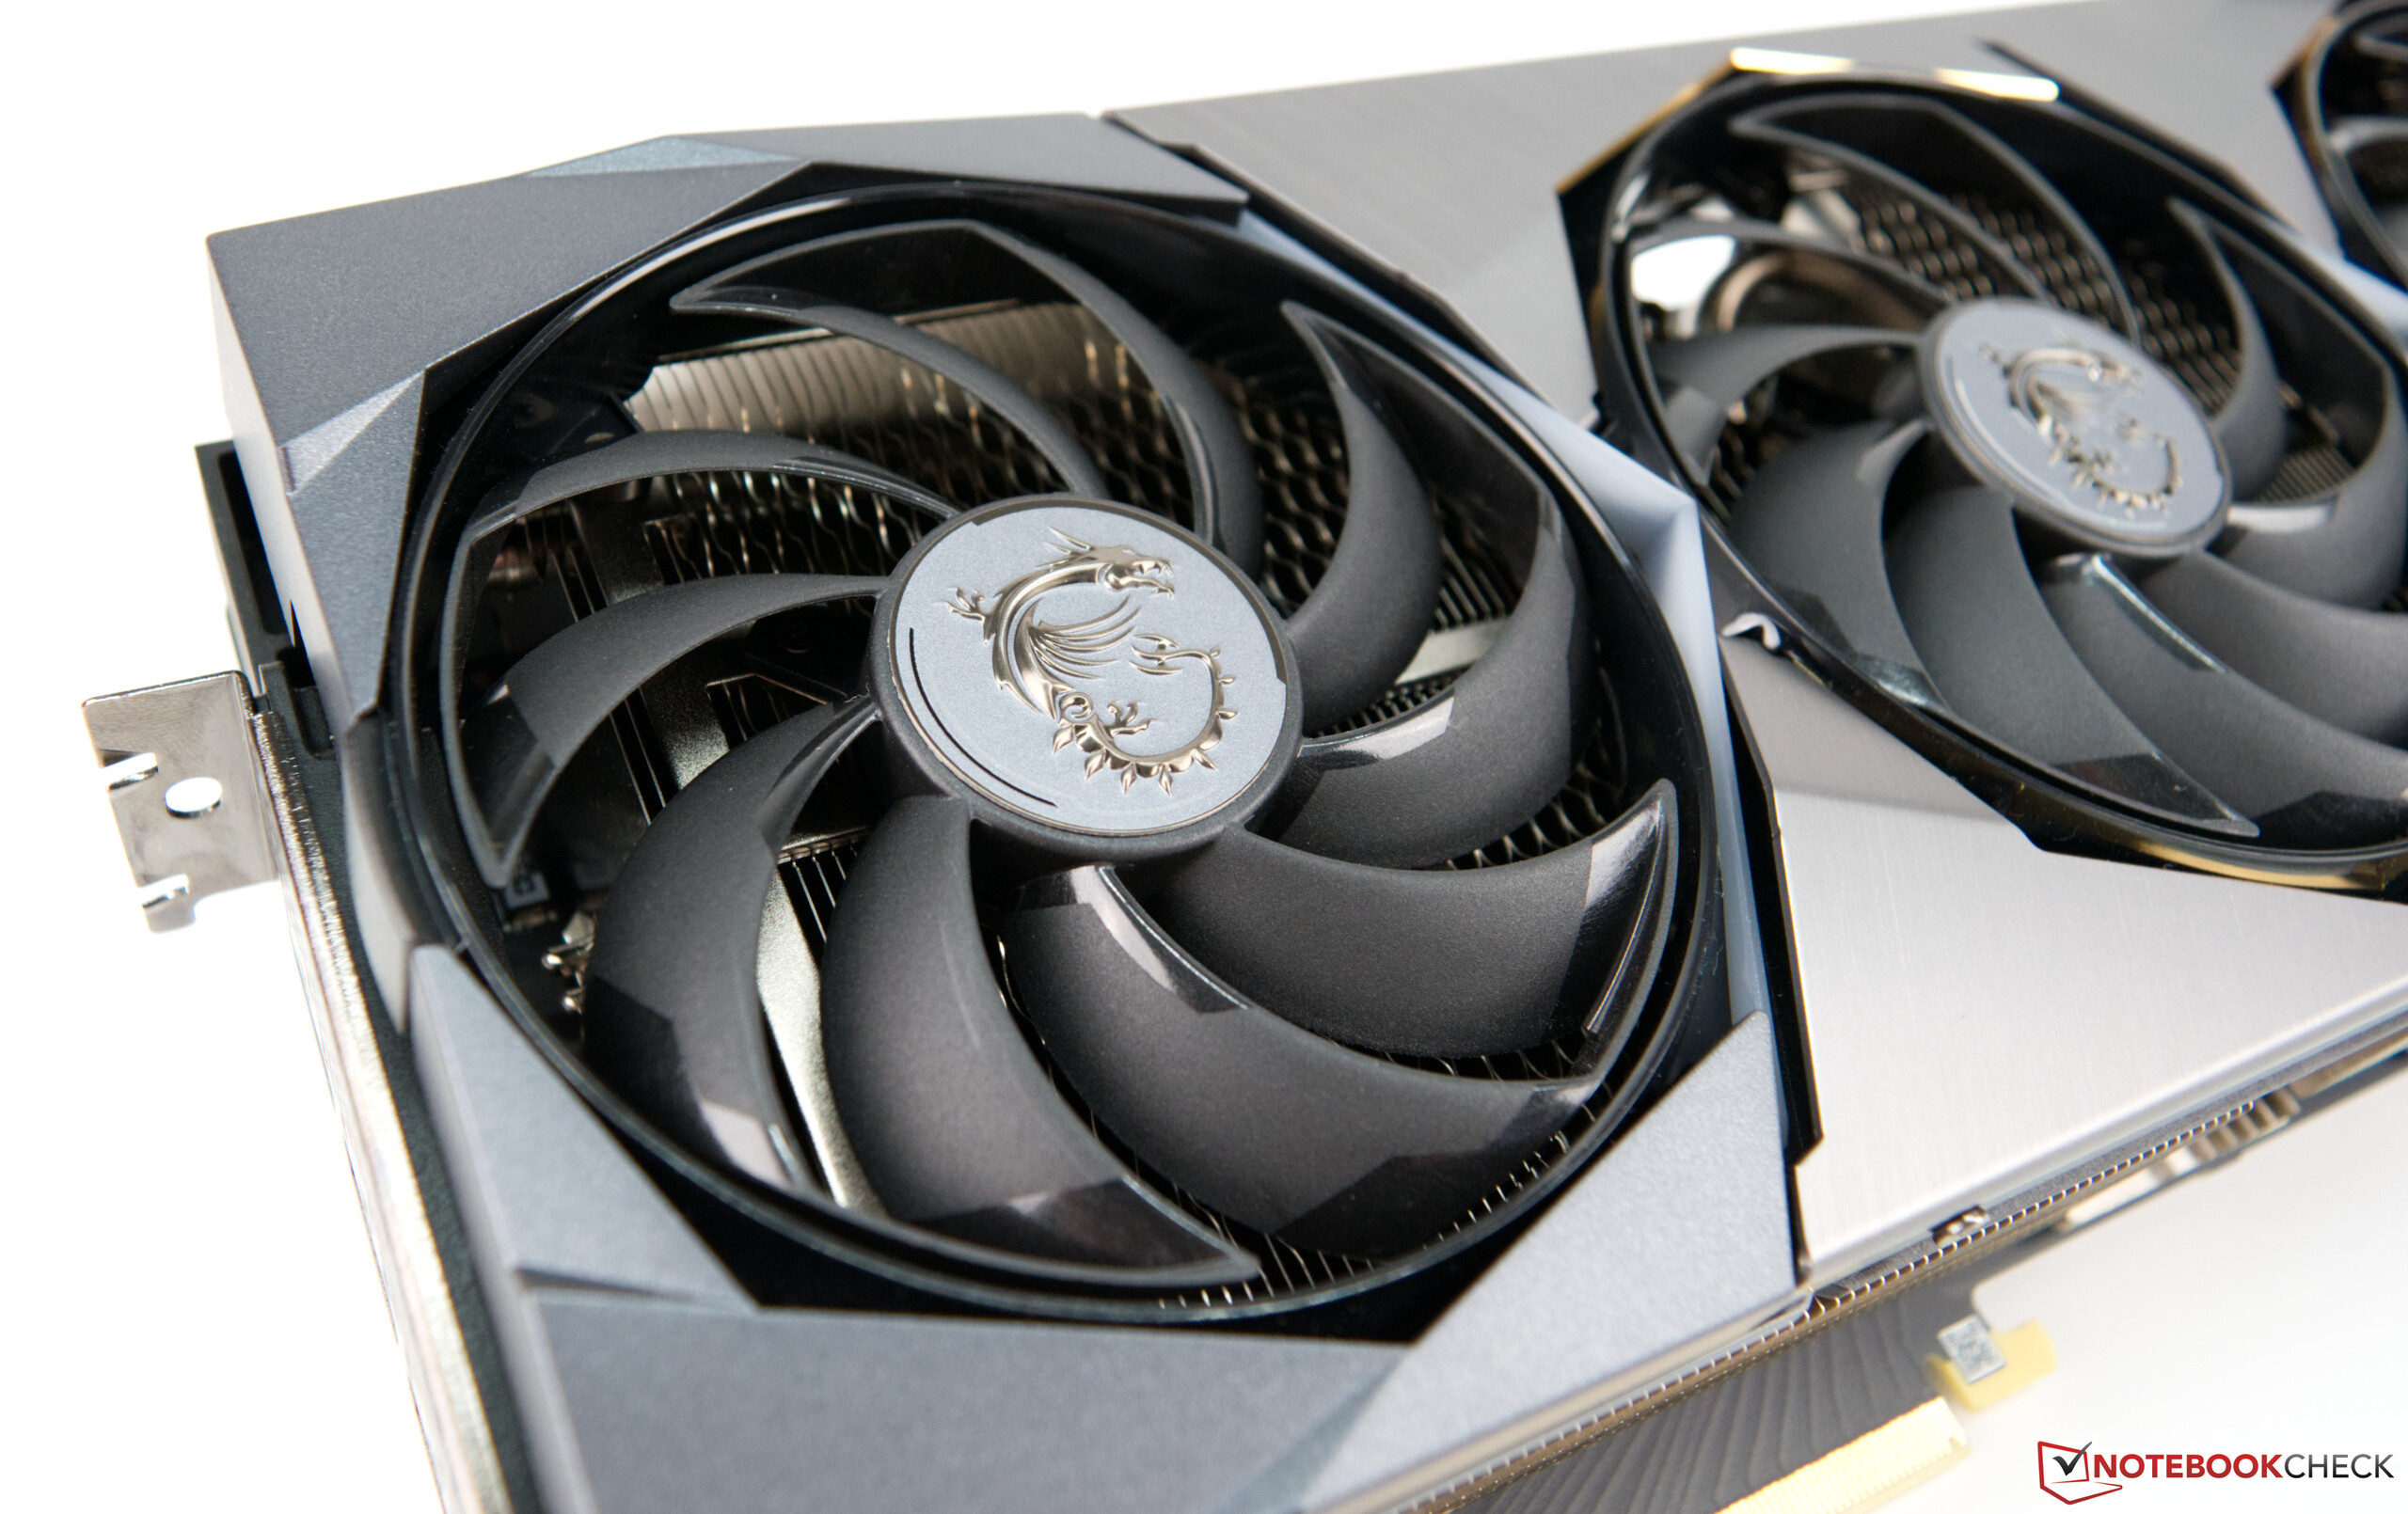
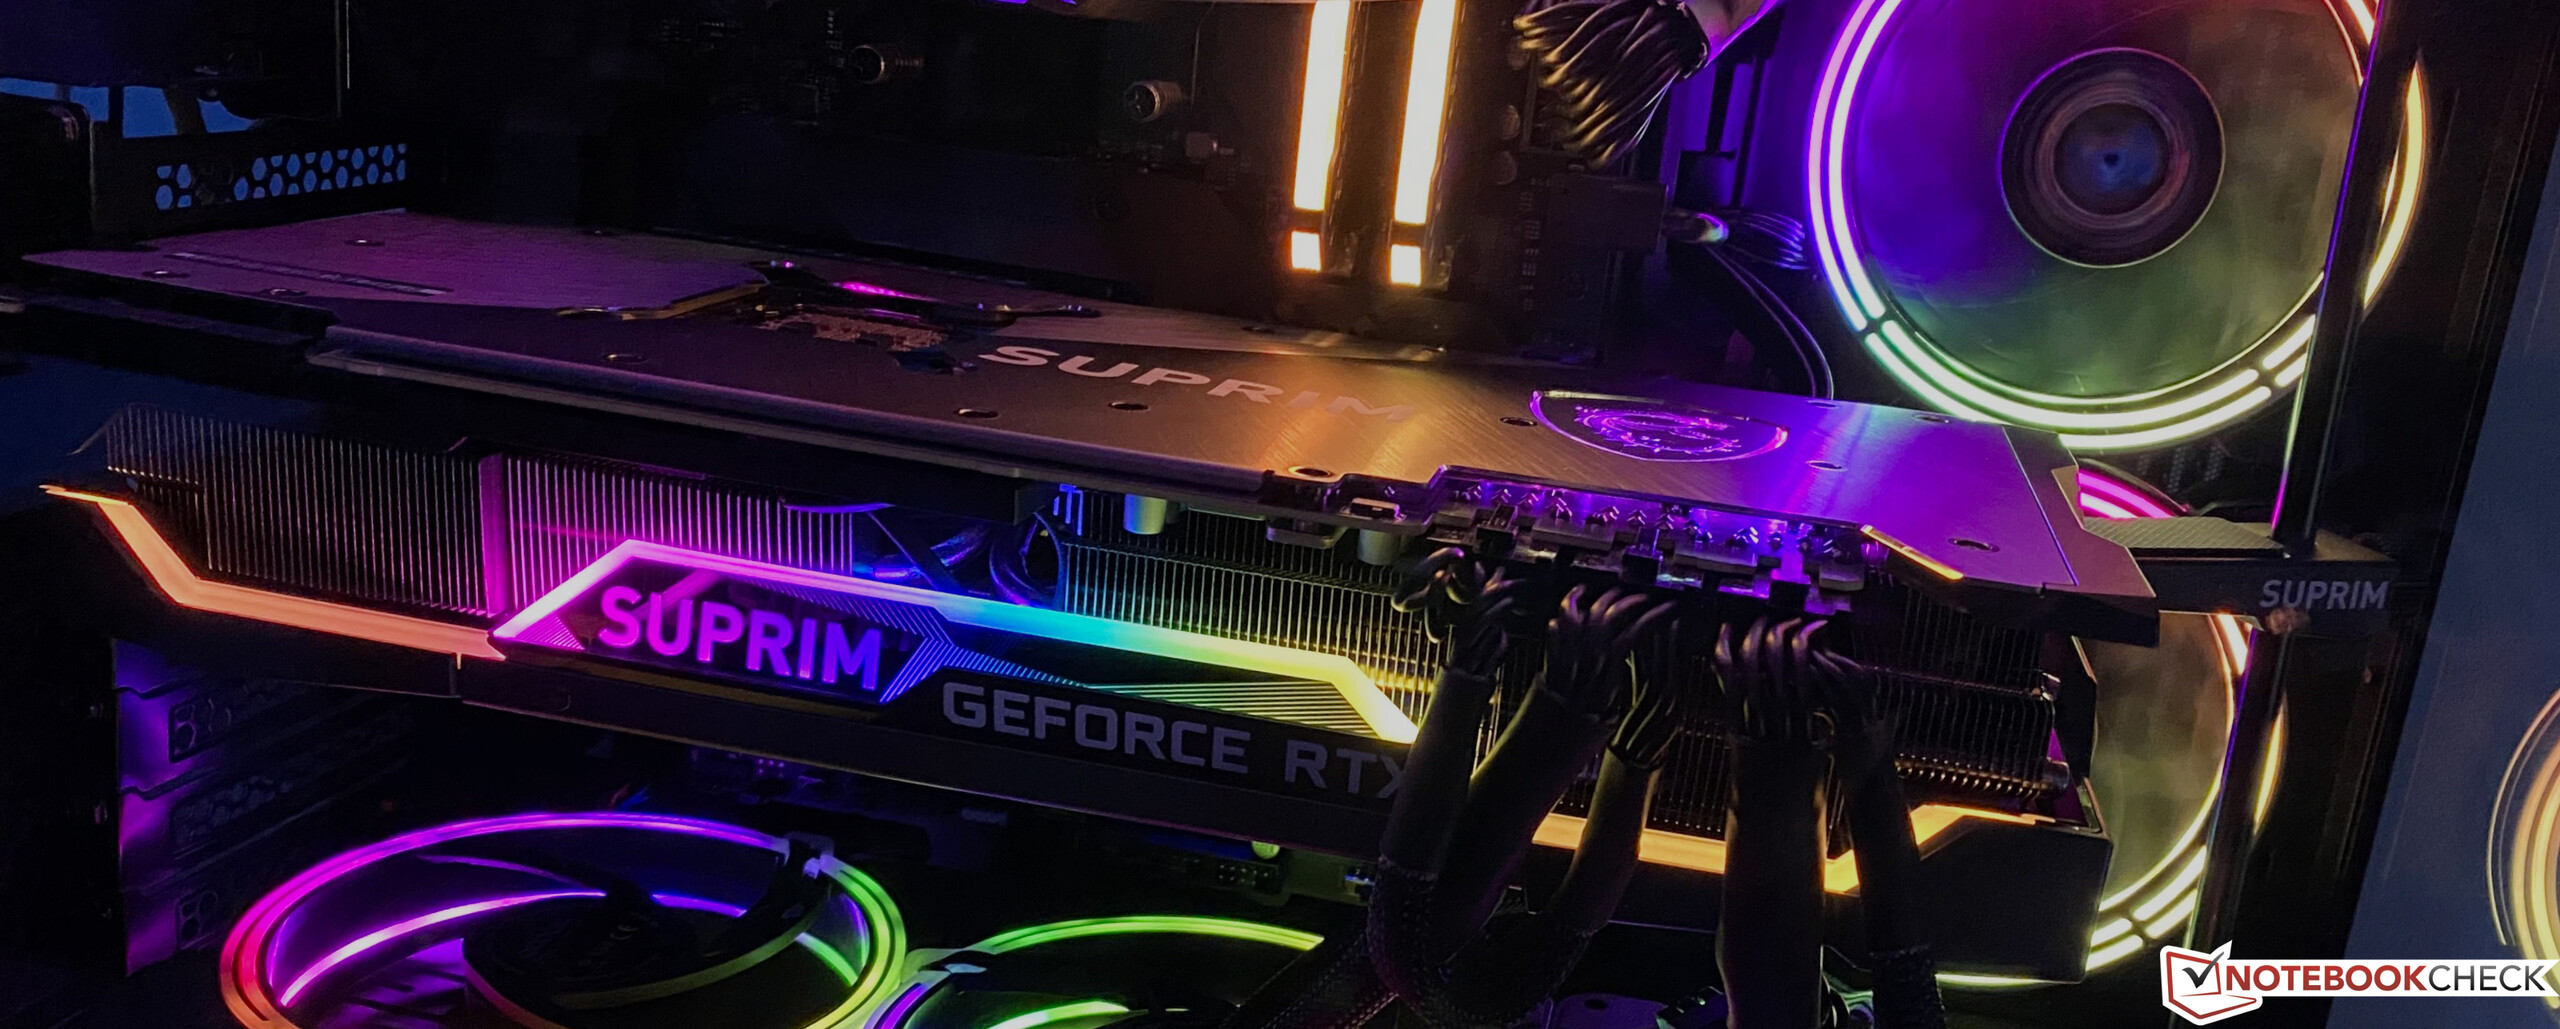
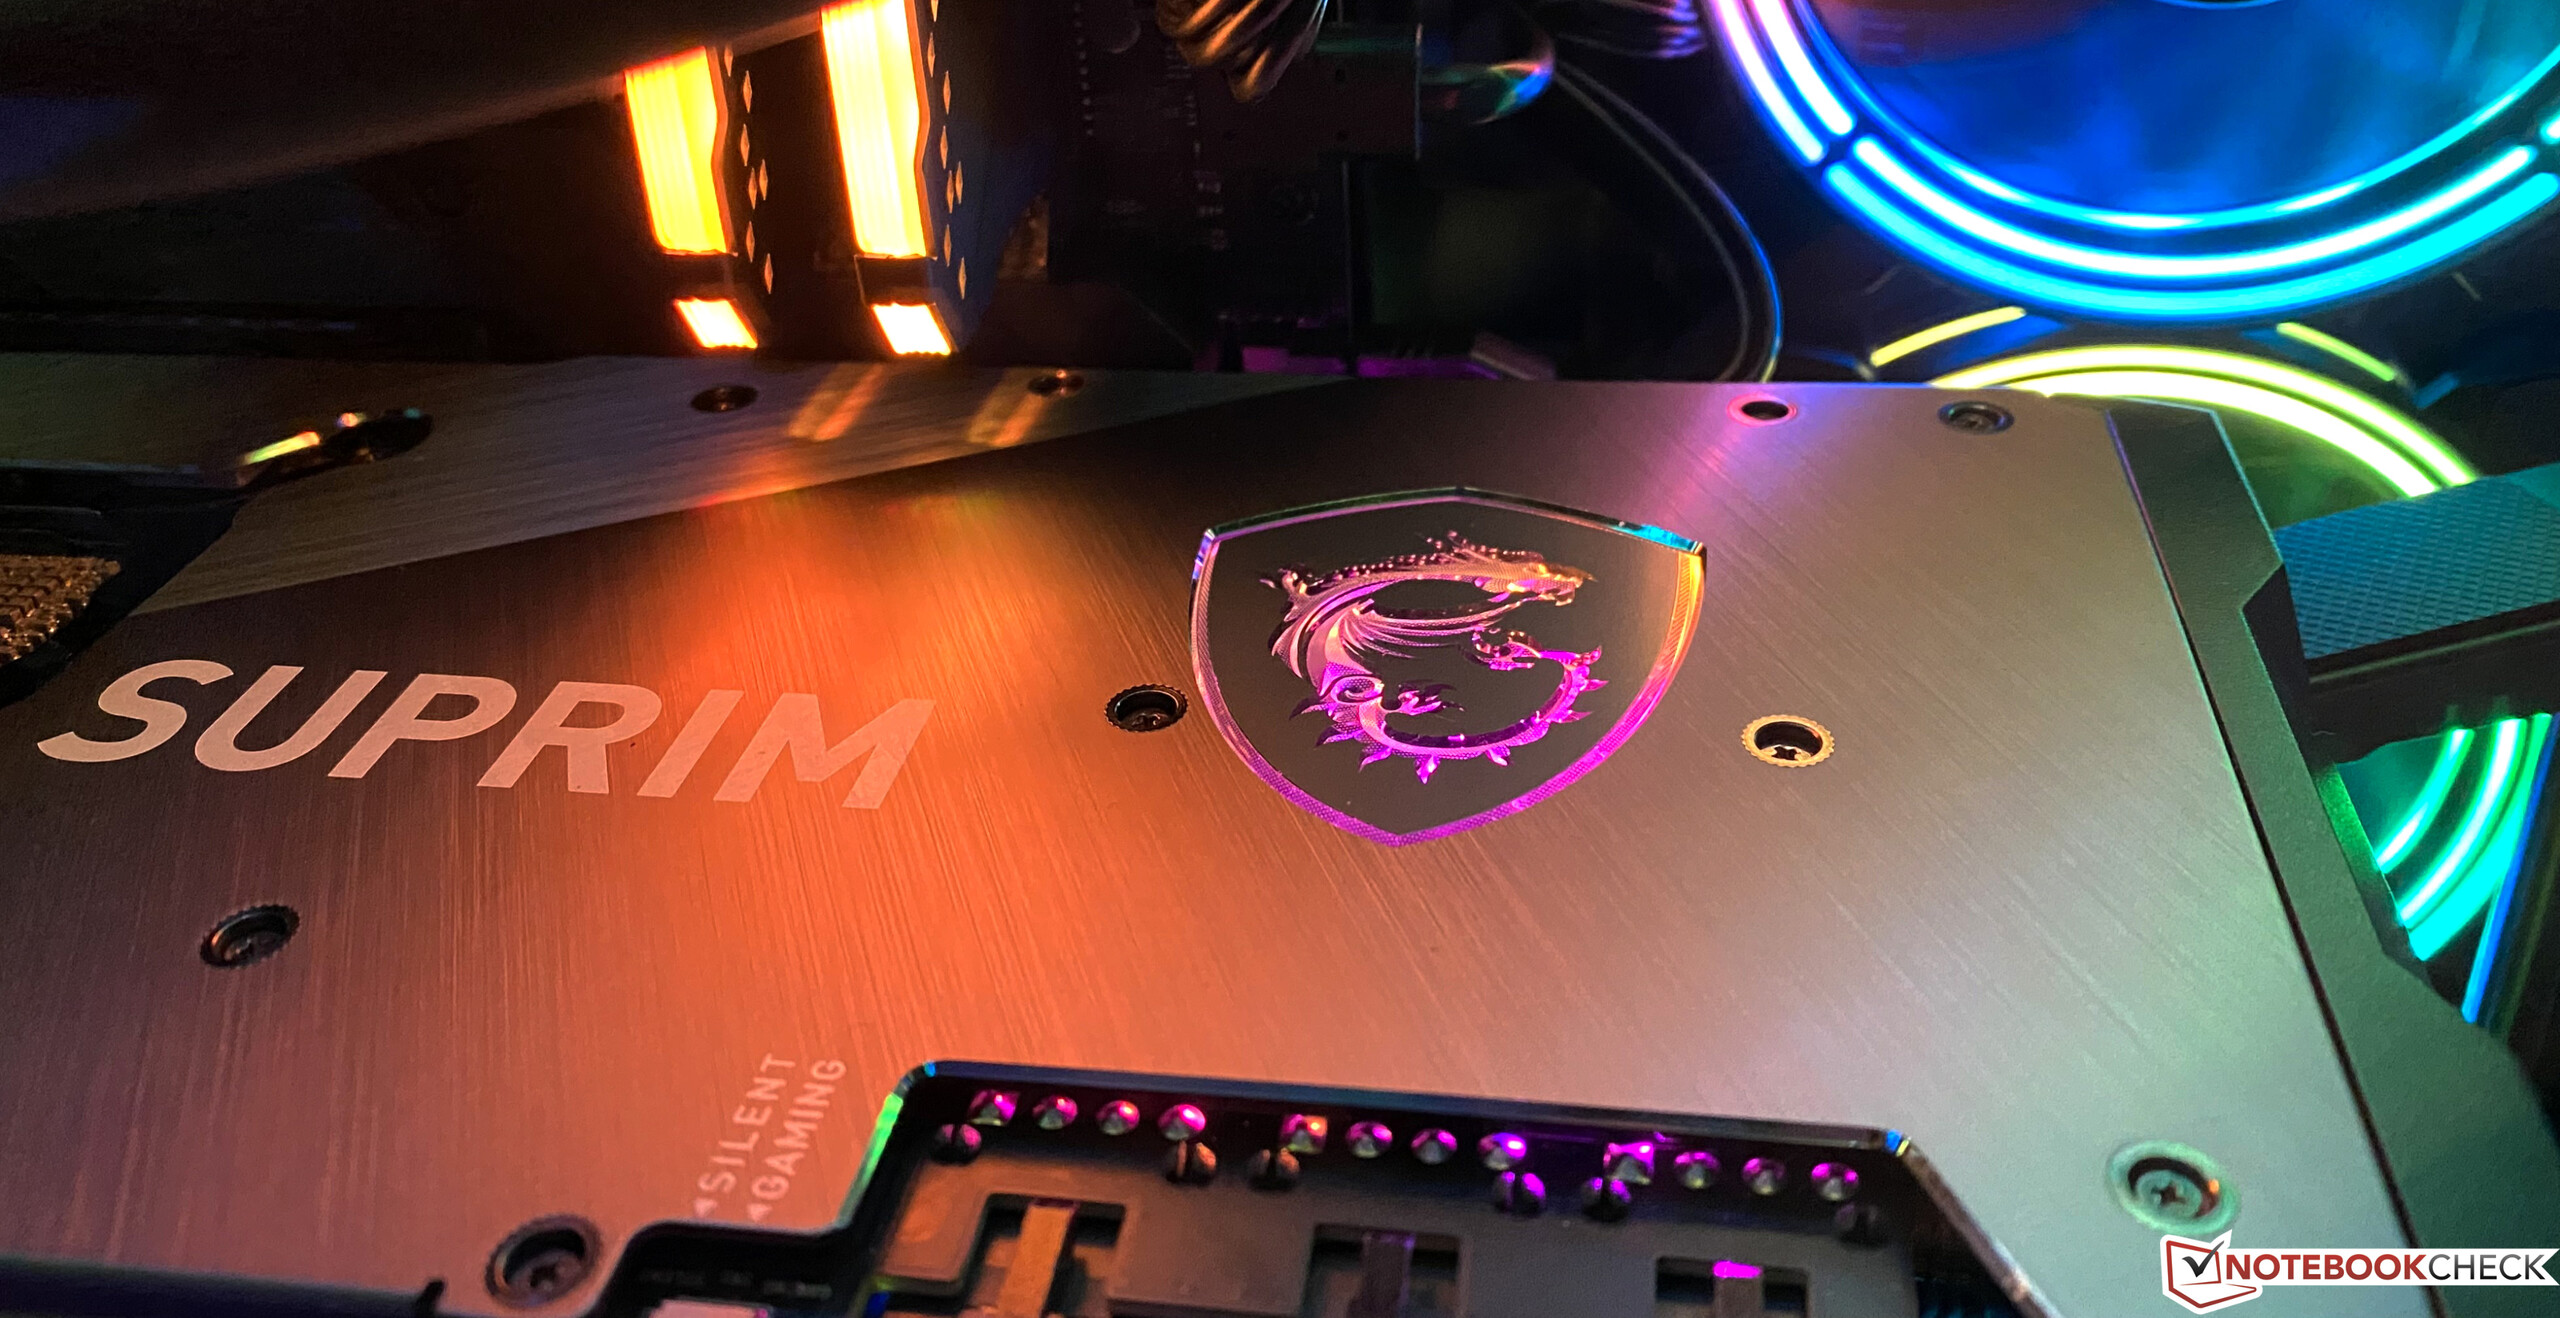
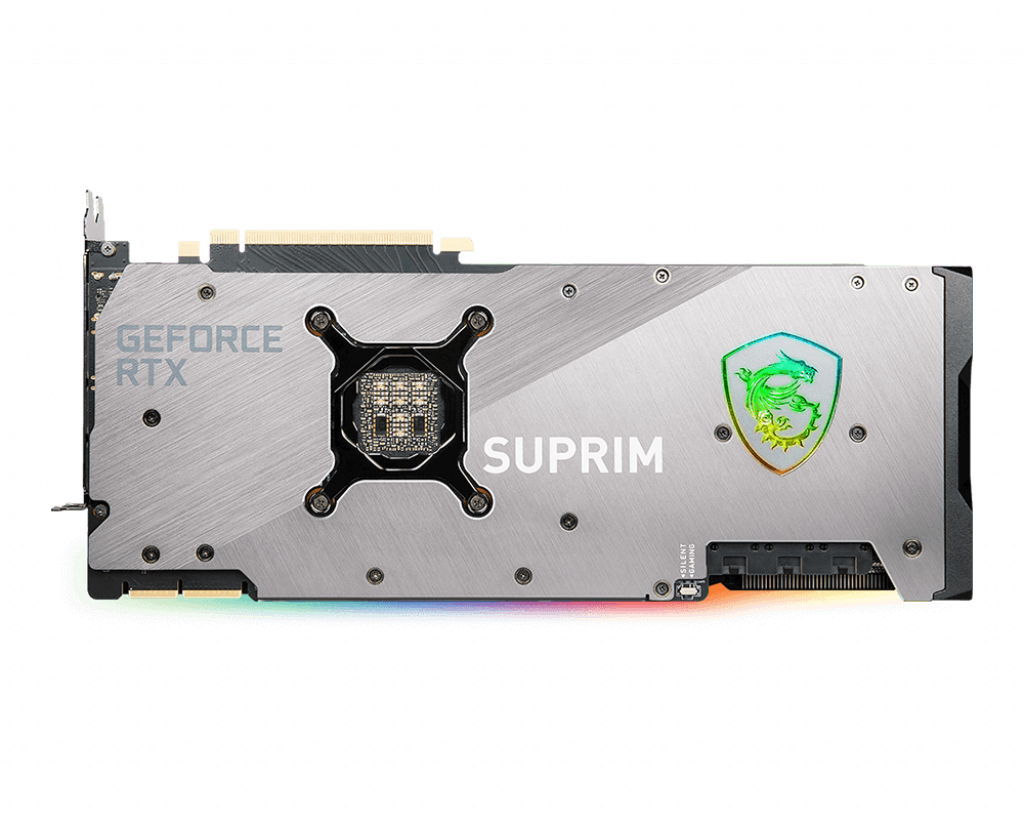
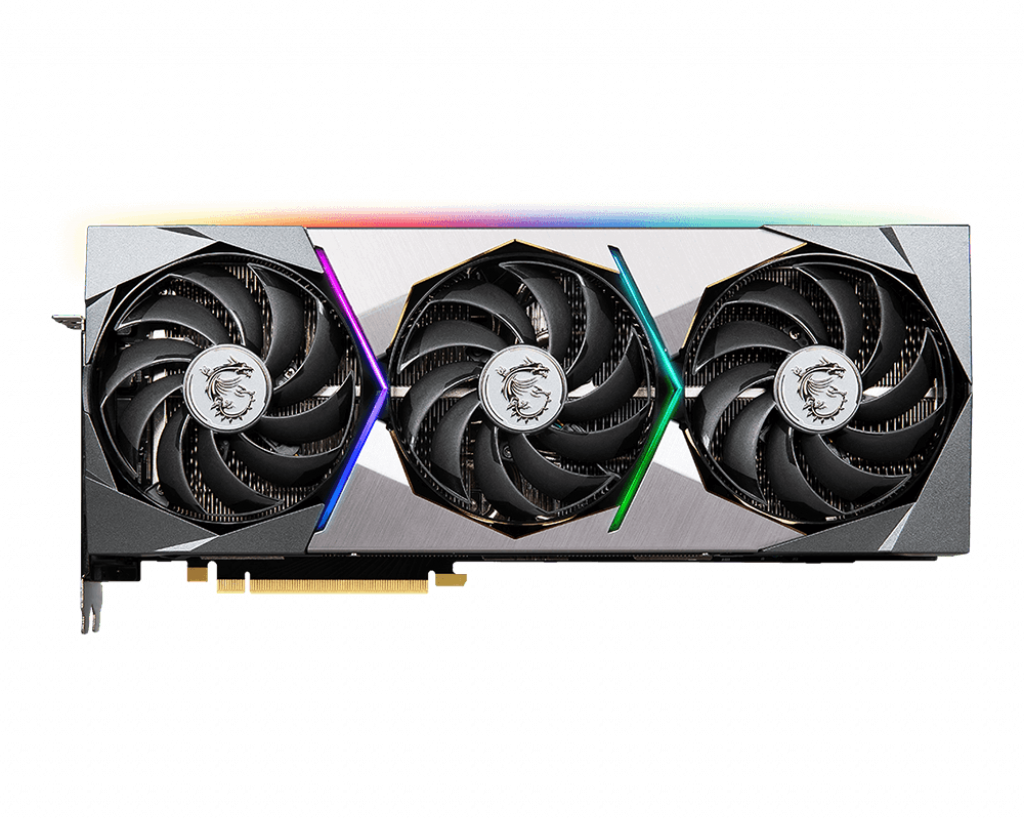
La calidad de construcción del MSI GeForce RTX 3090 Suprim X es muy alta. Esta tarjeta gráfica tiene un aspecto y una sensación de muy alta calidad. La parte delantera y trasera están hechas de aluminio, aunque también hay algunos elementos de plástico en la parte delantera. Sin embargo, estos no arruinan la impresión de alta calidad en absoluto. Un total de siete poderosos tubos de calor distribuyen el calor al enorme disipador de calor, porque los 420 vatios también necesitan ser controlados. Además, siempre se puede contar con iluminación RGB. El MSI GeForce RTX 3090 Suprim X tiene muchos elementos iluminados que literalmente piden una caja con un panel lateral de ventana
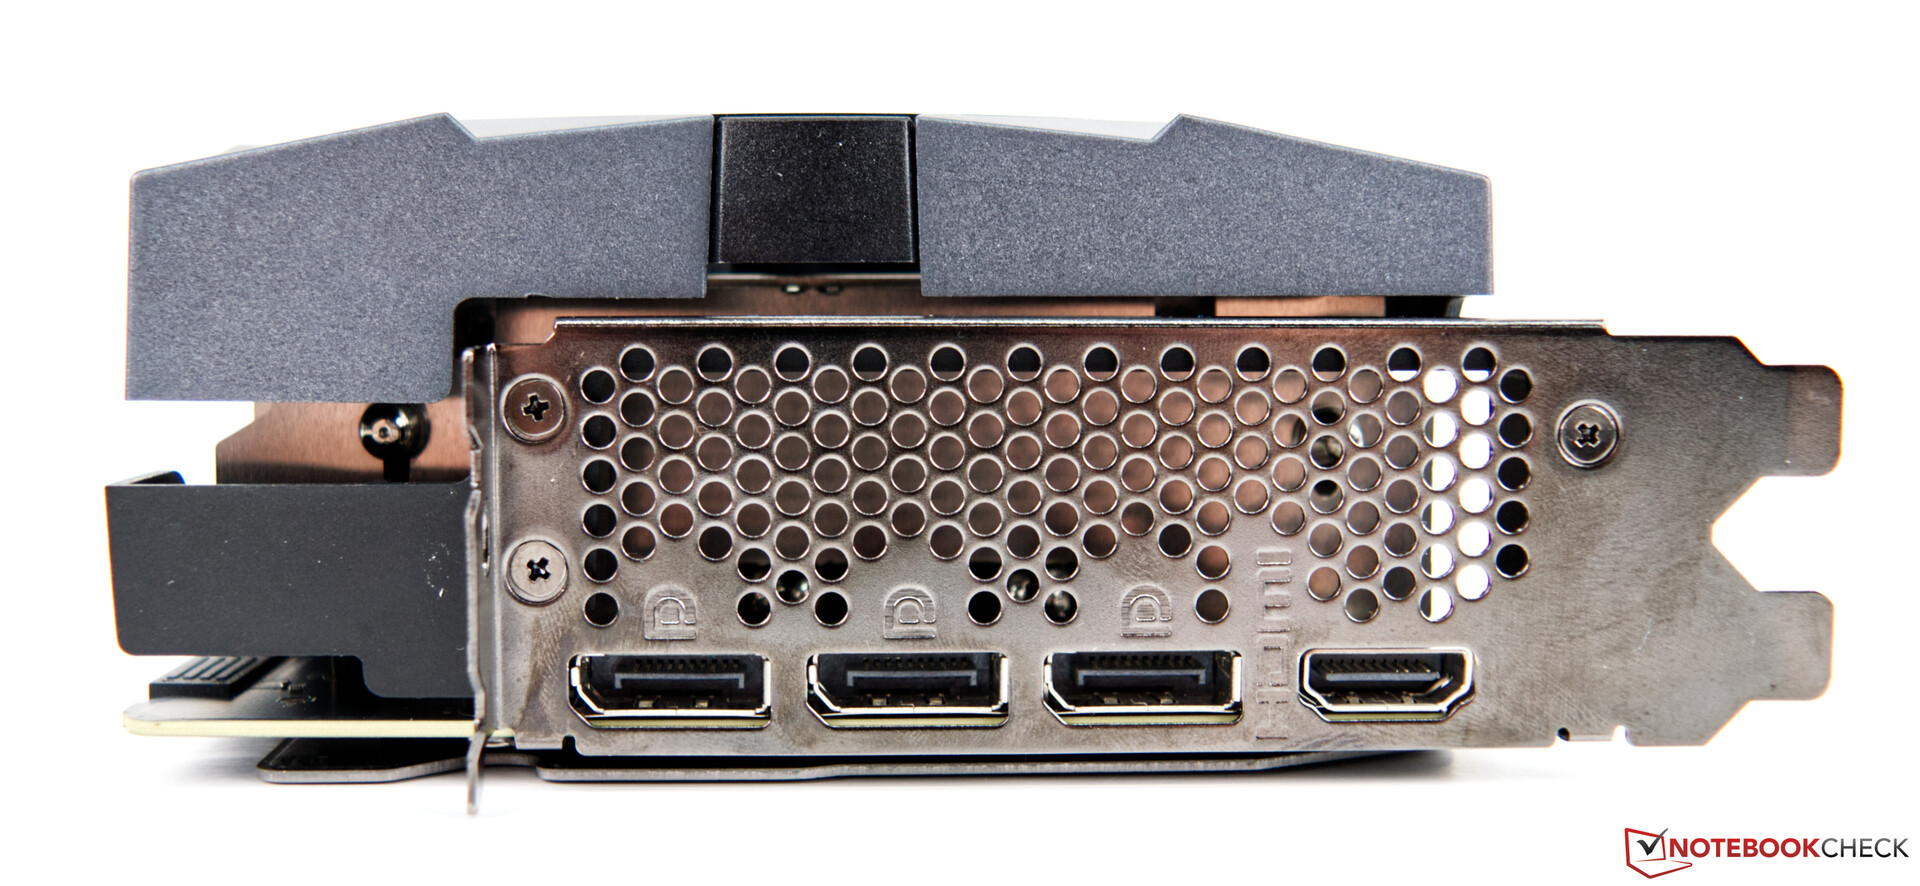
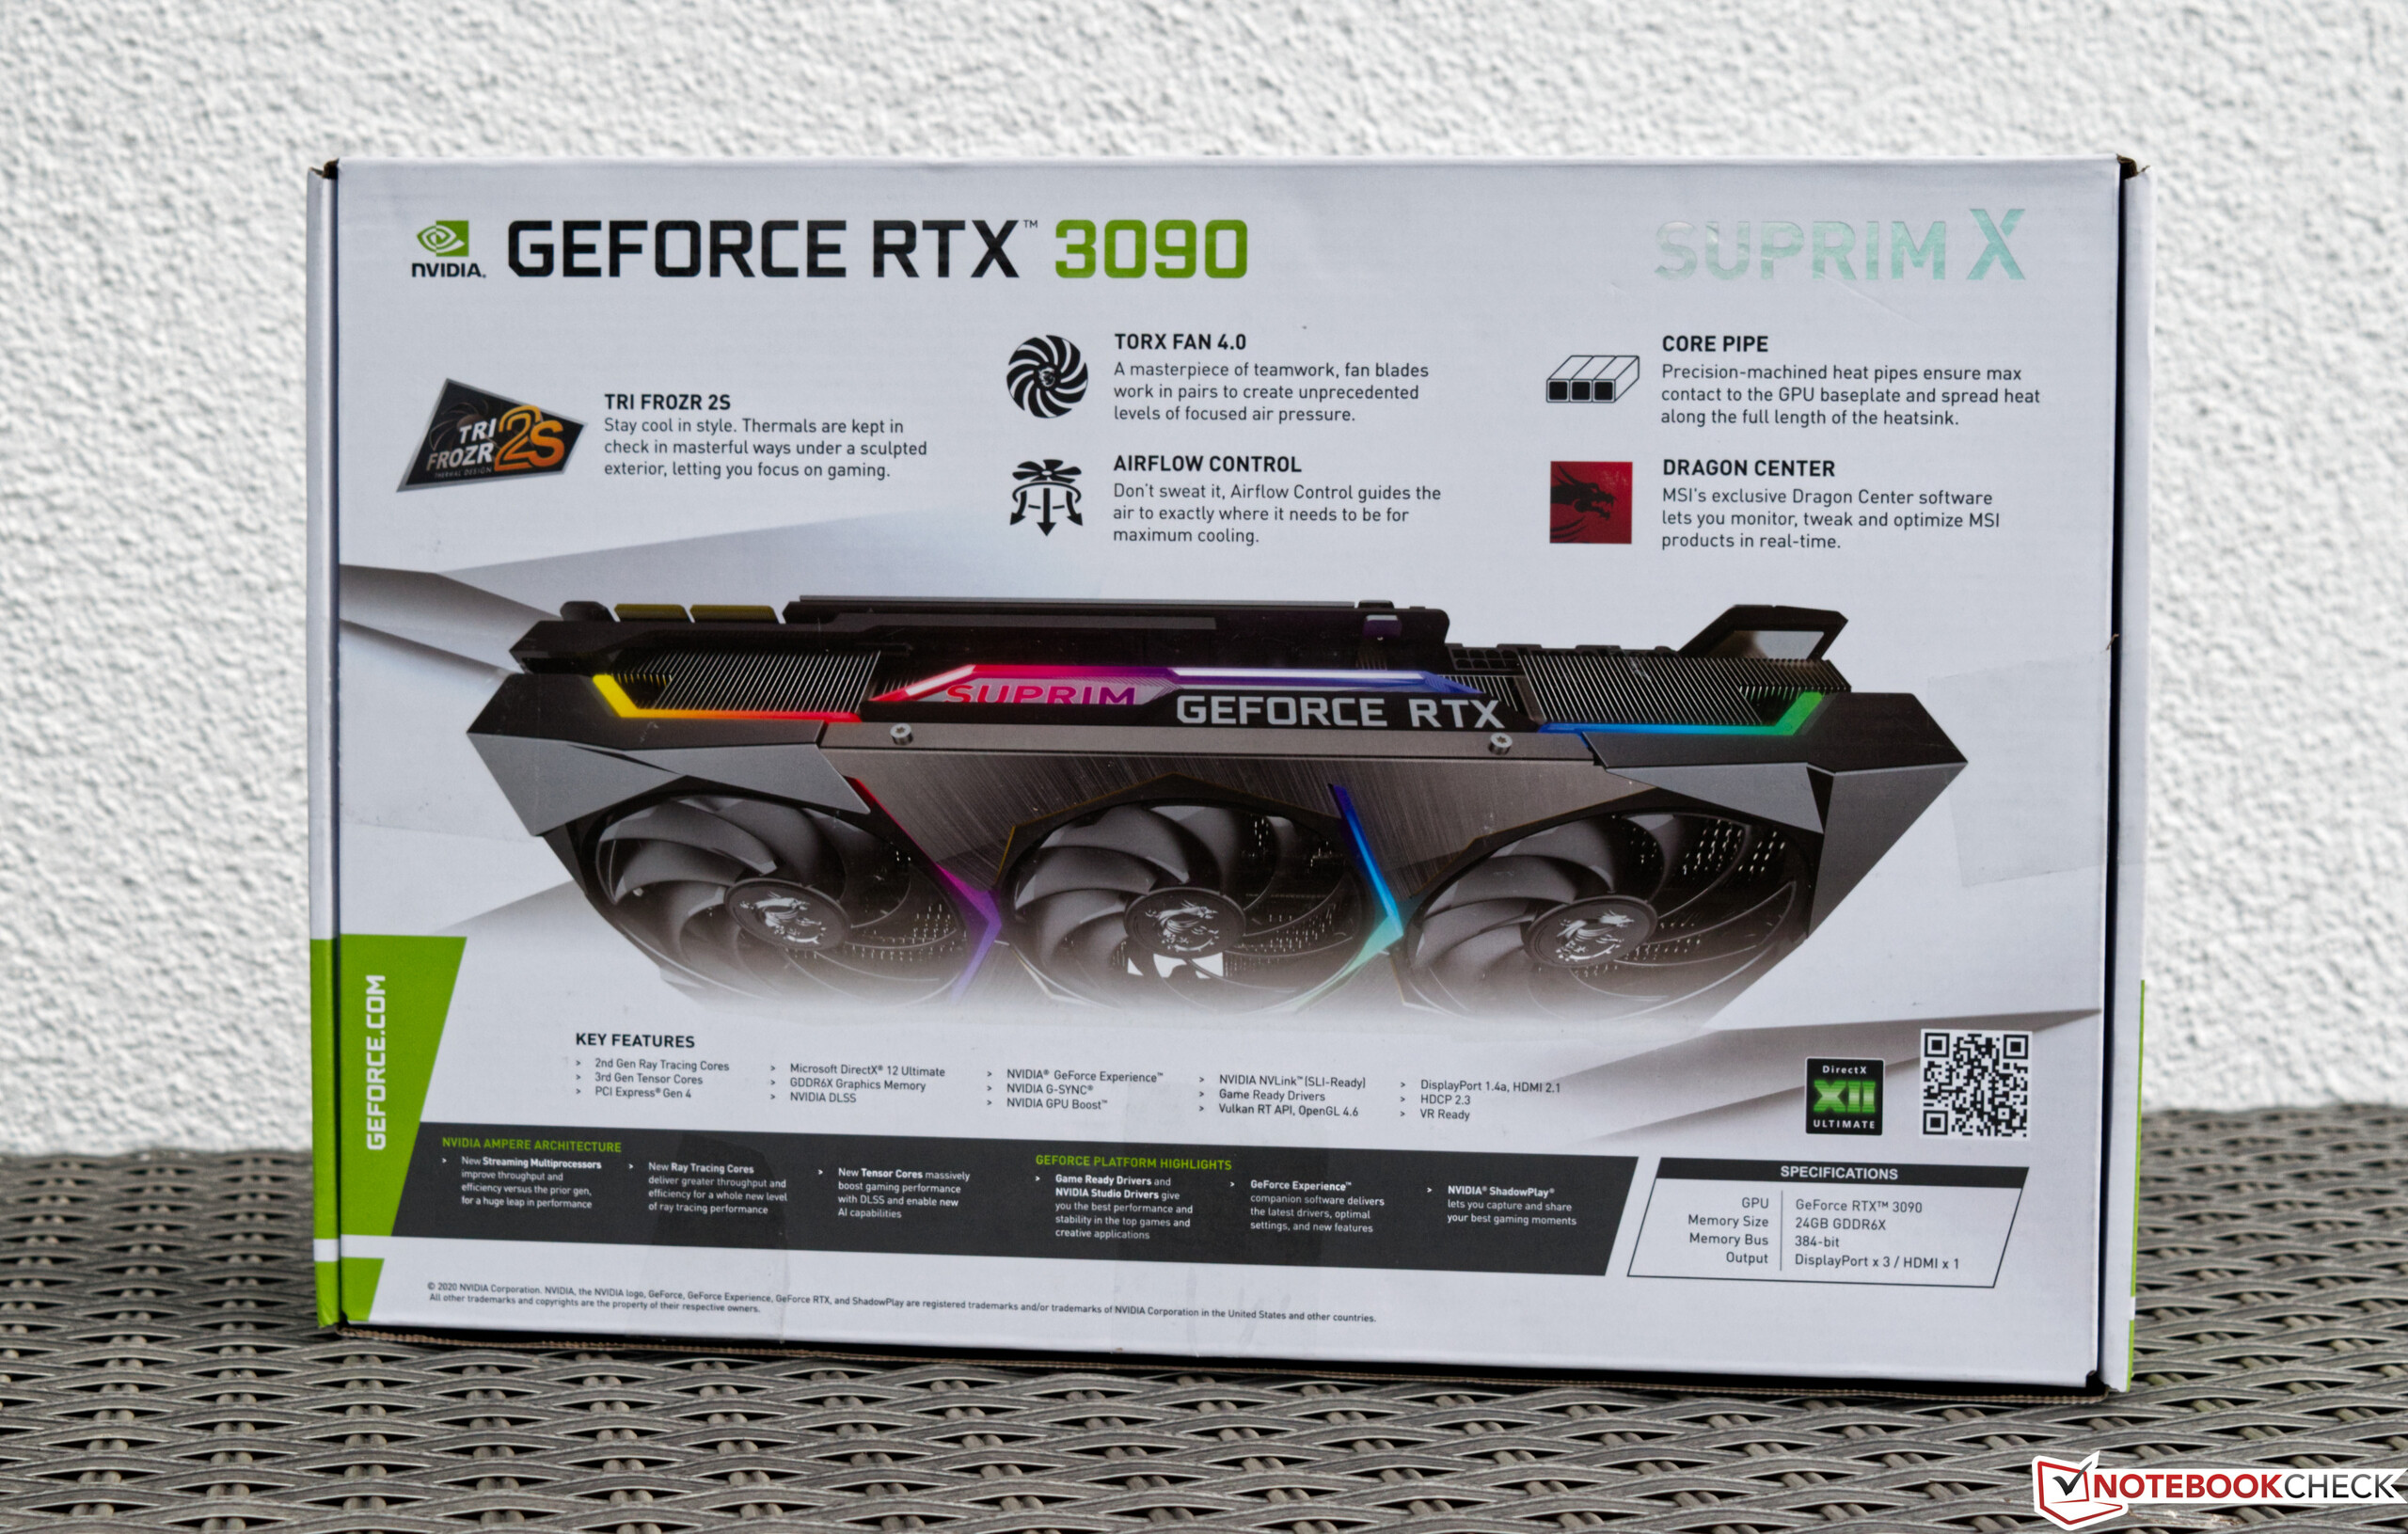
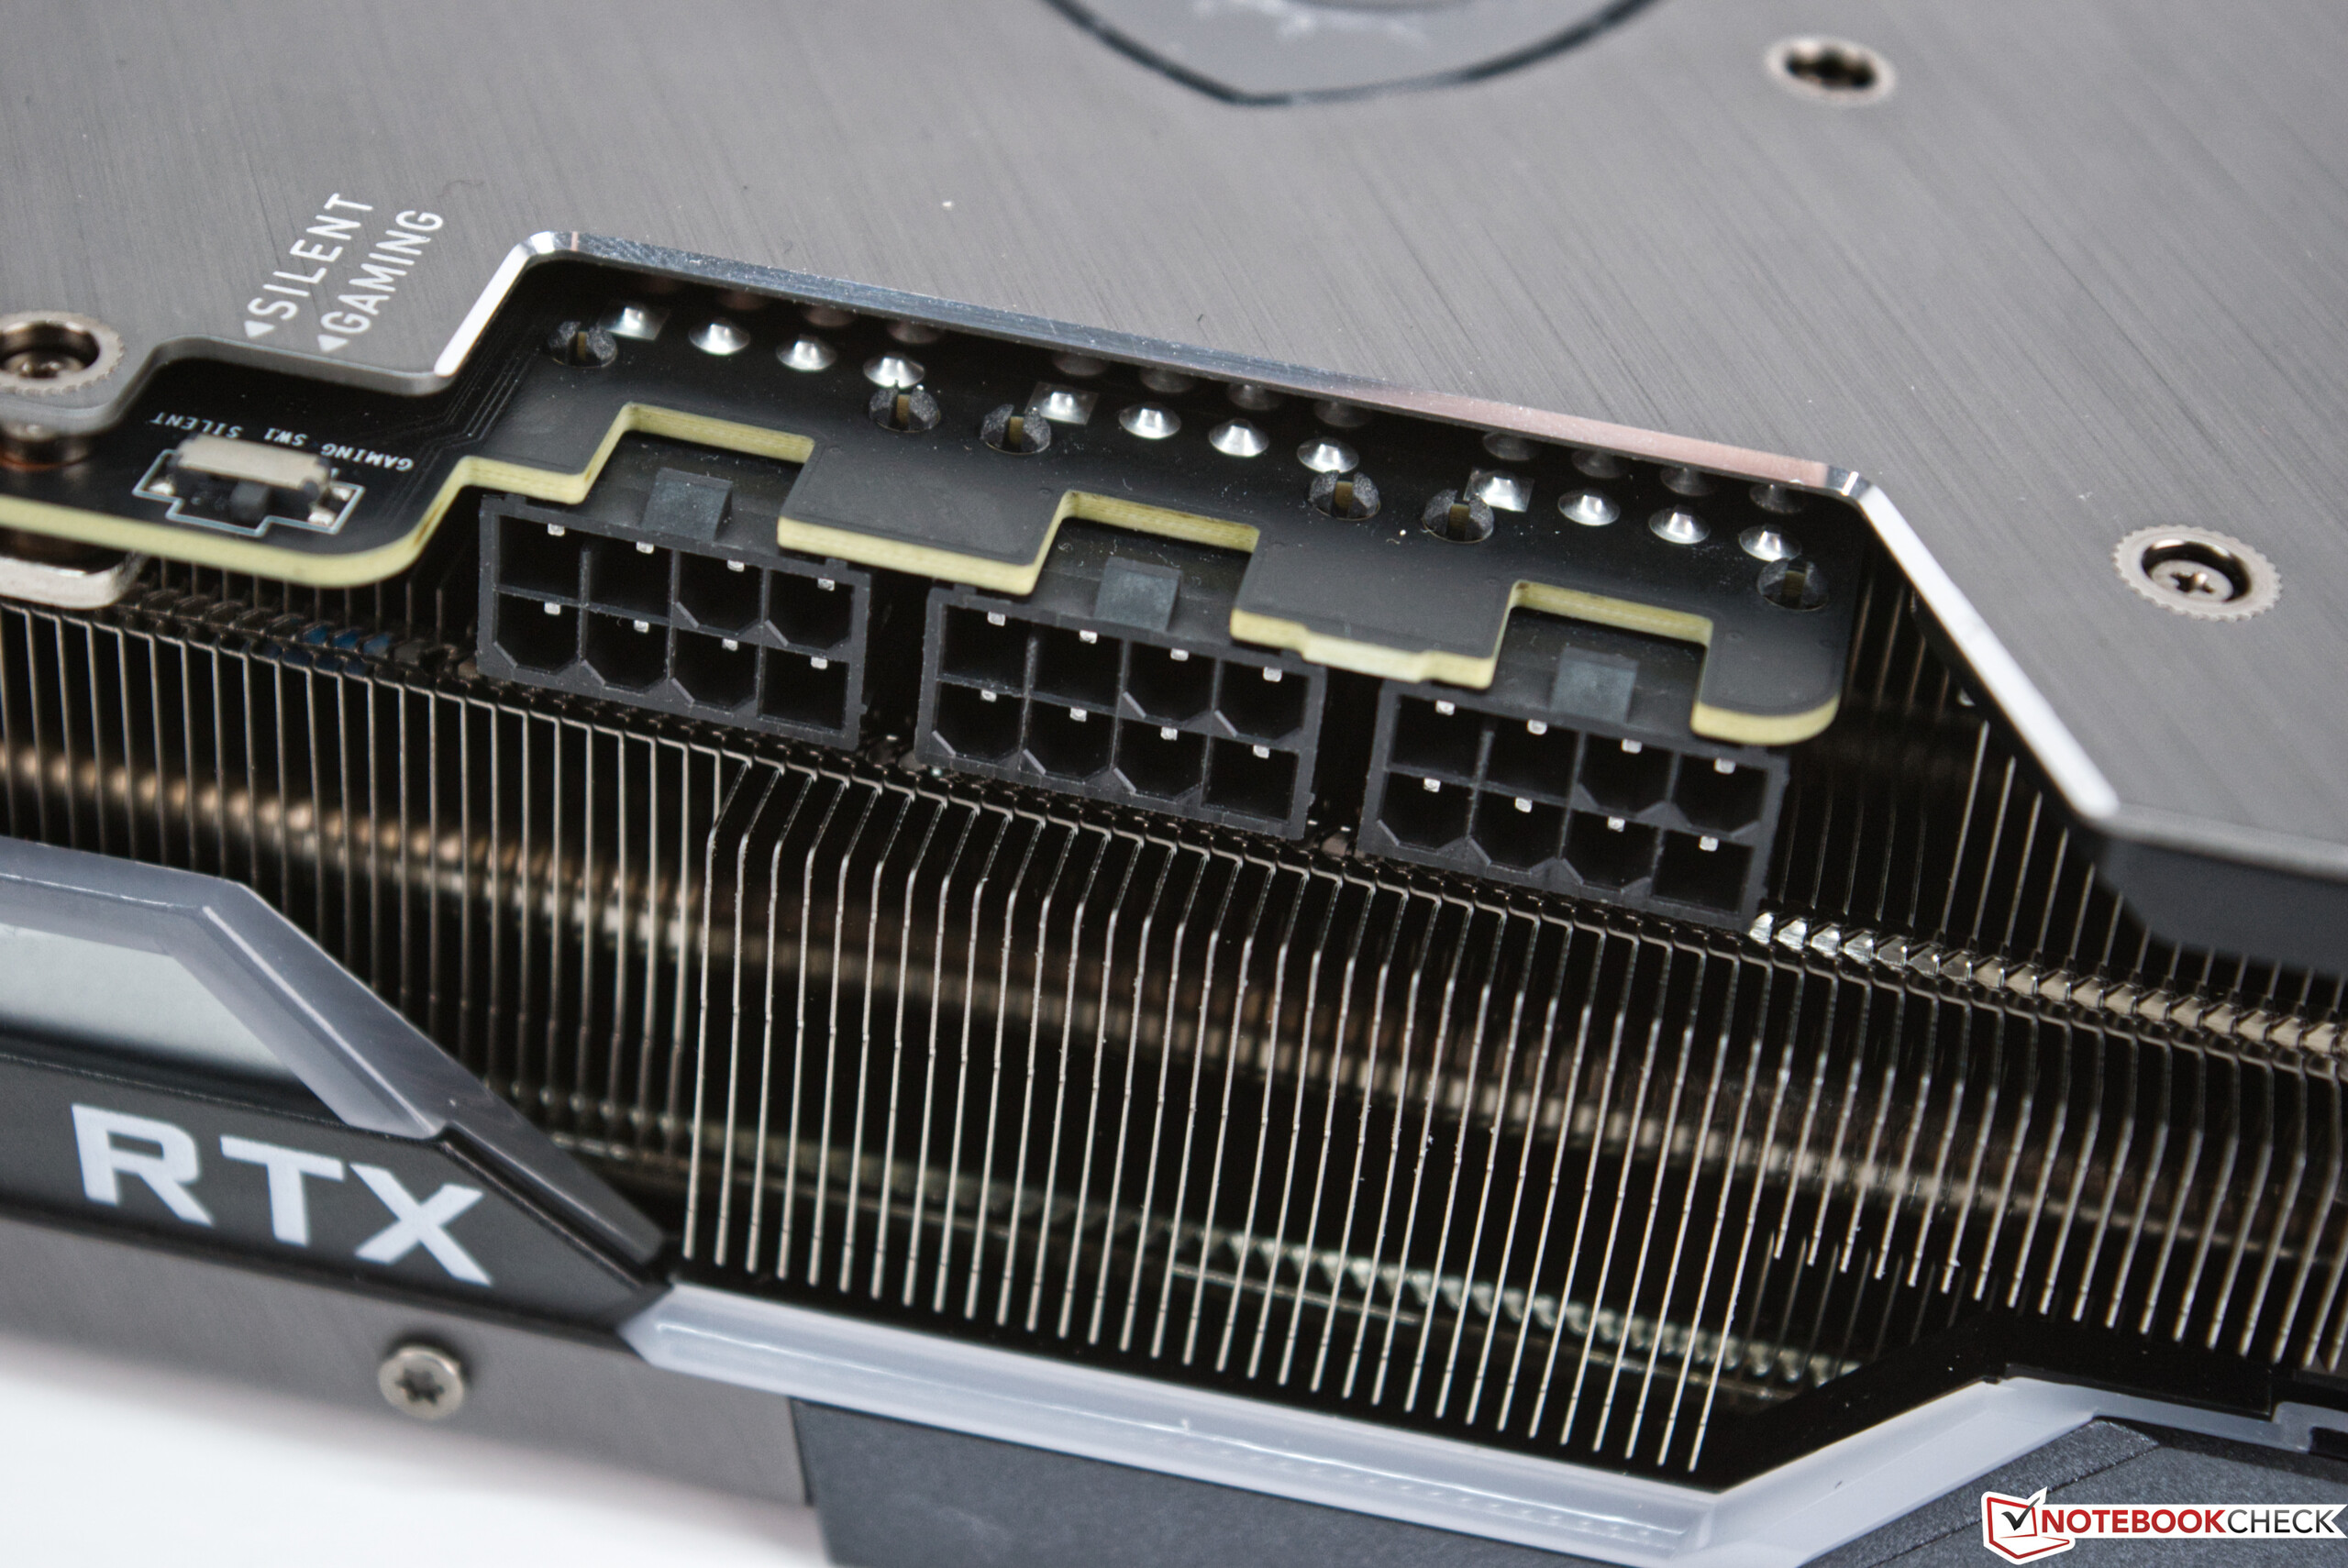
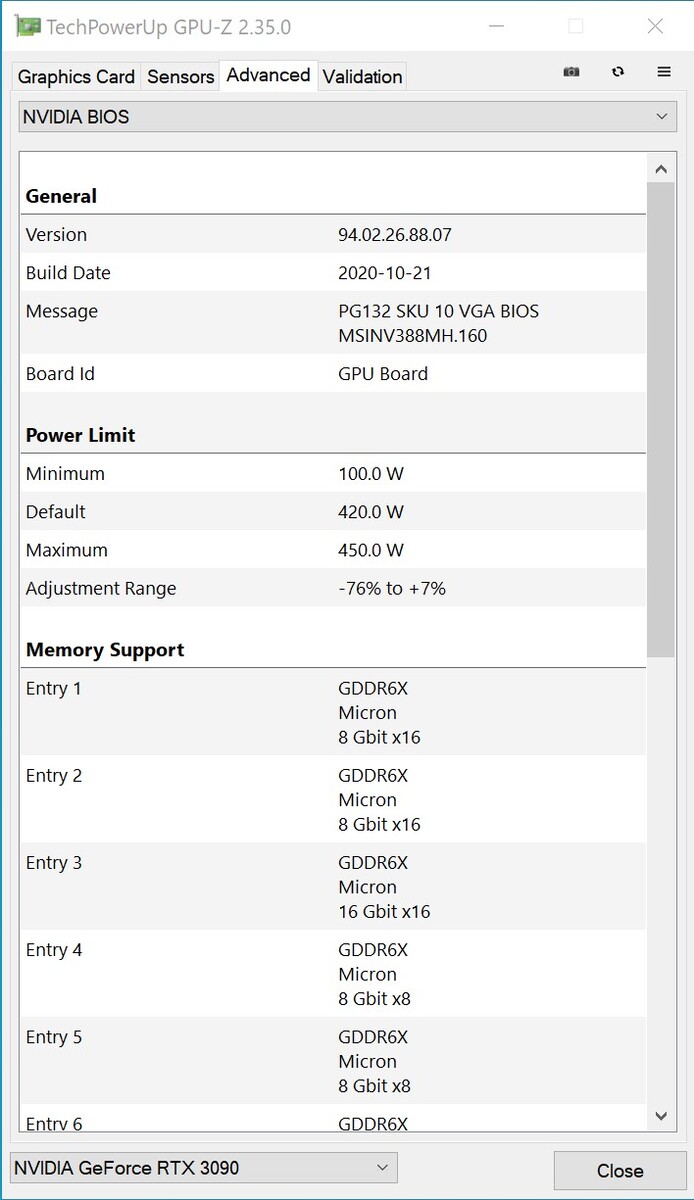
Como ya se ha mencionado, el MSI GeForce RTX 3090 Suprim X está equipado con un BIOS de 420 vatios, lo que significa que el uso de tres conectores de alimentación de 8 pines es inevitable. Externamente, se pueden conectar pantallas de 8K de hasta 60 Hz a través de HDMI gracias al estándar 2.1. Asimismo, 4K a 120 Hz también es posible a través de esta conexión, y esto también se pudo confirmar en la prueba. Además, hay tres conexiones DisplayPort 1.4a.

El MSI GeForce RTX 3090 Suprim X comparado con otras GPU NVIDIA
| Especificaciones -RTX 3090(Suprim X) | RTX 3090 (FE) | RTX 3080 FE | RTX 3070 FE | Titan RTX | TITAN X Pascal | RTX 2080 Ti | RTX 2080 |
| Chip | GA102 | GA102 | GA102 | GA104 | TU102 | GP102 | TU102 |
| El proceso FinFET... 8nm... 8 nm... 8 nm... 12 nm... 16 nm... 12 nm... 12 nm.. | |||||||
| CUDAcores | 10,496 | 10,496 | 8,704 | 5,888 | 4,608 | 3,584 | 4,352 |
| Textureunits | 328 | 328 | 272 | 184 | 288 | 224 | 272 |
| Tensor cores | 328 3ª Gen. | 328 3ª Gen. | 272 3ª Gen. | 184 3ª Gen. | 576 2ª Gen. | - | 544 2ª Gen. |
| RTcores | 82 | 82 | 68 | 46 | 72 | - | 68 |
| Reloj base de la GPU 1.395 MHz 1.395 MHz 1.440 MHz 1.500 MHz 1.350 MHz 1.417 MHz 1.350 MHz 1.515 MHz | |||||||
| Reloj de aumento de la GPU 1.860 MHz 1.695 MHz 1.710 MHz 1.750 MHz 1.770 MHz 1.531 MHz 1.545 MHz 1.710 MHz | |||||||
| Memorybus | 384-bit | 384-bit | 320-bit | 256-bit | 384-bit | 384-bit | 352-bit |
| Anchura de banda de la memoria | 936GB/s | 936 GB/s | 760 GB/s | 448 GB/s | 672 GB/s | 480,4 GB/s | 616 GB/s |
| Memoria de vídeo | 24 GBGDDR6X | 24 GB GDDR6X | 10 GB GDDR6X | 8 GB GDDR6 | 24 GB GDDR6 | 12 GB GDDR5X | 11 GB GDDR6 |
| Consumo de energía... 420W... 350 W... 320 W... 220 W... 280 W... 250 W... 250 W... 215 W.. |
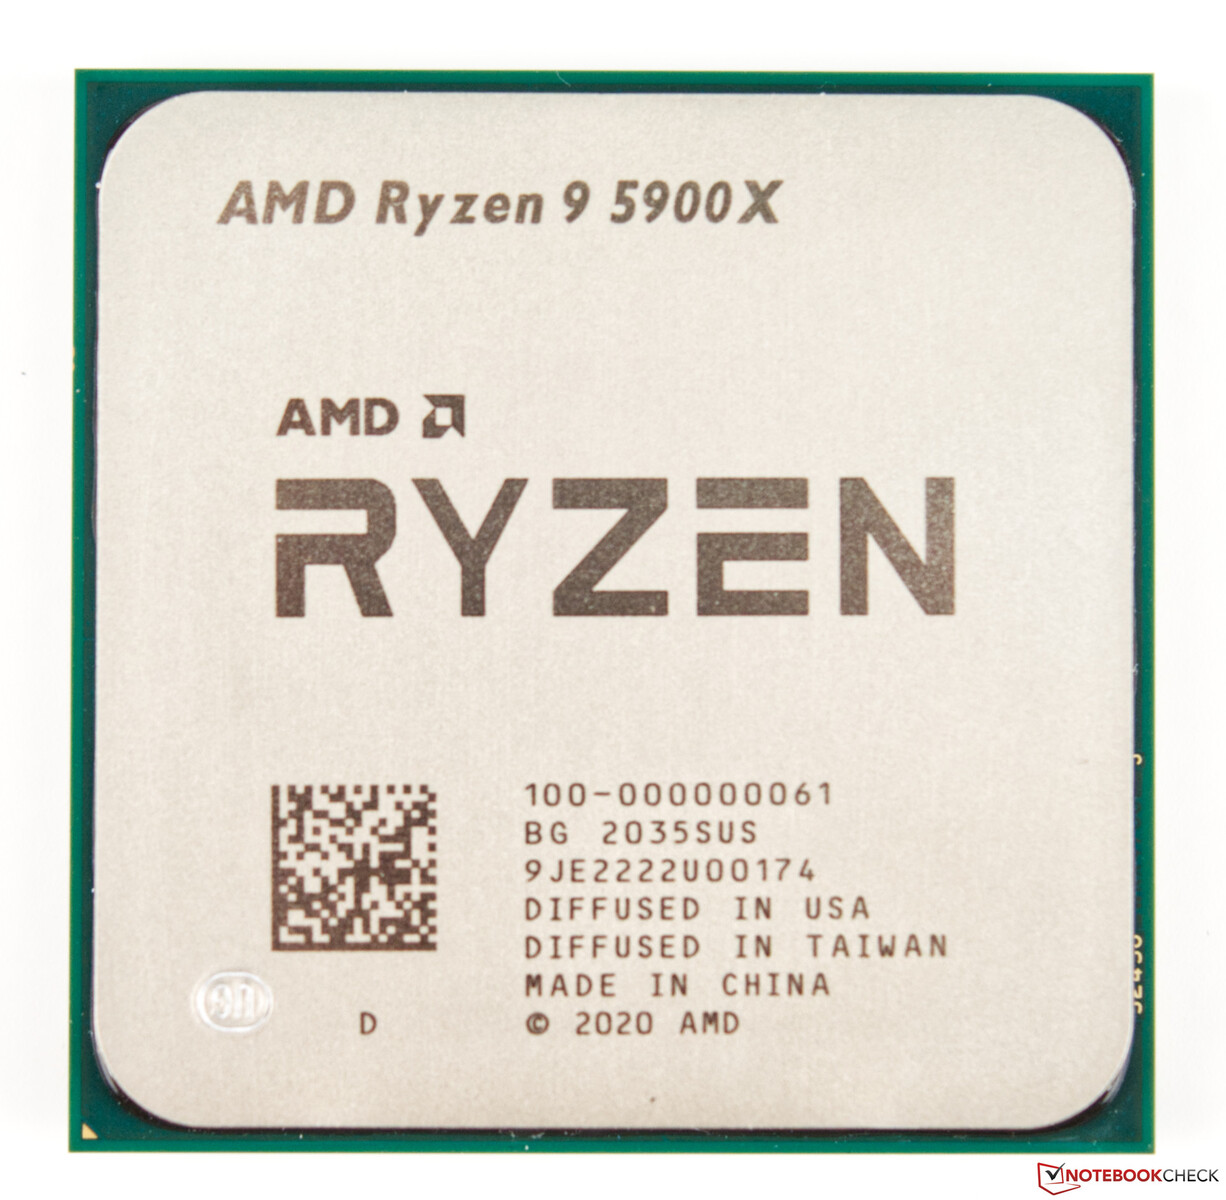
Nuestro sistema de pruebas con el AMD Ryzen 9 5900X como base
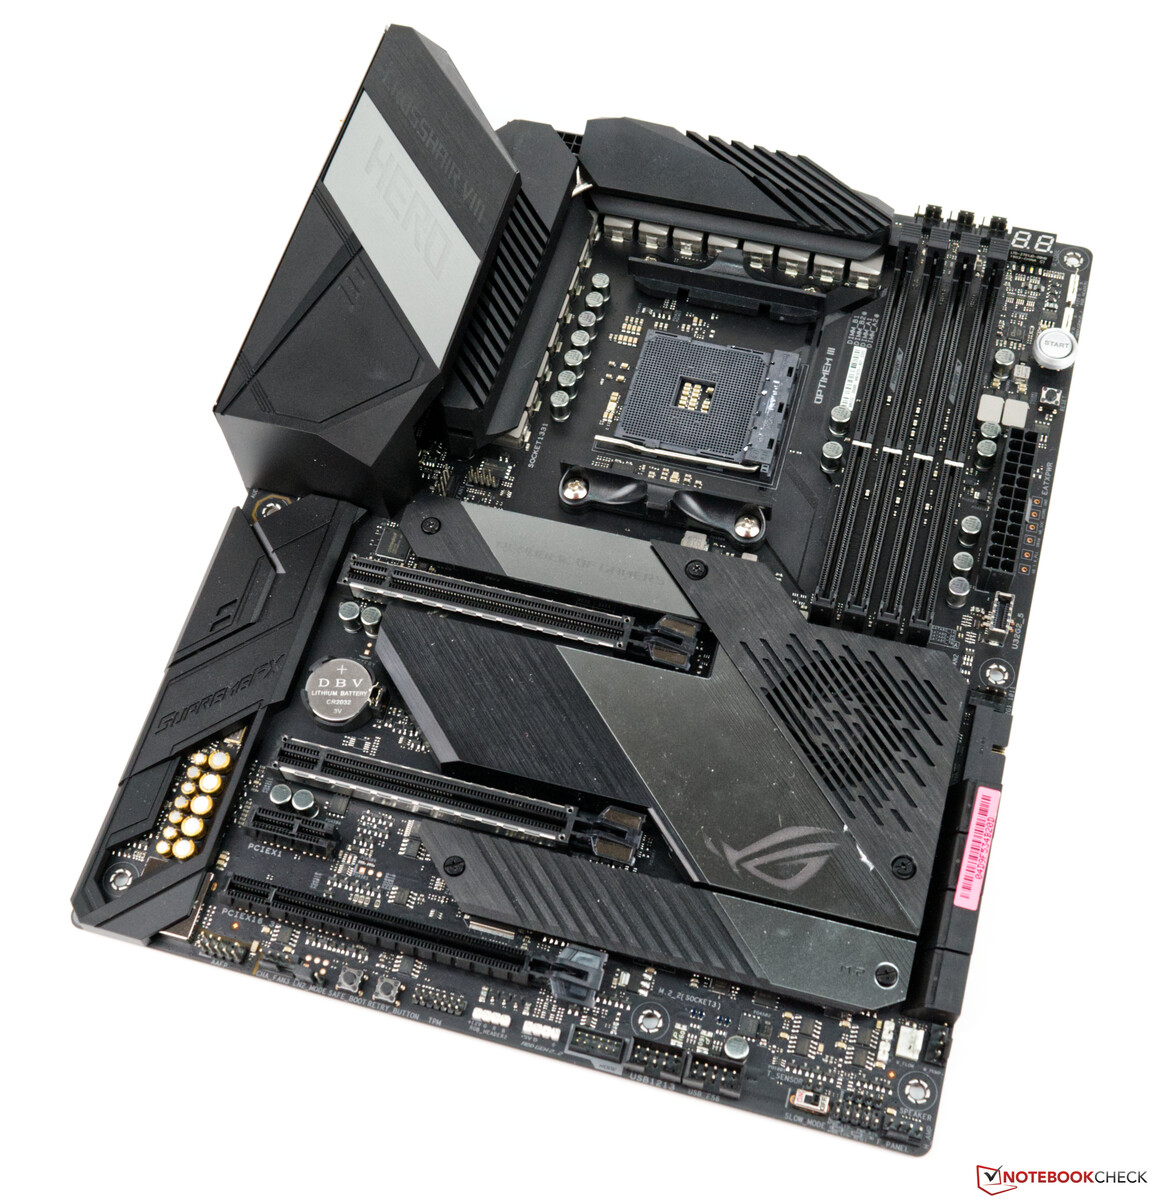
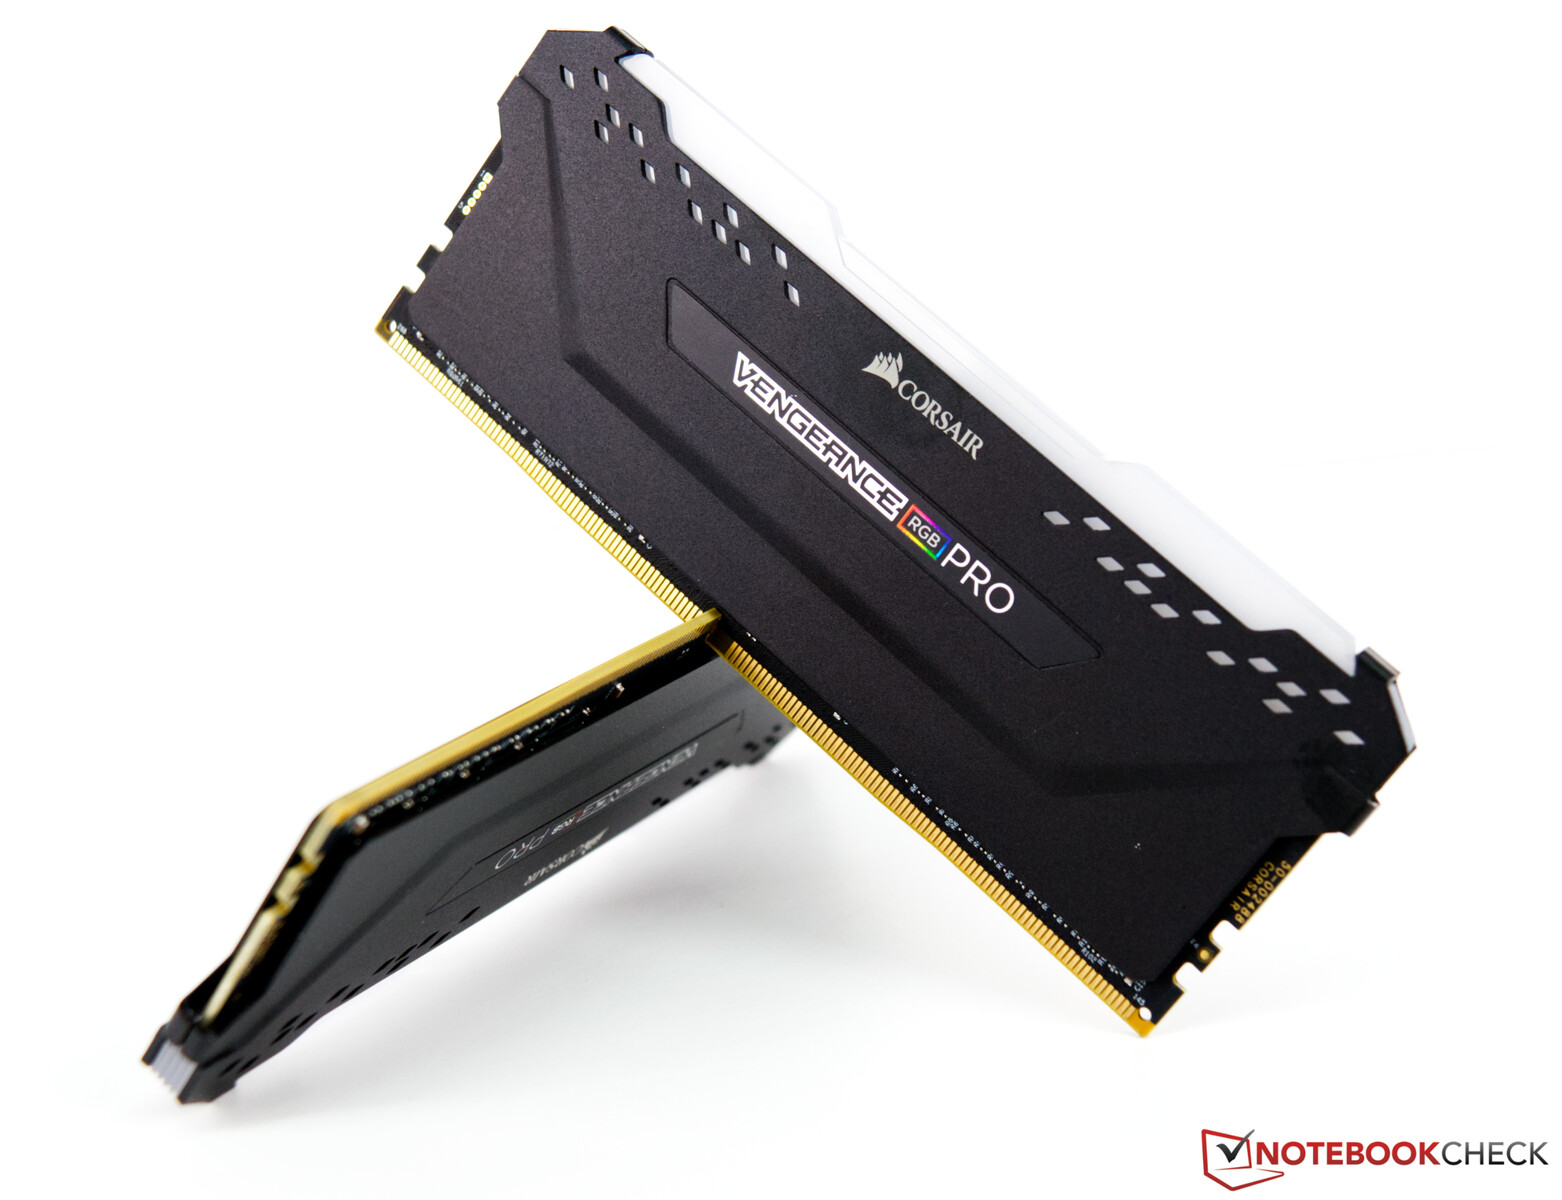
Una plataforma actual de AMD basada en el Asus X570 ROG Crosshair VIII sirve como sistema de prueba. La CPU (AMD Ryzen 9 5900X) ofrece un buen rendimiento de la CPU, y usamos un enfriador de agua AIO(Alphacool Eisbaer 280 mm) para enfriar. Los 32 GB de RAM provienen del Corsair y de los relojes a 4.000 MHz. Utilizamos el Acer Predator XB321HK como monitor. No nos limita debido a su capacidad de UHD. En este punto, nos gustaría agradecer a AMD por proporcionar la plataforma de prueba así como a Corsair por el kit de RAM
Para los próximos puntos de referencia y pruebas, usamos el siguiente sistema
- Lian Li O11 Dynamic
- AMD Ryzen 9 5900X
- MSI GeForce RTX 3090 Suprim X (Nvidiadriver 457.30)
- Asus X570 ROG Crosshair VIII Hero Wi-Fi (BIOS 2402, configuración por defecto, XMP 1 para DDR4-4000)
- Corsair RM1000X Fuente de alimentación de 1.000 vatios
- Corsair Vengeance RGB Pro DDR4-4000 2 x 16 GB RAM kit
- Corsair MP600 2 TB M.2 PCIe 4.0 SSD
- Crucial MX500 2 TB (para juegos)
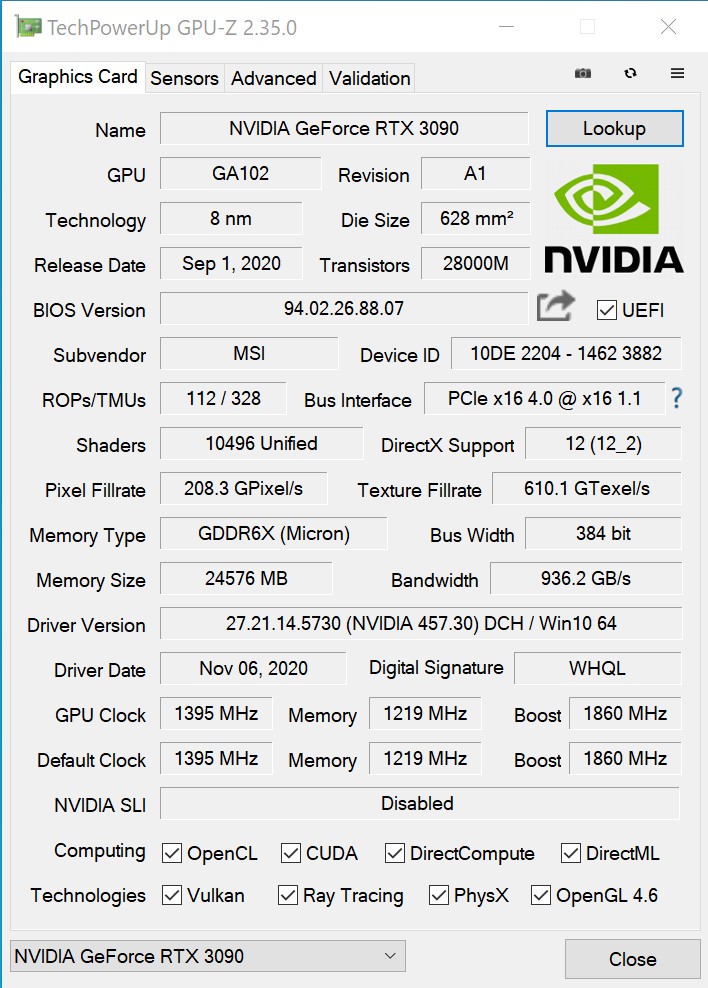
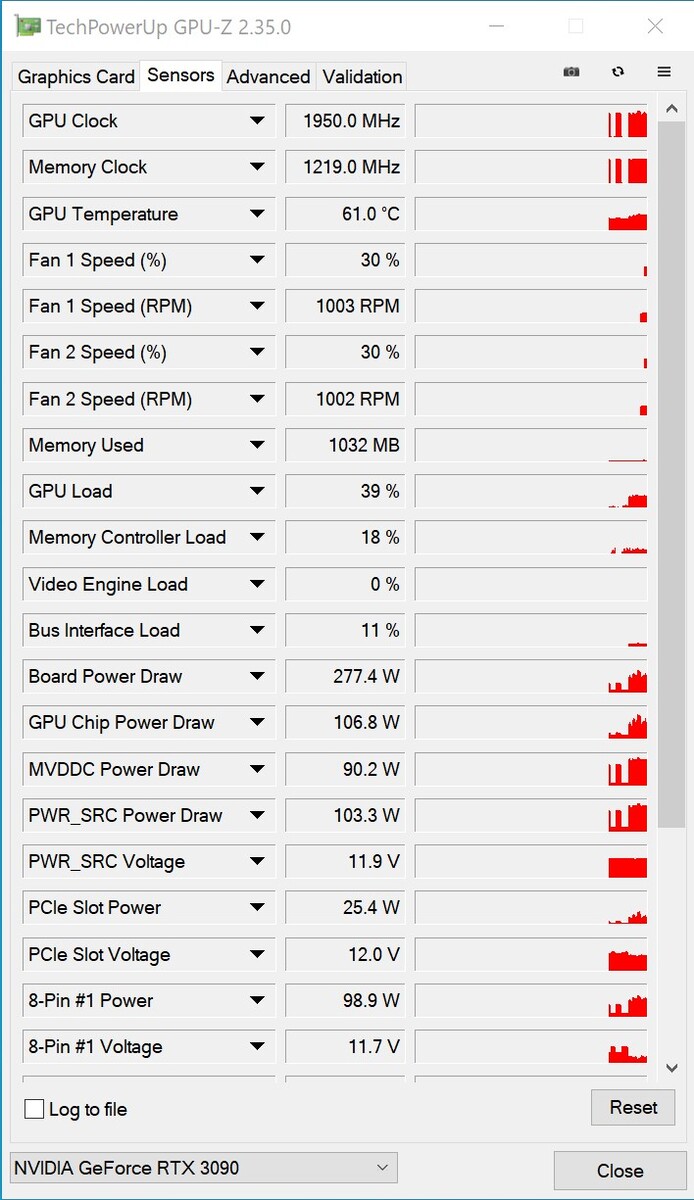
Las velocidades de reloj del MSI GeForce RTX 3090 Suprim X
MSI mantiene la velocidad del reloj base en línea con el modelo de referencia. Sin embargo, a 1.860 MHz, MSI aumenta significativamente la velocidad de reloj del RTX 3090 Suprim X. Además, el modo OC puede activarse en el Centro de Dragones de MSI, lo que aumenta la velocidad del reloj de impulso a 1.875 MHz aún más. Todas las pruebas de esta revisión se realizaron con la configuración predeterminada y sin el modo OC. La VRAM también permanece sin cambios, por lo que el ancho de banda de la memoria es idéntico al modelo de referencia
Puntos de referencia sintéticos
En los puntos de referencia sintéticos, el MSI GeForce RTX 3090 Suprim X y elAMD Radeon RX 6800 XT están casi a la par. La diferencia con elGeForce RTX 3080 es claramente visible y aumenta a resoluciones más altas. Comparado con el GeForce RTX 2080 Ti, la ventaja de la nueva nave insignia crece hasta el 40 o el 50%. ElNvidia Titan RTX se basa en el mismo chip que elRTX 2080 Ti y se queda atrás por un margen similar.
Debido a la buena refrigeración y al mayor TDP en el MSI GeForce RTX 3090 Suprim X, el rendimiento debería ser mejor que con la Edición Fundadora de Nvidia. Sin embargo, no podemos hacer afirmaciones válidas sobre el rendimiento del modelo de referencia por el momento, ya que no hemos podido probar este modelo todavía.
| Unigine Superposition | |
| 1280x720 720p Low | |
| Titan RTX | |
| Radeon RX 6800 XT | |
| MSI GeForce RTX 3090 Suprim X | |
| GeForce RTX 3070 | |
| GeForce RTX 3080 | |
| 1920x1080 1080p High | |
| MSI GeForce RTX 3090 Suprim X | |
| Radeon RX 6800 XT | |
| GeForce RTX 3080 | |
| Titan RTX | |
| GeForce RTX 3070 | |
| 1920x1080 1080p Extreme | |
| MSI GeForce RTX 3090 Suprim X | |
| GeForce RTX 3080 | |
| Radeon RX 6800 XT | |
| Titan RTX | |
| GeForce RTX 3070 | |
| 3840x2160 4k Optimized | |
| MSI GeForce RTX 3090 Suprim X | |
| GeForce RTX 3080 | |
| Radeon RX 6800 XT | |
| Titan RTX | |
| GeForce RTX 3070 | |
| 7680x4320 8k Optimized | |
| MSI GeForce RTX 3090 Suprim X | |
| GeForce RTX 3080 | |
| Titan RTX | |
| Radeon RX 6800 XT | |
| GeForce RTX 3070 | |
Los puntos de referencia del juego
Para empezar, podemos decir que el MSI GeForce RTX 3090 Suprim X puede manejar todos los títulos modernos sin ningún problema. Ocasionalmente, hay juegos en los que la velocidad media de fotogramas se desliza por debajo de la marca de 60 FPS en 2160p. Sin embargo, es posible jugar sin problemas, y no se tiene la impresión de estar viendo una presentación de diapositivas.
Comparado con el GeForce RTX 3080el GeForce RTX 3090 puede separarse un poco repetidamente. Sin embargo, la tarjeta gráfica siempre requiere resoluciones muy altas para poder aprovechar también la diferencia de rendimiento. Sin embargo, en comparación con El Radeon RX 6800 XT de AMDEl rendimiento del GeForce RTX 3090's plus es mucho mayor que el que vimos en los benchmarks sintéticos. El rendimiento varía dependiendo del juego, aunque el AMD Radeon RX 6800 XT siempre marca la pauta
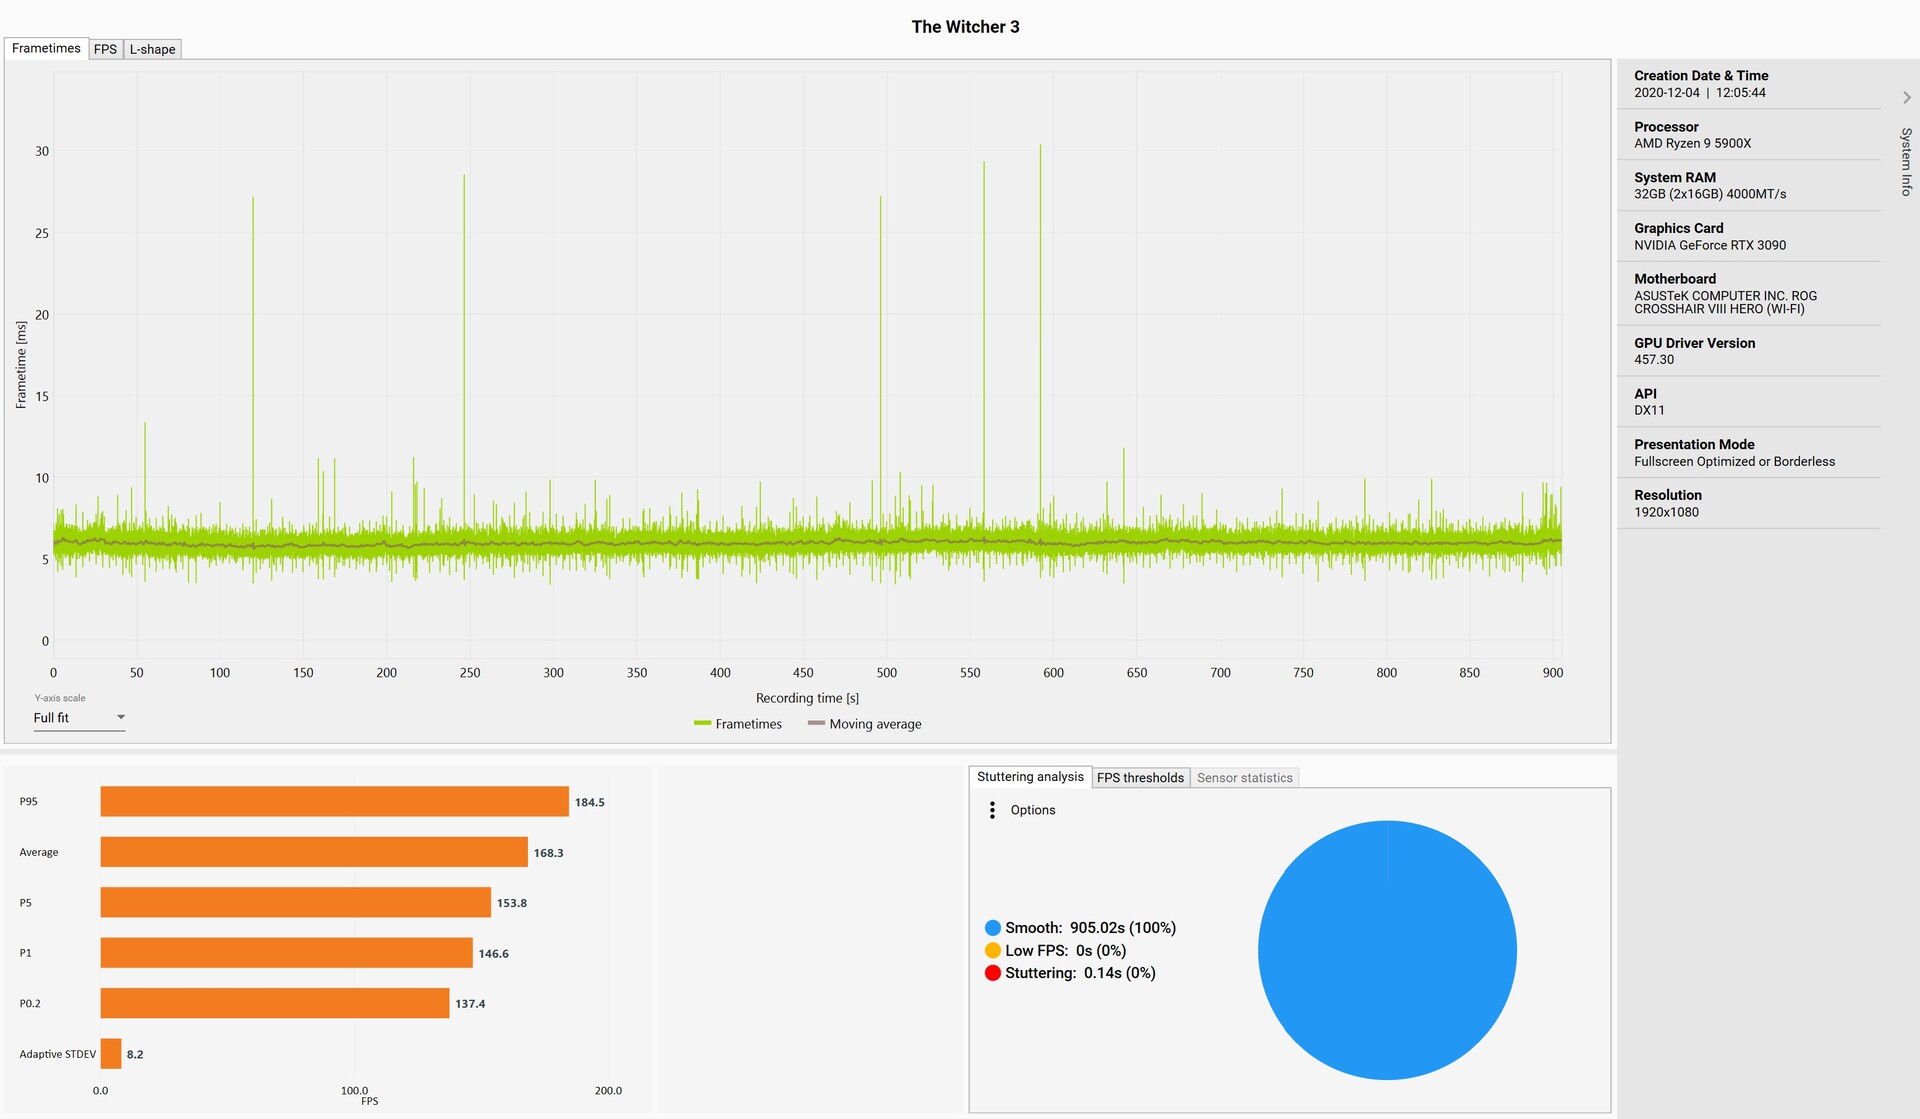
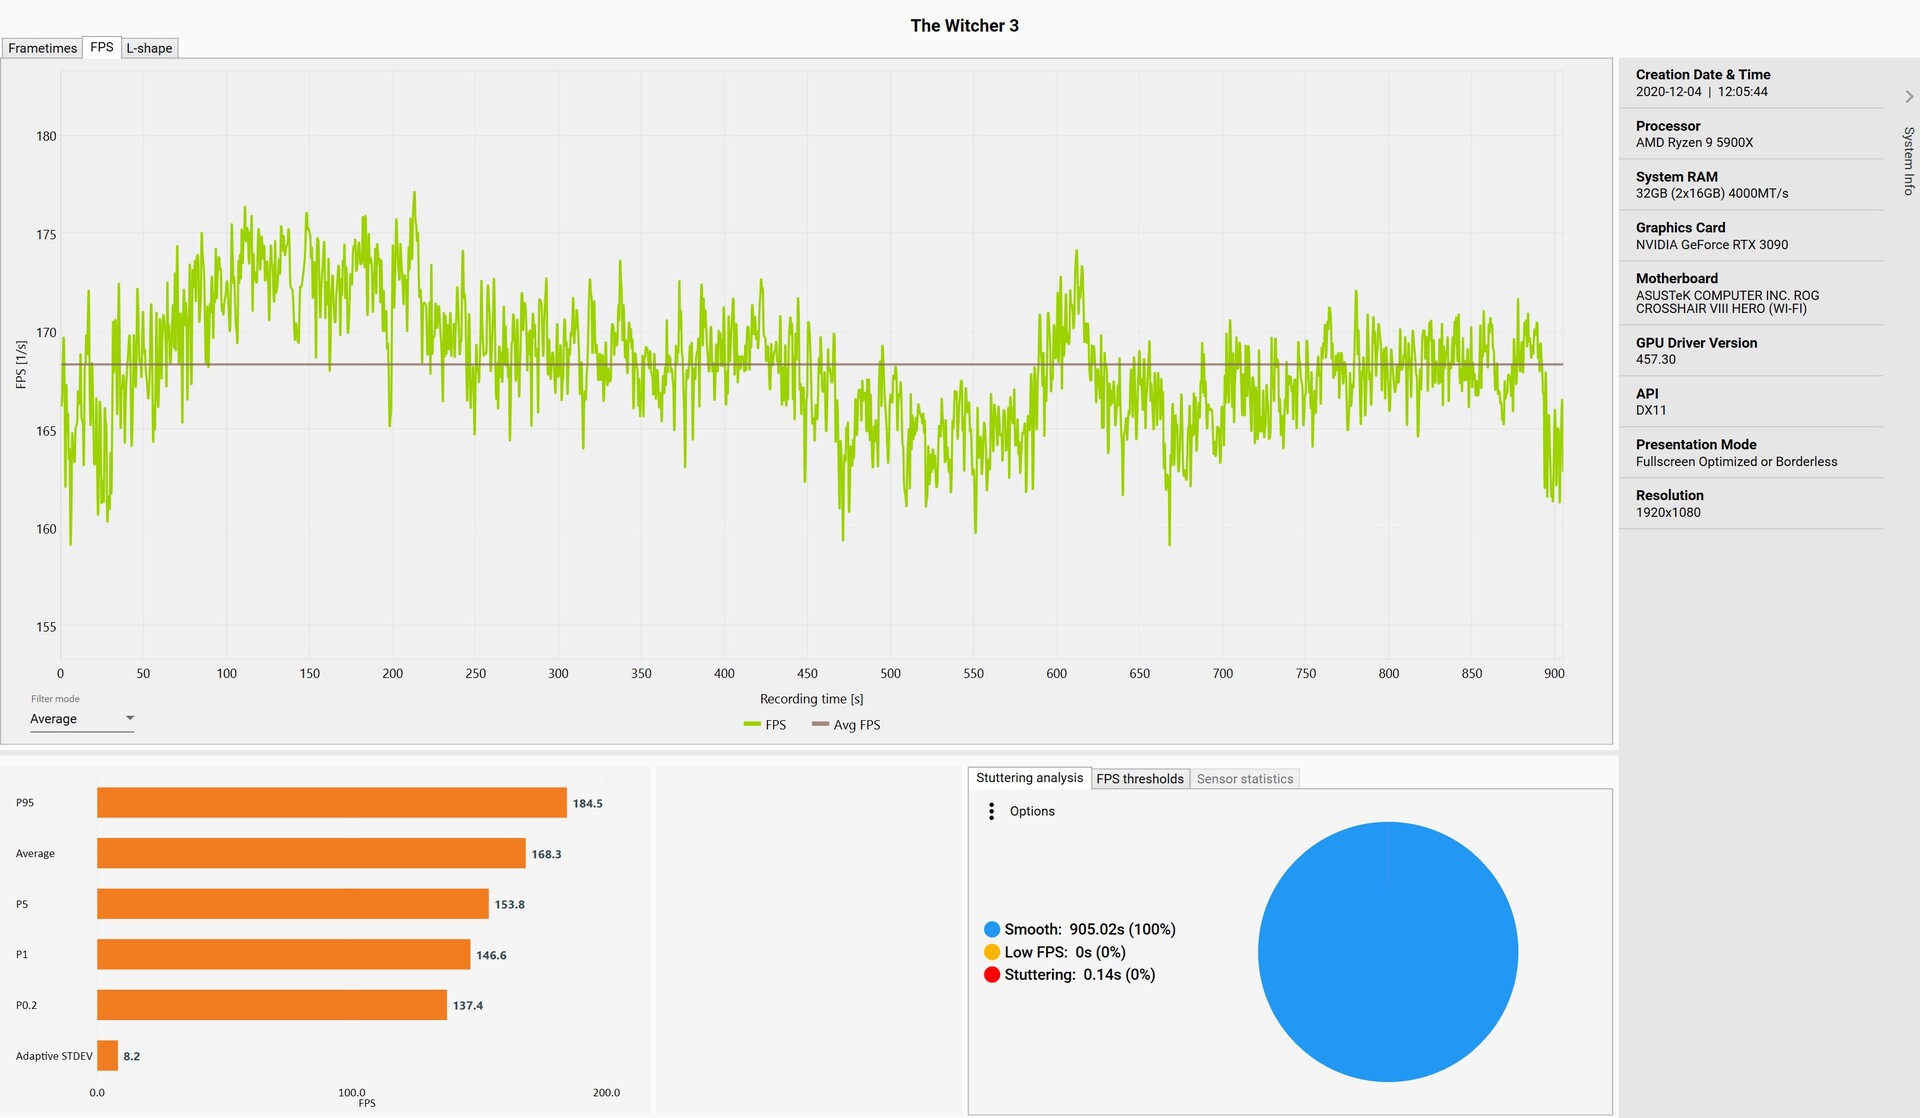
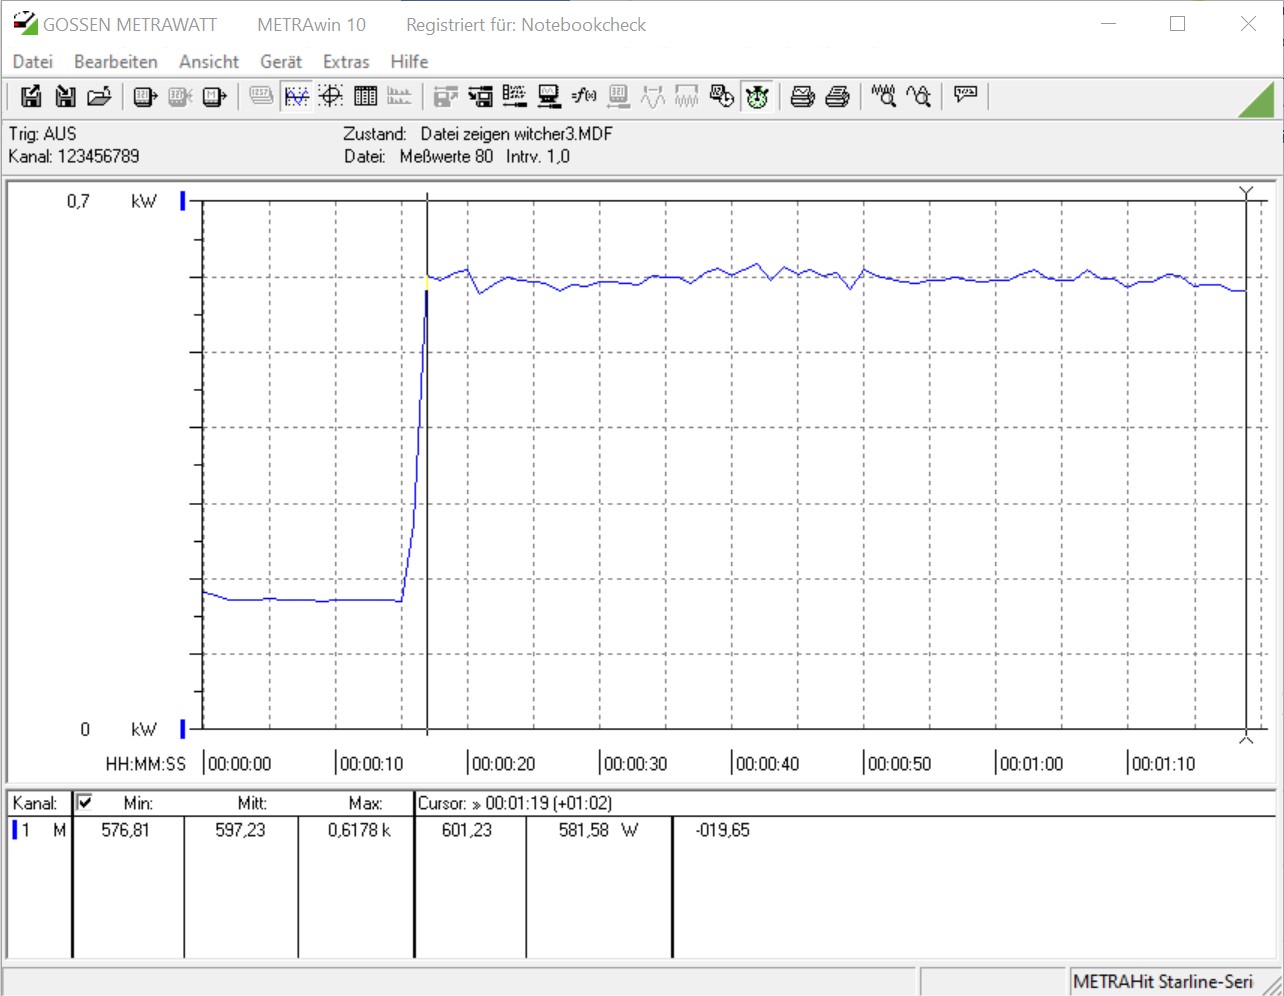
Utilizamos el juego The Witcher 3 (Ultra preset) para registrar los tiempos y la progresión de los cuadros, ya que también escala muy bien con las últimas tarjetas gráficas. No hay anomalías en los tiempos de los cuadros. Sin embargo, sólo hay unos pocos valores atípicos aislados que no afectan a la fluidez del juego. En cuanto a la progresión de fotogramas, las tasas de fotogramas son un poco mejores en el primer tercio; sin embargo, se estabilizan en el curso posterior, y muestran un muy buen resultado de 168 FPS en todo el período. A efectos de comparación: ElAsus GeForce RTX 3080 ROG Strix Gaming OC alcanzó 139 FPS.
| F1 2020 - 3840x2160 Ultra High Preset AA:T AF:16x | |
| MSI GeForce RTX 3090 Suprim X | |
| Radeon RX 6800 XT | |
| GeForce RTX 3080 | |
| Titan RTX | |
| GeForce RTX 3070 | |
| Borderlands 3 - 3840x2160 Badass Overall Quality (DX11) | |
| MSI GeForce RTX 3090 Suprim X | |
| GeForce RTX 3080 | |
| Radeon RX 6800 XT | |
| Titan RTX | |
| Titan RTX | |
| GeForce RTX 3070 | |
| GeForce RTX 2080 Ti (Desktop) | |
| Red Dead Redemption 2 - 3840x2160 Maximum Settings | |
| MSI GeForce RTX 3090 Suprim X | |
| GeForce RTX 3080 | |
| Radeon RX 6800 XT | |
| GeForce RTX 3070 | |
| Titan RTX | |
| Rise of the Tomb Raider - 3840x2160 High Preset AA:FX AF:4x | |
| MSI GeForce RTX 3090 Suprim X | |
| GeForce RTX 3080 | |
| Radeon RX 6800 XT | |
| GeForce RTX 2080 Ti (Desktop) | |
| GeForce RTX 3070 | |
| GeForce RTX 2080 Super (Desktop) | |
| GeForce RTX 2080 (Desktop) | |
| GeForce RTX 2070 Super (Desktop) | |
| GeForce RTX 2070 (Desktop) | |
| Radeon VII | |
| GeForce RTX 2060 Super (Desktop) | |
| RX Vega 64 | |
| GeForce RTX 2060 (Desktop) | |
| Shadow of the Tomb Raider - 3840x2160 Highest Preset AA:T | |
| MSI GeForce RTX 3090 Suprim X | |
| GeForce RTX 3080 | |
| Radeon RX 6800 XT | |
| Titan RTX | |
| Titan RTX | |
| GeForce RTX 3070 | |
| GeForce RTX 2080 Ti (Desktop) | |
| GeForce RTX 2080 Super (Desktop) | |
| GeForce RTX 2080 (Desktop) | |
| Radeon VII | |
| GeForce RTX 2070 Super (Desktop) | |
| GeForce RTX 2070 (Desktop) | |
| Radeon RX 5700 XT (Desktop) | |
| GeForce RTX 2060 Super (Desktop) | |
| Radeon RX 5700 (Desktop) | |
| GeForce RTX 2060 (Desktop) | |
| RX Vega 64 | |
| Mafia Definitive Edition - 3840x2160 High Preset | |
| MSI GeForce RTX 3090 Suprim X | |
| GeForce RTX 3080 | |
| Titan RTX | |
| Radeon RX 6800 XT | |
| GeForce RTX 3070 | |
| Watch Dogs Legion - 3840x2160 Ultra Preset (DX12) | |
| MSI GeForce RTX 3090 Suprim X | |
| GeForce RTX 3080 | |
| Radeon RX 6800 XT | |
| Titan RTX | |
| GeForce RTX 3070 | |
| The Witcher 3 - 3840x2160 High Graphics & Postprocessing (Nvidia HairWorks Off) | |
| MSI GeForce RTX 3090 Suprim X | |
| GeForce RTX 3080 | |
| Radeon RX 6800 XT | |
| Titan RTX | |
| Titan RTX | |
| GeForce RTX 2080 Ti (Desktop) | |
| GeForce RTX 3070 | |
| GeForce RTX 2080 Super (Desktop) | |
| GeForce RTX 2080 (Desktop) | |
| GeForce RTX 2070 Super (Desktop) | |
| GeForce RTX 2070 (Desktop) | |
| GeForce RTX 2060 Super (Desktop) | |
| Radeon VII | |
| Radeon RX 5700 XT (Desktop) | |
| GeForce RTX 2060 (Desktop) | |
| RX Vega 64 | |
| Radeon RX 5700 (Desktop) | |
| bajo | medio | alto | ultra | QHD | 4K | |
|---|---|---|---|---|---|---|
| GTA V (2015) | 184 | 176 | 175 | 114 | 109 | 164 |
| The Witcher 3 (2015) | 355 | 335 | 292 | 160 | 128 | |
| Dota 2 Reborn (2015) | 169.9 | 143.2 | 144.3 | 140.3 | 142.8 | |
| Rise of the Tomb Raider (2016) | 300 | 263 | 257 | 240 | 128 | |
| Final Fantasy XV Benchmark (2018) | 219 | 189 | 156 | 133 | 87.6 | |
| X-Plane 11.11 (2018) | 151 | 126 | 96.8 | 83 | ||
| Far Cry 5 (2018) | 179 | 162 | 153 | 141 | 137 | 106 |
| Strange Brigade (2018) | 525 | 415 | 372 | 330 | 255 | 158 |
| Shadow of the Tomb Raider (2018) | 201 | 193 | 177 | 188 | 162 | 95.6 |
| Battlefield V (2018) | 184 | 164 | 151 | 141 | 124 | 94 |
| Apex Legends (2019) | 144 | 144 | 144 | 144 | 144 | 139 |
| Far Cry New Dawn (2019) | 134 | 117 | 117 | 106 | 105 | 96 |
| Metro Exodus (2019) | 190 | 166 | 155 | 132 | 112 | 76.3 |
| The Division 2 (2019) | 239 | 221 | 188 | 160 | 128 | 77.5 |
| Anno 1800 (2019) | 145 | 145 | 105 | 54.8 | 53.9 | 52.5 |
| Rage 2 (2019) | 264 | 192 | 168 | 163 | 110 | 56.7 |
| Control (2019) | 238 | 215 | 177 | 123 | 66 | |
| Borderlands 3 (2019) | 178 | 157 | 145 | 135 | 117 | 73.4 |
| Star Wars Jedi Fallen Order (2019) | 133 | 132 | 131 | 130 | 111 | |
| Red Dead Redemption 2 (2019) | 175 | 174 | 155 | 115 | 96 | 67 |
| Hunt Showdown (2020) | 270 | 278 | 252 | 217 | 121 | |
| Doom Eternal (2020) | 314 | 310 | 298 | 296 | 295 | 188 |
| F1 2020 (2020) | 386 | 336 | 322 | 266 | 219 | 144 |
| Death Stranding (2020) | 209 | 207 | 203 | 210 | 176 | 110 |
| Horizon Zero Dawn (2020) | 203 | 196 | 181 | 166 | 148 | 95 |
| Crysis Remastered (2020) | 266 | 209 | 130 | 102 | 86.7 | 64.9 |
| Serious Sam 4 (2020) | 138.7 | 129.8 | 125.3 | 121.3 | 118.4 | 115.1 |
| Mafia Definitive Edition (2020) | 180 | 161 | 157 | 149 | 89.1 | |
| Star Wars Squadrons (2020) | 454 | 419 | 403 | 389 | 305 | 197 |
| FIFA 21 (2020) | 202 | 194 | 195 | 202 | 207 | 213 |
| Watch Dogs Legion (2020) | 128 | 127 | 111 | 103 | 89.7 | 60.3 |
| Dirt 5 (2020) | 191 | 149 | 127 | 112 | 100 | 73.8 |
| Assassin´s Creed Valhalla (2020) | 137 | 112 | 97 | 88 | 76 | 55 |
| Call of Duty Black Ops Cold War (2020) | 251 | 223 | 172 | 161 | 122 | 76.1 |
| Yakuza Like a Dragon (2020) | 116 | 114 | 115 | 116 | 116 | 80.2 |
Calcular el rendimiento
En LuxMark y ComputeMark, el MSI GeForce RTX 3090 Suprim X tiene una puntuación ligeramente mejor que el GeForce RTX 3080 debido al mejor rendimiento bruto. Sin embargo, el GeForce RTX 3090 tiene que admitir una clara derrota anteEl RX 6800 XT de AMD en la prueba de LuxMark Sala. Cada arquitectura tiene sus ventajas y desventajas, que son soportadas de manera diferente por los programas y drivers. Las pruebas SPECviewperf están principalmente dirigidas a las estaciones de trabajo. Éstas ofrecen más rendimiento con los modelos Quadro y FirePro que con los modelos de consumo debido a las optimizaciones de los controladores
| SPECviewperf 2020 | |
| 3840x2160 Solidworks (solidworks-05) | |
| MSI GeForce RTX 3090 Suprim X | |
| MSI GeForce RTX 3070 Gaming X Trio | |
| AMD Radeon RX 6800 XT | |
| 3840x2160 Siemens NX (snx-04) | |
| AMD Radeon RX 6800 XT | |
| MSI GeForce RTX 3090 Suprim X | |
| MSI GeForce RTX 3070 Gaming X Trio | |
| 3840x2160 Medical (medical-03) | |
| AMD Radeon RX 6800 XT | |
| MSI GeForce RTX 3090 Suprim X | |
| MSI GeForce RTX 3070 Gaming X Trio | |
| 3840x2160 Maya (maya-06) | |
| MSI GeForce RTX 3090 Suprim X | |
| MSI GeForce RTX 3070 Gaming X Trio | |
| AMD Radeon RX 6800 XT | |
| 3840x2160 Energy (energy-03) | |
| MSI GeForce RTX 3090 Suprim X | |
| AMD Radeon RX 6800 XT | |
| MSI GeForce RTX 3070 Gaming X Trio | |
| 3840x2160 Creo (creo-03) | |
| MSI GeForce RTX 3090 Suprim X | |
| MSI GeForce RTX 3070 Gaming X Trio | |
| AMD Radeon RX 6800 XT | |
| 3840x2160 CATIA (catia-06) | |
| MSI GeForce RTX 3090 Suprim X | |
| MSI GeForce RTX 3070 Gaming X Trio | |
| AMD Radeon RX 6800 XT | |
| 3840x2160 3ds Max (3dsmax-07) | |
| MSI GeForce RTX 3090 Suprim X | |
| AMD Radeon RX 6800 XT | |
| MSI GeForce RTX 3070 Gaming X Trio | |
Emisiones del MSI GeForce RTX 3090 Suprim X
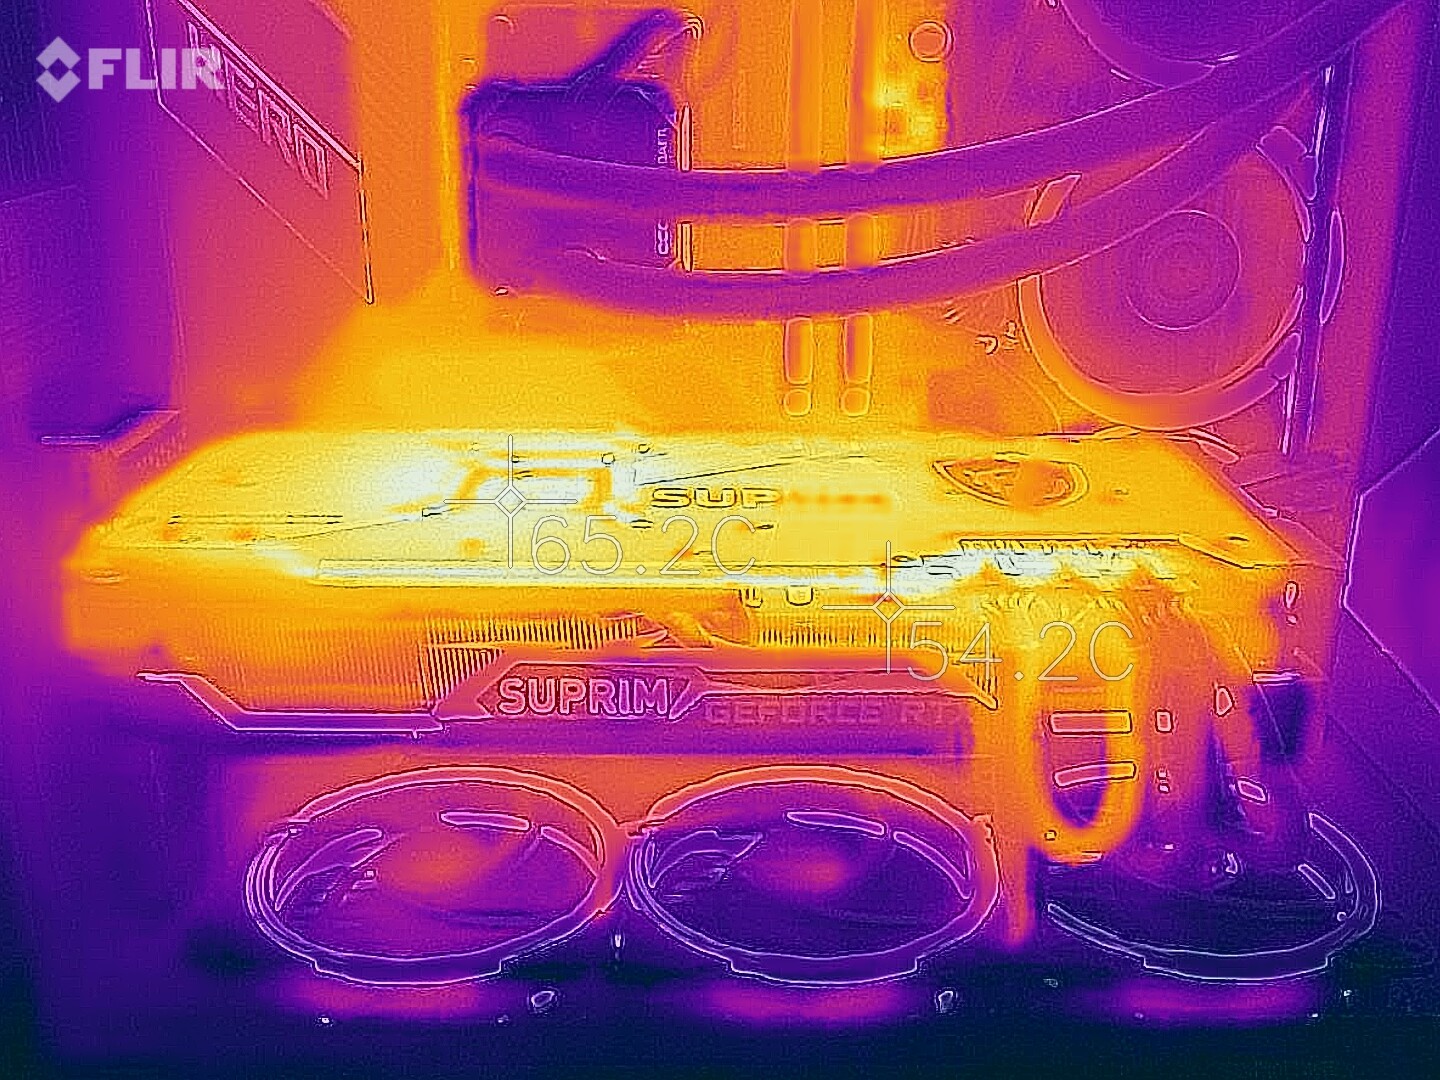
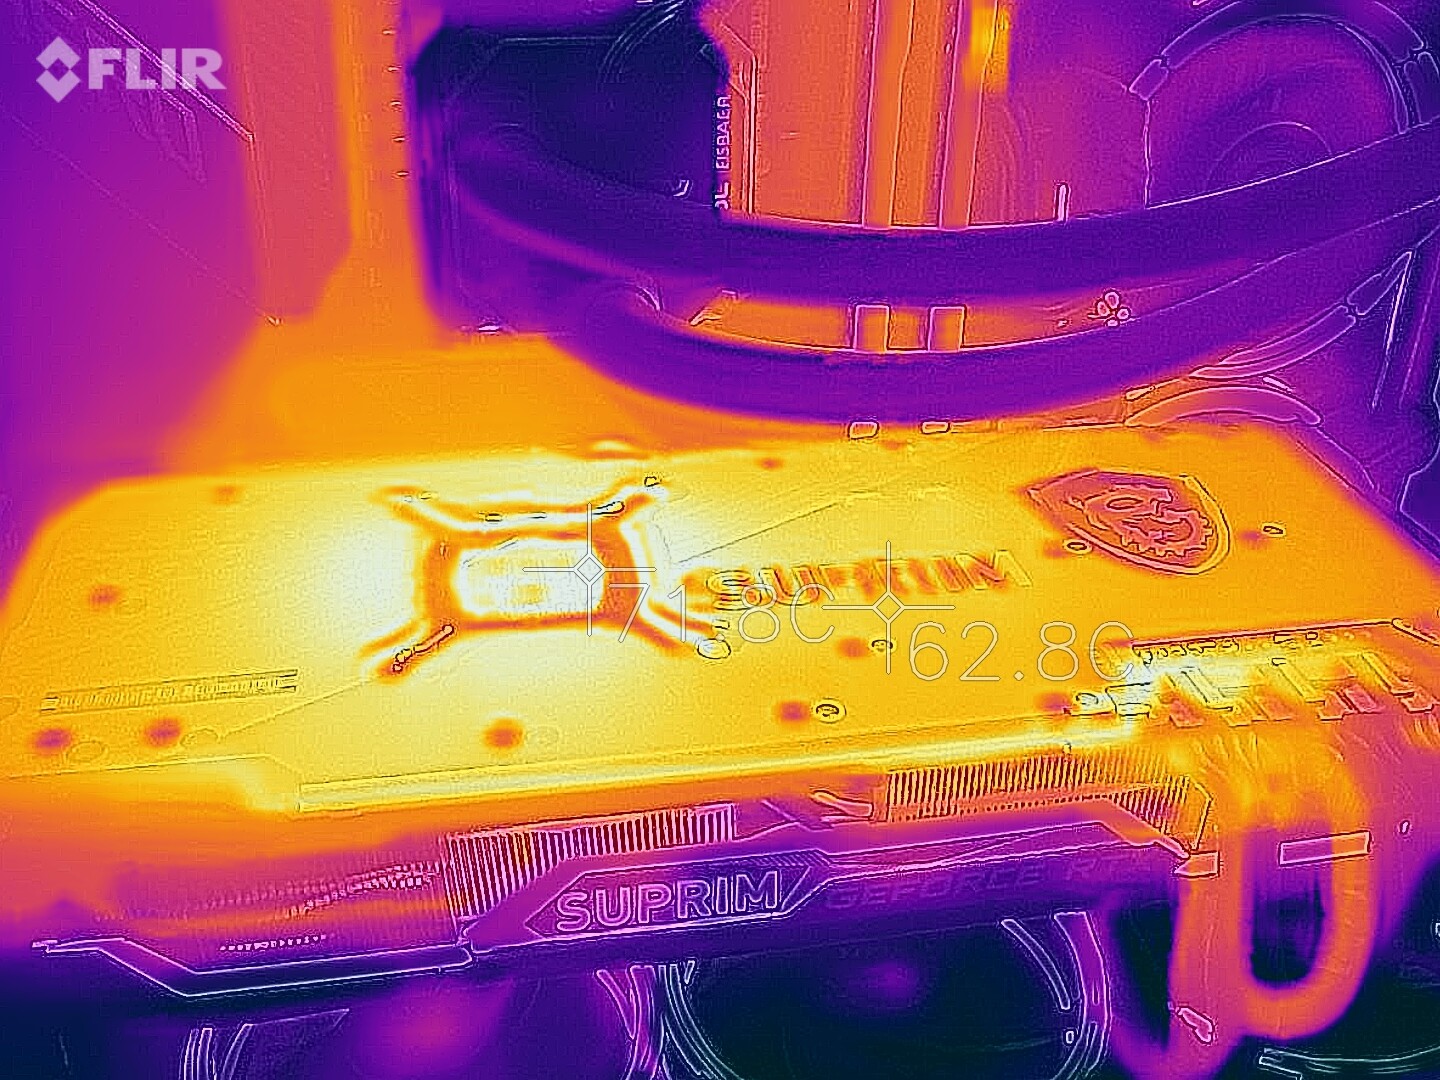
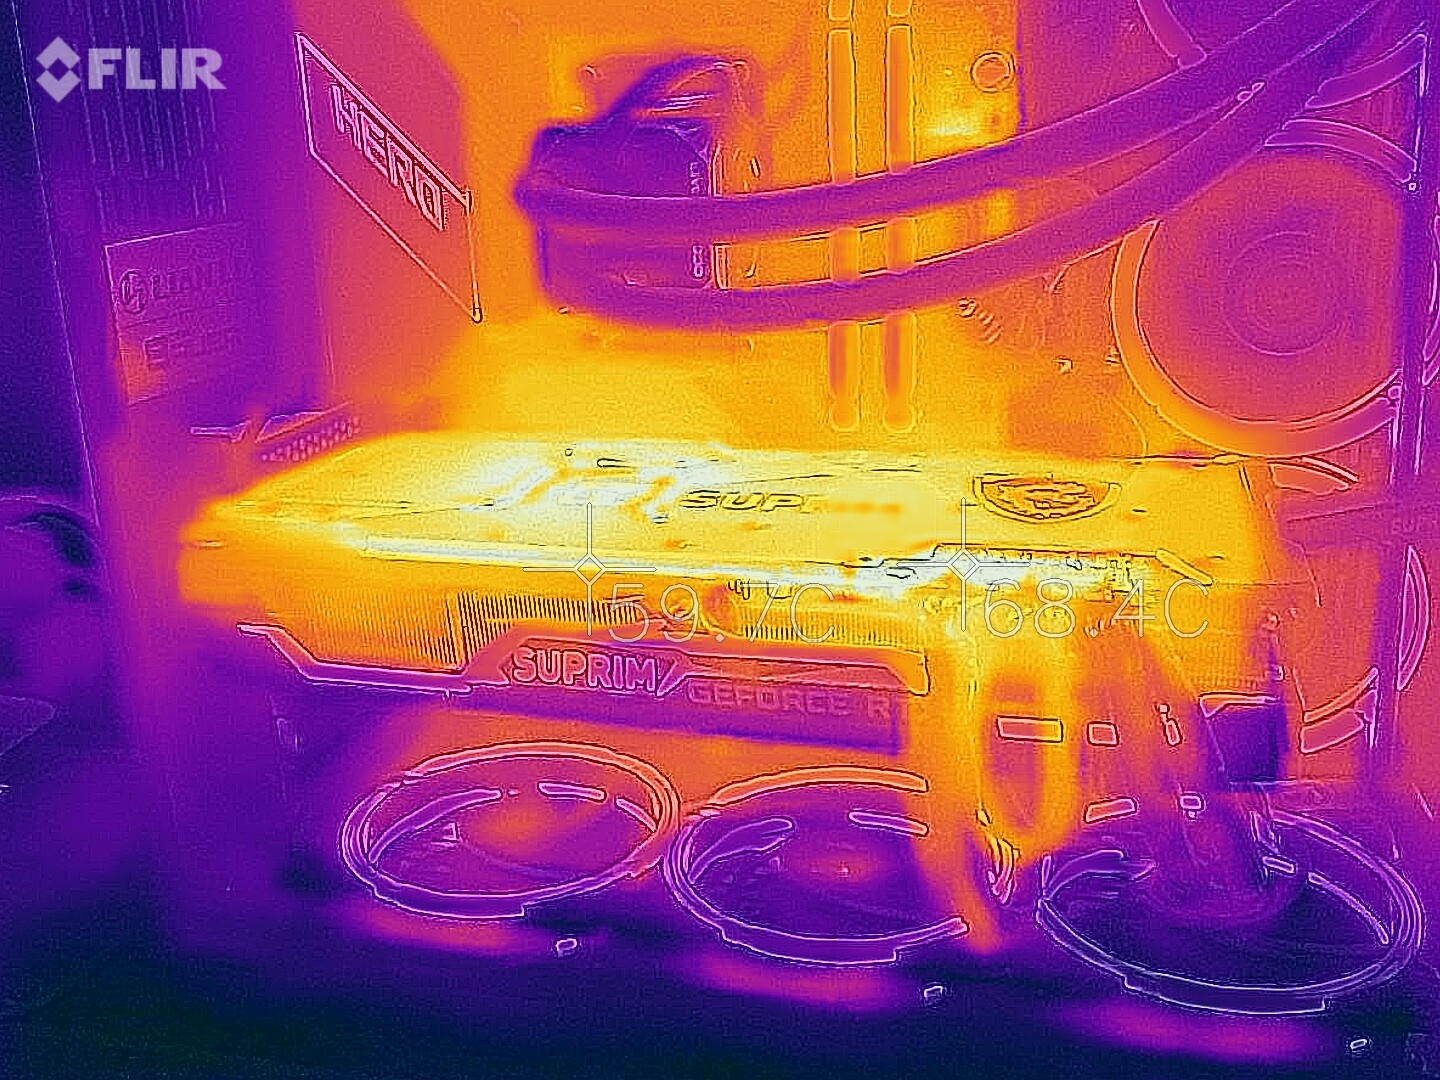
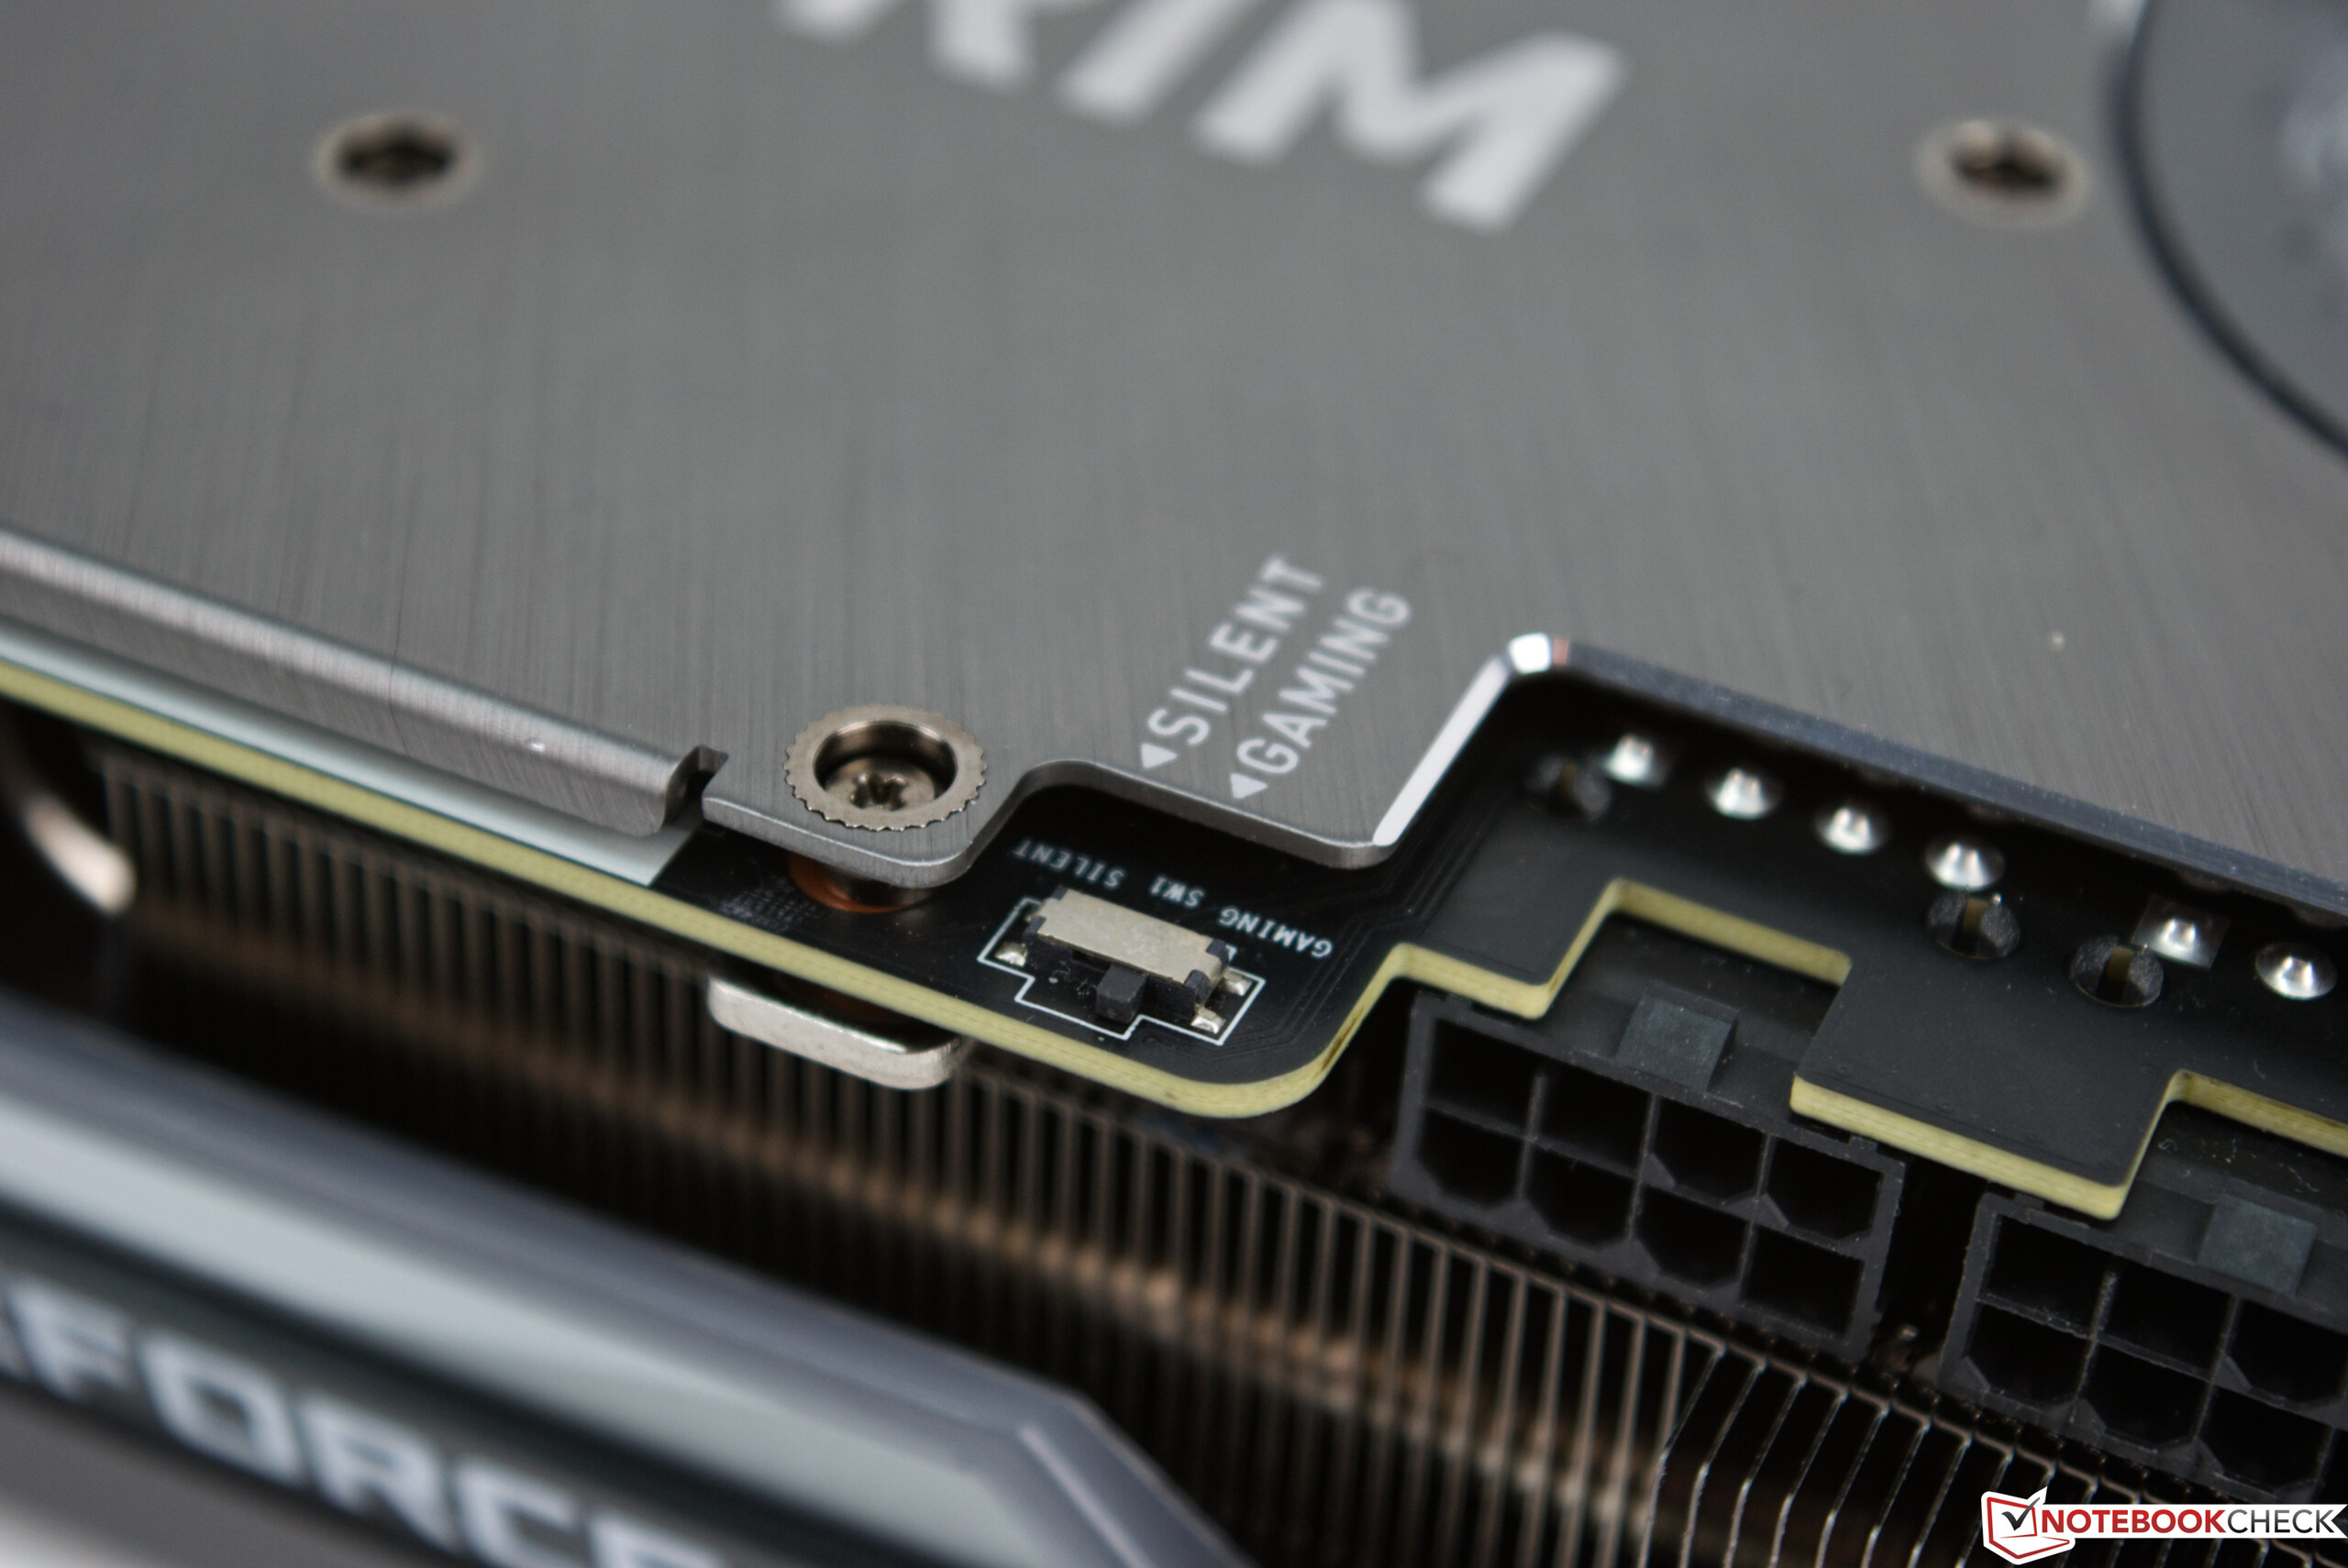
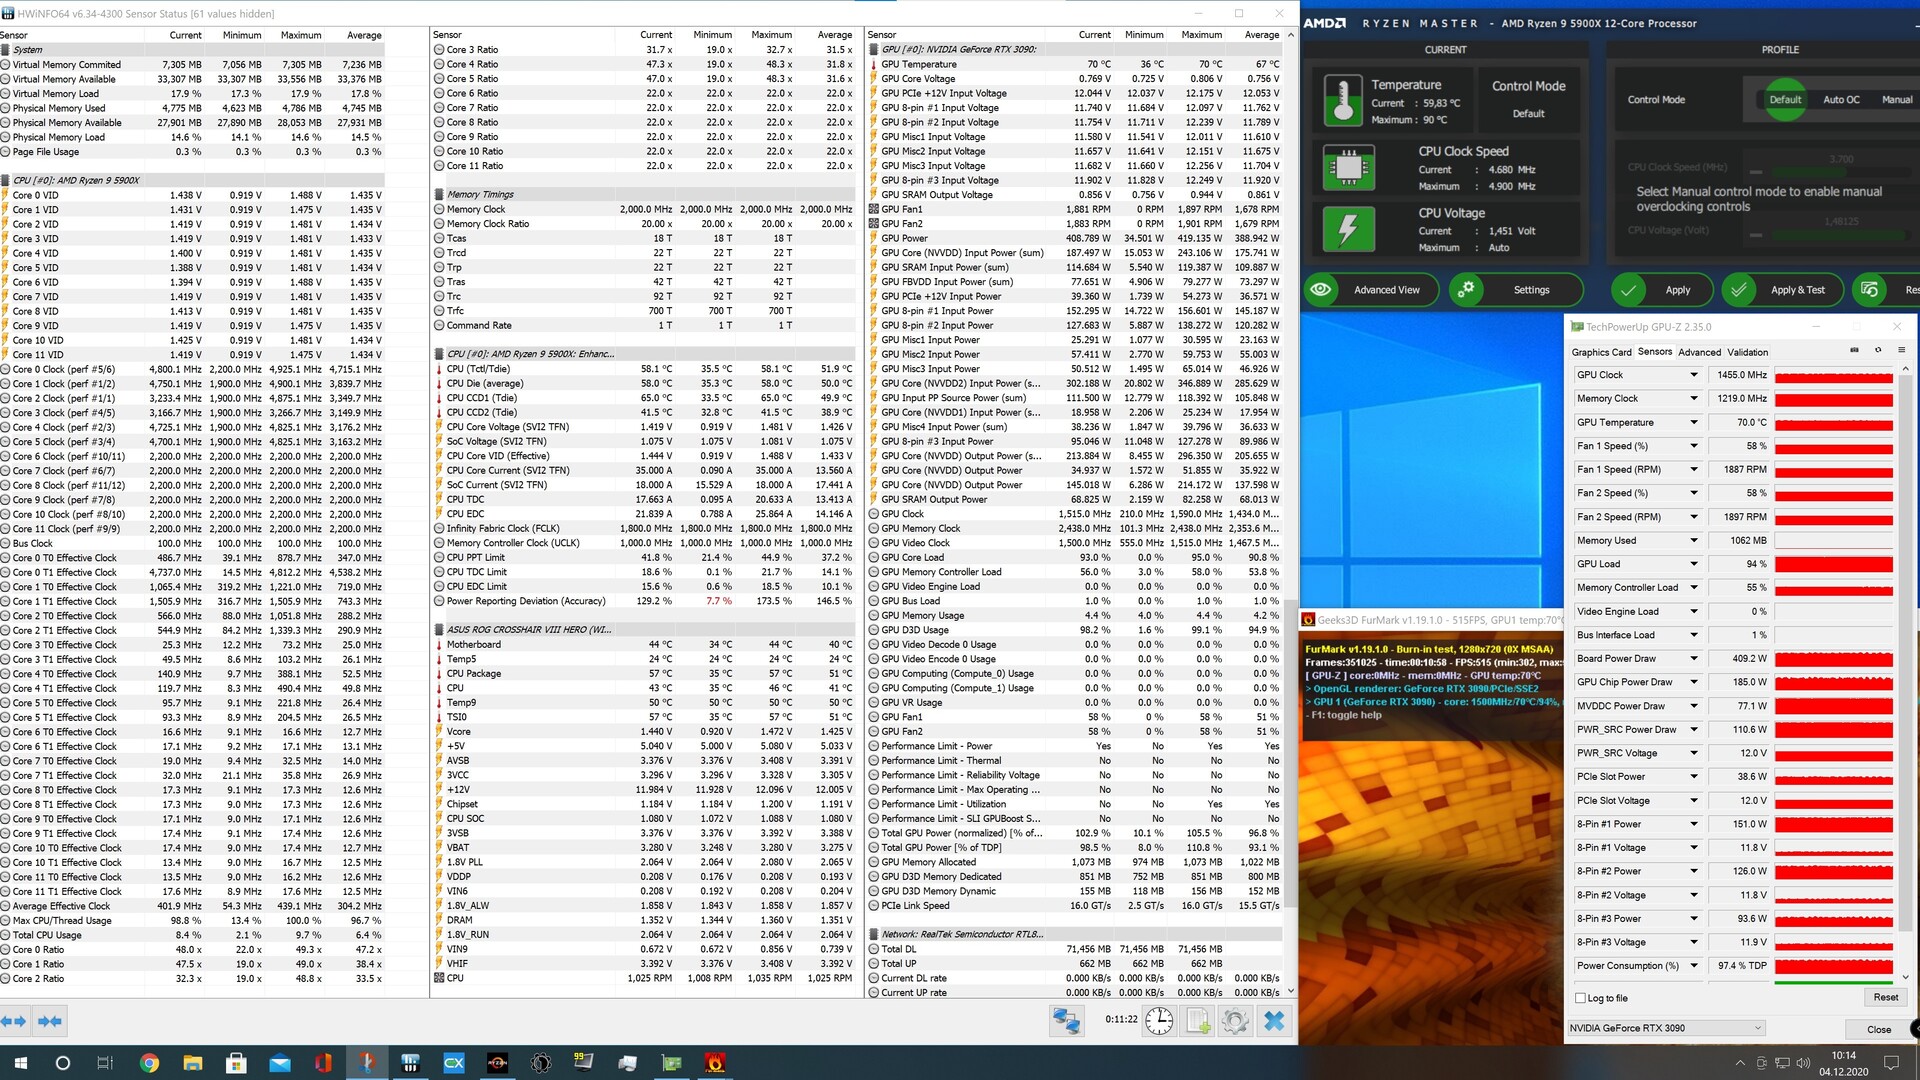
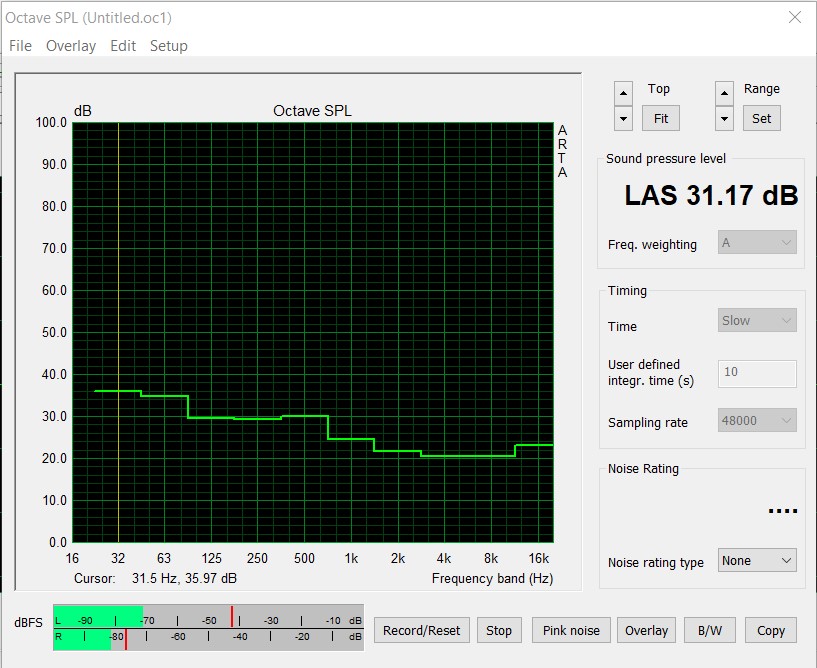
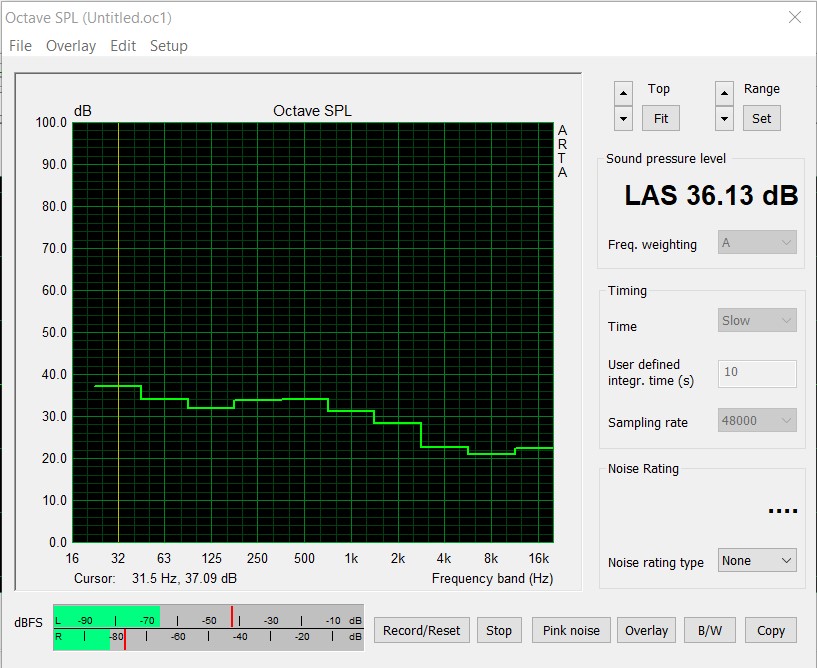
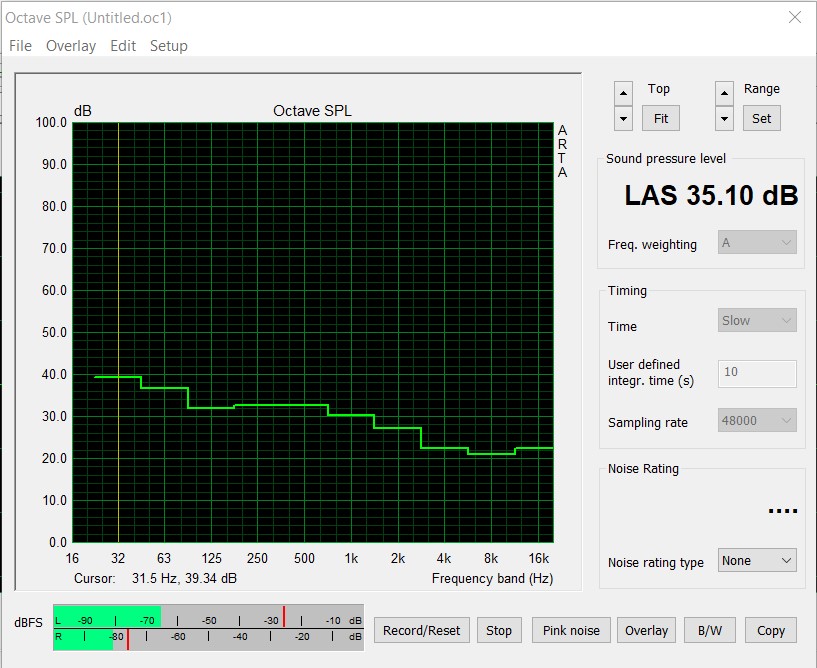
Debe quedar claro para todos que no se puede esperar ningún milagro de ahorro de energía con el GeForce RTX 3090. MSI aumenta el consumo de energía del GeForce RTX 3090 Suprim X aún más con un mayor TDP de hasta 420 vatios. Para fines de comparación: El modelo de referencia tiene un TDP especificado de hasta 350 vatios. Aunque MSI agrega otros 70 vatios, nuestra muestra de revisión se desempeña bastante bien en la prueba de carga. 70 °C (~158 °F) es la temperatura más alta en la prueba de carga cuando el caso está cerrado. Este es un buen valor y muestra que el concepto de enfriamiento funciona de manera óptima. Los tres ventiladores de 100 milímetros a menudo incluso se quedan quietos y sólo comienzan a girar a poco menos de 50 °C (~122 °F). Esto significa que la tarjeta gráfica no es audible en uso inactivo; los ventiladores no necesitan funcionar cuando hay un buen flujo de aire en la caja. Bajo carga, medimos un nivel de ruido de 36,1 dB(A) para todo el sistema a una distancia de 20 centímetros junto a la caja y a la altura de la tarjeta gráfica. Si se deja que la tarjeta gráfica trabaje en modo silencioso, el nivel de ruido desciende ligeramente a 35,1 dB(A)
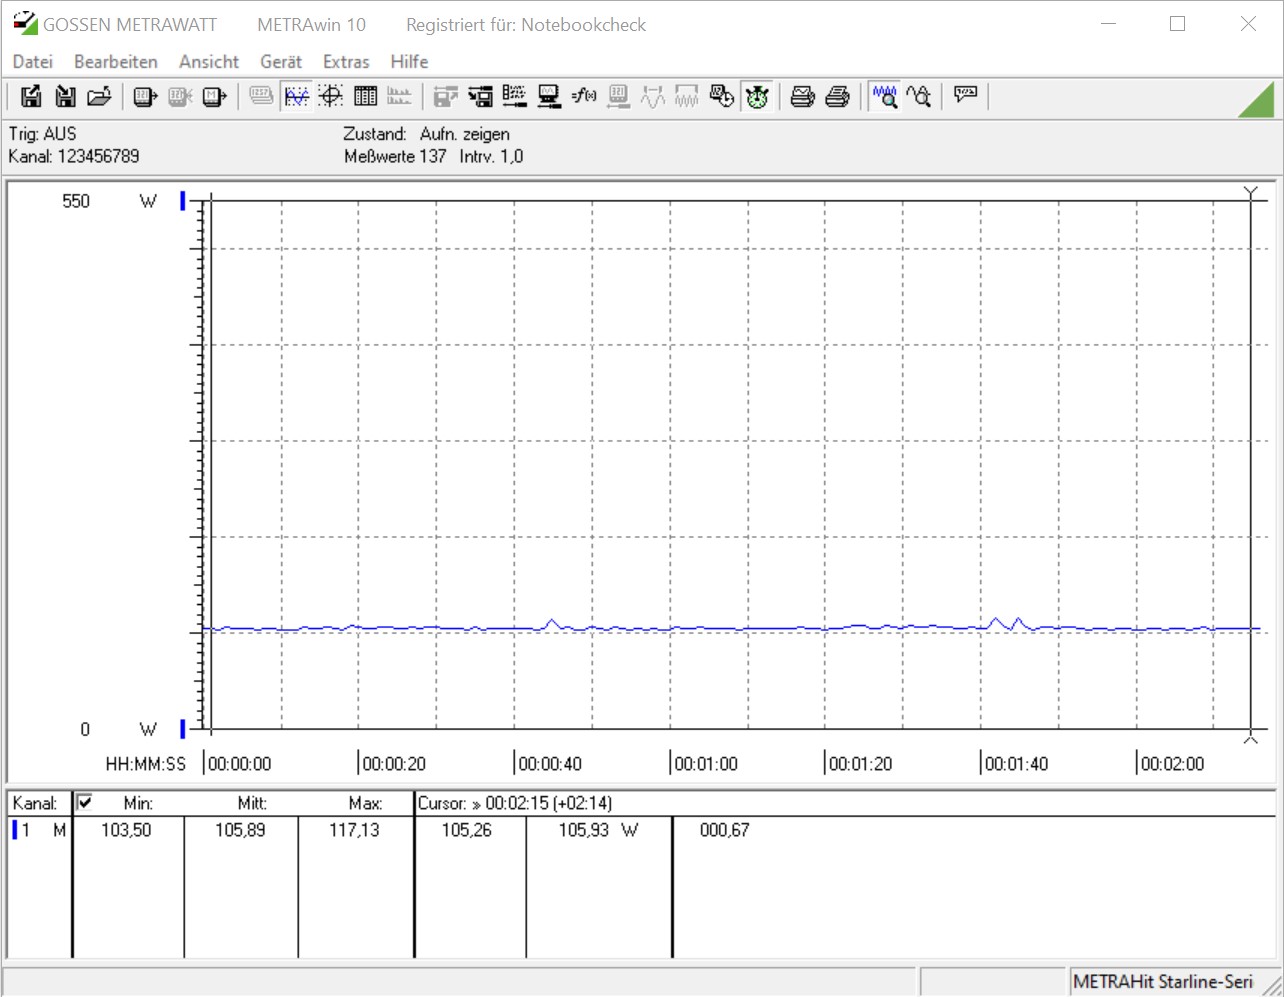
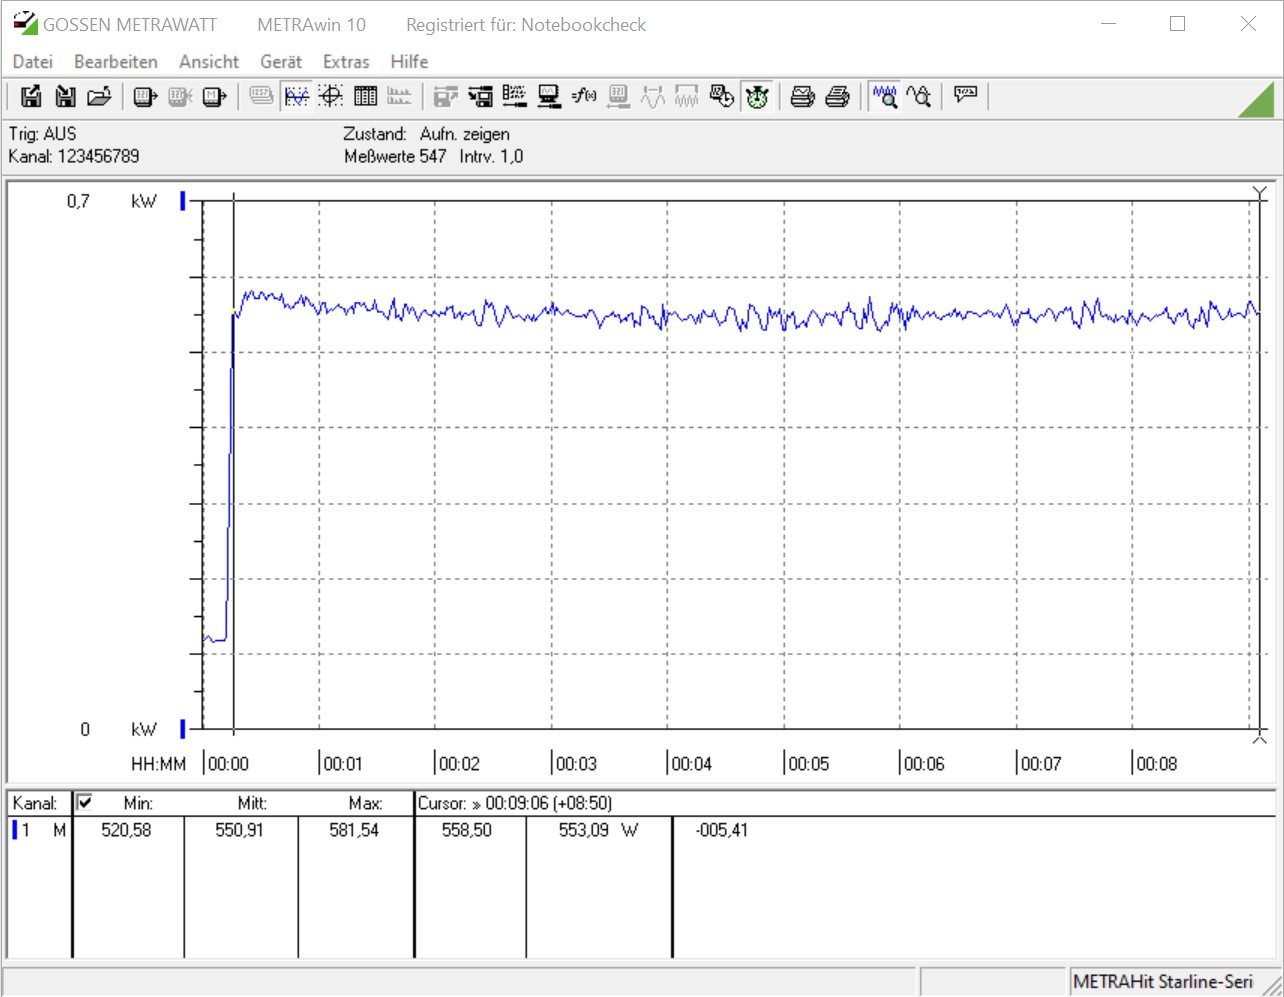
Como era de esperar, el consumo de energía es alto. También hay que mencionar que nuestras mediciones se refieren a todo el sistema (incluyendo nueve ventiladores de 120 milímetros). En el uso en reposo, se extraen algo menos de 106 vatios del enchufe; al mismo tiempo, se muestran 597 vatios en nuestro dispositivo de medición bajo carga cuando se juega. Si ahora aumentas el objetivo de potencia a 450 vatios, superarás fácilmente los 600 vatios durante el juego. Comparada con las otras tarjetas gráficas que hemos probado hasta ahora, la MSI GeForce RTX 3090 Suprim X lidera este campo por un amplio margen.
Aquellos que compren el MSI GeForce RTX 3090 Suprim X definitivamente deberían ser capaces de tener una fuerte fuente de alimentación. Nuestra recomendación es una fuente de alimentación de 850 vatios como mínimo.
| Power Consumption | |
| 1920x1080 The Witcher 3 ultra (external Monitor) | |
| MSI GeForce RTX 3090 Suprim X (Idle: 105.9 W) | |
| ASUS GeForce RTX 3080 ROG STRIX OC GAMING (Idle: 88.3 W) | |
| AMD Radeon RX 6800 XT (Idle: 99.5 W) | |
| KFA2 GeForce RTX 2080 Ti EX (Idle: 100.5 W) | |
| AMD Radeon RX Vega 64 (Idle: 74.3 W) | |
| MSI RTX 2080 Gaming X Trio (Idle: 87.78 W) | |
| MSI GeForce RTX 3070 Gaming X Trio (Idle: 95.1 W) | |
| Nvidia GeForce RTX 2080 Super (Idle: 78.87 W) | |
| AMD Radeon RX 5700 XT (Idle: 69.8 W) | |
| Nvidia GeForce RTX 2070 Super (96.8 fps, Idle: 80.5 W) | |
| MSI RTX 2070 Gaming Z 8G (Idle: 73.3 W) | |
| AMD Radeon VII (Idle: 81.39 W) | |
| Nvidia GeForce RTX 2060 Super (82.7 fps, Idle: 77.12 W) | |
| AMD Radeon RX 5700 (84.2 fps, Idle: 64.5 W) | |
| MSI RTX 2060 Gaming Z 6G (Idle: 74.66 W) | |
| 1280x720 FurMark 1.19 GPU Stress Test (external Monitor) | |
| MSI GeForce RTX 3090 Suprim X (Idle: 105.9 W) | |
| ASUS GeForce RTX 3080 ROG STRIX OC GAMING (Idle: 88.3 W) | |
| AMD Radeon RX 6800 XT (Idle: 99.5 W) | |
| AMD Radeon VII (Idle: 81.39 W) | |
| MSI RTX 2080 Gaming X Trio | |
| KFA2 GeForce RTX 2080 Ti EX (Idle: 100.5 W) | |
| MSI GeForce RTX 3070 Gaming X Trio (Idle: 95.1 W) | |
| Nvidia GeForce RTX 2080 Super (Idle: 78.87 W) | |
| MSI RTX 2070 Gaming Z 8G (Idle: 73.3 W) | |
| AMD Radeon RX 5700 XT (239 fps, Idle: 69.8 W) | |
| Nvidia GeForce RTX 2070 Super (283 fps, Idle: 80.5 W) | |
| MSI RTX 2060 Gaming Z 6G (Idle: 74.66 W) | |
| Nvidia GeForce RTX 2060 Super (237 fps, Idle: 77.12 W) | |
| AMD Radeon RX 5700 (207 fps, Idle: 64.5 W) | |
* ... más pequeño es mejor
Pro
Contra
Veredicto - Muy hambriento de poder y extremadamente rápido
La GeForce RTX 3090 es sin duda la tarjeta gráfica de juego más rápida del mercado en este momento. Con la MSI GeForce RTX 3090 Suprim X, tuvimos un modelo especial de MSI en la prueba; no sólo fue capaz de convencer con un muy buen rendimiento de juego, sino que el nuevo modelo Suprim X también tiene mucho que ofrecer en cuanto a su apariencia. Esto se complementa con la muy alta calidad de la mano de obra que se refleja tanto en términos de apariencia como de tacto. Sin embargo, debe ser consciente de que el muy alto rendimiento va acompañado de una demanda de energía muy alta. No se pueden dejar de mencionar los casi 600 vatios del sistema de prueba sin monitor. La mayor ventaja del GeForce RTX 3090 es la VRAM de 24 GB, ya que es más del doble de grande que la del GeForce RTX 3080. A largo plazo, esto podría significar el final del RTX 3080. AMD toma un enfoque diferente con sus tarjetas gráficas RX 6000 y ofrece los tres modelos con 16 GB de VRAM.
Mirando el rendimiento de los juegos, el MSI GeForce RTX 3090 Suprim X puede claramente sostenerse contra un GeForce RTX 3080. Con el Radeon RX 6800 XT, AMD se sitúa detrás del RTX 3080. En consecuencia, AMD sólo puede representar una amenaza para Nvidia con una Radeon RX 6900 XT. Actualmente no tenemos datos válidos para la comparación con una Radeon RX 6900 XT. Las mayores ventajas de Nvidia son actualmente el trazado de rayos y la DLSS. El primero también lo ofrecen las nuevas tarjetas gráficas Big Navi de AMD, pero AMD sigue estando muy por detrás en términos de rendimiento aquí.
MSI ha introducido una nueva serie de alta gama con el GeForce RTX 3090 Suprim X. El nuevo modelo superior ofrece diversión de juego sin compromisos, pero requiere resoluciones muy altas para no trabajar siempre en el límite de la CPU.
Desafortunadamente, la situación actual del mercado ha sido tensa durante meses, y aquellos que quieren comprar una nueva tarjeta gráfica tienen que tomar lo que está disponible. Conseguir la tarjeta que quieres es casi un milagro en este momento. Además, los precios se han disparado, lo que también se aplica al MSI GeForce RTX 3090 Suprim X. Según el MSI, el MSRP para nuestra muestra de revisión es de 1.649 Euros (~$1.998). Sin embargo, la tarjeta gráfica está listada en Geizhals por casi 2.000 Euros (~$2.423) y a veces por mucho más.
Todos los puntos de referencia y los resultados de las pruebas del RTX 3090 se pueden encontrar en el sitio de la tarjeta gráfica delGeForce RTX 3090(actualizado regularmente).

