Notebookcheck Logo

MSI GeForce RTX 3070 Gaming X Trio tarjeta gráfica de escritorio en revisión

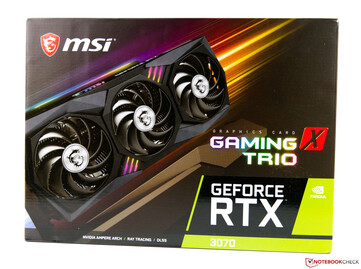
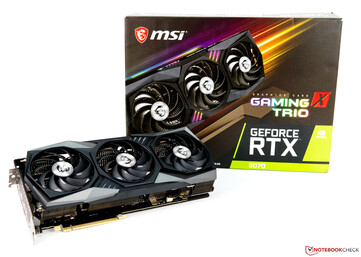
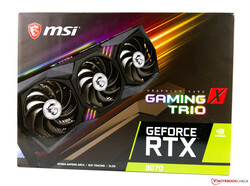
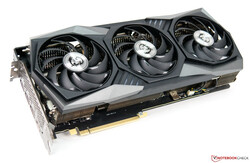
¡Rápido y en silencio! Las tarjetas gráficas Ampere están llamando la atención con un gran salto en el rendimiento. En esta revisión, miramos más de cerca el modelo MSI con un BIOS de 240 vatios. Como resultado, la GeForce Gaming X Trio ofrece un rendimiento ligeramente superior al modelo de referencia de Nvidia. Esta revisión revelará qué más tiene que ofrecer el modelo personalizado.
Las conexiones externas del MSI GeForce RTX 3070 Gaming X Trio
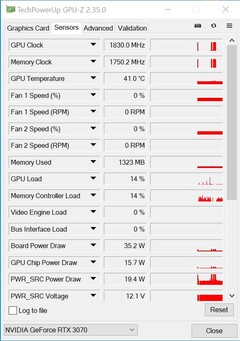
GPU-Z
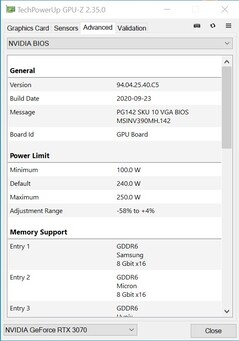
GPU-Z

La arquitectura del Ampere hizo su debut a principios de este año, aunque inicialmente sólo para el mercado de servidores. Los dispositivos de juego basados en los nuevos chips fabricados en 8 nm fueron los siguientes. Después de las pruebas iniciales, algunos de ellos han superado significativamente a las tarjetas gráficas de Turing. Dependiendo del caso de aplicación, el Ampere ofrece hasta un 30% más de rendimiento que el Turing.

De esta forma, la GeForce RTX 3070, como sucesora de la GeForce 2070 Superse lleva una herencia relativamente ligera, ya que el rendimiento se supera significativamente y es comparable a un GeForce RTX 2080 Ti. A la inversa, esto significa más rendimiento por un precio más bajo para los clientes, porque la GeForce RTX 2080 Ti cuesta 999 Euros (~$1,189) en su lanzamiento, mientras que Nvidia cobra 499 Euros (~$594) por la RTX 3070 Founders Edition. Dependiendo del modelo personalizado, los precios aumentaron debido a las mejores soluciones de refrigeración. Esto también se aplica a la generación actual, porque nuestra GeForce RTX 3070 Gaming X Trio de MSI cuesta actualmente poco menos de 720 Euros (~$857), cuando está disponible. Esto nos lleva directamente al siguiente tema, porque las escasas existencias han causado un aumento adicional de los precios desde su lanzamiento. Pero no sólo Nvidia siente el descontento de los clientes, ya que AMD también está luchando con este problema. Desafortunadamente, actualmente es imposible decir cuándo mejorará esta situación.

La MSI GeForce RTX 3070 Gaming X Trio es, sin duda, una tarjeta gráfica muy rápida y excelentemente trabajada. Además, se entrega con una BIOS de 240 vatios desde la caja. La Edición Fundadora, por otro lado, tiene que conformarse con 220 vatios. El muy bueno y masivo disipador de calor, que está equipado con tres ventiladores axiales, se encarga del calor desarrollado. El disipador de calor nunca aparece realmente, incluso bajo carga, como ya podemos revelar en este punto.

Para la alimentación, MSI prescinde del conector de 12 pines que Nvidia utiliza con sus tarjetas de la Edición Fundadora y se queda con el clásico. La GeForce RTX 3070 Gaming X Trio requiere dos conectores de alimentación de 8 pines. Externamente, se pueden operar hasta cuatro monitores simultáneamente. Para ello, hay una salida HDMI con el último estándar (2.1) y tres conexiones DisplayPort (1.4a).

MSI GeForce RTX 3070 Gaming X Trio

Comparación del RTX 3070 con otras GPU NVIDIA

Especificaciones -RTX 3090 -RTX 3080 FE -MSIRTX 3070-RTX 3070 FE -TITAN RTX -TITAN X Pascal -RTX 2080 Ti -RTX 2080 -RTX 2070 S
Chip
El proceso FinFET... 8 nm... 8 nm...8 nm... 12 nm... 16 nm... 12 nm... 12 nm... 12 nm..
CUDA cores
Textureunits
Tensor cores
RTcores
Reloj base de la GPU 1.395 MHz 1.440 MHz 1.500 MHz 1.350 MHz 1.417 MHz 1.350 MHz 1.515 MHz 1.605 MHz
Reloj de aumento de la GPU 1.695 MHz 1.710 MHz 1.830 MHz 1.750 MHz 1.770 MHz 1.531 MHz 1.545 MHz 1.710 MHz 1.770 MHz
Memorybus
Anchura de banda de la memoria
Memoria de vídeo
Consumo de energía... 350 W... 320W... 240 W... 220 W... 280 W... 250 W... 250 W... 250 W... 215 W..

Nuestro sistema de pruebas con el AMD Ryzen 9 3900X como base

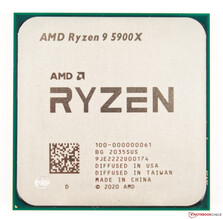
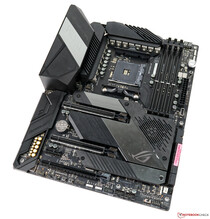
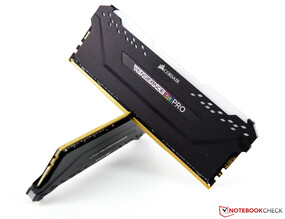
Una plataforma actual de AMD basada en el Asus X570 ROG Crosshair VIII sirve como nuestro sistema de pruebas. El CPU(AMD Ryzen 9 5900X) ofrece un buen rendimiento de CPU, y usamos un AIO(Alphacool Eisbaer 280 mm) como refrigeración. Los 32 GB de RAM son de Corsair y relojes a 4.000 MHz. Usamos el Acer Predator XB321HK como monitor. Esto no nos limita gracias a su idoneidad UHD. En este punto, nos gustaría agradecer a AMD por proporcionar la plataforma de prueba y a Corsair por el kit de RAM

AMD Ryzen 9 5900X
Asus X570 ROG Crosshair VIII Héroe
Corsair Vengeance RGB Pro DDR4 4000 2x 16 GB

Para los siguientes puntos de referencia y pruebas, utilizamos el siguiente sistema:

  • Corsair Carbide Air 540 ATX Cube
  • AMD Ryzen 9 5900X
  • MSI GeForce RTX 3070 Gaming X Trio(Nvidia driver 457.30)
  • Asus X570 ROG Crosshair VIII Hero Wi-Fi (BIOS 2402, configuración por defecto, XMP 1 - DDR4 4000)
  • Corsair RM1000X Fuente de alimentación de 1000 vatios
  • Corsair Vengeance RGB Pro DDR4 4000 2x 16 GBde memoria
  • Corsair MP600 2 TB M.2 PCIe 4.0 SSD
  • Crucial MX500 2 TB (para juegos)

Las velocidades de reloj del MSI GeForce RTX 3070 Gaming X Trio

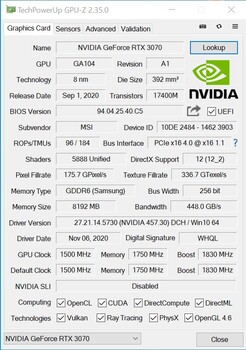
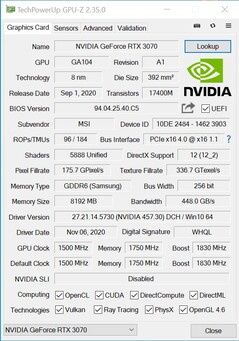
Comparado con el modelo de referencia, el MSI no ha tocado la velocidad de reloj base, lo que también se aplica a la velocidad de funcionamiento del VRAM. Sólo la máxima velocidad de reloj del turbo es algo mayor a 1.830 MHz (+6%). A cambio, la GeForce RTX 3070 Gaming X Trio también puede utilizar 20 vatios más de energía. Pero esto probablemente no será completamente beneficioso para el chip gráfico, porque el ventilador adicional y el espectáculo RGB también requieren energía.

Sin embargo, en general, la velocidad de impulso casi siempre se supera durante el juego, lo que se debe a la muy buena solución de refrigeración. Incluso bajo carga, asegura temperaturas muy por debajo del límite de temperatura.

GPU-Z
GPU-Z
GPU-Z
GPU-Z
GPU-Z
GPU-Z

Puntos de referencia sintéticos

Para una primera comparación de rendimiento, veamos los resultados de los puntos de referencia sintéticos. Aquí, el MSI GeForce RTX 3070 Gaming X Trio es casi tan rápido como una GeForce RTX 2080 Ti. El rendimiento del Nvidia Titan RTX no puede ser alcanzado, pero está casi al alcance de la mano. Comparado con el GeForce RTX 2070 Supernuestra muestra de prueba puede diferenciarse claramente del modelo de Turing en un 40%. La GeForce RTX 3070 sólo necesita un 10% más de energía para lograrlo

3DMark
1920x1080 Fire Strike Graphics
NVIDIA GeForce RTX 3090
43404 Points +40%
NVIDIA GeForce RTX 3080
40910 Points +32%
NVIDIA Titan RTX
34722 Points +12%
GeForce RTX 2080 Ti (Desktop)
32081 Points +3%
MSI GeForce RTX 3070 Gaming X Trio
31096 Points
GeForce RTX 2080 (Desktop)
27620 Points -11%
Radeon VII
27476 Points -12%
GeForce RTX 2080 Super (Desktop)
27075 Points -13%
Radeon RX 5700 XT (Desktop)
25383 Points -18%
GeForce RTX 2070 Super (Desktop)
24151 Points -22%
GeForce RTX 2070 (Desktop)
22999 Points -26%
Radeon RX 5700 (Desktop)
22457 Points -28%
RX Vega 64
22338 Points -28%
GeForce RTX 2060 Super (Desktop)
21970 Points -29%
GeForce RTX 2060 (Desktop)
19338 Points -38%
Fire Strike Extreme Graphics
NVIDIA GeForce RTX 3090
22423 Points +38%
NVIDIA GeForce RTX 3080
20861 Points +29%
NVIDIA Titan RTX
17176 Points +6%
MSI GeForce RTX 3070 Gaming X Trio
16196 Points
GeForce RTX 2080 Ti (Desktop)
15603 Points -4%
Radeon VII
13388 Points -17%
GeForce RTX 2080 (Desktop)
13355 Points -18%
GeForce RTX 2080 Super (Desktop)
12968 Points -20%
Radeon RX 5700 XT (Desktop)
12209 Points -25%
GeForce RTX 2070 Super (Desktop)
11634 Points -28%
GeForce RTX 2070 (Desktop)
11021 Points -32%
Radeon RX 5700 (Desktop)
10876 Points -33%
RX Vega 64
10758 Points -34%
GeForce RTX 2060 Super (Desktop)
10481 Points -35%
GeForce RTX 2060 (Desktop)
9097 Points -44%
3840x2160 Fire Strike Ultra Graphics
NVIDIA GeForce RTX 3090
11715 Points +38%
NVIDIA GeForce RTX 3080
10793 Points +27%
NVIDIA Titan RTX
8649 Points +2%
MSI GeForce RTX 3070 Gaming X Trio
8483 Points
GeForce RTX 2080 Ti (Desktop)
7925 Points -7%
Radeon VII
6837 Points -19%
GeForce RTX 2080 (Desktop)
6513 Points -23%
GeForce RTX 2080 Super (Desktop)
6500 Points -23%
Radeon RX 5700 XT (Desktop)
5955 Points -30%
GeForce RTX 2070 Super (Desktop)
5786 Points -32%
GeForce RTX 2070 (Desktop)
5450 Points -36%
RX Vega 64
5441 Points -36%
Radeon RX 5700 (Desktop)
5292 Points -38%
GeForce RTX 2060 Super (Desktop)
5175 Points -39%
GeForce RTX 2060 (Desktop)
4244 Points -50%
2560x1440 Time Spy Graphics
NVIDIA GeForce RTX 3090
18863 Points +39%
NVIDIA GeForce RTX 3080
17467 Points +29%
NVIDIA Titan RTX
15283 Points +13%
GeForce RTX 2080 Ti (Desktop)
13744 Points +1%
MSI GeForce RTX 3070 Gaming X Trio
13579 Points
GeForce RTX 2080 Super (Desktop)
11477 Points -15%
GeForce RTX 2080 (Desktop)
11294 Points -17%
GeForce RTX 2070 Super (Desktop)
10094 Points -26%
GeForce RTX 2070 (Desktop)
9236 Points -32%
Radeon VII
8803 Points -35%
GeForce RTX 2060 Super (Desktop)
8795 Points -35%
Radeon RX 5700 XT (Desktop)
8673 Points -36%
GeForce RTX 2060 (Desktop)
7732 Points -43%
Radeon RX 5700 (Desktop)
7675 Points -43%
RX Vega 64
7183 Points -47%
Unigine Superposition
1280x720 720p Low
NVIDIA Titan RTX
40994 Points +29%
MSI GeForce RTX 3070 Gaming X Trio
31666 Points
NVIDIA GeForce RTX 3080
30851 Points -3%
1920x1080 1080p High
NVIDIA GeForce RTX 3090
23626 (113.62min - 236.69max) Points +36%
NVIDIA GeForce RTX 3080
21333 Points +23%
NVIDIA Titan RTX
20315 Points +17%
MSI GeForce RTX 3070 Gaming X Trio
17346 Points
1920x1080 1080p Extreme
NVIDIA GeForce RTX 3090
11927 (69.49min - 121.03max) Points +40%
NVIDIA GeForce RTX 3080
10572 Points +24%
NVIDIA Titan RTX
9056 Points +6%
MSI GeForce RTX 3070 Gaming X Trio
8507 Points
3840x2160 4k Optimized
NVIDIA GeForce RTX 3090
15888 (99.72min - 146.92max) Points +48%
NVIDIA GeForce RTX 3080
13984 Points +30%
NVIDIA Titan RTX
12186 Points +13%
MSI GeForce RTX 3070 Gaming X Trio
10755 Points
7680x4320 8k Optimized
NVIDIA GeForce RTX 3090
6969 (43.54min - 60.14max) Points +48%
NVIDIA GeForce RTX 3080
6243 Points +33%
NVIDIA Titan RTX
5402 Points +15%
MSI GeForce RTX 3070 Gaming X Trio
4695 Points
Unigine Heaven 4.0
Extreme Preset OpenGL
NVIDIA GeForce RTX 3080
232.4 fps +19%
NVIDIA Titan RTX
215.1 fps +10%
GeForce RTX 2080 Ti (Desktop)
204.4 fps +4%
MSI GeForce RTX 3070 Gaming X Trio
196.1 fps
GeForce RTX 2080 Super (Desktop)
167.5 fps -15%
GeForce RTX 2080 (Desktop)
161.4 fps -18%
GeForce RTX 2070 Super (Desktop)
153.5 fps -22%
GeForce RTX 2070 (Desktop)
139 fps -29%
GeForce RTX 2060 Super (Desktop)
132.3 fps -33%
GeForce RTX 2060 (Desktop)
115.8 fps -41%
Radeon RX 5700 XT (Desktop)
110.2 fps -44%
Radeon VII
109 fps -44%
Radeon RX 5700 (Desktop)
100.7 fps -49%
Extreme Preset DX11
NVIDIA GeForce RTX 3090
272.4 (47.3min - 557.4max) fps +35%
NVIDIA Titan RTX
237.1 fps +17%
NVIDIA GeForce RTX 3080
232.6 fps +15%
GeForce RTX 2080 Ti (Desktop)
215.2 fps +6%
MSI GeForce RTX 3070 Gaming X Trio
202.5 fps
GeForce RTX 2080 (Desktop)
176.5 fps -13%
GeForce RTX 2080 Super (Desktop)
175.2 fps -13%
GeForce RTX 2070 Super (Desktop)
160.1 fps -21%
GeForce RTX 2070 (Desktop)
149.3 fps -26%
GeForce RTX 2060 Super (Desktop)
141.7 fps -30%
Radeon VII
140.3 fps -31%
Radeon RX 5700 XT (Desktop)
132.5 fps -35%
GeForce RTX 2060 (Desktop)
124.1 fps -39%
Radeon RX 5700 (Desktop)
119.9 fps -41%
Unigine Valley 1.0
1920x1080 Extreme HD DirectX AA:x8
NVIDIA GeForce RTX 3090
184.2 (47.3min - 301.5max) fps +19%
NVIDIA Titan RTX
180.1 fps +16%
NVIDIA GeForce RTX 3080
176.2 fps +14%
GeForce RTX 2080 Ti (Desktop)
159.4 fps +3%
MSI GeForce RTX 3070 Gaming X Trio
155.1 fps
GeForce RTX 2080 Super (Desktop)
120.2 fps -23%
GeForce RTX 2080 (Desktop)
119.6 fps -23%
GeForce RTX 2070 Super (Desktop)
113.7 fps -27%
GeForce RTX 2070 (Desktop)
111.5 fps -28%
Radeon VII
108.5 fps -30%
GeForce RTX 2060 Super (Desktop)
106.9 fps -31%
Radeon RX 5700 XT (Desktop)
106.3 fps -31%
Radeon RX 5700 (Desktop)
99.3 fps -36%
GeForce RTX 2060 (Desktop)
91.2 fps -41%
1920x1080 Extreme HD Preset OpenGL AA:x8
NVIDIA GeForce RTX 3080
163.8 fps +15%
NVIDIA Titan RTX
158.5 fps +11%
GeForce RTX 2080 Ti (Desktop)
145.1 fps +2%
MSI GeForce RTX 3070 Gaming X Trio
142.9 fps
GeForce RTX 2080 Super (Desktop)
114.5 fps -20%
GeForce RTX 2080 (Desktop)
110.5 fps -23%
GeForce RTX 2070 Super (Desktop)
105.6 fps -26%
GeForce RTX 2070 (Desktop)
101 fps -29%
GeForce RTX 2060 Super (Desktop)
98.3 fps -31%
Radeon RX 5700 XT (Desktop)
89.1 fps -38%
GeForce RTX 2060 (Desktop)
83.6 fps -41%
Radeon RX 5700 (Desktop)
82.7 fps -42%
Radeon VII
81.3 fps -43%
SiSoft Sandra 2016
GP Financial Analysis (FP High/Double Precision)
Radeon VII
1130 KOPT/s +657%
NVIDIA GeForce RTX 3080
212.8 KOPT/s +43%
GeForce RTX 2080 Ti (Desktop)
206.8 KOPT/s +39%
GeForce RTX 2080 (Desktop)
159.4 KOPT/s +7%
GeForce RTX 2080 Super (Desktop)
151.5 KOPT/s +2%
MSI GeForce RTX 3070 Gaming X Trio
149.2 KOPT/s
GeForce RTX 2070 Super (Desktop)
124.7 KOPT/s -16%
GeForce RTX 2070 (Desktop)
121.3 KOPT/s -19%
GeForce RTX 2060 Super (Desktop)
105.3 KOPT/s -29%
GeForce RTX 2060 (Desktop)
99.1 KOPT/s -34%
Radeon RX 5700 XT (Desktop)
24 KOPT/s -84%
Radeon RX 5700 (Desktop)
20.81 KOPT/s -86%
GP Cryptography (Higher Security AES256+SHA2-512)
NVIDIA GeForce RTX 3080
172.9 GB/s +42%
GeForce RTX 2080 Ti (Desktop)
129.3 GB/s +6%
MSI GeForce RTX 3070 Gaming X Trio
121.5 GB/s
GeForce RTX 2080 (Desktop)
101.8 GB/s -16%
Radeon VII
99.2 GB/s -18%
GeForce RTX 2080 Super (Desktop)
95.7 GB/s -21%
GeForce RTX 2070 Super (Desktop)
88.4 GB/s -27%
GeForce RTX 2070 (Desktop)
75.4 GB/s -38%
GeForce RTX 2060 Super (Desktop)
74.6 GB/s -39%
GeForce RTX 2060 (Desktop)
63.8 GB/s -47%
Image Processing
NVIDIA GeForce RTX 3080
3721 MPix/s +44%
Radeon VII
2800 MPix/s +8%
MSI GeForce RTX 3070 Gaming X Trio
2586 MPix/s
GeForce RTX 2080 Ti (Desktop)
1959 MPix/s -24%
GeForce RTX 2080 Super (Desktop)
1430 MPix/s -45%
GeForce RTX 2080 (Desktop)
1380 MPix/s -47%
GeForce RTX 2070 Super (Desktop)
1250 MPix/s -52%
GeForce RTX 2070 (Desktop)
1150 MPix/s -56%
GeForce RTX 2060 Super (Desktop)
1110 MPix/s -57%
Radeon RX 5700 XT (Desktop)
919 MPix/s -64%
GeForce RTX 2060 (Desktop)
912 MPix/s -65%
Radeon RX 5700 (Desktop)
775 MPix/s -70%
3DMark 05 Standard
51451 puntos
3DMark 06 Standard Score
42108 puntos
3DMark Vantage P Result
85505 puntos
3DMark 11 Performance
28358 puntos
3DMark Ice Storm Standard Score
201360 puntos
3DMark Cloud Gate Standard Score
59414 puntos
3DMark Fire Strike Score
26306 puntos
3DMark Fire Strike Extreme Score
15681 puntos
3DMark Time Spy Score
12889 puntos
ayuda

Los puntos de referencia del juego

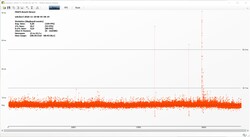
Los tiempos de fotogramas de Witcher 3 (Ultra preestablecido)
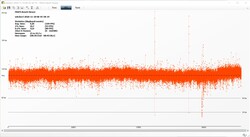
La progresión del cuadro Witcher 3 (Ultra preset)

Hemos probado la MSI GeForce RTX 3070 Gaming X Trio con una variedad de juegos y podemos confirmar que la tarjeta gráfica tiene un muy buen rendimiento en juegos Full HD y WQHD. Sin embargo, la GeForce RTX 3070 también domina muchos juegos en 4K, aunque algunos juegos sólo alcanzan los 40 FPS. Sin embargo, incluso en esta resolución, los juegos que no requieren tanto hardware no son un problema para la MSI GeForce RTX 3070 Gaming X Trio

Si juegas principalmente en 1080p o 1440p, estarás completamente satisfecho con el rendimiento del MSI GeForce RTX 3070 Gaming X Trio. Los 8 GB de VRAM pueden parecer un poco limitados a primera vista. Sin embargo, es suficiente para los juegos modernos. Con los tiempos de fotogramas y la progresión de fotogramas que registramos en el juego The Witcher 3 (Ultra preset), algunas latencias más altas sólo aparecen de vez en cuando, pero no afectan a la experiencia de juego de forma notable. La progresión de fotogramas también es constante a largo plazo, lo que de nuevo apunta a la buena unidad de refrigeración

Nuestra GeForce RTX 3070 de MSI apenas pierde contra la GeForce RTX 2080 Ti en esta comparación. La diferencia de rendimiento con la más rápida GeForce RTX 3080 es de alrededor de 25 a 30% en altas resoluciones (2160p).

The Witcher 3 frame progression Ultra preset

05101520253035404550556065707580859095100105110115Tooltip
MSI GeForce RTX 3070 Gaming X Trio NVIDIA GeForce RTX 3070, R9 5900X, Intel Optane 905P 480GB 2.5: Ø108.8 (101-119)
Far Cry New Dawn - 3840x2160 Ultra Preset
NVIDIA GeForce RTX 3090
92 (72min - 122max) fps +31%
NVIDIA GeForce RTX 3080
89 (72min - 108max) fps +27%
NVIDIA Titan RTX
84 (71min - 100max) fps +20%
NVIDIA Titan RTX
81 (68min - 98max) fps +16%
GeForce RTX 2080 Ti (Desktop)
73 (59min - 92max) fps +4%
MSI GeForce RTX 3070 Gaming X Trio
70 (52min - 86max) fps
GeForce RTX 2080 Super (Desktop)
64 (54min - 81max) fps -9%
GeForce RTX 2080 (Desktop)
62 (52min - 76max) fps -11%
Radeon VII
61 (50min - 80max) fps -13%
GeForce RTX 2070 Super (Desktop)
58 (48min - 72max) fps -17%
Radeon RX 5700 XT (Desktop)
56 (47min - 73max) fps -20%
GeForce RTX 2070 (Desktop)
51 (43min - 61max) fps -27%
Radeon RX 5700 (Desktop)
51 (42min - 67max) fps -27%
GeForce RTX 2060 Super (Desktop)
50 (41min - 62max) fps -29%
RX Vega 64
47 (38min - 60max) fps -33%
GeForce RTX 2060 (Desktop)
42 (35min - 52max) fps -40%
Far Cry 5 - 3840x2160 Ultra Preset AA:T
NVIDIA GeForce RTX 3090
101 (88min - 116max) fps +46%
NVIDIA GeForce RTX 3080
95 (85min - 107max) fps +38%
NVIDIA Titan RTX
81 (73min - 95max) fps +17%
NVIDIA Titan RTX
78 (66min - 93max) fps +13%
GeForce RTX 2080 Ti (Desktop)
74 (65min - 88max) fps +7%
MSI GeForce RTX 3070 Gaming X Trio
69 (61min - 81max) fps
GeForce RTX 2080 Super (Desktop)
61 (53min - 70max) fps -12%
GeForce RTX 2080 (Desktop)
59 (53min - 71max) fps -14%
Radeon VII
59 (50min - 75max) fps -14%
GeForce RTX 2070 Super (Desktop)
54 (48min - 65max) fps -22%
Radeon RX 5700 XT (Desktop)
51 (44min - 66max) fps -26%
GeForce RTX 2070 (Desktop)
48 (41min - 57max) fps -30%
GeForce RTX 2060 Super (Desktop)
45 (40min - 55max) fps -35%
Radeon RX 5700 (Desktop)
45 (38min - 58max) fps -35%
RX Vega 64
44 (37min - 56max) fps -36%
GeForce RTX 2060 (Desktop)
41 (37min - 49max) fps -41%
F1 2020 - 3840x2160 Ultra High Preset AA:T AF:16x
NVIDIA GeForce RTX 3090
133 (113min - 155max) fps +49%
NVIDIA GeForce RTX 3080
118 (102min - 137max) fps +32%
NVIDIA Titan RTX
97.4 (84min - 114max) fps +9%
MSI GeForce RTX 3070 Gaming X Trio
89.2 (73min - 104max) fps
Borderlands 3 - 3840x2160 Badass Overall Quality (DX11)
NVIDIA GeForce RTX 3090
71.5 fps +62%
NVIDIA GeForce RTX 3080
61.5 fps +39%
NVIDIA Titan RTX
46.7 fps +6%
NVIDIA Titan RTX
46 fps +4%
MSI GeForce RTX 3070 Gaming X Trio
44.2 fps
GeForce RTX 2080 Ti (Desktop)
43.6 fps -1%
Metro Exodus - 3840x2160 Ultra Quality AF:16x
NVIDIA GeForce RTX 3090
71.7 (40.9min - 110.8max) fps +46%
NVIDIA GeForce RTX 3080
64.1 (36.54min - 108.57max) fps +31%
NVIDIA Titan RTX
54.9 (34.88min - 89.73max) fps +12%
NVIDIA Titan RTX
53.7 (33.8min - 83.74max) fps +9%
MSI GeForce RTX 3070 Gaming X Trio
49.1 (30.24min - 89.89max) fps
GeForce RTX 2080 Ti (Desktop)
47.5 (31min - 69max) fps -3%
RX Vega 64
45.7 (26min - 67max) fps -7%
GeForce RTX 2080 Super (Desktop)
40 (25.84min - 59.35max) fps -19%
GeForce RTX 2080 (Desktop)
38.6 (25min - 58max) fps -21%
Radeon VII
37.4 (25min - 50max) fps -24%
GeForce RTX 2070 Super (Desktop)
35 (23min - 51max) fps -29%
GeForce RTX 2070 (Desktop)
31.9 (21min - 45max) fps -35%
GeForce RTX 2060 Super (Desktop)
29.7 (20min - 42max) fps -40%
Radeon RX 5700 XT (Desktop)
29.6 (20.7min - 36.64max) fps -40%
Radeon RX 5700 (Desktop)
28.6 (19.67min - 36.24max) fps -42%
GeForce RTX 2060 (Desktop)
26.3 (17min - 38max) fps -46%
Red Dead Redemption 2 - 3840x2160 Maximum Settings
NVIDIA GeForce RTX 3090
61.9 (32.6min, 55.6P1 - 85.2max) fps +41%
NVIDIA GeForce RTX 3080
56 fps +27%
MSI GeForce RTX 3070 Gaming X Trio
44 (32min - 55max) fps
NVIDIA Titan RTX
41 (29min - 50max) fps -7%
Rise of the Tomb Raider - 3840x2160 High Preset AA:FX AF:4x
NVIDIA GeForce RTX 3080
107 (99min - 120max) fps +28%
GeForce RTX 2080 Ti (Desktop)
93 (86min - 104max) fps +11%
MSI GeForce RTX 3070 Gaming X Trio
83.8 (75min - 93max) fps
GeForce RTX 2080 Super (Desktop)
79 (72min - 87max) fps -6%
GeForce RTX 2080 (Desktop)
77 (71min - 85max) fps -8%
GeForce RTX 2070 Super (Desktop)
68 (60min - 75max) fps -19%
GeForce RTX 2070 (Desktop)
58.1 (53min - 68max) fps -31%
Radeon VII
56.3 (51min - 65max) fps -33%
GeForce RTX 2060 Super (Desktop)
53.4 (47min - 61max) fps -36%
RX Vega 64
50.4 (45min - 57max) fps -40%
GeForce RTX 2060 (Desktop)
47.3 (43min - 55max) fps -44%
Shadow of the Tomb Raider - 3840x2160 Highest Preset AA:T
NVIDIA GeForce RTX 3090
89.3 fps +46%
NVIDIA GeForce RTX 3080
83.9 fps +38%
NVIDIA Titan RTX
66.3 fps +9%
NVIDIA Titan RTX
66 fps +8%
MSI GeForce RTX 3070 Gaming X Trio
61 fps
GeForce RTX 2080 Ti (Desktop)
60 fps -2%
GeForce RTX 2080 Super (Desktop)
49 fps -20%
GeForce RTX 2080 (Desktop)
48 fps -21%
Radeon VII
44 fps -28%
GeForce RTX 2070 Super (Desktop)
43 fps -30%
GeForce RTX 2070 (Desktop)
40 fps -34%
Radeon RX 5700 XT (Desktop)
38 fps -38%
GeForce RTX 2060 Super (Desktop)
36 fps -41%
Radeon RX 5700 (Desktop)
34 fps -44%
GeForce RTX 2060 (Desktop)
32 fps -48%
RX Vega 64
29 fps -52%
The Witcher 3 - 3840x2160 High Graphics & Postprocessing (Nvidia HairWorks Off)
NVIDIA GeForce RTX 3080
115 (107min - 124max) fps +30%
NVIDIA Titan RTX
104 (97min - 112max) fps +18%
NVIDIA Titan RTX
102 (95min - 110max) fps +16%
GeForce RTX 2080 Ti (Desktop)
96 (87min - 109max) fps +9%
MSI GeForce RTX 3070 Gaming X Trio
88.2 (82min - 97max) fps
GeForce RTX 2080 Super (Desktop)
79 (71min - 87max) fps -10%
GeForce RTX 2080 (Desktop)
78 (69min - 87max) fps -12%
GeForce RTX 2070 Super (Desktop)
68 (61min - 74max) fps -23%
GeForce RTX 2070 (Desktop)
64.3 (59min - 70max) fps -27%
GeForce RTX 2060 Super (Desktop)
57 (51min - 62max) fps -35%
Radeon VII
54.3 (50min - 59max) fps -38%
Radeon RX 5700 XT (Desktop)
52.1 (47min - 57max) fps -41%
GeForce RTX 2060 (Desktop)
51.3 (44min - 58max) fps -42%
RX Vega 64
49.1 (44min - 54max) fps -44%
Radeon RX 5700 (Desktop)
46.8 (42min - 51max) fps -47%
bajo medio alto ultraQHD4K
GTA V (2015) 182 172 157 91.1 86.5 112
The Witcher 3 (2015) 451 350 224 122 88.2
Dota 2 Reborn (2015) 162.9 140.5 137.6 128.6 123.4
Rise of the Tomb Raider (2016) 336 252 197 169 83.8
Final Fantasy XV Benchmark (2018) 190 148 115 93.9 56.9
X-Plane 11.11 (2018) 143 117 95.4 81.1
Far Cry 5 (2018) 159 139 133 127 113 69
Strange Brigade (2018) 439 311 256 223 166 97.6
Shadow of the Tomb Raider (2018) 155 143 143 138 108 61
Battlefield V (2018) 177.5 144.3 125.8 113.6 98.8 69
Apex Legends (2019) 144 144 144 144 144 107
Far Cry New Dawn (2019) 131 112 112 97 94 70
Metro Exodus (2019) 156 136 113 91.3 74.4 49.1
The Division 2 (2019) 220 173 142 112 82 49
Anno 1800 (2019) 115 112 82.7 46.5 46.2 34.3
Rage 2 (2019) 264 192 168 163 110 56.7
Control (2019) 238 147 122 82.5 42.3
Borderlands 3 (2019) 142 129 111 95.8 75.9 44.2
Star Wars Jedi Fallen Order (2019) 106 106 104 102 67.6
Red Dead Redemption 2 (2019) 168 156 119 78 65 44
Hunt Showdown (2020) 216 192 180 138 70.2
Doom Eternal (2020) 246 246 244 237 208 116
F1 2020 (2020) 321 288 249 179 146 89.2
Horizon Zero Dawn (2020) 172 152 132 125 109 77
Flight Simulator 2020 (2020) 115 97.4 79.9 62.8 55.6 37.3
Serious Sam 4 (2020) 161.2 130.6 121.3 104.2 91.3 67.6
Mafia Definitive Edition (2020) 152 128 124 98.7 56.6
Star Wars Squadrons (2020) 382 316 292 268 207 128
FIFA 21 (2020) 150 152 156 152 156 160
Watch Dogs Legion (2020) 100 100 88.9 79 65.7 37
Dirt 5 (2020) 169 119 102 86 74 52.9
Assassin´s Creed Valhalla (2020) 125 100 87 78 67 47
Call of Duty Black Ops Cold War (2020) 205 186 132 122 107 74

Calcular el rendimiento

En LuxMark y ComputeMark, el MSI GeForce RTX 3070 Gaming X Trio compite de nuevo con elGeForce RTX 2080 Ti y por lo tanto, también puede superar claramente alGeForce RTX 2070 Súper. Sin embargo, la diferencia con la más rápida GeForce RTX 3080 es menor aquí que en los puntos de referencia de los juegos puros. En comparación con las tarjetas gráficas para estaciones de trabajo, las tarjetas GeForce carecen de las optimizaciones de los controladores.

LuxMark v2.0 64Bit
Room GPUs-only
Zotac Gaming GeForce RTX 3090 Trinity
5790 Samples/s +35%
ASUS GeForce RTX 3080 ROG STRIX OC GAMING
5112 Samples/s +19%
Nvidia Titan RTX
4643 Samples/s +8%
MSI RTX 2080 Ti Gaming X Trio
4494 Samples/s +5%
KFA2 GeForce RTX 2080 Ti EX
4429 Samples/s +3%
MSI GeForce RTX 3070 Gaming X Trio
4293 Samples/s
AMD Radeon VII
3477 Samples/s -19%
MSI RTX 2080 Gaming X Trio
3453 Samples/s -20%
Nvidia GeForce RTX 2080 Super
3430 Samples/s -20%
Nvidia GeForce RTX 2070 Super
3404 Samples/s -21%
MSI RTX 2070 Gaming Z 8G
3300 Samples/s -23%
Nvidia GeForce RTX 2060 Super
3274 Samples/s -24%
MSI RTX 2060 Gaming Z 6G
2586 Samples/s -40%
AMD Radeon RX 5700 XT
2104 Samples/s -51%
AMD Radeon RX 5700
1856 Samples/s -57%
Sala GPUs-only
Zotac Gaming GeForce RTX 3090 Trinity
14740 Samples/s +46%
ASUS GeForce RTX 3080 ROG STRIX OC GAMING
12797 Samples/s +27%
Nvidia Titan RTX
10799 Samples/s +7%
MSI RTX 2080 Ti Gaming X Trio
10291 Samples/s +2%
MSI GeForce RTX 3070 Gaming X Trio
10115 Samples/s
KFA2 GeForce RTX 2080 Ti EX
9999 Samples/s -1%
MSI RTX 2080 Gaming X Trio
7928 Samples/s -22%
Nvidia GeForce RTX 2080 Super
7878 Samples/s -22%
Nvidia GeForce RTX 2070 Super
7594 Samples/s -25%
MSI RTX 2070 Gaming Z 8G
7179 Samples/s -29%
Nvidia GeForce RTX 2060 Super
6980 Samples/s -31%
AMD Radeon VII
6869 Samples/s -32%
AMD Radeon RX 5700 XT
6188 Samples/s -39%
MSI RTX 2060 Gaming Z 6G
5655 Samples/s -44%
AMD Radeon RX 5700
5312 Samples/s -47%
ComputeMark v2.1
1024x600 Normal, QJuliaRayTrace
Zotac Gaming GeForce RTX 3090 Trinity
16403 Points +39%
ASUS GeForce RTX 3080 ROG STRIX OC GAMING
14718 Points +25%
MSI GeForce RTX 3070 Gaming X Trio
11816 Points
MSI RTX 2080 Ti Gaming X Trio
9690 Points -18%
Nvidia Titan RTX
9418 Points -20%
KFA2 GeForce RTX 2080 Ti EX
9104 Points -23%
MSI RTX 2080 Gaming X Trio
7283 Points -38%
Nvidia GeForce RTX 2080 Super
7258 Points -39%
Nvidia GeForce RTX 2070 Super
6155 Points -48%
AMD Radeon VII
5878 Points -50%
AMD Radeon RX 5700 XT
5761 Points -51%
MSI RTX 2070 Gaming Z 8G
5747 Points -51%
Nvidia GeForce RTX 2060 Super
5271 Points -55%
MSI RTX 2060 Gaming Z 6G
4903 Points -59%
AMD Radeon RX 5700
4703 Points -60%
1024x600 Normal, Mandel Scalar
Zotac Gaming GeForce RTX 3090 Trinity
10766 Points +47%
ASUS GeForce RTX 3080 ROG STRIX OC GAMING
9554 Points +31%
MSI GeForce RTX 3070 Gaming X Trio
7314 Points
AMD Radeon VII
6312 Points -14%
MSI RTX 2080 Ti Gaming X Trio
6226 Points -15%
Nvidia Titan RTX
5977 Points -18%
KFA2 GeForce RTX 2080 Ti EX
5679 Points -22%
AMD Radeon RX 5700 XT
4869 Points -33%
MSI RTX 2080 Gaming X Trio
4526 Points -38%
Nvidia GeForce RTX 2080 Super
4525 Points -38%
AMD Radeon RX 5700
4043 Points -45%
Nvidia GeForce RTX 2070 Super
3782 Points -48%
MSI RTX 2070 Gaming Z 8G
3514 Points -52%
Nvidia GeForce RTX 2060 Super
3185 Points -56%
MSI RTX 2060 Gaming Z 6G
2982 Points -59%
1024x600 Normal, Mandel Vector
Zotac Gaming GeForce RTX 3090 Trinity
8038 Points +46%
ASUS GeForce RTX 3080 ROG STRIX OC GAMING
7148 Points +30%
MSI GeForce RTX 3070 Gaming X Trio
5490 Points
MSI RTX 2080 Ti Gaming X Trio
5037 Points -8%
Nvidia Titan RTX
4944 Points -10%
AMD Radeon VII
4714 Points -14%
KFA2 GeForce RTX 2080 Ti EX
4695 Points -14%
AMD Radeon RX 5700 XT
4246 Points -23%
MSI RTX 2080 Gaming X Trio
3892 Points -29%
Nvidia GeForce RTX 2080 Super
3835 Points -30%
AMD Radeon RX 5700
3532 Points -36%
Nvidia GeForce RTX 2070 Super
3358 Points -39%
MSI RTX 2070 Gaming Z 8G
3169 Points -42%
Nvidia GeForce RTX 2060 Super
2939 Points -46%
MSI RTX 2060 Gaming Z 6G
2800 Points -49%
1024x600 Normal, Fluid 2DTexArr
Zotac Gaming GeForce RTX 3090 Trinity
4366 Points +61%
ASUS GeForce RTX 3080 ROG STRIX OC GAMING
4087 Points +51%
Nvidia Titan RTX
3691 Points +37%
MSI RTX 2080 Ti Gaming X Trio
3539 Points +31%
KFA2 GeForce RTX 2080 Ti EX
3444 Points +27%
MSI GeForce RTX 3070 Gaming X Trio
2704 Points
Nvidia GeForce RTX 2080 Super
2655 Points -2%
MSI RTX 2080 Gaming X Trio
2482 Points -8%
Nvidia GeForce RTX 2070 Super
2331 Points -14%
AMD Radeon VII
2248 Points -17%
MSI RTX 2070 Gaming Z 8G
2221 Points -18%
Nvidia GeForce RTX 2060 Super
2064 Points -24%
AMD Radeon RX 5700 XT
1960 Points -28%
AMD Radeon RX 5700
1810 Points -33%
MSI RTX 2060 Gaming Z 6G
1801 Points -33%
1024x600 Normal, Fluid 3DTex
Zotac Gaming GeForce RTX 3090 Trinity
5376 Points +94%
ASUS GeForce RTX 3080 ROG STRIX OC GAMING
4417 Points +59%
Nvidia Titan RTX
3877 Points +40%
MSI RTX 2080 Ti Gaming X Trio
3653 Points +32%
AMD Radeon VII
3646 Points +31%
KFA2 GeForce RTX 2080 Ti EX
3589 Points +29%
MSI GeForce RTX 3070 Gaming X Trio
2776 Points
Nvidia GeForce RTX 2080 Super
2736 Points -1%
MSI RTX 2080 Gaming X Trio
2588 Points -7%
Nvidia GeForce RTX 2070 Super
2456 Points -12%
MSI RTX 2070 Gaming Z 8G
2380 Points -14%
AMD Radeon RX 5700 XT
2349 Points -15%
AMD Radeon RX 5700
2294 Points -17%
Nvidia GeForce RTX 2060 Super
2289 Points -18%
MSI RTX 2060 Gaming Z 6G
1889 Points -32%
1024x600 Normal, Score
Zotac Gaming GeForce RTX 3090 Trinity
44948 Points +49%
ASUS GeForce RTX 3080 ROG STRIX OC GAMING
39924 Points +33%
MSI GeForce RTX 3070 Gaming X Trio
30100 Points
MSI RTX 2080 Ti Gaming X Trio
28145 Points -6%
Nvidia Titan RTX
27907 Points -7%
KFA2 GeForce RTX 2080 Ti EX
26510 Points -12%
AMD Radeon VII
22798 Points -24%
Nvidia GeForce RTX 2080 Super
21009 Points -30%
MSI RTX 2080 Gaming X Trio
20771 Points -31%
AMD Radeon RX 5700 XT
19184 Points -36%
Nvidia GeForce RTX 2070 Super
18083 Points -40%
MSI RTX 2070 Gaming Z 8G
17031 Points -43%
AMD Radeon RX 5700
16383 Points -46%
Nvidia GeForce RTX 2060 Super
15749 Points -48%
MSI RTX 2060 Gaming Z 6G
14375 Points -52%
SPECviewperf 13
Solidworks (sw-04)
Nvidia Titan RTX
132.9 fps +57%
AMD Radeon RX 5700 XT
114.4 fps +35%
MSI RTX 2080 Ti Gaming X Trio
113.2 fps +33%
KFA2 GeForce RTX 2080 Ti EX
111.8 fps +32%
Zotac Gaming GeForce RTX 3090 Trinity
108 fps +27%
AMD Radeon RX 5700
101.8 fps +20%
MSI RTX 2080 Gaming X Trio
100.3 fps +18%
Nvidia GeForce RTX 2080 Super
99.6 fps +17%
AMD Radeon VII
95.1 fps +12%
Nvidia GeForce RTX 2070 Super
93.3 fps +10%
ASUS GeForce RTX 3080 ROG STRIX OC GAMING
92.4 fps +9%
MSI RTX 2070 Gaming Z 8G
86.7 fps +2%
MSI GeForce RTX 3070 Gaming X Trio
84.8 fps
MSI RTX 2060 Gaming Z 6G
83.4 fps -2%
Nvidia GeForce RTX 2060 Super
75.7 fps -11%
Siemens NX (snx-03)
Nvidia Titan RTX
462.4 fps +1968%
AMD Radeon RX 5700 XT
61.3 fps +174%
AMD Radeon RX 5700
60.5 fps +171%
AMD Radeon VII
37.03 fps +66%
Zotac Gaming GeForce RTX 3090 Trinity
23.62 fps +6%
ASUS GeForce RTX 3080 ROG STRIX OC GAMING
23.22 fps +4%
MSI RTX 2080 Ti Gaming X Trio
22.45 fps 0%
MSI GeForce RTX 3070 Gaming X Trio
22.36 fps
KFA2 GeForce RTX 2080 Ti EX
21.99 fps -2%
Nvidia GeForce RTX 2080 Super
21.94 fps -2%
MSI RTX 2080 Gaming X Trio
21.7 fps -3%
Nvidia GeForce RTX 2070 Super
20.71 fps -7%
MSI RTX 2070 Gaming Z 8G
15.6 fps -30%
Nvidia GeForce RTX 2060 Super
15.46 fps -31%
MSI RTX 2060 Gaming Z 6G
14.99 fps -33%
Showcase (showcase-02)
Zotac Gaming GeForce RTX 3090 Trinity
237 fps +63%
Nvidia Titan RTX
192 fps +32%
KFA2 GeForce RTX 2080 Ti EX
180.4 fps +24%
MSI RTX 2080 Ti Gaming X Trio
179.5 fps +23%
MSI GeForce RTX 3070 Gaming X Trio
145.5 fps
Nvidia GeForce RTX 2080 Super
144.5 fps -1%
AMD Radeon RX 5700 XT
137.6 fps -5%
Nvidia GeForce RTX 2070 Super
127.3 fps -13%
AMD Radeon RX 5700
127 fps -13%
Nvidia GeForce RTX 2060 Super
116.8 fps -20%
MSI RTX 2060 Gaming Z 6G
101.6 fps -30%
Medical (medical-02)
Zotac Gaming GeForce RTX 3090 Trinity
102 fps +25%
ASUS GeForce RTX 3080 ROG STRIX OC GAMING
91.8 fps +12%
Nvidia Titan RTX
89.3 fps +9%
MSI RTX 2080 Ti Gaming X Trio
84.8 fps +4%
AMD Radeon RX 5700 XT
82.8 fps +1%
KFA2 GeForce RTX 2080 Ti EX
82.1 fps 0%
MSI GeForce RTX 3070 Gaming X Trio
81.8 fps
AMD Radeon VII
77.9 fps -5%
Nvidia GeForce RTX 2080 Super
71.6 fps -12%
MSI RTX 2080 Gaming X Trio
71 fps -13%
AMD Radeon RX 5700
67.5 fps -17%
Nvidia GeForce RTX 2070 Super
63.8 fps -22%
MSI RTX 2070 Gaming Z 8G
57.7 fps -29%
Nvidia GeForce RTX 2060 Super
54.5 fps -33%
MSI RTX 2060 Gaming Z 6G
49.1 fps -40%
Maya (maya-05)
Zotac Gaming GeForce RTX 3090 Trinity
433 fps +69%
MSI RTX 2080 Ti Gaming X Trio
392.1 fps +53%
KFA2 GeForce RTX 2080 Ti EX
386.6 fps +51%
Nvidia Titan RTX
367.8 fps +43%
ASUS GeForce RTX 3080 ROG STRIX OC GAMING
360.2 fps +40%
Nvidia GeForce RTX 2080 Super
328.7 fps +28%
Nvidia GeForce RTX 2070 Super
290.4 fps +13%
MSI RTX 2070 Gaming Z 8G
275.3 fps +7%
Nvidia GeForce RTX 2060 Super
262.4 fps +2%
MSI GeForce RTX 3070 Gaming X Trio
256.5 fps
MSI RTX 2060 Gaming Z 6G
247 fps -4%
AMD Radeon RX 5700 XT
220.3 fps -14%
AMD Radeon VII
212.6 fps -17%
AMD Radeon RX 5700
185.2 fps -28%
Energy (energy-02)
Nvidia Titan RTX
51.9 fps +78%
Zotac Gaming GeForce RTX 3090 Trinity
44.36 fps +52%
ASUS GeForce RTX 3080 ROG STRIX OC GAMING
36.08 fps +24%
AMD Radeon VII
35.05 fps +20%
MSI RTX 2080 Ti Gaming X Trio
32.91 fps +13%
KFA2 GeForce RTX 2080 Ti EX
31.52 fps +8%
MSI GeForce RTX 3070 Gaming X Trio
29.12 fps
AMD Radeon RX 5700 XT
26.82 fps -8%
AMD Radeon RX 5700
24.55 fps -16%
Nvidia GeForce RTX 2080 Super
23.78 fps -18%
Nvidia GeForce RTX 2070 Super
23.76 fps -18%
MSI RTX 2070 Gaming Z 8G
22.33 fps -23%
Nvidia GeForce RTX 2060 Super
21.81 fps -25%
MSI RTX 2060 Gaming Z 6G
7.62 fps -74%
Creo (creo-02)
Zotac Gaming GeForce RTX 3090 Trinity
328 fps +44%
Nvidia Titan RTX
307.6 fps +35%
MSI RTX 2080 Ti Gaming X Trio
291.1 fps +28%
KFA2 GeForce RTX 2080 Ti EX
286.5 fps +26%
ASUS GeForce RTX 3080 ROG STRIX OC GAMING
281.2 fps +23%
MSI GeForce RTX 3070 Gaming X Trio
227.7 fps
MSI RTX 2080 Gaming X Trio
220.3 fps -3%
Nvidia GeForce RTX 2080 Super
220.1 fps -3%
MSI RTX 2070 Gaming Z 8G
184.2 fps -19%
Nvidia GeForce RTX 2060 Super
172.5 fps -24%
Nvidia GeForce RTX 2070 Super
171 fps -25%
MSI RTX 2060 Gaming Z 6G
169.8 fps -25%
AMD Radeon RX 5700 XT
157 fps -31%
AMD Radeon RX 5700
116.7 fps -49%
AMD Radeon VII
115.7 fps -49%
Catia (catia-05)
Nvidia Titan RTX
260.4 fps +54%
AMD Radeon RX 5700 XT
242.8 fps +44%
AMD Radeon VII
239.2 fps +42%
AMD Radeon RX 5700
209.2 fps +24%
Zotac Gaming GeForce RTX 3090 Trinity
203 fps +20%
ASUS GeForce RTX 3080 ROG STRIX OC GAMING
190.4 fps +13%
MSI RTX 2080 Ti Gaming X Trio
180.3 fps +7%
KFA2 GeForce RTX 2080 Ti EX
178.8 fps +6%
MSI GeForce RTX 3070 Gaming X Trio
168.7 fps
Nvidia GeForce RTX 2080 Super
157.7 fps -7%
Nvidia GeForce RTX 2070 Super
146.3 fps -13%
MSI RTX 2070 Gaming Z 8G
118.6 fps -30%
Nvidia GeForce RTX 2060 Super
114.6 fps -32%
MSI RTX 2060 Gaming Z 6G
108.2 fps -36%
3ds Max (3dsmax-06)
Zotac Gaming GeForce RTX 3090 Trinity
333 fps +32%
MSI RTX 2080 Ti Gaming X Trio
272.4 fps +8%
KFA2 GeForce RTX 2080 Ti EX
269.4 fps +7%
Nvidia Titan RTX
268.7 fps +7%
MSI GeForce RTX 3070 Gaming X Trio
252.1 fps
ASUS GeForce RTX 3080 ROG STRIX OC GAMING
238.2 fps -6%
Nvidia GeForce RTX 2080 Super
227.8 fps -10%
Nvidia GeForce RTX 2070 Super
212.4 fps -16%
MSI RTX 2070 Gaming Z 8G
207.3 fps -18%
Nvidia GeForce RTX 2060 Super
199.4 fps -21%
MSI RTX 2060 Gaming Z 6G
184.4 fps -27%
AMD Radeon RX 5700 XT
175.6 fps -30%
AMD Radeon VII
168.5 fps -33%
AMD Radeon RX 5700
157 fps -38%
SPECviewperf 12
1900x1060 Solidworks (sw-03)
Nvidia Titan RTX
139.6 fps +126%
AMD Radeon RX 5700 XT
89.6 fps +45%
MSI RTX 2080 Ti Gaming X Trio
79.3 fps +29%
AMD Radeon RX 5700
79.2 fps +28%
KFA2 GeForce RTX 2080 Ti EX
78.4 fps +27%
Zotac Gaming GeForce RTX 3090 Trinity
77.1 fps +25%
AMD Radeon VII
75.9 fps +23%
ASUS GeForce RTX 3080 ROG STRIX OC GAMING
71.1 fps +15%
Nvidia GeForce RTX 2080 Super
70.8 fps +15%
MSI RTX 2080 Gaming X Trio
70.1 fps +14%
Nvidia GeForce RTX 2070 Super
65.4 fps +6%
MSI GeForce RTX 3070 Gaming X Trio
61.7 fps
MSI RTX 2070 Gaming Z 8G
60.6 fps -2%
Nvidia GeForce RTX 2060 Super
58.9 fps -5%
MSI RTX 2060 Gaming Z 6G
57.6 fps -7%
1900x1060 Siemens NX (snx-02)
Nvidia Titan RTX
256.3 fps +1917%
AMD Radeon RX 5700 XT
35.27 fps +177%
AMD Radeon RX 5700
33.5 fps +164%
AMD Radeon VII
20.54 fps +62%
ASUS GeForce RTX 3080 ROG STRIX OC GAMING
13.27 fps +4%
Zotac Gaming GeForce RTX 3090 Trinity
13.03 fps +3%
MSI GeForce RTX 3070 Gaming X Trio
12.71 fps
MSI RTX 2080 Ti Gaming X Trio
12.4 fps -2%
Nvidia GeForce RTX 2080 Super
12.26 fps -4%
KFA2 GeForce RTX 2080 Ti EX
12.16 fps -4%
MSI RTX 2080 Gaming X Trio
12.08 fps -5%
Nvidia GeForce RTX 2070 Super
11.44 fps -10%
MSI RTX 2070 Gaming Z 8G
8.63 fps -32%
Nvidia GeForce RTX 2060 Super
8.57 fps -33%
MSI RTX 2060 Gaming Z 6G
8.35 fps -34%
1900x1060 Showcase (showcase-01)
Zotac Gaming GeForce RTX 3090 Trinity
237 fps +54%
ASUS GeForce RTX 3080 ROG STRIX OC GAMING
199.9 fps +30%
Nvidia Titan RTX
191.6 fps +24%
MSI RTX 2080 Ti Gaming X Trio
179.2 fps +16%
KFA2 GeForce RTX 2080 Ti EX
175.6 fps +14%
MSI GeForce RTX 3070 Gaming X Trio
153.9 fps
Nvidia GeForce RTX 2080 Super
143.6 fps -7%
AMD Radeon RX 5700 XT
137.8 fps -10%
Nvidia GeForce RTX 2070 Super
128.2 fps -17%
AMD Radeon RX 5700
126.9 fps -18%
Nvidia GeForce RTX 2060 Super
116.9 fps -24%
MSI RTX 2060 Gaming Z 6G
101 fps -34%
1900x1060 Medical (medical-01)
Nvidia Titan RTX
87 fps +137%
Zotac Gaming GeForce RTX 3090 Trinity
80.9 fps +121%
AMD Radeon VII
52.3 fps +43%
MSI RTX 2080 Ti Gaming X Trio
51.1 fps +39%
ASUS GeForce RTX 3080 ROG STRIX OC GAMING
50.8 fps +38%
KFA2 GeForce RTX 2080 Ti EX
48.61 fps +33%
AMD Radeon RX 5700 XT
46.9 fps +28%
Nvidia GeForce RTX 2080 Super
45 fps +23%
MSI RTX 2080 Gaming X Trio
44.89 fps +22%
Nvidia GeForce RTX 2070 Super
42.65 fps +16%
AMD Radeon RX 5700
40.97 fps +12%
MSI RTX 2070 Gaming Z 8G
39.61 fps +8%
Nvidia GeForce RTX 2060 Super
38 fps +4%
MSI GeForce RTX 3070 Gaming X Trio
36.68 fps
MSI RTX 2060 Gaming Z 6G
35.22 fps -4%
1900x1060 Maya (maya-04)
ASUS GeForce RTX 3080 ROG STRIX OC GAMING
184.6 fps +5%
MSI RTX 2080 Ti Gaming X Trio
180.8 fps +2%
KFA2 GeForce RTX 2080 Ti EX
177.8 fps +1%
MSI GeForce RTX 3070 Gaming X Trio
176.4 fps
Zotac Gaming GeForce RTX 3090 Trinity
170 fps -4%
MSI RTX 2080 Gaming X Trio
148.7 fps -16%
Nvidia GeForce RTX 2060 Super
146.3 fps -17%
MSI RTX 2070 Gaming Z 8G
146.2 fps -17%
Nvidia GeForce RTX 2080 Super
134.8 fps -24%
Nvidia Titan RTX
132.8 fps -25%
MSI RTX 2060 Gaming Z 6G
127.4 fps -28%
Nvidia GeForce RTX 2070 Super
125.1 fps -29%
AMD Radeon VII
88.1 fps -50%
AMD Radeon RX 5700 XT
86.5 fps -51%
AMD Radeon RX 5700
73.3 fps -58%
1900x1060 Energy (energy-01)
Nvidia Titan RTX
28.12 fps +124%
Zotac Gaming GeForce RTX 3090 Trinity
24.81 fps +98%
ASUS GeForce RTX 3080 ROG STRIX OC GAMING
18.47 fps +47%
MSI RTX 2080 Ti Gaming X Trio
16.68 fps +33%
AMD Radeon VII
16.63 fps +33%
KFA2 GeForce RTX 2080 Ti EX
15.86 fps +27%
Nvidia GeForce RTX 2080 Super
13.09 fps +4%
AMD Radeon RX 5700 XT
12.72 fps +2%
MSI GeForce RTX 3070 Gaming X Trio
12.53 fps
MSI RTX 2080 Gaming X Trio
12.52 fps 0%
Nvidia GeForce RTX 2070 Super
11.96 fps -5%
AMD Radeon RX 5700
11.53 fps -8%
MSI RTX 2070 Gaming Z 8G
11.27 fps -10%
Nvidia GeForce RTX 2060 Super
11.07 fps -12%
MSI RTX 2060 Gaming Z 6G
9.19 fps -27%
1900x1060 Creo (creo-01)
Nvidia Titan RTX
106.3 fps +85%
ASUS GeForce RTX 3080 ROG STRIX OC GAMING
74.2 fps +29%
Zotac Gaming GeForce RTX 3090 Trinity
69.4 fps +21%
AMD Radeon RX 5700 XT
66.9 fps +16%
MSI RTX 2080 Ti Gaming X Trio
63.3 fps +10%
KFA2 GeForce RTX 2080 Ti EX
63.1 fps +10%
AMD Radeon RX 5700
60.2 fps +5%
MSI GeForce RTX 3070 Gaming X Trio
57.5 fps
AMD Radeon VII
55.4 fps -4%
Nvidia GeForce RTX 2080 Super
52.7 fps -8%
MSI RTX 2080 Gaming X Trio
52.5 fps -9%
Nvidia GeForce RTX 2070 Super
47.4 fps -18%
MSI RTX 2070 Gaming Z 8G
45.67 fps -21%
MSI RTX 2060 Gaming Z 6G
44.45 fps -23%
Nvidia GeForce RTX 2060 Super
43.87 fps -24%
1900x1060 Catia (catia-04)
Nvidia Titan RTX
178.1 fps +60%
AMD Radeon VII
159.1 fps +43%
AMD Radeon RX 5700 XT
158.8 fps +43%
AMD Radeon RX 5700
135.7 fps +22%
Zotac Gaming GeForce RTX 3090 Trinity
132 fps +19%
ASUS GeForce RTX 3080 ROG STRIX OC GAMING
126.1 fps +13%
MSI RTX 2080 Ti Gaming X Trio
120.6 fps +8%
KFA2 GeForce RTX 2080 Ti EX
118.5 fps +7%
MSI GeForce RTX 3070 Gaming X Trio
111.2 fps
MSI RTX 2080 Gaming X Trio
109.4 fps -2%
Nvidia GeForce RTX 2080 Super
104.2 fps -6%
Nvidia GeForce RTX 2070 Super
96.3 fps -13%
MSI RTX 2070 Gaming Z 8G
81.9 fps -26%
Nvidia GeForce RTX 2060 Super
77.1 fps -31%
MSI RTX 2060 Gaming Z 6G
74.8 fps -33%
1900x1060 3ds Max (3dsmax-05)
Zotac Gaming GeForce RTX 3090 Trinity
329 fps +23%
ASUS GeForce RTX 3080 ROG STRIX OC GAMING
275.6 fps +3%
MSI RTX 2080 Ti Gaming X Trio
272.7 fps +2%
Nvidia Titan RTX
268.2 fps 0%
MSI GeForce RTX 3070 Gaming X Trio
267 fps
KFA2 GeForce RTX 2080 Ti EX
258.1 fps -3%
MSI RTX 2080 Gaming X Trio
234.1 fps -12%
Nvidia GeForce RTX 2080 Super
225.8 fps -15%
Nvidia GeForce RTX 2070 Super
211.8 fps -21%
MSI RTX 2070 Gaming Z 8G
207.2 fps -22%
Nvidia GeForce RTX 2060 Super
201.5 fps -25%
MSI RTX 2060 Gaming Z 6G
183.6 fps -31%
AMD Radeon RX 5700 XT
173.8 fps -35%
AMD Radeon VII
166.9 fps -37%
AMD Radeon RX 5700
155.7 fps -42%

Emisiones del MSI GeForce RTX 3070 Gaming X Trio

MSI GeForce RTX 3070 Gaming X Trio en la prueba de estrés

El MSI GeForce RTX 3070 Gaming X Trio tiene una BIOS de 240 vatios, en la que la tarjeta gráfica también se permite bajo carga. Esto es un poco menos que en la igualmente rápida GeForce RTX 2080 Ti pero también un poco más que en el modelo de referencia de Nvidia.

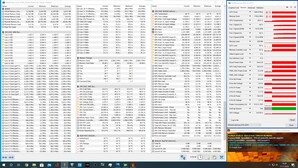
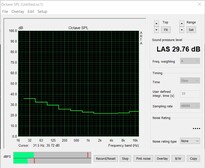
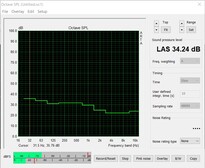
La unidad de refrigeración de la tarjeta gráfica del Gaming X Trio es muy grande, lo que debe tenerse en cuenta al elegir un caso. A cambio, el refrigerador incorporado hace un excelente trabajo y enfría la tarjeta gráfica de forma fiable y silenciosa. Sin carga, los ventiladores se quedan quietos, de modo que no se genera ningún ruido. Sólo bajo carga los tres ventiladores axiales suben un poco. Sin embargo, en la prueba de esfuerzo sólo pudimos medir un máximo de 34,24 dB(A). En consecuencia, esta tarjeta gráfica es muy silenciosa incluso bajo carga. Sin embargo, la temperatura de la GPU permanece lejos de los niveles críticos a un máximo de 67 °C (~153 °F).

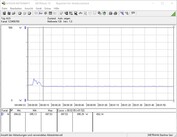
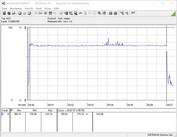
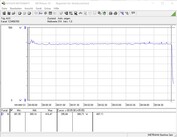
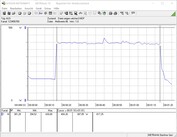
En cuanto al consumo de energía, la MSI GeForce RTX 3070 Gaming X Trio funciona bastante bien. El sistema de prueba requiere alrededor de 95 vatios en uso inactivo. Al mismo tiempo, sin embargo, 394 vatios se extraen de la toma de corriente durante los juegos. Pero el resultado sigue siendo bueno al final, porque la GeForce RTX 2080 Ti siempre necesitó un poco más de energía en nuestra prueba. La diferencia con la GeForce RTX 2070 Super es relativamente pequeña.

Consumo de energía del sistema de prueba (en reposo)
Consumo de energía del sistema de pruebas (FurMark PT 100%)
Consumo de energía del sistema de pruebas (FurMark PT 104%)
Consumo de energía del sistema de pruebas (juegos - El Witcher 3 Ultra preset)
Prueba de estrés FurMark (PT 100%)
Ruido en uso inactivo - Modo de parada de ventilador (ventiladores de caja apagados)
Ruido en la prueba de estrés (ventiladores de caso apagados)
 
Power Consumption
1920x1080 The Witcher 3 ultra (external Monitor)
ASUS GeForce RTX 3080 ROG STRIX OC GAMING
NVIDIA GeForce RTX 3080, R9 5900X, Intel Optane 905P 480GB 2.5 (Idle: 88.3 W)
505 (389min - 543max) Watt * -28%
KFA2 GeForce RTX 2080 Ti EX
GeForce RTX 2080 Ti (Desktop), R9 3900X, Corsair MP600 (Idle: 100.5 W)
438.8 (431min - 463max) Watt * -11%
AMD Radeon RX Vega 64
RX Vega 64, R7 2700X (Idle: 74.3 W)
408 Watt * -3%
MSI RTX 2080 Gaming X Trio
GeForce RTX 2080 (Desktop), R7 2700X (Idle: 87.78 W)
404.7 (389min - 421max) Watt * -3%
MSI GeForce RTX 3070 Gaming X Trio
NVIDIA GeForce RTX 3070, R9 5900X, Intel Optane 905P 480GB 2.5 (Idle: 95.1 W)
394.5 (381min - 430max) Watt *
Nvidia GeForce RTX 2080 Super
GeForce RTX 2080 Super (Desktop), R7 2700X (Idle: 78.87 W)
382.8 (360min - 410max) Watt * +3%
AMD Radeon RX 5700 XT
Radeon RX 5700 XT (Desktop), R7 2700X (Idle: 69.8 W)
348.7 (341min - 359max) Watt * +12%
Nvidia GeForce RTX 2070 Super
GeForce RTX 2070 Super (Desktop), R7 2700X (96.8 fps, Idle: 80.5 W)
344.7 (335min - 370max) Watt * +13%
MSI RTX 2070 Gaming Z 8G
GeForce RTX 2070 (Desktop), R7 2700X (Idle: 73.3 W)
342.9 (329min - 355max) Watt * +13%
AMD Radeon VII
Radeon VII, R7 2700X (Idle: 81.39 W)
339 (306min - 359max) Watt * +14%
Nvidia GeForce RTX 2060 Super
GeForce RTX 2060 Super (Desktop), R7 2700X (82.7 fps, Idle: 77.12 W)
298.2 (293min - 322max) Watt * +24%
AMD Radeon RX 5700
Radeon RX 5700 (Desktop), R7 2700X (84.2 fps, Idle: 64.5 W)
295.9 (284min - 304max) Watt * +25%
MSI RTX 2060 Gaming Z 6G
GeForce RTX 2060 (Desktop), R7 2700X (Idle: 74.66 W)
288.8 (284min - 299max) Watt * +27%
1280x720 FurMark 1.19 GPU Stress Test (external Monitor)
ASUS GeForce RTX 3080 ROG STRIX OC GAMING
NVIDIA GeForce RTX 3080, R9 5900X, Intel Optane 905P 480GB 2.5 (Idle: 88.3 W)
505 (493min - 541max) Watt * -34%
AMD Radeon VII
Radeon VII, R7 2700X (Idle: 81.39 W)
417.8 (399min - 446max) Watt * -11%
MSI RTX 2080 Gaming X Trio
GeForce RTX 2080 (Desktop), R7 2700X
402.2 (320min - 423max) Watt * -7%
KFA2 GeForce RTX 2080 Ti EX
GeForce RTX 2080 Ti (Desktop), R9 3900X, Corsair MP600 (Idle: 100.5 W)
400.8 (354min - 432max) Watt * -6%
MSI GeForce RTX 3070 Gaming X Trio
NVIDIA GeForce RTX 3070, R9 5900X, Intel Optane 905P 480GB 2.5 (Idle: 95.1 W)
376.9 (369min - 433max) Watt *
Nvidia GeForce RTX 2080 Super
GeForce RTX 2080 Super (Desktop), R7 2700X (Idle: 78.87 W)
376.8 (331min - 409max) Watt * -0%
MSI RTX 2070 Gaming Z 8G
GeForce RTX 2070 (Desktop), R7 2700X (Idle: 73.3 W)
343 (336min - 382max) Watt * +9%
AMD Radeon RX 5700 XT
Radeon RX 5700 XT (Desktop), R7 2700X (239 fps, Idle: 69.8 W)
326.6 (313min - 351max) Watt * +13%
Nvidia GeForce RTX 2070 Super
GeForce RTX 2070 Super (Desktop), R7 2700X (283 fps, Idle: 80.5 W)
326 (315min - 348max) Watt * +14%
MSI RTX 2060 Gaming Z 6G
GeForce RTX 2060 (Desktop), R7 2700X (Idle: 74.66 W)
295.2 (148min - 331max) Watt * +22%
Nvidia GeForce RTX 2060 Super
GeForce RTX 2060 Super (Desktop), R7 2700X (237 fps, Idle: 77.12 W)
281.4 (275min - 321max) Watt * +25%
AMD Radeon RX 5700
Radeon RX 5700 (Desktop), R7 2700X (207 fps, Idle: 64.5 W)
280.5 (271min - 312max) Watt * +26%

* ... más pequeño es mejor

Pro

+ lo suficientemente rápido para UWQHD
+ arquitectura moderna (8 nm)
+ La DLSS y el trazado de rayos
+ muy tranquilo bajo carga
+ 36 meses de garantía
+ Iluminación RGB
+ modo de parada de ventilador

Contra

- muy larga (compruebe la compatibilidad del caso por adelantado)
- 8 GB GDDR6 solamente
- difícil de conseguir

Veredicto - Casi inaudible a pesar de un mayor TDP

El MSI GeForce RTX 3070 Gaming X Trio - Proporcionado por MSI Alemania

La GeForce RTX 3070 sigue siendo la GPU en amperios más pequeña para el mercado de consumo hasta ahora. Con la GeForce RTX 3070 Gaming X Trio, MSI sigue desarrollando muy bien la serie Gaming X Trio. La muestra de prueba ofrece más rendimiento debido al mayor TDP, lo que resulta en una velocidad de impulso ligeramente superior. Pero el muy buen enfriador también contribuye a no tener que sacrificar el rendimiento bajo carga. Además, la GPU nunca alcanzó temperaturas críticas. Sin embargo, la tarjeta gráfica es apenas audible en una caja cerrada.

Cuando la tarjeta gráfica esté disponible, actualmente le costará casi 720 euros (~ 857 dólares). Esto es significativamente más alto que el MSRP que MSI ha establecido para la GeForce Gaming X Trio. Según el fabricante, este valor es de 559 euros (~$665). Es comprensible que estas tarjetas de socios de la placa cuesten un poco más que los modelos de referencia debido a la muy buena refrigeración y a la iluminación RGB. Pero en este momento, las escasas existencias están haciendo subir el precio aún más.

Los propietarios de unaGeForce RTX 2080 Ti pueden quedarse quietos y relajarse, porque una actualización no vale la pena en este caso. Los usuarios que todavía juegan con una GPU Pascal como la GTX 1070o elGTX 1080puede considerar la posibilidad de mejorar, ya que el aumento del rendimiento es significativamente notable aquí.

Con la GeForce RTX 3070 Gaming X Trio, MSI no sólo tiene una tarjeta gráfica muy silenciosa con una GPU Ampere en el mercado, sino que también aumenta el límite de TDP para lograr un poco más de rendimiento.

Además del precio, que es el único punto de crítica que se puede mencionar actualmente, el tamaño de la tarjeta gráfica también podría incluirse en este punto. Al mismo tiempo, sin embargo, el tamaño de la tarjeta también es responsable del bajo nivel de ruido bajo carga, porque un gran PCB permite que el calor se distribuya mejor. Por lo tanto, si quieres comprar la GeForce RTX 3070 Gaming X Trio, debes tener esto en cuenta al elegir la carcasa. En cuanto a la elección de la fuente de alimentación, está bien dotada de una fuente de alimentación de 650 vatios.

Todos los puntos de referencia y los valores de prueba del RTX 3070 se pueden encontrar en elsitio de la tarjeta gráfica de la GeForce RTX 3070 (actualizado regularmente).

Please share our article, every link counts!
> Análisis y pruebas de ordenadores portátiles y móviles teléfonos > Análisis > MSI GeForce RTX 3070 Gaming X Trio tarjeta gráfica de escritorio en revisión
Sebastian Bade, 2020-11-29 (Update: 2020-11-29)