Notebookcheck Logo

Primeros análisis de AMD Ryzen 7 6800U: Más cerca del Core i7-1260P en multinúcleo, la Radeon 680M impresiona en sintético pero se queda atrás en juegos

AMD Ryzen 7 6800U y Radeon 680M ofrecen un rendimiento decente siempre que haya suficiente espacio para el TDP. (Imagen vía AMD/Asus con ediciones)
Tenemos las primeras pruebas de la última APU Ryzen 6800U de AMD en un portátil Asus ZenBook S 13 OLED. Vemos que la Ryzen 6800U ofrece mejoras decentes en multi-core sobre una Ryzen 7 5800U pero pierde ante la Core i7-1260P en single-core. La mayor ventaja, sin embargo, está en la iGPU Radeon 680M que puede competir hábilmente con gente como una GTX 1650 Max-Q en algunas pruebas, aunque podría requerir algún impulso de escalado en los juegos.

AMD anunció por primera vez los nuevos Serie Ryzen 6000 durante el CES 2022, seguida de la serie Serie Ryzen Pro 6000 en abril. Los dispositivos con procesadores Ryzen 6000 han comenzado a estar disponibles.

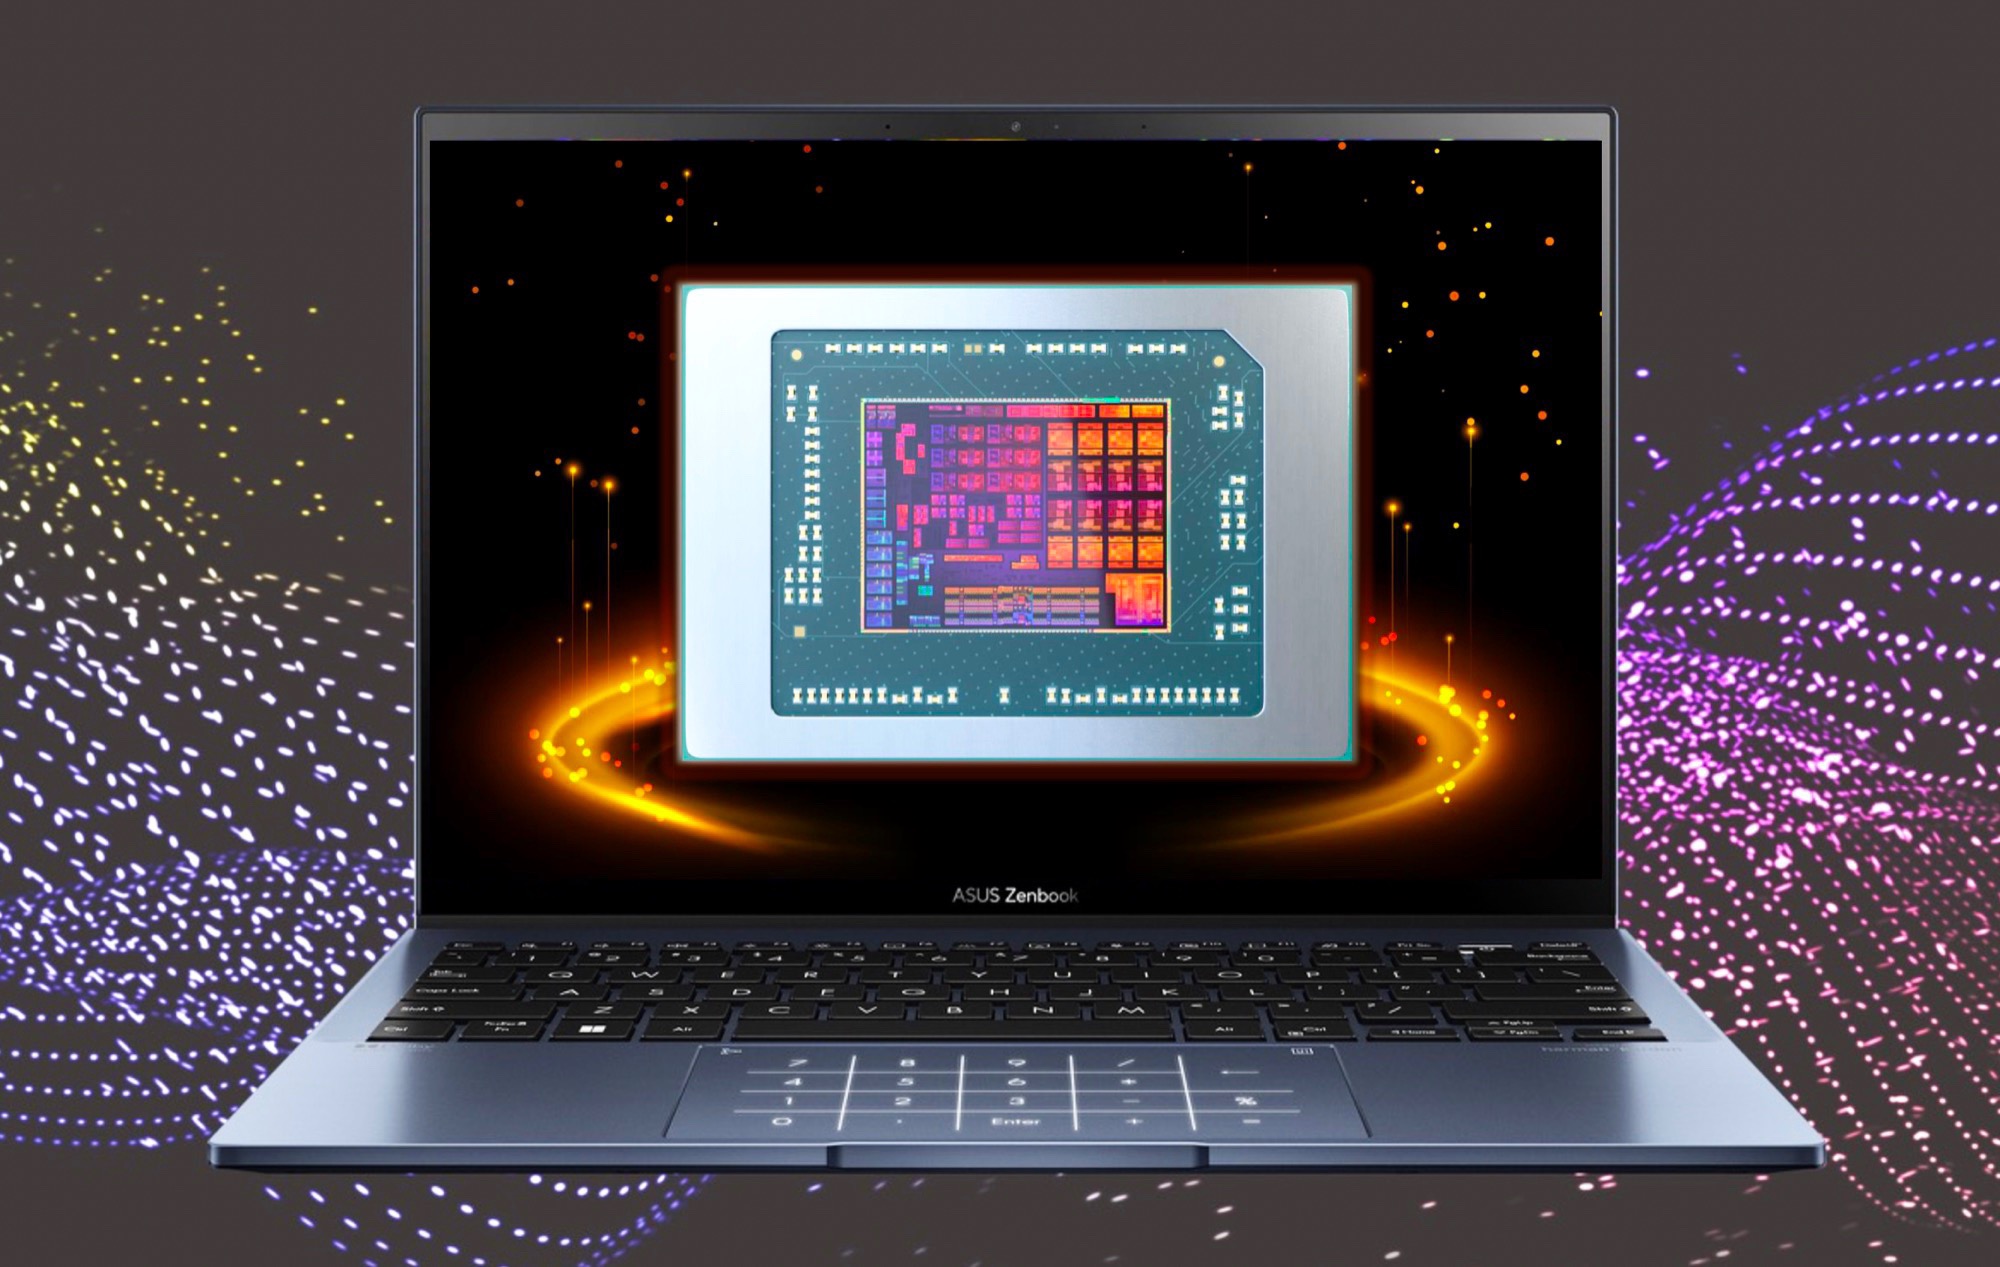
Ahora tenemos acceso al nuevo Asus ZenBook S 13 OLED que se basa en el procesador AMD Ryzen 7 6800U y en la integrada Radeon 680M INTEGRADA. La implementación de Asus permite que el Ryzen 7 6800U funcione a un PL1 sostenido de 17 W con breves ráfagas de PL2 de hasta 30 W en el perfil de energía de rendimiento.

En este artículo, echamos un vistazo preliminar al rendimiento del Ryzen 7 6800U y la Radeon 680M en el Asus ZenBook S 13 OLED. En breve haremos un análisis global del dispositivo. Como aún son datos iniciales de rendimiento, también hemos incluido puntuaciones de referencia de la guía de revisores de Asus para el ZenBook S 13 siempre que están disponibles.

Rendimiento de la CPU Ryzen 7 6800U: Apunta al Core i7-1260P en multinúcleo, iguala al Ryzen 9 5900HS en mononúcleo

A pesar de estar alojado en un formato compacto de 13 pulgadas, el Ryzen 7 6800U ofrece un espectáculo impresionante en los benchmarks de CPU. Las mejoras en el rendimiento de un solo núcleo hacen que el Ryzen 7 6800U se sitúe por fin a la altura de una CPU media de 35 W Ryzen 9 5900HS en Cinebench R23. Dicho esto, la diferencia de rendimiento real entre un Ryzen 7 5800U y un Ryzen 9 5900HS medio no es realmente significativa para empezar

La media de los Core i5-1240P queda por detrás del Ryzen 7 6800U en un 22% en Cinebench R23 de un solo núcleo, mientras que un Core i7-1260P logra una ventaja del 20%. Es útil señalar aquí que el Core i7-1260P del Lenovo Yoga 9i 14 funciona a más del doble del TDP bajo carga (38 W). Tendremos una imagen más completa cuando probemos más dispositivos Alder Lake-P

Cinebench R23 multi-core ve que el Ryzen 7 6800U se comporta un 20% mejor comparado con un Ryzen 7 5800U medio, lo que no es una mala mejora para una actualización intermedia. La ventaja con el Ryzen 9 5900HS disminuye aquí debido al mayor vataje del chip Cezanne. Aun así, el Ryzen 7 6800U casi empata con un Core i7-1260P medio, que a su vez es un 18% más rápido que un Ryzen 7 5800U medio

En Blender CPU, vemos que el Ryzen 7 6800U es alrededor de un 9% más rápido en completar el render comparado con un Ryzen 7 5800U promedio. La nueva APU Rembrandt-U casi empata con la Core i7-1260P y es un 24% más rápida que una Core i5-1240P.

El rendimiento general del sistema en PCMark 10 es aproximadamente un 5% mejor con la Ryzen 7 6800U que con una Ryzen 7 5800U media y un decente 10% más en comparación con los portátiles con Core i7-1260P.

Cinebench R23
Single Core
Lenovo Yoga 9i 14 2022 i7-1260P
Iris Xe G7 96EUs, i7-1260P, Samsung PM9A1 MZVL21T0HCLR
1793 Points
Average Intel Core i7-1260P
  (1155 - 1812, n=25)
1674 Points
Average AMD Ryzen 9 5900HS
  (1457 - 1488, n=4)
1474 Points
Asus ZenBook 13 OLED UM5302T
Radeon 680M, R7 6800U
1472 Points
Lenovo Yoga Slim 7 Pro 14 OLED Ryzen 9
GeForce MX450, R9 5900HS, SK Hynix PC711 1TB HFS001TDE9X084N
1468 Points
Average Intel Core i7-1185G7
  (1251 - 1532, n=24)
1449 Points
Average Intel Core i5-1240P
  (640 - 1689, n=18)
1436 Points
Average AMD Ryzen 7 5800U
  (1415 - 1430, n=5)
1425 Points
HP ProBook x360 435 G8 R7-5800U
Vega 8, R7 5800U, Samsung PM991 MZVLQ512HALU
1423 Points
Multi Core
Average AMD Ryzen 9 5900HS
  (11426 - 13214, n=4)
12533 Points
Lenovo Yoga Slim 7 Pro 14 OLED Ryzen 9
GeForce MX450, R9 5900HS, SK Hynix PC711 1TB HFS001TDE9X084N
11426 Points
Lenovo Yoga 9i 14 2022 i7-1260P
Iris Xe G7 96EUs, i7-1260P, Samsung PM9A1 MZVL21T0HCLR
10735 Points
Asus ZenBook 13 OLED UM5302T
Radeon 680M, R7 6800U
10127 Points
HP ProBook x360 435 G8 R7-5800U
Vega 8, R7 5800U, Samsung PM991 MZVLQ512HALU
9539 Points
Average Intel Core i7-1260P
  (3173 - 12150, n=27)
9314 Points
Average AMD Ryzen 7 5800U
  (7872 - 10624, n=5)
8851 Points
Average Intel Core i5-1240P
  (277 - 11556, n=20)
7949 Points
Average Intel Core i7-1185G7
  (3610 - 6383, n=24)
5324 Points
Cinebench R20
CPU (Single Core)
Lenovo Yoga 9i 14 2022 i7-1260P
Iris Xe G7 96EUs, i7-1260P, Samsung PM9A1 MZVL21T0HCLR
657 Points +13%
Average Intel Core i7-1260P
  (448 - 698, n=25)
645 Points +11%
Asus Zenbook S 13 OLED AMD Reference Values
Radeon 680M, R7 6800U
579 Points
Lenovo Yoga Slim 7 Pro 14 OLED Ryzen 9
GeForce MX450, R9 5900HS, SK Hynix PC711 1TB HFS001TDE9X084N
575 Points -1%
Average AMD Ryzen 9 5900HS
  (560 - 584, n=4)
572 Points -1%
Average Intel Core i7-1185G7
  (489 - 593, n=28)
557 Points -4%
HP ProBook x360 435 G8 R7-5800U
Vega 8, R7 5800U, Samsung PM991 MZVLQ512HALU
555 Points -4%
Average AMD Ryzen 7 5800U
  (551 - 560, n=5)
555 Points -4%
Asus ZenBook 13 OLED UM5302T
Radeon 680M, R7 6800U
554 Points -4%
Average Intel Core i5-1240P
  (251 - 653, n=16)
549 Points -5%
CPU (Multi Core)
Average AMD Ryzen 9 5900HS
  (4414 - 5167, n=4)
4843 Points +21%
Lenovo Yoga Slim 7 Pro 14 OLED Ryzen 9
GeForce MX450, R9 5900HS, SK Hynix PC711 1TB HFS001TDE9X084N
4414 Points +10%
Lenovo Yoga 9i 14 2022 i7-1260P
Iris Xe G7 96EUs, i7-1260P, Samsung PM9A1 MZVL21T0HCLR
4048 Points +1%
Asus Zenbook S 13 OLED AMD Reference Values
Radeon 680M, R7 6800U
4018 Points
Asus ZenBook 13 OLED UM5302T
Radeon 680M, R7 6800U
3837 Points -5%
HP ProBook x360 435 G8 R7-5800U
Vega 8, R7 5800U, Samsung PM991 MZVLQ512HALU
3691 Points -8%
Average Intel Core i7-1260P
  (1234 - 4748, n=25)
3595 Points -11%
Average AMD Ryzen 7 5800U
  (2995 - 3691, n=5)
3347 Points -17%
Average Intel Core i5-1240P
  (763 - 4456, n=16)
3077 Points -23%
Average Intel Core i7-1185G7
  (1425 - 2493, n=28)
2039 Points -49%
Cinebench R15
CPU Single 64Bit
Lenovo Yoga 9i 14 2022 i7-1260P
Iris Xe G7 96EUs, i7-1260P, Samsung PM9A1 MZVL21T0HCLR
243 Points
Lenovo Yoga Slim 7 Pro 14 OLED Ryzen 9
GeForce MX450, R9 5900HS, SK Hynix PC711 1TB HFS001TDE9X084N
238 Points
Average Intel Core i7-1260P
  (165.4 - 260, n=27)
232 Points
Average AMD Ryzen 9 5900HS
  (211 - 240, n=4)
231 Points
HP ProBook x360 435 G8 R7-5800U
Vega 8, R7 5800U, Samsung PM991 MZVLQ512HALU
229 Points
Average AMD Ryzen 7 5800U
  (227 - 229, n=4)
229 Points
Average Intel Core i7-1185G7
  (168 - 230, n=27)
215 Points
Average Intel Core i5-1240P
  (91.8 - 243, n=18)
205 Points
CPU Multi 64Bit
Average AMD Ryzen 9 5900HS
  (1927 - 2180, n=5)
2053 Points
Lenovo Yoga Slim 7 Pro 14 OLED Ryzen 9
GeForce MX450, R9 5900HS, SK Hynix PC711 1TB HFS001TDE9X084N
1927 (1860.38min - 1927max) Points
Lenovo Yoga 9i 14 2022 i7-1260P
Iris Xe G7 96EUs, i7-1260P, Samsung PM9A1 MZVL21T0HCLR
1805 (1600.9min - 1805.05max) Points
Asus ZenBook 13 OLED UM5302T
Radeon 680M, R7 6800U
1690 Points
Average AMD Ryzen 7 5800U
  (1390 - 1925, n=5)
1628 Points
HP ProBook x360 435 G8 R7-5800U
Vega 8, R7 5800U, Samsung PM991 MZVLQ512HALU
1613 (1461.4min - 1613.49max) Points
Average Intel Core i7-1260P
  (549 - 2034, n=29)
1553 Points
Average Intel Core i5-1240P
  (407 - 2007, n=19)
1487 Points
Average Intel Core i7-1185G7
  (617 - 1066, n=32)
859 Points
Blender - v2.79 BMW27 CPU
Average Intel Core i7-1185G7
  (478 - 745, n=28)
588 Seconds *
Average Intel Core i5-1240P
  (285 - 1926, n=16)
503 Seconds *
Average Intel Core i7-1260P
  (264 - 906, n=26)
366 Seconds *
Average AMD Ryzen 7 5800U
  (319 - 391, n=4)
353 Seconds *
Asus ZenBook 13 OLED UM5302T
Radeon 680M, R7 6800U
321.5 Seconds *
HP ProBook x360 435 G8 R7-5800U
Vega 8, R7 5800U, Samsung PM991 MZVLQ512HALU
319 Seconds *
Lenovo Yoga Slim 7 Pro 14 OLED Ryzen 9
GeForce MX450, R9 5900HS, SK Hynix PC711 1TB HFS001TDE9X084N
305 Seconds *
Lenovo Yoga 9i 14 2022 i7-1260P
Iris Xe G7 96EUs, i7-1260P, Samsung PM9A1 MZVL21T0HCLR
300 Seconds *
Average AMD Ryzen 9 5900HS
  (231 - 305, n=4)
254 Seconds *
Geekbench 5.5
Single-Core
Lenovo Yoga 9i 14 2022 i7-1260P
Iris Xe G7 96EUs, i7-1260P, Samsung PM9A1 MZVL21T0HCLR
1764 Points +16%
Average Intel Core i7-1260P
  (1436 - 1786, n=25)
1693 Points +11%
Average Intel Core i5-1240P
  (672 - 1658, n=15)
1523 Points 0%
Average Intel Core i7-1185G7
  (1398 - 1626, n=21)
1520 Points 0%
Asus Zenbook S 13 OLED AMD Reference Values
Radeon 680M, R7 6800U
1519 Points
Lenovo Yoga Slim 7 Pro 14 OLED Ryzen 9
GeForce MX450, R9 5900HS, SK Hynix PC711 1TB HFS001TDE9X084N
1497 Points -1%
Average AMD Ryzen 9 5900HS
  (1410 - 1547, n=3)
1485 Points -2%
Asus ZenBook 13 OLED UM5302T
Radeon 680M, R7 6800U
1472 Points -3%
Average AMD Ryzen 7 5800U
  (1411 - 1450, n=4)
1430 Points -6%
HP ProBook x360 435 G8 R7-5800U
Vega 8, R7 5800U, Samsung PM991 MZVLQ512HALU
1411 Points -7%
Multi-Core
Lenovo Yoga 9i 14 2022 i7-1260P
Iris Xe G7 96EUs, i7-1260P, Samsung PM9A1 MZVL21T0HCLR
10321 Points +34%
Average Intel Core i7-1260P
  (3866 - 10570, n=25)
8763 Points +14%
Lenovo Yoga Slim 7 Pro 14 OLED Ryzen 9
GeForce MX450, R9 5900HS, SK Hynix PC711 1TB HFS001TDE9X084N
7867 Points +2%
Average AMD Ryzen 9 5900HS
  (7767 - 7910, n=3)
7848 Points +2%
Asus Zenbook S 13 OLED AMD Reference Values
Radeon 680M, R7 6800U
7678 Points
Average Intel Core i5-1240P
  (1763 - 10112, n=15)
7594 Points -1%
Asus ZenBook 13 OLED UM5302T
Radeon 680M, R7 6800U
7522 Points -2%
Average AMD Ryzen 7 5800U
  (6093 - 7026, n=4)
6641 Points -14%
HP ProBook x360 435 G8 R7-5800U
Vega 8, R7 5800U, Samsung PM991 MZVLQ512HALU
6093 Points -21%
Average Intel Core i7-1185G7
  (4620 - 5944, n=21)
5460 Points -29%
PCMark 10 - Score
Average AMD Ryzen 9 5900HS
  (5844 - 6896, n=4)
6533 Points +6%
Asus Zenbook S 13 OLED AMD Reference Values
Radeon 680M, R7 6800U
6149 Points
Lenovo Yoga Slim 7 Pro 14 OLED Ryzen 9
GeForce MX450, R9 5900HS, SK Hynix PC711 1TB HFS001TDE9X084N
5844 Points -5%
Average AMD Ryzen 7 5800U
  (5334 - 6090, n=4)
5797 Points -6%
Lenovo Yoga 9i 14 2022 i7-1260P
Iris Xe G7 96EUs, i7-1260P, Samsung PM9A1 MZVL21T0HCLR
5738 Points -7%
Average Intel Core i7-1260P
  (4796 - 6909, n=25)
5701 Points -7%
HP ProBook x360 435 G8 R7-5800U
Vega 8, R7 5800U, Samsung PM991 MZVLQ512HALU
5334 Points -13%
Average Intel Core i5-1240P
  (4881 - 5898, n=14)
5253 Points -15%
Average Intel Core i7-1185G7
  (4746 - 5880, n=24)
5089 Points -17%

* ... más pequeño es mejor

Ryzen 7 6800U: El rendimiento sostenido se ve afectado por las limitaciones del chasis

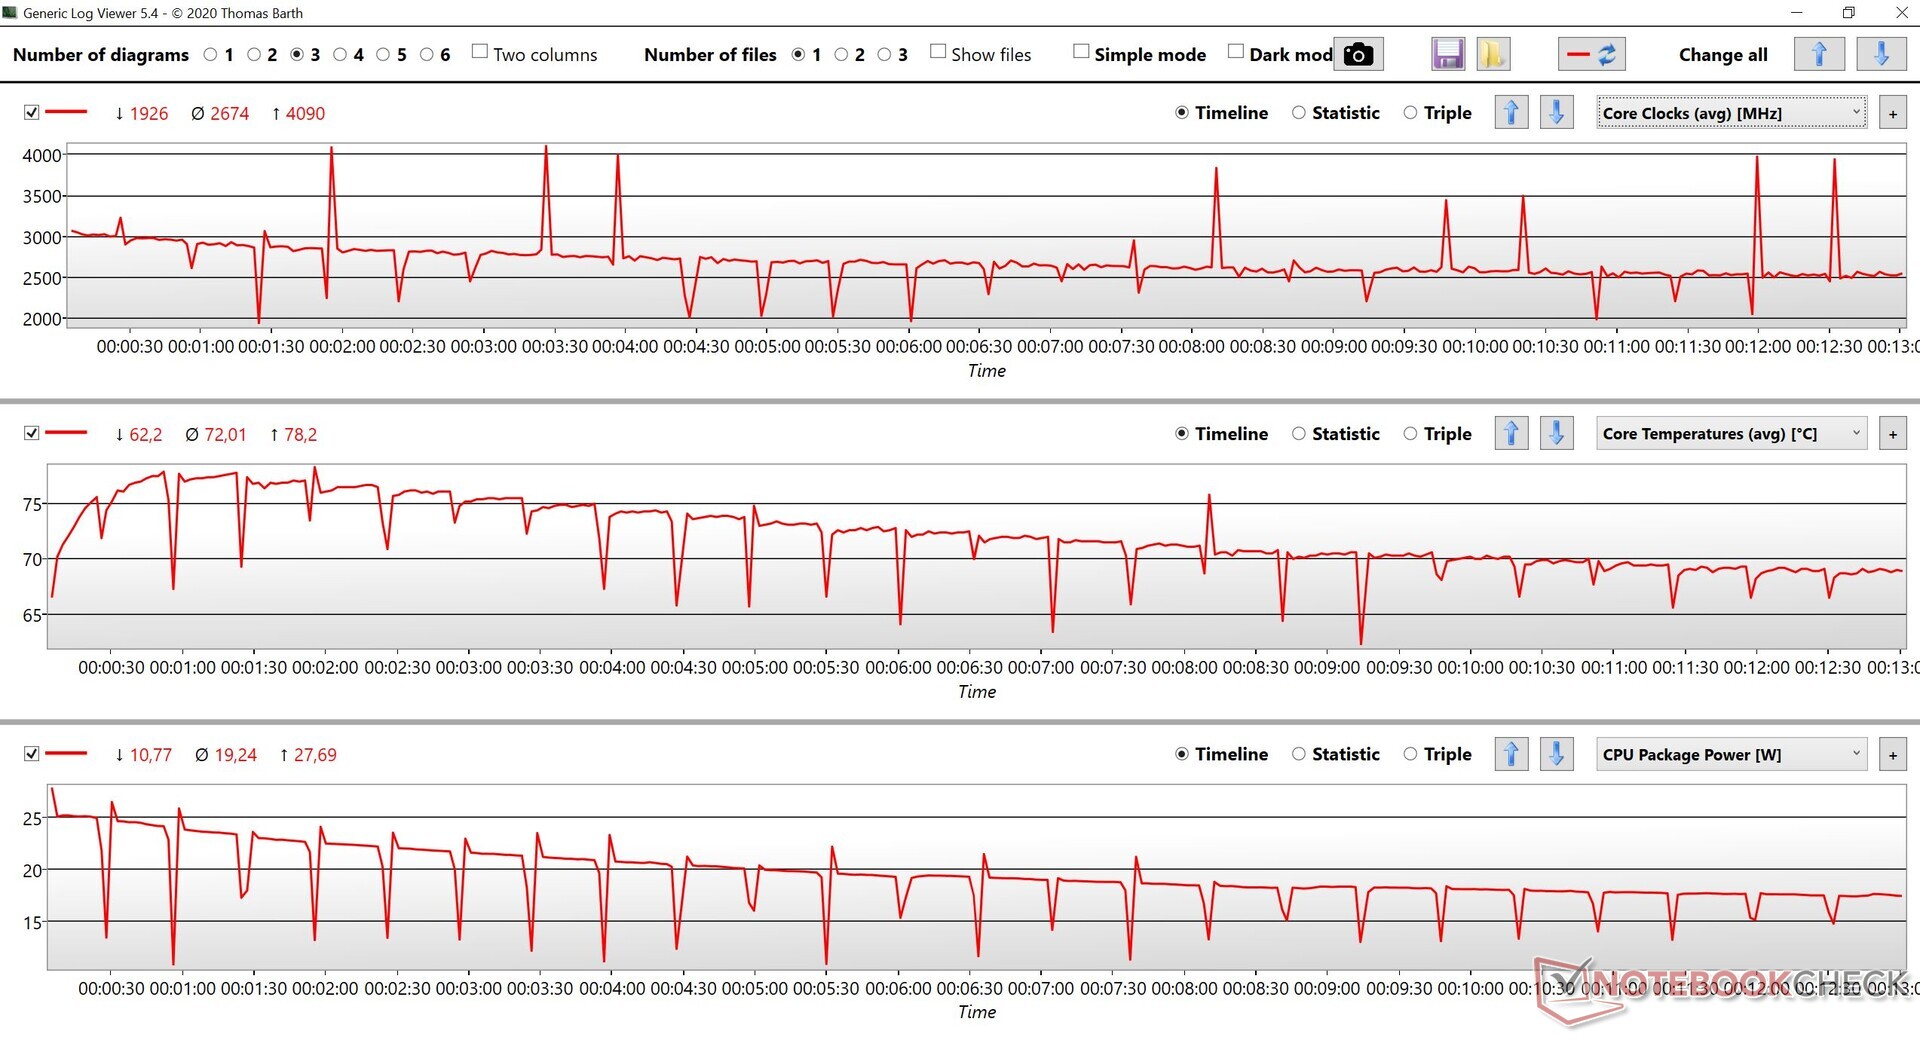
El Ryzen 7 6800U parece ser capaz de un rendimiento sostenido decente en un bucle Cinebench R15. Sin embargo, en esta prueba, vemos que las limitaciones del chasis del Asus ZenBook S 13 OLED afectan a la capacidad de la CPU para estirar al máximo sus músculos. El HP ProBook x360 435 con un Ryzen 7 5800U es capaz de ofrecer puntuaciones más altas y un mejor rendimiento sostenido comparativamente.

095190285380475570665760855950104511401235133014251520161517101805Tooltip
Asus ZenBook 13 OLED UM5302T Radeon 680M, R7 6800U: Ø1378 (1323.71-1602.82)
Lenovo Yoga 9i 14 2022 i7-1260P Iris Xe G7 96EUs, i7-1260P, Samsung PM9A1 MZVL21T0HCLR: Ø1634 (1600.9-1805.05)
HP ProBook x360 435 G8 R7-5800U Vega 8, R7 5800U, Samsung PM991 MZVLQ512HALU: Ø1520 (1461.4-1613.49)
Lenovo Yoga Slim 7i Pro 14IAP G7 Iris Xe G7 80EUs, i5-1240P, Samsung PM9A1 MZVL2512HCJQ: Ø1675 (1651.8-1830.66)
Samsung Galaxy Book2 Pro 13 NP930XED-KA1DE Iris Xe G7 80EUs, i5-1240P, Samsung PM991a MZVLQ256HBJD: Ø878 (859.75-883.65)

Durante la ejecución, observamos que el portátil no es capaz de mantener el TDP de 30 W de pico. Poco a poco va bajando hasta los 17 W, con los núcleos estabilizados cerca de los 2,5 GHz y las temperaturas en torno a los 70 °C.

Ryzen 7 6800U: Relojes de la CPU, temperatura y potencia del paquete durante un bucle multinúcleo de Cinebench R15

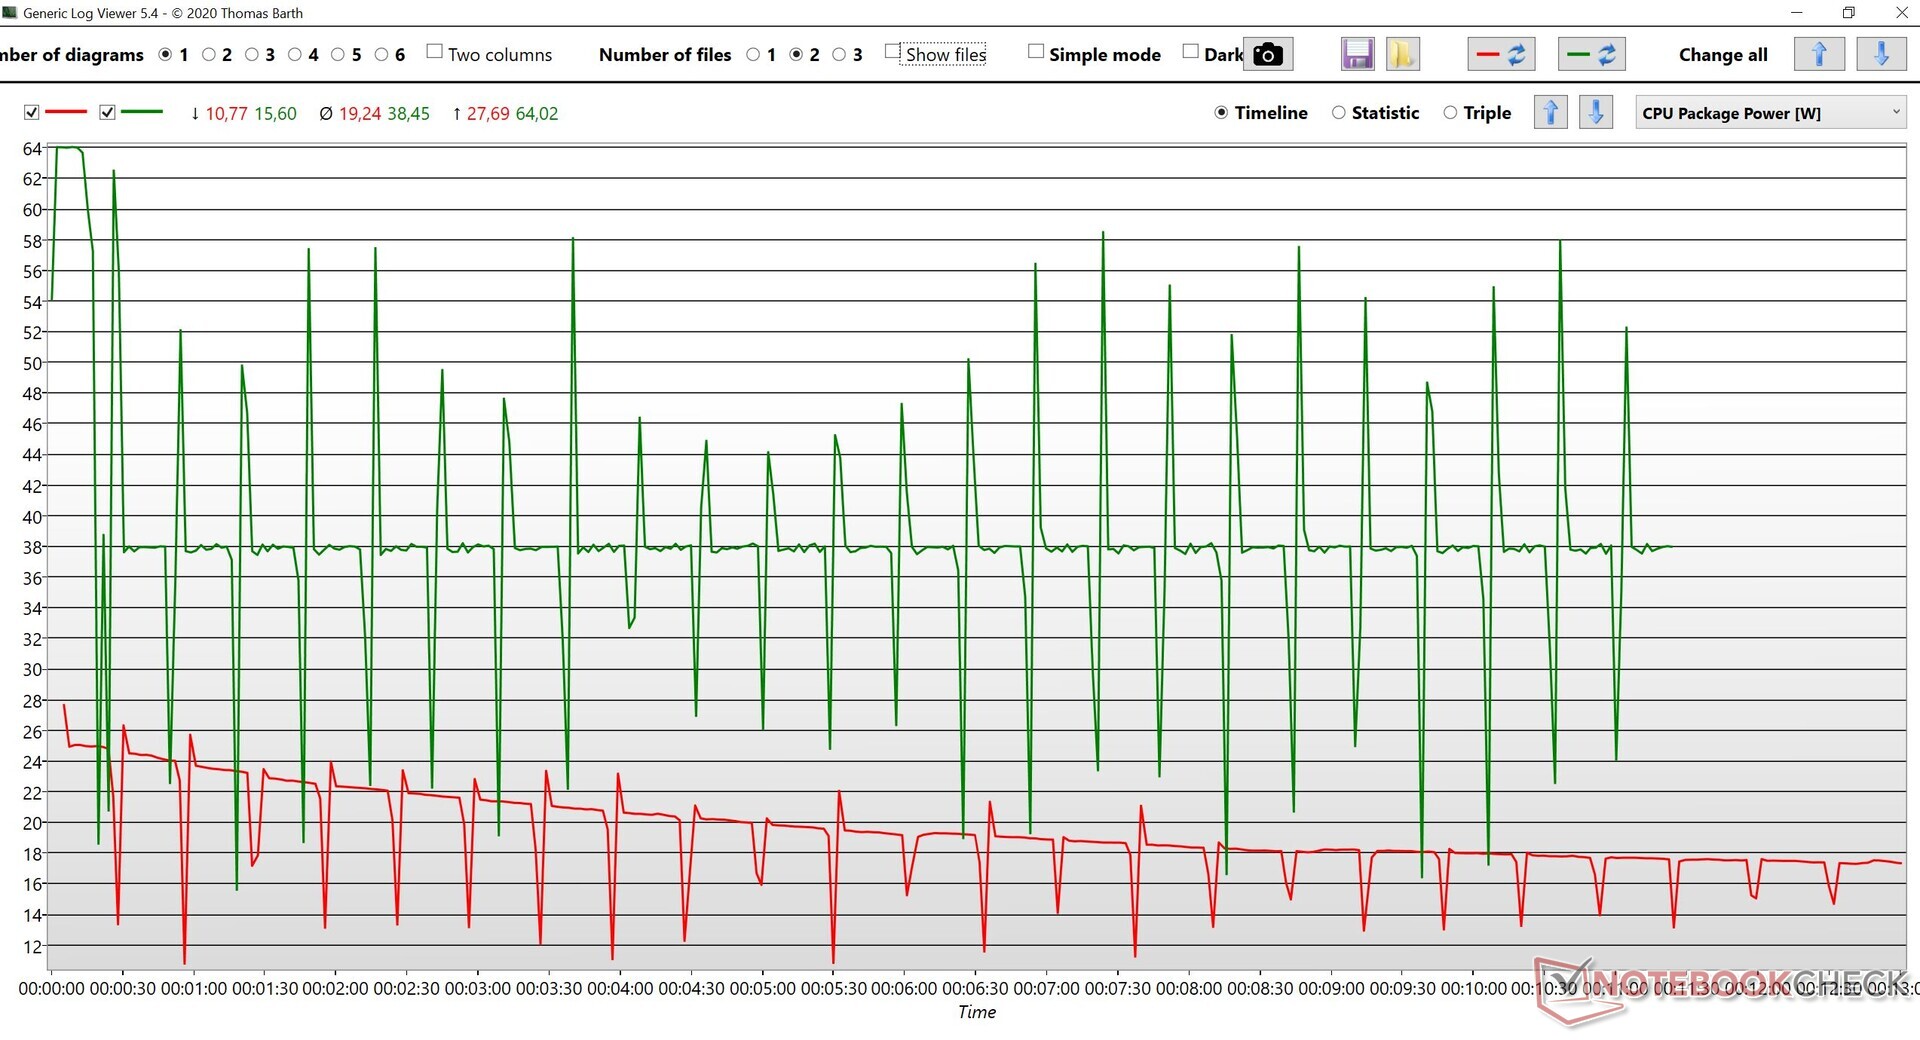
Comparado con el Lenovo Yoga 9i 14 con un Core i7-1260P, el Asus ZenBook S 13 OLED está en desventaja. El Core i7-1260P puede elevar el PL2 hasta los 64 W, lo que permite aumentos mucho mayores, mientras que el Ryzen 7 6800U sólo puede alcanzar 30 W de PL2 en el modo Rendimiento del ZenBook S 13.

Ryzen 7 6800U vs Core i7-1260P: potencias del paquete de CPU durante un bucle multinúcleo de Cinebench R15

Radeon 680M iGPU: Supera a la MX450 en síntesis pero no en juegos, requiere FSR

Uno de los principales puntos fuertes de la generación Ryzen 6000 es la introducción de una iGPU basada en RDNA 2 que debería acabar con la necesidad de una dGPU básica como la GeForce MX450.

En las pruebas de cálculo de Geekbench 5.3, la Radeon 680M es capaz de superar con creces a una MX450 media en las pruebas OpenCL y Vulkan con un rendimiento comparable al de una GTX 1650 Mobile. En 3DMark, la Radeon 680M es capaz de superar a una MX450 media hasta en un 37% en Fire Strike Graphics y en un 25% en Time Spy Graphics. Sin embargo, pierde ante la GTX 1650 Mobile y la GTX 1650 Max-Q en esta prueba.

Los juegos presentan un extraño enigma. Sólo tenemos las puntuaciones de Dota 2: Reborn por el momento, pero la Radeon 680M queda por detrás de la media de la MX450 y la media de la GTX 1650 Max-Q en un 21% y un 28%, respectivamente, en 1080p High. Esta diferencia de rendimiento entre las GPUs aumenta hasta un 7% en 1080p Ultra. Los deltas son algo menores en resoluciones y configuraciones inferiores.

Probaremos más juegos con esta GPU, pero las primeras impresiones indican que el rendimiento puede mejorarse aún más con FidelityFX Super Resolution (FSR) 2.0 en los juegos compatibles o mediante Radeon Super Resolution (RSR) en el controlador.

Geekbench 5.5
OpenCL Score
Average NVIDIA GeForce RTX 3050 4GB Laptop GPU
  (42735 - 60557, n=19)
54484 Points
Average NVIDIA GeForce GTX 1650 Max-Q
  ()
36507 Points
Lenovo Yoga Slim 7 Pro 14 OLED Ryzen 9
GeForce MX450, R9 5900HS, SK Hynix PC711 1TB HFS001TDE9X084N
33703 Points
Asus ZenBook 13 OLED UM5302T
Radeon 680M, R7 6800U
31716 Points
Average NVIDIA GeForce GTX 1650 Mobile
  (6025 - 40979, n=14)
31228 Points
Average NVIDIA GeForce MX450
  (9083 - 33703, n=21)
28822 Points
Lenovo Yoga 9i 14 2022 i7-1260P
Iris Xe G7 96EUs, i7-1260P, Samsung PM9A1 MZVL21T0HCLR
20391 Points
Average Intel Iris Xe Graphics G7 96EUs
  (11261 - 28770, n=197)
17740 Points
Average AMD Radeon RX Vega 8 (Ryzen 4000/5000)
  (11298 - 19234, n=54)
15078 Points
HP ProBook x360 435 G8 R7-5800U
Vega 8, R7 5800U, Samsung PM991 MZVLQ512HALU
13045 Points
Vulkan Score
Average NVIDIA GeForce GTX 1650 Mobile
  (12185 - 34431, n=14)
28995 Points
Asus ZenBook 13 OLED UM5302T
Radeon 680M, R7 6800U
25243 Points
Average NVIDIA GeForce RTX 3050 4GB Laptop GPU
  (4239 - 44208, n=19)
22852 Points
Lenovo Yoga 9i 14 2022 i7-1260P
Iris Xe G7 96EUs, i7-1260P, Samsung PM9A1 MZVL21T0HCLR
19510 Points
Lenovo Yoga Slim 7 Pro 14 OLED Ryzen 9
GeForce MX450, R9 5900HS, SK Hynix PC711 1TB HFS001TDE9X084N
19285 Points
Average NVIDIA GeForce MX450
  (9955 - 28854, n=21)
18938 Points
Average NVIDIA GeForce GTX 1650 Max-Q
  ()
18595 Points
Average AMD Radeon RX Vega 8 (Ryzen 4000/5000)
  (10358 - 22015, n=54)
16921 Points
Average Intel Iris Xe Graphics G7 96EUs
  (10358 - 21312, n=198)
16574 Points
HP ProBook x360 435 G8 R7-5800U
Vega 8, R7 5800U, Samsung PM991 MZVLQ512HALU
13123 Points
3DMark
2560x1440 Time Spy Graphics
Average NVIDIA GeForce RTX 3050 4GB Laptop GPU
  (3281 - 5295, n=21)
4517 Points
Average NVIDIA GeForce GTX 1650 Mobile
  (2900 - 3700, n=31)
3430 Points
Average NVIDIA GeForce GTX 1650 Max-Q
  (2836 - 3238, n=10)
2998 Points
Lenovo Yoga Slim 7 Pro 14 OLED Ryzen 9
GeForce MX450, R9 5900HS, SK Hynix PC711 1TB HFS001TDE9X084N
2297 Points
Asus ZenBook 13 OLED UM5302T
Radeon 680M, R7 6800U
2244 Points
Average NVIDIA GeForce MX450
  (1086 - 2300, n=16)
1796 Points
Lenovo Yoga 9i 14 2022 i7-1260P
Iris Xe G7 96EUs, i7-1260P, Samsung PM9A1 MZVL21T0HCLR
1784 Points
Average Intel Iris Xe Graphics G7 96EUs
  (707 - 1871, n=203)
1494 Points
Average AMD Radeon RX Vega 8 (Ryzen 4000/5000)
  (540 - 1557, n=54)
1156 Points
HP ProBook x360 435 G8 R7-5800U
Vega 8, R7 5800U, Samsung PM991 MZVLQ512HALU
863 Points
1920x1080 Fire Strike Graphics
Average NVIDIA GeForce RTX 3050 4GB Laptop GPU
  (9138 - 14157, n=20)
11915 Points
Average NVIDIA GeForce GTX 1650 Mobile
  (7741 - 9810, n=32)
9195 Points
Average NVIDIA GeForce GTX 1650 Max-Q
  (6985 - 8618, n=12)
7853 Points
Asus ZenBook 13 OLED UM5302T
Radeon 680M, R7 6800U
6665 Points
Lenovo Yoga Slim 7 Pro 14 OLED Ryzen 9
GeForce MX450, R9 5900HS, SK Hynix PC711 1TB HFS001TDE9X084N
5540 Points
Lenovo Yoga 9i 14 2022 i7-1260P
Iris Xe G7 96EUs, i7-1260P, Samsung PM9A1 MZVL21T0HCLR
5479 Points
Average Intel Iris Xe Graphics G7 96EUs
  (2286 - 6143, n=206)
4903 Points
Average NVIDIA GeForce MX450
  (4336 - 5753, n=17)
4869 Points
Average AMD Radeon RX Vega 8 (Ryzen 4000/5000)
  (1694 - 5041, n=54)
3676 Points
HP ProBook x360 435 G8 R7-5800U
Vega 8, R7 5800U, Samsung PM991 MZVLQ512HALU
2659 Points
Dota 2 Reborn
1280x720 min (0/3) fastest
Average NVIDIA GeForce RTX 3050 4GB Laptop GPU
  (91.1 - 187, n=20)
142.2 fps
Lenovo Yoga Slim 7 Pro 14 OLED Ryzen 9
GeForce MX450, R9 5900HS, SK Hynix PC711 1TB HFS001TDE9X084N
136 (122.3min) fps
Average NVIDIA GeForce MX450
  (36.1 - 144, n=21)
121.1 fps
Average NVIDIA GeForce GTX 1650 Mobile
  (75.8 - 148, n=20)
120.7 fps
Average NVIDIA GeForce GTX 1650 Max-Q
  (61.2 - 158.2, n=5)
111.6 fps
Lenovo Yoga 9i 14 2022 i7-1260P
Iris Xe G7 96EUs, i7-1260P, Samsung PM9A1 MZVL21T0HCLR
110.8 (88.4min) fps
Asus ZenBook 13 OLED UM5302T
Radeon 680M, R7 6800U
110.3 (94.8min) fps
Average AMD Radeon RX Vega 8 (Ryzen 4000/5000)
  (67.9 - 152, n=57)
108.1 fps
HP ProBook x360 435 G8 R7-5800U
Vega 8, R7 5800U, Samsung PM991 MZVLQ512HALU
108 (91.4min) fps
Average Intel Iris Xe Graphics G7 96EUs
  (36 - 148, n=206)
99.9 fps
1366x768 med (1/3)
Lenovo Yoga Slim 7 Pro 14 OLED Ryzen 9
GeForce MX450, R9 5900HS, SK Hynix PC711 1TB HFS001TDE9X084N
133 (116.7min) fps
Average NVIDIA GeForce RTX 3050 4GB Laptop GPU
  (90.3 - 170.8, n=20)
130 fps
Average NVIDIA GeForce GTX 1650 Mobile
  (69.1 - 136, n=20)
109.1 fps
Average NVIDIA GeForce MX450
  (35.5 - 133, n=21)
107.9 fps
Average NVIDIA GeForce GTX 1650 Max-Q
  (76.5 - 130.9, n=5)
103.6 fps
Asus ZenBook 13 OLED UM5302T
Radeon 680M, R7 6800U
93.6 (77.6min) fps
Average AMD Radeon RX Vega 8 (Ryzen 4000/5000)
  (49.9 - 122.3, n=57)
86.1 fps
Lenovo Yoga 9i 14 2022 i7-1260P
Iris Xe G7 96EUs, i7-1260P, Samsung PM9A1 MZVL21T0HCLR
83.6 (66min) fps
HP ProBook x360 435 G8 R7-5800U
Vega 8, R7 5800U, Samsung PM991 MZVLQ512HALU
79.2 (65.5min) fps
Average Intel Iris Xe Graphics G7 96EUs
  (31.6 - 108.5, n=206)
75.5 fps
1920x1080 high (2/3)
Average NVIDIA GeForce RTX 3050 4GB Laptop GPU
  (84 - 160.3, n=20)
122.1 fps
Lenovo Yoga Slim 7 Pro 14 OLED Ryzen 9
GeForce MX450, R9 5900HS, SK Hynix PC711 1TB HFS001TDE9X084N
106 (94.6min) fps
Average NVIDIA GeForce GTX 1650 Mobile
  (63.3 - 127, n=20)
99.2 fps
Average NVIDIA GeForce GTX 1650 Max-Q
  (71.2 - 128, n=5)
97.1 fps
Average NVIDIA GeForce MX450
  (35.4 - 115, n=21)
87.7 fps
Asus ZenBook 13 OLED UM5302T
Radeon 680M, R7 6800U
69.8 (59.9min) fps
Lenovo Yoga 9i 14 2022 i7-1260P
Iris Xe G7 96EUs, i7-1260P, Samsung PM9A1 MZVL21T0HCLR
67.8 (58.8min) fps
Average Intel Iris Xe Graphics G7 96EUs
  (23.2 - 88.1, n=206)
53.8 fps
Average AMD Radeon RX Vega 8 (Ryzen 4000/5000)
  (25.5 - 76.7, n=57)
51.8 fps
HP ProBook x360 435 G8 R7-5800U
Vega 8, R7 5800U, Samsung PM991 MZVLQ512HALU
38.6 (35.2min) fps
1920x1080 ultra (3/3) best looking
Average NVIDIA GeForce RTX 3050 4GB Laptop GPU
  (82.8 - 147.7, n=20)
114.8 fps
Lenovo Yoga Slim 7 Pro 14 OLED Ryzen 9
GeForce MX450, R9 5900HS, SK Hynix PC711 1TB HFS001TDE9X084N
96.1 (84.7min) fps
Average NVIDIA GeForce GTX 1650 Mobile
  (58.5 - 119, n=20)
93.2 fps
Average NVIDIA GeForce GTX 1650 Max-Q
  (64.4 - 105.6, n=5)
85.6 fps
Average NVIDIA GeForce MX450
  (34.9 - 104.6, n=20)
79.9 fps
Lenovo Yoga 9i 14 2022 i7-1260P
Iris Xe G7 96EUs, i7-1260P, Samsung PM9A1 MZVL21T0HCLR
62.7 (53.2min) fps
Asus ZenBook 13 OLED UM5302T
Radeon 680M, R7 6800U
57.7 (50min) fps
Average Intel Iris Xe Graphics G7 96EUs
  (20.6 - 78.5, n=206)
49 fps
Average AMD Radeon RX Vega 8 (Ryzen 4000/5000)
  (23.3 - 72, n=57)
48.6 fps
HP ProBook x360 435 G8 R7-5800U
Vega 8, R7 5800U, Samsung PM991 MZVLQ512HALU
36.4 (33.2min) fps

En general, el Ryzen 7 6800U impresiona en varios aspectos aunque el procesador en sí no es demasiado diferente de las ofertas anteriores de Cezanne. El rendimiento sostenido definitivamente tiene margen de mejora, pero es más probable que sea una limitación del compacto chasis del Asus ZenBook S 13 OLED que del propio procesador.

Ahora tenemos una iGPU que rinde de forma comparable a las dGPUs de nivel básico gracias a la Radeon 680M basada en RDNA 2. Aunque encontramos que la Radeon 680M rinde bien en las pruebas de computación y sintéticas, parece que necesita un impulso adicional en los juegos a través de FSR o RSR.

Evaluaremos otras métricas del Asus ZenBook S 13 OLED en nuestro análisis completo que se publicará pronto y también probaremos más ofertas Ryzen 6000 y Alder Lake en los próximos días para tener una visión más holística, así que permanezcan atentos.

Fuente(s)

Propio

Pricecompare

Please share our article, every link counts!
> Análisis y pruebas de ordenadores portátiles y móviles teléfonos > Noticias > Archivo de noticias > Archivo de noticias 2022 05 > Primeros análisis de AMD Ryzen 7 6800U: Más cerca del Core i7-1260P en multinúcleo, la Radeon 680M impresiona en sintético pero se queda atrás en juegos
Vaidyanathan Subramaniam, 2022-05-20 (Update: 2022-05-20)