Análisis del ASUS ZenBook 13 UX331UN (i7-8550, GeForce MX150, SSD, FHD)
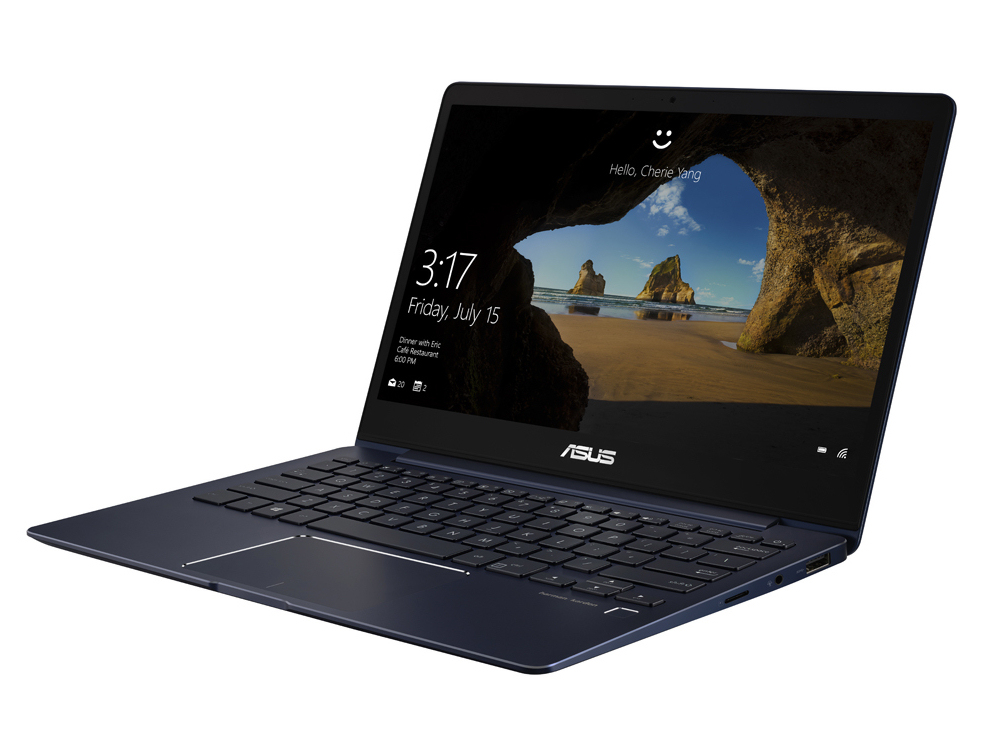
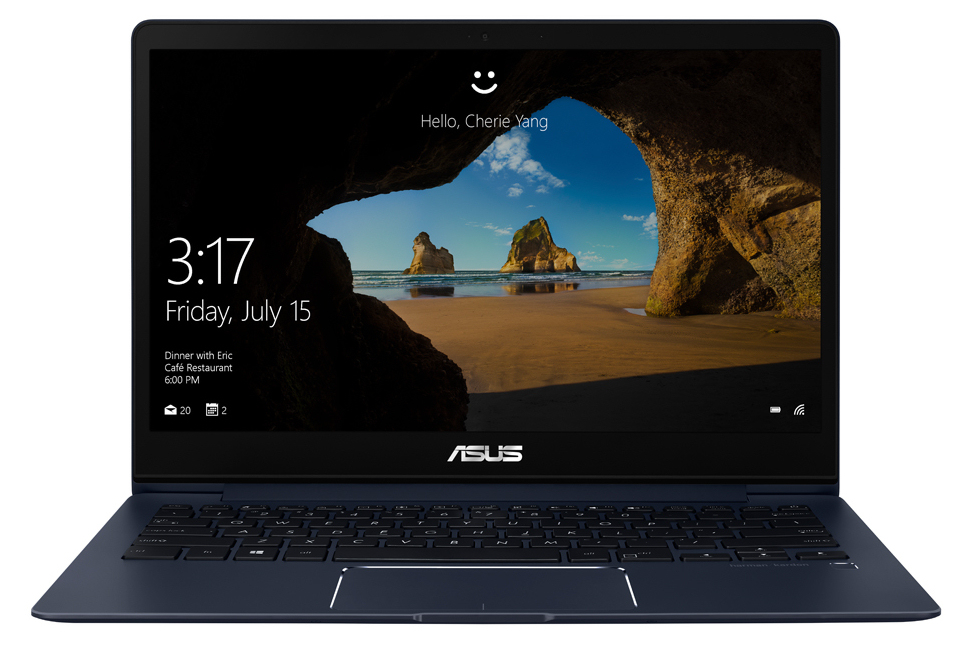
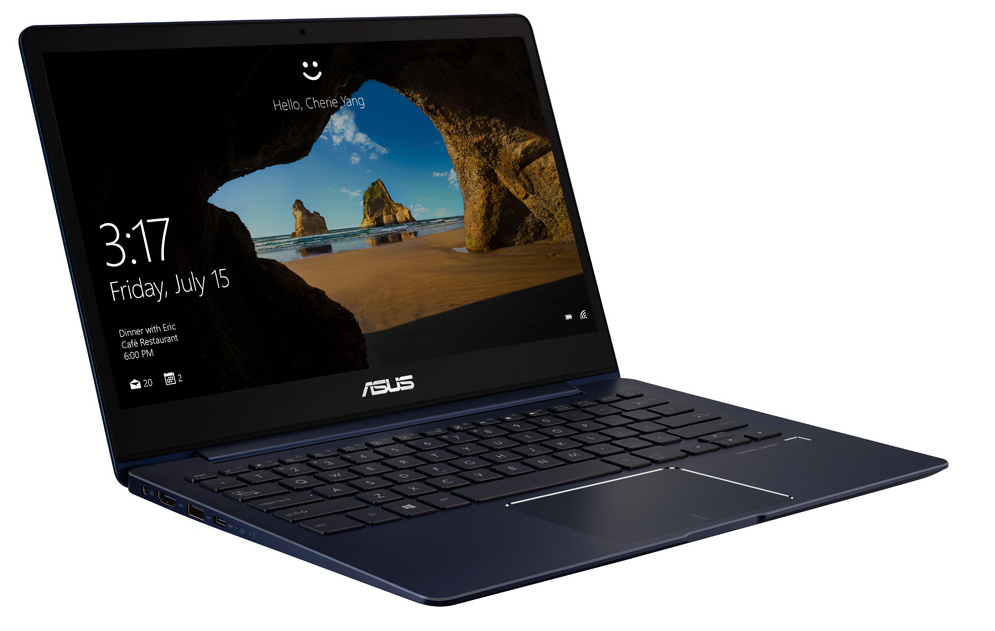
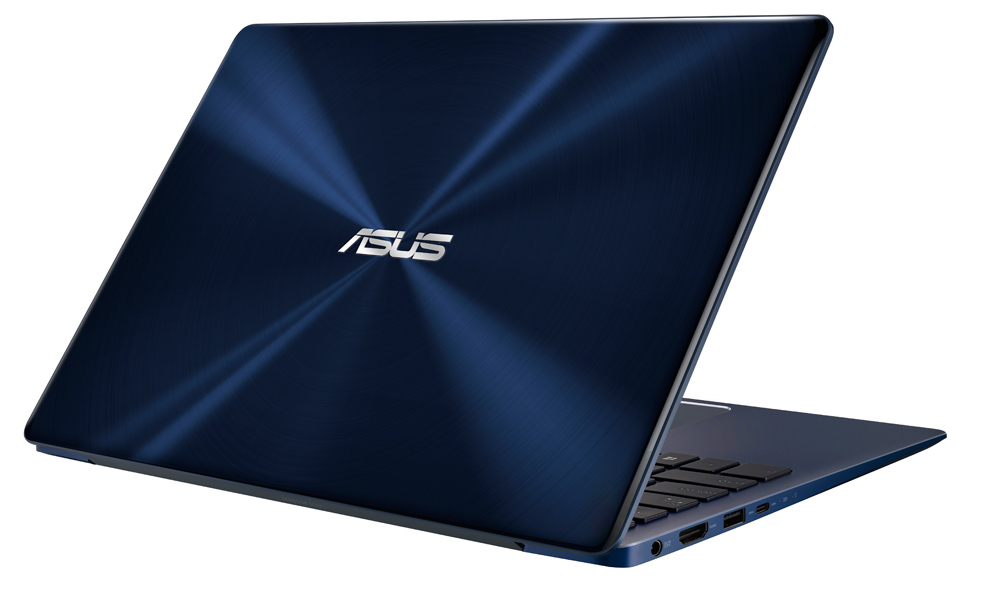
El ASUS ZenBook 13 es un Ultrabook elegante y compacto de 13.3 pulgadas. Onboard es un procesador Core i7-8550U de cuatro núcleos y una tarjeta gráfica dedicada GeForce MX150. Revisamos el hermano prácticamente idéntico del ZenBook a principios de este año, gran parte del dispositivo ya fue cubierto por nosotros. Como tal, no comentaremos sobre la carcasa, la conectividad, los dispositivos de entrada, la pantalla o los altavoces en esta revisión. La información sobre esto se puede leer en nuestra revisión del otro ZenBook 13. Elegimos Lenovo Ideapad 720S-13IKB, HP Envy 13, Dell XPS 9370 y MacBook Air 13 como dispositivos de comparación.
Comunicación
| SD Card Reader | |
| average JPG Copy Test (av. of 3 runs) | |
| Dell XPS 13 9370 FHD i5 (Toshiba Exceria Pro M501 64 GB UHS-II) | |
| Apple MacBook Air 13.3" 1.8 GHz (2017) (Toshiba Exceria Pro SDXC 64 GB UHS-II) | |
| Media de la clase Subnotebook (23.7 - 188, n=9, últimos 2 años) | |
| Asus ZenBook 13 UX331UN (Toshiba Exceria Pro M501) | |
| HP Envy 13-ad006ng (Toshiba Exceria Pro SDXC 64 GB UHS-II) | |
| Asus ZenBook 13 UX331UN (Toshiba Exceria Pro M501 microSDXC 64GB) | |
| maximum AS SSD Seq Read Test (1GB) | |
| Dell XPS 13 9370 FHD i5 (Toshiba Exceria Pro M501 64 GB UHS-II) | |
| Media de la clase Subnotebook (24.9 - 195, n=8, últimos 2 años) | |
| Apple MacBook Air 13.3" 1.8 GHz (2017) (Toshiba Exceria Pro SDXC 64 GB UHS-II) | |
| Asus ZenBook 13 UX331UN (Toshiba Exceria Pro M501 microSDXC 64GB) | |
| Asus ZenBook 13 UX331UN (Toshiba Exceria Pro M501) | |
| HP Envy 13-ad006ng (Toshiba Exceria Pro SDXC 64 GB UHS-II) | |
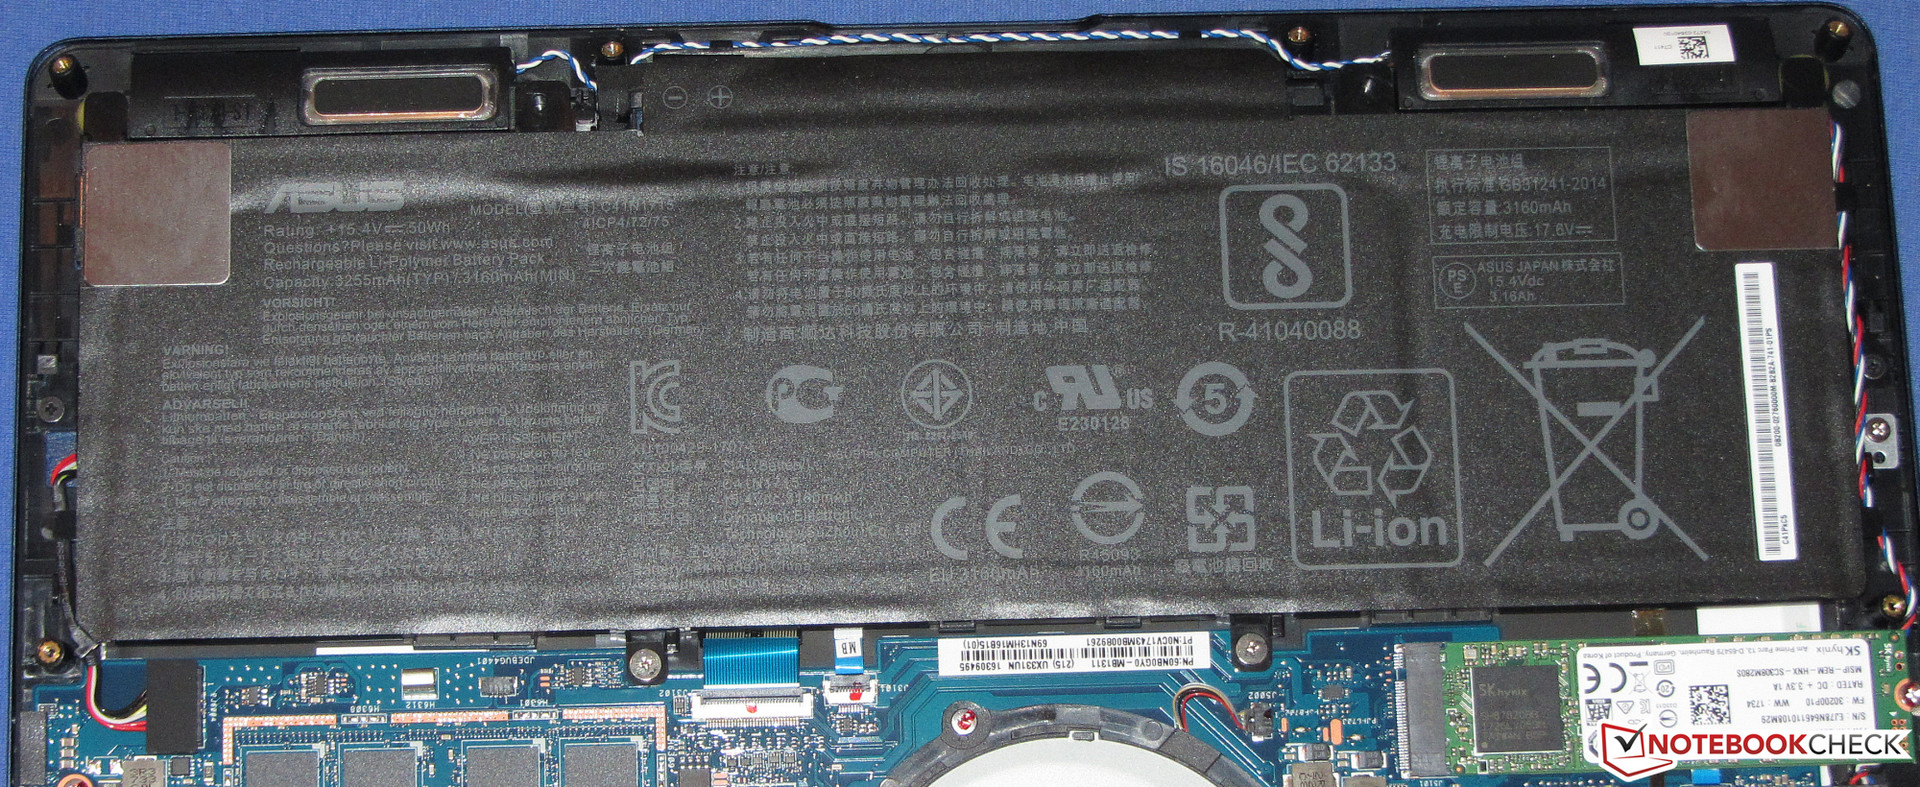
Mantenimiento
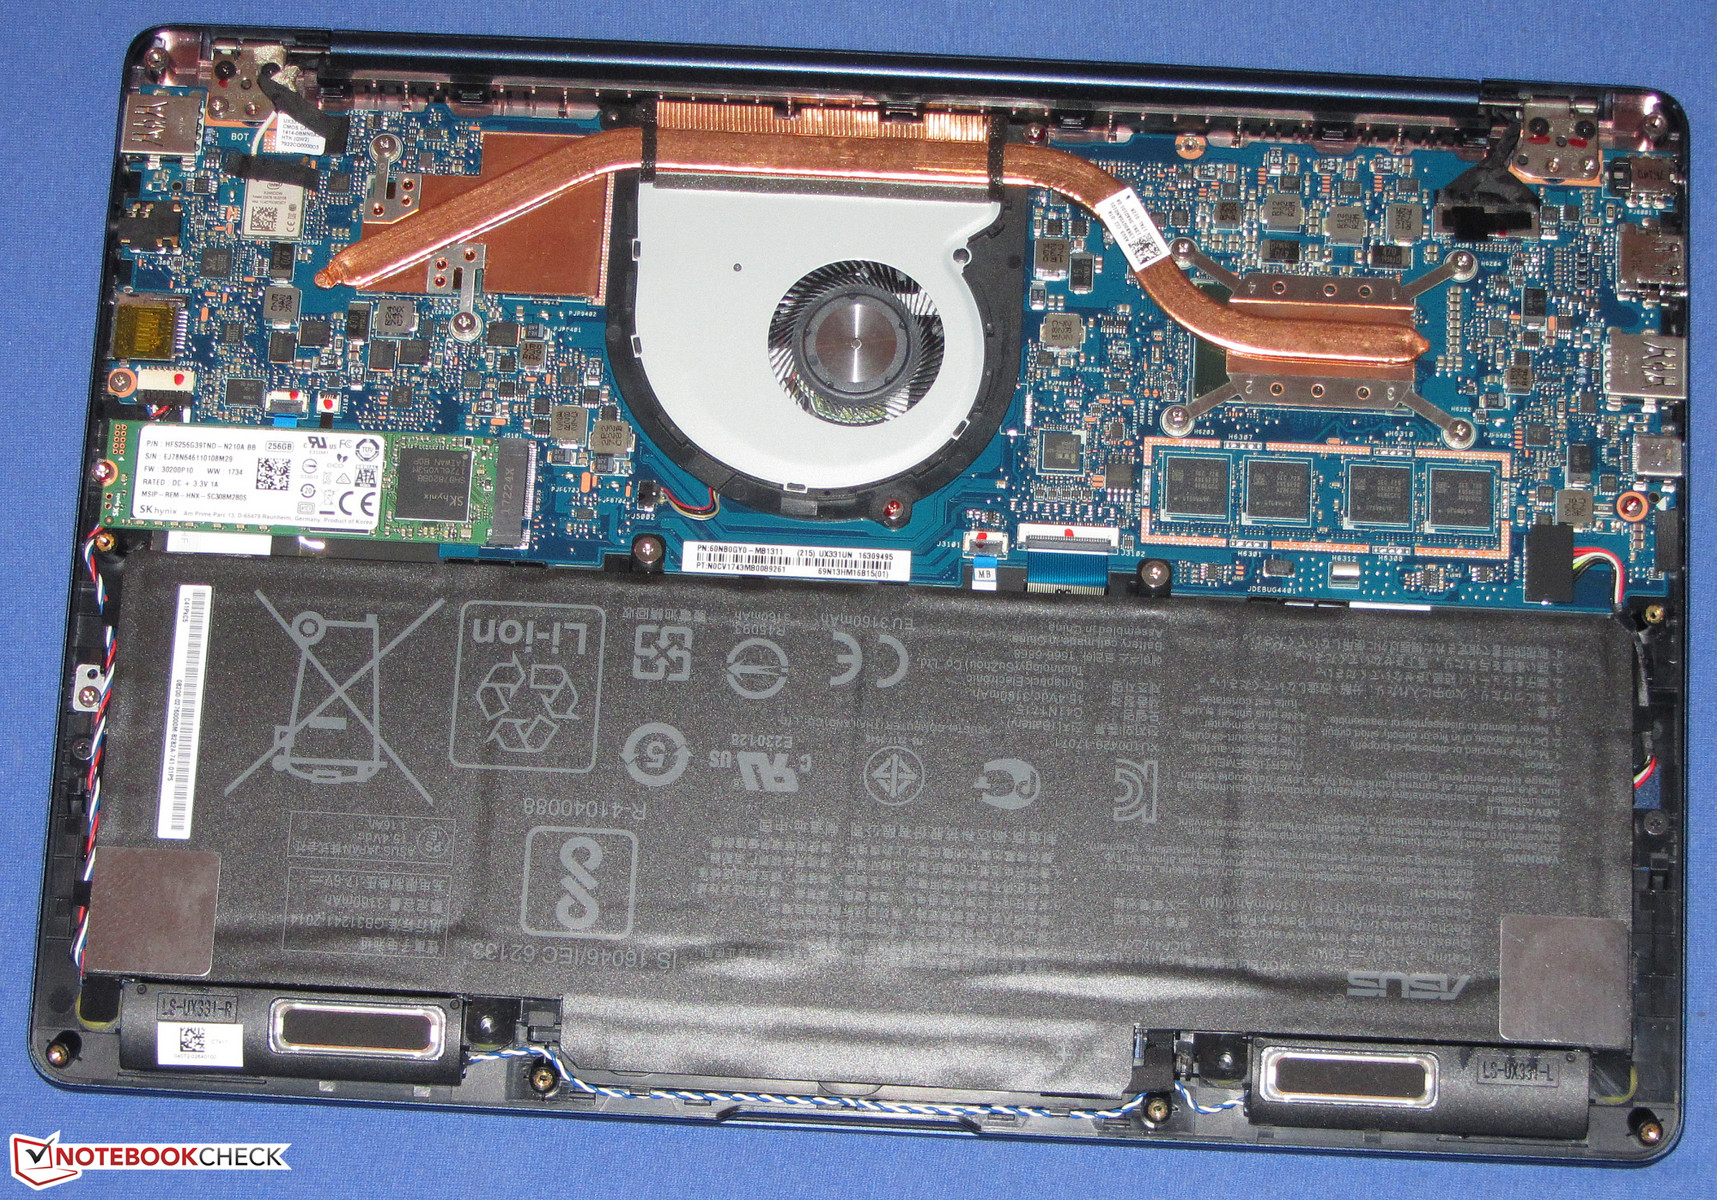
El ZenBook se puede reparar y mantener desenroscando la carcasa inferior del chasis. Hay tornillos ocultos debajo de dos pies de goma además de los tornillos visibles. La carcasa inferior solo se puede quitar desatornillando estos y los otros tornillos. Al hacerlo, da acceso a los componentes, de los cuales la batería, la SSD, la tarjeta WiFi y el ventilador son reemplazables por el usuario, mientras que la CPU, la GPU y la RAM están soldadas a la placa base.
Display

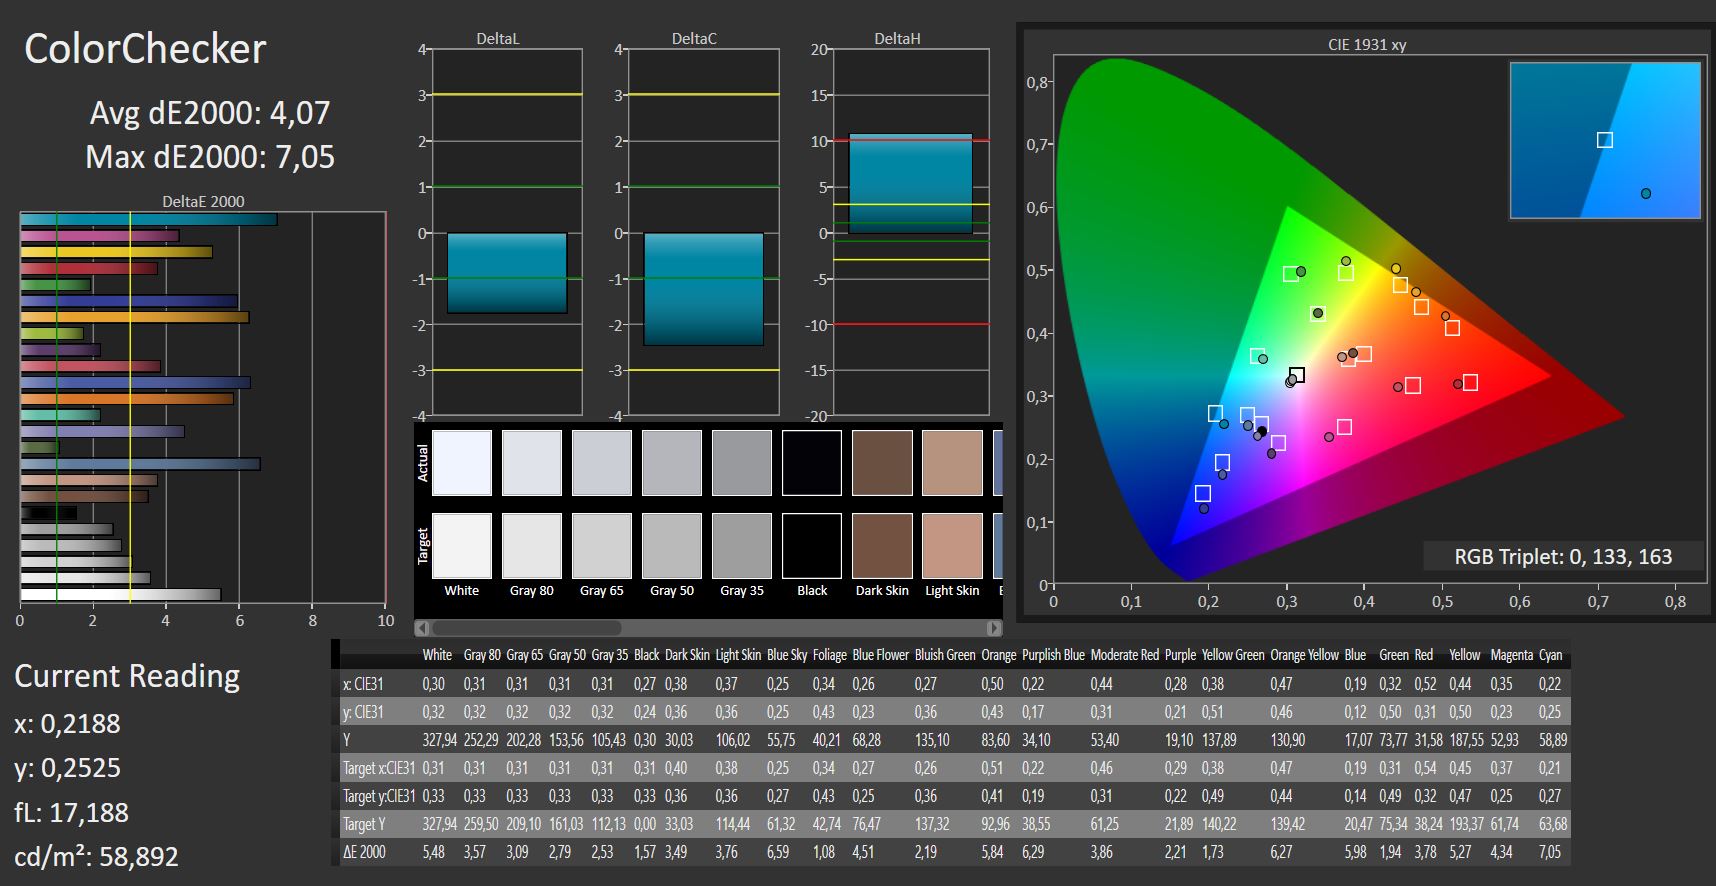
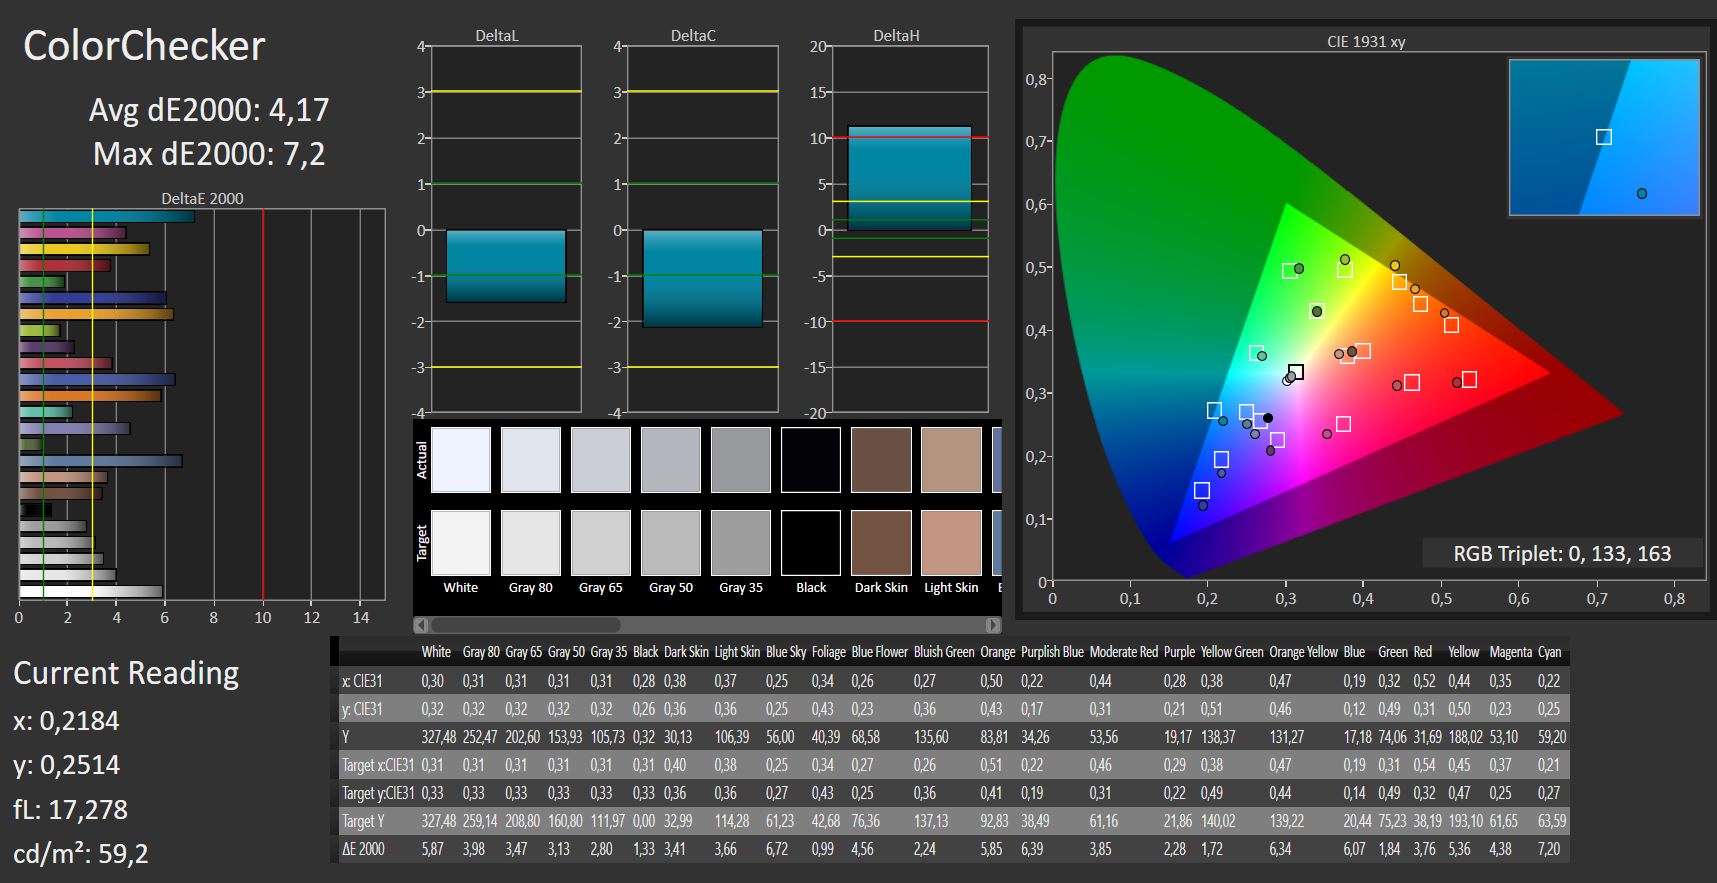
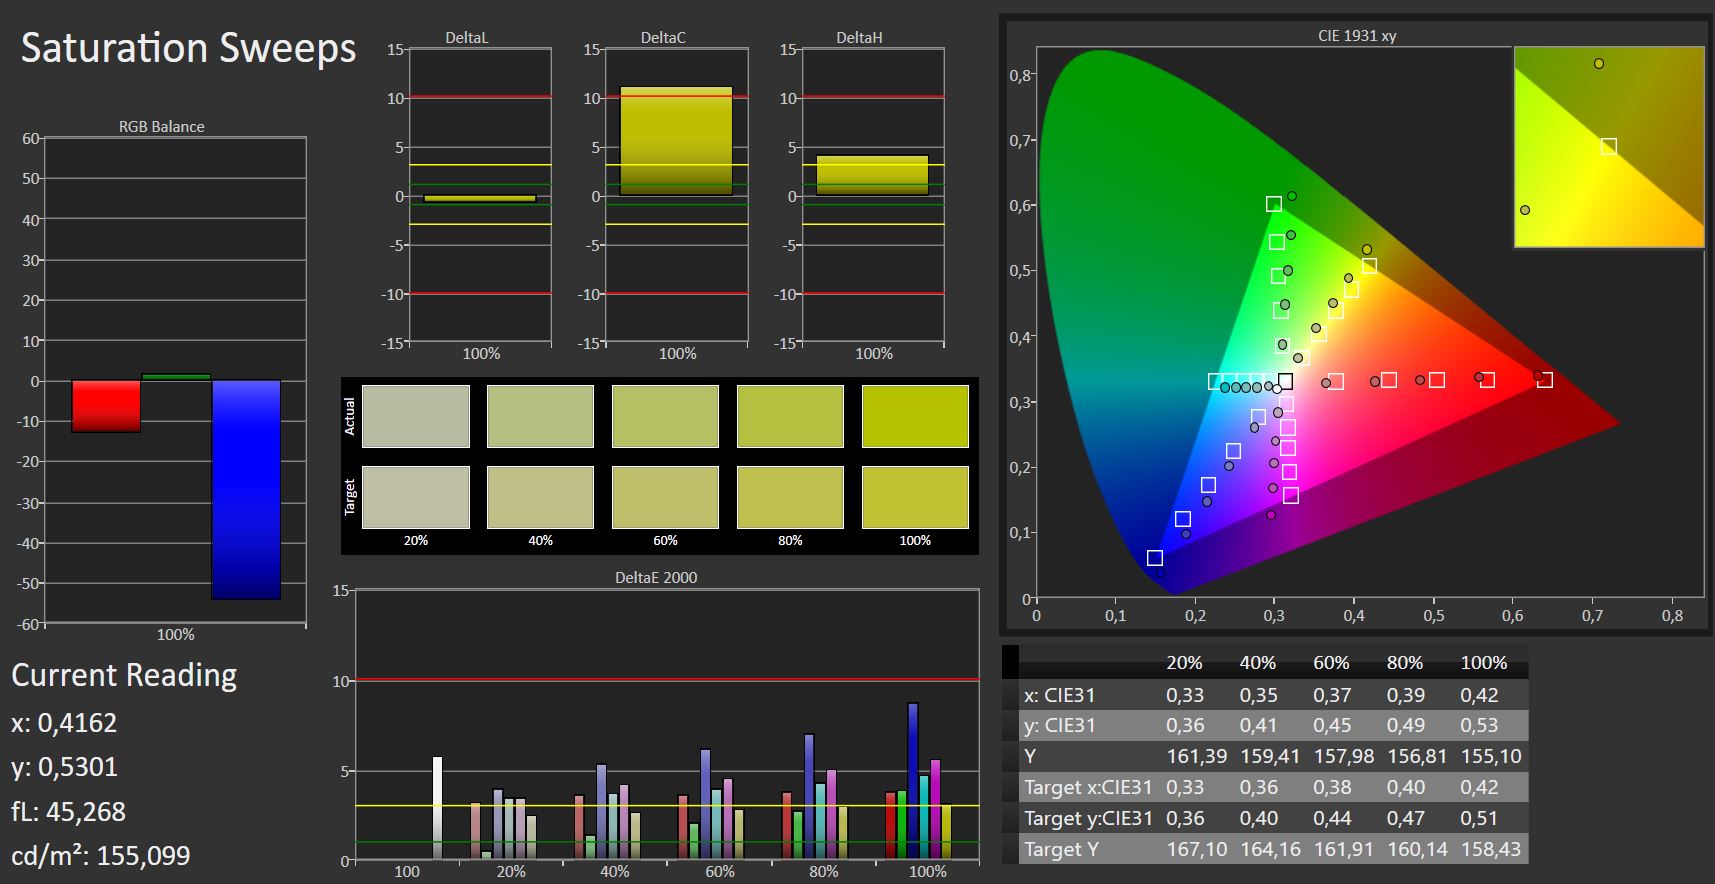
El ZenBook tiene la misma pantalla Full-HD que se puede encontrar en su hermano. El panel IPS es brillante, con buen contraste, ángulos de visión estables y sin parpadeo PWM. Estos valores exactos varían marginalmente entre los dos modelos, pero esto es de esperar ya que no hay dos paneles de visualización idénticos.
Sin embargo, hay una diferencia observable, que es que con la batería, nuestro dispositivo de prueba tiene un brillo máximo menor que cuando se está cargando. Esto no es replicado por el hermano del UX331UA.
| |||||||||||||||||||||||||
iluminación: 86 %
Brillo con batería: 277 cd/m²
Contraste: 1097:1 (Negro: 0.3 cd/m²)
ΔE ColorChecker Calman: 4.07 | ∀{0.5-29.43 Ø4.73}
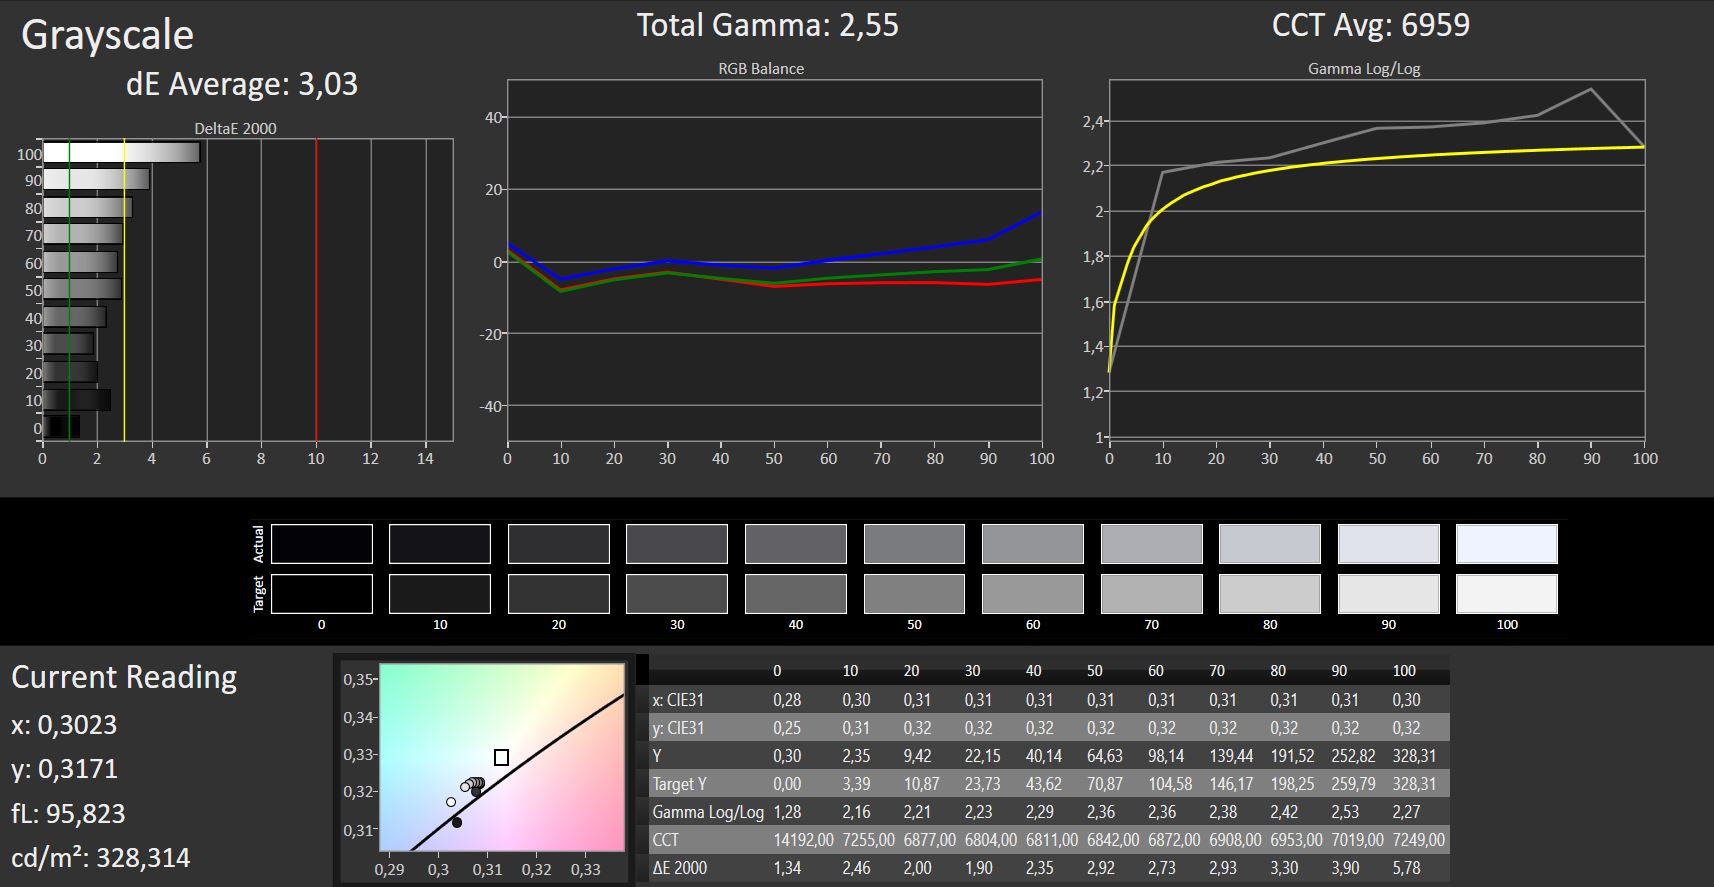
ΔE Greyscale Calman: 2.76 | ∀{0.09-98 Ø4.97}
86% sRGB (Argyll 1.6.3 3D)
56% AdobeRGB 1998 (Argyll 1.6.3 3D)
63.4% AdobeRGB 1998 (Argyll 3D)
86.7% sRGB (Argyll 3D)
63.3% Display P3 (Argyll 3D)
Gamma: 2.56
CCT: 6915 K
| Asus ZenBook 13 UX331UN IPS, 1920x1080, 13.3" | Asus ZenBook 13 UX331UN IPS LED, 1920x1080, 13.3" | Lenovo Ideapad 720S-13IKB IPS, 1920x1080, 13.3" | Dell XPS 13 9370 FHD i5 IPS, 1920x1080, 13.3" | HP Envy 13-ad006ng IPS LED, 1920x1080, 13.3" | Apple MacBook Air 13.3" 1.8 GHz (2017) TN LED, 1440x900, 13.3" | |
|---|---|---|---|---|---|---|
| Display | 5% | -3% | 10% | 2% | ||
| Display P3 Coverage (%) | 63.3 | 65.4 3% | 64.3 2% | 68.9 9% | 66.8 6% | |
| sRGB Coverage (%) | 86.7 | 93.1 7% | 82.3 -5% | 96.6 11% | 86.3 0% | |
| AdobeRGB 1998 Coverage (%) | 63.4 | 66.4 5% | 60.2 -5% | 69.6 10% | 63.1 0% | |
| Response Times | 10% | 8% | -66% | -21% | -19% | |
| Response Time Grey 50% / Grey 80% * (ms) | 44 ? | 22.4 ? 49% | 35 ? 20% | 62.4 ? -42% | 48 ? -9% | 52.4 ? -19% |
| Response Time Black / White * (ms) | 24 ? | 31.2 ? -30% | 25 ? -4% | 45.6 ? -90% | 32 ? -33% | 28.4 ? -18% |
| PWM Frequency (Hz) | 131000 ? | 1008 ? | 1000 ? | 58000 | ||
| Screen | -4% | -21% | 10% | -18% | ||
| Brightness middle (cd/m²) | 329 | 338 3% | 335 2% | 428 30% | 281 -15% | |
| Brightness (cd/m²) | 306 | 321 5% | 303 -1% | 405 32% | 264 -14% | |
| Brightness Distribution (%) | 86 | 90 5% | 85 -1% | 87 1% | 83 -3% | |
| Black Level * (cd/m²) | 0.3 | 0.35 -17% | 0.46 -53% | 0.26 13% | 0.23 23% | |
| Contrast (:1) | 1097 | 966 -12% | 728 -34% | 1646 50% | 1222 11% | |
| Colorchecker dE 2000 * | 4.07 | 4.2 -3% | 5.09 -25% | 3.8 7% | 4.83 -19% | |
| Colorchecker dE 2000 max. * | 7.05 | 6.5 8% | 11.92 -69% | 7.2 -2% | 8.89 -26% | |
| Greyscale dE 2000 * | 2.76 | 3.9 -41% | 3.23 -17% | 4.4 -59% | 6.63 -140% | |
| Gamma | 2.56 86% | 2.43 91% | 2.18 101% | 2.21 100% | 1.85 119% | |
| CCT | 6915 94% | 7144 91% | 6214 105% | 7067 92% | 6794 96% | |
| Color Space (Percent of AdobeRGB 1998) (%) | 56 | 60.4 8% | 54 -4% | 62.8 12% | 56 0% | |
| Color Space (Percent of sRGB) (%) | 86 | 93.1 8% | 82 -5% | 96.4 12% | 86 0% | |
| Media total (Programa/Opciones) | 4% /
-0% | -5% /
-13% | -15% /
-0% | -12% /
-15% | -19% /
-19% |
* ... más pequeño es mejor
Parpadeo de Pantalla / PWM (Pulse-Width Modulation)
| Parpadeo de Pantalla / PWM no detectado | ||
Comparación: 52 % de todos los dispositivos testados no usaron PWM para atenuar el display. Si se usó, medimos una media de 7798 (mínimo: 5 - máxmo: 343500) Hz. | ||


Tiempos de respuesta del display
| ↔ Tiempo de respuesta de Negro a Blanco | ||
|---|---|---|
| 24 ms ... subida ↗ y bajada ↘ combinada | ↗ 13 ms subida | 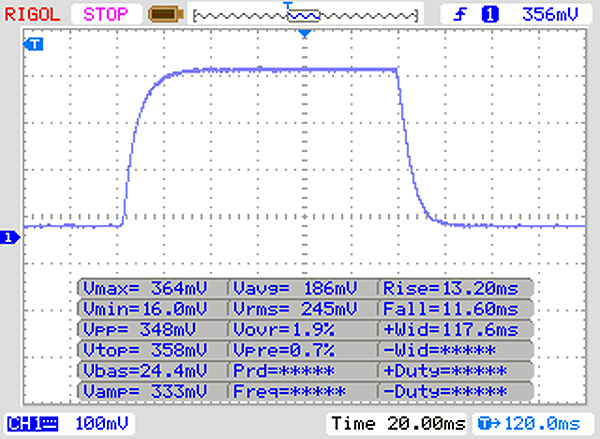 |
| ↘ 11 ms bajada | ||
| La pantalla mostró buenos tiempos de respuesta en nuestros tests pero podría ser demasiado lenta para los jugones competitivos. En comparación, todos los dispositivos de prueba van de ##min### (mínimo) a 240 (máximo) ms. » 54 % de todos los dispositivos son mejores. Eso quiere decir que el tiempo de respuesta es peor que la media (19.9 ms) de todos los dispositivos testados. | ||
| ↔ Tiempo de respuesta 50% Gris a 80% Gris | ||
| 44 ms ... subida ↗ y bajada ↘ combinada | ↗ 22 ms subida | 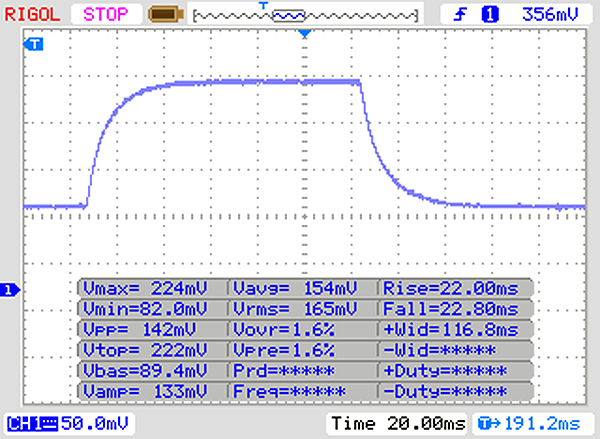 |
| ↘ 22 ms bajada | ||
| La pantalla mostró tiempos de respuesta lentos en nuestros tests y podría ser demasiado lenta para los jugones. En comparación, todos los dispositivos de prueba van de ##min### (mínimo) a 636 (máximo) ms. » 73 % de todos los dispositivos son mejores. Eso quiere decir que el tiempo de respuesta es peor que la media (31.1 ms) de todos los dispositivos testados. | ||
Rendimiento
El ZenBook 13 es un elegante Ultrabook de 13.3 pulgadas que ofrece potencia más que suficiente para aplicaciones de Office e Internet. La tarjeta gráfica dedicada es poderosa para el juego en el ZenBook también. Los precios para el dispositivo comienzan en € 960, con nuestro dispositivo de prueba que cuesta aproximadamente € 1.200 en el momento de la escritura.
Condiciónes de la prueba
En términos de opciones de potencia, el ZenBook 13 viene con solo un modo "Balanceado". No hay modos de 'Alto rendimiento' o 'Baja potencia'. No se pueden crear más tarde ni hay opciones de administración de energía en el menú de UEFI. Por lo tanto, todas las pruebas se llevaron a cabo con el modo "Balanceado" habilitado.
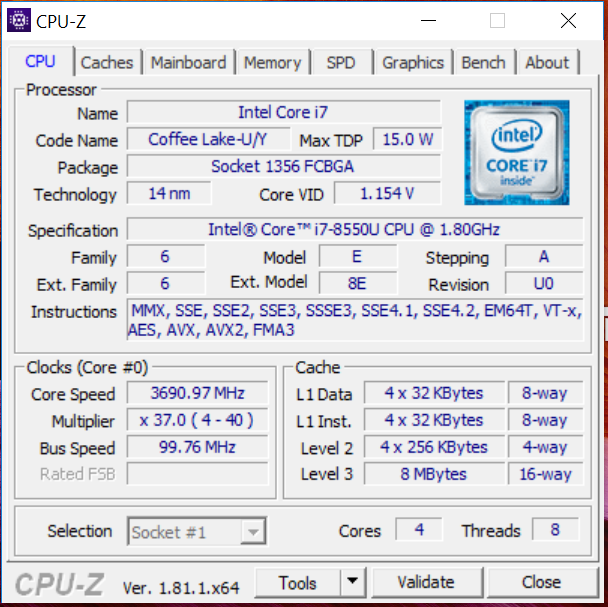
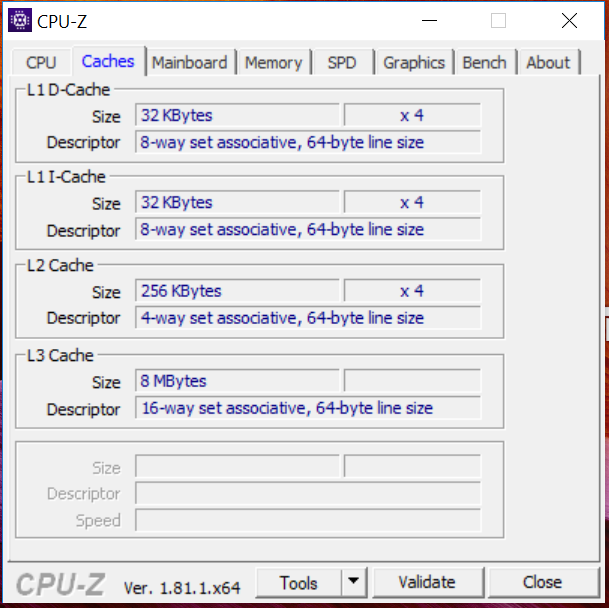
Procesador
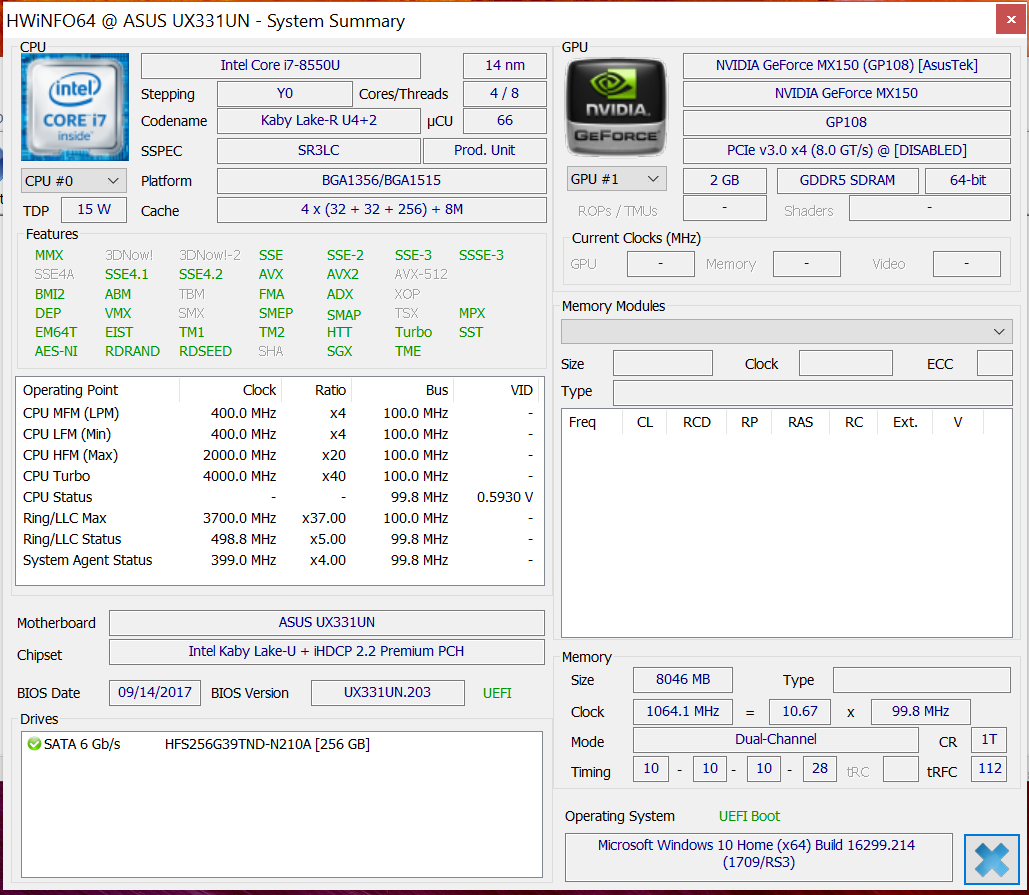
El ZenBook está impulsado por un procesador Intel Core i7-8550U Kaby Lake R de cuatro núcleos. El i7-8550U es una CPU de voltaje ultrabajo (ULV) que tiene una potencia de diseño térmico (TDP) de 15 W y admite el hyperthreading. Hyperthreading permite procesar dos hilos por núcleo, lo que significa que el i7-8550U tiene un total de ocho hilos en sus cuatro núcleos. La CPU tiene un reloj base de 1.8 GHz que con Turbo Boost se puede aumentar temporalmente hasta 4 GHz.
Cuando se ejecutan benchmarks de Cinebench de subprocesos múltiples, el i7-8550U inicialmente funciona entre 3 y 3,3 GHz. Después de unos segundos, esto se reduce a entre 2,6 y 2,8 GHz. En las pruebas de un solo hilo, el procesador funciona a velocidades entre 3,3 y 4 GHz. Tenga en cuenta que esto solo es cierto cuando el ZenBook se está cargando. Si está en la batería, la velocidad de la CPU caerá a entre 1,5 y 1,9 GHz para pruebas de un solo hilo con velocidades para pruebas de múltiples hilos que caen a entre 1,5 y 2,7 GHz.
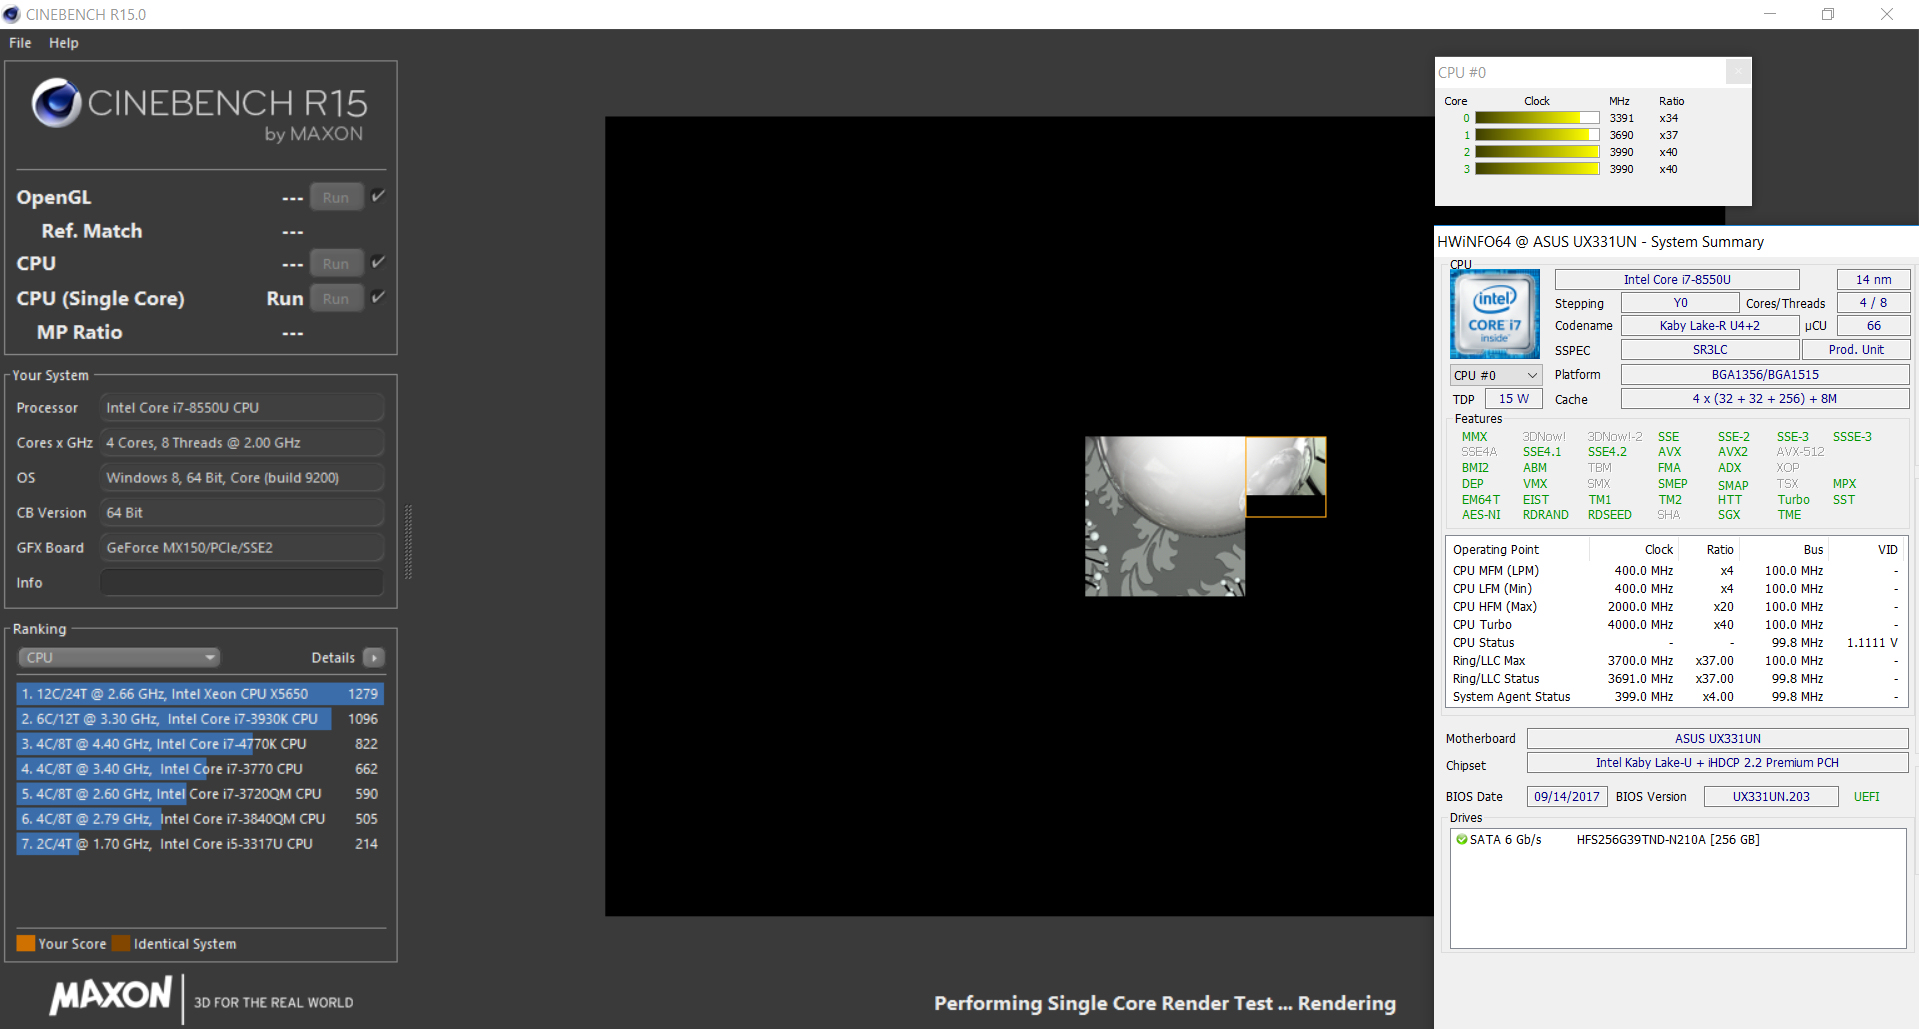
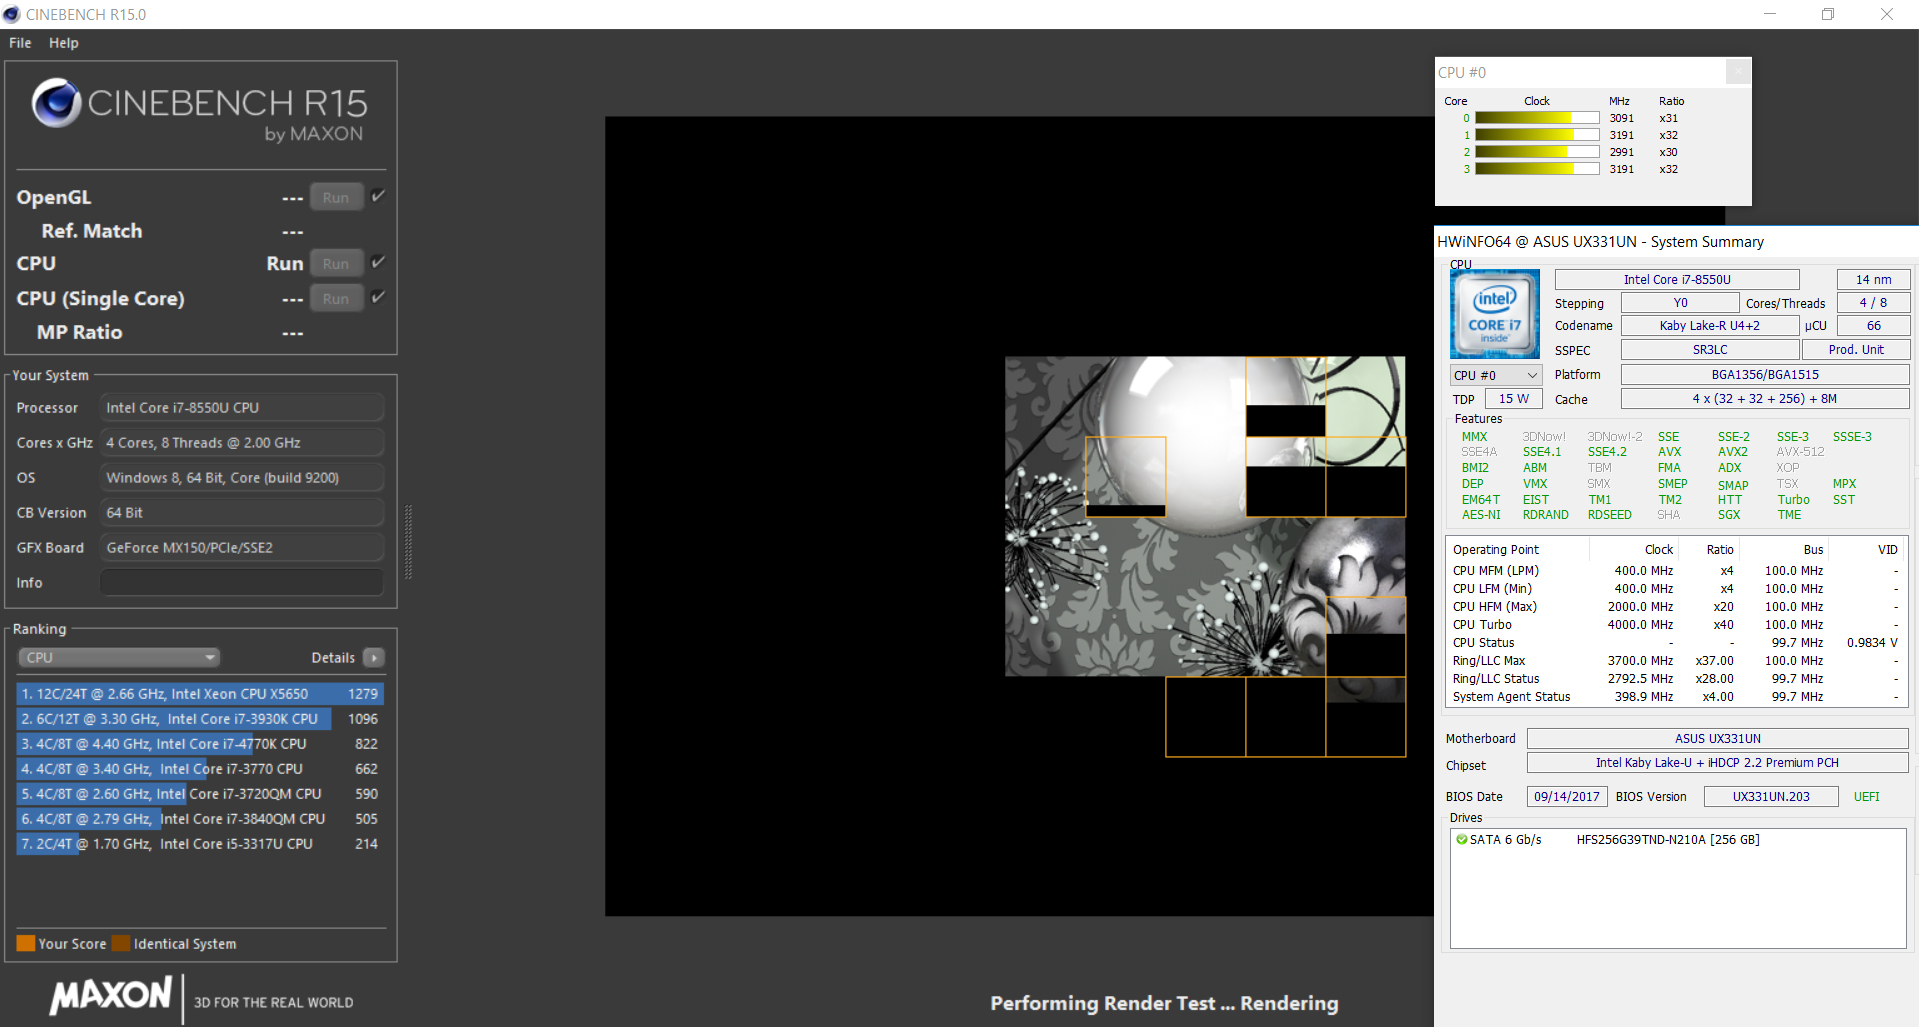
También probamos si el Turbo Boost se ejecuta constantemente cuando el ZenBook se está cargando. Lo hicimos ejecutando una prueba de Cinebench R15 de múltiples hilos en un ciclo de treinta minutos. Nuestros resultados muestran que, si bien Turbo Boost funciona permanentemente cuando el dispositivo está bajo carga completa y cargando, las velocidades a las que se impulsa el procesador varían significativamente. Turbo Boost no mantiene el procesador a una velocidad fija por ningún período de tiempo.
Vale la pena tener en cuenta que los resultados de nuestras pruebas de CPU son típicos para el Core i7-8550U, y el ZenBook no es atípico en este aspecto.
| Geekbench 3 | |
| 32 Bit Single-Core Score | |
| Media de la clase Subnotebook (n=1últimos 2 años) | |
| Lenovo Miix 520-12IKB 20M3000LGE | |
| Asus ZenBook 13 UX331UN | |
| Acer Swift 3 SF314-52G-89SL | |
| Medio Intel Core i7-8550U (2471 - 4020, n=12) | |
| Acer Aspire 5 A517-51G-80L | |
| 64 Bit Multi-Core Score | |
| Acer Aspire 5 A517-51G-80L | |
| Medio Intel Core i7-8550U (11637 - 14030, n=2) | |
| Octane V2 - Total Score | |
| Media de la clase Subnotebook (35801 - 142020, n=29, últimos 2 años) | |
| Acer Aspire 5 A517-51G-80L (EDGE: 40.15063.674.0) | |
| Asus ZenBook 13 UX331UN (Edge 41) | |
| Asus ZenBook 13 UX331UN (Edge) | |
| Dell XPS 13 9370 FHD i5 (Edge 41.15399.15.0) | |
| Medio Intel Core i7-8550U (17296 - 42043, n=39) | |
| HP Envy 13-ad006ng (Edge) | |
| Lenovo Ideapad 720S-13IKB | |
| Mozilla Kraken 1.1 - Total | |
| HP Envy 13-ad006ng (Edge) | |
| Medio Intel Core i7-8550U (877 - 2114, n=45) | |
| Dell XPS 13 9370 FHD i5 (Edge 41.15399.15.0) | |
| Lenovo Ideapad 720S-13IKB | |
| Acer Aspire 5 A517-51G-80L (EDGE: 40.15063.674.0) | |
| Asus ZenBook 13 UX331UN (Edge) | |
| Asus ZenBook 13 UX331UN (Edge 41) | |
| Media de la clase Subnotebook (234 - 1104, n=63, últimos 2 años) | |
| JetStream 1.1 - 1.1 Total | |
| Media de la clase Subnotebook (215 - 476, n=2, últimos 2 años) | |
| Acer Swift 3 SF314-52G-89SL (Edge 40) | |
| Acer Aspire 5 A517-51G-80L (EDGE: 40.15063.674.0) | |
| Lenovo Miix 520-12IKB 20M3000LGE (Edge 41) | |
| Asus ZenBook 13 UX331UN (Edge) | |
| Asus ZenBook 13 UX331UN (Edge 41) | |
| Dell XPS 13 9370 FHD i5 (Edge 41.15399.15.0) | |
| Medio Intel Core i7-8550U (141.9 - 288, n=61) | |
| HP Envy 13-ad006ng (Edge) | |
| Lenovo Ideapad 720S-13IKB | |
* ... más pequeño es mejor
Rendimiento de sistema
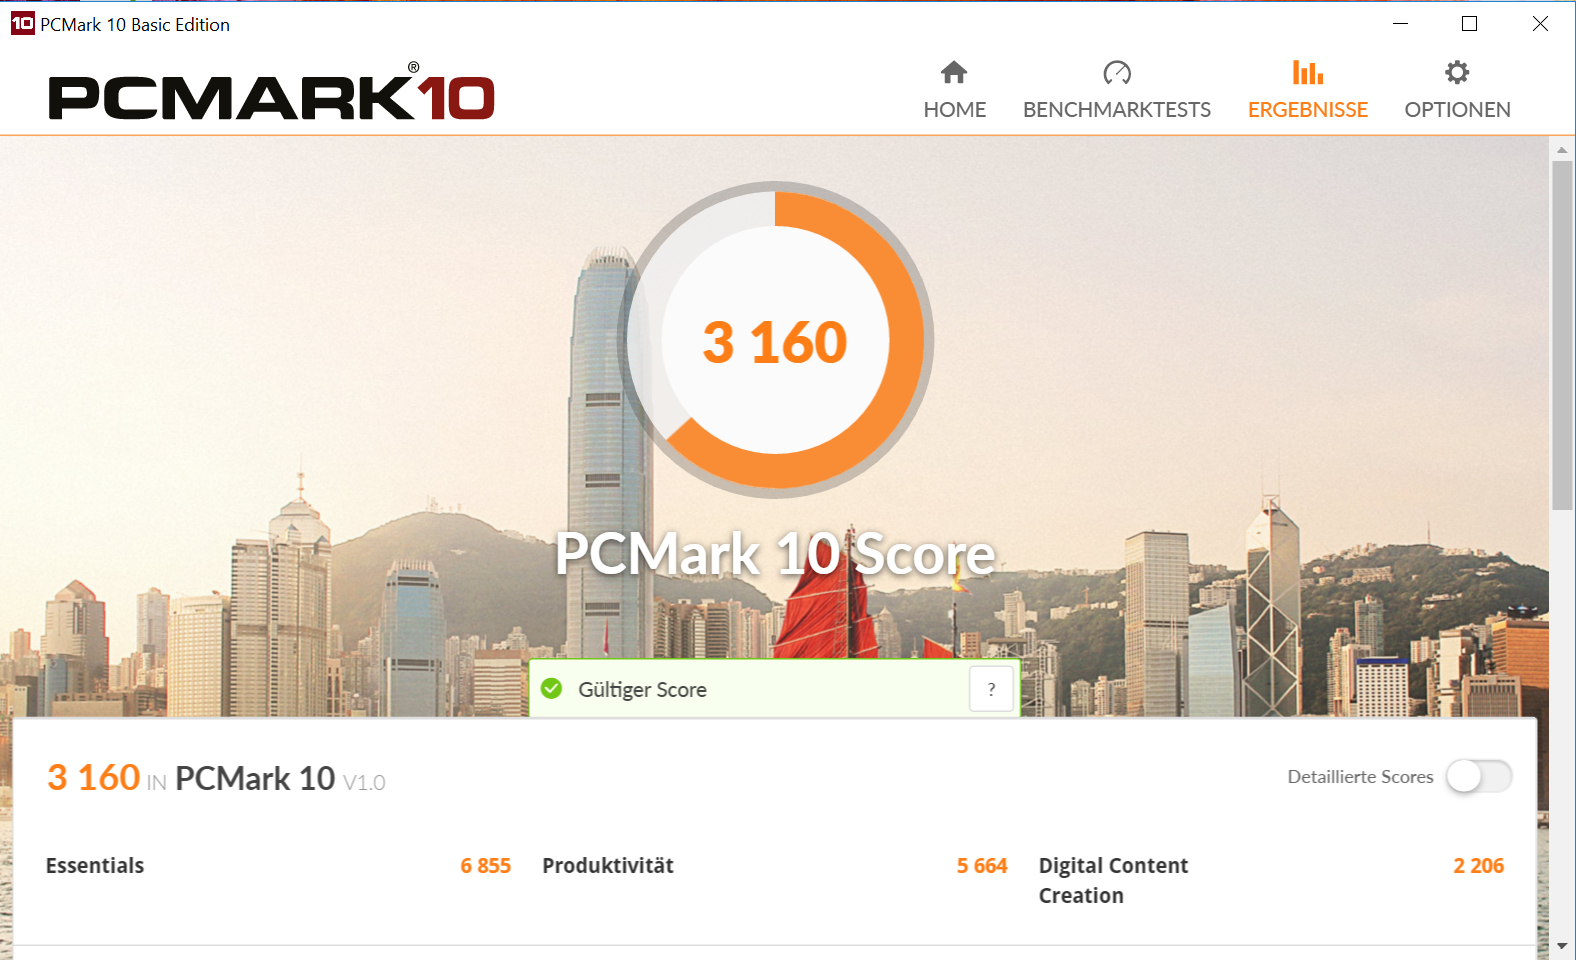
Las pruebas confirman nuestra idea inicial de que el ZenBook funciona sin problemas. Los resultados de nuestro PCMark son muy buenos, pero no es posible overclockear el dispositivo para mejorar el rendimiento.
| PCMark 7 Score | 5647 puntos | |
| PCMark 8 Home Score Accelerated v2 | 3780 puntos | |
| PCMark 8 Creative Score Accelerated v2 | 4765 puntos | |
| PCMark 8 Work Score Accelerated v2 | 4811 puntos | |
| PCMark 10 Score | 3160 puntos | |
ayuda | ||
Dispositivos de almacenamiento
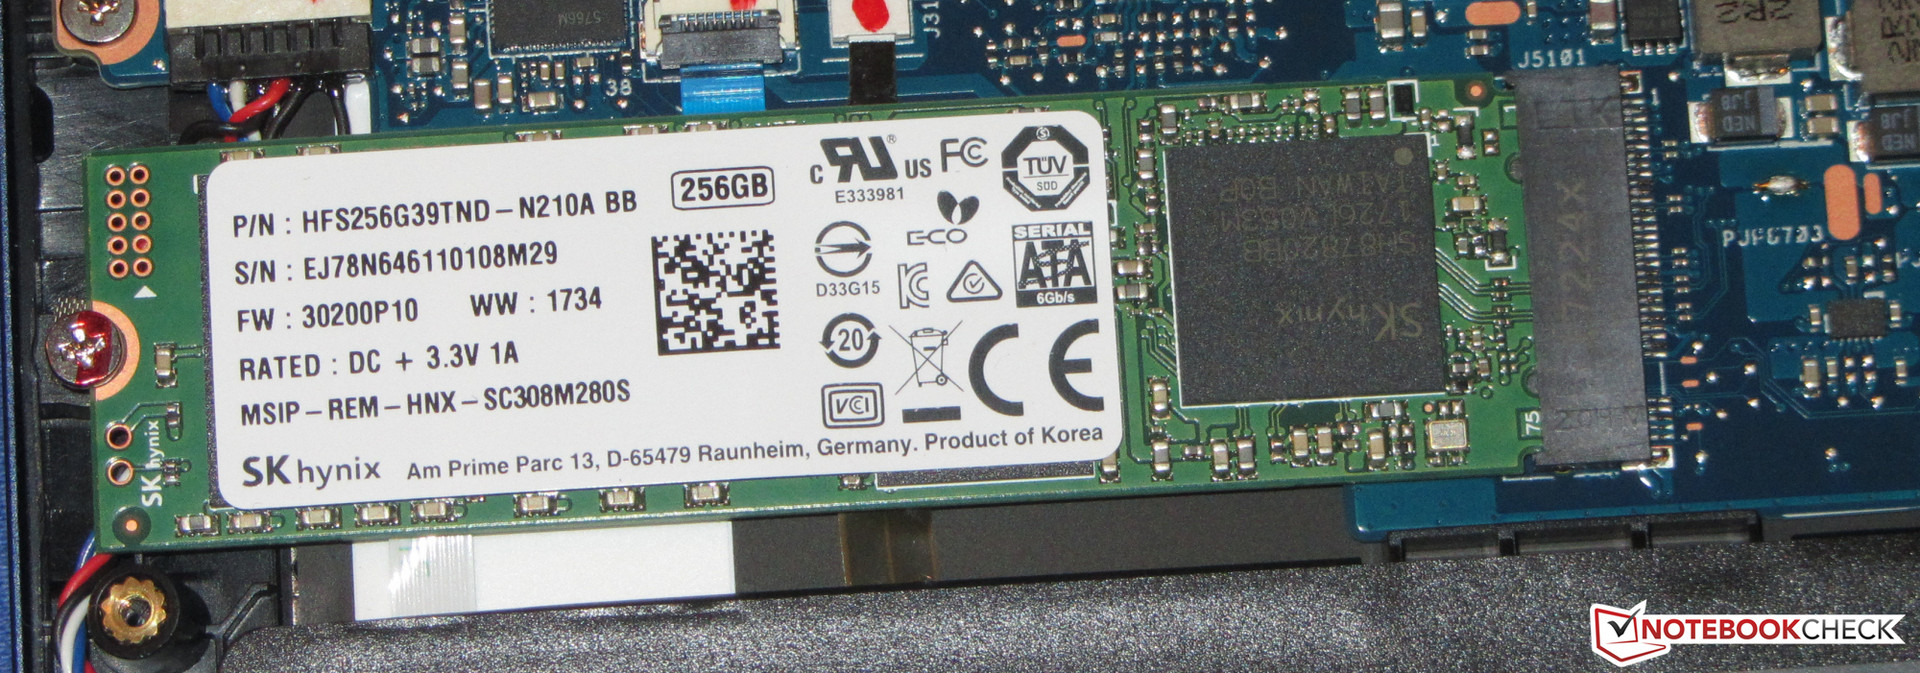
El ZenBook viene con un SSD M.2-2280 de SK Hynix con 256 GB de almacenamiento, de los cuales se pueden usar alrededor de 200 GB. Es un disco SATA III que tiene buenas velocidades de transferencia.
De acuerdo con el sitio web de ASUS, la ranura M.2-2280 es compatible con SATA III y NVMe SSD. Las unidades NVMe admiten velocidades de transferencia más rápidas que SATA III, con cuatro carriles de PCI Express 3.0. Reemplazar el disco SATA III preinstalado acortaría los tiempos de carga y haría que el ZenBook se sienta más ágil de lo que ya es.

| Asus ZenBook 13 UX331UN SK Hynix HFS256G39TND-N210A | Asus ZenBook 13 UX331UN SanDisk SD8SN8U512G1002 | Lenovo Ideapad 720S-13IKB Samsung PM961 MZVLW256HEHP | Dell XPS 13 9370 FHD i5 Toshiba XG5 KXG50ZNV256G | HP Envy 13-ad006ng Toshiba NVMe THNSN5256GPUK | Apple MacBook Air 13.3" 1.8 GHz (2017) Apple SSD SM0128G | Medio SK Hynix HFS256G39TND-N210A | |
|---|---|---|---|---|---|---|---|
| CrystalDiskMark 3.0 | 5% | 146% | 93% | 39% | 88% | -1% | |
| Read Seq (MB/s) | 435.6 | 430.6 -1% | 1674 284% | 1875 330% | 1019 134% | 1390 219% | 482 ? 11% |
| Write Seq (MB/s) | 263 | 424.1 61% | 1191 353% | 352.7 34% | 195.4 -26% | 731 178% | 246 ? -6% |
| Read 512 (MB/s) | 258.1 | 275 7% | 658 155% | 840 225% | 735 185% | 899 248% | 328 ? 27% |
| Write 512 (MB/s) | 256.6 | 369.8 44% | 852 232% | 353.9 38% | 172.3 -33% | 715 179% | 243 ? -5% |
| Read 4k (MB/s) | 30.37 | 28.04 -8% | 51.8 71% | 34.18 13% | 34.5 14% | 16.29 -46% | 28 ? -8% |
| Write 4k (MB/s) | 78.6 | 53.5 -32% | 114.9 46% | 127.5 62% | 109.4 39% | 27.17 -65% | 74.8 ? -5% |
| Read 4k QD32 (MB/s) | 356.8 | 322.9 -10% | 349.2 -2% | 381.8 7% | 494.6 39% | 300.9 -16% | 323 ? -9% |
| Write 4k QD32 (MB/s) | 257.2 | 211.9 -18% | 332.2 29% | 339.9 32% | 161.3 -37% | 273.7 6% | 220 ? -14% |
Tarjeta grafica
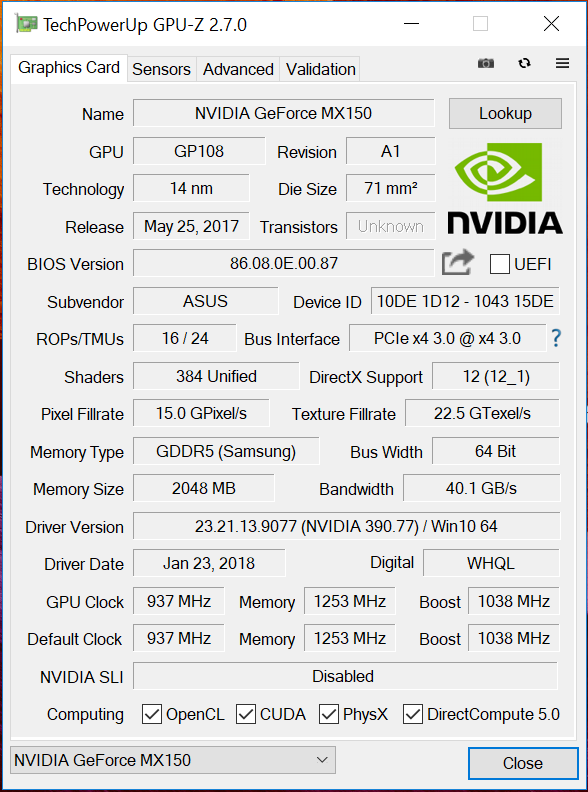
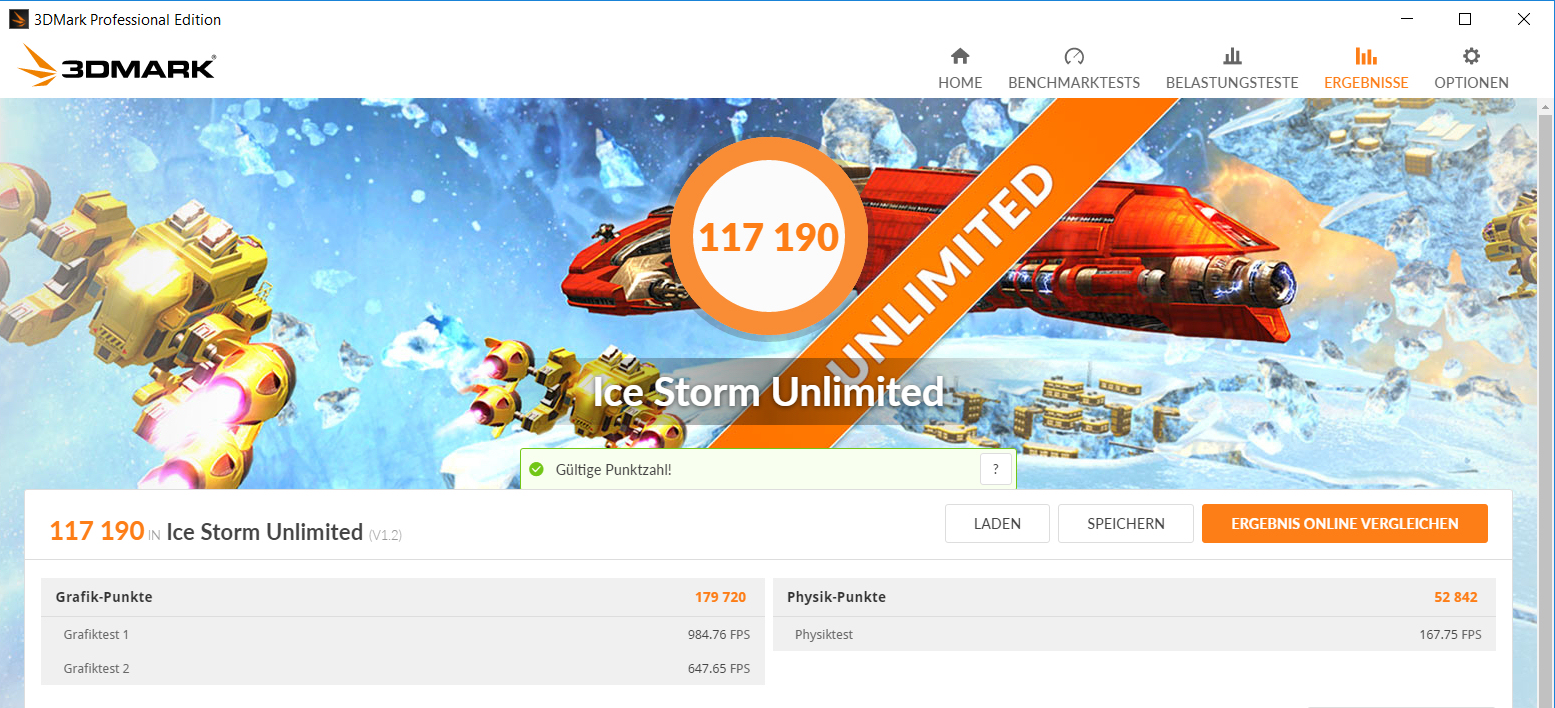
El ZenBook viene con una Nvidia GeForce MX150. La tarjeta gráfica de rango medio es la versión móvil de la GeForce GT 1030. La GPU es compatible con DirectX 12 y opera en un reloj base de 937 MHz, que puede aumentarse hasta 1.607 MHz. También tiene 2.048 MB de memoria GDDR5.
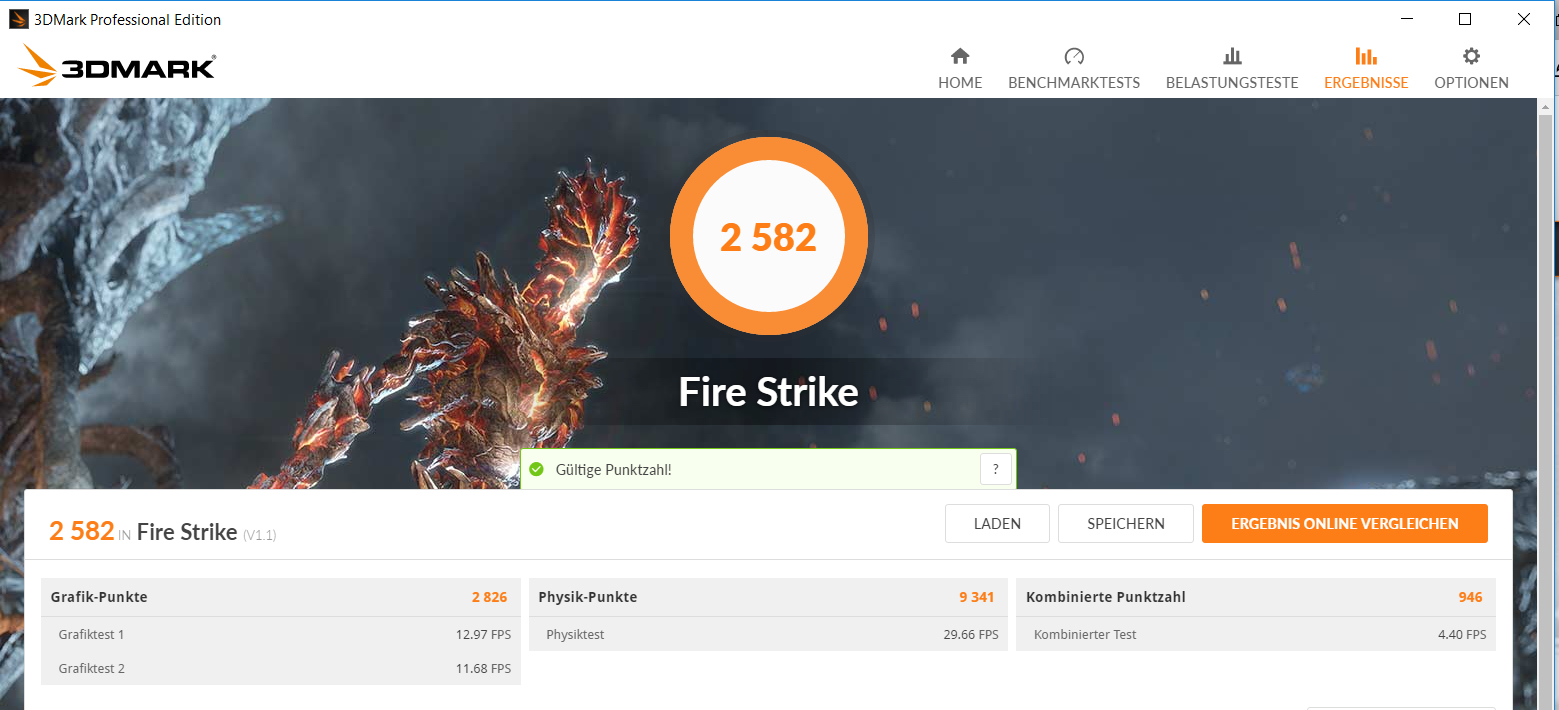
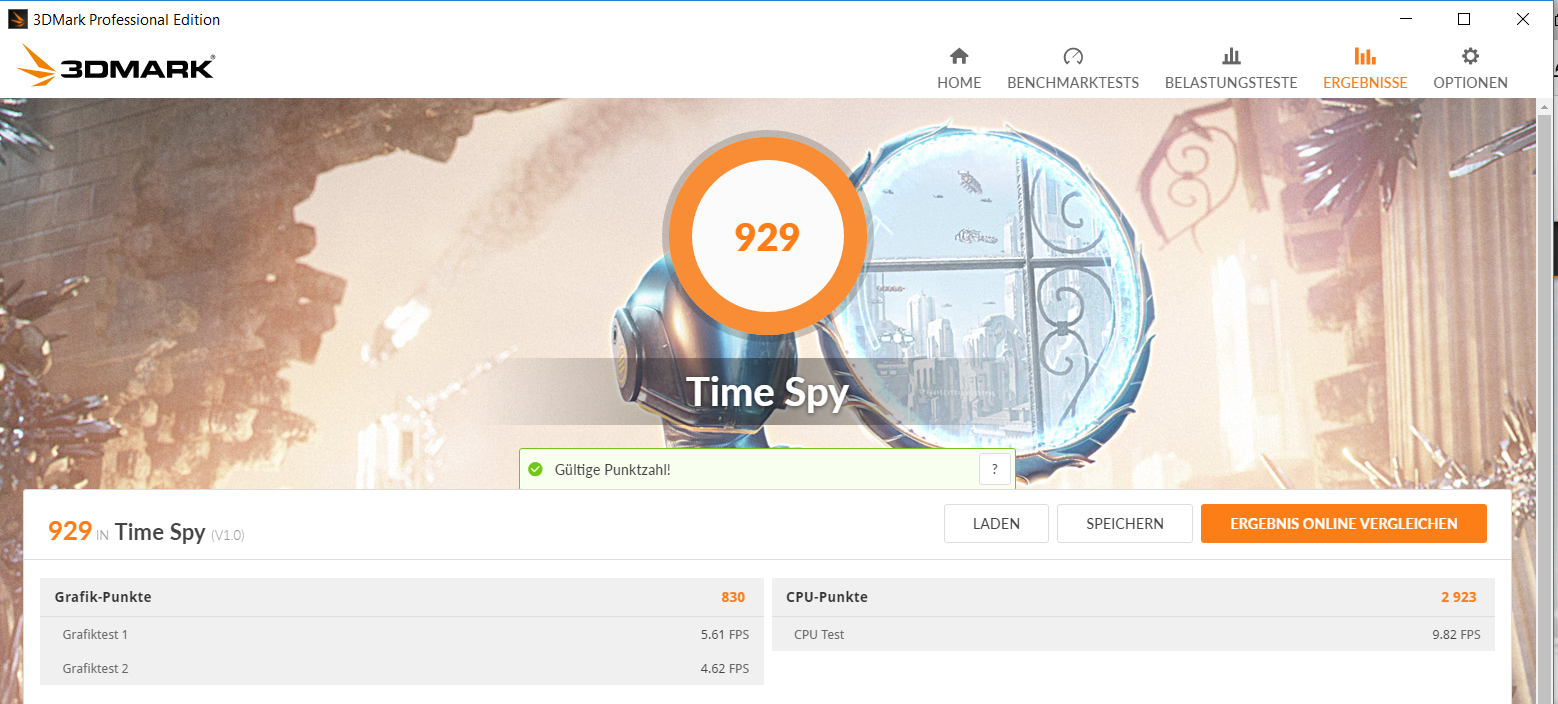
Los puntajes de referencia 3DMark son decepcionantes, con el ZenBook muy por detrás de la competencia. Por ejemplo, el Acer Swift 3 SF315-51G-57E5 alcanza casi un doce por ciento más de velocidad de reloj máxima de 1,798 MHz y aproximadamente un cincuenta y ocho por ciento más de velocidad de reloj base de 1,469 MHz. ASUS ha fabricado la máquina underclockeada GeForce MX150 ya que no hay suficiente espacio en la carcasa del ZenBook para enfriar adecuadamente a la tarjeta gráfica y así evitar el sobrecalentamiento.
Del mismo modo, la HP Envy 13-ad006ng y la Lenovo IdeaPad 320S-13IKB no aprovechan el rendimiento completo de la GeForce MX150. Por lo tanto, una refrigeración inadecuada que limita el rendimiento de los gráficos no es un problema exclusivo de ZenBook.
| 3DMark 06 Standard Score | 12911 puntos | |
| 3DMark 11 Performance | 3779 puntos | |
| 3DMark Cloud Gate Standard Score | 13058 puntos | |
| 3DMark Fire Strike Score | 2582 puntos | |
| 3DMark Fire Strike Extreme Score | 1257 puntos | |
| 3DMark Time Spy Score | 929 puntos | |
ayuda | ||
| 3DMark 11 - 1280x720 Performance GPU | |
| Media de la clase Subnotebook (995 - 18489, n=57, últimos 2 años) | |
| Acer Swift 3 SF315-51G-57E5 | |
| Acer Swift 3 SF314-52G-89SL | |
| Lenovo IdeaPad 320-15IKBRN 81BG001KGE | |
| Acer Aspire 5 A515-51G-51RL | |
| Medio NVIDIA GeForce MX150 (2796 - 4905, n=47) | |
| Asus ZenBook 13 UX331UN | |
| Asus ZenBook 13 UX331UN | |
| HP Envy 13-ad006ng | |
| Lenovo IdeaPad 320S-13IKB | |
| Dell XPS 13 9370 FHD i5 | |
| Lenovo Ideapad 720S-13IKB | |
| Apple MacBook Air 13.3" 1.8 GHz (2017) | |
| 3DMark | |
| 1280x720 Cloud Gate Standard Graphics | |
| Media de la clase Subnotebook (5577 - 61591, n=30, últimos 2 años) | |
| Acer Swift 3 SF315-51G-57E5 | |
| Medio NVIDIA GeForce MX150 (16227 - 22183, n=43) | |
| Acer Aspire 5 A515-51G-51RL | |
| Lenovo IdeaPad 320-15IKBRN 81BG001KGE | |
| Asus ZenBook 13 UX331UN | |
| Asus ZenBook 13 UX331UN | |
| HP Envy 13-ad006ng | |
| Lenovo IdeaPad 320S-13IKB | |
| Lenovo Ideapad 720S-13IKB | |
| Apple MacBook Air 13.3" 1.8 GHz (2017) | |
| 1920x1080 Fire Strike Graphics | |
| Media de la clase Subnotebook (832 - 16347, n=58, últimos 2 años) | |
| Acer Swift 3 SF315-51G-57E5 | |
| Acer Aspire 5 A515-51G-51RL | |
| Lenovo IdeaPad 320-15IKBRN 81BG001KGE | |
| Medio NVIDIA GeForce MX150 (2323 - 3739, n=44) | |
| Asus ZenBook 13 UX331UN | |
| HP Envy 13-ad006ng | |
| Asus ZenBook 13 UX331UN | |
| Lenovo IdeaPad 320S-13IKB | |
| Dell XPS 13 9370 FHD i5 | |
| Lenovo Ideapad 720S-13IKB | |
| Geekbench 4.0 - Compute OpenCL Score | |
| Acer Swift 3 SF314-52G-89SL | |
| Acer Swift 3 SF315-51G-57E5 | |
| Acer Aspire 5 A515-51G-51RL | |
| Medio NVIDIA GeForce MX150 (41337 - 47999, n=8) | |
| Asus ZenBook 13 UX331UN | |
| Geekbench 4.4 - Compute OpenCL Score | |
| Media de la clase Subnotebook (60571 - 101219, n=5, últimos 2 años) | |
| Acer Swift 3 SF314-52G-89SL | |
| Acer Swift 3 SF315-51G-57E5 | |
| Acer Aspire 5 A515-51G-51RL | |
| Asus ZenBook 13 UX331UN | |
| Medio NVIDIA GeForce MX150 (22675 - 47762, n=11) | |
| ComputeMark v2.1 - 1024x600 Normal, Score | |
| Media de la clase Subnotebook (944 - 10728, n=10, últimos 2 años) | |
| Acer Aspire 5 A515-51G-51RL | |
| Medio NVIDIA GeForce MX150 (2256 - 2856, n=9) | |
| Asus ZenBook 13 UX331UN | |
| GFXBench (DX / GLBenchmark) 2.7 | |
| 1920x1080 T-Rex Offscreen | |
| Media de la clase Subnotebook (81 - 915, n=7, últimos 2 años) | |
| Acer Aspire 5 A515-51G-51RL | |
| Medio NVIDIA GeForce MX150 (203 - 284, n=4) | |
| Asus ZenBook 13 UX331UN | |
| T-Rex Onscreen | |
| Media de la clase Subnotebook (54.3 - 794, n=7, últimos 2 años) | |
| Asus ZenBook 13 UX331UN | |
| Acer Aspire 5 A515-51G-51RL | |
| Medio NVIDIA GeForce MX150 (59.8 - 210, n=4) | |
| GFXBench 3.0 | |
| 1920x1080 1080p Manhattan Offscreen | |
| Media de la clase Subnotebook (206 - 591, n=6, últimos 2 años) | |
| Acer Aspire 5 A515-51G-51RL | |
| Medio NVIDIA GeForce MX150 (121.5 - 148.7, n=4) | |
| Asus ZenBook 13 UX331UN | |
| on screen Manhattan Onscreen OGL | |
| Media de la clase Subnotebook (60 - 338, n=6, últimos 2 años) | |
| Asus ZenBook 13 UX331UN | |
| Acer Aspire 5 A515-51G-51RL | |
| Medio NVIDIA GeForce MX150 (57.9 - 112.7, n=4) | |
| GFXBench 3.1 | |
| 1920x1080 Manhattan ES 3.1 Offscreen | |
| Media de la clase Subnotebook (157.5 - 336, n=6, últimos 2 años) | |
| Acer Aspire 5 A515-51G-51RL | |
| Medio NVIDIA GeForce MX150 (85.1 - 111.5, n=4) | |
| Asus ZenBook 13 UX331UN | |
| on screen Manhattan ES 3.1 Onscreen | |
| Media de la clase Subnotebook (60 - 222, n=6, últimos 2 años) | |
| Acer Aspire 5 A515-51G-51RL | |
| Asus ZenBook 13 UX331UN | |
| Medio NVIDIA GeForce MX150 (49 - 92.1, n=4) | |
| GFXBench | |
| 1920x1080 Car Chase Offscreen | |
| Media de la clase Subnotebook (107.4 - 260, n=8, últimos 2 años) | |
| Acer Aspire 5 A515-51G-51RL | |
| Medio NVIDIA GeForce MX150 (52.9 - 75.4, n=4) | |
| Asus ZenBook 13 UX331UN | |
| on screen Car Chase Onscreen | |
| Media de la clase Subnotebook (50.5 - 154.5, n=8, últimos 2 años) | |
| Acer Aspire 5 A515-51G-51RL | |
| Medio NVIDIA GeForce MX150 (31.8 - 63.1, n=4) | |
| Asus ZenBook 13 UX331UN | |
| LuxMark v2.0 64Bit | |
| Room GPUs-only | |
| Media de la clase Subnotebook (42 - 877, n=9, últimos 2 años) | |
| Medio NVIDIA GeForce MX150 (415 - 769, n=6) | |
| Acer Aspire 5 A515-51G-51RL | |
| Asus ZenBook 13 UX331UN | |
| Sala GPUs-only | |
| Media de la clase Subnotebook (53 - 2908, n=9, últimos 2 años) | |
| Medio NVIDIA GeForce MX150 (734 - 1451, n=6) | |
| Acer Aspire 5 A515-51G-51RL | |
| Asus ZenBook 13 UX331UN | |
Rendimiento de juego
La mayoría de los juegos modernos se pueden jugar en HD (1,366 x 768) de baja a media calidad, mientras que los juegos con requisitos de sistema más bajos se pueden jugar en configuraciones más altas. Sin embargo, el ajuste de fábrica de la GPU afecta a los cuadros por segundo con portátiles equipados de manera similar, como el Lenovo IdeaPad 320-15IKBRN y el Acer Swift 3 SF315-51G, logrando entre veinte y treinta por ciento más cuadros por segundo que el ZenBook. A pesar de la subclavija de fábrica, el ZenBook funciona mejor que los portátiles GeForce 940MX.
| bajo | medio | alto | ultra | |
|---|---|---|---|---|
| Tomb Raider (2013) | 188.2 | 105.2 | 70.9 | 34.2 |
| BioShock Infinite (2013) | 98.1 | 78.9 | 71.7 | 27.8 |
| The Witcher 3 (2015) | 46.4 | 28.1 | 15.6 | 9.6 |
| Metal Gear Solid V (2015) | 60 | 60 | 38.8 | 25.2 |
| Just Cause 3 (2015) | 35.8 | 34.2 | 22.9 | 20 |
| Dishonored 2 (2016) | 36.4 | 20.1 | 19.4 | 14.4 |
| The Evil Within 2 (2017) | 25.6 | 14.2 | 13 | 12 |
| ELEX (2017) | 37.2 | 22.2 | 17.2 | 12.2 |
| Destiny 2 (2017) | 48.4 | 28.2 | 22.8 | 11.9 |
| Call of Duty WWII (2017) | 62.2 | 52.9 | 28.6 | 17.9 |
| Need for Speed Payback (2017) | 39.9 | 25.8 | 20.6 | 19.7 |
| Star Wars Battlefront 2 (2017) | 52.1 | 20.7 | 17.9 | 15.9 |
| Final Fantasy XV Benchmark (2018) | 28.3 | 13.8 | 8.2 |
| BioShock Infinite - 1366x768 High Preset | |
| Acer Swift 3 SF315-51G-57E5 | |
| Medio NVIDIA GeForce MX150 (59.7 - 98, n=33) | |
| Lenovo IdeaPad 320-15IKBRN 81BG001KGE | |
| HP Envy 13-ad006ng | |
| Asus ZenBook 13 UX331UN | |
| Asus ZenBook 13 UX331UN | |
| Acer TravelMate P259-MG-71UU | |
| Lenovo IdeaPad 320-15IKB 80XL01NEGE | |
| HP Pavilion 15-cc107ng | |
| Lenovo Ideapad 510-15ISK | |
| Asus VivoBook Flip TP501UQ-FZ119T | |
| Dell XPS 13 9370 FHD i5 | |
| Lenovo Ideapad 720S-13IKB | |
| Tomb Raider - 1366x768 High Preset AA:FX AF:8x | |
| Medio NVIDIA GeForce MX150 (70.9 - 87.2, n=4) | |
| Asus ZenBook 13 UX331UN | |
| Acer TravelMate P259-MG-71UU | |
| Dell XPS 13 9370 FHD i5 | |
| Star Wars Battlefront 2 - 1280x720 Low Preset | |
| Medio NVIDIA GeForce MX150 (52.1 - 102, n=3) | |
| Asus ZenBook 13 UX331UN | |
| HP Pavilion 15-cc107ng | |
| The Witcher 3 - 1024x768 Low Graphics & Postprocessing | |
| Media de la clase Subnotebook (38.8 - 176, n=15, últimos 2 años) | |
| Lenovo IdeaPad 320-15IKBRN 81BG001KGE | |
| Medio NVIDIA GeForce MX150 (42.6 - 72, n=24) | |
| Asus ZenBook 13 UX331UN | |
| Asus ZenBook 13 UX331UN | |
| HP Envy 13-ad006ng | |
| Lenovo IdeaPad 320S-13IKB | |
| Asus Vivobook S15 S510UQ-BQ189T | |
| Lenovo Ideapad 510-15ISK | |
| Dell XPS 13 9370 FHD i5 | |
Emisiones
Ruido del sistema
El ventilador suele estar en silencio cuando el sistema está en inactivo, aunque no es el caso a media carga, donde el ruido del ventilador mide hasta 39.2 db (A), aumentando aún más a 41 dB (A) durante nuestras pruebas de estrés. Si bien el ruido del ventilador es soportable, sospechamos que tales volúmenes distraerían si alguien intentara concentrarse.
Ruido
| Ocioso |
| 30.13 / 30.3 / 30.3 dB(A) |
| Carga |
| 39.2 / 41 dB(A) |
 | ||
30 dB silencioso 40 dB(A) audible 50 dB(A) ruidosamente alto |
||
min: | ||
| Asus ZenBook 13 UX331UN i5-8550U, GeForce MX150 | Asus ZenBook 13 UX331UN i5-8550U, GeForce MX150 | Lenovo Ideapad 720S-13IKB i5-8250U, UHD Graphics 620 | Dell XPS 13 9370 FHD i5 i5-8250U, UHD Graphics 620 | HP Envy 13-ad006ng i7-7500U, GeForce MX150 | |
|---|---|---|---|---|---|
| Noise | -1% | 5% | 7% | 3% | |
| apagado / medio ambiente * (dB) | 30.13 | 29.6 2% | 30.13 -0% | 29.1 3% | 30.5 -1% |
| Idle Minimum * (dB) | 30.13 | 29.6 2% | 30.13 -0% | 29.1 3% | 30.5 -1% |
| Idle Average * (dB) | 30.3 | 29.6 2% | 30.13 1% | 29.1 4% | 30.5 -1% |
| Idle Maximum * (dB) | 30.3 | 29.6 2% | 30.9 -2% | 29.1 4% | 30.5 -1% |
| Load Average * (dB) | 39.2 | 41.7 -6% | 34.7 11% | 32.2 18% | 37.3 5% |
| Load Maximum * (dB) | 41 | 43.5 -6% | 33.3 19% | 37.3 9% | 34.2 17% |
| Witcher 3 ultra * (dB) | 43.5 | 37.3 |
* ... más pequeño es mejor
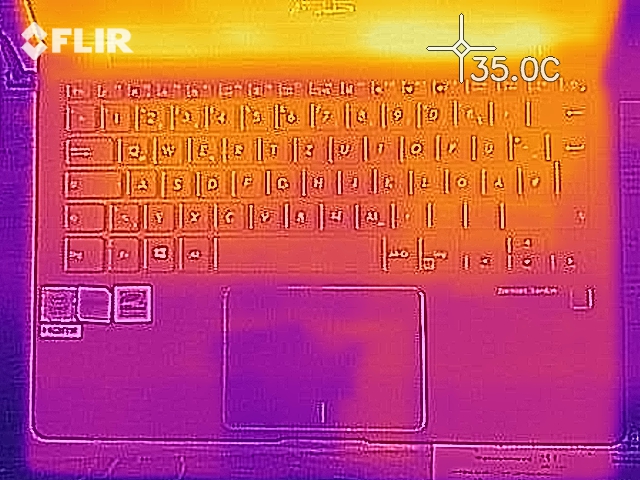
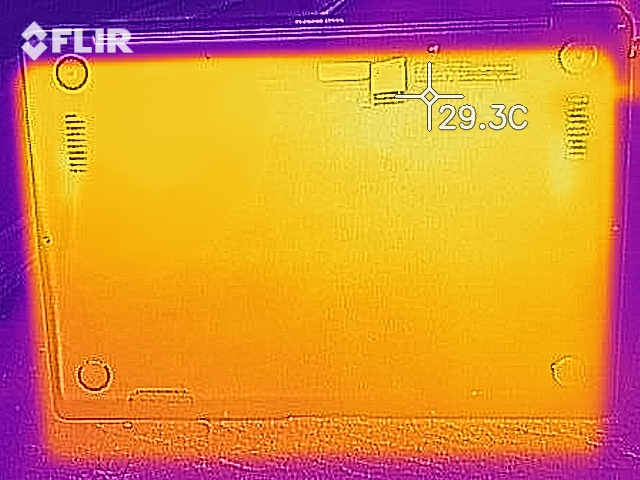
Temperatura
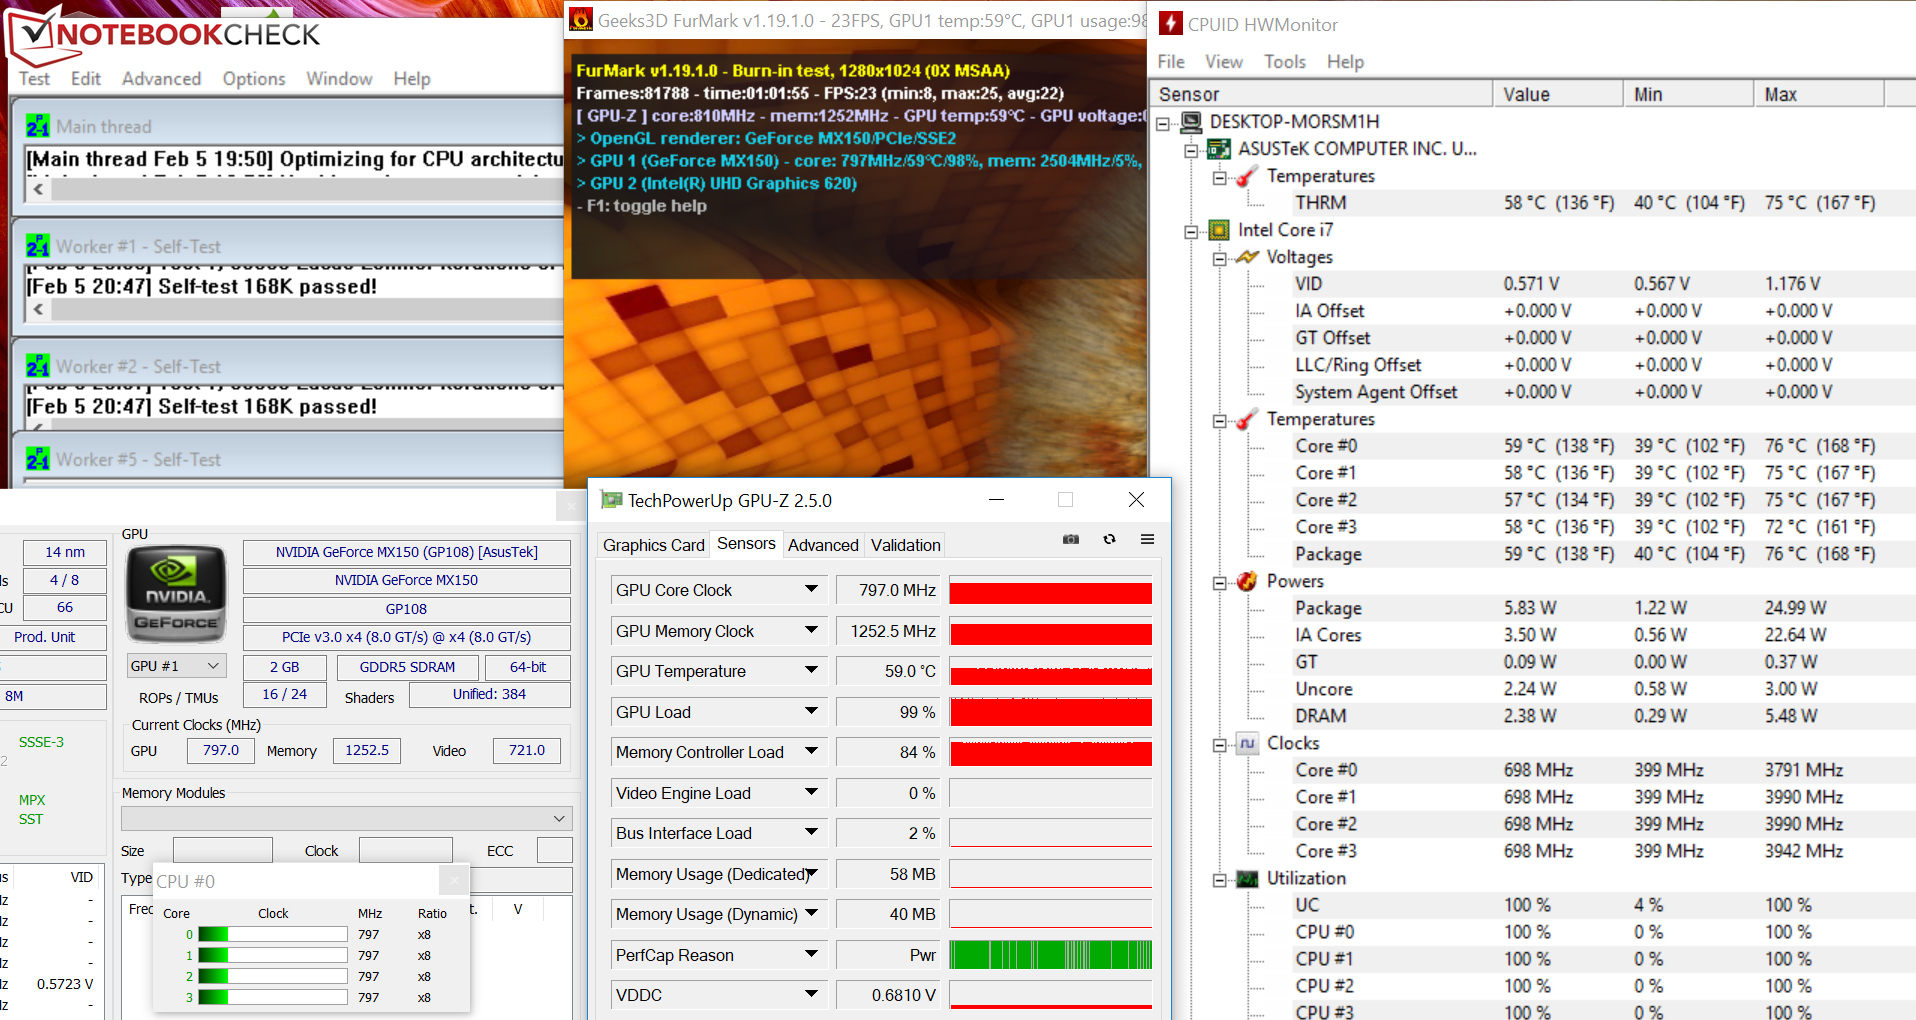
Durante nuestras pruebas de estrés de una hora Prime95 y Furmark, el ZenBook funcionó igual de bien con la carga que con la batería. Las velocidades del procesador varían entre 1.2 a 2.7 GHz durante los primeros diez minutos antes de caer y permanecer entre 800 y 900 MHz. Esta aceleración no se replica con la tarjeta de gráficos, que comenzó las pruebas de tensión entre 600 y 800 MHz, antes de estabilizarse a 800 MHz.
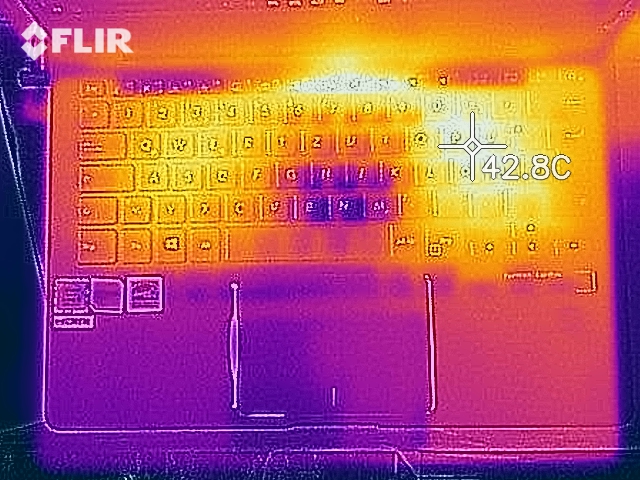
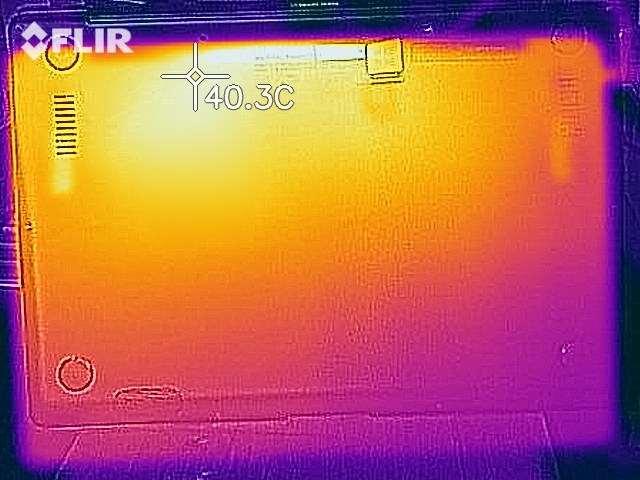
Cabe destacar que nuestro dispositivo de prueba se mantuvo relativamente frío durante nuestras pruebas de estrés, con temperaturas superficiales que permanecen por debajo de 40 ° C.
(+) La temperatura máxima en la parte superior es de 39.3 °C / 103 F, frente a la media de 35.9 °C / 97 F, que oscila entre 21.4 y 59 °C para la clase Subnotebook.
(+) El fondo se calienta hasta un máximo de 36.5 °C / 98 F, frente a la media de 39.2 °C / 103 F
(+) En reposo, la temperatura media de la parte superior es de 27.9 °C / 82# F, frente a la media del dispositivo de 30.8 °C / 87 F.
(+) El reposamanos y el panel táctil están a una temperatura inferior a la de la piel, con un máximo de 29.7 °C / 85.5 F y, por tanto, son fríos al tacto.
(±) La temperatura media de la zona del reposamanos de dispositivos similares fue de 28.2 °C / 82.8 F (-1.5 °C / -2.7 F).
| Asus ZenBook 13 UX331UN i5-8550U, GeForce MX150 | Asus ZenBook 13 UX331UN i5-8550U, GeForce MX150 | Lenovo Ideapad 720S-13IKB i5-8250U, UHD Graphics 620 | Dell XPS 13 9370 FHD i5 i5-8250U, UHD Graphics 620 | HP Envy 13-ad006ng i7-7500U, GeForce MX150 | Apple MacBook Air 13.3" 1.8 GHz (2017) 5350U, HD Graphics 6000 | |
|---|---|---|---|---|---|---|
| Heat | 8% | -5% | 0% | 10% | -3% | |
| Maximum Upper Side * (°C) | 39.3 | 40.9 -4% | 43.6 -11% | 44.2 -12% | 41.6 -6% | 42.8 -9% |
| Maximum Bottom * (°C) | 36.5 | 38.1 -4% | 42 -15% | 45.5 -25% | 33.4 8% | 41.5 -14% |
| Idle Upper Side * (°C) | 30 | 23.9 20% | 28.6 5% | 24.1 20% | 23.1 23% | 27.6 8% |
| Idle Bottom * (°C) | 28.3 | 23.1 18% | 28.2 -0% | 23.2 18% | 24.1 15% | 26.9 5% |
* ... más pequeño es mejor
Altavoces
Asus ZenBook 13 UX331UN análisis de audio
(-) | altavoces no muy altos (#67.9 dB)
Graves 100 - 315 Hz
(±) | lubina reducida - en promedio 13% inferior a la mediana
(+) | el bajo es lineal (6.8% delta a la frecuencia anterior)
Medios 400 - 2000 Hz
(+) | medios equilibrados - a sólo 2.7% de la mediana
(+) | los medios son lineales (3.6% delta a la frecuencia anterior)
Altos 2 - 16 kHz
(+) | máximos equilibrados - a sólo 0.9% de la mediana
(+) | los máximos son lineales (2.7% delta a la frecuencia anterior)
Total 100 - 16.000 Hz
(±) | la linealidad del sonido global es media (15.2% de diferencia con la mediana)
En comparación con la misma clase
» 34% de todos los dispositivos probados de esta clase eran mejores, 5% similares, 61% peores
» El mejor tuvo un delta de 5%, la media fue 18%, el peor fue ###max##%
En comparación con todos los dispositivos probados
» 21% de todos los dispositivos probados eran mejores, 4% similares, 74% peores
» El mejor tuvo un delta de 4%, la media fue 24%, el peor fue ###max##%
Apple MacBook 12 (Early 2016) 1.1 GHz análisis de audio
(+) | los altavoces pueden reproducir a un volumen relativamente alto (#83.6 dB)
Graves 100 - 315 Hz
(±) | lubina reducida - en promedio 11.3% inferior a la mediana
(±) | la linealidad de los graves es media (14.2% delta a frecuencia anterior)
Medios 400 - 2000 Hz
(+) | medios equilibrados - a sólo 2.4% de la mediana
(+) | los medios son lineales (5.5% delta a la frecuencia anterior)
Altos 2 - 16 kHz
(+) | máximos equilibrados - a sólo 2% de la mediana
(+) | los máximos son lineales (4.5% delta a la frecuencia anterior)
Total 100 - 16.000 Hz
(+) | el sonido global es lineal (10.2% de diferencia con la mediana)
En comparación con la misma clase
» 7% de todos los dispositivos probados de esta clase eran mejores, 2% similares, 91% peores
» El mejor tuvo un delta de 5%, la media fue 18%, el peor fue ###max##%
En comparación con todos los dispositivos probados
» 5% de todos los dispositivos probados eran mejores, 1% similares, 94% peores
» El mejor tuvo un delta de 4%, la media fue 24%, el peor fue ###max##%
Comparación de frecuencia (¡casilla de verificación seleccionable!)
Administración de energía
Consumo de energía
Medimos el dibujo del ZenBook 8 W en inactivo, lo que hace que nuestro dispositivo de prueba sea un poco más sediento que su hermano. Además, al comienzo de nuestras pruebas de estrés, el ZenBook dibujó brevemente 49.4 W. Este consumo de energía varía de acuerdo con las fluctuaciones de la velocidad del reloj de la CPU. La fuente de alimentación tiene una potencia de 65 W.
| Off / Standby | |
| Ocioso | |
| Carga |
|
Clave:
min: | |
| Asus ZenBook 13 UX331UN i5-8550U, GeForce MX150 | Asus ZenBook 13 UX331UN i5-8550U, GeForce MX150 | Lenovo Ideapad 720S-13IKB i5-8250U, UHD Graphics 620 | Dell XPS 13 9370 FHD i5 i5-8250U, UHD Graphics 620 | HP Envy 13-ad006ng i7-7500U, GeForce MX150 | Apple MacBook Air 13.3" 1.8 GHz (2017) 5350U, HD Graphics 6000 | |
|---|---|---|---|---|---|---|
| Power Consumption | -9% | -26% | -8% | -16% | -11% | |
| Idle Minimum * (Watt) | 2.2 | 2.7 -23% | 3.9 -77% | 3.14 -43% | 2.8 -27% | 3.4 -55% |
| Idle Average * (Watt) | 5 | 5.3 -6% | 7.7 -54% | 5.22 -4% | 5.8 -16% | 6.3 -26% |
| Idle Maximum * (Watt) | 8 | 6.2 22% | 10.4 -30% | 6 25% | 7.7 4% | 7 12% |
| Load Average * (Watt) | 33 | 37.6 -14% | 33.3 -1% | 38.5 -17% | 48 -45% | 34.5 -5% |
| Load Maximum * (Watt) | 49.4 | 60.1 -22% | 34 31% | 50.4 -2% | 48 3% | 40 19% |
| Witcher 3 ultra * (Watt) | 35 |
* ... más pequeño es mejor
Duración de la batería
El ZenBook tiene un aguante de ocho horas y cincuenta y ocho minutos en nuestra práctica prueba WiFi cuando se establece en 150 cd / m ². Durante esta prueba simulamos la carga efectiva creada al cargar sitios web. Del mismo modo, el ZenBook dura ocho horas y cincuenta y cuatro minutos en nuestra prueba de video. Para esta prueba, reproducimos el cortometraje Big Buck Bunny en un bucle continuo con codificación H.264 con una resolución de 1.920 x 1.080. Los módulos WiFi están desactivados y el brillo está establecido en 150 cd / m².
Si bien la duración de la batería es buena, está por detrás de su hermano. Posteriormente descubrimos que nuestro dispositivo de prueba tiene una tasa de desgaste de la batería del 7,4%, lo que de alguna manera explica las diferencias de tiempo de la batería entre los dos modelos de ZenBook.
| Asus ZenBook 13 UX331UN i5-8550U, GeForce MX150, 50 Wh | Asus ZenBook 13 UX331UN i5-8550U, GeForce MX150, 50 Wh | Lenovo Ideapad 720S-13IKB i5-8250U, UHD Graphics 620, 46 Wh | Dell XPS 13 9370 FHD i5 i5-8250U, UHD Graphics 620, 52 Wh | HP Envy 13-ad006ng i7-7500U, GeForce MX150, 51 Wh | Apple MacBook Air 13.3" 1.8 GHz (2017) 5350U, HD Graphics 6000, 54 Wh | |
|---|---|---|---|---|---|---|
| Duración de Batería | 5% | -7% | 25% | -6% | 18% | |
| Reader / Idle (h) | 20.7 | 22 6% | 17.3 -16% | 23.6 14% | 20 -3% | |
| H.264 (h) | 8.9 | 9.6 8% | 13.9 56% | 7.9 -11% | ||
| WiFi v1.3 (h) | 9 | 8.4 -7% | 10.1 12% | 10.7 19% | 7.1 -21% | 10.6 18% |
| Load (h) | 1.8 | 2 11% | 1.5 -17% | 2 11% | 2 11% |
Veredicto
Pro
Contra
El ASUS ZenBook 13 obtiene puntajes excelentes al instalar una potente CPU y una GPU en un chasis compacto. Sin embargo, esto tiene un costo, ya que las dimensiones de la carcasa impidieron que ASUS incluyera un sistema de enfriamiento que pudiera enfriar adecuadamente el dispositivo. Entre otras cosas, ASUS se ha comprometido en el rendimiento de GPU para eludir este problema de refrigeración.
A pesar de esto, el ZenBook sigue siendo un buen todoterreno que juega juegos cómodamente.
Considerando el diseño compacto, el ZenBook permanece relativamente frío bajo carga, lo cual es positivo. El ventilador generalmente está silencioso cuando el dispositivo está en inactivo, pero es claramente audible cuando el dispositivo comienza a probarse. Los usuarios que buscan un dispositivo silencioso y potente probablemente no estén contentos con el ZenBook.
Dado el precio del ZenBook, hubiéramos esperado que ASUS incluyera una unidad NVMe en lugar de la unidad SATA III más lenta que viene con el ZenBook. Esto también habría sido posible, como el sitio web de ASUS, que la ranura M.2-2280 es compatible tanto con NVMe como con SATA III. La pantalla IPS es respetable con ángulos de visión decentes, buen contraste y brillo adecuado. Además, nos gustó el teclado retroiluminado y quedamos impresionados por la larga duración de la batería.
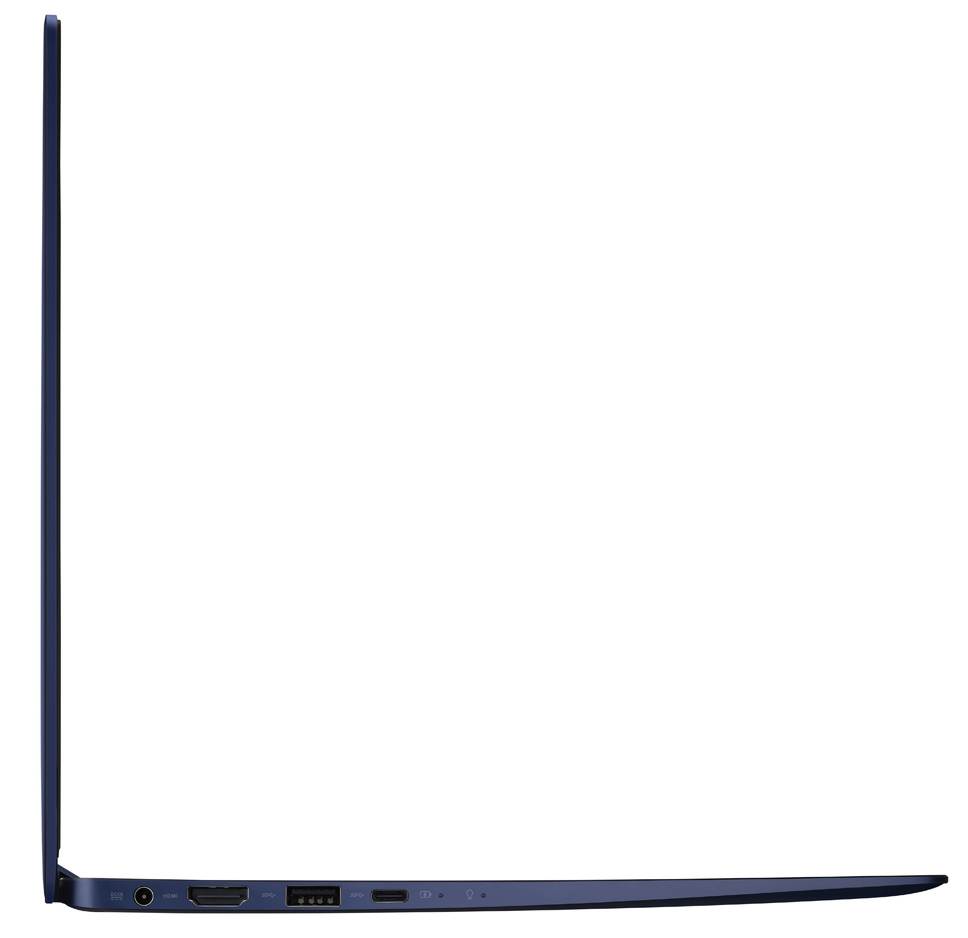
La E/S no sorprenderá a nadie de todos modos. Hubiera sido bueno si ASUS hubiera incluido un puerto Thunderbolt 3 en lugar del puerto USB 3.1 Gen 1 tipo C. Hacerlo habría permitido que el ZenBook se cargara con USB C, lo que sin duda habría aumentado el atractivo del ZenBook y lo habría probado en el futuro..
Asus ZenBook 13 UX331UN
- 10/26/2019 v7 (old)
Sascha Mölck
Price comparison
