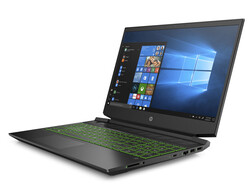
Review del HP Pavilion Gaming 15: Un portátil de juegos barato con mucha potencia bajo el capó.

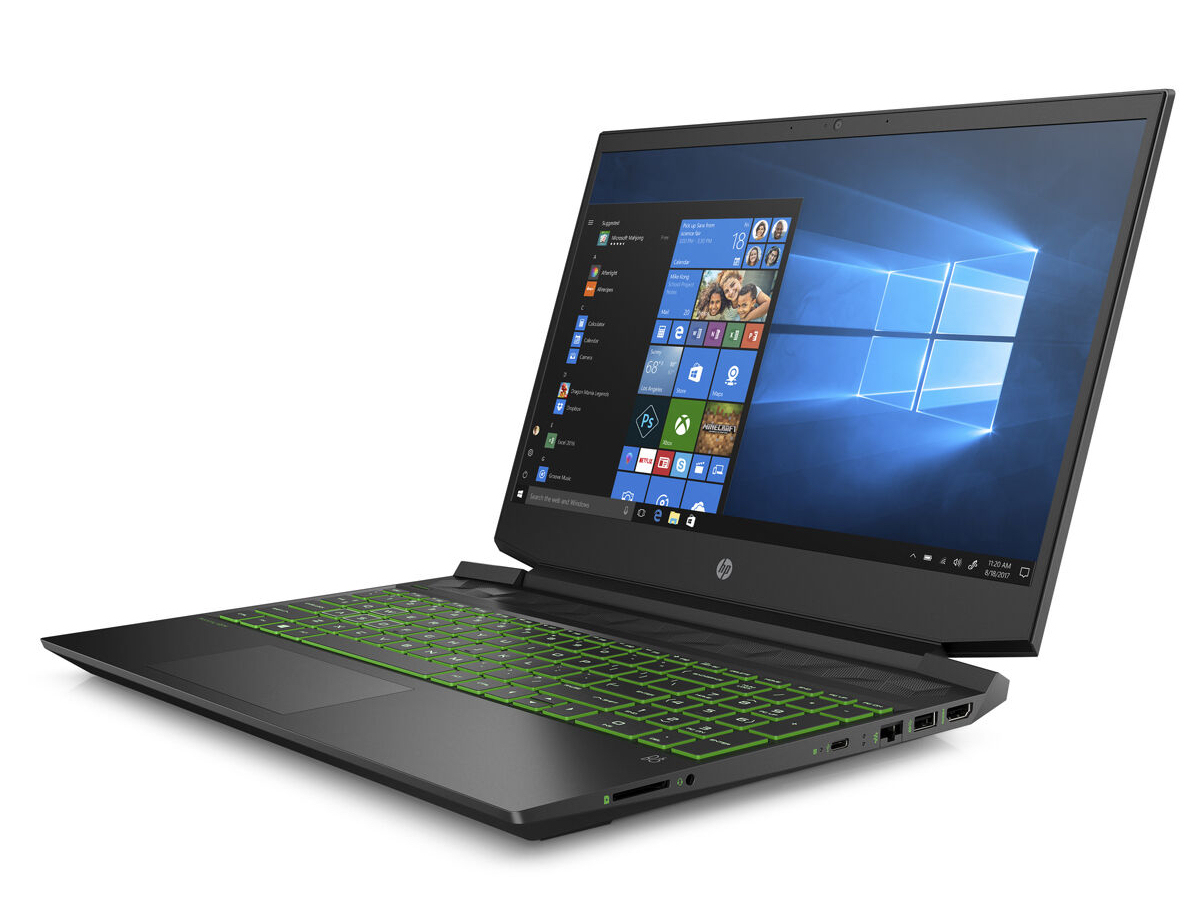
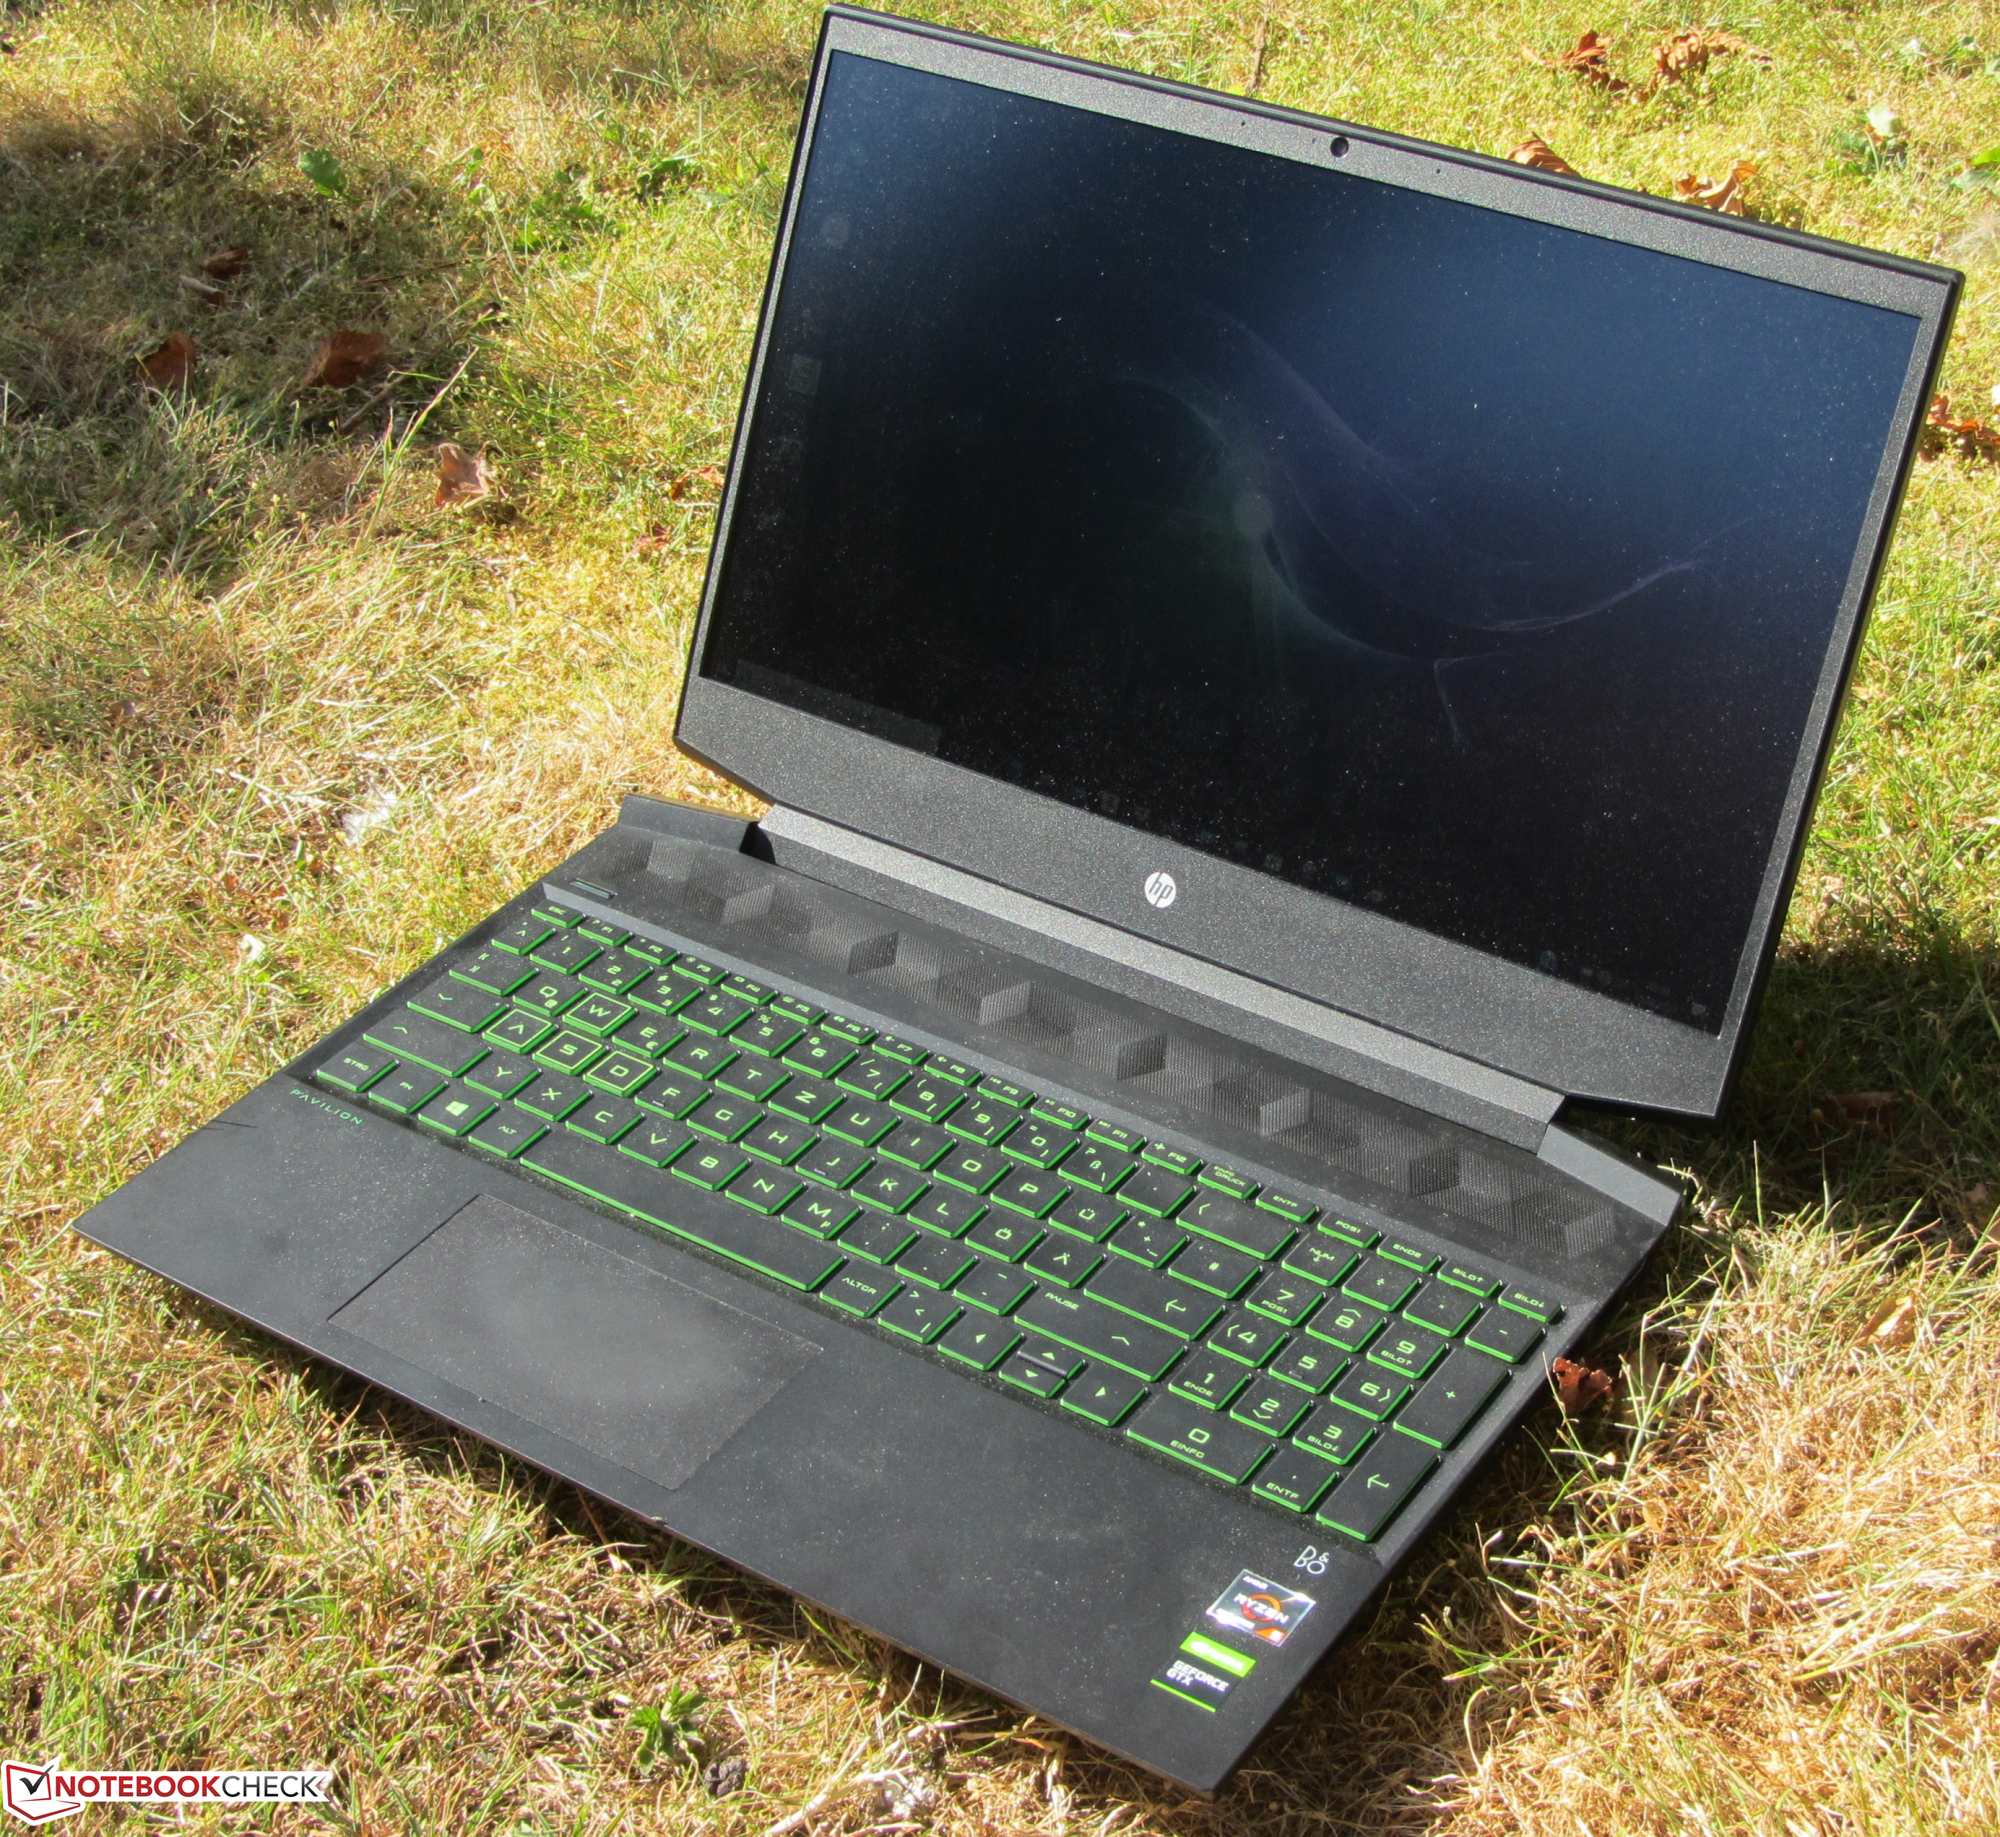
La serie Pavilion Gaming 15 es una serie de portátiles para juegos de 15,6 pulgadas que ofrecen una buena relación calidad-precio. Ya hemos revisado tres modelos actuales de la serie. Ahora tenemos el Pavilion Gaming 15-ec1177ng, uno de los representantes más potentes y caros (unos 1.200 euros (~ 1.407 dólares)) de la serie. A bordo hay un APU Ryzen 7 4800H y un núcleo gráfico GeForce GTX 1660 Ti Max-Q. Los competidores incluyen dispositivos como el Dell G3 15 3500, el Acer Nitro 5 AN515-44, el Asus TUF A15 FA506I, y el Lenovo IdeaPad Gaming 3i 15IMH05.
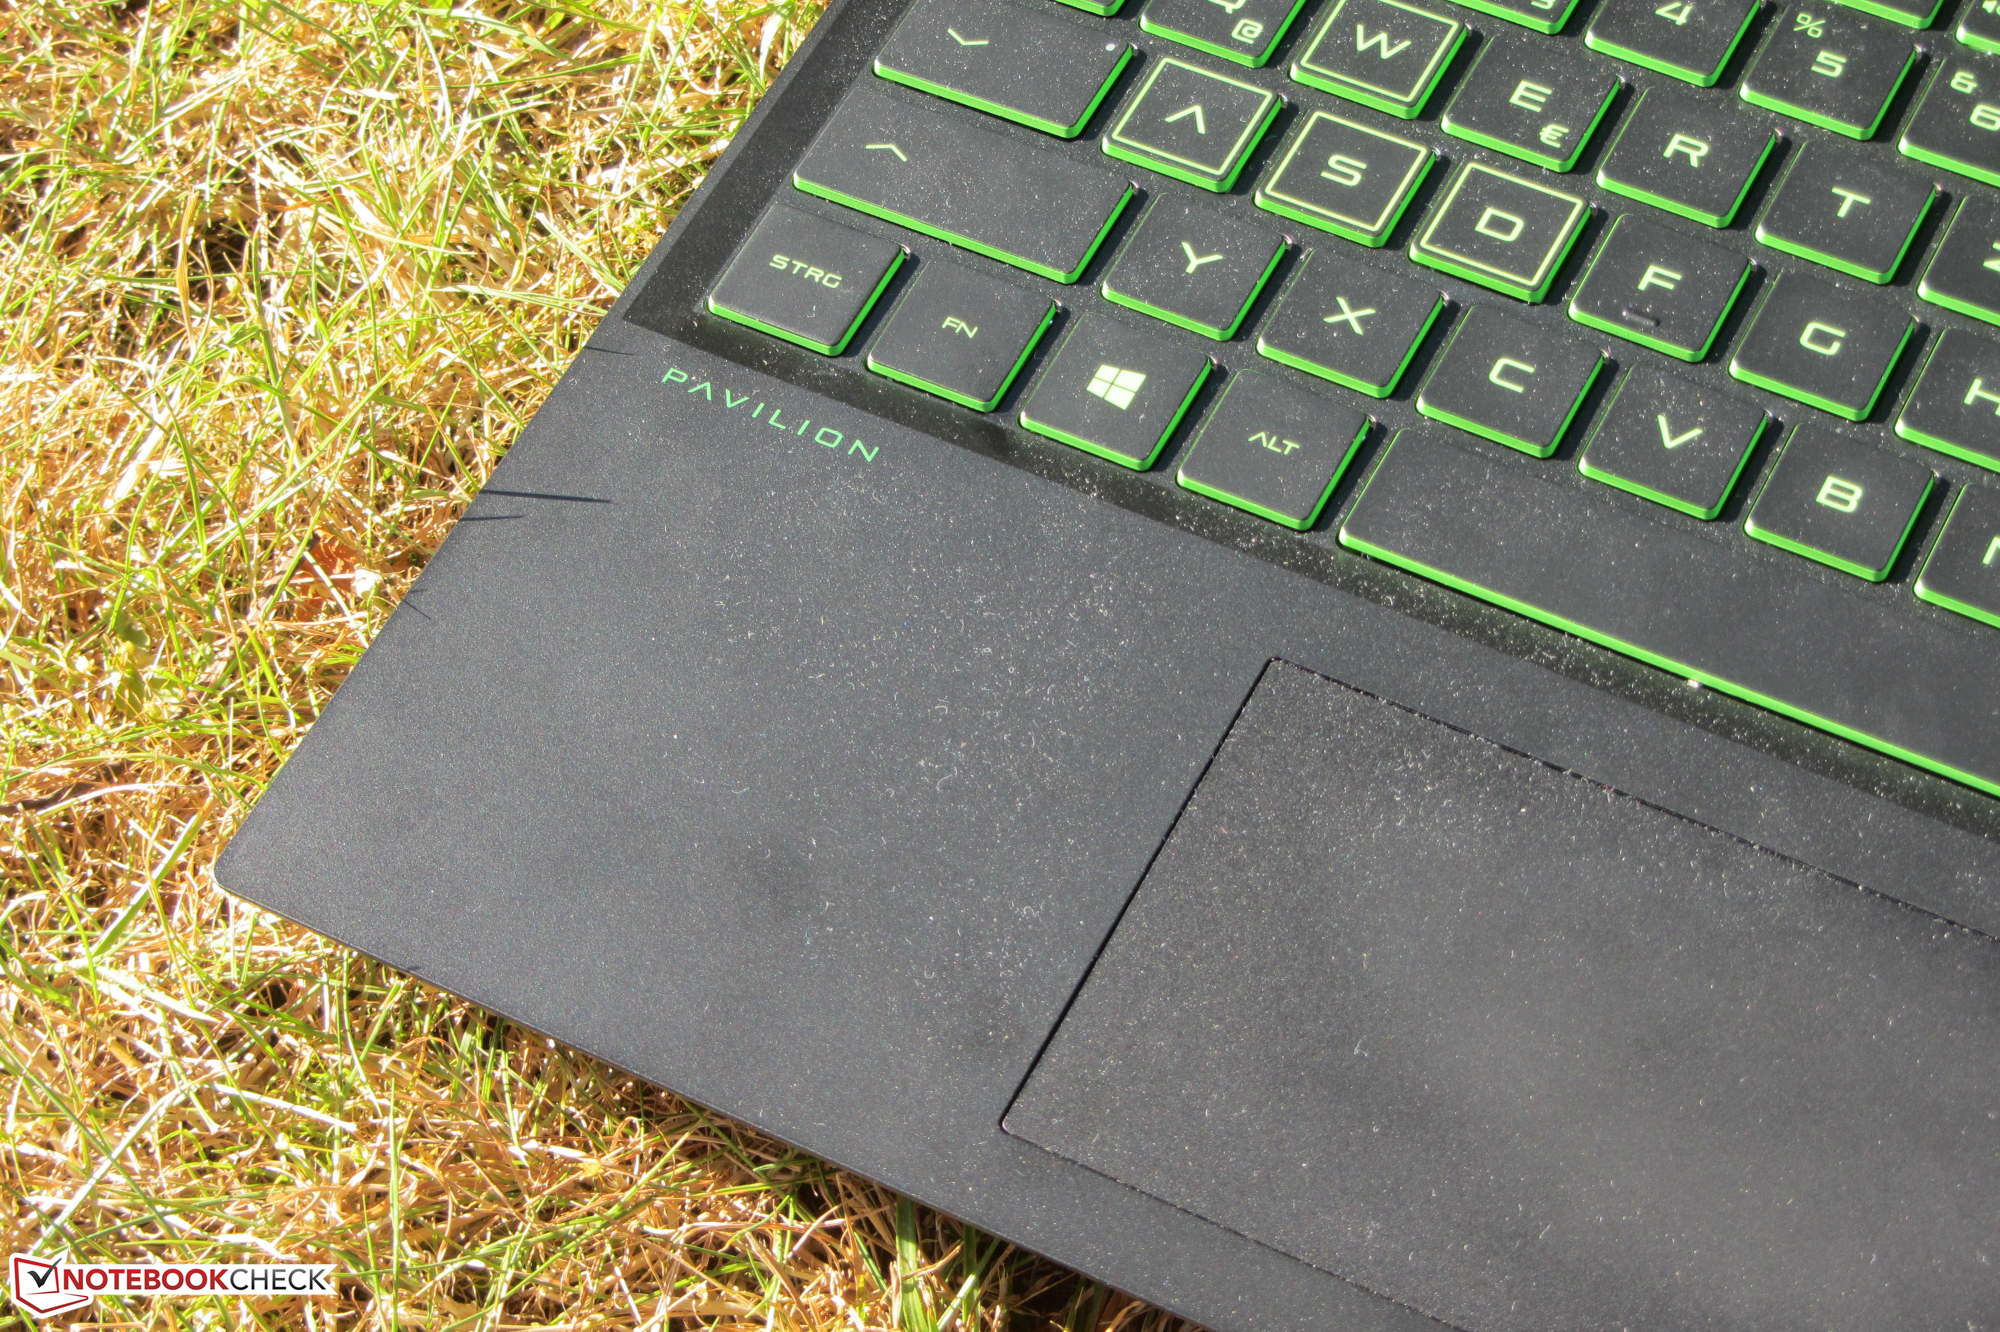
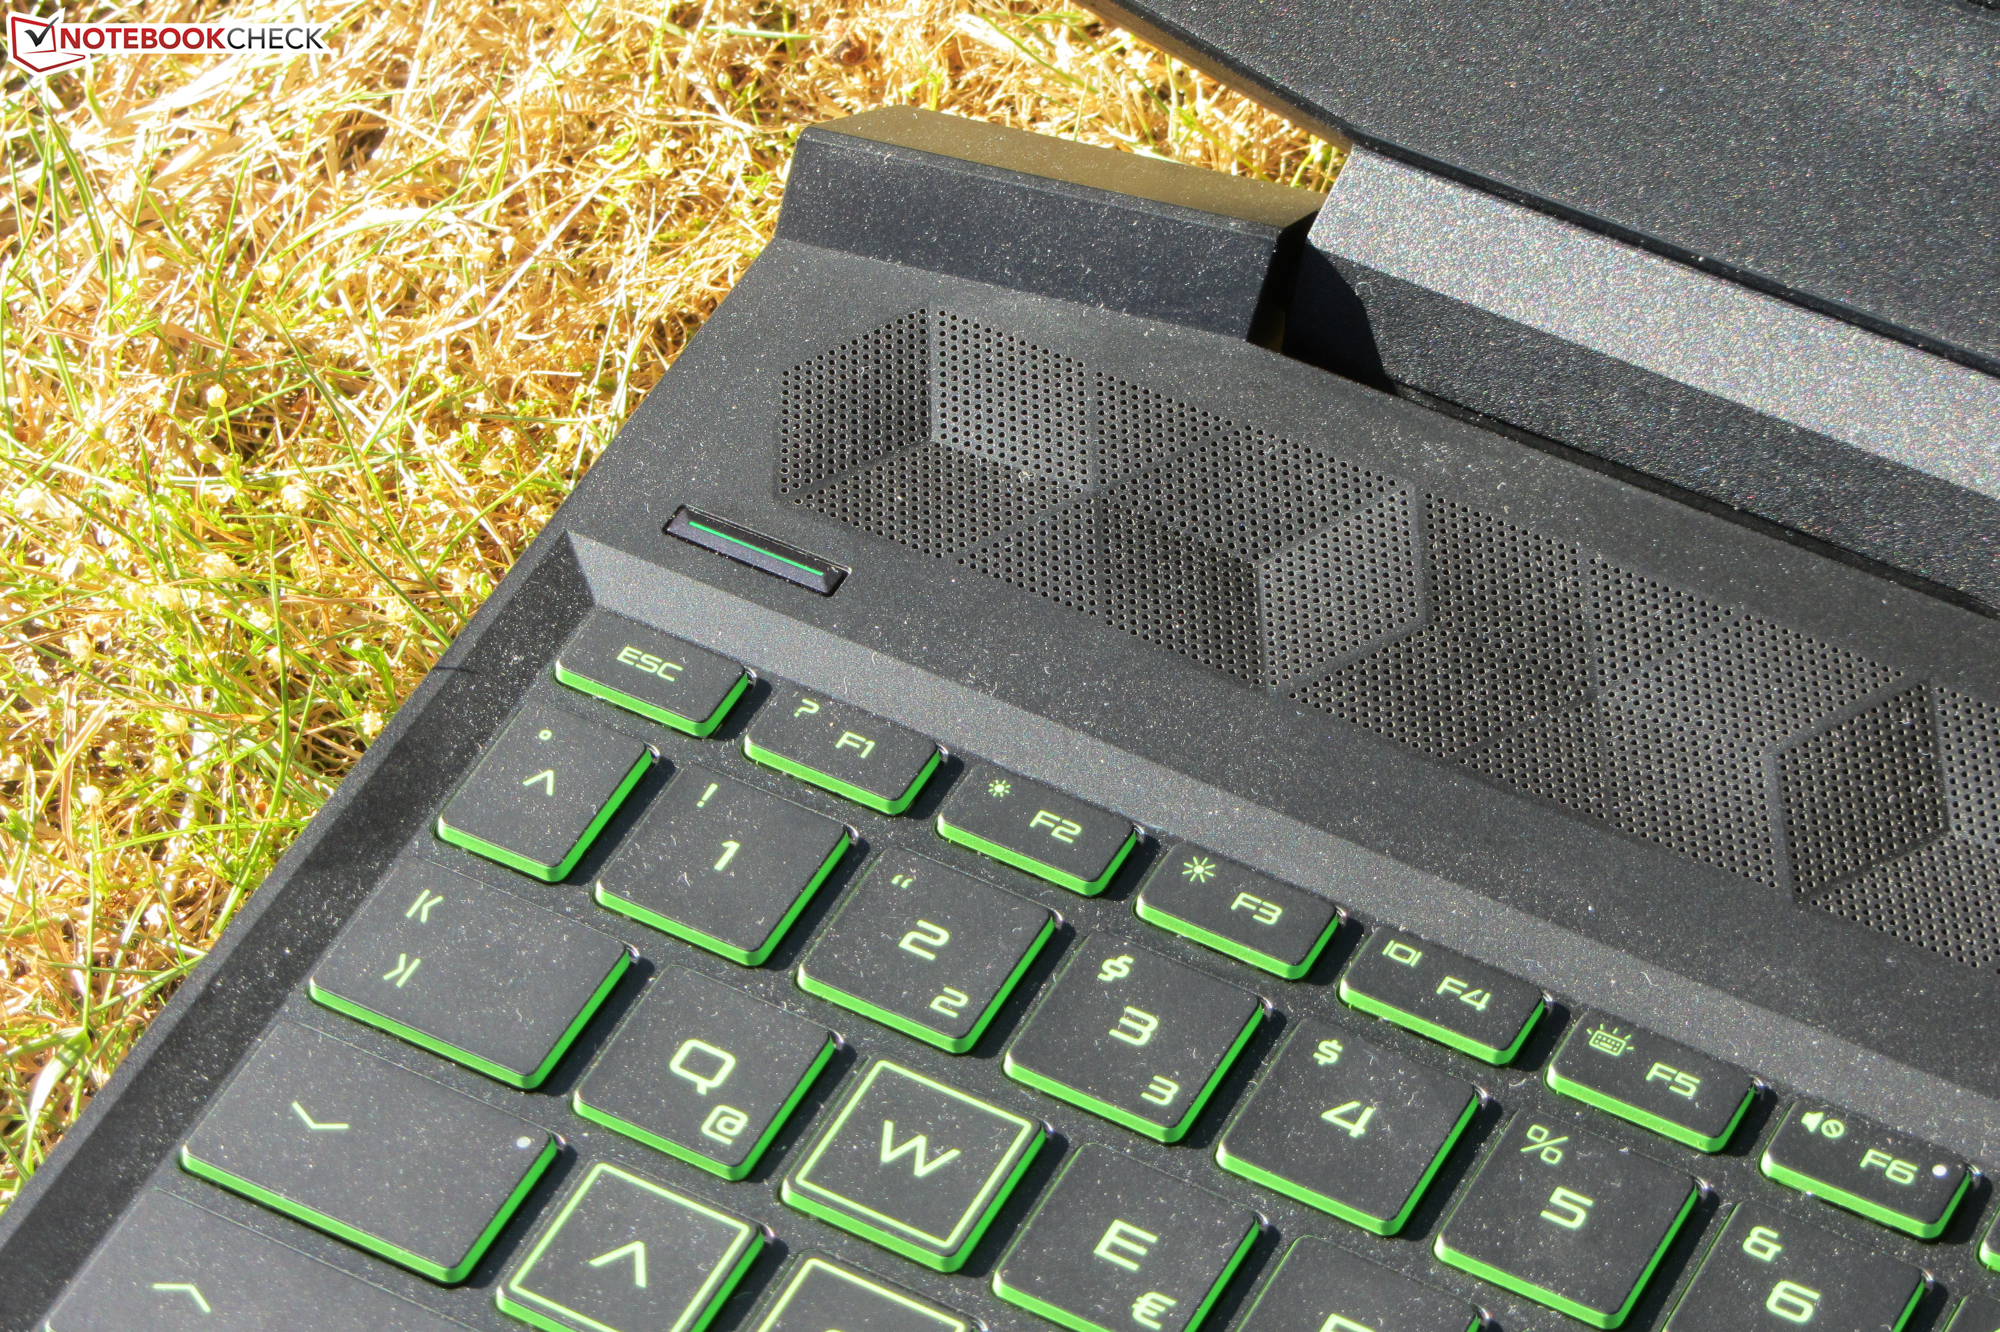
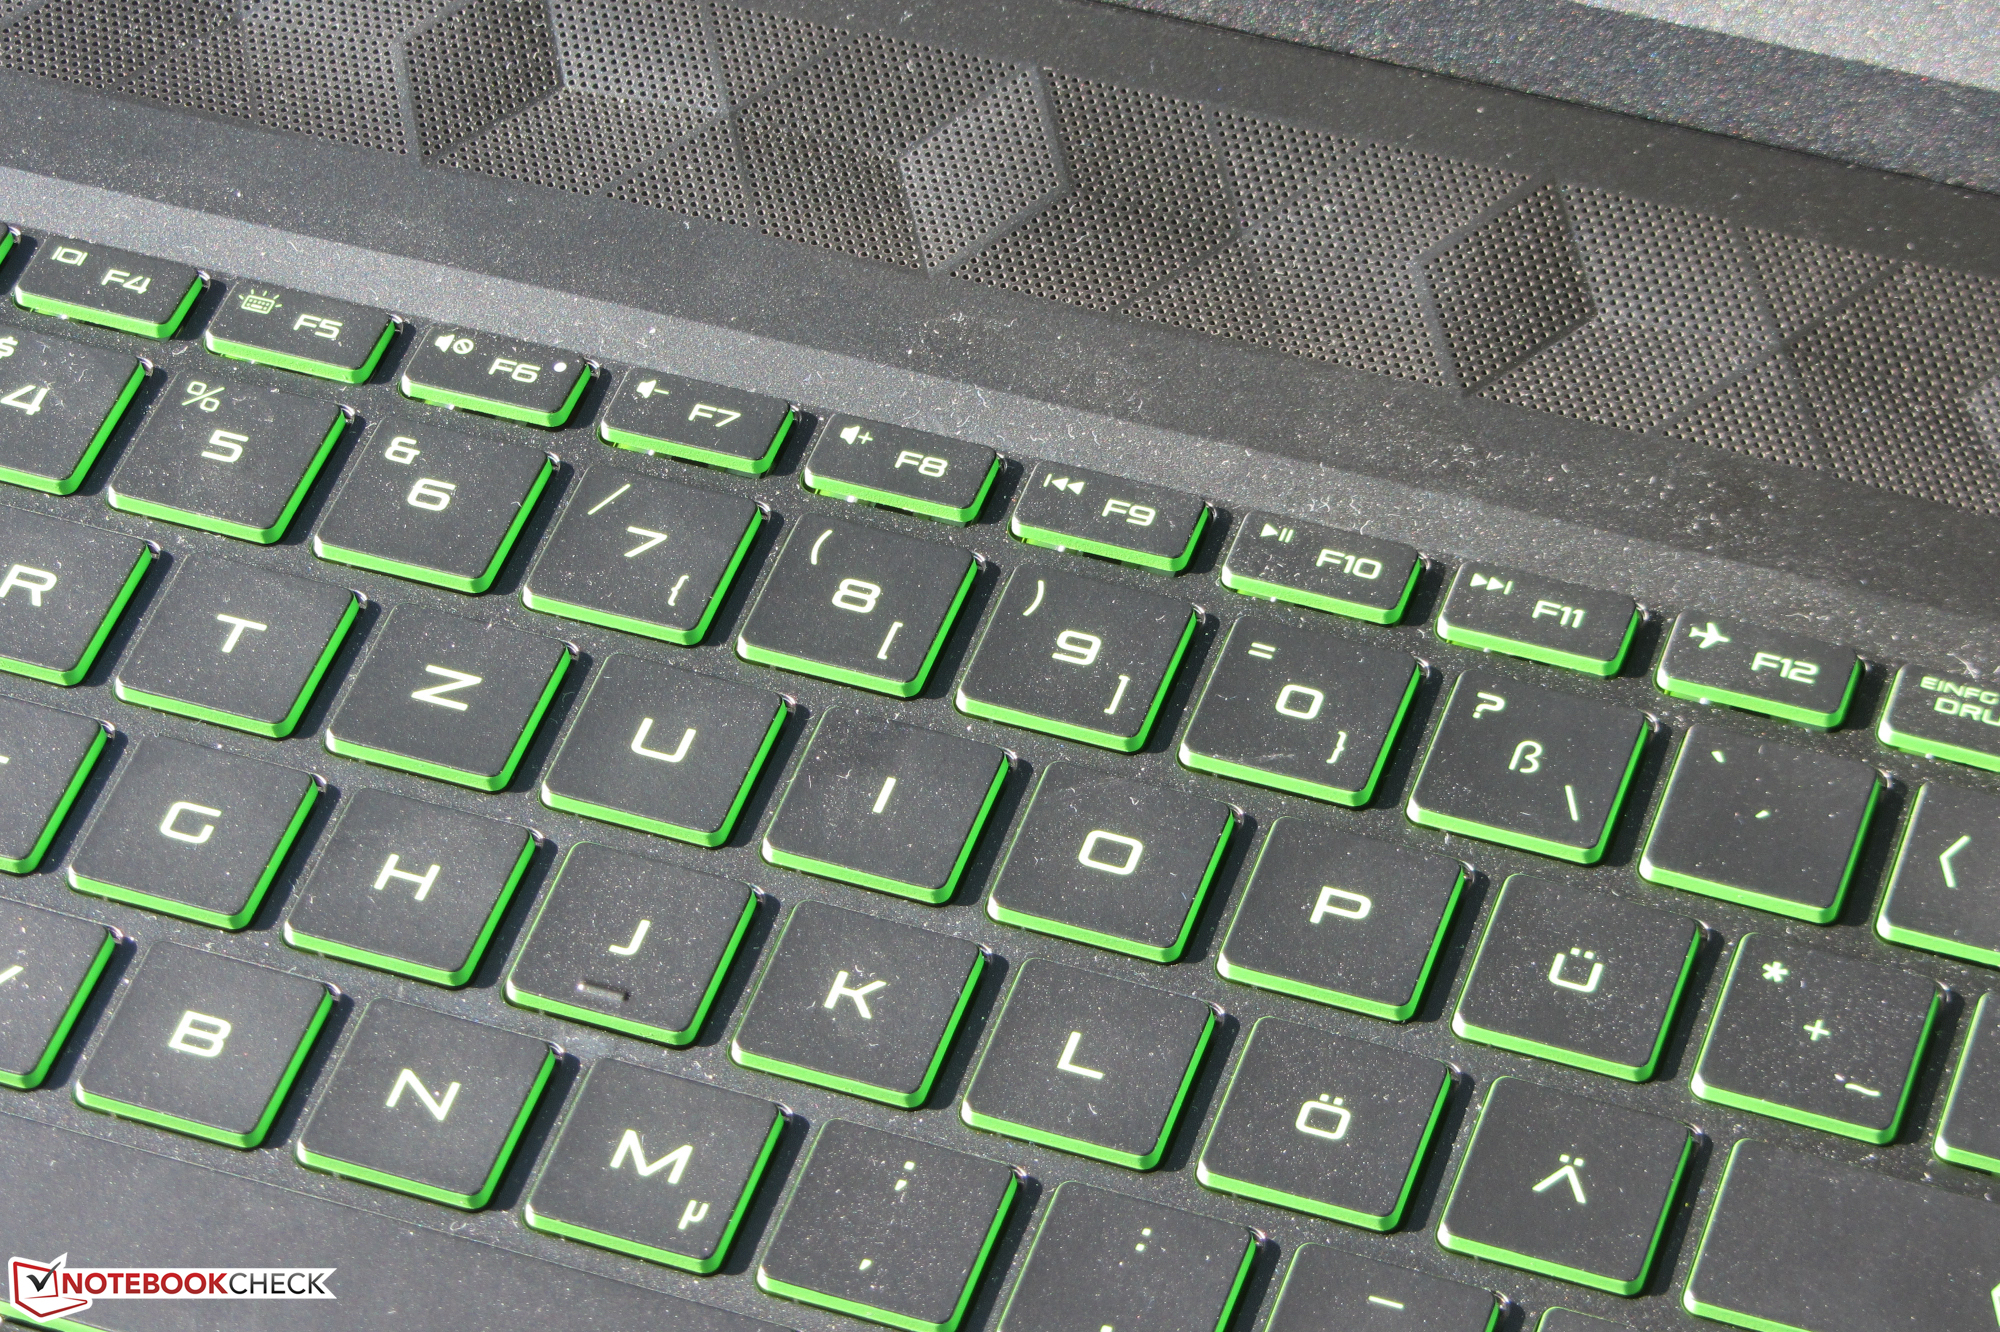
Como el Pavilion es idéntico en su construcción a sus modelos hermanos, no iremos más lejos en la carcasa, la conectividad, los dispositivos de entrada y los altavoces. La información correspondiente se puede encontrar en la revisión del HP Pavilion Gaming 15-ec0002ng.
Valoración | Fecha | Modelo | Peso | Altura | Tamaño | Resolución | Precio |
|---|---|---|---|---|---|---|---|
| 81.1 % v7 (old) | 10/2020 | HP Pavilion Gaming 15-ec1177ng R7 4800H, GeForce GTX 1660 Ti Max-Q | 2 kg | 23.5 mm | 15.60" | 1920x1080 | |
| 81.6 % v7 (old) | 09/2020 | Dell G3 15 3500-G4DG2 i7-10750H, GeForce RTX 2060 Mobile | 2.3 kg | 22 mm | 15.60" | 1920x1080 | |
| 79.8 % v7 (old) | 07/2020 | Acer Nitro 5 AN515-44-R5FT R5 4600H, GeForce GTX 1650 Ti Mobile | 2.2 kg | 24 mm | 15.60" | 1920x1080 | |
| 82.7 % v7 (old) | 06/2020 | Asus TUF Gaming A15 FA506IV-HN172 R7 4800H, GeForce RTX 2060 Mobile | 2.2 kg | 24.9 mm | 15.60" | 1920x1080 | |
| 78.4 % v7 (old) | 07/2020 | Lenovo IdeaPad Gaming 3i 15IMH05 i5-10300H, GeForce GTX 1650 Mobile | 2.2 kg | 24.9 mm | 15.60" | 1920x1080 |
Configuración del puerto
| SD Card Reader | |
| average JPG Copy Test (av. of 3 runs) | |
| Media de la clase Gaming (20.9 - 210, n=55, últimos 2 años) | |
| HP Pavilion Gaming 15-ec1206ng (Toshiba Exceria Pro SDXC 64 GB UHS-II) | |
| HP Pavilion Gaming 15-ec1177ng (Toshiba Exceria Pro SDXC 64 GB UHS-II) | |
| HP Pavilion Gaming 15-ec0017ng (Toshiba Exceria Pro SDXC 64 GB UHS-II) | |
| HP Pavilion Gaming 15-ec0002ng (Toshiba Exceria Pro SDXC 64 GB UHS-II) | |
| Dell G3 15 3500-G4DG2 (Toshiba Exceria Pro SDXC 64 GB UHS-II) | |
| maximum AS SSD Seq Read Test (1GB) | |
| Media de la clase Gaming (25.5 - 261, n=52, últimos 2 años) | |
| HP Pavilion Gaming 15-ec0017ng (Toshiba Exceria Pro SDXC 64 GB UHS-II) | |
| HP Pavilion Gaming 15-ec0002ng (Toshiba Exceria Pro SDXC 64 GB UHS-II) | |
| HP Pavilion Gaming 15-ec1177ng (Toshiba Exceria Pro SDXC 64 GB UHS-II) | |
| HP Pavilion Gaming 15-ec1206ng (Toshiba Exceria Pro SDXC 64 GB UHS-II) | |
| Dell G3 15 3500-G4DG2 (Toshiba Exceria Pro SDXC 64 GB UHS-II) | |


Pantalla - Brillante, de alto contraste, sensible
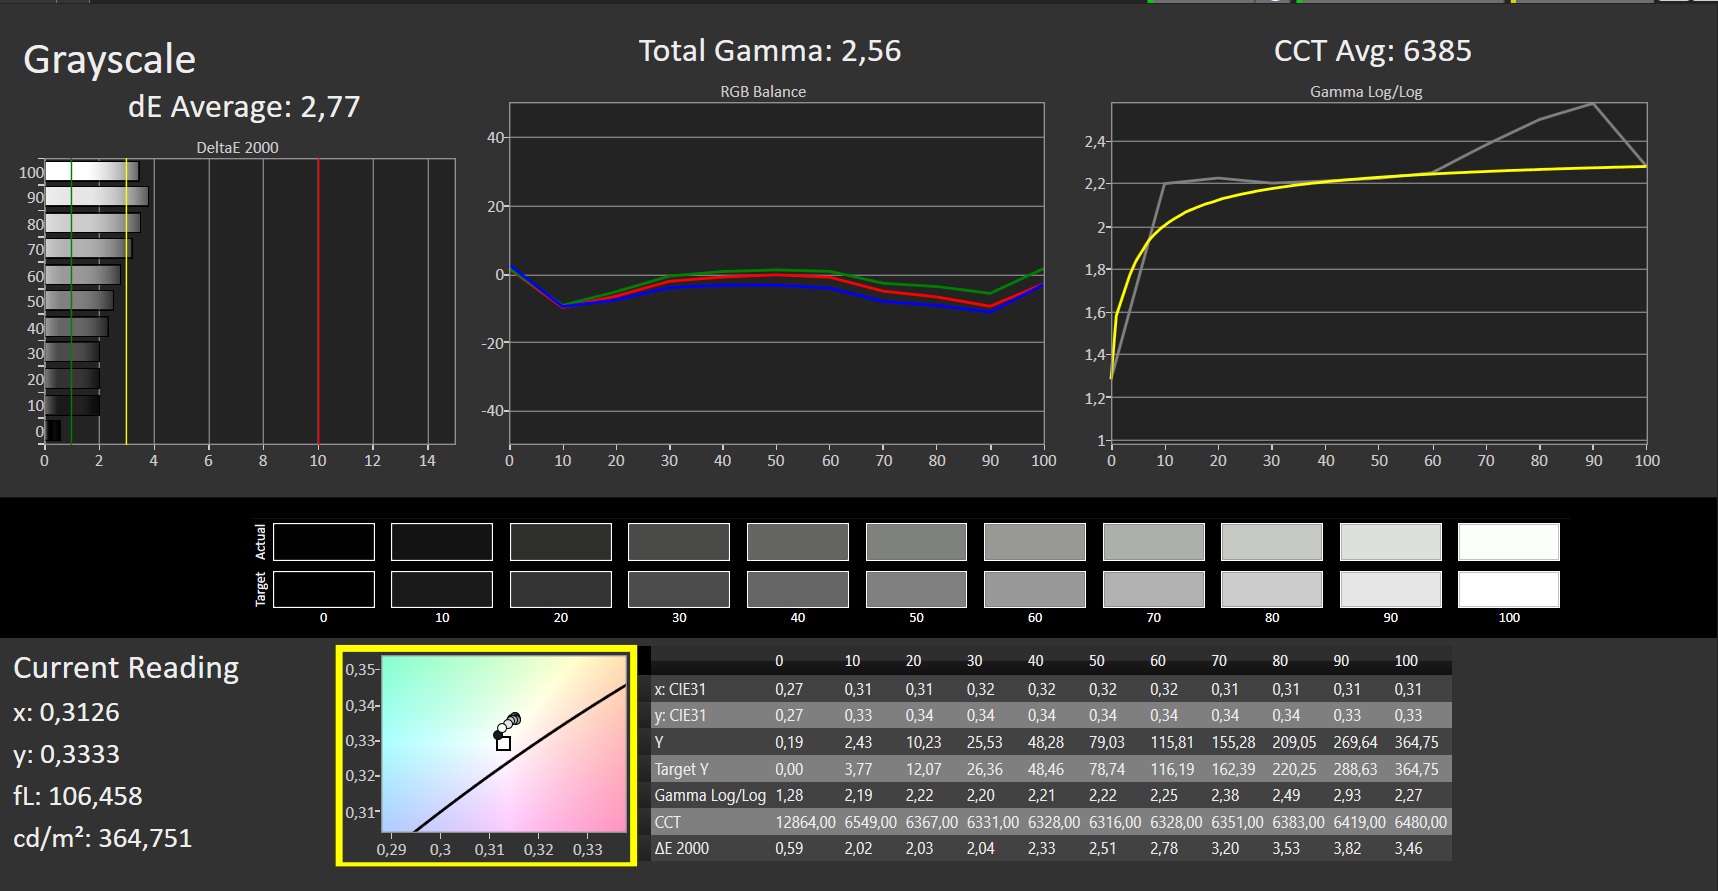
El brillo (327,1 cd/m²) y el contraste (1.962:1) de la pantalla mate de 15,6 pulgadas (1920x1080 píxeles) son agradables. Además, el panel de 144 Hz ofrece tiempos de respuesta rápidos. Es positivo: No pudimos detectar ningún parpadeo de PWM.
| |||||||||||||||||||||||||
iluminación: 84 %
Brillo con batería: 365 cd/m²
Contraste: 1962:1 (Negro: 0.185 cd/m²)
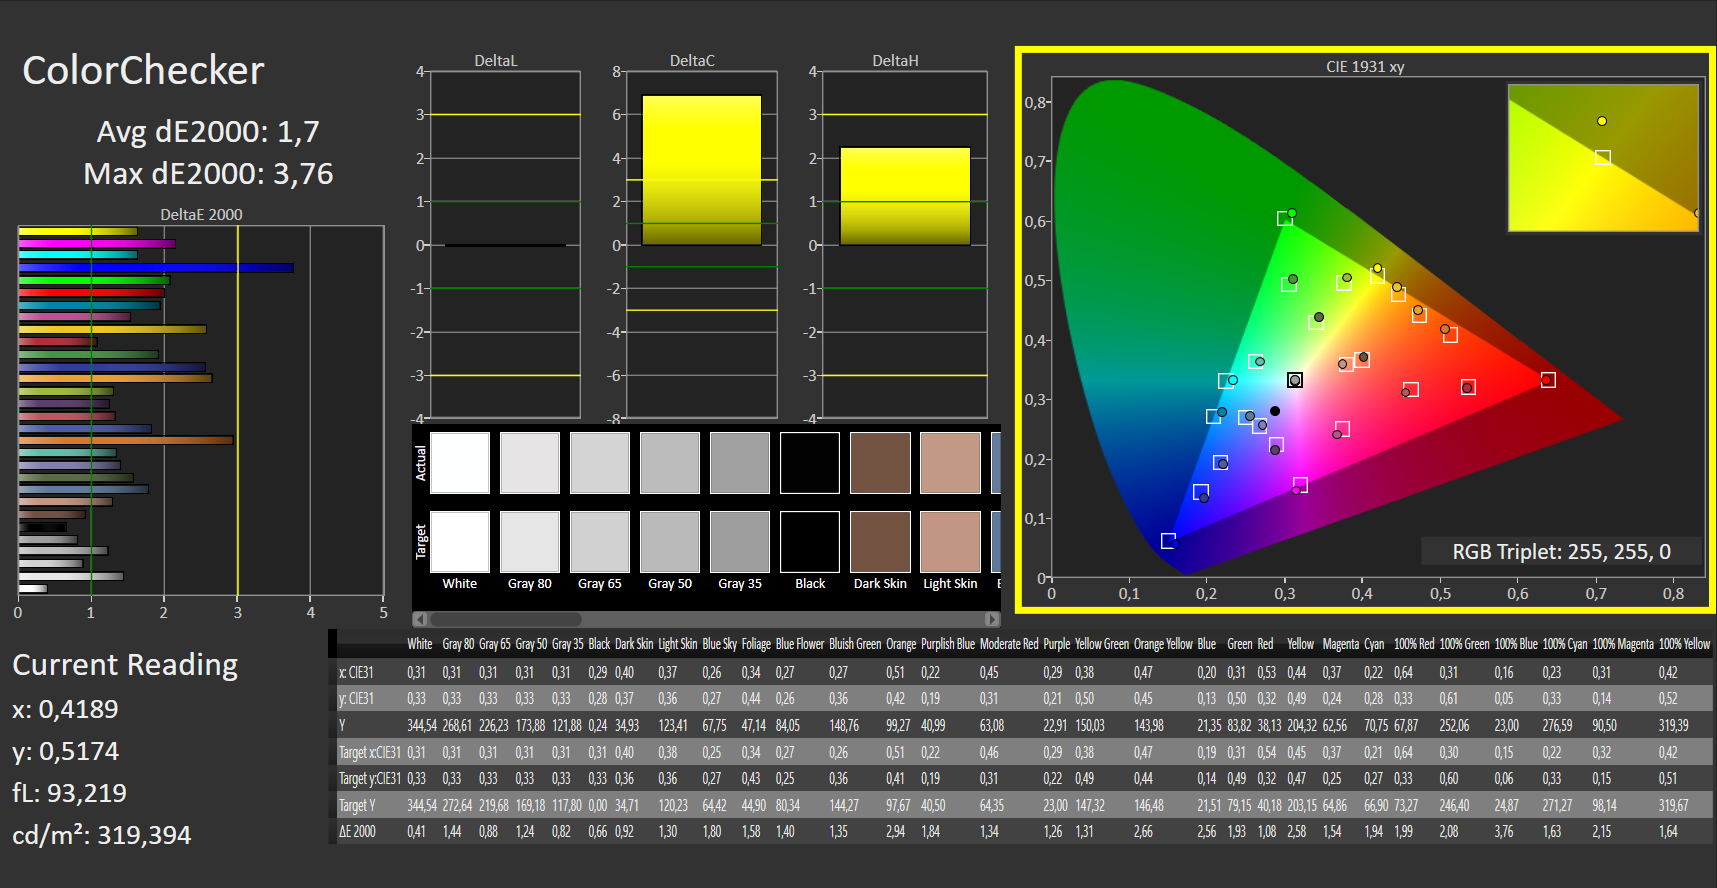
ΔE ColorChecker Calman: 2.69 | ∀{0.5-29.43 Ø4.73}
calibrated: 1.7
ΔE Greyscale Calman: 2.77 | ∀{0.09-98 Ø4.97}
92.8% sRGB (Argyll 1.6.3 3D)
60.3% AdobeRGB 1998 (Argyll 1.6.3 3D)
65.9% AdobeRGB 1998 (Argyll 3D)
93.1% sRGB (Argyll 3D)
64.9% Display P3 (Argyll 3D)
Gamma: 2.56
CCT: 6385 K
| HP Pavilion Gaming 15-ec1177ng LG Philips LP156WFG-SPK1, IPS, 1920x1080, 15.6" | Dell G3 15 3500-G4DG2 AU Optronics AUO80ED, IPS, 1920x1080, 15.6" | Acer Nitro 5 AN515-44-R5FT Panda LM156LF-2F01 (NCP004D), IPS, 1920x1080, 15.6" | Asus TUF Gaming A15 FA506IV-HN172 LM156LF-2F01, IPS, 1920x1080, 15.6" | Lenovo IdeaPad Gaming 3i 15IMH05 BOE CQ NV156FHM-NX1, IPS, 1920x1080, 15.6" | Asus ROG Strix G15 G512LI Panda LM156LF-2F01, IPS, 1920x1080, 15.6" | HP Pavilion Gaming 15-ec1206ng Chi Mei CMN150D, IPS, 1920x1080, 15.6" | HP Pavilion Gaming 15-ec0002ng Chi Mei N156HGA-EA3, TN LED, 1920x1080, 15.6" | HP Pavilion Gaming 15-ec0017ng AU Optronics B156HAK02.0, IPS, 1920x1080, 15.6" | |
|---|---|---|---|---|---|---|---|---|---|
| Display | 1% | -35% | -39% | -40% | -38% | -35% | -35% | -3% | |
| Display P3 Coverage (%) | 64.9 | 64.6 0% | 41.16 -37% | 38.92 -40% | 38.04 -41% | 39.73 -39% | 41.36 -36% | 41.22 -36% | 62.8 -3% |
| sRGB Coverage (%) | 93.1 | 93.9 1% | 61.8 -34% | 58.5 -37% | 56.6 -39% | 59.8 -36% | 62 -33% | 61.8 -34% | 89.2 -4% |
| AdobeRGB 1998 Coverage (%) | 65.9 | 66.4 1% | 42.56 -35% | 40.22 -39% | 39.3 -40% | 41.06 -38% | 42.76 -35% | 42.62 -35% | 63.8 -3% |
| Response Times | 20% | -164% | -116% | -56% | -131% | -107% | -106% | -157% | |
| Response Time Grey 50% / Grey 80% * (ms) | 16 ? | 14 ? 12% | 40.8 ? -155% | 34 ? -113% | 25 ? -56% | 33.6 ? -110% | 33.6 ? -110% | 44 ? -175% | 40 ? -150% |
| Response Time Black / White * (ms) | 11 ? | 8 ? 27% | 30 ? -173% | 24 ? -118% | 17 ? -55% | 27.6 ? -151% | 22.4 ? -104% | 15 ? -36% | 29 ? -164% |
| PWM Frequency (Hz) | 24750 ? | 250 ? | |||||||
| Screen | -28% | -55% | -66% | -89% | -79% | -23% | -107% | -33% | |
| Brightness middle (cd/m²) | 363 | 301 -17% | 287 -21% | 280 -23% | 305 -16% | 271.2 -25% | 277 -24% | 233 -36% | 302 -17% |
| Brightness (cd/m²) | 327 | 298 -9% | 271 -17% | 254 -22% | 294 -10% | 252 -23% | 248 -24% | 211 -35% | 291 -11% |
| Brightness Distribution (%) | 84 | 81 -4% | 88 5% | 88 5% | 70 -17% | 79 -6% | 83 -1% | 82 -2% | 84 0% |
| Black Level * (cd/m²) | 0.185 | 0.23 -24% | 0.25 -35% | 0.15 19% | 0.405 -119% | 0.53 -186% | 0.16 14% | 0.405 -119% | 0.25 -35% |
| Contrast (:1) | 1962 | 1309 -33% | 1148 -41% | 1867 -5% | 753 -62% | 512 -74% | 1731 -12% | 575 -71% | 1208 -38% |
| Colorchecker dE 2000 * | 2.69 | 4.68 -74% | 4.77 -77% | 5.89 -119% | 6.01 -123% | 5.04 -87% | 3.6 -34% | 8.22 -206% | 4.84 -80% |
| Colorchecker dE 2000 max. * | 5.06 | 17.15 -239% | 19 -275% | 21.9 -333% | 16.07 -218% | 8.53 -69% | 18.6 -268% | 8.18 -62% | |
| Colorchecker dE 2000 calibrated * | 1.7 | 1.87 -10% | 3.73 -119% | 4.79 -182% | 5.12 -201% | 4.26 -151% | 2.88 -69% | 2.63 -55% | |
| Greyscale dE 2000 * | 2.77 | 5.79 -109% | 2.7 3% | 4.08 -47% | 3.23 -17% | 3.4 -23% | 1.75 37% | 10.13 -266% | 4.31 -56% |
| Gamma | 2.56 86% | 2.46 89% | 2.115 104% | 2.33 94% | 2.43 91% | 2.09 105% | 2.23 99% | 2.27 97% | 2.56 86% |
| CCT | 6385 102% | 7706 84% | 7187 90% | 7303 89% | 6818 95% | 7079 92% | 6695 97% | 11323 57% | 7318 89% |
| Color Space (Percent of AdobeRGB 1998) (%) | 60.3 | 61 1% | 43 -29% | 37 -39% | 36 -40% | 37.8 -37% | 39 -35% | 39 -35% | 58 -4% |
| Color Space (Percent of sRGB) (%) | 92.8 | 94 1% | 61 -34% | 58 -37% | 56 -40% | 59.5 -36% | 62 -33% | 62 -33% | 89 -4% |
| Media total (Programa/Opciones) | -2% /
-16% | -85% /
-65% | -74% /
-67% | -62% /
-76% | -83% /
-78% | -55% /
-36% | -83% /
-92% | -64% /
-43% |
* ... más pequeño es mejor
Tiempos de respuesta del display
| ↔ Tiempo de respuesta de Negro a Blanco | ||
|---|---|---|
| 11 ms ... subida ↗ y bajada ↘ combinada | ↗ 7 ms subida | 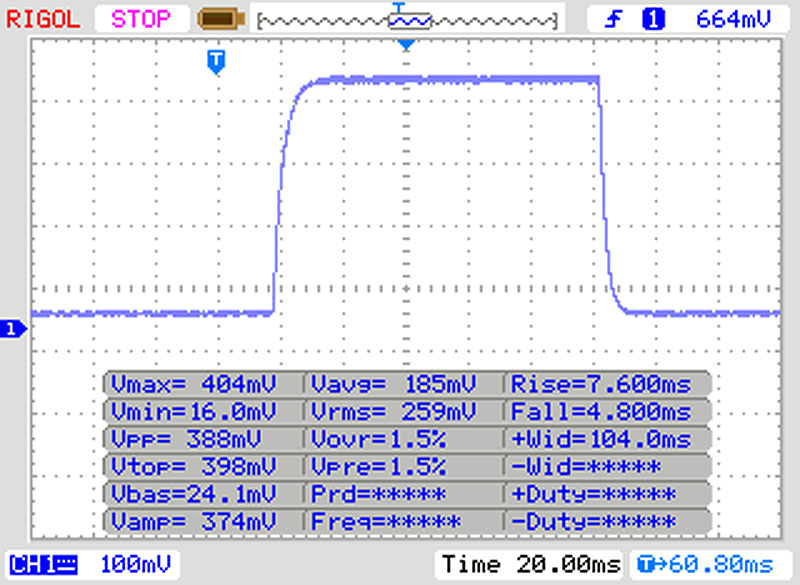 |
| ↘ 4 ms bajada | ||
| La pantalla mostró buenos tiempos de respuesta en nuestros tests pero podría ser demasiado lenta para los jugones competitivos. En comparación, todos los dispositivos de prueba van de ##min### (mínimo) a 240 (máximo) ms. » 29 % de todos los dispositivos son mejores. Esto quiere decir que el tiempo de respuesta medido es mejor que la media (19.9 ms) de todos los dispositivos testados. | ||
| ↔ Tiempo de respuesta 50% Gris a 80% Gris | ||
| 16 ms ... subida ↗ y bajada ↘ combinada | ↗ 9 ms subida | 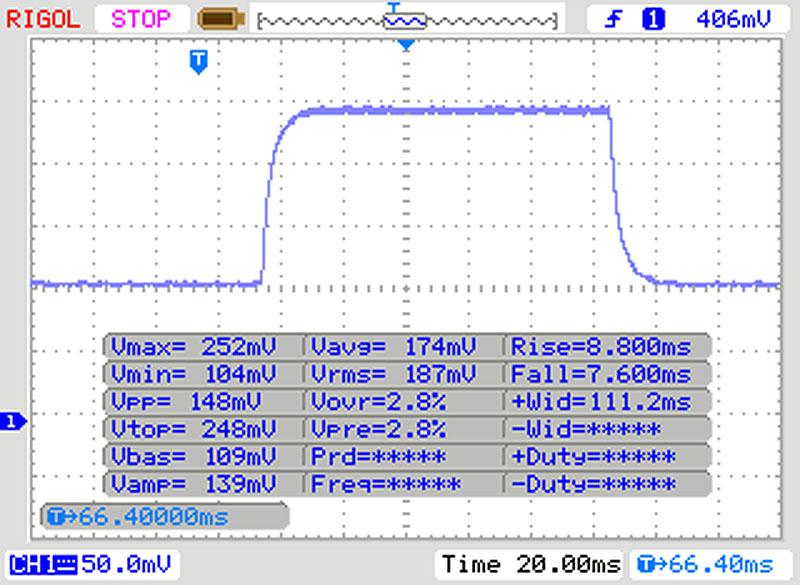 |
| ↘ 7 ms bajada | ||
| La pantalla mostró buenos tiempos de respuesta en nuestros tests pero podría ser demasiado lenta para los jugones competitivos. En comparación, todos los dispositivos de prueba van de ##min### (mínimo) a 636 (máximo) ms. » 30 % de todos los dispositivos son mejores. Esto quiere decir que el tiempo de respuesta medido es mejor que la media (31.1 ms) de todos los dispositivos testados. | ||
Parpadeo de Pantalla / PWM (Pulse-Width Modulation)
| Parpadeo de Pantalla / PWM no detectado | 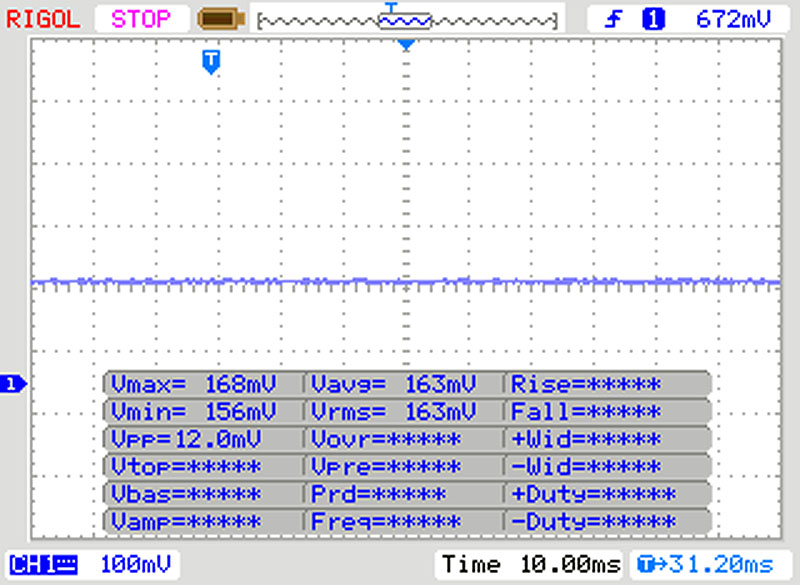 | ||
Comparación: 52 % de todos los dispositivos testados no usaron PWM para atenuar el display. Si se usó, medimos una media de 7798 (mínimo: 5 - máxmo: 343500) Hz. | |||
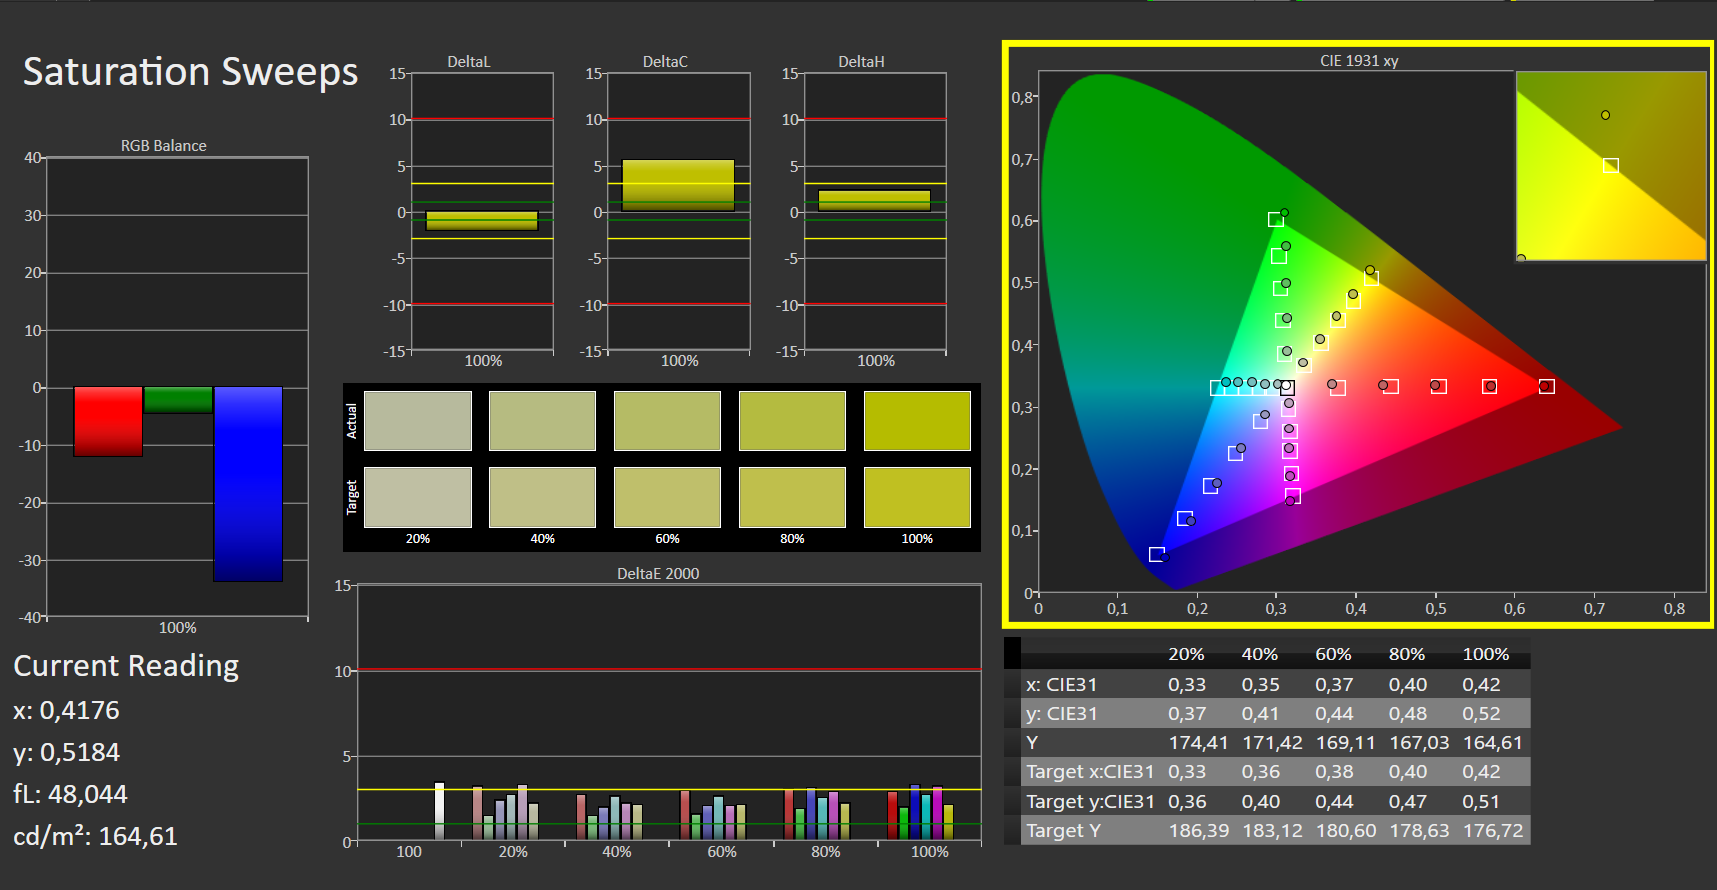
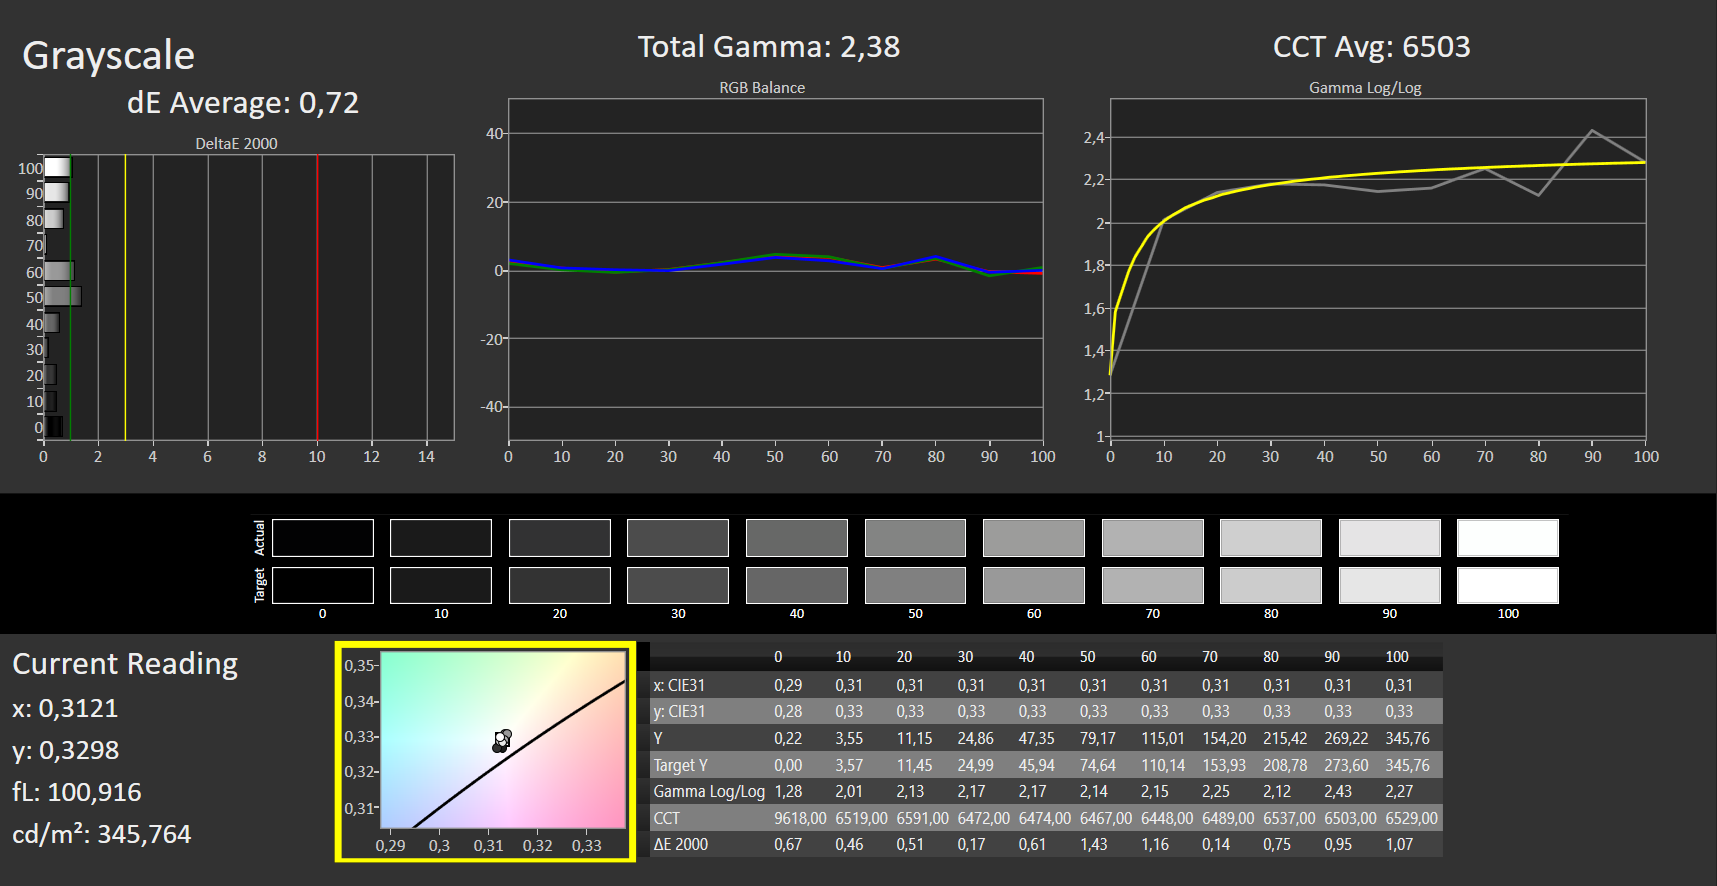
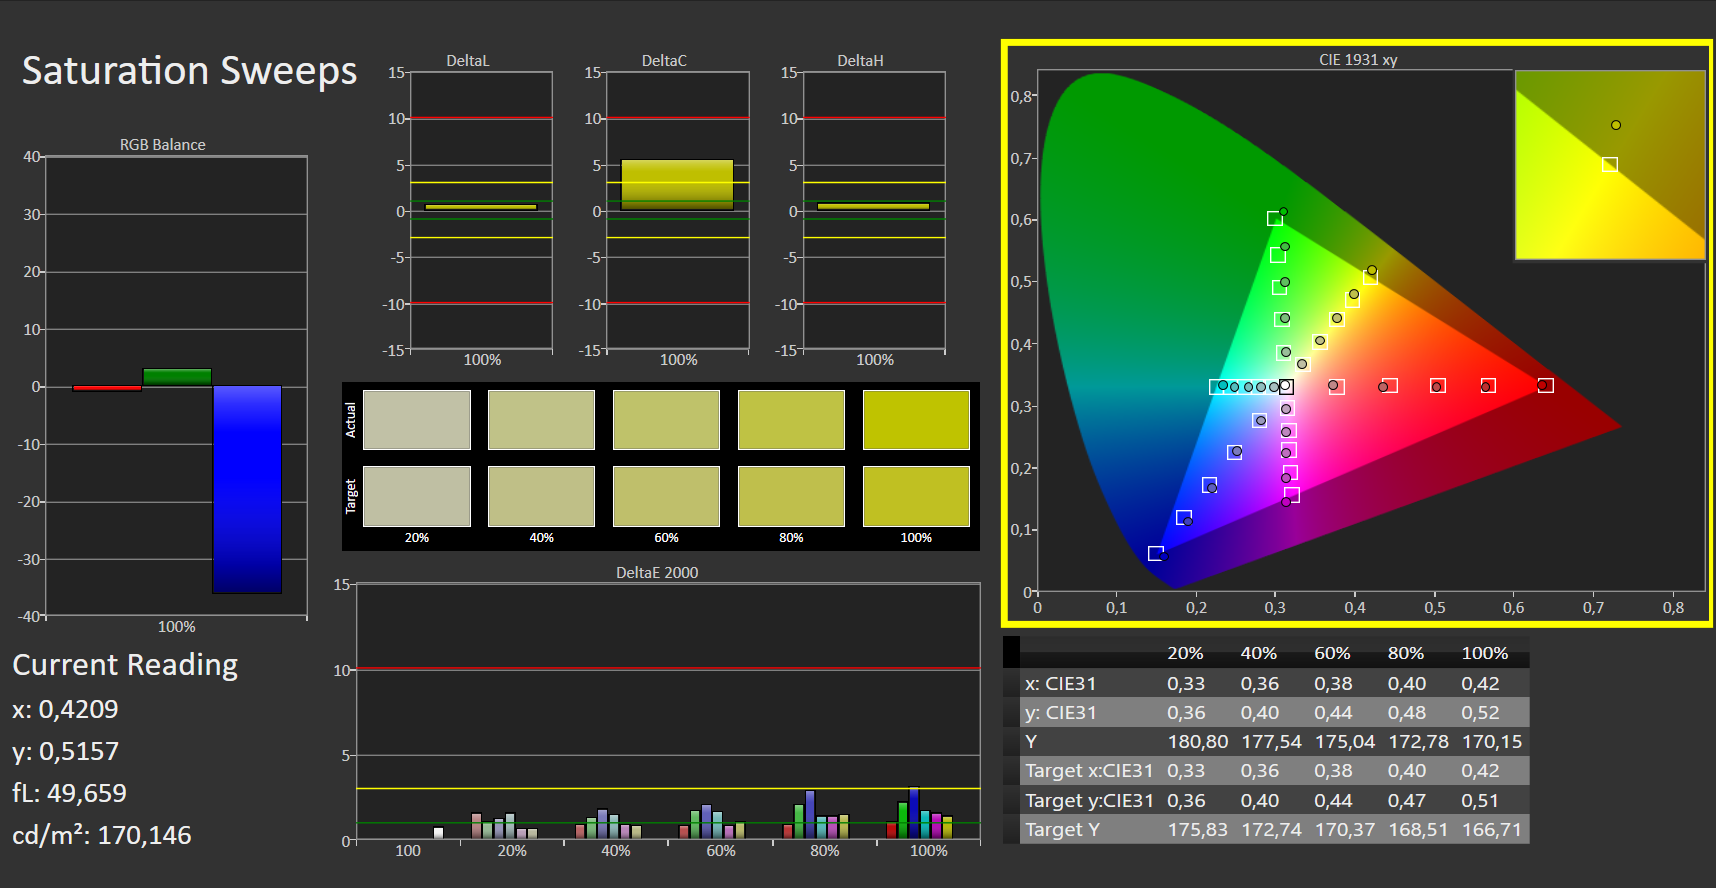
La pantalla ya muestra una buena reproducción del color fuera de la caja. Con una desviación de color Delta E 2000 de poco menos de 2,7, el objetivo (Delta E menos de 3) se cumple. La pantalla no sufre de un tinte azul. Además, la calibración proporciona mejoras. De esta manera, la desviación de color se reduce a 1,7, y las escalas de grises se muestran de una manera más equilibrada. Los espacios de color AdobeRGB (60,3%) y sRGB (92,8%) no se reproducen completamente.
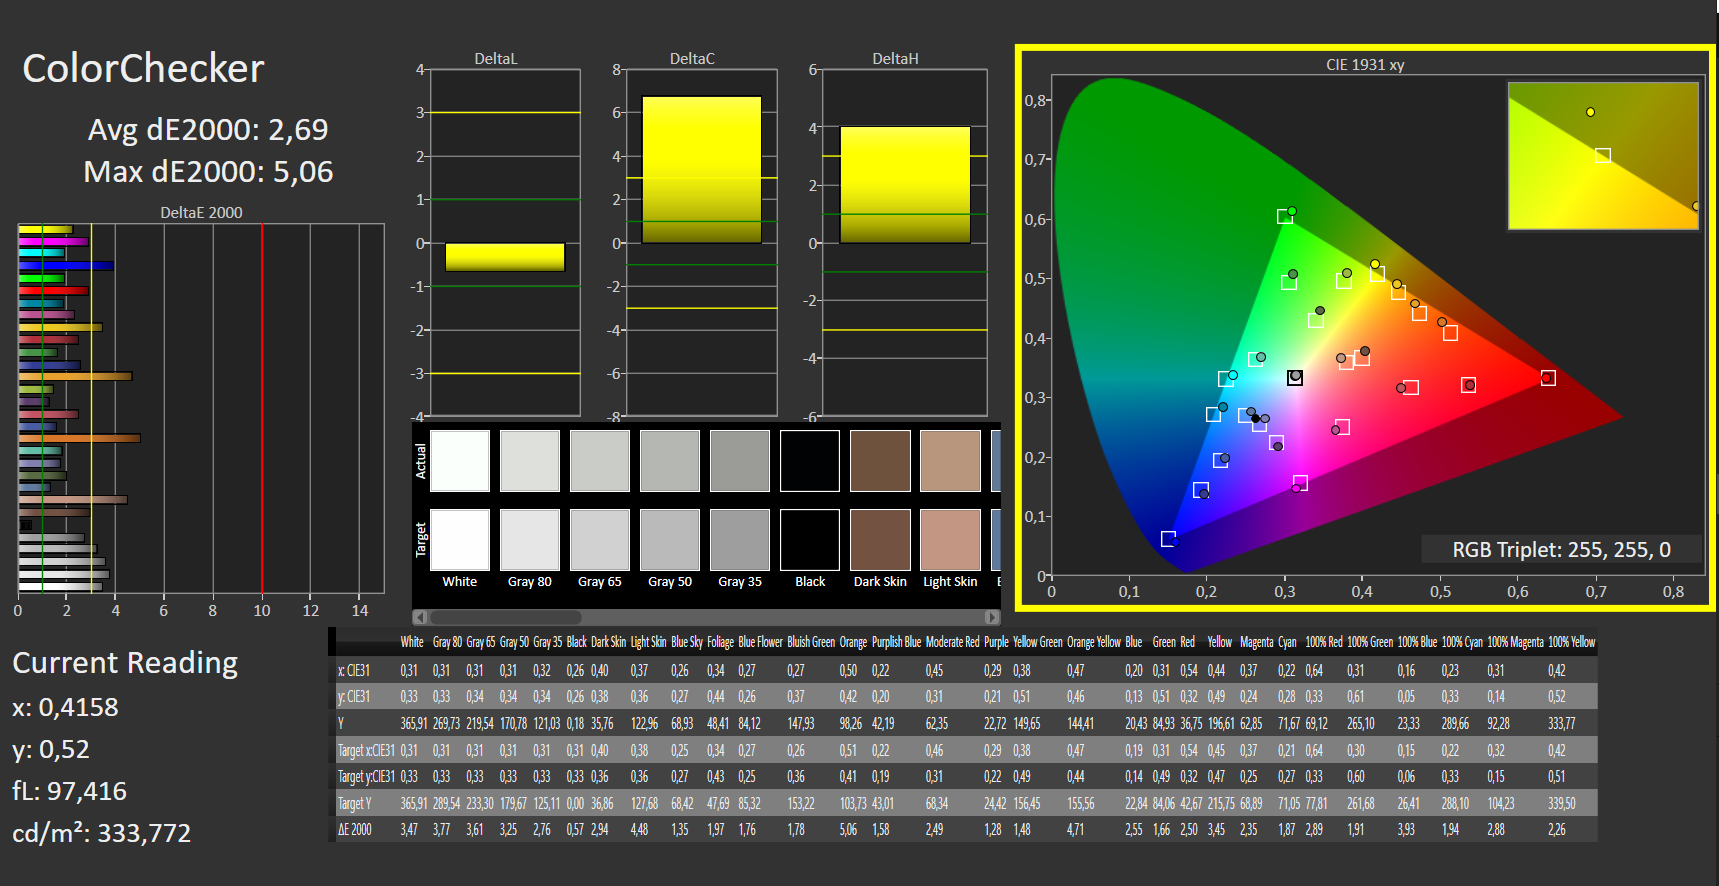
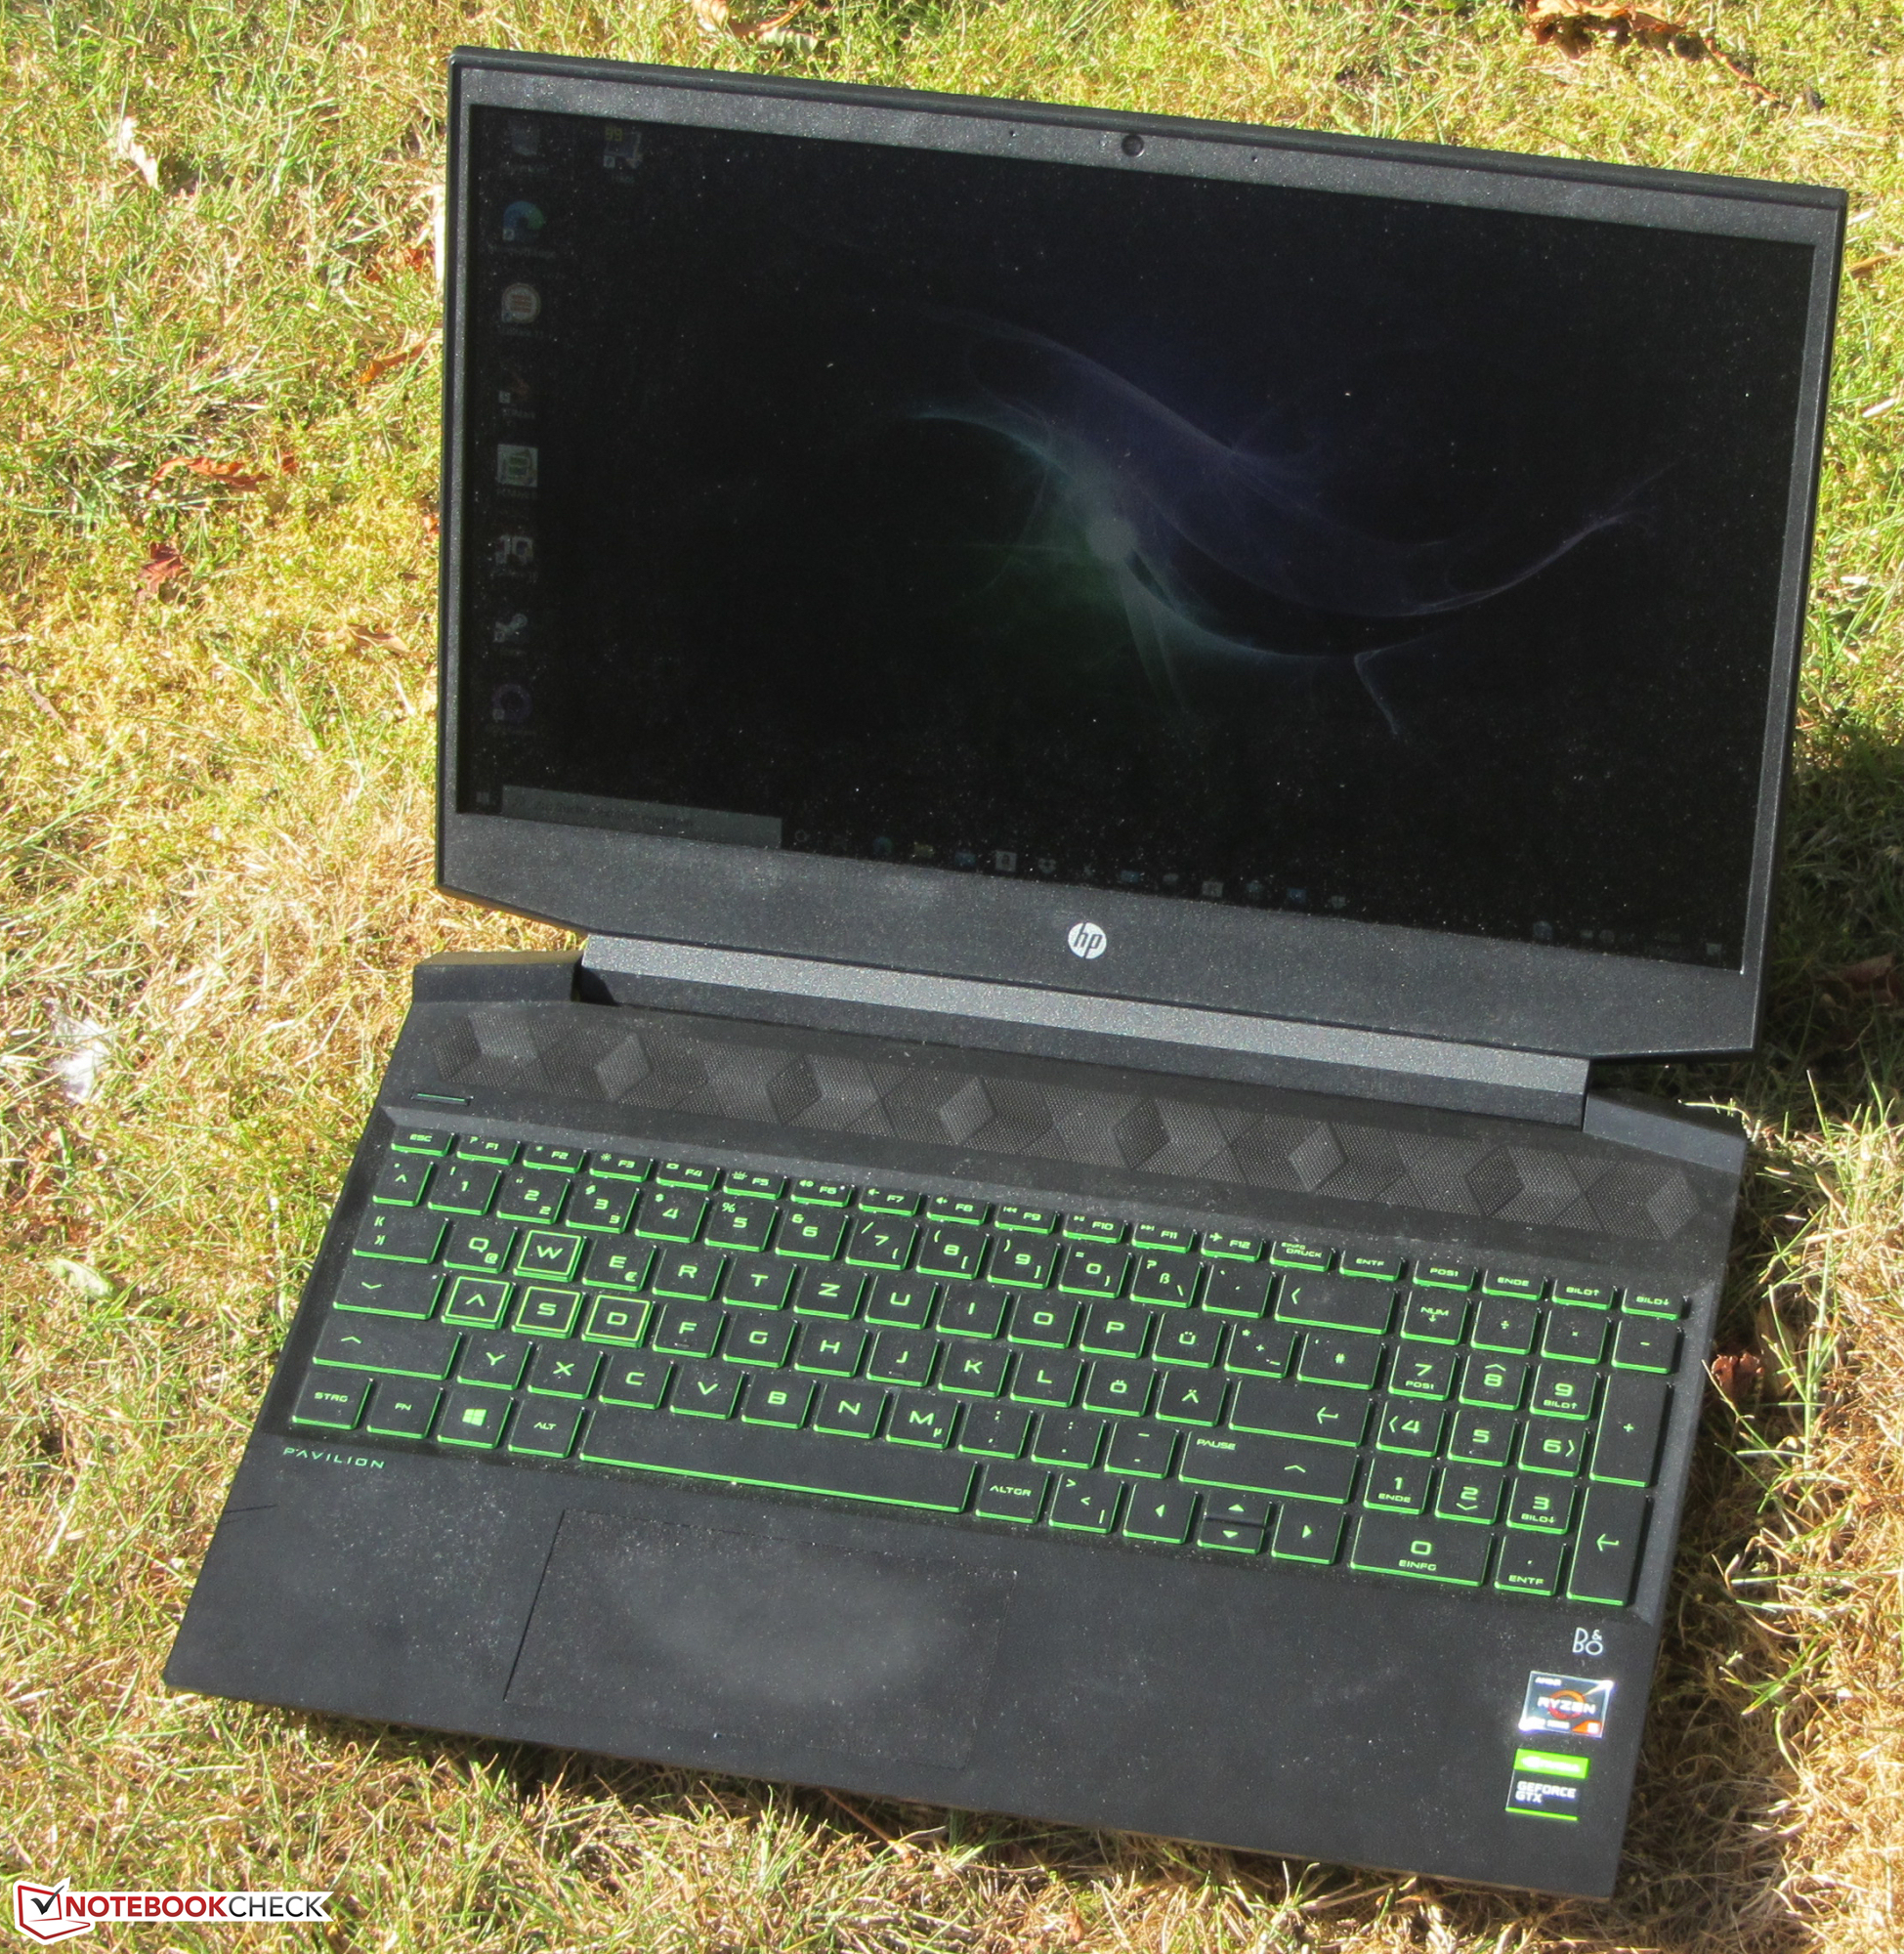
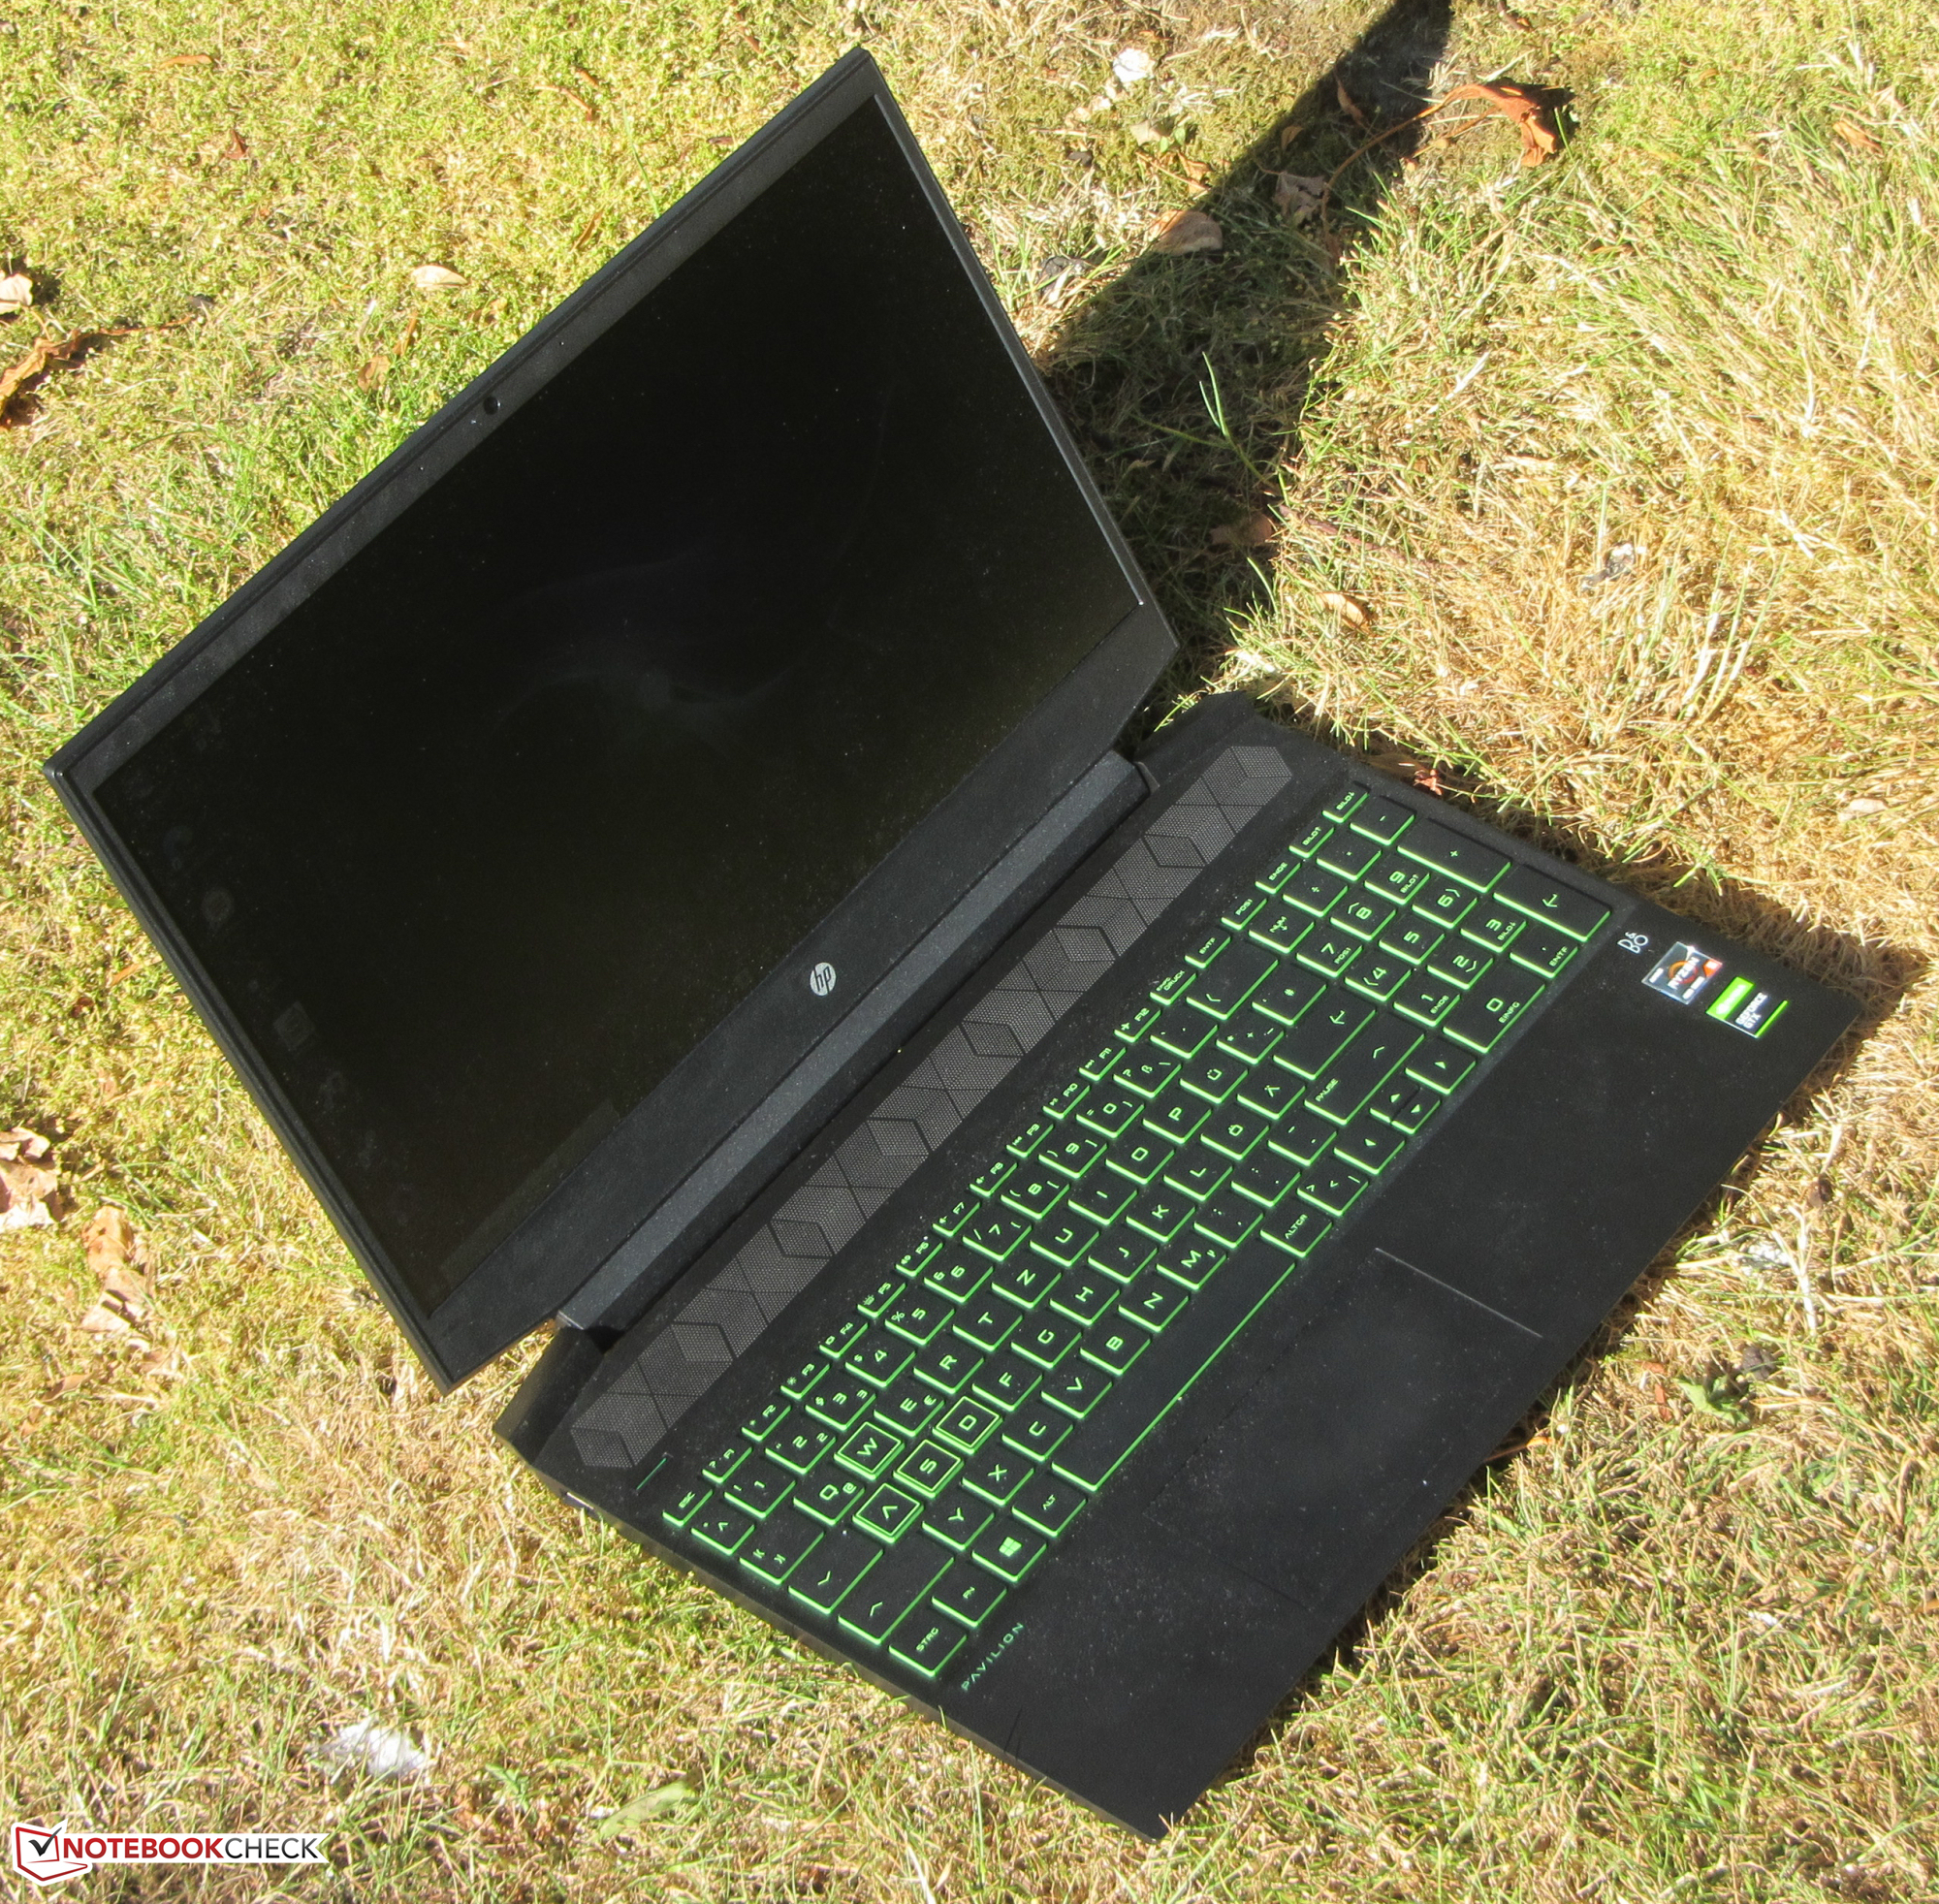
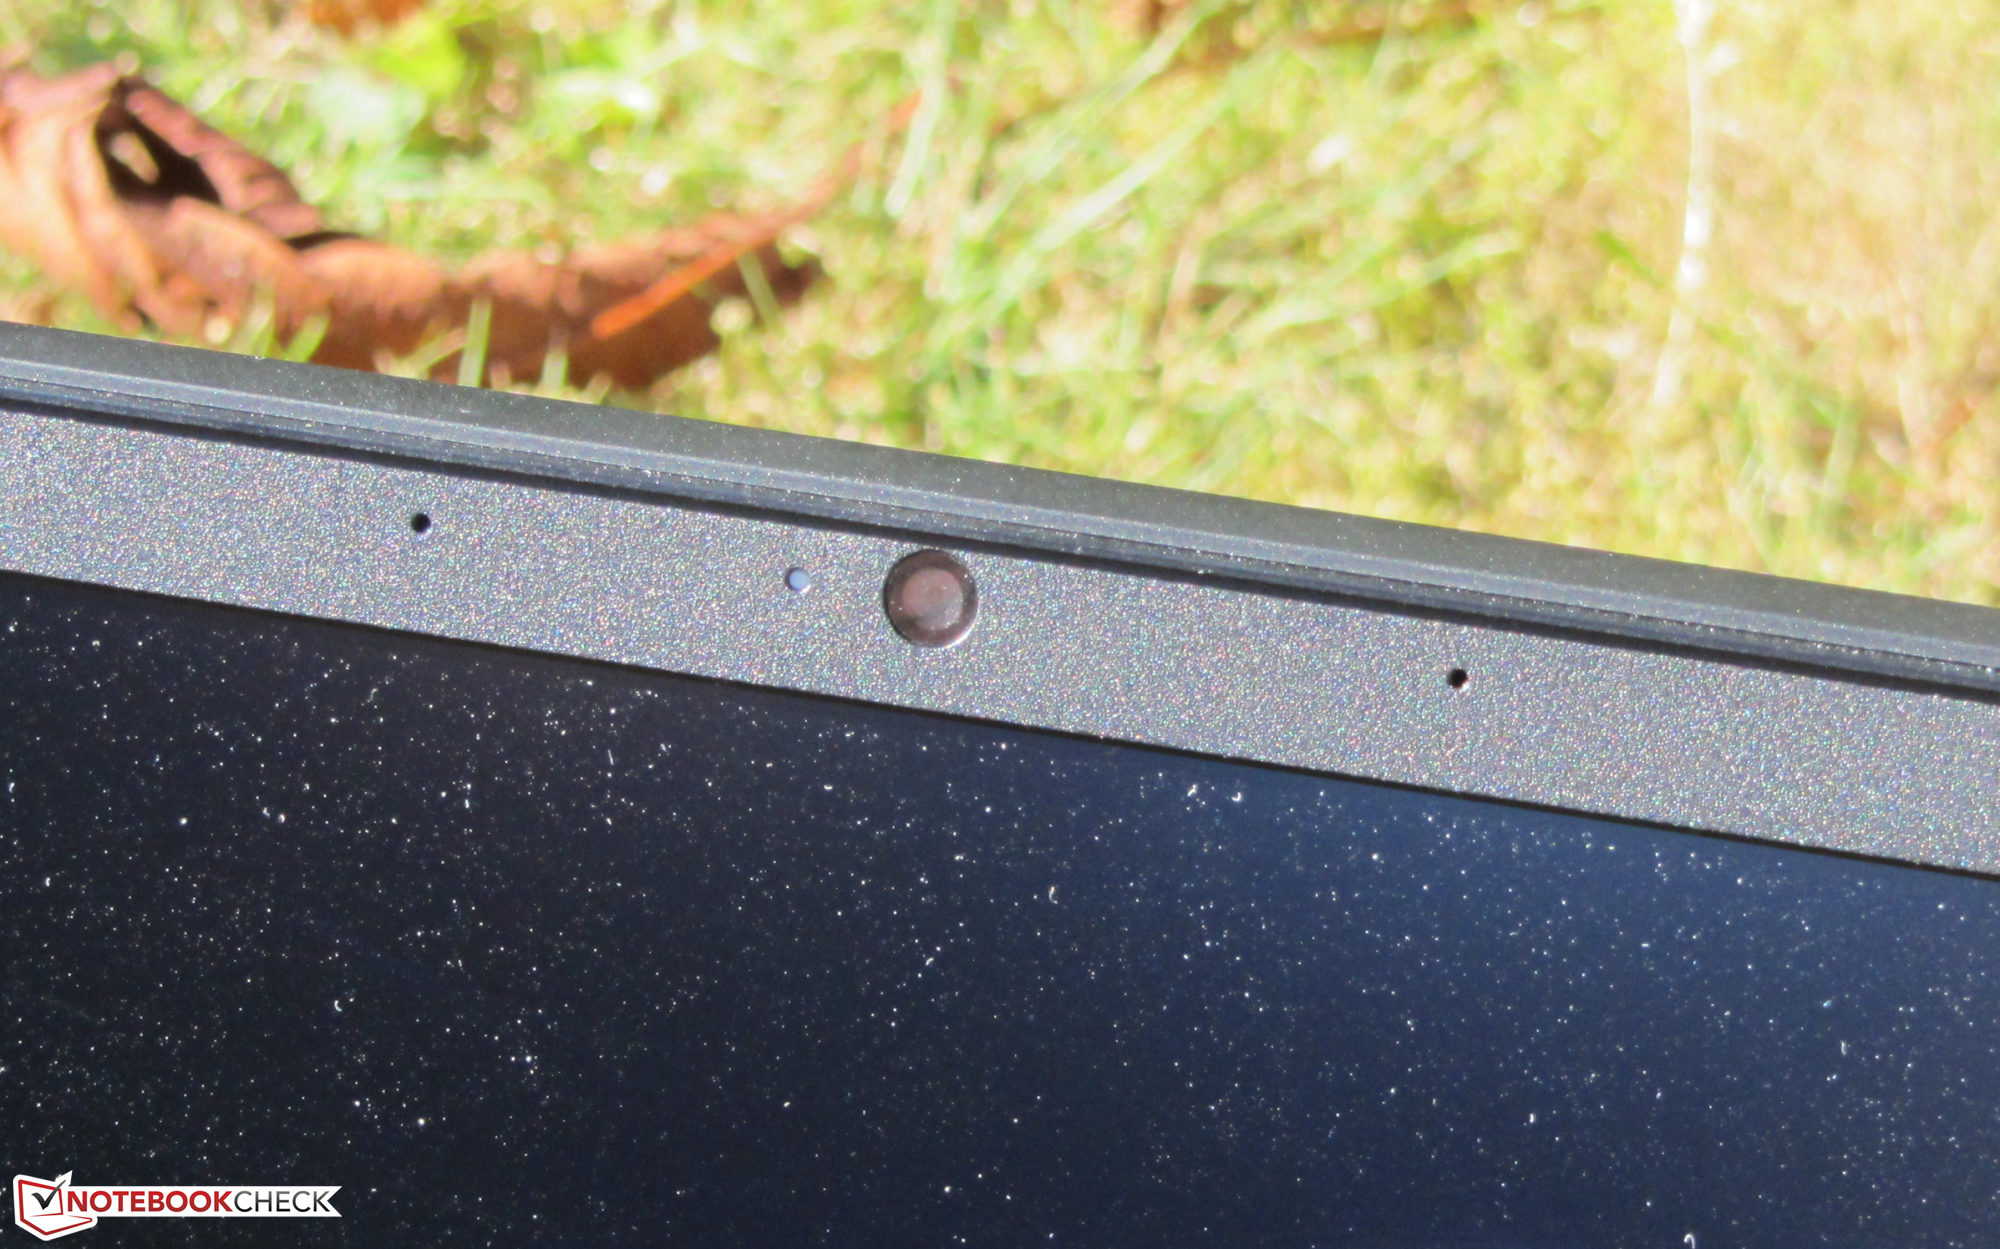
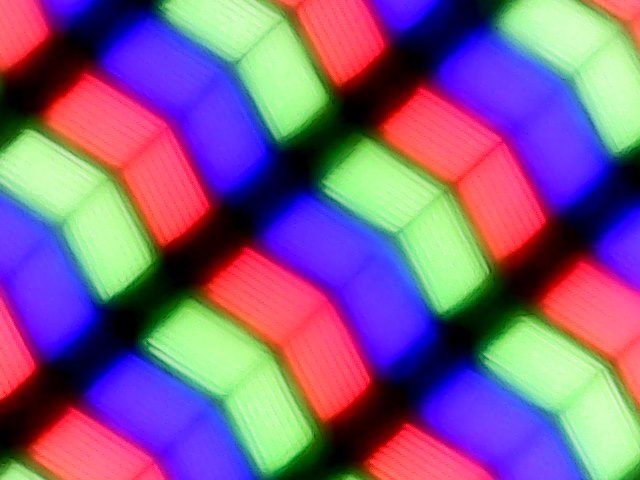
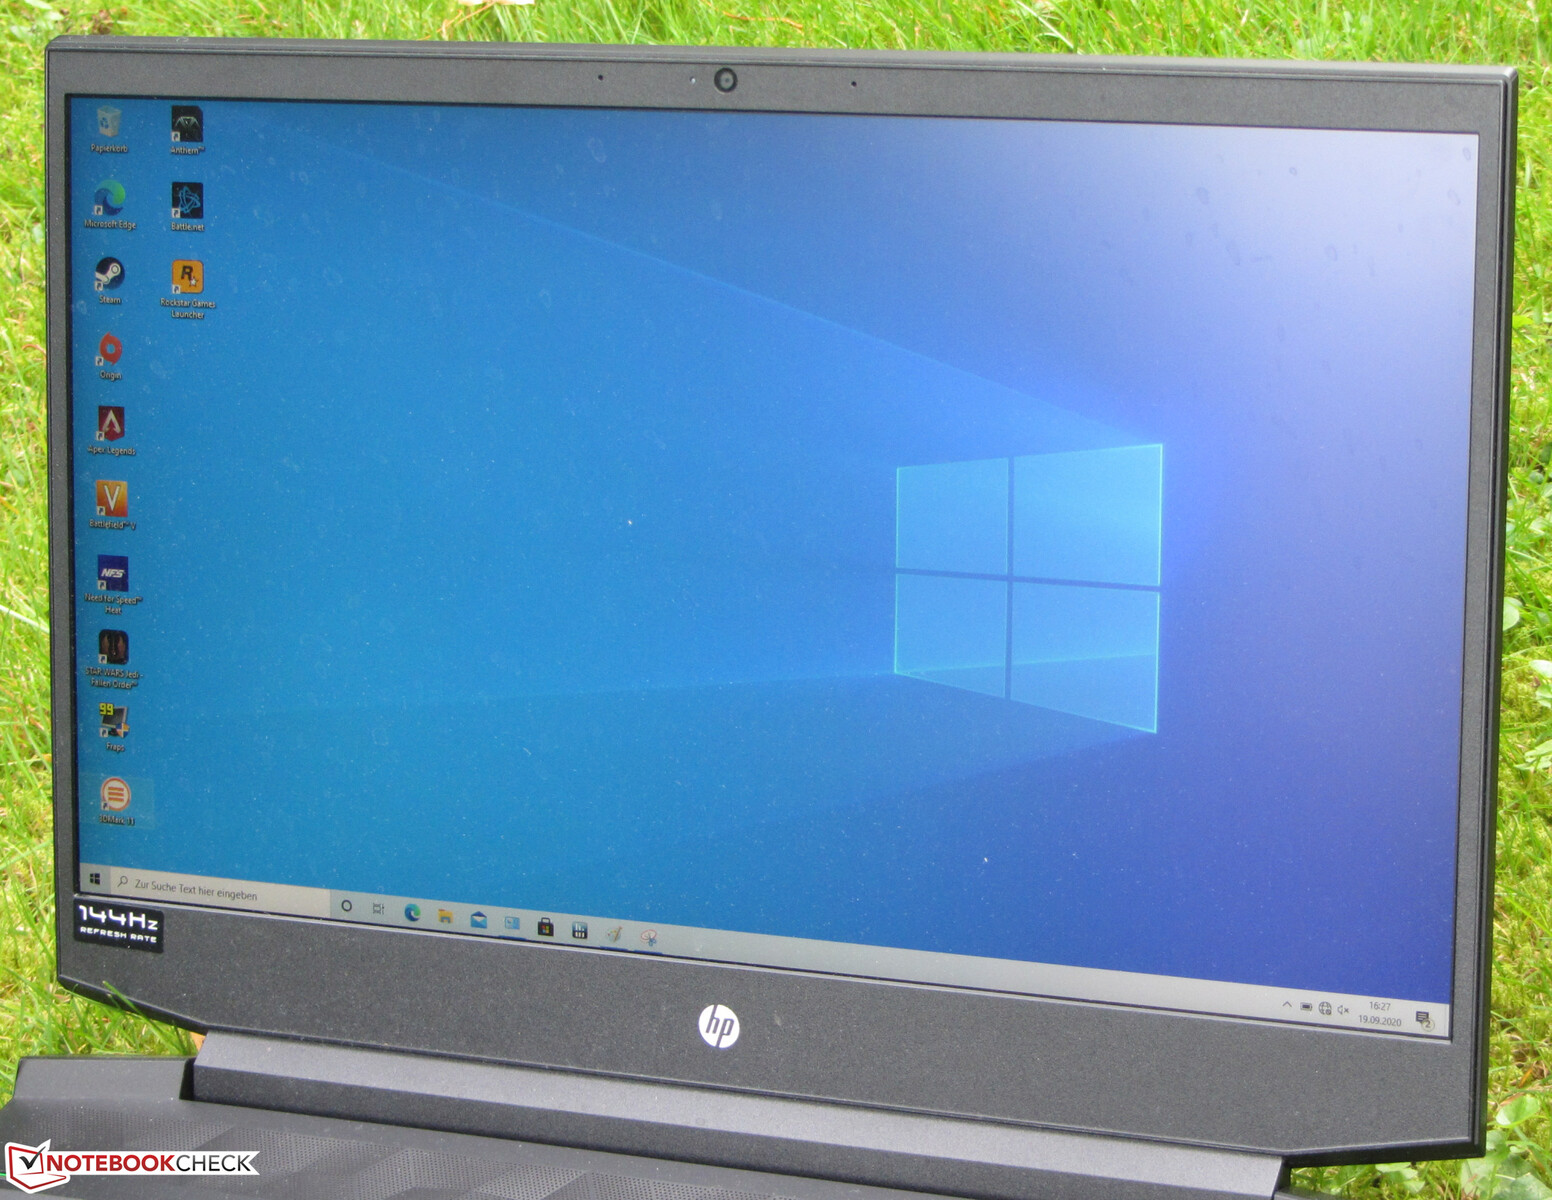
HP equipa el portátil para juegos con un panel IPS de ángulo de visión estable. Así la pantalla puede ser leída desde cualquier posición. En el exterior, la pantalla puede ser leída cuando el sol no es demasiado brillante.
Performance - Pavilion con APU ultrapotente
Con el Pavilion Gaming 15, HP entrega un portátil para juegos en el formato de 15,6 pulgadas. Lleva todos los juegos de ordenador modernos sin problemas a la pantalla y, gracias a una CPU muy potente, también da una buena imagen más allá de los juegos. Nuestro dispositivo de prueba cuesta un poco menos de 1.200 euros (~$1.407). Además, hay otras variantes de configuración disponibles. Los precios comienzan en poco menos de 700 Euros (~$821).
Procesador
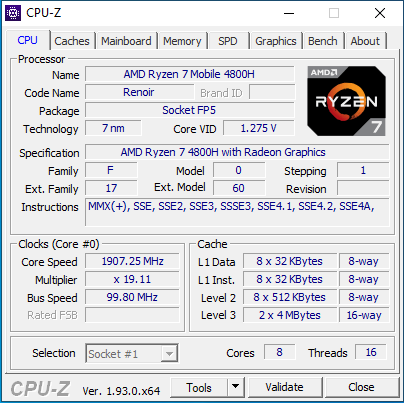
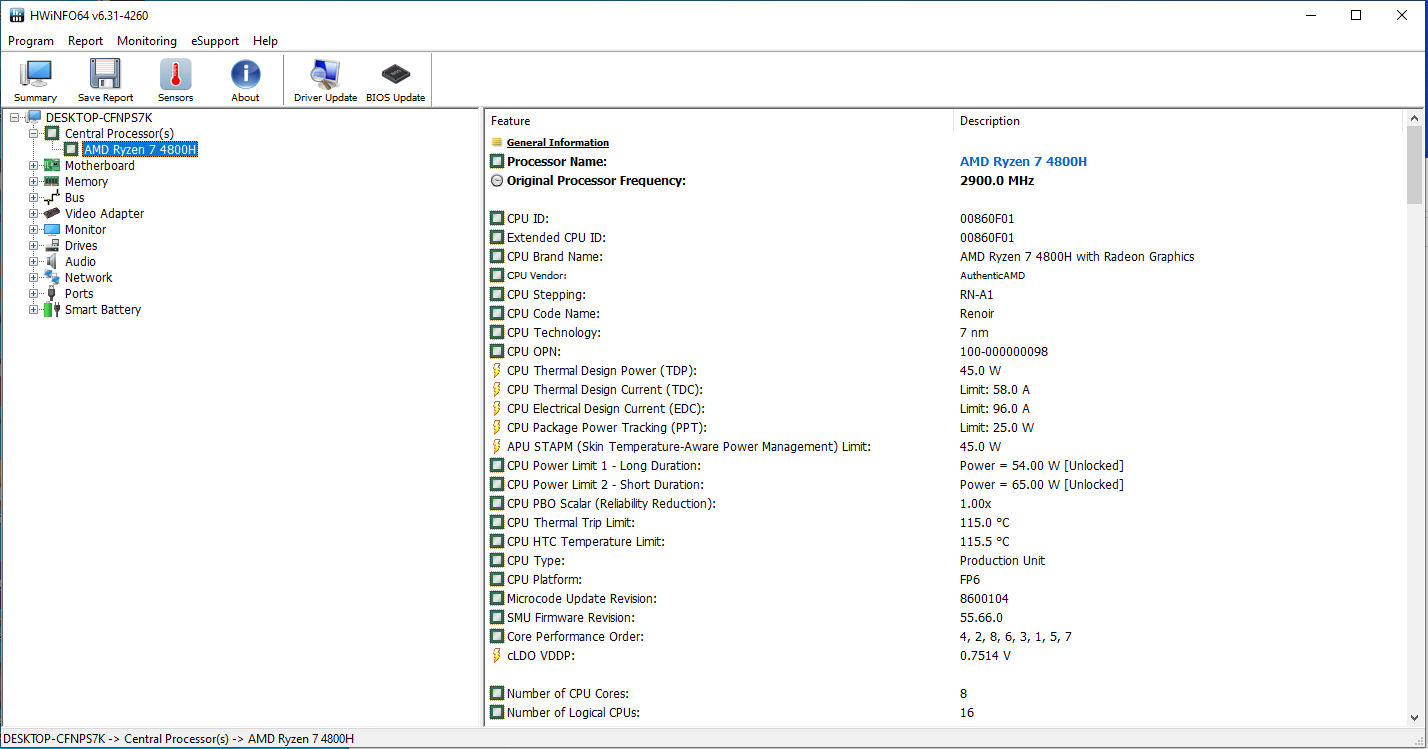
El portátil de HP tiene un Ryzen 7 4800H (Renoir) APU a bordo. La parte de la CPU de la APU consiste en un procesador de octa-núcleo que opera a una velocidad base de 2,9 GHz. Un aumento de hasta 4,2 GHz es posible a través de Turbo. Se admite el multihilo simultáneo (se pueden procesar dos hilos por núcleo).
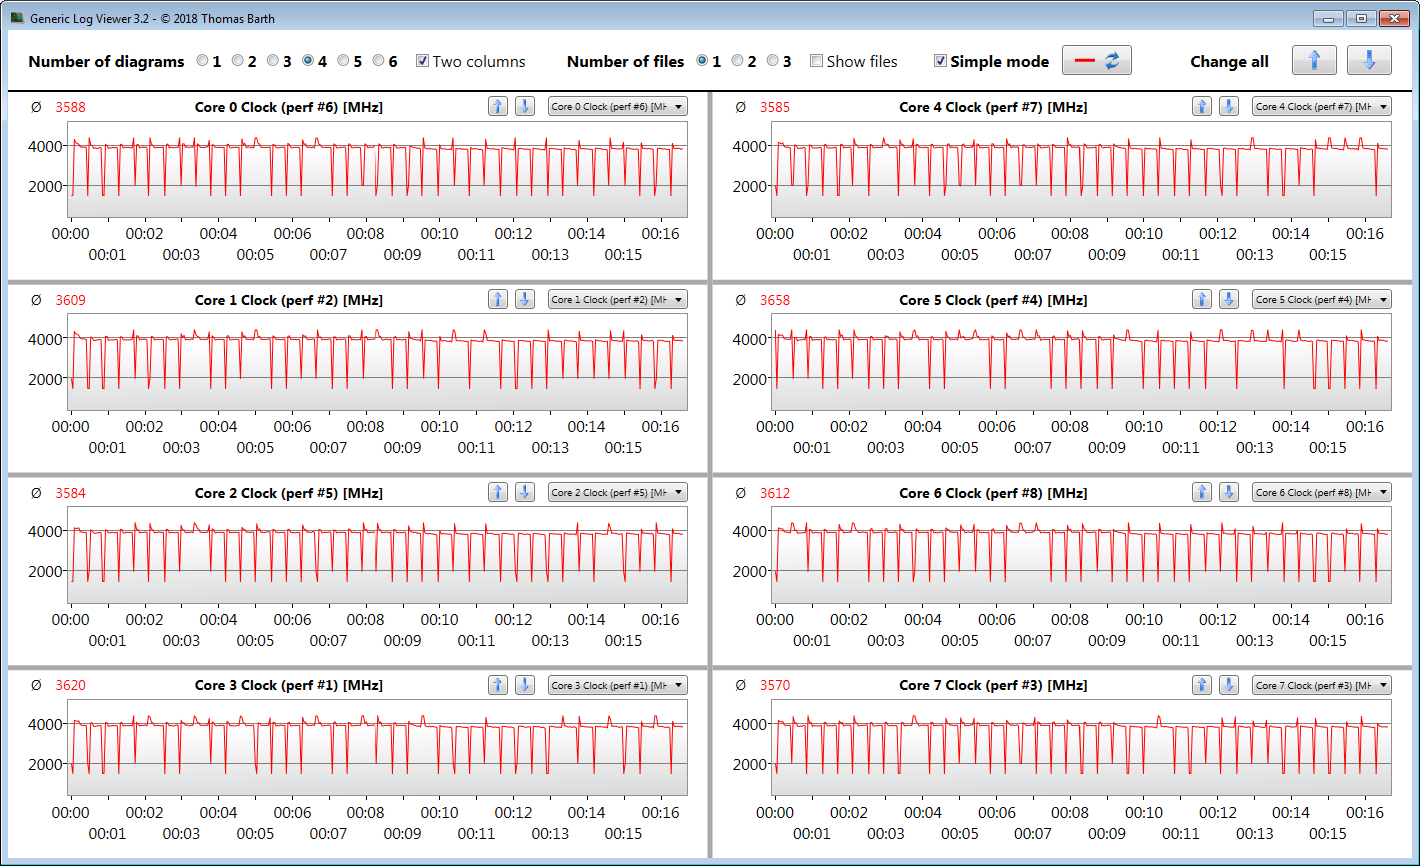
Las pruebas de multihilo de los puntos de referencia de Cinebench se realizan a 3,7 a 4,1 GHz (enchufado) y 3 a 3,1 GHz (con pilas). Las pruebas de un solo hilo se procesan a 1,4 a 4,2 GHz (enchufado y con batería).
Verificamos si el Turbo de la CPU también se usa consistentemente cuando se conecta ejecutando la prueba multihilo del Cinebench R15 en un bucle continuo durante al menos 30 minutos. El Turbo se utiliza en gran medida.
* ... más pequeño es mejor
Rendimiento del sistema
El sistema es rápido y suave. El hardware incorporado proporciona una potencia de cálculo más que suficiente para todas las áreas de aplicación comunes: juegos, edición de vídeo, procesamiento de imágenes, aplicaciones de oficina y uso de Internet. Esto va acompañado de muy buenos resultados de PCMark.
| PCMark 8 Home Score Accelerated v2 | 4805 puntos | |
| PCMark 8 Creative Score Accelerated v2 | 5920 puntos | |
| PCMark 8 Work Score Accelerated v2 | 5580 puntos | |
| PCMark 10 Score | 5602 puntos | |
ayuda | ||
Latencias DPC
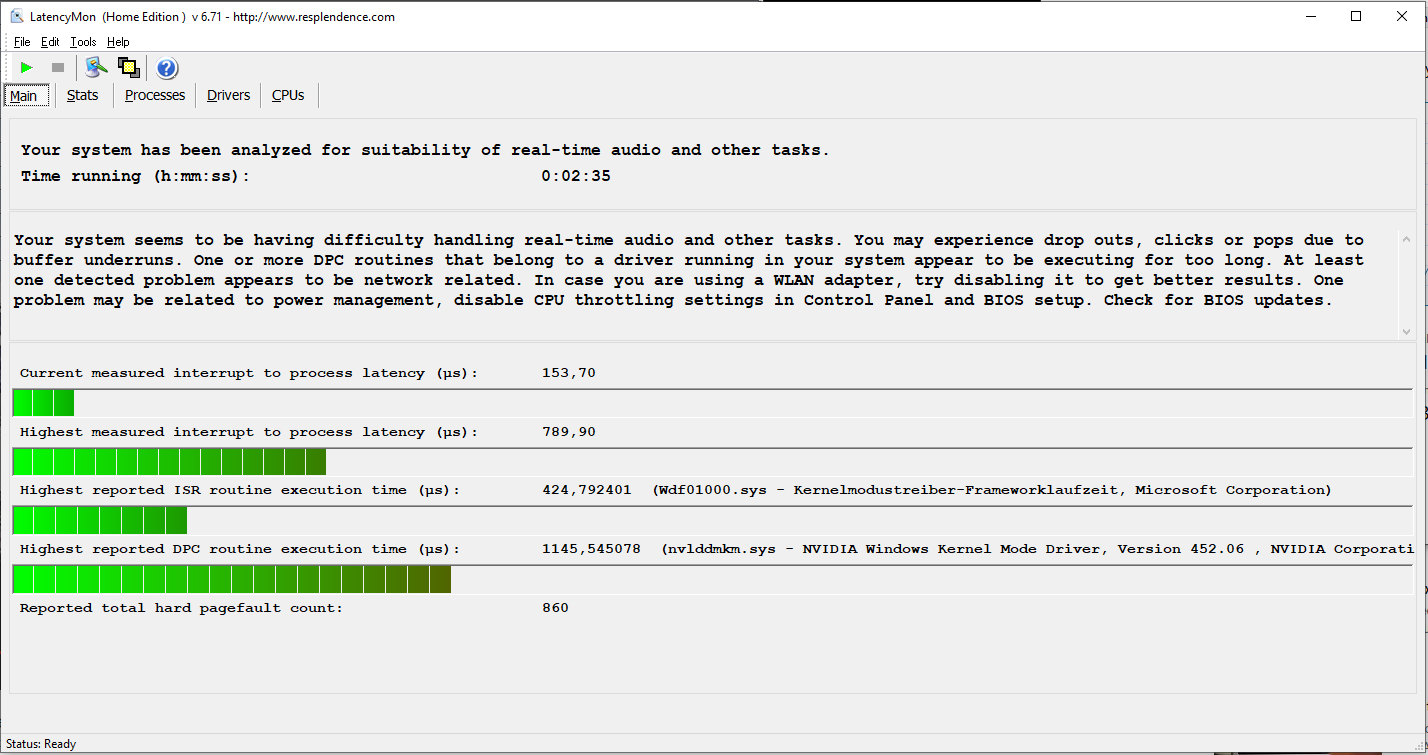
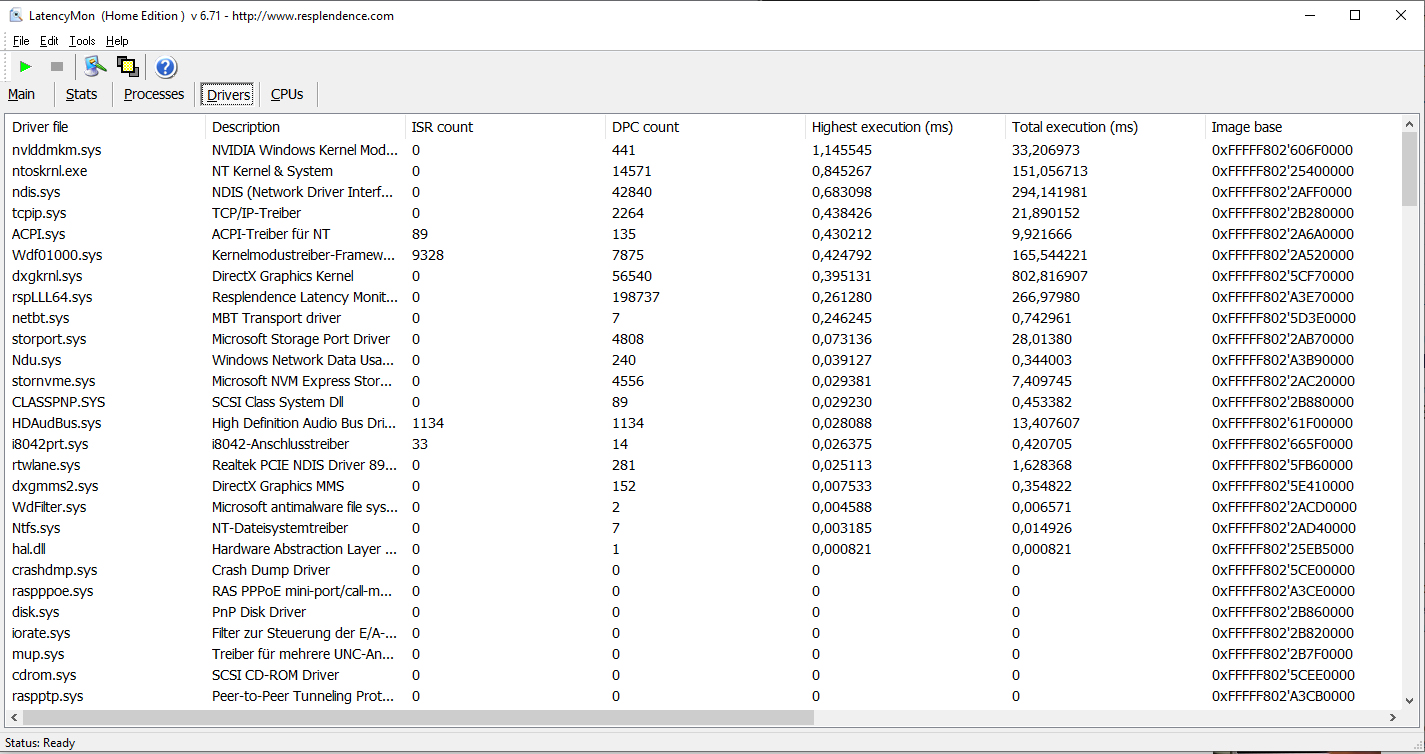
En nuestra prueba de monitor de latencia estandarizada (navegación por la web, reproducción de vídeo 4K, Prime95 de alta carga), pudimos observar problemas con las latencias DPC. El sistema no parece ser adecuado para la edición de vídeo y audio en tiempo real.
| DPC Latencies / LatencyMon - interrupt to process latency (max), Web, Youtube, Prime95 | |
| Dell G3 15 3500-G4DG2 | |
| Asus ROG Strix G15 G512LI | |
| Acer Nitro 5 AN515-44-R5FT | |
| Asus TUF Gaming A15 FA506IV-HN172 | |
| HP Pavilion Gaming 15-ec1177ng | |
| Lenovo IdeaPad Gaming 3i 15IMH05 | |
| HP Pavilion Gaming 15-ec1206ng | |
* ... más pequeño es mejor
Almacenamiento
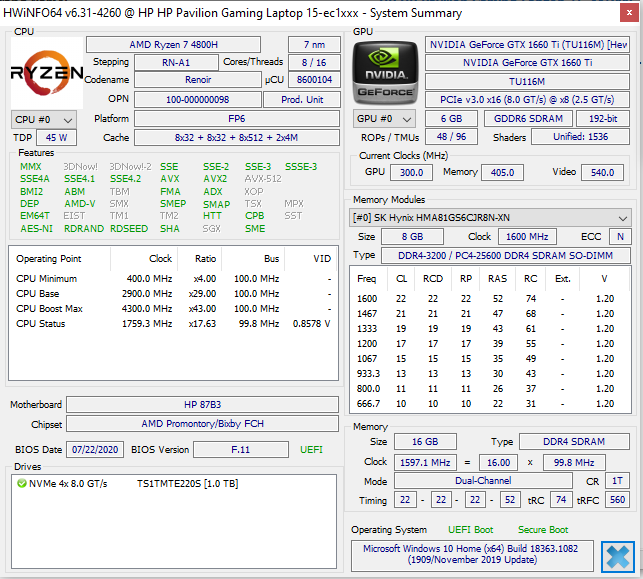
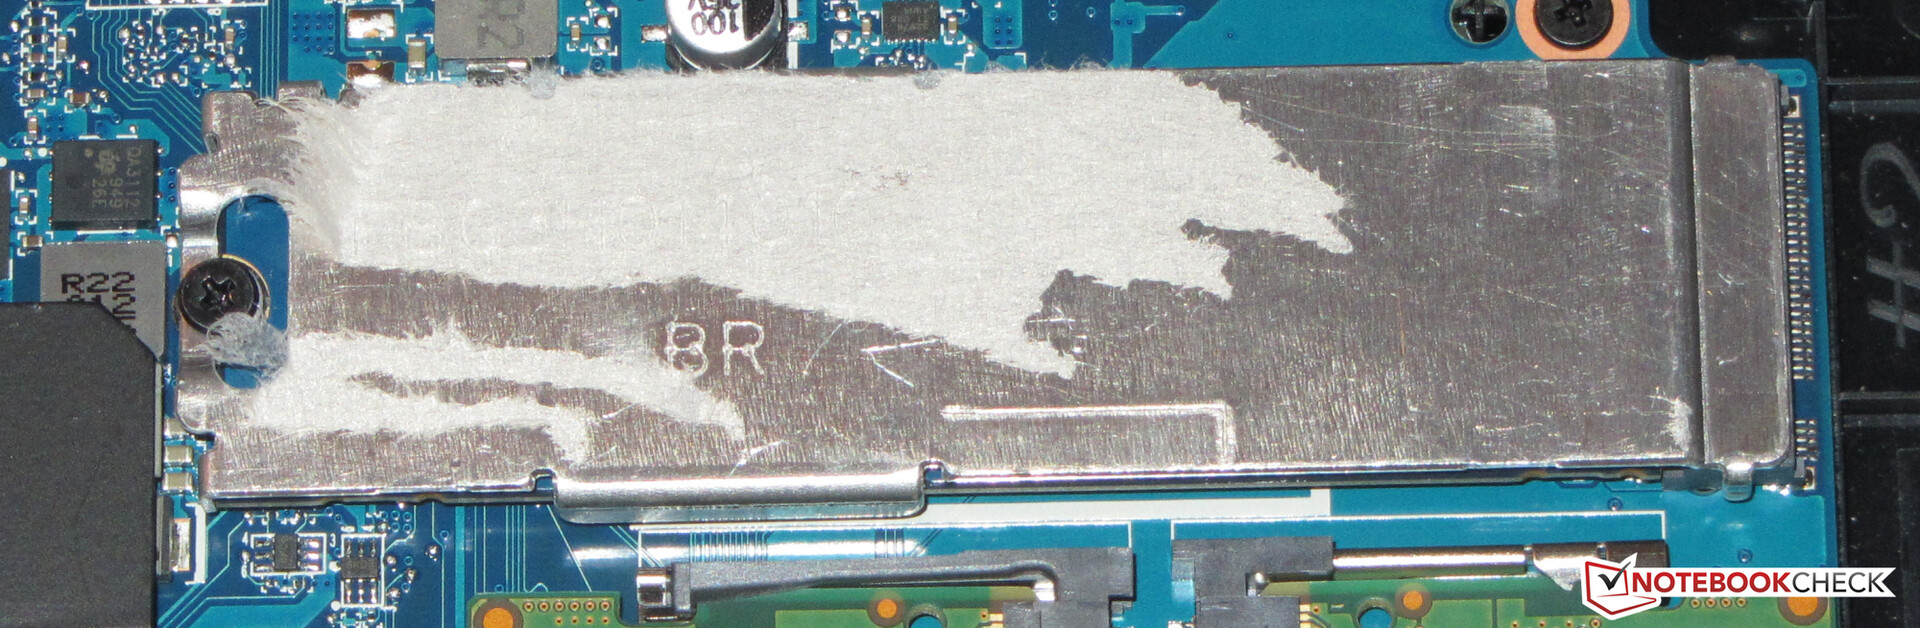
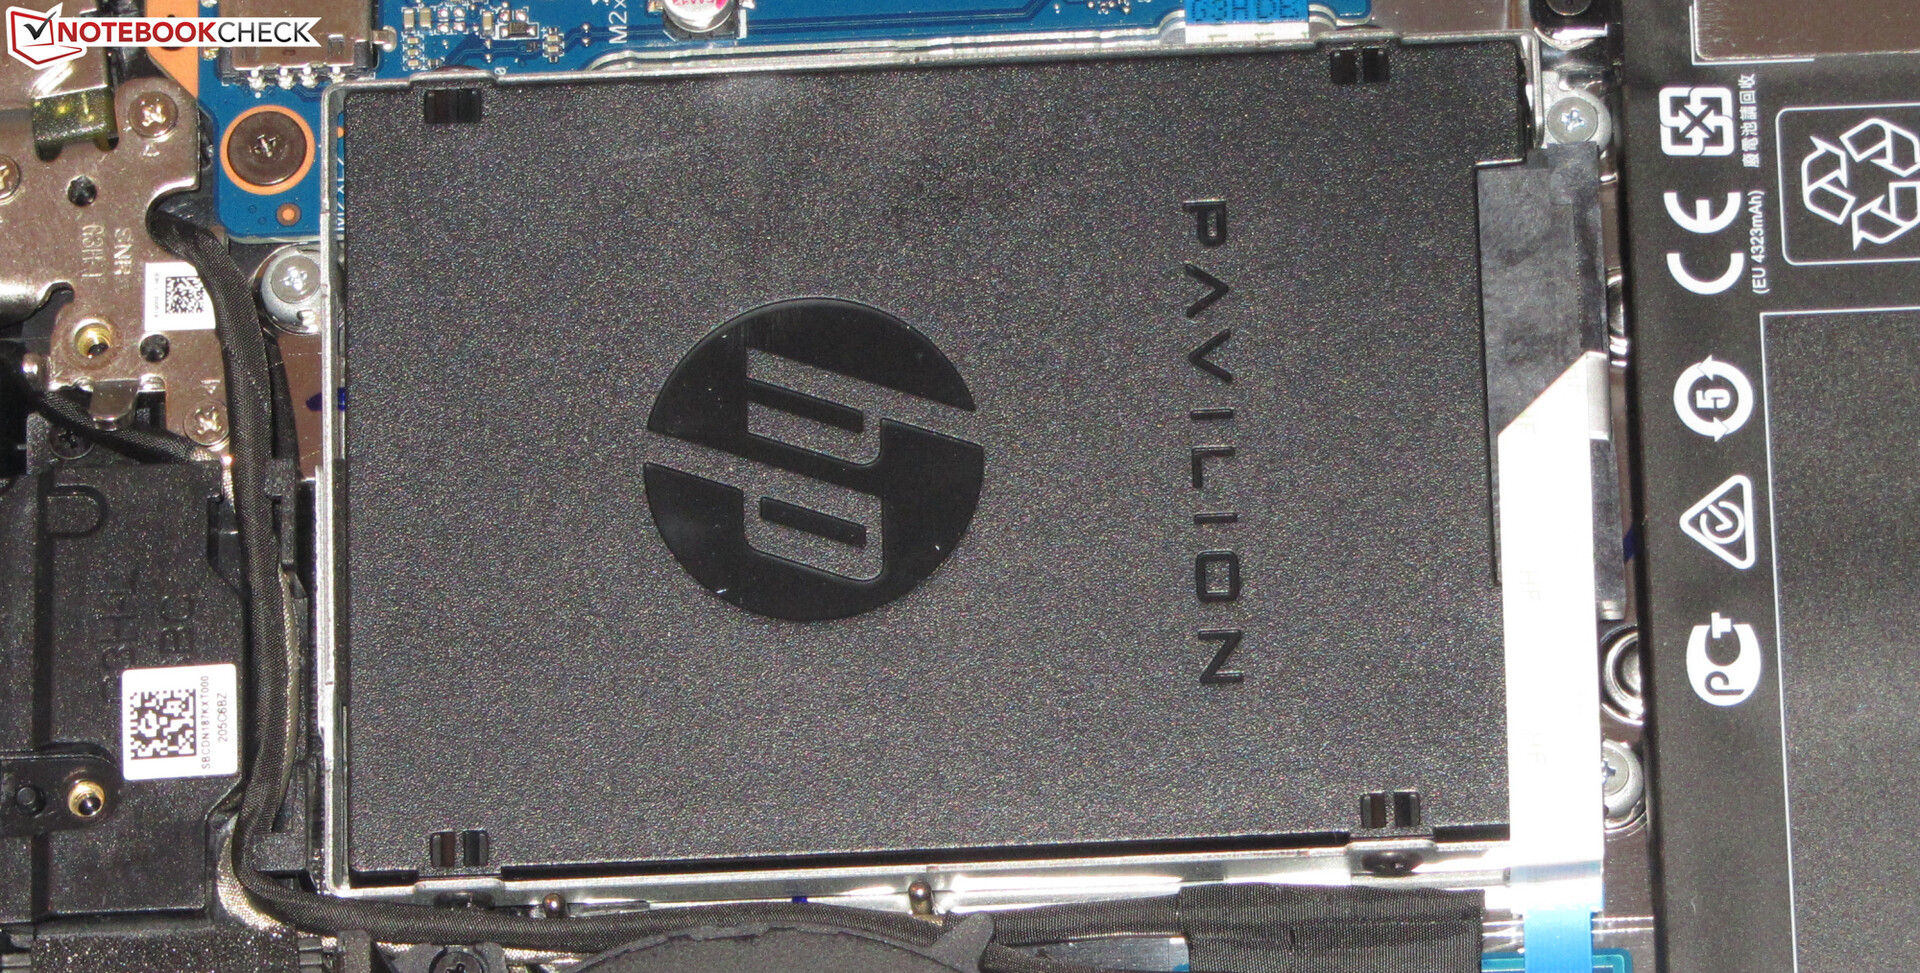
La unidad del sistema es un SSD NVMe de 512 GB (M.2 2280) de Intel que proporciona buenas velocidades de transferencia. Sin embargo, no es uno de los SSD más rápidos. El portátil también tiene espacio para un dispositivo de almacenamiento de 2,5 pulgadas. La ranura SATA y el marco de montaje están disponibles.

| HP Pavilion Gaming 15-ec1177ng Intel SSD 660p SSDPEKNW512G8 | Dell G3 15 3500-G4DG2 SK Hynix BC511 HFM512GDJTNI | Acer Nitro 5 AN515-44-R5FT SK Hynix BC511 HFM512GDJTNI | Asus TUF Gaming A15 FA506IV-HN172 Kingston OM8PCP3512F-AB | Lenovo IdeaPad Gaming 3i 15IMH05 SK hynix BC511 HFM512GDHTNI-87A0B | Asus ROG Strix G15 G512LI Intel SSD 660p SSDPEKNW512G8 | HP Pavilion Gaming 15-ec1206ng Toshiba KBG40ZNV512G | HP Pavilion Gaming 15-ec0002ng Intel SSD 660p SSDPEKNW512G8 | HP Pavilion Gaming 15-ec0017ng WDC PC SN720 SDAPNTW-256G | Medio Intel SSD 660p SSDPEKNW512G8 | Media de la clase Gaming | |
|---|---|---|---|---|---|---|---|---|---|---|---|
| CrystalDiskMark 5.2 / 6 | -4% | 0% | 15% | 1% | -4% | 16% | -3% | 23% | -1% | 174% | |
| Write 4K (MB/s) | 110 | 99.6 -9% | 94.7 -14% | 219.8 100% | 130 18% | 125.4 14% | 111.5 1% | 136.9 24% | 148 35% | 136 ? 24% | 203 ? 85% |
| Read 4K (MB/s) | 52.8 | 38.8 -27% | 38.91 -26% | 50.2 -5% | 44.44 -16% | 52.7 0% | 38.17 -28% | 57 8% | 43.73 -17% | 55.2 ? 5% | 78.2 ? 48% |
| Write Seq (MB/s) | 983 | 1117 14% | 1056 7% | 979 0% | 1059 8% | 943 -4% | 1515 54% | 968 -2% | 1617 64% | 926 ? -6% | 3724 ? 279% |
| Read Seq (MB/s) | 1608 | 1030 -36% | 1183 -26% | 1990 24% | 1105 -31% | 1383 -14% | 1576 -2% | 1631 1% | 1753 9% | 1523 ? -5% | 3596 ? 124% |
| Write 4K Q32T1 (MB/s) | 461.3 | 445.2 -3% | 445.3 -3% | 516 12% | 490.3 6% | 437.9 -5% | 365.4 -21% | 237 -49% | 246.3 -47% | 380 ? -18% | 610 ? 32% |
| Read 4K Q32T1 (MB/s) | 345.4 | 331.8 -4% | 477.7 38% | 298.3 -14% | 309.2 -10% | 334.9 -3% | 504 46% | 337.1 -2% | 368 7% | 334 ? -3% | 714 ? 107% |
| Write Seq Q32T1 (MB/s) | 982 | 1102 12% | 1063 8% | 982 0% | 1053 7% | 960 -2% | 1493 52% | 963 -2% | 1618 65% | 987 ? 1% | 5210 ? 431% |
| Read Seq Q32T1 (MB/s) | 1820 | 2227 22% | 2154 18% | 1907 5% | 2261 24% | 1530 -16% | 2340 29% | 1863 2% | 3027 66% | 1744 ? -4% | 6960 ? 282% |
| Write 4K Q8T8 (MB/s) | 981 | 810 ? | 1306 ? | ||||||||
| Read 4K Q8T8 (MB/s) | 300.9 | 344 ? | 1633 ? | ||||||||
| AS SSD | 10% | 22% | 7% | 13% | -17% | 7% | -40% | 12% | -7% | 200% | |
| Seq Read (MB/s) | 1553 | 1305 -16% | 1504 -3% | 1682 8% | 1348 -13% | 1157 -25% | 2048 32% | 1623 5% | 2607 68% | 1423 ? -8% | 5487 ? 253% |
| Seq Write (MB/s) | 868 | 767 -12% | 1064 23% | 904 4% | 1000 15% | 675 -22% | 1039 20% | 891 3% | 1518 75% | 828 ? -5% | 3926 ? 352% |
| 4K Read (MB/s) | 56.6 | 41.84 -26% | 51.5 -9% | 60.2 6% | 48.04 -15% | 49.99 -12% | 52.8 -7% | 48.06 -15% | 39.16 -31% | 51.3 ? -9% | 70.1 ? 24% |
| 4K Write (MB/s) | 153.6 | 90.1 -41% | 123.2 -20% | 164.8 7% | 103.3 -33% | 114 -26% | 146 -5% | 102.1 -34% | 104.9 -32% | 128.9 ? -16% | 215 ? 40% |
| 4K-64 Read (MB/s) | 325.3 | 773 138% | 703 116% | 472.5 45% | 755 132% | 322.2 -1% | 1285 295% | 325.6 0% | 513 58% | 326 ? 0% | 1647 ? 406% |
| 4K-64 Write (MB/s) | 762 | 711 -7% | 730 -4% | 845 11% | 749 -2% | 759 0% | 758 -1% | 94.1 -88% | 416.7 -45% | 721 ? -5% | 2876 ? 277% |
| Access Time Read * (ms) | 0.07 | 0.09 -29% | 0.064 9% | 0.087 -24% | 0.061 13% | 0.07 -0% | 0.155 -121% | 0.171 -144% | 0.076 -9% | 0.09003 ? -29% | 0.06383 ? 9% |
| Access Time Write * (ms) | 0.046 | 0.04 13% | 0.031 33% | 0.02 57% | 0.036 22% | 0.137 -198% | 0.202 -339% | 0.048 -4% | 0.037 20% | 0.07378 ? -60% | 0.03932 ? 15% |
| Score Read (Points) | 537 | 945 76% | 905 69% | 701 31% | 938 75% | 488 -9% | 1543 187% | 536 0% | 813 51% | 519 ? -3% | 2266 ? 322% |
| Score Write (Points) | 1002 | 878 -12% | 960 -4% | 1101 10% | 952 -5% | 940 -6% | 1008 1% | 285 -72% | 673 -33% | 932 ? -7% | 3483 ? 248% |
| Score Total (Points) | 1802 | 2290 27% | 2321 29% | 2143 19% | 2365 31% | 1673 -7% | 3298 83% | 1077 -40% | 1858 3% | 1708 ? -5% | 6838 ? 279% |
| Copy ISO MB/s (MB/s) | 1301 | 675 -48% | 749 -42% | 939 -28% | 691 -47% | 566 -56% | 1639 26% | 1109 ? -15% | 3083 ? 137% | ||
| Copy Program MB/s (MB/s) | 313.7 | 248.4 -21% | 342.5 9% | 489.9 56% | 345.8 10% | 223.8 -29% | 284.2 -9% | 468 ? 49% | 956 ? 205% | ||
| Copy Game MB/s (MB/s) | 621 | 535 -14% | 571 -8% | 895 44% | 517 -17% | 104.3 -83% | 767 24% | 760 ? 22% | 2043 ? 229% | ||
| Media total (Programa/Opciones) | 3% /
4% | 11% /
13% | 11% /
10% | 7% /
8% | -11% /
-12% | 12% /
10% | -22% /
-26% | 18% /
16% | -4% /
-4% | 187% /
190% |
* ... más pequeño es mejor
Carga continua de lectura: DiskSpd Read Loop, Queue Depth 8
Tarjeta gráfica
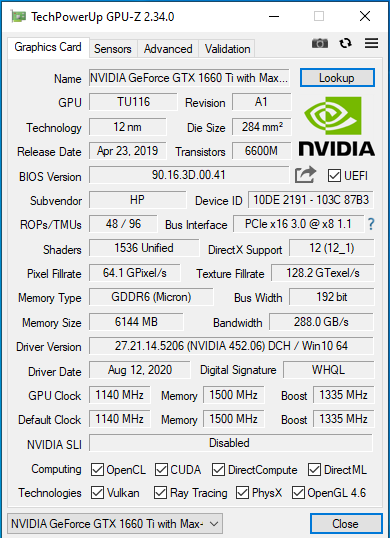
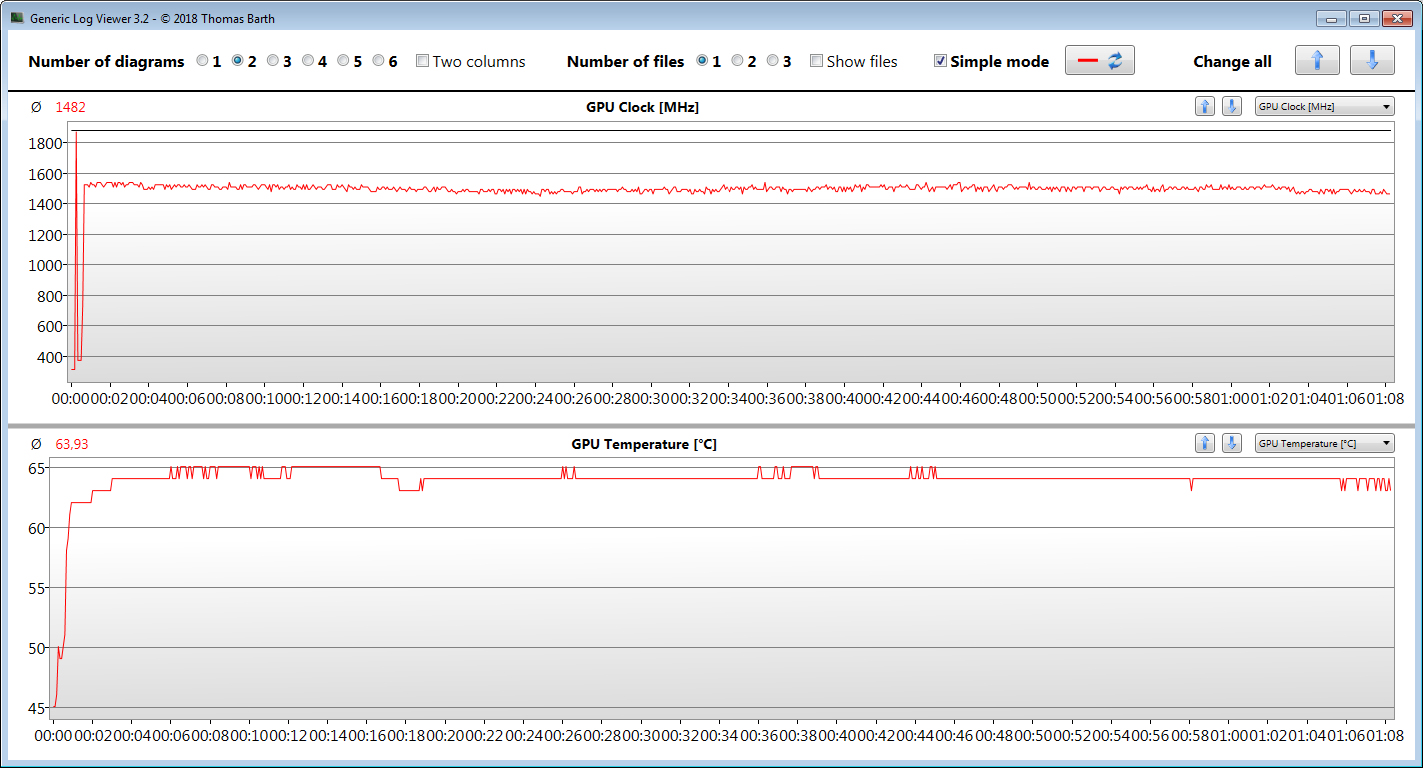
El núcleo gráfico de la GeForce GTX 1660 Ti Max-Q (Turing) pertenece a la gama media superior. Nvidia especifica un nivel de velocidad entre 1.140 MHz (base) y 1.335 MHz (boost) para esta GPU DirectX 12.
Se pueden alcanzar velocidades más altas si la GPU no alcanza un umbral de temperatura y/o energía especificado. De esta forma, registramos un máximo de 1.869 MHz. Además, nuestra prueba de The Witcher 3 se realiza a una velocidad media de 1.482 MHz. La GPU puede hacer uso de la rápida memoria de gráficos GDDR6 (6.144 MB).
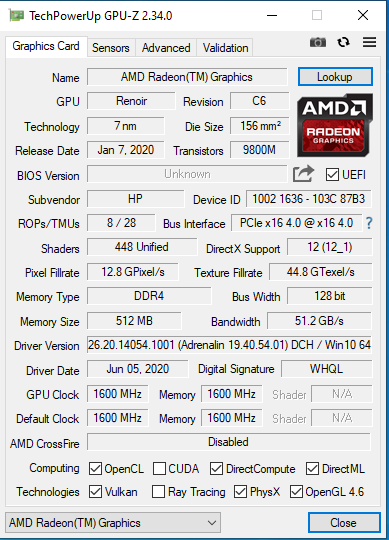
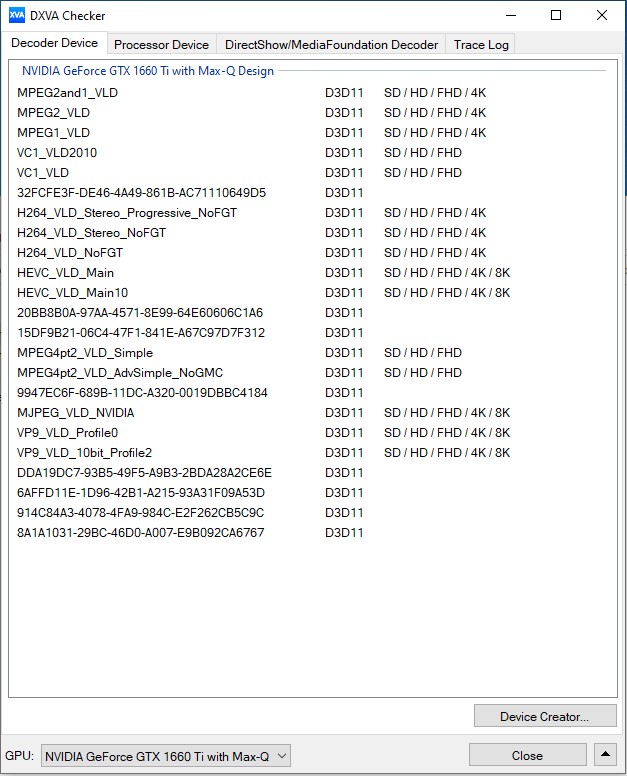
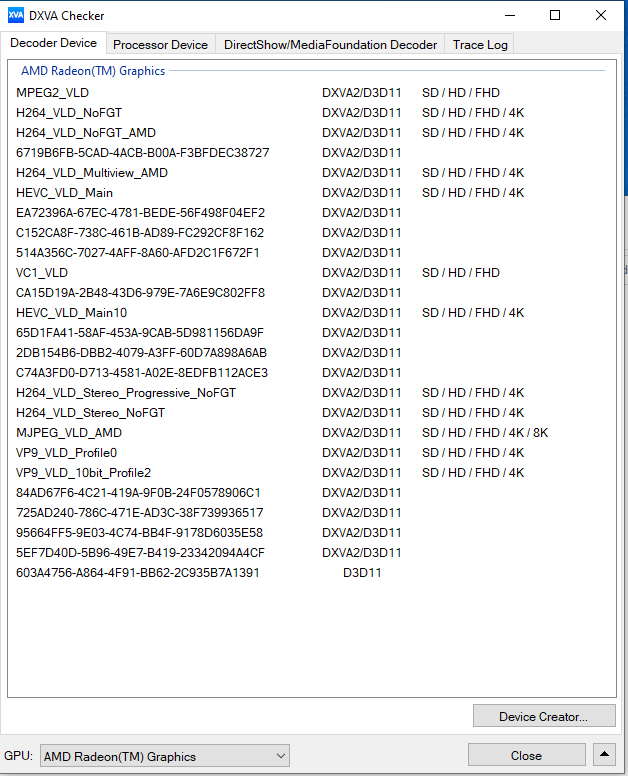
Los resultados en las pruebas de 3DMark están a un nivel normal para esta GPU. La GPU Vega 7 integrada en el procesador está activa, y el portátil funciona con la solución de conmutación de gráficos Optimus de Nvidia.
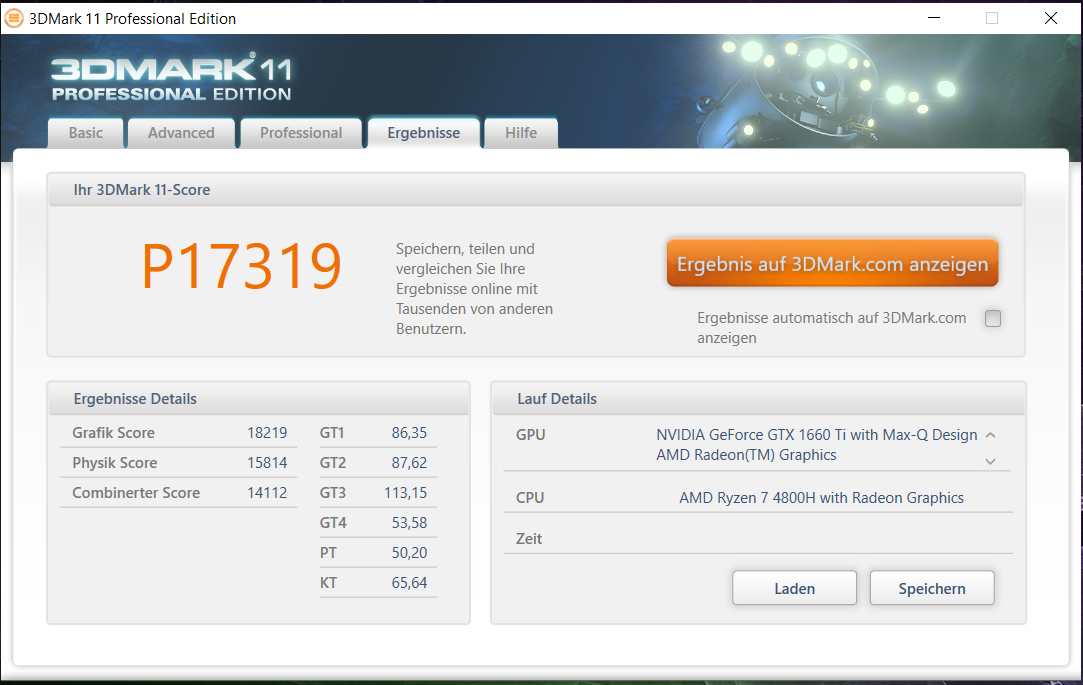
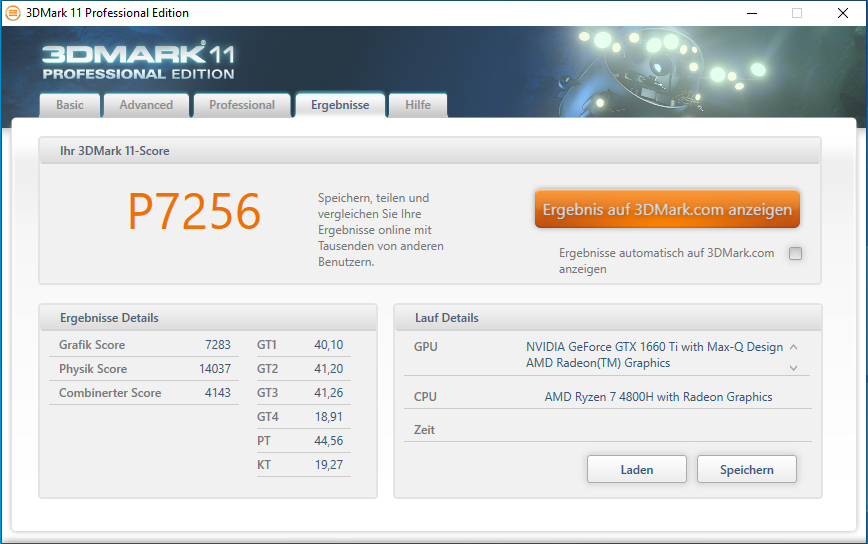
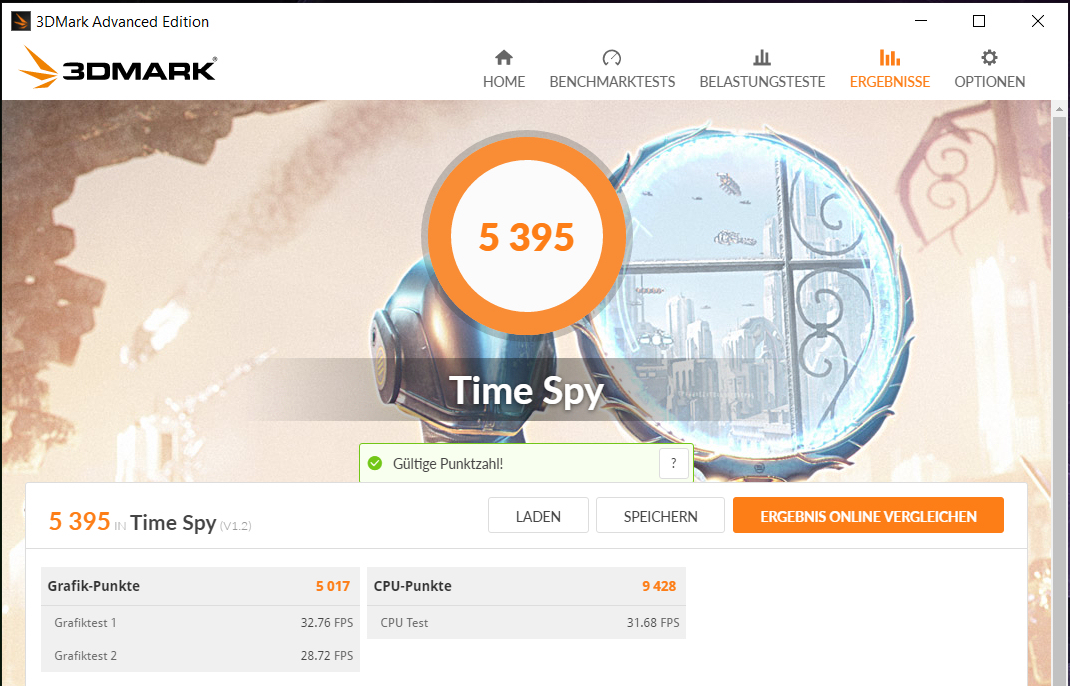
| 3DMark 11 Performance | 17319 puntos | |
| 3DMark Cloud Gate Standard Score | 39942 puntos | |
| 3DMark Fire Strike Score | 12487 puntos | |
| 3DMark Time Spy Score | 6395 puntos | |
ayuda | ||
El rendimiento de los juegos
El hardware incorporado lleva todos los juegos de nuestra base de datos sin problemas a la pantalla. Se puede seleccionar una resolución Full HD y ajustes de alta o a veces máxima calidad. Resoluciones más allá de Full HD (un monitor apropiado tendría que estar conectado para esto) son posibles a un nivel de calidad reducido en algunos casos.
| Red Dead Redemption 2 - 1920x1080 High Settings | |
| HP Pavilion Gaming 15-ec1177ng | |
| Medio NVIDIA GeForce GTX 1660 Ti Max-Q (n=1) | |
| Acer Nitro 5 AN515-44-R5FT | |
| Lenovo IdeaPad Gaming 3i 15IMH05 | |
| HP Pavilion Gaming 15-ec0002ng | |
| Escape from Tarkov - 1920x1080 Ultra Preset | |
| HP Pavilion Gaming 15-ec1177ng | |
| Medio NVIDIA GeForce GTX 1660 Ti Max-Q (n=1) | |
| Lenovo IdeaPad Gaming 3i 15IMH05 | |
| Star Wars Jedi Fallen Order - 1920x1080 Epic Preset | |
| HP Pavilion Gaming 15-ec1177ng | |
| Medio NVIDIA GeForce GTX 1660 Ti Max-Q (n=1) | |
| Lenovo IdeaPad Gaming 3i 15IMH05 | |
| HP Pavilion Gaming 15-ec0002ng | |
| Call of Duty Modern Warfare 2019 - 1920x1080 Maximum Settings AA:T2X Filmic SM | |
| HP Pavilion Gaming 15-ec1177ng | |
| Medio NVIDIA GeForce GTX 1660 Ti Max-Q (n=1) | |
| Acer Nitro 5 AN515-44-R5FT | |
| Lenovo IdeaPad Gaming 3i 15IMH05 | |
| HP Pavilion Gaming 15-ec1206ng | |
| HP Pavilion Gaming 15-ec0002ng | |
| Doom Eternal - 1920x1080 Ultra Preset | |
| Dell G3 15 3500-G4DG2 | |
| HP Pavilion Gaming 15-ec1177ng | |
| Medio NVIDIA GeForce GTX 1660 Ti Max-Q (n=1) | |
| F1 2020 - 1920x1080 Ultra High Preset AA:T AF:16x | |
| HP Pavilion Gaming 15-ec1177ng | |
| Medio NVIDIA GeForce GTX 1660 Ti Max-Q (n=1) | |
| HP Pavilion Gaming 15-ec1206ng | |
| Death Stranding - 1920x1080 Very High Preset | |
| HP Pavilion Gaming 15-ec1177ng | |
| Medio NVIDIA GeForce GTX 1660 Ti Max-Q (n=1) | |
| HP Pavilion Gaming 15-ec1206ng | |
Para verificar si las frecuencias de cuadro se mantienen en gran medida constantes incluso durante un período de tiempo prolongado, dejamos que el juego The Witcher 3 se ejecute durante unos 60 minutos con una resolución Full HD y una configuración de máxima calidad. El personaje no se mueve. No se encontró una caída en la frecuencia de fotogramas.
| bajo | medio | alto | ultra | |
|---|---|---|---|---|
| BioShock Infinite (2013) | 263.2 | 249.5 | 226.9 | 119.2 |
| The Witcher 3 (2015) | 258.3 | 166.4 | 95.3 | 53.2 |
| Battlefield V (2018) | 152 | 102.6 | 92.2 | 85 |
| Apex Legends (2019) | 144 | 133.9 | 99.6 | 99.6 |
| Ghost Recon Breakpoint (2019) | 114 | 72 | 66 | 51 |
| Call of Duty Modern Warfare 2019 (2019) | 135.2 | 88 | 72.6 | 62.6 |
| Need for Speed Heat (2019) | 95.8 | 83 | 73.9 | 66.9 |
| Star Wars Jedi Fallen Order (2019) | 91.5 | 78.1 | 72.4 | |
| Red Dead Redemption 2 (2019) | 115.1 | 71.7 | 47.2 | 29.4 |
| Escape from Tarkov (2020) | 121.2 | 98.3 | 90.5 | 87.7 |
| Hunt Showdown (2020) | 176.8 | 81.2 | 63.3 | |
| Doom Eternal (2020) | 168.9 | 101.7 | 95.4 | 93.4 |
| Gears Tactics (2020) | 214.7 | 130.2 | 79.9 | 56.1 |
| F1 2020 (2020) | 219 | 130 | 112 | 79 |
| Death Stranding (2020) | 136.1 | 87.7 | 81.3 | 78.4 |
| Horizon Zero Dawn (2020) | 119 | 78 | 65 | 51 |
| Flight Simulator 2020 (2020) | 55.1 | 49.4 | 37.1 | 25.3 |
Emisiones y energía - El portátil de HP no se calienta especialmente
Emisiones de ruido
Los dos ventiladores suelen ser silenciosos en el uso ocioso y hay silencio. Pero aparecen bajo carga. De esta manera, registramos un nivel máximo de presión sonora de 47 dB(A) durante la prueba de esfuerzo. A un nivel de 42,2 dB(A), hay menos ruido durante nuestra prueba de The Witcher 3.
Ruido
| Ocioso |
| 27 / 27 / 27 dB(A) |
| Carga |
| 42.4 / 47 dB(A) |
 | ||
30 dB silencioso 40 dB(A) audible 50 dB(A) ruidosamente alto |
||
min: | ||
Temperatura
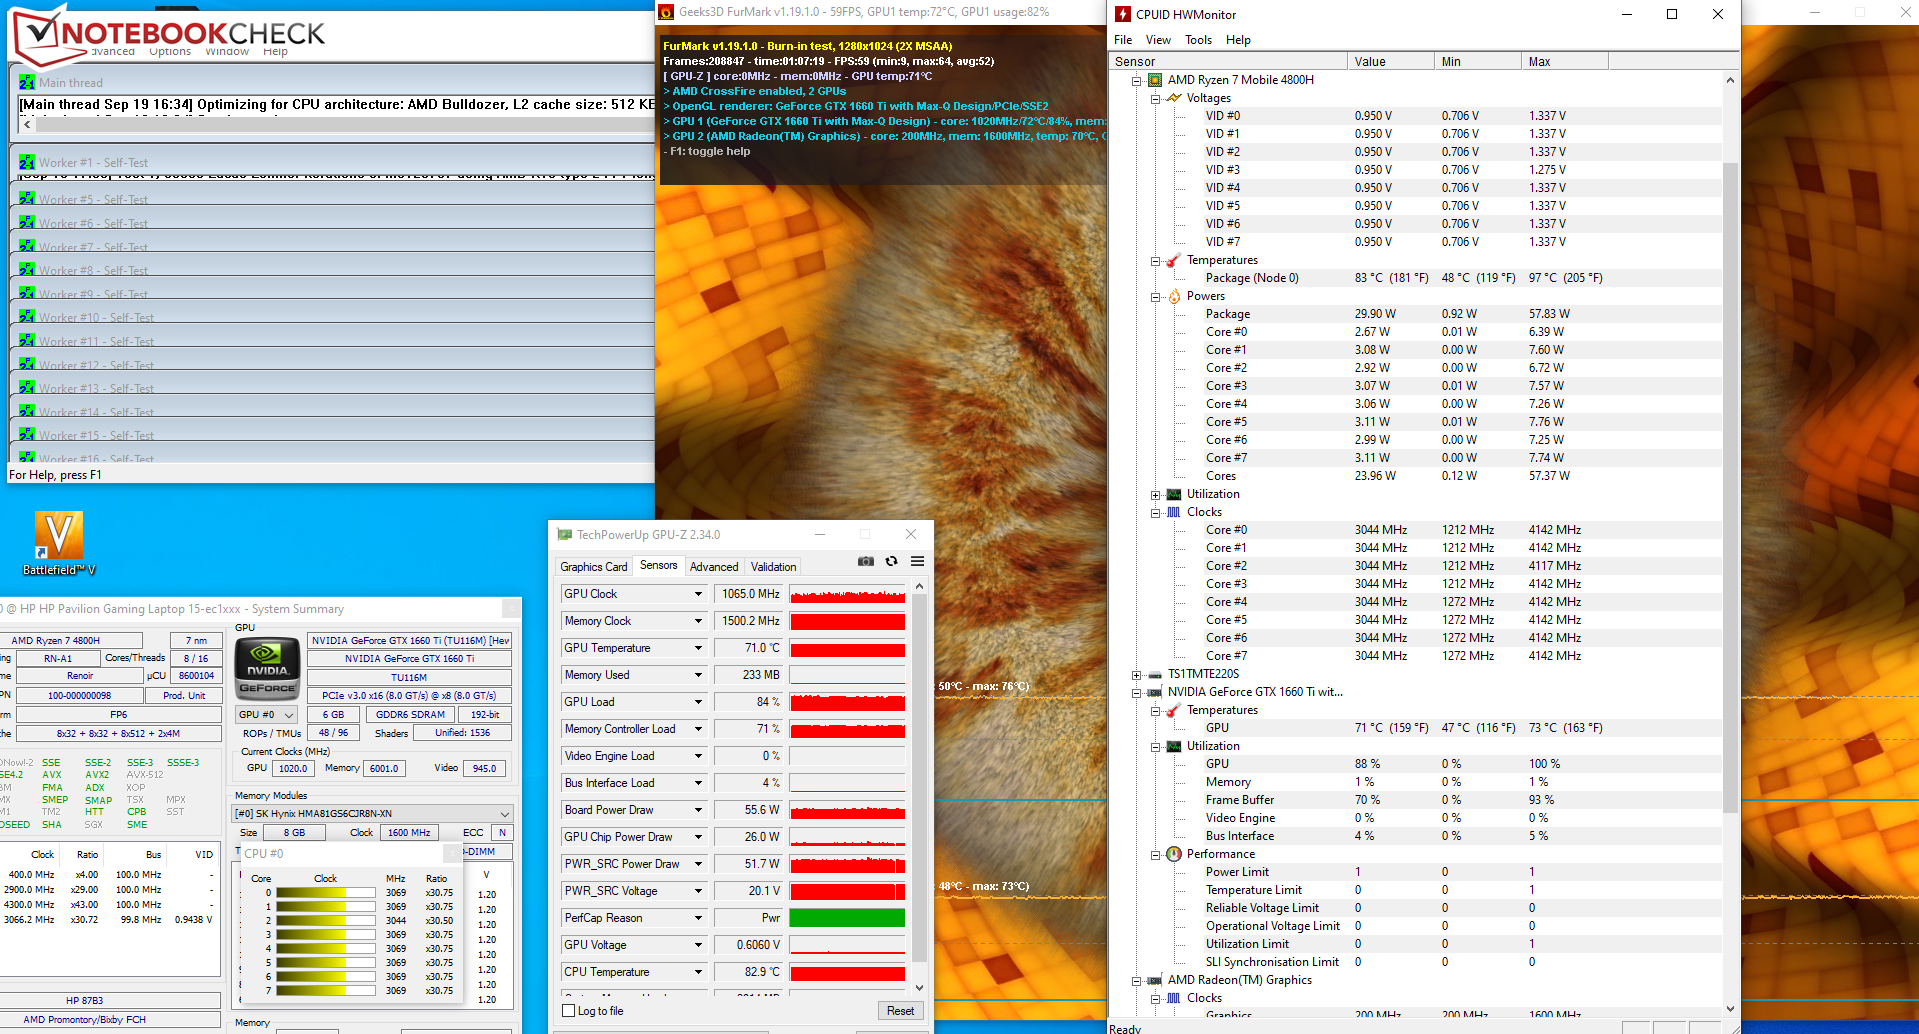
Nuestra prueba de estrés (Prime95 y FurMark funcionan durante al menos una hora) es ejecutada por el procesador a 4 GHz durante un corto tiempo. La velocidad entonces baja a entre 3 y 3,1 GHz y permanece en este nivel. El núcleo de gráficos funciona entre 900 y 1.200 MHz. Con la energía de la batería, las velocidades son de 1,7 a 1,9 GHz (CPU) y de 1.000 a 1.700 MHz (GPU), respectivamente. La prueba de esfuerzo representa un escenario extremo que no ocurre en la vida cotidiana. Con esta prueba, comprobamos si el sistema se mantiene estable incluso a plena carga.
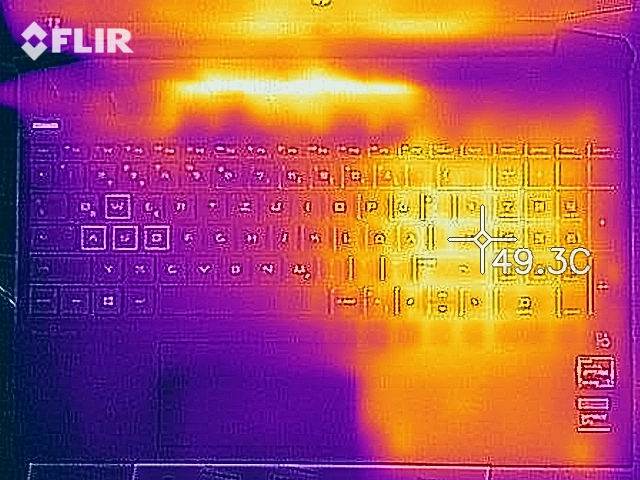
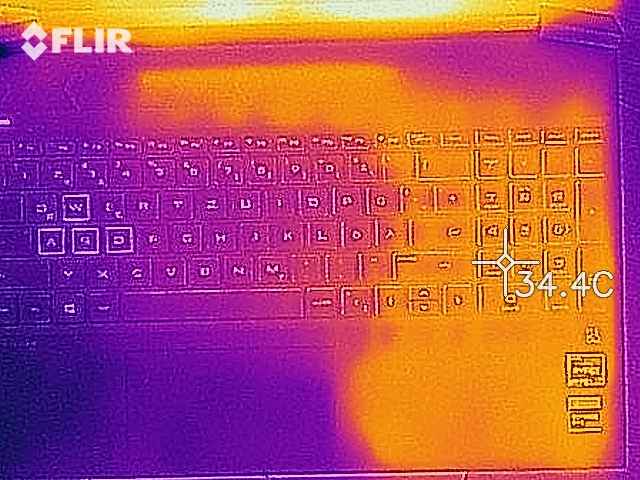
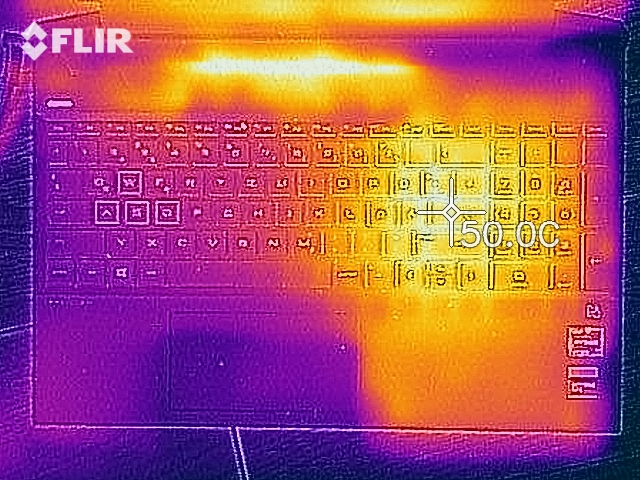
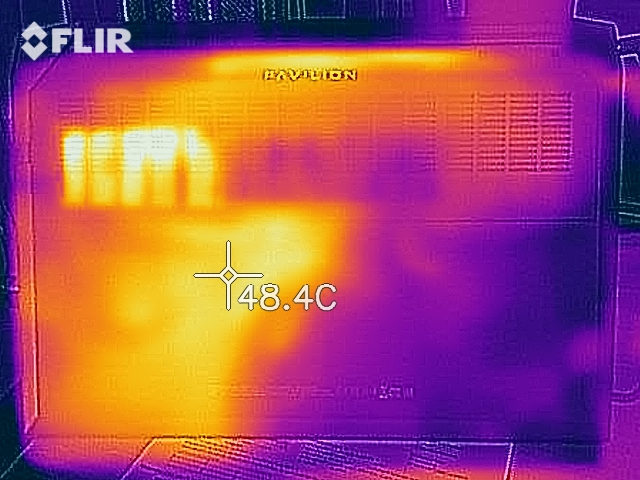
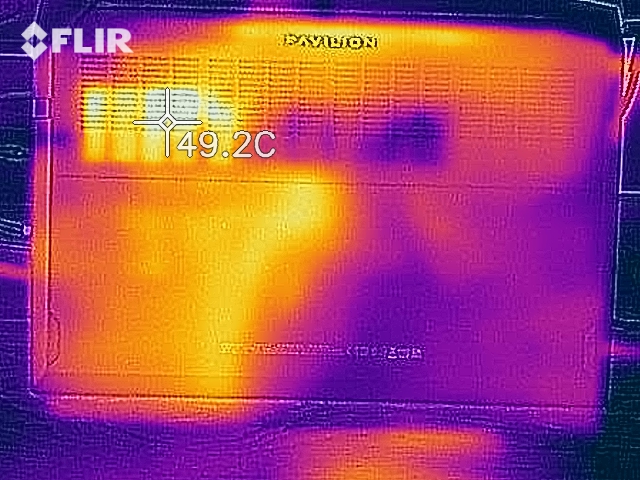
El portátil no se calienta con especial fuerza. Durante la prueba de estrés, registramos temperaturas en el rango inferior de 40°C (~104 °F) en tres puntos de medición. Además, el desarrollo de calor es significativamente menor cuando realizamos nuestra prueba de The Witcher 3. En el uso diario, las temperaturas están en el rango verde.
(±) La temperatura máxima en la parte superior es de 42.9 °C / 109 F, frente a la media de 40.4 °C / 105 F, que oscila entre 21.2 y 68.8 °C para la clase Gaming.
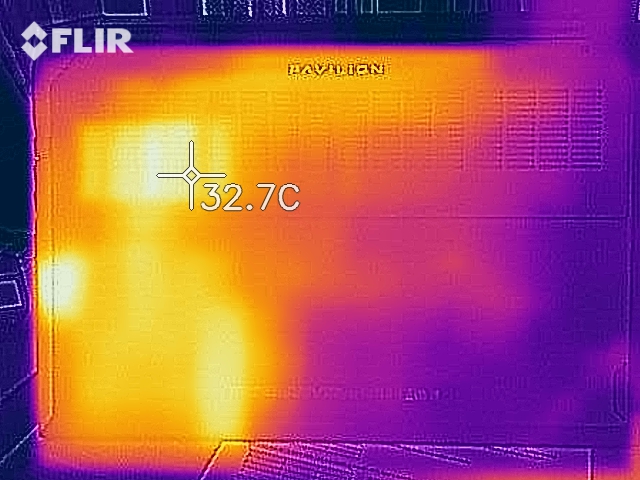
(+) El fondo se calienta hasta un máximo de 39.5 °C / 103 F, frente a la media de 43.2 °C / 110 F
(+) En reposo, la temperatura media de la parte superior es de 25.6 °C / 78# F, frente a la media del dispositivo de 33.9 °C / 93 F.
(±) Jugando a The Witcher 3, la temperatura media de la parte superior es de 32.5 °C / 91 F, frente a la media del dispositivo de 33.9 °C / 93 F.
(±) El reposamanos y el touchpad pueden calentarse mucho al tacto con un máximo de 36.5 °C / 97.7 F.
(-) La temperatura media de la zona del reposamanos de dispositivos similares fue de 28.8 °C / 83.8 F (-7.7 °C / -13.9 F).
Altavoces
HP Pavilion Gaming 15-ec1177ng análisis de audio
(-) | altavoces no muy altos (#60.8 dB)
Graves 100 - 315 Hz
(-) | casi sin bajos - de media 22% inferior a la mediana
(±) | la linealidad de los graves es media (11.9% delta a frecuencia anterior)
Medios 400 - 2000 Hz
(+) | medios equilibrados - a sólo 2.7% de la mediana
(±) | la linealidad de los medios es media (10.9% delta respecto a la frecuencia anterior)
Altos 2 - 16 kHz
(+) | máximos equilibrados - a sólo 2.3% de la mediana
(±) | la linealidad de los máximos es media (7.3% delta a frecuencia anterior)
Total 100 - 16.000 Hz
(±) | la linealidad del sonido global es media (23.2% de diferencia con la mediana)
En comparación con la misma clase
» 84% de todos los dispositivos probados de esta clase eran mejores, 4% similares, 11% peores
» El mejor tuvo un delta de 6%, la media fue 18%, el peor fue ###max##%
En comparación con todos los dispositivos probados
» 69% de todos los dispositivos probados eran mejores, 5% similares, 25% peores
» El mejor tuvo un delta de 4%, la media fue 24%, el peor fue ###max##%
Consumo de energía
No hay anormalidades en cuanto al consumo de energía. Registramos un consumo máximo de energía de 9,5 vatios en uso inactivo. Durante nuestra prueba de esfuerzo, el valor se eleva hasta 156 vatios. En el modo de juego (la prueba de Witcher 3), la demanda es menor con un promedio de 99 vatios (96 a 106 vatios). El adaptador de corriente de 200 vatios sigue ofreciendo mucho margen de maniobra.
| Off / Standby | |
| Ocioso | |
| Carga |
|
Clave:
min: | |
Duración de la batería
En nuestra prueba práctica de WLAN (se utiliza un script para reproducir la carga causada por el acceso a los sitios web), el portátil de HP alcanza un tiempo de ejecución de 6:07 horas. Este valor está perfectamente bien para un portátil para juegos, pero es significativamente más bajo que los valores de sus modelos hermanos.
Dedicamos mucho tiempo a investigar la duración de la batería. Intentamos averiguar si el hardware instalado generalmente requiere más energía que el hardware de los modelos hermanos en funcionamiento WLAN, o si un problema o una mala configuración en nuestro dispositivo de prueba estaba llevando a un aumento de la demanda.
No podemos dar una respuesta clara aquí, pero podemos excluir algunas explicaciones al menos: Ni una nueva instalación de Windows 10 en uno de nuestros SSDs ni el uso de la versión anterior de la BIOS ha llevado a mejoras.
Pro
Contra
Veredicto

Gracias al APU Ryzen 7 4800H y al núcleo gráfico de la GeForce GTX 1660 Ti Max-Q, el Pavilion Gaming puede llevar a la pantalla todos los últimos juegos de ordenador sin problemas. Normalmente se puede utilizar una resolución Full HD y una configuración de alta a máxima calidad
El modelo superior de la serie Pavilion Gaming 15 ofrece muchas prestaciones a un precio atractivo.
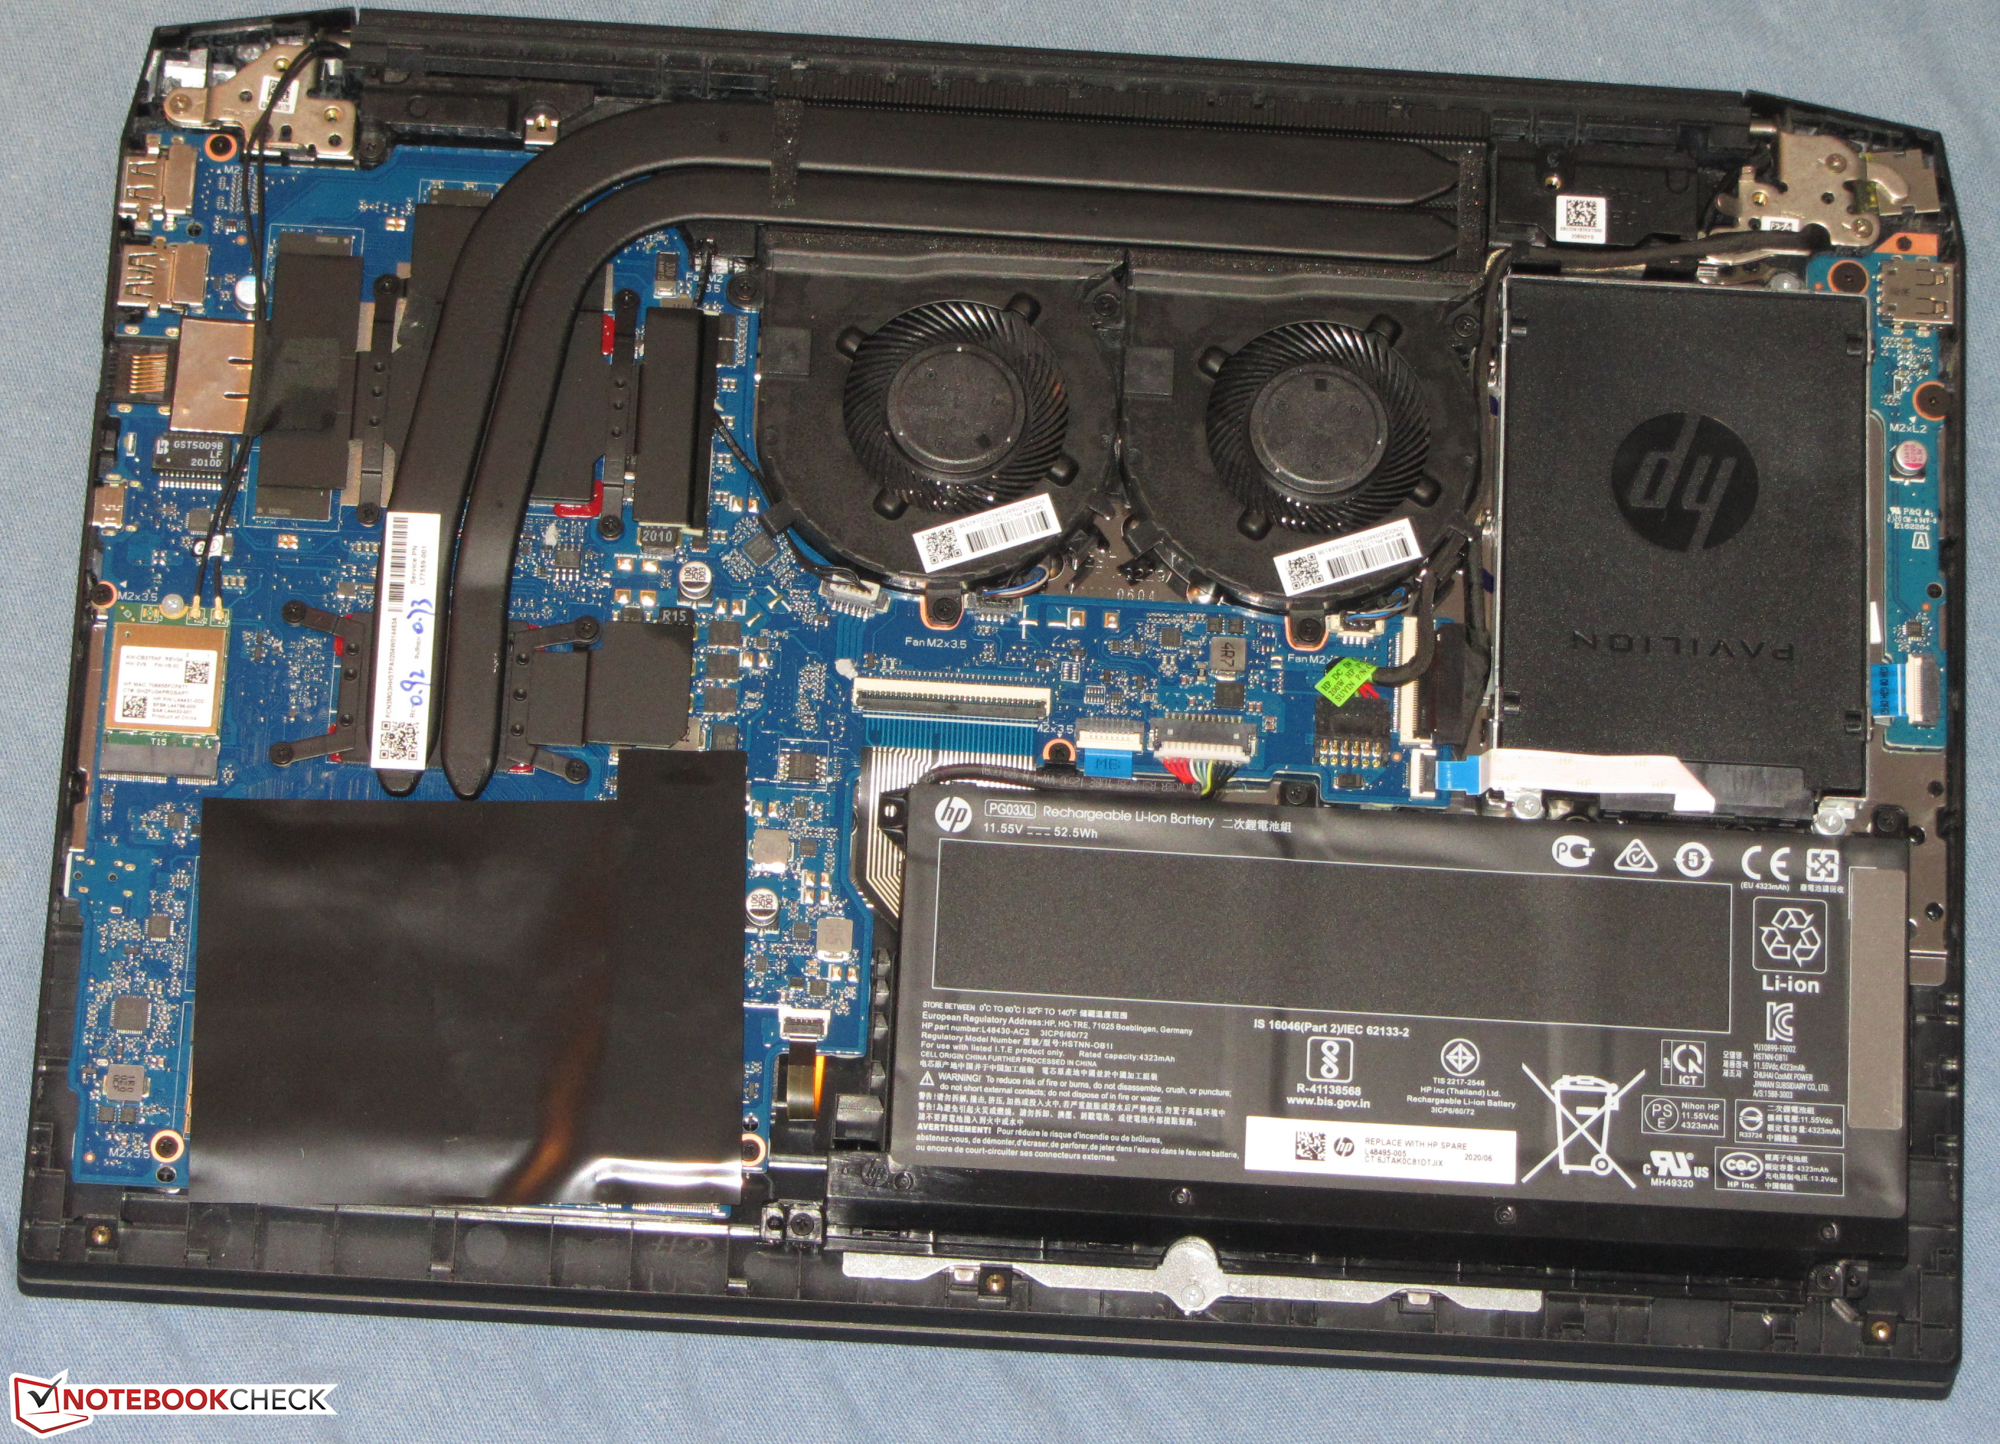
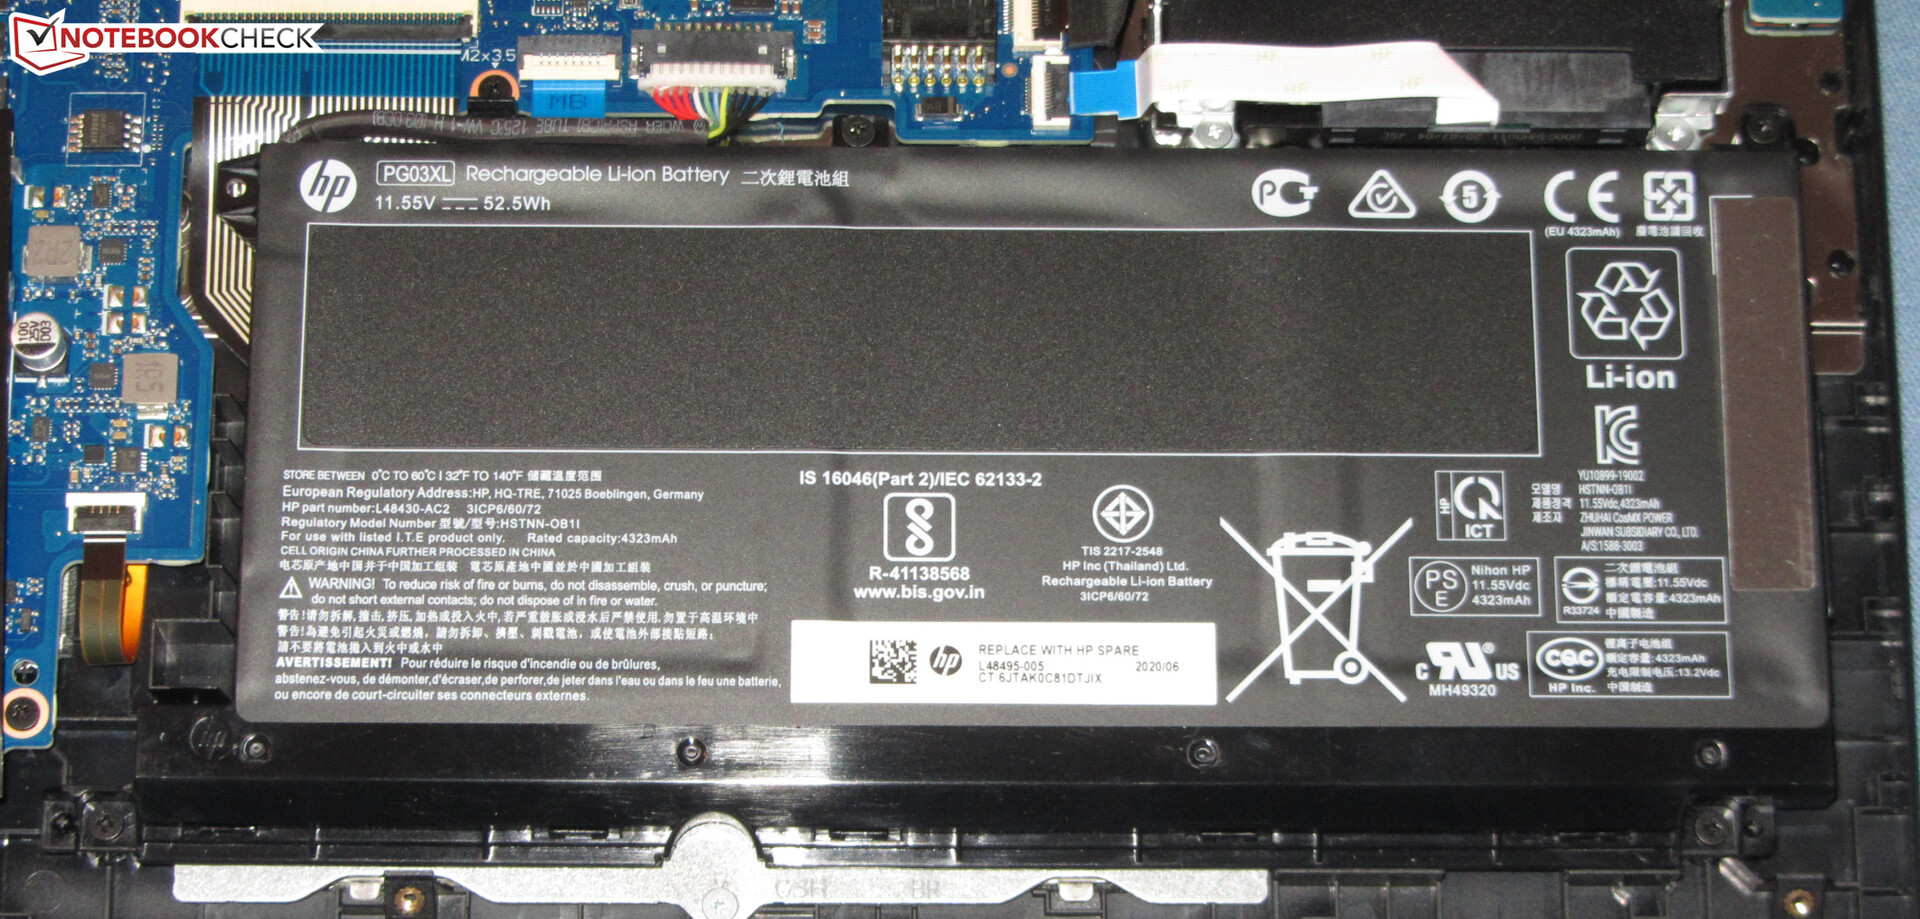
El hardware está equipado con 16 GB de RAM (2x 8 GB, modo de doble canal; 32 GB máx.). Con 512 GB, el espacio de almacenamiento es un poco reducido para un portátil para juegos. Sería posible reemplazar la rápida SSD NVMe. Como alternativa, se puede instalar adicionalmente una unidad de almacenamiento de 2,5 pulgadas. Todos los procedimientos de mantenimiento y actualización requieren la retirada de la tapa inferior.
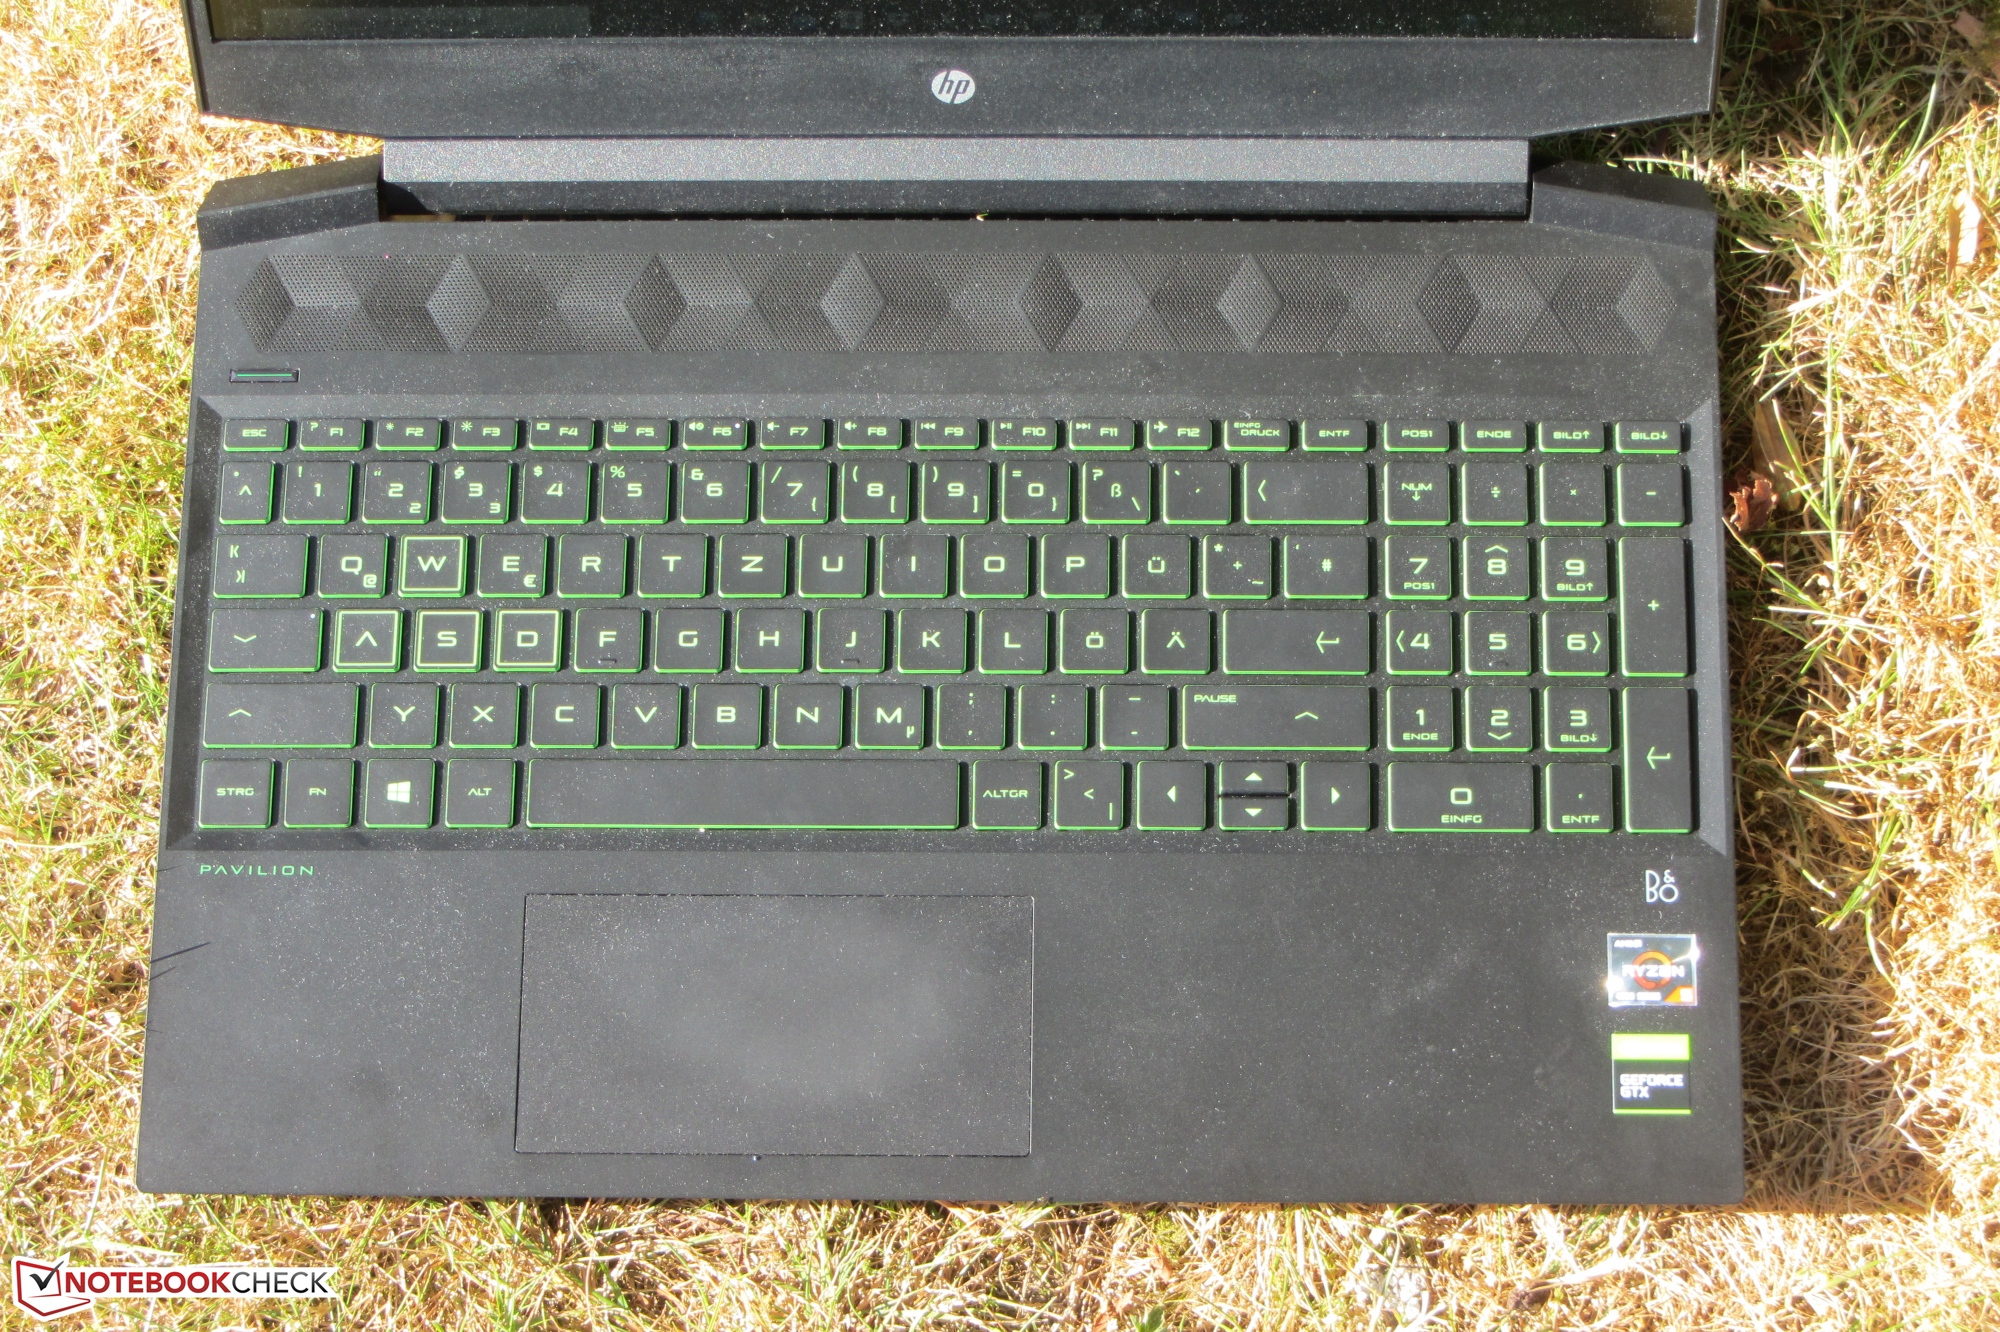
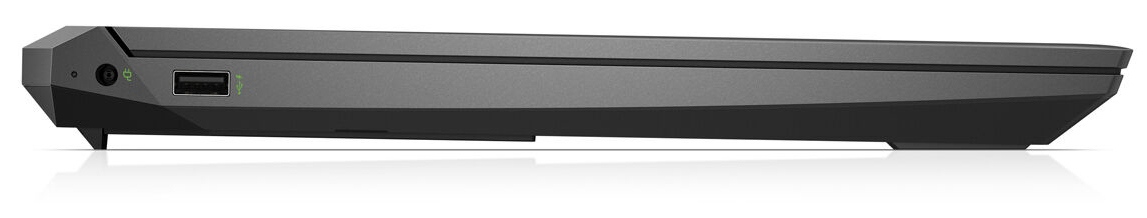
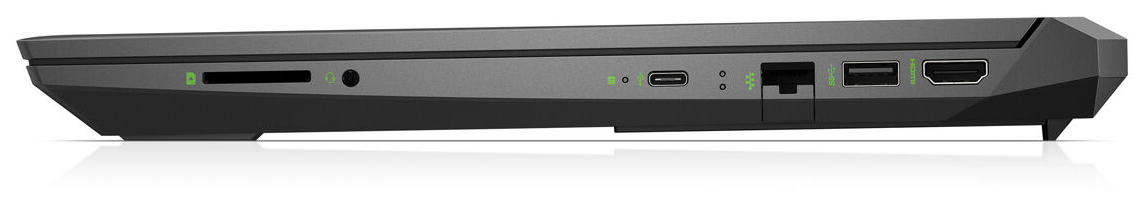
La duración de la batería es perfectamente aceptable, pero no alcanza los muy buenos valores de los modelos hermanos de idéntica construcción. El teclado chicle (retroiluminación verde, dos niveles de brillo) ha demostrado ser adecuado para el uso diario. Por otro lado, el portátil no tiene una configuración de puertos generosa, pero las conexiones más necesarias están disponibles.
La pantalla IPS (Full HD, 144 Hz) marca puntos con una superficie mate, ángulos de visión estables, alto contraste, buen brillo, tiempos de respuesta rápidos y una gran reproducción del color. La cobertura del espacio de color también es agradable.
HP Pavilion Gaming 15-ec1177ng
- 09/29/2020 v7 (old)
Sascha Mölck
Price comparison
