 Deutsch
 English
 Español
 Français
 Italiano
 Nederlands
 Polski
 Português
 Русский
 Türkçe
 Svenska
 Chinese
 Magyar
Breve análisis del Gigabyte P57X v6


| SD Card Reader | |
| average JPG Copy Test (av. of 3 runs) | |
| MSI GT72VR 6RD-063US | |
| Acer Predator 17 G9-793-77LG | |
| Gigabyte P57X v6 | |
| Asus G752VS-XB78K | |
| Lenovo IdeaPad Y900 | |
| maximum AS SSD Seq Read Test (1GB) | |
| MSI GT72VR 6RD-063US | |
| Lenovo IdeaPad Y900 | |
| Gigabyte P57X v6 | |
| Acer Predator 17 G9-793-77LG | |
| Asus G752VS-XB78K | |
| Networking | |
| iperf Server (receive) TCP 1 m 512KB | |
| Lenovo IdeaPad Y900 | |
| Gigabyte P57X v6 | |
| iperf Client (transmit) TCP 1 m 512KB | |
| Lenovo IdeaPad Y900 | |
| Gigabyte P57X v6 | |
| |||||||||||||||||||||||||
iluminación: 93 %
Brillo con batería: 329.2 cd/m²
Contraste: 1233:1 (Negro: 0.267 cd/m²)
ΔE Color 5.93 | 0.5-29.43 Ø5
ΔE Greyscale 6.72 | 0.57-98 Ø5.3
87% sRGB (Argyll 1.6.3 3D)
57% AdobeRGB 1998 (Argyll 1.6.3 3D)
64% AdobeRGB 1998 (Argyll 2.2.0 3D)
87.5% sRGB (Argyll 2.2.0 3D)
68% Display P3 (Argyll 2.2.0 3D)
Gamma: 2.12
| Gigabyte P57X v6 LGD0469, IPS, 17.30, 1920x1080 | Lenovo IdeaPad Y900 17.30, 1920x1080 | MSI GT72VR 6RD-063US LG Philips LGD046E, IPS, 17.30, 1920x1080 | Acer Predator 17 G9-793-77LG AU Optronics B173ZAN01.0 (AUO109B), IPS, 17.30, 3840x2160 | EVGA SC17 IPS, 17.30, 3840x2160 | Asus G752VS-XB78K LG Philips LP173WF4-SPF3 (LGD04E8), IPS, 17.30, 1920x1080 | Gigabyte P57W LG Philips LP173WF4-SPF1 (LGD0469), IPS, 17.30, 1920x1080 | |
|---|---|---|---|---|---|---|---|
| Display | -1% | -1% | 32% | 33% | -3% | -3% | |
| Display P3 Coverage | 68 | 67.4 -1% | 67.6 -1% | 86.9 28% | 87.6 29% | 66.9 -2% | 66.5 -2% |
| sRGB Coverage | 87.5 | 86.3 -1% | 86.2 -1% | 100 14% | 100 14% | 85.2 -3% | 84.4 -4% |
| AdobeRGB 1998 Coverage | 64 | 63.2 -1% | 63 -2% | 99.4 55% | 99 55% | 62.3 -3% | 61.7 -4% |
| Response Times | -2% | -3% | -2% | -82% | 1% | -2% | |
| Response Time Grey 50% / Grey 80% * | 33.6 ? | 34.8 ? -4% | 34.4 ? -2% | 37 ? -10% | 69.6 ? -107% | 38 ? -13% | 37 ? -10% |
| Response Time Black / White * | 25.6 ? | 25.6 ? -0% | 26.4 ? -3% | 24 ? 6% | 40 ? -56% | 22 ? 14% | 24 ? 6% |
| PWM Frequency | 1000 ? | ||||||
| Screen | 2% | 7% | 20% | 6% | 8% | 0% | |
| Brightness middle | 329.2 | 344.9 5% | 351.7 7% | 336 2% | 394.1 20% | 328 0% | 286 -13% |
| Brightness | 321 | 329 2% | 339 6% | 320 0% | 368 15% | 317 -1% | 274 -15% |
| Brightness Distribution | 93 | 86 -8% | 91 -2% | 88 -5% | 83 -11% | 88 -5% | 87 -6% |
| Black Level * | 0.267 | 0.349 -31% | 0.37 -39% | 0.25 6% | 0.439 -64% | 0.3 -12% | 0.31 -16% |
| Contrast | 1233 | 988 -20% | 951 -23% | 1344 9% | 898 -27% | 1093 -11% | 923 -25% |
| Colorchecker dE 2000 * | 5.93 | 4.49 24% | 3.71 37% | 3.61 39% | 5.79 2% | 3.74 37% | 4.49 24% |
| Colorchecker dE 2000 max. * | 11.07 | 8.72 21% | 8.48 23% | 6.02 46% | 8.44 24% | 8.97 19% | 7.83 29% |
| Greyscale dE 2000 * | 6.72 | 4.63 31% | 2.46 63% | 4.78 29% | 4.23 37% | 2.67 60% | 4.76 29% |
| Gamma | 2.12 104% | 2.11 104% | 2.29 96% | 2.32 95% | 2.11 104% | 2.41 91% | 2.47 89% |
| CCT | 7611 85% | 6905 94% | 6849 95% | 6185 105% | 7479 87% | 6861 95% | 6843 95% |
| Color Space (Percent of AdobeRGB 1998) | 57 | 56.7 -1% | 56.6 -1% | 88 54% | 86.6 52% | 56 -2% | 55 -4% |
| Color Space (Percent of sRGB) | 87 | 86.4 -1% | 86.1 -1% | 100 15% | 100 15% | 85 -2% | 84 -3% |
| Media total (Programa/Opciones) | -0% /
1% | 1% /
4% | 17% /
19% | -14% /
-0% | 2% /
5% | -2% /
-1% |
* ... más pequeño es mejor
Tiempos de respuesta del display
| ↔ Tiempo de respuesta de Negro a Blanco | ||
|---|---|---|
| 25.6 ms ... subida ↗ y bajada ↘ combinada | ↗ 5.2 ms subida | 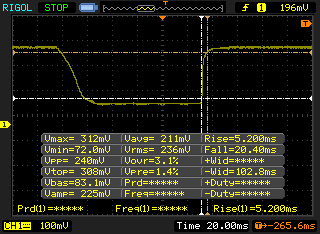 |
| ↘ 20.4 ms bajada | ||
| La pantalla mostró tiempos de respuesta relativamente lentos en nuestros tests pero podría ser demasiado lenta para los jugones. En comparación, todos los dispositivos de prueba van de ##min### (mínimo) a 240 (máximo) ms. » 56 % de todos los dispositivos son mejores. Eso quiere decir que el tiempo de respuesta es peor que la media (21.5 ms) de todos los dispositivos testados. | ||
| ↔ Tiempo de respuesta 50% Gris a 80% Gris | ||
| 33.6 ms ... subida ↗ y bajada ↘ combinada | ↗ 14 ms subida | 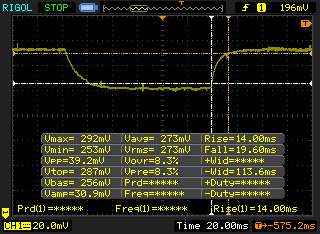 |
| ↘ 19.6 ms bajada | ||
| La pantalla mostró tiempos de respuesta lentos en nuestros tests y podría ser demasiado lenta para los jugones. En comparación, todos los dispositivos de prueba van de ##min### (mínimo) a 636 (máximo) ms. » 39 % de todos los dispositivos son mejores. Eso quiere decir que el tiempo de respuesta es similar al dispositivo testado medio (33.7 ms). | ||
Parpadeo de Pantalla / PWM (Pulse-Width Modulation)
| Parpadeo de Pantalla / PWM no detectado | 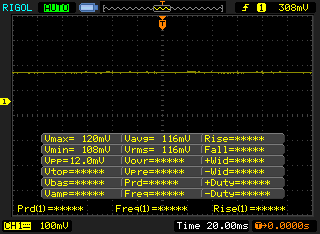 | ||
Comparación: 53 % de todos los dispositivos testados no usaron PWM para atenuar el display. Si se usó, medimos una media de 17900 (mínimo: 5 - máxmo: 3846000) Hz. | |||
| Cinebench R11.5 | |
| CPU Single 64Bit | |
| Asus G752VS-XB78K | |
| EVGA SC17 | |
| Lenovo IdeaPad Y900 | |
| Gigabyte P57W | |
| MSI GT72VR 6RD-063US | |
| Gigabyte P57X v6 | |
| CPU Multi 64Bit | |
| Asus G752VS-XB78K | |
| Lenovo IdeaPad Y900 | |
| EVGA SC17 | |
| Gigabyte P57W | |
| Gigabyte P57X v6 | |
| MSI GT72VR 6RD-063US | |
| wPrime 2.10 - 1024m | |
| Gigabyte P57X v6 | |
| MSI GT72VR 6RD-063US | |
| Lenovo IdeaPad Y900 | |
| EVGA SC17 | |
| Super Pi Mod 1.5 XS 32M - 32M | |
| MSI GT72VR 6RD-063US | |
| EVGA SC17 | |
| Lenovo IdeaPad Y900 | |
| Gigabyte P57X v6 | |
* ... más pequeño es mejor
| PCMark 8 | |
| Home Score Accelerated v2 | |
| Asus G752VS-XB78K | |
| Lenovo IdeaPad Y900 | |
| MSI GT72VR 6RD-063US | |
| Gigabyte P57X v6 | |
| Acer Predator 17 G9-793-77LG | |
| Gigabyte P57W | |
| EVGA SC17 | |
| Work Score Accelerated v2 | |
| Asus G752VS-XB78K | |
| Lenovo IdeaPad Y900 | |
| Gigabyte P57X v6 | |
| Gigabyte P57W | |
| MSI GT72VR 6RD-063US | |
| EVGA SC17 | |
| Creative Score Accelerated v2 | |
| Asus G752VS-XB78K | |
| MSI GT72VR 6RD-063US | |
| Lenovo IdeaPad Y900 | |
| Gigabyte P57X v6 | |
| Gigabyte P57W | |
| EVGA SC17 | |
| Acer Predator 17 G9-793-77LG | |
| PCMark 8 Home Score Accelerated v2 | 4206 puntos | |
| PCMark 8 Creative Score Accelerated v2 | 5192 puntos | |
| PCMark 8 Work Score Accelerated v2 | 5014 puntos | |
ayuda | ||
| Gigabyte P57X v6 Transcend MTS800 256GB M.2 (TS256GMTS800) | Lenovo IdeaPad Y900 Samsung SM951 MZVPV256 m.2 | EVGA SC17 Samsung SSD 950 Pro 512GB m.2 NVMe | Asus G752VS-XB78K Toshiba NVMe THNSN5512GPU7 | Gigabyte P57W Lite-On IT L8T-256L9G | |
|---|---|---|---|---|---|
| CrystalDiskMark 3.0 | 159% | 220% | 210% | 6% | |
| Read Seq | 481.7 | 1559 224% | 2247 366% | 1718 257% | 491.6 2% |
| Write Seq | 315.4 | 1254 298% | 1534 386% | 1305 314% | 391.1 24% |
| Read 512 | 303.1 | 850 180% | 1113 267% | 1250 312% | 352.8 16% |
| Write 512 | 314.4 | 1228 291% | 1490 374% | 1438 357% | 371.7 18% |
| Read 4k | 25.93 | 49.32 90% | 52.1 101% | 44.42 71% | 29.89 15% |
| Write 4k | 84.6 | 140.3 66% | 149.2 76% | 154.4 83% | 37.75 -55% |
| Read 4k QD32 | 273.9 | 539 97% | 635 132% | 744 172% | 338.7 24% |
| Write 4k QD32 | 274.9 | 345.3 26% | 422 54% | 578 110% | 278 1% |

| 3DMark | |
| Fire Strike Extreme Graphics | |
| Gigabyte P57X v6 | |
| Asus G752VS-XB78K | |
| MSI GT72VR 6RD-063US | |
| EVGA SC17 | |
| Lenovo IdeaPad Y900 | |
| 1920x1080 Fire Strike Graphics | |
| Asus G752VS-XB78K | |
| Acer Predator 17 G9-793-77LG | |
| MSI GT72VR 6RD-063US | |
| Lenovo IdeaPad Y900 | |
| EVGA SC17 | |
| Gigabyte P57W | |
| 3DMark 11 | |
| 1280x720 Performance GPU | |
| Gigabyte P57X v6 | |
| Asus G752VS-XB78K | |
| Acer Predator 17 G9-793-77LG | |
| Lenovo IdeaPad Y900 | |
| EVGA SC17 | |
| MSI GT72VR 6RD-063US | |
| Gigabyte P57W | |
| 1280x720 Performance Combined | |
| Asus G752VS-XB78K | |
| Lenovo IdeaPad Y900 | |
| EVGA SC17 | |
| Gigabyte P57X v6 | |
| MSI GT72VR 6RD-063US | |
| Gigabyte P57W | |
| Acer Predator 17 G9-793-77LG | |
| 3DMark 06 Standard Score | 25589 puntos | |
| 3DMark 11 Performance | 16231 puntos | |
| 3DMark Ice Storm Standard Score | 85198 puntos | |
| 3DMark Cloud Gate Standard Score | 23781 puntos | |
| 3DMark Fire Strike Extreme Score | 7559 puntos | |
ayuda | ||
| BioShock Infinite - 1920x1080 Ultra Preset, DX11 (DDOF) (ordenar por valor) | |
| Gigabyte P57X v6 | |
| Lenovo IdeaPad Y900 | |
| MSI GT72VR 6RD-063US | |
| EVGA SC17 | |
| Asus G752VS-XB78K | |
| Metro: Last Light - 1920x1080 Very High (DX11) AF:16x (ordenar por valor) | |
| Gigabyte P57X v6 | |
| Lenovo IdeaPad Y900 | |
| MSI GT72VR 6RD-063US | |
| EVGA SC17 | |
| Thief - 1920x1080 Very High Preset AA:FXAA & High SS AF:8x (ordenar por valor) | |
| Gigabyte P57X v6 | |
| Lenovo IdeaPad Y900 | |
| MSI GT72VR 6RD-063US | |
| EVGA SC17 | |
| Asus G752VS-XB78K | |
| Batman: Arkham Knight - 1920x1080 High / On AA:SM AF:16x (ordenar por valor) | |
| Gigabyte P57X v6 | |
| Lenovo IdeaPad Y900 | |
| MSI GT72VR 6RD-063US | |
| EVGA SC17 | |
| Asus G752VS-XB78K | |
| Fallout 4 - 1920x1080 Ultra Preset AA:T AF:16x (ordenar por valor) | |
| Gigabyte P57X v6 | |
| Lenovo IdeaPad Y900 | |
| MSI GT72VR 6RD-063US | |
| EVGA SC17 | |
| Rise of the Tomb Raider - 1920x1080 Very High Preset AA:FX AF:16x (ordenar por valor) | |
| Gigabyte P57X v6 | |
| Lenovo IdeaPad Y900 | |
| MSI GT72VR 6RD-063US | |
| Acer Predator 17 G9-793-77LG | |
| EVGA SC17 | |
| Asus G752VS-XB78K | |
| Gigabyte P57W | |
| Doom - 1920x1080 Ultra Preset AA:SM (ordenar por valor) | |
| Gigabyte P57X v6 | |
| Lenovo IdeaPad Y900 | |
| MSI GT72VR 6RD-063US | |
| bajo | medio | alto | ultra | |
| BioShock Infinite (2013) | 123.8 | |||
| Metro: Last Light (2013) | 99 | |||
| Thief (2014) | 88.5 | |||
| Batman: Arkham Knight (2015) | 78 | |||
| Fallout 4 (2015) | 96 | |||
| Rise of the Tomb Raider (2016) | 90 | |||
| Doom (2016) | 104 |
Ruido
| Ocioso |
| 33.2 / 33.2 / 33.2 dB(A) |
| Carga |
| 47.5 / 52.5 dB(A) |
 | ||
30 dB silencioso 40 dB(A) audible 50 dB(A) ruidosamente alto |
||
min: | ||
| Gigabyte P57X v6 GeForce GTX 1070 Mobile, 6700HQ, Transcend MTS800 256GB M.2 (TS256GMTS800) | Lenovo IdeaPad Y900 GeForce GTX 980M, 6820HK, Samsung SM951 MZVPV256 m.2 | Acer Predator 17 G9-793-77LG GeForce GTX 1070 Mobile, 6700HQ, Toshiba NVMe THNSN5256GPU7 | Asus G752VS-XB78K GeForce GTX 1070 Mobile, 6820HK, Toshiba NVMe THNSN5512GPU7 | Gigabyte P57W GeForce GTX 970M, 6700HQ, Lite-On IT L8T-256L9G | |
|---|---|---|---|---|---|
| Noise | -2% | -2% | 6% | 4% | |
| off / environment * | 29.7 | 28.8 3% | 31 -4% | 30 -1% | 30 -1% |
| Idle Minimum * | 33.2 | 29.4 11% | 33 1% | 31 7% | 32 4% |
| Idle Average * | 33.2 | 32.4 2% | 34 -2% | 32 4% | 33 1% |
| Idle Maximum * | 33.2 | 48 -45% | 40 -20% | 33 1% | 37 -11% |
| Load Average * | 47.5 | 42.5 11% | 44 7% | 40 16% | 37 22% |
| Load Maximum * | 52.5 | 48.5 8% | 50 5% | 47 10% | 47 10% |
* ... más pequeño es mejor
(-) The maximum temperature on the upper side is 59 °C / 138 F, compared to the average of 40.4 °C / 105 F, ranging from 21.2 to 68.8 °C for the class Gaming.
(-) The bottom heats up to a maximum of 66 °C / 151 F, compared to the average of 43.2 °C / 110 F
(+) In idle usage, the average temperature for the upper side is 28 °C / 82 F, compared to the device average of 33.8 °C / 93 F.
(+) The palmrests and touchpad are cooler than skin temperature with a maximum of 27.2 °C / 81 F and are therefore cool to the touch.
(±) The average temperature of the palmrest area of similar devices was 28.9 °C / 84 F (+1.7 °C / 3 F).
Gigabyte P57X v6 audio analysis
(±) | speaker loudness is average but good (72.7 dB)
Bass 100 - 315 Hz
(-) | nearly no bass - on average 15.5% lower than median
(±) | linearity of bass is average (9.2% delta to prev. frequency)
Mids 400 - 2000 Hz
(+) | balanced mids - only 1.9% away from median
(+) | mids are linear (5.2% delta to prev. frequency)
Highs 2 - 16 kHz
(±) | higher highs - on average 7.1% higher than median
(±) | linearity of highs is average (8.9% delta to prev. frequency)
Overall 100 - 16.000 Hz
(±) | linearity of overall sound is average (27.4% difference to median)
Compared to same class
» 92% of all tested devices in this class were better, 2% similar, 6% worse
» The best had a delta of 6%, average was 18%, worst was 132%
Compared to all devices tested
» 81% of all tested devices were better, 4% similar, 15% worse
» The best had a delta of 4%, average was 25%, worst was 134%
Apple MacBook 12 (Early 2016) 1.1 GHz audio analysis
(+) | speakers can play relatively loud (83.6 dB)
Bass 100 - 315 Hz
(±) | reduced bass - on average 11.3% lower than median
(±) | linearity of bass is average (14.2% delta to prev. frequency)
Mids 400 - 2000 Hz
(+) | balanced mids - only 2.4% away from median
(+) | mids are linear (5.5% delta to prev. frequency)
Highs 2 - 16 kHz
(+) | balanced highs - only 2% away from median
(+) | highs are linear (4.5% delta to prev. frequency)
Overall 100 - 16.000 Hz
(+) | overall sound is linear (10.2% difference to median)
Compared to same class
» 5% of all tested devices in this class were better, 2% similar, 93% worse
» The best had a delta of 5%, average was 19%, worst was 53%
Compared to all devices tested
» 3% of all tested devices were better, 1% similar, 96% worse
» The best had a delta of 4%, average was 25%, worst was 134%
| Off / Standby | |
| Ocioso | |
| Carga |
|
| Gigabyte P57X v6 6700HQ, GeForce GTX 1070 Mobile, Transcend MTS800 256GB M.2 (TS256GMTS800), IPS, 1920x1080, 17.30 | Lenovo IdeaPad Y900 6820HK, GeForce GTX 980M, Samsung SM951 MZVPV256 m.2, , 1920x1080, 17.30 | Acer Predator 17 G9-793-77LG 6700HQ, GeForce GTX 1070 Mobile, Toshiba NVMe THNSN5256GPU7, IPS, 3840x2160, 17.30 | Asus G752VS-XB78K 6820HK, GeForce GTX 1070 Mobile, Toshiba NVMe THNSN5512GPU7, IPS, 1920x1080, 17.30 | Gigabyte P57W 6700HQ, GeForce GTX 970M, Lite-On IT L8T-256L9G, IPS, 1920x1080, 17.30 | |
|---|---|---|---|---|---|
| Power Consumption | -5% | -28% | -12% | 29% | |
| Idle Minimum * | 18.4 | 24.3 -32% | 25 -36% | 24 -30% | 11 40% |
| Idle Average * | 22.8 | 29.6 -30% | 35 -54% | 31 -36% | 17 25% |
| Idle Maximum * | 24 | 29.9 -25% | 46 -92% | 36 -50% | 22 8% |
| Load Average * | 175.5 | 110.1 37% | 103 41% | 94 46% | 85 52% |
| Load Maximum * | 229.5 | 171.4 25% | 223 3% | 204 11% | 178 22% |
* ... más pequeño es mejor
| Gigabyte P57X v6 6700HQ, GeForce GTX 1070 Mobile, 75.81 Wh | Lenovo IdeaPad Y900 6820HK, GeForce GTX 980M, 90 Wh | MSI GT72VR 6RD-063US 6700HQ, GeForce GTX 1060 Mobile, 83 Wh | Acer Predator 17 G9-793-77LG 6700HQ, GeForce GTX 1070 Mobile, 88 Wh | EVGA SC17 6820HK, GeForce GTX 980M, 74.48 Wh | Asus G752VS-XB78K 6820HK, GeForce GTX 1070 Mobile, 90 Wh | Gigabyte P57W 6700HQ, GeForce GTX 970M, 75.81 Wh | |
|---|---|---|---|---|---|---|---|
| Duración de Batería | 13% | -8% | -16% | -17% | -13% | 24% | |
| Reader / Idle | 418 | 349 -17% | 323 -23% | 278 -33% | 310 -26% | 311 -26% | 460 10% |
| WiFi v1.3 | 201 | 248 23% | 221 10% | 200 0% | 206 2% | 210 4% | 334 66% |
| Load | 103 | 136 32% | 93 -10% | 89 -14% | 76 -26% | 84 -18% | 99 -4% |
Pro
Contra

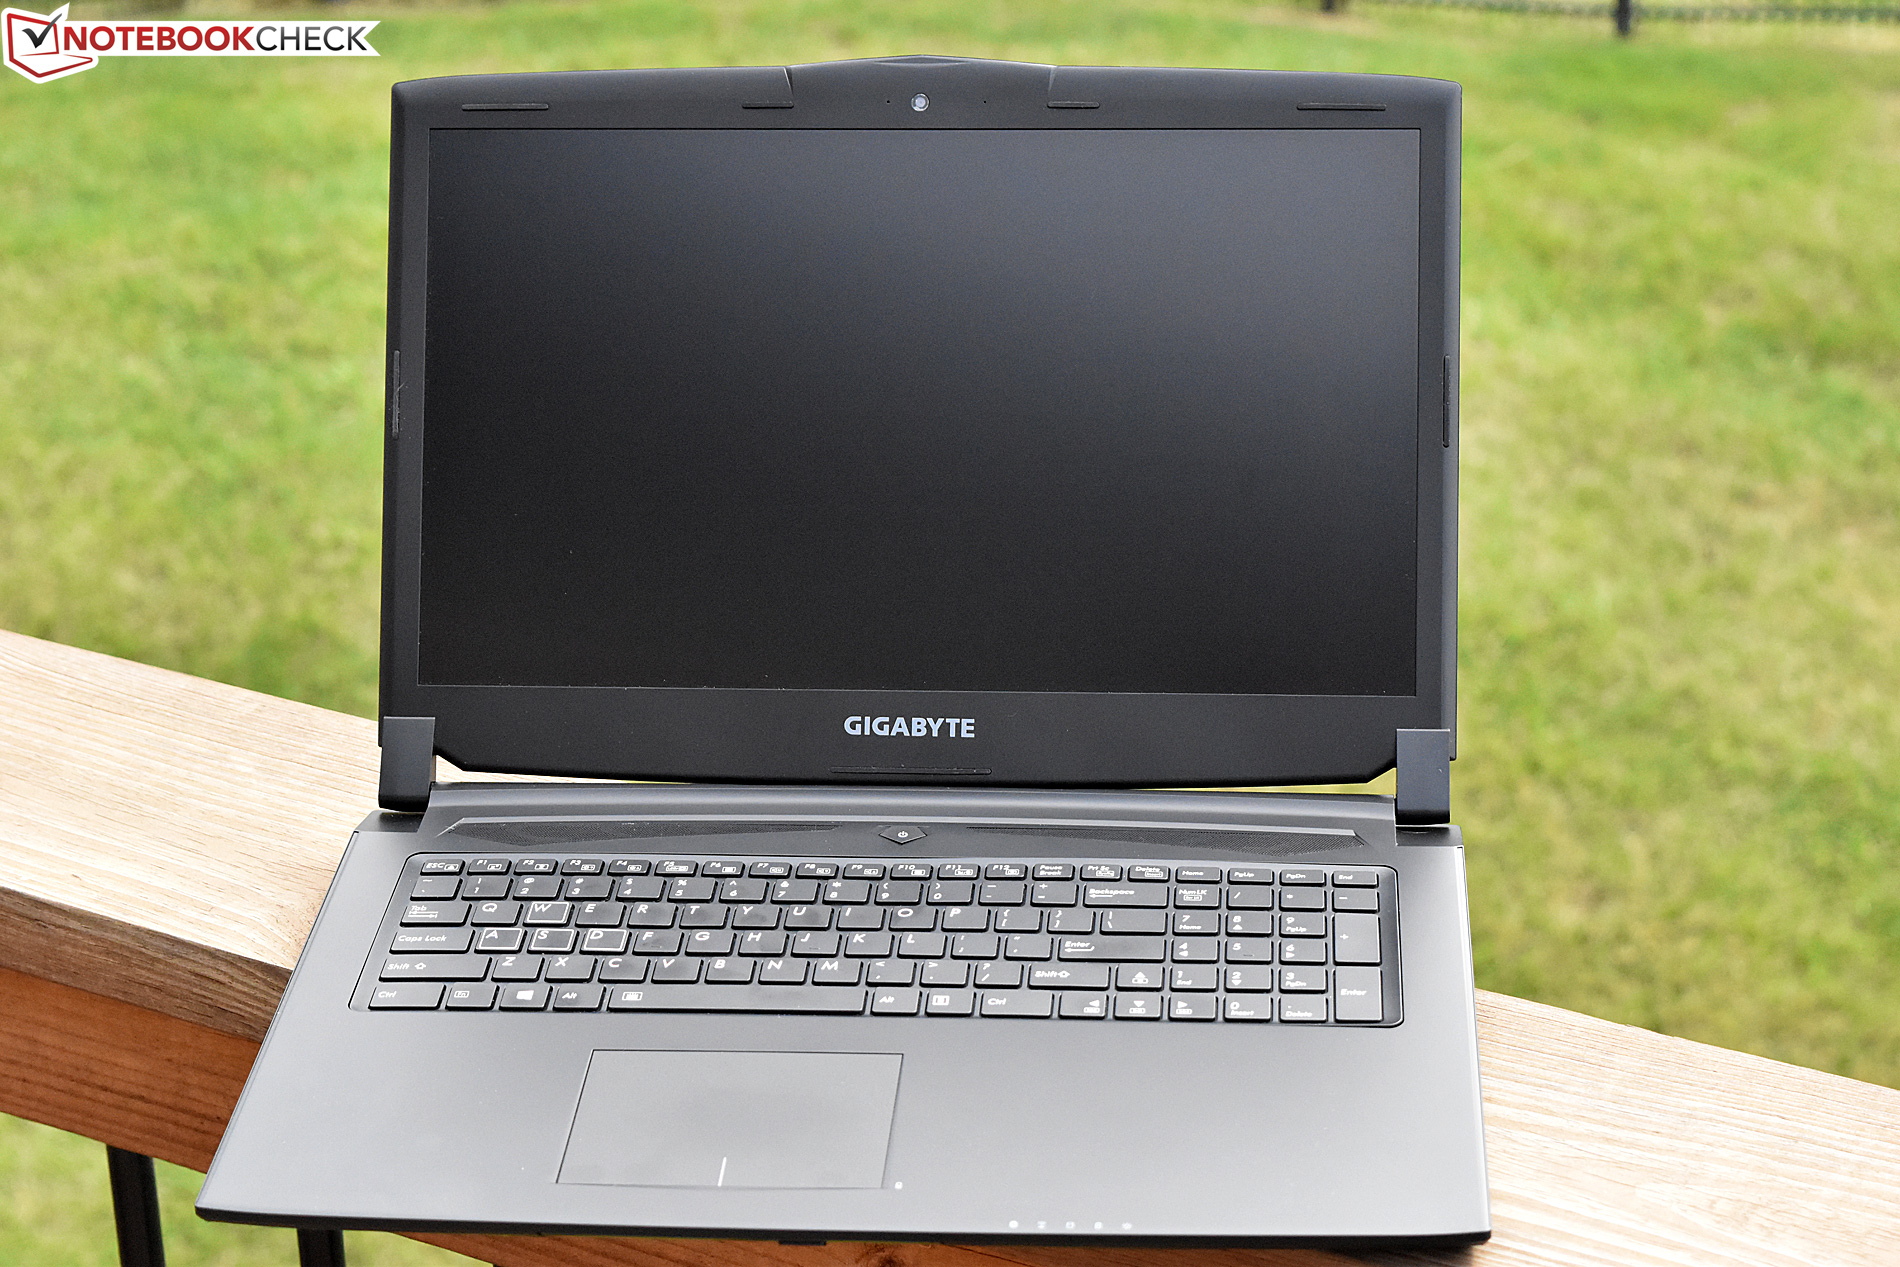
Aunque es casi idéntico a su predecesor P57W, el Gigabyte P57X v6 sube a la cumbre de las tablas de juego con la ayuda de la magnífica GPU NVIDIA GeForce GTX 1070. Por unos relativamente manejables $1,999, tenemos uno de los portátiles de juego más rápidos del planeta (al menos, respecto a las exigencias de juego), capaz de vérselas con los juegos modernos a 1080p con los ajustes al máximo y frame rates fluidos, y con su conectividad HDMI 2.0, capaz de llevar los juegos al 4K en un monitor externo compatible sin demasiadas dificultades.
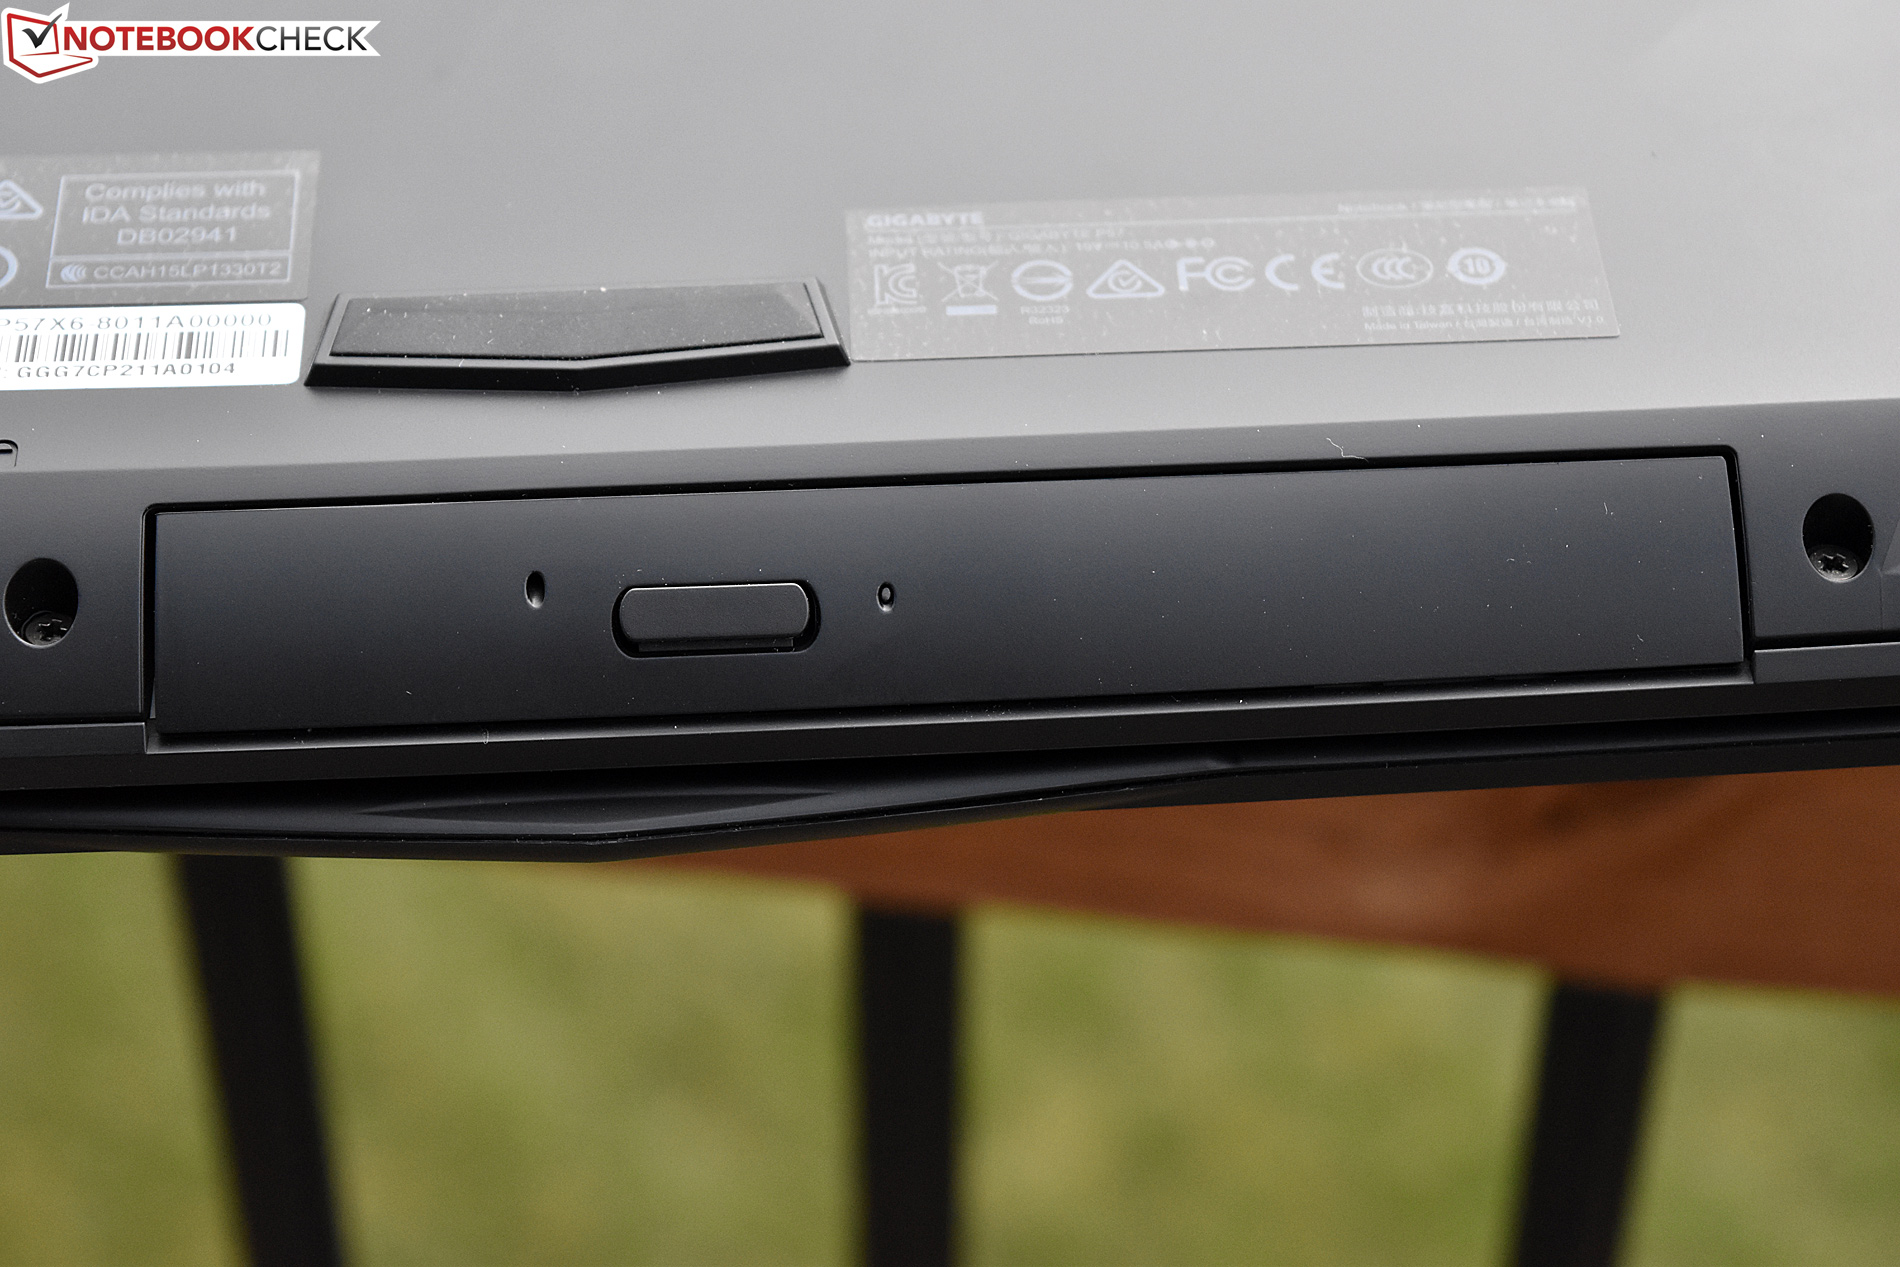
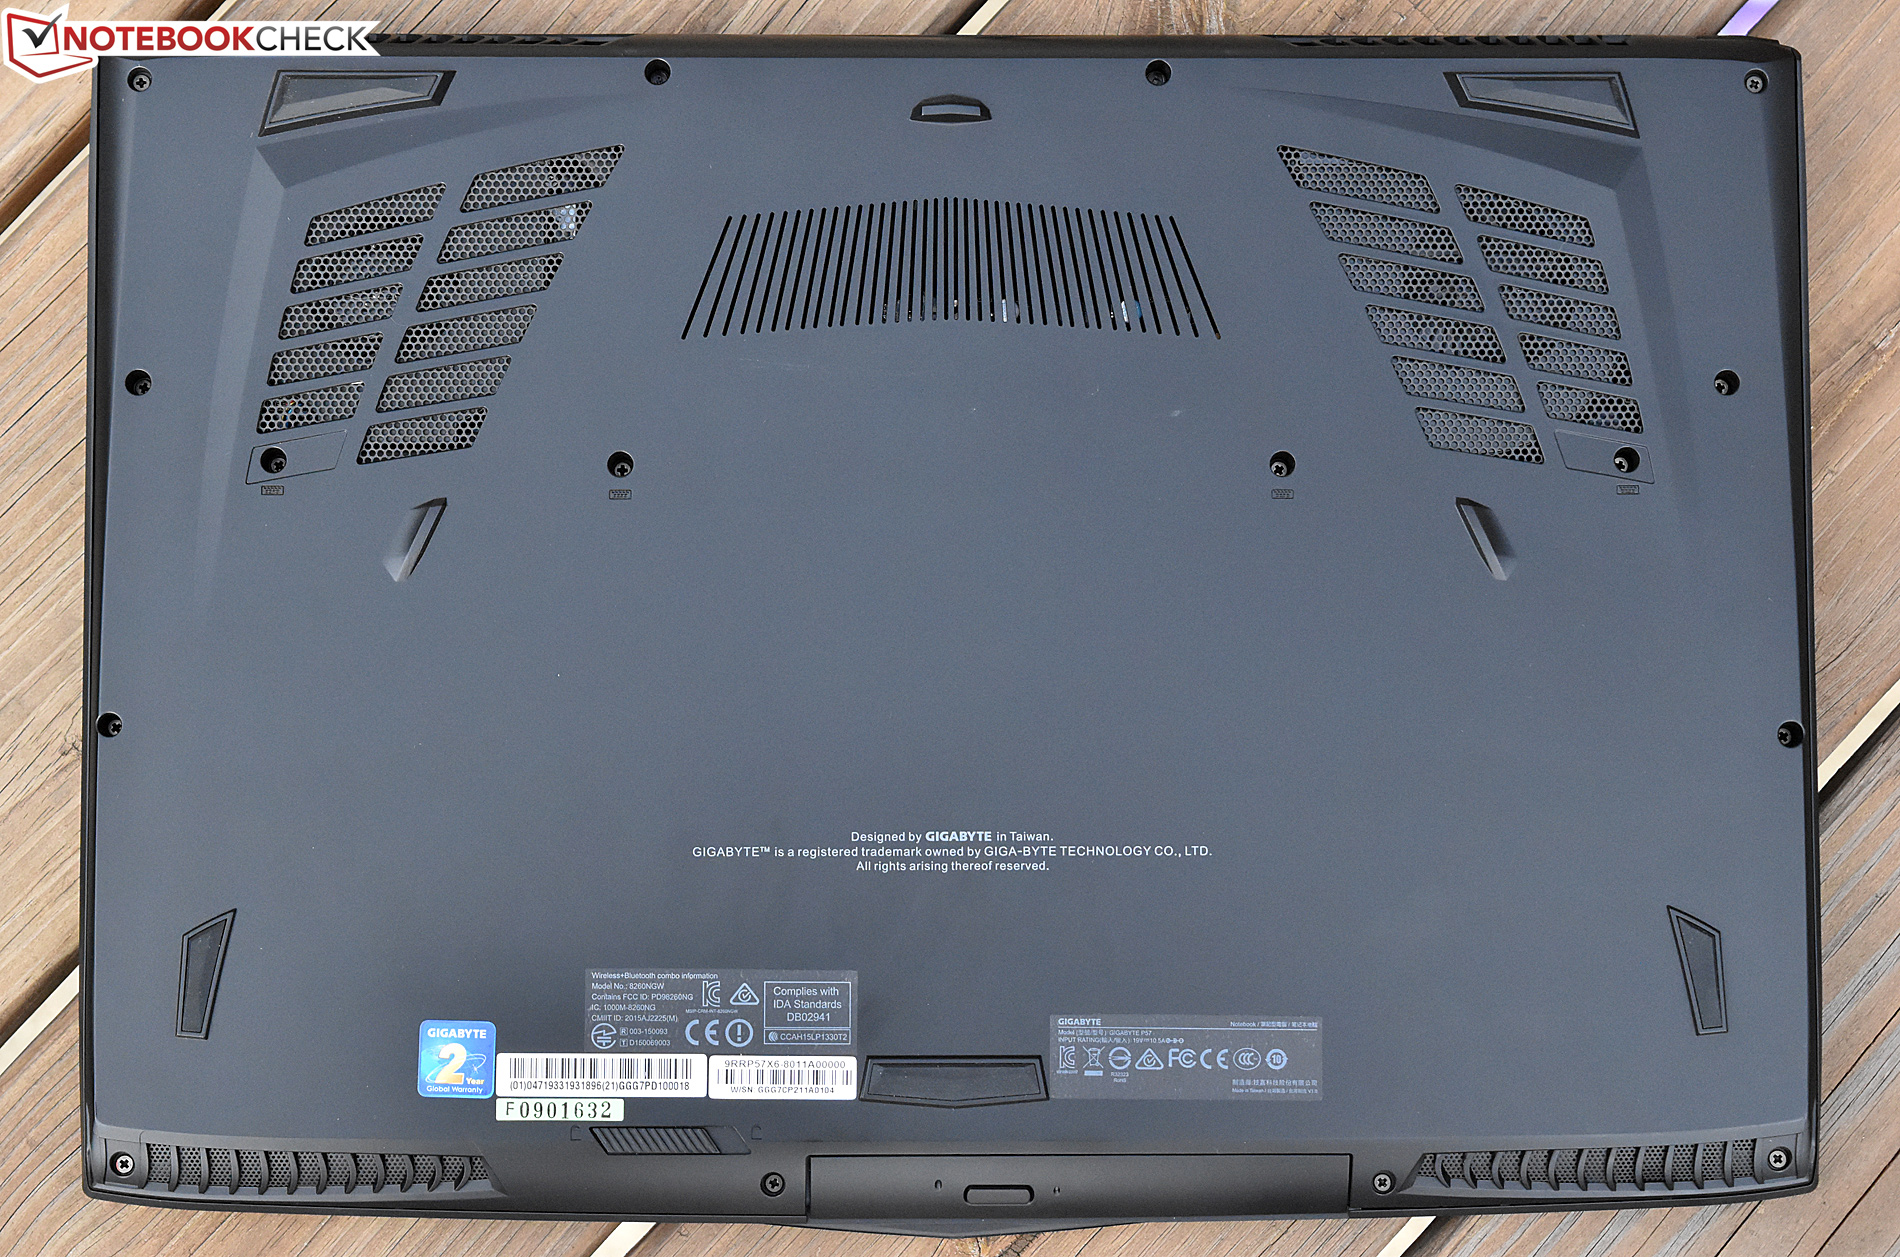
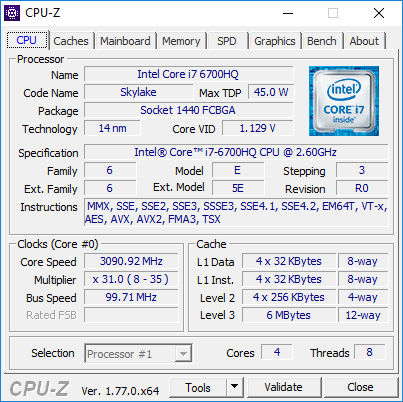
Además de todo eso, seguimos teniendo la misma potente configuración rodeando a la nueva GPU, incluyendo una CPU quad-core Intel Core i7-6700HQ, 16 GB de RAM DDR4-2133, una configuración de almacenamiento dual con un SSD M.2 de 256 GB y un HDD de 1 TB a 7200 RPM, y por último, un display IPS antirreflejos a 1080p. Gigabyte también ha facilitado el mantenimiento y las mejoras, pudiendo reemplazarse casi cualquier componente desde la base. Los usuarios que exigan aún más velocidad pueden optar por un SSD NVMe para reemplazar el convencional M.2 con el que viene la máquina, y pueden añadir incluso una tercera bahía de almacenamiento con el adaptador HDD incluido, que se puede cambiar en la bahía de expansión frontal de forma rápida y fácil, cambiando la unidad DVD-RAM preinstalada.
El P57X también hace una gran labor de incluir software útil para facilitar el control respecto al sistema de ventilación de la máquina y la aceleración de la GPU, junto con una útil actualización de drivers y otros extras sobresalientes (control de temperatura LCD, creación de medios de recuperación USB, etc.).
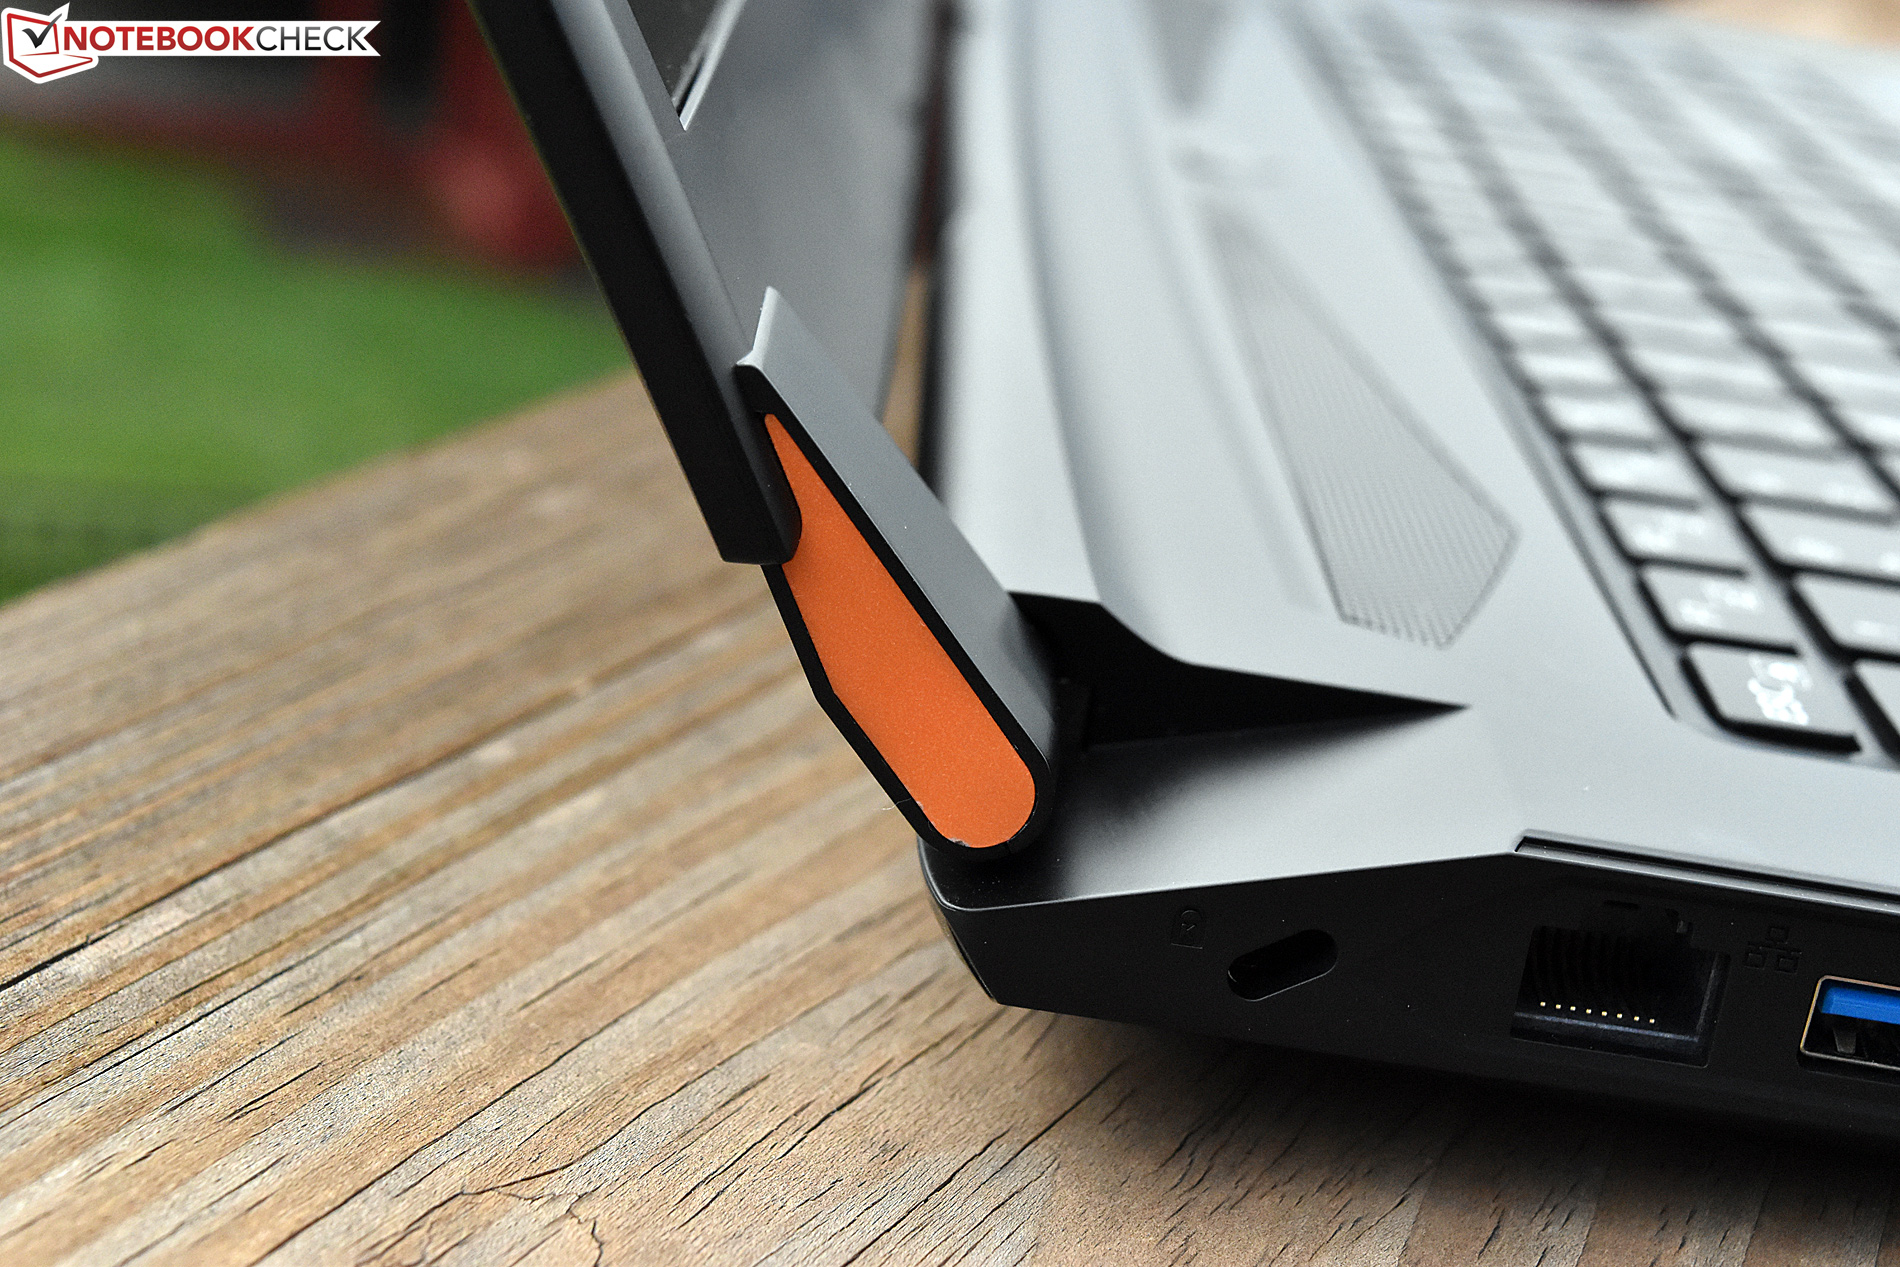
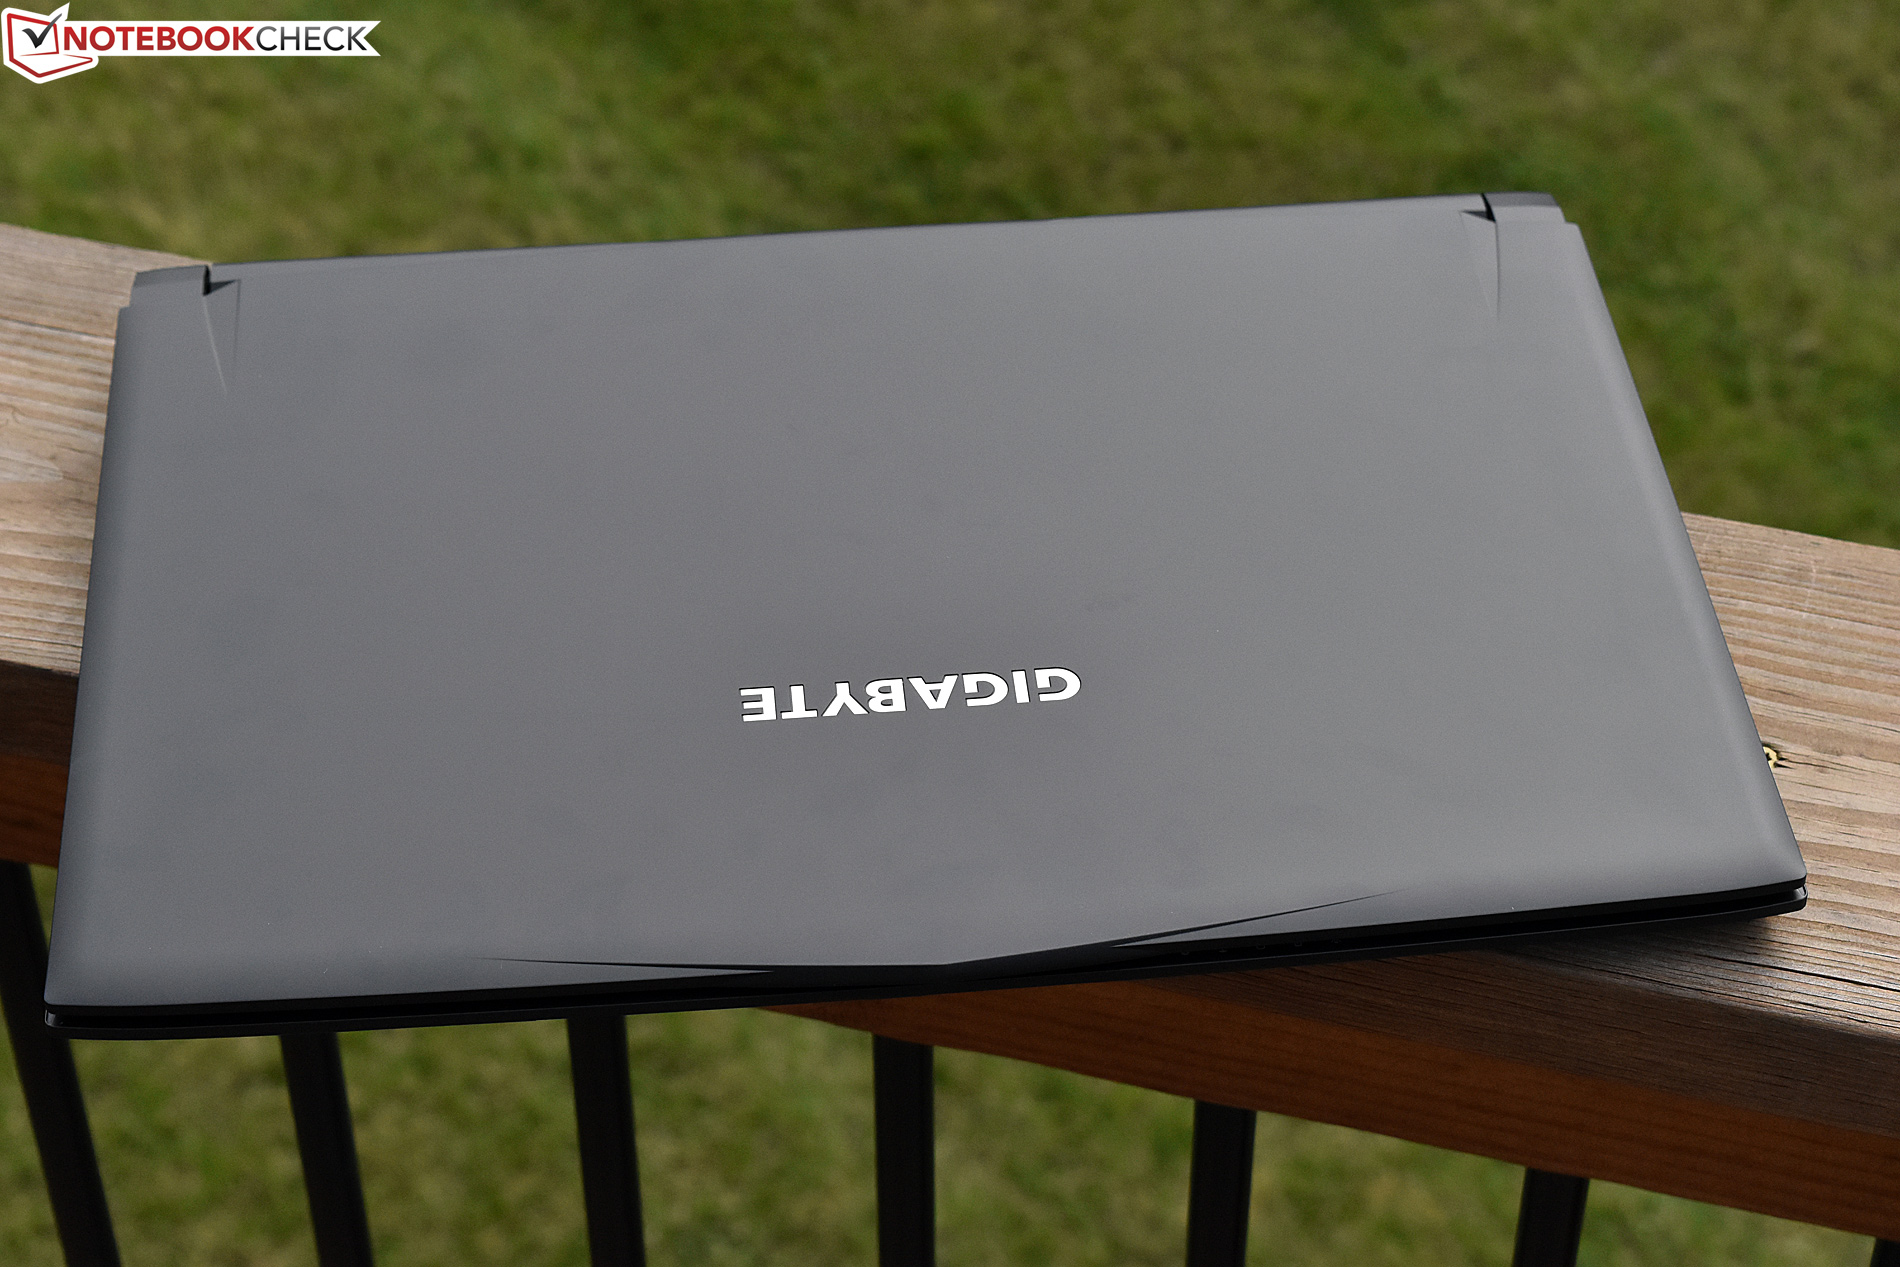
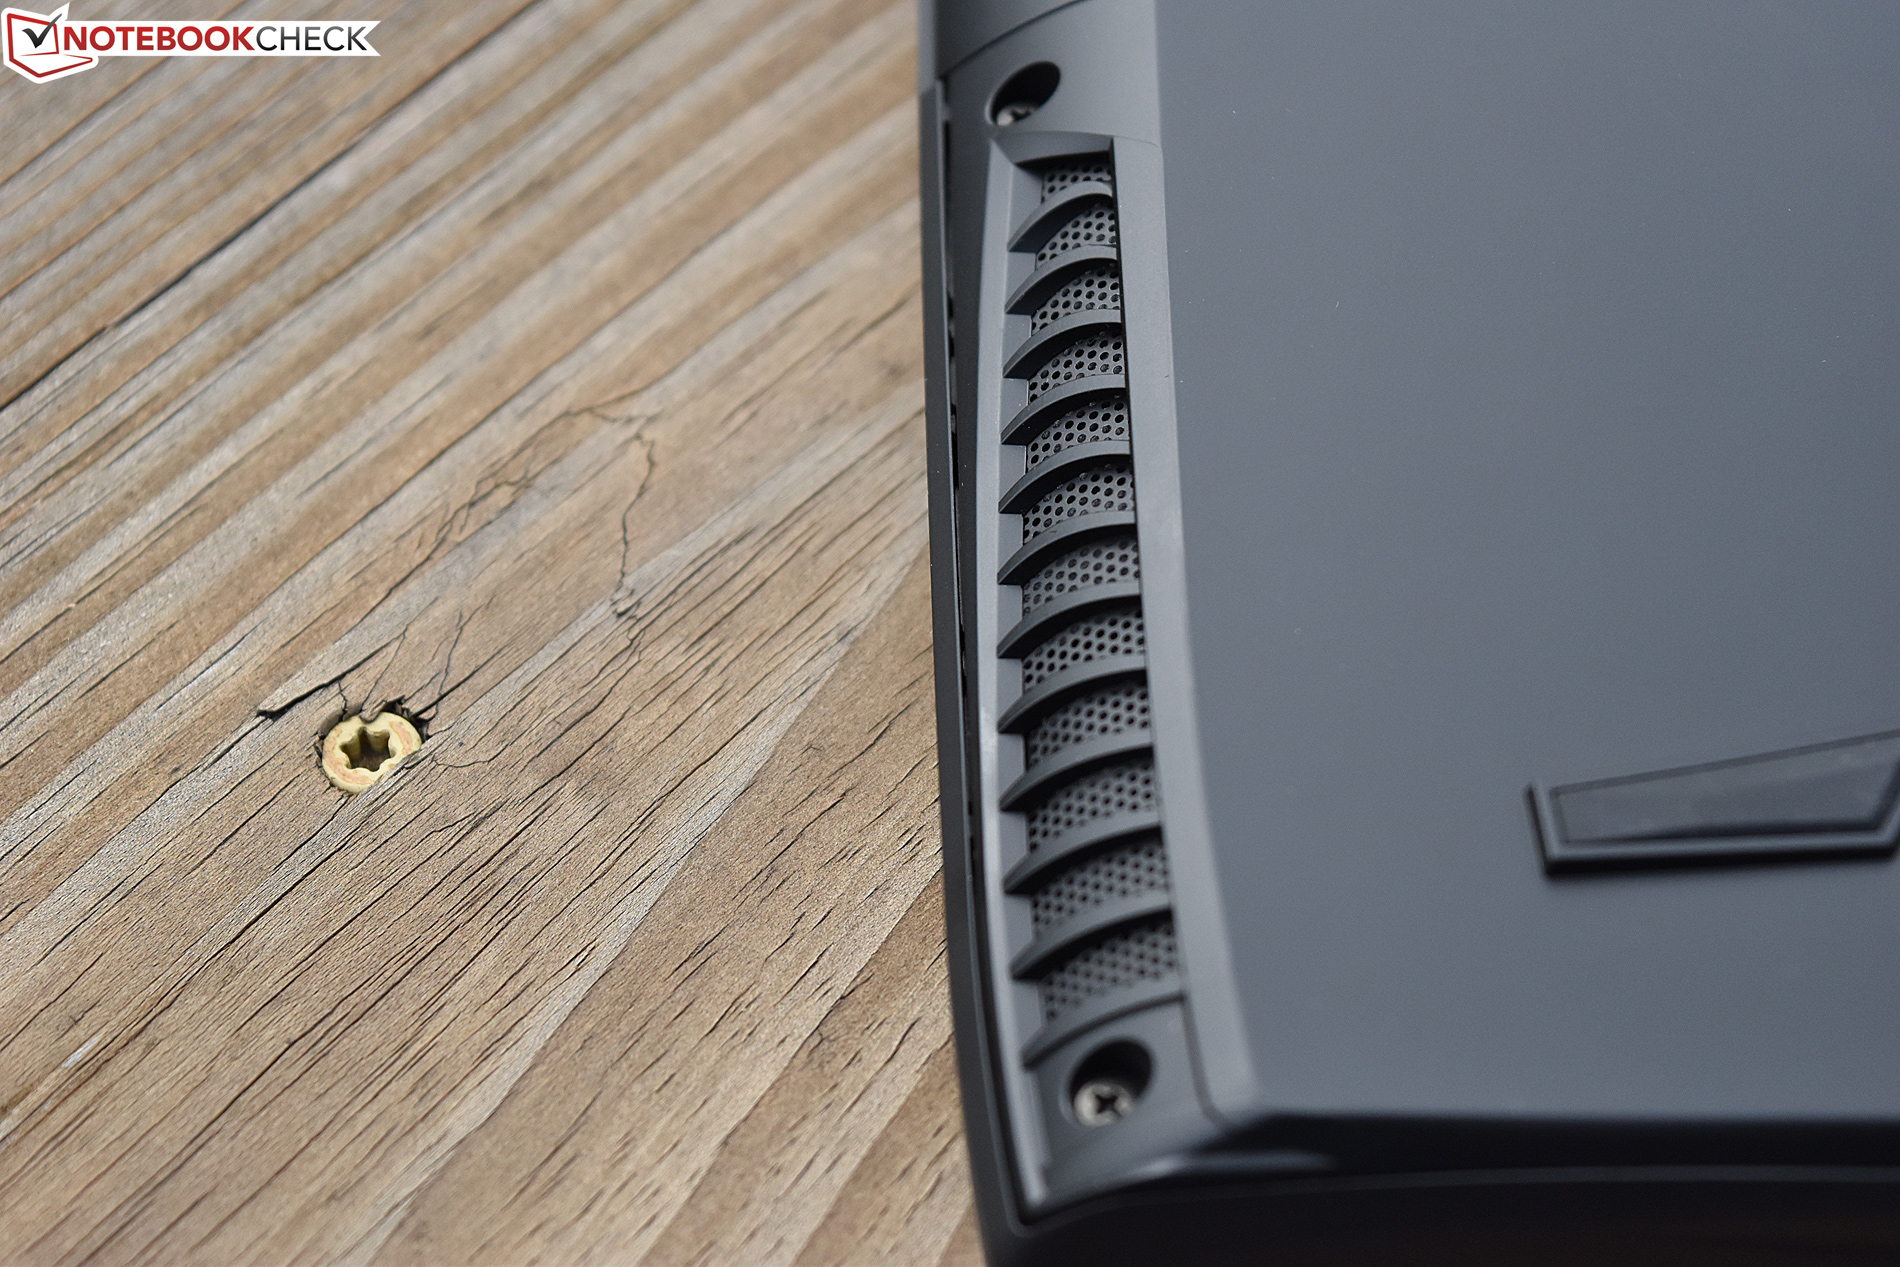
Obviamente, cuando encojes un portátil de juego tan potente—y además trabajas para mantener el precio por debajo de los $2,000— se van a dar sacrificios. Éstos se manifiestan en la forma de la construcción predominantemente plástica del P57X y el desafortunado desarrollo de calor, que rápidamente se apodera de la mitad derecha del teclado incluso con sesiones de juego moderadas y sin importar la configuración del ventilador. También es un dispositivo bastante ruidoso, aunque sendos ventiladores estén montados en la parte trasera (lo que ayuda algo). El consumo de energía es predeciblemente muy superior al del P57W, y el aguante de batería (por poca importancia que pueda tener en un portátil de juego) sufre en consecuencia. Por último, el touchpad es positivamente horrible para todas las tareas salvo las más triviales, por lo que tendrás tu ratón externo a mano en todo momento.
Algunos también condenarán la exclusión de una opción de display 4K, pero en definitiva, difícilmente será un motivo para no comprarlo. Está bien tener un portátil que puede fácilmente con cualquier tarea que le tires a su resolución nativa, y basado en nuestras pruebas, eso no va a cambiar en un tiempo. El juego a 4K sigue siendo posible con monitores externos (como ya mencionamos).
Al final, el P57X es un portátil de juego de alta potencia sin tonterías que se centra principalmente en la funcionalidad, portabilidad, y (relativamente hablando) la asequibilidad. Si el presupuesto no es un problema y el peso tampoco te molesta, puedes encontrarlo mejor. Por lo demás, a pesar de sus abúlicos dispositivos de entrada, su desarrollo de temperatura subóptimo, y la falta de un display 4K, el P57X es una auténtica bestia - y podrá jugar con los ajustes más altos y resolución nativa durante bastante tiempo.
Ésta es una versión acortada del análisis original. Puedes leer el análisis completo en inglés aquí.
Gigabyte P57X v6
-
10/03/2016 v5.1(old)
Steve Schardein
Pricecompare
