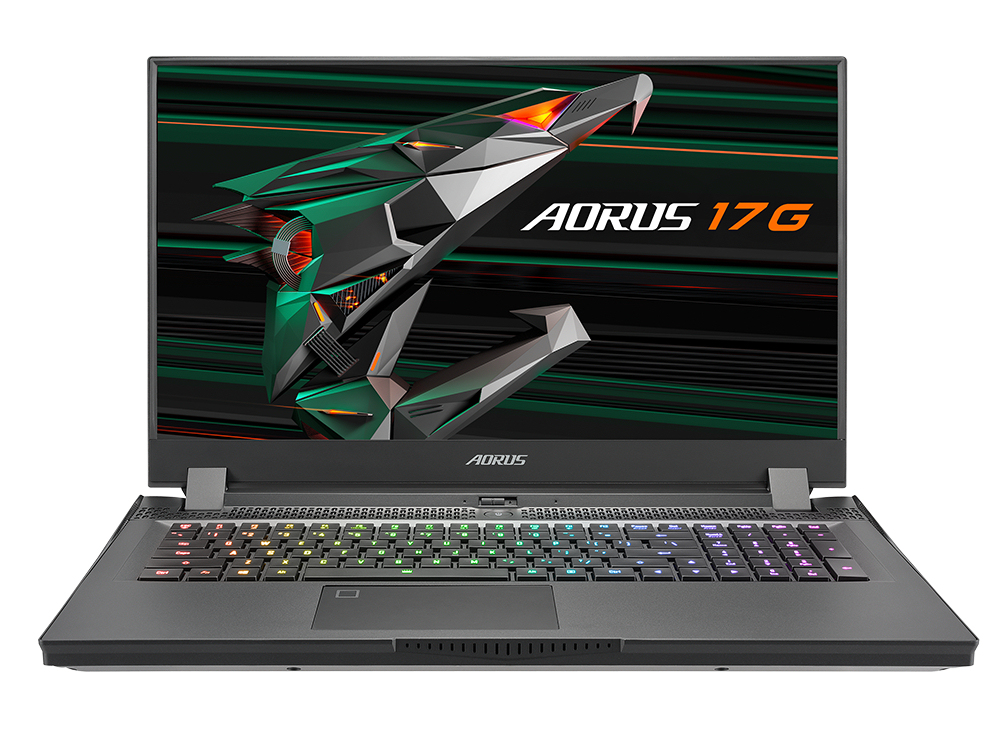
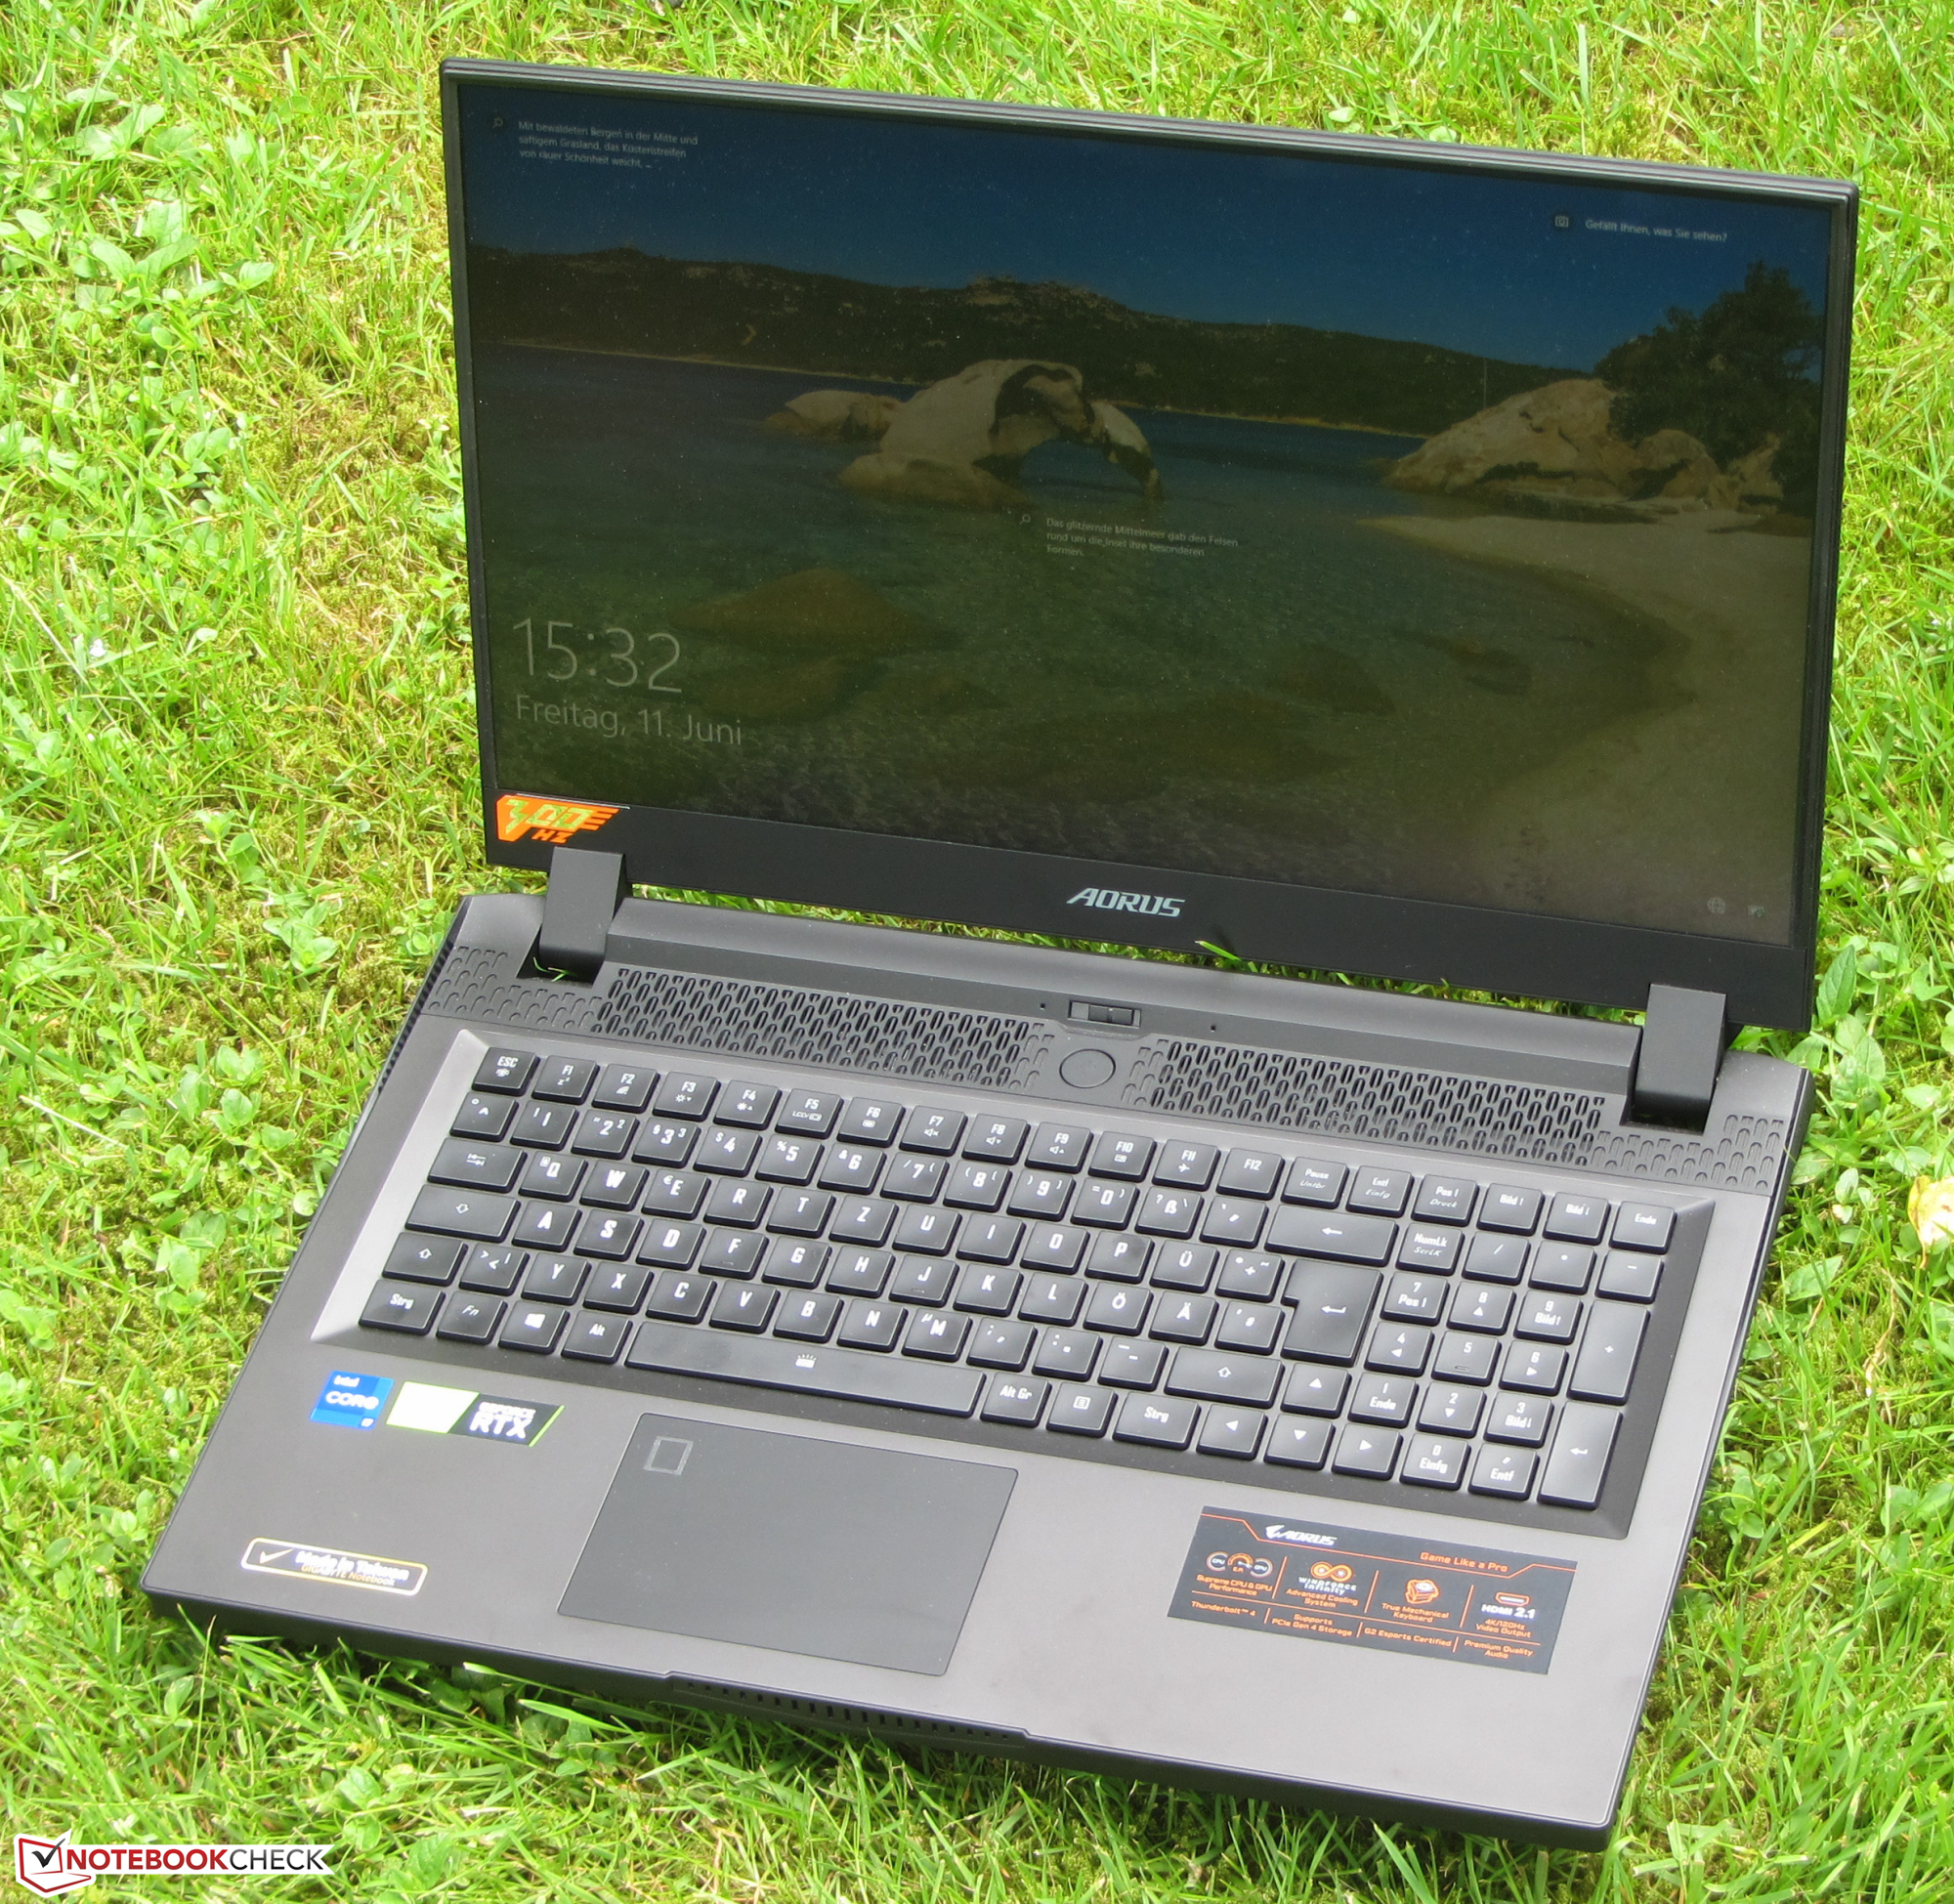
Análisis del Aorus 17G YD: Un portátil para juegos ruidoso con un buen teclado mecánico

Gigabyte presenta un portátil para juegos actualizado en el formato de 17,3 pulgadas con el Aorus 17G YD. Es el mismo modelo hermano delAorus 17G XBque ya analizamos. Entre los competidores están dispositivos como el Asus Strix Scar 17 G733QSA, elLenovo Legion 7 16ACHg6, elSchenker XMG Neo 17 (Early 2021), elAlienware m17 R4, y el MSI GE76 Raider 10UH.
Dado que los dos modelos Aorus 17G son idénticos en su construcción, no profundizaremos en la carcasa, la conectividad, los dispositivos de entrada y los altavoces. La información correspondiente puede encontrarse en elanálisis del Aorus 17G XB enReview del portátil Aorus 17G XB: El teclado mecánico es genial .
Possible contenders in comparison
Valoración | Fecha | Modelo | Peso | Altura | Tamaño | Resolución | Precio |
|---|---|---|---|---|---|---|---|
| 86 % v7 (old) | 06/2021 | Aorus 17G YD i7-11800H, GeForce RTX 3080 Laptop GPU | 2.8 kg | 26 mm | 17.30" | 1920x1080 | |
| 86.6 % v7 (old) | 05/2021 | Asus Strix Scar 17 G733QSA-XS99 R9 5900HX, GeForce RTX 3080 Laptop GPU | 2.8 kg | 28.3 mm | 17.30" | 1920x1080 | |
| 88.1 % v7 (old) | 06/2021 | Lenovo Legion 7 16ACHg6 R9 5900HX, GeForce RTX 3080 Laptop GPU | 2.5 kg | 23.5 mm | 16.00" | 2560x1600 | |
| 85.1 % v7 (old) | 01/2021 | Schenker XMG Neo 17 (Early 2021, RTX 3070, 5800H) R7 5800H, GeForce RTX 3070 Laptop GPU | 2.5 kg | 27 mm | 17.30" | 2560x1440 | |
| 85.3 % v7 (old) | 04/2021 | Alienware m17 R4 i9-10980HK, GeForce RTX 3080 Laptop GPU | 3 kg | 22 mm | 17.30" | 1920x1080 | |
| 87.1 % v7 (old) | 03/2021 | MSI GE76 Raider 10UH i7-10870H, GeForce RTX 3080 Laptop GPU | 3 kg | 27.4 mm | 17.30" | 1920x1080 |
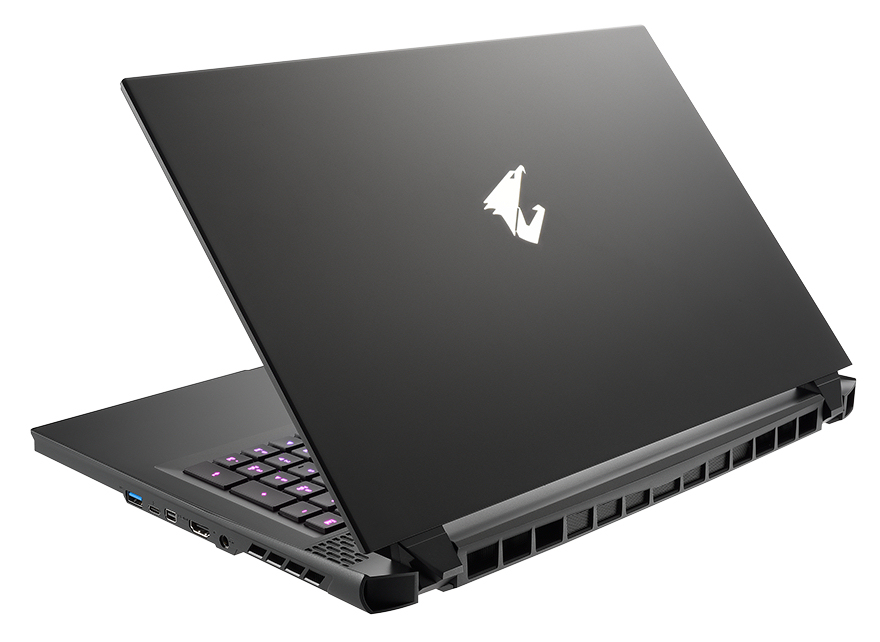
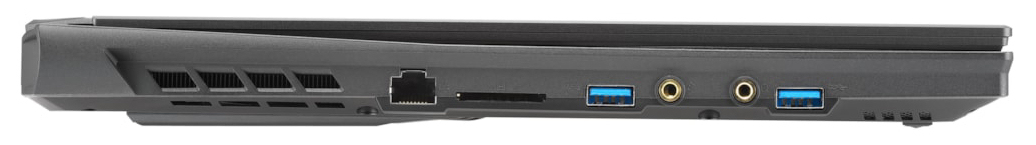
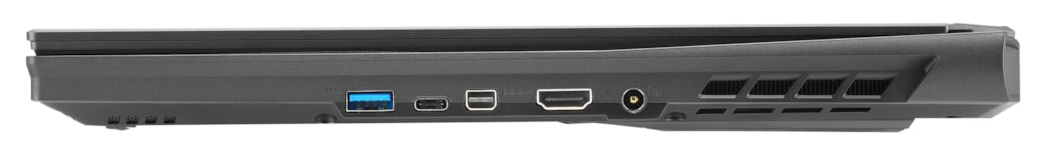
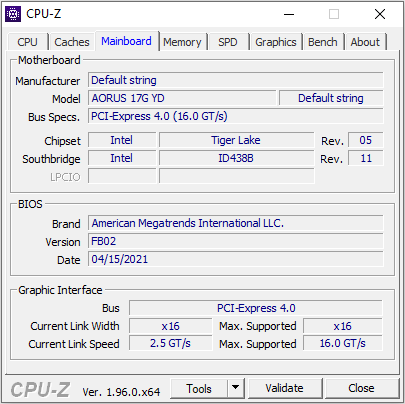
Conectividad - Ahora con Thunderbolt 4
En comparación con el Aorus 17G XB, el 17G YD ha recibido algunas mejoras en términos de puertos. El puerto HDMI soporta el estándar 2.1 (XB: 2.0), que permite mayores resoluciones y tasas de frames. El actual modelo 17G también viene con un puerto Thunderbolt 4 en lugar de uno Thunderbolt 3. Soporta DisplayPort vía USB-C y Power Delivery
| SD Card Reader | |
| average JPG Copy Test (av. of 3 runs) | |
| Aorus 17G XB (Toshiba Exceria Pro SDXC 64 GB UHS-II) | |
| MSI GE76 Raider 10UH (Toshiba Exceria Pro SDXC 64 GB UHS-II) | |
| Aorus 17G YD (AV PRO microSD 128 GB V60) | |
| Alienware m17 R4 (AV PRO microSD 128 GB V60) | |
| Media de la clase Gaming (20.9 - 210, n=54, últimos 2 años) | |
| Schenker XMG Neo 17 (Early 2021, RTX 3070, 5800H) (Toshiba Exceria Pro SDXC 64 GB UHS-II) | |
| maximum AS SSD Seq Read Test (1GB) | |
| Aorus 17G XB (Toshiba Exceria Pro SDXC 64 GB UHS-II) | |
| Alienware m17 R4 (AV PRO microSD 128 GB V60) | |
| MSI GE76 Raider 10UH (Toshiba Exceria Pro SDXC 64 GB UHS-II) | |
| Aorus 17G YD (AV PRO microSD 128 GB V60) | |
| Media de la clase Gaming (25.5 - 261, n=51, últimos 2 años) | |
| Schenker XMG Neo 17 (Early 2021, RTX 3070, 5800H) (Toshiba Exceria Pro SDXC 64 GB UHS-II) | |


 GeForce RTX 3070 Laptop GPU, R7 5800H, Samsung SSD 970 EVO Plus 500GB")
 GeForce RTX 3070 Laptop GPU, R7 5800H, Samsung SSD 970 EVO Plus 500GB")


")
")


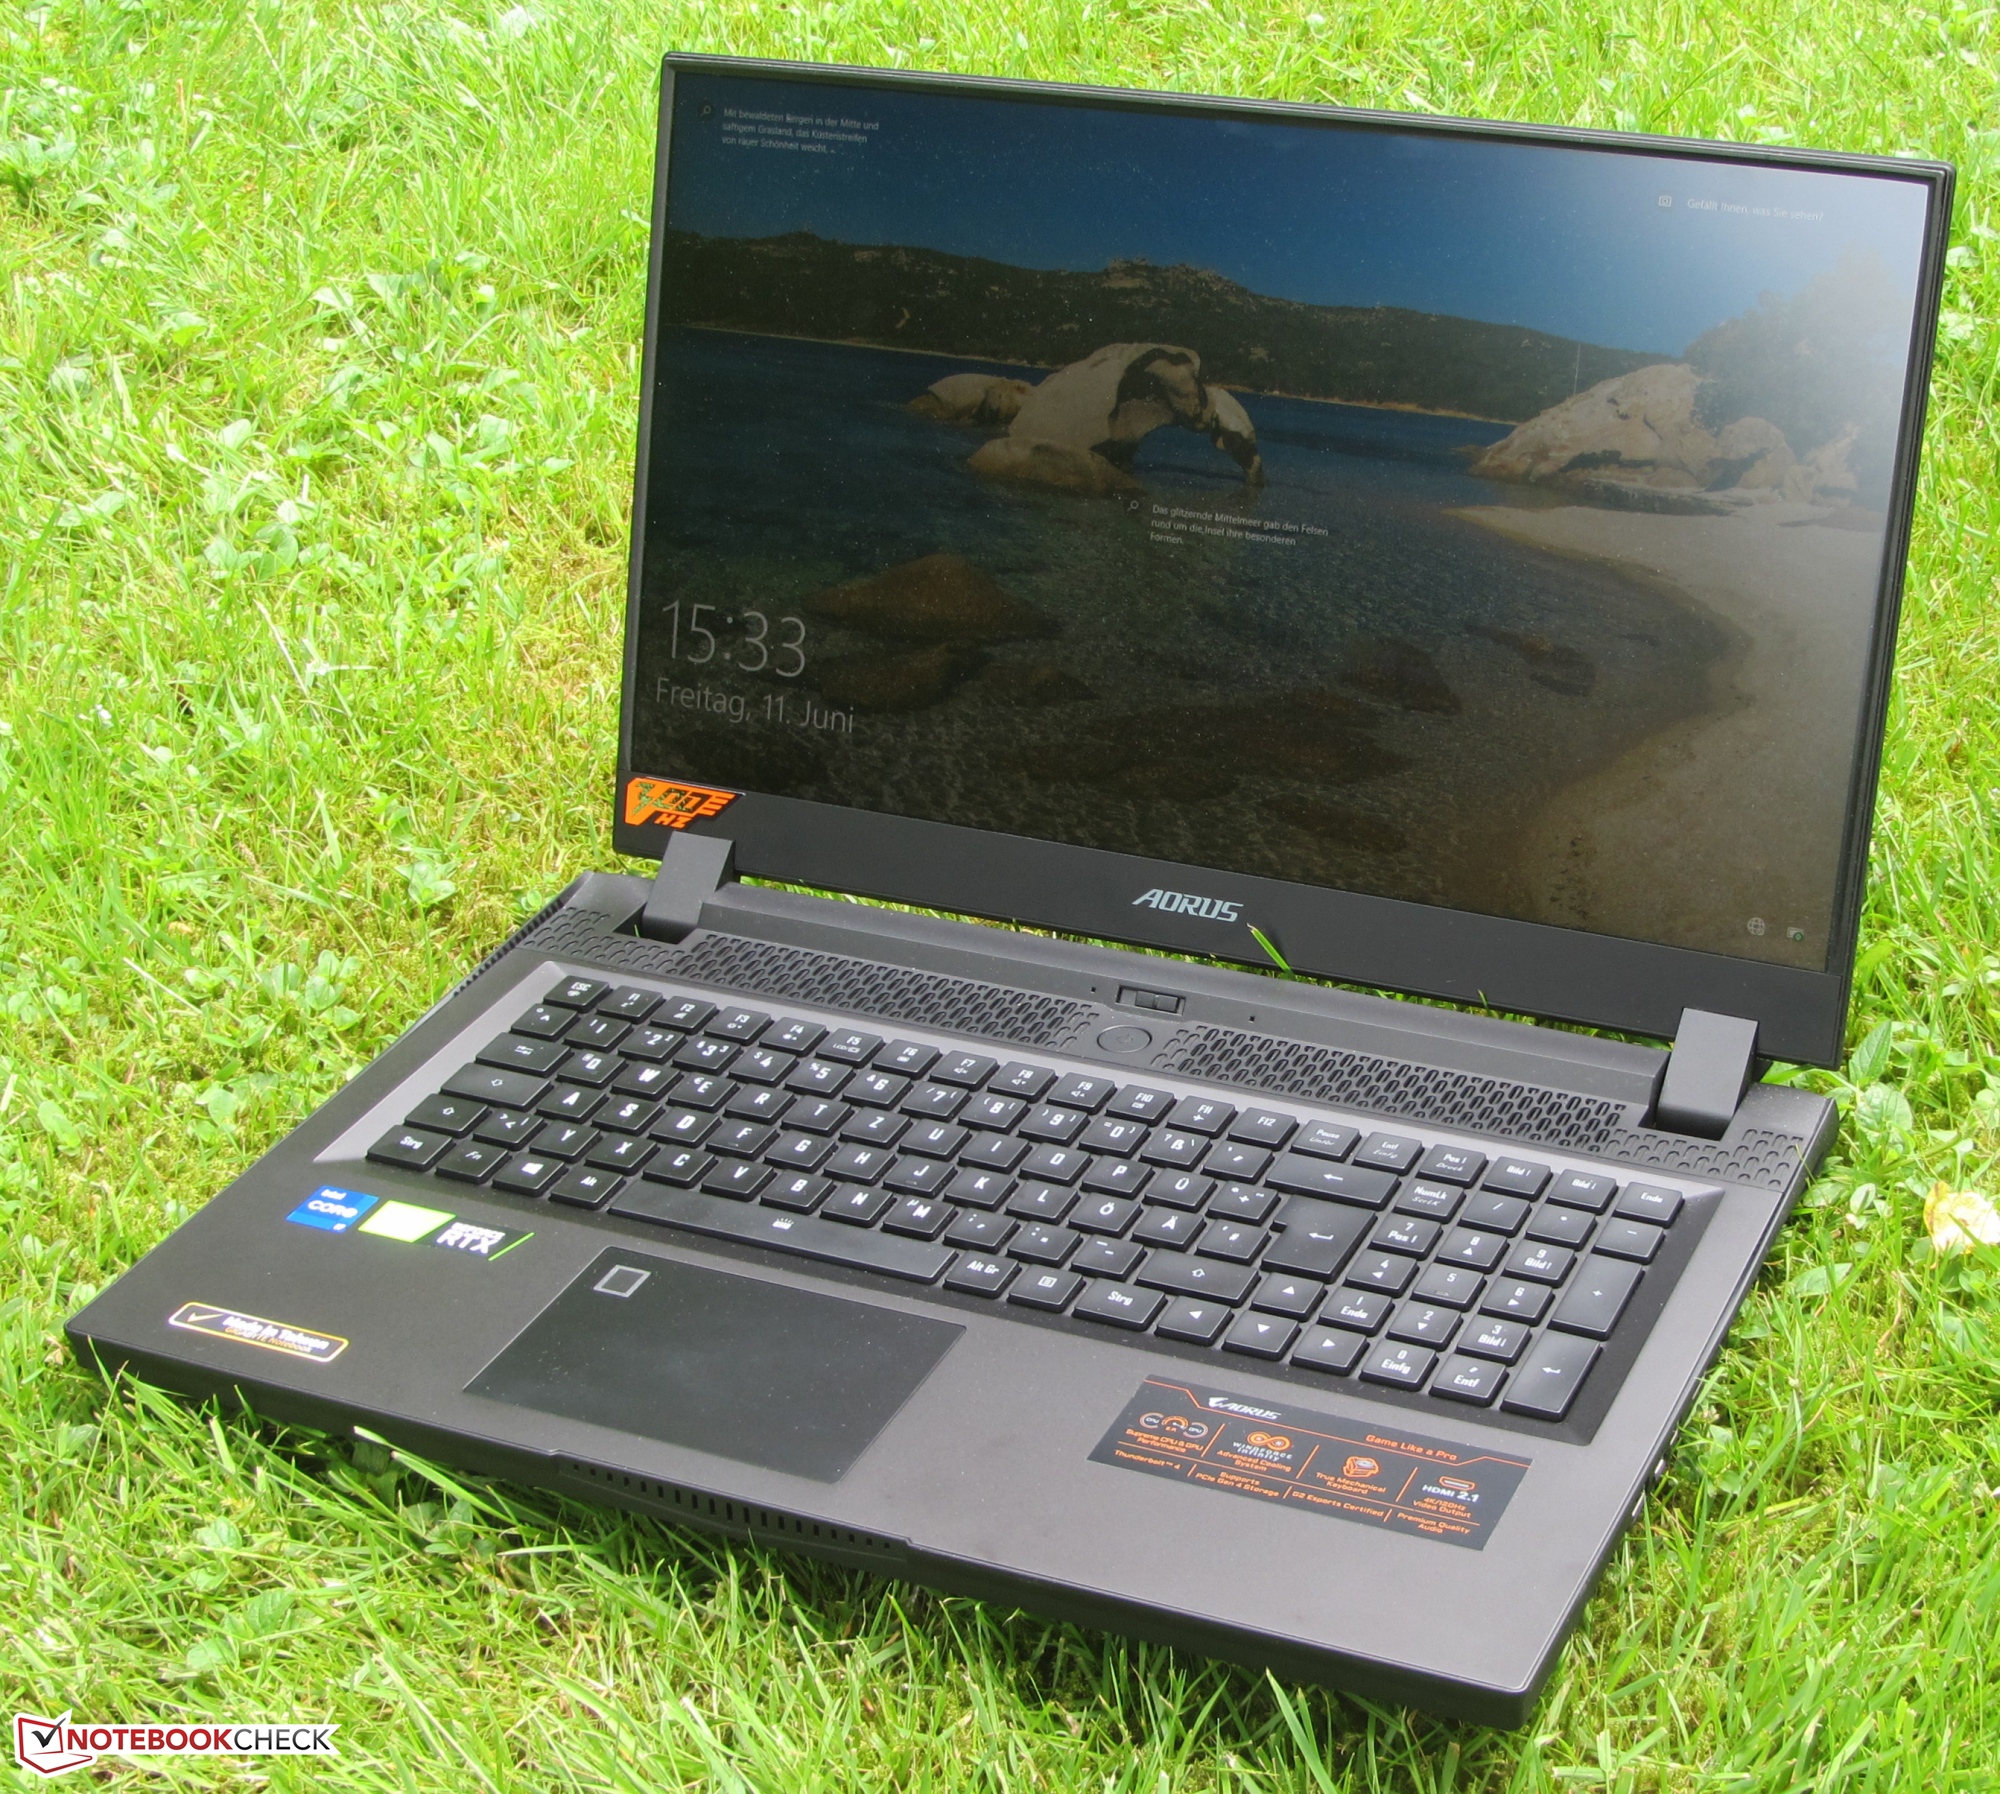
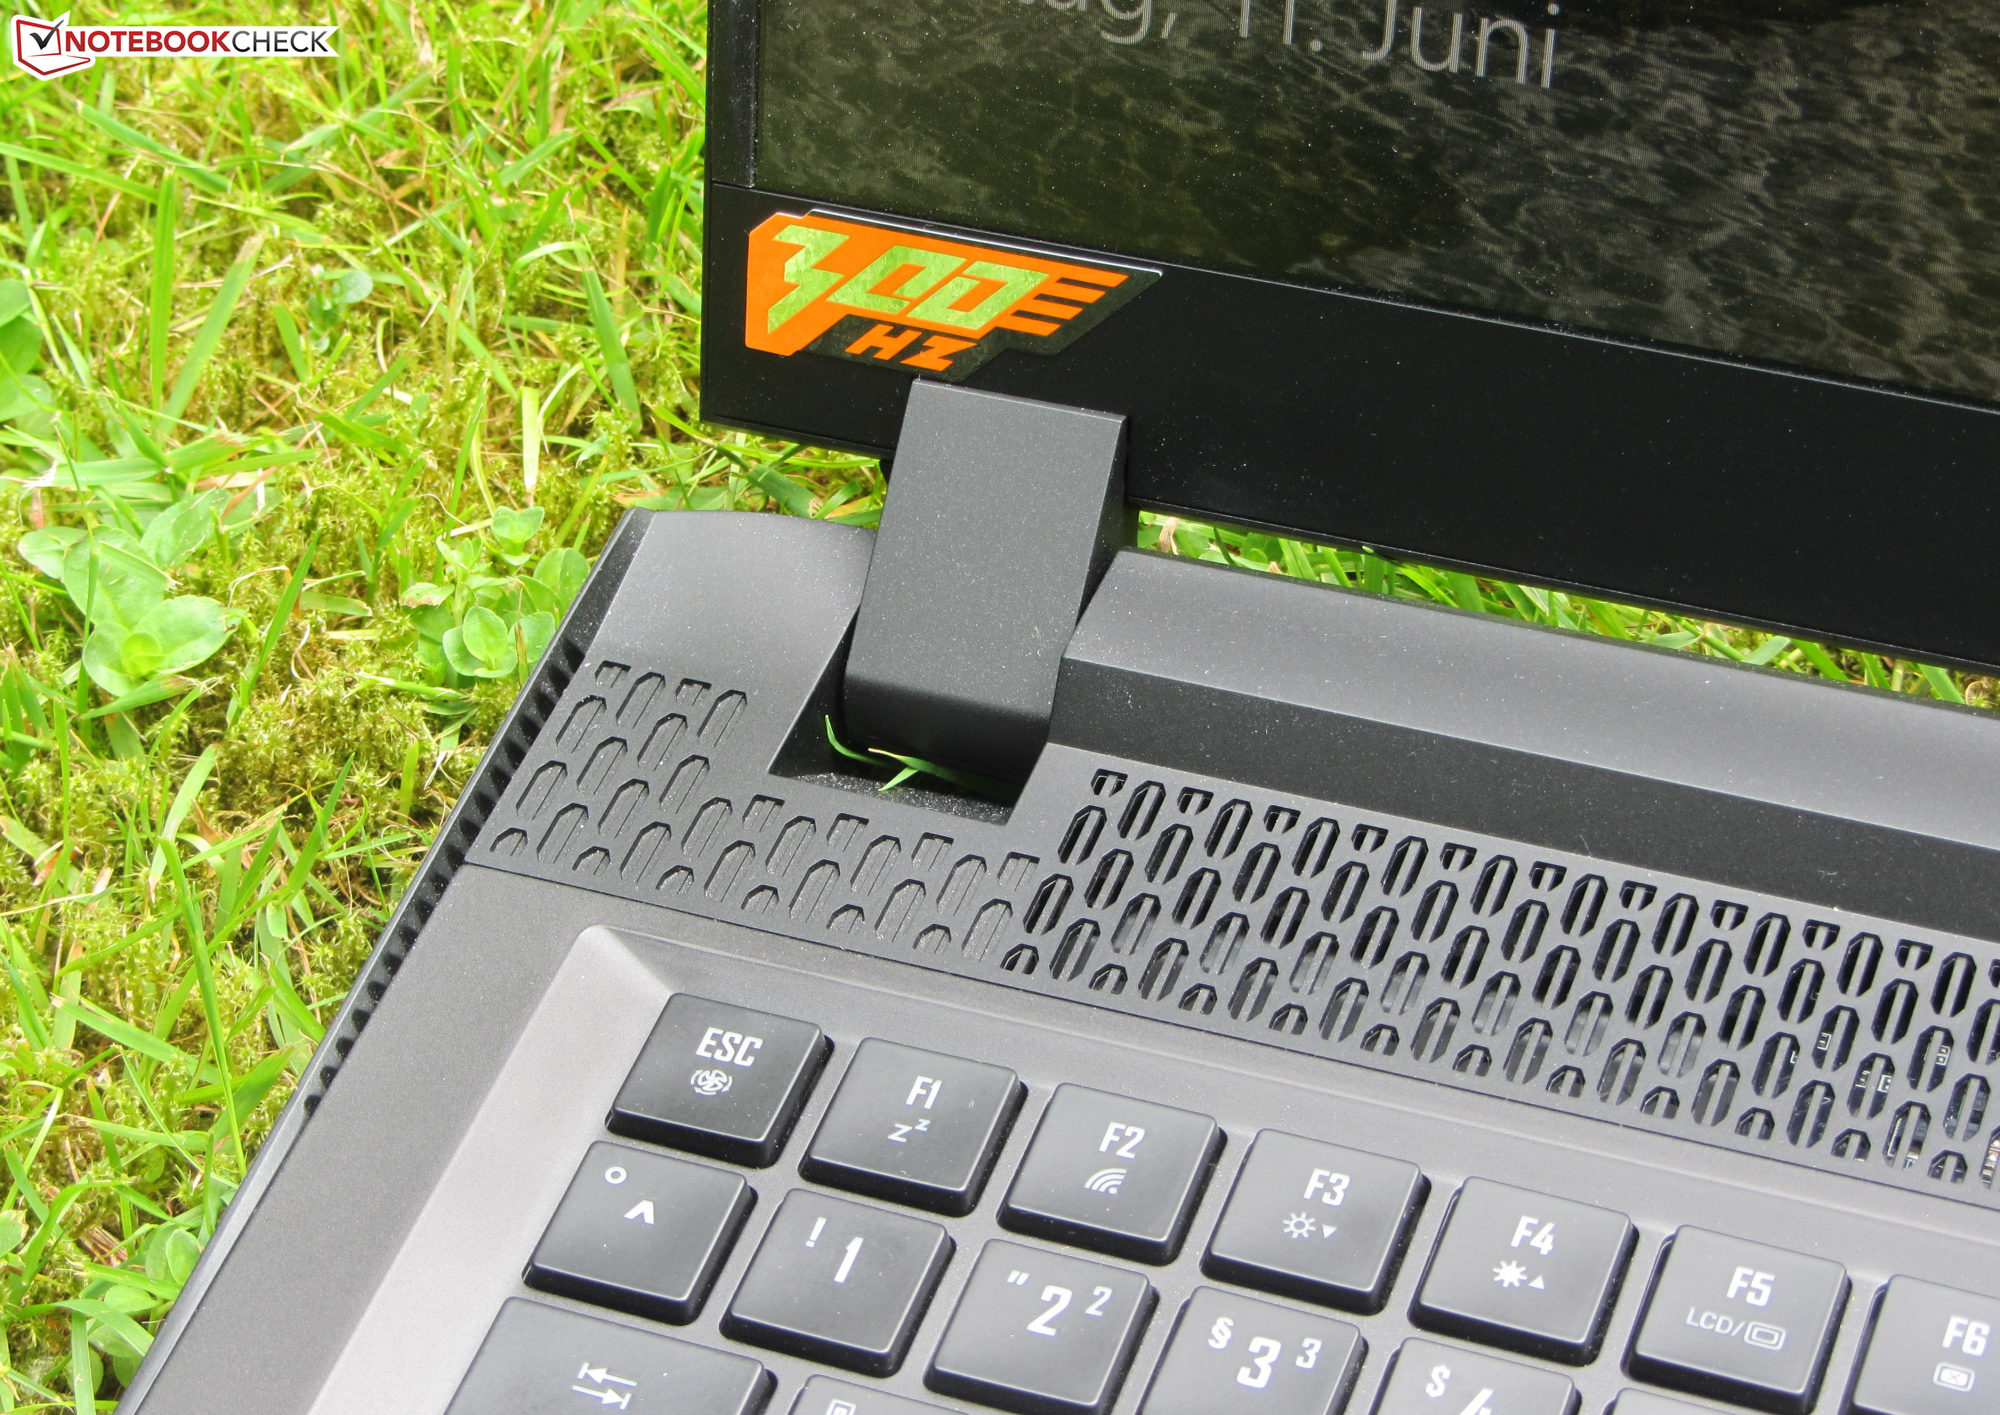
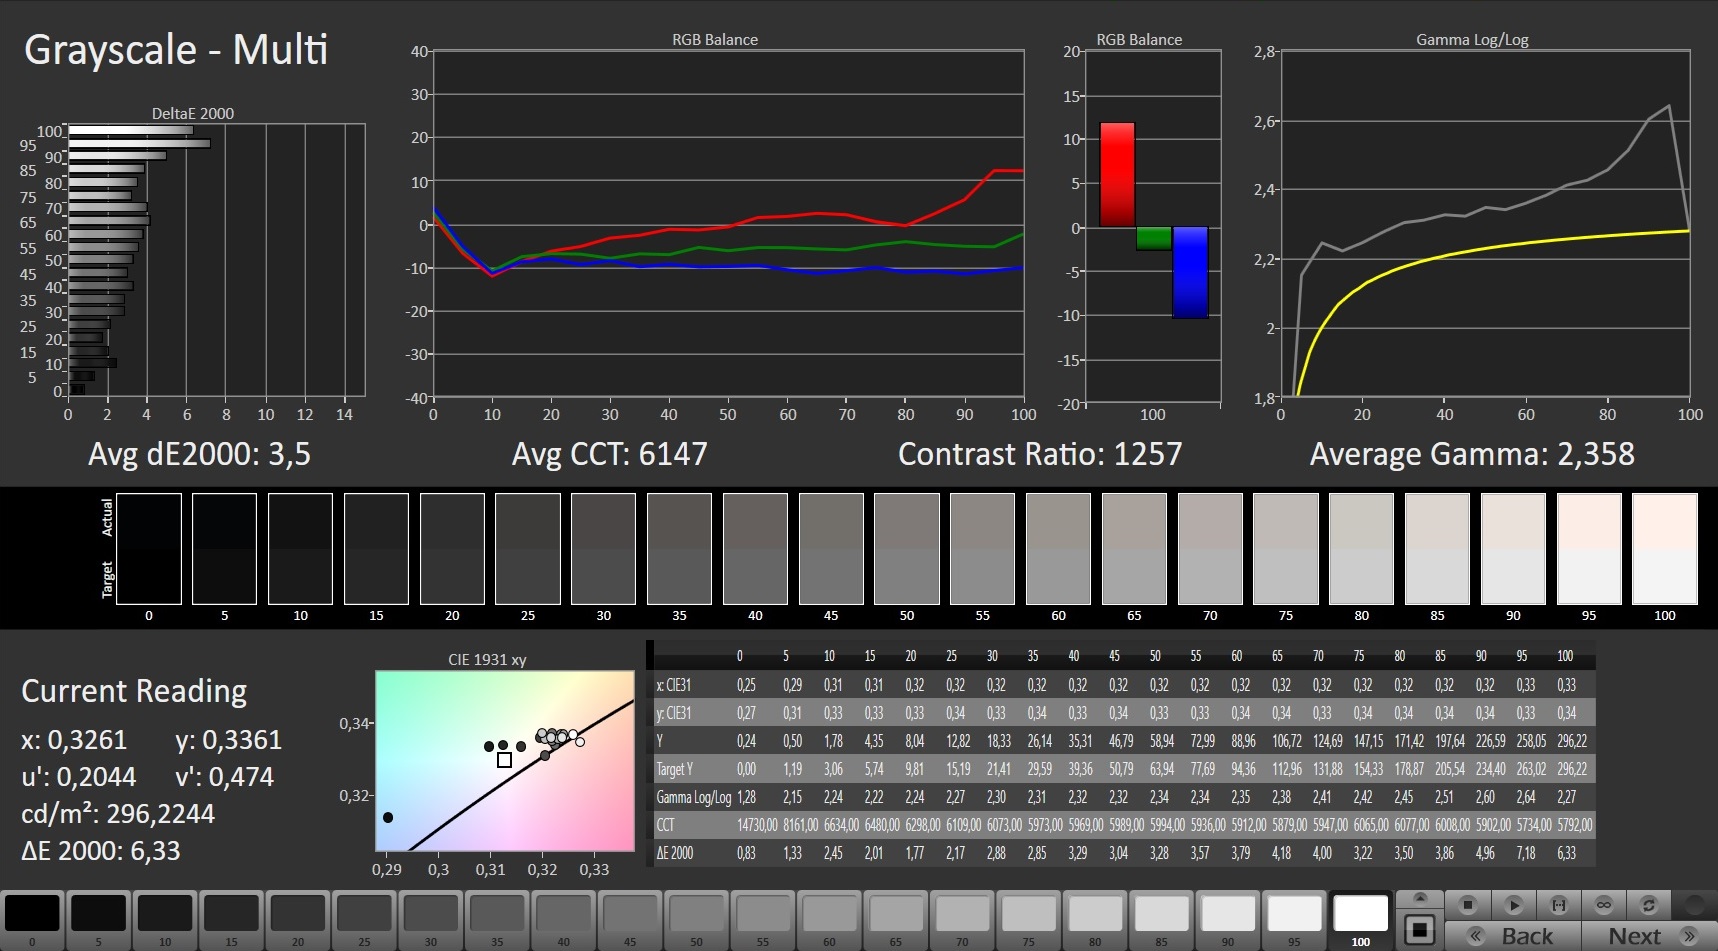
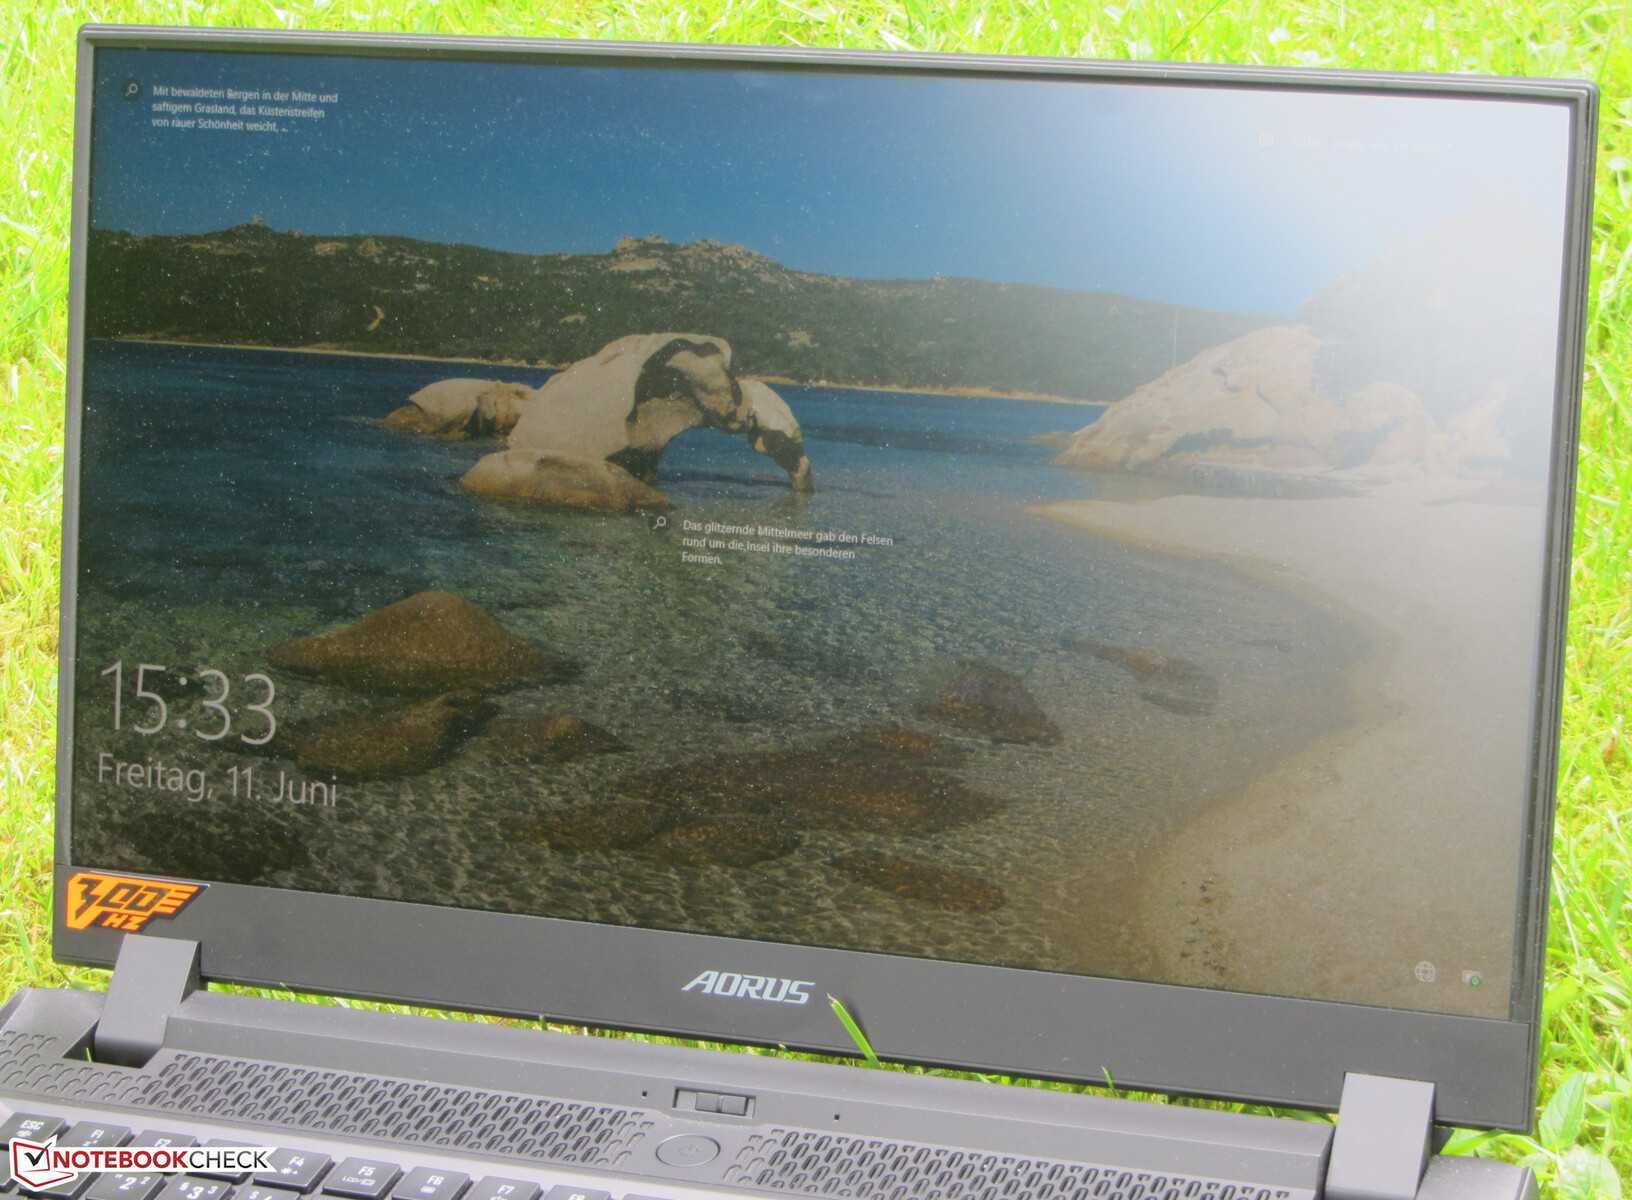
Pantalla - Panel IPS de 300 Hz
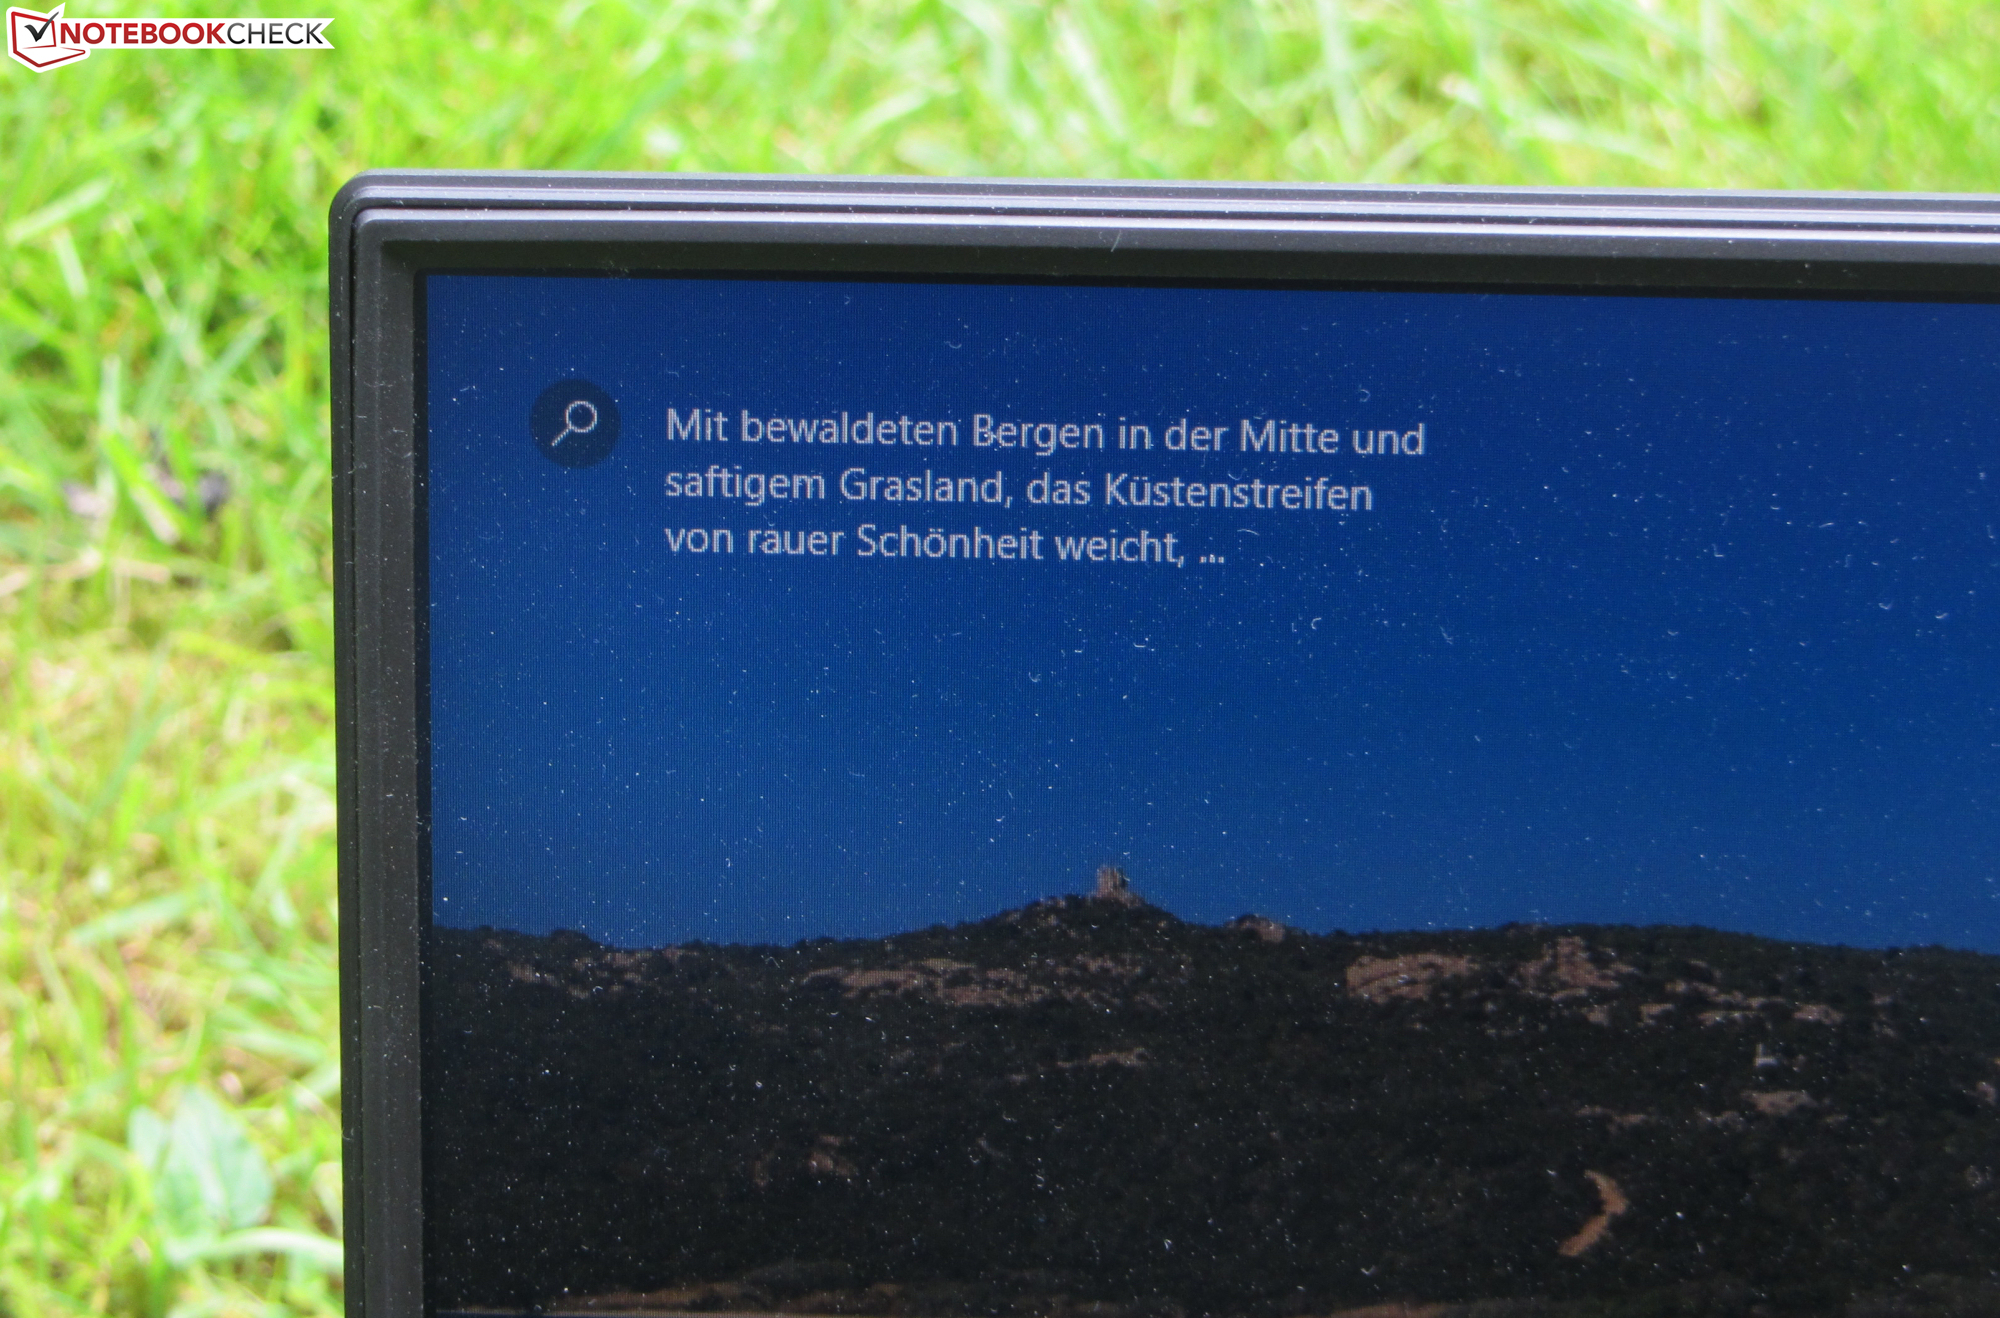
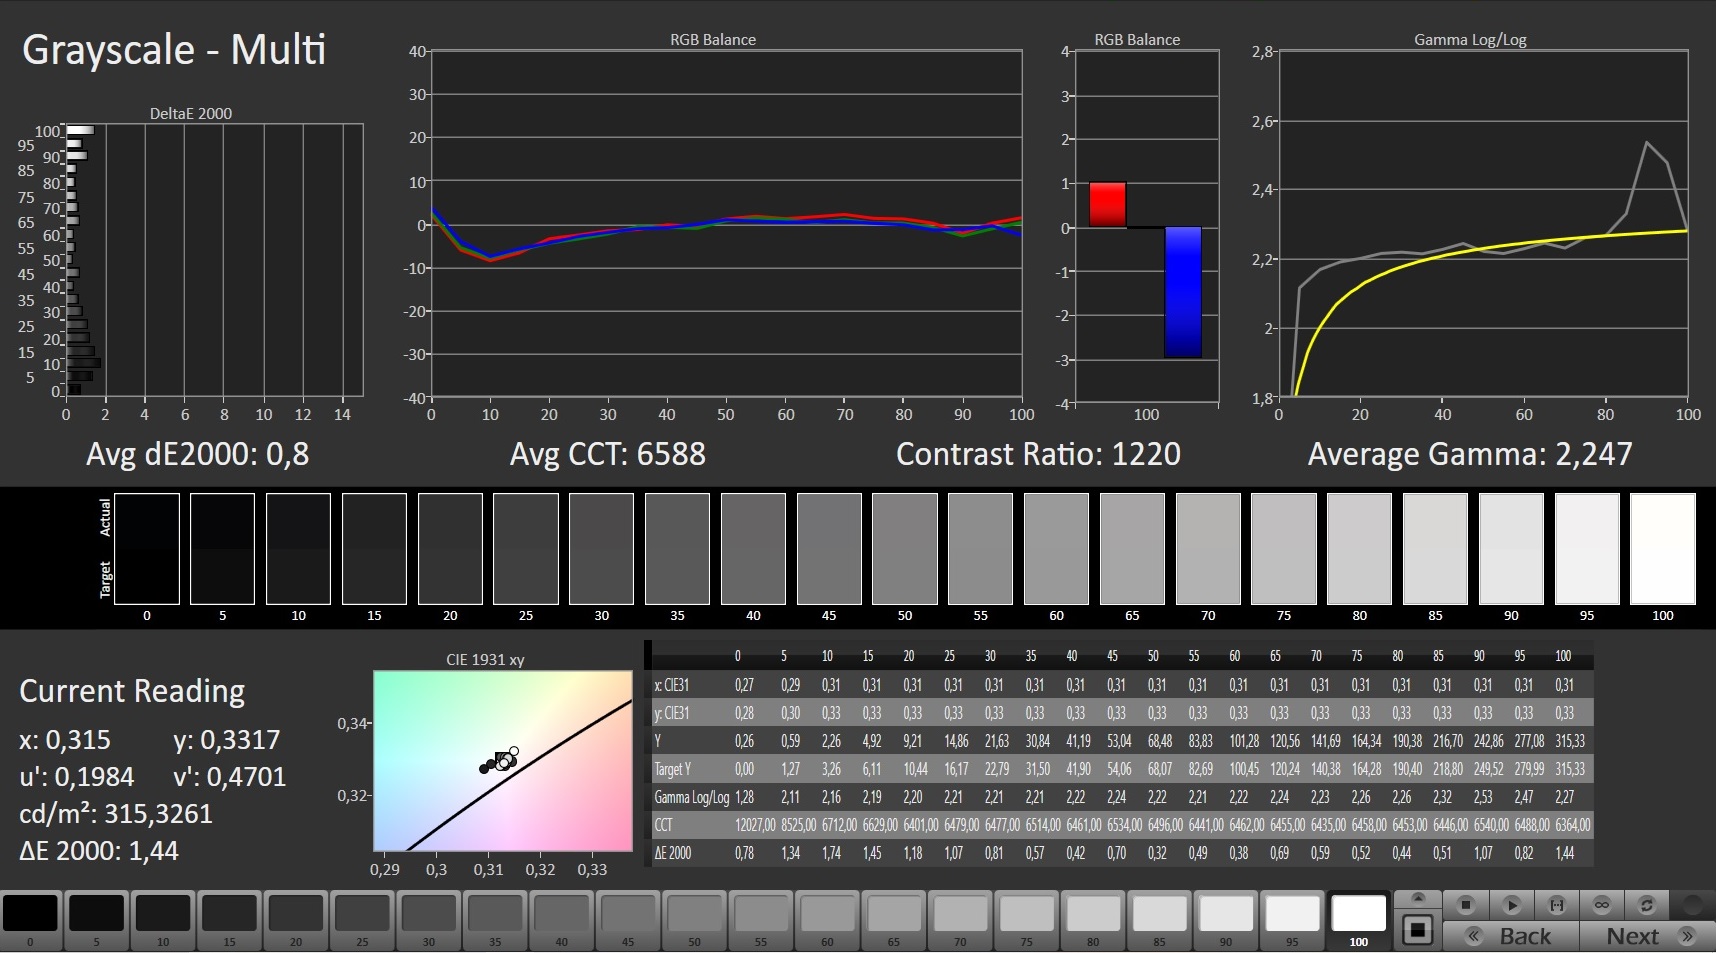
Aunque el contraste (1.192:1) de la pantalla mate de 17,3 pulgadas (1920x1080 píxeles) cumple el objetivo (> 1.000:1), el brillo medio (282,4 cd/m²) es demasiado bajo. Consideramos que los valores superiores a 300 cd/m² son buenos. La pantalla también muestra una distribución desigual del brillo. Sin embargo, el panel de 300 Hz tiene tiempos de respuesta rápidos y no hay parpadeo PWM
| |||||||||||||||||||||||||
iluminación: 73 %
Brillo con batería: 286 cd/m²
Contraste: 1192:1 (Negro: 0.24 cd/m²)
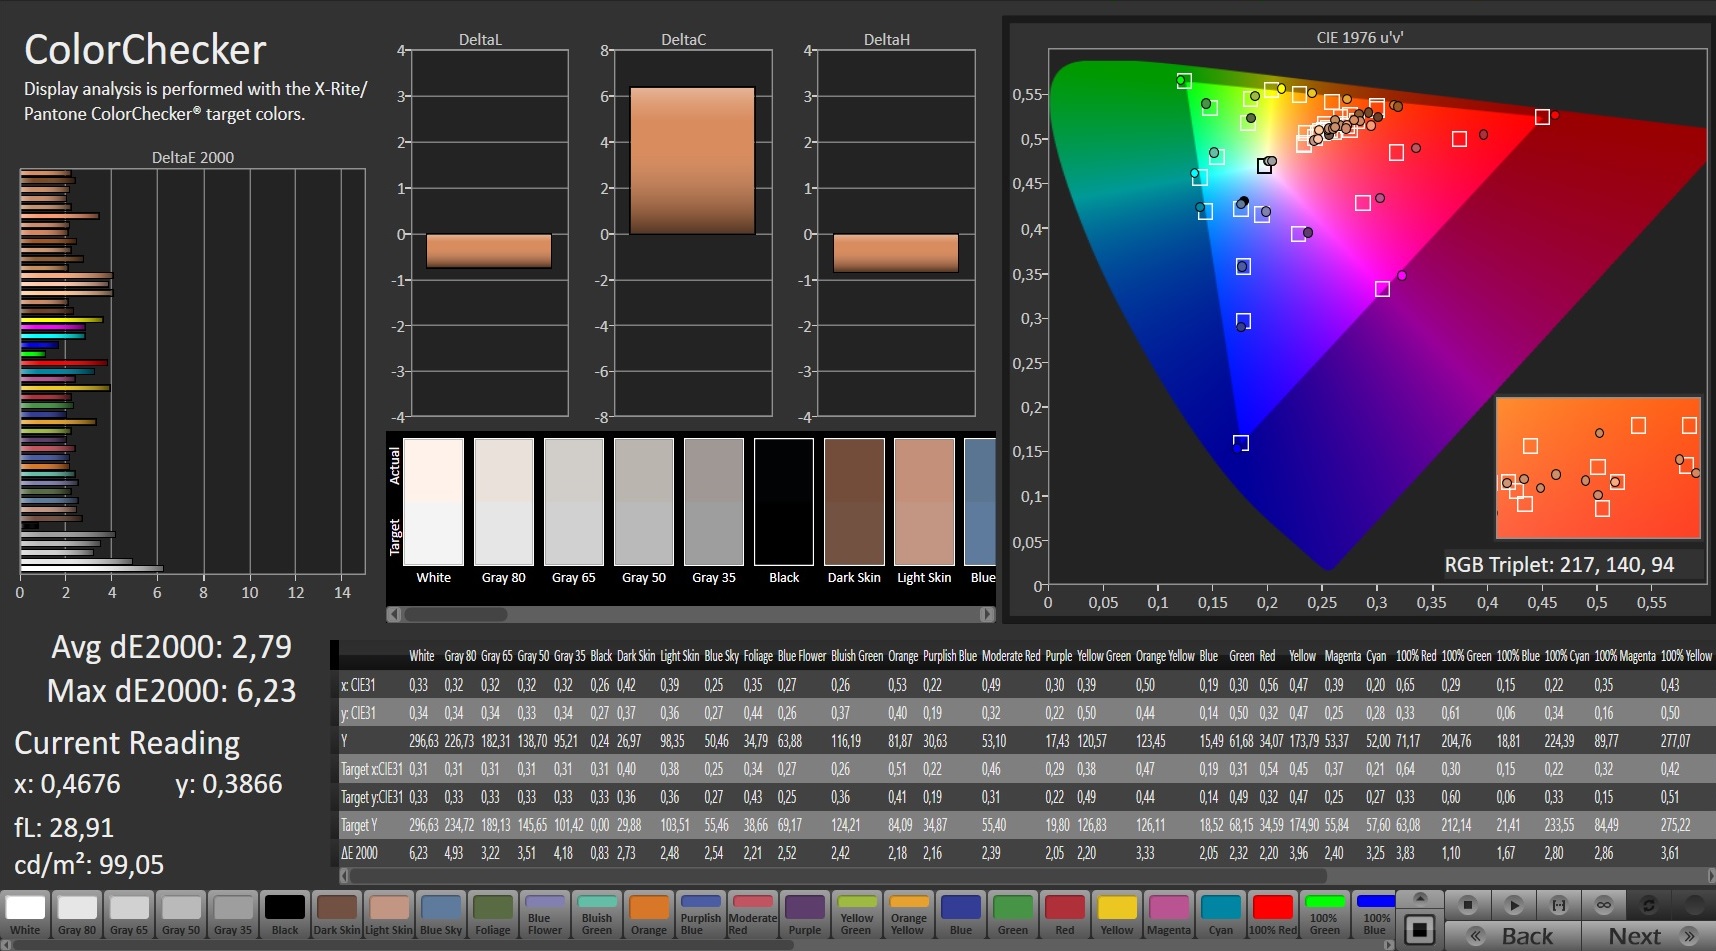
ΔE ColorChecker Calman: 2.79 | ∀{0.5-29.43 Ø4.73}
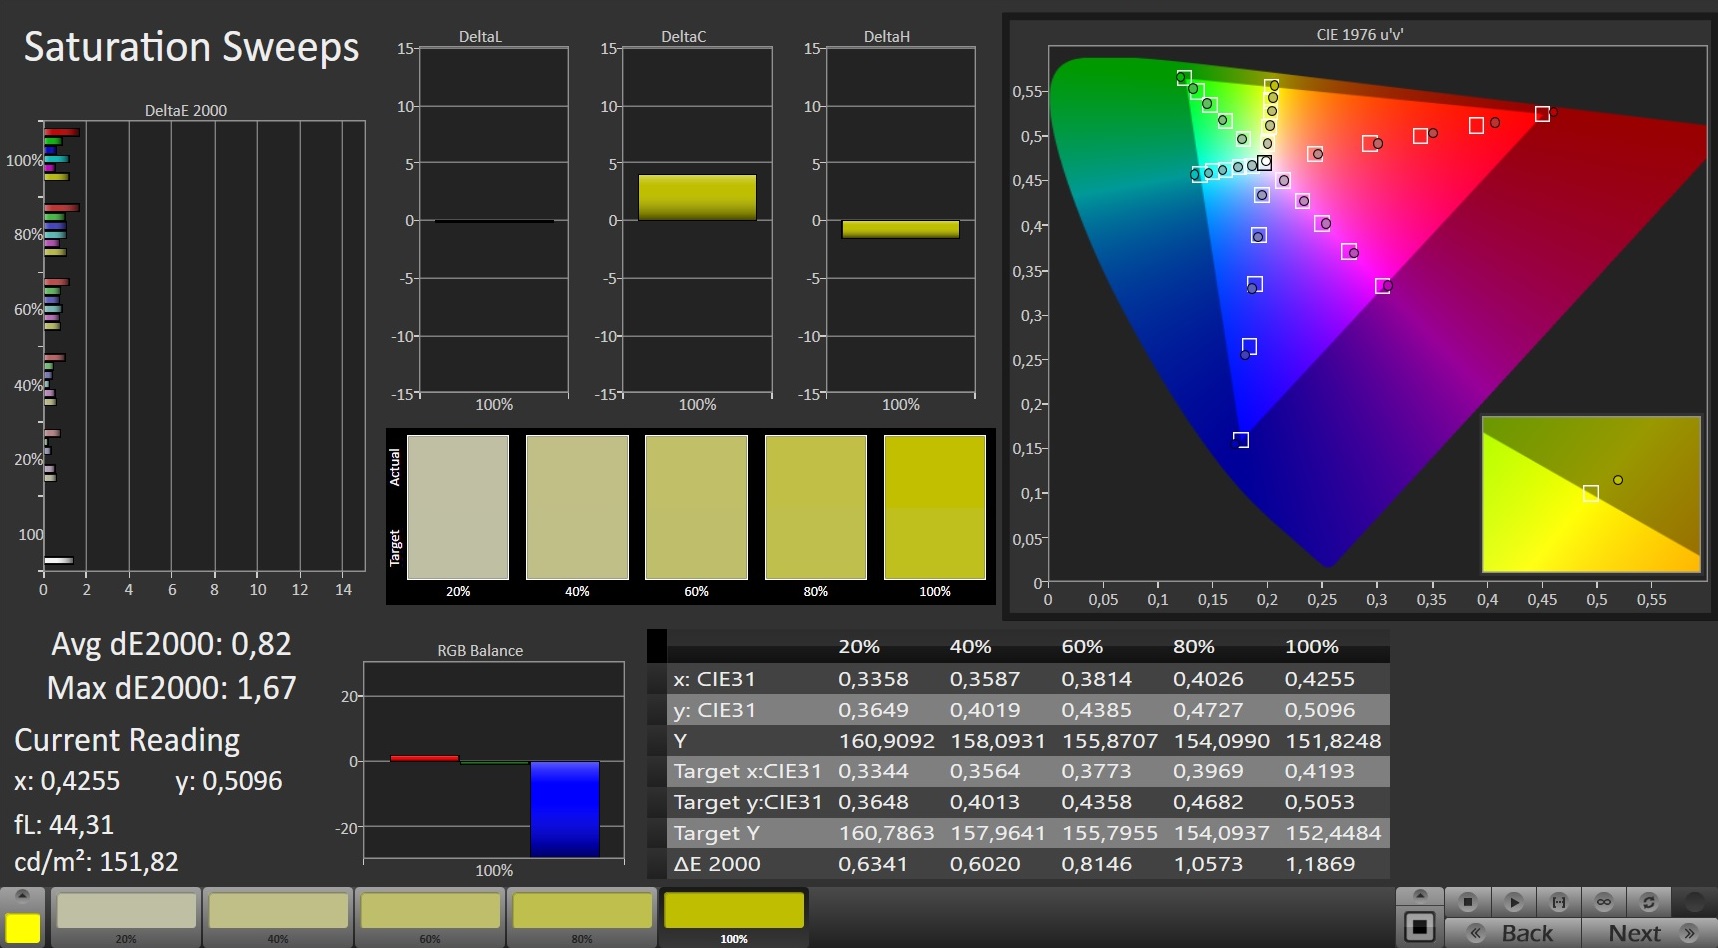
calibrated: 0.82
ΔE Greyscale Calman: 3.5 | ∀{0.09-98 Ø4.97}
96% sRGB (Argyll 1.6.3 3D)
74% AdobeRGB 1998 (Argyll 1.6.3 3D)
73.7% AdobeRGB 1998 (Argyll 3D)
100% sRGB (Argyll 3D)
72.3% Display P3 (Argyll 3D)
Gamma: 2.358
CCT: 6147 K
| Aorus 17G YD Sharp LQ173M1JW04, IPS, 1920x1080, 17.3" | Asus Strix Scar 17 G733QSA-XS99 AU Optronics B173HAN05.4, IPS, 1920x1080, 17.3" | Lenovo Legion 7 16ACHg6 CSOT T3 MNG007DA1-1, IPS, 2560x1600, 16" | Schenker XMG Neo 17 (Early 2021, RTX 3070, 5800H) BOE NE173QHM-NY2 (BOE0977), IPS, 2560x1440, 17.3" | Aorus 17G XB AU Optronics B173HAN05.0 (AUO509D), IPS, 1920x1080, 17.3" | Alienware m17 R4 AU Optronics AUOEC91, IPS, 1920x1080, 17.3" | MSI GE76 Raider 10UH AU Optronics B173HAN05.1, IPS, 1920x1080, 17.3" | |
|---|---|---|---|---|---|---|---|
| Display | -2% | -2% | -2% | -2% | -2% | -1% | |
| Display P3 Coverage (%) | 72.3 | 71 -2% | 70.3 -3% | 70.5 -2% | 70.6 -2% | 69.8 -3% | 71.8 -1% |
| sRGB Coverage (%) | 100 | 99.4 -1% | 99.4 -1% | 99.5 0% | 97.2 -3% | 99.7 0% | 98.1 -2% |
| AdobeRGB 1998 Coverage (%) | 73.7 | 72.2 -2% | 72.7 -1% | 71.8 -3% | 72.8 -1% | 71.6 -3% | 73.9 0% |
| Response Times | 17% | 14% | -17% | -24% | 2% | -30% | |
| Response Time Grey 50% / Grey 80% * (ms) | 13.6 ? | 6.6 ? 51% | 14 ? -3% | 16.8 ? -24% | 16 ? -18% | 13.2 ? 3% | 20.4 ? -50% |
| Response Time Black / White * (ms) | 9.2 ? | 10.8 ? -17% | 6.4 ? 30% | 10 ? -9% | 12 ? -30% | 9.2 ? -0% | 10 ? -9% |
| PWM Frequency (Hz) | 151500 | ||||||
| Screen | 6% | 21% | 2% | 17% | 21% | -21% | |
| Brightness middle (cd/m²) | 286 | 303.8 6% | 489 71% | 410 43% | 293 2% | 305 7% | 324.6 13% |
| Brightness (cd/m²) | 282 | 292 4% | 469 66% | 381 35% | 285 1% | 301 7% | 312 11% |
| Brightness Distribution (%) | 73 | 85 16% | 92 26% | 88 21% | 95 30% | 93 27% | 87 19% |
| Black Level * (cd/m²) | 0.24 | 0.23 4% | 0.38 -58% | 0.37 -54% | 0.24 -0% | 0.19 21% | 0.28 -17% |
| Contrast (:1) | 1192 | 1321 11% | 1287 8% | 1108 -7% | 1221 2% | 1605 35% | 1159 -3% |
| Colorchecker dE 2000 * | 2.79 | 1.87 33% | 1.45 48% | 2.55 9% | 1.27 54% | 1.31 53% | 3.87 -39% |
| Colorchecker dE 2000 max. * | 6.23 | 3.26 48% | 2.16 65% | 4.33 30% | 2.24 64% | 2.32 63% | 9.35 -50% |
| Colorchecker dE 2000 calibrated * | 0.82 | 1.45 -77% | 1.16 -41% | 1.28 -56% | 1.06 -29% | 0.91 -11% | 1.42 -73% |
| Greyscale dE 2000 * | 3.5 | 2.7 23% | 1.6 54% | 3.4 3% | 1.34 62% | 2.3 34% | 6.5 -86% |
| Gamma | 2.358 93% | 2.26 97% | 2.197 100% | 2.275 97% | 2.38 92% | 2.281 96% | 2.23 99% |
| CCT | 6147 106% | 6436 101% | 6377 102% | 6637 98% | 6542 99% | 6449 101% | 5702 114% |
| Color Space (Percent of AdobeRGB 1998) (%) | 74 | 65.6 -11% | 73 -1% | 72 -3% | 73 -1% | 72 -3% | 66.3 -10% |
| Color Space (Percent of sRGB) (%) | 96 | 99.4 4% | 94 -2% | 95 -1% | 94 -2% | 94 -2% | 98 2% |
| Media total (Programa/Opciones) | 7% /
6% | 11% /
16% | -6% /
-1% | -3% /
8% | 7% /
14% | -17% /
-18% |
* ... más pequeño es mejor
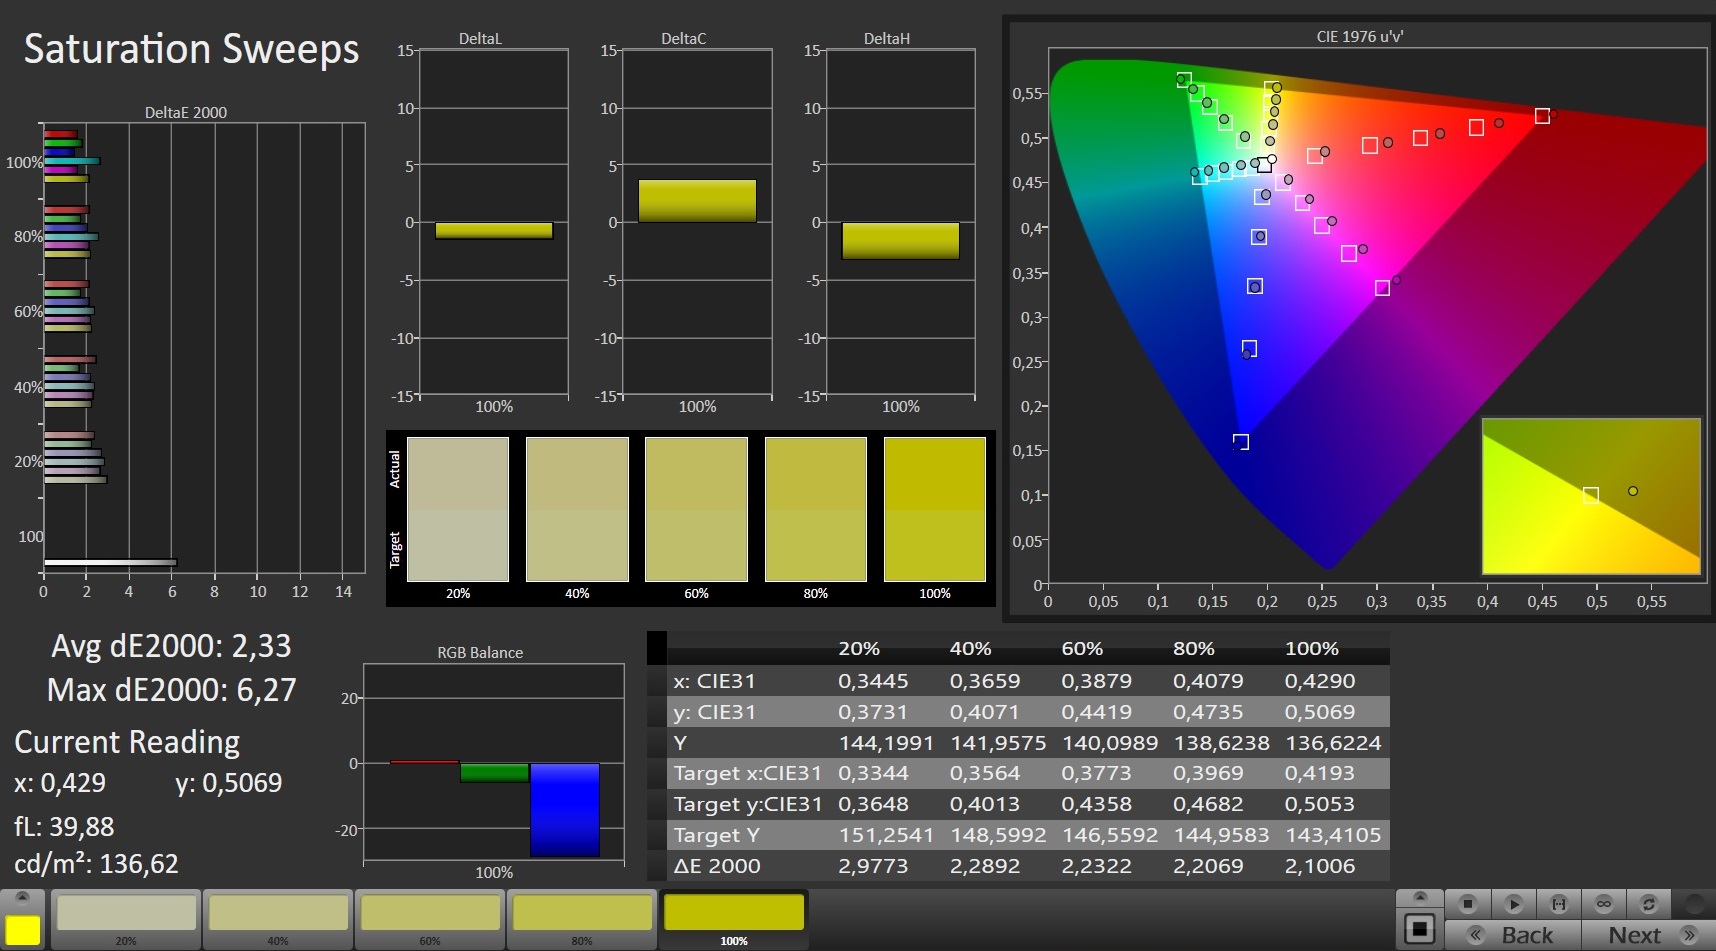
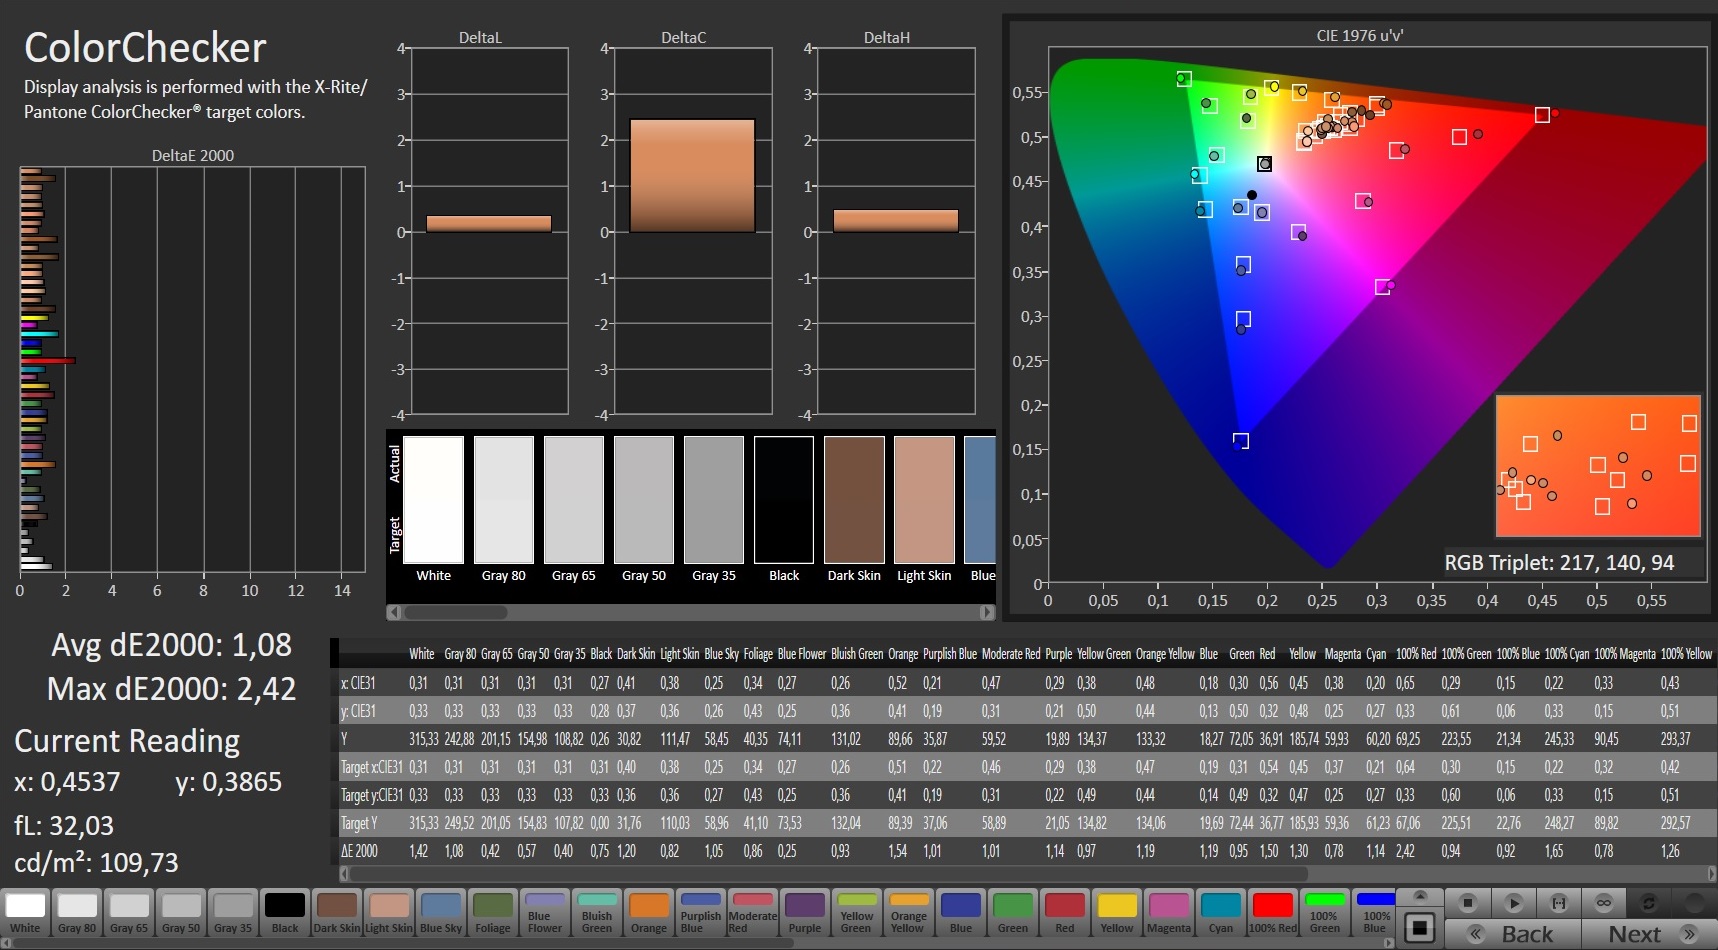
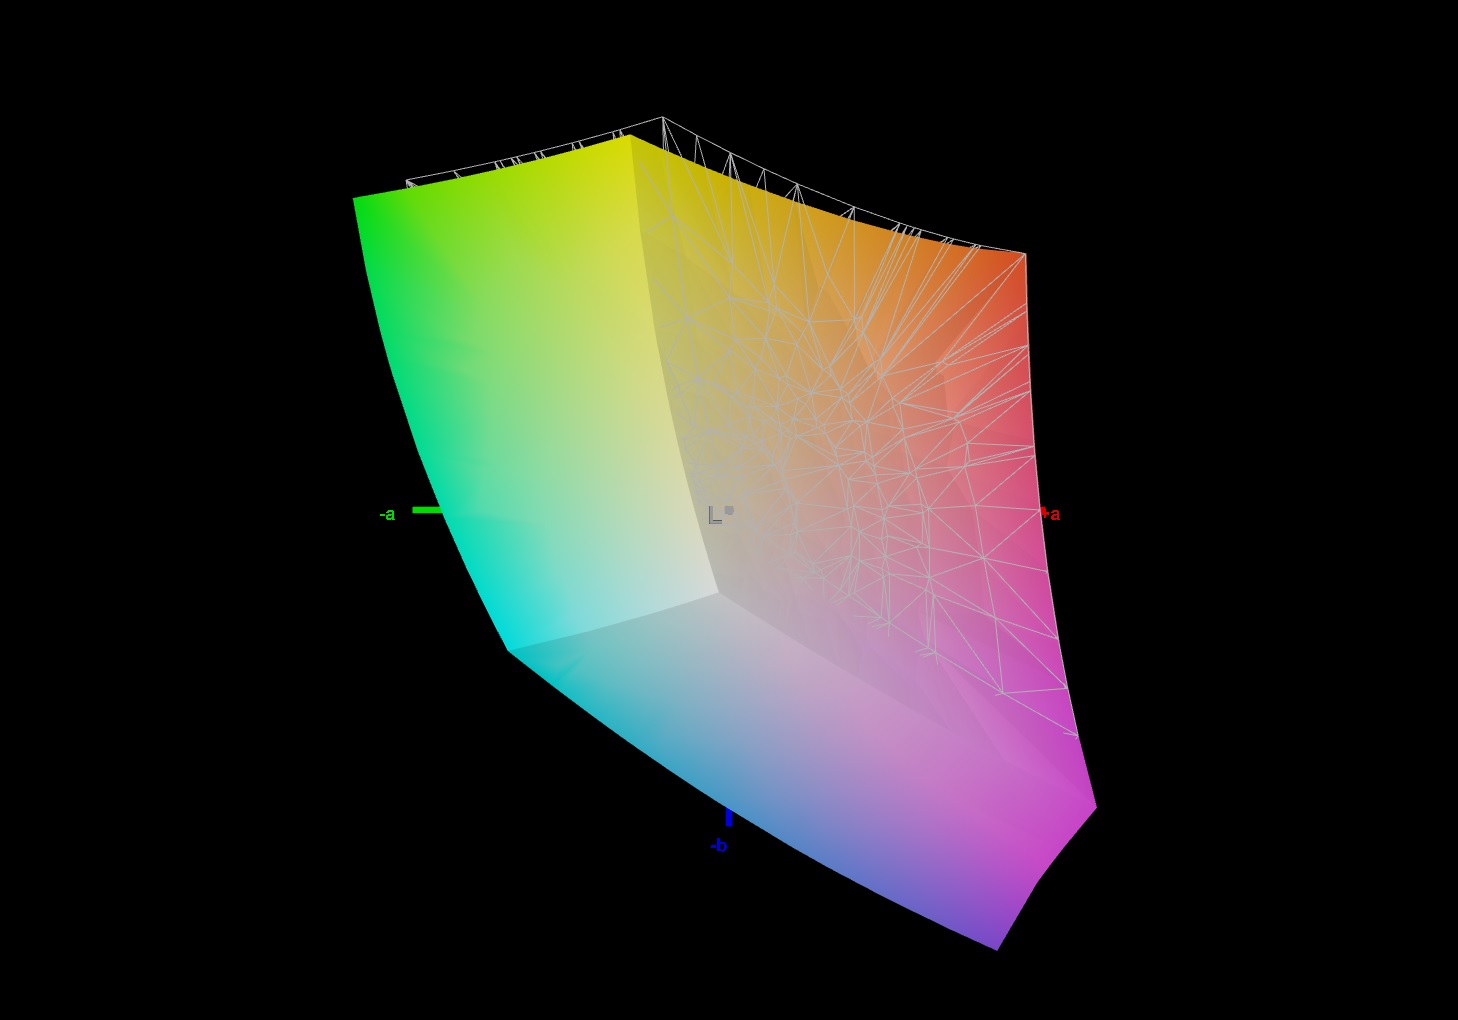
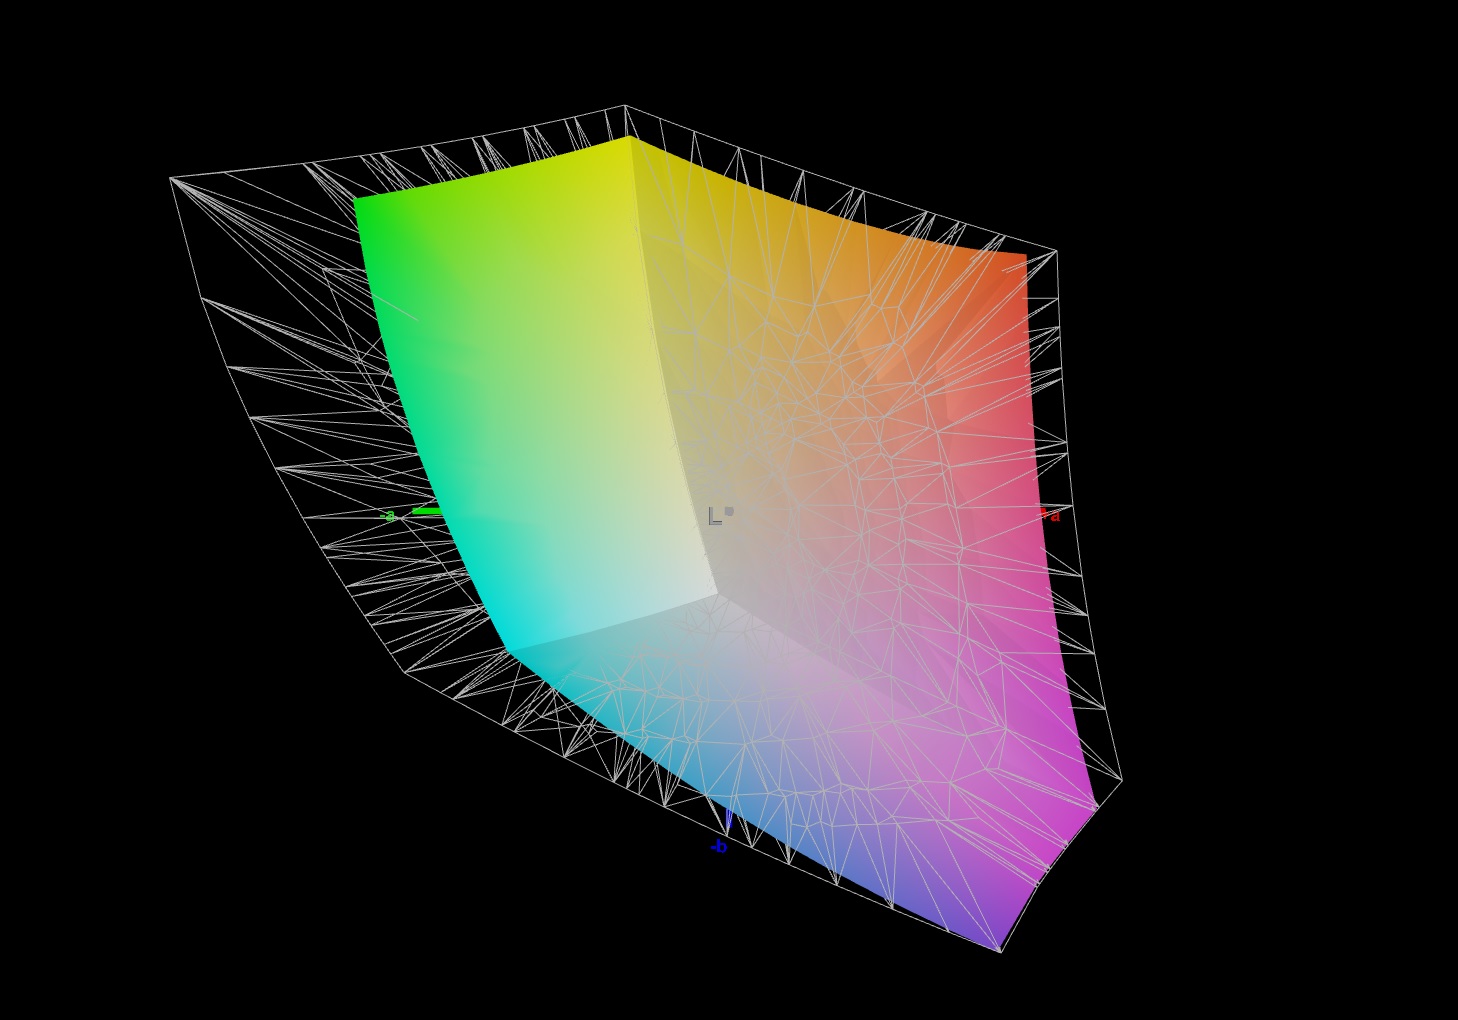
Nada más sacarla de la caja, la pantalla muestra una buena reproducción del color y cumple el objetivo con una desviación del color de 2,79 (DeltaE inferior a 3). Además, no sufre de un tinte azul. Se puede utilizar la calibración para conseguir mejoras. La desviación de color baja a 1,08 y las escalas de grises se representan de forma más equilibrada. El espacio de color sRGB se cubre en un 100%, mientras que el espacio de color AdobeRGB se cubre en un 74%
Tiempos de respuesta del display
| ↔ Tiempo de respuesta de Negro a Blanco | ||
|---|---|---|
| 9.2 ms ... subida ↗ y bajada ↘ combinada | ↗ 5.2 ms subida | 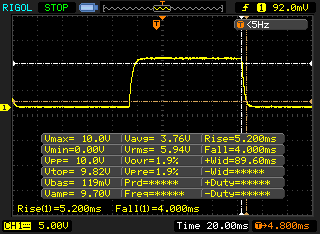 |
| ↘ 4 ms bajada | ||
| La pantalla mostró tiempos de respuesta rápidos en nuestros tests y debería ser adecuada para juegos. En comparación, todos los dispositivos de prueba van de ##min### (mínimo) a 240 (máximo) ms. » 25 % de todos los dispositivos son mejores. Esto quiere decir que el tiempo de respuesta medido es mejor que la media (19.9 ms) de todos los dispositivos testados. | ||
| ↔ Tiempo de respuesta 50% Gris a 80% Gris | ||
| 13.6 ms ... subida ↗ y bajada ↘ combinada | ↗ 6.8 ms subida | 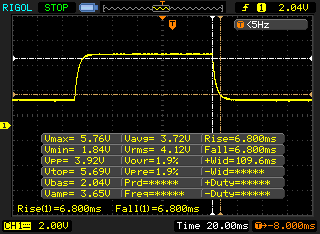 |
| ↘ 6.8 ms bajada | ||
| La pantalla mostró buenos tiempos de respuesta en nuestros tests pero podría ser demasiado lenta para los jugones competitivos. En comparación, todos los dispositivos de prueba van de ##min### (mínimo) a 636 (máximo) ms. » 27 % de todos los dispositivos son mejores. Esto quiere decir que el tiempo de respuesta medido es mejor que la media (31.1 ms) de todos los dispositivos testados. | ||
Parpadeo de Pantalla / PWM (Pulse-Width Modulation)
| Parpadeo de Pantalla / PWM no detectado | 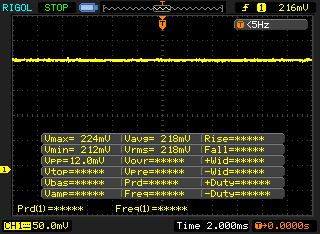 | ||
Comparación: 52 % de todos los dispositivos testados no usaron PWM para atenuar el display. Si se usó, medimos una media de 7784 (mínimo: 5 - máxmo: 343500) Hz. | |||
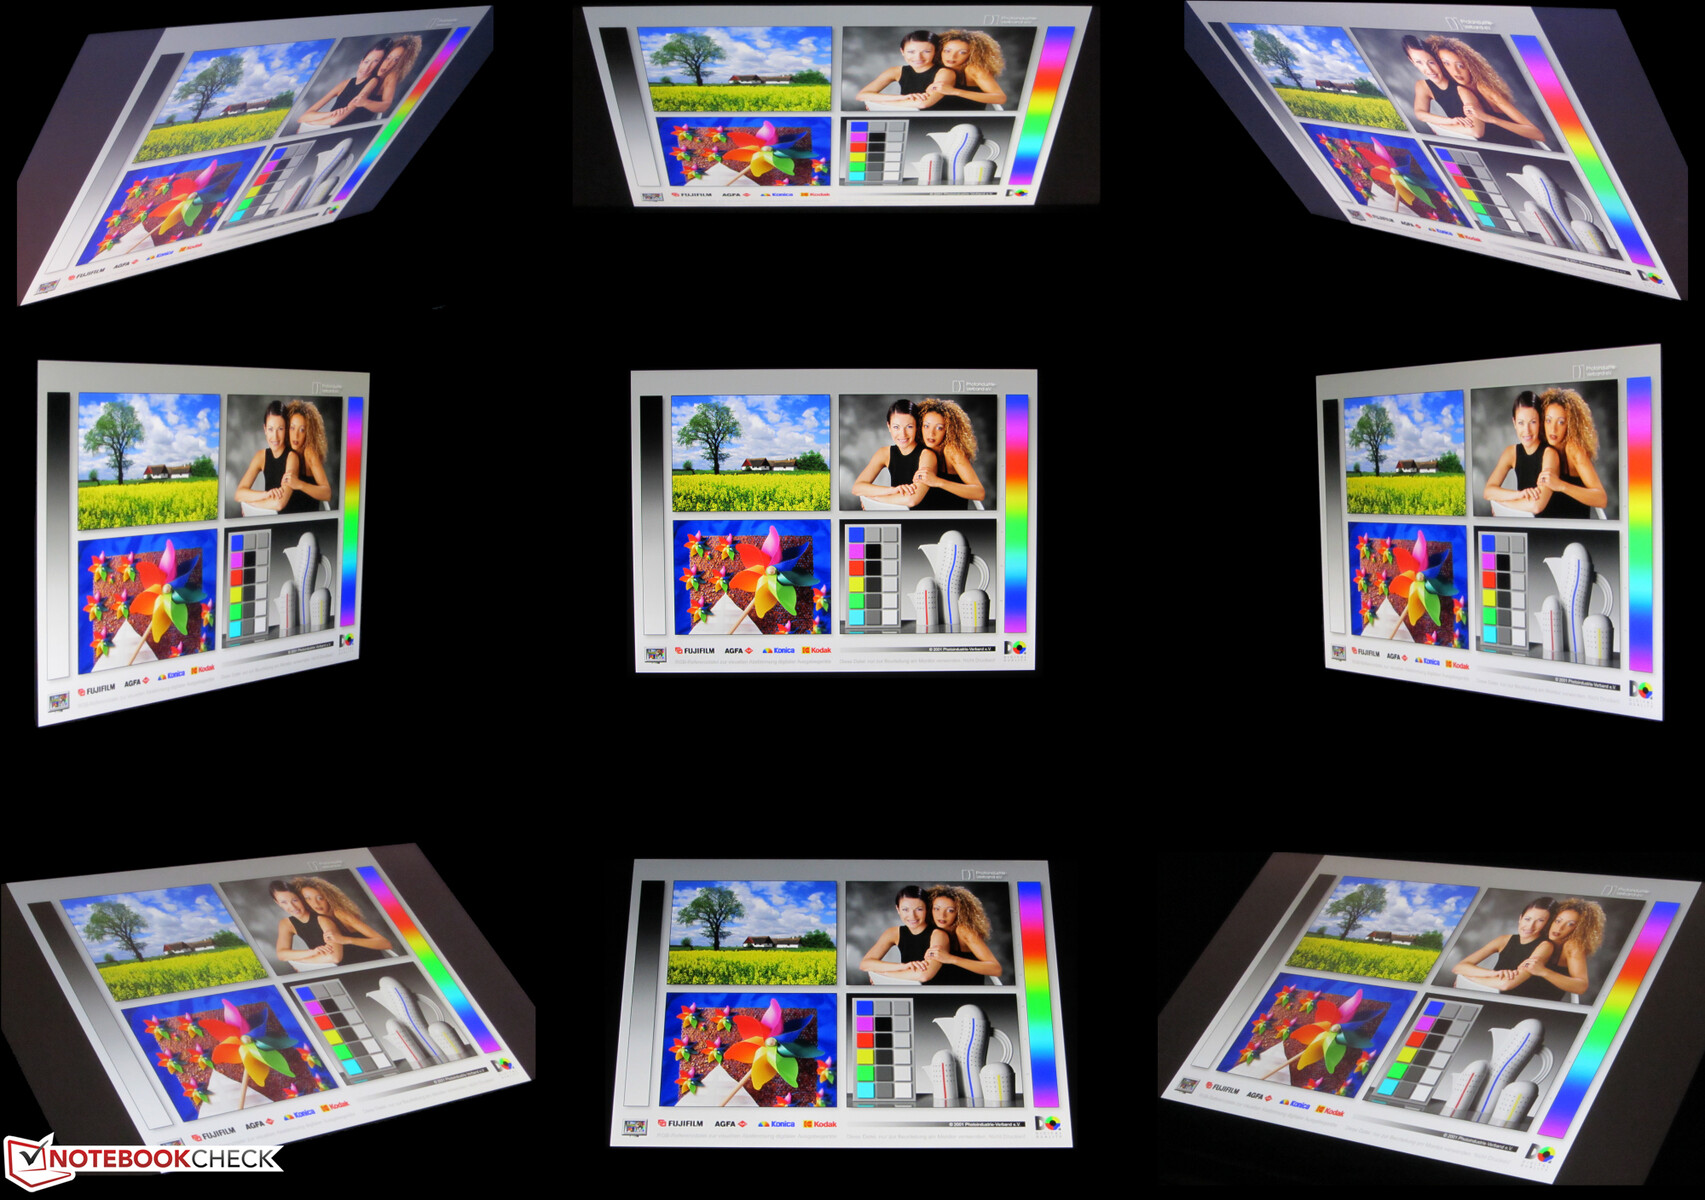
El panel IPS de ángulo de visión estable es legible desde cualquier posición. La lectura del contenido de la pantalla en exteriores es posible cuando el sol no es demasiado brillante
Rendimiento - Tiger Lake se encuentra con Ampere
Con el Aorus 17G YD, Gigabyte tiene un portátil para juegos de 17,3 pulgadas en su línea que trae todos los juegos modernos sin problemas en la pantalla y también corta una figura fina en todas las otras áreas de aplicación
Condiciones de la prueba
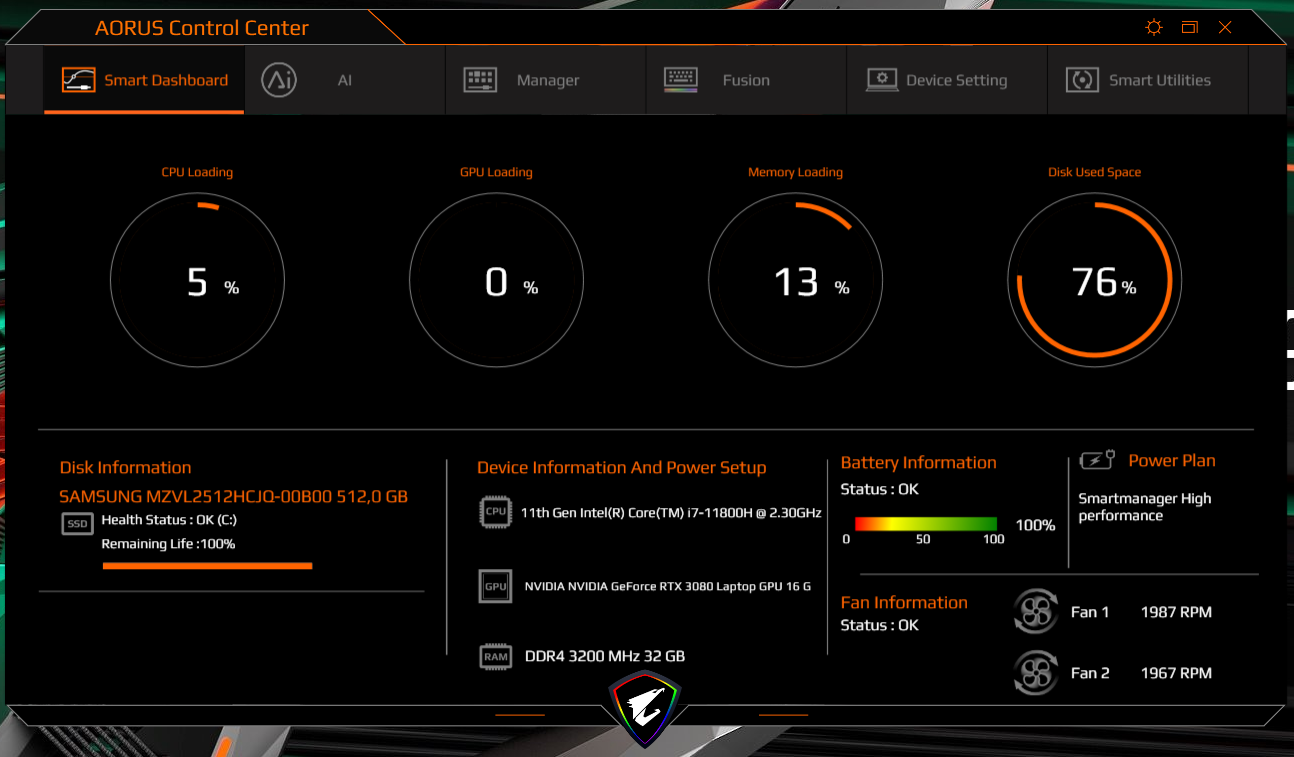
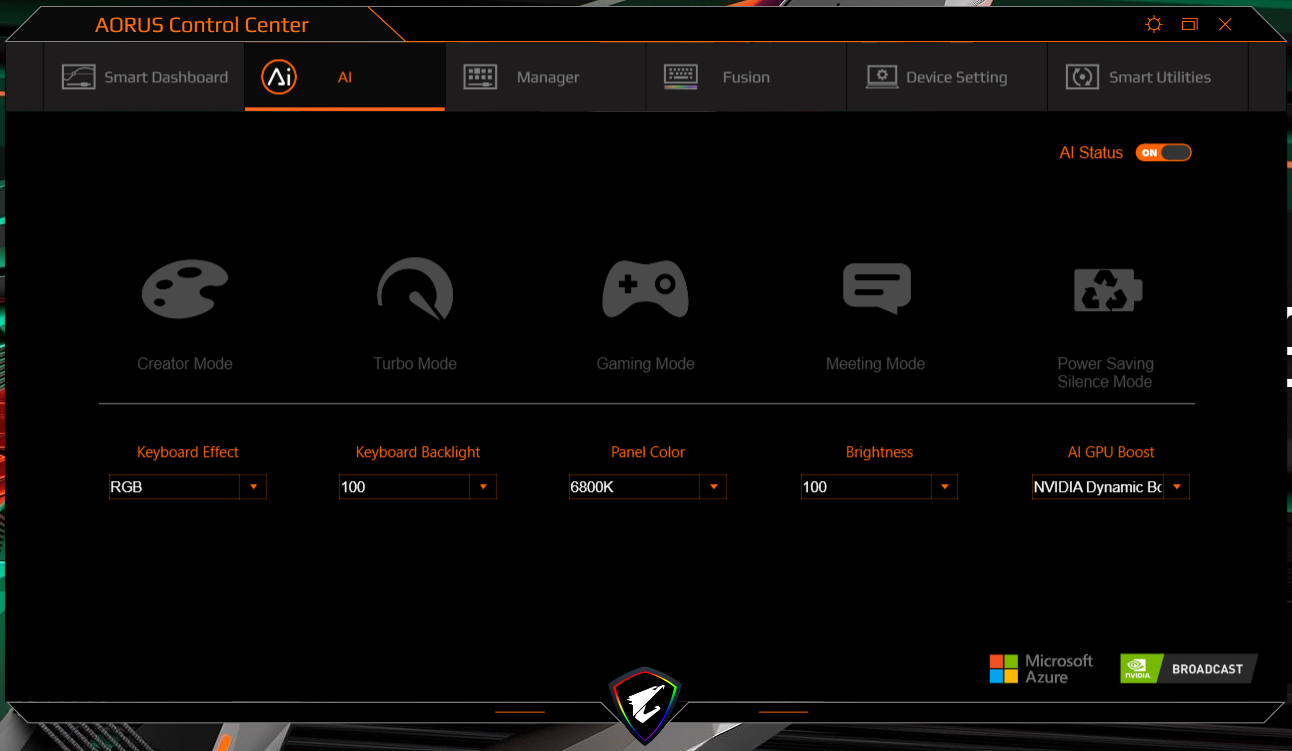
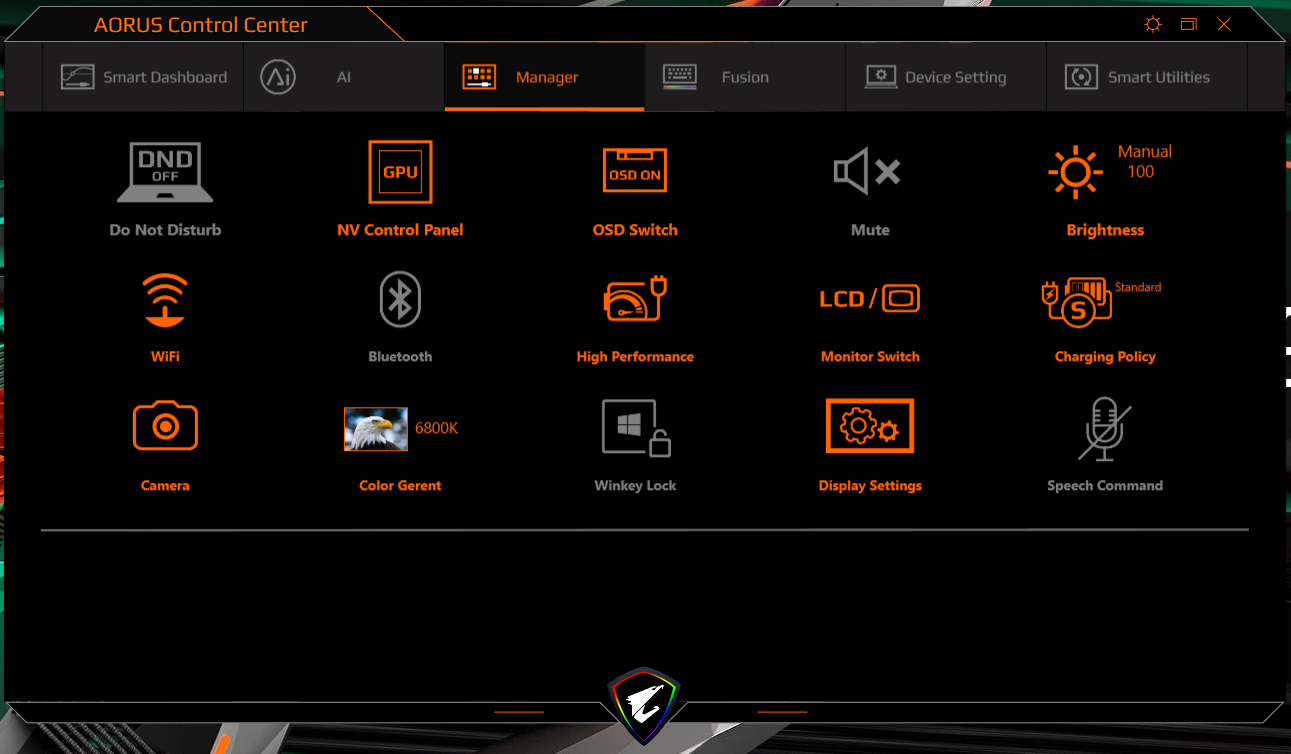
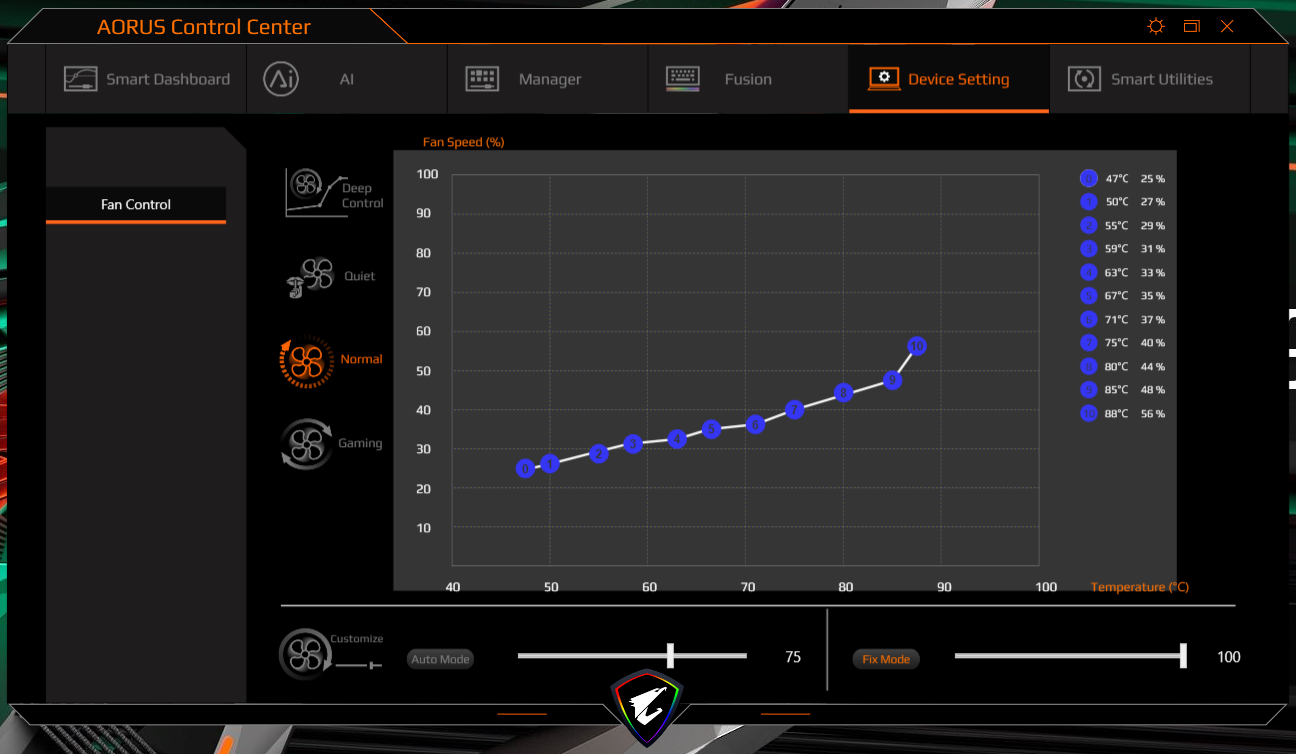
El Aorus Control Center preinstalado ofrece la opción de especificar un perfil energético, entre otras cosas. Aquí utilizamos la función automática de IA. Como resultado, el Centro de Control elige los ajustes apropiados por sí mismo. No sólo incluye la potencia de cálculo de la CPU y la GPU y el overclocking, sino que también cubre el brillo de la pantalla, la temperatura del color, y la retroiluminación del teclado.
También se ejecutaron algunos benchmarks con el perfil "Modo Turbo" activado. Este último permite que la CPU y la GPU funcionen permanentemente al máximo rendimiento. Comparado con la selección automática de perfiles, las diferencias son pequeñas. Este perfil no se recomienda para un uso prolongado porque mantiene los ventiladores funcionando a plena potencia.
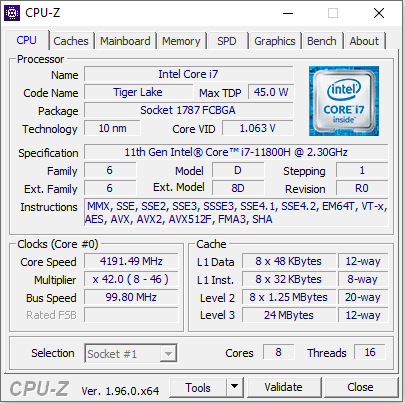
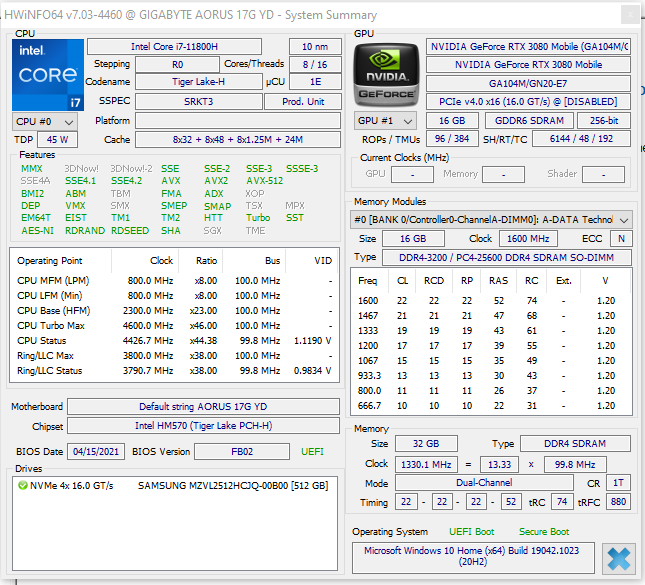
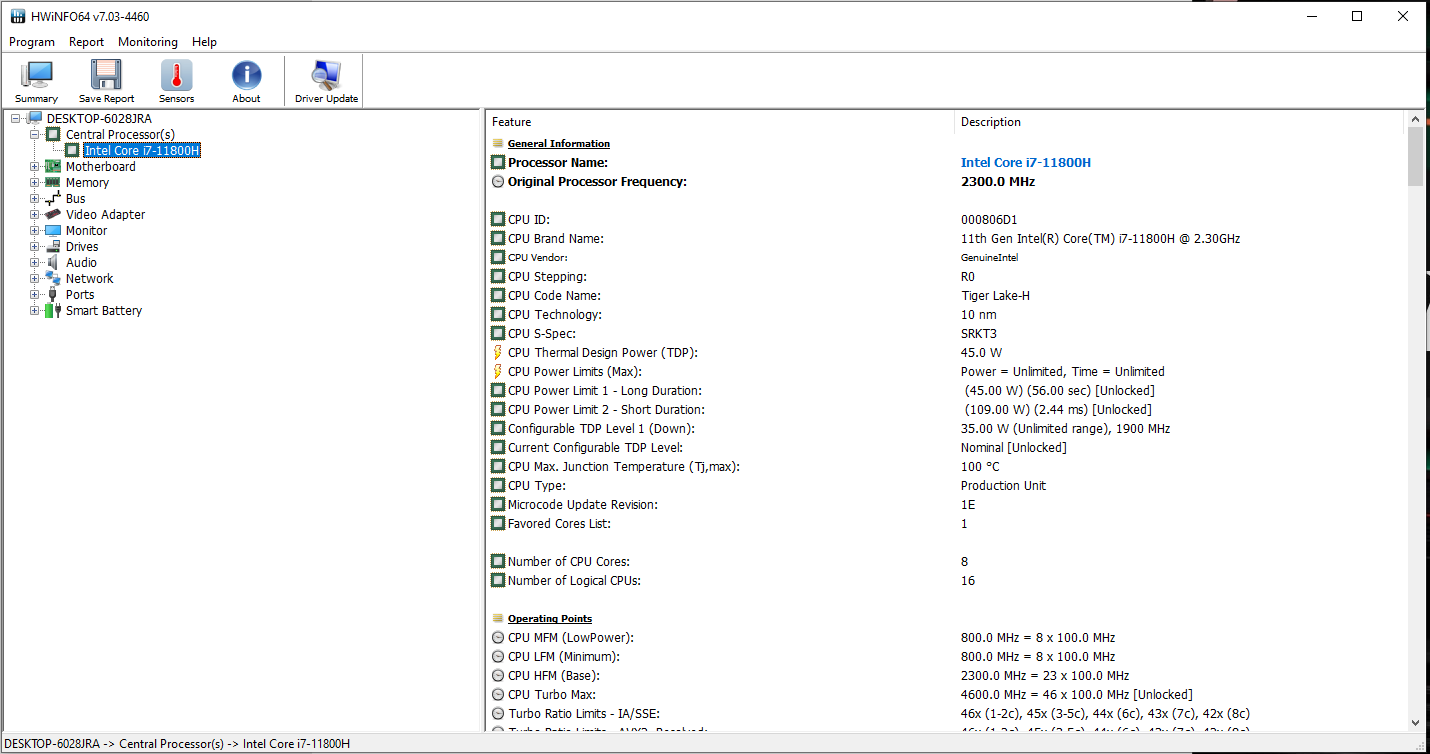
Procesador
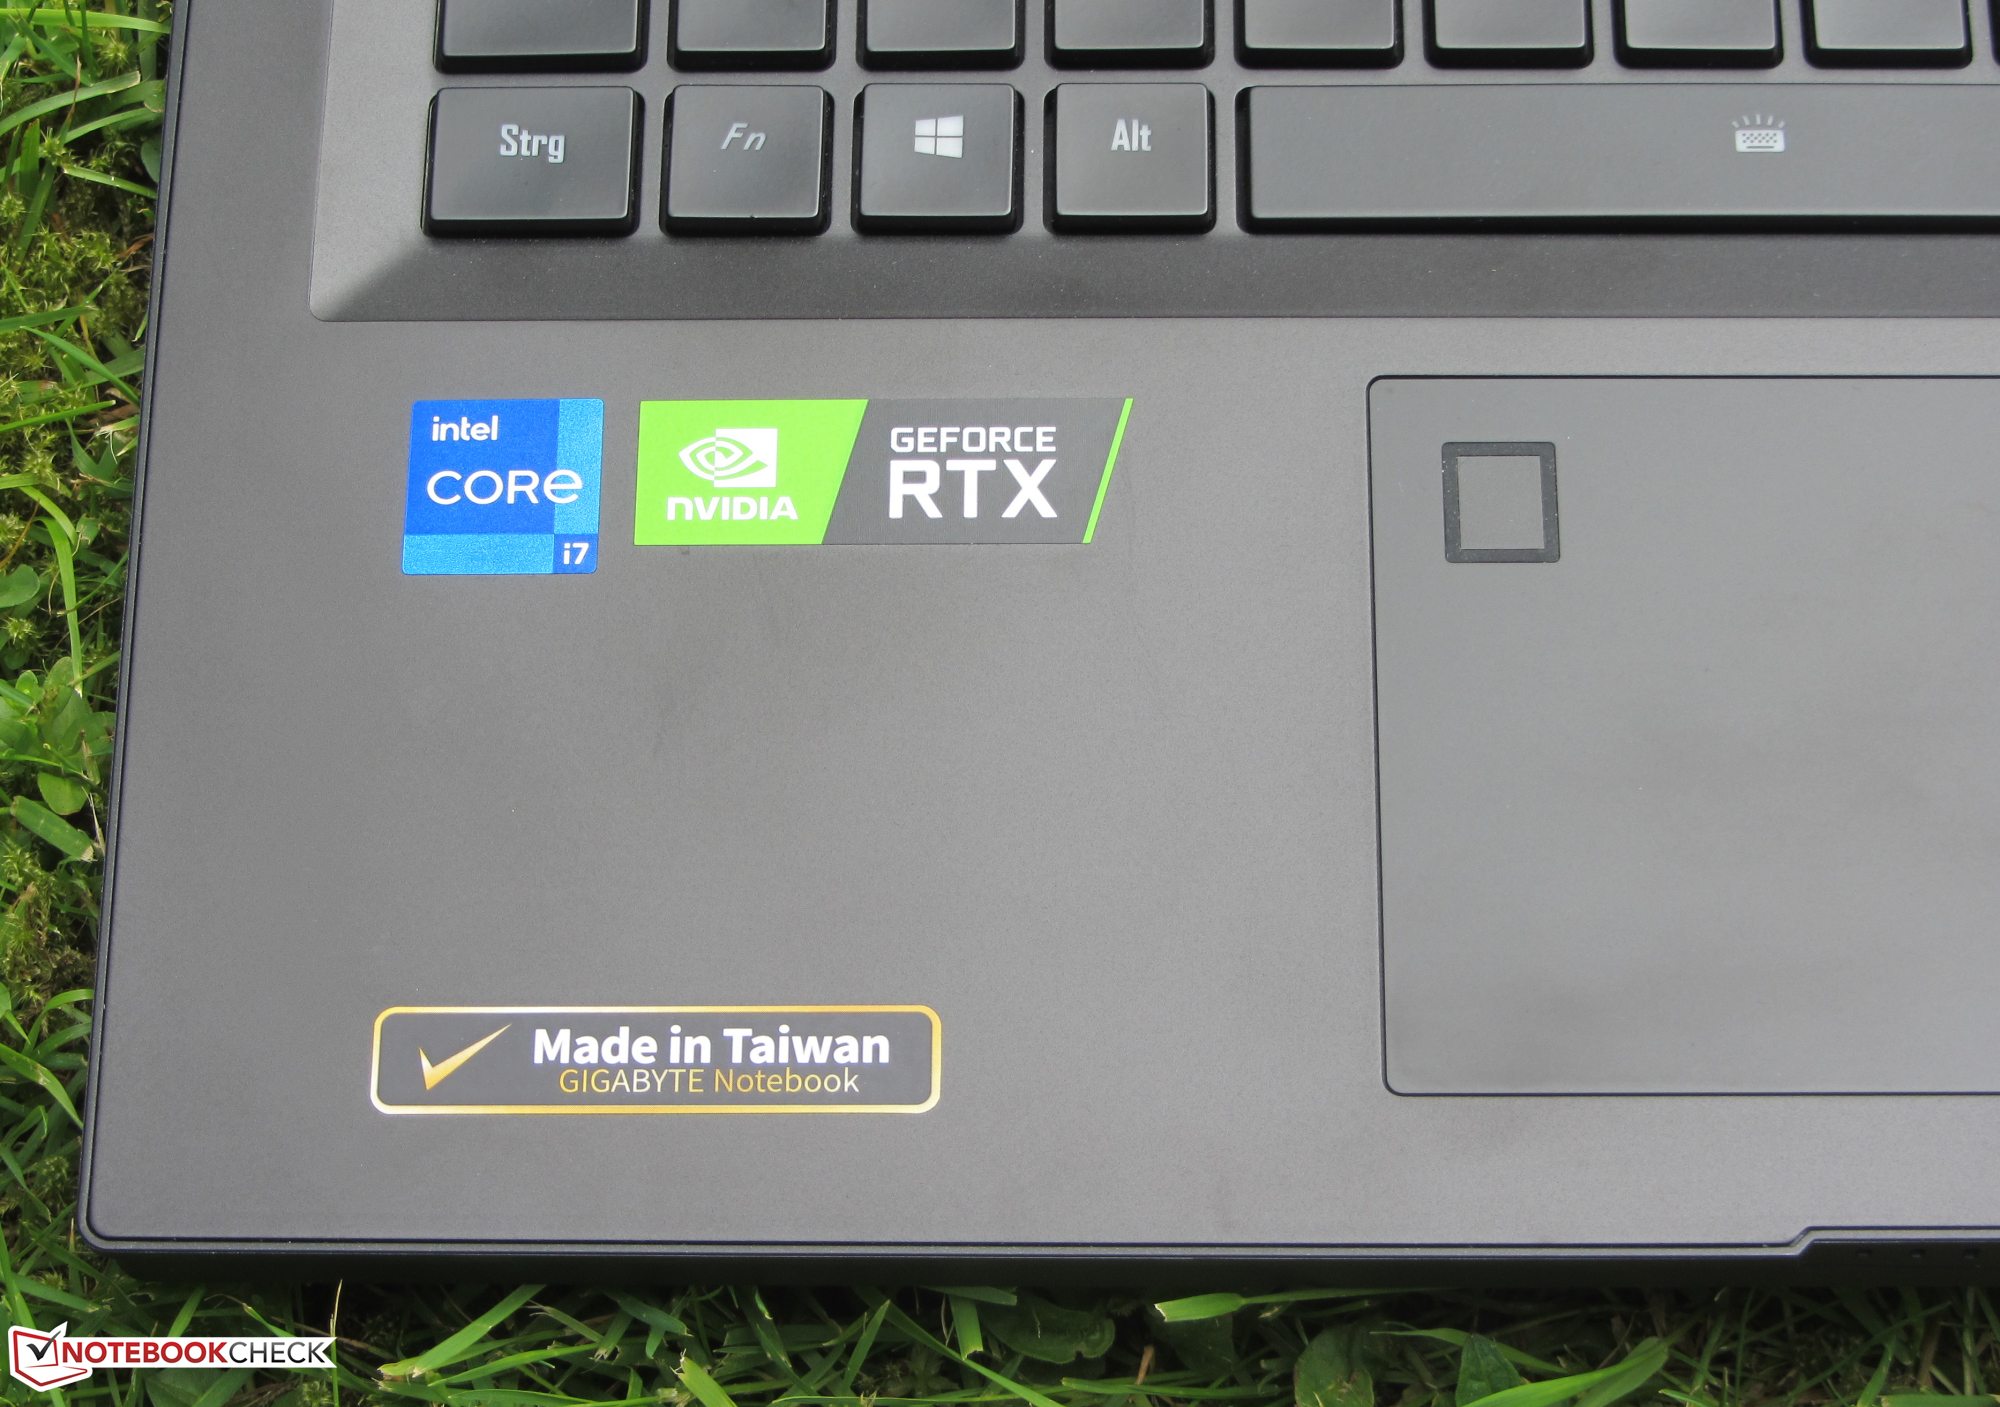
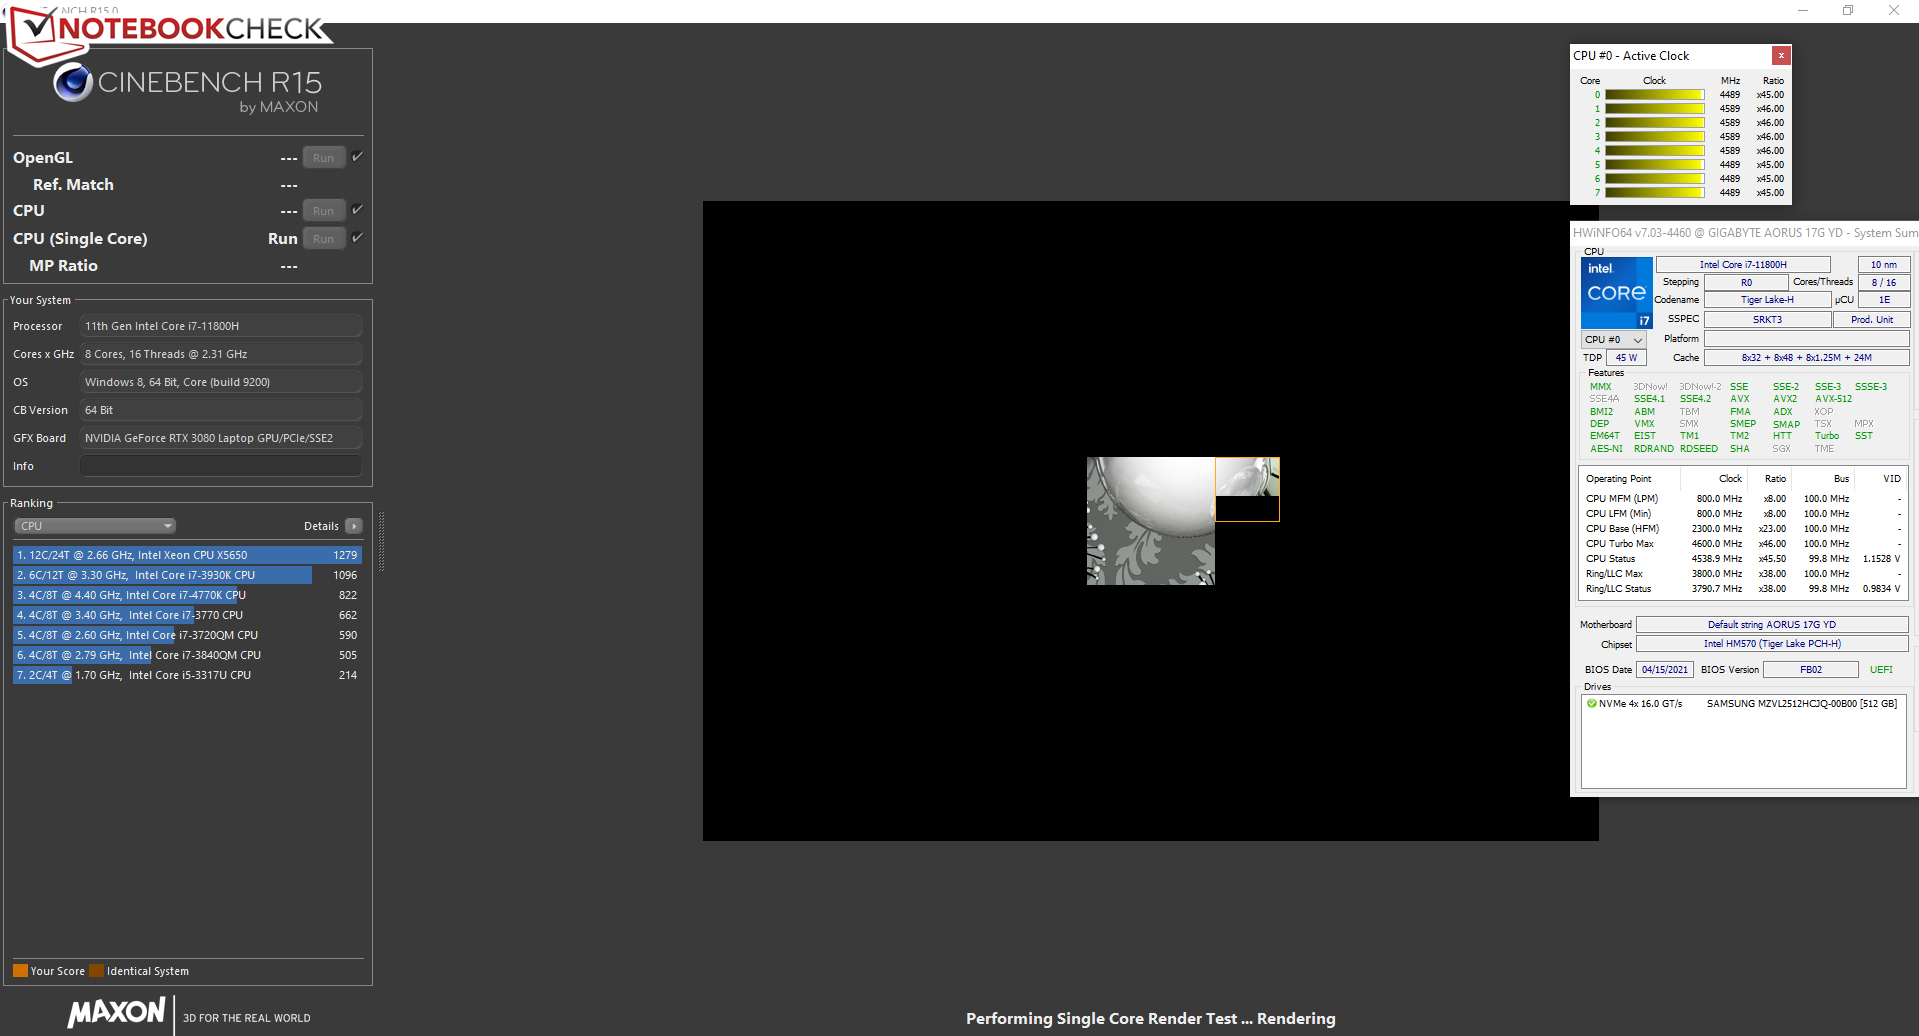
El procesadorocta-core
Core-i7-11800H</span> (Tiger Lake) funciona a una velocidad de reloj base de 2,3 GHz. Se puede aumentar a 4,2 GHz (ocho núcleos) o a 4,6 GHz (un núcleo) mediante Turbo. Soporta Hyper-Threading (dos hilos por núcleo). </p> Las pruebas de CPU del benchmark Cinebench R15 se realizan a 4,2 GHz (multihilo) y de 4,2 a 4,5 GHz (un solo hilo), respectivamente. En batería, la CPU funciona a 1,6-4,3 GHz (multihilo) y a 3,2-4,5 GHz (un solo hilo).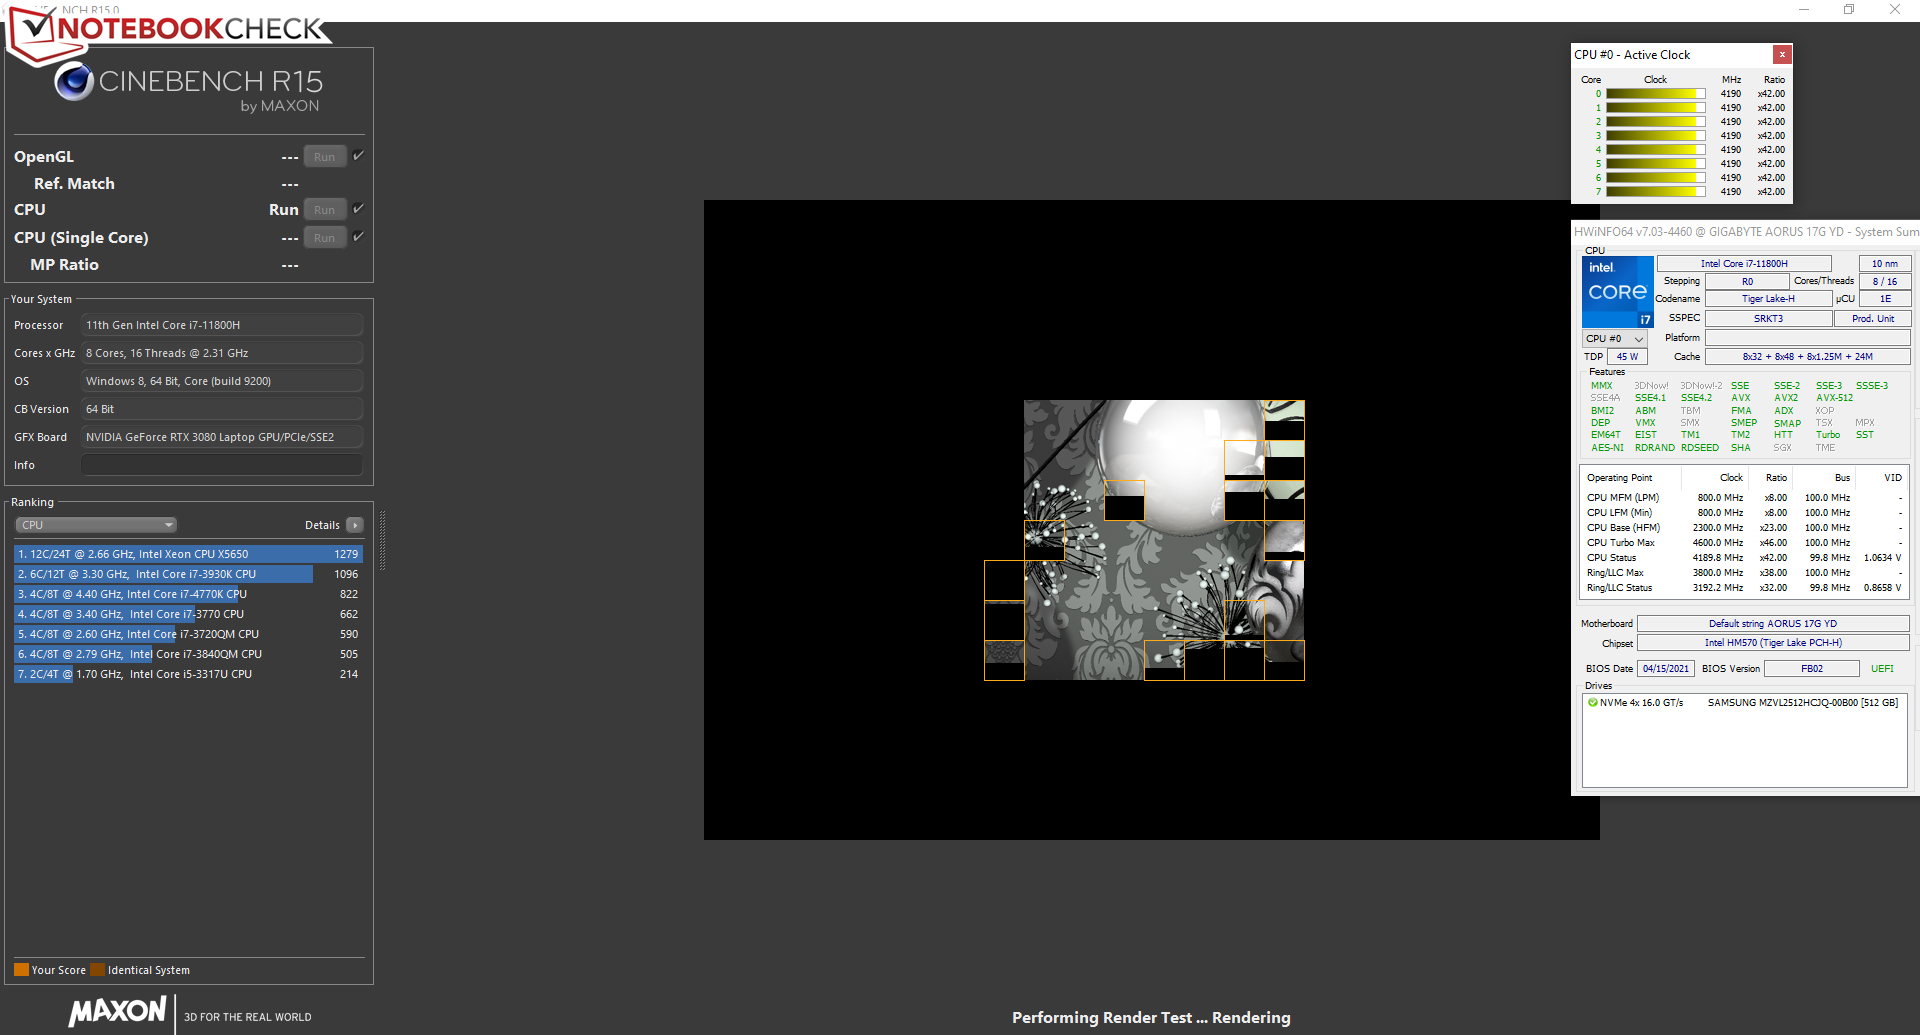
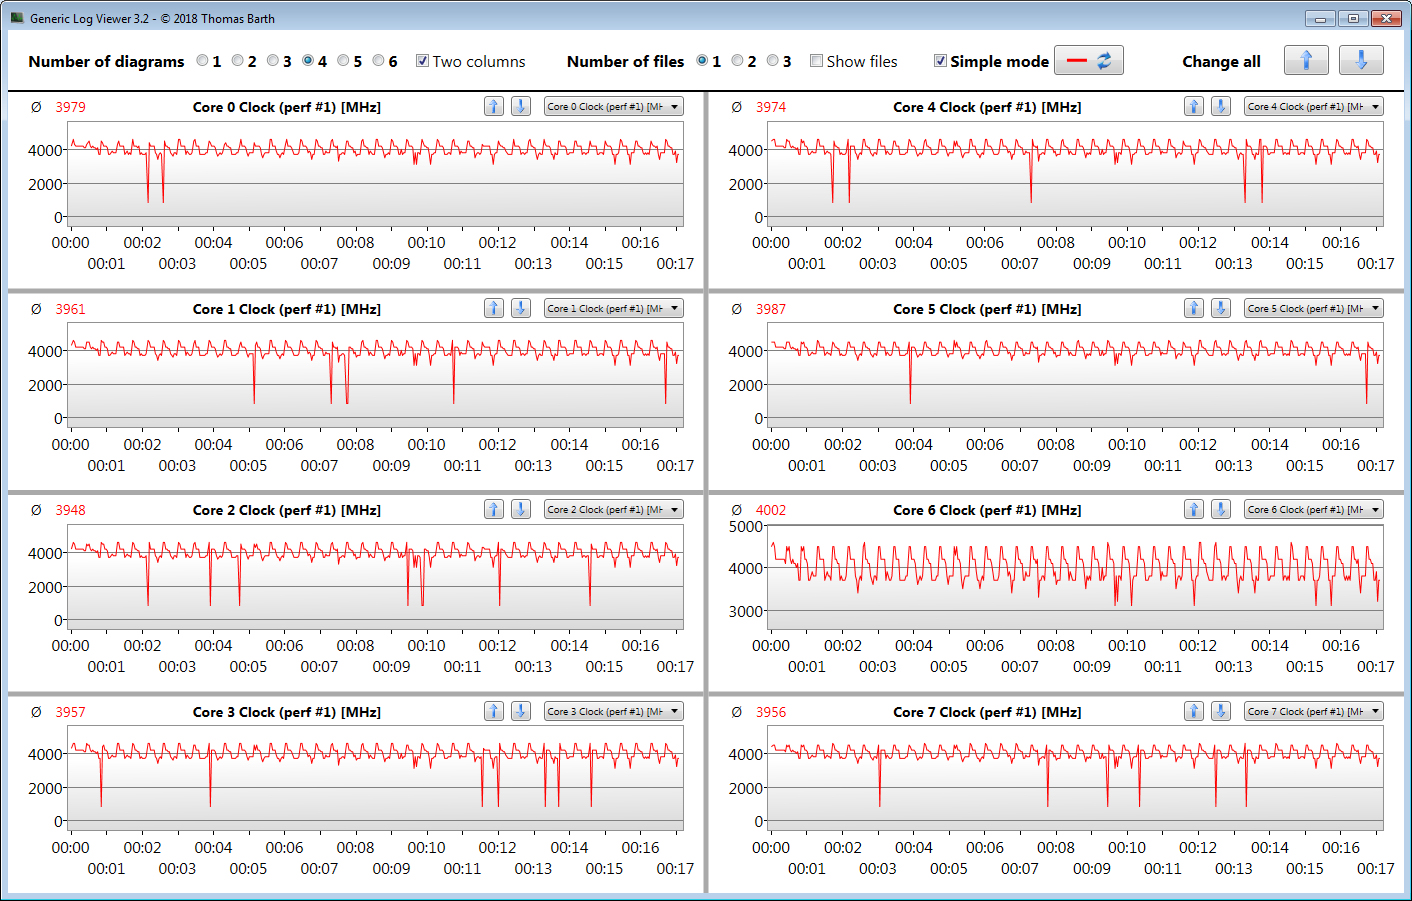
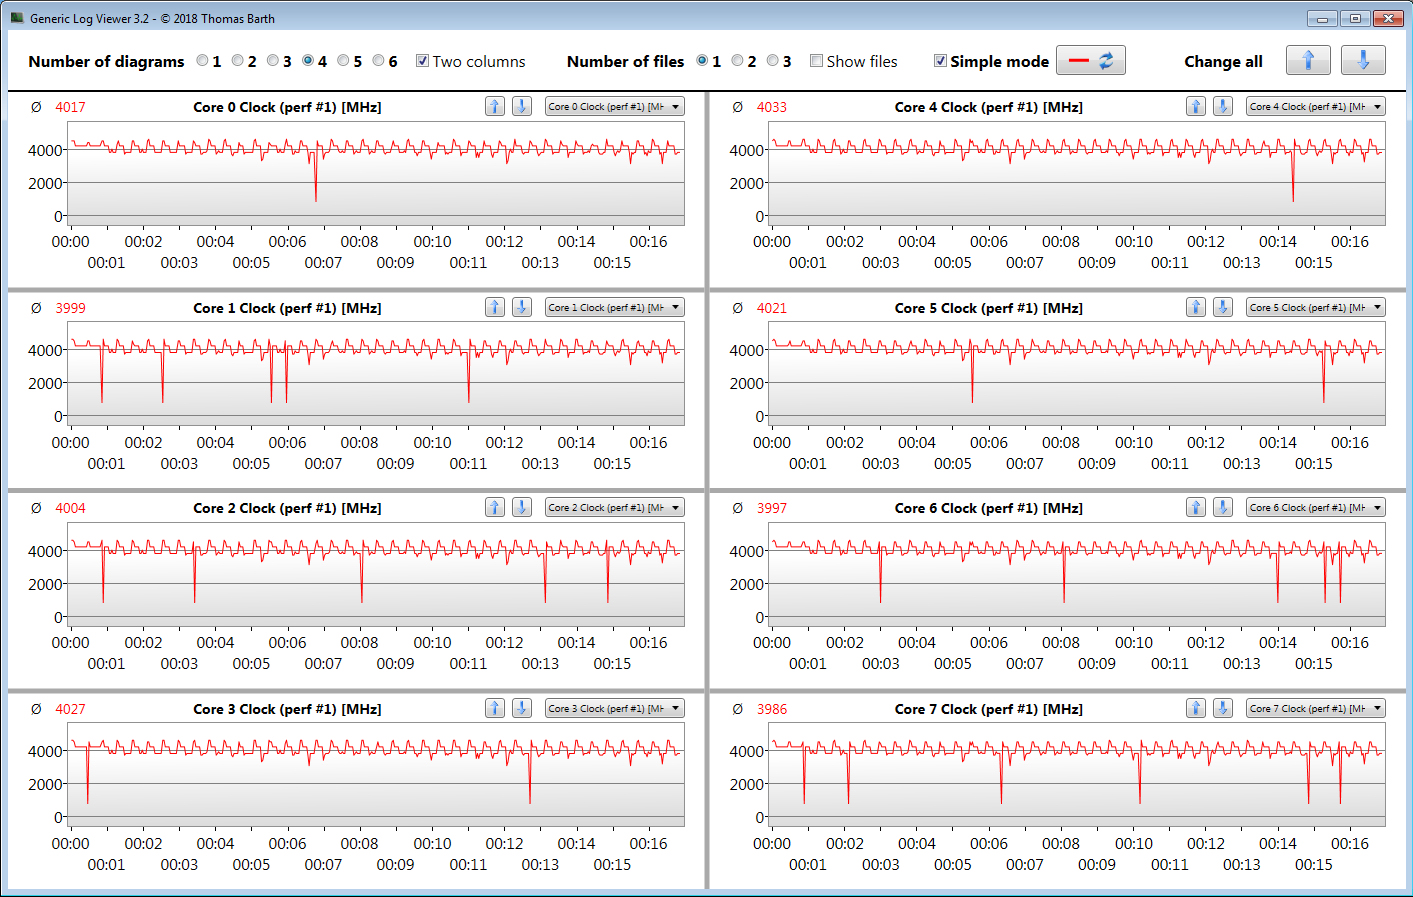
Verificamos si el Turbo de la CPU también se usa consistentemente cuando está conectado ejecutando la prueba multihilo del benchmark Cinebench R15 en un bucle continuo durante al menos 30 minutos. El Turbo funciona casi a plena potencia.
| HWBOT x265 Benchmark v2.2 - 4k Preset | |
| Media de la clase Gaming (11.5 - 44.3, n=108, últimos 2 años) | |
| Asus Strix Scar 17 G733QSA-XS99 | |
| Lenovo Legion 7 16ACHg6 | |
| Aorus 17G YD (Turbo Mode) | |
| Aorus 17G YD | |
| Schenker XMG Neo 17 (Early 2021, RTX 3070, 5800H) | |
| Alienware m17 R4 | |
| Medio Intel Core i7-11800H (7.38 - 17.4, n=46) | |
| MSI GE76 Raider 10UH | |
| Aorus 17G XB | |
* ... más pequeño es mejor
Rendimiento del sistema
El sistema funciona bien y sin problemas. No experimentamos ningún problema aparte de las altas latencias del CPD. El hardware proporciona una potencia de cálculo más que suficiente para las aplicaciones que exigen rendimiento, como los juegos. Esto va acompañado de buenos resultados en PCMark
| PCMark 8 Home Score Accelerated v2 | 5265 puntos | |
| PCMark 8 Creative Score Accelerated v2 | 7359 puntos | |
| PCMark 8 Work Score Accelerated v2 | 7104 puntos | |
| PCMark 10 Score | 7073 puntos | |
ayuda | ||
| PCMark 8 | |
| Home Score Accelerated v2 | |
| Media de la clase Gaming (n=1últimos 2 años) | |
| Aorus 17G YD | |
| Medio Intel Core i7-11800H, NVIDIA GeForce RTX 3080 Laptop GPU (3941 - 5640, n=3) | |
| Work Score Accelerated v2 | |
| Aorus 17G YD | |
| Medio Intel Core i7-11800H, NVIDIA GeForce RTX 3080 Laptop GPU (4756 - 7104, n=3) | |
| Media de la clase Gaming (n=1últimos 2 años) | |
Latencias del CPD
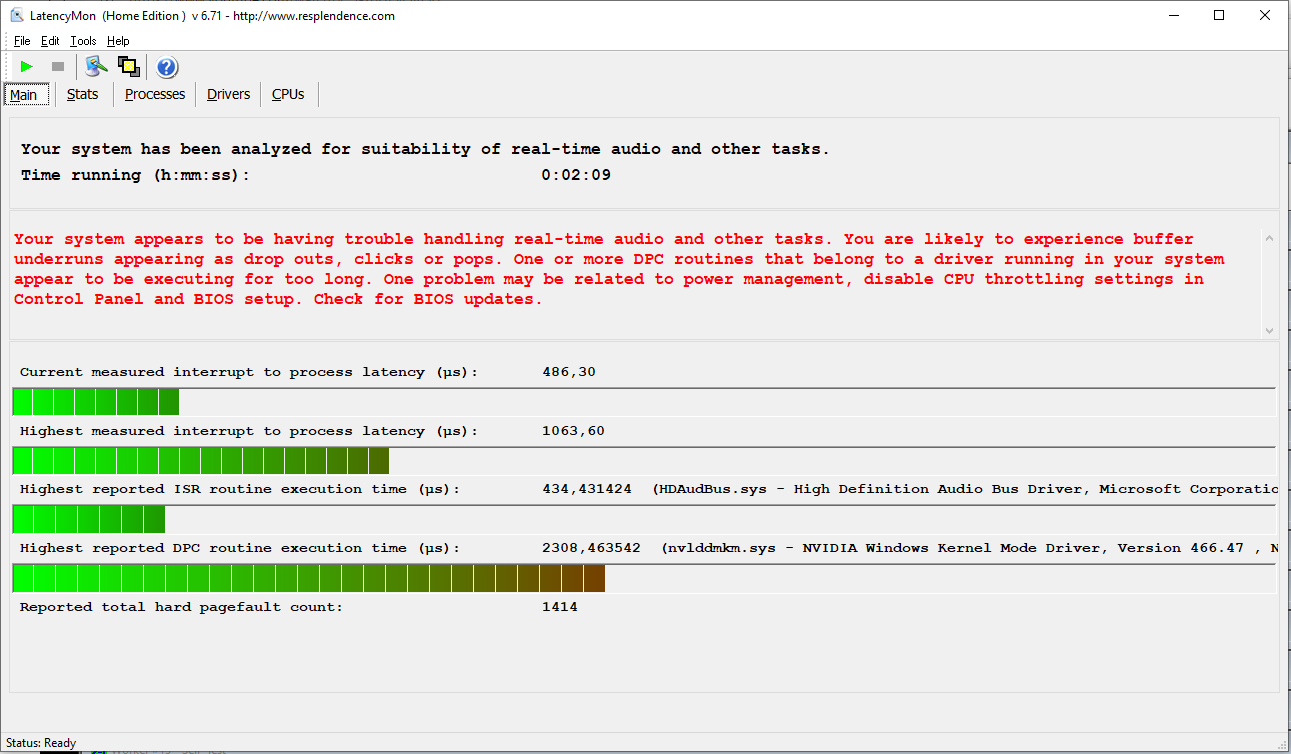
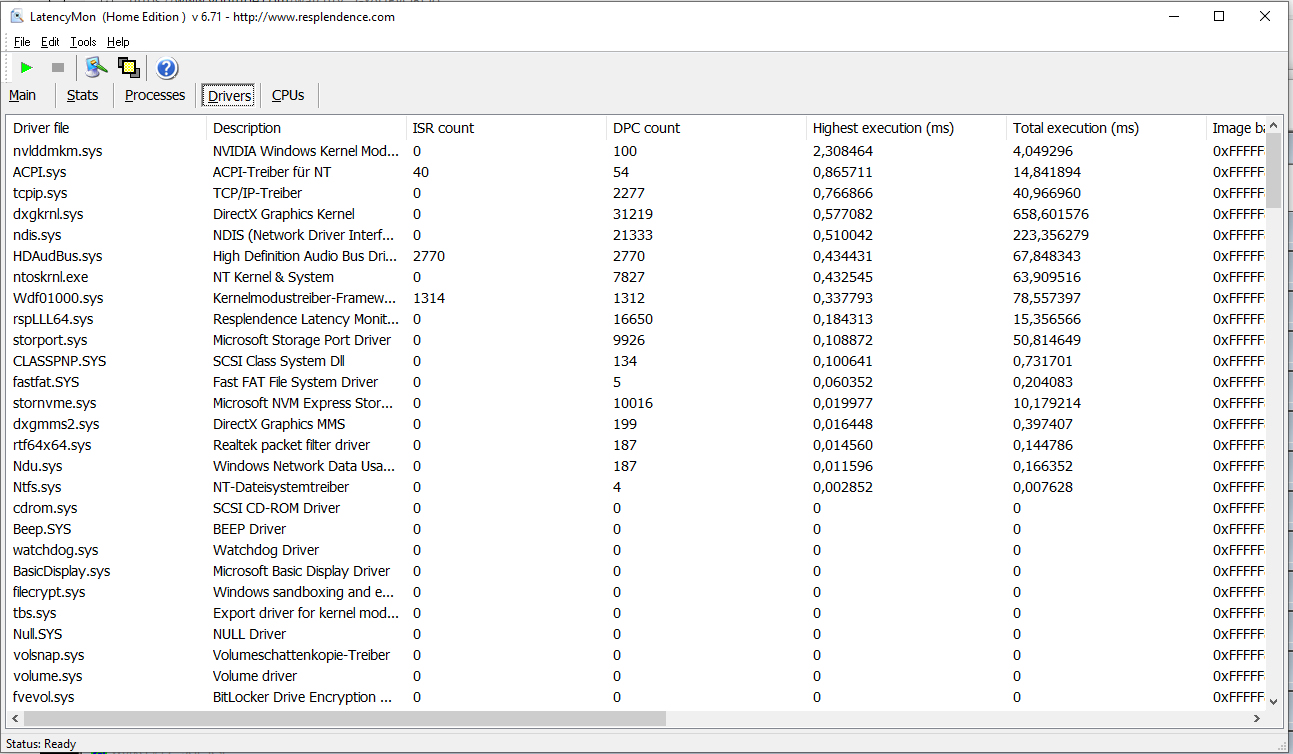
Nuestra prueba de monitorización de latencia estandarizada (navegación web, reproducción de vídeo 4K, Prime95 de alta carga) reveló problemas con las latencias del CPD. El sistema no parece adecuado para la edición de vídeo y audio en tiempo real
| DPC Latencies / LatencyMon - interrupt to process latency (max), Web, Youtube, Prime95 | |
| Aorus 17G XB | |
| Schenker XMG Neo 17 (Early 2021, RTX 3070, 5800H) | |
| MSI GP76 Leopard 10UG | |
| Aorus 17G YD | |
| Asus Strix Scar 17 G733QSA-XS99 | |
| Lenovo Legion 7 16ACHg6 | |
* ... más pequeño es mejor
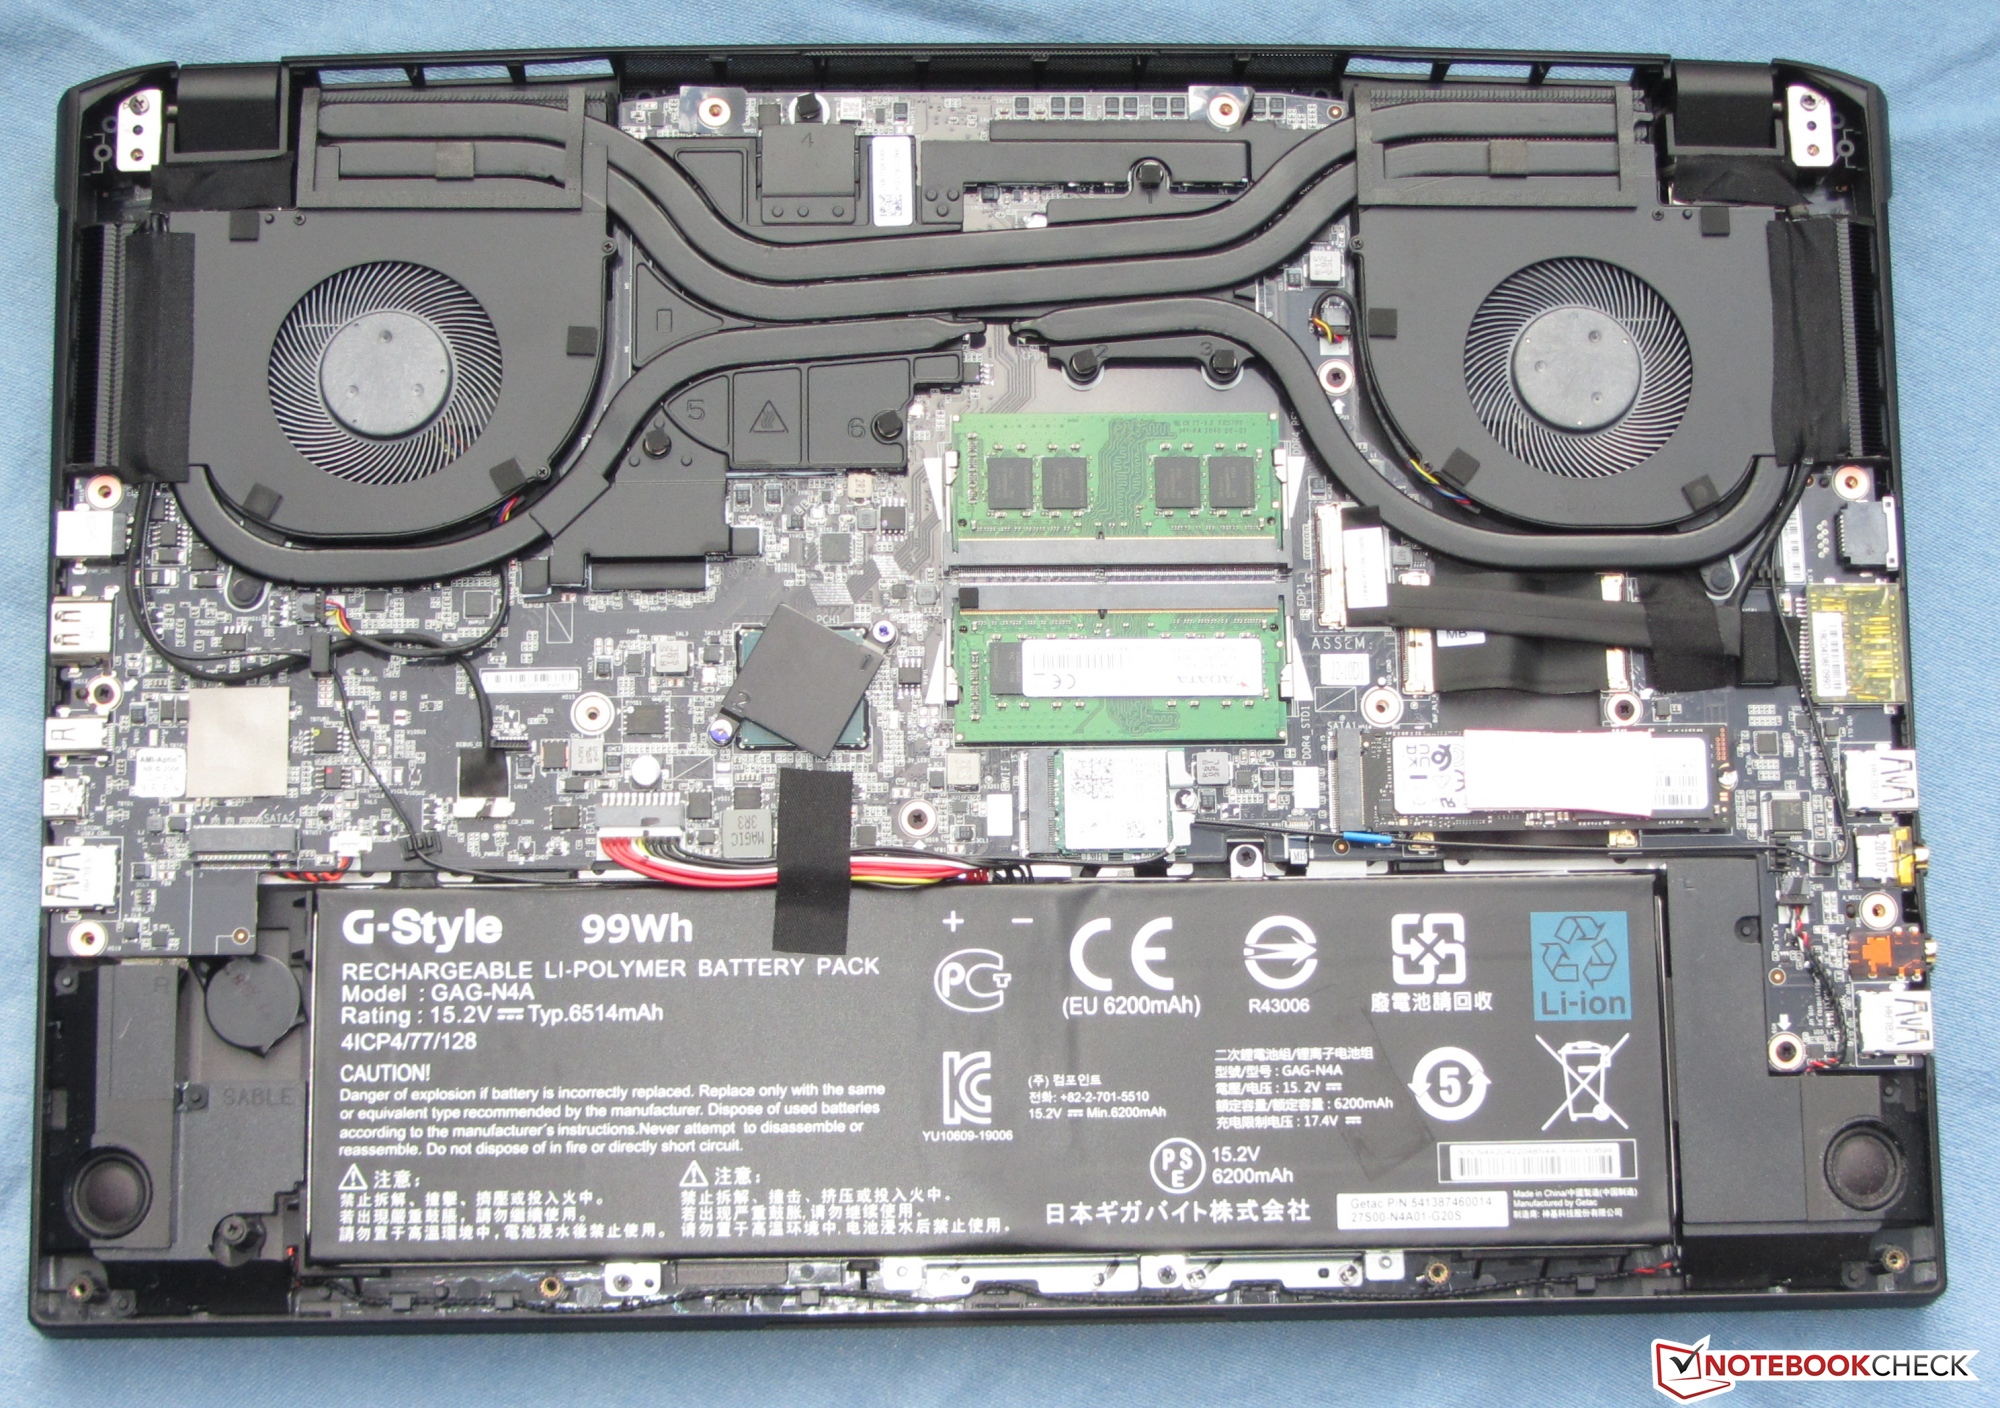
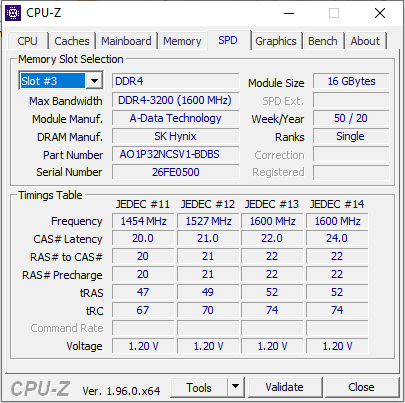
Almacenamiento
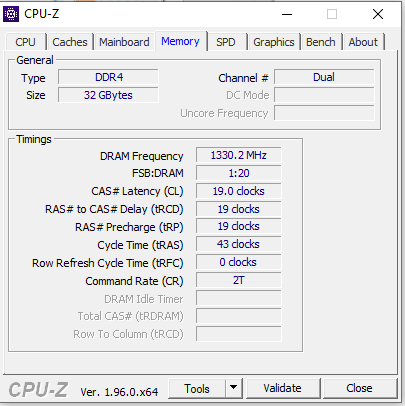
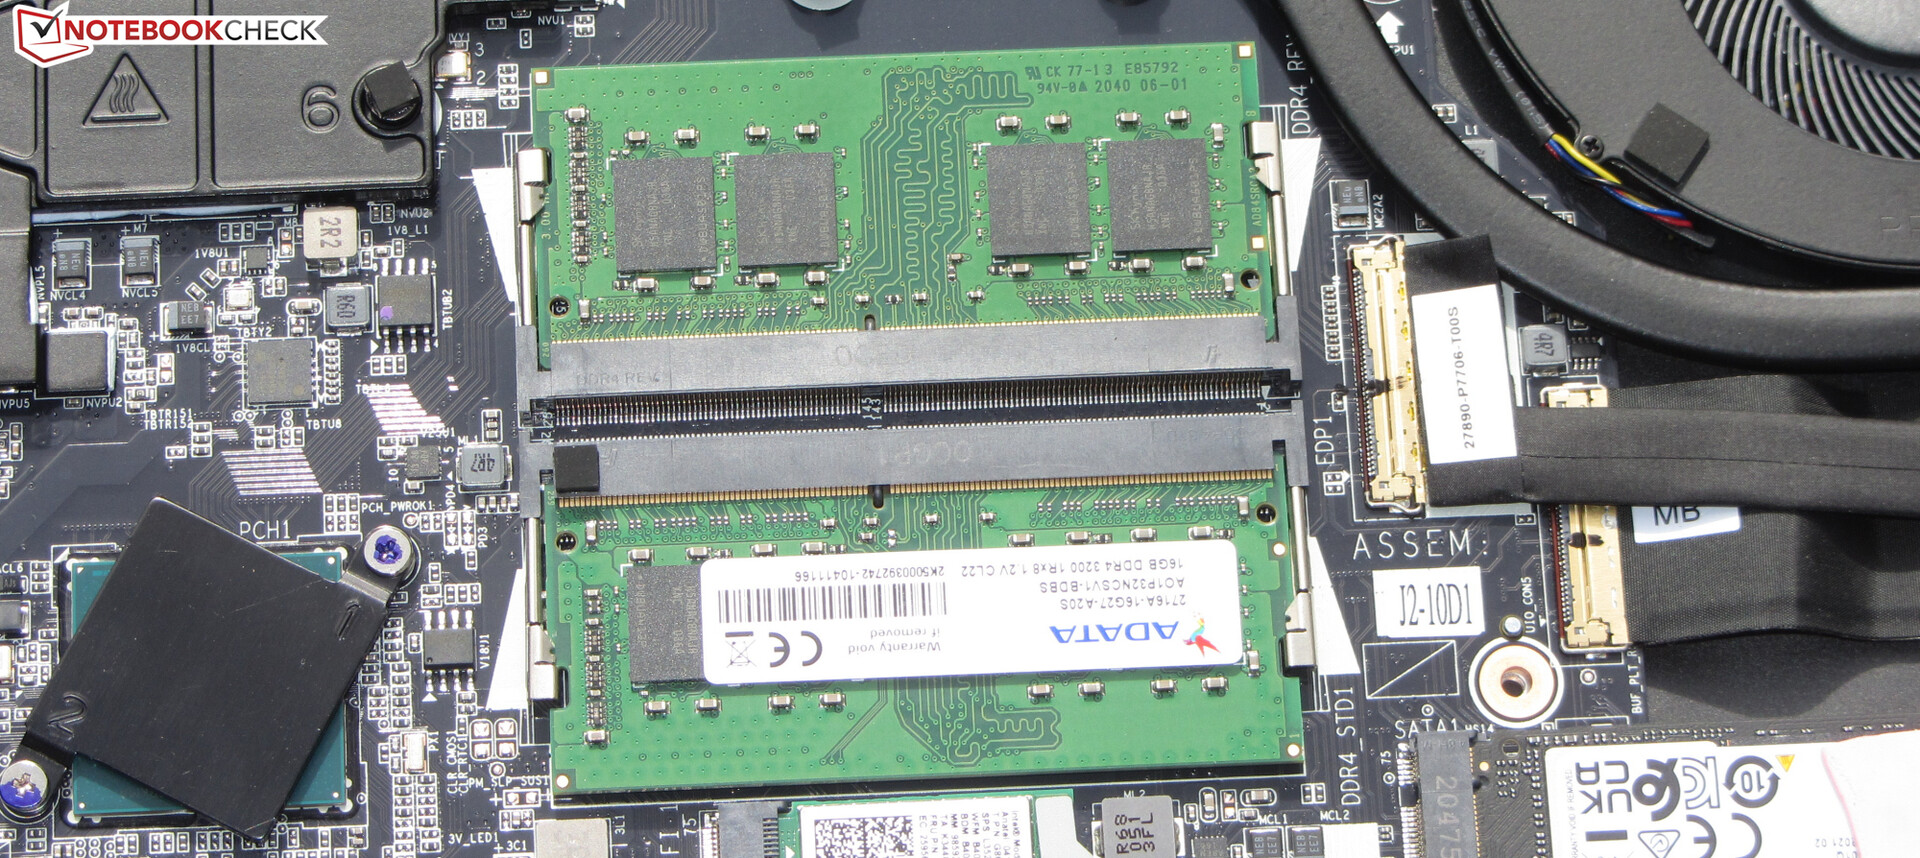
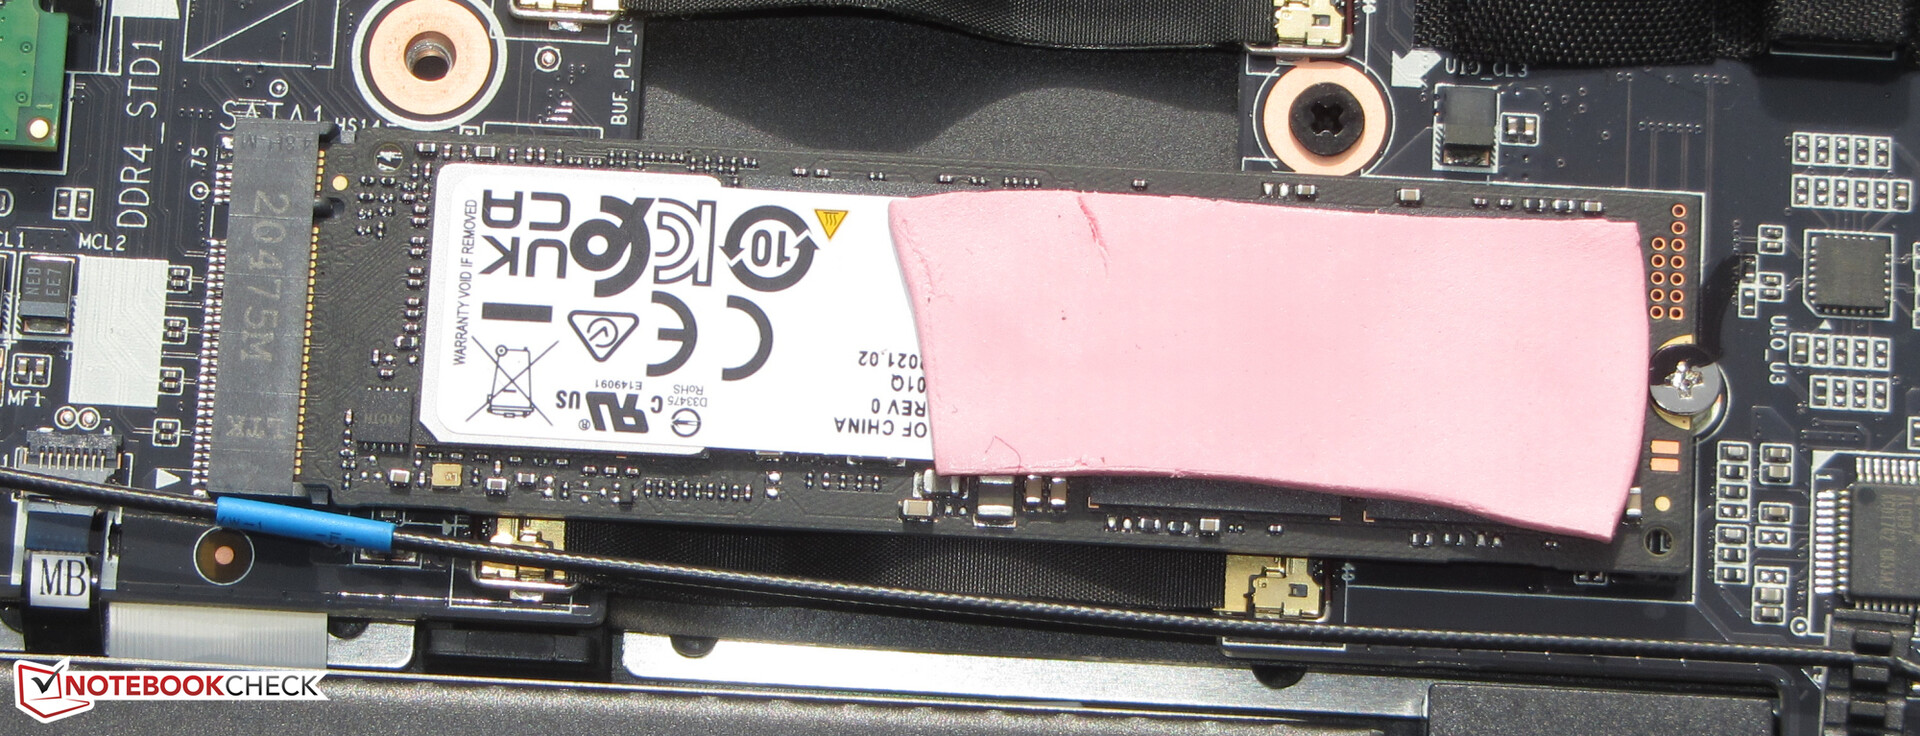
Un SSD NVMe de 512 GB (M.2-2280) de Samsung sirve como unidad de sistema, y ofrece excelentes tasas de transferencia gracias a su conexión PCI Express 4.0. En total, el portátil tiene espacio para dos SSDs M.2-2280 (1x PCIe 4.0, 1x PCIe 3.0/SATA). Sin embargo, no admite RAID 0/1

| Aorus 17G YD Samsung PM9A1 MZVL2512HCJQ | MSI GP76 Leopard 10UG Kingston OM8PCP3512F-AB | Asus Strix Scar 17 G733QSA-XS99 2x Samsung PM981a MZVLB1T0HBLR (RAID 0) | Lenovo Legion 7 16ACHg6 WDC PC SN730 SDBPNTY-1T00 | Schenker XMG Neo 17 (Early 2021, RTX 3070, 5800H) Samsung SSD 970 EVO Plus 500GB | Aorus 17G XB Samsung SSD PM981a MZVLB512HBJQ | Medio Samsung PM9A1 MZVL2512HCJQ | |
|---|---|---|---|---|---|---|---|
| CrystalDiskMark 5.2 / 6 | -50% | 36% | -12% | -4% | -17% | 12% | |
| Write 4K (MB/s) | 227.4 | 143.7 -37% | 235.9 4% | 157.6 -31% | 206.1 -9% | 123.4 -46% | 179.1 ? -21% |
| Read 4K (MB/s) | 91.3 | 45.1 -51% | 48.02 -47% | 48.97 -46% | 53 -42% | 45.02 -51% | 75.6 ? -17% |
| Write Seq (MB/s) | 2241 | 978 -56% | 4822 115% | 2789 24% | 3018 35% | 2526 13% | 3016 ? 35% |
| Read Seq (MB/s) | 4496 | 1163 -74% | 5043 12% | 2494 -45% | 2575 -43% | 2062 -54% | 3350 ? -25% |
| Write 4K Q32T1 (MB/s) | 661 | 519 -21% | 625 -5% | 456.7 -31% | 535 -19% | 497.9 -25% | 459 ? -31% |
| Read 4K Q32T1 (MB/s) | 712 | 302.7 -57% | 392.3 -45% | 575 -19% | 608 -15% | 579 -19% | 554 ? -22% |
| Write Seq Q32T1 (MB/s) | 1540 | 981 -36% | 5350 247% | 3088 101% | 3242 111% | 2982 94% | 4346 ? 182% |
| Read Seq Q32T1 (MB/s) | 6806 | 1983 -71% | 7130 5% | 3388 -50% | 3617 -47% | 3440 -49% | 6346 ? -7% |
| AS SSD | -59% | -9% | -30% | -9% | -25% | -12% | |
| Seq Read (MB/s) | 5150 | 1659 -68% | 4981 -3% | 2944 -43% | 3020 -41% | 1791 -65% | 4656 ? -10% |
| Seq Write (MB/s) | 3920 | 921 -77% | 3050 -22% | 2657 -32% | 2631 -33% | 2193 -44% | 2742 ? -30% |
| 4K Read (MB/s) | 46.6 | 51 9% | 57 22% | 41.86 -10% | 60.3 29% | 50.7 9% | 67 ? 44% |
| 4K Write (MB/s) | 145.8 | 120.1 -18% | 261.3 79% | 111.3 -24% | 171.6 18% | 116.8 -20% | 173.8 ? 19% |
| 4K-64 Read (MB/s) | 2071 | 463.5 -78% | 1205 -42% | 1733 -16% | 1410 -32% | 1525 -26% | 1514 ? -27% |
| 4K-64 Write (MB/s) | 3267 | 909 -72% | 1290 -61% | 2119 -35% | 2324 -29% | 1958 -40% | 2355 ? -28% |
| Access Time Read * (ms) | 0.078 | 0.179 -129% | 0.032 59% | 0.157 -101% | 0.045 42% | 0.07 10% | 0.04867 ? 38% |
| Access Time Write * (ms) | 0.029 | 0.032 -10% | 0.044 -52% | 0.035 -21% | 0.024 17% | 0.032 -10% | 0.03605 ? -24% |
| Score Read (Points) | 2633 | 680 -74% | 1760 -33% | 2070 -21% | 1773 -33% | 1755 -33% | 2047 ? -22% |
| Score Write (Points) | 2805 | 1121 -60% | 1857 -34% | 2496 -11% | 2759 -2% | 2294 -18% | 2778 ? -1% |
| Score Total (Points) | 7716 | 2130 -72% | 4428 -43% | 5607 -27% | 5429 -30% | 4972 -36% | 5812 ? -25% |
| Copy ISO MB/s (MB/s) | 3190 | 3357 5% | 2310 -28% | 2192 ? -31% | |||
| Copy Program MB/s (MB/s) | 987 | 966 -2% | 748 -24% | 629 ? -36% | |||
| Copy Game MB/s (MB/s) | 2096 | 2051 -2% | 1523 -27% | 1393 ? -34% | |||
| Media total (Programa/Opciones) | -55% /
-55% | 14% /
7% | -21% /
-24% | -7% /
-6% | -21% /
-22% | 0% /
-3% |
* ... más pequeño es mejor
Continuous load read: DiskSpd Read Loop, Queue Depth 8
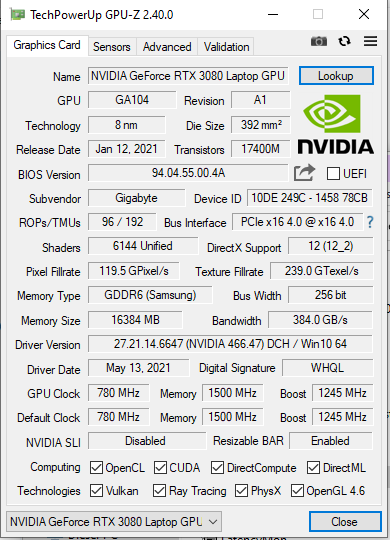
Tarjeta gráfica
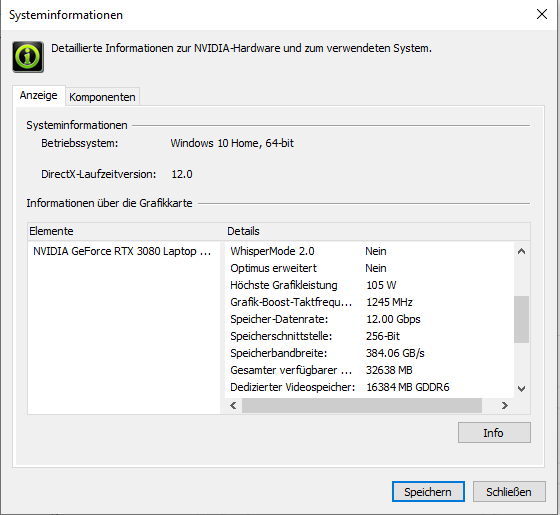
El rendimiento real de un núcleo gráfico RTX 3000 depende del TGP máximo que el fabricante del portátil haya elegido dentro de los límites definidos por Nvidia. Con un TGP de 105 vatios (90 vatios + 15 vatios de Dynamic Boost), Gigabyte sigue habiendo optado por el rango más bajo de posibilidades en el caso delportátilGeForce RTX 3080GPU instalado aquí (resumen de todos los portátiles RTX 3080 incluyendo sus TGPs).
Los resultados de 3DMark están entre la media y por debajo de la media en comparación con los portátiles RTX 3080 que hemos probado hasta ahora. Debido al bajo TGP, el 17G tiene que admitir la derrota ante elMSI GP76 Leopard 10UGque está equipado con laGPU nominalmente más débil delportátilGeForce RTX 3070. Las limitaciones técnicas de la RTX 3070 en comparación con la RTX 3080 se compensan con creces con el mayor TGP (140 vatios).
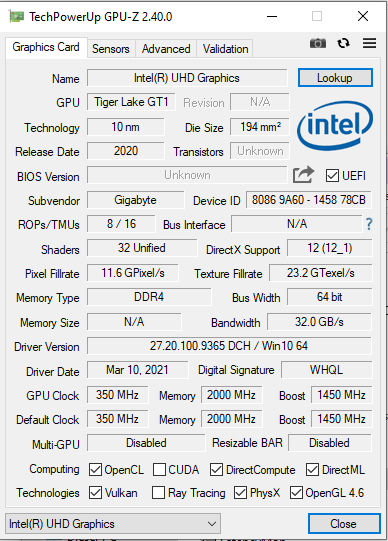
La RTX 3080 puede acceder a la rápida memoria gráfica GDDR6 (16 GB). LaGPUUHD Graphics Xe 750 integrada en el procesador está activa, y el portátil funciona con la solución de conmutación de gráficos Optimus de Nvidia.
| 3DMark 11 Performance | 28733 puntos | |
| 3DMark Cloud Gate Standard Score | 49494 puntos | |
| 3DMark Fire Strike Score | 22898 puntos | |
| 3DMark Time Spy Score | 10195 puntos | |
ayuda | ||
Rendimiento de los juegos
El hardware instalado hace que todos los juegos más recientes aparezcan sin problemas en la pantalla. Normalmente se puede seleccionar la resolución Full HD y el nivel de calidad máximo. La GPU también puede manejar resoluciones más allá de Full HD (habría que conectar un monitor apropiado para ello) - con ajustes de calidad reducidos en algunos casos.
Comparado con los portátiles RTX 3080 probados hasta ahora, el 17G rinde decentemente y ofrece tasas de frames medias o ligeramente por debajo de la media.
| The Witcher 3 - 1920x1080 Ultra Graphics & Postprocessing (HBAO+) | |
| Media de la clase Gaming (95 - 240, n=8, últimos 2 años) | |
| Lenovo Legion 7 16ACHg6 | |
| MSI GP76 Leopard 10UG | |
| Aorus 17G YD | |
| Asus Strix Scar 17 G733QSA-XS99 | |
| Medio NVIDIA GeForce RTX 3080 Laptop GPU (85.1 - 123, n=40) | |
| Schenker XMG Neo 17 (Early 2021, RTX 3070, 5800H) | |
| Aorus 17G XB | |
| Dota 2 Reborn - 1920x1080 ultra (3/3) best looking | |
| Media de la clase Gaming (84.8 - 248, n=110, últimos 2 años) | |
| Aorus 17G YD | |
| Aorus 17G XB | |
| Schenker XMG Neo 17 (Early 2021, RTX 3070, 5800H) | |
| Aorus 17G YD (Turbo Mode) | |
| Medio NVIDIA GeForce RTX 3080 Laptop GPU (98 - 156, n=45) | |
| Lenovo Legion 7 16ACHg6 | |
| Asus Strix Scar 17 G733QSA-XS99 | |
| MSI GP76 Leopard 10UG | |
| X-Plane 11.11 - 1920x1080 high (fps_test=3) | |
| Media de la clase Gaming (52.1 - 143.5, n=113, últimos 2 años) | |
| Aorus 17G XB | |
| Medio NVIDIA GeForce RTX 3080 Laptop GPU (65.6 - 113, n=44) | |
| Aorus 17G YD (Turbo Mode) | |
| Aorus 17G YD | |
| Lenovo Legion 7 16ACHg6 | |
| MSI GP76 Leopard 10UG | |
| Asus Strix Scar 17 G733QSA-XS99 | |
| Schenker XMG Neo 17 (Early 2021, RTX 3070, 5800H) | |
| Final Fantasy XV Benchmark - 1920x1080 High Quality | |
| Media de la clase Gaming (41 - 215, n=101, últimos 2 años) | |
| Lenovo Legion 7 16ACHg6 (1.3) | |
| Asus Strix Scar 17 G733QSA-XS99 (1.3) | |
| Medio NVIDIA GeForce RTX 3080 Laptop GPU (55.5 - 115, n=34) | |
| Aorus 17G YD (1.3, Turbo Mode) | |
| Aorus 17G YD (1.3) | |
| MSI GP76 Leopard 10UG | |
| Strange Brigade - 1920x1080 ultra AA:ultra AF:16 | |
| Media de la clase Gaming (76.3 - 456, n=91, últimos 2 años) | |
| Lenovo Legion 7 16ACHg6 (1.47.22.14 D3D12) | |
| Medio NVIDIA GeForce RTX 3080 Laptop GPU (117 - 219, n=34) | |
| Asus Strix Scar 17 G733QSA-XS99 (1.47.22.14 D3D12) | |
| Aorus 17G YD (1.47.22.14 D3D12) | |
| Dirt 5 - 1920x1080 Ultra High Preset | |
| Lenovo Legion 7 16ACHg6 | |
| Aorus 17G YD | |
| Medio NVIDIA GeForce RTX 3080 Laptop GPU (52 - 110, n=11) | |
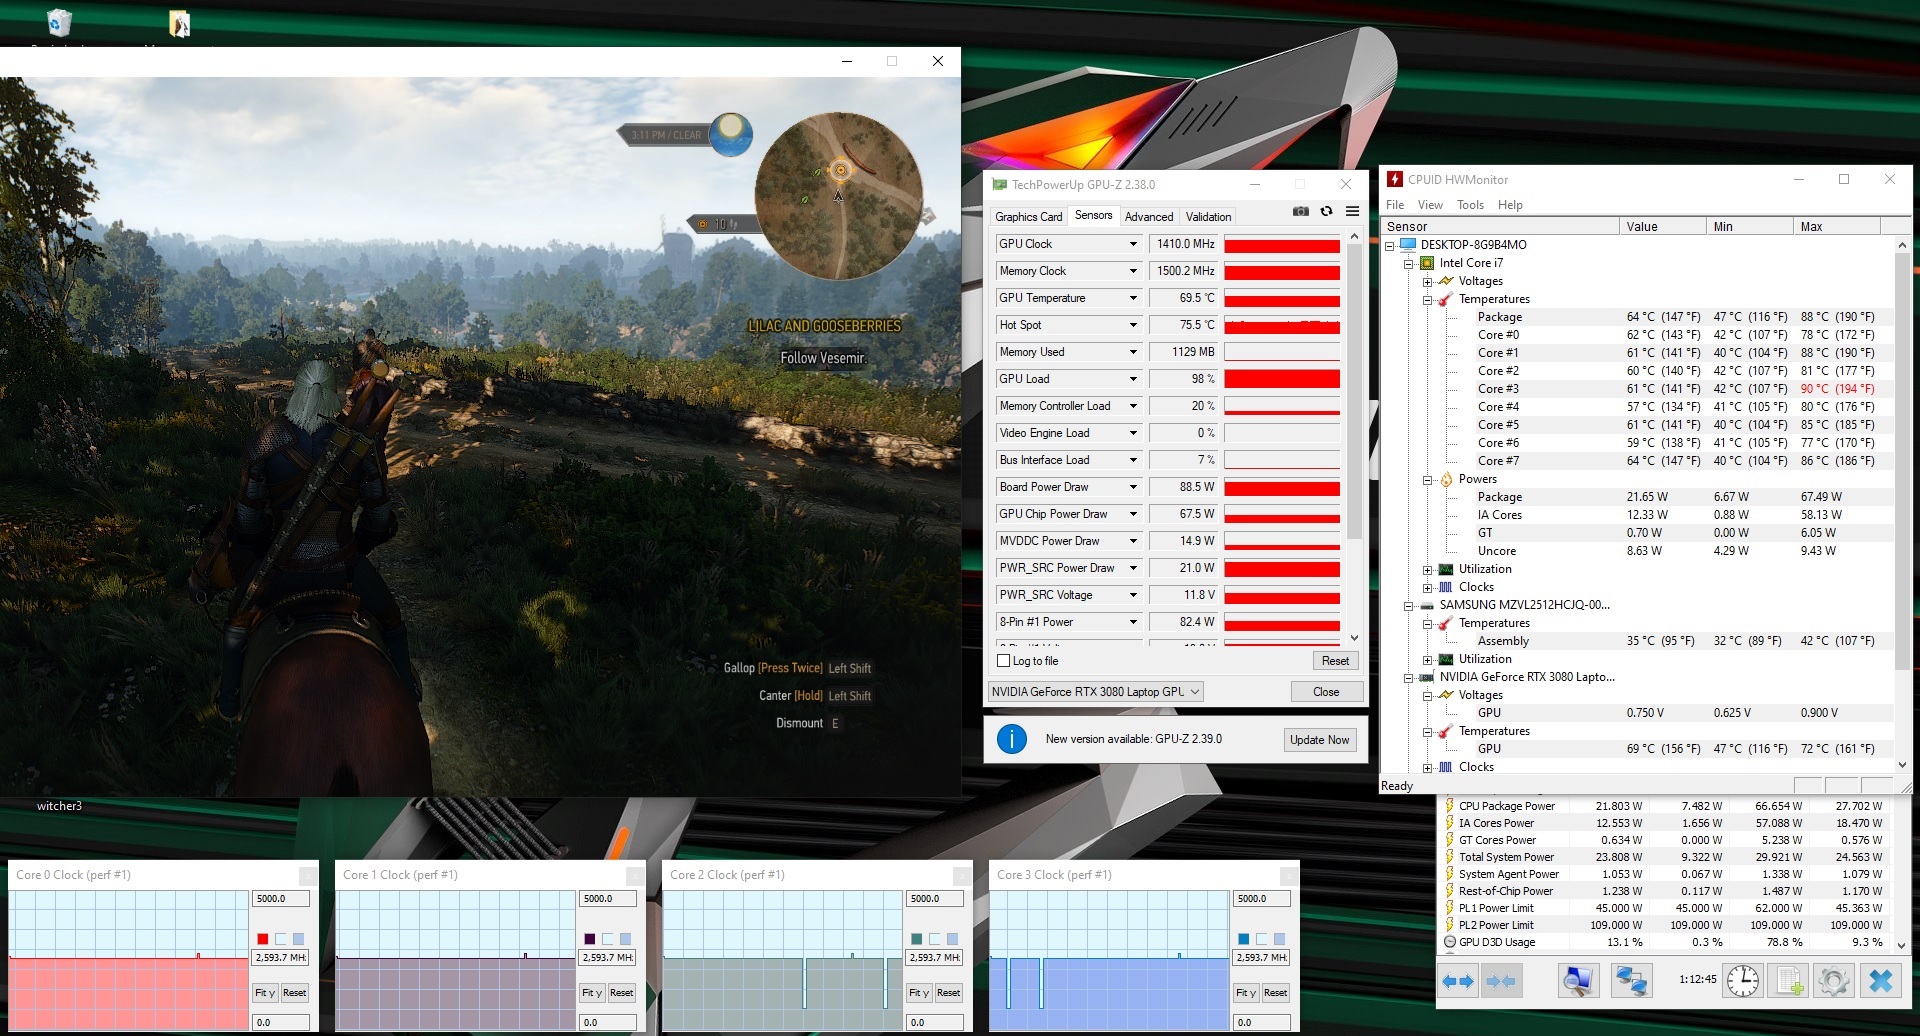
Para comprobar si la velocidad de fotogramas se mantiene prácticamente constante durante un periodo de tiempo prolongado, dejamos que el juego The Witcher 3 funcionara durante unos 60 minutos a resolución Full HD y con los ajustes de máxima calidad. El personaje no se mueve. No se encontró una caída de la tasa de imágenes por segundo
| bajo | medio | alto | ultra | |
|---|---|---|---|---|
| GTA V (2015) | 183 | 176 | 158 | 95.7 |
| The Witcher 3 (2015) | 365 | 267 | 183 | 106 |
| Dota 2 Reborn (2015) | 164 | 146 | 139 | 130 |
| Final Fantasy XV Benchmark (2018) | 172 | 123 | 93.8 | |
| X-Plane 11.11 (2018) | 123 | 103 | 82.9 | |
| Far Cry 5 (2018) | 153 | 119 | 115 | 108 |
| Strange Brigade (2018) | 420 | 225 | 184 | 163 |
| Horizon Zero Dawn (2020) | 133 | 119 | 109 | 100 |
| Serious Sam 4 (2020) | 152 | 107 | 93.6 | 85 |
| Dirt 5 (2020) | 178 | 123 | 104 | 87.5 |
| Yakuza Like a Dragon (2020) | 141 | 121 | 117 | 108 |
| Outriders (2021) | 119 | 101 | 110 | 106 |
| Mass Effect Legendary Edition (2021) | 135 | 115 | ||
| Days Gone (2021) | 175 | 139 | 126 | 98.2 |
Emisiones - El portátil Aorus hace mucho ruido bajo carga
Emisiones acústicas
Incluso en reposo, los ventiladores son claramente audibles a veces con niveles de presión sonora de hasta 39 dB(A). El ruido es aún mayor bajo carga, con niveles máximos de presión sonora de 61 dB(A) (prueba de esfuerzo) y 52 dB(A)( Witcher 3 prueba ), respectivamente. El uso de auriculares es prácticamente inevitable
Ruido
| Ocioso |
| 32 / 33 / 39 dB(A) |
| Carga |
| 43 / 61 dB(A) |
 | ||
30 dB silencioso 40 dB(A) audible 50 dB(A) ruidosamente alto |
||
min: | ||
| Aorus 17G YD i7-11800H, GeForce RTX 3080 Laptop GPU | MSI GP76 Leopard 10UG i7-10750H, GeForce RTX 3070 Laptop GPU | Asus Strix Scar 17 G733QSA-XS99 R9 5900HX, GeForce RTX 3080 Laptop GPU | Lenovo Legion 7 16ACHg6 R9 5900HX, GeForce RTX 3080 Laptop GPU | Schenker XMG Neo 17 (Early 2021, RTX 3070, 5800H) R7 5800H, GeForce RTX 3070 Laptop GPU | Aorus 17G XB i7-10875H, GeForce RTX 2070 Super Max-Q | Media de la clase Gaming | |
|---|---|---|---|---|---|---|---|
| Noise | 4% | 18% | 10% | 2% | -3% | 12% | |
| apagado / medio ambiente * (dB) | 25 | 24 4% | 25 -0% | 26 -4% | 24 4% | 30 -20% | 24.1 ? 4% |
| Idle Minimum * (dB) | 32 | 25 22% | 25.2 21% | 26 19% | 29 9% | 35 -9% | 25.8 ? 19% |
| Idle Average * (dB) | 33 | 32 3% | 25.2 24% | 30 9% | 32 3% | 36 -9% | 27.4 ? 17% |
| Idle Maximum * (dB) | 39 | 34 13% | 25.2 35% | 35 10% | 38 3% | 41 -5% | 29.9 ? 23% |
| Load Average * (dB) | 43 | 54 -26% | 30.7 29% | 40 7% | 49 -14% | 47 -9% | 43 ? -0% |
| Witcher 3 ultra * (dB) | 52 | 51 2% | 51.3 1% | 46 12% | 53 -2% | 48 8% | |
| Load Maximum * (dB) | 61 | 54 11% | 51.3 16% | 50 18% | 55 10% | 49 20% | 54 ? 11% |
* ... más pequeño es mejor
Temperatura
Nuestra prueba de estrés (Prime95 y FurMark se ejecutan durante al menos una hora) es ejecutada por la CPU y la GPU a 2,9 GHz y 1.425 MHz, respectivamente. La prueba de estrés representa un escenario extremo. Utilizamos esta prueba para verificar que el sistema se mantiene estable a plena carga
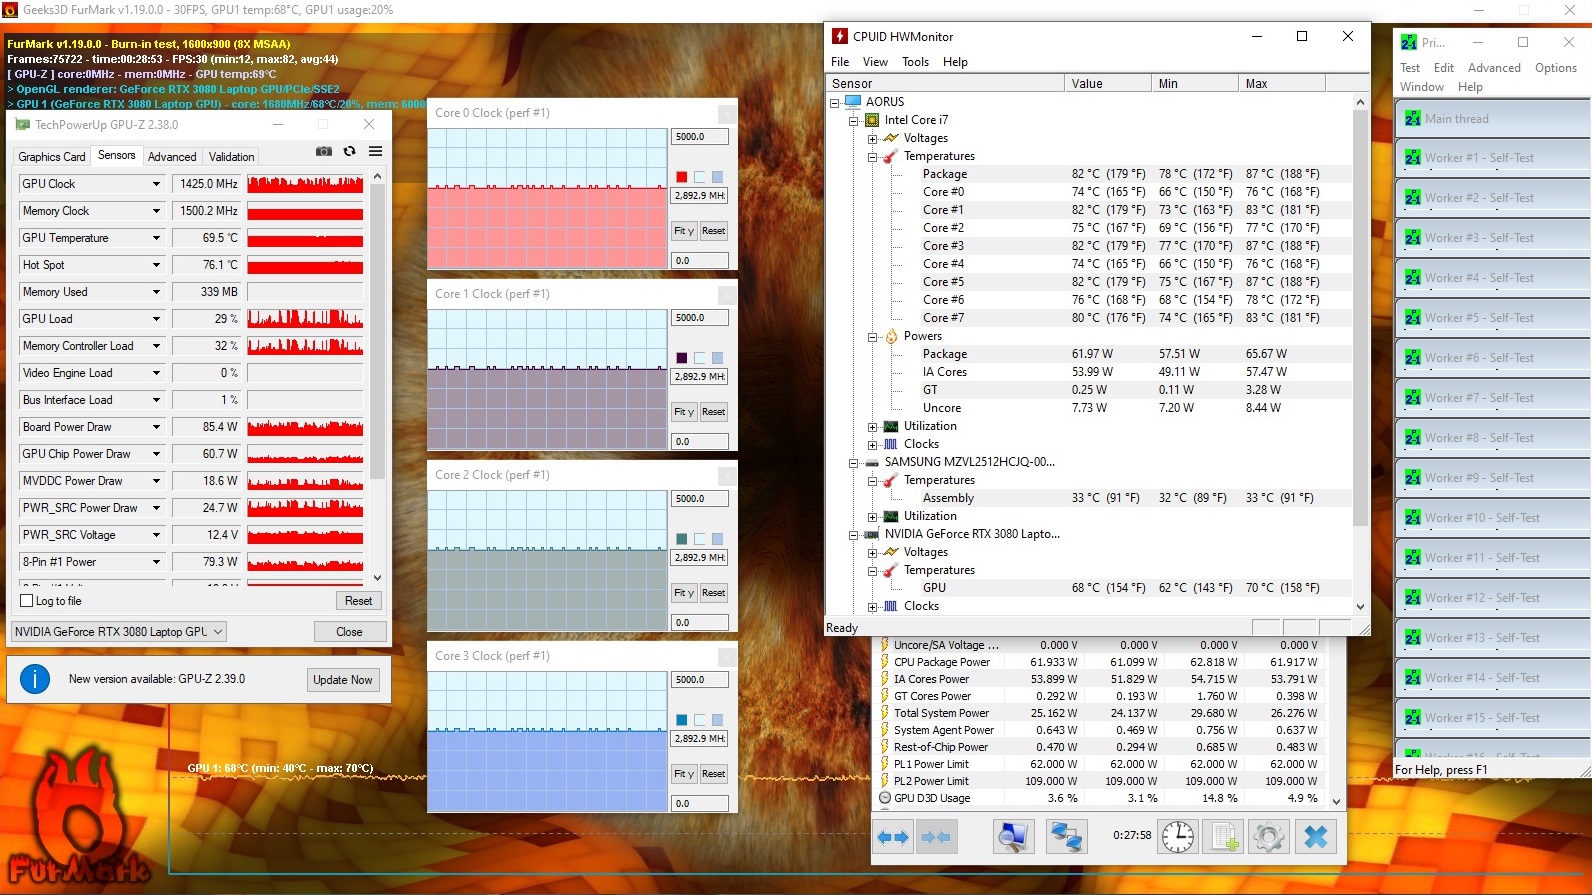
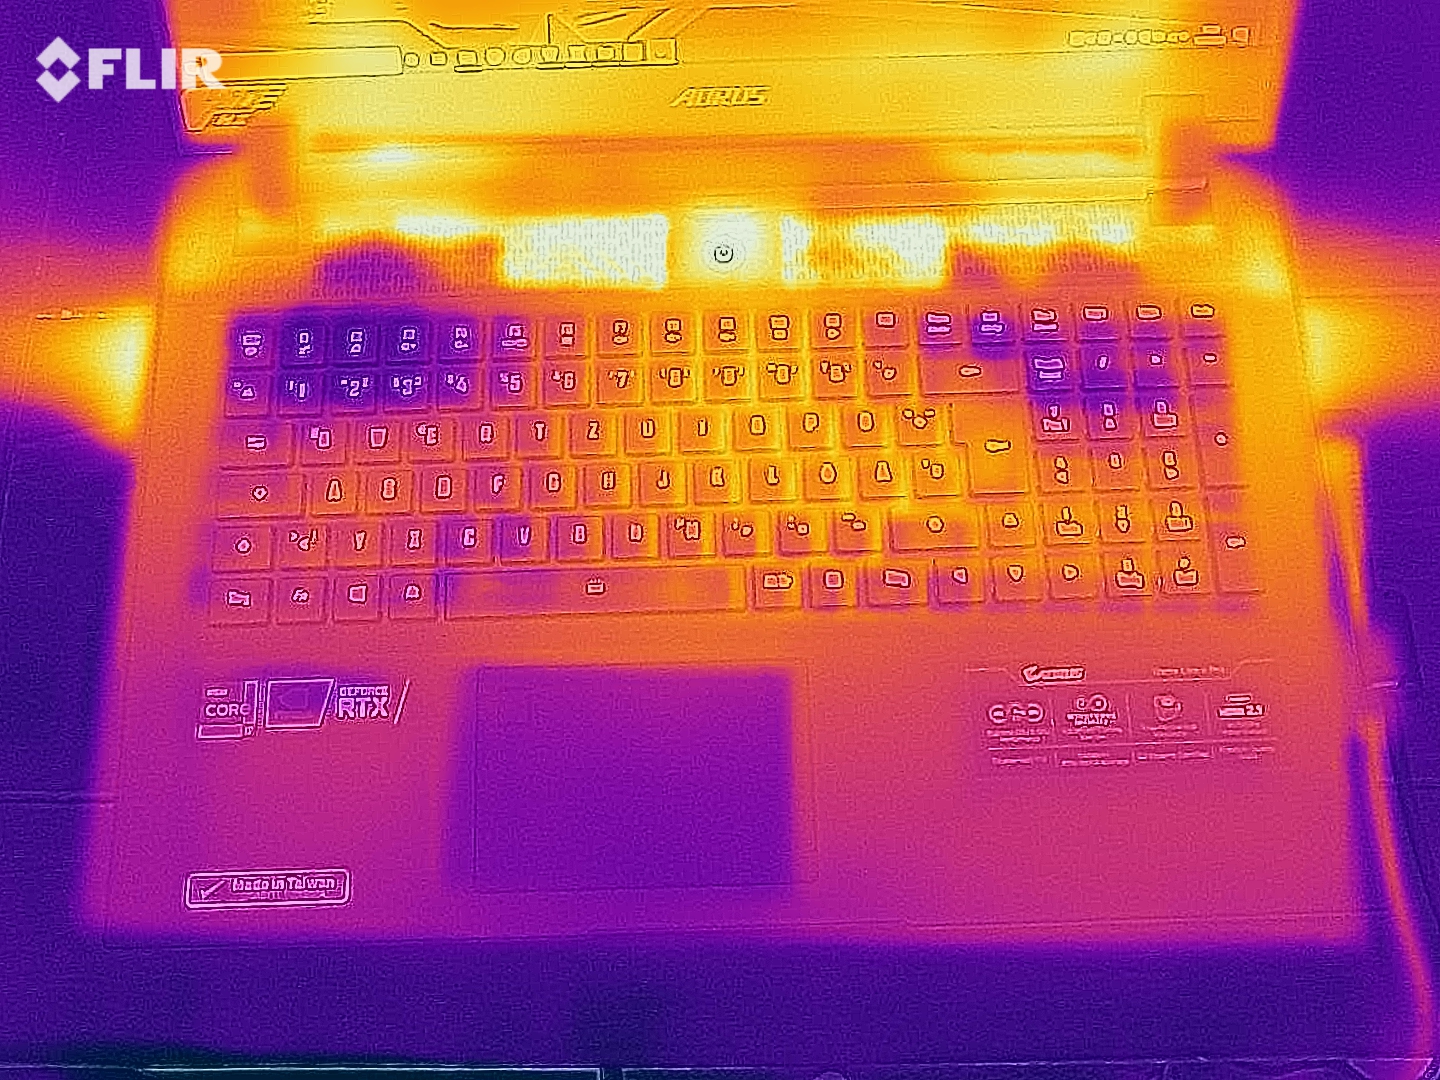
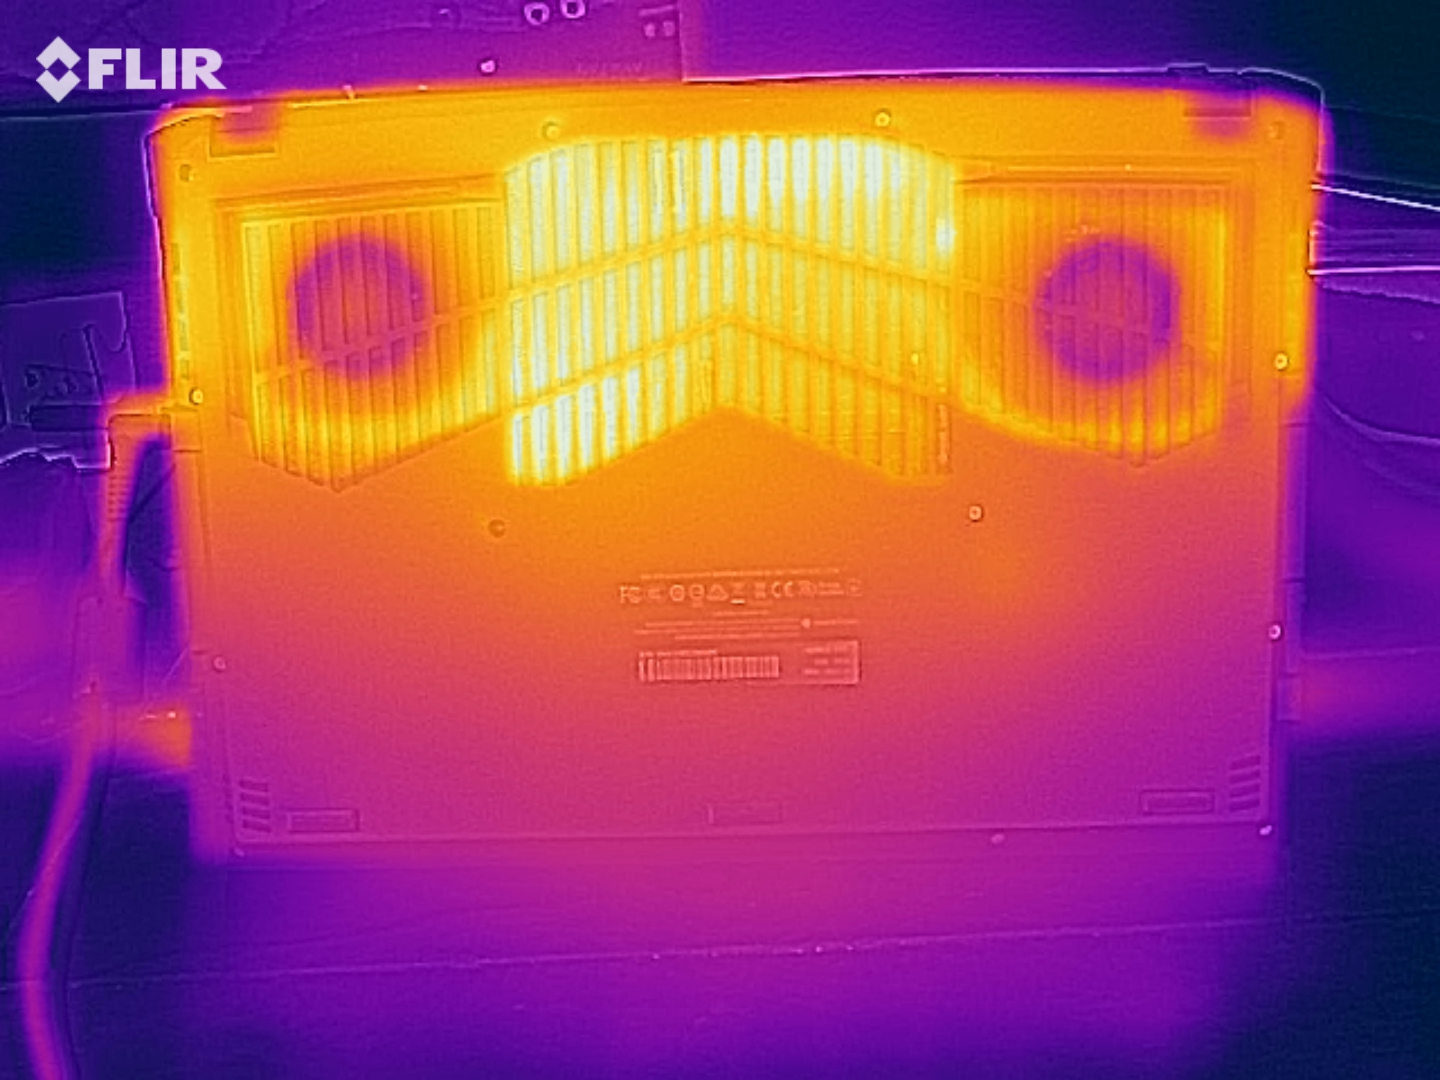
El portátil se calienta notablemente. Durante el test de estrés, registramos temperaturas por debajo de los 50 °C en varios puntos de medición de la parte inferior. El desarrollo de calor es ligeramente superior cuando ejecutamos nuestro test The Witcher 3. El dispositivo no debería colocarse sobre el regazo en ninguno de los dos casos
(+) La temperatura máxima en la parte superior es de 36 °C / 97 F, frente a la media de 40.4 °C / 105 F, que oscila entre 21.2 y 68.8 °C para la clase Gaming.
(-) El fondo se calienta hasta un máximo de 52 °C / 126 F, frente a la media de 43.2 °C / 110 F
(+) En reposo, la temperatura media de la parte superior es de 27.7 °C / 82# F, frente a la media del dispositivo de 33.9 °C / 93 F.
(±) Jugando a The Witcher 3, la temperatura media de la parte superior es de 33 °C / 91 F, frente a la media del dispositivo de 33.9 °C / 93 F.
(+) El reposamanos y el panel táctil están a una temperatura inferior a la de la piel, con un máximo de 29 °C / 84.2 F y, por tanto, son fríos al tacto.
(±) La temperatura media de la zona del reposamanos de dispositivos similares fue de 28.8 °C / 83.8 F (-0.2 °C / -0.4 F).
| Aorus 17G YD i7-11800H, GeForce RTX 3080 Laptop GPU | MSI GP76 Leopard 10UG i7-10750H, GeForce RTX 3070 Laptop GPU | Asus Strix Scar 17 G733QSA-XS99 R9 5900HX, GeForce RTX 3080 Laptop GPU | Lenovo Legion 7 16ACHg6 R9 5900HX, GeForce RTX 3080 Laptop GPU | Schenker XMG Neo 17 (Early 2021, RTX 3070, 5800H) R7 5800H, GeForce RTX 3070 Laptop GPU | Aorus 17G XB i7-10875H, GeForce RTX 2070 Super Max-Q | Media de la clase Gaming | |
|---|---|---|---|---|---|---|---|
| Heat | -3% | -6% | -21% | -13% | -6% | -7% | |
| Maximum Upper Side * (°C) | 36 | 43 -19% | 40 -11% | 51 -42% | 47 -31% | 48 -33% | 45.2 ? -26% |
| Maximum Bottom * (°C) | 52 | 47 10% | 39.8 23% | 52 -0% | 51 2% | 59 -13% | 47.9 ? 8% |
| Idle Upper Side * (°C) | 29 | 30 -3% | 34.6 -19% | 37 -28% | 32 -10% | 26 10% | 31.1 ? -7% |
| Idle Bottom * (°C) | 33 | 33 -0% | 38.4 -16% | 38 -15% | 37 -12% | 29 12% | 34.2 ? -4% |
* ... más pequeño es mejor
Altavoces
Aorus 17G YD análisis de audio
(+) | los altavoces pueden reproducir a un volumen relativamente alto (#83 dB)
Graves 100 - 315 Hz
(-) | casi sin bajos - de media 31.4% inferior a la mediana
(±) | la linealidad de los graves es media (14.2% delta a frecuencia anterior)
Medios 400 - 2000 Hz
(±) | medias más altas - de media 5.4% más altas que la mediana
(±) | la linealidad de los medios es media (7.1% delta respecto a la frecuencia anterior)
Altos 2 - 16 kHz
(+) | máximos equilibrados - a sólo 1.4% de la mediana
(+) | los máximos son lineales (3% delta a la frecuencia anterior)
Total 100 - 16.000 Hz
(±) | la linealidad del sonido global es media (20.6% de diferencia con la mediana)
En comparación con la misma clase
» 74% de todos los dispositivos probados de esta clase eran mejores, 5% similares, 21% peores
» El mejor tuvo un delta de 6%, la media fue 18%, el peor fue ###max##%
En comparación con todos los dispositivos probados
» 55% de todos los dispositivos probados eran mejores, 8% similares, 37% peores
» El mejor tuvo un delta de 4%, la media fue 24%, el peor fue ###max##%
Asus Strix Scar 17 G733QSA-XS99 análisis de audio
(±) | la sonoridad del altavoz es media pero buena (73.7 dB)
Graves 100 - 315 Hz
(+) | buen bajo - sólo 2.1% lejos de la mediana
(±) | la linealidad de los graves es media (7% delta a frecuencia anterior)
Medios 400 - 2000 Hz
(+) | medios equilibrados - a sólo 1.4% de la mediana
(+) | los medios son lineales (4.8% delta a la frecuencia anterior)
Altos 2 - 16 kHz
(±) | máximos más altos - de media 5.9% más altos que la mediana
(±) | la linealidad de los máximos es media (8.7% delta a frecuencia anterior)
Total 100 - 16.000 Hz
(+) | el sonido global es lineal (10.7% de diferencia con la mediana)
En comparación con la misma clase
» 7% de todos los dispositivos probados de esta clase eran mejores, 2% similares, 91% peores
» El mejor tuvo un delta de 6%, la media fue 18%, el peor fue ###max##%
En comparación con todos los dispositivos probados
» 6% de todos los dispositivos probados eran mejores, 2% similares, 93% peores
» El mejor tuvo un delta de 4%, la media fue 24%, el peor fue ###max##%
Gestión de la energía - El 17G ofrece una duración de la batería muy decente
Consumo de energía
Registramos un consumo máximo de energía de 38 vatios en uso inactivo, un índice bastante alto teniendo en cuenta que la conmutación de gráficos está activada. El test de estrés y nuestro test Witcher 3permiten que la demanda aumente hasta los 230 vatios y una media de 164 vatios, respectivamente. La potencia nominal del adaptador de corriente es de 230 vatios
| Off / Standby | |
| Ocioso | |
| Carga |
|
Clave:
min: | |
| Aorus 17G YD i7-11800H, GeForce RTX 3080 Laptop GPU | MSI GP76 Leopard 10UG i7-10750H, GeForce RTX 3070 Laptop GPU | Asus Strix Scar 17 G733QSA-XS99 R9 5900HX, GeForce RTX 3080 Laptop GPU | Lenovo Legion 7 16ACHg6 R9 5900HX, GeForce RTX 3080 Laptop GPU | Schenker XMG Neo 17 (Early 2021, RTX 3070, 5800H) R7 5800H, GeForce RTX 3070 Laptop GPU | Aorus 17G XB i7-10875H, GeForce RTX 2070 Super Max-Q | Media de la clase Gaming | |
|---|---|---|---|---|---|---|---|
| Power Consumption | 19% | 18% | -16% | 11% | 4% | 18% | |
| Idle Minimum * (Watt) | 24 | 12 50% | 10.9 55% | 31 -29% | 13 46% | 20 17% | 13.2 ? 45% |
| Idle Average * (Watt) | 26 | 16 38% | 14.7 43% | 33 -27% | 16 38% | 23 12% | 18.9 ? 27% |
| Idle Maximum * (Watt) | 38 | 28 26% | 26.8 29% | 46 -21% | 26 32% | 38 -0% | 24.3 ? 36% |
| Load Average * (Watt) | 101 | 92 9% | 106.7 -6% | 110 -9% | 125 -24% | 105 -4% | 108.3 ? -7% |
| Witcher 3 ultra * (Watt) | 164 | 198 -21% | 192.4 -17% | 180 -10% | 187 -14% | 158 4% | |
| Load Maximum * (Watt) | 230 | 210 9% | 228.4 1% | 235 -2% | 259 -13% | 243 -6% | 254 ? -10% |
* ... más pequeño es mejor
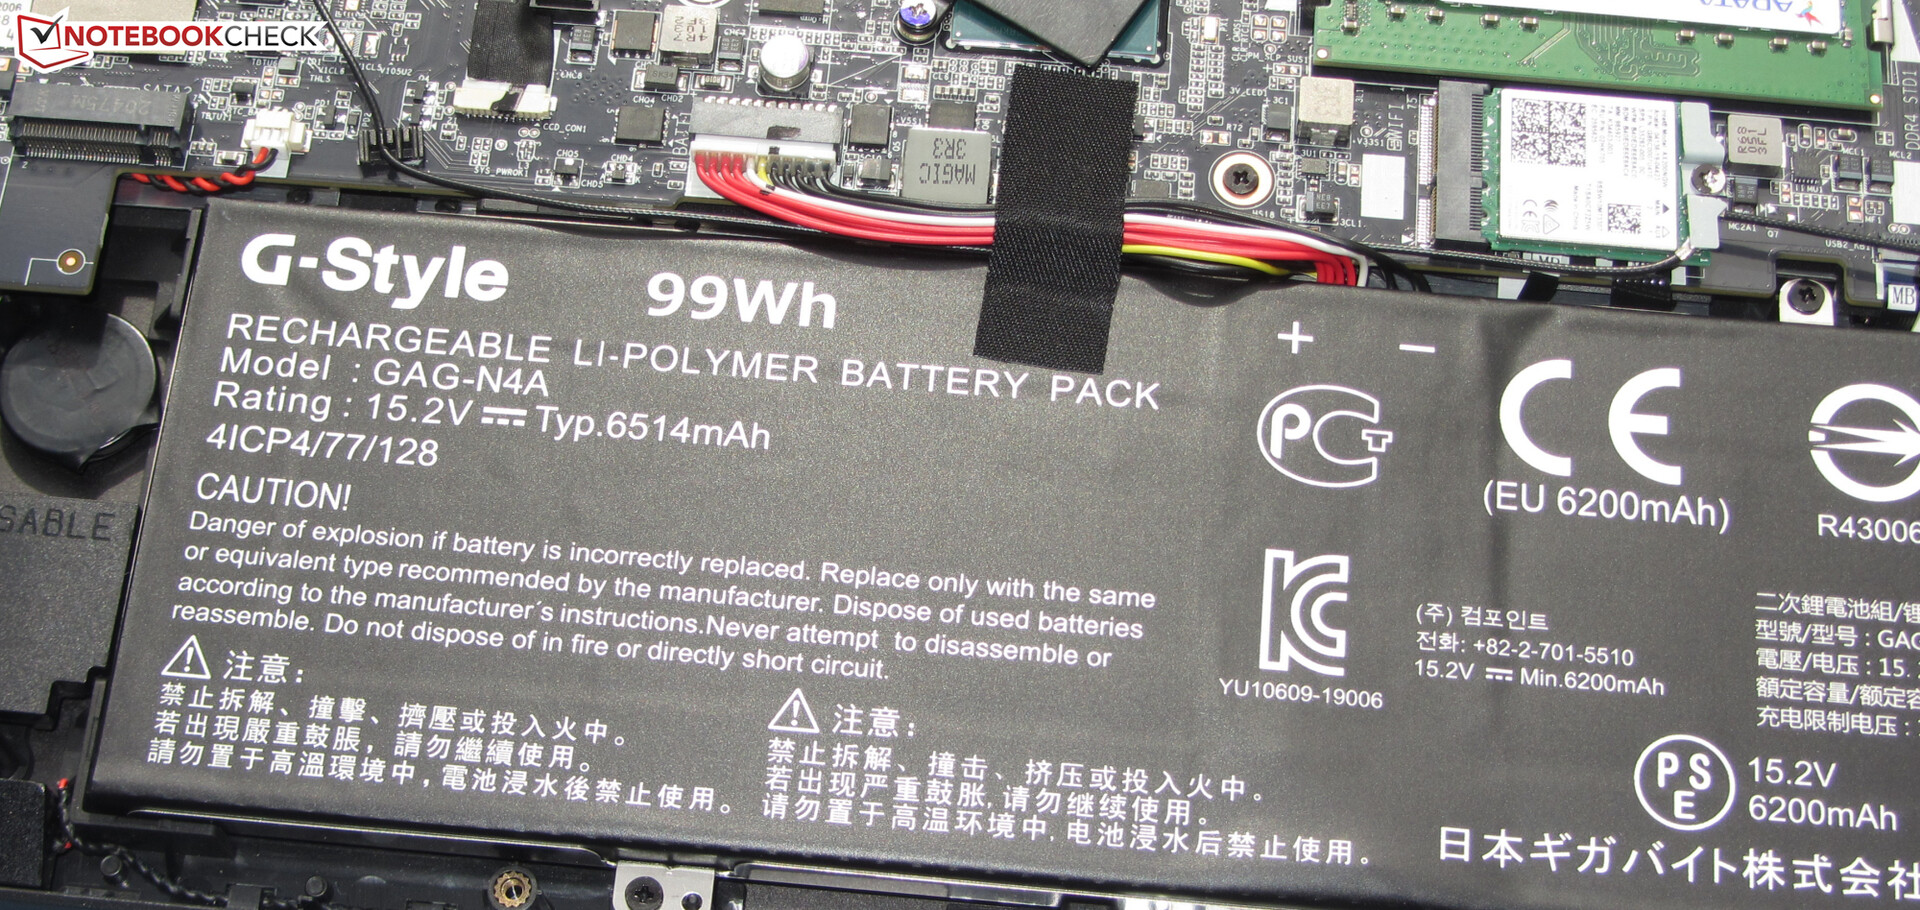
Duración de la batería
El portátil de 17,3 pulgadas logra duraciones de 6:00 horas y 6:10 horas en el test Wi-Fi (acceso a sitios web usando un script) y el test de vídeo (el corto Big Buck Bunny
(codificación H.264, Full HD) ejecutado en bucle), respectivamente. Las funciones de ahorro de energía del portátil están desactivadas durante ambas pruebas, y el brillo de la pantalla está ajustado a unos 150 cd/m². Además, los módulos inalámbricos están desactivados para la prueba de vídeo.Las pruebas de duración de la batería se realizaron sin la opción de perfil automático compatible con IA del Centro de Control. Se utilizaron los perfiles de energía estándar.
| Aorus 17G YD i7-11800H, GeForce RTX 3080 Laptop GPU, 99 Wh | MSI GP76 Leopard 10UG i7-10750H, GeForce RTX 3070 Laptop GPU, 65 Wh | Asus Strix Scar 17 G733QSA-XS99 R9 5900HX, GeForce RTX 3080 Laptop GPU, 90 Wh | Lenovo Legion 7 16ACHg6 R9 5900HX, GeForce RTX 3080 Laptop GPU, 80 Wh | Schenker XMG Neo 17 (Early 2021, RTX 3070, 5800H) R7 5800H, GeForce RTX 3070 Laptop GPU, 62 Wh | Aorus 17G XB i7-10875H, GeForce RTX 2070 Super Max-Q, 94 Wh | Media de la clase Gaming | |
|---|---|---|---|---|---|---|---|
| Duración de Batería | -39% | 30% | 4% | -49% | 25% | 10% | |
| Reader / Idle (h) | 9 | 5.6 -38% | 13.3 48% | 8.2 -9% | 4.7 -48% | 10 11% | 8.71 ? -3% |
| H.264 (h) | 6.2 | 6.8 10% | 8.26 ? 33% | ||||
| WiFi v1.3 (h) | 6 | 4.2 -30% | 9.3 55% | 6.8 13% | 3.5 -42% | 7.5 25% | 7.04 ? 17% |
| Load (h) | 1.6 | 0.8 -50% | 1.4 -13% | 1.6 0% | 0.7 -56% | 2.2 38% | 1.47 ? -8% |
Pro
Contra
Veredicto - El Aorus 17G está a la vanguardia de la tecnología
El 17G YD no está entre los mejores portátiles RTX 3080 debido a su relativamente bajo TGP de 105 vatios. El rendimiento de juego del dispositivo está en la media para una RTX 3080. Para un rendimiento máximo, se recomiendan competidores como elLenovo Legion 7 16ACHg6o elAlienware m17 R4.
Con el Aorus 17G YD, Gigabyte ofrece un portátil gaming muy completo. Sin embargo, el dispositivo genera un alto nivel de ruido.
La ralentización no es un problema. La CPU y la GPU pueden desarrollar su rendimiento uniformemente. No obstante, el dispositivo produce mucho ruido bajo carga - más que muchos competidores. Gigabyte podría mejorar esto con una actualización de la BIOS. El consumo de energía en inactividad también es demasiado alto.
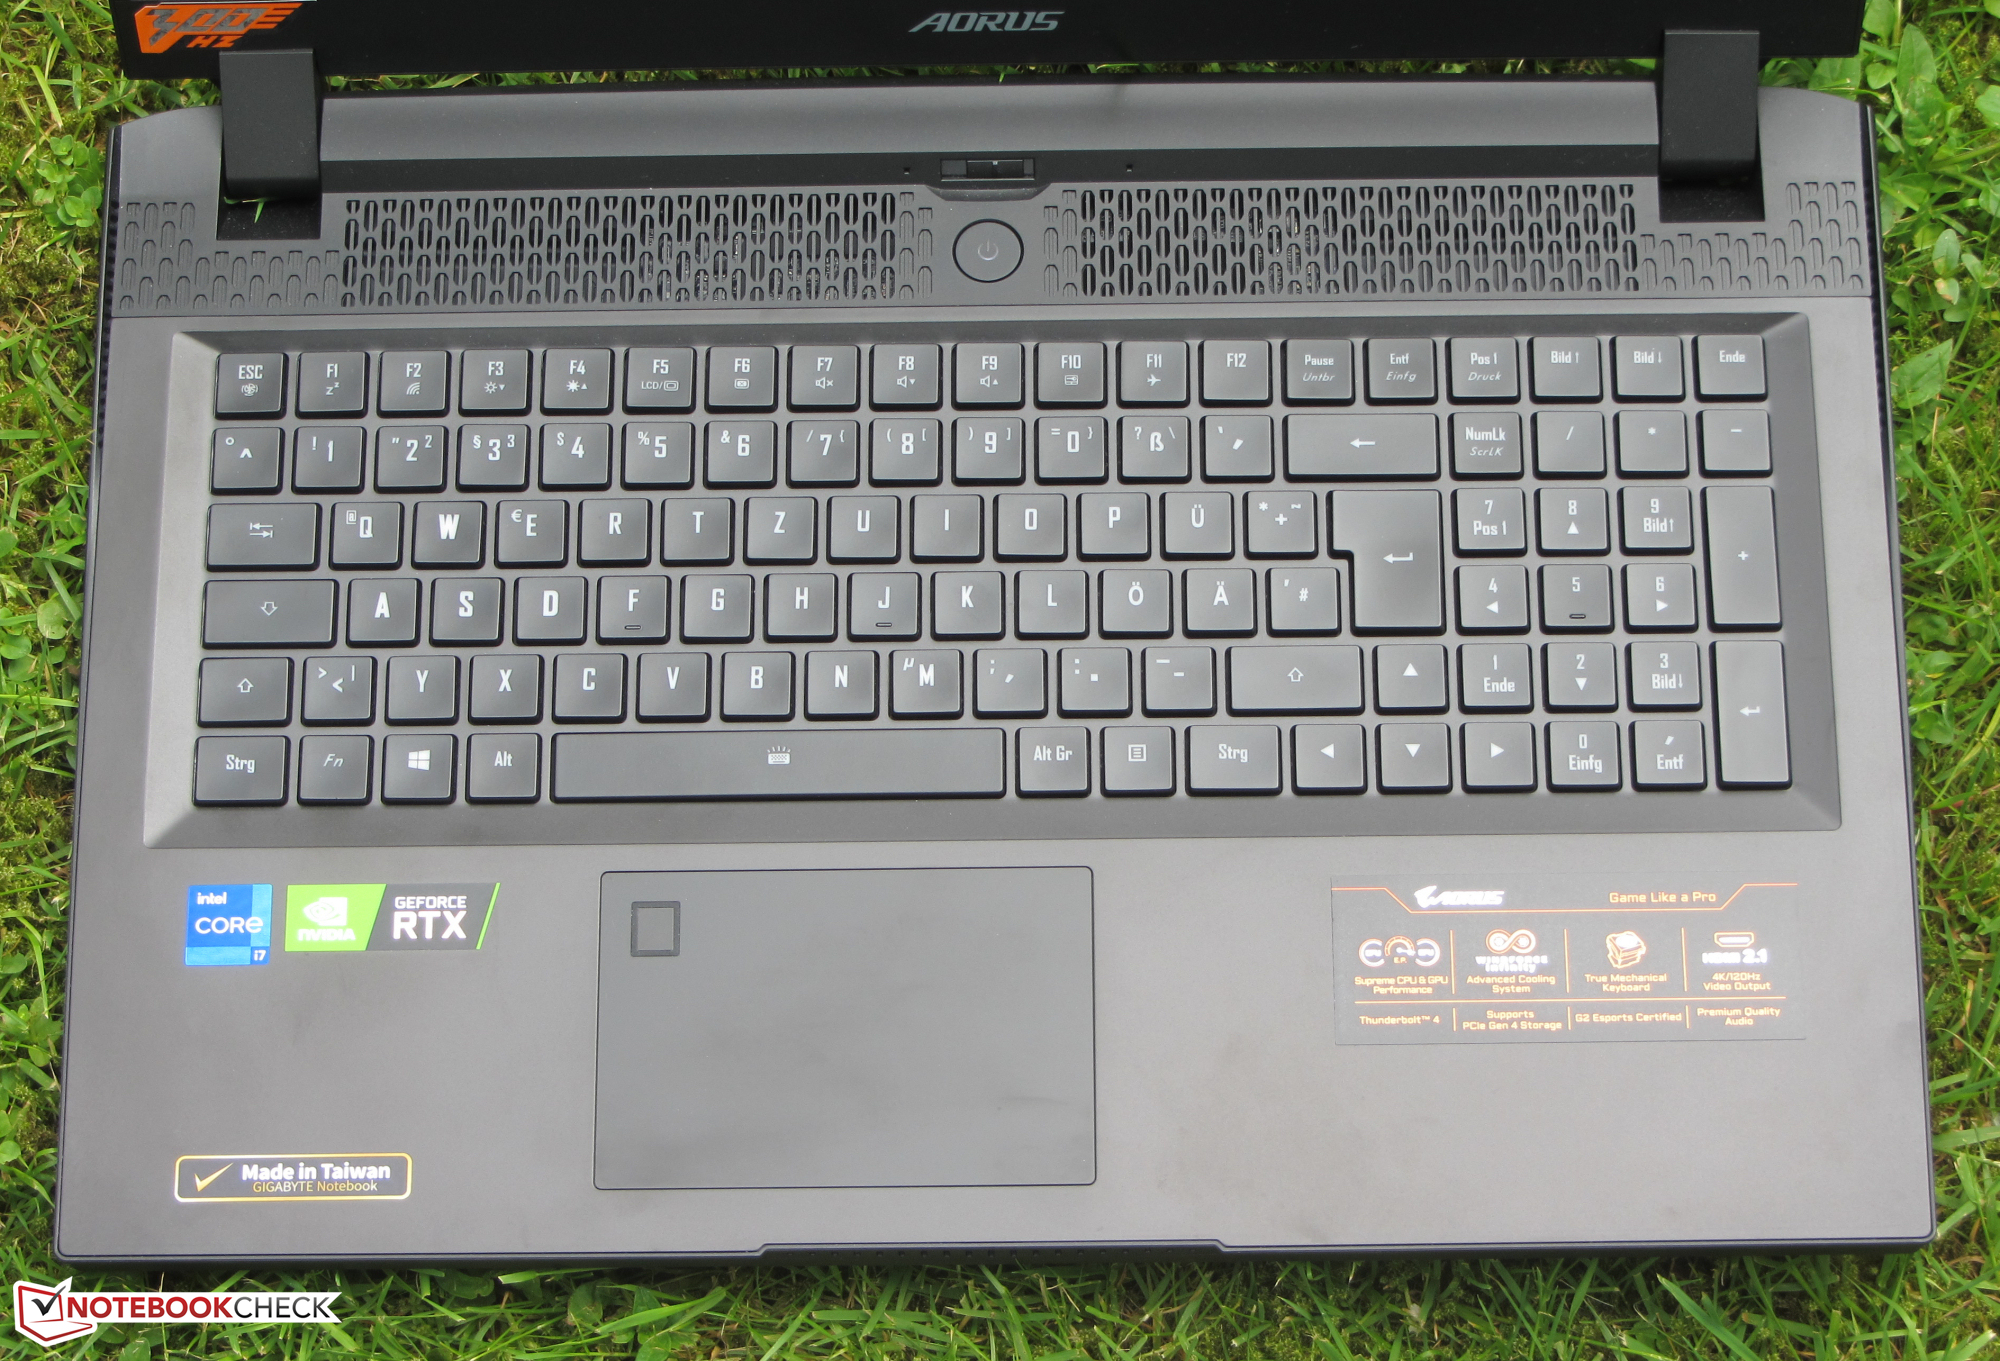
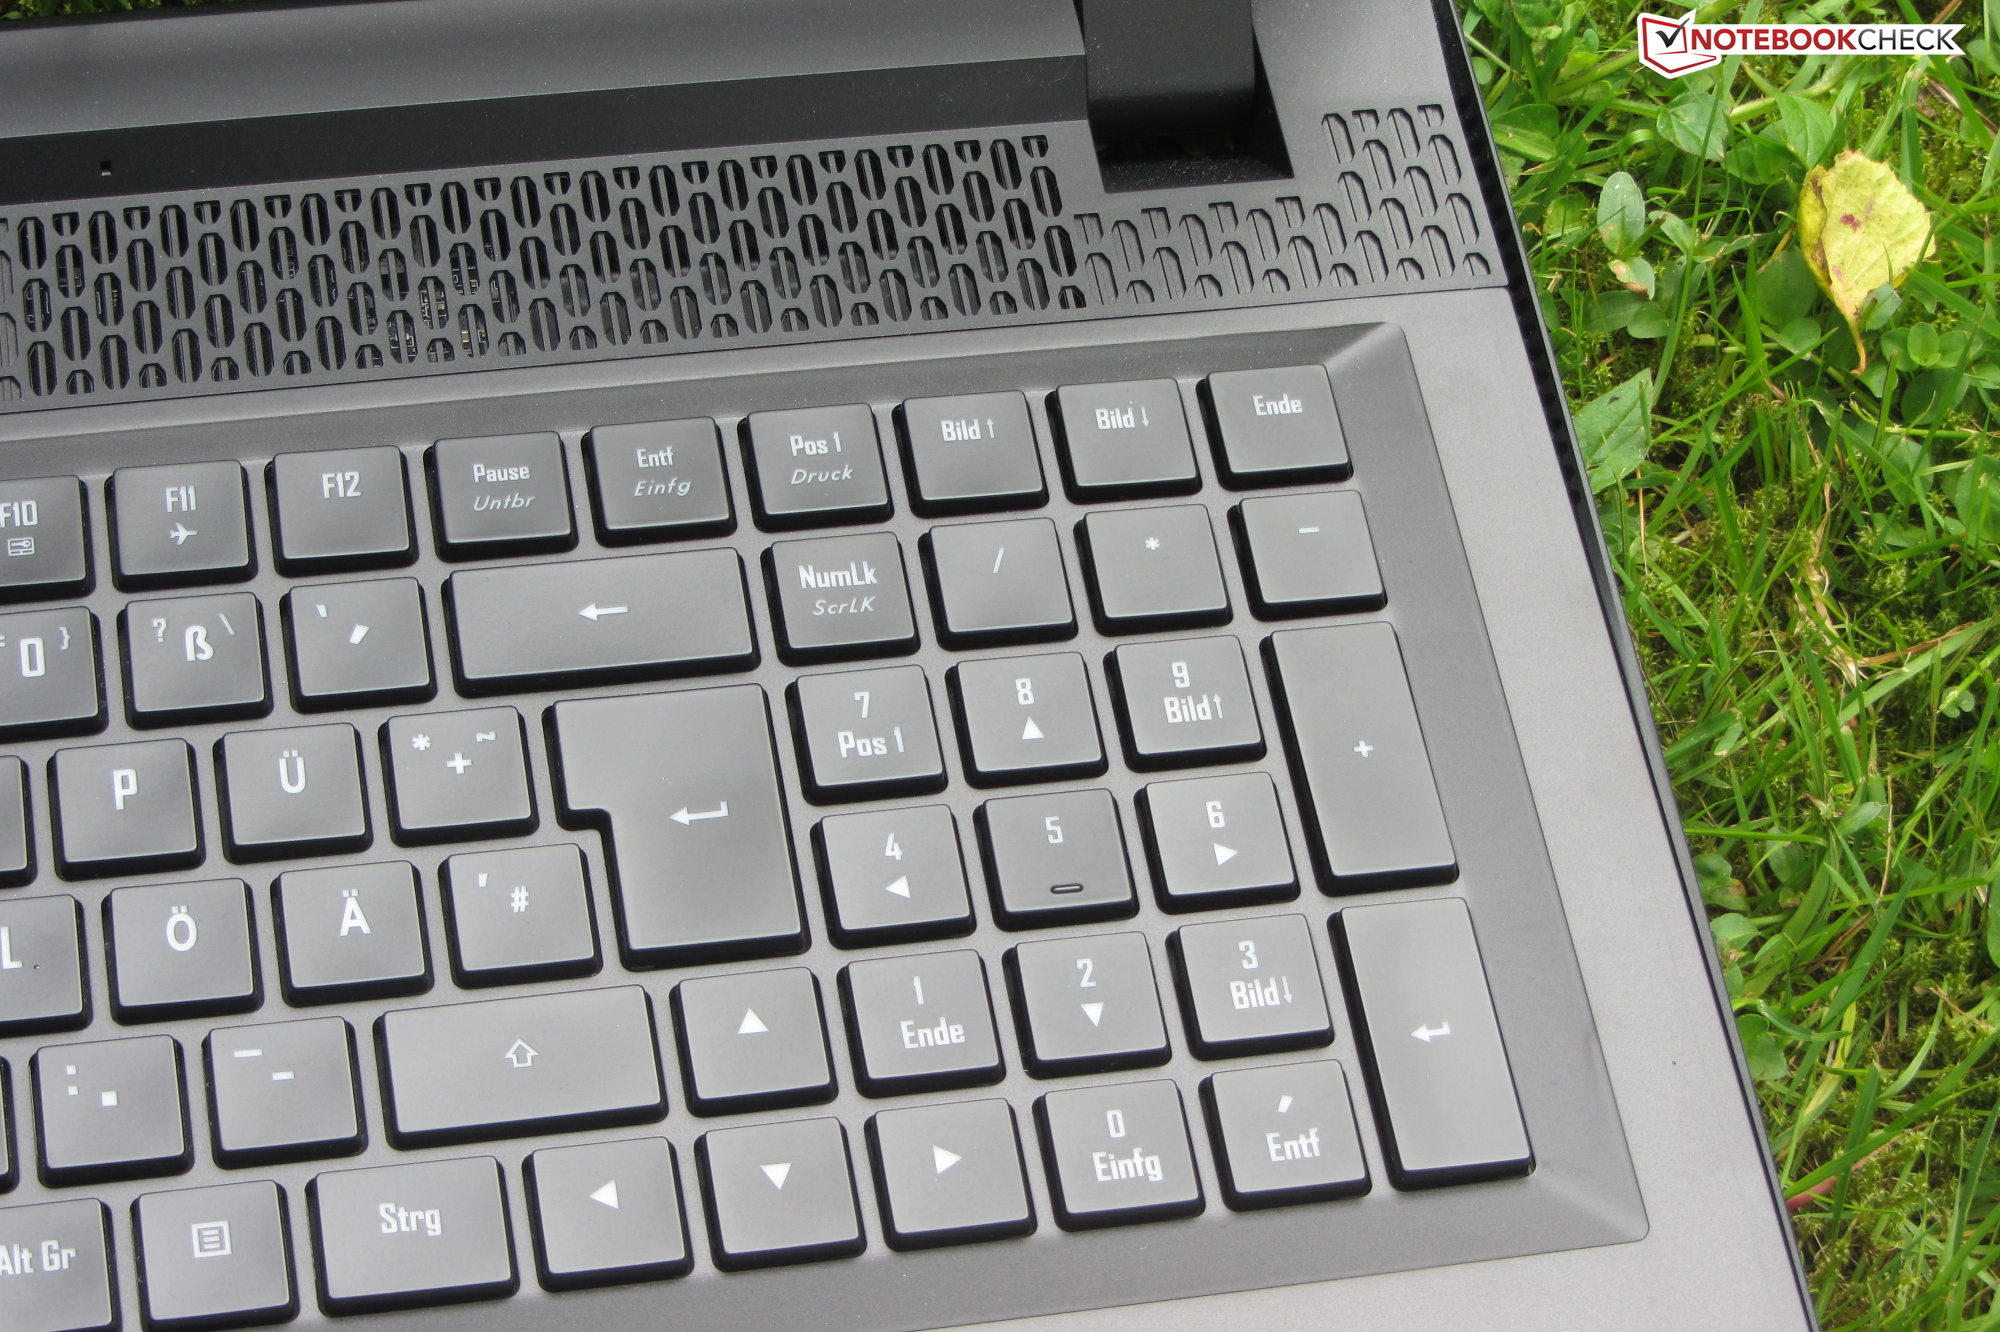
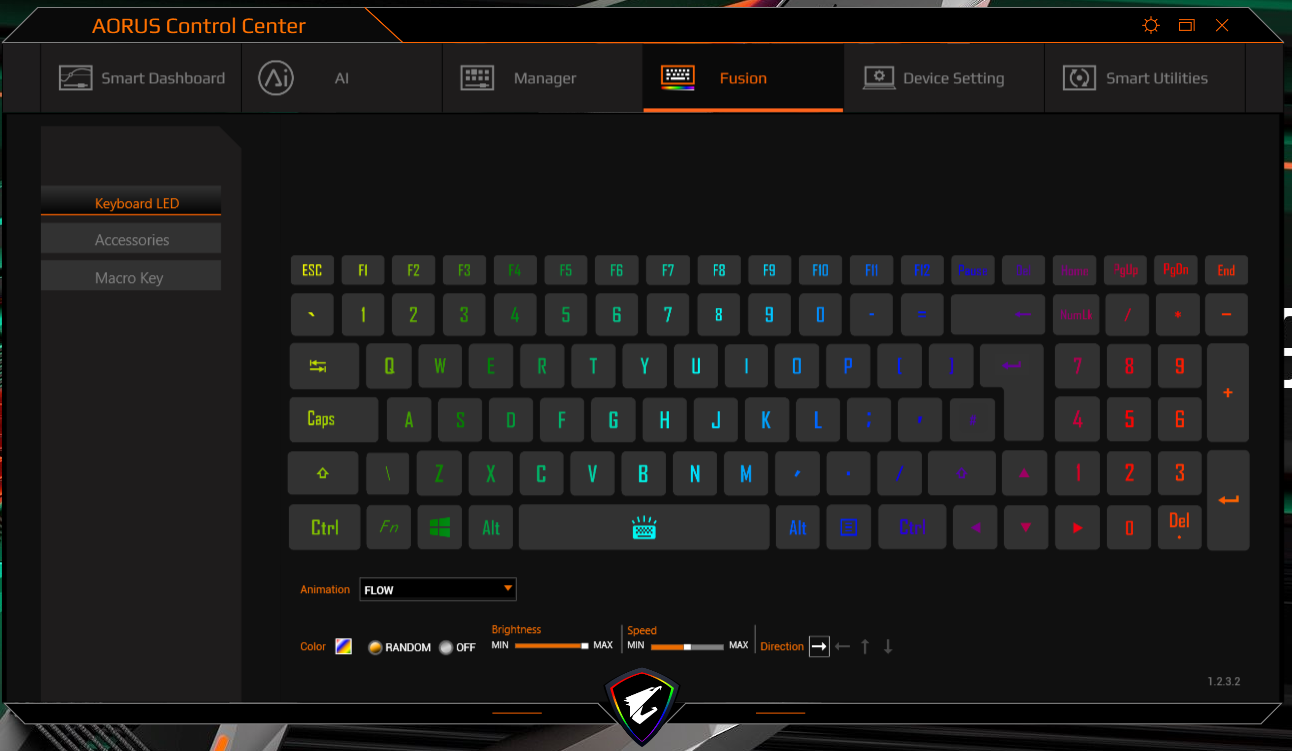
El teclado mecánico (con iluminación RGB) dejó una buena impresión y será un factor importante para muchos posibles compradores. Los usuarios que nunca hayan usado este tipo de teclado tendrán que acostumbrarse a la experiencia de escribir. La duración de la batería está bien, pero queda por detrás de la del modelo hermano - a pesar de que la batería tiene una capacidad ligeramente mayor (94 Wh frente a 99 Wh).
El display (Full HD, IPS, 300 Hz) ofrece ángulos de visión estables, buen contraste, una superficie mate, rápidos tiempos de respuesta, gran reproducción del color, y buena cobertura del espacio de color (sRGB: 100%). Sin embargo, el brillo máximo es demasiado bajo. Un portátil de este rango de precios debería ofrecer más en este sentido.
Precio y disponibilidad
Aorus 17G YD
- 06/21/2021 v7 (old)
Sascha Mölck
Price comparison

