Análisis del Aorus 15 YE5: El portátil para juegos de gama alta para ahorradores
Sólo por su bajo precio, el Aorus 15 YE ya es un interesante portátil para juegos. Desde el exterior, tiene un aspecto moderno y delgado; el asequible paquete incluye incluso Thunderbolt 4 y DDR5. En el interior, por el contrario, se instala hardware (fuerte) de última generación, a saber, un Core i5-12500H y el anterior buque insignia de Nvidia RTX 3080 Ti. Todo ello convierte al Aorus 15 YE5 en uno de los portátiles para juegos más potentes que se pueden conseguir por 1.500 dólares.
A pesar de que su CPU y su GPU son de la generación anterior, el Aorus tiene que defenderse de sus competidores actuales para demostrar si puede mantener el ritmo y si realmente consigue ofrecerle una buena relación calidad-precio. A continuación, lo enfrentaremos a portátiles actuales con la RTX 4060 o la RTX 4070, como el Aorus 15 BSF (RTX 4070), Captiva Advanced Gaming I74-121 (RTX 4060), HP Victus 16 (RTX 4070), HP Omen 16 (RTX 4080) y el mucho más caro Dell XPS 15 9530 (RTX 4070).
Possible competitors compared
Valoración | Fecha | Modelo | Peso | Altura | Tamaño | Resolución | Precio |
|---|---|---|---|---|---|---|---|
| 86.6 % v7 (old) | 12/2023 | Aorus 15 YE5-54DEB34SH i5-12500H, GeForce RTX 3080 Ti Laptop GPU | 2.3 kg | 27 mm | 15.60" | 2560x1440 | |
| 85.7 % v7 (old) | 08/2023 | Aorus 15 BSF i7-13700H, GeForce RTX 4070 Laptop GPU | 2.4 kg | 20.9 mm | 15.60" | 2560x1440 | |
| 85.7 % v7 (old) | 09/2023 | Captiva Advanced Gaming I74-121 i5-13500H, GeForce RTX 4060 Laptop GPU | 2.3 kg | 29 mm | 15.60" | 1920x1080 | |
| 85.1 % v7 (old) | 09/2023 | HP Victus 16-r0077ng i7-13700H, GeForce RTX 4070 Laptop GPU | 2.4 kg | 24 mm | 16.10" | 1920x1080 | |
| 90.3 % v7 (old) | 04/2023 | Dell XPS 15 9530 RTX 4070 i7-13700H, GeForce RTX 4070 Laptop GPU | 1.9 kg | 18 mm | 15.60" | 3456x2160 | |
| 87.4 % v7 (old) | 07/2023 | HP Omen 16-wf000 i7-13700HX, GeForce RTX 4080 Laptop GPU | 2.4 kg | 23.6 mm | 16.10" | 2560x1440 |
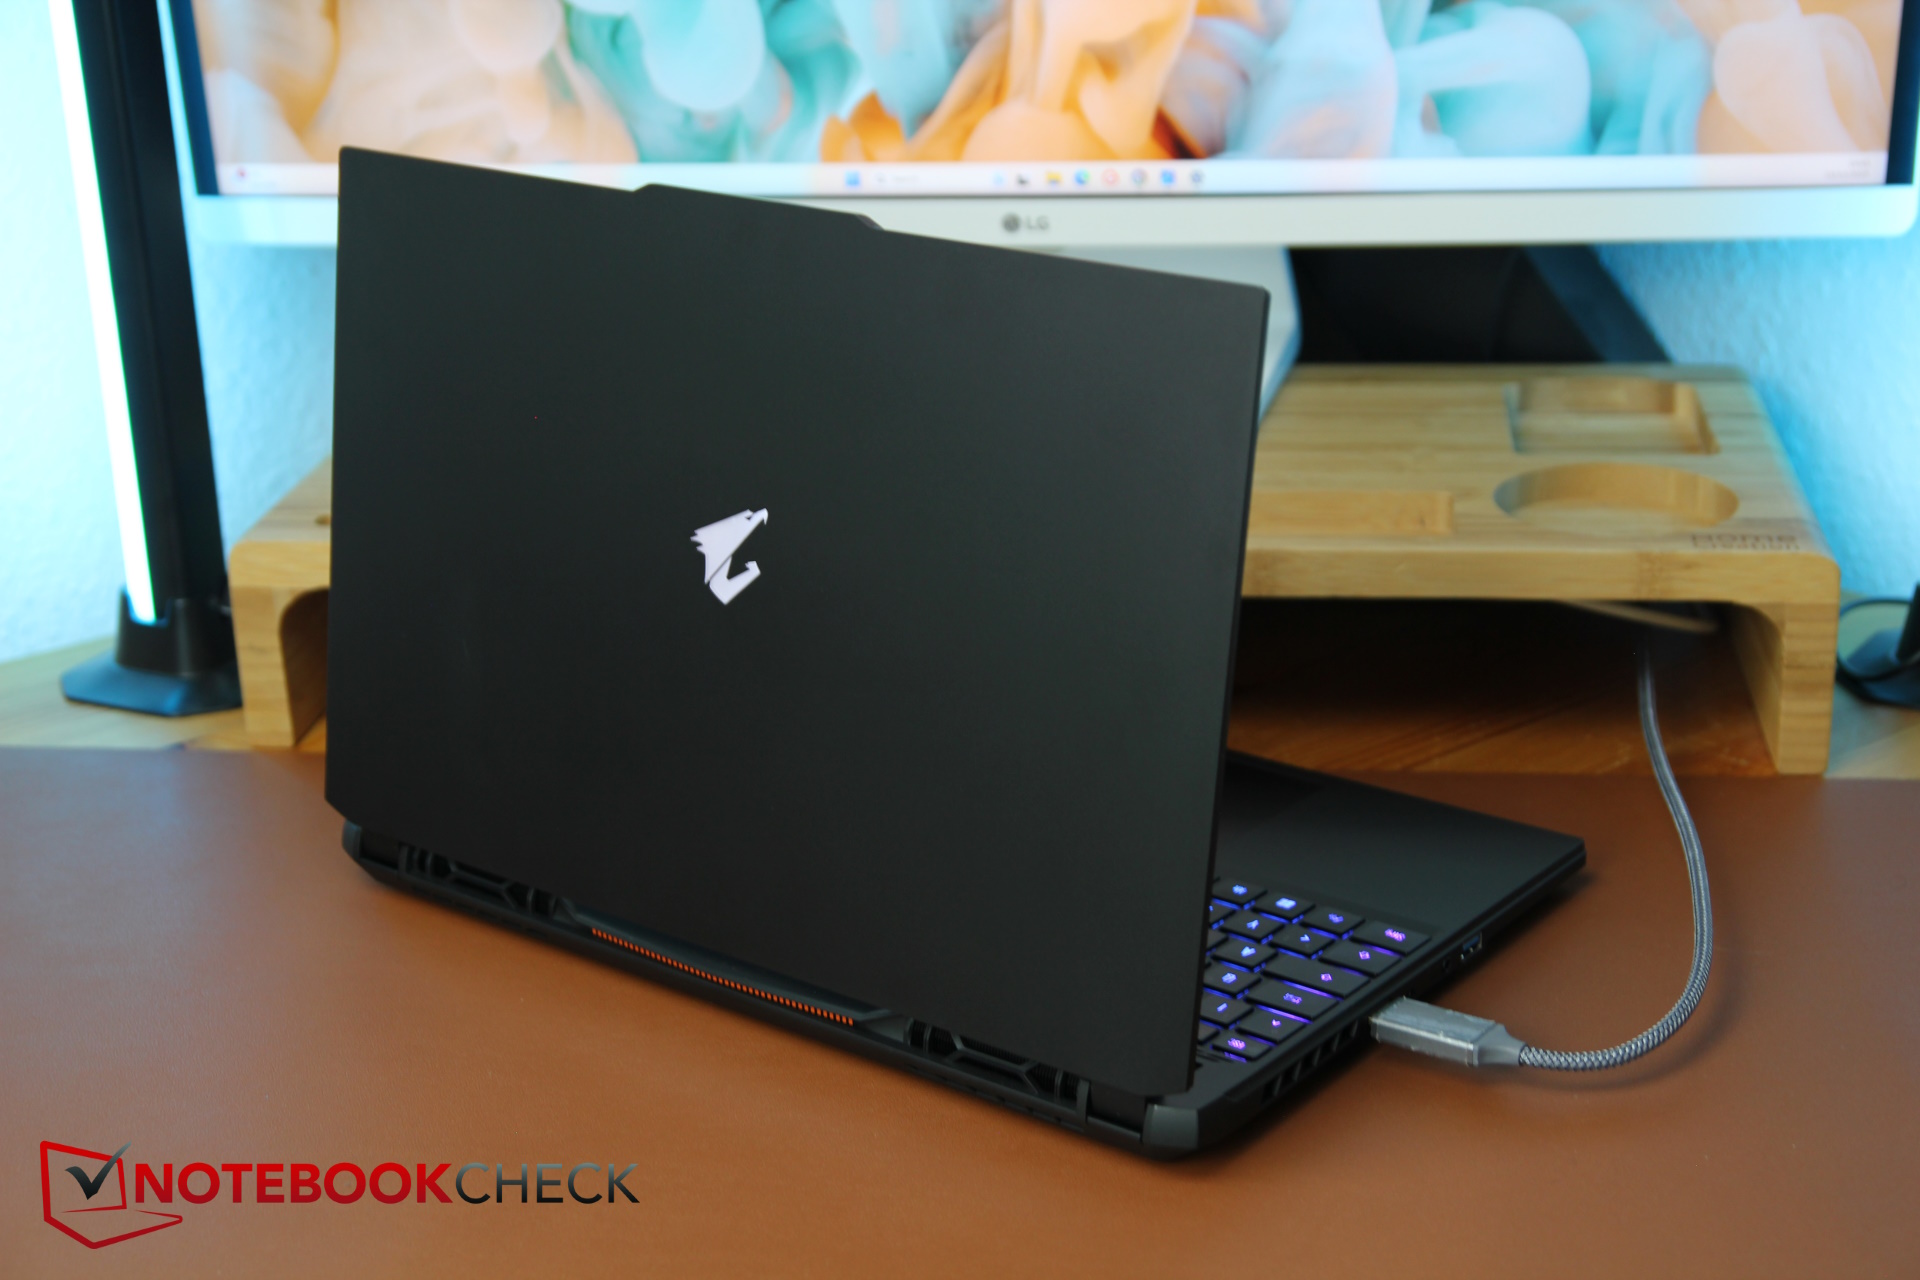
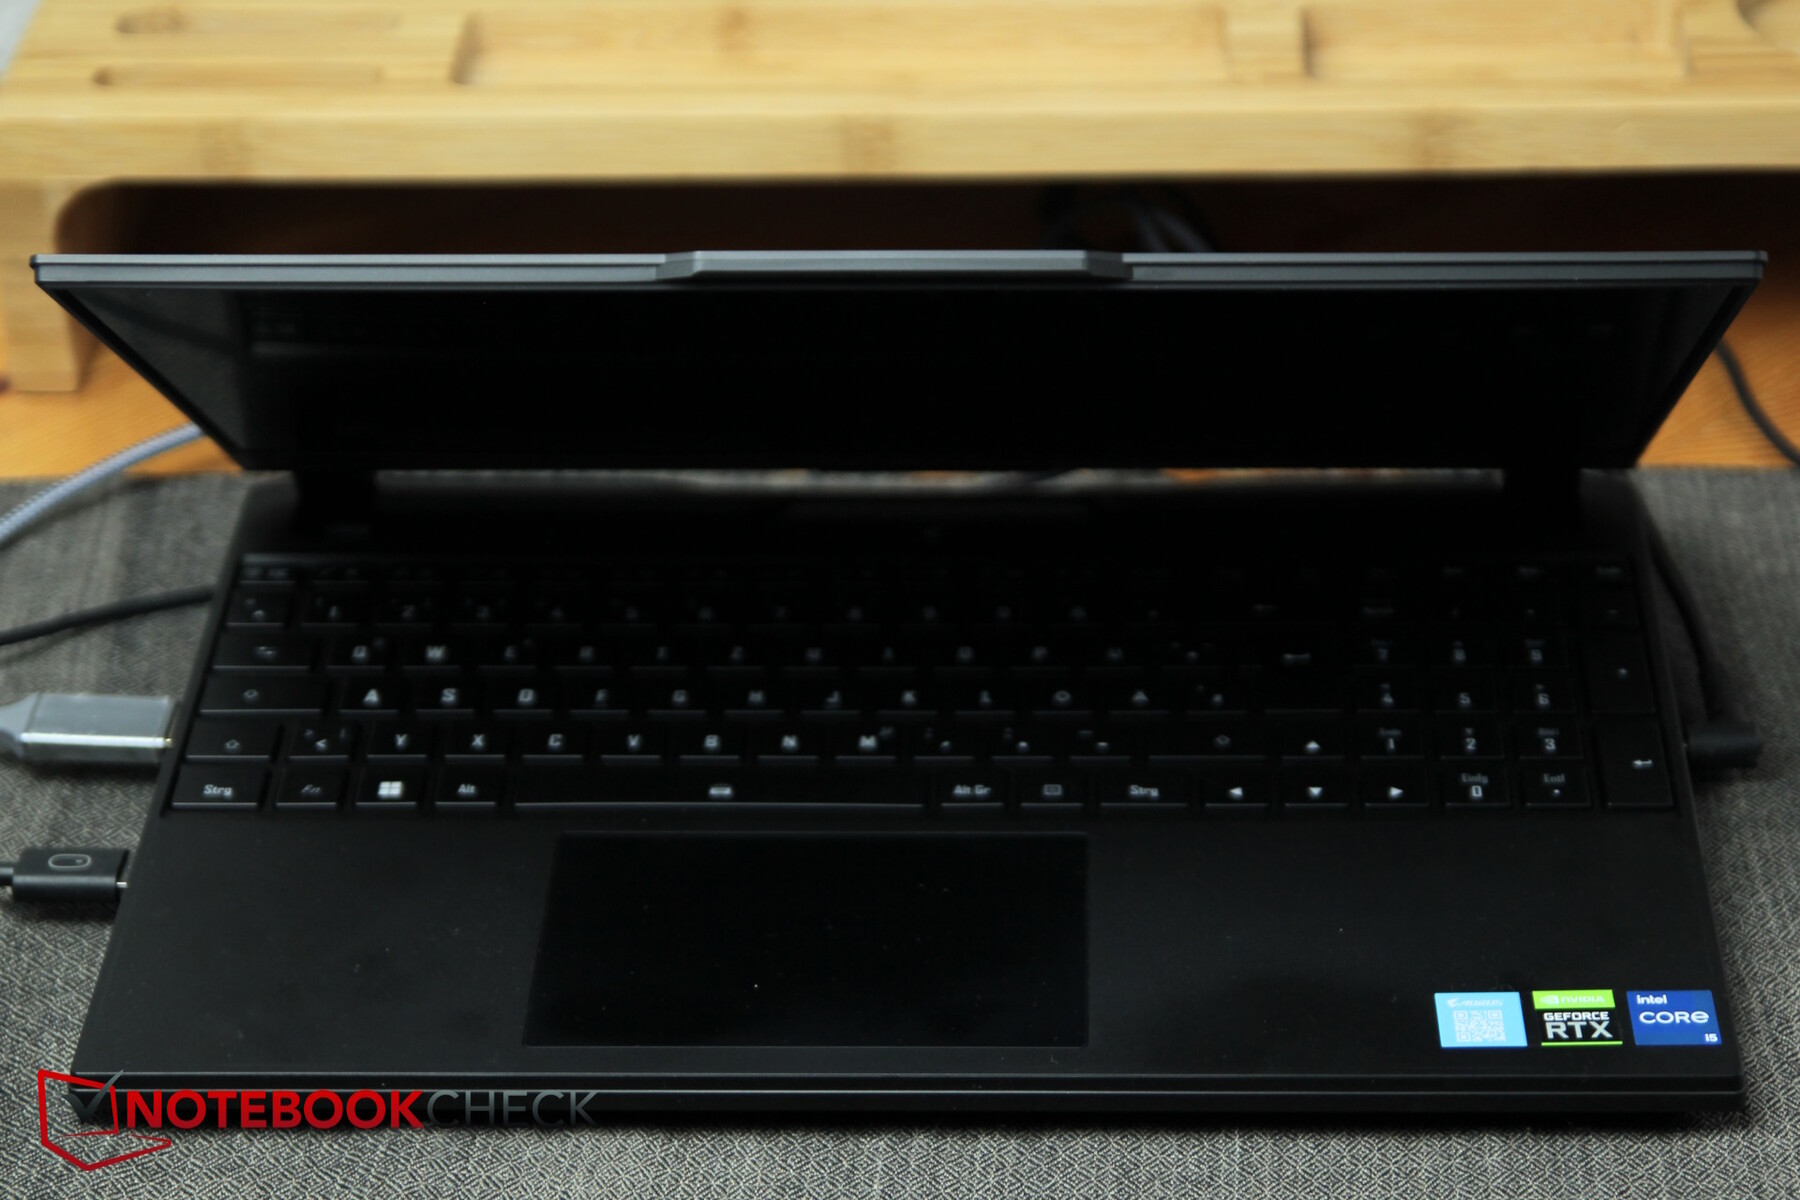
Caja y conectividad: Moderna, pero reducida al mínimo
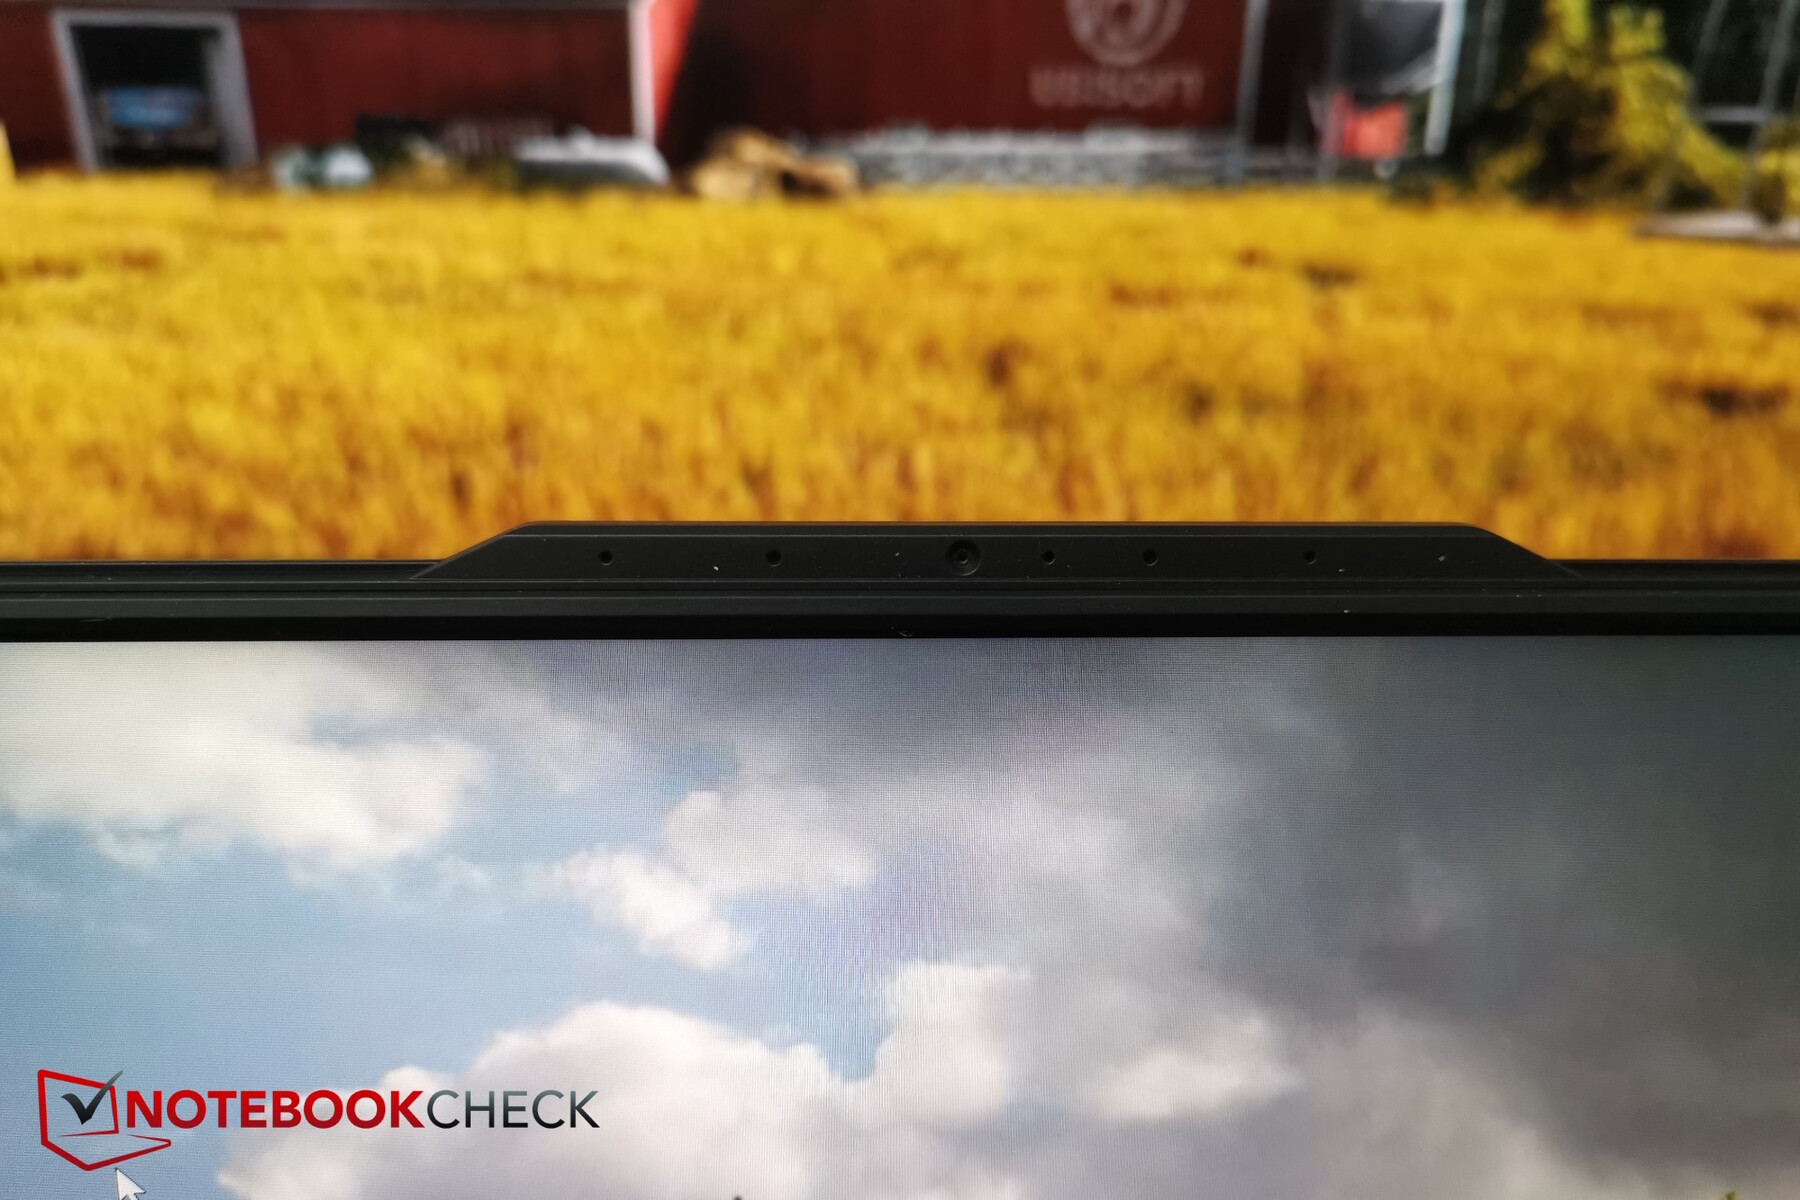
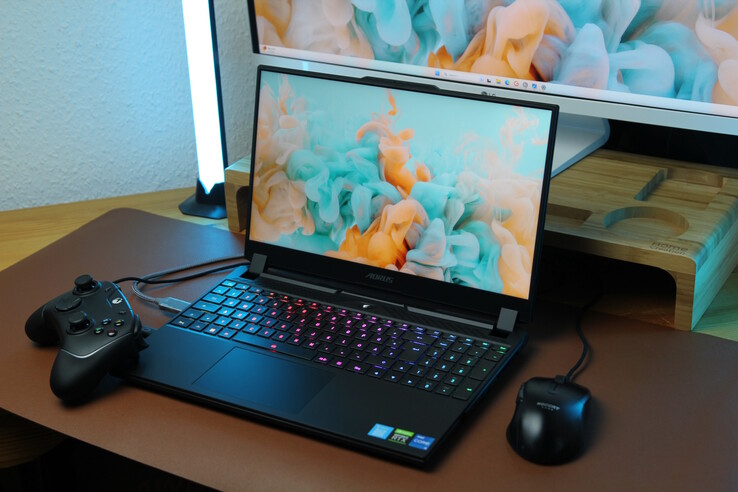
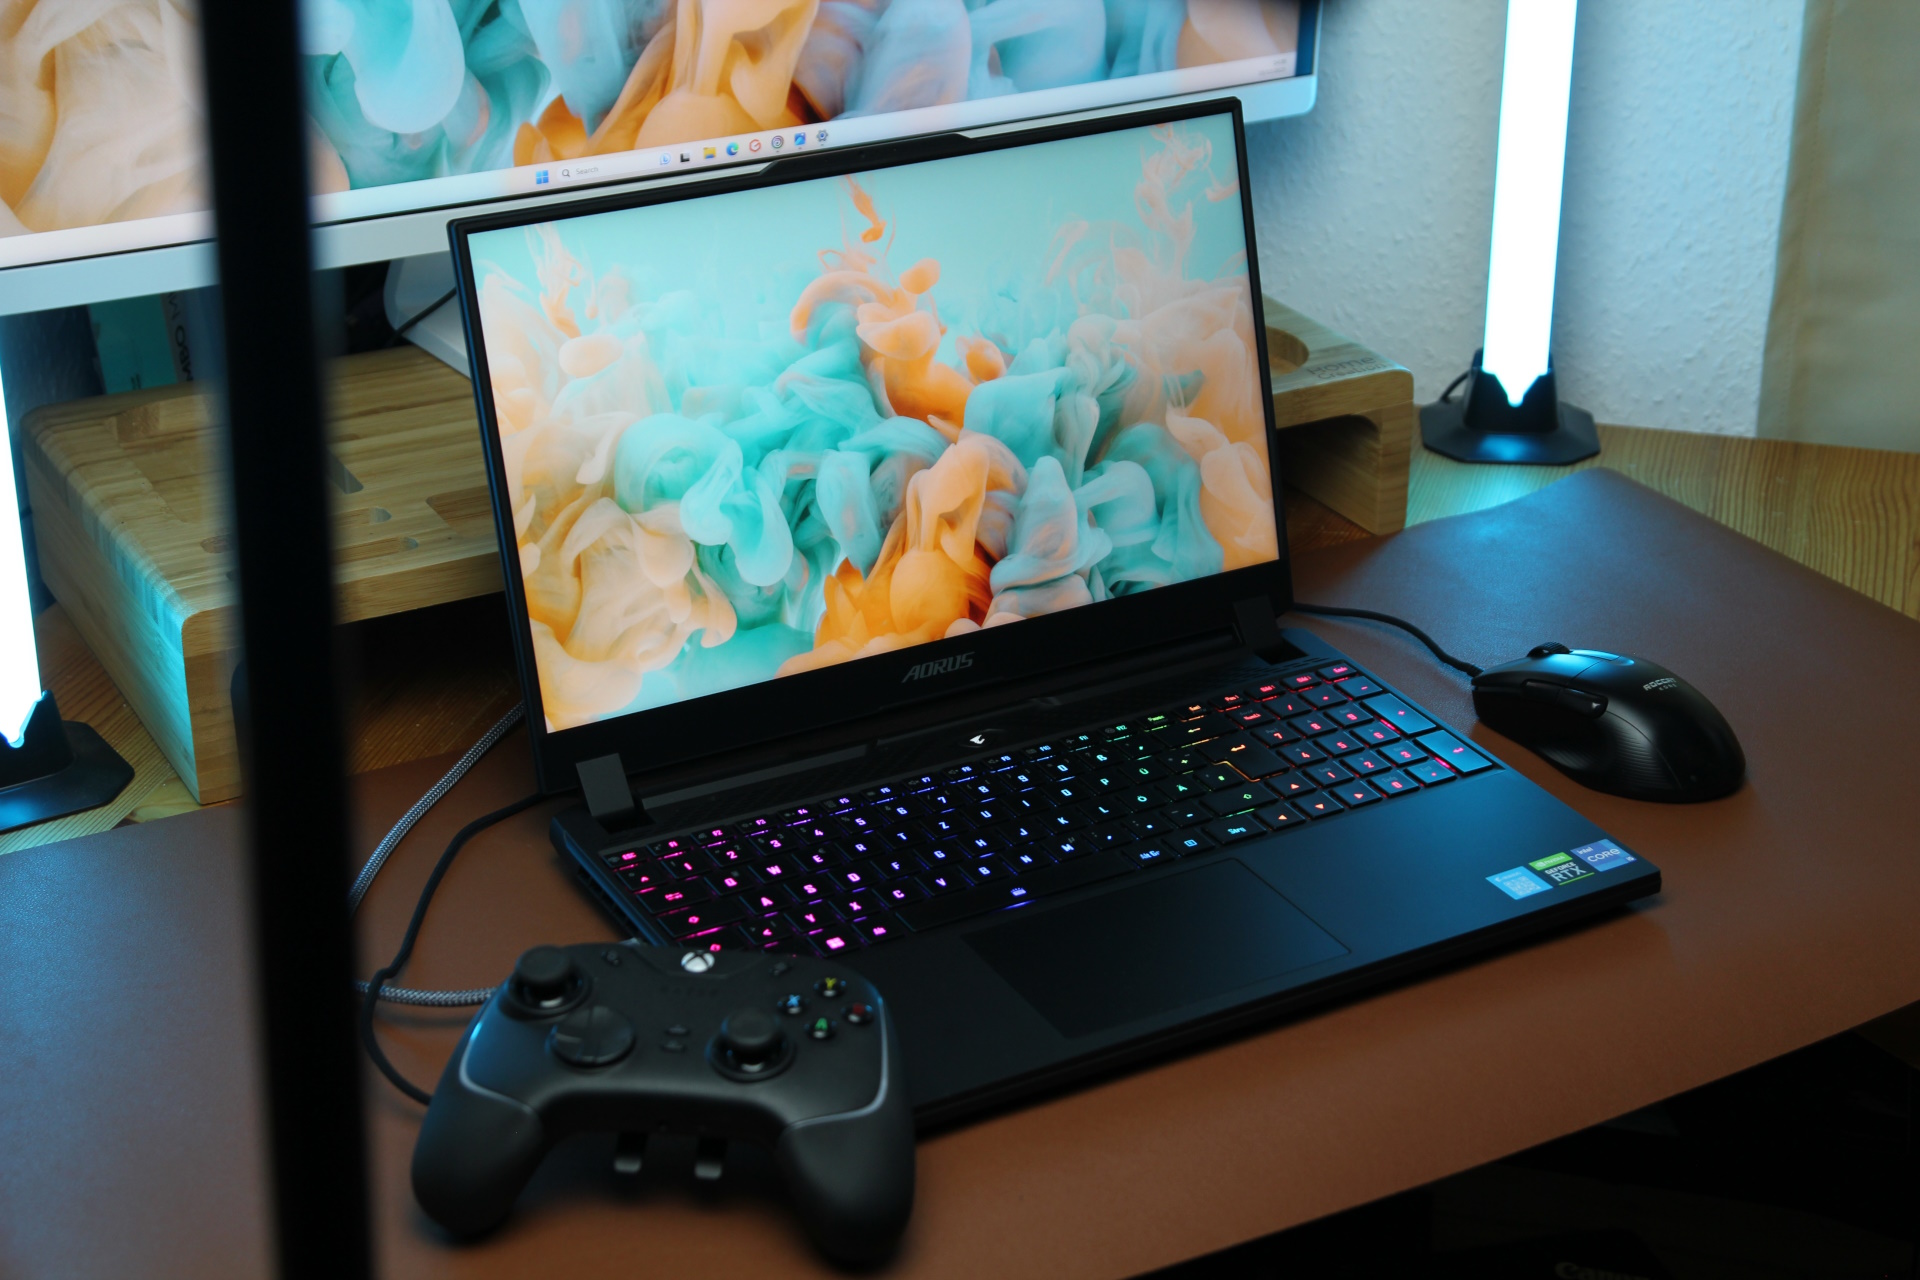
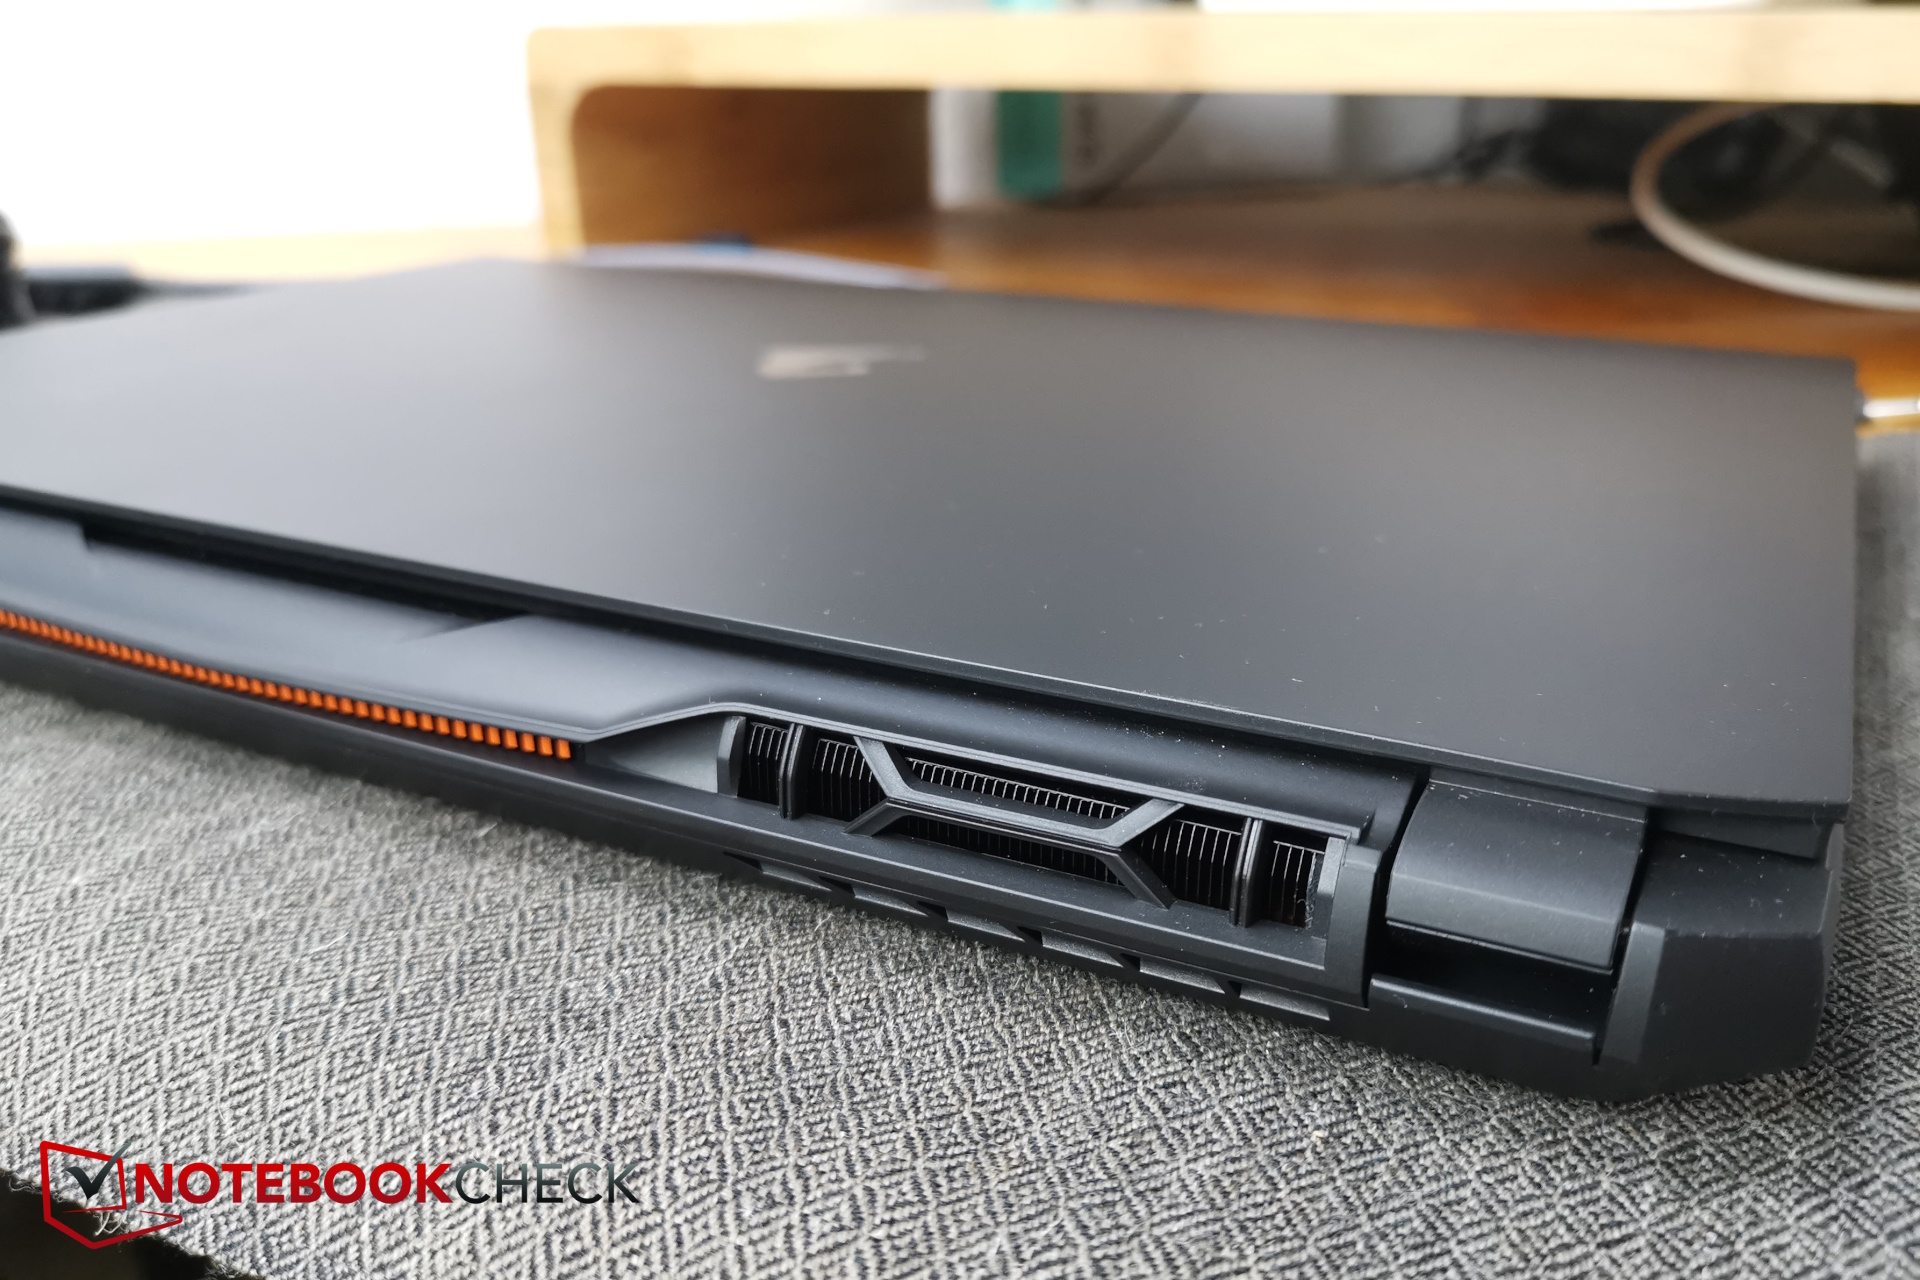
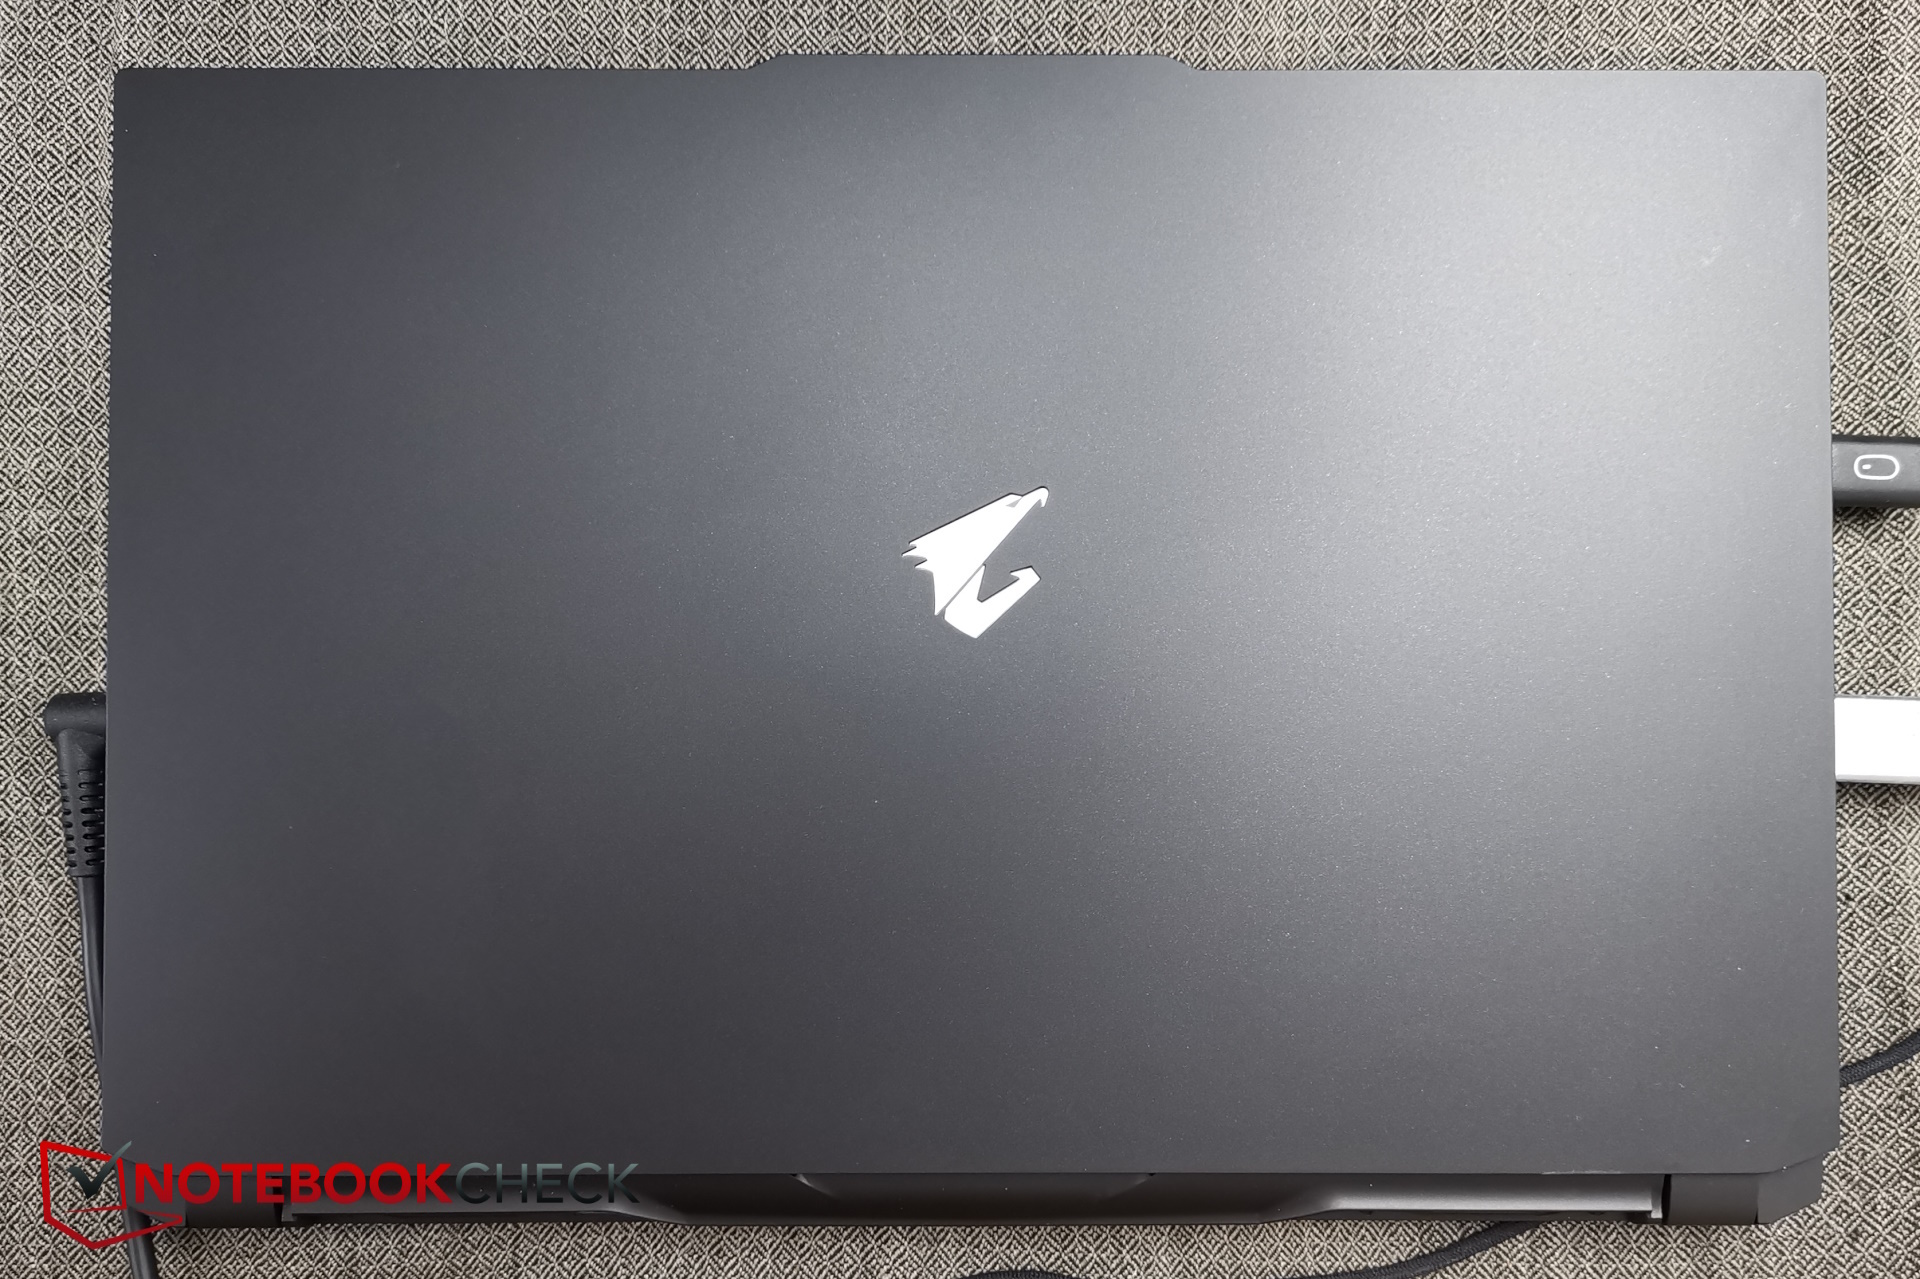
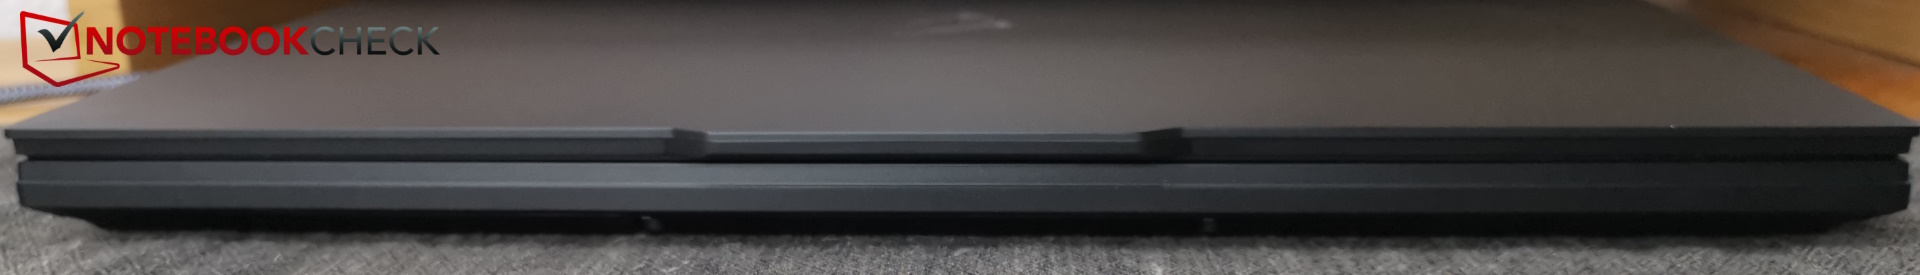
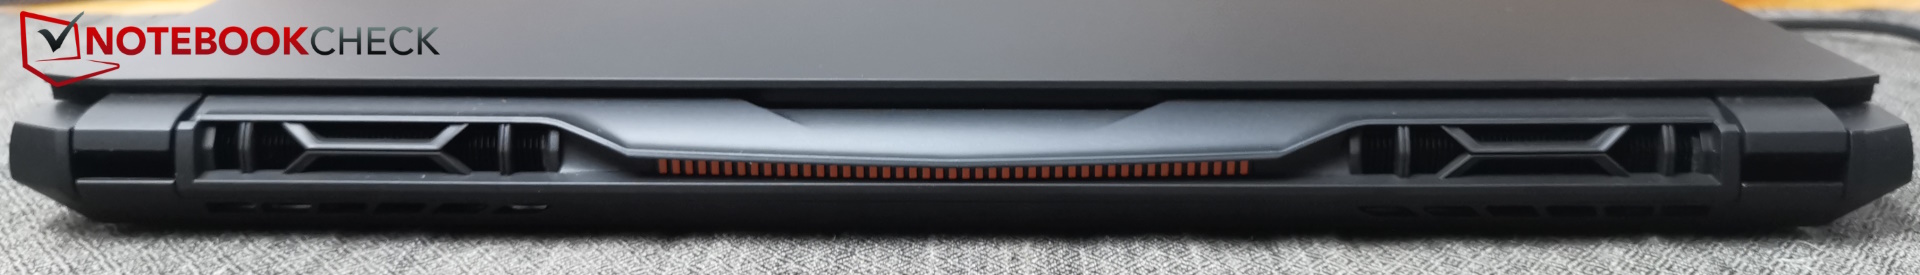
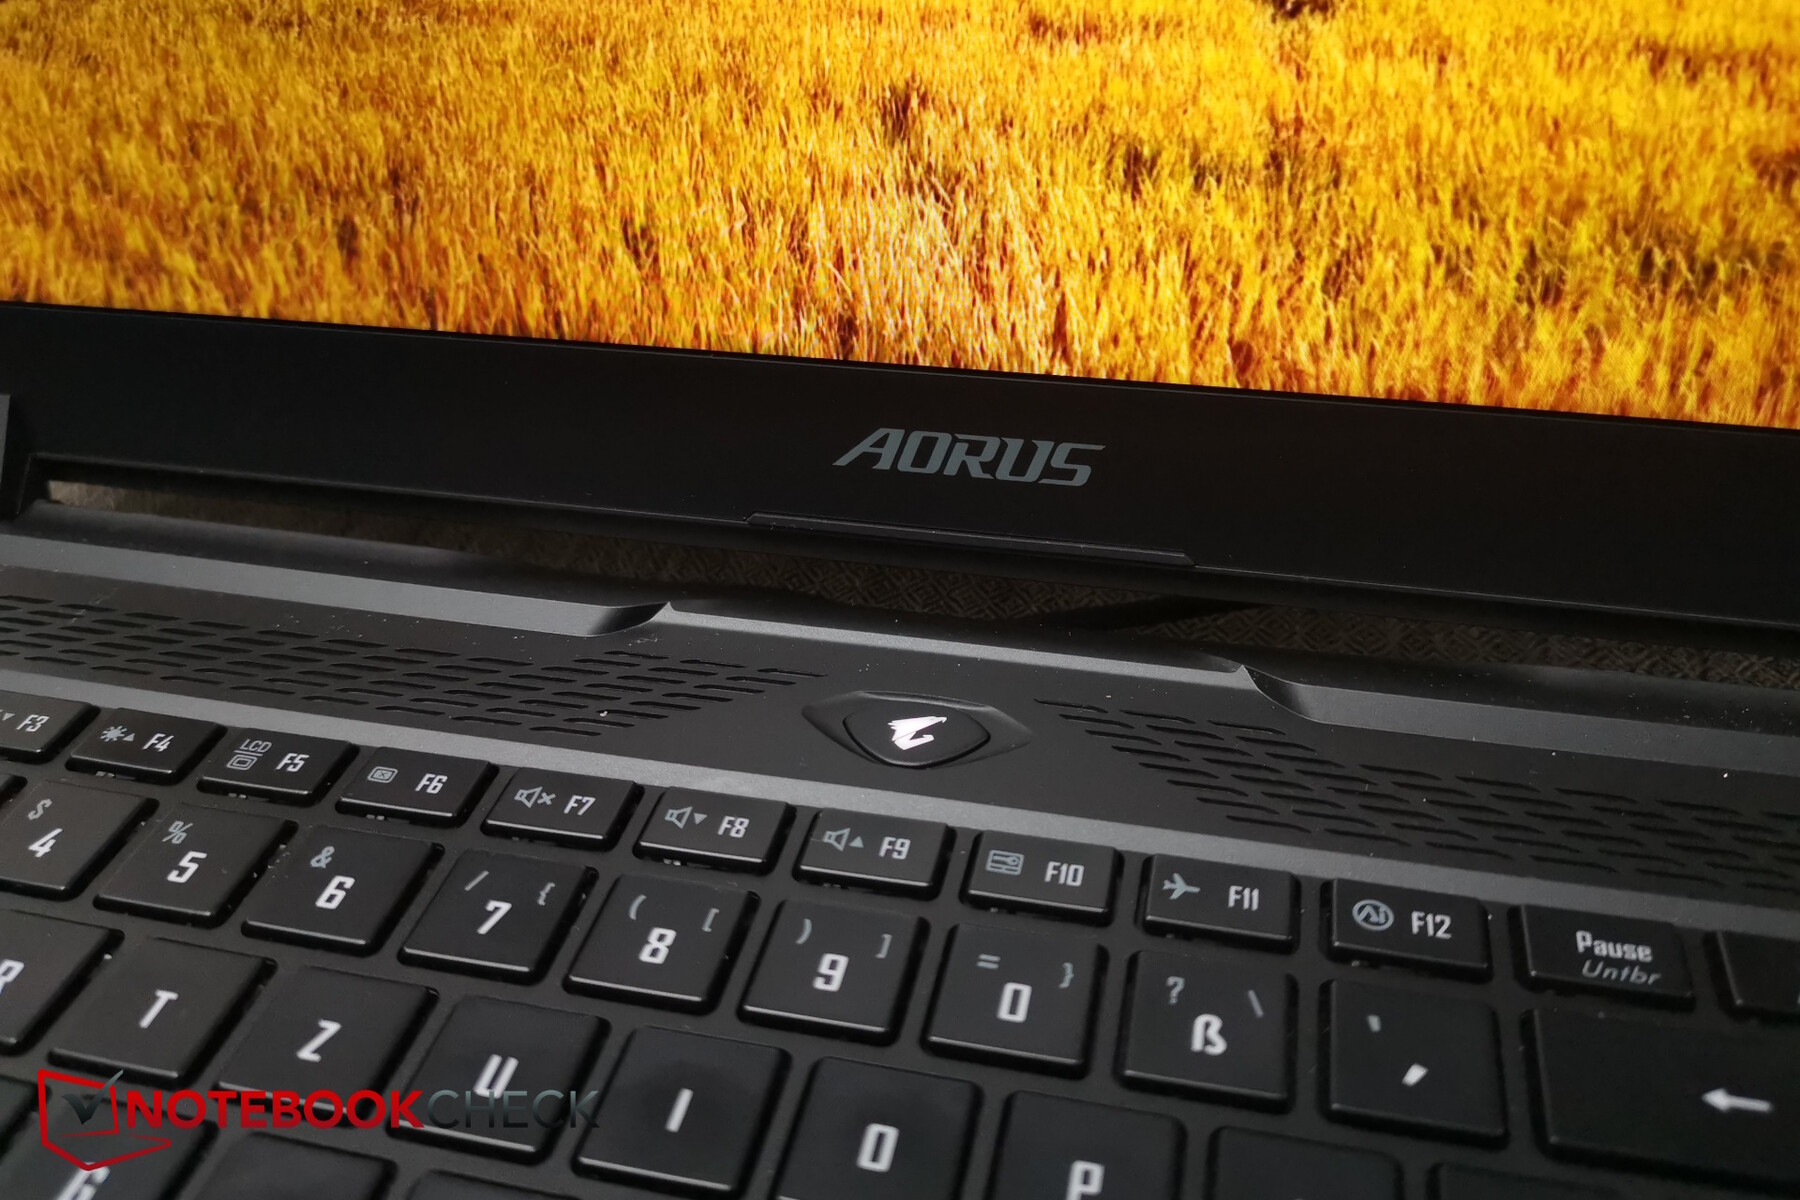
Visualmente, el Aorus tiene un aspecto bastante moderno y atractivo. Esto se debe a su diseño negro mate de apariencia delgada, aunque en realidad el portátil no es tan delgado (hasta 27 mm). Al mismo tiempo, es elegante sin dejar de ser único, por ejemplo, como resultado de su estructura a lo largo de la rejilla del ventilador trasero y las pequeñas coloraciones naranjas que aparecen allí, o sus bordes biselados especialmente diseñados. El logotipo plateado de Aorus atrae su atención hacia la parte superior del dispositivo. La tapa tiene una pequeña muesca a lo largo del borde superior delantero que alberga la cámara web y los altavoces - además, le proporciona un agarre realmente bueno al abrir el portátil con una mano.
Todos los lados de la carcasa son de plástico liso. Esto tiene un aspecto estupendo pero no es tan resistente a la torsión en comparación con algunos competidores. El teclado no cede cuando se escribe en él, lo que significa que su estabilidad está bien en total.
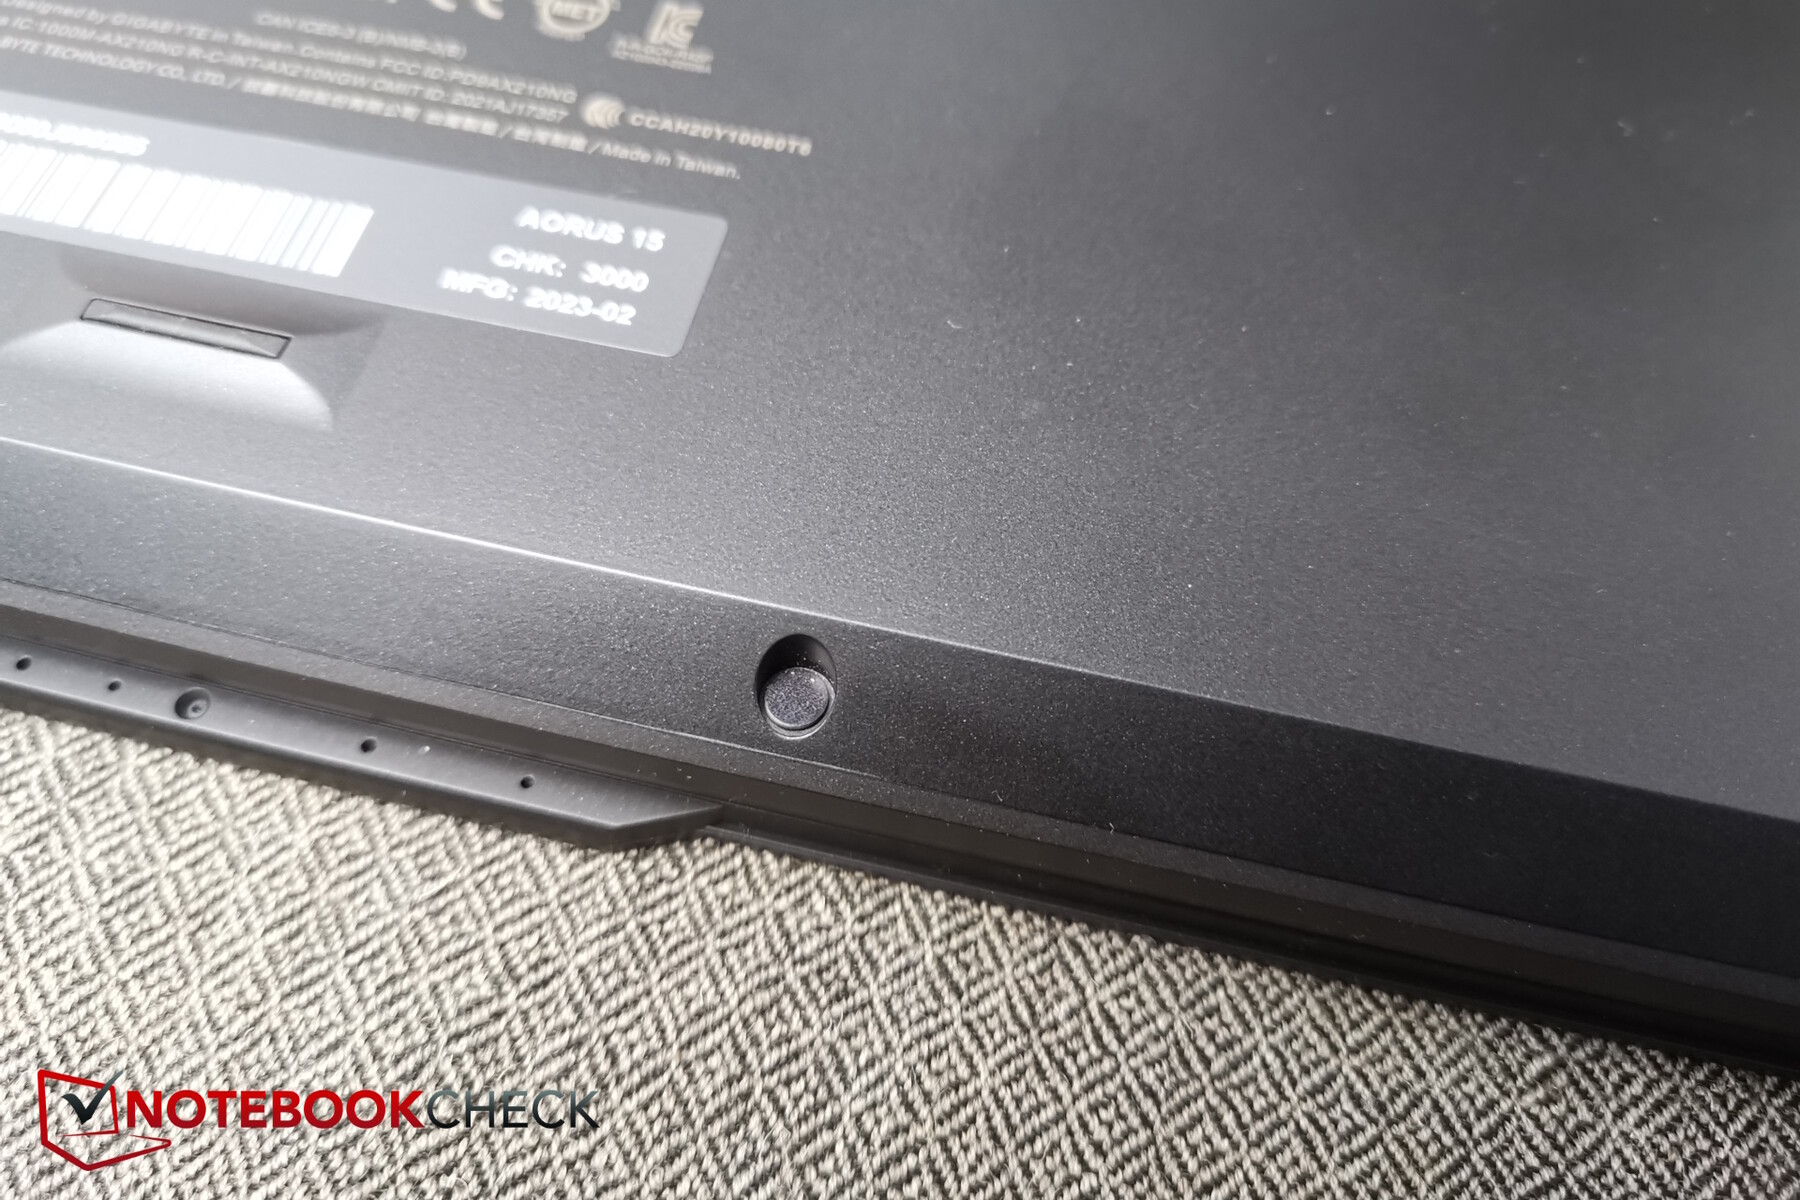
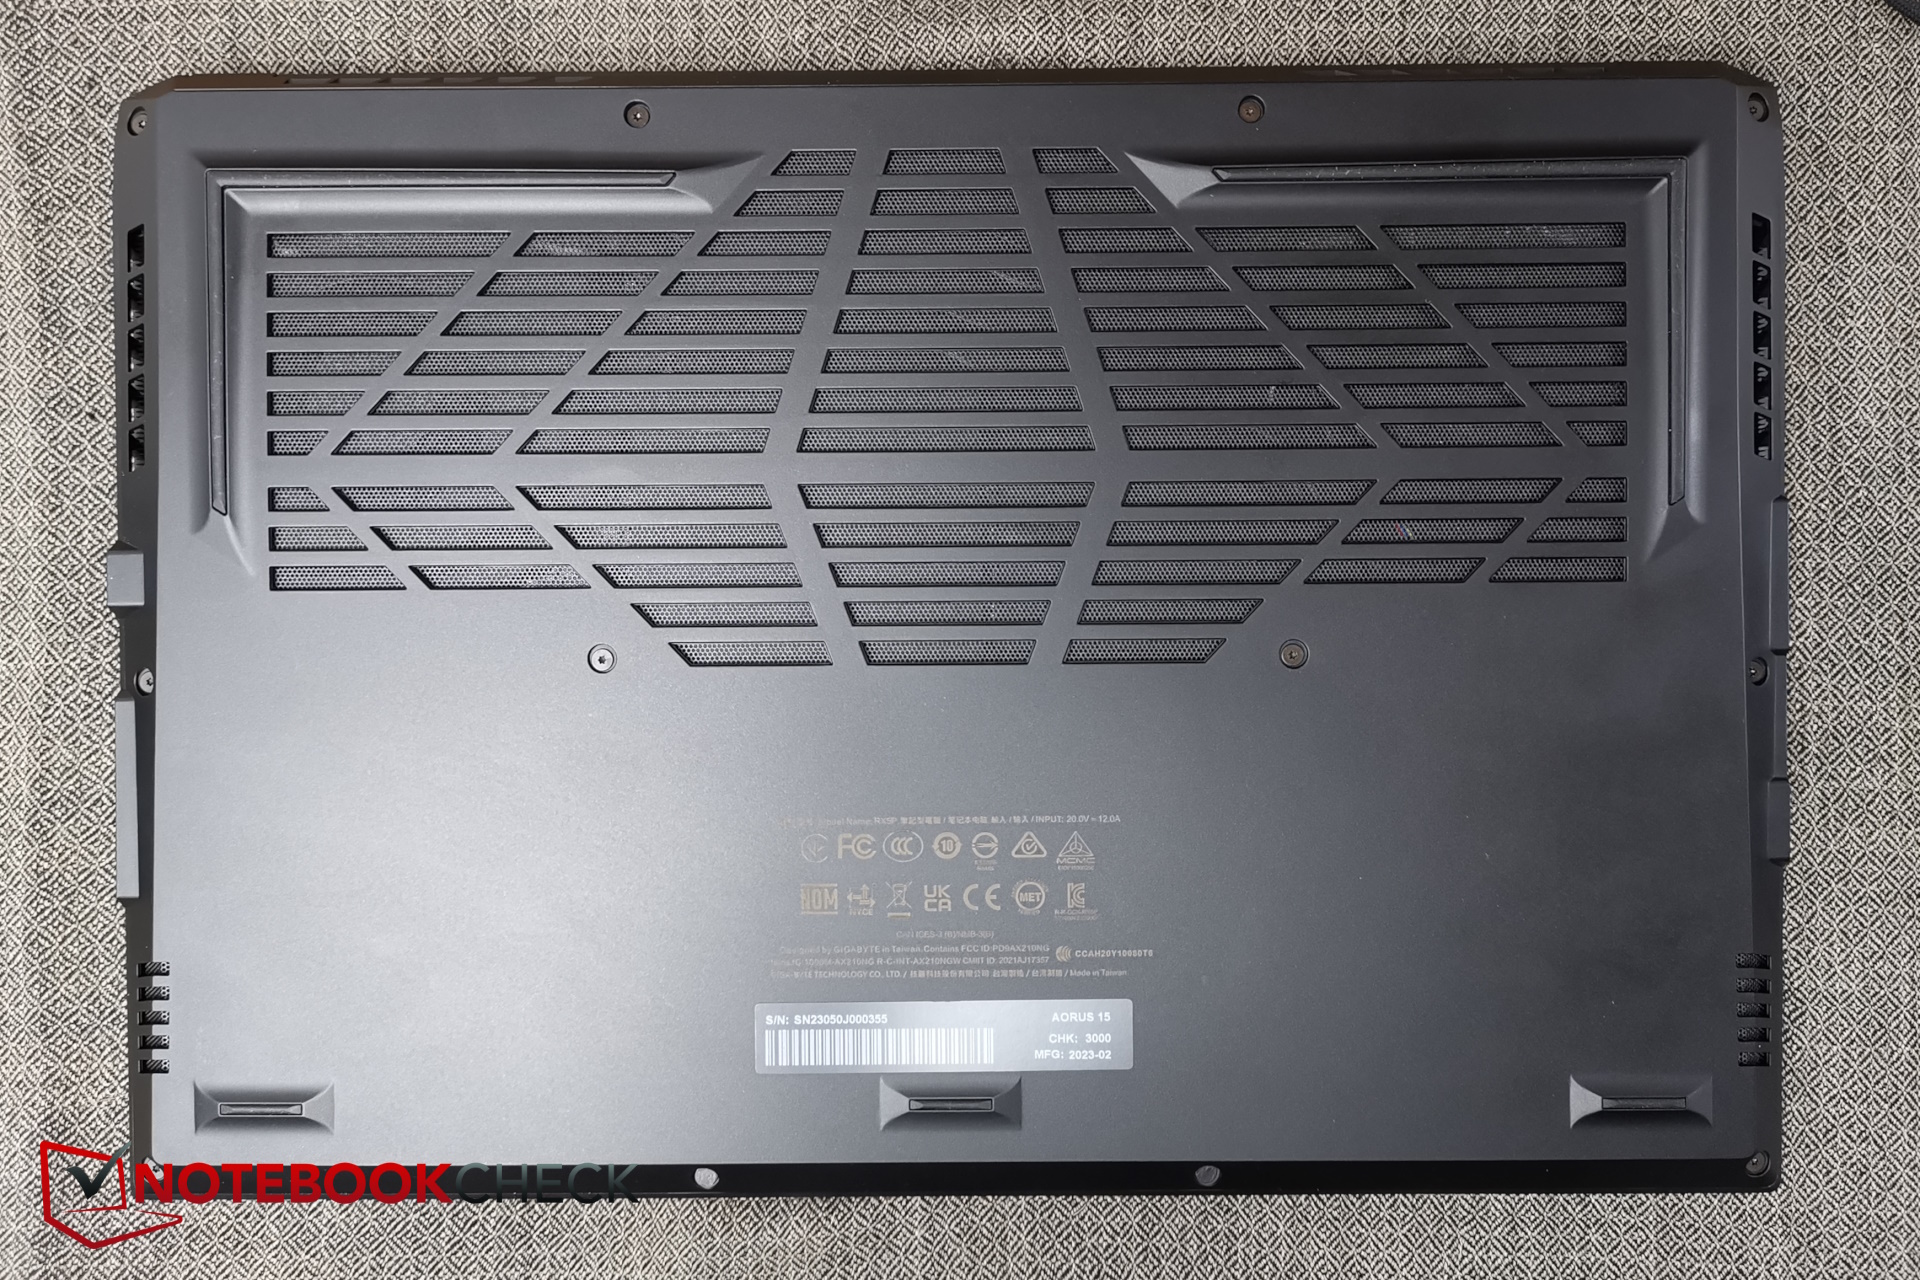
No abrimos el Aorus, ya que los dos tornillos Torx están cubiertos por una pegatina y no queríamos dañarlos en interés de nuestro Cyberport de préstamo.
Conectividad
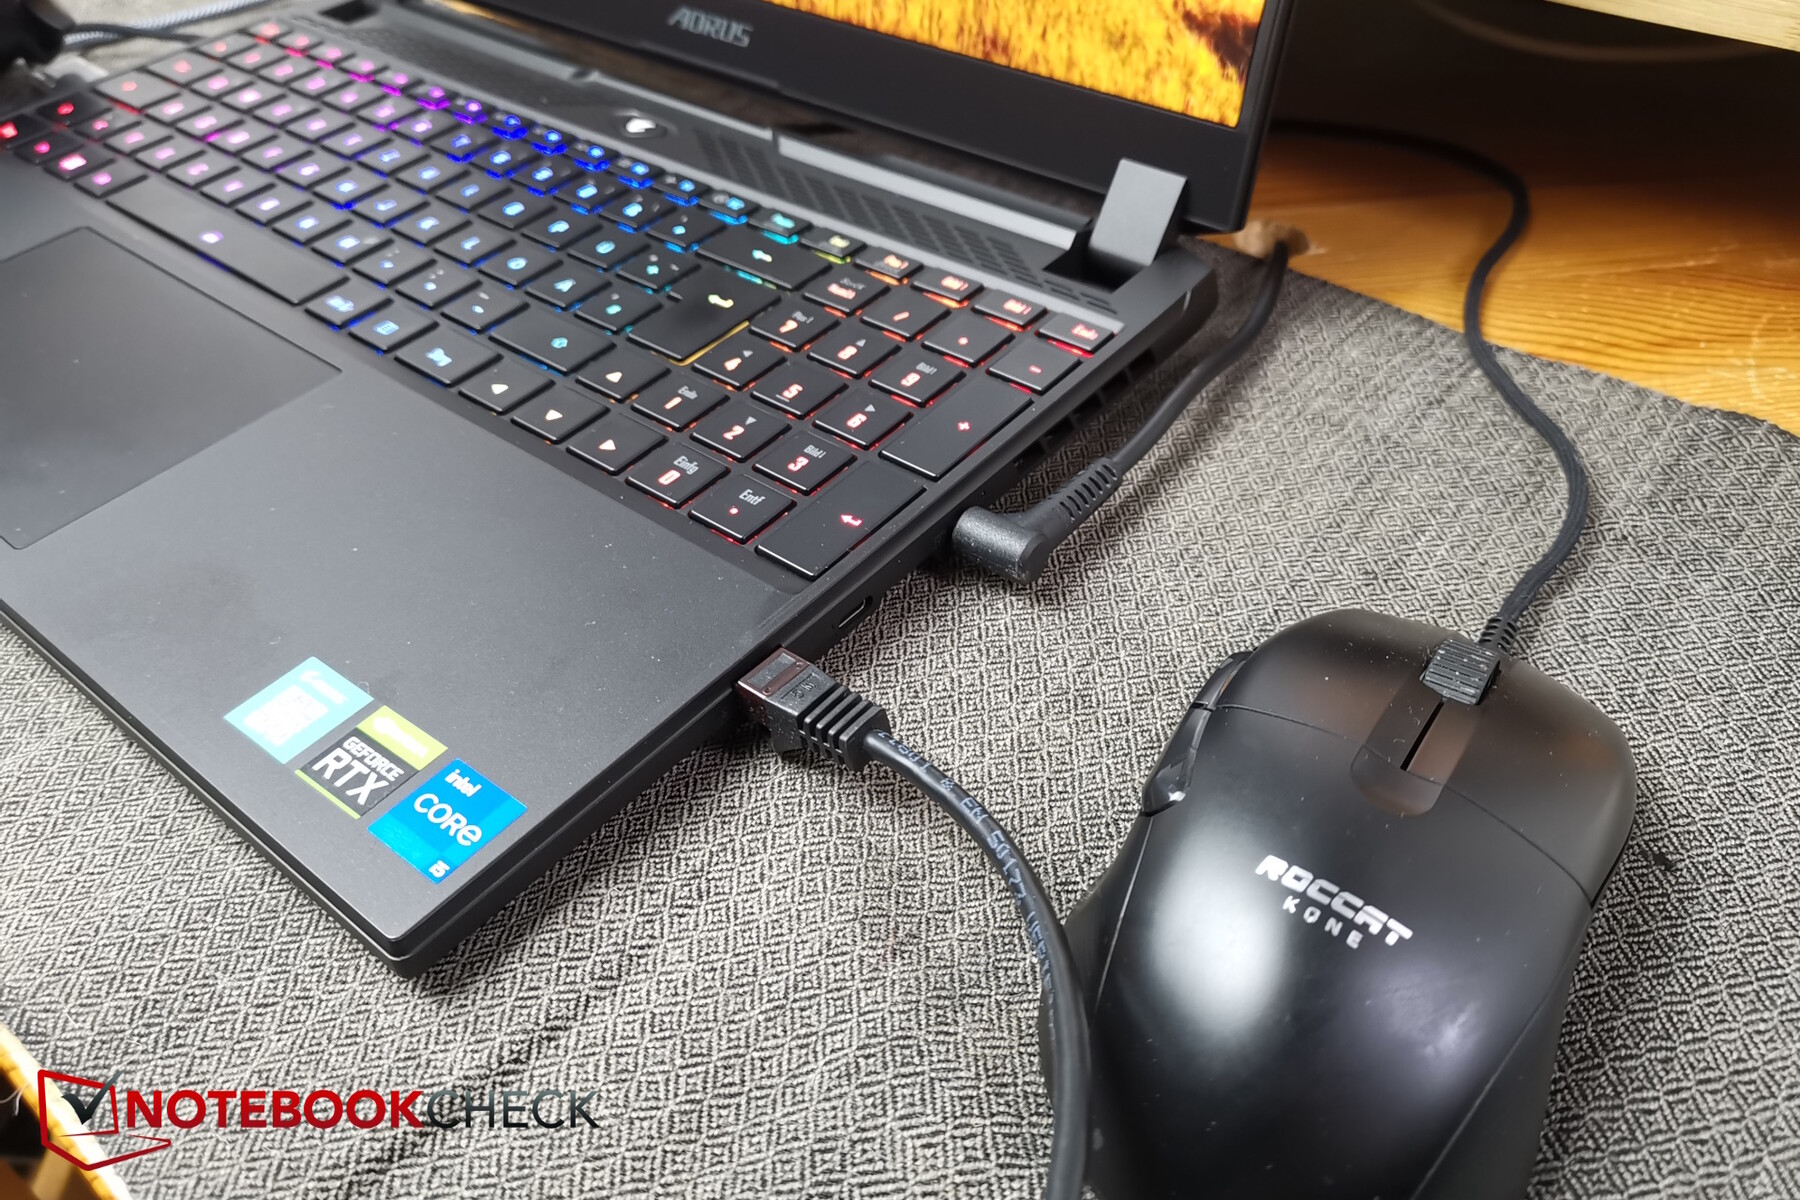
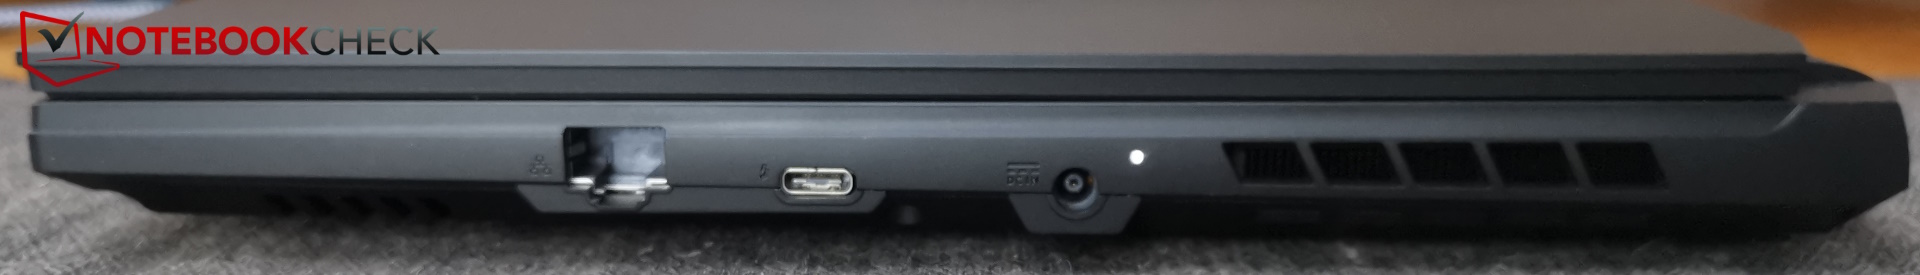
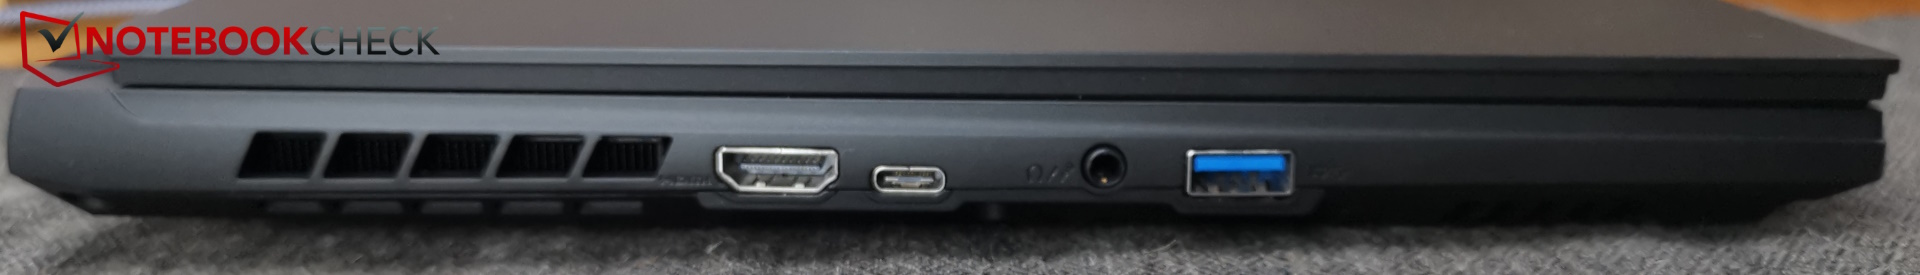
Las opciones de conectividad del portátil Aorus son modernas, aunque también se mantienen al mínimo. De los tres puertos USB, sólo uno es Tipo-A, lo que no es suficiente. A su vez, uno de los dos puertos Tipo-C es compatible con Thunderbolt 4. Aparte de una cuarta conexión USB, al dispositivo también le falta un lector de tarjetas SD, un bloqueo Kensington y un DisplayPort dedicado (2x disponible a través de USB-C).
A pesar de sus pocos puertos, no están muy bien distribuidos: el puerto RJ45 para cables LAN rígidos está situado a la derecha y hacia la parte delantera. El espacio de la parte trasera del Aorus, como es habitual, no se utiliza. Sólo aloja las salidas del ventilador.
WiFi y cámara web
Sus velocidades de transmisión WLAN se encuentran entre las más altas de la comparativa tanto en la red de 6 GHz (WiFi 6E) como en la de 5 GHz.
Por desgracia, la cámara web del dispositivo sigue siendo de última generación: Sólo tiene una resolución de 720p, sus desviaciones de color son bastante altas y no hay obturador en el Centro de Control.


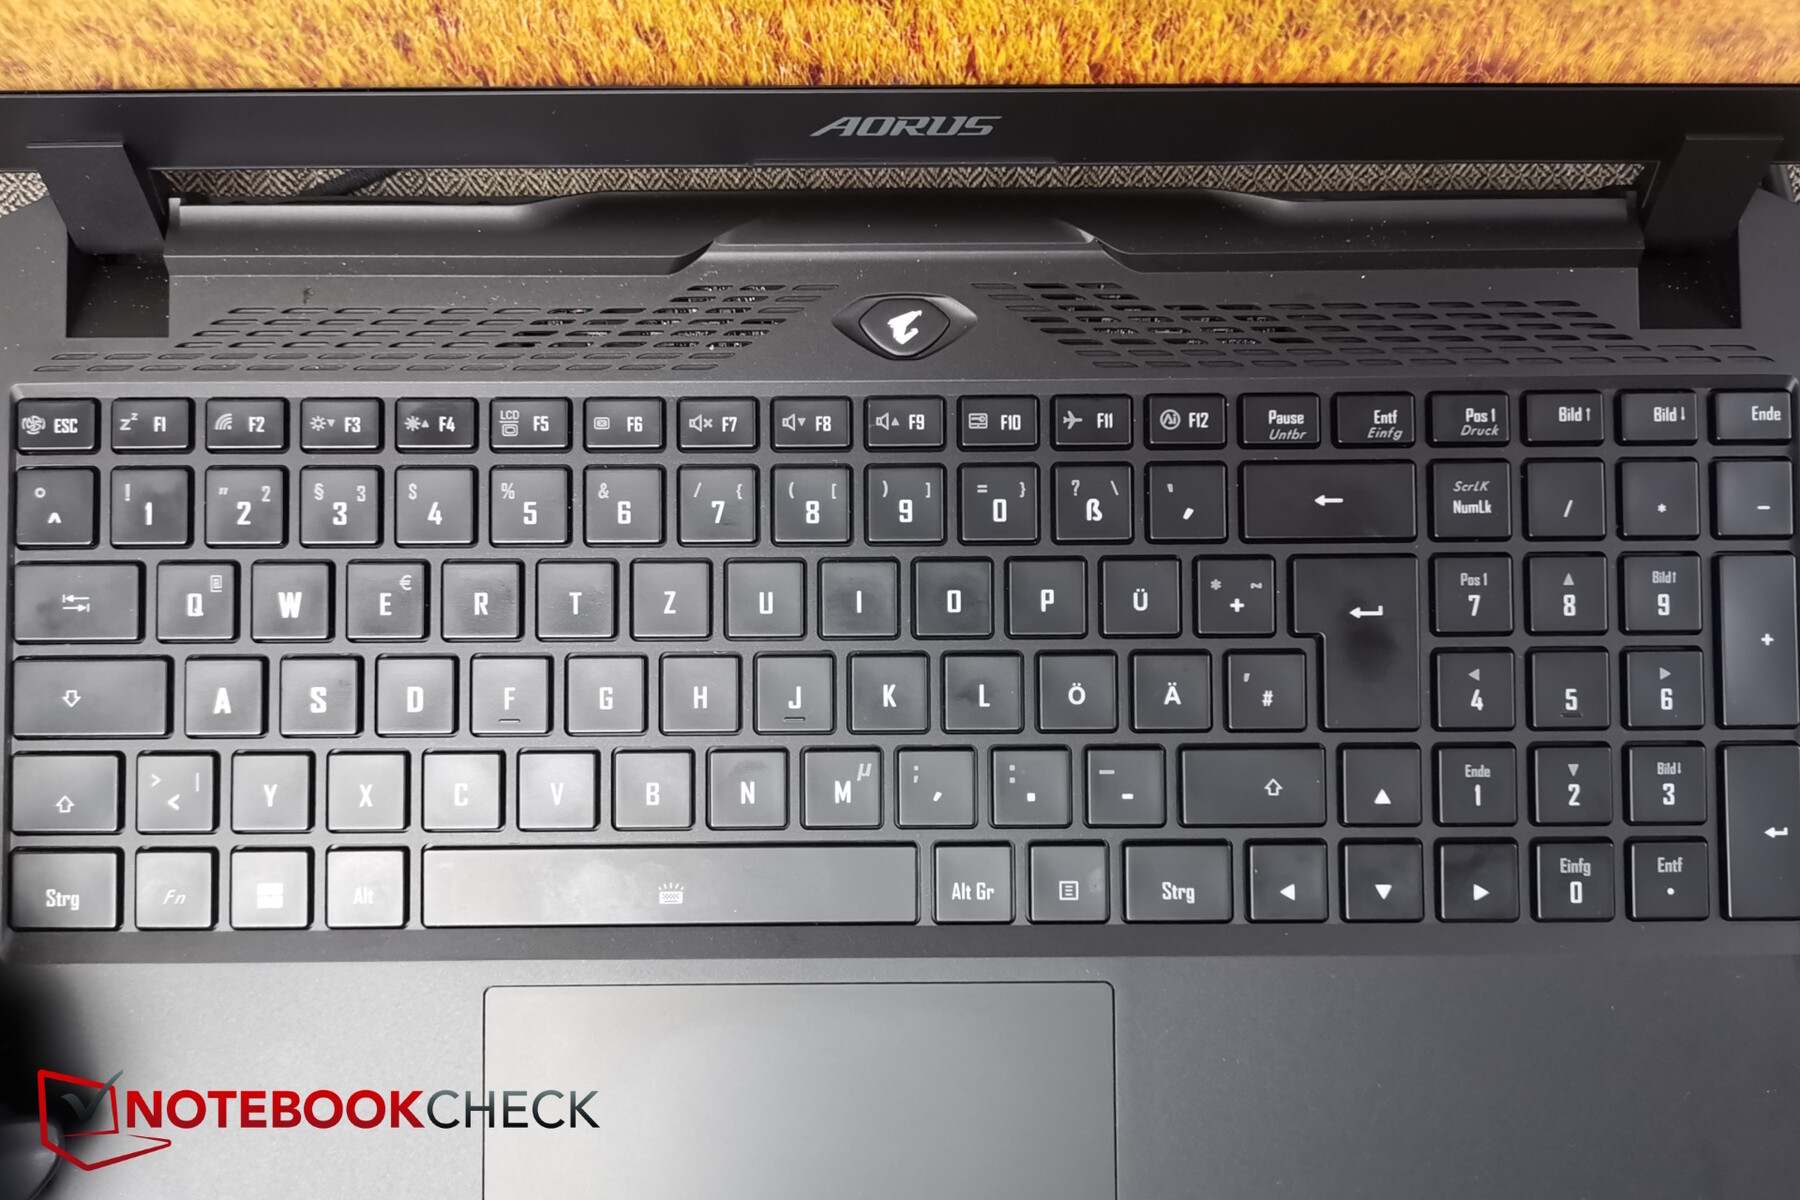
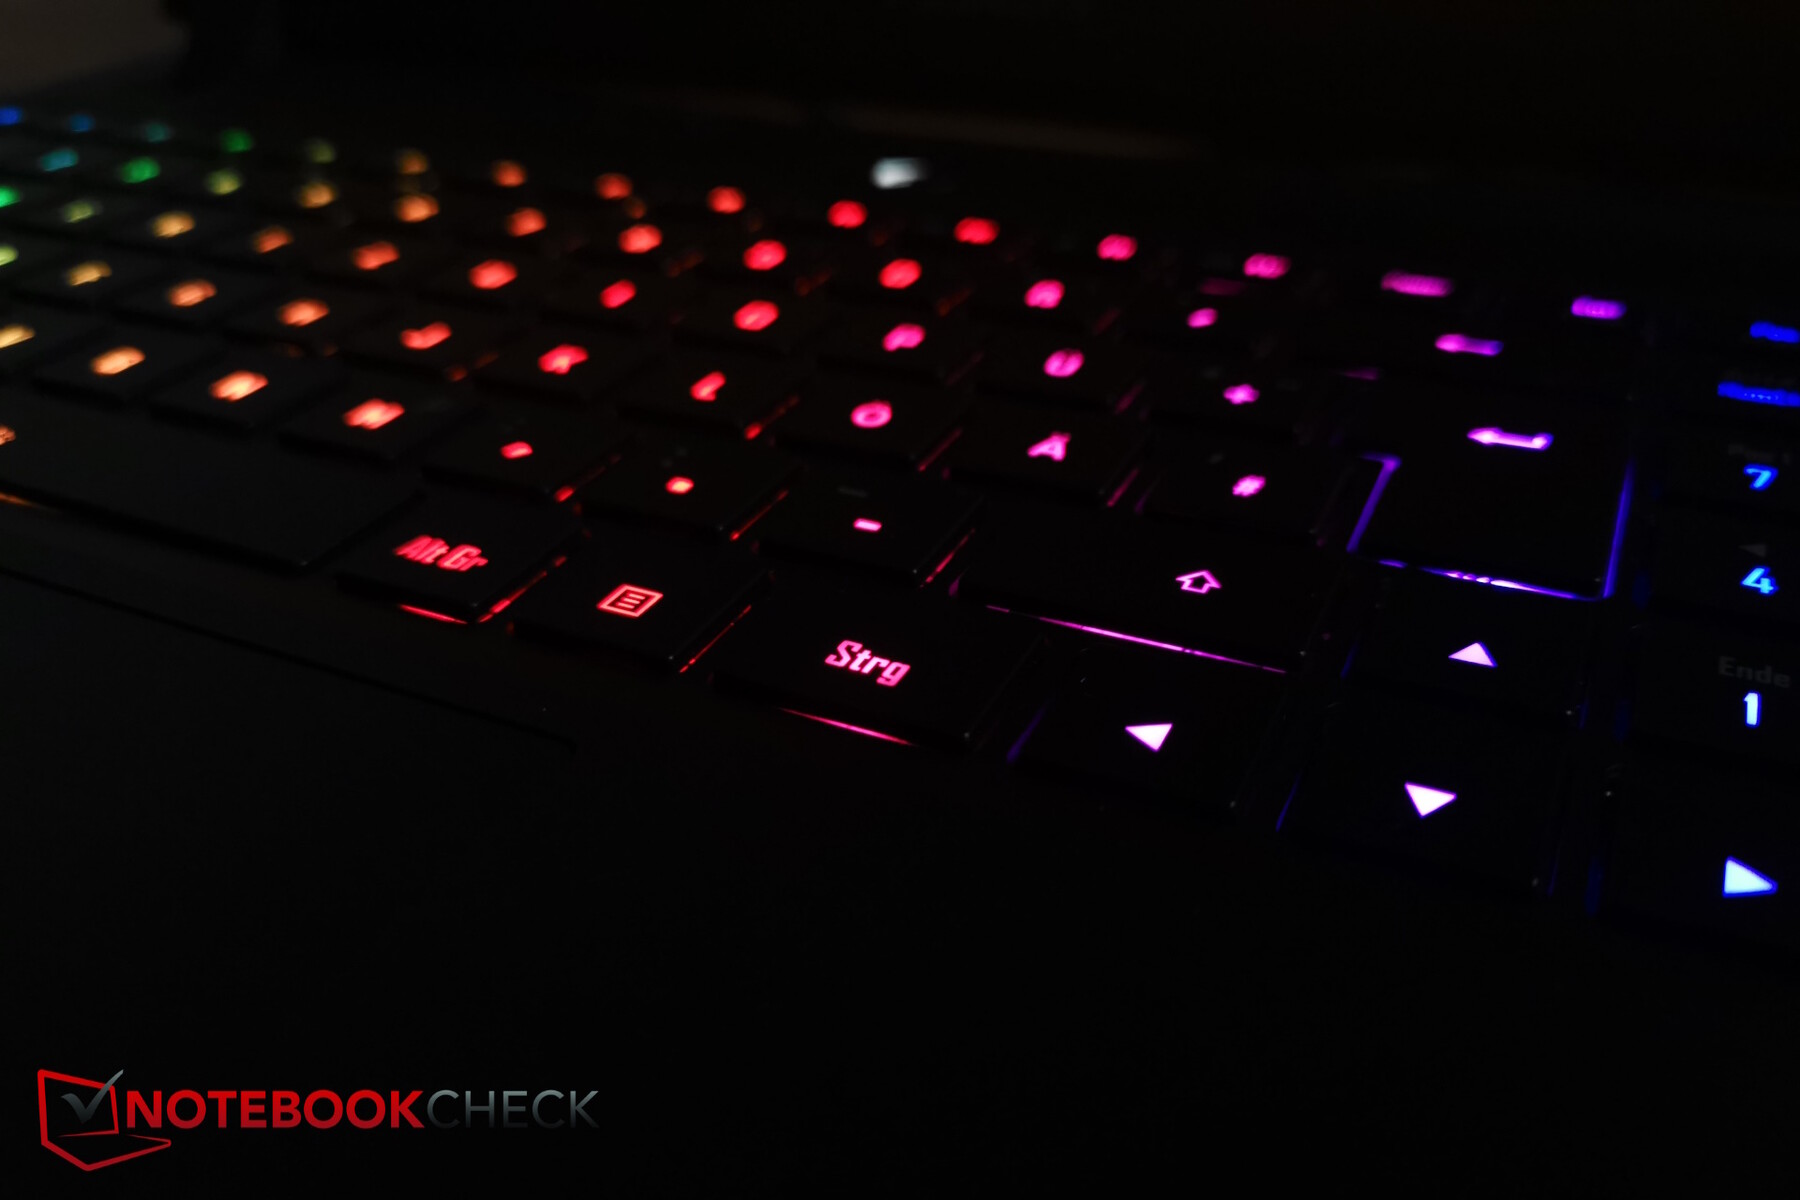
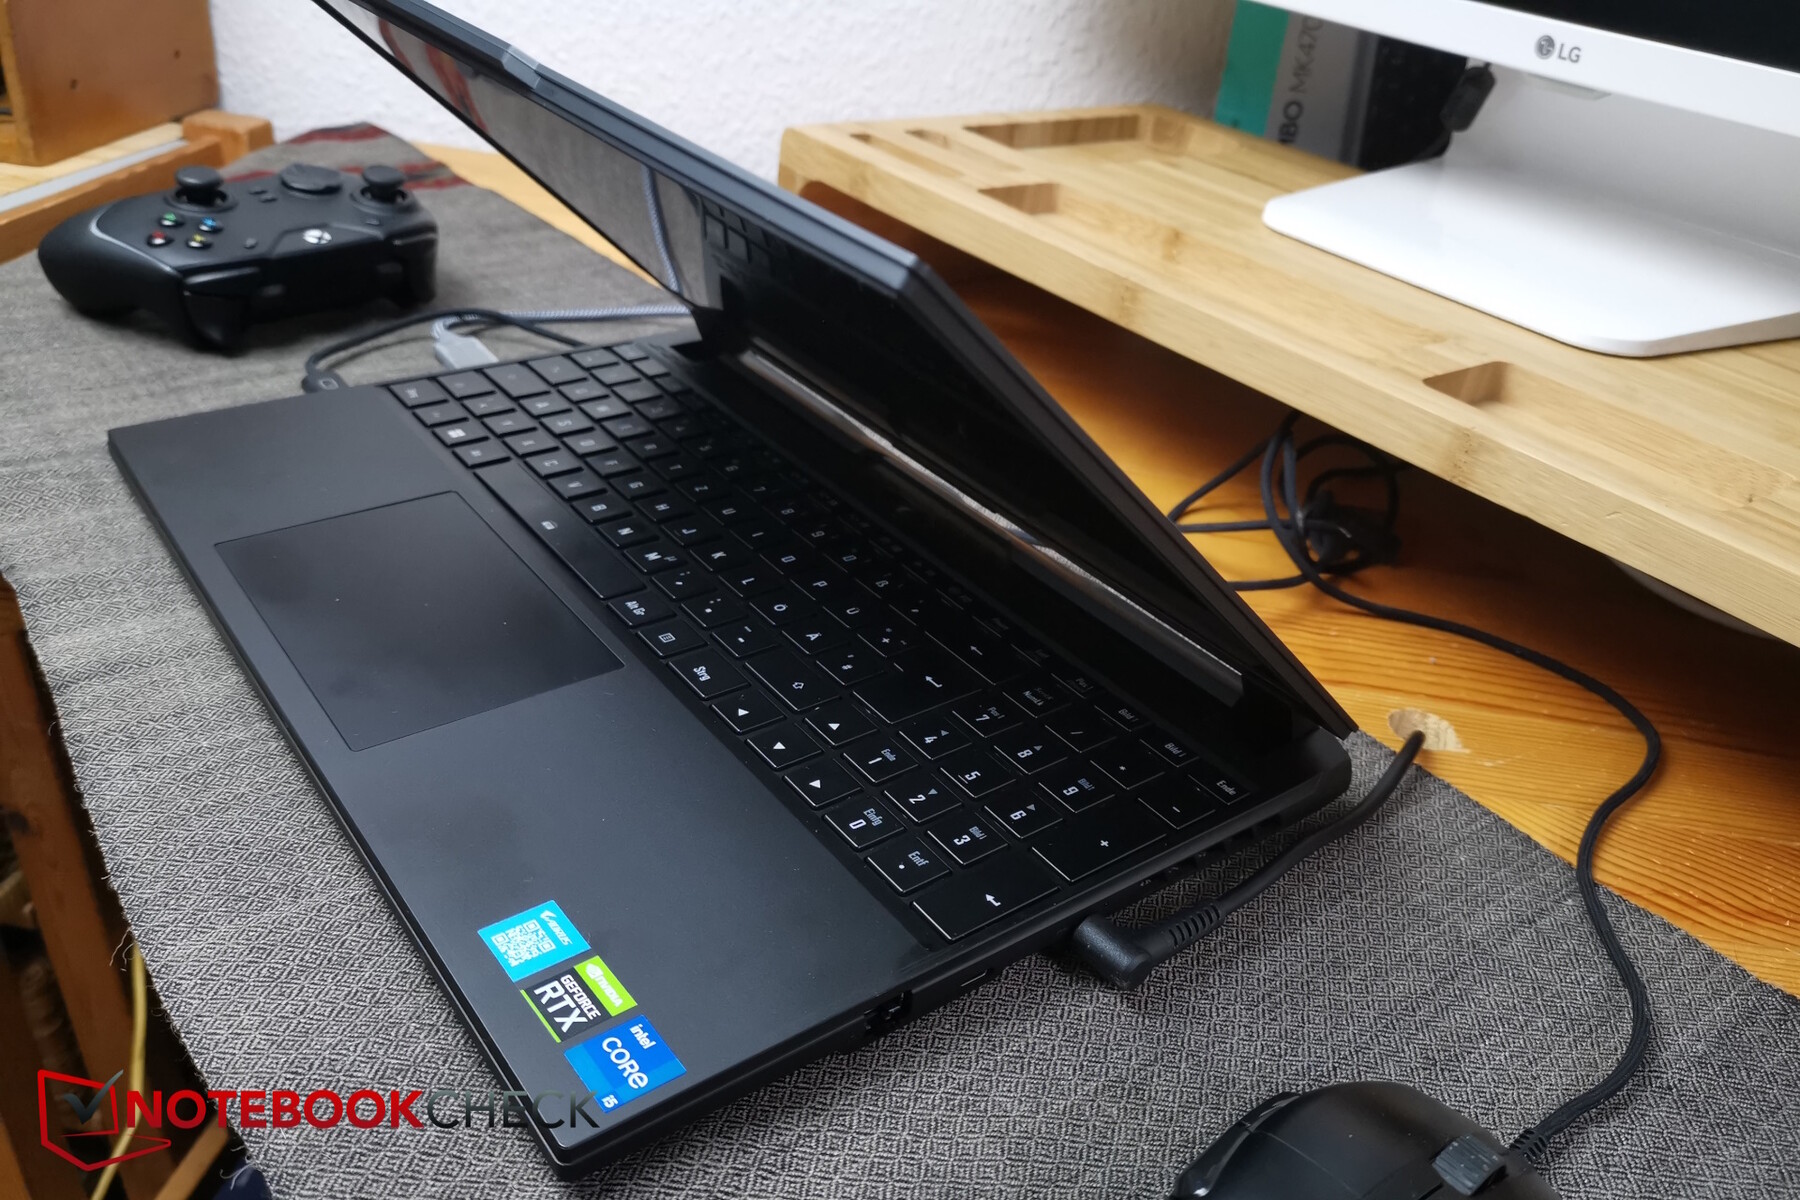
Dispositivos de entrada - Etiquetado de teclas especiales más que sólidas, pero oscuras
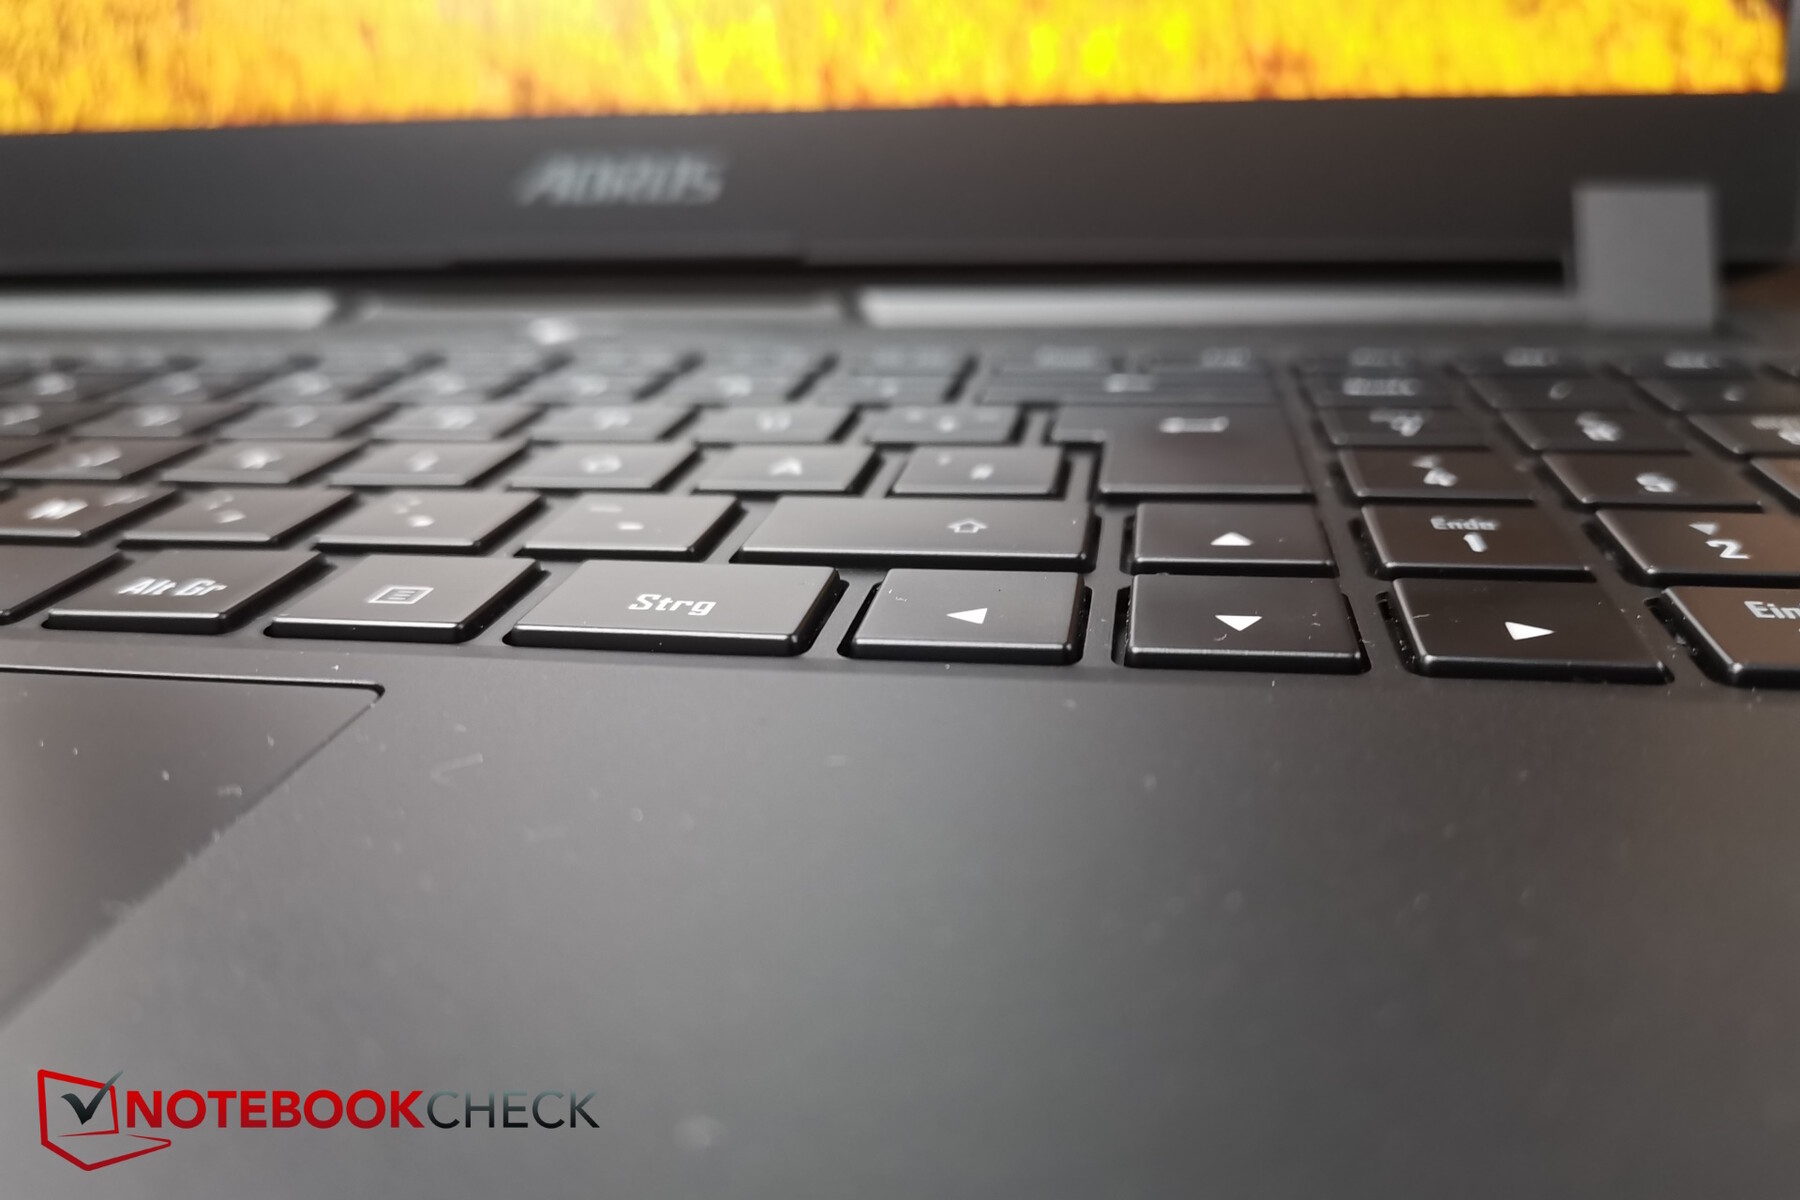
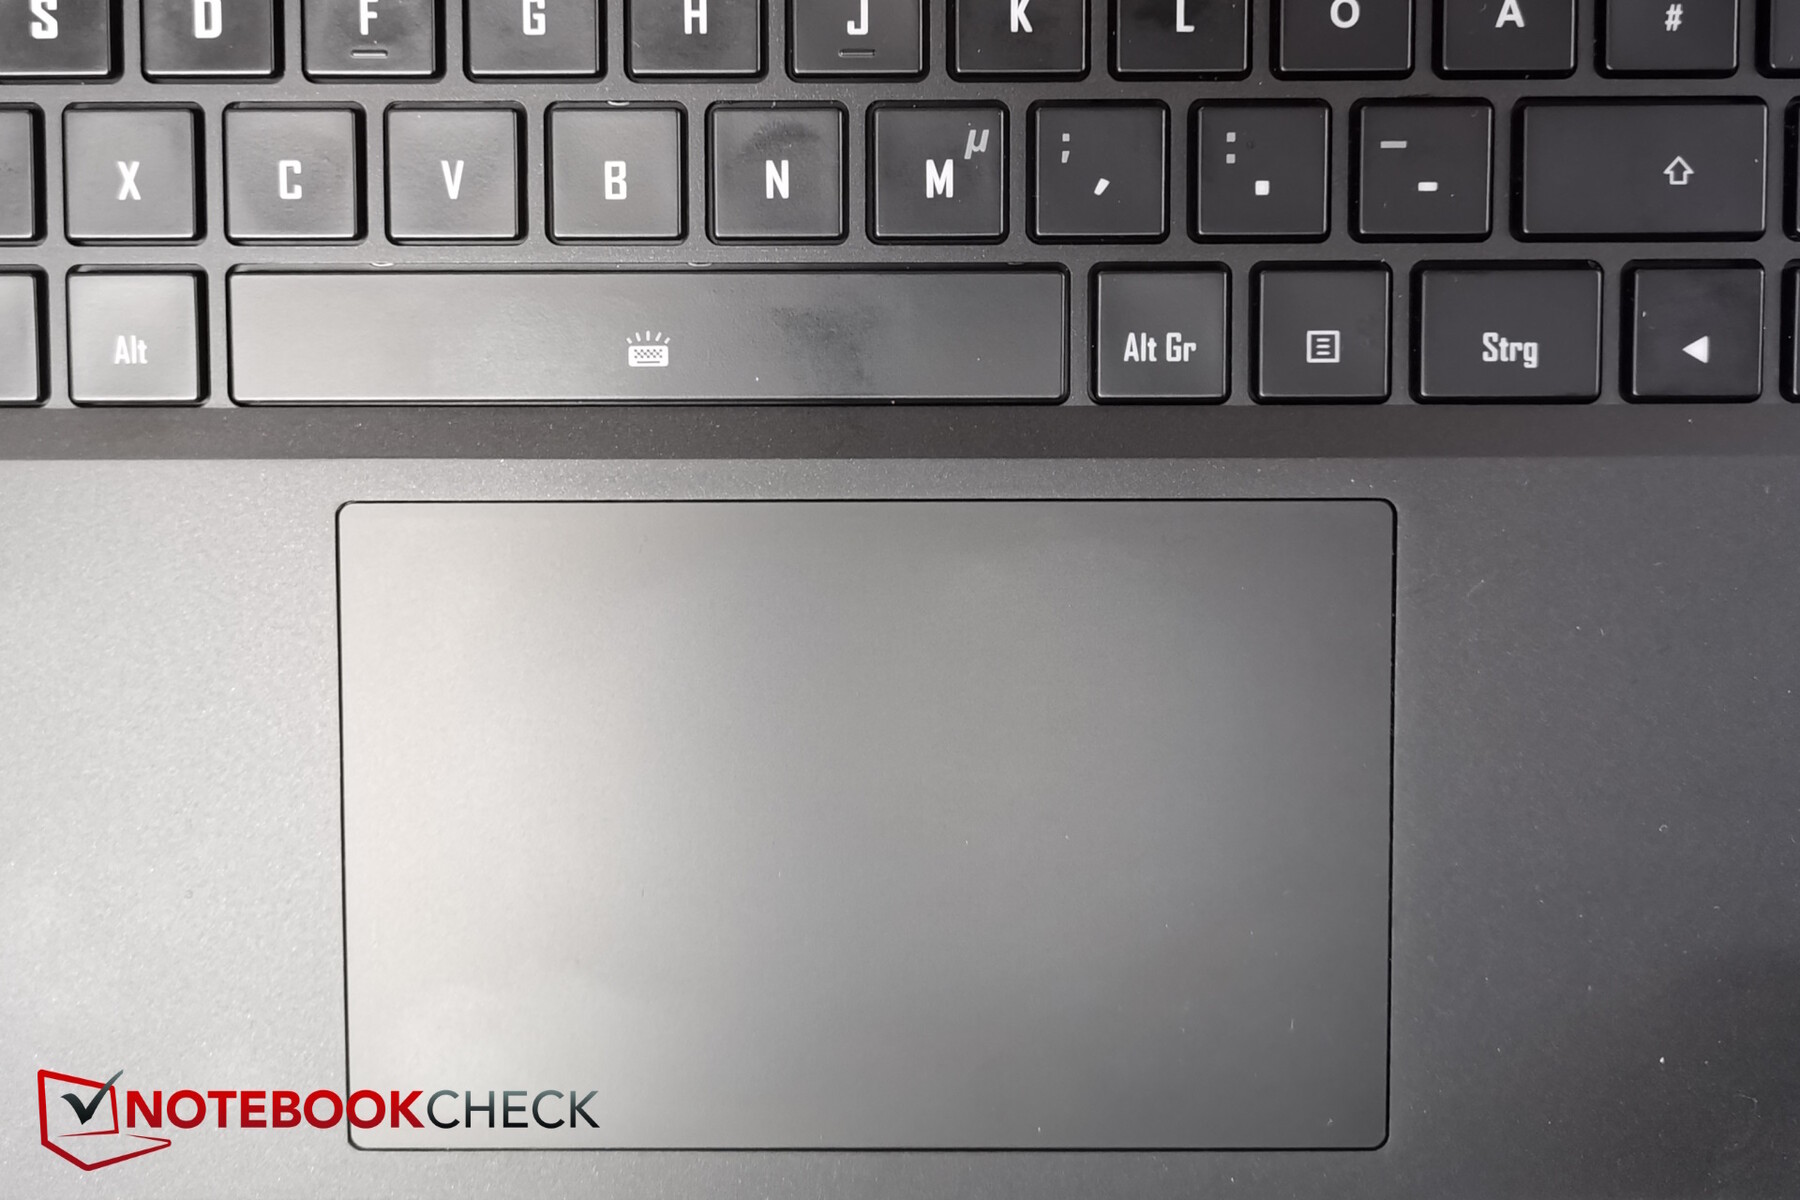
La disposición de las teclas es muy ordenada: el teclado está ligeramente rebajado en la base del portátil. Las teclas de dirección también tienen un tamaño normal y hay un teclado numérico directamente a la derecha.
Las teclas sólo tienen una elevación de baja a media, pero aun así resultan sorprendentemente cómodas al teclear, lo que también se debe a su decente retroalimentación. Sus ruidos al teclear están en el lado más silencioso, por lo que también son adecuadas para entornos poco ruidosos.
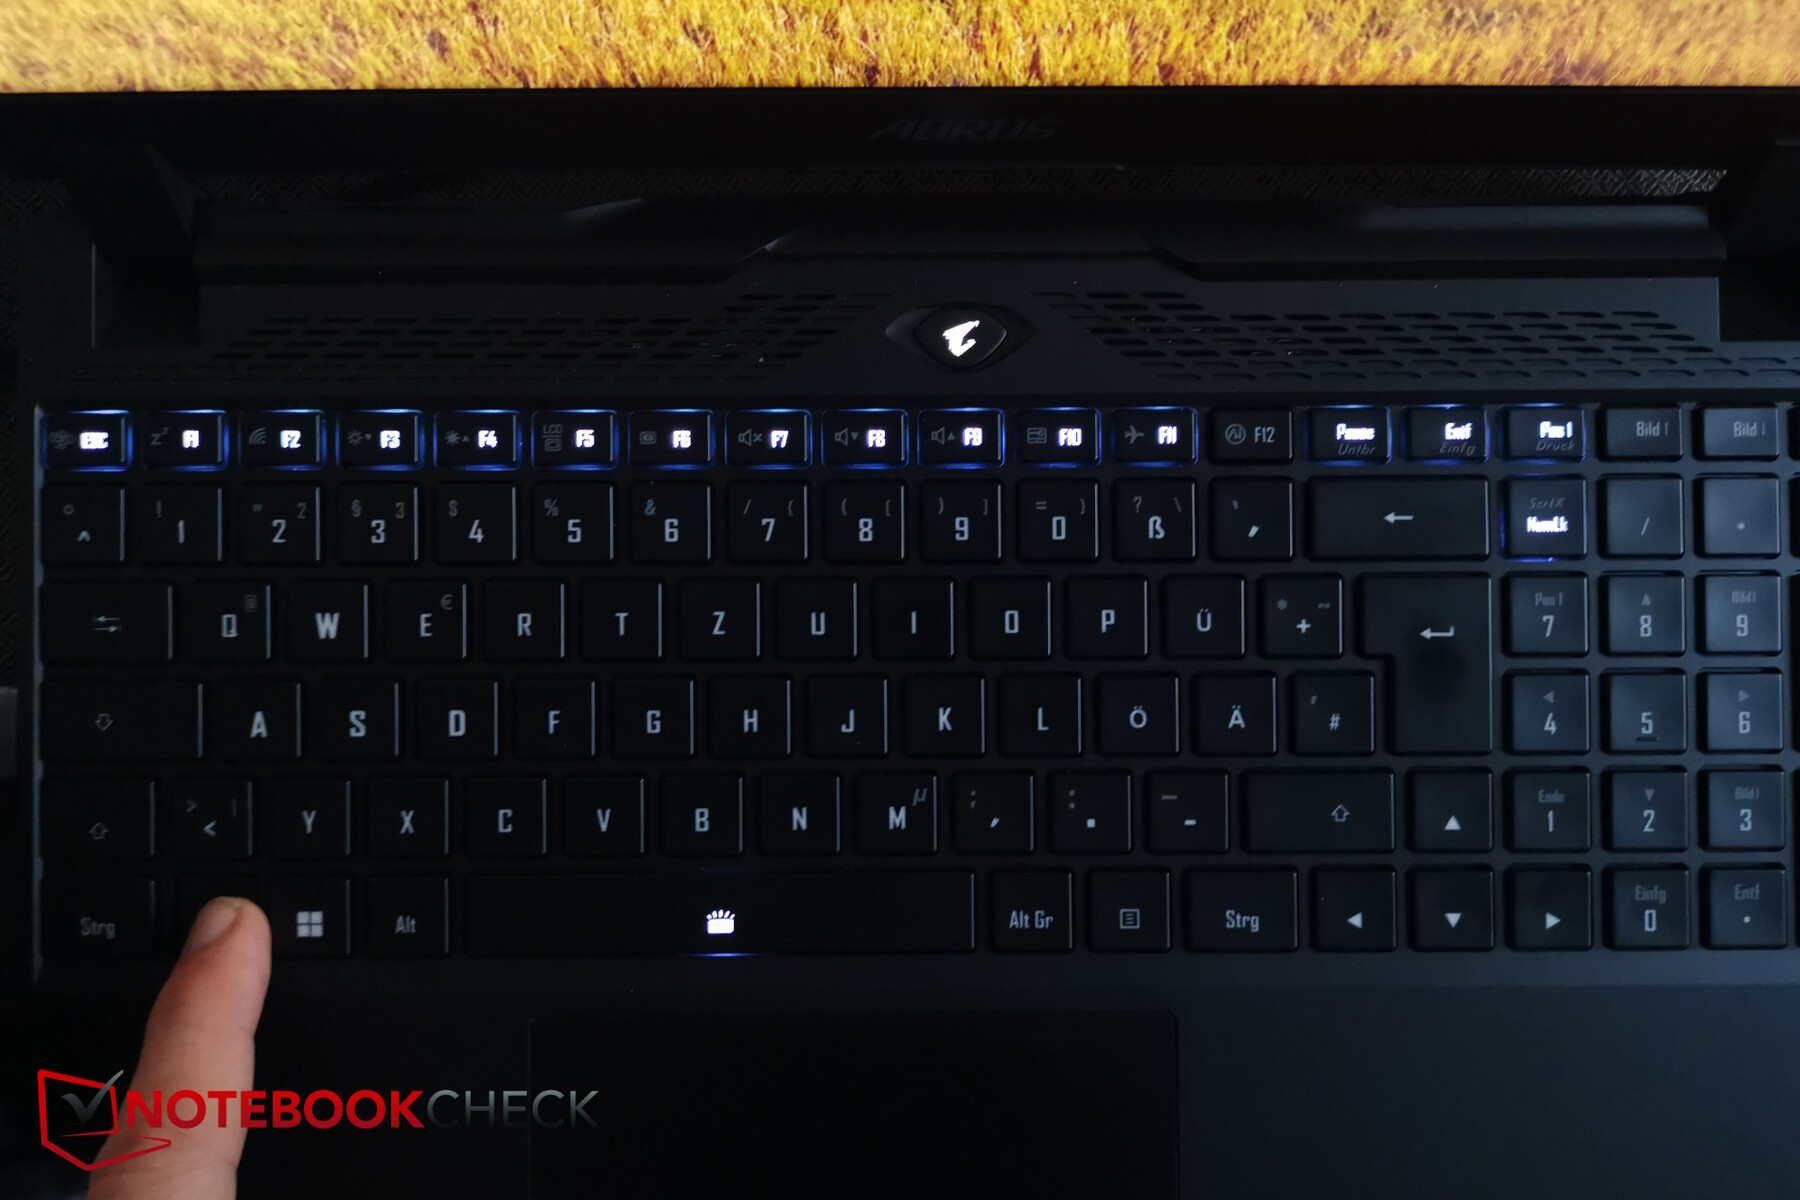
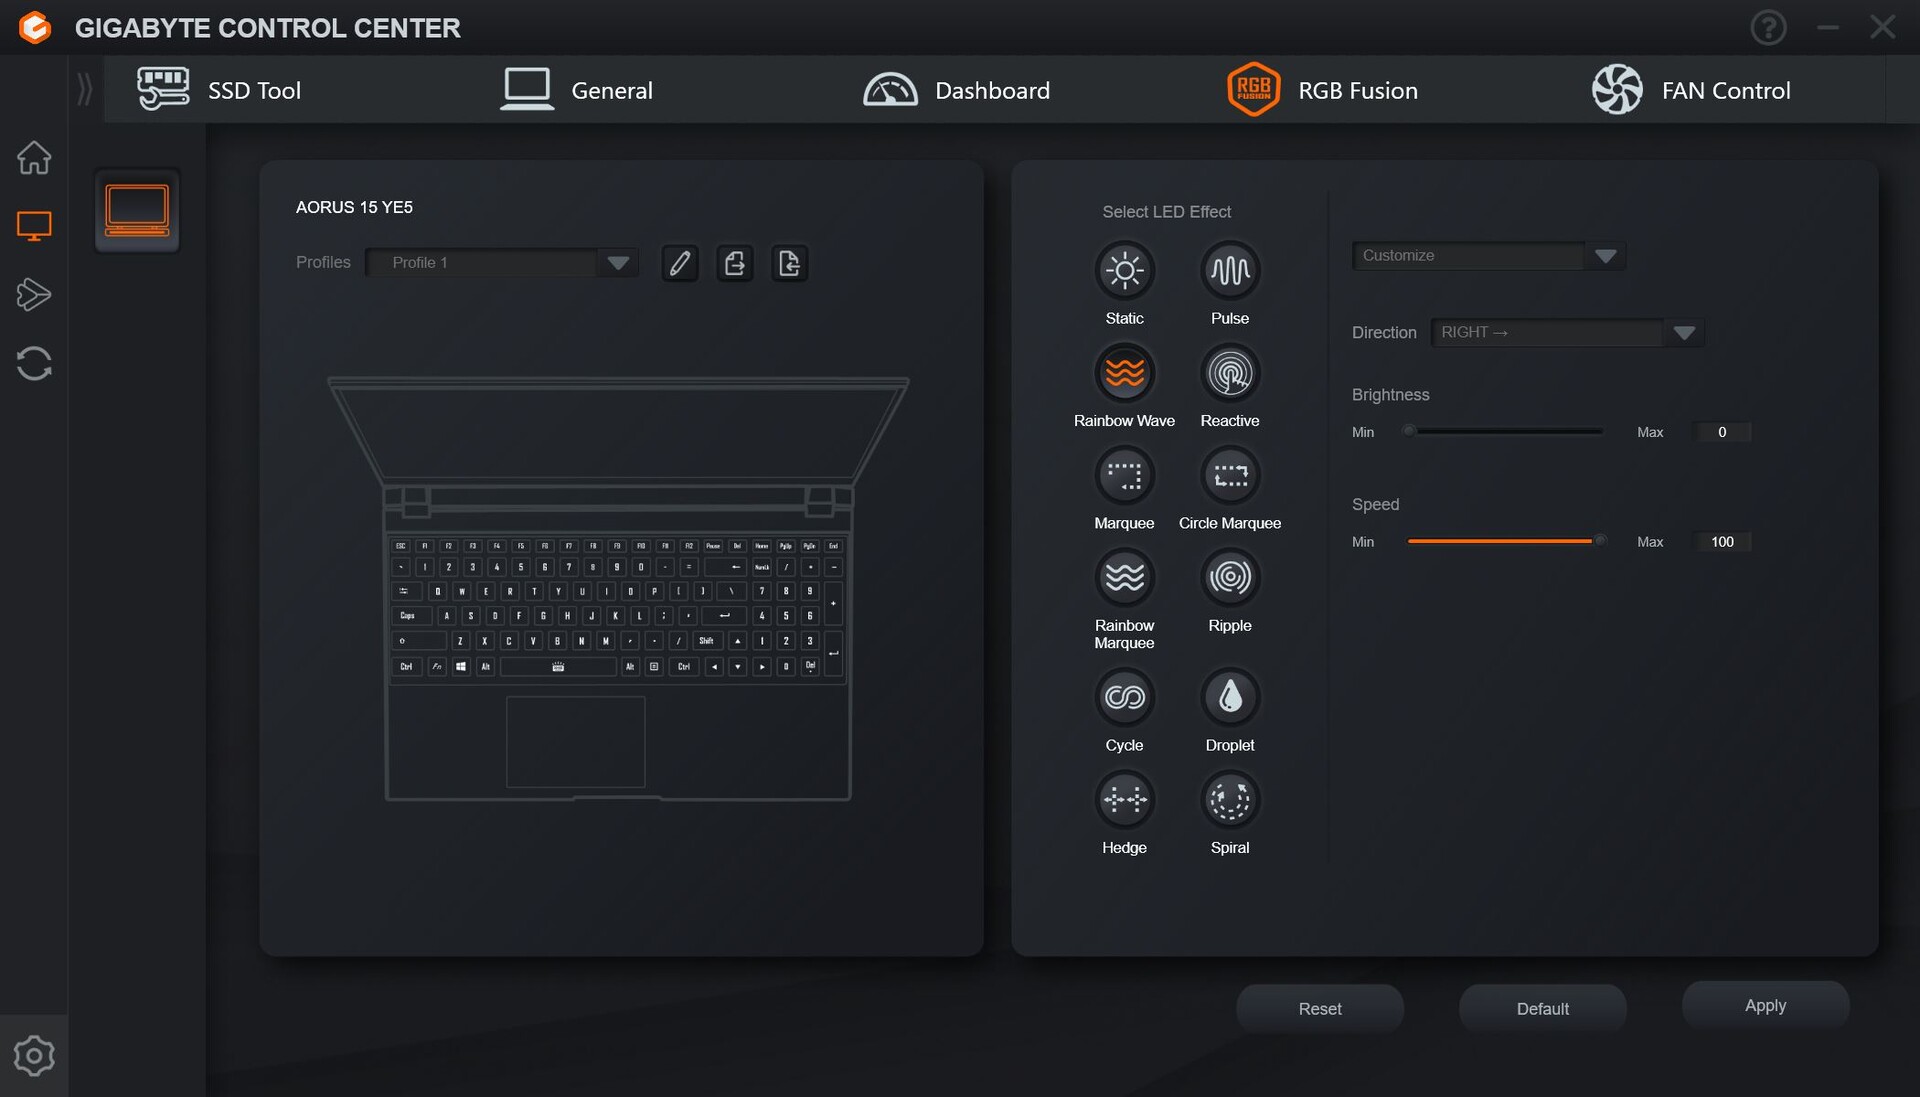
La retroiluminación de las teclas es capaz de varios efectos RGB, pero no se puede configurar individualmente para cada tecla - aunque éstas se pueden iluminar en diferentes colores para ciertos efectos (Rain Drop). Práctico: si pulsa la tecla fn, se iluminan todas las teclas que pueden combinarse con fn para crear funciones especiales. Sin embargo, sólo se iluminan las etiquetas de las teclas normales (por ejemplo, "F7"), pero no su función especial ("silenciar"), lo que hace que la función especial de una tecla F no sea reconocible en entornos oscuros.
El touchpad suficientemente grande (21,1 x 7,6 cm) es agradable y suave, incluso si sus manos no están totalmente secas. Los botones de clic integrados requieren bastante fuerza, lo que significa que su punto de presión es claro. Los ruidos de clic son moderados.
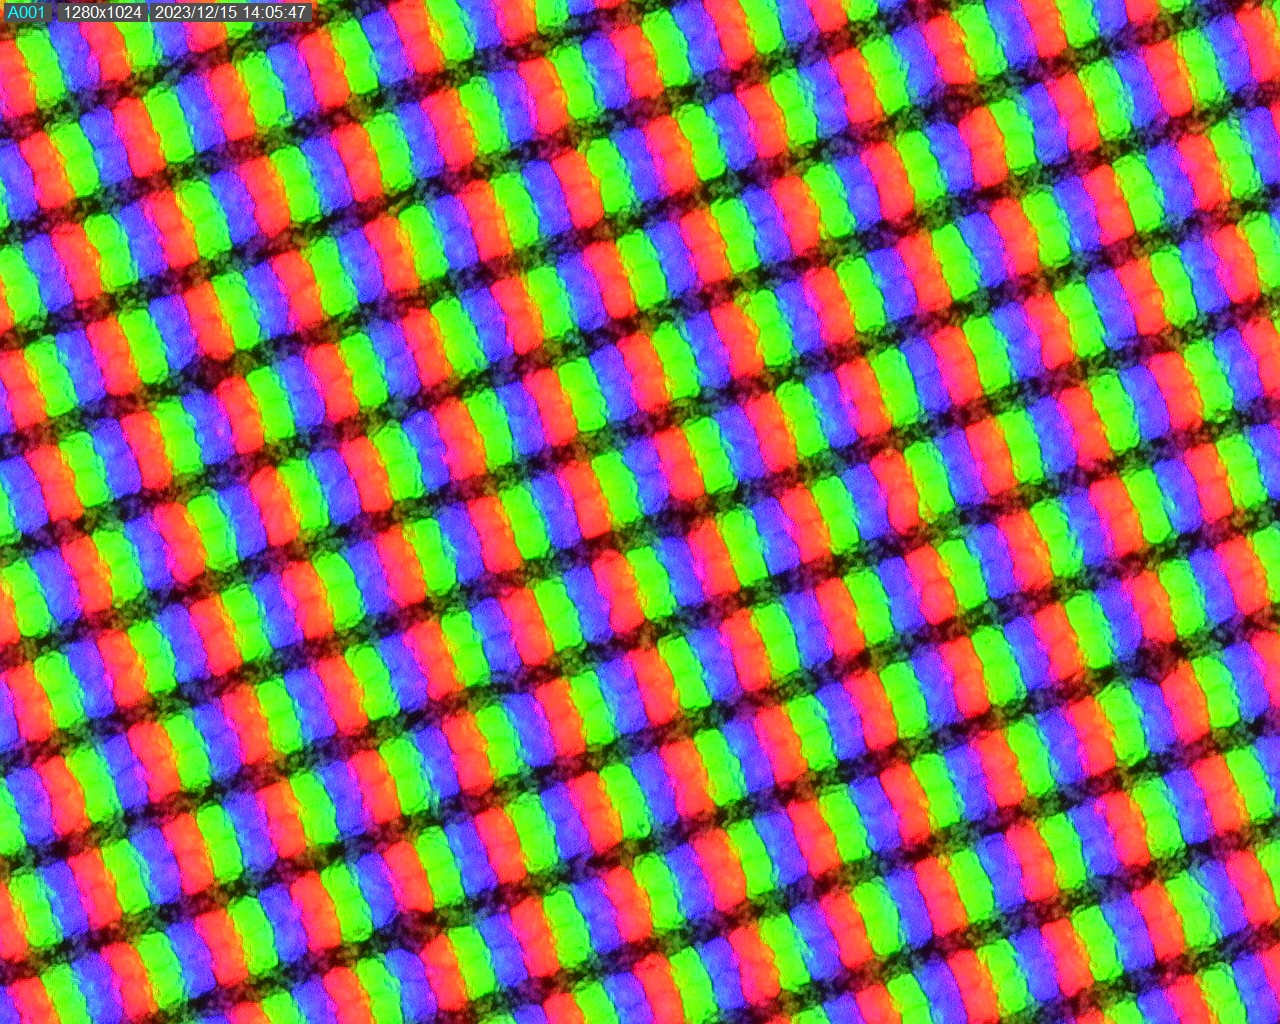
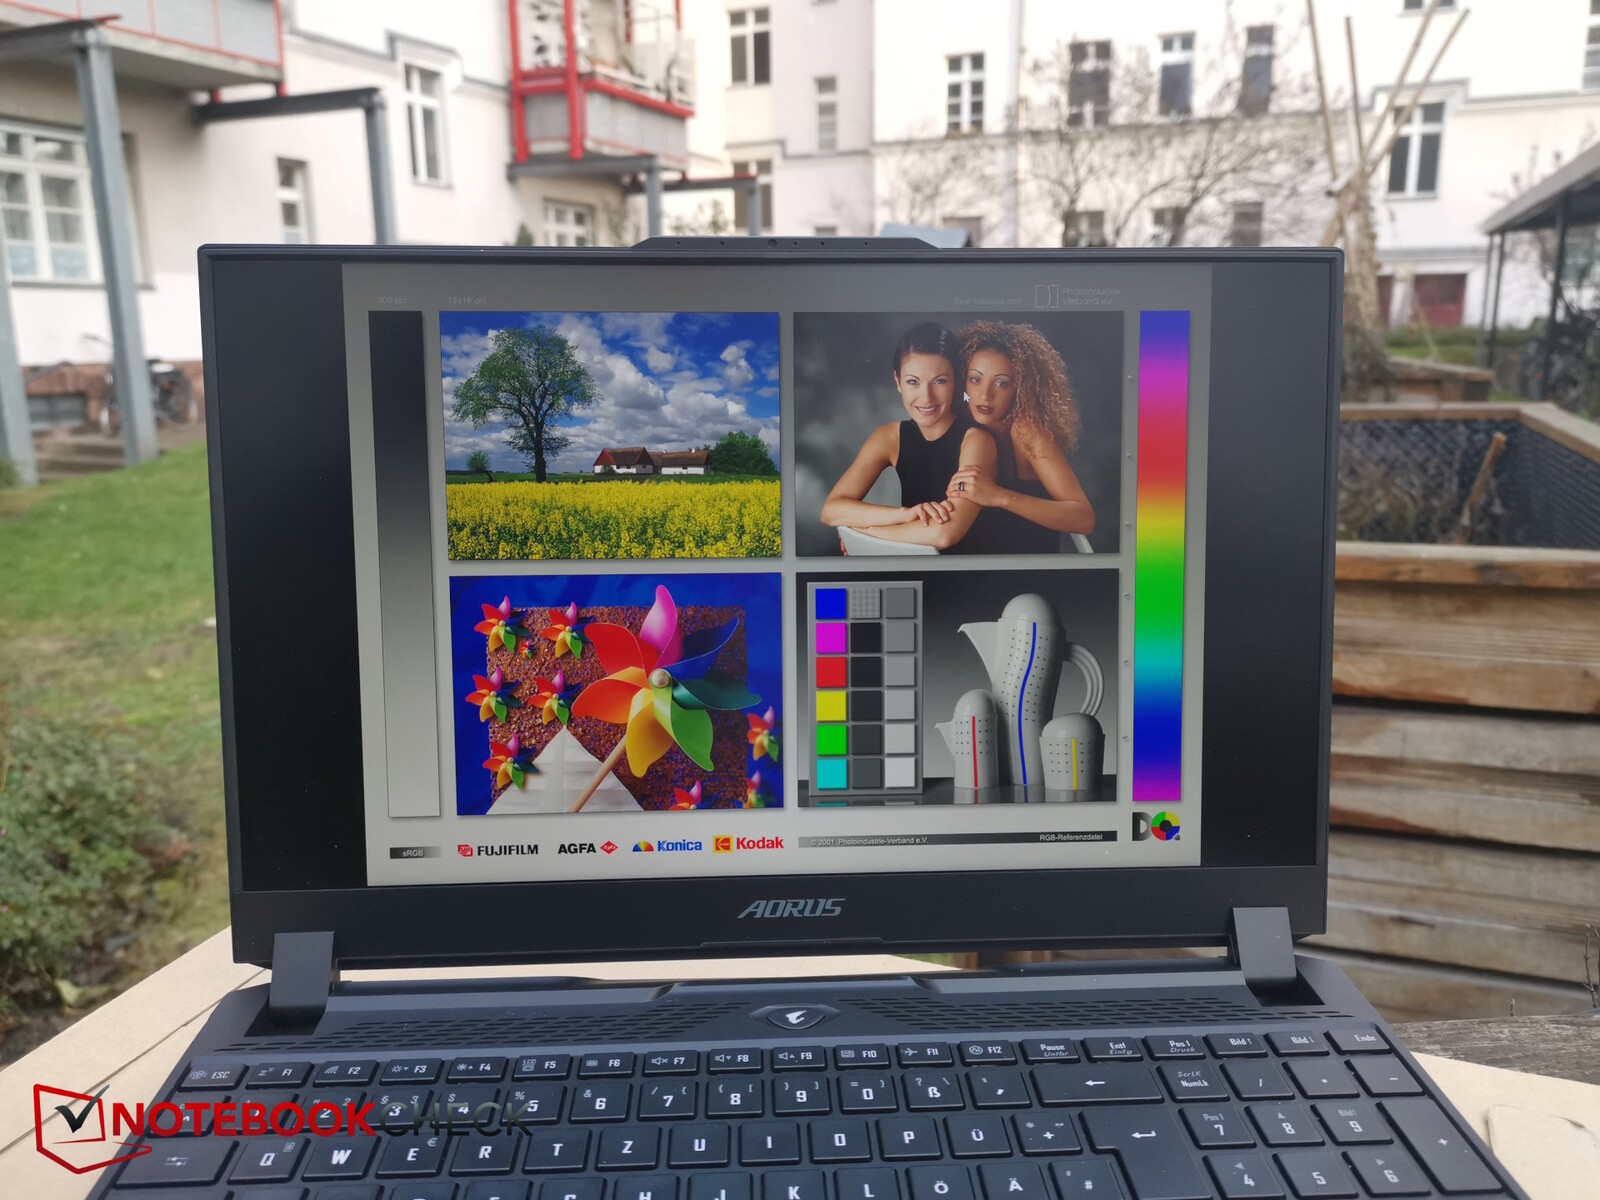
Pantalla - 1.440p con buena precisión de color
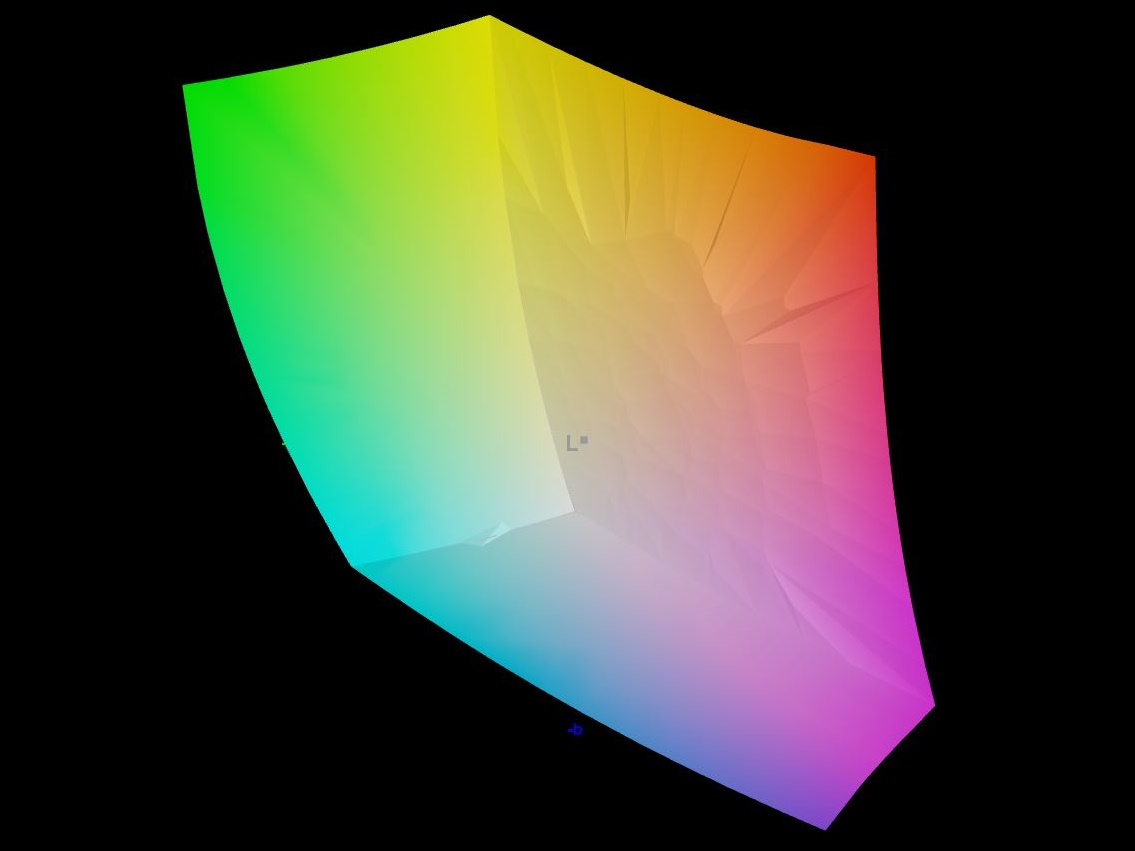
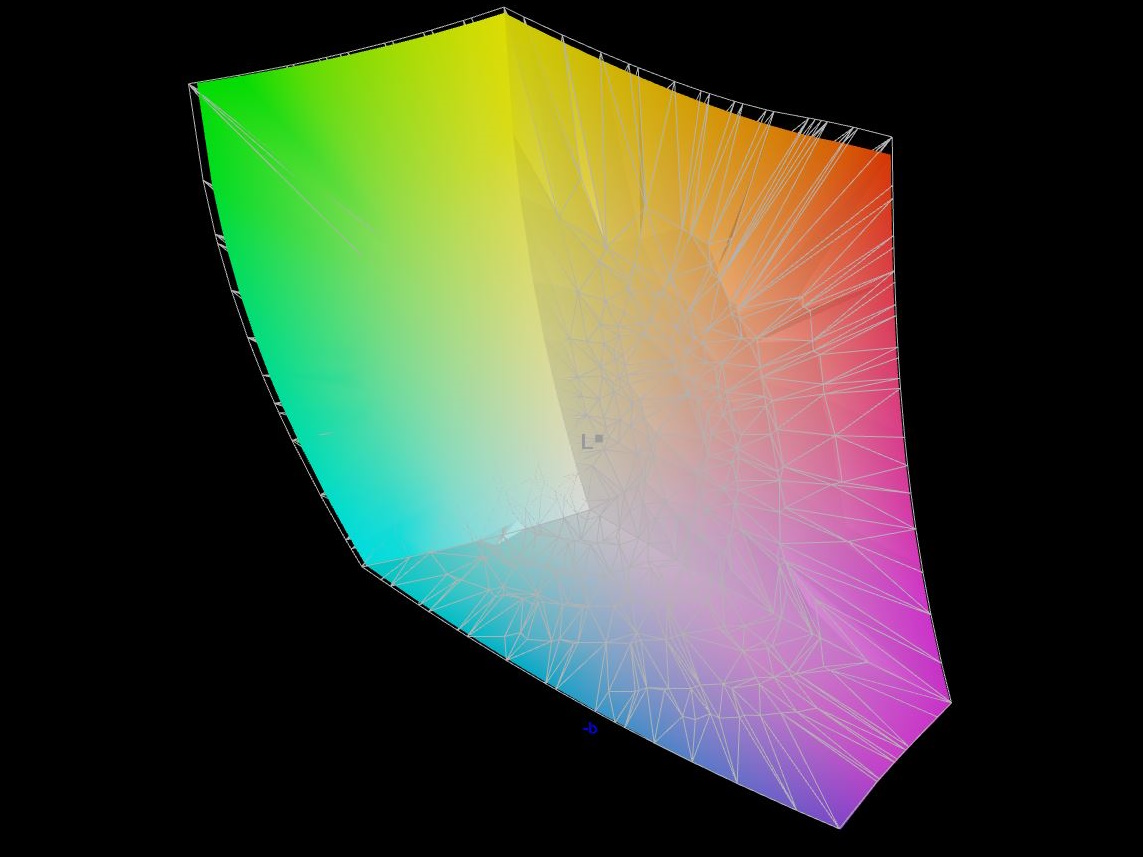
La pantalla mate WQHD del portátil Aorus está fabricada por Chi Mei y ya se utilizó en el Asus ROG Zephyrus G15 en 2021. Fue un éxito, por lo que tampoco parece anticuada en 2023. Su resolución de 2.560 x 1.440 píxeles es tan impresionante como su frecuencia de actualización de 165 Hz, sus tiempos de respuesta relativamente rápidos y su cobertura del espacio de color (100% sRGB, 97% Display P3). El brillo y el contraste de la pantalla, en cambio, son medios. Como alternativa, también existe un modelo Full HD con una frecuencia de actualización de 360 Hz.
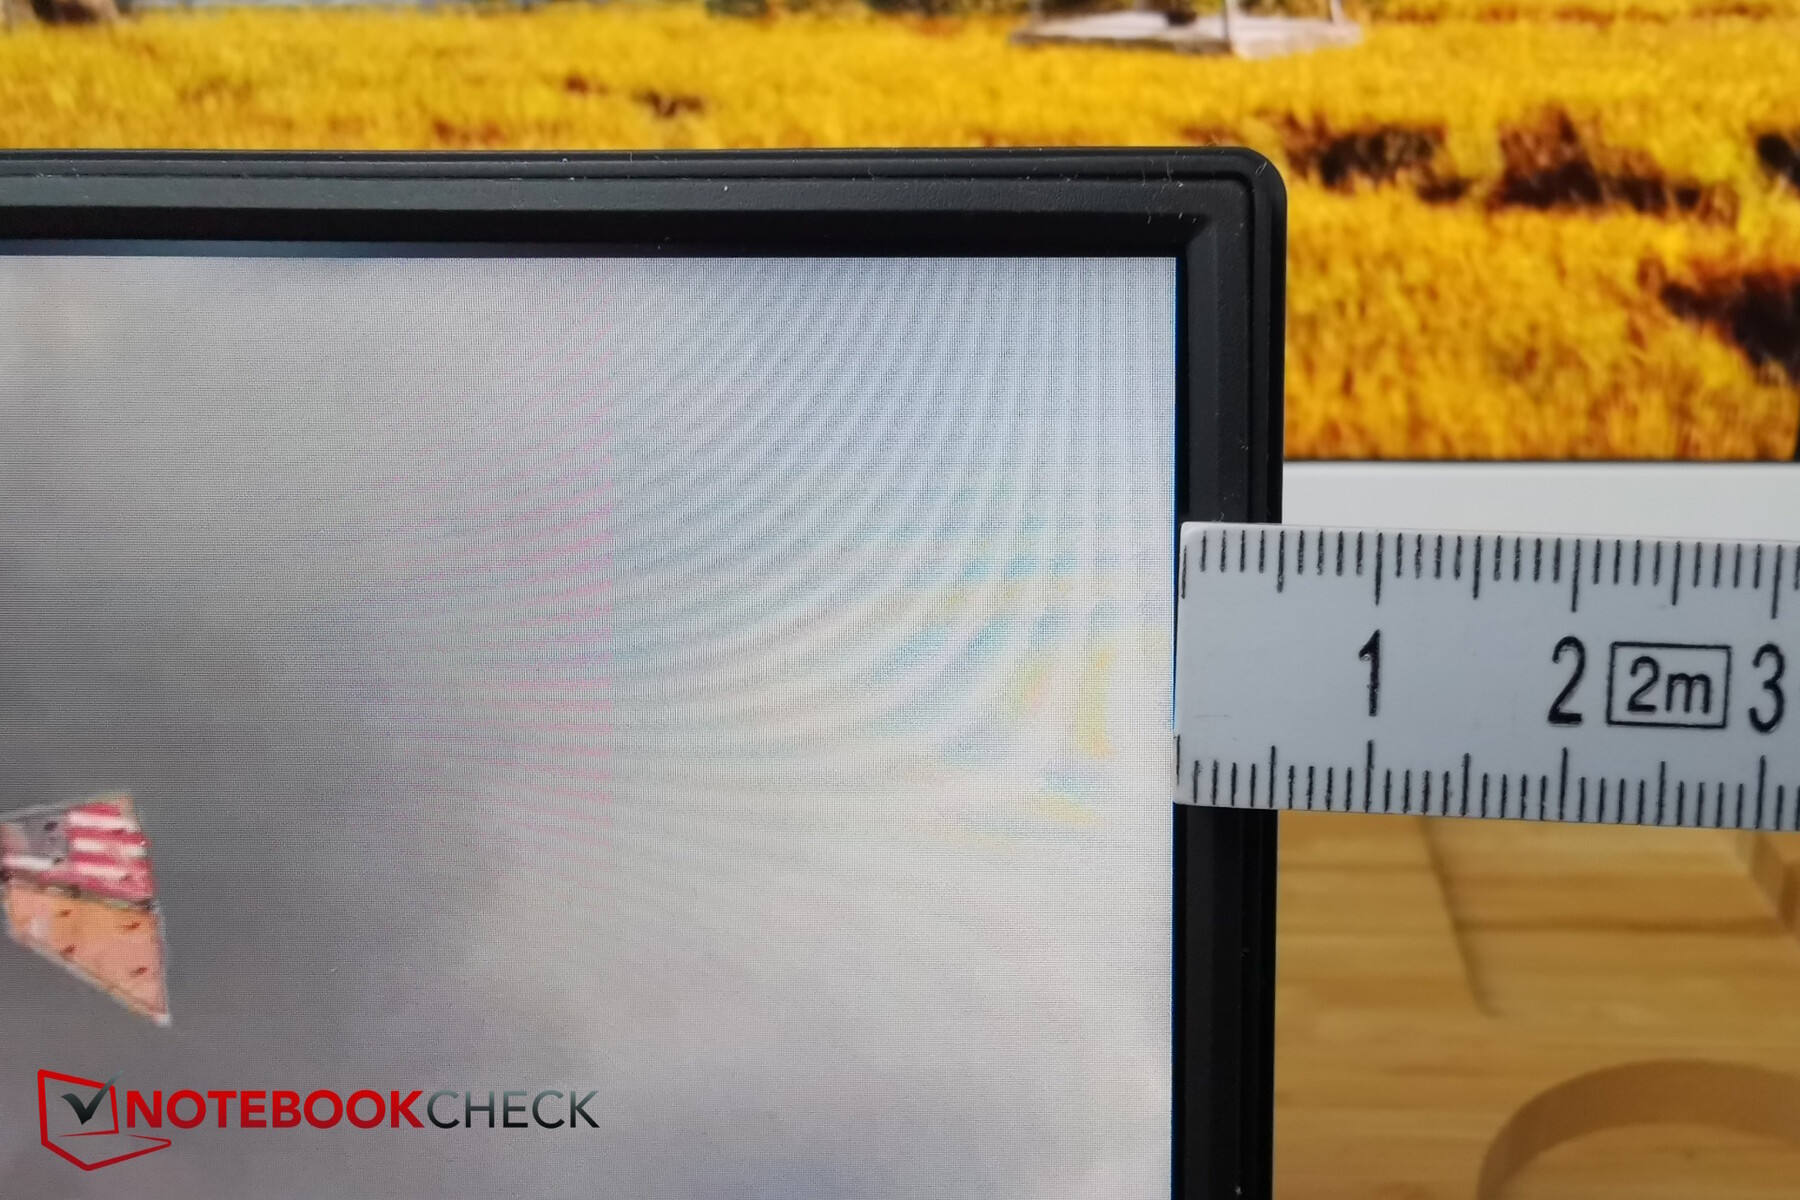
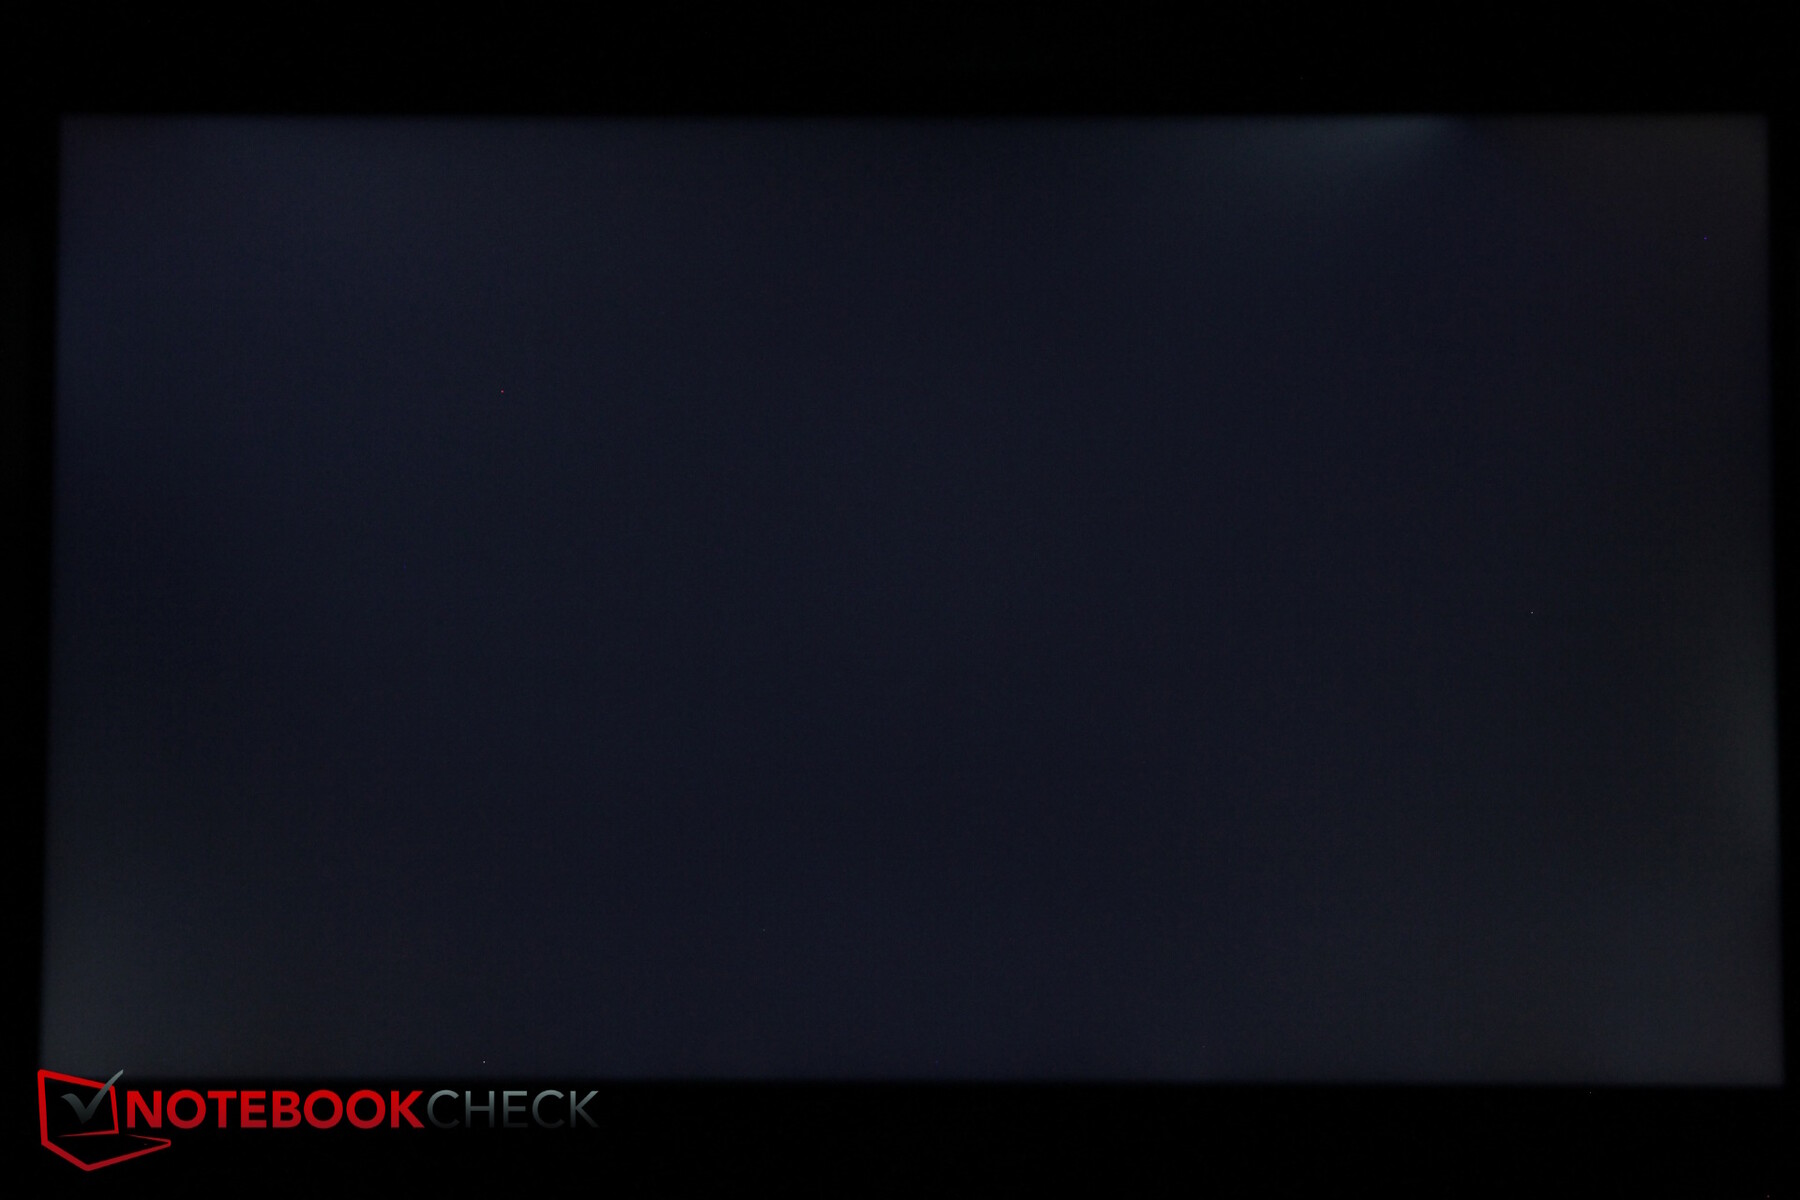
Menos bueno es el sangrado de retroiluminación muy visible en la esquina inferior izquierda y a lo largo del borde superior derecho. Sin embargo, no se utiliza PWM para el control del brillo. Sus tiempos de respuesta son mediocres en el mejor de los casos.
| |||||||||||||||||||||||||
iluminación: 81 %
Brillo con batería: 350 cd/m²
Contraste: 939:1 (Negro: 0.38 cd/m²)
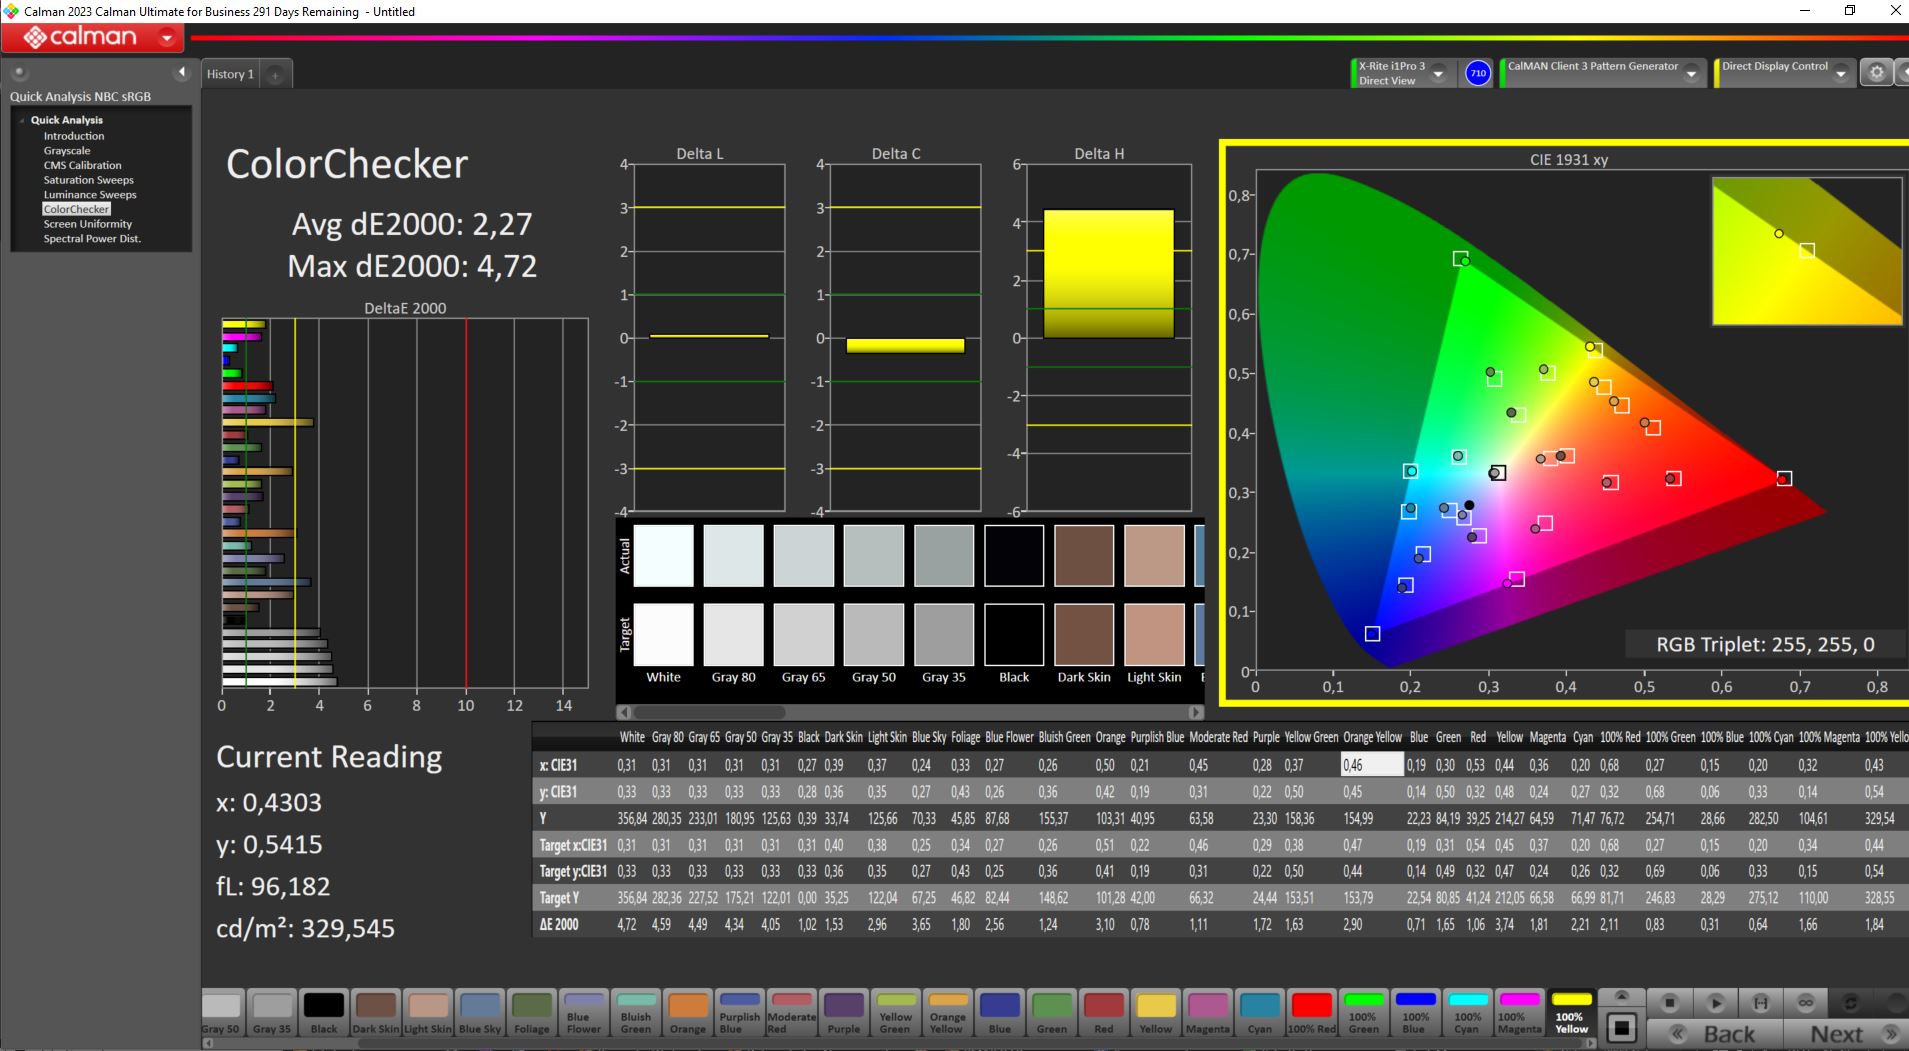
ΔE ColorChecker Calman: 2.27 | ∀{0.5-29.43 Ø4.71}
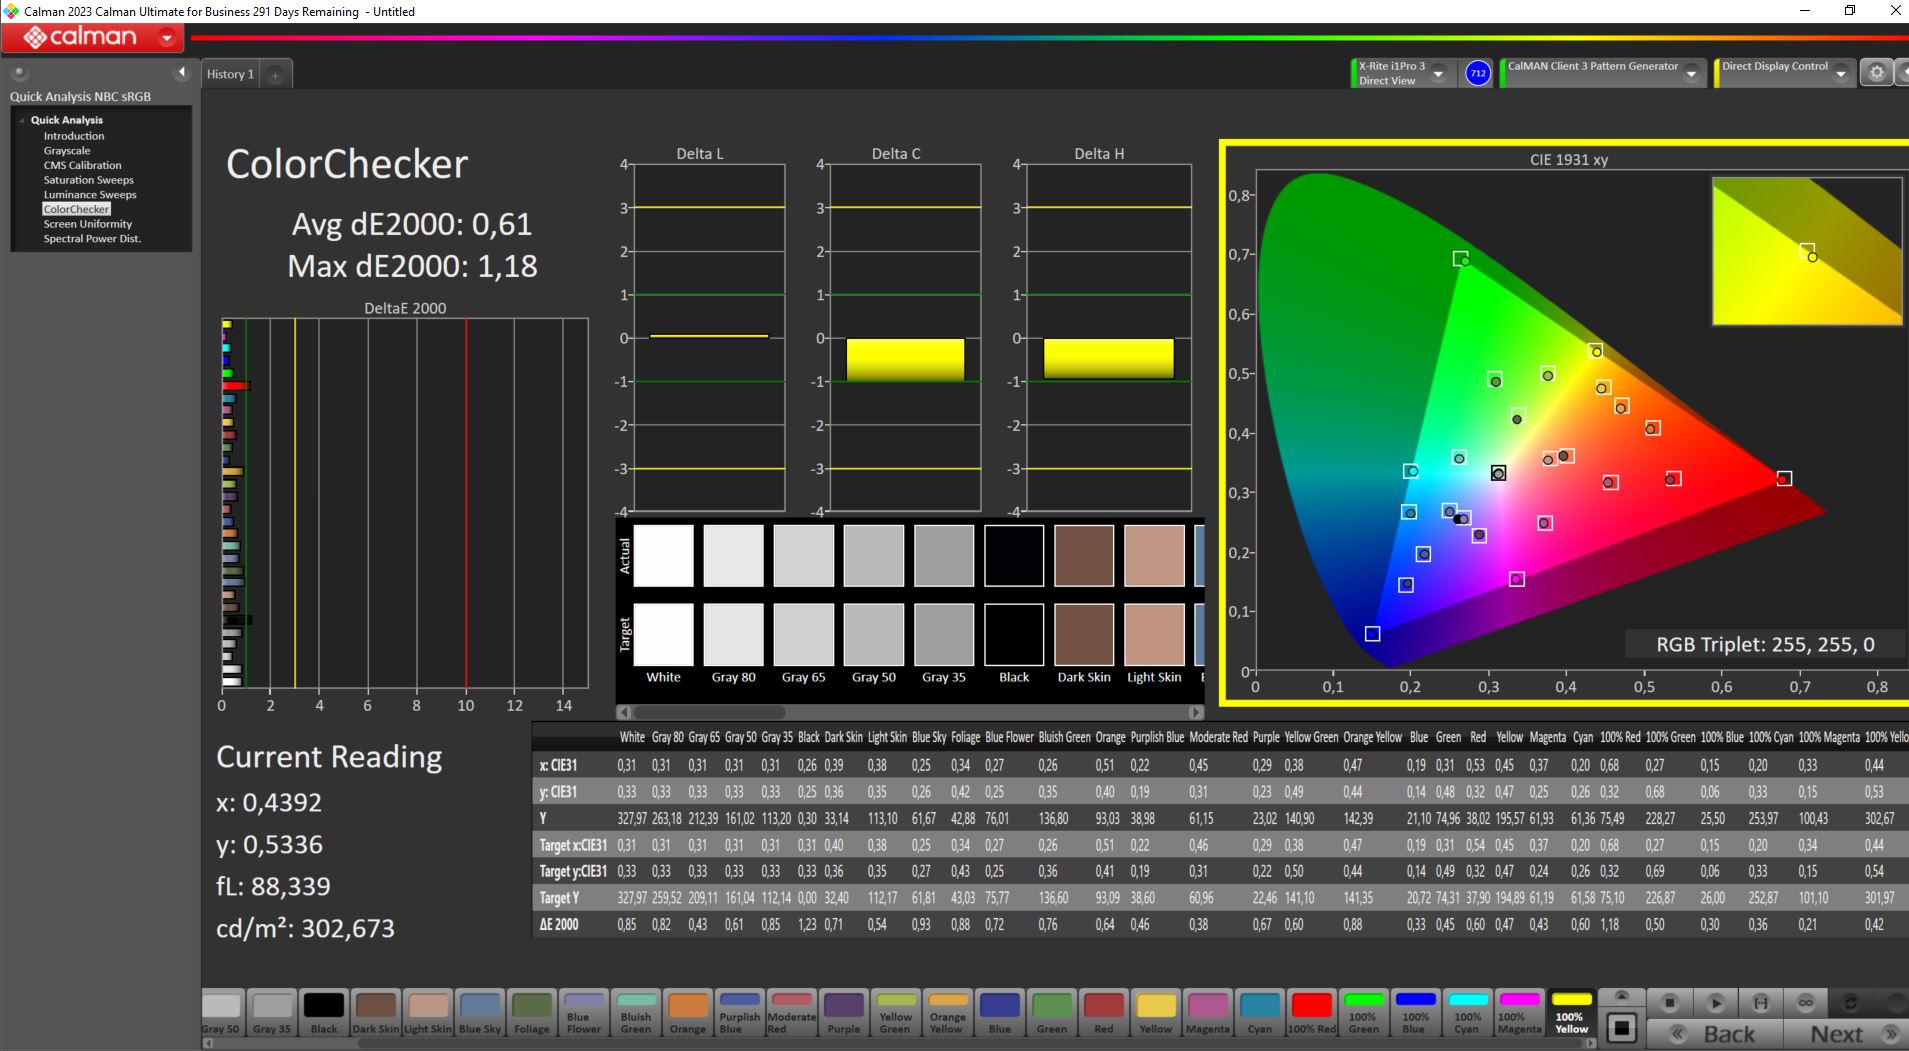
calibrated: 0.61
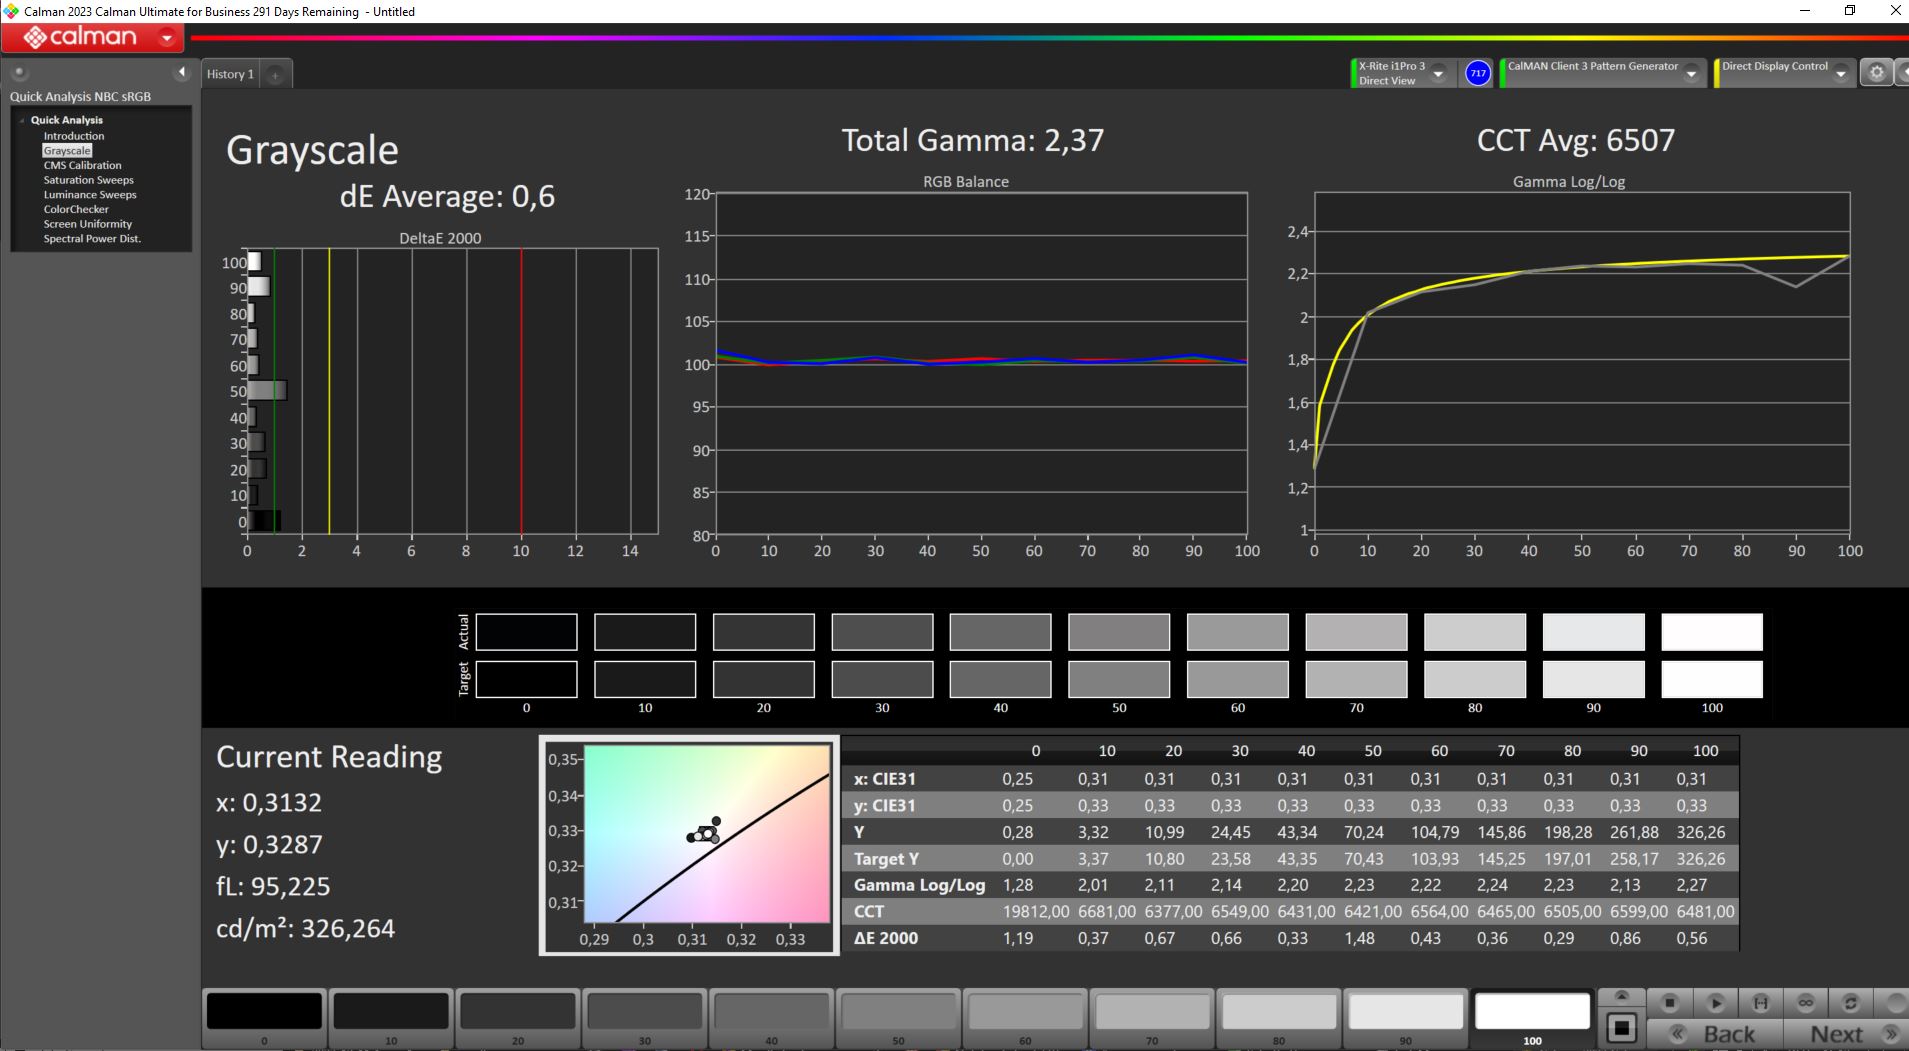
ΔE Greyscale Calman: 3.67 | ∀{0.09-98 Ø4.96}
85.9% AdobeRGB 1998 (Argyll 3D)
100% sRGB (Argyll 3D)
97.7% Display P3 (Argyll 3D)
Gamma: 2.38
CCT: 7899 K
| Aorus 15 YE5-54DEB34SH Chi Mei CMN1540 (CMN N156KME-GNA), IPS, 2560x1440, 15.6" | Aorus 15 BSF Sharp LQ156T1JW05, IPS, 2560x1440, 15.6" | Captiva Advanced Gaming I74-121 BOE08B3, IPS, 1920x1080, 15.6" | HP Victus 16-r0077ng CMN162D, IPS, 1920x1080, 16.1" | Dell XPS 15 9530 RTX 4070 Samsung 156XG01, OLED, 3456x2160, 15.6" | HP Omen 16-wf000 BOE0B7D, IPS, 2560x1440, 16.1" | |
|---|---|---|---|---|---|---|
| Display | 0% | -21% | -18% | 6% | -16% | |
| Display P3 Coverage (%) | 97.7 | 98.2 1% | 64 -34% | 66.7 -32% | 99.8 2% | 69 -29% |
| sRGB Coverage (%) | 100 | 99.9 0% | 93.2 -7% | 98 -2% | 100 0% | 99.2 -1% |
| AdobeRGB 1998 Coverage (%) | 85.9 | 85.7 0% | 66 -23% | 69 -20% | 98.4 15% | 71.2 -17% |
| Response Times | 40% | 55% | 30% | 87% | 47% | |
| Response Time Grey 50% / Grey 80% * (ms) | 18.9 ? | 11.3 ? 40% | 5 ? 74% | 13.3 ? 30% | 1.68 ? 91% | 4.6 ? 76% |
| Response Time Black / White * (ms) | 11.7 ? | 7 ? 40% | 7.55 ? 35% | 8.2 ? 30% | 1.94 ? 83% | 9.7 ? 17% |
| PWM Frequency (Hz) | 239 | |||||
| Screen | -34% | -28% | 15% | -36% | 7% | |
| Brightness middle (cd/m²) | 357 | 299 -16% | 346 -3% | 308 -14% | 389.5 9% | 310.9 -13% |
| Brightness (cd/m²) | 322 | 282 -12% | 324 1% | 285 -11% | 392 22% | 296 -8% |
| Brightness Distribution (%) | 81 | 82 1% | 90 11% | 85 5% | 98 21% | 91 12% |
| Black Level * (cd/m²) | 0.38 | 0.31 18% | 0.35 8% | 0.25 34% | 0.35 8% | |
| Contrast (:1) | 939 | 965 3% | 989 5% | 1232 31% | 888 -5% | |
| Colorchecker dE 2000 * | 2.27 | 2.24 1% | 4.12 -81% | 1.3 43% | 4.95 -118% | 2.18 4% |
| Colorchecker dE 2000 max. * | 4.72 | 4.29 9% | 7.78 -65% | 2.76 42% | 8.65 -83% | 3.58 24% |
| Colorchecker dE 2000 calibrated * | 0.61 | 2.62 -330% | 1.22 -100% | 0.92 -51% | 1.53 -151% | 0.52 15% |
| Greyscale dE 2000 * | 3.67 | 3 18% | 4.81 -31% | 1.7 54% | 2 46% | 2.8 24% |
| Gamma | 2.38 92% | 2.086 105% | 2.31 95% | 2.167 102% | 2.27 97% | 2.18 101% |
| CCT | 7899 82% | 6289 103% | 7633 85% | 6767 96% | 6265 104% | 6002 108% |
| Media total (Programa/Opciones) | 2% /
-16% | 2% /
-15% | 9% /
10% | 19% /
-5% | 13% /
8% |
* ... más pequeño es mejor
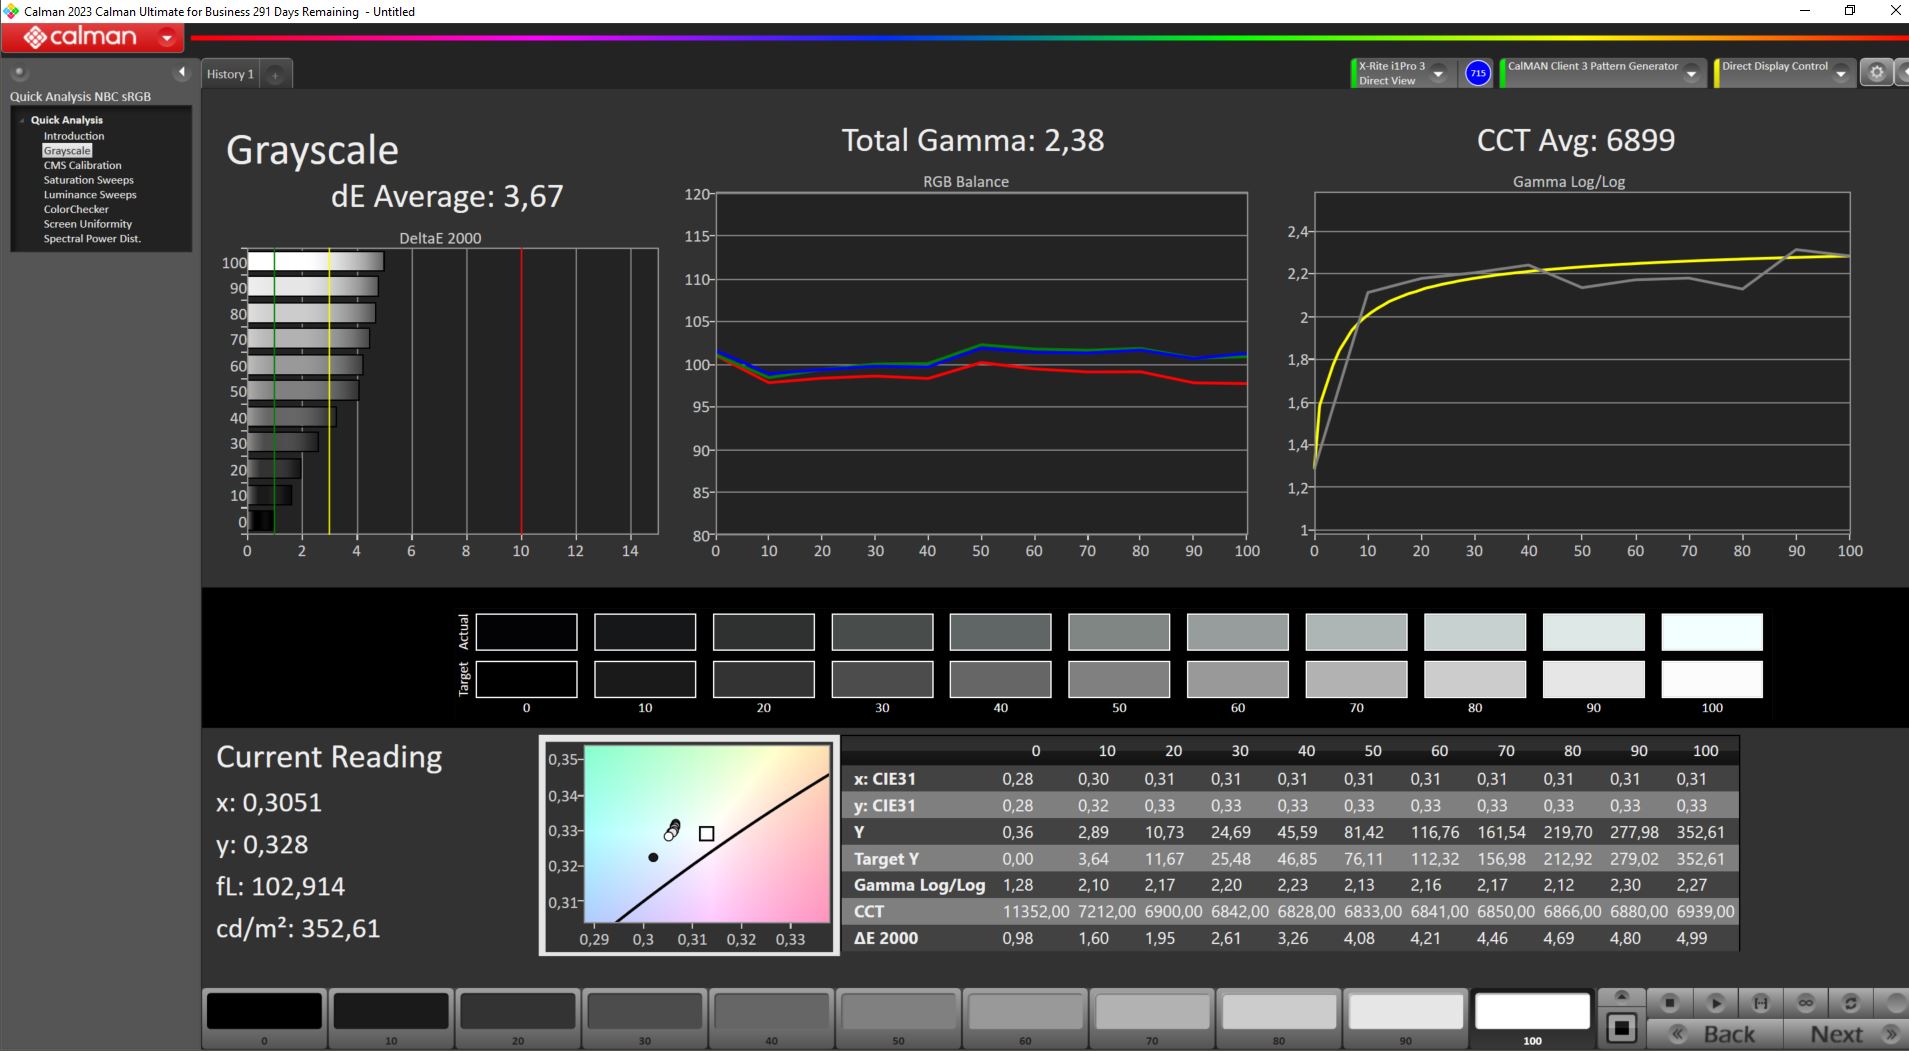
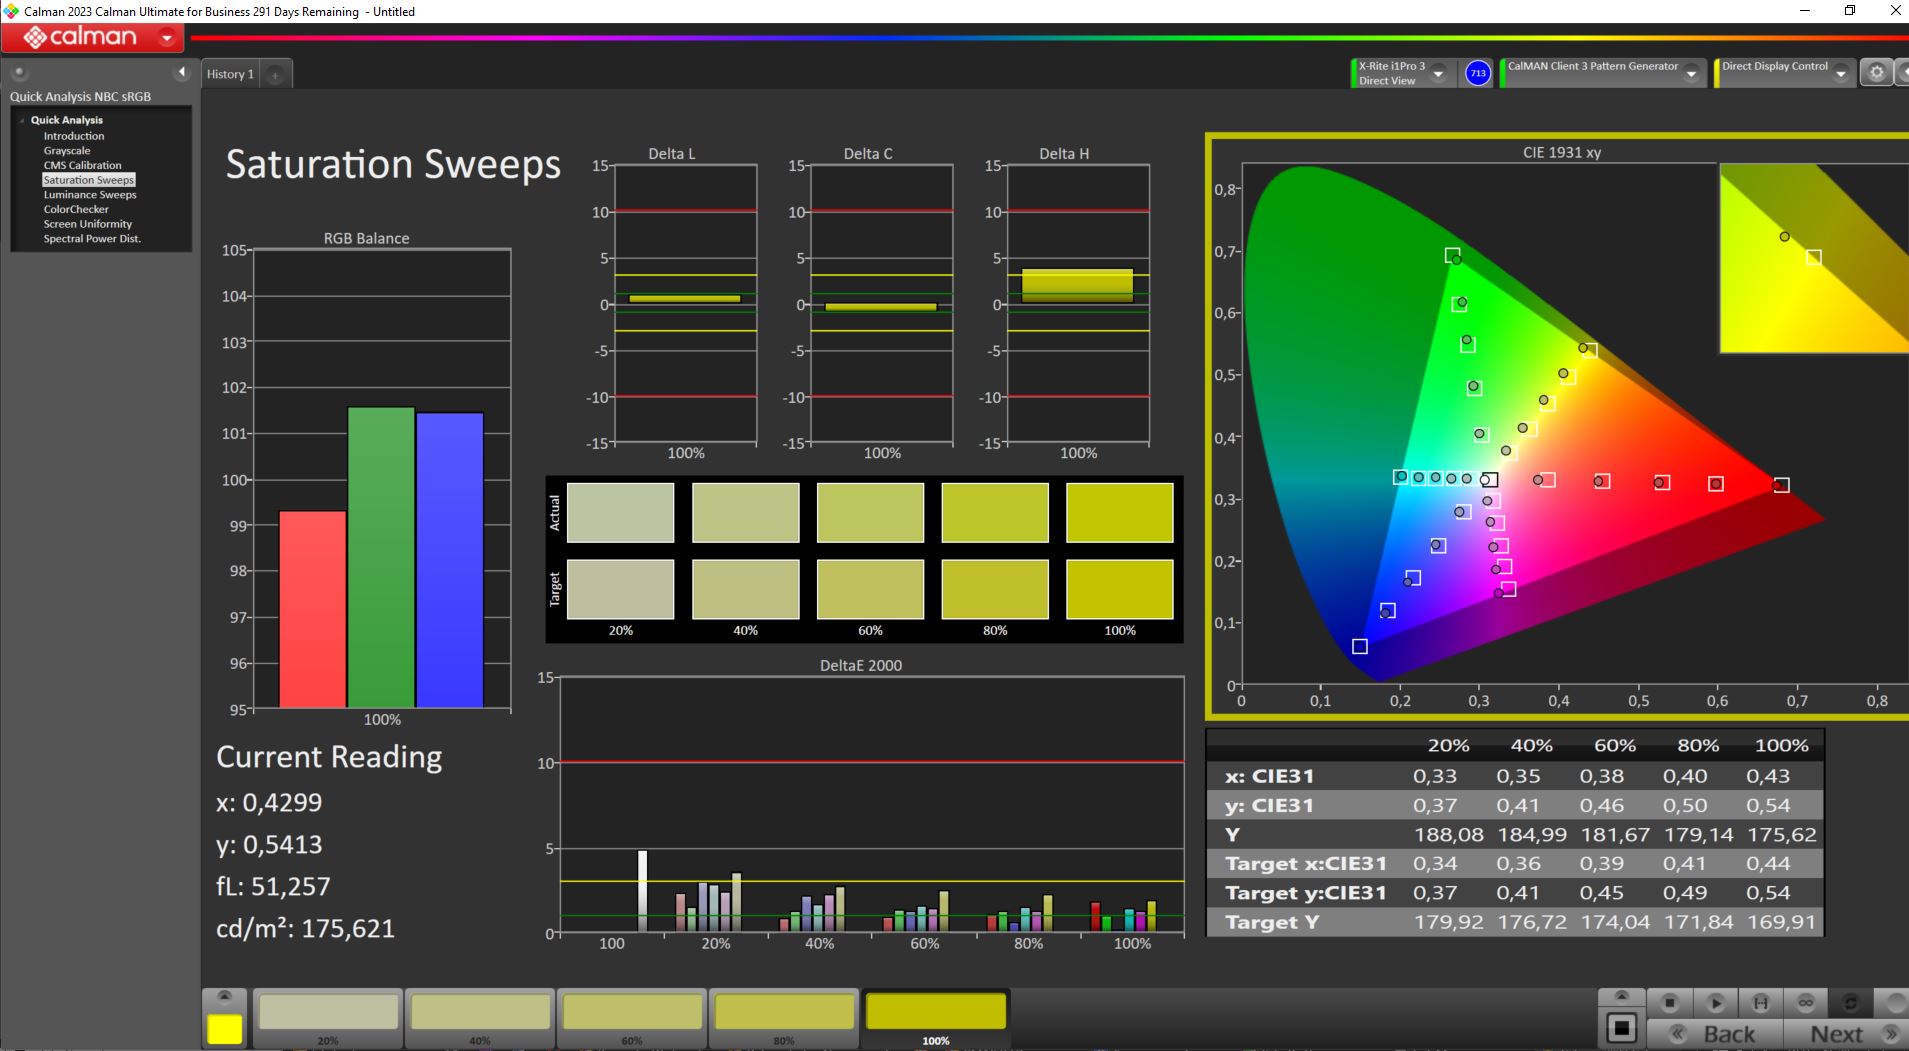
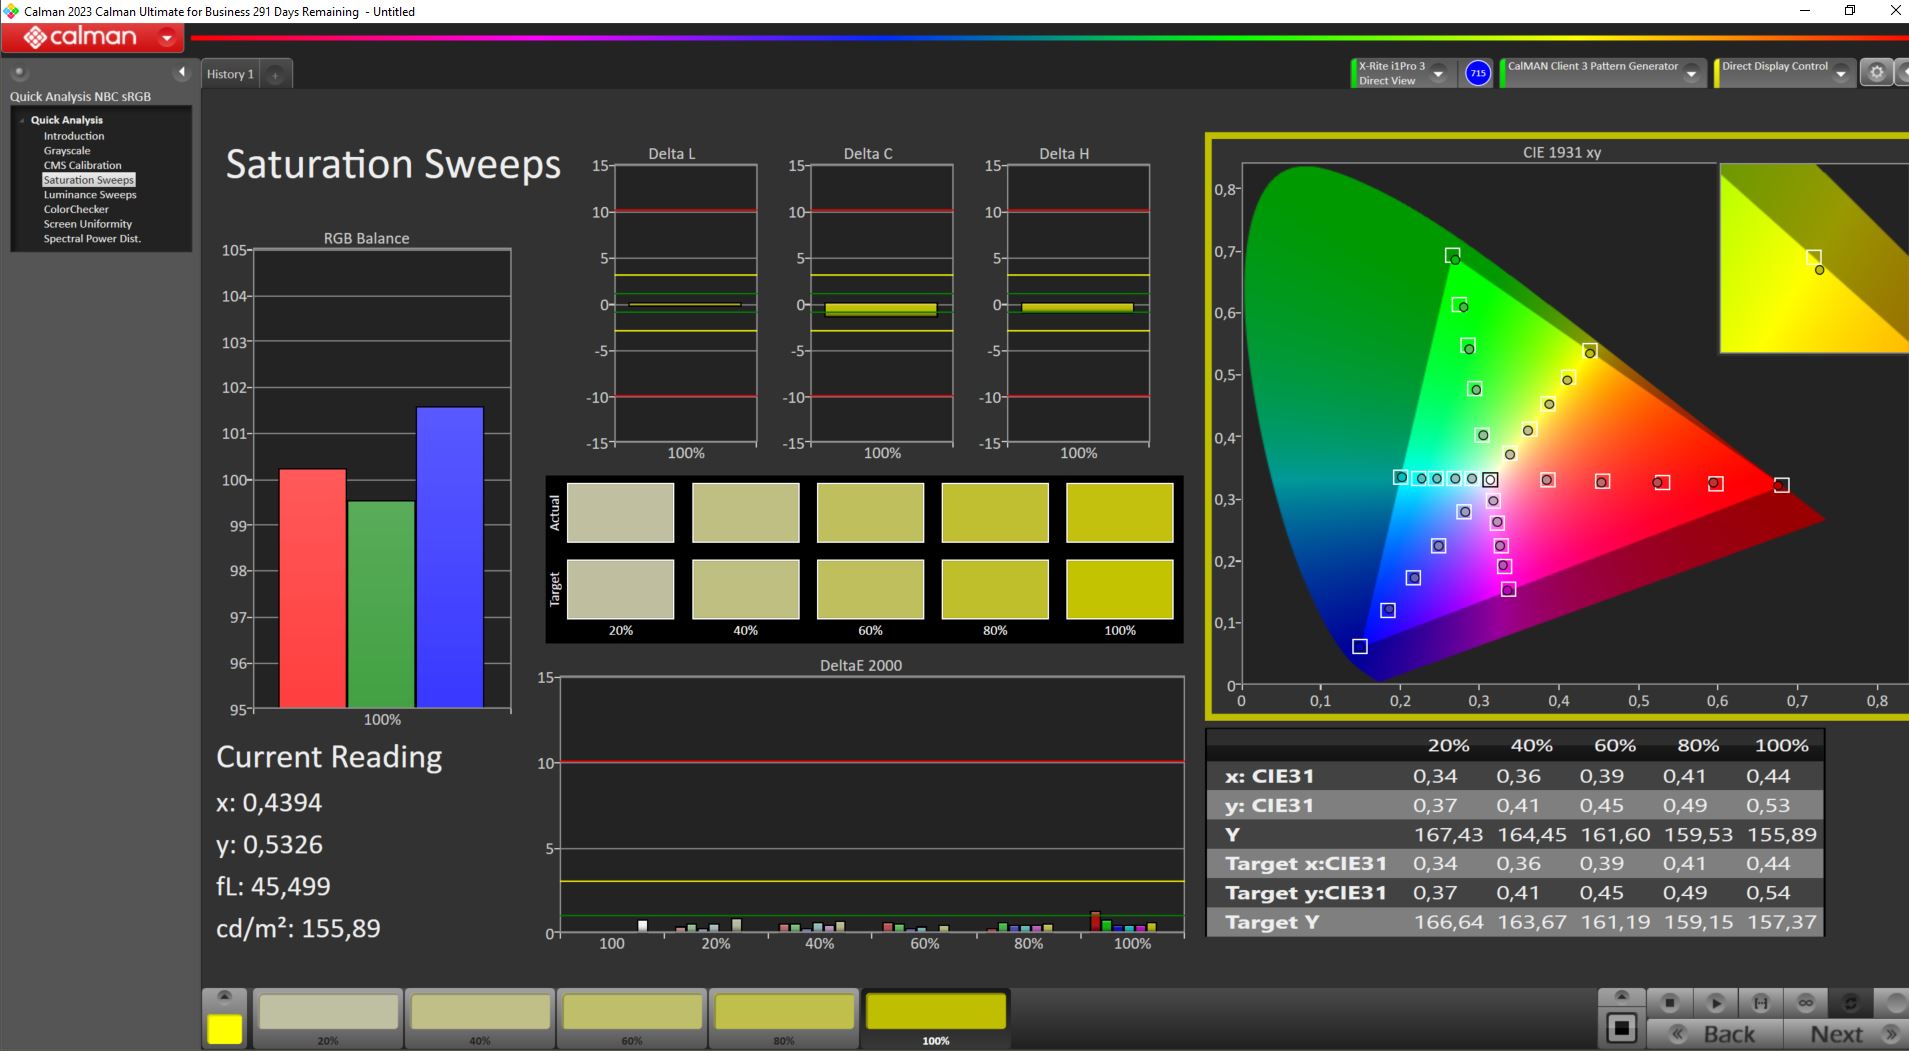
De fábrica, la pantalla no viene calibrada de forma óptima, pero nuestra calibración con el dispositivo de medición X-Rite Fab y el software Calman reduce el valor DeltaE (significativo para las desviaciones (de color)) muy por debajo de 1, tanto para la escala de grises como para los colores. Junto con su buena cobertura del espacio de color (véase la última fila de imágenes a continuación), la pantalla también es adecuada para la edición semiprofesional de imágenes y vídeo.

Tiempos de respuesta del display
| ↔ Tiempo de respuesta de Negro a Blanco | ||
|---|---|---|
| 11.7 ms ... subida ↗ y bajada ↘ combinada | ↗ 7.2 ms subida | 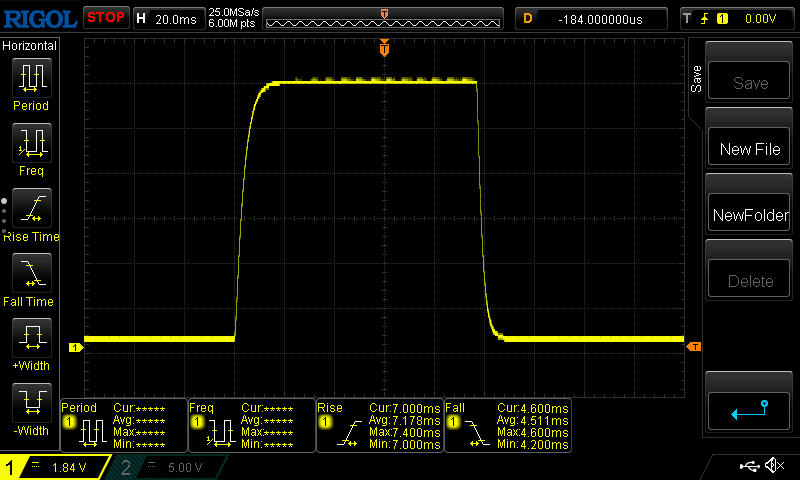 |
| ↘ 4.5 ms bajada | ||
| La pantalla mostró buenos tiempos de respuesta en nuestros tests pero podría ser demasiado lenta para los jugones competitivos. En comparación, todos los dispositivos de prueba van de ##min### (mínimo) a 240 (máximo) ms. » 32 % de todos los dispositivos son mejores. Esto quiere decir que el tiempo de respuesta medido es mejor que la media (19.8 ms) de todos los dispositivos testados. | ||
| ↔ Tiempo de respuesta 50% Gris a 80% Gris | ||
| 18.9 ms ... subida ↗ y bajada ↘ combinada | ↗ 9.4 ms subida | 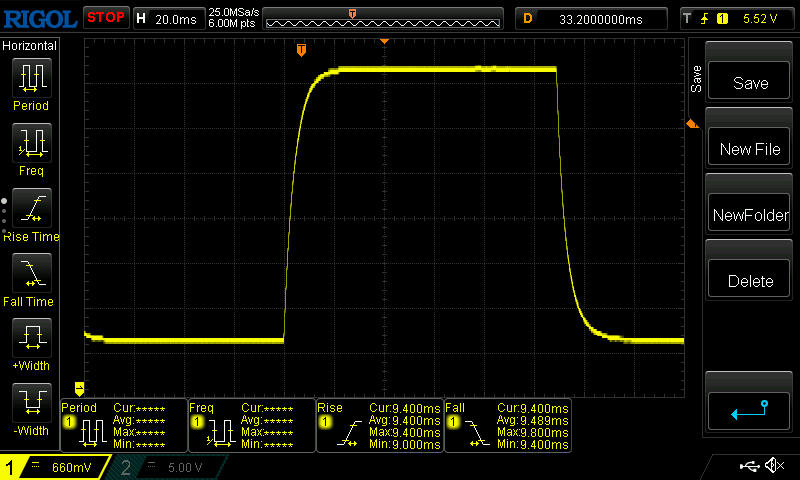 |
| ↘ 9.5 ms bajada | ||
| La pantalla mostró buenos tiempos de respuesta en nuestros tests pero podría ser demasiado lenta para los jugones competitivos. En comparación, todos los dispositivos de prueba van de ##min### (mínimo) a 636 (máximo) ms. » 33 % de todos los dispositivos son mejores. Esto quiere decir que el tiempo de respuesta medido es mejor que la media (31 ms) de todos los dispositivos testados. | ||
Parpadeo de Pantalla / PWM (Pulse-Width Modulation)
| Parpadeo de Pantalla / PWM no detectado | 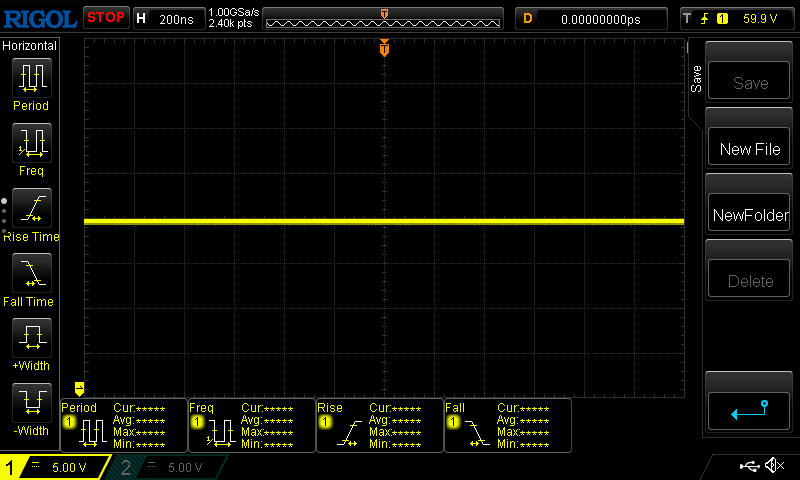 | ||
Comparación: 52 % de todos los dispositivos testados no usaron PWM para atenuar el display. Si se usó, medimos una media de 7751 (mínimo: 5 - máxmo: 343500) Hz. | |||
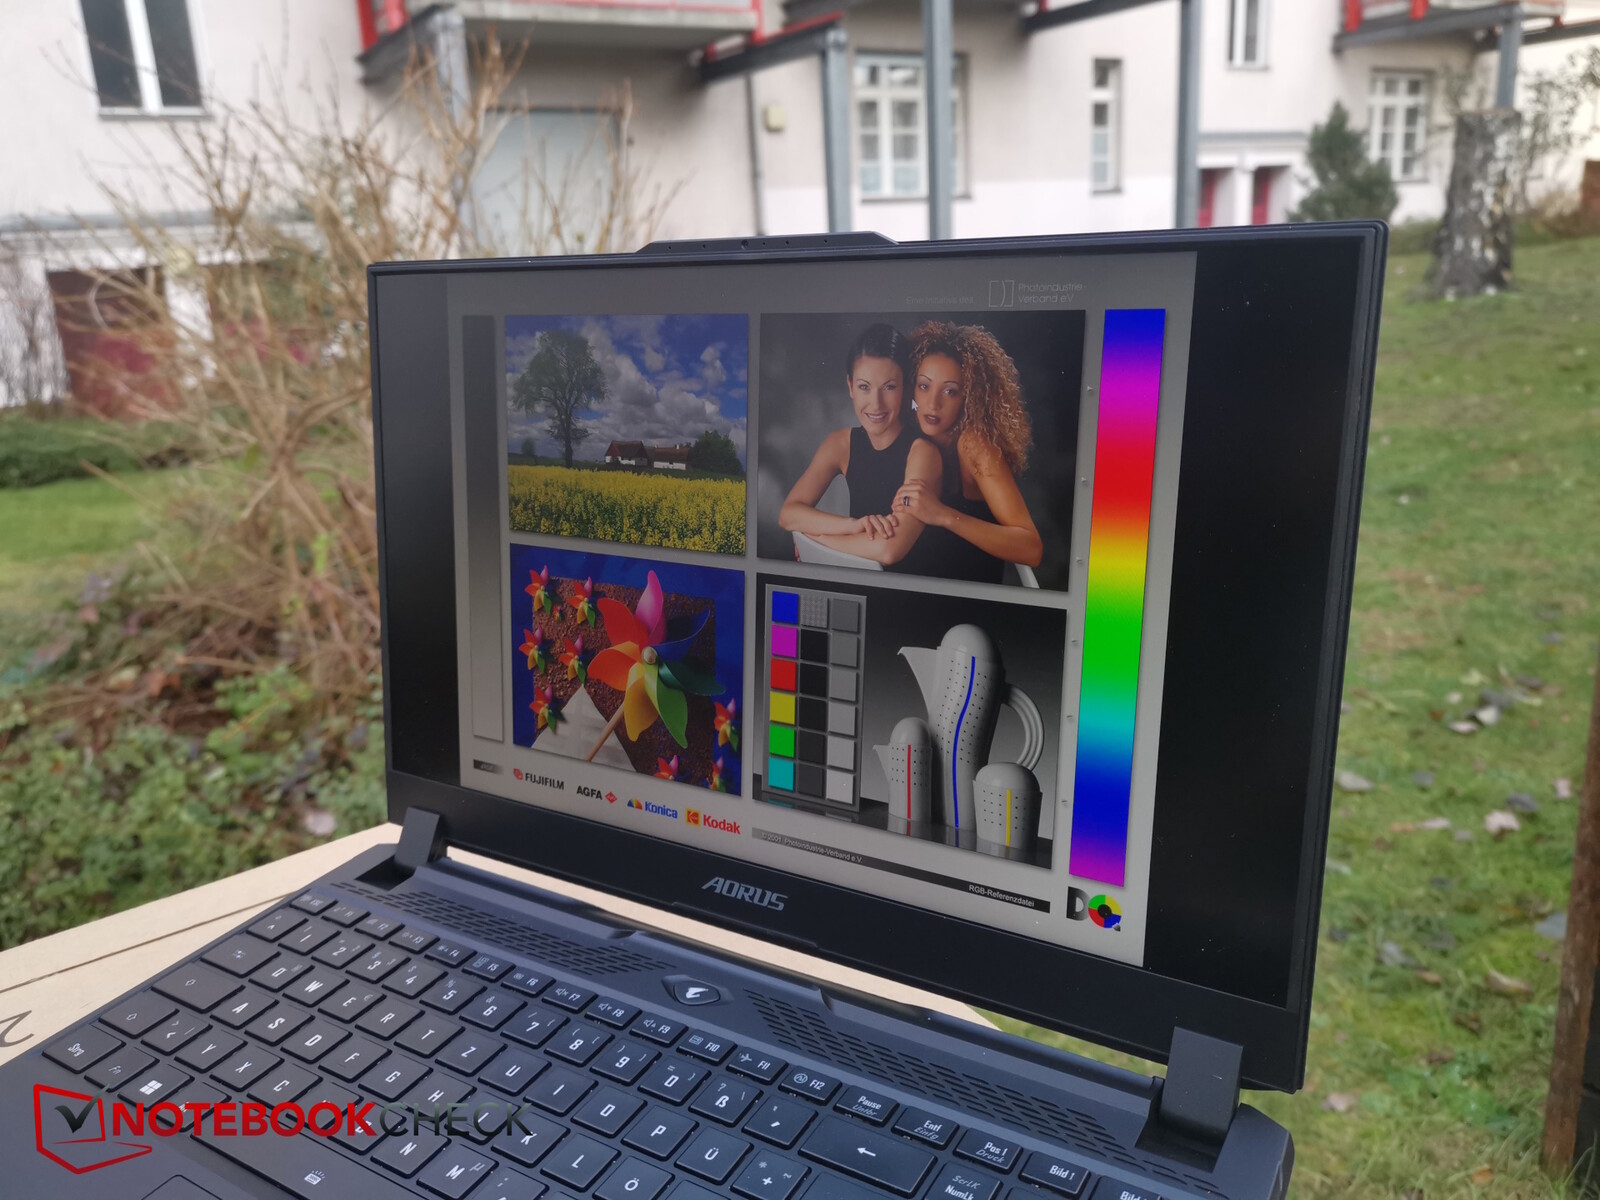
Gracias a su aceptable brillo de más de 300 nits y a su superficie mate, el contenido de la pantalla del portátil sigue siendo fácil de ver en entornos sombreados.

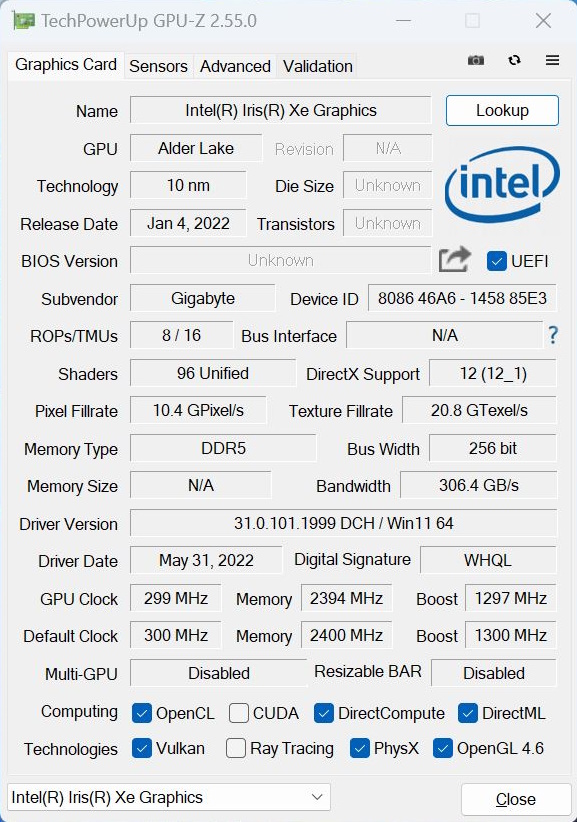
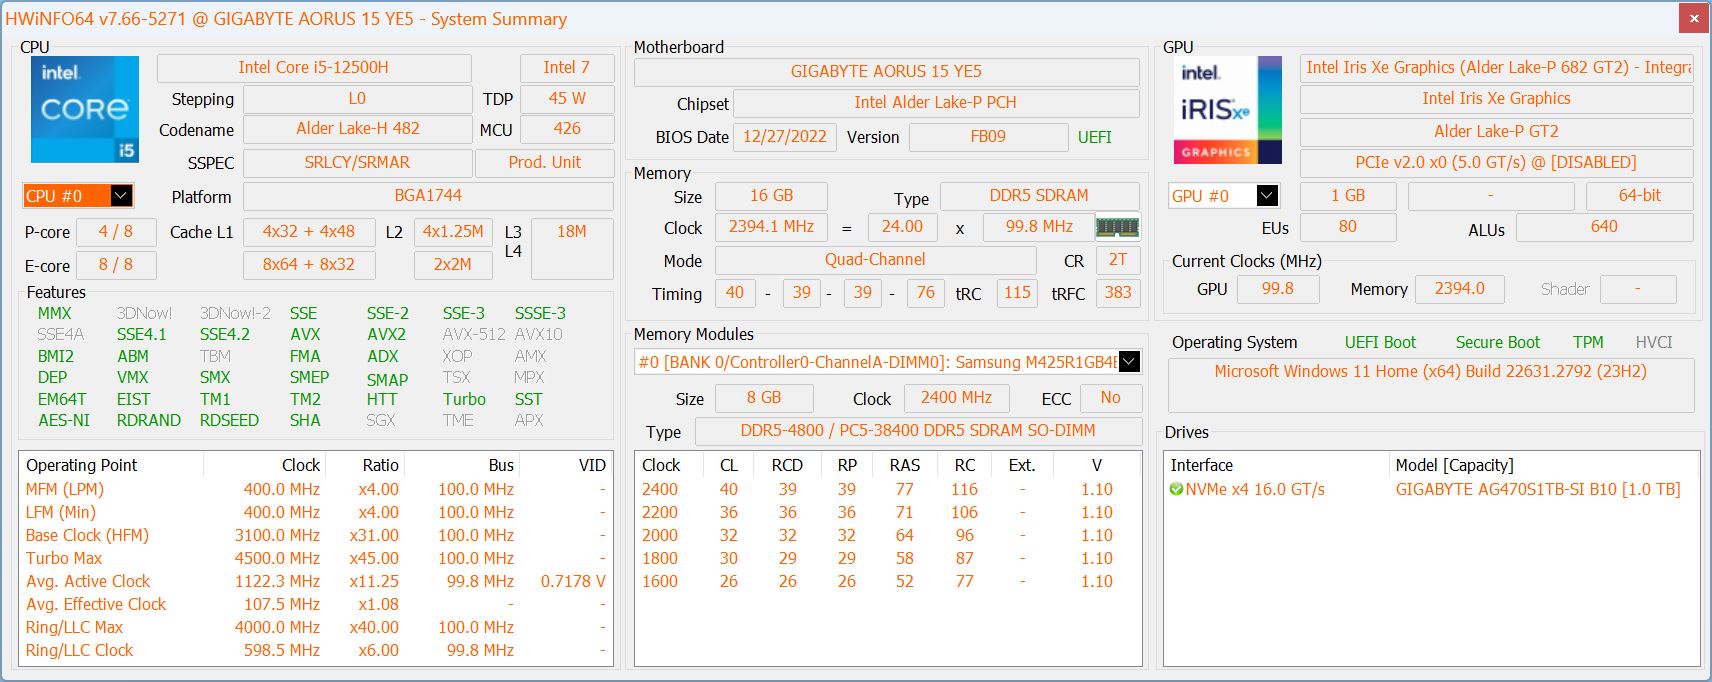
Rendimiento - La última generación sigue cumpliendo
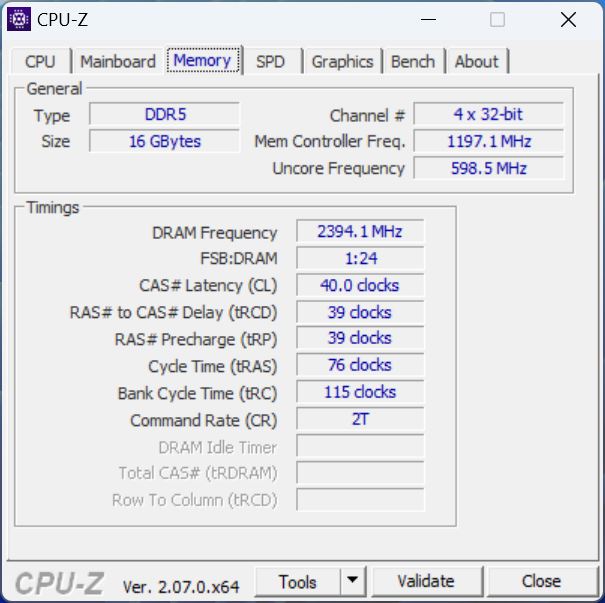
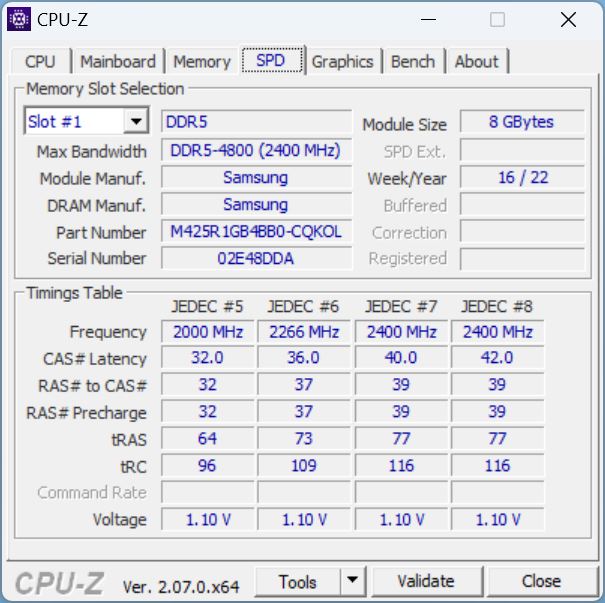
La CPU y la GPU de última generación alimentan el sistema. El antiguo Core i5-12500H tiene acceso a 16 GB de moderna RAM DDR5 4800 y a una SSD NVMe de 1 TB de Gigabyte. Junto con su RTX 3080 Tiel Aorus 15 YE5 puede clasificarse definitivamente como un gamer de gama alta - a pesar de su CPU de última generación y de gama media.
Condiciones de prueba
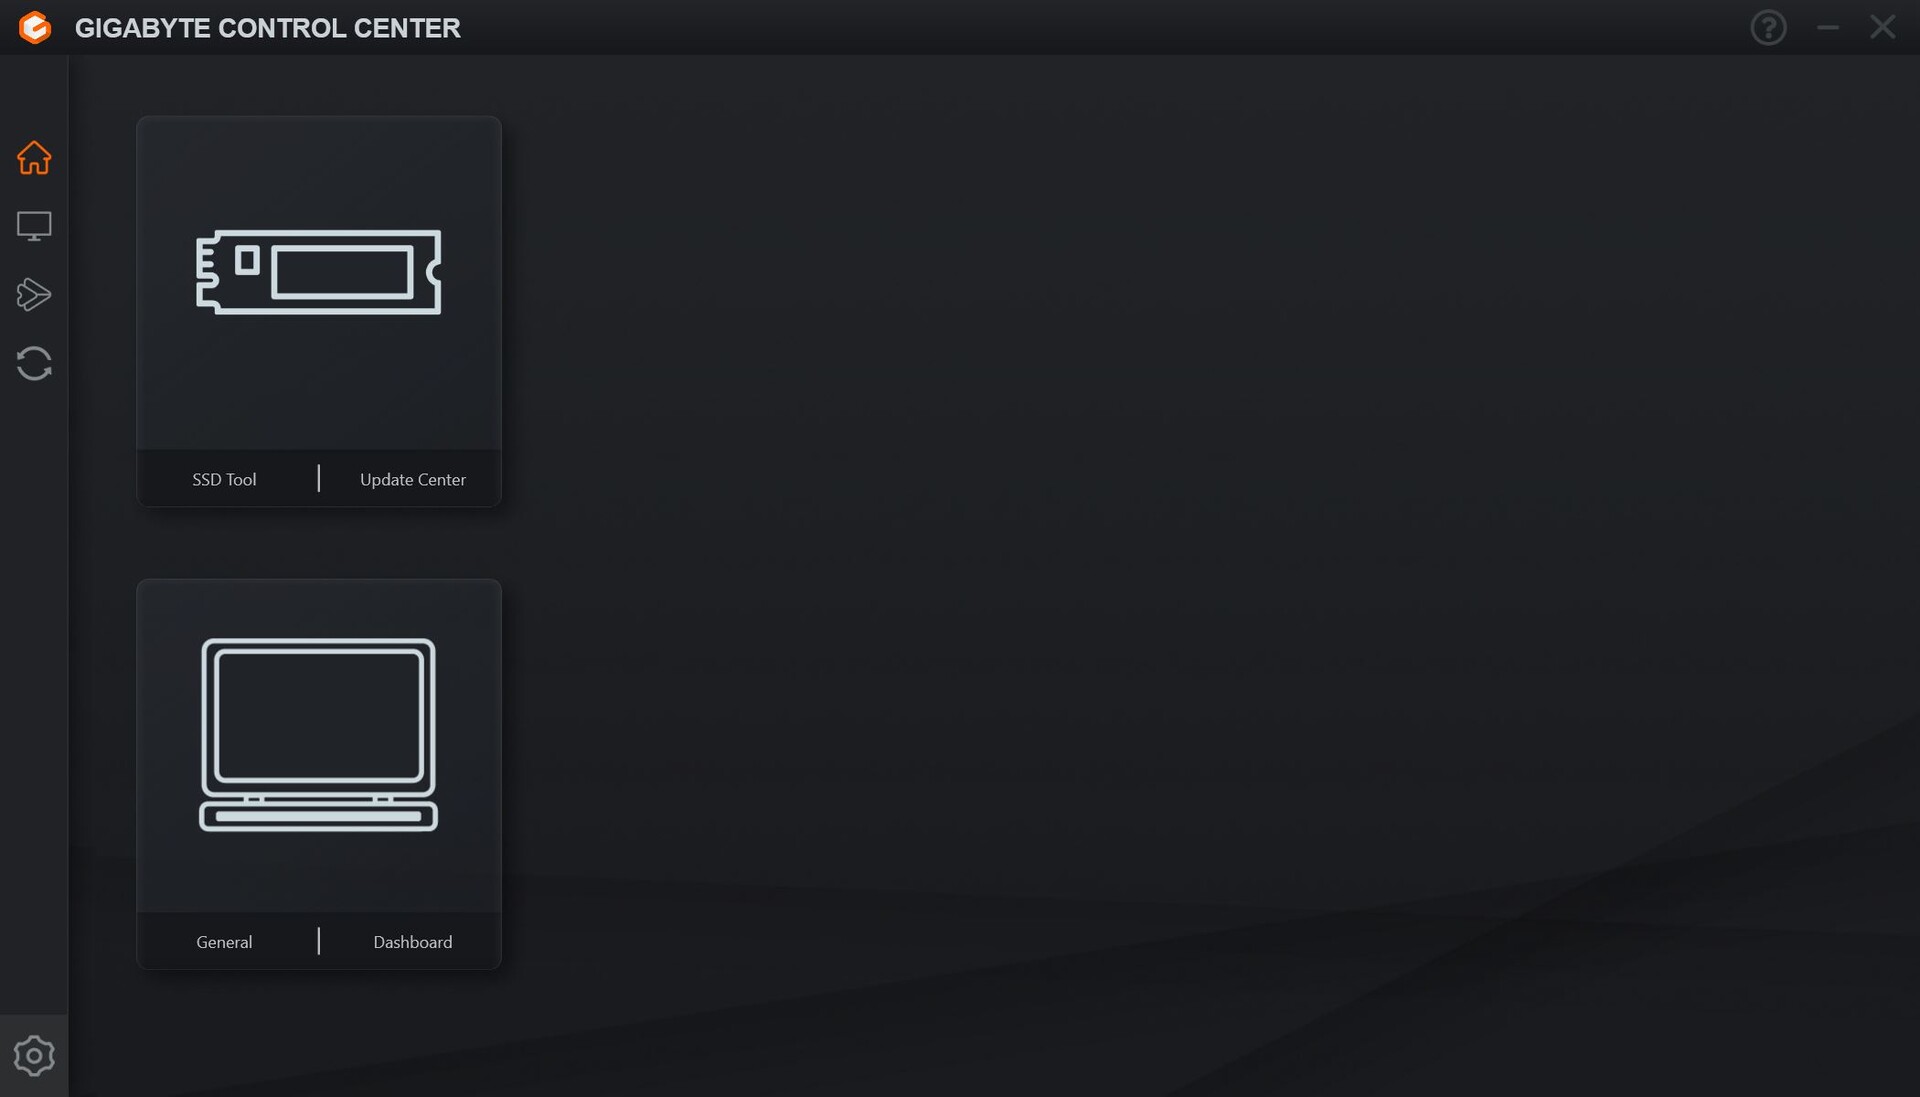
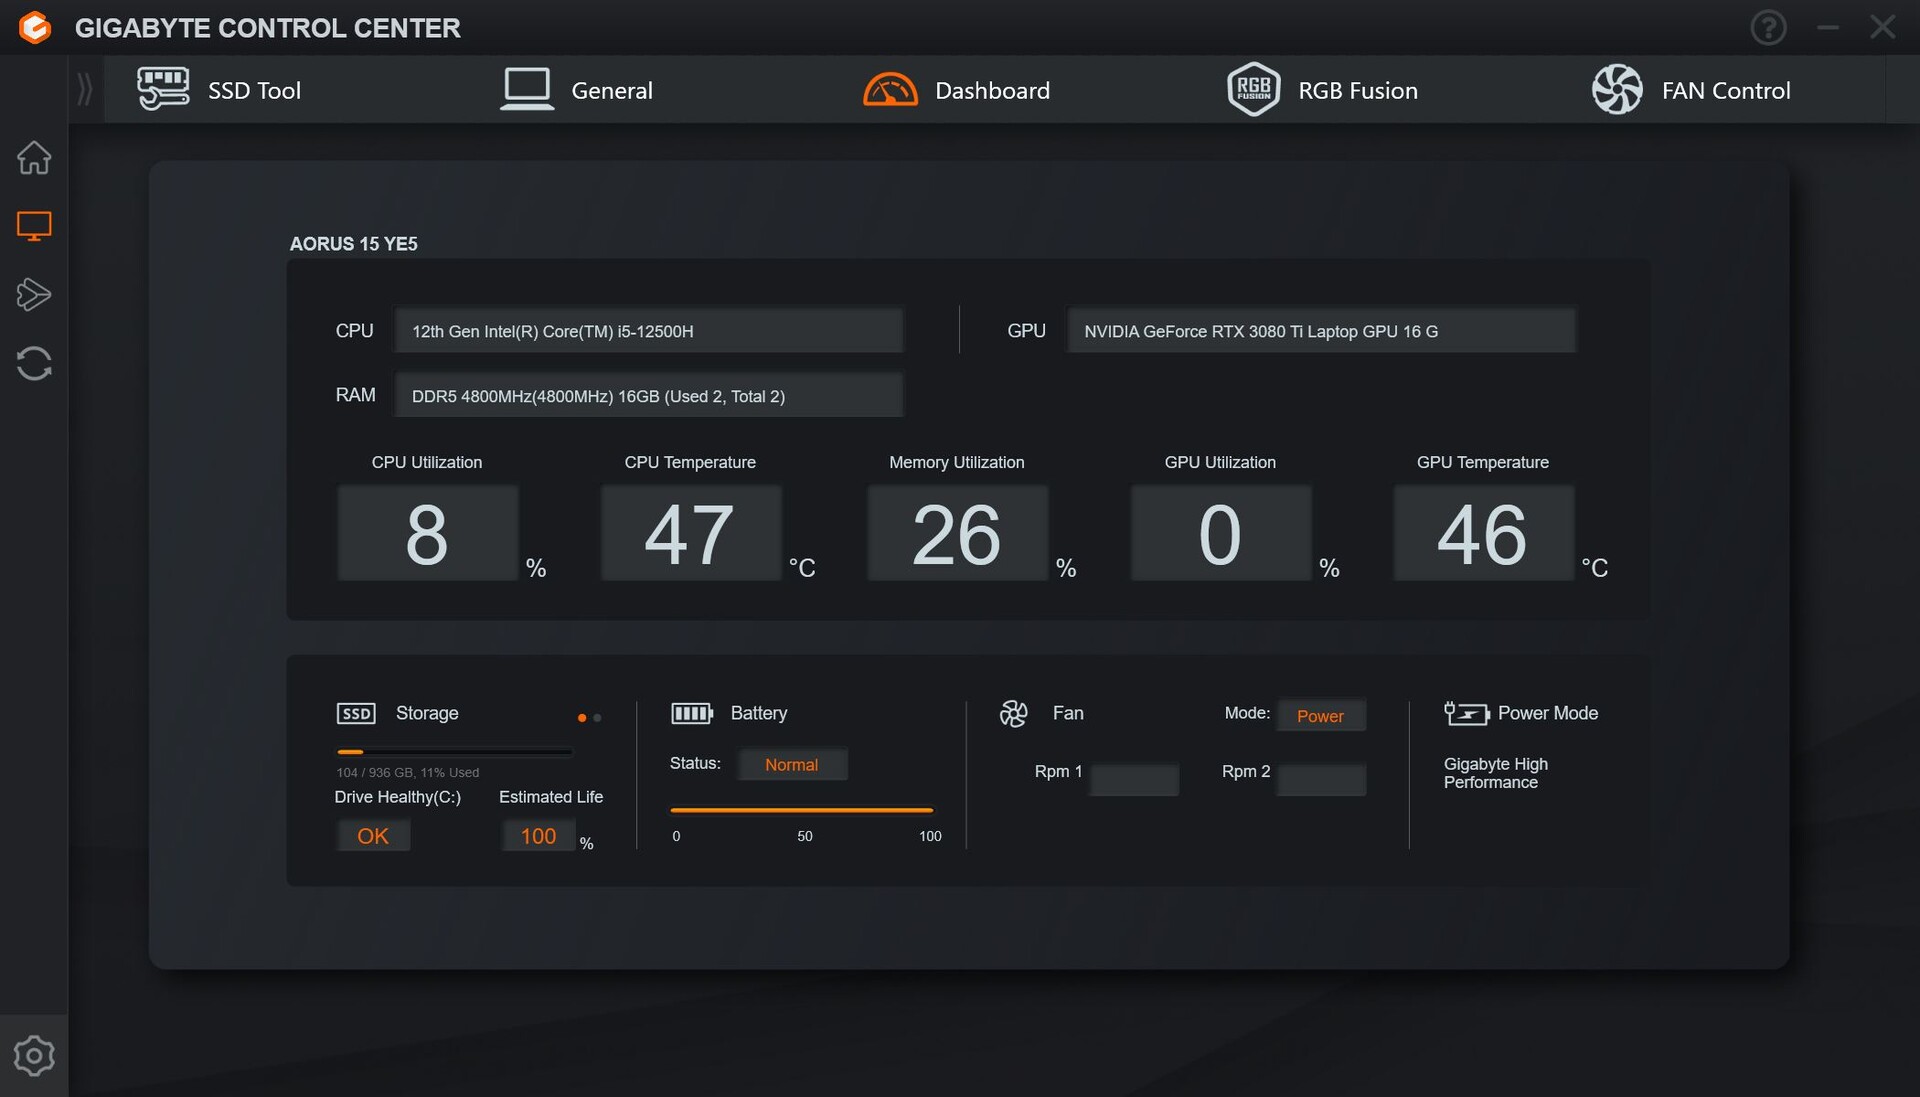
Ex funciona, el portátil no venía preinstalado con un Centro de Control - debería o puede descargarse de la página web de soporte de Gigabyte https://www.gigabyte.com/de/Laptop/AORUS-15--Intel-12th-Gen/support#support-dl-utility si es necesario.
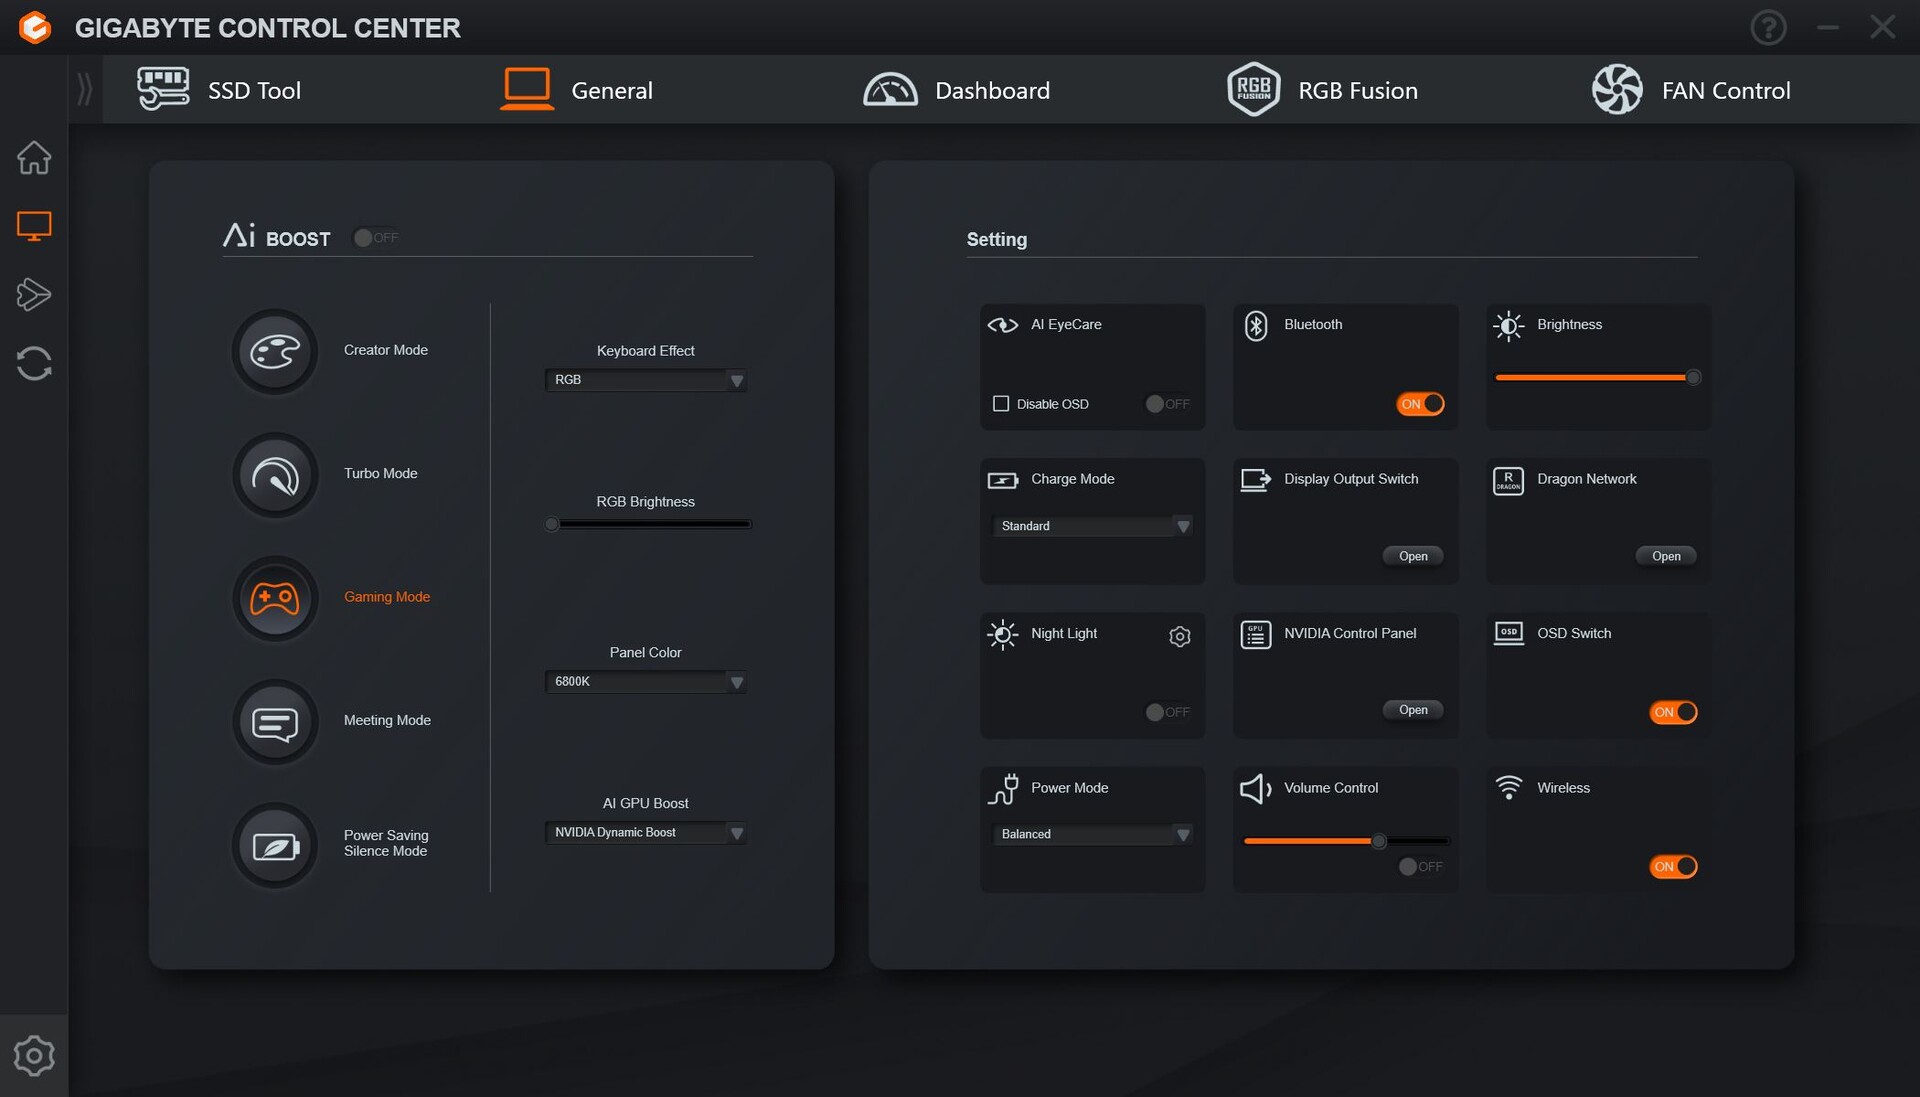
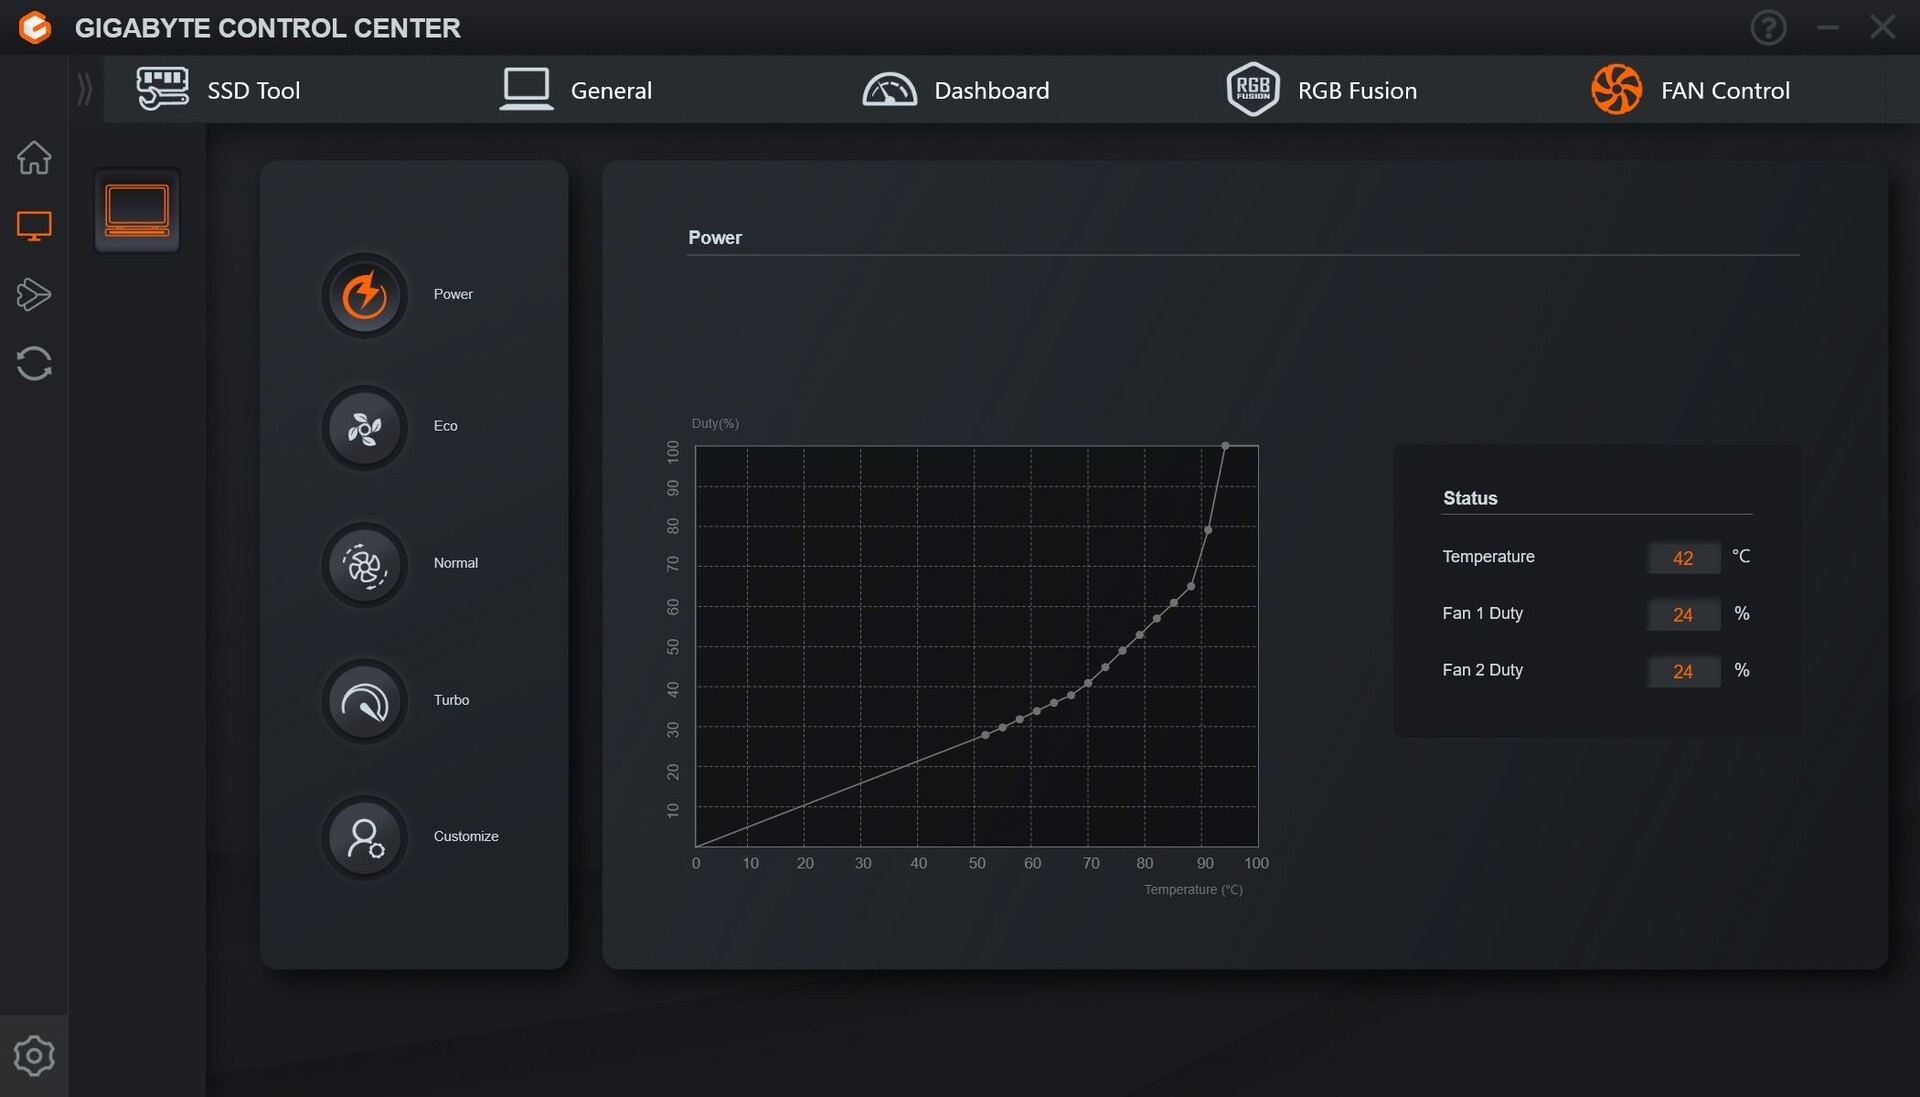
El Centro de Control de Gigabyte contiene muchos ajustes importantes que controlan el rendimiento, la retroiluminación del teclado y el SSD. Al menú le vendría bien estar un poco mejor estructurado, ya que la pantalla de inicio no parece mostrar ninguna información útil - se supone que primero debe seleccionar el propio portátil o el SSD para obtener más información. Sin embargo, puede hacer lo mismo en los menús correspondientes, por lo que la pantalla de inicio en particular parece carecer de sentido. También echamos de menos la opción de cambiar de GPU.
Por lo demás, hay modos de rendimiento, así como curvas de ventilador, un modo de rendimiento ajustable por separado y varias opciones más. Utilizamos el modo de juego para nuestros puntos de referencia. Al utilizar el modo turbo, aún más potente, los ventiladores siempre funcionan a toda velocidad.
Unas palabras sobre su modo de espera: Con Aorus (incluido el Aorus 15G), parece ser habitual que el portátil pase al modo de espera en cuanto se cierra ligeramente la tapa del portátil. Esto es extremadamente molesto, por ejemplo, si está utilizando un monitor externo y desea plegar ligeramente la tapa del portátil hacia delante. Sin embargo, el sistema se apaga en torno a los 40 o 45 grados, lo que es demasiado pronto y le pone de los nervios. Un portátil sólo debería apagarse cuando está realmente cerrado y no a medio camino.
Procesador
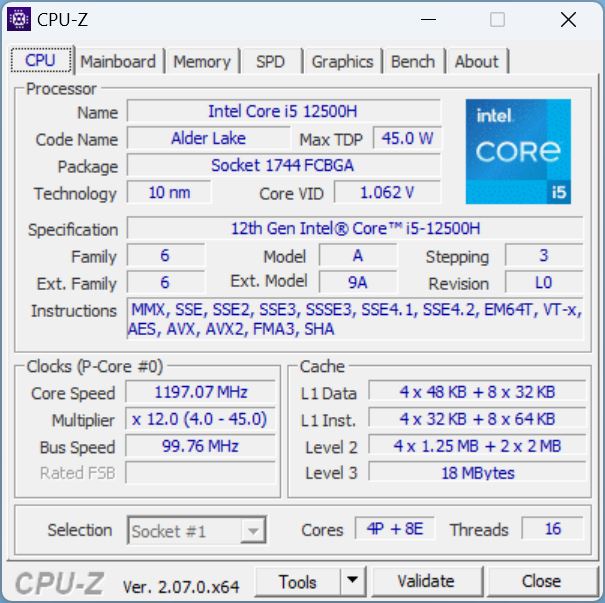
El portátil incorpora una CPU Alder Lake - el Core i5-12500H - con 4 núcleos P y 8 núcleos E. Esto suma 8 núcleos y 16 hilos en total. La antigua CPU de gama media-alta ha ahorrado dinero al fabricante.
Durante el bucle Cinebench R15, su rendimiento se hundió un poco en las dos primeras ejecuciones, después se mantuvo estable.
A lo largo de todas las pruebas de la CPU, quedó claro que la Gen 13 ofrece una ventaja de velocidad significativa (pero no enorme) sobre la Gen 12.
El Captiva con un i5-13500H quedó un 13% por delante. Los otros competidores con el mejor i7-13700H oscilaron entre ser un escaso 8 por ciento mejores (HP Victus) hasta un notable 22% mejor (Aorus 15 BSF).
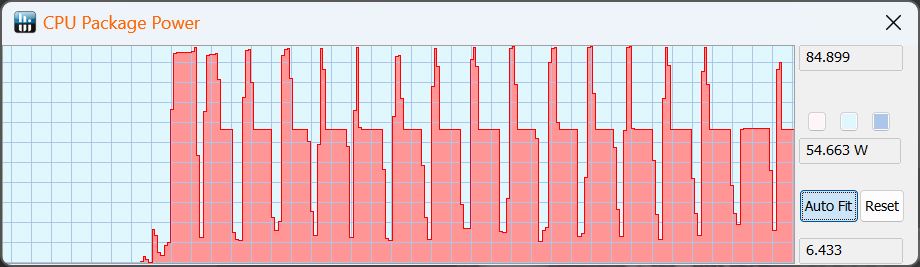
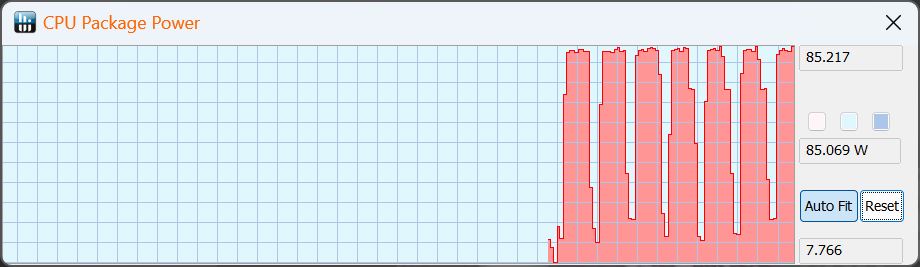
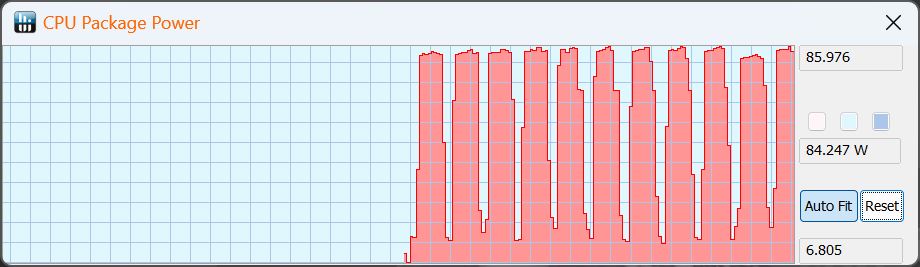
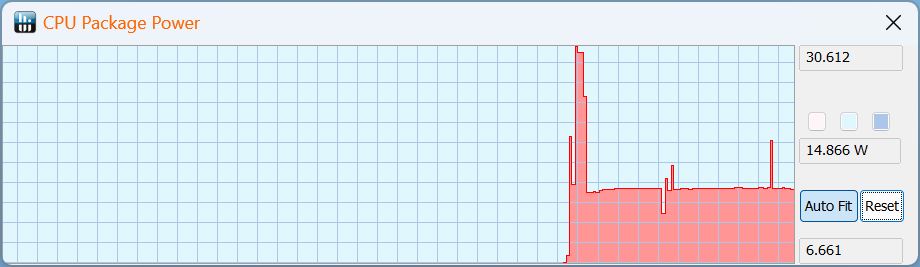
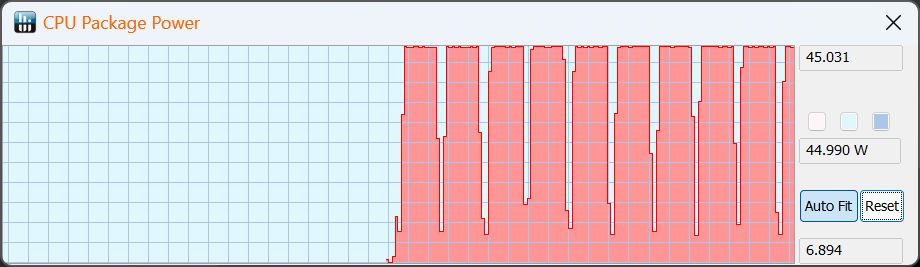
| Cinebench R15 | Puntuación multihilo (1ª ejecución) | Consumo de energía de la CPU en vatios |
|---|---|---|
| AI Boost | 2.277 | 85 |
| Turbo | 2.283 | 85 |
| Gaming | 2.283 | 85, baja a 55 |
| Creador | 2.239 | 85 |
| Reunión | 836 | 30, baja rápidamente a 15 |
| Ahorro de energía | 724 | 30, baja al 15 |
| Batería | 1.670 | 45 |
Cinebench R15 Multi continuous test
Cinebench R23: Multi Core | Single Core
Cinebench R20: CPU (Multi Core) | CPU (Single Core)
Cinebench R15: CPU Multi 64Bit | CPU Single 64Bit
Blender: v2.79 BMW27 CPU
7-Zip 18.03: 7z b 4 | 7z b 4 -mmt1
Geekbench 5.5: Multi-Core | Single-Core
HWBOT x265 Benchmark v2.2: 4k Preset
LibreOffice : 20 Documents To PDF
R Benchmark 2.5: Overall mean
| CPU Performance rating | |
| Media de la clase Gaming | |
| HP Omen 16-wf000 -1! | |
| Aorus 15 BSF | |
| Dell XPS 15 9530 RTX 4070 | |
| Captiva Advanced Gaming I74-121 | |
| HP Victus 16-r0077ng | |
| Medio Intel Core i5-12500H | |
| Aorus 15 YE5-54DEB34SH | |
| Cinebench R23 / Multi Core | |
| Media de la clase Gaming (10488 - 42661, n=108, últimos 2 años) | |
| HP Omen 16-wf000 | |
| Aorus 15 BSF | |
| Captiva Advanced Gaming I74-121 | |
| Dell XPS 15 9530 RTX 4070 | |
| HP Victus 16-r0077ng | |
| Aorus 15 YE5-54DEB34SH | |
| Medio Intel Core i5-12500H (11330 - 14686, n=9) | |
| Cinebench R23 / Single Core | |
| Media de la clase Gaming (1166 - 2415, n=108, últimos 2 años) | |
| Aorus 15 BSF | |
| HP Omen 16-wf000 | |
| Dell XPS 15 9530 RTX 4070 | |
| Captiva Advanced Gaming I74-121 | |
| Aorus 15 YE5-54DEB34SH | |
| HP Victus 16-r0077ng | |
| Medio Intel Core i5-12500H (1558 - 1701, n=9) | |
| Cinebench R20 / CPU (Multi Core) | |
| Media de la clase Gaming (4029 - 16433, n=107, últimos 2 años) | |
| HP Omen 16-wf000 | |
| Aorus 15 BSF | |
| Captiva Advanced Gaming I74-121 | |
| Dell XPS 15 9530 RTX 4070 | |
| HP Victus 16-r0077ng | |
| Medio Intel Core i5-12500H (4687 - 5640, n=9) | |
| Aorus 15 YE5-54DEB34SH | |
| Cinebench R20 / CPU (Single Core) | |
| Media de la clase Gaming (442 - 913, n=107, últimos 2 años) | |
| Aorus 15 BSF | |
| HP Omen 16-wf000 | |
| Dell XPS 15 9530 RTX 4070 | |
| Captiva Advanced Gaming I74-121 | |
| Aorus 15 YE5-54DEB34SH | |
| HP Victus 16-r0077ng | |
| Medio Intel Core i5-12500H (602 - 656, n=9) | |
| Cinebench R15 / CPU Multi 64Bit | |
| Media de la clase Gaming (1578 - 6330, n=106, últimos 2 años) | |
| HP Omen 16-wf000 | |
| Aorus 15 BSF | |
| Dell XPS 15 9530 RTX 4070 | |
| Captiva Advanced Gaming I74-121 | |
| HP Victus 16-r0077ng | |
| Aorus 15 YE5-54DEB34SH | |
| Medio Intel Core i5-12500H (1970 - 2283, n=10) | |
| Cinebench R15 / CPU Single 64Bit | |
| Media de la clase Gaming (188.8 - 350, n=107, últimos 2 años) | |
| Aorus 15 BSF | |
| Dell XPS 15 9530 RTX 4070 | |
| HP Omen 16-wf000 | |
| Captiva Advanced Gaming I74-121 | |
| Aorus 15 YE5-54DEB34SH | |
| HP Victus 16-r0077ng | |
| Medio Intel Core i5-12500H (220 - 250, n=9) | |
| Blender / v2.79 BMW27 CPU | |
| Aorus 15 YE5-54DEB34SH | |
| Medio Intel Core i5-12500H (223 - 288, n=9) | |
| Aorus 15 BSF | |
| Dell XPS 15 9530 RTX 4070 | |
| HP Victus 16-r0077ng | |
| Captiva Advanced Gaming I74-121 | |
| Media de la clase Gaming (79 - 330, n=105, últimos 2 años) | |
| 7-Zip 18.03 / 7z b 4 | |
| Media de la clase Gaming (33491 - 148086, n=106, últimos 2 años) | |
| HP Omen 16-wf000 | |
| HP Victus 16-r0077ng | |
| Aorus 15 BSF | |
| Dell XPS 15 9530 RTX 4070 | |
| Captiva Advanced Gaming I74-121 | |
| Aorus 15 YE5-54DEB34SH | |
| Medio Intel Core i5-12500H (44105 - 54380, n=9) | |
| 7-Zip 18.03 / 7z b 4 -mmt1 | |
| Media de la clase Gaming (4199 - 7436, n=106, últimos 2 años) | |
| Aorus 15 BSF | |
| Dell XPS 15 9530 RTX 4070 | |
| HP Omen 16-wf000 | |
| Captiva Advanced Gaming I74-121 | |
| HP Victus 16-r0077ng | |
| Aorus 15 YE5-54DEB34SH | |
| Medio Intel Core i5-12500H (5151 - 5563, n=9) | |
| Geekbench 5.5 / Multi-Core | |
| Media de la clase Gaming (6460 - 28263, n=106, últimos 2 años) | |
| HP Omen 16-wf000 | |
| Aorus 15 BSF | |
| Dell XPS 15 9530 RTX 4070 | |
| HP Victus 16-r0077ng | |
| Aorus 15 YE5-54DEB34SH | |
| Captiva Advanced Gaming I74-121 | |
| Medio Intel Core i5-12500H (7962 - 10828, n=9) | |
| Geekbench 5.5 / Single-Core | |
| Media de la clase Gaming (986 - 2474, n=106, últimos 2 años) | |
| Dell XPS 15 9530 RTX 4070 | |
| HP Omen 16-wf000 | |
| Aorus 15 BSF | |
| Captiva Advanced Gaming I74-121 | |
| HP Victus 16-r0077ng | |
| Aorus 15 YE5-54DEB34SH | |
| Medio Intel Core i5-12500H (1471 - 1693, n=9) | |
| HWBOT x265 Benchmark v2.2 / 4k Preset | |
| Media de la clase Gaming (11.5 - 44.4, n=106, últimos 2 años) | |
| HP Omen 16-wf000 | |
| Captiva Advanced Gaming I74-121 | |
| Dell XPS 15 9530 RTX 4070 | |
| HP Victus 16-r0077ng | |
| Aorus 15 BSF | |
| Aorus 15 YE5-54DEB34SH | |
| Medio Intel Core i5-12500H (12 - 16.6, n=9) | |
| LibreOffice / 20 Documents To PDF | |
| HP Victus 16-r0077ng | |
| Aorus 15 YE5-54DEB34SH | |
| Captiva Advanced Gaming I74-121 | |
| Media de la clase Gaming (33.2 - 88.8, n=106, últimos 2 años) | |
| Medio Intel Core i5-12500H (40.1 - 58.5, n=9) | |
| Aorus 15 BSF | |
| HP Omen 16-wf000 | |
| Dell XPS 15 9530 RTX 4070 | |
| R Benchmark 2.5 / Overall mean | |
| Aorus 15 YE5-54DEB34SH | |
| Medio Intel Core i5-12500H (0.4748 - 0.535, n=9) | |
| HP Victus 16-r0077ng | |
| Captiva Advanced Gaming I74-121 | |
| HP Omen 16-wf000 | |
| Aorus 15 BSF | |
| Dell XPS 15 9530 RTX 4070 | |
| Media de la clase Gaming (0.3439 - 0.759, n=107, últimos 2 años) | |
* ... más pequeño es mejor
AIDA64: FP32 Ray-Trace | FPU Julia | CPU SHA3 | CPU Queen | FPU SinJulia | FPU Mandel | CPU AES | CPU ZLib | FP64 Ray-Trace | CPU PhotoWorxx
| Performance rating | |
| Media de la clase Gaming | |
| Aorus 15 BSF | |
| Captiva Advanced Gaming I74-121 | |
| Dell XPS 15 9530 RTX 4070 | |
| HP Victus 16-r0077ng | |
| Aorus 15 YE5-54DEB34SH | |
| Medio Intel Core i5-12500H | |
| AIDA64 / FP32 Ray-Trace | |
| Media de la clase Gaming (10227 - 85542, n=106, últimos 2 años) | |
| Captiva Advanced Gaming I74-121 | |
| HP Victus 16-r0077ng | |
| Dell XPS 15 9530 RTX 4070 | |
| Aorus 15 BSF | |
| Aorus 15 YE5-54DEB34SH | |
| Medio Intel Core i5-12500H (6851 - 13947, n=9) | |
| AIDA64 / FPU Julia | |
| Media de la clase Gaming (51376 - 372155, n=106, últimos 2 años) | |
| Captiva Advanced Gaming I74-121 | |
| HP Victus 16-r0077ng | |
| Aorus 15 BSF | |
| Dell XPS 15 9530 RTX 4070 | |
| Aorus 15 YE5-54DEB34SH | |
| Medio Intel Core i5-12500H (29874 - 68178, n=9) | |
| AIDA64 / CPU SHA3 | |
| Media de la clase Gaming (2180 - 10115, n=106, últimos 2 años) | |
| Captiva Advanced Gaming I74-121 | |
| HP Victus 16-r0077ng | |
| Aorus 15 BSF | |
| Dell XPS 15 9530 RTX 4070 | |
| Aorus 15 YE5-54DEB34SH | |
| Medio Intel Core i5-12500H (2287 - 3337, n=9) | |
| AIDA64 / CPU Queen | |
| Media de la clase Gaming (49785 - 173351, n=90, últimos 2 años) | |
| Aorus 15 BSF | |
| Dell XPS 15 9530 RTX 4070 | |
| HP Victus 16-r0077ng | |
| Captiva Advanced Gaming I74-121 | |
| Aorus 15 YE5-54DEB34SH | |
| Medio Intel Core i5-12500H (77935 - 80703, n=9) | |
| AIDA64 / FPU SinJulia | |
| Media de la clase Gaming (4424 - 33636, n=106, últimos 2 años) | |
| Aorus 15 BSF | |
| Dell XPS 15 9530 RTX 4070 | |
| HP Victus 16-r0077ng | |
| Captiva Advanced Gaming I74-121 | |
| Aorus 15 YE5-54DEB34SH | |
| Medio Intel Core i5-12500H (6590 - 7431, n=9) | |
| AIDA64 / FPU Mandel | |
| Media de la clase Gaming (25115 - 196829, n=106, últimos 2 años) | |
| Captiva Advanced Gaming I74-121 | |
| HP Victus 16-r0077ng | |
| Dell XPS 15 9530 RTX 4070 | |
| Aorus 15 BSF | |
| Aorus 15 YE5-54DEB34SH | |
| Medio Intel Core i5-12500H (18252 - 34041, n=9) | |
| AIDA64 / CPU AES | |
| Captiva Advanced Gaming I74-121 | |
| Aorus 15 BSF | |
| Aorus 15 YE5-54DEB34SH | |
| Media de la clase Gaming (39258 - 247074, n=106, últimos 2 años) | |
| Medio Intel Core i5-12500H (50298 - 111567, n=9) | |
| HP Victus 16-r0077ng | |
| Dell XPS 15 9530 RTX 4070 | |
| AIDA64 / CPU ZLib | |
| Media de la clase Gaming (574 - 2531, n=106, últimos 2 años) | |
| Captiva Advanced Gaming I74-121 | |
| HP Victus 16-r0077ng | |
| Aorus 15 YE5-54DEB34SH | |
| Dell XPS 15 9530 RTX 4070 | |
| Aorus 15 BSF | |
| Medio Intel Core i5-12500H (746 - 924, n=9) | |
| AIDA64 / FP64 Ray-Trace | |
| Media de la clase Gaming (5509 - 45446, n=106, últimos 2 años) | |
| Captiva Advanced Gaming I74-121 | |
| HP Victus 16-r0077ng | |
| Dell XPS 15 9530 RTX 4070 | |
| Aorus 15 BSF | |
| Aorus 15 YE5-54DEB34SH | |
| Medio Intel Core i5-12500H (3848 - 7405, n=9) | |
| AIDA64 / CPU PhotoWorxx | |
| Media de la clase Gaming (12271 - 89891, n=106, últimos 2 años) | |
| Dell XPS 15 9530 RTX 4070 | |
| HP Victus 16-r0077ng | |
| Aorus 15 BSF | |
| Aorus 15 YE5-54DEB34SH | |
| Medio Intel Core i5-12500H (13686 - 43813, n=9) | |
| Captiva Advanced Gaming I74-121 | |
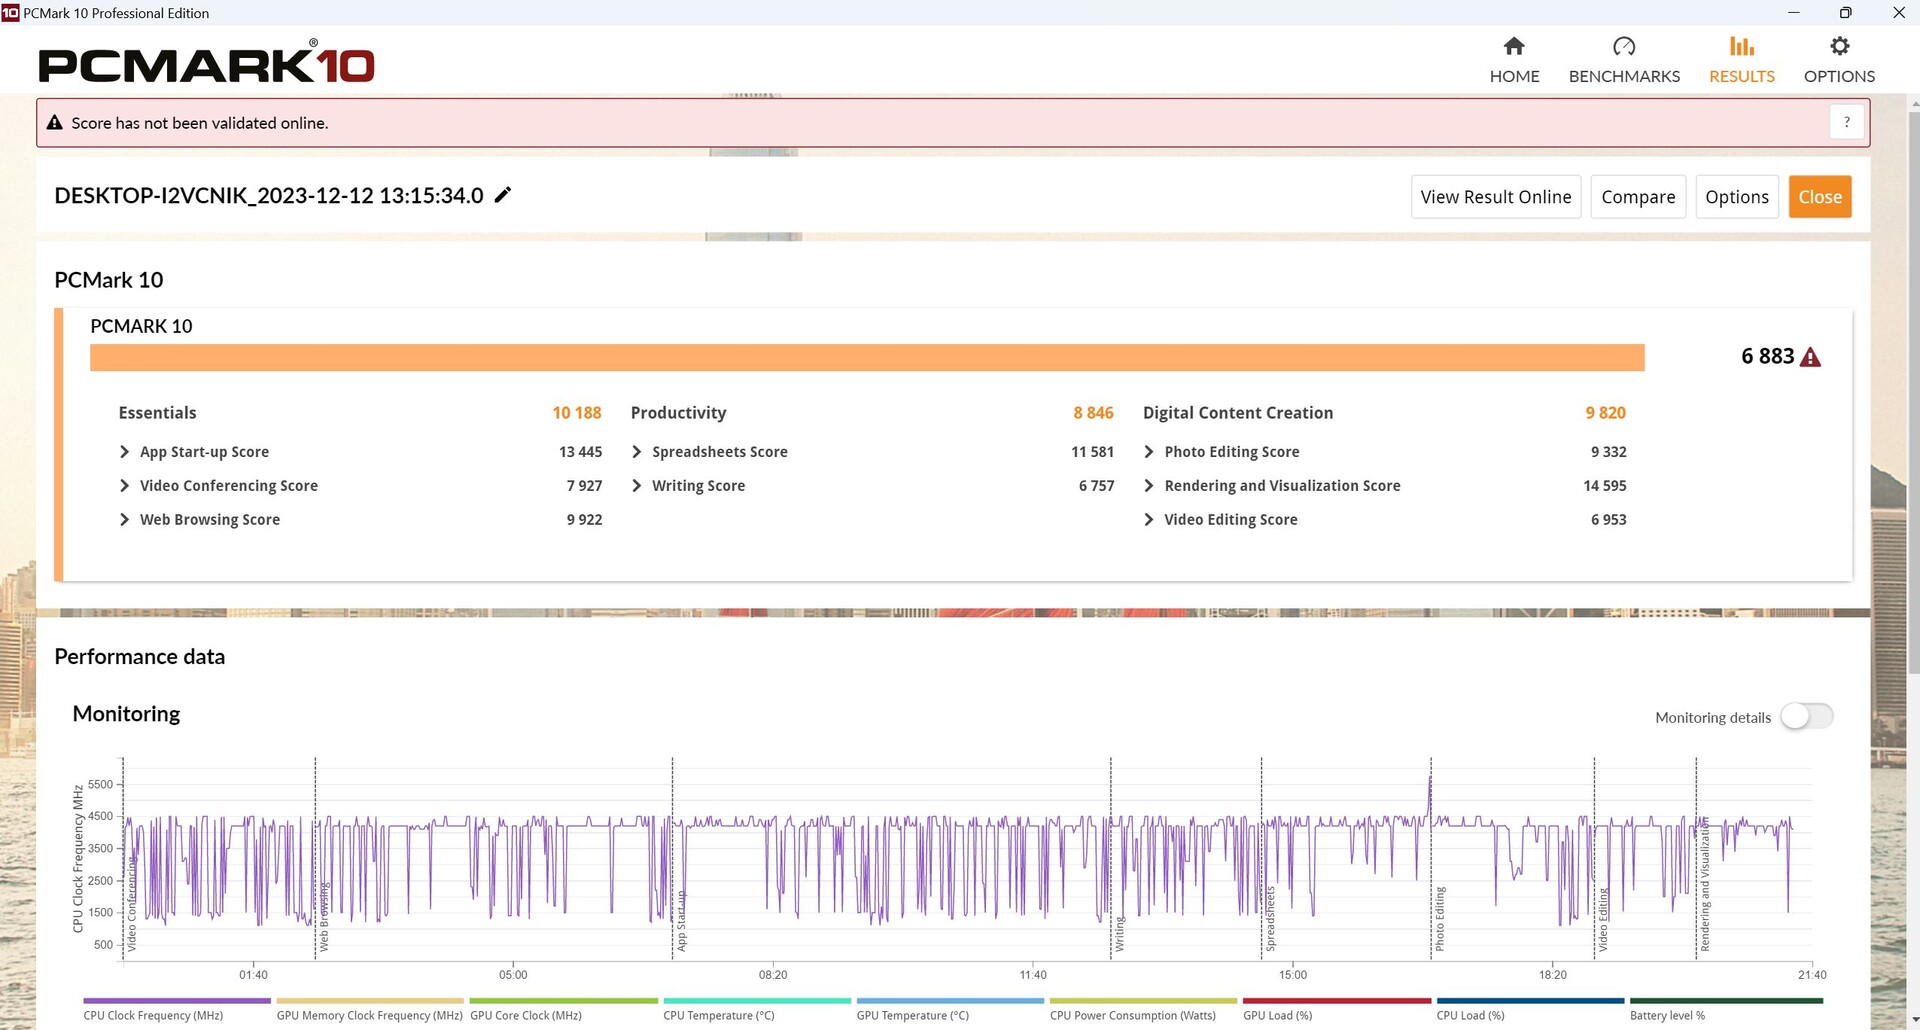
Rendimiento del sistema
Durante PCMark 10, el Captiva con la CPU sucesora quedó un 7% por delante, mientras que ambos dispositivos hicieron lo mismo durante CrossMark.
CrossMark: Overall | Productivity | Creativity | Responsiveness
WebXPRT 3: Overall
WebXPRT 4: Overall
Mozilla Kraken 1.1: Total
| PCMark 10 / Score | |
| Media de la clase Gaming (5828 - 12414, n=94, últimos 2 años) | |
| HP Omen 16-wf000 | |
| Captiva Advanced Gaming I74-121 | |
| Aorus 15 BSF | |
| Dell XPS 15 9530 RTX 4070 | |
| HP Victus 16-r0077ng | |
| Aorus 15 YE5-54DEB34SH | |
| Medio Intel Core i5-12500H, NVIDIA GeForce RTX 3080 Ti Laptop GPU (n=1) | |
| PCMark 10 / Essentials | |
| Captiva Advanced Gaming I74-121 | |
| Dell XPS 15 9530 RTX 4070 | |
| Aorus 15 BSF | |
| HP Victus 16-r0077ng | |
| Media de la clase Gaming (8810 - 11935, n=98, últimos 2 años) | |
| HP Omen 16-wf000 | |
| Aorus 15 YE5-54DEB34SH | |
| Medio Intel Core i5-12500H, NVIDIA GeForce RTX 3080 Ti Laptop GPU (n=1) | |
| PCMark 10 / Productivity | |
| Media de la clase Gaming (6845 - 25323, n=96, últimos 2 años) | |
| HP Omen 16-wf000 | |
| Captiva Advanced Gaming I74-121 | |
| Aorus 15 BSF | |
| HP Victus 16-r0077ng | |
| Aorus 15 YE5-54DEB34SH | |
| Medio Intel Core i5-12500H, NVIDIA GeForce RTX 3080 Ti Laptop GPU (n=1) | |
| Dell XPS 15 9530 RTX 4070 | |
| PCMark 10 / Digital Content Creation | |
| Media de la clase Gaming (7602 - 19954, n=96, últimos 2 años) | |
| HP Omen 16-wf000 | |
| Aorus 15 BSF | |
| Dell XPS 15 9530 RTX 4070 | |
| Captiva Advanced Gaming I74-121 | |
| HP Victus 16-r0077ng | |
| Aorus 15 YE5-54DEB34SH | |
| Medio Intel Core i5-12500H, NVIDIA GeForce RTX 3080 Ti Laptop GPU (n=1) | |
| CrossMark / Overall | |
| Aorus 15 BSF | |
| Media de la clase Gaming (1366 - 2409, n=95, últimos 2 años) | |
| Dell XPS 15 9530 RTX 4070 | |
| HP Omen 16-wf000 | |
| Captiva Advanced Gaming I74-121 | |
| Aorus 15 YE5-54DEB34SH | |
| Medio Intel Core i5-12500H, NVIDIA GeForce RTX 3080 Ti Laptop GPU (n=1) | |
| CrossMark / Productivity | |
| Aorus 15 BSF | |
| Media de la clase Gaming (1386 - 2254, n=95, últimos 2 años) | |
| Dell XPS 15 9530 RTX 4070 | |
| Captiva Advanced Gaming I74-121 | |
| Aorus 15 YE5-54DEB34SH | |
| Medio Intel Core i5-12500H, NVIDIA GeForce RTX 3080 Ti Laptop GPU (n=1) | |
| HP Omen 16-wf000 | |
| CrossMark / Creativity | |
| Media de la clase Gaming (1343 - 2786, n=95, últimos 2 años) | |
| Dell XPS 15 9530 RTX 4070 | |
| Aorus 15 BSF | |
| HP Omen 16-wf000 | |
| Aorus 15 YE5-54DEB34SH | |
| Medio Intel Core i5-12500H, NVIDIA GeForce RTX 3080 Ti Laptop GPU (n=1) | |
| Captiva Advanced Gaming I74-121 | |
| CrossMark / Responsiveness | |
| Aorus 15 BSF | |
| Media de la clase Gaming (1226 - 2334, n=95, últimos 2 años) | |
| Dell XPS 15 9530 RTX 4070 | |
| Captiva Advanced Gaming I74-121 | |
| Aorus 15 YE5-54DEB34SH | |
| Medio Intel Core i5-12500H, NVIDIA GeForce RTX 3080 Ti Laptop GPU (n=1) | |
| HP Omen 16-wf000 | |
| WebXPRT 3 / Overall | |
| Dell XPS 15 9530 RTX 4070 | |
| Media de la clase Gaming (220 - 532, n=99, últimos 2 años) | |
| Aorus 15 BSF | |
| HP Omen 16-wf000 | |
| HP Victus 16-r0077ng | |
| HP Victus 16-r0077ng | |
| Captiva Advanced Gaming I74-121 | |
| Captiva Advanced Gaming I74-121 | |
| Aorus 15 YE5-54DEB34SH | |
| Medio Intel Core i5-12500H, NVIDIA GeForce RTX 3080 Ti Laptop GPU (n=1) | |
| WebXPRT 4 / Overall | |
| Media de la clase Gaming (165 - 354, n=99, últimos 2 años) | |
| Dell XPS 15 9530 RTX 4070 | |
| Aorus 15 BSF | |
| HP Omen 16-wf000 | |
| HP Victus 16-r0077ng | |
| HP Victus 16-r0077ng | |
| Aorus 15 YE5-54DEB34SH | |
| Medio Intel Core i5-12500H, NVIDIA GeForce RTX 3080 Ti Laptop GPU (n=1) | |
| Captiva Advanced Gaming I74-121 | |
| Captiva Advanced Gaming I74-121 | |
| Mozilla Kraken 1.1 / Total | |
| Aorus 15 YE5-54DEB34SH | |
| Medio Intel Core i5-12500H, NVIDIA GeForce RTX 3080 Ti Laptop GPU (n=1) | |
| HP Victus 16-r0077ng | |
| HP Victus 16-r0077ng | |
| Captiva Advanced Gaming I74-121 | |
| Captiva Advanced Gaming I74-121 | |
| HP Omen 16-wf000 | |
| Dell XPS 15 9530 RTX 4070 | |
| Aorus 15 BSF | |
| Media de la clase Gaming (391 - 590, n=101, últimos 2 años) | |
* ... más pequeño es mejor
| PCMark 10 Score | 6883 puntos | |
ayuda | ||
| AIDA64 / Memory Copy | |
| Media de la clase Gaming (21750 - 129946, n=106, últimos 2 años) | |
| Dell XPS 15 9530 RTX 4070 | |
| HP Victus 16-r0077ng | |
| Aorus 15 BSF | |
| Aorus 15 YE5-54DEB34SH | |
| Medio Intel Core i5-12500H (23850 - 66598, n=9) | |
| Captiva Advanced Gaming I74-121 | |
| AIDA64 / Memory Read | |
| Media de la clase Gaming (22956 - 118858, n=106, últimos 2 años) | |
| Dell XPS 15 9530 RTX 4070 | |
| HP Victus 16-r0077ng | |
| Aorus 15 BSF | |
| Aorus 15 YE5-54DEB34SH | |
| Medio Intel Core i5-12500H (24879 - 68013, n=9) | |
| Captiva Advanced Gaming I74-121 | |
| AIDA64 / Memory Write | |
| Aorus 15 BSF | |
| Media de la clase Gaming (22297 - 135096, n=106, últimos 2 años) | |
| Dell XPS 15 9530 RTX 4070 | |
| HP Victus 16-r0077ng | |
| Aorus 15 YE5-54DEB34SH | |
| Medio Intel Core i5-12500H (23543 - 58797, n=9) | |
| Captiva Advanced Gaming I74-121 | |
| AIDA64 / Memory Latency | |
| Media de la clase Gaming (75.3 - 259, n=106, últimos 2 años) | |
| Aorus 15 YE5-54DEB34SH | |
| Medio Intel Core i5-12500H (83.8 - 114.7, n=9) | |
| HP Victus 16-r0077ng | |
| Aorus 15 BSF | |
| Dell XPS 15 9530 RTX 4070 | |
| Captiva Advanced Gaming I74-121 | |
* ... más pequeño es mejor
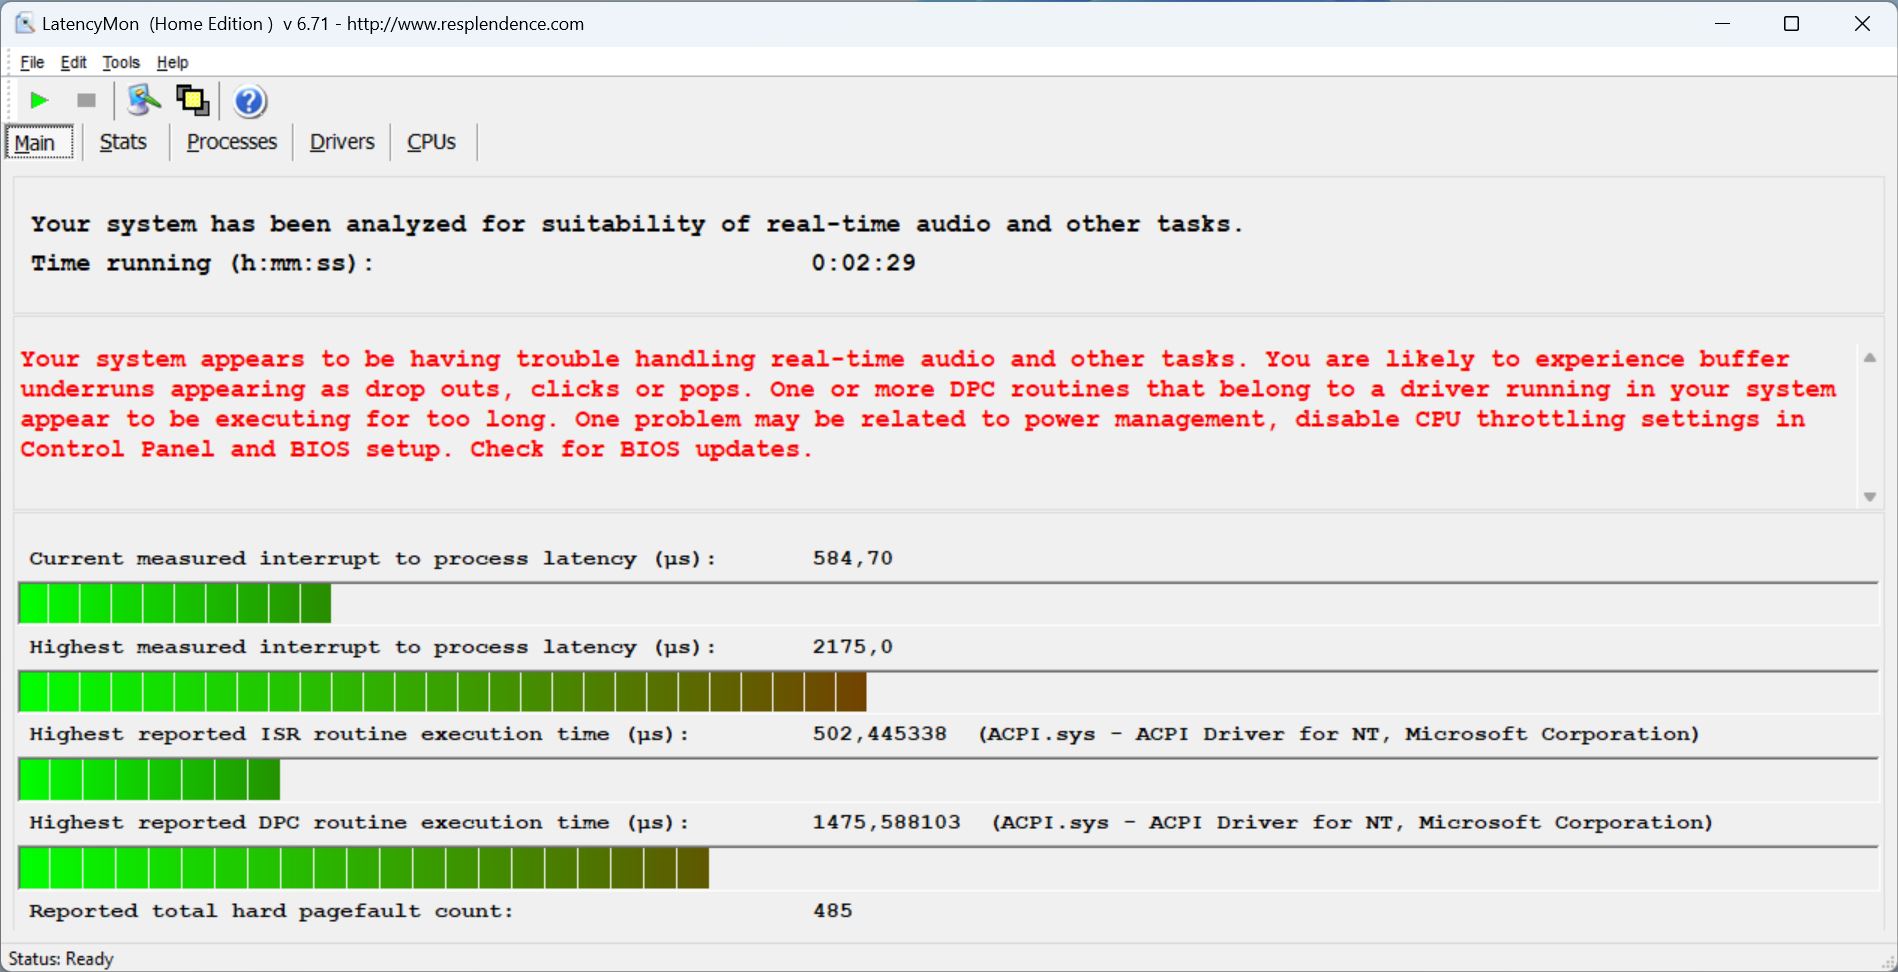
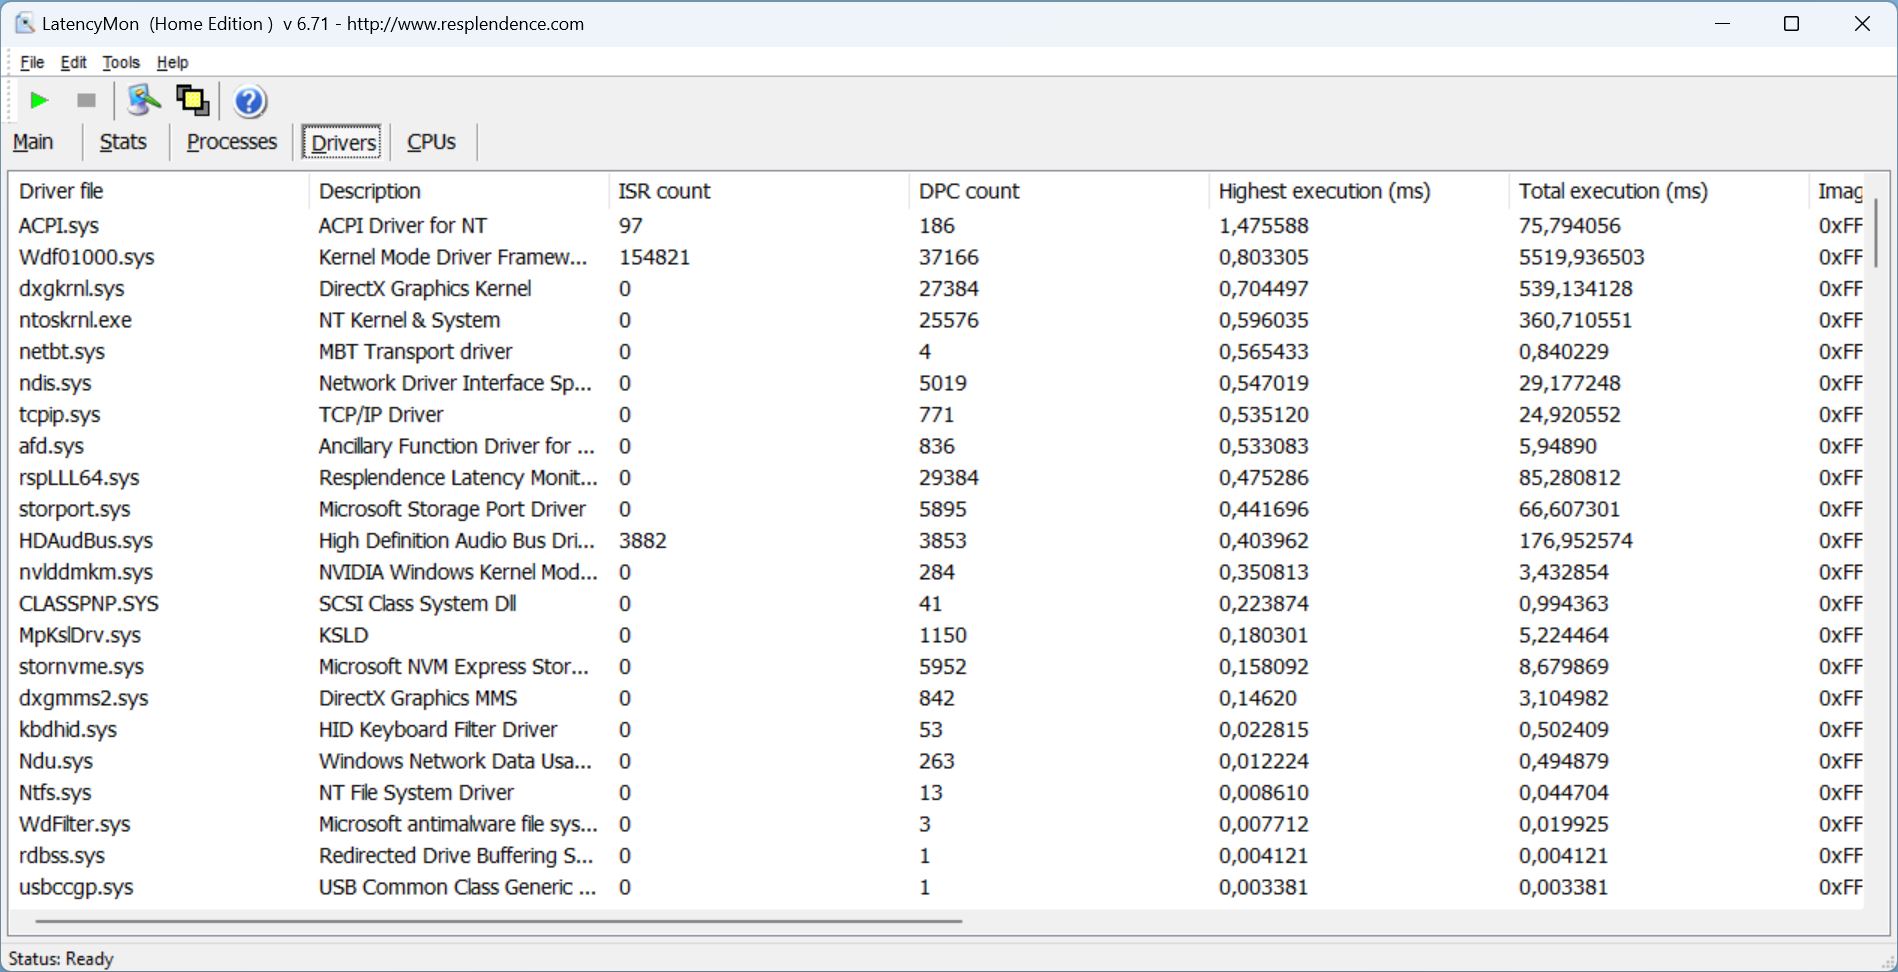
Latencia del CPD
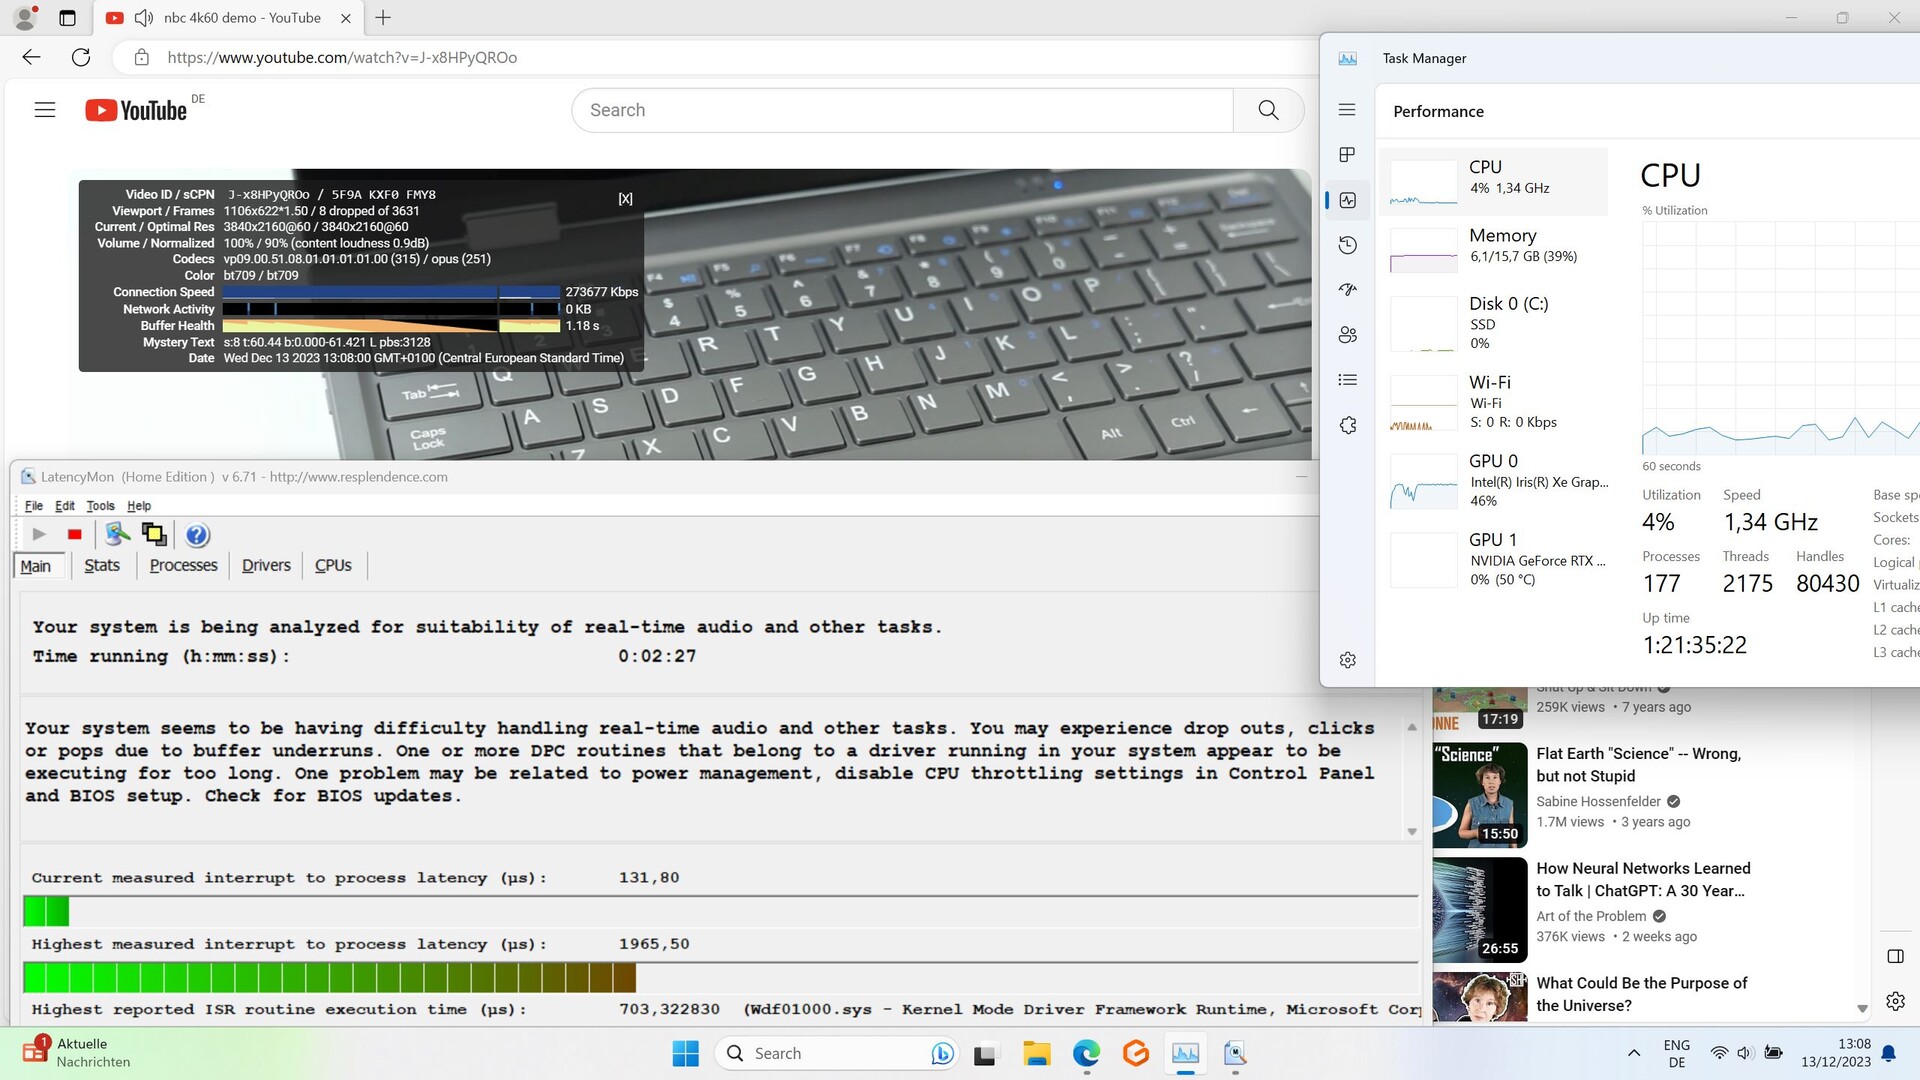
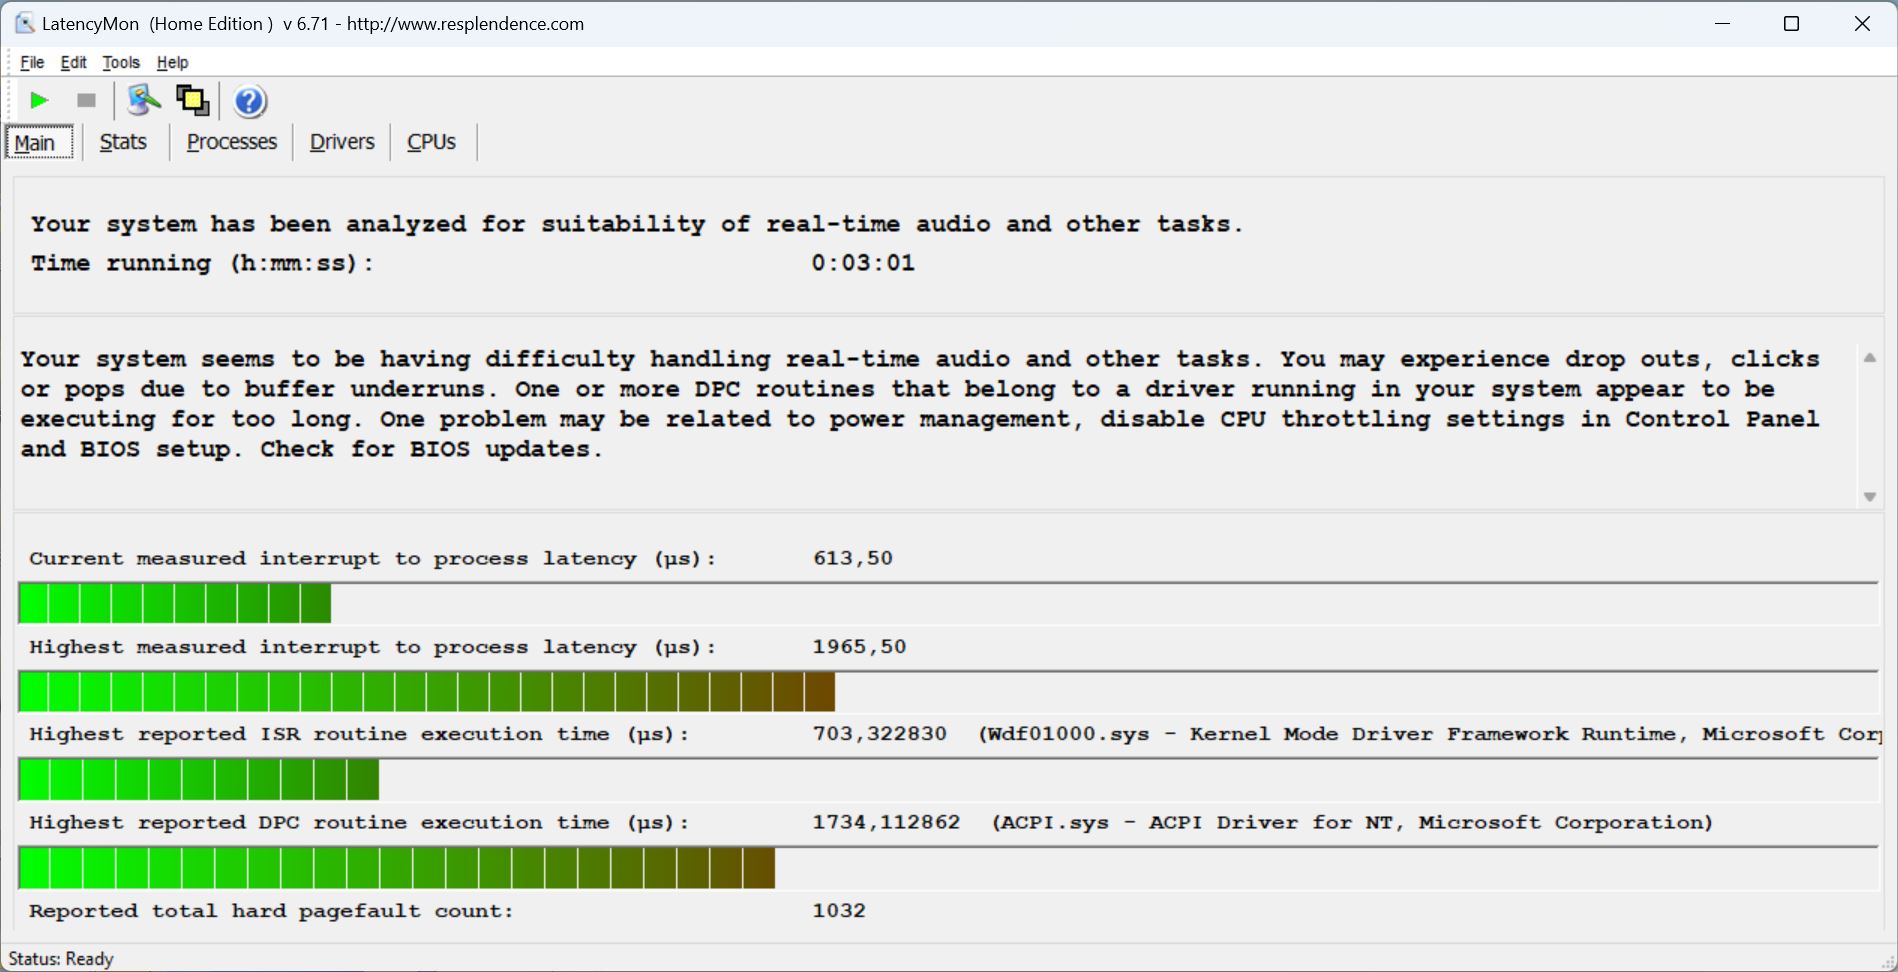
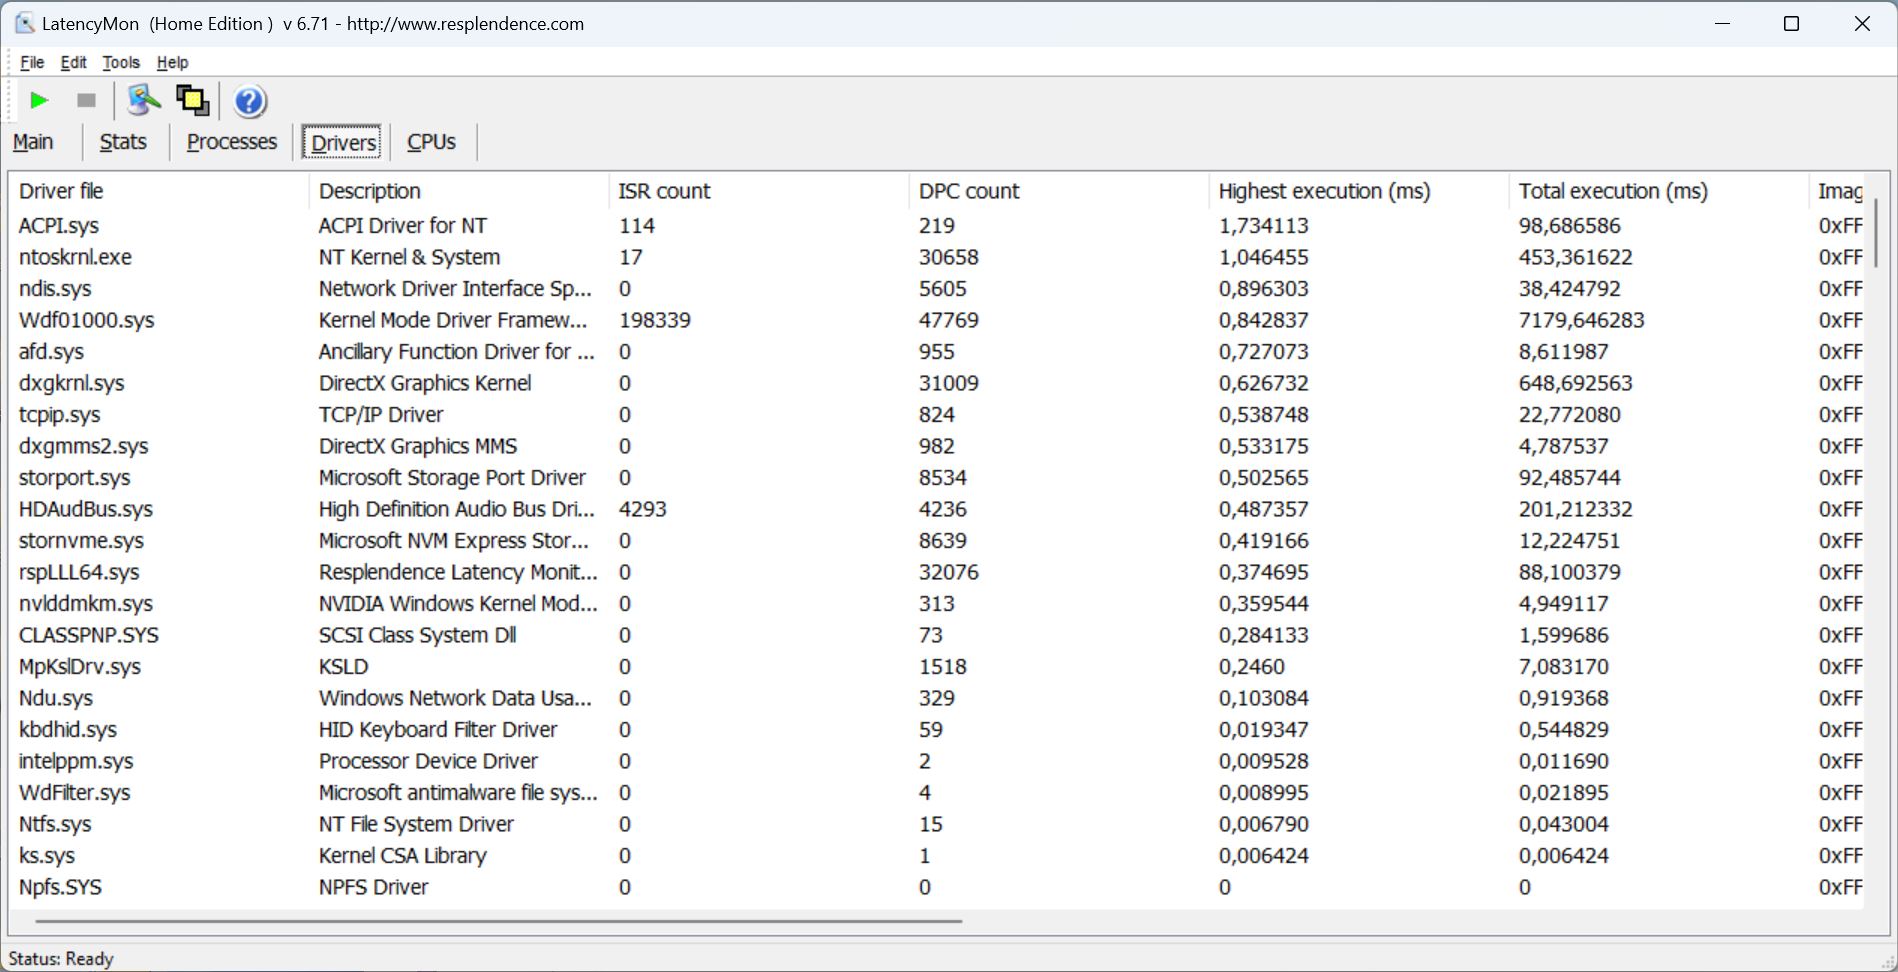
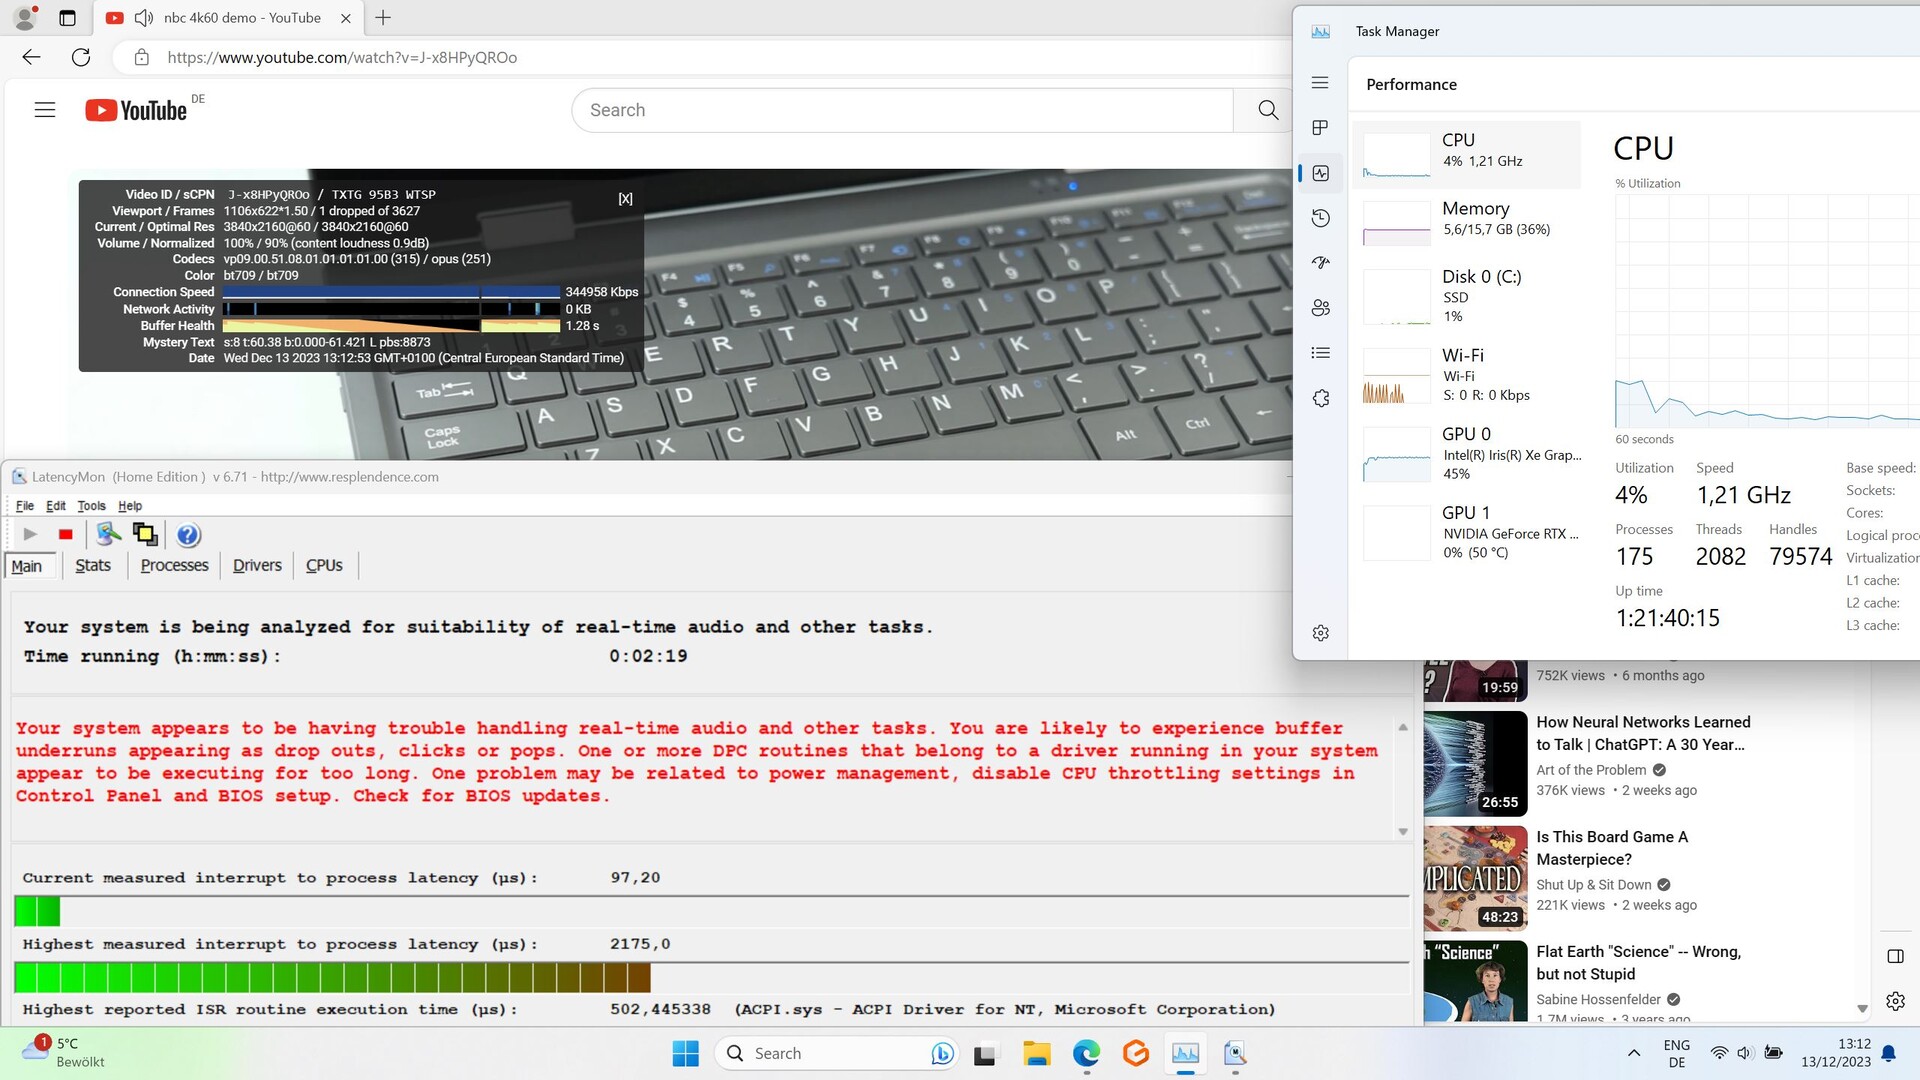
Como el Centro de Control no ofrece un modo equilibrado, probamos el portátil utilizando los modos de reunión y creador. El primero mostró algunos problemas de latencia al abrir varias pestañas del navegador - estos se hicieron aún mayores durante el vídeo 4K/60-fps de YouTube, resultando en ocho fotogramas caídos.
Si piensa que esto podría cambiar utilizando el modo creador, más potente, lamentablemente se equivoca. Ya notamos un aumento de las latencias al abrir el navegador. Por otro lado, el vídeo se ejecutó con un solo fotograma caído.
| DPC Latencies / LatencyMon - interrupt to process latency (max), Web, Youtube, Prime95 | |
| HP Omen 16-wf000 | |
| Aorus 15 YE5-54DEB34SH | |
| HP Victus 16-r0077ng | |
| Aorus 15 BSF | |
| Dell XPS 15 9530 RTX 4070 | |
| Captiva Advanced Gaming I74-121 | |
* ... más pequeño es mejor
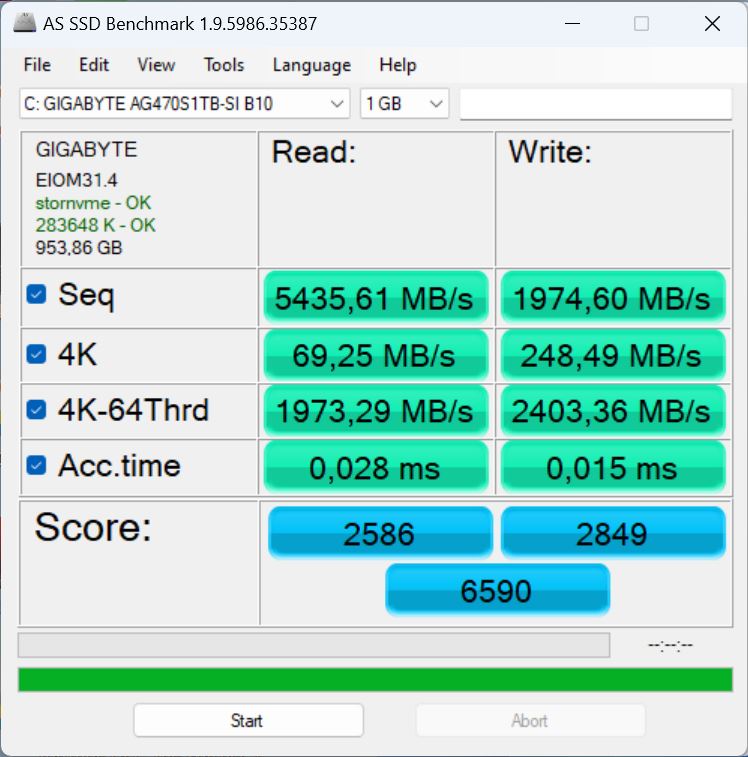
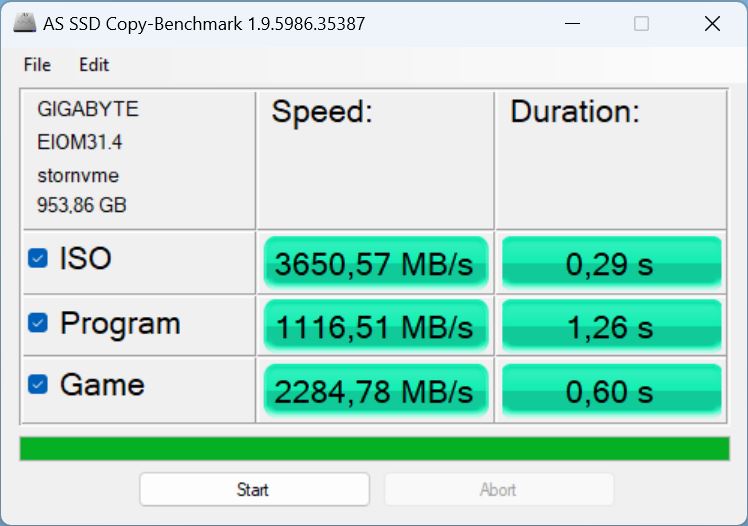
Dispositivos de almacenamiento
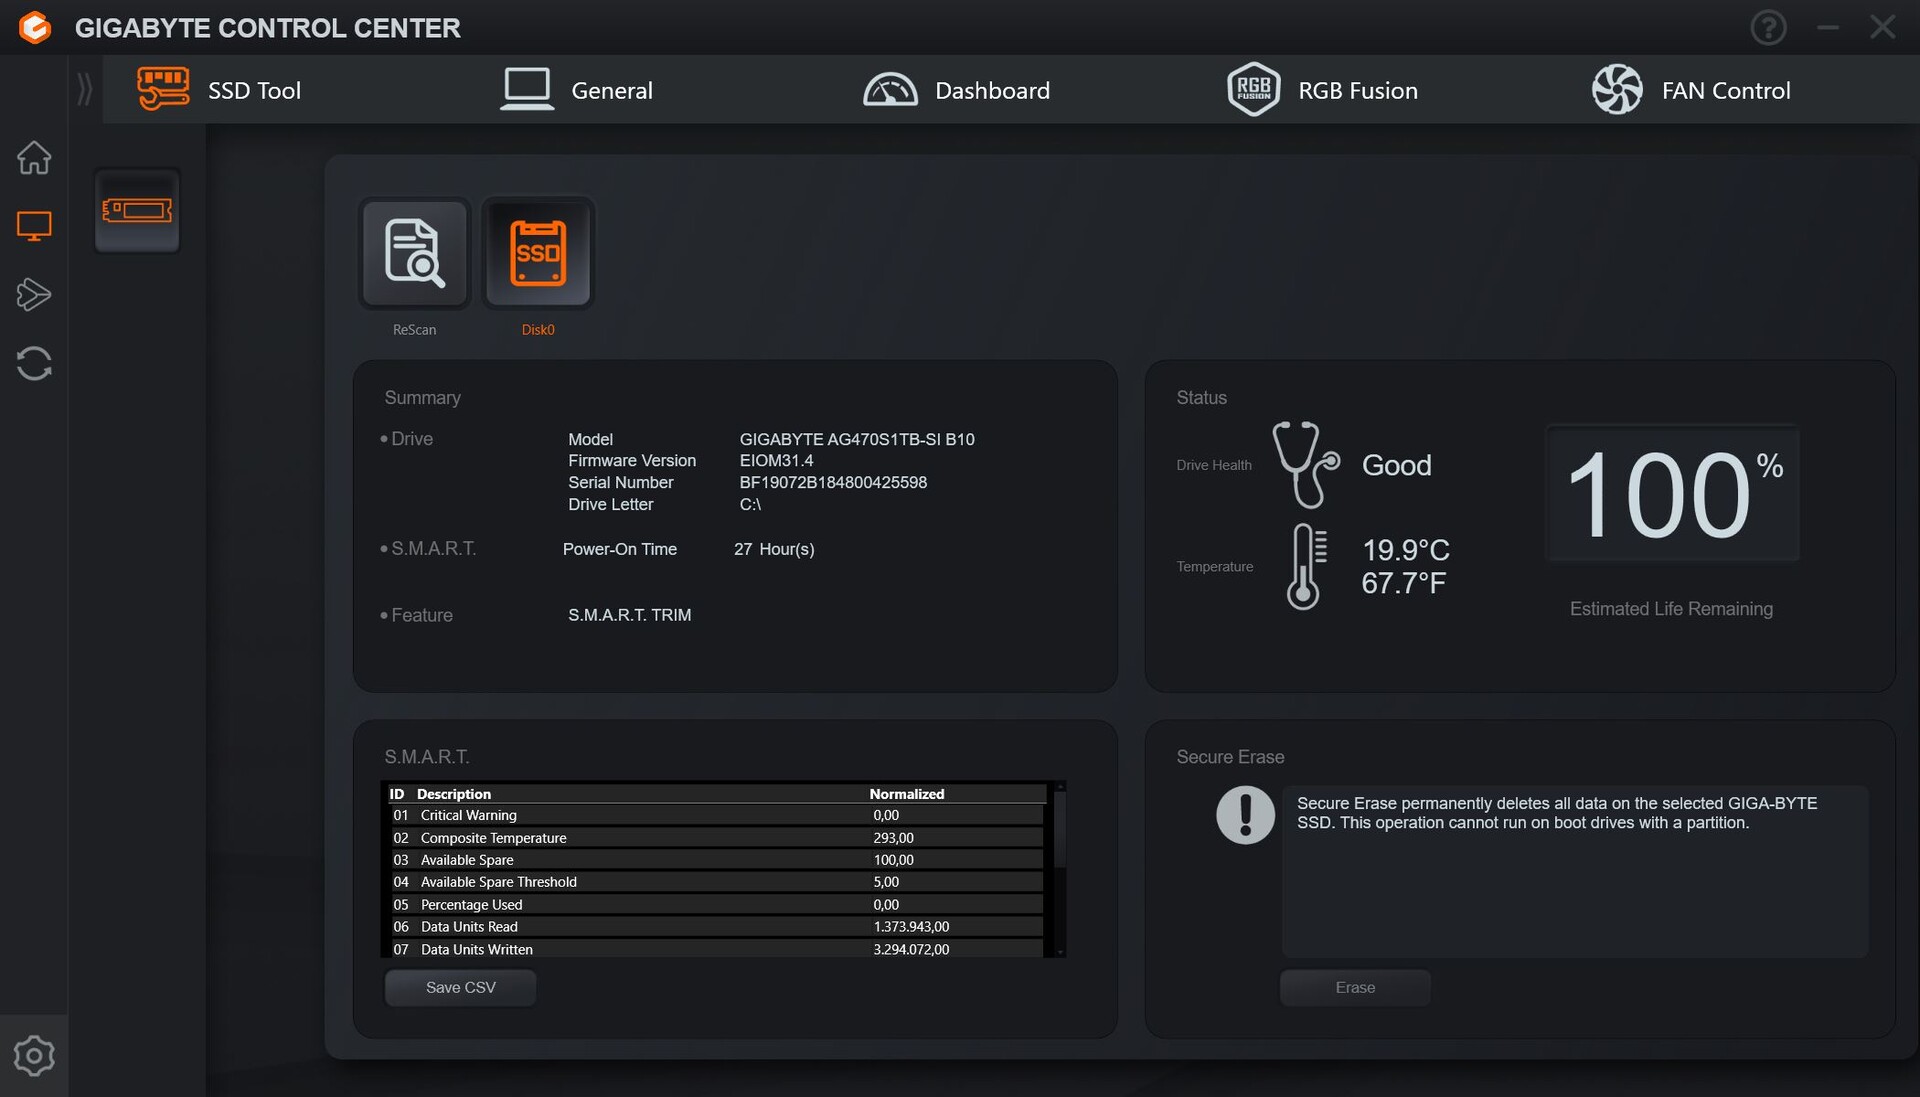
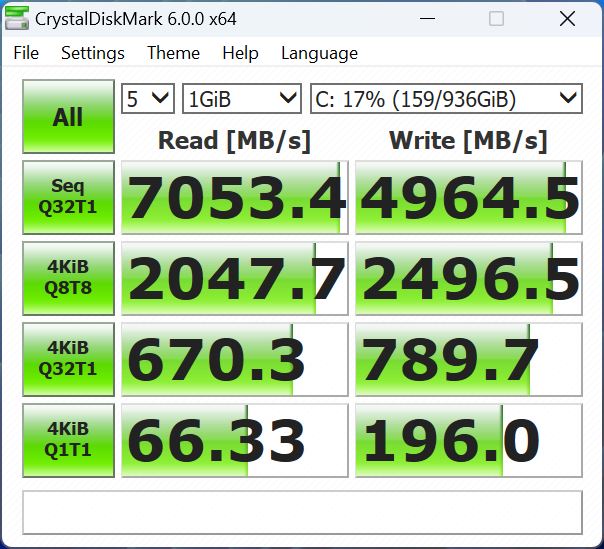
La unidad Gigabyte AG470S1TB-SI B10 instalada con 1 TB de almacenamiento es una rápida SSD NVMe PCIe Gen 4 de gama alta. En nuestra Lista de mejores SSDocupa actualmente la posición 3, lo que es excelente.
Dentro del Aorus 15 YE5, puede que no sea capaz de aprovechar todo su potencial (quedando un 12% por detrás del modelo de referencia), sin embargo, sigue siendo más rápido que las SSD de sus competidores. La única excepción es el Aorus 15 de la generación actual. Hace uso de la misma SSD pero es un 28 por ciento más rápida. Aun así, el rendimiento de nuestra muestra de prueba sigue siendo estupendo y, sobre todo, se mantuvo constante y no mostró problemas de ralentización durante el uso continuo.

* ... más pequeño es mejor
Reading continuous performance: DiskSpd Read Loop, Queue Depth 8
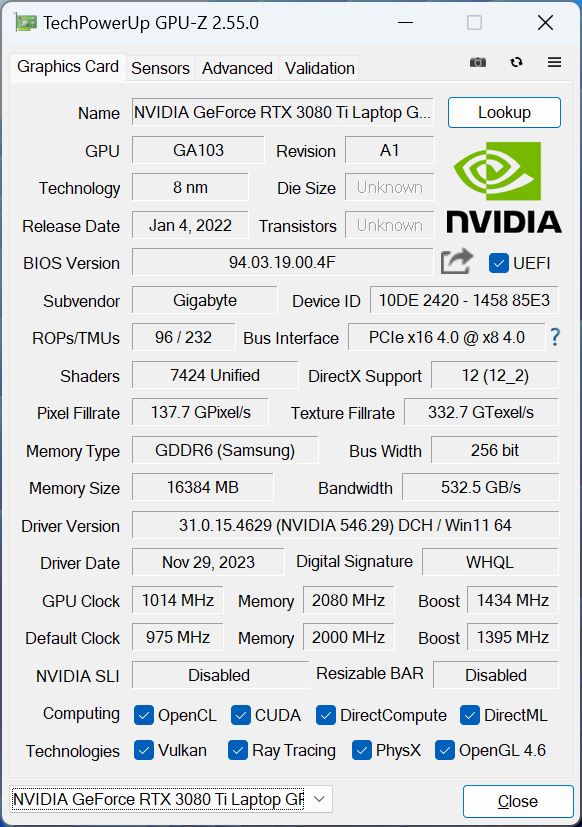
Tarjeta gráfica
El antiguo modelo insignia Geforce RTX 3080 Ti con 16 GB de RAM se encarga de los cálculos 3D como tarjeta gráfica del portátil. Sin embargo, sólo dispone de 130 vatios del máximo posible de 165 vatios. El potente chip Ampere no es tan eficiente como la actual arquitectura Ada Lovelace y es probable que genere más calor.
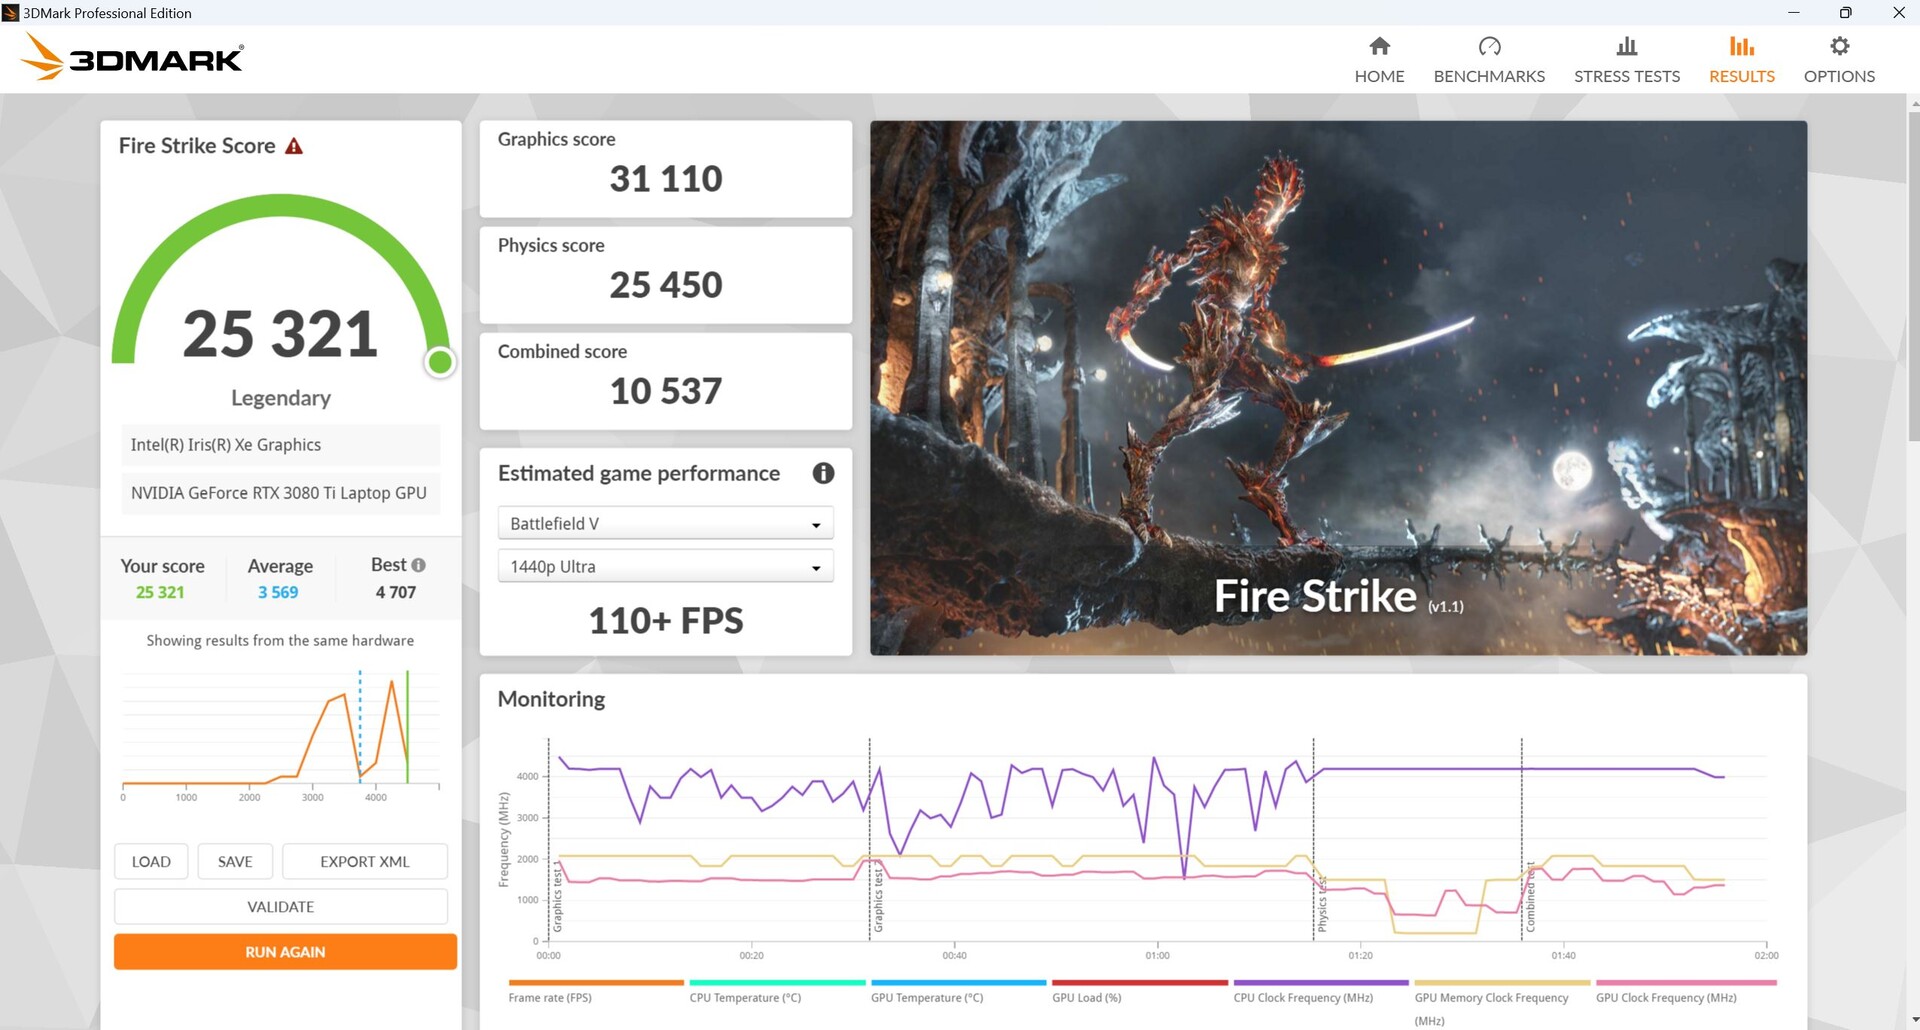
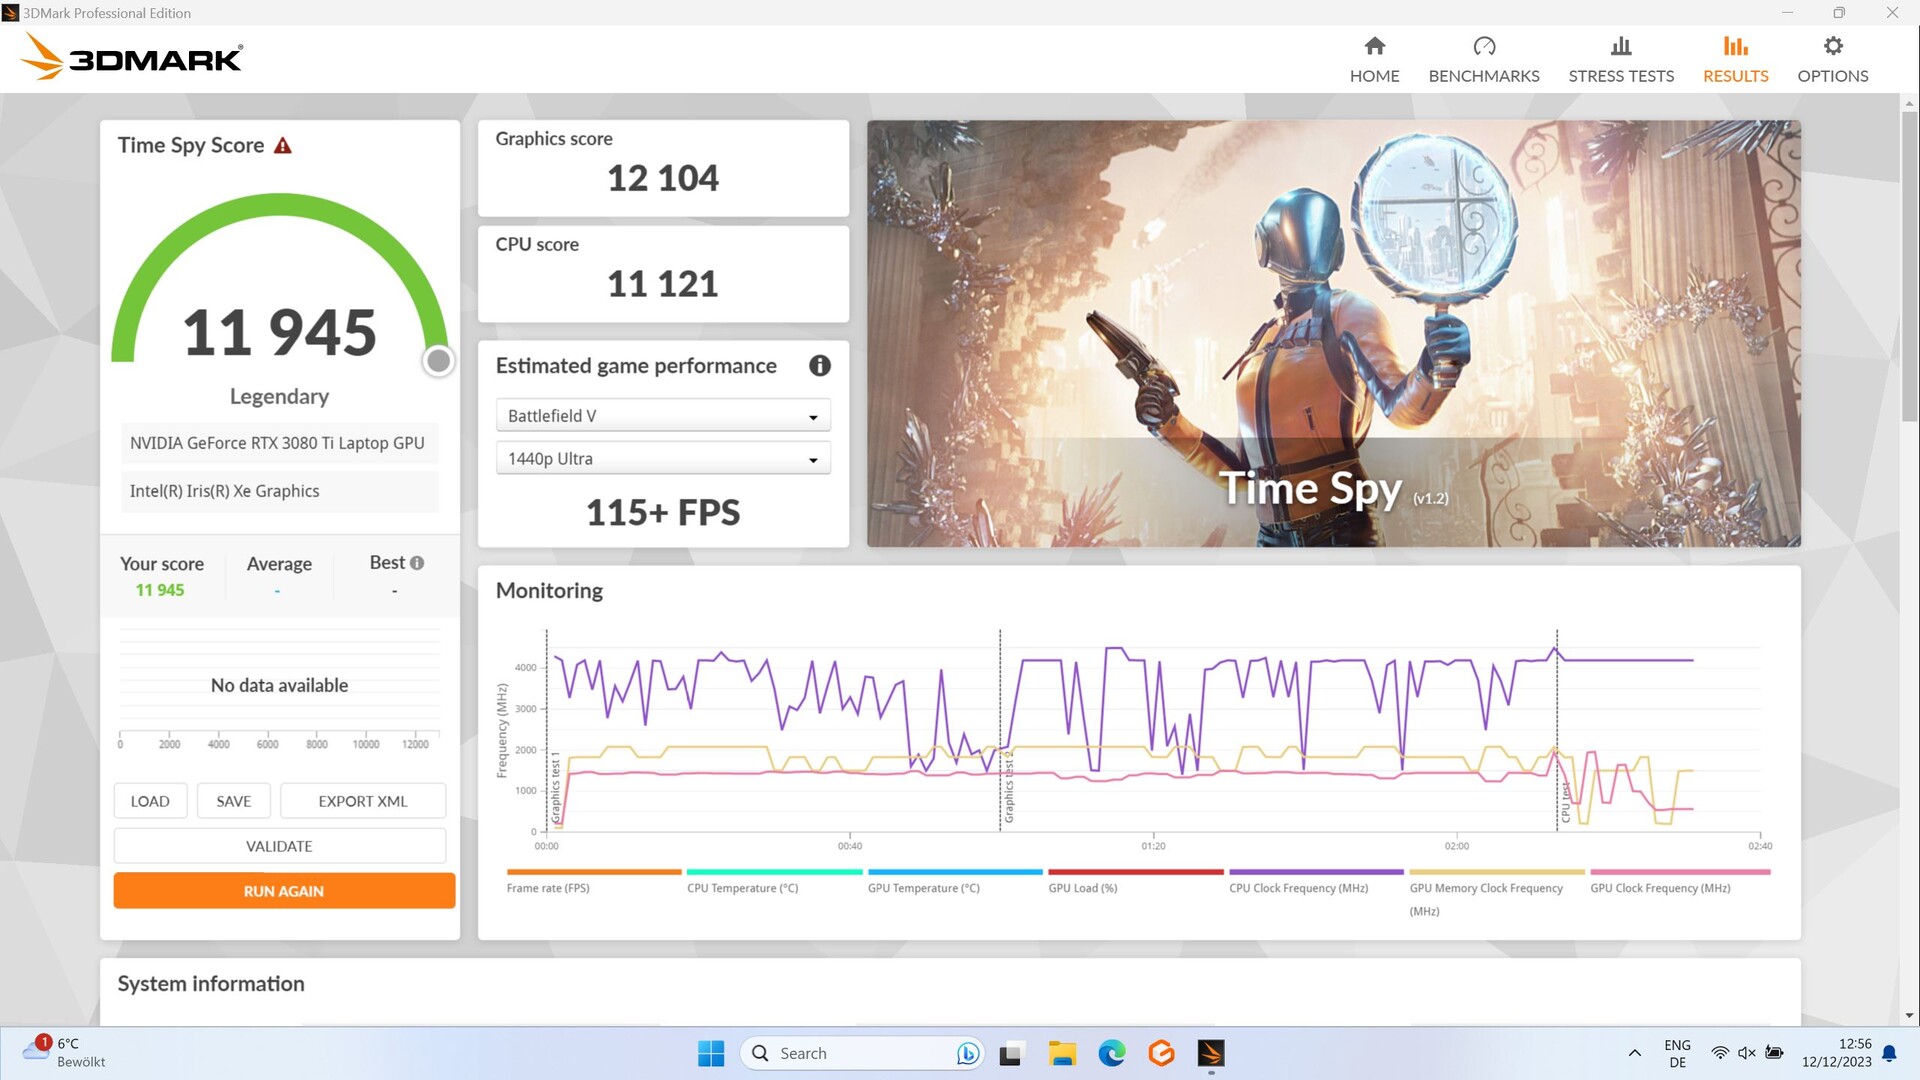
Durante las pruebas comparativas sintéticas 3DMark, nuestra Aorus superó a la competencia de generación actual con una RTX 4060 y una RTX 4070. Nuestra RTX 3080 Ti quedó por delante en casi todas las pruebas, aunque sólo fuera por unos pocos puntos porcentuales. Sin embargo, las diferencias entre ellas son bastante pequeñas, pero constantes en todas las pruebas.
En modo batería, su rendimiento en Fire Strike bajó de 31.110 a sólo 6.921 puntos, ¡una caída de la friolera del 78%!
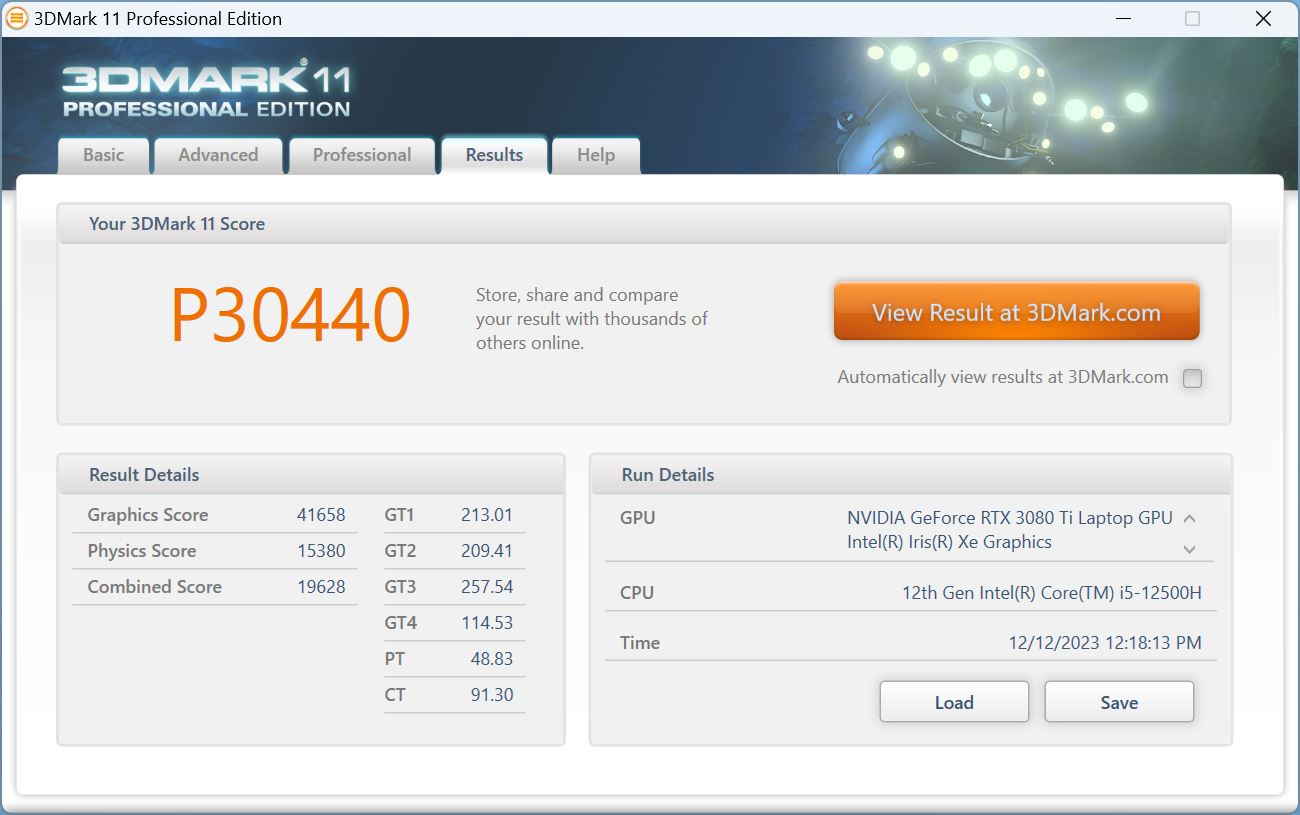
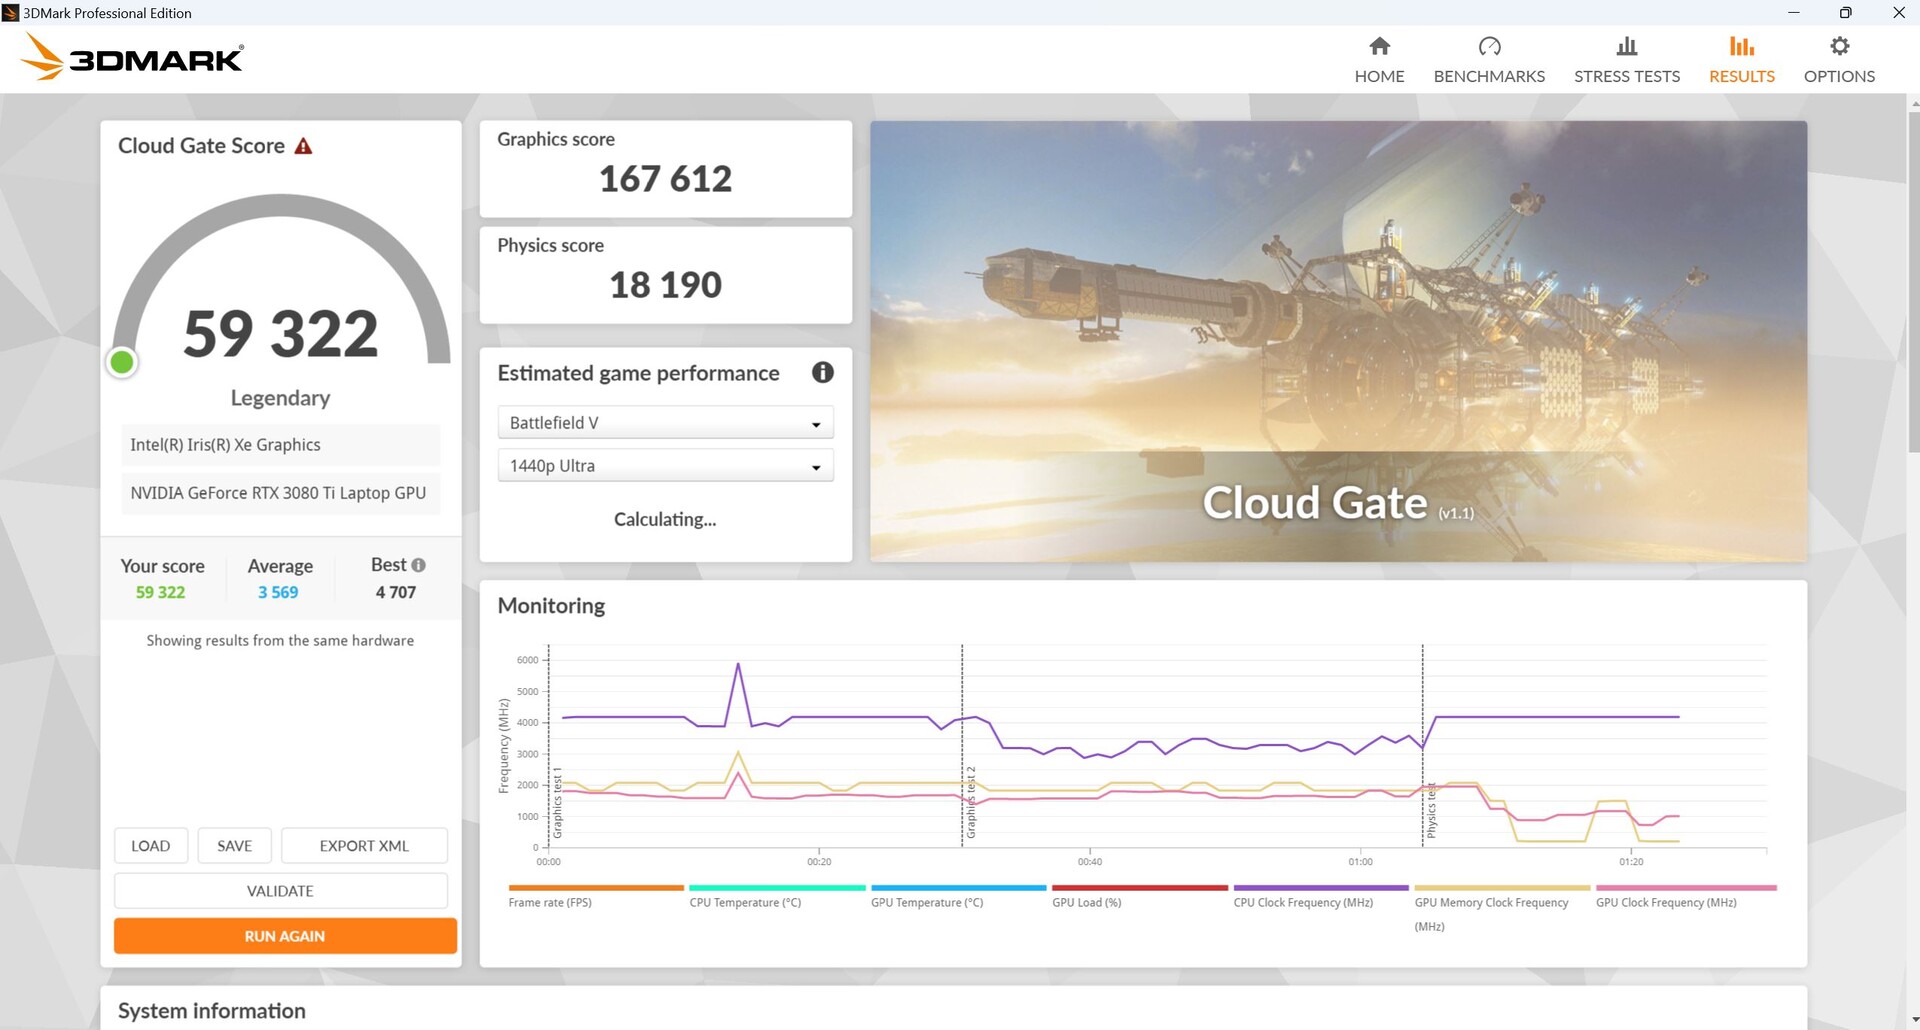
| 3DMark 11 Performance | 30440 puntos | |
| 3DMark Cloud Gate Standard Score | 59322 puntos | |
| 3DMark Fire Strike Score | 25321 puntos | |
| 3DMark Time Spy Score | 11945 puntos | |
ayuda | ||
* ... más pequeño es mejor
Juegos
Mientras jugaba, nuestra Aorus estuvo codo con codo con la aorus de nueva generación con una RTX 4070 e incluso consiguió vencerla por un estrecho margen. El resto de competidores con una RTX 4070 también fueron superados por poco. El Omen 16 con una RTX 4080 se mantuvo inalcanzable en la cima y fue alrededor de un 18% más rápido que nuestro Aorus, segundo clasificado, en todas las pruebas de juegos. En los juegos centrados en la CPU, su rendimiento quedó por detrás de la competencia debido a su mediocre i5-12500H.
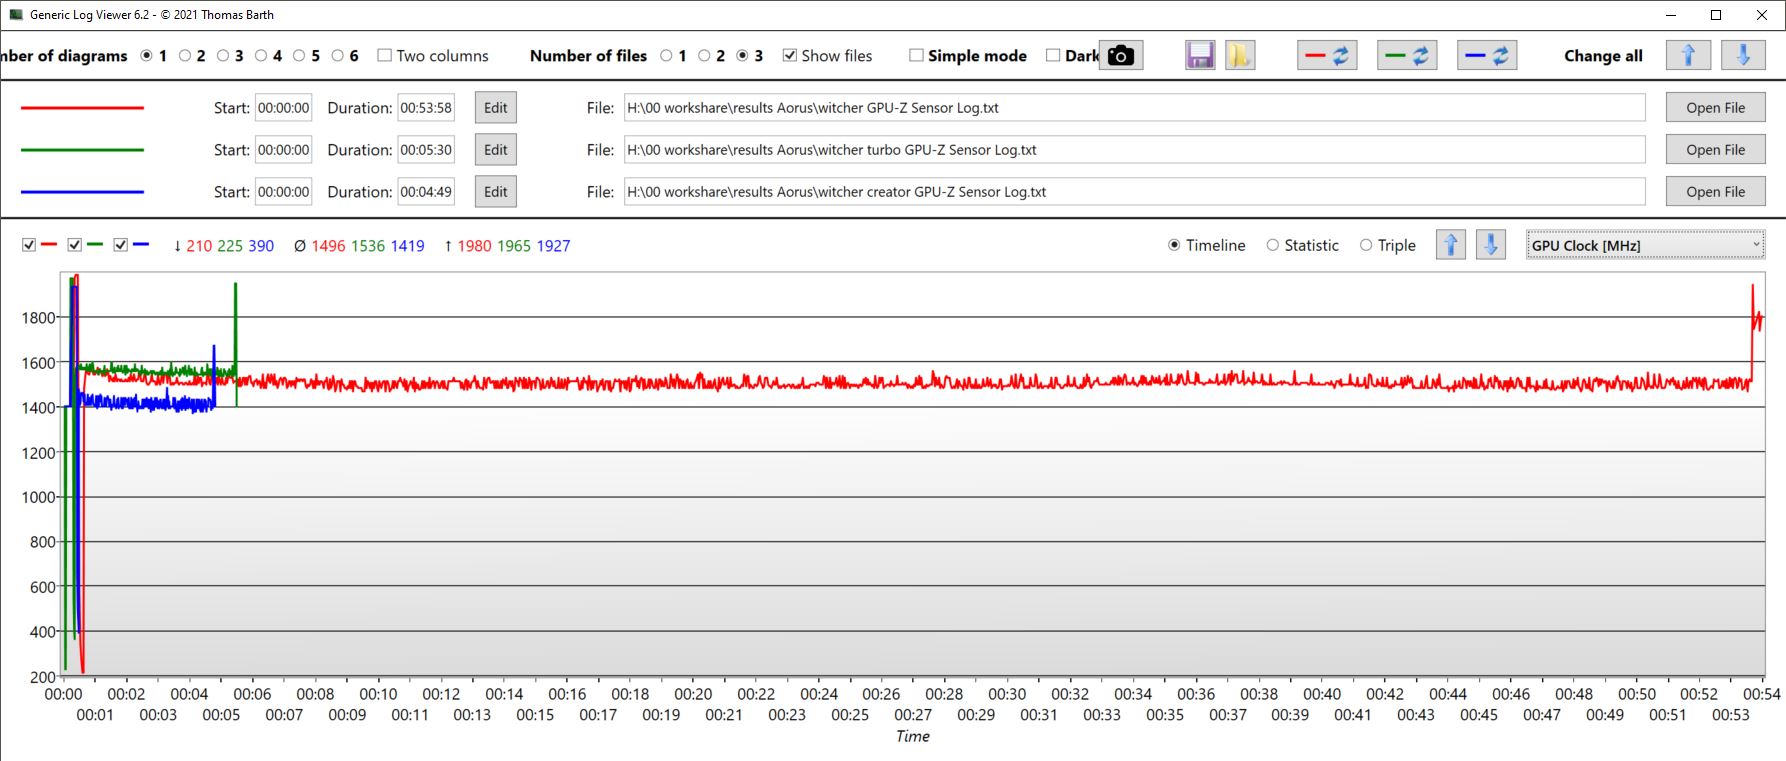
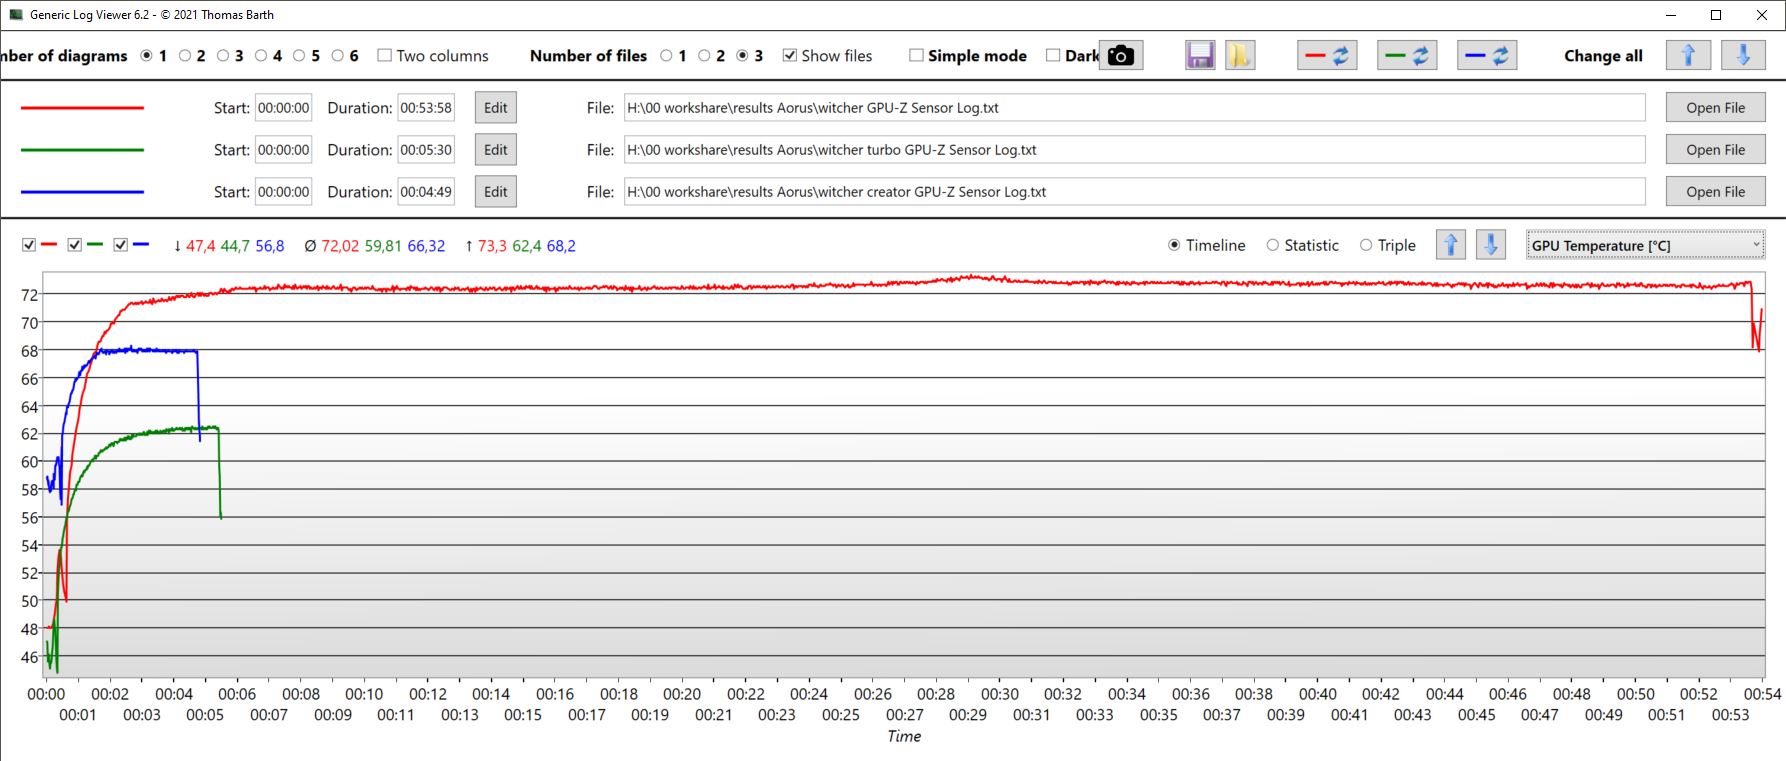
Al comparar los modos, se observa que tanto el turbo como la IA y los juegos ofrecieron prácticamente el mismo rendimiento de la GPU en The Witcher 3. La única diferencia es que la GPU se mantuvo significativamente más fría en el modo turbo, pero este modo también fue significativamente más ruidoso.
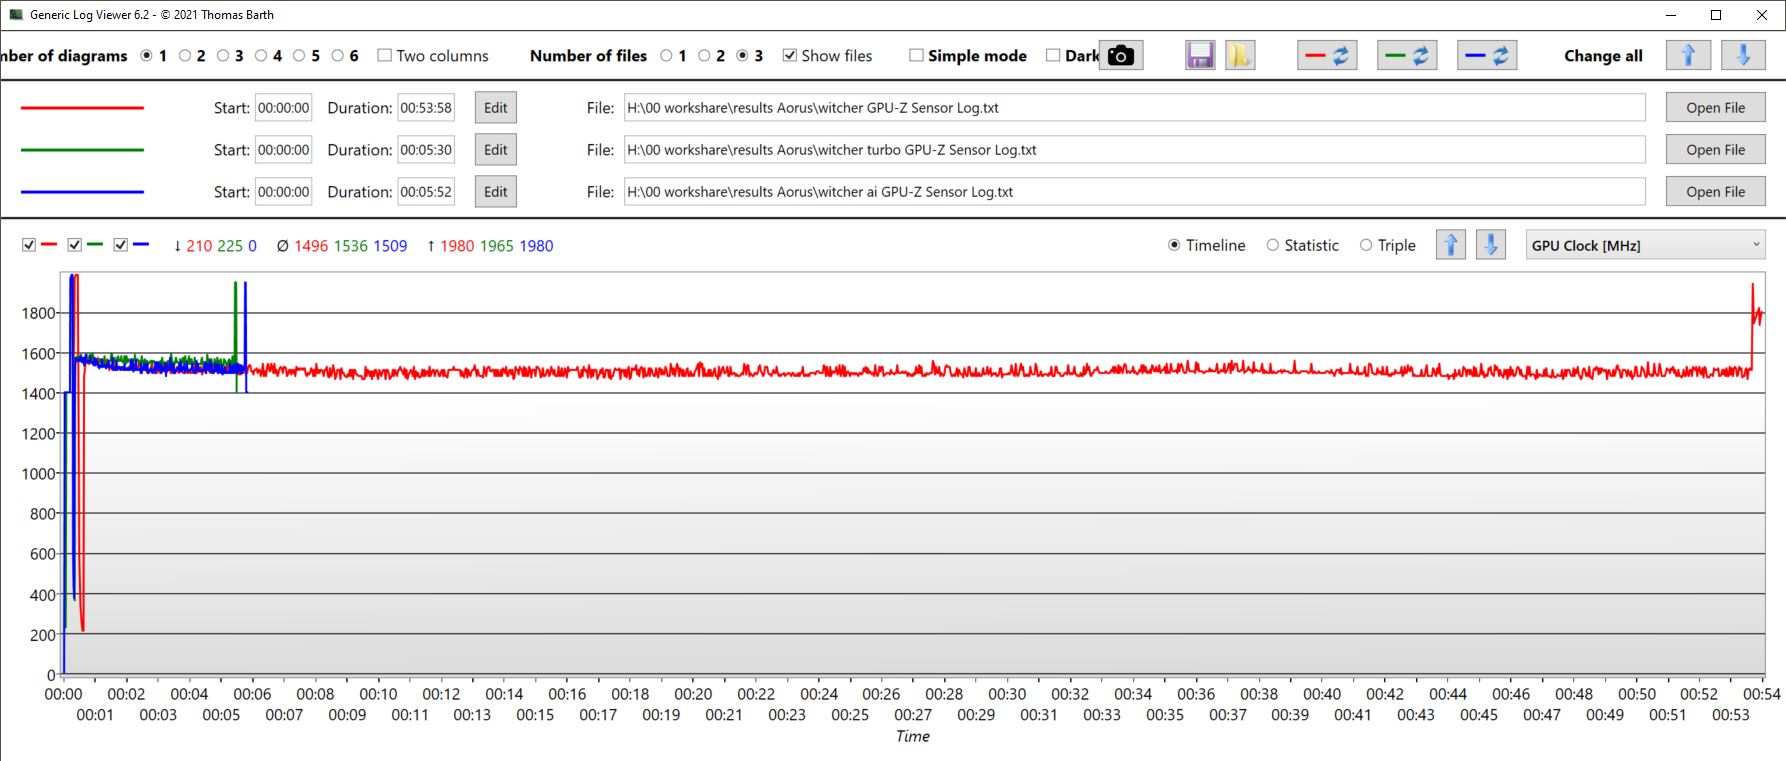
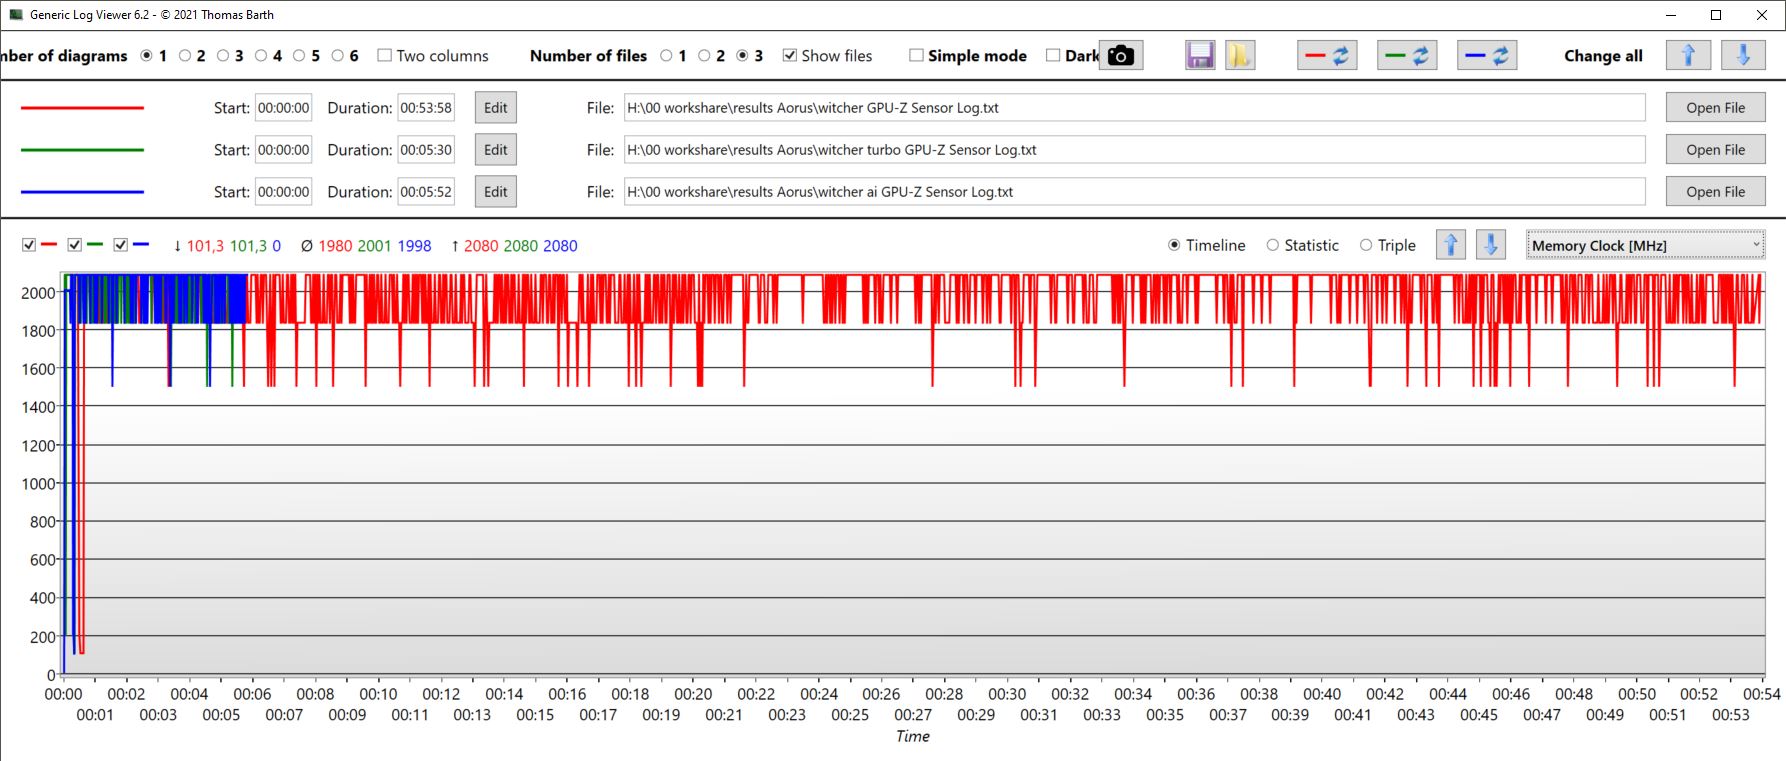
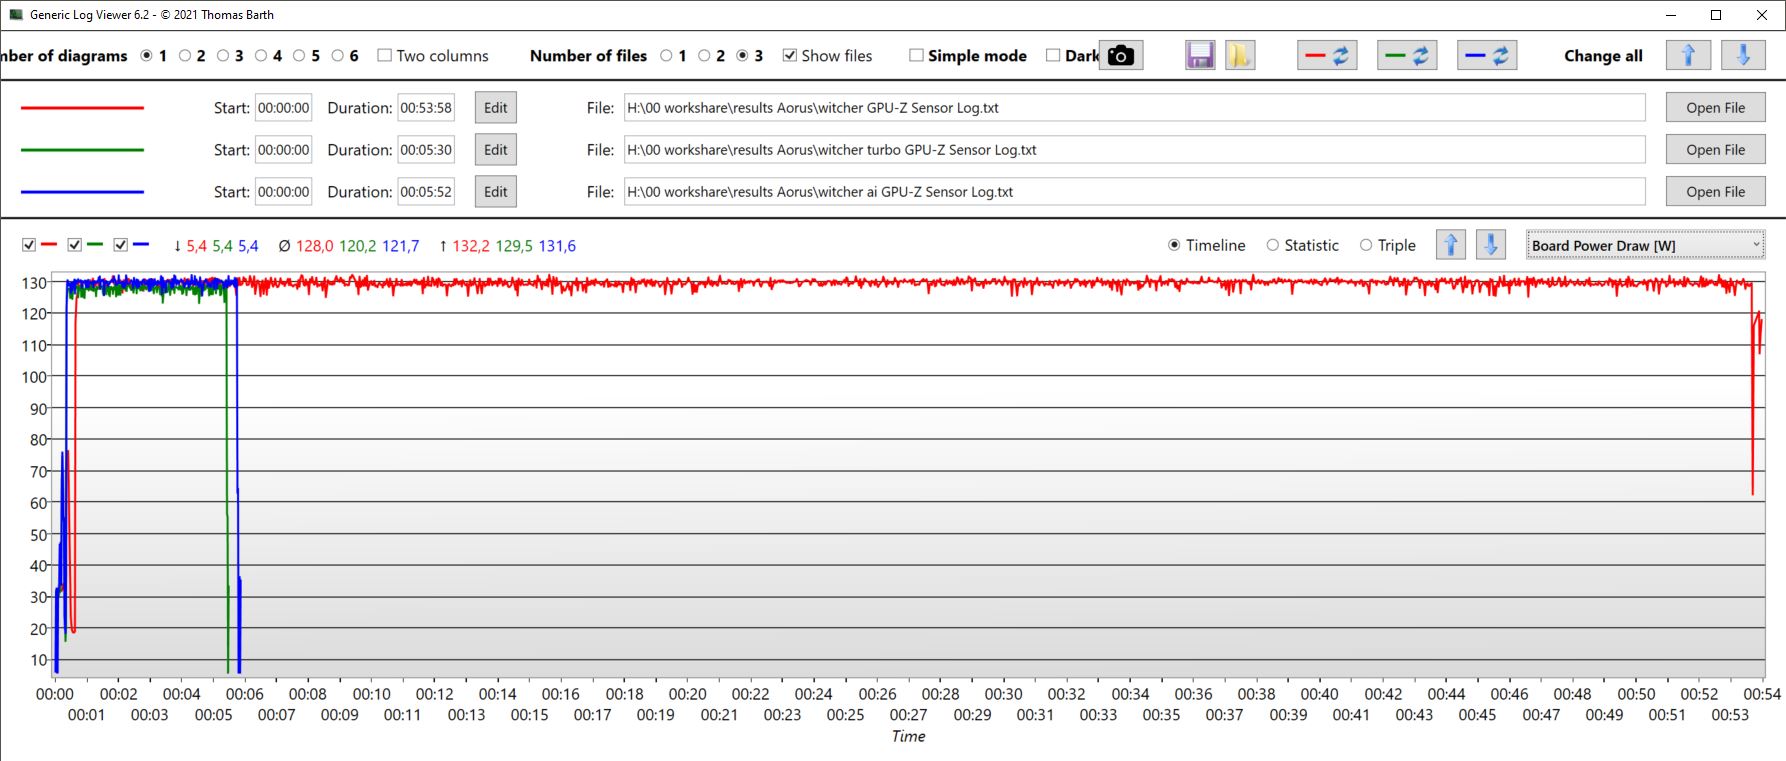
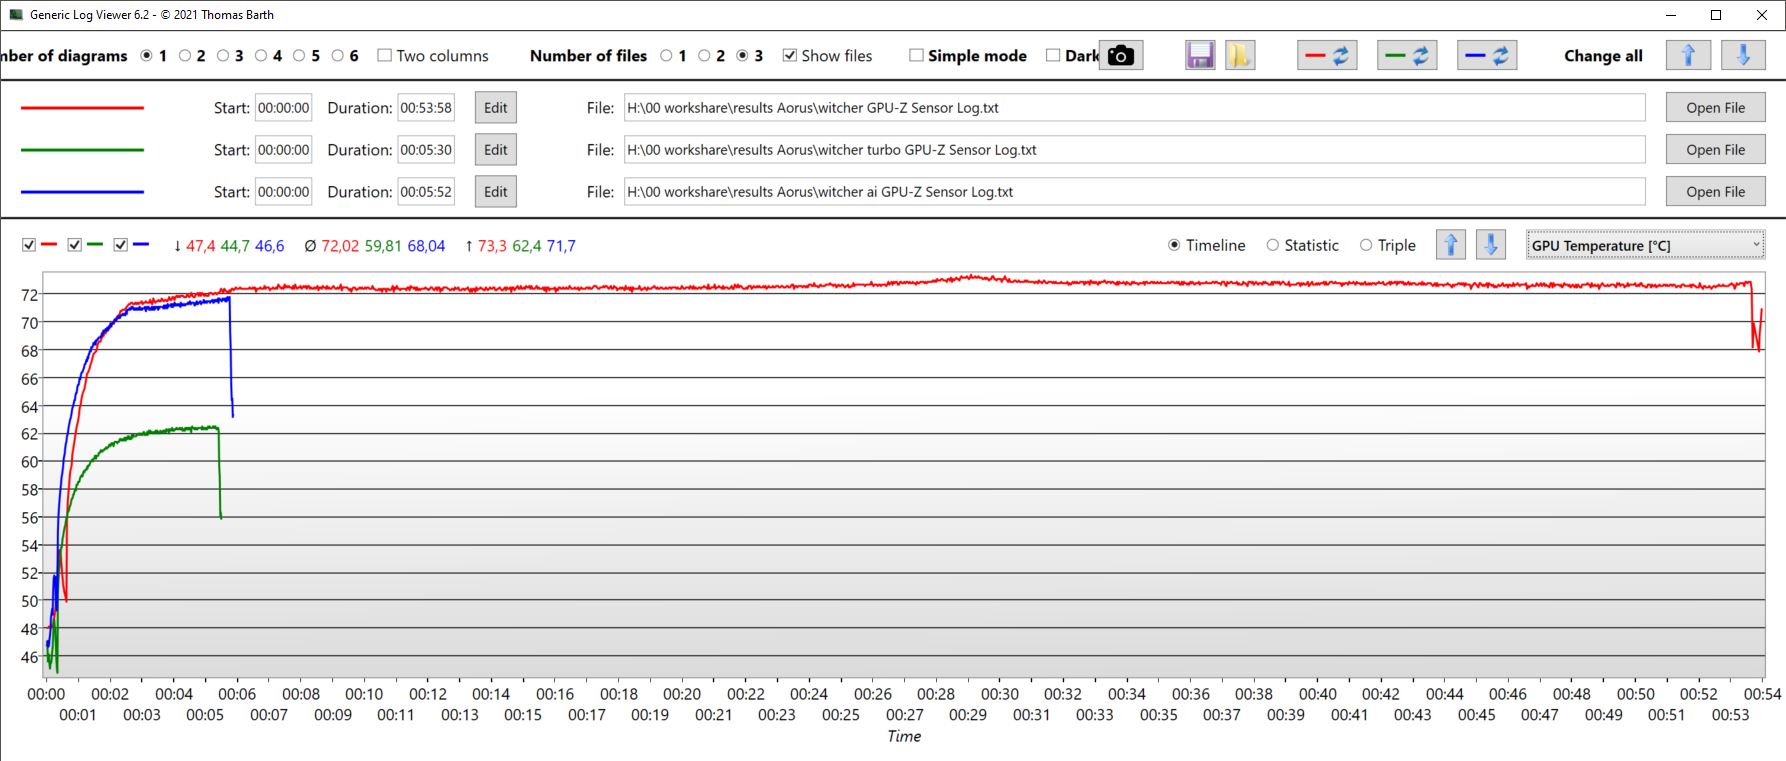
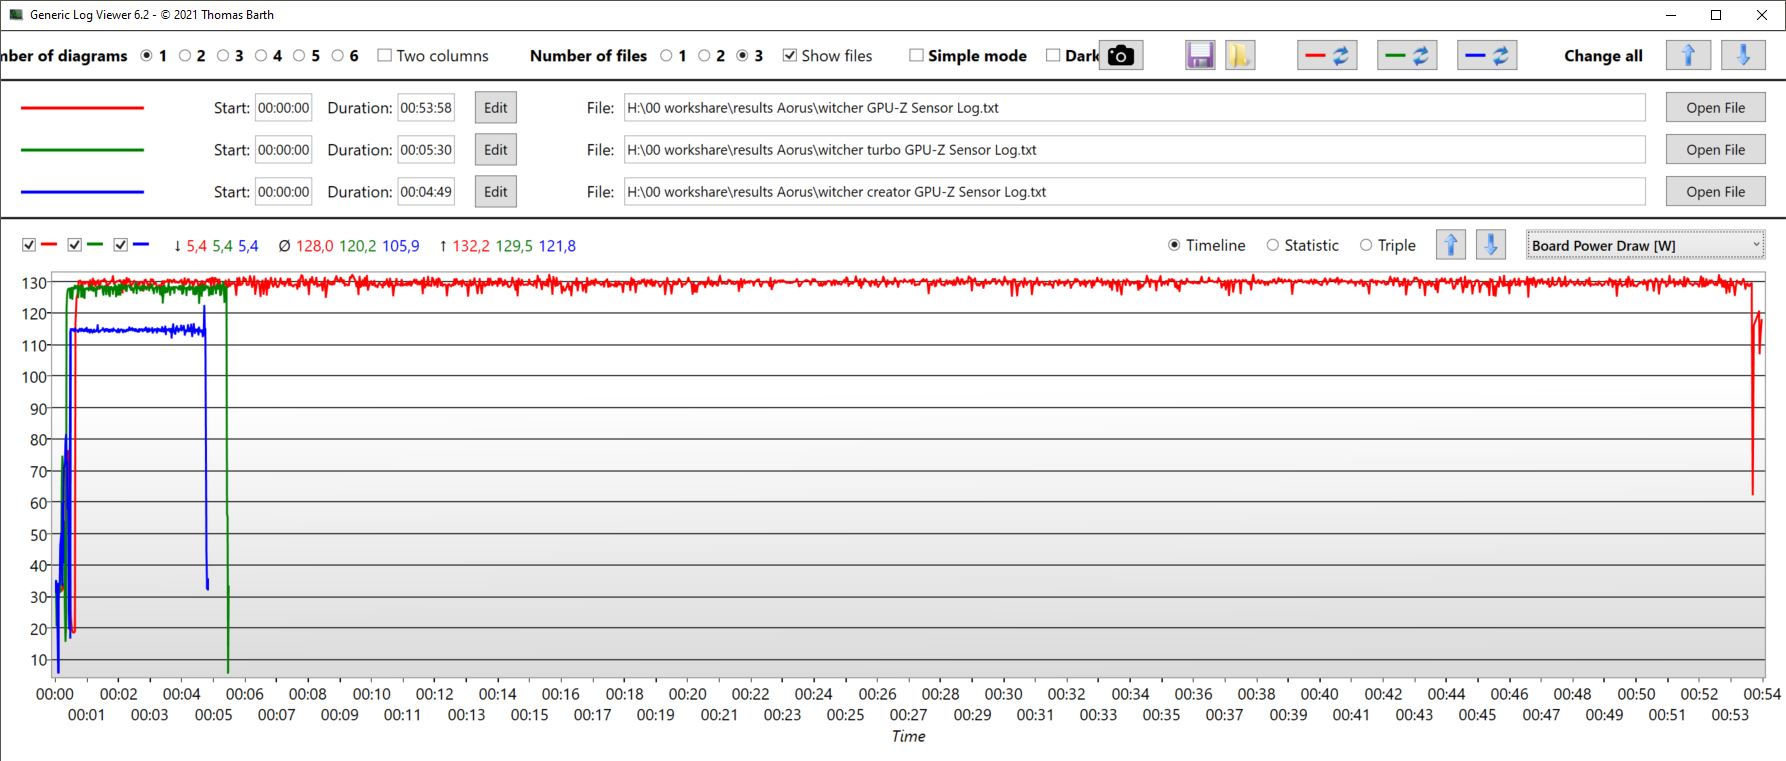
El modo Creador (curva azul esta vez) tuvo un rendimiento ligeramente peor, no consumió tanta energía y se mantuvo ligeramente más frío. En la sección de emisiones de ruido, hemos enumerado los modos y su efecto sobre los FPS y las emisiones de ruido al ejecutar The Witcher 3.
| Performance rating - Percent | |
| Media de la clase Gaming | |
| HP Omen 16-wf000 | |
| Aorus 15 YE5-54DEB34SH -1! | |
| Aorus 15 BSF -1! | |
| Captiva Advanced Gaming I74-121 | |
| HP Victus 16-r0077ng | |
| Dell XPS 15 9530 RTX 4070 | |
| The Witcher 3 - 1920x1080 Ultra Graphics & Postprocessing (HBAO+) | |
| Media de la clase Gaming (104.7 - 240, n=7, últimos 2 años) | |
| HP Omen 16-wf000 | |
| Aorus 15 YE5-54DEB34SH | |
| Aorus 15 BSF | |
| HP Victus 16-r0077ng | |
| Captiva Advanced Gaming I74-121 | |
| Dell XPS 15 9530 RTX 4070 | |
| GTA V - 1920x1080 Highest AA:4xMSAA + FX AF:16x | |
| Media de la clase Gaming (48.3 - 186.9, n=94, últimos 2 años) | |
| Aorus 15 YE5-54DEB34SH | |
| Captiva Advanced Gaming I74-121 | |
| HP Omen 16-wf000 | |
| HP Victus 16-r0077ng | |
| Dell XPS 15 9530 RTX 4070 | |
| Final Fantasy XV Benchmark - 1920x1080 High Quality | |
| HP Omen 16-wf000 | |
| Media de la clase Gaming (41 - 215, n=95, últimos 2 años) | |
| Aorus 15 YE5-54DEB34SH | |
| Aorus 15 BSF | |
| HP Victus 16-r0077ng | |
| Captiva Advanced Gaming I74-121 | |
| Dell XPS 15 9530 RTX 4070 | |
| Strange Brigade - 1920x1080 ultra AA:ultra AF:16 | |
| HP Omen 16-wf000 | |
| Media de la clase Gaming (76.3 - 458, n=87, últimos 2 años) | |
| Aorus 15 BSF | |
| HP Victus 16-r0077ng | |
| Captiva Advanced Gaming I74-121 | |
| Dell XPS 15 9530 RTX 4070 | |
| Dota 2 Reborn - 1920x1080 ultra (3/3) best looking | |
| Media de la clase Gaming (84.8 - 252, n=108, últimos 2 años) | |
| HP Omen 16-wf000 | |
| Aorus 15 BSF | |
| Captiva Advanced Gaming I74-121 | |
| Aorus 15 YE5-54DEB34SH | |
| Dell XPS 15 9530 RTX 4070 | |
| HP Victus 16-r0077ng | |
| X-Plane 11.11 - 1920x1080 high (fps_test=3) | |
| HP Omen 16-wf000 | |
| Aorus 15 BSF | |
| Captiva Advanced Gaming I74-121 | |
| Media de la clase Gaming (55.5 - 148.5, n=110, últimos 2 años) | |
| HP Victus 16-r0077ng | |
| Aorus 15 YE5-54DEB34SH | |
| Dell XPS 15 9530 RTX 4070 | |
Witcher 3 FPS diagram
| bajo | medio | alto | ultra | QHD | 4K | |
|---|---|---|---|---|---|---|
| GTA V (2015) | 184.4 | 180.8 | 176 | 118 | ||
| The Witcher 3 (2015) | 385 | 306 | 222 | 120 | 86 | |
| Dota 2 Reborn (2015) | 167.6 | 154.1 | 146.4 | 138.9 | 140.1 | |
| Final Fantasy XV Benchmark (2018) | 206 | 151.7 | 119.2 | 92.2 | ||
| X-Plane 11.11 (2018) | 134.1 | 121.3 | 94.9 | 85.4 | ||
| Far Cry 5 (2018) | 165 | 137 | 131 | 124 | 116 |
Emisiones y potencia - Mejor de lo que podría sugerir la RTX 3080 Ti
Emisiones sonoras
En el modo turbo, los ventiladores están siempre cerca de su límite, es decir, entre 52 y 55 dB. En los otros modos, los ventiladores funcionan de forma más situacional. La siguiente tabla muestra los niveles de emisión de ruido de los distintos modos tras unos 10 minutos de juego en The Witcher 3. En general, sus emisiones pueden calificarse de moderadas en relación con su rendimiento y pueden ajustarse de forma muy variable gracias a los numerosos modos. Tanto el Captiva como el HP Victus rinden peor en aplicaciones 3D pero son igualmente ruidosos - siendo el Captiva aún más ruidoso.
En el modo de juego, los ventiladores también están activos cuando el portátil está en reposo, aunque de forma silenciosa. Suelen ser silenciosos en modo de reunión o de ahorro de energía. Durante el escenario de carga media simulada (3DMark06) con el modo de juego seleccionado, sus emisiones de ruido aumentaron gradualmente hasta los 43 dB. En Ahorro de energía, la misma prueba se desarrolló a sólo 27 dB.
| Modo de rendimiento/Witcher 3 | Frecuencia de imagen máxima | Frecuencia de imagen media | Emisiones sonoras en dB | Consumo en vatios |
|---|---|---|---|---|
| Turbo | 124 | 118 | 52,68 | 199 |
| AI | 122 | 116 | 44,78 | 197 |
| Juego | 125 | 116 | 46,77 | 196 |
| Creador | 115 | 110 | 44,78 | 185 |
| Reunión | 111 | 105 | 36.53 | 163 |
| Economizador | 115 | 106 | 36.53 | 162 |
Ruido
| Ocioso |
| 23 / 23 / 26.42 dB(A) |
| Carga |
| 43.5 / 50.21 dB(A) |
 | ||
30 dB silencioso 40 dB(A) audible 50 dB(A) ruidosamente alto |
||
min: | ||
| Aorus 15 YE5-54DEB34SH GeForce RTX 3080 Ti Laptop GPU, i5-12500H, Gigabyte AG470S1TB-SI B10 | Aorus 15 BSF GeForce RTX 4070 Laptop GPU, i7-13700H, Gigabyte AG470S1TB-SI B10 | Captiva Advanced Gaming I74-121 GeForce RTX 4060 Laptop GPU, i5-13500H, Samsung SSD 980 1TB MZ-V8V1T0BW | HP Victus 16-r0077ng GeForce RTX 4070 Laptop GPU, i7-13700H, Kioxia XG8 KXG80ZNV1T02 | Dell XPS 15 9530 RTX 4070 GeForce RTX 4070 Laptop GPU, i7-13700H, SK hynix PC801 HFS001TEJ9X101N | HP Omen 16-wf000 GeForce RTX 4080 Laptop GPU, i7-13700HX, SK hynix PC801 HFS002TEJ9X101N | |
|---|---|---|---|---|---|---|
| Noise | -20% | -3% | -9% | 10% | -13% | |
| apagado / medio ambiente * (dB) | 23 | 24 -4% | 23 -0% | 25 -9% | 23.1 -0% | 23 -0% |
| Idle Minimum * (dB) | 23 | 25 -9% | 23 -0% | 28 -22% | 23.1 -0% | 29.6 -29% |
| Idle Average * (dB) | 23 | 31 -35% | 25.67 -12% | 29 -26% | 23.1 -0% | 29.8 -30% |
| Idle Maximum * (dB) | 26.42 | 37 -40% | 25.67 3% | 30 -14% | 24.2 8% | 30.4 -15% |
| Load Average * (dB) | 43.5 | 51 -17% | 38.52 11% | 43 1% | 27.1 38% | 33.8 22% |
| Witcher 3 ultra * (dB) | 46.77 | 54.17 -16% | 46 2% | 40.1 14% | 57 -22% | |
| Load Maximum * (dB) | 50.21 | 57 -14% | 54.17 -8% | 48 4% | 44.6 11% | 58.3 -16% |
* ... más pequeño es mejor
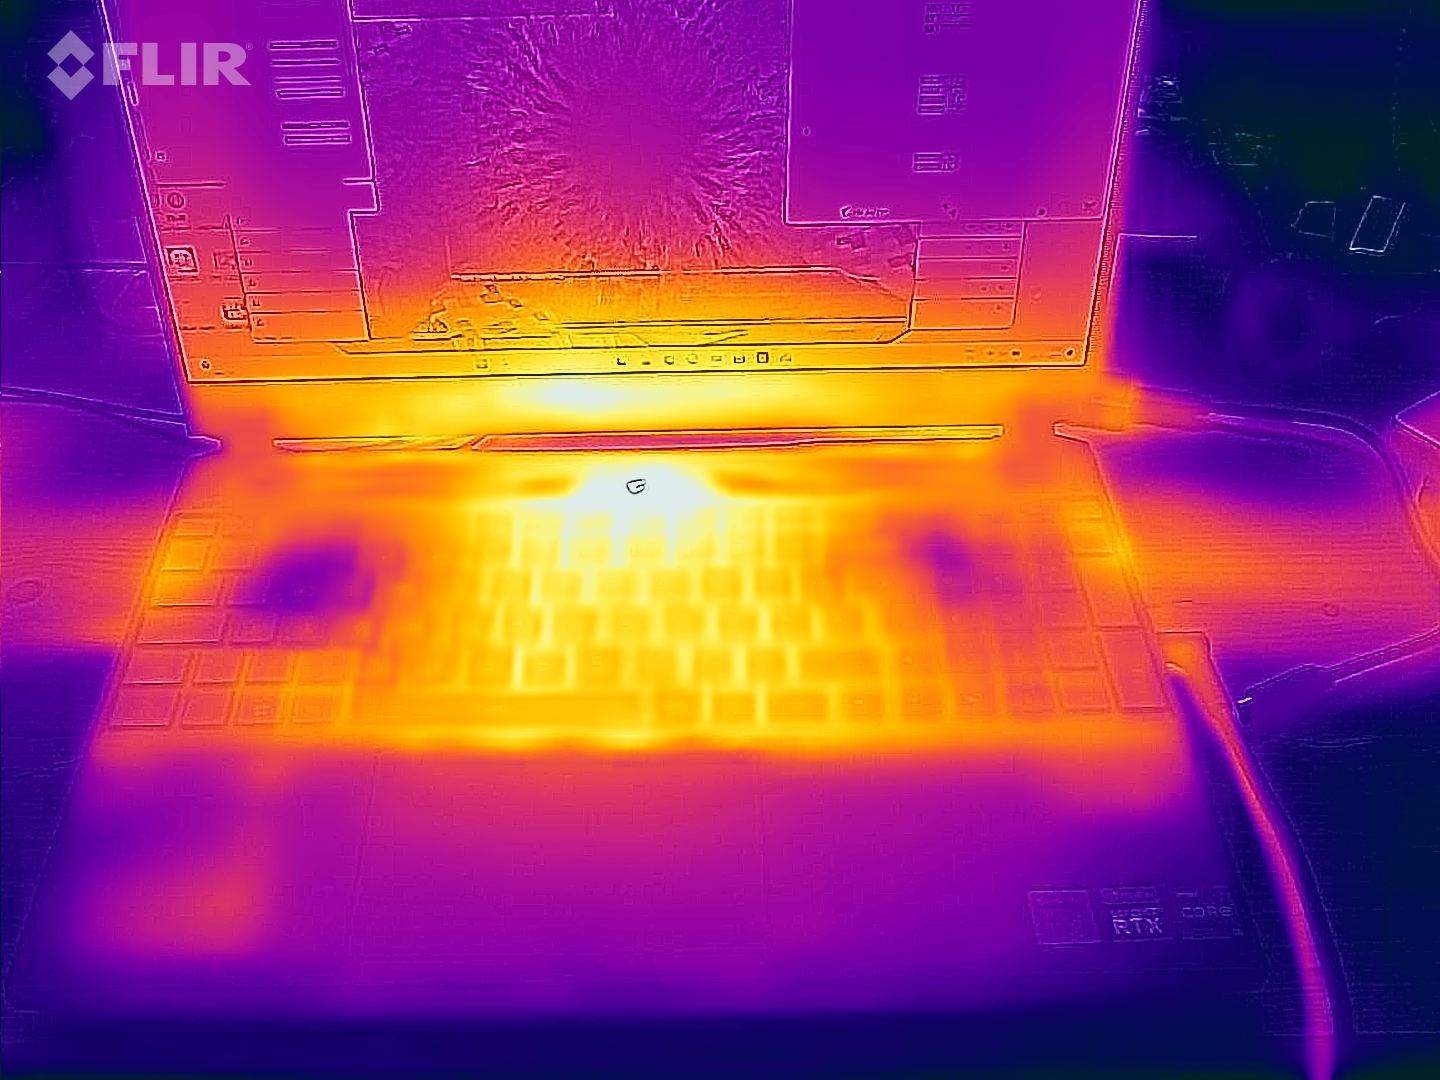
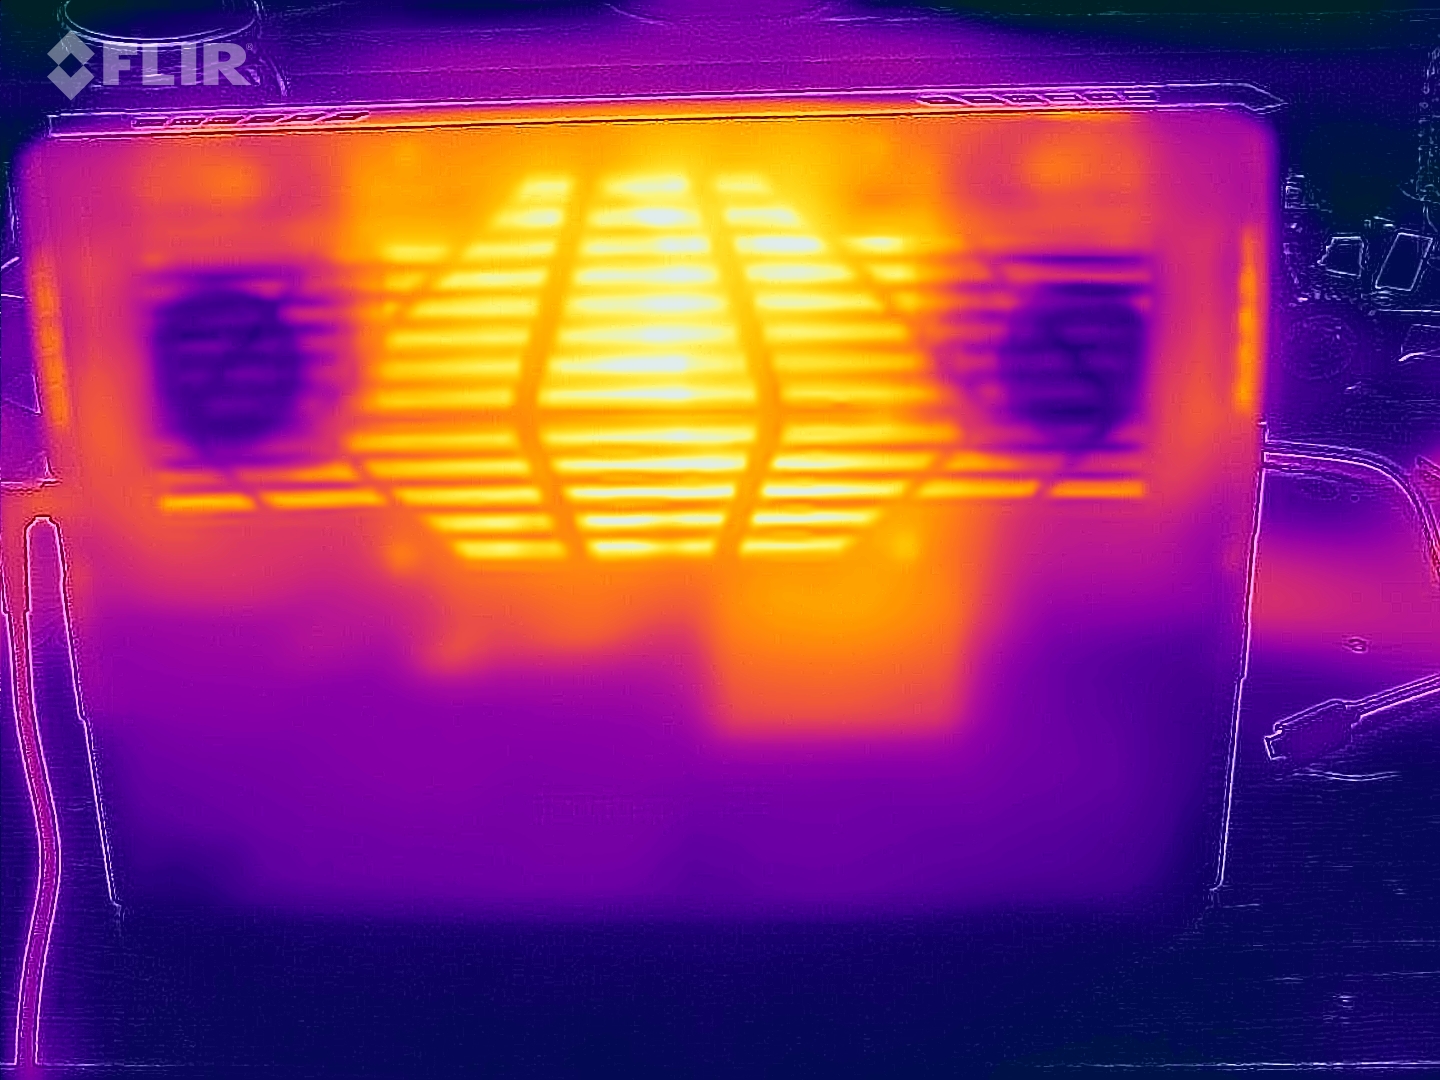
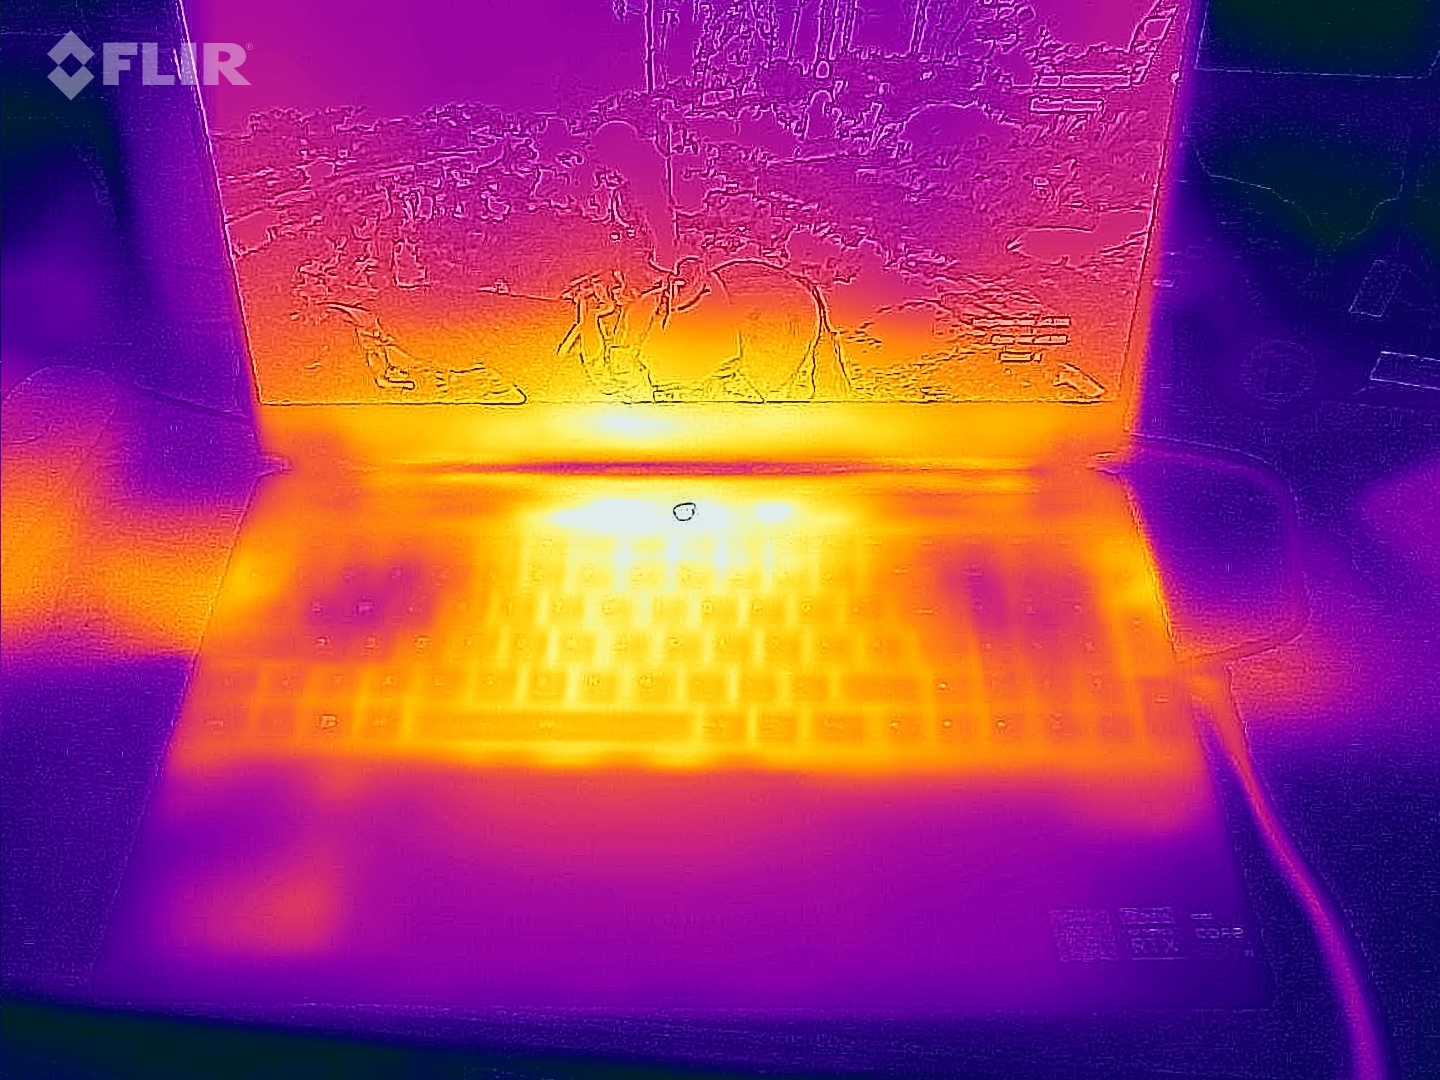
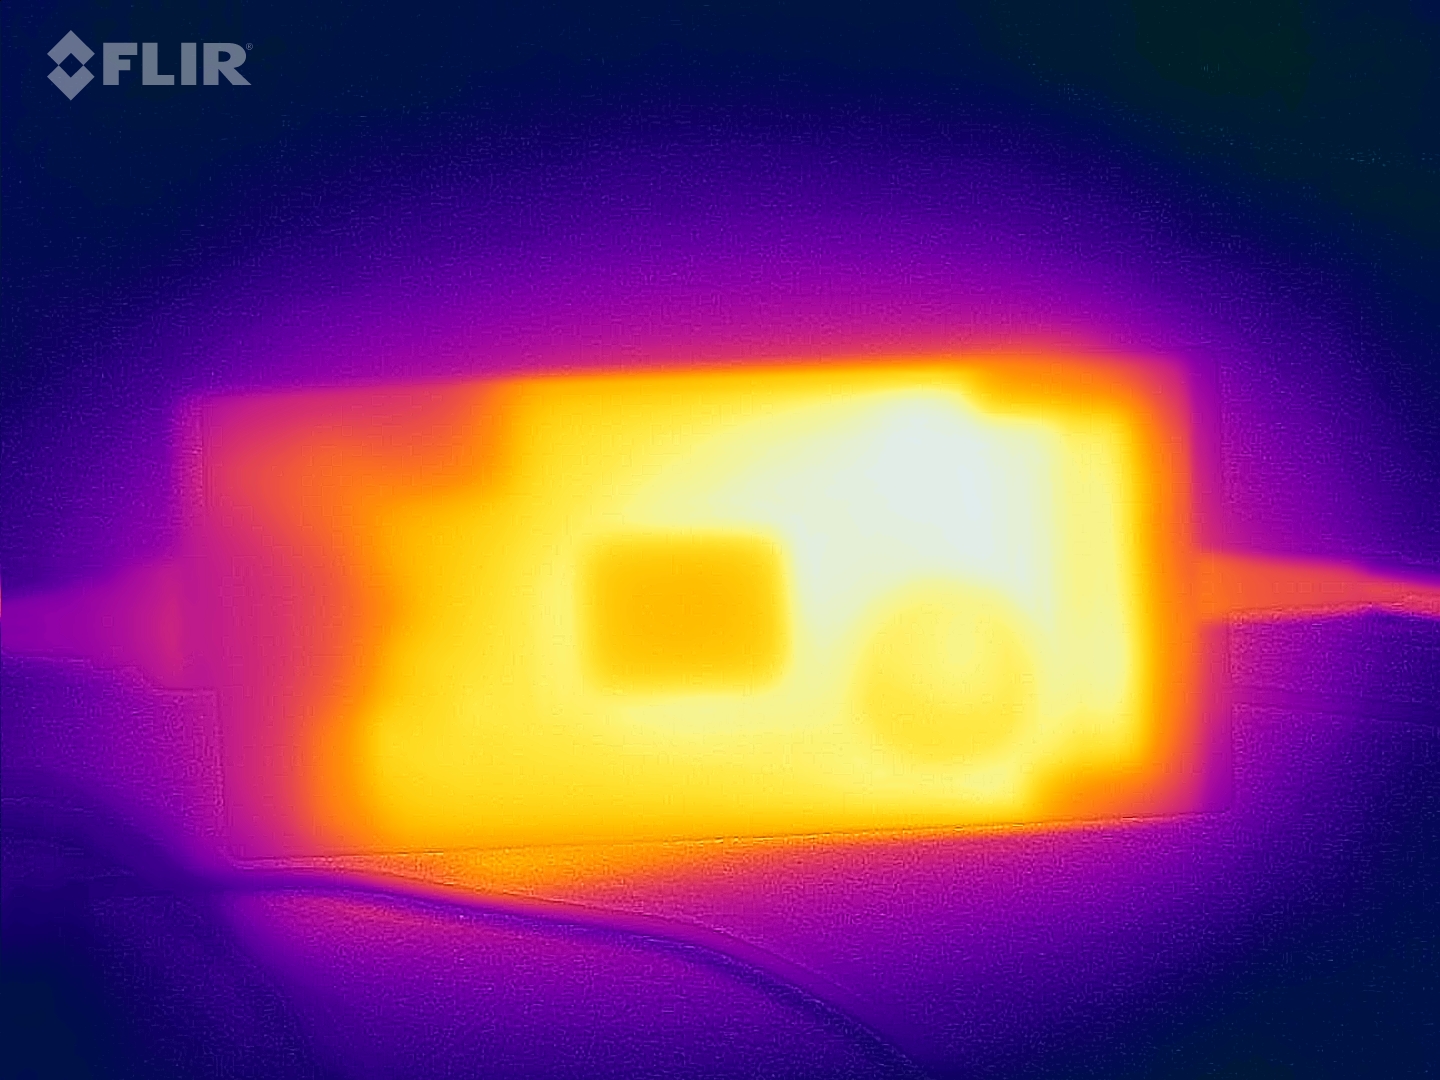
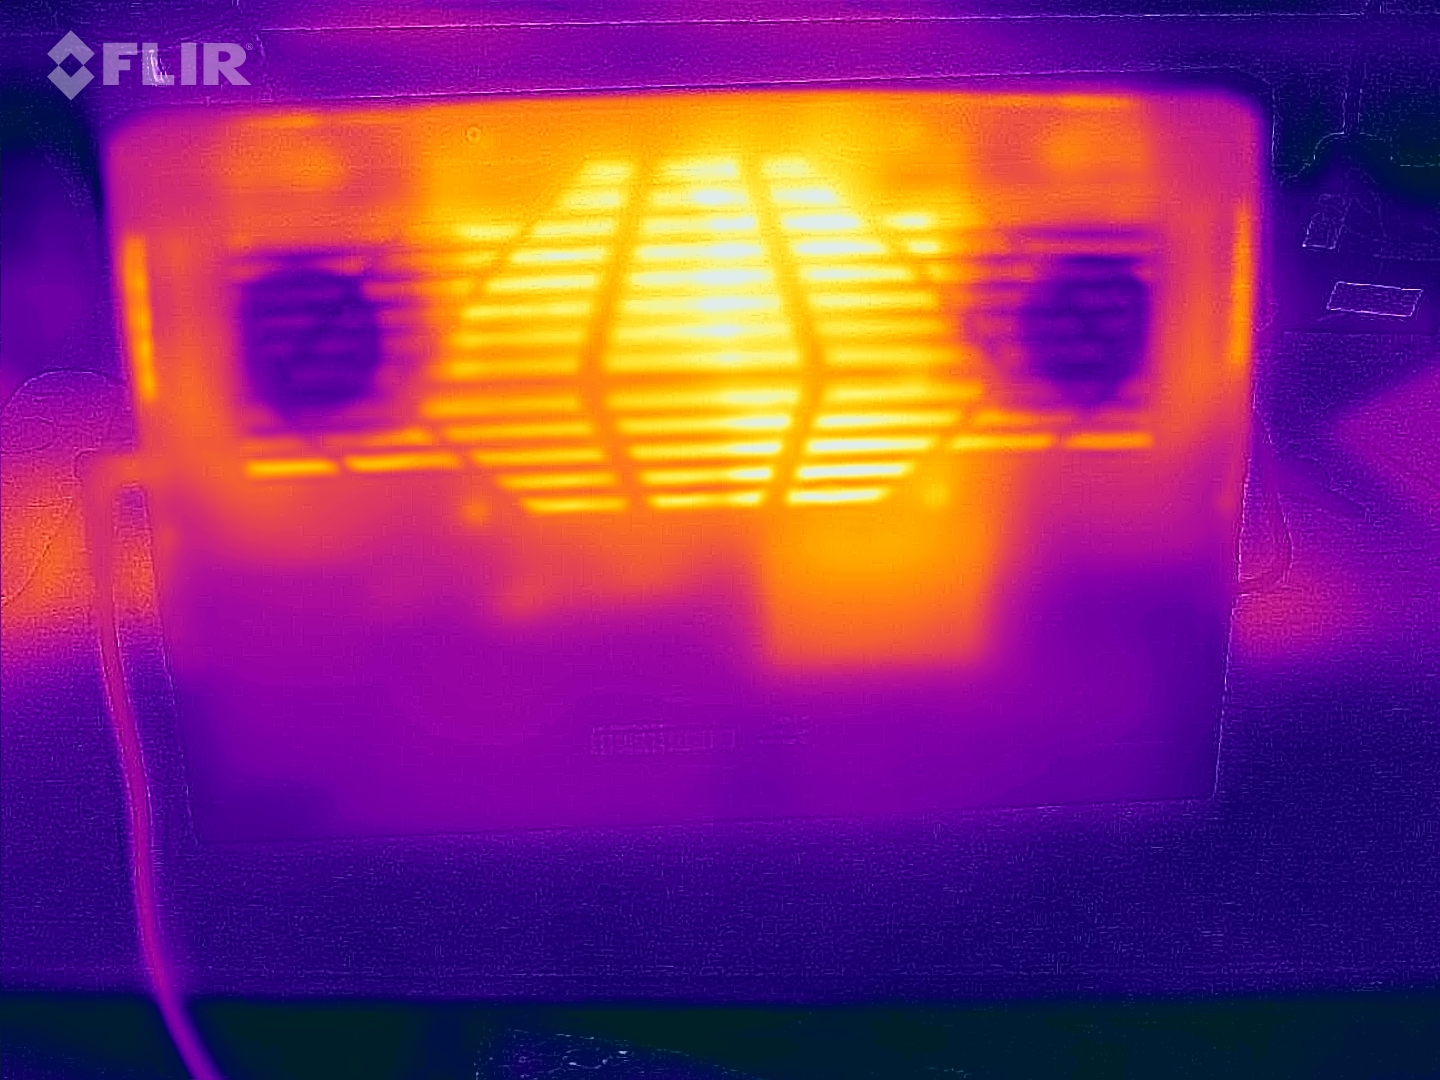
Temperatura
Se calienta bajo carga elevada, especialmente en la parte inferior, en el centro del dispositivo, hacia la pantalla. Sin embargo, con un máximo de 50 °C, su temperatura está dentro del rango de los típicos portátiles para juegos. La parte superior incluso se mantiene sorprendentemente fría con un máximo de 43 °C. En modo turbo, las temperaturas son aún más bajas.
(±) La temperatura máxima en la parte superior es de 43 °C / 109 F, frente a la media de 40.4 °C / 105 F, que oscila entre 21.2 y 68.8 °C para la clase Gaming.
(-) El fondo se calienta hasta un máximo de 50 °C / 122 F, frente a la media de 43.2 °C / 110 F
(+) En reposo, la temperatura media de la parte superior es de 27.3 °C / 81# F, frente a la media del dispositivo de 33.9 °C / 93 F.
(+) Jugando a The Witcher 3, la temperatura media de la parte superior es de 29.7 °C / 85 F, frente a la media del dispositivo de 33.9 °C / 93 F.
(+) El reposamanos y el panel táctil están a una temperatura inferior a la de la piel, con un máximo de 26 °C / 78.8 F y, por tanto, son fríos al tacto.
(+) La temperatura media de la zona del reposamanos de dispositivos similares fue de 28.8 °C / 83.8 F (+2.8 °C / 5 F).
| Aorus 15 YE5-54DEB34SH Intel Core i5-12500H, NVIDIA GeForce RTX 3080 Ti Laptop GPU | Aorus 15 BSF Intel Core i7-13700H, NVIDIA GeForce RTX 4070 Laptop GPU | Captiva Advanced Gaming I74-121 Intel Core i5-13500H, NVIDIA GeForce RTX 4060 Laptop GPU | HP Victus 16-r0077ng Intel Core i7-13700H, NVIDIA GeForce RTX 4070 Laptop GPU | Dell XPS 15 9530 RTX 4070 Intel Core i7-13700H, NVIDIA GeForce RTX 4070 Laptop GPU | HP Omen 16-wf000 Intel Core i7-13700HX, NVIDIA GeForce RTX 4080 Laptop GPU | |
|---|---|---|---|---|---|---|
| Heat | -8% | 4% | -8% | 1% | 5% | |
| Maximum Upper Side * (°C) | 43 | 48 -12% | 41 5% | 51 -19% | 45.6 -6% | 45 -5% |
| Maximum Bottom * (°C) | 50 | 47 6% | 42 16% | 54 -8% | 42 16% | 48.8 2% |
| Idle Upper Side * (°C) | 33 | 39 -18% | 32 3% | 37 -12% | 34.4 -4% | 29.2 12% |
| Idle Bottom * (°C) | 32 | 35 -9% | 35 -9% | 29 9% | 33.2 -4% | 28.8 10% |
* ... más pequeño es mejor
Altavoces
Un aspecto positivo es el volumen decente de los altavoces. Sin embargo, apenas hay graves e incluso los medios y agudos no están especialmente equilibrados.
Para conectar dispositivos de audio externos dispone de una toma combinada de 3,5 mm para micrófonos y auriculares.
Aorus 15 YE5-54DEB34SH análisis de audio
(+) | los altavoces pueden reproducir a un volumen relativamente alto (#84.15 dB)
Graves 100 - 315 Hz
(-) | casi sin bajos - de media 27.1% inferior a la mediana
(±) | la linealidad de los graves es media (12.4% delta a frecuencia anterior)
Medios 400 - 2000 Hz
(±) | medias más altas - de media 6.2% más altas que la mediana
(±) | la linealidad de los medios es media (7.7% delta respecto a la frecuencia anterior)
Altos 2 - 16 kHz
(±) | máximos más altos - de media 7.4% más altos que la mediana
(±) | la linealidad de los máximos es media (7.5% delta a frecuencia anterior)
Total 100 - 16.000 Hz
(±) | la linealidad del sonido global es media (22.5% de diferencia con la mediana)
En comparación con la misma clase
» 81% de todos los dispositivos probados de esta clase eran mejores, 5% similares, 14% peores
» El mejor tuvo un delta de 6%, la media fue 18%, el peor fue ###max##%
En comparación con todos los dispositivos probados
» 66% de todos los dispositivos probados eran mejores, 6% similares, 28% peores
» El mejor tuvo un delta de 4%, la media fue 23%, el peor fue ###max##%
Apple MacBook Pro 16 2021 M1 Pro análisis de audio
(+) | los altavoces pueden reproducir a un volumen relativamente alto (#84.7 dB)
Graves 100 - 315 Hz
(+) | buen bajo - sólo 3.8% lejos de la mediana
(+) | el bajo es lineal (5.2% delta a la frecuencia anterior)
Medios 400 - 2000 Hz
(+) | medios equilibrados - a sólo 1.3% de la mediana
(+) | los medios son lineales (2.1% delta a la frecuencia anterior)
Altos 2 - 16 kHz
(+) | máximos equilibrados - a sólo 1.9% de la mediana
(+) | los máximos son lineales (2.7% delta a la frecuencia anterior)
Total 100 - 16.000 Hz
(+) | el sonido global es lineal (4.6% de diferencia con la mediana)
En comparación con la misma clase
» 0% de todos los dispositivos probados de esta clase eran mejores, 0% similares, 100% peores
» El mejor tuvo un delta de 5%, la media fue 17%, el peor fue ###max##%
En comparación con todos los dispositivos probados
» 0% de todos los dispositivos probados eran mejores, 0% similares, 100% peores
» El mejor tuvo un delta de 4%, la media fue 23%, el peor fue ###max##%
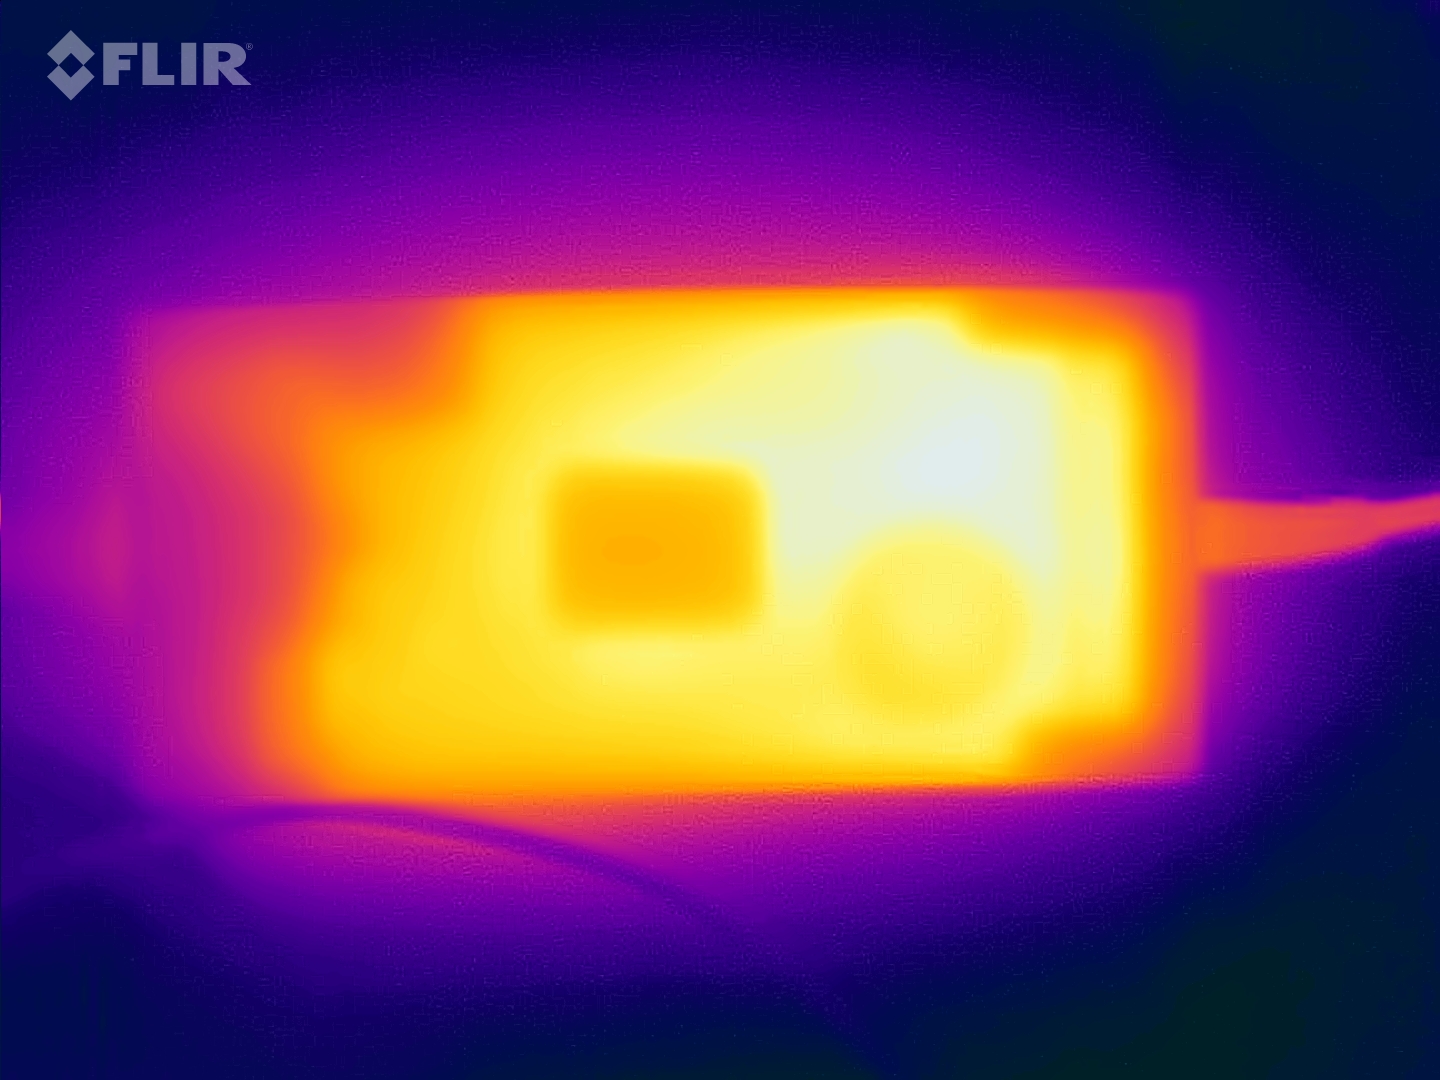
Consumo de energía
De acuerdo, la RTX 3080 Ti no es exactamente frugal - técnicamente, la actual generación de CPU/GPU debería ser más eficiente a estas alturas.
Para consumir tan "poco" como la Captiva al jugar a The Witcher 3, por ejemplo, tendría que poner nuestra Aorus en modo de reunión o de ahorro de energía. Sin embargo, las tasas de refresco en el juego también están entonces a un nivel algo sorprendente (véase la tabla en la sección de emisiones sonoras).
Sobre todo, destacan negativamente los 150 vatios que medimos en nuestra prueba 3DMark06 (carga media); por el contrario, el Captiva sólo consume 85 vatios. En general, incluso en reposo, cabe esperar un consumo ligeramente superior, pero esto se relativiza al jugar.
Medimos un valor máximo y temporal de 204 vatios, al que la fuente de alimentación de 240 vatios de Delta puede hacer frente sin problemas.
| Off / Standby | |
| Ocioso | |
| Carga |
|
Clave:
min: | |
| Aorus 15 YE5-54DEB34SH GeForce RTX 3080 Ti Laptop GPU, i5-12500H, Gigabyte AG470S1TB-SI B10 | Aorus 15 BSF GeForce RTX 4070 Laptop GPU, i7-13700H, Gigabyte AG470S1TB-SI B10 | Captiva Advanced Gaming I74-121 GeForce RTX 4060 Laptop GPU, i5-13500H, Samsung SSD 980 1TB MZ-V8V1T0BW | HP Victus 16-r0077ng GeForce RTX 4070 Laptop GPU, i7-13700H, Kioxia XG8 KXG80ZNV1T02 | Dell XPS 15 9530 RTX 4070 GeForce RTX 4070 Laptop GPU, i7-13700H, SK hynix PC801 HFS001TEJ9X101N | HP Omen 16-wf000 GeForce RTX 4080 Laptop GPU, i7-13700HX, SK hynix PC801 HFS002TEJ9X101N | |
|---|---|---|---|---|---|---|
| Power Consumption | 10% | 15% | 23% | 23% | -24% | |
| Idle 150cd/m2 * (Watt) | 16 | 12.4 22% | 18 -13% | 12.8 20% | 20.1 -26% | 23.2 -45% |
| 3DMark06 Return To Proxycon * (Watt) | 150 | 85 43% | ||||
| Witcher 3 ultra * (Watt) | 196 | 175.8 10% | 164 16% | 141.8 28% | 95.4 51% | 214 -9% |
| 1280x720 Prime95 28.10 and Furmark 1.25 * (Watt) | 204 | 210 -3% | 179 12% | 164.1 20% | 117.2 43% | 240 -18% |
* ... más pequeño es mejor
Power consumption Witcher 3 / stress test
Power consumption with external monitor
Tiempos de ejecución
El Aorus decepciona en cuanto a sus tiempos de ejecución, presumiblemente debido a su mayor consumo en reposo. Gigabyte ha instalado una generosa batería de 99 Wh, pero su autonomía sigue estando al mismo nivel que la del Captiva con una batería de ¡53 Wh! El Aorus BSF de generación actual con un i7-13700H y una RTX 4070 duró un 65% más con su batería de 99 Wh, ¡y casi el doble en la prueba WLAN! Duró más de 10 horas, mientras que nuestro Aorus duró menos de 5,5 horas.
| Aorus 15 YE5-54DEB34SH i5-12500H, GeForce RTX 3080 Ti Laptop GPU, 99 Wh | Aorus 15 BSF i7-13700H, GeForce RTX 4070 Laptop GPU, 99 Wh | Captiva Advanced Gaming I74-121 i5-13500H, GeForce RTX 4060 Laptop GPU, 53 Wh | HP Victus 16-r0077ng i7-13700H, GeForce RTX 4070 Laptop GPU, 83 Wh | Dell XPS 15 9530 RTX 4070 i7-13700H, GeForce RTX 4070 Laptop GPU, 86 Wh | HP Omen 16-wf000 i7-13700HX, GeForce RTX 4080 Laptop GPU, 83 Wh | Media de la clase Gaming | |
|---|---|---|---|---|---|---|---|
| Duración de Batería | 64% | -5% | 34% | 20% | -20% | 26% | |
| H.264 (h) | 5.3 | 9 70% | 4.9 -8% | 8.32 ? 57% | |||
| WiFi v1.3 (h) | 5.3 | 10.3 94% | 5.3 0% | 7.1 34% | 8 51% | 5.1 -4% | 7.11 ? 34% |
| Load (h) | 1.7 | 2.2 29% | 1.6 -6% | 1.5 -12% | 1.1 -35% | 1.502 ? -12% | |
| Reader / Idle (h) | 10.9 | 11.5 | 5.5 | 8.27 ? |
Pro
Contra
Veredicto - ¡Definitivamente competitivo!


La combinación de una CPU Gen-12 y una RTX 3080 Ti no es en absoluto cosa del pasado, especialmente en lo que respecta al rendimiento (3D). El Aorus 15 YE5 puede batir a la mayoría de portátiles para juegos con una RTX 4070, lo que hace que merezca la pena tenerlo en cuenta, especialmente por su bajo precio. A pesar de ello, el Aorus no ha renunciado a características modernas como Thunderbolt 4, un rápido SSD o un diseño bien acabado como han hecho muchos de sus competidores.
Su escasa eficiencia ya no está del todo al día, lo que se refleja sobre todo en la decepcionante autonomía del portátil a pesar de su gran batería. Su vieja webcam de 720p puede no ser un absoluto no-go, sin embargo, para los jugadores, esto es una clara desventaja. Una característica molesta y típica de Aorus es que el dispositivo pasa al modo de espera muy rápidamente en cuanto se cierra la pantalla 45 grados.
El Aorus 15 YE5 ofrece un rendimiento muy sólido en juegos a un precio bajo, sin parecer barato, como hacen otros competidores más caros. Su GPU de última generación es particularmente impresionante cuando se trata de rendimiento 3D, mientras que su eficiencia y tiempos de ejecución son deficientes.
Existen algunas alternativas de precio similar, como la MSI Katana con una RTX 4070. Sin embargo, la Aorus debería ser un poco más rápida en muchos juegos. Además, el Katana no cuenta con Thunderbolt 4 ni da la sensación de ser de tan alta calidad. A su vez, el MSI se beneficia de tiempos de ejecución más largos. El HP Victus 16 se comporta de forma similar - incluso cuesta un poco más pero no es tan rápido ni se siente de tan alta calidad como el Aorus. Actualmente tendrá que desembolsar unos 300 dólares más para adquirir la Aorus de generación actual.
Precio y disponibilidad
El Aorus 15 YE5 se vende actualmente por unos 1.500 dólares. En el momento de escribir estas líneas, no pudimos encontrarlo a la venta en ningún minorista en línea de EE. UU.
Aorus 15 YE5-54DEB34SH
- 12/15/2023 v7 (old)
Christian Hintze
Transparencia
La selección de los dispositivos que se van a reseñar corre a cargo de nuestro equipo editorial. La muestra de prueba fue proporcionada al autor en calidad de préstamo por el fabricante o el minorista a los efectos de esta reseña. El prestamista no tuvo ninguna influencia en esta reseña, ni el fabricante recibió una copia de la misma antes de su publicación. No había ninguna obligación de publicar esta reseña. Como empresa de medios independiente, Notebookcheck no está sujeta a la autoridad de fabricantes, minoristas o editores.
Así es como prueba Notebookcheck
Cada año, Notebookcheck revisa de forma independiente cientos de portátiles y smartphones utilizando procedimientos estandarizados para asegurar que todos los resultados son comparables. Hemos desarrollado continuamente nuestros métodos de prueba durante unos 20 años y hemos establecido los estándares de la industria en el proceso. En nuestros laboratorios de pruebas, técnicos y editores experimentados utilizan equipos de medición de alta calidad. Estas pruebas implican un proceso de validación en varias fases. Nuestro complejo sistema de clasificación se basa en cientos de mediciones y puntos de referencia bien fundamentados, lo que mantiene la objetividad.Price comparison

