Análisis del Aorus 15 XE5: Portátil de juegos compacto QHD con Thunderbolt 4
El Aorus 15 XE5 de 15,6 pulgadas se une a las filas de los portátiles compactos para juegos y está equipado con un Core i7-12700H y una GeForce Portátil RTX 3070 Ti. La máquina compite con dispositivos como el Acer Nitro 5 AN515-46el MSI Katana GF66 12UGSy el Schenker XMG Fusion 15 (Mid 22) y el Asus TUF DASH F15 FX517ZR.
Posibles contendientes en la comparación
Valoración | Fecha | Modelo | Peso | Altura | Tamaño | Resolución | Precio |
|---|---|---|---|---|---|---|---|
| 85.5 % v7 (old) | 12/2022 | Aorus 15 XE5 i7-12700H, GeForce RTX 3070 Ti Laptop GPU | 2.3 kg | 24 mm | 15.60" | 2560x1440 | |
| 83.9 % v7 (old) | 11/2022 | Acer Nitro 5 AN515-46-R1A1 R7 6800H, GeForce RTX 3070 Ti Laptop GPU | 2.5 kg | 26.8 mm | 15.60" | 1920x1080 | |
| 87.4 % v7 (old) | 08/2022 | Schenker XMG Fusion 15 (Mid 22) i7-11800H, GeForce RTX 3070 Laptop GPU | 1.9 kg | 21.65 mm | 15.60" | 2560x1440 | |
| 85.8 % v7 (old) | 07/2022 | Asus TUF Dash F15 FX517ZR i7-12650H, GeForce RTX 3070 Laptop GPU | 2 kg | 20.7 mm | 15.60" | 2560x1440 | |
| 80.3 % v7 (old) | 06/2022 | MSI Katana GF66 12UGS i7-12700H, GeForce RTX 3070 Ti Laptop GPU | 2.3 kg | 27.5 mm | 15.60" | 1920x1080 |
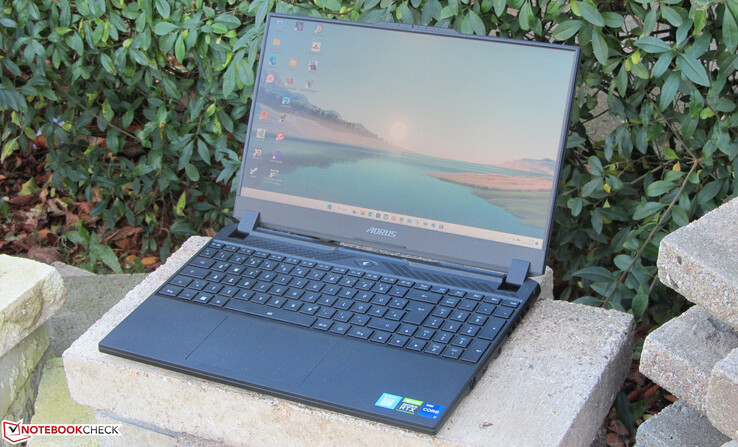
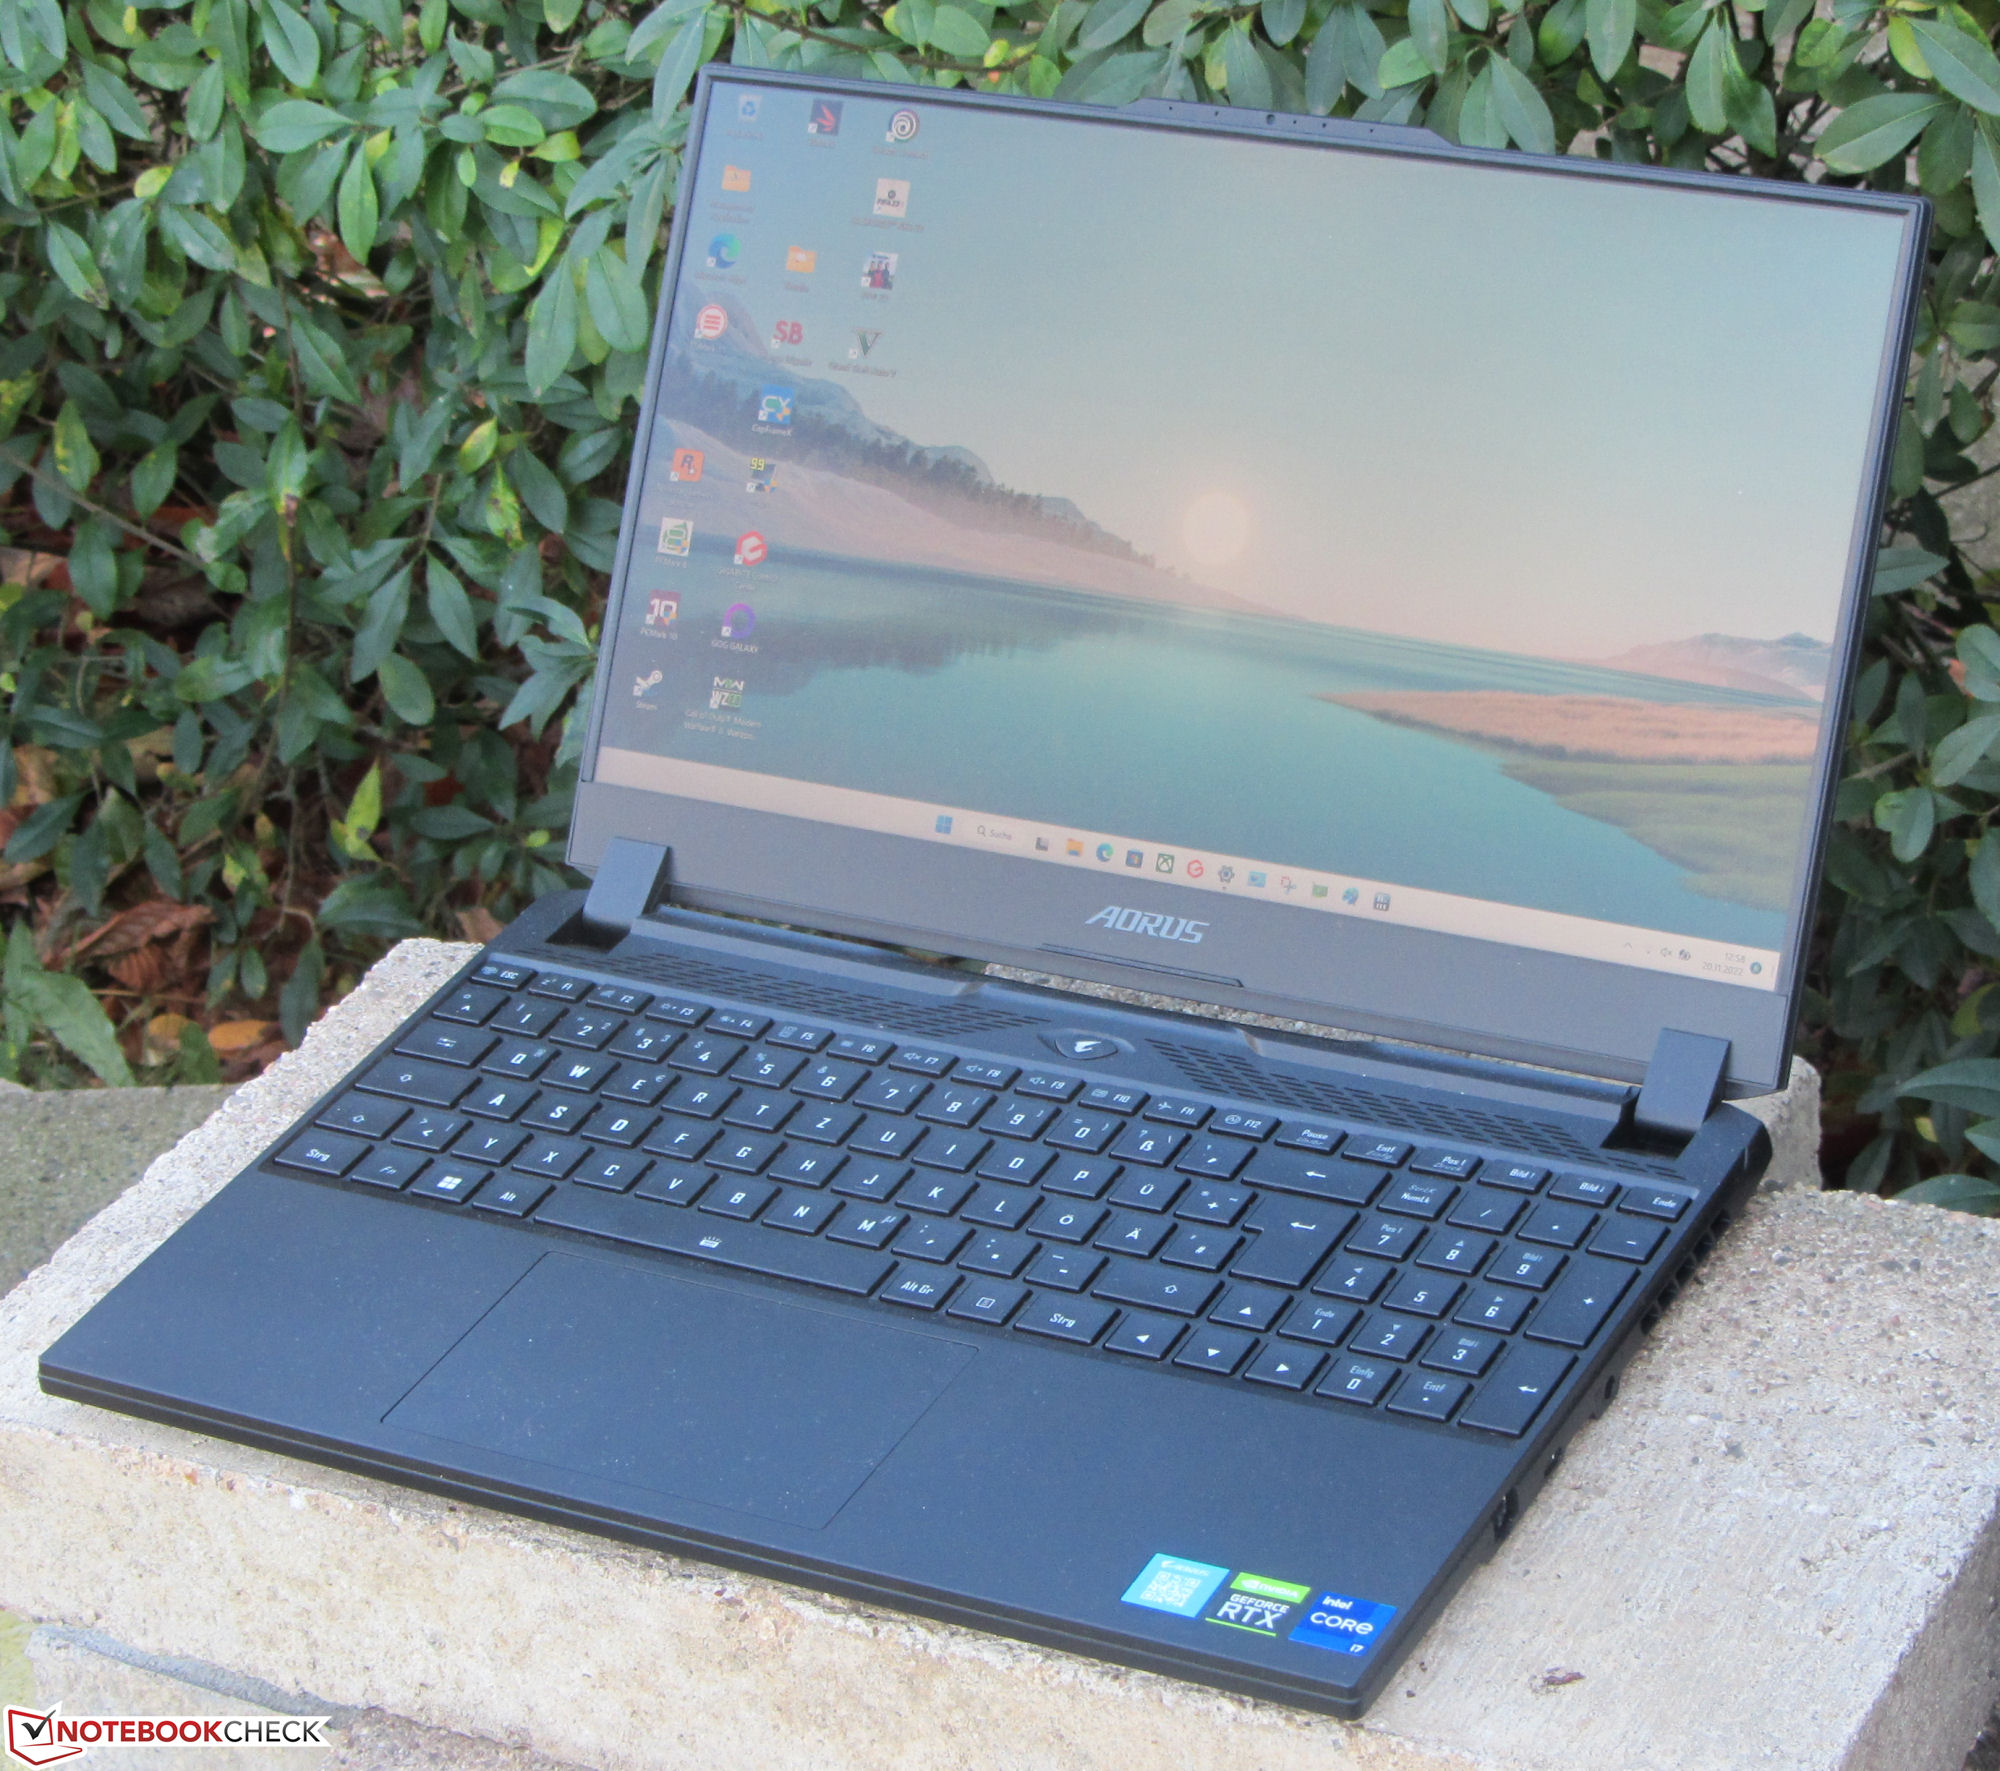
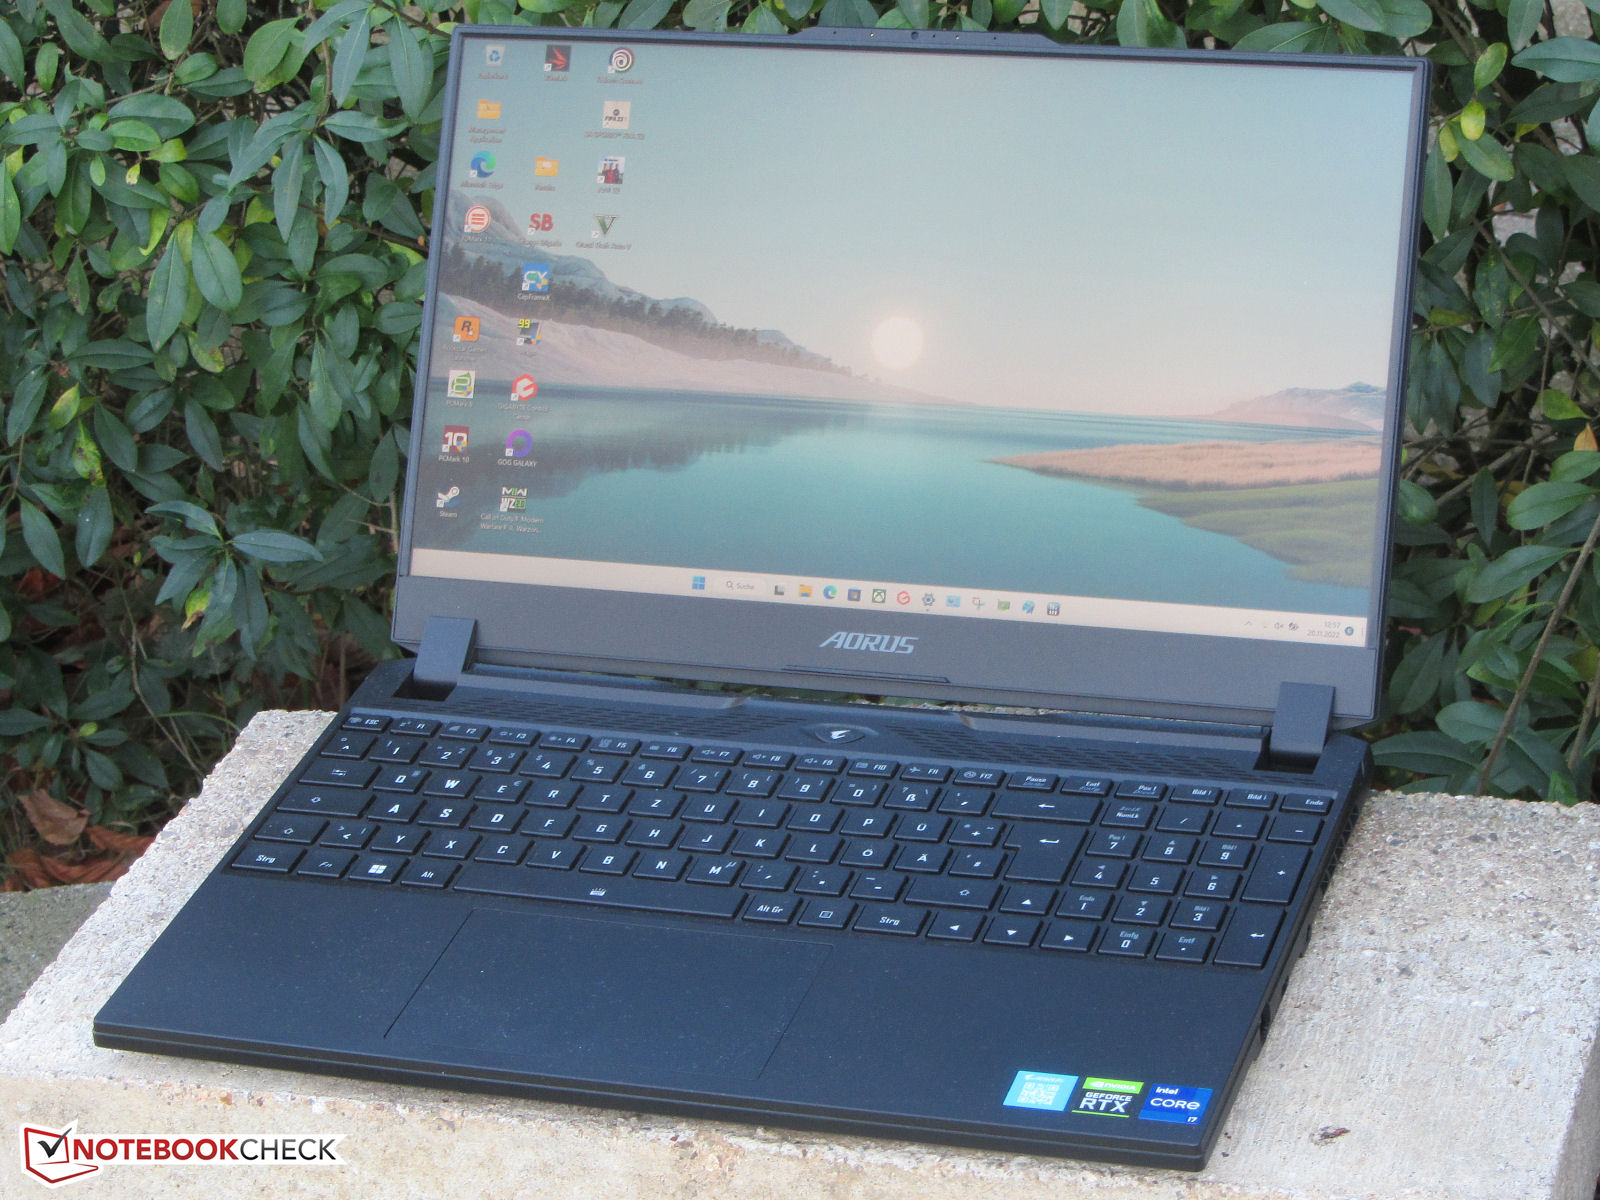
Carcasa - La Aorus es impresionantemente compacta
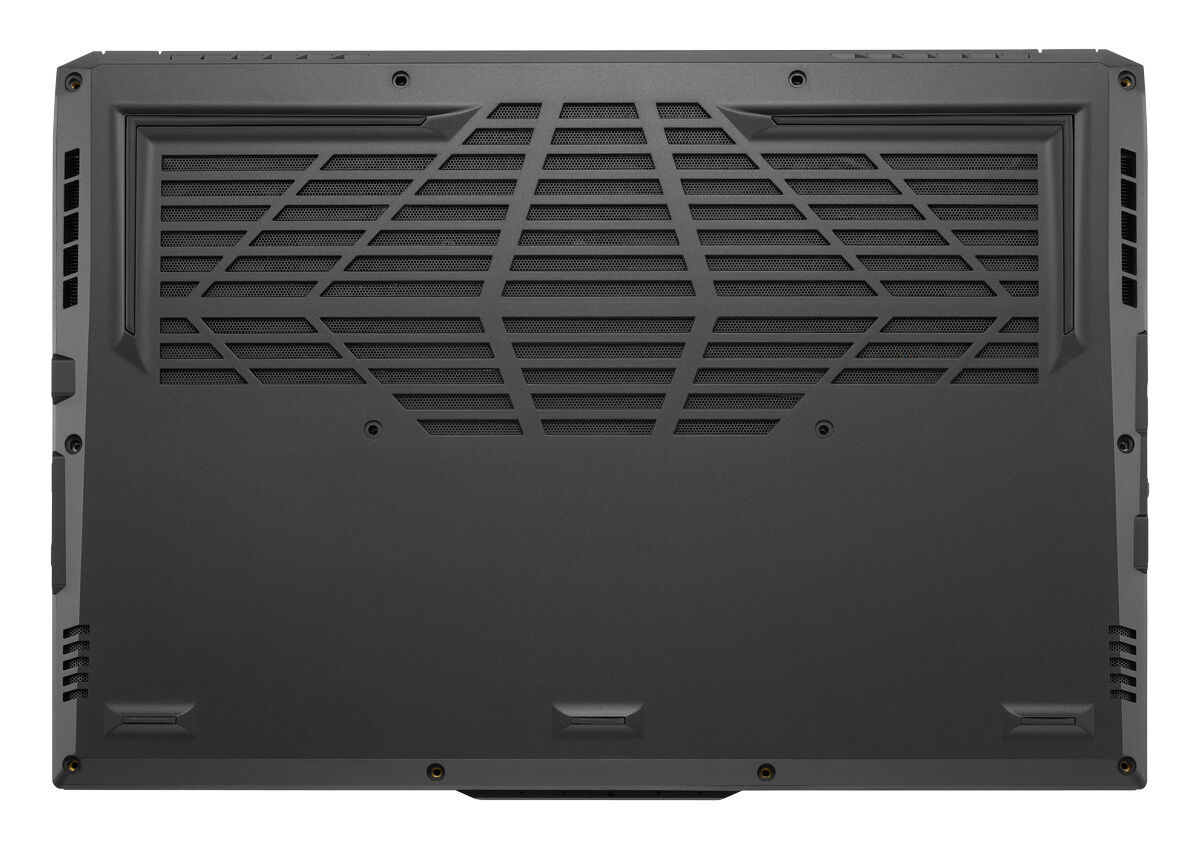
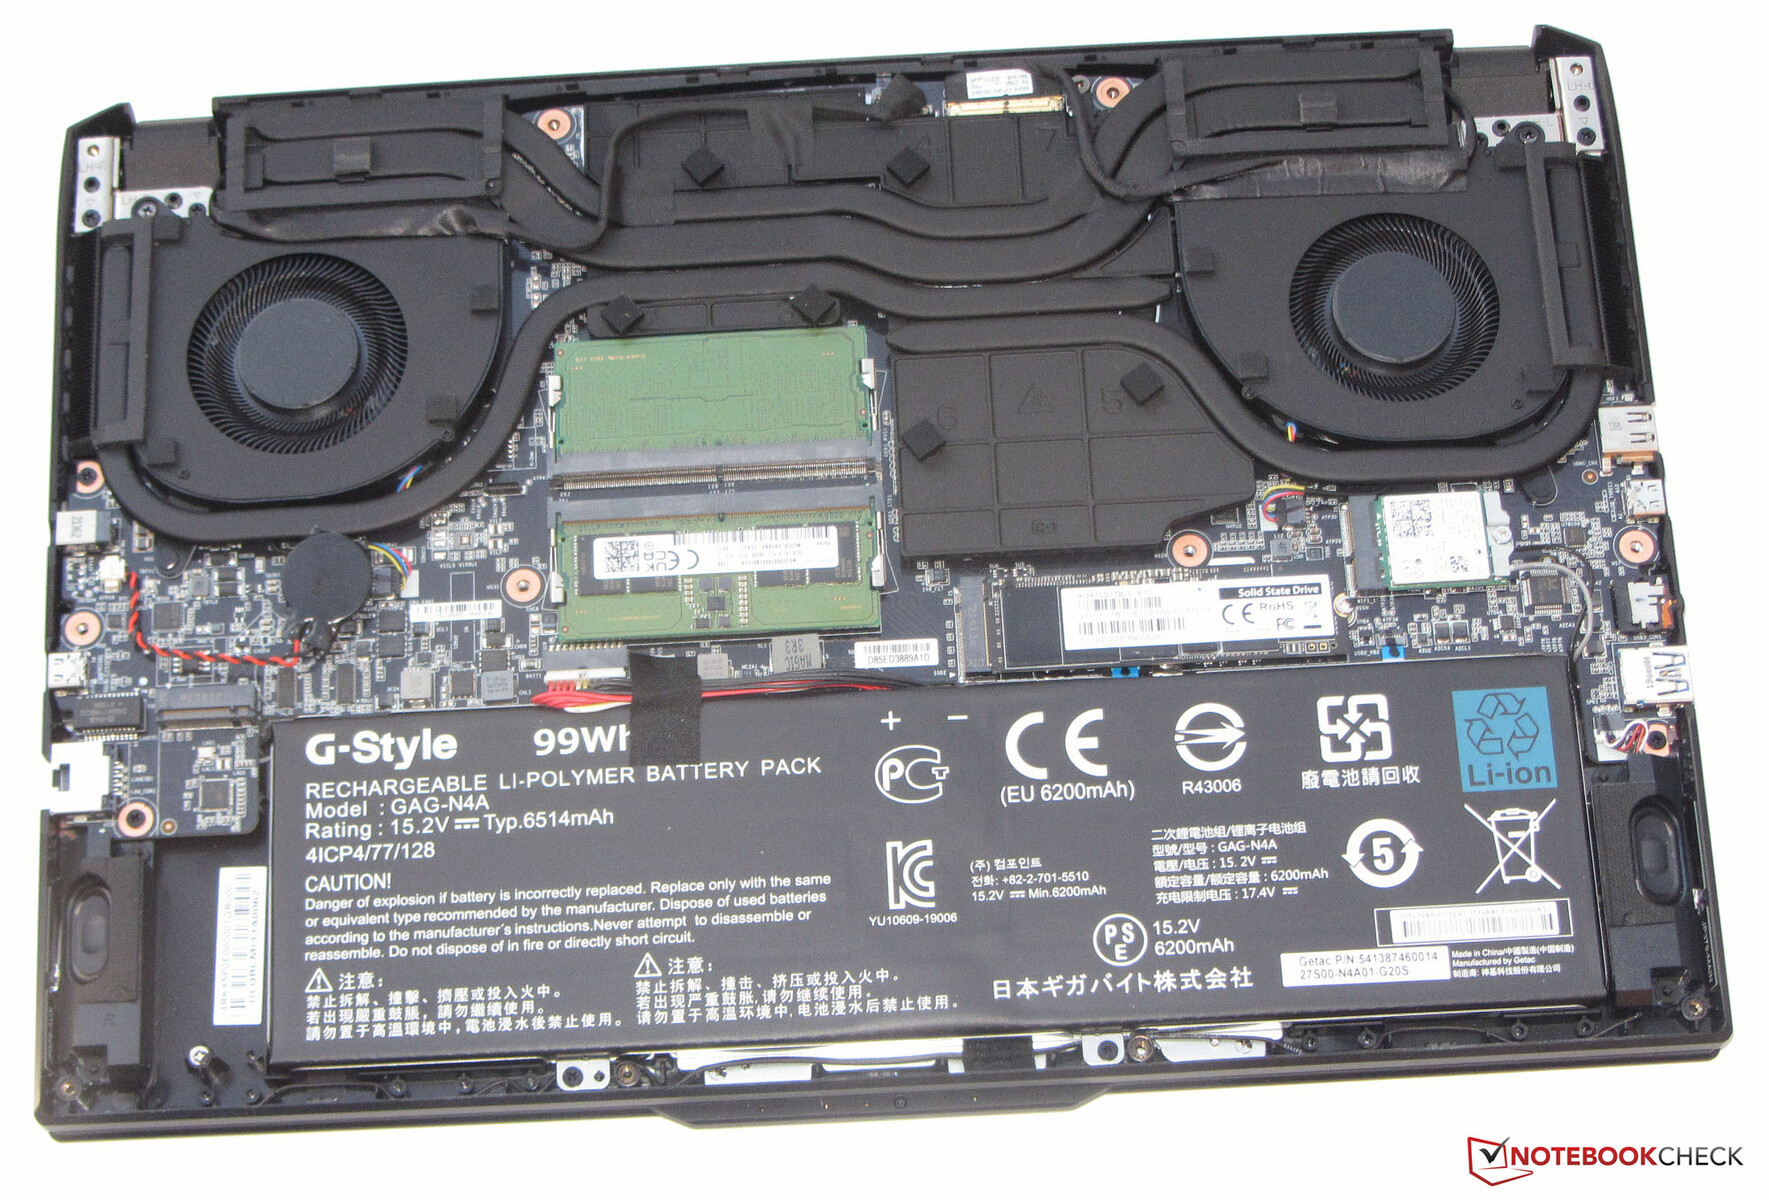
El Gigabyte Aorus 15 XE5 tiene un chasis de plástico negro con superficies lisas y mates. El dispositivo no presenta elementos de diseño extravagantes. El fino bisel que rodea la pantalla da al portátil un cierto aire de elegancia. El logotipo Aorus iluminado en la parte posterior de la tapa acentúa el diseño del portátil. Una vez retirado el panel inferior, tendrás acceso a la batería (atornillada, no pegada) y al resto de las partes internas.
Nuestra unidad de prueba no parece tener ningún problema de fabricación. Los huecos en el chasis están bien ajustados y no hay exceso de materiales que sobresalgan del portátil. La sección base apenas se mueve al girarla, pero la tapa muestra bastante más flexibilidad. La tapa está sujeta por dos bisagras que permiten replegar la pantalla unos 150 grados. El portátil puede abrirse con una sola mano.
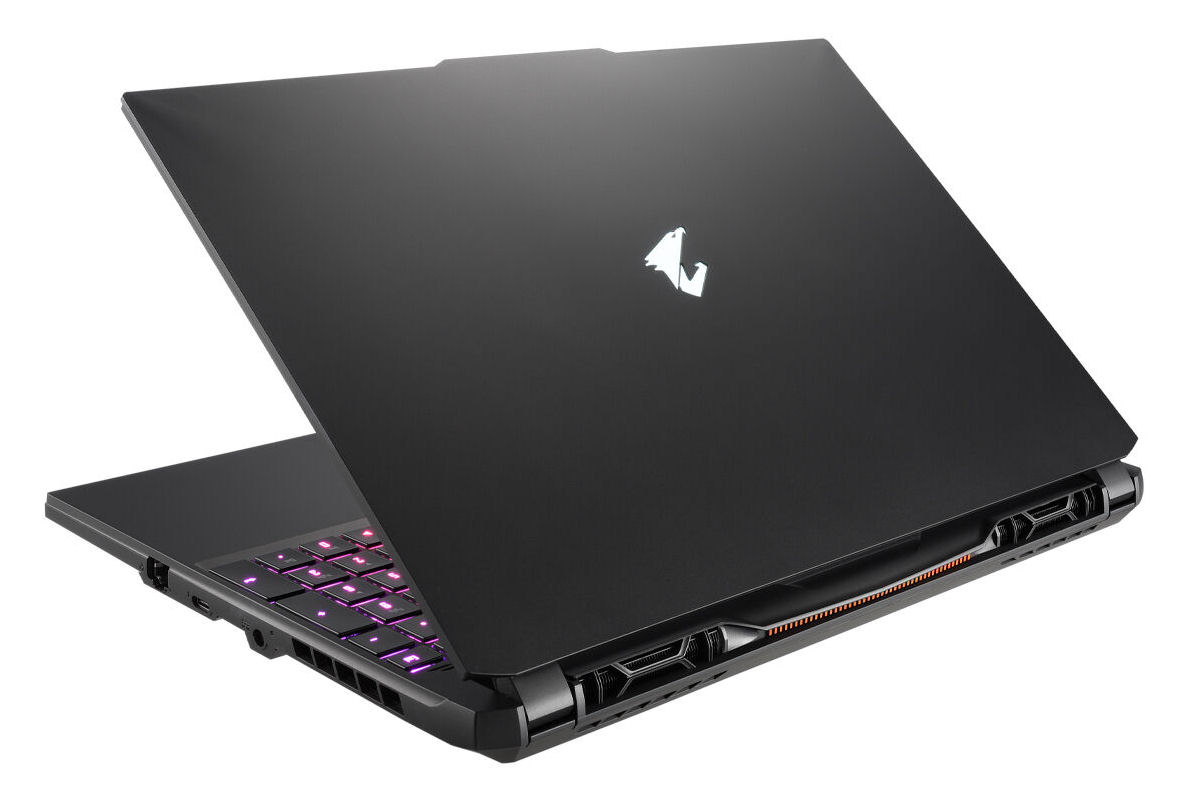

El 15 XE5 es uno de los portátiles más compactos de nuestra comparativa. Sin embargo, con unos 2,3 kg (5,07 lb), es más pesado que dispositivos de la competencia como el XMG Fusion 15 y el TUF Dash F15.
Especificaciones - Compatibilidad con Thunderbolt 4
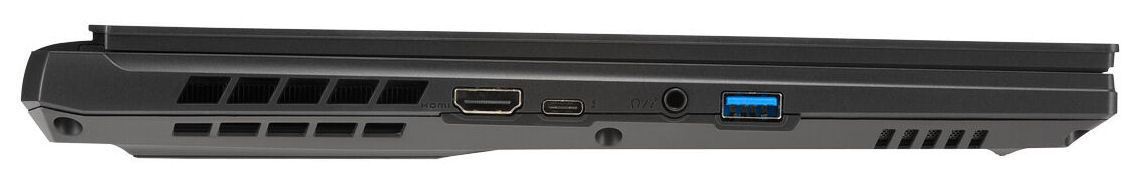
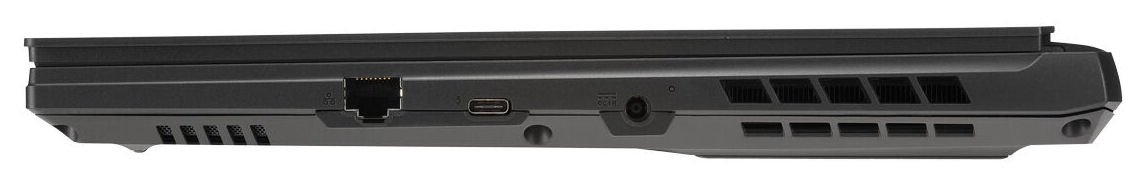
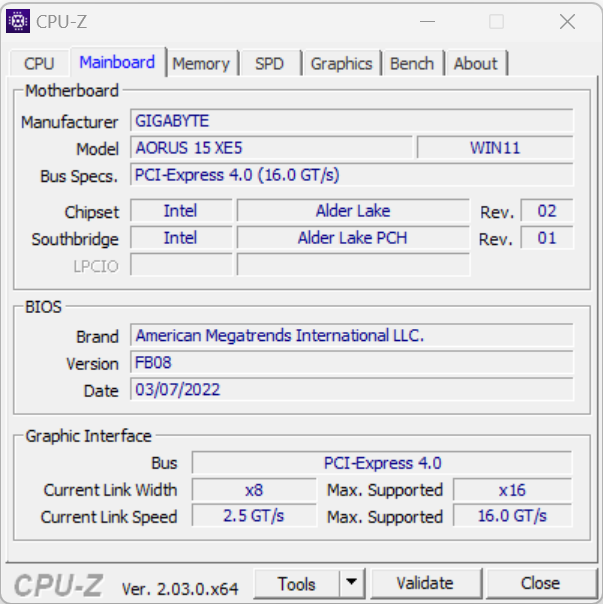
Los dos puertos USB-C (1x Thunderbolt 4, 1x USB 3.2 Gen 1) soportan DisplayPort sobre USB-C, y el conector Thunderbolt 4 también ofrece Power Delivery. Lástima que sólo haya un puerto USB-A (USB 3.2 Gen 1) en el dispositivo. Los que necesiten más conectividad externa tendrían que usar un adaptador o un dock. Se pueden conectar hasta tres pantallas al portátil (2x DP, 1x HDMI). Completan la selección de puertos una clavija de audio combo y un puerto Gigabit Ethernet. El Aorus 15 XE5 no tiene lector de tarjetas integrado.
Conectividad
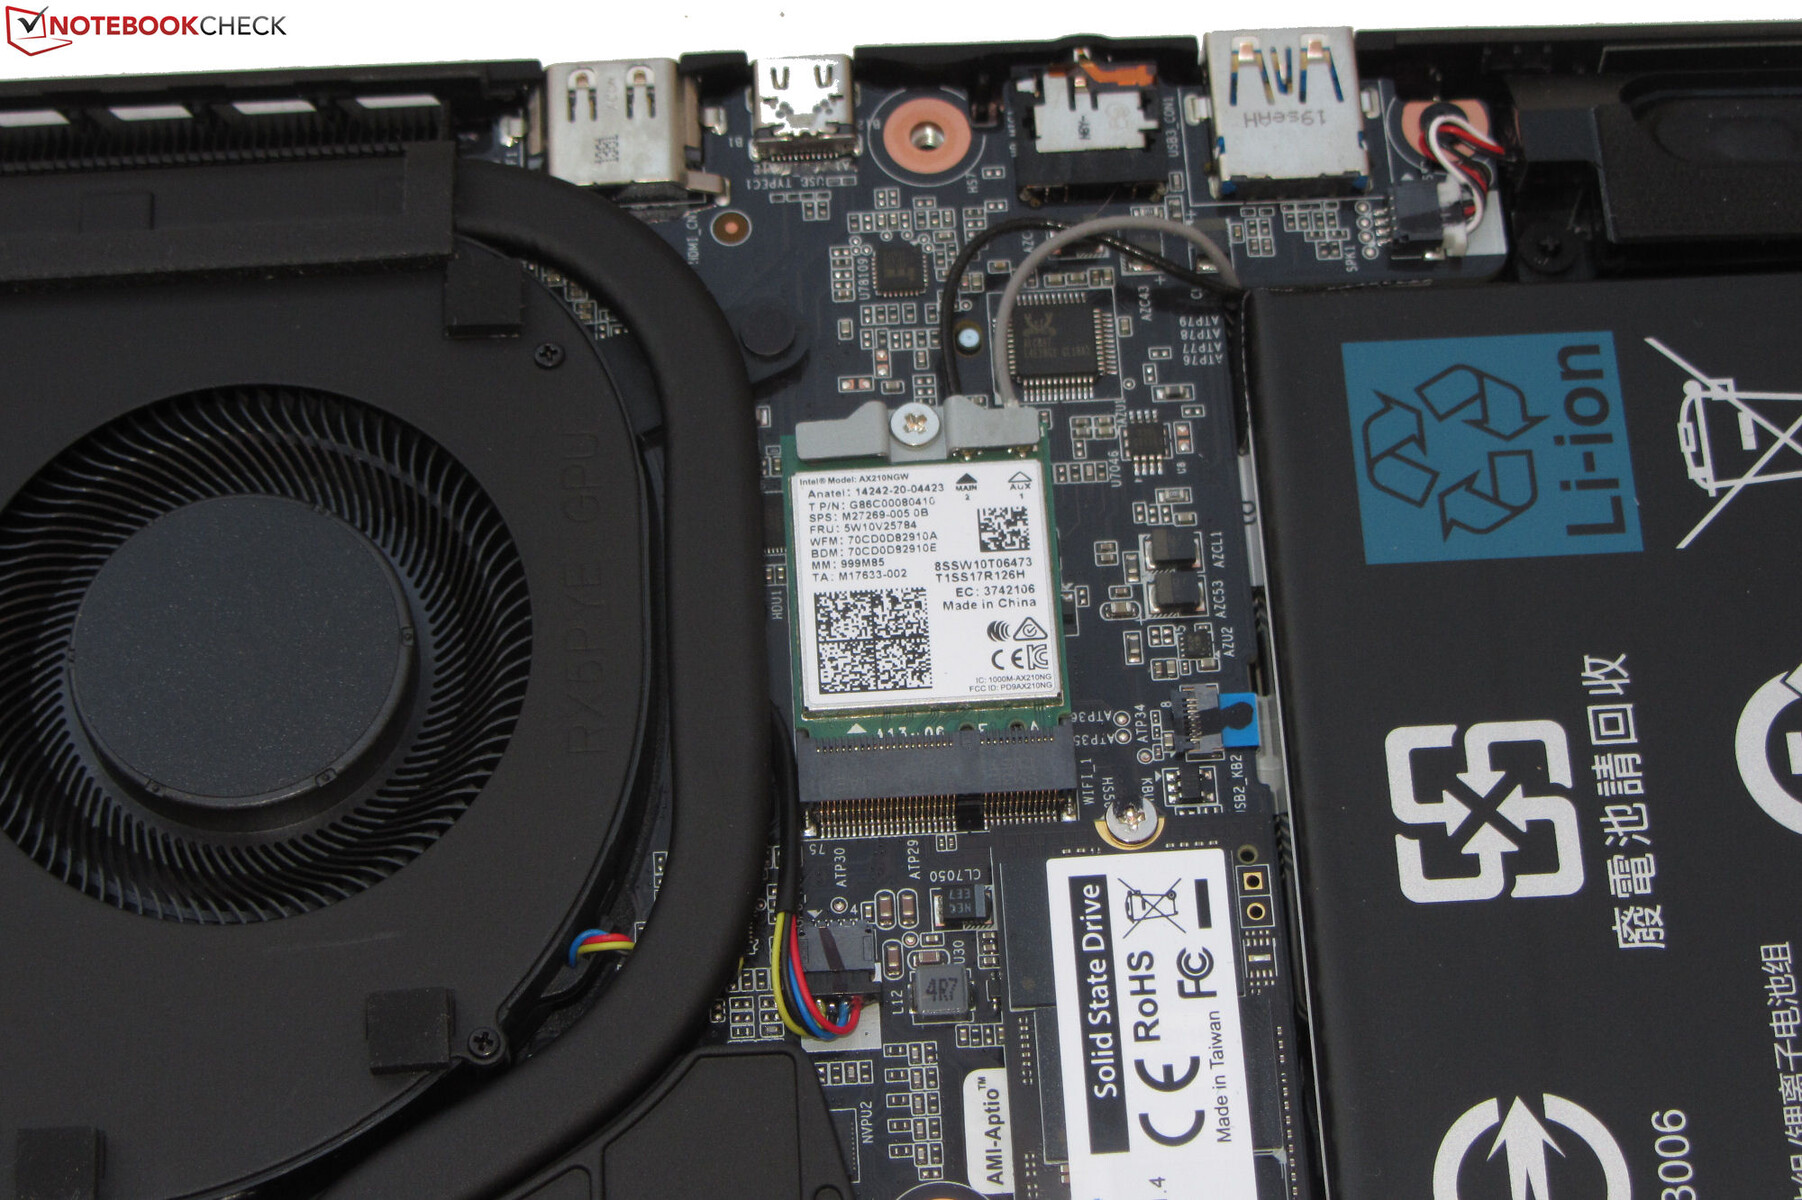
En condiciones óptimas (sin otros dispositivos Wi-Fi cerca, corta distancia entre el portátil y el PC servidor), medimos excelentes velocidades de transferencia Wi-Fi que corresponden a lo que es capaz de hacer el módulo Wi-Fi interior (Intel AX210, 802.11ax). De las conexiones de red por cable se encarga un chip Gigabit Ethernet de Realtek (RTL8125, 2,5 Gbit).
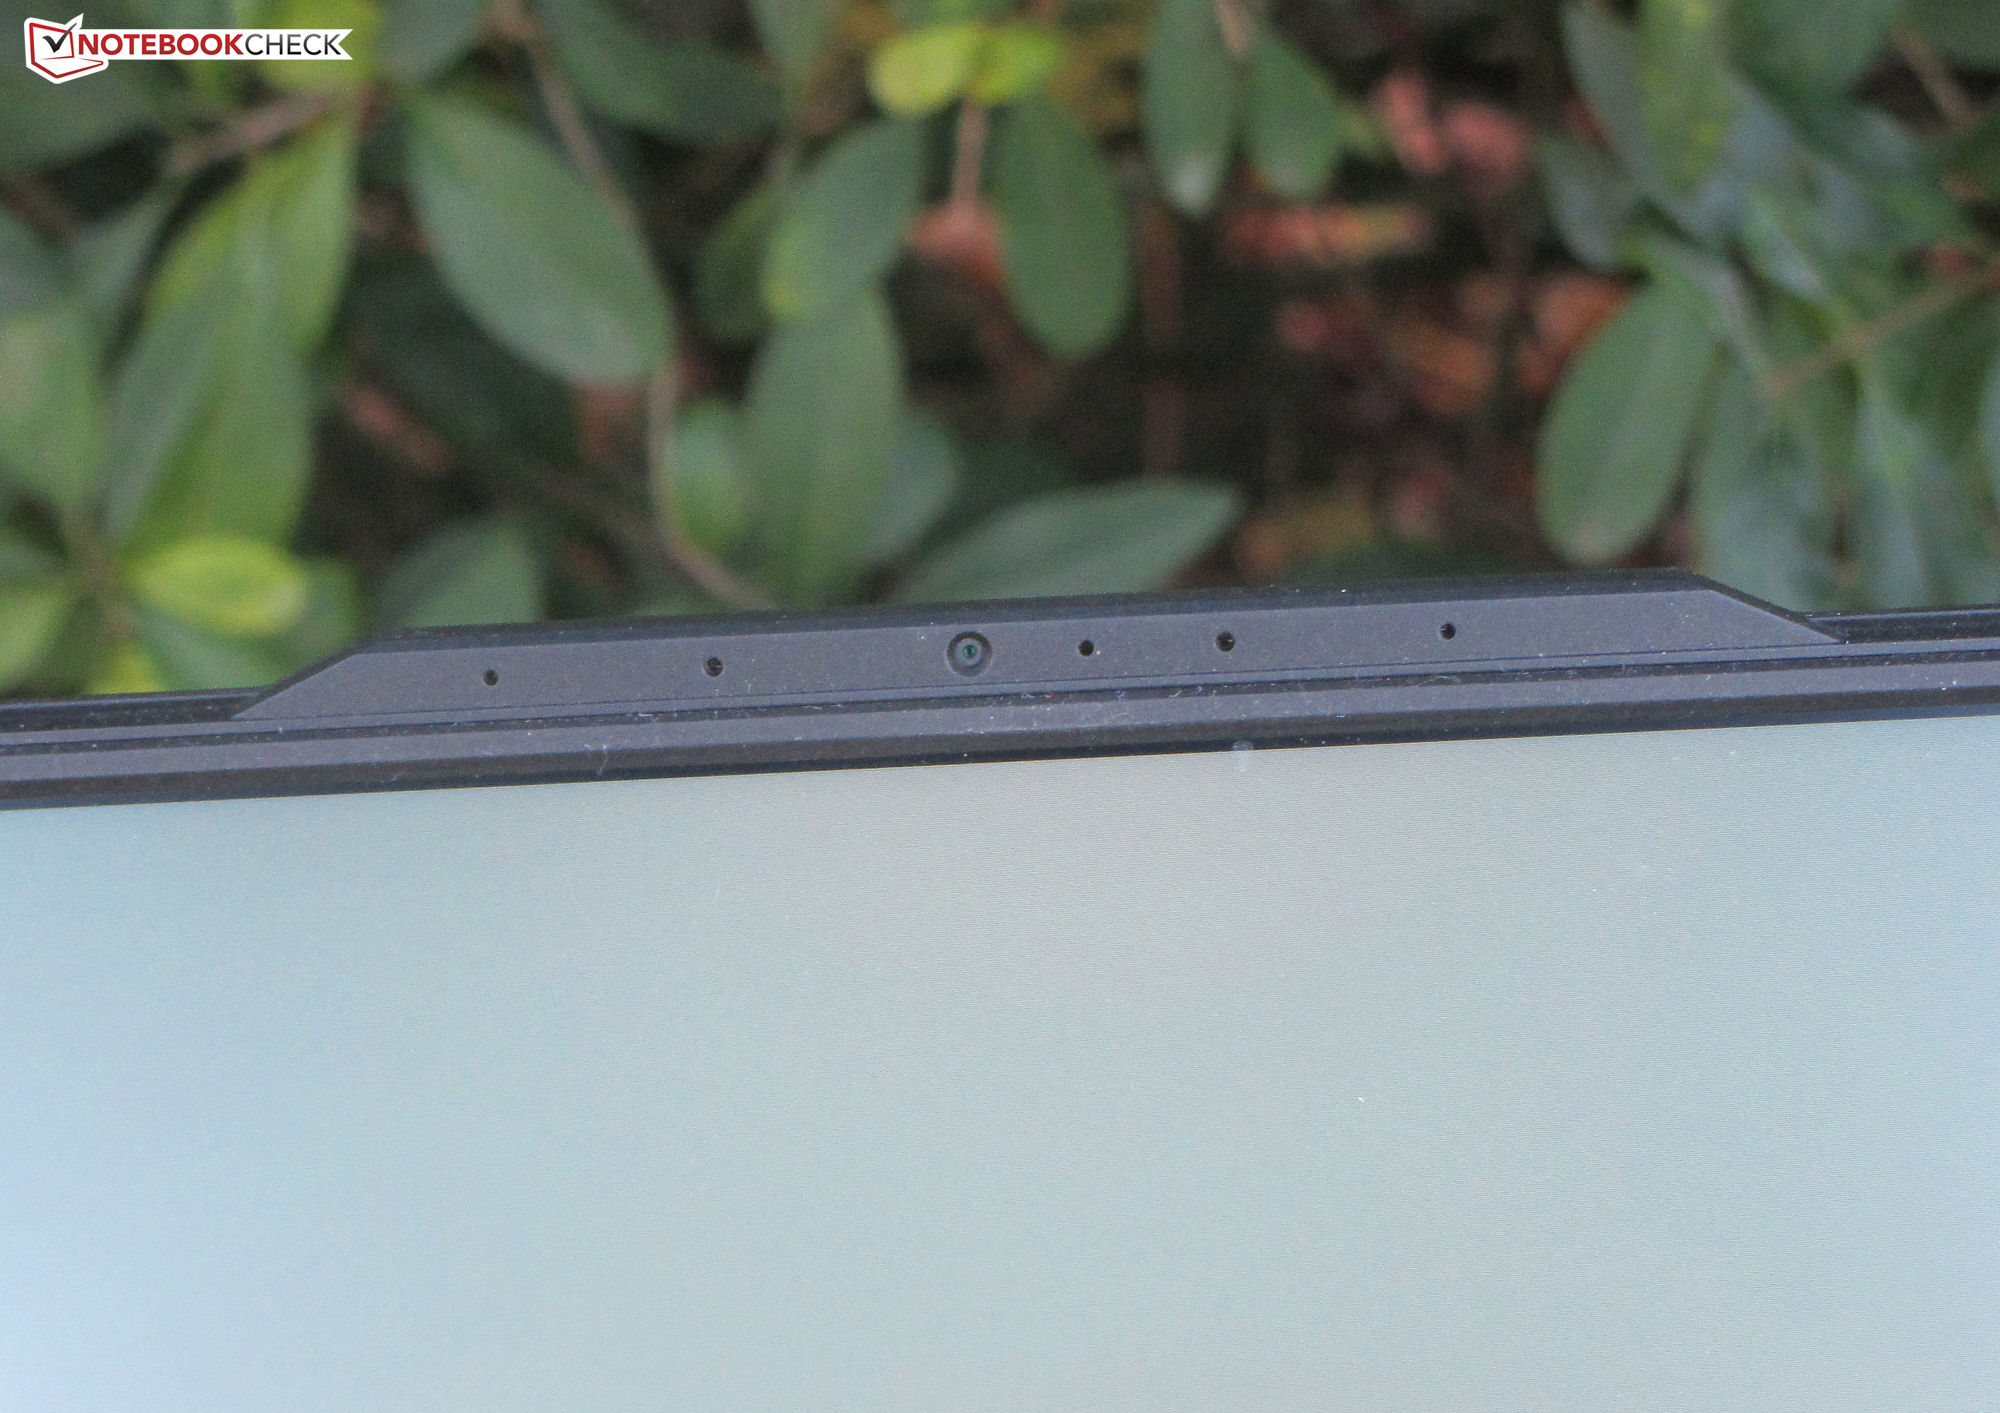
Cámara web
La webcam (0,9 MP) puede capturar imágenes con una resolución de hasta 1.280 x 720 píxeles. Carece de precisión cromática, produciendo colores que se desvían significativamente de los valores de referencia. Tampoco hay obturador mecánico de privacidad en la webcam.


Accesorios
El Aorus 15 XE5 no viene con más accesorios que un cargador y los documentos habituales (guía de inicio rápido e información sobre la garantía).
Mantenimiento
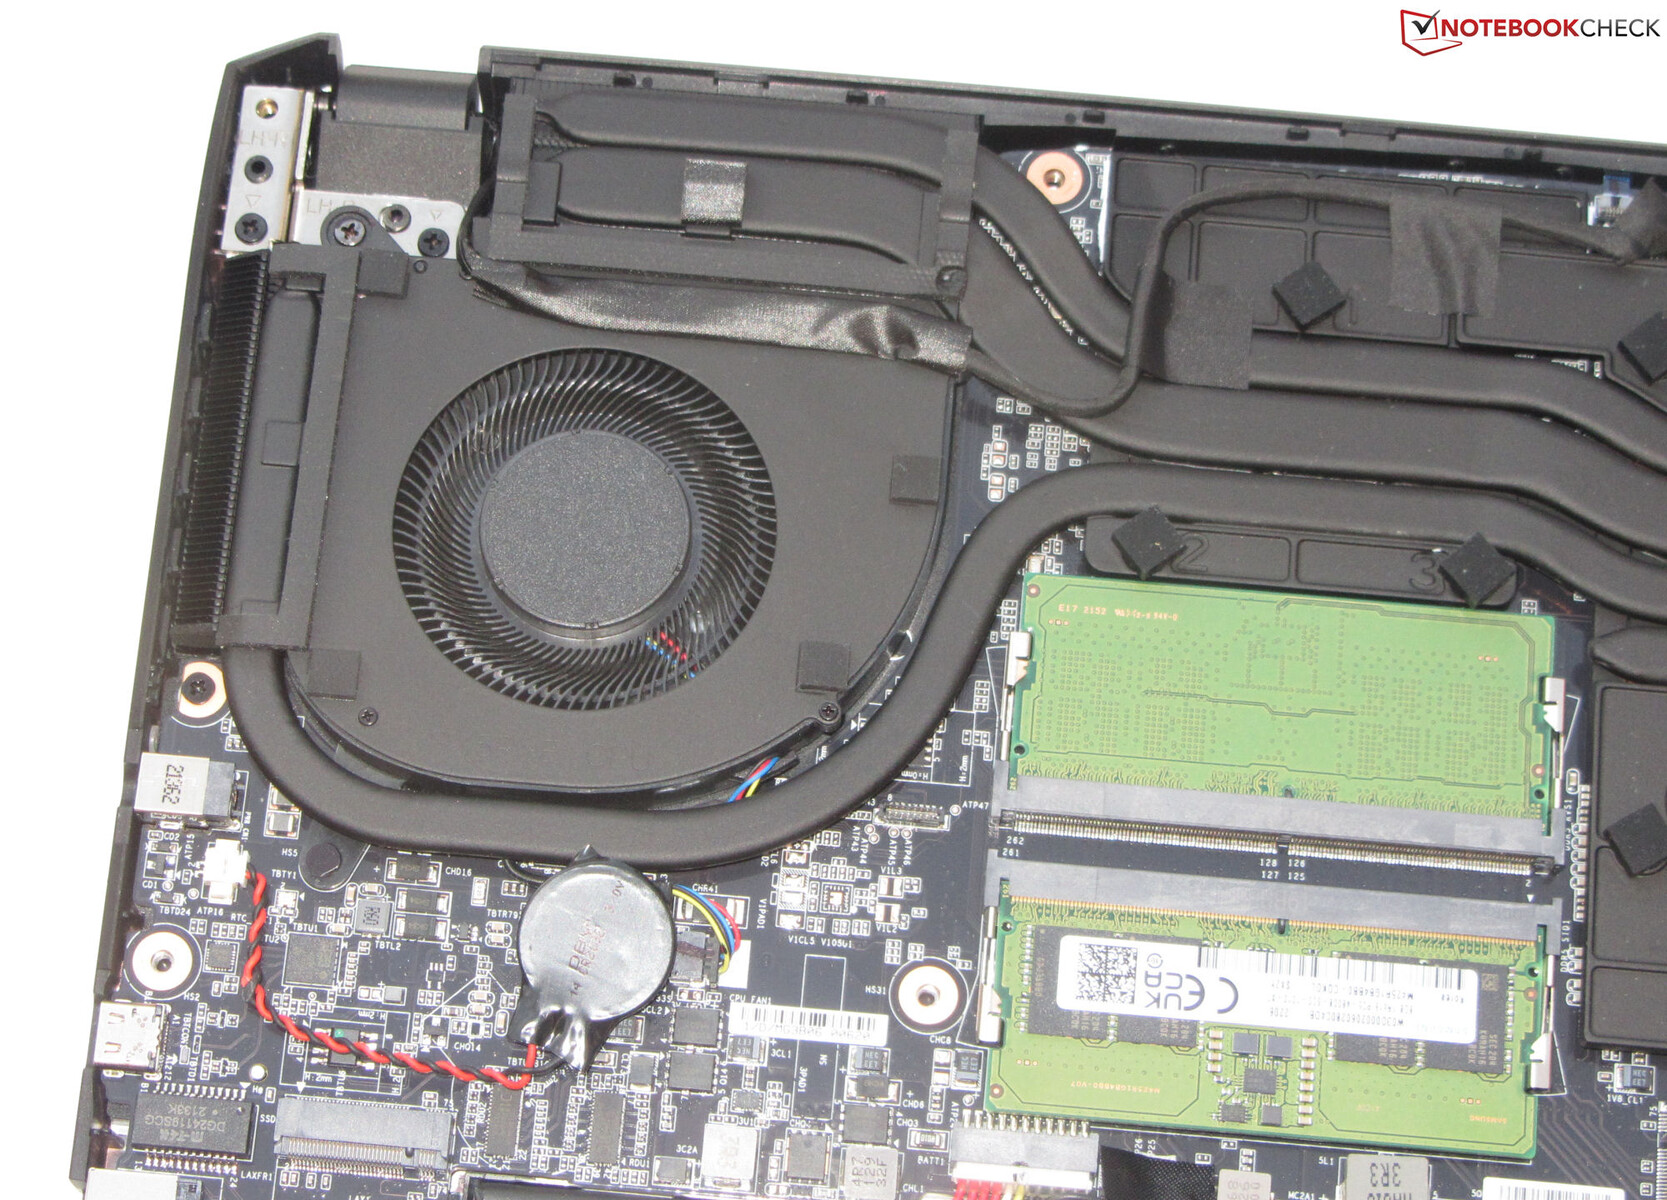
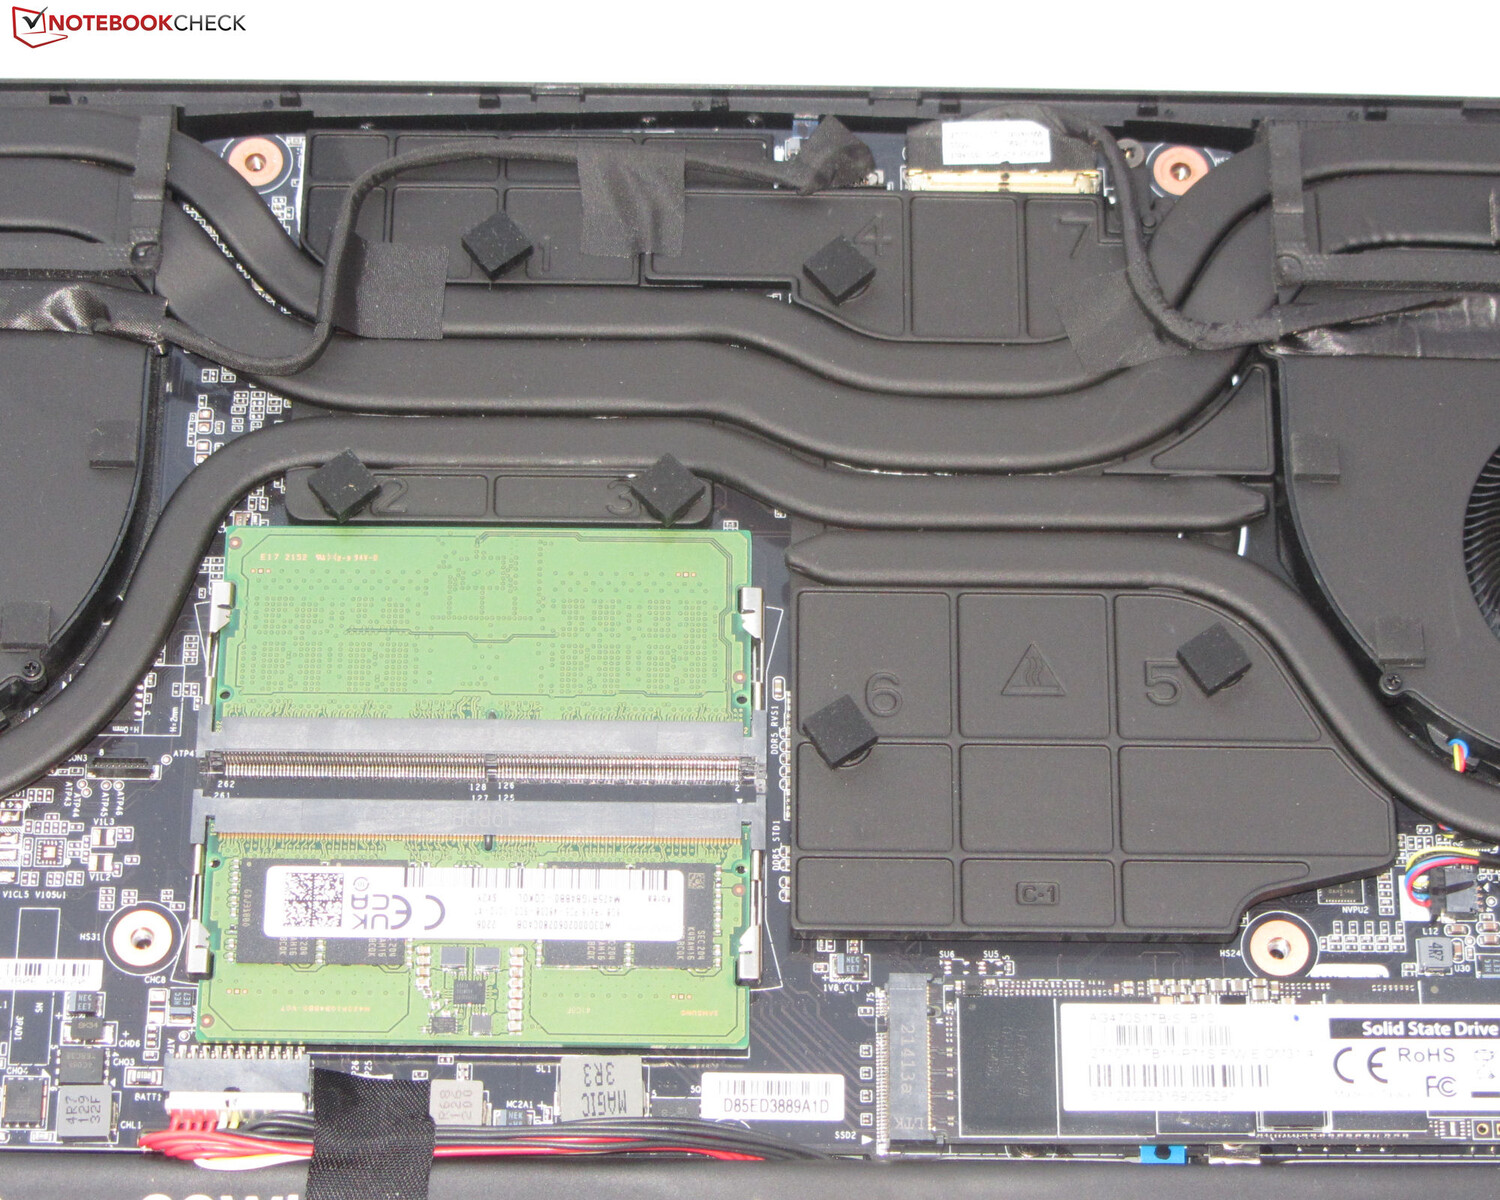
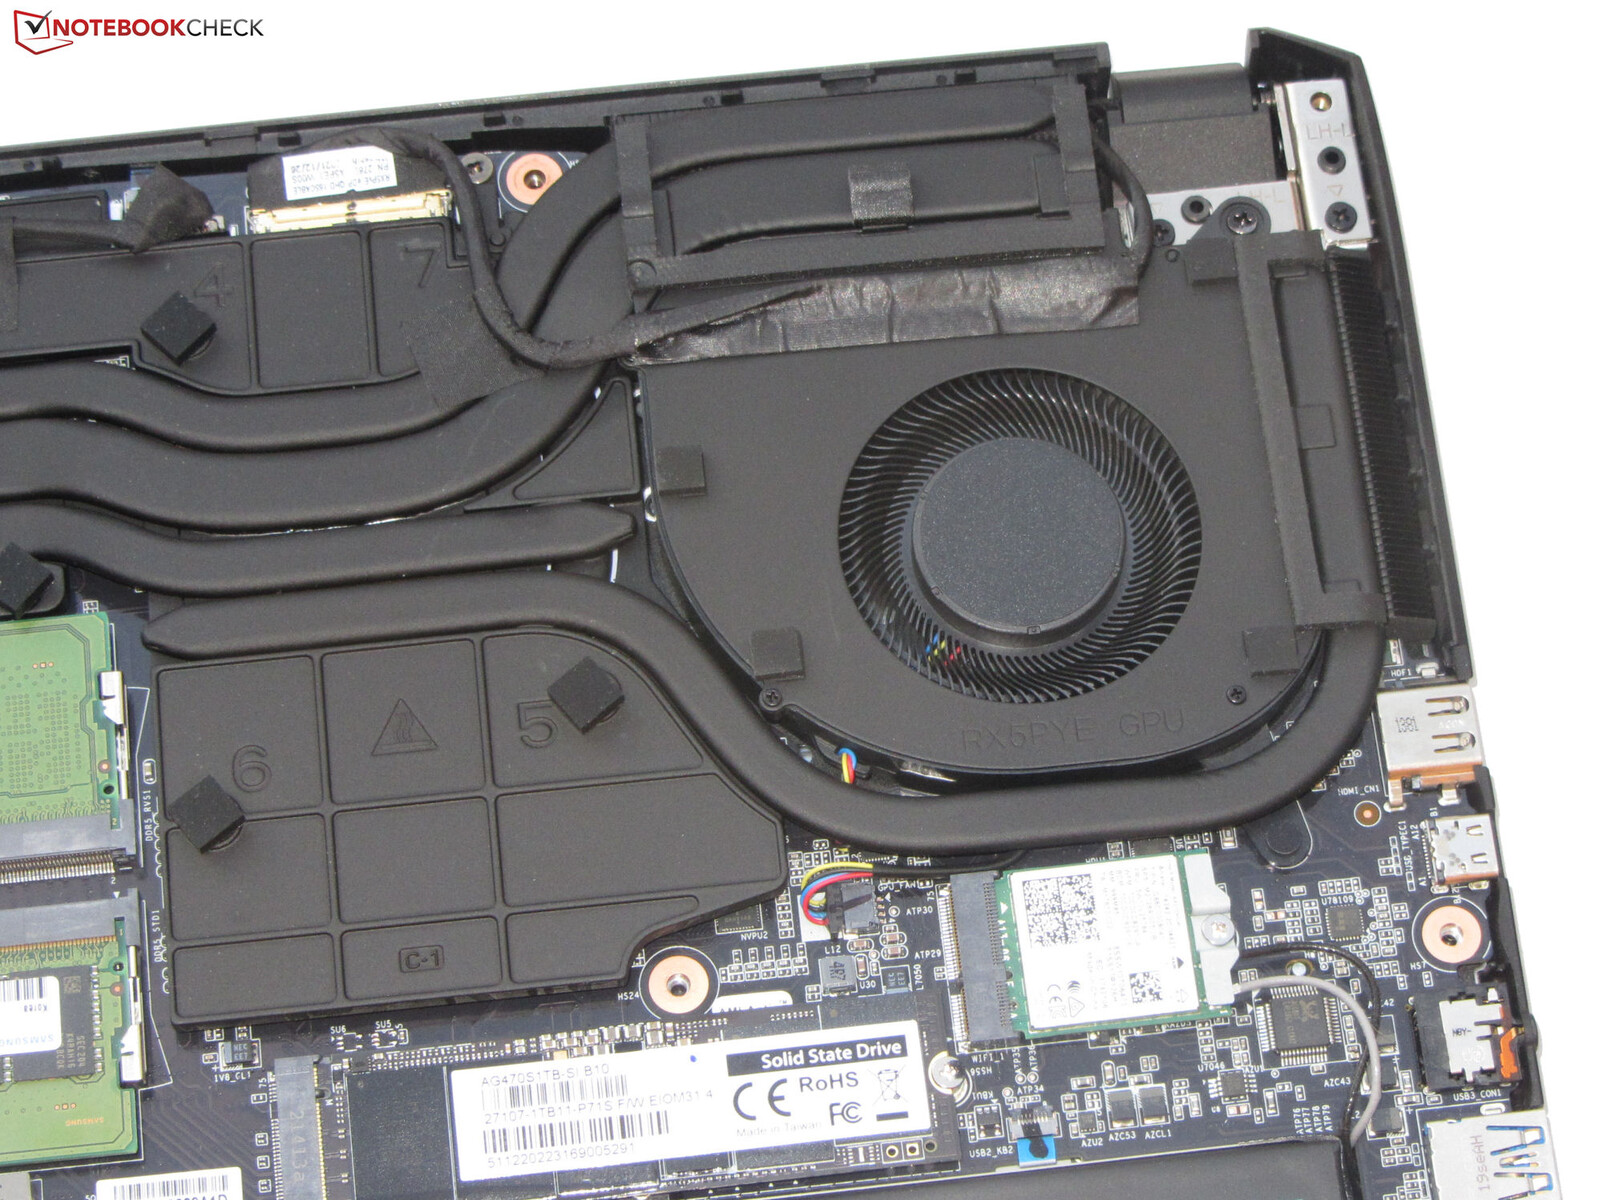
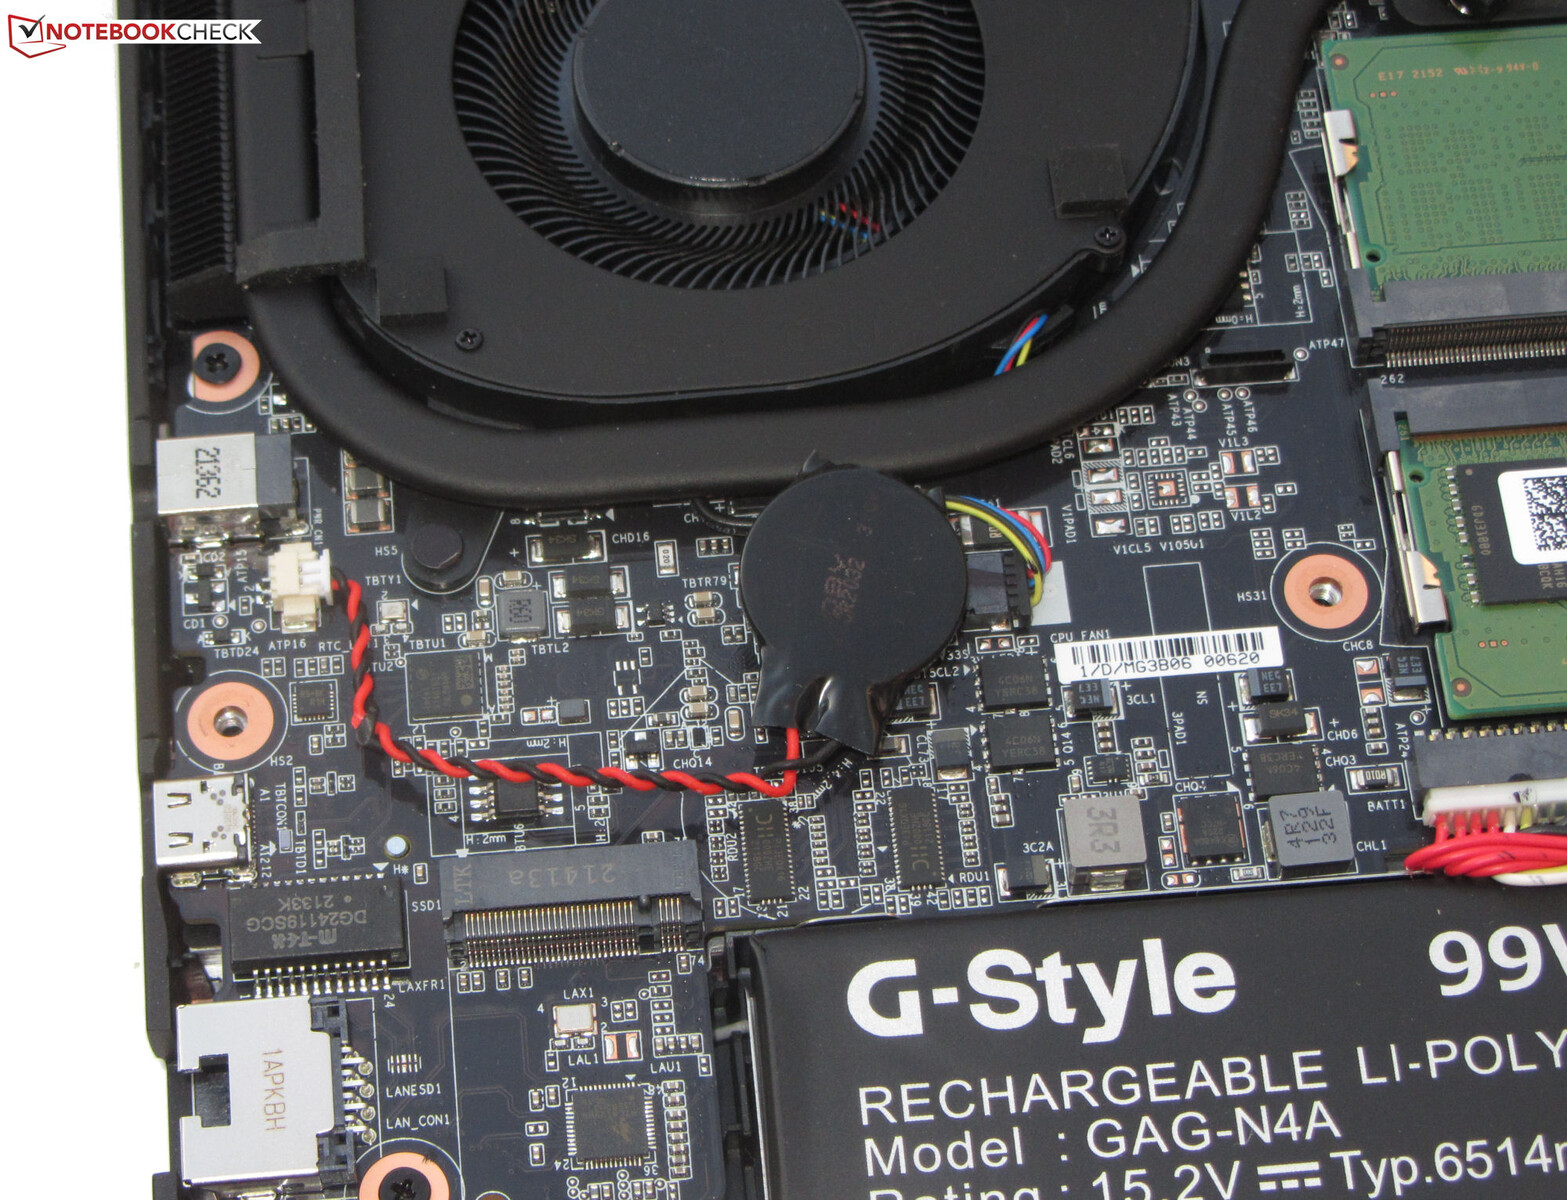
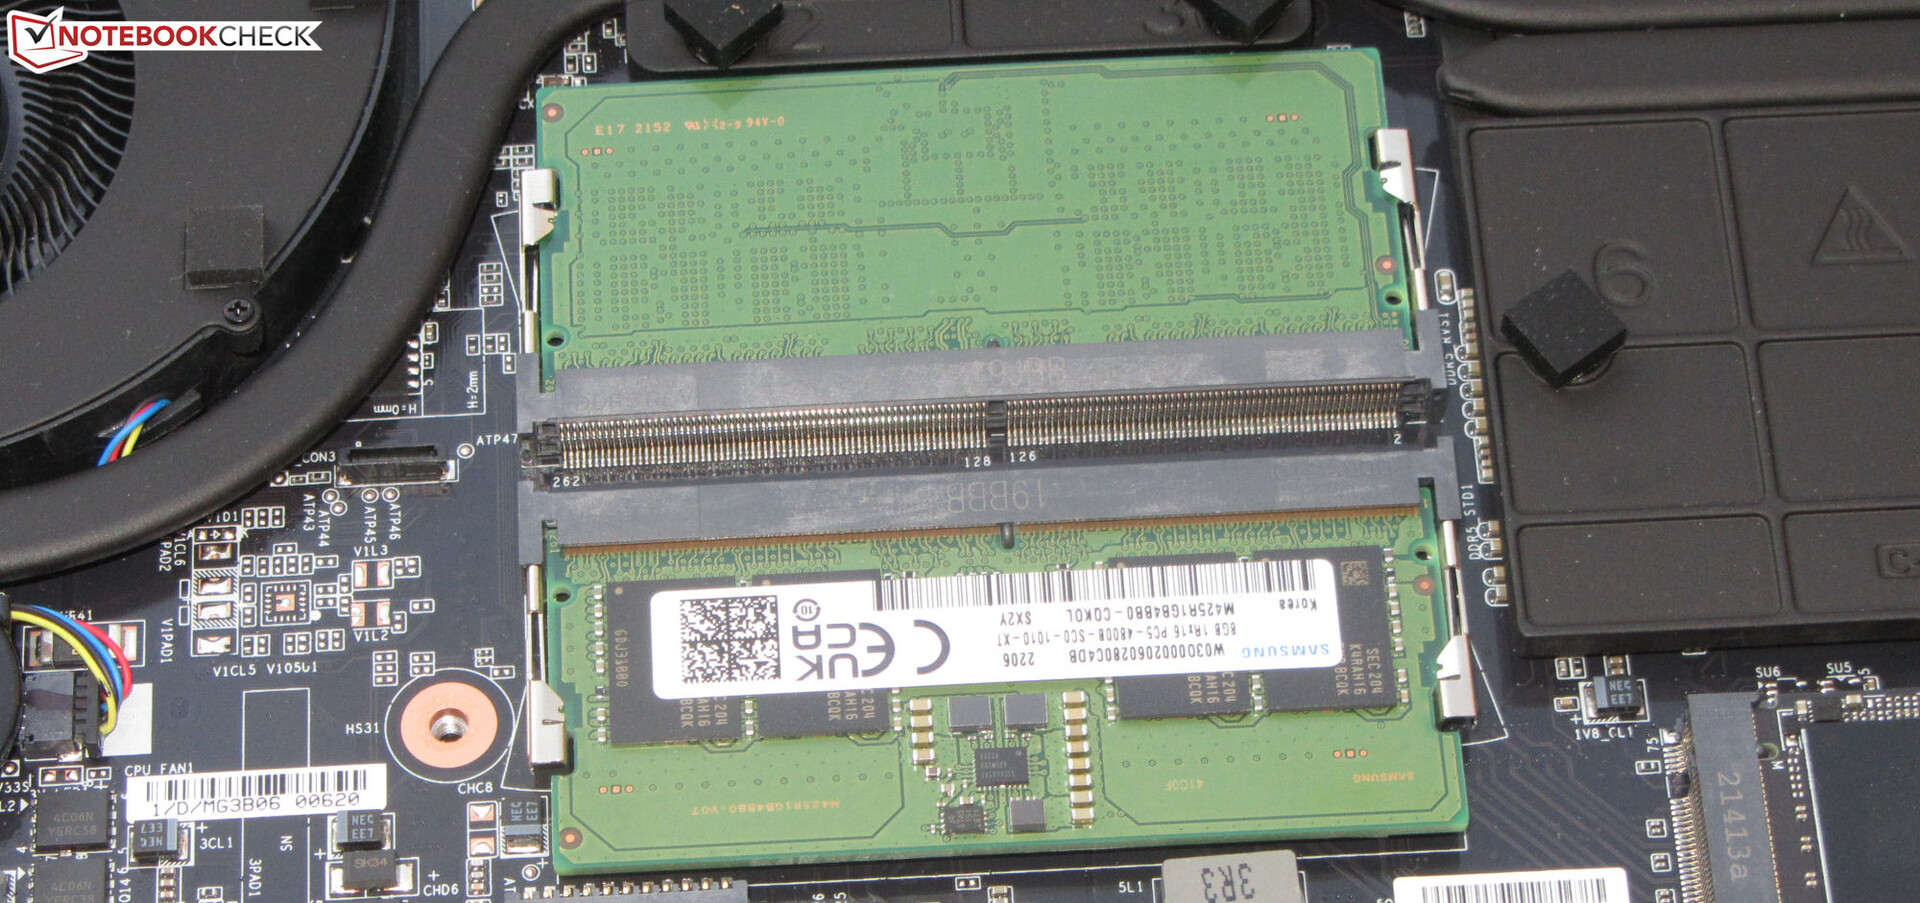
Después de quitar todos los tornillos de la parte inferior, se puede abrir el panel inferior con una espátula plana o un raspador de calafateo. Una vez quitado el panel, tendrás acceso a las dos ranuras de RAM (ambas ocupadas), el SSD PCIe 4.0, la segunda ranura M.2 2280 (PCIe 4.0), la batería de la BIOS, el módulo Wi-Fi, dos ventiladores, los altavoces y la batería.
Garantía
En Alemania, Gigabyte ofrece una garantía de dos años para el portátil de 15,6 pulgadas sin opciones de ampliación. El alcance y el periodo de garantía pueden variar según la región.
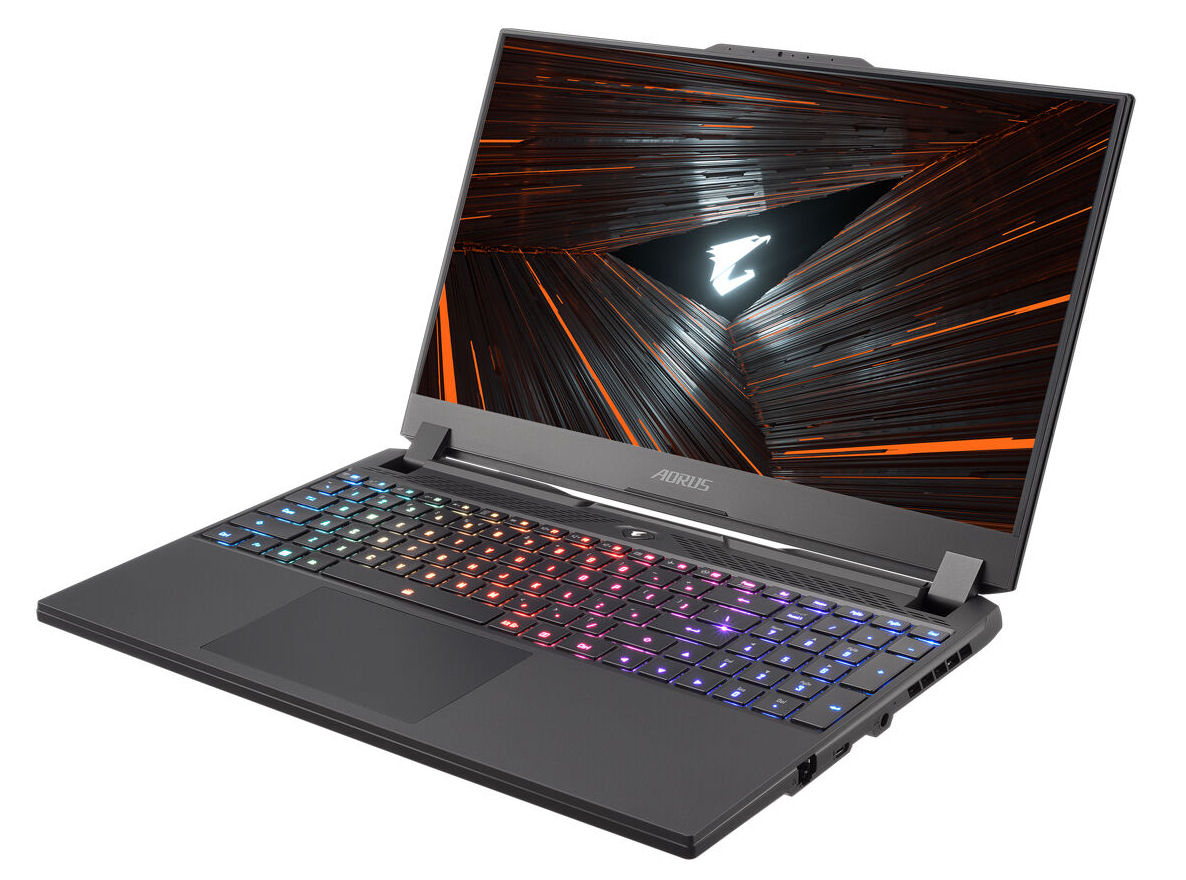
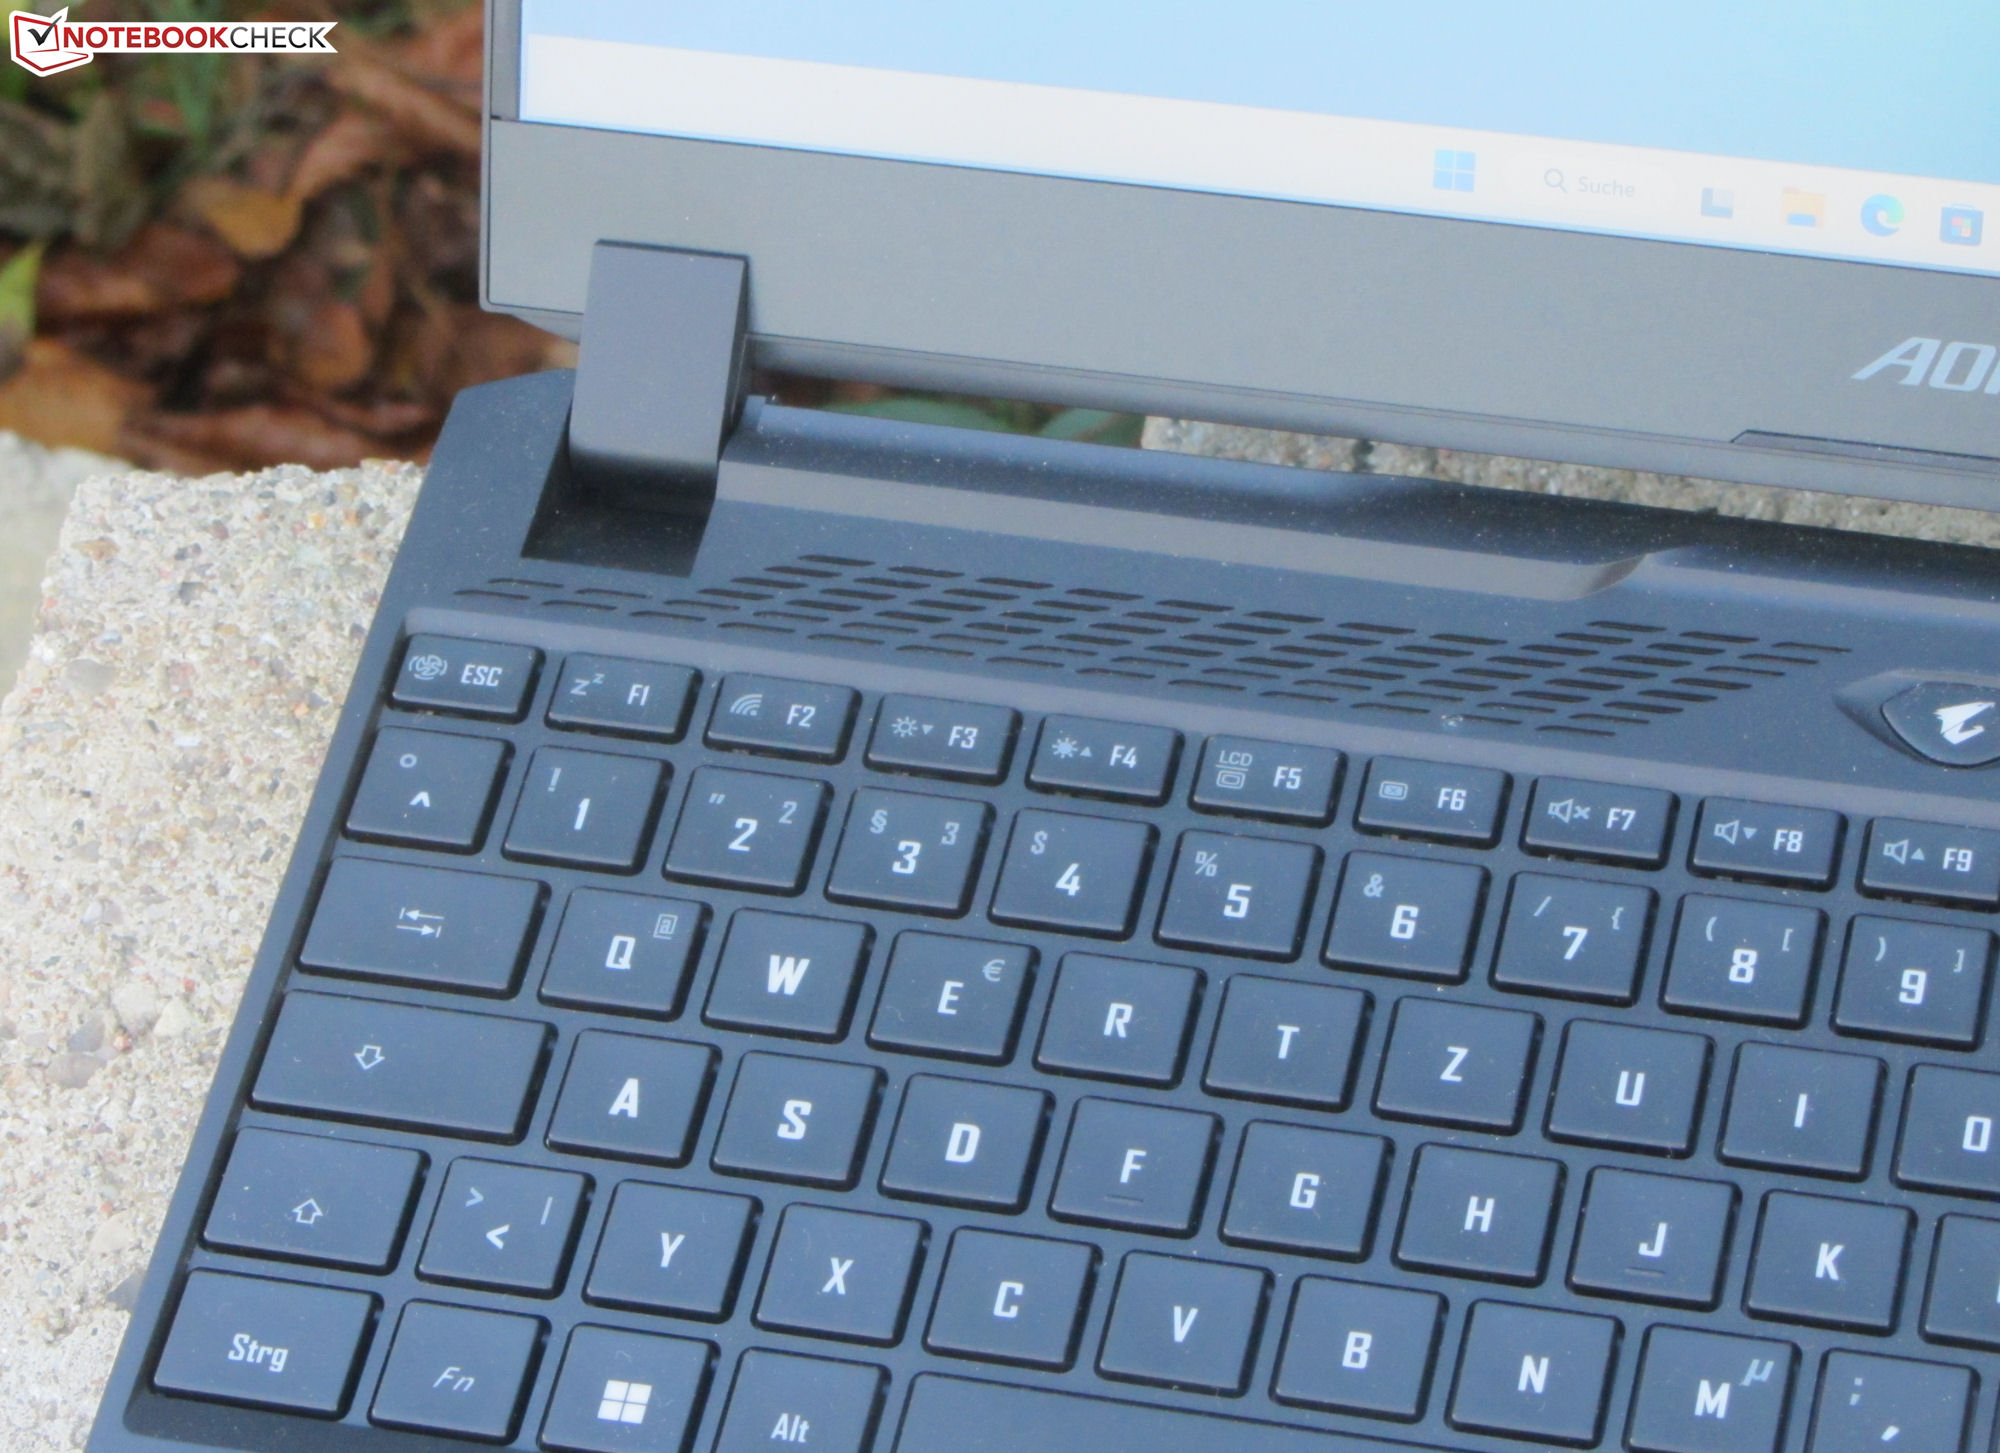
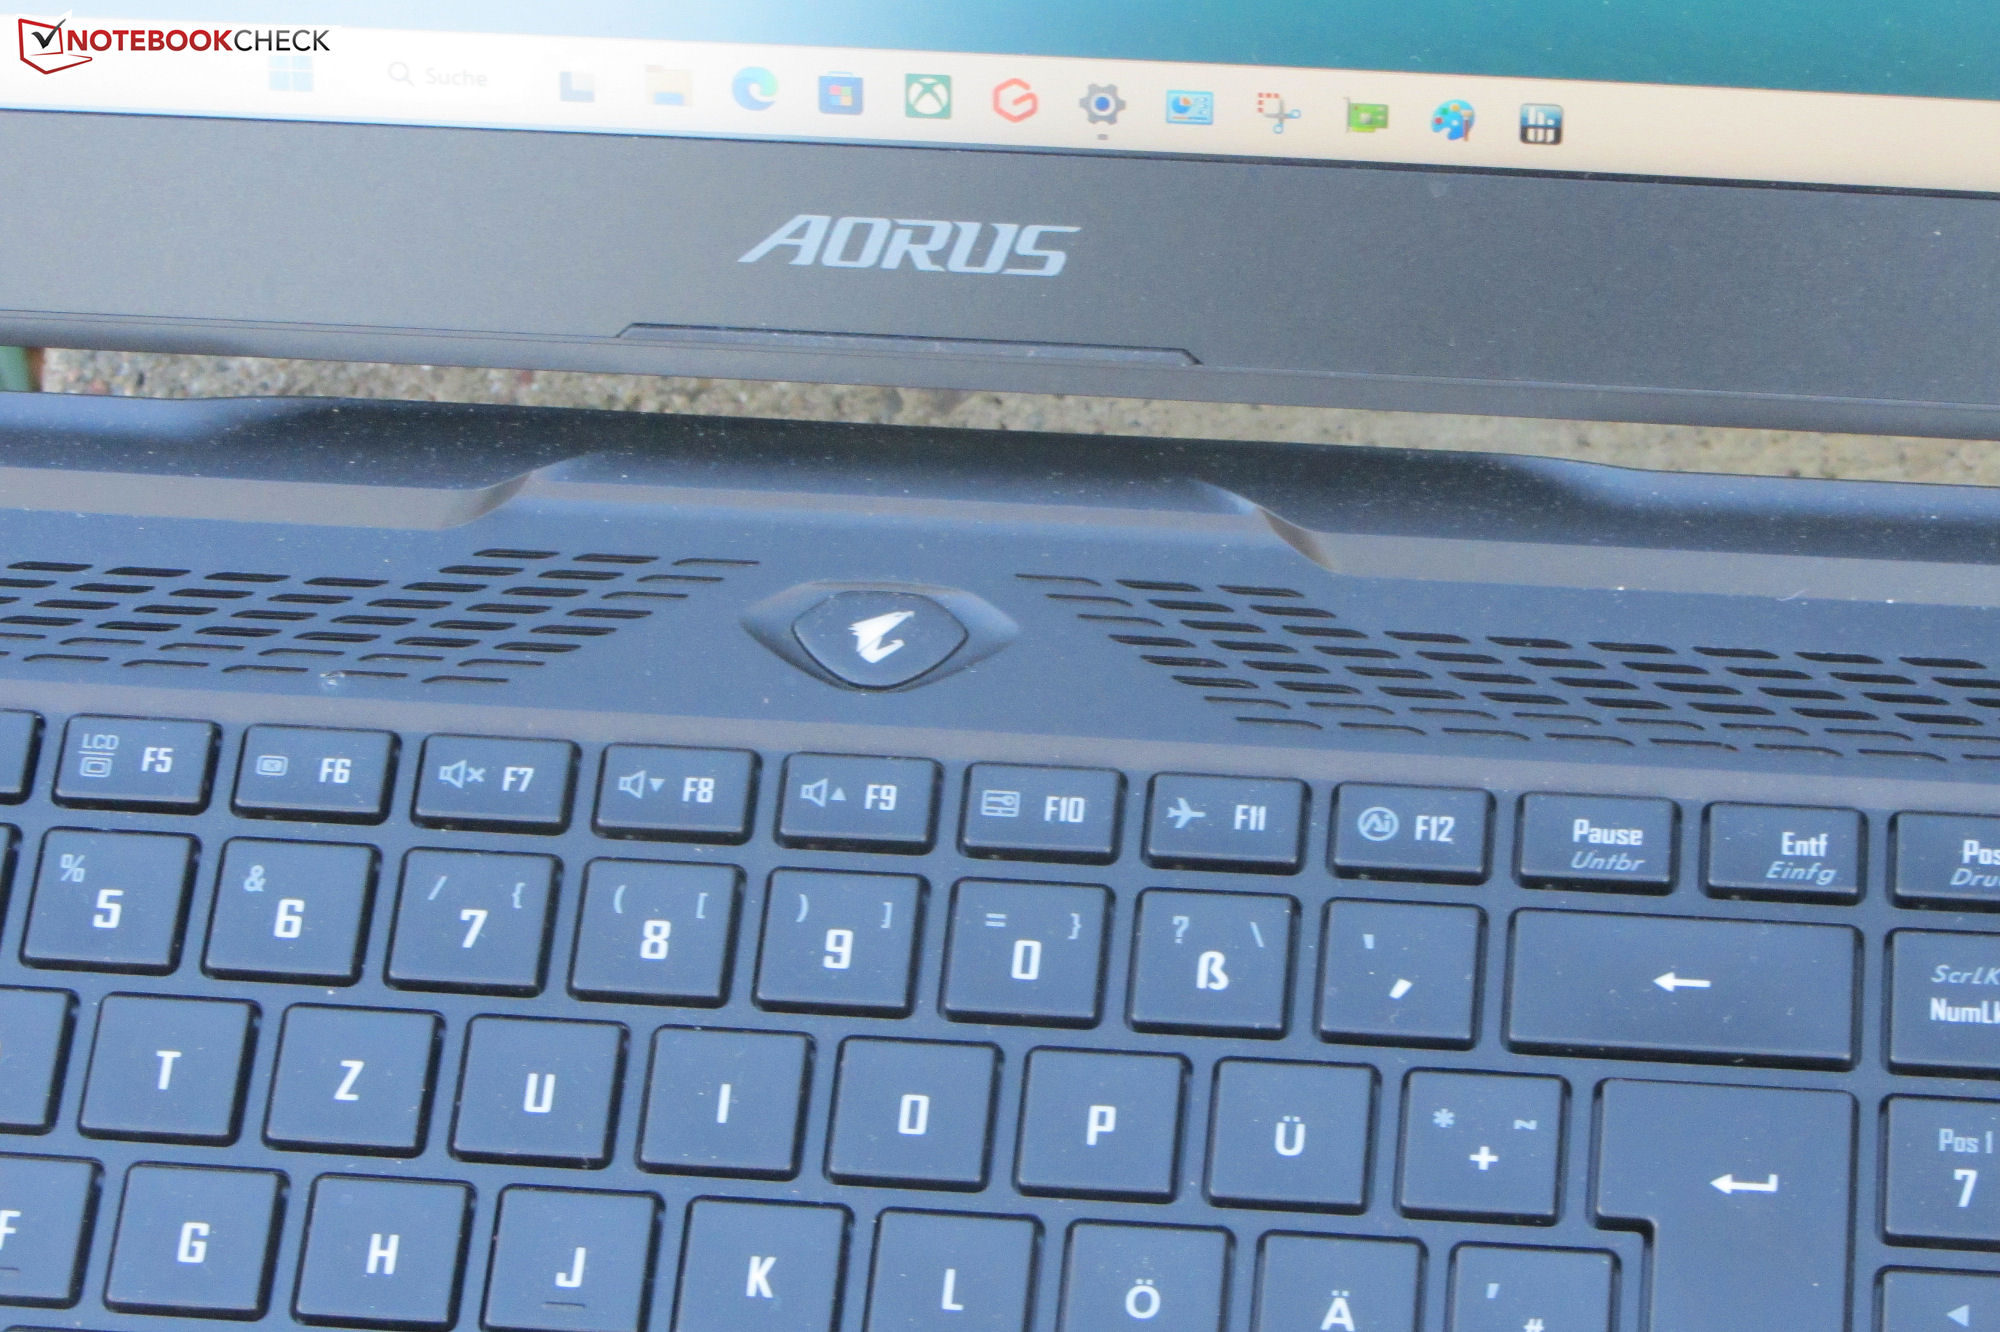
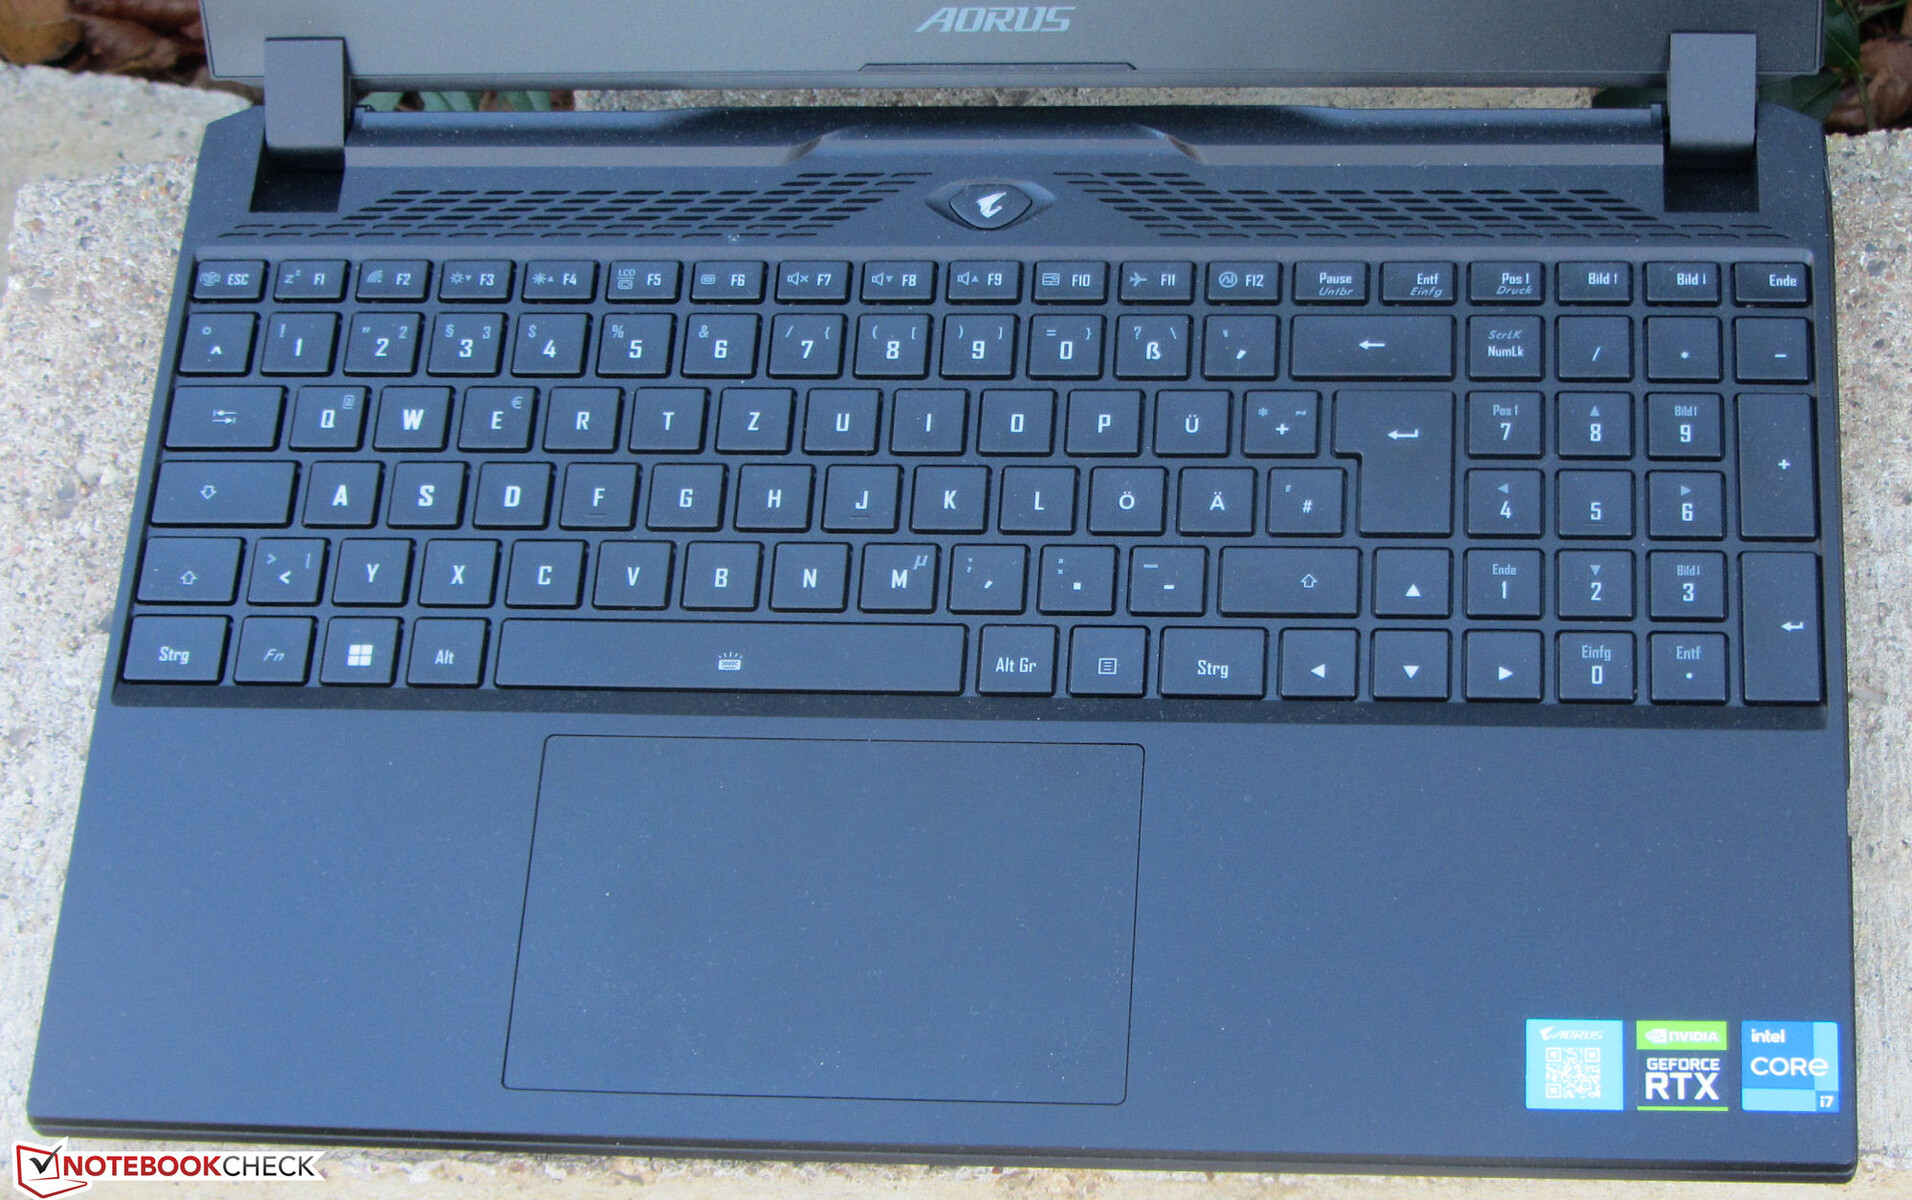
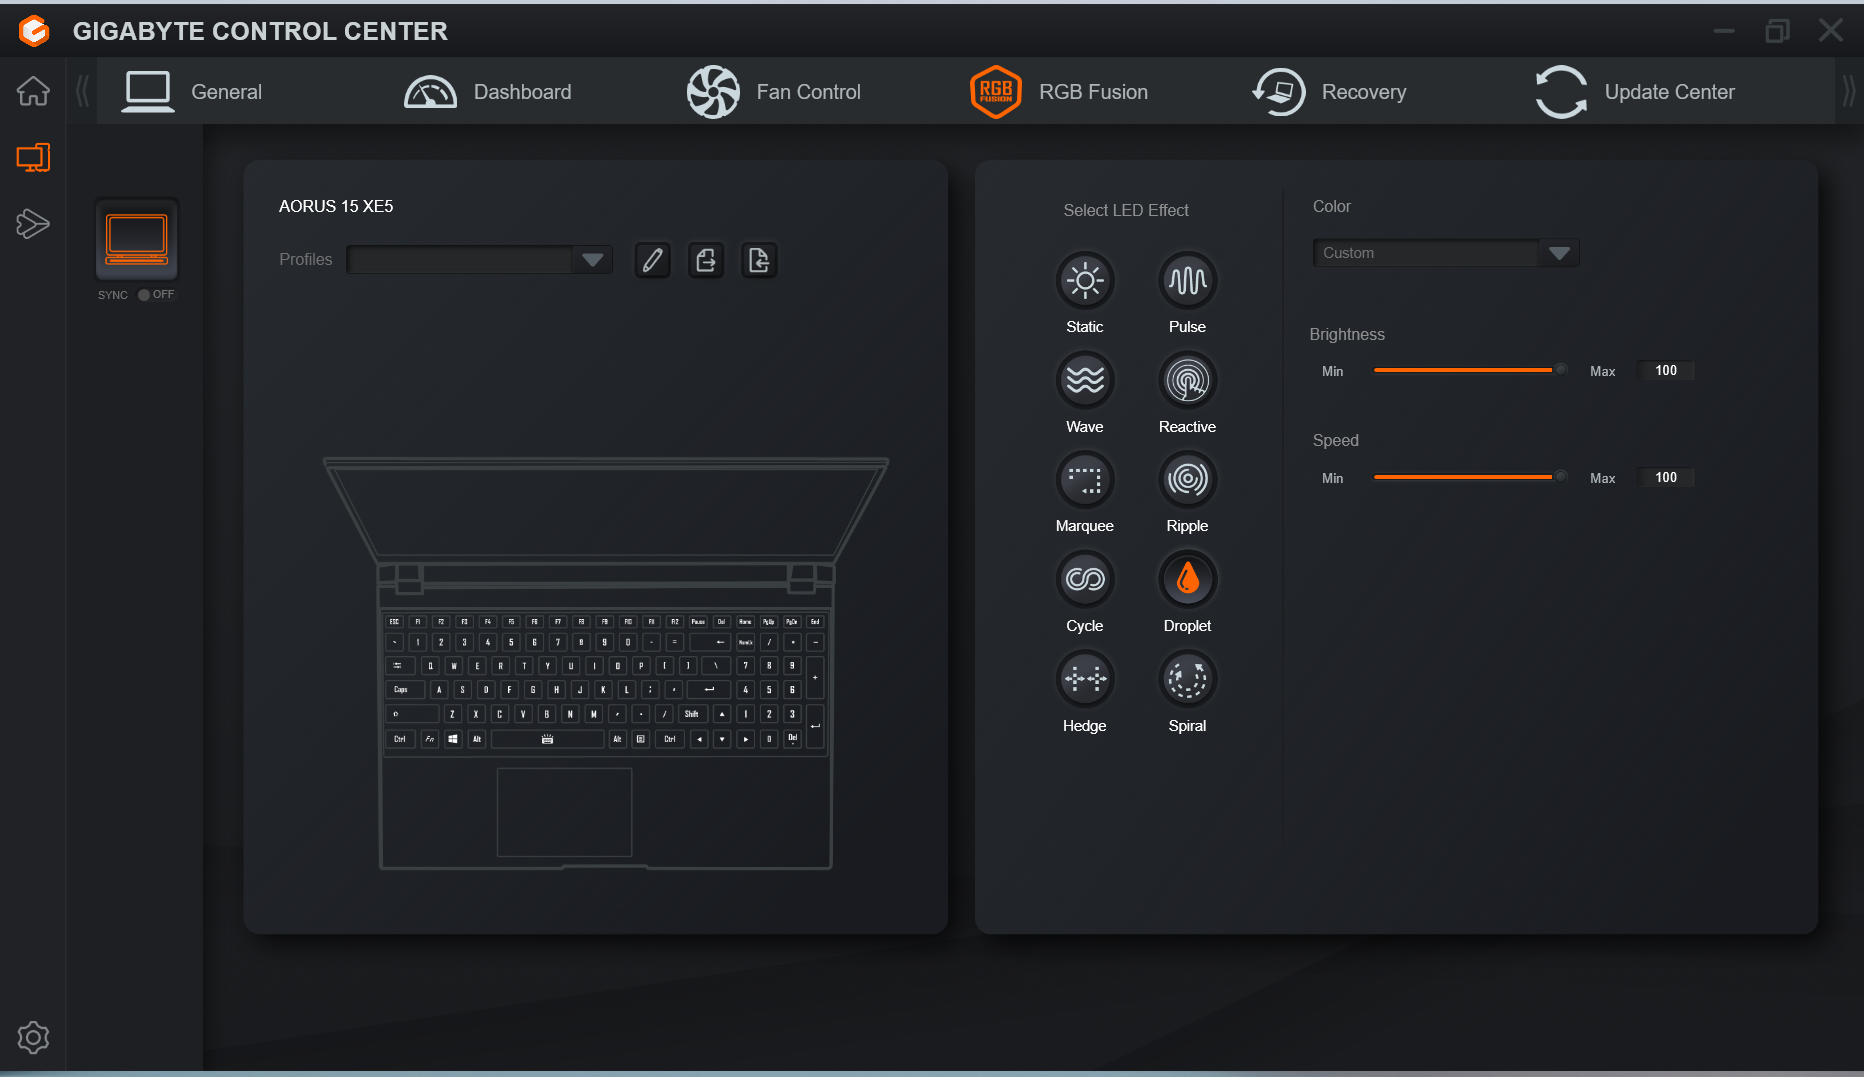
Dispositivos de entrada - Teclas RGB con iluminación individual
Teclado
El portátil para juegos viene con un teclado chiclet que incluye un teclado numérico. Las suaves teclas ofrecen una distancia de recorrido moderada y un punto de accionamiento bien definido. El teclado no se dobla al escribir. Cada tecla se ilumina individualmente y tiene dos niveles de brillo. En general, Gigabyte ha conseguido un teclado apto para el uso diario.
Panel táctil
El clickpad multitáctil del portátil (aprox. 12,1 x 7,6 cm, o 4,8 x 3,0") tiene una superficie lisa que facilita el deslizamiento de los dedos. Es sensible a las entradas incluso en las esquinas y tiene un clic poco profundo y un punto de accionamiento bien definido.
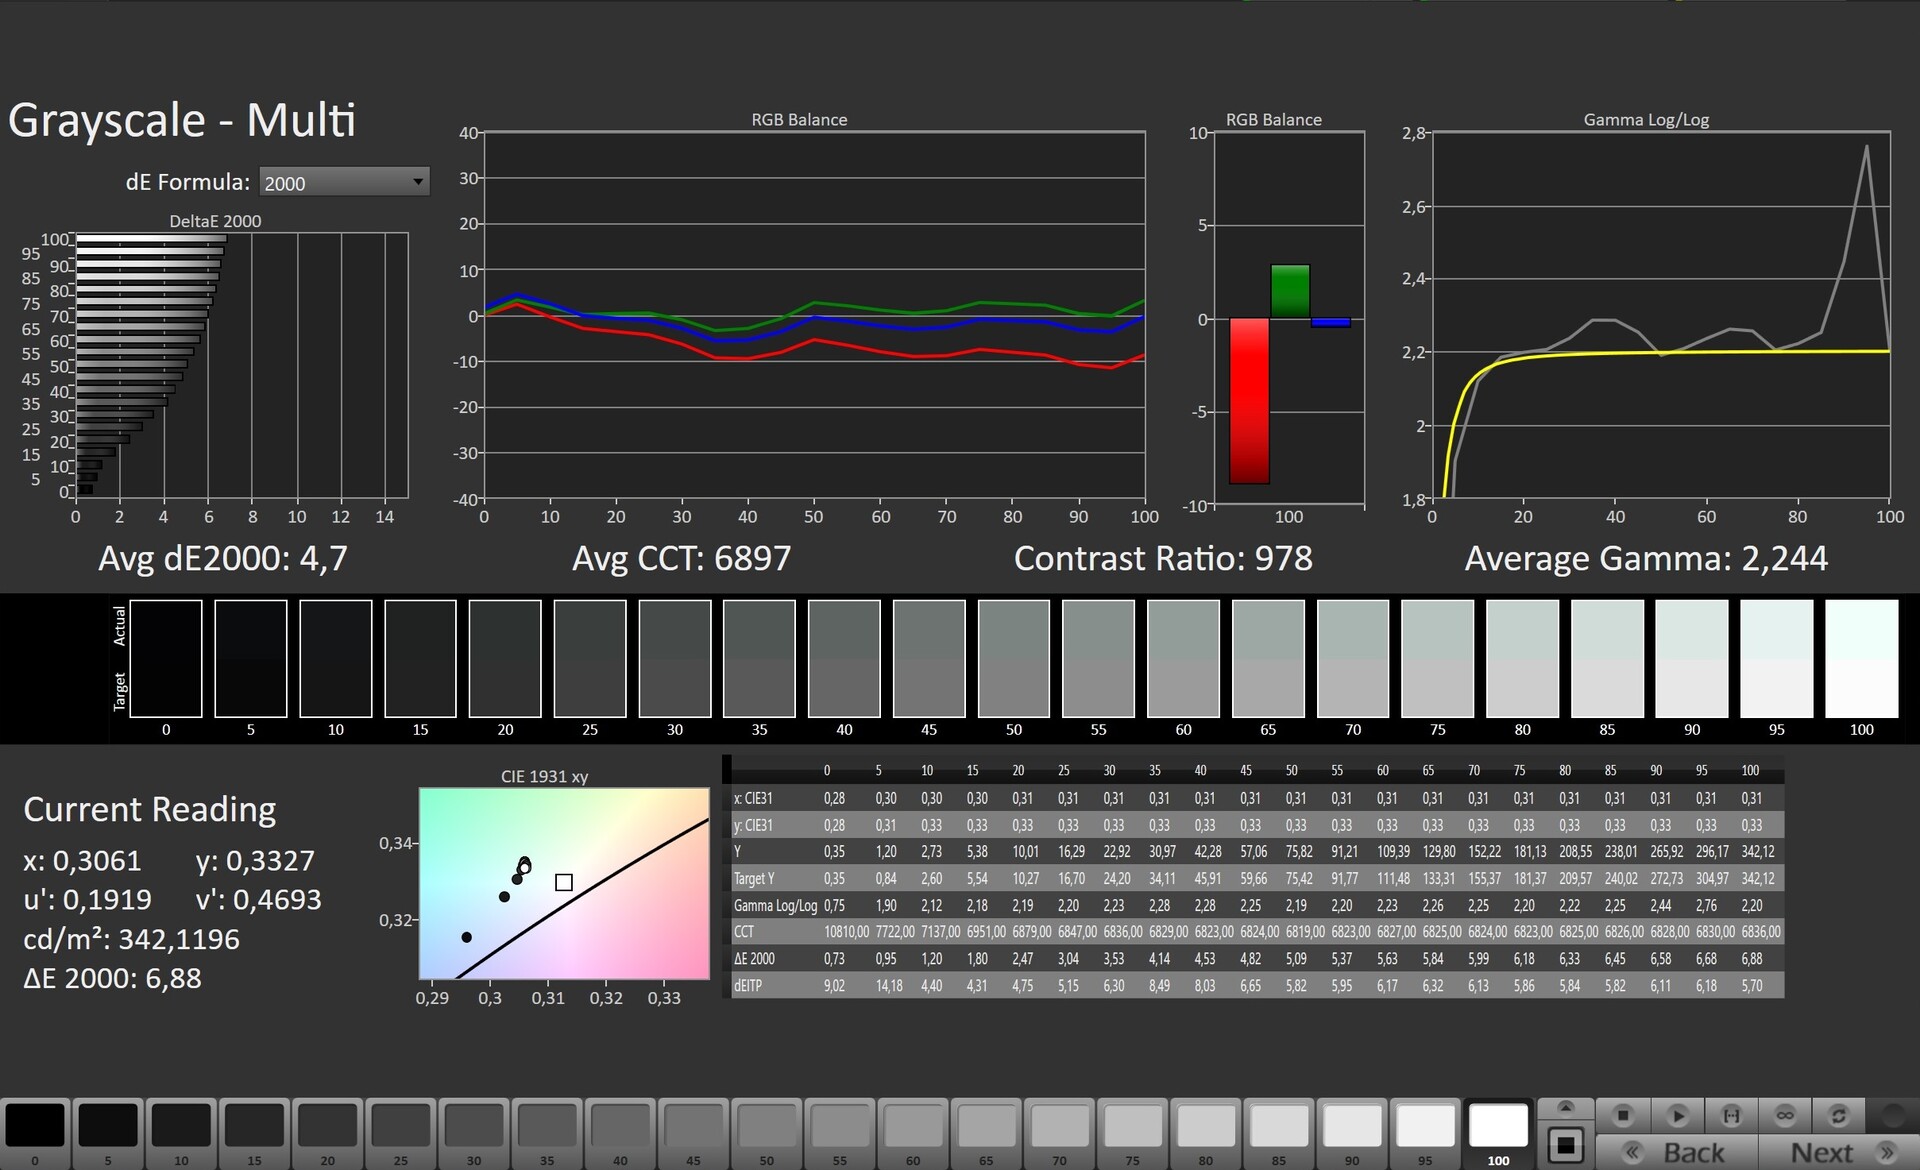
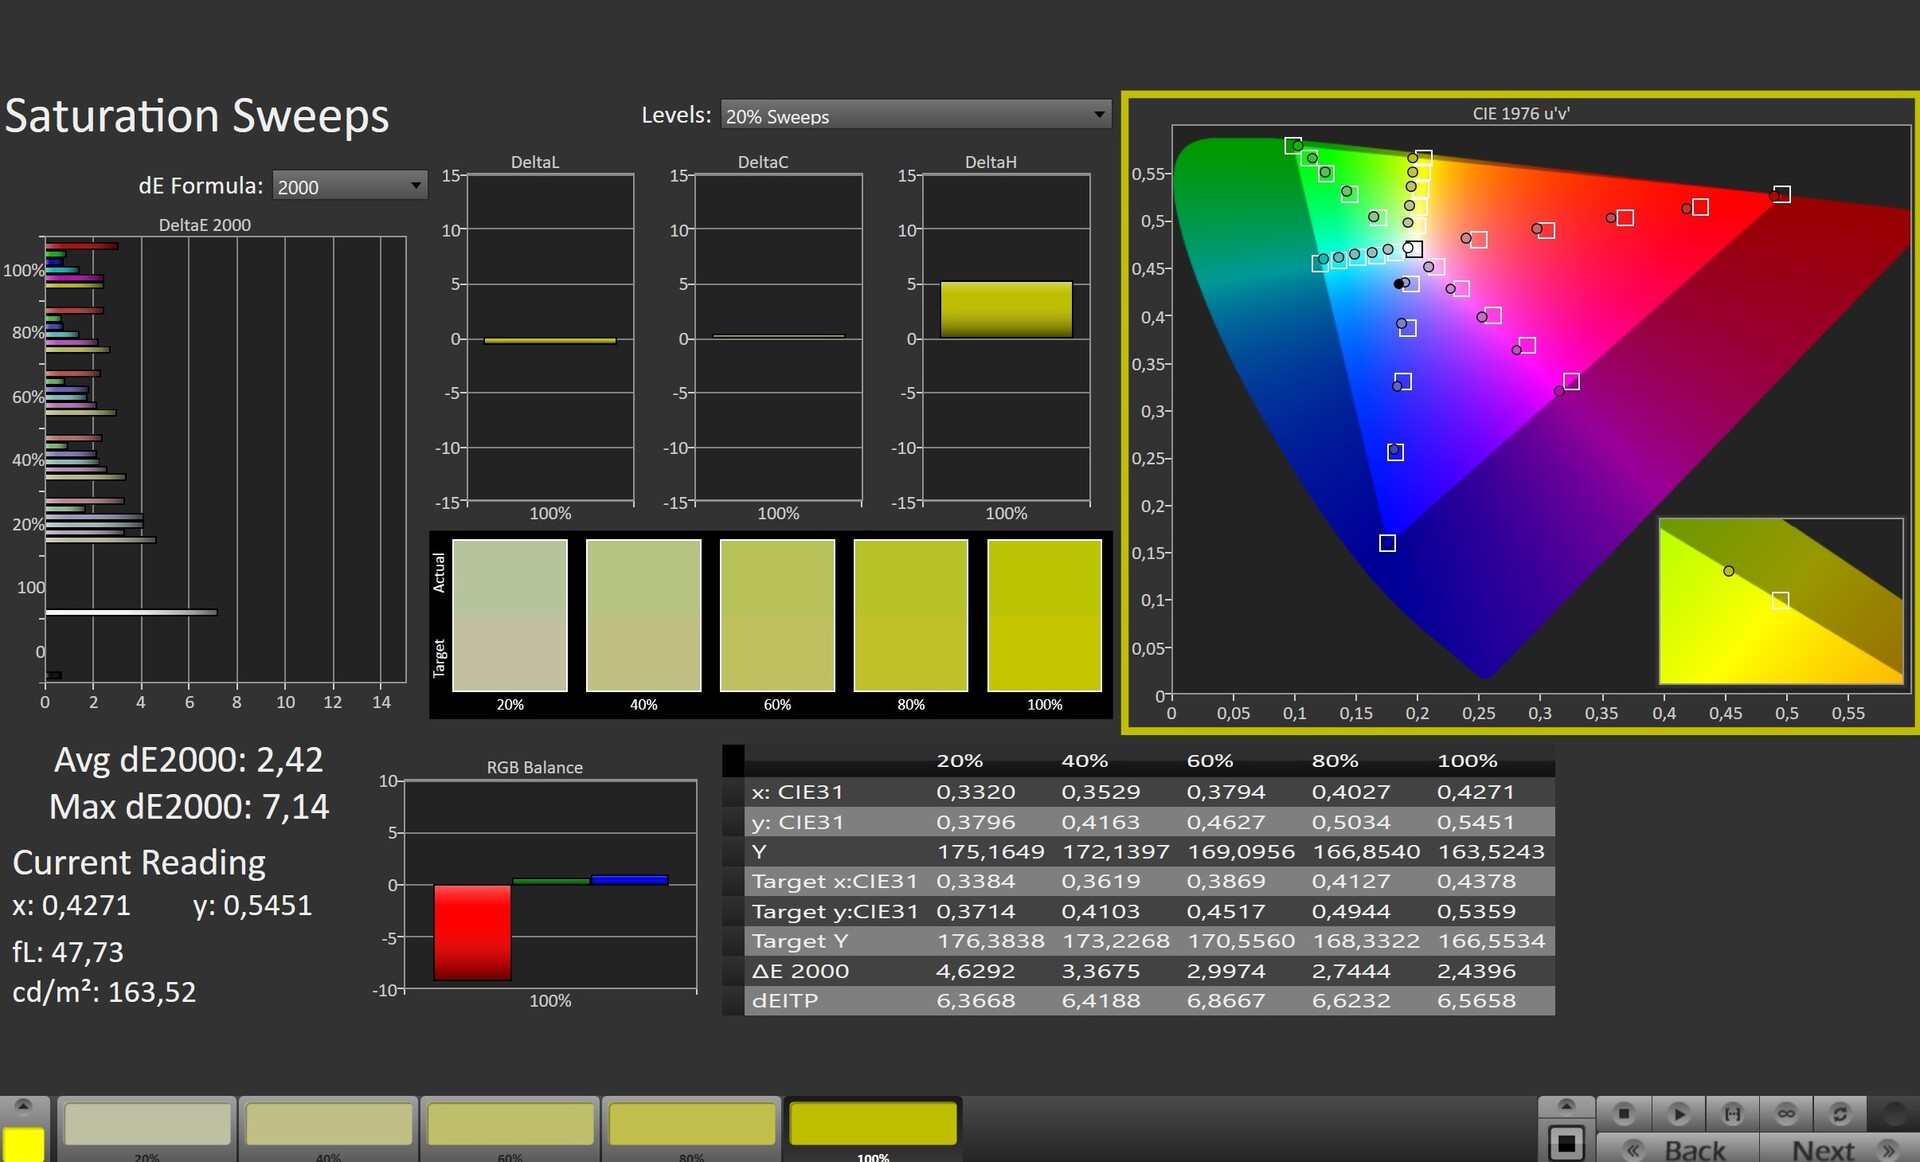
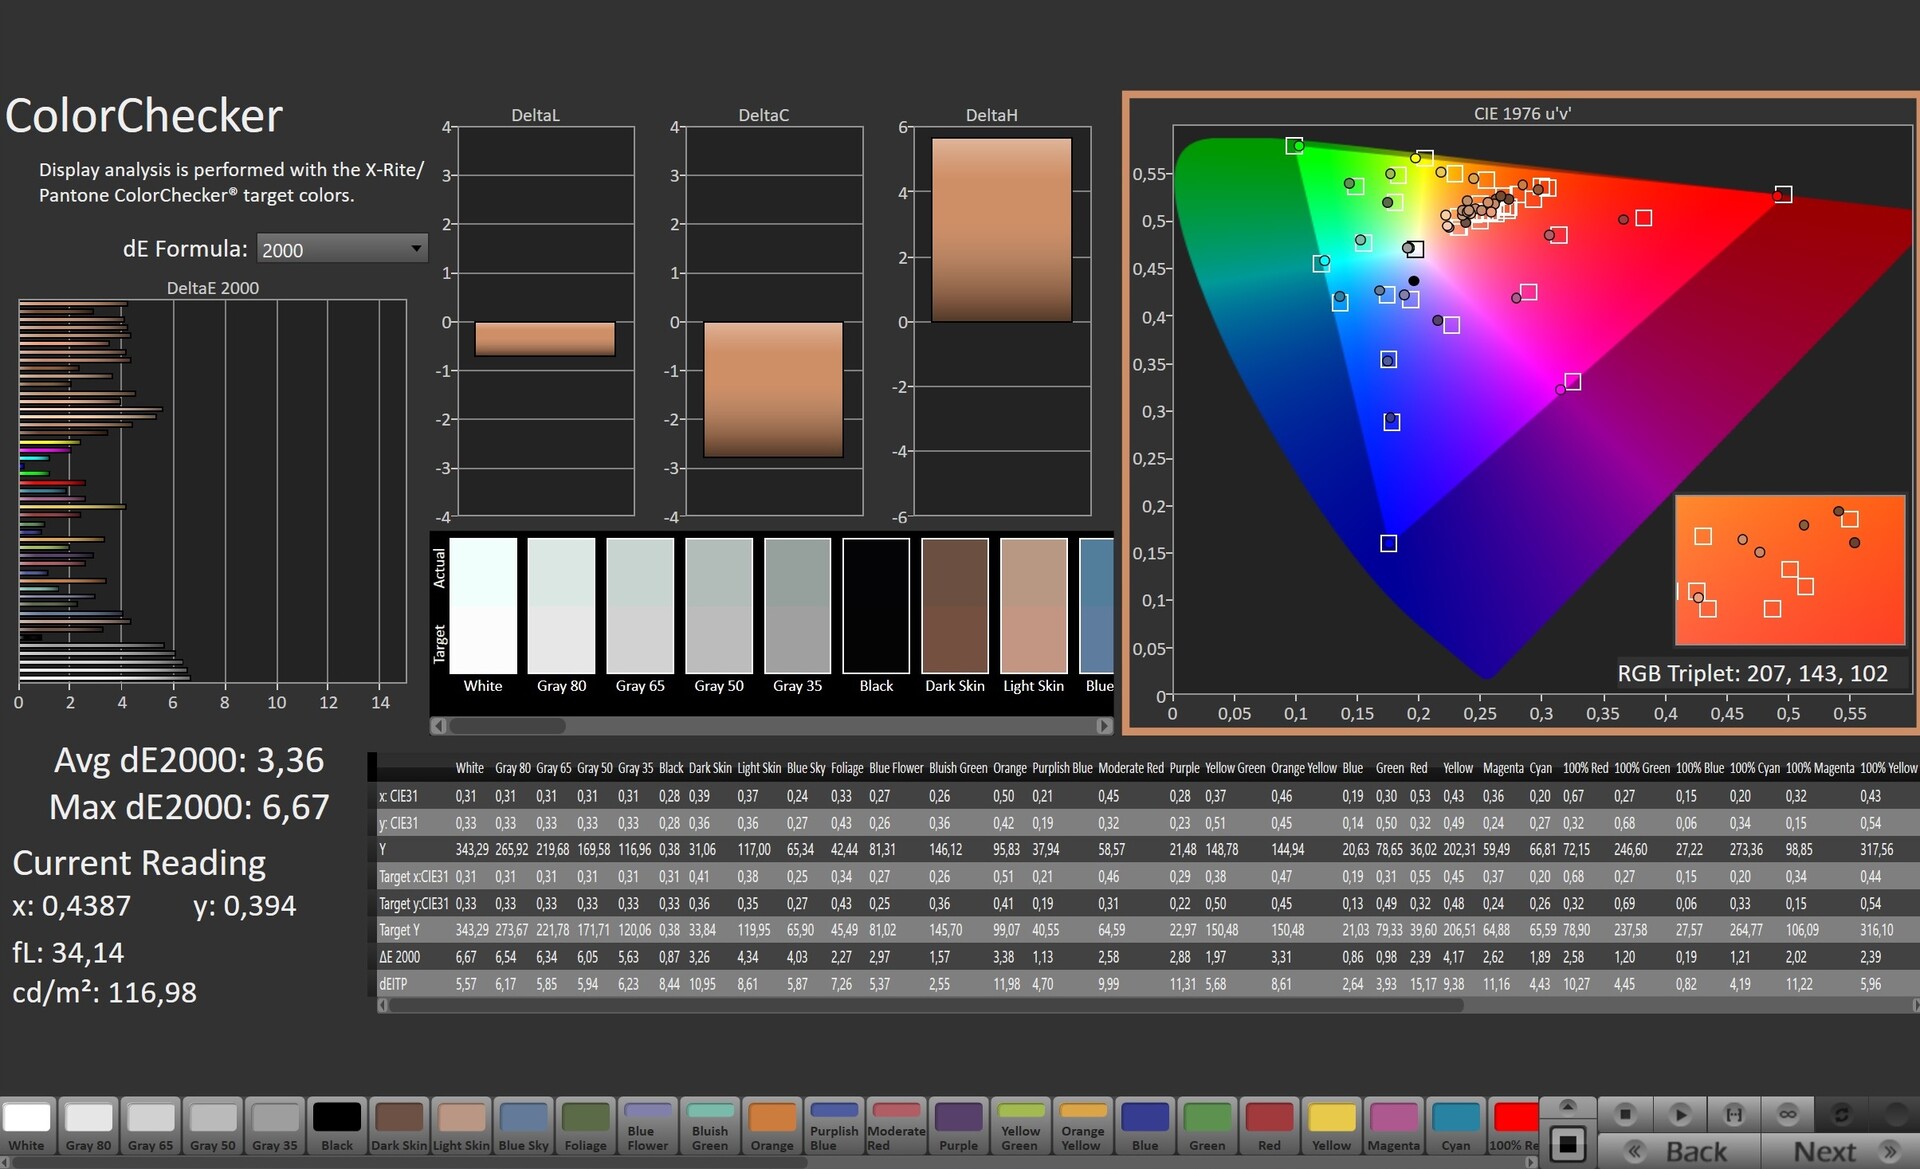
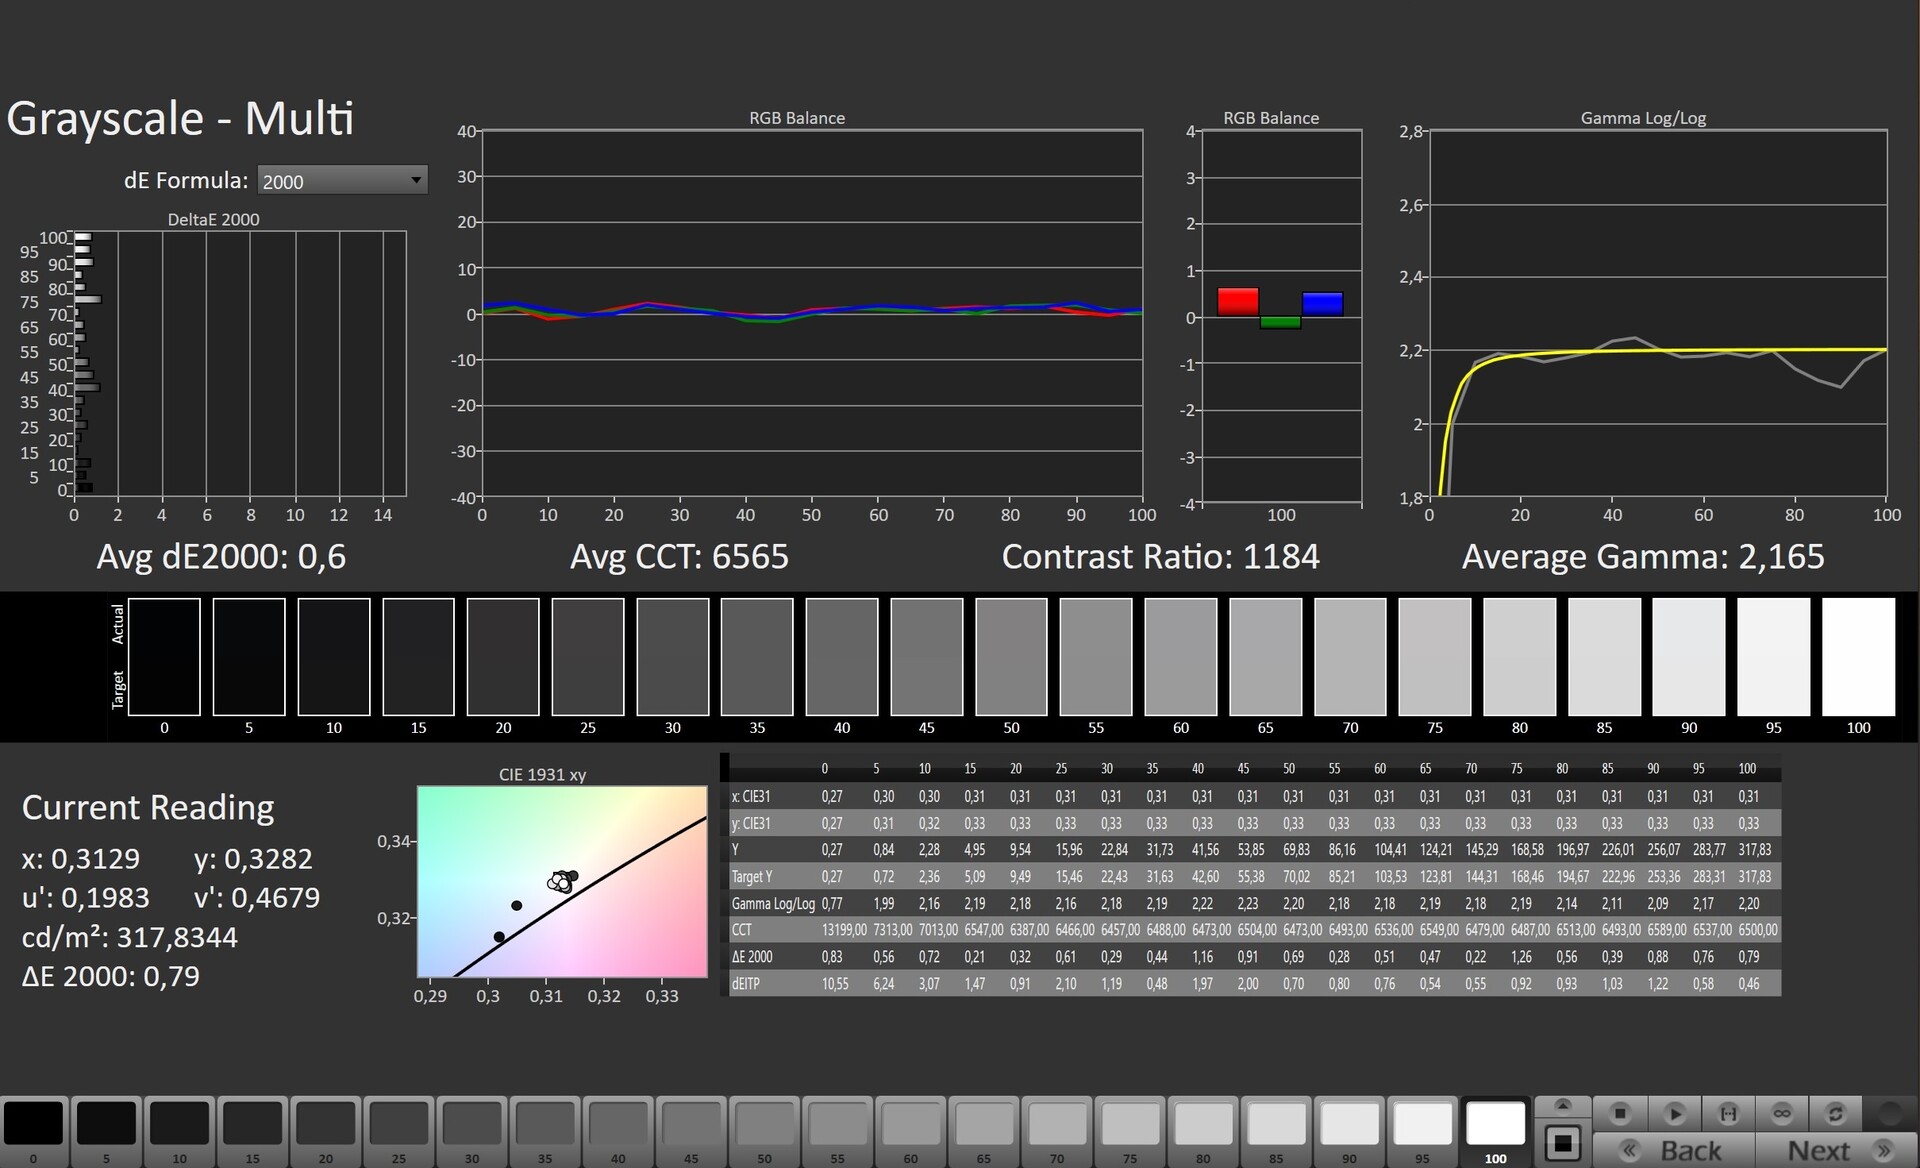
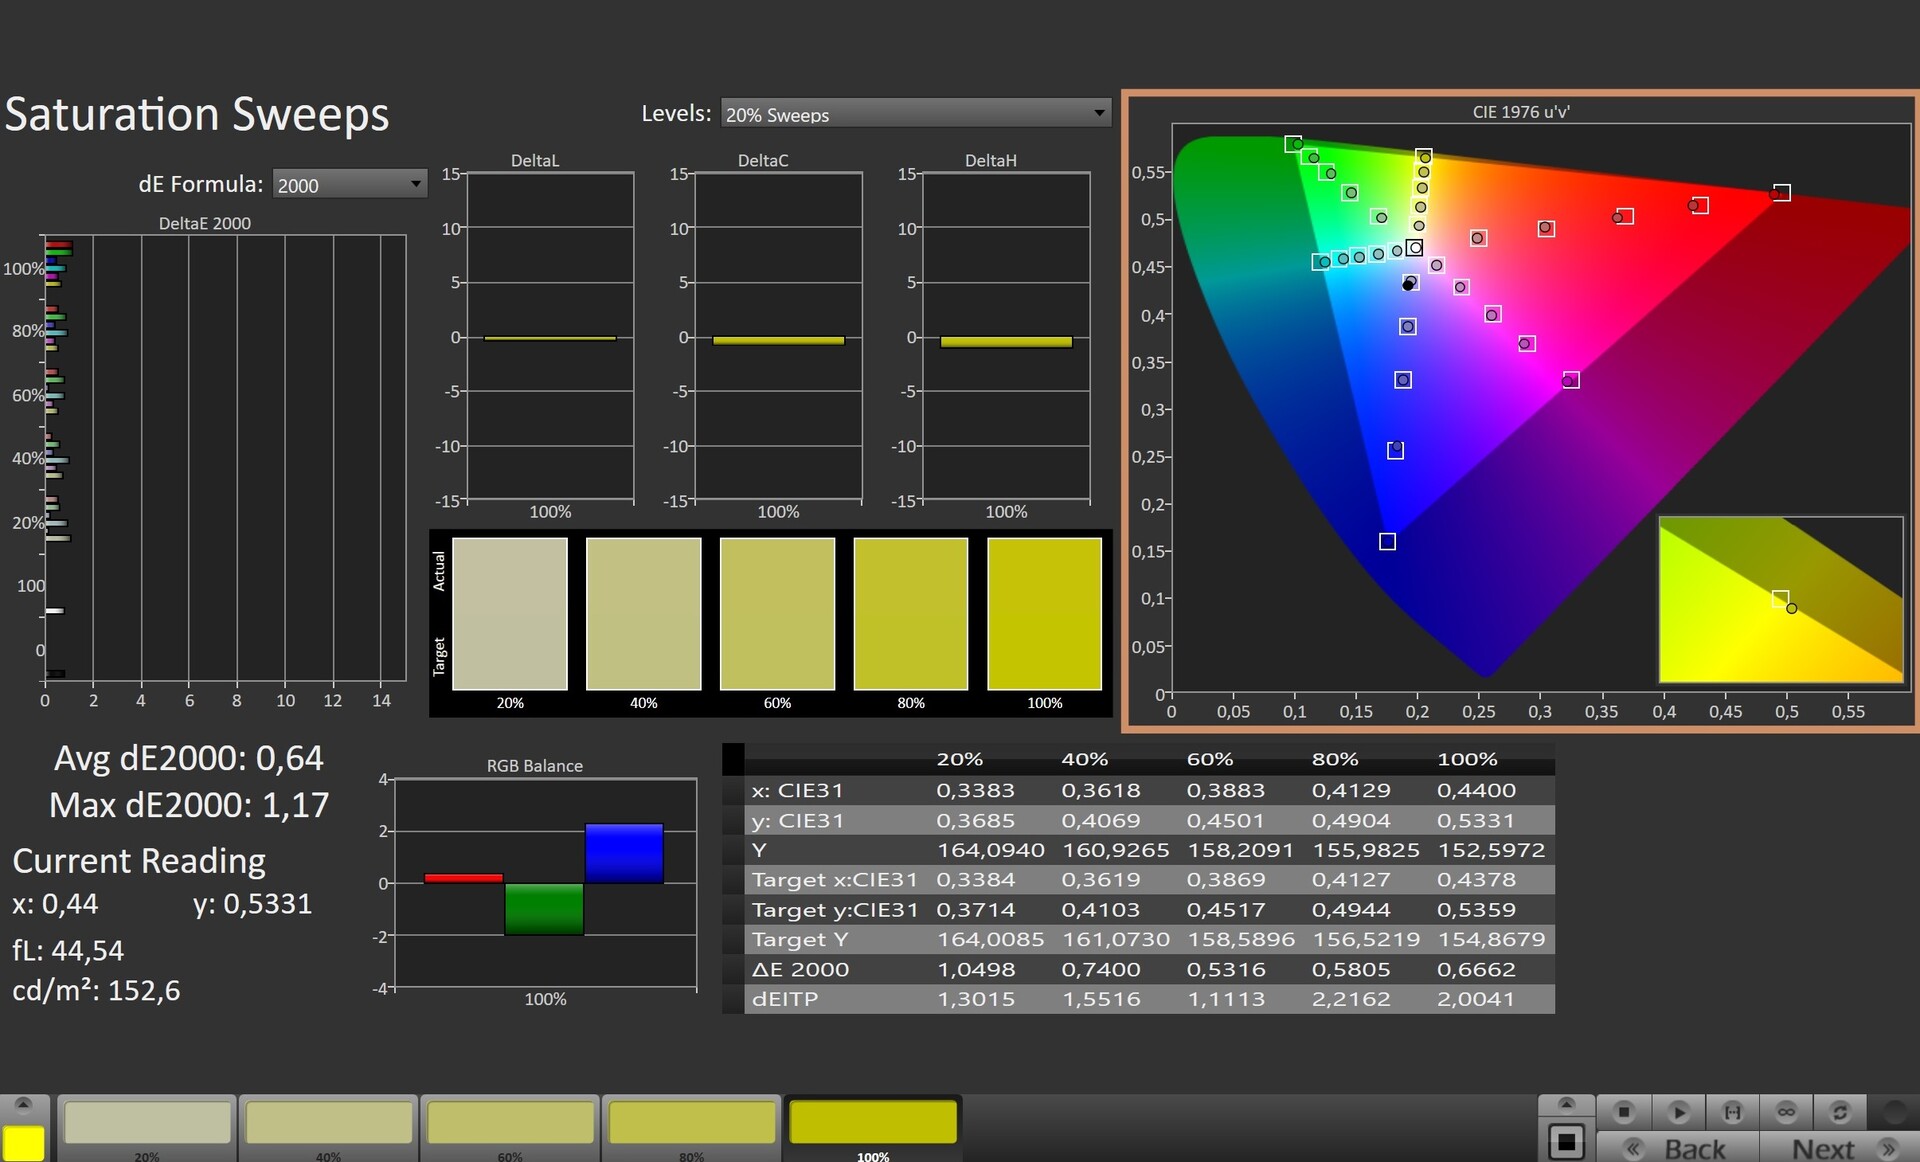
Pantalla - Gran cobertura de color
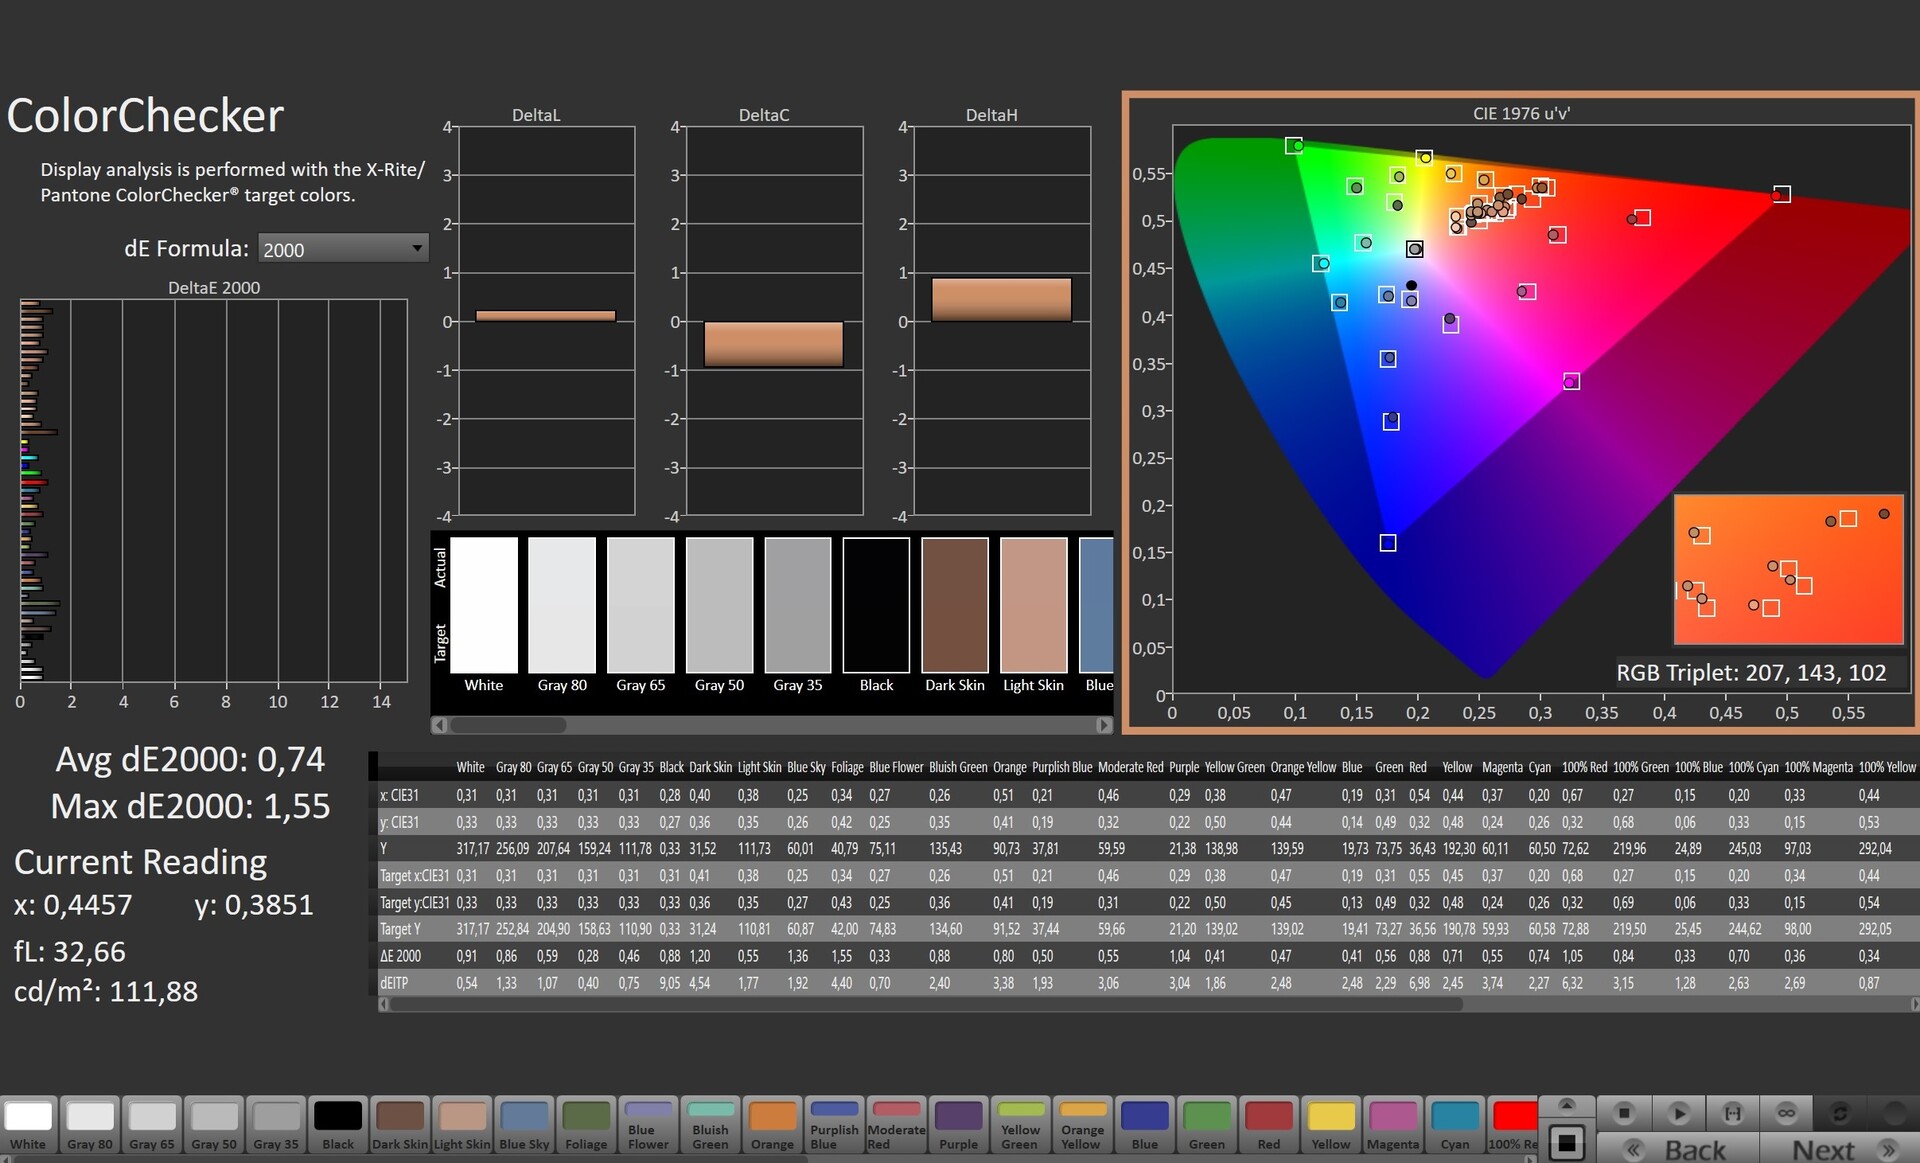
El portátil está equipado con un panel de 165 Hz de gran respuesta que no muestra parpadeo PWM. La pantalla mate de 15,6 pulgadas (2.560 x 1.440 píxeles) puede conseguir un brillo aceptable (>300 cd/m²), pero su contraste (988:1) está por debajo de lo que se considera bueno (>1.000:1). La situación es al revés con algunos de los competidores. Sólo el Nitro tiene una pantalla que rinde bien en ambos departamentos.
| |||||||||||||||||||||||||
iluminación: 89 %
Brillo con batería: 336 cd/m²
Contraste: 988:1 (Negro: 0.34 cd/m²)
ΔE ColorChecker Calman: 3.36 | ∀{0.5-29.43 Ø4.71}
calibrated: 0.74
ΔE Greyscale Calman: 4.7 | ∀{0.09-98 Ø4.96}
84.5% AdobeRGB 1998 (Argyll 3D)
99.9% sRGB (Argyll 3D)
95.2% Display P3 (Argyll 3D)
Gamma: 2.244
CCT: 6897 K
| Aorus 15 XE5 Chi Mei N156KME-GNA, IPS, 2560x1440, 15.6" | Acer Nitro 5 AN515-46-R1A1 AU Optronics B156HAN12.H, IPS, 1920x1080, 15.6" | Schenker XMG Fusion 15 (Mid 22) BOE CQ NE156QHM-NY2, IPS, 2560x1440, 15.6" | Asus TUF Dash F15 FX517ZR BOE CQ NE156QHM-NY1, IPS, 2560x1440, 15.6" | MSI Katana GF66 12UGS AU Optronics AUOAF90, IPS, 1920x1080, 15.6" | |
|---|---|---|---|---|---|
| Display | -16% | -17% | 2% | -51% | |
| Display P3 Coverage (%) | 95.2 | 68.8 -28% | 67.3 -29% | 98.4 3% | 39.1 -59% |
| sRGB Coverage (%) | 99.9 | 98.1 -2% | 96.7 -3% | 99.9 0% | 58.3 -42% |
| AdobeRGB 1998 Coverage (%) | 84.5 | 69.7 -18% | 68.2 -19% | 85.9 2% | 40.4 -52% |
| Response Times | 9% | 19% | 26% | -204% | |
| Response Time Grey 50% / Grey 80% * (ms) | 14.4 ? | 13 ? 10% | 11.6 ? 19% | 5.6 ? 61% | 40 ? -178% |
| Response Time Black / White * (ms) | 8.6 ? | 8 ? 7% | 7 ? 19% | 9.4 ? -9% | 28.4 ? -230% |
| PWM Frequency (Hz) | |||||
| Screen | 2% | -14% | 13% | -64% | |
| Brightness middle (cd/m²) | 336 | 327 -3% | 326 -3% | 286 -15% | 227 -32% |
| Brightness (cd/m²) | 316 | 320 1% | 303 -4% | 266 -16% | 225 -29% |
| Brightness Distribution (%) | 89 | 93 4% | 89 0% | 87 -2% | 90 1% |
| Black Level * (cd/m²) | 0.34 | 0.24 29% | 0.33 3% | 0.25 26% | 0.21 38% |
| Contrast (:1) | 988 | 1363 38% | 988 0% | 1144 16% | 1081 9% |
| Colorchecker dE 2000 * | 3.36 | 3.26 3% | 2.73 19% | 2.14 36% | 4.19 -25% |
| Colorchecker dE 2000 max. * | 6.67 | 8.73 -31% | 9.54 -43% | 5.22 22% | 17.45 -162% |
| Colorchecker dE 2000 calibrated * | 0.74 | 0.87 -18% | 1.36 -84% | 0.67 9% | 3.81 -415% |
| Greyscale dE 2000 * | 4.7 | 4.87 -4% | 5.2 -11% | 2.8 40% | 2.7 43% |
| Gamma | 2.244 98% | 2.3 96% | 2.074 106% | 2.23 99% | 2.208 100% |
| CCT | 6897 94% | 7070 92% | 6911 94% | 7092 92% | 6176 105% |
| Media total (Programa/Opciones) | -2% /
-1% | -4% /
-10% | 14% /
12% | -106% /
-81% |
* ... más pequeño es mejor
La pantalla tiene una reproducción del color decente nada más sacarla de la caja. Su diferencia de color de 3,36 está ligeramente fuera del rango ideal (DeltaE <3). Calibrar la pantalla redujo la diferencia de color a 0,74 e hizo que los tonos grises parecieran más suaves. La pantalla cubre totalmente el espacio de color sRGB (100%) y casi consigue reproducir toda la gama DCI-P3 (95%). También tiene una cobertura AdobeRGB del 85%.
El perfil de color creado por nosotros puede descargarse y utilizarse gratuitamente. Encontrarás un enlace de descarga en el infobox de la pantalla.
Tiempos de respuesta del display
| ↔ Tiempo de respuesta de Negro a Blanco | ||
|---|---|---|
| 8.6 ms ... subida ↗ y bajada ↘ combinada | ↗ 5.1 ms subida | 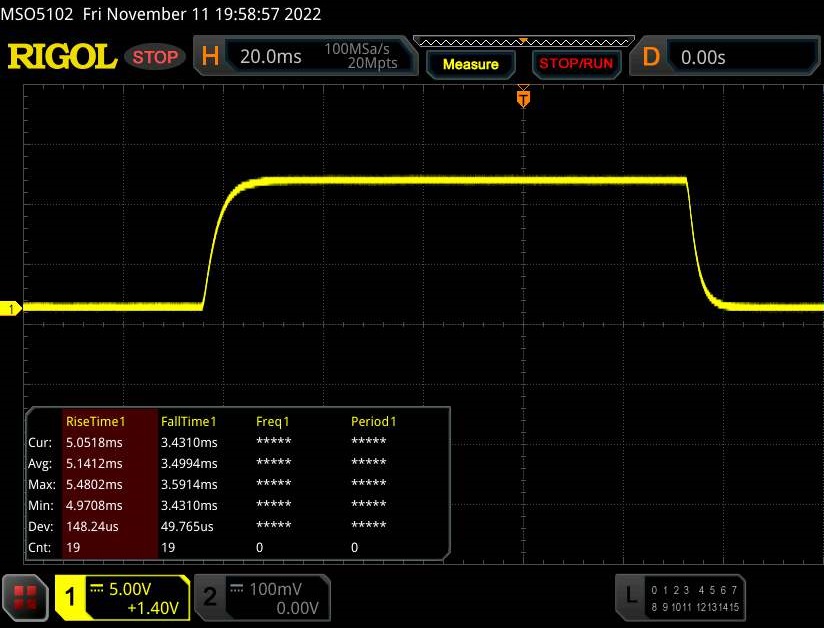 |
| ↘ 3.5 ms bajada | ||
| La pantalla mostró tiempos de respuesta rápidos en nuestros tests y debería ser adecuada para juegos. En comparación, todos los dispositivos de prueba van de ##min### (mínimo) a 240 (máximo) ms. » 24 % de todos los dispositivos son mejores. Esto quiere decir que el tiempo de respuesta medido es mejor que la media (19.8 ms) de todos los dispositivos testados. | ||
| ↔ Tiempo de respuesta 50% Gris a 80% Gris | ||
| 14.4 ms ... subida ↗ y bajada ↘ combinada | ↗ 6.9 ms subida | 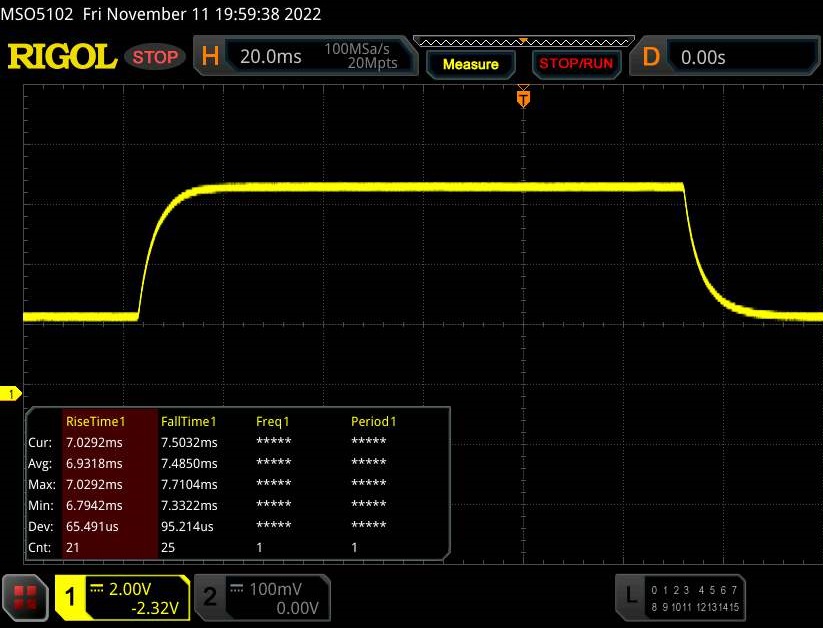 |
| ↘ 7.5 ms bajada | ||
| La pantalla mostró buenos tiempos de respuesta en nuestros tests pero podría ser demasiado lenta para los jugones competitivos. En comparación, todos los dispositivos de prueba van de ##min### (mínimo) a 636 (máximo) ms. » 28 % de todos los dispositivos son mejores. Esto quiere decir que el tiempo de respuesta medido es mejor que la media (31 ms) de todos los dispositivos testados. | ||
Parpadeo de Pantalla / PWM (Pulse-Width Modulation)
| Parpadeo de Pantalla / PWM no detectado | 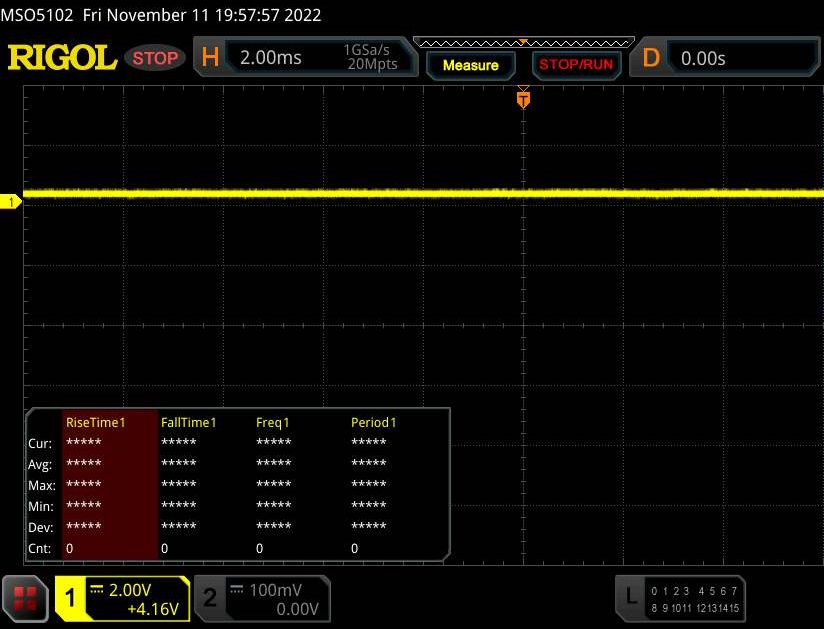 | ||
Comparación: 52 % de todos los dispositivos testados no usaron PWM para atenuar el display. Si se usó, medimos una media de 7754 (mínimo: 5 - máxmo: 343500) Hz. | |||
La pantalla IPS tiene un amplio ángulo de visión y se puede leer desde cualquier posición. También es posible utilizar la pantalla en exteriores, siempre que el sol no brille demasiado.

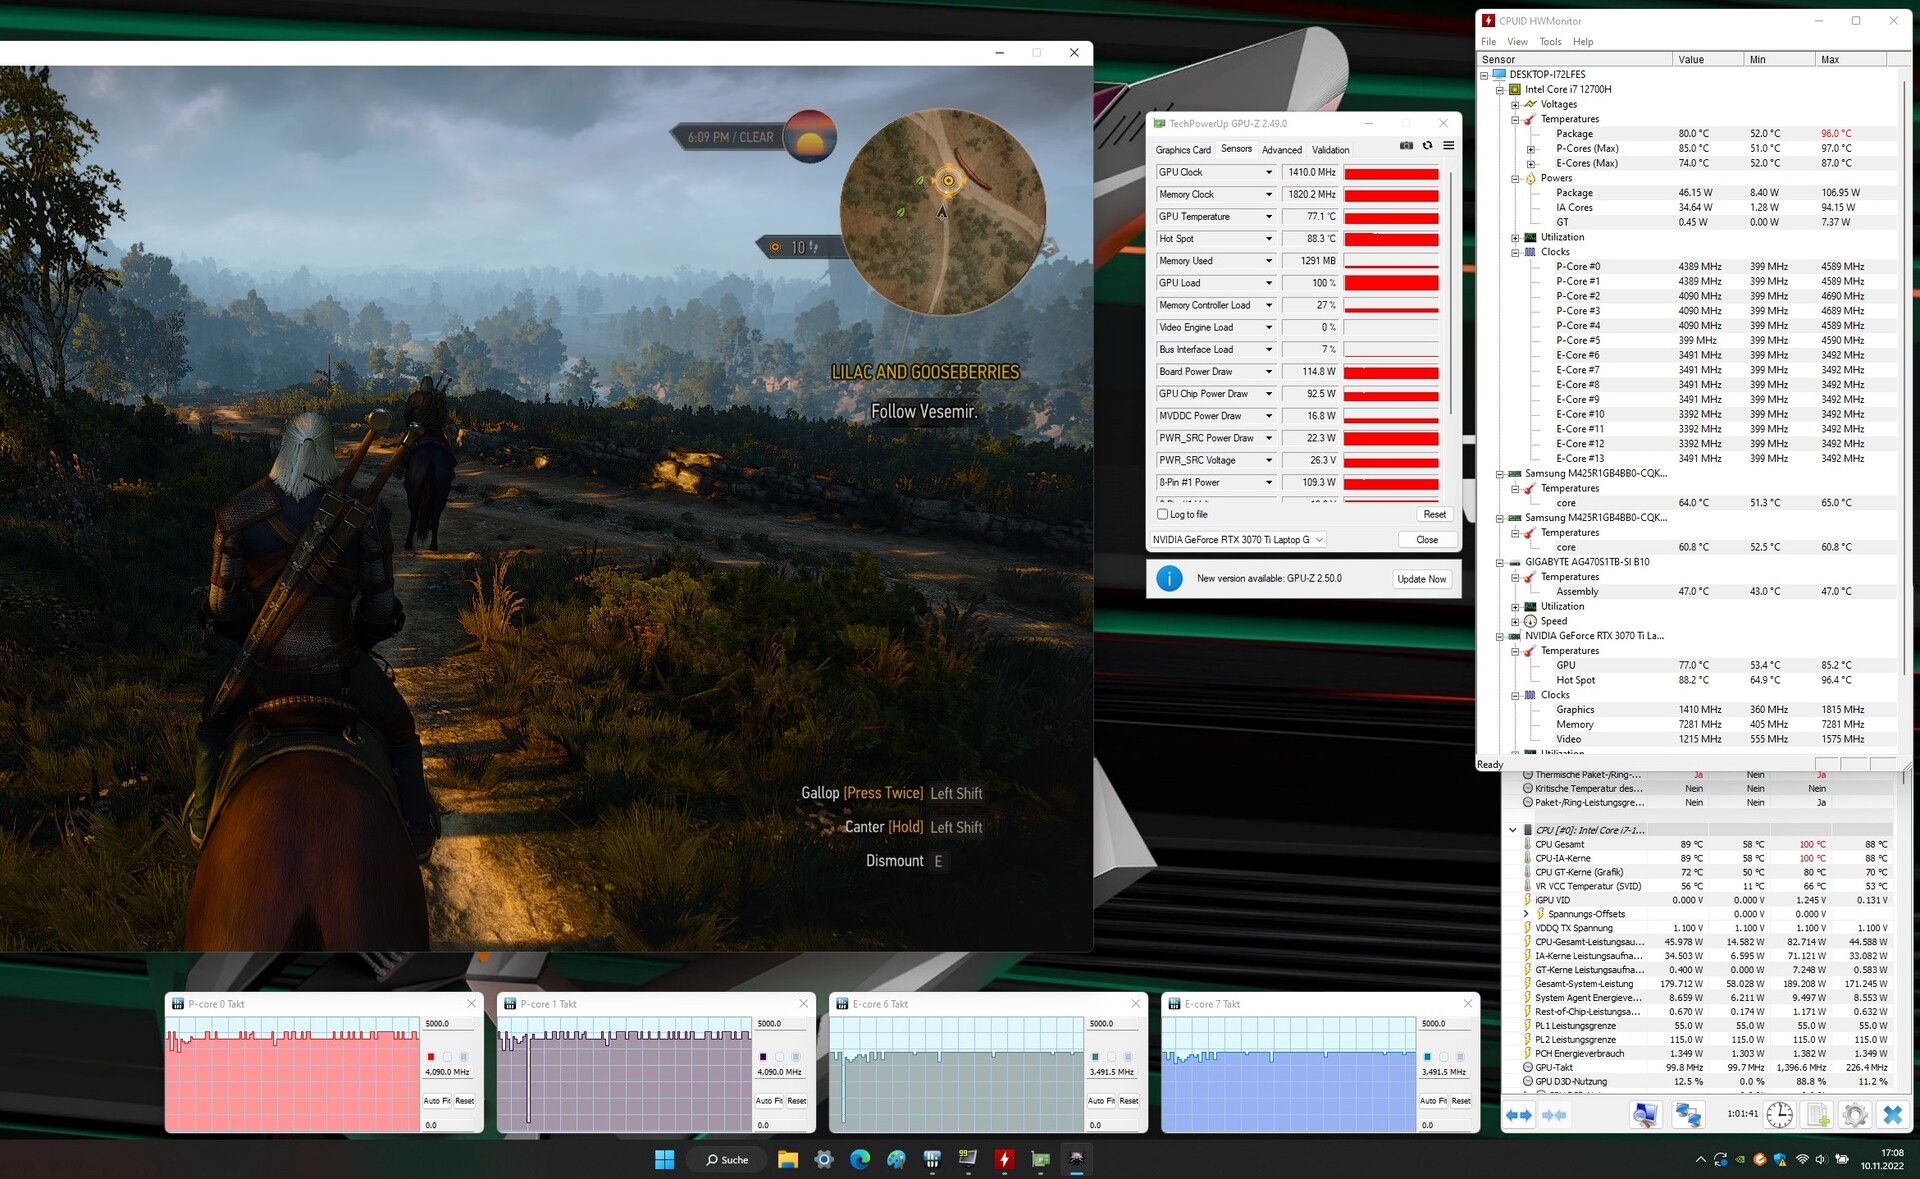
Rendimiento - Gran potencia gracias a Alder Lake y Ampere
El Gigabyte Aorus 15 XE5 es un potente portátil de 15.6 pulgadas que rinde bien en todo tipo de escenarios de uso exigentes. Además de la configuración de análisis, Gigabyte también ofrece otros dos modelos: uno con una RTX 3080 Ti Laptop (Aorus 15 YE5) y otro con una RTX 3060 Laptop (Aorus 15 KE5).
Condiciones de la prueba
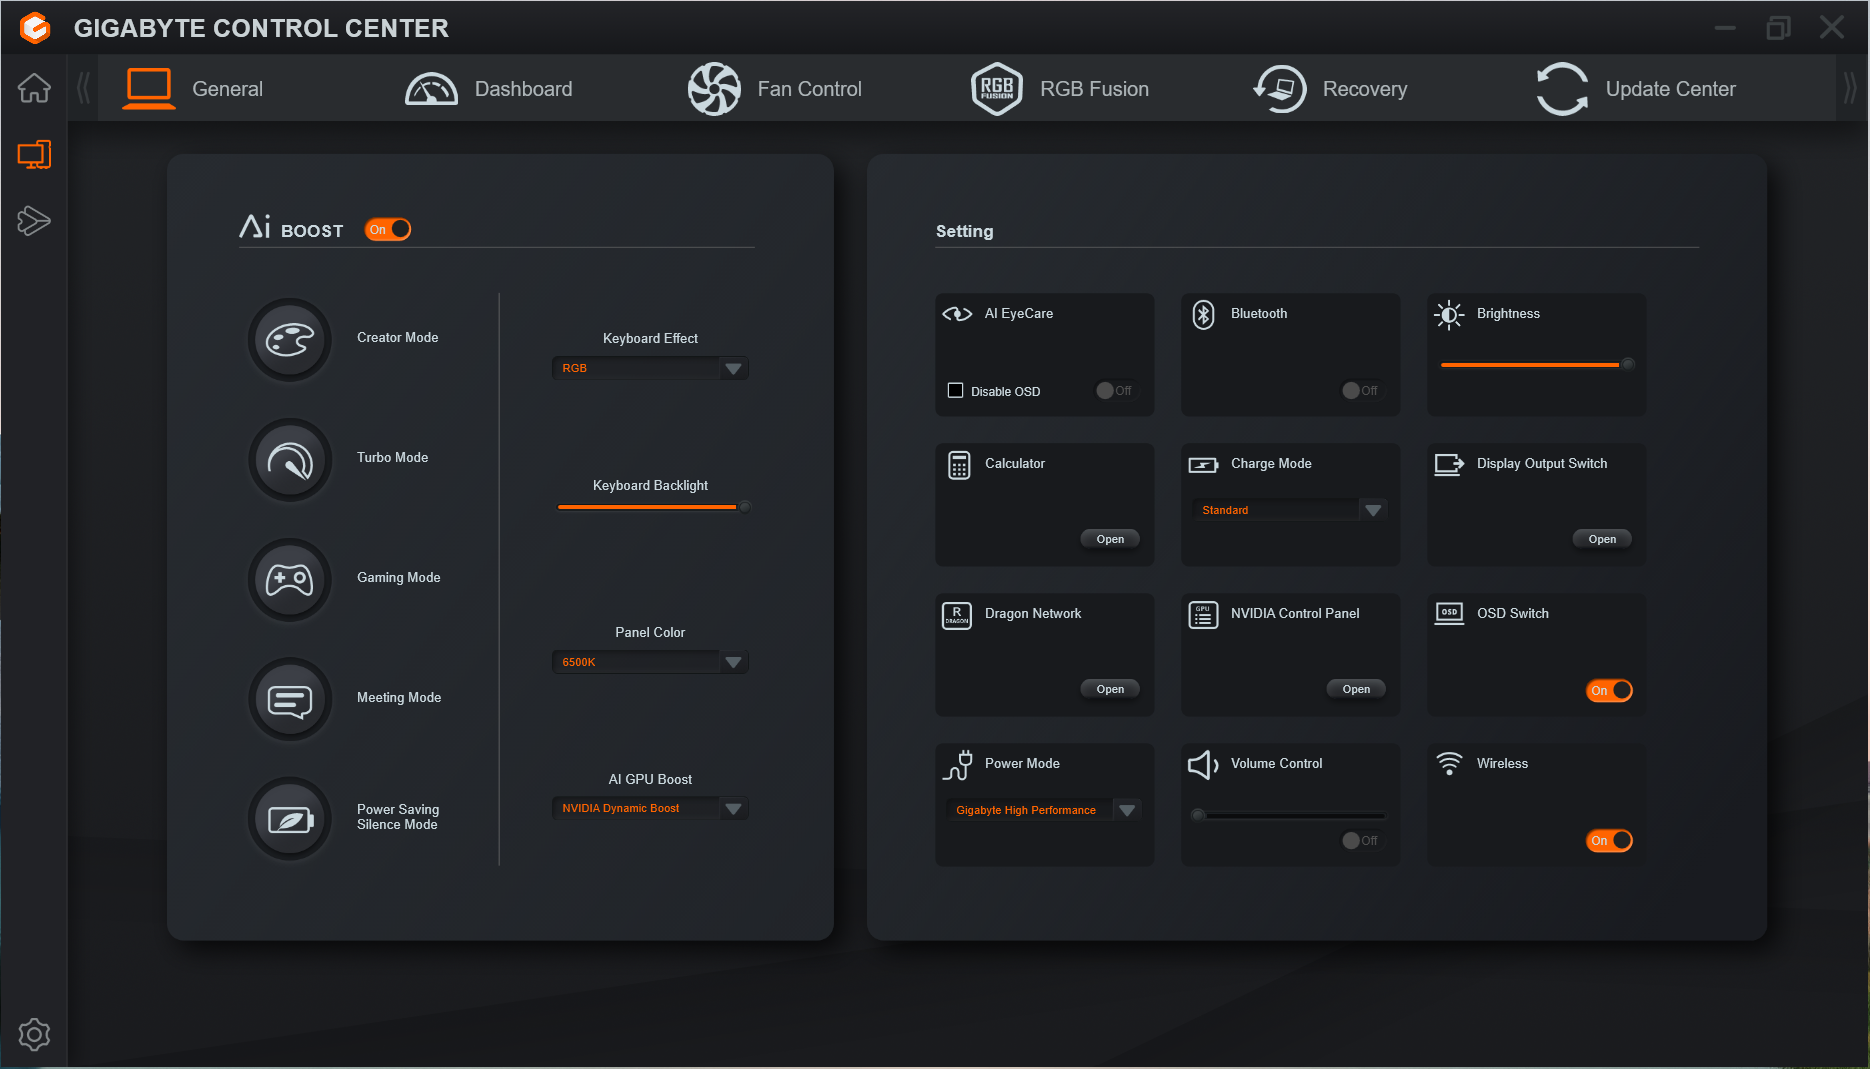
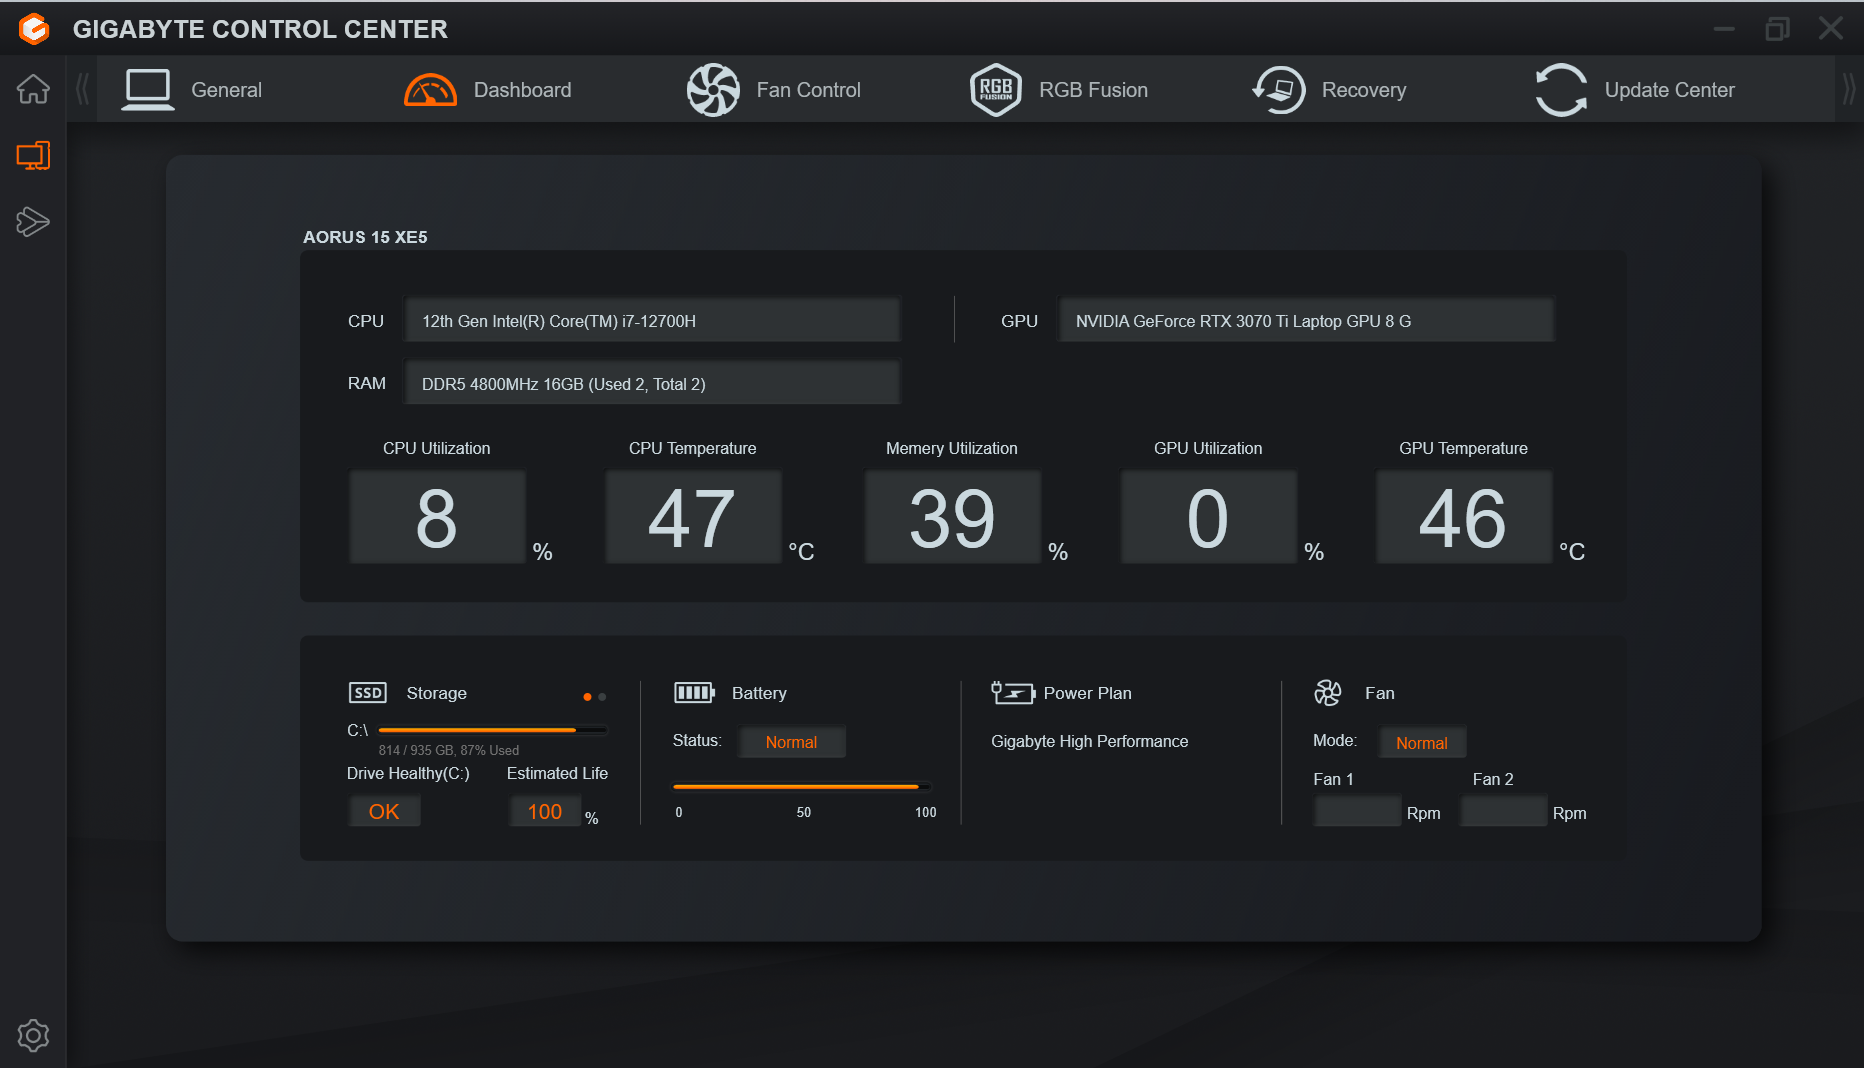
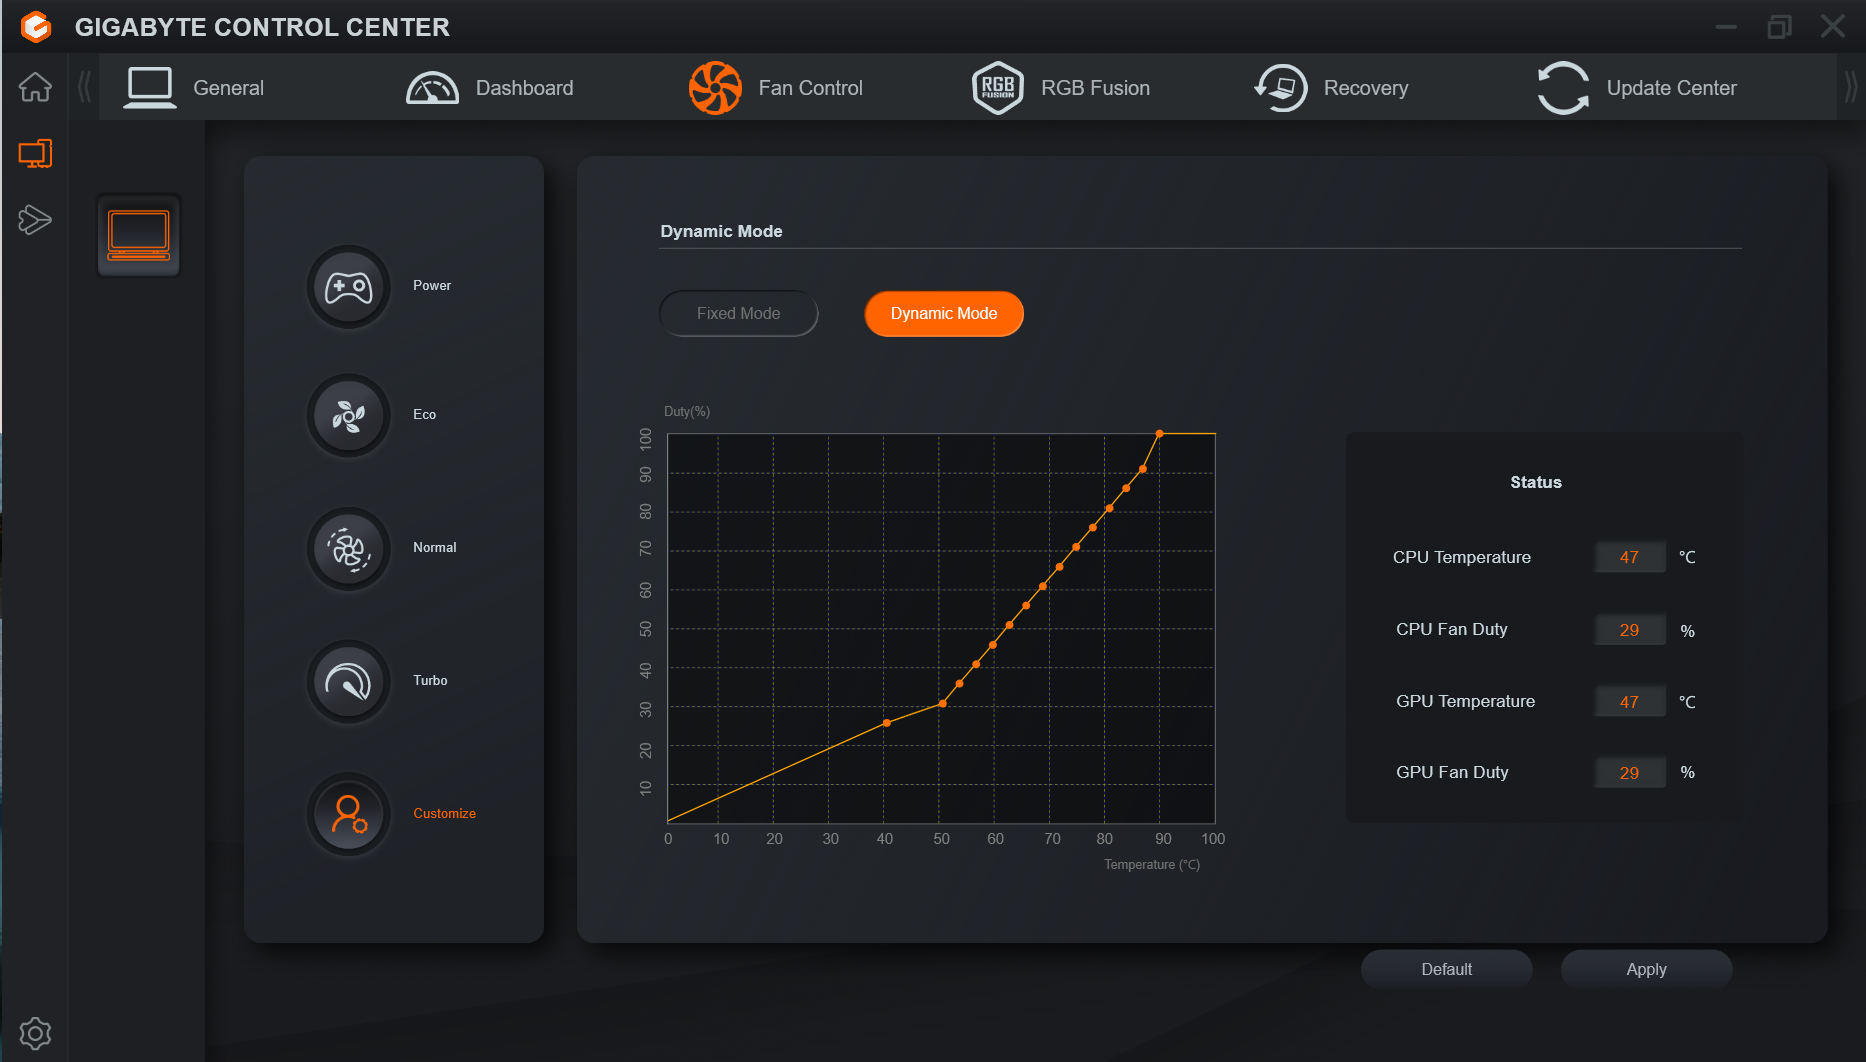
El Gigabyte Control Center preinstalado tiene varios perfiles de rendimiento que permiten configurar el rendimiento de la CPU y la GPU, la actividad del ventilador, el brillo y la temperatura de color de la pantalla, etcétera. Para nuestras pruebas, usamos la función AI Boost, que anula cualquier configuración manual de rendimiento y permite al Centro de Control elegir el perfil adecuado.
El uso del "Modo Turbo" apenas mejoró el rendimiento máximo, pero dio lugar a un mayor rendimiento sostenido bajo carga constante (véanse los resultados del bucle CB15). No obstante, esta ganancia tiene un precio: los ventiladores funcionaban continuamente a toda velocidad.
| Modo Creador | Modo Turbo | Modo Juego | Modo Reunión | Modo Silencio Ahorro Energía | |
|---|---|---|---|---|---|
| Límite de potencia 1 | 70 vatios | 70 vatios | 55 vatios | 15 vatios | 15 vatios |
| Límite de potencia 2 | 115 vatios | 115 vatios | 115 vatios | 30 vatios | 30 vatios |
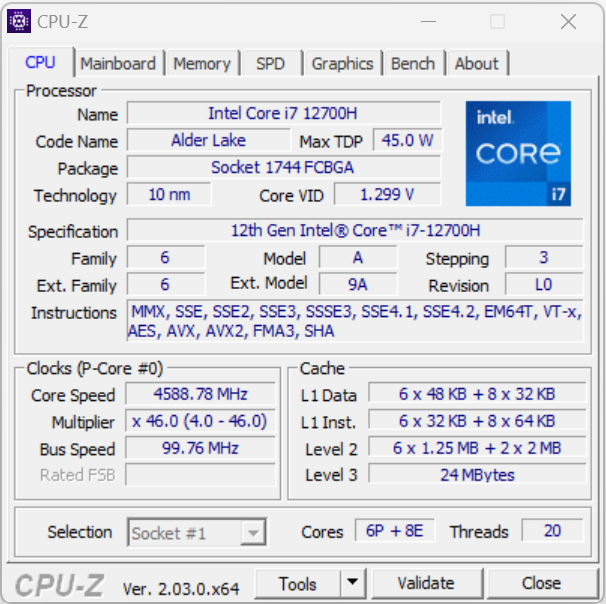
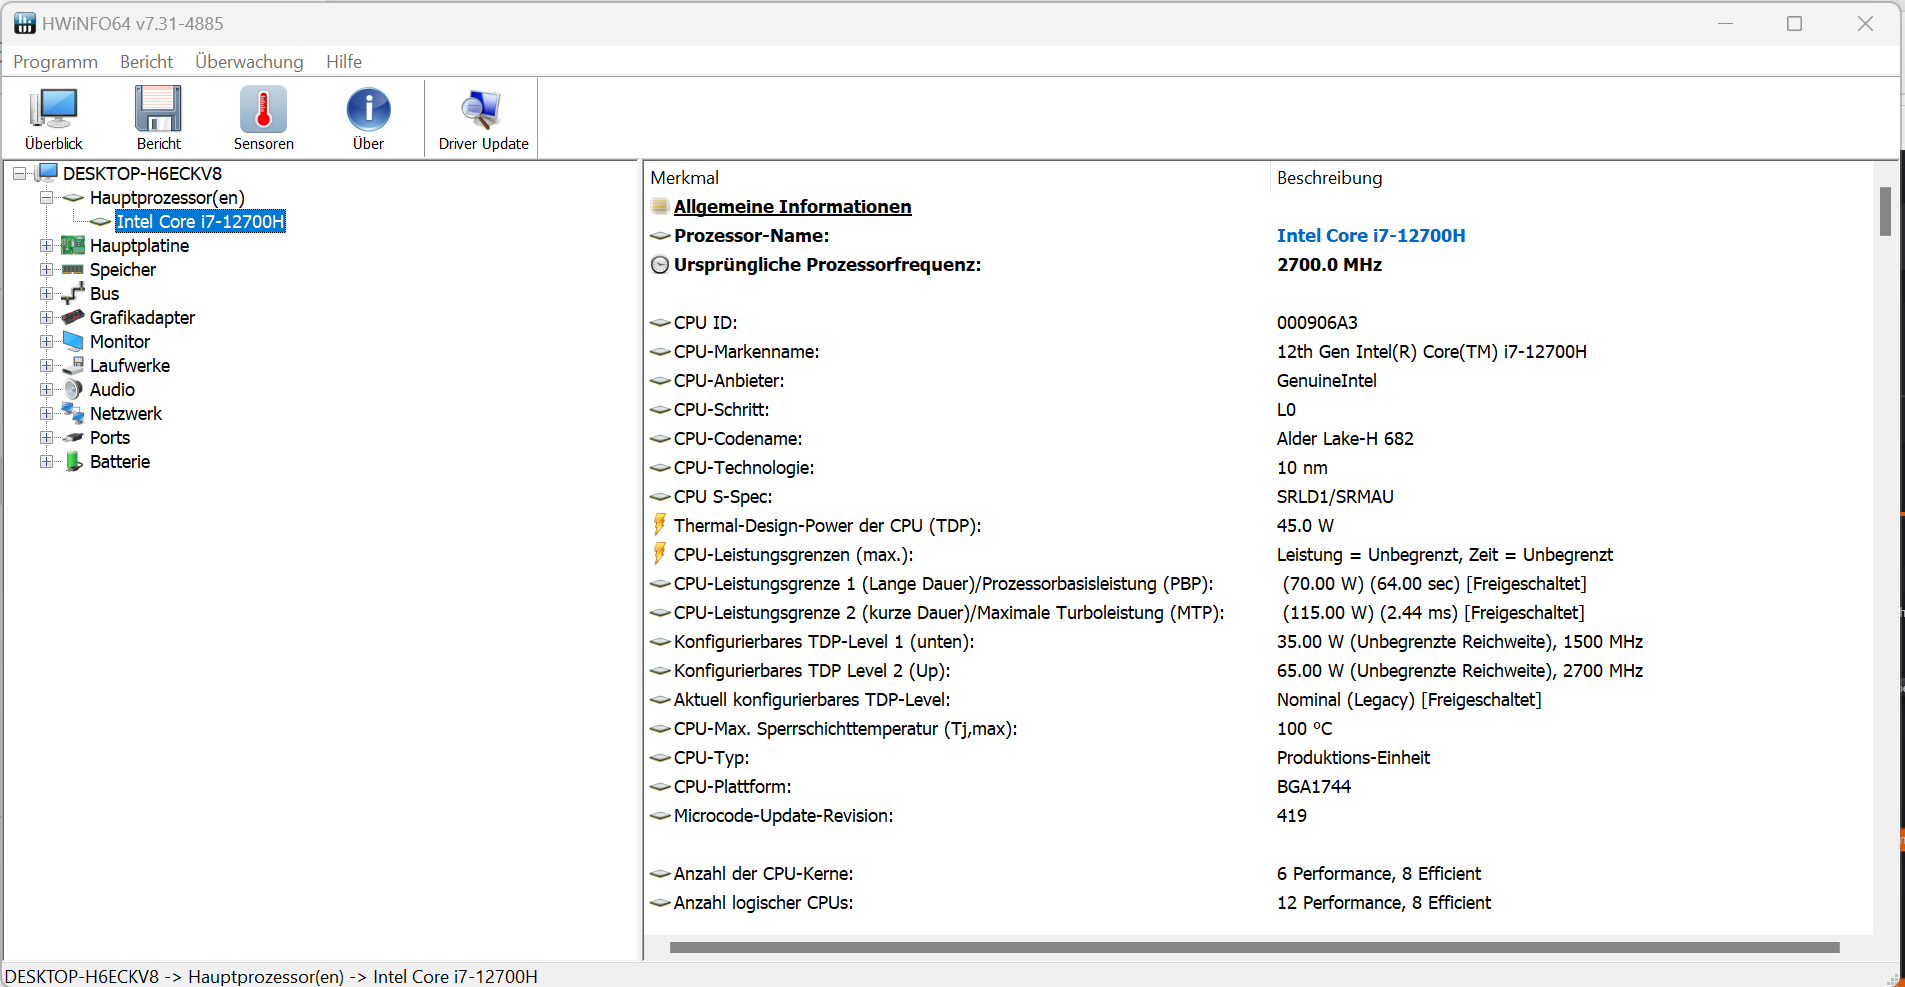
Procesador
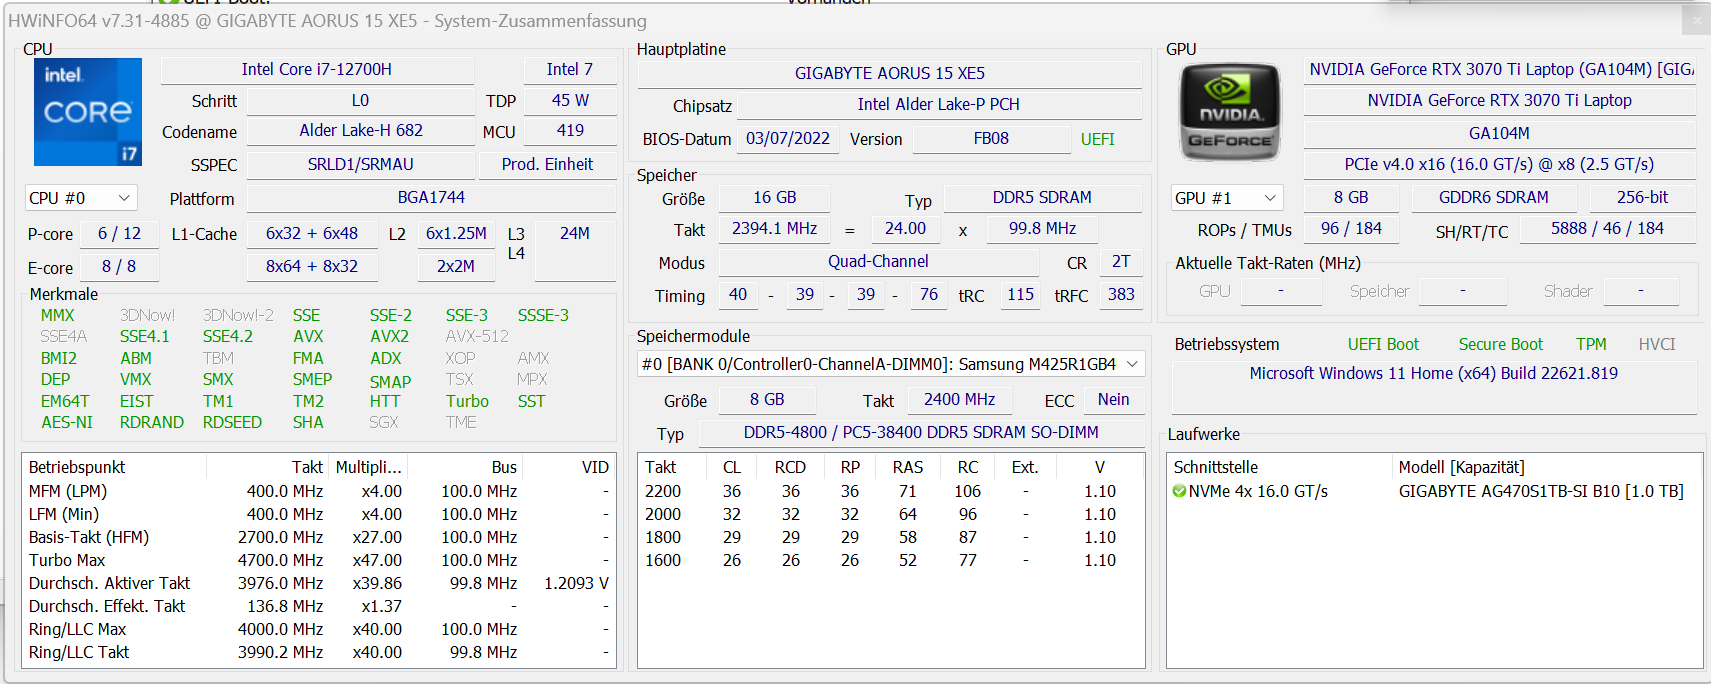
El Core i7-12700H (Alder Lake) contiene seis núcleos de rendimiento (hyper-threading, 2.4 a 4.7 GHz) y ocho núcleos de eficiencia (sin hyper-threading, 1.8 a 3.5 GHz), dando un total de 20 núcleos lógicos de CPU.
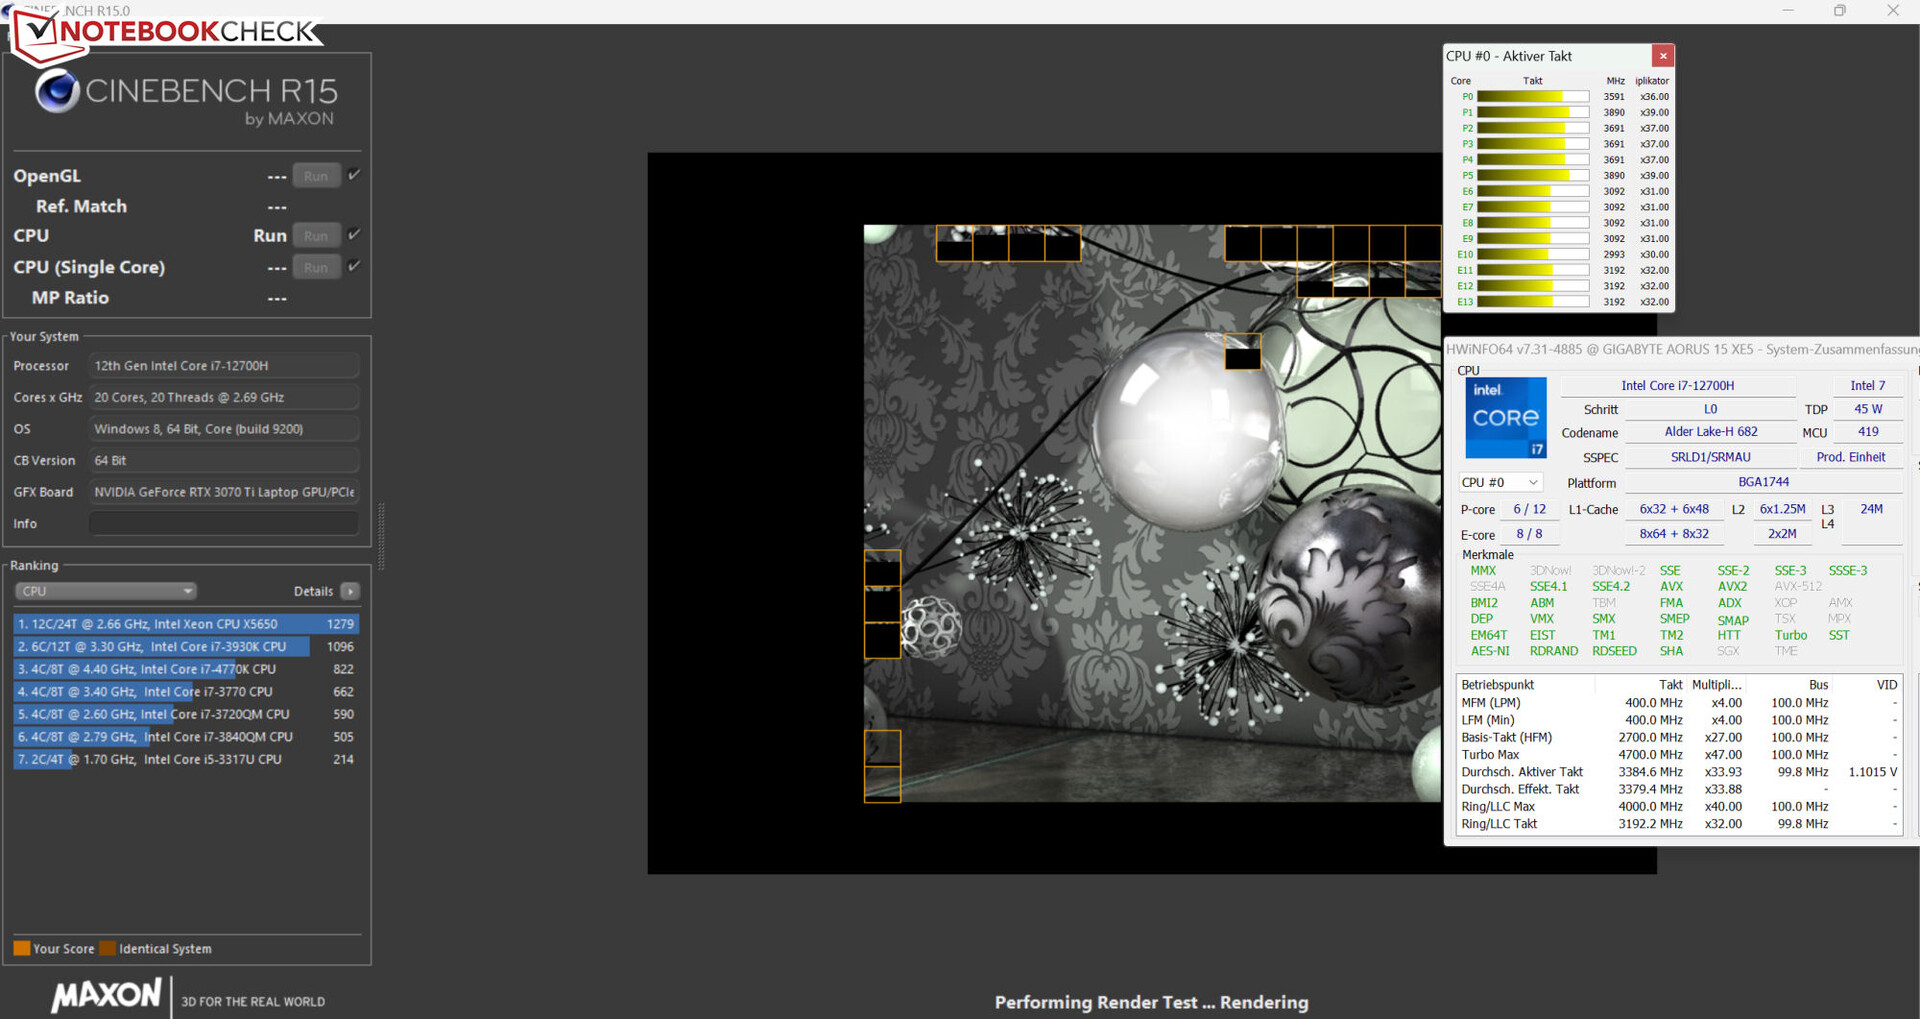
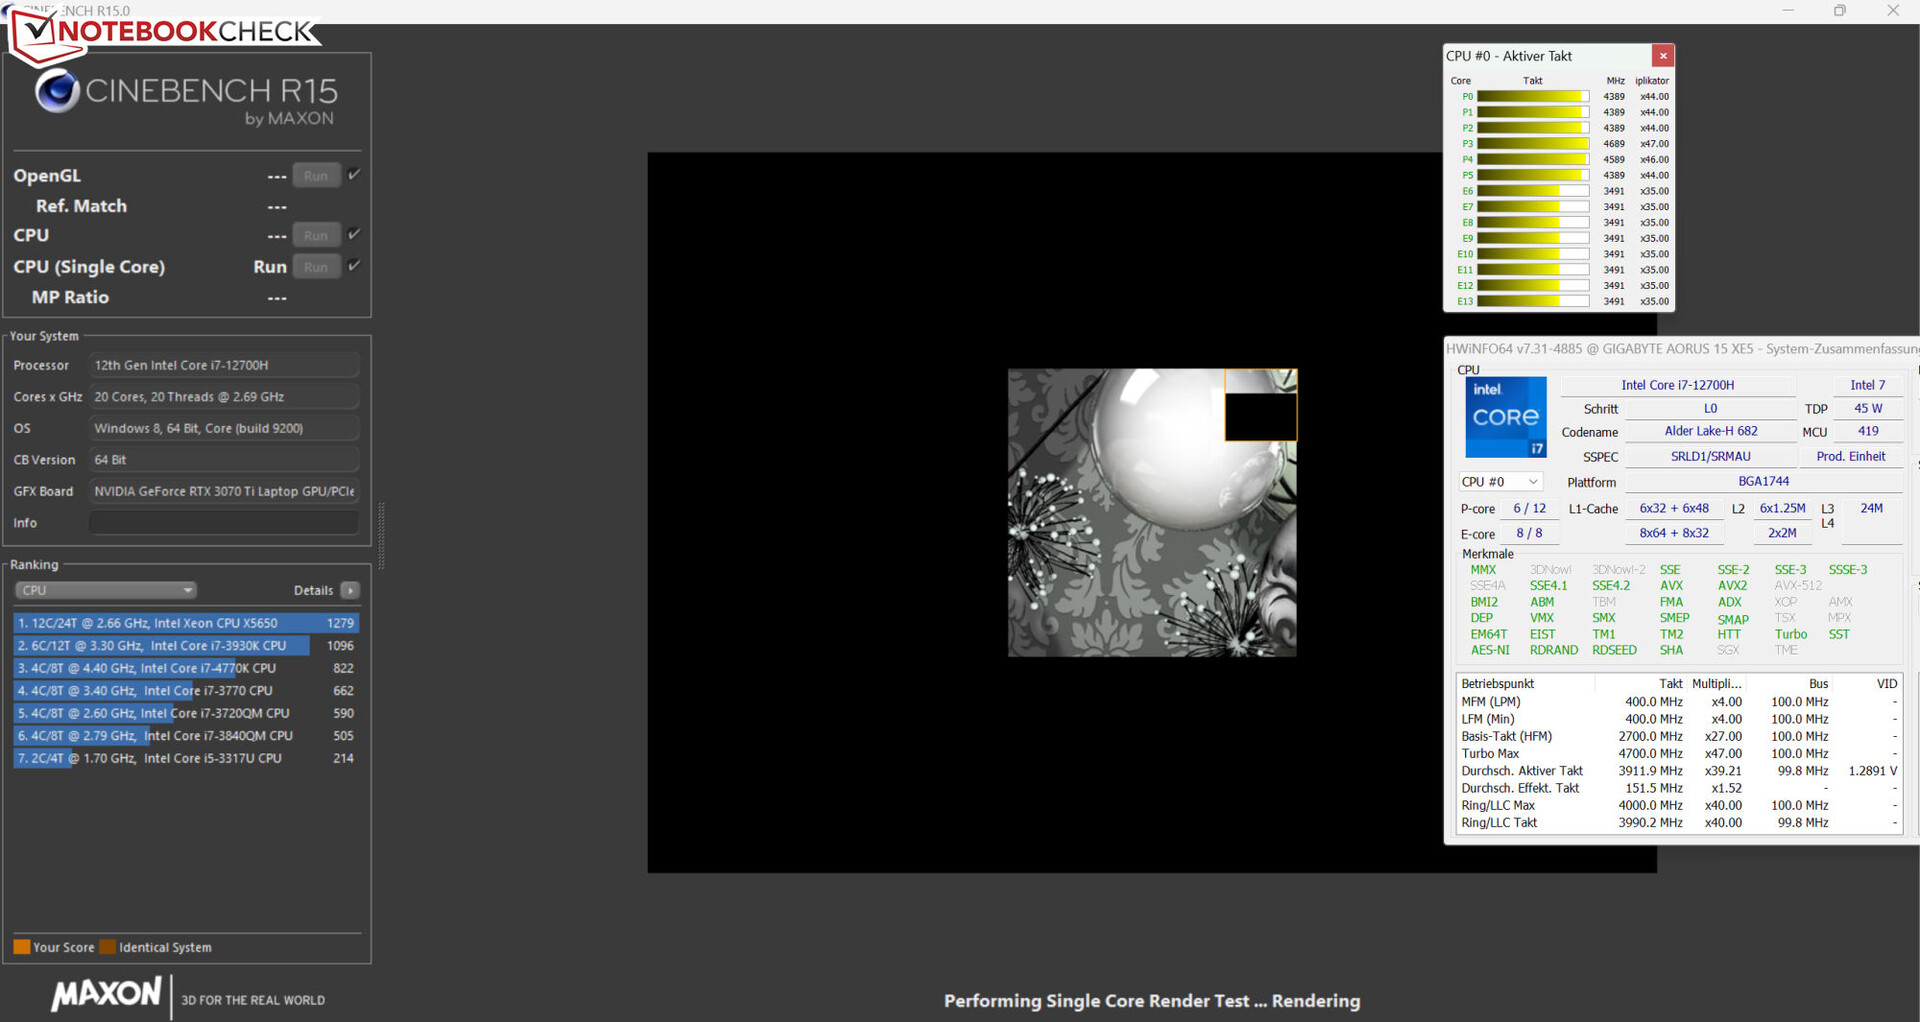
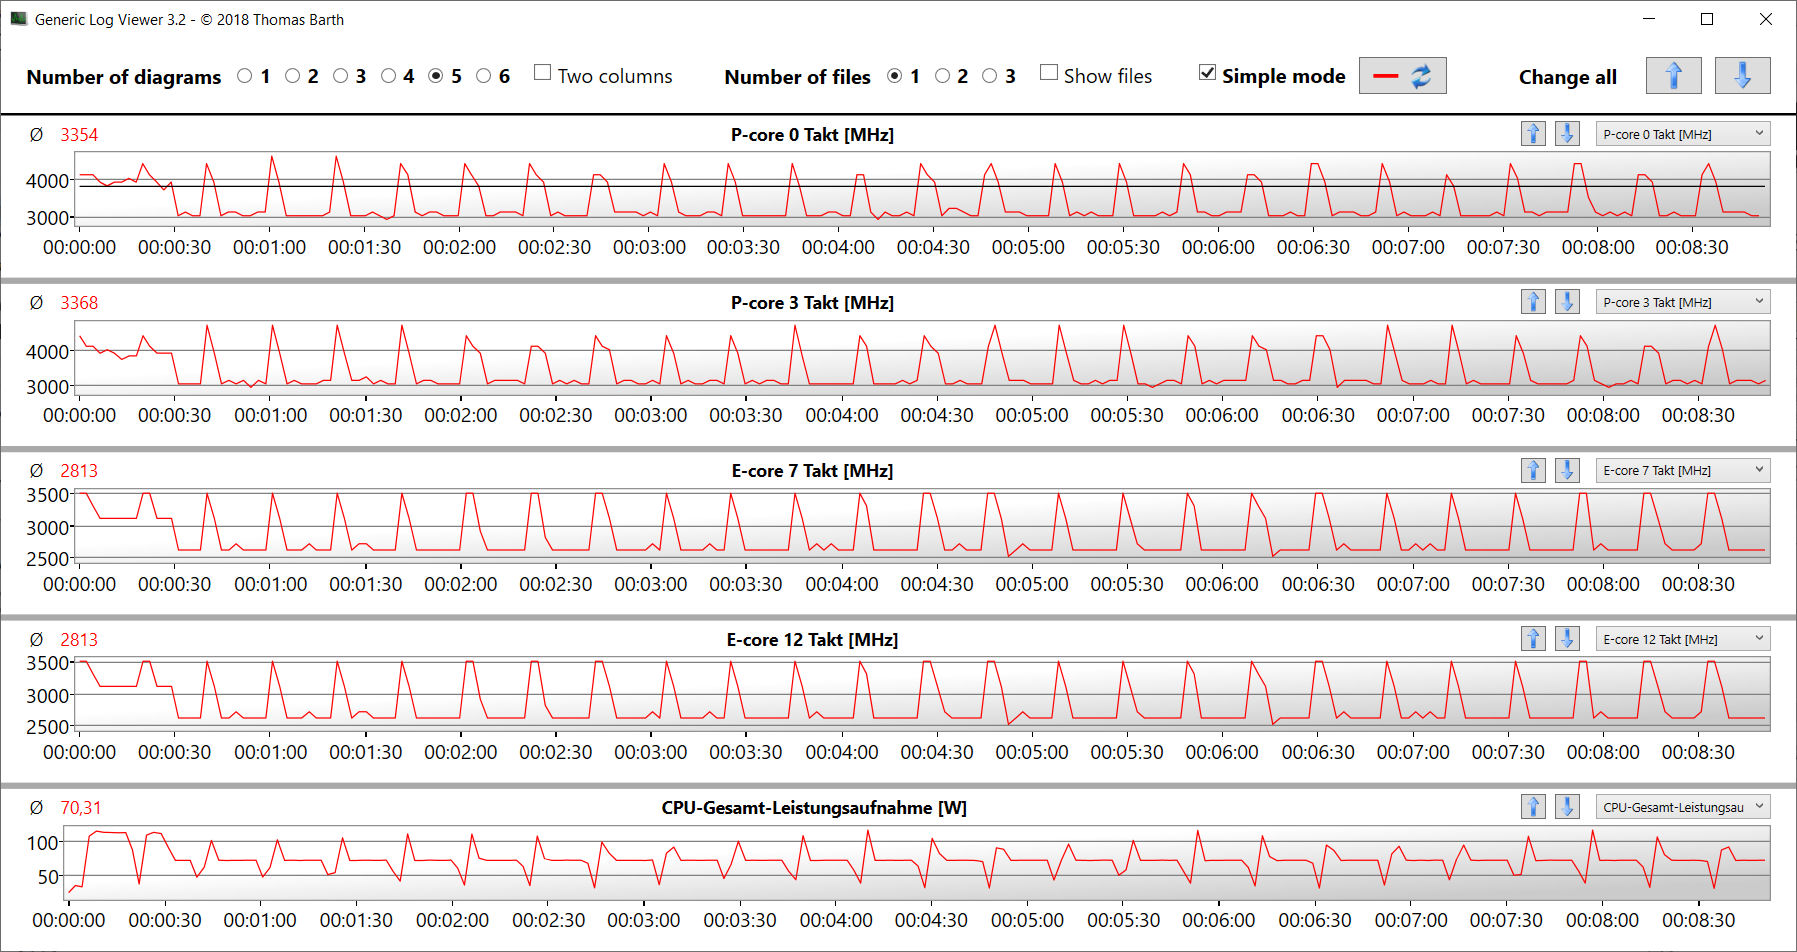
La CPU funcionó brevemente a altas velocidades de reloj (núcleos P: 4,4 GHz, núcleos E: 3,5 GHz) durante la prueba multihilo Cinebench R15 antes de estabilizarse a frecuencias ligeramente inferiores (núcleos P: 3,5 a 3,8 GHz, núcleos E: 3 a 3,2 GHz). Durante la prueba monohilo, los núcleos P funcionaron a 4,4-4,7 GHz y los núcleos E a 3,5 GHz. Las velocidades de reloj fueron sustancialmente inferiores cuando el portátil funcionaba con batería. En general, el Core i7 del Aorus 15 XE5 ofreció unos resultados ligeramente por encima de la media.
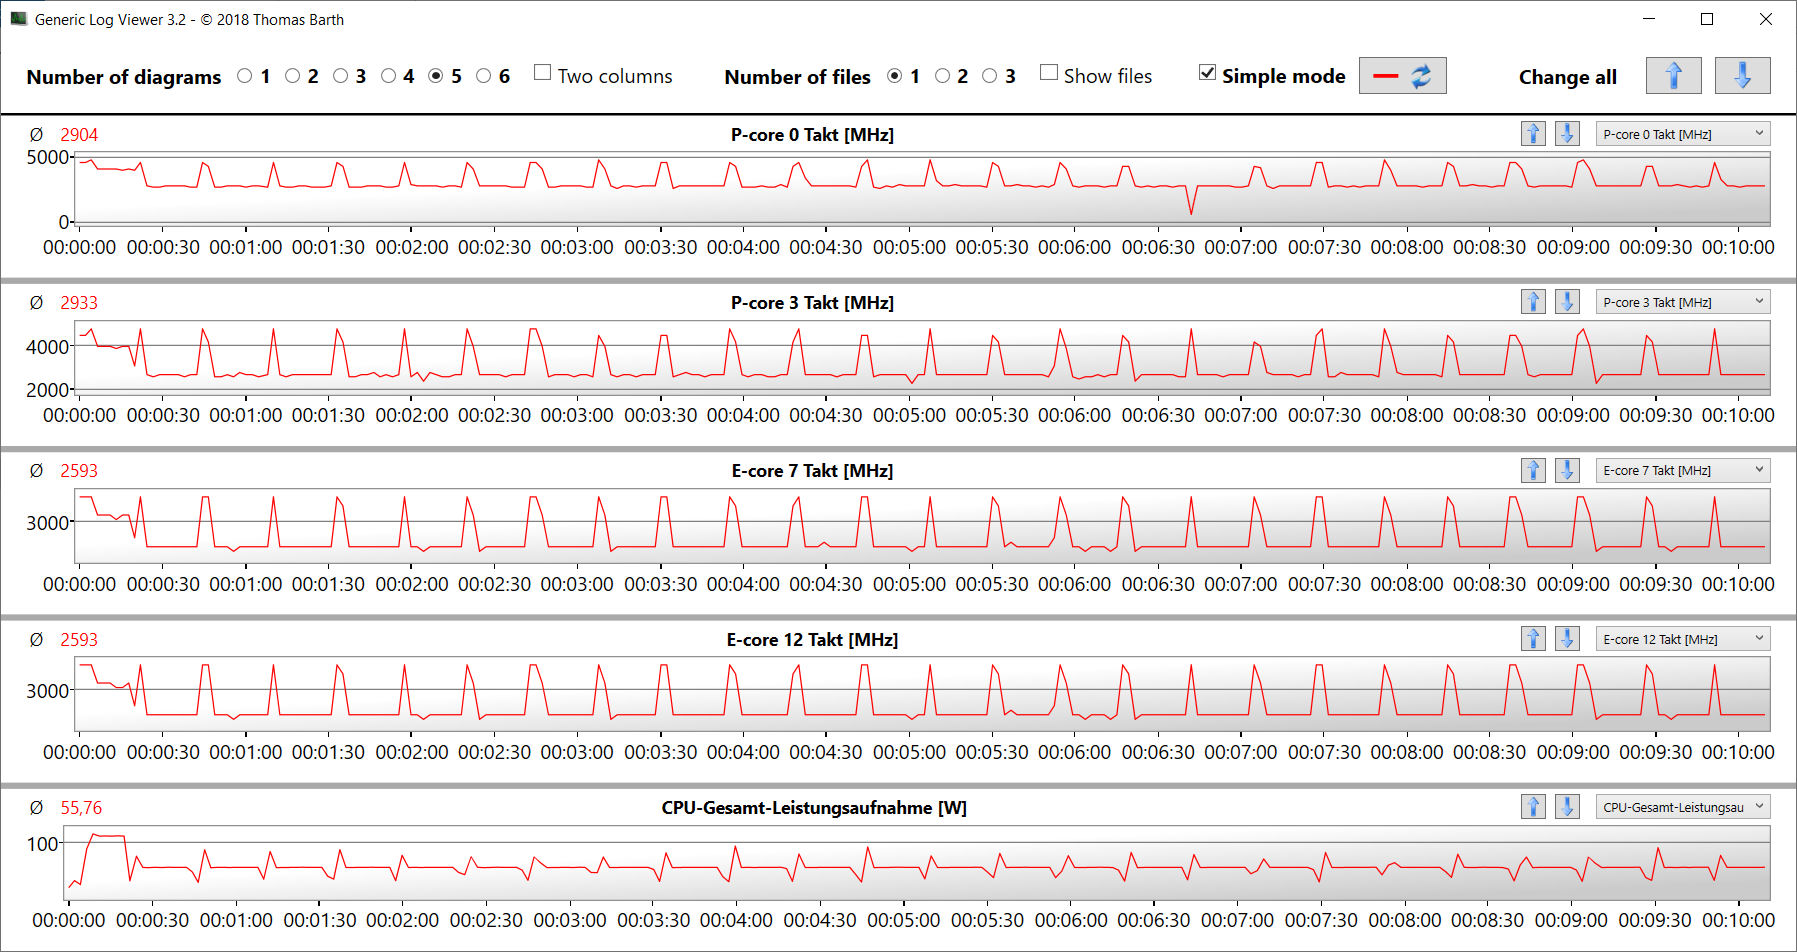
También ejecutamos la prueba multihilo en Cinebench R15 en bucle para determinar si la CPU es capaz de mantener su velocidad turbo durante un periodo prolongado. La CPU sólo fue capaz de mantener las altas velocidades de reloj durante un breve periodo de tiempo. Posteriormente, los núcleos P fueron principalmente los que operaron en el medio del rango turbo. Activar el "Modo Turbo" resultó en un aumento menor del rendimiento de la CPU - no en el pico, sino más bien en el promedio.
Cinebench R15 Multi Sustained Load
| CPU Performance rating - Percent | |
| Media de la clase Gaming | |
| Aorus 15 XE5 | |
| Aorus 15 XE5 | |
| MSI Katana GF66 12UGS | |
| Medio Intel Core i7-12700H | |
| Asus TUF Dash F15 FX517ZR | |
| Acer Nitro 5 AN515-46-R1A1 | |
| Schenker XMG Fusion 15 (Mid 22) | |
| Cinebench R20 | |
| CPU (Multi Core) | |
| Media de la clase Gaming (4029 - 16433, n=106, últimos 2 años) | |
| MSI Katana GF66 12UGS | |
| Aorus 15 XE5 (Turbo Mode) | |
| Aorus 15 XE5 | |
| Medio Intel Core i7-12700H (1576 - 7407, n=64) | |
| Asus TUF Dash F15 FX517ZR | |
| Acer Nitro 5 AN515-46-R1A1 | |
| Schenker XMG Fusion 15 (Mid 22) | |
| CPU (Single Core) | |
| Media de la clase Gaming (442 - 913, n=106, últimos 2 años) | |
| MSI Katana GF66 12UGS | |
| Asus TUF Dash F15 FX517ZR | |
| Aorus 15 XE5 | |
| Medio Intel Core i7-12700H (300 - 704, n=64) | |
| Aorus 15 XE5 (Turbo Mode) | |
| Acer Nitro 5 AN515-46-R1A1 | |
| Schenker XMG Fusion 15 (Mid 22) | |
| Blender - v2.79 BMW27 CPU | |
| Schenker XMG Fusion 15 (Mid 22) | |
| MSI Katana GF66 12UGS | |
| Aorus 15 XE5 | |
| Acer Nitro 5 AN515-46-R1A1 | |
| Asus TUF Dash F15 FX517ZR | |
| Medio Intel Core i7-12700H (168 - 732, n=63) | |
| Aorus 15 XE5 (Turbo Mode) | |
| Media de la clase Gaming (79 - 330, n=104, últimos 2 años) | |
| HWBOT x265 Benchmark v2.2 - 4k Preset | |
| Media de la clase Gaming (11.5 - 44.4, n=105, últimos 2 años) | |
| Aorus 15 XE5 (Turbo Mode) | |
| Acer Nitro 5 AN515-46-R1A1 | |
| Asus TUF Dash F15 FX517ZR | |
| Medio Intel Core i7-12700H (4.67 - 21.8, n=64) | |
| Aorus 15 XE5 | |
| MSI Katana GF66 12UGS | |
| Schenker XMG Fusion 15 (Mid 22) | |
| LibreOffice - 20 Documents To PDF | |
| Acer Nitro 5 AN515-46-R1A1 | |
| Media de la clase Gaming (33.2 - 88.8, n=105, últimos 2 años) | |
| Schenker XMG Fusion 15 (Mid 22) | |
| Medio Intel Core i7-12700H (34.2 - 95.3, n=63) | |
| Asus TUF Dash F15 FX517ZR | |
| Aorus 15 XE5 (Turbo Mode) | |
| Aorus 15 XE5 | |
| MSI Katana GF66 12UGS | |
| R Benchmark 2.5 - Overall mean | |
| Schenker XMG Fusion 15 (Mid 22) | |
| Acer Nitro 5 AN515-46-R1A1 | |
| Aorus 15 XE5 (Turbo Mode) | |
| Medio Intel Core i7-12700H (0.4441 - 1.052, n=63) | |
| Aorus 15 XE5 | |
| Asus TUF Dash F15 FX517ZR | |
| MSI Katana GF66 12UGS | |
| Media de la clase Gaming (0.3439 - 0.759, n=106, últimos 2 años) | |
* ... más pequeño es mejor
AIDA64: FP32 Ray-Trace | FPU Julia | CPU SHA3 | CPU Queen | FPU SinJulia | FPU Mandel | CPU AES | CPU ZLib | FP64 Ray-Trace | CPU PhotoWorxx
| Performance rating | |
| Media de la clase Gaming | |
| Acer Nitro 5 AN515-46-R1A1 | |
| Aorus 15 XE5 | |
| Aorus 15 XE5 | |
| Schenker XMG Fusion 15 (Mid 22) | |
| Asus TUF Dash F15 FX517ZR | |
| Medio Intel Core i7-12700H | |
| MSI Katana GF66 12UGS | |
| AIDA64 / FP32 Ray-Trace | |
| Media de la clase Gaming (10227 - 85542, n=105, últimos 2 años) | |
| Acer Nitro 5 AN515-46-R1A1 (v6.75.6100) | |
| Aorus 15 XE5 (v6.75.6100, Turbo Mode) | |
| Asus TUF Dash F15 FX517ZR (v6.70.6000) | |
| Aorus 15 XE5 (v6.75.6100) | |
| Schenker XMG Fusion 15 (Mid 22) (v6.70.6000) | |
| Medio Intel Core i7-12700H (2585 - 17957, n=64) | |
| MSI Katana GF66 12UGS (v6.50.5800) | |
| AIDA64 / FPU Julia | |
| Media de la clase Gaming (51376 - 238426, n=105, últimos 2 años) | |
| Acer Nitro 5 AN515-46-R1A1 (v6.75.6100) | |
| Aorus 15 XE5 (v6.75.6100, Turbo Mode) | |
| Asus TUF Dash F15 FX517ZR (v6.70.6000) | |
| Aorus 15 XE5 (v6.75.6100) | |
| Schenker XMG Fusion 15 (Mid 22) (v6.70.6000) | |
| Medio Intel Core i7-12700H (12439 - 90760, n=64) | |
| MSI Katana GF66 12UGS (v6.50.5800) | |
| AIDA64 / CPU SHA3 | |
| Media de la clase Gaming (2180 - 10115, n=105, últimos 2 años) | |
| Schenker XMG Fusion 15 (Mid 22) (v6.70.6000) | |
| Aorus 15 XE5 (v6.75.6100, Turbo Mode) | |
| Acer Nitro 5 AN515-46-R1A1 (v6.75.6100) | |
| Medio Intel Core i7-12700H (833 - 4242, n=64) | |
| MSI Katana GF66 12UGS (v6.50.5800) | |
| Aorus 15 XE5 (v6.75.6100) | |
| Asus TUF Dash F15 FX517ZR (v6.70.6000) | |
| AIDA64 / CPU Queen | |
| Media de la clase Gaming (49785 - 173351, n=90, últimos 2 años) | |
| Acer Nitro 5 AN515-46-R1A1 (v6.75.6100) | |
| Aorus 15 XE5 (v6.75.6100) | |
| Aorus 15 XE5 (v6.75.6100, Turbo Mode) | |
| MSI Katana GF66 12UGS (v6.50.5800) | |
| Medio Intel Core i7-12700H (57923 - 103202, n=63) | |
| Asus TUF Dash F15 FX517ZR (v6.70.6000) | |
| Schenker XMG Fusion 15 (Mid 22) | |
| AIDA64 / FPU SinJulia | |
| Media de la clase Gaming (4424 - 33636, n=105, últimos 2 años) | |
| Acer Nitro 5 AN515-46-R1A1 (v6.75.6100) | |
| MSI Katana GF66 12UGS (v6.50.5800) | |
| Aorus 15 XE5 (v6.75.6100, Turbo Mode) | |
| Medio Intel Core i7-12700H (3249 - 9939, n=64) | |
| Schenker XMG Fusion 15 (Mid 22) (v6.70.6000) | |
| Asus TUF Dash F15 FX517ZR (v6.70.6000) | |
| Aorus 15 XE5 (v6.75.6100) | |
| AIDA64 / FPU Mandel | |
| Media de la clase Gaming (25115 - 128721, n=105, últimos 2 años) | |
| Acer Nitro 5 AN515-46-R1A1 (v6.75.6100) | |
| Schenker XMG Fusion 15 (Mid 22) (v6.70.6000) | |
| Aorus 15 XE5 (v6.75.6100, Turbo Mode) | |
| Asus TUF Dash F15 FX517ZR (v6.70.6000) | |
| Aorus 15 XE5 (v6.75.6100) | |
| Medio Intel Core i7-12700H (7135 - 44760, n=64) | |
| MSI Katana GF66 12UGS (v6.50.5800) | |
| AIDA64 / CPU AES | |
| Schenker XMG Fusion 15 (Mid 22) (v6.70.6000) | |
| Acer Nitro 5 AN515-46-R1A1 | |
| Aorus 15 XE5 (v6.75.6100, Turbo Mode) | |
| Aorus 15 XE5 (v6.75.6100) | |
| Media de la clase Gaming (39258 - 247074, n=105, últimos 2 años) | |
| MSI Katana GF66 12UGS (v6.50.5800) | |
| Medio Intel Core i7-12700H (31839 - 144360, n=64) | |
| Asus TUF Dash F15 FX517ZR (v6.70.6000) | |
| AIDA64 / CPU ZLib | |
| Media de la clase Gaming (574 - 2531, n=105, últimos 2 años) | |
| MSI Katana GF66 12UGS (v6.50.5800) | |
| Aorus 15 XE5 (v6.75.6100, Turbo Mode) | |
| Medio Intel Core i7-12700H (305 - 1171, n=64) | |
| Asus TUF Dash F15 FX517ZR (v6.70.6000) | |
| Acer Nitro 5 AN515-46-R1A1 (v6.75.6100) | |
| Aorus 15 XE5 (v6.75.6100) | |
| Schenker XMG Fusion 15 (Mid 22) (v6.70.6000) | |
| AIDA64 / FP64 Ray-Trace | |
| Media de la clase Gaming (5509 - 45446, n=105, últimos 2 años) | |
| Acer Nitro 5 AN515-46-R1A1 (v6.75.6100) | |
| Aorus 15 XE5 (v6.75.6100, Turbo Mode) | |
| Asus TUF Dash F15 FX517ZR (v6.70.6000) | |
| Schenker XMG Fusion 15 (Mid 22) (v6.70.6000) | |
| Aorus 15 XE5 (v6.75.6100) | |
| Medio Intel Core i7-12700H (1437 - 9692, n=64) | |
| MSI Katana GF66 12UGS (v6.50.5800) | |
| AIDA64 / CPU PhotoWorxx | |
| Media de la clase Gaming (12271 - 89891, n=105, últimos 2 años) | |
| Aorus 15 XE5 (v6.75.6100, Turbo Mode) | |
| Aorus 15 XE5 (v6.75.6100) | |
| Asus TUF Dash F15 FX517ZR (v6.70.6000) | |
| Medio Intel Core i7-12700H (12863 - 52207, n=64) | |
| Acer Nitro 5 AN515-46-R1A1 | |
| MSI Katana GF66 12UGS (v6.50.5800) | |
| Schenker XMG Fusion 15 (Mid 22) (v6.70.6000) | |
Rendimiento del sistema
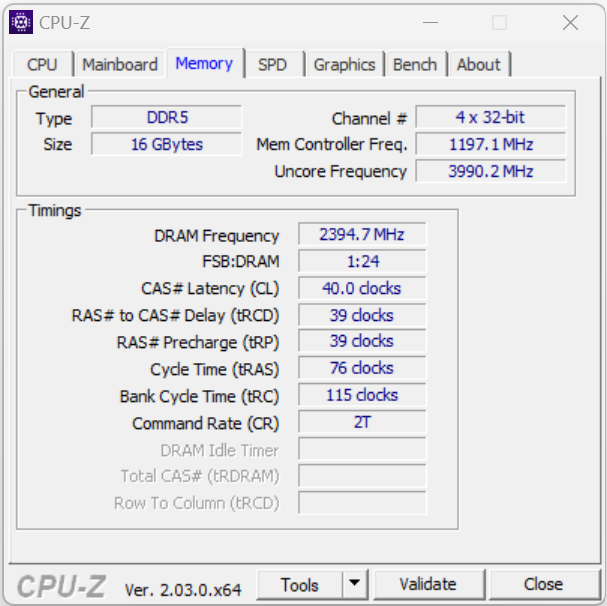
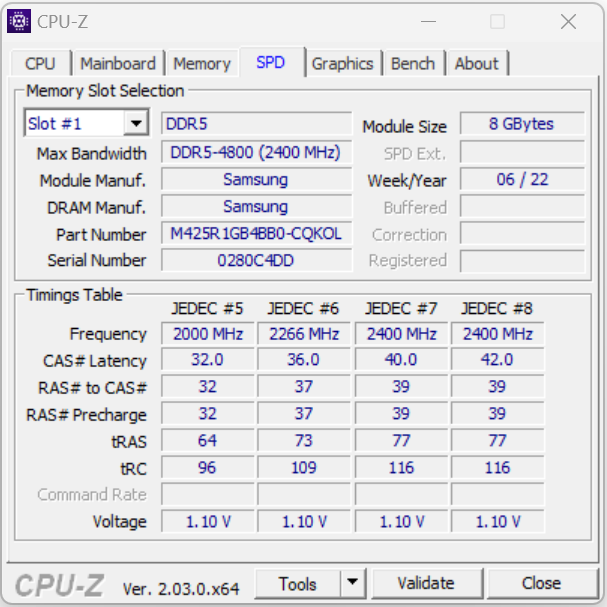
El sistema funciona con fluidez y ofrece suficiente potencia de cálculo para aplicaciones exigentes como renderizado, edición de vídeo y juegos. El portátil consiguió unos resultados excelentes en PCMark. Las tasas de transferencia de datos de la RAM son bastante típicas para una memoria DDR5-4800.
CrossMark: Overall | Productivity | Creativity | Responsiveness
| PCMark 10 / Score | |
| Media de la clase Gaming (5828 - 12414, n=93, últimos 2 años) | |
| Aorus 15 XE5 | |
| Medio Intel Core i7-12700H, NVIDIA GeForce RTX 3070 Ti Laptop GPU (6941 - 7947, n=11) | |
| MSI Katana GF66 12UGS | |
| Asus TUF Dash F15 FX517ZR | |
| Acer Nitro 5 AN515-46-R1A1 | |
| Schenker XMG Fusion 15 (Mid 22) | |
| PCMark 10 / Essentials | |
| Aorus 15 XE5 | |
| Media de la clase Gaming (8810 - 11935, n=97, últimos 2 años) | |
| Medio Intel Core i7-12700H, NVIDIA GeForce RTX 3070 Ti Laptop GPU (9892 - 10935, n=11) | |
| MSI Katana GF66 12UGS | |
| Acer Nitro 5 AN515-46-R1A1 | |
| Asus TUF Dash F15 FX517ZR | |
| Schenker XMG Fusion 15 (Mid 22) | |
| PCMark 10 / Productivity | |
| Media de la clase Gaming (6845 - 25323, n=95, últimos 2 años) | |
| Aorus 15 XE5 | |
| MSI Katana GF66 12UGS | |
| Medio Intel Core i7-12700H, NVIDIA GeForce RTX 3070 Ti Laptop GPU (9024 - 10638, n=11) | |
| Asus TUF Dash F15 FX517ZR | |
| Acer Nitro 5 AN515-46-R1A1 | |
| Schenker XMG Fusion 15 (Mid 22) | |
| PCMark 10 / Digital Content Creation | |
| Media de la clase Gaming (7602 - 19954, n=95, últimos 2 años) | |
| Medio Intel Core i7-12700H, NVIDIA GeForce RTX 3070 Ti Laptop GPU (10165 - 12546, n=11) | |
| Aorus 15 XE5 | |
| MSI Katana GF66 12UGS | |
| Asus TUF Dash F15 FX517ZR | |
| Acer Nitro 5 AN515-46-R1A1 | |
| Schenker XMG Fusion 15 (Mid 22) | |
| CrossMark / Overall | |
| Media de la clase Gaming (1366 - 2409, n=94, últimos 2 años) | |
| Aorus 15 XE5 | |
| MSI Katana GF66 12UGS | |
| Medio Intel Core i7-12700H, NVIDIA GeForce RTX 3070 Ti Laptop GPU (974 - 2000, n=12) | |
| Asus TUF Dash F15 FX517ZR | |
| Schenker XMG Fusion 15 (Mid 22) | |
| Acer Nitro 5 AN515-46-R1A1 | |
| CrossMark / Productivity | |
| MSI Katana GF66 12UGS | |
| Aorus 15 XE5 | |
| Media de la clase Gaming (1386 - 2254, n=94, últimos 2 años) | |
| Medio Intel Core i7-12700H, NVIDIA GeForce RTX 3070 Ti Laptop GPU (907 - 1962, n=12) | |
| Asus TUF Dash F15 FX517ZR | |
| Schenker XMG Fusion 15 (Mid 22) | |
| Acer Nitro 5 AN515-46-R1A1 | |
| CrossMark / Creativity | |
| Media de la clase Gaming (1343 - 2786, n=94, últimos 2 años) | |
| Asus TUF Dash F15 FX517ZR | |
| Aorus 15 XE5 | |
| MSI Katana GF66 12UGS | |
| Medio Intel Core i7-12700H, NVIDIA GeForce RTX 3070 Ti Laptop GPU (1027 - 2057, n=12) | |
| Schenker XMG Fusion 15 (Mid 22) | |
| Acer Nitro 5 AN515-46-R1A1 | |
| CrossMark / Responsiveness | |
| MSI Katana GF66 12UGS | |
| Aorus 15 XE5 | |
| Medio Intel Core i7-12700H, NVIDIA GeForce RTX 3070 Ti Laptop GPU (1029 - 2142, n=12) | |
| Media de la clase Gaming (1226 - 2334, n=94, últimos 2 años) | |
| Schenker XMG Fusion 15 (Mid 22) | |
| Asus TUF Dash F15 FX517ZR | |
| Acer Nitro 5 AN515-46-R1A1 | |
| PCMark 8 Home Score Accelerated v2 | 5280 puntos | |
| PCMark 8 Work Score Accelerated v2 | 6287 puntos | |
| PCMark 10 Score | 7695 puntos | |
ayuda | ||
| AIDA64 / Memory Copy | |
| Media de la clase Gaming (21750 - 129946, n=105, últimos 2 años) | |
| Medio Intel Core i7-12700H (25615 - 80511, n=64) | |
| Asus TUF Dash F15 FX517ZR | |
| Aorus 15 XE5 | |
| Acer Nitro 5 AN515-46-R1A1 | |
| Schenker XMG Fusion 15 (Mid 22) | |
| MSI Katana GF66 12UGS | |
| AIDA64 / Memory Read | |
| Media de la clase Gaming (22956 - 118858, n=105, últimos 2 años) | |
| Asus TUF Dash F15 FX517ZR | |
| Aorus 15 XE5 | |
| Medio Intel Core i7-12700H (25586 - 79442, n=64) | |
| Acer Nitro 5 AN515-46-R1A1 | |
| Schenker XMG Fusion 15 (Mid 22) | |
| MSI Katana GF66 12UGS | |
| AIDA64 / Memory Write | |
| Media de la clase Gaming (22297 - 135096, n=105, últimos 2 años) | |
| Asus TUF Dash F15 FX517ZR | |
| Aorus 15 XE5 | |
| Acer Nitro 5 AN515-46-R1A1 | |
| Medio Intel Core i7-12700H (23679 - 88660, n=64) | |
| MSI Katana GF66 12UGS | |
| Schenker XMG Fusion 15 (Mid 22) | |
| AIDA64 / Memory Latency | |
| Media de la clase Gaming (75.3 - 259, n=105, últimos 2 años) | |
| MSI Katana GF66 12UGS | |
| Asus TUF Dash F15 FX517ZR | |
| Aorus 15 XE5 | |
| Schenker XMG Fusion 15 (Mid 22) | |
| Acer Nitro 5 AN515-46-R1A1 | |
| Medio Intel Core i7-12700H (76.2 - 133.9, n=62) | |
* ... más pequeño es mejor
Latencia del CPD
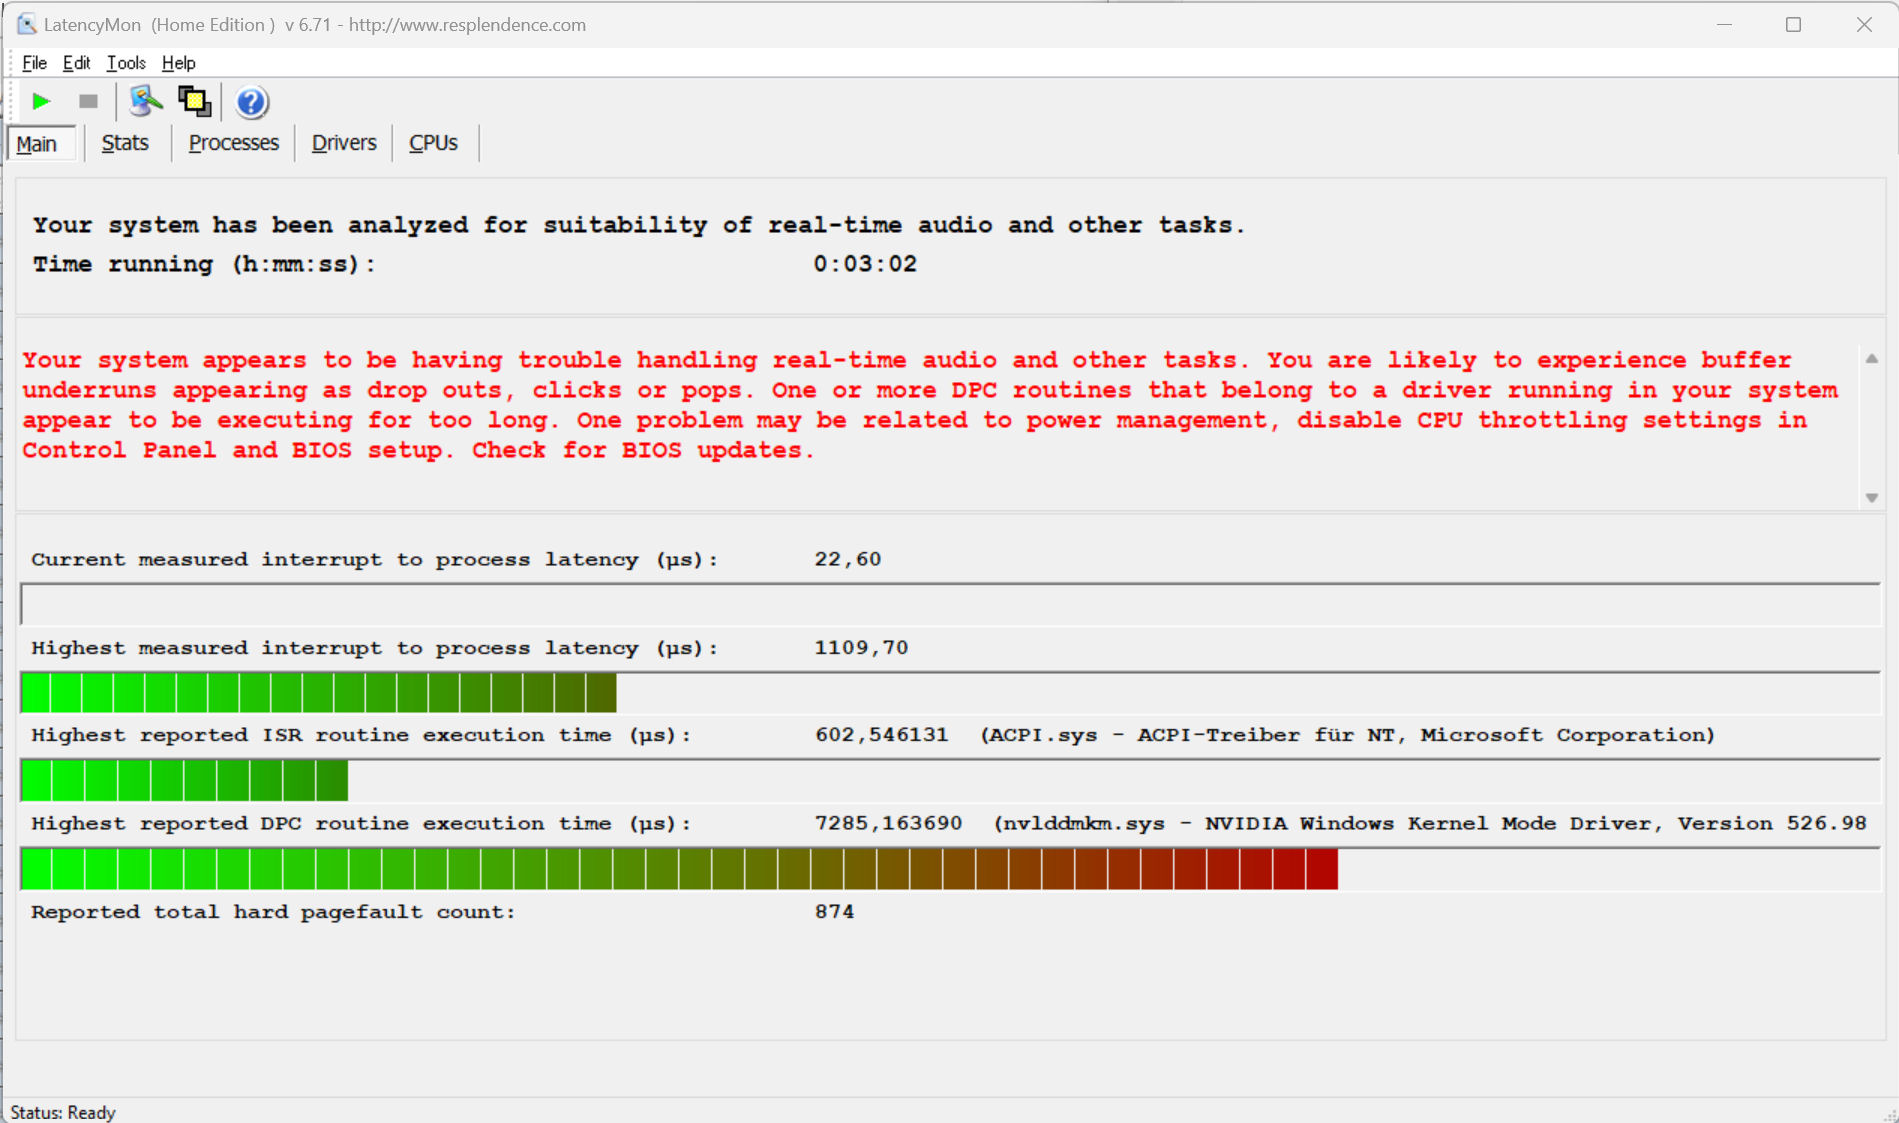
Nuestra prueba de monitor de latencia estandarizada (navegación web, reproducción de vídeo 4K, carga alta de Prime95) reveló algunos problemas con el sistema. Aunque el portátil no tiene una latencia demasiado alta, parece tener un problema de drivers. Esperemos que futuras actualizaciones de software solucionen el problema.
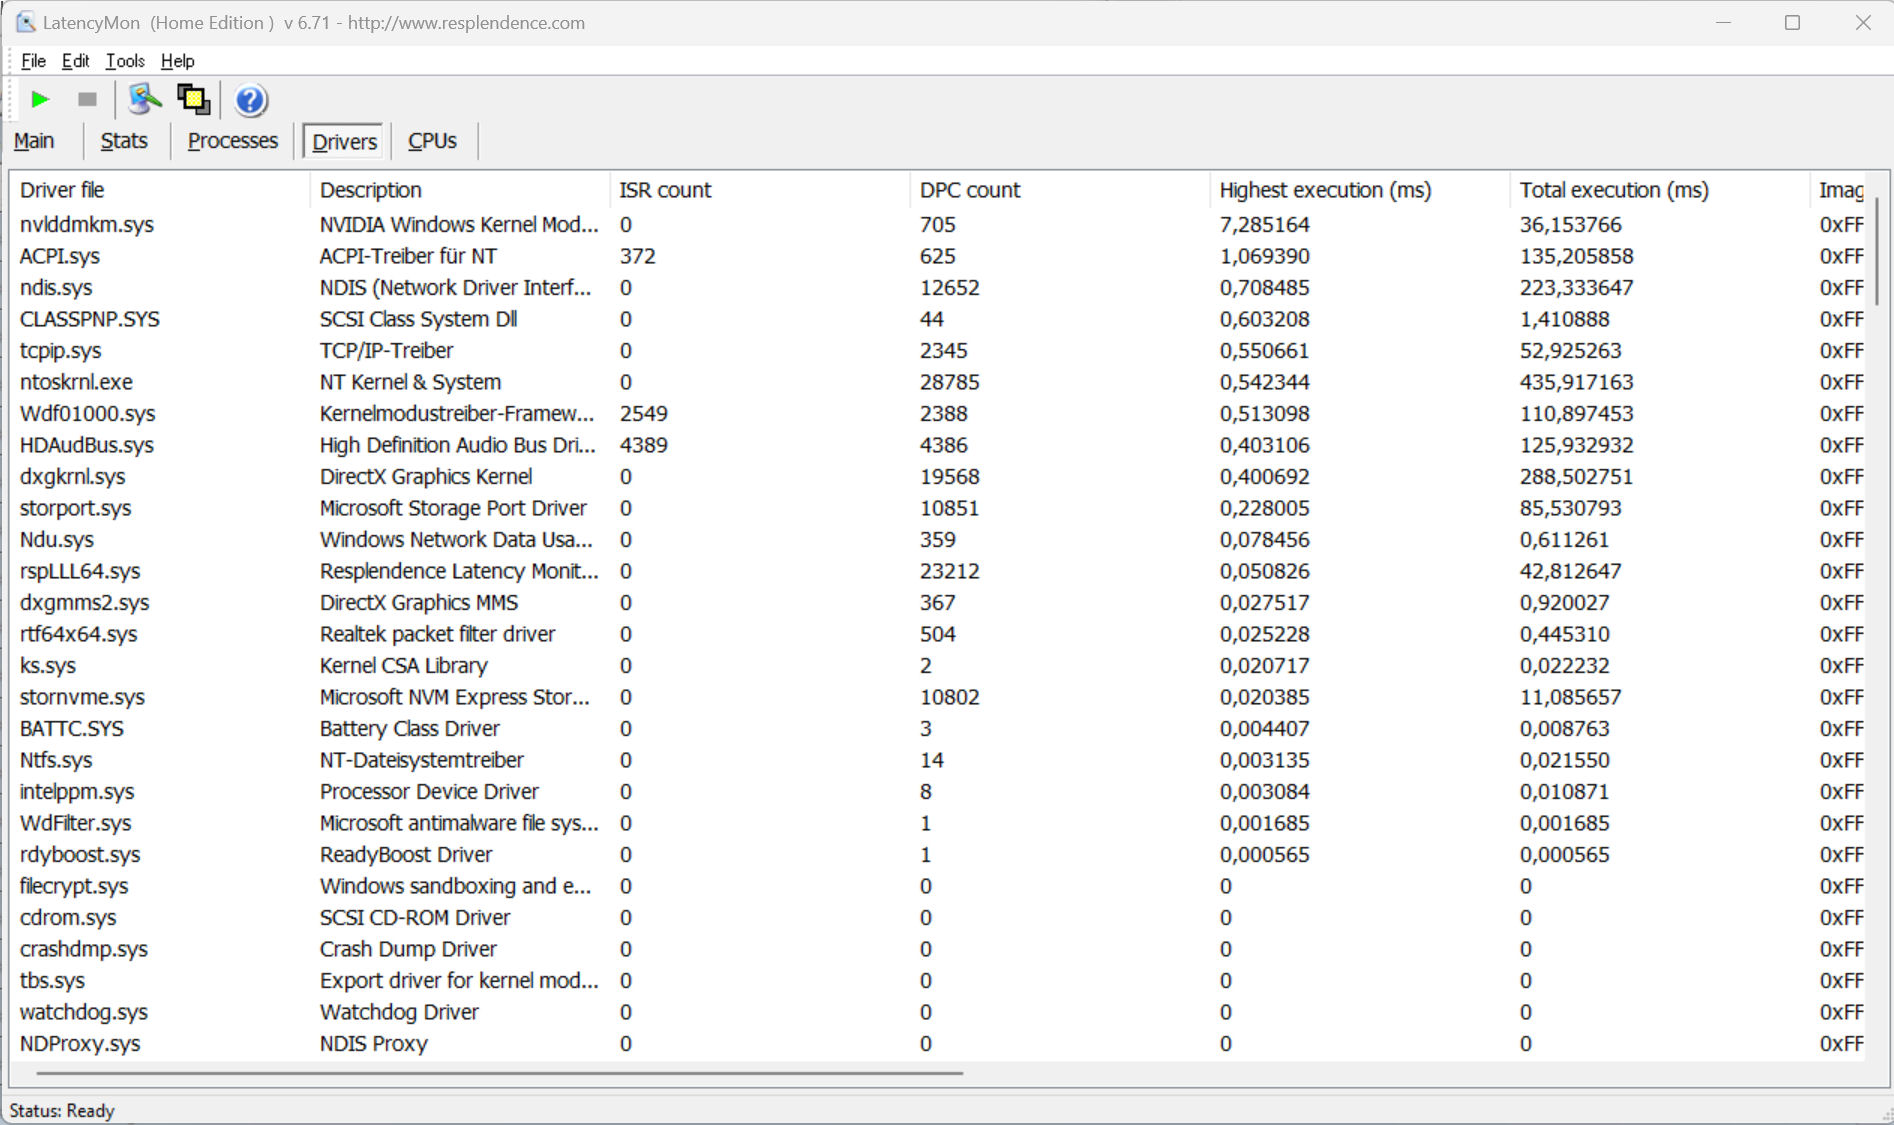
| DPC Latencies / LatencyMon - interrupt to process latency (max), Web, Youtube, Prime95 | |
| Acer Nitro 5 AN515-46-R1A1 | |
| Schenker XMG Fusion 15 (Mid 22) | |
| Aorus 15 XE5 | |
| MSI Katana GF66 12UGS | |
| Asus TUF Dash F15 FX517ZR | |
* ... más pequeño es mejor
Almacenamiento masivo
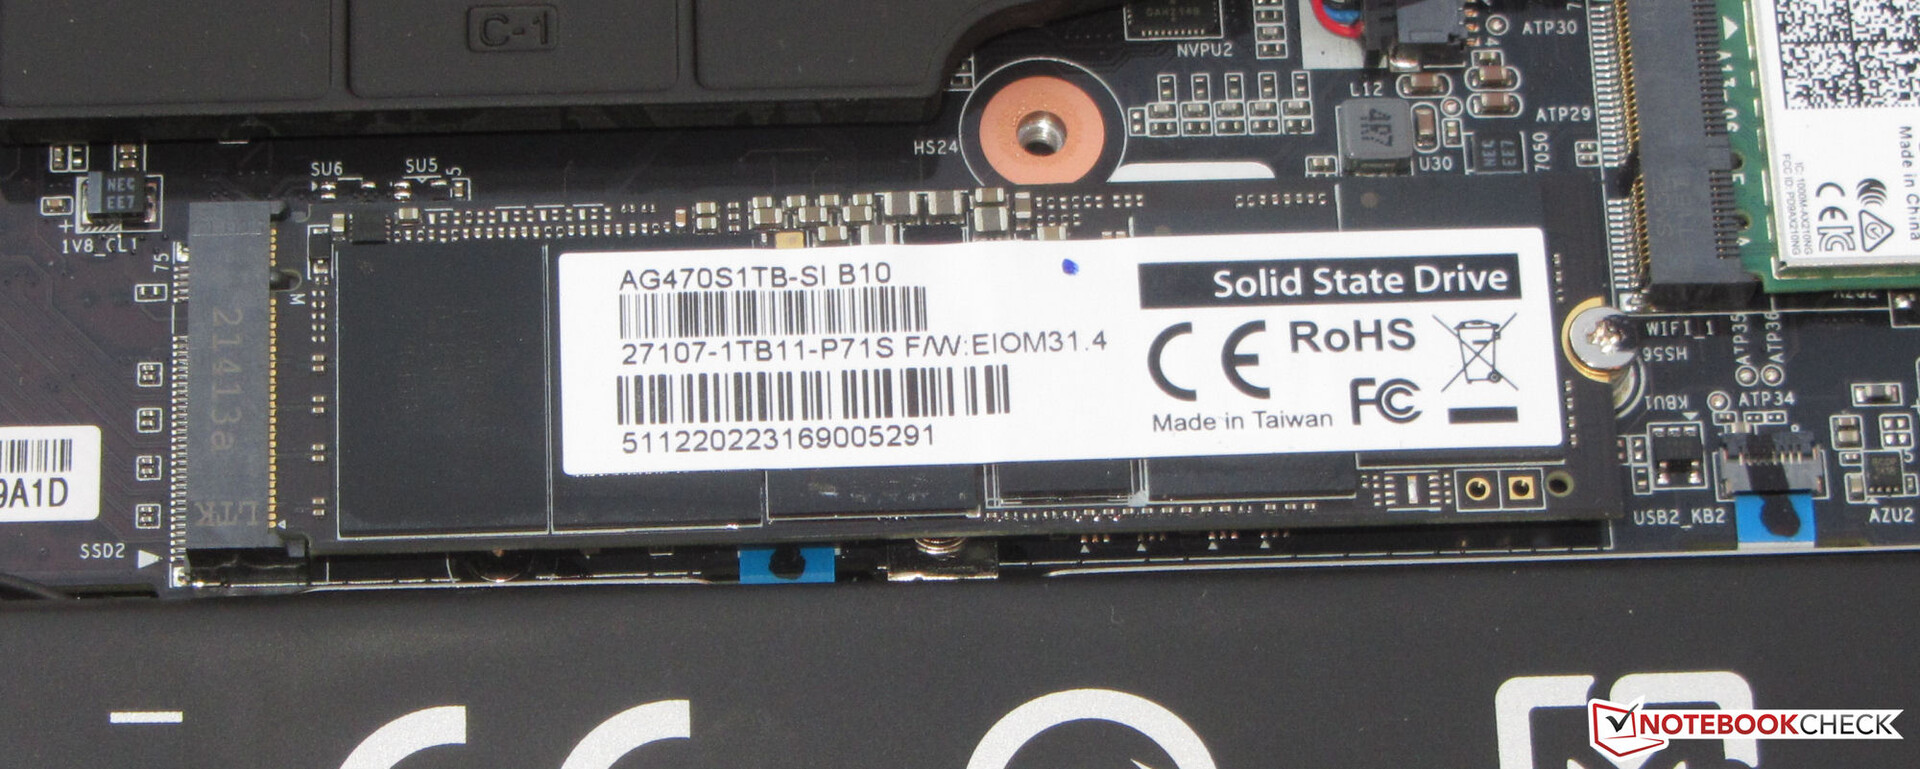
Gigabyte equipó el Aorus 15 XE5 con un SSD PCIe 4.0 (1 TB, M.2 2280) fabricado por la propia compañía. Esta unidad de almacenamiento ofrece excelentes velocidades de transferencia. El portátil también tiene una ranura M.2 2280 libre para añadir un segundo SSD PCIe 4.0.

* ... más pequeño es mejor
Sustained Read: DiskSpd Read Loop, Queue Depth 8
Tarjeta gráfica
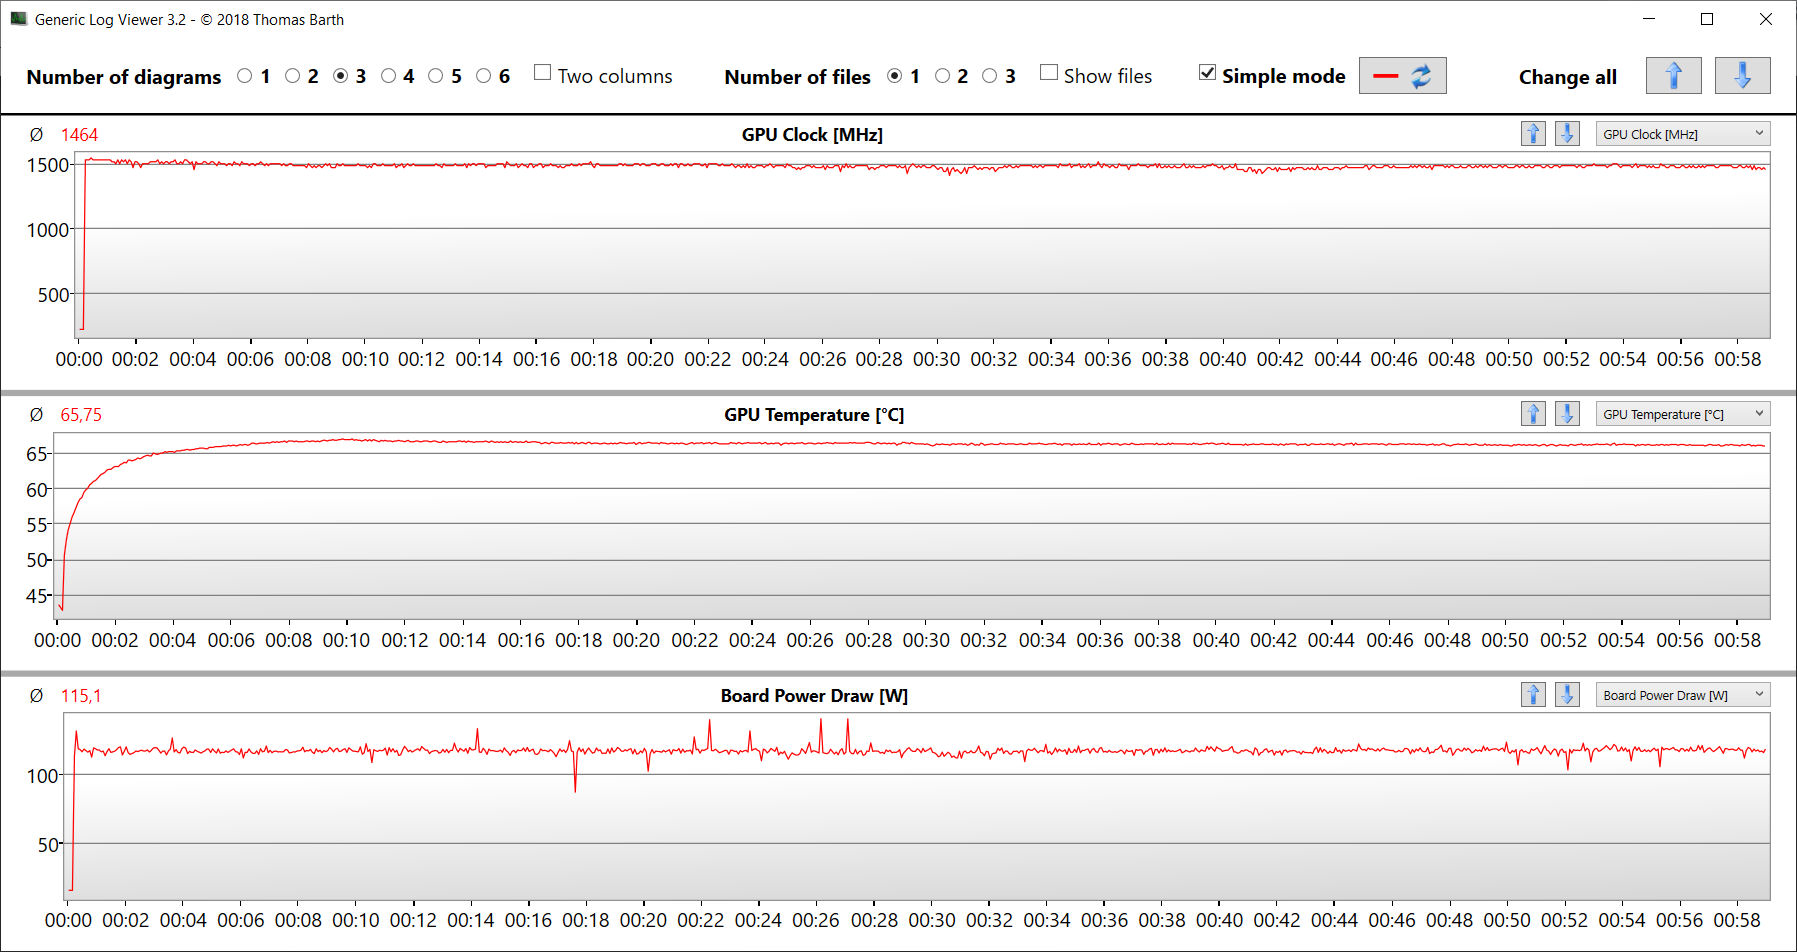
El rendimiento real de una GPU de la serie RTX 30 depende de algunos factores: la refrigeración, la configuración de la RAM y el TGP especificado por el fabricante del portátil (dentro de los límites definidos por Nvidia). Gigabyte optó por dar a la RTX 3070 Ti portátil un TGP de 130 vatios. Sin embargo, nuestra prueba Witcher 3 muestra que el sistema no utiliza plenamente este TGP.
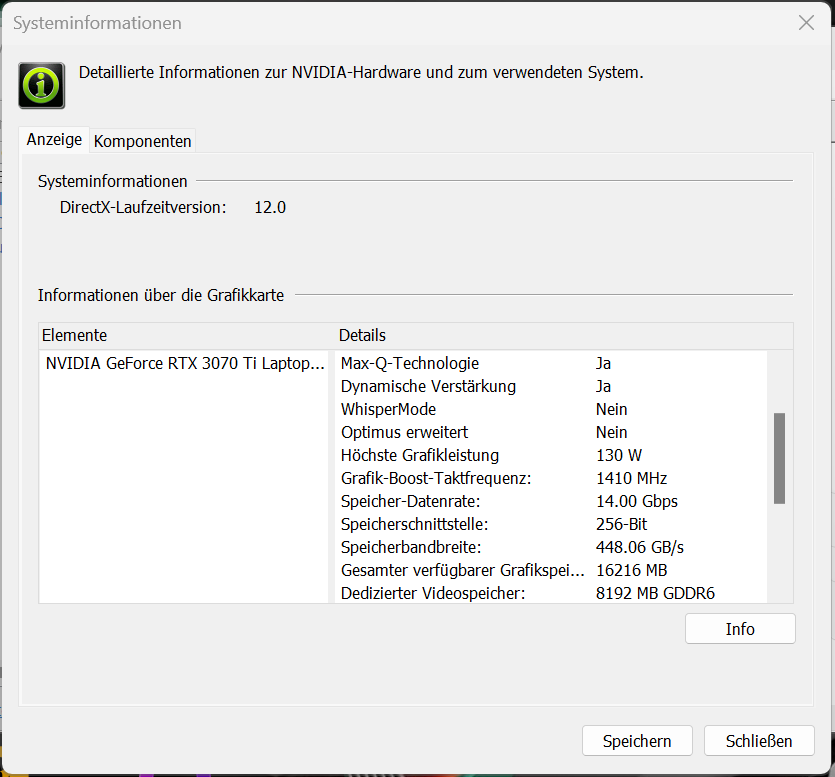
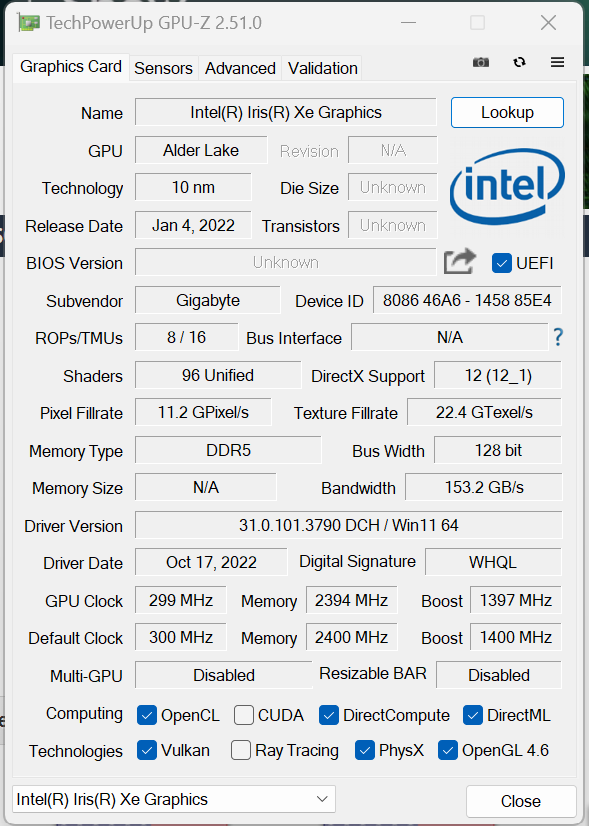
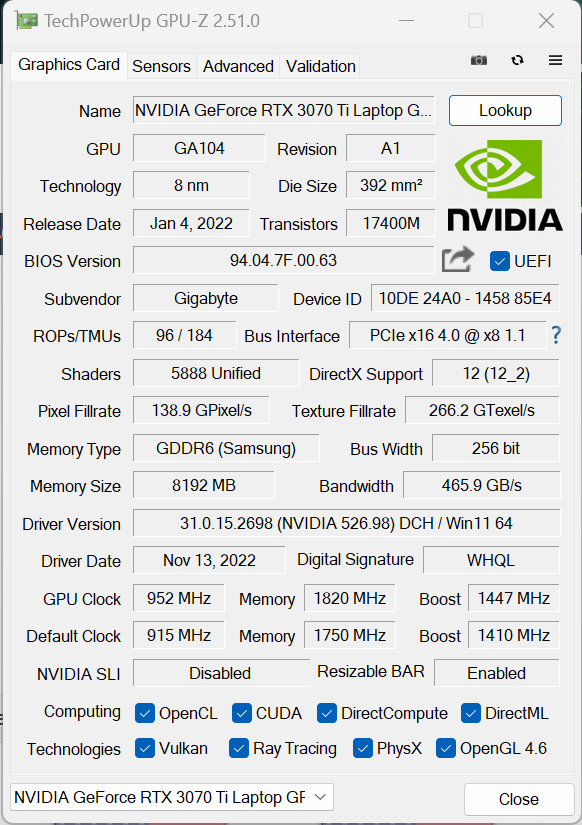
La GPU del Aorus tiene acceso a 8.192 MB de VRAM GDDR6 y ofrece unos resultados 3DMark ligeramente mejores que la media de la RTX 3070 Ti. La tarjeta gráfica integrada Iris Xe Graphics G7 96EU está activa; el portátil usa la tecnología de conmutación gráfica Optimus de Nvidia y no ofrece un modo dGPU.
| 3DMark Performance rating - Percent | |
| Media de la clase Gaming | |
| Acer Nitro 5 AN515-46-R1A1 | |
| Aorus 15 XE5 | |
| Aorus 15 XE5 | |
| Medio NVIDIA GeForce RTX 3070 Ti Laptop GPU | |
| MSI Katana GF66 12UGS | |
| Schenker XMG Fusion 15 (Mid 22) | |
| Asus TUF Dash F15 FX517ZR | |
| 3DMark 11 - 1280x720 Performance GPU | |
| Media de la clase Gaming (21841 - 80022, n=104, últimos 2 años) | |
| Aorus 15 XE5 (Turbo Mode) | |
| Aorus 15 XE5 | |
| Acer Nitro 5 AN515-46-R1A1 | |
| Medio NVIDIA GeForce RTX 3070 Ti Laptop GPU (13799 - 42569, n=36) | |
| MSI Katana GF66 12UGS | |
| Schenker XMG Fusion 15 (Mid 22) | |
| Asus TUF Dash F15 FX517ZR | |
| 3DMark | |
| 1920x1080 Fire Strike Graphics | |
| Media de la clase Gaming (12242 - 62849, n=115, últimos 2 años) | |
| Acer Nitro 5 AN515-46-R1A1 | |
| Aorus 15 XE5 (Turbo Mode) | |
| Aorus 15 XE5 | |
| Medio NVIDIA GeForce RTX 3070 Ti Laptop GPU (22612 - 32550, n=37) | |
| MSI Katana GF66 12UGS | |
| Schenker XMG Fusion 15 (Mid 22) | |
| Asus TUF Dash F15 FX517ZR | |
| 2560x1440 Time Spy Graphics | |
| Media de la clase Gaming (5012 - 26212, n=115, últimos 2 años) | |
| Acer Nitro 5 AN515-46-R1A1 | |
| Aorus 15 XE5 | |
| Aorus 15 XE5 (Turbo Mode) | |
| Medio NVIDIA GeForce RTX 3070 Ti Laptop GPU (8142 - 12324, n=37) | |
| MSI Katana GF66 12UGS | |
| Schenker XMG Fusion 15 (Mid 22) | |
| Asus TUF Dash F15 FX517ZR | |
| 2560x1440 Port Royal Graphics | |
| Media de la clase Gaming (4395 - 17286, n=71, últimos 2 años) | |
| Acer Nitro 5 AN515-46-R1A1 | |
| Aorus 15 XE5 (Turbo Mode) | |
| Aorus 15 XE5 | |
| Medio NVIDIA GeForce RTX 3070 Ti Laptop GPU (5091 - 7510, n=23) | |
| MSI Katana GF66 12UGS | |
| Schenker XMG Fusion 15 (Mid 22) | |
| Asus TUF Dash F15 FX517ZR | |
| 3DMark 06 Standard Score | 51253 puntos | |
| 3DMark 11 Performance | 32155 puntos | |
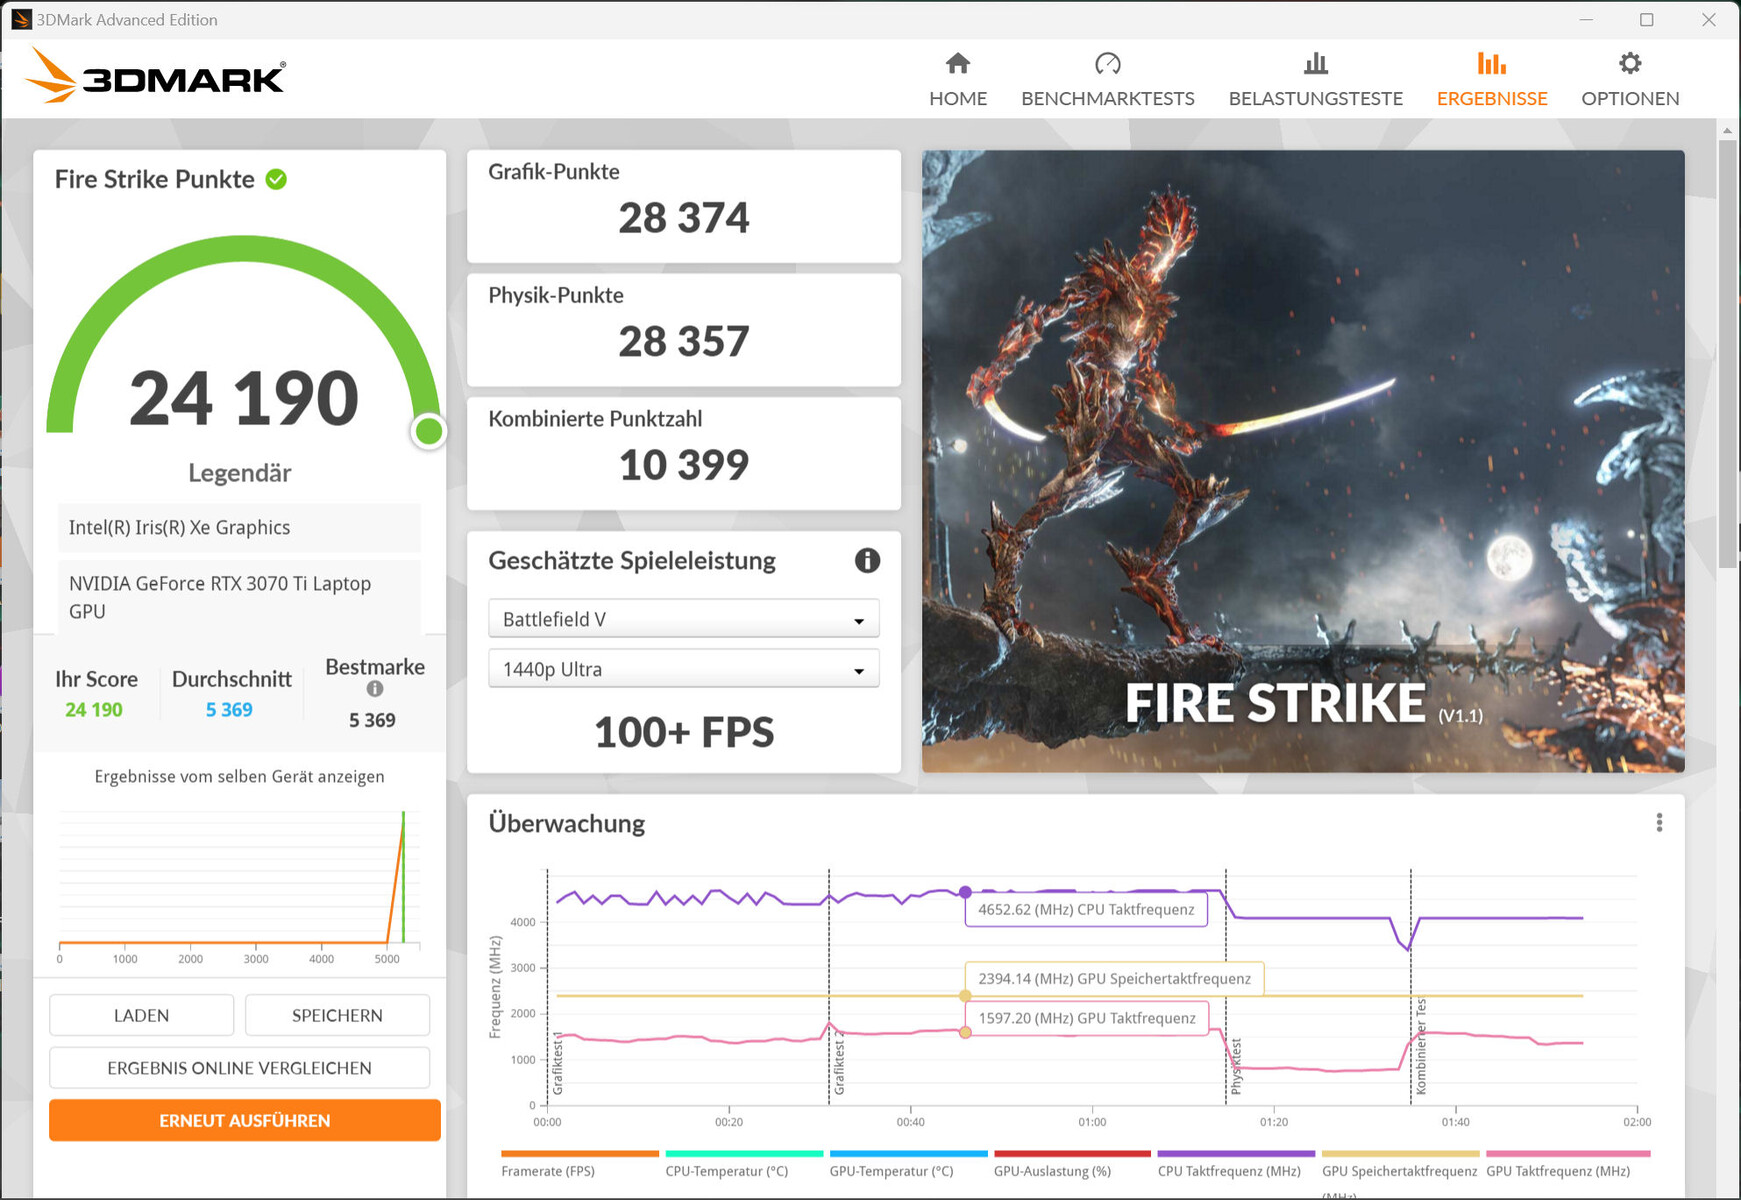
| 3DMark Fire Strike Score | 24190 puntos | |
| 3DMark Time Spy Score | 10840 puntos | |
ayuda | ||
| Blender | |
| v3.3 Classroom OPTIX/RTX | |
| Asus TUF Dash F15 FX517ZR | |
| Medio NVIDIA GeForce RTX 3070 Ti Laptop GPU (22 - 30, n=15) | |
| Acer Nitro 5 AN515-46-R1A1 (3.3.0) | |
| Aorus 15 XE5 (3.3.0) | |
| Aorus 15 XE5 (3.3.0, Turbo Mode) | |
| Media de la clase Gaming (9 - 32, n=106, últimos 2 años) | |
| v3.3 Classroom CUDA | |
| Asus TUF Dash F15 FX517ZR | |
| Medio NVIDIA GeForce RTX 3070 Ti Laptop GPU (36 - 46, n=16) | |
| Acer Nitro 5 AN515-46-R1A1 (3.3.0) | |
| Aorus 15 XE5 (3.3.0) | |
| Aorus 15 XE5 (3.3.0, Turbo Mode) | |
| Media de la clase Gaming (15 - 228, n=106, últimos 2 años) | |
| v3.3 Classroom CPU | |
| Schenker XMG Fusion 15 (Mid 22) | |
| Asus TUF Dash F15 FX517ZR | |
| Aorus 15 XE5 (3.3.0) | |
| Acer Nitro 5 AN515-46-R1A1 (3.3.0) | |
| Medio NVIDIA GeForce RTX 3070 Ti Laptop GPU (285 - 459, n=16) | |
| Aorus 15 XE5 (3.3.0, Turbo Mode) | |
| Media de la clase Gaming (122 - 565, n=102, últimos 2 años) | |
* ... más pequeño es mejor
Rendimiento de juego
El hardware del portátil es capaz de ejecutar juegos en QHD y con ajustes de altos a máximos. También puedes jugar a resoluciones más altas si conectas el dispositivo a un display adecuado, aunque a veces tengas que bajar los ajustes. En el Aorus 15 XE5, los juegos que usamos para las pruebas se ejecutaron normalmente a velocidades de fotogramas superiores a las que la RTX 3070 Ti puede producir de media. En algunos casos, activar el "Modo Turbo" llevó a un ligero aumento de las tasas de frames.
| Performance rating - Percent | |
| Media de la clase Gaming | |
| Aorus 15 XE5 | |
| MSI Katana GF66 12UGS | |
| Schenker XMG Fusion 15 (Mid 22) | |
| Asus TUF Dash F15 FX517ZR | |
| Acer Nitro 5 AN515-46-R1A1 | |
| The Witcher 3 - 1920x1080 Ultra Graphics & Postprocessing (HBAO+) | |
| Media de la clase Gaming (104.7 - 240, n=7, últimos 2 años) | |
| Acer Nitro 5 AN515-46-R1A1 | |
| Aorus 15 XE5 | |
| MSI Katana GF66 12UGS | |
| Schenker XMG Fusion 15 (Mid 22) | |
| Asus TUF Dash F15 FX517ZR | |
| GTA V - 1920x1080 Highest AA:4xMSAA + FX AF:16x | |
| Media de la clase Gaming (48.3 - 186.9, n=94, últimos 2 años) | |
| Aorus 15 XE5 | |
| Asus TUF Dash F15 FX517ZR | |
| MSI Katana GF66 12UGS | |
| Schenker XMG Fusion 15 (Mid 22) | |
| Acer Nitro 5 AN515-46-R1A1 | |
| Final Fantasy XV Benchmark - 1920x1080 High Quality | |
| Media de la clase Gaming (41 - 215, n=95, últimos 2 años) | |
| Acer Nitro 5 AN515-46-R1A1 | |
| Aorus 15 XE5 | |
| Schenker XMG Fusion 15 (Mid 22) | |
| MSI Katana GF66 12UGS | |
| Asus TUF Dash F15 FX517ZR | |
| Strange Brigade - 1920x1080 ultra AA:ultra AF:16 | |
| Media de la clase Gaming (76.3 - 458, n=87, últimos 2 años) | |
| Aorus 15 XE5 | |
| Acer Nitro 5 AN515-46-R1A1 | |
| MSI Katana GF66 12UGS | |
| Schenker XMG Fusion 15 (Mid 22) | |
| Asus TUF Dash F15 FX517ZR | |
| Dota 2 Reborn - 1920x1080 ultra (3/3) best looking | |
| Media de la clase Gaming (84.8 - 248, n=107, últimos 2 años) | |
| Aorus 15 XE5 | |
| MSI Katana GF66 12UGS | |
| Schenker XMG Fusion 15 (Mid 22) | |
| Asus TUF Dash F15 FX517ZR | |
| Acer Nitro 5 AN515-46-R1A1 | |
| X-Plane 11.11 - 1920x1080 high (fps_test=3) | |
| Aorus 15 XE5 | |
| MSI Katana GF66 12UGS | |
| Asus TUF Dash F15 FX517ZR | |
| Media de la clase Gaming (55.5 - 143.5, n=109, últimos 2 años) | |
| Schenker XMG Fusion 15 (Mid 22) | |
| Acer Nitro 5 AN515-46-R1A1 | |
| Performance rating - Percent | |
| Media de la clase Gaming -5! | |
| Aorus 15 XE5 | |
| Medio NVIDIA GeForce RTX 3070 Ti Laptop GPU | |
| Aorus 15 XE5 -6! | |
| Acer Nitro 5 AN515-46-R1A1 -4! | |
| MSI Katana GF66 12UGS -6! | |
| Schenker XMG Fusion 15 (Mid 22) -6! | |
| Asus TUF Dash F15 FX517ZR -6! | |
| The Witcher 3 - 1920x1080 Ultra Graphics & Postprocessing (HBAO+) | |
| Media de la clase Gaming (104.7 - 240, n=7, últimos 2 años) | |
| Acer Nitro 5 AN515-46-R1A1 | |
| Aorus 15 XE5 (Turbo Mode) | |
| Medio NVIDIA GeForce RTX 3070 Ti Laptop GPU (76.8 - 124.1, n=39) | |
| Aorus 15 XE5 | |
| MSI Katana GF66 12UGS | |
| Schenker XMG Fusion 15 (Mid 22) | |
| Asus TUF Dash F15 FX517ZR | |
| GTA V - 1920x1080 Highest AA:4xMSAA + FX AF:16x | |
| Media de la clase Gaming (48.3 - 186.9, n=94, últimos 2 años) | |
| Aorus 15 XE5 (Turbo Mode) | |
| Aorus 15 XE5 | |
| Medio NVIDIA GeForce RTX 3070 Ti Laptop GPU (44 - 123.9, n=36) | |
| Asus TUF Dash F15 FX517ZR | |
| MSI Katana GF66 12UGS | |
| Schenker XMG Fusion 15 (Mid 22) | |
| Acer Nitro 5 AN515-46-R1A1 | |
| Final Fantasy XV Benchmark - 1920x1080 High Quality | |
| Media de la clase Gaming (41 - 215, n=95, últimos 2 años) | |
| Acer Nitro 5 AN515-46-R1A1 (1.3) | |
| Aorus 15 XE5 (1.3, Turbo Mode) | |
| Aorus 15 XE5 (1.3) | |
| Medio NVIDIA GeForce RTX 3070 Ti Laptop GPU (49.5 - 122.4, n=35) | |
| Schenker XMG Fusion 15 (Mid 22) (1.3) | |
| MSI Katana GF66 12UGS (1.3) | |
| Asus TUF Dash F15 FX517ZR (1.3) | |
| Strange Brigade - 1920x1080 ultra AA:ultra AF:16 | |
| Media de la clase Gaming (76.3 - 458, n=87, últimos 2 años) | |
| Aorus 15 XE5 (1.47.22.14 D3D12, Turbo Mode) | |
| Aorus 15 XE5 (1.47.22.14 D3D12) | |
| Medio NVIDIA GeForce RTX 3070 Ti Laptop GPU (109 - 221, n=37) | |
| Acer Nitro 5 AN515-46-R1A1 (1.47.22.14 D3D12) | |
| MSI Katana GF66 12UGS (1.47.22.14 D3D12) | |
| Schenker XMG Fusion 15 (Mid 22) (1.47.22.14 D3D12) | |
| Asus TUF Dash F15 FX517ZR (1.47.22.14 D3D12) | |
| Dota 2 Reborn - 1920x1080 ultra (3/3) best looking | |
| Media de la clase Gaming (84.8 - 248, n=107, últimos 2 años) | |
| Aorus 15 XE5 | |
| Aorus 15 XE5 (Turbo Mode) | |
| MSI Katana GF66 12UGS | |
| Medio NVIDIA GeForce RTX 3070 Ti Laptop GPU (68.7 - 160.5, n=38) | |
| Schenker XMG Fusion 15 (Mid 22) | |
| Asus TUF Dash F15 FX517ZR | |
| Acer Nitro 5 AN515-46-R1A1 | |
| X-Plane 11.11 - 1920x1080 high (fps_test=3) | |
| Aorus 15 XE5 | |
| Aorus 15 XE5 (Turbo Mode) | |
| MSI Katana GF66 12UGS | |
| Asus TUF Dash F15 FX517ZR | |
| Media de la clase Gaming (55.5 - 143.5, n=109, últimos 2 años) | |
| Medio NVIDIA GeForce RTX 3070 Ti Laptop GPU (51.6 - 116.9, n=37) | |
| Schenker XMG Fusion 15 (Mid 22) | |
| Acer Nitro 5 AN515-46-R1A1 | |
| F1 22 - 1920x1080 Ultra High Preset AA:T AF:16x | |
| Media de la clase Gaming (40.1 - 121.2, n=4, últimos 2 años) | |
| Acer Nitro 5 AN515-46-R1A1 (923662) | |
| Medio NVIDIA GeForce RTX 3070 Ti Laptop GPU (58.1 - 80, n=8) | |
| Aorus 15 XE5 (928484, Turbo Mode) | |
| Aorus 15 XE5 (928484) | |
| The Quarry - 1920x1080 Ultra Preset | |
| Acer Nitro 5 AN515-46-R1A1 | |
| Medio NVIDIA GeForce RTX 3070 Ti Laptop GPU (80 - 81.5, n=2) | |
| Aorus 15 XE5 | |
| A Plague Tale Requiem - 1920x1080 Ultra Preset | |
| Medio NVIDIA GeForce RTX 3070 Ti Laptop GPU (61.9 - 62.9, n=2) | |
| Aorus 15 XE5 | |
| Uncharted Legacy of Thieves Collection - 1920x1080 Ultra Preset | |
| Aorus 15 XE5 | |
| Medio NVIDIA GeForce RTX 3070 Ti Laptop GPU (69.3 - 72.4, n=2) | |
| Call of Duty Modern Warfare 2 2022 - 1920x1080 Extreme Quality Preset AA:T2X Filmic SM | |
| Aorus 15 XE5 | |
| Medio NVIDIA GeForce RTX 3070 Ti Laptop GPU (84 - 86, n=3) | |
| Spider-Man Miles Morales - 1920x1080 Very High Preset AA:T | |
| Medio NVIDIA GeForce RTX 3070 Ti Laptop GPU (91 - 93.2, n=2) | |
| Aorus 15 XE5 | |
Para averiguar si el portátil puede ejecutar juegos con frecuencias de cuadro constantes durante un periodo prolongado, ejecutamos "The Witcher 3" durante unos 60 minutos a resolución Full HD y ajustes de máxima calidad, sin mover el personaje del jugador. El resultado: no hubo caídas en la tasa de imágenes por segundo.
Witcher 3 FPS chart
| bajo | medio | alto | ultra | QHD | |
|---|---|---|---|---|---|
| GTA V (2015) | 186.4 | 182.3 | 176.4 | 115.6 | 99.9 |
| The Witcher 3 (2015) | 357 | 300 | 183.2 | 100.1 | |
| Dota 2 Reborn (2015) | 168.4 | 158 | 148.4 | 140.8 | |
| Final Fantasy XV Benchmark (2018) | 196.3 | 138.8 | 104.6 | 79.2 | |
| X-Plane 11.11 (2018) | 142 | 130.7 | 105.3 | ||
| Far Cry 5 (2018) | 166 | 144 | 137 | 129 | 103 |
| Strange Brigade (2018) | 445 | 255 | 212 | 188.5 | 140.9 |
| F1 22 (2022) | 220 | 215 | 181.3 | 64.2 | 42.7 |
| The Quarry (2022) | 156.2 | 119.1 | 98.4 | 80 | 56.1 |
| A Plague Tale Requiem (2022) | 93.8 | 81.8 | 71.1 | 61.9 | 48.6 |
| Uncharted Legacy of Thieves Collection (2022) | 81 | 80.2 | 75.4 | 72.4 | 55.5 |
| Call of Duty Modern Warfare 2 2022 (2022) | 127 | 111 | 87 | 86 | 61 |
| Spider-Man Miles Morales (2022) | 108.2 | 103.8 | 93 | 91 | 73.5 |
Emisiones - Se requiere cierto perfeccionamiento
Emisiones sonoras
En el uso diario (por ejemplo, aplicaciones ofimáticas, navegación web) y en reposo, los dos ventiladores del portátil son relativamente silenciosos y a veces ni siquiera giran. Bajo carga media-alta, el sistema se vuelve bastante ruidoso, con niveles de ruido que alcanzan los 52 dB(A) durante el test de estrés y el test Witcher 3. El Gigabyte Control Center permite ajustar la velocidad de los ventiladores y configurar sus curvas.
Ruido
| Ocioso |
| 26 / 28 / 30 dB(A) |
| Carga |
| 48 / 52 dB(A) |
 | ||
30 dB silencioso 40 dB(A) audible 50 dB(A) ruidosamente alto |
||
min: | ||
| Aorus 15 XE5 i7-12700H, GeForce RTX 3070 Ti Laptop GPU | Acer Nitro 5 AN515-46-R1A1 R7 6800H, GeForce RTX 3070 Ti Laptop GPU | Schenker XMG Fusion 15 (Mid 22) i7-11800H, GeForce RTX 3070 Laptop GPU | Asus TUF Dash F15 FX517ZR i7-12650H, GeForce RTX 3070 Laptop GPU | MSI Katana GF66 12UGS i7-12700H, GeForce RTX 3070 Ti Laptop GPU | |
|---|---|---|---|---|---|
| Noise | -9% | 2% | -2% | 3% | |
| apagado / medio ambiente * (dB) | 24 | 25 -4% | 26 -8% | 26 -8% | 26 -8% |
| Idle Minimum * (dB) | 26 | 25 4% | 26 -0% | 26 -0% | 27 -4% |
| Idle Average * (dB) | 28 | 28.6 -2% | 28 -0% | 32 -14% | 28 -0% |
| Idle Maximum * (dB) | 30 | 44.3 -48% | 31 -3% | 33 -10% | 31 -3% |
| Load Average * (dB) | 48 | 47.6 1% | 45 6% | 48 -0% | 44 8% |
| Witcher 3 ultra * (dB) | 52 | 46 12% | 47 10% | 44 15% | |
| Load Maximum * (dB) | 52 | 53.6 -3% | 48 8% | 49 6% | 45 13% |
* ... más pequeño es mejor
Temperaturas
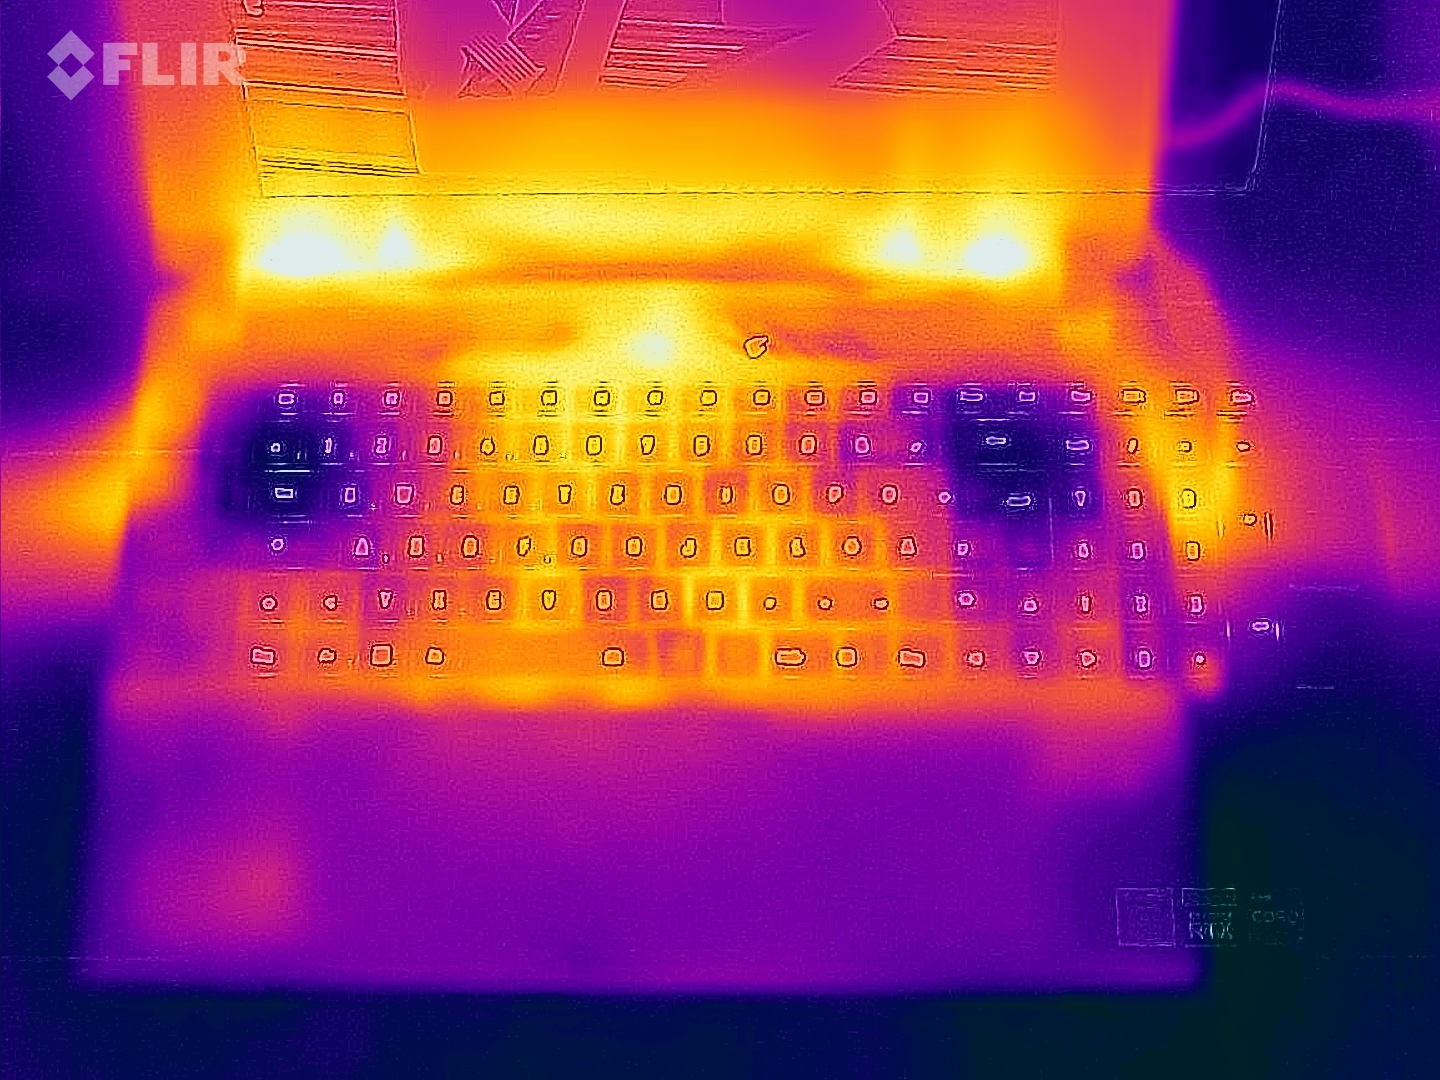
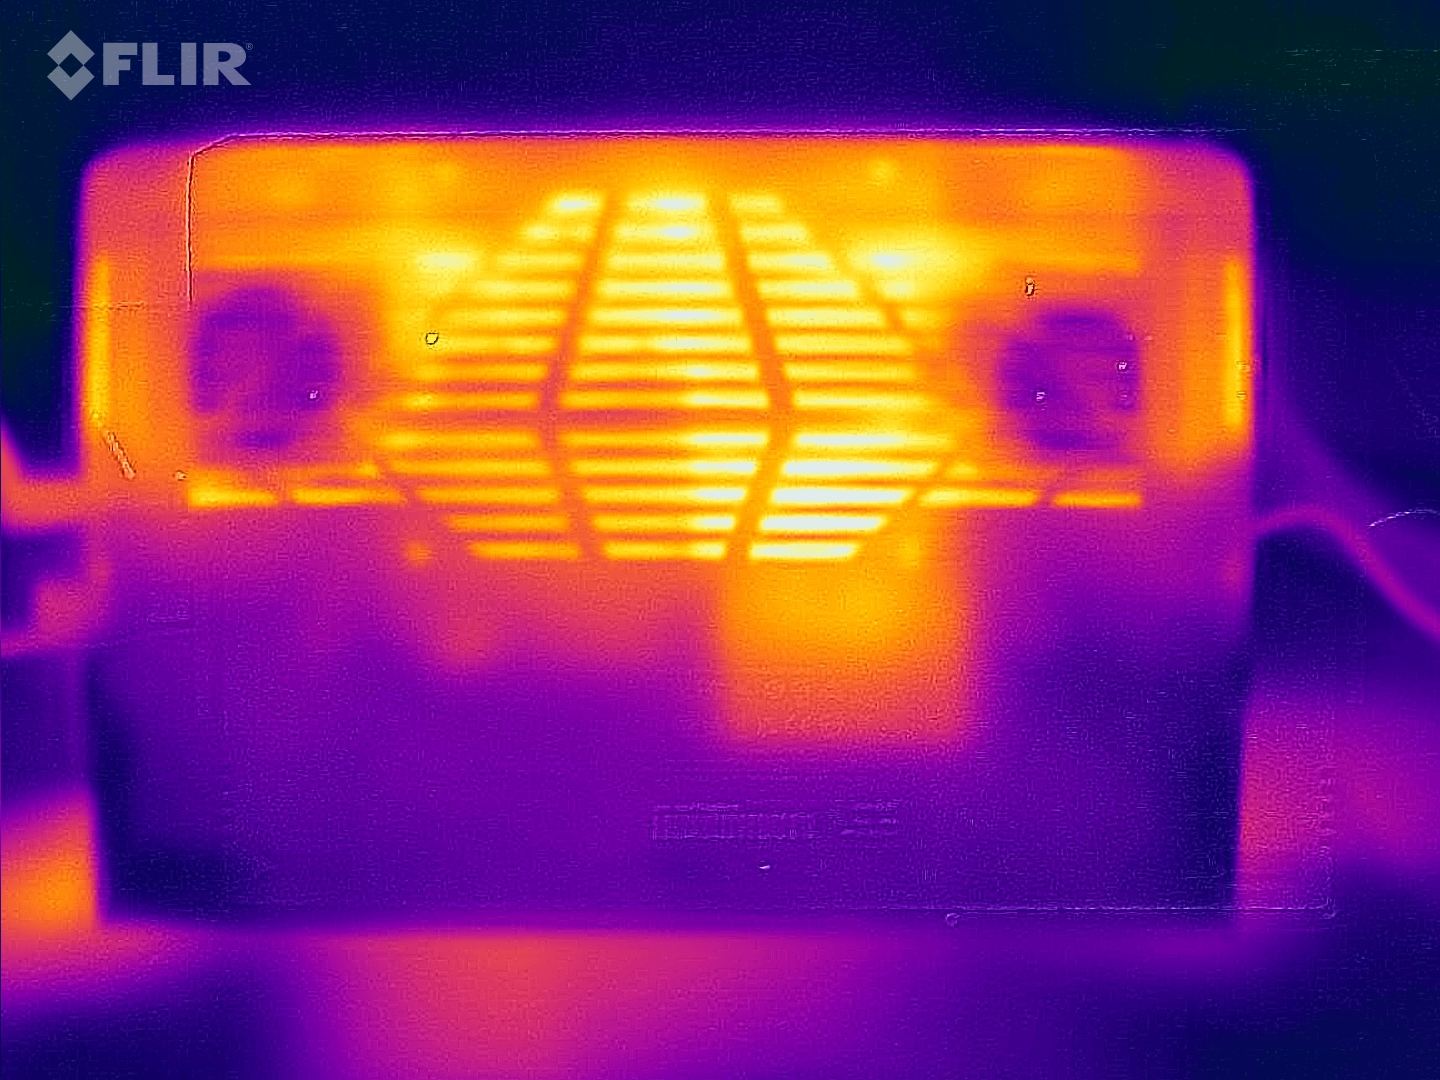
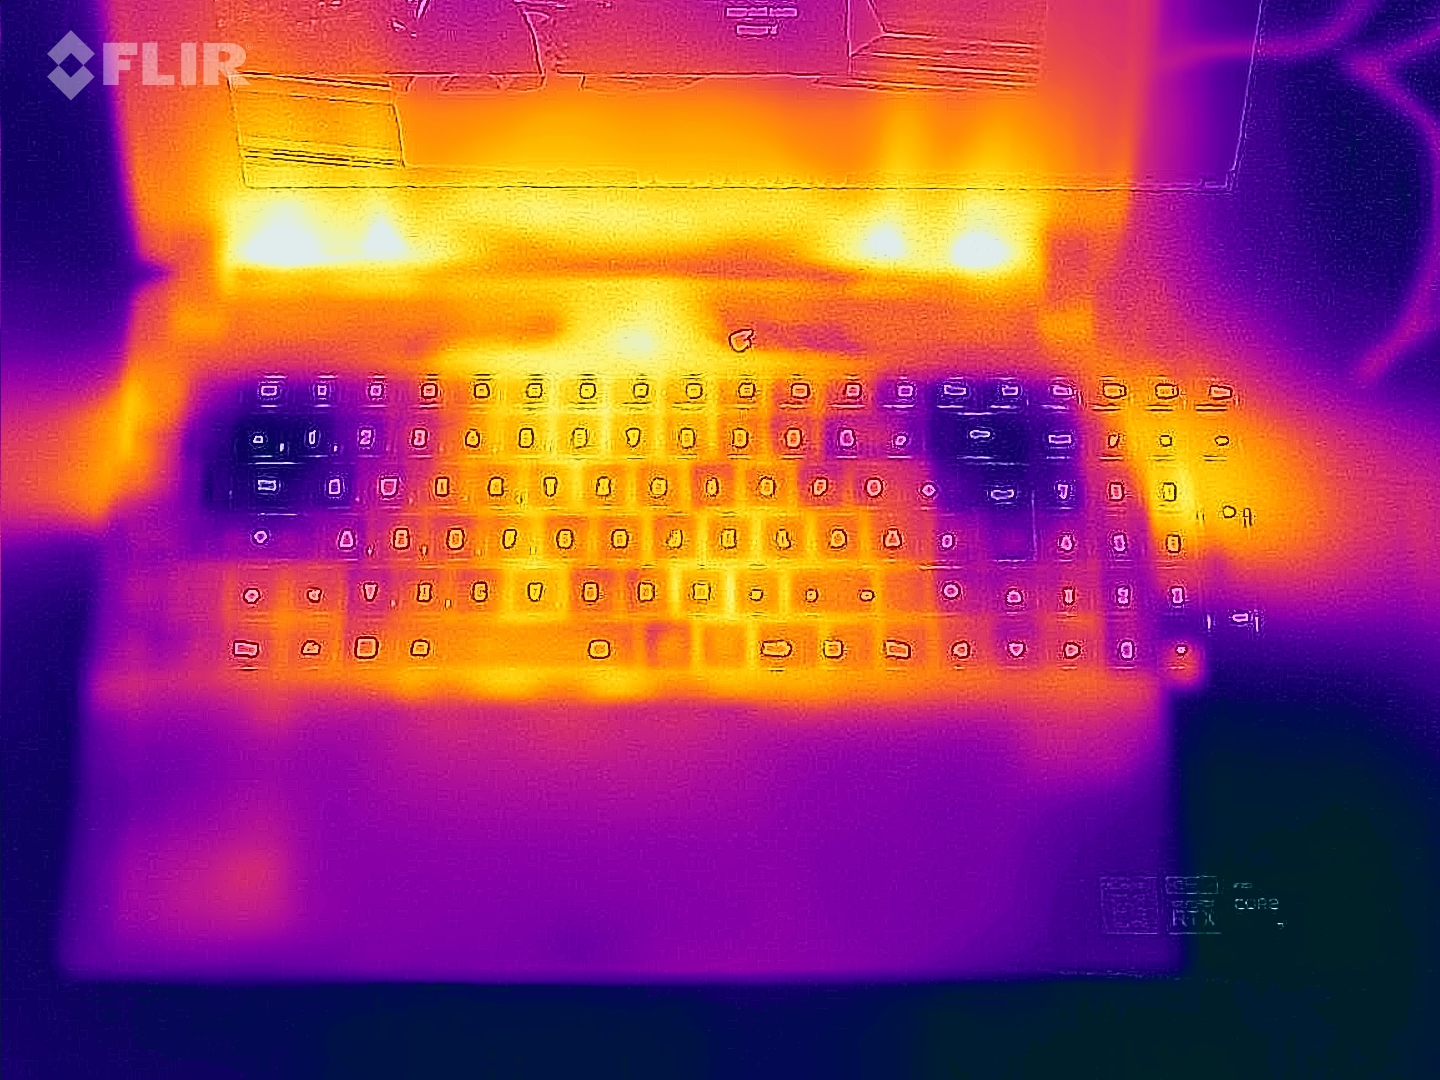
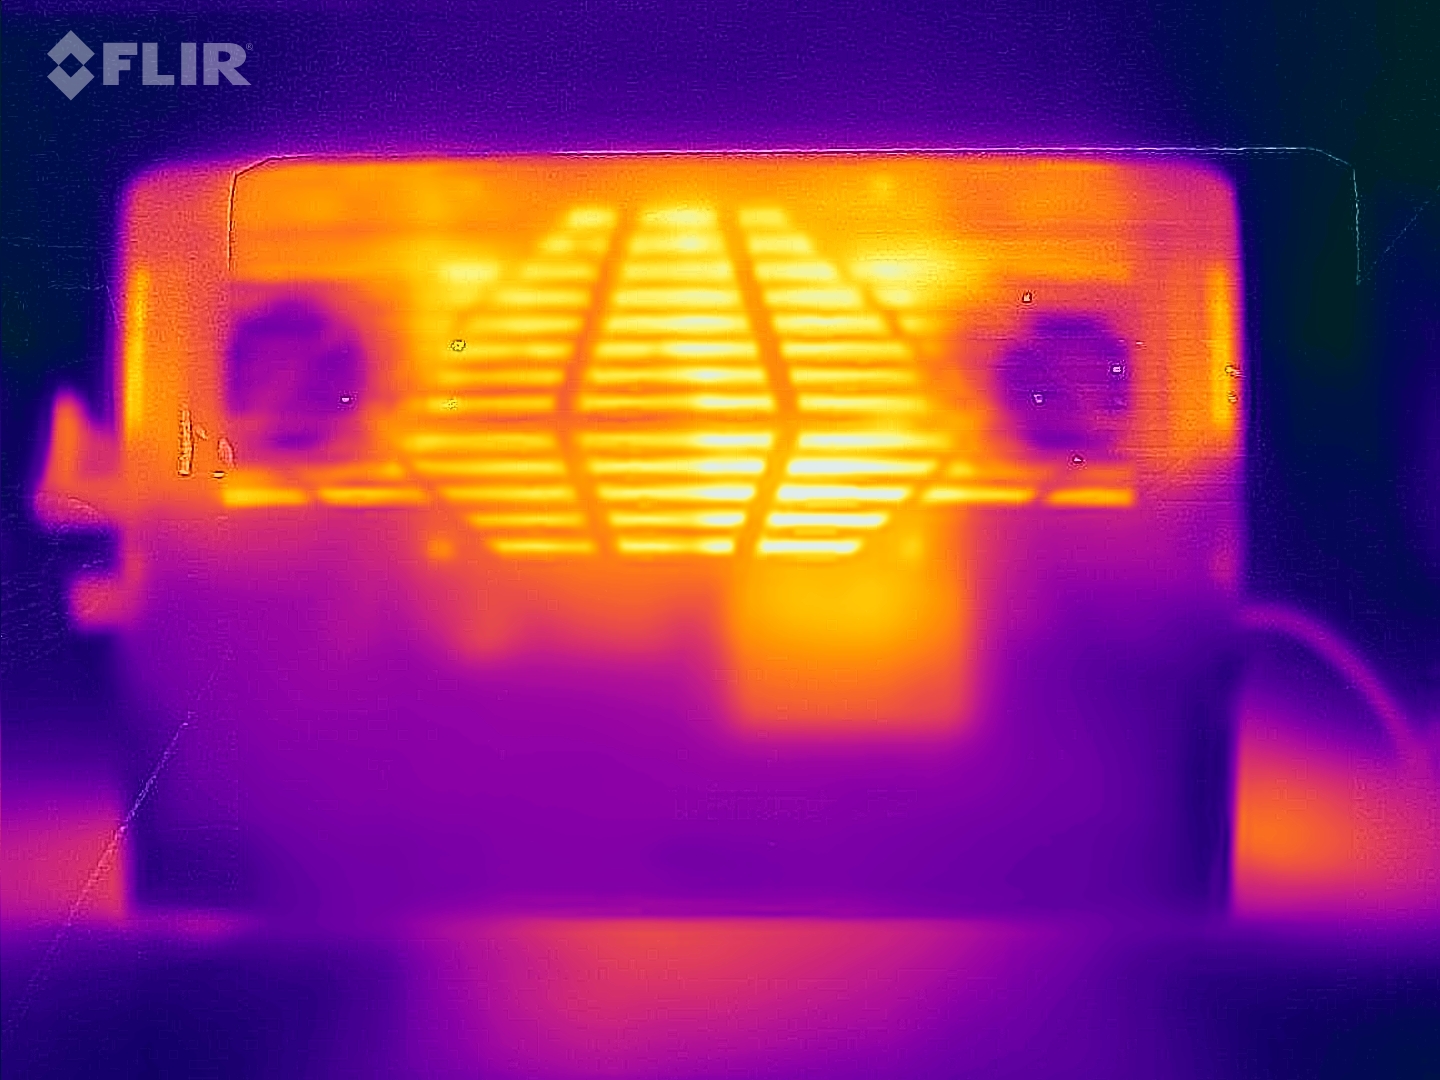
Cuando el portátil está realizando tareas cotidianas, el chasis puede calentarse relativamente, pero sus temperaturas siguen estando dentro de un rango aceptable. Bajo carga (test de estrés, Witcher 3), el portátil se calienta moderadamente de media en todo el dispositivo, pero hay algunos puntos calientes muy notables. Dicho esto, las temperaturas de la CPU no son motivo de preocupación.
(-) La temperatura máxima en la parte superior es de 46 °C / 115 F, frente a la media de 40.4 °C / 105 F, que oscila entre 21.2 y 68.8 °C para la clase Gaming.
(-) El fondo se calienta hasta un máximo de 57 °C / 135 F, frente a la media de 43.2 °C / 110 F
(±) En reposo, la temperatura media de la parte superior es de 32.4 °C / 90# F, frente a la media del dispositivo de 33.9 °C / 93 F.
(±) Jugando a The Witcher 3, la temperatura media de la parte superior es de 37.6 °C / 100 F, frente a la media del dispositivo de 33.9 °C / 93 F.
(+) Los reposamanos y el panel táctil alcanzan como máximo la temperatura de la piel (35 °C / 95 F) y, por tanto, no están calientes.
(-) La temperatura media de la zona del reposamanos de dispositivos similares fue de 28.8 °C / 83.8 F (-6.2 °C / -11.2 F).
| Aorus 15 XE5 Intel Core i7-12700H, NVIDIA GeForce RTX 3070 Ti Laptop GPU | Acer Nitro 5 AN515-46-R1A1 AMD Ryzen 7 6800H, NVIDIA GeForce RTX 3070 Ti Laptop GPU | Schenker XMG Fusion 15 (Mid 22) Intel Core i7-11800H, NVIDIA GeForce RTX 3070 Laptop GPU | Asus TUF Dash F15 FX517ZR Intel Core i7-12650H, NVIDIA GeForce RTX 3070 Laptop GPU | MSI Katana GF66 12UGS Intel Core i7-12700H, NVIDIA GeForce RTX 3070 Ti Laptop GPU | |
|---|---|---|---|---|---|
| Heat | 14% | -3% | 6% | -8% | |
| Maximum Upper Side * (°C) | 46 | 48.1 -5% | 52 -13% | 52 -13% | 61 -33% |
| Maximum Bottom * (°C) | 57 | 49.7 13% | 63 -11% | 52 9% | 55 4% |
| Idle Upper Side * (°C) | 38 | 30 21% | 37 3% | 33 13% | 43 -13% |
| Idle Bottom * (°C) | 42 | 31.7 25% | 38 10% | 36 14% | 38 10% |
* ... más pequeño es mejor
Prueba de esfuerzo
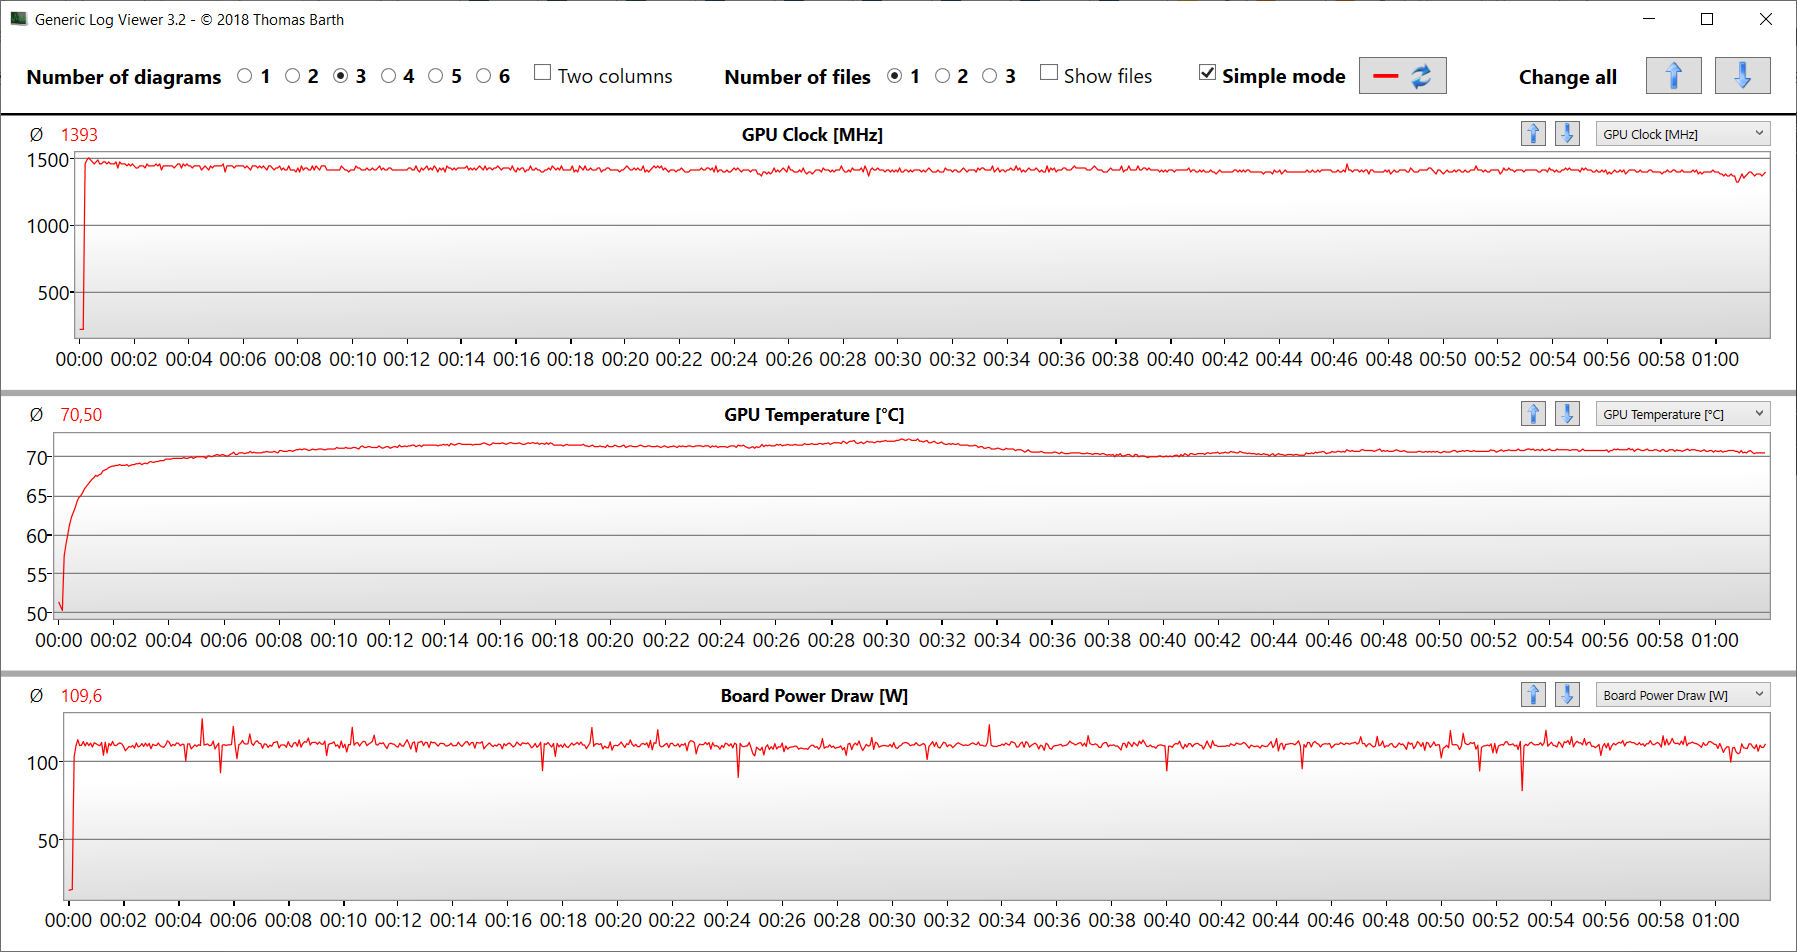
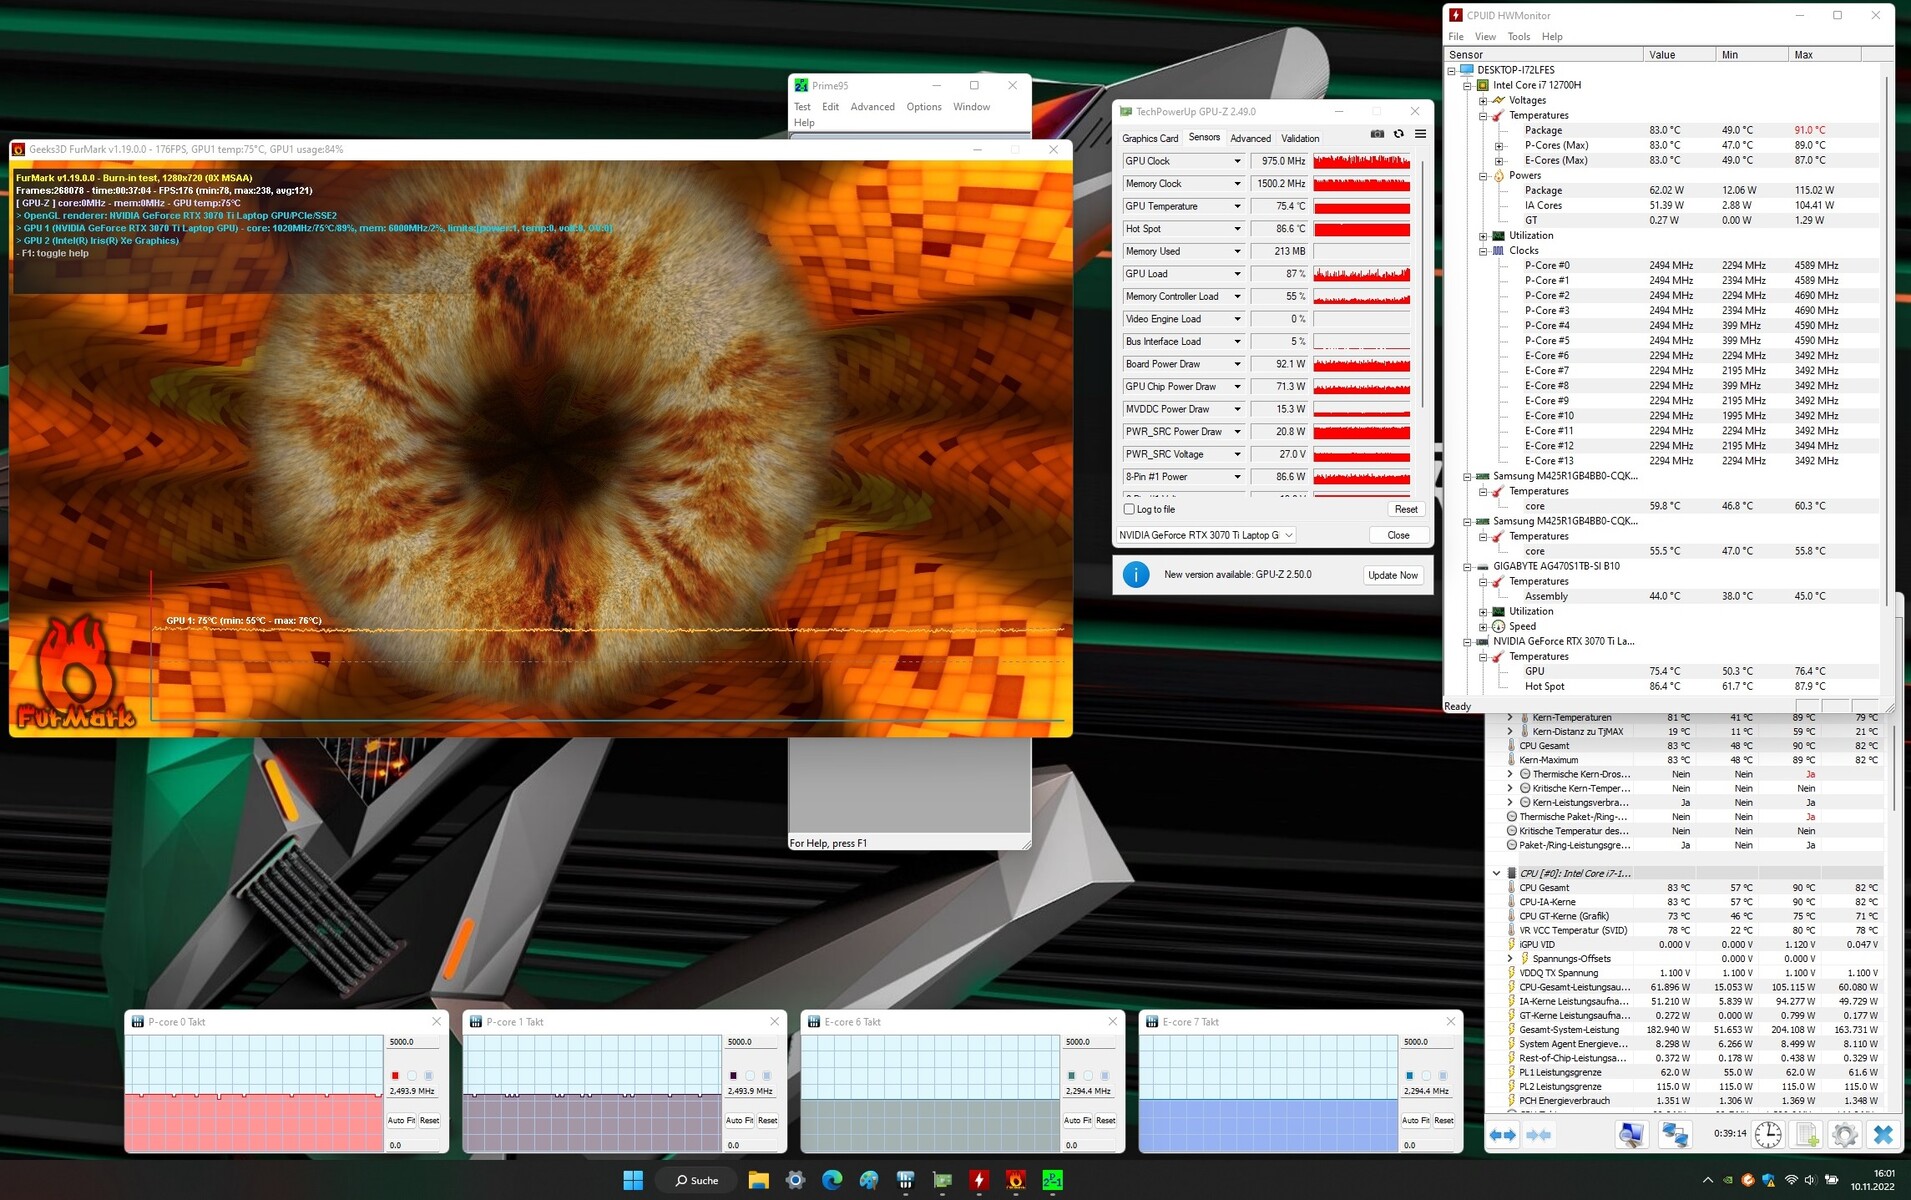
Nuestra prueba de estrés, que consiste en ejecutar Prime95 y FurMark al mismo tiempo de forma continua, representa un escenario extremo diseñado para evaluar la estabilidad de un sistema a plena carga. Durante la prueba (que duró al menos una hora), la CPU funcionó a velocidades de reloj moderadas (núcleos P: aprox. 2,5 GHz; núcleos E: aprox. 2,3 GHz), mientras que la GPU fluctuó entre 1.000 y 1.500 MHz.
Altavoces
Los altavoces estéreo suenan decentemente pero apenas tienen graves. Recomendamos usar auriculares o altavoces externos para disfrutar de una mejor experiencia auditiva.
Aorus 15 XE5 análisis de audio
(+) | los altavoces pueden reproducir a un volumen relativamente alto (#85 dB)
Graves 100 - 315 Hz
(-) | casi sin bajos - de media 27.9% inferior a la mediana
(±) | la linealidad de los graves es media (11.4% delta a frecuencia anterior)
Medios 400 - 2000 Hz
(+) | medios equilibrados - a sólo 4.9% de la mediana
(+) | los medios son lineales (4.4% delta a la frecuencia anterior)
Altos 2 - 16 kHz
(+) | máximos equilibrados - a sólo 3.5% de la mediana
(+) | los máximos son lineales (2.9% delta a la frecuencia anterior)
Total 100 - 16.000 Hz
(±) | la linealidad del sonido global es media (19.4% de diferencia con la mediana)
En comparación con la misma clase
» 67% de todos los dispositivos probados de esta clase eran mejores, 7% similares, 26% peores
» El mejor tuvo un delta de 6%, la media fue 18%, el peor fue ###max##%
En comparación con todos los dispositivos probados
» 48% de todos los dispositivos probados eran mejores, 7% similares, 45% peores
» El mejor tuvo un delta de 4%, la media fue 23%, el peor fue ###max##%
Asus TUF Dash F15 FX517ZR análisis de audio
(±) | la sonoridad del altavoz es media pero buena (79 dB)
Graves 100 - 315 Hz
(-) | casi sin bajos - de media 19.2% inferior a la mediana
(±) | la linealidad de los graves es media (9.6% delta a frecuencia anterior)
Medios 400 - 2000 Hz
(+) | medios equilibrados - a sólo 2.7% de la mediana
(+) | los medios son lineales (5% delta a la frecuencia anterior)
Altos 2 - 16 kHz
(+) | máximos equilibrados - a sólo 2.2% de la mediana
(±) | la linealidad de los máximos es media (7.7% delta a frecuencia anterior)
Total 100 - 16.000 Hz
(±) | la linealidad del sonido global es media (15.3% de diferencia con la mediana)
En comparación con la misma clase
» 34% de todos los dispositivos probados de esta clase eran mejores, 6% similares, 60% peores
» El mejor tuvo un delta de 6%, la media fue 18%, el peor fue ###max##%
En comparación con todos los dispositivos probados
» 22% de todos los dispositivos probados eran mejores, 4% similares, 74% peores
» El mejor tuvo un delta de 4%, la media fue 23%, el peor fue ###max##%
Gestión de la alimentación: el XE5 consume demasiada energía
Consumo de energía
El Aorus 15 XE5 consume demasiada energía en inactivo, entre 31 y 46 vatios y a veces hasta 80 vatios en el peor de los casos. Comparar el XE5 con los competidores revela más o menos cuánta energía debería consumir un portátil con Optimus en inactivo. Este elevado consumo se debe probablemente a un error. El problema persiste incluso cuando la función AI Boost está desactivada. Así que tendremos que esperar para ver si Gigabyte es capaz de solucionar el problema mediante actualizaciones de software o de la BIOS.
A lo largo de la prueba de estrés y el test Witcher 3, el consumo de energía del portátil se mantuvo estable a un nivel normal para el hardware. El cargador incluido tiene capacidad suficiente para alimentar el portátil y también es capaz de hacer frente a picos transitorios por encima de su potencia nominal (240 vatios).
| Off / Standby | |
| Ocioso | |
| Carga |
|
Clave:
min: | |
| Aorus 15 XE5 i7-12700H, GeForce RTX 3070 Ti Laptop GPU | Acer Nitro 5 AN515-46-R1A1 R7 6800H, GeForce RTX 3070 Ti Laptop GPU | Schenker XMG Fusion 15 (Mid 22) i7-11800H, GeForce RTX 3070 Laptop GPU | Asus TUF Dash F15 FX517ZR i7-12650H, GeForce RTX 3070 Laptop GPU | MSI Katana GF66 12UGS i7-12700H, GeForce RTX 3070 Ti Laptop GPU | Medio NVIDIA GeForce RTX 3070 Ti Laptop GPU | Media de la clase Gaming | |
|---|---|---|---|---|---|---|---|
| Power Consumption | 28% | 36% | 41% | 43% | 28% | 32% | |
| Idle Minimum * (Watt) | 31 | 7 77% | 12 61% | 10 68% | 9 71% | 14.2 ? 54% | 13 ? 58% |
| Idle Average * (Watt) | 35 | 8.9 75% | 17 51% | 14 60% | 13 63% | 19.9 ? 43% | 19 ? 46% |
| Idle Maximum * (Watt) | 46 | 14.4 69% | 24 48% | 20 57% | 20 57% | 26.2 ? 43% | 24.6 ? 47% |
| Load Average * (Watt) | 120 | 202 -68% | 106 12% | 122 -2% | 100 17% | 125.8 ? -5% | 110.7 ? 8% |
| Witcher 3 ultra * (Watt) | 202 | 203 -0% | 159.9 21% | 138.6 31% | 149 26% | ||
| Load Maximum * (Watt) | 268 | 230 14% | 208 22% | 189 29% | 212 21% | 248 ? 7% | 259 ? 3% |
* ... más pequeño es mejor
Power consumption Witcher 3 / Stress test
Power consumption with external monitor
Duración de la batería
El dispositivo de 15,6 pulgadas duró 6h 50m y 6h 11m respectivamente en nuestro test Wi-Fi (accediendo a sitios web usando un script) y en el test de vídeo (reproduciendo en bucle el corto "Big Buck Bunny" en FHD, codificado en H.264). Durante ambas pruebas, se desactivaron todas las funciones de ahorro de energía del portátil y se ajustó el brillo de la pantalla a unos 150 cd/m². Además, el módulo inalámbrico también se desactivó para la prueba de vídeo.
Con todo, el XE5 definitivamente ofrece una gran duración de batería para un portátil de juegos QHD. No obstante, no sorprende que el Aorus no esté muy por delante de un competidor como el Nitro 5en términos de duración de la batería a pesar de tener casi el doble de capacidad (99 Wh frente a 57,5 Wh). Esto se debe a que el portátil Acer está equipado con un procesador más eficiente y una pantalla FHD.
| Aorus 15 XE5 i7-12700H, GeForce RTX 3070 Ti Laptop GPU, 99 Wh | Acer Nitro 5 AN515-46-R1A1 R7 6800H, GeForce RTX 3070 Ti Laptop GPU, 57.5 Wh | Schenker XMG Fusion 15 (Mid 22) i7-11800H, GeForce RTX 3070 Laptop GPU, 93.48 Wh | Asus TUF Dash F15 FX517ZR i7-12650H, GeForce RTX 3070 Laptop GPU, 76 Wh | MSI Katana GF66 12UGS i7-12700H, GeForce RTX 3070 Ti Laptop GPU, 52 Wh | Media de la clase Gaming | |
|---|---|---|---|---|---|---|
| Duración de Batería | -13% | 20% | 7% | -46% | 0% | |
| Reader / Idle (h) | 10 | 10.5 5% | 15.5 55% | 10.8 8% | 8.27 ? -17% | |
| H.264 (h) | 6.2 | 5.7 -8% | 7.5 21% | 5.8 -6% | 8.32 ? 34% | |
| WiFi v1.3 (h) | 6.8 | 5.8 -15% | 7.4 9% | 7 3% | 2.4 -65% | 7.11 ? 5% |
| Load (h) | 1.9 | 1.3 -32% | 1.8 -5% | 2.3 21% | 1.4 -26% | 1.502 ? -21% |
Pro
Contra
Veredicto - Una bestia de los juegos hambrienta de potencia
El Aorus 15 XE5 está diseñado para ejecutar juegos en QHD y con ajustes altos al máximo. Pero también da la talla en otras aplicaciones exigentes como la edición de vídeo y el renderizado. Esto es posible gracias al Core i7 12700H y GeForce RTX 3070 Ti portátil en el interior de la máquina. Un rapidísimo SSD PCIe 4.0 (1 TB) permite tiempos de carga cortos.
El Aorus 15 XE5 hace lo que se supone que debe hacer: ejecutar juegos con fluidez en su fluida pantalla. Sin embargo, su consumo de energía es demasiado alto.
La CPU y la GPU del portátil pueden funcionar a velocidades de reloj constantemente altas. Aunque la cantidad de ruido producida por el Aorus 15 XE5 es típica para un portátil de juego, genera demasiado calor en inactivo. Lo mismo cabe decir de su consumo de energía en inactivo y a baja carga - sólo cabe esperar que Gigabyte lance una actualización para resolver este problema. Sin embargo, el portátil no tiene este problema cuando funciona con batería, durando entre 6 y 7 horas en uso diario, lo que es bastante respetable
La pantalla mate QHD (15.6 pulgadas, IPS, 165Hz de frecuencia de refresco) deja una impresión positiva, aunque ciertamente le vendría bien un poco más de contraste. El puerto Thunderbolt 4 permite conectar varias opciones de expansión, como una solución docking o una GPU externa. También soporta Power Delivery, lo que significa que el portátil puede cargarse por el puerto (adaptador USB-C, mín. 65 w, 20V).
El Schenker XMG Fusion 15 (mediados de 22) y el Asus TUF Dash F15son dos alternativas al Aorus 15 XE5. Aunque estos dos portátiles ofrecen menos rendimiento y se calientan mucho bajo carga, son más ligeros y tienen mayor duración de batería en algunos casos.
Precio y disponibilidad
Aorus 15 XE5
- 12/06/2022 v7 (old)
Sascha Mölck
Price comparison

