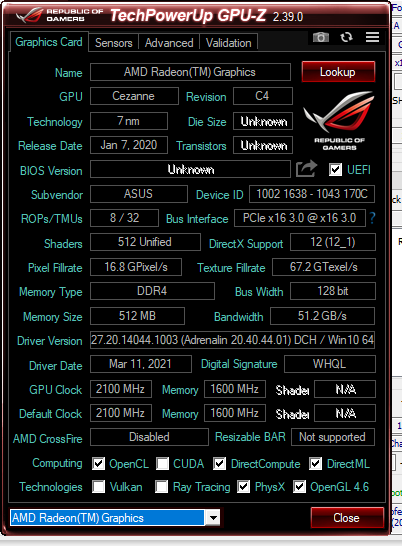
Análisis del portátil Asus Strix Scar 17 G733QS: El Liquid Metal 7 nm AMD Zen 3 es impresionante
La serie Asus ROG Strix Scar 17 G733 es la sucesora directa de la serie del año pasado ROG Strix Scar 17 G732 del año pasado introduciendo un chasis renovado, una pantalla FHD de 360 Hz, CPUs AMD Zen 3 Cezanne, GPUs Nvidia Ampere de 130 W TGP y un nuevo teclado mecánico integrado. Las actualizaciones de un año a otro son significativas en este modelo si se tiene en cuenta que el G732 funcionaba con CPUs Intel y GPUs Turing. Asus no ofrece ninguna opción Intel por el momento, lo que significa que la compañía está apostando fuerte por AMD y su última generación de CPUs Ryzen.
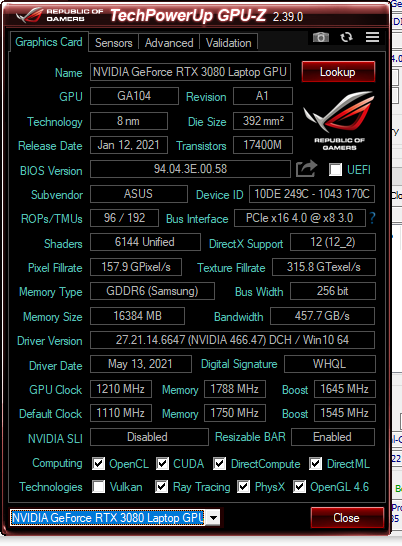
Nuestra unidad de pruebas es la configuración de gama más alta con la CPU Ryzen 9 5900HX, la GPU GeForce RTX 3080, y la pantalla FHD de 360 Hz por unos $3000 USD pero hay otras SKUs disponibles con el Ryzen 7 5800H, GeForce RTX 3060/3070, o la pantalla QHD de 165 Hz. Entre los competidores directos se encuentran otros portátiles para juegos de 17,3 pulgadas como el MSI GE76, Razer Blade Pro 17, Schenker XMG Ultra 17o Gigabyte Aorus 17X.
Más reseñas de Asus:
potential competitors in comparison
Valoración | Fecha | Modelo | Peso | Altura | Tamaño | Resolución | Precio |
|---|---|---|---|---|---|---|---|
| 86.6 % v7 (old) | 05/2021 | Asus Strix Scar 17 G733QSA-XS99 R9 5900HX, GeForce RTX 3080 Laptop GPU | 2.8 kg | 28.3 mm | 17.30" | 1920x1080 | |
| 82.7 % v7 (old) | 07/2020 | Asus Strix Scar 17 G732LXS i9-10980HK, GeForce RTX 2080 Super Mobile | 2.9 kg | 26.5 mm | 17.30" | 1920x1080 | |
| 87.1 % v7 (old) | 03/2021 | MSI GE76 Raider 10UH i7-10870H, GeForce RTX 3080 Laptop GPU | 3 kg | 27.4 mm | 17.30" | 1920x1080 | |
| 85.3 % v7 (old) | 04/2021 | Alienware m17 R4 i9-10980HK, GeForce RTX 3080 Laptop GPU | 3 kg | 22 mm | 17.30" | 1920x1080 | |
| 87.8 % v7 (old) | 02/2021 | Razer Blade Pro 17 2021 (QHD Touch) i7-10875H, GeForce RTX 3080 Laptop GPU | 3 kg | 19.9 mm | 17.30" | 3840x2160 | |
| 82.4 % v7 (old) | 08/2020 | Asus Zephyrus S17 GX701LXS i7-10875H, GeForce RTX 2080 Super Max-Q | 2.6 kg | 18.7 mm | 17.30" | 1920x1080 |
Caso
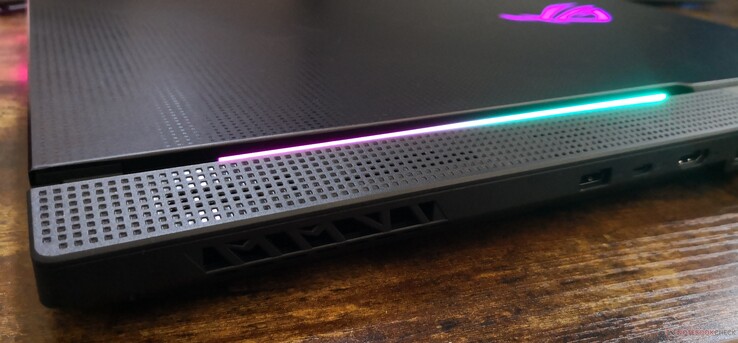
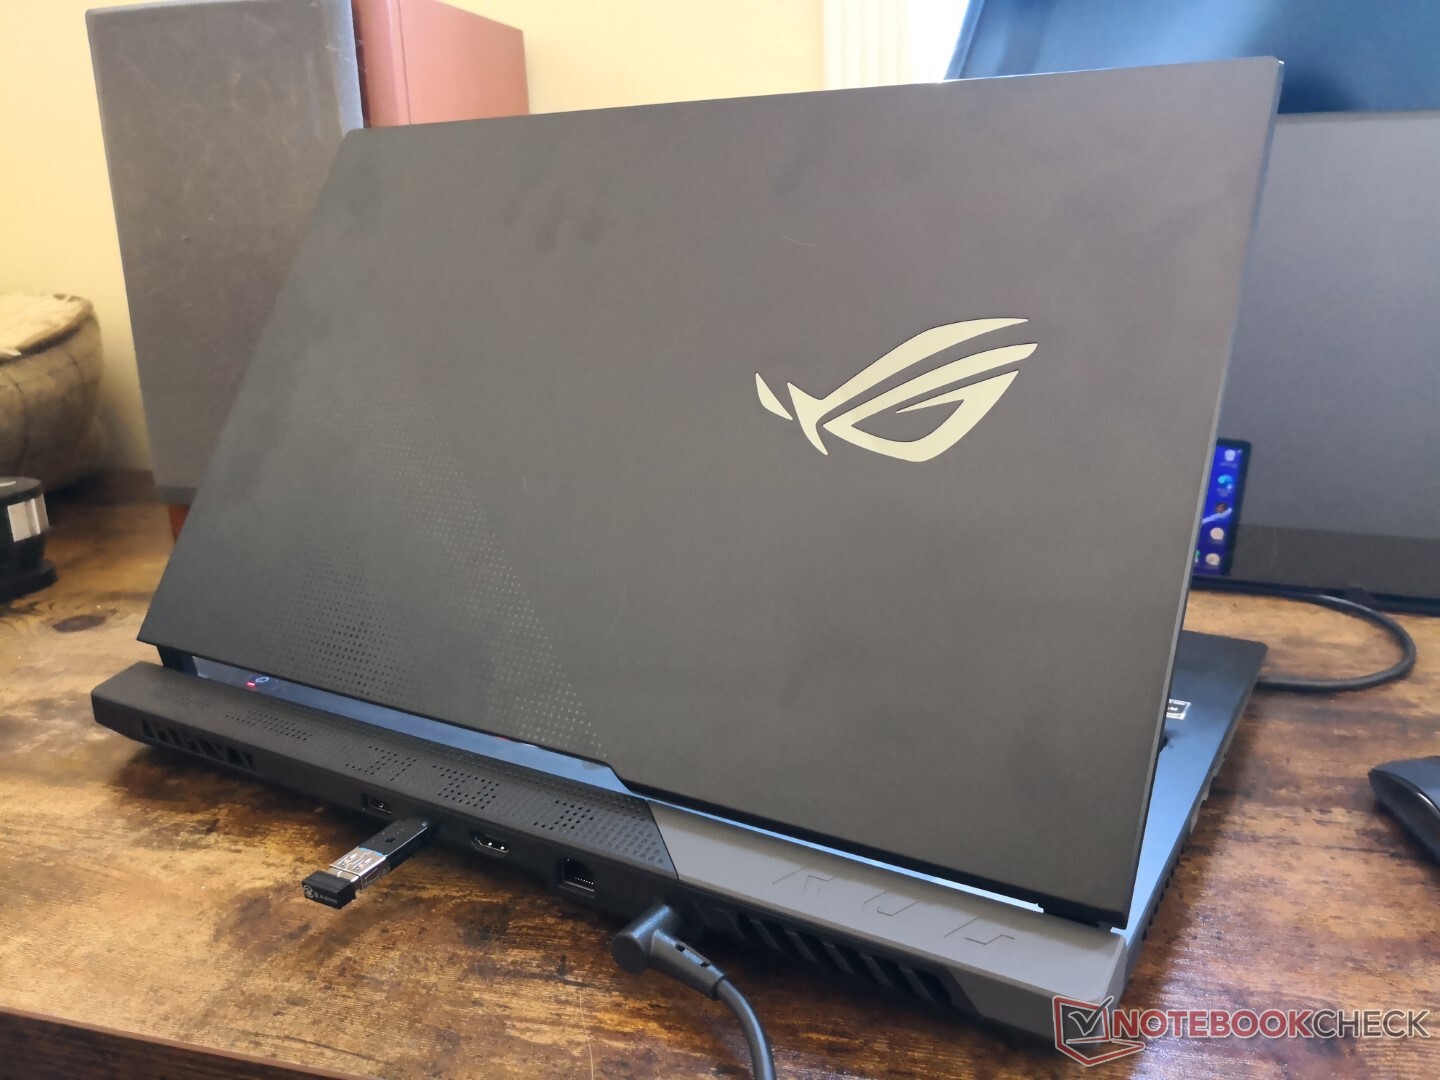
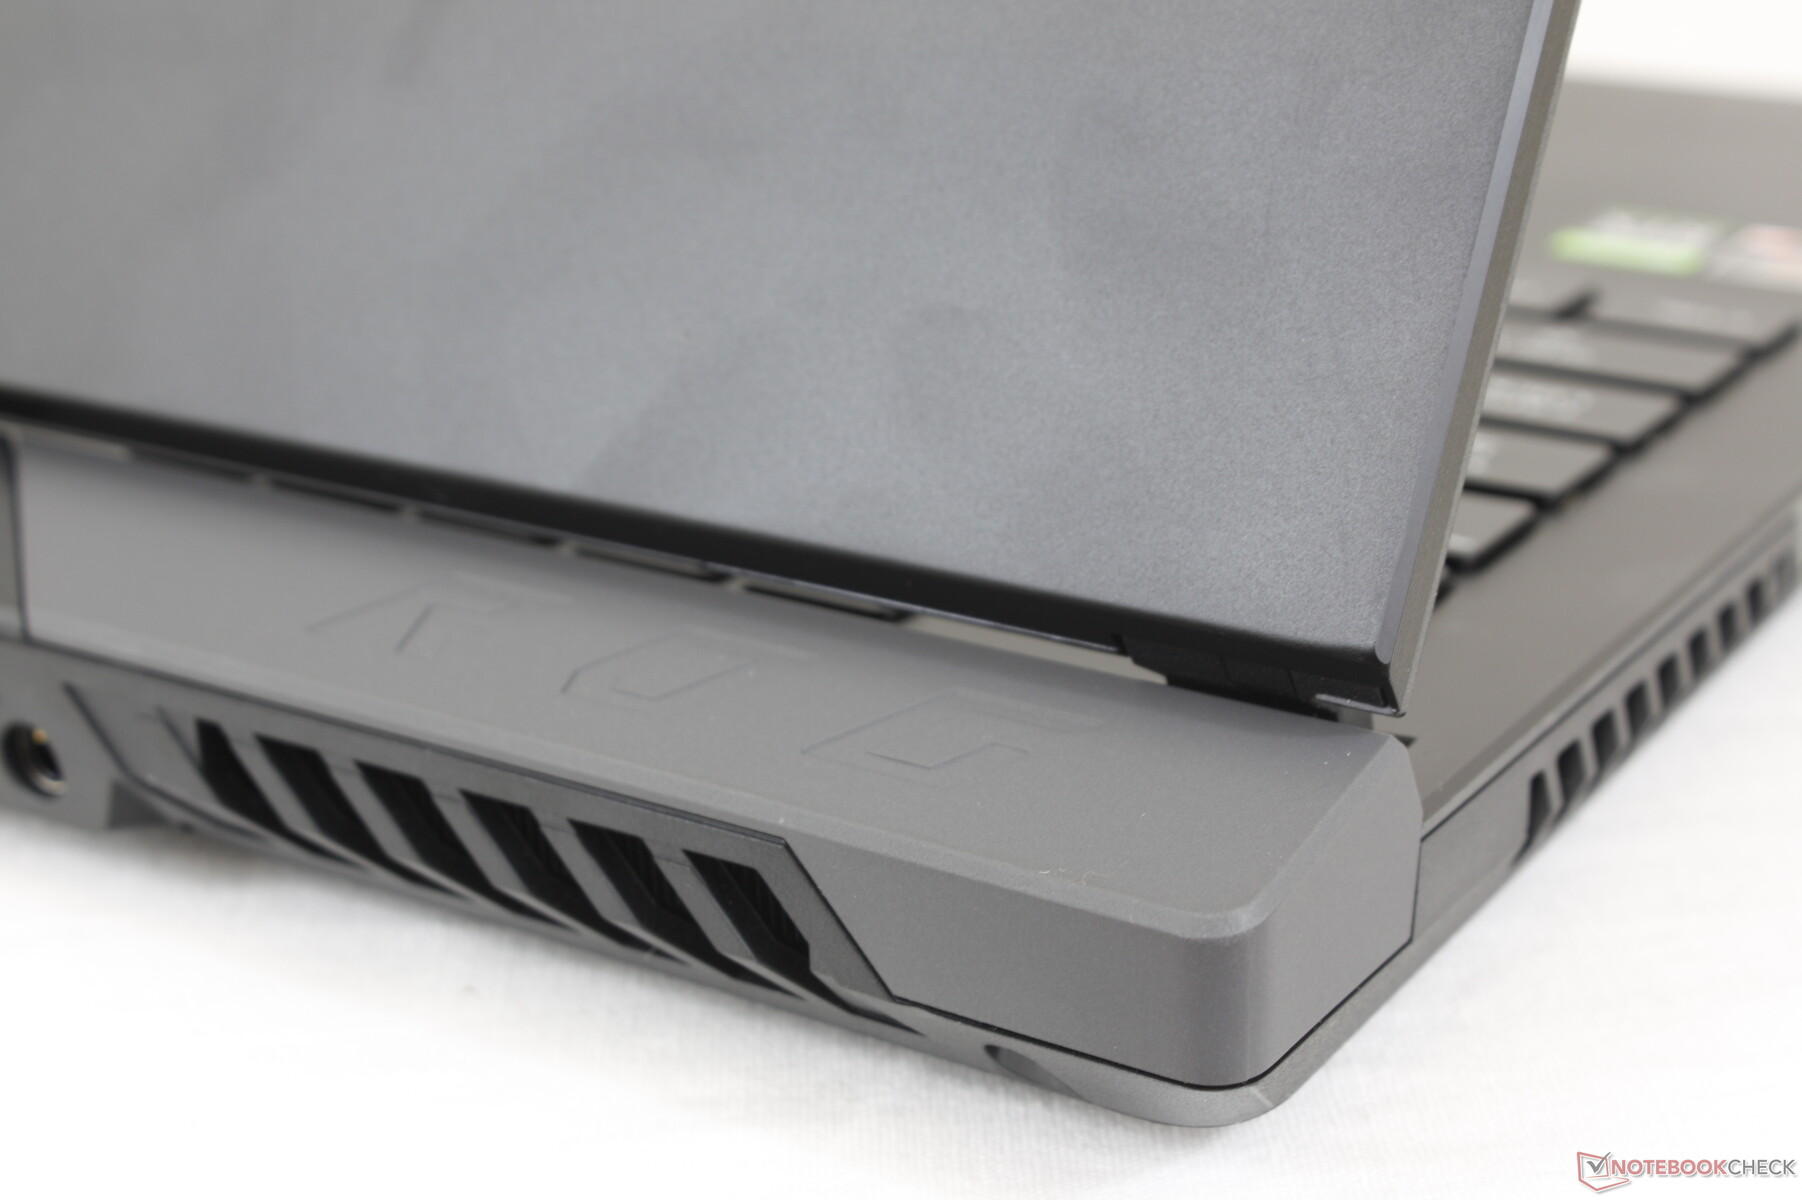
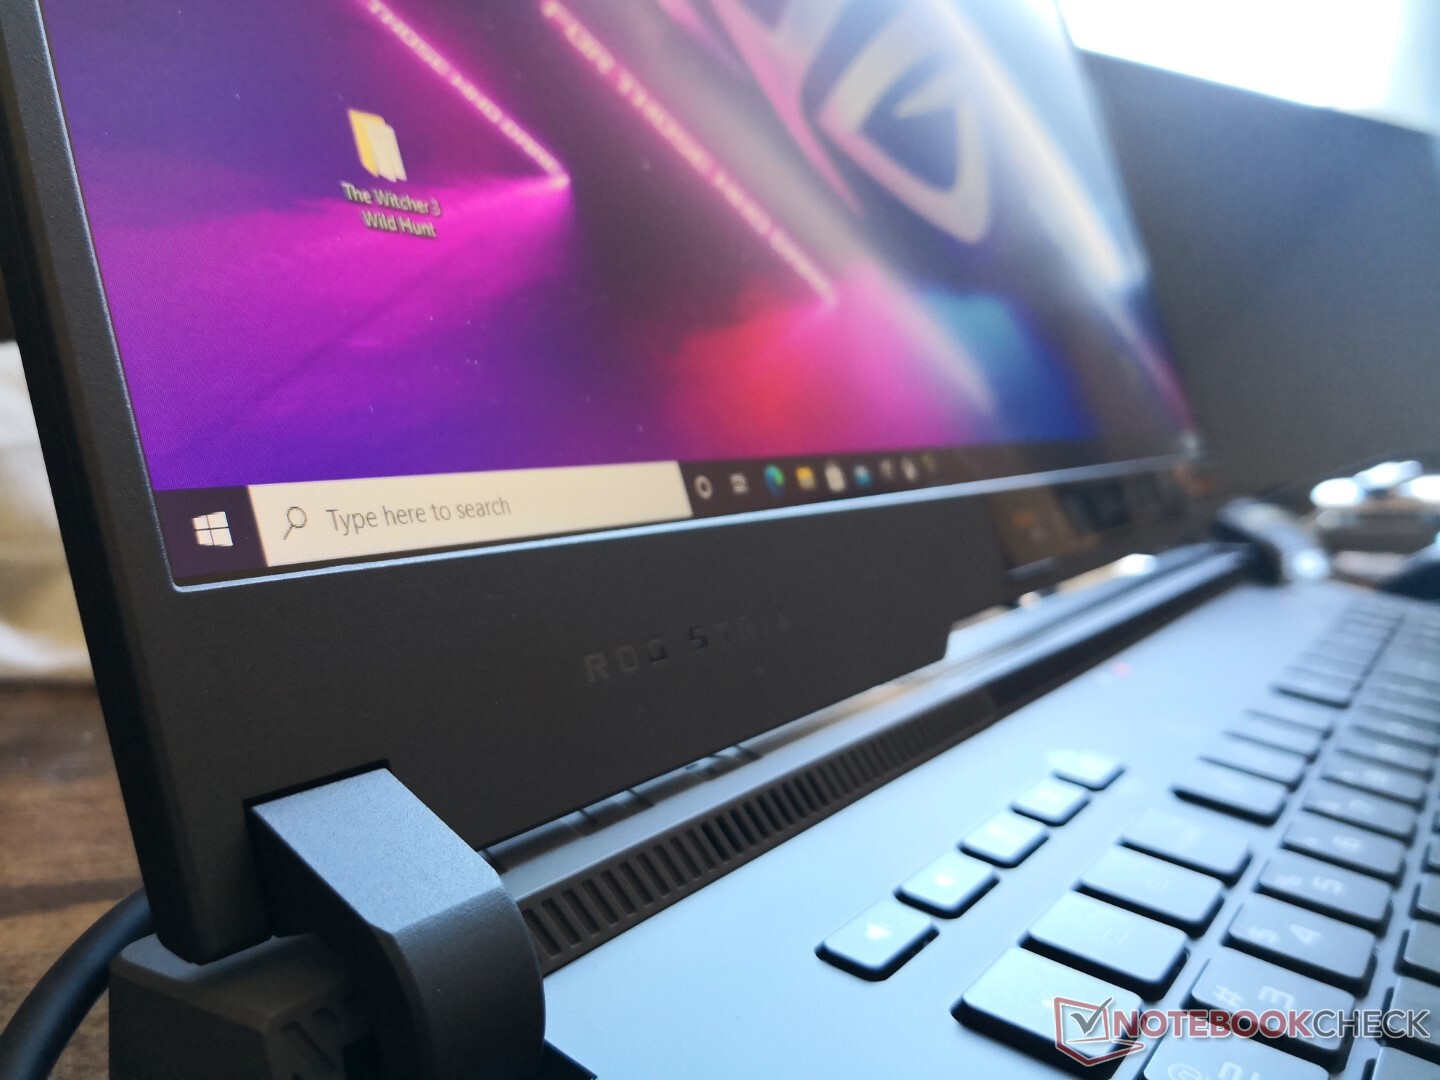
Los portátiles ROG de Asus son casi lo contrario a los de Razer en cuanto a diseño estético. Mientras que los modelos de Razer tienden a ser planos y minimalistas sin extremos LED, los de Asus tienden a tener un aspecto más recargado con todo tipo de protuberancias y curvas y opciones LED RGB. El G733 va un paso más allá al incorporar translucidez en partes de su chasis para que los usuarios puedan ver un poco de la placa base en su interior.
La rigidez del chasis sigue siendo prácticamente la misma que en el G732 del año pasado, a pesar de todos los cambios estéticos. La base es bastante rígida, pero cruje ligeramente al abrir la tapa o girar sus esquinas. La tapa también se flexiona más fácilmente que las tapas del MSI GE76 o del Razer Blade Pro.
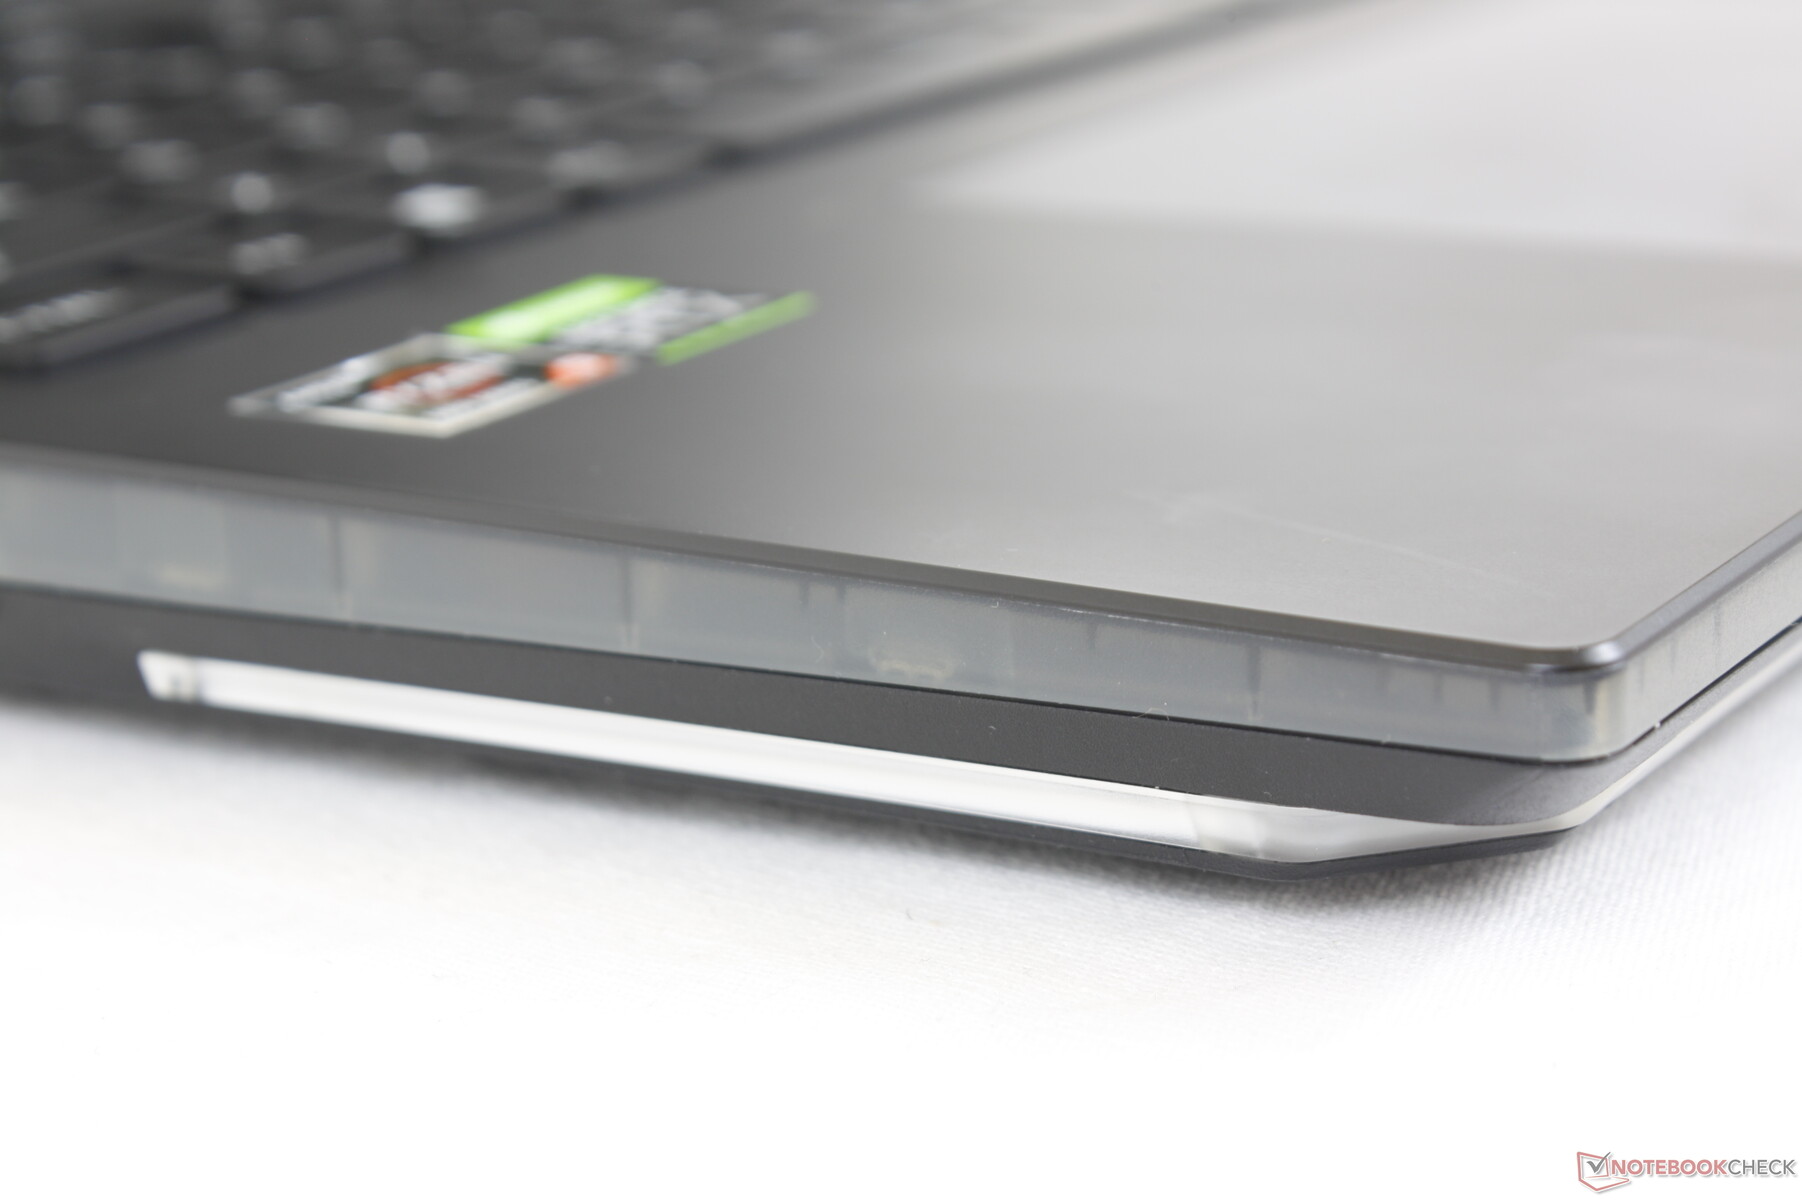
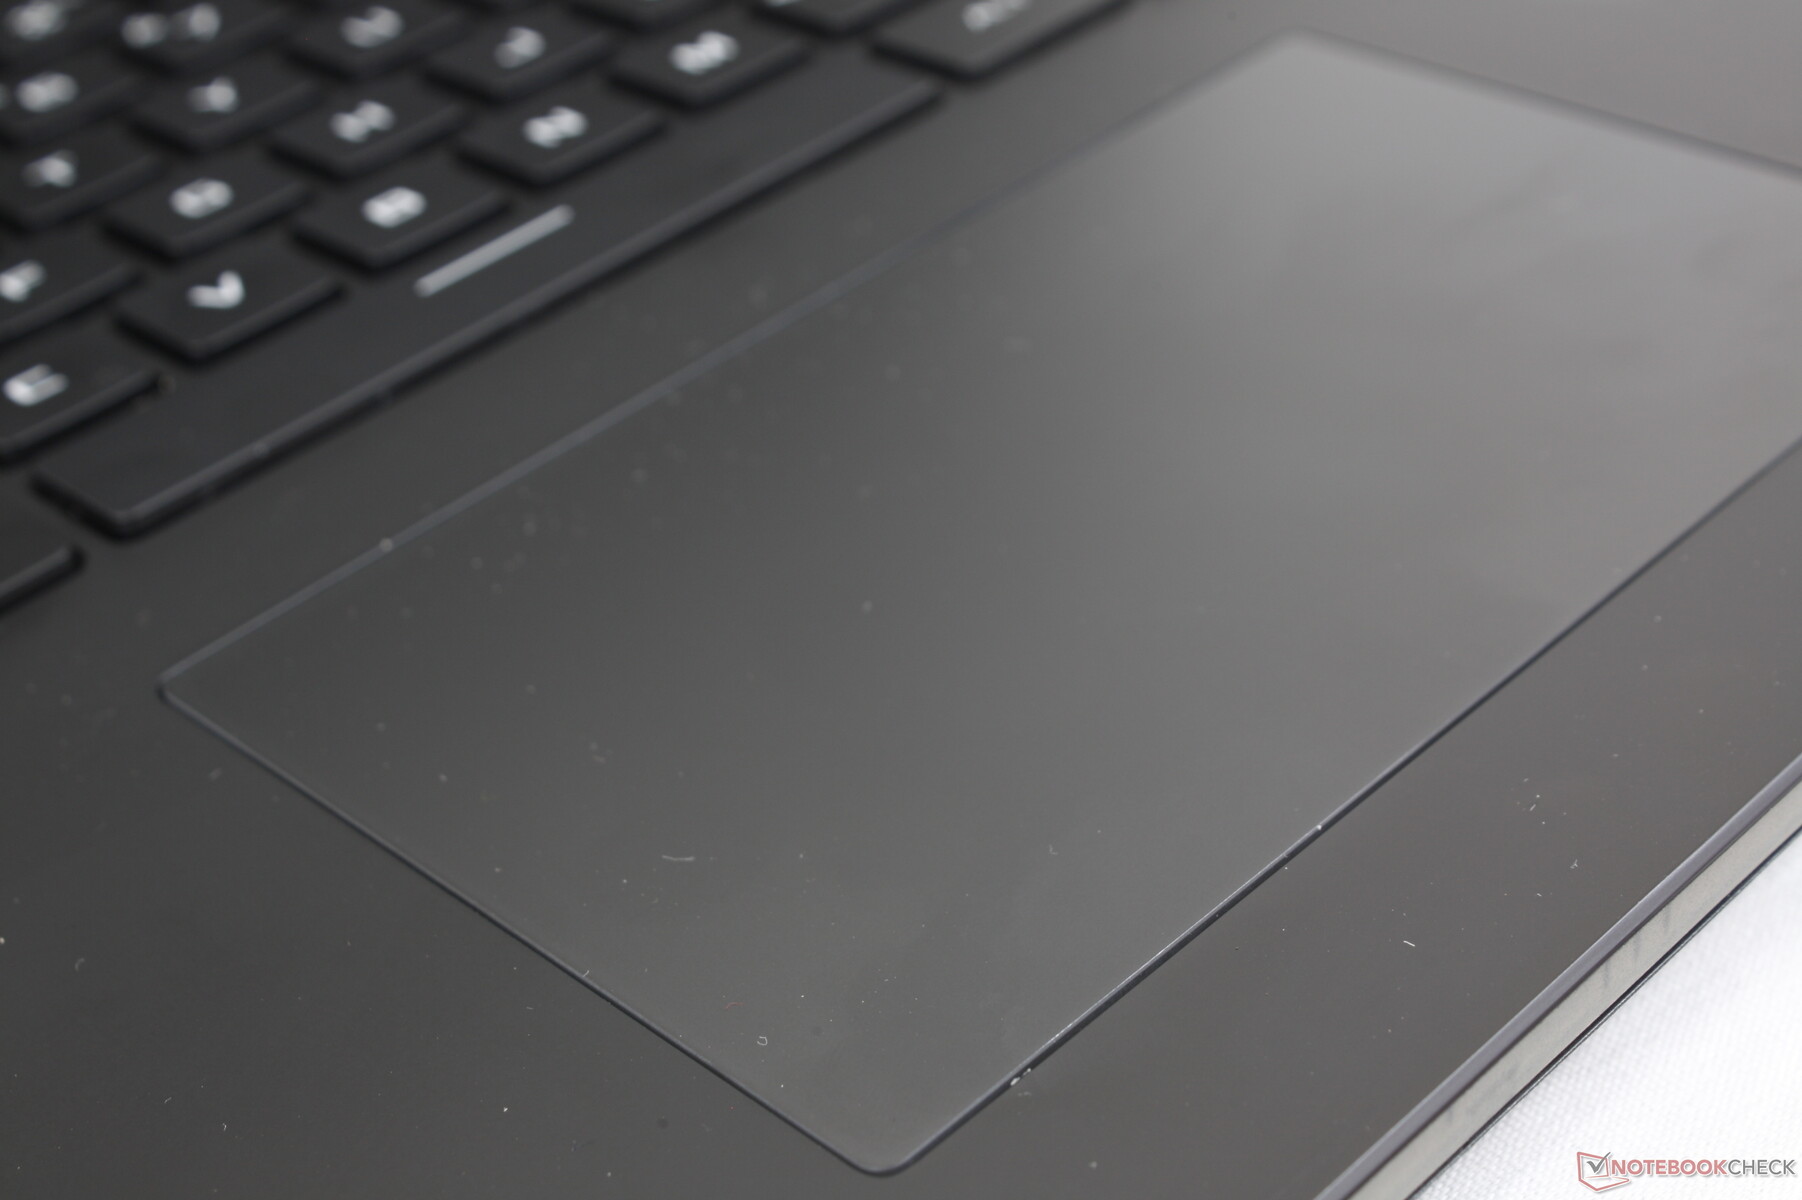
Una de nuestras mayores quejas sobre la carcasa es que sus superficies, el clickpad y las teclas son enormes imanes de huellas dactilares, como muestra la imagen de abajo, incluso después de unos pocos días de uso.
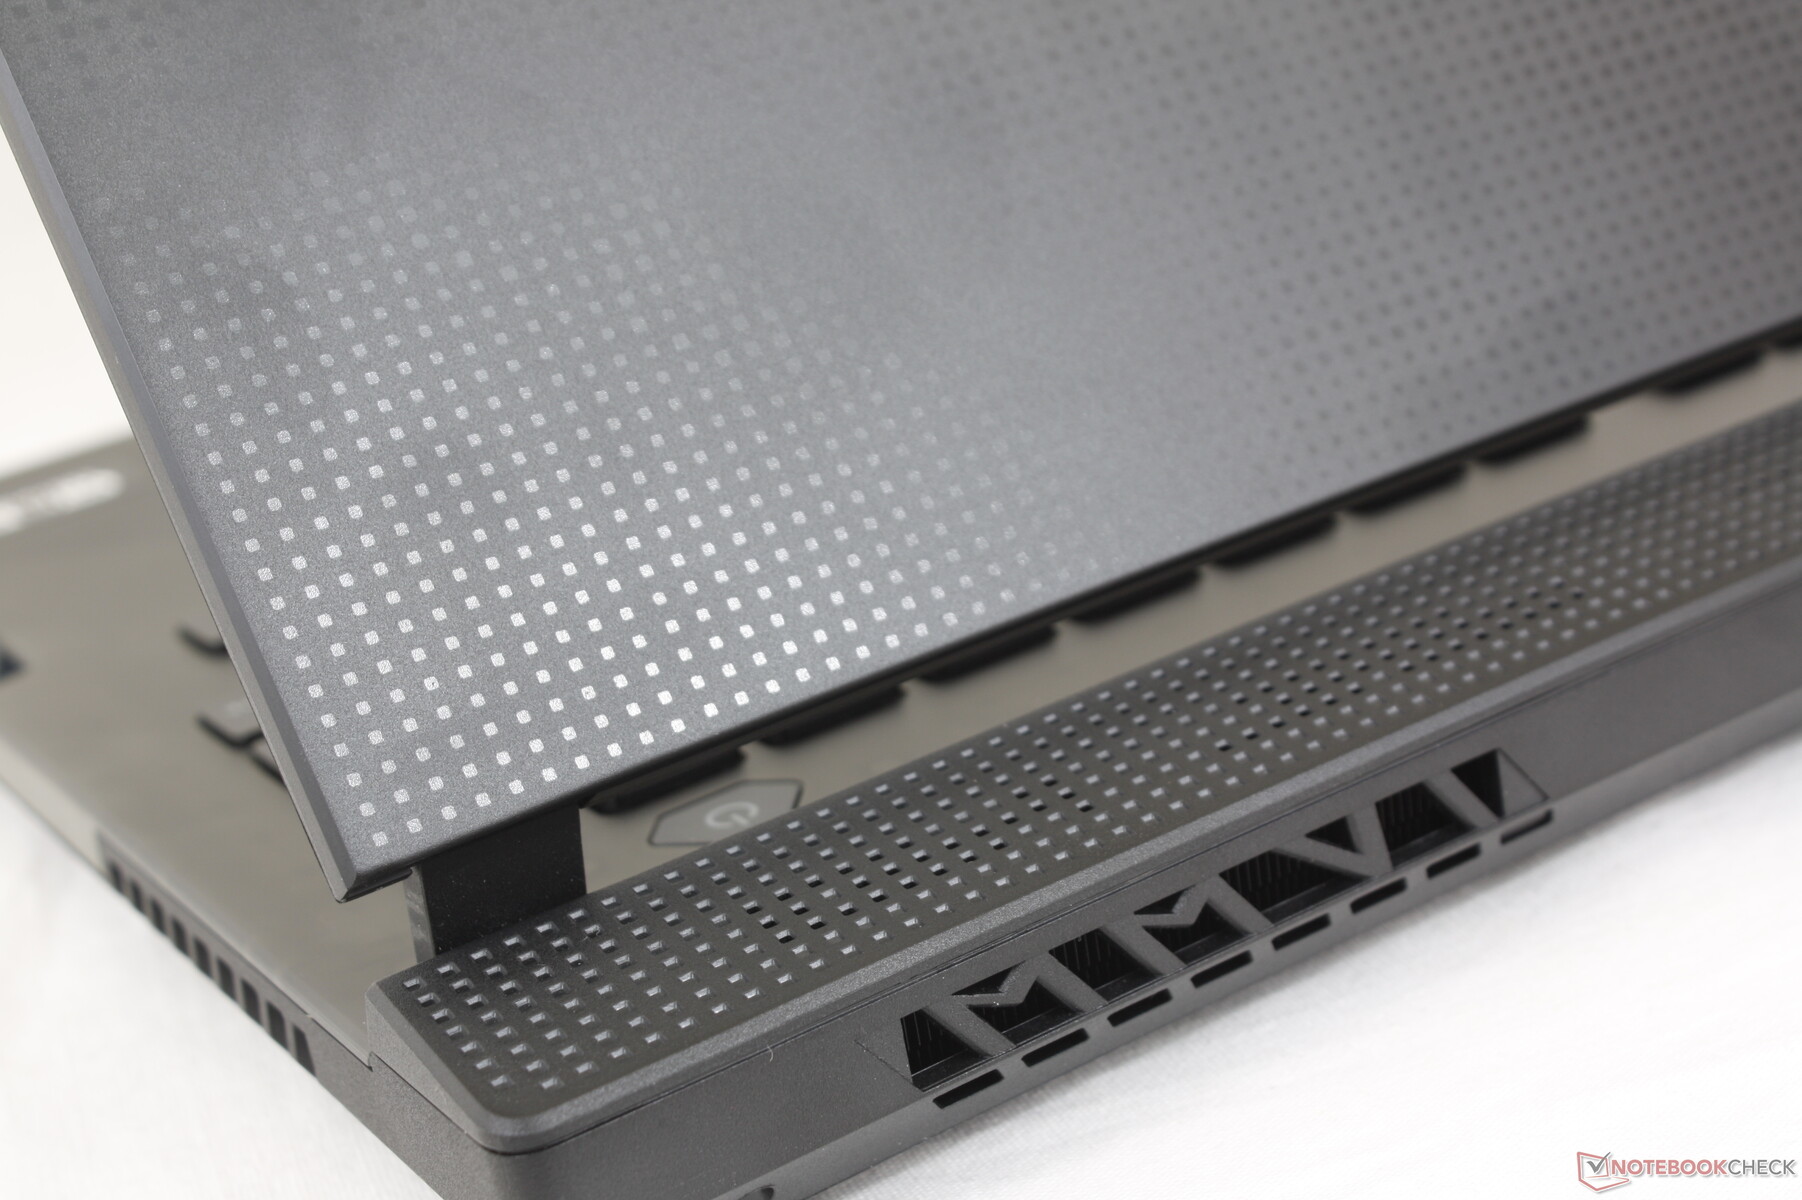
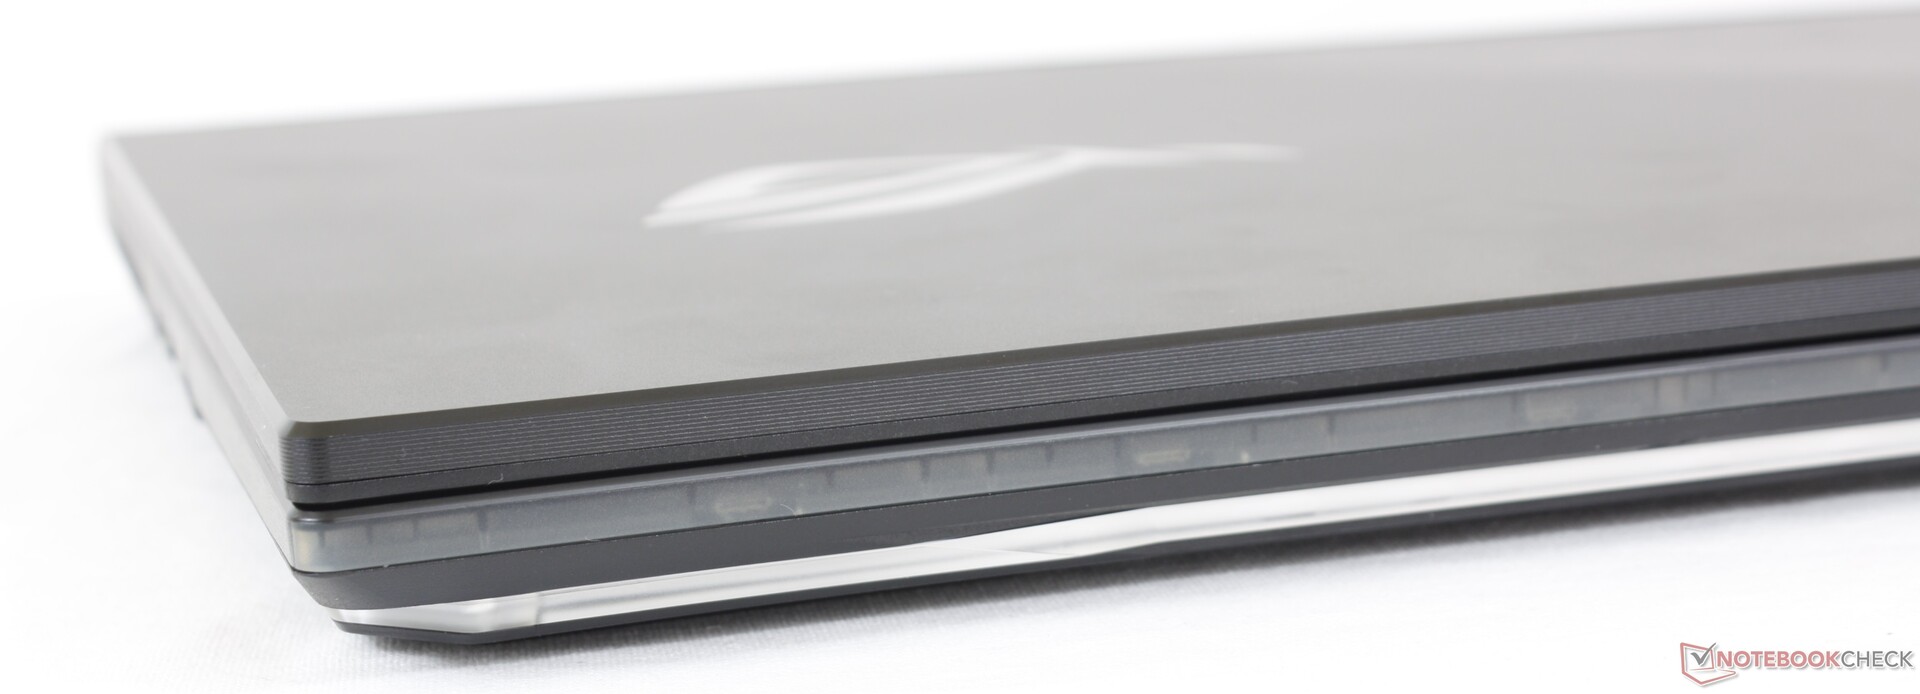
El chasis es ligeramente más grueso que el del G732 del año pasado a la vez que es más pequeño en longitud y anchura. El MSI GE76 de la competencia, sin embargo, es tanto más pequeño como más pesado que nuestro G733 para ser el portátil más denso. El tamaño y el peso totales se sitúan cómodamente entre la serie Zephyrus S y la serie G703, más grande.
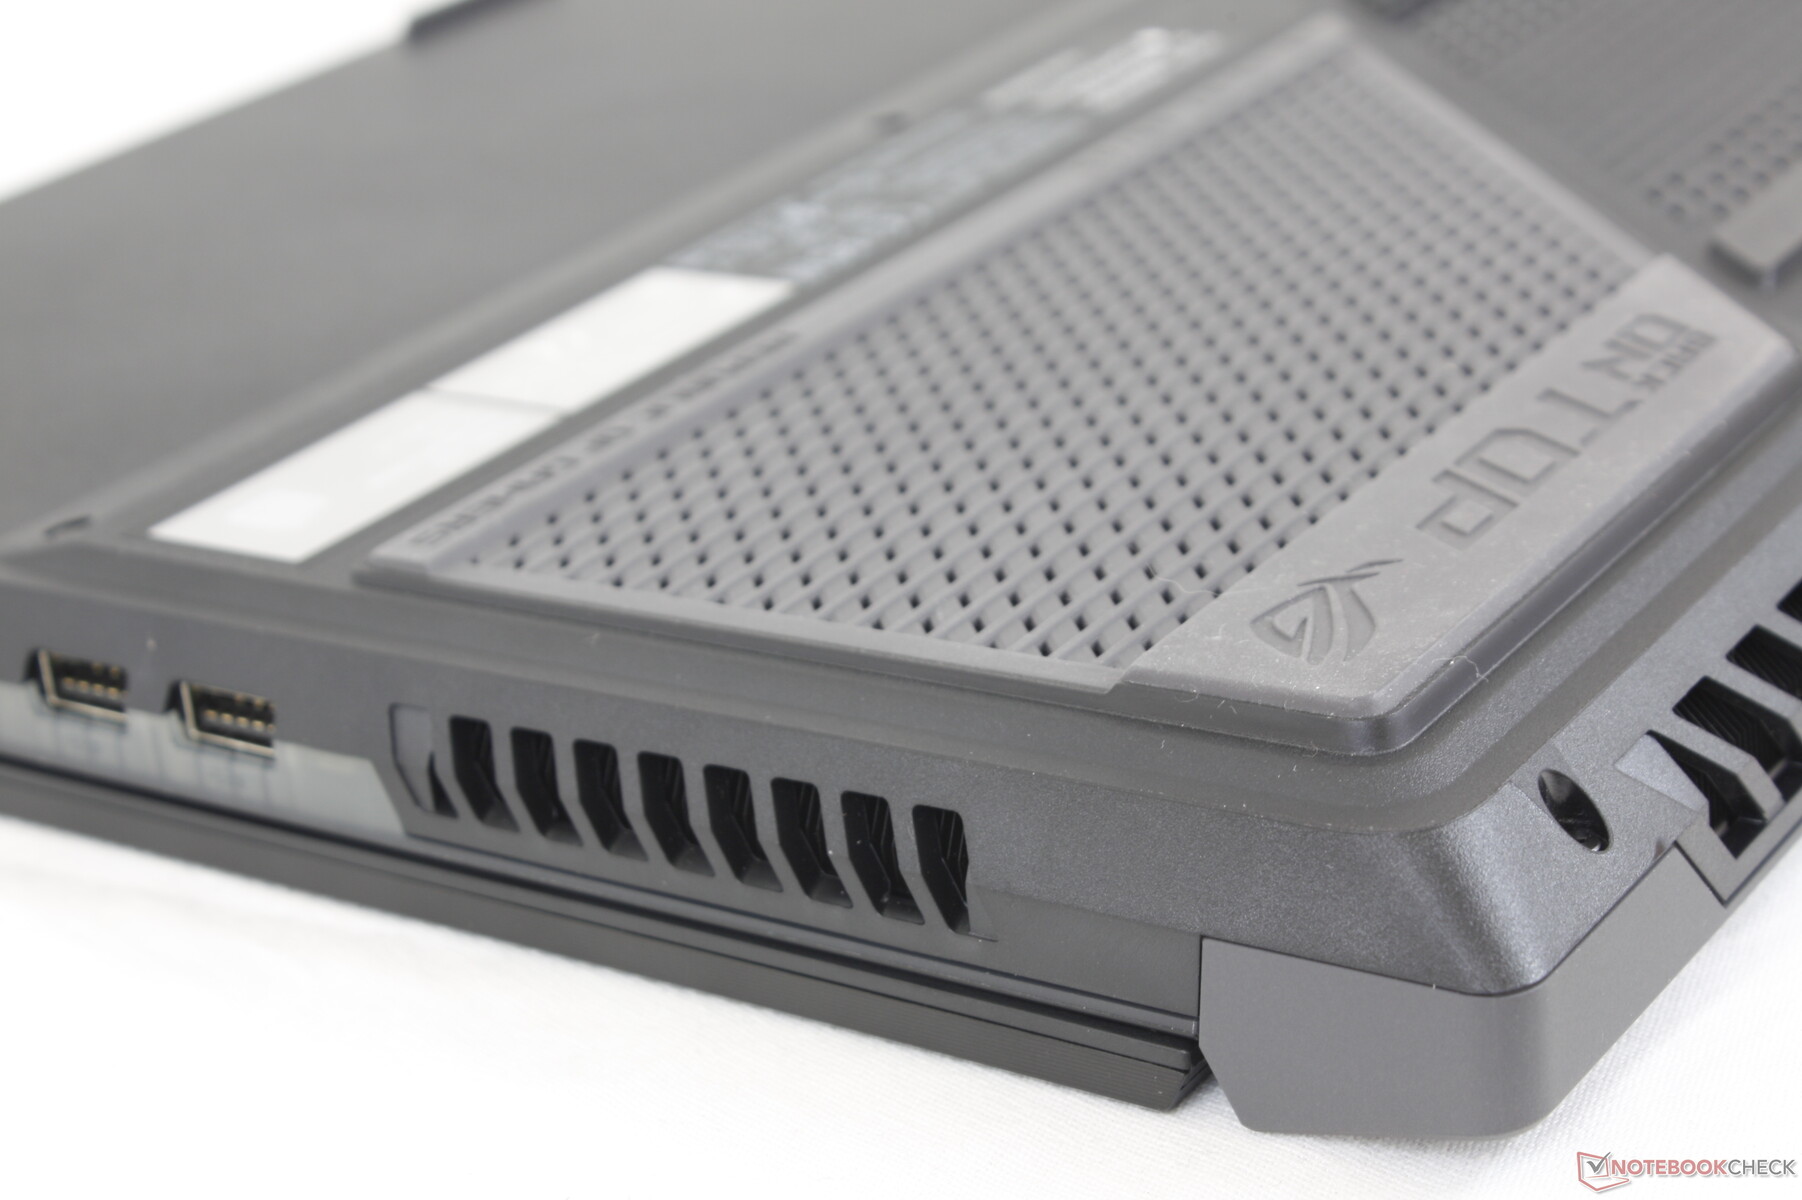
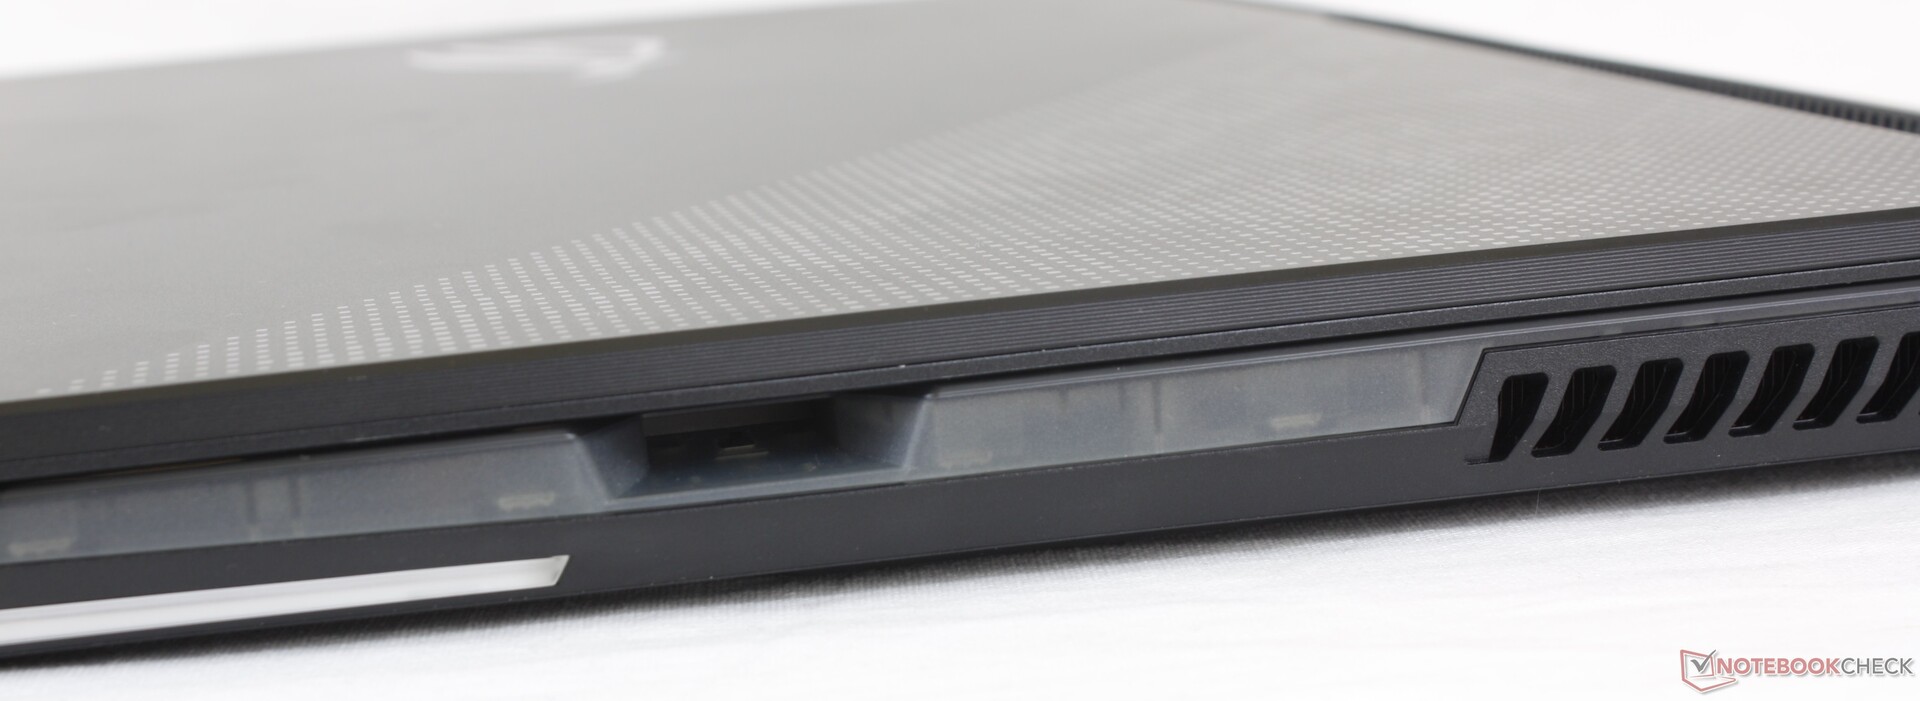
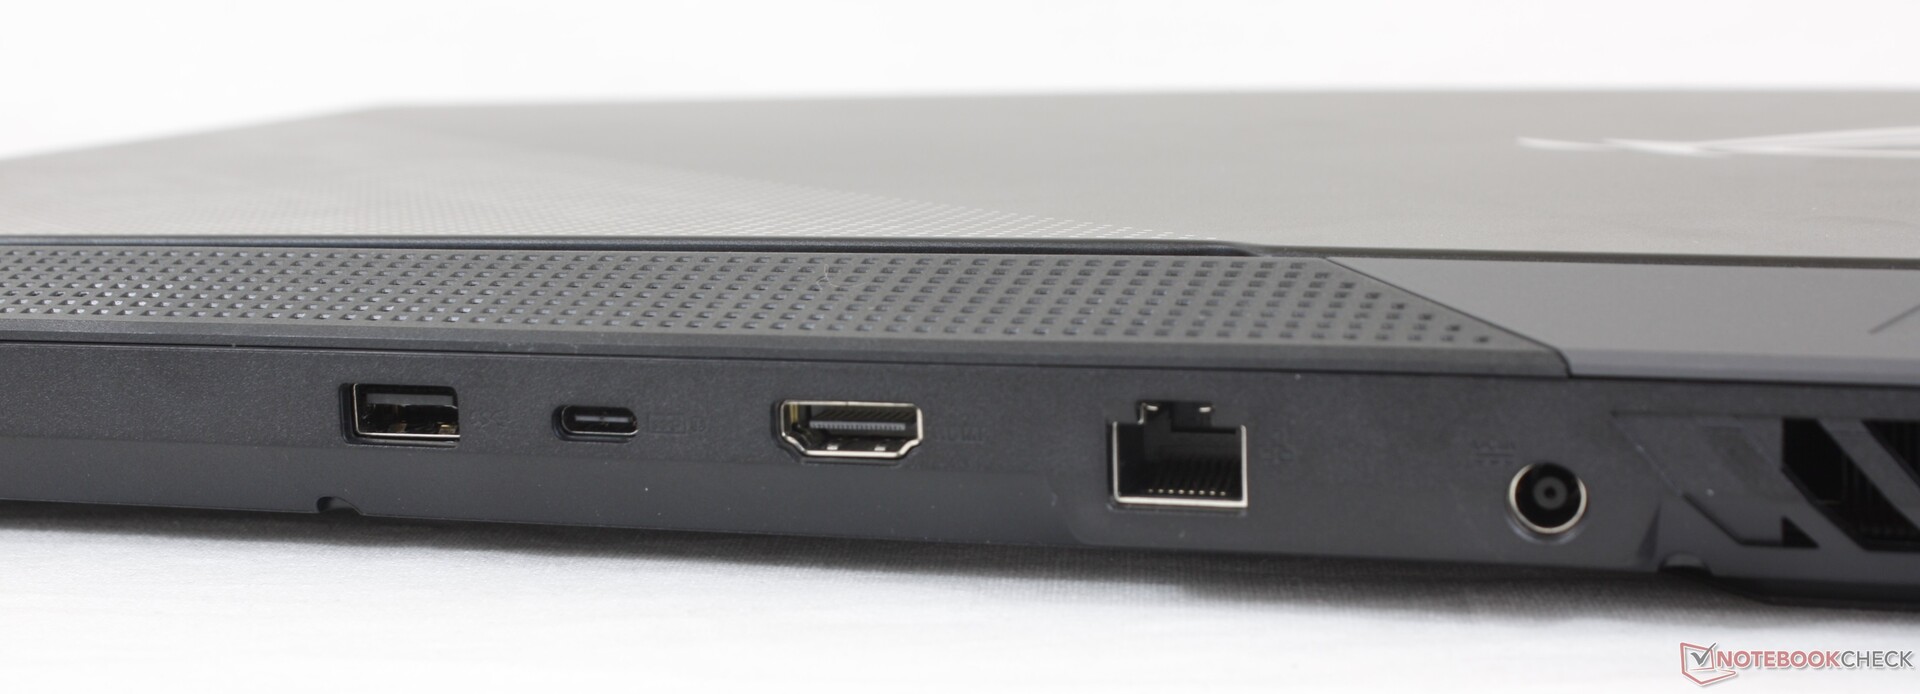
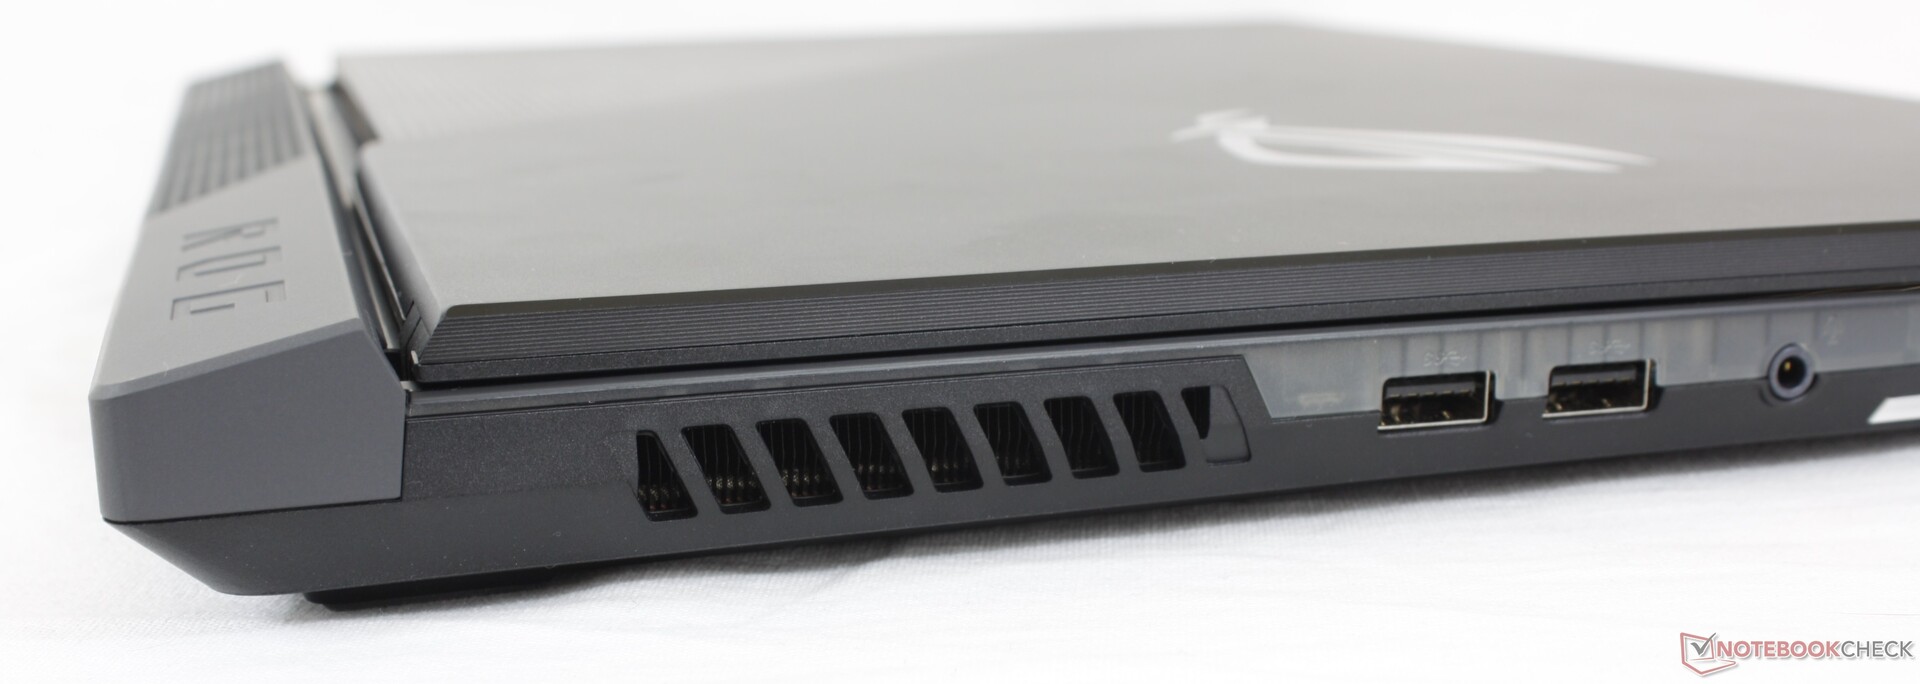
Conectividad
Las opciones de puerto no han cambiado respecto al ROG Strix Scar 17 G732LXS del año pasado, incluyendo la falta de soporte Thunderbolt. Nos habría gustado un lector de tarjetas SD integrado o al menos un puerto USB-C adicional. La mayoría de los puertos también están en la parte trasera del sistema, lo que puede ser molesto de alcanzar.
Comunicación
Mantenimiento
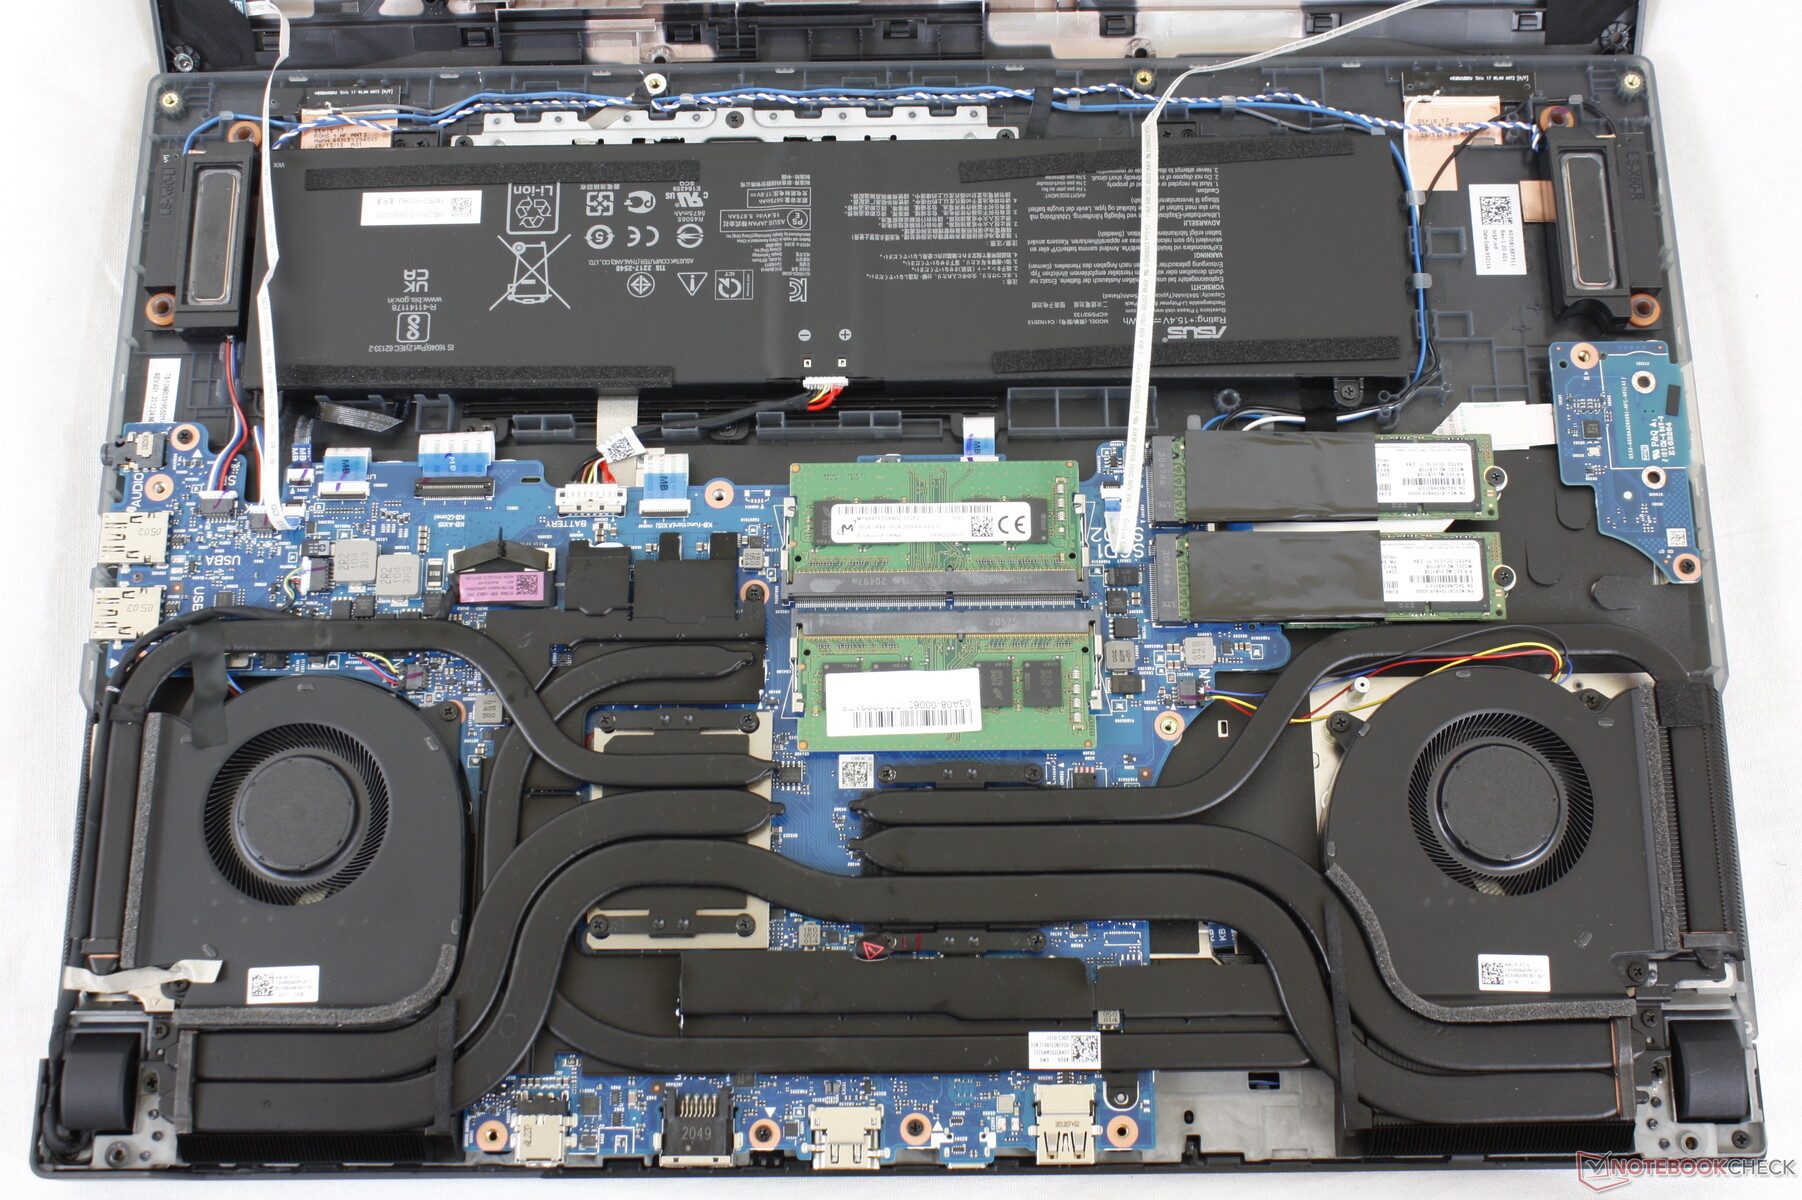
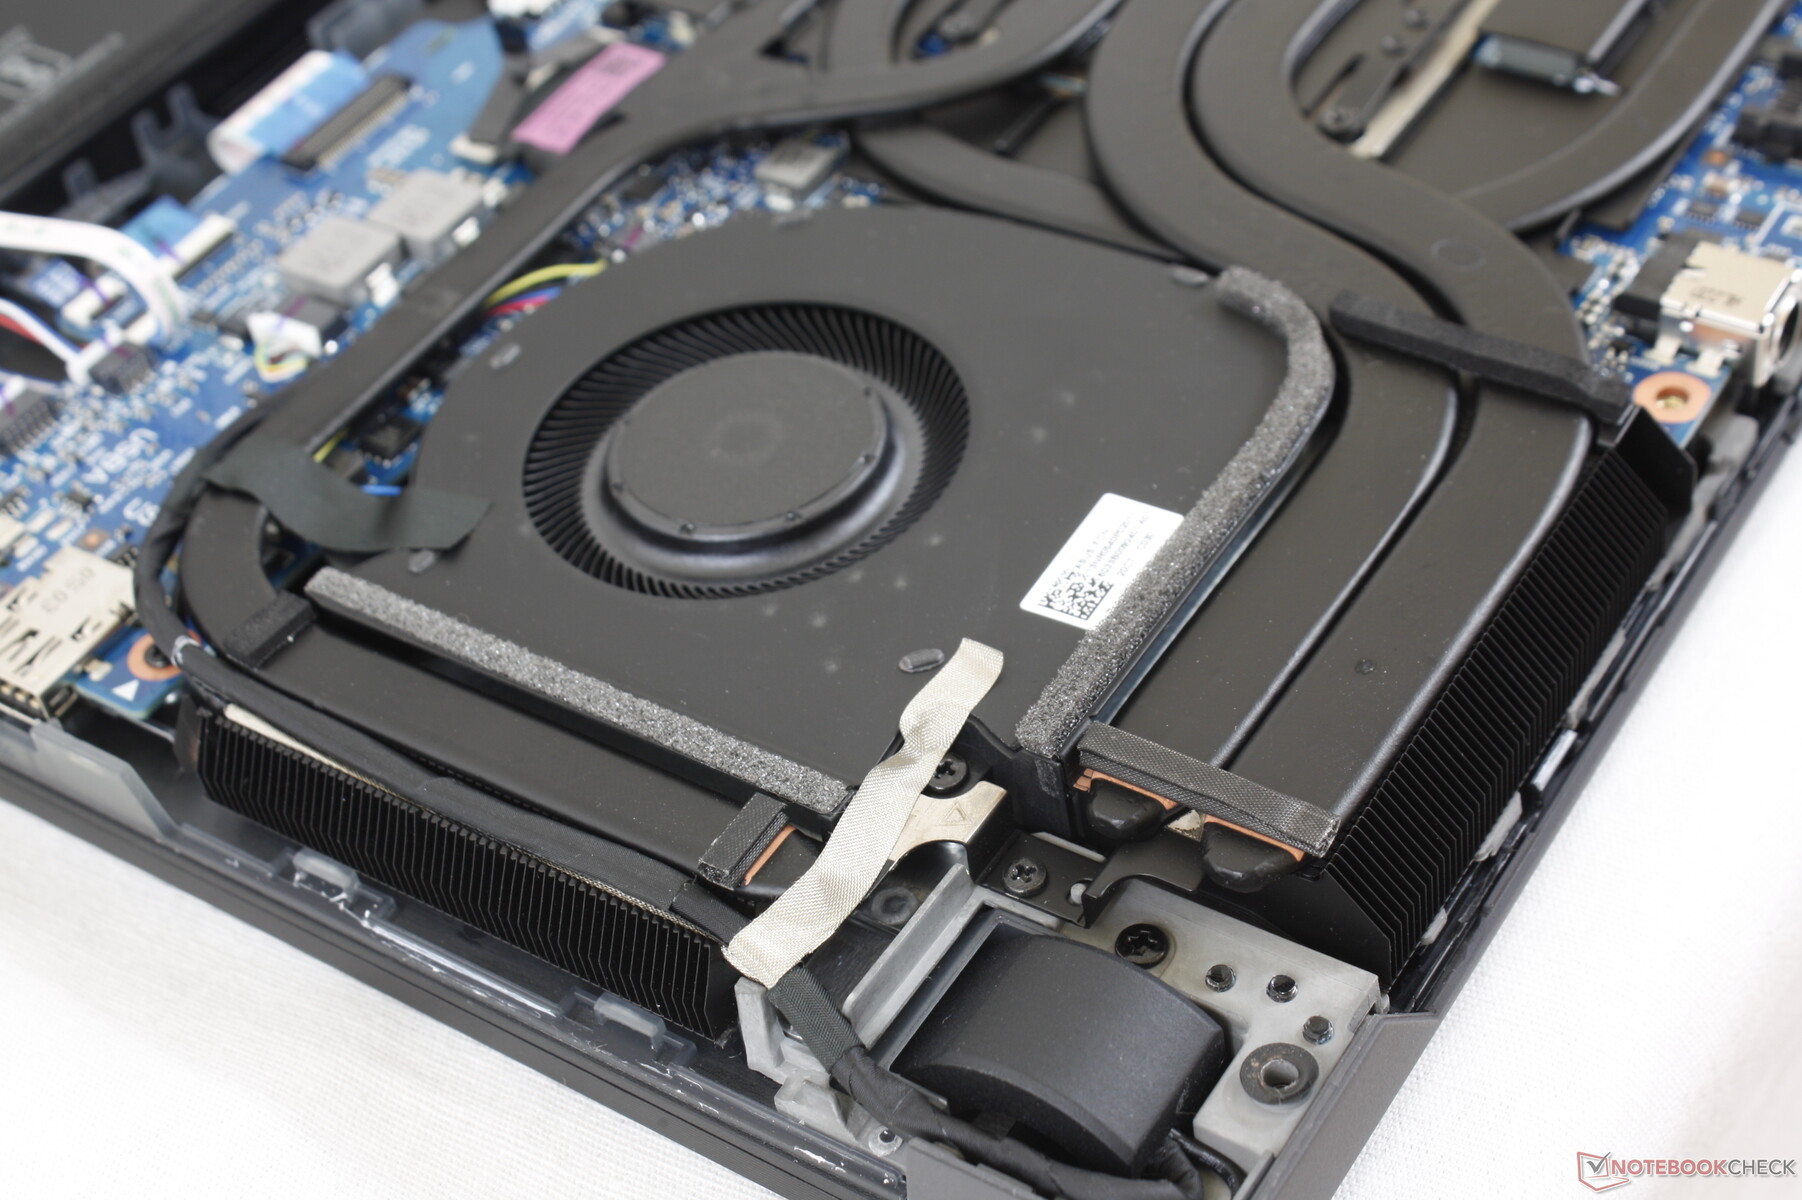
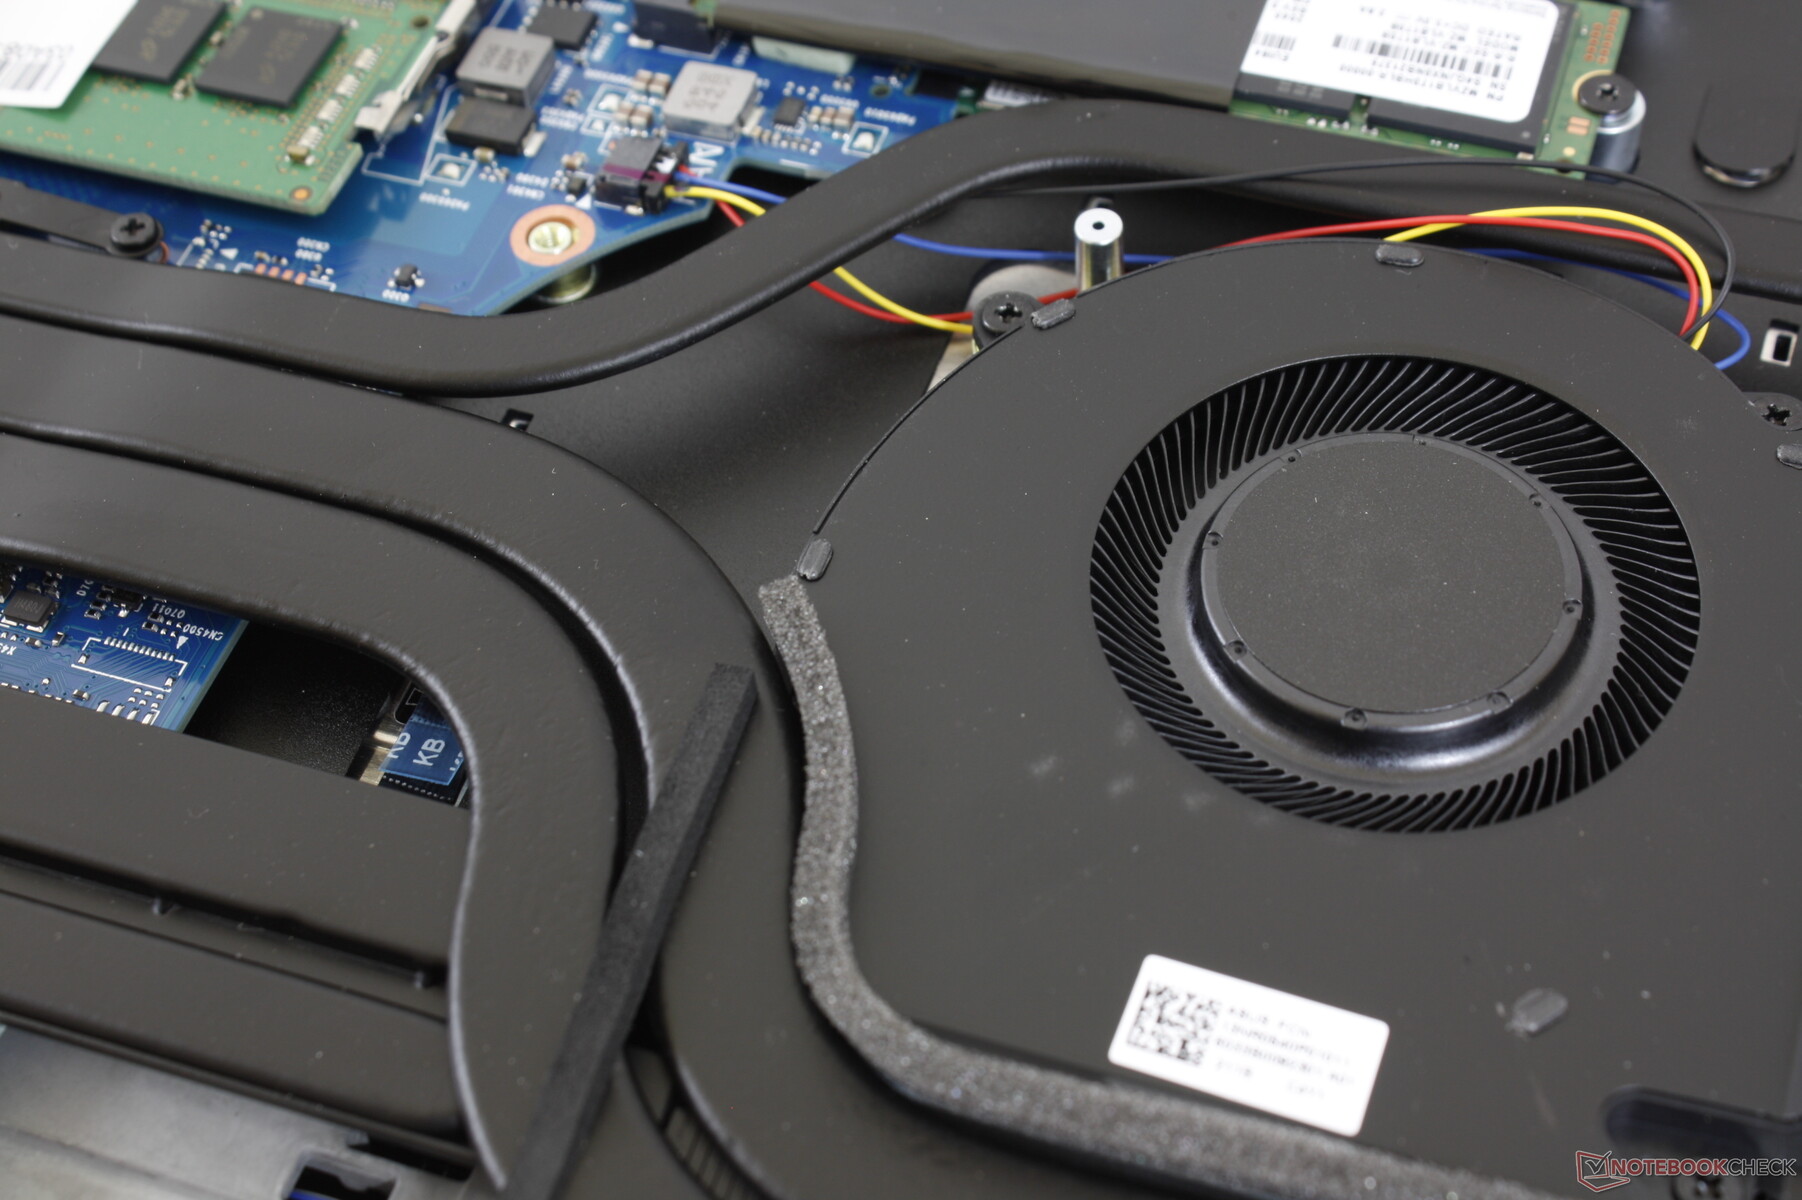
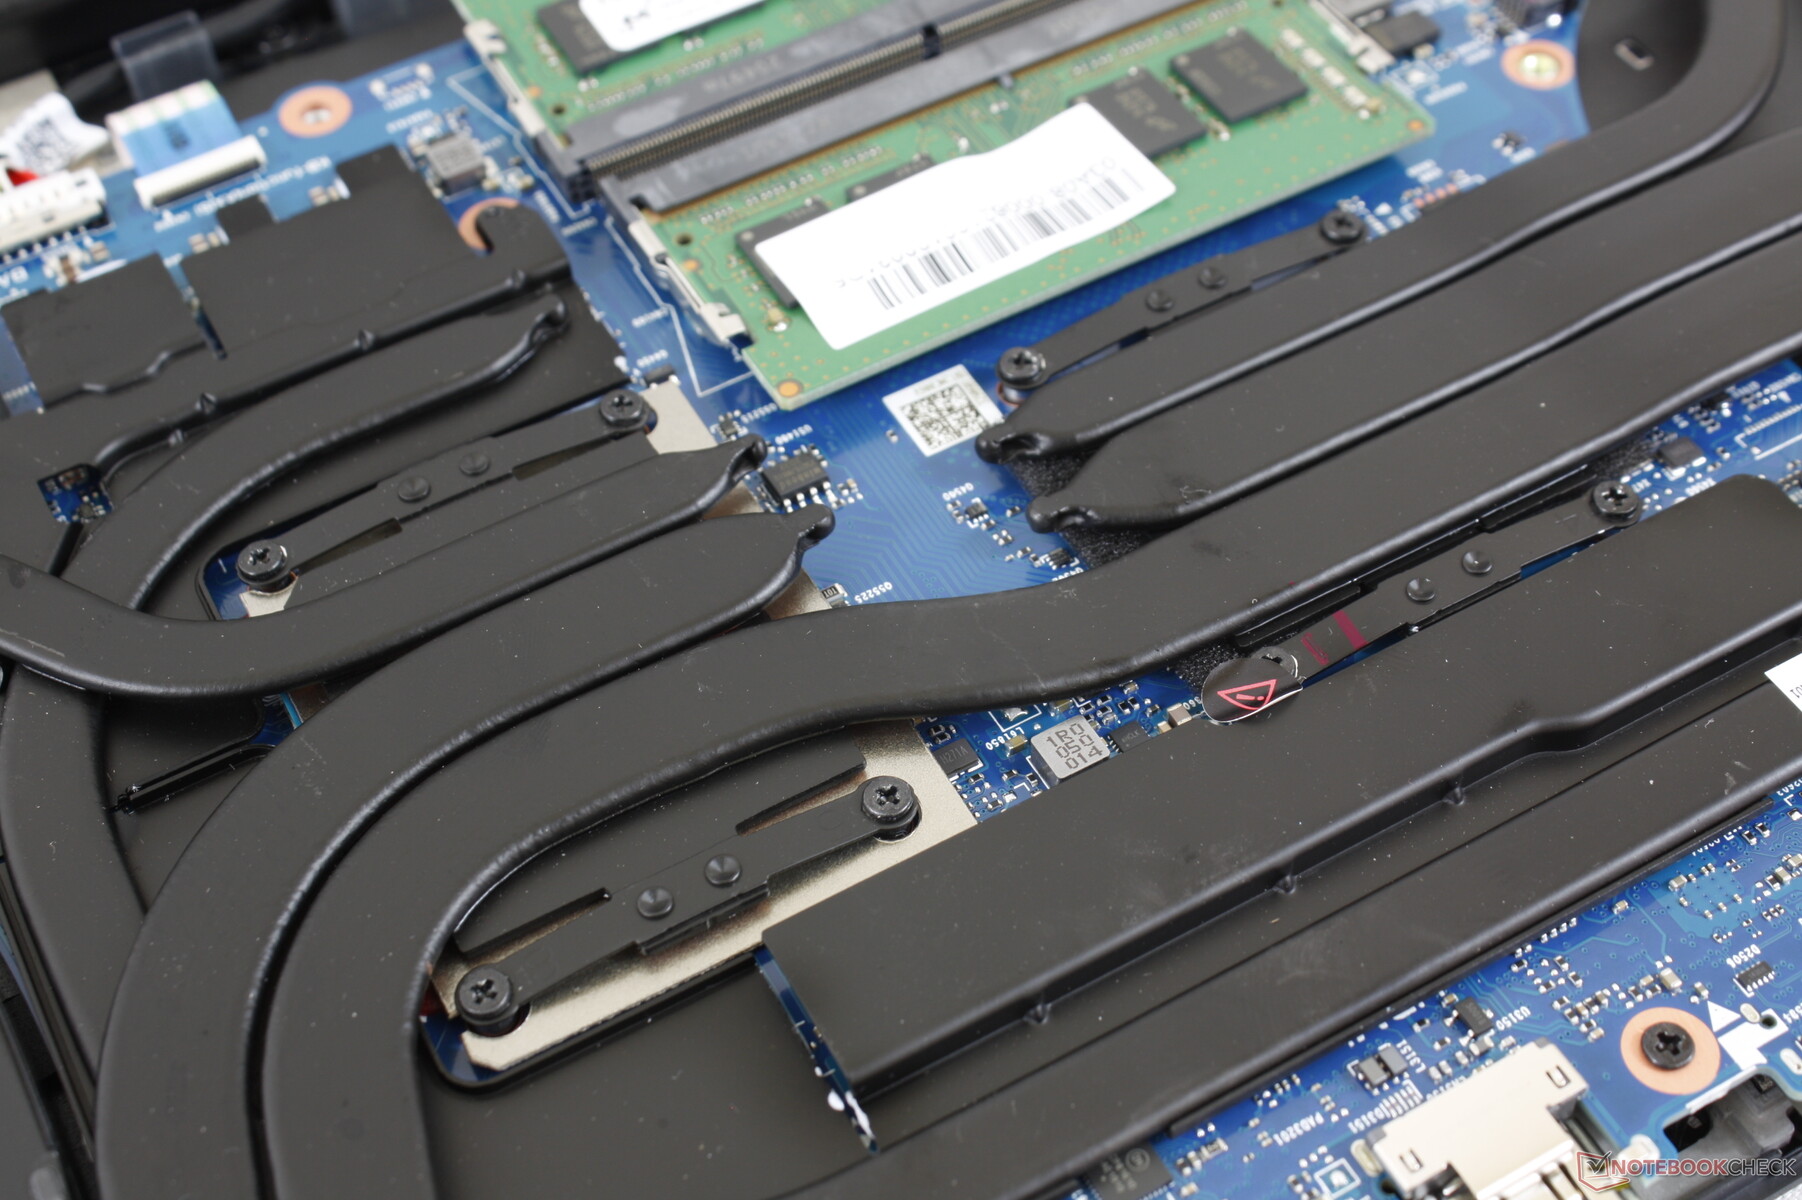
El panel inferior está asegurado por 11 tornillos Philips accesibles. Sin embargo, sus bordes y esquinas son difíciles de separar, por lo que es muy recomendable utilizar un borde plano como el de una tarjeta de crédito. El panel está conectado a la base a través de dos cables de cinta, ya que alberga LEDs personalizables a diferencia de la mayoría de otros portátiles.
Accesorios y garantía
La caja de venta incluye dos piezas adicionales "ROG" extraíbles que van en la esquina trasera del chasis, además de un Keystone y un mosquetón.
Se aplica la garantía estándar de un año limitada del fabricante.
Dispositivos de entrada
Teclado
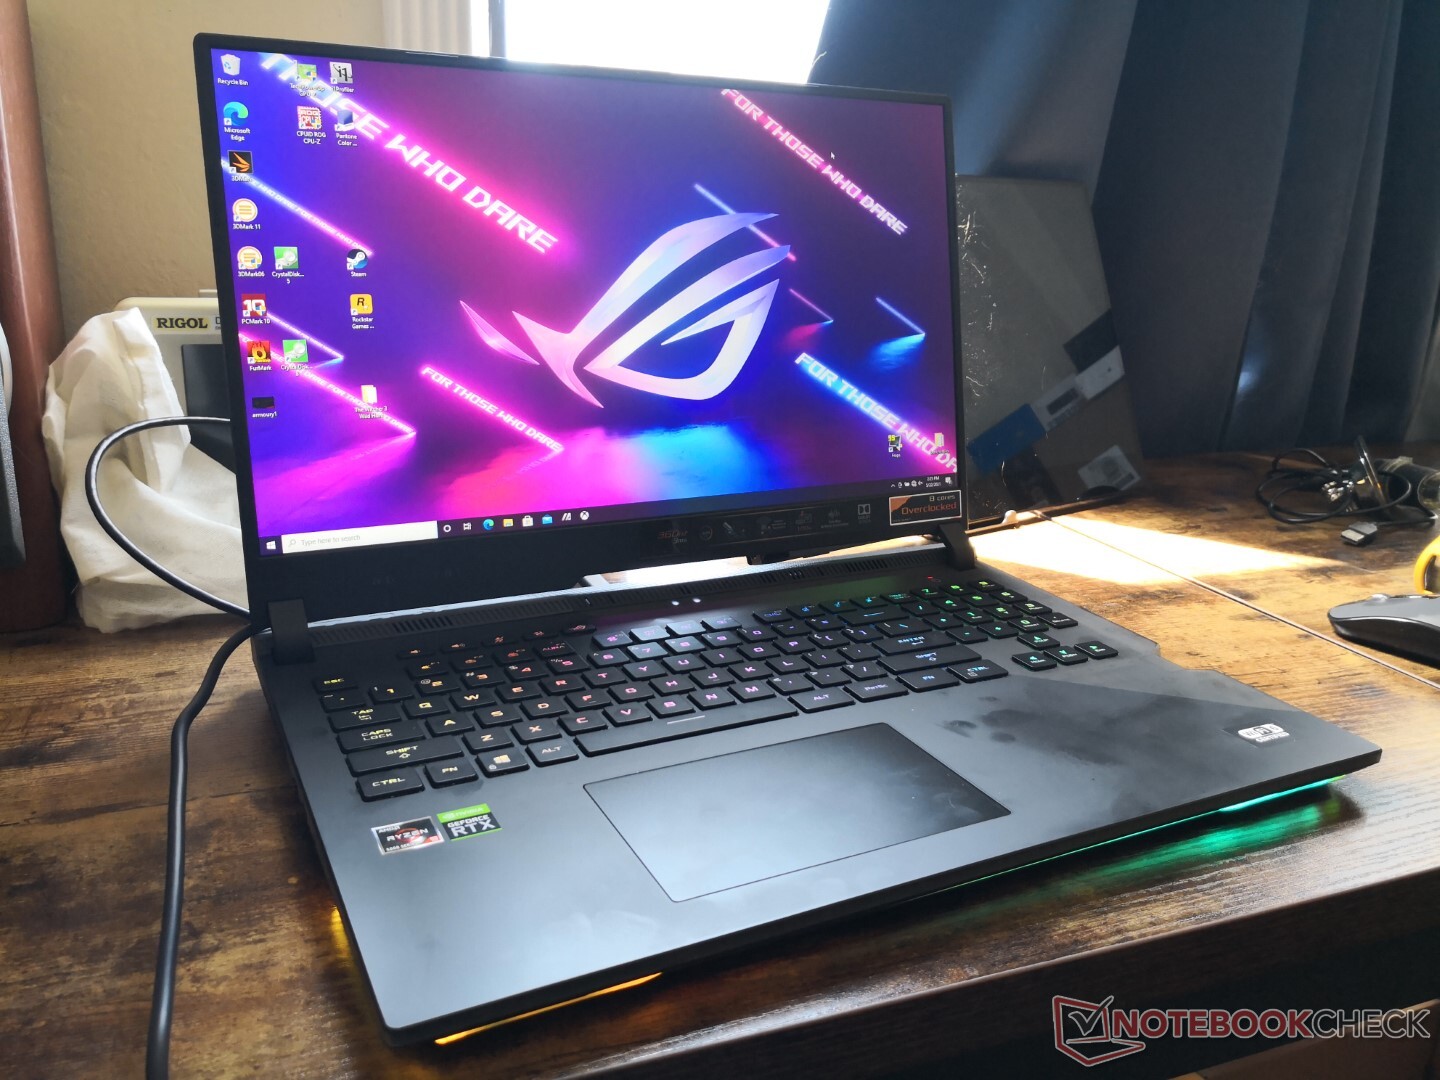
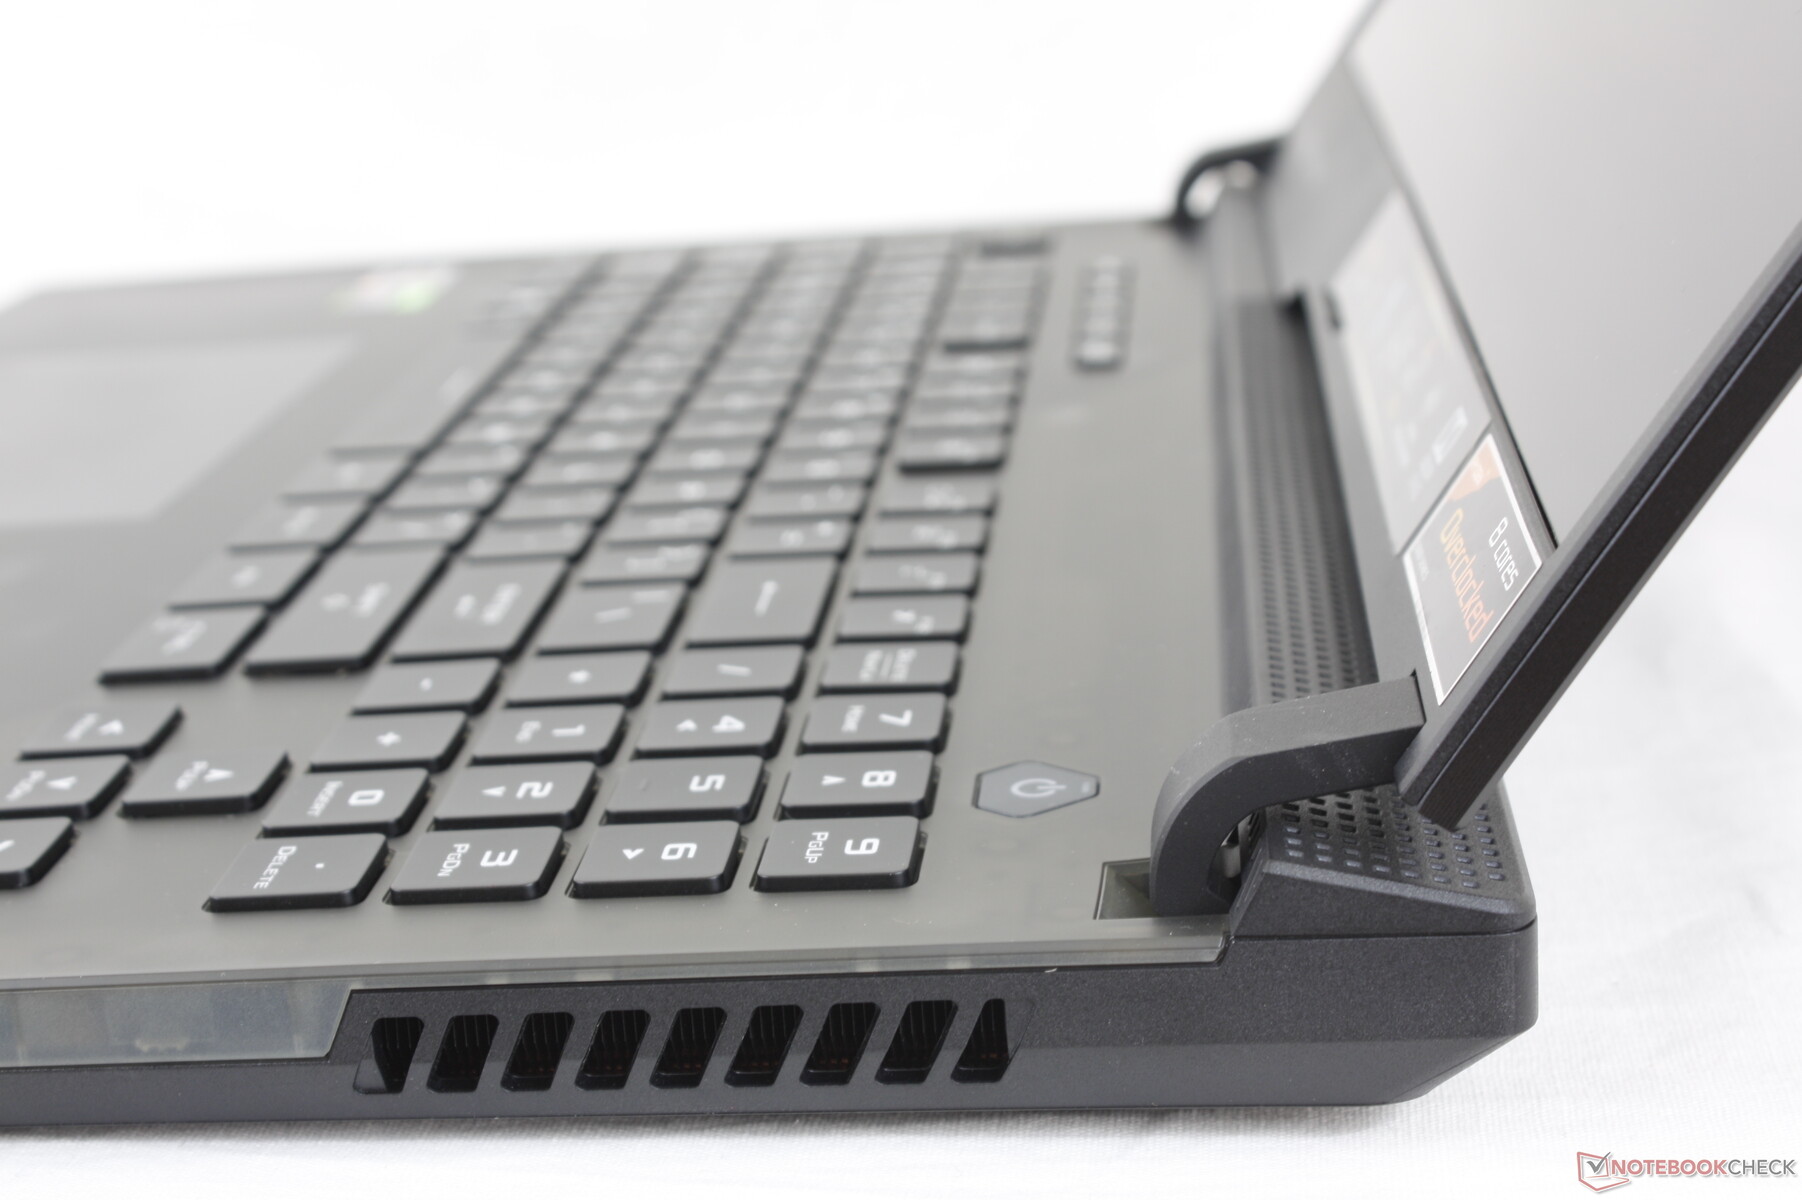
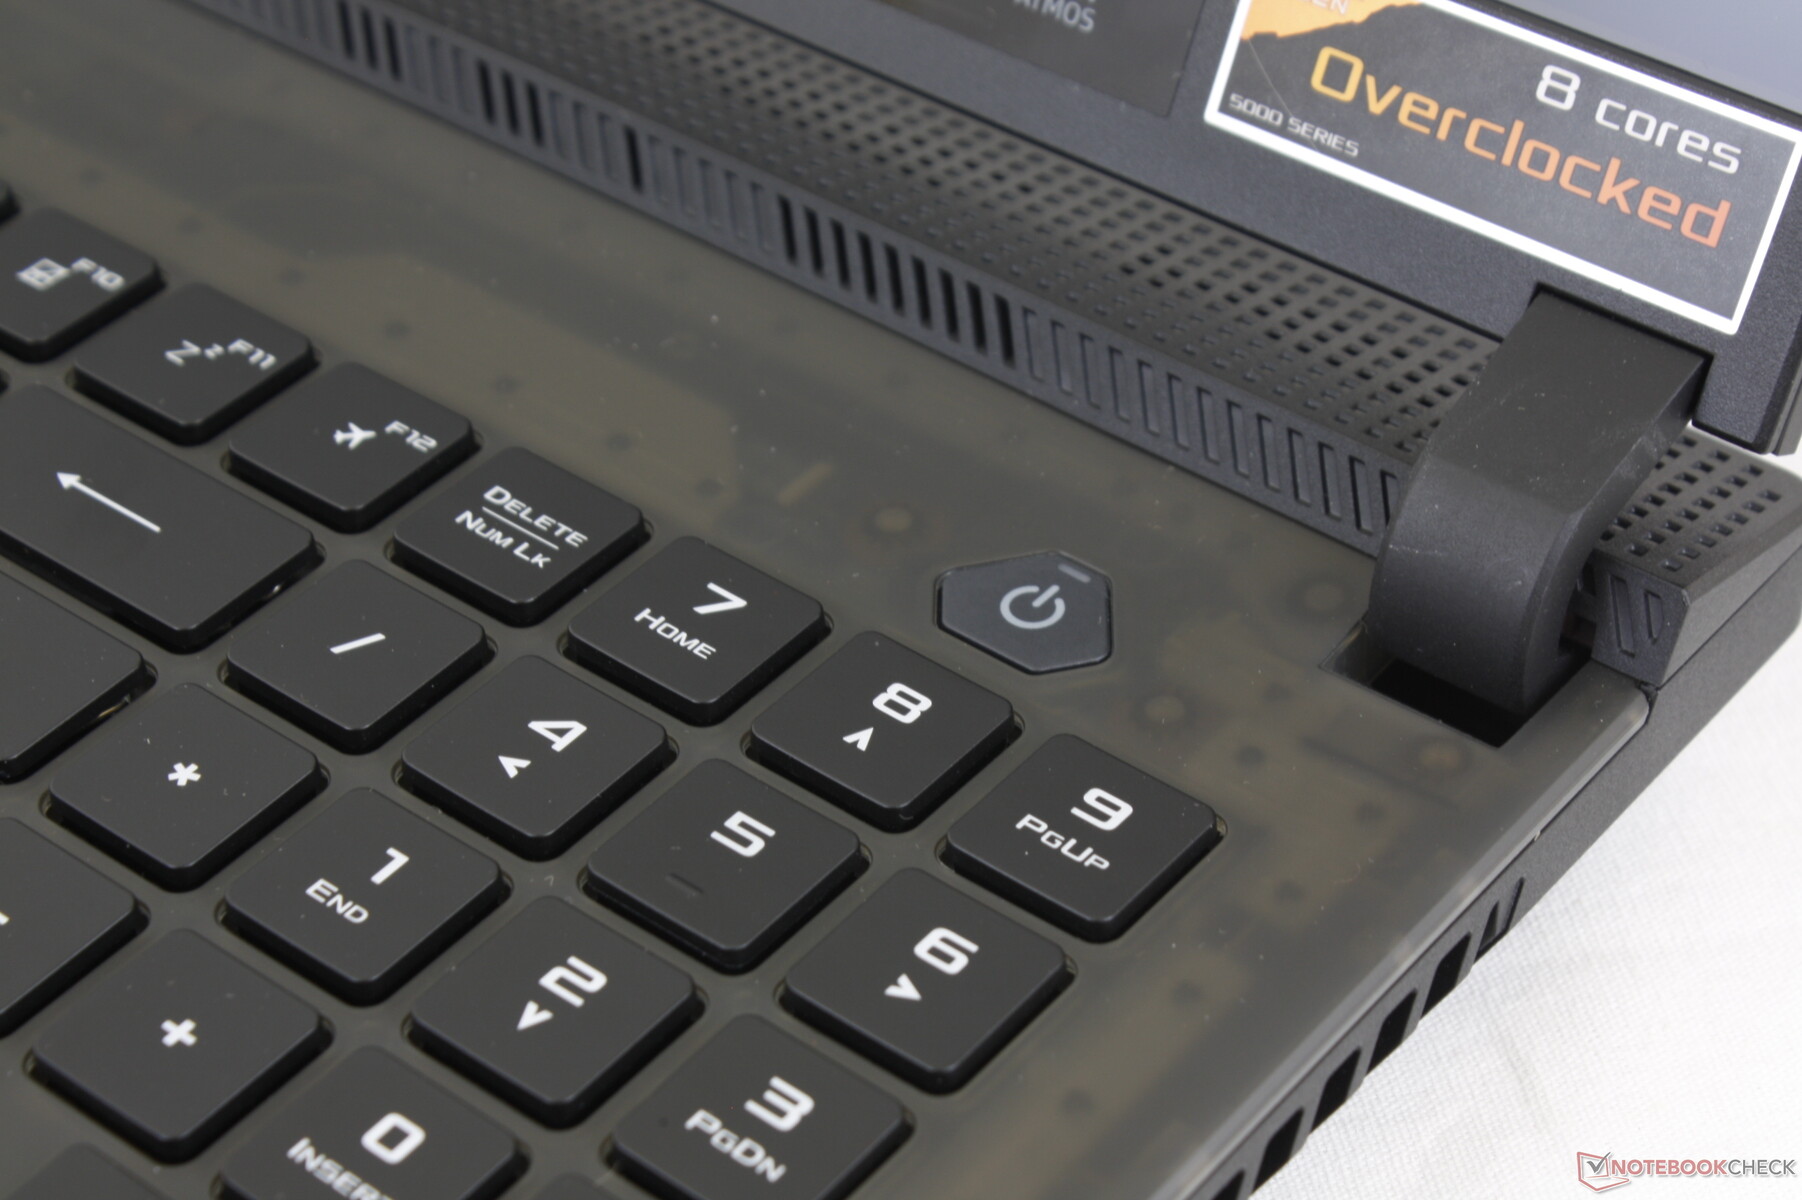
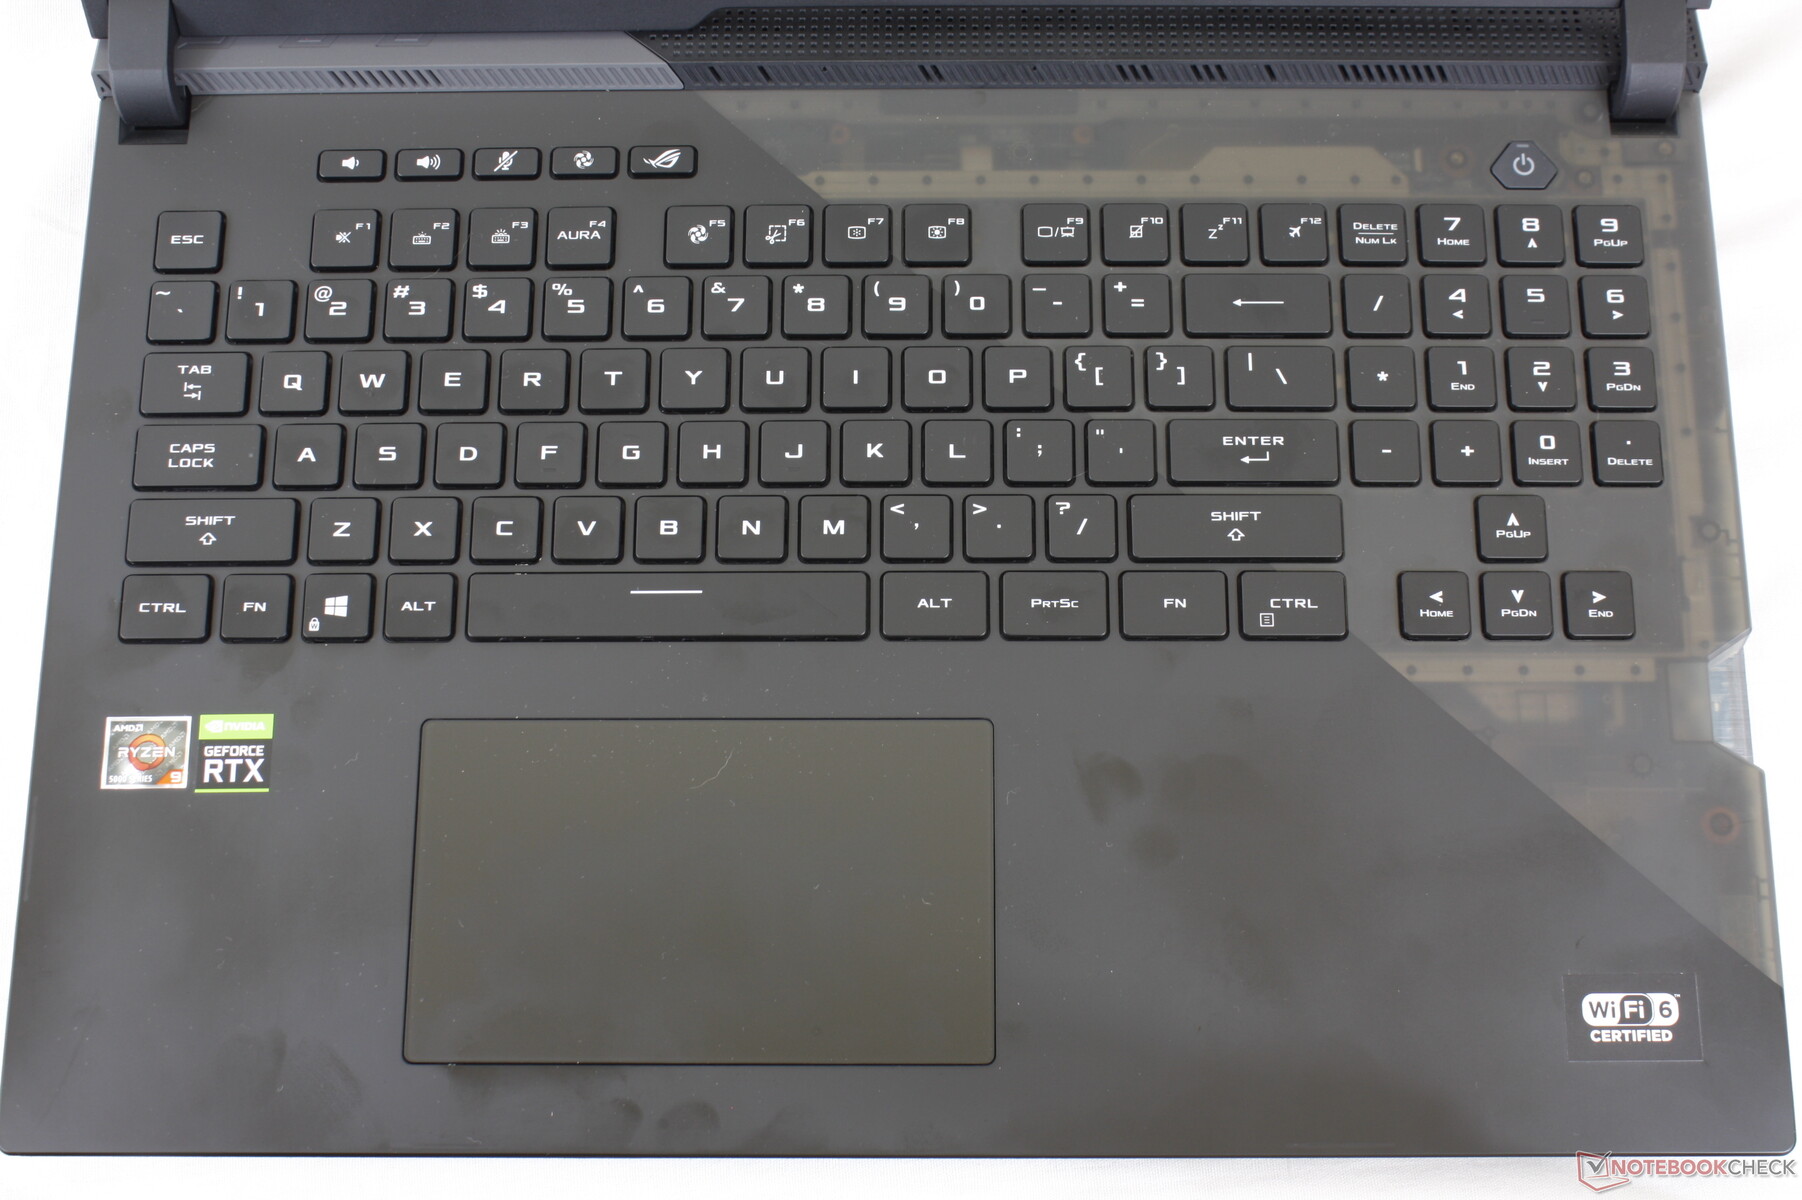
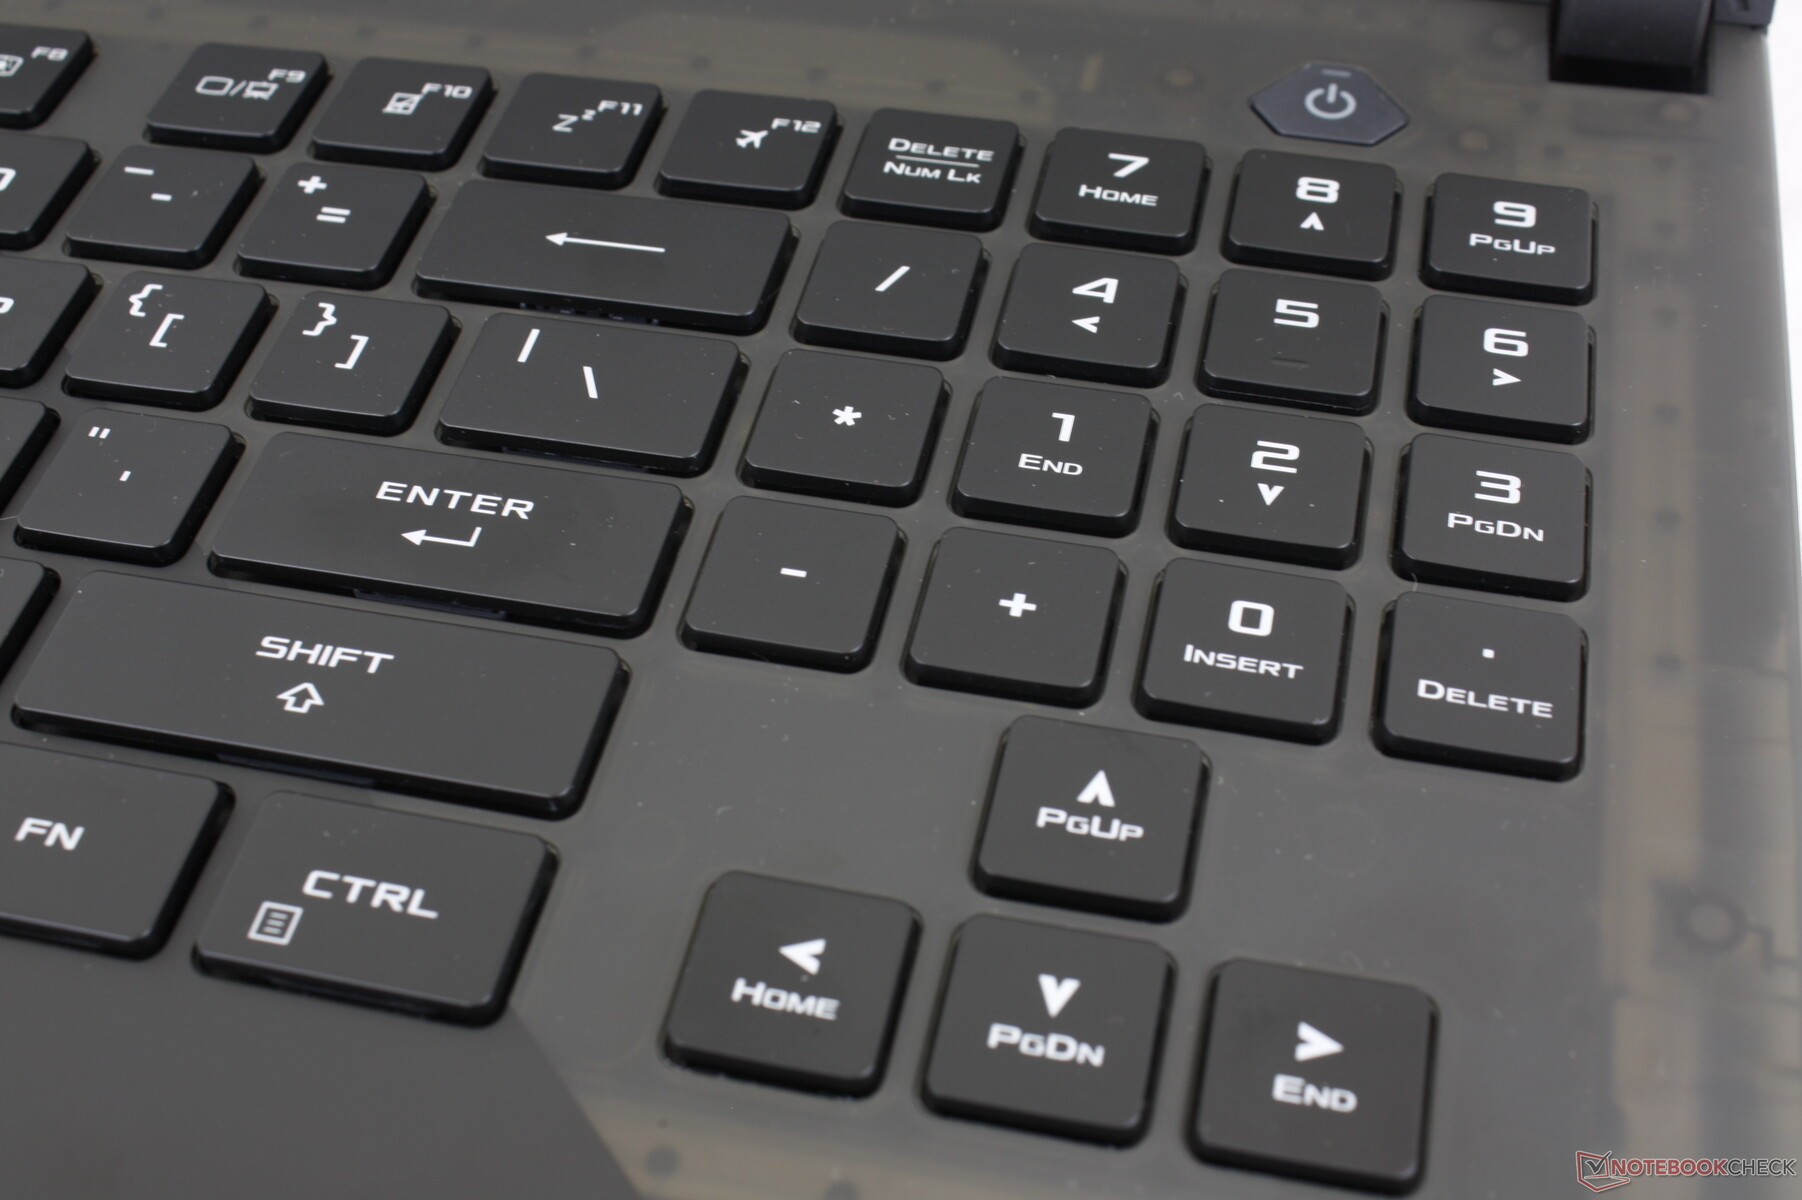
La experiencia de tecleo es muy diferente a la del G732 del año pasado porque Asus ha cambiado tanto la distribución de las teclas como la tecnología subyacente de los interruptores. En primer lugar, muchas de las teclas auxiliares como las de función, el teclado numérico y las teclas de dirección son ahora más grandes y, por tanto, más uniformes y no tan estrechas de usar. En segundo lugar, las teclas son ahora mecánicas en lugar de la habitual membrana de goma, lo que proporciona una sensación diferente a la de la mayoría de los portátiles para juegos. Es discutible si las nuevas teclas son mejores para los juegos, pero a los fans de las teclas ruidosas les encantará el cambio.
Las cinco teclas más pequeñas de la fila superior son teclas normales y no mecánicas.
La iluminación RGB Aura Sync por tecla está disponible por defecto. Todos los símbolos de las teclas se iluminan, a diferencia de algunos modelos Razer Blade.
Panel táctil
Asus ha eliminado los botones dedicados del ratón en el G732 en favor de un clickpad más grande (13 x 7,6 cm) en el G733. La tracción es muy suave y apenas se pega, incluso si se desliza a baja velocidad. Al hacer clic en el clickpad se oye un clic muy fuerte, pero el desplazamiento es demasiado superficial y la respuesta es débil.

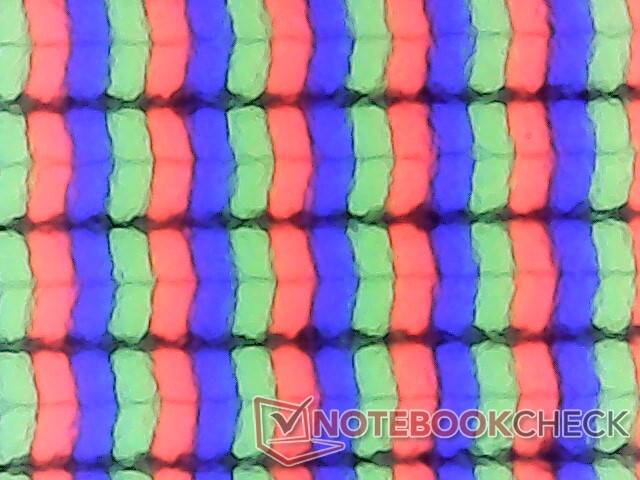
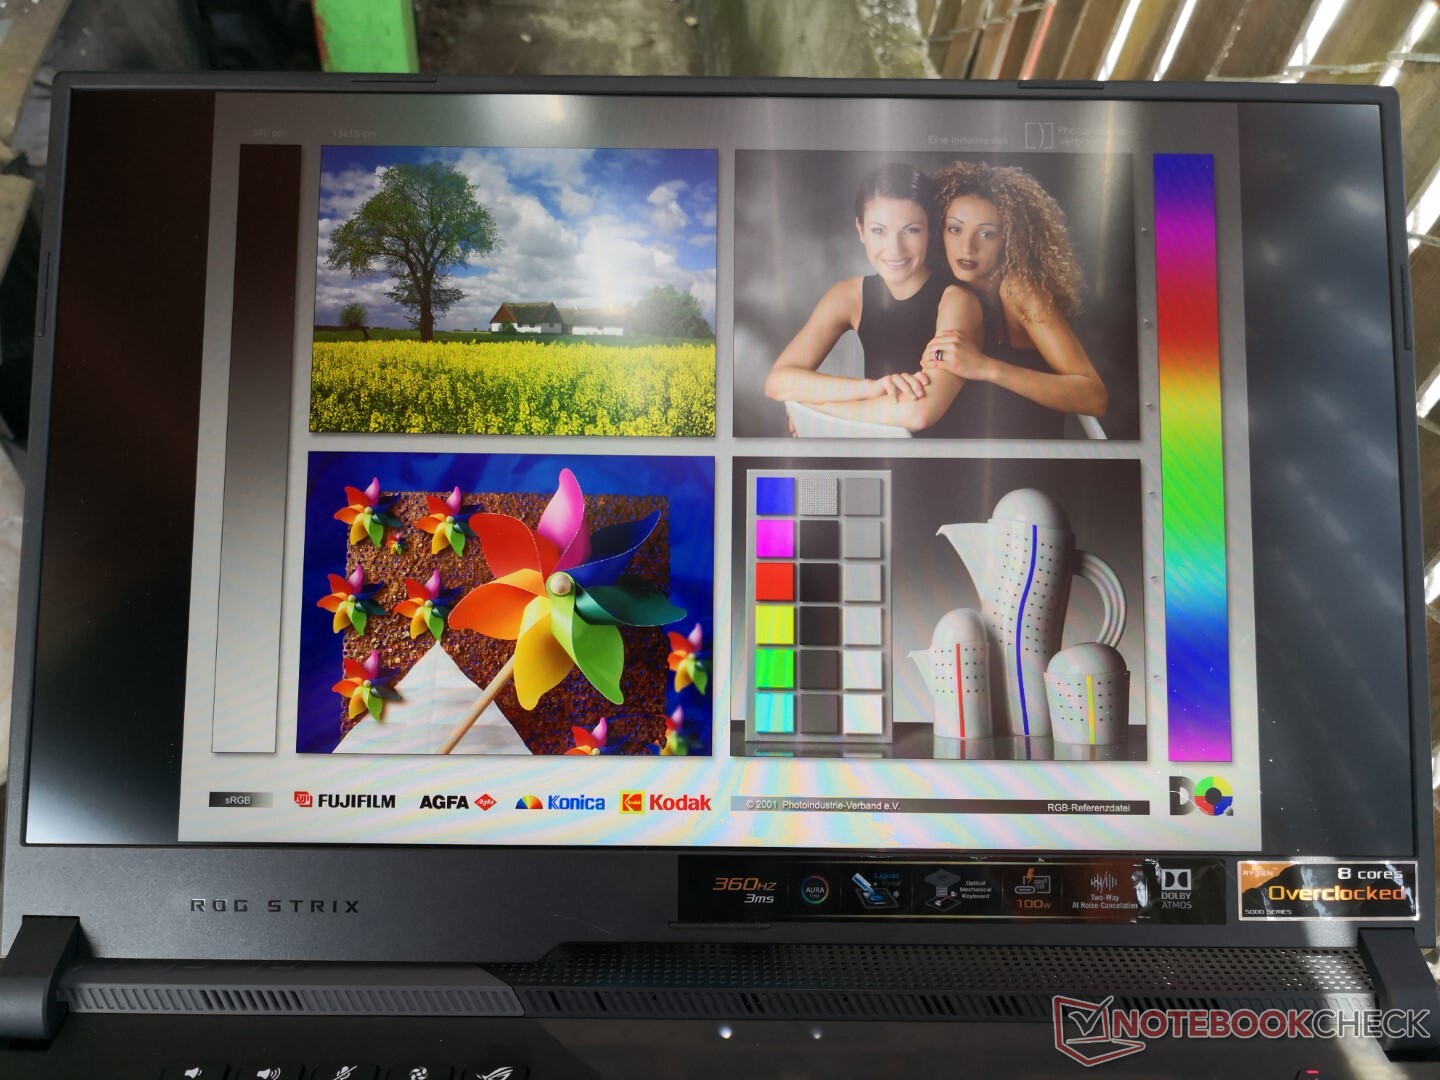
Mostrar
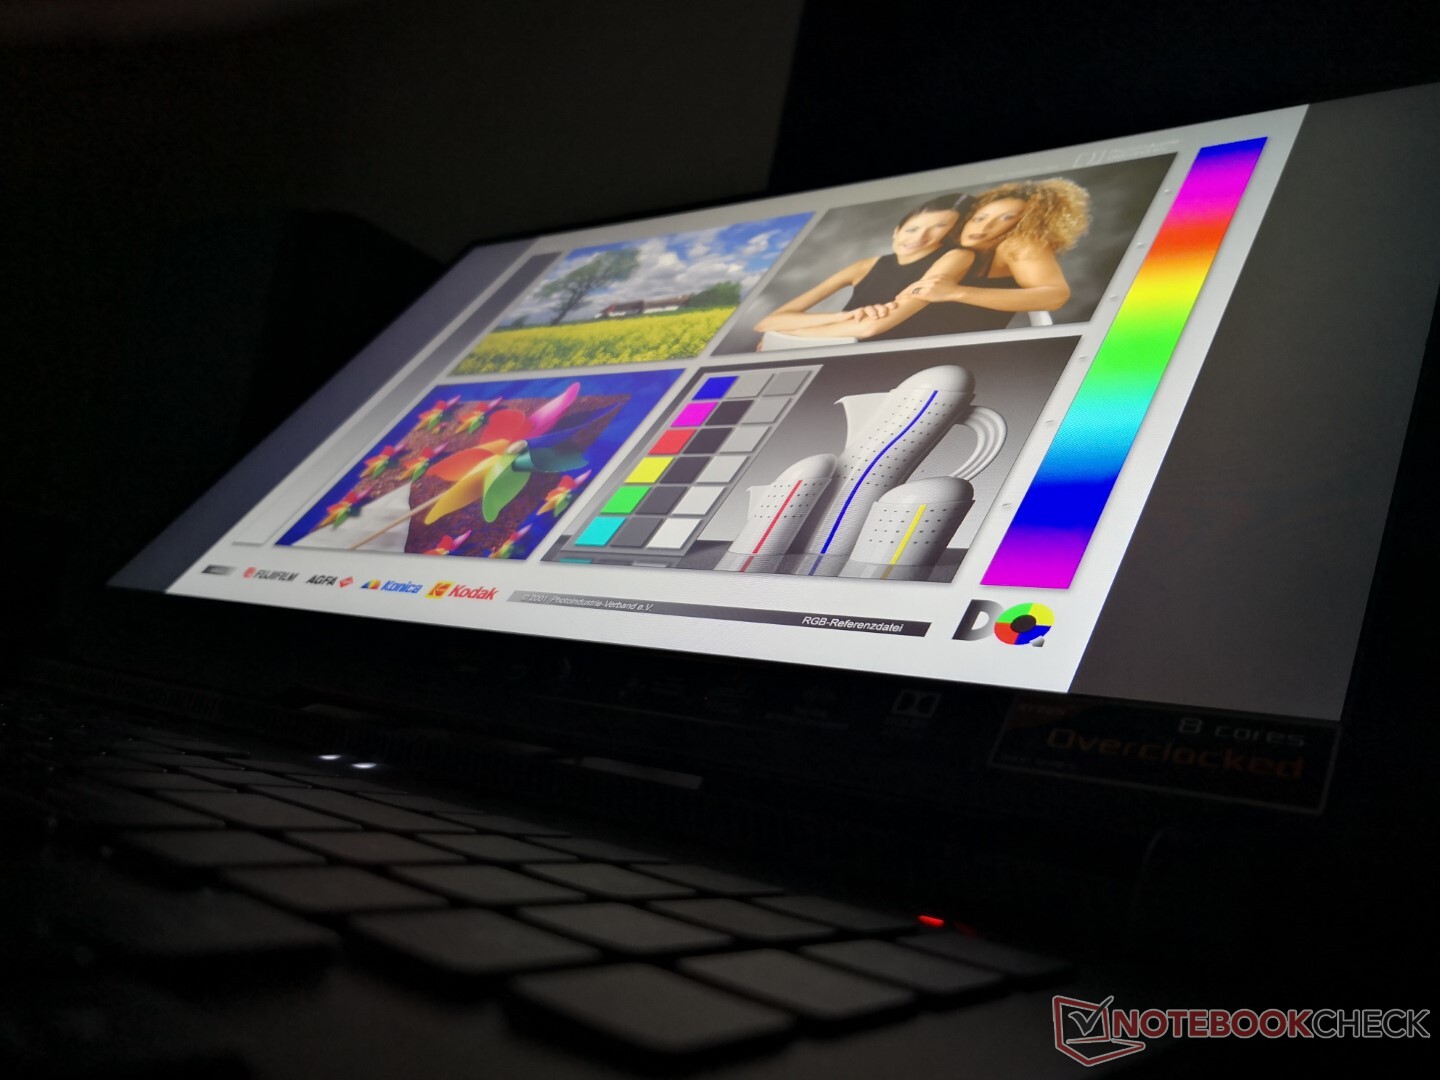
El G733 es uno de los primeros portátiles que viene equipado con el panel IPS AU Optronics B173HAN05.4 de 360 Hz, que es una actualización directa del AU Optronics B173HAN05.1 de 300 Hz del año pasado. La tasa de refresco es mayor sin sacrificar los tiempos de respuesta en blanco y negro o gris, las relaciones de contraste, la reproducción del color o el brillo, lo que significa que se trata de una actualización directa de la tasa de refresco y nada más. Aunque, obviamente, su uso es extremadamente fluido y sensible, las ventajas de las tasas de refresco cada vez más altas son cada vez más marginales. Los usuarios no se perderán mucho si "sólo" pueden permitirse un panel de 240 Hz o 300 Hz en su lugar.
Asus no ofrece opciones de pantalla 4K u OLED para su serie G733 por el momento.
| |||||||||||||||||||||||||
iluminación: 85 %
Brillo con batería: 303.8 cd/m²
Contraste: 1321:1 (Negro: 0.23 cd/m²)
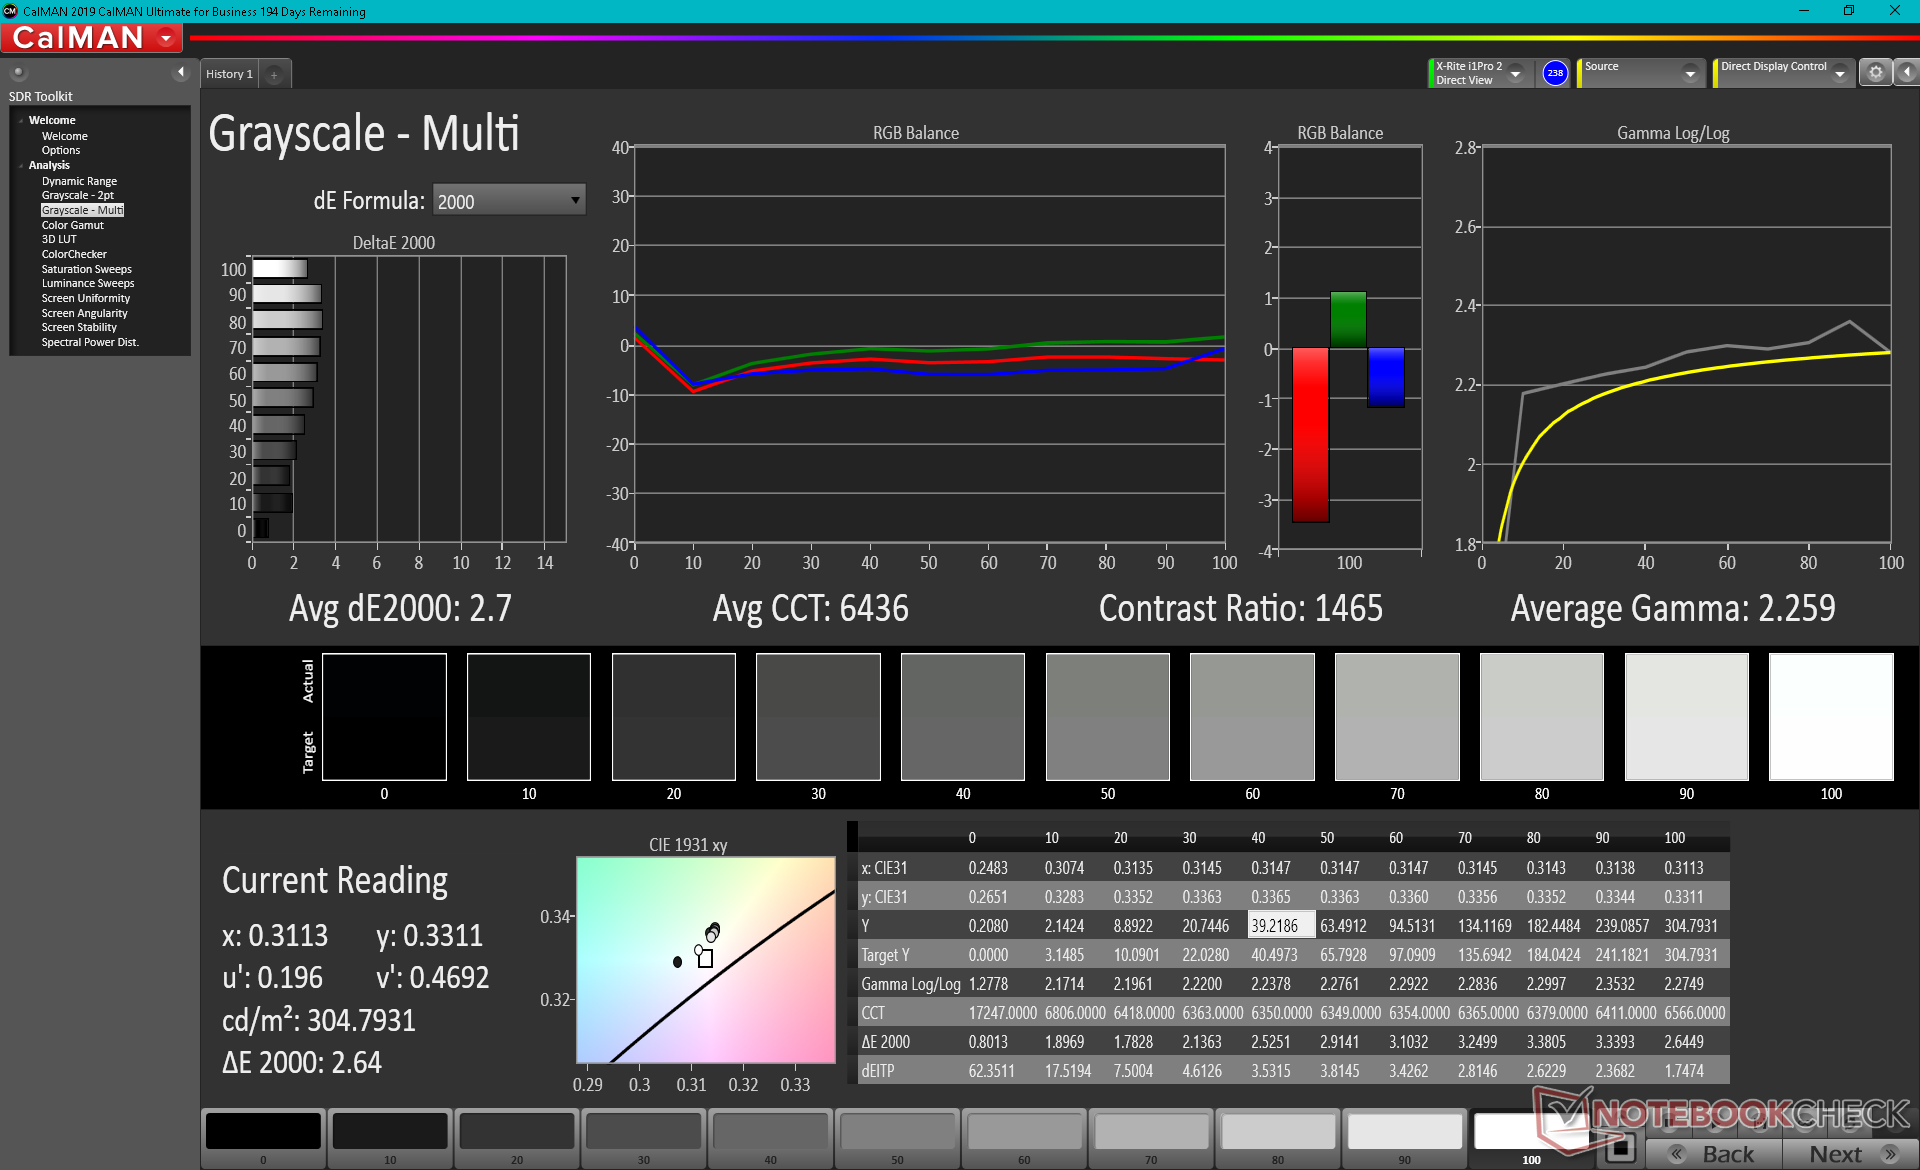
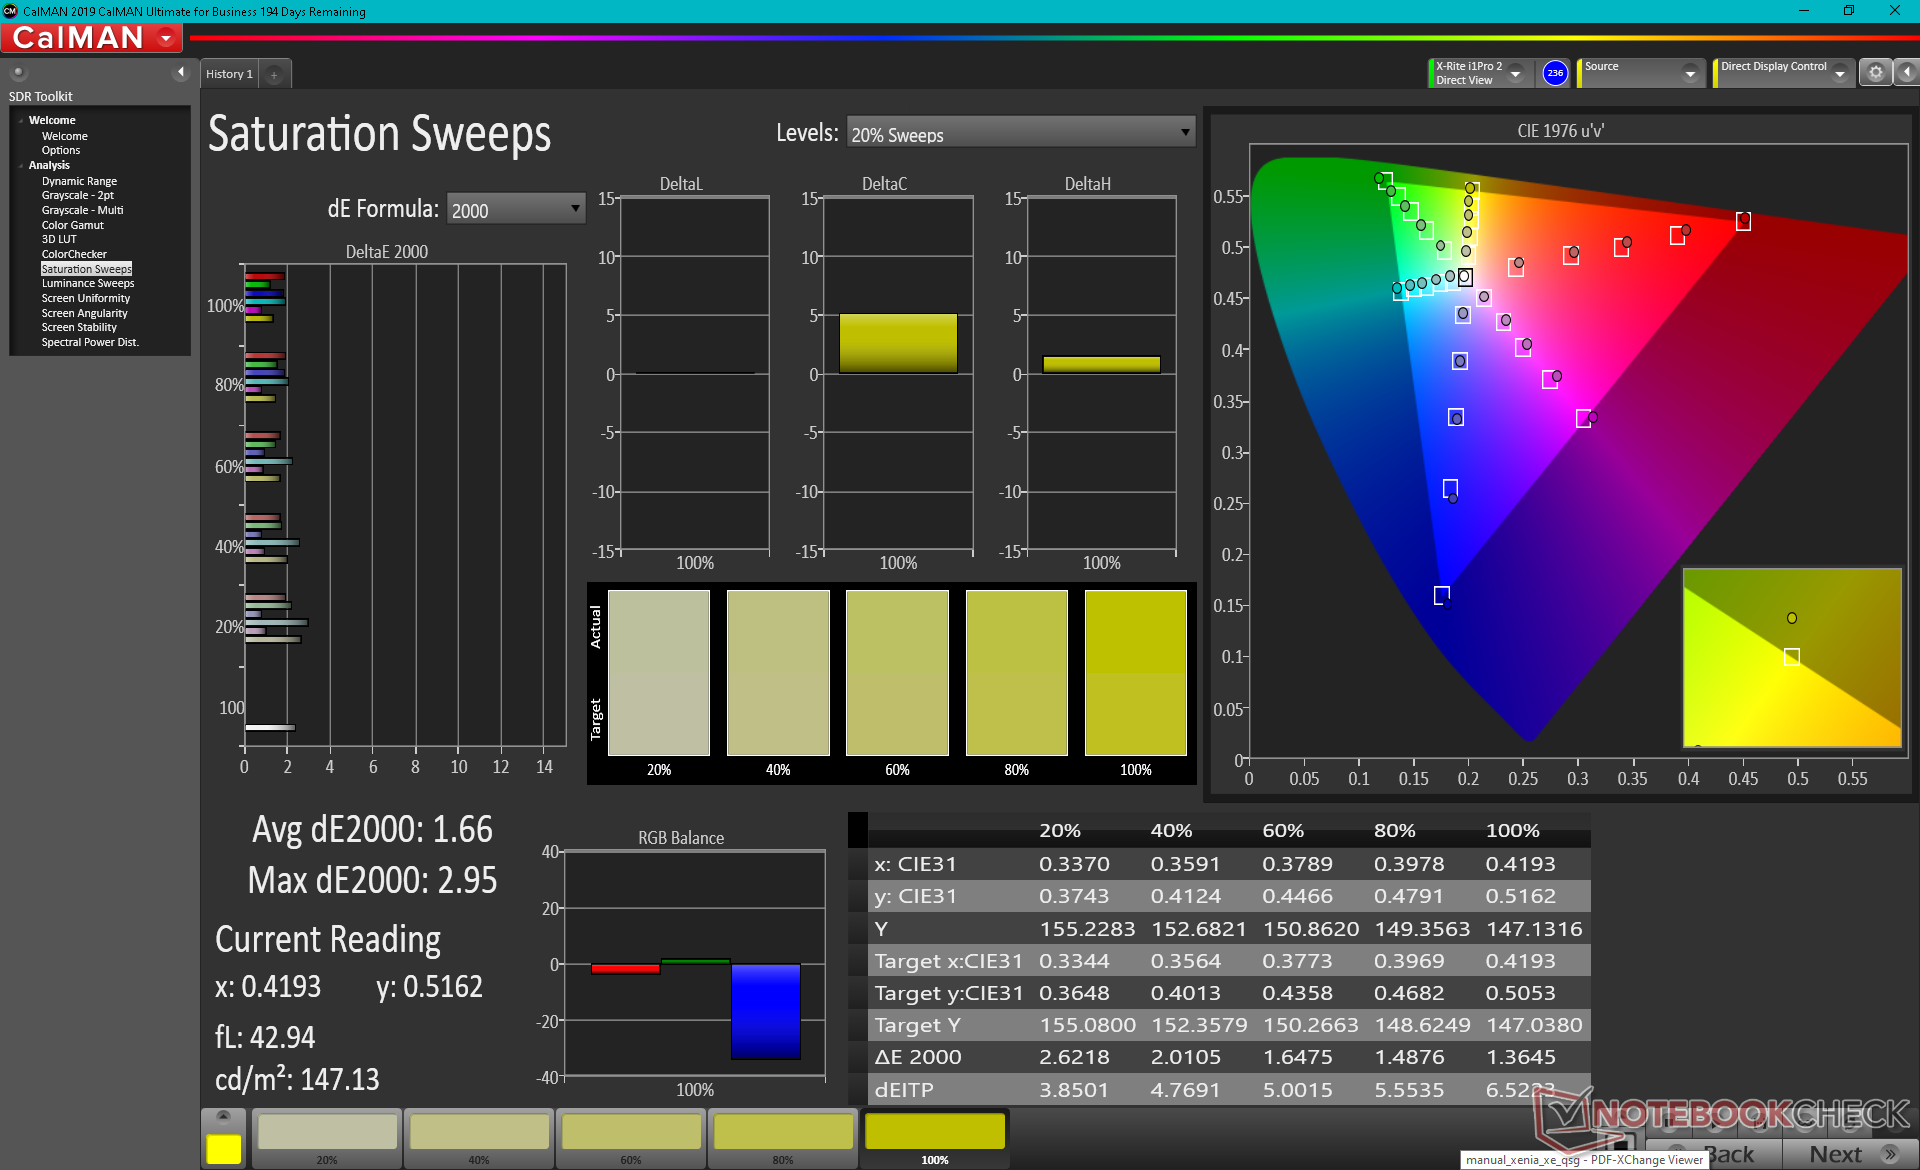
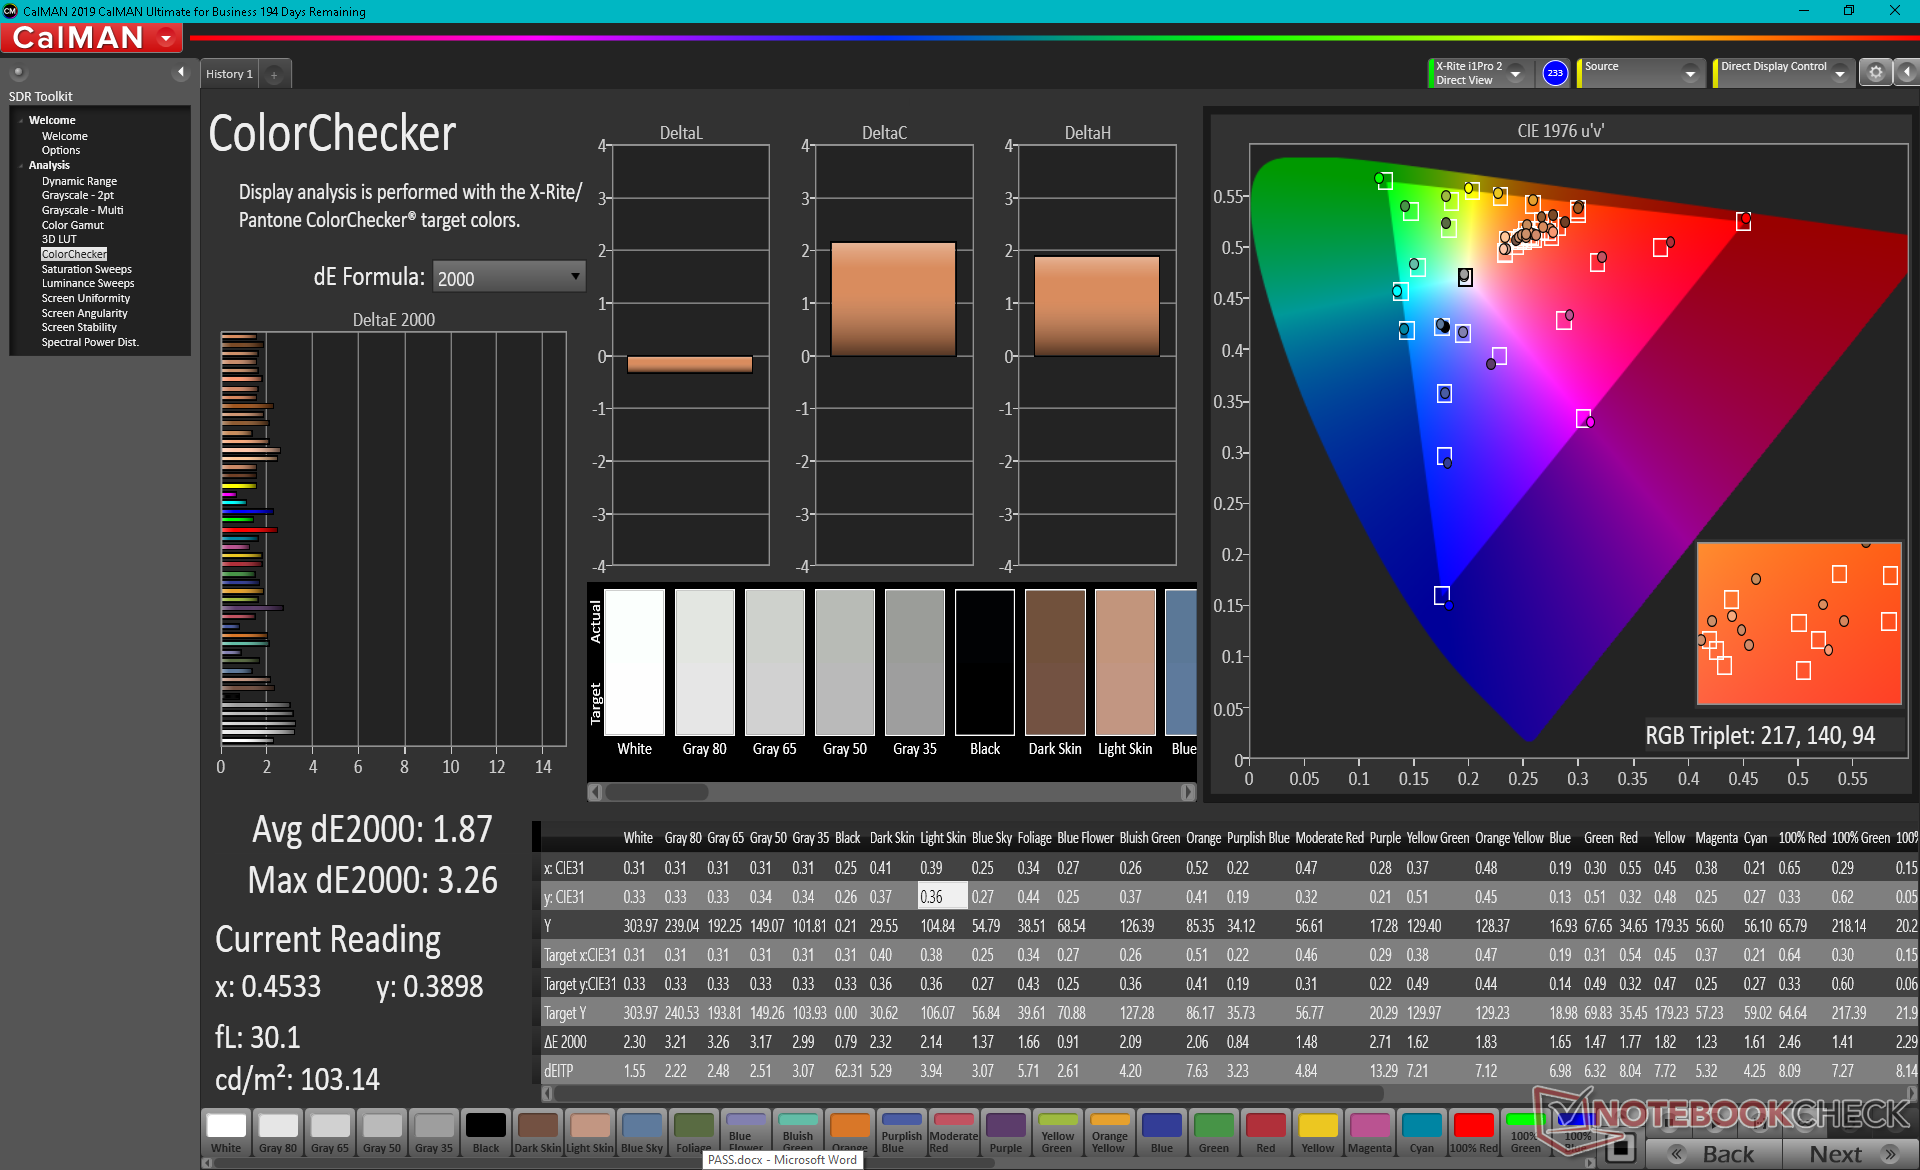
ΔE ColorChecker Calman: 1.87 | ∀{0.5-29.43 Ø4.72}
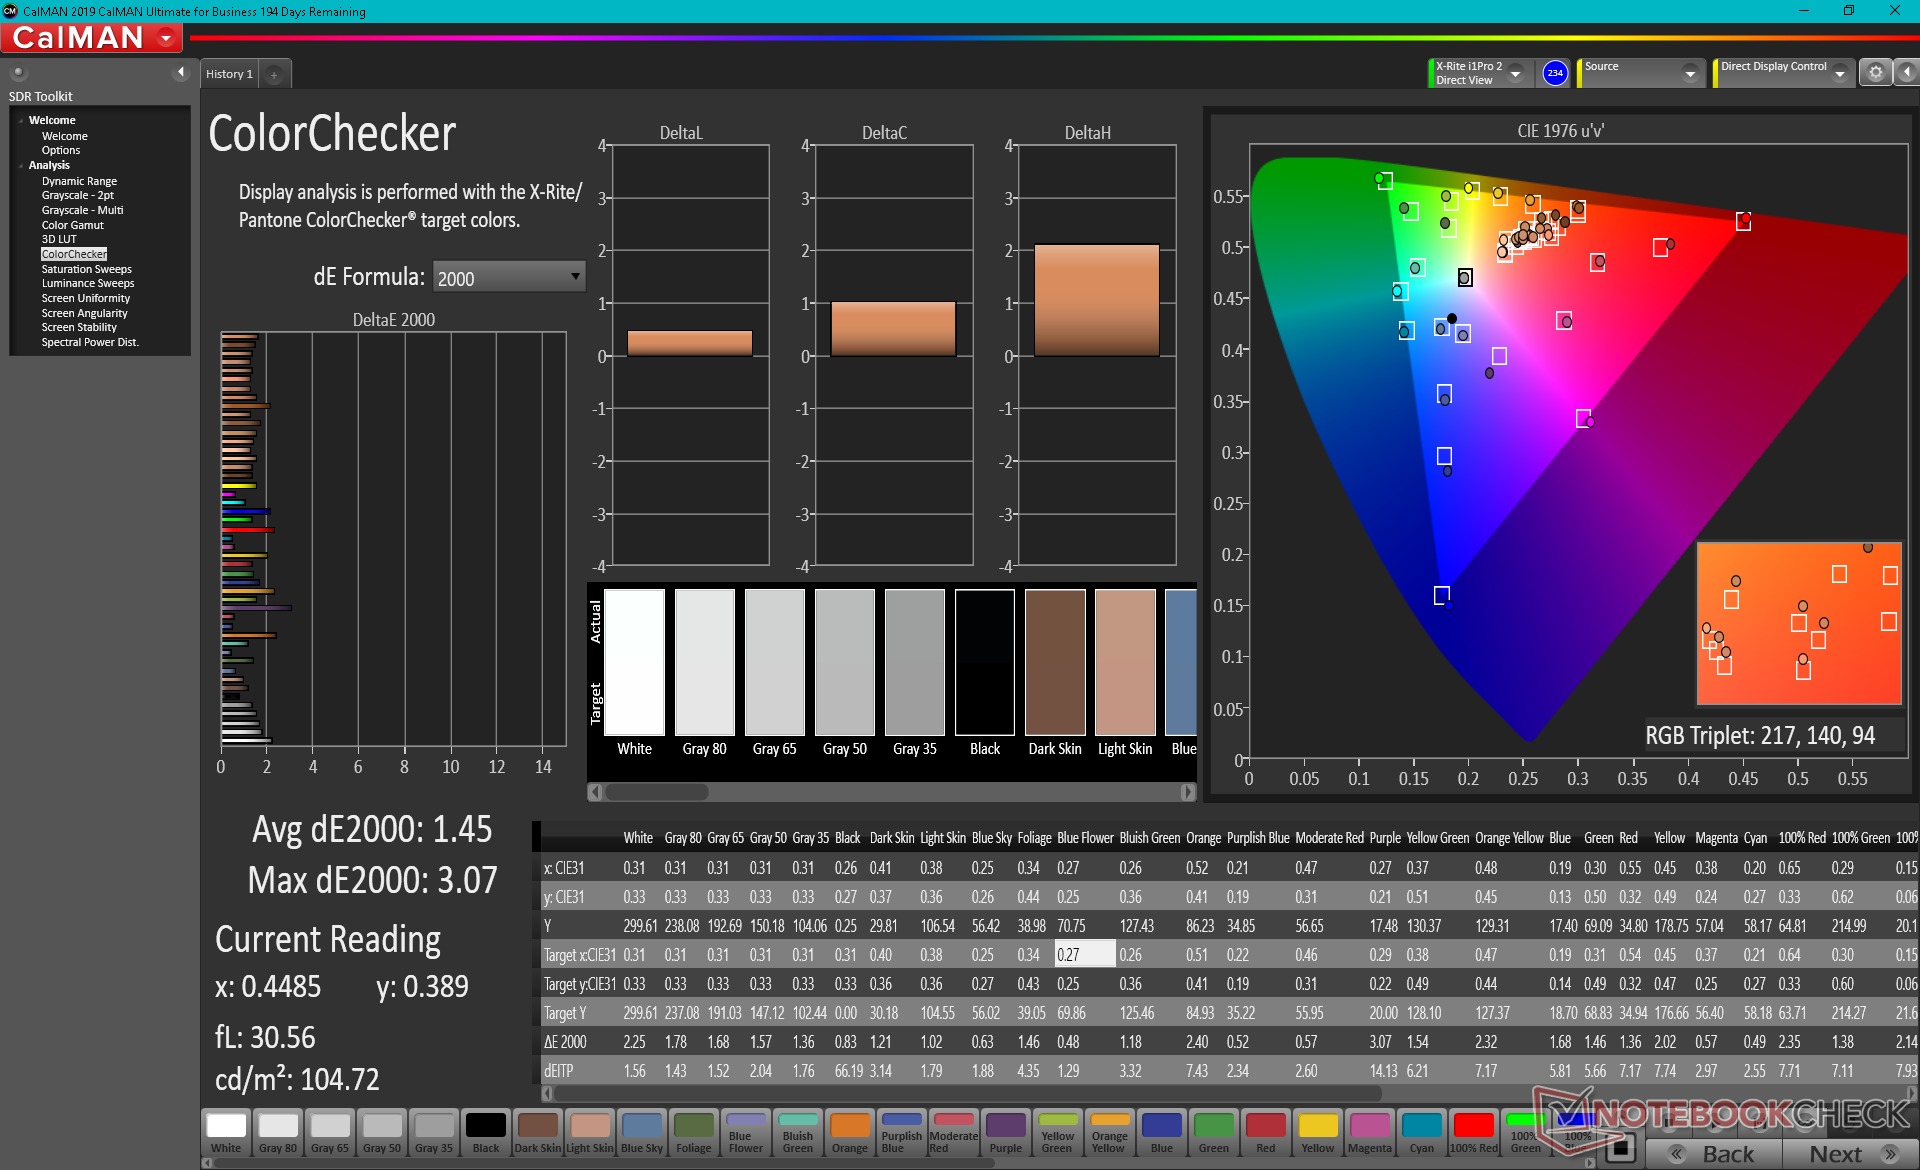
calibrated: 1.45
ΔE Greyscale Calman: 2.7 | ∀{0.09-98 Ø4.97}
99.4% sRGB (Argyll 1.6.3 3D)
65.6% AdobeRGB 1998 (Argyll 1.6.3 3D)
72.2% AdobeRGB 1998 (Argyll 3D)
99.4% sRGB (Argyll 3D)
71% Display P3 (Argyll 3D)
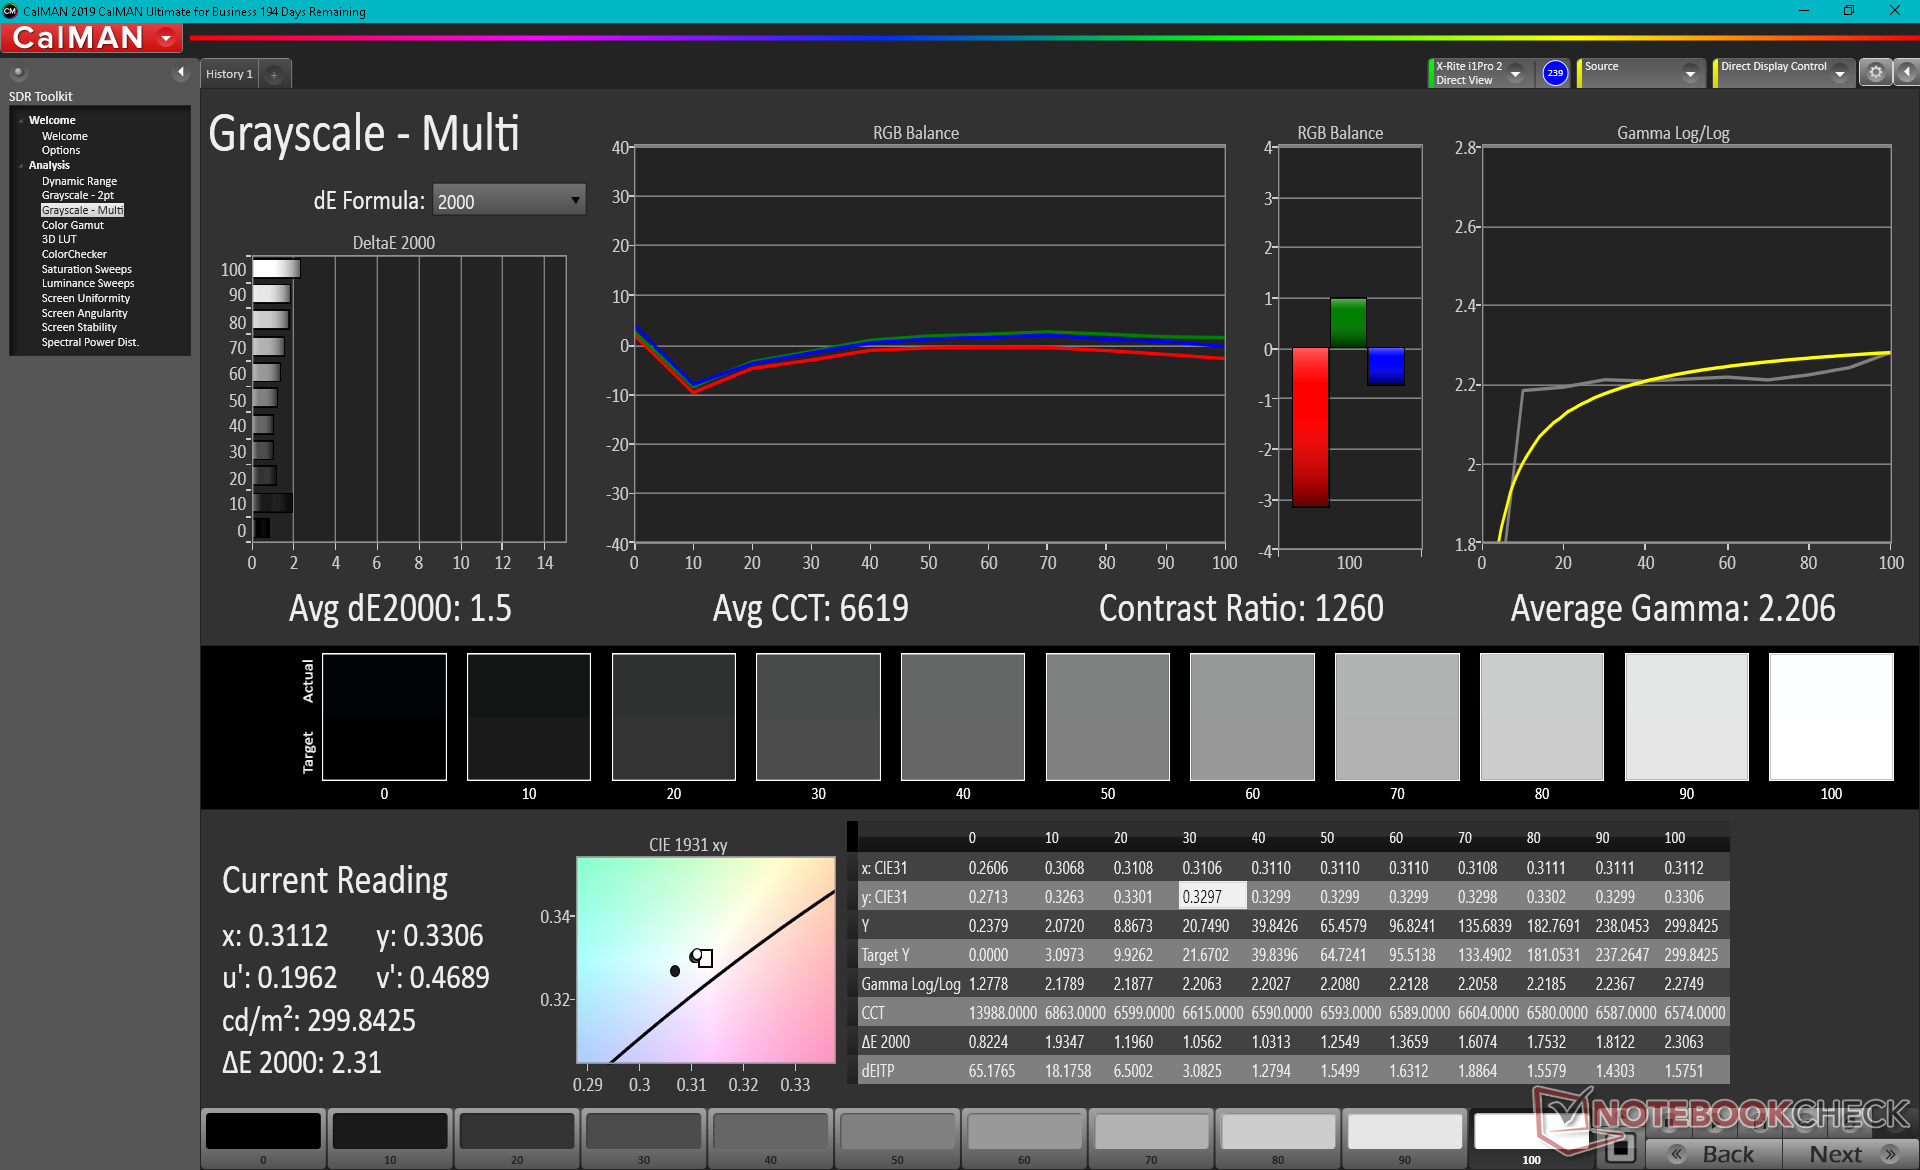
Gamma: 2.26
CCT: 6436 K
| Asus Strix Scar 17 G733QSA-XS99 AU Optronics B173HAN05.4, IPS, 17.3", 1920x1080 | Asus Strix Scar 17 G732LXS LQ173M1JW03 (SHP14DC), IPS, 17.3", 1920x1080 | MSI GE76 Raider 10UH AU Optronics B173HAN05.1, IPS, 17.3", 1920x1080 | Alienware m17 R4 AU Optronics AUOEC91, IPS, 17.3", 1920x1080 | Razer Blade Pro 17 2021 (QHD Touch) AU Optronics B173ZAN03.3, IPS, 17.3", 3840x2160 | Asus Zephyrus S17 GX701LXS Sharp SHP14DC, IPS, 17.3", 1920x1080 | |
|---|---|---|---|---|---|---|
| Display | -0% | 1% | -1% | 21% | 2% | |
| Display P3 Coverage (%) | 71 | 71 0% | 71.8 1% | 69.8 -2% | 88.6 25% | 73.6 4% |
| sRGB Coverage (%) | 99.4 | 99 0% | 98.1 -1% | 99.7 0% | 100 1% | 99.7 0% |
| AdobeRGB 1998 Coverage (%) | 72.2 | 71.6 -1% | 73.9 2% | 71.6 -1% | 99.9 38% | 73.7 2% |
| Response Times | 17% | -101% | -43% | -71% | 25% | |
| Response Time Grey 50% / Grey 80% * (ms) | 6.6 ? | 5.8 ? 12% | 20.4 ? -209% | 13.2 ? -100% | 15.2 ? -130% | 5 ? 24% |
| Response Time Black / White * (ms) | 10.8 ? | 8.4 ? 22% | 10 ? 7% | 9.2 ? 15% | 12 ? -11% | 8 ? 26% |
| PWM Frequency (Hz) | 151500 | |||||
| Screen | -31% | -41% | 15% | -84% | -3% | |
| Brightness middle (cd/m²) | 303.8 | 310 2% | 324.6 7% | 305 0% | 407.2 34% | 308 1% |
| Brightness (cd/m²) | 292 | 311 7% | 312 7% | 301 3% | 403 38% | 310 6% |
| Brightness Distribution (%) | 85 | 82 -4% | 87 2% | 93 9% | 90 6% | 76 -11% |
| Black Level * (cd/m²) | 0.23 | 0.41 -78% | 0.28 -22% | 0.19 17% | 0.42 -83% | 0.34 -48% |
| Contrast (:1) | 1321 | 756 -43% | 1159 -12% | 1605 21% | 970 -27% | 906 -31% |
| Colorchecker dE 2000 * | 1.87 | 2.41 -29% | 3.87 -107% | 1.31 30% | 7.25 -288% | 1.49 20% |
| Colorchecker dE 2000 max. * | 3.26 | 8.59 -163% | 9.35 -187% | 2.32 29% | 12.51 -284% | 3.97 -22% |
| Colorchecker dE 2000 calibrated * | 1.45 | 1.13 22% | 1.42 2% | 0.91 37% | 3.62 -150% | 0.99 32% |
| Greyscale dE 2000 * | 2.7 | 4.3 -59% | 6.5 -141% | 2.3 15% | 8.1 -200% | 2.3 15% |
| Gamma | 2.26 97% | 2.149 102% | 2.23 99% | 2.281 96% | 2.24 98% | 2.193 100% |
| CCT | 6436 101% | 7059 92% | 5702 114% | 6449 101% | 5925 110% | 6981 93% |
| Color Space (Percent of AdobeRGB 1998) (%) | 65.6 | 72 10% | 66.3 1% | 72 10% | 88.1 34% | 74 13% |
| Color Space (Percent of sRGB) (%) | 99.4 | 94 -5% | 98 -1% | 94 -5% | 100 1% | 96 -3% |
| Media total (Programa/Opciones) | -5% /
-19% | -47% /
-41% | -10% /
5% | -45% /
-62% | 8% /
2% |
* ... más pequeño es mejor
El espacio de color cubre todo el sRGB para ser suficiente para muchos editores digitales. Para colores aún más profundos, Asus tiene una unidad IPS WQHD (2560 x 1440) que promete una cobertura completa de DCI-P3 a costa de una frecuencia de actualización nativa más lenta (165 Hz frente a 360 Hz).
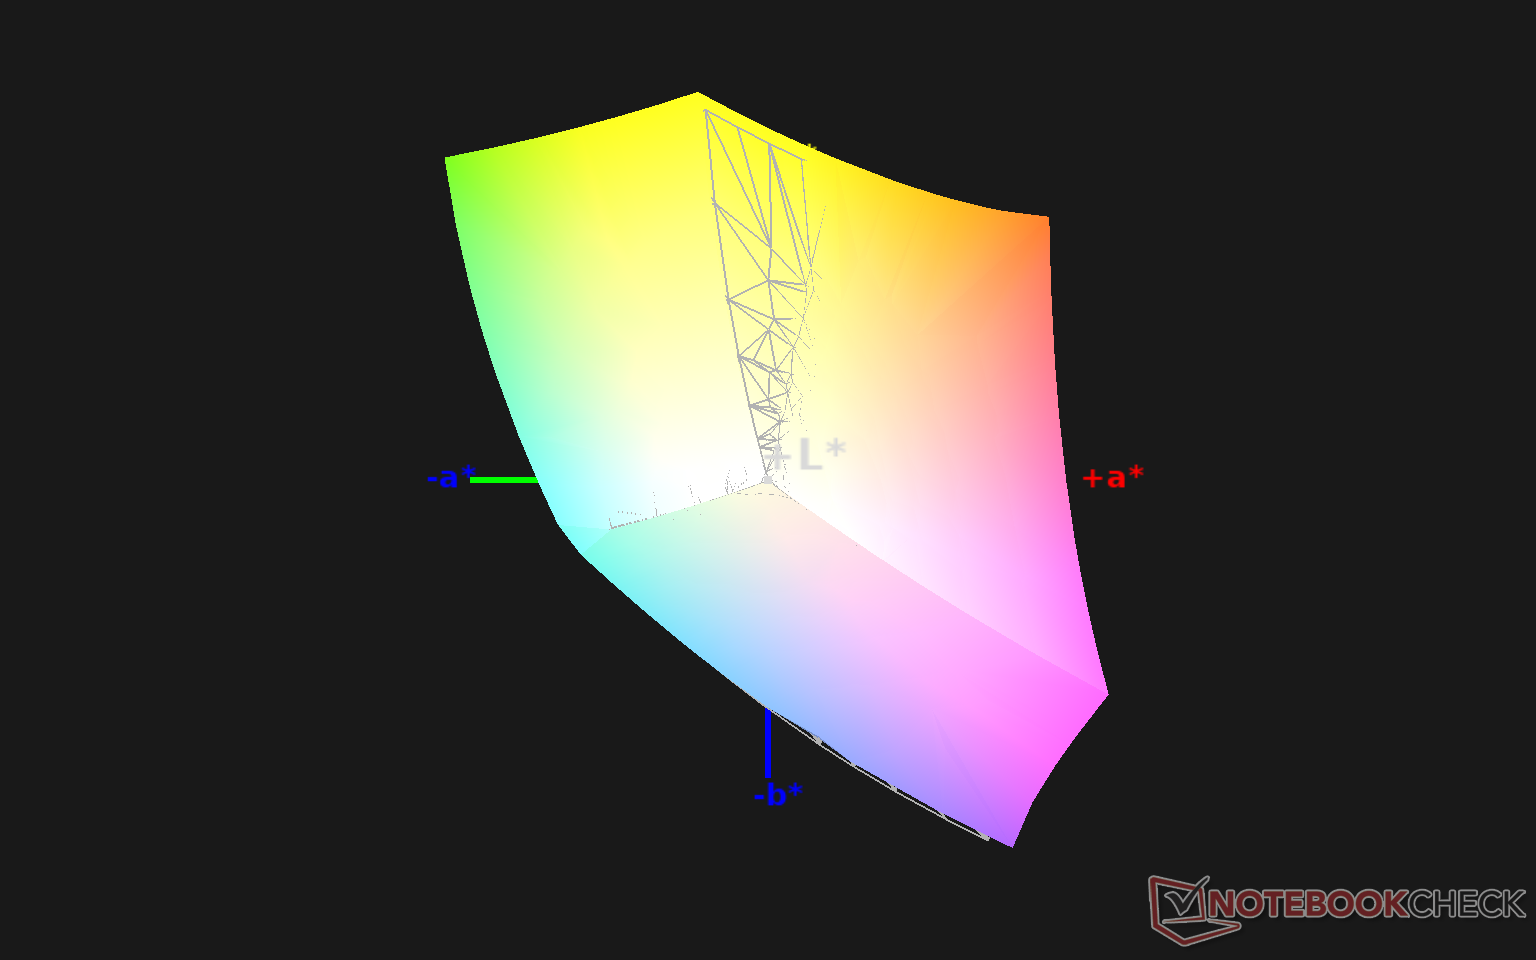
La pantalla ya está bien calibrada al sacarla de la caja, con unos valores medios de escala de grises y color DeltaE de sólo 2,7 y 1,87, respectivamente. Nuestra propia calibración reduciría aún más estos promedios por unos estrechos márgenes.
Tiempos de respuesta del display
| ↔ Tiempo de respuesta de Negro a Blanco | ||
|---|---|---|
| 10.8 ms ... subida ↗ y bajada ↘ combinada | ↗ 5.2 ms subida | 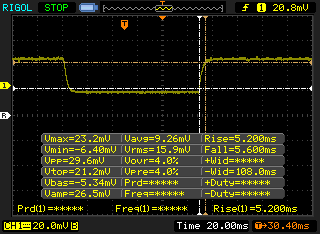 |
| ↘ 5.6 ms bajada | ||
| La pantalla mostró buenos tiempos de respuesta en nuestros tests pero podría ser demasiado lenta para los jugones competitivos. En comparación, todos los dispositivos de prueba van de ##min### (mínimo) a 240 (máximo) ms. » 29 % de todos los dispositivos son mejores. Esto quiere decir que el tiempo de respuesta medido es mejor que la media (19.8 ms) de todos los dispositivos testados. | ||
| ↔ Tiempo de respuesta 50% Gris a 80% Gris | ||
| 6.6 ms ... subida ↗ y bajada ↘ combinada | ↗ 2.2 ms subida | 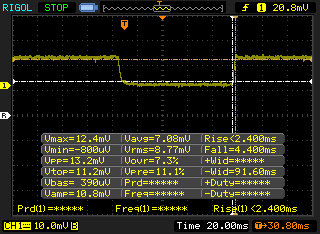 |
| ↘ 4.4 ms bajada | ||
| La pantalla mostró tiempos de respuesta muy rápidos en nuestros tests y debería ser adecuada para juegos frenéticos. En comparación, todos los dispositivos de prueba van de ##min### (mínimo) a 636 (máximo) ms. » 19 % de todos los dispositivos son mejores. Esto quiere decir que el tiempo de respuesta medido es mejor que la media (31 ms) de todos los dispositivos testados. | ||
Parpadeo de Pantalla / PWM (Pulse-Width Modulation)
| Parpadeo de Pantalla / PWM no detectado | 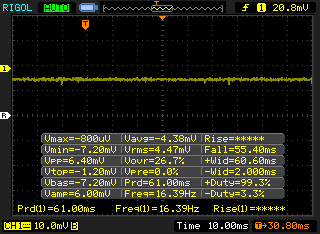 | ||
Comparación: 52 % de todos los dispositivos testados no usaron PWM para atenuar el display. Si se usó, medimos una media de 7769 (mínimo: 5 - máxmo: 343500) Hz. | |||
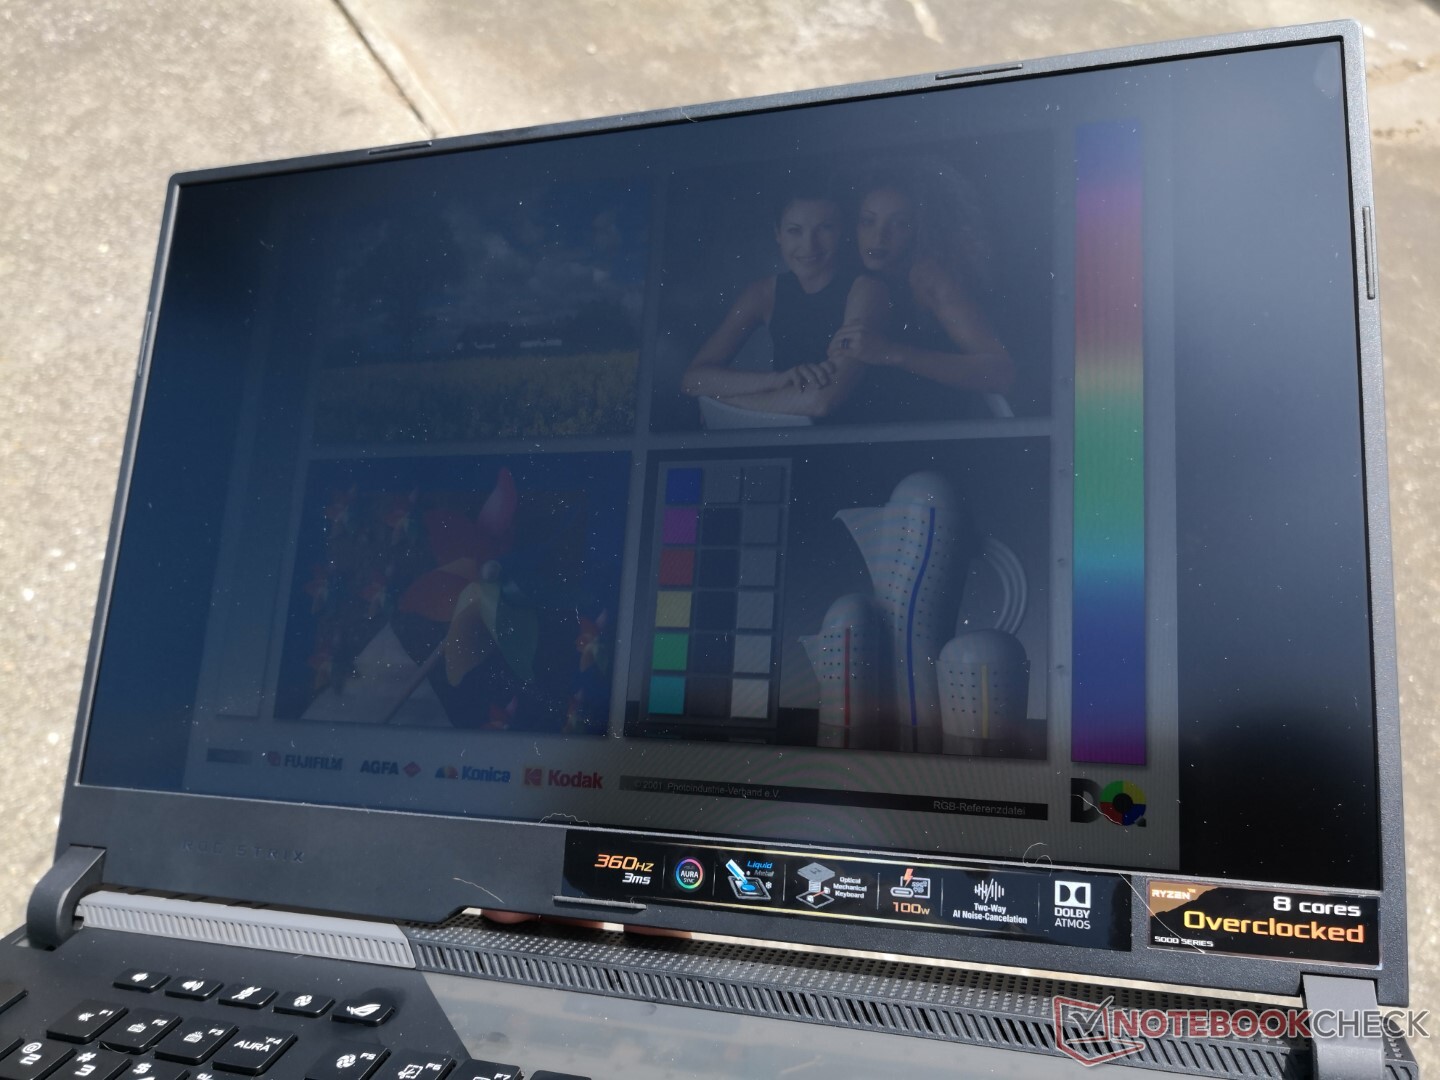
La visibilidad en exteriores es media cuando está a la sombra; las condiciones más brillantes desvanecerán los colores. Como la mayoría de los portátiles de juego de 17,3 pulgadas, el G733 es más un portátil para interiores que para exteriores. No obstante, la pantalla del Razer Blade Pro 17 es más brillante si la visibilidad en exteriores es una preocupación.
La función AMD Vari-Bright está activada por defecto, lo que reduce el brillo máximo a sólo 177,6 nits si funciona con batería. Esta característica puede desactivarse a través del software Radeon.
Rendimiento
El ROG Strix Scar 17 G733 es un sistema de juego de gama alta que no cuenta con modelos de gama media. Así, incluso las opciones de gama baja vienen con la CPU Ryzen 7 5800H con la GPU GeForce RTX 3060 y la pantalla FHD de 360 Hz.
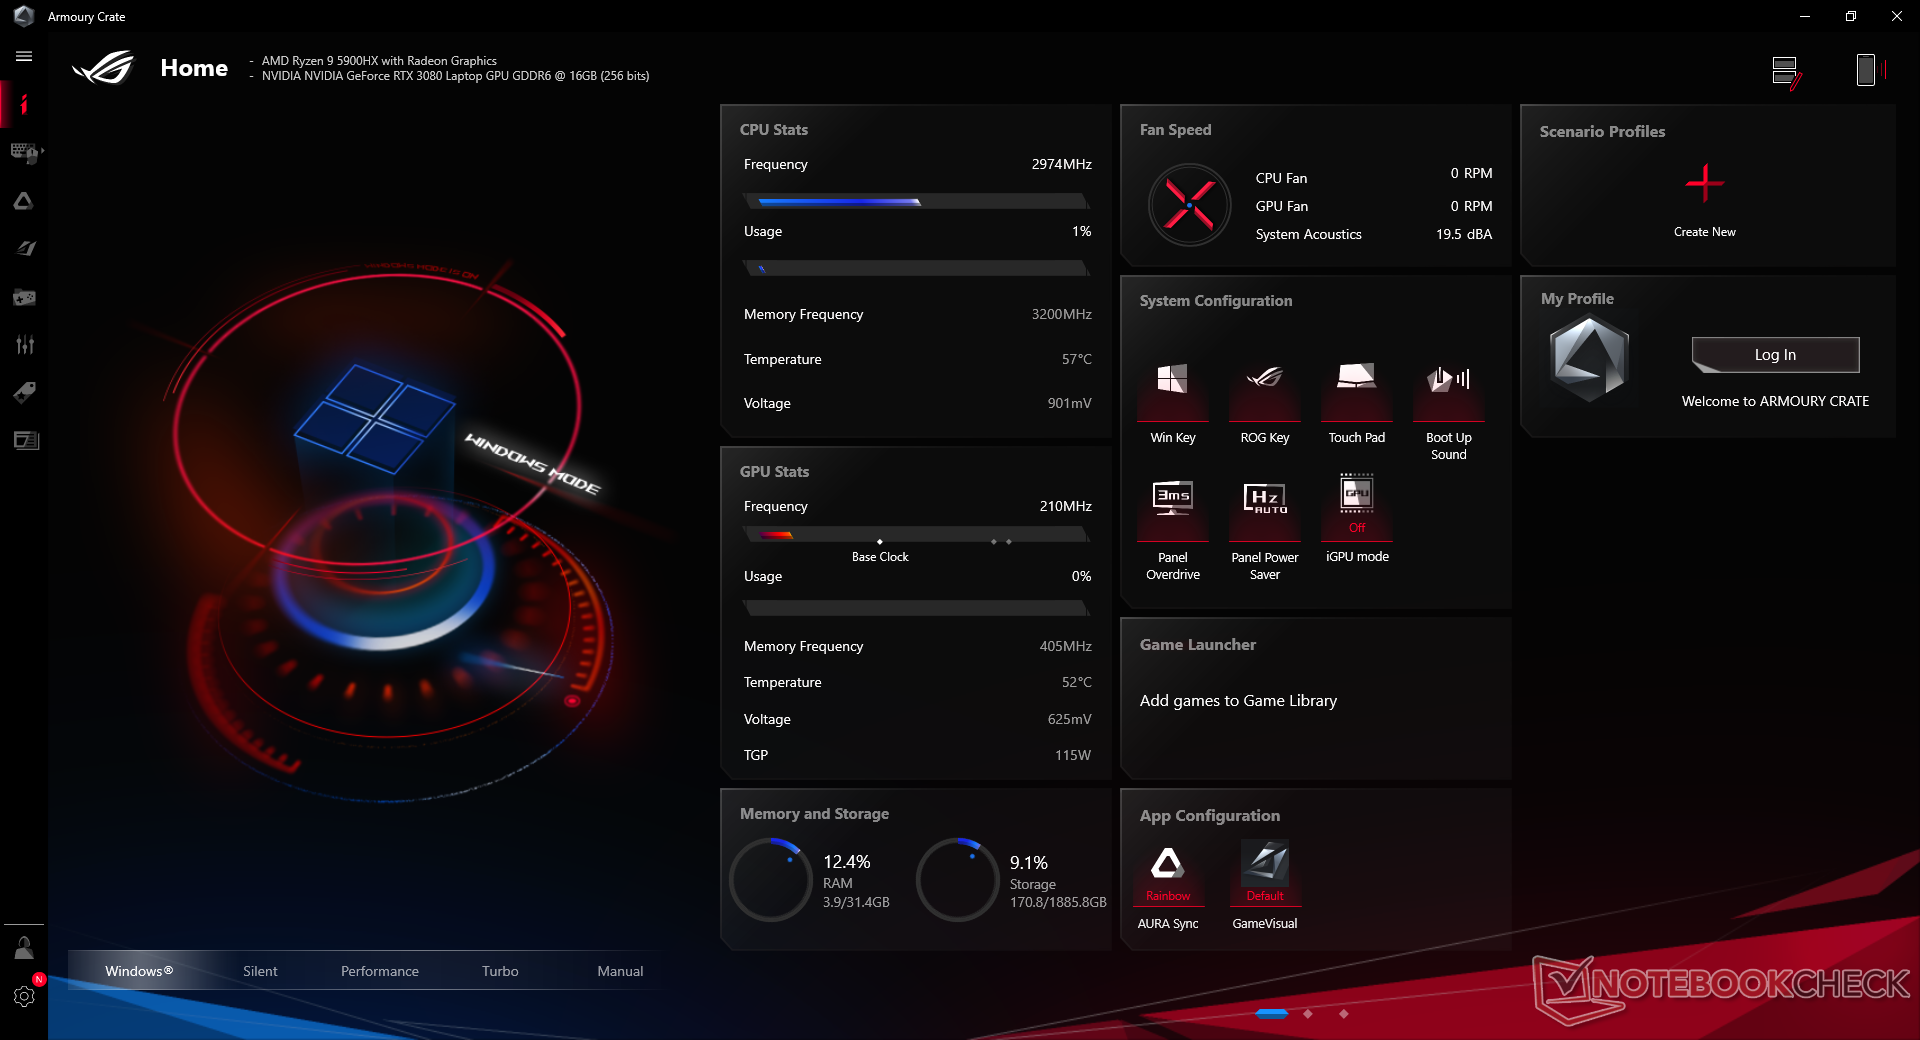
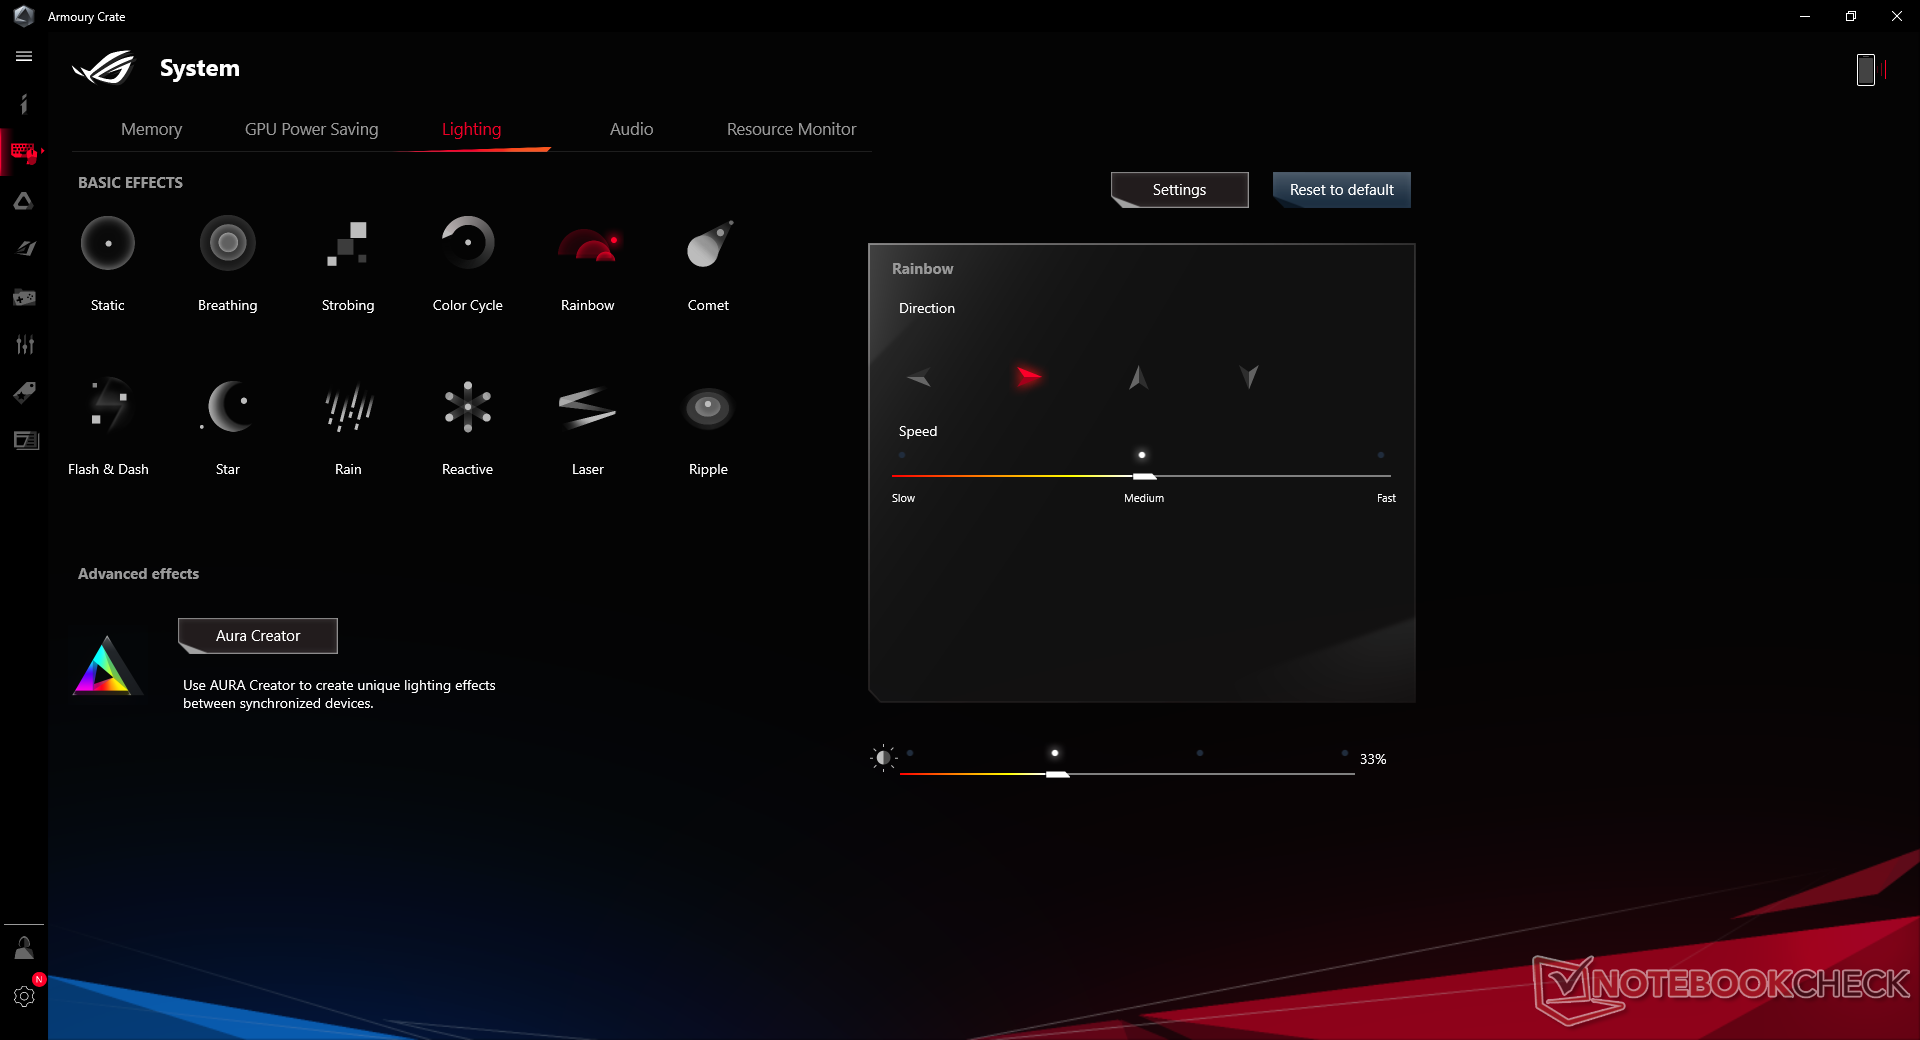
Recomendamos encarecidamente a los usuarios que se familiaricen con el software preinstalado Asus Armoury Crate, ya que los perfiles de energía aquí anulan los perfiles de energía básicos de Windows. Además, todos los efectos de iluminación se pueden cambiar aquí también. Nuestra unidad se puso en modo Turbo antes de ejecutar cualquier prueba de rendimiento para obtener las puntuaciones más altas posibles.
El sistema viene con Nvidia Optimus y barra redimensionable. Advanced Optimus y G-Sync, sin embargo, no son compatibles con la pantalla principal.
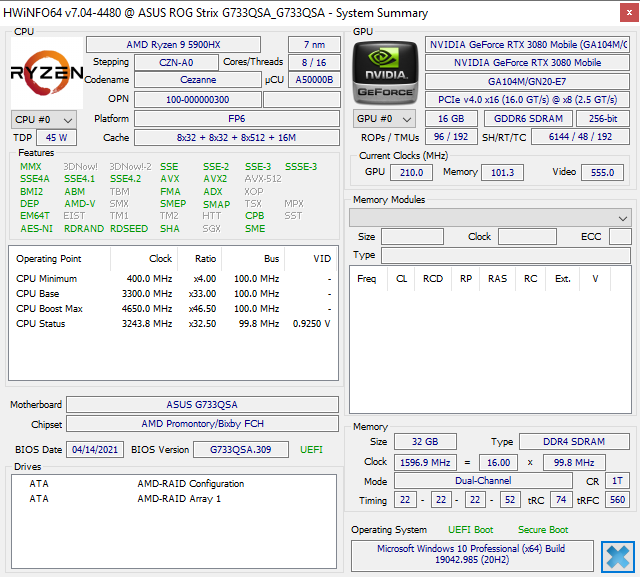
Procesador
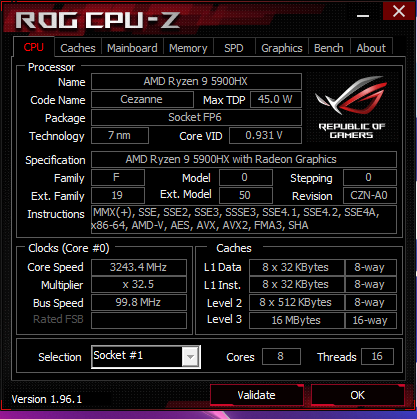
Como prácticamente cualquier otro procesador móvil Zen 2 o Zen 3 que existe, el Ryzen 9 5900HX es increíblemente rápido en comparación con lo que ofrece Intel. El rendimiento multihilo bruto es comparable al del Core i9-11900K en el Schenker XMG Ultra 17 de 17,3 pulgadas, mientras que es un 10% más lento en el rendimiento de un solo hilo. Hay que tener en cuenta que el mencionado Core i9 es un procesador de sobremesa de 125 W TDP más costoso, en contraste con nuestro procesador AMD móvil de 45 W.
Sin embargo, si se compara con la serie Zen 2 para móviles, el aumento de rendimiento de una generación a otra es, como mucho, decente. El Ryzen 7 4800H del año pasado Ryzen 7 4800Hdel año pasado, por ejemplo, es sólo un 15 por ciento más lento que el Ryzen 9 5900HX, tanto en cargas de un solo hilo como de varios. Las CPUs Ryzen 4000H ya eran extremadamente impresionantes en su lanzamiento, por lo que tal vez no sea inesperado que la serie Ryzen 5000H suponga un salto menor.
Cinebench R23: Multi Core | Single Core
Cinebench R15: CPU Multi 64Bit | CPU Single 64Bit
Blender: v2.79 BMW27 CPU
7-Zip 18.03: 7z b 4 -mmt1 | 7z b 4
Geekbench 5.5: Single-Core | Multi-Core
HWBOT x265 Benchmark v2.2: 4k Preset
LibreOffice : 20 Documents To PDF
R Benchmark 2.5: Overall mean
| Cinebench R23 / Multi Core | |
| AMD Ryzen 9 5900X | |
| MSI MEG Z590 ACE | |
| Schenker XMG Ultra 17 Rocket Lake | |
| Asus Strix Scar 17 G733QSA-XS99 | |
| Medio AMD Ryzen 9 5900HX (6622 - 14363, n=30) | |
| Asus ROG Zephyrus G15 GA503Q | |
| Schenker XMG Neo 17 (Early 2021, RTX 3070, 5800H) | |
| Alienware m17 R4 | |
| MSI GE76 Raider 10UH | |
| Cinebench R23 / Single Core | |
| MSI MEG Z590 ACE | |
| Schenker XMG Ultra 17 Rocket Lake | |
| AMD Ryzen 9 5900X | |
| Asus Strix Scar 17 G733QSA-XS99 | |
| Asus ROG Zephyrus G15 GA503Q | |
| Medio AMD Ryzen 9 5900HX (1218 - 1499, n=29) | |
| Schenker XMG Neo 17 (Early 2021, RTX 3070, 5800H) | |
| Alienware m17 R4 | |
| MSI GE76 Raider 10UH | |
| LibreOffice / 20 Documents To PDF | |
| Eluktronics RP-17 | |
| Asus ROG Zephyrus G15 GA503Q | |
| Schenker Compact 17 | |
| Medio AMD Ryzen 9 5900HX (44.1 - 87.4, n=29) | |
| Asus Strix Scar 17 G732LXS | |
| Alienware m17 R4 | |
| MSI GP76 Leopard 10UG | |
| Schenker XMG Neo 17 (Early 2021, RTX 3070, 5800H) | |
| MSI GE76 Raider 10UH | |
| AMD Ryzen 9 5900X | |
| Asus Strix Scar 17 G733QSA-XS99 | |
| MSI MEG Z590 ACE | |
| Schenker XMG Ultra 17 Rocket Lake | |
Cinebench R23: Multi Core | Single Core
Cinebench R15: CPU Multi 64Bit | CPU Single 64Bit
Blender: v2.79 BMW27 CPU
7-Zip 18.03: 7z b 4 -mmt1 | 7z b 4
Geekbench 5.5: Single-Core | Multi-Core
HWBOT x265 Benchmark v2.2: 4k Preset
LibreOffice : 20 Documents To PDF
R Benchmark 2.5: Overall mean
* ... más pequeño es mejor
Rendimiento del sistema
Los resultados de PCMark son excelentes con puntuaciones que están constantemente por encima de otros portátiles equipados con la misma GPU GeForce RTX 3080.
Experimentamos un extraño problema en nuestra unidad de pruebas en el que la pantalla a veces se quedaba en blanco tras reiniciar. No pudimos repetir el problema de forma fiable, pero ocurrió un puñado de veces durante las pruebas. Un apagado forzado y un reinicio solucionaban el problema cada vez que ocurría.
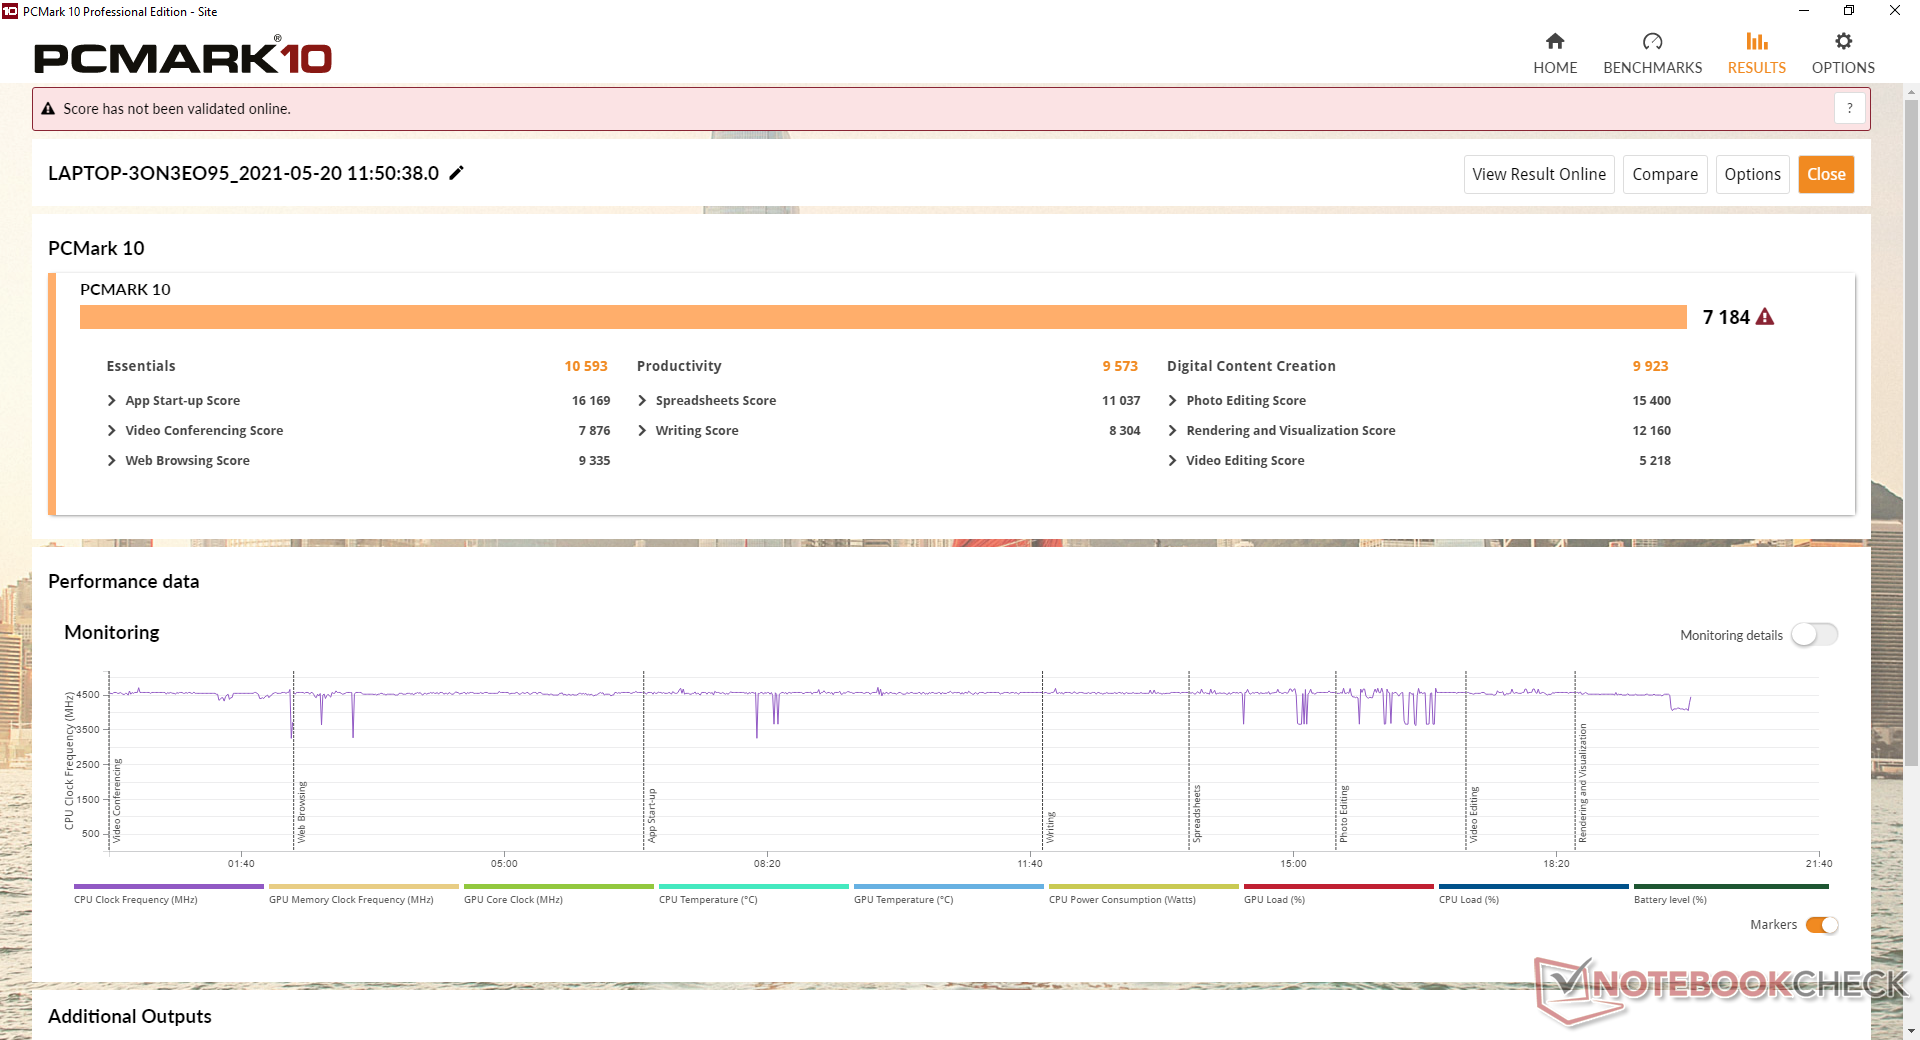
| PCMark 10 Score | 7184 puntos | |
ayuda | ||
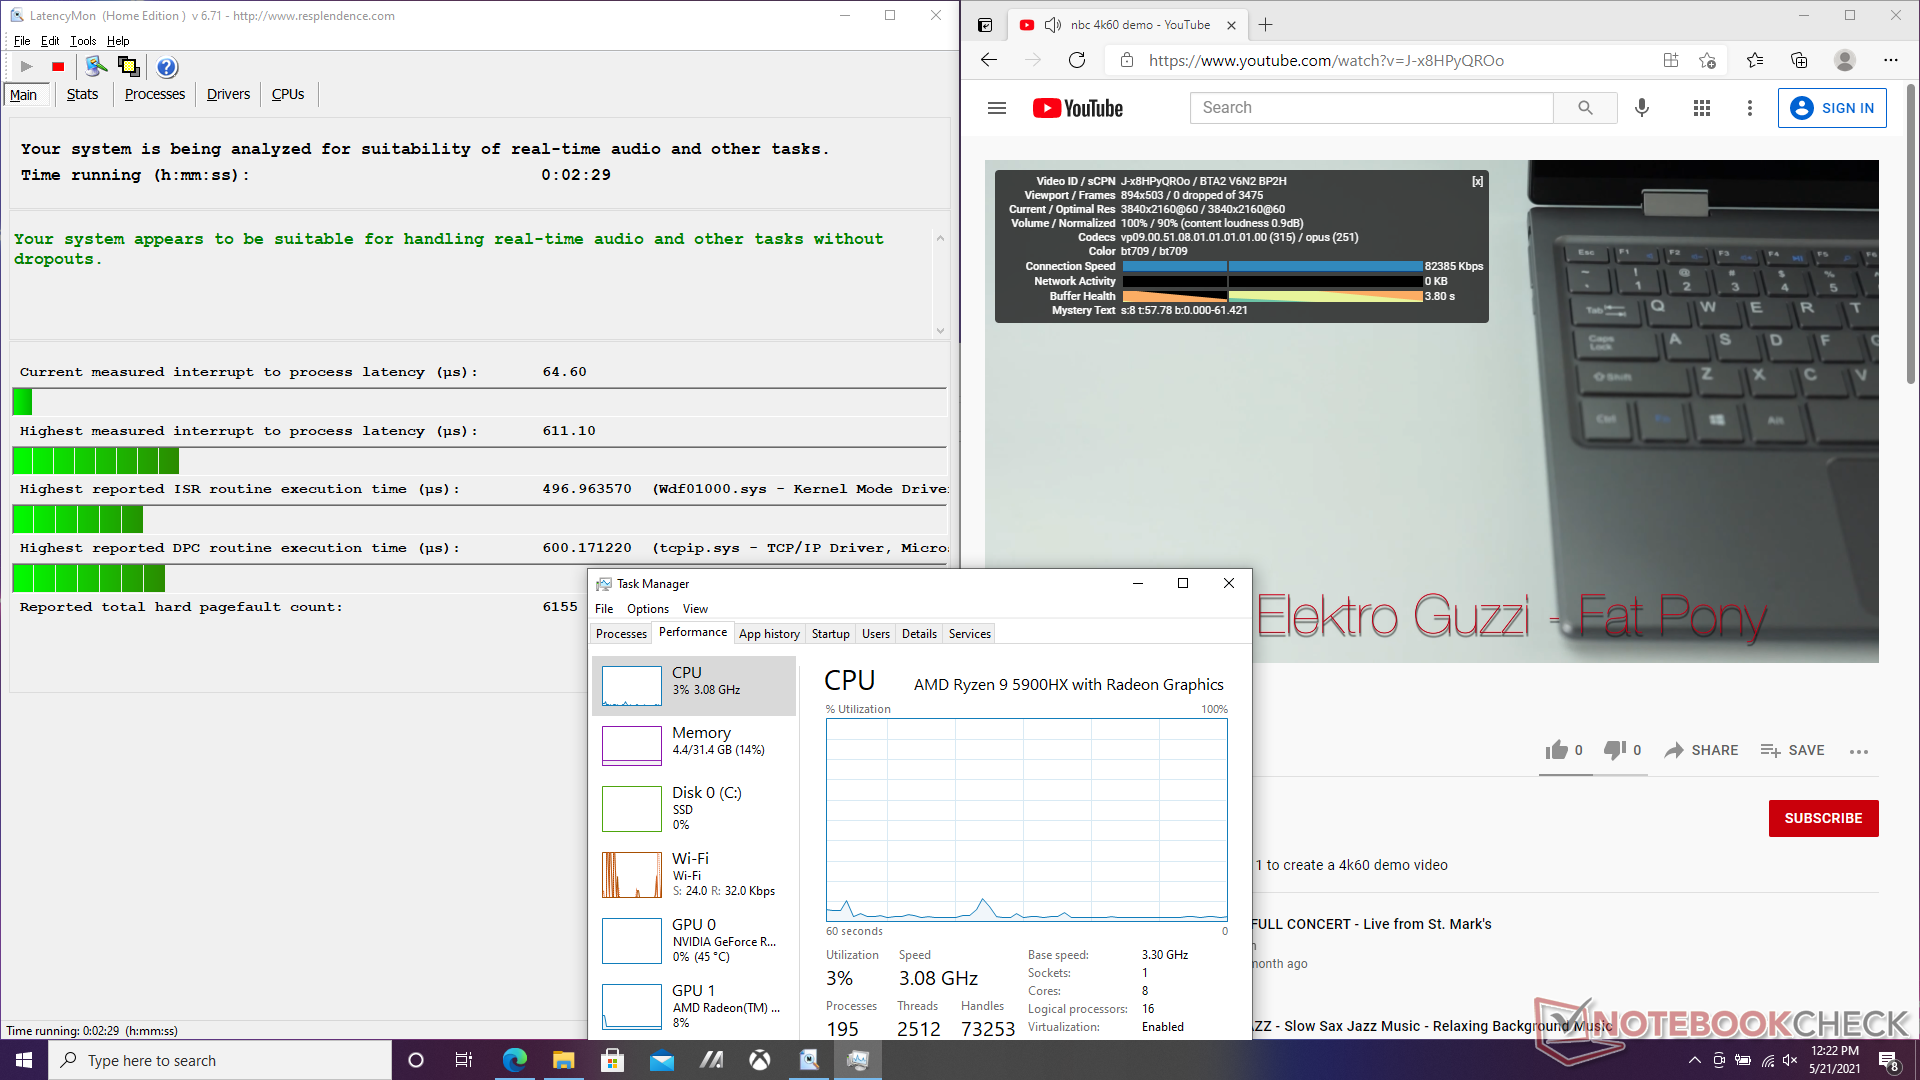
Latencia del CPD
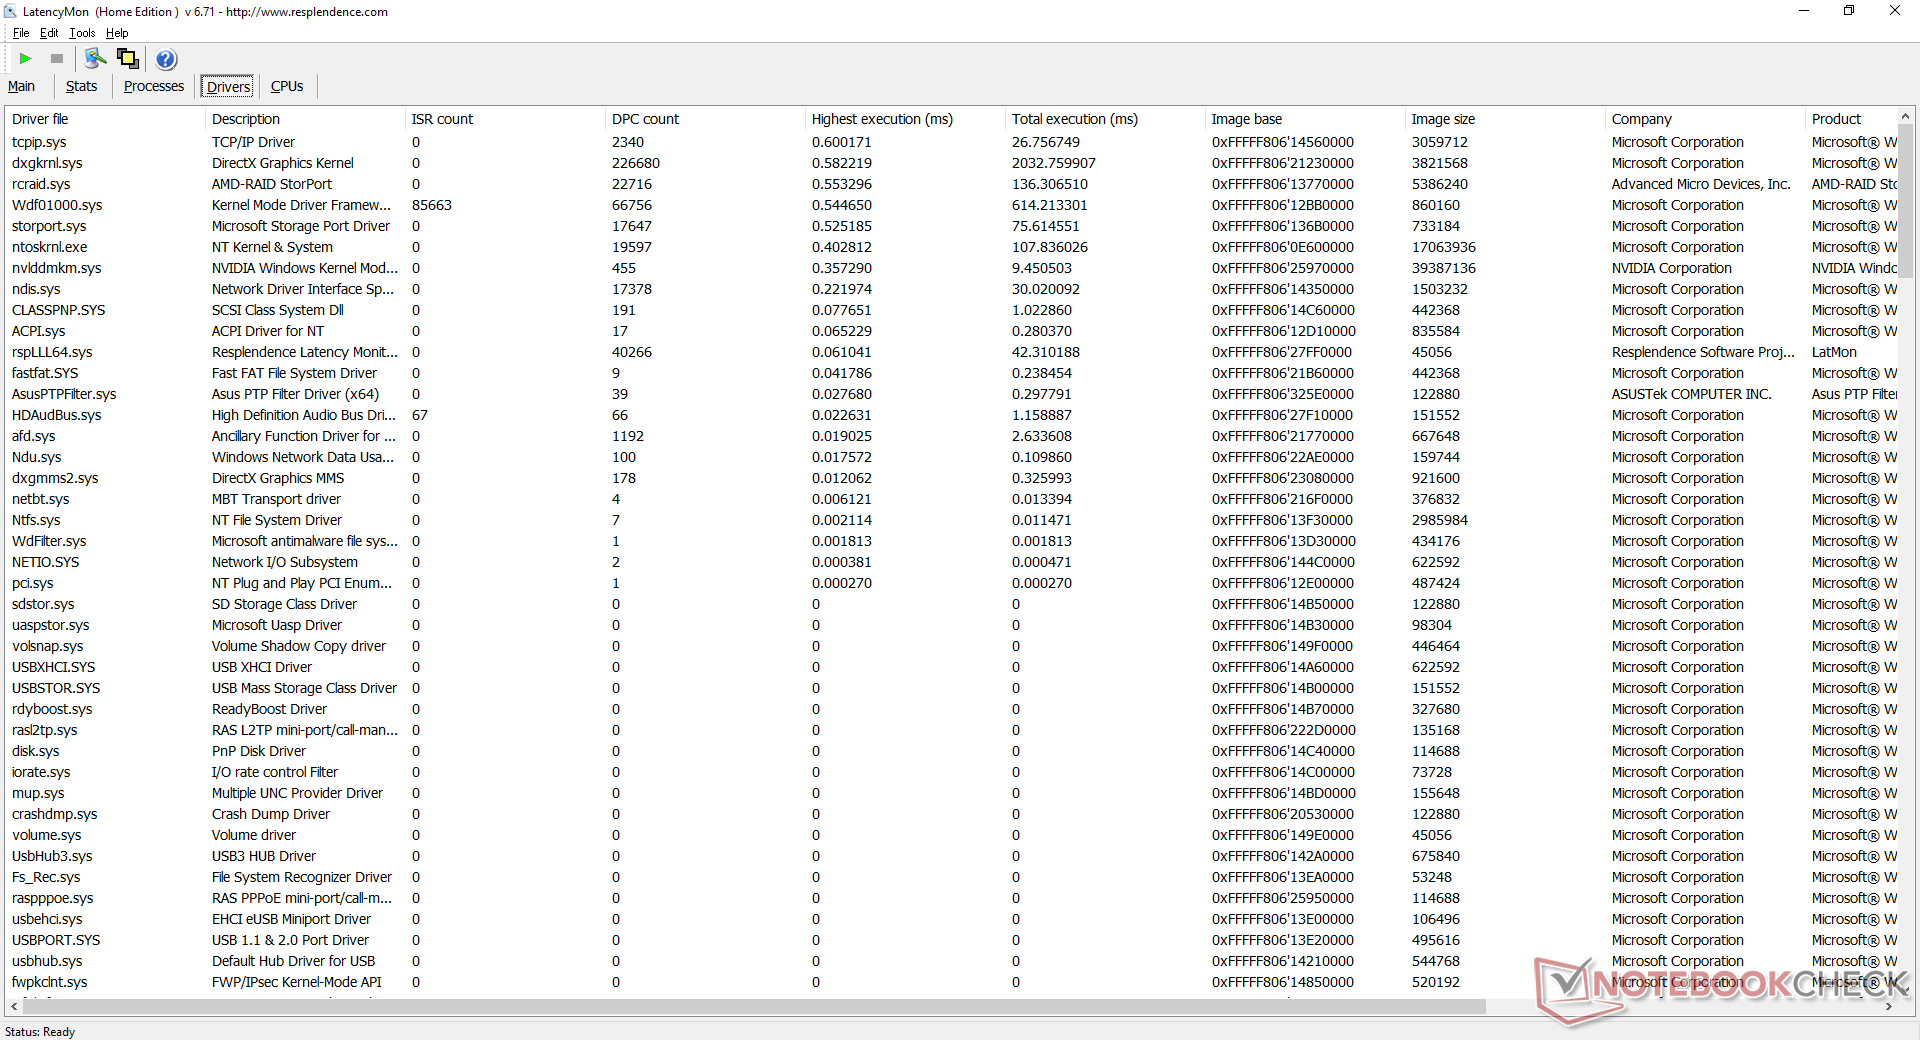
LatencyMon no revela problemas de latencia del CPD al abrir varias pestañas en nuestra página web. La reproducción de vídeo 4K a 60 FPS también es perfecta, con un uso muy bajo de la CPU y la GPU y sin pérdida de fotogramas.
| DPC Latencies / LatencyMon - interrupt to process latency (max), Web, Youtube, Prime95 | |
| MSI GE76 Raider 10UH | |
| Asus Strix Scar 17 G732LXS | |
| Razer Blade Pro 17 2021 (QHD Touch) | |
| Asus Strix Scar 17 G733QSA-XS99 | |
| Alienware m17 R4 | |
| Asus Zephyrus S17 GX701LXS | |
* ... más pequeño es mejor
Dispositivos de almacenamiento
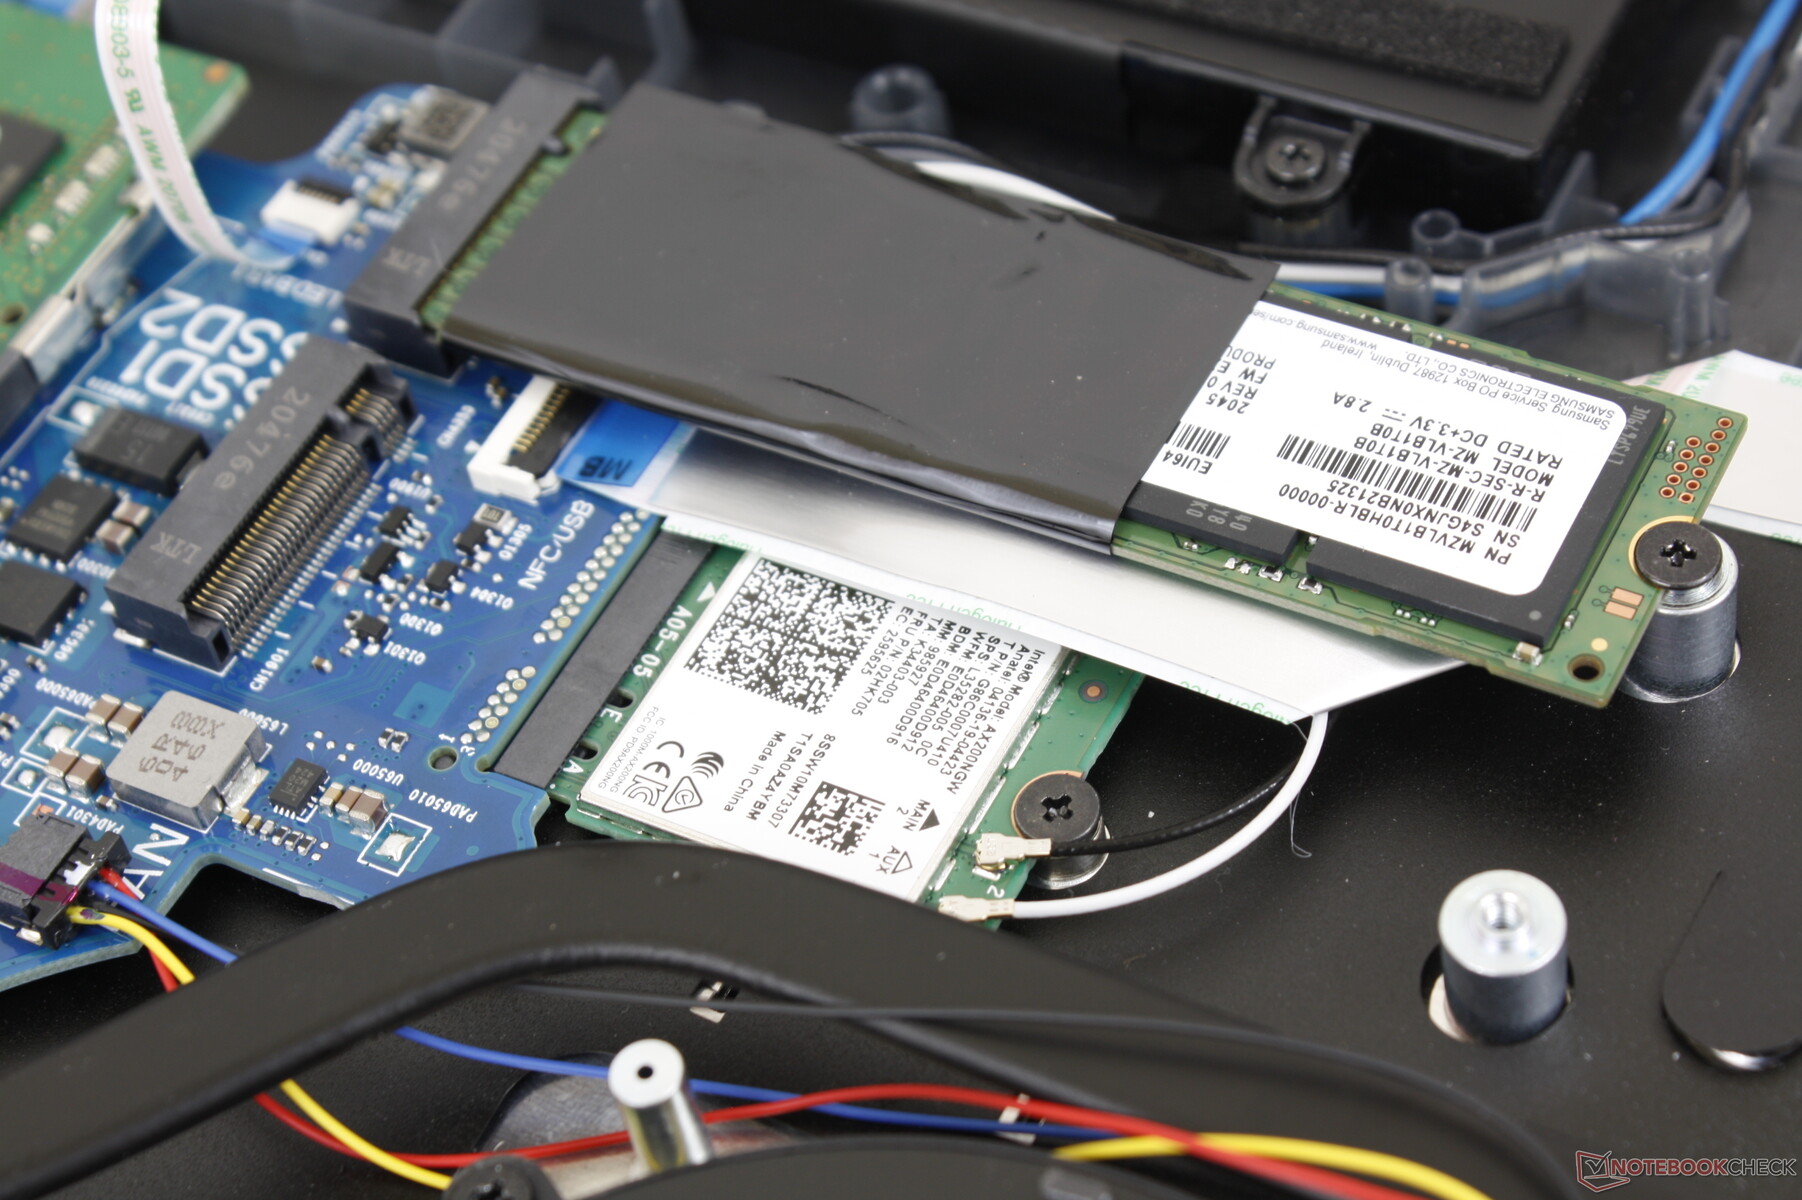
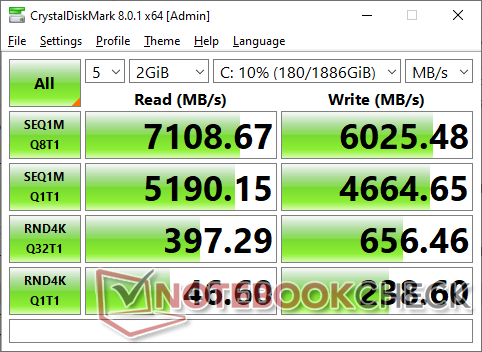
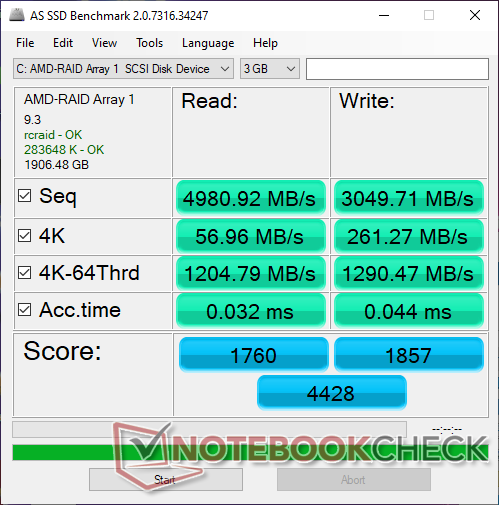
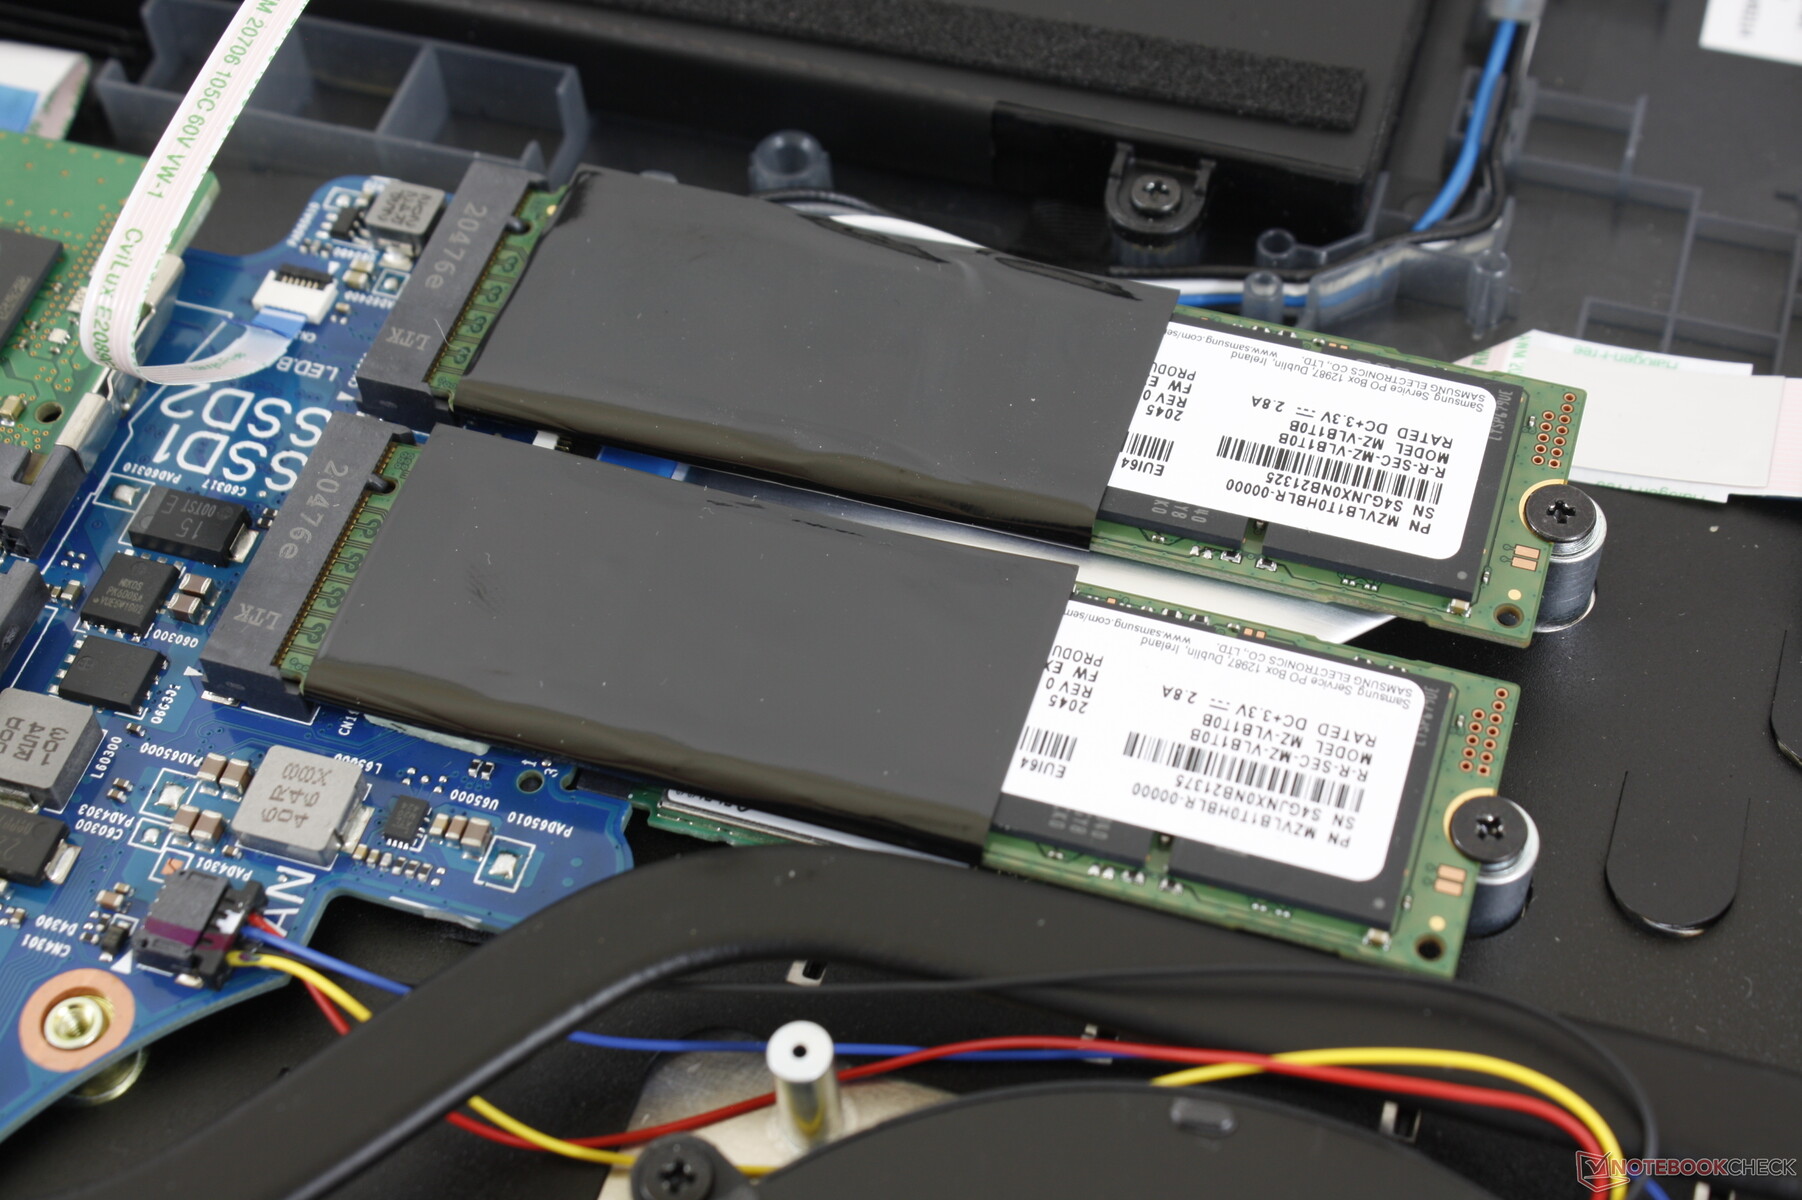
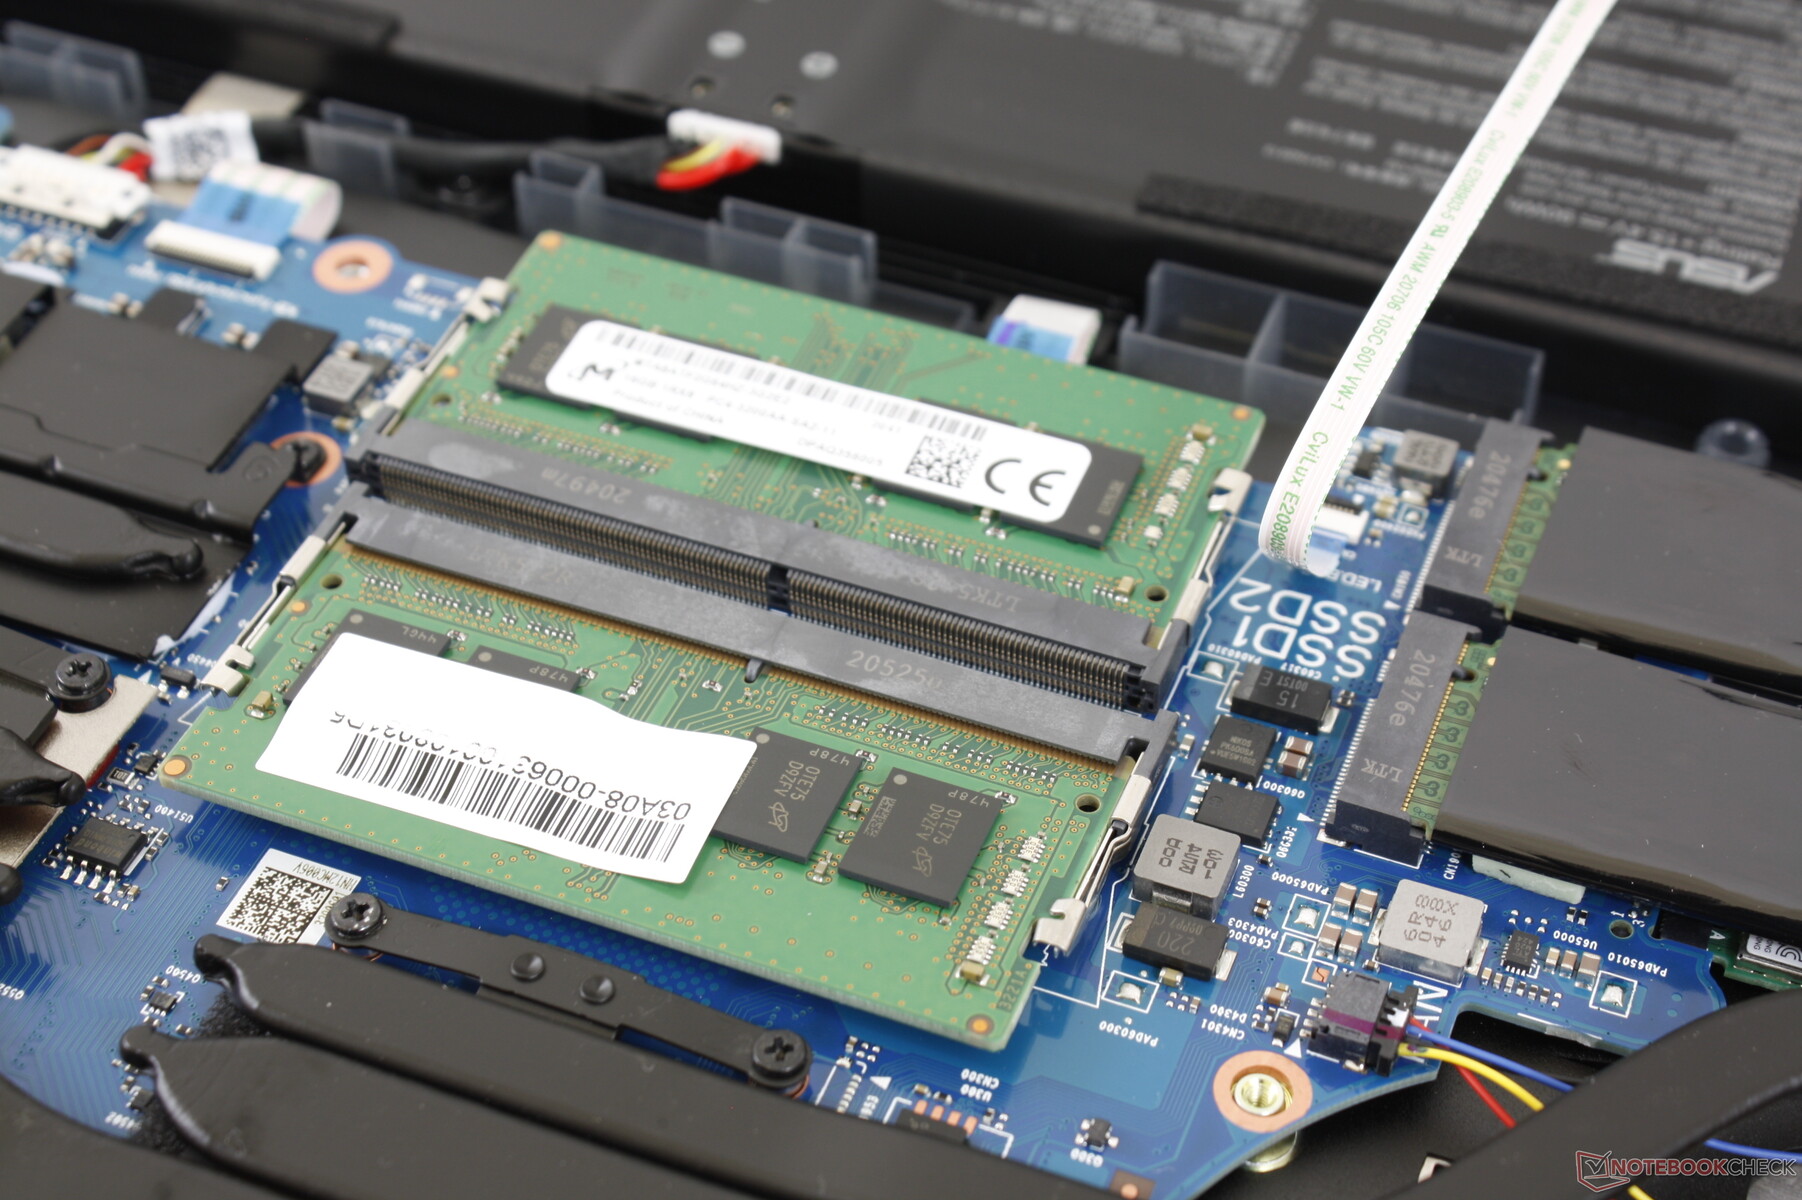
El G733 admite hasta dos unidades M.2 PCIe 3.0 x4, frente a las tres del G732 del año pasado. Nuestra unidad de prueba viene con dos unidades Samsung PM981a MZVLB1T0HBLR en RAID 0 para obtener tasas de transferencia que superan los 7.000 MB/s, pero sospechamos que el modelo del año que viene soportará unidades PCIe 4.0 para lograr niveles de rendimiento similares sin RAID.
Consulta nuestra tabla de discos duros y SSDs para más comparaciones.
| Asus Strix Scar 17 G733QSA-XS99 2x Samsung PM981a MZVLB1T0HBLR (RAID 0) | Asus Strix Scar 17 G732LXS 2x Intel SSD 660p 1TB SSDPEKNW010T8 (RAID 0) | MSI GE76 Raider 10UH WDC PC SN730 SDBPNTY-1T00 | Alienware m17 R4 2x Micron 2300 512 GB (RAID 0) | Asus Zephyrus S17 GX701LXS Samsung PM981a MZVLB1T0HBLR | |
|---|---|---|---|---|---|
| AS SSD | -54% | -32% | -31% | -20% | |
| Seq Read (MB/s) | 4981 | 2450 -51% | 2967 -40% | 2733 -45% | 2744 -45% |
| Seq Write (MB/s) | 3050 | 1436 -53% | 2604 -15% | 2822 -7% | 1351 -56% |
| 4K Read (MB/s) | 57 | 49.48 -13% | 42.97 -25% | 45.04 -21% | 47.24 -17% |
| 4K Write (MB/s) | 261.3 | 119.4 -54% | 107.8 -59% | 88.4 -66% | 109.1 -58% |
| 4K-64 Read (MB/s) | 1205 | 1032 -14% | 1684 40% | 1388 15% | 1118 -7% |
| 4K-64 Write (MB/s) | 1290 | 1229 -5% | 2164 68% | 1227 -5% | 1926 49% |
| Access Time Read * (ms) | 0.032 | 0.145 -353% | 0.116 -263% | 0.079 -147% | 0.064 -100% |
| Access Time Write * (ms) | 0.044 | 0.036 18% | 0.106 -141% | 0.095 -116% | 0.034 23% |
| Score Read (Points) | 1760 | 1327 -25% | 2023 15% | 1706 -3% | 1439 -18% |
| Score Write (Points) | 1857 | 1492 -20% | 2532 36% | 1598 -14% | 2170 17% |
| Score Total (Points) | 4428 | 3456 -22% | 5571 26% | 4184 -6% | 4283 -3% |
| Copy ISO MB/s (MB/s) | 3357 | 2106 -37% | 2414 -28% | ||
| Copy Program MB/s (MB/s) | 966 | 687 -29% | 1030 7% | ||
| Copy Game MB/s (MB/s) | 2051 | 1590 -22% | 1991 -3% | ||
| CrystalDiskMark 5.2 / 6 | -36% | -29% | -29% | -39% | |
| Write 4K (MB/s) | 235.9 | 125.8 -47% | 157.1 -33% | 93.1 -61% | 120 -49% |
| Read 4K (MB/s) | 48.02 | 52.9 10% | 46.3 -4% | 46.79 -3% | 45.24 -6% |
| Write Seq (MB/s) | 4822 | 1795 -63% | 2396 -50% | 2853 -41% | 2090 -57% |
| Read Seq (MB/s) | 5043 | 2315 -54% | 2245 -55% | 2556 -49% | 2246 -55% |
| Write 4K Q32T1 (MB/s) | 625 | 407.1 -35% | 436.1 -30% | 475 -24% | 392.5 -37% |
| Read 4K Q32T1 (MB/s) | 392.3 | 411.9 5% | 524 34% | 529 35% | 348.4 -11% |
| Write Seq Q32T1 (MB/s) | 5350 | 2844 -47% | 3086 -42% | 3331 -38% | 3015 -44% |
| Read Seq Q32T1 (MB/s) | 7130 | 3130 -56% | 3363 -53% | 3319 -53% | 3445 -52% |
| Media total (Programa/Opciones) | -45% /
-46% | -31% /
-31% | -30% /
-31% | -30% /
-28% |
* ... más pequeño es mejor

Disk Throttling: DiskSpd Read Loop, Queue Depth 8
Rendimiento de la GPU
Nuestro GeForce RTX 3080 de 130 W está dentro del 5 por ciento de la media de portátiles de nuestra base de datos equipados con la misma GPU GeForce RTX 3080. Quizá lo más destacable es que las puntuaciones en 3DMark son entre un 25 y un 30 por ciento más altas que en elAsus ROG Zephyrus G15 que viene con la menos exigente GeForce RTX 3080 de 100 W. Los usuarios que se actualicen a partir de una GTX 1080 o RTX 2080 verán un aumento de los gráficos de aproximadamente el 70% y el 15%, respectivamente.
En la mayoría de los casos, las velocidades de fotogramas se sitúan entre el 2 y el 3 por ciento de la media de los portátiles equipados con la misma GPU GeForce RTX 3080 y, dado que la mayoría de estos portátiles están equipados con CPUs Intel, podemos afirmar con seguridad que nuestro sistema AMD es comparable a cualquier homólogo de la 10ª generación de Intel a la hora de jugar. La única excepción de los 9 juegos probados es Strange Brigade, donde nuestro sistema AMD es un 10% más lento que la media.
La GeForce RTX 3080 de sobremesa sigue siendo notablemente más rápida que cualquier GeForce RTX 3080 de portátil. En este caso, nuestro pC de sobremesa MSI GeForce RTX 3080 de referencia supera a nuestro portátil Asus entre un 25 y un 50 por ciento.
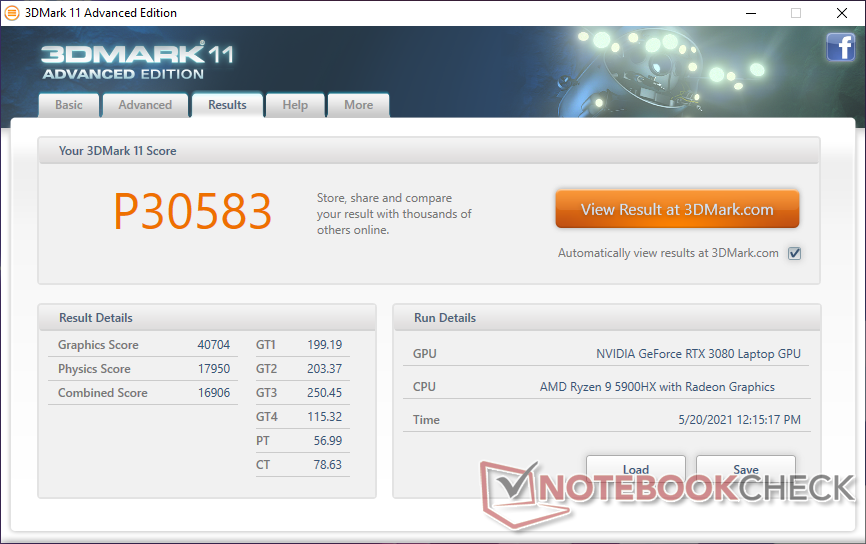
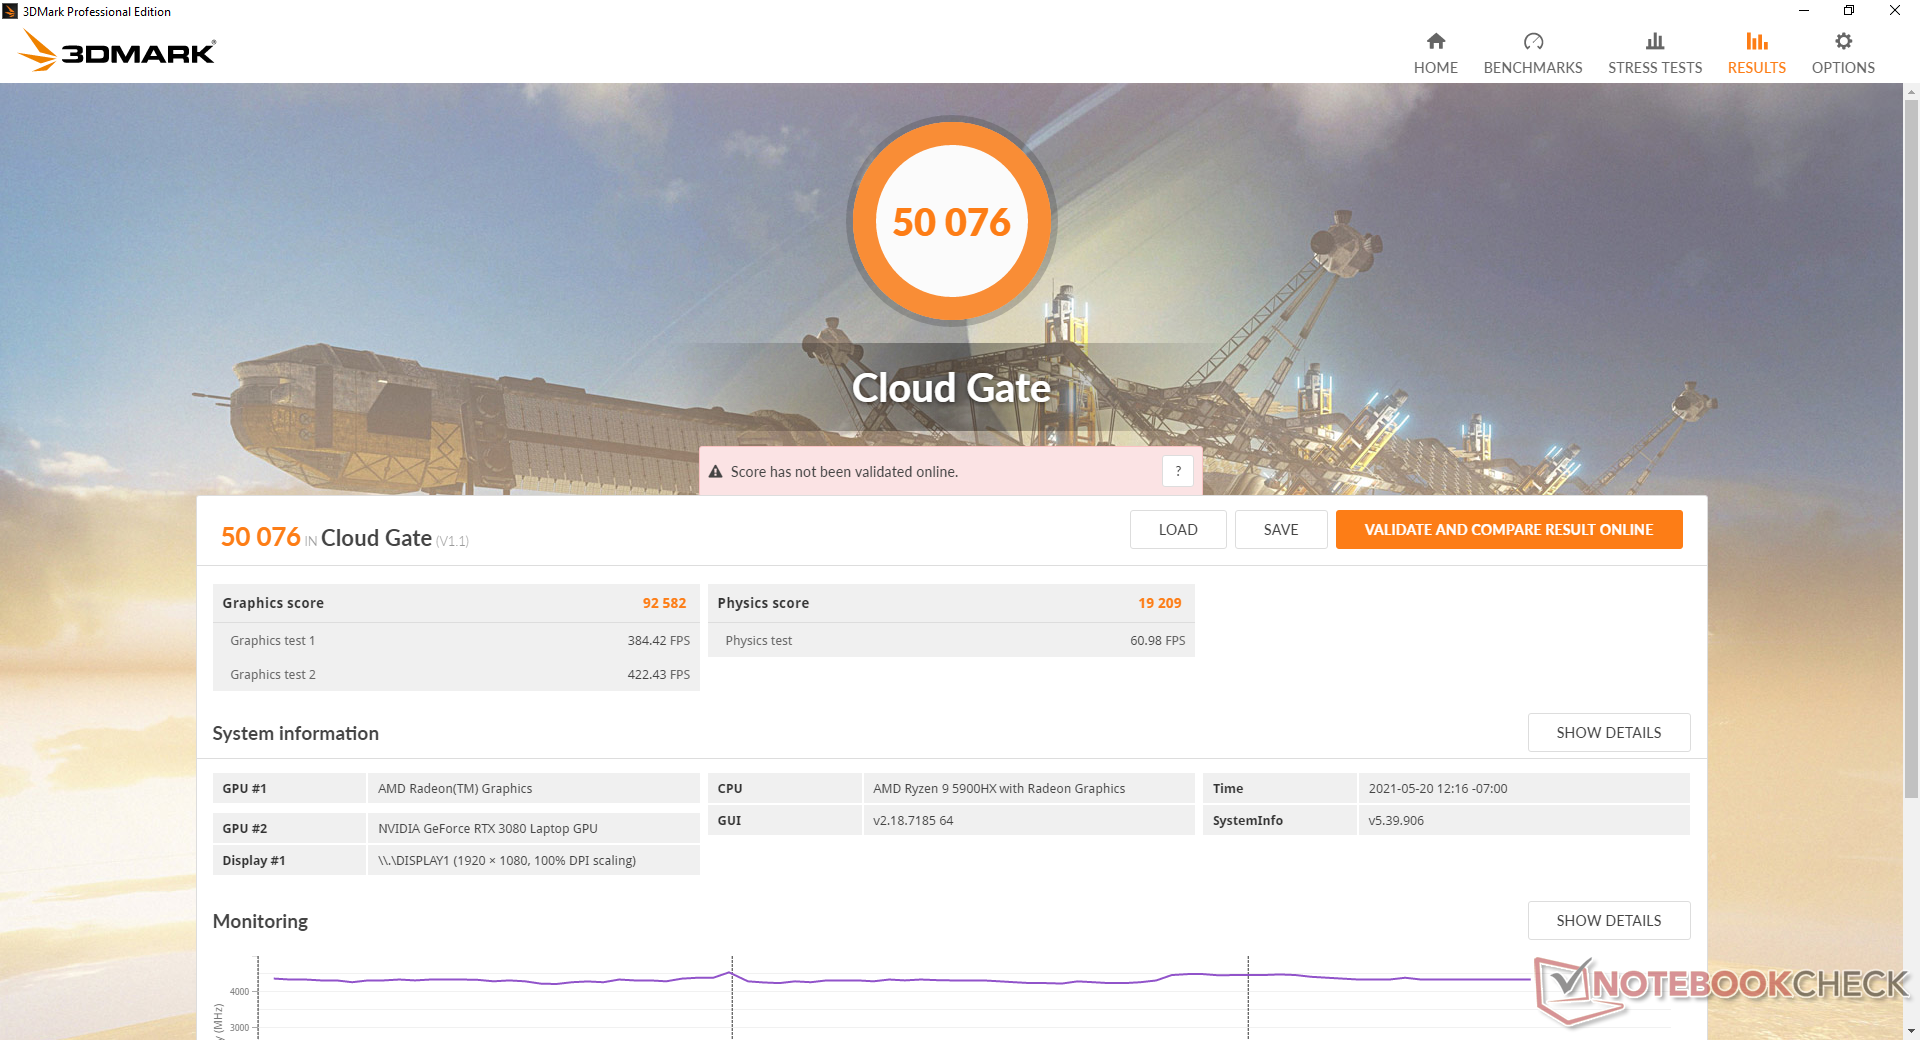
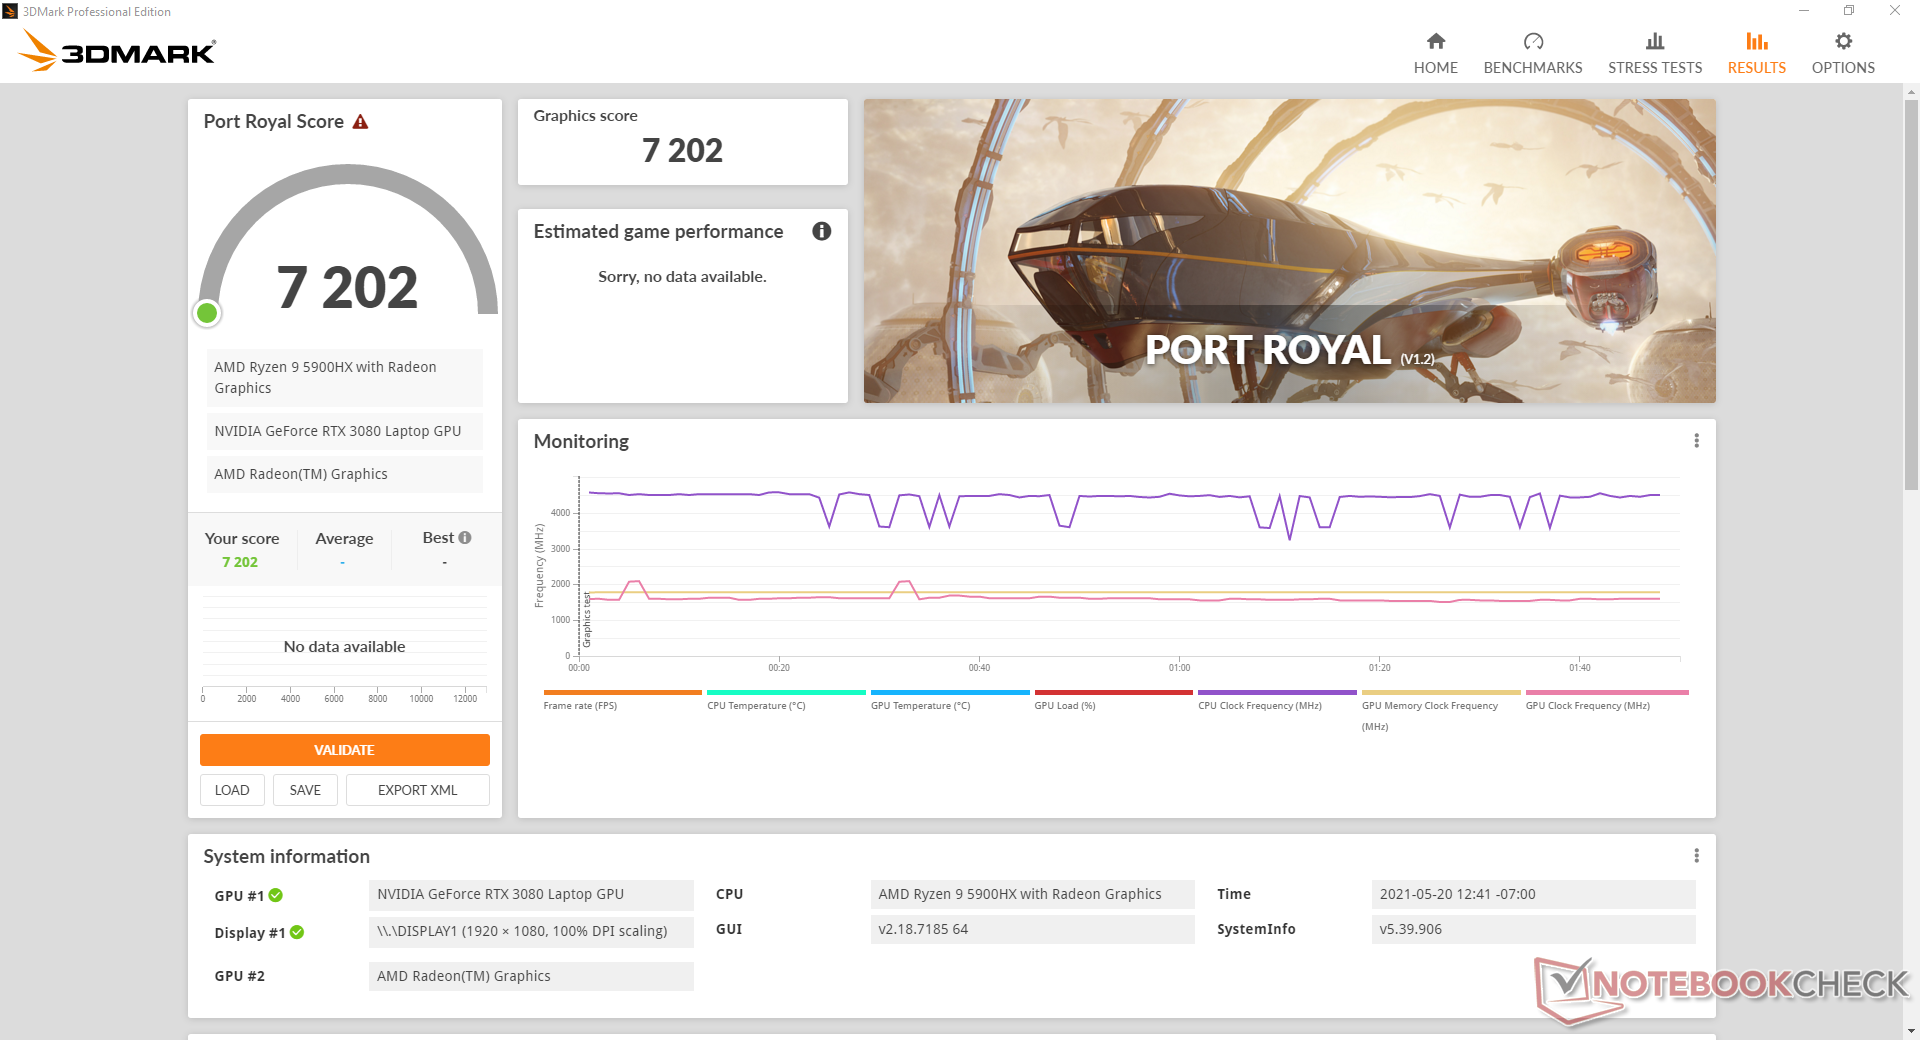
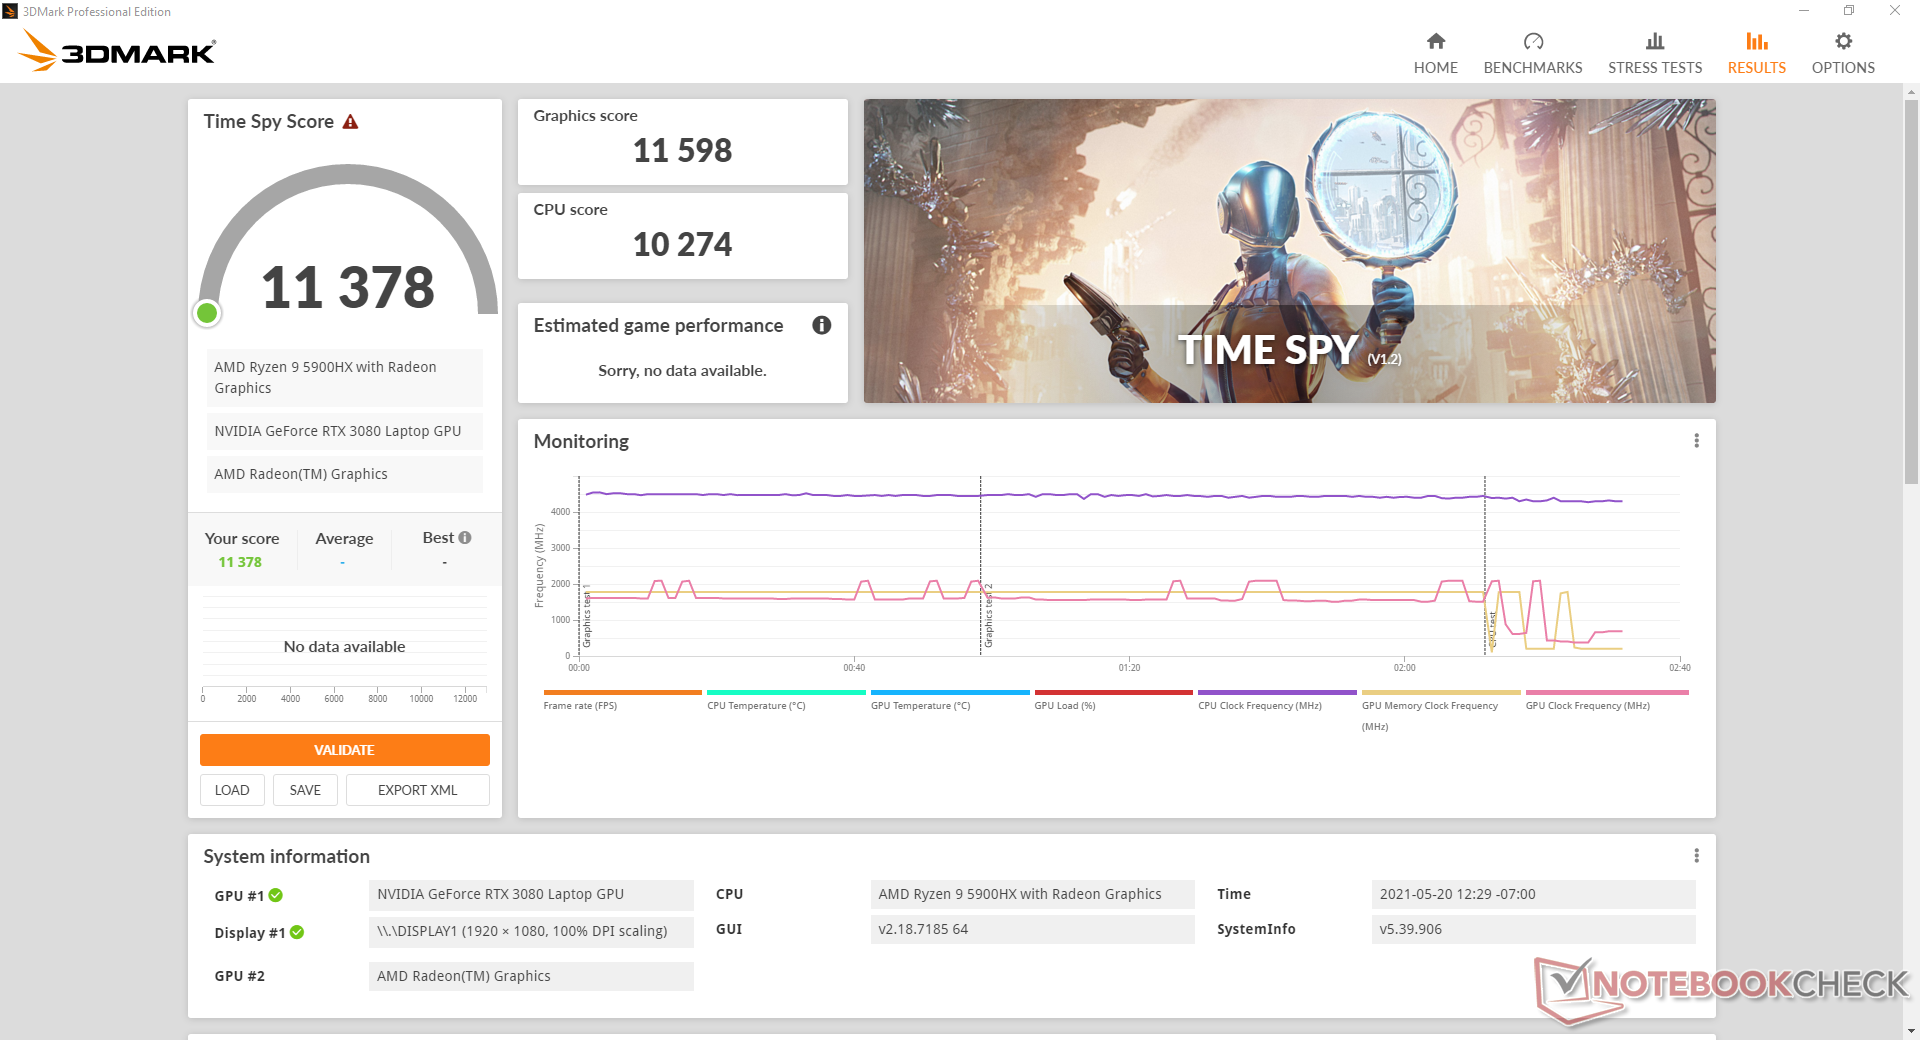
| 3DMark 11 Performance | 30583 puntos | |
| 3DMark Cloud Gate Standard Score | 50076 puntos | |
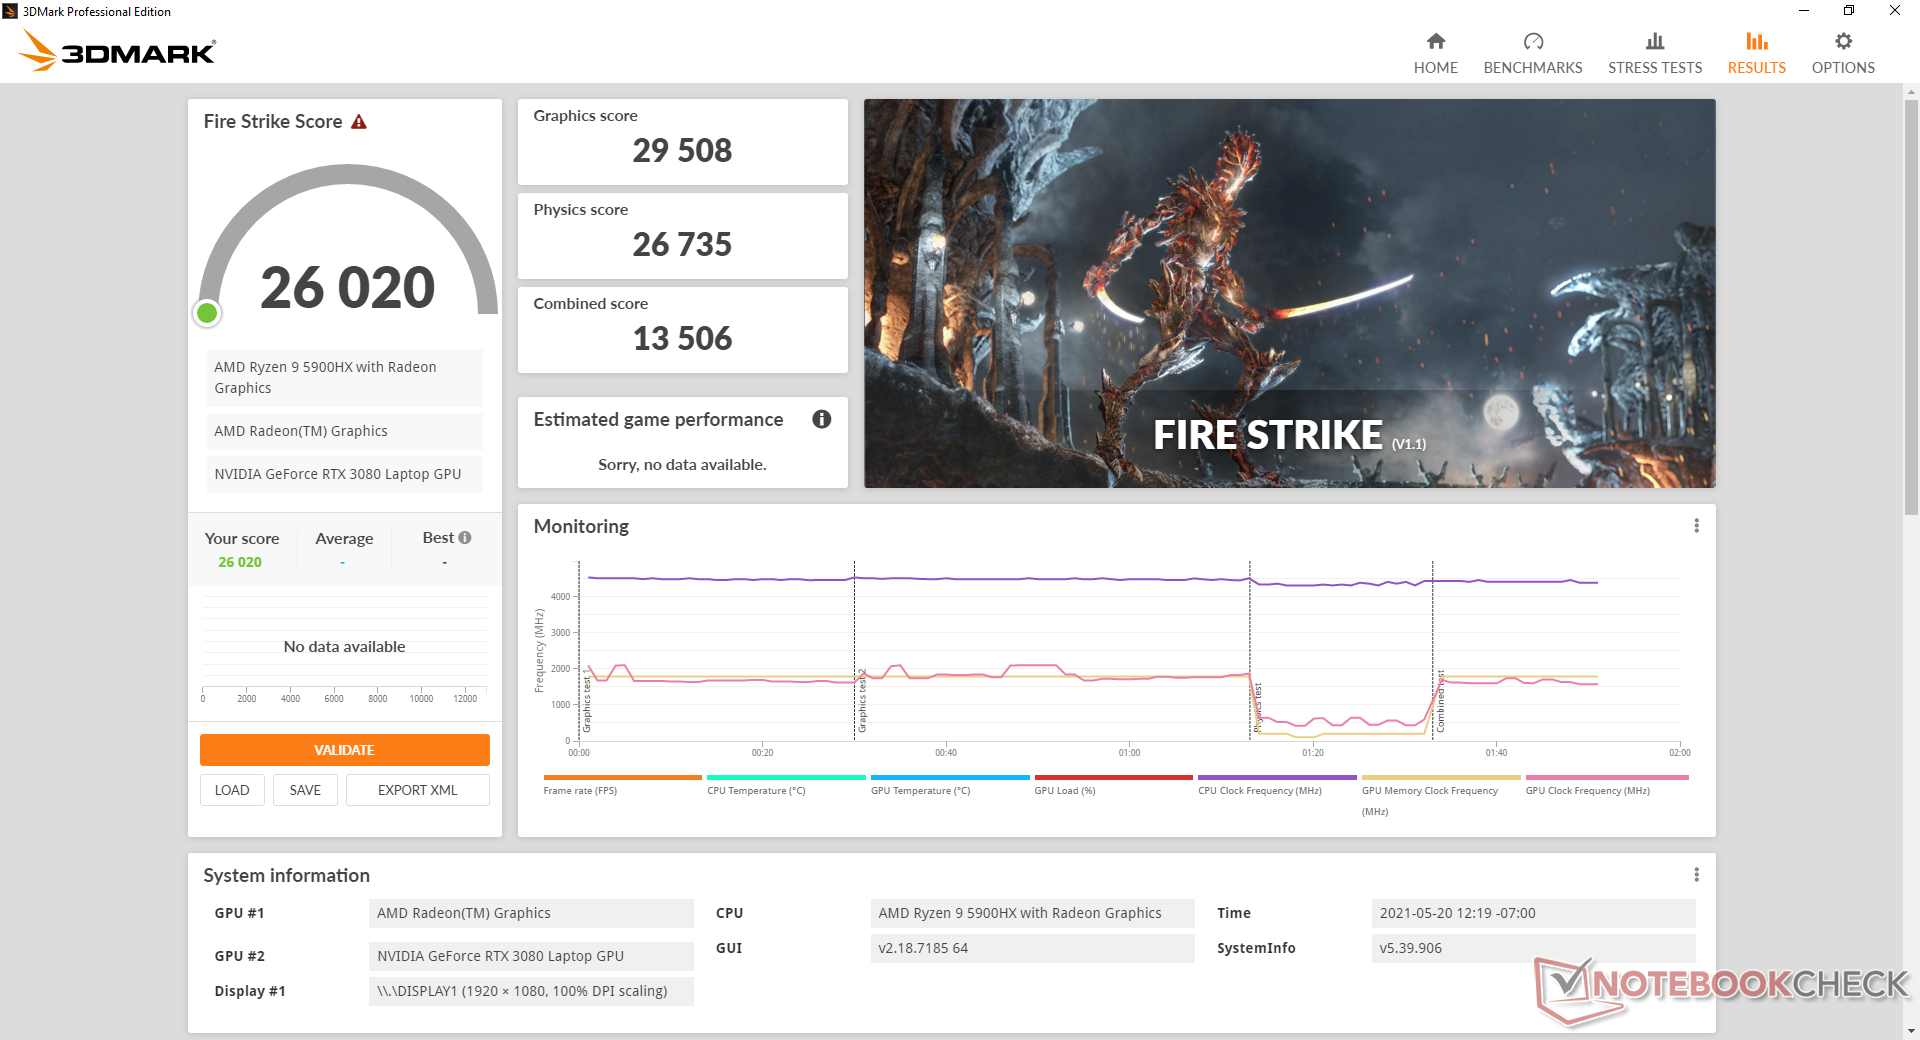
| 3DMark Fire Strike Score | 26020 puntos | |
| 3DMark Time Spy Score | 11378 puntos | |
ayuda | ||
Las tasas de fotogramas son constantes cuando se está en reposo Witcher 3 salvo por una única y breve caída en el rango de los 40 FPS. La caída parece ser un fenómeno atípico, ya que solo se produjo una vez durante la prueba de una hora de duración.
| bajo | medio | alto | ultra | |
|---|---|---|---|---|
| GTA V (2015) | 179 | 156 | 93 | |
| The Witcher 3 (2015) | 318.8 | 184.9 | 105.5 | |
| Dota 2 Reborn (2015) | 153 | 146 | 130 | 123 |
| Final Fantasy XV Benchmark (2018) | 177 | 136 | 106 | |
| X-Plane 11.11 (2018) | 104 | 92.6 | 75.9 | |
| Far Cry 5 (2018) | 143 | 122 | 117 | 111 |
| Strange Brigade (2018) | 344 | 205 | 189 | 175 |
| Assassin´s Creed Valhalla (2020) | 127 | 98 | 85 | 76 |
Emissions
Ruido del sistema
El comportamiento del ventilador está íntimamente ligado al software Armoury Crate de Asus. Cuando se juega en modo equilibrado o Windows, el ruido del ventilador alcanza un máximo de 46.9 dB(A). Si se pone el sistema en modo Turbo, el límite se eleva a 51,3 dB(A), lo que está en la media de un portátil de juego de gama alta. Las frecuencias de reloj de la CPU y la GPU son máximas sólo cuando se pone el modo Turbo, lo que significa que los usuarios deben sucumbir a un ruido de ventilador más fuerte si desean obtener la máxima velocidad de fotogramas.
Por el contrario, el ruido del ventilador es sorprendentemente silencioso en la mayoría de los escenarios cotidianos si se configura en modo equilibrado o inferior. Una ejecución de 90 segundos en 3DMark 06 induciría un ruido de poco menos de 31 dB(A) comparado con >40 dB(A) en la mayoría de otros portátiles de juego para sugerir que los ventiladores del Asus pueden permanecer más silenciosos durante más tiempo. Si se transmite vídeo 4K, el ruido del ventilador se mantendría constante en unos 31.2 dB(A), lo que es apenas audible en la mayoría de escenarios.
| Asus Strix Scar 17 G733QSA-XS99 GeForce RTX 3080 Laptop GPU, R9 5900HX, 2x Samsung PM981a MZVLB1T0HBLR (RAID 0) | Asus Strix Scar 17 G732LXS GeForce RTX 2080 Super Mobile, i9-10980HK, 2x Intel SSD 660p 1TB SSDPEKNW010T8 (RAID 0) | MSI GE76 Raider 10UH GeForce RTX 3080 Laptop GPU, i7-10870H, WDC PC SN730 SDBPNTY-1T00 | Alienware m17 R4 GeForce RTX 3080 Laptop GPU, i9-10980HK, 2x Micron 2300 512 GB (RAID 0) | Razer Blade Pro 17 2021 (QHD Touch) GeForce RTX 3080 Laptop GPU, i7-10875H, Samsung PM981a MZVLB1T0HBLR | Asus Zephyrus S17 GX701LXS GeForce RTX 2080 Super Max-Q, i7-10875H, Samsung PM981a MZVLB1T0HBLR | |
|---|---|---|---|---|---|---|
| Noise | -34% | -2% | -10% | -13% | -21% | |
| apagado / medio ambiente * (dB) | 25 | 25 -0% | 25.3 -1% | 24 4% | 26.1 -4% | 25 -0% |
| Idle Minimum * (dB) | 25.2 | 33 -31% | 26.1 -4% | 24 5% | 26.1 -4% | 32 -27% |
| Idle Average * (dB) | 25.2 | 38 -51% | 26.1 -4% | 25 1% | 26.5 -5% | 35 -39% |
| Idle Maximum * (dB) | 25.2 | 45 -79% | 26.1 -4% | 36 -43% | 30.7 -22% | 43 -71% |
| Load Average * (dB) | 30.7 | 54 -76% | 37.2 -21% | 45 -47% | 43.5 -42% | 44 -43% |
| Witcher 3 ultra * (dB) | 51.3 | 50 3% | 36.8 28% | 47 8% | 54 -5% | 41 20% |
| Load Maximum * (dB) | 51.3 | 55 -7% | 56.9 -11% | 50 3% | 55 -7% | 45 12% |
* ... más pequeño es mejor
Ruido
| Ocioso |
| 25.2 / 25.2 / 25.2 dB(A) |
| Carga |
| 30.7 / 51.3 dB(A) |
 | ||
30 dB silencioso 40 dB(A) audible 50 dB(A) ruidosamente alto |
||
min: | ||
Temperatura
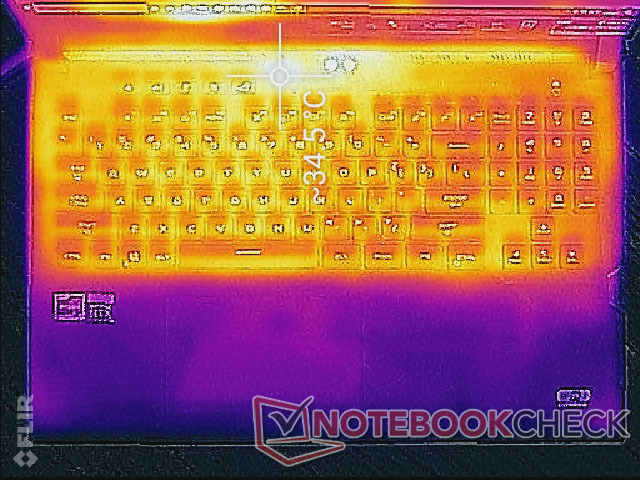
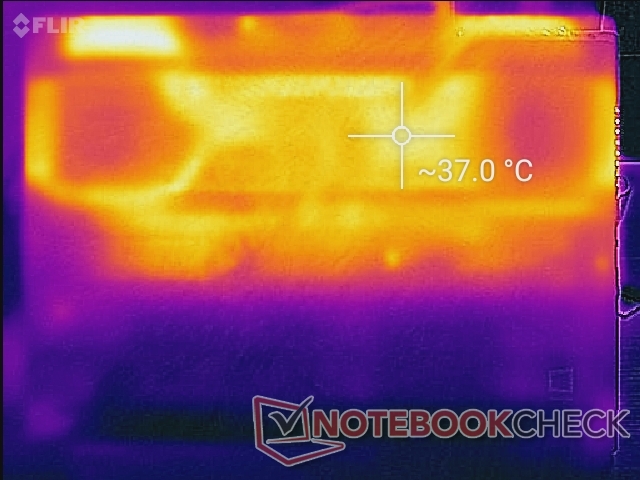
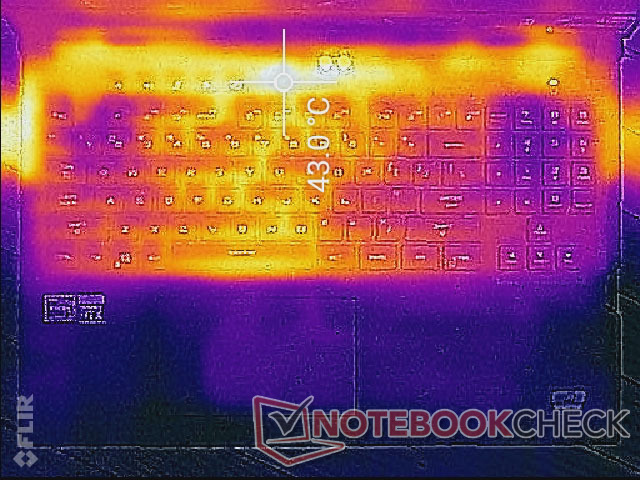
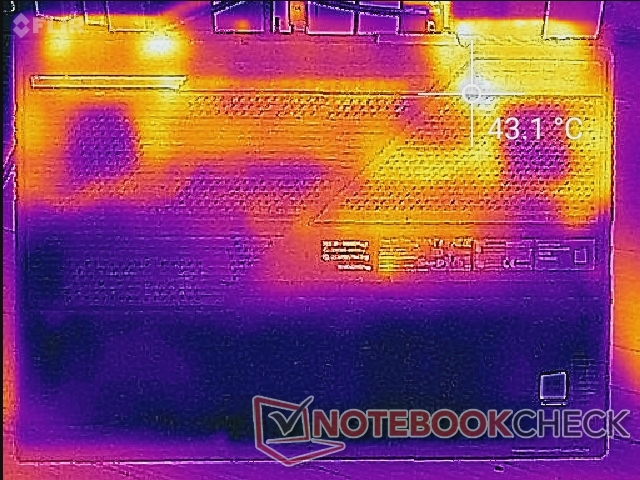
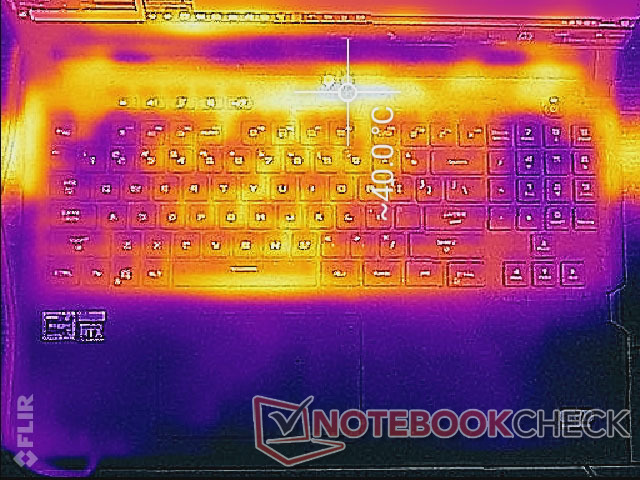
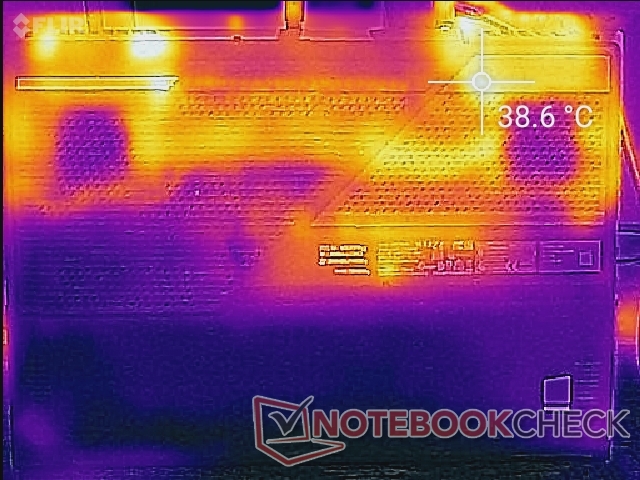
El clickpad y el reposamanos siempre están fríos sin importar la carga ya que sólo la batería se encuentra debajo de ellos. Cuando se ejecutan cargas más altas, como los juegos, el centro del teclado puede llegar a calentarse hasta 38 C, mientras que las teclas WASD y el NumPad permanecen más frías, a unos 31 C cada una. La temperatura media de la superficie es unos pocos grados más fría que la observada en el competidor MSI GE76 tanto en la parte superior como en la inferior.
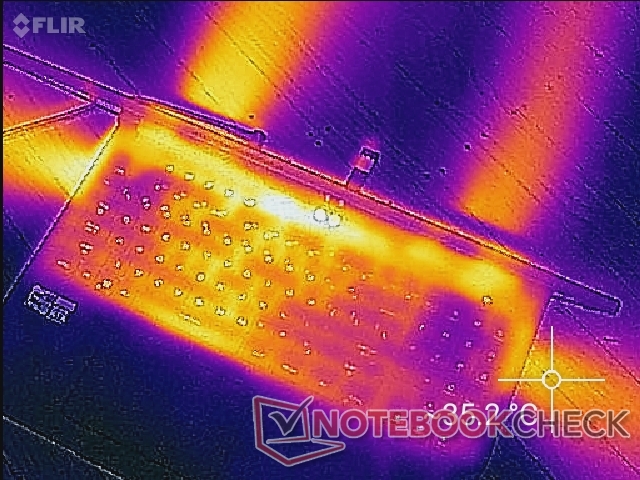
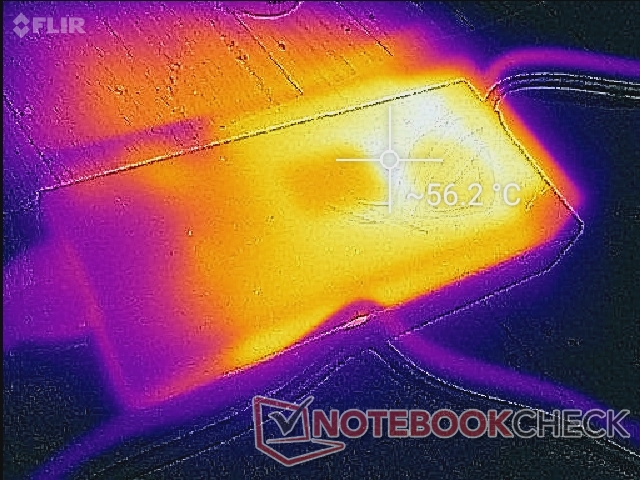
(±) La temperatura máxima en la parte superior es de 40 °C / 104 F, frente a la media de 40.4 °C / 105 F, que oscila entre 21.2 y 68.8 °C para la clase Gaming.
(+) El fondo se calienta hasta un máximo de 39.8 °C / 104 F, frente a la media de 43.2 °C / 110 F
(+) En reposo, la temperatura media de la parte superior es de 28.3 °C / 83# F, frente a la media del dispositivo de 33.9 °C / 93 F.
(±) Jugando a The Witcher 3, la temperatura media de la parte superior es de 32.3 °C / 90 F, frente a la media del dispositivo de 33.9 °C / 93 F.
(+) El reposamanos y el panel táctil están a una temperatura inferior a la de la piel, con un máximo de 23 °C / 73.4 F y, por tanto, son fríos al tacto.
(+) La temperatura media de la zona del reposamanos de dispositivos similares fue de 28.8 °C / 83.8 F (+5.8 °C / 10.4 F).
Prueba de esfuerzo
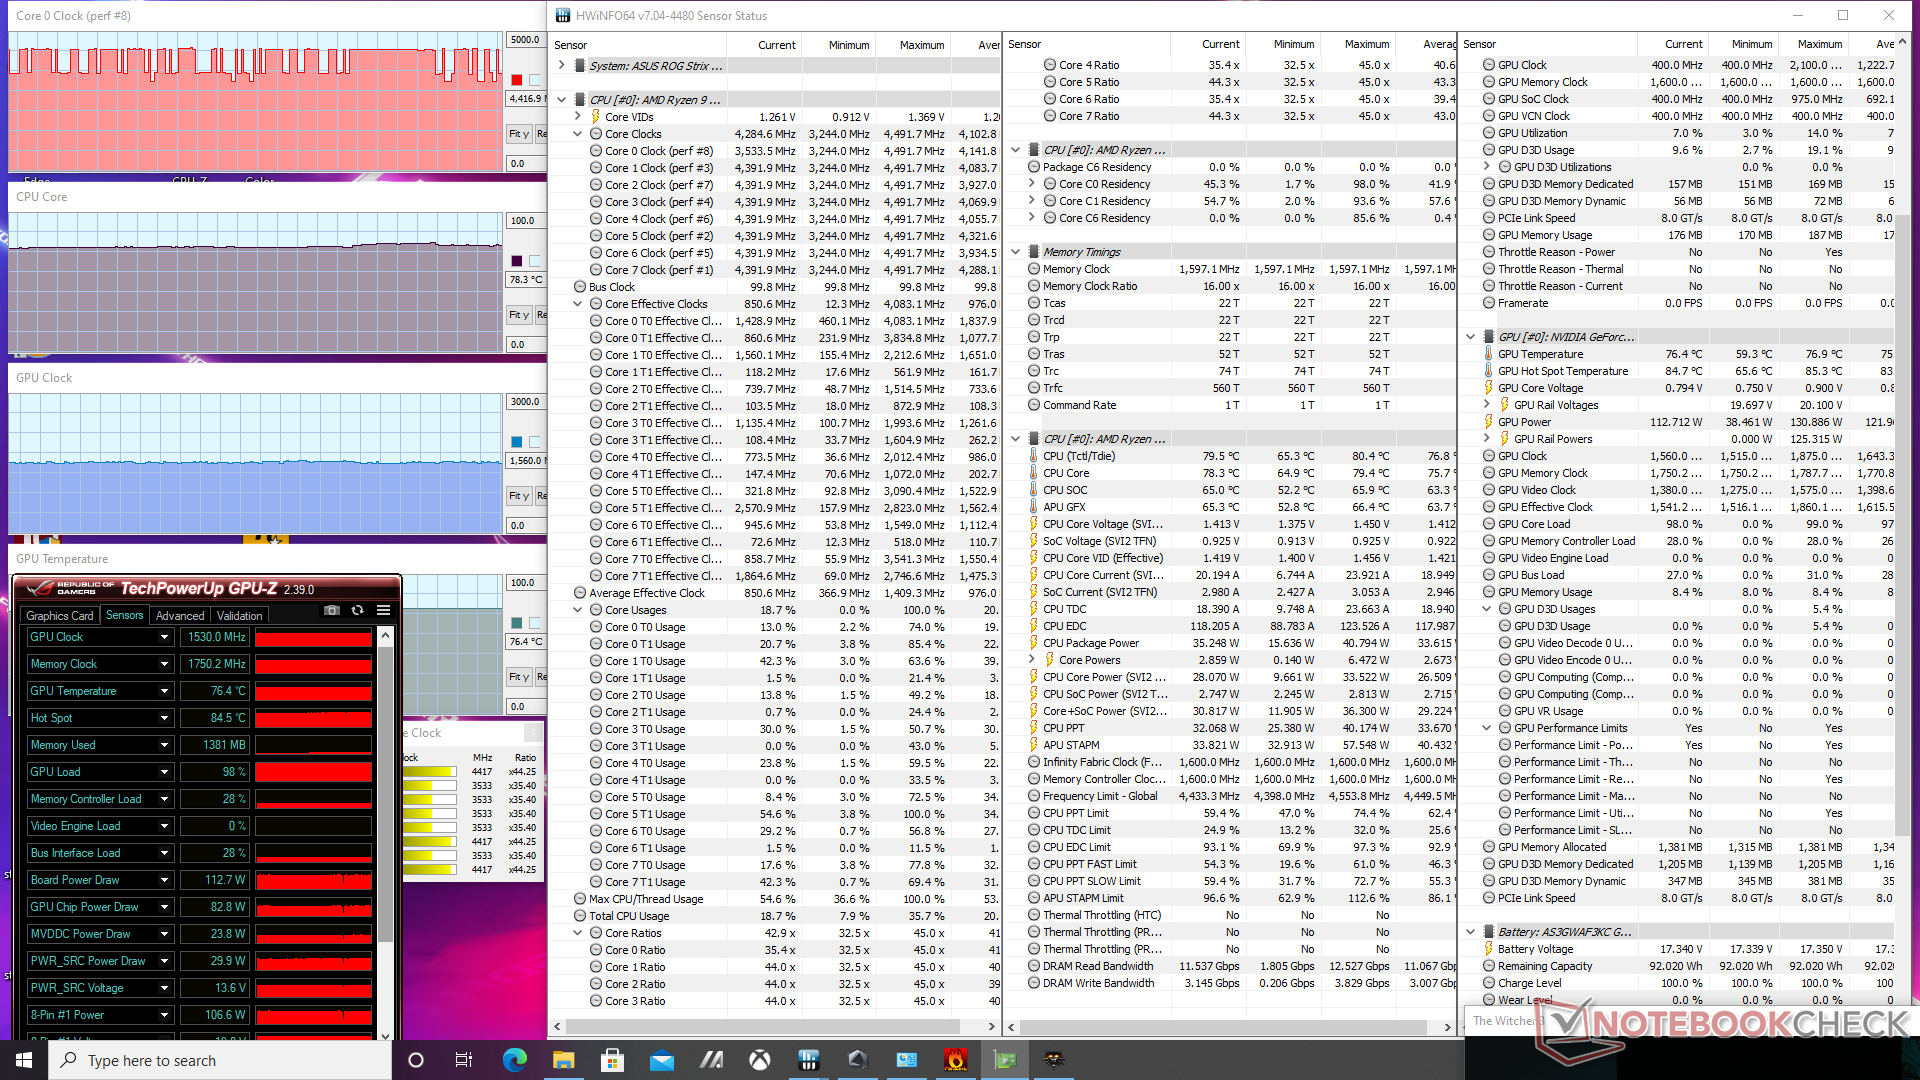
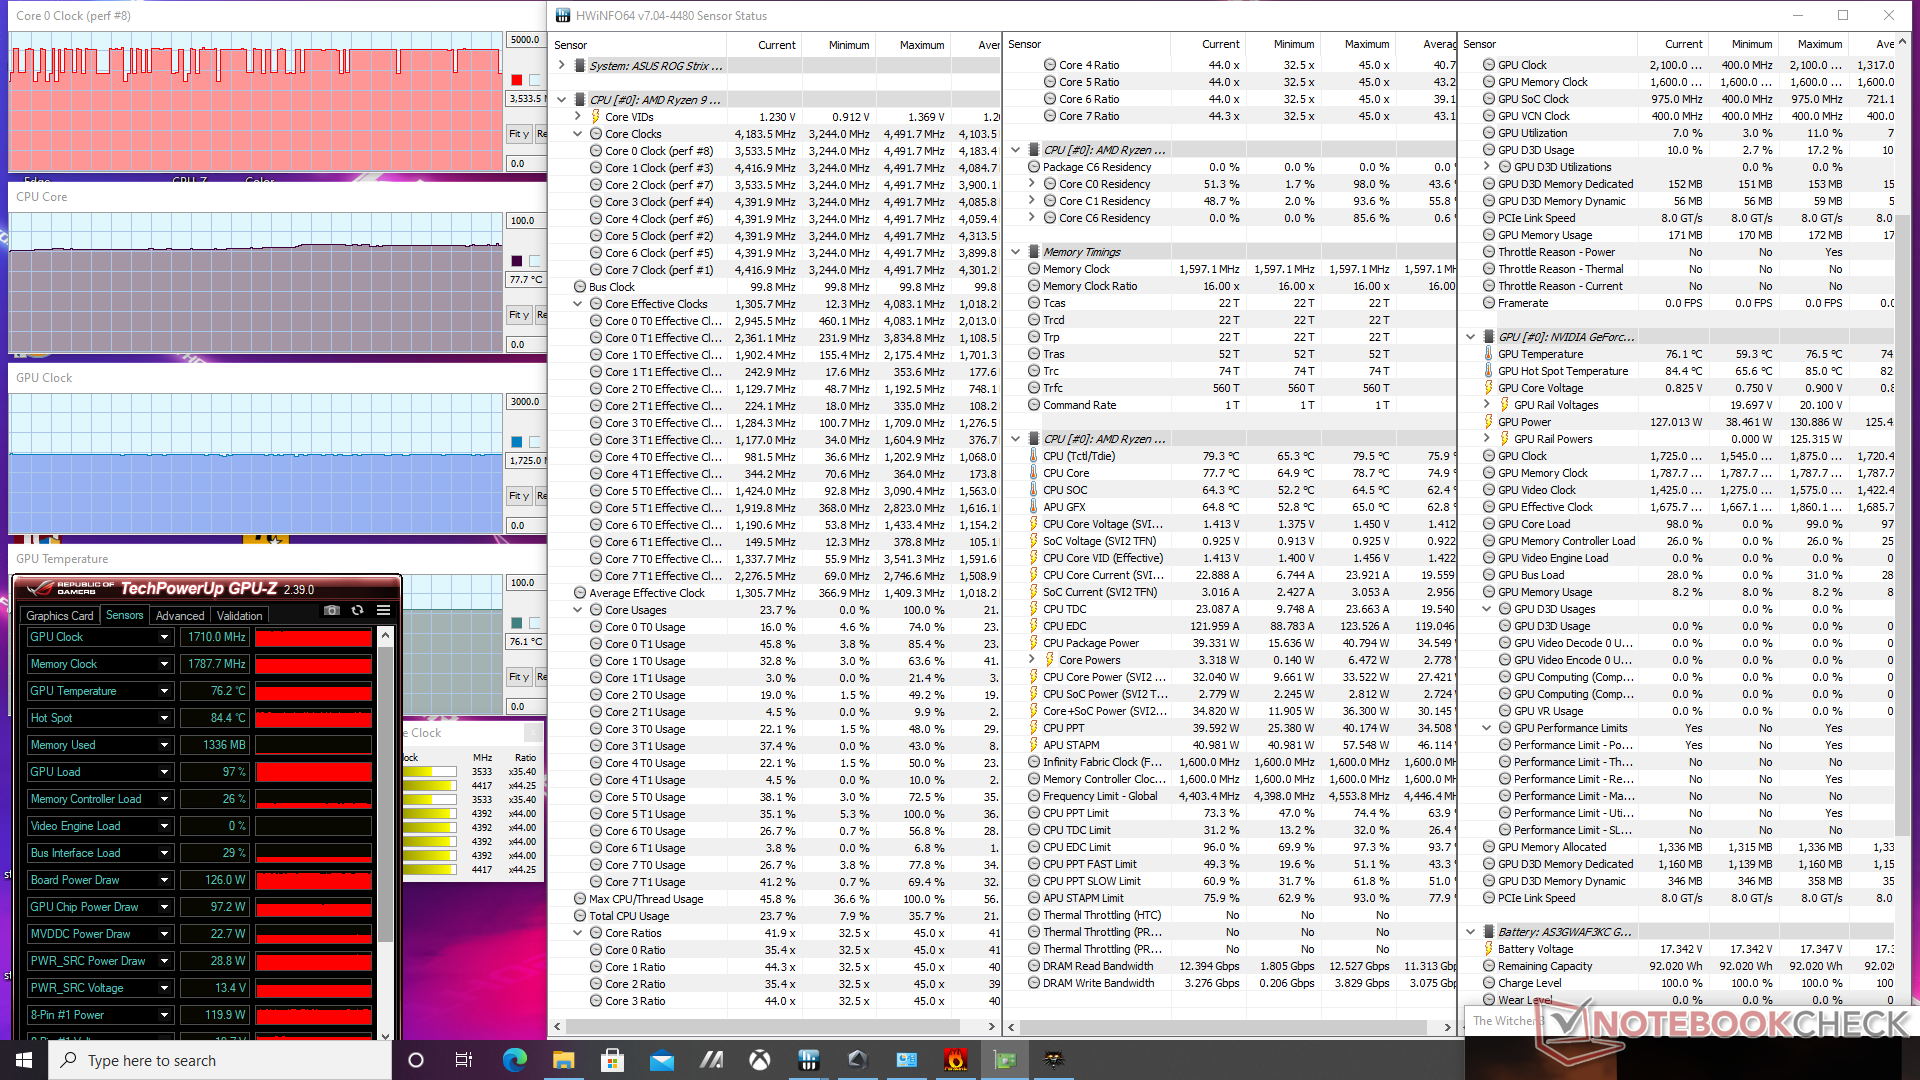
Cuando se ejecuta Prime95 en modo Turbo para estresar la CPU, las velocidades de reloj oscilan entre 3,9 y 4,3 GHz a una temperatura constante del núcleo de 79 C. Sin embargo, la mayoría de las veces las velocidades de reloj se estabilizan más cerca de los 3,9 GHz en lugar de los 4 GHz o más. Si se desactiva el modo Turbo, las frecuencias de reloj caerán al rango de 3,2 a 3,7 GHz para una temperatura de núcleo más fría de 61 C.
El modo turbo también tiene un impacto en el rendimiento de los juegos. Con el modo Turbo desactivado Witcher 3 con el modo Turbo desactivado da como resultado una velocidad de reloj de la GPU y de la memoria constante de 1530 MHz y 1750 MHz, respectivamente. Si el modo Turbo está activado, la velocidad de reloj de la GPU y de la memoria aumentará a 1710 MHz y 1787,7 MHz (es decir, +300 MHz). En consecuencia, el consumo de energía de la placa pasaría de 113 W a 126 W, según GPU-Z.
Curiosamente, las temperaturas de la CPU y la GPU durante los juegos se mantienen prácticamente iguales independientemente de la configuración del modo Turbo, ya que los ventiladores más ruidosos del modo Turbo son capaces de compensar las temperaturas más altas de las velocidades de reloj más rápidas. El modo Turbo de Asus es, por tanto, muy diferente del Modo Turbo de MSI en el que las temperaturas simplemente caen sin que el rendimiento aumente en absoluto.
El funcionamiento con batería afecta al rendimiento. Una prueba de Fire Strike en batería arrojaría unas puntuaciones de Física y Gráficos de 24105 y 15479 puntos, respectivamente, frente a 26735 y 29508 puntos cuando está conectado a la red eléctrica.
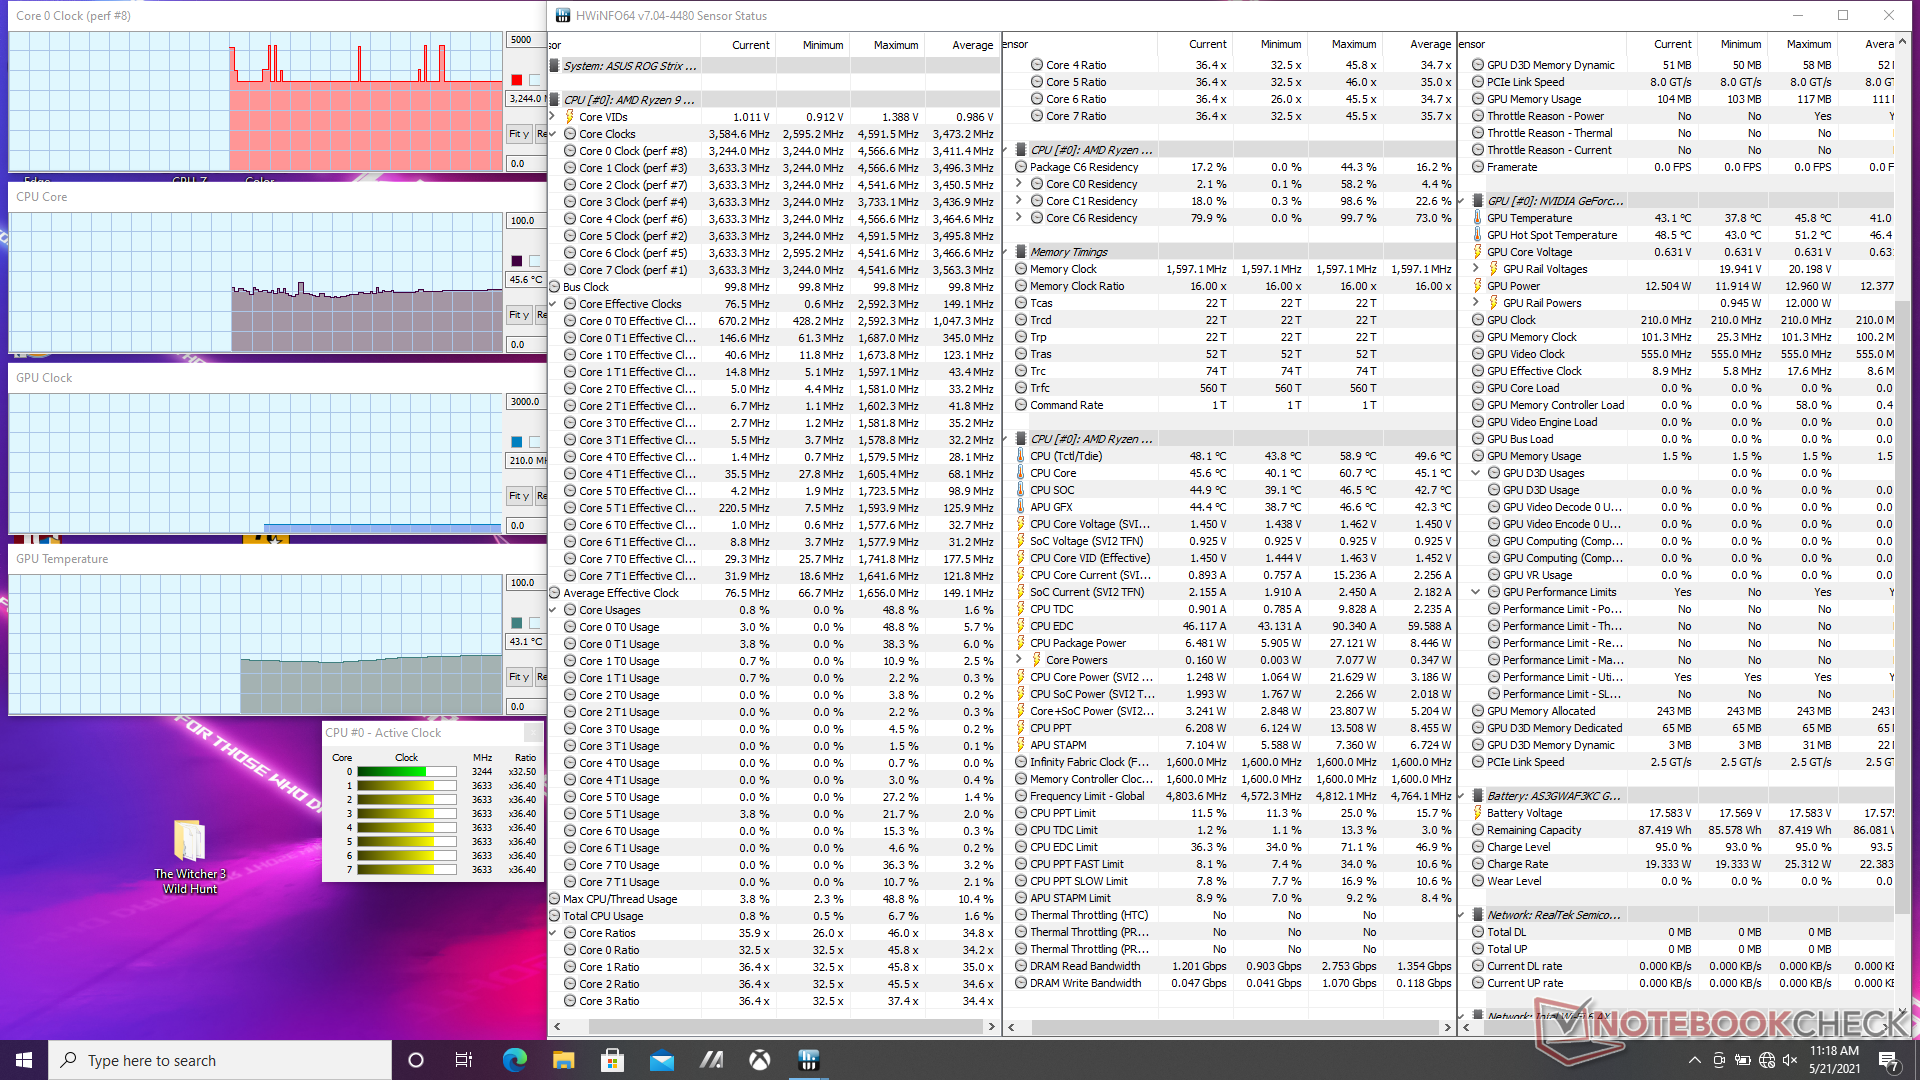
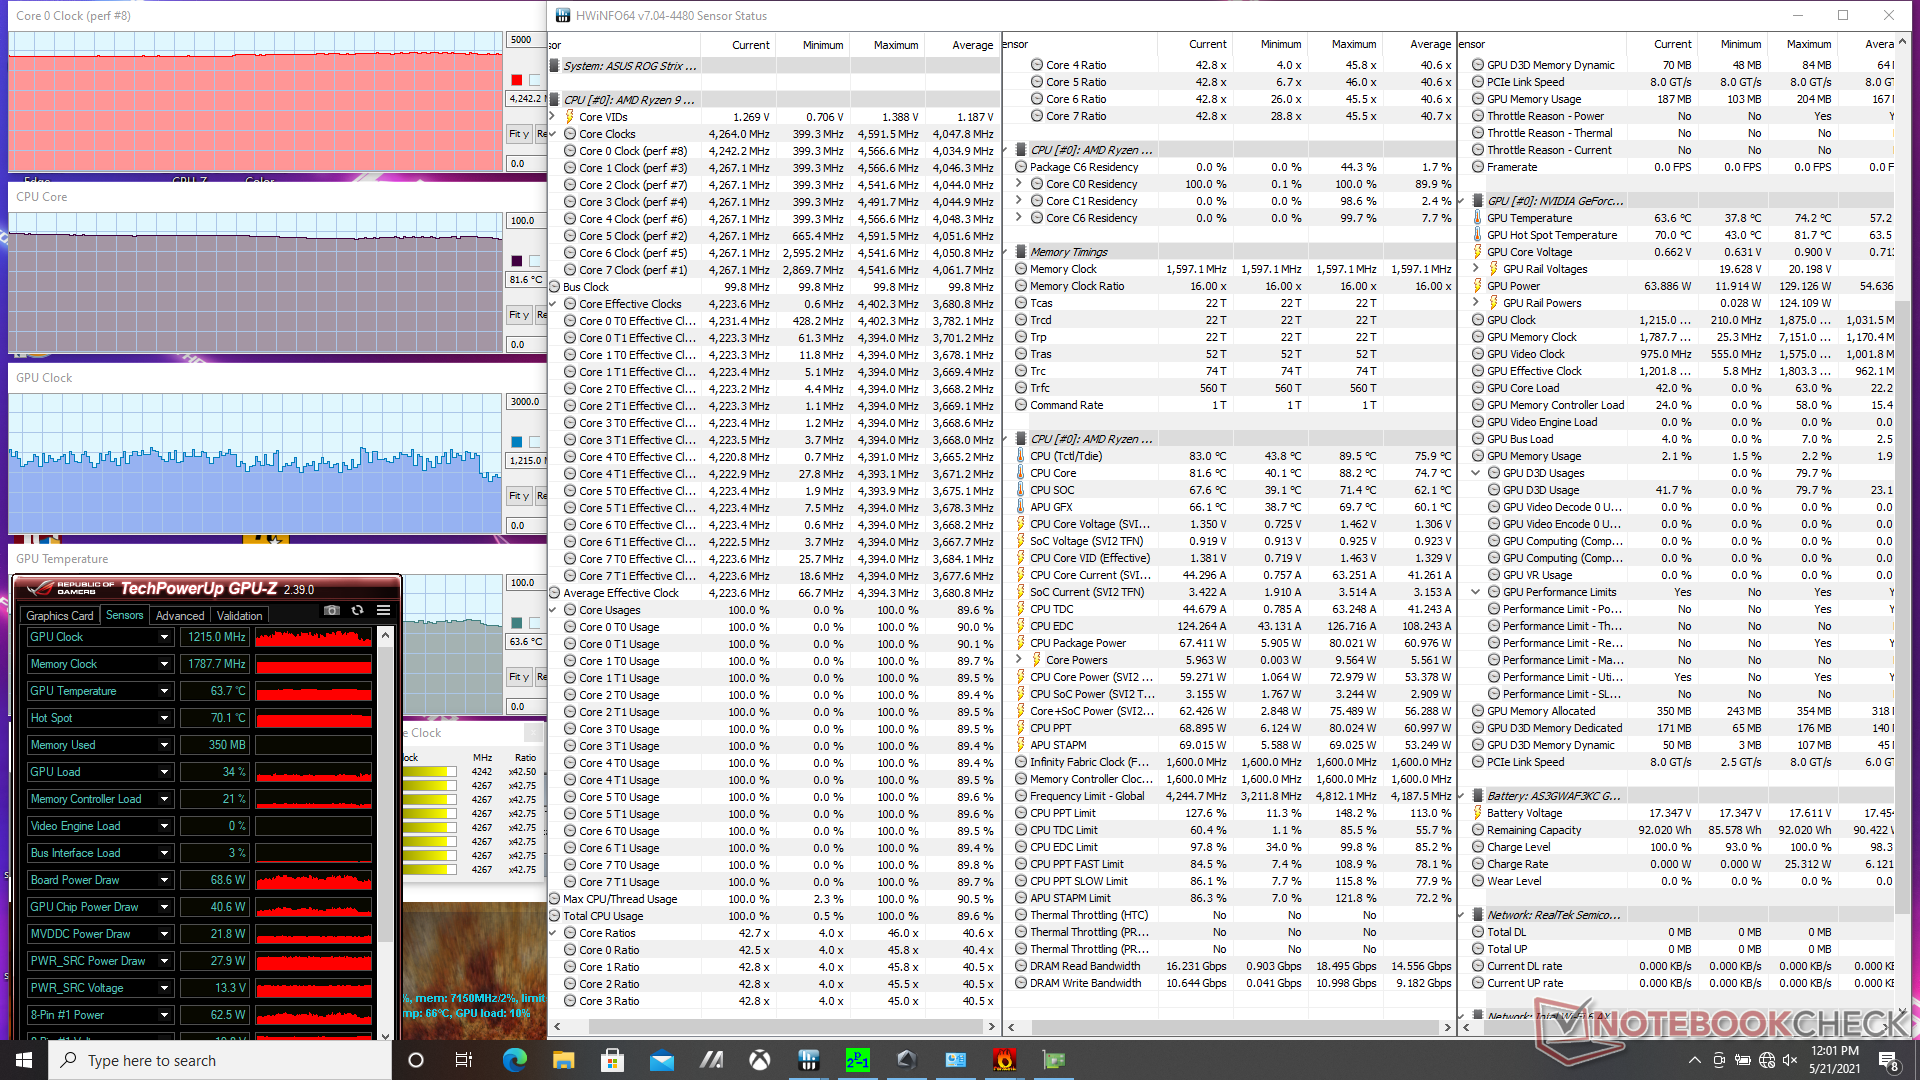
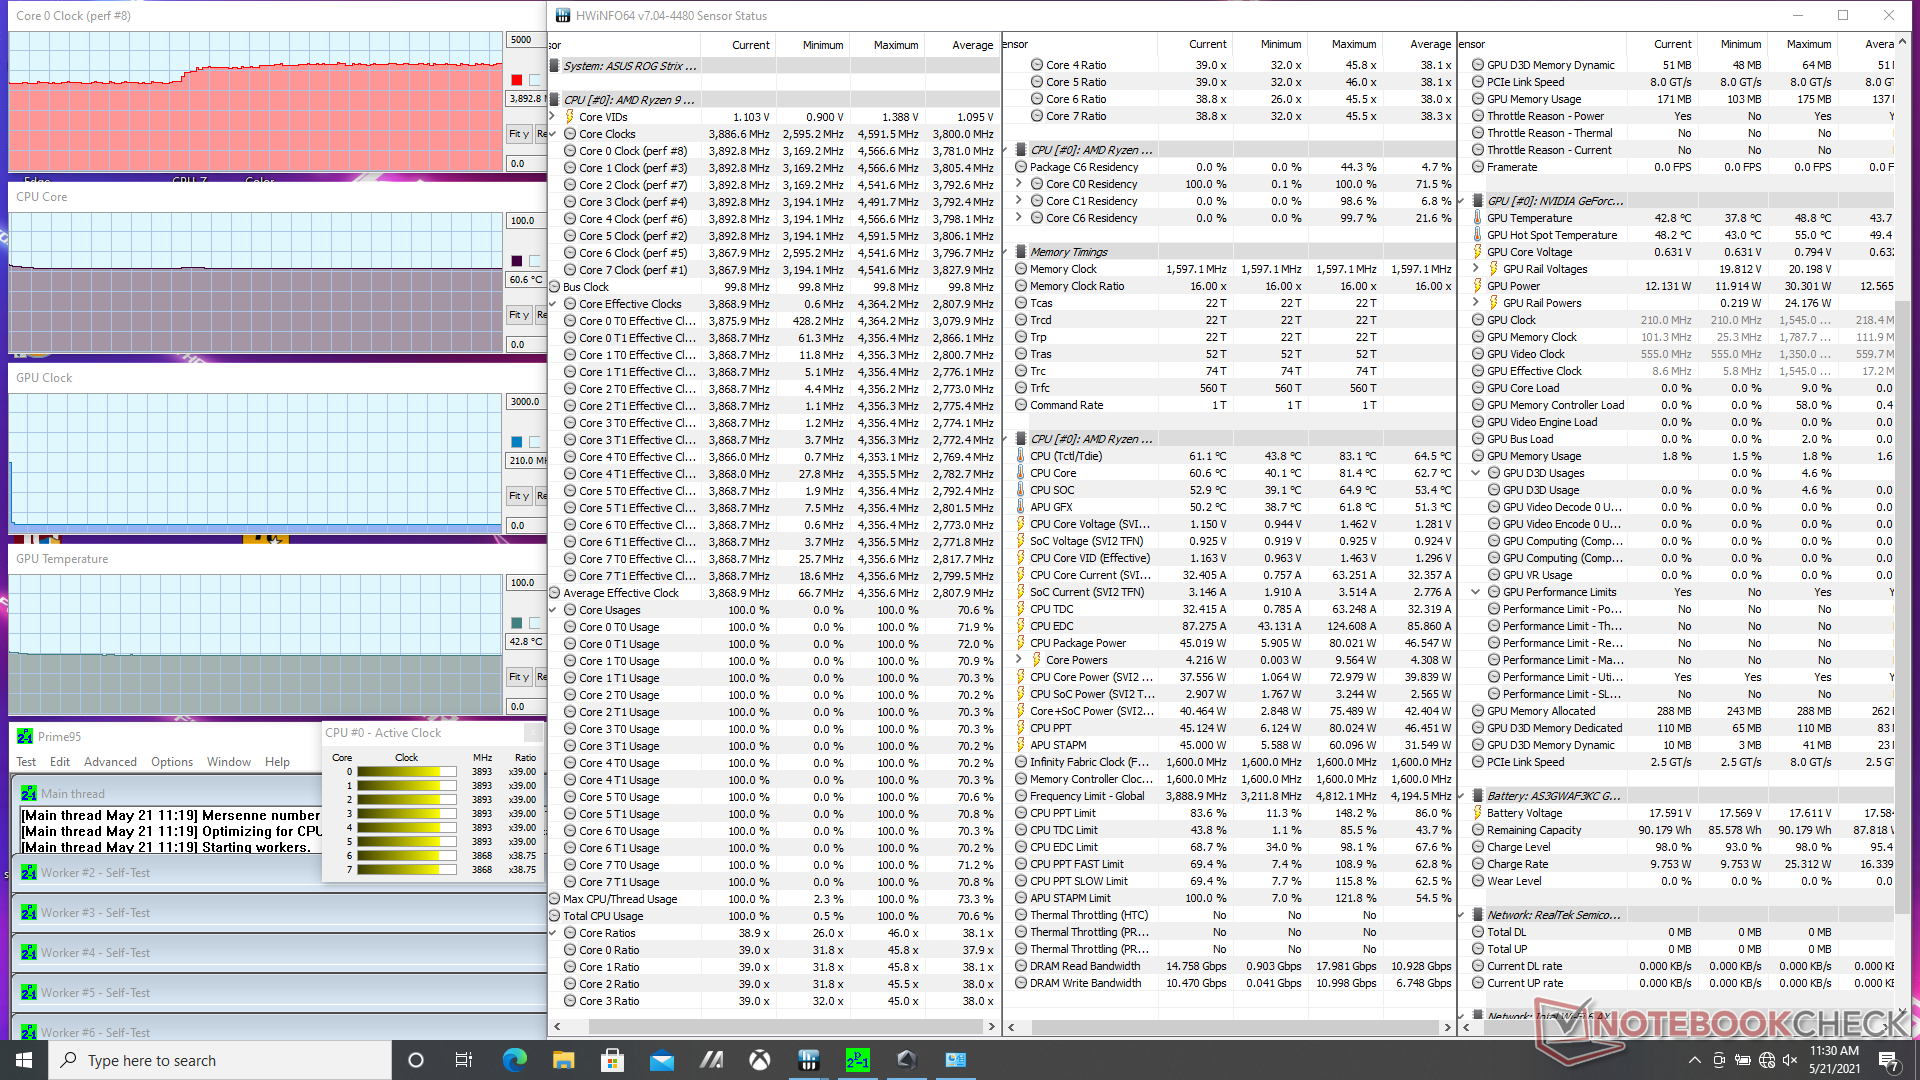
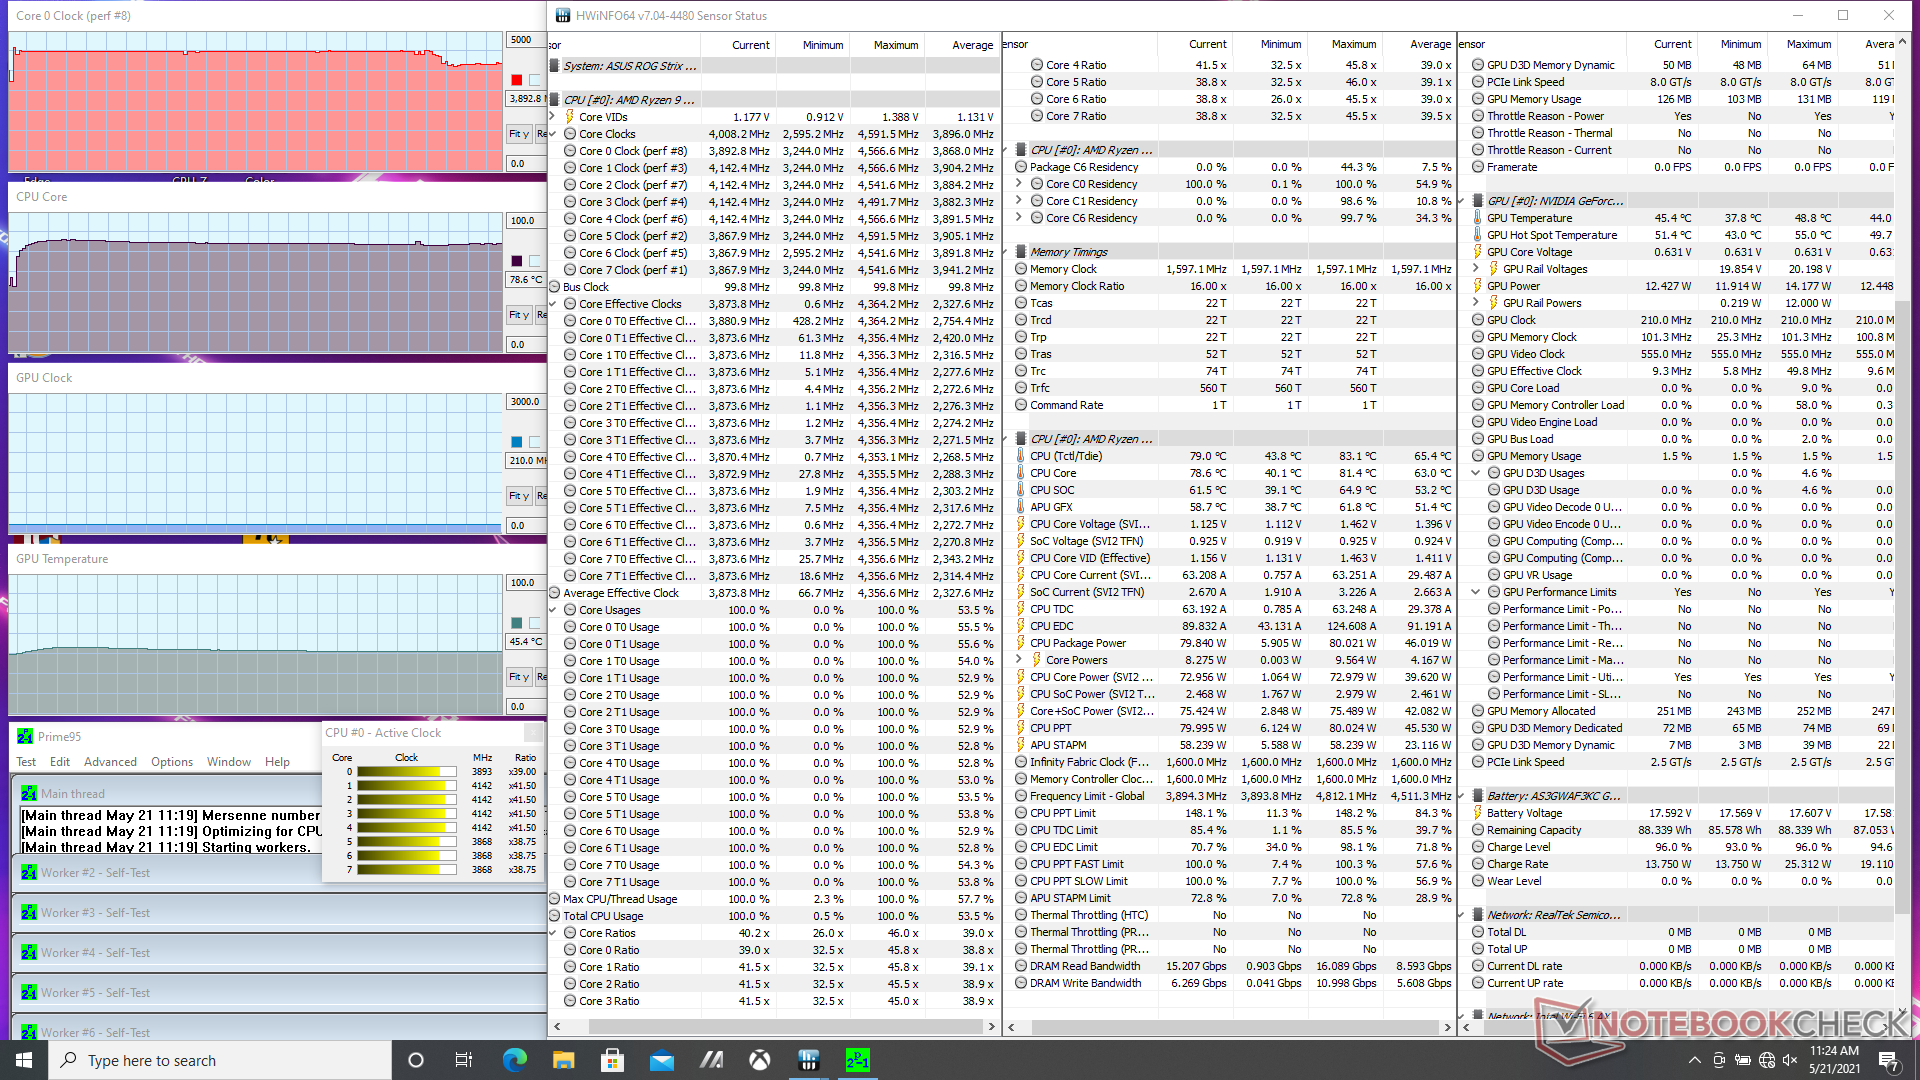
| Relojde la CPU(GHz) | Reloj dela GPU(MHz) | Temperatura media de la CPU (°C) | Temperaturamediade la GPU (°C) | |
| Sistema en reposo | 46 | 43 | ||
| Estrés Prime95 (Turbodesactivado) | 3,2 - 3,7 | -- | 61 | 43 |
| Estrés de Prime95 (Turboactivado) | 3,9 - 4,3 | -- | 79 | 45 |
| Prime95+ FurMark Stress (Turbo on) | 4.2 | ~1215 | 82 | 64 |
| Witcher 3 Estrés (Turbo off) | 3,6 - 4,4 | 1530 | 79 | 77 |
| Witcher 3 Estrés (Turbo activado) | 3,6 - 4,4 | 1710 | 78 | 76 |
Altavoces


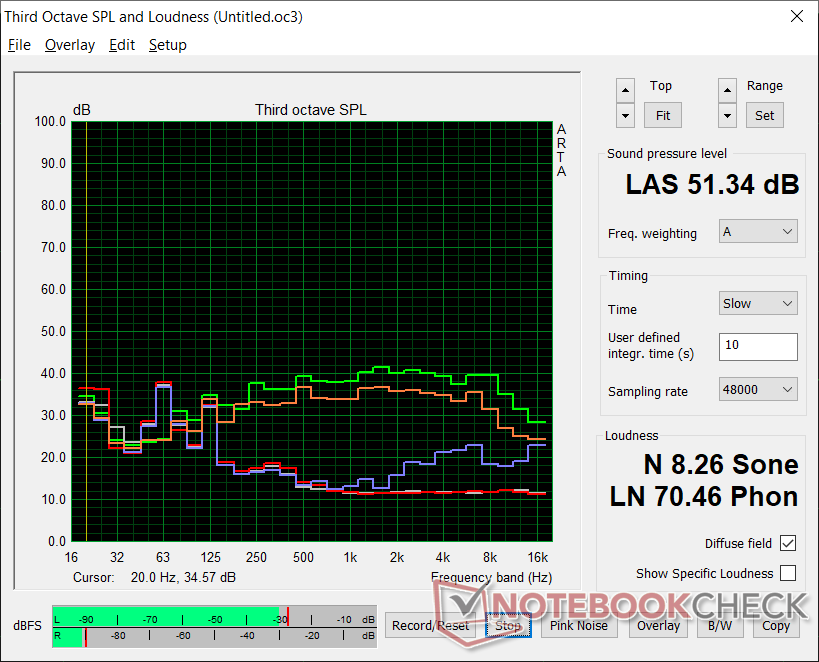
Asus Strix Scar 17 G733QSA-XS99 análisis de audio
(±) | la sonoridad del altavoz es media pero buena (73.7 dB)
Graves 100 - 315 Hz
(+) | buen bajo - sólo 2.1% lejos de la mediana
(±) | la linealidad de los graves es media (7% delta a frecuencia anterior)
Medios 400 - 2000 Hz
(+) | medios equilibrados - a sólo 1.4% de la mediana
(+) | los medios son lineales (4.8% delta a la frecuencia anterior)
Altos 2 - 16 kHz
(±) | máximos más altos - de media 5.9% más altos que la mediana
(±) | la linealidad de los máximos es media (8.7% delta a frecuencia anterior)
Total 100 - 16.000 Hz
(+) | el sonido global es lineal (10.7% de diferencia con la mediana)
En comparación con la misma clase
» 7% de todos los dispositivos probados de esta clase eran mejores, 2% similares, 91% peores
» El mejor tuvo un delta de 6%, la media fue 18%, el peor fue ###max##%
En comparación con todos los dispositivos probados
» 6% de todos los dispositivos probados eran mejores, 2% similares, 93% peores
» El mejor tuvo un delta de 4%, la media fue 24%, el peor fue ###max##%
Apple MacBook 12 (Early 2016) 1.1 GHz análisis de audio
(+) | los altavoces pueden reproducir a un volumen relativamente alto (#83.6 dB)
Graves 100 - 315 Hz
(±) | lubina reducida - en promedio 11.3% inferior a la mediana
(±) | la linealidad de los graves es media (14.2% delta a frecuencia anterior)
Medios 400 - 2000 Hz
(+) | medios equilibrados - a sólo 2.4% de la mediana
(+) | los medios son lineales (5.5% delta a la frecuencia anterior)
Altos 2 - 16 kHz
(+) | máximos equilibrados - a sólo 2% de la mediana
(+) | los máximos son lineales (4.5% delta a la frecuencia anterior)
Total 100 - 16.000 Hz
(+) | el sonido global es lineal (10.2% de diferencia con la mediana)
En comparación con la misma clase
» 7% de todos los dispositivos probados de esta clase eran mejores, 2% similares, 91% peores
» El mejor tuvo un delta de 5%, la media fue 18%, el peor fue ###max##%
En comparación con todos los dispositivos probados
» 5% de todos los dispositivos probados eran mejores, 1% similares, 94% peores
» El mejor tuvo un delta de 4%, la media fue 24%, el peor fue ###max##%
Energy Management
Consumo de energía
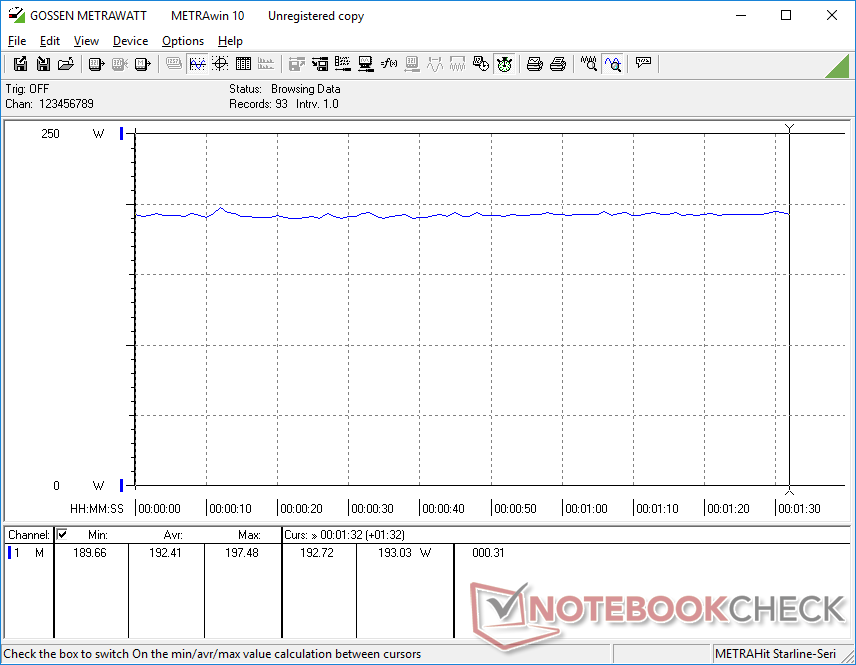
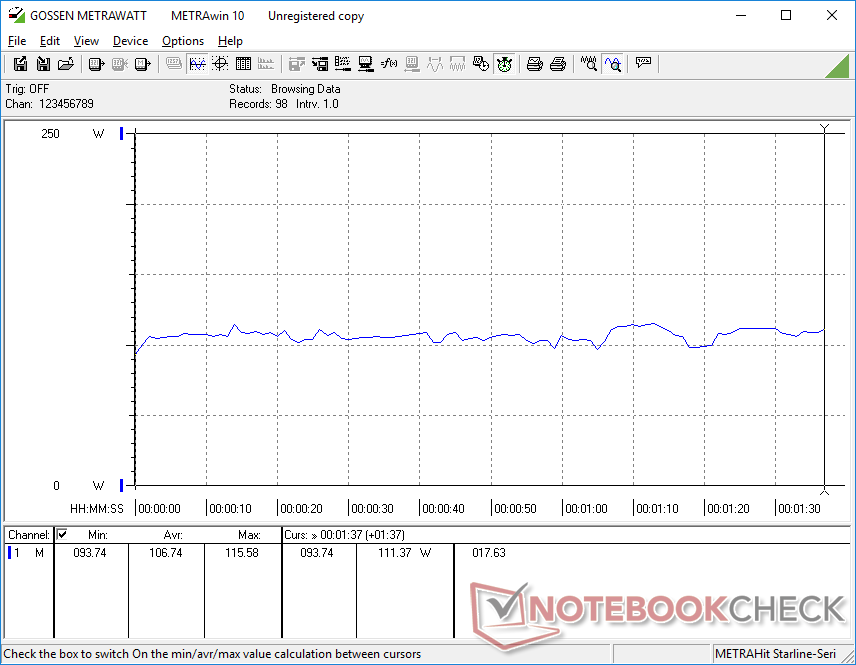
El funcionamiento en vacío en el escritorio con el ajuste de brillo y el perfil de energía más bajos consume algo menos de 11 W, mientras que el ajuste de brillo máximo en modo Turbo consumiría más del doble, 27 W. Por tanto, merece la pena poner el sistema en modo de ahorro de energía cuando no se necesita la potencia extra
El consumo general de energía es notablemente inferior al del Strix Scar 17 G732LXS del año pasado, equipado con el Core i9 y GeForce RTX 2080 Super, aunque nuestro G733 ofrece un rendimiento de la CPU y un rendimiento gráfico un 35 y un 20 por ciento más rápidos, respectivamente. El rendimiento por vatio es, por tanto, muy superior de generación en generación. El Razer Blade Pro 17 consume incluso menos energía que nuestro G733 aunque viene con una versión ligeramente más lenta de la RTX 3080
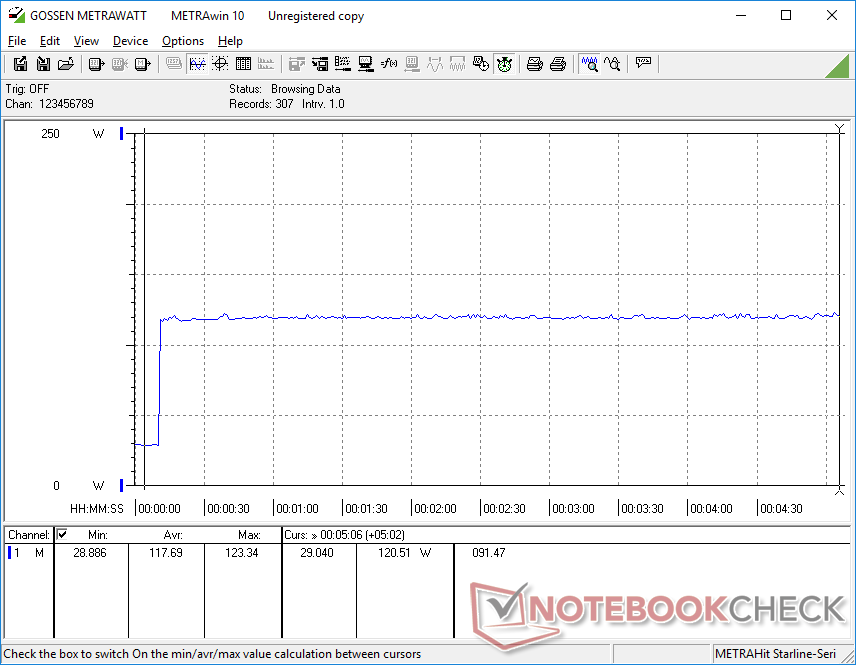
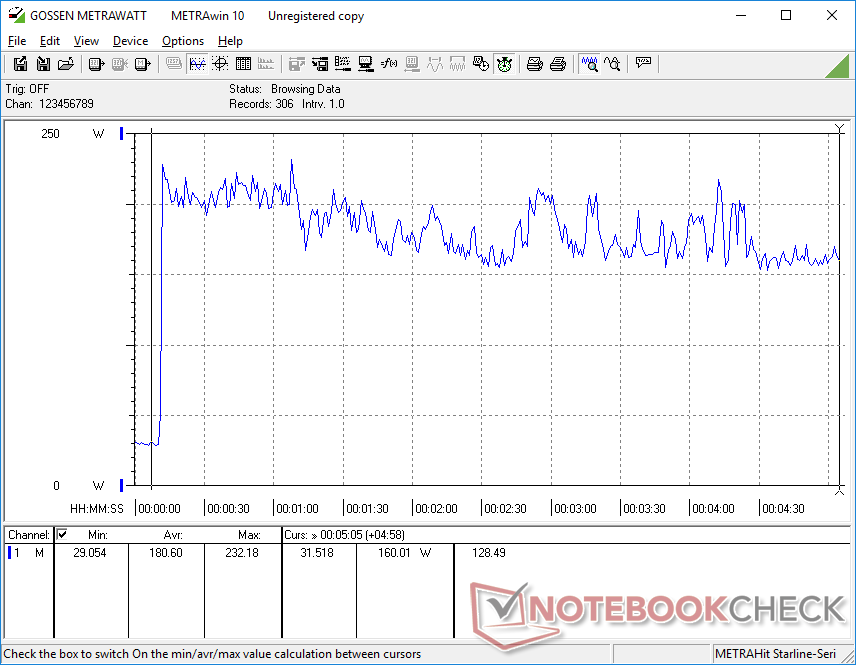
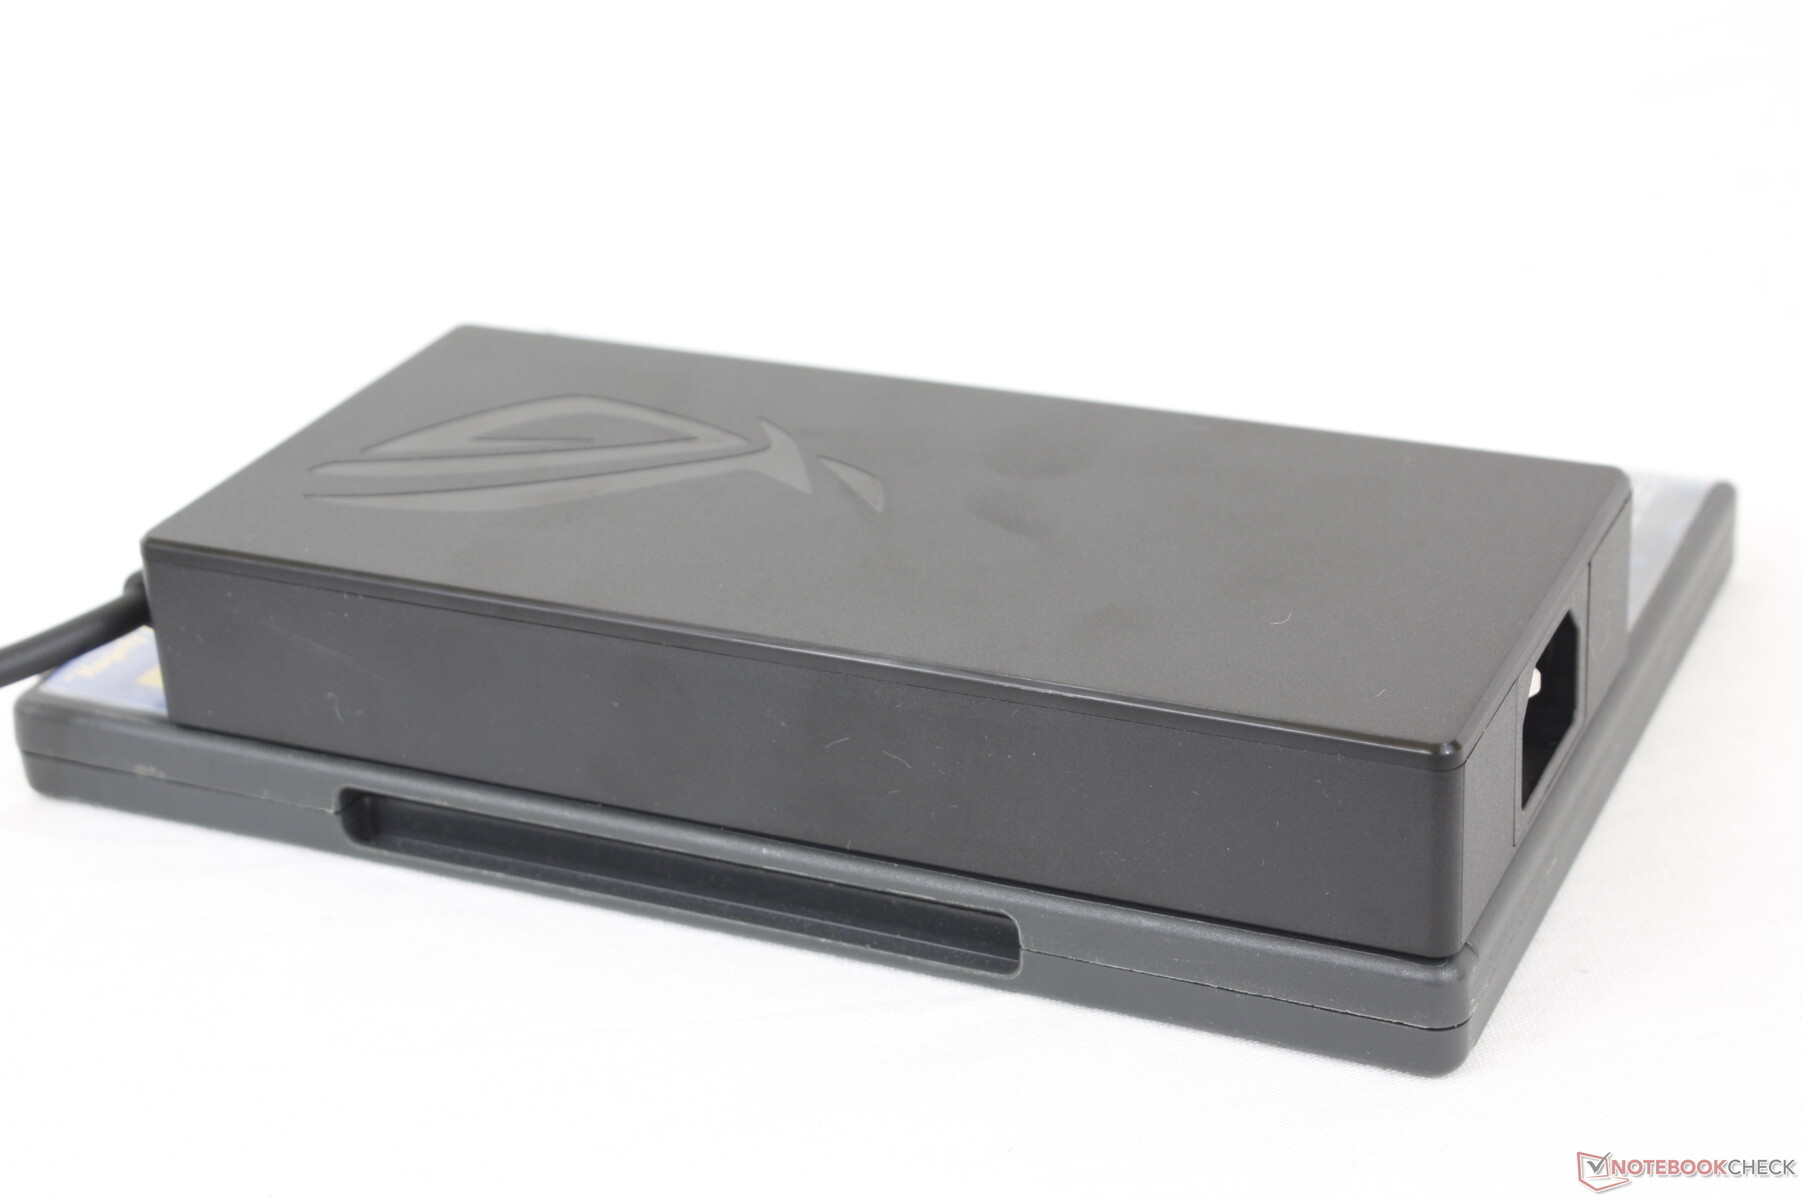
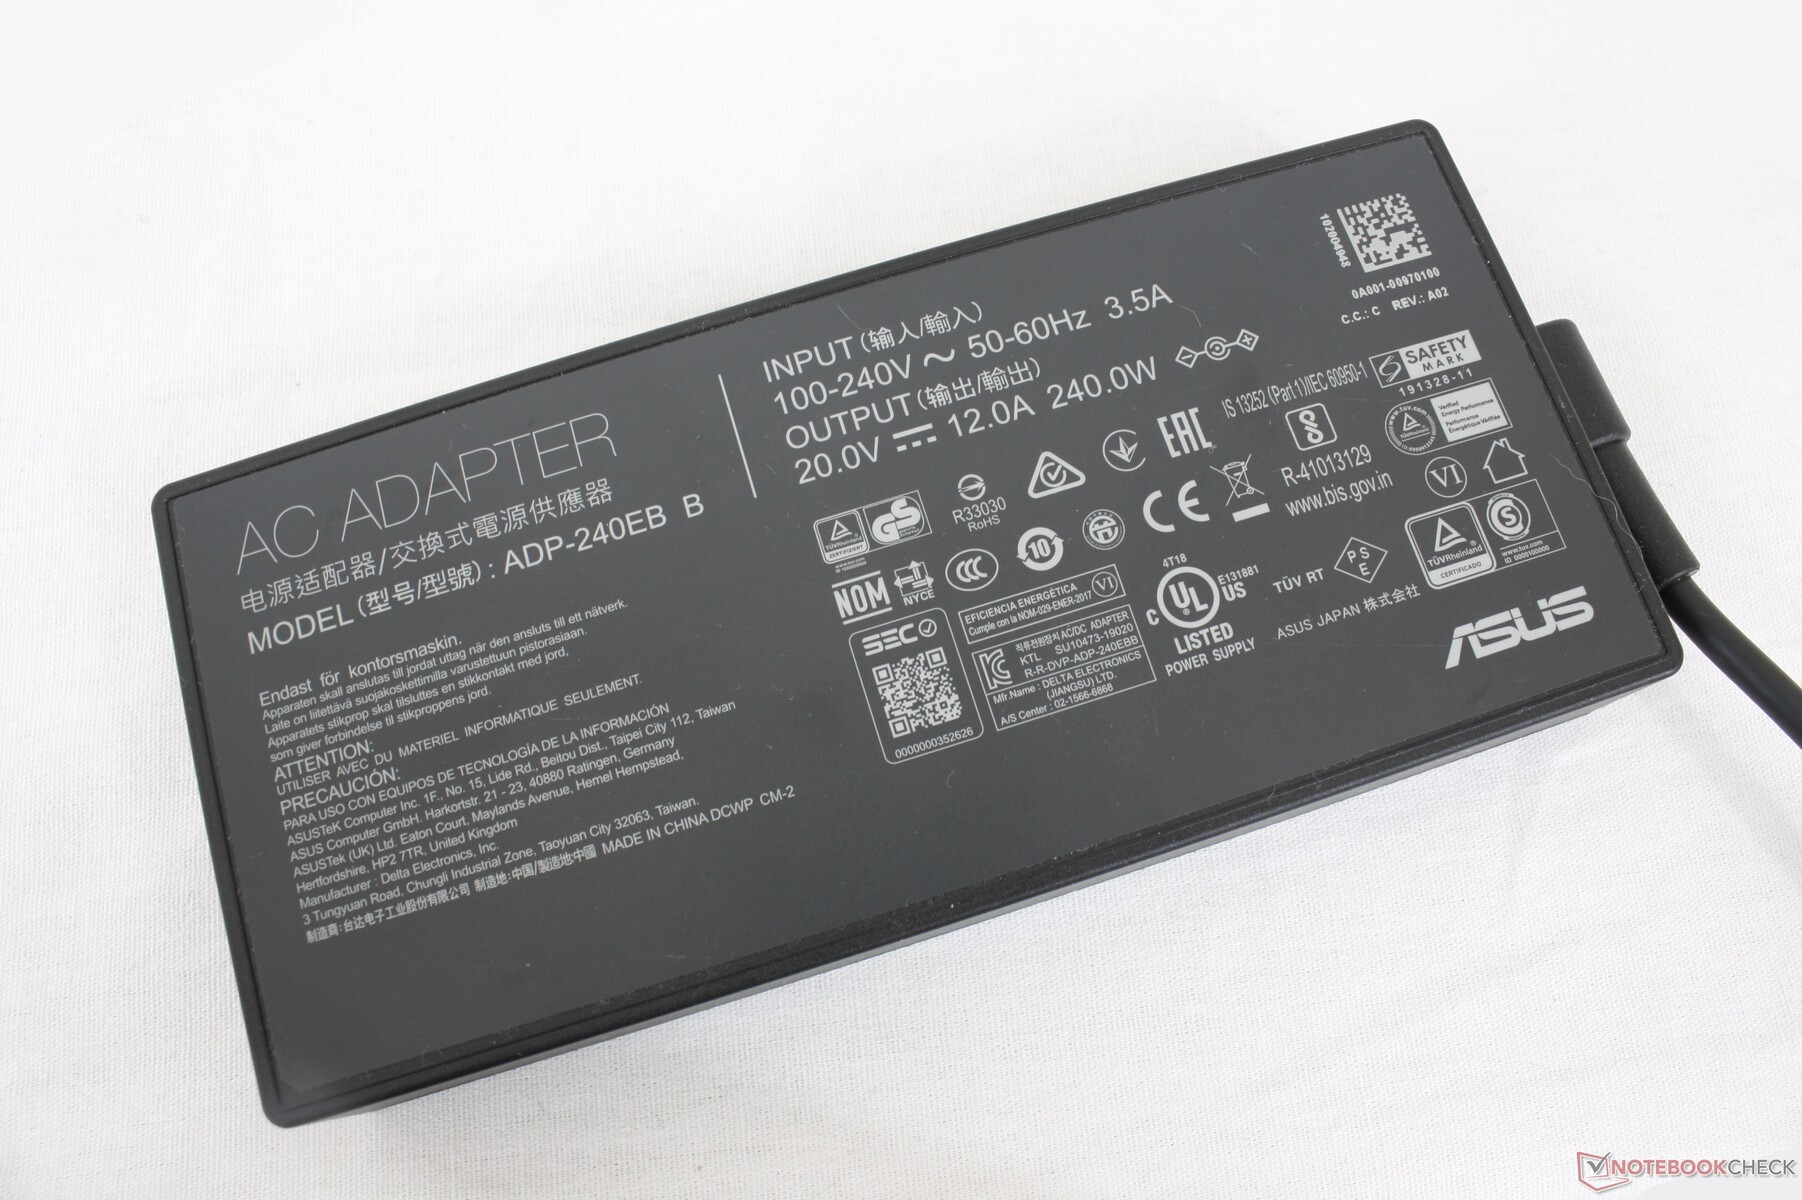
Pudimos medir un consumo máximo temporal de 228.4 W desde el adaptador de CA de tamaño medio (~16.4 x 7.5 x 2.6 cm) de 240 W al ejecutar Prime95 y FurMark simultáneamente.
| Off / Standby | |
| Ocioso | |
| Carga |
|
Clave:
min: | |
| Asus Strix Scar 17 G733QSA-XS99 R9 5900HX, GeForce RTX 3080 Laptop GPU, 2x Samsung PM981a MZVLB1T0HBLR (RAID 0), IPS, 1920x1080, 17.3" | Asus Strix Scar 17 G732LXS i9-10980HK, GeForce RTX 2080 Super Mobile, 2x Intel SSD 660p 1TB SSDPEKNW010T8 (RAID 0), IPS, 1920x1080, 17.3" | MSI GE76 Raider 10UH i7-10870H, GeForce RTX 3080 Laptop GPU, WDC PC SN730 SDBPNTY-1T00, IPS, 1920x1080, 17.3" | Alienware m17 R4 i9-10980HK, GeForce RTX 3080 Laptop GPU, 2x Micron 2300 512 GB (RAID 0), IPS, 1920x1080, 17.3" | Razer Blade Pro 17 2021 (QHD Touch) i7-10875H, GeForce RTX 3080 Laptop GPU, Samsung PM981a MZVLB1T0HBLR, IPS, 3840x2160, 17.3" | Asus Zephyrus S17 GX701LXS i7-10875H, GeForce RTX 2080 Super Max-Q, Samsung PM981a MZVLB1T0HBLR, IPS, 1920x1080, 17.3" | |
|---|---|---|---|---|---|---|
| Power Consumption | -43% | -33% | -118% | -17% | -2% | |
| Idle Minimum * (Watt) | 10.9 | 16 -47% | 15.5 -42% | 42 -285% | 15.2 -39% | 10 8% |
| Idle Average * (Watt) | 14.7 | 25 -70% | 31.3 -113% | 48 -227% | 20.3 -38% | 16 -9% |
| Idle Maximum * (Watt) | 26.8 | 35 -31% | 31.7 -18% | 58 -116% | 37.3 -39% | 29 -8% |
| Load Average * (Watt) | 106.7 | 177 -66% | 93.6 12% | 124 -16% | 114.9 -8% | 143 -34% |
| Witcher 3 ultra * (Watt) | 192.4 | 227 -18% | 233 -21% | 219 -14% | 158.4 18% | 146 24% |
| Load Maximum * (Watt) | 228.4 | 280 -23% | 260.3 -14% | 337 -48% | 223.7 2% | 205 10% |
* ... más pequeño es mejor
Duración de la batería
Las duraciones son sorprendentemente largas para un portátil de juegos tan grande. Pudimos conseguir casi 9.5 horas de uso WLAN en el mundo real con el perfil de energía equilibrado y la iGPU activa comparado con varias horas menos en el antiguo Strix Scar 17 G732LXS. La mayor batería de 90 Wh es un factor importante que contribuye a la mayor duración de la batería.
La carga de vacío a plena capacidad es relativamente rápida, menos de 1,5 horas con el adaptador de CA incluido. La batería sigue cargándose incluso cuando se juega o se ejecutan cargas extremas, lo que no siempre es el caso de muchos portátiles de alto rendimiento. La carga por USB-C también es posible, aunque a un ritmo más lento.
| Asus Strix Scar 17 G733QSA-XS99 R9 5900HX, GeForce RTX 3080 Laptop GPU, 90 Wh | Asus Strix Scar 17 G732LXS i9-10980HK, GeForce RTX 2080 Super Mobile, 66 Wh | MSI GE76 Raider 10UH i7-10870H, GeForce RTX 3080 Laptop GPU, 99.9 Wh | Alienware m17 R4 i9-10980HK, GeForce RTX 3080 Laptop GPU, 86 Wh | Razer Blade Pro 17 2021 (QHD Touch) i7-10875H, GeForce RTX 3080 Laptop GPU, 70.5 Wh | Asus Zephyrus S17 GX701LXS i7-10875H, GeForce RTX 2080 Super Max-Q, 76 Wh | |
|---|---|---|---|---|---|---|
| Duración de Batería | -18% | -16% | -44% | -21% | -46% | |
| Reader / Idle (h) | 13.3 | 10 -25% | 8.2 -38% | 9.9 -26% | 3.5 -74% | |
| WiFi v1.3 (h) | 9.3 | 5.9 -37% | 6.3 -32% | 2.4 -74% | 5.9 -37% | 2.8 -70% |
| Load (h) | 1.4 | 1.5 7% | 1.7 21% | 1.2 -14% | 1.4 0% | 1.5 7% |
Pro
Contra
Veredicto
El aumento de rendimiento en bruto es absolutamente alucinante si se actualiza desde un portátil con Coffee Lake-H o anterior. El Ryzen 9 5900HX de 45 W está a la altura del Schenker Ultra 17, más grueso, pesado y caliente, que funciona con un Core i9-11900K de clase de sobremesa a pesar de sus grandes diferencias de TDP. Las ventajas de rendimiento por vatio pueden hacer que el Rocket Lake de Intel parezca a veces una plataforma de última generación.
En cuanto al chasis en sí, es un enorme espectáculo de luces con LEDs RGB en casi todos los lados del sistema. Aunque no nos importa el toque visual, los reposamanos negros, el clickpad y la cubierta del teclado atraen la grasa antiestética con demasiada facilidad, lo que choca con los LEDs de colores. Tal vez un material o textura diferente de la cubierta en futuros modelos ayudaría a mitigar la acumulación de huellas dactilares.
Un colorido portátil para juegos de gama alta que se centra en el rendimiento del procesador y en los juegos. Las teclas mecánicas forzadas pueden ser geniales para las fiestas LAN, pero el fuerte traqueteo de las teclas puede ser una molestia en la mayoría de los demás escenarios.
Los usuarios deben ejecutar el sistema en modo Turbo para explotar al máximo la CPU y la GPU o, de lo contrario, las velocidades de fotogramas cuando se juega serán ligeramente inferiores. Como resultado, los ventiladores deben estar en su máximo nivel de ruido para un rendimiento completo.
Algunas características auxiliares comunes en la mayoría de los otros portátiles para juegos están discretamente ausentes en este sistema Asus. IR, webcam, Thunderbolt, lector de tarjetas SD, lector de huellas dactilares, RJ-45 a 2,5 Gbps, G-Sync, Advanced Optimus y bloqueo Kensington no están disponibles aquí, lo que resulta extraño para un portátil de juego de 3.000 dólares.
Por último, las nuevas teclas mecánicas son tan ruidosas que es posible que molesten a los compañeros de clase o de habitación cercanos. Si estás pensando en usar este portátil para todo, desde apuntes de clase hasta juegos de dormitorio, entonces un ZenBook Pro podría ser la mejor opción, lo que es una pena porque el teclado numérico más grande y las teclas de flecha del G733 son por lo demás más cómodos de usar. Habría sido genial ver aquí una opción de teclado no mecánico estándar, muy parecido a lo que hace Dell con sus últimos modelos Alienware.
Precio y disponibilidad
Asus Strix Scar 17 G733QSA-XS99
- 05/24/2021 v7 (old)
Allen Ngo
Price comparison

