Debut del rendimiento de la Radeon RX 6650M: Análisis del portátil HP Omen 16 2022
Aunque la serie HP Omen 16 apenas tiene un año de vida, el último modelo de 2022 ya es una actualización significativa del original tanto por dentro como por fuera. La nueva versión añade opciones de CPU Intel Alder Lake-H de 12ª generación y AMD Zen 3+, opciones de GPU GeForce RTX 3070 Ti y Radeon RX 6000M, y varios cambios exteriores.
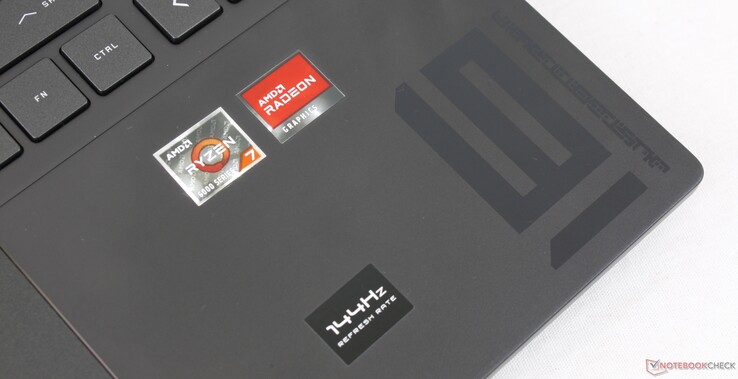
Nuestra configuración en la revisión es el SKU todo AMD que ofrece el Ryzen 7 6800H, 105 W TGP Radeon RX 6650M, y 144 Hz 1080p pantalla IPS para aproximadamente $1600 USD al por menor. Este también es uno de los pocos portátiles que cuentan con gráficos Radeon RX 6650M.
El Omen 16 compite directamente con otros portátiles de juego de 16 pulgadas de gama media alta como el Dell G16 7620, Lenovo Legion S7 16, o el Asus Zephyrus M16. Para una alternativa más económica, los usuarios pueden considerar el HP Victus 16 de gama baja.
Más opiniones de HP:
Posibles contendientes en la comparación
Valoración | Fecha | Modelo | Peso | Altura | Tamaño | Resolución | Precio |
|---|---|---|---|---|---|---|---|
| 86.4 % v7 (old) | 12/2022 | HP Omen 16-n0033dx R7 6800H, Radeon RX 6650M | 2.4 kg | 22.6 mm | 16.10" | 1920x1080 | |
| 86.9 % v7 (old) | 09/2022 | HP Envy 16 h0112nr i7-12700H, GeForce RTX 3060 Laptop GPU | 2.3 kg | 19.8 mm | 16.00" | 3840x2400 | |
| 85.5 % v7 (old) | 05/2022 | HP Omen 16-b1090ng i7-12700H, GeForce RTX 3070 Ti Laptop GPU | 2.3 kg | 23 mm | 16.10" | 2560x1440 | |
| 82.3 % v7 (old) | 05/2022 | HP Victus 16-e0145ng R5 5600H, GeForce RTX 3050 Ti Laptop GPU | 2.4 kg | 23.5 mm | 16.10" | 1920x1080 | |
| 89.3 % v7 (old) | 01/2023 | Lenovo Legion S7 16ARHA7 R9 6900HX, Radeon RX 6800S | 2.2 kg | 16.9 mm | 16.00" | 2560x1600 | |
| 86.1 % v7 (old) | 10/2022 | Dell G16 7620 i7-12700H, GeForce RTX 3060 Laptop GPU | 2.6 kg | 26.9 mm | 16.00" | 2560x1600 |
Estuche - Inspirado en el Envy 16
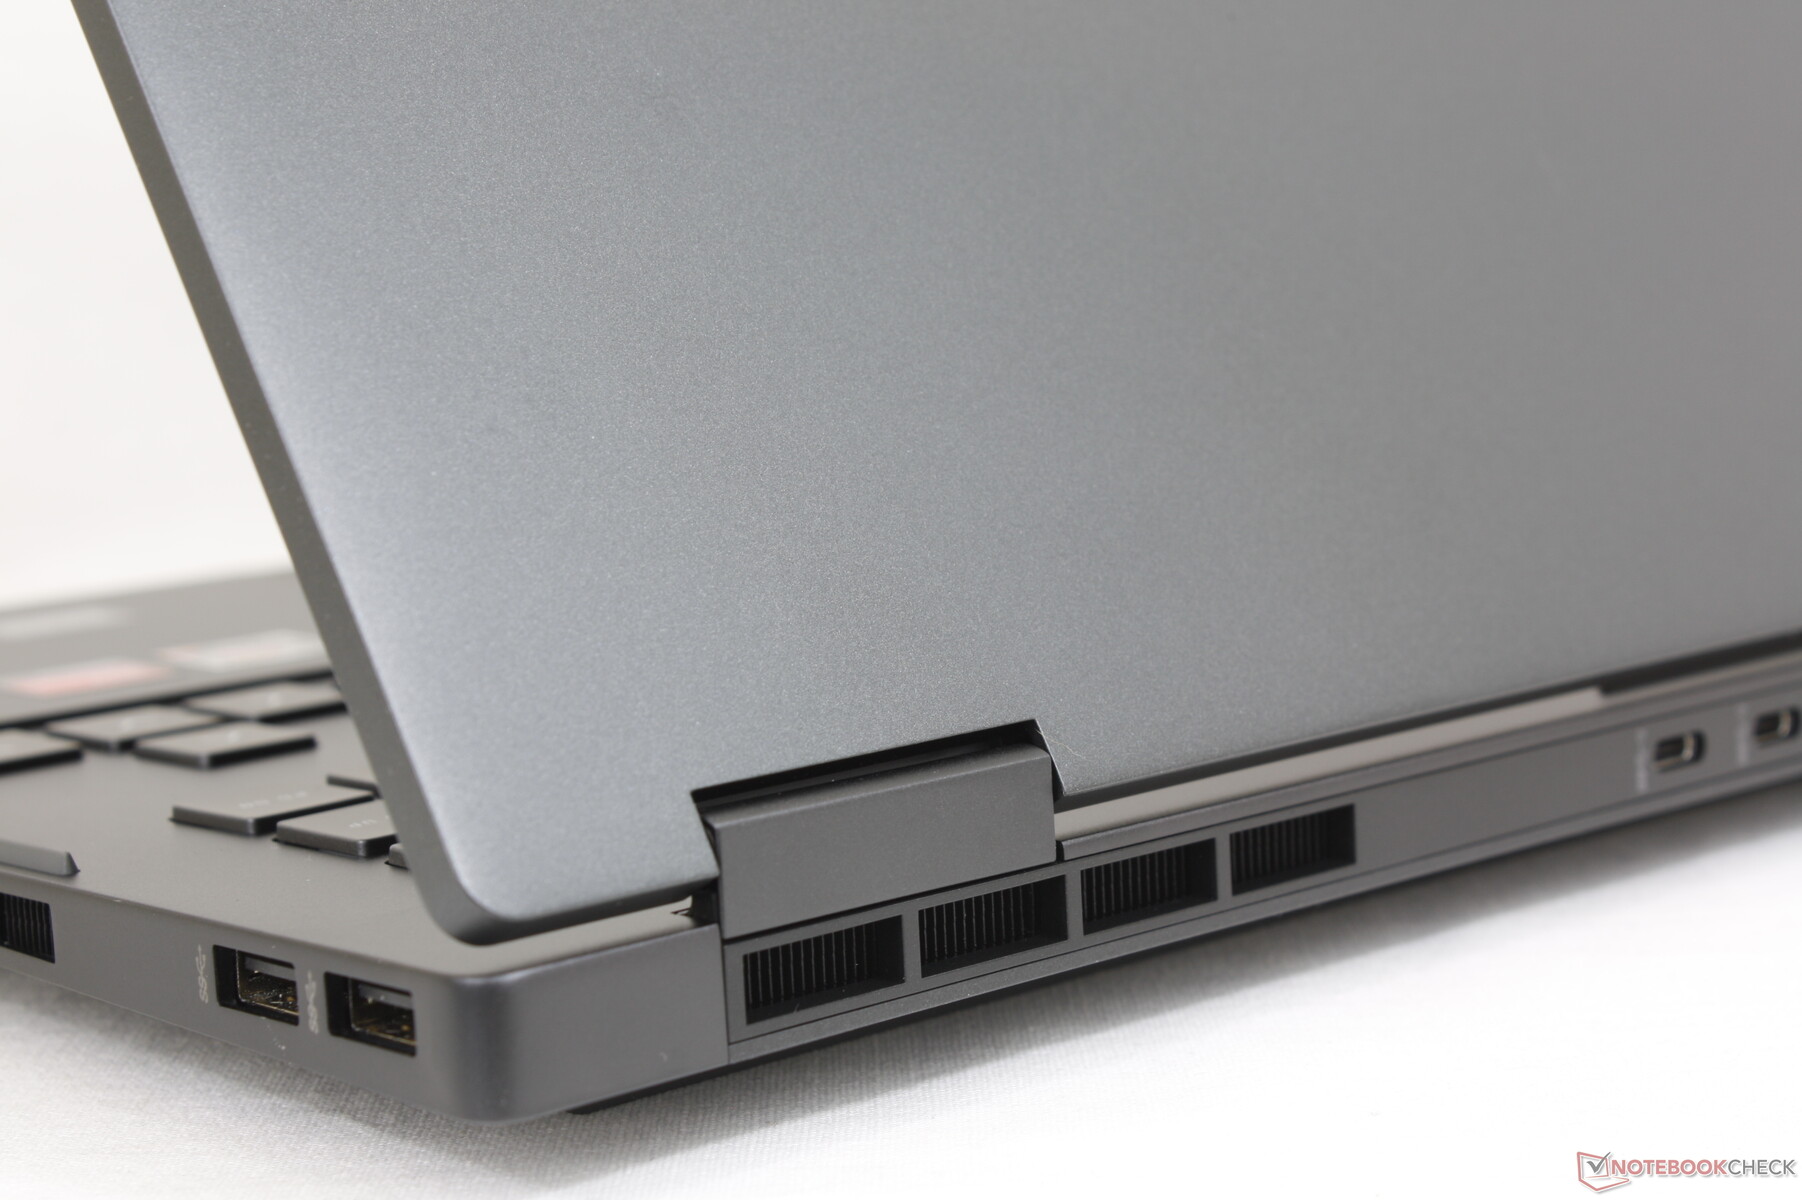
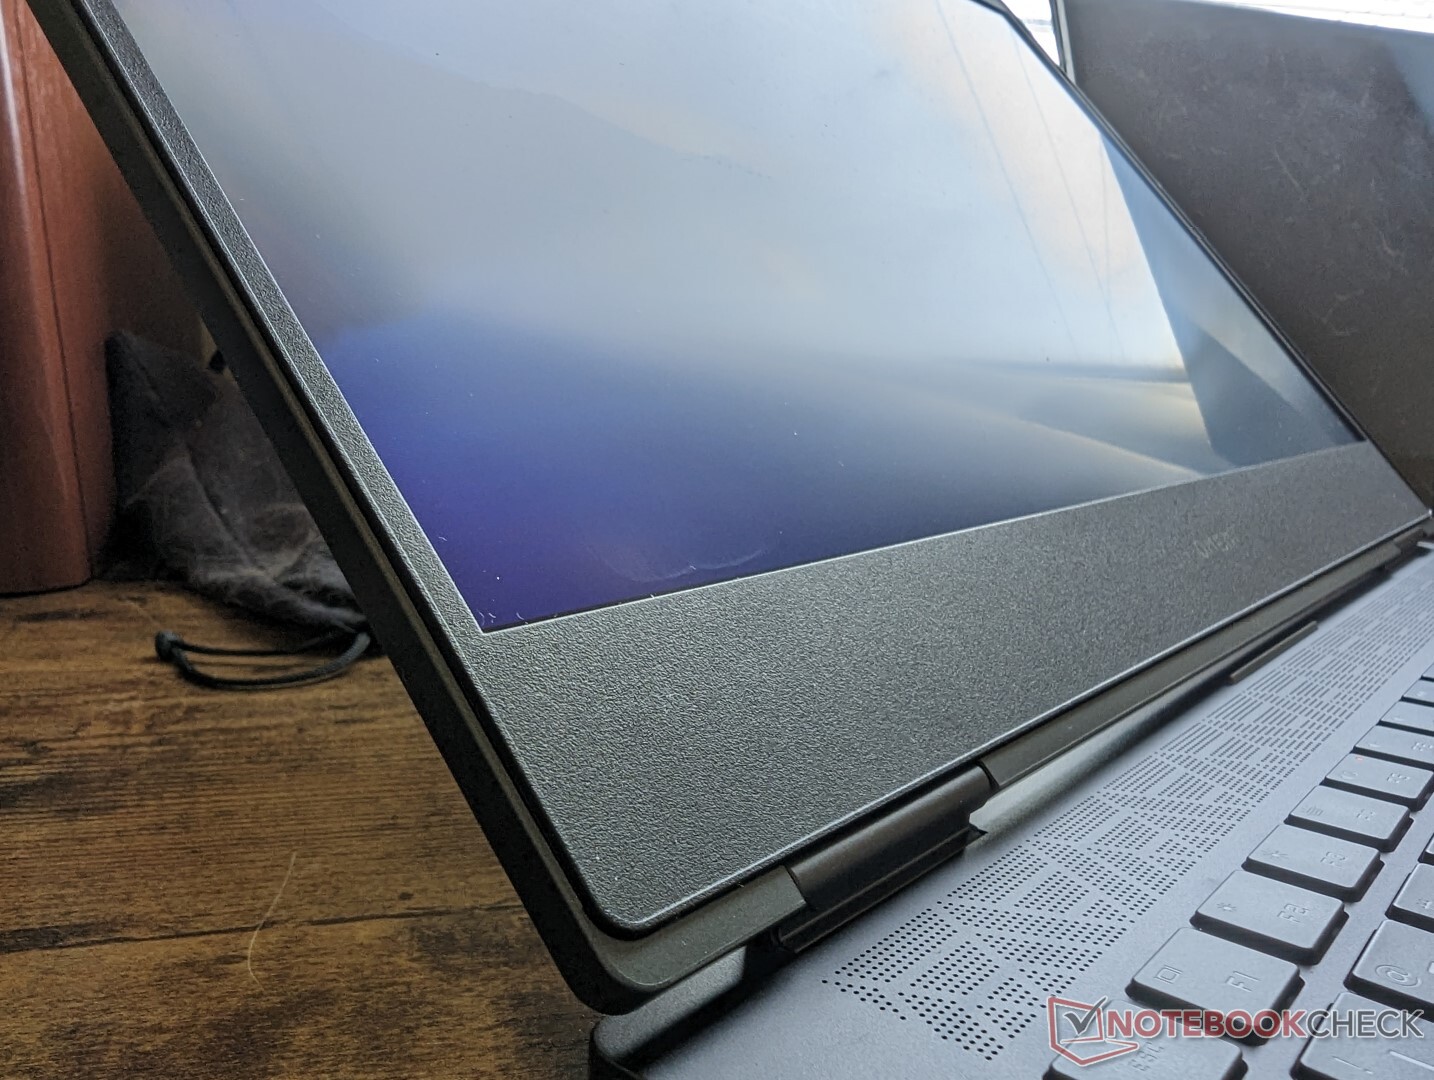
El Omen 16 2022 es casi idéntico al modelo 2021 desde la parte delantera, pero los detalles de la parte trasera y la parte inferior han cambiado. Los puertos ya no están donde solían estar, por ejemplo, mientras que las esquinas traseras son ahora más redondas que antes. Las rejillas de ventilación y de los altavoces también han sido rediseñadas y la placa inferior, en particular, tiene una rejilla de ventilación aún más grande
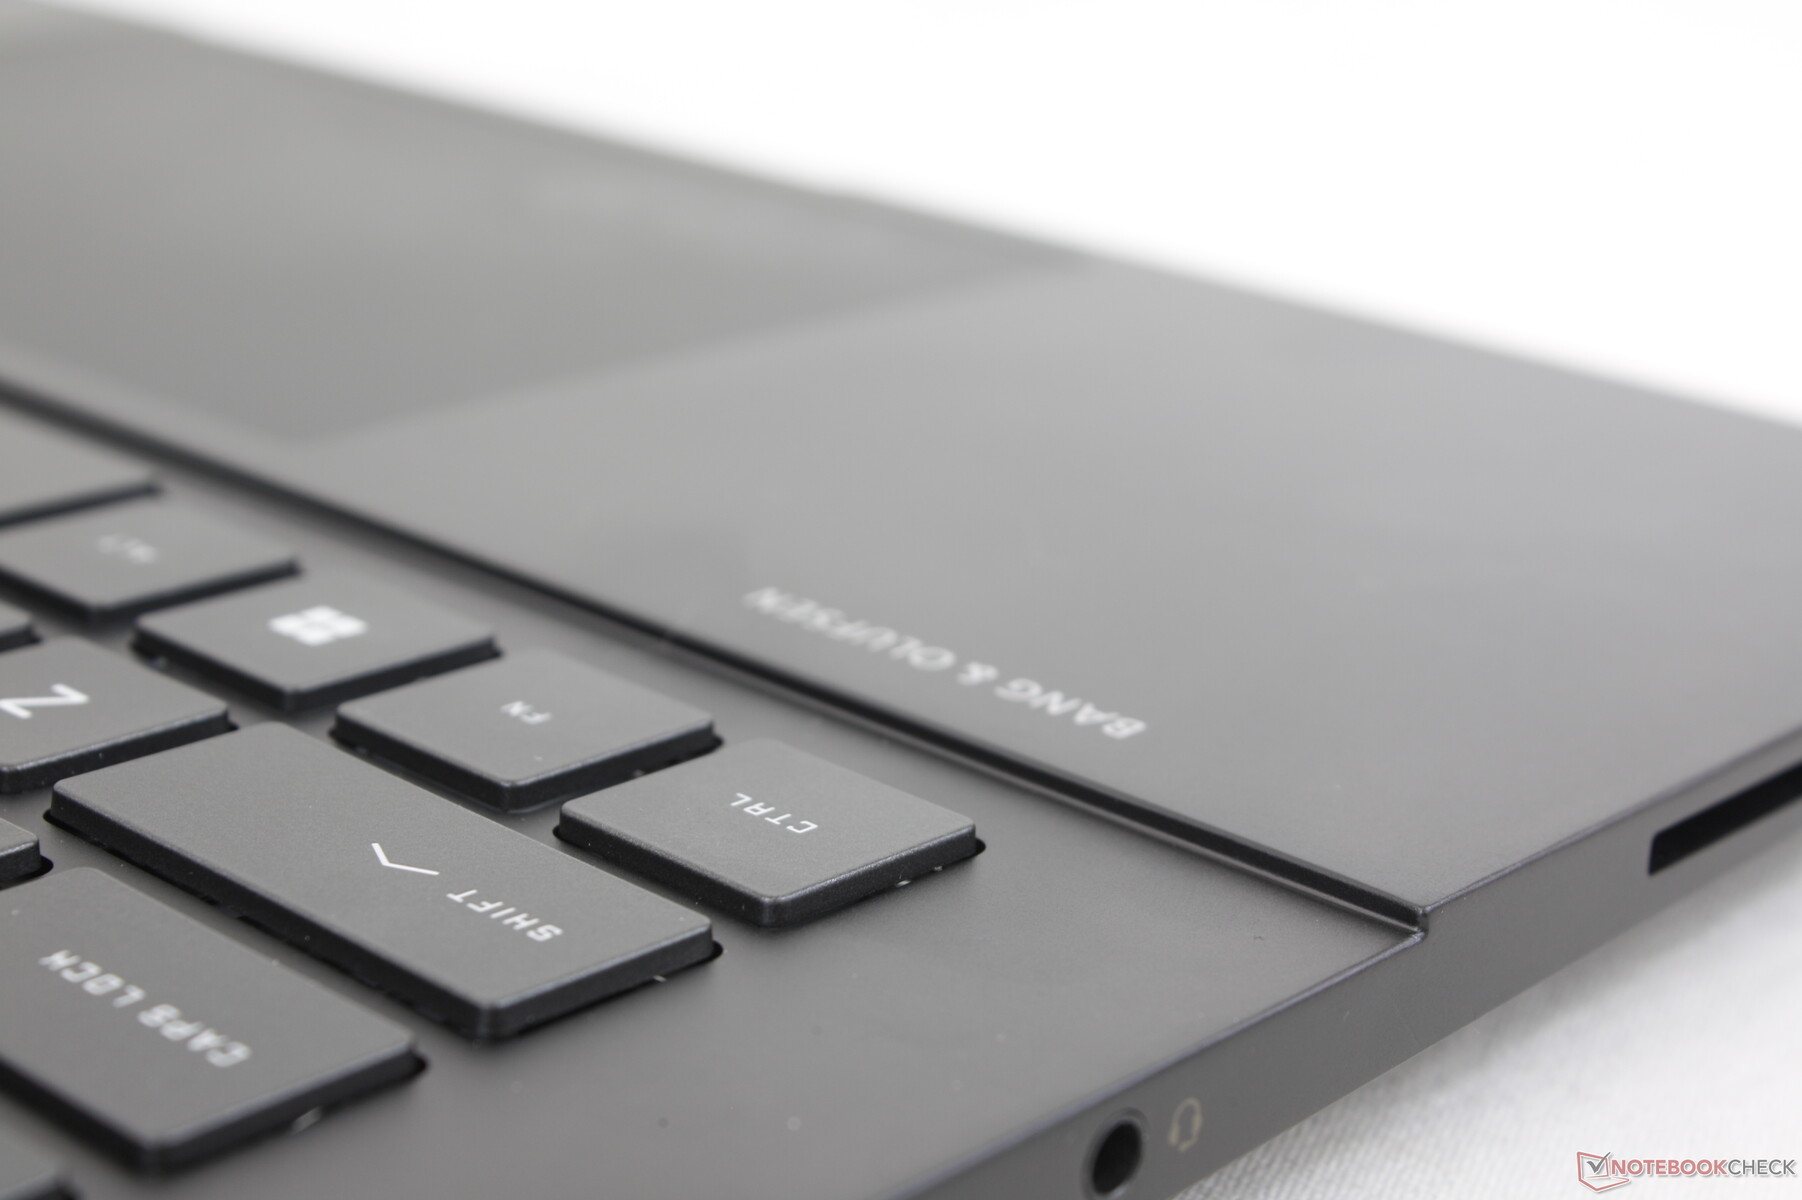
Por lo demás, los materiales del chasis metálico son los mismos que en el modelo del año pasado para que la sensación y la impresión sean similares. La base sigue siendo rígida y casi similar a la del Envy 16, pero la tapa tiende a tambalearse al ajustar los ángulos. Las pequeñas bisagras también son susceptibles de romperse cuando se abren a su ángulo máximo. Las bisagras del Dell G16 se sienten más fuertes en comparación.
Las dimensiones y el peso se mantienen casi sin cambios respecto al modelo del año pasado a pesar de todas las actualizaciones externas. El modelo se encuentra cómodamente entre el más delgado y ligero Lenovo Legion S7 16 y el más grueso y pesado Dell G16. El Asus Zephyrus M16 es significativamente más ligero en medio kilo si los usuarios quieren un portátil de juegos de 16 pulgadas más portátil.
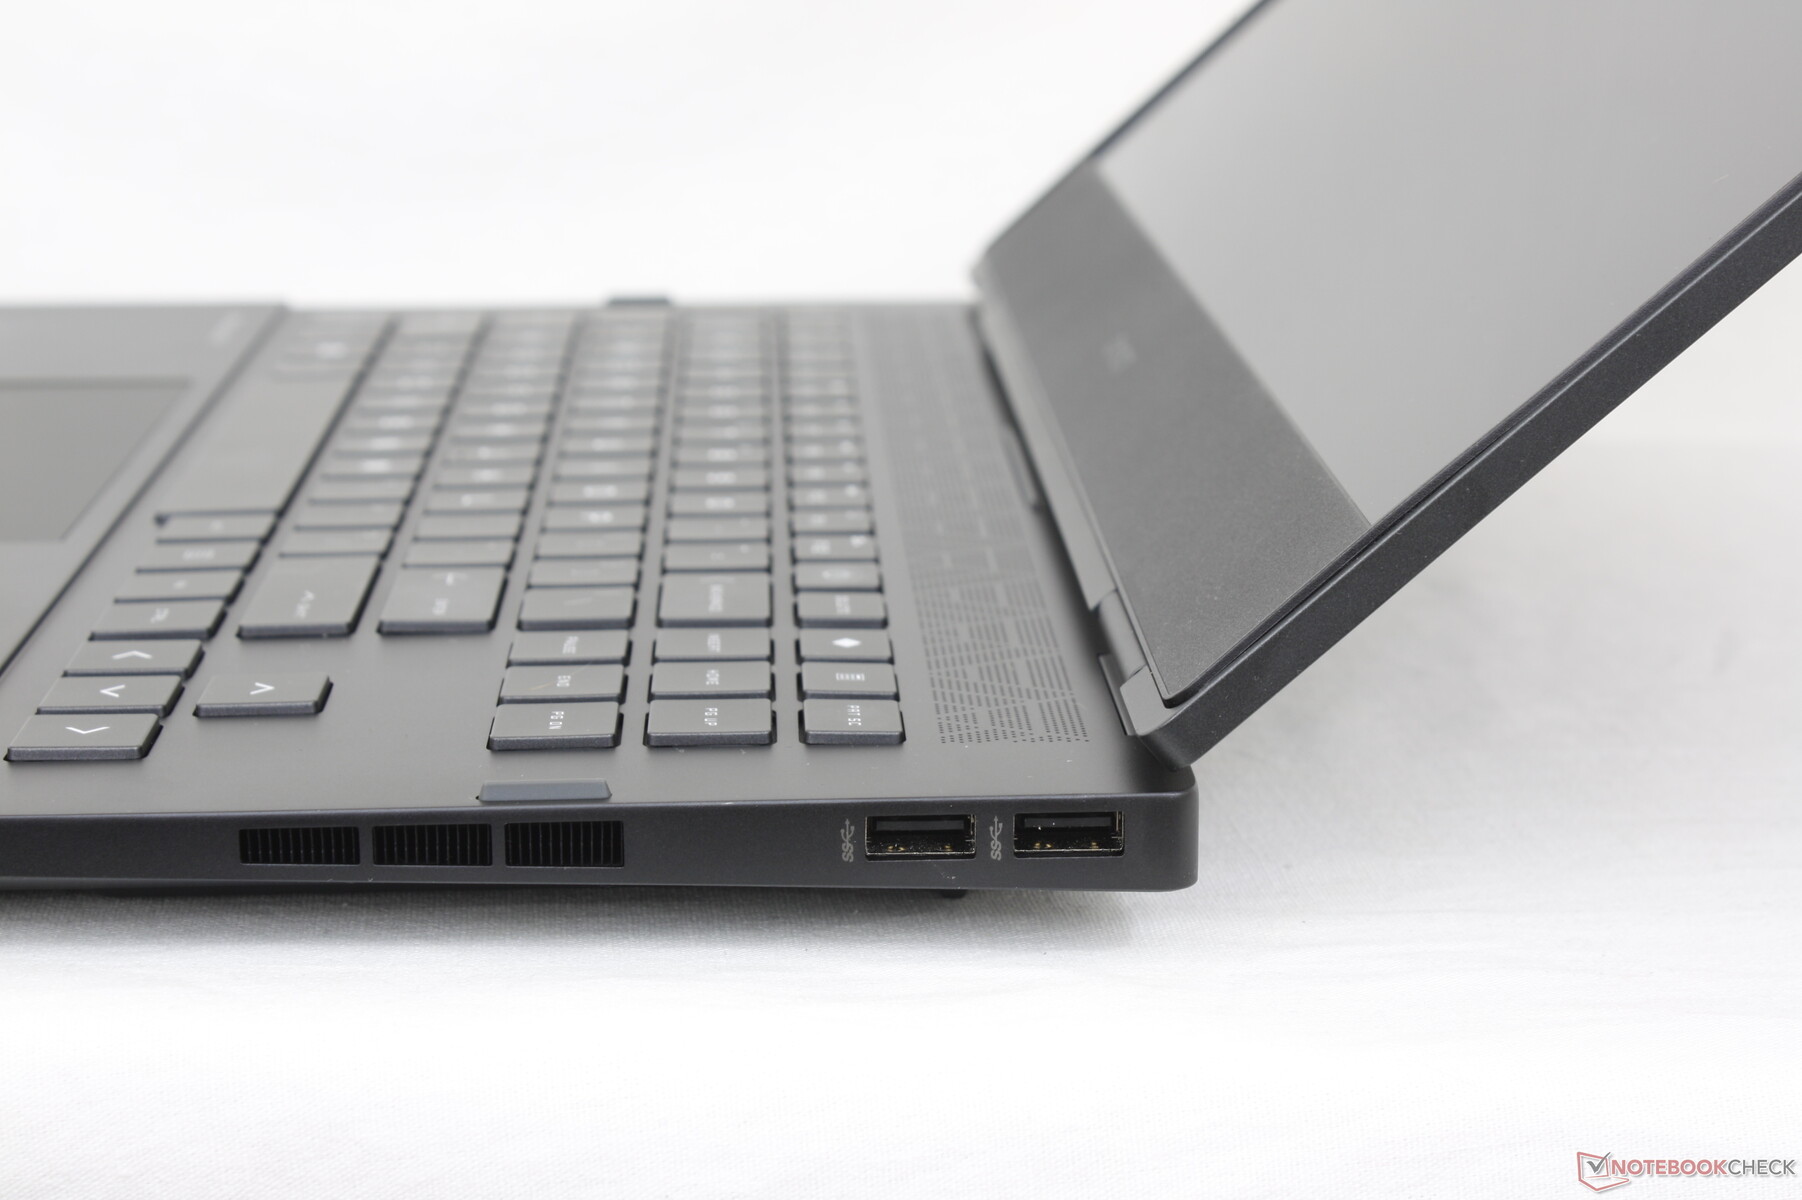
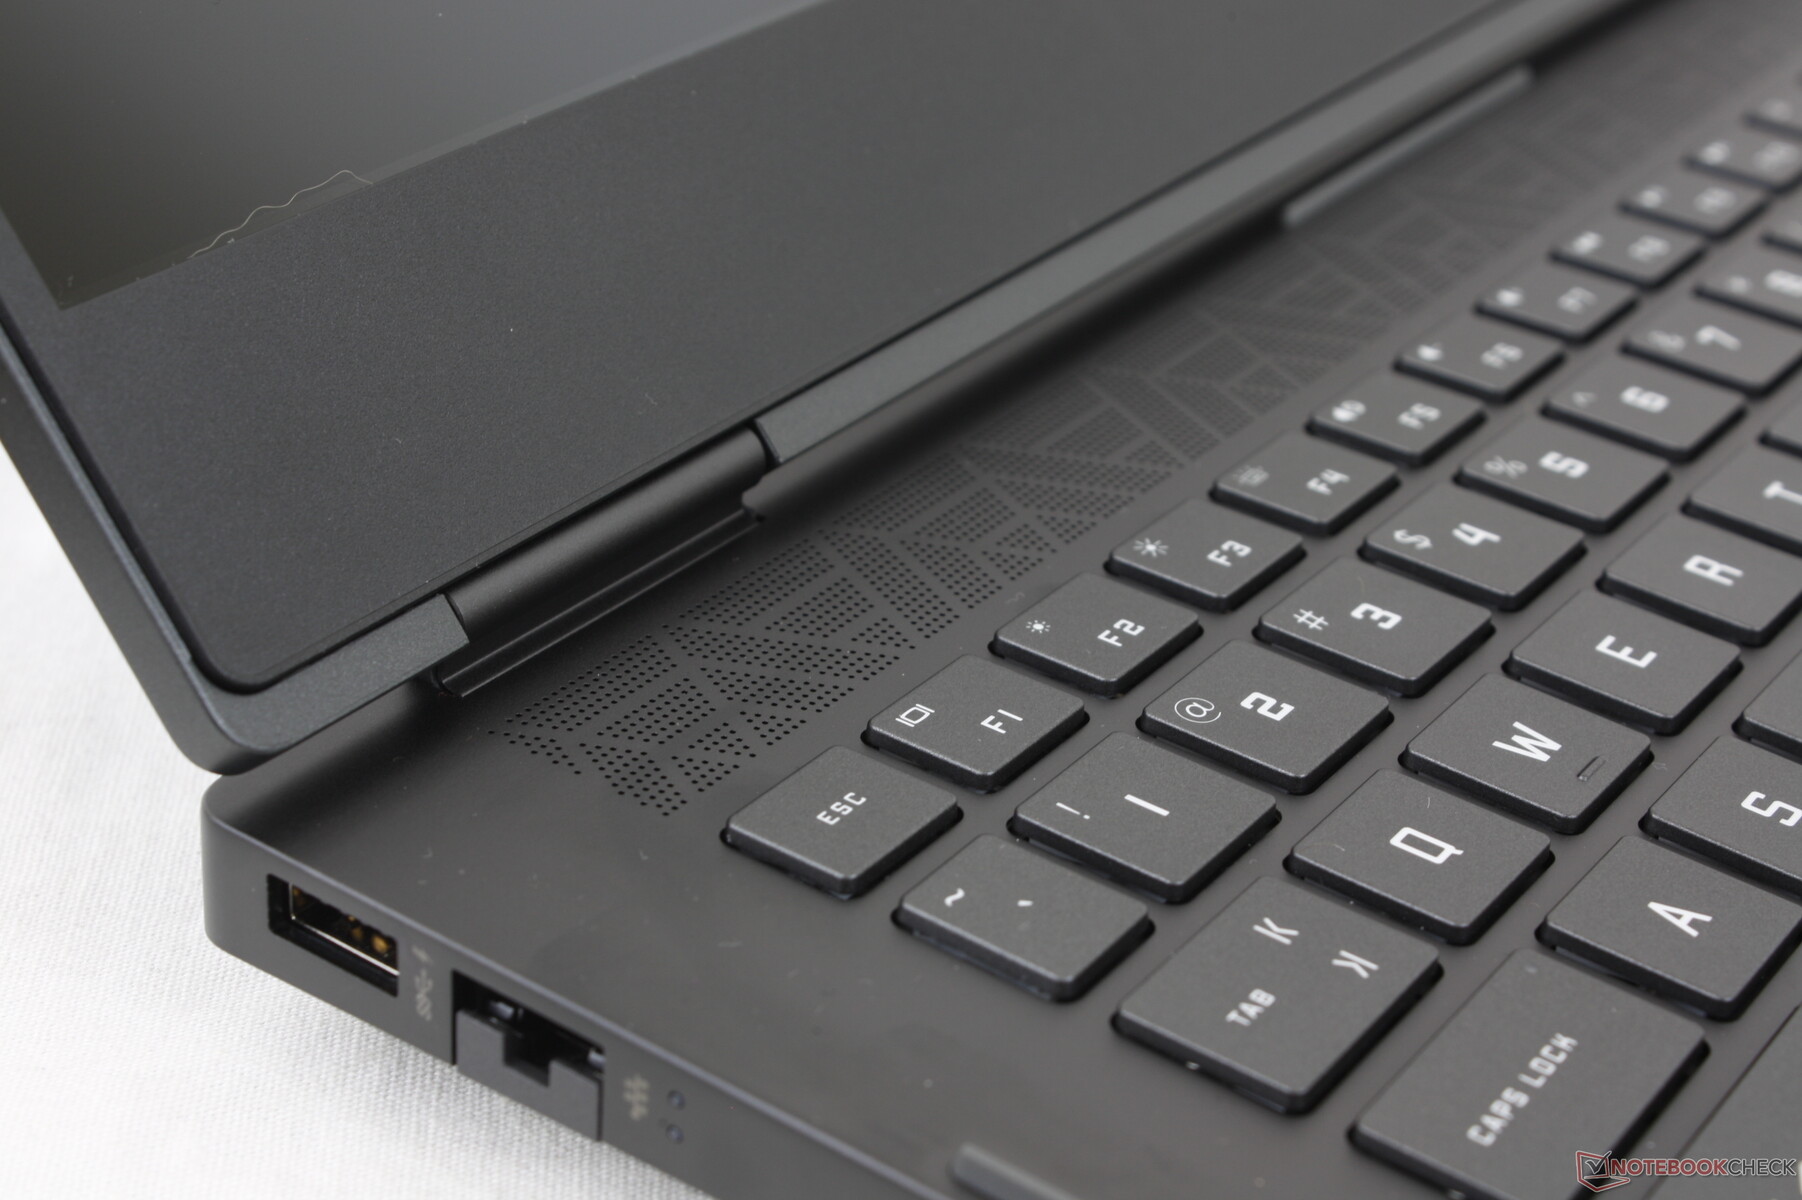
Conectividad - No es compatible con Thunderbolt
El modelo de este año ha cambiado el mini-DisplayPort en favor de un segundo puerto USB-C en comparación con el modelo 2021. Las opciones de puerto son esencialmente las mismas entre los dos modelos
El cambio más notable de un año a otro tiene que ver con la posición de los puertos. Los puertos del modelo del año pasado estaban demasiado amontonados en el borde izquierdo, por lo que algunos se han reasignado al borde trasero. Aunque no es lo ideal, es preferible a tener menos puertos.
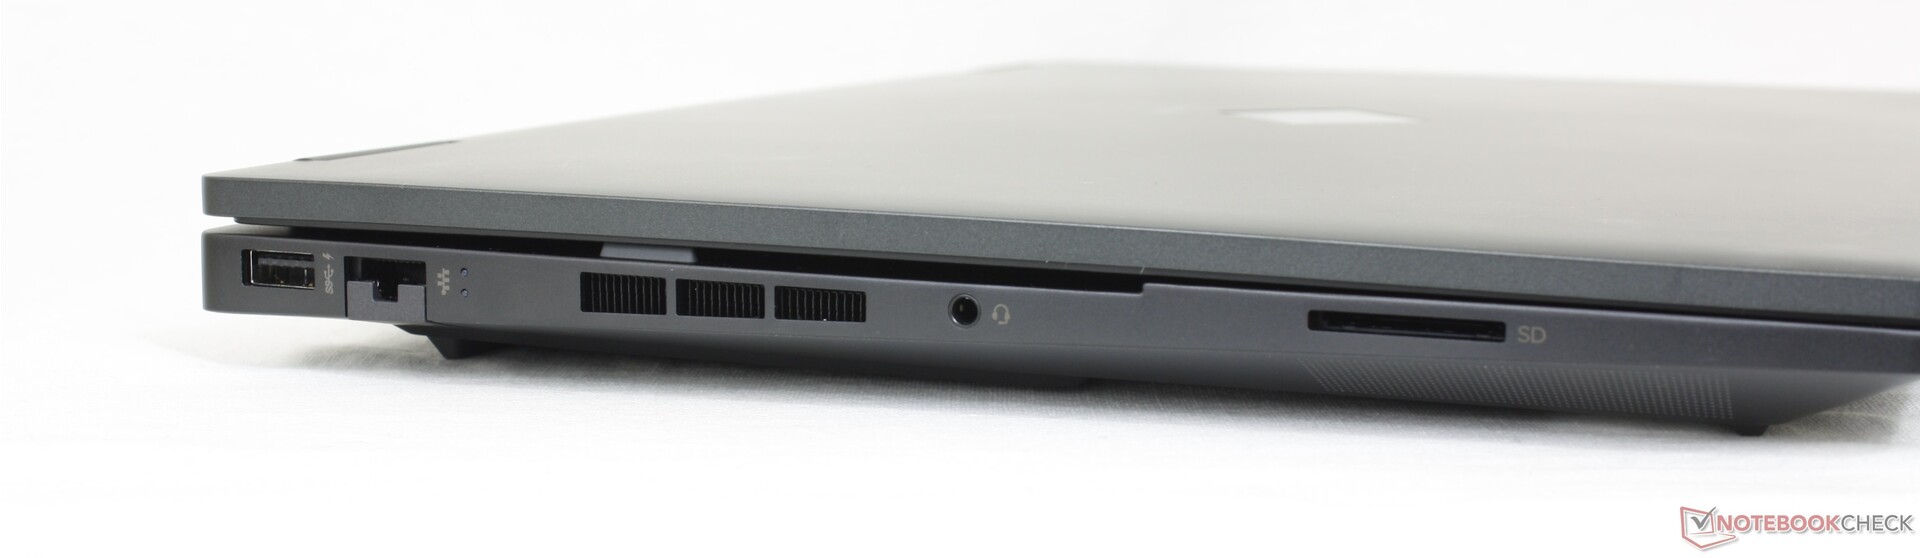
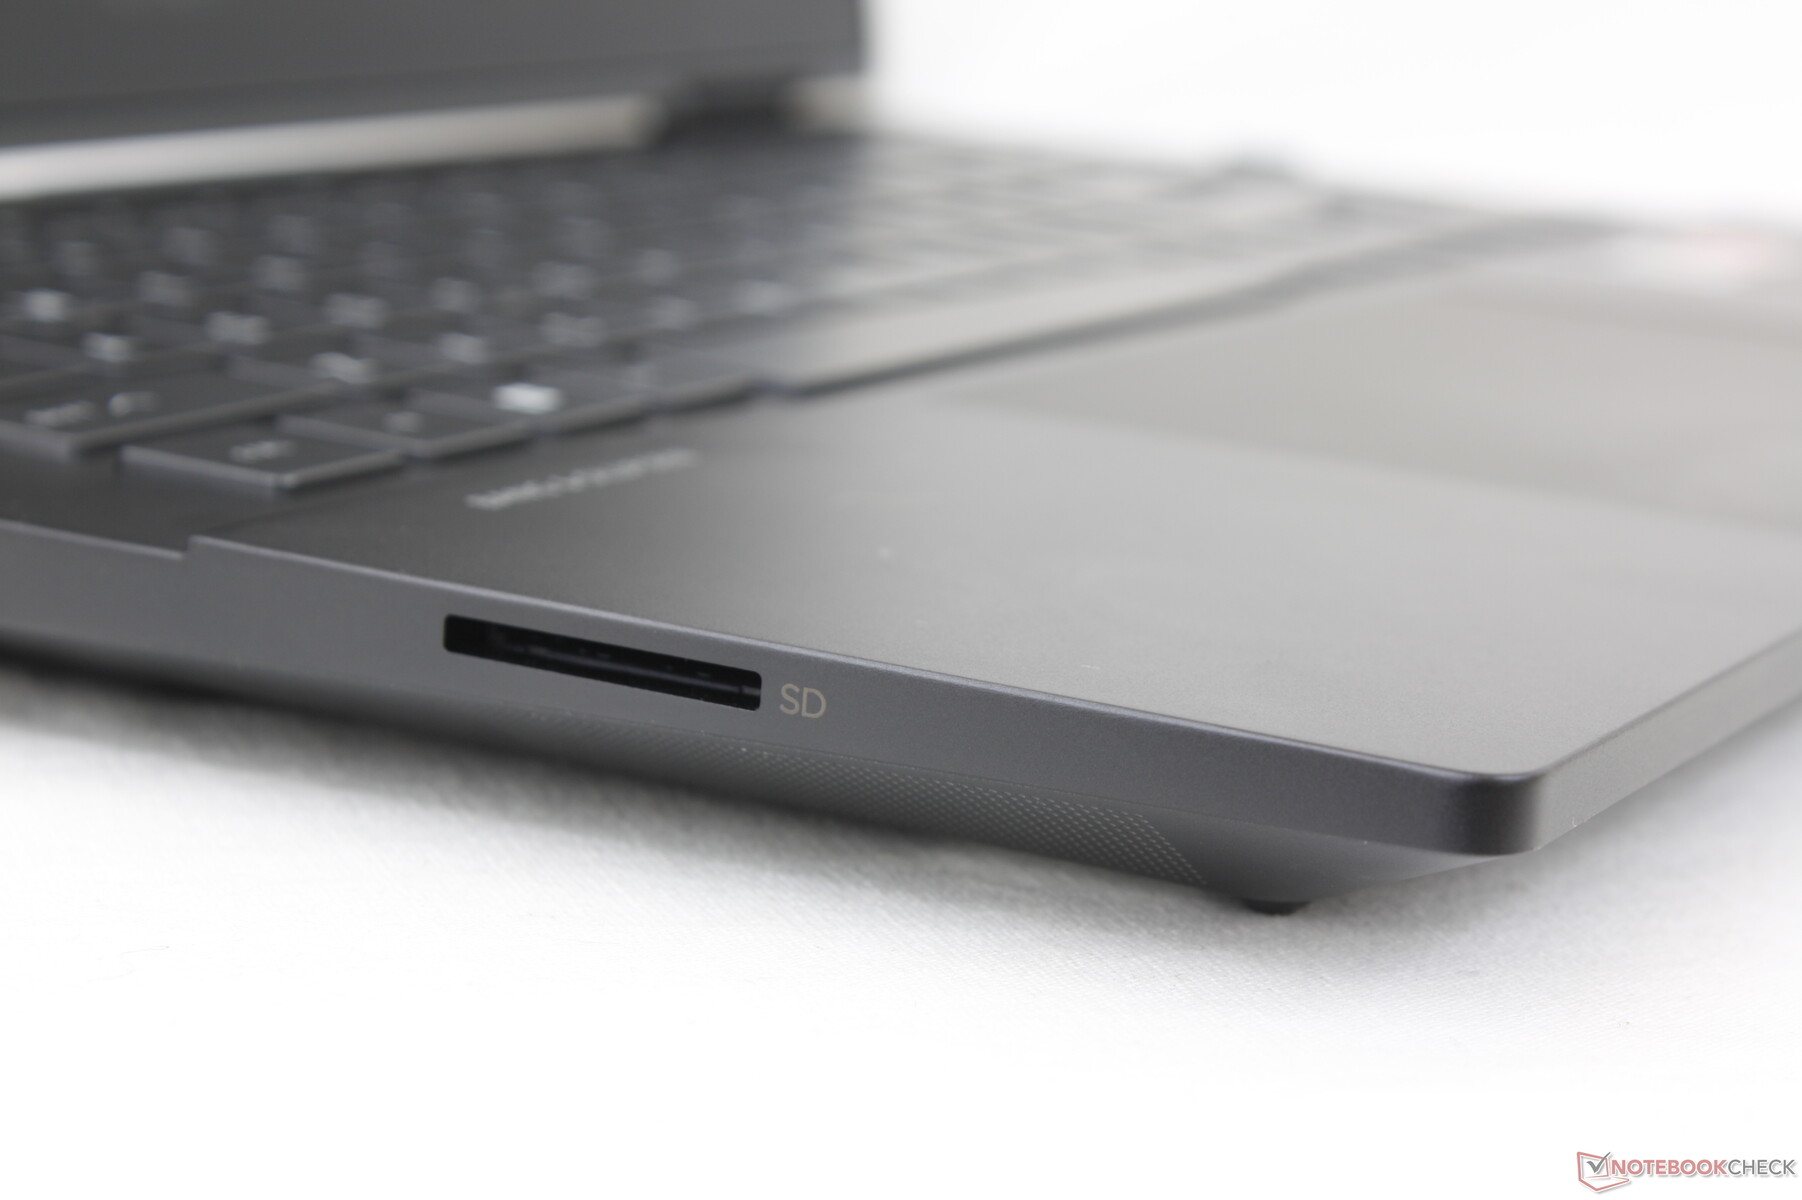
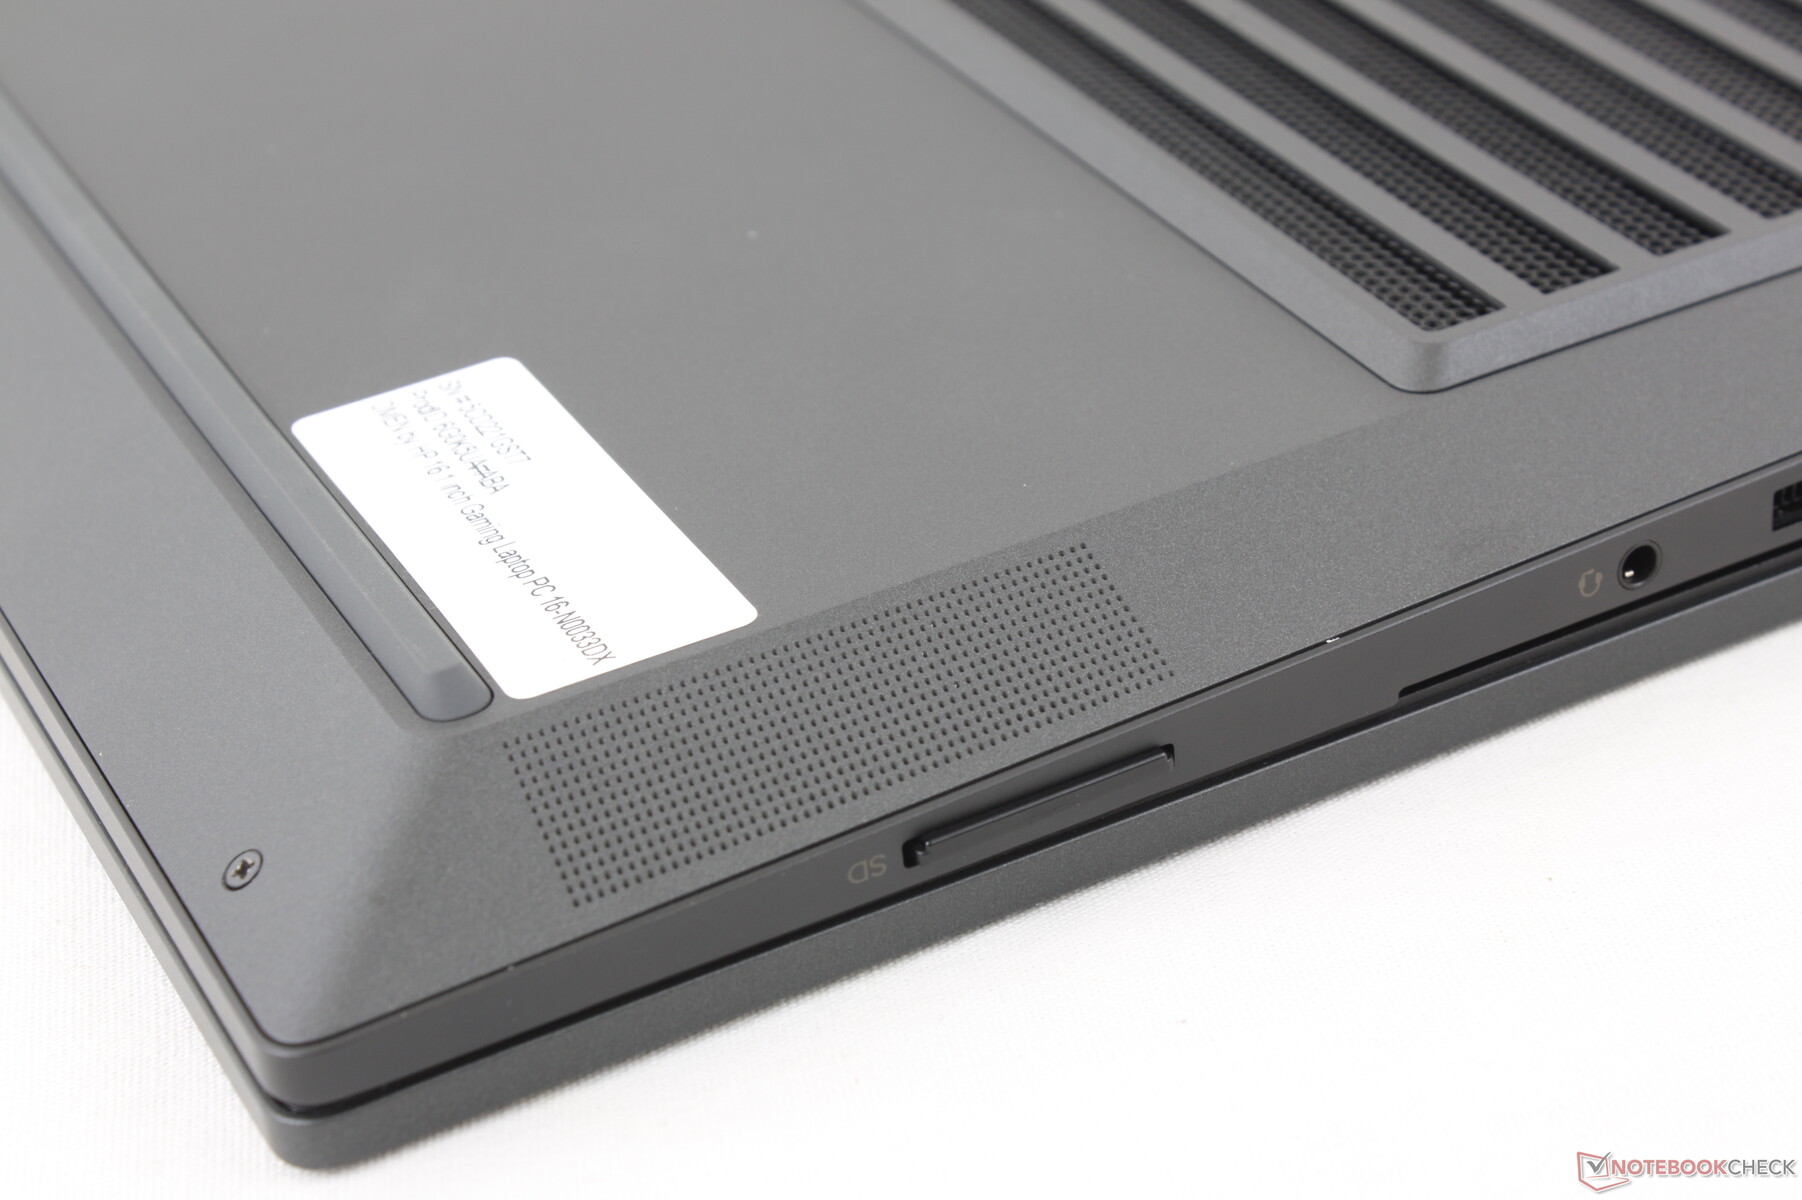
Lector de tarjetas SD
Las tasas de transferencia con el lector SD no cambian respecto al modelo del año pasado. Muchos portátiles para juegos de la competencia, como el Dell G16, omiten por completo el lector de tarjetas. Mientras tanto, el lector SD del Razer Blade 15 ofrece el doble de rendimiento.
| SD Card Reader | |
| average JPG Copy Test (av. of 3 runs) | |
| Lenovo Legion S7 16ARHA7 (AV PRO microSD 128 GB V60) | |
| HP Omen 16-n0033dx (AV PRO microSD 128 GB V60) | |
| HP Victus 16-e0145ng (AV PRO microSD 128 GB V60) | |
| HP Envy 16 h0112nr (AV Pro SD microSD 128 GB V60) | |
| HP Omen 16-b1090ng (AV PRO microSD 128 GB V60) | |
| maximum AS SSD Seq Read Test (1GB) | |
| Lenovo Legion S7 16ARHA7 (AV PRO microSD 128 GB V60) | |
| HP Omen 16-n0033dx (AV PRO microSD 128 GB V60) | |
| HP Envy 16 h0112nr (AV Pro SD microSD 128 GB V60) | |
Comunicación
Un MediaTek MT7922 viene de serie para la conectividad Wi-Fi 6E y Bluetooth 5.2. La mayoría de los otros portátiles para juegos vienen con la serie Intel AX201/210, pero la solución MediaTek es probablemente la opción más asequible. Las tasas de transferencia son excelentes y sin problemas de rendimiento cuando se conecta a nuestra red de 6 GHz.
| Networking | |
| iperf3 receive AXE11000 6GHz | |
| Lenovo Legion S7 16ARHA7 | |
| HP Omen 16-n0033dx | |
| HP Envy 16 h0112nr | |
| iperf3 receive AXE11000 | |
| HP Omen 16-n0033dx | |
| Dell G16 7620 | |
| HP Omen 16-b1090ng | |
| HP Victus 16-e0145ng | |
| iperf3 transmit AXE11000 | |
| HP Omen 16-n0033dx | |
| HP Omen 16-b1090ng | |
| Dell G16 7620 | |
| HP Victus 16-e0145ng | |
| iperf3 transmit AXE11000 6GHz | |
| Lenovo Legion S7 16ARHA7 | |
| HP Omen 16-n0033dx | |
| HP Envy 16 h0112nr | |
Cámara web
La cámara web es decepcionante, con sólo 720p o 1 MP, mientras que otros portátiles para juegos como el Razer Blade 15 tienen cámaras web de 1080p o 2 MP. Además, el modelo carece de obturador de cámara web y de sensor IR.


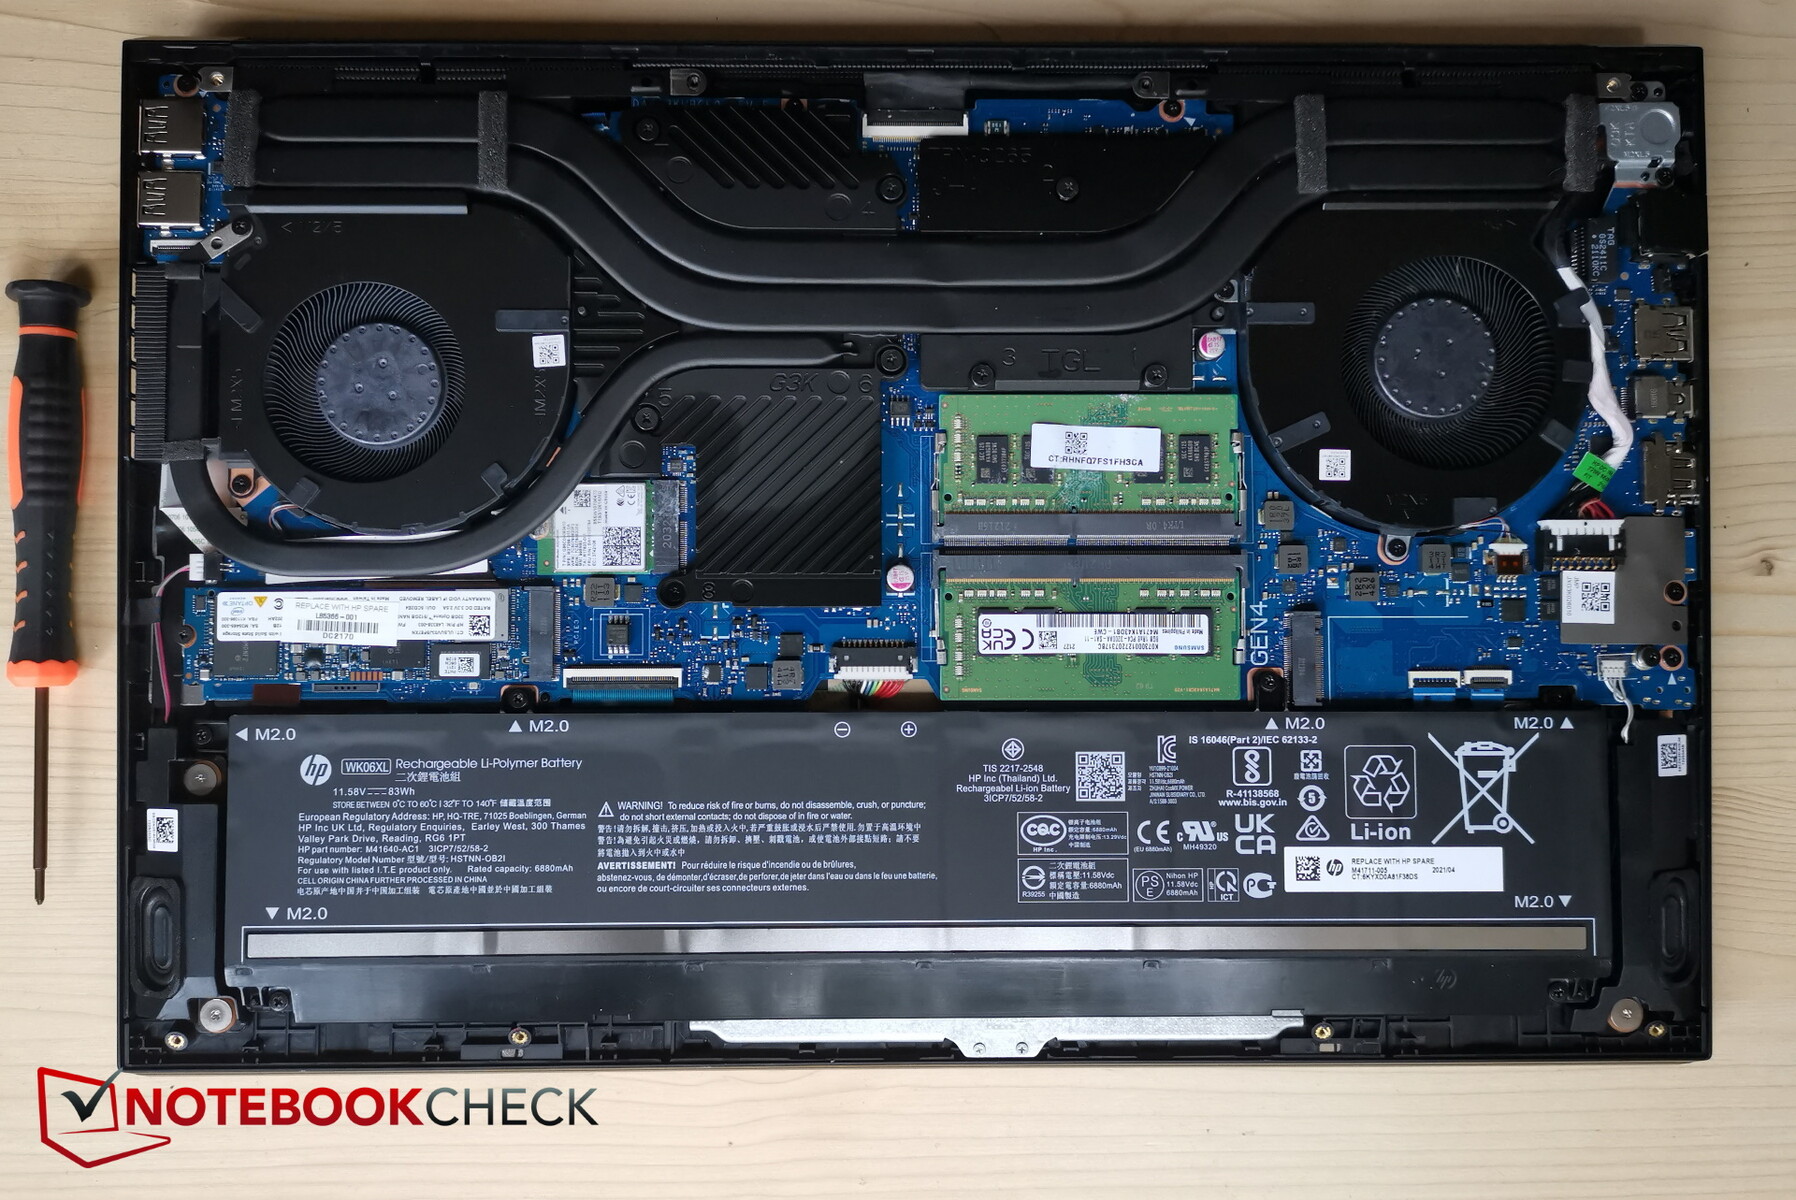
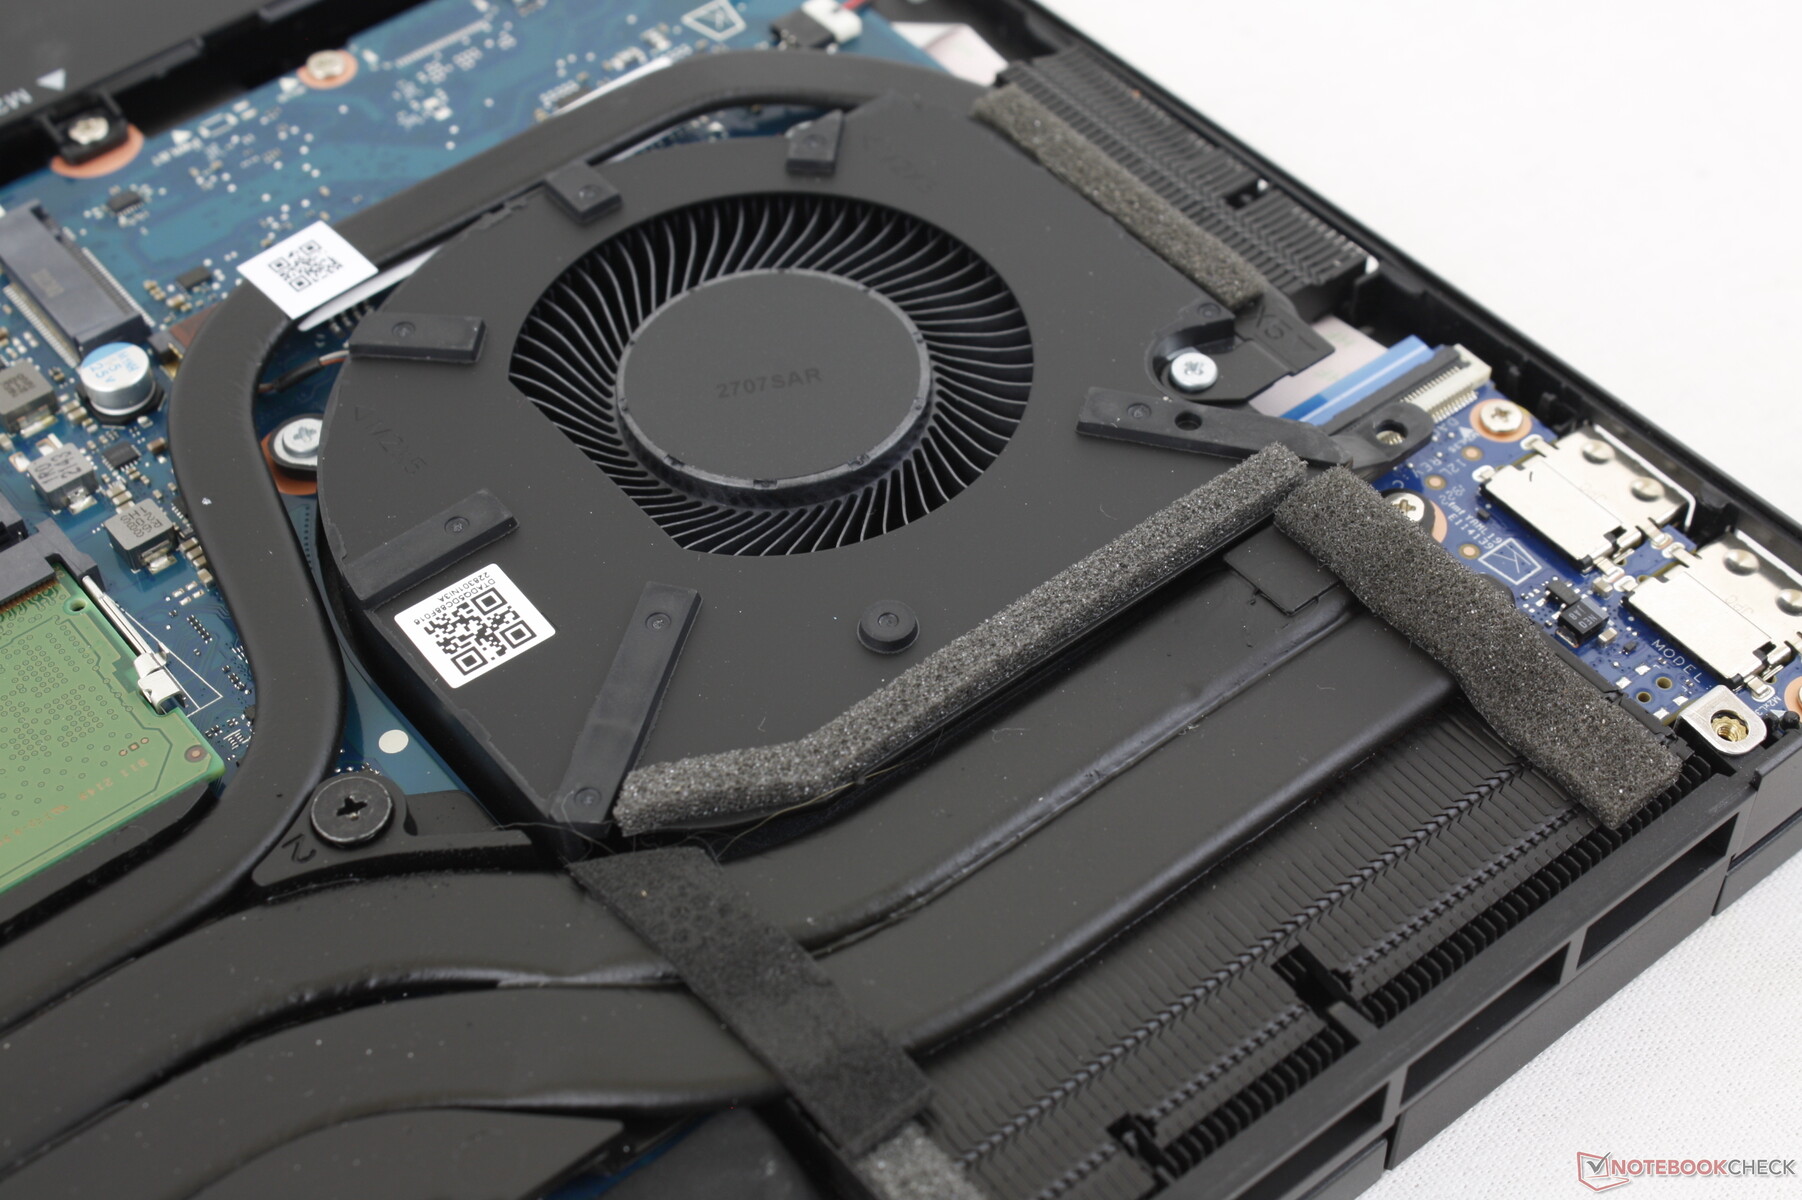
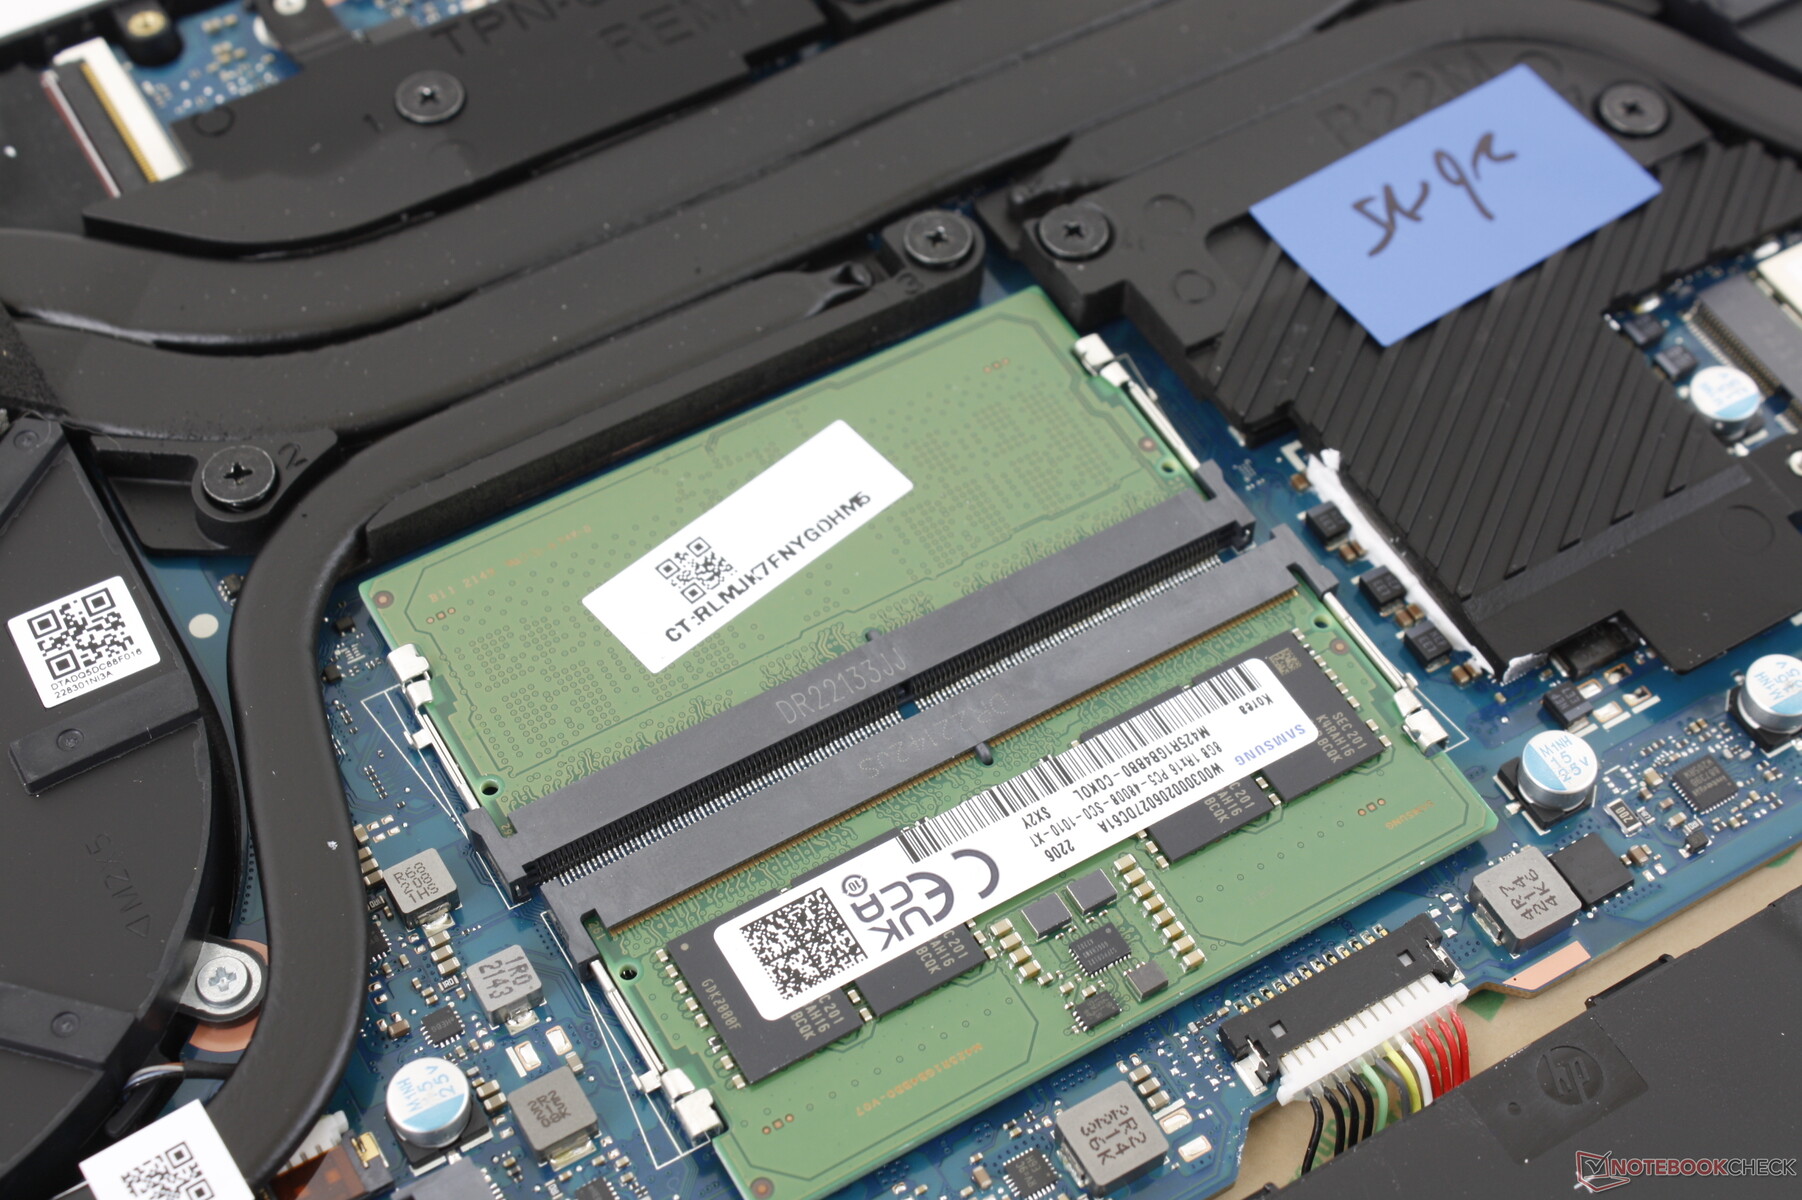
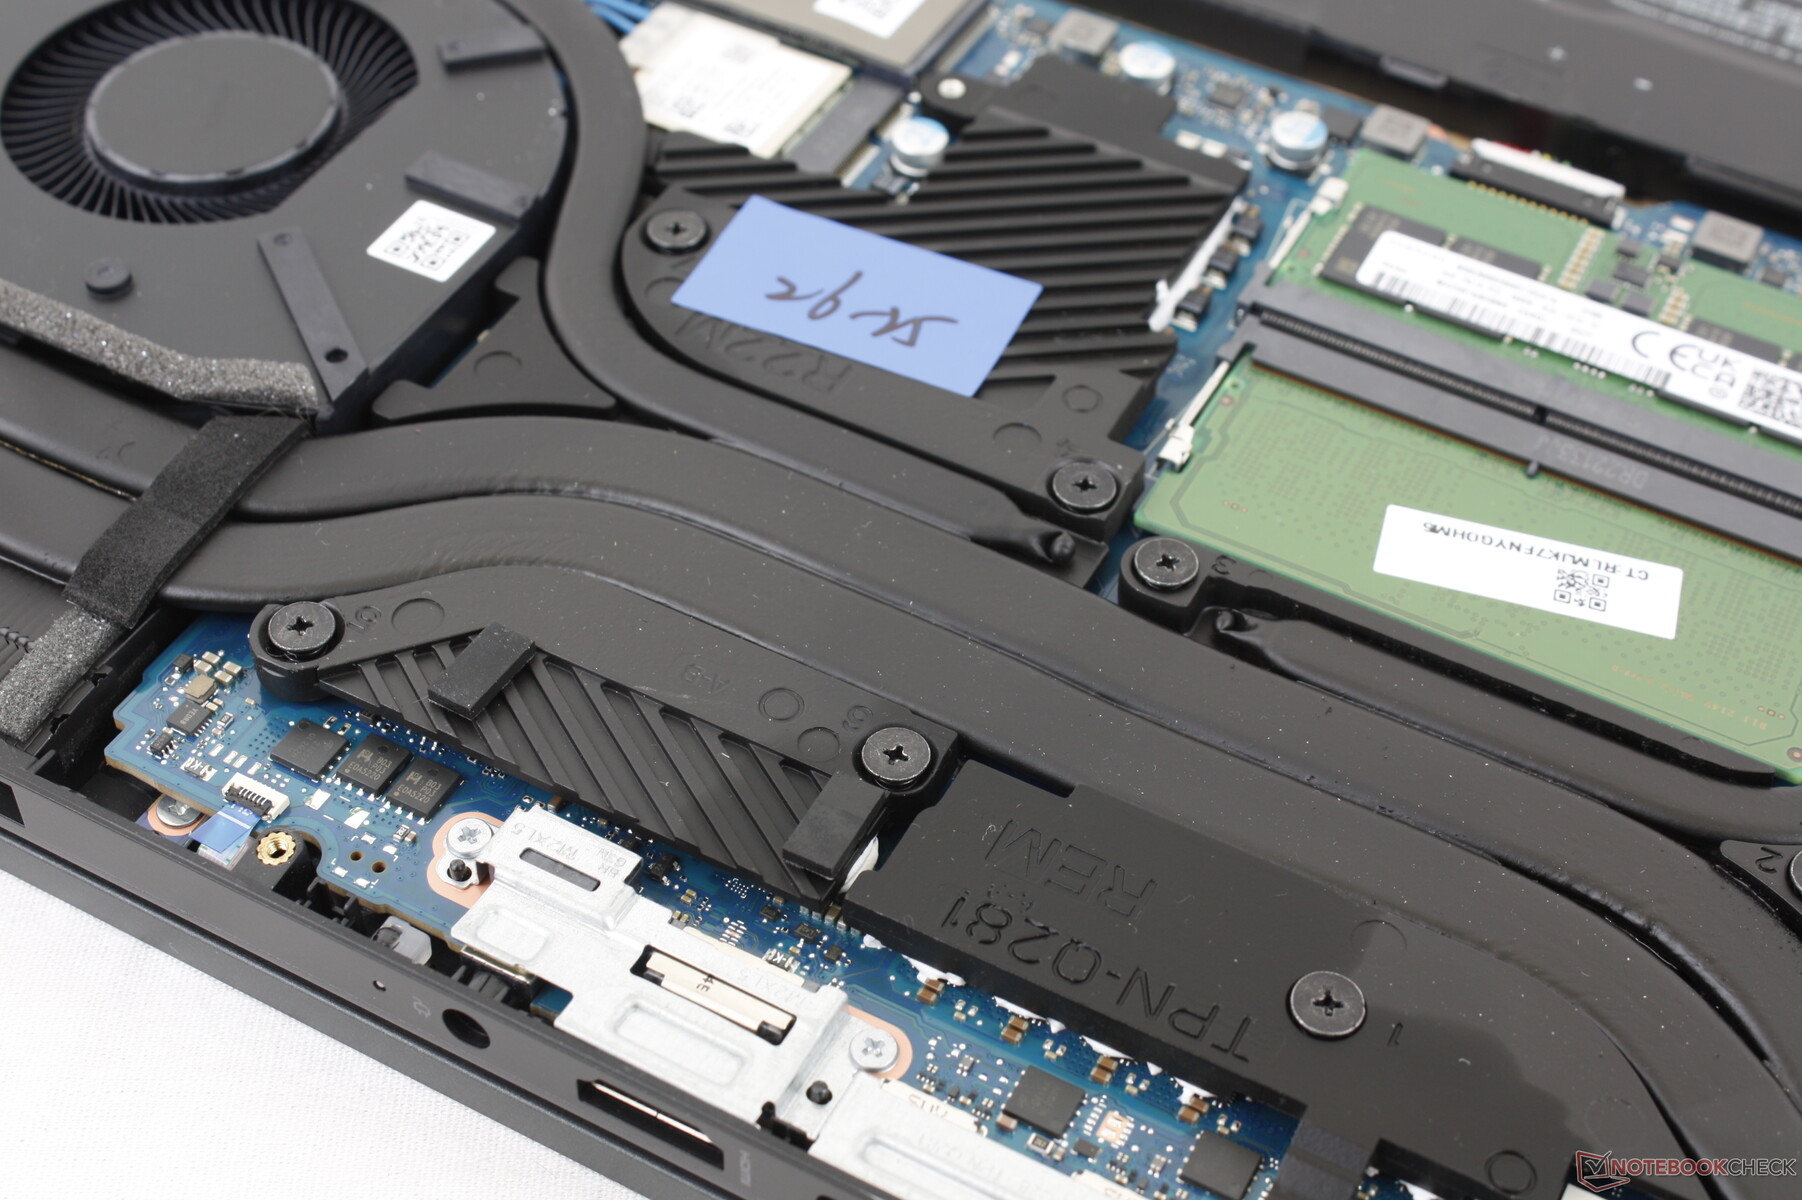
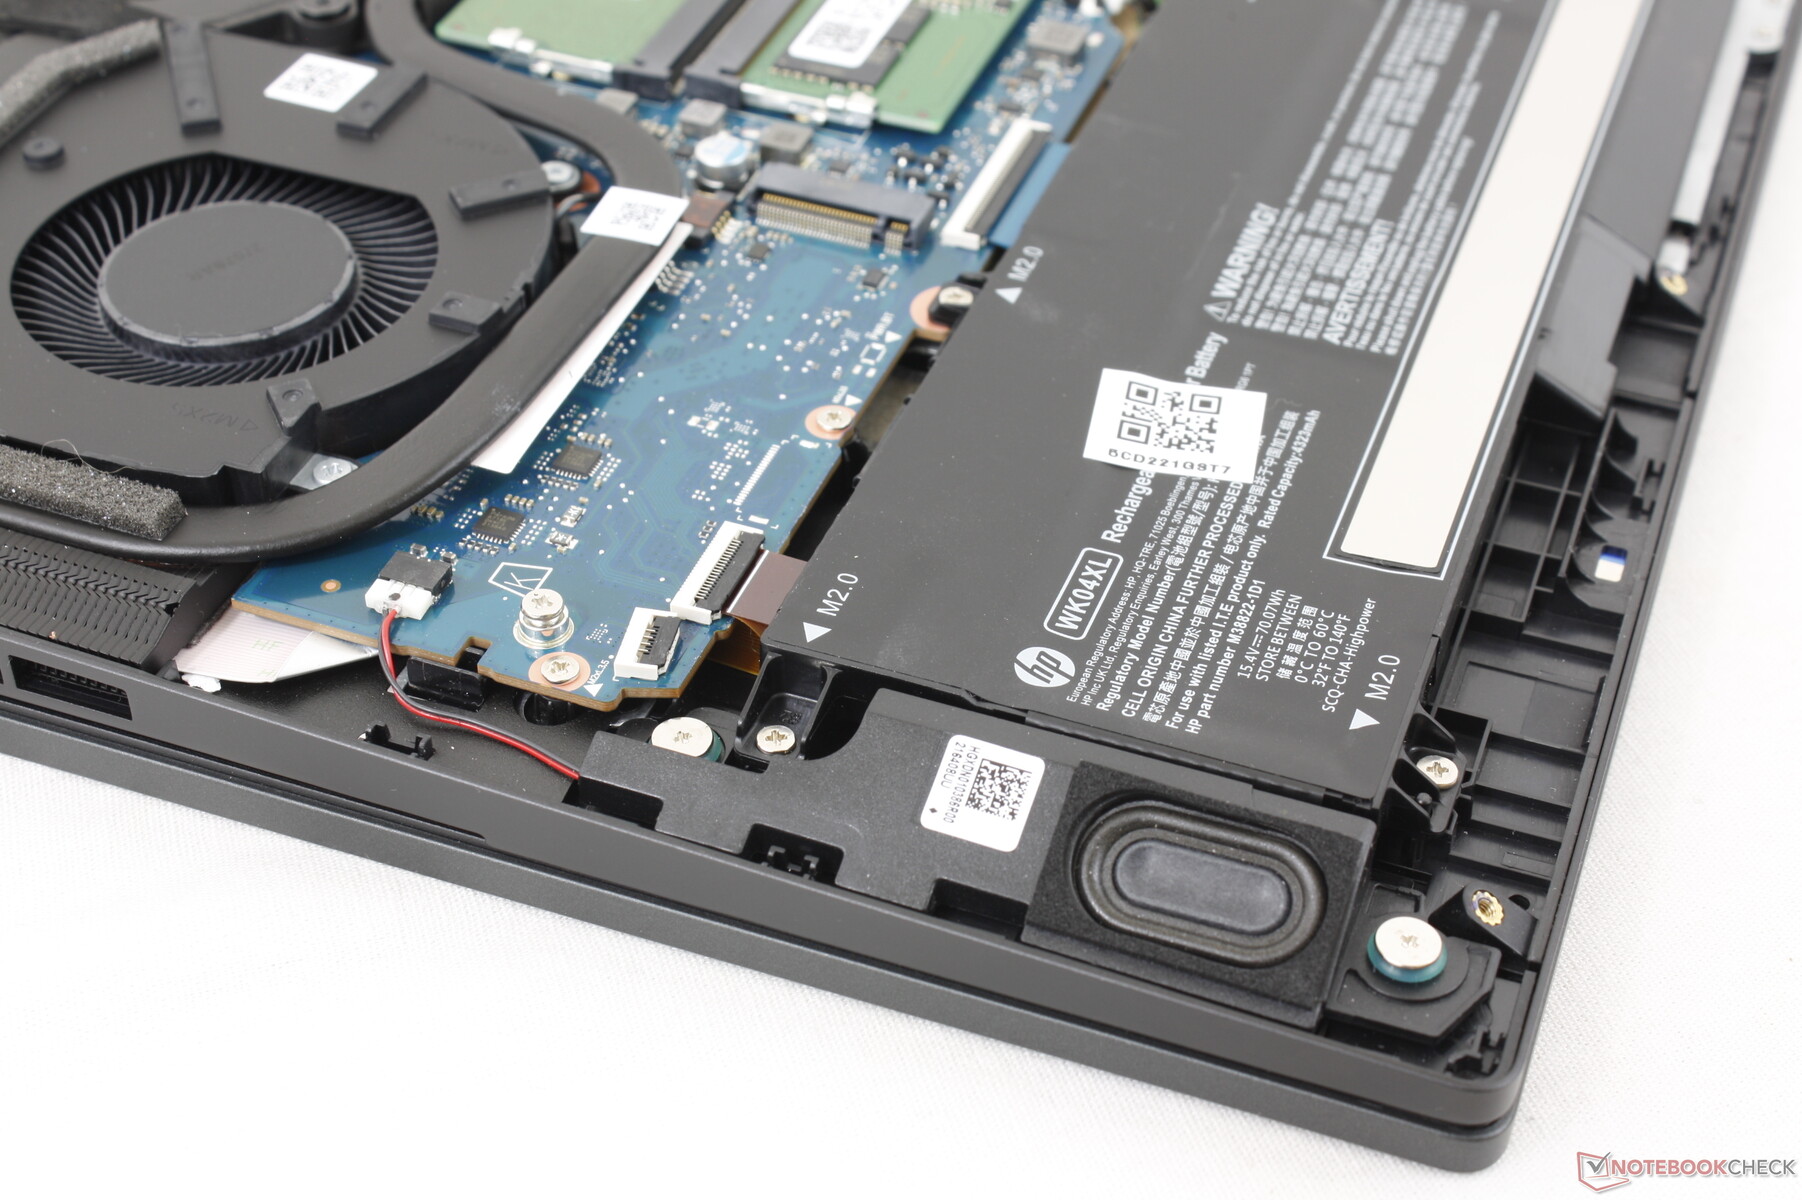
Mantenimiento
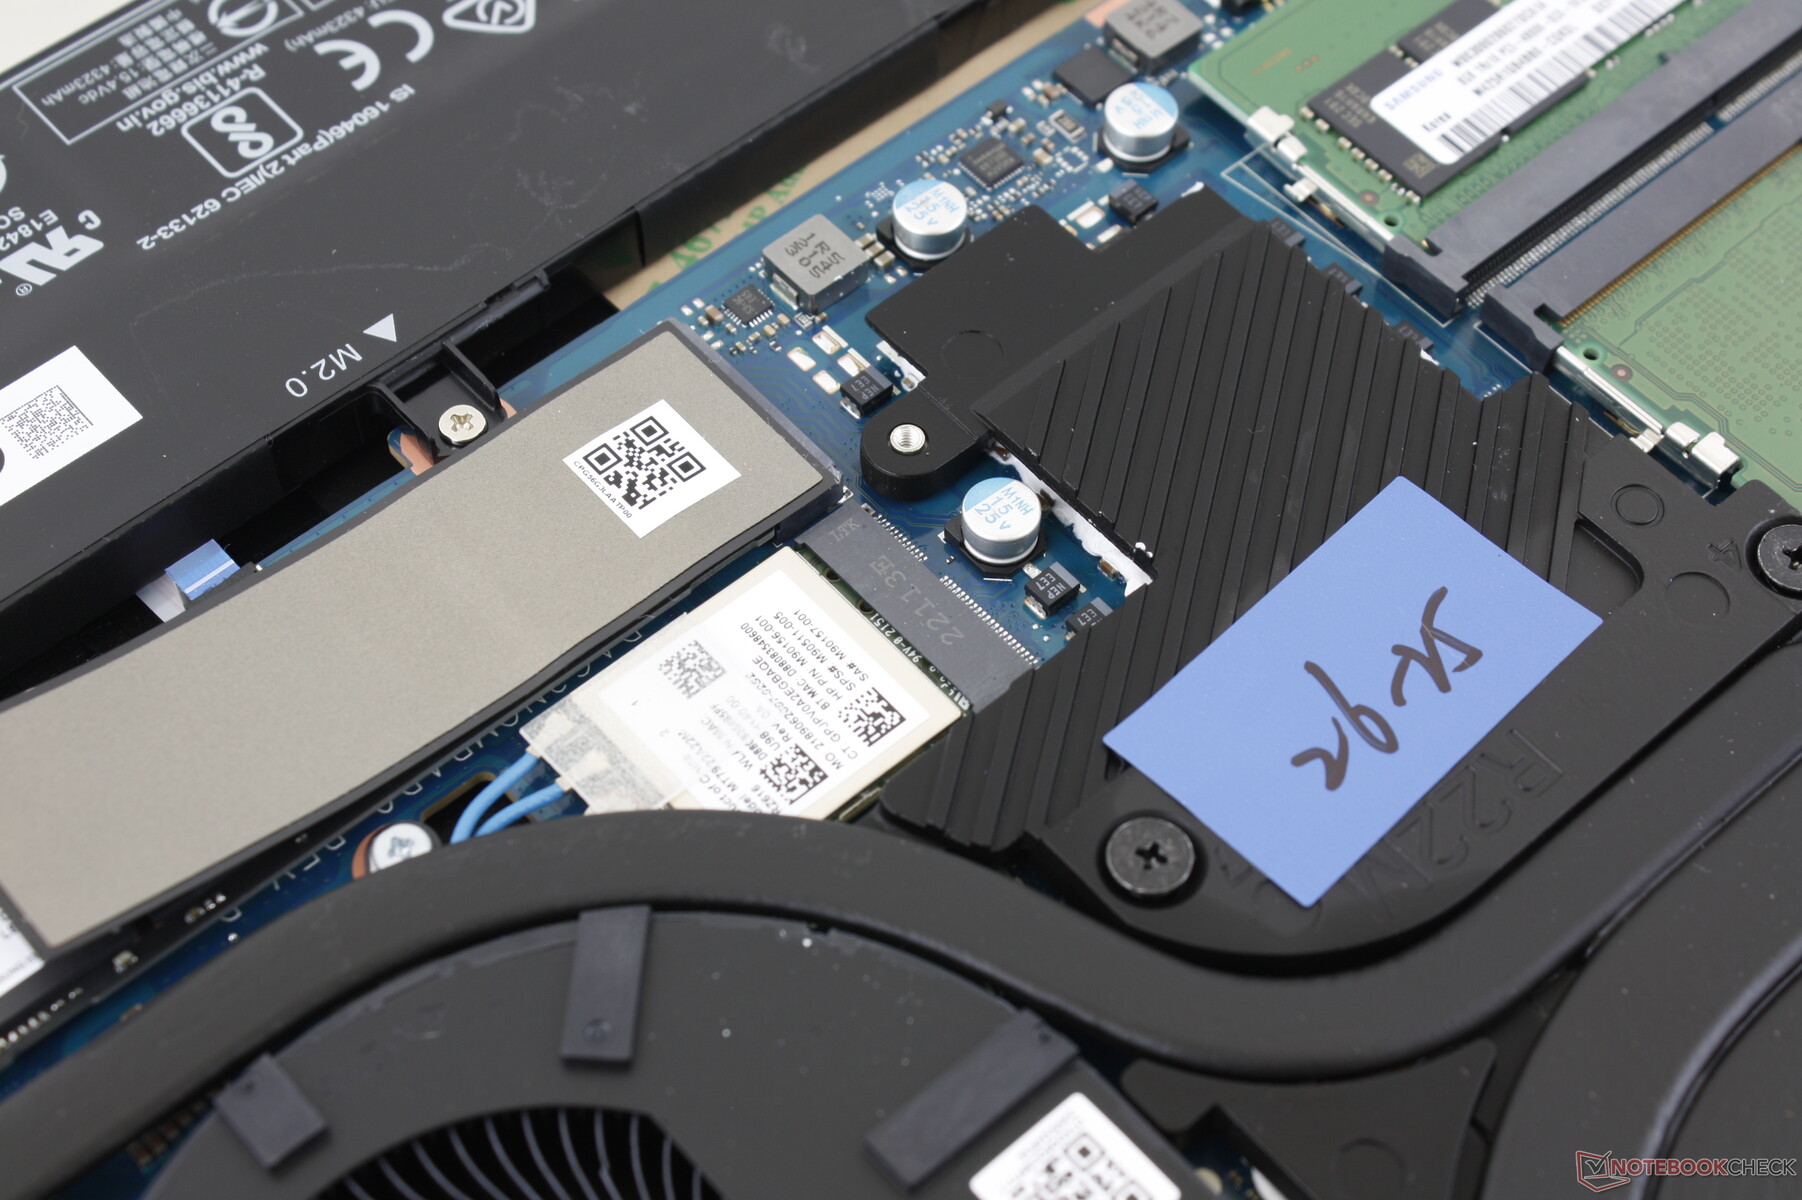
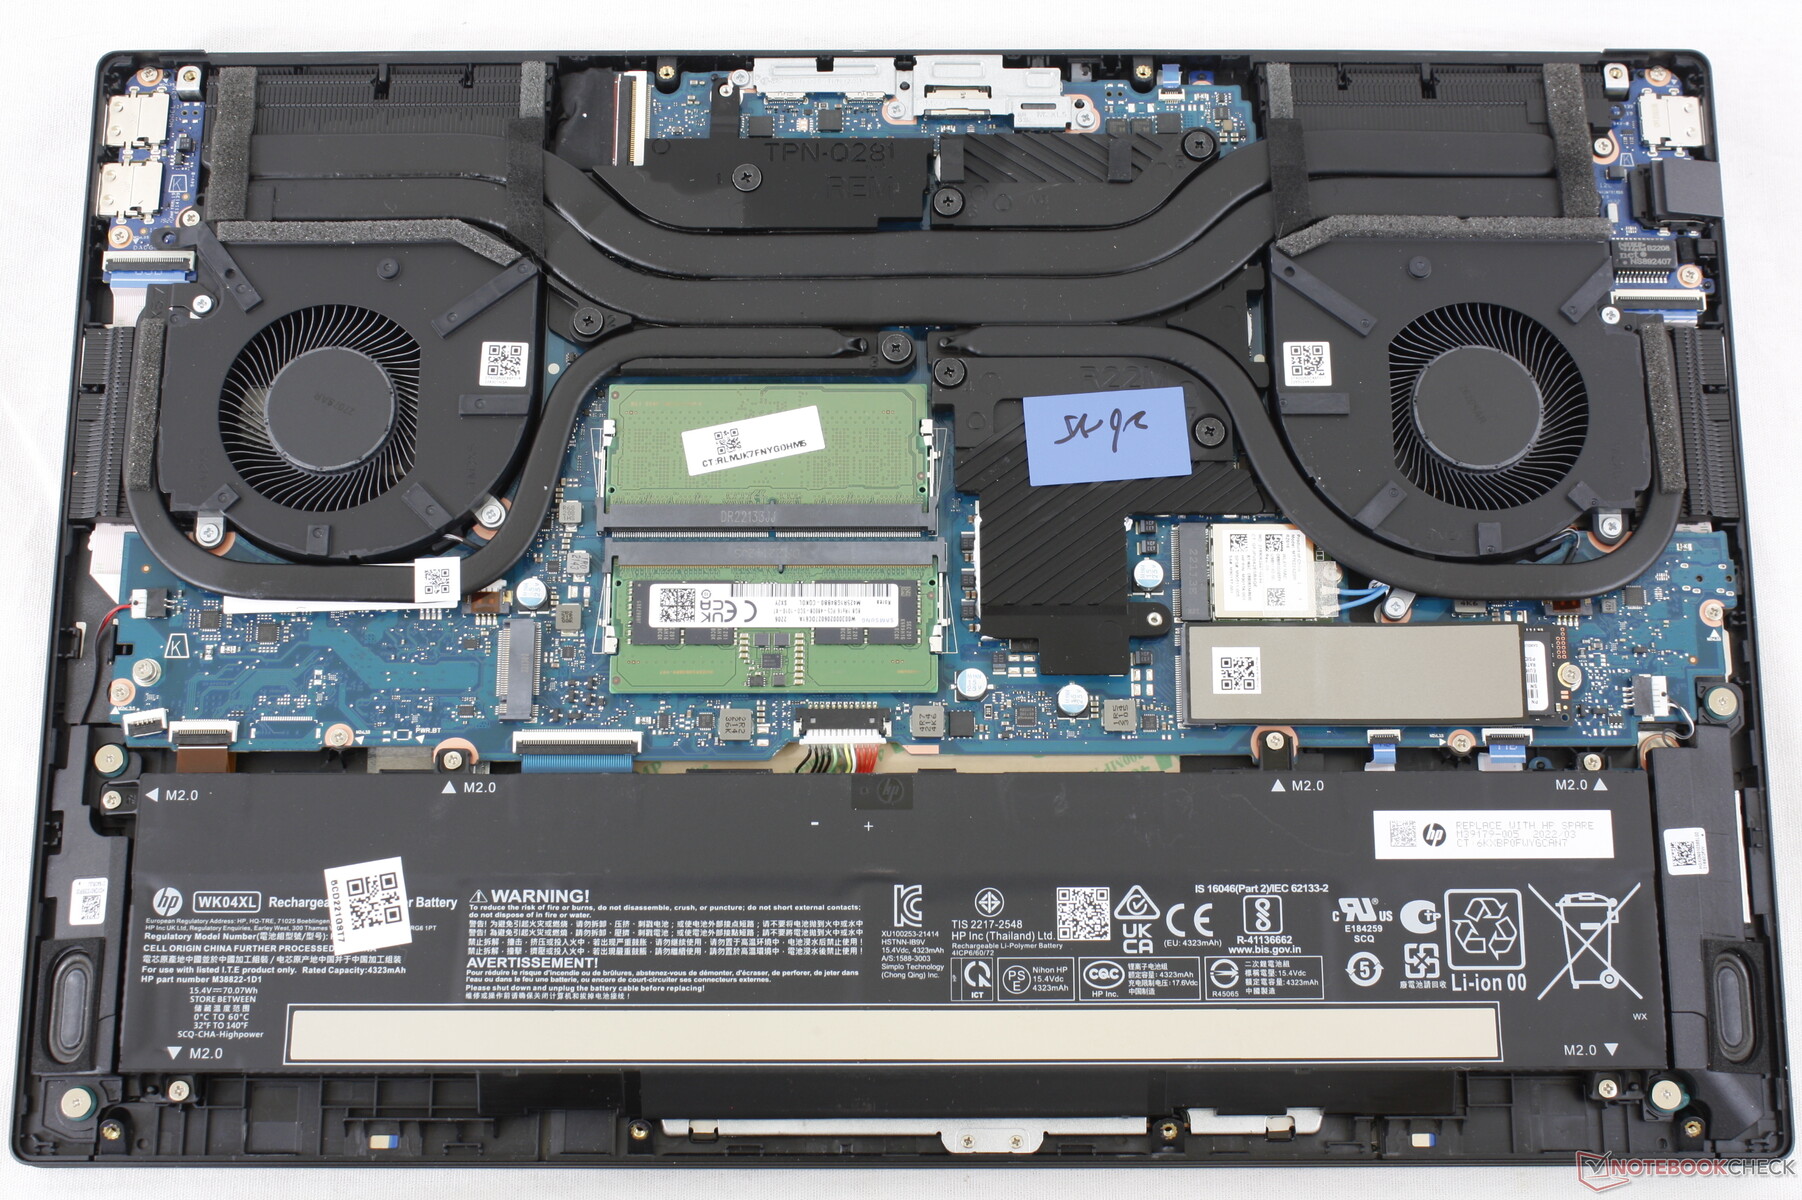
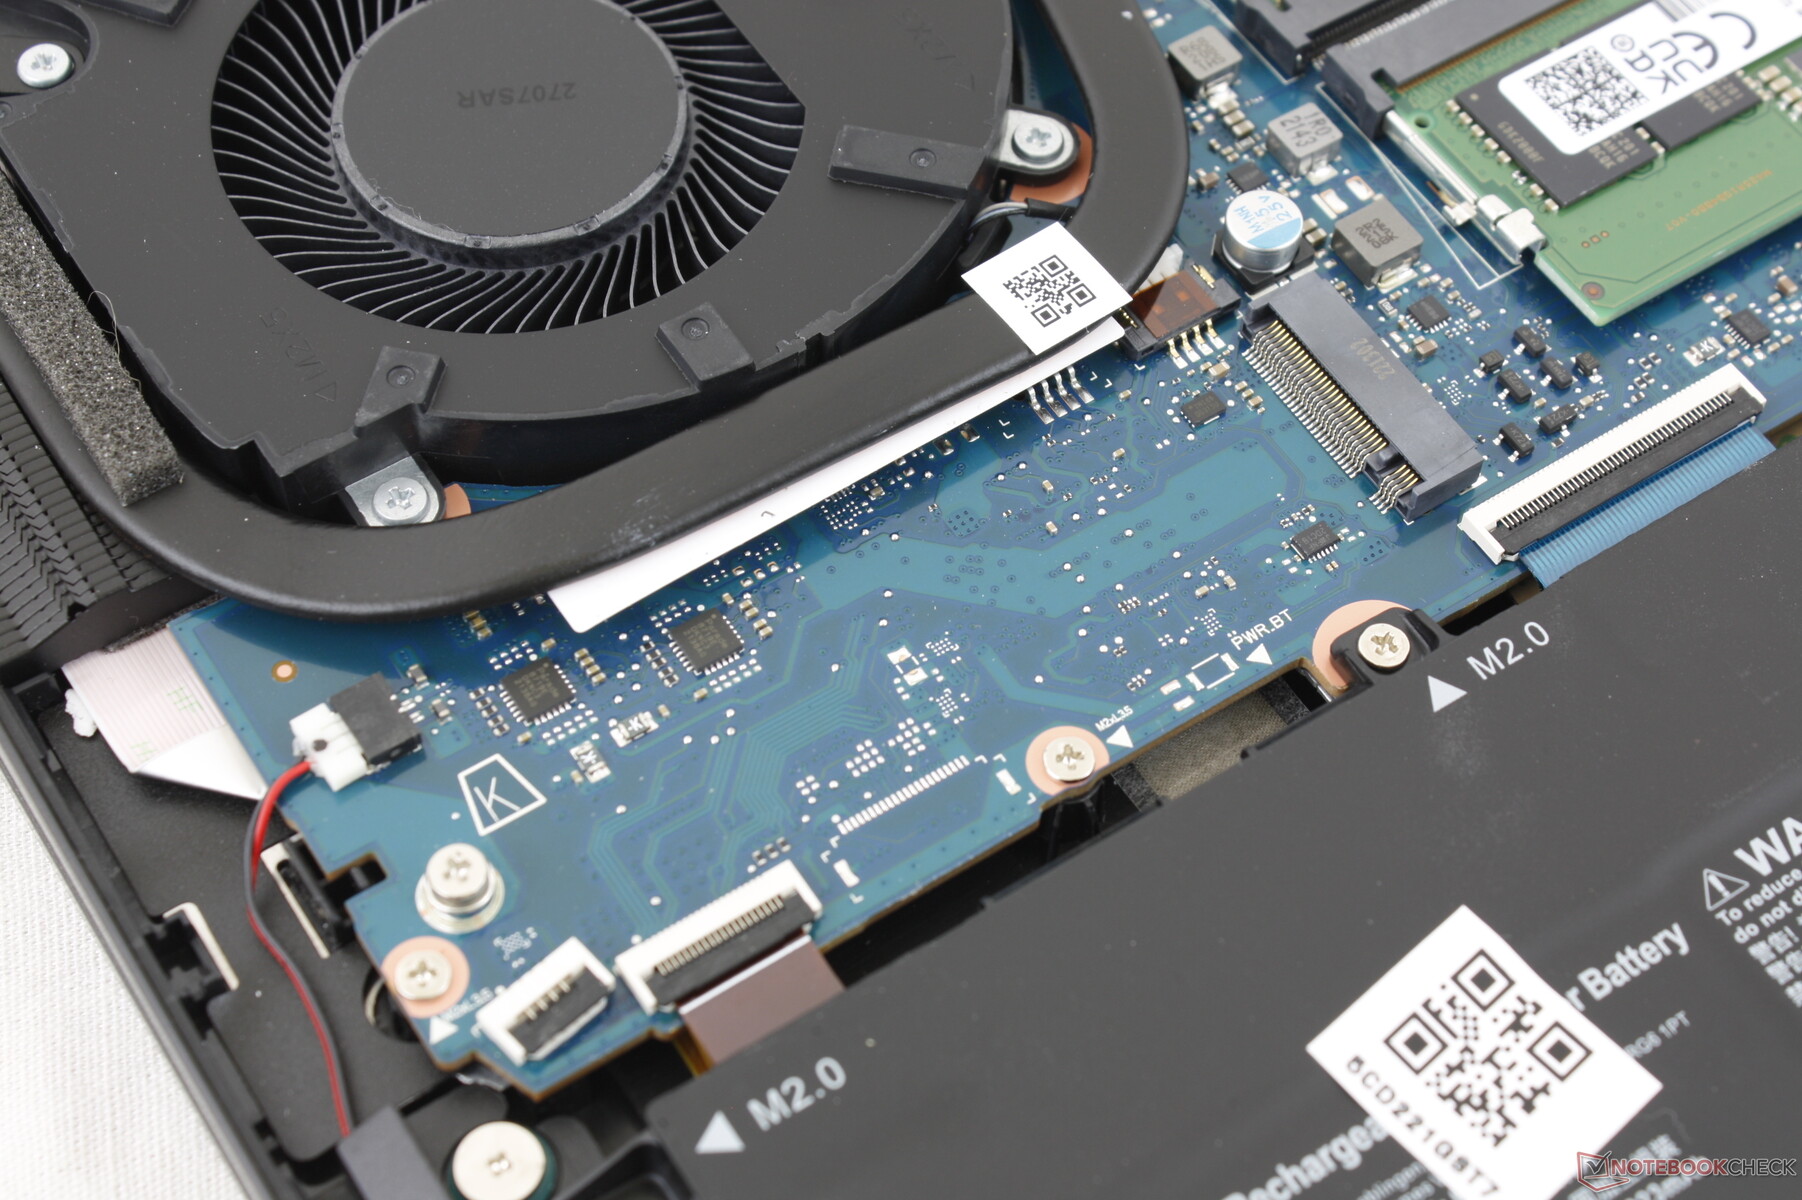
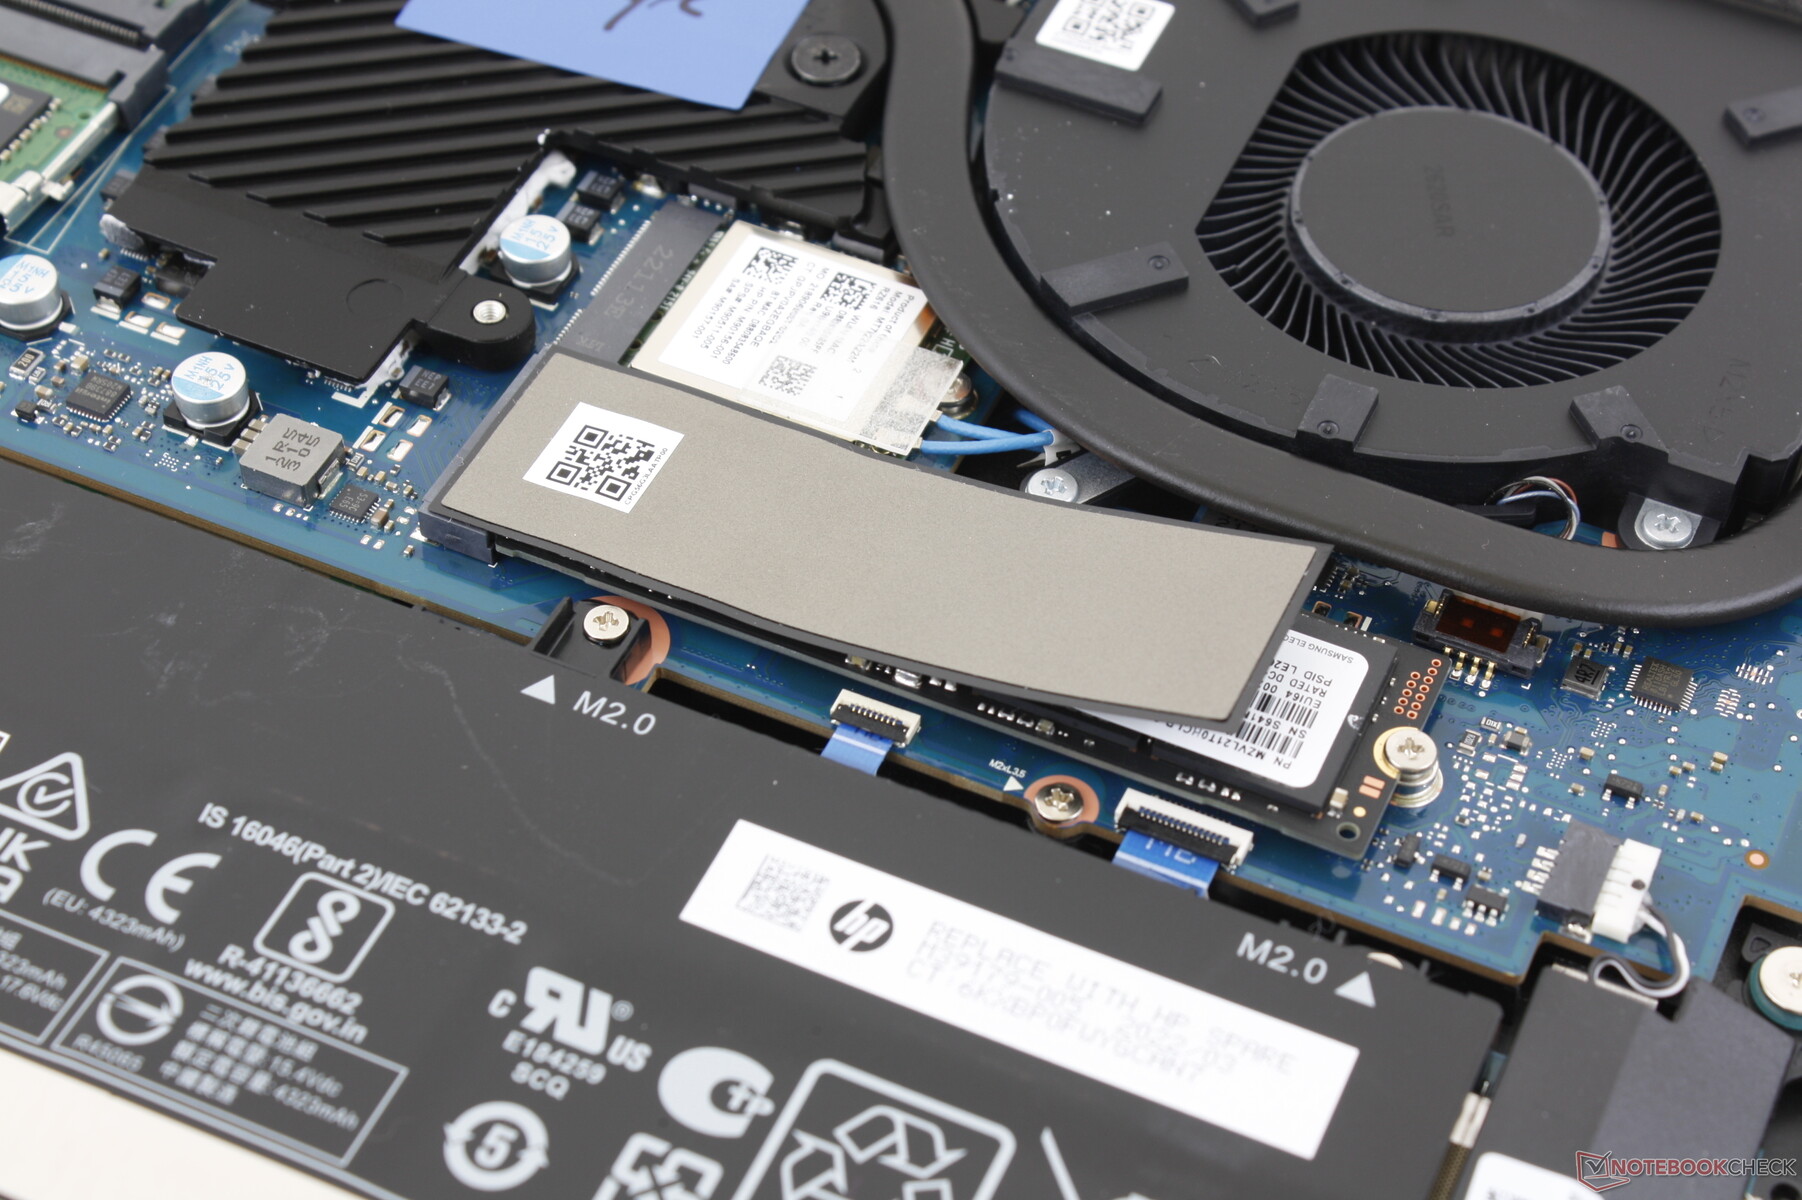
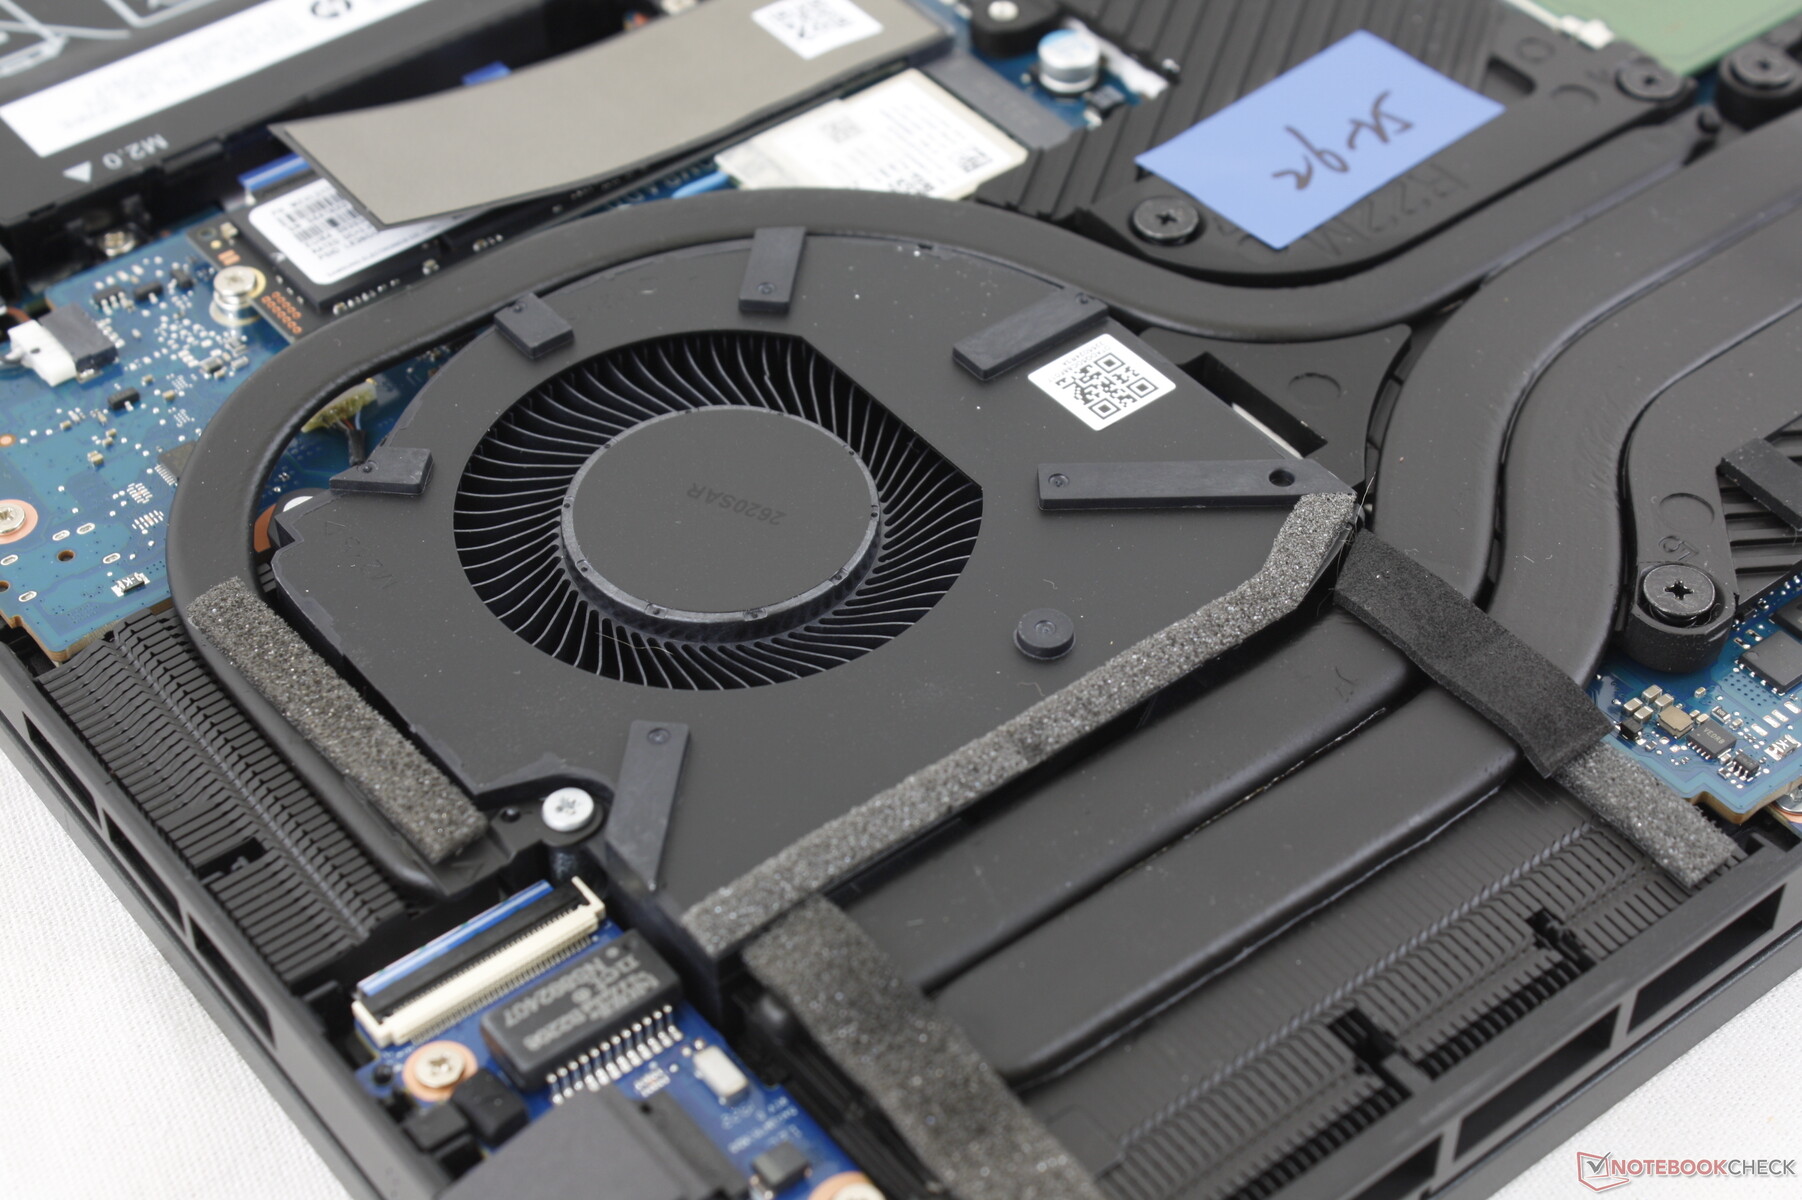
El panel inferior está asegurado por ocho tornillos Philips para facilitar el mantenimiento. Los usuarios tienen acceso directo a 2 bahías de almacenamiento M.2, 2 ranuras SODIMM DDR5, el módulo WLAN extraíble y la batería principal.
Accesorios y garantía
No hay más extras en la caja que el adaptador de CA y la documentación. Se aplica la garantía limitada habitual de un año.
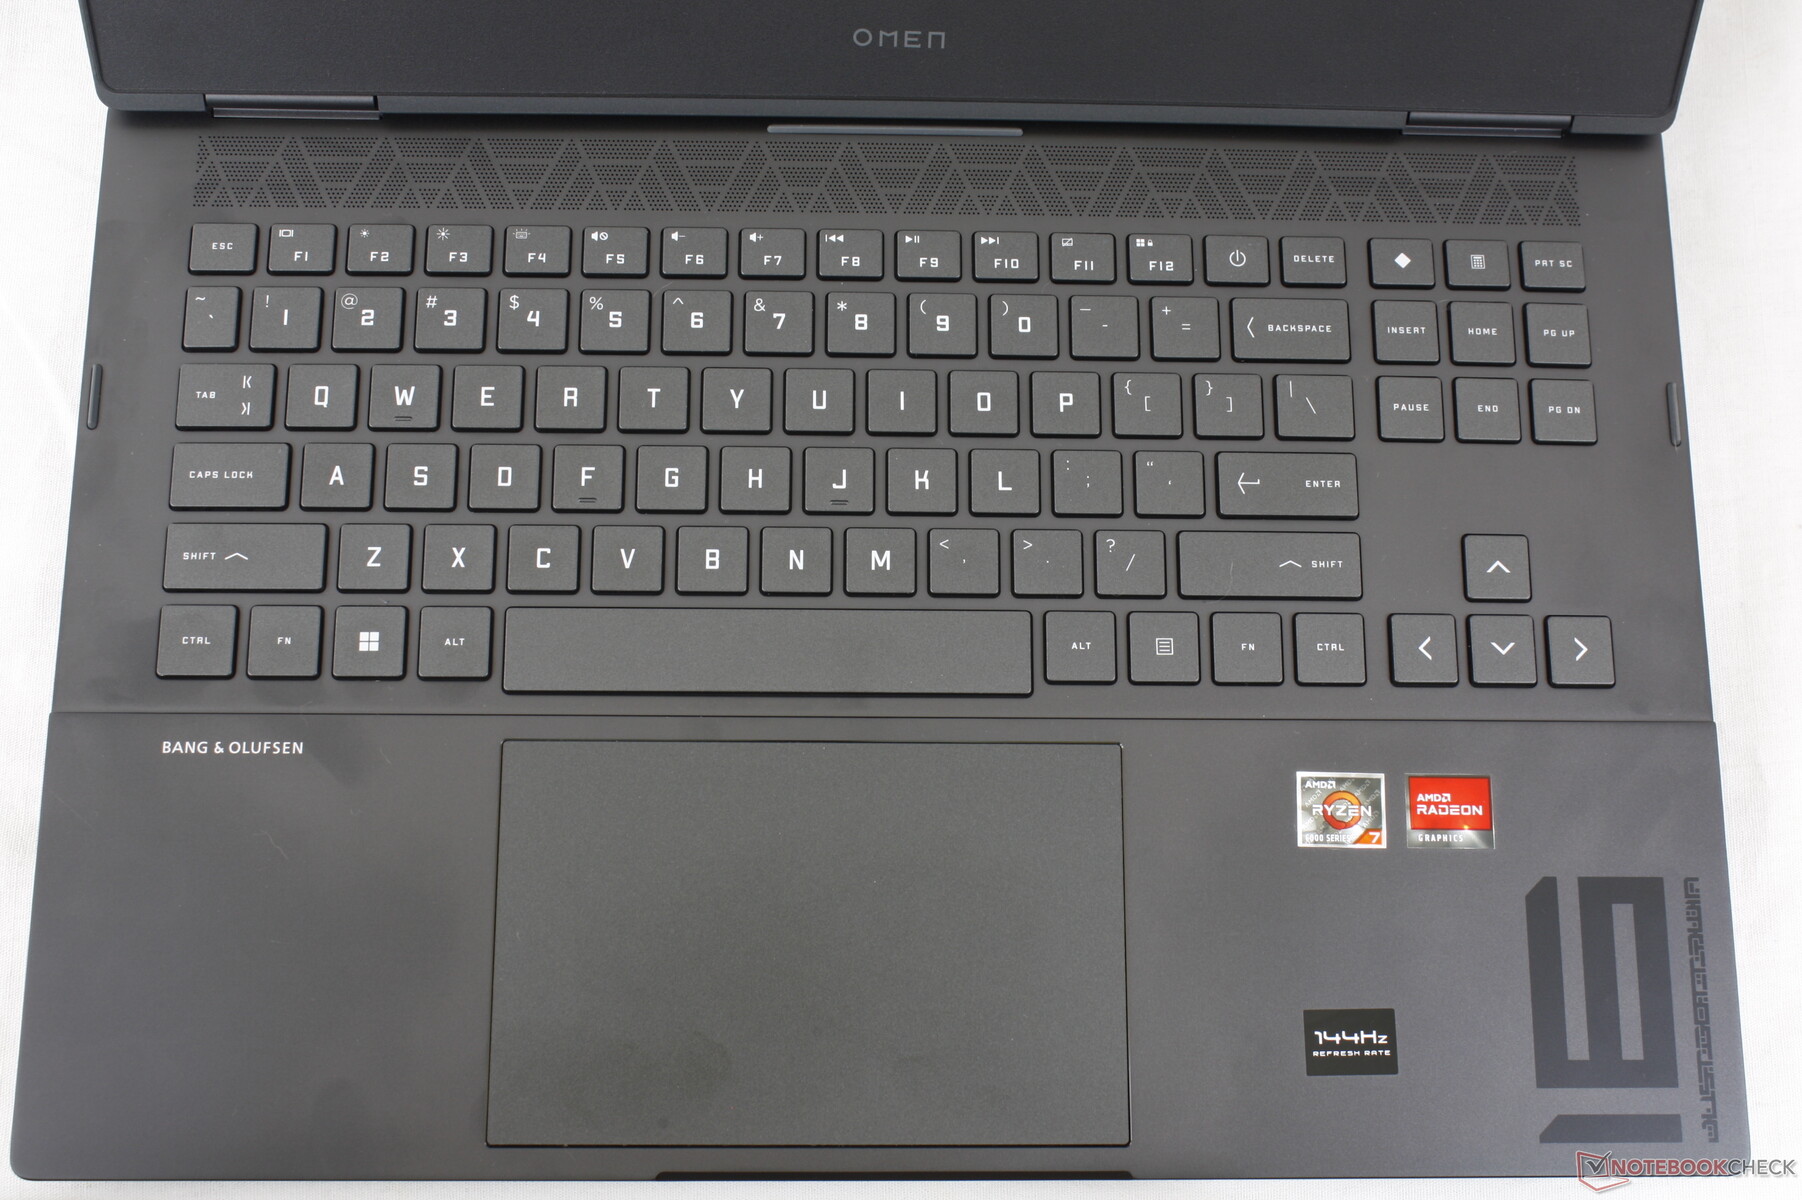
Dispositivos de entrada - Teclado cómodo, Clickpad incómodo
Teclado
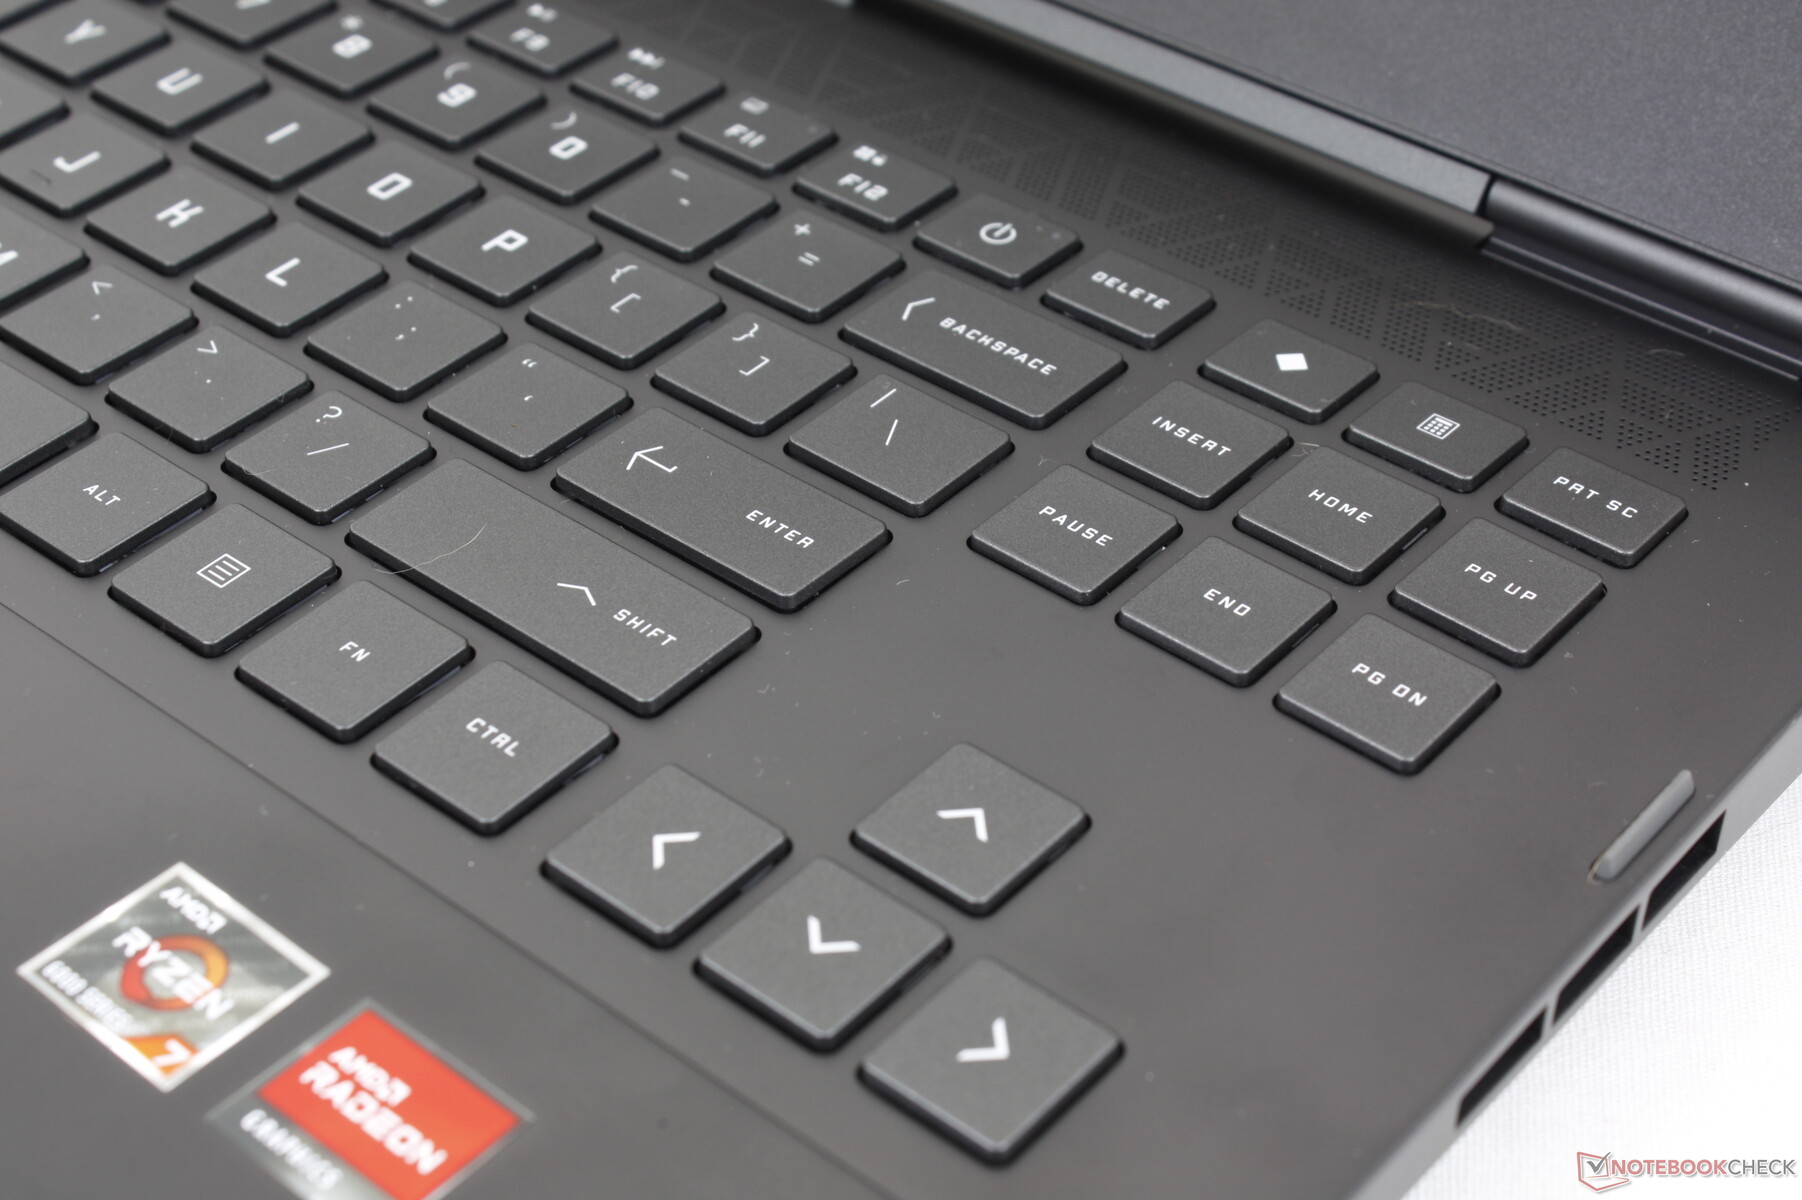
La experiencia de escritura sigue siendo idéntica a la del Omen 16 del año pasado, ya que no hay cambios en el teclado. El recorrido de las teclas es poco profundo y similar al de un Ultrabook, pero la respuesta firme y la tecla Espacio extragrande lo compensan. Nos gustaría que el botón de encendido se moviera a otro lugar en futuras revisiones, ya que su ubicación actual junto a las teclas de retroceso y supresión hace que sea fácil pulsarlo accidentalmente.
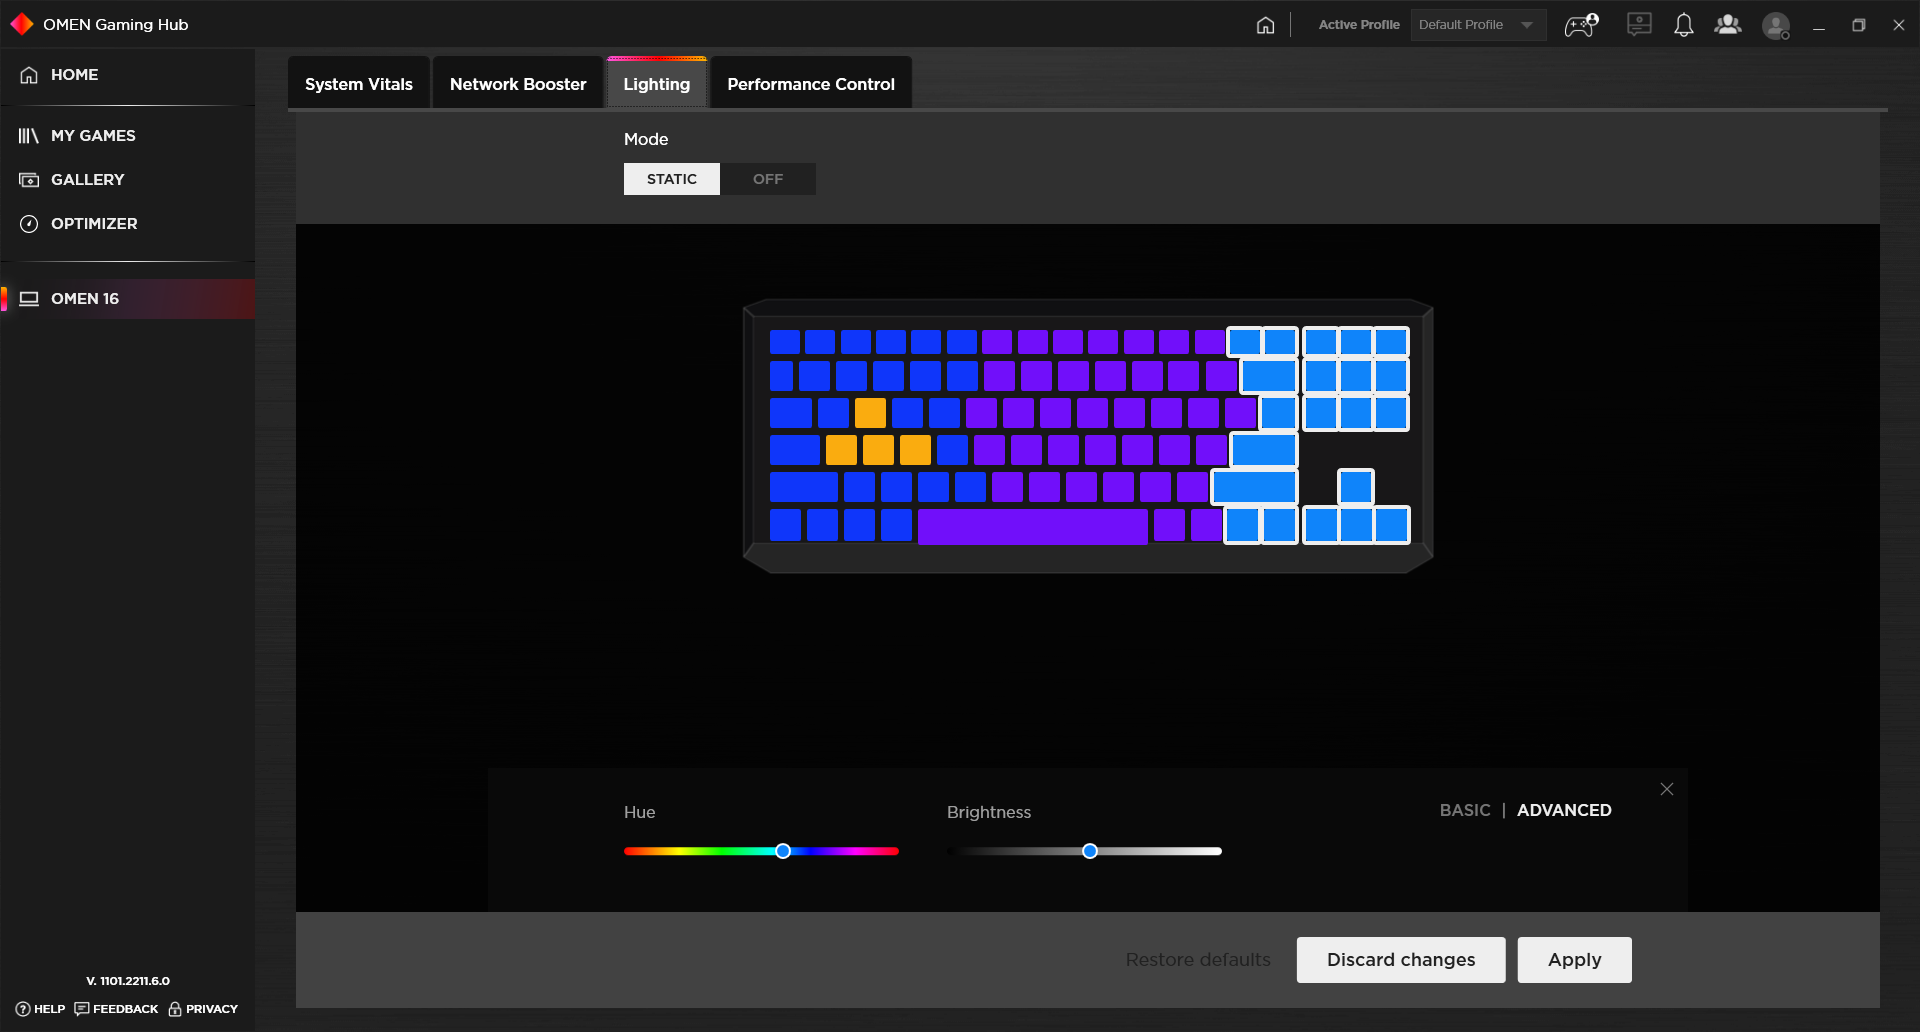
La retroiluminación del teclado está dividida en cuatro zonas diferentes en lugar de ser RGB por tecla, lo cual es decepcionante teniendo en cuenta el alto precio y los niveles de rendimiento del Omen 16.
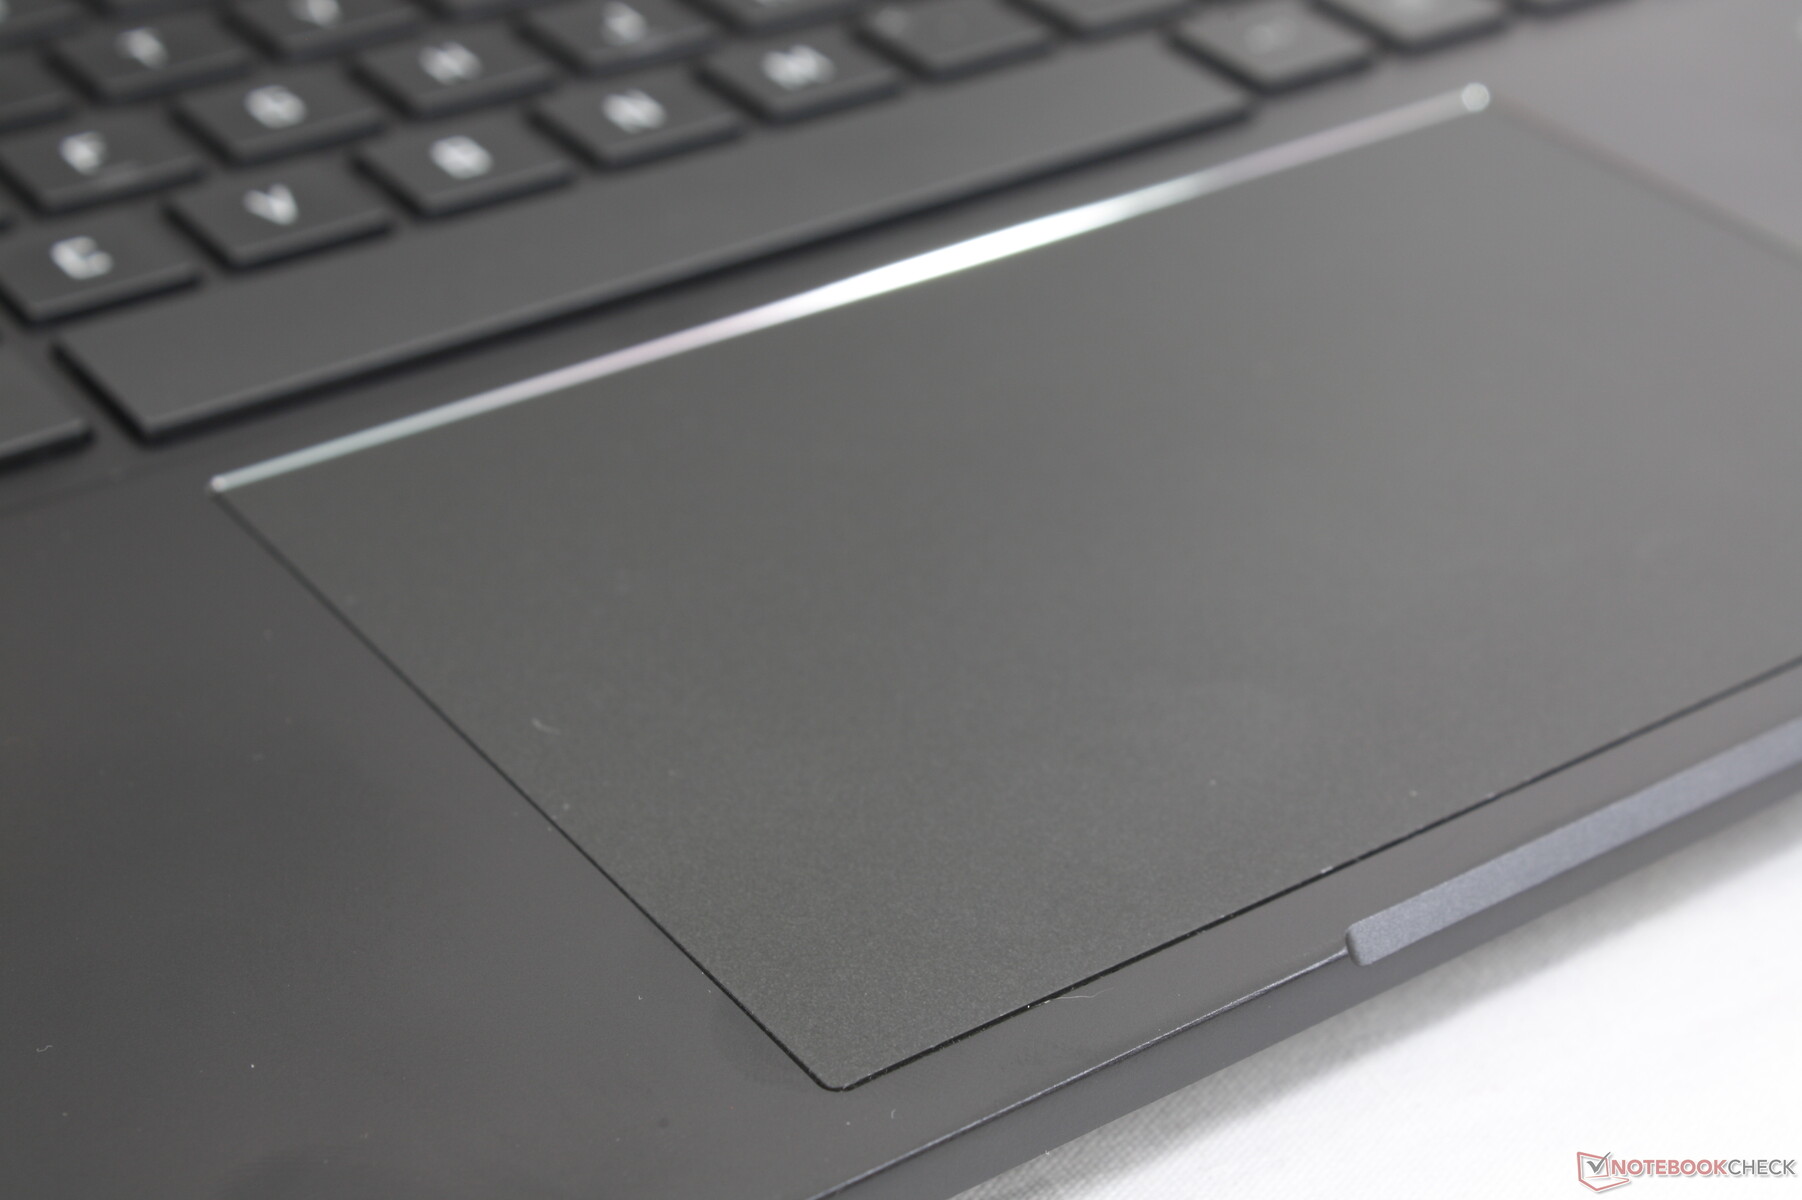
Teclado táctil
El clickpad es mucho más grande que el del Dell G16 (13 x 8,6 cm frente a 10,5 x 6 cm) para facilitar las entradas multitáctiles. La tracción es suave y con un mínimo de adherencia al igual que en la tapa exterior o los reposamanos circundantes
Desgraciadamente, un inconveniente importante del clickpad es su excesiva sensibilidad a la presión. Al desplazarse con el dedo, por ejemplo, es demasiado fácil introducir accidentalmente un clic, lo que hace que todo el portátil sea muy molesto de usar sin un ratón externo. Los clickpads de otros portátiles para juegos son mucho menos sensibles en comparación.

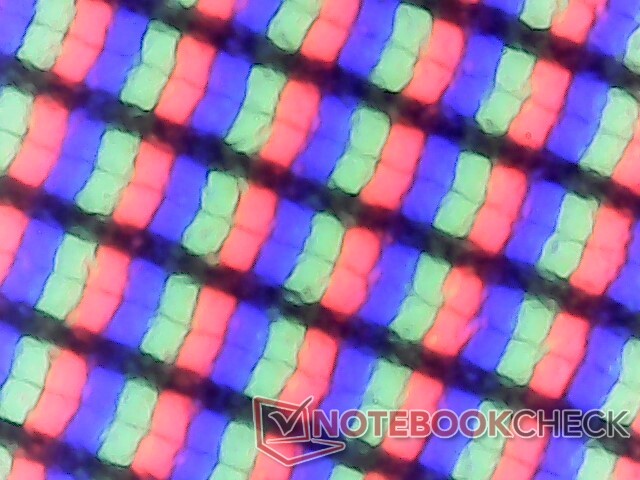
Pantalla - FreeSync con 144 Hz y 100% sRGB
Hay tres opciones de pantalla para elegir, como se indica a continuación:
- 1080p, 144 Hz, 250 nits
- 1080p, 144 Hz, 300 nits
- 1440p, 165 Hz, 300 nits
Nuestras mediciones de pantalla aquí reflejan sólo la opción en negrita de arriba. La opción más alta, de 165 Hz, está disponible en los SKU Omen 16 de Intel y AMD.
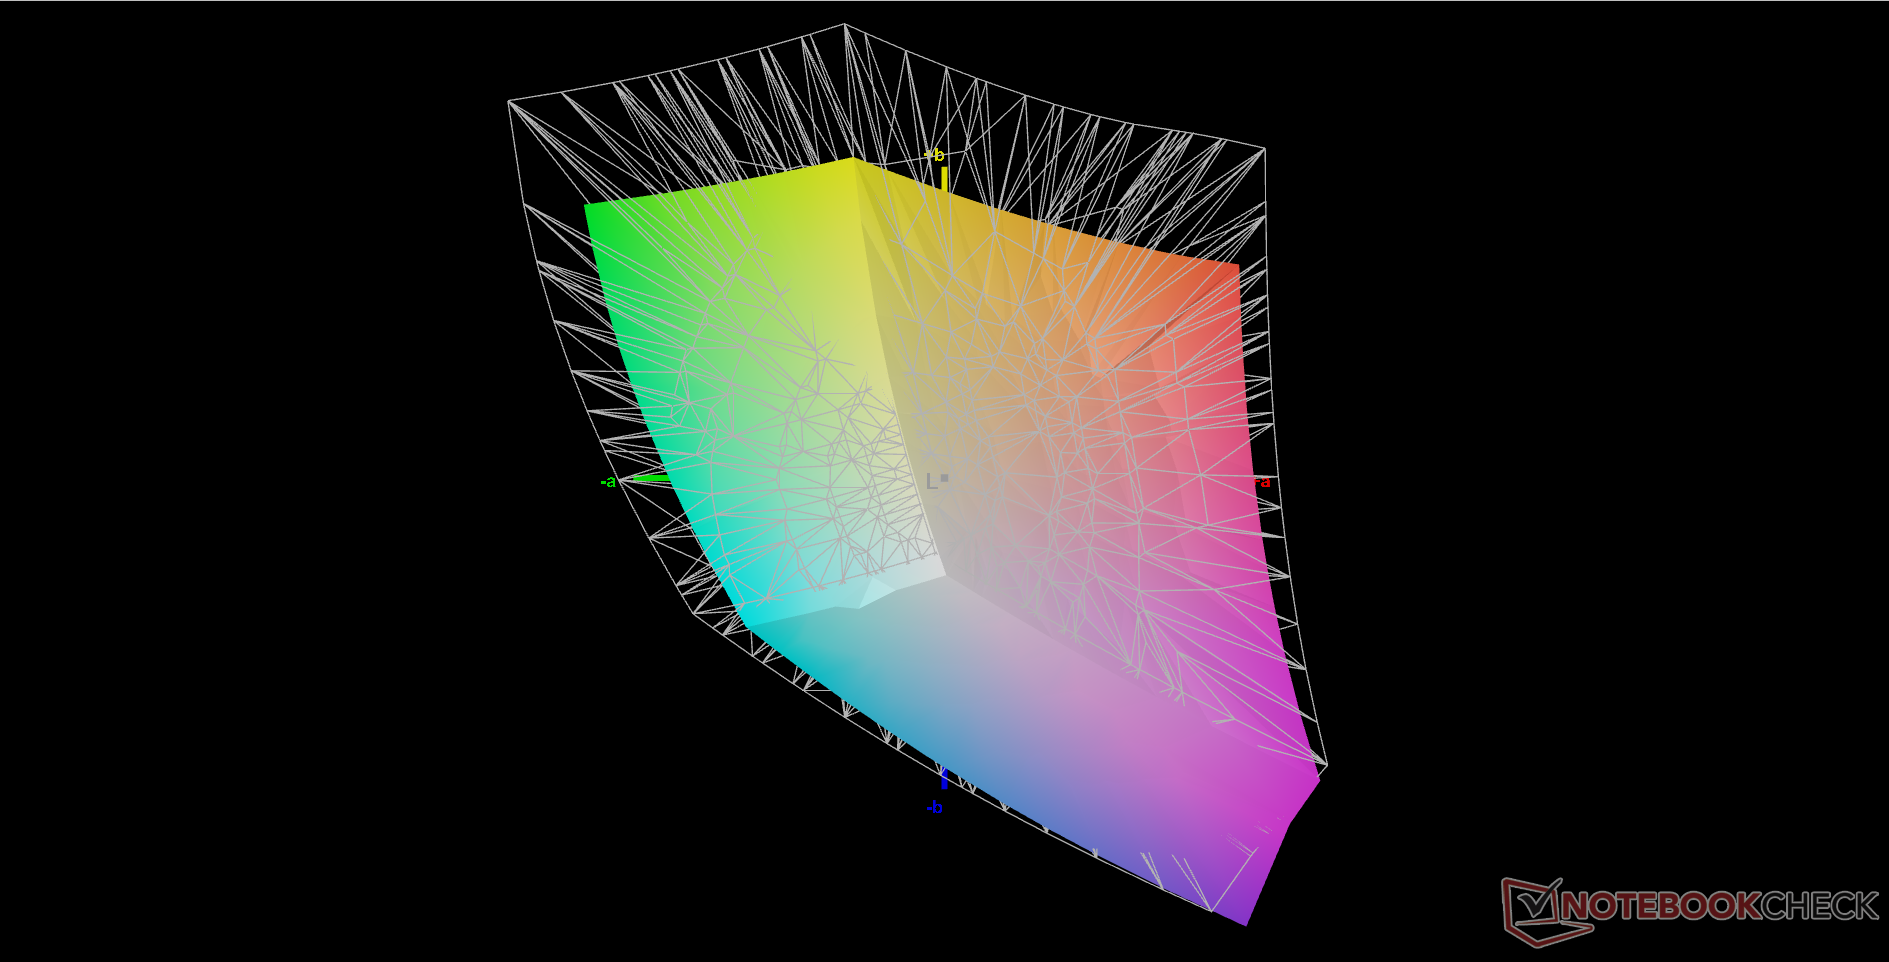
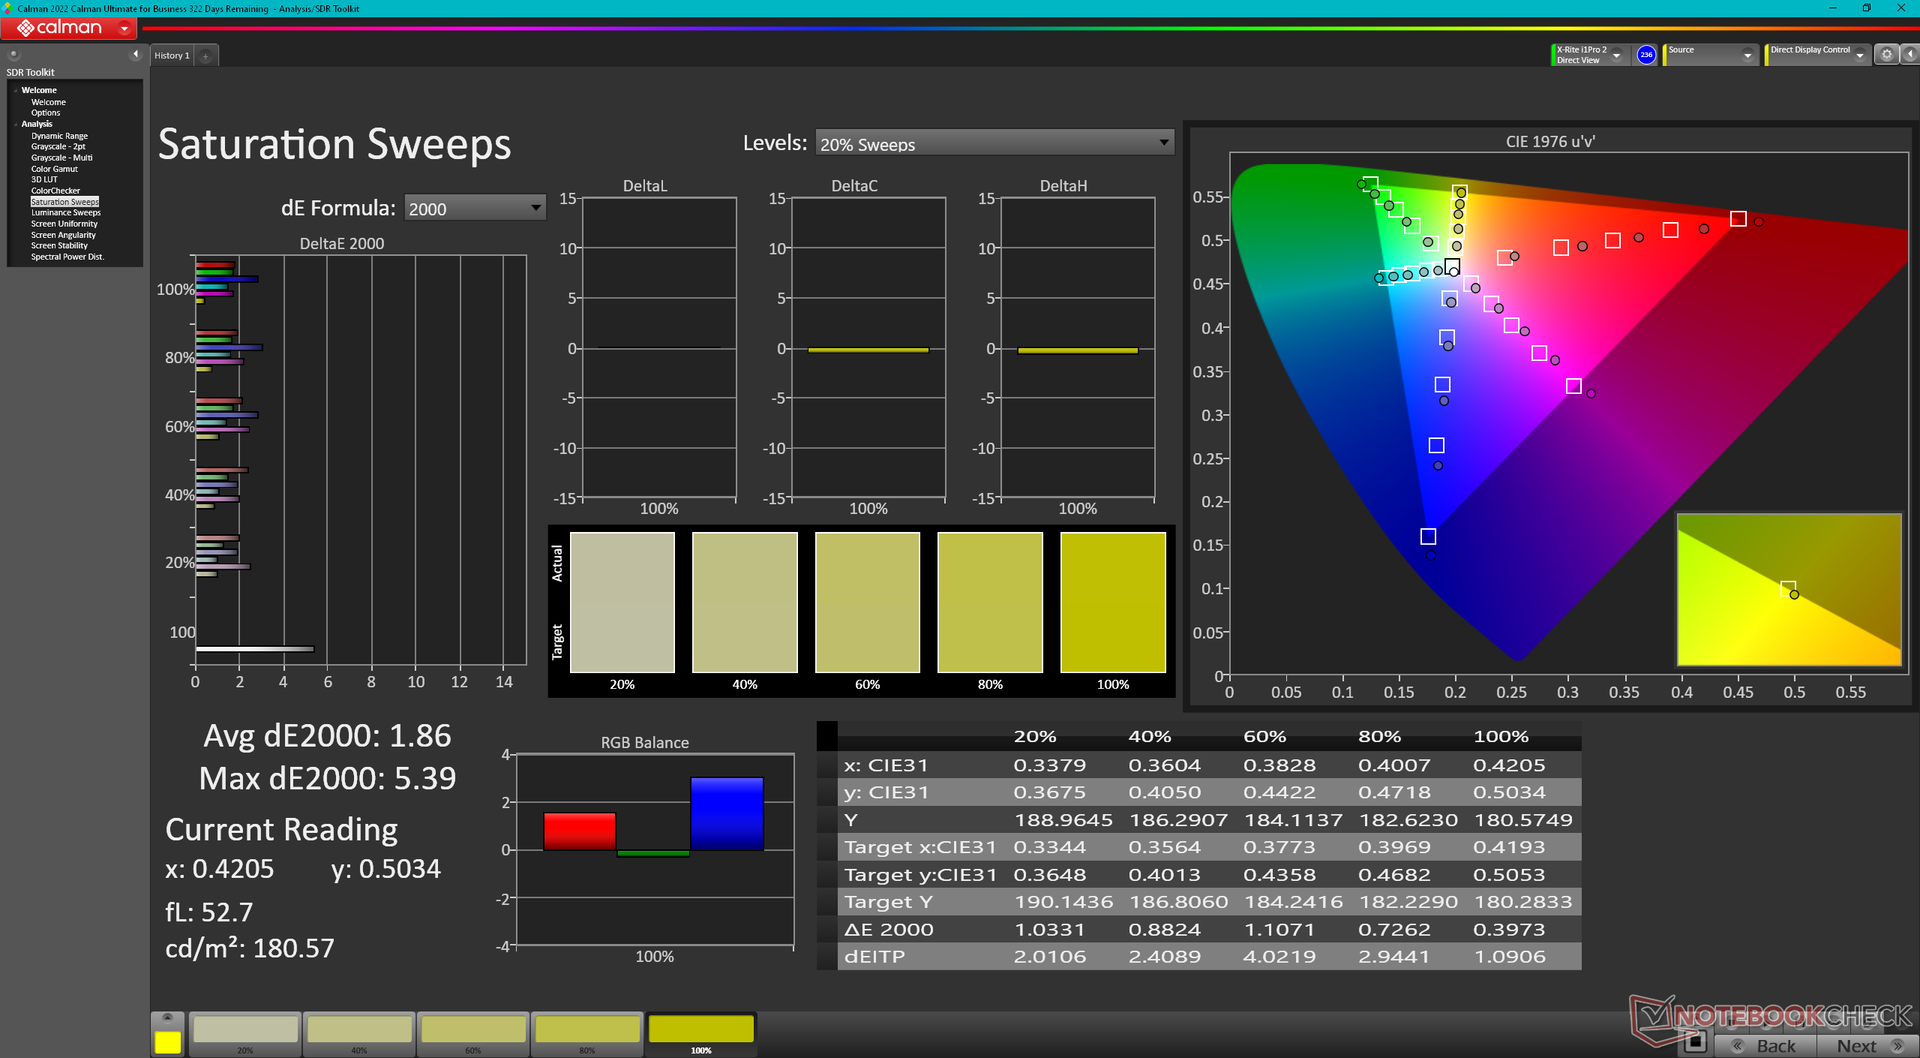
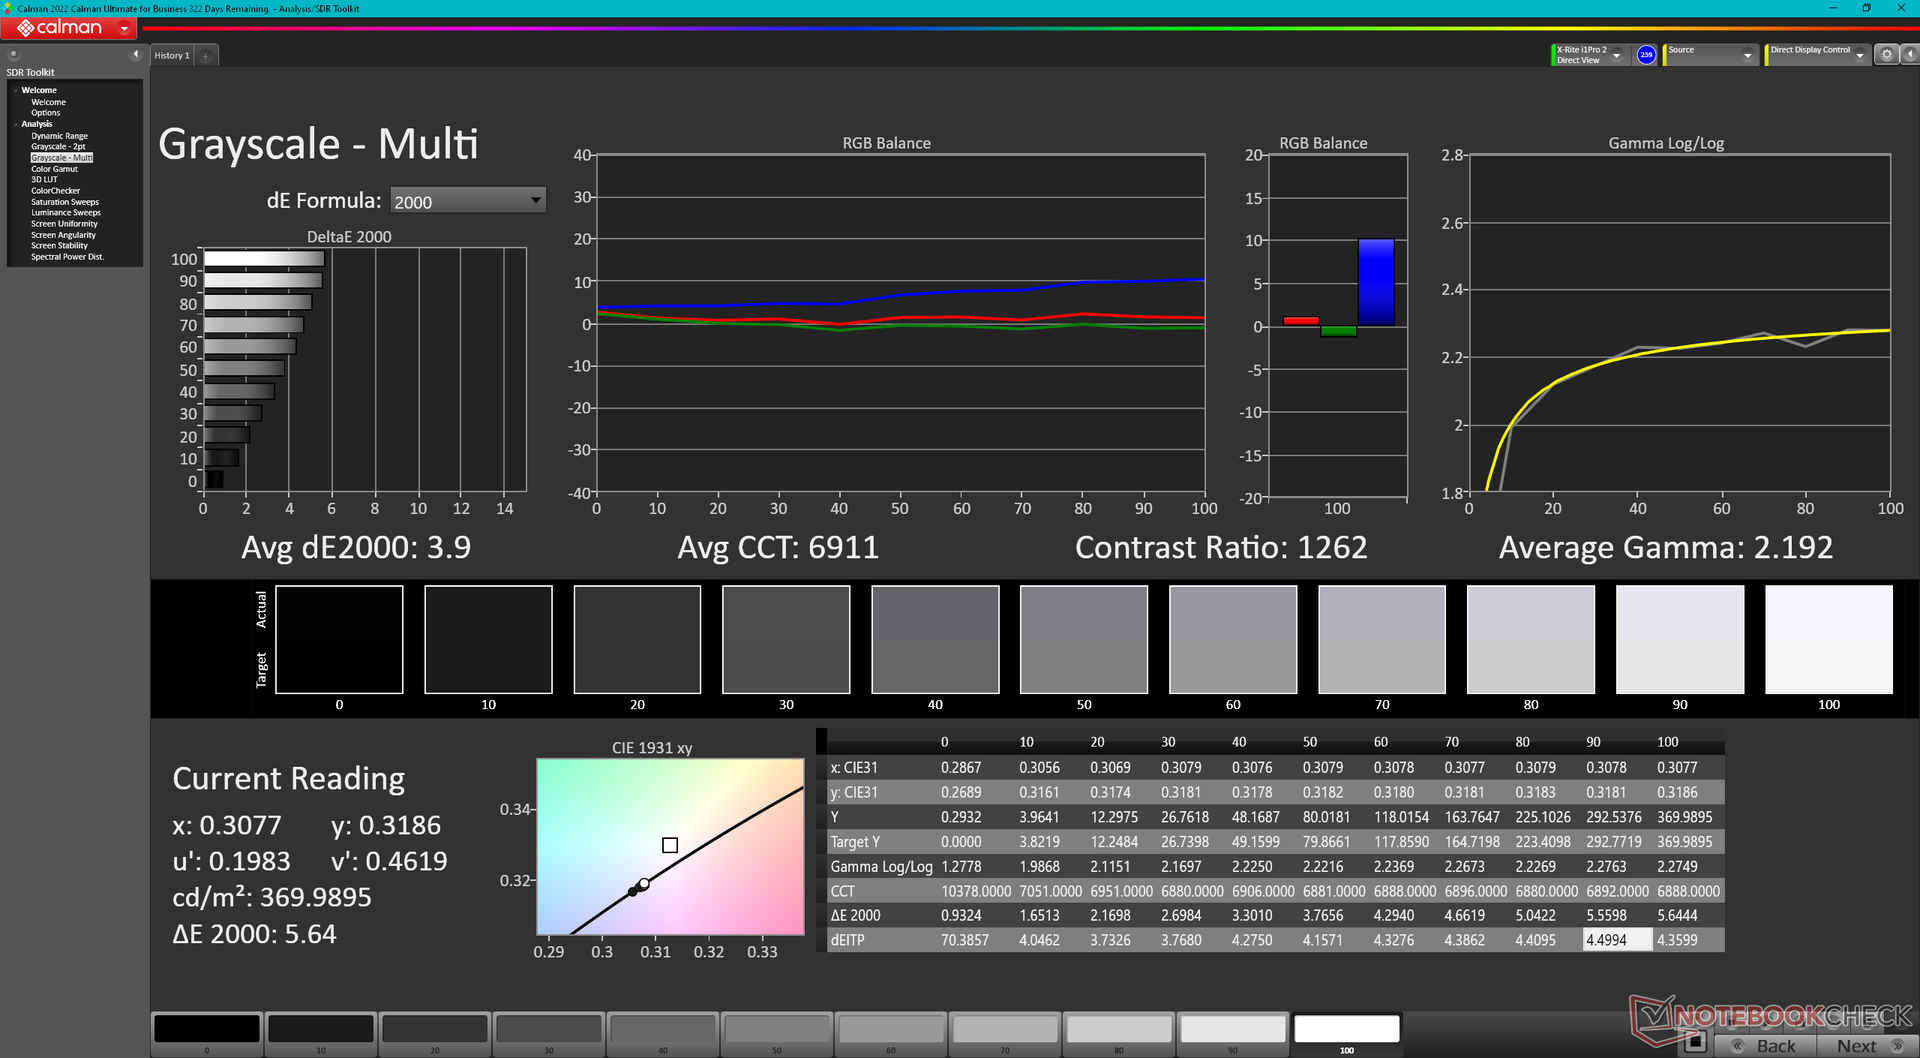
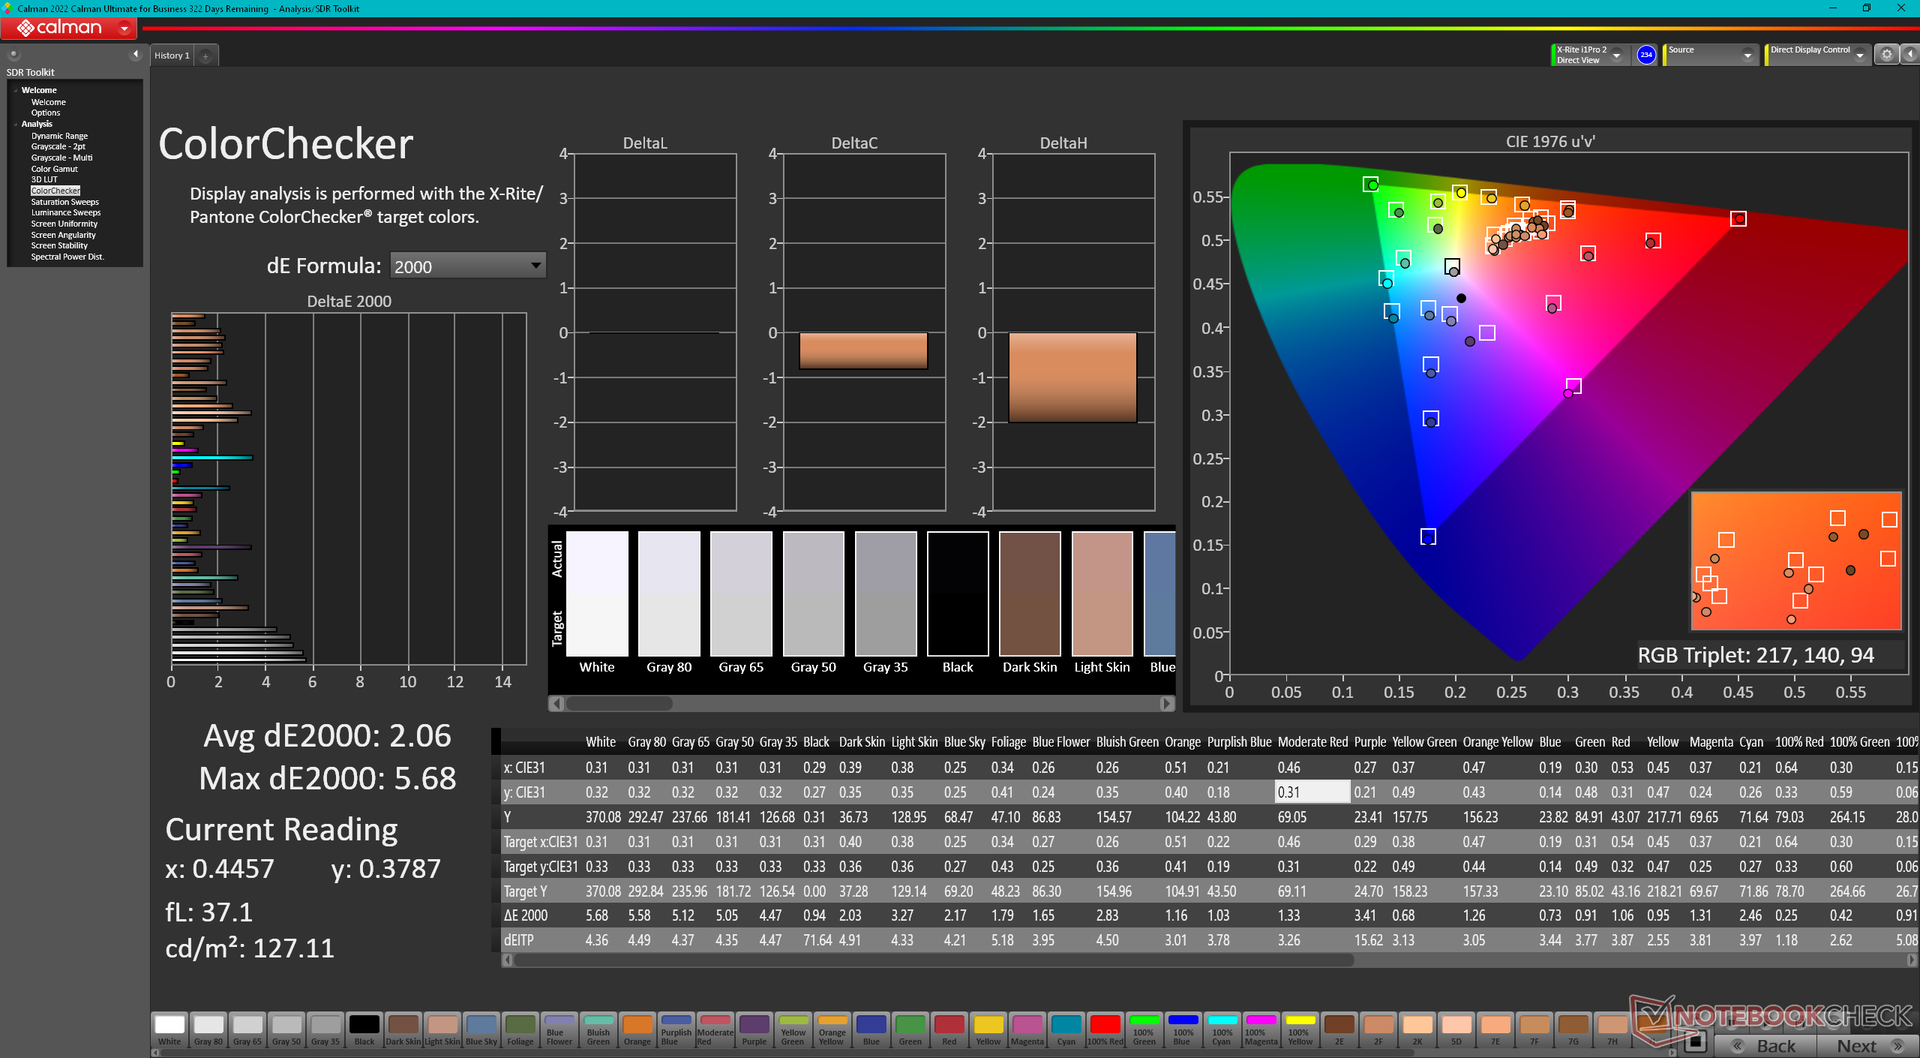
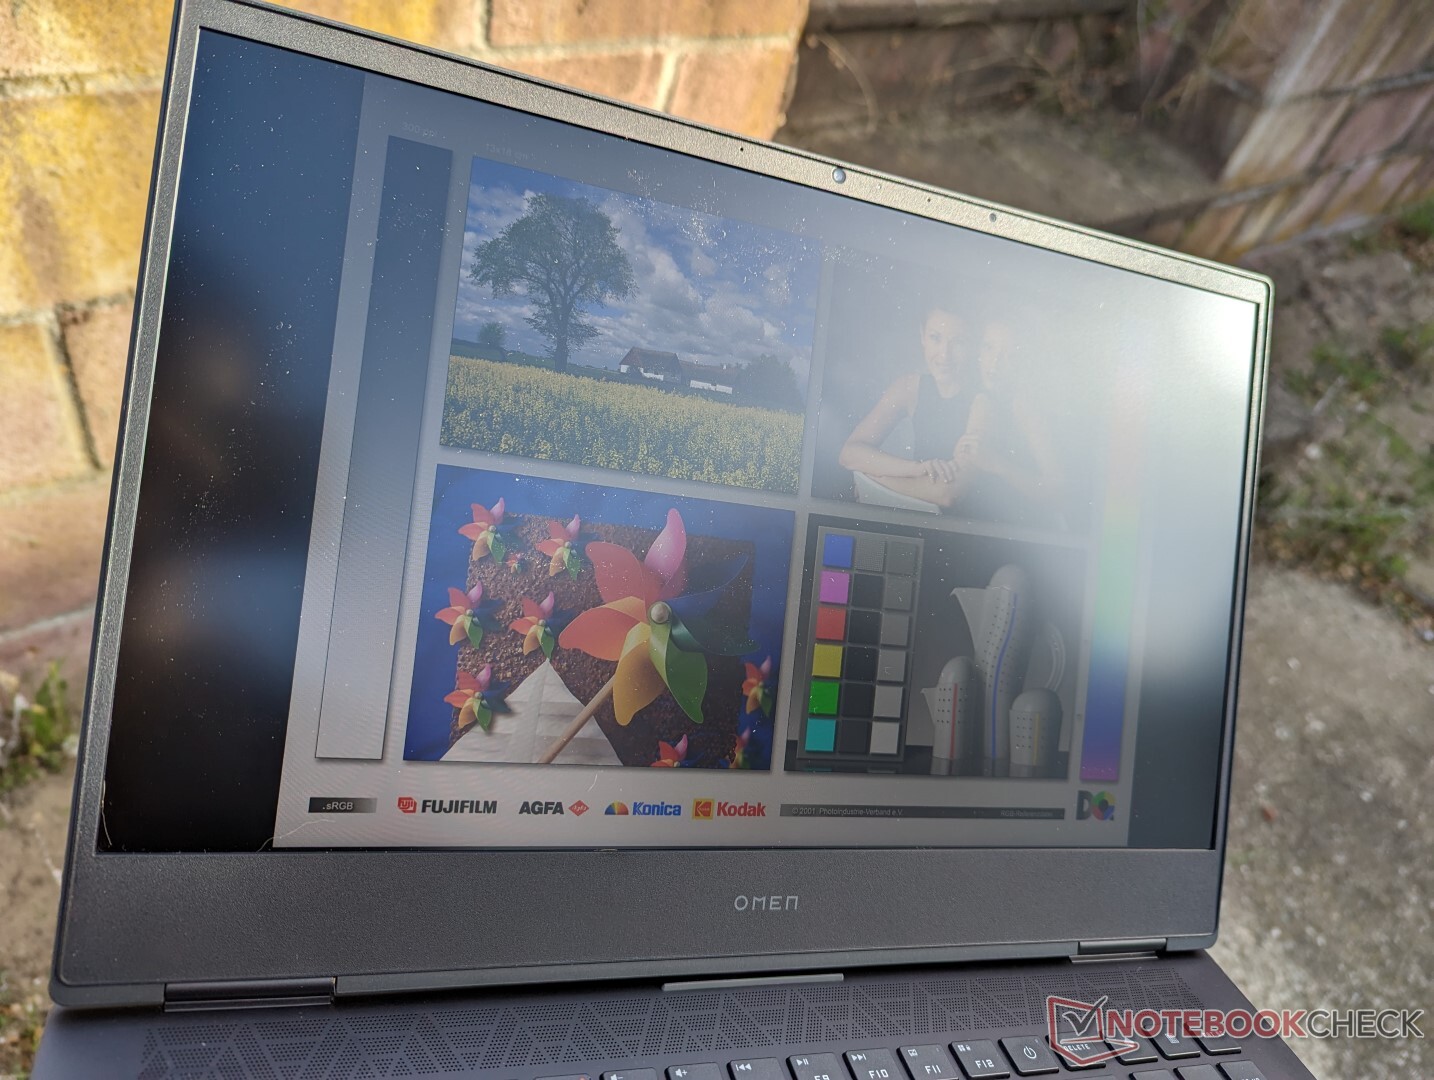
El panel IPS de nuestra unidad AMD sigue siendo muy bueno con su completa cobertura sRGB, decente ratio de contraste, y decentes tiempos de respuesta en blanco y negro. Incluso el brillo máximo de la pantalla es un 20 por ciento superior al que anuncia HP según nuestro propio colorímetro X-Rite. La calidad general de la imagen es significativamente mejor que la del HP Victus 16, menos caro, que utiliza un panel Chi Mei mucho más barato con peores colores y un efecto fantasma más notable.

| |||||||||||||||||||||||||
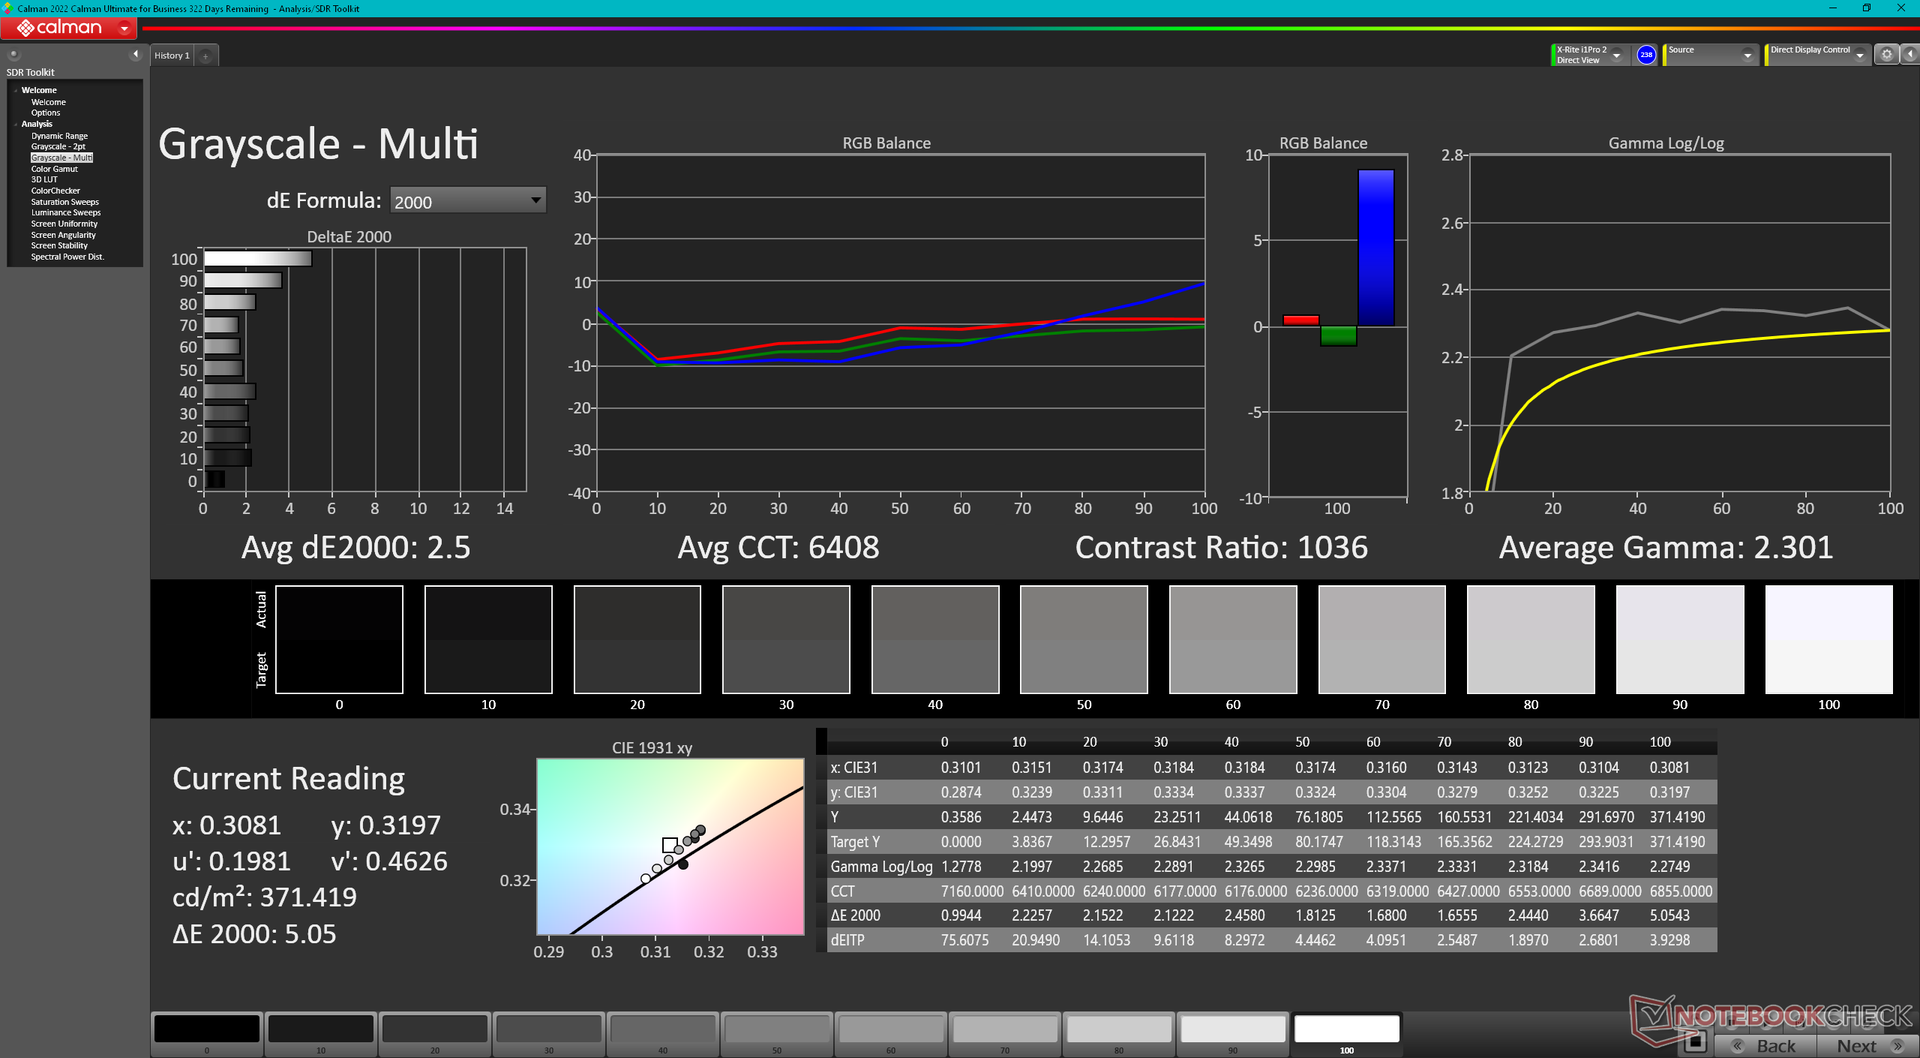
iluminación: 79 %
Brillo con batería: 373.3 cd/m²
Contraste: 848:1 (Negro: 0.44 cd/m²)
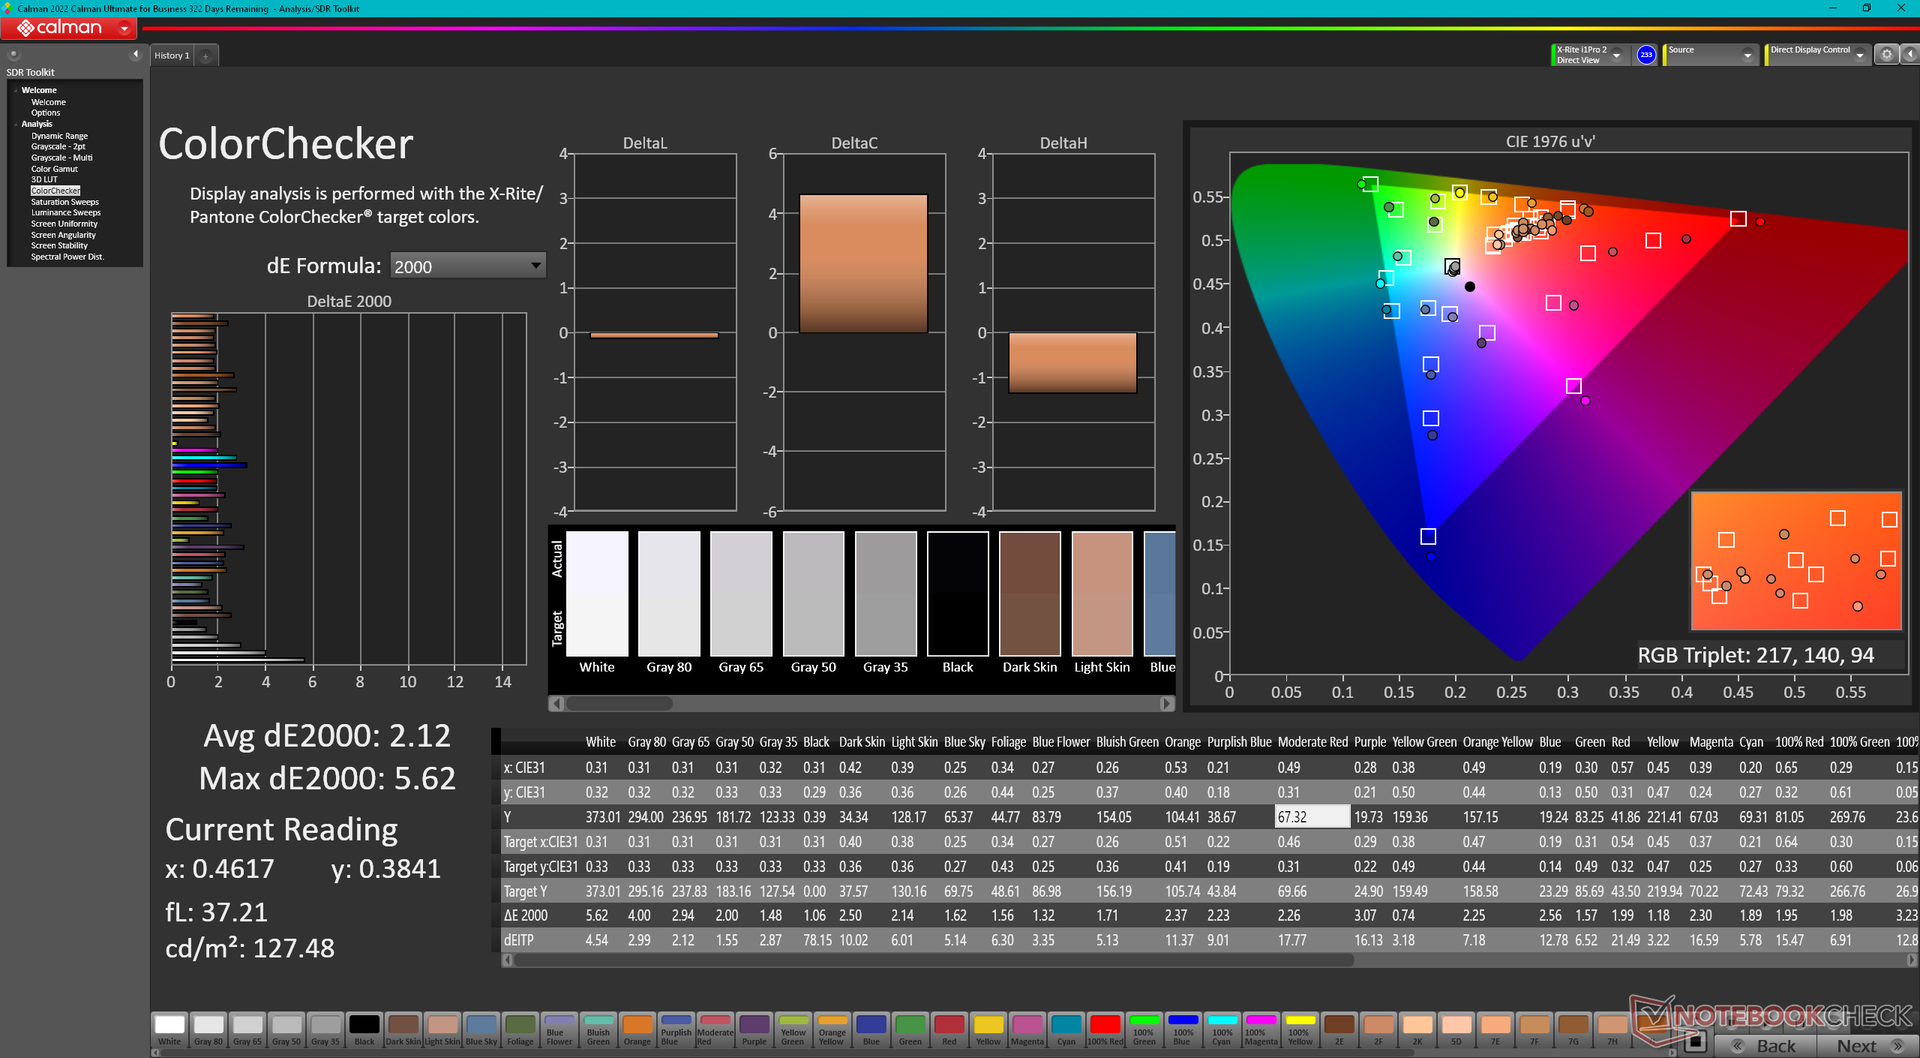
ΔE ColorChecker Calman: 2.12 | ∀{0.5-29.43 Ø4.71}
calibrated: 2.06
ΔE Greyscale Calman: 2.5 | ∀{0.09-98 Ø4.96}
73.4% AdobeRGB 1998 (Argyll 3D)
99.2% sRGB (Argyll 3D)
74.4% Display P3 (Argyll 3D)
Gamma: 2.3
CCT: 6408 K
| HP Omen 16-n0033dx BOE0AAE, IPS, 1920x1080, 16.1" | HP Envy 16 h0112nr Samsung SDC4174, OLED, 3840x2400, 16" | HP Omen 16-b1090ng BOE09E5, IPS, 2560x1440, 16.1" | HP Victus 16-e0145ng CMN1609, IPS, 1920x1080, 16.1" | Lenovo Legion S7 16ARHA7 BOE CQ NE160QDM-NY1, IPS, 2560x1600, 16" | Dell G16 7620 BOE NE16QDM, IPS, 2560x1600, 16" | |
|---|---|---|---|---|---|---|
| Display | 18% | -2% | -41% | -3% | -4% | |
| Display P3 Coverage (%) | 74.4 | 99.3 33% | 71 -5% | 41.6 -44% | 69.8 -6% | 68.3 -8% |
| sRGB Coverage (%) | 99.2 | 100 1% | 97.9 -1% | 61.9 -38% | 98.1 -1% | 98 -1% |
| AdobeRGB 1998 Coverage (%) | 73.4 | 88 20% | 73.3 0% | 43 -41% | 71.9 -2% | 70.5 -4% |
| Response Times | 86% | 17% | -71% | 15% | 29% | |
| Response Time Grey 50% / Grey 80% * (ms) | 17.6 ? | 2 ? 89% | 14.5 ? 18% | 29.6 ? -68% | 10 ? 43% | 8.6 ? 51% |
| Response Time Black / White * (ms) | 11.2 ? | 1.9 ? 83% | 9.4 ? 16% | 19.4 ? -73% | 12.8 ? -14% | 10.4 ? 7% |
| PWM Frequency (Hz) | 240.4 ? | |||||
| Screen | 12% | -28% | -87% | 28% | 13% | |
| Brightness middle (cd/m²) | 373.3 | 328.8 -12% | 335 -10% | 257 -31% | 492.4 32% | 369.4 -1% |
| Brightness (cd/m²) | 361 | 332 -8% | 319 -12% | 239 -34% | 471 30% | 348 -4% |
| Brightness Distribution (%) | 79 | 97 23% | 90 14% | 88 11% | 90 14% | 83 5% |
| Black Level * (cd/m²) | 0.44 | 0.28 36% | 0.25 43% | 0.4 9% | 0.32 27% | |
| Contrast (:1) | 848 | 1196 41% | 1028 21% | 1231 45% | 1154 36% | |
| Colorchecker dE 2000 * | 2.12 | 1.53 28% | 4.38 -107% | 6.91 -226% | 1.9 10% | 1.78 16% |
| Colorchecker dE 2000 max. * | 5.62 | 6.04 -7% | 9.48 -69% | 22.27 -296% | 3.81 32% | 4.41 22% |
| Colorchecker dE 2000 calibrated * | 2.06 | 1.33 35% | 3.61 -75% | 0.99 52% | 1.22 41% | |
| Greyscale dE 2000 * | 2.5 | 1.3 48% | 7 -180% | 7.5 -200% | 1.7 32% | 3.2 -28% |
| Gamma | 2.3 96% | 2.18 101% | 2.103 105% | 2.125 104% | 2.36 93% | 2.2 100% |
| CCT | 6408 101% | 6362 102% | 6244 104% | 6025 108% | 6497 100% | 6750 96% |
| Media total (Programa/Opciones) | 39% /
27% | -4% /
-16% | -66% /
-75% | 13% /
20% | 13% /
11% |
* ... más pequeño es mejor
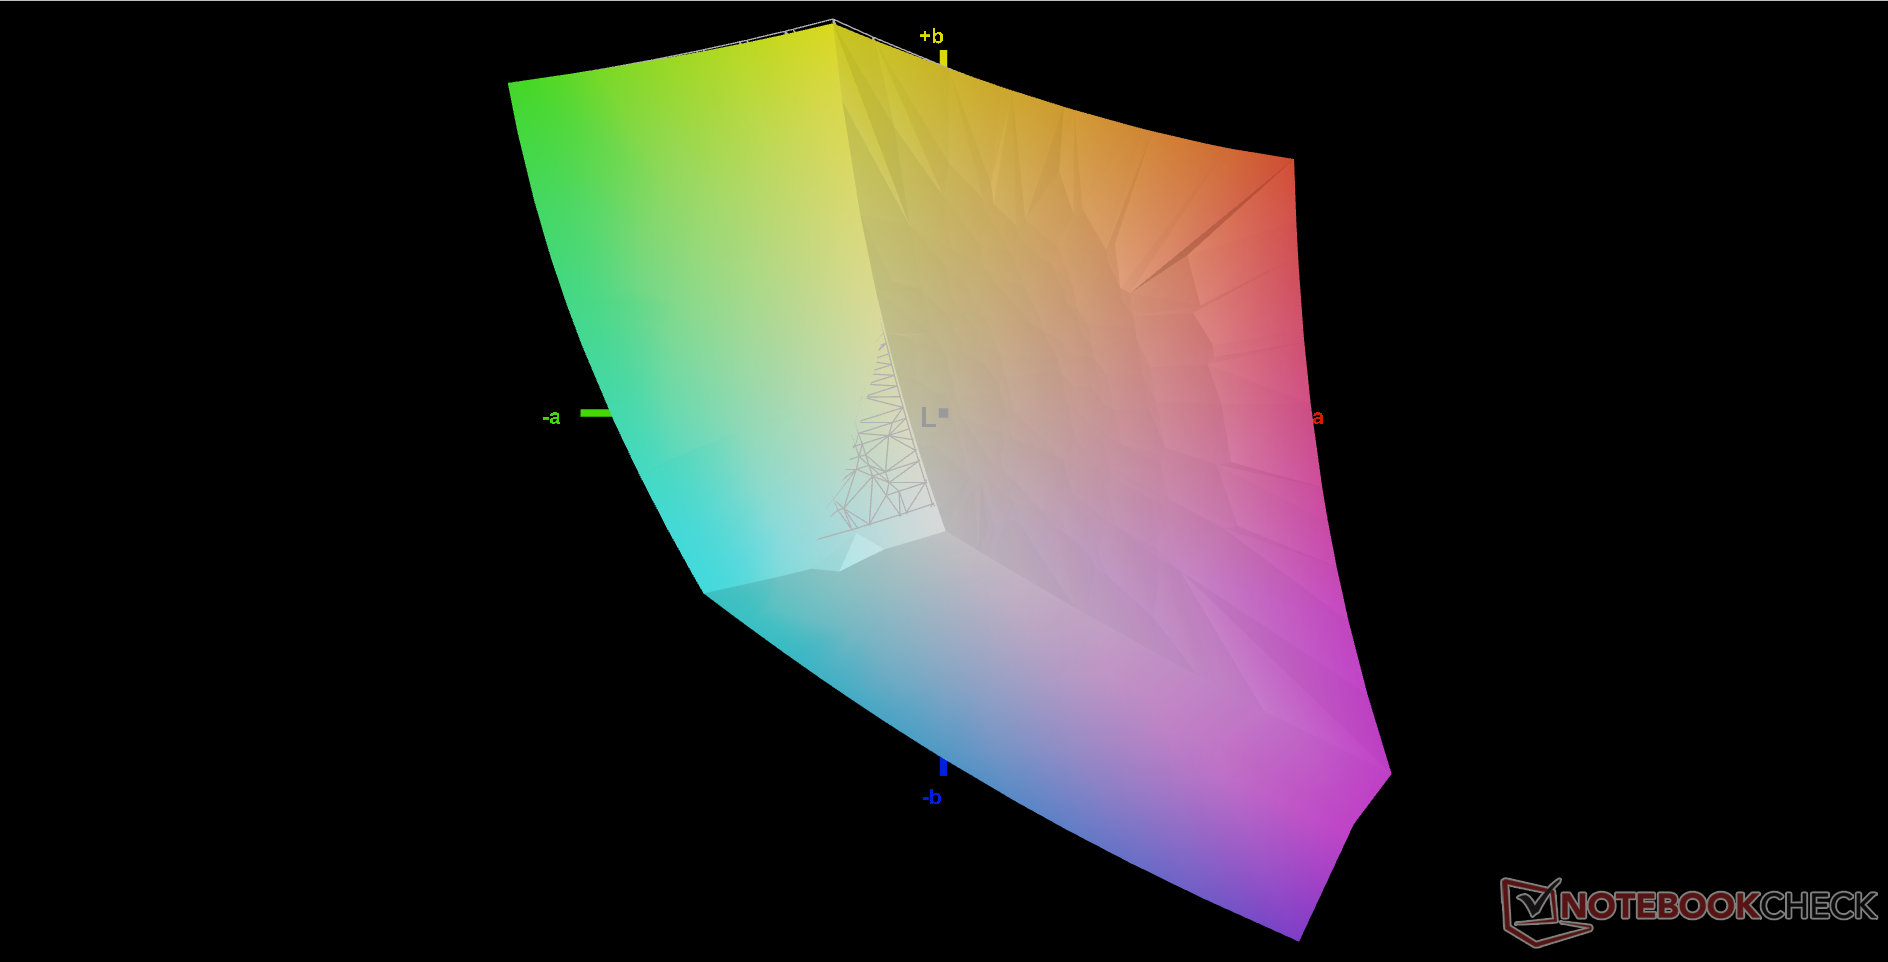
La pantalla ya está decentemente calibrada al sacarla de la caja, con unos valores medios de escala de grises y color deltaE de sólo 2,5 y 2,12, respectivamente. Intentar calibrarlo más con nuestro colorímetro X-Rite mejoraría ligeramente los colores, pero no lo suficiente como para que la calibración del usuario final sea esencial.

Tiempos de respuesta del display
| ↔ Tiempo de respuesta de Negro a Blanco | ||
|---|---|---|
| 11.2 ms ... subida ↗ y bajada ↘ combinada | ↗ 6.8 ms subida | 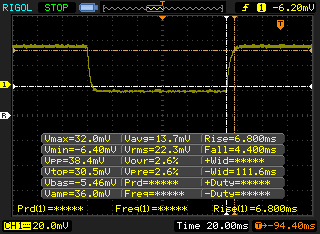 |
| ↘ 4.4 ms bajada | ||
| La pantalla mostró buenos tiempos de respuesta en nuestros tests pero podría ser demasiado lenta para los jugones competitivos. En comparación, todos los dispositivos de prueba van de ##min### (mínimo) a 240 (máximo) ms. » 30 % de todos los dispositivos son mejores. Esto quiere decir que el tiempo de respuesta medido es mejor que la media (19.8 ms) de todos los dispositivos testados. | ||
| ↔ Tiempo de respuesta 50% Gris a 80% Gris | ||
| 17.6 ms ... subida ↗ y bajada ↘ combinada | ↗ 10 ms subida | 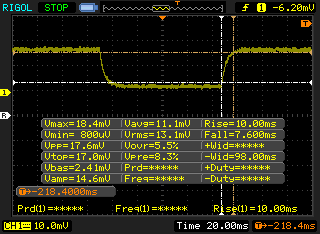 |
| ↘ 7.6 ms bajada | ||
| La pantalla mostró buenos tiempos de respuesta en nuestros tests pero podría ser demasiado lenta para los jugones competitivos. En comparación, todos los dispositivos de prueba van de ##min### (mínimo) a 636 (máximo) ms. » 32 % de todos los dispositivos son mejores. Esto quiere decir que el tiempo de respuesta medido es mejor que la media (30.9 ms) de todos los dispositivos testados. | ||
Parpadeo de Pantalla / PWM (Pulse-Width Modulation)
| Parpadeo de Pantalla / PWM no detectado | 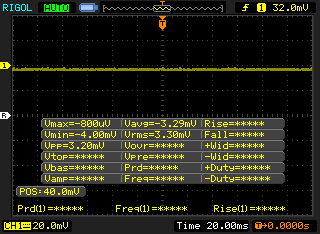 | ||
Comparación: 52 % de todos los dispositivos testados no usaron PWM para atenuar el display. Si se usó, medimos una media de 7744 (mínimo: 5 - máxmo: 343500) Hz. | |||
La visibilidad en exteriores es buena bajo la sombra mientras que cualquier cosa más brillante lavará la pantalla. La pantalla del Lenovo Legion S7 16 puede alcanzar casi 500 nits en comparación con los 370 nits de nuestro HP para ser la mejor opción si la visibilidad en exteriores es una preocupación. Asegúrate de desactivar AMD Vari-Bright en el HP o de lo contrario el brillo máximo caerá automáticamente cuando funcione con batería.
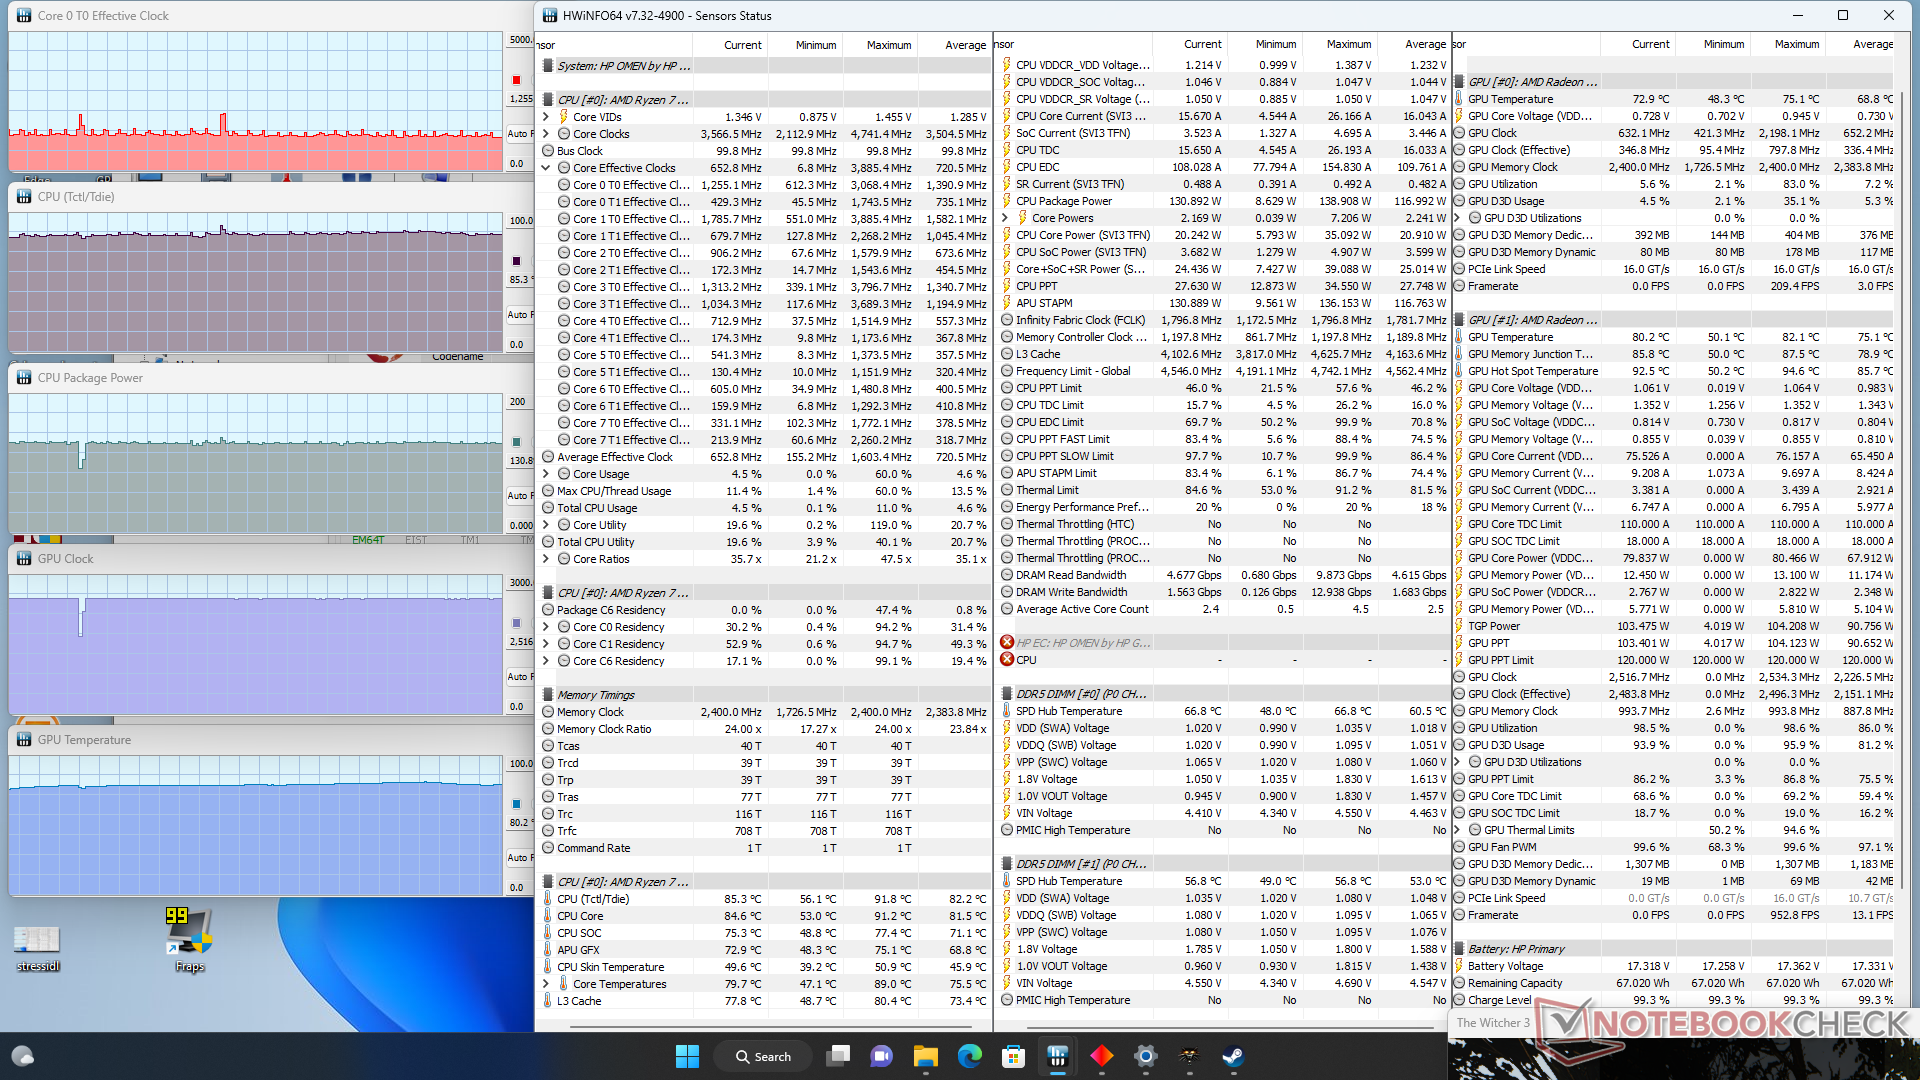
Rendimiento
Condiciones de la prueba
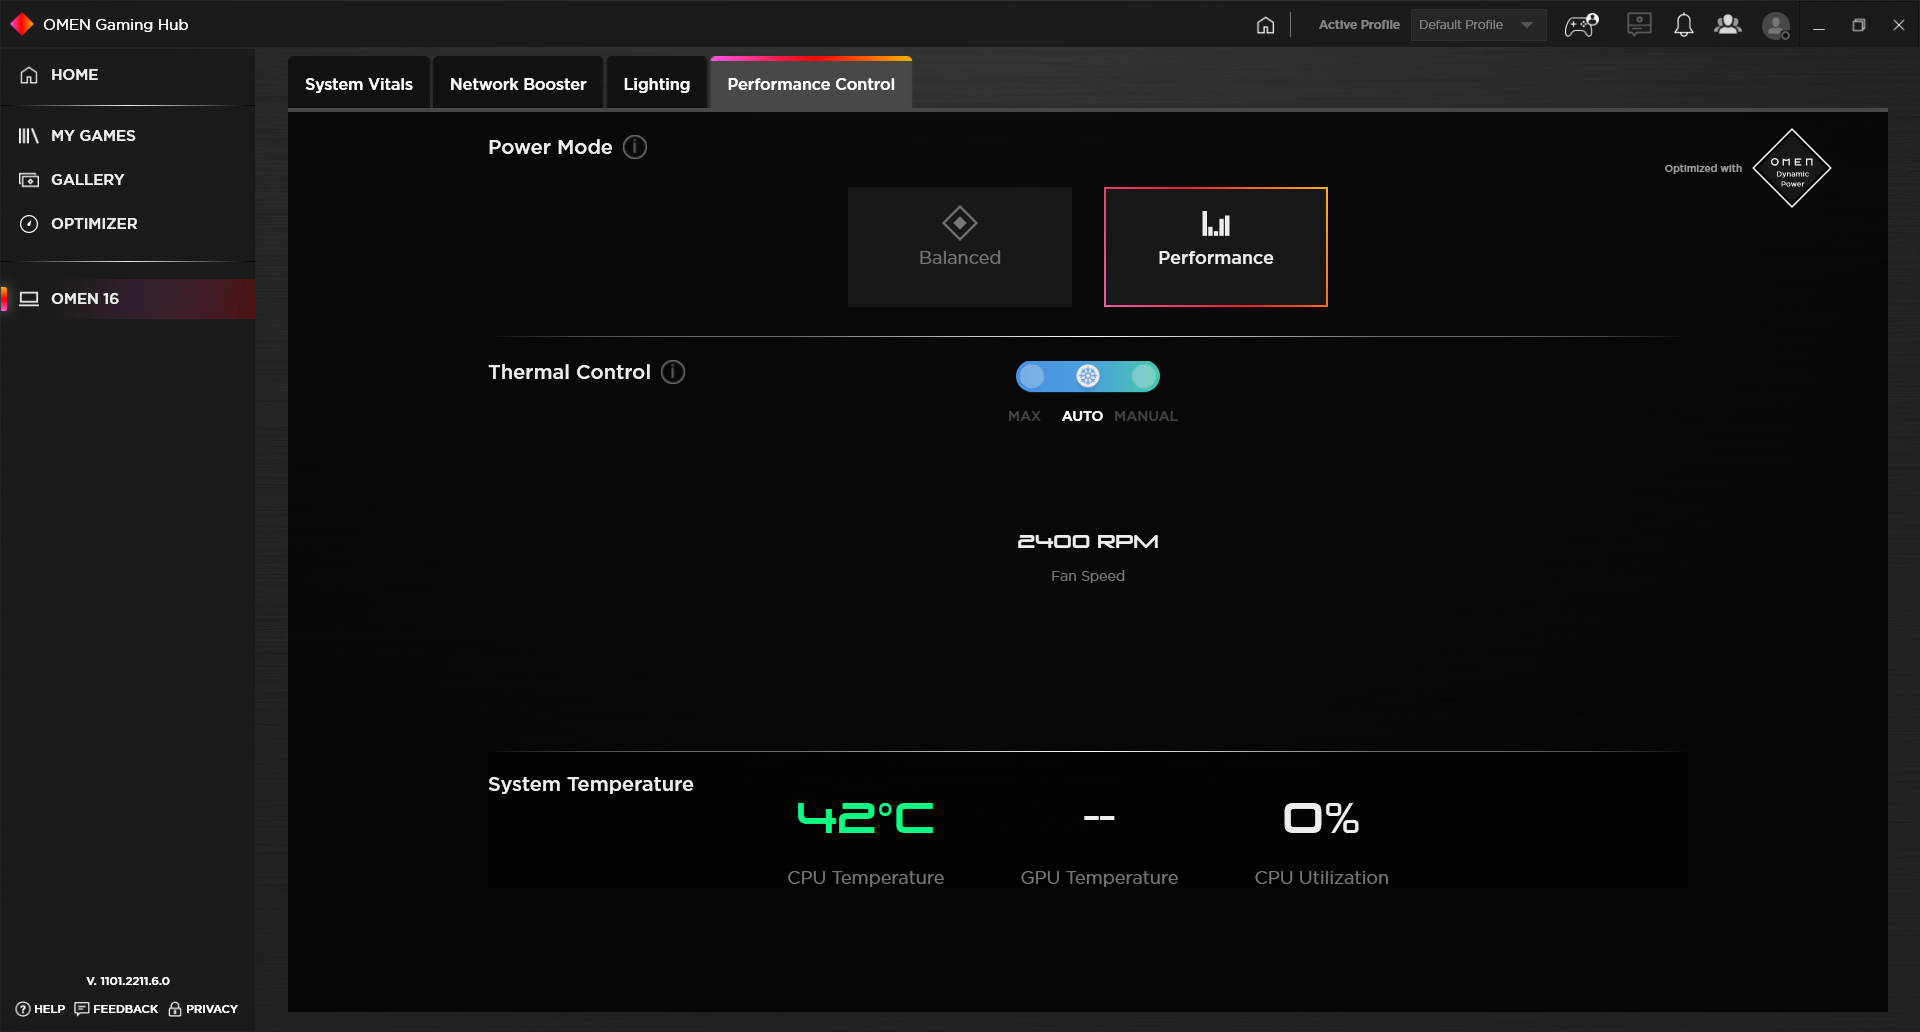
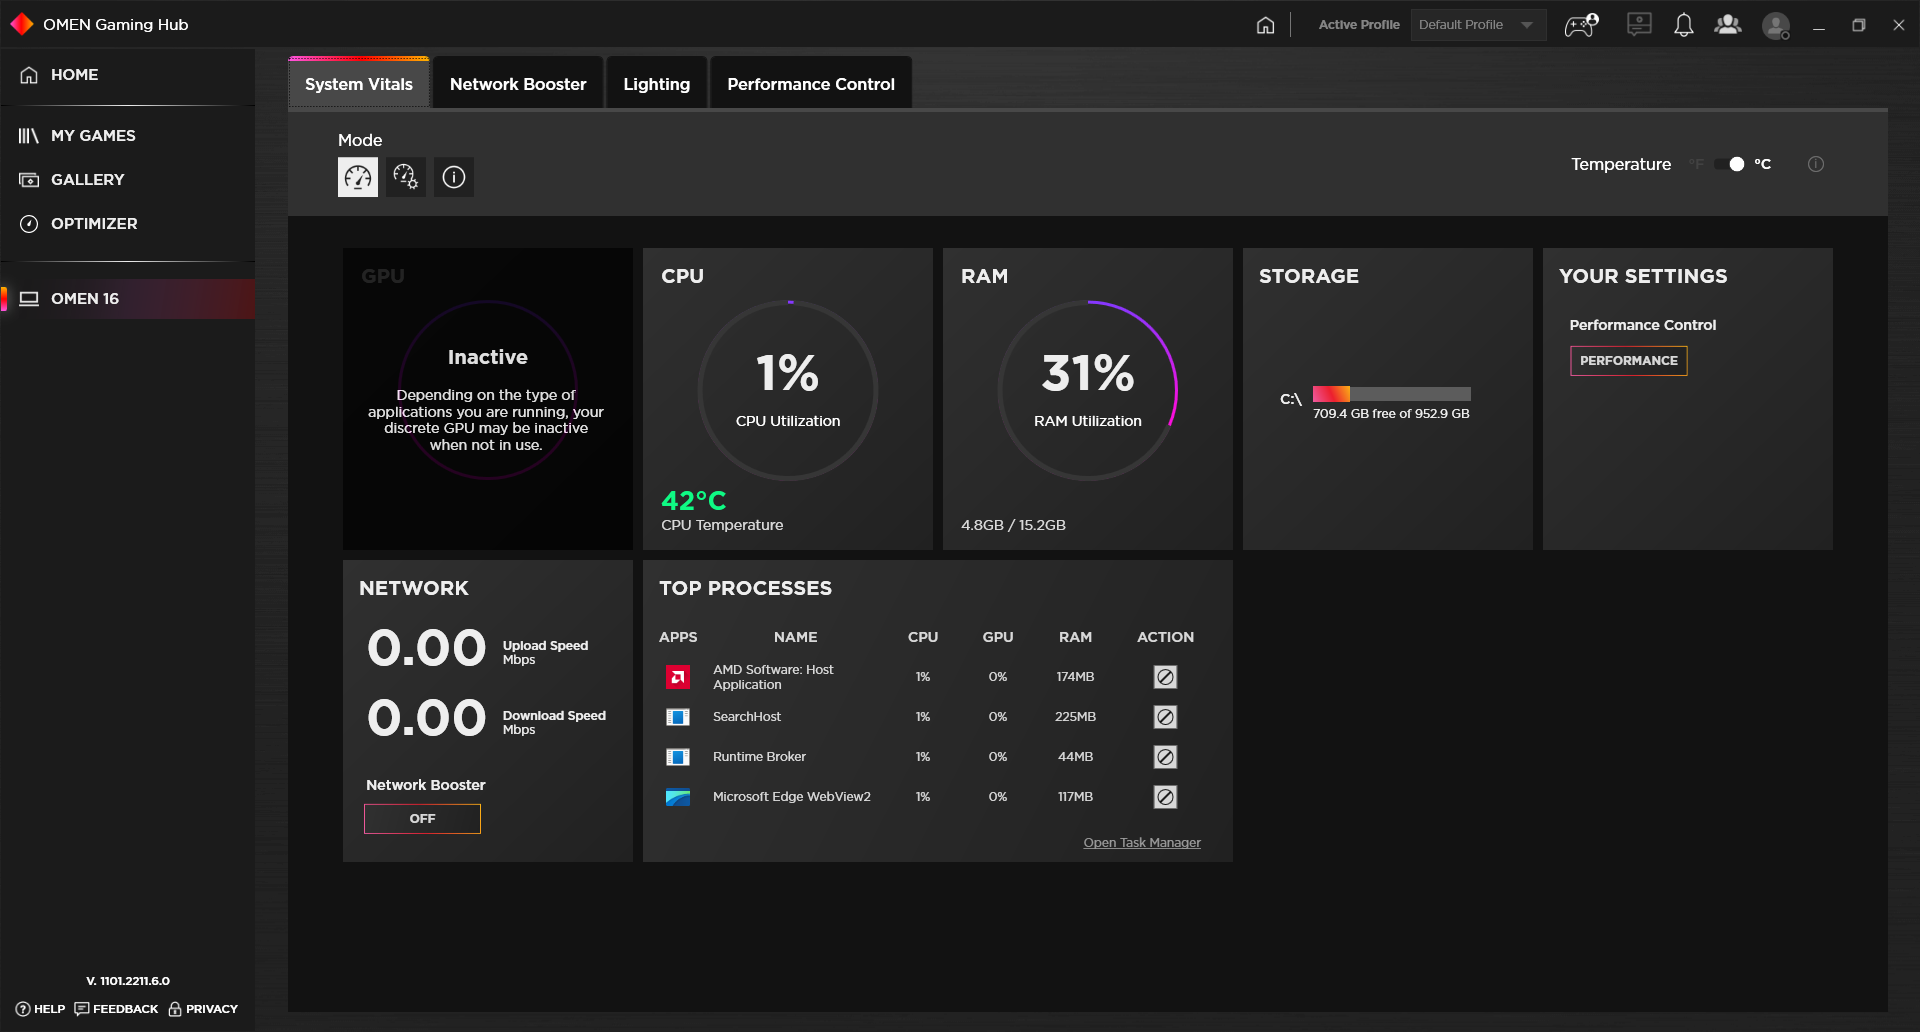
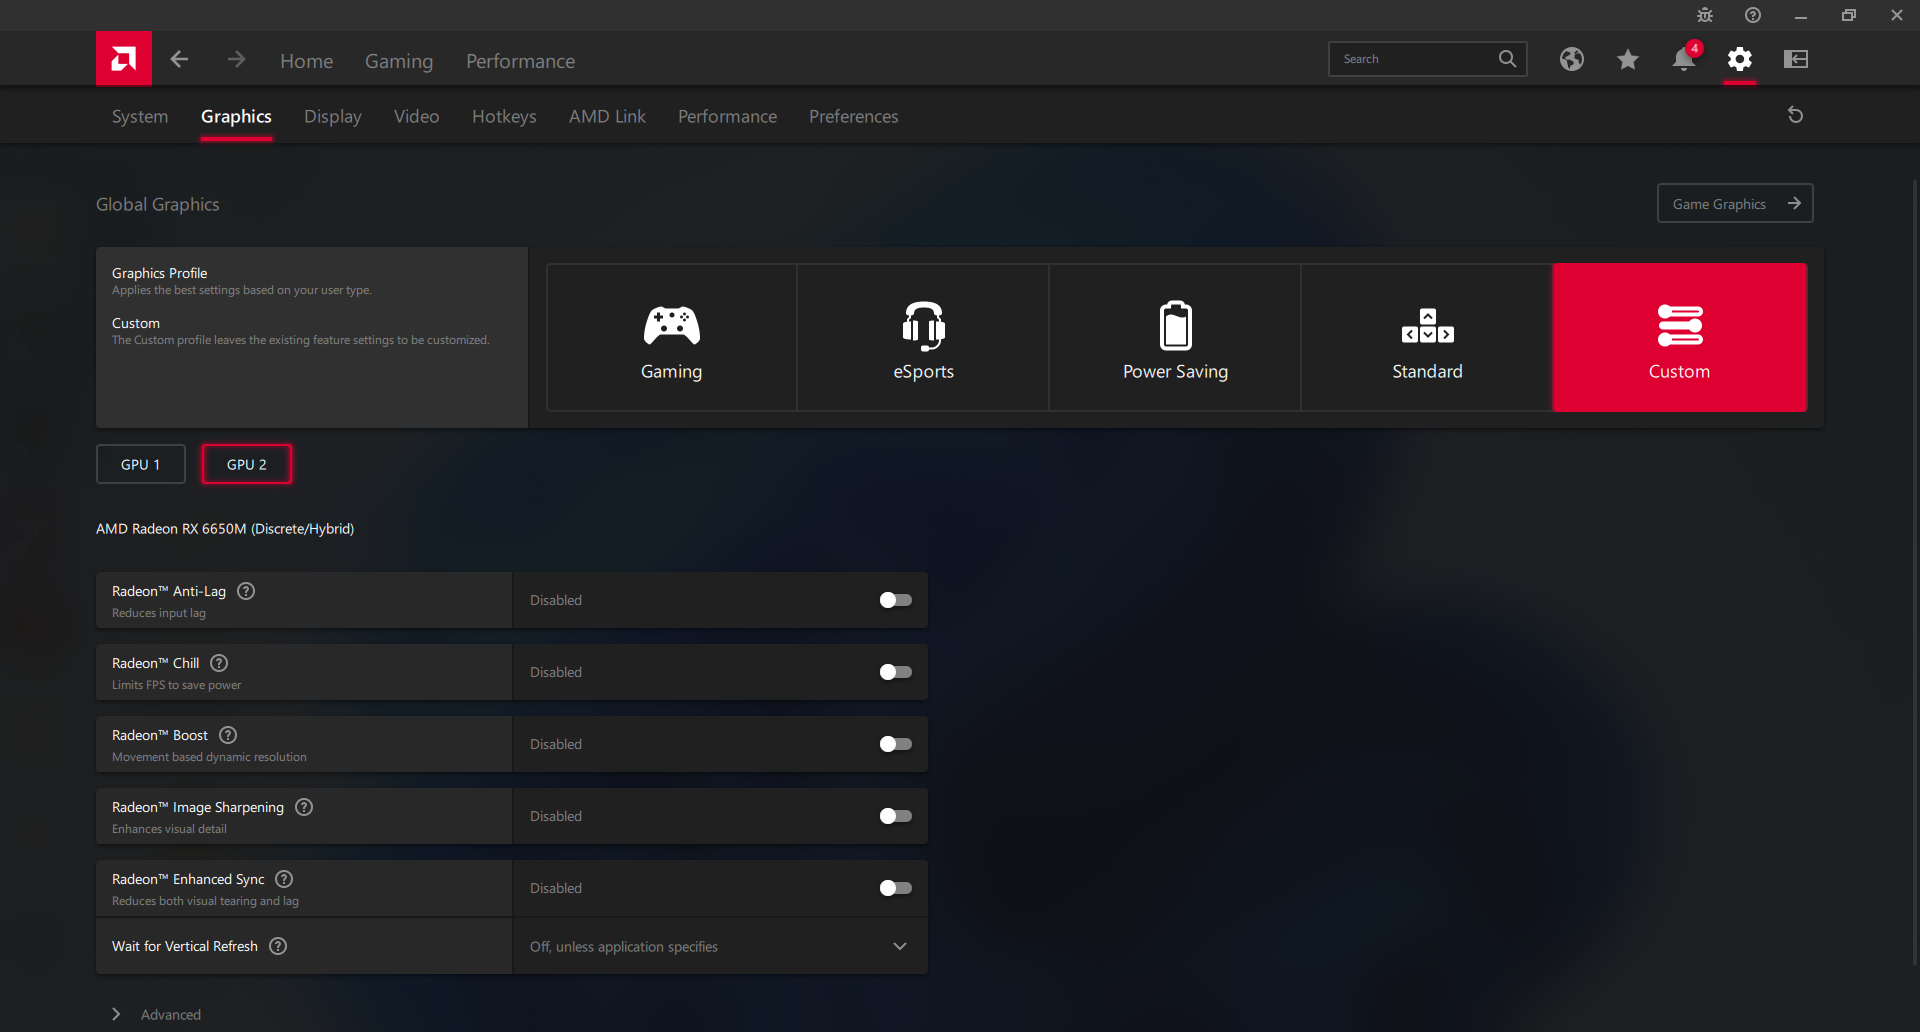
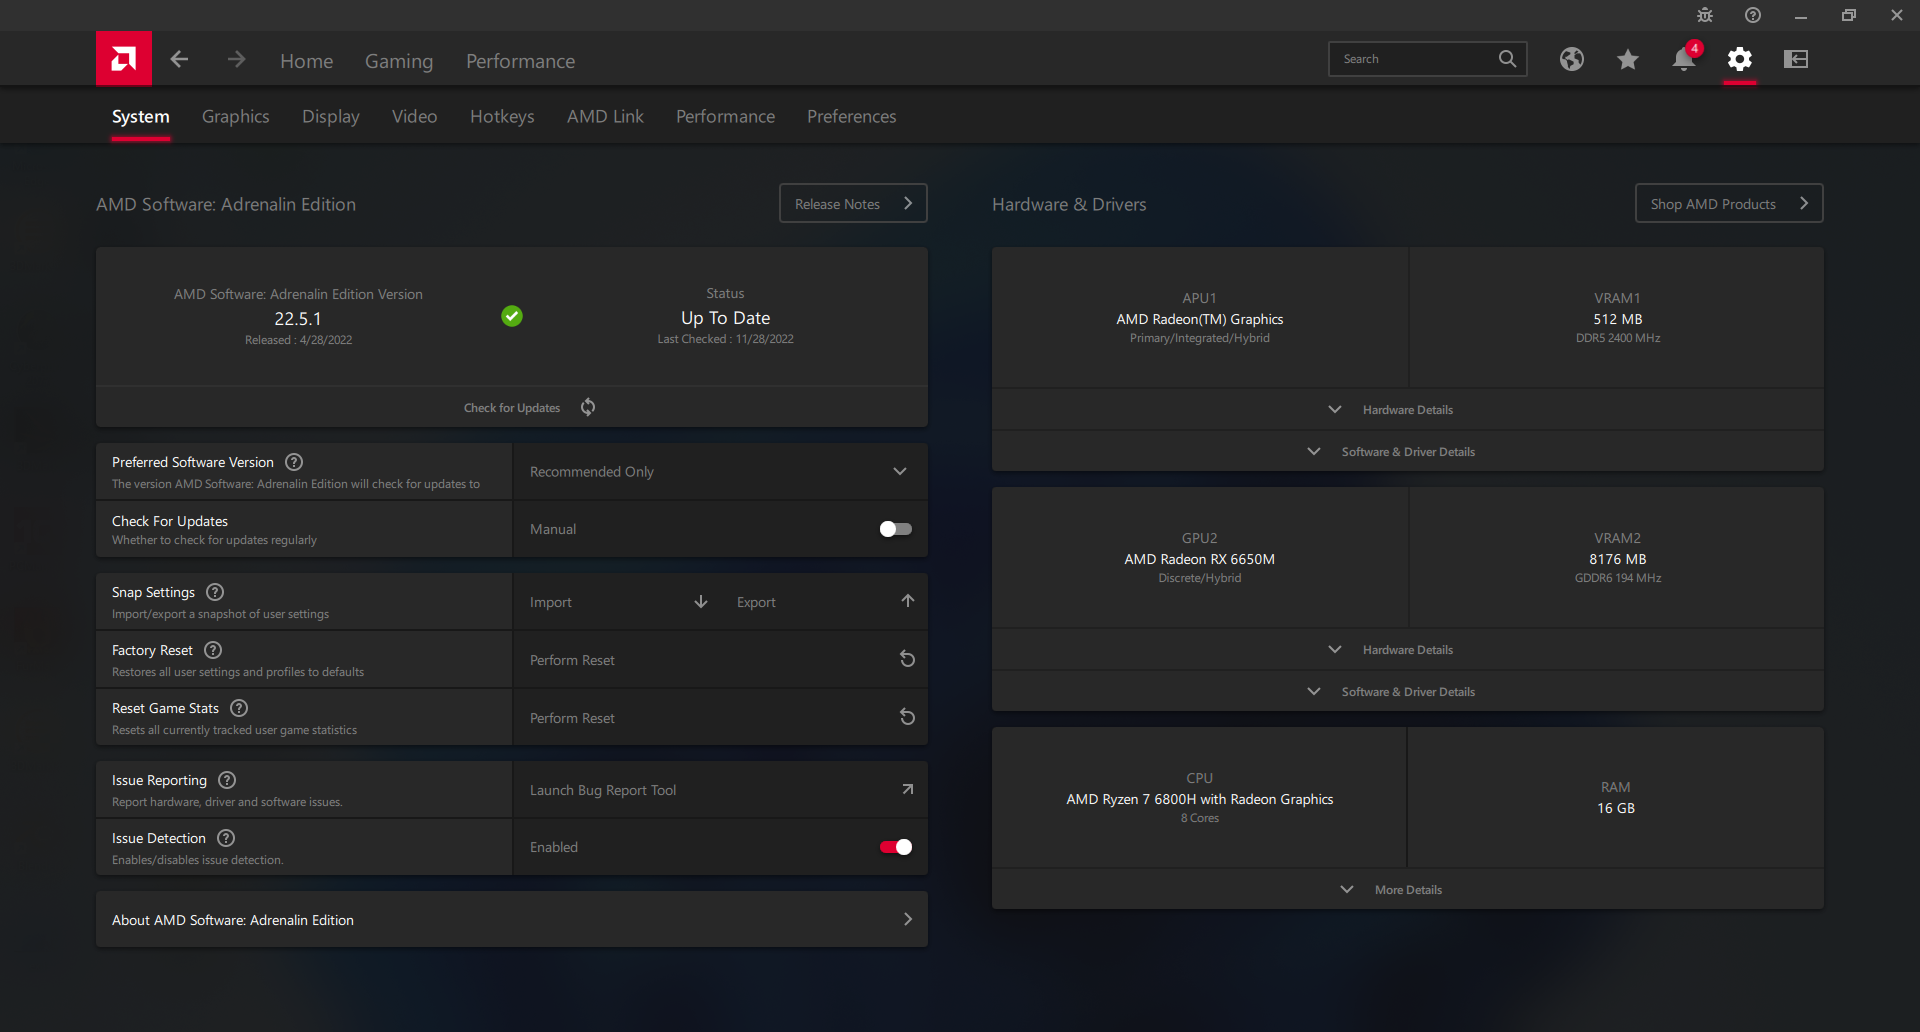
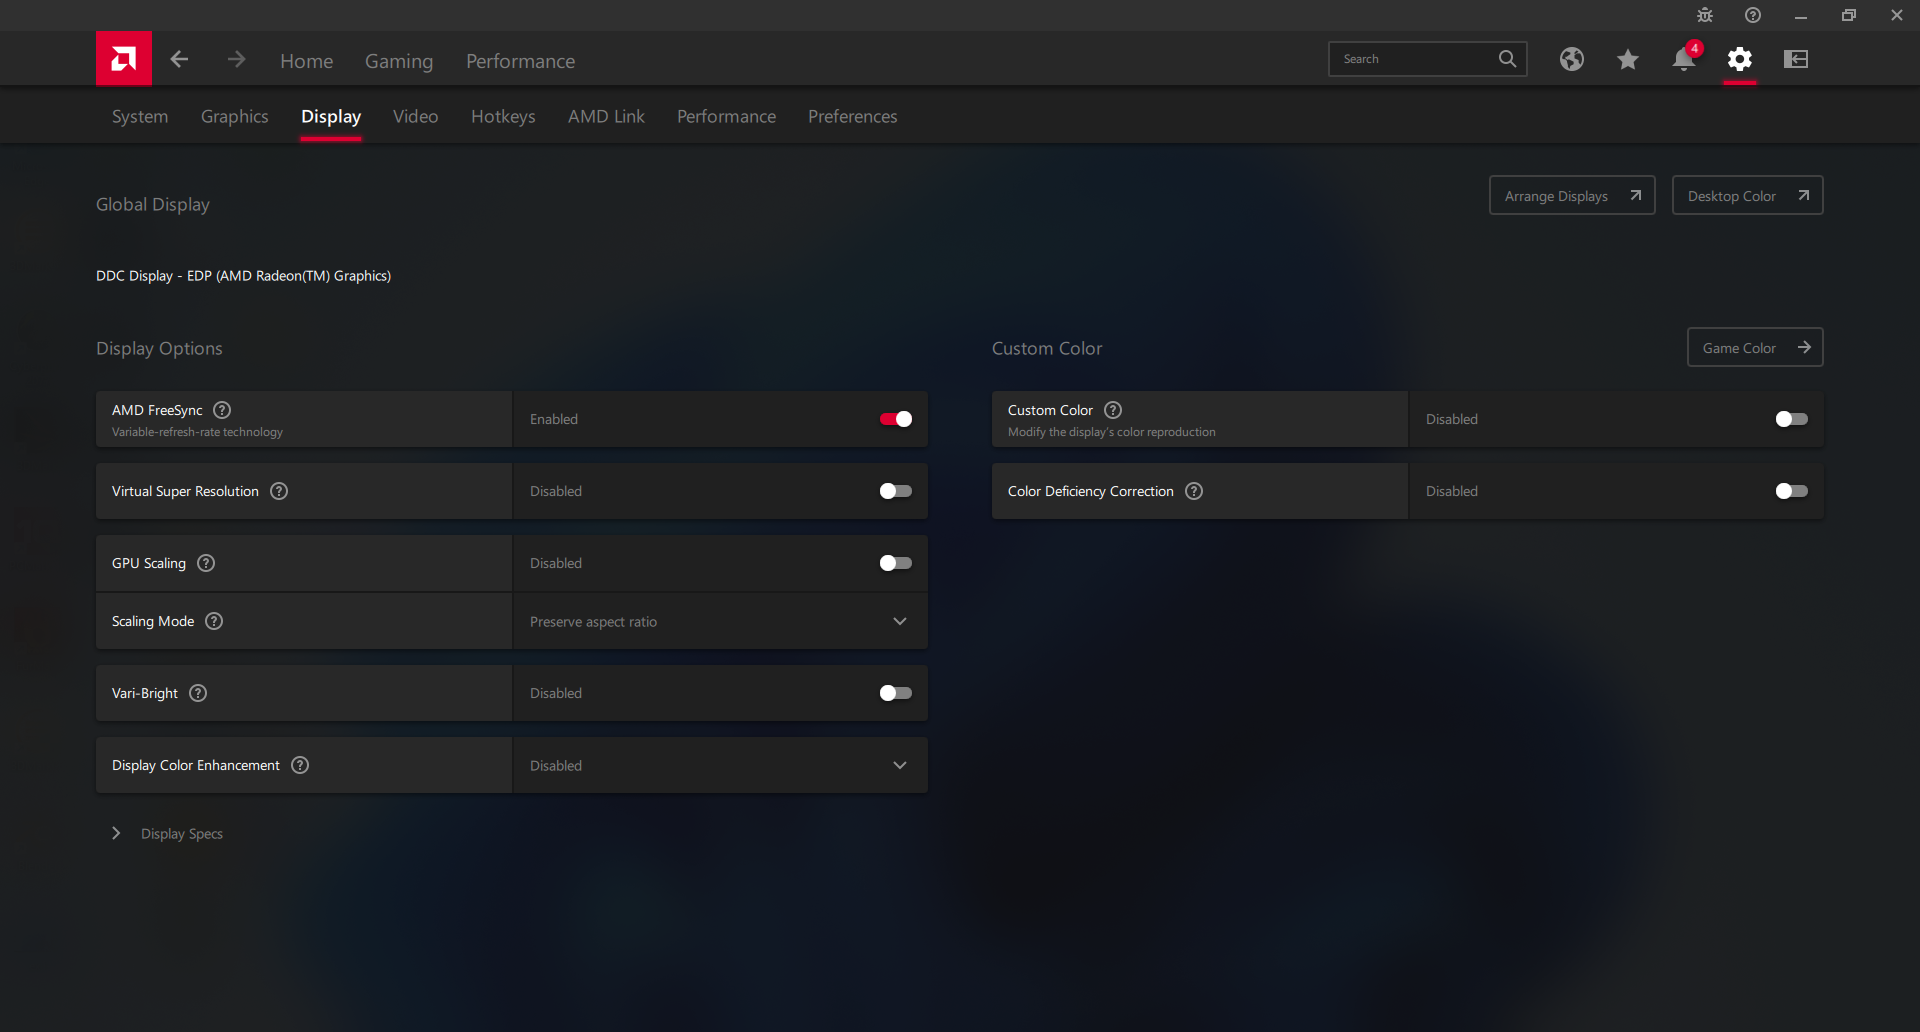
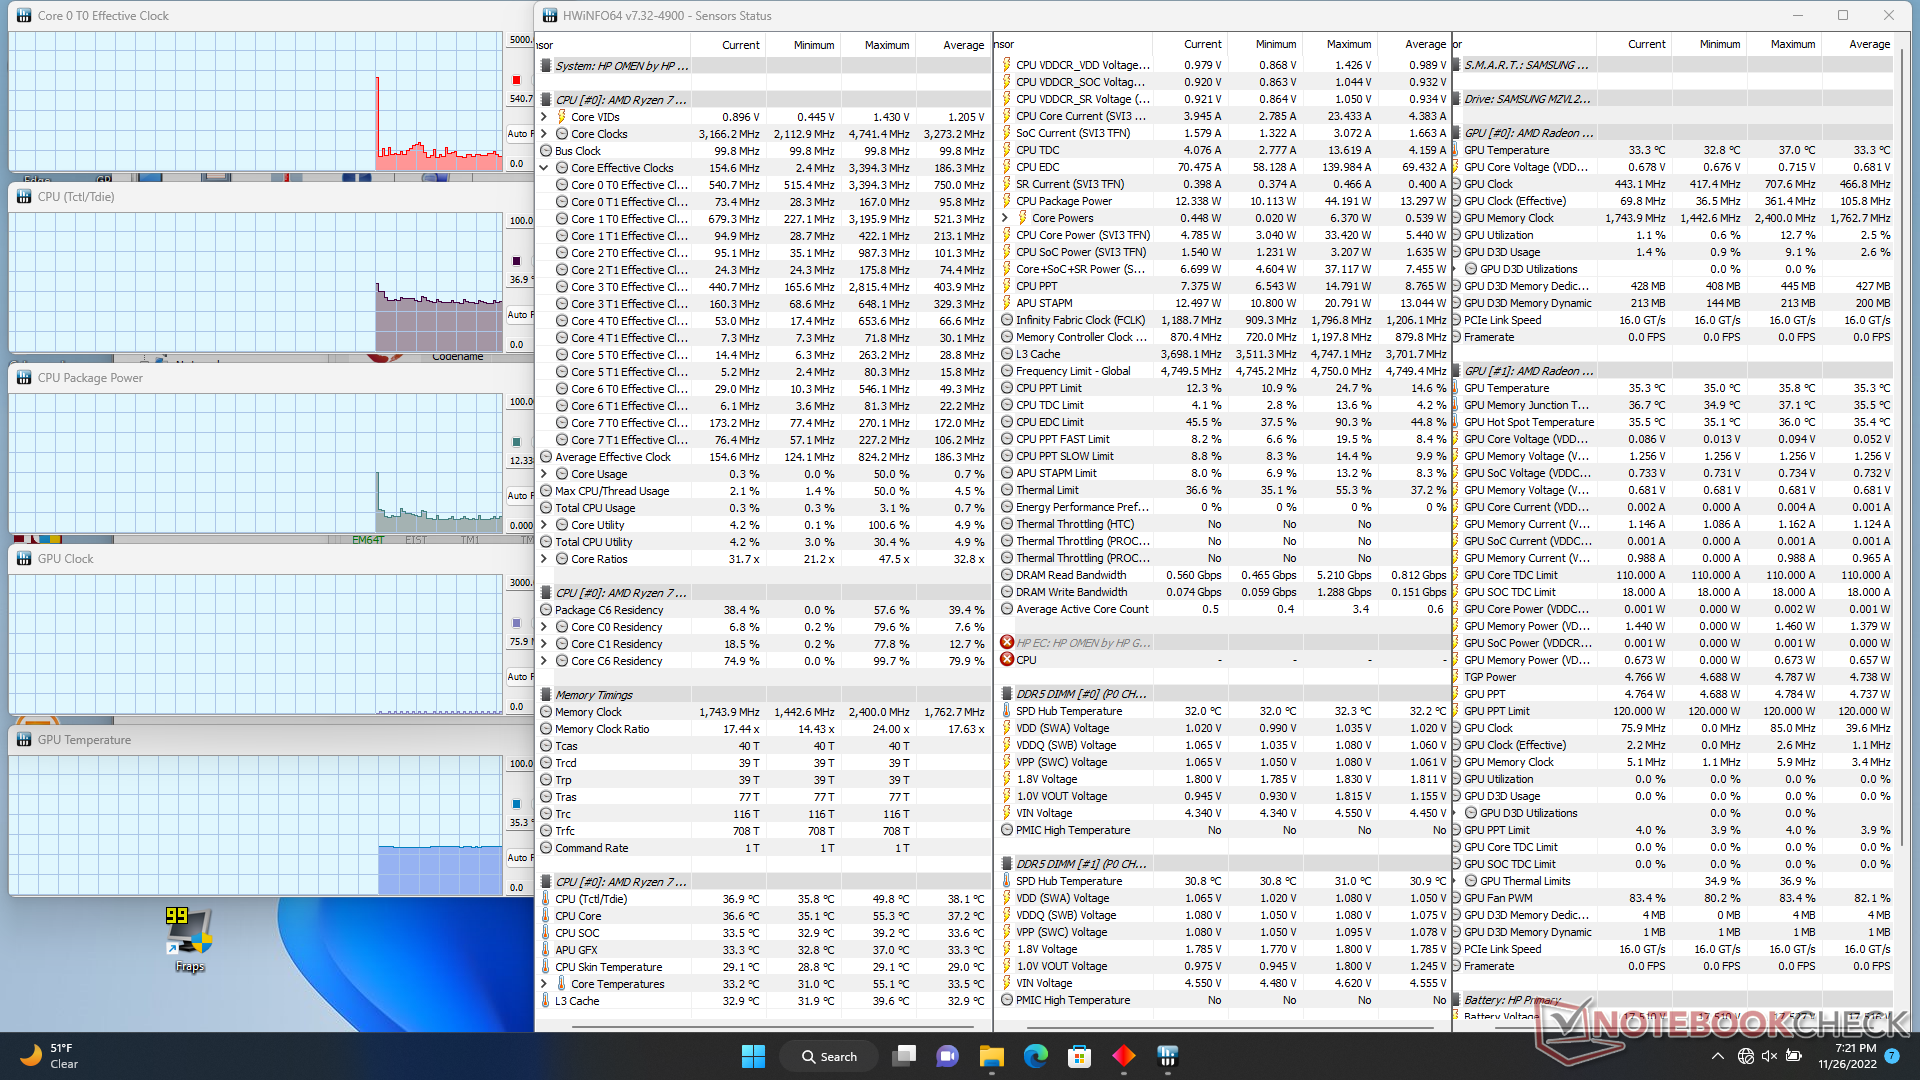
Configuramos nuestra unidad en el modo "Mejor Rendimiento" a través de Windows y en el modo "Rendimiento" a través del software Omen Gaming Hub antes de ejecutar cualquier prueba de rendimiento a continuación. Recomendamos encarecidamente acostumbrarse a Omen Gaming Hub y a las aplicaciones Radeon Adrenalin, ya que ambos son centros de control para ajustar los perfiles de energía, la iluminación del teclado, la sincronización adaptativa, Vari-Bright, y más, como se muestra en las capturas de pantalla a continuación.
No encontramos ningún interruptor MUX en ninguna parte del portátil, ni en la pantalla de la BIOS ni en el software Omen Gaming Hub.
Procesador
El rendimiento bruto de la CPU es aproximadamente un 5 por ciento más lento que el de la media de portátiles de nuestra base de datos equipados con el mismo Ryzen 7 6800H que el mismo procesador Ryzen 7 6800H. Nuestra CPU es, por tanto, sólo un 10 por ciento más rápida que el Ryzen 7 5800H del año pasado para ser una actualización marginal de un año a otro. La mayor diferencia entre los Zen 3 móviles y los Zen 3+ radica en sus soluciones gráficas integradas, pero esto es casi irrelevante en portátiles para juegos como el Omen 16 ya que casi siempre vienen con GPUs dedicadas más rápidas.
El rendimiento de un solo hilo y de varios hilos es aproximadamente un 10 y un 25 por ciento más lento, respectivamente, que el competidor Core i7-12700H del Dell G16 7620. Si se opta por el más caro Core i9-12900H Omen 16 aumentaría el rendimiento entre un 30 y un 35 por ciento respecto a nuestro SKU Ryzen.
Cinebench R15 Multi Loop
Cinebench R23: Multi Core | Single Core
Cinebench R15: CPU Multi 64Bit | CPU Single 64Bit
Blender: v2.79 BMW27 CPU
7-Zip 18.03: 7z b 4 | 7z b 4 -mmt1
Geekbench 5.5: Multi-Core | Single-Core
HWBOT x265 Benchmark v2.2: 4k Preset
LibreOffice : 20 Documents To PDF
R Benchmark 2.5: Overall mean
Cinebench R23: Multi Core | Single Core
Cinebench R15: CPU Multi 64Bit | CPU Single 64Bit
Blender: v2.79 BMW27 CPU
7-Zip 18.03: 7z b 4 | 7z b 4 -mmt1
Geekbench 5.5: Multi-Core | Single-Core
HWBOT x265 Benchmark v2.2: 4k Preset
LibreOffice : 20 Documents To PDF
R Benchmark 2.5: Overall mean
* ... más pequeño es mejor
AIDA64: FP32 Ray-Trace | FPU Julia | CPU SHA3 | CPU Queen | FPU SinJulia | FPU Mandel | CPU AES | CPU ZLib | FP64 Ray-Trace | CPU PhotoWorxx
| Performance rating | |
| Lenovo Legion S7 16ARHA7 | |
| HP Omen 16-n0033dx | |
| Medio AMD Ryzen 7 6800H | |
| Dell G16 7620 | |
| HP Envy 16 h0112nr | |
| HP Omen 16-b1090ng | |
| HP Victus 16-e0145ng | |
| AIDA64 / FP32 Ray-Trace | |
| Lenovo Legion S7 16ARHA7 | |
| HP Omen 16-n0033dx | |
| Medio AMD Ryzen 7 6800H (12876 - 17031, n=8) | |
| Dell G16 7620 | |
| HP Envy 16 h0112nr | |
| HP Victus 16-e0145ng | |
| HP Omen 16-b1090ng | |
| AIDA64 / FPU Julia | |
| Lenovo Legion S7 16ARHA7 | |
| HP Omen 16-n0033dx | |
| Medio AMD Ryzen 7 6800H (82673 - 105987, n=8) | |
| Dell G16 7620 | |
| HP Victus 16-e0145ng | |
| HP Envy 16 h0112nr | |
| HP Omen 16-b1090ng | |
| AIDA64 / CPU SHA3 | |
| Dell G16 7620 | |
| Lenovo Legion S7 16ARHA7 | |
| HP Omen 16-n0033dx | |
| Medio AMD Ryzen 7 6800H (2886 - 3634, n=8) | |
| HP Envy 16 h0112nr | |
| HP Omen 16-b1090ng | |
| HP Victus 16-e0145ng | |
| AIDA64 / CPU Queen | |
| Lenovo Legion S7 16ARHA7 | |
| HP Omen 16-n0033dx | |
| Dell G16 7620 | |
| HP Envy 16 h0112nr | |
| HP Omen 16-b1090ng | |
| Medio AMD Ryzen 7 6800H (75117 - 106322, n=8) | |
| HP Victus 16-e0145ng | |
| AIDA64 / FPU SinJulia | |
| Lenovo Legion S7 16ARHA7 | |
| HP Omen 16-n0033dx | |
| Medio AMD Ryzen 7 6800H (11771 - 13120, n=8) | |
| Dell G16 7620 | |
| HP Omen 16-b1090ng | |
| HP Victus 16-e0145ng | |
| HP Envy 16 h0112nr | |
| AIDA64 / FPU Mandel | |
| Lenovo Legion S7 16ARHA7 | |
| HP Omen 16-n0033dx | |
| Medio AMD Ryzen 7 6800H (45287 - 58327, n=8) | |
| HP Victus 16-e0145ng | |
| Dell G16 7620 | |
| HP Envy 16 h0112nr | |
| HP Omen 16-b1090ng | |
| AIDA64 / CPU AES | |
| Lenovo Legion S7 16ARHA7 | |
| HP Omen 16-n0033dx | |
| Medio AMD Ryzen 7 6800H (67816 - 137383, n=8) | |
| HP Envy 16 h0112nr | |
| HP Omen 16-b1090ng | |
| Dell G16 7620 | |
| HP Victus 16-e0145ng | |
| AIDA64 / CPU ZLib | |
| Dell G16 7620 | |
| HP Omen 16-b1090ng | |
| Lenovo Legion S7 16ARHA7 | |
| HP Omen 16-n0033dx | |
| Medio AMD Ryzen 7 6800H (732 - 901, n=8) | |
| HP Envy 16 h0112nr | |
| HP Victus 16-e0145ng | |
| AIDA64 / FP64 Ray-Trace | |
| Lenovo Legion S7 16ARHA7 | |
| HP Omen 16-n0033dx | |
| Medio AMD Ryzen 7 6800H (6917 - 8980, n=8) | |
| Dell G16 7620 | |
| HP Envy 16 h0112nr | |
| HP Victus 16-e0145ng | |
| HP Omen 16-b1090ng | |
| AIDA64 / CPU PhotoWorxx | |
| HP Omen 16-b1090ng | |
| HP Envy 16 h0112nr | |
| Dell G16 7620 | |
| Medio AMD Ryzen 7 6800H (26496 - 30360, n=8) | |
| Lenovo Legion S7 16ARHA7 | |
| HP Omen 16-n0033dx | |
| HP Victus 16-e0145ng | |
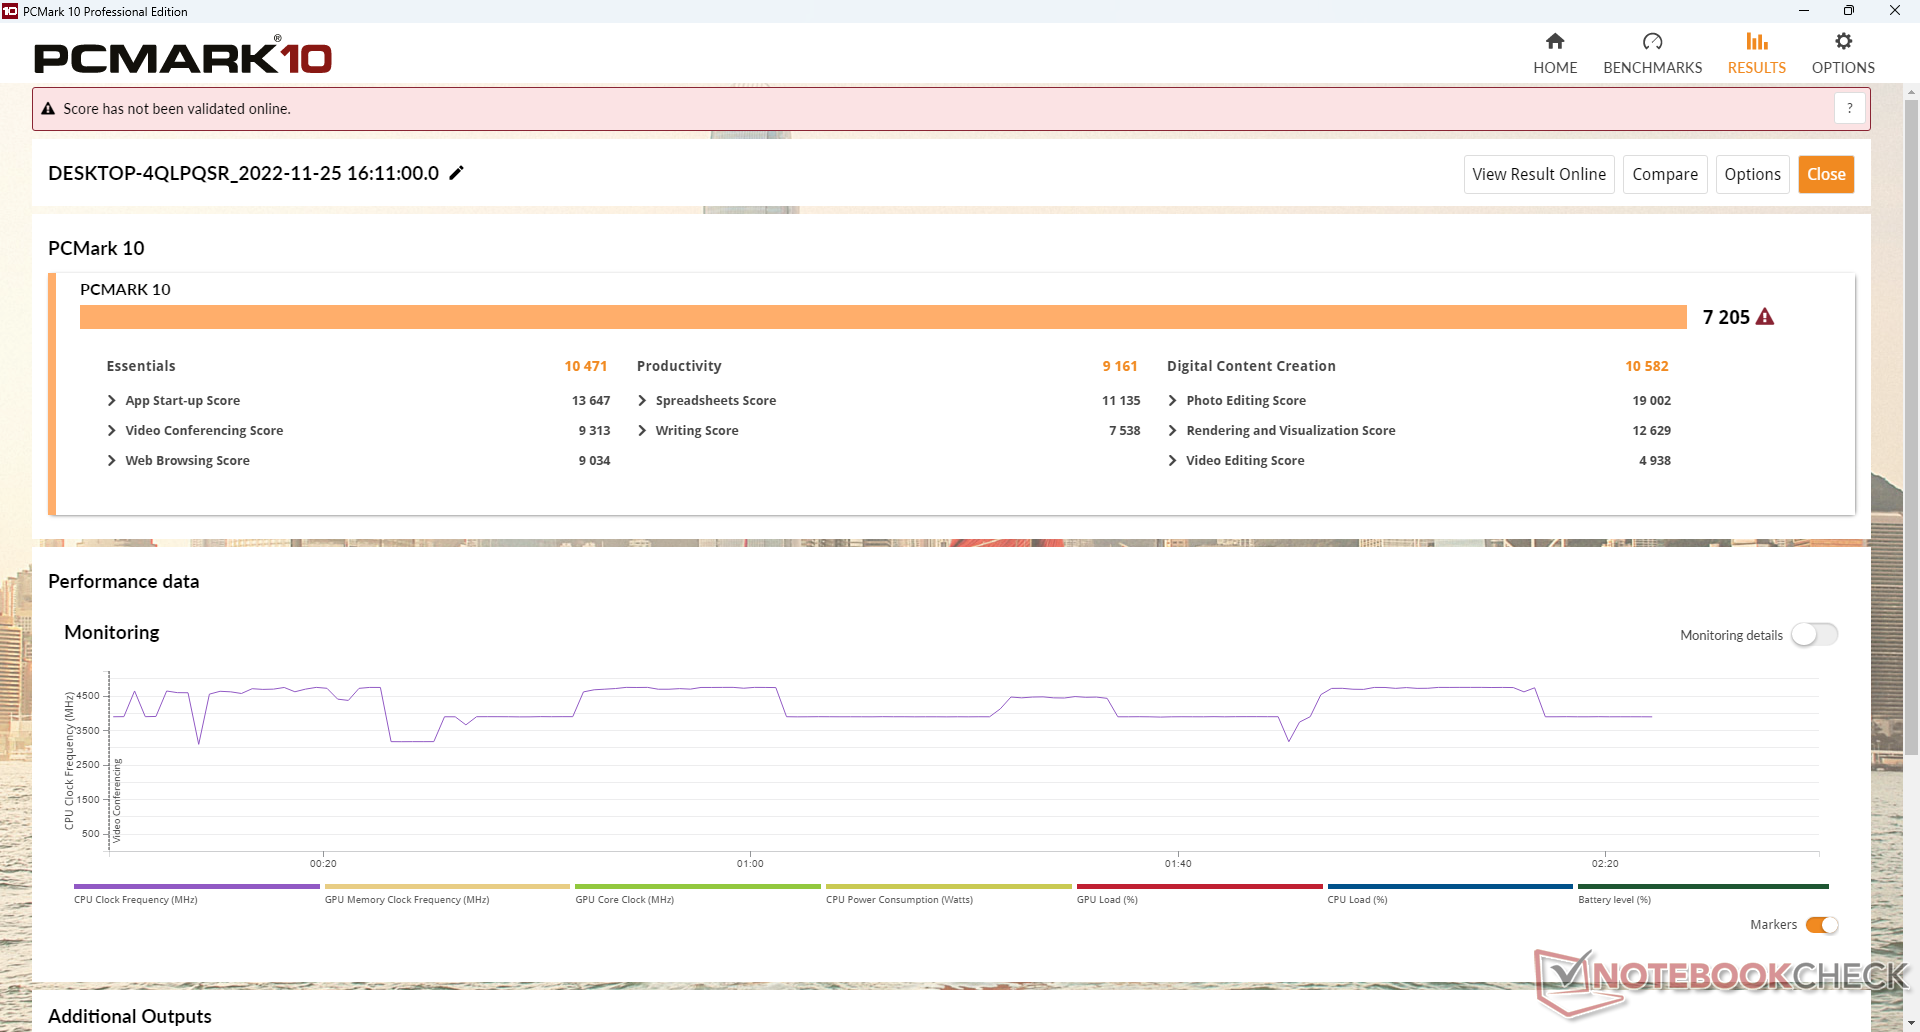
Rendimiento del sistema
Las puntuaciones de PCMark son comparables a las de los últimos portátiles para juegos que funcionan con CPUs Intel de 12ª generación y GPUs Nvidia GeForce RTX. Los resultados están constantemente por delante del Victus 16 que es una serie de juegos más económica de HP.
CrossMark: Overall | Productivity | Creativity | Responsiveness
| PCMark 10 / Score | |
| Lenovo Legion S7 16ARHA7 | |
| HP Envy 16 h0112nr | |
| HP Omen 16-b1090ng | |
| Dell G16 7620 | |
| HP Omen 16-n0033dx | |
| HP Victus 16-e0145ng | |
| PCMark 10 / Essentials | |
| HP Envy 16 h0112nr | |
| Lenovo Legion S7 16ARHA7 | |
| HP Omen 16-n0033dx | |
| Dell G16 7620 | |
| HP Omen 16-b1090ng | |
| HP Victus 16-e0145ng | |
| PCMark 10 / Productivity | |
| Lenovo Legion S7 16ARHA7 | |
| HP Omen 16-b1090ng | |
| HP Envy 16 h0112nr | |
| HP Omen 16-n0033dx | |
| Dell G16 7620 | |
| HP Victus 16-e0145ng | |
| PCMark 10 / Digital Content Creation | |
| Lenovo Legion S7 16ARHA7 | |
| Dell G16 7620 | |
| HP Omen 16-b1090ng | |
| HP Envy 16 h0112nr | |
| HP Omen 16-n0033dx | |
| HP Victus 16-e0145ng | |
| CrossMark / Overall | |
| HP Envy 16 h0112nr | |
| Dell G16 7620 | |
| Lenovo Legion S7 16ARHA7 | |
| HP Omen 16-n0033dx | |
| CrossMark / Productivity | |
| HP Envy 16 h0112nr | |
| Dell G16 7620 | |
| Lenovo Legion S7 16ARHA7 | |
| HP Omen 16-n0033dx | |
| CrossMark / Creativity | |
| HP Envy 16 h0112nr | |
| Dell G16 7620 | |
| Lenovo Legion S7 16ARHA7 | |
| HP Omen 16-n0033dx | |
| CrossMark / Responsiveness | |
| Dell G16 7620 | |
| HP Envy 16 h0112nr | |
| Lenovo Legion S7 16ARHA7 | |
| HP Omen 16-n0033dx | |
| PCMark 10 Score | 7205 puntos | |
ayuda | ||
| AIDA64 / Memory Copy | |
| HP Omen 16-b1090ng | |
| HP Envy 16 h0112nr | |
| Dell G16 7620 | |
| Medio AMD Ryzen 7 6800H (48209 - 51186, n=8) | |
| Lenovo Legion S7 16ARHA7 | |
| HP Omen 16-n0033dx | |
| HP Victus 16-e0145ng | |
| AIDA64 / Memory Read | |
| HP Omen 16-b1090ng | |
| HP Envy 16 h0112nr | |
| Dell G16 7620 | |
| Lenovo Legion S7 16ARHA7 | |
| HP Omen 16-n0033dx | |
| Medio AMD Ryzen 7 6800H (43828 - 51778, n=8) | |
| HP Victus 16-e0145ng | |
| AIDA64 / Memory Write | |
| HP Omen 16-b1090ng | |
| HP Envy 16 h0112nr | |
| Dell G16 7620 | |
| Lenovo Legion S7 16ARHA7 | |
| HP Omen 16-n0033dx | |
| Medio AMD Ryzen 7 6800H (51116 - 55307, n=8) | |
| HP Victus 16-e0145ng | |
| AIDA64 / Memory Latency | |
| Dell G16 7620 | |
| HP Envy 16 h0112nr | |
| HP Omen 16-b1090ng | |
| Medio AMD Ryzen 7 6800H (83.1 - 104.1, n=8) | |
| HP Omen 16-n0033dx | |
| Lenovo Legion S7 16ARHA7 | |
| HP Victus 16-e0145ng | |
* ... más pequeño es mejor
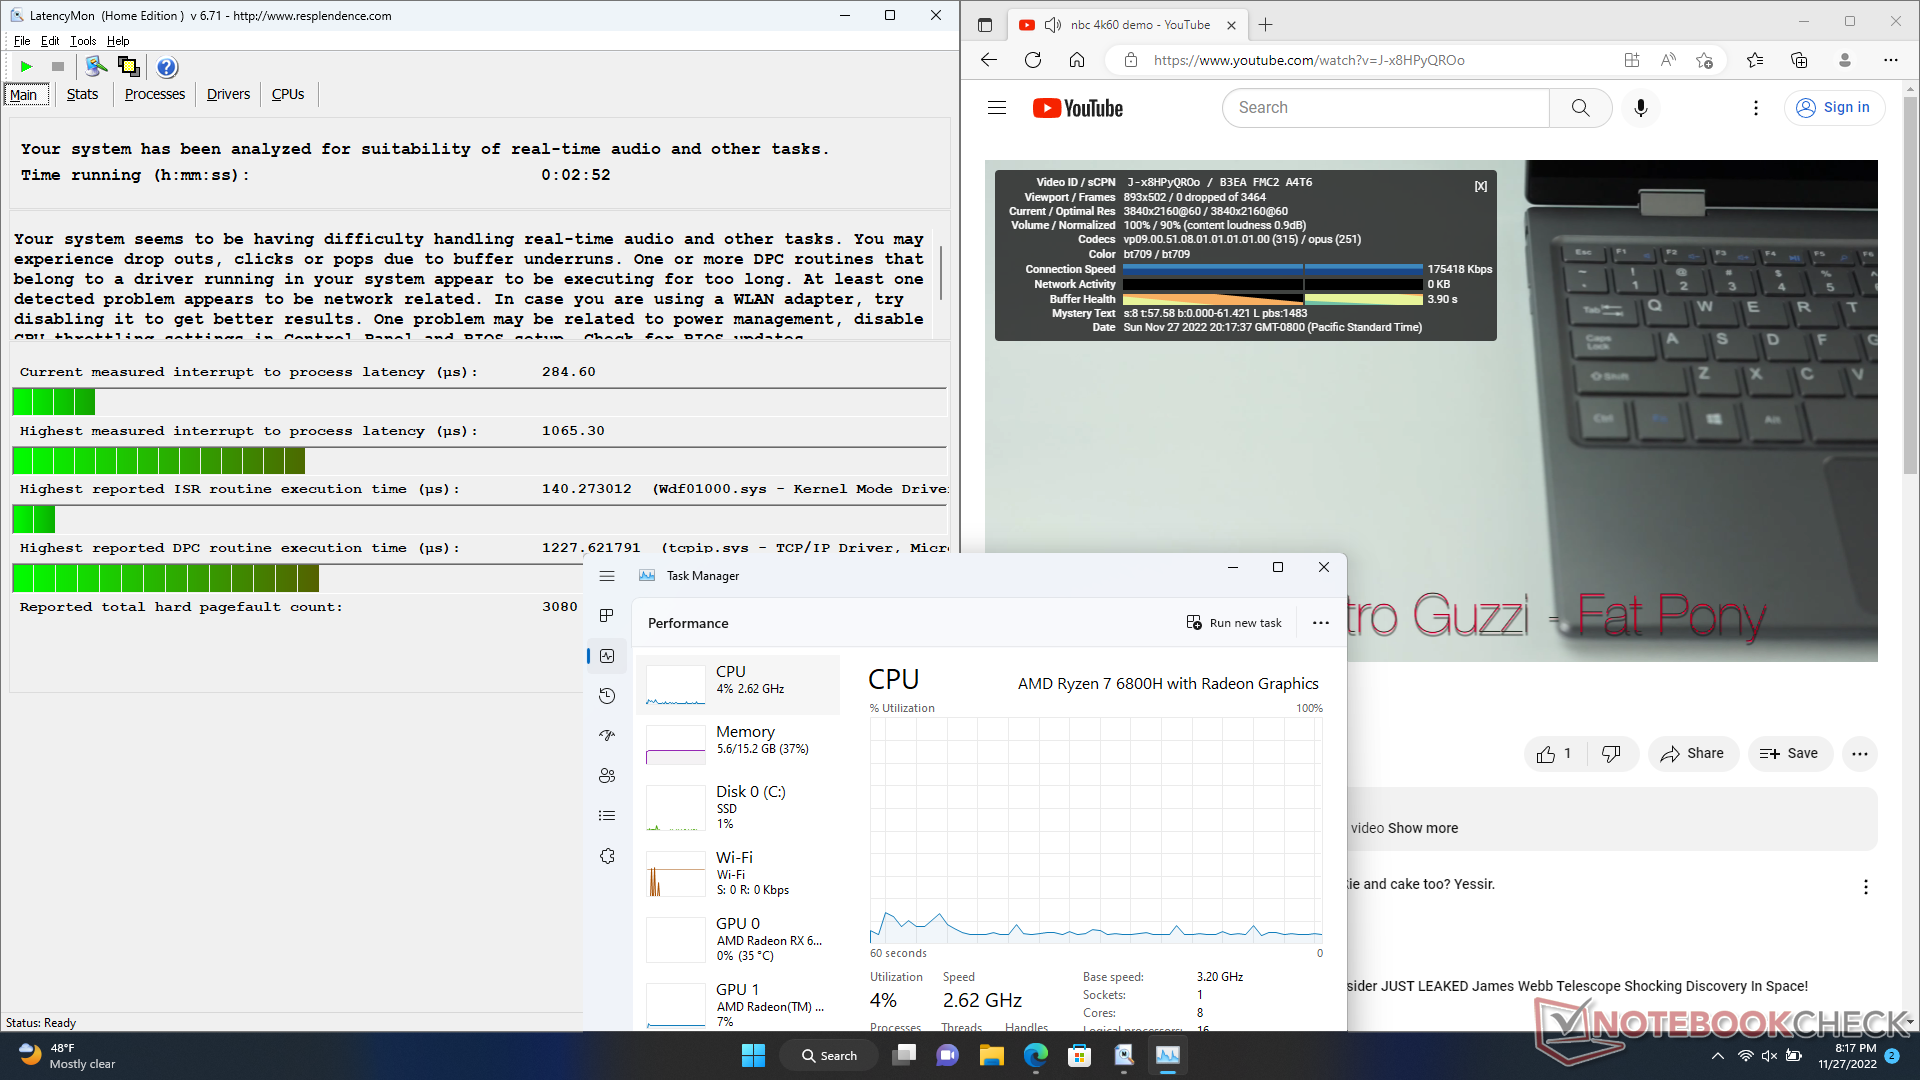
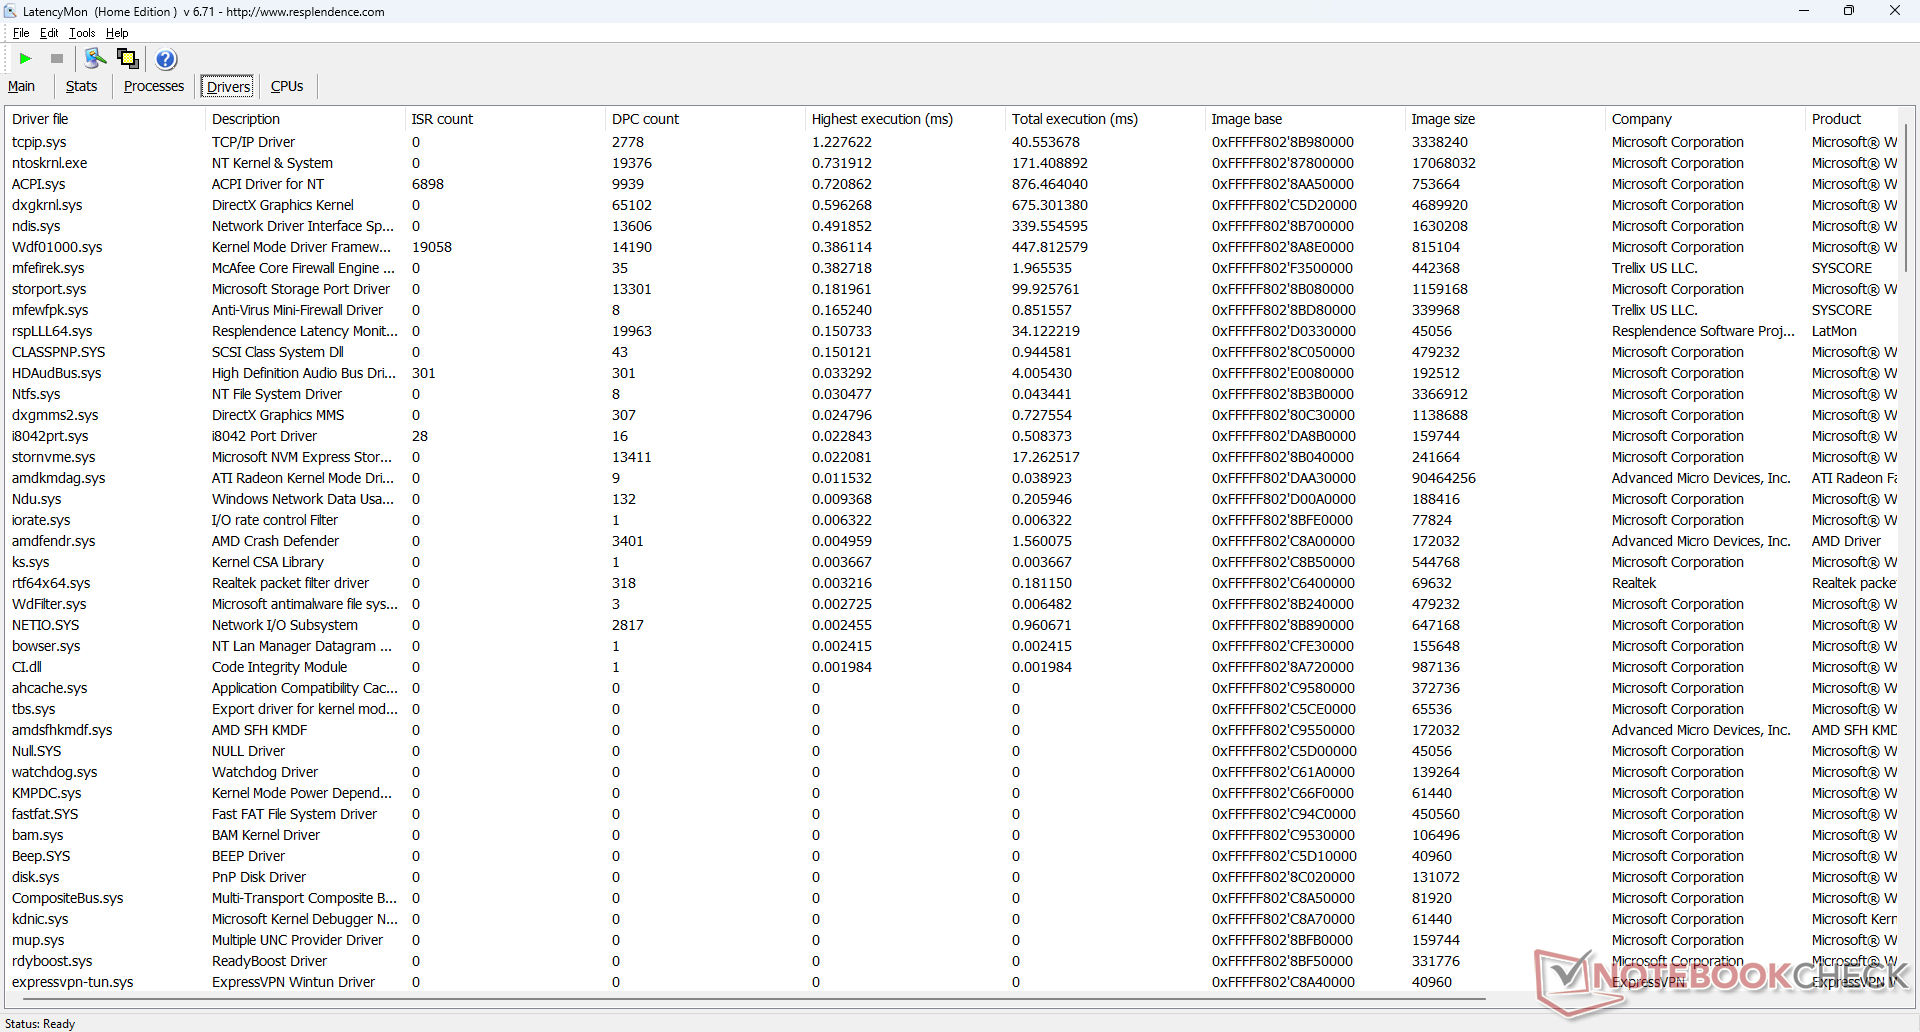
Latencia del CPD
LatencyMon revela problemas de CPD al abrir varias pestañas del navegador en nuestra página de inicio. por lo demás, la reproducción de vídeo 4K a 60 FPS es perfecta, con una baja utilización de la CPU/GPU y sin pérdida de fotogramas.
| DPC Latencies / LatencyMon - interrupt to process latency (max), Web, Youtube, Prime95 | |
| HP Omen 16-n0033dx | |
| Lenovo Legion S7 16ARHA7 | |
| Dell G16 7620 | |
| HP Victus 16-e0145ng | |
| HP Envy 16 h0112nr | |
| HP Omen 16-b1090ng | |
* ... más pequeño es mejor
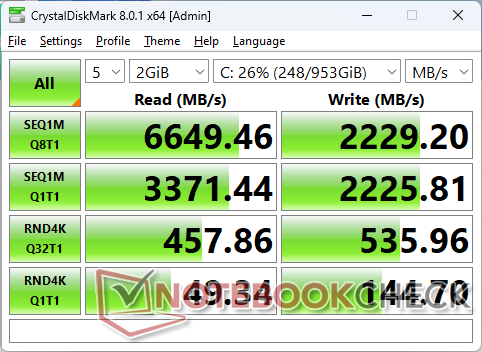
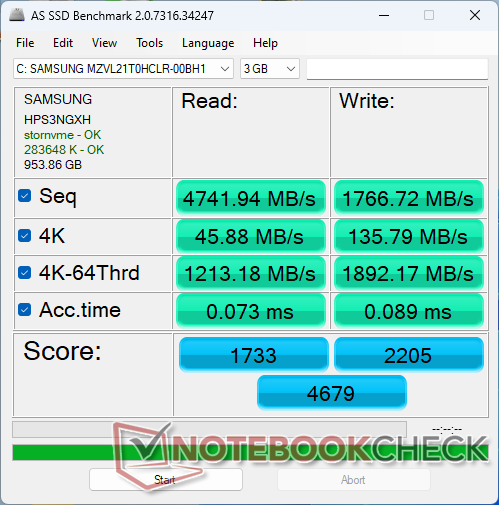
Dispositivos de almacenamiento: hasta dos SSD PCIe4 x4 NVMe
Nuestra unidad de prueba se entrega con una unidad de 1 TB Samsung PM9A1 Que promete una velocidad de lectura y escritura secuencial de 7000 MB/s y 5100 MB/s, respectivamente. El sistema es capaz de mantener una velocidad de lectura en el mundo real de unos 6700 MB/s de forma indefinida, pero la unidad ocasionalmente bajaba al rango de los 3000 MB/s antes de volver a subir, como muestran los resultados de nuestra prueba en bucle más abajo. Es probable que se trate de un error del sistema y no de una medida de estrangulamiento del rendimiento. Cada una de las dos ranuras M.2 2280 tiene su propia almohadilla térmica para disipar el calor en el panel inferior de metal, por lo que el sobrecalentamiento del SSD no debería ser un problema.

| Drive Performance rating - Percent | |
| Dell G16 7620 | |
| HP Omen 16-b1090ng | |
| Lenovo Legion S7 16ARHA7 | |
| HP Envy 16 h0112nr | |
| HP Victus 16-e0145ng | |
| HP Omen 16-n0033dx | |
* ... más pequeño es mejor
Disk Throttling: DiskSpd Read Loop, Queue Depth 8
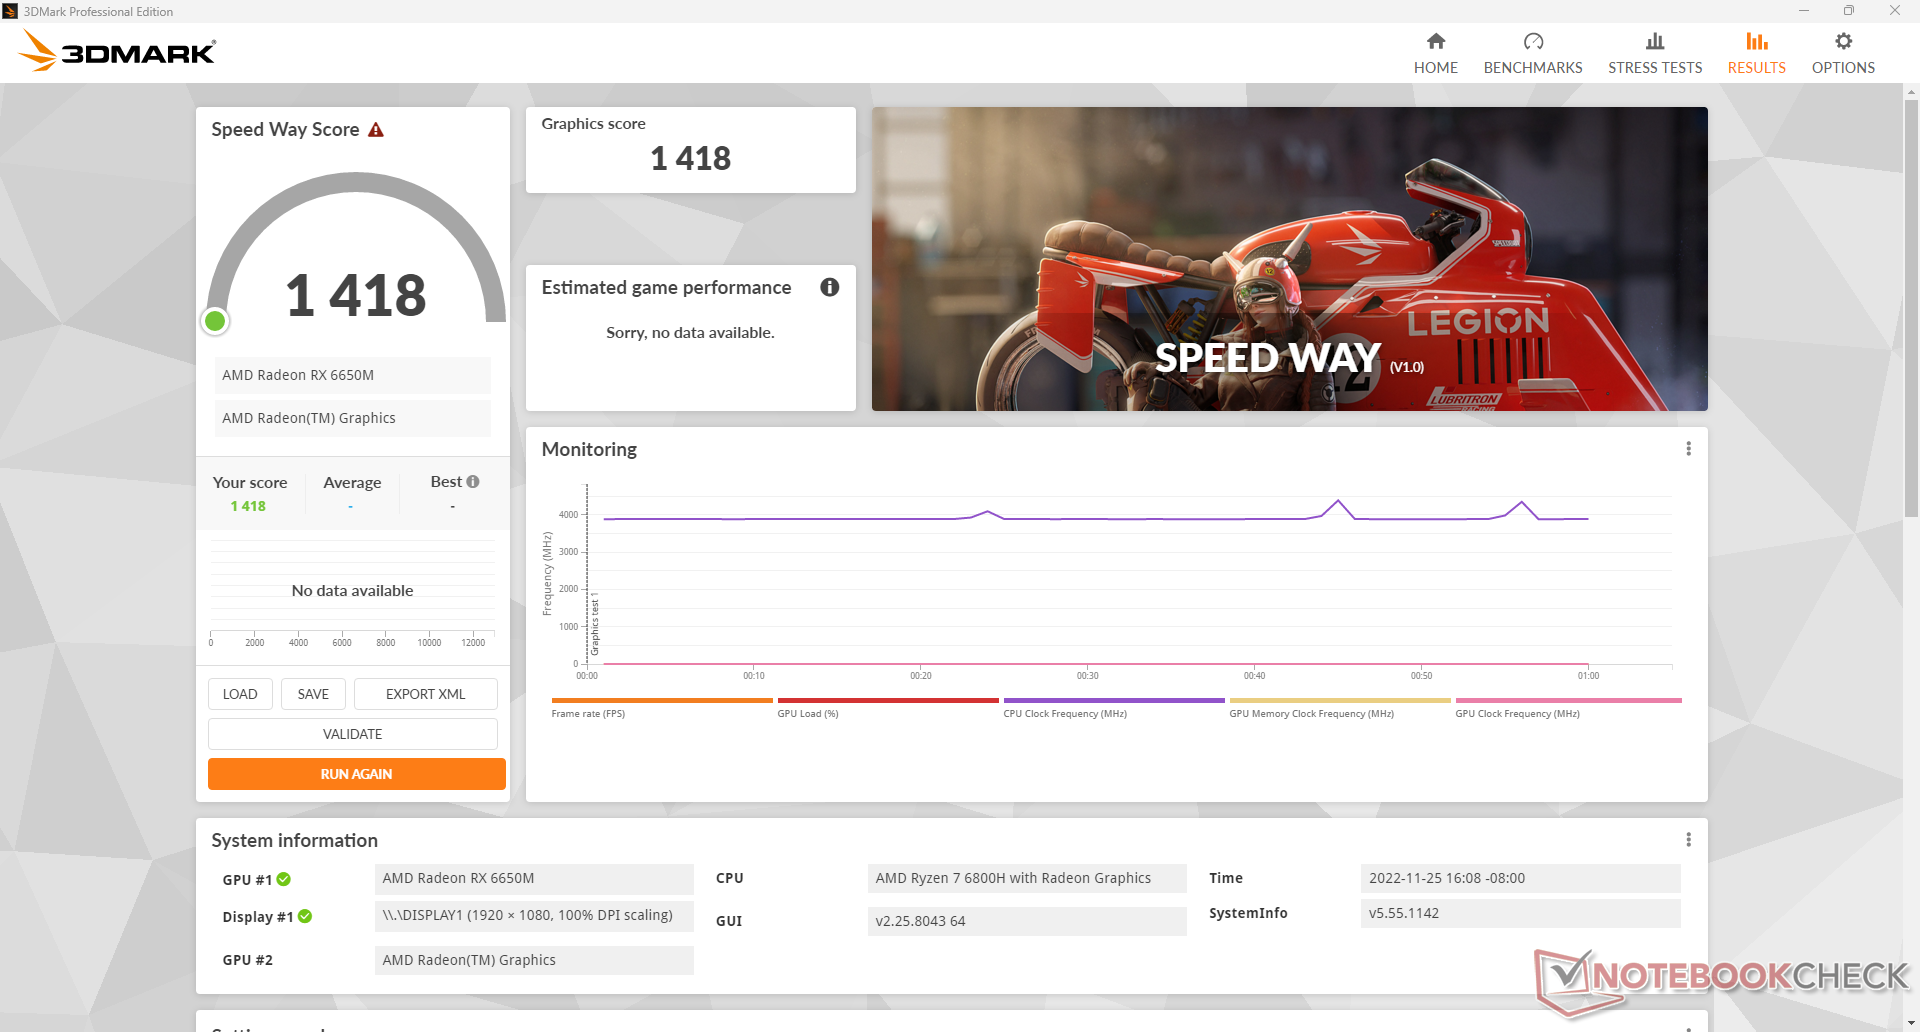
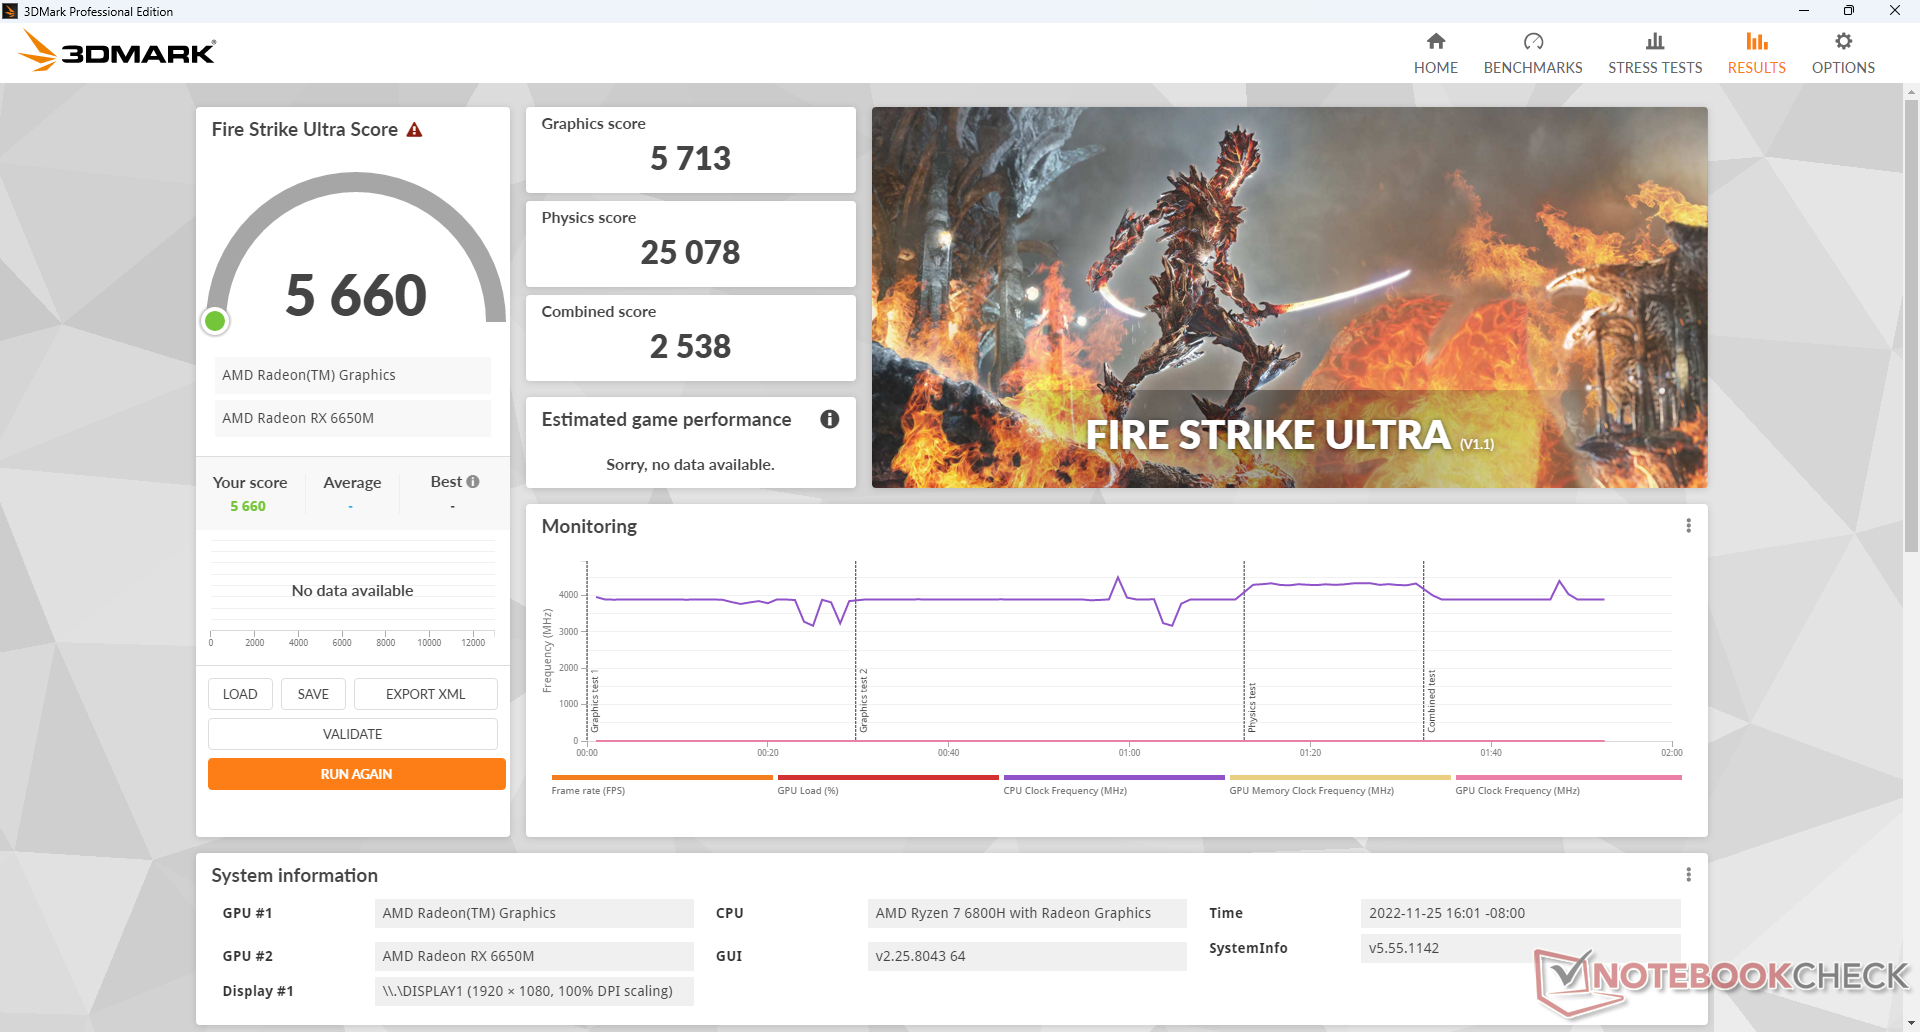
Rendimiento de la GPU: superando a la GeForce RTX 3060
La Radeon RX 6650M se sitúa entre la móvil GeForce RTX 3060 y móvil GeForce RTX 3070 cuando se trata de rendimiento. Sin embargo, lamentablemente está más cerca de la RTX 3060 que de la RTX 3070, por lo que los usuarios solo deberían esperar tasas de fotogramas que sean entre un 5 y un 10 por ciento más altas que la media de los portátiles RTX 3060 al jugar a la mayoría de los juegos.
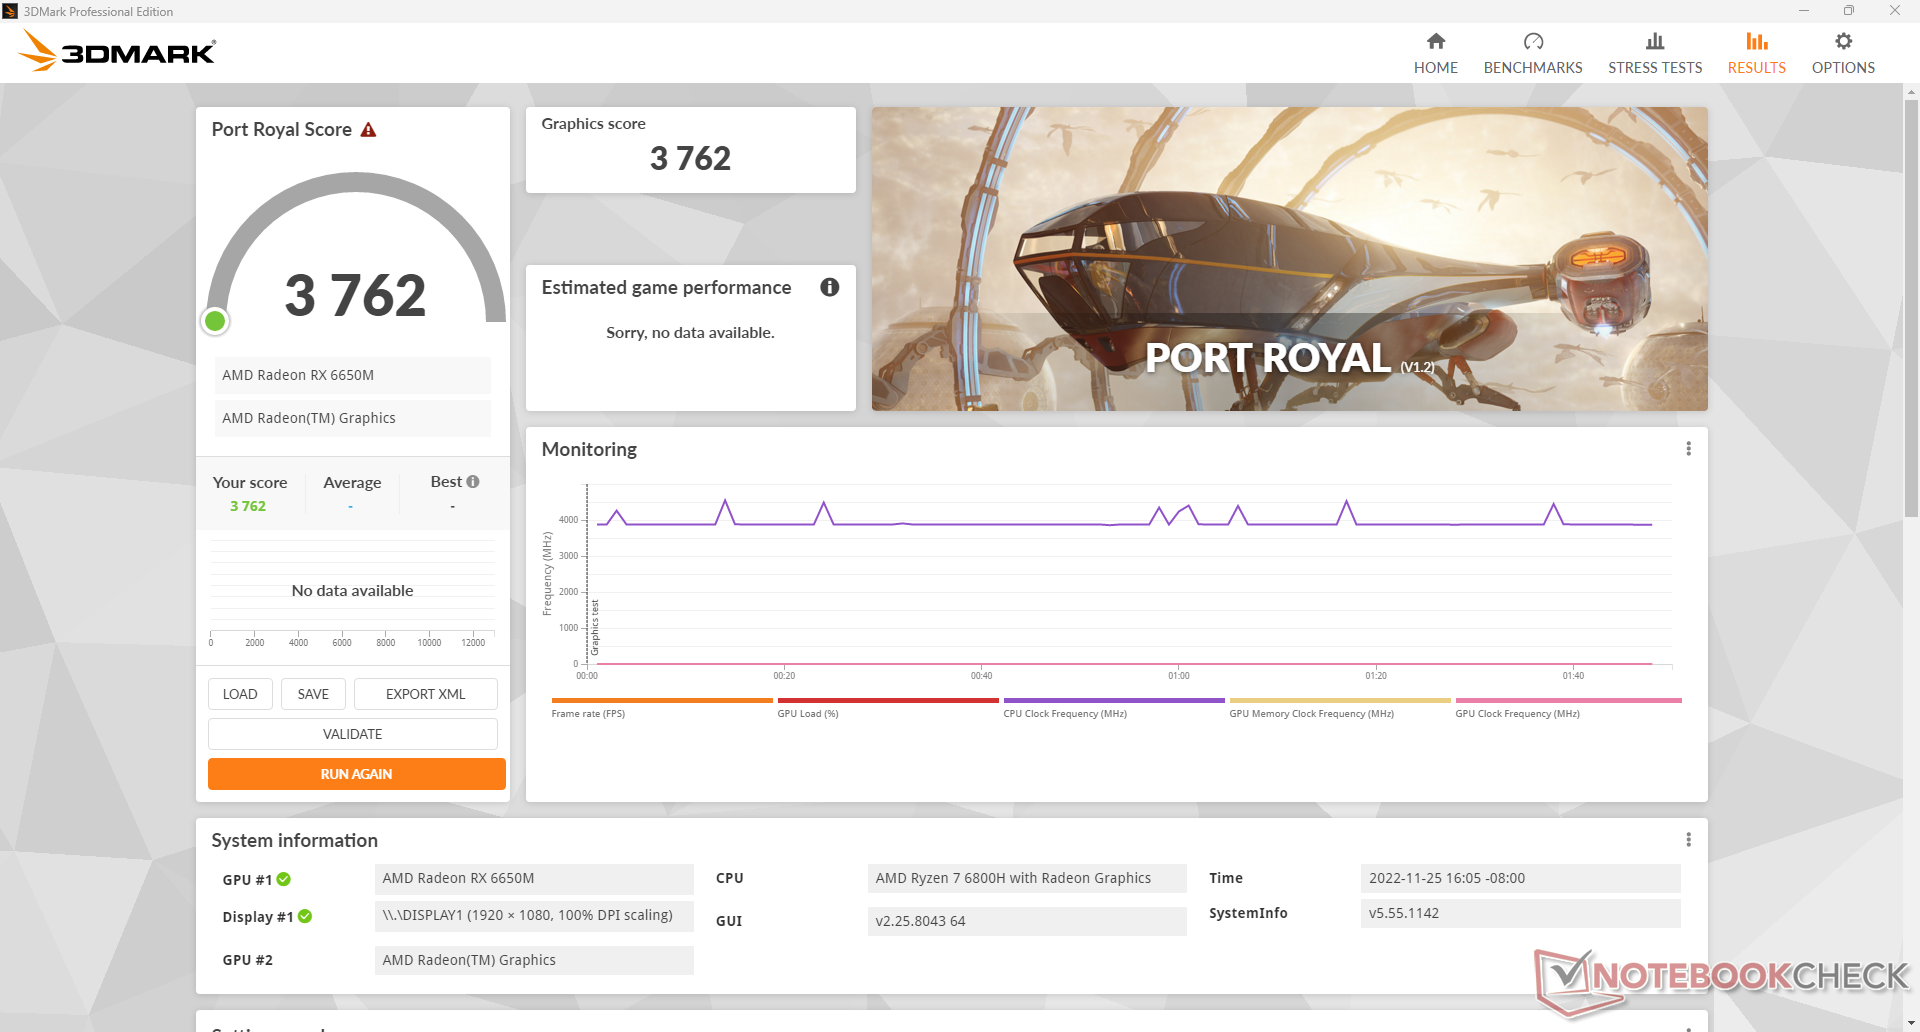
Aunque la Radeon RX 6650M supera ligeramente a los portátiles RTX 3060 en lo que respecta al rendimiento de rasterización, es significativamente más lenta en lo que respecta al rendimiento de trazado de rayos en tiempo real. los resultados de 3DMark Port Royal son casi un 30% más bajos que en el Dell G16 con la RTX 3060. Para probar esto en un juego real, ejecutamos F1 22 en la configuración de 1080p con y sin RT en nuestro portátil HP impulsado por AMD. Cuando el RT está desactivado, las velocidades de fotogramas superan sistemáticamente a las de cualquier portátil con RTX 3060. Cuando RT está desactivado, las velocidades de fotogramas caen hasta ser un 15 por ciento más lentas que las de esos mismos portátiles RTX 3060. Si el rendimiento de RT es importante para ti, entonces definitivamente querrás considerar un SKU de Nvidia en su lugar.
Ejecutar el modo equilibrado en lugar del modo de rendimiento reducirá el rendimiento de la GPU en aproximadamente un 11%.
Por desgracia, la GPU no está exenta de algunos problemas. El renderizado de Blender HIP y Horizon Zero Dawn, por ejemplo, bloquearon el programa y tuvieron problemas de lanzamiento, respectivamente, a pesar de tener los últimos controladores gráficos en el momento del análisis.
Puedes encontrar más detalles técnicos y pruebas de rendimiento en nuestra página dedicada a la Radeon RX 6650M aquí.
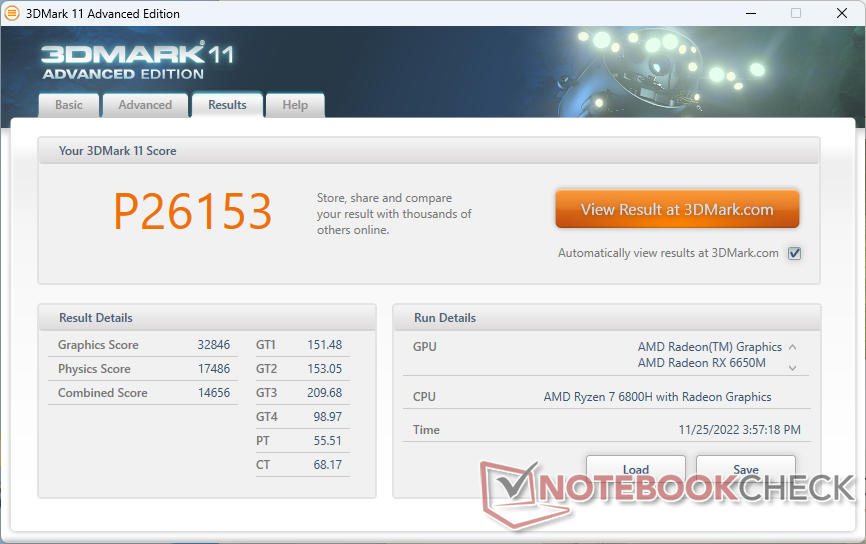
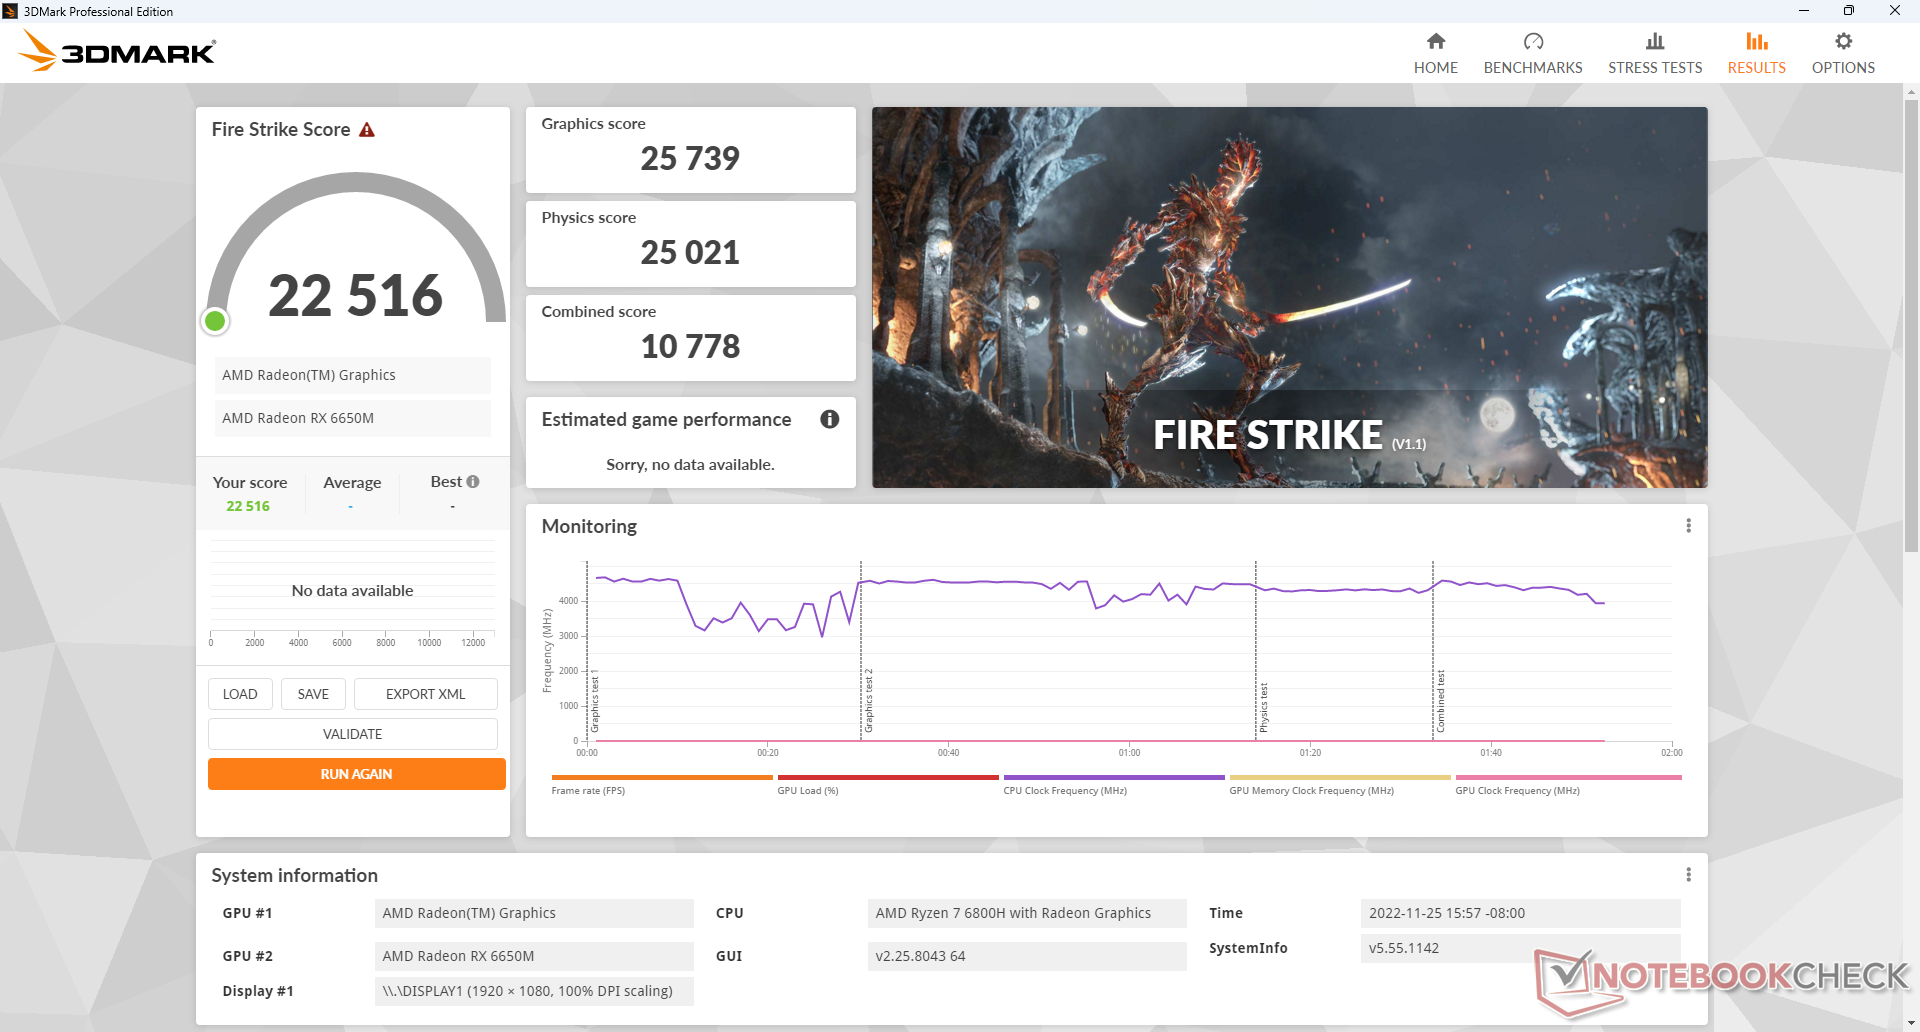
| 3DMark 11 Performance | 26153 puntos | |
| 3DMark Fire Strike Score | 22516 puntos | |
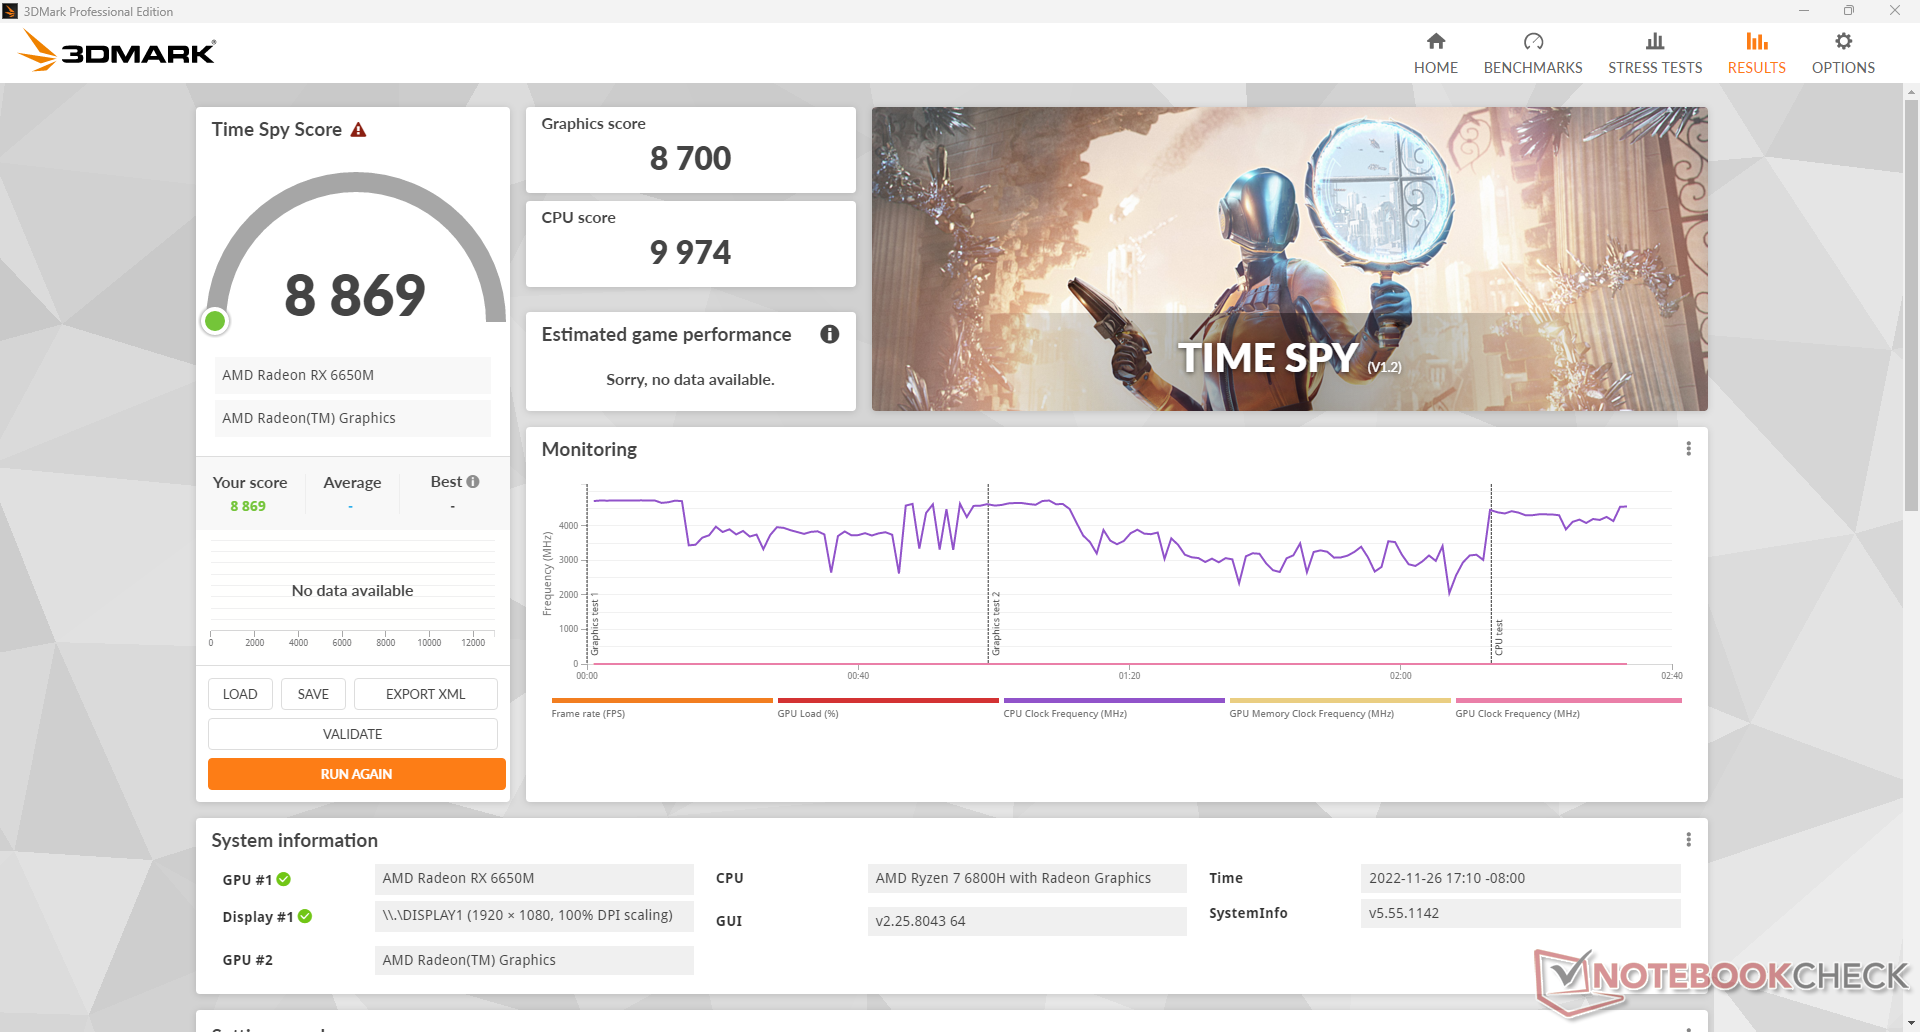
| 3DMark Time Spy Score | 8869 puntos | |
ayuda | ||
| Blender - v3.3 Classroom CPU | |
| HP Envy 16 h0112nr | |
| HP Omen 16-n0033dx | |
| Lenovo Legion S7 16ARHA7 | |
| Dell G16 7620 | |
| Lenovo Legion 7 16IAX7-82TD004SGE | |
* ... más pequeño es mejor
La velocidad de fotogramas en reposo en Witcher 3 es generalmente estable, salvo una breve caída a 13 FPS. Esto podría deberse a un error o a una mala priorización de la actividad en segundo plano, similar a las caídas de rendimiento que observamos anteriormente al probar el SSD.
Witcher 3 FPS Chart
| bajo | medio | alto | ultra | |
|---|---|---|---|---|
| The Witcher 3 (2015) | 276.5 | 217.4 | 167 | 90.1 |
| Dota 2 Reborn (2015) | 141 | 130.7 | 118 | 100 |
| Overwatch (2016) | 507.9 | 481.9 | 350.9 | 150 |
| Fortnite (2018) | 95.5 | 54.1 | 46 | 40.4 |
| Final Fantasy XV Benchmark (2018) | 164.7 | 113.3 | 83.2 | |
| X-Plane 11.11 (2018) | 66.4 | 52.7 | 46.4 | |
| Strange Brigade (2018) | 337 | 222 | 190 | 167.2 |
| Metro Exodus (2019) | 138.8 | 111.5 | 81 | 65.8 |
| Borderlands 3 (2019) | 110.4 | 95.9 | 85.2 | 67.4 |
| Gears Tactics (2020) | 162.8 | 205.9 | 124.2 | 100.4 |
| Watch Dogs Legion (2020) | 109 | 104 | 94 | 62 |
| Dirt 5 (2020) | 236.6 | 135.4 | 109.1 | 83.6 |
| Hitman 3 (2021) | 224.8 | 178.8 | 165.5 | 156.3 |
| F1 2021 (2021) | 315 | 247 | 216 | 100 |
| Far Cry 6 (2021) | 111 | 105 | 96 | 88 |
| Guardians of the Galaxy (2021) | 117 | 110 | 111 | 105 |
| God of War (2022) | 69.3 | 68.4 | 64.3 | 51.5 |
| Cyberpunk 2077 1.6 (2022) | 126.8 | 106.3 | 78.9 | 63.8 |
| F1 22 (2022) | 217 | 215 | 178.2 | 40.6 |
Emisiones
Ruido del sistema - Alto en el modo de rendimiento
Los ventiladores internos están siempre activos a un bajo de 27 dB(A) contra un fondo silencioso de 24 dB(A). Sin embargo, son buenos para permanecer silenciosos durante largos periodos de estrés, por lo que los pulsos de RPM ocurren con mucha menos frecuencia cuando se navega por la web o se hace streaming de vídeo.
El ruido del ventilador está ligado al perfil de potencia cuando se juega. Si se ejecuta Witcher 3 en el modo equilibrado, por ejemplo, el ruido del ventilador es de sólo 39,4 dB(A) frente a 54,1 dB(A) en el modo de rendimiento. El rango medio de 50 dB(A) es notablemente más ruidoso que en el Dell G16 en condiciones similares. Los usuarios deben soportar los ventiladores mucho más ruidosos si desean ejecutar la GPU en su objetivo TGP más alto.
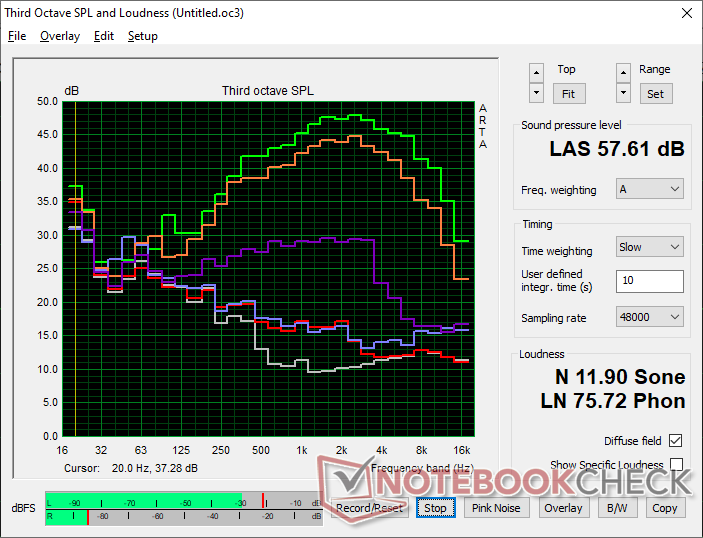
Ruido
| Ocioso |
| 27.4 / 27.4 / 28.9 dB(A) |
| Carga |
| 32.3 / 57.6 dB(A) |
 | ||
30 dB silencioso 40 dB(A) audible 50 dB(A) ruidosamente alto |
||
min: | ||
| HP Omen 16-n0033dx Radeon RX 6650M, R7 6800H, Samsung PM9A1 MZVL21T0HCLR | HP Envy 16 h0112nr GeForce RTX 3060 Laptop GPU, i7-12700H, Micron 3400 1TB MTFDKBA1T0TFH | HP Omen 16-b1090ng GeForce RTX 3070 Ti Laptop GPU, i7-12700H, WDC PC SN810 1TB | HP Victus 16-e0145ng GeForce RTX 3050 Ti Laptop GPU, R5 5600H, Samsung SSD PM981a MZVLB512HBJQ | Lenovo Legion S7 16ARHA7 Radeon RX 6800S, R9 6900HX, SK Hynix HFS001TEJ9X115N | Dell G16 7620 GeForce RTX 3060 Laptop GPU, i7-12700H, WDC PC SN810 512GB | |
|---|---|---|---|---|---|---|
| Noise | 3% | -13% | -6% | 11% | 3% | |
| apagado / medio ambiente * (dB) | 24.2 | 22.8 6% | 26 -7% | 26 -7% | 23.1 5% | 23.2 4% |
| Idle Minimum * (dB) | 27.4 | 22.9 16% | 30 -9% | 26 5% | 23.1 16% | 28.3 -3% |
| Idle Average * (dB) | 27.4 | 22.9 16% | 31 -13% | 28 -2% | 23.1 16% | 28.8 -5% |
| Idle Maximum * (dB) | 28.9 | 30.5 -6% | 33 -14% | 34 -18% | 23.1 20% | 28.9 -0% |
| Load Average * (dB) | 32.3 | 41.4 -28% | 49 -52% | 44 -36% | 31.4 3% | 32.4 -0% |
| Witcher 3 ultra * (dB) | 54.1 | 51.1 6% | 53 2% | 48 11% | 51.4 5% | 48.3 11% |
| Load Maximum * (dB) | 57.6 | 51.4 11% | 57 1% | 53 8% | 51.2 11% | 48.1 16% |
* ... más pequeño es mejor
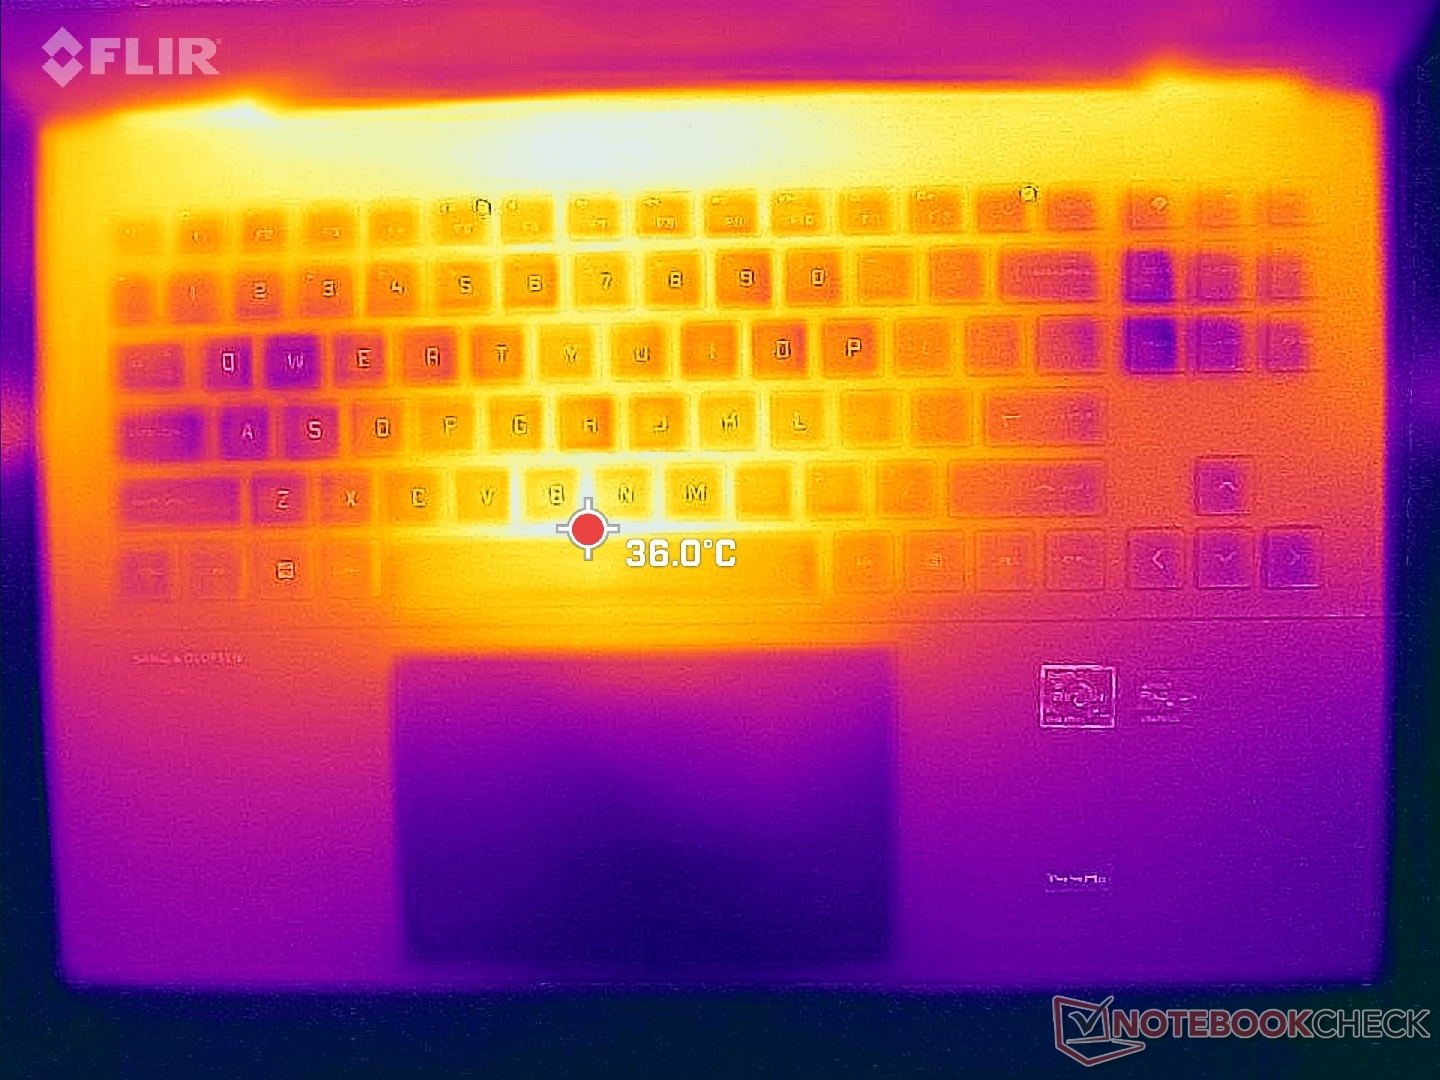
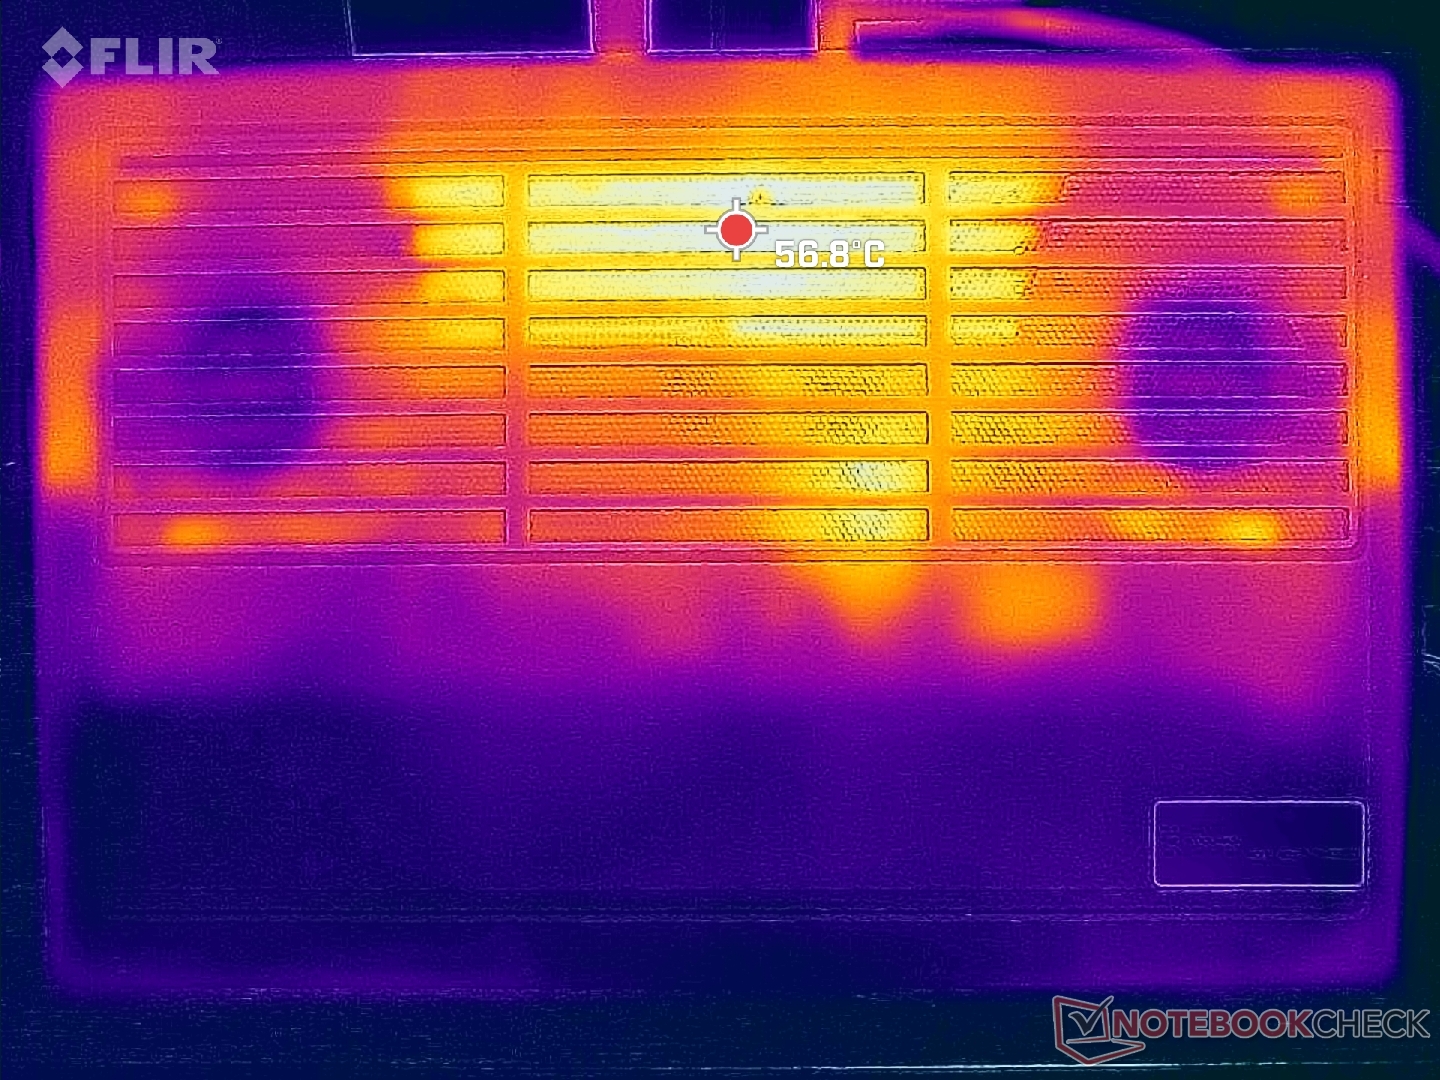
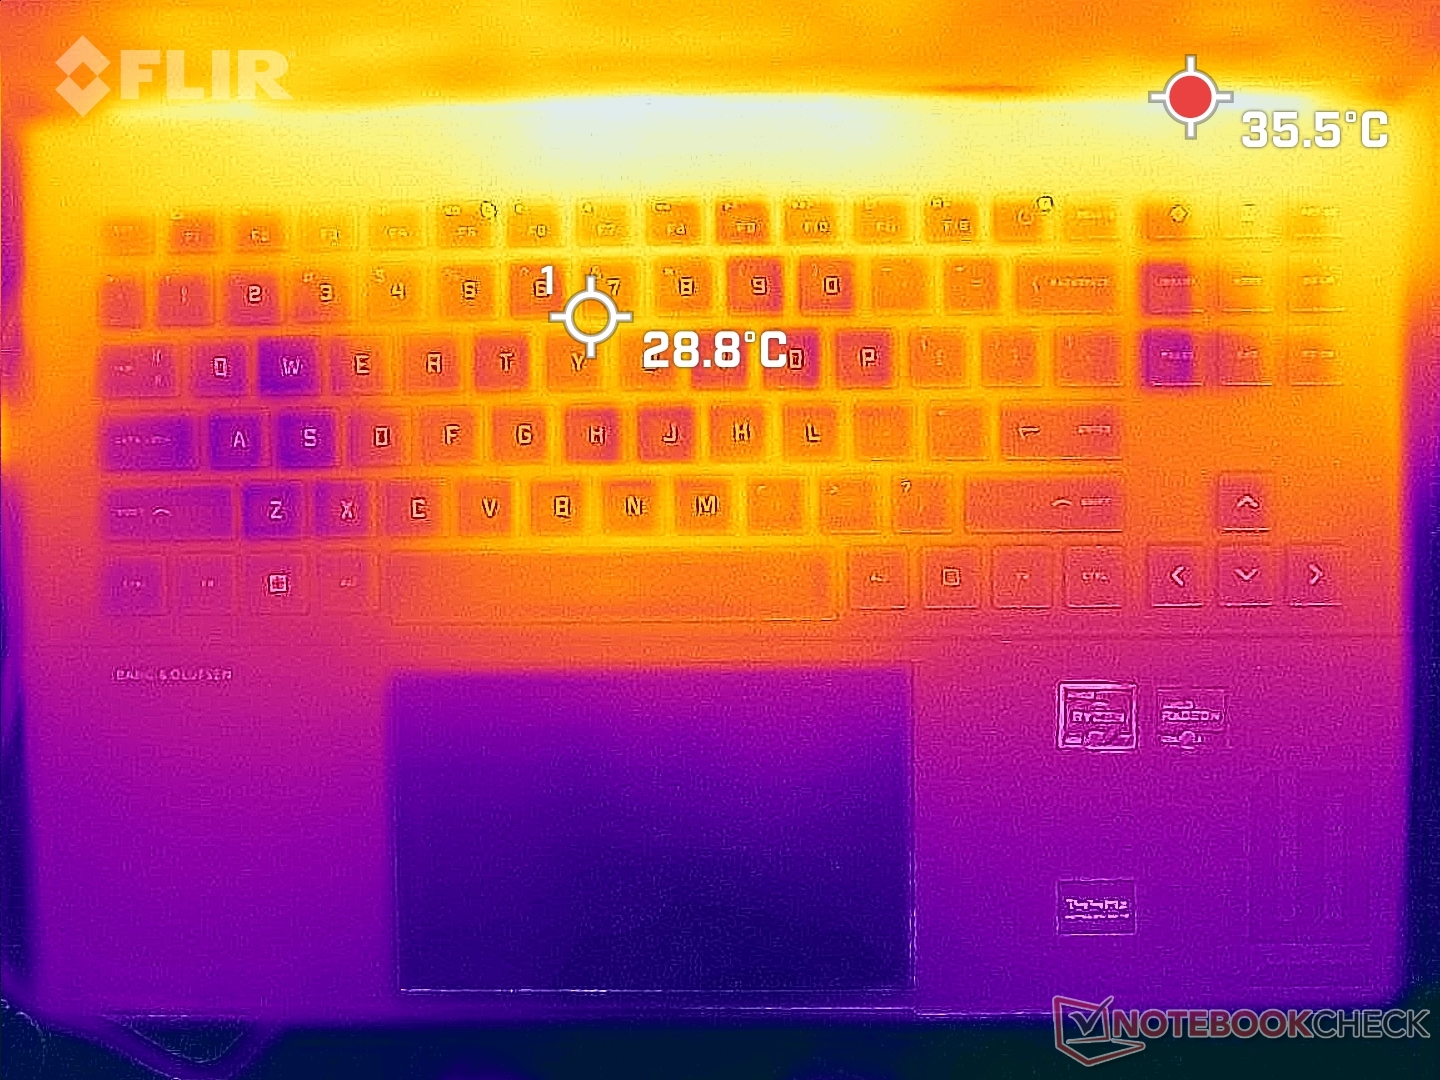
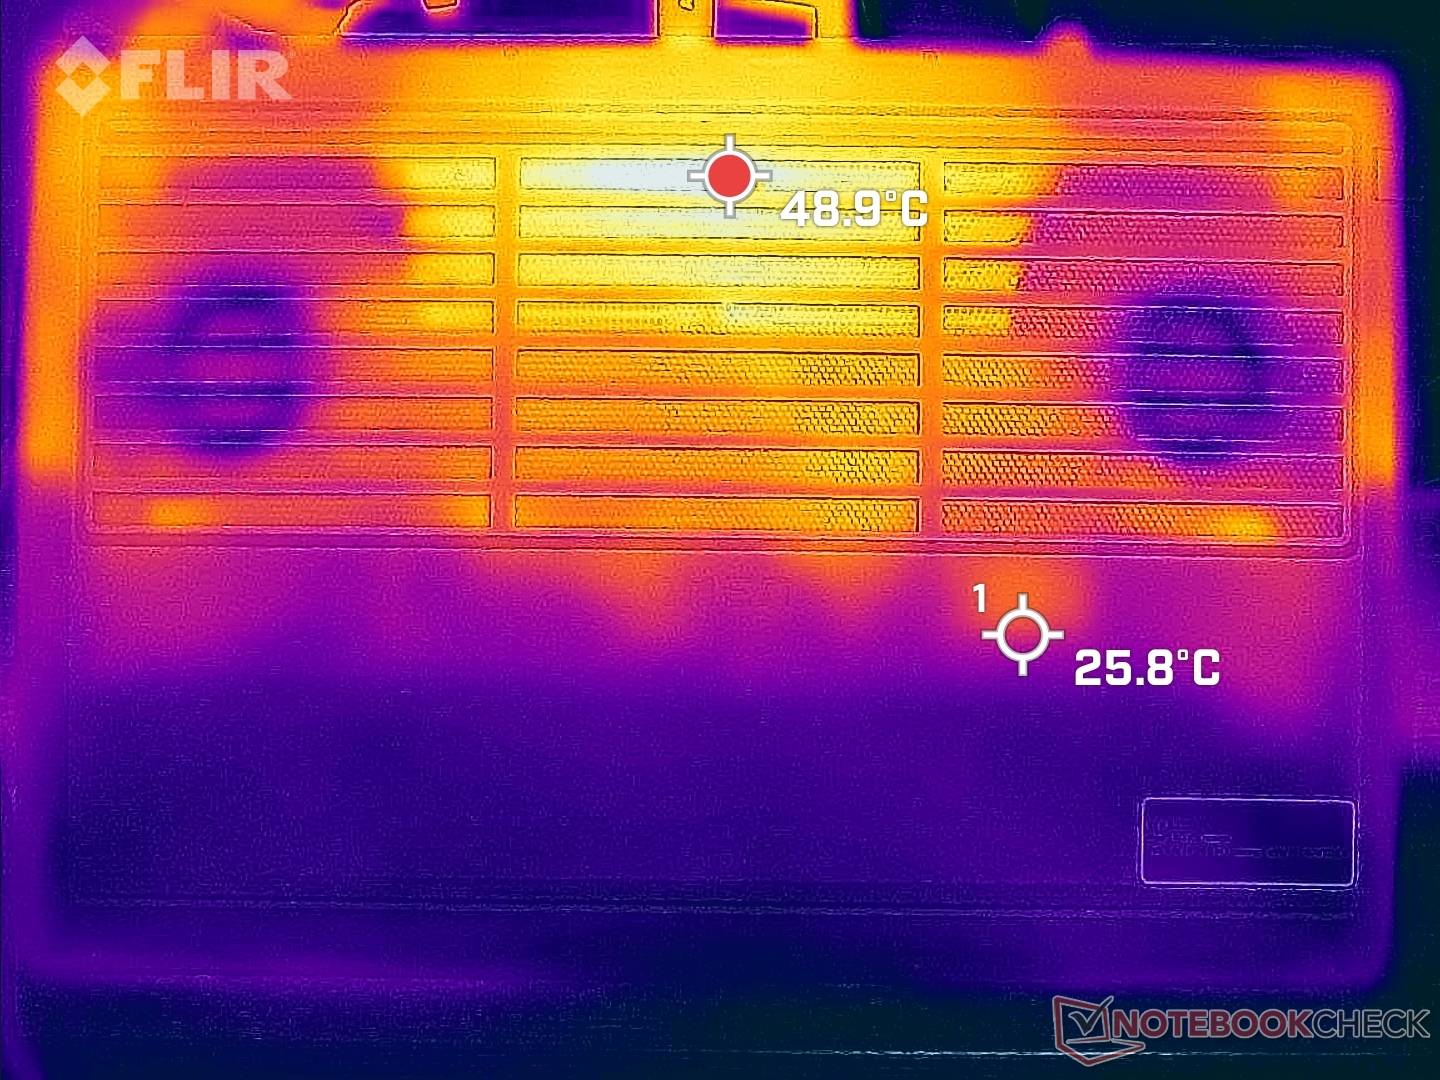
Temperatura
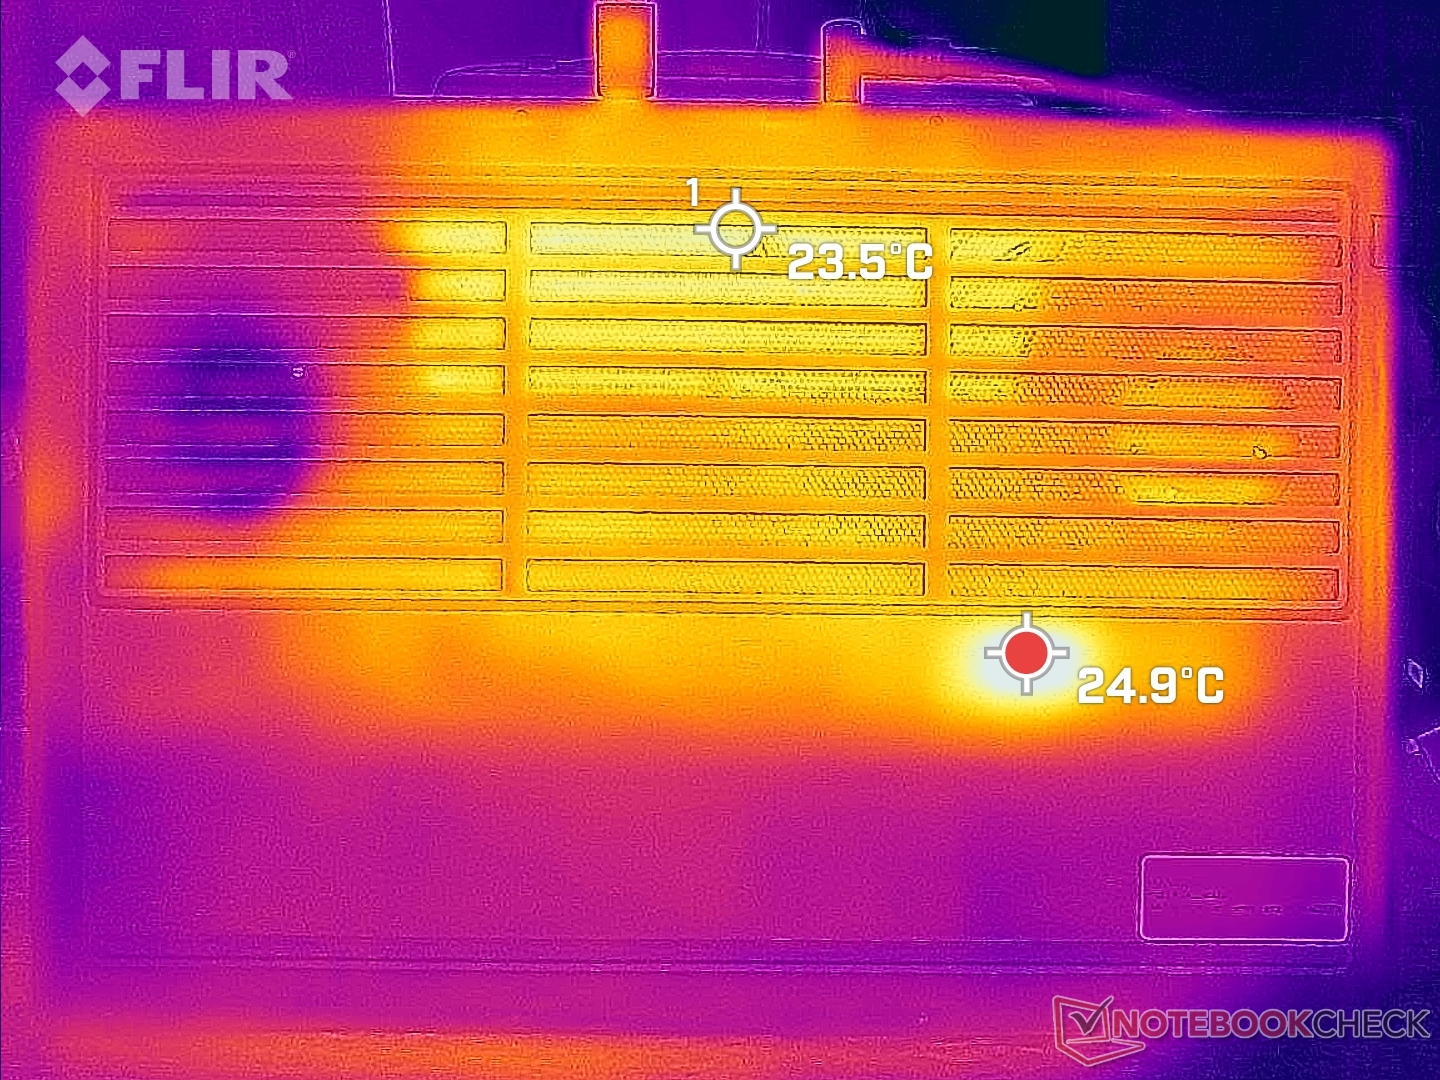
Las temperaturas de la superficie son mucho más frías en la cubierta del teclado en comparación con la cubierta inferior. Los puntos calientes en la parte superior alcanzan unos 40 C cuando se juega, en comparación con más de 50 C en la parte inferior. El Omen 16 con tecnología Intel puede ser incluso más cálido, hasta 60 C, en condiciones similares. Estos puntos calientes se encuentran hacia la parte trasera del chasis, donde es poco probable que los dedos y las palmas toquen.
Ten en cuenta que la mayor parte de la parte inferior y trasera del modelo está dedicada a la refrigeración. puede ser fácil bloquear accidentalmente las rejillas de ventilación si no tienes cuidado.
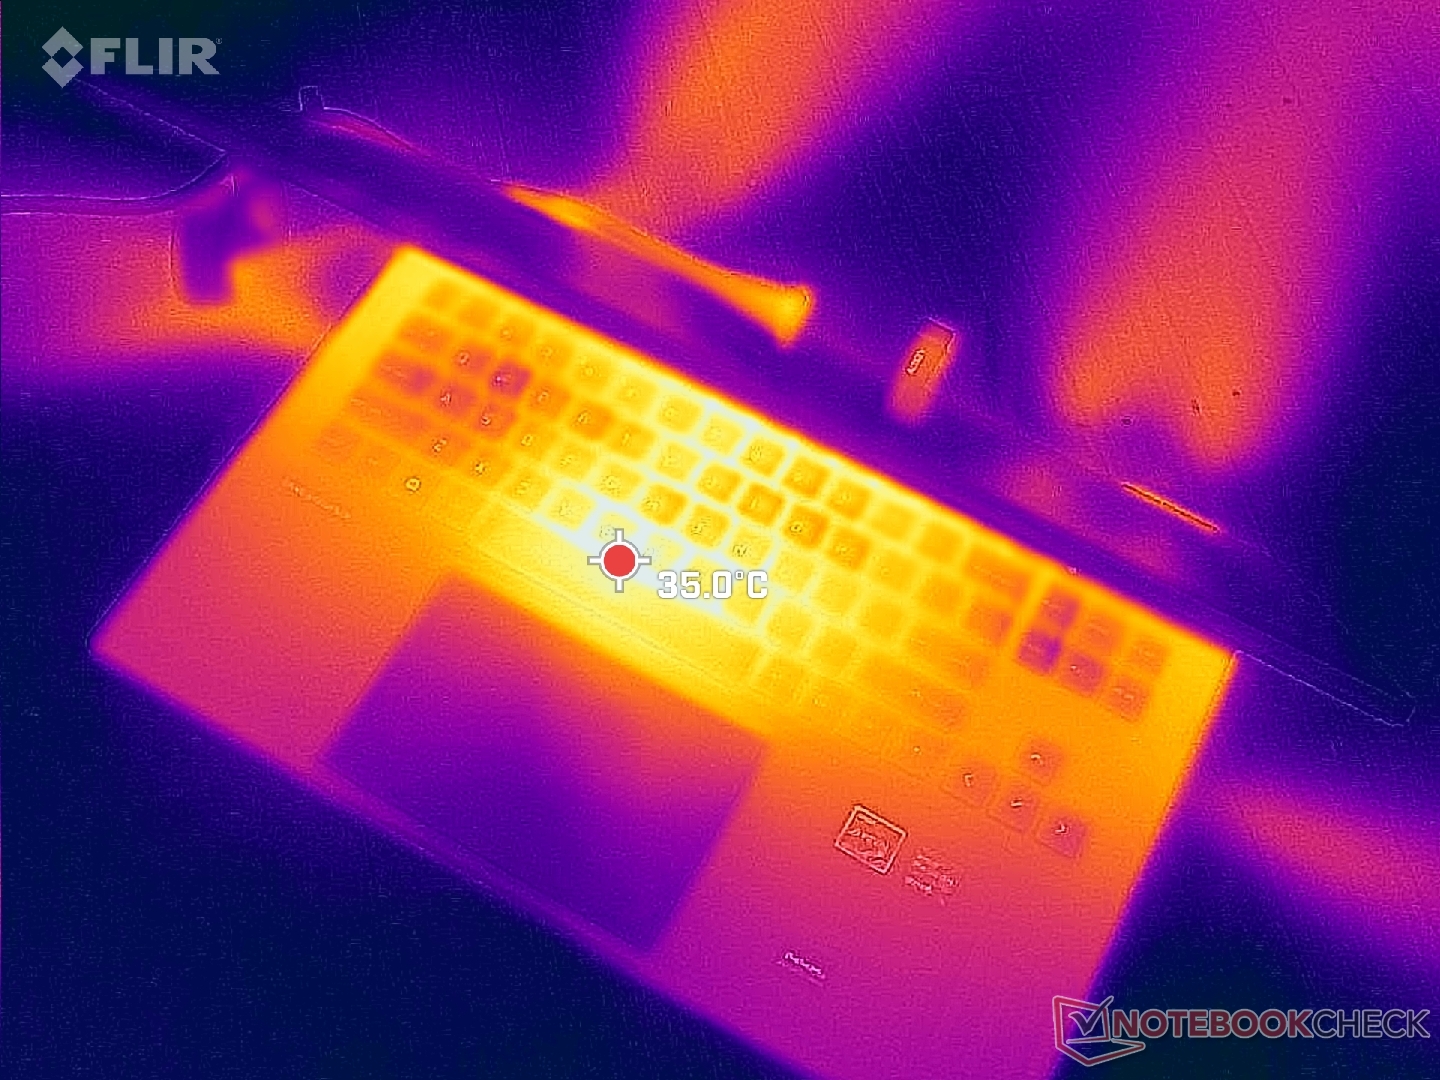
(±) La temperatura máxima en la parte superior es de 41.2 °C / 106 F, frente a la media de 40.4 °C / 105 F, que oscila entre 21.2 y 68.8 °C para la clase Gaming.
(-) El fondo se calienta hasta un máximo de 53.2 °C / 128 F, frente a la media de 43.2 °C / 110 F
(+) En reposo, la temperatura media de la parte superior es de 24.4 °C / 76# F, frente a la media del dispositivo de 33.9 °C / 93 F.
(±) Jugando a The Witcher 3, la temperatura media de la parte superior es de 32.3 °C / 90 F, frente a la media del dispositivo de 33.9 °C / 93 F.
(+) El reposamanos y el panel táctil están a una temperatura inferior a la de la piel, con un máximo de 26.2 °C / 79.2 F y, por tanto, son fríos al tacto.
(+) La temperatura media de la zona del reposamanos de dispositivos similares fue de 28.8 °C / 83.8 F (+2.6 °C / 4.6 F).
| HP Omen 16-n0033dx AMD Ryzen 7 6800H, AMD Radeon RX 6650M | HP Envy 16 h0112nr Intel Core i7-12700H, NVIDIA GeForce RTX 3060 Laptop GPU | HP Omen 16-b1090ng Intel Core i7-12700H, NVIDIA GeForce RTX 3070 Ti Laptop GPU | HP Victus 16-e0145ng AMD Ryzen 5 5600H, NVIDIA GeForce RTX 3050 Ti Laptop GPU | Lenovo Legion S7 16ARHA7 AMD Ryzen 9 6900HX, AMD Radeon RX 6800S | Dell G16 7620 Intel Core i7-12700H, NVIDIA GeForce RTX 3060 Laptop GPU | |
|---|---|---|---|---|---|---|
| Heat | -9% | -2% | -22% | -2% | 2% | |
| Maximum Upper Side * (°C) | 41.2 | 45.2 -10% | 41 -0% | 54 -31% | 46.6 -13% | 47.6 -16% |
| Maximum Bottom * (°C) | 53.2 | 44 17% | 62 -17% | 47 12% | 50.8 5% | 54 -2% |
| Idle Upper Side * (°C) | 26.4 | 33.6 -27% | 25 5% | 41 -55% | 26.4 -0% | 23 13% |
| Idle Bottom * (°C) | 27.8 | 32.6 -17% | 26 6% | 31 -12% | 27.2 2% | 24.6 12% |
* ... más pequeño es mejor
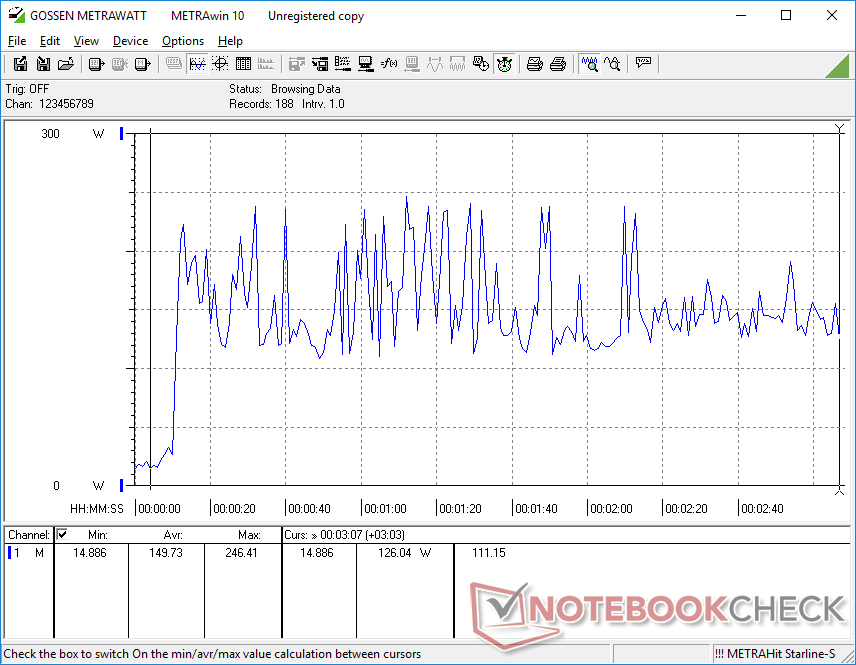
Prueba de esfuerzo
Cuando se estresa con Prime95, la CPU se eleva a 4,4 GHz y 93 W durante un par de segundos antes de caer y estabilizarse en 3,7 GHz y 64 W. Las velocidades de reloj máximas son, por tanto, de corta duración en el Omen 16. Repitiendo esta misma prueba en elLenovo Legion 5 Pro Gen 7 con la misma CPU Ryzen 7 6800H resultaría en una velocidad de reloj estable más alta y una temperatura de 4.1 GHz y 93 C, respectivamente, comparado con sólo 3.7 GHz y 78 C en nuestro HP.
Cuando se ejecuta Witcher 3 en modo Rendimiento para representar las cargas típicas de los juegos, la GPU se estabilizaría a 2516 MHz, 80 C y 103 W. Bajar al modo Equilibrado daría como resultado un reloj de GPU más bajo de 2178 MHz y un TGP más bajo de 72 W pero sin cambios significativos en la temperatura del núcleo. Por tanto, los usuarios deben recordar que deben activar el modo Rendimiento a través del software Omen Gaming Hub para poder aprovechar al máximo la GPU.
El funcionamiento con baterías limita el rendimiento. Una prueba de Fire Strike con baterías arroja unas puntuaciones de Física y Gráficos de sólo 21063 y 5722 puntos, respectivamente, frente a los 25021 y 25739 puntos de la red eléctrica.
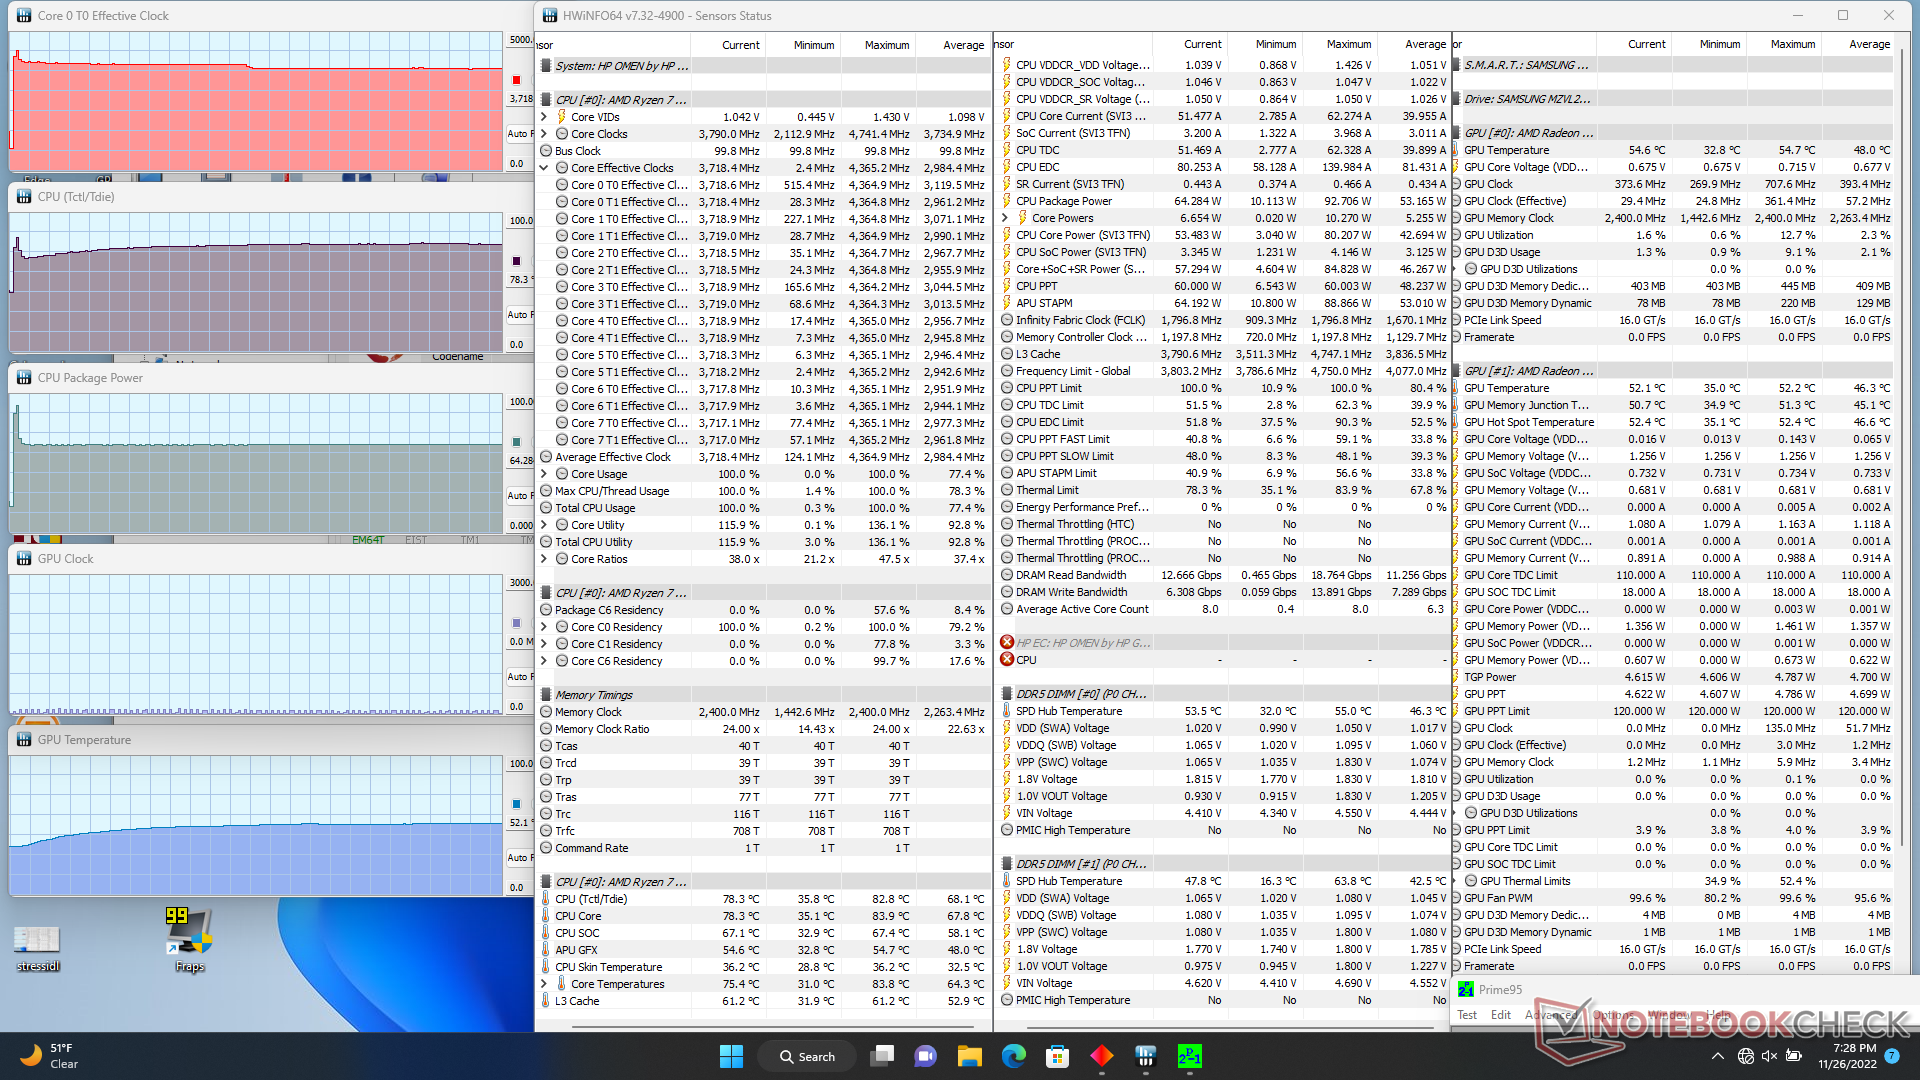
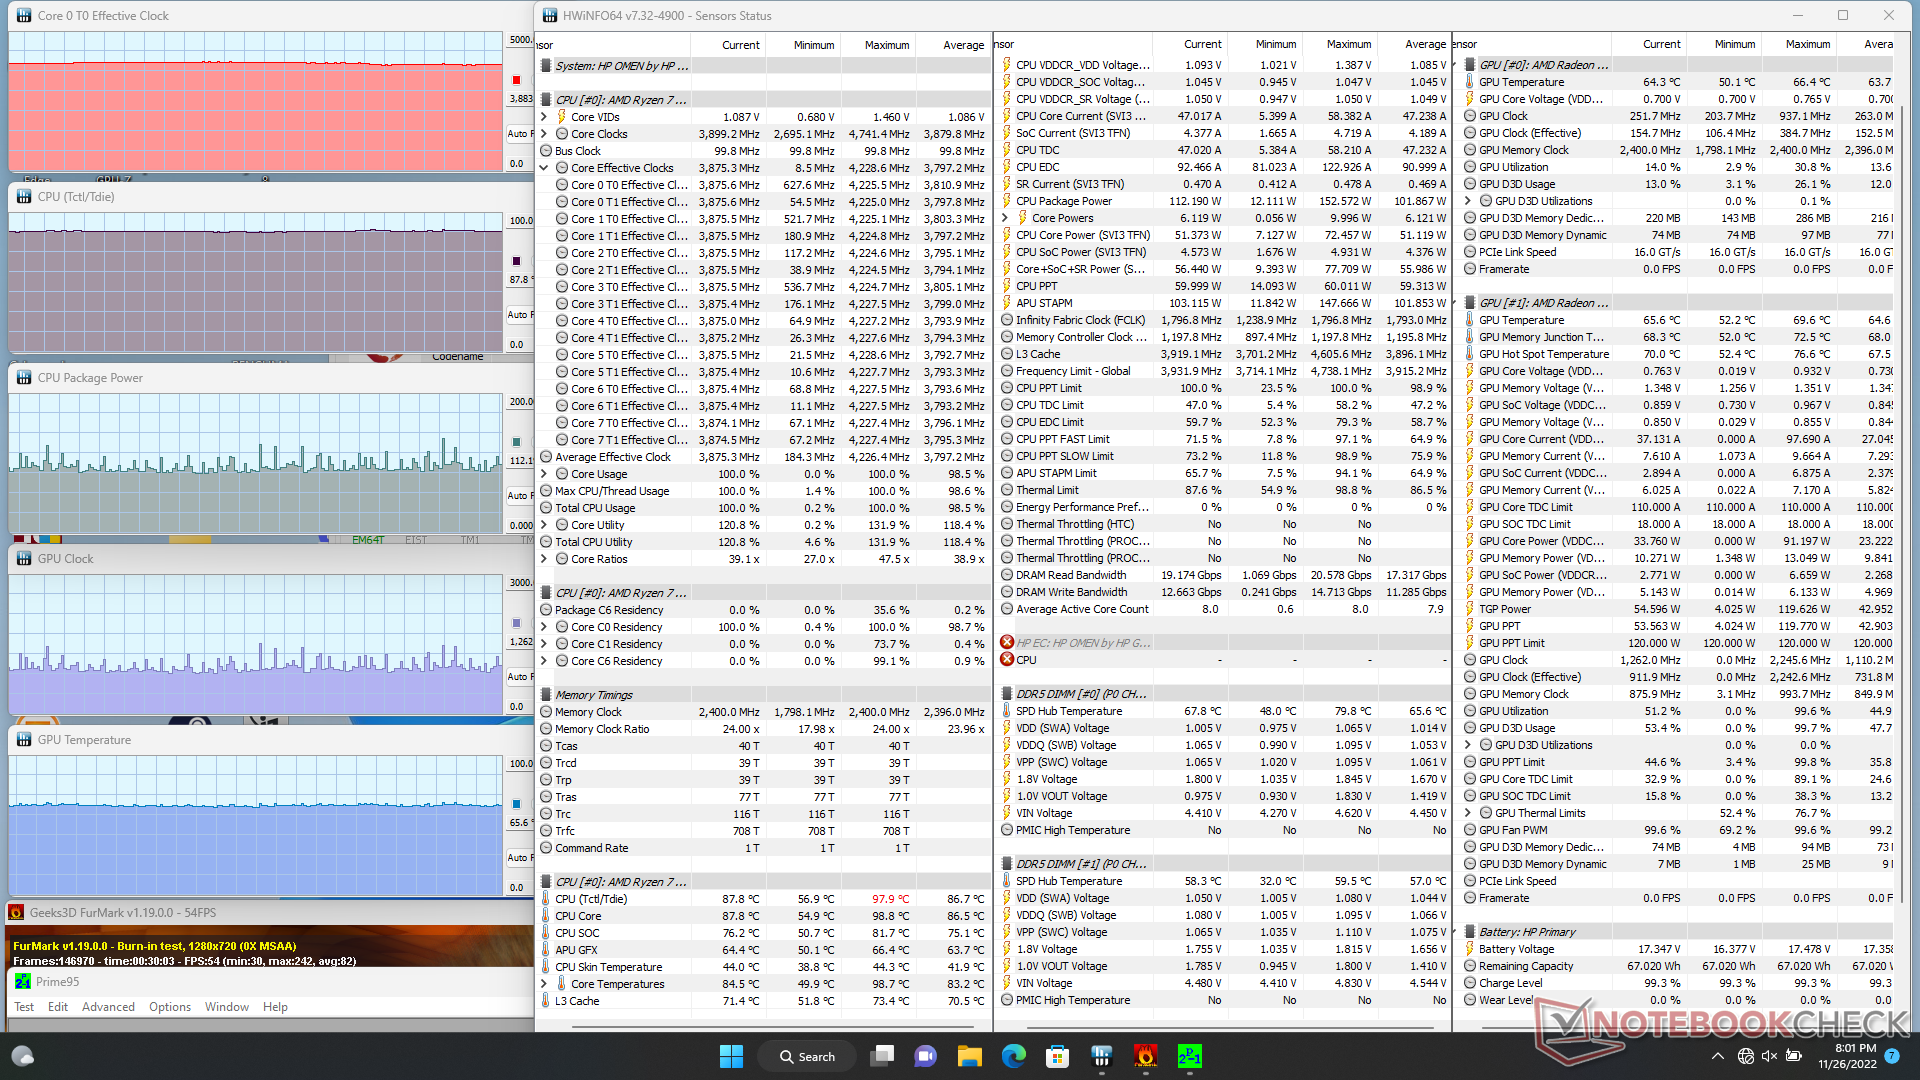
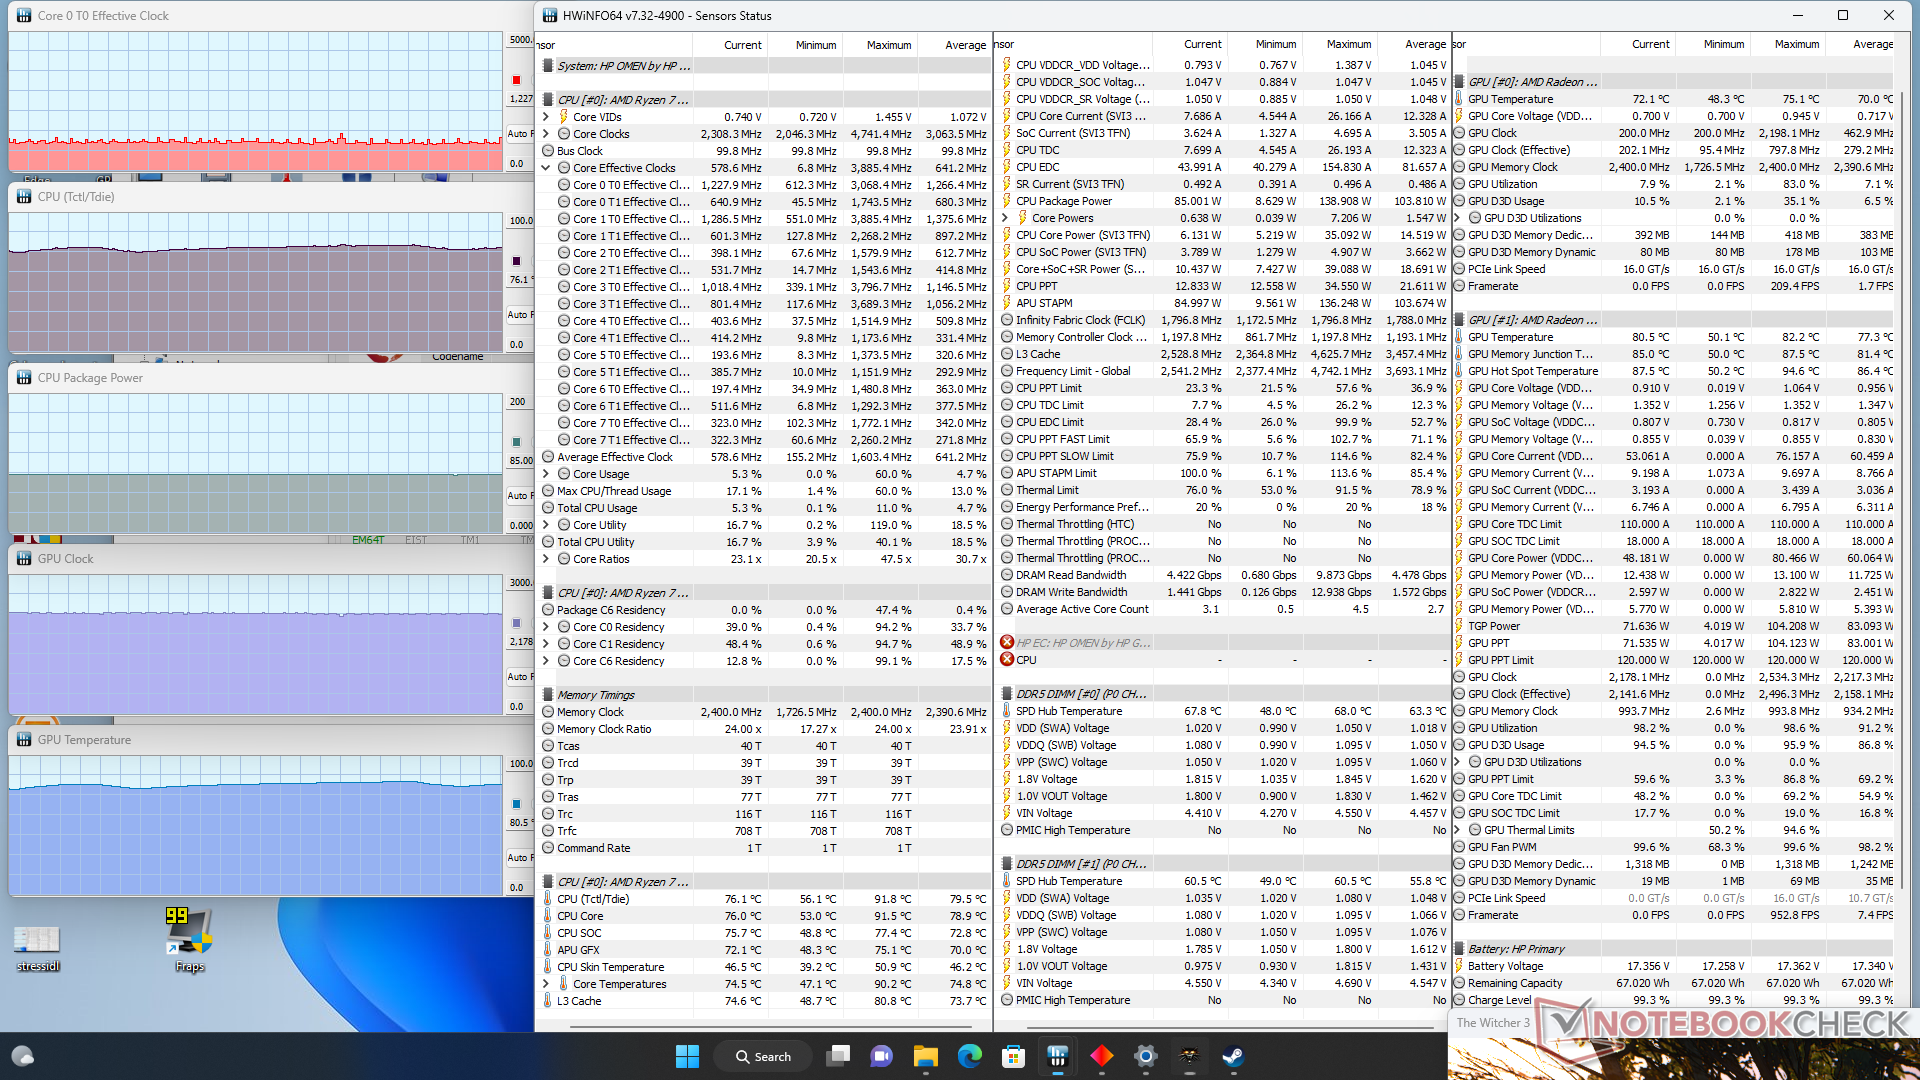
| Reloj dela CPU (GHz) | Reloj de la GPU (MHz) | Temperatura media dela CPU (°C) | Temperatura media de la GPU (°C) | |
| Sistema en reposo | -- | -- | 37 | 35 |
| Estrés dePrime95 | 3,7 | -- | 79 | 52 |
| Estrés de Prime95+ FurMark | 3,9 | ~1262 | 88 | 66 |
| Witcher 3 Estrés (modoequilibrado) | ~1,1 | 2178 | 76 | 81 |
| Witcher 3 Estrés (modorendimiento) | ~1,1 | 2516 | 85 | 80 |
Altavoces
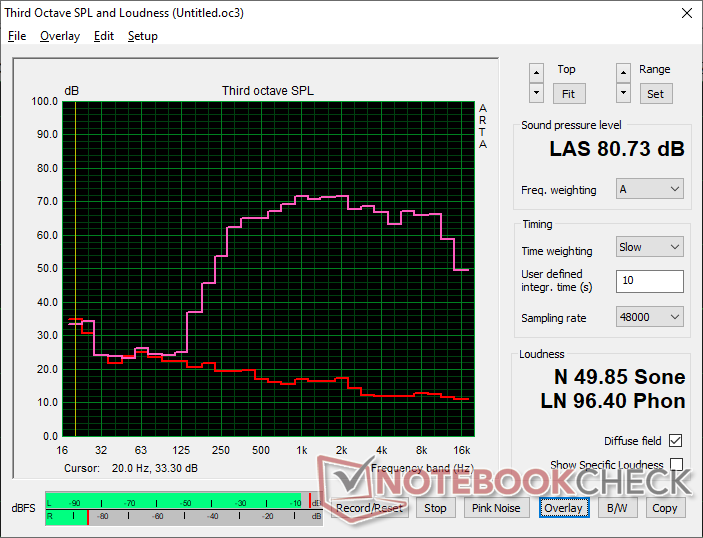
HP Omen 16-n0033dx análisis de audio
(±) | la sonoridad del altavoz es media pero buena (80.7 dB)
Graves 100 - 315 Hz
(-) | casi sin bajos - de media 24.7% inferior a la mediana
(±) | la linealidad de los graves es media (13% delta a frecuencia anterior)
Medios 400 - 2000 Hz
(+) | medios equilibrados - a sólo 3.4% de la mediana
(+) | los medios son lineales (2.8% delta a la frecuencia anterior)
Altos 2 - 16 kHz
(+) | máximos equilibrados - a sólo 1.3% de la mediana
(+) | los máximos son lineales (4.4% delta a la frecuencia anterior)
Total 100 - 16.000 Hz
(±) | la linealidad del sonido global es media (19.3% de diferencia con la mediana)
En comparación con la misma clase
» 65% de todos los dispositivos probados de esta clase eran mejores, 8% similares, 27% peores
» El mejor tuvo un delta de 6%, la media fue 18%, el peor fue ###max##%
En comparación con todos los dispositivos probados
» 47% de todos los dispositivos probados eran mejores, 8% similares, 46% peores
» El mejor tuvo un delta de 4%, la media fue 23%, el peor fue ###max##%
Apple MacBook Pro 16 2021 M1 Pro análisis de audio
(+) | los altavoces pueden reproducir a un volumen relativamente alto (#84.7 dB)
Graves 100 - 315 Hz
(+) | buen bajo - sólo 3.8% lejos de la mediana
(+) | el bajo es lineal (5.2% delta a la frecuencia anterior)
Medios 400 - 2000 Hz
(+) | medios equilibrados - a sólo 1.3% de la mediana
(+) | los medios son lineales (2.1% delta a la frecuencia anterior)
Altos 2 - 16 kHz
(+) | máximos equilibrados - a sólo 1.9% de la mediana
(+) | los máximos son lineales (2.7% delta a la frecuencia anterior)
Total 100 - 16.000 Hz
(+) | el sonido global es lineal (4.6% de diferencia con la mediana)
En comparación con la misma clase
» 0% de todos los dispositivos probados de esta clase eran mejores, 0% similares, 100% peores
» El mejor tuvo un delta de 5%, la media fue 17%, el peor fue ###max##%
En comparación con todos los dispositivos probados
» 0% de todos los dispositivos probados eran mejores, 0% similares, 100% peores
» El mejor tuvo un delta de 4%, la media fue 23%, el peor fue ###max##%
Gestión de la energía - Gamer exigente
Consumo de energía
Dado que la Radeon RX 6650M es ligeramente más rápida que la RTX 3060, deberíamos esperar que el consumo medio de energía sea también ligeramente superior. Por desgracia para AMD, la realidad es que nuestro Omen 16 puede consumir mucha más energía que la mayoría de portátiles con RTX 2060 al jugar. Ejecutando Witcher 3por ejemplo, exige 206 W en comparación con los 177 W, 187 W y 155 W del Dell G16 con RTX 3060,Lenovo Legion 5 15y Lenovo Legion Slim 7 16, respectivamente. Estas mismas alternativas pueden incluso ofrecer un rendimiento de CPU más rápido con sus procesadores Intel de 12ª generación
Afortunadamente, el consumo de energía es comparable al de muchos portátiles Intel-Nvidia cuando no se ejecutan aplicaciones exigentes. Esto significa que la duración de la batería no será mucho menor que la de la mayoría de las alternativas Intel-Nvidia cuando se navega por la web o se hace streaming, a pesar de que el portátil puede consumir mucha energía cuando se juega
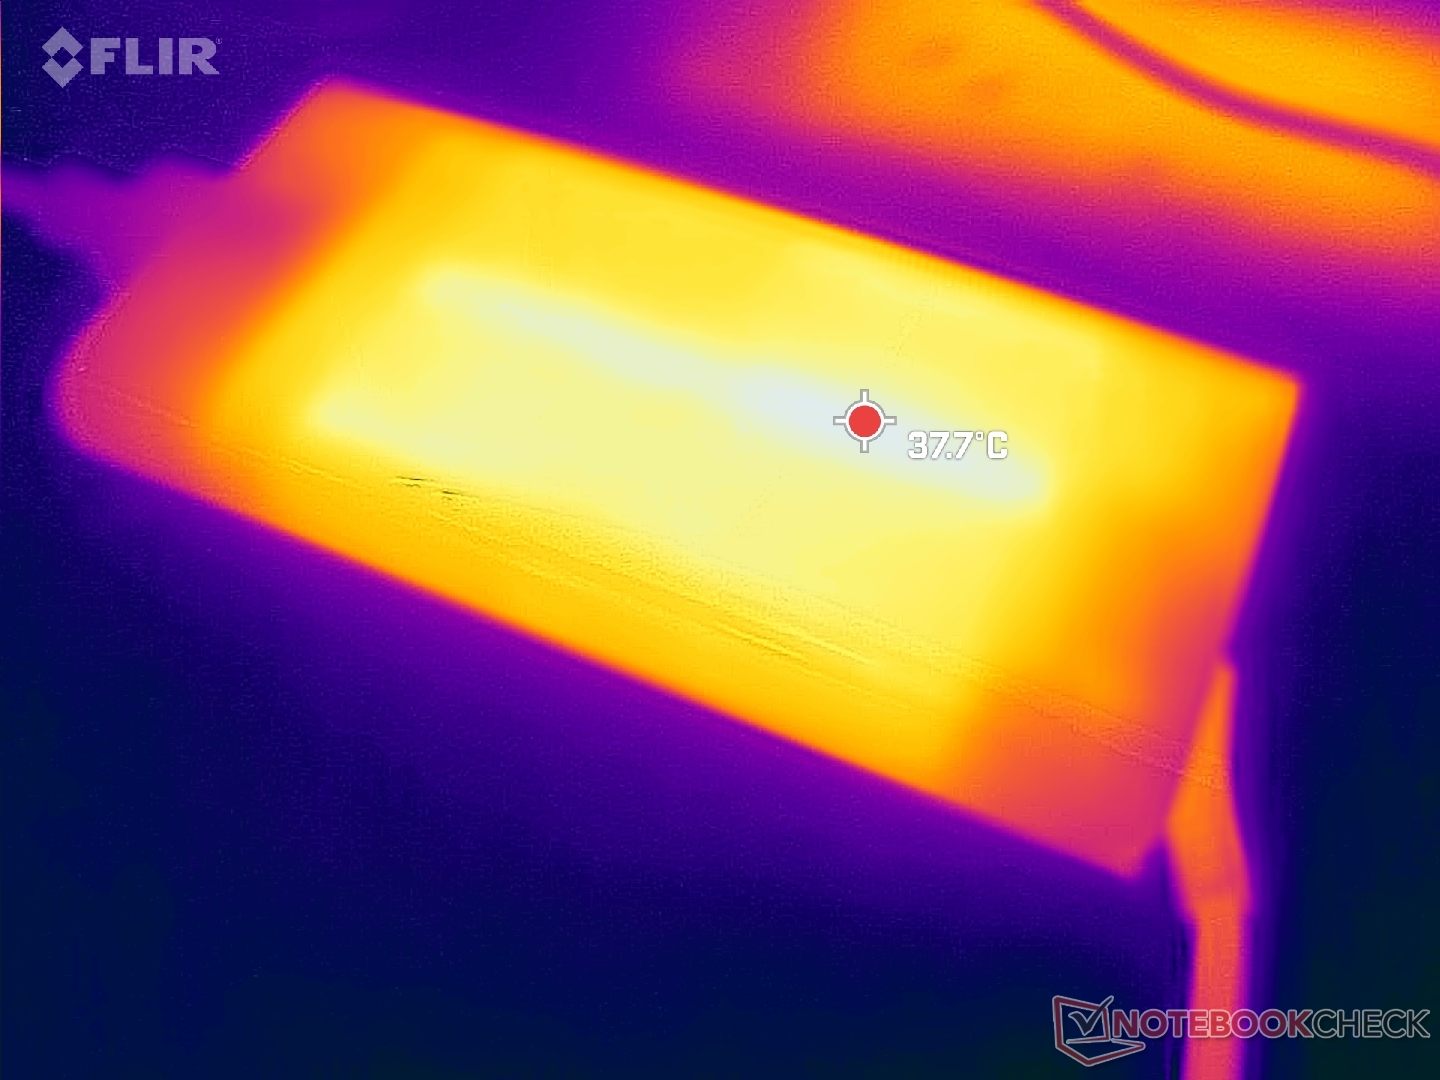
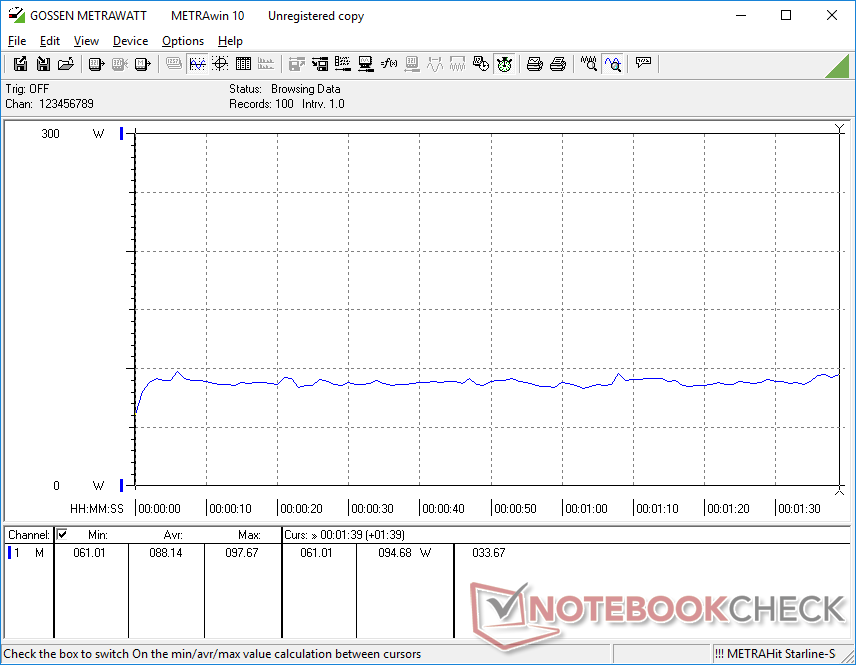
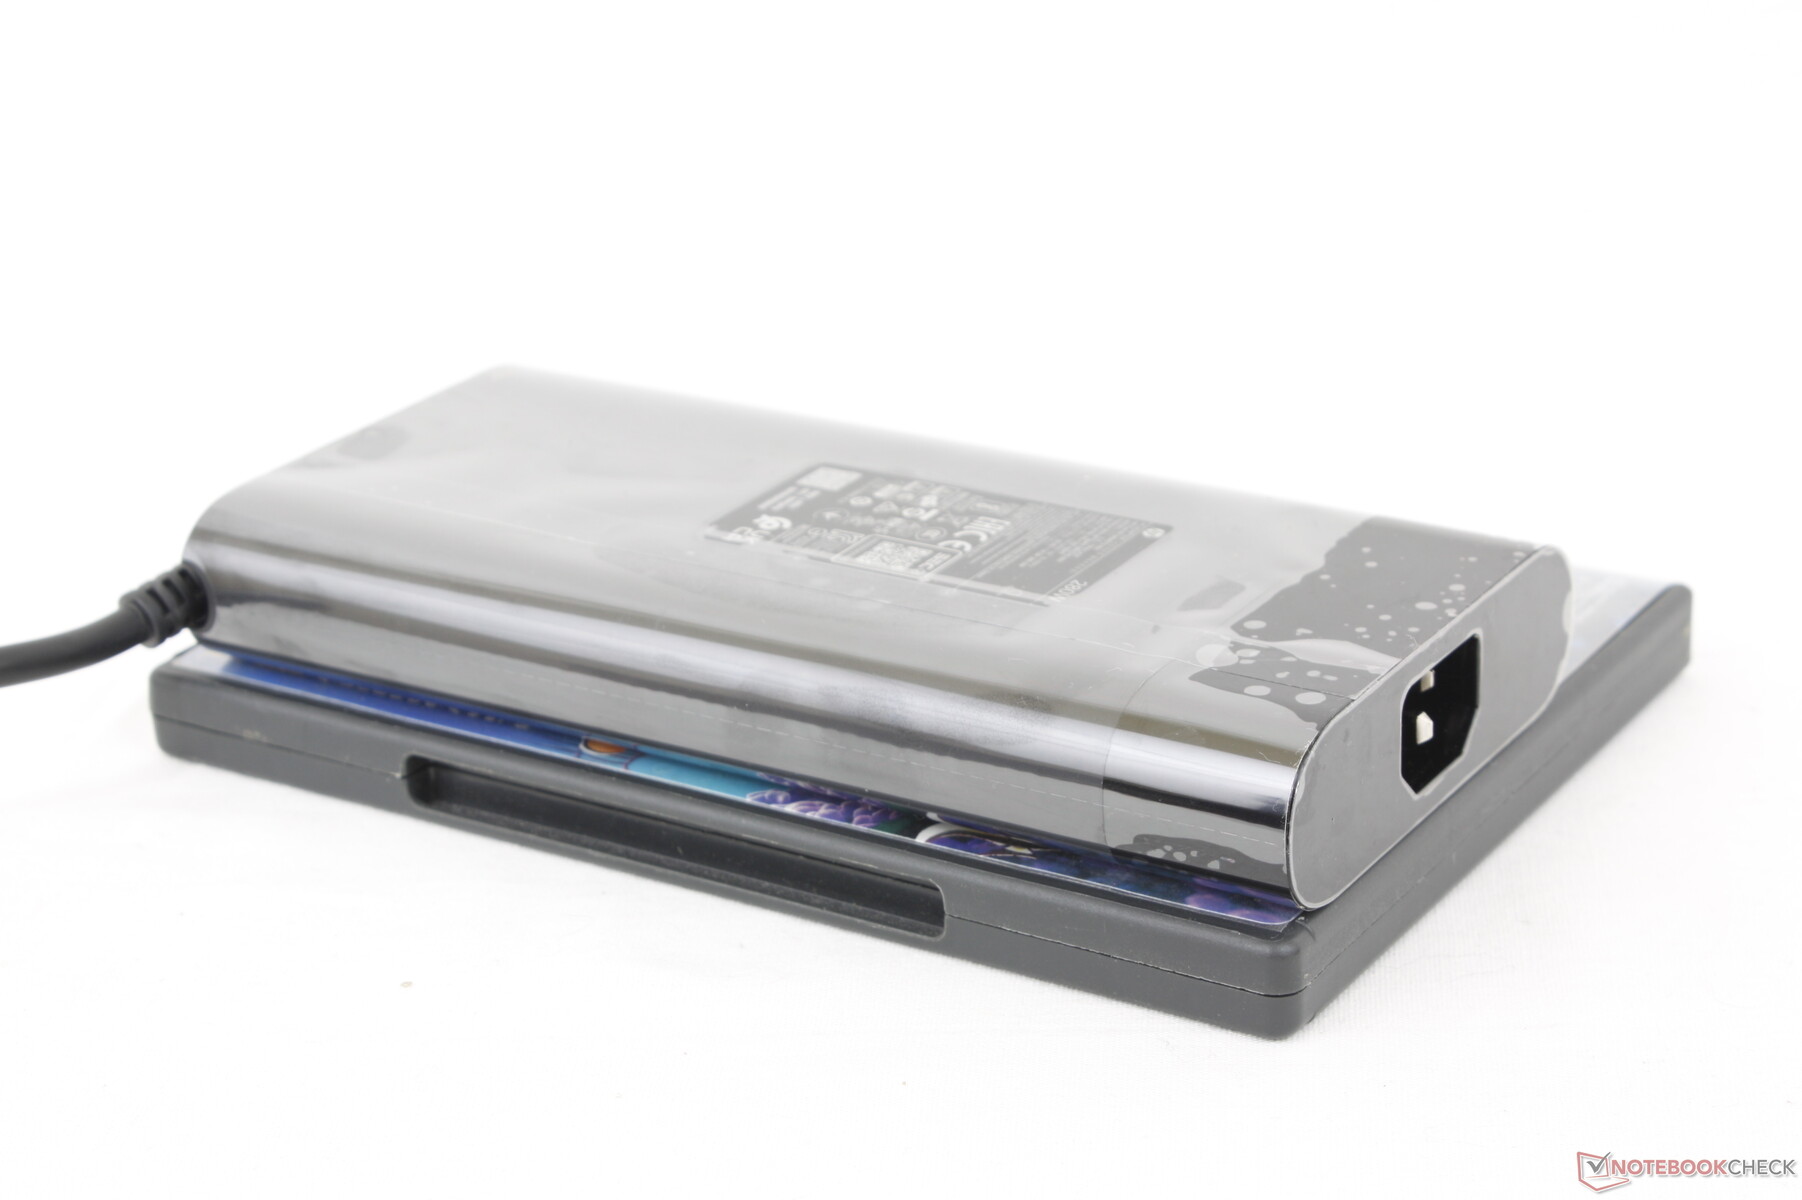
Hemos podido registrar un consumo máximo temporal de 246 W en el gran adaptador de CA de 280 W (~17,9 x 8,5 x 2,5 cm) cuando la CPU y la GPU están al 100% de su capacidad.
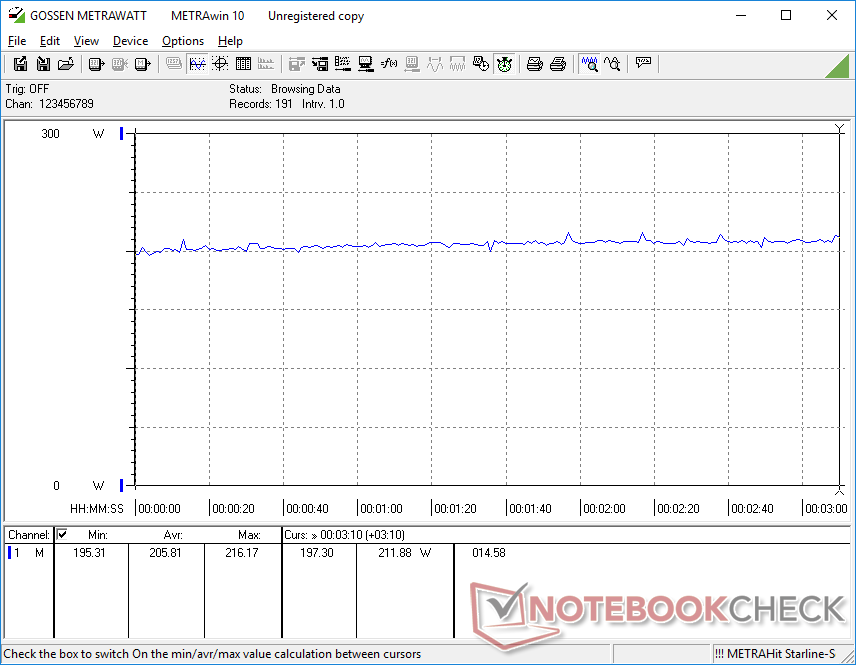
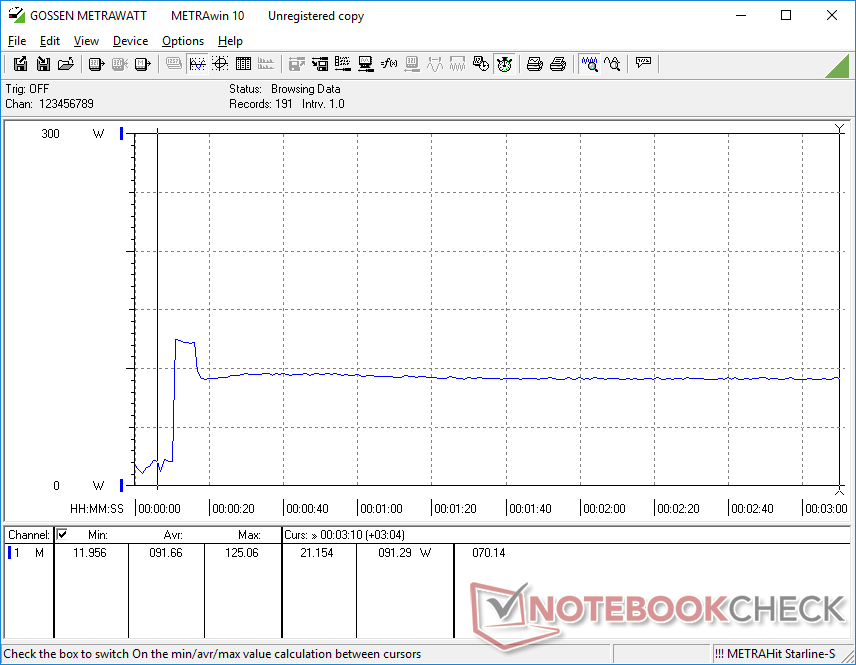
| Off / Standby | |
| Ocioso | |
| Carga |
|
Clave:
min: | |
| HP Omen 16-n0033dx R7 6800H, Radeon RX 6650M, Samsung PM9A1 MZVL21T0HCLR, IPS, 1920x1080, 16.1" | HP Envy 16 h0112nr i7-12700H, GeForce RTX 3060 Laptop GPU, Micron 3400 1TB MTFDKBA1T0TFH, OLED, 3840x2400, 16" | HP Omen 16-b1090ng i7-12700H, GeForce RTX 3070 Ti Laptop GPU, WDC PC SN810 1TB, IPS, 2560x1440, 16.1" | HP Victus 16-e0145ng R5 5600H, GeForce RTX 3050 Ti Laptop GPU, Samsung SSD PM981a MZVLB512HBJQ, IPS, 1920x1080, 16.1" | Lenovo Legion S7 16ARHA7 R9 6900HX, Radeon RX 6800S, SK Hynix HFS001TEJ9X115N, IPS, 2560x1600, 16" | Dell G16 7620 i7-12700H, GeForce RTX 3060 Laptop GPU, WDC PC SN810 512GB, IPS, 2560x1600, 16" | |
|---|---|---|---|---|---|---|
| Power Consumption | -9% | 8% | 18% | -3% | -35% | |
| Idle Minimum * (Watt) | 7.9 | 10 -27% | 4 49% | 7 11% | 8.8 -11% | 14.4 -82% |
| Idle Average * (Watt) | 11.5 | 10.9 5% | 10 13% | 9 22% | 14.7 -28% | 17.8 -55% |
| Idle Maximum * (Watt) | 18.3 | 27.8 -52% | 19 -4% | 15 18% | 19.8 -8% | 31.5 -72% |
| Load Average * (Watt) | 88.1 | 116.4 -32% | 114 -29% | 93 -6% | 85.3 3% | 101.2 -15% |
| Witcher 3 ultra * (Watt) | 206 | 133.7 35% | 183.2 11% | 134.5 35% | 167.5 19% | 176.9 14% |
| Load Maximum * (Watt) | 246.4 | 209.8 15% | 221 10% | 185 25% | 230.7 6% | 242.9 1% |
* ... más pequeño es mejor
Power Consumption Witcher 3 / Stresstest
Power Consumption external Monitor
Duración de la batería
La capacidad de la batería es notablemente menor que en las versiones Intel del antiguo Omen 16 (68 Wh frente a 83 Wh). No obstante, la duración total no es significativamente menor en nuestro modelo AMD. Pudimos registrar una duración real de WLAN de casi 7 horas con el perfil de energía equilibrado, que está por encima de la media para un portátil de juegos
La carga desde el vacío hasta la capacidad total con el adaptador de CA incluido es relativamente lenta, de 2 a 2,5 horas, en comparación con 1,5 horas en la mayoría de los portátiles. Además, el portátil no es compatible con la mayoría de cargadores USB-C AC de terceros. HP anuncia que el modelo es compatible con USB-C Power Delivery, pero al conectar nuestro propio adaptador de CA USB-C de 100 W aparecía el mensaje de advertencia "El adaptador de CA no es compatible con el sistema". En comparación, los portátiles de juego con PD de Razer, MSI, o Asus funcionan con todos nuestros adaptadores USB-C probados.
| HP Omen 16-n0033dx R7 6800H, Radeon RX 6650M, 68 Wh | HP Envy 16 h0112nr i7-12700H, GeForce RTX 3060 Laptop GPU, 83 Wh | HP Omen 16-b1090ng i7-12700H, GeForce RTX 3070 Ti Laptop GPU, 83 Wh | HP Victus 16-e0145ng R5 5600H, GeForce RTX 3050 Ti Laptop GPU, 70 Wh | Lenovo Legion S7 16ARHA7 R9 6900HX, Radeon RX 6800S, 71 Wh | Dell G16 7620 i7-12700H, GeForce RTX 3060 Laptop GPU, 84 Wh | |
|---|---|---|---|---|---|---|
| Duración de Batería | 45% | 18% | 1% | -11% | -31% | |
| Reader / Idle (h) | 10 | 17.8 78% | 10.1 1% | 7.1 -29% | ||
| WiFi v1.3 (h) | 7 | 7.9 13% | 5.6 -20% | 7.1 1% | 6.2 -11% | 5 -29% |
| Load (h) | 1.1 | 1.6 45% | 1.9 73% | 0.7 -36% |
Pro
Contra
Veredicto: alternativa competente a la GeForce RTX 3060
Como la mayoría de portátiles basados en AMD, el AMD Omen 16 se vende por varios cientos de dólares menos que un portátil Intel Core i7 y GeForce RTX equivalente. El Ryzen 7 6800H no puede competir con las últimas CPUs Core de 12ª generación en rendimiento bruto, pero la Radeon RX 6650M se mantiene mejor de lo esperado frente a la RTX 3060. Dado que la mayoría de los juegos están vinculados a la GPU, el déficit de CPU entre Intel y AMD en este caso importa mucho menos cuando se ejecutan juegos reales. Los propietarios estarían obteniendo un rendimiento de juego ligeramente mejor que el de una RTX 3060 por un precio notablemente inferior, que es el principal atractivo del AMD Omen 16.
Otros aspectos positivos son el cómodo teclado, la amplia selección de puertos, la buena calidad de la pantalla de 144 Hz y un chasis suave similar al del Envy 16. Algunos usuarios pueden apreciar la falta de LEDs o diseños superficiales para jugadores, a diferencia de la mayoría de las alternativas de MSI o Asus.
El AMD Omen 16 ofrece mejor rendimiento por dólar que la mayoría de los portátiles equipados con la GeForce RTX 3060. Sin embargo, si valoras un mayor rendimiento de la CPU y el potencial de ray-tracing, entonces seguirás queriendo invertir en una solución Intel-Nvidia.
No obstante, hay mucho que mejorar. El bisel de la barbilla de la pantalla, por ejemplo, es demasiado grueso, por lo que ocupa más espacio y pesa más que otros competidores, como elAsus Zephyrus M16 o Lenovo Legion S7. El clickpad es demasiado sensible y los ventiladores siguen siendo más ruidosos que la media si están en modo Rendimiento. Los usuarios pueden considerar jugar en modo equilibrado por los ventiladores significativamente más silenciosos aunque suponga un ligero golpe al rendimiento.
Precio y disponibilidad
Nuestra unidad de revisión, tal y como está configurada, es , que ya está a la venta en Best Buy por $1580 USD. Sin embargo, HP está ofreciendo la misma configuración en a un precio tan bajo como $900 USD en el momento de la publicación. Las variantes Intel-Nvidia del Omen 16 también están ampliamente disponibles.
HP Omen 16-n0033dx
- 11/29/2022 v7 (old)
Allen Ngo
Price comparison

