Análisis del Medion Erazer Beast X40 (2024): Portátil gaming de gama alta con RTX 4090 y teclado mecánico

El Medion Beast X40 es uno de los portátiles más potentes actualmente disponibles. Intel Raptor Lake, Nvidia Ada Lovelace, 2 TB de espacio de almacenamiento y 32 GB de RAM se suman para equipar al portátil para streaming, renderizado y juegos, al tiempo que cuestan una bomba, unos 4.000 euros.
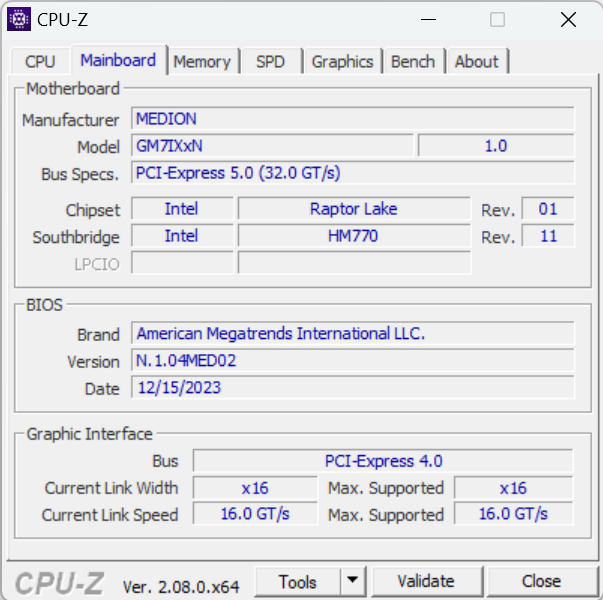
Como fue el caso de su predecesorun chasis barebone de Tongfang (GM7IX9N) sirve de base para la construcción del Beast X40. La competencia incluye portátiles para juegos como el Asus ROG Strix Scar 17 G733PYV, el Schenker Key 17 Pro (23 temprano)y el MSI Titan 18 HX A14VIG.
Posibles contendientes en la comparación
Valoración | Fecha | Modelo | Peso | Altura | Tamaño | Resolución | Precio |
|---|---|---|---|---|---|---|---|
| 89.2 % v7 (old) | 02/2024 | Medion Erazer Beast X40 2024 i9-14900HX, GeForce RTX 4090 Laptop GPU | 2.9 kg | 36 mm | 17.00" | 2560x1600 | |
| 87.2 % v7 (old) | 08/2023 | Asus ROG Strix Scar 17 G733PYV-LL053X R9 7945HX3D, GeForce RTX 4090 Laptop GPU | 2.9 kg | 28.3 mm | 17.30" | 2560x1440 | |
| 85.5 % v7 (old) | 06/2023 | Schenker Key 17 Pro (Early 23) i9-13900HX, GeForce RTX 4090 Laptop GPU | 3.4 kg | 24.9 mm | 17.30" | 3840x2160 | |
| 88.3 % v7 (old) | 02/2024 | Asus ROG Strix Scar 18 G834JYR (2024) i9-14900HX, GeForce RTX 4090 Laptop GPU | 3.1 kg | 30.8 mm | 18.00" | 2560x1600 | |
| 88.8 % v7 (old) | 01/2024 | MSI Titan 18 HX A14VIG i9-14900HX, GeForce RTX 4090 Laptop GPU | 3.6 kg | 32.1 mm | 18.00" | 3840x2400 |
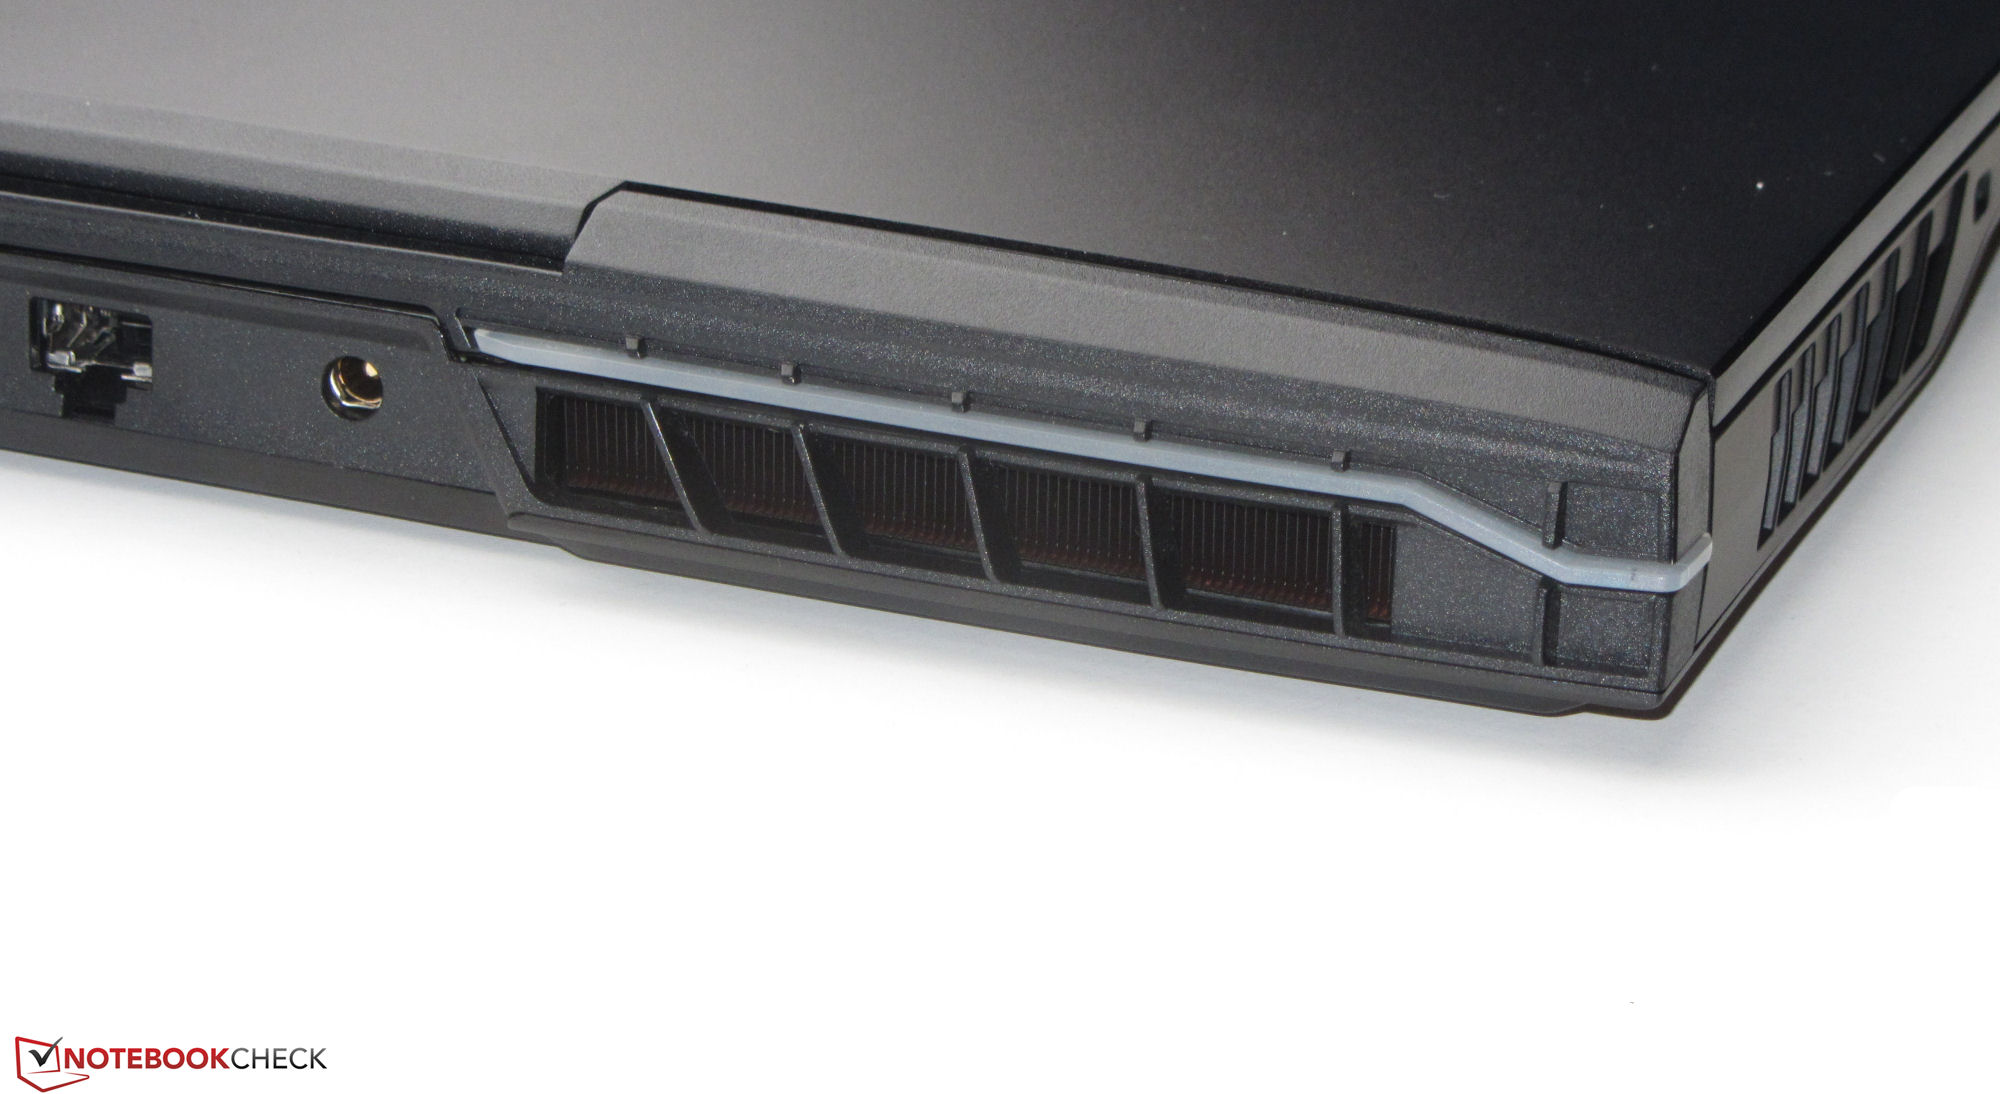
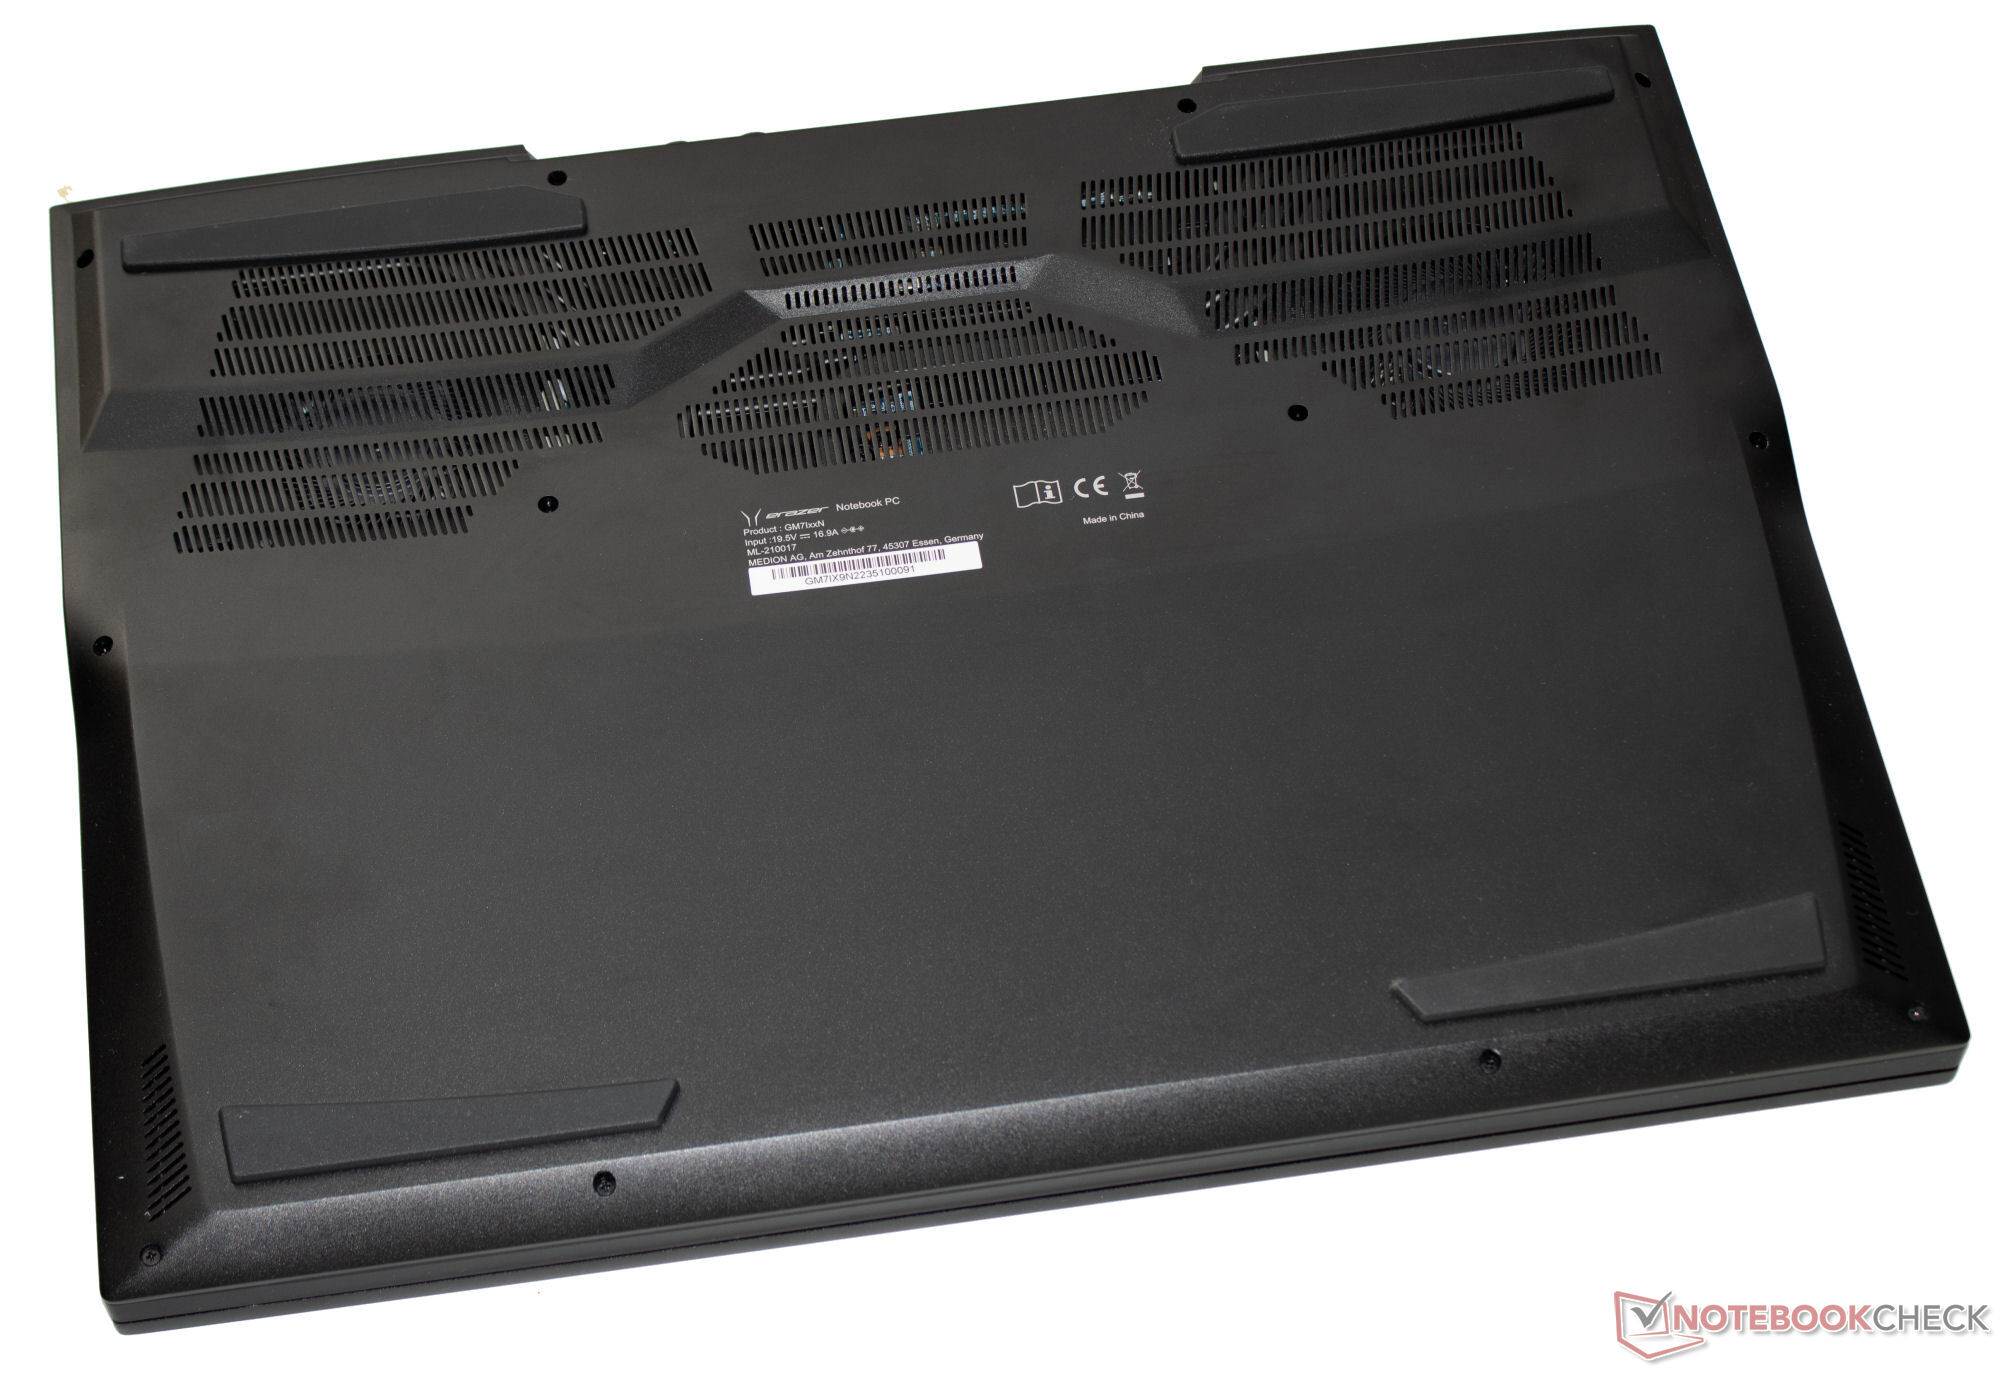
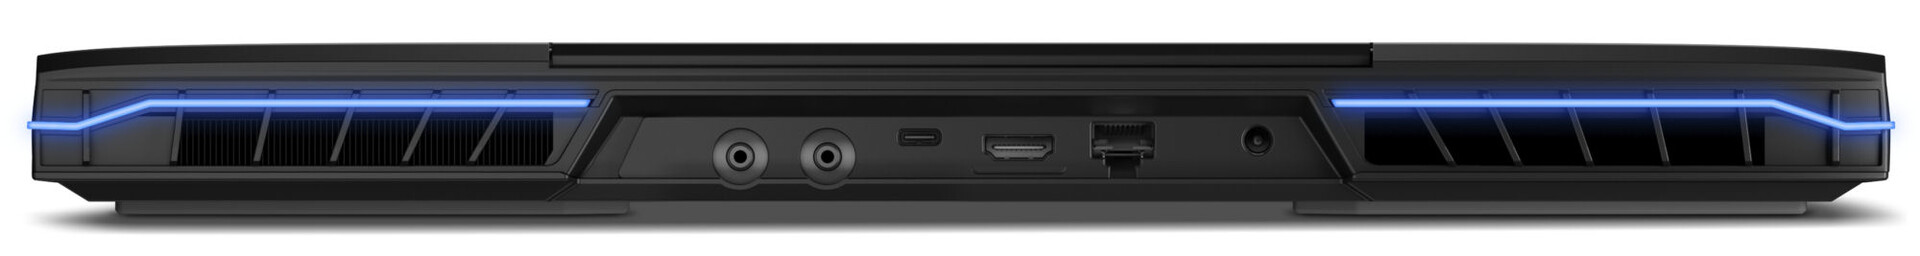
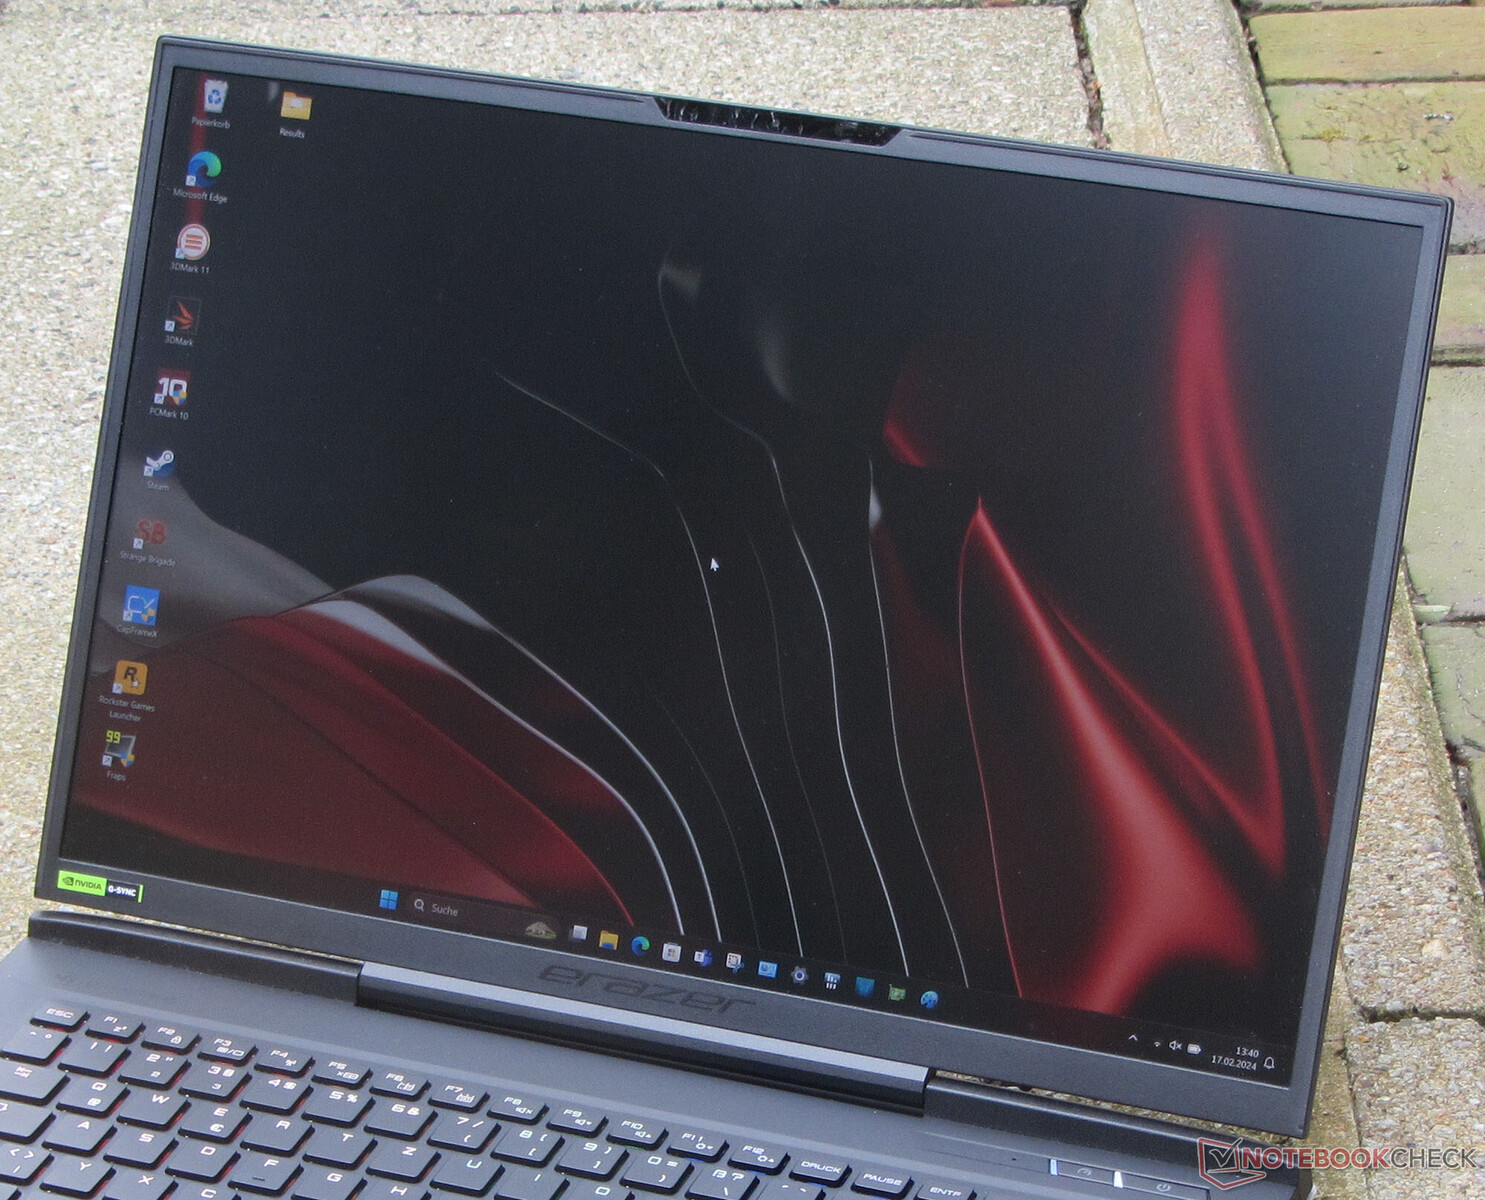
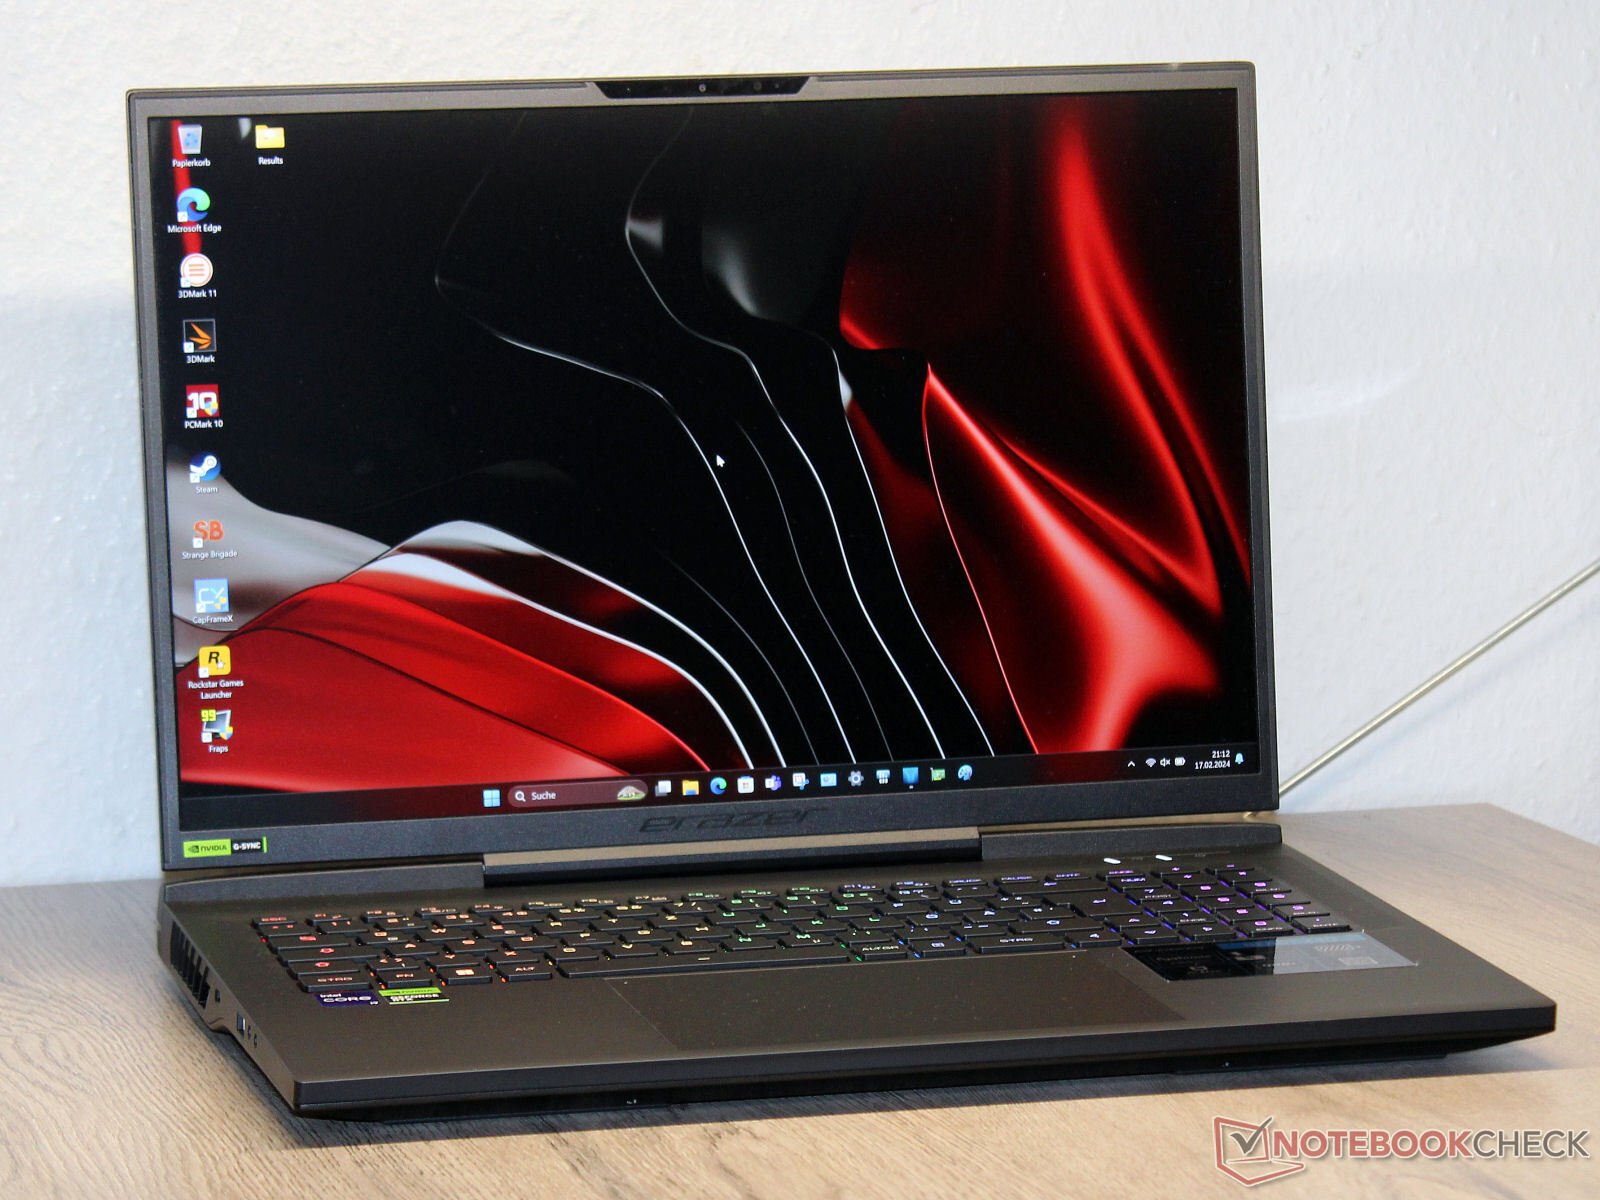
Chasis y características: El Beast X40 ofrece Thunderbolt 4
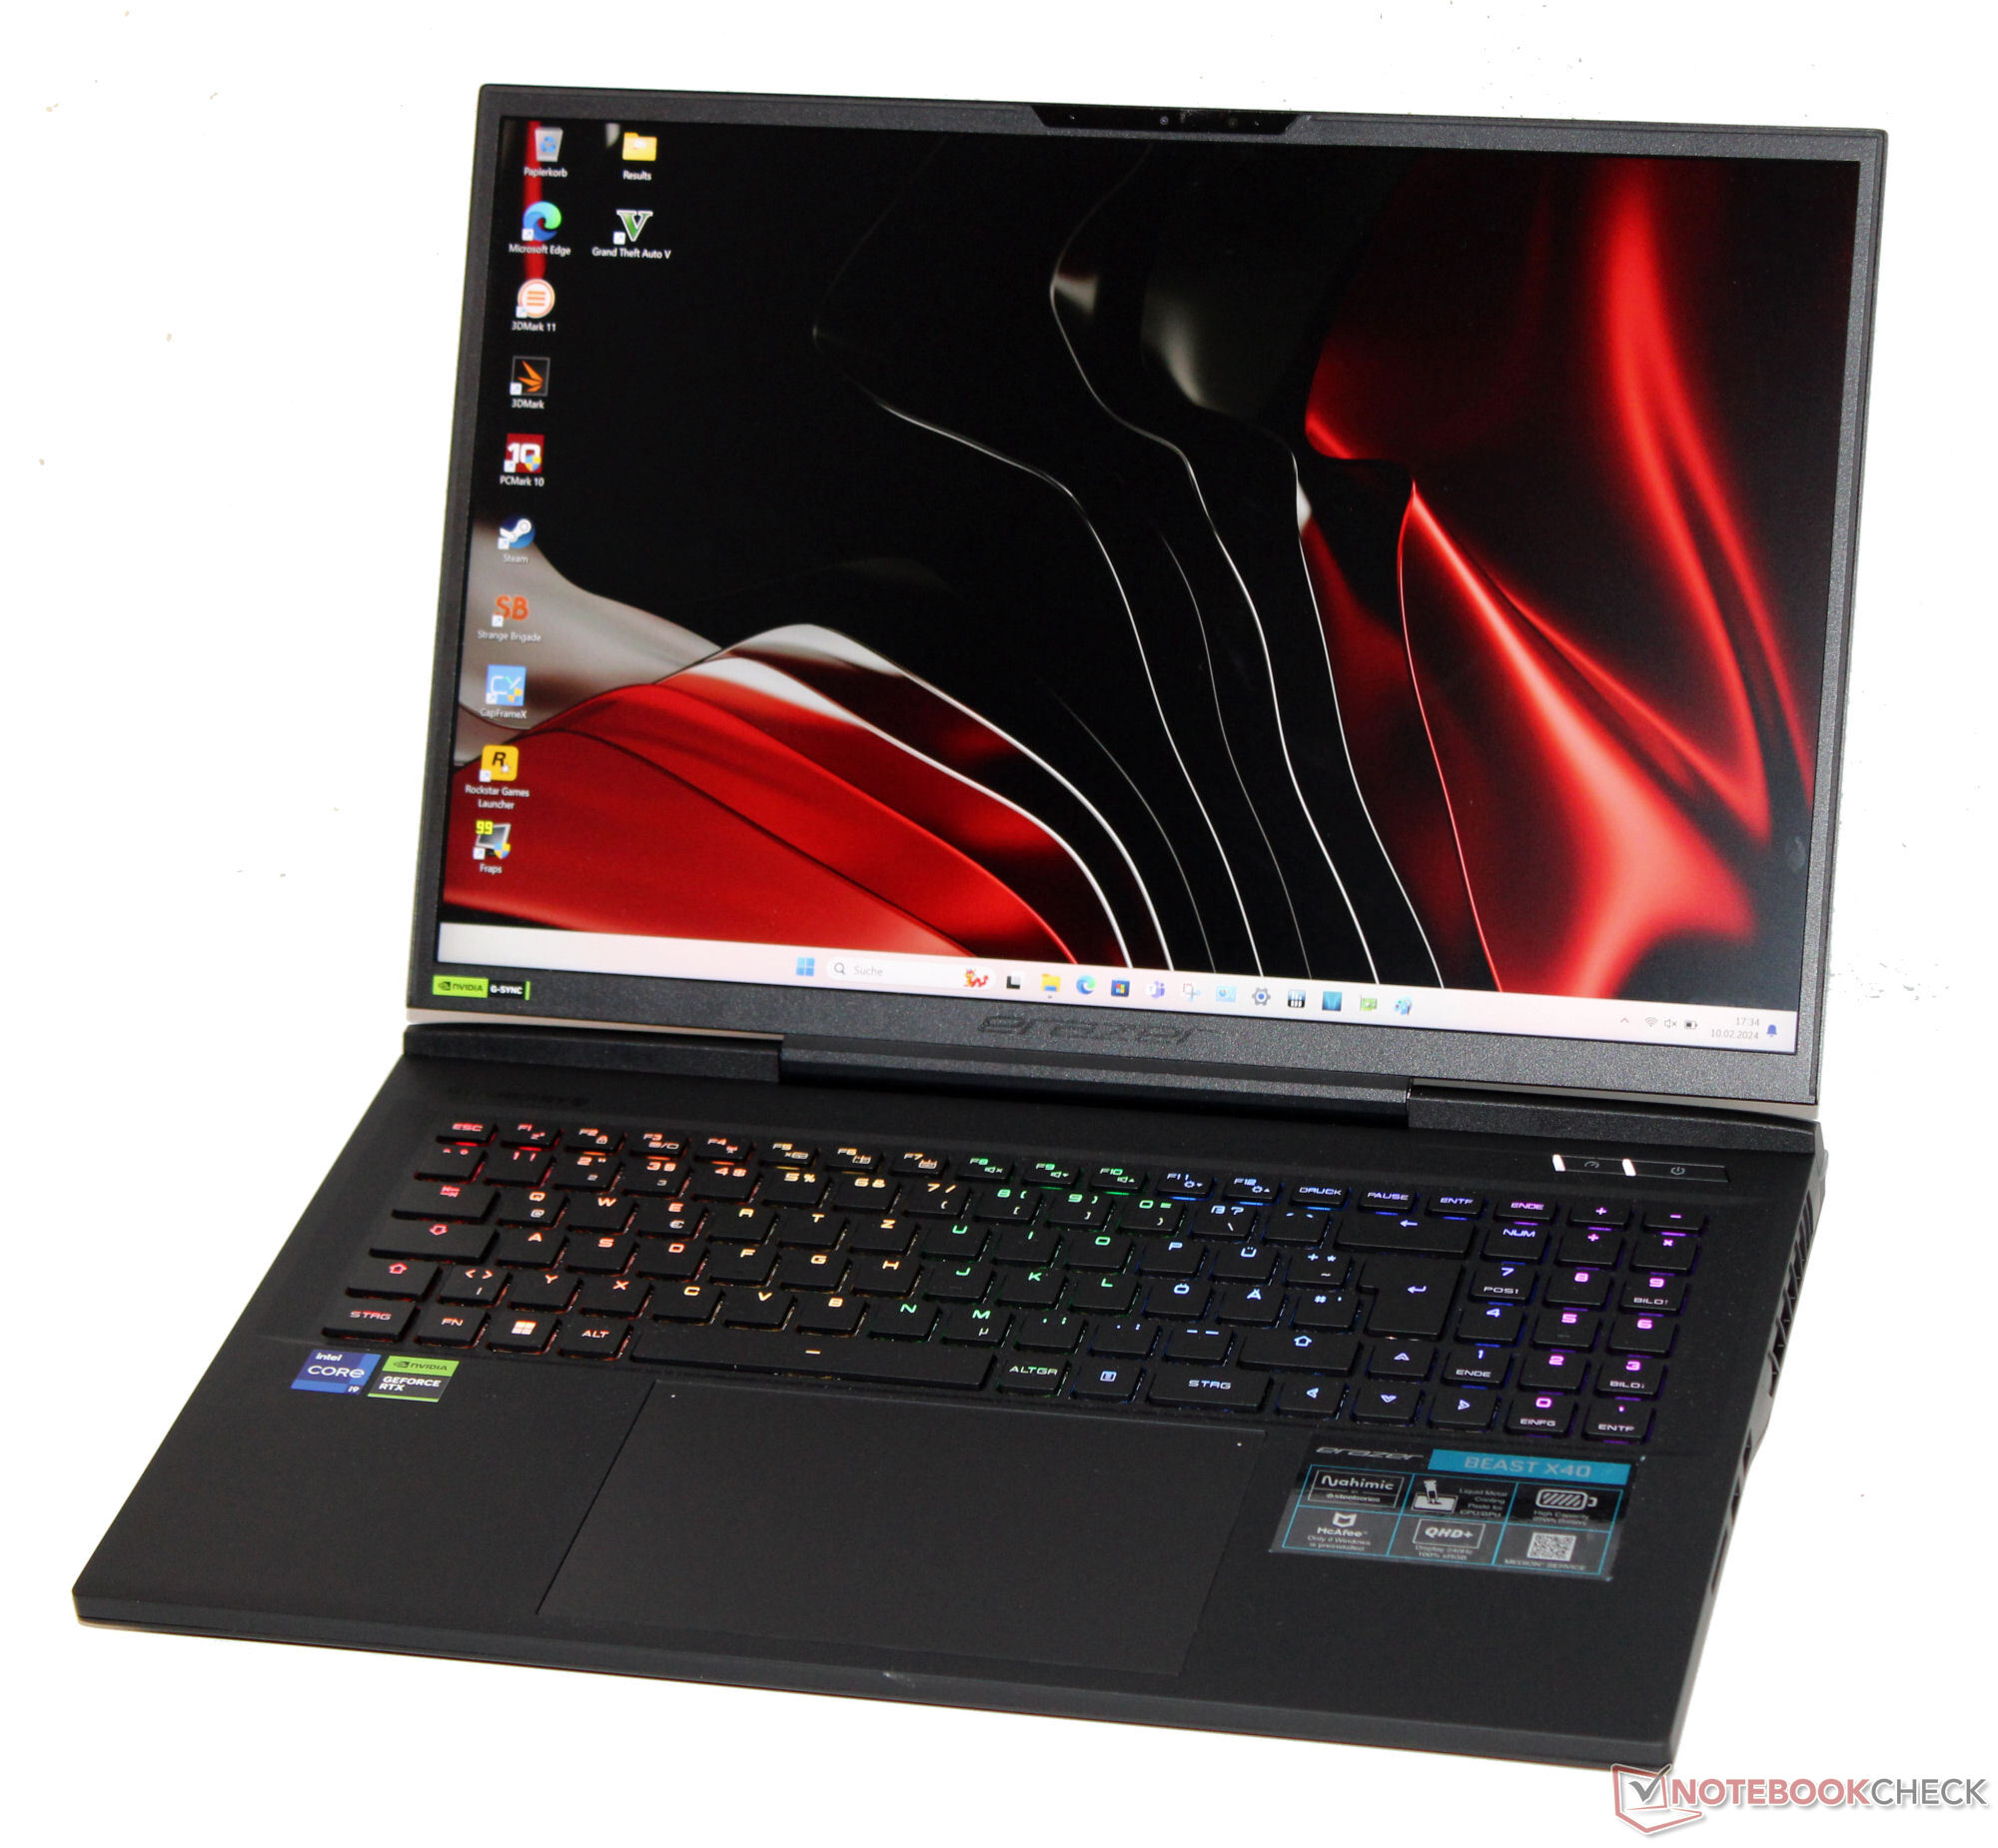
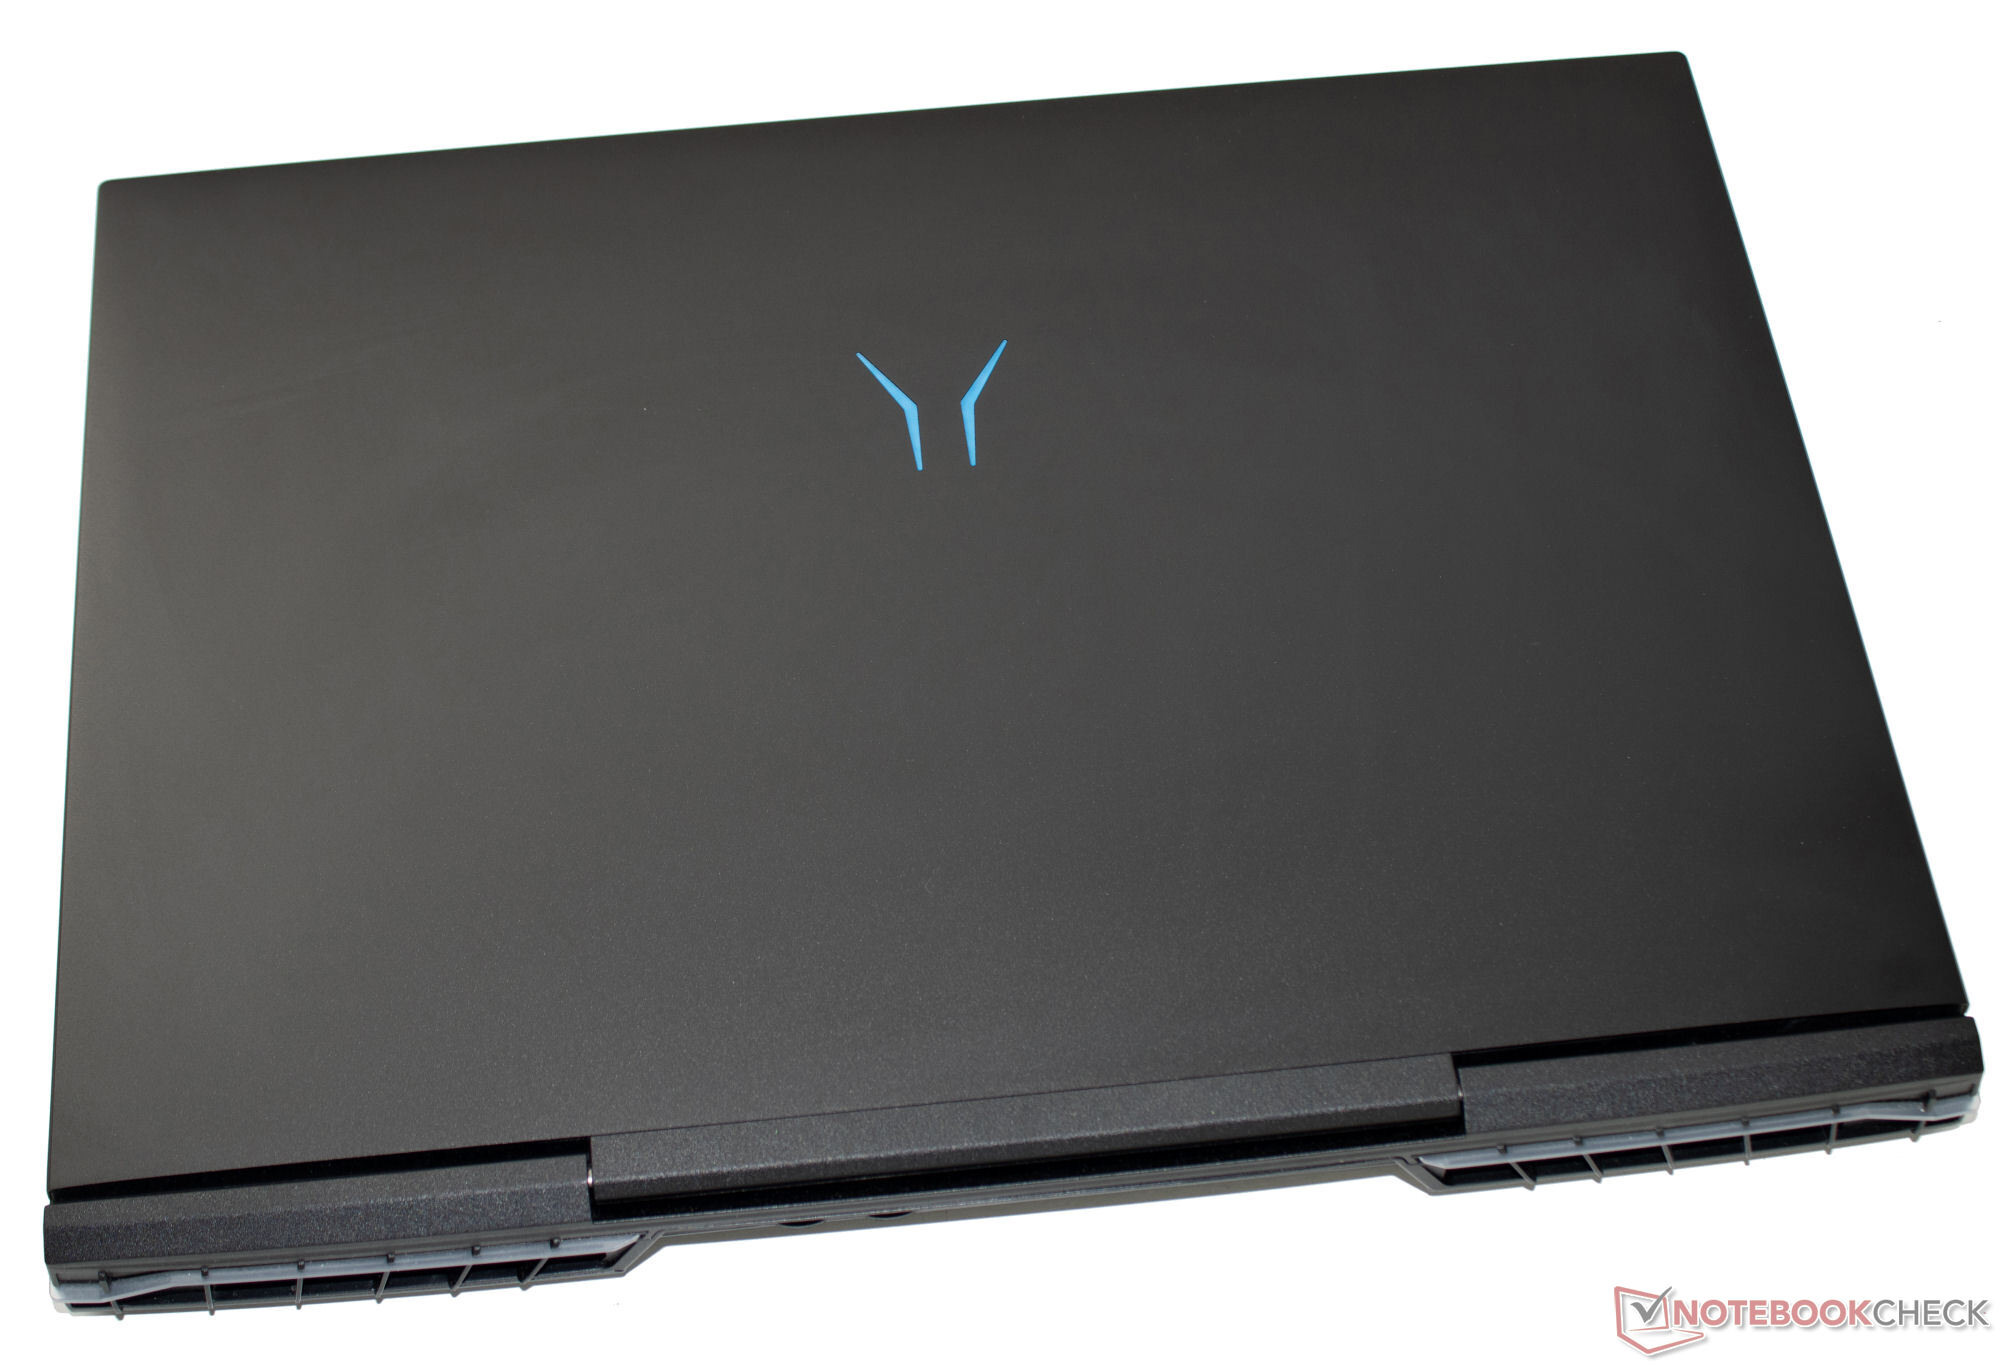
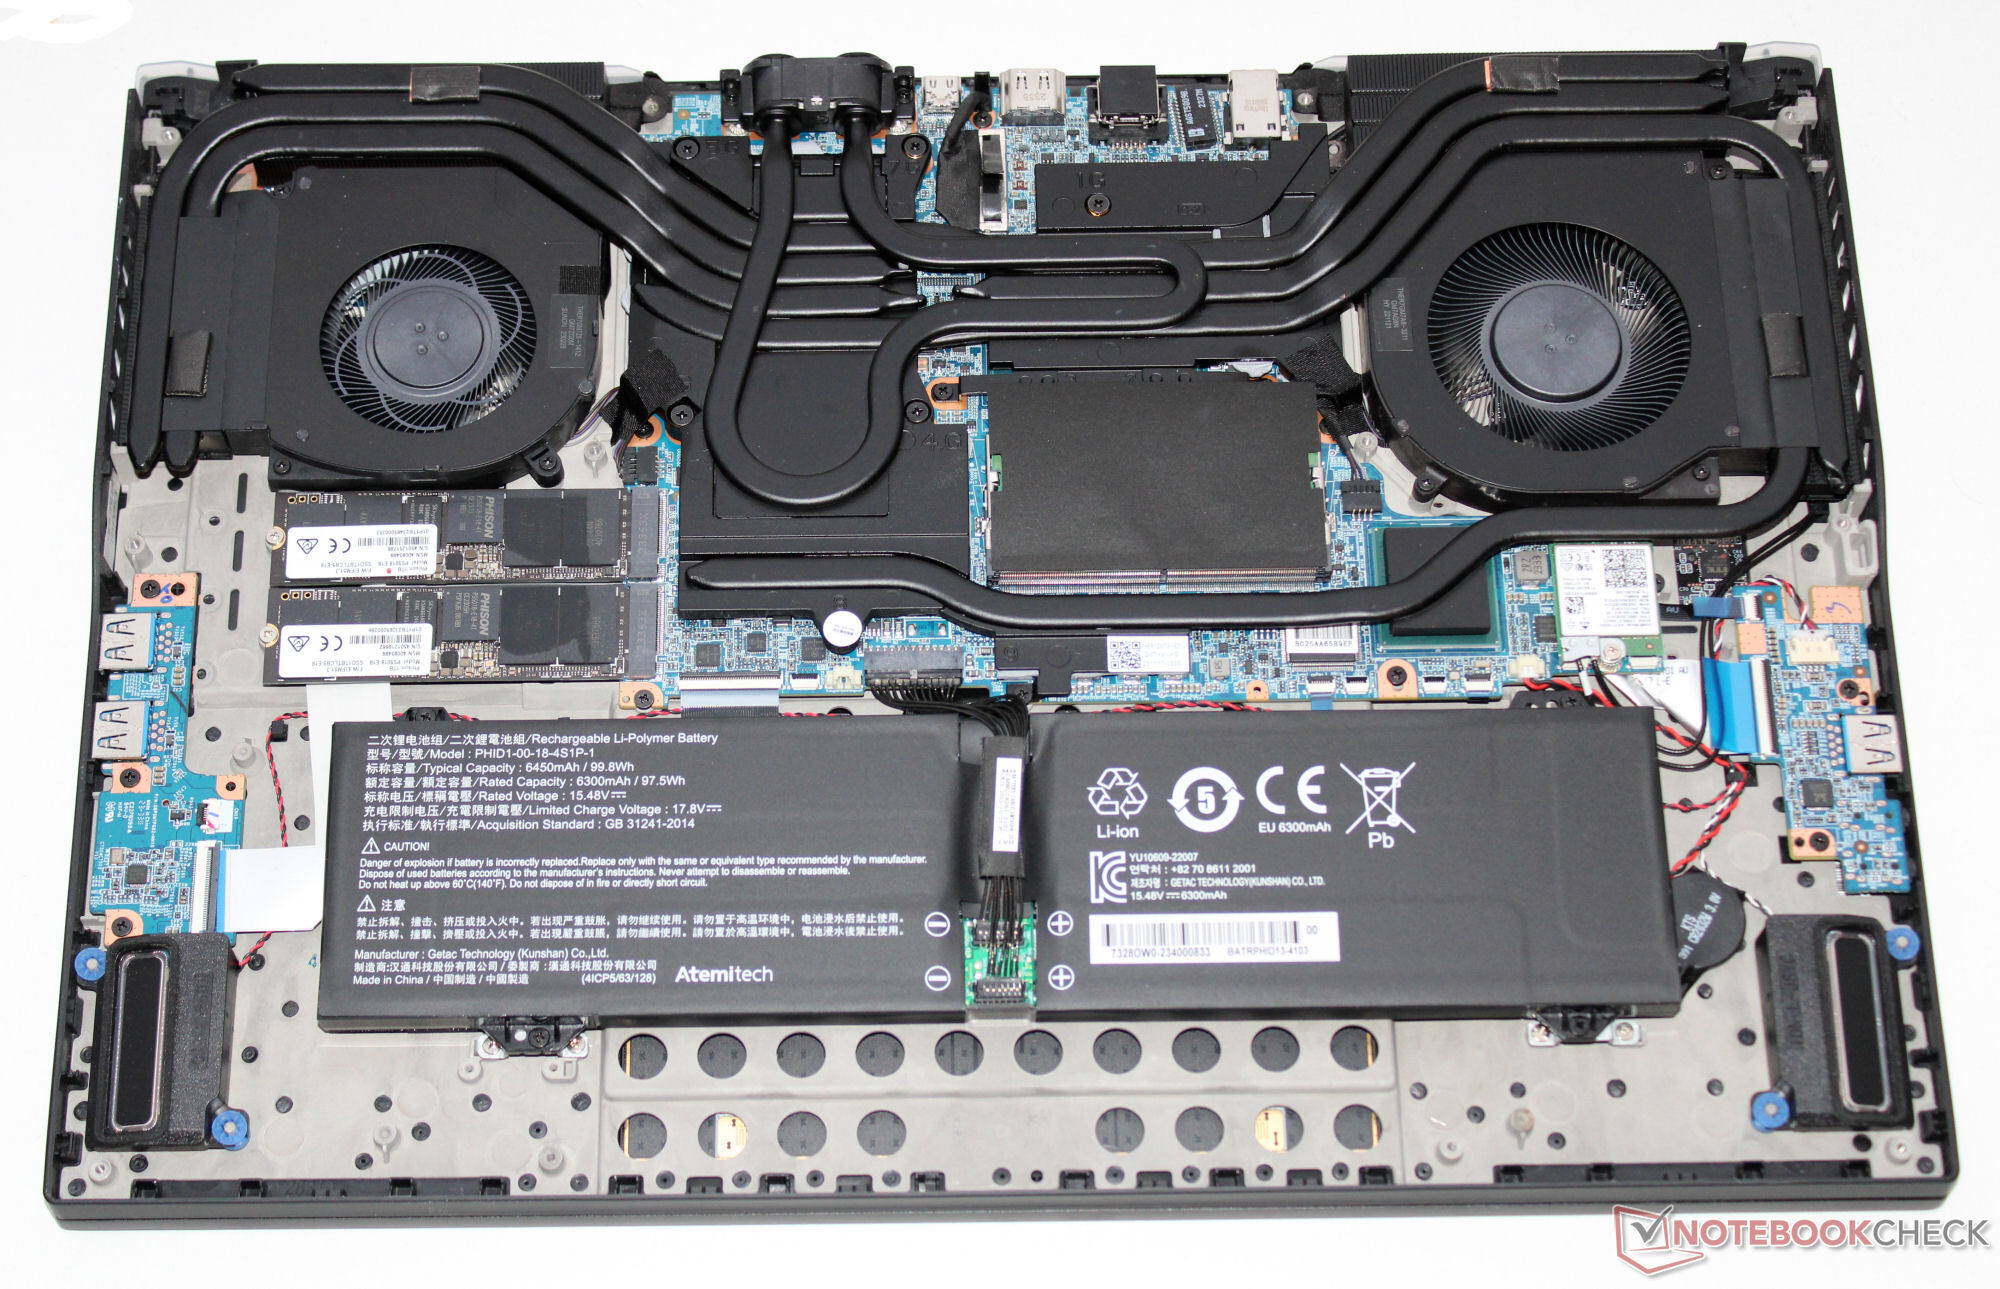
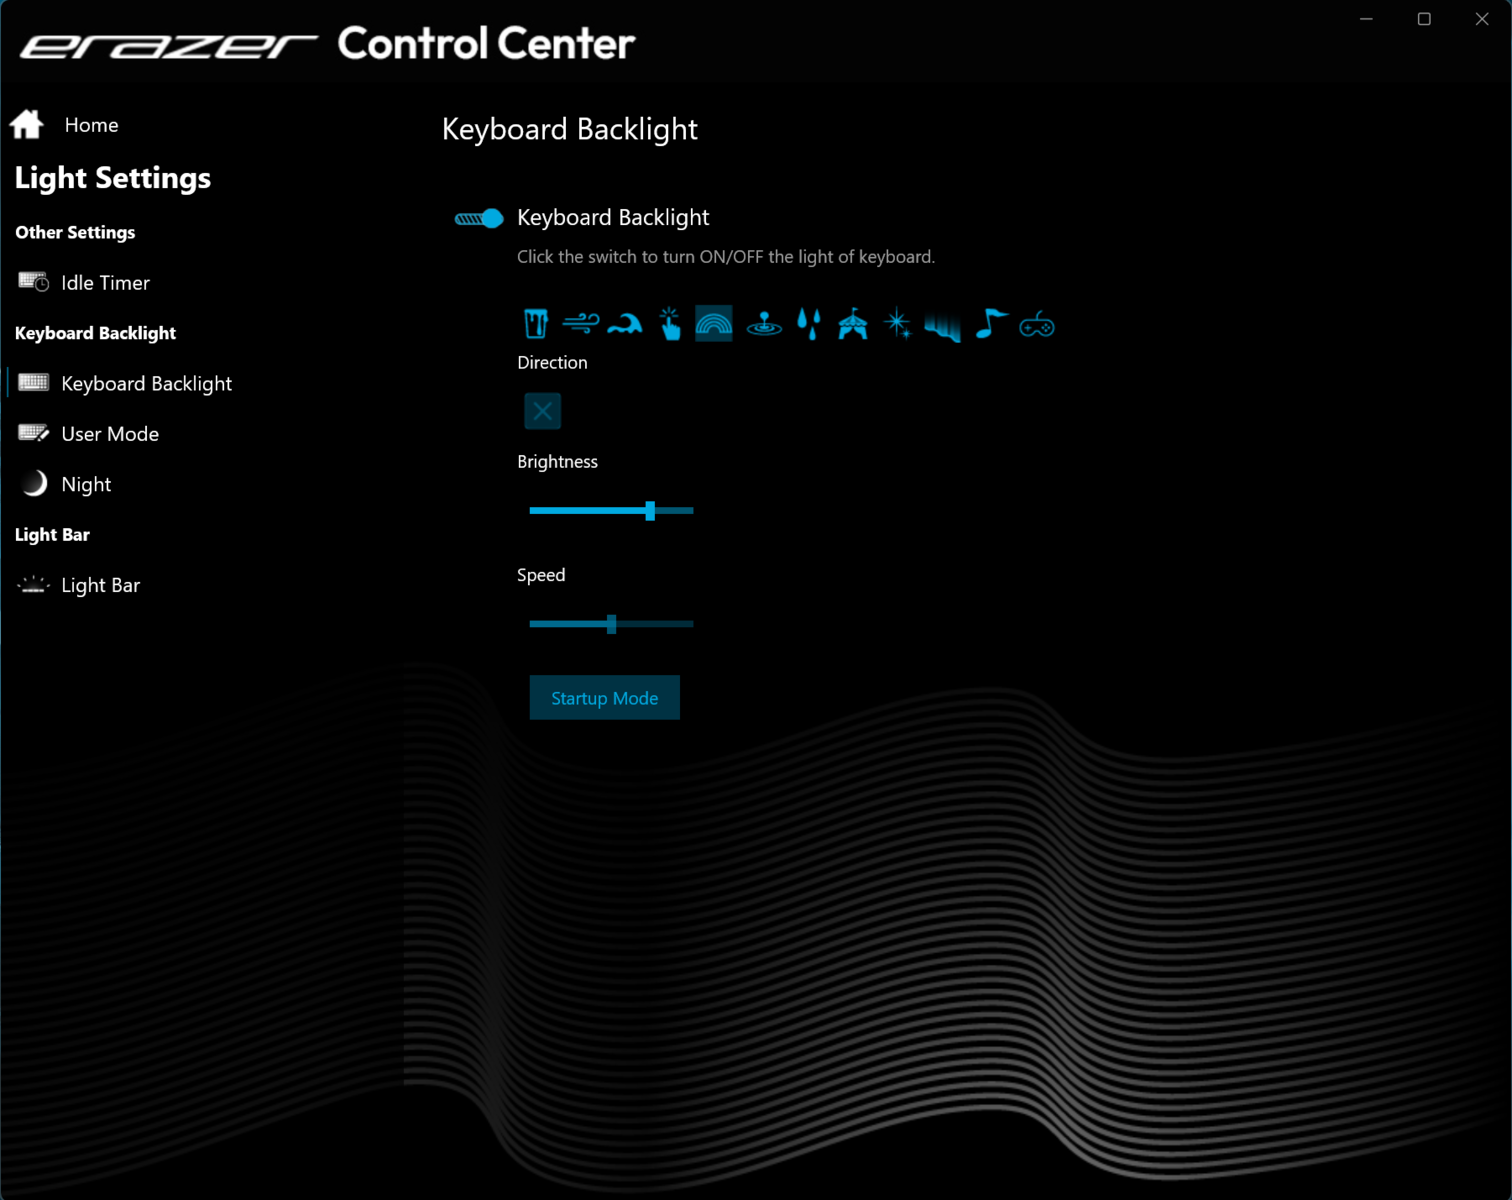
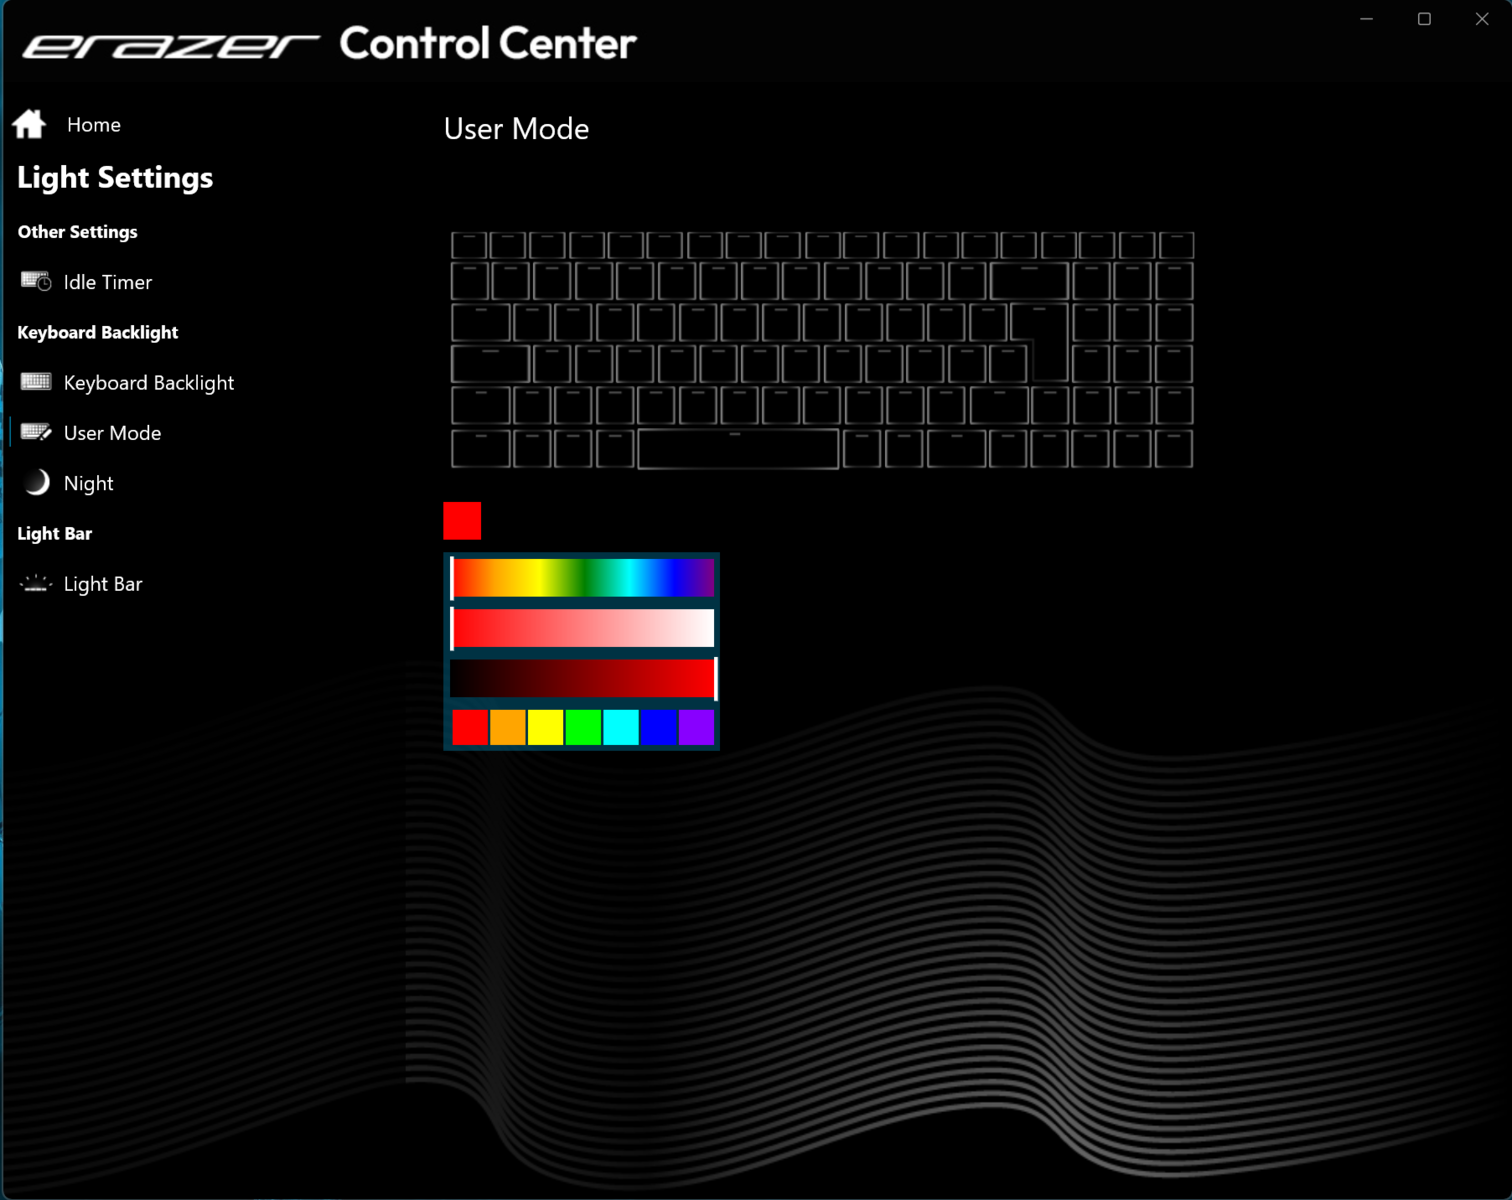
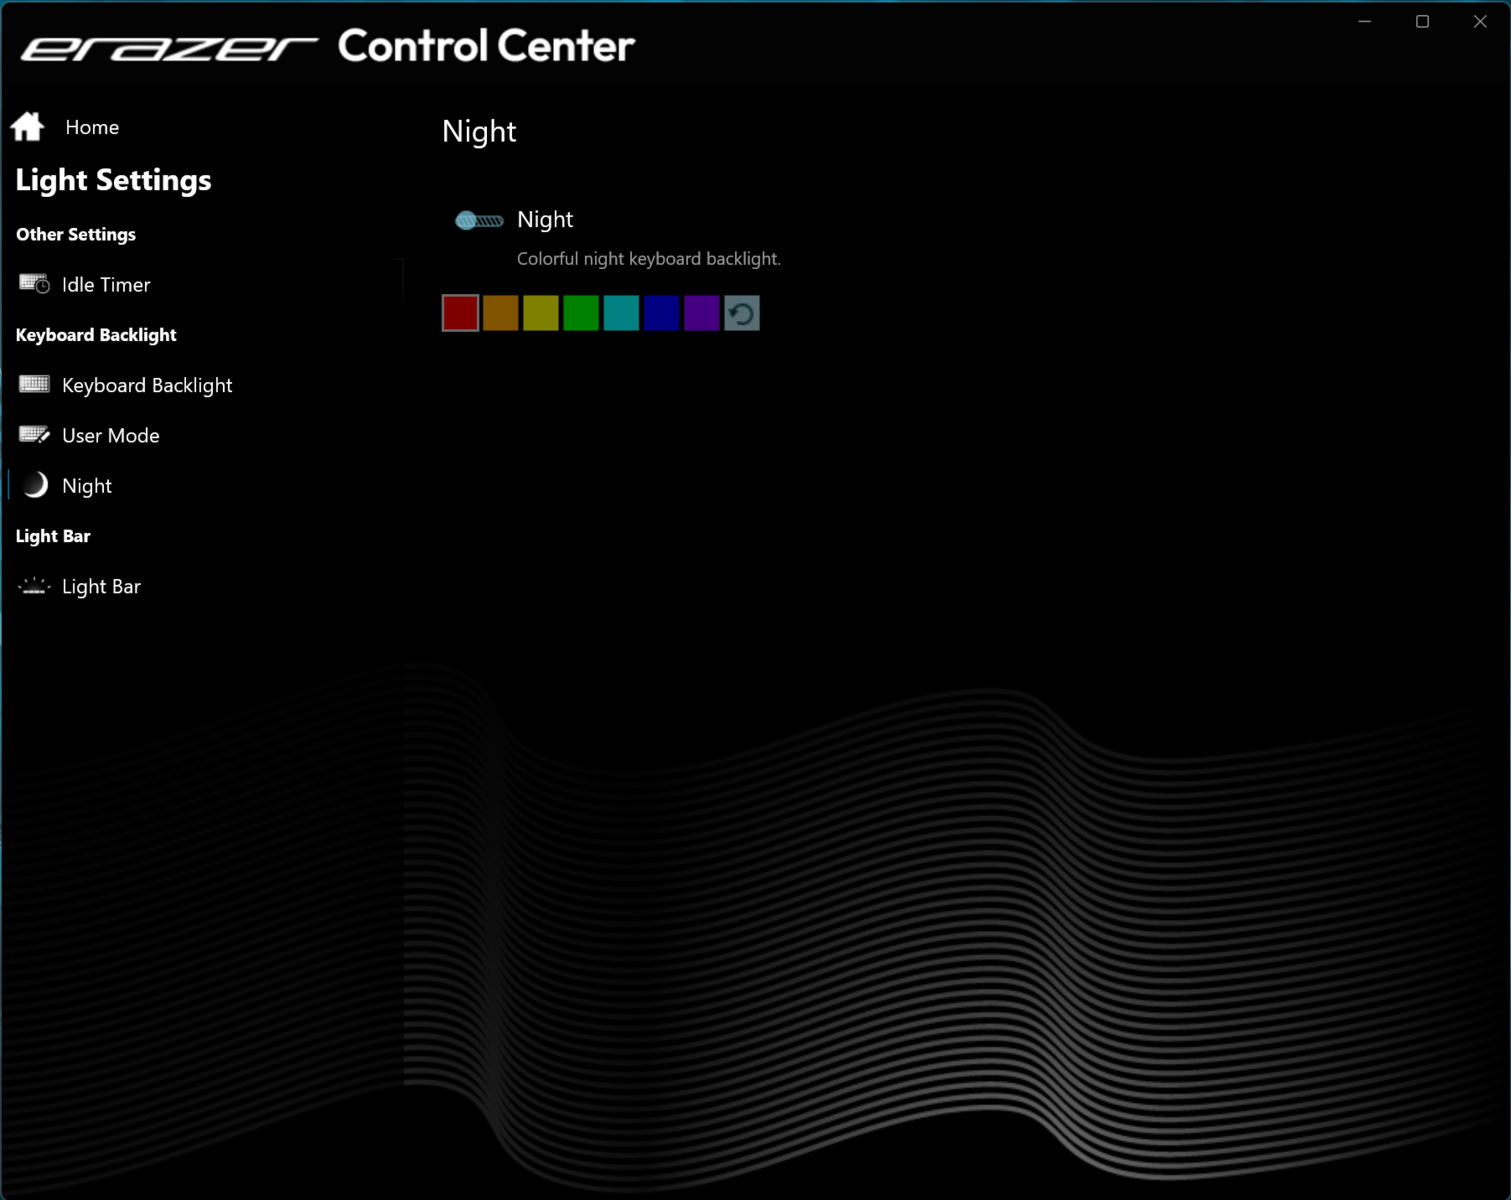
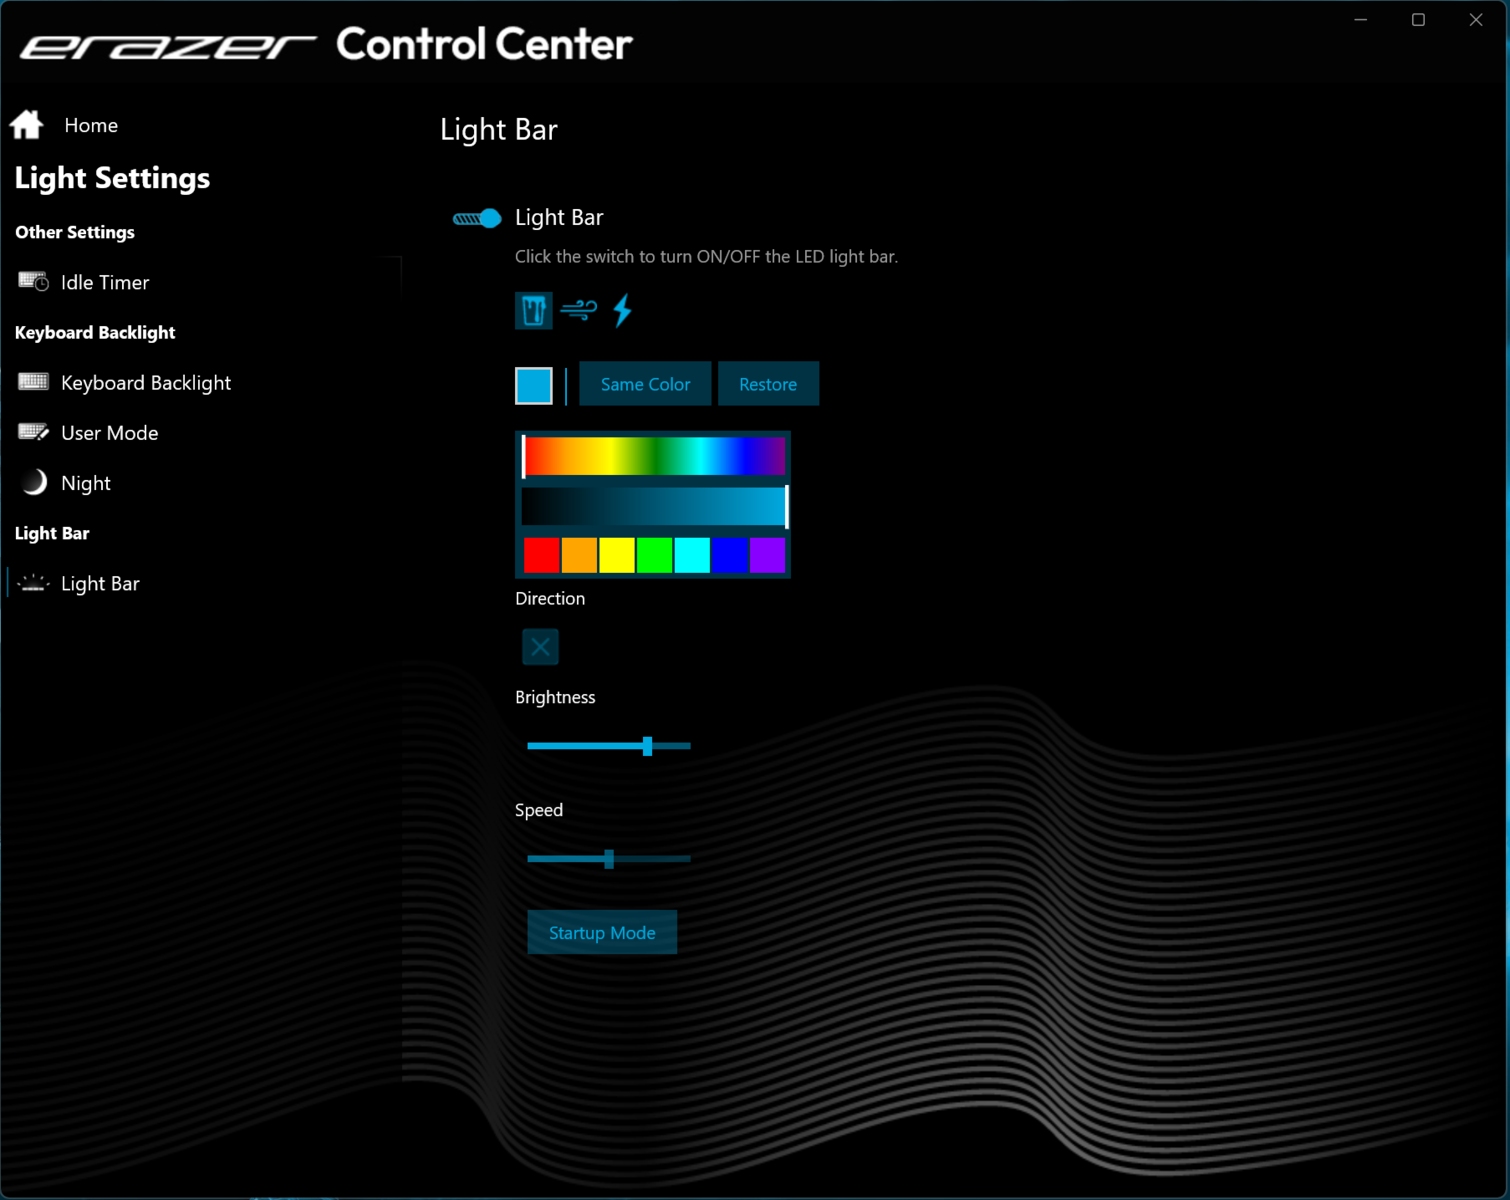
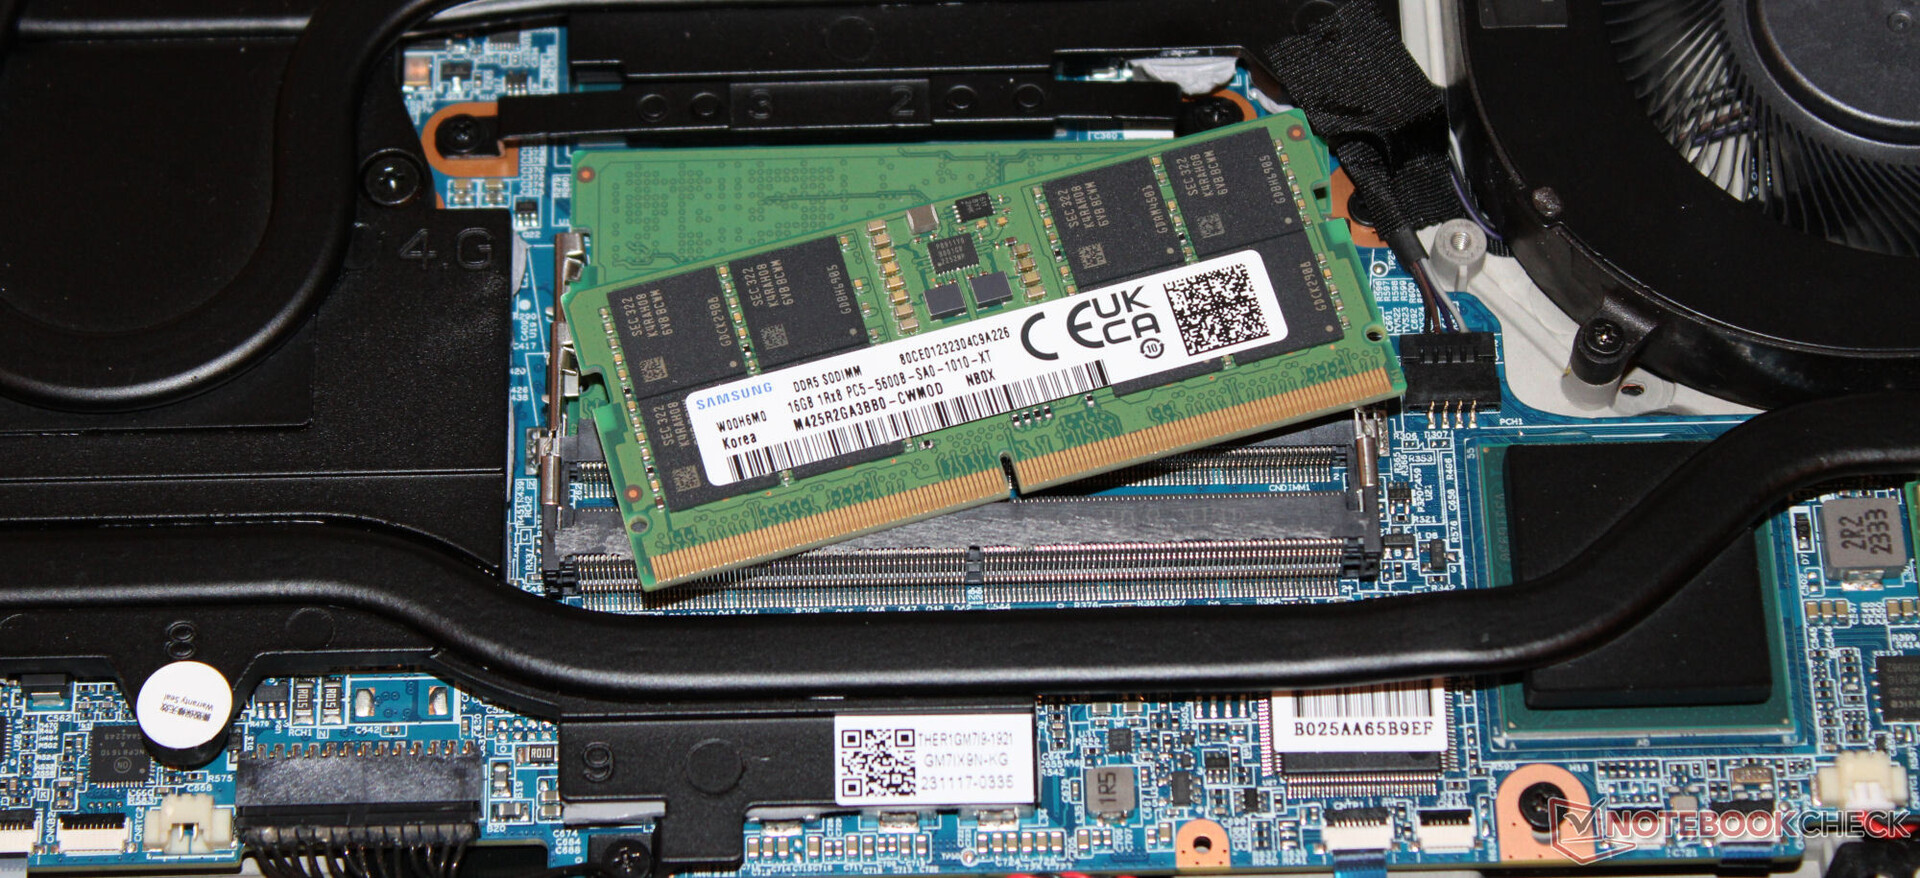
La tecnología de la Beast X40 se aloja en una robusta carcasa de metal negro mate de elegante diseño y superficies lisas. La unidad base está cubierta con un revestimiento de goma antideslizante. Dos tiras de LED RGB sobre las salidas de aire traseras, el logotipo iluminado de la tapa y la iluminación RGB de las teclas añaden un toque de color. La batería (atornillada, no pegada) y los demás componentes internos son accesibles tras retirar el panel inferior.
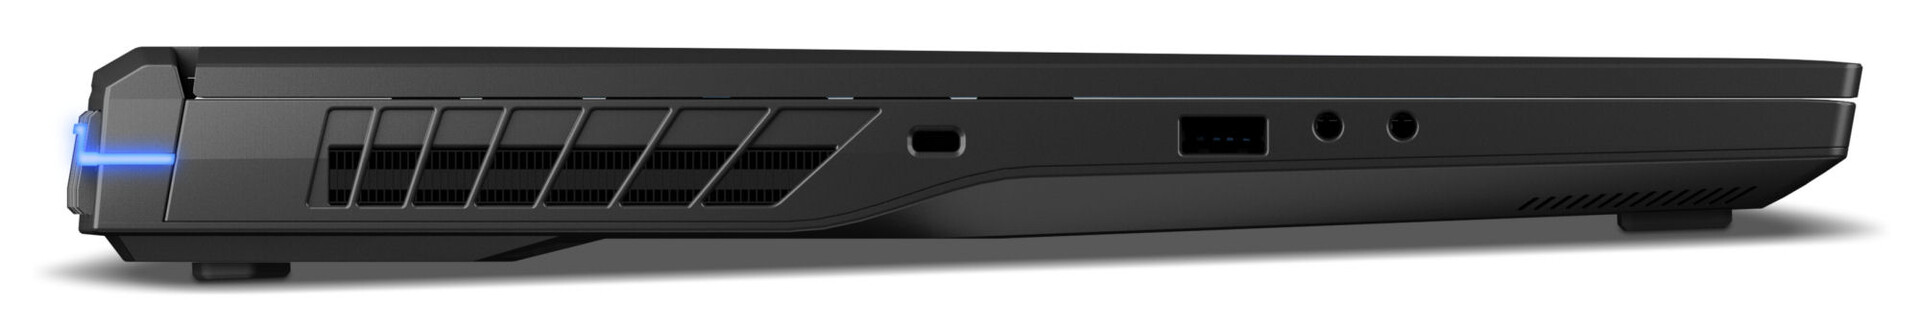
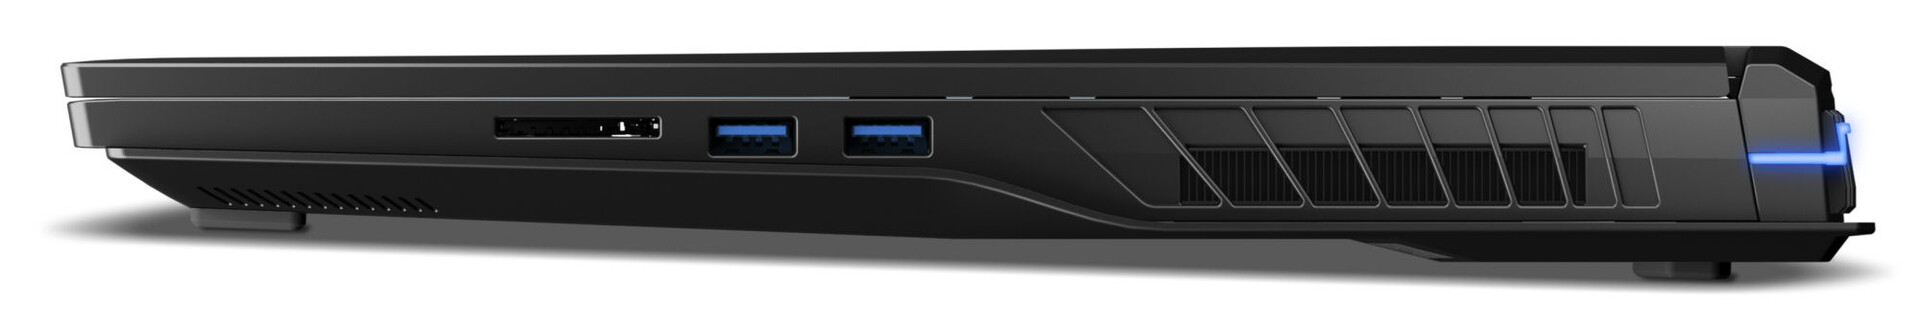
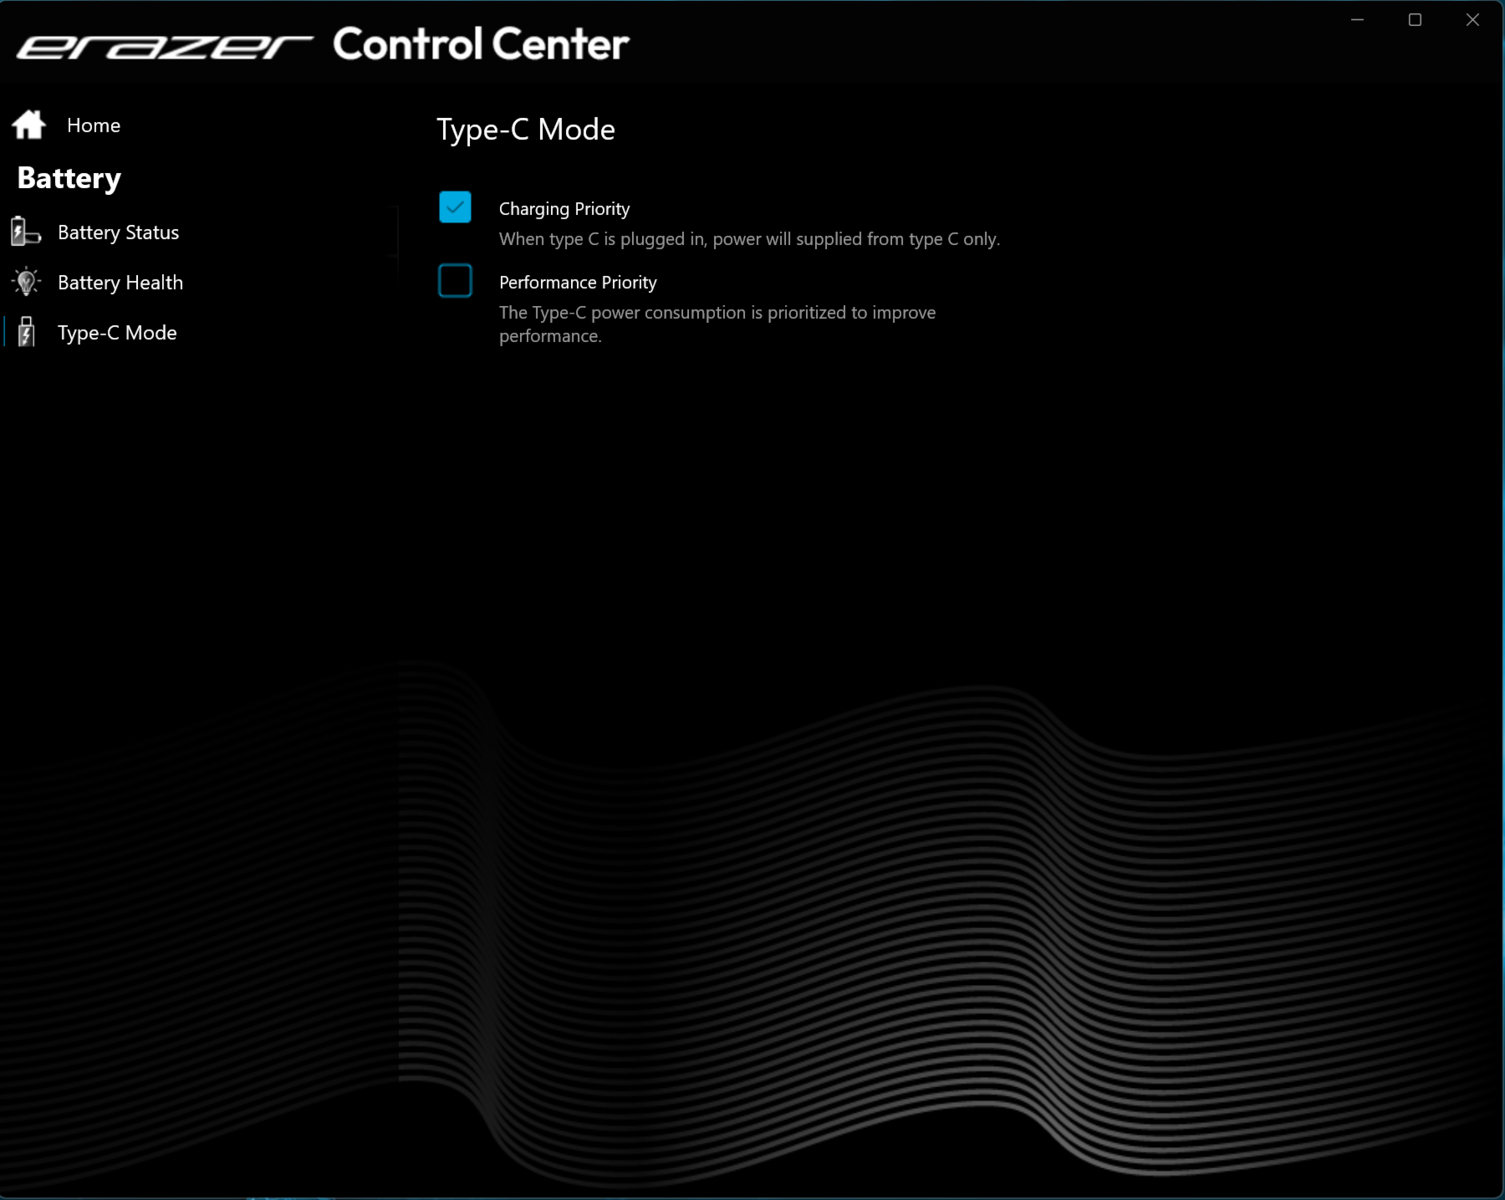
El Erazer cuenta con tres puertos USB-A (2x USB 3.2 Gen 1 y 1x USB 3.2 Gen 2) y un puerto USB Tipo-C en forma de Thunderbolt 4. Pudimos confirmar que este último puede emitir una señal DisplayPort y admite Power Delivery. En total, el portátil tiene dos salidas de vídeo (HDMI 2.1 y DisplayPort).
Probamos el lector de tarjetas de memoria SD con nuestra tarjeta de referencia AV Pro SD microSD 128 GB V60 y comprobamos que ofrece velocidades de lectura por encima de la media. La cámara web de 1080p viene de serie.
El Erazer Beast X40 utiliza un chip Intel Wi-Fi 6E AX211 mientras que las conexiones por cable las gestiona un controlador Realtek RTL8125 2,5 GbE. El portátil ofrece un sólido rendimiento Wi-Fi en nuestras pruebas utilizando el router de referencia Asus ROG Rapture GT-AXE11000 sin otros dispositivos Wi-Fi en las inmediaciones y a corta distancia entre el portátil y el PC servidor.
| SD Card Reader | |
| average JPG Copy Test (av. of 3 runs) | |
| Media de la clase Gaming (20.9 - 210, n=54, últimos 2 años) | |
| MSI Titan 18 HX A14VIG (Toshiba Exceria Pro SDXC 64 GB UHS-II) | |
| Medion Erazer Beast X40 (AV PRO microSD 128 GB V60) | |
| Medion Erazer Beast X40 2024 (AV PRO microSD 128 GB V60) | |
| maximum AS SSD Seq Read Test (1GB) | |
| Media de la clase Gaming (25.5 - 261, n=51, últimos 2 años) | |
| MSI Titan 18 HX A14VIG (Toshiba Exceria Pro SDXC 64 GB UHS-II) | |
| Medion Erazer Beast X40 2024 (AV PRO microSD 128 GB V60) | |
| Medion Erazer Beast X40 (AV PRO microSD 128 GB V60) | |


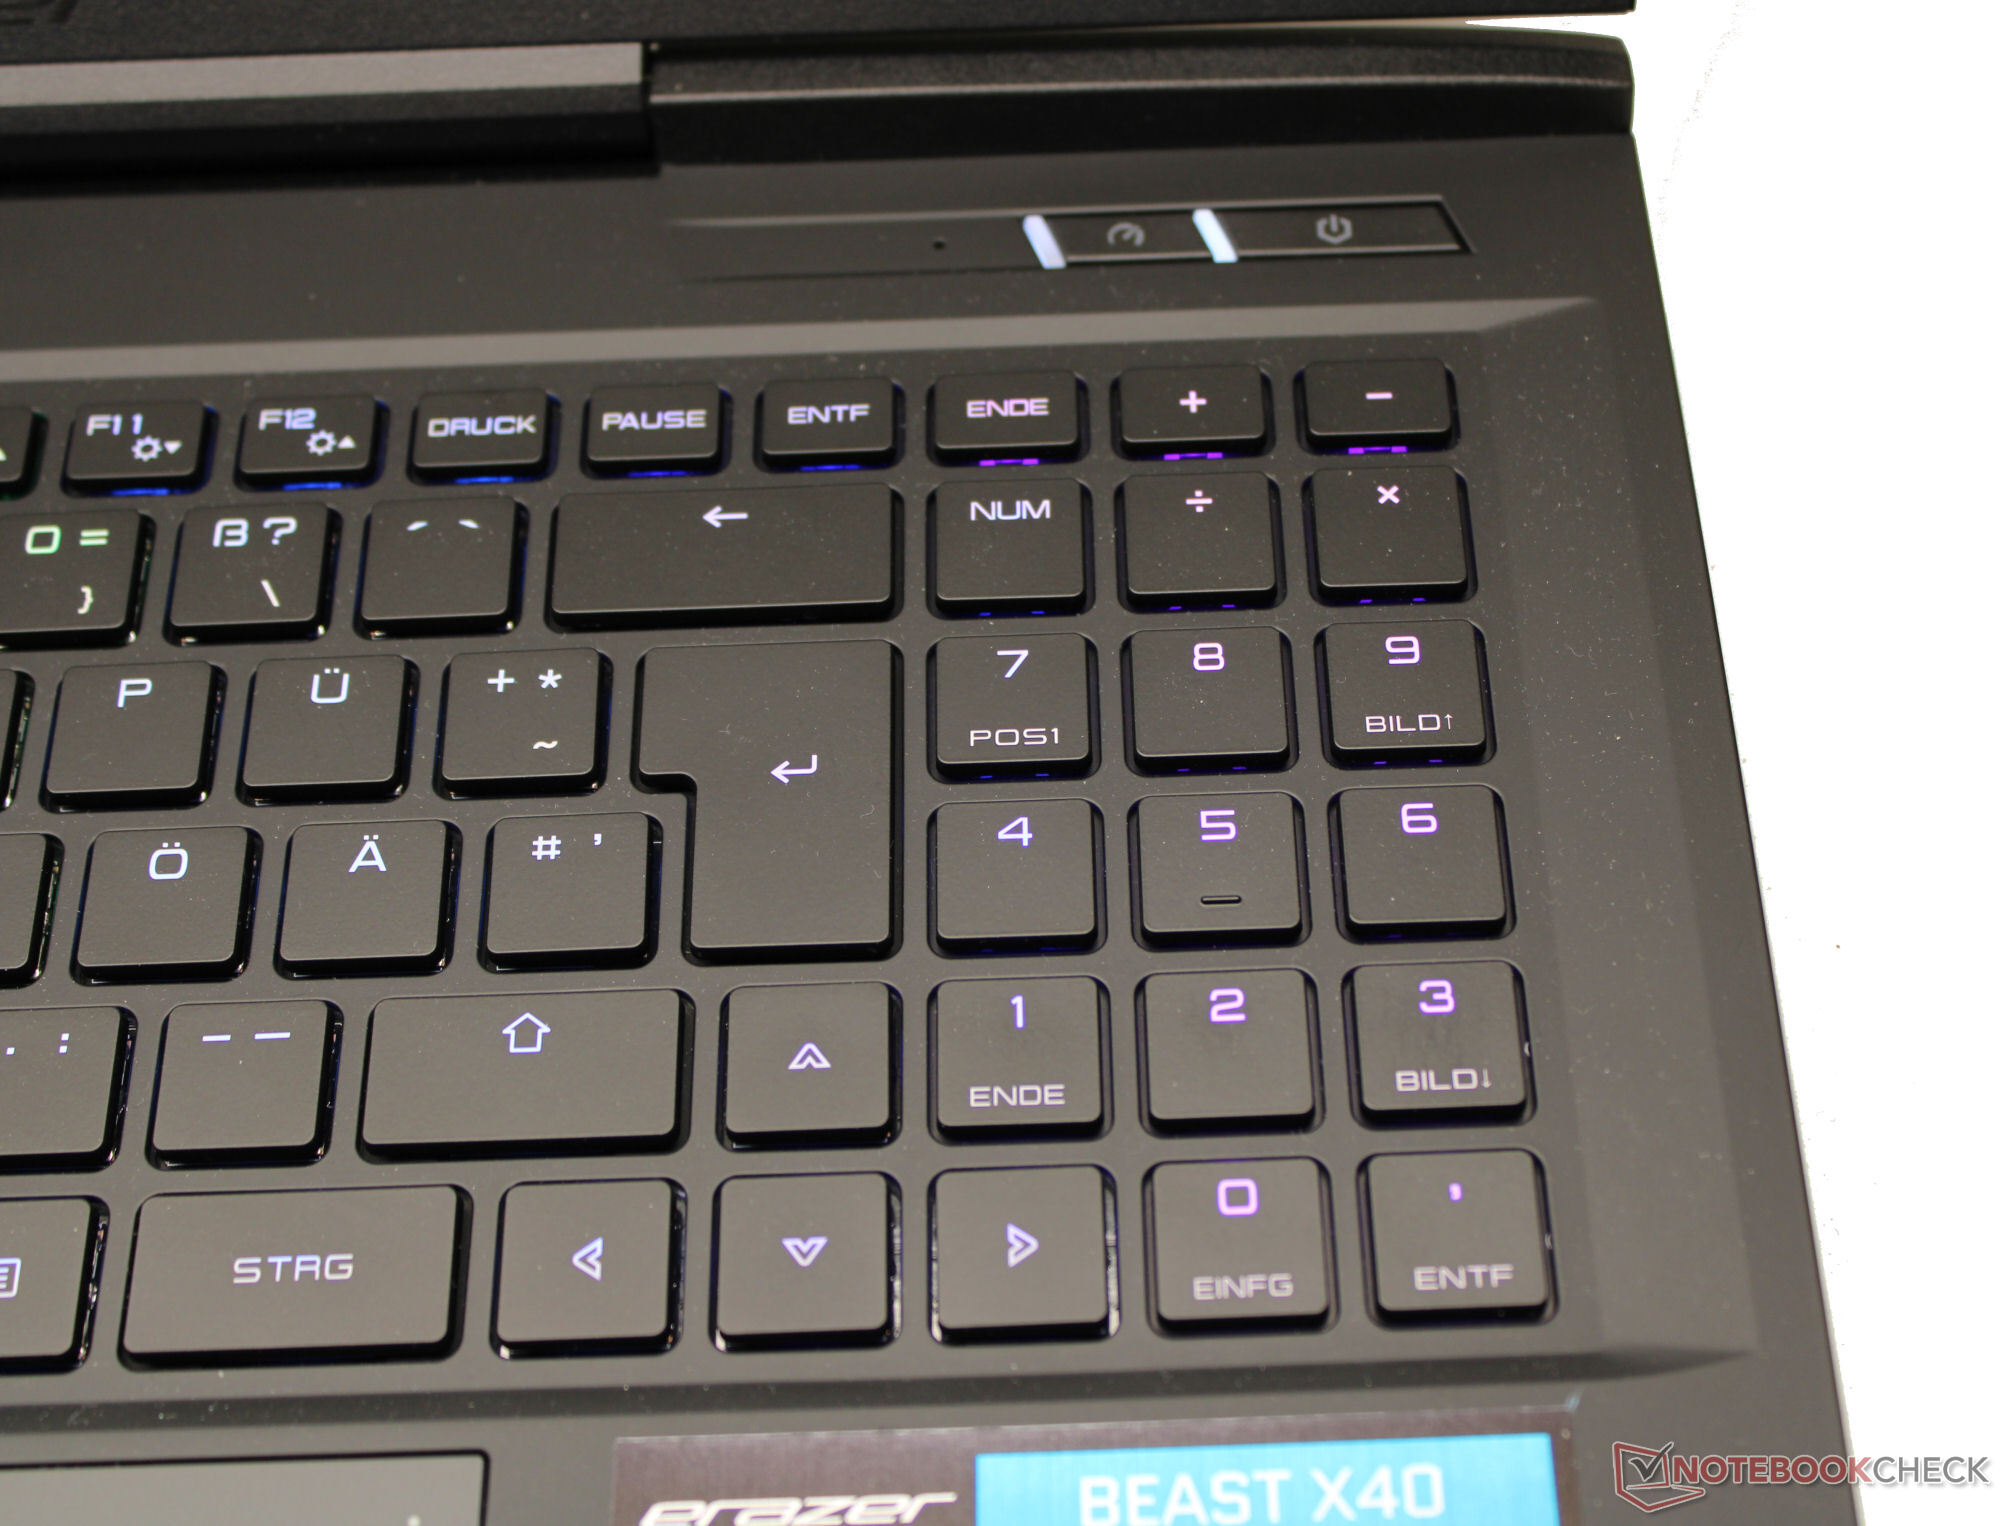
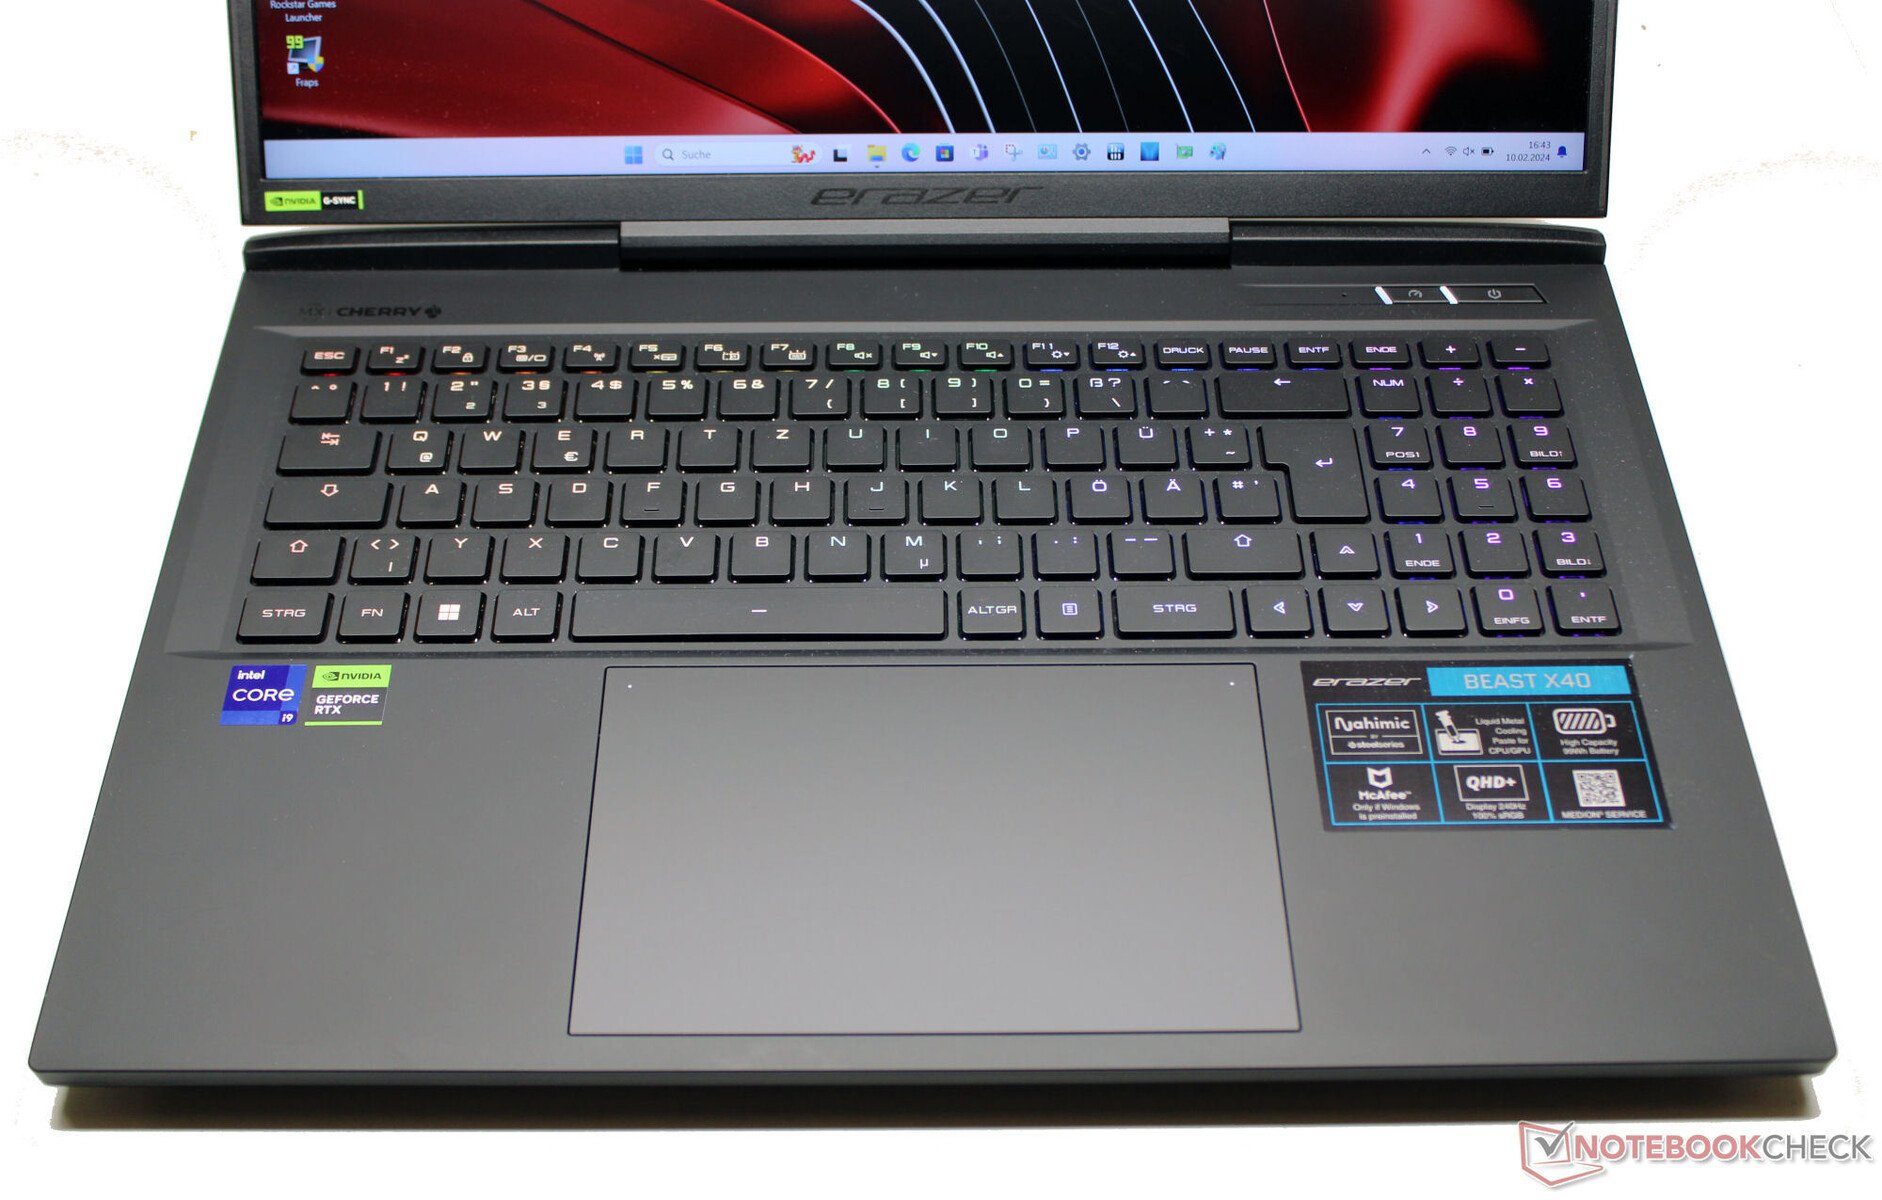
Dispositivos de entrada: Teclado mecánico con interruptores Cherry MX
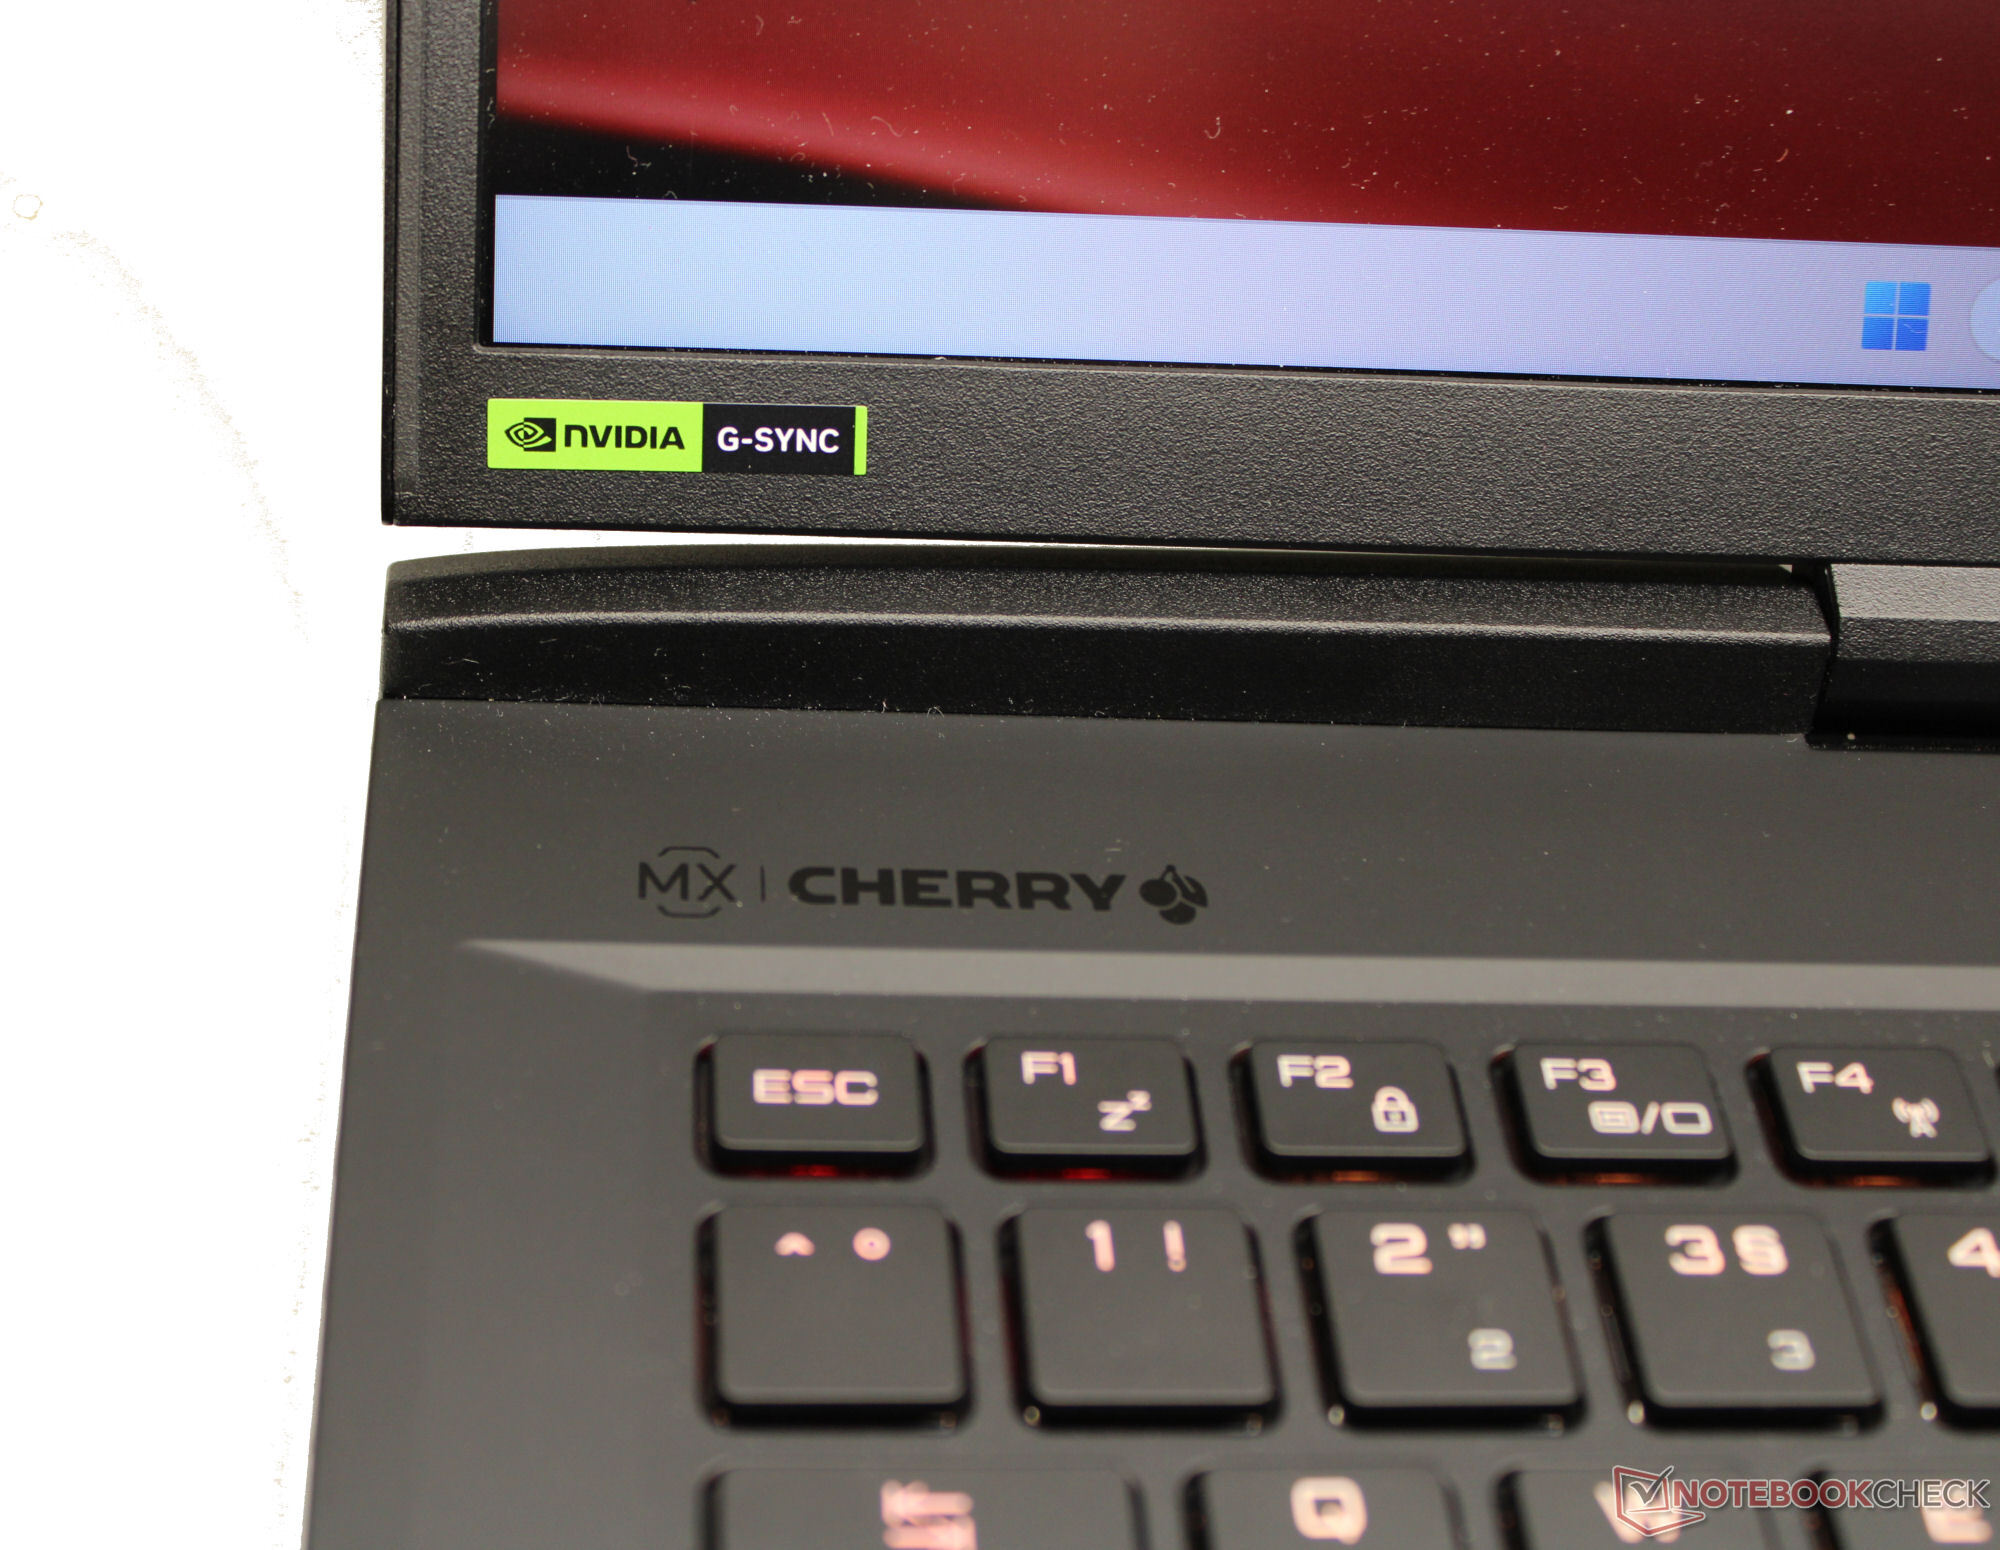
El teclado mecánico de la Beast X40 gana puntos con su rica sensación de tecleo y sus entradas precisas. Sus interruptores Cherry MX ofrecen un recorrido medio y un punto de presión claramente audible y perceptible. El teclado numérico y la iluminación RGB individual de las teclas completan la armonía general del teclado.
El panel táctil multitáctil (15,5 x 10 cm) tiene un recorrido corto y un punto de presión claro. Puede desactivarse por completo o sólo en un lado (derecho).
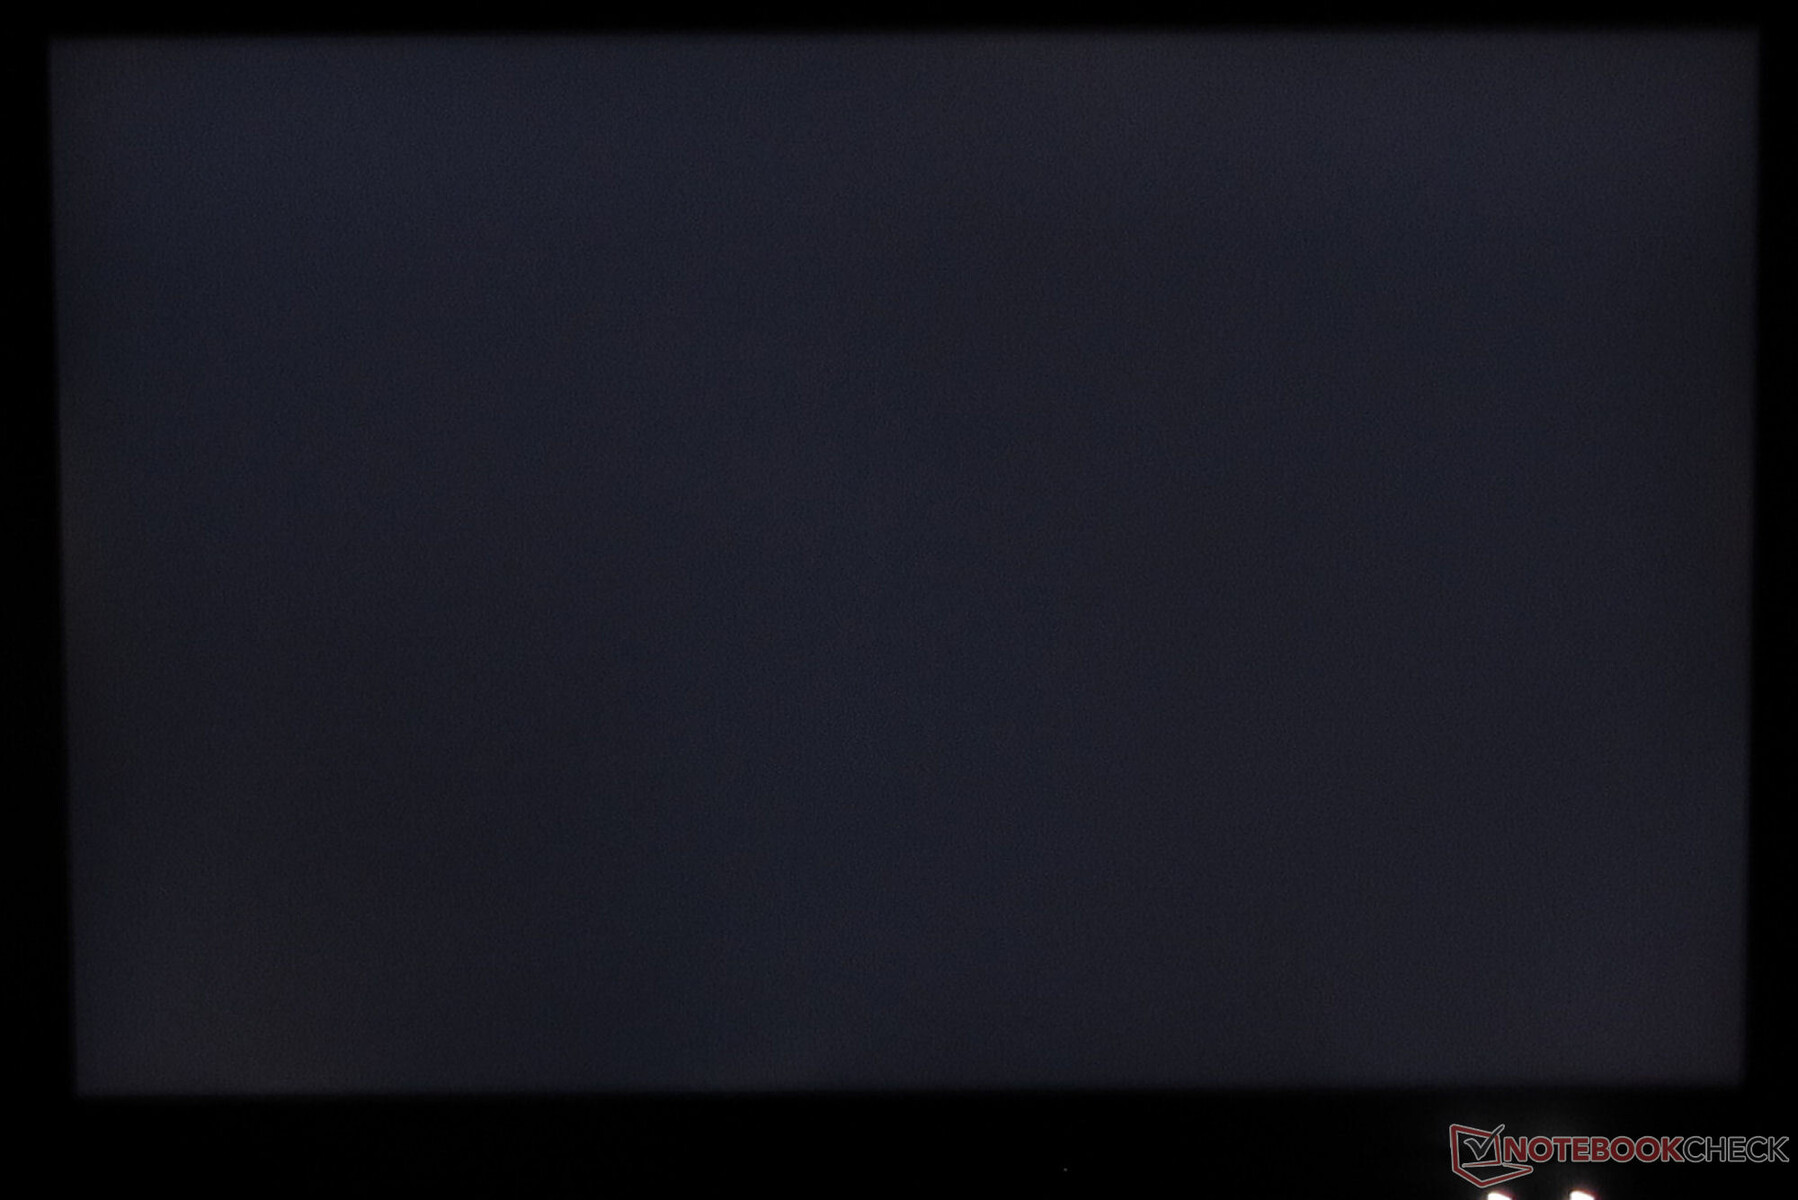
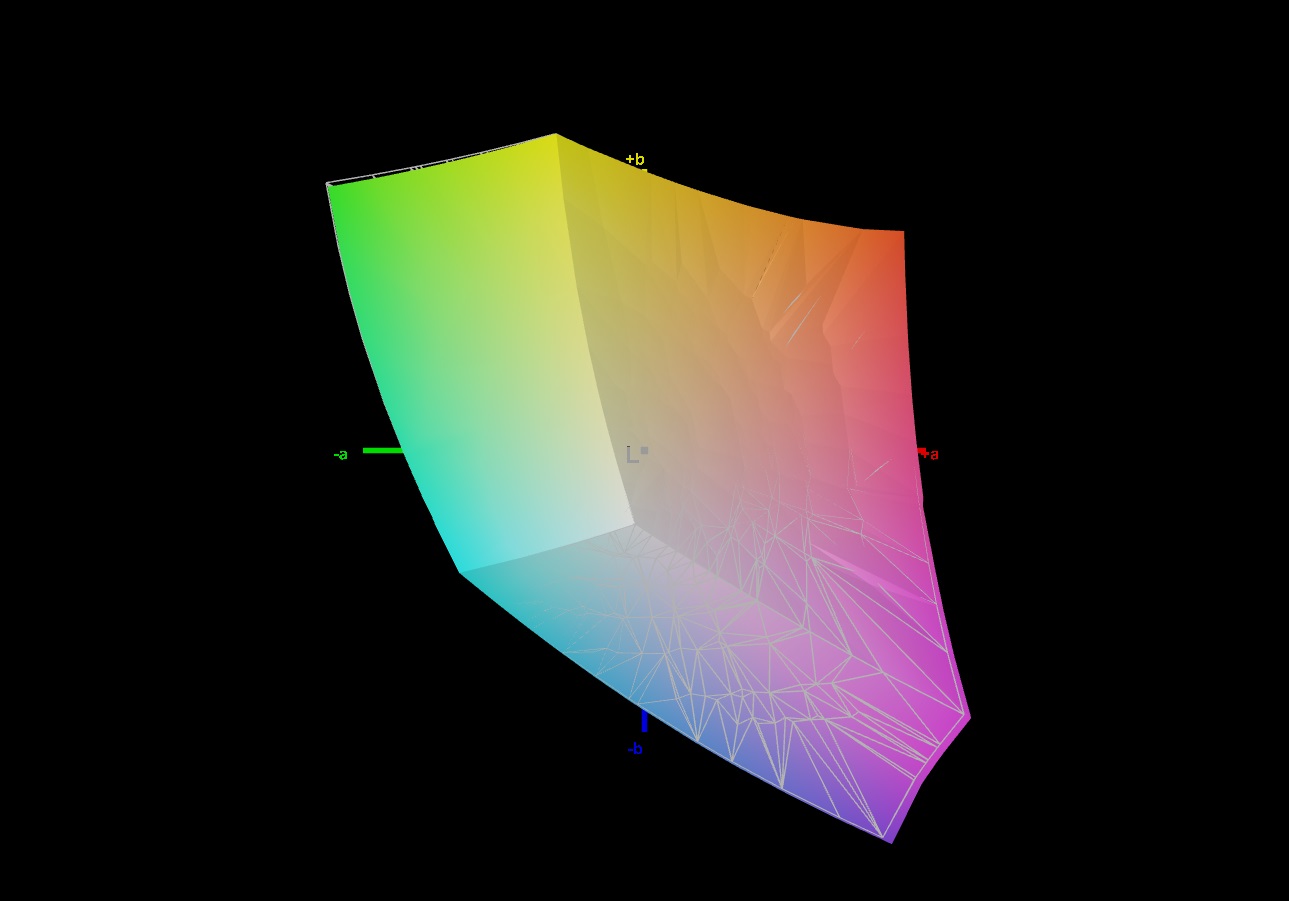
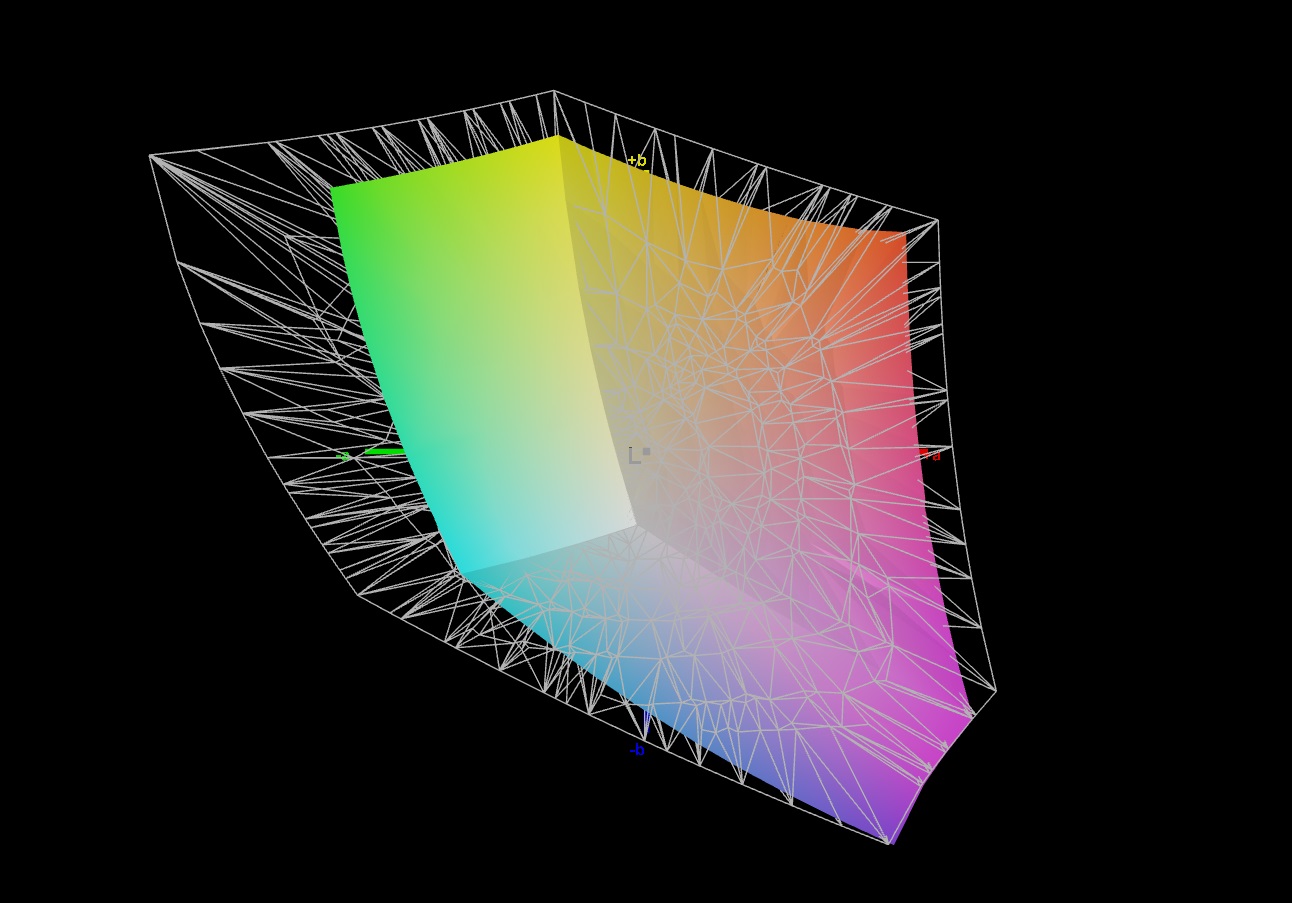
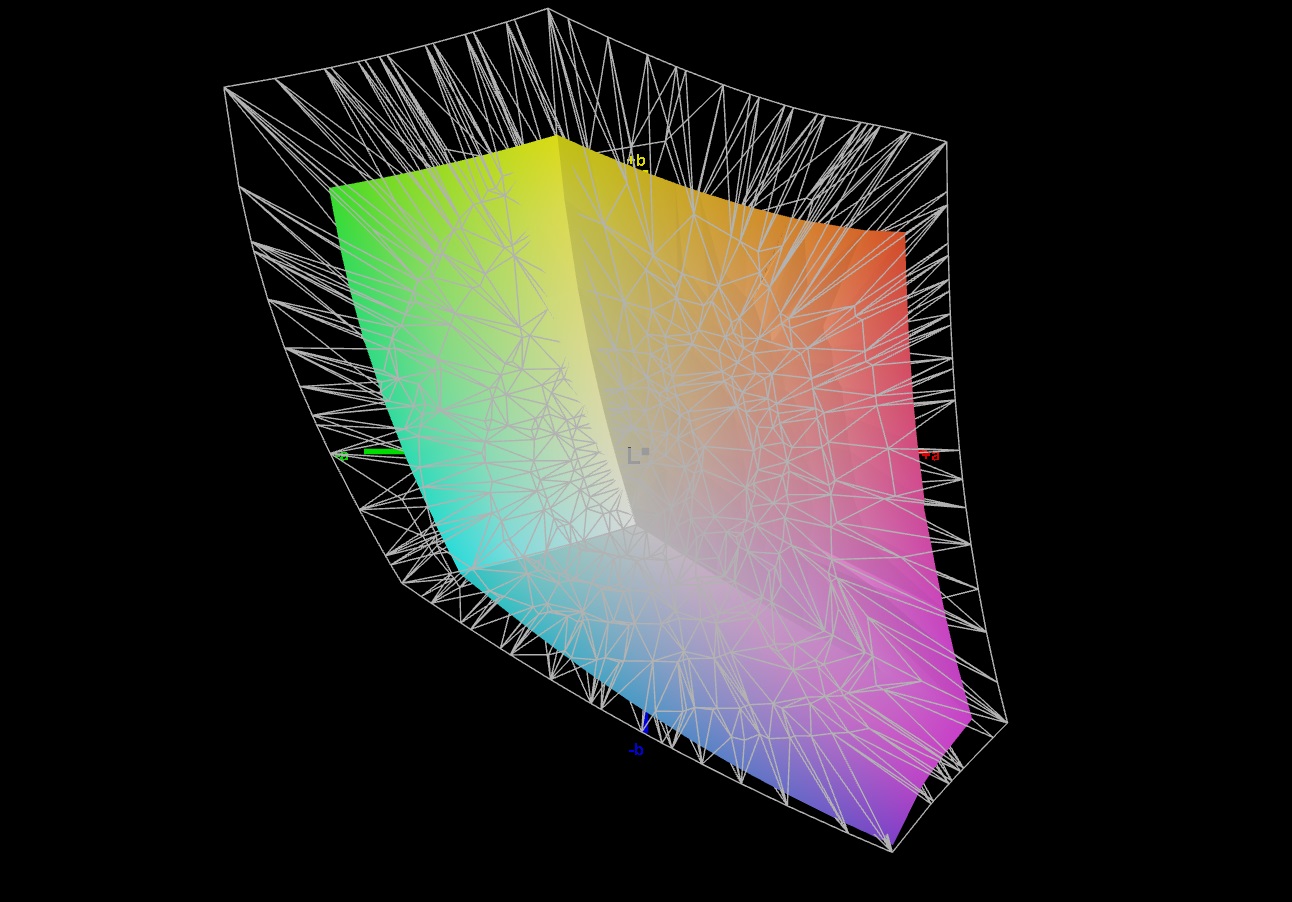
Pantalla: QHD+ con una decente cobertura sRGB
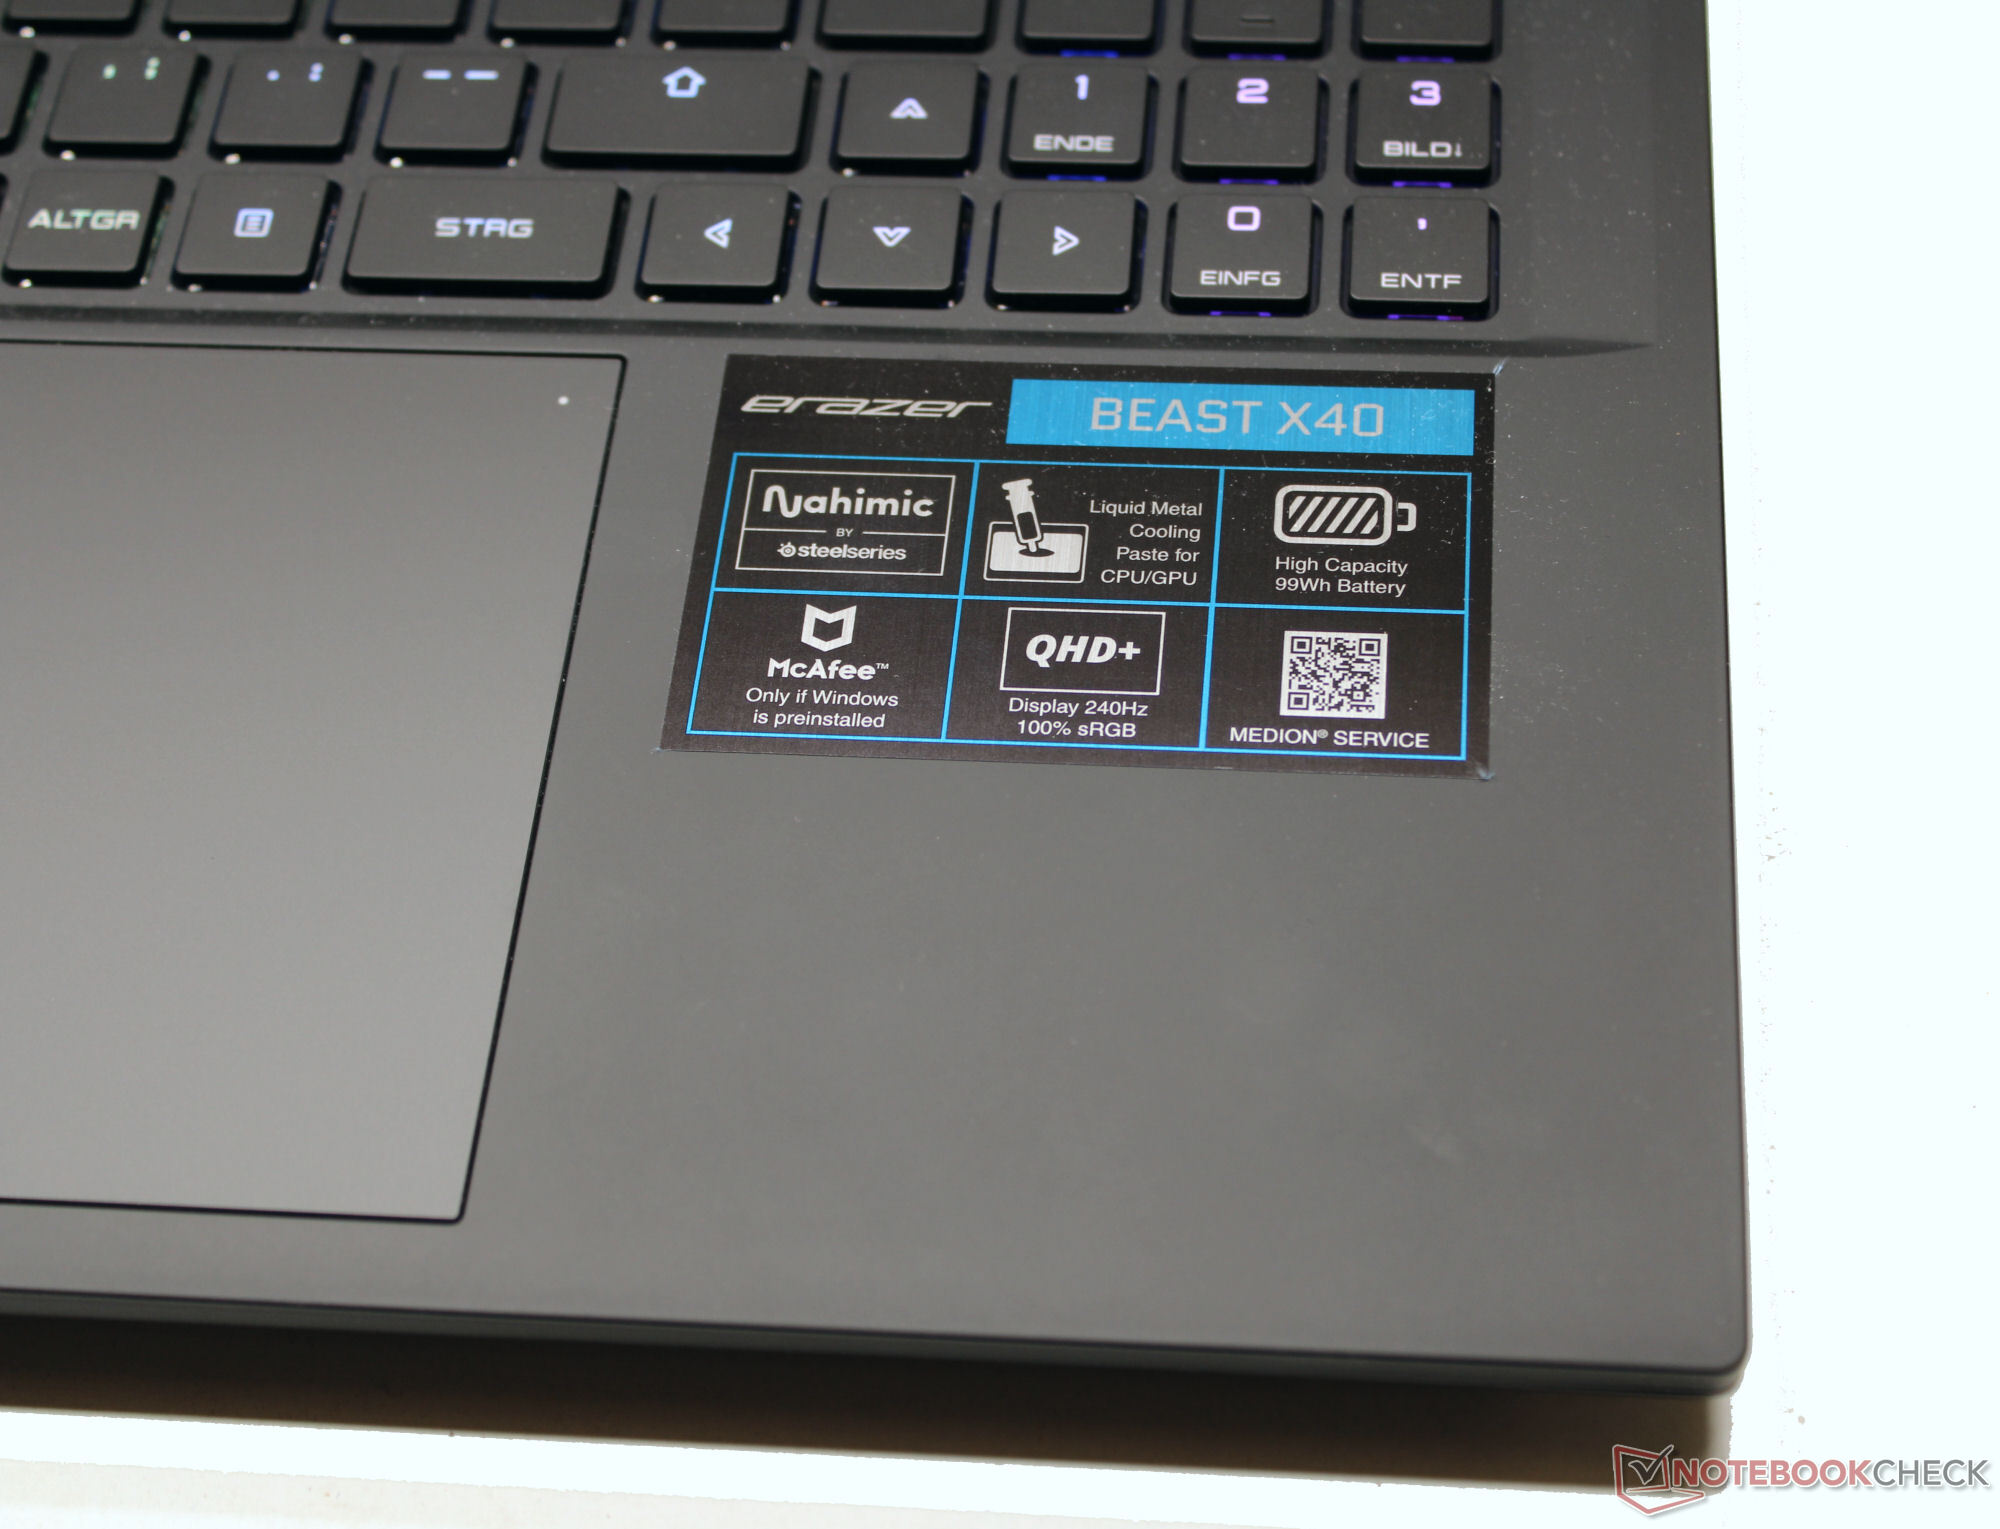
El 2024 Beast X40 utiliza la misma pantalla mate QHD+ 240 Hz (2.560 x 1.600 píxeles) desarrollada por BOE similar al 2023 Beast X40. El panel tiene buenos niveles de brillo, tiempos de respuesta cortos, altas frecuencias de cuadro y no presenta parpadeo PWM.
Medion no ofrece actualmente otras opciones de pantalla entre las que elegir.
| |||||||||||||||||||||||||
iluminación: 87 %
Brillo con batería: 422 cd/m²
Contraste: 1005:1 (Negro: 0.42 cd/m²)
ΔE ColorChecker Calman: 1.42 | ∀{0.5-29.43 Ø4.71}
calibrated: 0.7
ΔE Greyscale Calman: 1.2 | ∀{0.09-98 Ø4.96}
69% AdobeRGB 1998 (Argyll 3D)
99.5% sRGB (Argyll 3D)
68.1% Display P3 (Argyll 3D)
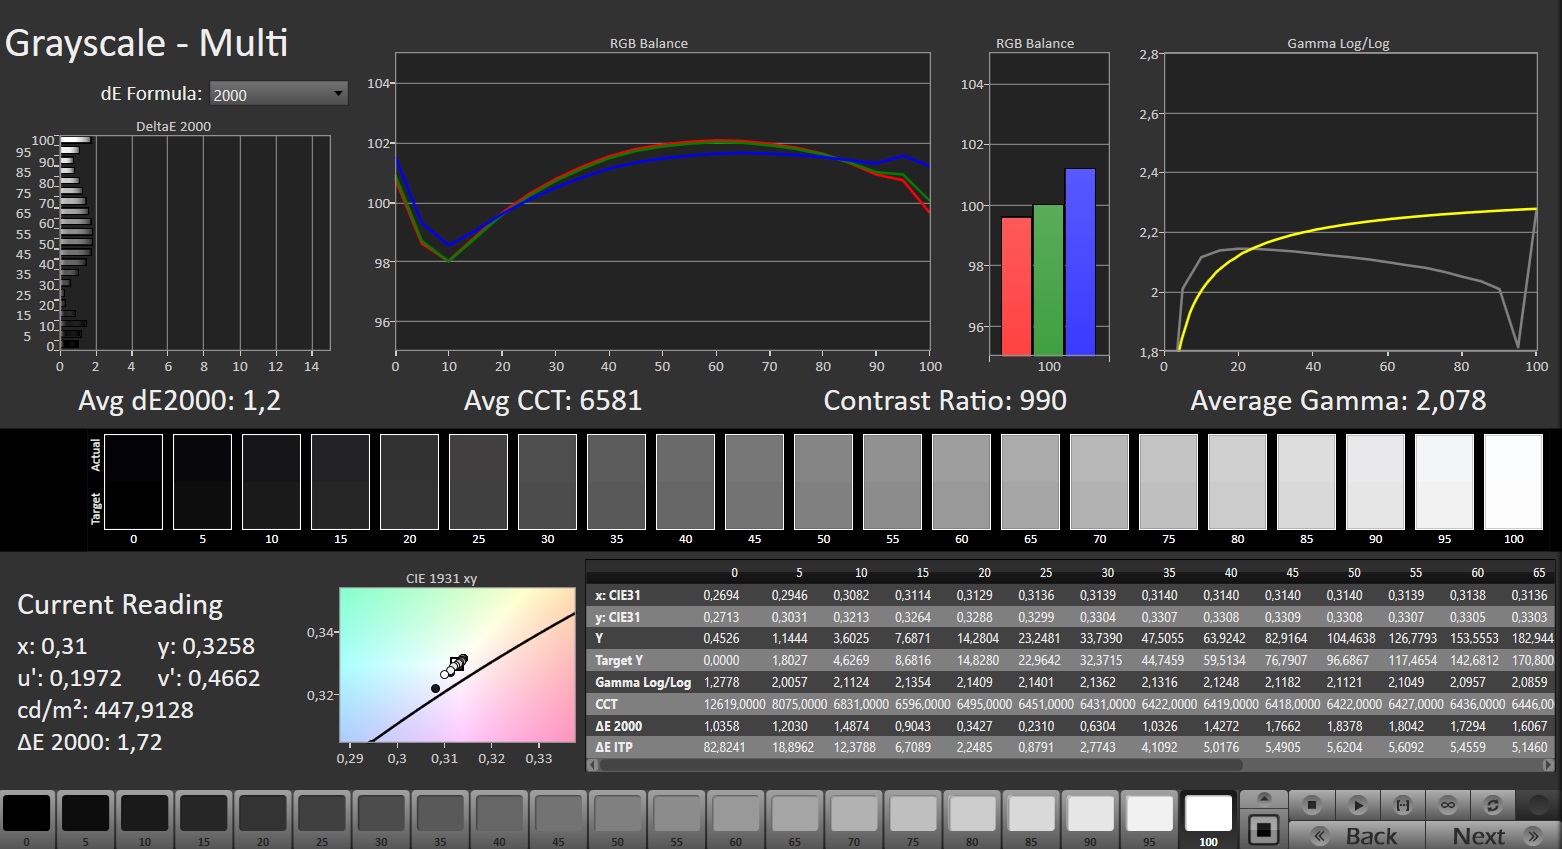
Gamma: 2.078
CCT: 6581 K
| Medion Erazer Beast X40 2024 BOE NE170QDM-NZ1, IPS, 2560x1600, 17" | Schenker Key 17 Pro (Early 23) BOE CQ NE173QUM-NY1, IPS, 3840x2160, 17.3" | Asus ROG Strix Scar 17 G733PY-XS96 NE173QHM-NZ2, IPS, 2560x1440, 17.3" | Asus ROG Strix Scar 18 G834JYR (2024) BOE NE180QDM-NM1, Mini LED, 2560x1600, 18" | MSI Titan 18 HX A14VIG AU Optronics B180ZAN01.0, Mini-LED, 3840x2400, 18" | Medion Erazer Beast X40 BOE NE170QDM-NZ1, IPS, 2560x1600, 17" | |
|---|---|---|---|---|---|---|
| Display | 21% | 23% | 26% | 23% | 1% | |
| Display P3 Coverage (%) | 68.1 | 96.4 42% | 98 44% | 99.9 47% | 98.1 44% | 68.6 1% |
| sRGB Coverage (%) | 99.5 | 99.9 0% | 100 1% | 100 1% | 99.8 0% | 99.8 0% |
| AdobeRGB 1998 Coverage (%) | 69 | 84.3 22% | 85.6 24% | 90 30% | 86.2 25% | 69.4 1% |
| Response Times | -15% | -9% | -29% | -530% | -3% | |
| Response Time Grey 50% / Grey 80% * (ms) | 11.7 ? | 14.8 ? -26% | 6.2 ? 47% | 12 ? -3% | 8.6 ? 26% | 11.3 ? 3% |
| Response Time Black / White * (ms) | 6.9 ? | 7.2 ? -4% | 11.4 ? -65% | 10.7 ? -55% | 81.8 ? -1086% | 7.5 ? -9% |
| PWM Frequency (Hz) | 5733 ? | 2592 ? | ||||
| Screen | -0% | -6% | 166% | -119% | -29% | |
| Brightness middle (cd/m²) | 422 | 487 15% | 322.5 -24% | 937 122% | 467.5 11% | 384 -9% |
| Brightness (cd/m²) | 388 | 485 25% | 317 -18% | 934 141% | 459 18% | 377 -3% |
| Brightness Distribution (%) | 87 | 87 0% | 86 -1% | 89 2% | 90 3% | 90 3% |
| Black Level * (cd/m²) | 0.42 | 0.51 -21% | 0.29 31% | 0.066 84% | 0.45 -7% | |
| Contrast (:1) | 1005 | 955 -5% | 1112 11% | 14197 1313% | 853 -15% | |
| Colorchecker dE 2000 * | 1.42 | 1.51 -6% | 1.15 19% | 1.52 -7% | 3.77 -165% | 2.05 -44% |
| Colorchecker dE 2000 max. * | 1.97 | 2.19 -11% | 3.03 -54% | 2.82 -43% | 6.12 -211% | 3.64 -85% |
| Colorchecker dE 2000 calibrated * | 0.7 | 0.56 20% | 1.21 -73% | 2.94 -320% | 0.74 -6% | |
| Greyscale dE 2000 * | 1.2 | 1.2 -0% | 1.7 -42% | 1.7 -42% | 3.2 -167% | 2.3 -92% |
| Gamma | 2.078 106% | 2.273 97% | 2.27 97% | 2.042 108% | 2.43 91% | 2.017 109% |
| CCT | 6581 99% | 6451 101% | 6299 103% | 6578 99% | 6478 100% | 6546 99% |
| Media total (Programa/Opciones) | 2% /
2% | 3% /
-1% | 54% /
108% | -209% /
-152% | -10% /
-19% |
* ... más pequeño es mejor
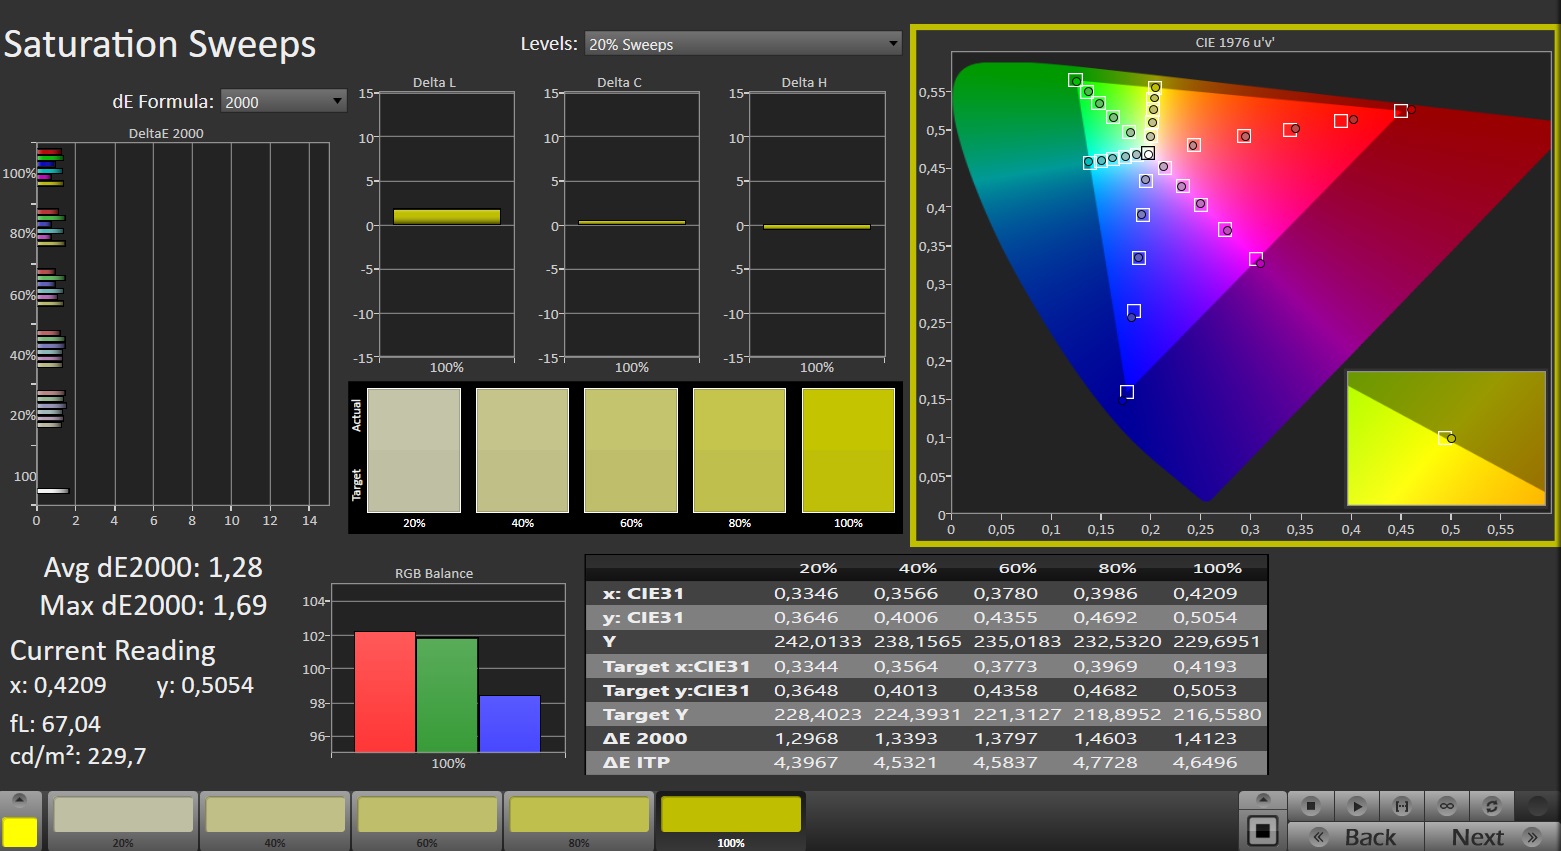
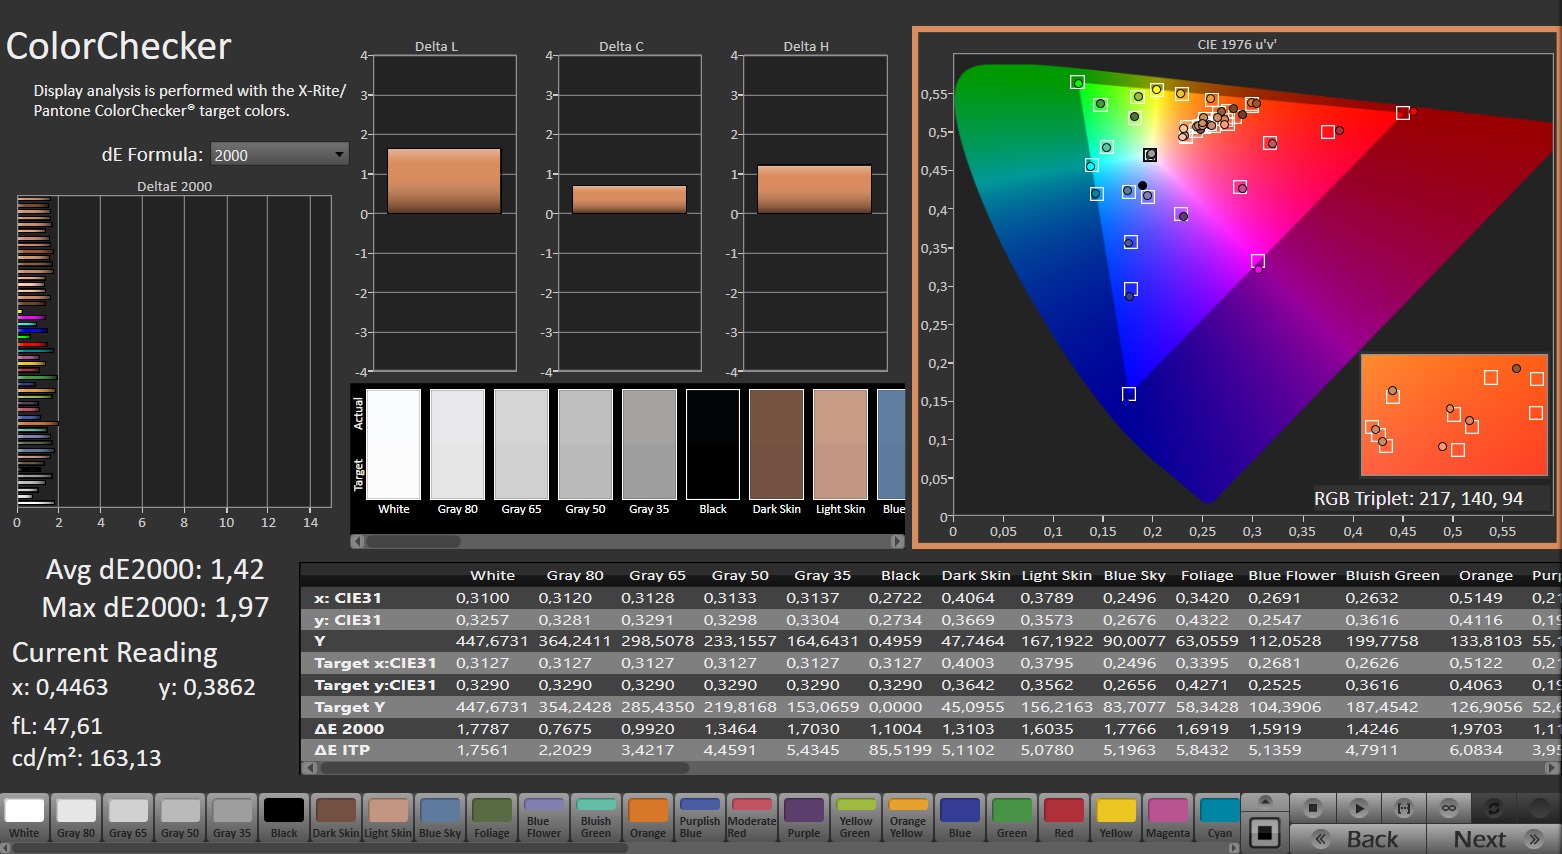
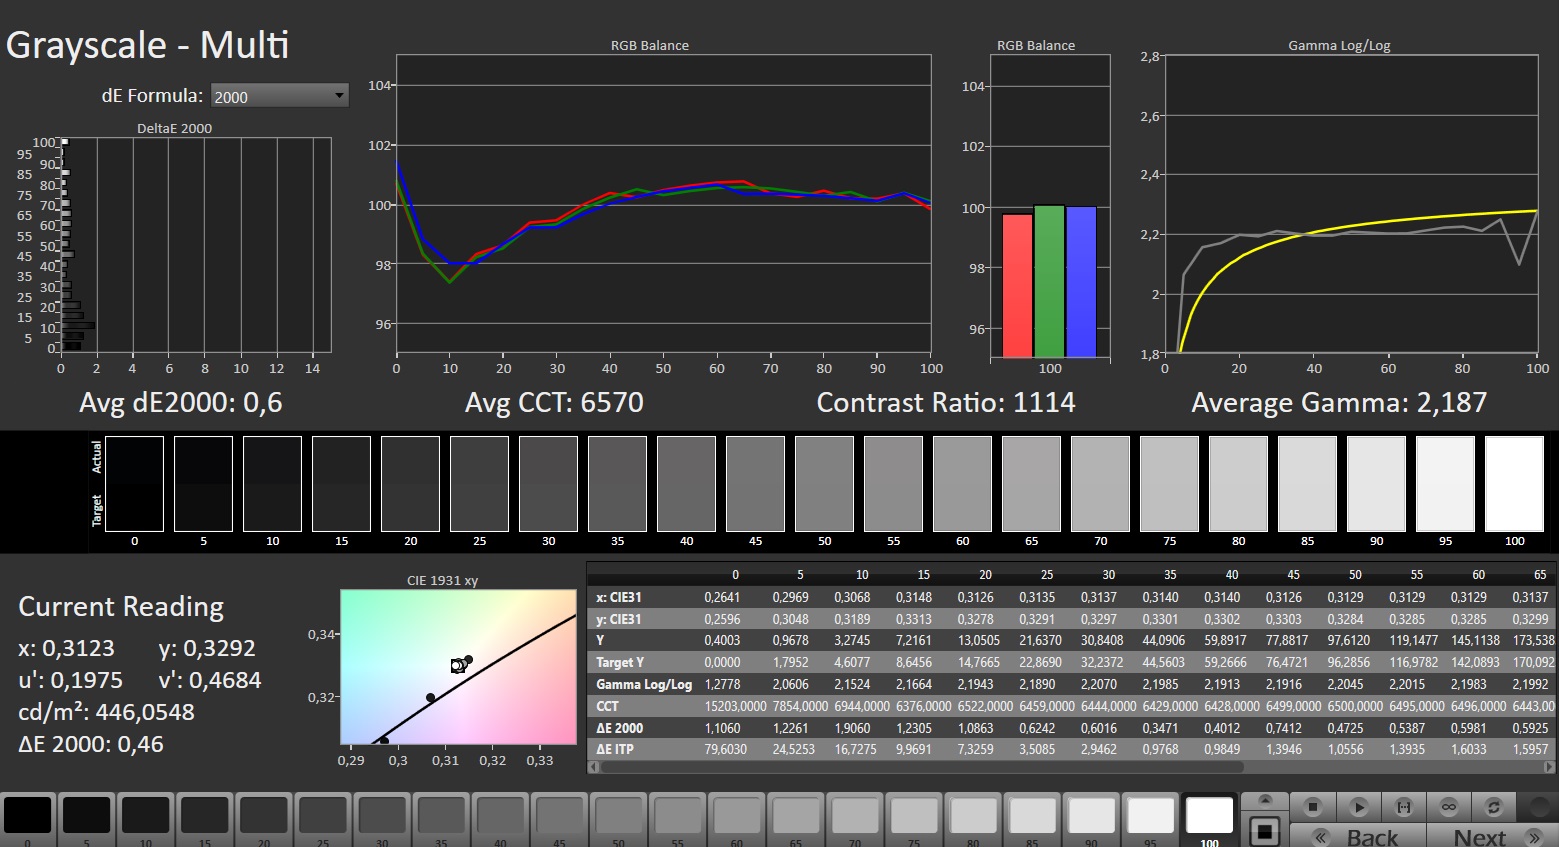
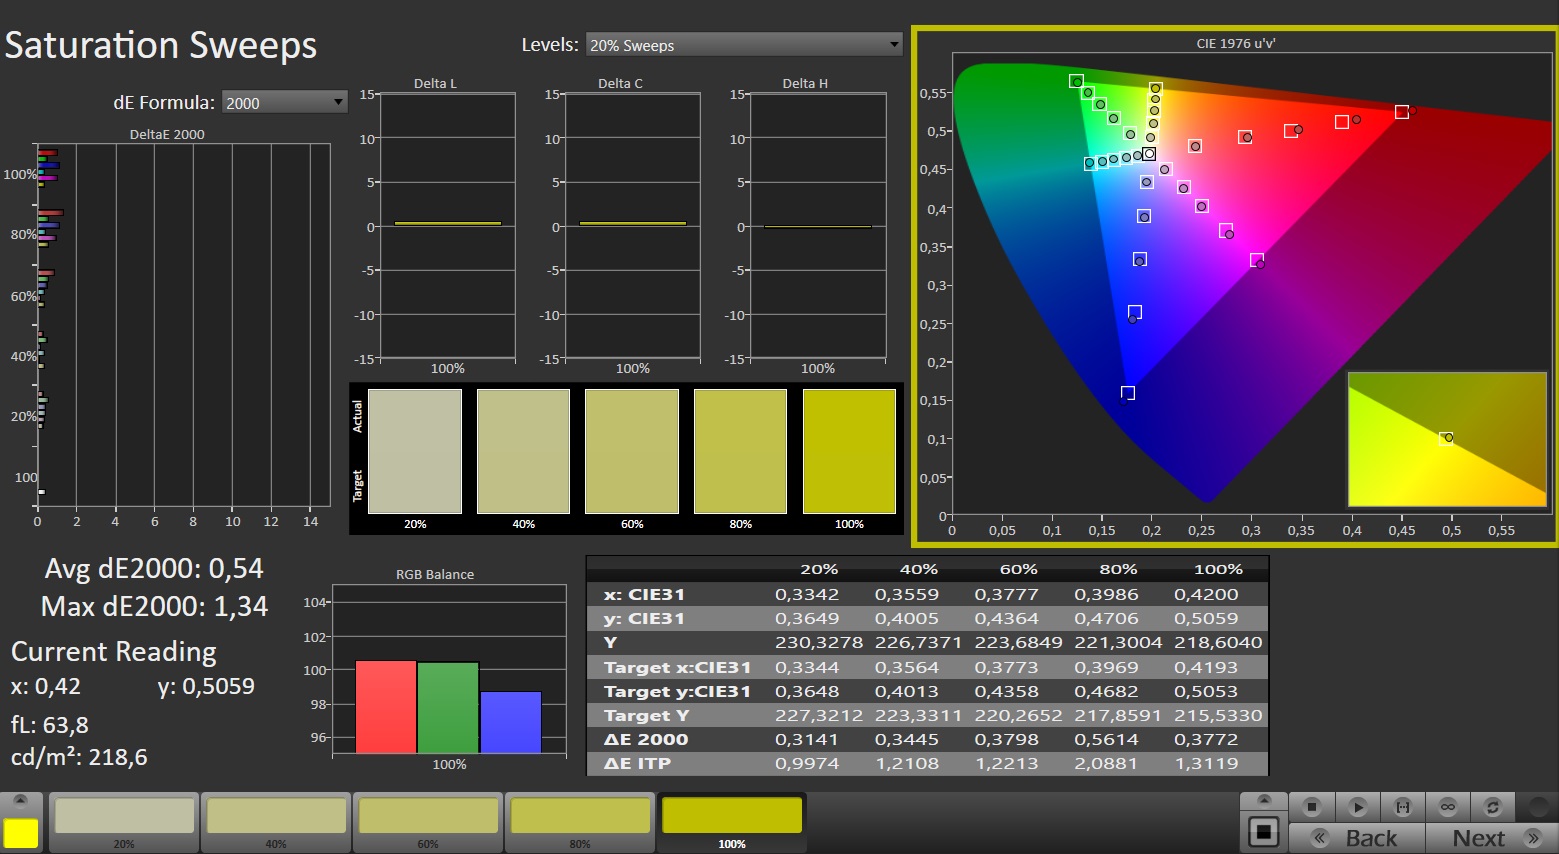
La pantalla muestra una buena representación del color de fábrica: Con una desviación de alrededor de 1,4, se cumple el objetivo (DeltaE < 3). El calibrado reduce la desviación a 0,7 y garantiza unas escalas de grises más equilibradas.
El panel puede reproducir completamente el espacio de color sRGB, pero no los espacios de color AdobeRGB y DCI P3. Las pantallas de la competencia ofrecen más aquí.

Tiempos de respuesta del display
| ↔ Tiempo de respuesta de Negro a Blanco | ||
|---|---|---|
| 6.9 ms ... subida ↗ y bajada ↘ combinada | ↗ 2.8 ms subida | 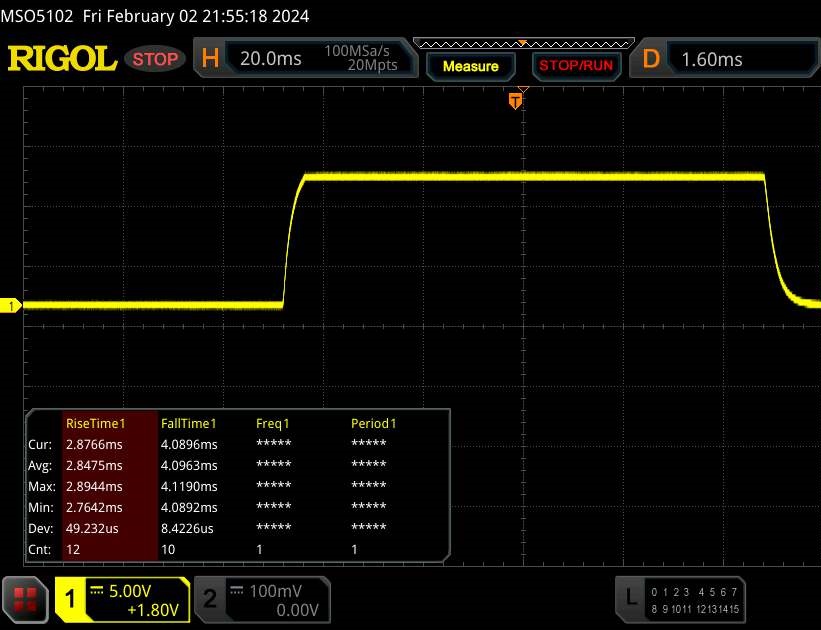 |
| ↘ 4.1 ms bajada | ||
| La pantalla mostró tiempos de respuesta muy rápidos en nuestros tests y debería ser adecuada para juegos frenéticos. En comparación, todos los dispositivos de prueba van de ##min### (mínimo) a 240 (máximo) ms. » 21 % de todos los dispositivos son mejores. Esto quiere decir que el tiempo de respuesta medido es mejor que la media (19.8 ms) de todos los dispositivos testados. | ||
| ↔ Tiempo de respuesta 50% Gris a 80% Gris | ||
| 11.7 ms ... subida ↗ y bajada ↘ combinada | ↗ 5.7 ms subida | 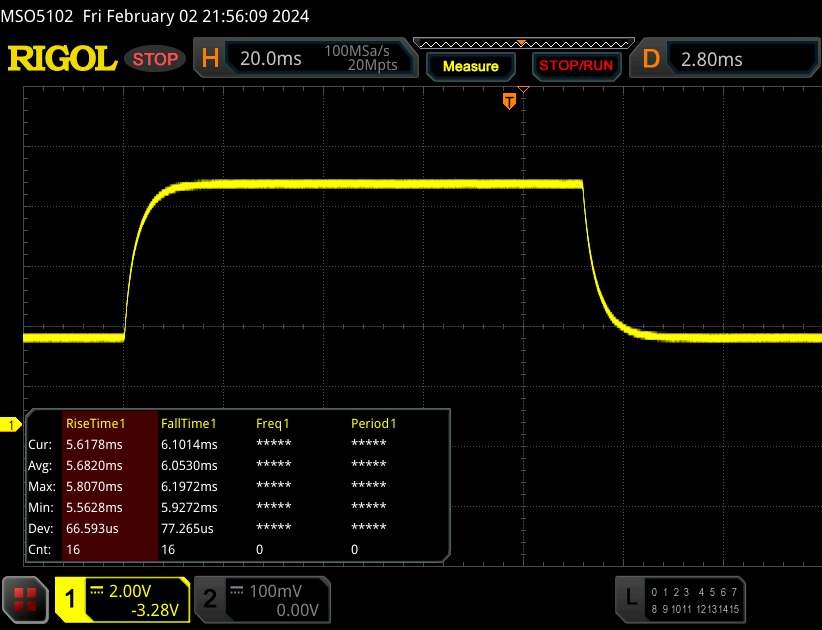 |
| ↘ 6 ms bajada | ||
| La pantalla mostró buenos tiempos de respuesta en nuestros tests pero podría ser demasiado lenta para los jugones competitivos. En comparación, todos los dispositivos de prueba van de ##min### (mínimo) a 636 (máximo) ms. » 25 % de todos los dispositivos son mejores. Esto quiere decir que el tiempo de respuesta medido es mejor que la media (31 ms) de todos los dispositivos testados. | ||
Parpadeo de Pantalla / PWM (Pulse-Width Modulation)
| Parpadeo de Pantalla / PWM no detectado | 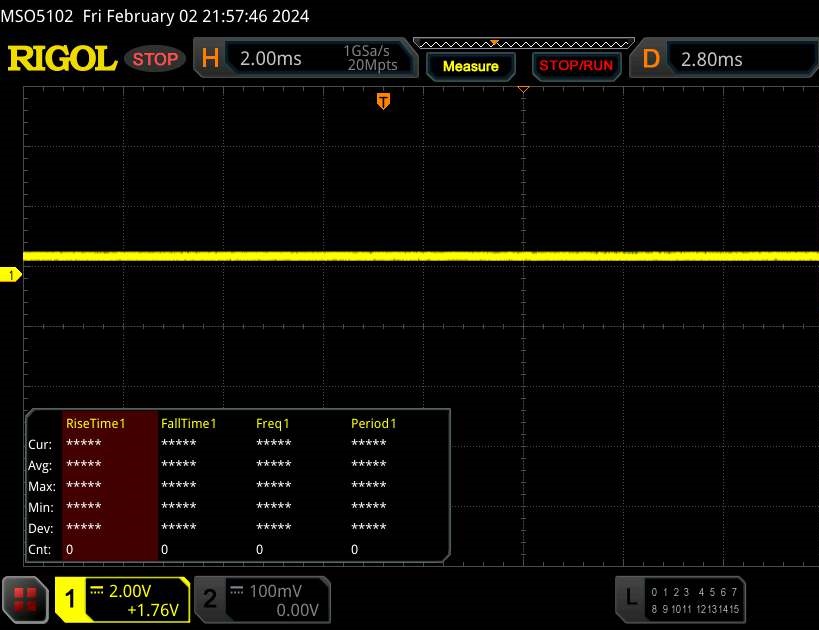 | ||
Comparación: 52 % de todos los dispositivos testados no usaron PWM para atenuar el display. Si se usó, medimos una media de 7757 (mínimo: 5 - máxmo: 343500) Hz. | |||
El panel IPS de ángulo de visión estable puede leerse desde cualquier posición. Es posible leer la pantalla en exteriores si el sol no brilla demasiado.
Rendimiento: Medion Beast X40 viene con hardware de gama alta
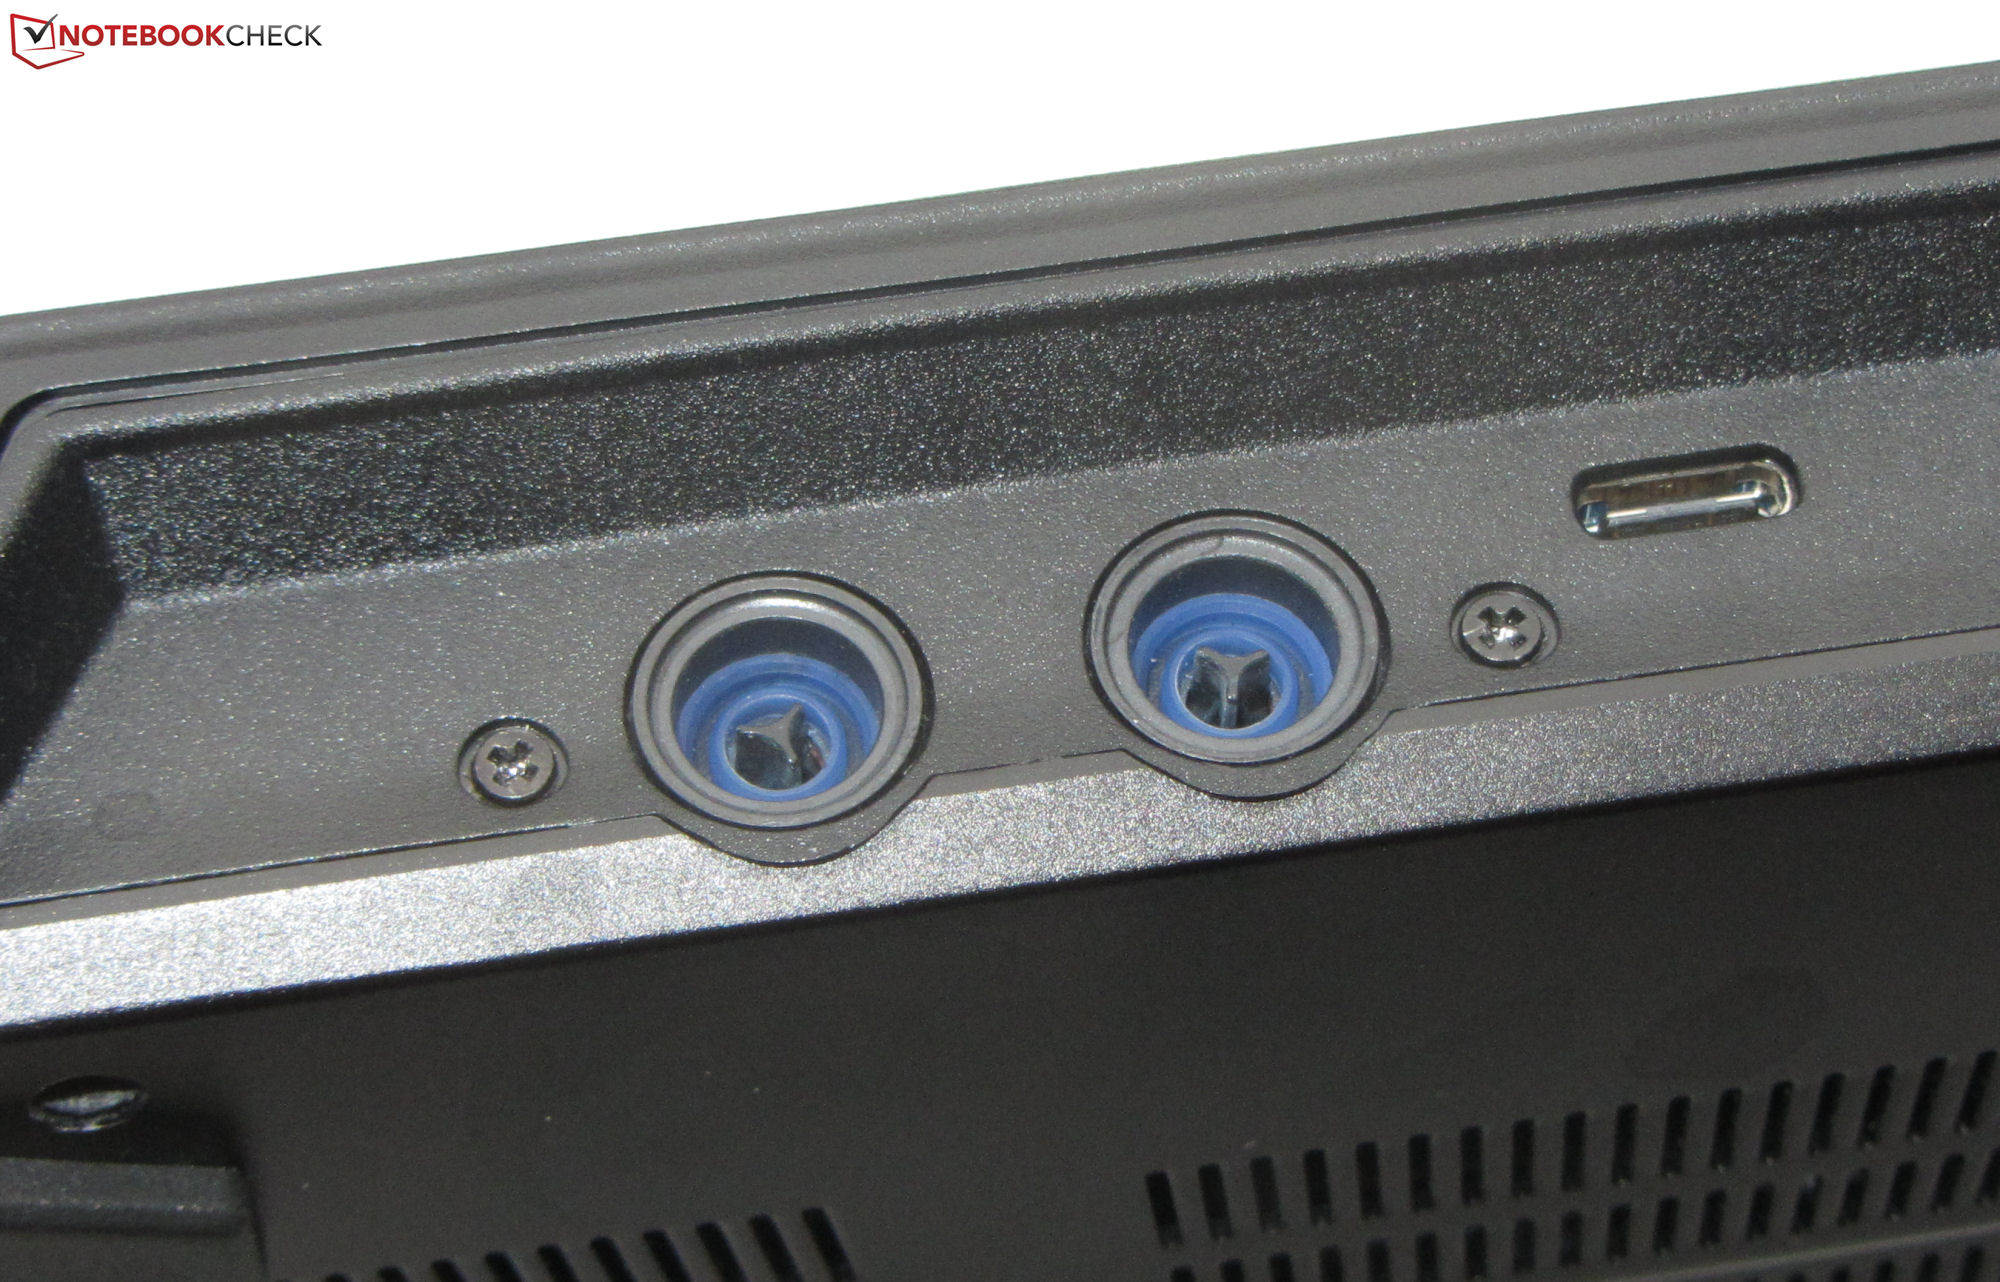
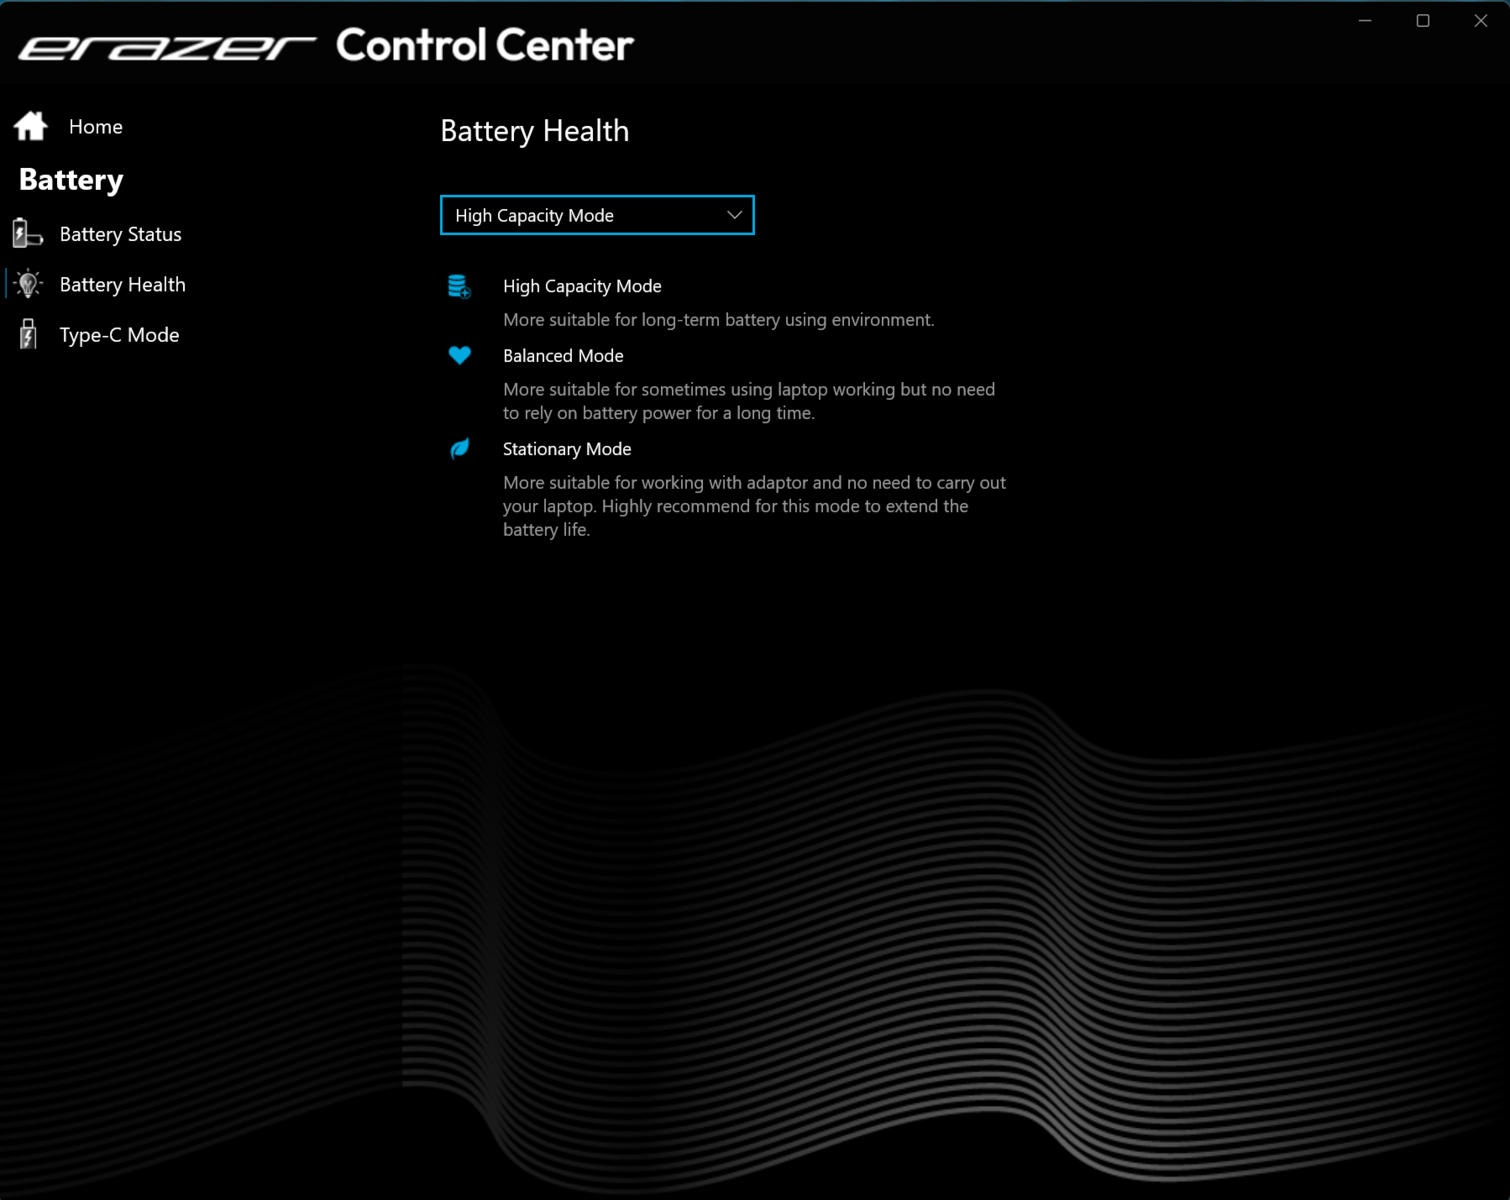
El portátil de gama alta de Medion da la talla en todas las áreas de aplicación que exigen un gran rendimiento (por ejemplo, juegos, renderizado). La potencia de cálculo necesaria la proporcionan Raptor Lake y Ada Lovelace. Este modelo X40 está disponible por unos 4.000 euros. Existen versiones más económicas a partir de 2. 500 euros. Como accesorio opcional, Medion ofrece un sistema de refrigeración por agua (unos 200 euros), que puede suponer un pequeño aumento del rendimiento y menores emisiones.
Condiciones de la prueba
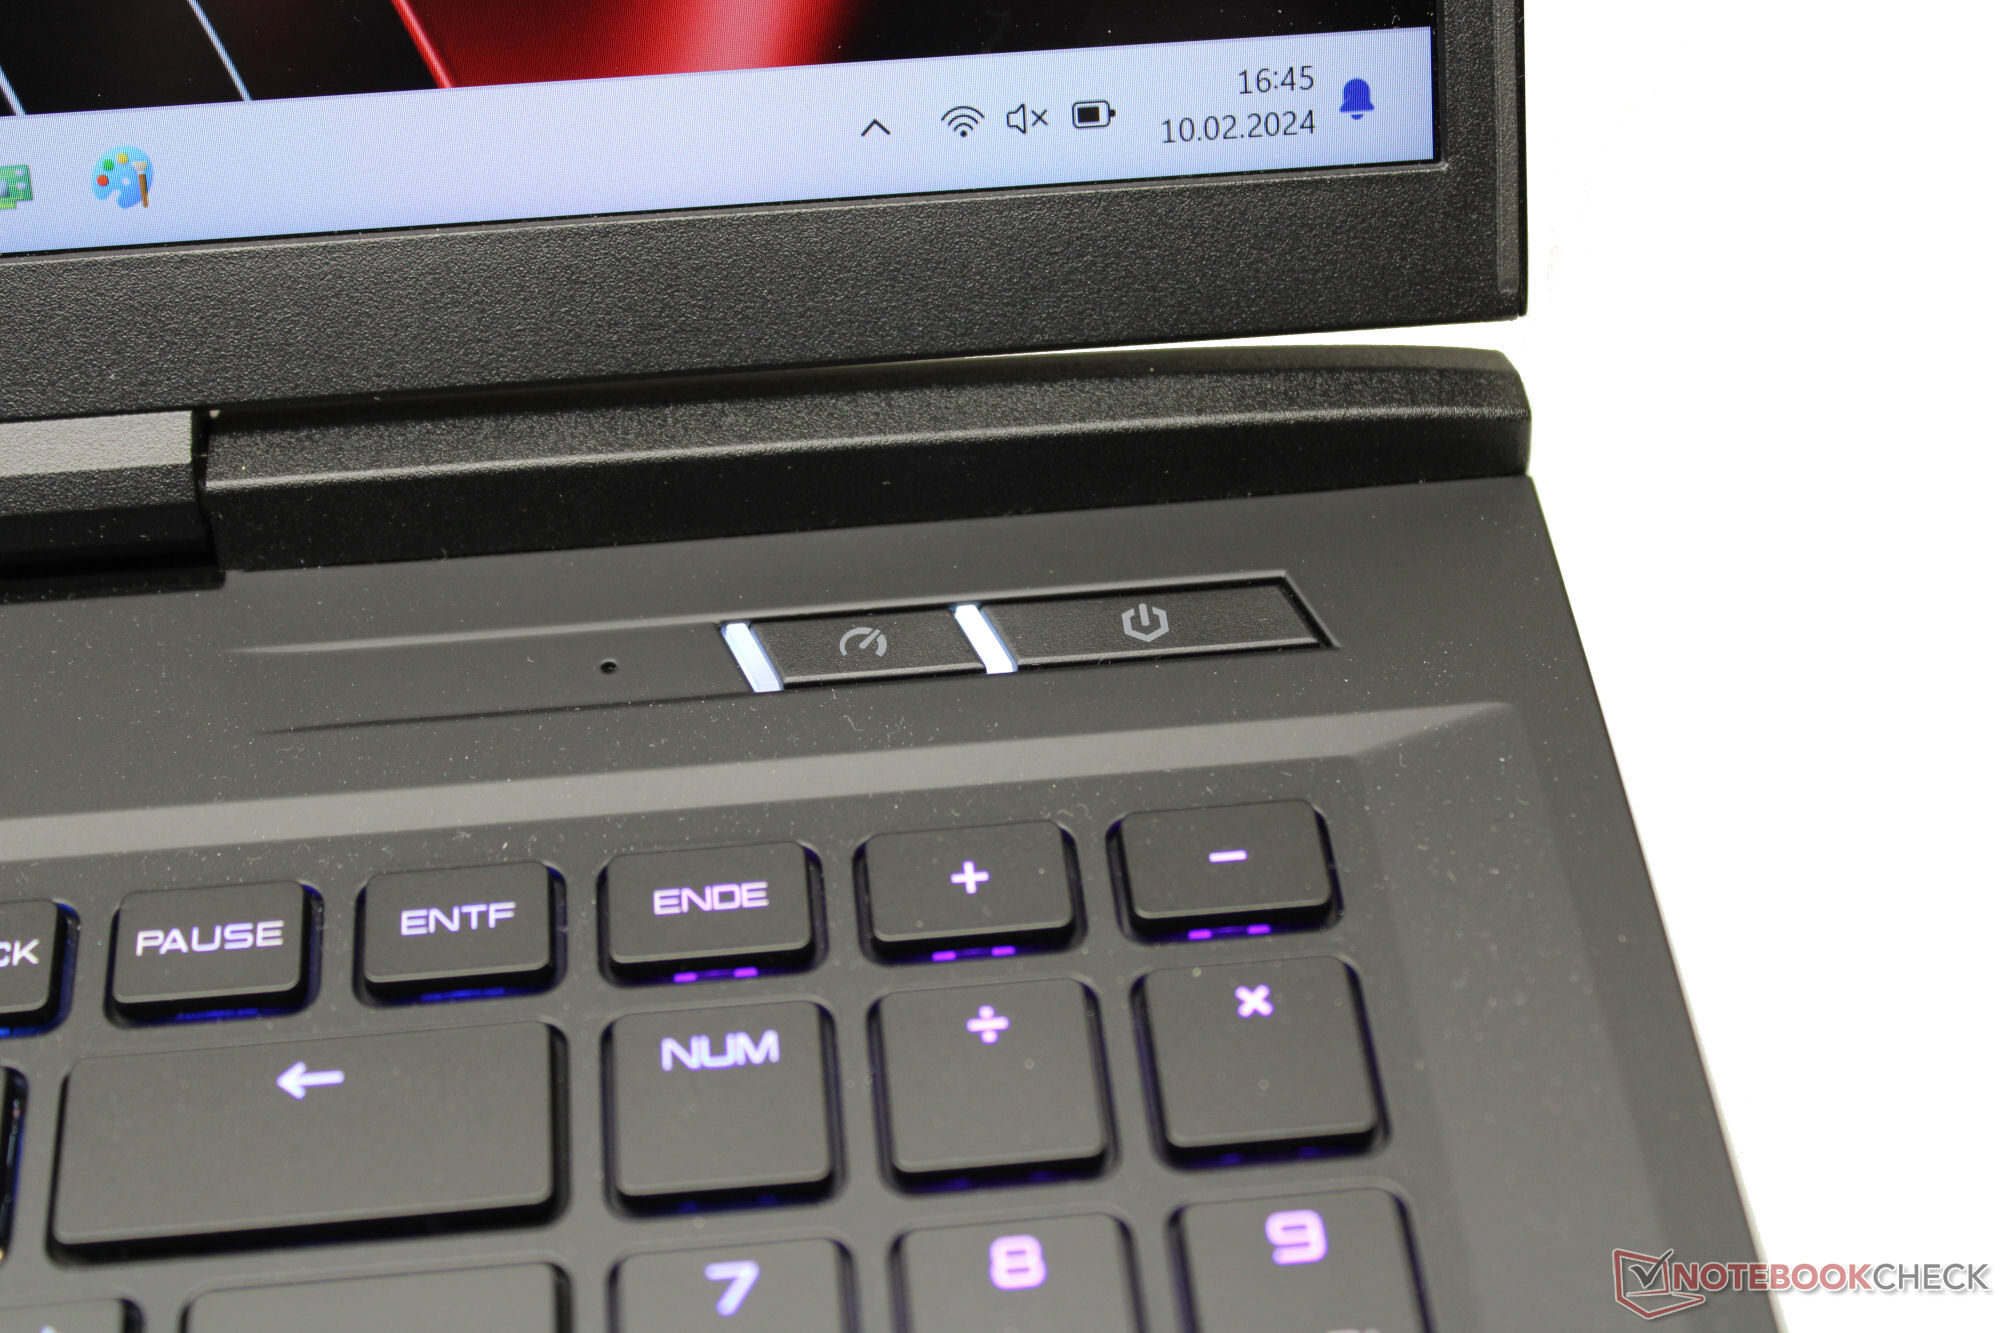
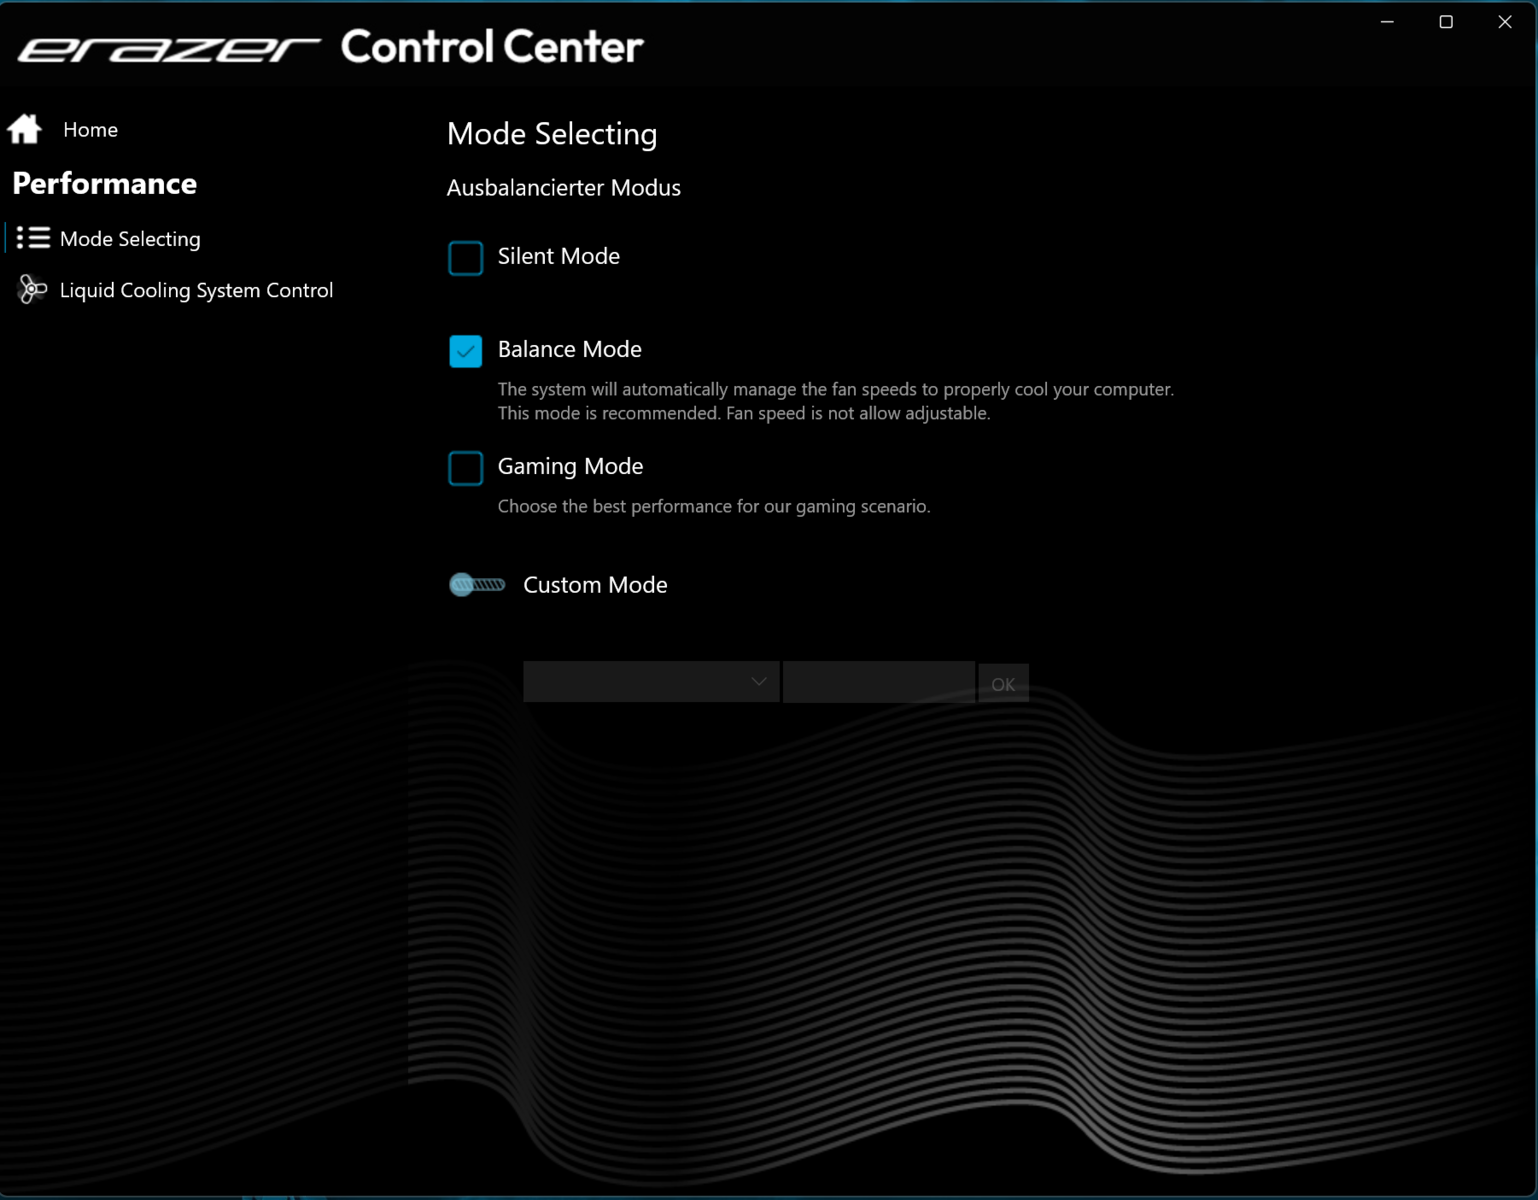
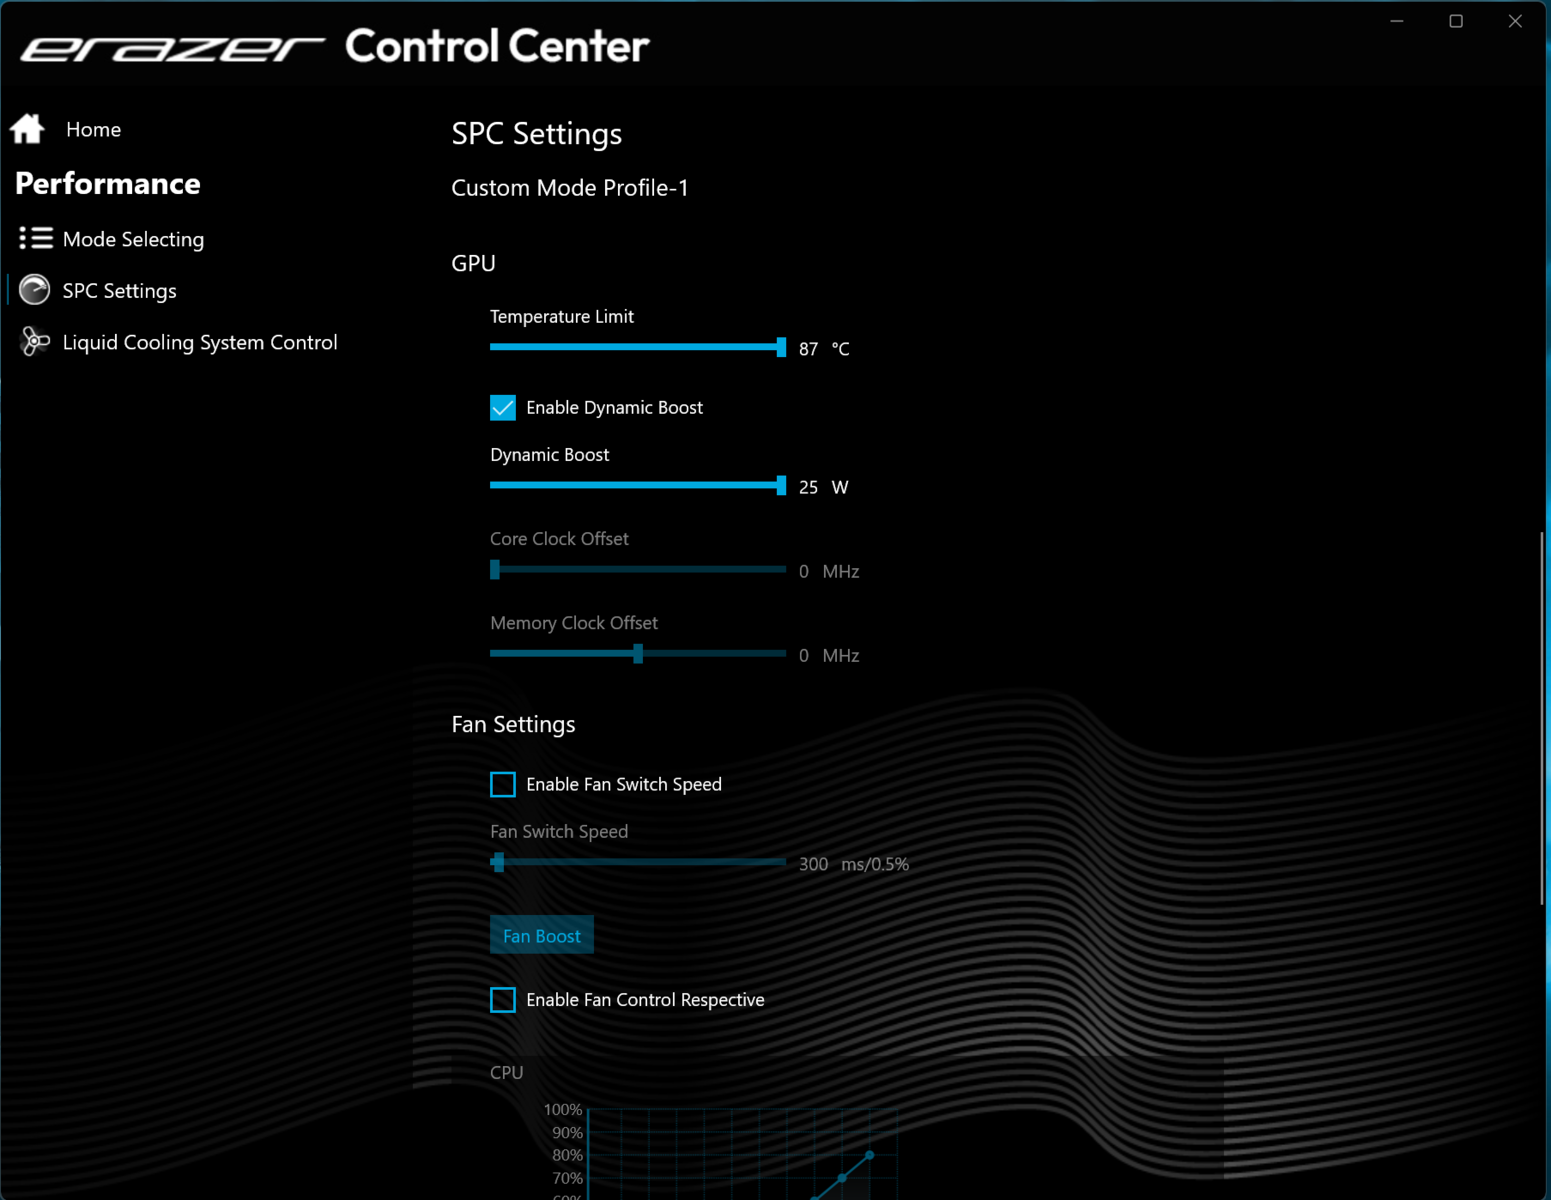
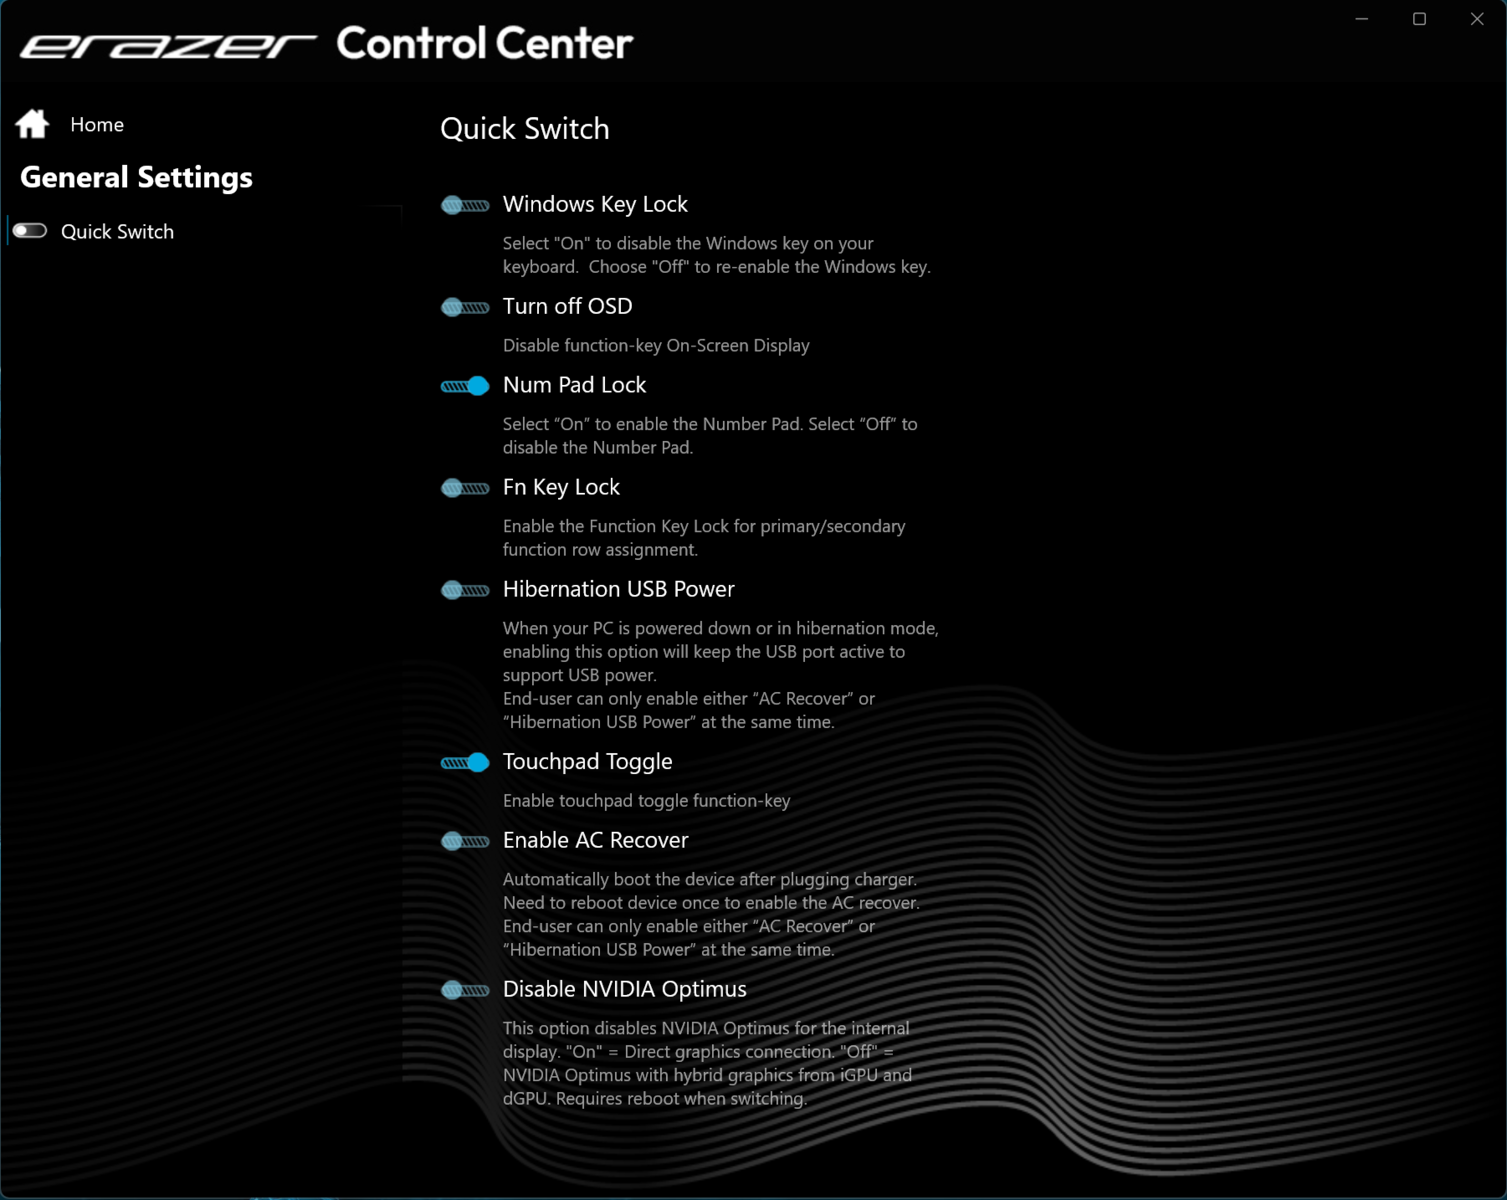
Una tecla específica situada junto al botón de encendido permite cambiar rápidamente entre los tres modos de rendimiento específicos del fabricante (véase la tabla siguiente). Se utilizaron los modos "Modo equilibrado" (pruebas de rendimiento) y "Modo silencioso" (pruebas de batería).
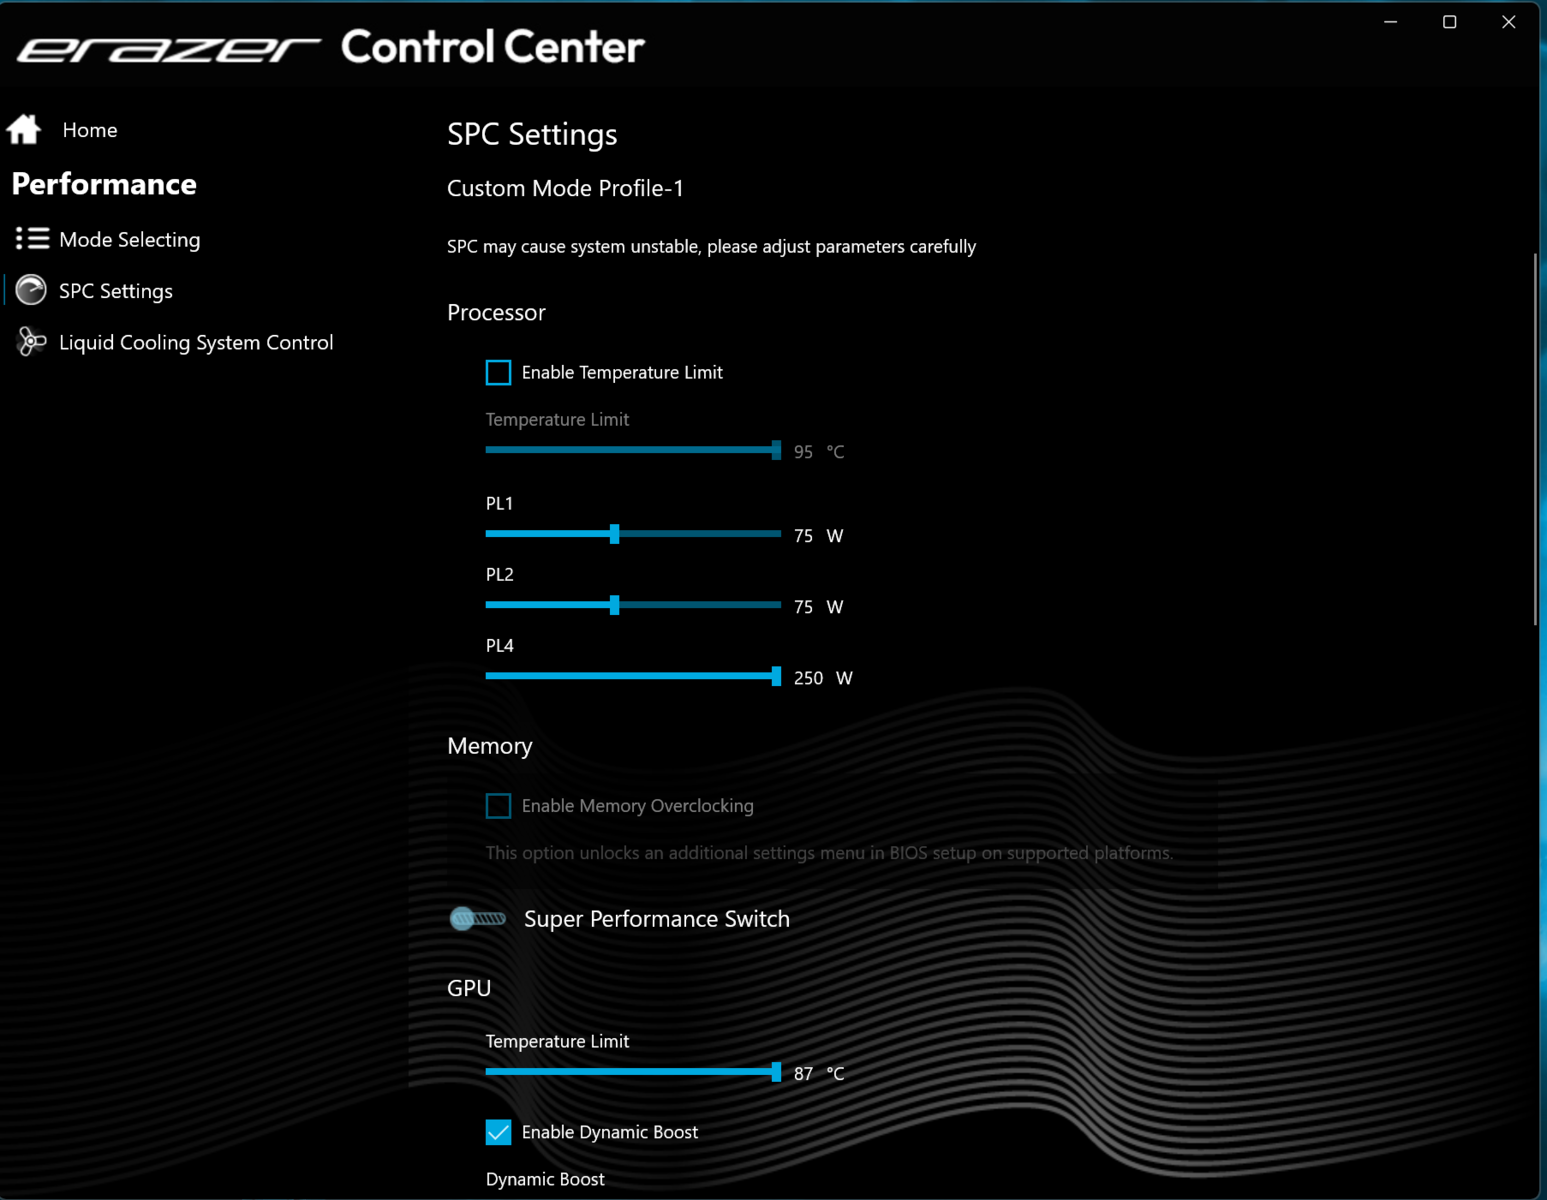
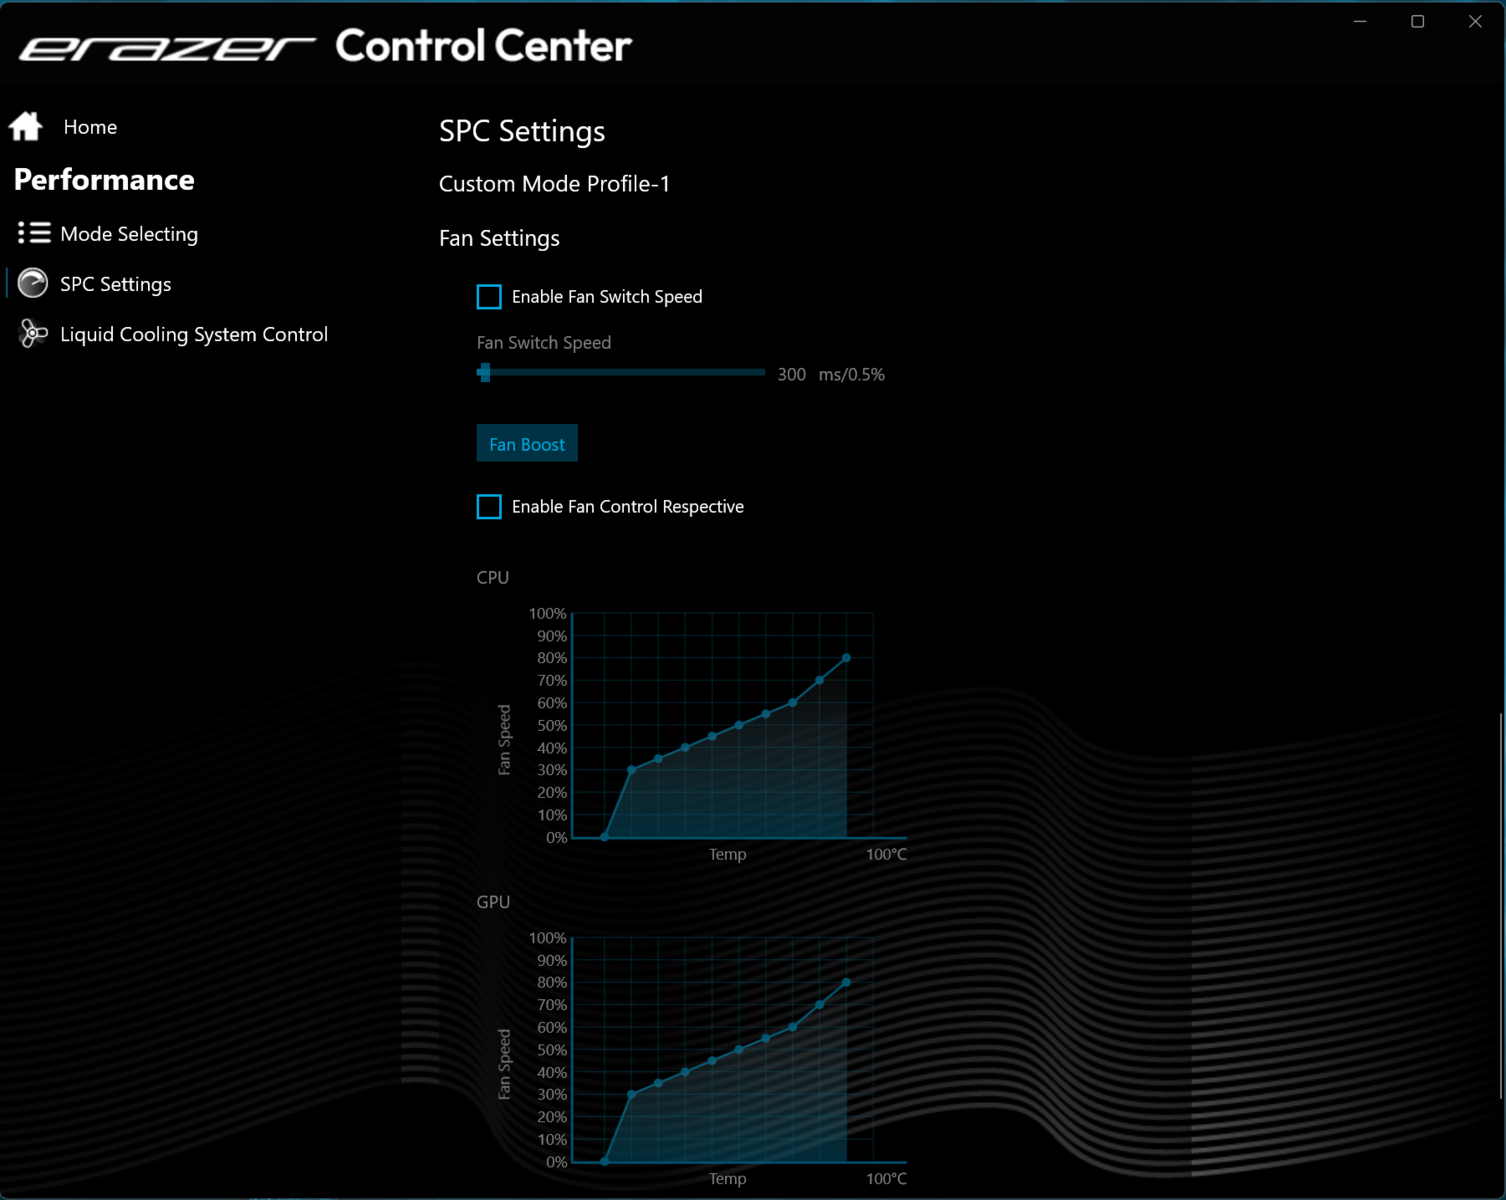
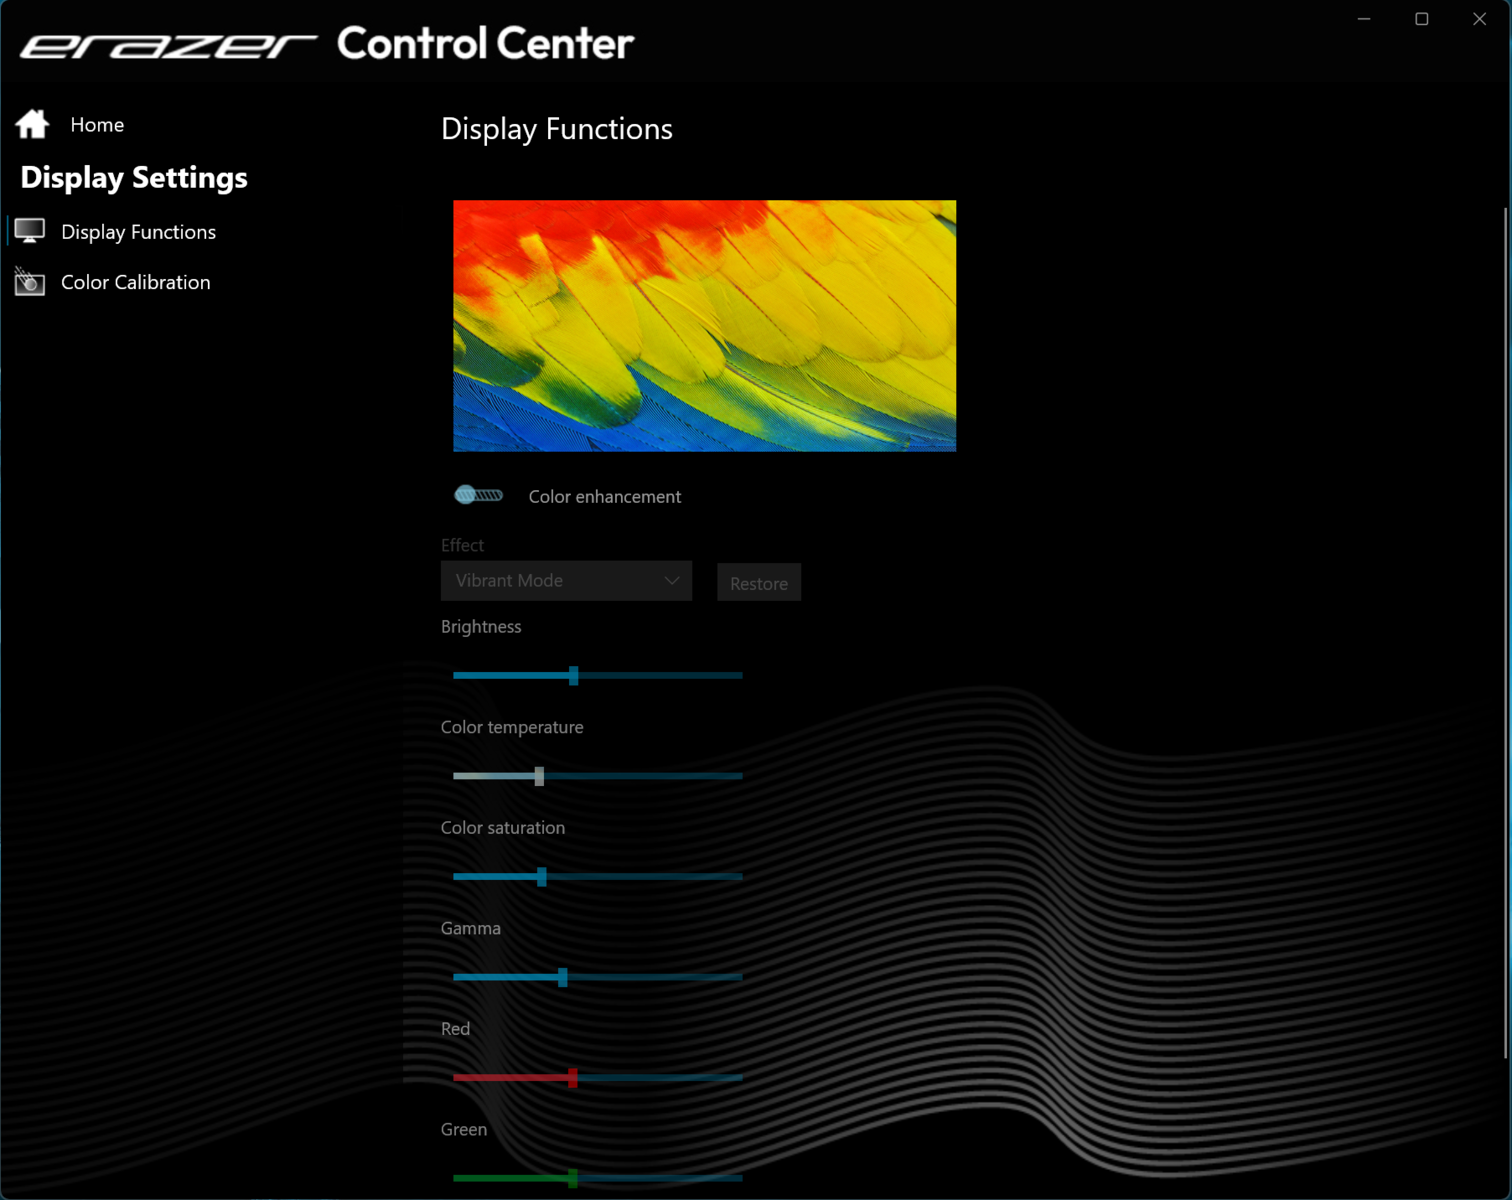
Se pueden crear perfiles individuales mediante el software Control Center preinstalado, en los que se pueden ajustar los límites de potencia de la CPU, el TGP de la GPU y/o los límites superiores de temperatura.
| Modo Juego | Modo Equilibrado | Modo Silencioso | |
|---|---|---|---|
| Límite de potencia 1 (HWInfo) | 160 vatios | 160 vatios | 160 vatios |
| Límite de potencia 2 (HWInfo) | 160 vatios | 160 vatios | 160 vatios |
| Ruido (Witcher 3) | 52 dB(A) | 50 dB(A) | 34 dB(A) |
| Rendimiento (Witcher 3) | ~214 fps | ~204 fps | 30 fps (bloqueado) |
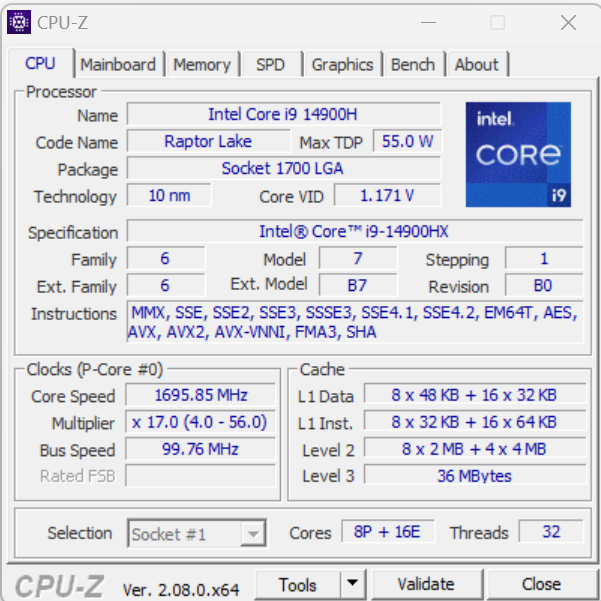
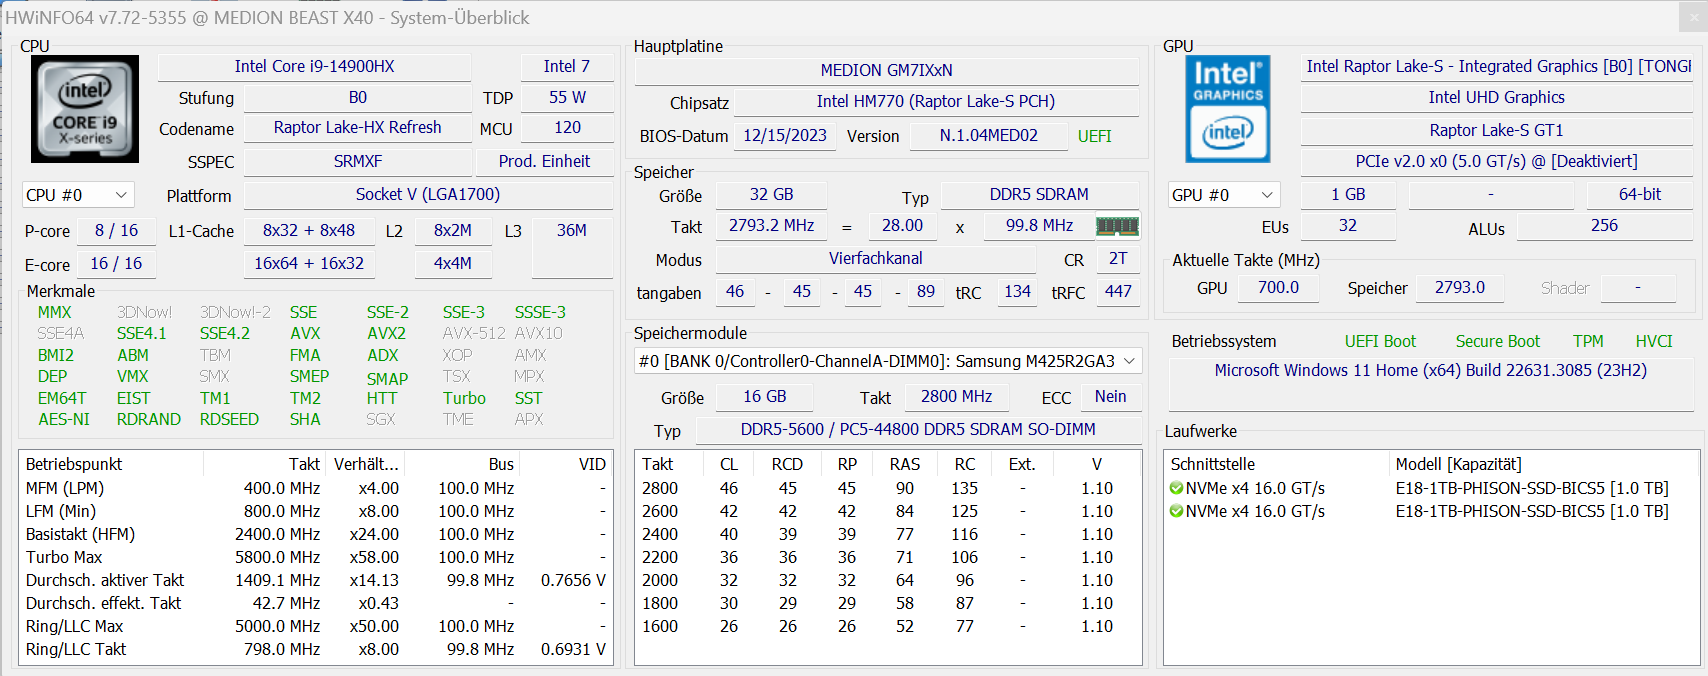
Procesador
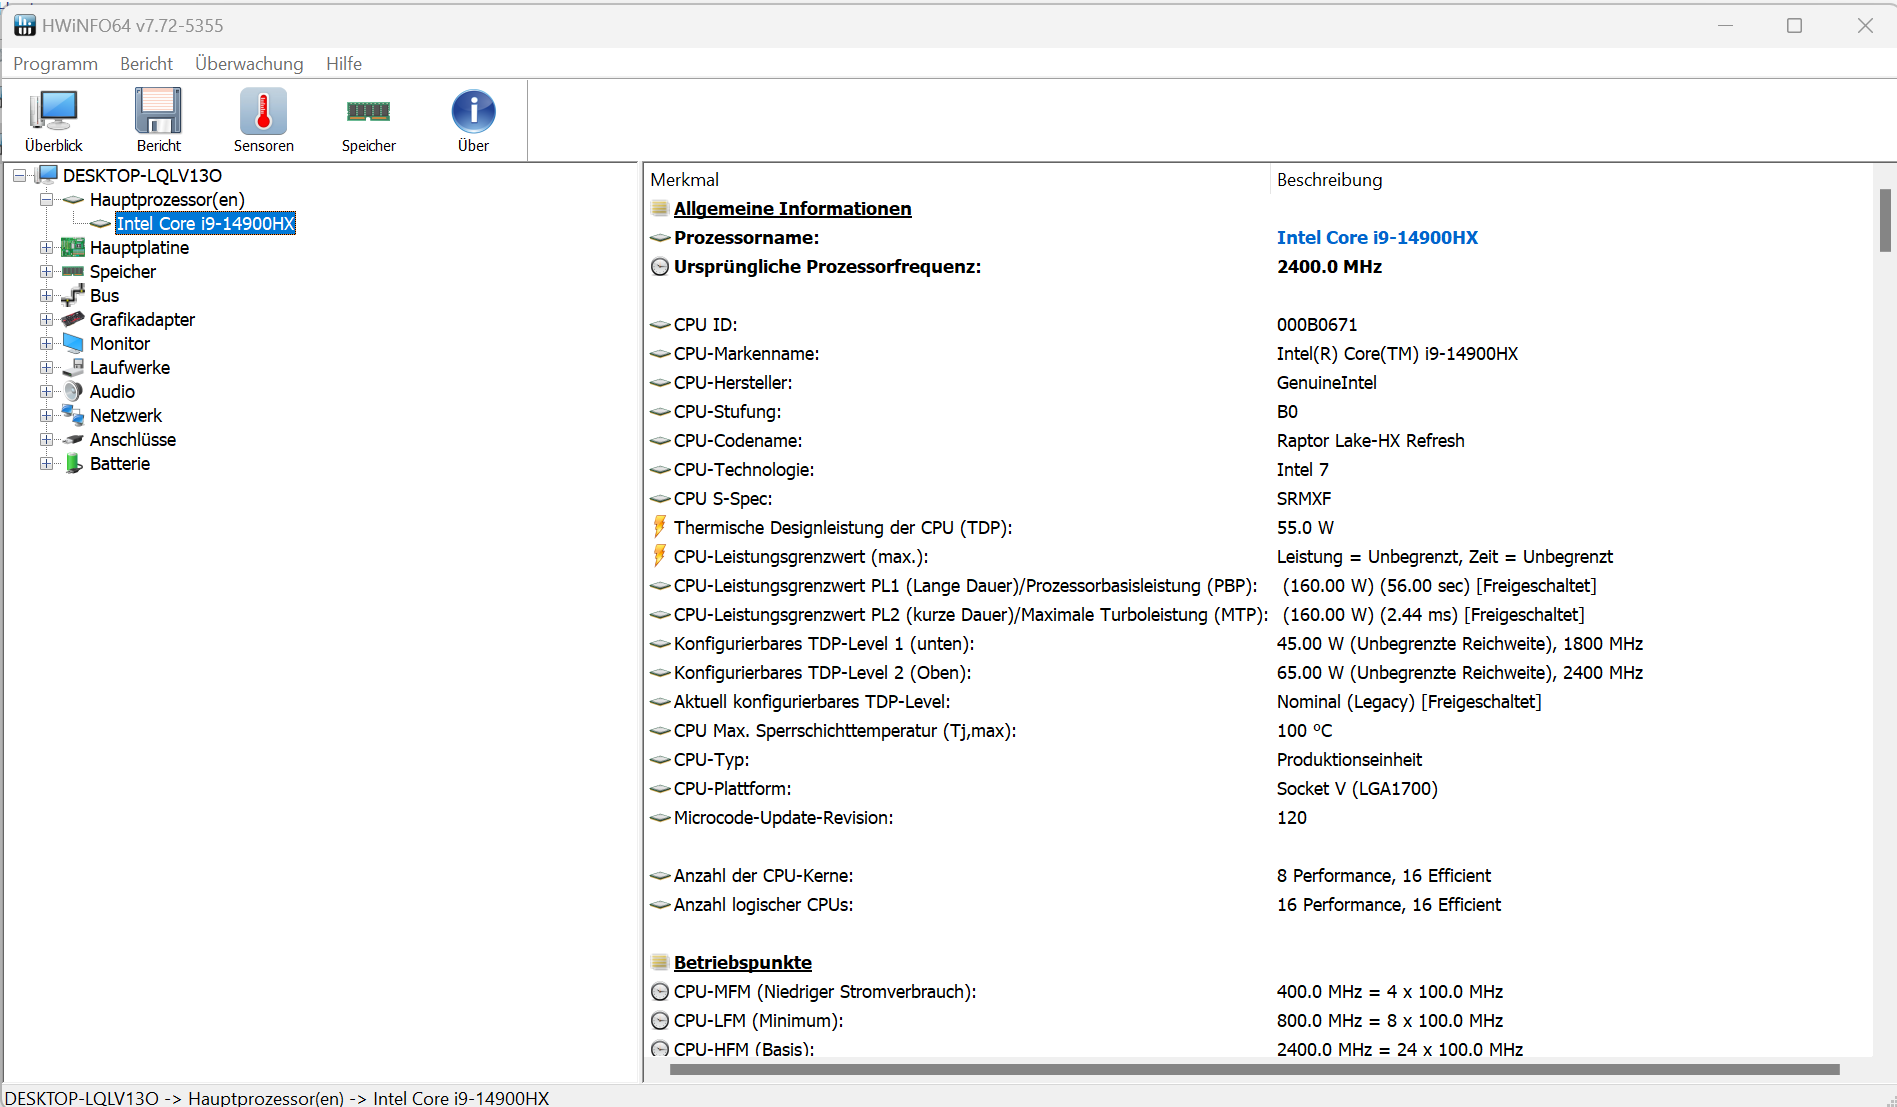
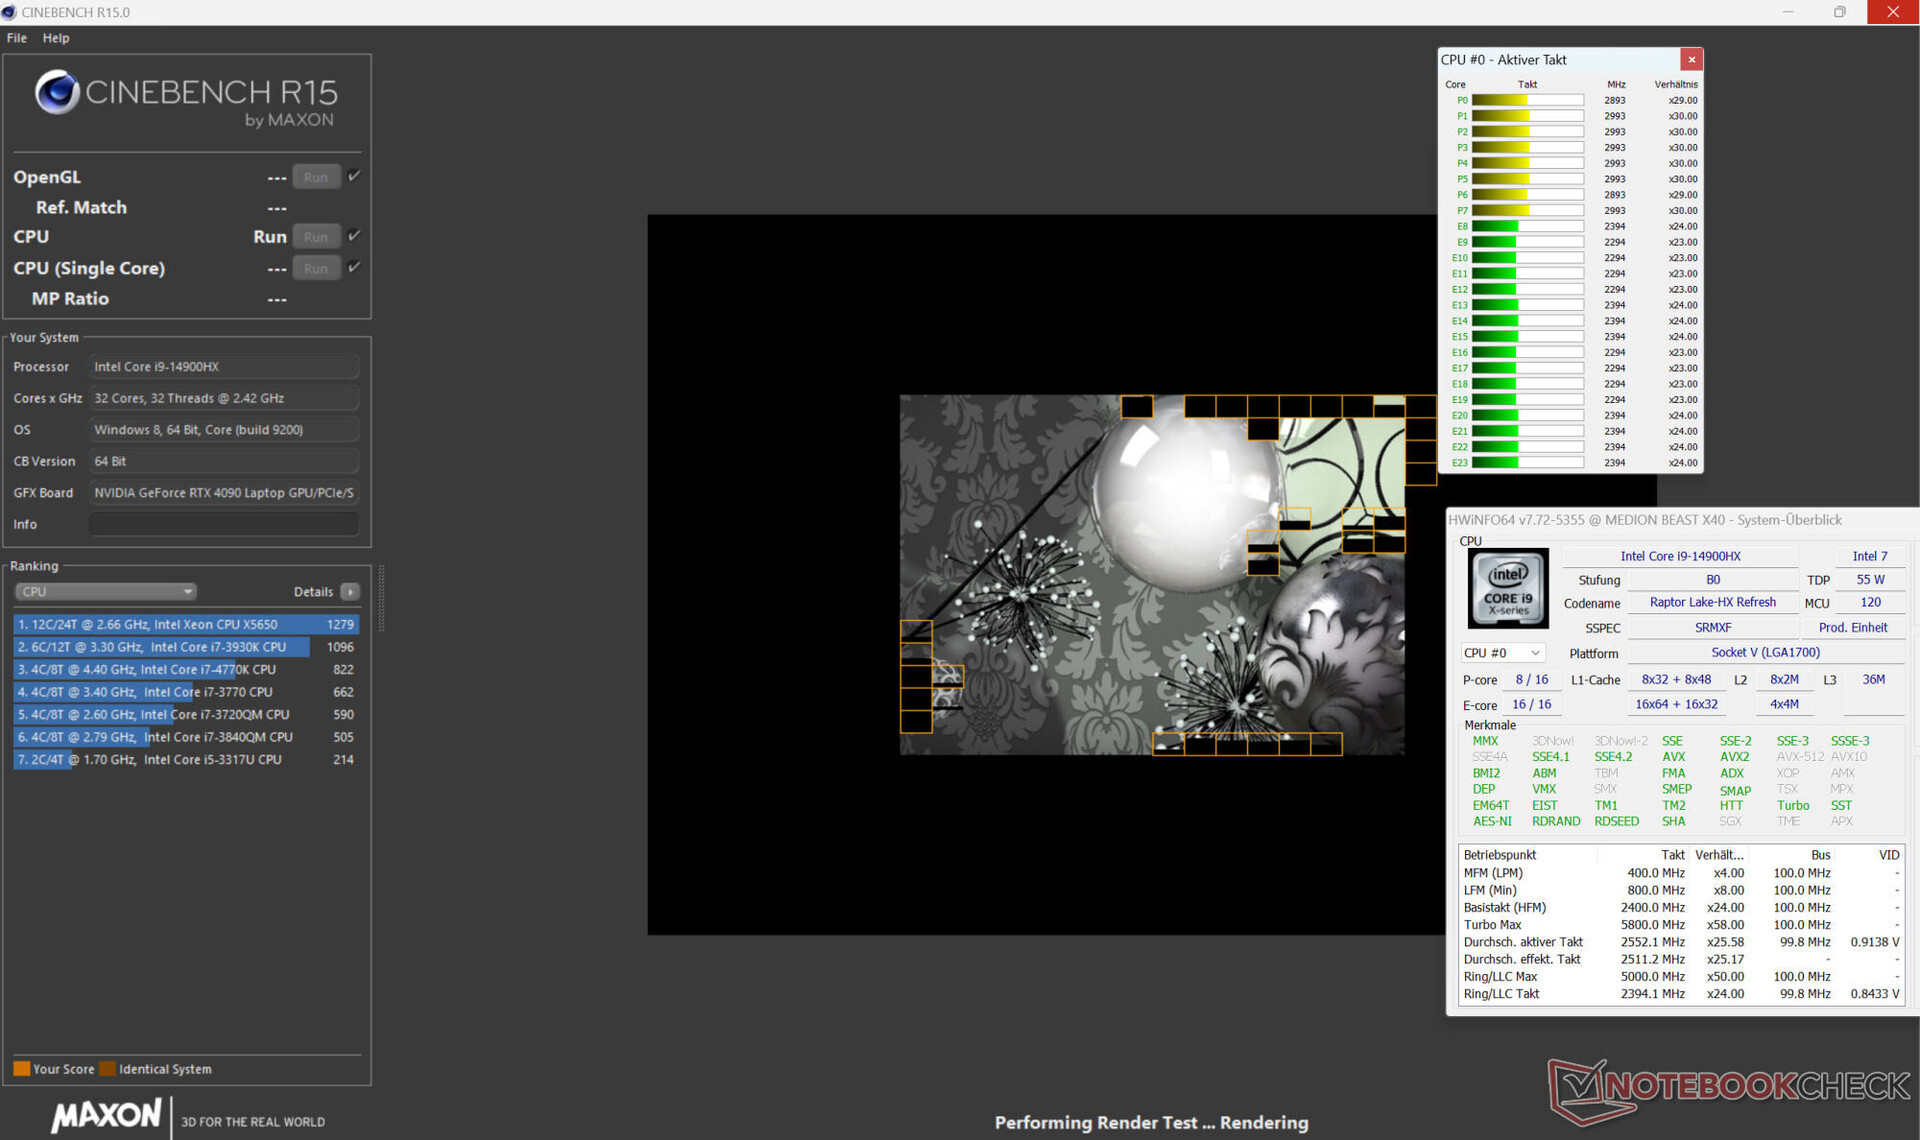
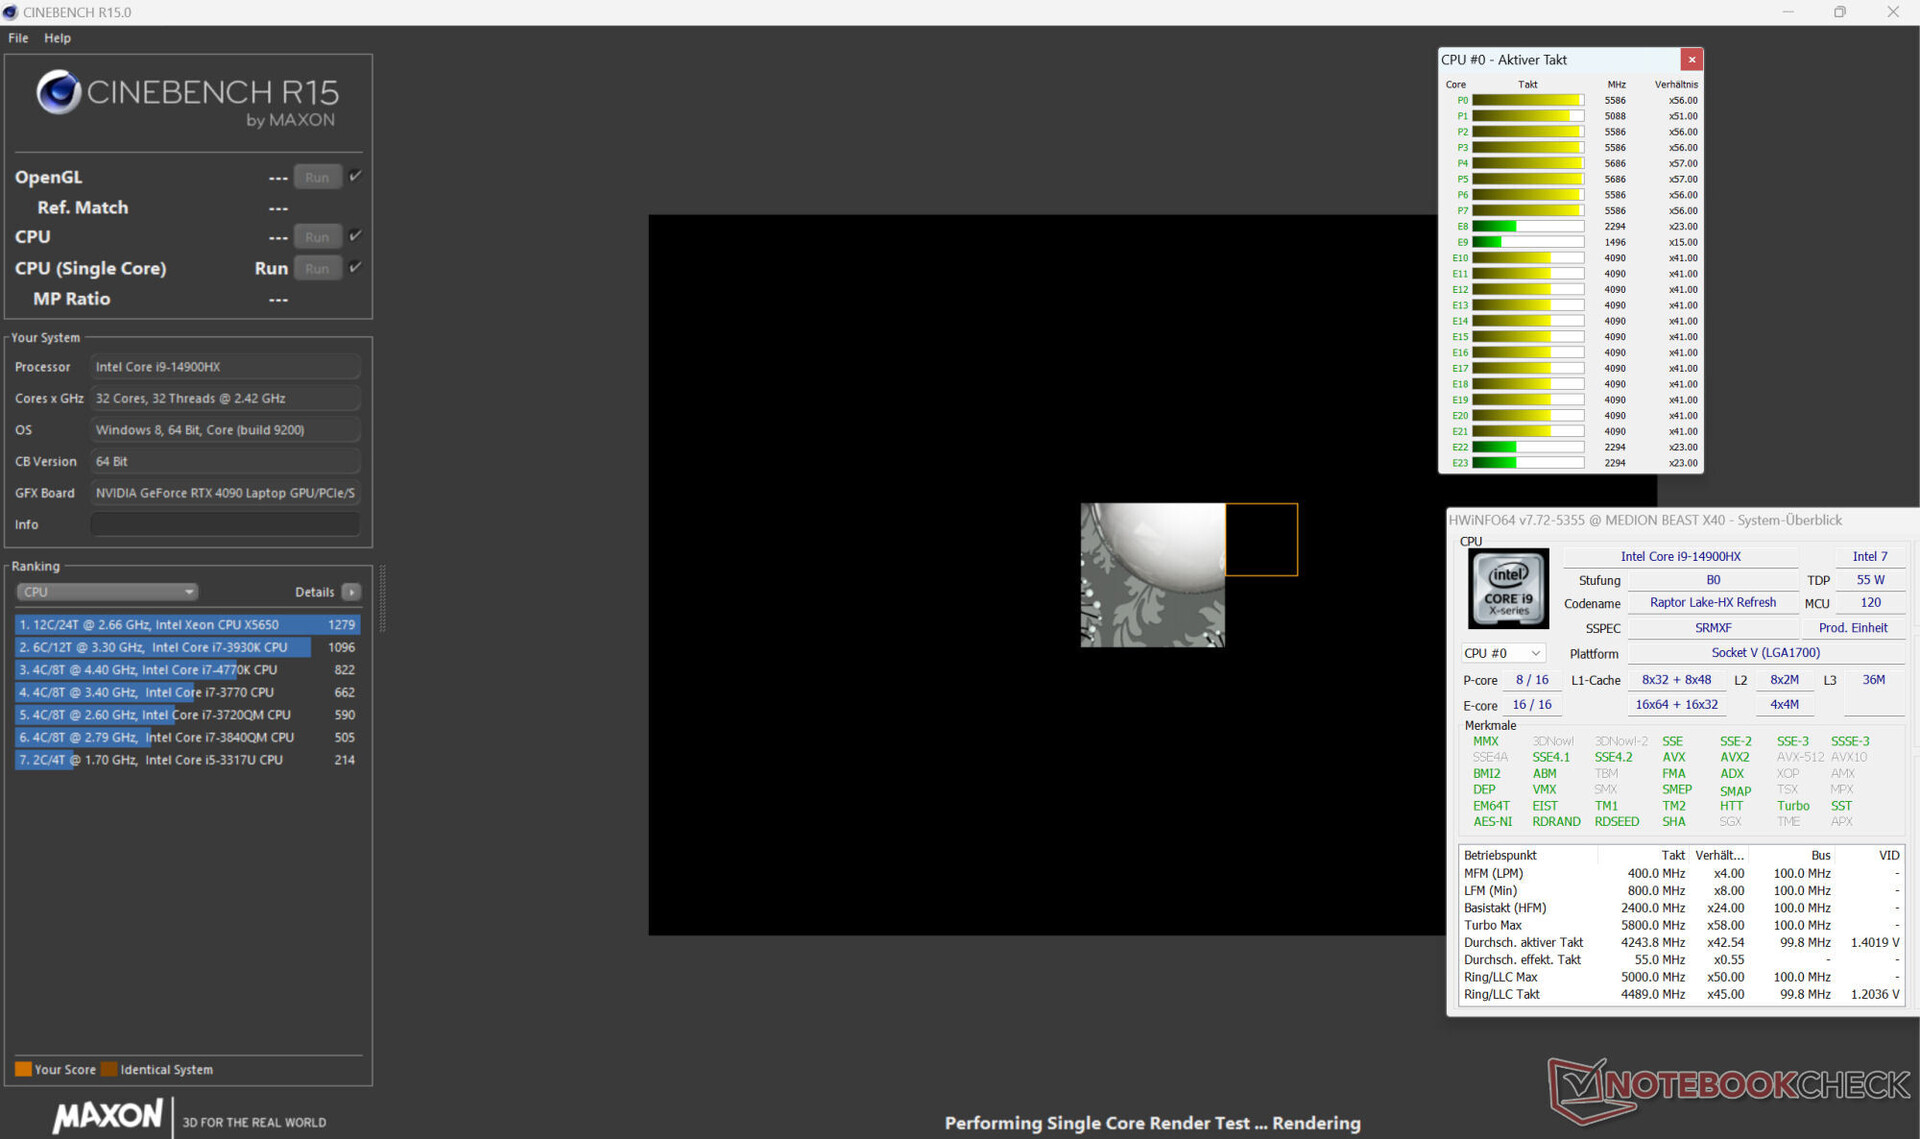
Los 24 núcleos de CPU (8P + 16E y 32 hilos) del Raptor Lake-HX Core i9-14900HX alcanzan velocidades de reloj máximas de 5,8 GHz (núcleo P) y 4,1 GHz (núcleo E). Gracias a unas velocidades de reloj ligeramente superiores, la CPU ofrece un poco más de rendimiento que la CPU del 2023 Beast X40 predecesor con un Core i9-13900HX.
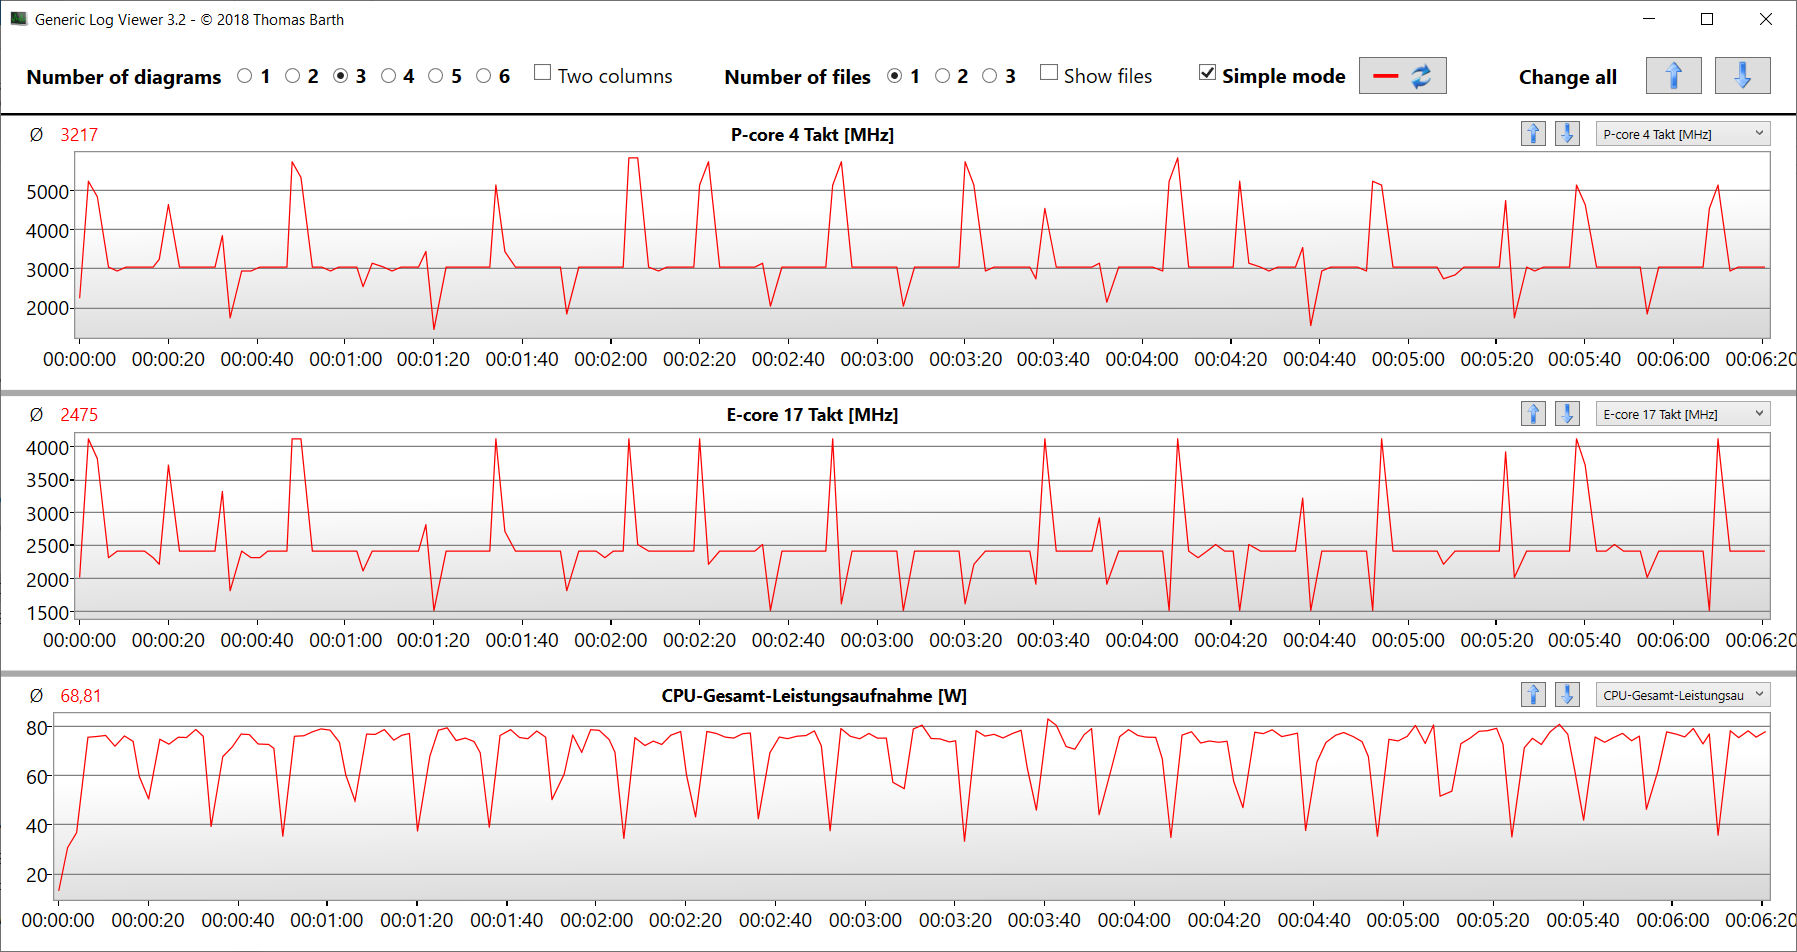
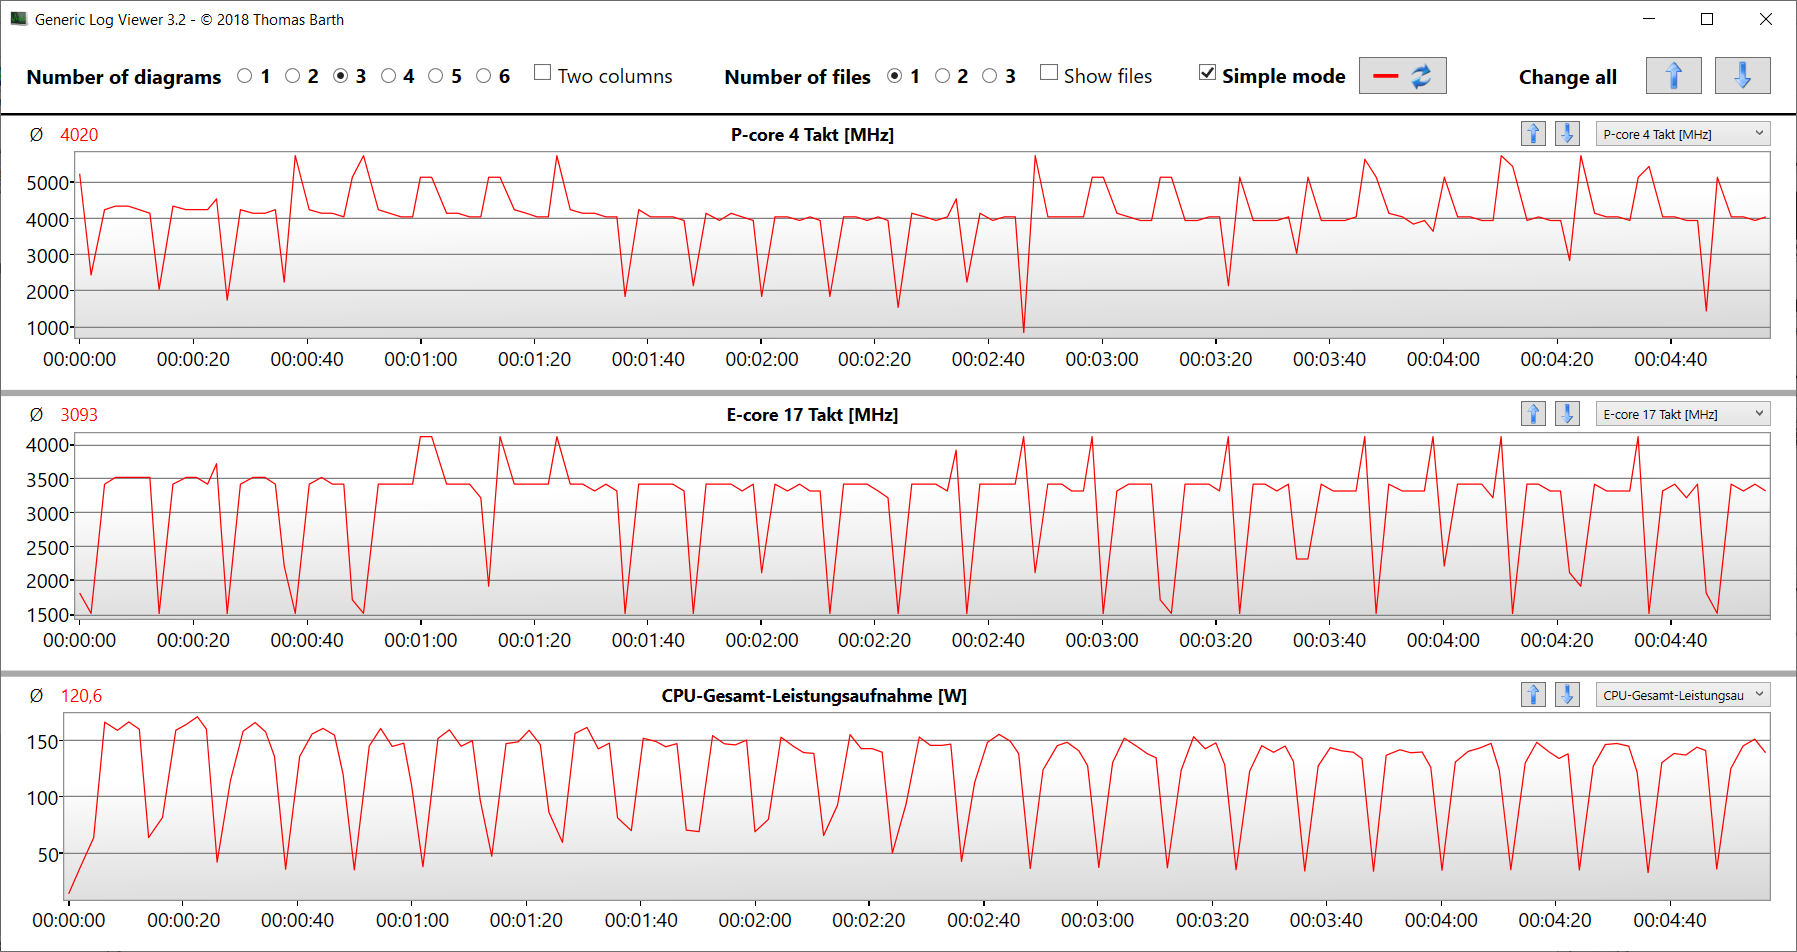
La carga multihilo continua (bucle CB15) se reconoce con una velocidad de reloj constante - el nivel depende del modo de alimentación. el "Modo Equilibrio" ofrece valores de referencia por debajo de la media de la CPU, el "Modo Juego" los eleva por encima. El rendimiento monohilo es diferente: está a un nivel alto, casi idéntico en los tres perfiles.
Encontrará más información sobre el Core i9-14900HX en nuestro artículo de análisis Análisis de la actualización Intel Raptor Lake-HX: Core i9-14900HX con más rendimiento de un solo núcleo .
Cinebench R15 Multi Dauertest
| CPU Performance rating - Percent | |
| Asus ROG Strix Scar 17 G733PYV-LL053X | |
| Medion Erazer Beast X40 2024 | |
| MSI Titan 18 HX A14VIG | |
| Asus ROG Strix Scar 18 G834JYR (2024) | |
| Medio Intel Core i9-14900HX | |
| Medion Erazer Beast X40 -2! | |
| Schenker Key 17 Pro (Early 23) -2! | |
| Medion Erazer Beast X40 2024 | |
| Media de la clase Gaming | |
| Cinebench R20 | |
| CPU (Multi Core) | |
| Asus ROG Strix Scar 17 G733PYV-LL053X | |
| MSI Titan 18 HX A14VIG | |
| Medion Erazer Beast X40 2024 (Gaming Mode) | |
| Medion Erazer Beast X40 | |
| Medio Intel Core i9-14900HX (6579 - 13832, n=37) | |
| Asus ROG Strix Scar 18 G834JYR (2024) | |
| Schenker Key 17 Pro (Early 23) | |
| Media de la clase Gaming (4029 - 16433, n=106, últimos 2 años) | |
| Medion Erazer Beast X40 2024 | |
| CPU (Single Core) | |
| Medion Erazer Beast X40 2024 | |
| Asus ROG Strix Scar 18 G834JYR (2024) | |
| Medion Erazer Beast X40 2024 (Gaming Mode) | |
| Medio Intel Core i9-14900HX (657 - 859, n=37) | |
| MSI Titan 18 HX A14VIG | |
| Schenker Key 17 Pro (Early 23) | |
| Medion Erazer Beast X40 | |
| Media de la clase Gaming (442 - 913, n=106, últimos 2 años) | |
| Asus ROG Strix Scar 17 G733PYV-LL053X | |
| Cinebench R15 | |
| CPU Multi 64Bit | |
| Asus ROG Strix Scar 17 G733PYV-LL053X | |
| Medion Erazer Beast X40 | |
| MSI Titan 18 HX A14VIG | |
| Medion Erazer Beast X40 2024 (Gaming Mode) | |
| Medio Intel Core i9-14900HX (3263 - 5589, n=38) | |
| Schenker Key 17 Pro (Early 23) | |
| Asus ROG Strix Scar 18 G834JYR (2024) | |
| Media de la clase Gaming (1578 - 6330, n=105, últimos 2 años) | |
| Medion Erazer Beast X40 2024 | |
| CPU Single 64Bit | |
| Medion Erazer Beast X40 2024 (Gaming Mode) | |
| Medion Erazer Beast X40 2024 | |
| Asus ROG Strix Scar 17 G733PYV-LL053X | |
| Medio Intel Core i9-14900HX (247 - 323, n=37) | |
| Asus ROG Strix Scar 18 G834JYR (2024) | |
| MSI Titan 18 HX A14VIG | |
| Medion Erazer Beast X40 | |
| Media de la clase Gaming (188.8 - 350, n=106, últimos 2 años) | |
| Schenker Key 17 Pro (Early 23) | |
| Blender - v2.79 BMW27 CPU | |
| Media de la clase Gaming (79 - 330, n=104, últimos 2 años) | |
| Medion Erazer Beast X40 2024 | |
| Medio Intel Core i9-14900HX (91 - 206, n=37) | |
| Schenker Key 17 Pro (Early 23) | |
| Asus ROG Strix Scar 18 G834JYR (2024) | |
| Medion Erazer Beast X40 2024 (Gaming Mode) | |
| Medion Erazer Beast X40 | |
| MSI Titan 18 HX A14VIG | |
| Asus ROG Strix Scar 17 G733PYV-LL053X | |
| Geekbench 6.7 | |
| Multi-Core | |
| Medion Erazer Beast X40 2024 (6.2.1, Gaming Mode) | |
| Asus ROG Strix Scar 18 G834JYR (2024) (6.2.1) | |
| Medio Intel Core i9-14900HX (13158 - 19665, n=37) | |
| Asus ROG Strix Scar 17 G733PYV-LL053X | |
| MSI Titan 18 HX A14VIG (6.2.1) | |
| Media de la clase Gaming (6625 - 22850, n=106, últimos 2 años) | |
| Medion Erazer Beast X40 2024 (6.2.1) | |
| Single-Core | |
| Medion Erazer Beast X40 2024 (6.2.1, Gaming Mode) | |
| Medion Erazer Beast X40 2024 (6.2.1) | |
| Asus ROG Strix Scar 18 G834JYR (2024) (6.2.1) | |
| Medio Intel Core i9-14900HX (2419 - 3129, n=37) | |
| Asus ROG Strix Scar 17 G733PYV-LL053X | |
| Media de la clase Gaming (1490 - 3259, n=106, últimos 2 años) | |
| MSI Titan 18 HX A14VIG (6.2.1) | |
| HWBOT x265 Benchmark v2.2 - 4k Preset | |
| Asus ROG Strix Scar 17 G733PYV-LL053X | |
| Medion Erazer Beast X40 2024 (Gaming Mode) | |
| MSI Titan 18 HX A14VIG | |
| Medion Erazer Beast X40 | |
| Medio Intel Core i9-14900HX (16.8 - 38.9, n=37) | |
| Asus ROG Strix Scar 18 G834JYR (2024) | |
| Media de la clase Gaming (11.5 - 44.4, n=105, últimos 2 años) | |
| Schenker Key 17 Pro (Early 23) | |
| Medion Erazer Beast X40 2024 | |
| LibreOffice - 20 Documents To PDF | |
| Media de la clase Gaming (33.2 - 88.8, n=105, últimos 2 años) | |
| MSI Titan 18 HX A14VIG (6.3.4.2) | |
| Asus ROG Strix Scar 18 G834JYR (2024) (6.3.4.2) | |
| Medion Erazer Beast X40 | |
| Medion Erazer Beast X40 2024 (6.3.4.2) | |
| Medio Intel Core i9-14900HX (19 - 85.1, n=37) | |
| Schenker Key 17 Pro (Early 23) | |
| Medion Erazer Beast X40 2024 (6.3.4.2, Gaming Mode) | |
| Asus ROG Strix Scar 17 G733PYV-LL053X | |
| R Benchmark 2.5 - Overall mean | |
| Media de la clase Gaming (0.3439 - 0.759, n=106, últimos 2 años) | |
| Asus ROG Strix Scar 17 G733PYV-LL053X | |
| Medion Erazer Beast X40 | |
| Schenker Key 17 Pro (Early 23) | |
| Asus ROG Strix Scar 18 G834JYR (2024) | |
| MSI Titan 18 HX A14VIG | |
| Medio Intel Core i9-14900HX (0.3604 - 0.4859, n=37) | |
| Medion Erazer Beast X40 2024 | |
| Medion Erazer Beast X40 2024 (Gaming Mode) | |
* ... más pequeño es mejor
AIDA64: FP32 Ray-Trace | FPU Julia | CPU SHA3 | CPU Queen | FPU SinJulia | FPU Mandel | CPU AES | CPU ZLib | FP64 Ray-Trace | CPU PhotoWorxx
| Performance rating | |
| Asus ROG Strix Scar 17 G733PYV-LL053X | |
| Medion Erazer Beast X40 2024 | |
| MSI Titan 18 HX A14VIG | |
| Medion Erazer Beast X40 | |
| Asus ROG Strix Scar 18 G834JYR (2024) | |
| Schenker Key 17 Pro (Early 23) | |
| Media de la clase Gaming | |
| Medio Intel Core i9-14900HX | |
| Medion Erazer Beast X40 2024 | |
| AIDA64 / FP32 Ray-Trace | |
| Asus ROG Strix Scar 17 G733PYV-LL053X (v6.88.6413 Beta) | |
| Media de la clase Gaming (10227 - 85542, n=105, últimos 2 años) | |
| MSI Titan 18 HX A14VIG (v6.92.6600) | |
| Medion Erazer Beast X40 2024 (v6.92.6600, Gaming Mode) | |
| Medion Erazer Beast X40 (v6.75.6100) | |
| Asus ROG Strix Scar 18 G834JYR (2024) (v6.92.6600) | |
| Medio Intel Core i9-14900HX (13098 - 33474, n=36) | |
| Schenker Key 17 Pro (Early 23) (v6.75.6100) | |
| Medion Erazer Beast X40 2024 (v6.92.6600) | |
| AIDA64 / FPU Julia | |
| Asus ROG Strix Scar 17 G733PYV-LL053X (v6.88.6413 Beta) | |
| MSI Titan 18 HX A14VIG (v6.92.6600) | |
| Medion Erazer Beast X40 2024 (v6.92.6600, Gaming Mode) | |
| Media de la clase Gaming (51376 - 238426, n=105, últimos 2 años) | |
| Medion Erazer Beast X40 (v6.75.6100) | |
| Asus ROG Strix Scar 18 G834JYR (2024) (v6.92.6600) | |
| Medio Intel Core i9-14900HX (67573 - 166040, n=36) | |
| Schenker Key 17 Pro (Early 23) (v6.75.6100) | |
| Medion Erazer Beast X40 2024 (v6.92.6600) | |
| AIDA64 / CPU SHA3 | |
| Asus ROG Strix Scar 17 G733PYV-LL053X (v6.88.6413 Beta) | |
| MSI Titan 18 HX A14VIG (v6.92.6600) | |
| Medion Erazer Beast X40 2024 (v6.92.6600, Gaming Mode) | |
| Medion Erazer Beast X40 (v6.75.6100) | |
| Media de la clase Gaming (2180 - 10115, n=105, últimos 2 años) | |
| Asus ROG Strix Scar 18 G834JYR (2024) (v6.92.6600) | |
| Medio Intel Core i9-14900HX (3589 - 7979, n=36) | |
| Schenker Key 17 Pro (Early 23) (v6.75.6100) | |
| Medion Erazer Beast X40 2024 (v6.92.6600) | |
| AIDA64 / CPU Queen | |
| Asus ROG Strix Scar 17 G733PYV-LL053X (v6.88.6413 Beta) | |
| MSI Titan 18 HX A14VIG (v6.92.6600) | |
| Medion Erazer Beast X40 2024 (v6.92.6600, Gaming Mode) | |
| Asus ROG Strix Scar 18 G834JYR (2024) (v6.92.6600) | |
| Medio Intel Core i9-14900HX (118405 - 148966, n=36) | |
| Schenker Key 17 Pro (Early 23) (v6.75.6100) | |
| Medion Erazer Beast X40 (v6.75.6100) | |
| Medion Erazer Beast X40 2024 (v6.92.6600) | |
| Media de la clase Gaming (49785 - 173351, n=90, últimos 2 años) | |
| AIDA64 / FPU SinJulia | |
| Asus ROG Strix Scar 17 G733PYV-LL053X (v6.88.6413 Beta) | |
| MSI Titan 18 HX A14VIG (v6.92.6600) | |
| Medion Erazer Beast X40 2024 (v6.92.6600, Gaming Mode) | |
| Asus ROG Strix Scar 18 G834JYR (2024) (v6.92.6600) | |
| Medion Erazer Beast X40 (v6.75.6100) | |
| Medio Intel Core i9-14900HX (10475 - 18517, n=36) | |
| Schenker Key 17 Pro (Early 23) (v6.75.6100) | |
| Media de la clase Gaming (4424 - 33636, n=105, últimos 2 años) | |
| Medion Erazer Beast X40 2024 (v6.92.6600) | |
| AIDA64 / FPU Mandel | |
| Asus ROG Strix Scar 17 G733PYV-LL053X (v6.88.6413 Beta) | |
| Media de la clase Gaming (25115 - 128721, n=105, últimos 2 años) | |
| MSI Titan 18 HX A14VIG (v6.92.6600) | |
| Medion Erazer Beast X40 2024 (v6.92.6600, Gaming Mode) | |
| Medion Erazer Beast X40 (v6.75.6100) | |
| Asus ROG Strix Scar 18 G834JYR (2024) (v6.92.6600) | |
| Medio Intel Core i9-14900HX (32543 - 83662, n=36) | |
| Schenker Key 17 Pro (Early 23) (v6.75.6100) | |
| Medion Erazer Beast X40 2024 | |
| AIDA64 / CPU AES | |
| Asus ROG Strix Scar 17 G733PYV-LL053X (v6.88.6413 Beta) | |
| Schenker Key 17 Pro (Early 23) (v6.75.6100) | |
| Medio Intel Core i9-14900HX (86964 - 241777, n=36) | |
| MSI Titan 18 HX A14VIG (v6.92.6600) | |
| Medion Erazer Beast X40 2024 (v6.92.6600, Gaming Mode) | |
| Medion Erazer Beast X40 (v6.75.6100) | |
| Asus ROG Strix Scar 18 G834JYR (2024) (v6.92.6600) | |
| Media de la clase Gaming (39258 - 247074, n=105, últimos 2 años) | |
| Medion Erazer Beast X40 2024 (v6.92.6600) | |
| AIDA64 / CPU ZLib | |
| MSI Titan 18 HX A14VIG (v6.92.6600) | |
| Medion Erazer Beast X40 2024 (v6.92.6600, Gaming Mode) | |
| Asus ROG Strix Scar 17 G733PYV-LL053X (v6.88.6413 Beta) | |
| Medion Erazer Beast X40 (v6.75.6100) | |
| Medio Intel Core i9-14900HX (1054 - 2292, n=36) | |
| Asus ROG Strix Scar 18 G834JYR (2024) | |
| Schenker Key 17 Pro (Early 23) (v6.75.6100) | |
| Media de la clase Gaming (574 - 2531, n=105, últimos 2 años) | |
| Medion Erazer Beast X40 2024 (v6.92.6600) | |
| AIDA64 / FP64 Ray-Trace | |
| Asus ROG Strix Scar 17 G733PYV-LL053X (v6.88.6413 Beta) | |
| Media de la clase Gaming (5509 - 45446, n=105, últimos 2 años) | |
| MSI Titan 18 HX A14VIG (v6.92.6600) | |
| Medion Erazer Beast X40 2024 (v6.92.6600, Gaming Mode) | |
| Medion Erazer Beast X40 (v6.75.6100) | |
| Asus ROG Strix Scar 18 G834JYR (2024) (v6.92.6600) | |
| Medio Intel Core i9-14900HX (6809 - 18349, n=36) | |
| Schenker Key 17 Pro (Early 23) (v6.75.6100) | |
| Medion Erazer Beast X40 2024 (v6.92.6600) | |
| AIDA64 / CPU PhotoWorxx | |
| Schenker Key 17 Pro (Early 23) (v6.75.6100) | |
| Asus ROG Strix Scar 18 G834JYR (2024) (v6.92.6600) | |
| Medion Erazer Beast X40 2024 (v6.92.6600) | |
| Medion Erazer Beast X40 2024 (v6.92.6600, Gaming Mode) | |
| Medio Intel Core i9-14900HX (23903 - 54702, n=36) | |
| Media de la clase Gaming (12271 - 89891, n=105, últimos 2 años) | |
| Medion Erazer Beast X40 (v6.75.6100) | |
| Asus ROG Strix Scar 17 G733PYV-LL053X (v6.88.6413 Beta) | |
| MSI Titan 18 HX A14VIG (v6.92.6600) | |
Rendimiento del sistema
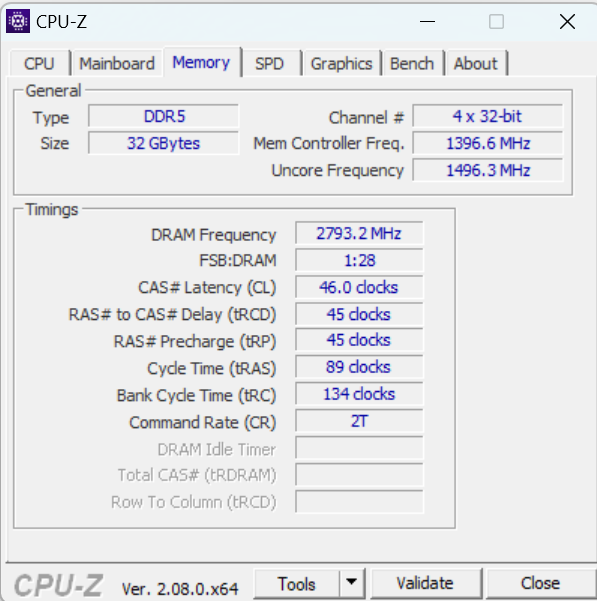
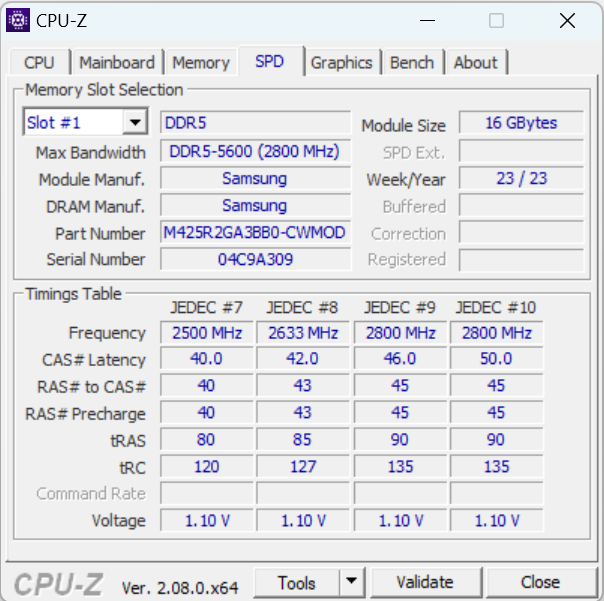
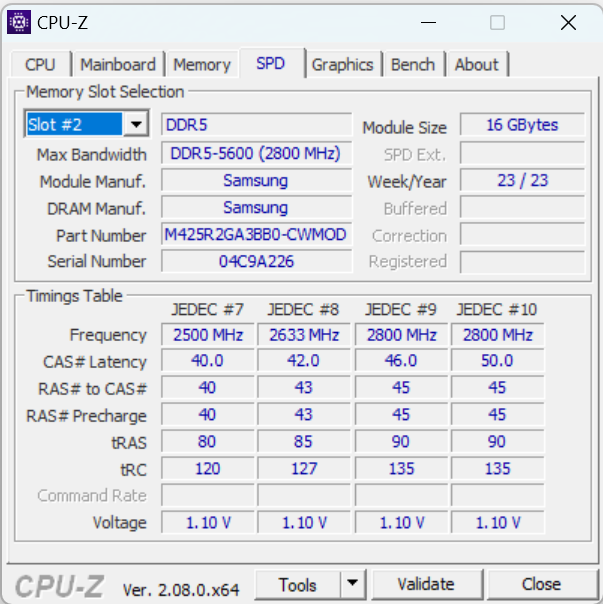
Un rápido vistazo a la hoja de especificaciones basta para confirmar que el sistema ofrece potencia suficiente para ejecutar sin problemas aplicaciones exigentes como juegos, renderizado y streaming. Las tasas de transferencia de la RAM están a un nivel normal para una RAM DDR5-5600.
CrossMark: Overall | Productivity | Creativity | Responsiveness
WebXPRT 3: Overall
WebXPRT 4: Overall
Mozilla Kraken 1.1: Total
| PCMark 10 / Score | |
| Asus ROG Strix Scar 17 G733PYV-LL053X | |
| MSI Titan 18 HX A14VIG | |
| Medion Erazer Beast X40 2024 | |
| Schenker Key 17 Pro (Early 23) | |
| Asus ROG Strix Scar 18 G834JYR (2024) | |
| Medio Intel Core i9-14900HX, NVIDIA GeForce RTX 4090 Laptop GPU (8230 - 9234, n=13) | |
| Media de la clase Gaming (5828 - 12414, n=93, últimos 2 años) | |
| Medion Erazer Beast X40 | |
| PCMark 10 / Essentials | |
| MSI Titan 18 HX A14VIG | |
| Asus ROG Strix Scar 17 G733PYV-LL053X | |
| Asus ROG Strix Scar 18 G834JYR (2024) | |
| Schenker Key 17 Pro (Early 23) | |
| Medion Erazer Beast X40 | |
| Medio Intel Core i9-14900HX, NVIDIA GeForce RTX 4090 Laptop GPU (10778 - 11628, n=13) | |
| Medion Erazer Beast X40 2024 | |
| Media de la clase Gaming (8810 - 11935, n=97, últimos 2 años) | |
| PCMark 10 / Productivity | |
| Medion Erazer Beast X40 2024 | |
| Medion Erazer Beast X40 | |
| Schenker Key 17 Pro (Early 23) | |
| Media de la clase Gaming (6845 - 25323, n=95, últimos 2 años) | |
| Asus ROG Strix Scar 17 G733PYV-LL053X | |
| Medio Intel Core i9-14900HX, NVIDIA GeForce RTX 4090 Laptop GPU (9458 - 11759, n=13) | |
| Asus ROG Strix Scar 18 G834JYR (2024) | |
| MSI Titan 18 HX A14VIG | |
| PCMark 10 / Digital Content Creation | |
| MSI Titan 18 HX A14VIG | |
| Asus ROG Strix Scar 17 G733PYV-LL053X | |
| Asus ROG Strix Scar 18 G834JYR (2024) | |
| Medion Erazer Beast X40 2024 | |
| Medio Intel Core i9-14900HX, NVIDIA GeForce RTX 4090 Laptop GPU (13219 - 16462, n=13) | |
| Schenker Key 17 Pro (Early 23) | |
| Media de la clase Gaming (7602 - 19954, n=95, últimos 2 años) | |
| Medion Erazer Beast X40 | |
| CrossMark / Overall | |
| Schenker Key 17 Pro (Early 23) | |
| Asus ROG Strix Scar 18 G834JYR (2024) | |
| Medion Erazer Beast X40 2024 | |
| Medion Erazer Beast X40 | |
| Medio Intel Core i9-14900HX, NVIDIA GeForce RTX 4090 Laptop GPU (1877 - 2344, n=10) | |
| Asus ROG Strix Scar 17 G733PYV-LL053X | |
| Media de la clase Gaming (1366 - 2409, n=94, últimos 2 años) | |
| MSI Titan 18 HX A14VIG | |
| CrossMark / Productivity | |
| Schenker Key 17 Pro (Early 23) | |
| Medion Erazer Beast X40 2024 | |
| Asus ROG Strix Scar 18 G834JYR (2024) | |
| Medion Erazer Beast X40 | |
| Medio Intel Core i9-14900HX, NVIDIA GeForce RTX 4090 Laptop GPU (1738 - 2162, n=10) | |
| Asus ROG Strix Scar 17 G733PYV-LL053X | |
| Media de la clase Gaming (1386 - 2254, n=94, últimos 2 años) | |
| MSI Titan 18 HX A14VIG | |
| CrossMark / Creativity | |
| Asus ROG Strix Scar 18 G834JYR (2024) | |
| Schenker Key 17 Pro (Early 23) | |
| Asus ROG Strix Scar 17 G733PYV-LL053X | |
| Medion Erazer Beast X40 | |
| Medio Intel Core i9-14900HX, NVIDIA GeForce RTX 4090 Laptop GPU (2195 - 2660, n=10) | |
| Medion Erazer Beast X40 2024 | |
| Media de la clase Gaming (1343 - 2786, n=94, últimos 2 años) | |
| MSI Titan 18 HX A14VIG | |
| CrossMark / Responsiveness | |
| Schenker Key 17 Pro (Early 23) | |
| Asus ROG Strix Scar 18 G834JYR (2024) | |
| Medion Erazer Beast X40 2024 | |
| Medio Intel Core i9-14900HX, NVIDIA GeForce RTX 4090 Laptop GPU (1478 - 2327, n=10) | |
| Medion Erazer Beast X40 | |
| Media de la clase Gaming (1226 - 2334, n=94, últimos 2 años) | |
| Asus ROG Strix Scar 17 G733PYV-LL053X | |
| MSI Titan 18 HX A14VIG | |
| WebXPRT 3 / Overall | |
| Asus ROG Strix Scar 17 G733PYV-LL053X | |
| MSI Titan 18 HX A14VIG | |
| Medion Erazer Beast X40 2024 | |
| Medio Intel Core i9-14900HX, NVIDIA GeForce RTX 4090 Laptop GPU (279 - 339, n=10) | |
| Medion Erazer Beast X40 | |
| Asus ROG Strix Scar 18 G834JYR (2024) | |
| Media de la clase Gaming (220 - 532, n=98, últimos 2 años) | |
| Schenker Key 17 Pro (Early 23) | |
| WebXPRT 4 / Overall | |
| Asus ROG Strix Scar 17 G733PYV-LL053X | |
| Asus ROG Strix Scar 18 G834JYR (2024) | |
| Medion Erazer Beast X40 2024 | |
| Schenker Key 17 Pro (Early 23) | |
| Medio Intel Core i9-14900HX, NVIDIA GeForce RTX 4090 Laptop GPU (246 - 309, n=8) | |
| MSI Titan 18 HX A14VIG | |
| Media de la clase Gaming (165 - 354, n=98, últimos 2 años) | |
| Mozilla Kraken 1.1 / Total | |
| Schenker Key 17 Pro (Early 23) | |
| Medion Erazer Beast X40 | |
| Media de la clase Gaming (391 - 590, n=100, últimos 2 años) | |
| Medio Intel Core i9-14900HX, NVIDIA GeForce RTX 4090 Laptop GPU (428 - 535, n=11) | |
| MSI Titan 18 HX A14VIG | |
| Asus ROG Strix Scar 18 G834JYR (2024) | |
| Medion Erazer Beast X40 2024 | |
| Asus ROG Strix Scar 17 G733PYV-LL053X | |
* ... más pequeño es mejor
| PCMark 10 Score | 8963 puntos | |
ayuda | ||
| AIDA64 / Memory Copy | |
| Asus ROG Strix Scar 18 G834JYR (2024) | |
| Schenker Key 17 Pro (Early 23) | |
| Medion Erazer Beast X40 2024 | |
| Medio Intel Core i9-14900HX (38028 - 83392, n=36) | |
| Media de la clase Gaming (21750 - 129946, n=105, últimos 2 años) | |
| Medion Erazer Beast X40 | |
| MSI Titan 18 HX A14VIG | |
| Asus ROG Strix Scar 17 G733PYV-LL053X | |
| AIDA64 / Memory Read | |
| Asus ROG Strix Scar 18 G834JYR (2024) | |
| Medion Erazer Beast X40 2024 | |
| Schenker Key 17 Pro (Early 23) | |
| Medio Intel Core i9-14900HX (43306 - 87568, n=36) | |
| Medion Erazer Beast X40 | |
| Media de la clase Gaming (22956 - 118858, n=105, últimos 2 años) | |
| Asus ROG Strix Scar 17 G733PYV-LL053X | |
| MSI Titan 18 HX A14VIG | |
| AIDA64 / Memory Write | |
| Asus ROG Strix Scar 18 G834JYR (2024) | |
| Medion Erazer Beast X40 2024 | |
| Schenker Key 17 Pro (Early 23) | |
| Media de la clase Gaming (22297 - 135096, n=105, últimos 2 años) | |
| Medio Intel Core i9-14900HX (37146 - 80589, n=36) | |
| Medion Erazer Beast X40 | |
| Asus ROG Strix Scar 17 G733PYV-LL053X | |
| MSI Titan 18 HX A14VIG | |
| AIDA64 / Memory Latency | |
| Media de la clase Gaming (75.3 - 259, n=105, últimos 2 años) | |
| MSI Titan 18 HX A14VIG | |
| Schenker Key 17 Pro (Early 23) | |
| Medion Erazer Beast X40 | |
| Asus ROG Strix Scar 17 G733PYV-LL053X | |
| Medio Intel Core i9-14900HX (76.1 - 105, n=36) | |
| Asus ROG Strix Scar 18 G834JYR (2024) | |
| Medion Erazer Beast X40 2024 | |
* ... más pequeño es mejor
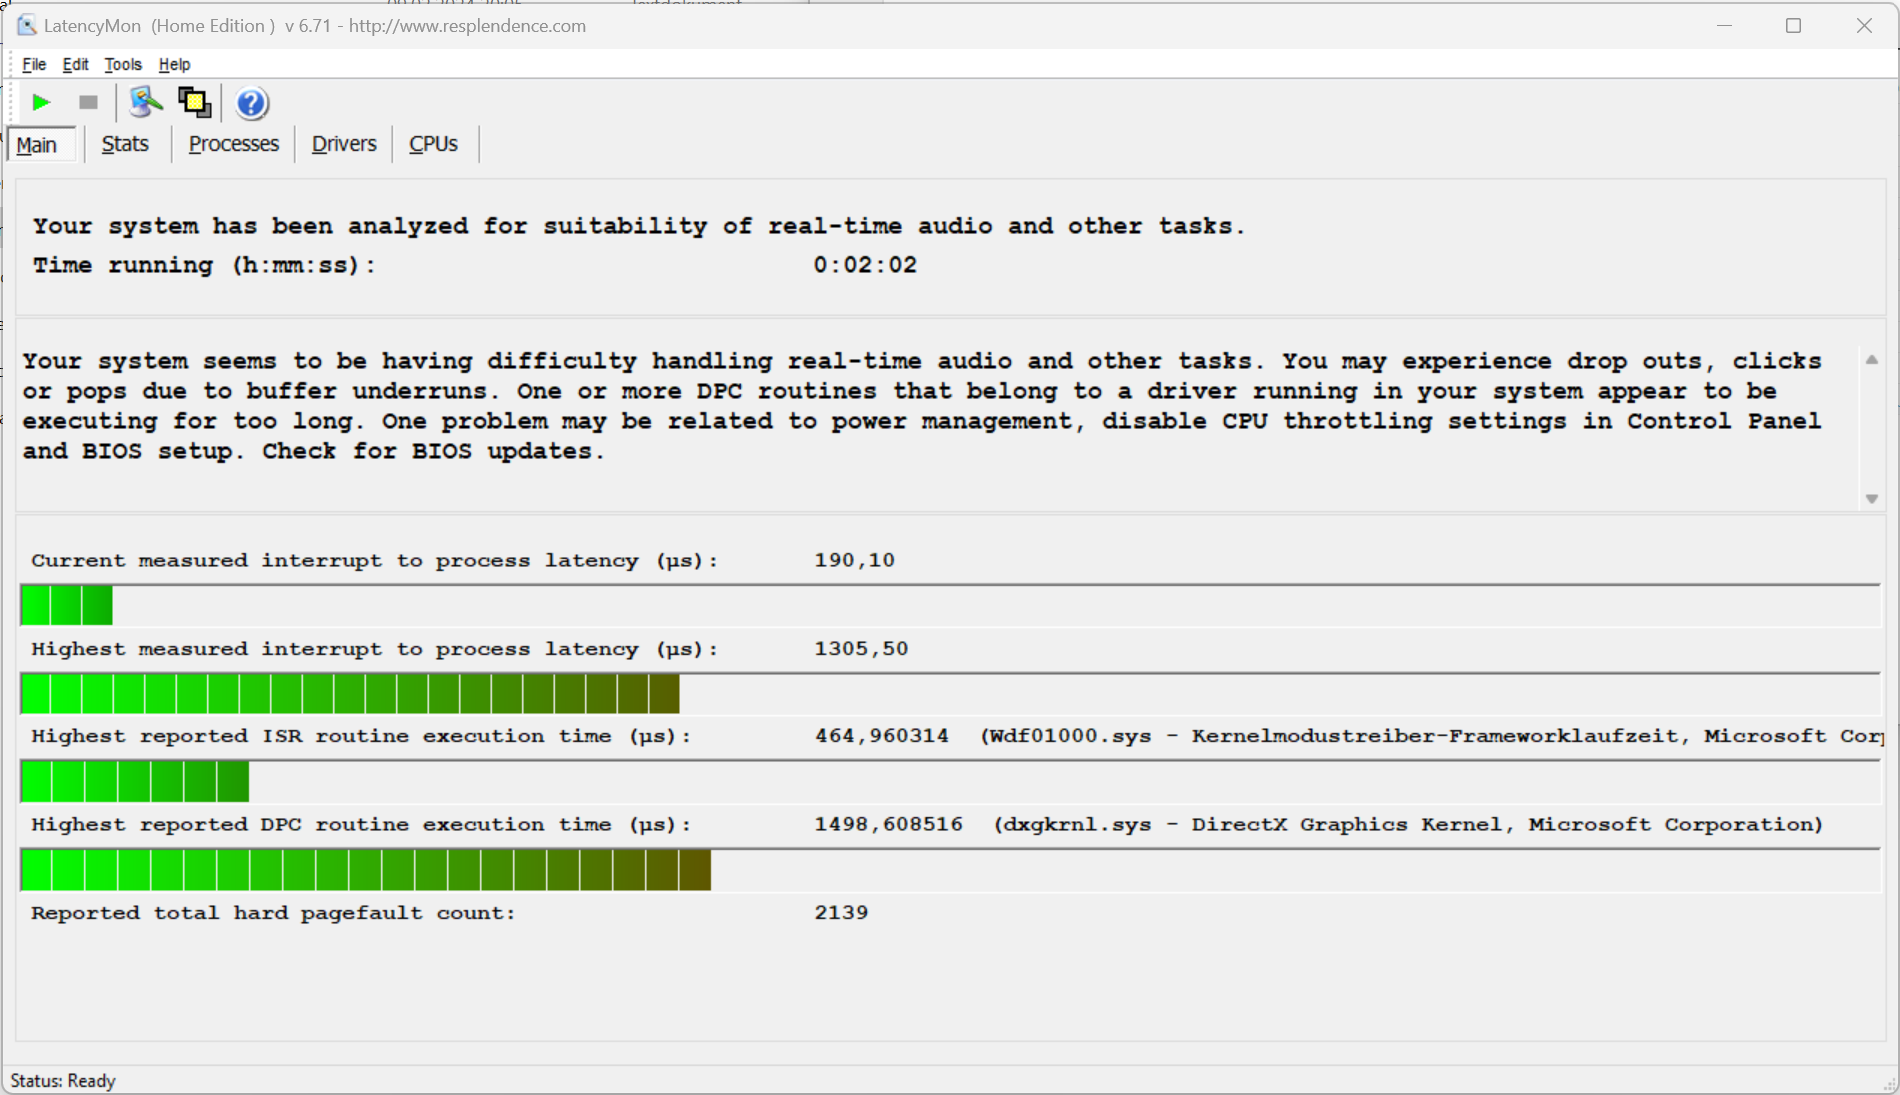
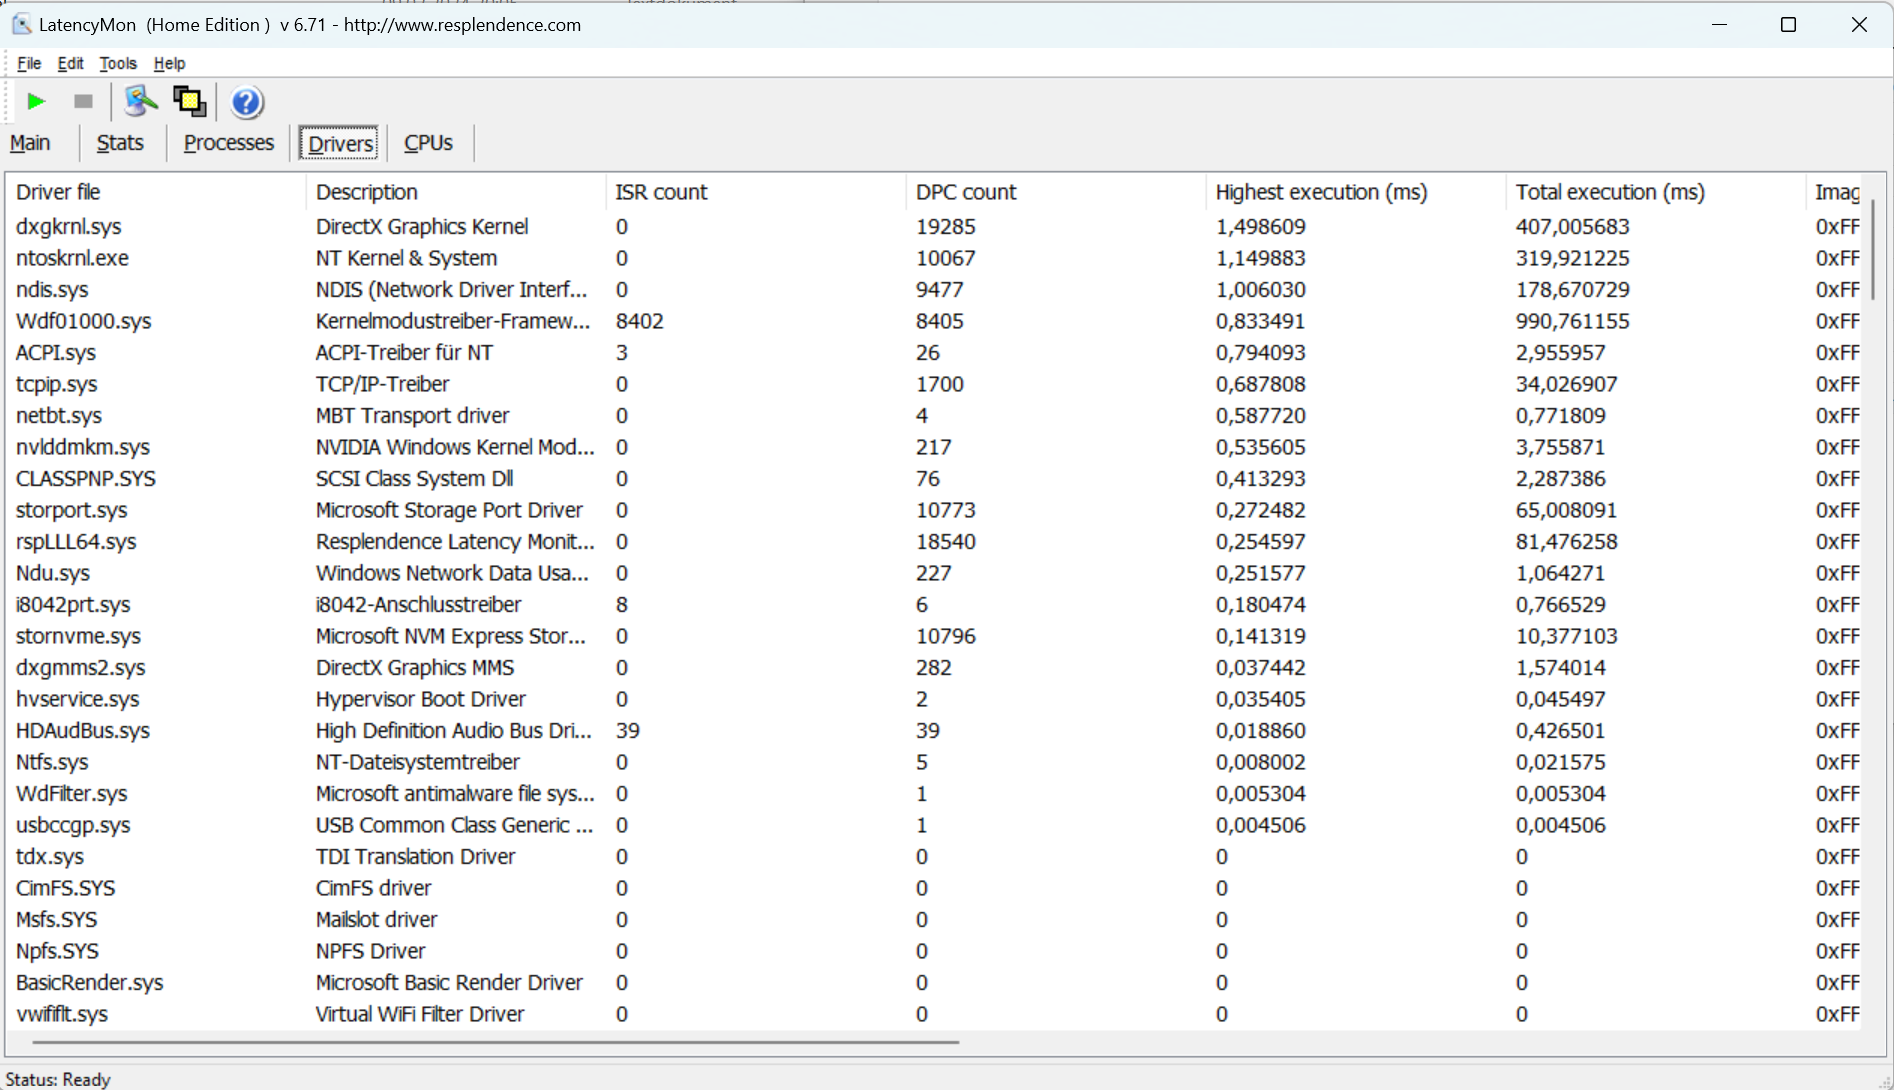
Latencia del CPD
El monitor de latencia revela anomalías durante la prueba de latencia (navegación web, reproducción de vídeo 4k y Prime95 de alta carga). El sistema no parece adecuado para la edición de vídeo y audio en tiempo real. Futuras actualizaciones de software y controladores podrían suponer mejoras potenciales o incluso deterioros.
| DPC Latencies / LatencyMon - interrupt to process latency (max), Web, Youtube, Prime95 | |
| Schenker Key 17 Pro (Early 23) | |
| MSI Titan 18 HX A14VIG | |
| Medion Erazer Beast X40 | |
| Medion Erazer Beast X40 2024 | |
| Asus ROG Strix Scar 18 G834JYR (2024) | |
| Asus ROG Strix Scar 17 G733PYV-LL053X | |
* ... más pequeño es mejor
Almacenamiento masivo
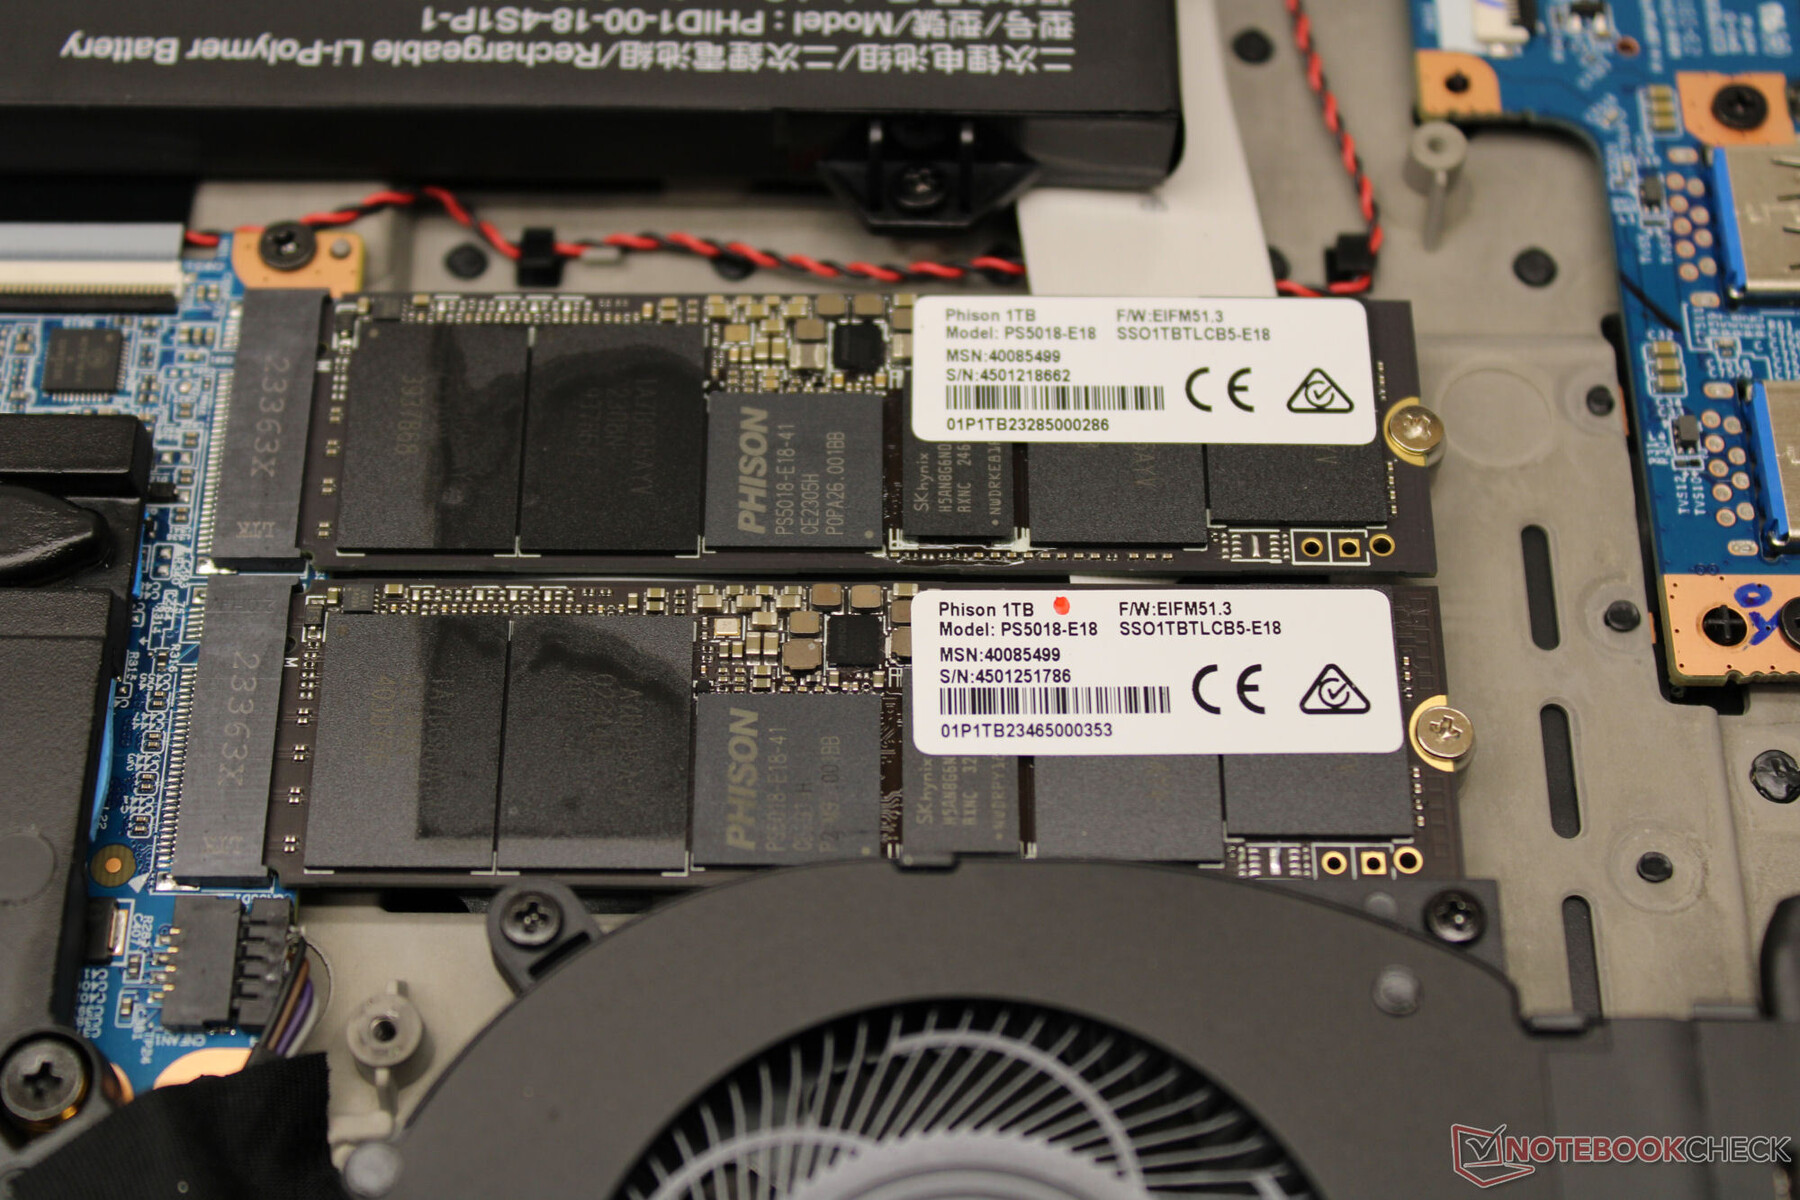
El X40 cuenta con dos unidades SSD PCIe Gen 4 M.2 2280 de 1 TB cada una a bordo, pero no están configuradas en una matriz RAID. Una SSD sirve como unidad del sistema y la otra como almacenamiento de datos. Se alcanzan velocidades de datos muy buenas. No hay caídas de rendimiento debidas al estrangulamiento térmico.
En general, el X40 admite RAID-0/1, pero primero habría que activar la opción correspondiente en la BIOS, tras lo cual es necesario reinstalar Windows. Este procedimiento no es recomendable para los no iniciados.

* ... más pequeño es mejor
Disk throttling: DiskSpd Read Loop, Queue Depth 8
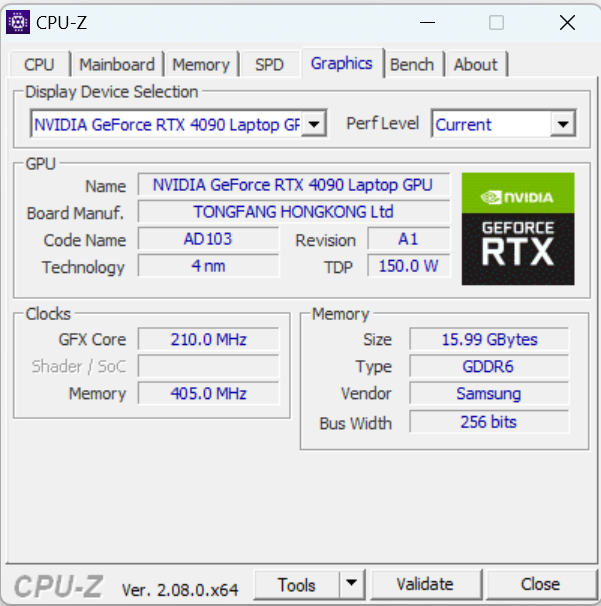
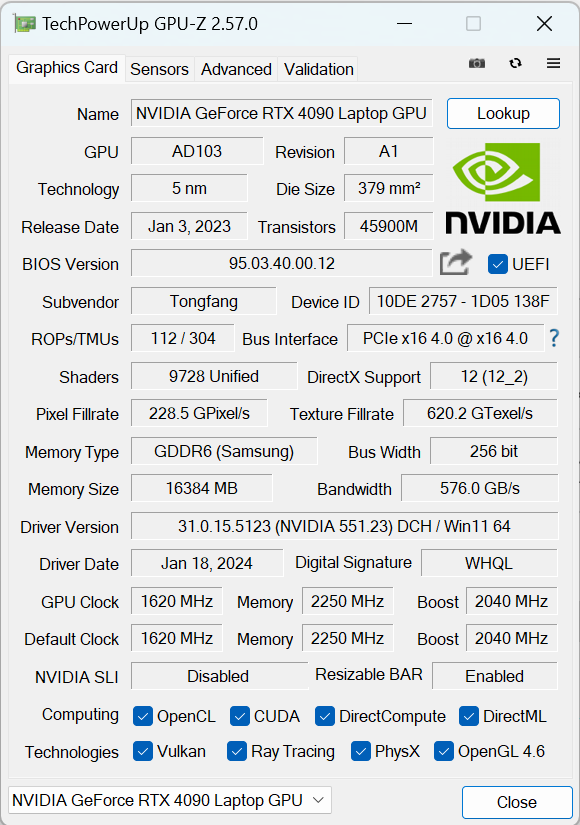
Tarjeta gráfica
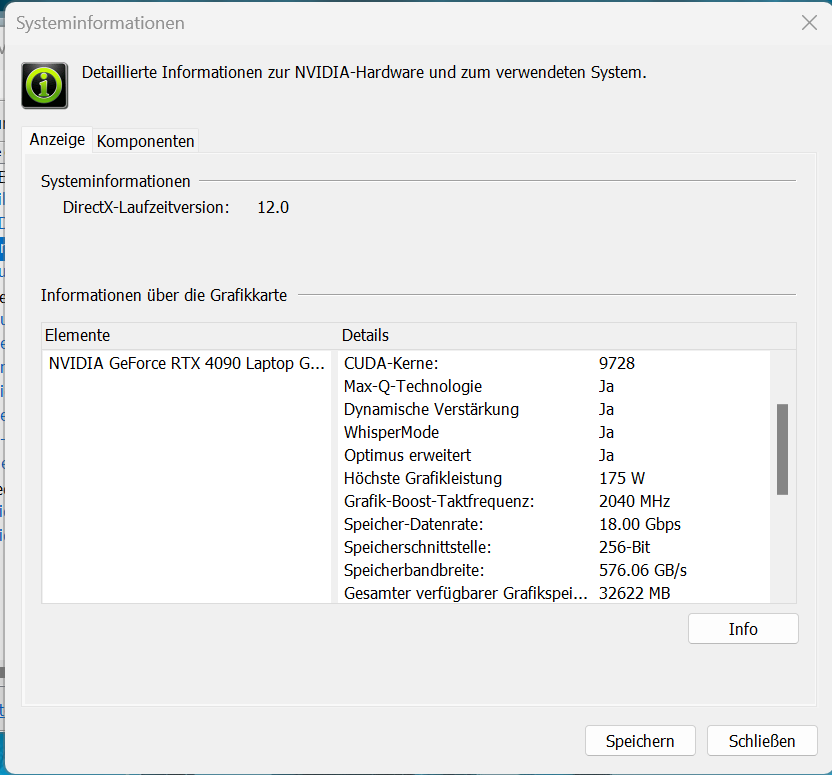
La Medion Erazer Beast X40 se basa en la GeForce RTX 4090 - actualmente la GPU móvil más potente de Nvidia. Cuenta con 9.728 sombreadores, un bus de memoria de 256 bits de ancho y una rápida memoria GDDR6 de 16 GB. La RTX 4090 tiene un TGP máximo de 175 W (150 vatios + 25 vatios de Dynamic Boost): no hay forma de superar este límite.
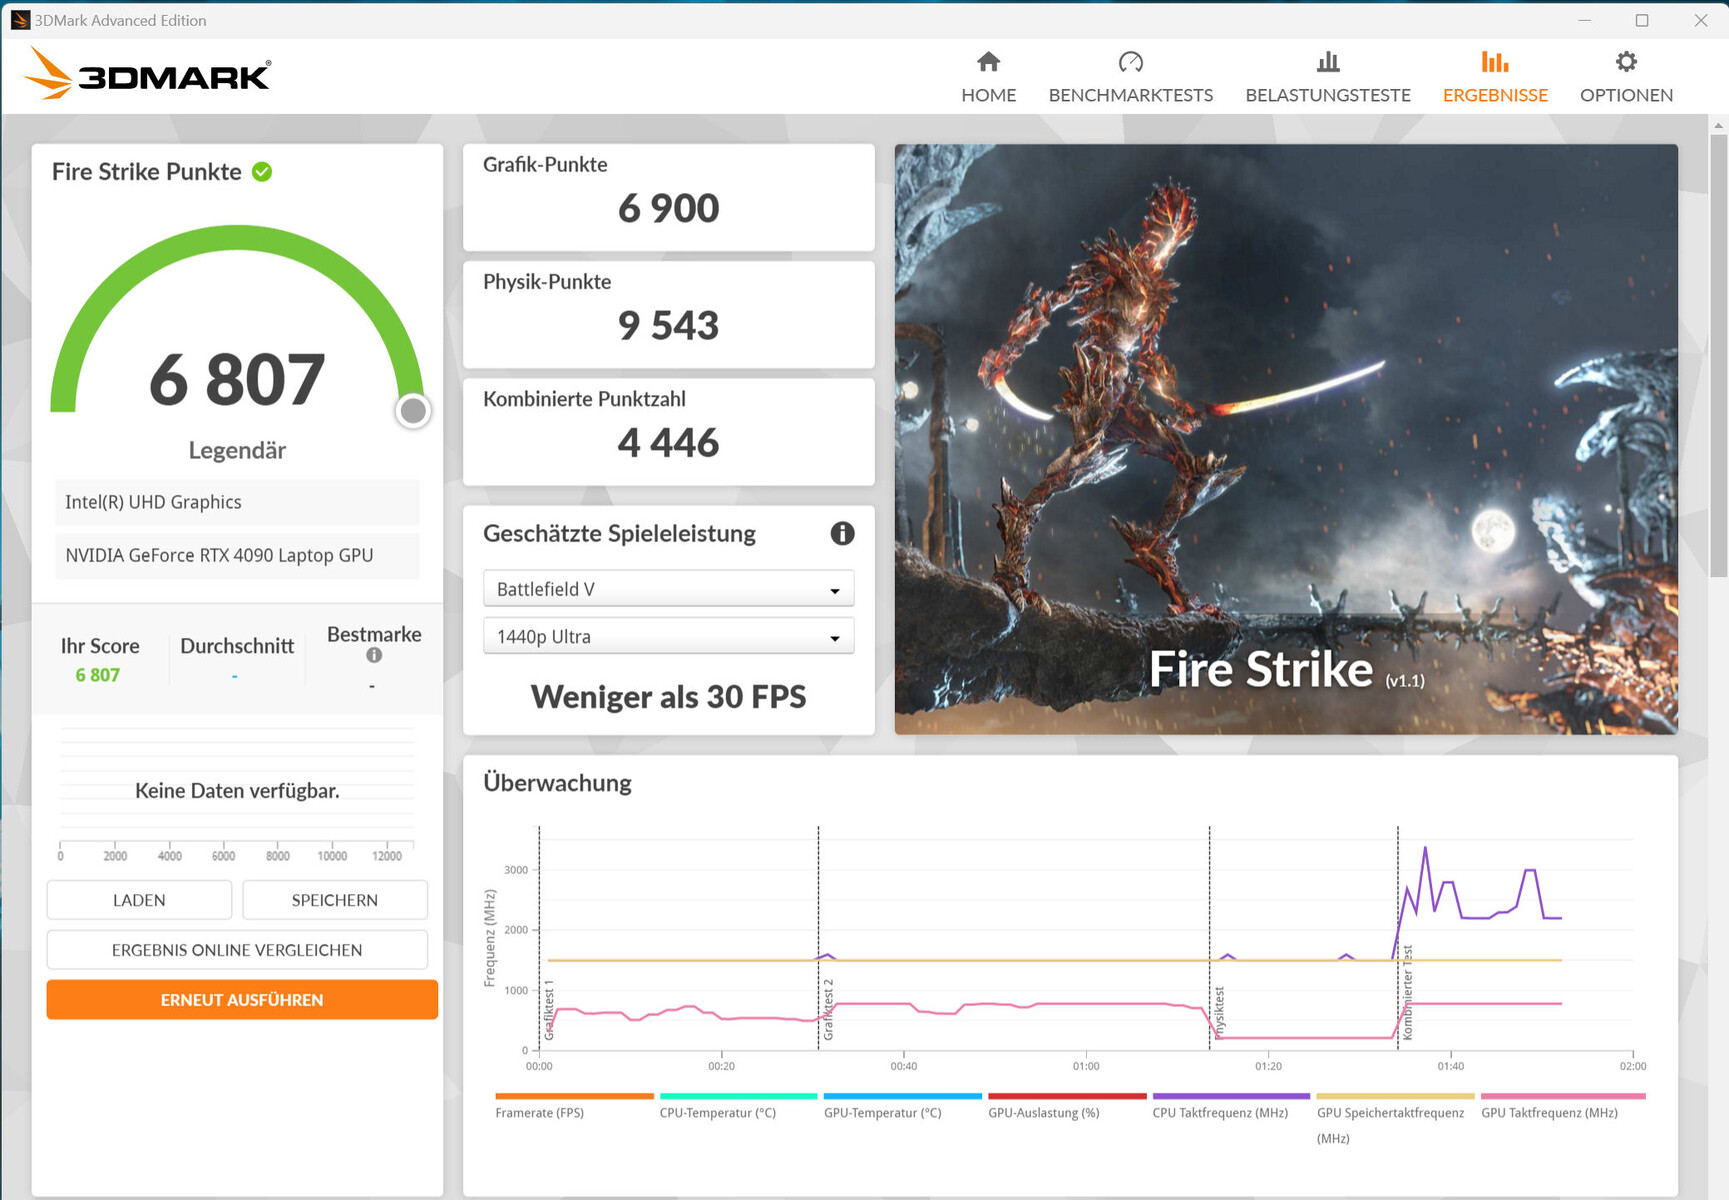
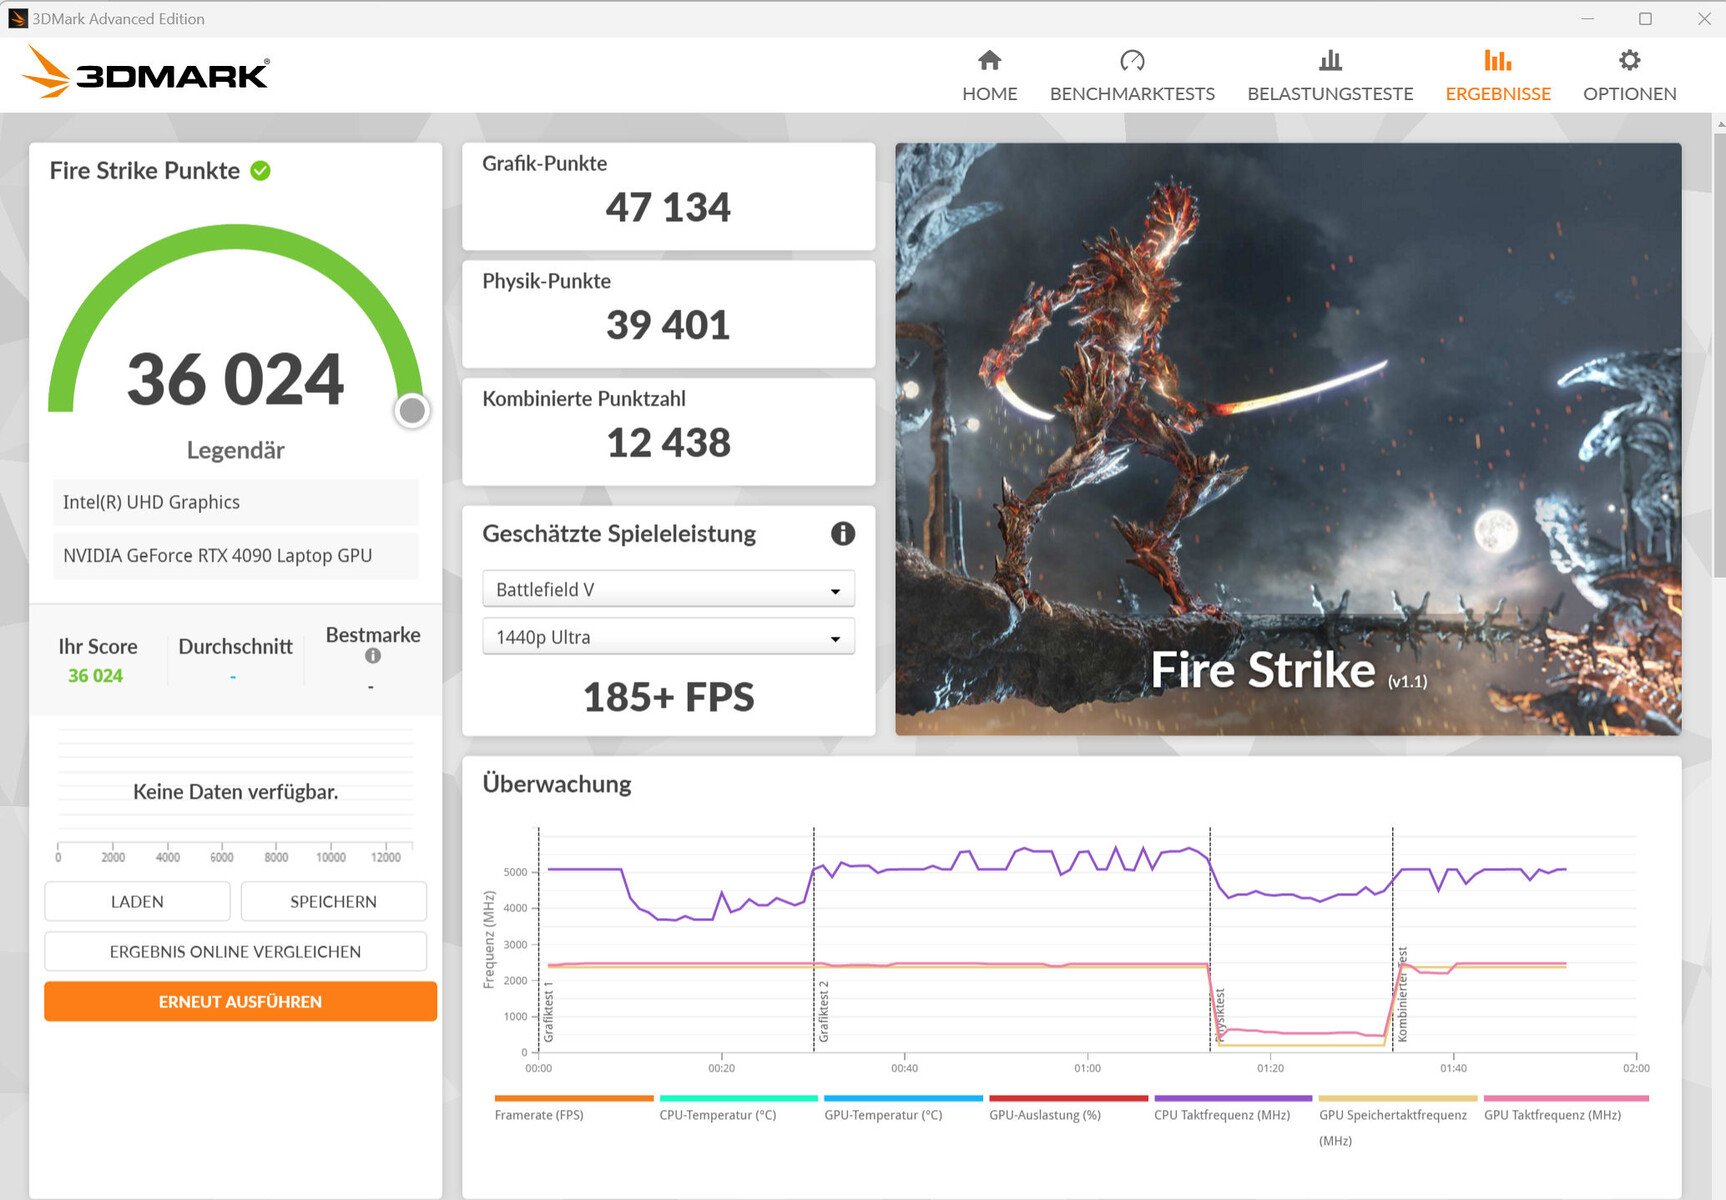
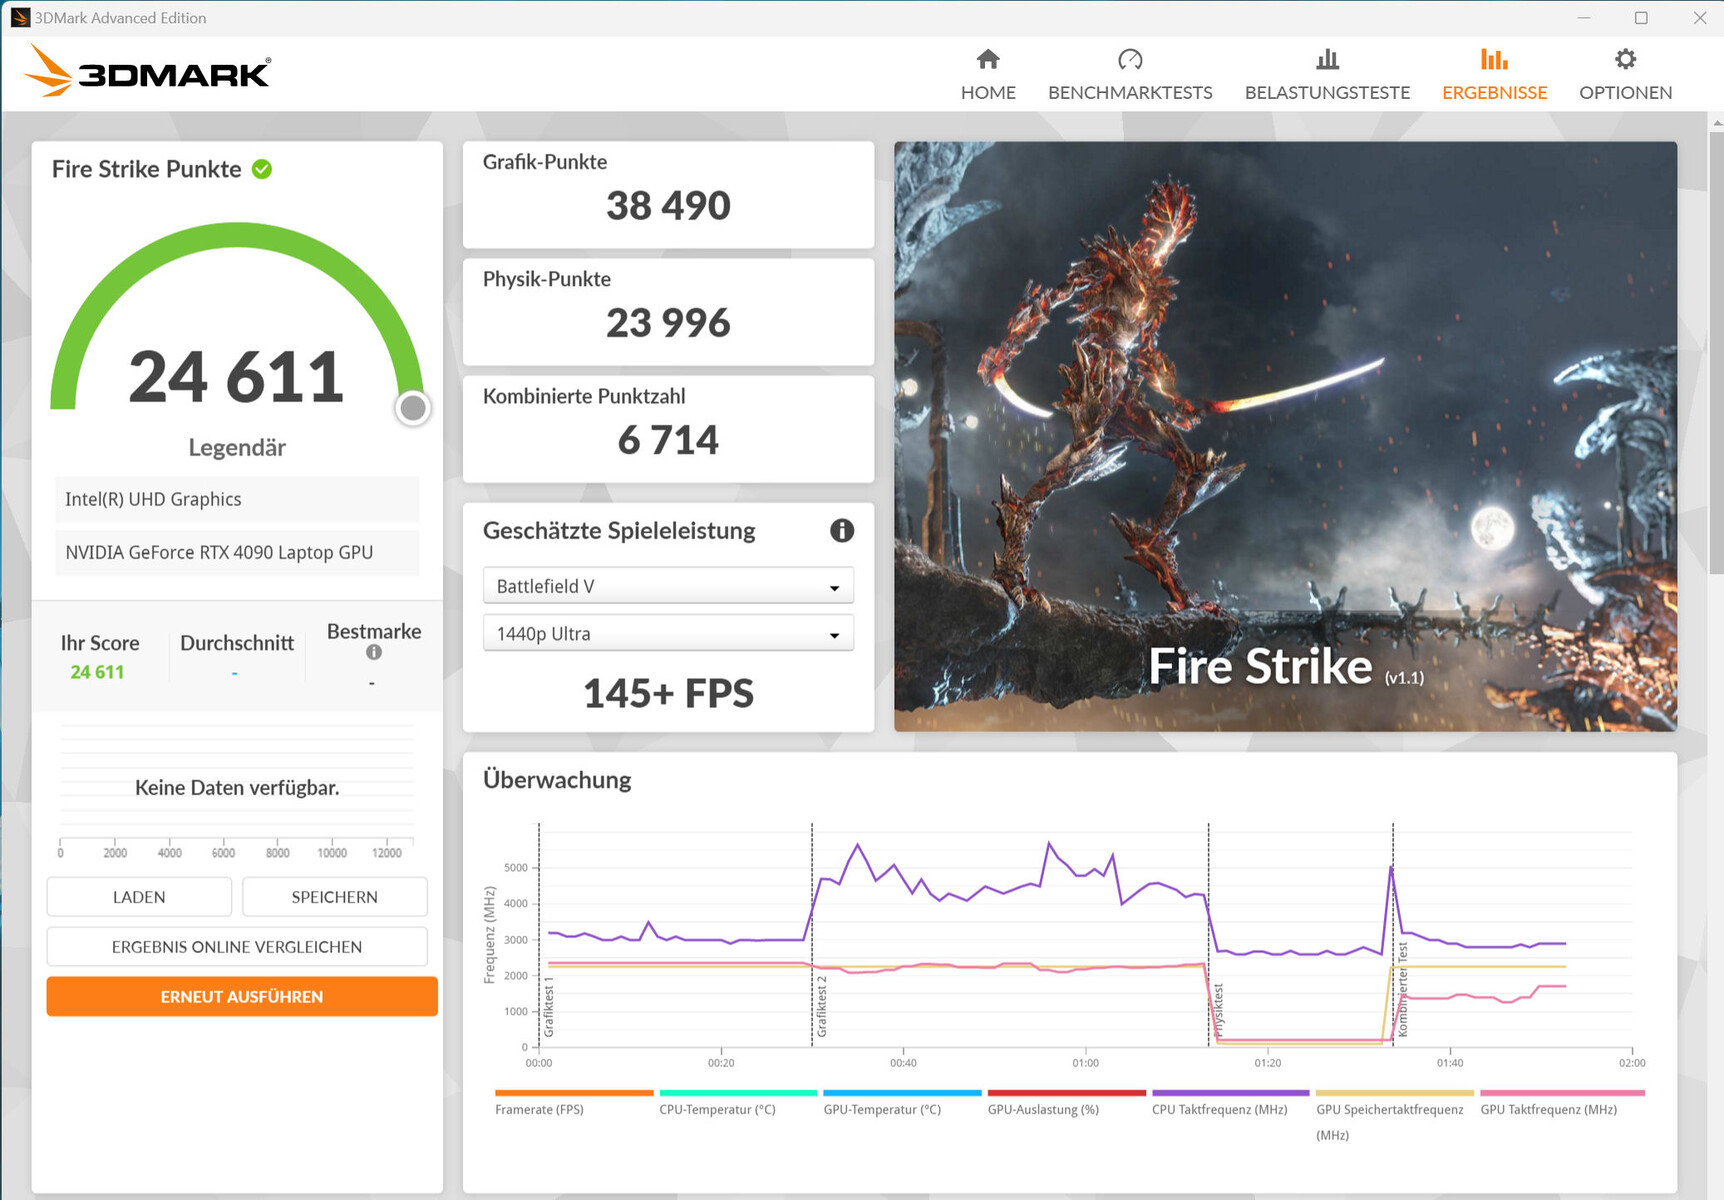
Los resultados del benchmark están al mismo nivel (Modo Equilibrio) o por encima (Modo Juego) de la media de la RTX 4090 anterior. Sin embargo, la situación es diferente en los juegos.
En ambos casos se alcanzan frecuencias de cuadro superiores a la media de la GPU. Se admite Optimus avanzado, por lo que el cambio entre dGPU y Optimus no requiere un reinicio.
| 3DMark Performance rating - Percent | |
| Medion Erazer Beast X40 2024 | |
| MSI Titan 18 HX A14VIG | |
| Asus ROG Strix Scar 17 G733PYV-LL053X | |
| Medion Erazer Beast X40 | |
| Schenker Key 17 Pro (Early 23) | |
| Medio NVIDIA GeForce RTX 4090 Laptop GPU | |
| Medion Erazer Beast X40 2024 | |
| Asus ROG Strix Scar 18 G834JYR (2024) | |
| Media de la clase Gaming | |
| 3DMark 11 - 1280x720 Performance GPU | |
| Medion Erazer Beast X40 2024 (Gaming Mode) | |
| Schenker Key 17 Pro (Early 23) | |
| Medion Erazer Beast X40 | |
| Medio NVIDIA GeForce RTX 4090 Laptop GPU (54073 - 73027, n=42) | |
| Medion Erazer Beast X40 2024 | |
| Asus ROG Strix Scar 17 G733PYV-LL053X | |
| MSI Titan 18 HX A14VIG | |
| Asus ROG Strix Scar 18 G834JYR (2024) | |
| Media de la clase Gaming (21841 - 80022, n=104, últimos 2 años) | |
| 3DMark | |
| 1920x1080 Fire Strike Graphics | |
| MSI Titan 18 HX A14VIG | |
| Asus ROG Strix Scar 17 G733PYV-LL053X | |
| Medion Erazer Beast X40 2024 (Gaming Mode) | |
| Medio NVIDIA GeForce RTX 4090 Laptop GPU (40259 - 53059, n=41) | |
| Medion Erazer Beast X40 | |
| Medion Erazer Beast X40 2024 | |
| Asus ROG Strix Scar 18 G834JYR (2024) | |
| Schenker Key 17 Pro (Early 23) | |
| Media de la clase Gaming (12242 - 62849, n=115, últimos 2 años) | |
| 2560x1440 Time Spy Graphics | |
| Medion Erazer Beast X40 2024 (Gaming Mode) | |
| MSI Titan 18 HX A14VIG | |
| Schenker Key 17 Pro (Early 23) | |
| Asus ROG Strix Scar 17 G733PYV-LL053X | |
| Medion Erazer Beast X40 | |
| Medio NVIDIA GeForce RTX 4090 Laptop GPU (16950 - 23292, n=43) | |
| Medion Erazer Beast X40 2024 | |
| Asus ROG Strix Scar 18 G834JYR (2024) | |
| Media de la clase Gaming (5012 - 26212, n=115, últimos 2 años) | |
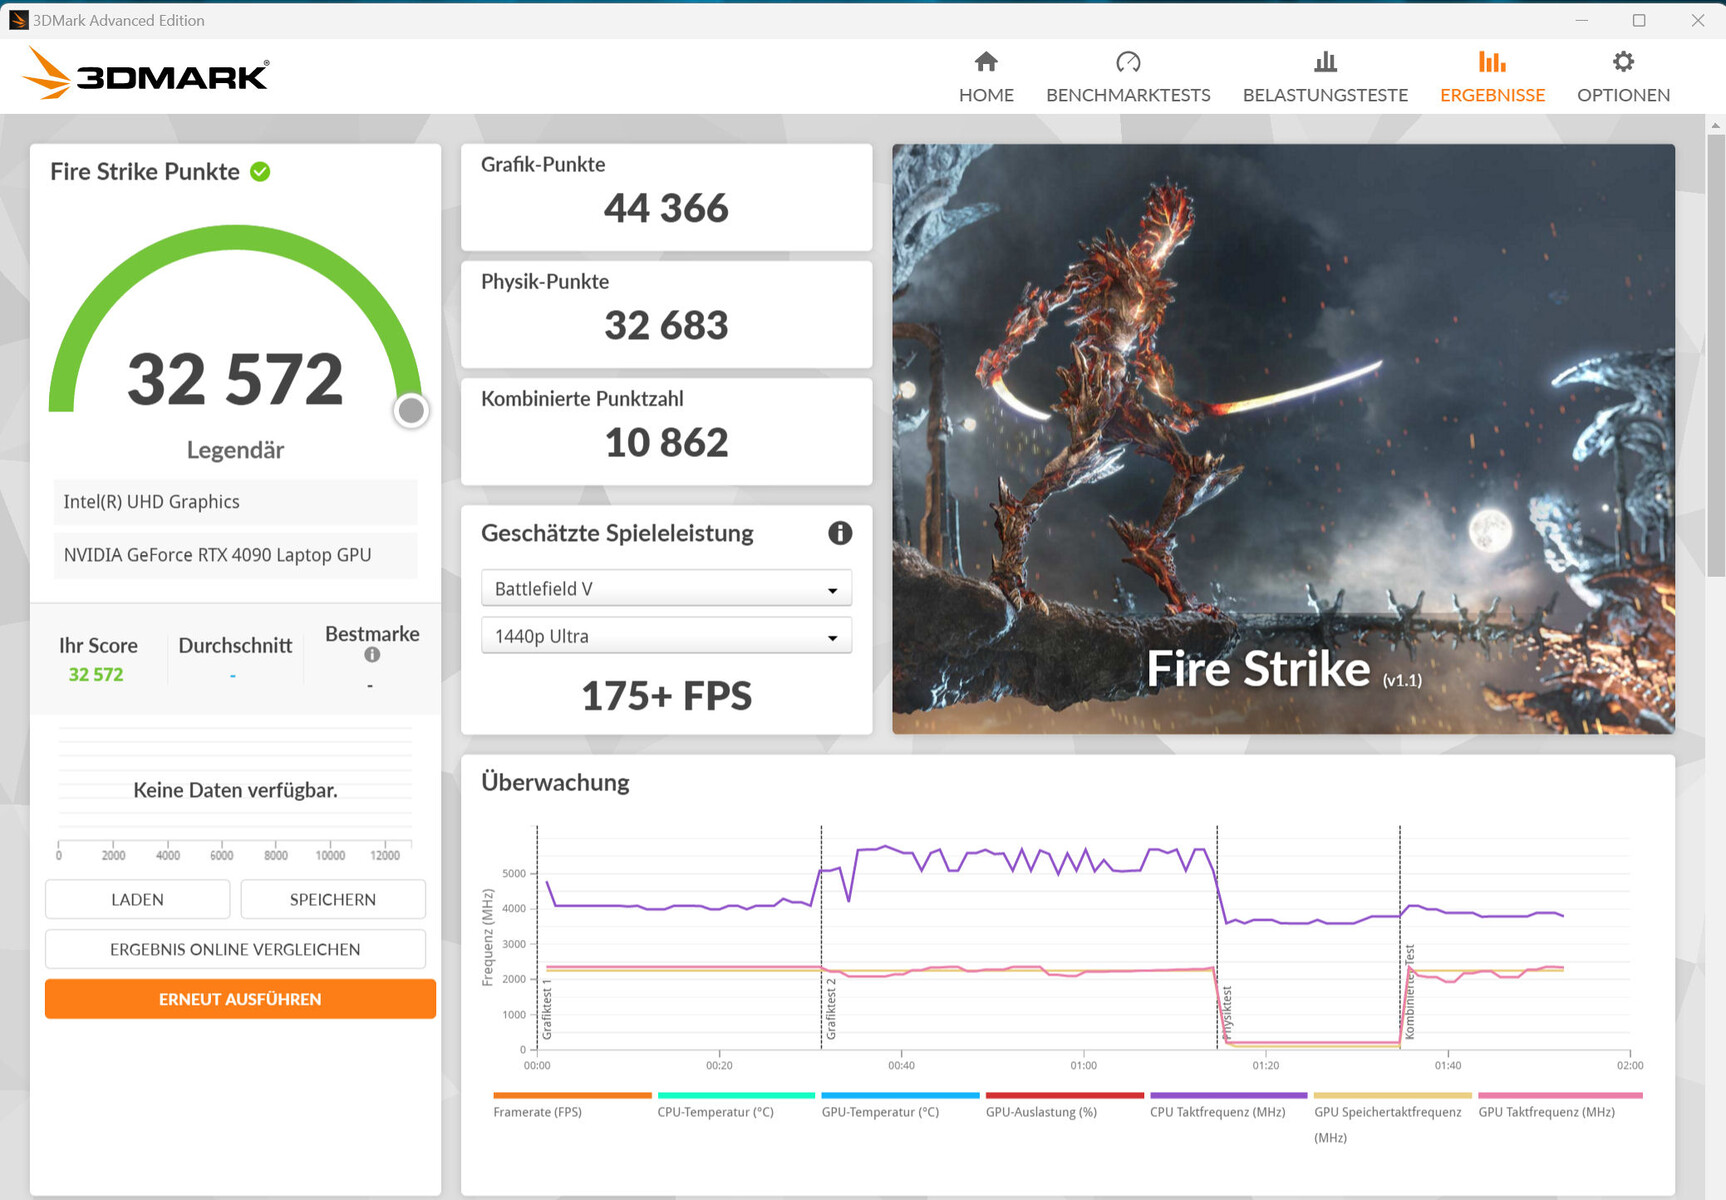
| 3DMark 11 Performance | 41974 puntos | |
| 3DMark Fire Strike Score | 32572 puntos | |
| 3DMark Time Spy Score | 19655 puntos | |
ayuda | ||
| Geekbench 5.5 | |
| OpenCL Score | |
| Medion Erazer Beast X40 2024 (Gaming Mode) | |
| Asus ROG Strix Scar 18 G834JYR (2024) | |
| Schenker Key 17 Pro (Early 23) | |
| Asus ROG Strix Scar 17 G733PYV-LL053X | |
| Medion Erazer Beast X40 2024 | |
| Medio NVIDIA GeForce RTX 4090 Laptop GPU (6841 - 237138, n=39) | |
| MSI Titan 18 HX A14VIG | |
| Medion Erazer Beast X40 | |
| Media de la clase Gaming (80702 - 277970, n=101, últimos 2 años) | |
| Vulkan Score 5.5 | |
| Medion Erazer Beast X40 2024 (Gaming Mode) | |
| Medion Erazer Beast X40 2024 | |
| MSI Titan 18 HX A14VIG | |
| Asus ROG Strix Scar 18 G834JYR (2024) | |
| Asus ROG Strix Scar 17 G733PYV-LL053X | |
| Media de la clase Gaming (18857 - 246759, n=76, últimos 2 años) | |
| Medio NVIDIA GeForce RTX 4090 Laptop GPU (49663 - 163089, n=28) | |
| Geekbench 6.7 | |
| GPU Vulkan | |
| Medion Erazer Beast X40 2024 (6.2.1, Gaming Mode) | |
| Medion Erazer Beast X40 2024 (6.2.1) | |
| Asus ROG Strix Scar 18 G834JYR (2024) (6.2.1) | |
| Asus ROG Strix Scar 17 G733PYV-LL053X | |
| MSI Titan 18 HX A14VIG (6.2.1) | |
| Medio NVIDIA GeForce RTX 4090 Laptop GPU (128748 - 196201, n=16) | |
| Media de la clase Gaming (7562 - 244348, n=59, últimos 2 años) | |
| GPU OpenCL | |
| Medion Erazer Beast X40 2024 (6.2.1) | |
| Medion Erazer Beast X40 2024 (6.2.1, Gaming Mode) | |
| Asus ROG Strix Scar 17 G733PYV-LL053X | |
| Asus ROG Strix Scar 18 G834JYR (2024) (6.2.1) | |
| Medio NVIDIA GeForce RTX 4090 Laptop GPU (159127 - 209521, n=20) | |
| MSI Titan 18 HX A14VIG (6.2.1) | |
| Media de la clase Gaming (67235 - 253130, n=103, últimos 2 años) | |
| V-Ray Benchmark Next 4.10 | |
| GPU | |
| Medion Erazer Beast X40 2024 (v4.10.07, Gaming Mode) | |
| Asus ROG Strix Scar 17 G733PYV-LL053X (v4.10.07 ) | |
| Schenker Key 17 Pro (Early 23) (v4.10.07 ) | |
| Medion Erazer Beast X40 (v4.10.07 ) | |
| Medio NVIDIA GeForce RTX 4090 Laptop GPU (873 - 1334, n=30) | |
| Asus ROG Strix Scar 18 G834JYR (2024) (v4.10.07 ) | |
| Medion Erazer Beast X40 2024 (v4.10.07 ) | |
| Media de la clase Gaming (427 - 1627, n=99, últimos 2 años) | |
| CPU | |
| Asus ROG Strix Scar 17 G733PYV-LL053X (v4.10.07 ) | |
| Medion Erazer Beast X40 2024 (v4.10.07, Gaming Mode) | |
| Medion Erazer Beast X40 (v4.10.07 ) | |
| Medio NVIDIA GeForce RTX 4090 Laptop GPU (18206 - 37629, n=30) | |
| Asus ROG Strix Scar 18 G834JYR (2024) (v4.10.07 ) | |
| Schenker Key 17 Pro (Early 23) (v4.10.07 ) | |
| Media de la clase Gaming (10048 - 45327, n=97, últimos 2 años) | |
| Medion Erazer Beast X40 2024 (v4.10.07 ) | |
* ... más pequeño es mejor
| The Witcher 3 - 1920x1080 Ultra Graphics & Postprocessing (HBAO+) | |
| Medion Erazer Beast X40 2024 (Gaming Mode) | |
| MSI Titan 18 HX A14VIG | |
| Asus ROG Strix Scar 17 G733PYV-LL053X | |
| Schenker Key 17 Pro (Early 23) | |
| Medion Erazer Beast X40 2024 | |
| Medio NVIDIA GeForce RTX 4090 Laptop GPU (139.2 - 216, n=35) | |
| Media de la clase Gaming (104.7 - 240, n=7, últimos 2 años) | |
| Medion Erazer Beast X40 | |
| Asus ROG Strix Scar 18 G834JYR (2024) | |
| GTA V - 1920x1080 Highest AA:4xMSAA + FX AF:16x | |
| Asus ROG Strix Scar 17 G733PYV-LL053X | |
| Medion Erazer Beast X40 2024 (Gaming Mode) | |
| Medion Erazer Beast X40 | |
| Schenker Key 17 Pro (Early 23) | |
| Medion Erazer Beast X40 2024 | |
| MSI Titan 18 HX A14VIG | |
| Medio NVIDIA GeForce RTX 4090 Laptop GPU (91.1 - 167.7, n=40) | |
| Asus ROG Strix Scar 18 G834JYR (2024) | |
| Media de la clase Gaming (48.3 - 186.9, n=94, últimos 2 años) | |
| Final Fantasy XV Benchmark - 1920x1080 High Quality | |
| Medion Erazer Beast X40 2024 (1.3, Gaming Mode) | |
| MSI Titan 18 HX A14VIG (1.3) | |
| Schenker Key 17 Pro (Early 23) (1.3) | |
| Medion Erazer Beast X40 2024 (1.3) | |
| Asus ROG Strix Scar 17 G733PYV-LL053X (1.3) | |
| Medion Erazer Beast X40 (1.3) | |
| Medio NVIDIA GeForce RTX 4090 Laptop GPU (122.2 - 201, n=40) | |
| Asus ROG Strix Scar 18 G834JYR (2024) (1.3) | |
| Media de la clase Gaming (41 - 215, n=95, últimos 2 años) | |
| Strange Brigade - 1920x1080 ultra AA:ultra AF:16 | |
| Asus ROG Strix Scar 17 G733PYV-LL053X (1.47.22.14 D3D12) | |
| MSI Titan 18 HX A14VIG (1.47.22.14 D3D12) | |
| Schenker Key 17 Pro (Early 23) (1.47.22.14 D3D12) | |
| Medion Erazer Beast X40 2024 (1.47.22.14 D3D12, Gaming Mode) | |
| Medion Erazer Beast X40 2024 (1.47.22.14 D3D12) | |
| Medion Erazer Beast X40 (1.47.22.14 D3D12) | |
| Medio NVIDIA GeForce RTX 4090 Laptop GPU (233 - 421, n=39) | |
| Asus ROG Strix Scar 18 G834JYR (2024) (1.47.22.14 D3D12) | |
| Media de la clase Gaming (76.3 - 458, n=87, últimos 2 años) | |
| Dota 2 Reborn - 1920x1080 ultra (3/3) best looking | |
| Asus ROG Strix Scar 17 G733PYV-LL053X | |
| Medion Erazer Beast X40 2024 | |
| Medion Erazer Beast X40 2024 (Gaming Mode) | |
| Schenker Key 17 Pro (Early 23) | |
| Medio NVIDIA GeForce RTX 4090 Laptop GPU (115.7 - 220, n=42) | |
| MSI Titan 18 HX A14VIG | |
| Medion Erazer Beast X40 | |
| Asus ROG Strix Scar 18 G834JYR (2024) | |
| Media de la clase Gaming (84.8 - 248, n=107, últimos 2 años) | |
| X-Plane 11.11 - 1920x1080 high (fps_test=3) | |
| Asus ROG Strix Scar 17 G733PYV-LL053X | |
| Medion Erazer Beast X40 2024 | |
| Medion Erazer Beast X40 2024 (Gaming Mode) | |
| Asus ROG Strix Scar 18 G834JYR (2024) | |
| Schenker Key 17 Pro (Early 23) | |
| Medio NVIDIA GeForce RTX 4090 Laptop GPU (77.8 - 166.2, n=46) | |
| Medion Erazer Beast X40 | |
| MSI Titan 18 HX A14VIG | |
| Media de la clase Gaming (55.5 - 143.5, n=109, últimos 2 años) | |
| Helldivers 2 | |
| 1920x1080 Ultra Preset | |
| Medion Erazer Beast X40 2024 | |
| Medio NVIDIA GeForce RTX 4090 Laptop GPU (130.2 - 141.2, n=2) | |
| Asus ROG Zephyrus M16 | |
| Media de la clase Gaming (18.4 - 153.8, n=5, últimos 2 años) | |
| 2560x1440 Ultra Preset | |
| Medion Erazer Beast X40 2024 | |
| Media de la clase Gaming (81.3 - 140.1, n=5, últimos 2 años) | |
| Medio NVIDIA GeForce RTX 4090 Laptop GPU (105.5 - 122.6, n=2) | |
| Asus ROG Zephyrus M16 | |
| Enshrouded | |
| 1920x1080 Max. Quality AA:FX | |
| Medion Erazer Beast X40 2024 | |
| Medio NVIDIA GeForce RTX 4090 Laptop GPU (79 - 101.5, n=3) | |
| Asus ROG Strix Scar 18 G834JYR (2024) | |
| Asus ROG Zephyrus M16 | |
| Media de la clase Gaming (n=1últimos 2 años) | |
| 2560x1440 Max. Quality AA:FX | |
| Medion Erazer Beast X40 2024 | |
| Asus ROG Strix Scar 18 G834JYR (2024) | |
| Medio NVIDIA GeForce RTX 4090 Laptop GPU (61.8 - 76, n=3) | |
| Asus ROG Zephyrus M16 | |
| Ready or Not | |
| 1920x1080 Epic Preset | |
| Asus ROG Zephyrus M16 | |
| Medio NVIDIA GeForce RTX 4090 Laptop GPU (155.1 - 203, n=2) | |
| Medion Erazer Beast X40 2024 | |
| 2560x1440 Epic Preset | |
| Medion Erazer Beast X40 2024 | |
| Medio NVIDIA GeForce RTX 4090 Laptop GPU (141.1 - 144.3, n=2) | |
| Asus ROG Zephyrus M16 | |
| Immortals of Aveum | |
| 1920x1080 Ultra AF:16x | |
| Medion Erazer Beast X40 2024 | |
| Medio NVIDIA GeForce RTX 4090 Laptop GPU (90.6 - 106.3, n=2) | |
| 2560x1440 Ultra AF:16x | |
| Medion Erazer Beast X40 2024 | |
| Medio NVIDIA GeForce RTX 4090 Laptop GPU (62.9 - 76.5, n=2) | |
The Witcher 3 FPS chart
| bajo | medio | alto | ultra | QHD | |
|---|---|---|---|---|---|
| GTA V (2015) | 187.3 | 186.7 | 183 | 141.5 | 139.8 |
| The Witcher 3 (2015) | 555 | 518 | 394 | 204 | 157.6 |
| Dota 2 Reborn (2015) | 241 | 214 | 205 | 189.9 | |
| Final Fantasy XV Benchmark (2018) | 225 | 210 | 181.1 | 147.7 | |
| X-Plane 11.11 (2018) | 207 | 182.2 | 143.9 | ||
| Strange Brigade (2018) | 484 | 401 | 387 | 371 | 289 |
| Immortals of Aveum (2023) | 119.3 | 109.6 | 106.3 | 76.5 | |
| Cyberpunk 2077 (2023) | 133.2 | 131 | 120.9 | 118.9 | 87.5 |
| Ready or Not (2023) | 289 | 166.6 | 158 | 155.1 | 144.3 |
| Enshrouded (2024) | 150.5 | 134.5 | 116.2 | 101.5 | 76 |
| Helldivers 2 (2024) | 146.8 | 143.8 | 143.3 | 141.2 | 122.6 |
Emisiones y energía: La Beast X40 puede trabajar en silencio
Emisiones sonoras
El esfuerzo a plena carga revela que es posible alcanzar niveles de presión sonora de hasta 52 dB(A) con el Beast X40. El portátil es sólo ligeramente más silencioso en modo Juego.
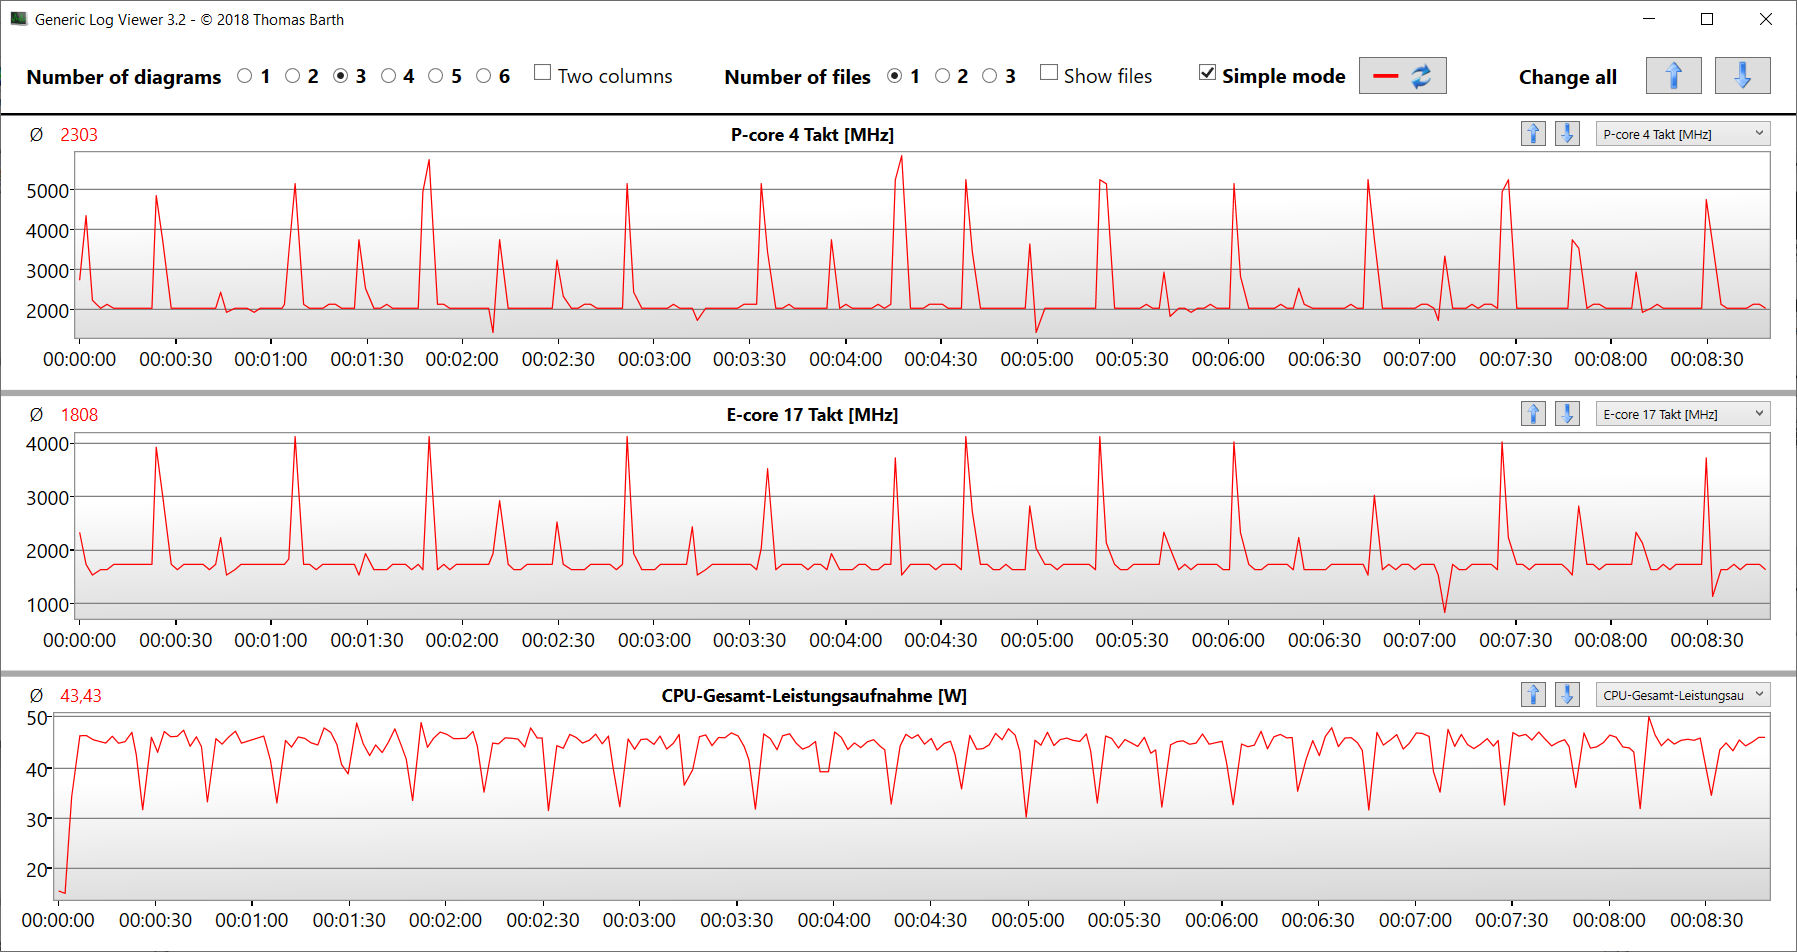
El "Modo silencioso" garantiza un nivel de ruido muy bajo, pero aún así proporciona potencia más que suficiente para tareas cotidianas como la oficina e Internet. También es posible jugar en este modo. Sin embargo, la velocidad de fotogramas está bloqueada a 30 fps por el sistema en nuestra prueba Witcher 3.
En determinadas circunstancias, puede oírse un zumbido electrónico procedente del interior del portátil durante la prueba Witcher 3, por ejemplo, o al ejecutar el punto de referencia Specviewperf.
Ruido
| Ocioso |
| 28 / 29 / 32 dB(A) |
| Carga |
| 48 / 52 dB(A) |
 | ||
30 dB silencioso 40 dB(A) audible 50 dB(A) ruidosamente alto |
||
min: | ||
| Medion Erazer Beast X40 2024 i9-14900HX, GeForce RTX 4090 Laptop GPU | Asus ROG Strix Scar 17 G733PYV-LL053X R9 7945HX3D, GeForce RTX 4090 Laptop GPU | Schenker Key 17 Pro (Early 23) i9-13900HX, GeForce RTX 4090 Laptop GPU | Asus ROG Strix Scar 18 G834JYR (2024) i9-14900HX, GeForce RTX 4090 Laptop GPU | MSI Titan 18 HX A14VIG i9-14900HX, GeForce RTX 4090 Laptop GPU | Medion Erazer Beast X40 i9-13900HX, GeForce RTX 4090 Laptop GPU | |
|---|---|---|---|---|---|---|
| Noise | 0% | -17% | 1% | 6% | -1% | |
| apagado / medio ambiente * (dB) | 25 | 23 8% | 26 -4% | 24 4% | 22.8 9% | 24 4% |
| Idle Minimum * (dB) | 28 | 23 18% | 26 7% | 27 4% | 23.8 15% | 25 11% |
| Idle Average * (dB) | 29 | 27.7 4% | 33 -14% | 28 3% | 23.8 18% | 29 -0% |
| Idle Maximum * (dB) | 32 | 34.7 -8% | 46 -44% | 32 -0% | 28 12% | 35 -9% |
| Load Average * (dB) | 48 | 53.4 -11% | 56 -17% | 50 -4% | 38 21% | 51 -6% |
| Witcher 3 ultra * (dB) | 50 | 53.4 -7% | 62 -24% | 50 -0% | 57.3 -15% | 51 -2% |
| Load Maximum * (dB) | 52 | 53.4 -3% | 64 -23% | 52 -0% | 62.8 -21% | 53 -2% |
* ... más pequeño es mejor
Temperatura
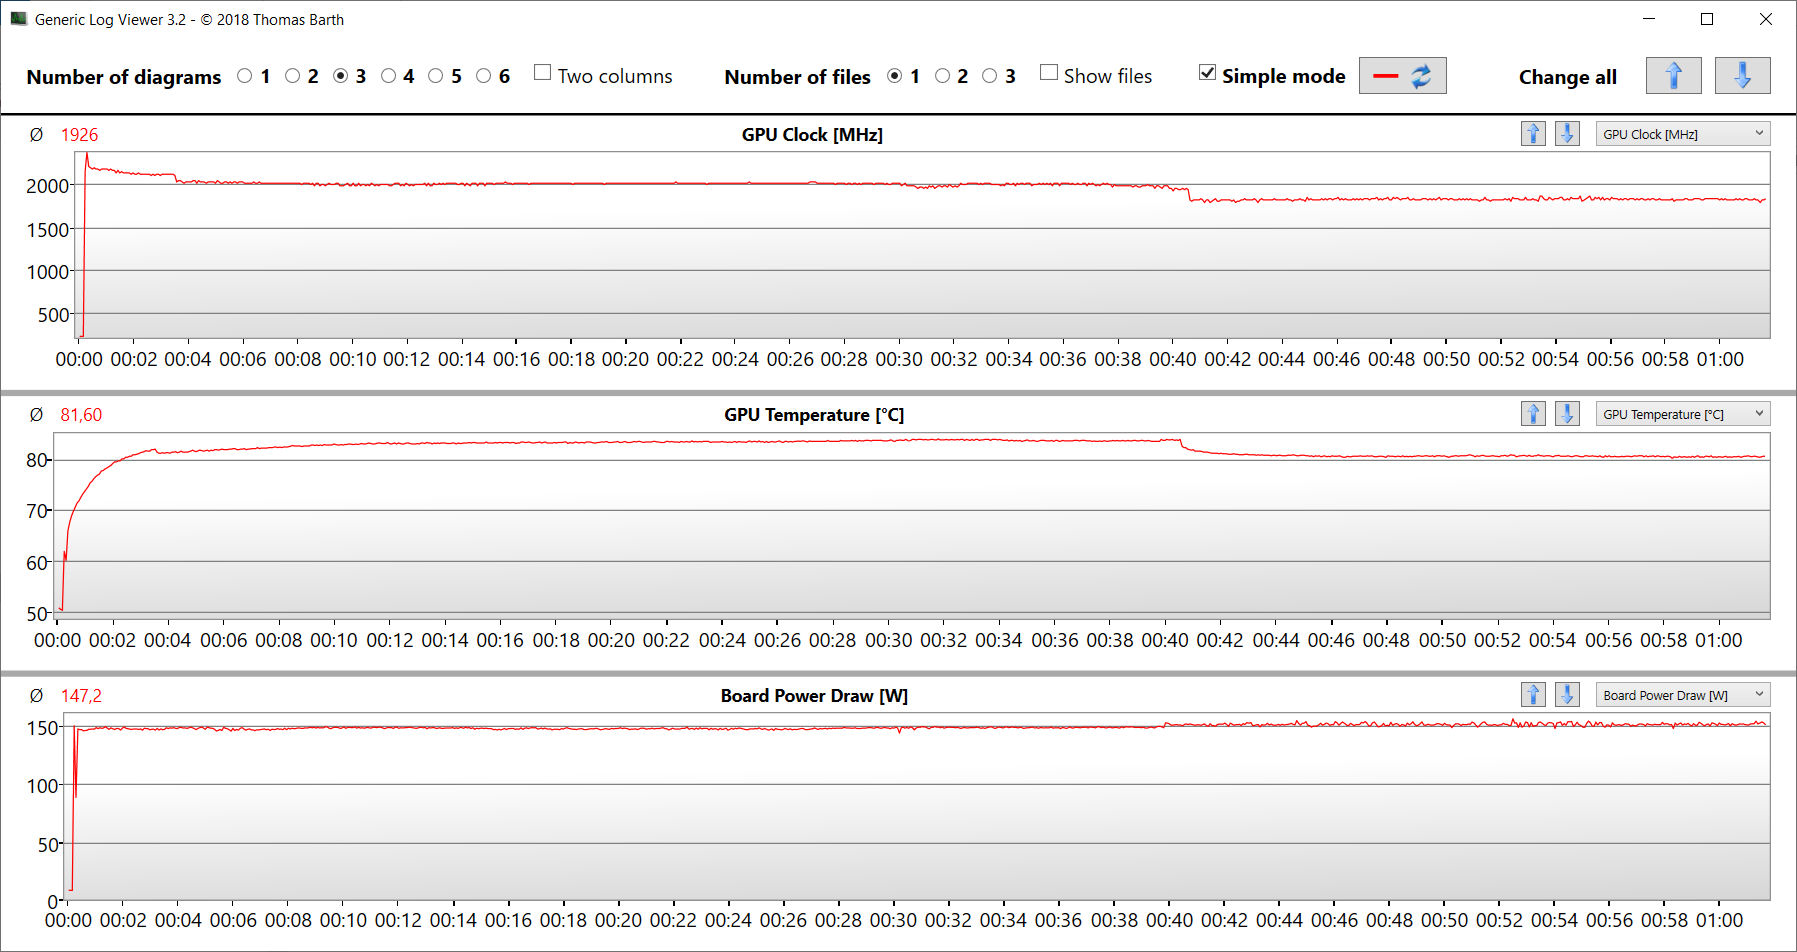
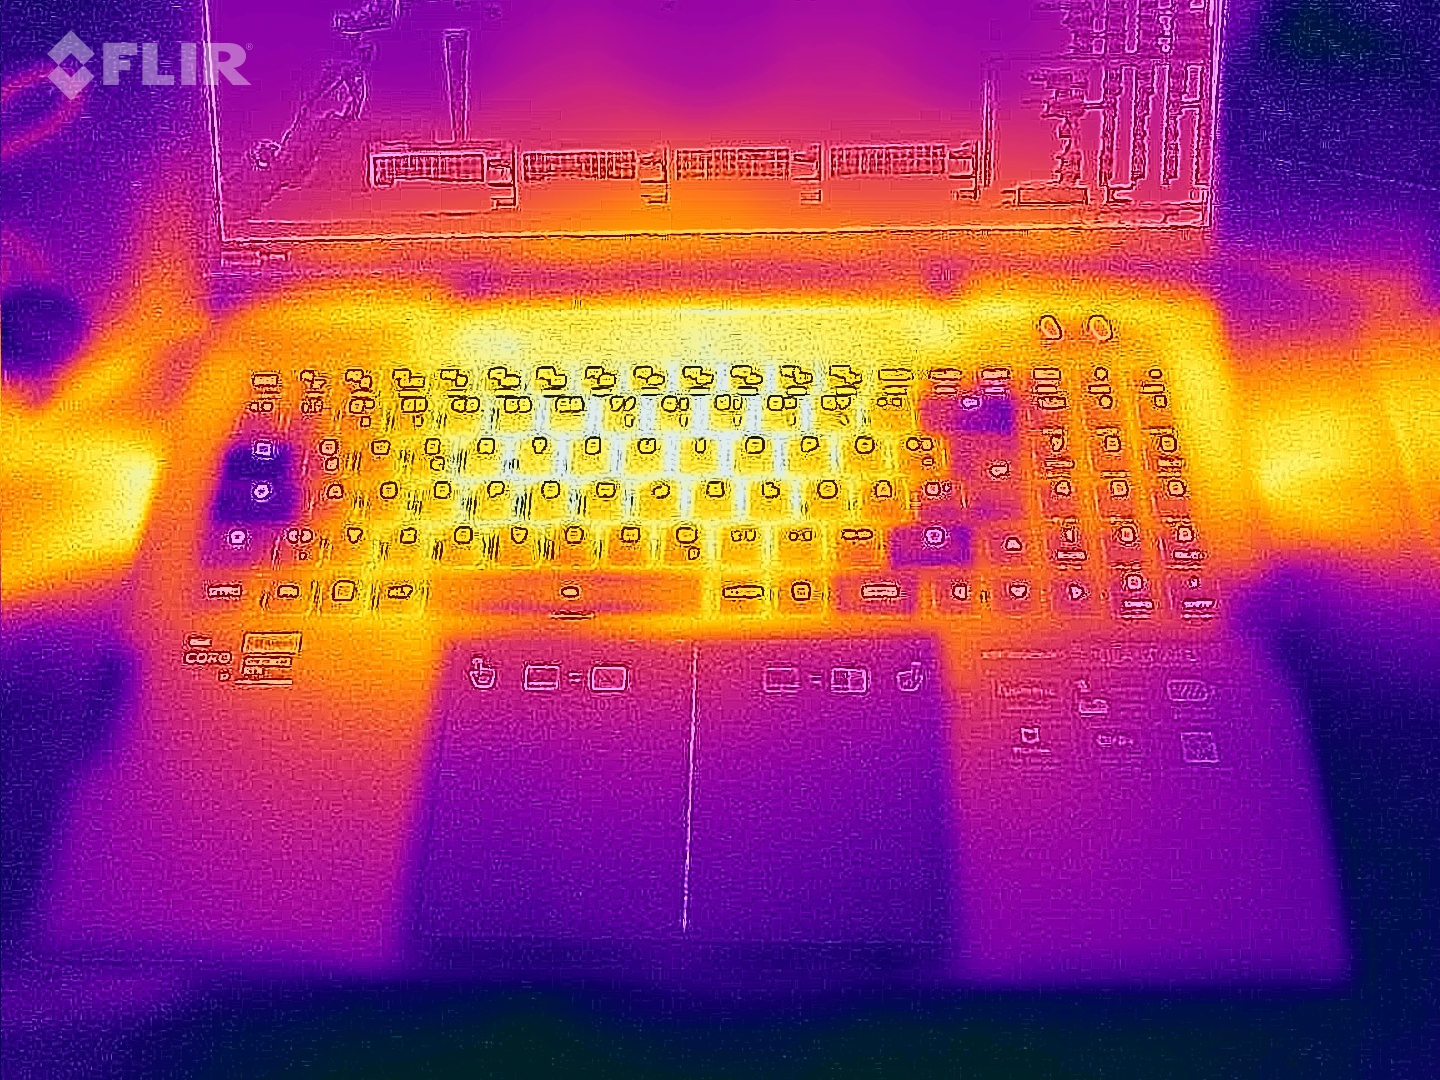
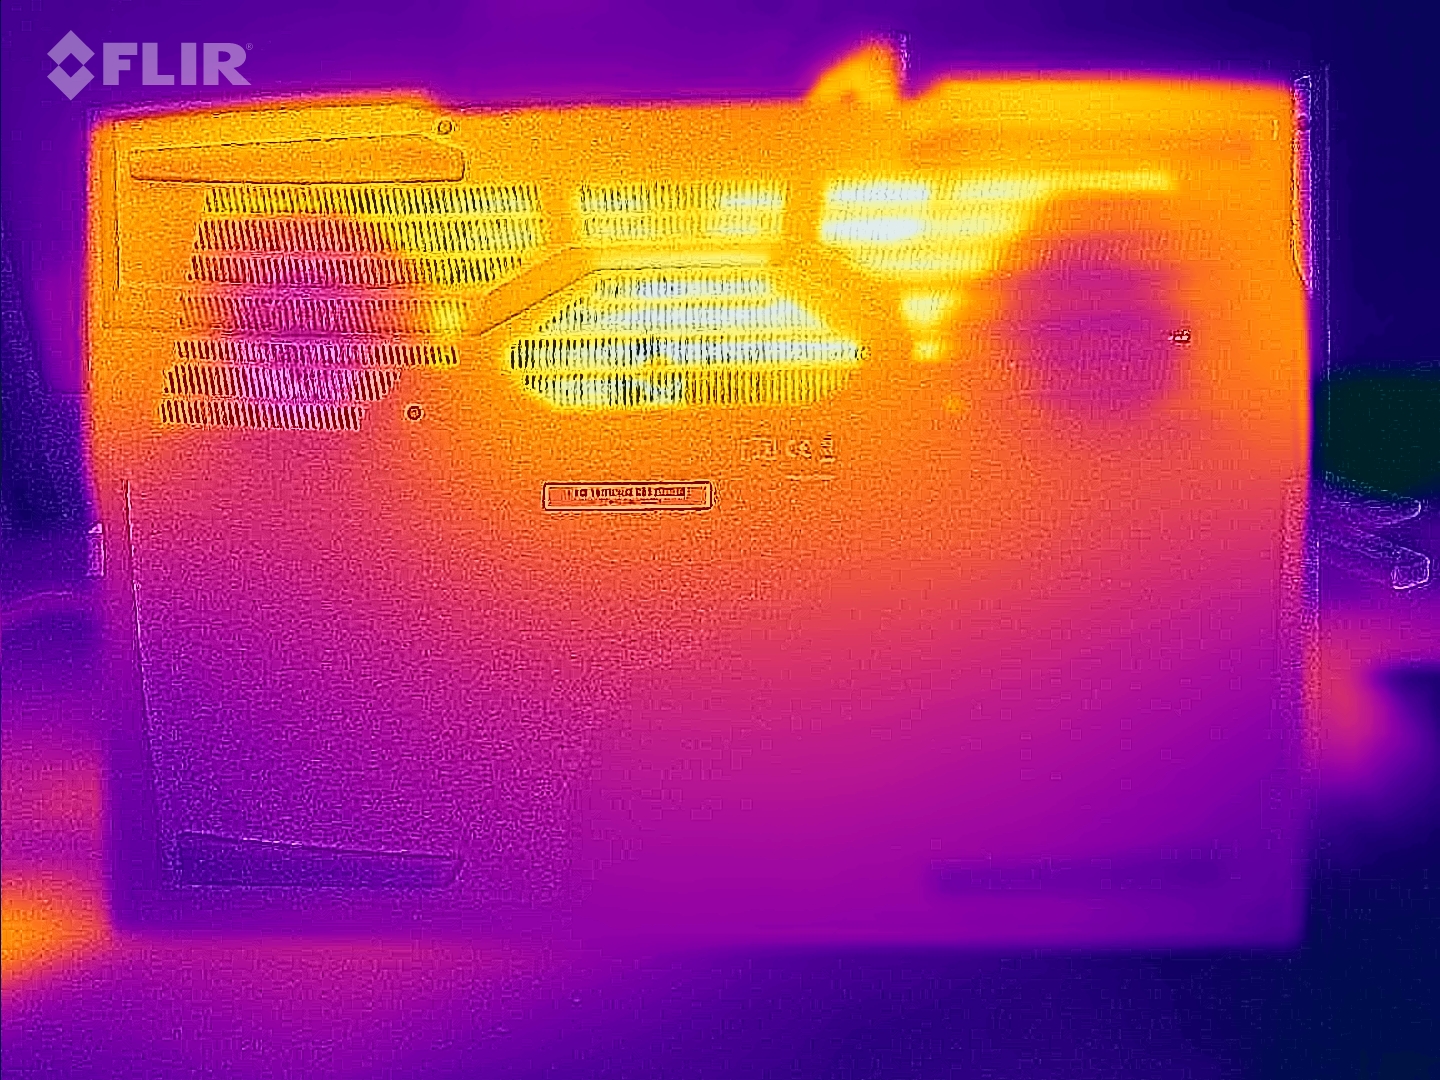
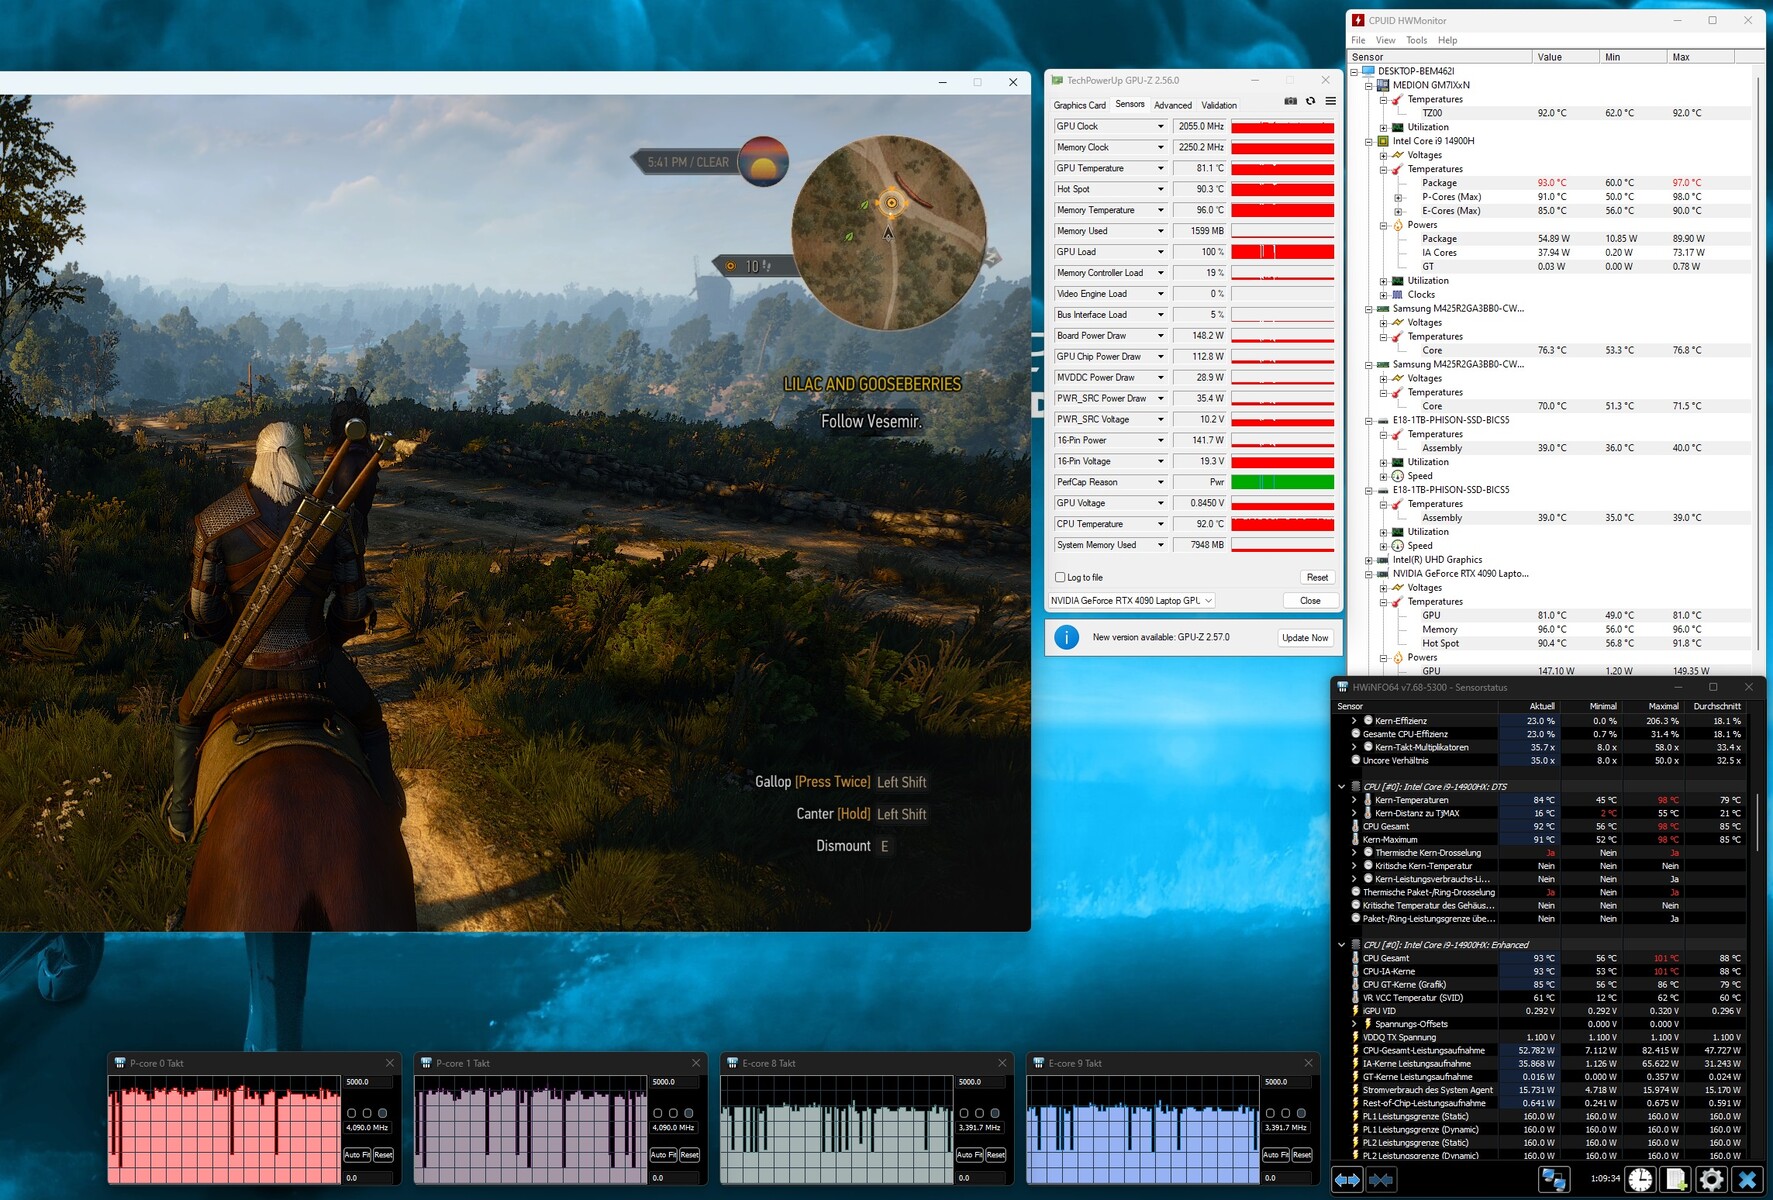
La prueba de estrés y la prueba Witcher 3 hacen que el portátil se caliente notablemente pero no en exceso. En algunos momentos se alcanzan valores superiores a 50 grados Celsius. En el uso cotidiano (Office, Internet), los valores se mantienen en la franja verde.
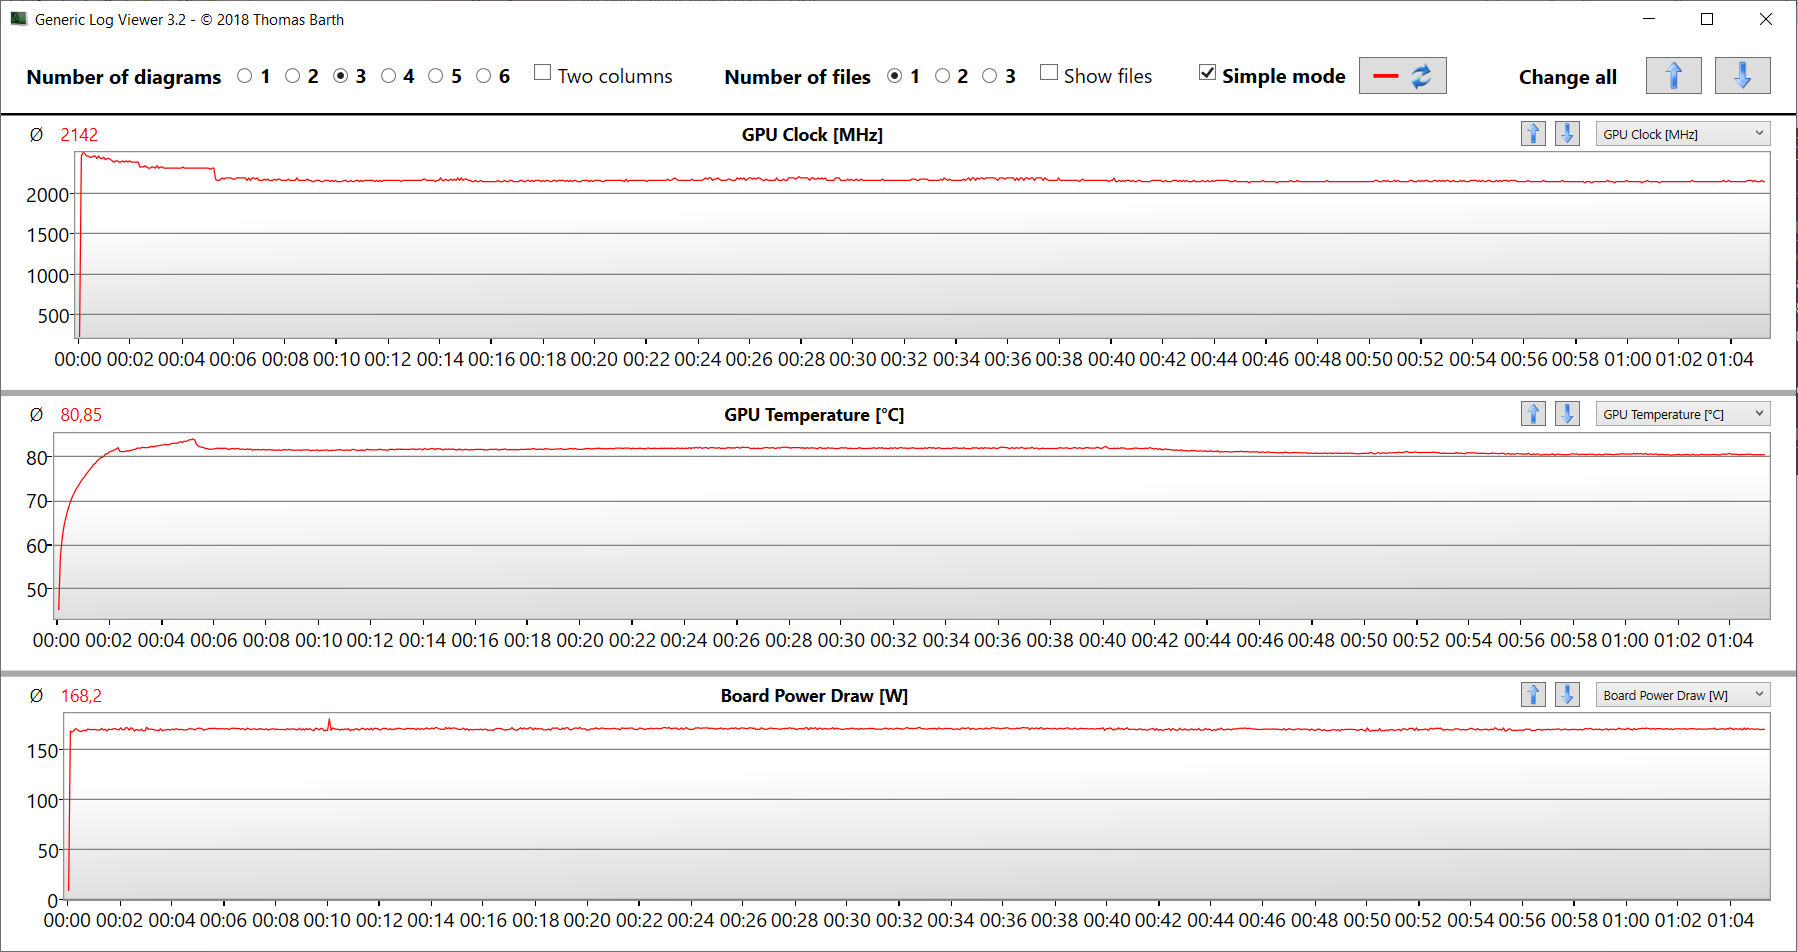
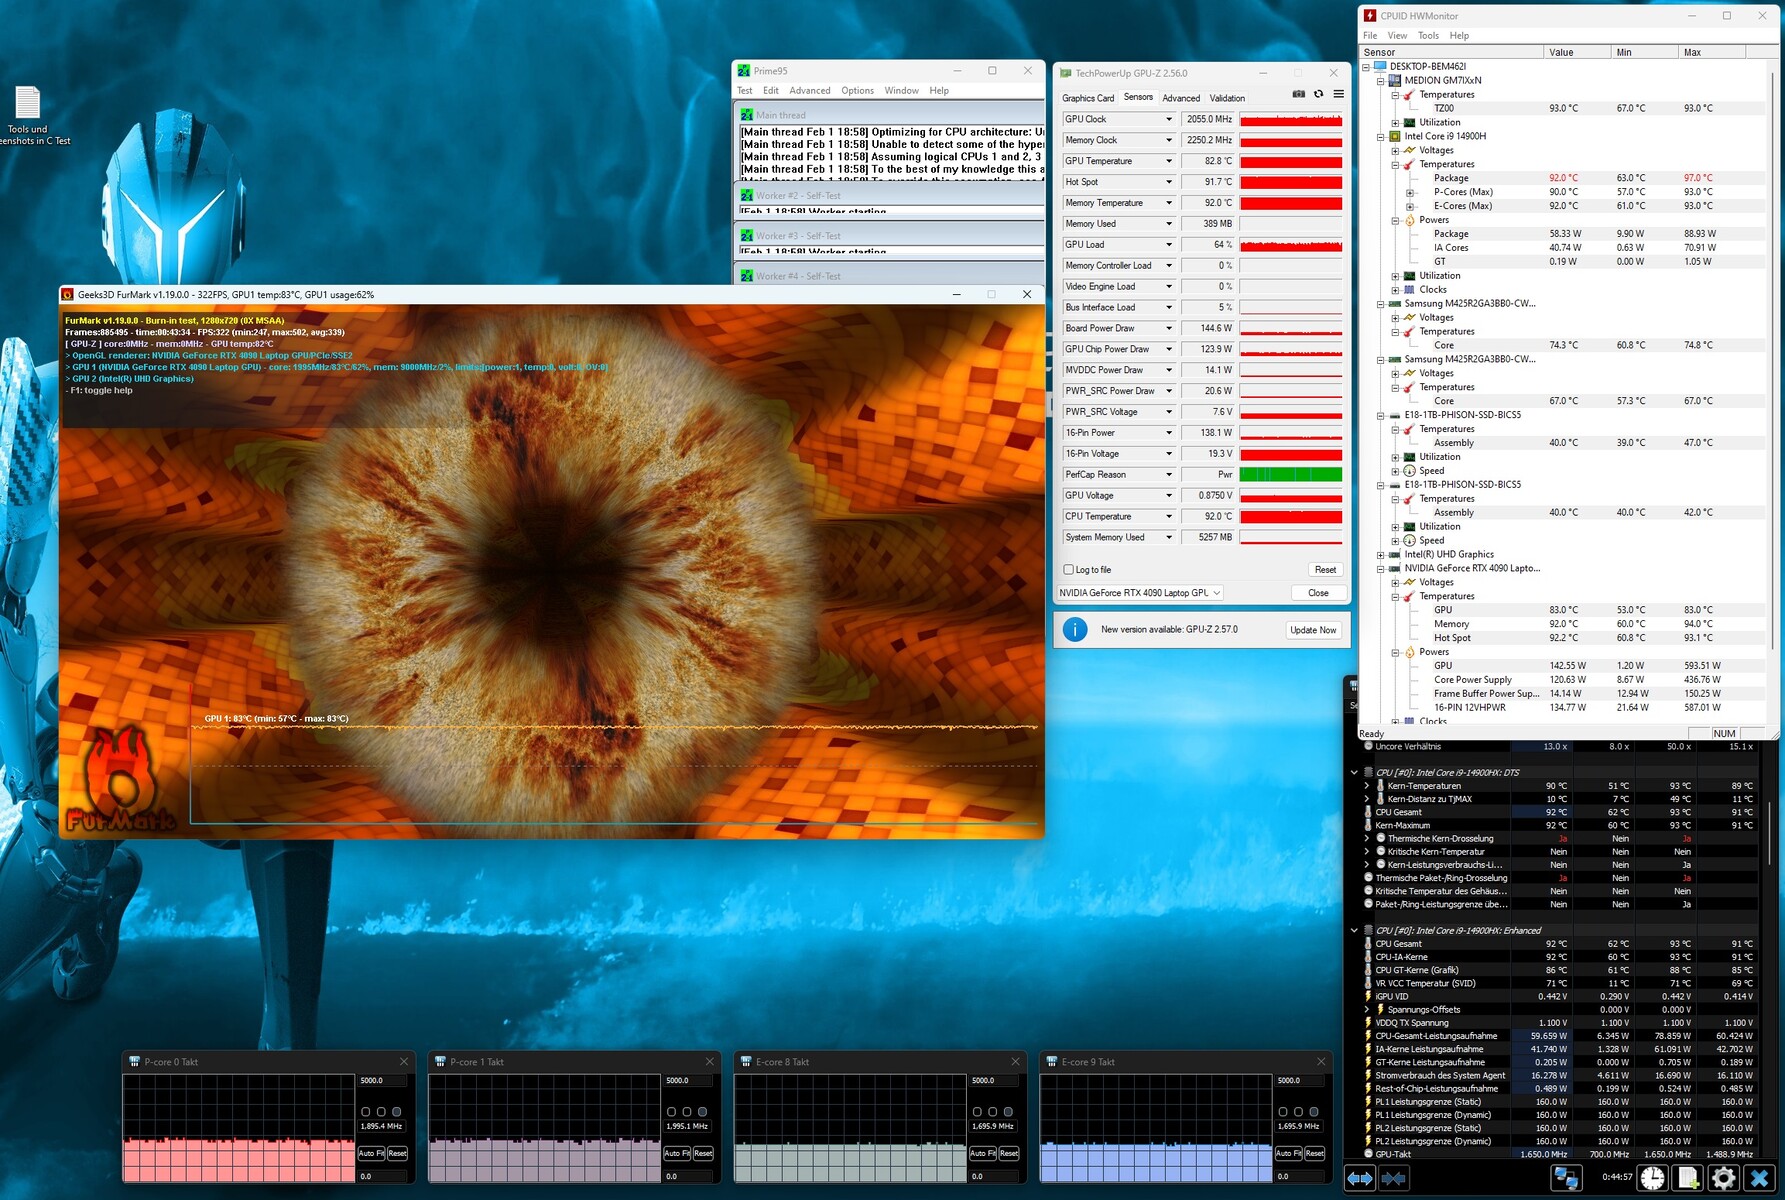
La prueba de estrés (Prime95 y Furmark en funcionamiento continuo) es un escenario extremo para probar la estabilidad del sistema a plena carga. La velocidad de reloj de la CPU cae hasta 1,9 a 2 GHz (núcleos P) o 1,7 GHz (núcleos E) en los primeros minutos y se mantiene en este nivel. La GPU funciona a velocidades de entre 2 y 2,1 GHz.
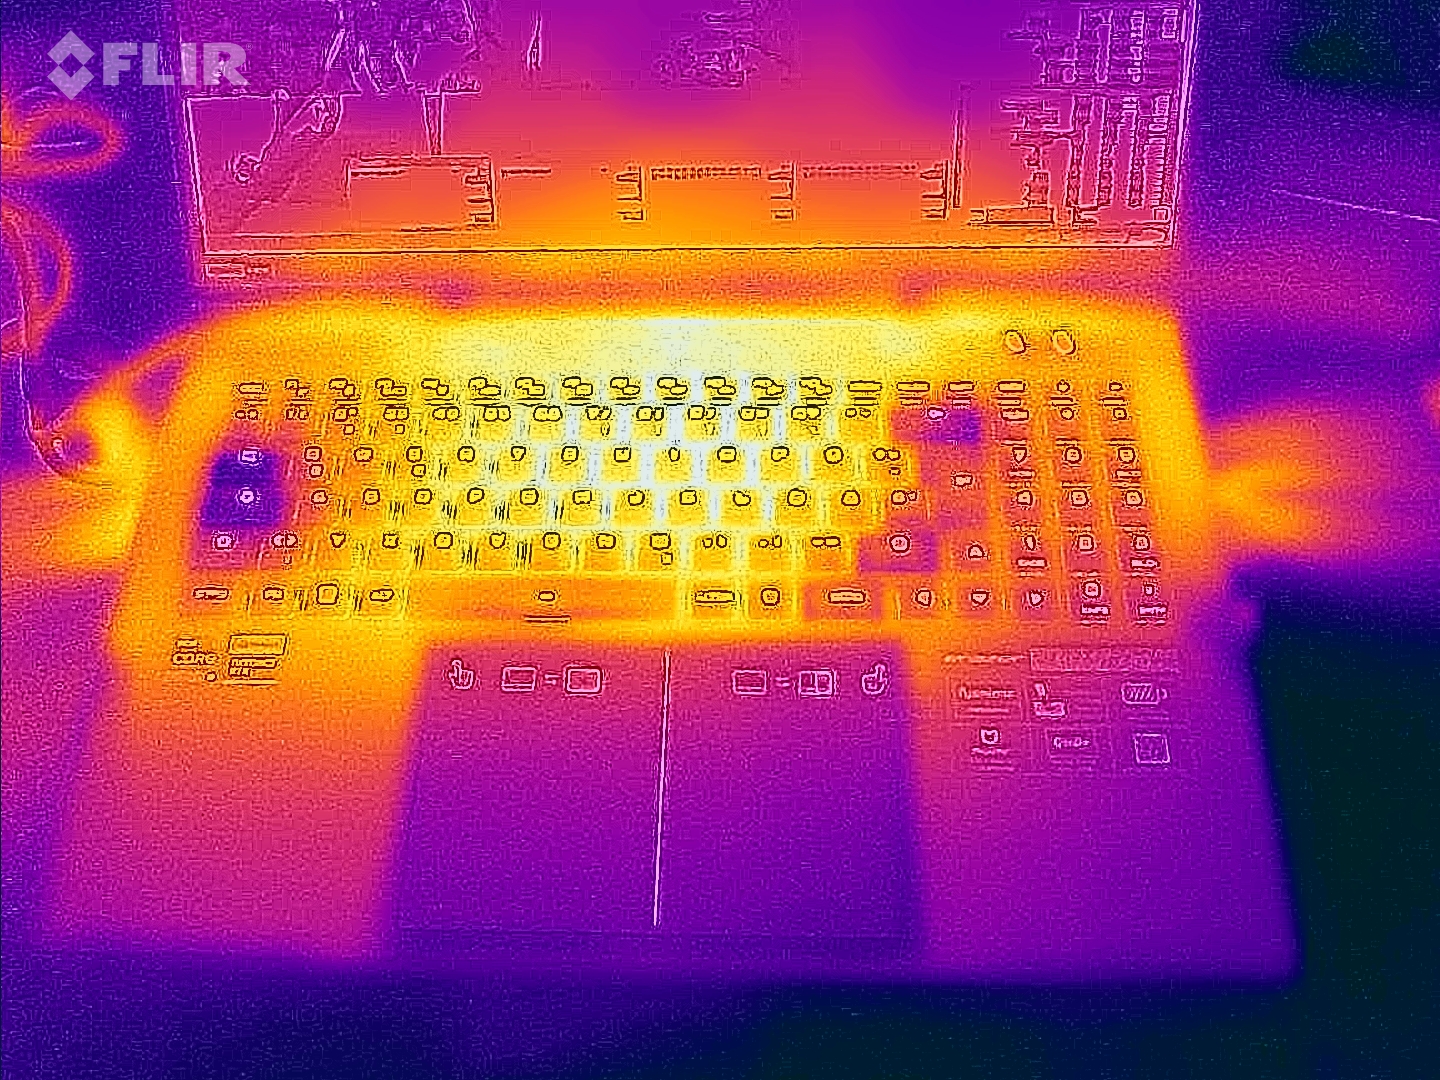
(-) La temperatura máxima en la parte superior es de 47 °C / 117 F, frente a la media de 40.4 °C / 105 F, que oscila entre 21.2 y 68.8 °C para la clase Gaming.
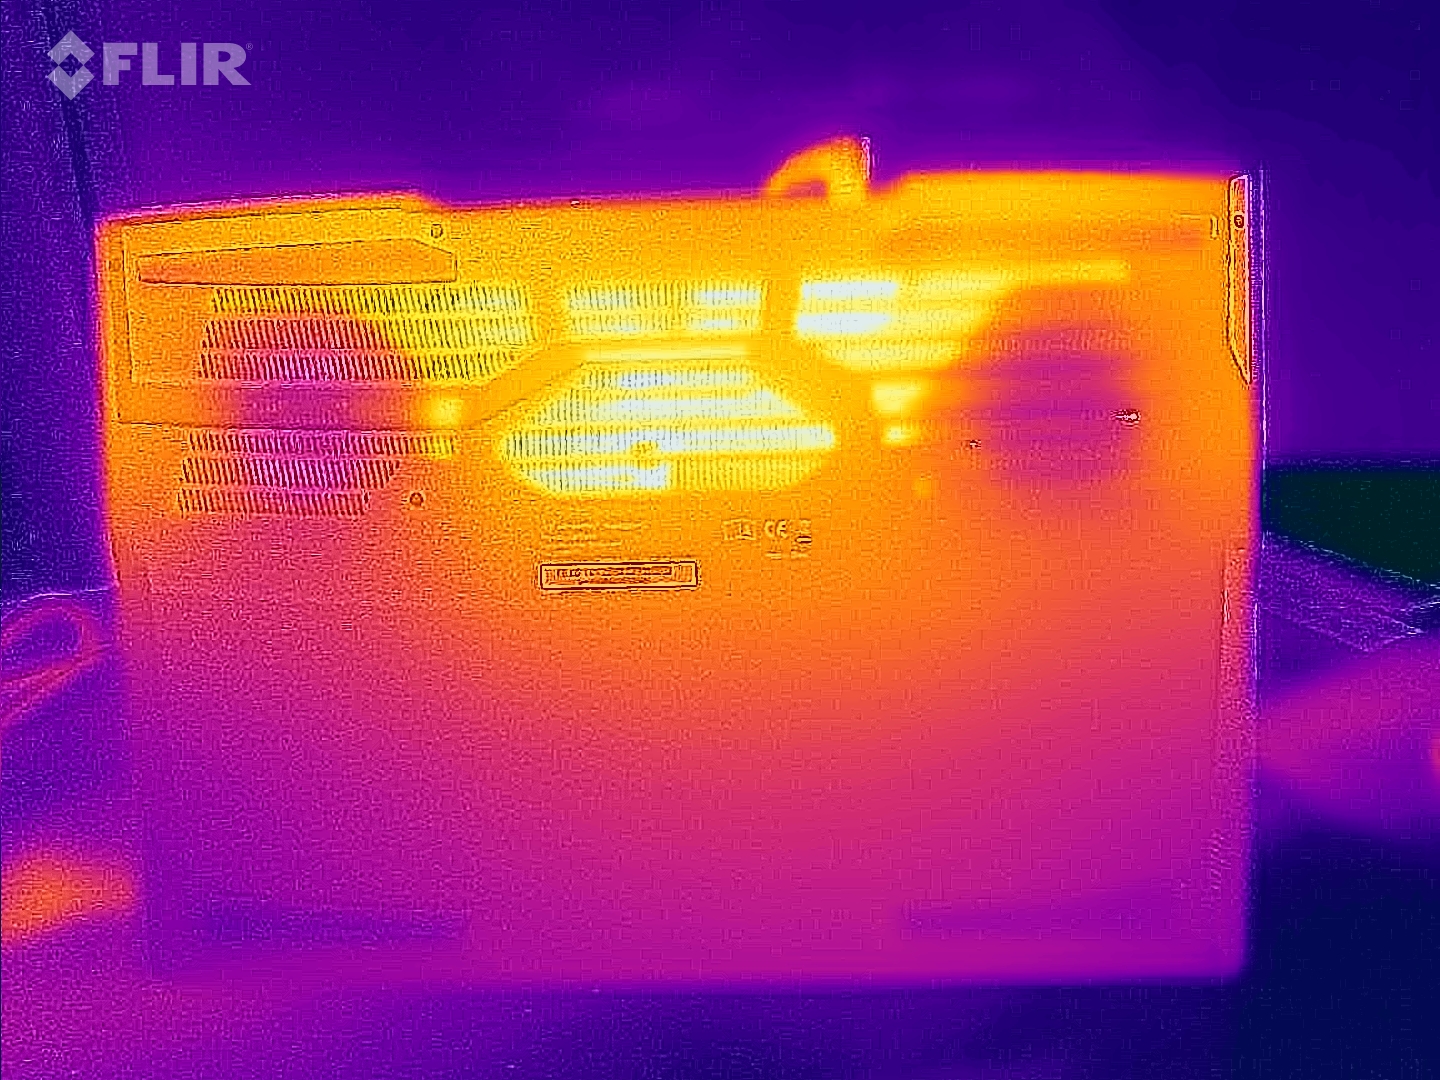
(-) El fondo se calienta hasta un máximo de 54 °C / 129 F, frente a la media de 43.2 °C / 110 F
(+) En reposo, la temperatura media de la parte superior es de 28.1 °C / 83# F, frente a la media del dispositivo de 33.9 °C / 93 F.
(-) Jugando a The Witcher 3, la temperatura media de la parte superior es de 39.1 °C / 102 F, frente a la media del dispositivo de 33.9 °C / 93 F.
(+) Los reposamanos y el panel táctil alcanzan como máximo la temperatura de la piel (34 °C / 93.2 F) y, por tanto, no están calientes.
(-) La temperatura media de la zona del reposamanos de dispositivos similares fue de 28.8 °C / 83.8 F (-5.2 °C / -9.4 F).
| Medion Erazer Beast X40 2024 Intel Core i9-14900HX, NVIDIA GeForce RTX 4090 Laptop GPU | Asus ROG Strix Scar 17 G733PYV-LL053X AMD Ryzen 9 7945HX3D, NVIDIA GeForce RTX 4090 Laptop GPU | Schenker Key 17 Pro (Early 23) Intel Core i9-13900HX, NVIDIA GeForce RTX 4090 Laptop GPU | Asus ROG Strix Scar 18 G834JYR (2024) Intel Core i9-14900HX, NVIDIA GeForce RTX 4090 Laptop GPU | MSI Titan 18 HX A14VIG Intel Core i9-14900HX, NVIDIA GeForce RTX 4090 Laptop GPU | Medion Erazer Beast X40 Intel Core i9-13900HX, NVIDIA GeForce RTX 4090 Laptop GPU | |
|---|---|---|---|---|---|---|
| Heat | 14% | -11% | 4% | 5% | 1% | |
| Maximum Upper Side * (°C) | 47 | 40.1 15% | 57 -21% | 49 -4% | 37.8 20% | 48 -2% |
| Maximum Bottom * (°C) | 54 | 46.7 14% | 60 -11% | 47 13% | 37.6 30% | 52 4% |
| Idle Upper Side * (°C) | 30 | 26.5 12% | 32 -7% | 29 3% | 34.8 -16% | 30 -0% |
| Idle Bottom * (°C) | 32 | 27.7 13% | 34 -6% | 31 3% | 36 -13% | 31 3% |
* ... más pequeño es mejor
Altavoz
Los altavoces estéreo producen un sonido muy decente en general.
Medion Erazer Beast X40 2024 análisis de audio
(+) | los altavoces pueden reproducir a un volumen relativamente alto (#88 dB)
Graves 100 - 315 Hz
(±) | lubina reducida - en promedio 14.7% inferior a la mediana
(±) | la linealidad de los graves es media (7.2% delta a frecuencia anterior)
Medios 400 - 2000 Hz
(+) | medios equilibrados - a sólo 3.7% de la mediana
(+) | los medios son lineales (5.8% delta a la frecuencia anterior)
Altos 2 - 16 kHz
(+) | máximos equilibrados - a sólo 2.8% de la mediana
(+) | los máximos son lineales (6.4% delta a la frecuencia anterior)
Total 100 - 16.000 Hz
(+) | el sonido global es lineal (12.1% de diferencia con la mediana)
En comparación con la misma clase
» 12% de todos los dispositivos probados de esta clase eran mejores, 4% similares, 84% peores
» El mejor tuvo un delta de 6%, la media fue 18%, el peor fue ###max##%
En comparación con todos los dispositivos probados
» 10% de todos los dispositivos probados eran mejores, 2% similares, 88% peores
» El mejor tuvo un delta de 4%, la media fue 23%, el peor fue ###max##%
Consumo de energía
La Beast X40 no arroja sorpresas en términos de consumo de energía. Los valores se sitúan en un nivel normal para el hardware instalado.
La prueba Witcher 3 y la prueba de estrés se ejecutan con un consumo de energía ligeramente inferior. La fuente de alimentación de 330 W demuestra ser adecuada durante el estrés.
| Off / Standby | |
| Ocioso | |
| Carga |
|
Clave:
min: | |
Power consumption: The Witcher 3 / Stress test
Power consumption: External monitor
Duración de las pilas
El Beast X40 alcanza un tiempo de funcionamiento de 6:14 h en la prueba práctica WLAN (ilustración de la carga al acceder a sitios web utilizando un script), lo que es un valor decente.
Esto sitúa al X40 al mismo nivel que su predecesor.
Pro
Contra
Veredicto: Potencia de gama alta
La Medion Erazer Beast X40 procede del extremo superior de la escala de rendimiento: la GeForce RTX 4090 y Core i9-14900HX ofrecen la potencia necesaria para juegos, streaming, renderizado y edición de vídeo. El compromiso entre rendimiento y ruido es posible. Con un sistema opcional de refrigeración por agua (aprox. 200 euros), se puede conseguir un pequeño aumento del rendimiento y, en general, menos emisiones.
Medion ofrece un portátil para juegos extremadamente potente con el Erazer Beast X40.
En el lado positivo, cuenta con una pantalla de 17 pulgadas de alta calidad (2.560 x 1.600 píxeles, 240 Hz, G-Sync, sRGB) en formato 16:10, un teclado mecánico táctil y un puerto Thunderbolt 4. Este último abre opciones de ampliación (GPU externa, solución de acoplamiento), admite Power Delivery y puede emitir una señal DisplayPort. También tiene una duración de batería decente.
Las diferencias entre el actual y el del año pasado x40 del año pasado no son sustanciales. Gracias a unas velocidades de reloj ligeramente superiores, el Core i9-14900HX ofrece algo más de rendimiento con el mismo número de núcleos e hilos que el Core i9-13900HX del modelo del año anterior. Este último sería una alternativa (más barata): Medion lo vende actualmente por algo menos de 3.500 euros.
Otra alternativa sería el Asus ROG Strix Scar 17 X3D. Ofrece un nivel de rendimiento comparable y una pantalla con cobertura DCI-P3. Sin embargo, el portátil Asus no ofrece Thunderbolt 4. También es inferior en términos de duración de la batería.
Precio y disponibilidad
El Medion Erazer Beast X40 (2024) está disponible en la tienda de Medion y en Cyberport.de a un precio inferior a 4.000 euros.
Medion Erazer Beast X40 2024
- 02/21/2024 v7 (old)
Sascha Mölck
Transparencia
La selección de los dispositivos que se van a reseñar corre a cargo de nuestro equipo editorial. La muestra de prueba fue proporcionada al autor en calidad de préstamo por el fabricante o el minorista a los efectos de esta reseña. El prestamista no tuvo ninguna influencia en esta reseña, ni el fabricante recibió una copia de la misma antes de su publicación. No había ninguna obligación de publicar esta reseña. Como empresa de medios independiente, Notebookcheck no está sujeta a la autoridad de fabricantes, minoristas o editores.
Así es como prueba Notebookcheck
Cada año, Notebookcheck revisa de forma independiente cientos de portátiles y smartphones utilizando procedimientos estandarizados para asegurar que todos los resultados son comparables. Hemos desarrollado continuamente nuestros métodos de prueba durante unos 20 años y hemos establecido los estándares de la industria en el proceso. En nuestros laboratorios de pruebas, técnicos y editores experimentados utilizan equipos de medición de alta calidad. Estas pruebas implican un proceso de validación en varias fases. Nuestro complejo sistema de clasificación se basa en cientos de mediciones y puntos de referencia bien fundamentados, lo que mantiene la objetividad.Price comparison
