Veredicto - Uno de los portátiles RTX 5090 más rápidos
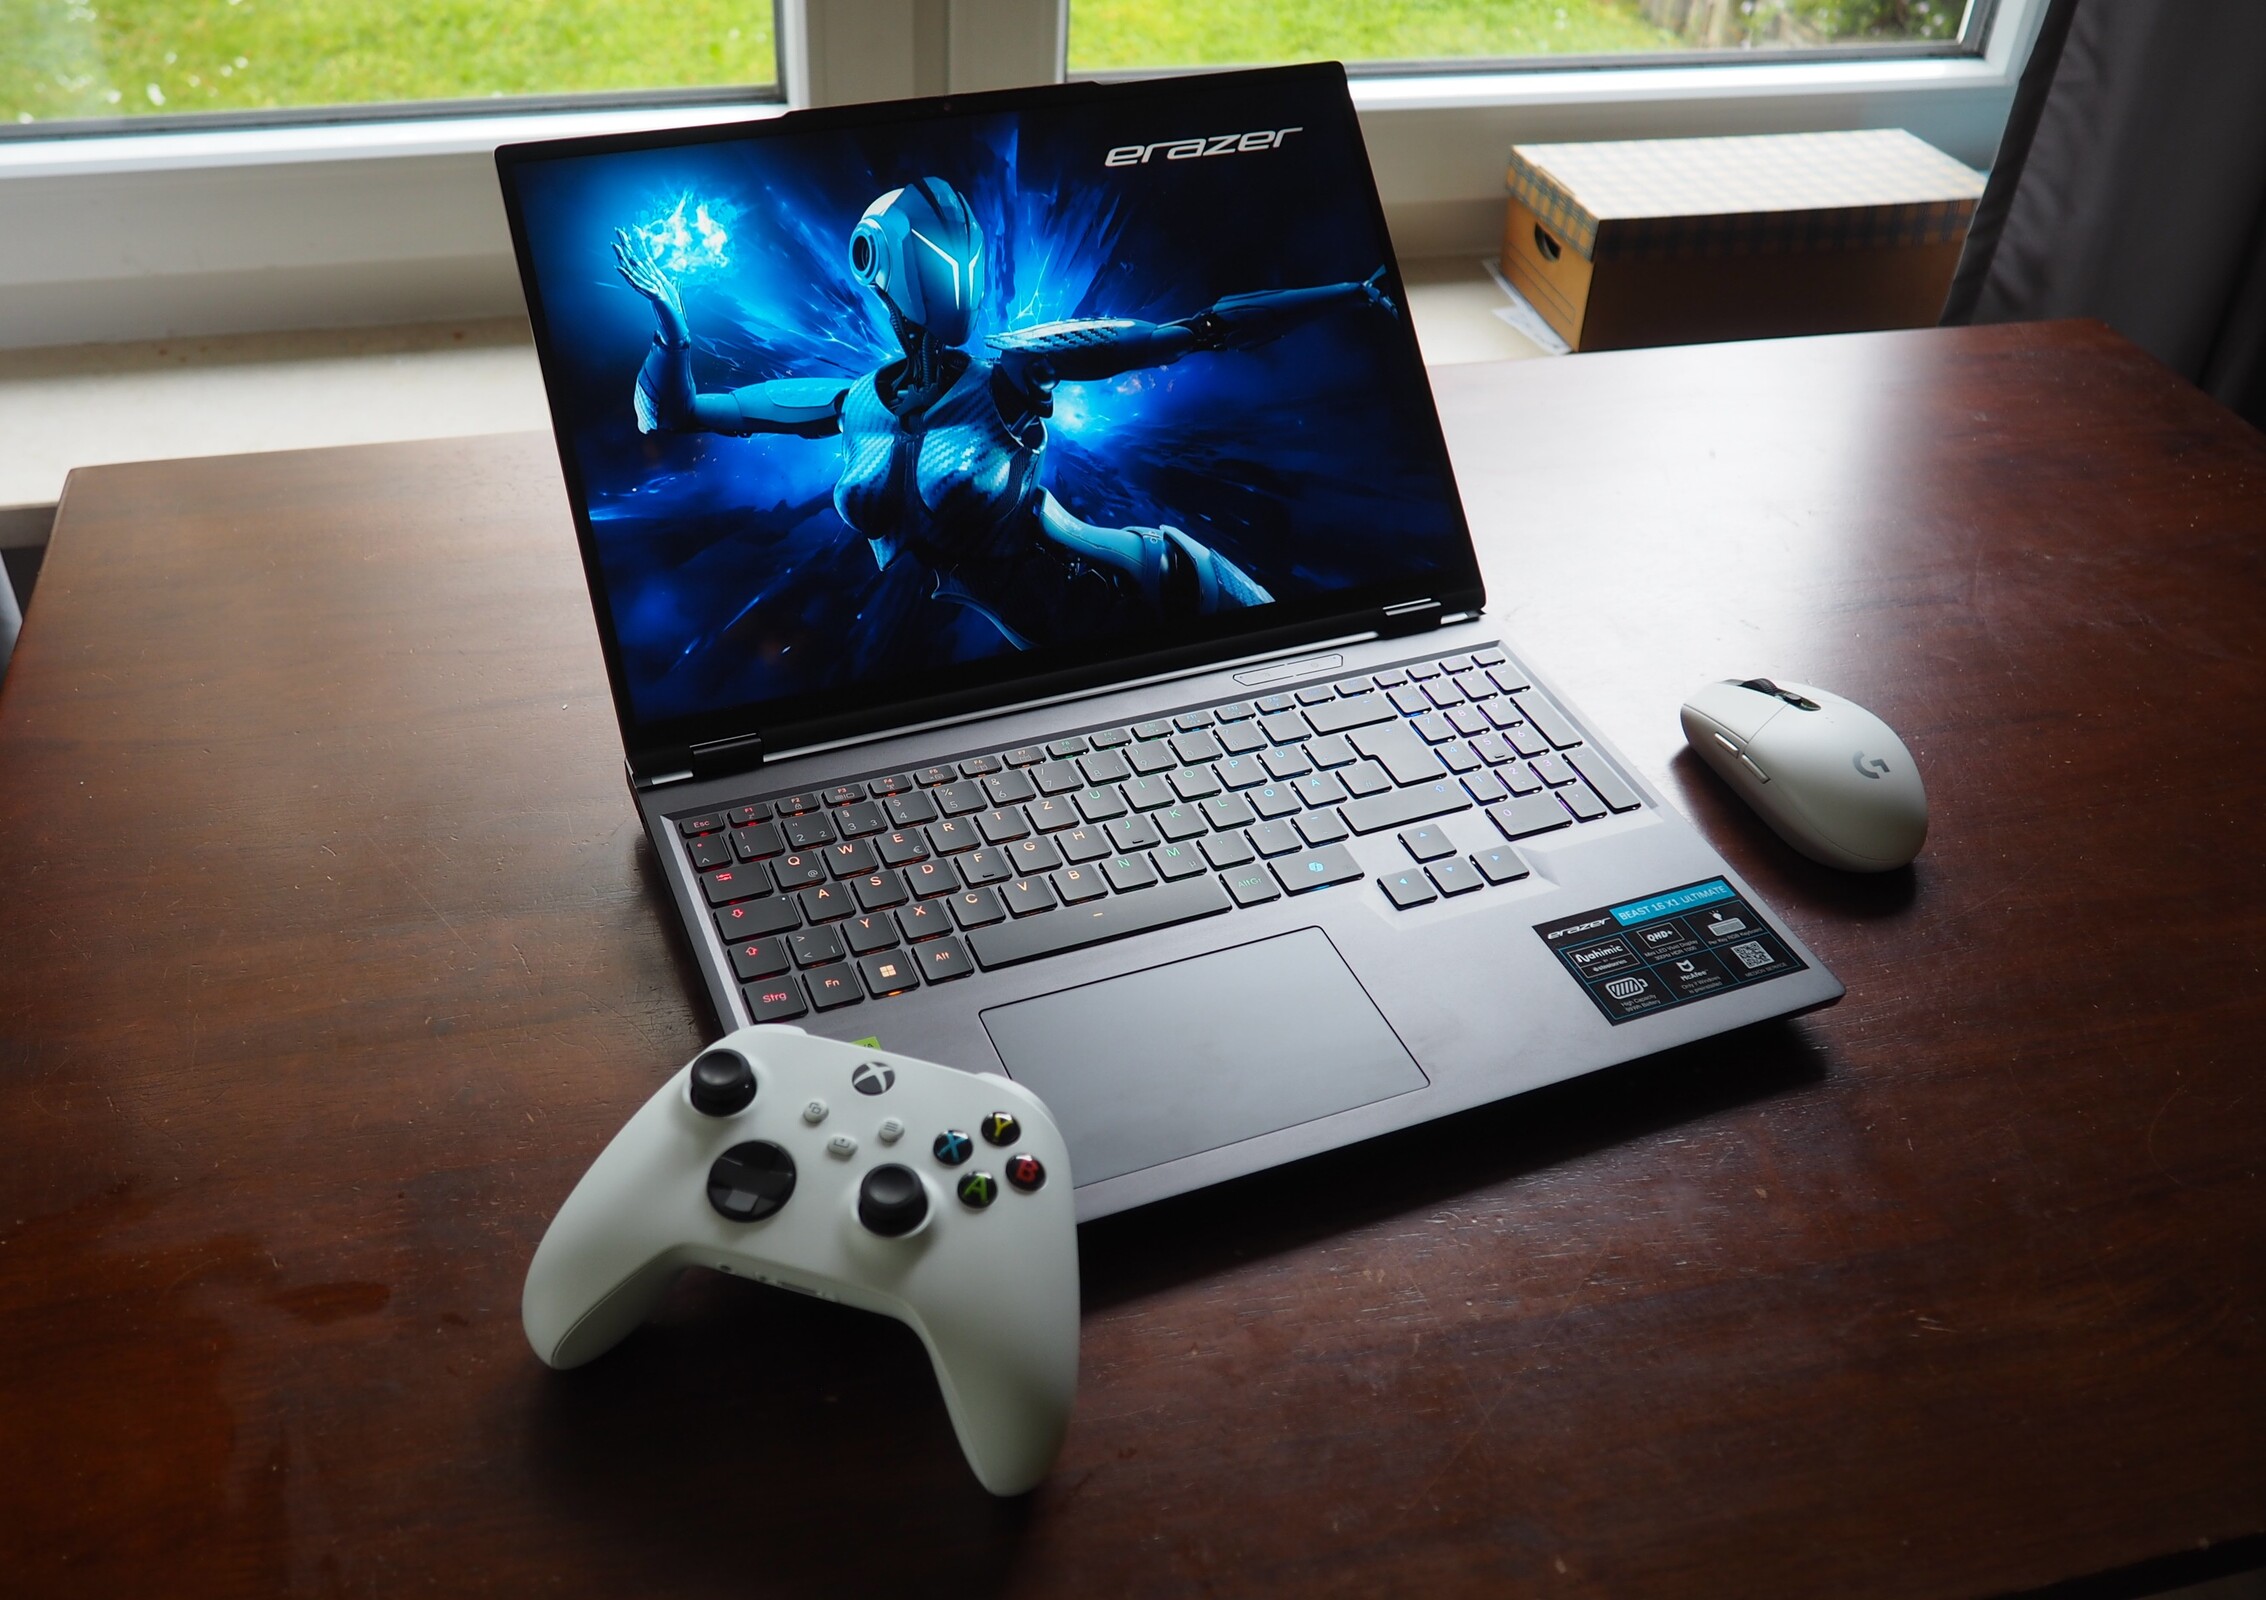
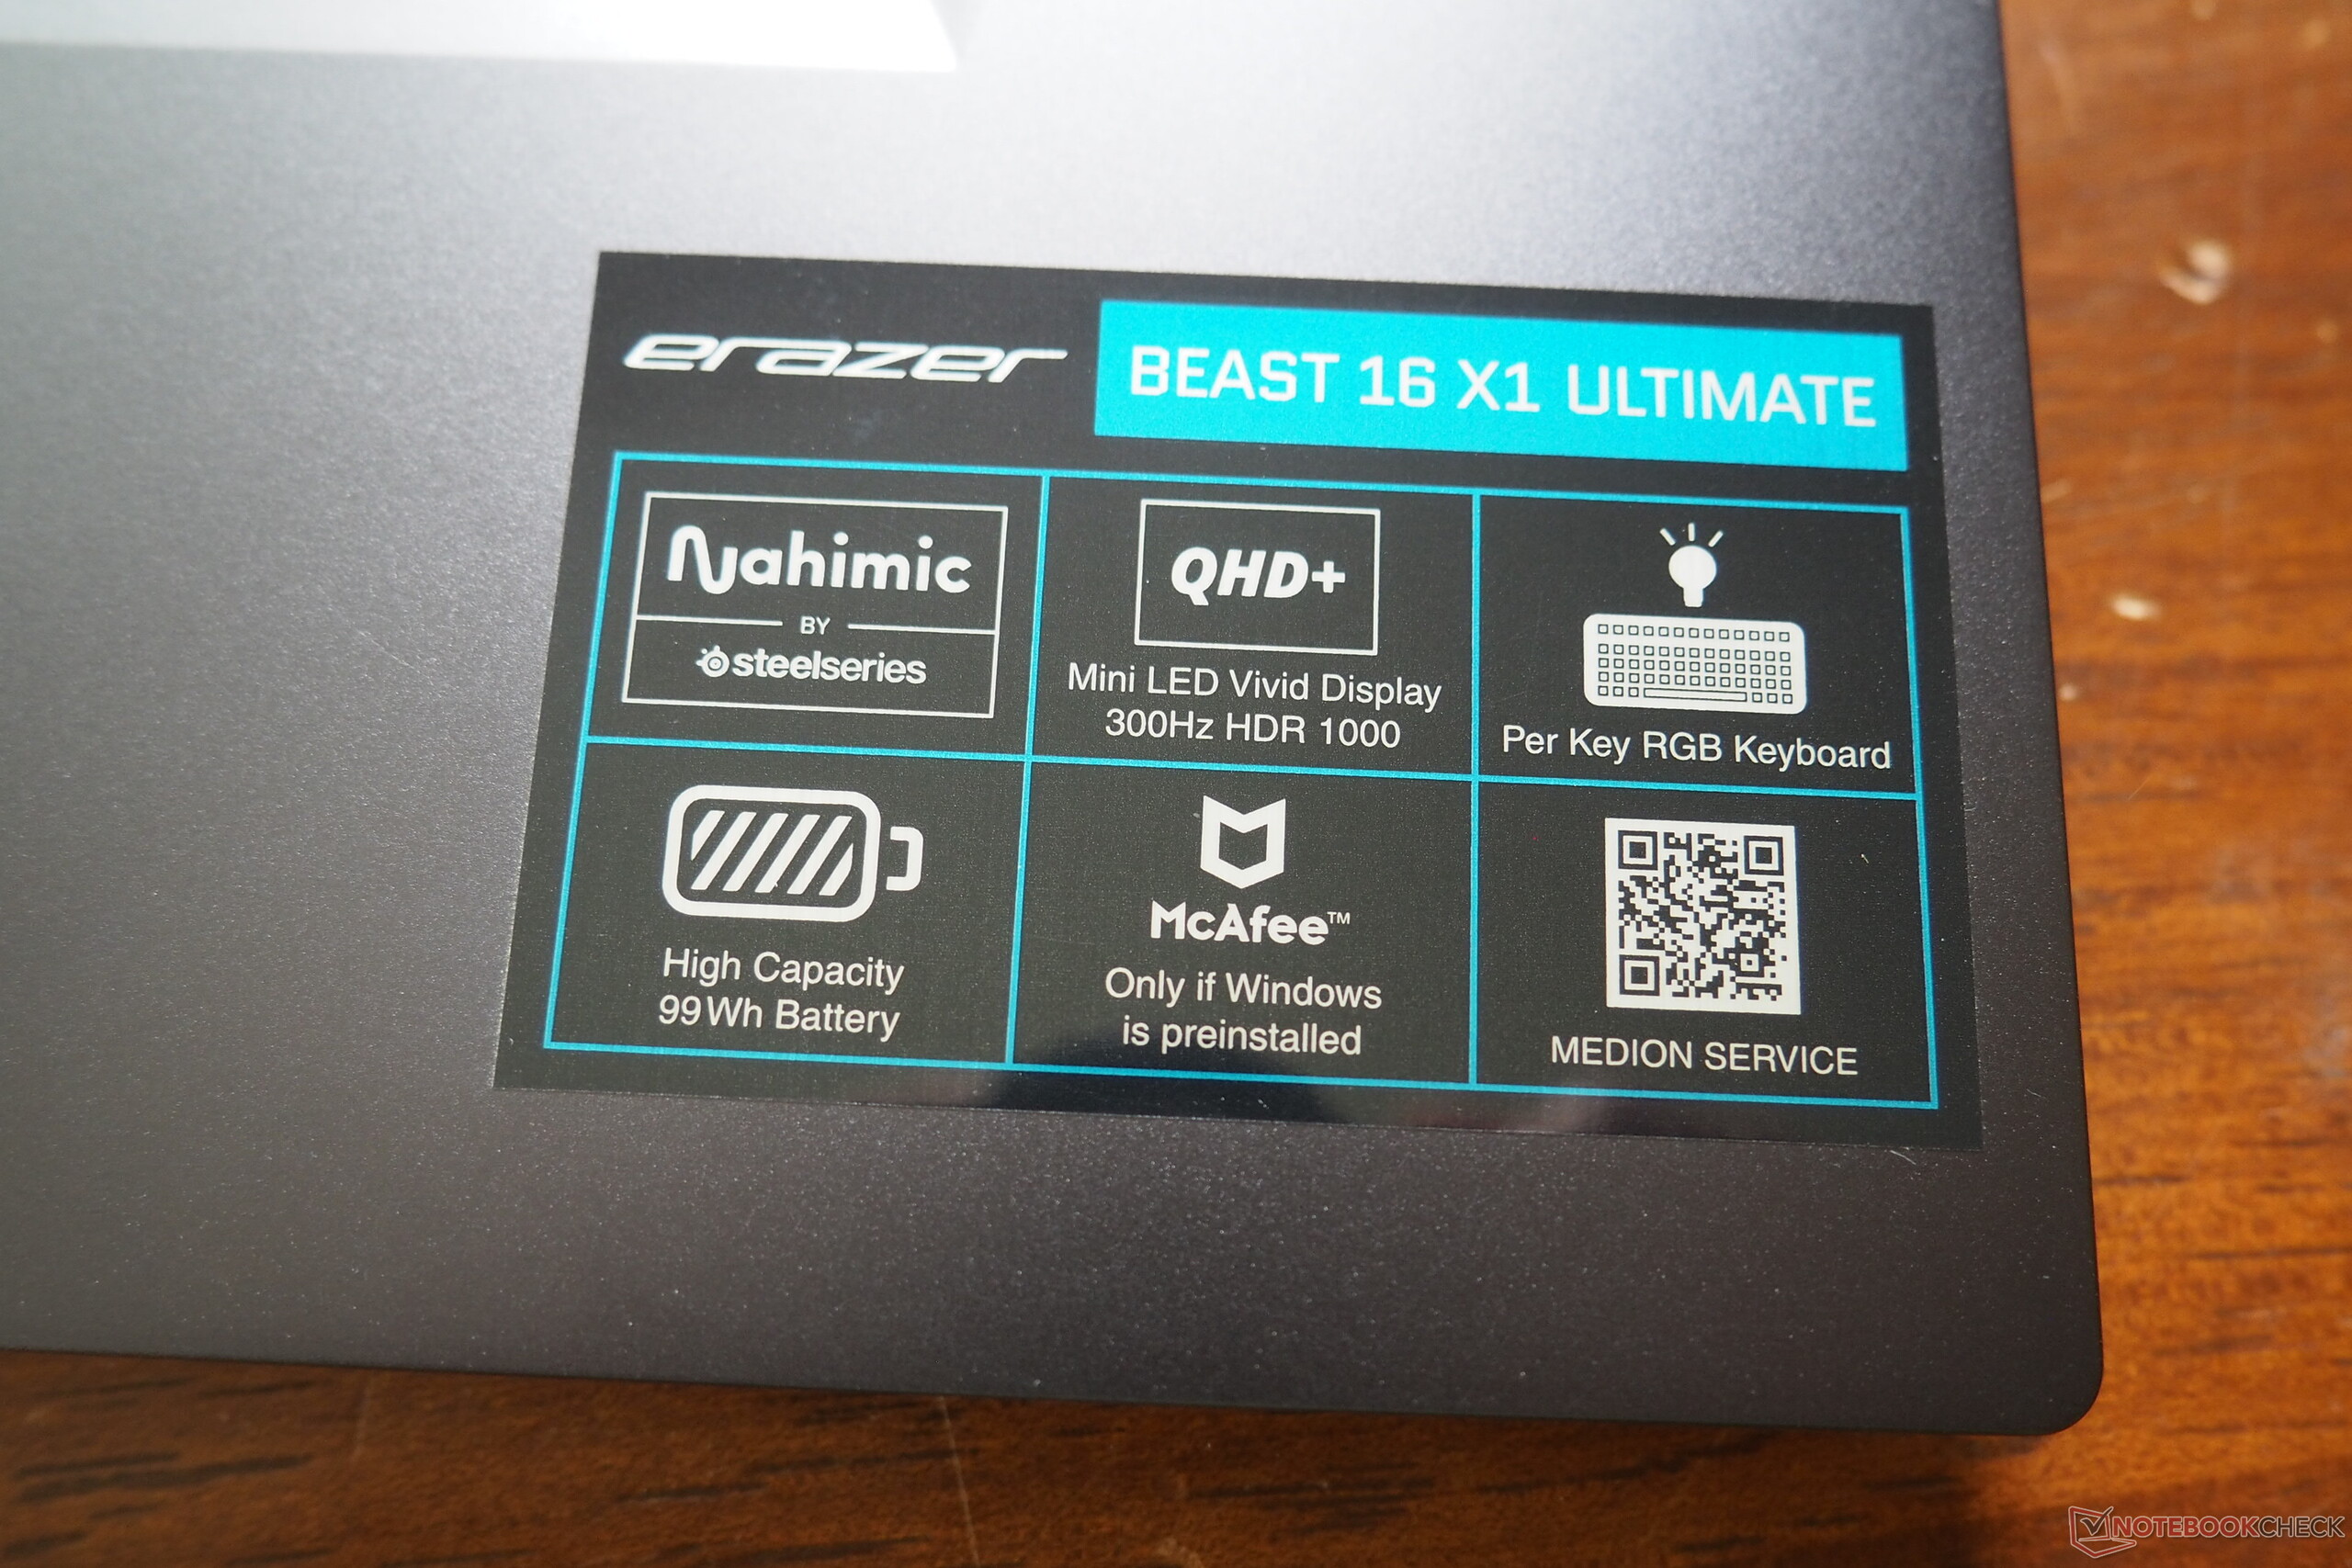
El Medion Erazer Beast 16 X1 no es ninguna ganga: Para la versión superior MD62732 con Core Ultra 9 275HX, GeForce RTX 5090, 32 GB de RAM y SSD de 2 TB, hay que poner sobre la mesa más de 4.000 euros (~4539 dólares) en el momento de la prueba. Analizaremos si el sobreprecio en comparación con los dispositivos RTX 5080 merece la pena en el transcurso de este artículo. En conjunto, el portátil de 16 pulgadas recibió una calificación de "muy bueno", lo que se debe a su rendimiento, pantalla y carcasa. El minipanel LED en formato 16:10 (2.560 x 1.600 píxeles, 300 Hz) suma puntos, entre otras cosas, por su alto brillo, rico contraste y amplia gama de colores, que deberían complacer no sólo a los jugadores, sino también a los usuarios profesionales.
El chasis es de gran calidad gracias a la inserción metálica e impresiona por su buena estabilidad. Los dispositivos de entrada y las conexiones tampoco están nada mal. El Erazer Beast 16 X1 ofrece un puerto Thunderbolt 4, entre otras cosas. Hay pocos puntos criticables, pero lo que más nos molestó en la prueba fue el fuerte desarrollo de ruido bajo carga. Por desgracia, este defecto afecta a casi todos los portátiles para juegos.
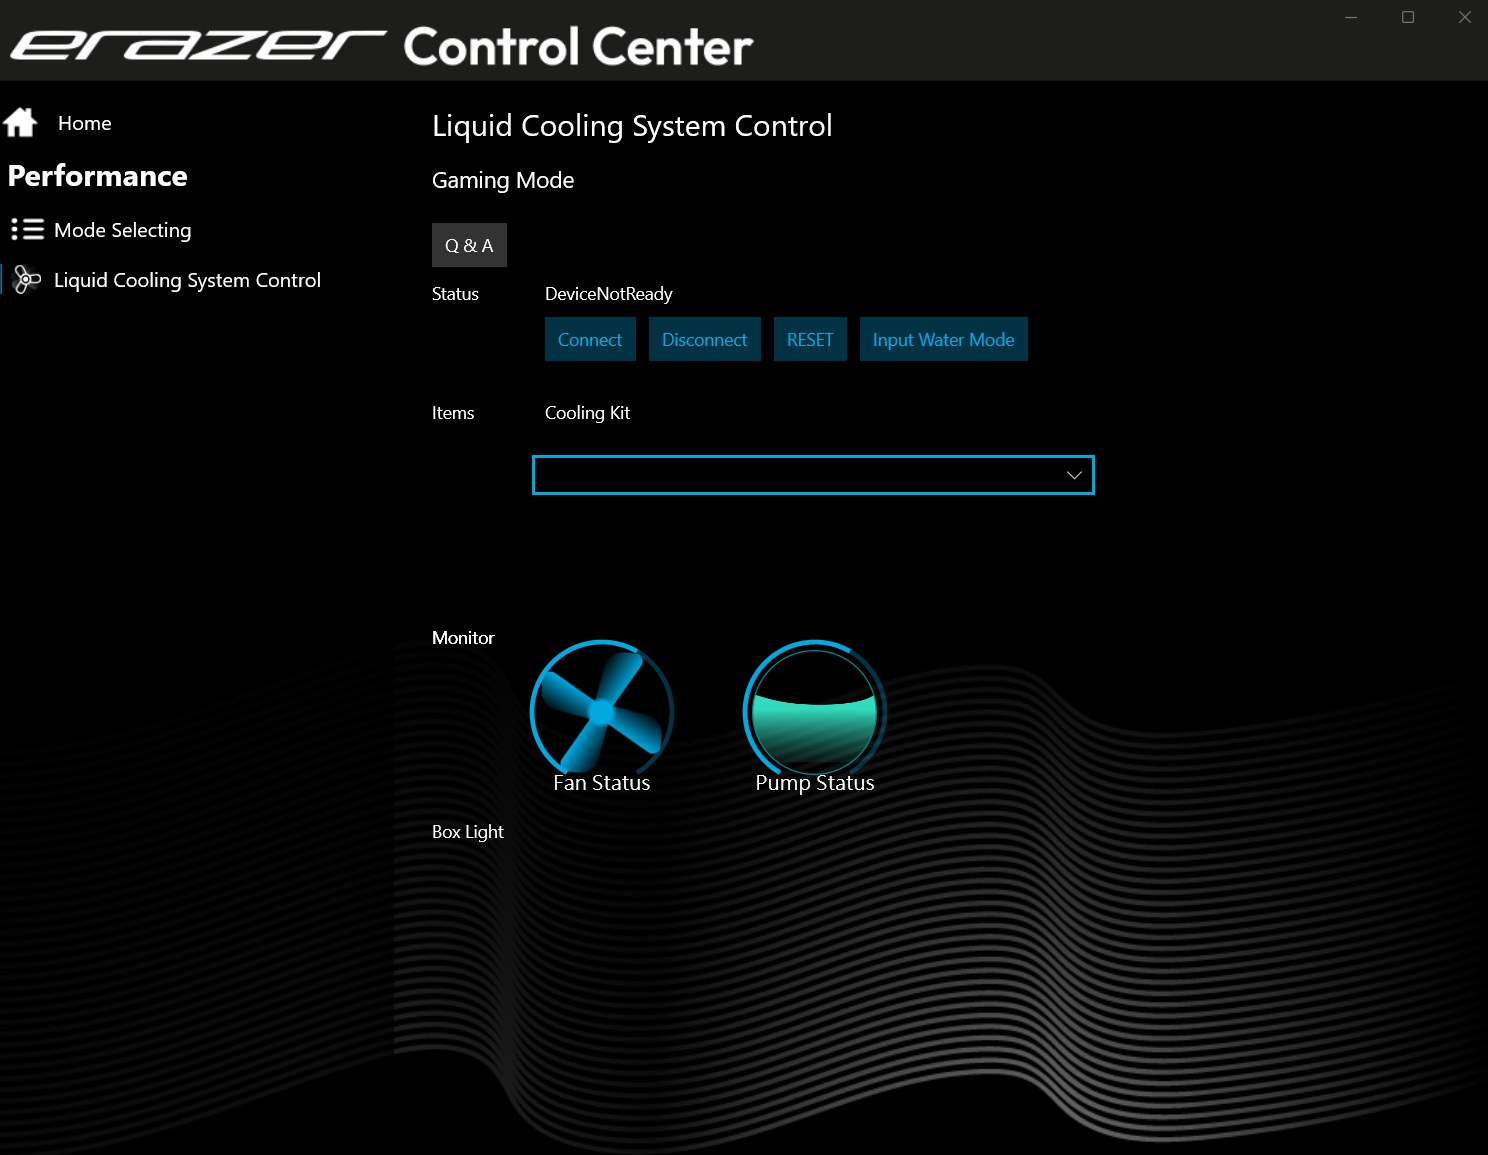
Si quiere sacarle aún más partido al portátil, puede adquirir el kit de refrigeración opcional Erazer Cooling Kit V2 por unos 250 euros (~284 dólares). En breve publicaremos un artículo aparte con algunas mediciones adecuadas.
Pro
Contra
Precio y disponibilidad
El Erazer Beast 16 X1 Ultimate MD62732 está disponible por unos 4.300 euros (~4879 dólares) en la página web de Medion https://www.medion.com/de/shop/p/high-end-gaming-notebooks-medion-erazer-beast-16-x1-ultimate-high-end-gaming-laptop-intel-core-ultra-9-prozessor-275hx-windows-11-home-40-6-cm-16--mini-led-vivid-display-mit-300hz-rtx-5090-2-tb-pcie-ssd-32-gb-ram-30039605A1 (actualmente rebajado a 4.090 Euros/~4641).
los homólogos de 16 pulgadas que también contienen una GPU RTX 5000 son, por ejemplo, el HP Omen Max 16y el Asus ROG Strix Scar 16, el Lenovo Legion Pro 7i 16 y el Asus ROG Strix G16que aparecen todos en las tablas como dispositivos de comparación. Sin embargo, el principal competidor es el más o menos idéntico XMG Neo 16 E25.
Especificaciones
Vivienda
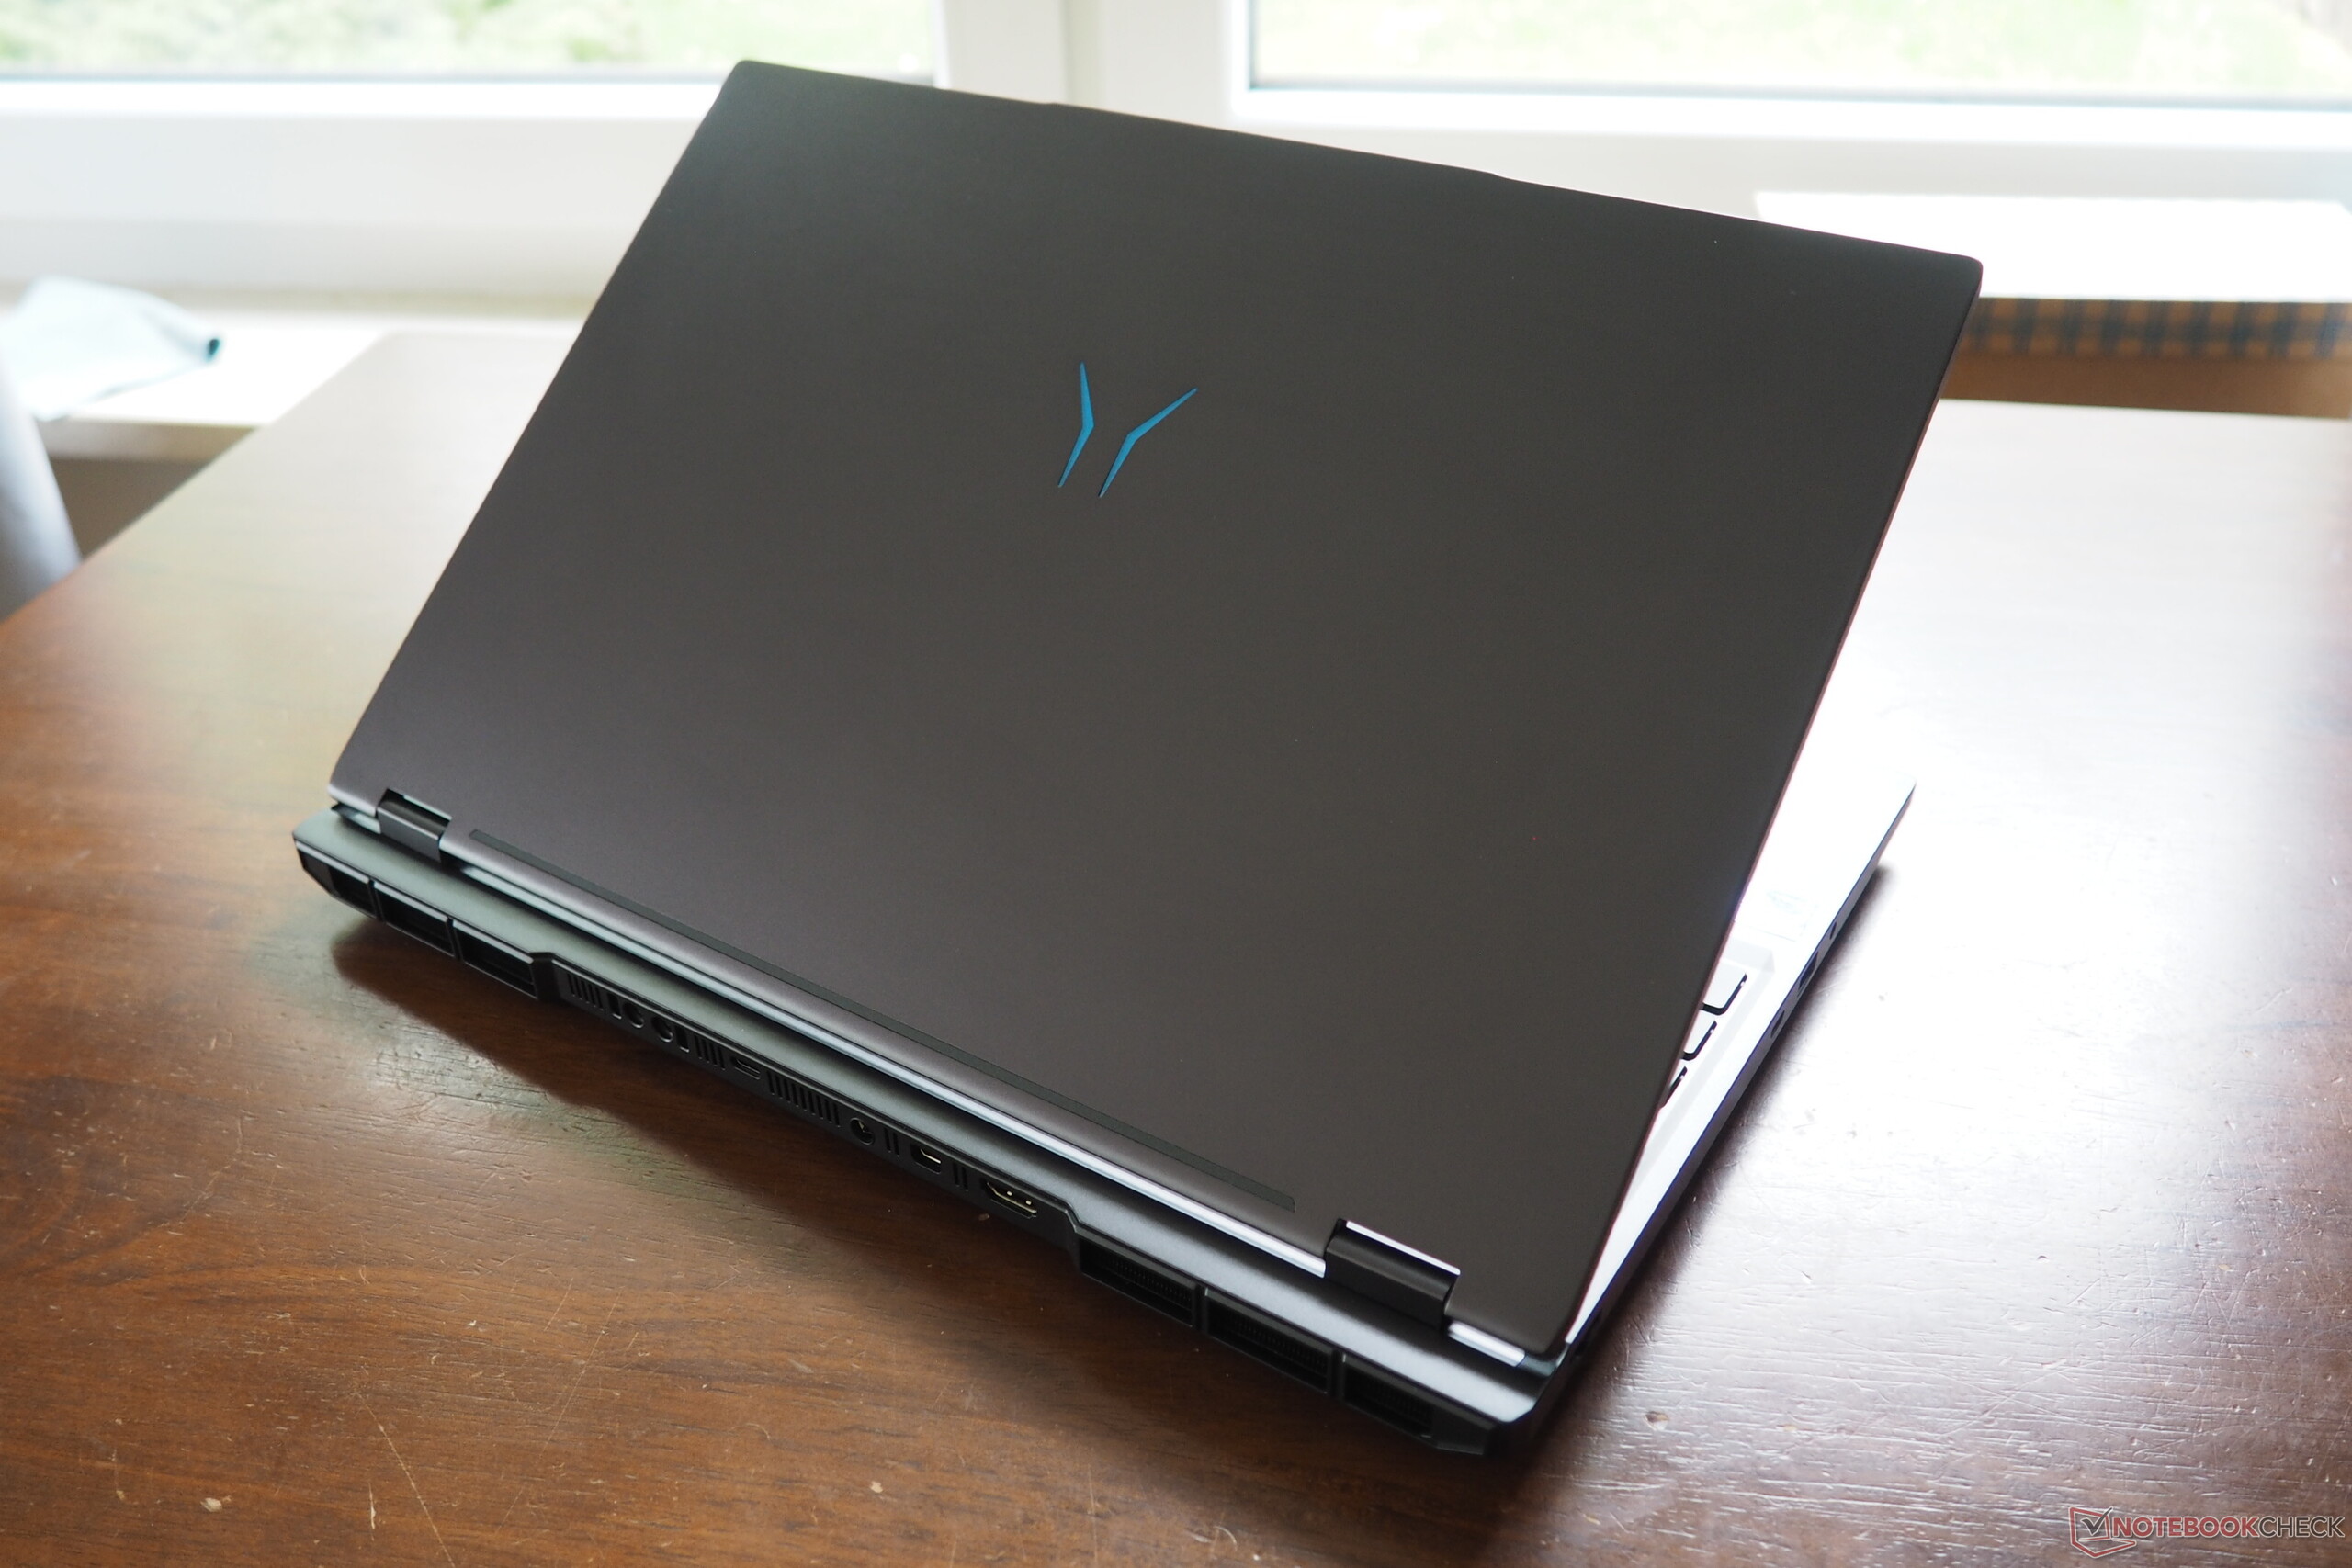
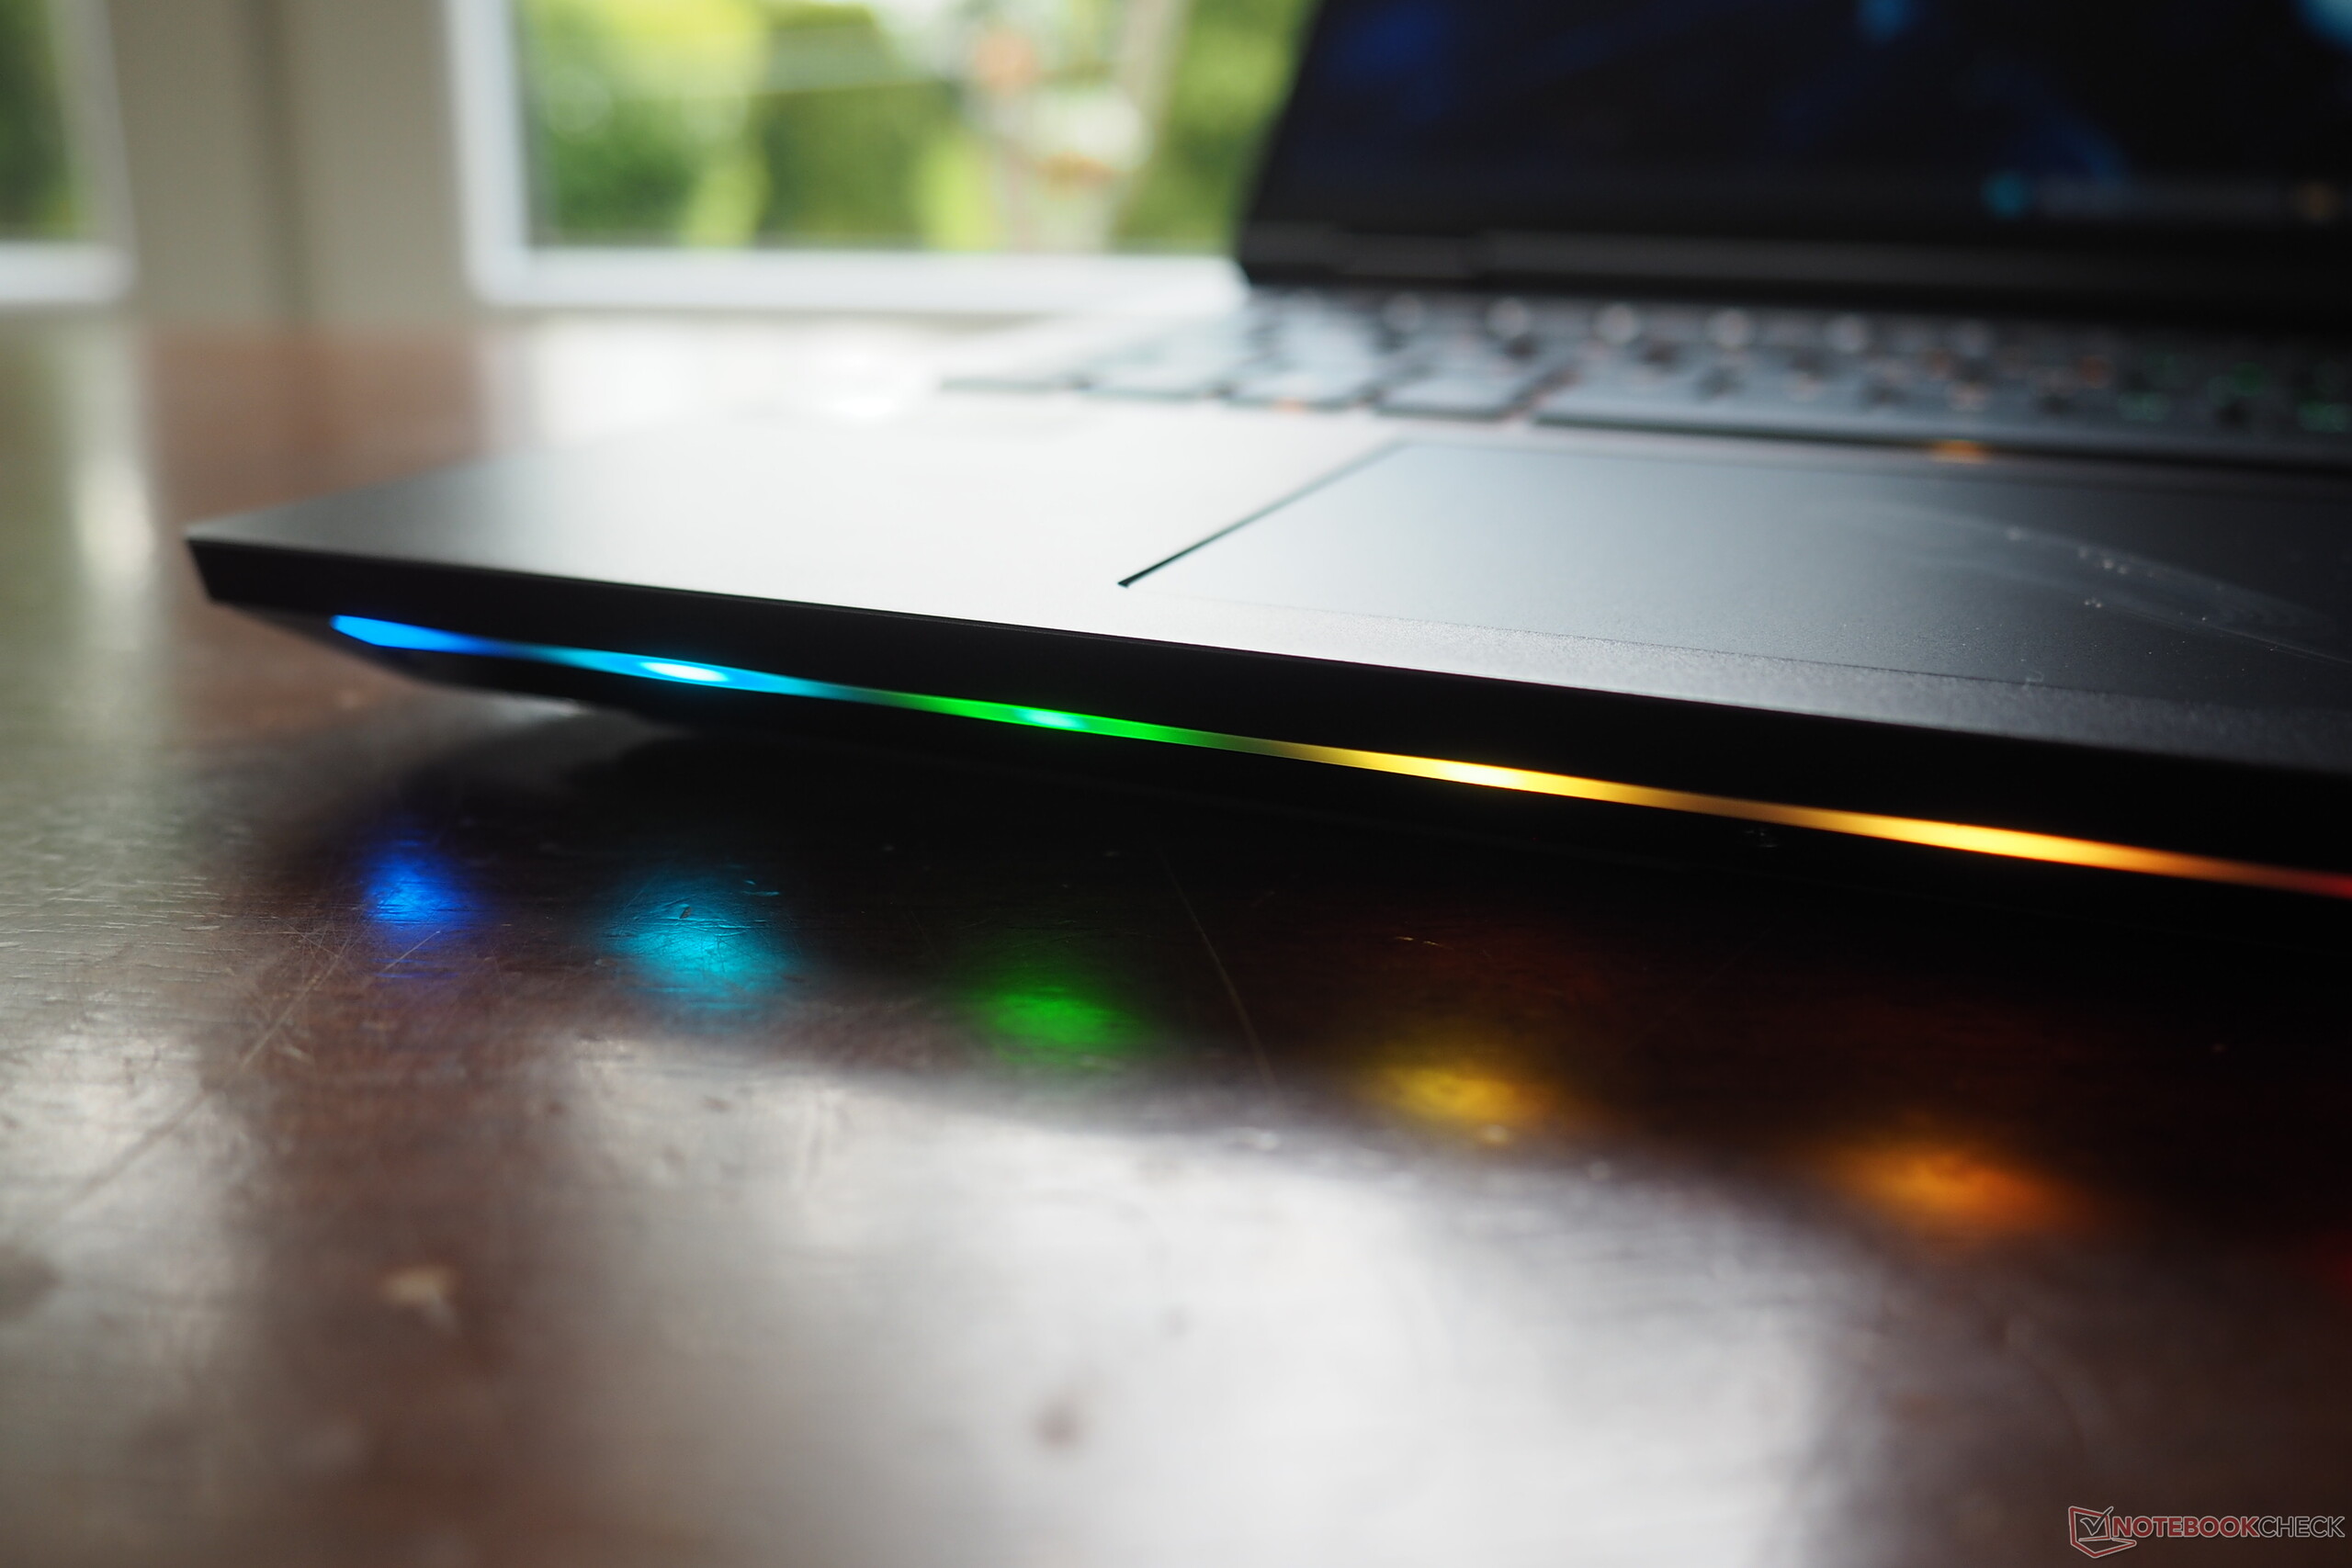
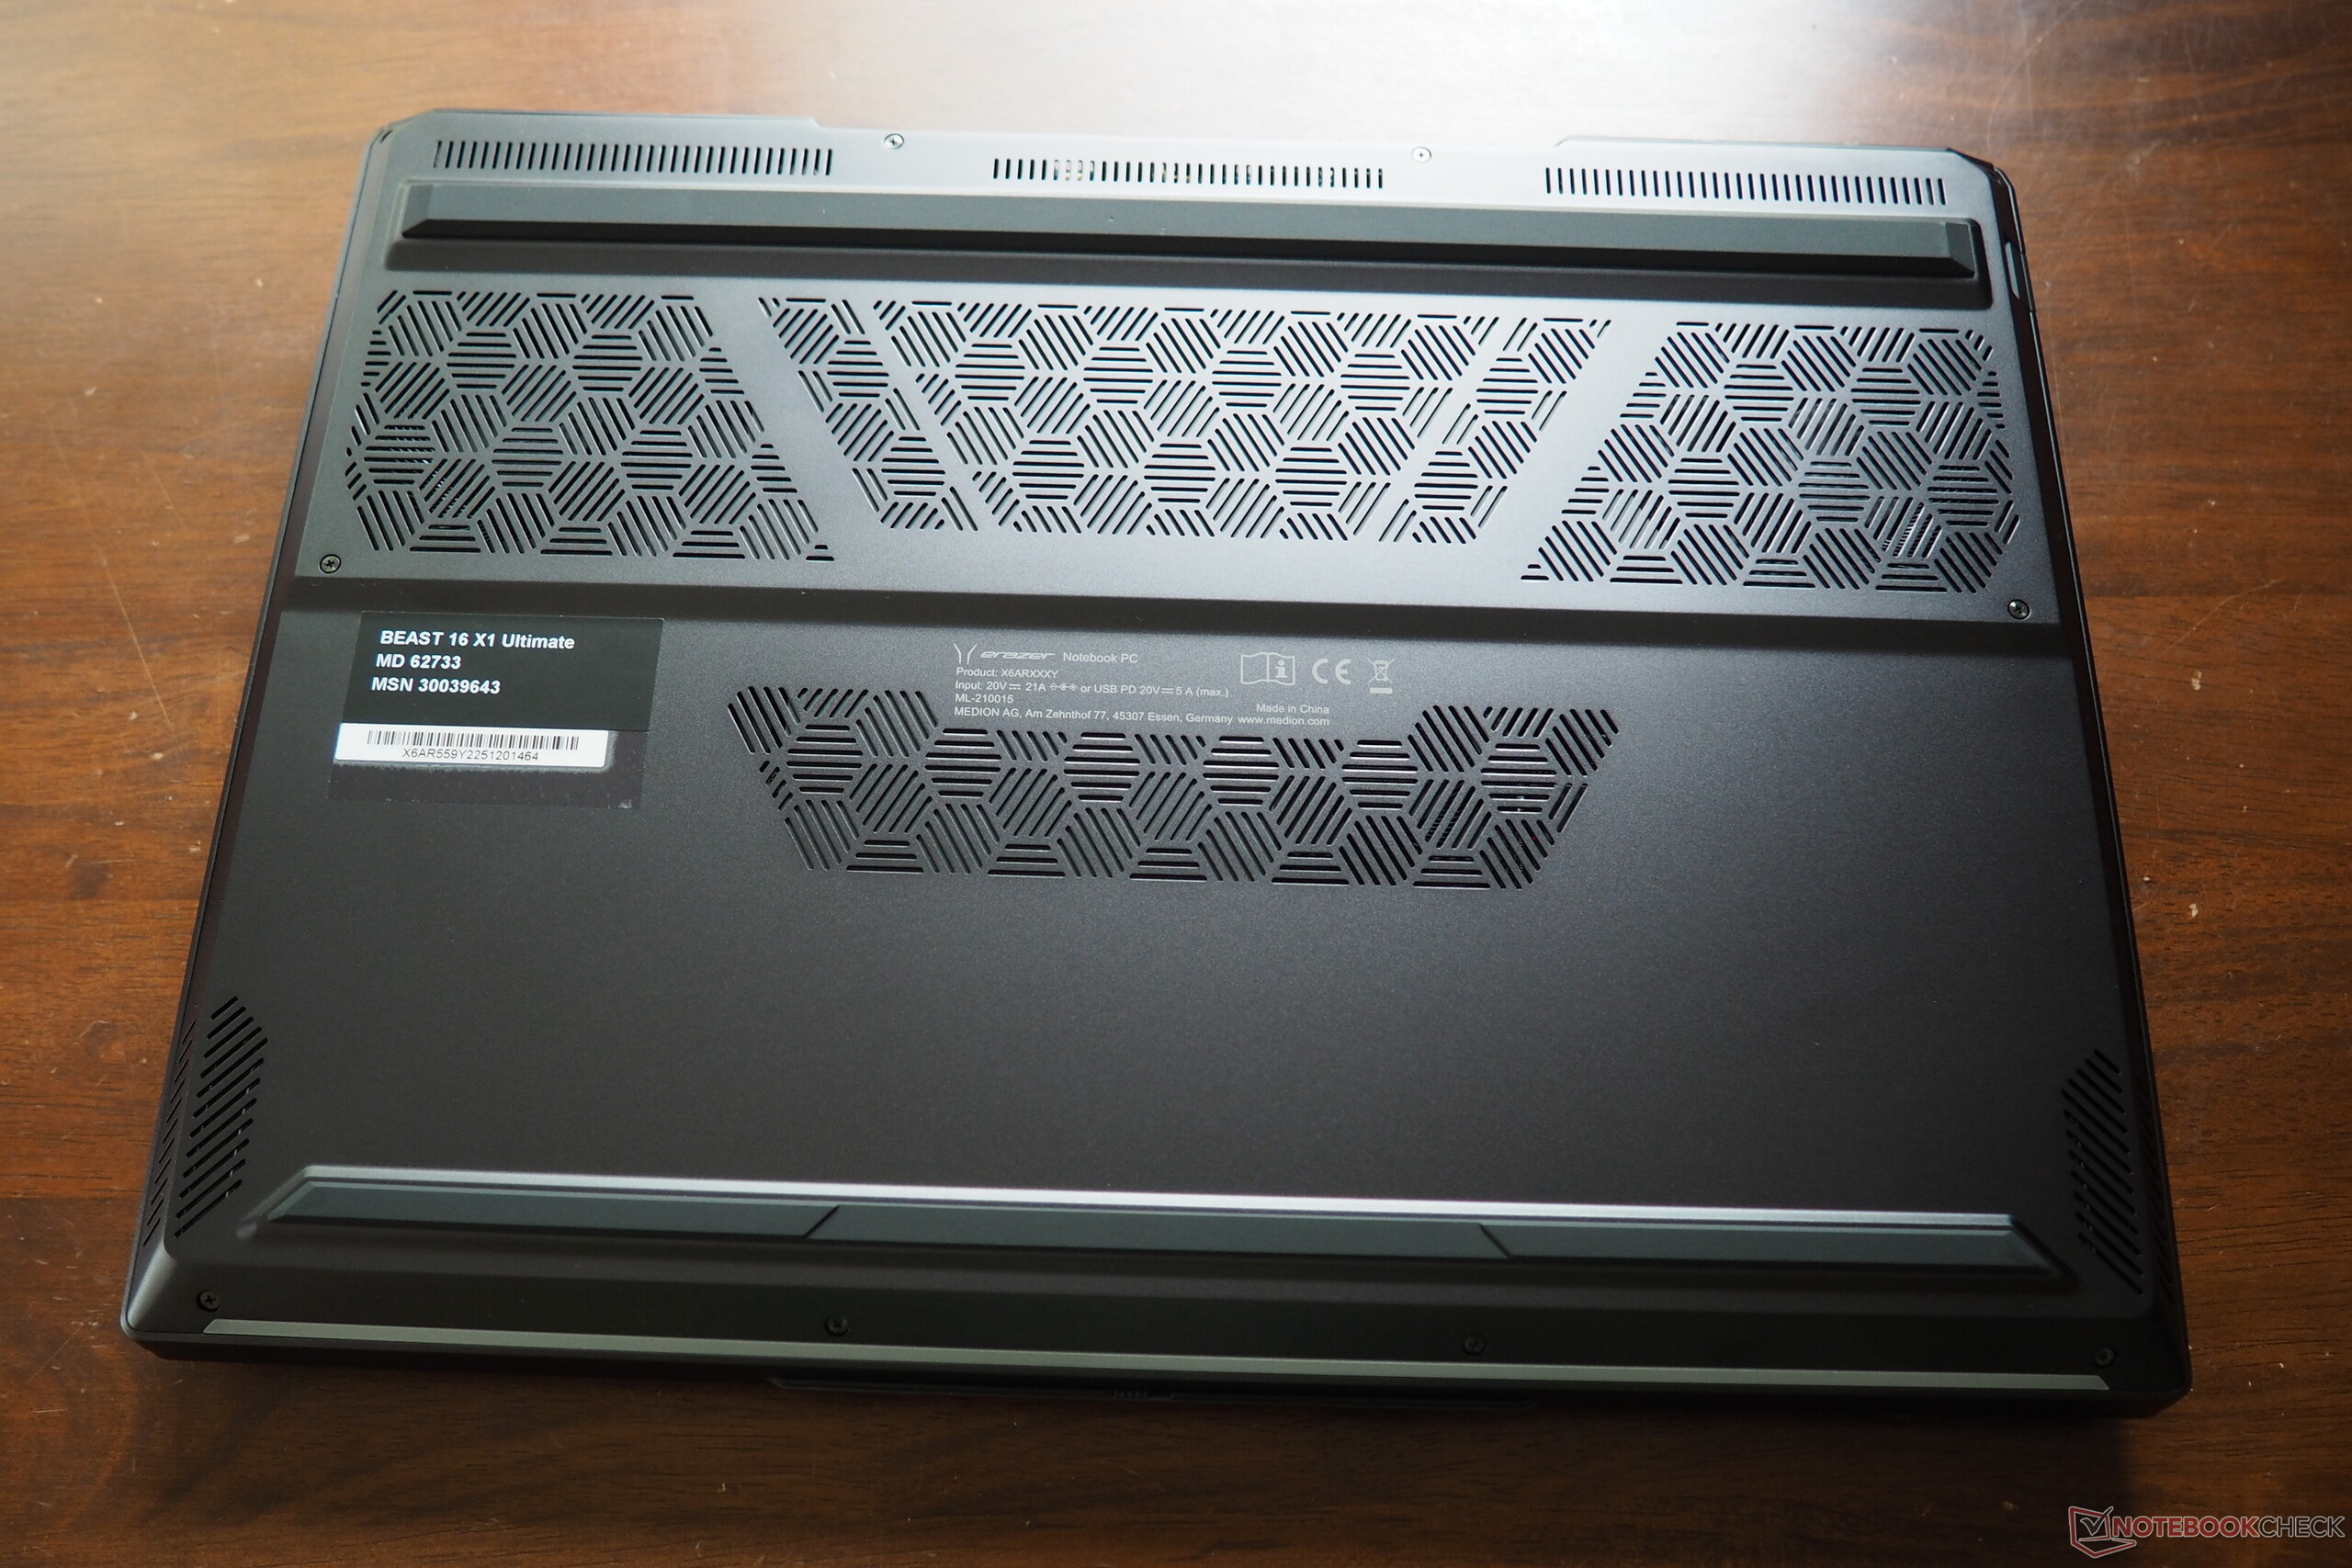
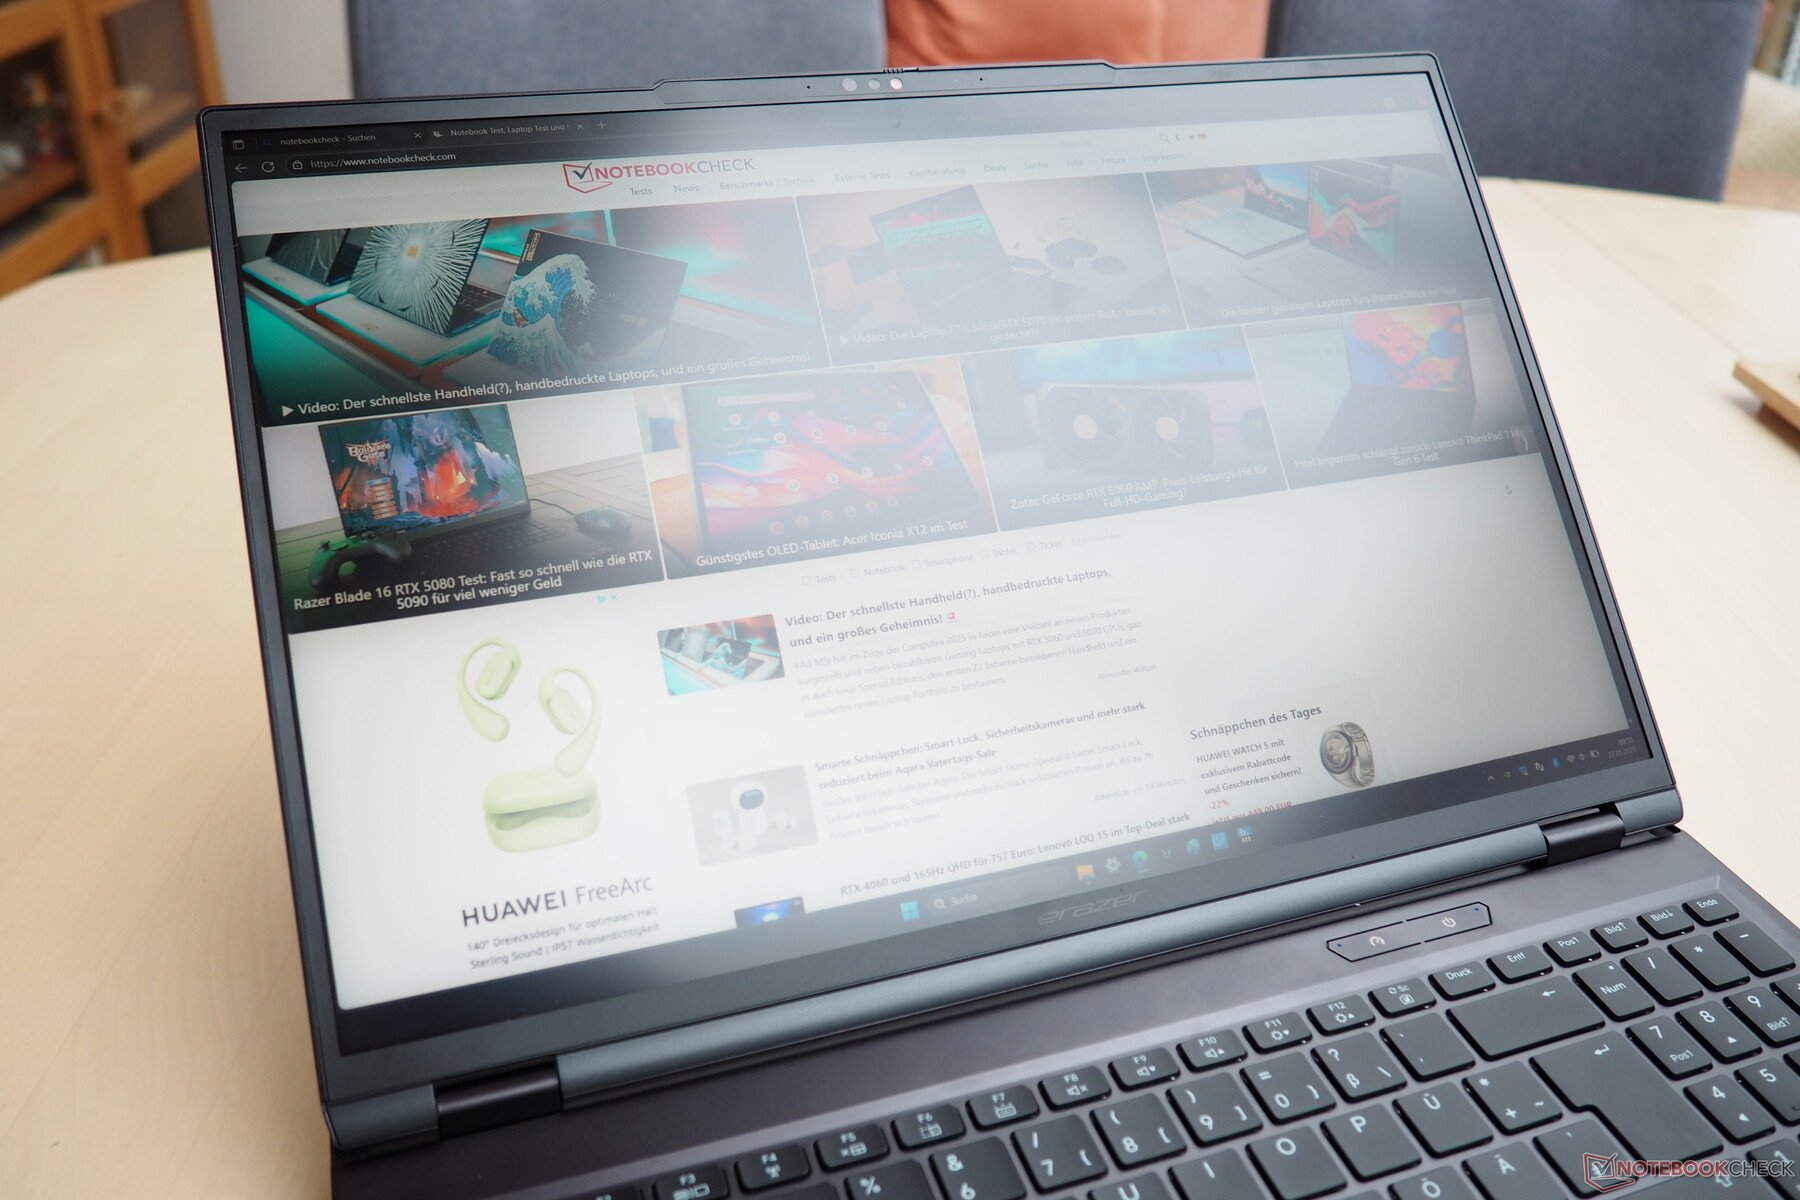
Como se mencionaba al principio, la carcasa deja una muy buena impresión. Medion ha optado por un chasis de Tonfang, que se mantiene agradablemente estable incluso bajo fuertes presiones y, en general, tiene un tacto muy elegante. El diseño con sus formas y bordes ofrece una agradable mezcla de elegancia y jovialidad, y los aficionados a la iluminación pueden esperar una elegante tira de LED en la parte frontal (ver fotos). Con 2,8 kg, el peso no es ni bajo ni especialmente elevado, comparable al de la Strix Scar 16 y la Omen Max 16. Con 3 cm, la altura no es excesiva. El generoso ángulo de apertura de 180° merece un respeto especial - no todos los competidores pueden conseguirlo.

Equipamiento
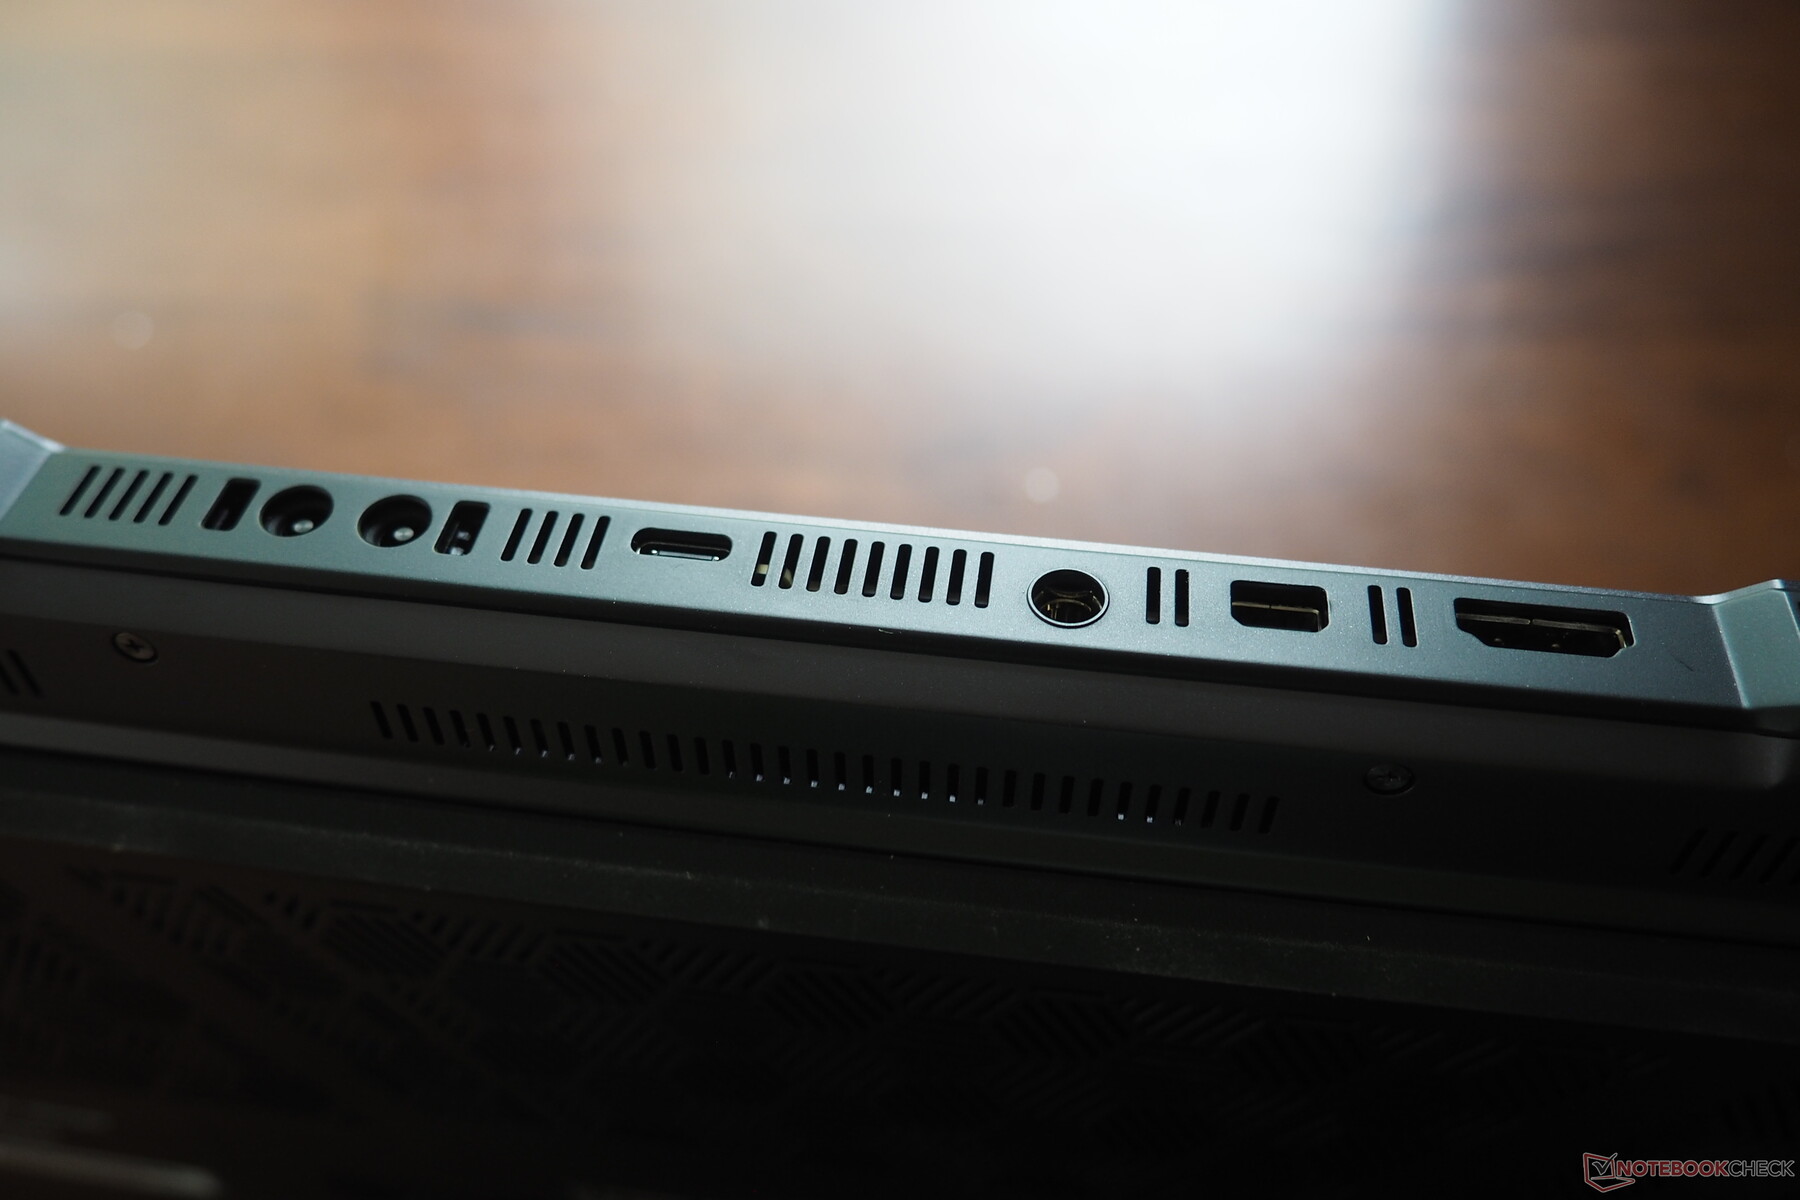
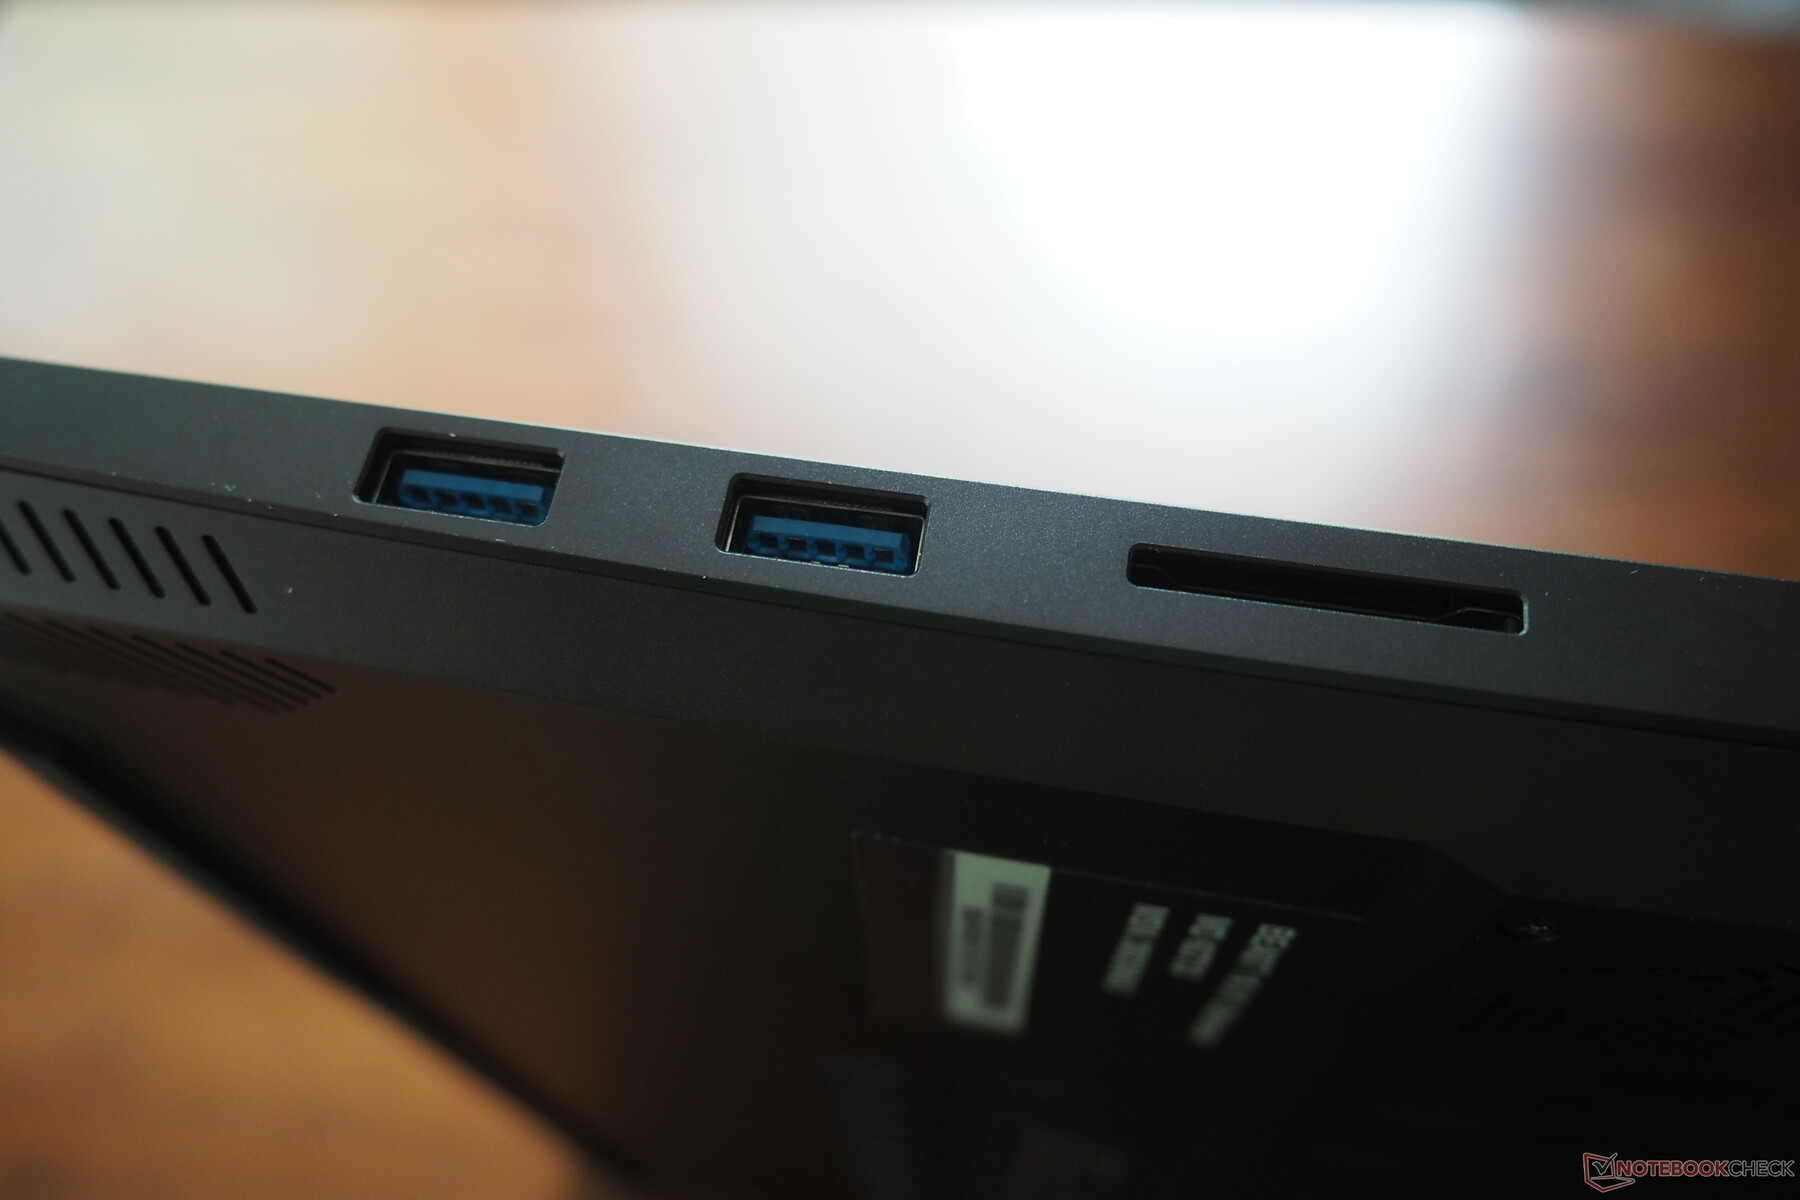
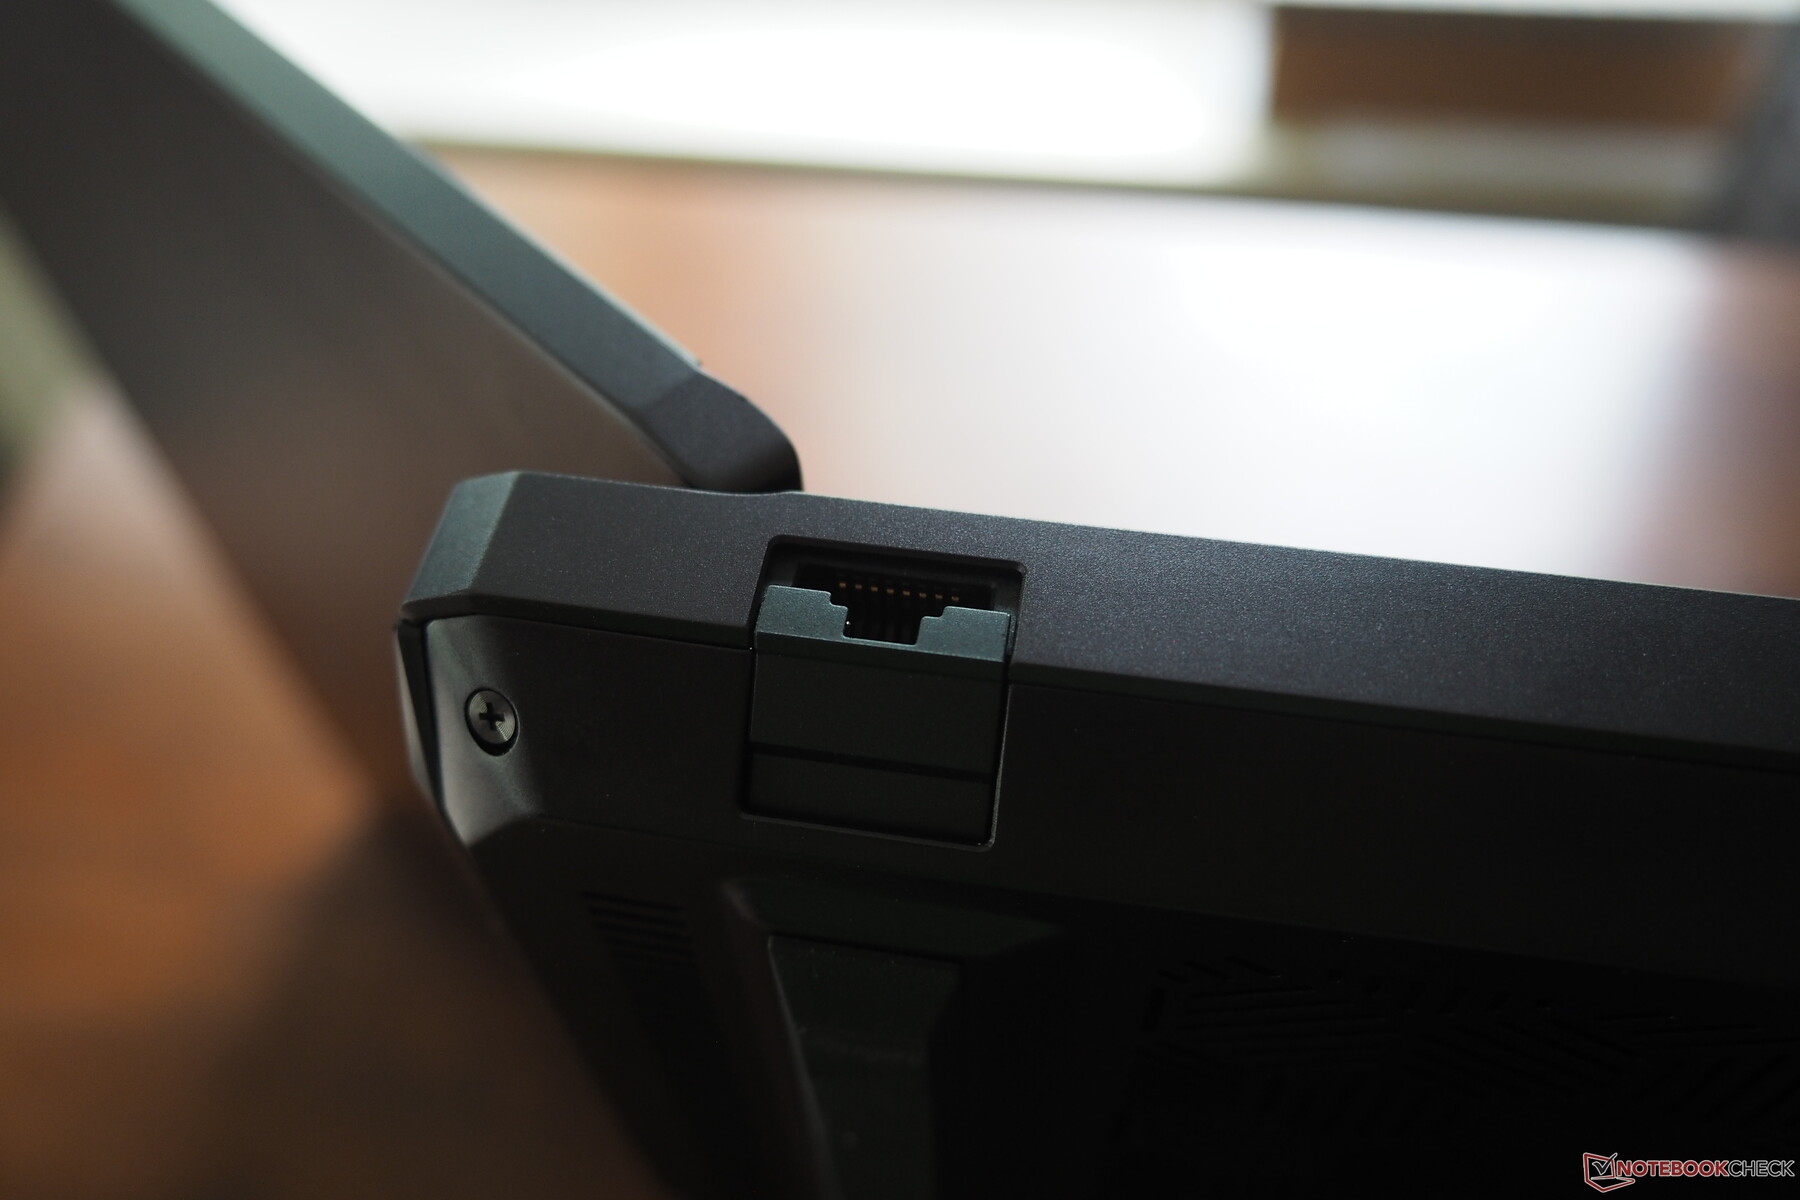
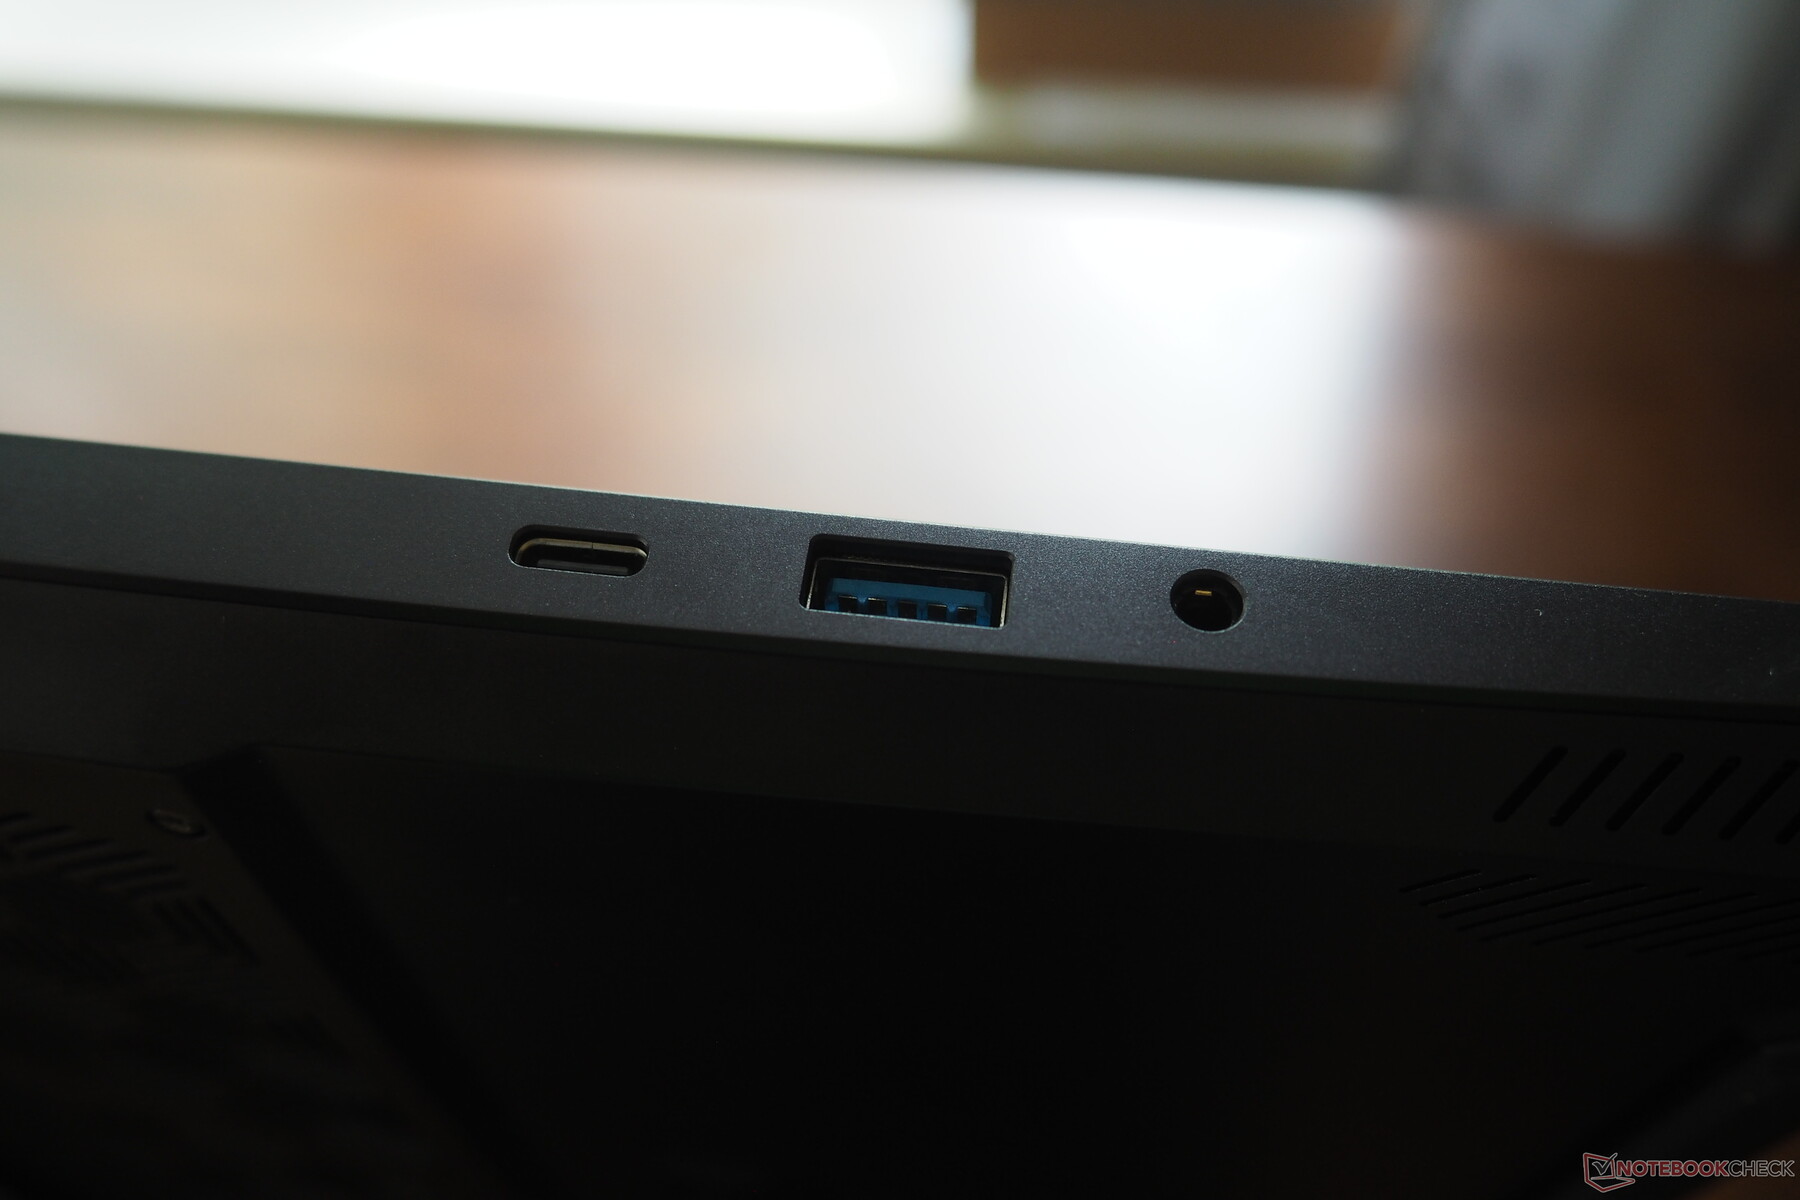
La Beast 16 X1 puede presumir de todo tipo de interfaces modernas. 2.lAN de 5 Gbit está tan al día como HDMI 2.1, (mini) DisplayPort 2.1a y Thunderbolt 4, así como un puerto USB-C 3.2 Gen2, dos puertos USB-A 3.2 Gen1, una toma de audio y un lector de tarjetas muy rápido. La entrada para el sistema externo de refrigeración por agua también se encuentra en la parte trasera. Tampoco hay nada que criticar sobre el rendimiento del módulo inalámbrico; aunque el chip AX211 de Intel no es compatible con Wi-Fi 7, sigue alcanzando velocidades de altas a muy altas.
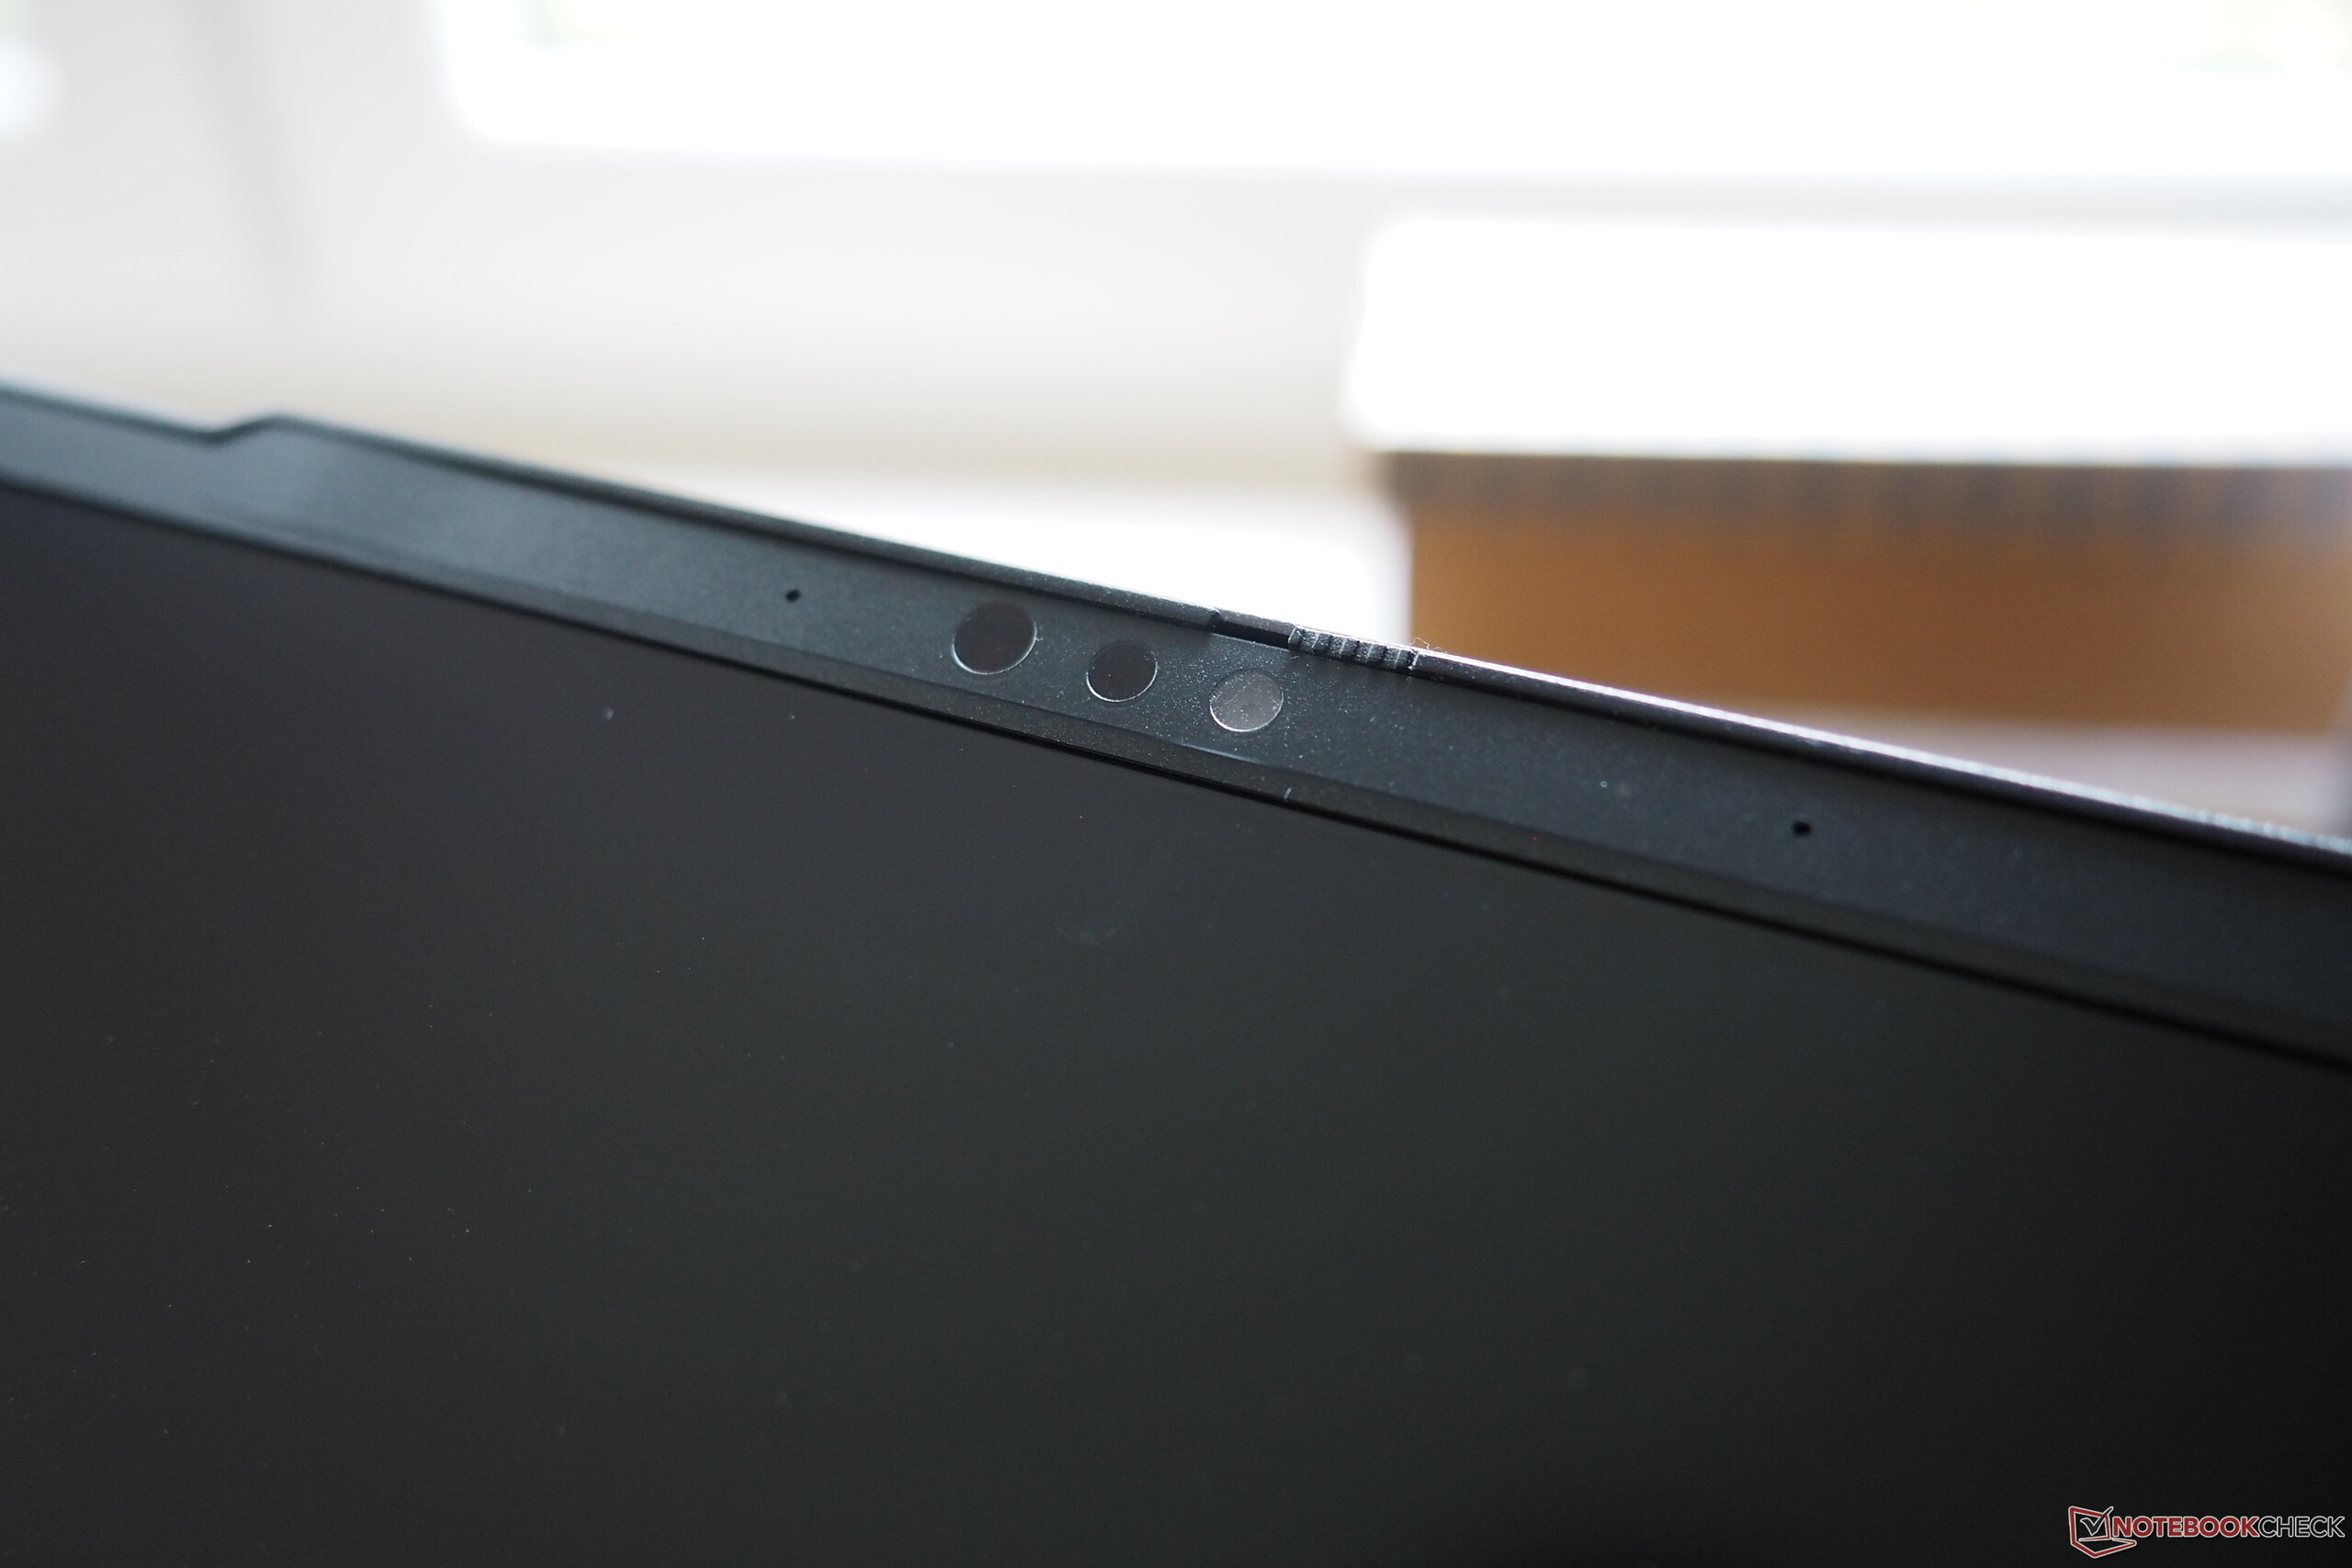
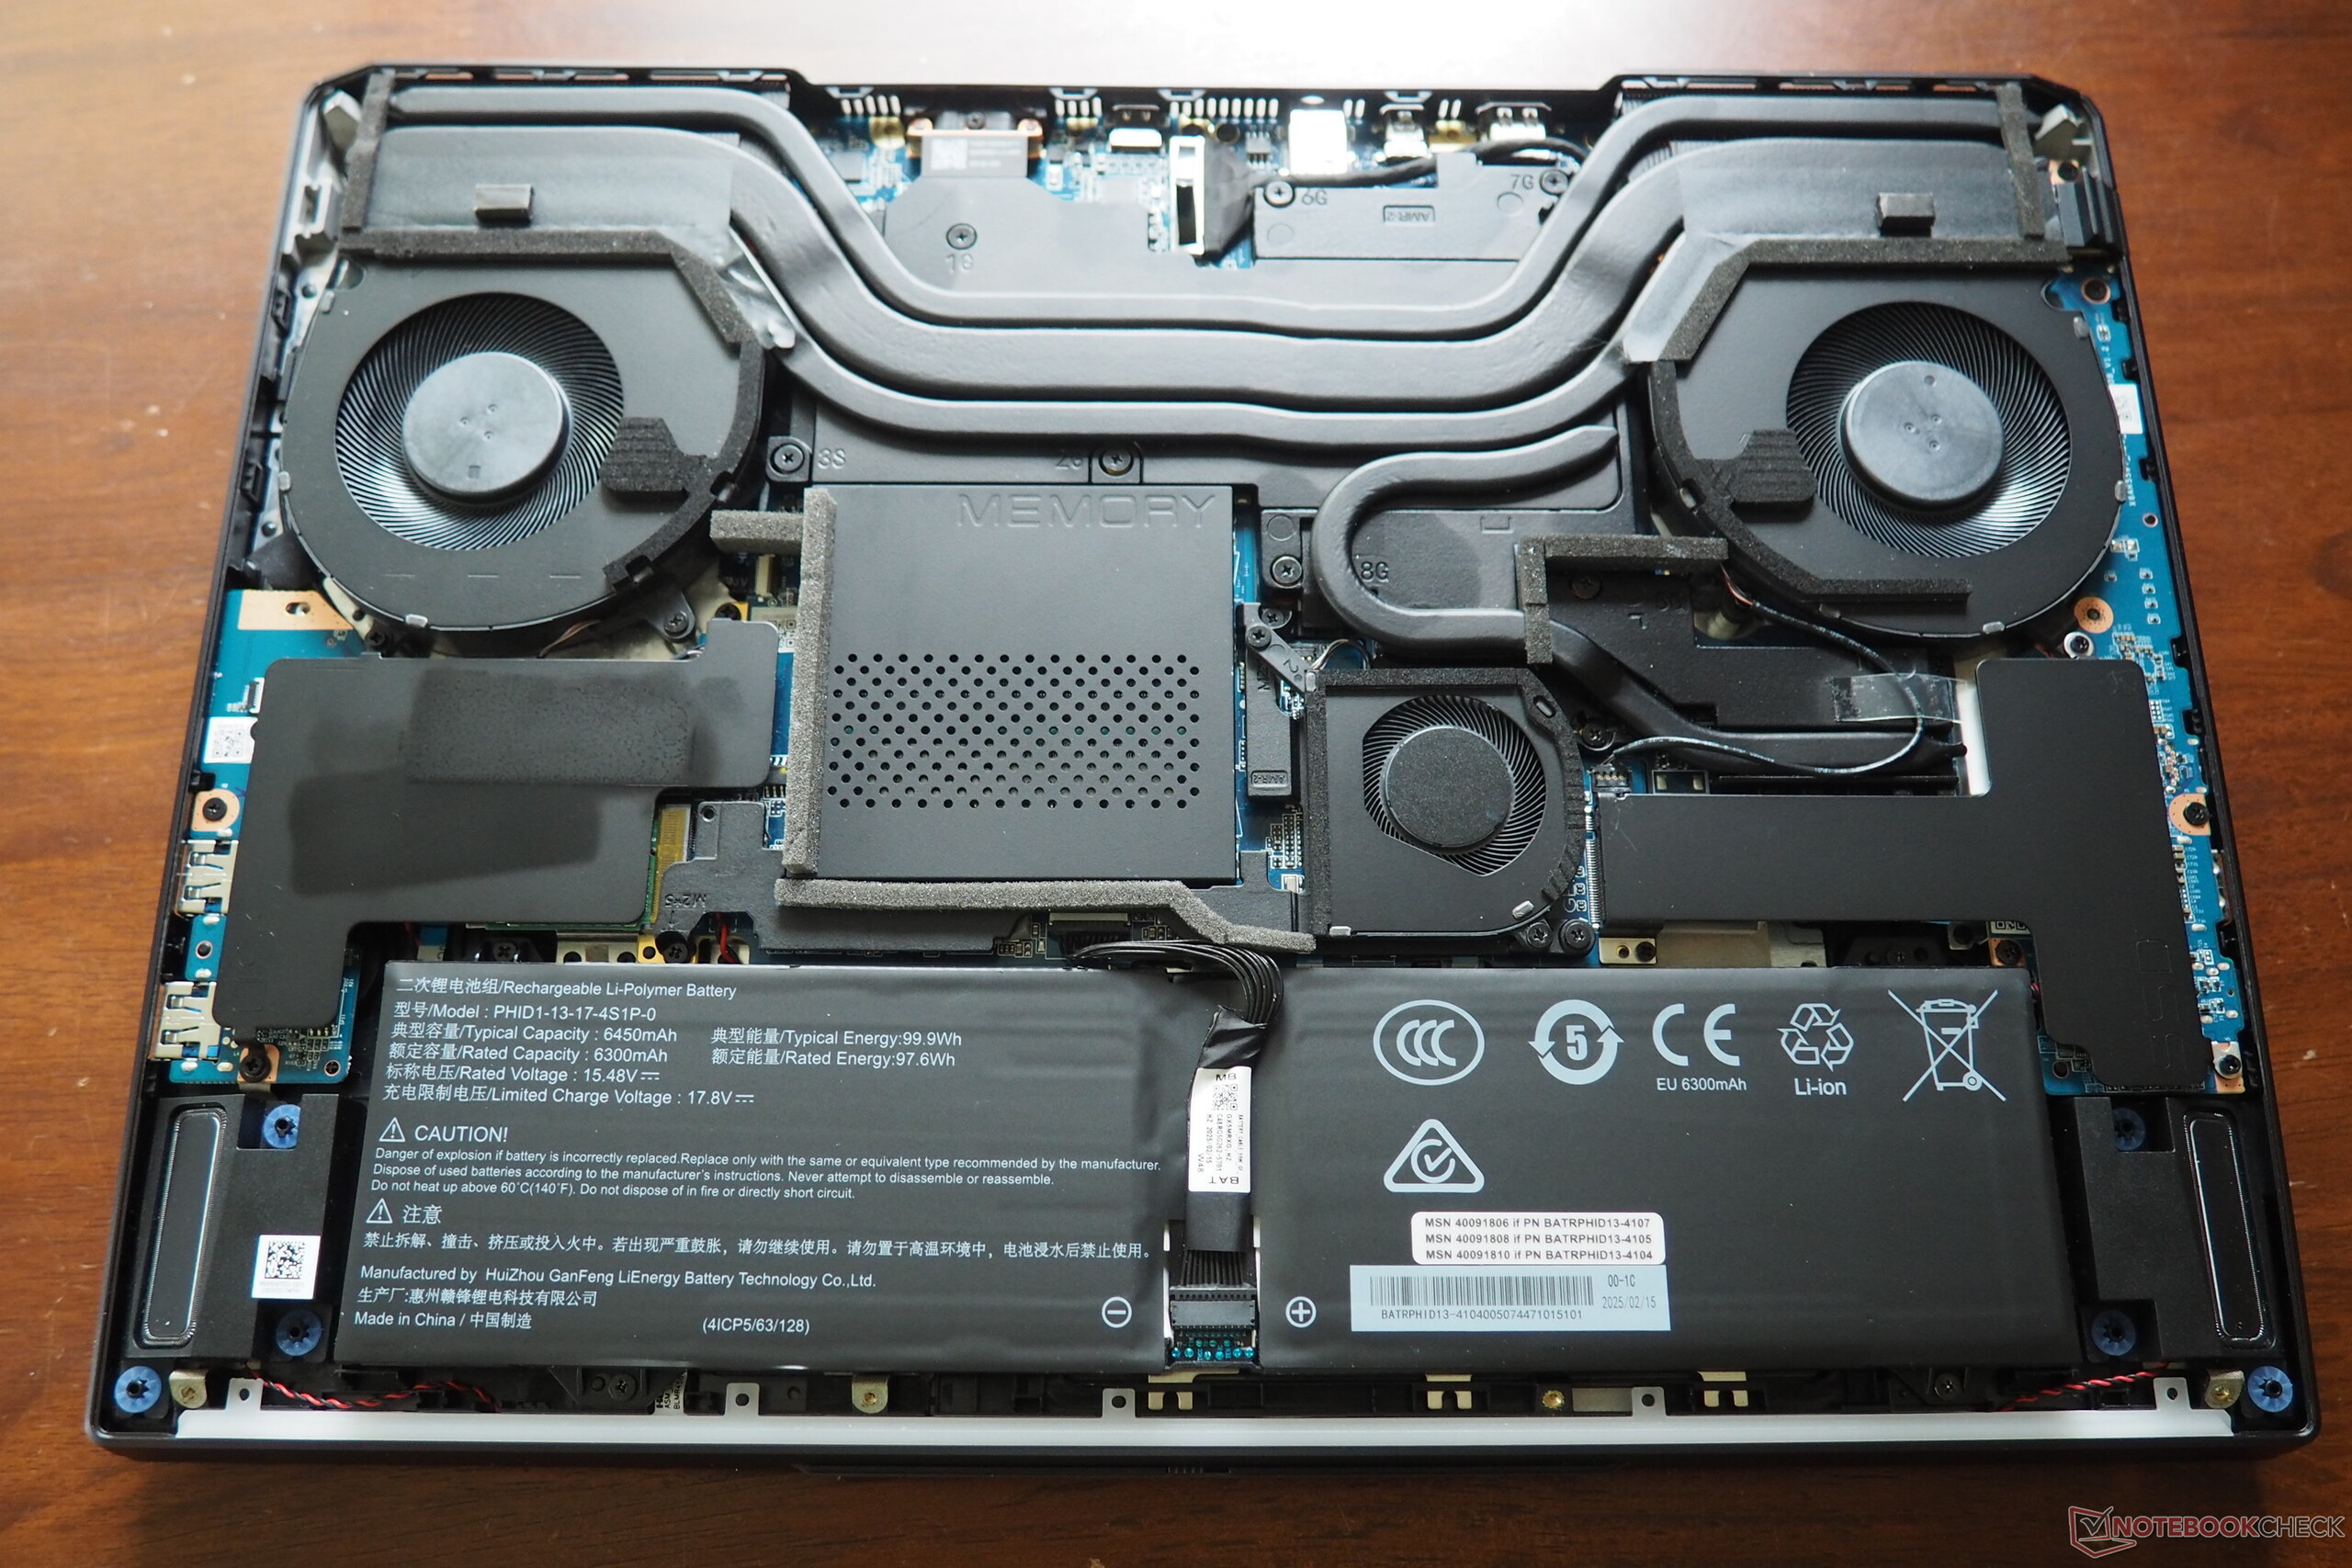
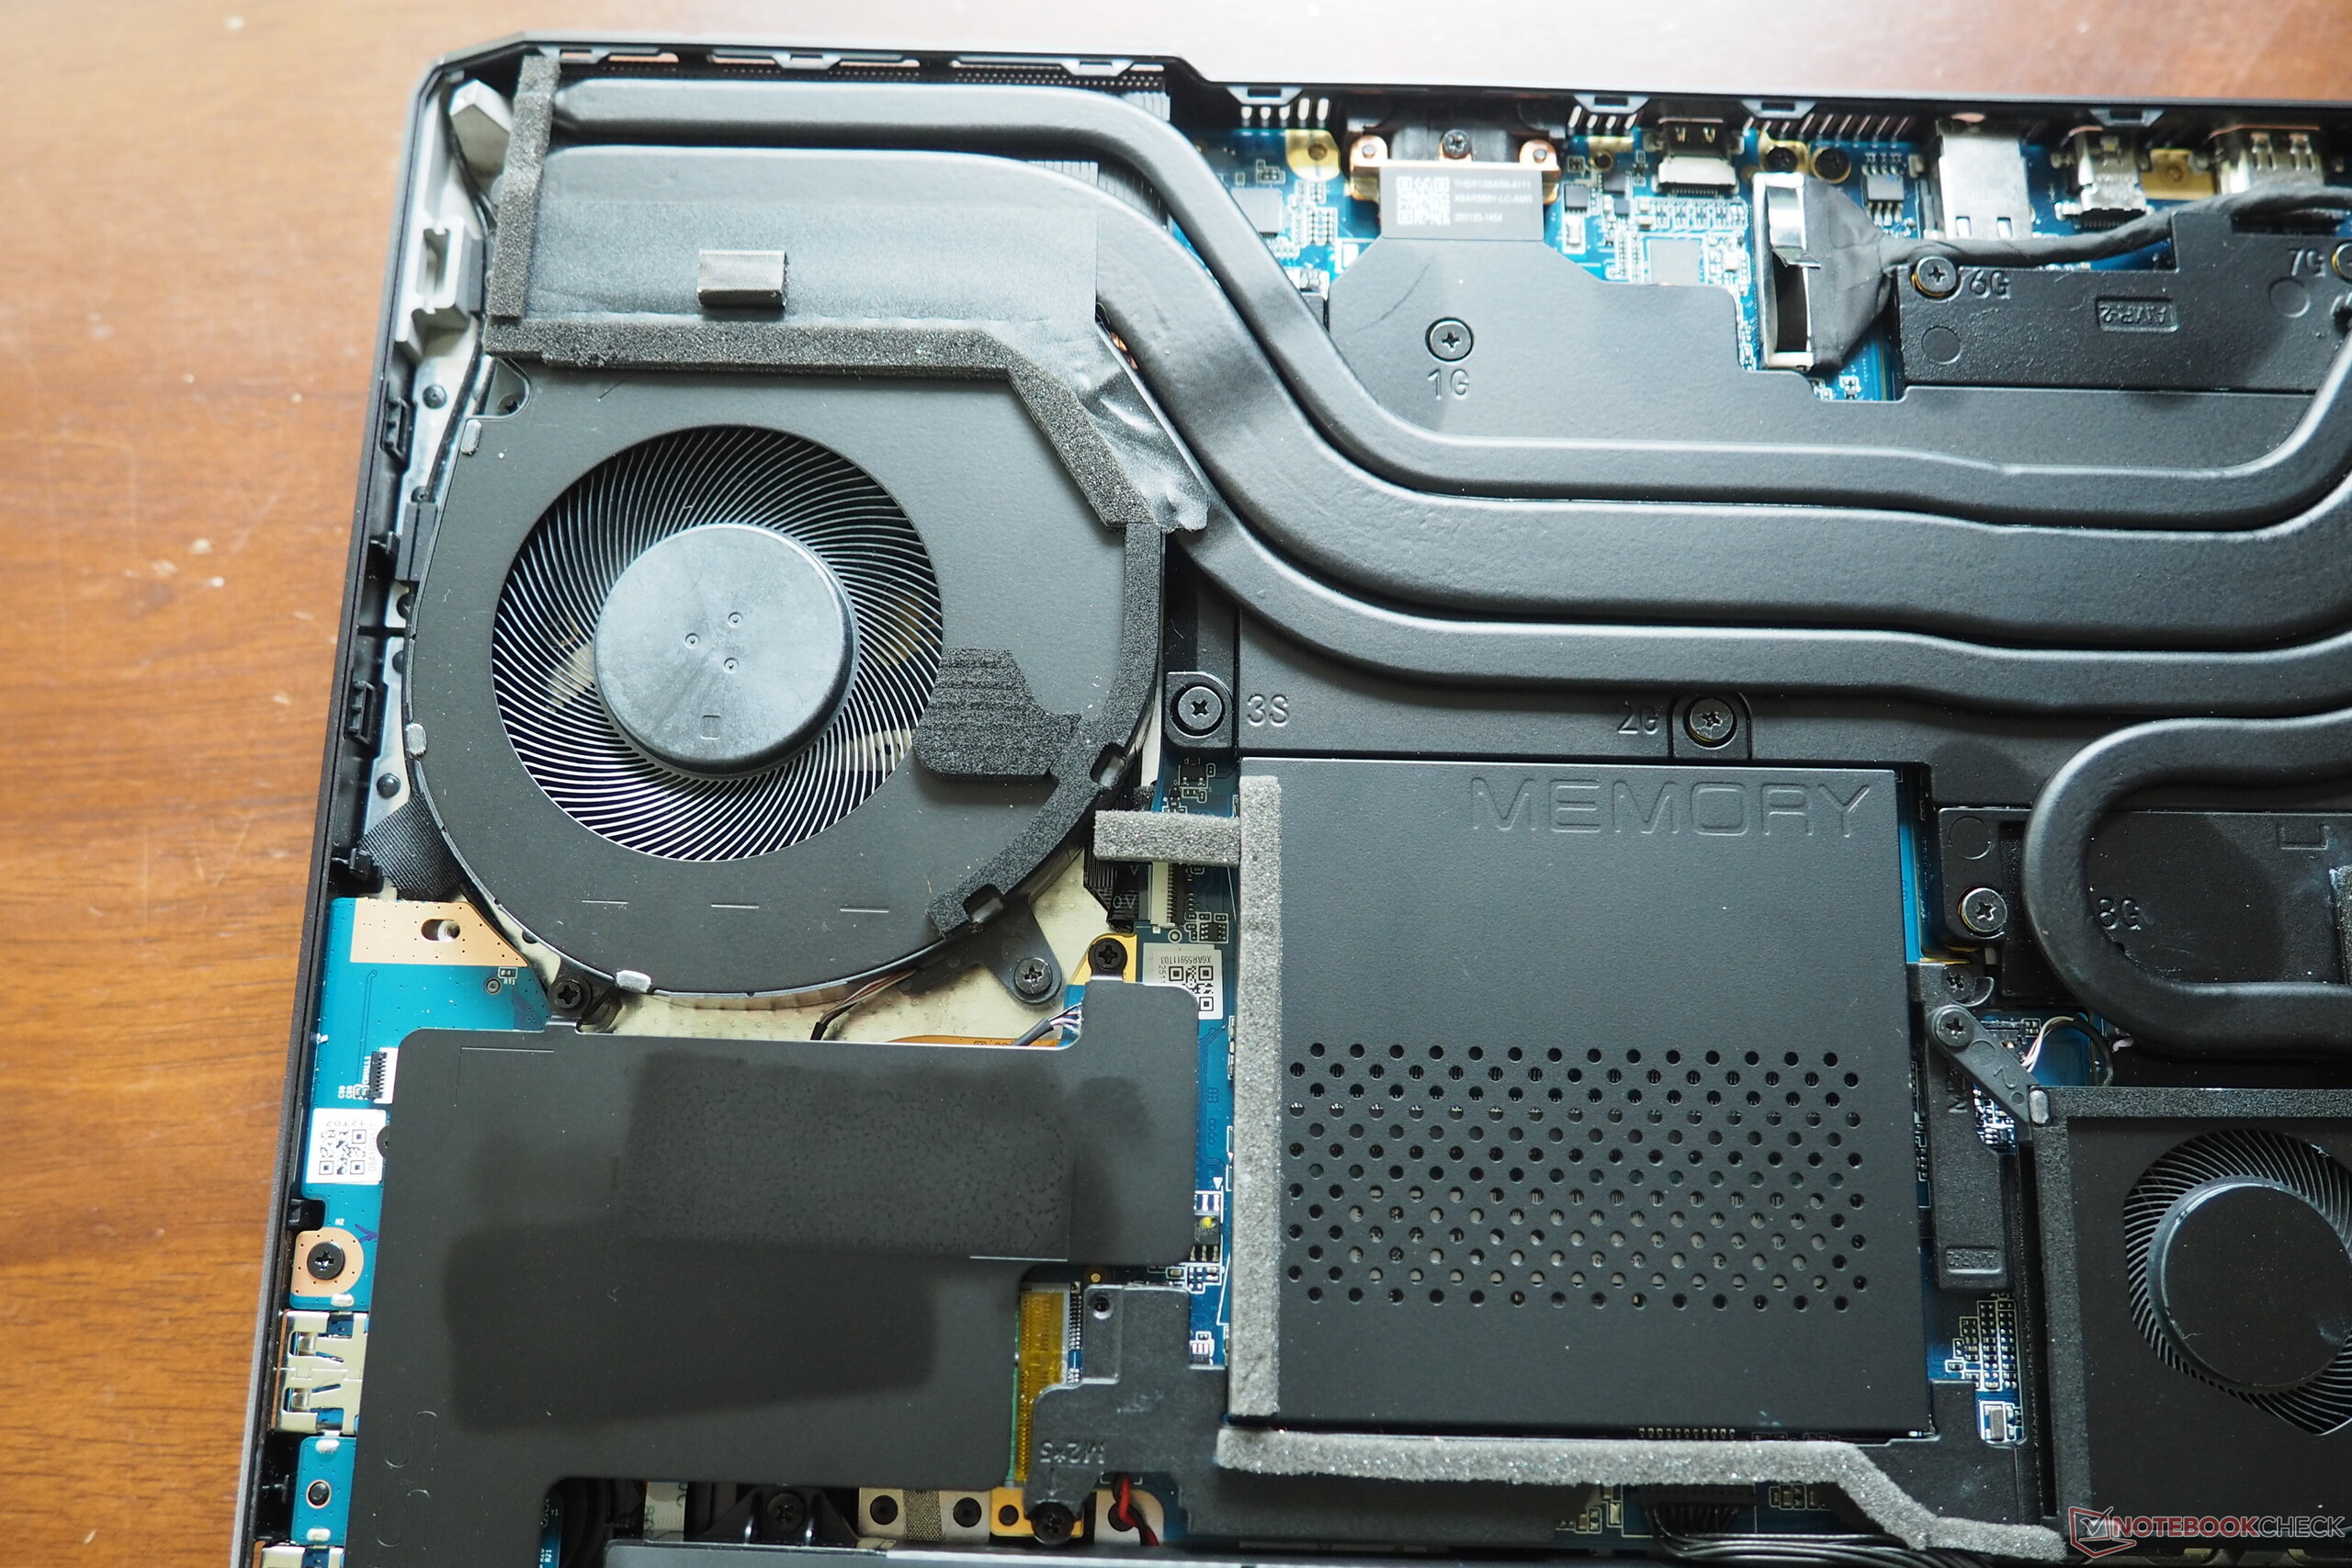
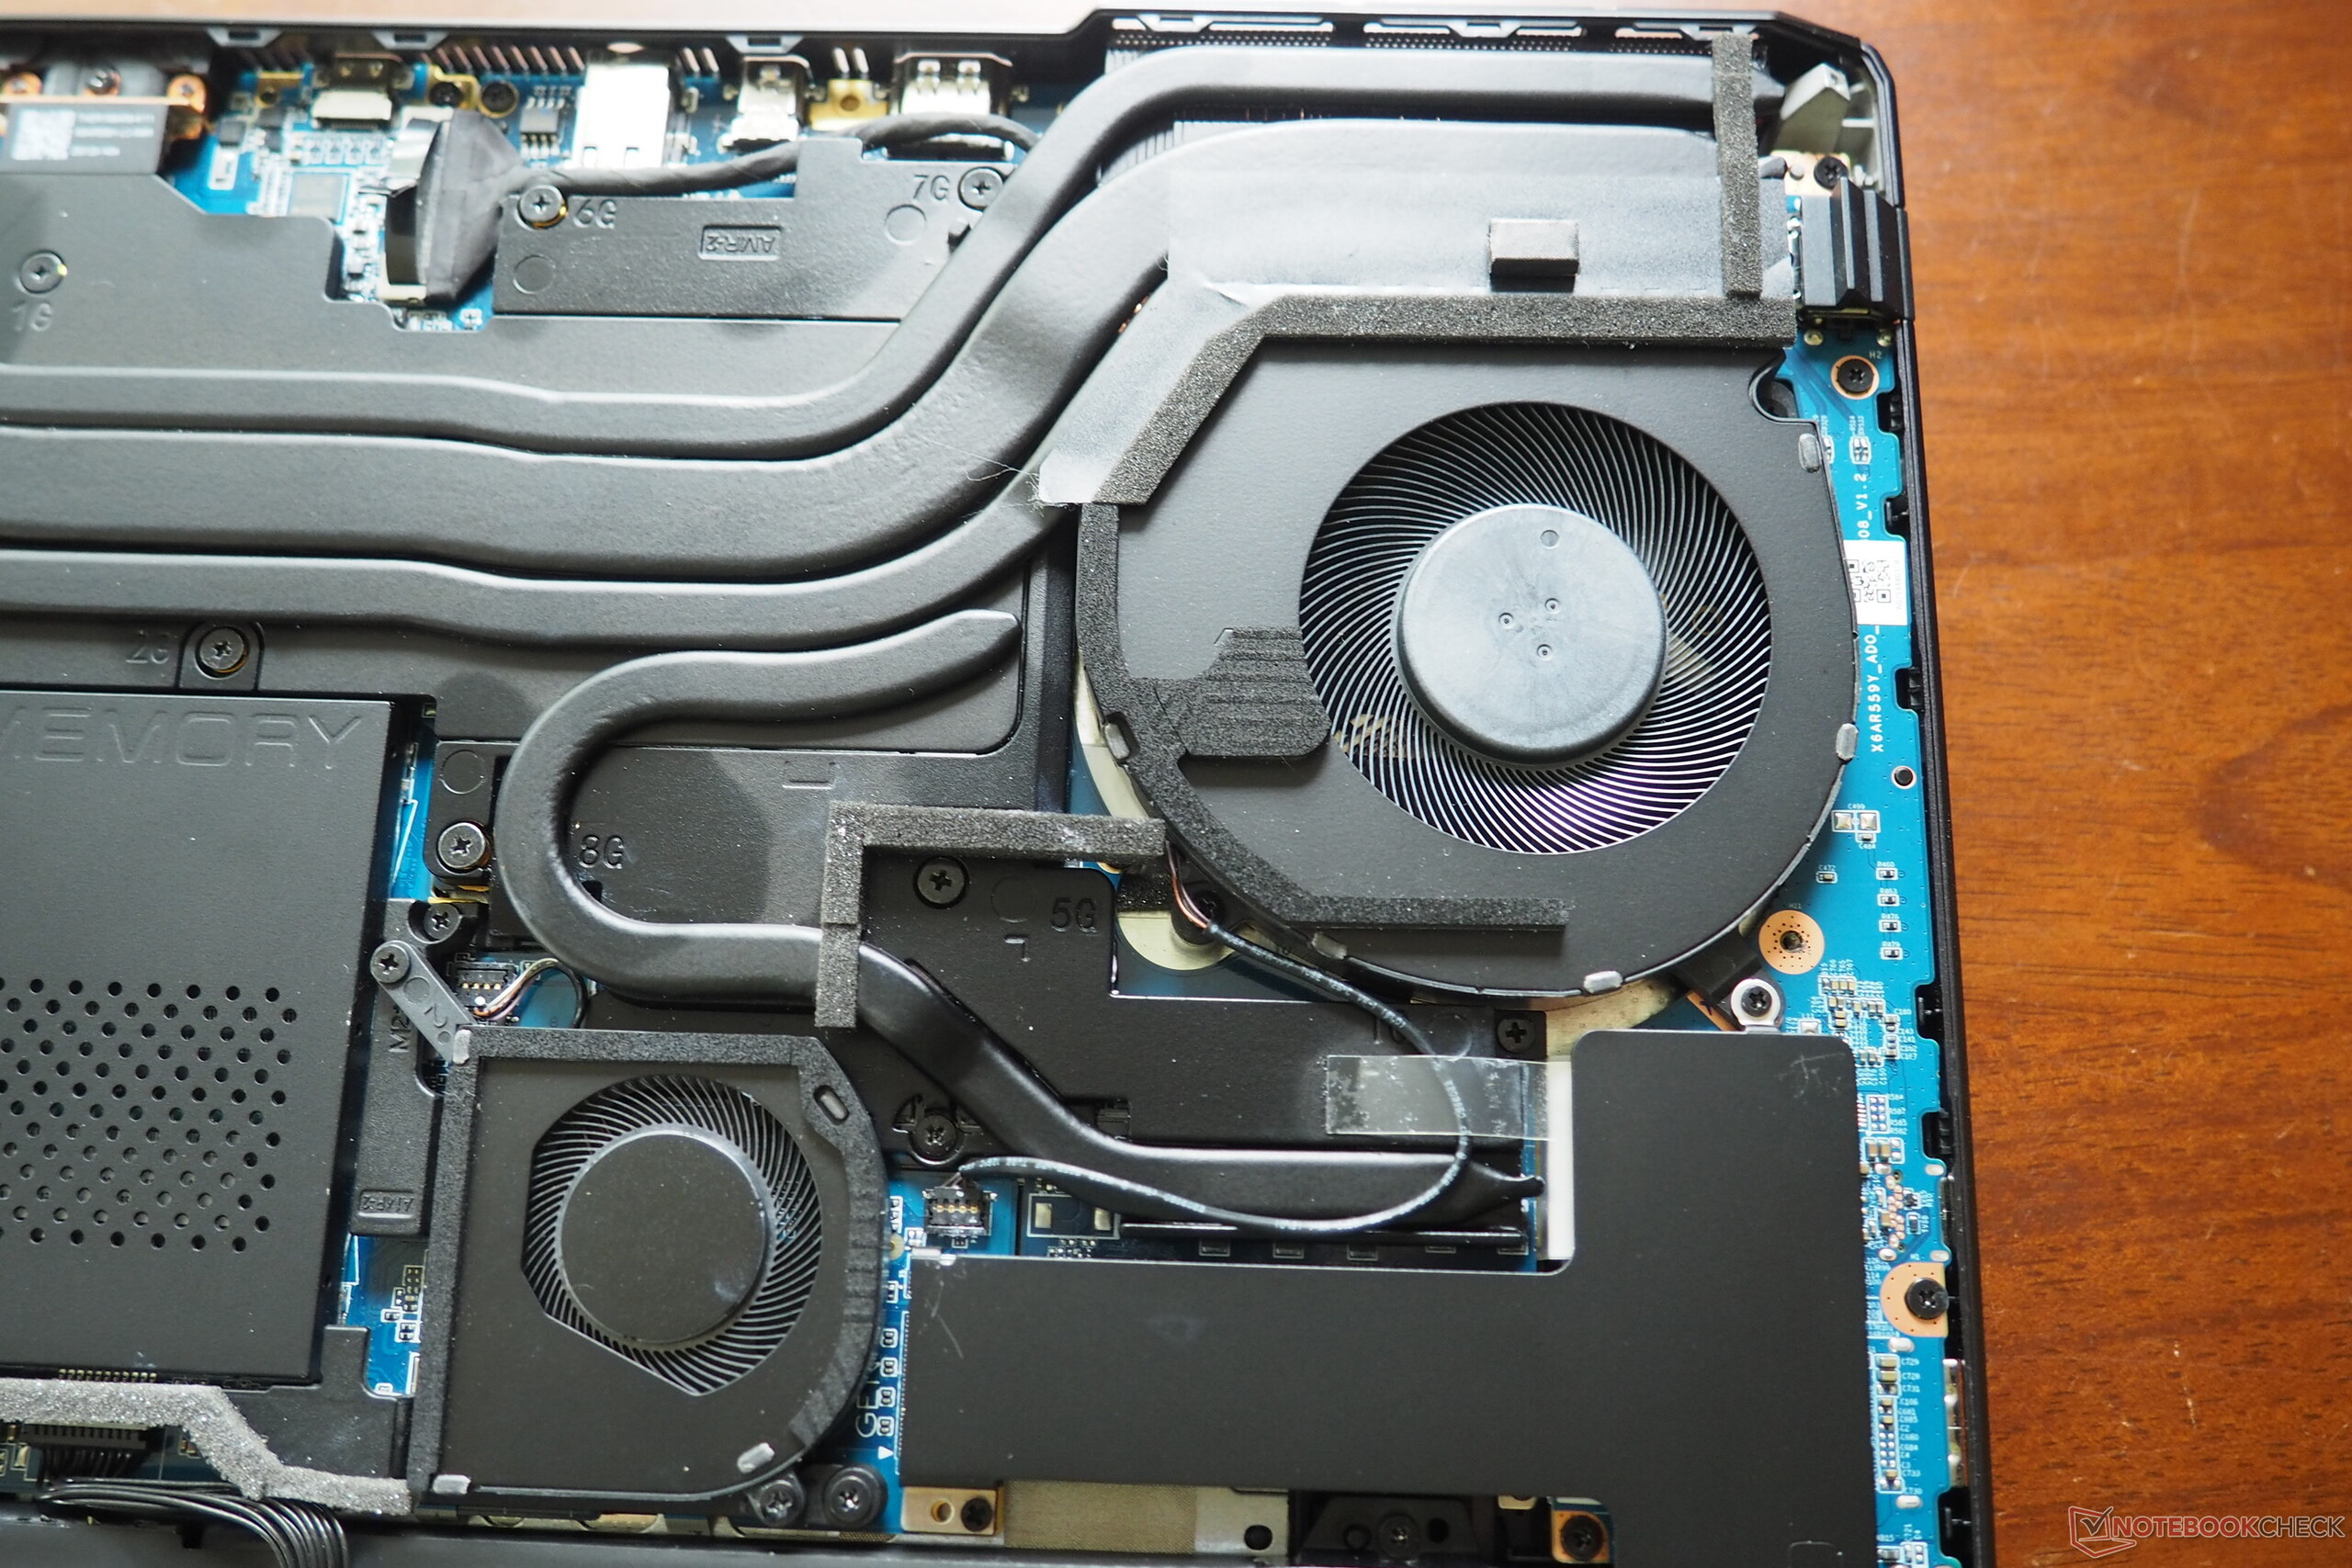
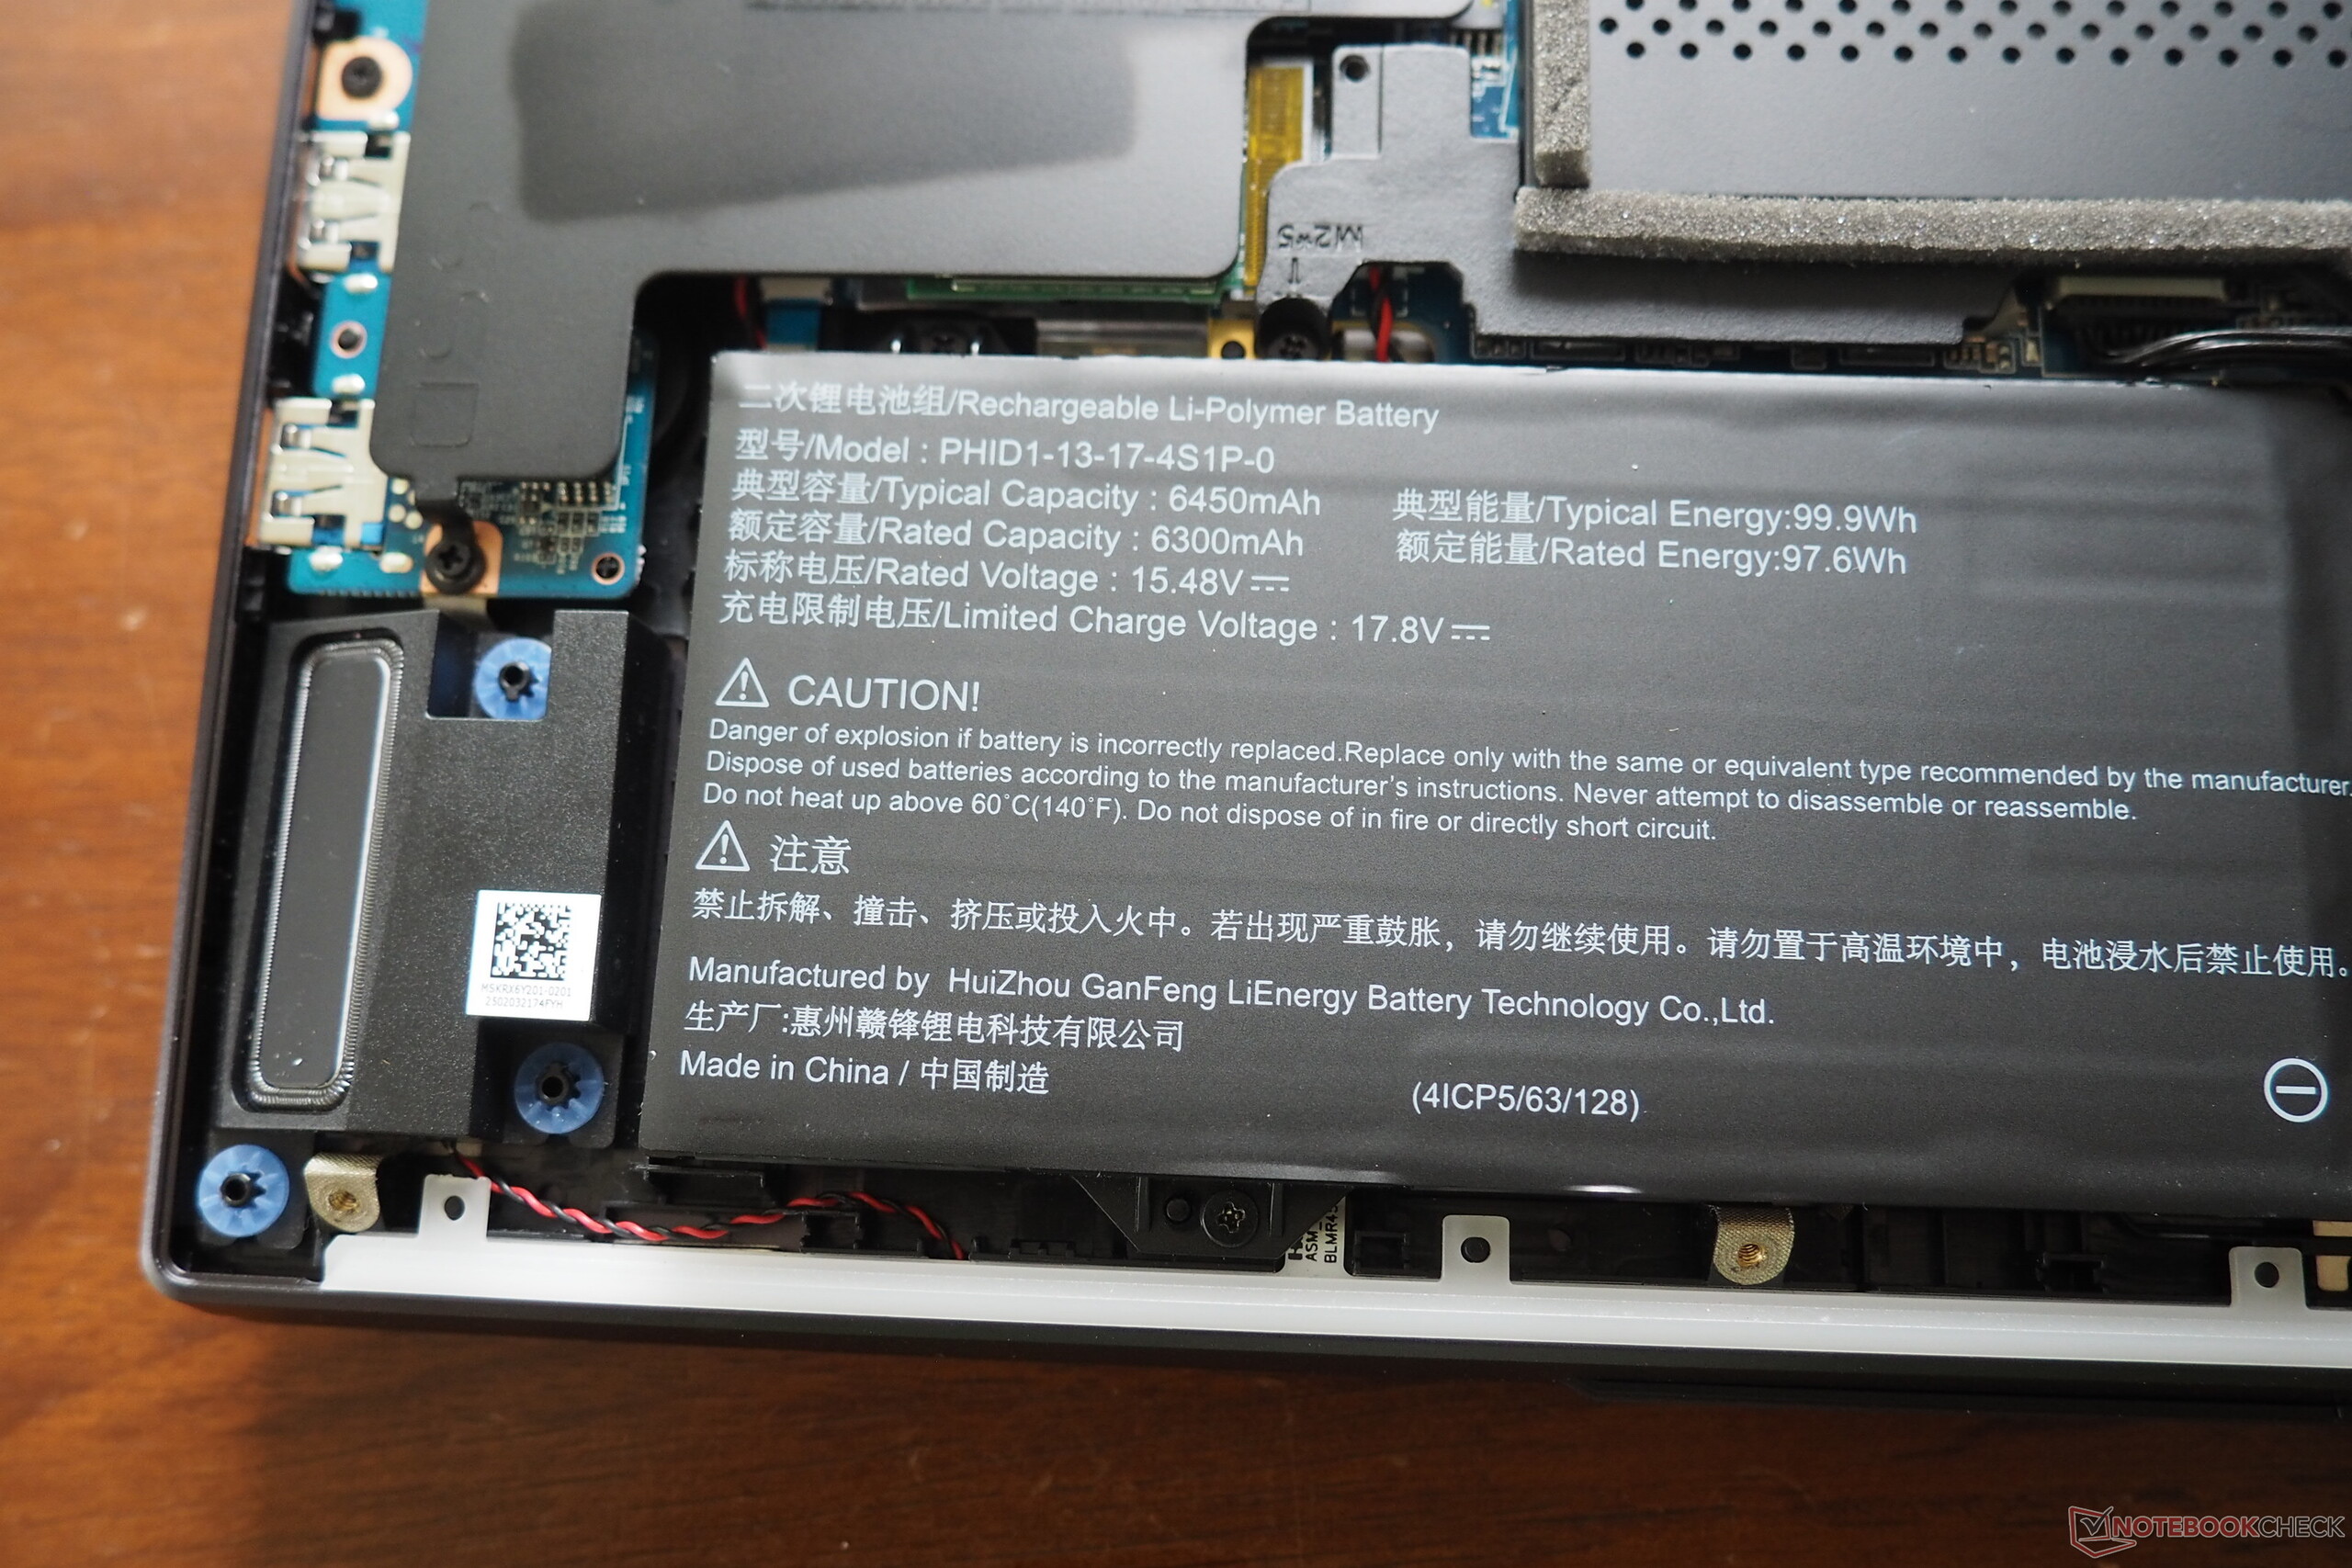
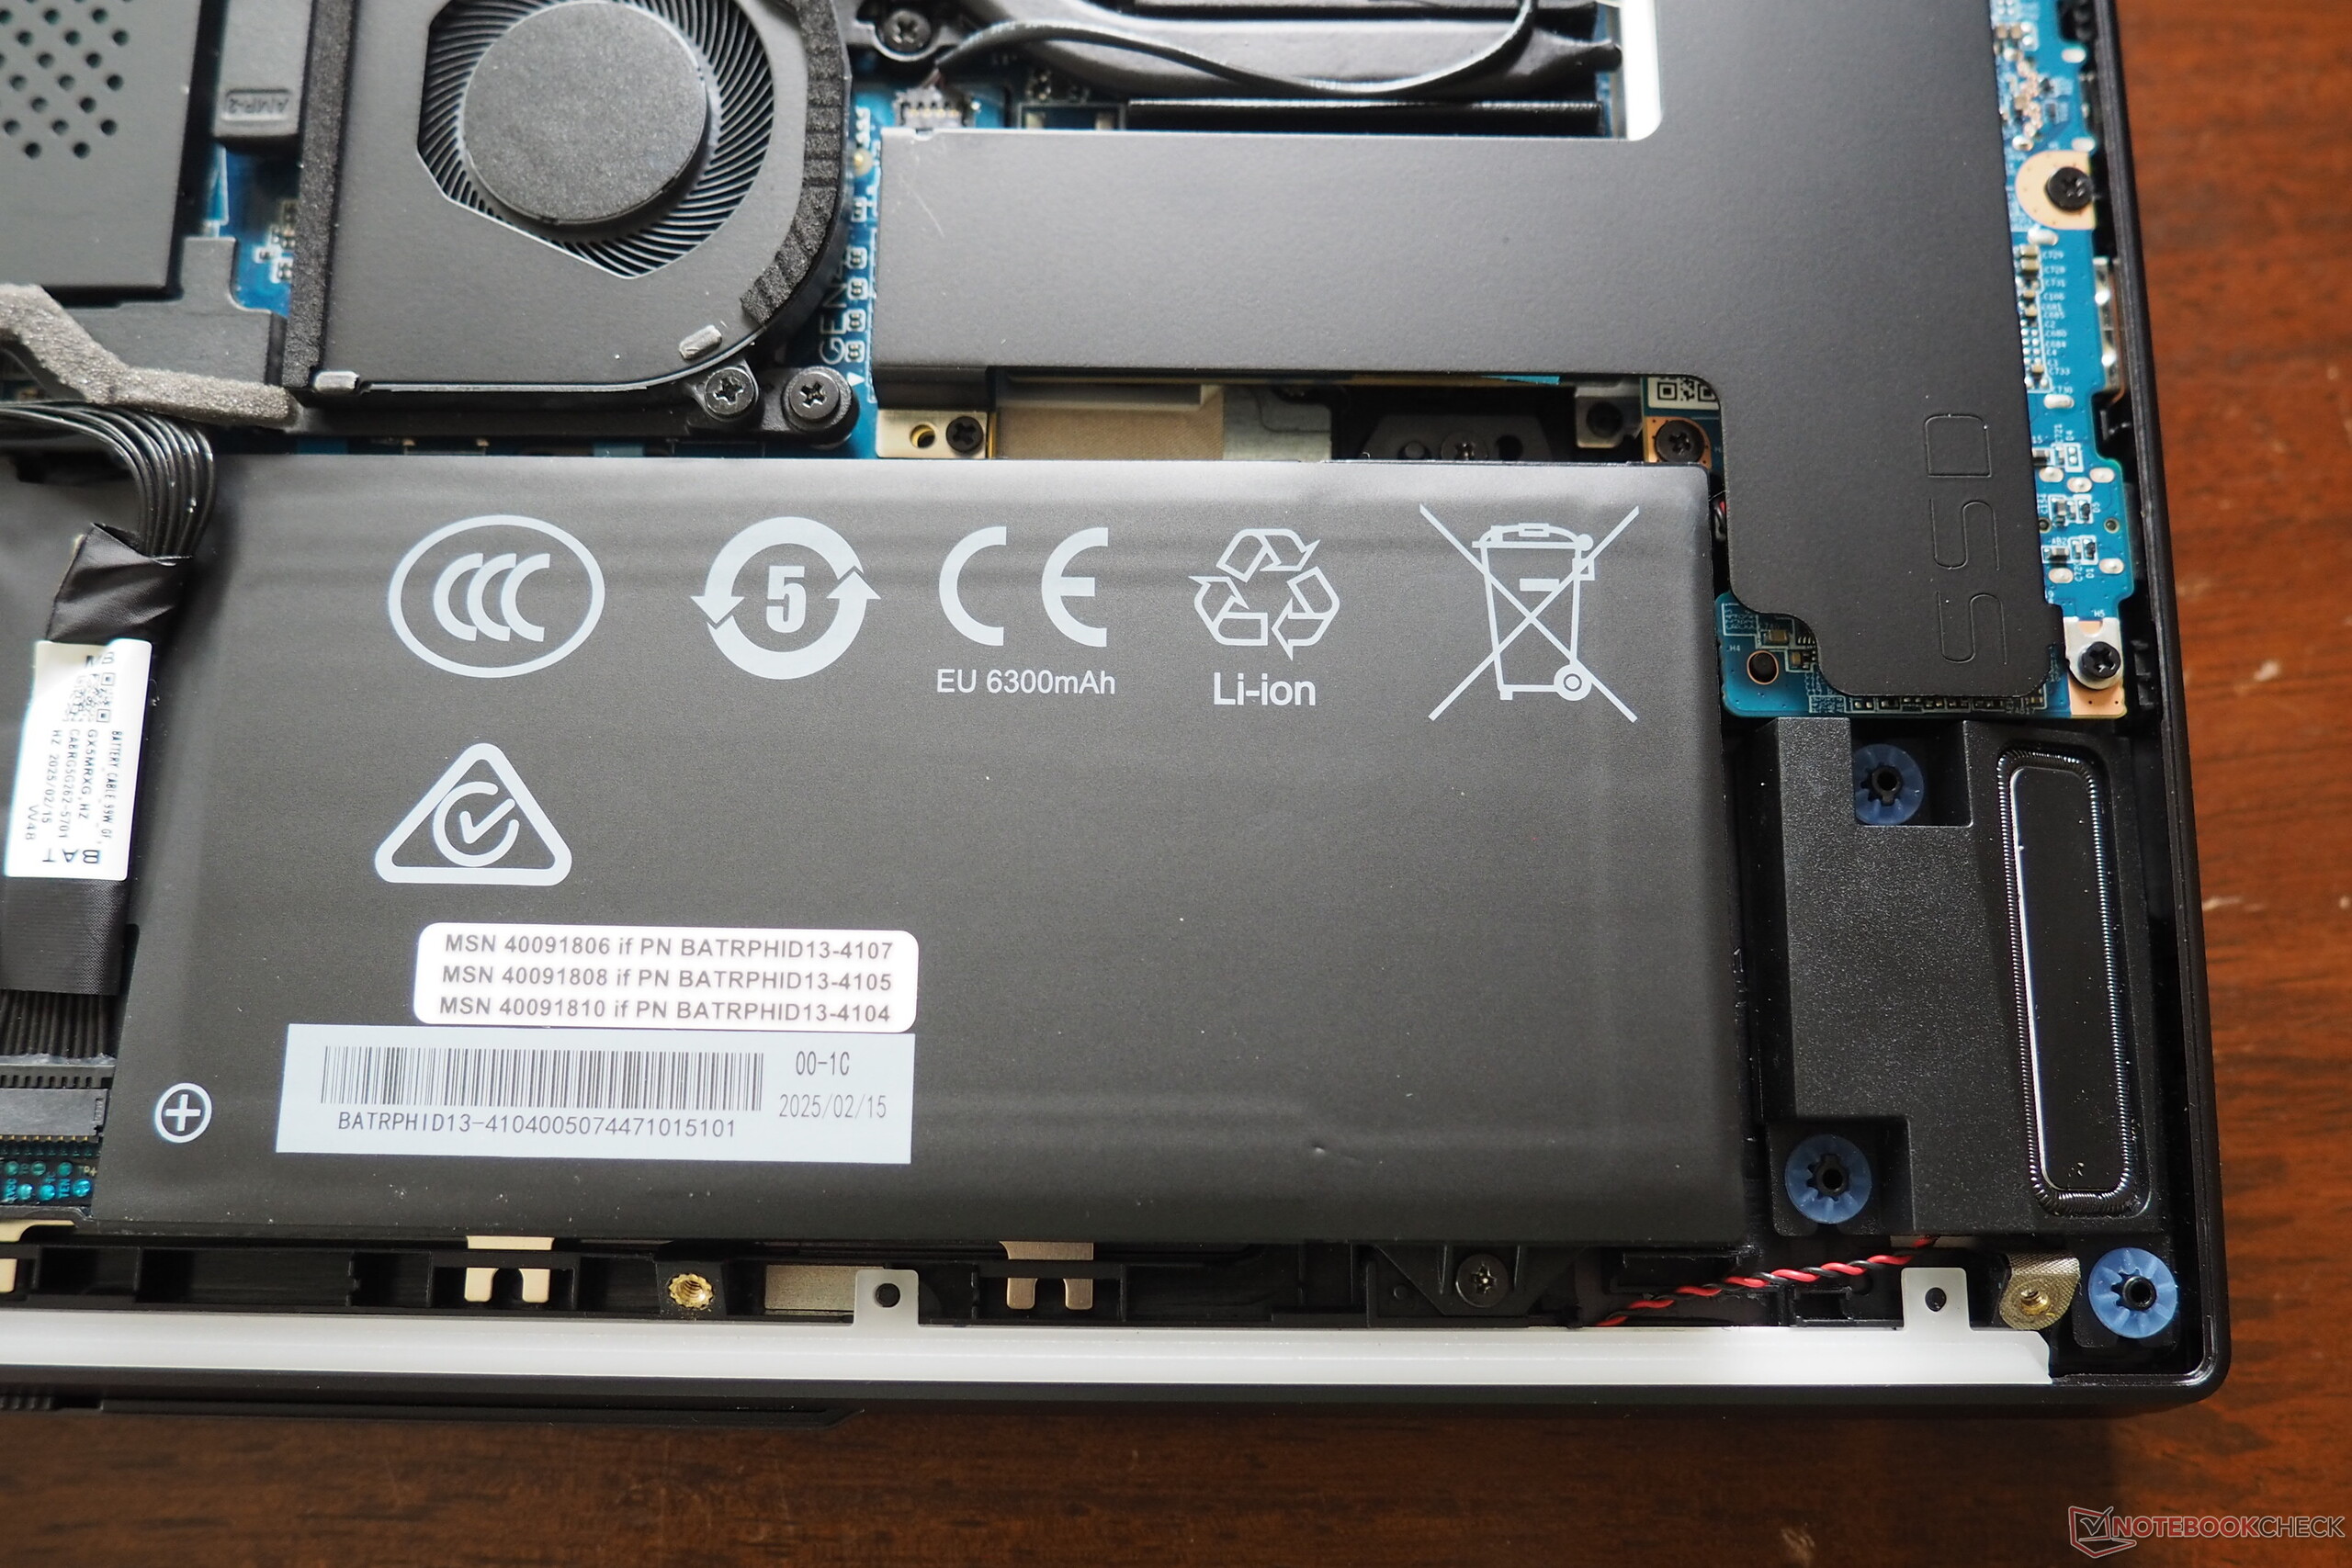
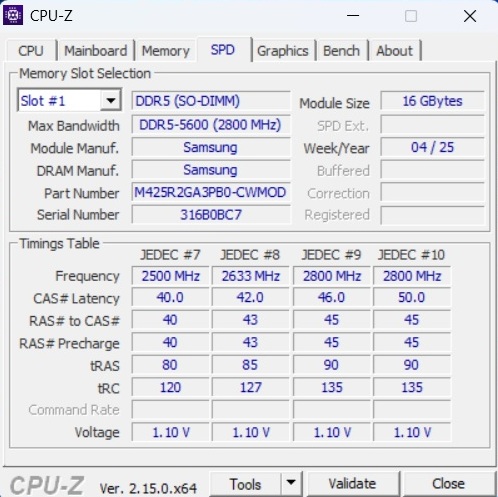
Describiríamos la calidad de imagen de la cámara web como media: Gracias a su resolución Full HD, es algo más nítida que las cámaras HD de algunos competidores, pero no hay que esperar milagros. Medion merece puntos extra por la cobertura física. El Beast 16 X1 puede repararse tras retirar 10 tornillos Phillips y la base de la carcasa. El modelo de 16 pulgadas alberga dos bancos SO-DIMM y dos ranuras M.2-2280 (1x PCIe 5, 1x PCIe 4), cada una de ellas oculta bajo disipadores de calor. Hablando del sistema de refrigeración: la máquina de juegos está equipada con tres ventiladores.
Lector de tarjetas SD
| SD Card Reader | |
| average JPG Copy Test (av. of 3 runs) | |
| Medion Erazer Beast 16 X1 Ultimate (AV PRO microSD 128 GB V60) | |
| Media de la clase Gaming (20.9 - 210, n=54, últimos 2 años) | |
| Schenker XMG Neo 16 E25 RTX 5090 Laptop (Angelbird AV Pro V60) | |
| maximum AS SSD Seq Read Test (1GB) | |
| Schenker XMG Neo 16 E25 RTX 5090 Laptop (Angelbird AV Pro V60) | |
| Medion Erazer Beast 16 X1 Ultimate (AV PRO microSD 128 GB V60) | |
| Media de la clase Gaming (25.5 - 261, n=51, últimos 2 años) | |
Comunicación
Cámara web


Mantenimiento
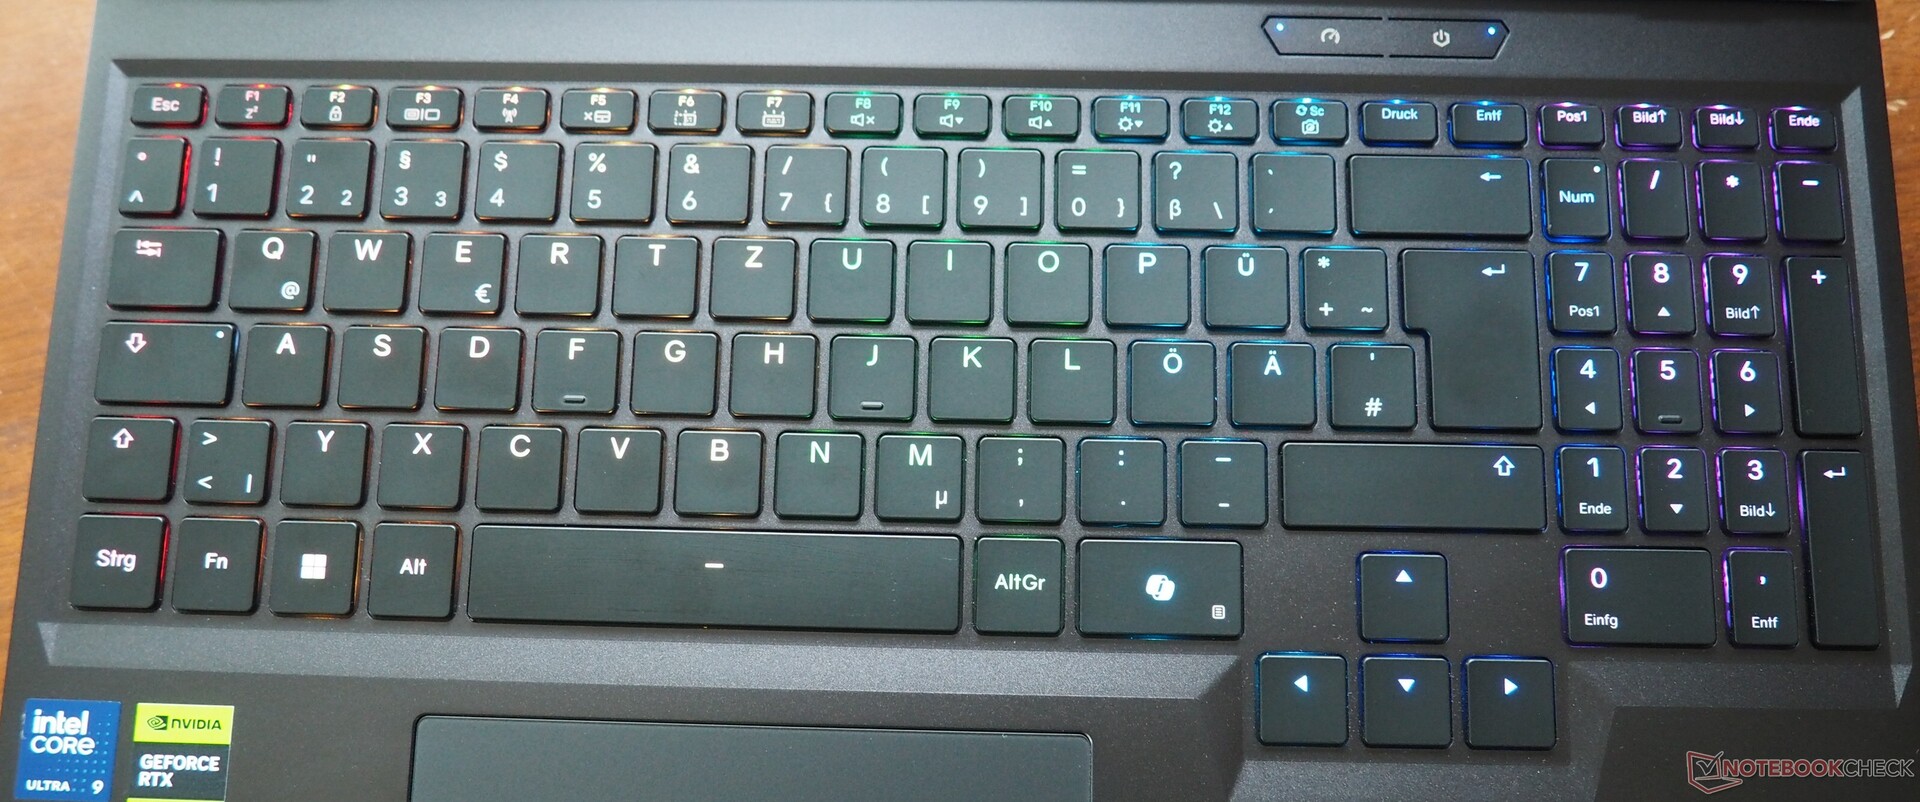
Dispositivos de entrada
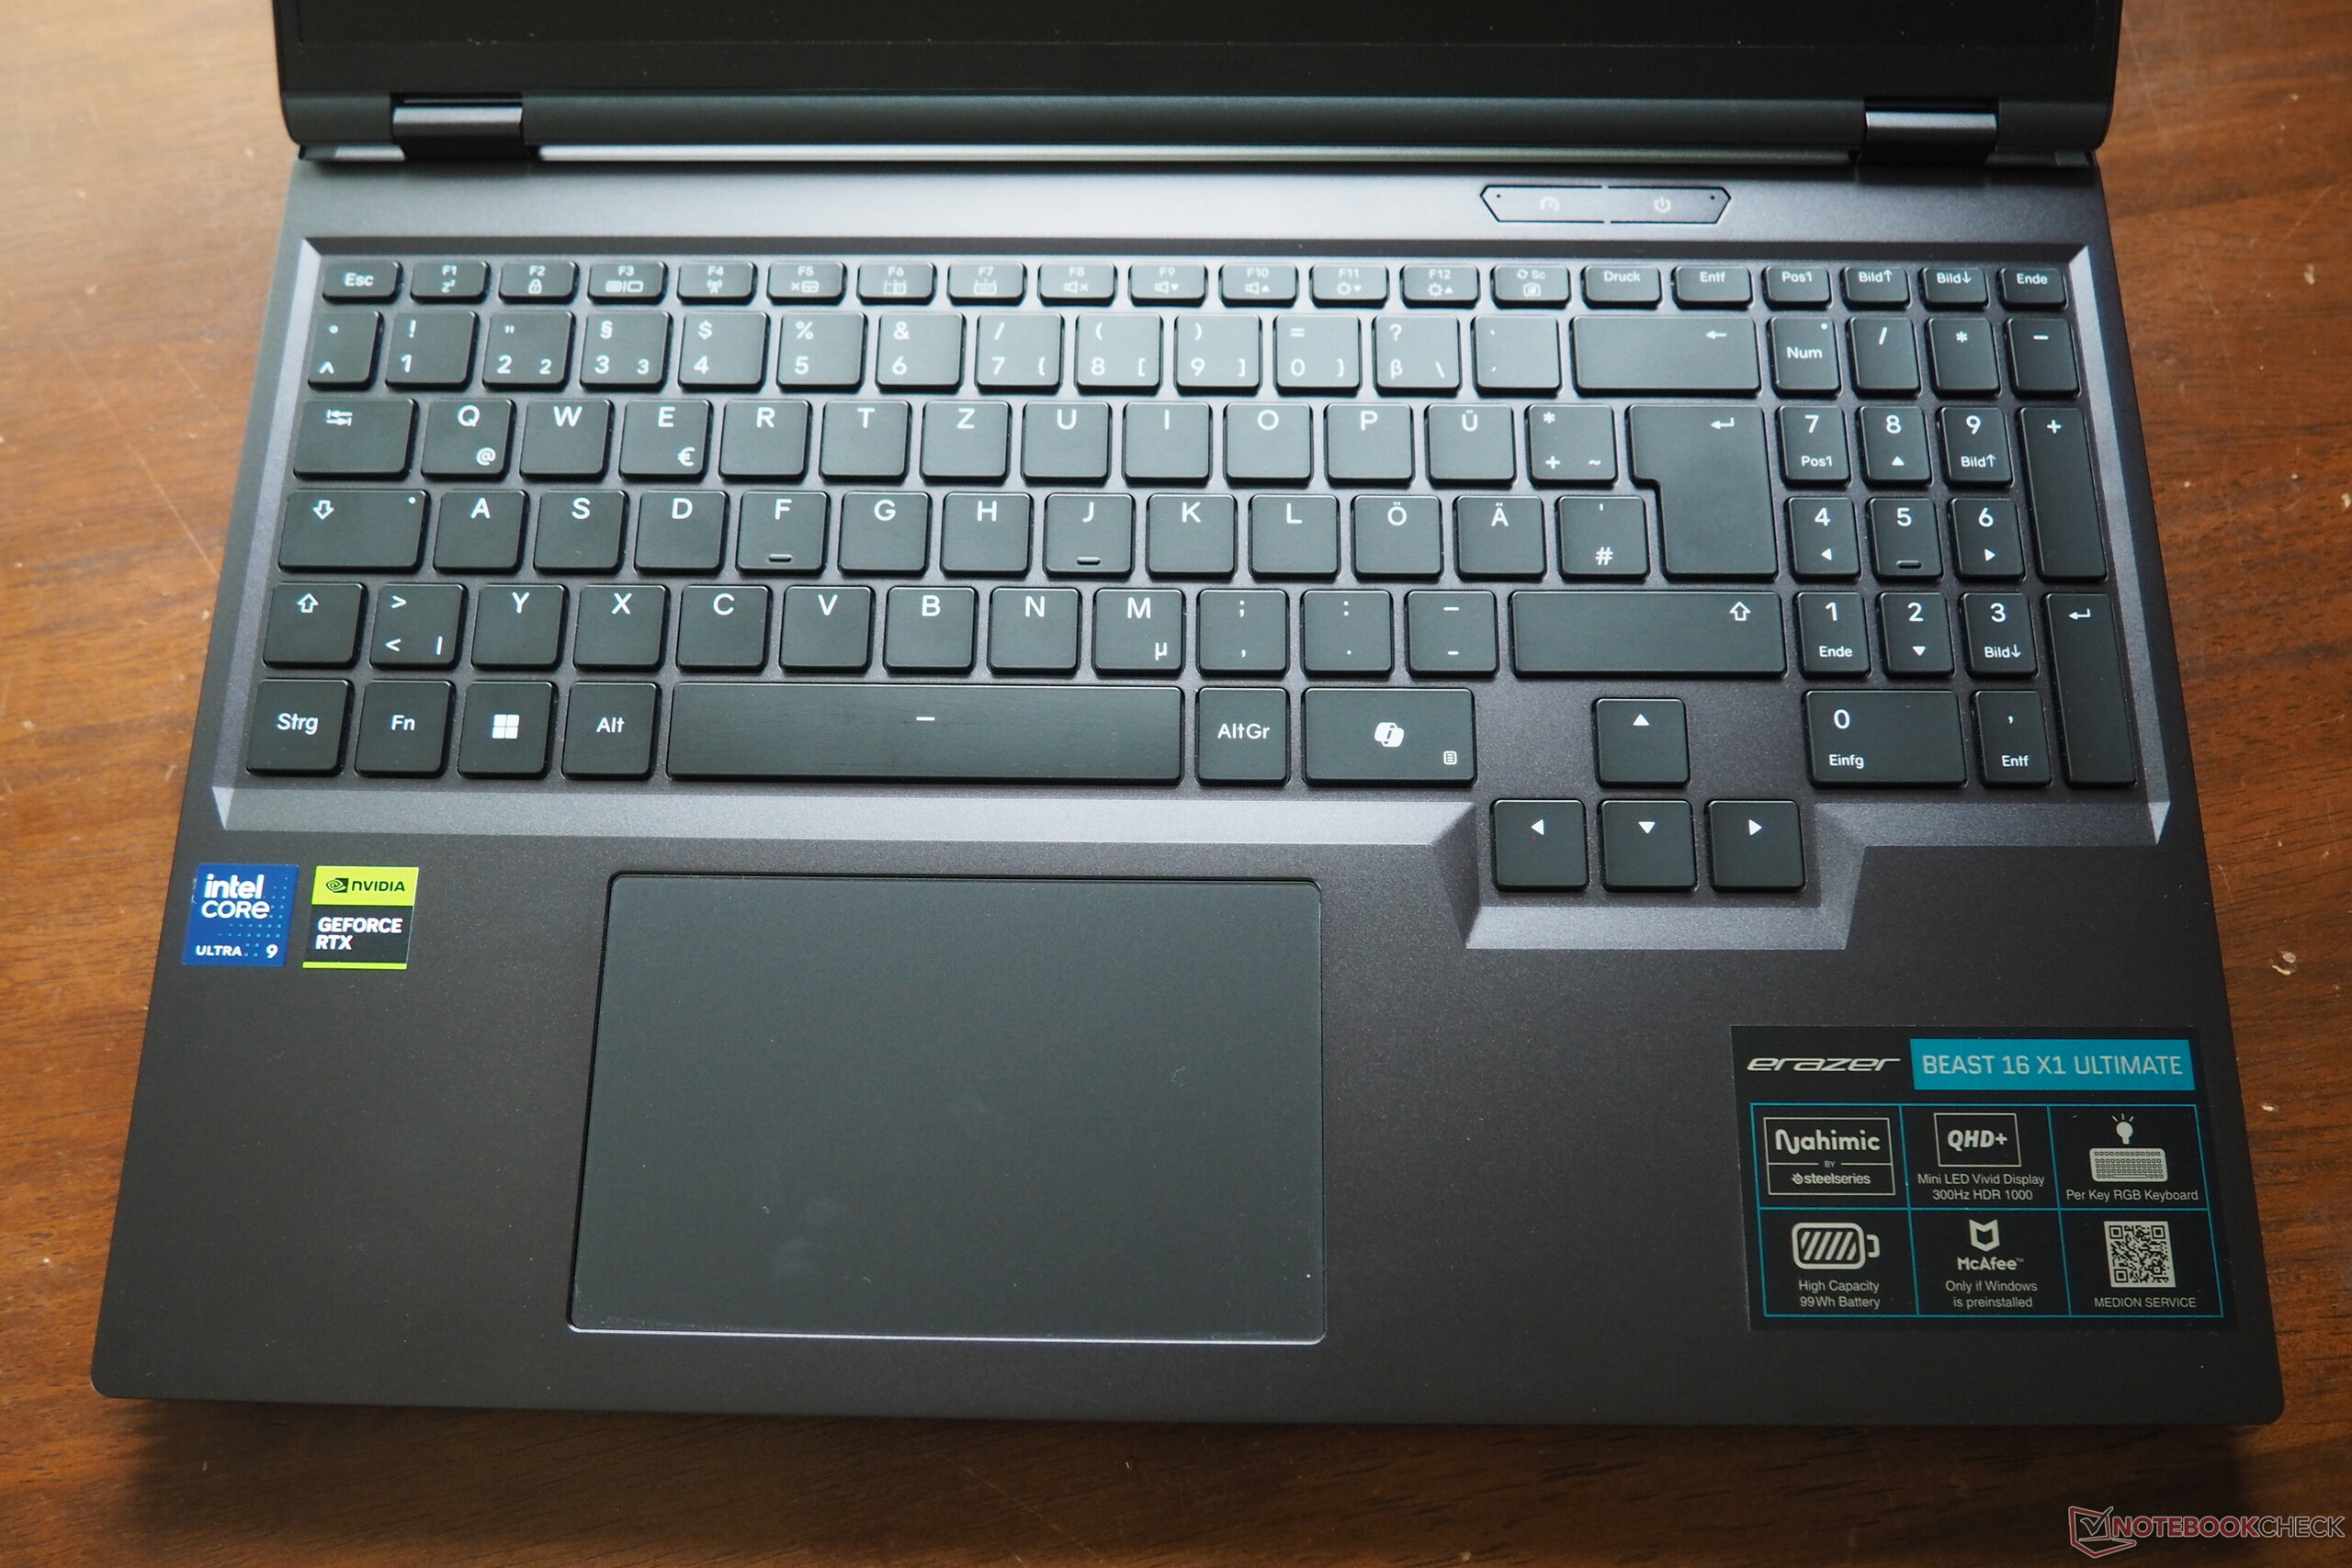
El teclado de la Beast 16 X1 impresiona por su muy buena respuesta, que está casi a la altura de los modelos mecánicos. Hay un teclado numérico dedicado en el lado derecho, cuyas teclas son ligeramente más estrechas que el resto. Los aficionados a las flechas de dirección se alegrarán de las dimensiones normales de estas teclas. La iluminación integrada (RGB por tecla) puede ajustarse a varios niveles.
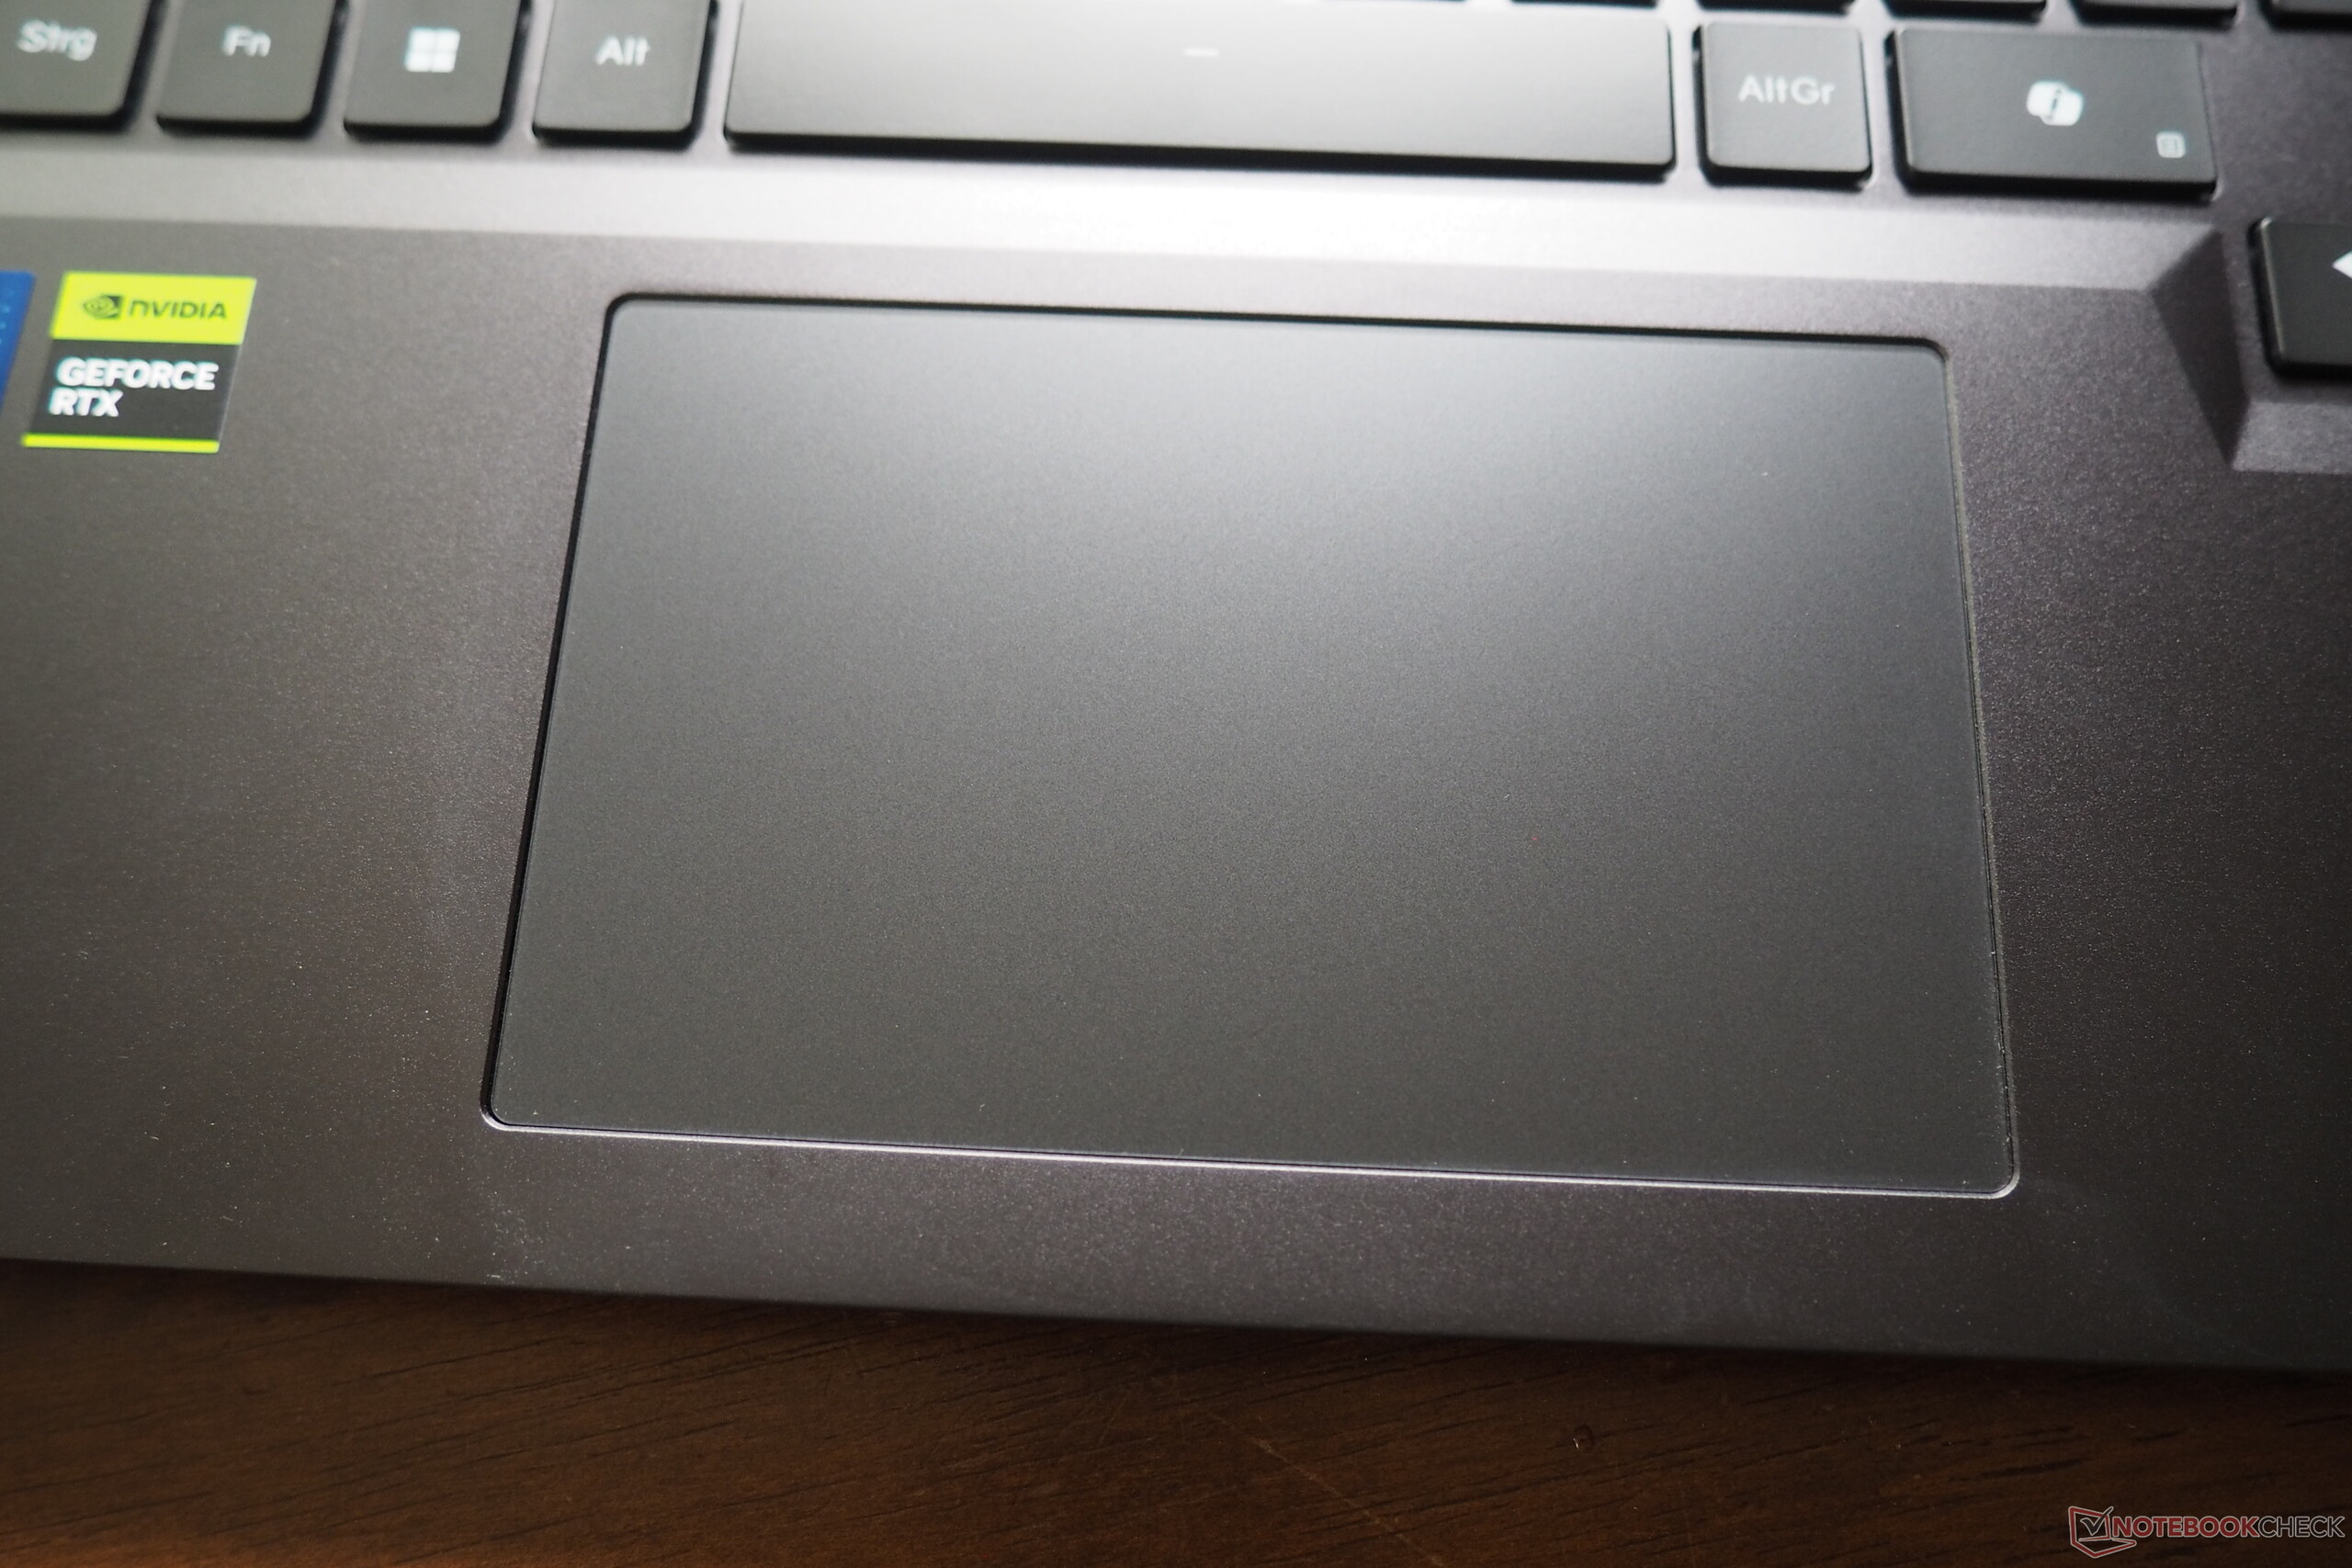
El touchpad pasa desapercibido en sentido positivo en cuanto a precisión, propiedades de deslizamiento y soporte de gestos. Con un tamaño de 12,4 x 7,6 cm (~4,9 x 3,0 in), ha sido dimensionado adecuadamente. Las zonas de clic en el borde inferior se activan de forma algo ruidosa, pero tienen una respuesta sólida (háptica) similar a la del teclado.
Mostrar
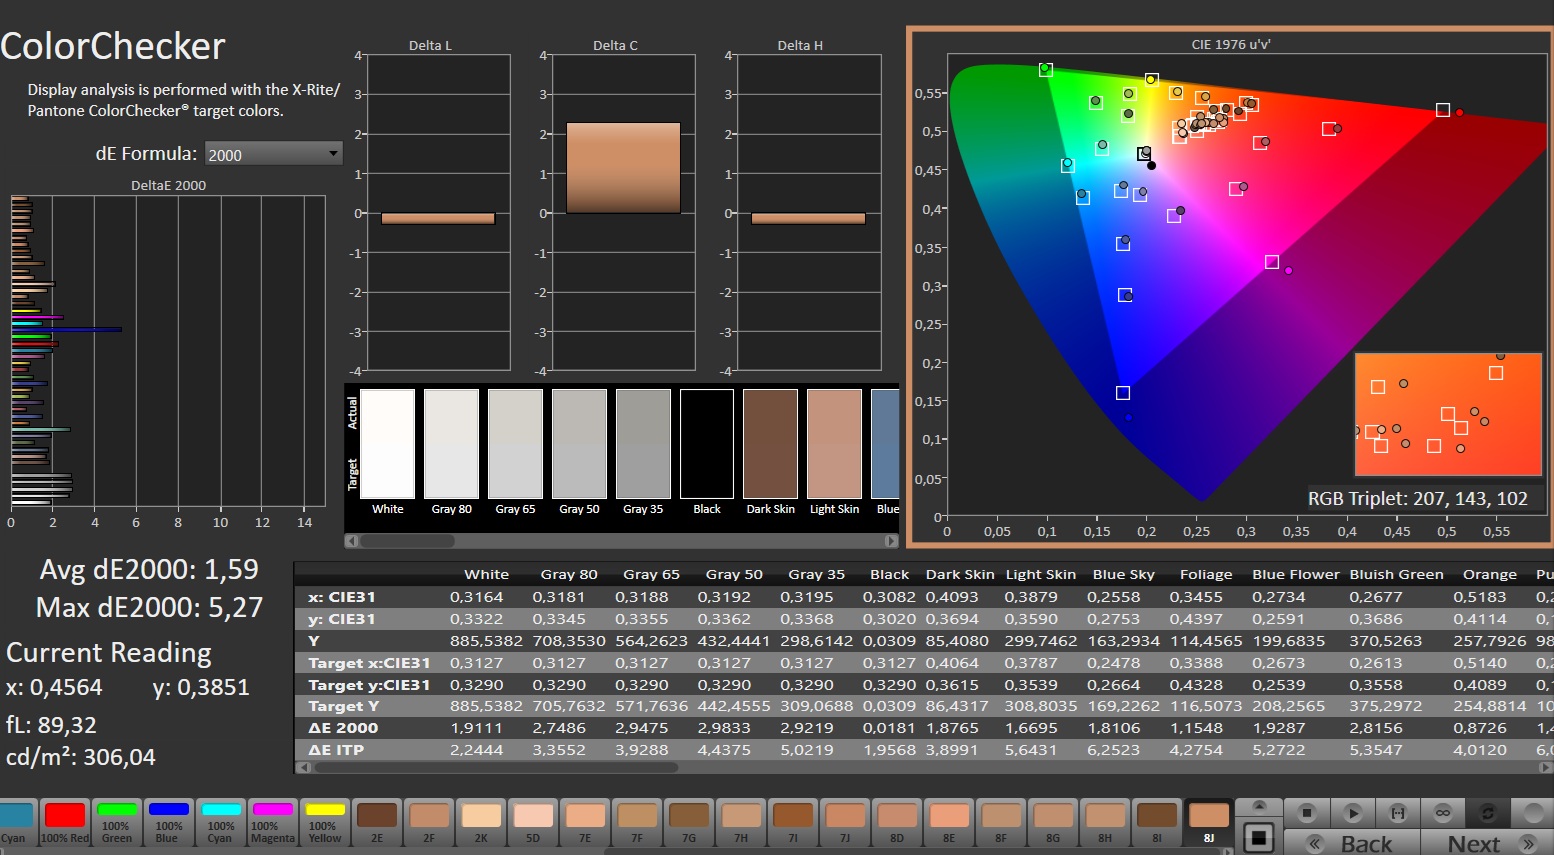
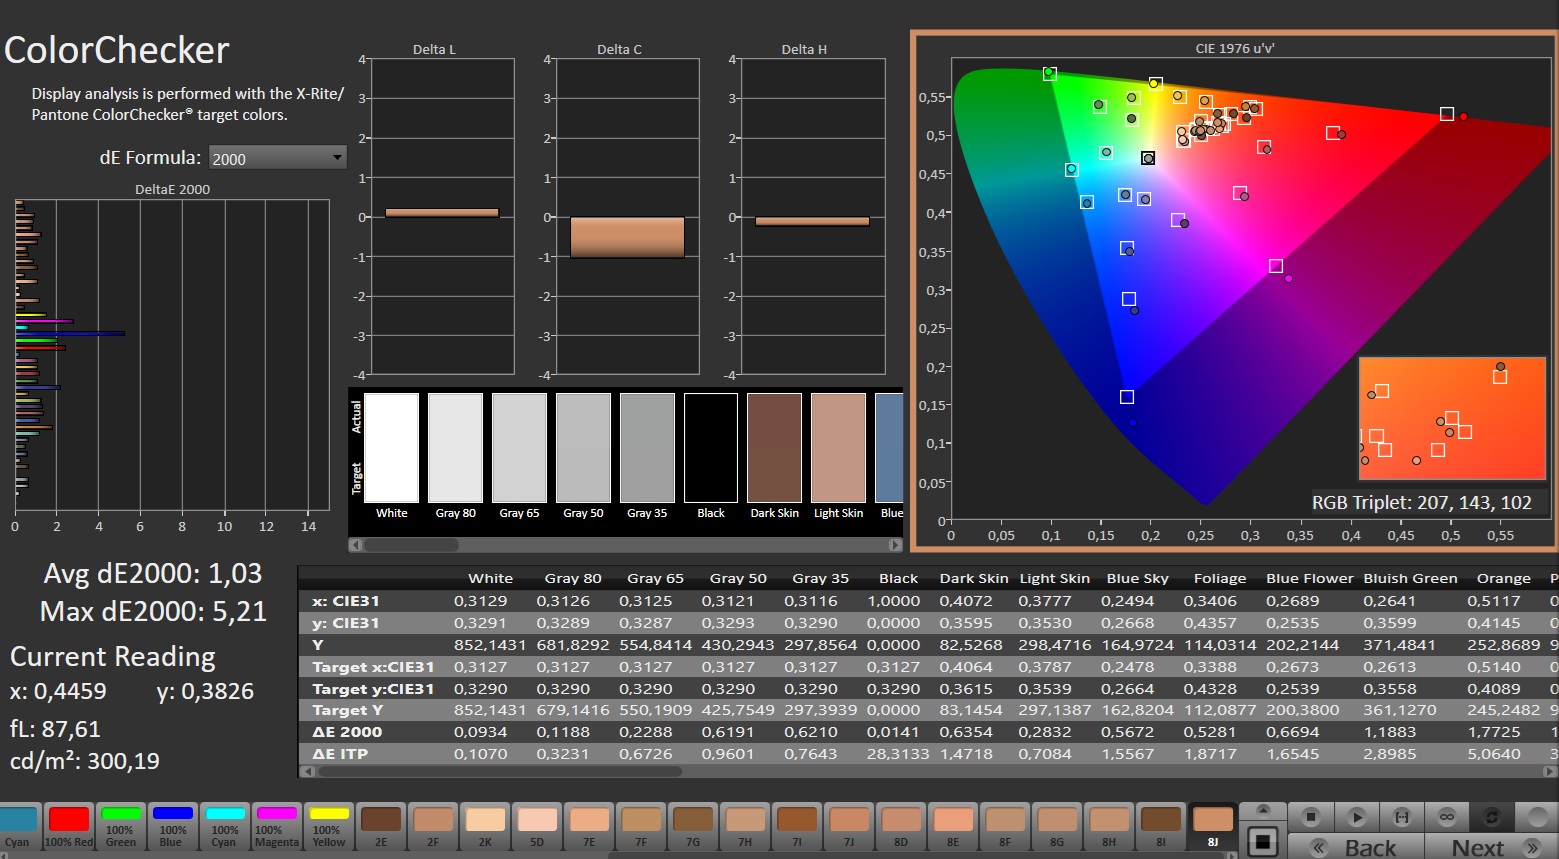
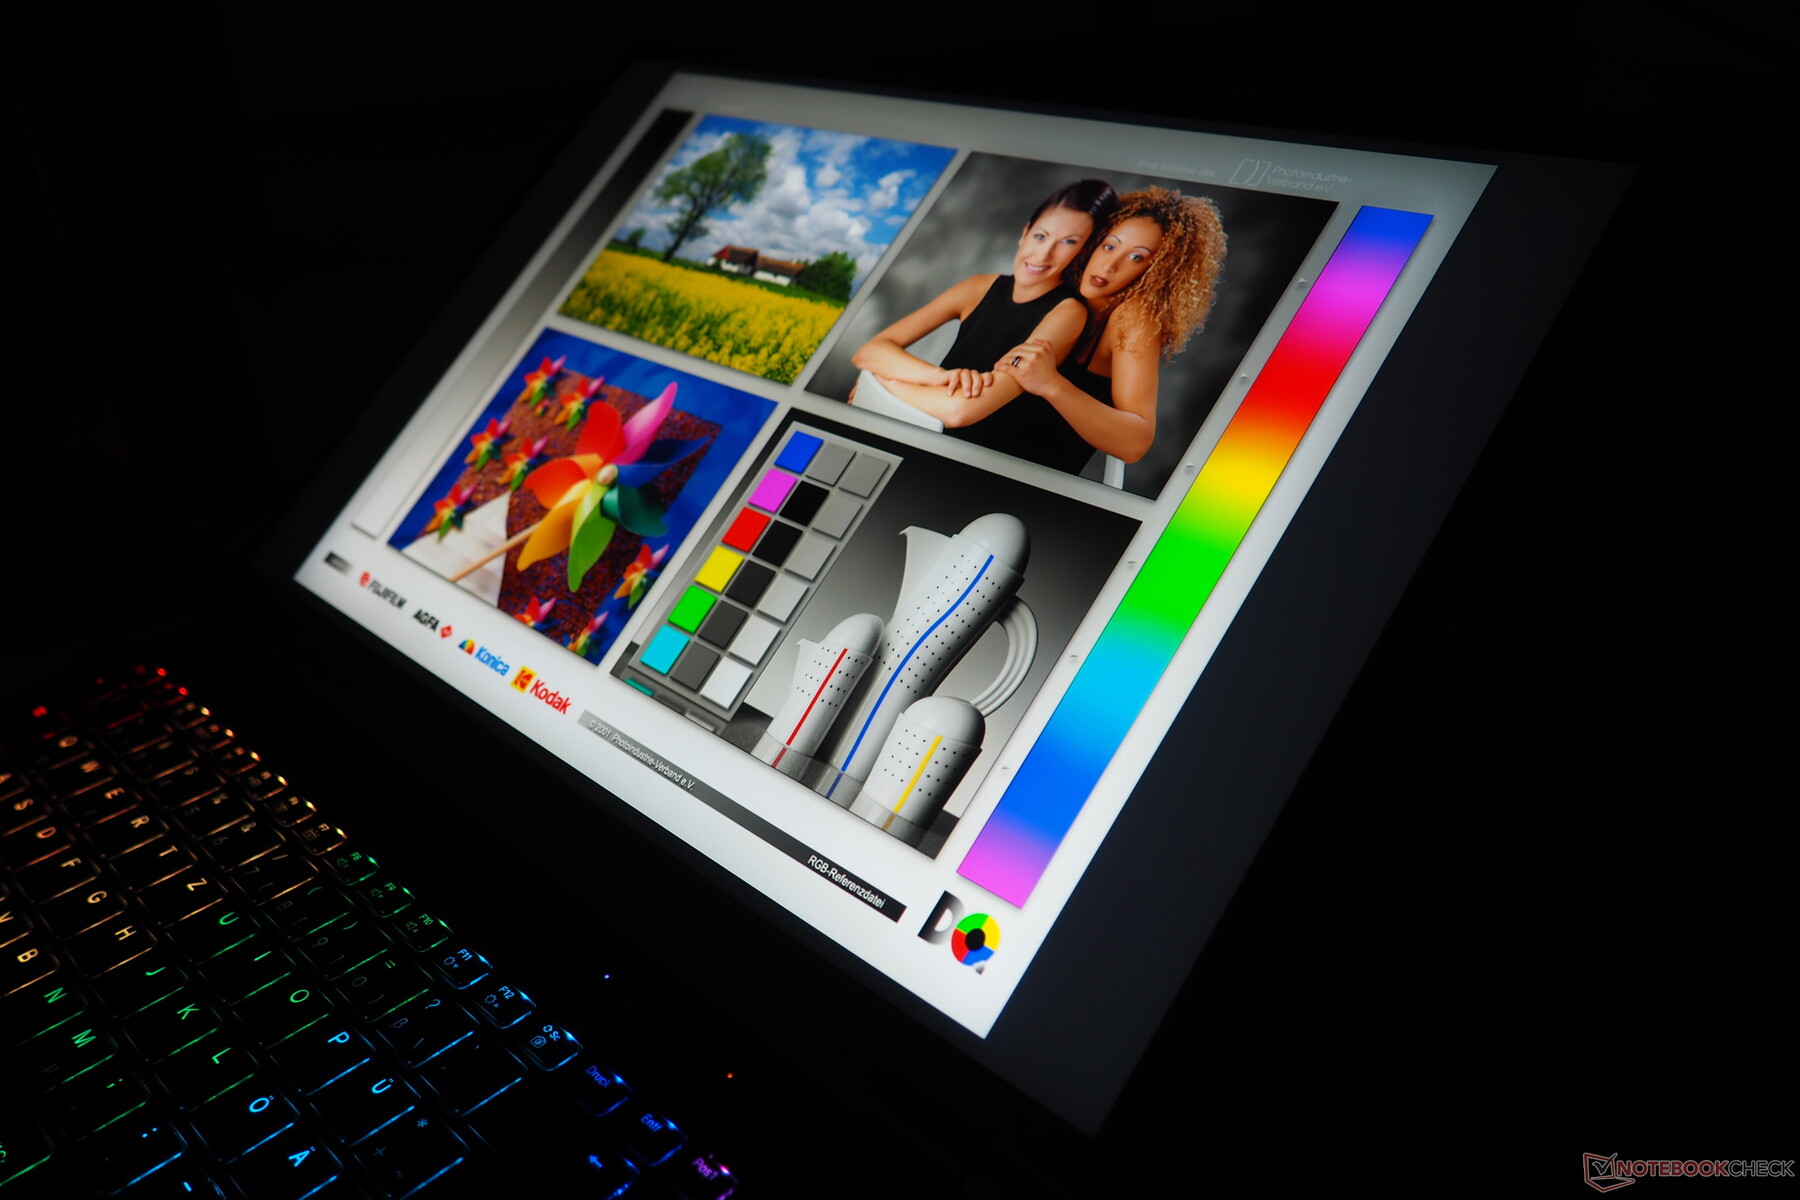
Uno de los aspectos más destacados de la Beast 16 X1 es su minipantalla LED de primera clase. Incluso fuera de la caja, la pantalla de 16 pulgadas ofrece un nivel bastante alto de precisión cromática.
| |||||||||||||||||||||||||
iluminación: 94 %
Brillo con batería: 837 cd/m²
Contraste: ∞:1 (Negro: 0 cd/m²)
ΔE ColorChecker Calman: 1.59 | ∀{0.5-29.43 Ø4.72}
calibrated: 1.03
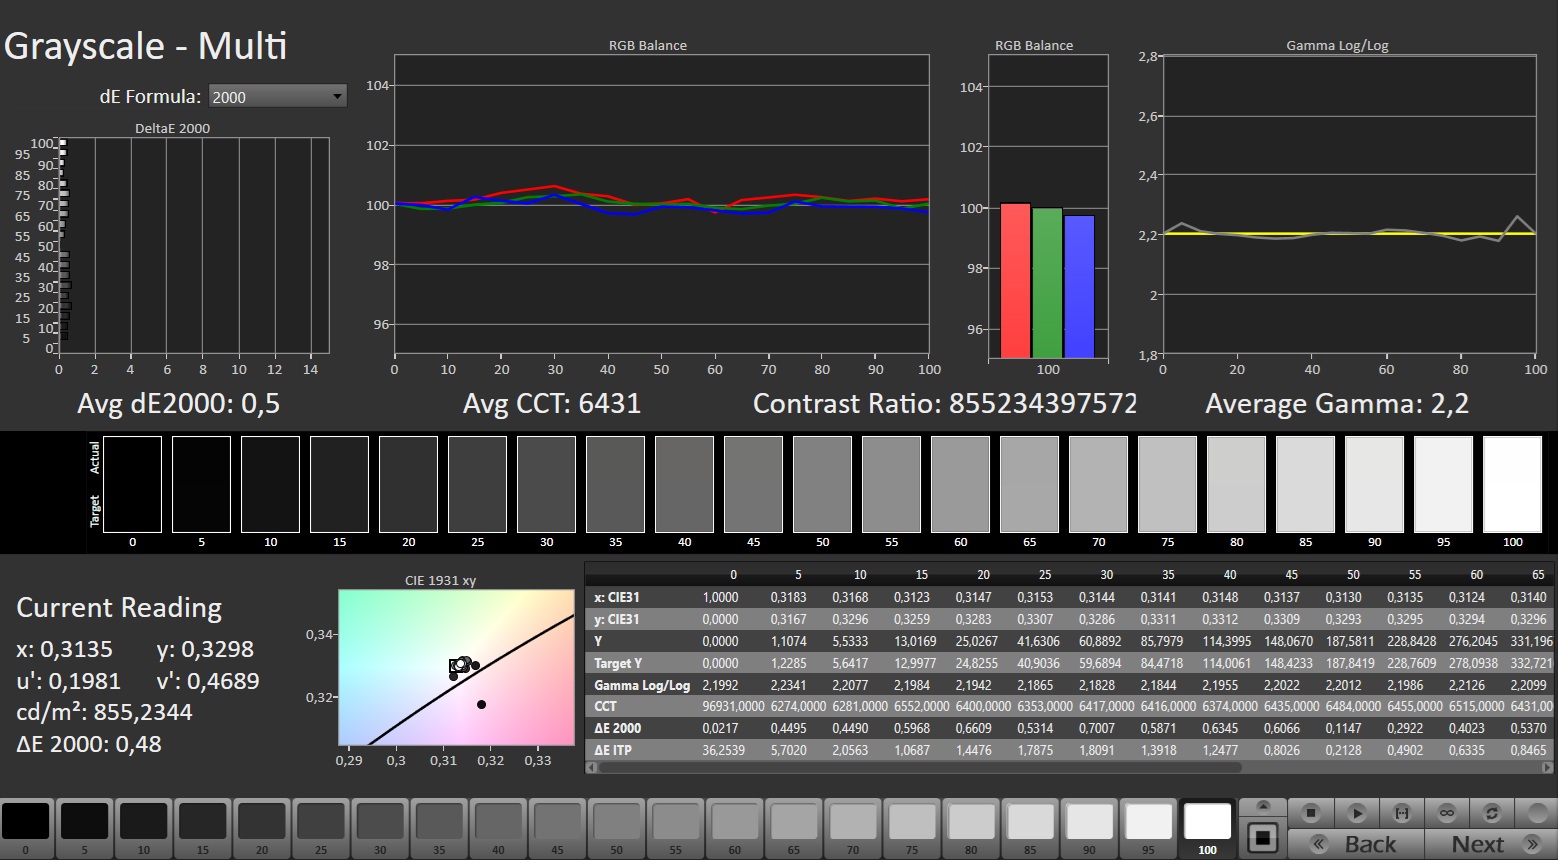
ΔE Greyscale Calman: 2.4 | ∀{0.09-98 Ø4.97}
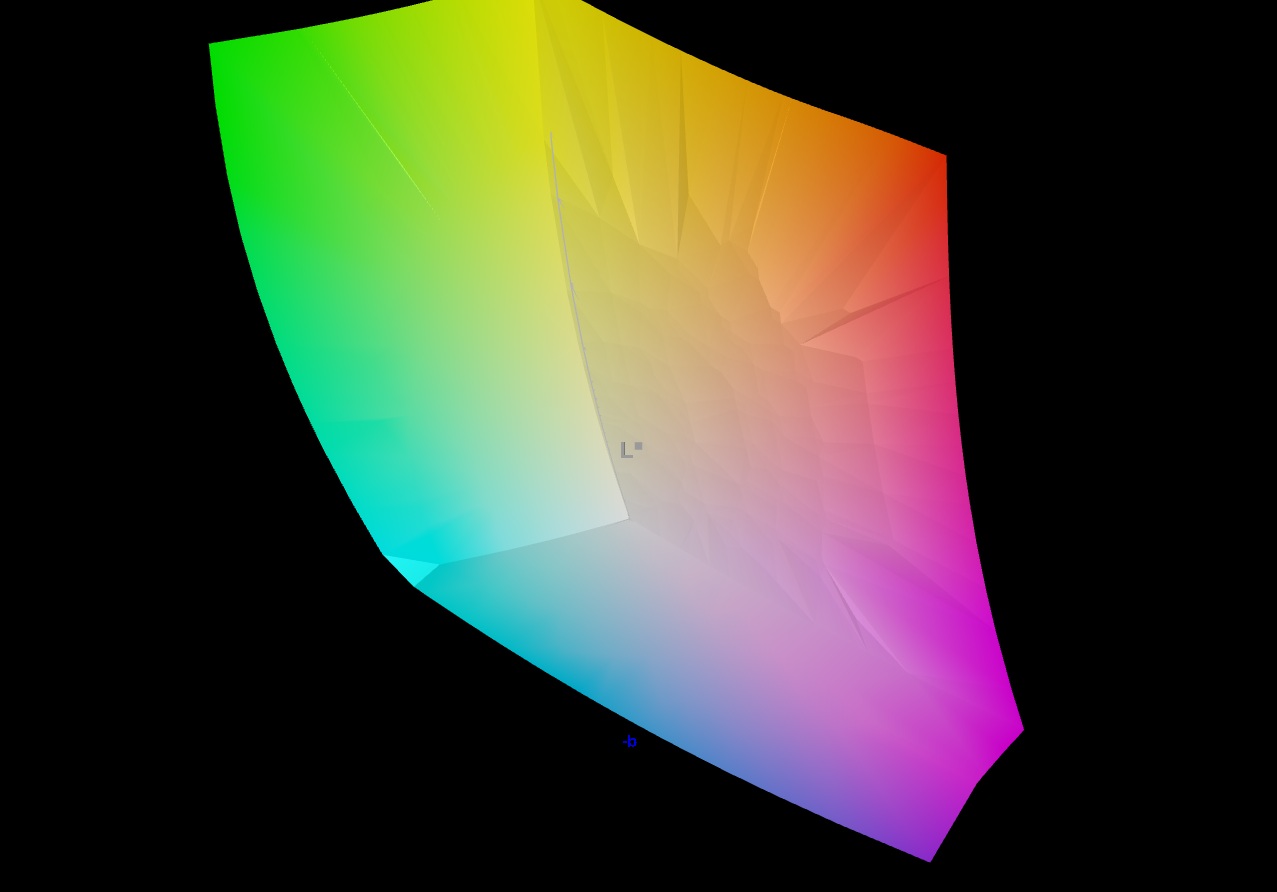
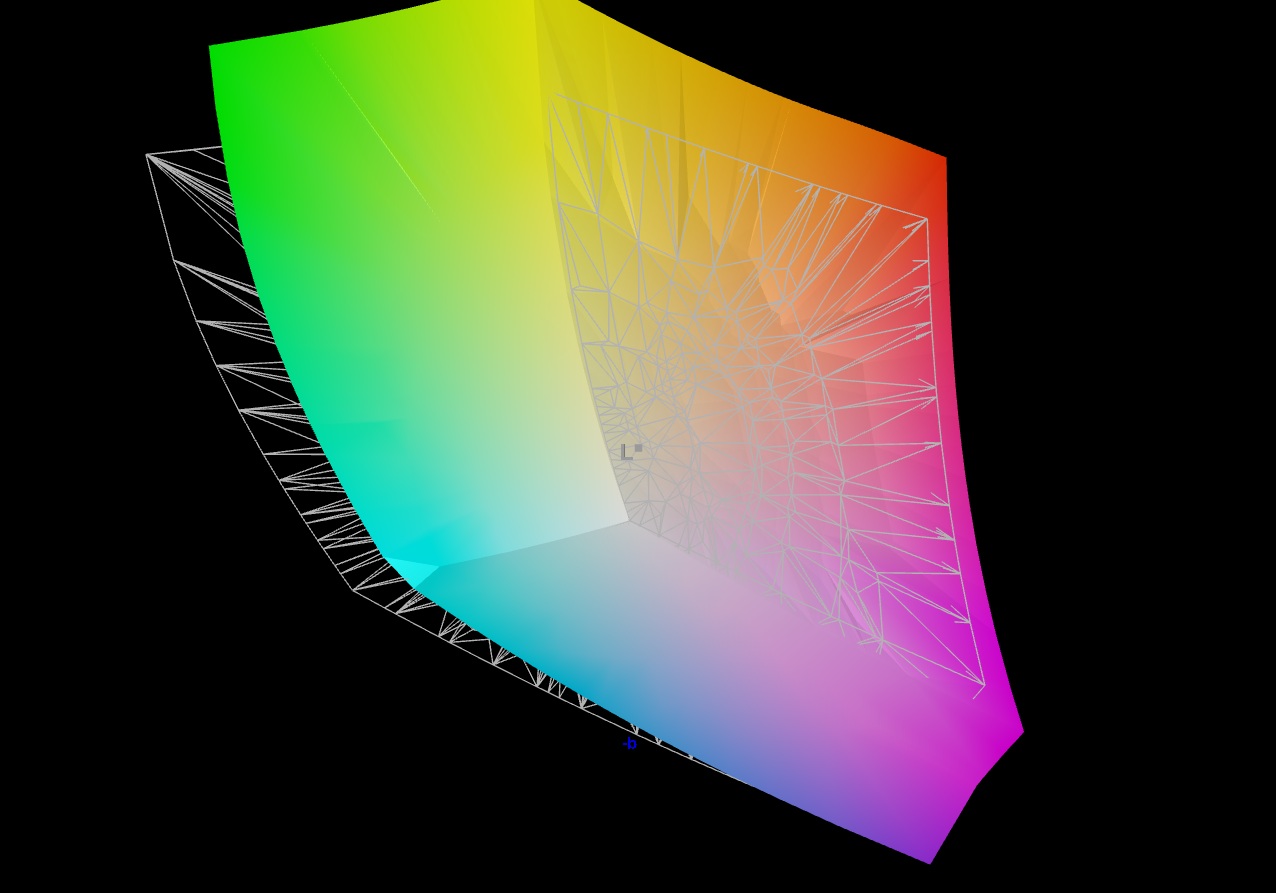
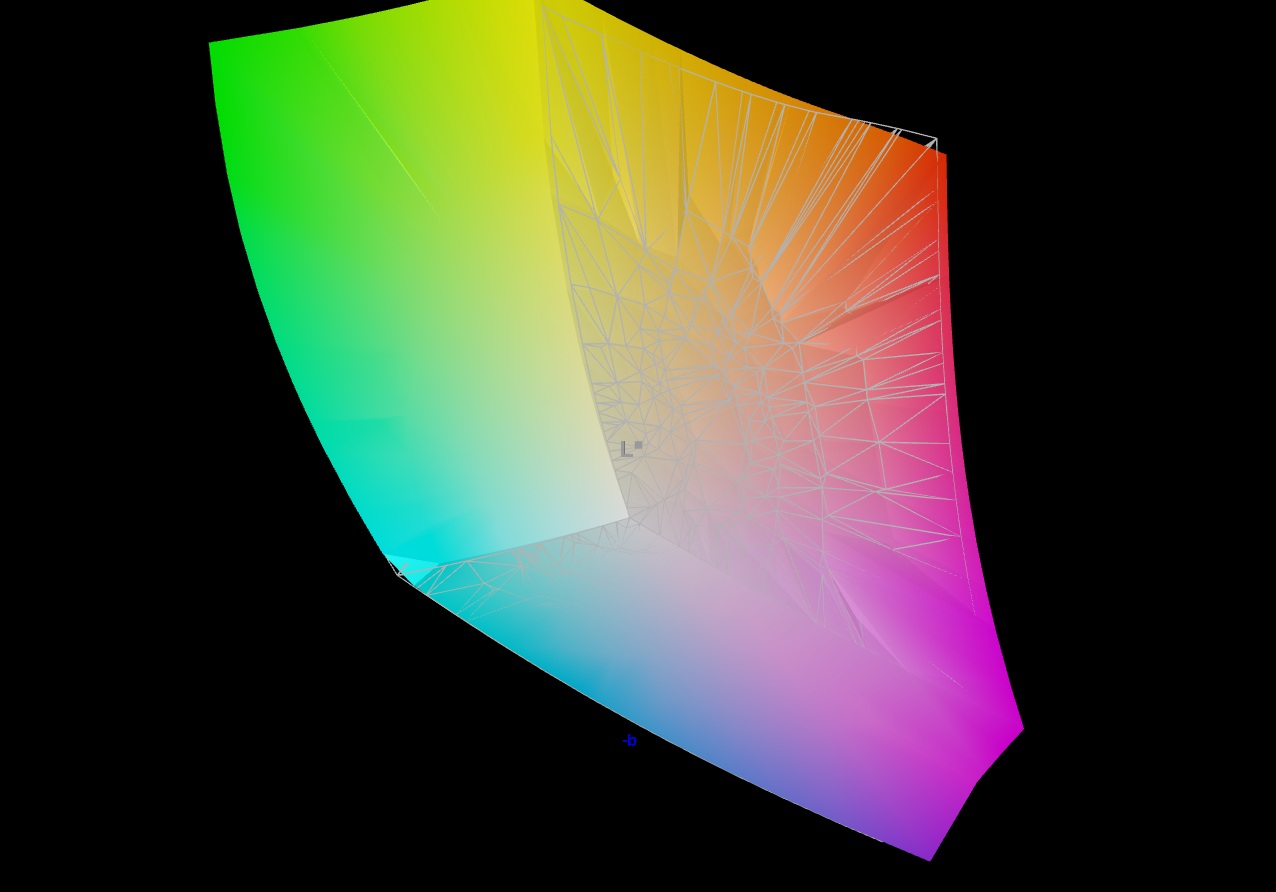
86.9% AdobeRGB 1998 (Argyll 3D)
100% sRGB (Argyll 3D)
99.7% Display P3 (Argyll 3D)
Gamma: 2.214
CCT: 6186 K
| Medion Erazer Beast 16 X1 Ultimate NE160QDM-NM9 (BOE0D5A), Mini-LED, 2560x1600, 16", 300 Hz | Schenker XMG Neo 16 E25 RTX 5090 Laptop NE160QDM-NM9, Mini-LED, 2560x1600, 16", 300 Hz | HP Omen Max 16 ah000 Samsung ATNA60DL02-0, OLED, 2560x1600, 16", 240 Hz | Asus ROG Strix Scar 16 2025 NE160QDM-NM8, Mini-LED, 2560x1600, 16", 240 Hz | Lenovo Legion Pro 7i 16 Gen 10 Samsung ATNA60HU01-0, OLED, 2560x1600, 16", 240 Hz | Asus ROG Strix G16 G615 NE160QDM-NZC, IPS, 2560x1600, 16", 240 Hz | |
|---|---|---|---|---|---|---|
| Display | 1% | 4% | 1% | 3% | 1% | |
| Display P3 Coverage (%) | 99.7 | 99.9 0% | 99.7 0% | 99.9 0% | 99.5 0% | 99.1 -1% |
| sRGB Coverage (%) | 100 | 100 0% | 100 0% | 100 0% | 100 0% | 99.9 0% |
| AdobeRGB 1998 Coverage (%) | 86.9 | 88.5 2% | 98.2 13% | 88.4 2% | 94.4 9% | 89.1 3% |
| Response Times | -33% | 87% | 16% | 88% | 42% | |
| Response Time Grey 50% / Grey 80% * (ms) | 10 ? | 17.4 ? -74% | 0.29 ? 97% | 7 ? 30% | 0.28 ? 97% | 4.6 ? 54% |
| Response Time Black / White * (ms) | 8.6 ? | 13 ? -51% | 0.47 ? 95% | 8.4 ? 2% | 0.43 ? 95% | 6.1 ? 29% |
| PWM Frequency (Hz) | 20457 ? | 20253 | 960 ? | 20555 ? | 1438 ? | |
| PWM Amplitude * (%) | 100 | 75 25% | 31 69% | 29 71% | ||
| Screen | -29% | -30% | 23% | -17% | -4% | |
| Brightness middle (cd/m²) | 837 | 888 6% | 376.5 -55% | 754 -10% | 490.4 -41% | 545 -35% |
| Brightness (cd/m²) | 821 | 859 5% | 382 -53% | 773 -6% | 498 -39% | 536 -35% |
| Brightness Distribution (%) | 94 | 94 0% | 96 2% | 91 -3% | 97 3% | 89 -5% |
| Black Level * (cd/m²) | 0.07 | 0.41 | ||||
| Colorchecker dE 2000 * | 1.59 | 3.3 -108% | 3.67 -131% | 1 37% | 3.2 -101% | 1.6 -1% |
| Colorchecker dE 2000 max. * | 5.27 | 5.5 -4% | 7.24 -37% | 2 62% | 6.04 -15% | 4 24% |
| Colorchecker dE 2000 calibrated * | 1.03 | 1.5 -46% | 0.94 9% | 0.84 18% | 0.8 22% | |
| Greyscale dE 2000 * | 2.4 | 3.8 -58% | 1.1 54% | 1 58% | 1 58% | 2.4 -0% |
| Gamma | 2.214 99% | 2.46 89% | 2.25 98% | 2.14 103% | 2.24 98% | 2.25 98% |
| CCT | 6186 105% | 6267 104% | 6319 103% | 6493 100% | 6373 102% | 6737 96% |
| Contrast (:1) | 10771 | 1329 | ||||
| Media total (Programa/Opciones) | -20% /
-23% | 20% /
5% | 13% /
16% | 25% /
12% | 13% /
5% |
* ... más pequeño es mejor
En general, la cobertura del espacio de color del 100% sRGB o DCI-P3 y del 87% AdobeRGB es impresionante, aunque esto también se aplica a los paneles OLED o IPS de la competencia. En términos de brillo (lo probamos en modo SDR; el HDR también puede activarse si se desea), el Beast 16 X1 y el Neo 16 se llevan la palma con una media de 821 cd/m², lo que es un resultado excelente.
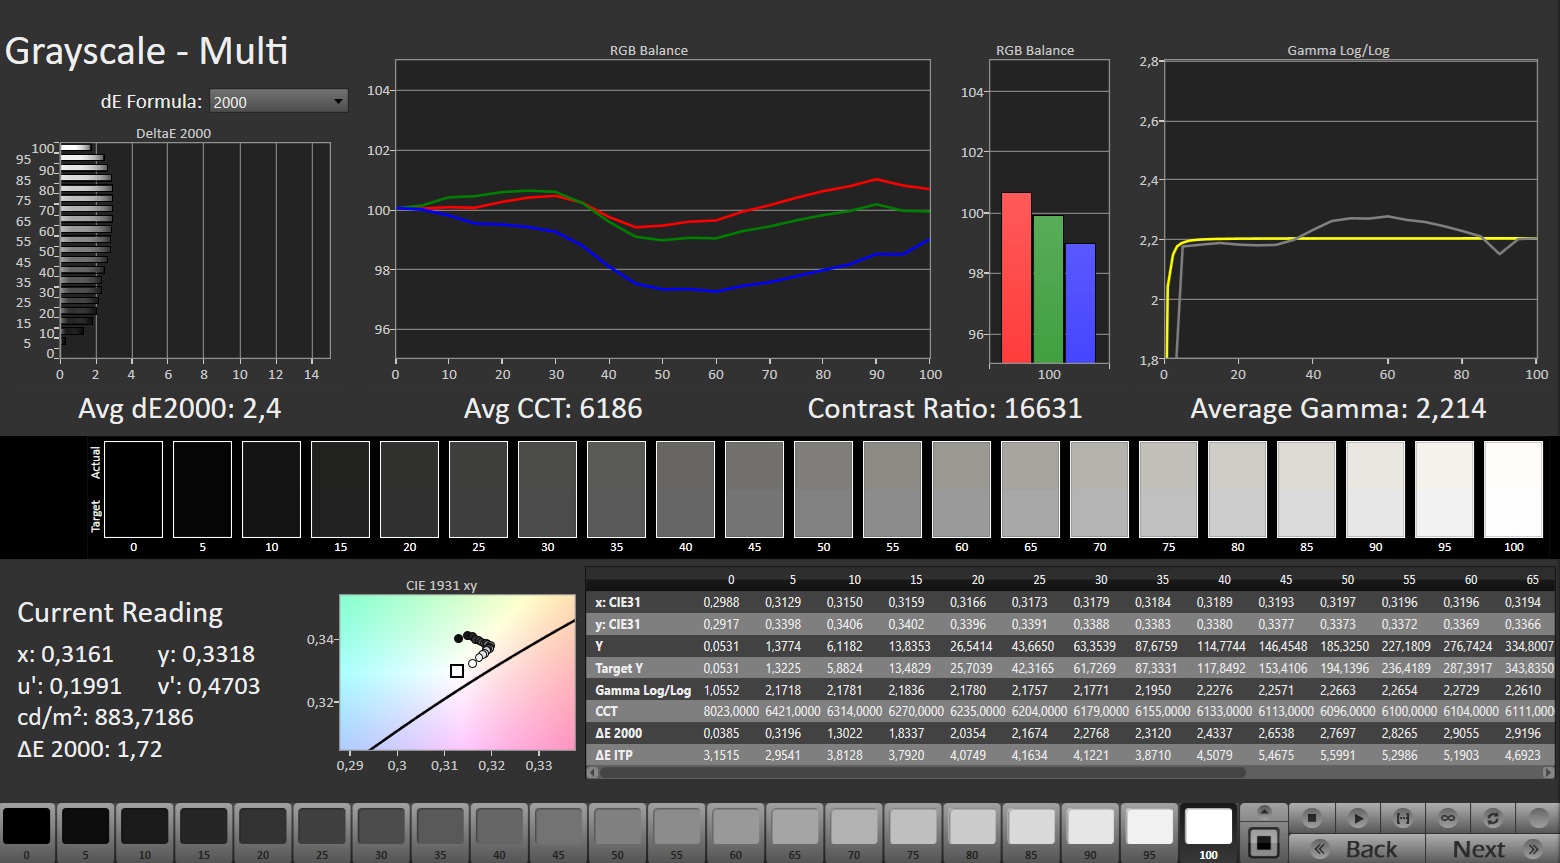
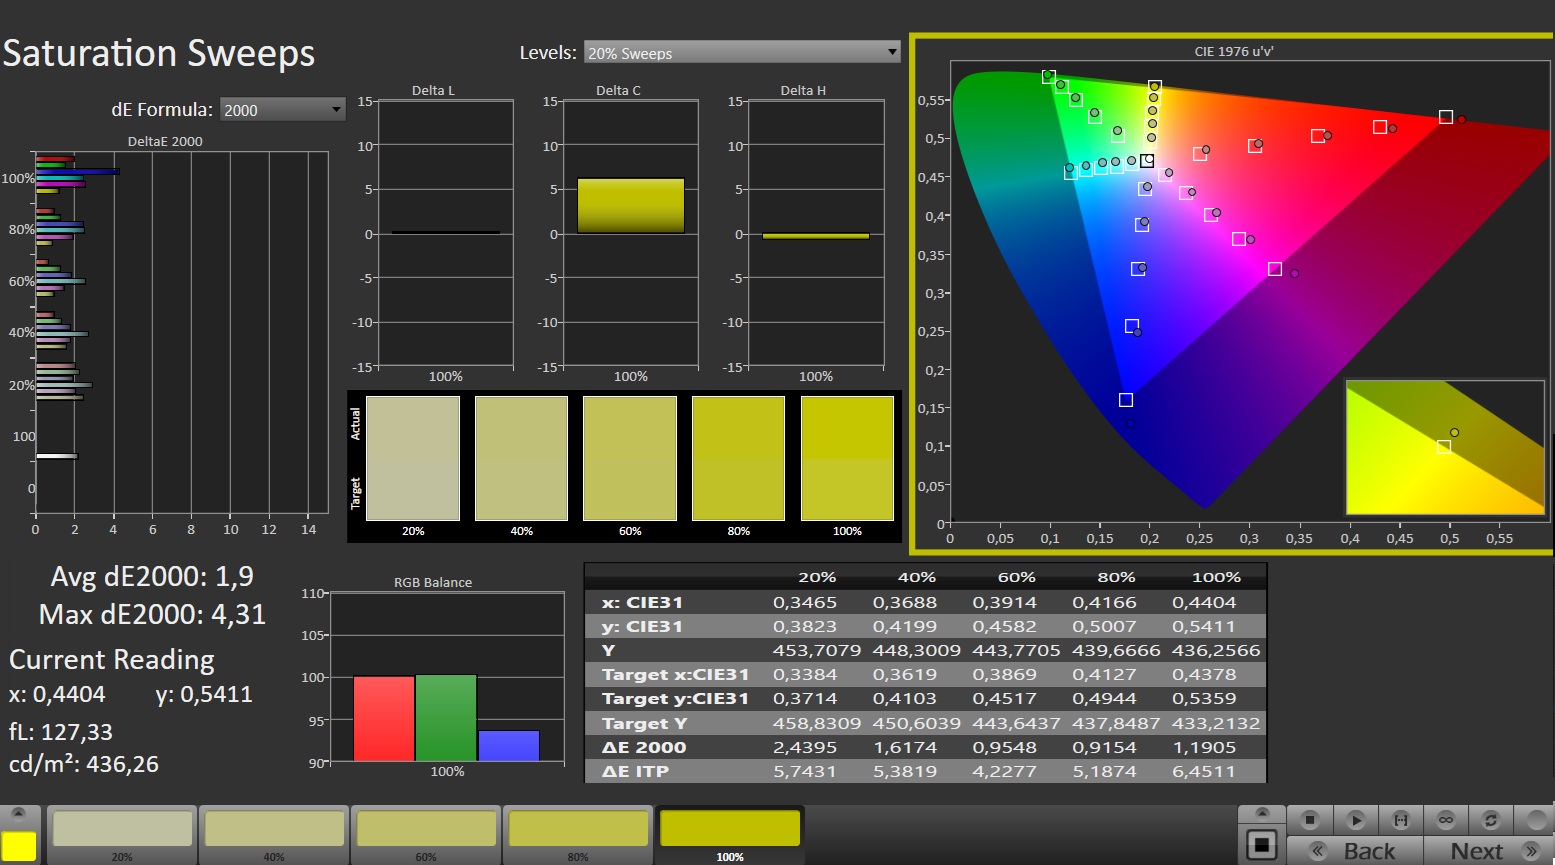
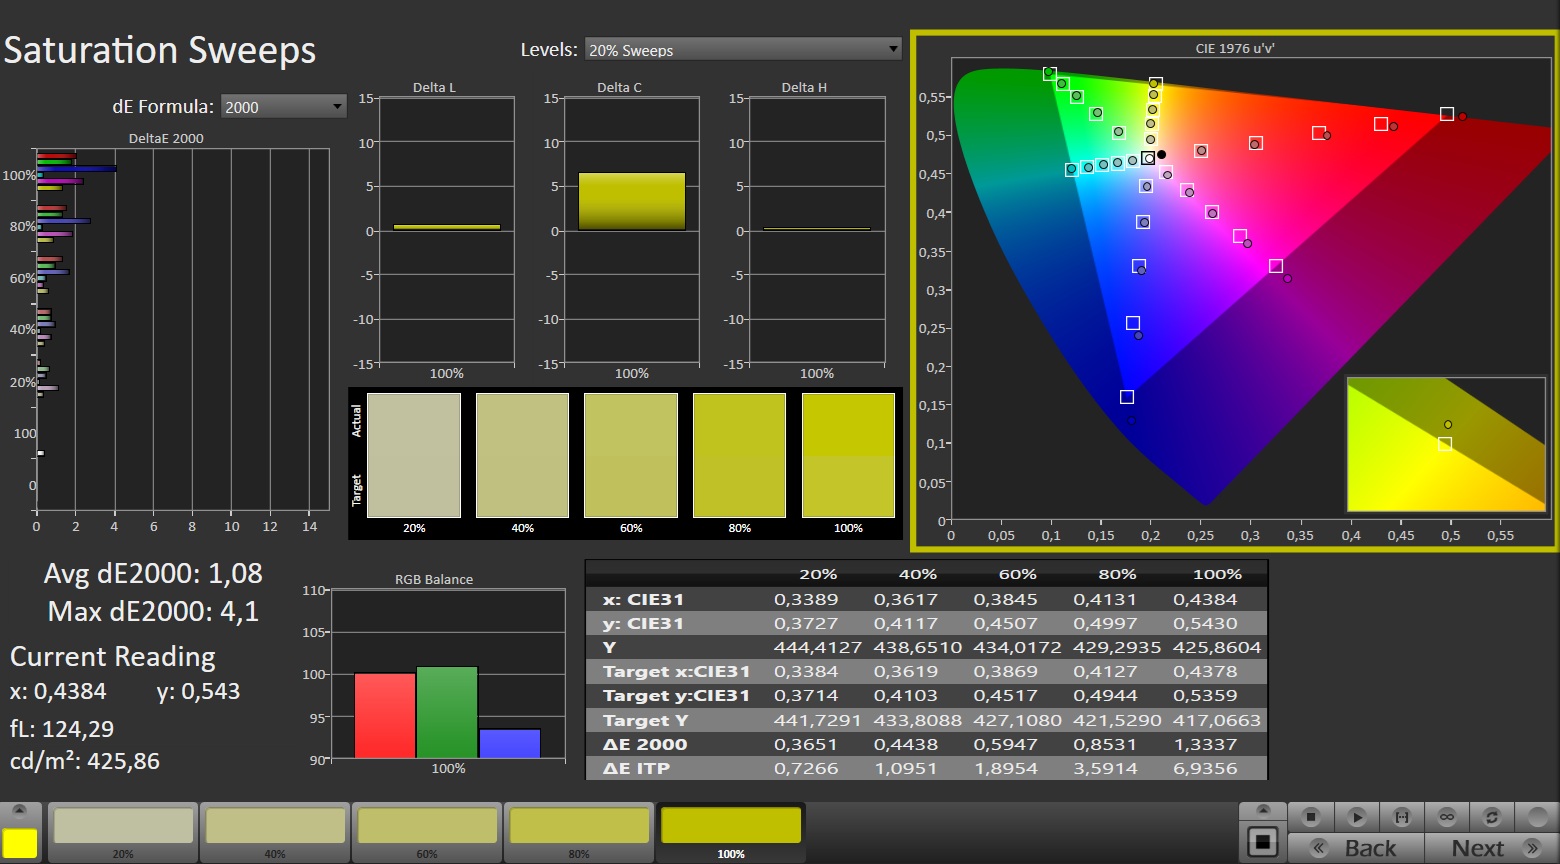
En combinación con el bajo nivel de negro, esto da como resultado un contraste excelente. Los tiempos de respuesta están más al nivel de un panel IPS típico.
Por desgracia, la pantalla tiene problemas de parpadeo hasta un nivel de brillo del 92%. Sin embargo, la frecuencia es tan alta que ni siquiera las personas sensibles deberían tener problemas.
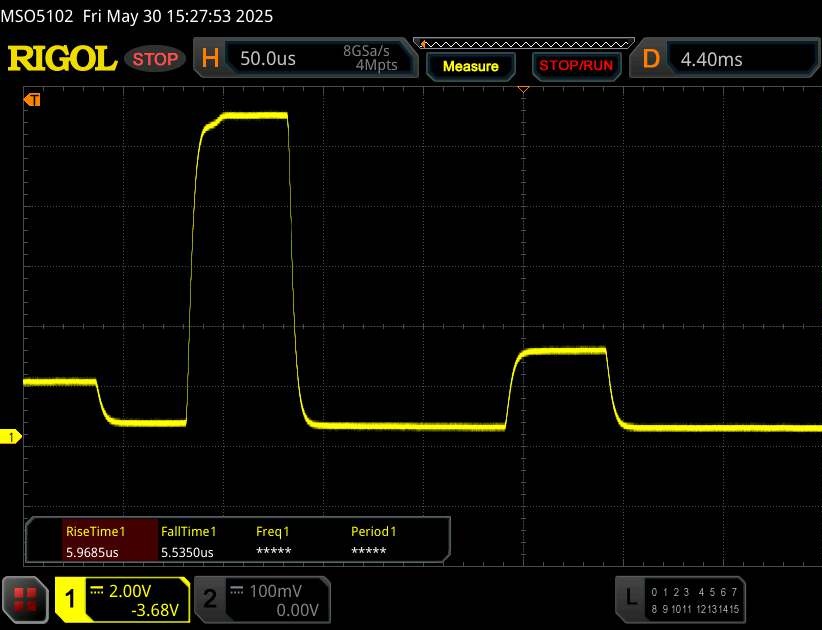
Tiempos de respuesta del display
| ↔ Tiempo de respuesta de Negro a Blanco | ||
|---|---|---|
| 8.6 ms ... subida ↗ y bajada ↘ combinada | ↗ 4.2 ms subida | 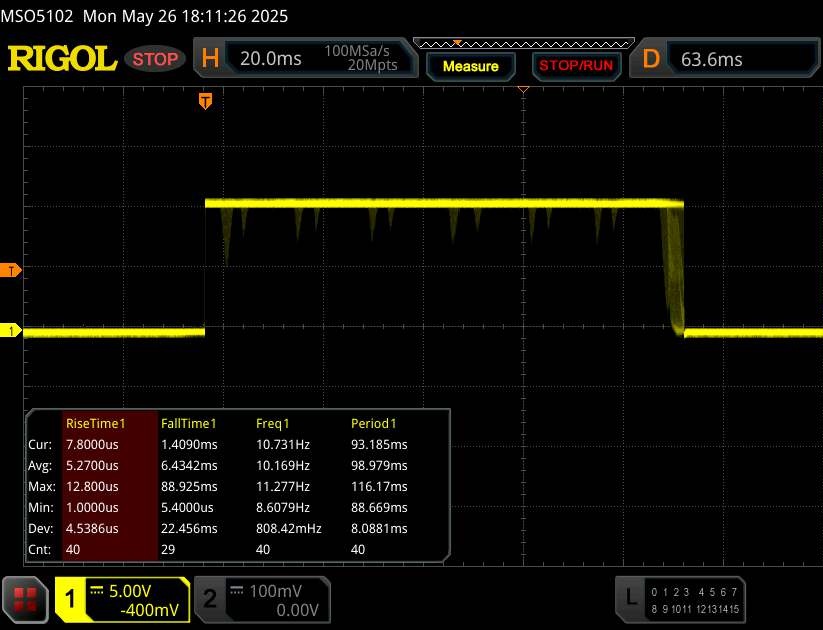 |
| ↘ 6.4 ms bajada | ||
| La pantalla mostró tiempos de respuesta rápidos en nuestros tests y debería ser adecuada para juegos. En comparación, todos los dispositivos de prueba van de ##min### (mínimo) a 240 (máximo) ms. » 24 % de todos los dispositivos son mejores. Esto quiere decir que el tiempo de respuesta medido es mejor que la media (19.8 ms) de todos los dispositivos testados. | ||
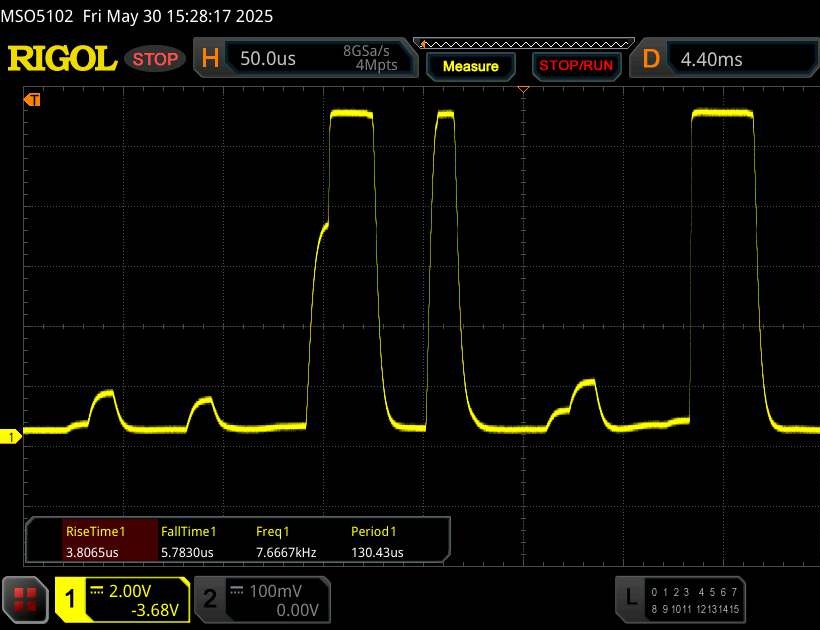
| ↔ Tiempo de respuesta 50% Gris a 80% Gris | ||
| 10 ms ... subida ↗ y bajada ↘ combinada | ↗ 4.7 ms subida | 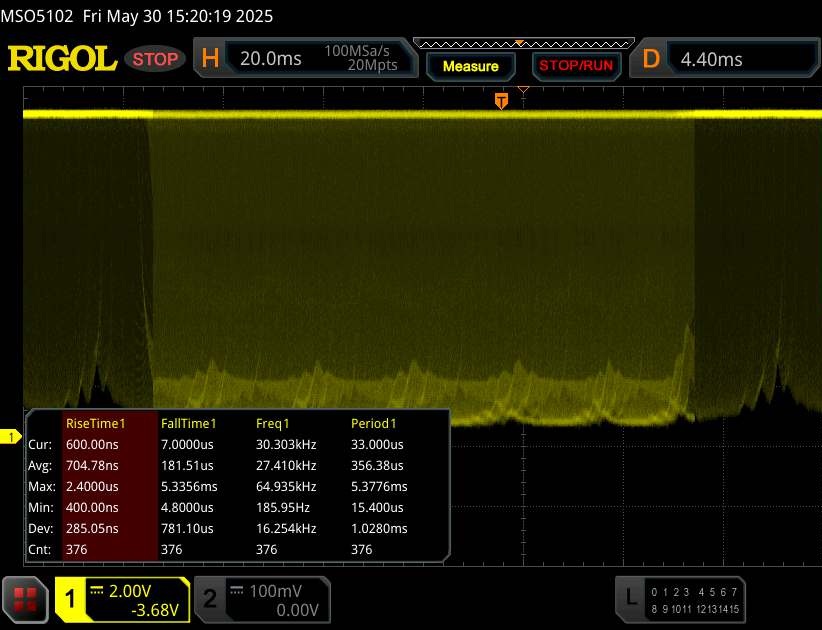 |
| ↘ 5.3 ms bajada | ||
| La pantalla mostró buenos tiempos de respuesta en nuestros tests pero podría ser demasiado lenta para los jugones competitivos. En comparación, todos los dispositivos de prueba van de ##min### (mínimo) a 636 (máximo) ms. » 23 % de todos los dispositivos son mejores. Esto quiere decir que el tiempo de respuesta medido es mejor que la media (31 ms) de todos los dispositivos testados. | ||
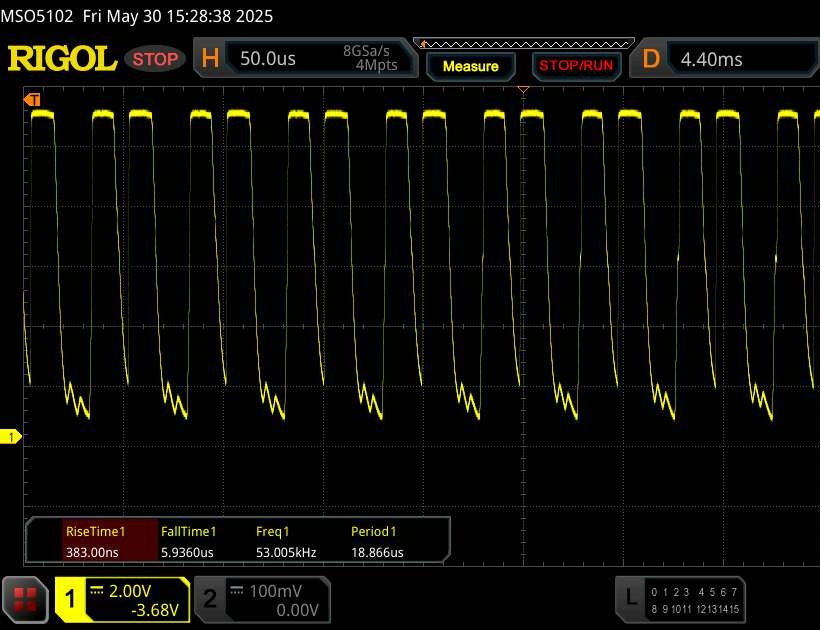
Parpadeo de Pantalla / PWM (Pulse-Width Modulation)
| Parpadeo de Pantalla / PWM detectado | 20457 Hz Amplitude: 100 % | ≤ 92 % de brillo | 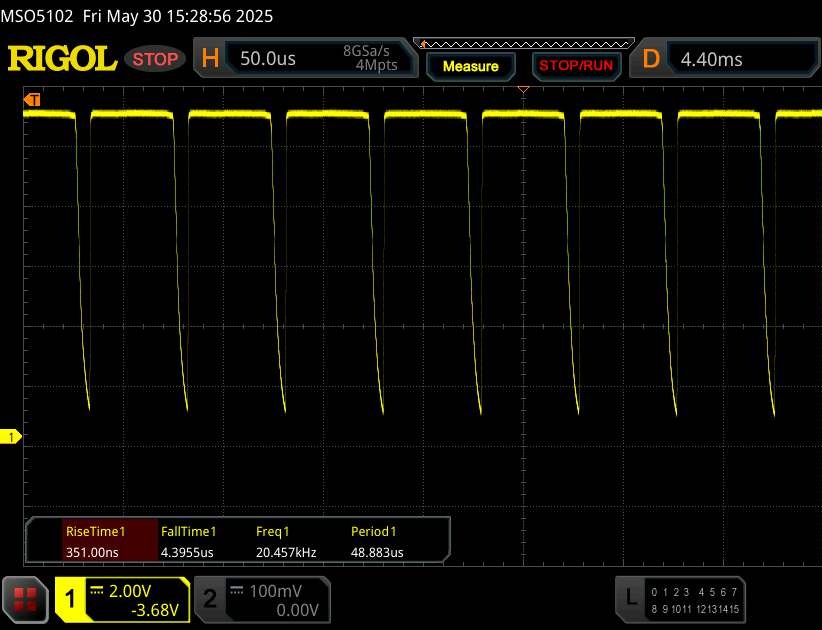 |
La retroiluminación del display parpadea a 20457 Hz (seguramente usa PWM - Pulse-Width Modulation) a un brillo del 92 % e inferior. Sobre este nivel de brillo no debería darse parpadeo / PWM. La frecuencia de 20457 Hz es bastante alta, por lo que la mayoría de gente sensible al parpadeo no debería ver parpadeo o tener fatiga visual. Comparación: 52 % de todos los dispositivos testados no usaron PWM para atenuar el display. Si se usó, medimos una media de 7747 (mínimo: 5 - máxmo: 343500) Hz. | |||
Rendimiento
El Beast 16 X1 está disponible con la RTX 5090 portátil o con el Portátil RTX 5080 por lo que pertenece al segmento de gama alta en cualquiera de los dos casos. Con esta última GPU, el dispositivo cuesta unos 1.000 euros (~1135 dólares) menos, el sobreprecio de la versión RTX 5090 es correspondientemente alto.
Condiciones de la prueba
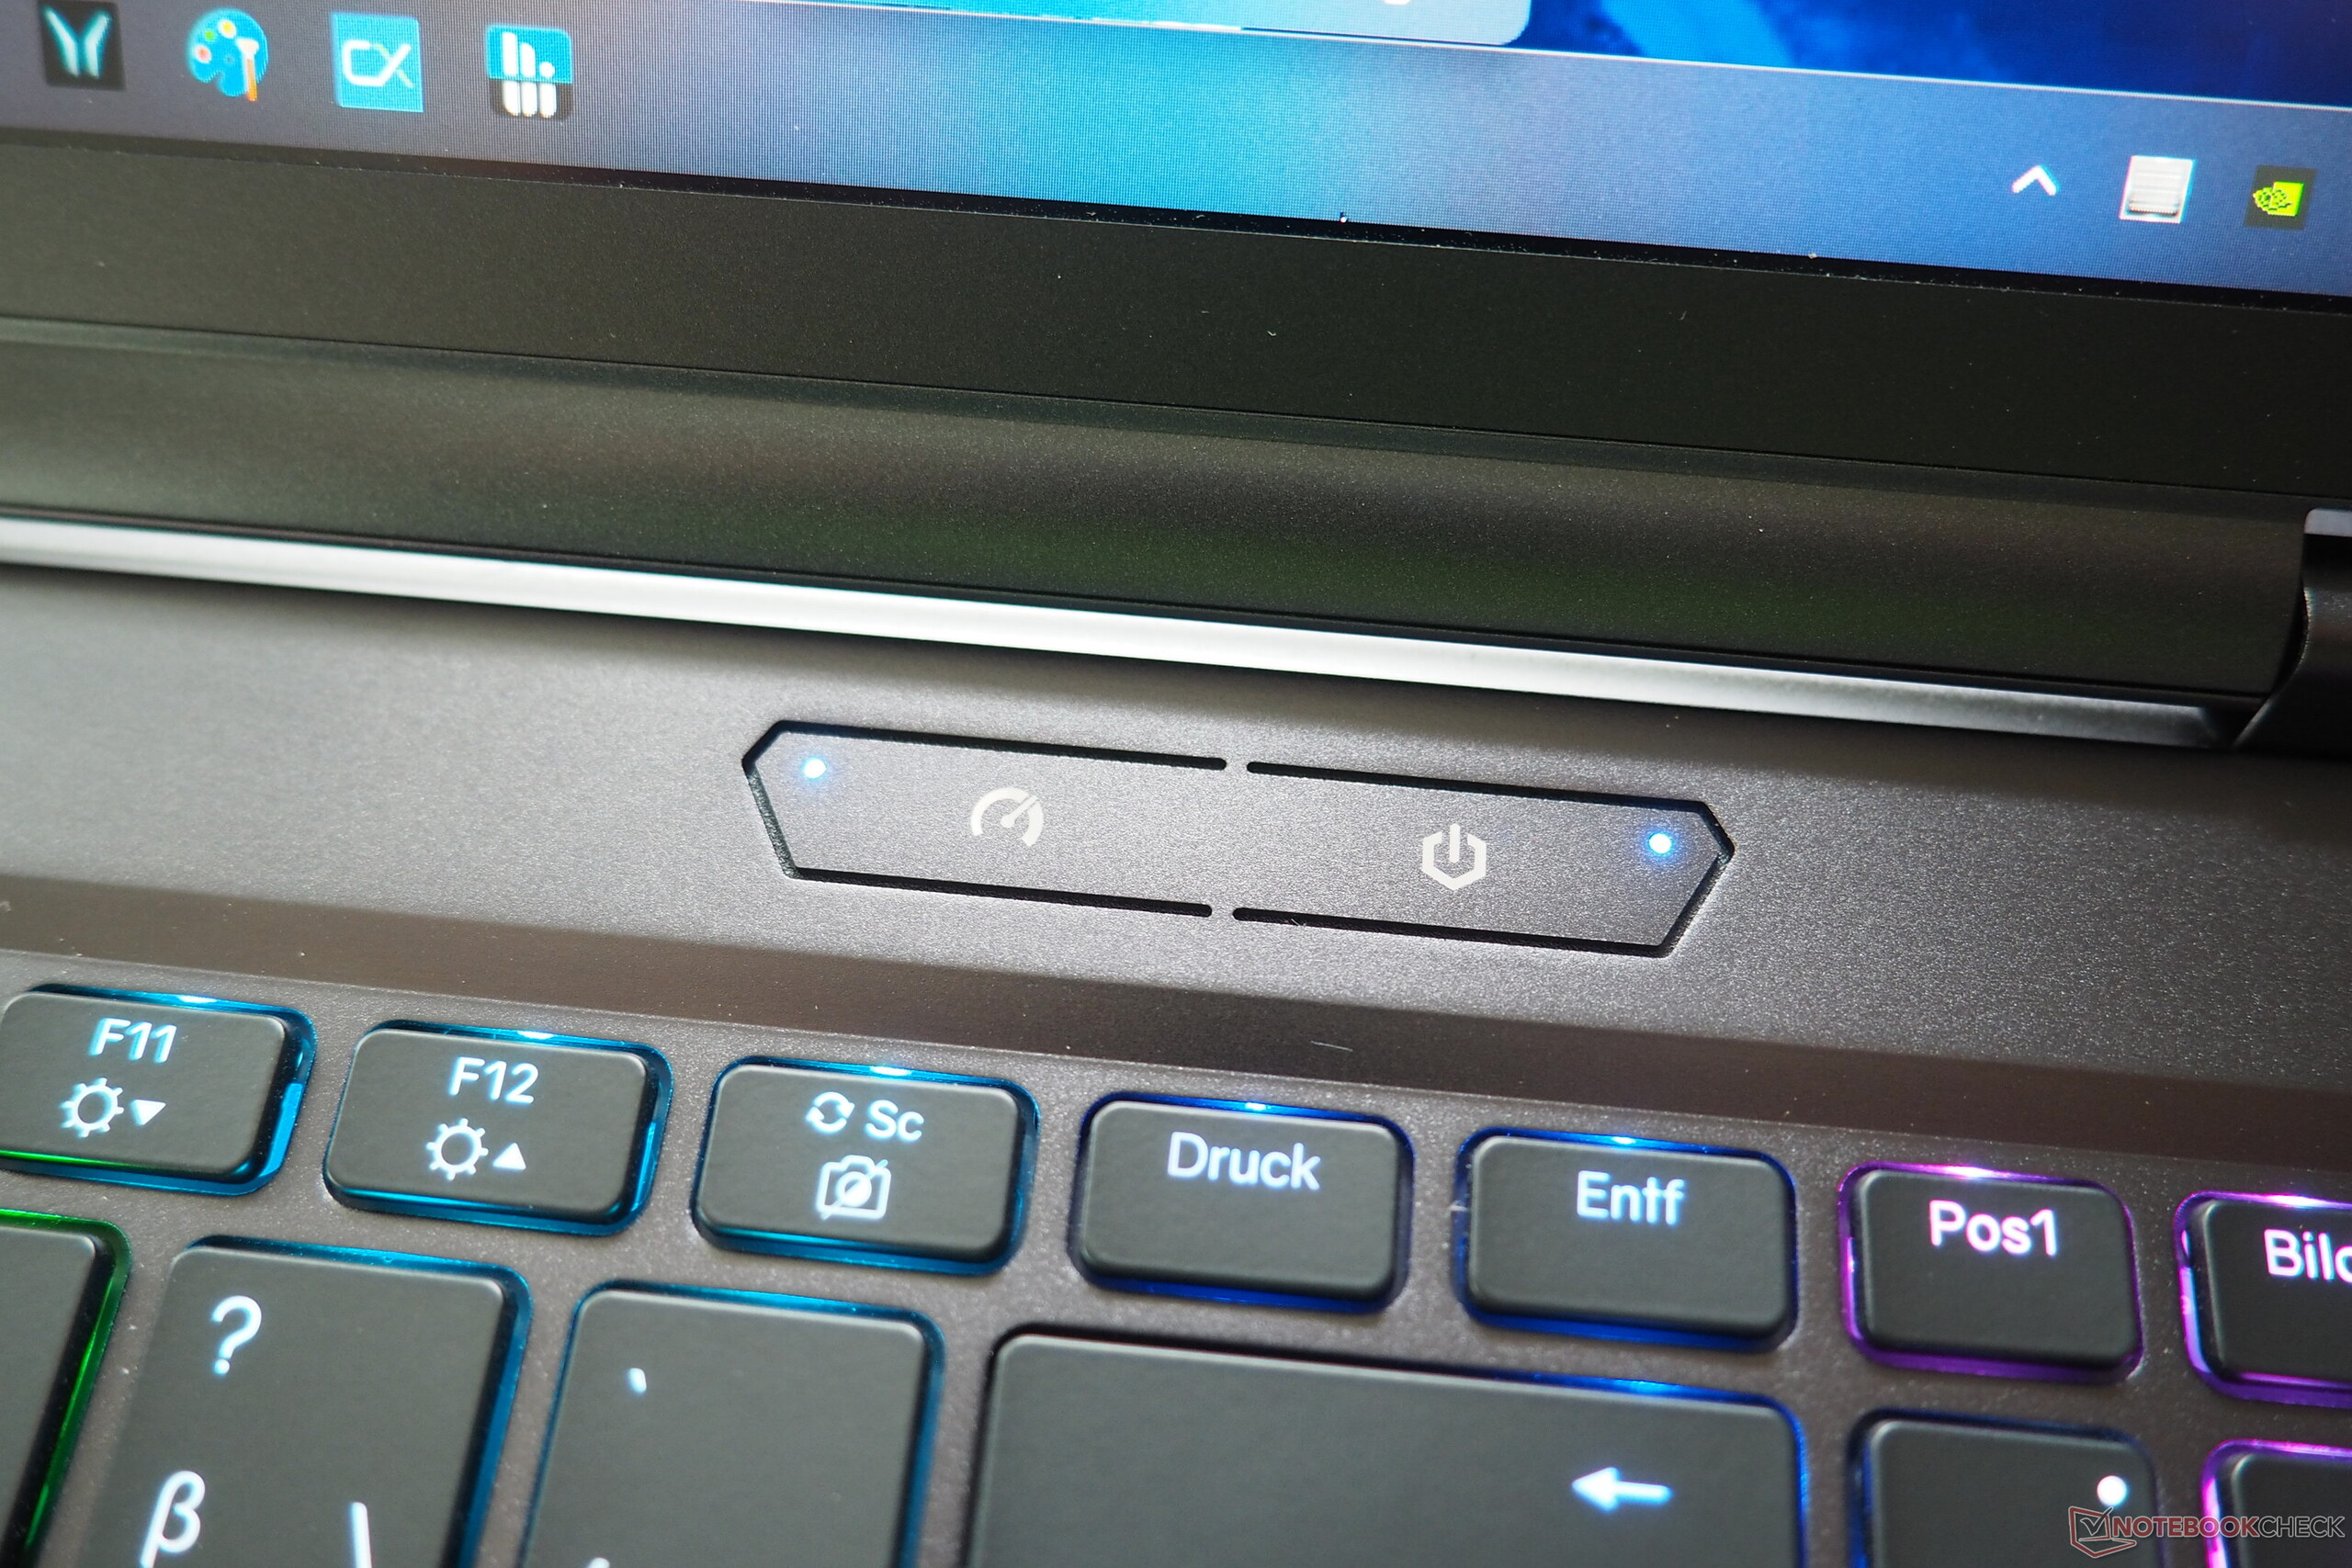
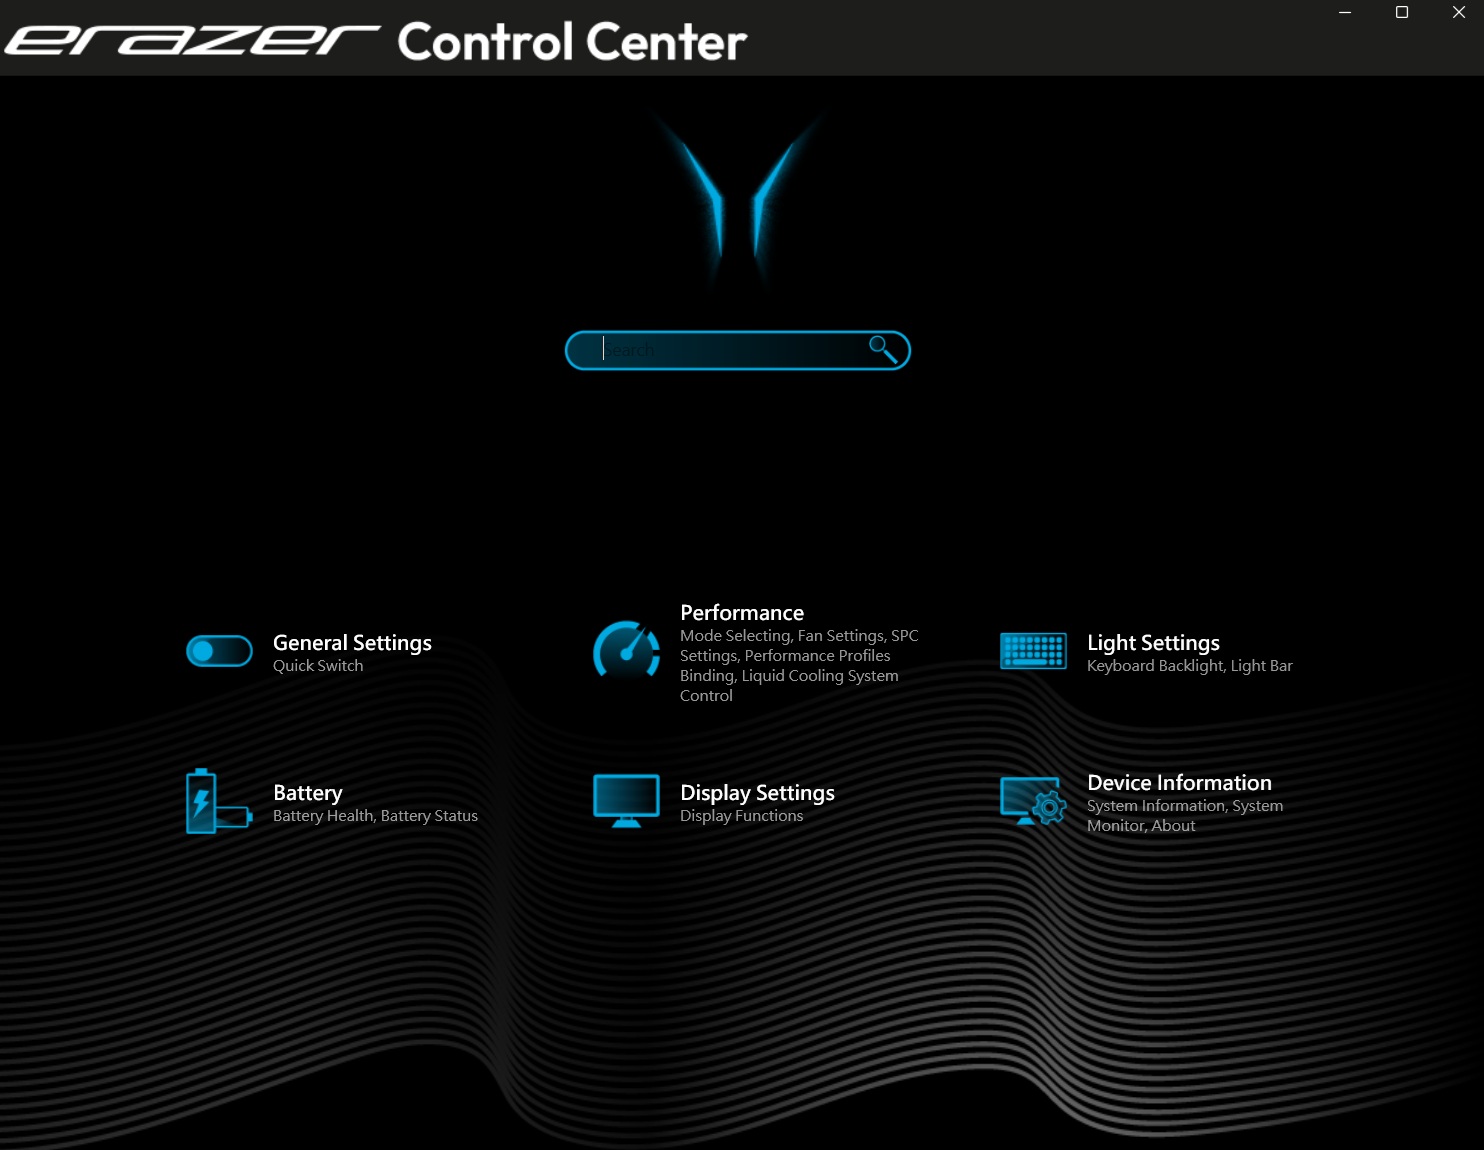
Práctico: Un botón especial (junto al botón de encendido) permite cambiar rápidamente entre los modos de funcionamiento. "Silencio" se ilumina en verde, "Equilibrio" en azul y "Juego" en morado. Los efectos sobre el nivel de ruido y el rendimiento pueden verse en la siguiente tabla. A excepción de la prueba de la batería, nuestras mediciones se completaron con el perfil Gaming. Todavía parece haber un error en el Centro de Control de Erazer, que también puede utilizarse para cambiar de modo: Después de (re)arrancar el portátil, sólo se selecciona aquí el perfil Silencio, al menos en lo que se refiere a la pantalla.
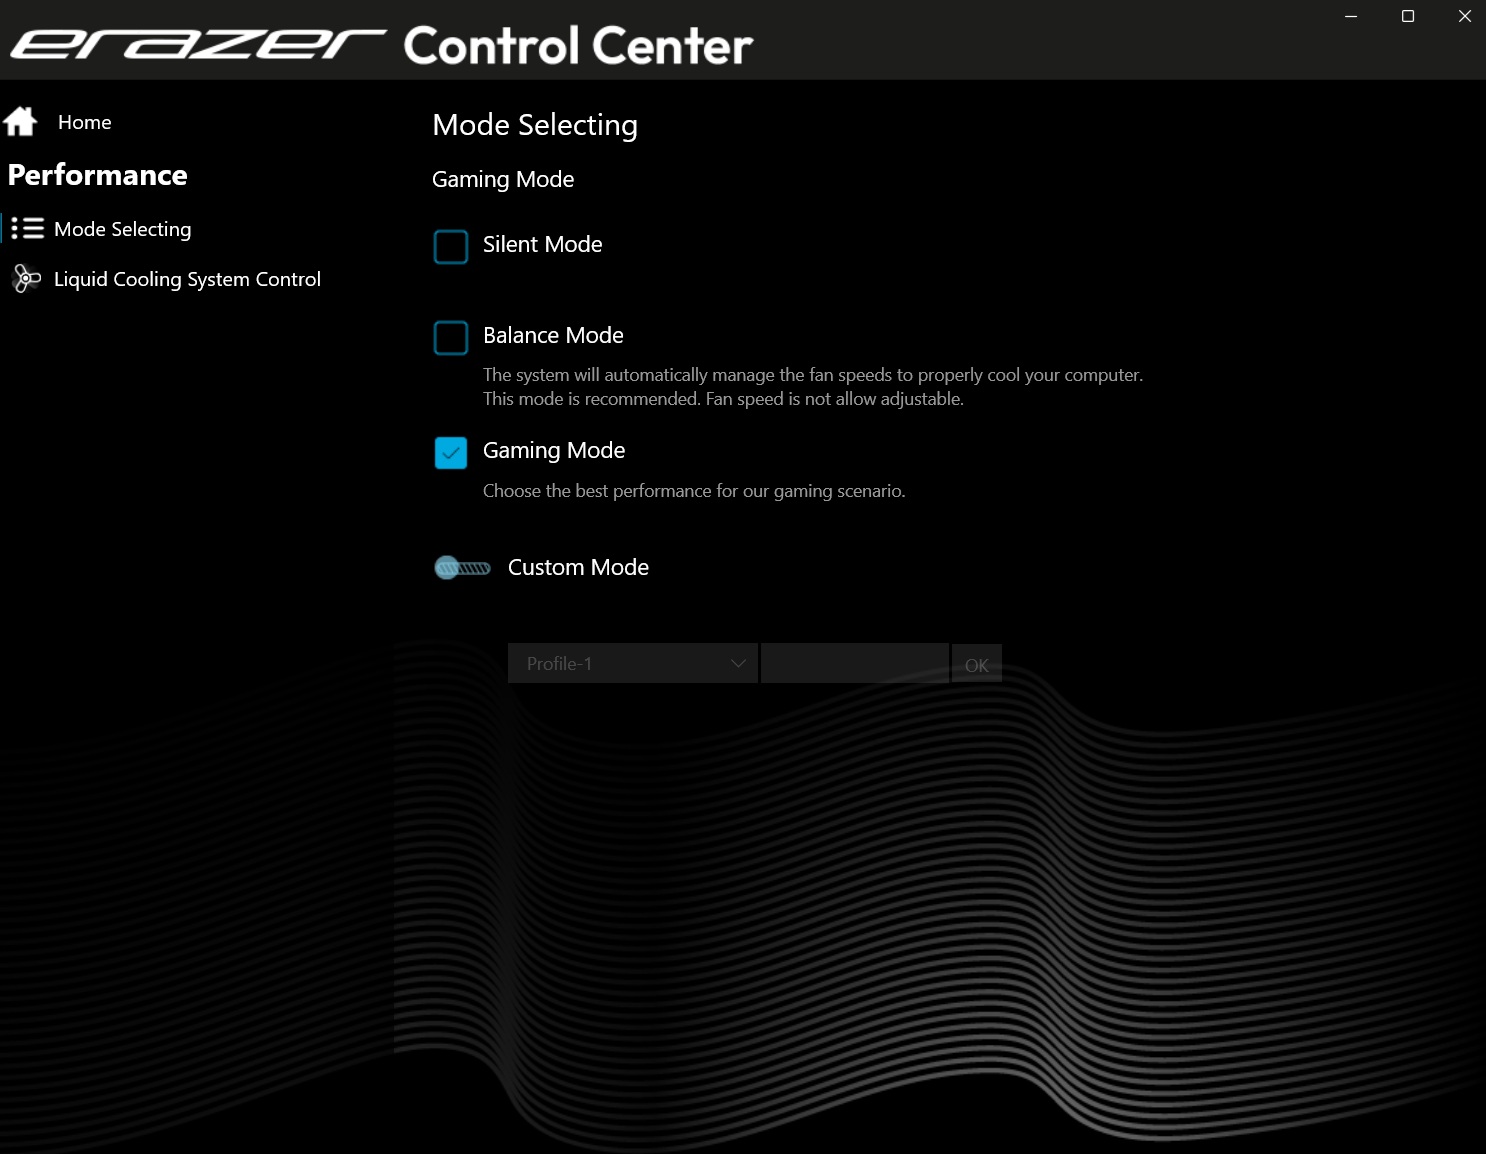
| Erazer Control Center Modo | Silencio | Equilibrio | Juego |
| Cyberpunk 2077 Ruido | 42 dB(A) | 48 dB(A) | 55 dB(A) |
| Rendimiento de Cyberpunk 2077 (FHD/Ultra) | 83,8 fps | 148,6 fps | 158,5 fps |
| Puntuación múltiple Cinebench R15 | 3318 puntos | 4494 puntos | 6067 puntos |
Procesador
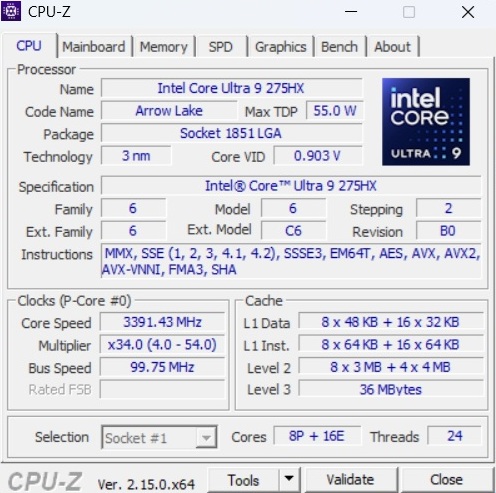
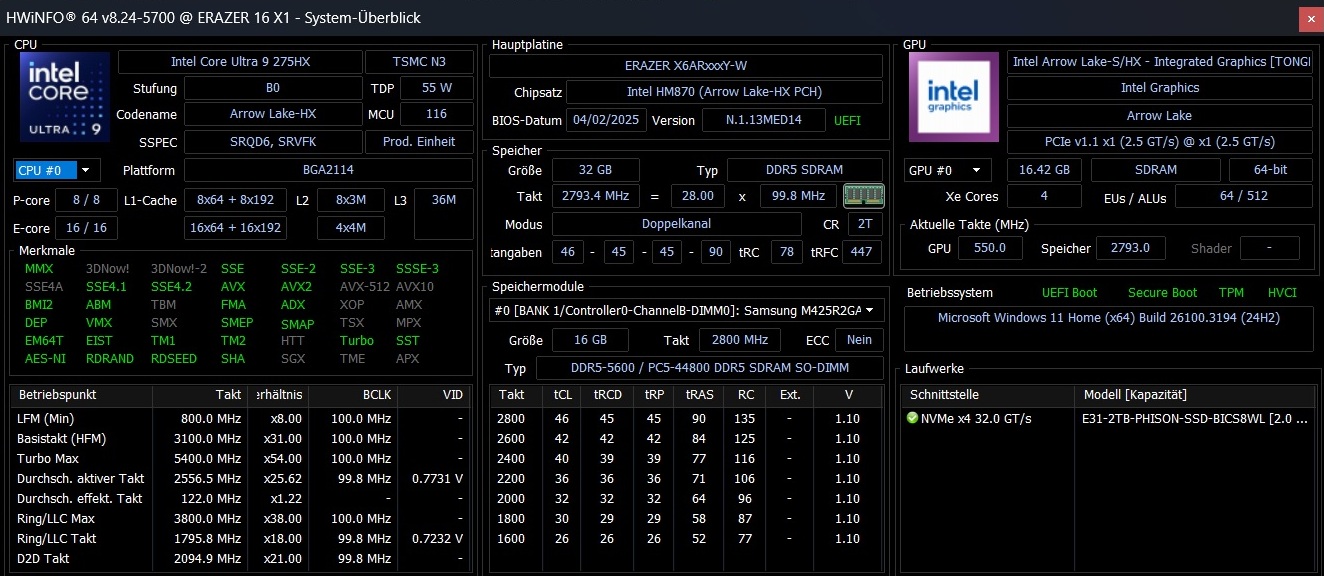
El Intel Core Ultra 9 275HX de la generación Arrow Lake deja sensaciones encontradas en el Beast 16 X1. A primera vista, los resultados están al nivel esperado o incluso son superiores en algunos casos. Sin embargo, como ha demostrado nuestro bucle Cinebench, entretanto se producen bajadas de rendimiento bajo carga prolongada, de las que se libra la competencia.
Cinebench R15 Multi Endurance test
* ... más pequeño es mejor
AIDA64: FP32 Ray-Trace | FPU Julia | CPU SHA3 | CPU Queen | FPU SinJulia | FPU Mandel | CPU AES | CPU ZLib | FP64 Ray-Trace | CPU PhotoWorxx
| Performance rating | |
| Schenker XMG Neo 16 E25 RTX 5090 Laptop | |
| Asus ROG Strix Scar 16 2025 | |
| Asus ROG Strix G16 G615 | |
| Medion Erazer Beast 16 X1 Ultimate | |
| Lenovo Legion Pro 7i 16 Gen 10 | |
| Medio Intel Core Ultra 9 275HX | |
| HP Omen Max 16 ah000 | |
| Media de la clase Gaming | |
| AIDA64 / FP32 Ray-Trace | |
| Schenker XMG Neo 16 E25 RTX 5090 Laptop | |
| Asus ROG Strix Scar 16 2025 | |
| Asus ROG Strix G16 G615 | |
| Medion Erazer Beast 16 X1 Ultimate | |
| Lenovo Legion Pro 7i 16 Gen 10 | |
| Medio Intel Core Ultra 9 275HX (28039 - 39895, n=30) | |
| HP Omen Max 16 ah000 | |
| Media de la clase Gaming (10227 - 85542, n=103, últimos 2 años) | |
| AIDA64 / FPU Julia | |
| Schenker XMG Neo 16 E25 RTX 5090 Laptop | |
| Asus ROG Strix G16 G615 | |
| Asus ROG Strix Scar 16 2025 | |
| Medion Erazer Beast 16 X1 Ultimate | |
| Lenovo Legion Pro 7i 16 Gen 10 | |
| Medio Intel Core Ultra 9 275HX (140254 - 200744, n=30) | |
| HP Omen Max 16 ah000 | |
| Media de la clase Gaming (51376 - 238426, n=103, últimos 2 años) | |
| AIDA64 / CPU SHA3 | |
| Schenker XMG Neo 16 E25 RTX 5090 Laptop | |
| Asus ROG Strix Scar 16 2025 | |
| Asus ROG Strix G16 G615 | |
| Medion Erazer Beast 16 X1 Ultimate | |
| Lenovo Legion Pro 7i 16 Gen 10 | |
| Medio Intel Core Ultra 9 275HX (6710 - 9817, n=30) | |
| HP Omen Max 16 ah000 | |
| Media de la clase Gaming (2180 - 9817, n=103, últimos 2 años) | |
| AIDA64 / CPU Queen | |
| Schenker XMG Neo 16 E25 RTX 5090 Laptop | |
| Medion Erazer Beast 16 X1 Ultimate | |
| Asus ROG Strix Scar 16 2025 | |
| Asus ROG Strix G16 G615 | |
| Lenovo Legion Pro 7i 16 Gen 10 | |
| Medio Intel Core Ultra 9 275HX (113887 - 140937, n=30) | |
| HP Omen Max 16 ah000 | |
| Media de la clase Gaming (49785 - 173351, n=89, últimos 2 años) | |
| AIDA64 / FPU SinJulia | |
| Media de la clase Gaming (4424 - 33636, n=103, últimos 2 años) | |
| Medion Erazer Beast 16 X1 Ultimate | |
| Schenker XMG Neo 16 E25 RTX 5090 Laptop | |
| Lenovo Legion Pro 7i 16 Gen 10 | |
| Asus ROG Strix Scar 16 2025 | |
| Asus ROG Strix G16 G615 | |
| Medio Intel Core Ultra 9 275HX (11172 - 14425, n=30) | |
| HP Omen Max 16 ah000 | |
| AIDA64 / FPU Mandel | |
| Asus ROG Strix G16 G615 | |
| Asus ROG Strix Scar 16 2025 | |
| Schenker XMG Neo 16 E25 RTX 5090 Laptop | |
| Medion Erazer Beast 16 X1 Ultimate | |
| Lenovo Legion Pro 7i 16 Gen 10 | |
| Medio Intel Core Ultra 9 275HX (72596 - 104508, n=30) | |
| HP Omen Max 16 ah000 | |
| Media de la clase Gaming (25115 - 128721, n=103, últimos 2 años) | |
| AIDA64 / CPU AES | |
| Schenker XMG Neo 16 E25 RTX 5090 Laptop | |
| Medion Erazer Beast 16 X1 Ultimate | |
| Asus ROG Strix G16 G615 | |
| Lenovo Legion Pro 7i 16 Gen 10 | |
| Asus ROG Strix Scar 16 2025 | |
| Medio Intel Core Ultra 9 275HX (105608 - 247074, n=30) | |
| HP Omen Max 16 ah000 | |
| Media de la clase Gaming (39258 - 247074, n=103, últimos 2 años) | |
| AIDA64 / CPU ZLib | |
| Schenker XMG Neo 16 E25 RTX 5090 Laptop | |
| Medion Erazer Beast 16 X1 Ultimate | |
| Asus ROG Strix G16 G615 | |
| Asus ROG Strix Scar 16 2025 | |
| Lenovo Legion Pro 7i 16 Gen 10 | |
| Medio Intel Core Ultra 9 275HX (1582 - 2263, n=30) | |
| HP Omen Max 16 ah000 | |
| Media de la clase Gaming (574 - 2531, n=103, últimos 2 años) | |
| AIDA64 / FP64 Ray-Trace | |
| Asus ROG Strix Scar 16 2025 | |
| Asus ROG Strix G16 G615 | |
| Schenker XMG Neo 16 E25 RTX 5090 Laptop | |
| Medion Erazer Beast 16 X1 Ultimate | |
| Lenovo Legion Pro 7i 16 Gen 10 | |
| Medio Intel Core Ultra 9 275HX (14847 - 21854, n=30) | |
| HP Omen Max 16 ah000 | |
| Media de la clase Gaming (5509 - 45446, n=103, últimos 2 años) | |
| AIDA64 / CPU PhotoWorxx | |
| Asus ROG Strix Scar 16 2025 | |
| Schenker XMG Neo 16 E25 RTX 5090 Laptop | |
| Lenovo Legion Pro 7i 16 Gen 10 | |
| Medio Intel Core Ultra 9 275HX (37482 - 62916, n=30) | |
| Medion Erazer Beast 16 X1 Ultimate | |
| HP Omen Max 16 ah000 | |
| Asus ROG Strix G16 G615 | |
| Media de la clase Gaming (12271 - 89891, n=103, últimos 2 años) | |
Rendimiento del sistema
Sin embargo, en términos de rendimiento del sistema, el portátil Medion se lleva la palma en la clasificación general.
PCMark 10: Score | Essentials | Productivity | Digital Content Creation
CrossMark: Overall | Productivity | Creativity | Responsiveness
WebXPRT 3: Overall
WebXPRT 4: Overall
Mozilla Kraken 1.1: Total
| Performance rating | |
| Schenker XMG Neo 16 E25 RTX 5090 Laptop | |
| Asus ROG Strix G16 G615 | |
| Medio Intel Core Ultra 9 275HX, NVIDIA GeForce RTX 5090 Laptop | |
| Asus ROG Strix Scar 16 2025 | |
| Medion Erazer Beast 16 X1 Ultimate | |
| Lenovo Legion Pro 7i 16 Gen 10 | |
| HP Omen Max 16 ah000 -1! | |
| Media de la clase Gaming | |
| PCMark 10 / Score | |
| Lenovo Legion Pro 7i 16 Gen 10 | |
| Schenker XMG Neo 16 E25 RTX 5090 Laptop | |
| Asus ROG Strix G16 G615 | |
| Asus ROG Strix Scar 16 2025 | |
| HP Omen Max 16 ah000 | |
| Medio Intel Core Ultra 9 275HX, NVIDIA GeForce RTX 5090 Laptop (7474 - 9497, n=11) | |
| Medion Erazer Beast 16 X1 Ultimate | |
| Media de la clase Gaming (5828 - 11730, n=92, últimos 2 años) | |
| PCMark 10 / Essentials | |
| Medion Erazer Beast 16 X1 Ultimate | |
| Lenovo Legion Pro 7i 16 Gen 10 | |
| Asus ROG Strix G16 G615 | |
| Schenker XMG Neo 16 E25 RTX 5090 Laptop | |
| Asus ROG Strix Scar 16 2025 | |
| HP Omen Max 16 ah000 | |
| Medio Intel Core Ultra 9 275HX, NVIDIA GeForce RTX 5090 Laptop (9994 - 11369, n=12) | |
| Media de la clase Gaming (8810 - 11935, n=96, últimos 2 años) | |
| PCMark 10 / Productivity | |
| Media de la clase Gaming (6845 - 21327, n=94, últimos 2 años) | |
| Medio Intel Core Ultra 9 275HX, NVIDIA GeForce RTX 5090 Laptop (9122 - 10925, n=11) | |
| Lenovo Legion Pro 7i 16 Gen 10 | |
| Medion Erazer Beast 16 X1 Ultimate | |
| Schenker XMG Neo 16 E25 RTX 5090 Laptop | |
| Asus ROG Strix G16 G615 | |
| Asus ROG Strix Scar 16 2025 | |
| HP Omen Max 16 ah000 | |
| PCMark 10 / Digital Content Creation | |
| Lenovo Legion Pro 7i 16 Gen 10 | |
| Schenker XMG Neo 16 E25 RTX 5090 Laptop | |
| HP Omen Max 16 ah000 | |
| Asus ROG Strix G16 G615 | |
| Asus ROG Strix Scar 16 2025 | |
| Medio Intel Core Ultra 9 275HX, NVIDIA GeForce RTX 5090 Laptop (9952 - 19234, n=11) | |
| Medion Erazer Beast 16 X1 Ultimate | |
| Media de la clase Gaming (7602 - 19954, n=94, últimos 2 años) | |
| CrossMark / Overall | |
| Schenker XMG Neo 16 E25 RTX 5090 Laptop | |
| Medion Erazer Beast 16 X1 Ultimate | |
| Medio Intel Core Ultra 9 275HX, NVIDIA GeForce RTX 5090 Laptop (1995 - 2339, n=12) | |
| Asus ROG Strix G16 G615 | |
| Asus ROG Strix Scar 16 2025 | |
| Lenovo Legion Pro 7i 16 Gen 10 | |
| HP Omen Max 16 ah000 | |
| Media de la clase Gaming (1366 - 2409, n=93, últimos 2 años) | |
| CrossMark / Productivity | |
| Schenker XMG Neo 16 E25 RTX 5090 Laptop | |
| Medion Erazer Beast 16 X1 Ultimate | |
| Medio Intel Core Ultra 9 275HX, NVIDIA GeForce RTX 5090 Laptop (1847 - 2211, n=12) | |
| Asus ROG Strix G16 G615 | |
| Asus ROG Strix Scar 16 2025 | |
| Lenovo Legion Pro 7i 16 Gen 10 | |
| Media de la clase Gaming (1386 - 2254, n=93, últimos 2 años) | |
| HP Omen Max 16 ah000 | |
| CrossMark / Creativity | |
| Schenker XMG Neo 16 E25 RTX 5090 Laptop | |
| Medion Erazer Beast 16 X1 Ultimate | |
| Asus ROG Strix Scar 16 2025 | |
| Medio Intel Core Ultra 9 275HX, NVIDIA GeForce RTX 5090 Laptop (2170 - 2642, n=12) | |
| Asus ROG Strix G16 G615 | |
| Lenovo Legion Pro 7i 16 Gen 10 | |
| HP Omen Max 16 ah000 | |
| Media de la clase Gaming (1343 - 2729, n=93, últimos 2 años) | |
| CrossMark / Responsiveness | |
| Medio Intel Core Ultra 9 275HX, NVIDIA GeForce RTX 5090 Laptop (1673 - 2217, n=12) | |
| Schenker XMG Neo 16 E25 RTX 5090 Laptop | |
| Asus ROG Strix G16 G615 | |
| Medion Erazer Beast 16 X1 Ultimate | |
| Media de la clase Gaming (1226 - 2334, n=93, últimos 2 años) | |
| Asus ROG Strix Scar 16 2025 | |
| HP Omen Max 16 ah000 | |
| Lenovo Legion Pro 7i 16 Gen 10 | |
| WebXPRT 3 / Overall | |
| HP Omen Max 16 ah000 | |
| Lenovo Legion Pro 7i 16 Gen 10 | |
| Schenker XMG Neo 16 E25 RTX 5090 Laptop | |
| Asus ROG Strix G16 G615 | |
| Medio Intel Core Ultra 9 275HX, NVIDIA GeForce RTX 5090 Laptop (315 - 372, n=12) | |
| Asus ROG Strix Scar 16 2025 | |
| Medion Erazer Beast 16 X1 Ultimate | |
| Media de la clase Gaming (220 - 532, n=97, últimos 2 años) | |
| WebXPRT 4 / Overall | |
| Asus ROG Strix Scar 16 2025 | |
| Asus ROG Strix G16 G615 | |
| Medion Erazer Beast 16 X1 Ultimate | |
| Lenovo Legion Pro 7i 16 Gen 10 | |
| Schenker XMG Neo 16 E25 RTX 5090 Laptop | |
| Medio Intel Core Ultra 9 275HX, NVIDIA GeForce RTX 5090 Laptop (301 - 341, n=11) | |
| Media de la clase Gaming (165 - 354, n=97, últimos 2 años) | |
| Mozilla Kraken 1.1 / Total | |
| Media de la clase Gaming (391 - 590, n=99, últimos 2 años) | |
| HP Omen Max 16 ah000 | |
| Asus ROG Strix Scar 16 2025 | |
| Medio Intel Core Ultra 9 275HX, NVIDIA GeForce RTX 5090 Laptop (402 - 424, n=12) | |
| Medion Erazer Beast 16 X1 Ultimate | |
| Lenovo Legion Pro 7i 16 Gen 10 | |
| Asus ROG Strix G16 G615 | |
| Schenker XMG Neo 16 E25 RTX 5090 Laptop | |
* ... más pequeño es mejor
| PCMark 10 Score | 8518 puntos | |
ayuda | ||
| AIDA64 / Memory Copy | |
| Schenker XMG Neo 16 E25 RTX 5090 Laptop | |
| Asus ROG Strix G16 G615 | |
| Lenovo Legion Pro 7i 16 Gen 10 | |
| Asus ROG Strix Scar 16 2025 | |
| Medion Erazer Beast 16 X1 Ultimate | |
| Medio Intel Core Ultra 9 275HX (56003 - 94460, n=30) | |
| HP Omen Max 16 ah000 | |
| Media de la clase Gaming (21750 - 129946, n=103, últimos 2 años) | |
| AIDA64 / Memory Read | |
| Schenker XMG Neo 16 E25 RTX 5090 Laptop | |
| Lenovo Legion Pro 7i 16 Gen 10 | |
| Asus ROG Strix Scar 16 2025 | |
| Medion Erazer Beast 16 X1 Ultimate | |
| Medio Intel Core Ultra 9 275HX (55795 - 97151, n=30) | |
| HP Omen Max 16 ah000 | |
| Asus ROG Strix G16 G615 | |
| Media de la clase Gaming (22956 - 118858, n=103, últimos 2 años) | |
| AIDA64 / Memory Write | |
| Schenker XMG Neo 16 E25 RTX 5090 Laptop | |
| Lenovo Legion Pro 7i 16 Gen 10 | |
| Asus ROG Strix Scar 16 2025 | |
| Medio Intel Core Ultra 9 275HX (55663 - 116129, n=30) | |
| HP Omen Max 16 ah000 | |
| Medion Erazer Beast 16 X1 Ultimate | |
| Media de la clase Gaming (22297 - 135096, n=103, últimos 2 años) | |
| Asus ROG Strix G16 G615 | |
| AIDA64 / Memory Latency | |
| HP Omen Max 16 ah000 | |
| Medio Intel Core Ultra 9 275HX (105.8 - 161.6, n=30) | |
| Asus ROG Strix G16 G615 | |
| Asus ROG Strix Scar 16 2025 | |
| Medion Erazer Beast 16 X1 Ultimate | |
| Lenovo Legion Pro 7i 16 Gen 10 | |
| Schenker XMG Neo 16 E25 RTX 5090 Laptop | |
| Media de la clase Gaming (75.3 - 259, n=103, últimos 2 años) | |
* ... más pequeño es mejor
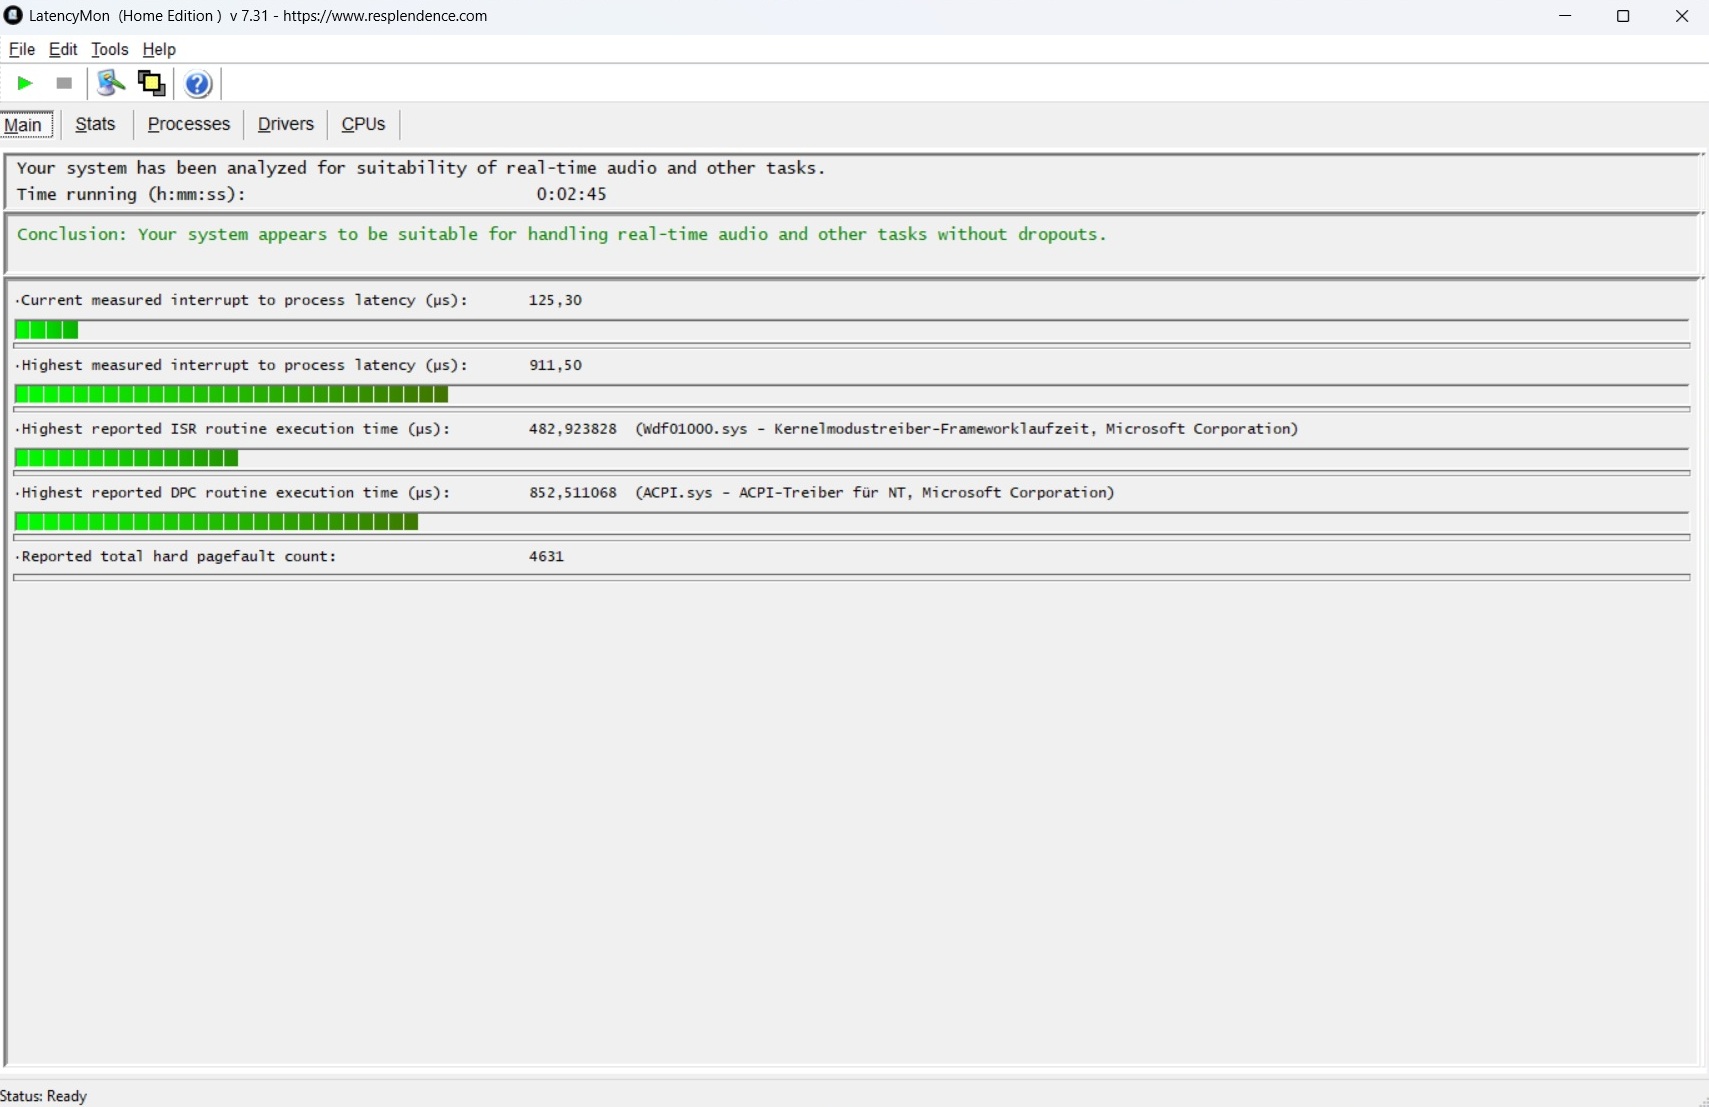
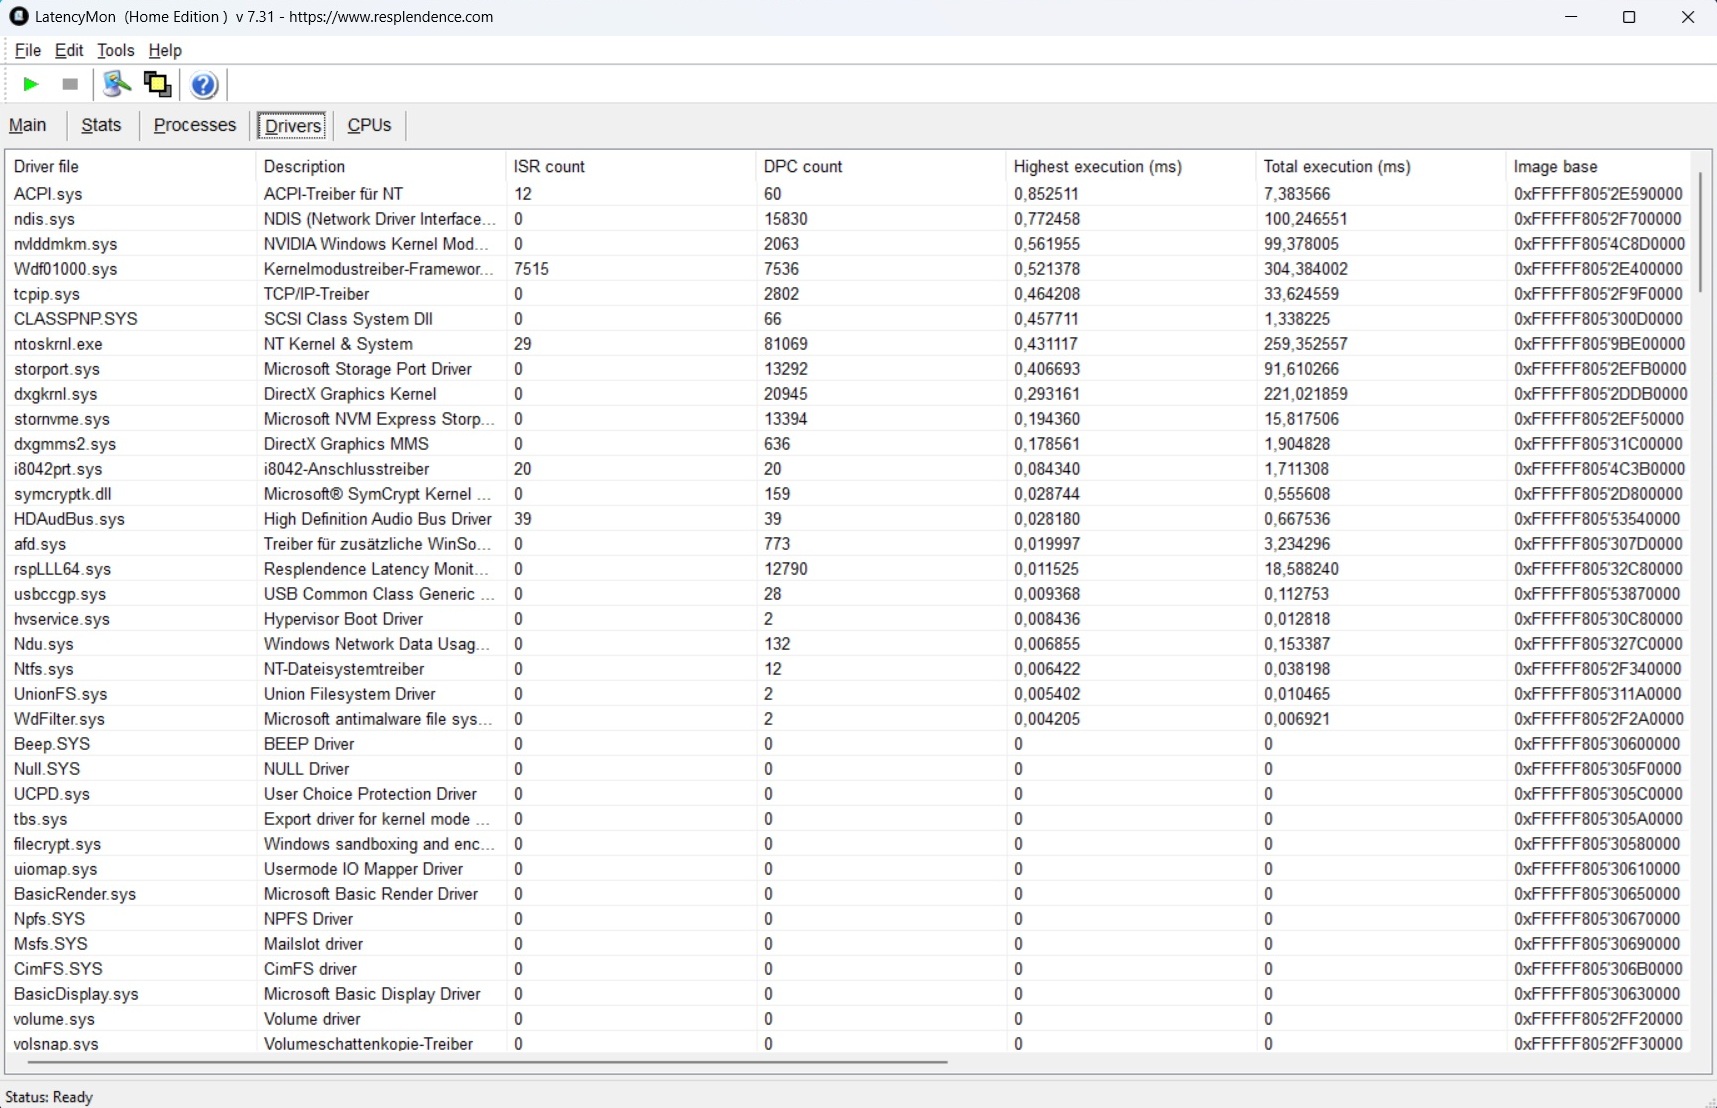
Latencias del CPD
Las latencias tampoco son motivo de queja. Según la herramienta LatencyMon, no debería haber problemas con el procesamiento de audio y vídeo en tiempo real.
| DPC Latencies / LatencyMon - interrupt to process latency (max), Web, Youtube, Prime95 | |
| Asus ROG Strix Scar 16 2025 | |
| HP Omen Max 16 ah000 | |
| Asus ROG Strix G16 G615 | |
| Schenker XMG Neo 16 E25 RTX 5090 Laptop | |
| Medion Erazer Beast 16 X1 Ultimate | |
| Lenovo Legion Pro 7i 16 Gen 10 | |
* ... más pequeño es mejor
Almacenamiento masivo
El almacenamiento masivo también es impresionante. Secuencialmente, la unidad PCIe 5 integrada de Phison alcanza unos 10.000 MB/s en el mejor de los casos, aunque también cabría esperar un modelo de 4 TB en lugar de 2 TB por el precio. Arriba: En contraste con el rendimiento de la CPU, el rendimiento de la unidad SSD se mantiene estable.

* ... más pequeño es mejor
Continuous Power: DiskSpd Read Loop, Queue Depth 8
Rendimiento de la GPU
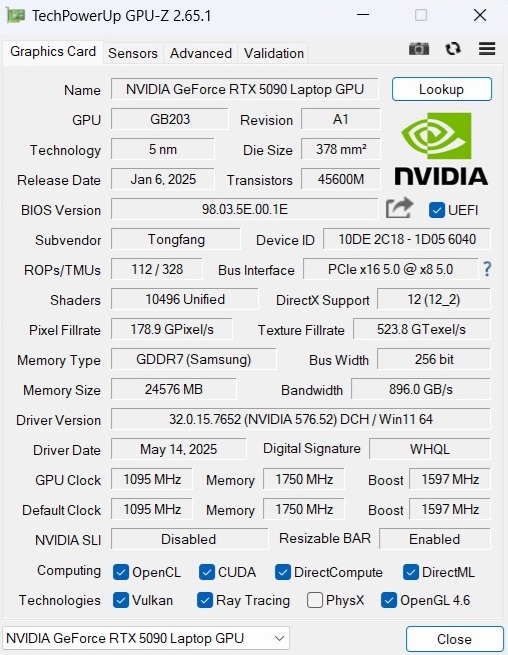
En comparación con la RTX 5080, la RTX 5090 ofrece 24 GB completos de VRAM GDDR7 en lugar de 16 GB. En las pruebas de GPU, la Beast 16 X1 ofrece un rendimiento muy bueno y a menudo se sitúa unos porcentajes por encima de la competencia o de la media determinada previamente para la RTX 5090. Sin embargo, la RTX 5080 sólo queda parcialmente rezagada si nos fijamos en sus rivales.
| 3DMark 11 Performance | 54178 puntos | |
| 3DMark Cloud Gate Standard Score | 75355 puntos | |
| 3DMark Fire Strike Score | 42189 puntos | |
| 3DMark Time Spy Score | 22368 puntos | |
ayuda | ||
Rendimiento en juegos
La situación es similar en las pruebas de juegos. Aquí también, la RTX 5090 rinde a veces apenas más rápido que la RTX 5080, especialmente a resoluciones moderadas (Full HD).
Cuando se utilizan resoluciones QHD, las distancias aumentan y suele haber aún reservas suficientes para los ajustes máximos. De los juegos probados, sólo F1 25 (con trazado de trayectorias) y el moderadamente optimizado Oblivion Remasterizado no superaron la marca de los 60 FPS. Si las cosas se ponen difíciles en el futuro, el escalado y la generación (multi) de fotogramas pueden ayudar. Los aumentos de rendimiento que son posibles como resultado pueden verse en la tabla siguiente; incluyendo la calidad DLSS y FG, la tasa de fotogramas se duplica en Stalker 2 por ejemplo.
| Stalker 2 | |
| 2560x1440 Epic Preset | |
| Medio NVIDIA GeForce RTX 5090 Laptop (59.8 - 110.7, n=3) | |
| Medion Erazer Beast 16 X1 Ultimate | |
| Aorus Master 18 AM8H | |
| Media de la clase Gaming (29 - 110.7, n=13, últimos 2 años) | |
| 2560x1440 Epic Preset + Quality DLSS + FG | |
| Medion Erazer Beast 16 X1 Ultimate | |
| Medio NVIDIA GeForce RTX 5090 Laptop (124.9 - 134.6, n=2) | |
| Aorus Master 18 AM8H | |
| Media de la clase Gaming (58.3 - 134.6, n=12, últimos 2 años) | |
| Doom: The Dark Ages | |
| 2560x1440 Ultra Nightmare AA:T | |
| Medio NVIDIA GeForce RTX 5090 Laptop (77 - 92.2, n=3) | |
| Medion Erazer Beast 16 X1 Ultimate | |
| Asus ROG Strix G16 G615 | |
| Media de la clase Gaming (30.4 - 92.2, n=19, últimos 2 años) | |
| 2560x1440 Ultra Nightmare - DLSS Quality | |
| Medion Erazer Beast 16 X1 Ultimate | |
| Medio NVIDIA GeForce RTX 5090 Laptop (102.3 - 107.3, n=2) | |
| Asus ROG Strix G16 G615 | |
| Media de la clase Gaming (48 - 107.3, n=18, últimos 2 años) | |
| F1 25 | |
| 2560x1440 Ultra Max Preset AA:T AF:16x | |
| Medio NVIDIA GeForce RTX 5090 Laptop (30.2 - 37.7, n=9) | |
| Medion Erazer Beast 16 X1 Ultimate | |
| Media de la clase Gaming (5 - 37.7, n=25, últimos 2 años) | |
| 2560x1440 Ultra Max Preset + DLSS Quality AA:DLSS AF:16x | |
| Medion Erazer Beast 16 X1 Ultimate | |
| Medio NVIDIA GeForce RTX 5090 Laptop (51.8 - 67.5, n=7) | |
| Media de la clase Gaming (9 - 67.5, n=23, últimos 2 años) | |
| The Elder Scrolls IV Oblivion Remastered | |
| 2560x1440 Ultra Preset AA:T | |
| Medio NVIDIA GeForce RTX 5090 Laptop (41.7 - 45.9, n=2) | |
| Medion Erazer Beast 16 X1 Ultimate | |
| Media de la clase Gaming (12.7 - 45.9, n=14, últimos 2 años) | |
| 2560x1440 Ultra Preset + Quality DLSS | |
| Medion Erazer Beast 16 X1 Ultimate | |
| Medio NVIDIA GeForce RTX 5090 Laptop (n=1) | |
| Media de la clase Gaming (25.3 - 59.7, n=12, últimos 2 años) | |
| Kingdom Come Deliverance 2 | |
| 2560x1440 Ultra Preset | |
| Medio NVIDIA GeForce RTX 5090 Laptop (82.6 - 97.2, n=3) | |
| Medion Erazer Beast 16 X1 Ultimate | |
| Aorus Master 18 AM8H | |
| Media de la clase Gaming (36.8 - 97.2, n=13, últimos 2 años) | |
| 2560x1440 Ultra Preset + Quality DLSS | |
| Medion Erazer Beast 16 X1 Ultimate | |
| Medio NVIDIA GeForce RTX 5090 Laptop (98.7 - 115.5, n=3) | |
| Aorus Master 18 AM8H | |
| Media de la clase Gaming (50.3 - 115.5, n=13, últimos 2 años) | |
| Until Dawn | |
| 2560x1440 Ultra Preset | |
| Medio NVIDIA GeForce RTX 5090 Laptop (65.6 - 76.6, n=3) | |
| Medion Erazer Beast 16 X1 Ultimate | |
| Aorus Master 18 AM8H | |
| Media de la clase Gaming (30.4 - 76.6, n=11, últimos 2 años) | |
| 2560x1440 Ultra Preset + Quality DLSS + Ray Tracing | |
| Medion Erazer Beast 16 X1 Ultimate | |
| Medio NVIDIA GeForce RTX 5090 Laptop (79.7 - 86.3, n=2) | |
| Aorus Master 18 AM8H | |
| Media de la clase Gaming (39.5 - 86.3, n=10, últimos 2 años) | |
| Space Marine 2 | |
| 2560x1440 Ultra Preset AA:T | |
| Medio NVIDIA GeForce RTX 5090 Laptop (97.2 - 107.4, n=3) | |
| Aorus Master 18 AM8H | |
| Medion Erazer Beast 16 X1 Ultimate | |
| Media de la clase Gaming (48.2 - 107.4, n=11, últimos 2 años) | |
| 2560x1440 Ultra Preset + Quality DLSS | |
| Aorus Master 18 AM8H | |
| Medio NVIDIA GeForce RTX 5090 Laptop (97.5 - 100.8, n=2) | |
| Medion Erazer Beast 16 X1 Ultimate | |
| Media de la clase Gaming (58.5 - 100.8, n=10, últimos 2 años) | |
| bajo | medio | alto | ultra | QHD DLSS | QHD | |
|---|---|---|---|---|---|---|
| GTA V (2015) | 187.5 | 185.3 | 142.4 | 133.4 | ||
| Dota 2 Reborn (2015) | 234 | 204 | 193 | 176.4 | ||
| Final Fantasy XV Benchmark (2018) | 234 | 205 | 172.2 | |||
| X-Plane 11.11 (2018) | 161.6 | 139.2 | 114.2 | |||
| Baldur's Gate 3 (2023) | 217 | 202 | 200 | 151 | ||
| Cyberpunk 2077 (2023) | 188.1 | 171.9 | 158.5 | 110.8 | ||
| Star Wars Outlaws (2024) | 79.3 | 72.7 | 70 | 70.8 | 61 | |
| Space Marine 2 (2024) | 102.8 | 102.1 | 101.4 | 97.5 | 97.2 | |
| Until Dawn (2024) | 109.9 | 102.4 | 93.9 | 86.3 | 69.5 | |
| Stalker 2 (2024) | 106.1 | 92.6 | 81.8 | 134.6 | 65.4 | |
| Kingdom Come Deliverance 2 (2025) | 195.8 | 165.7 | 118.5 | 114.5 | 86 | |
| Civilization 7 (2025) | 231 | 225 | 184.9 | |||
| The Elder Scrolls IV Oblivion Remastered (2025) | 118.4 | 104.2 | 57.5 | 59.7 | 41.7 | |
| Doom: The Dark Ages (2025) | 124.3 | 113.9 | 111.3 | 107.3 | 82.1 | |
| F1 25 (2025) | 256 | 241 | 57 | 61 | 34 |
Una carga prolongada de la GPU provoca una ligera caída del rendimiento en la Beast 16 X1. Sin embargo, la pérdida de FPS es limitada. Nuestro Cyberpunk-Test ilustra el fenómeno (línea roja).
Cyberpunk 2077 ultra FPS-Diagram
Emisiones
Emisiones sonoras
La 16 pulgadas es tan ruidosa como la competencia bajo carga. Algo menos de 55 dB(A) en el modo típico de juego es claramente audible y exige unos auriculares. El portátil Medion es mucho más silencioso en modo inactivo, donde los ventiladores suelen alcanzar entre 25 y 29 dB(A).
Ruido
| Ocioso |
| 25 / 27 / 29 dB(A) |
| Carga |
| 52 / 55 dB(A) |
 | ||
30 dB silencioso 40 dB(A) audible 50 dB(A) ruidosamente alto |
||
min: | ||
| Medion Erazer Beast 16 X1 Ultimate GeForce RTX 5090 Laptop, Ultra 9 275HX | Schenker XMG Neo 16 E25 RTX 5090 Laptop GeForce RTX 5090 Laptop, Ultra 9 275HX | HP Omen Max 16 ah000 GeForce RTX 5090 Laptop, Ultra 9 275HX | Asus ROG Strix Scar 16 2025 GeForce RTX 5090 Laptop, Ultra 9 275HX | Lenovo Legion Pro 7i 16 Gen 10 GeForce RTX 5080 Laptop, Ultra 9 275HX | Asus ROG Strix G16 G615 GeForce RTX 5080 Laptop, Ultra 9 275HX | |
|---|---|---|---|---|---|---|
| Noise | 1% | -3% | 1% | 12% | 2% | |
| apagado / medio ambiente * (dB) | 24 | 24 -0% | 22.8 5% | 23.8 1% | 22.9 5% | 24 -0% |
| Idle Minimum * (dB) | 25 | 26 -4% | 29 -16% | 29 -16% | 22.9 8% | 24 4% |
| Idle Average * (dB) | 27 | 26 4% | 29 -7% | 29 -7% | 22.9 15% | 30.1 -11% |
| Idle Maximum * (dB) | 29 | 26 10% | 29 -0% | 29 -0% | 26.3 9% | 30.1 -4% |
| Load Average * (dB) | 52 | 52.4 -1% | 47.7 8% | 40.5 22% | 27.8 47% | 41.1 21% |
| Cyberpunk 2077 ultra * (dB) | 55 | 55.4 -1% | 54.8 -0% | 53.6 3% | 54.2 1% | 54.2 1% |
| Load Maximum * (dB) | 55 | 55.4 -1% | 61.1 -11% | 53.6 3% | 53.9 2% | 54.2 1% |
* ... más pequeño es mejor
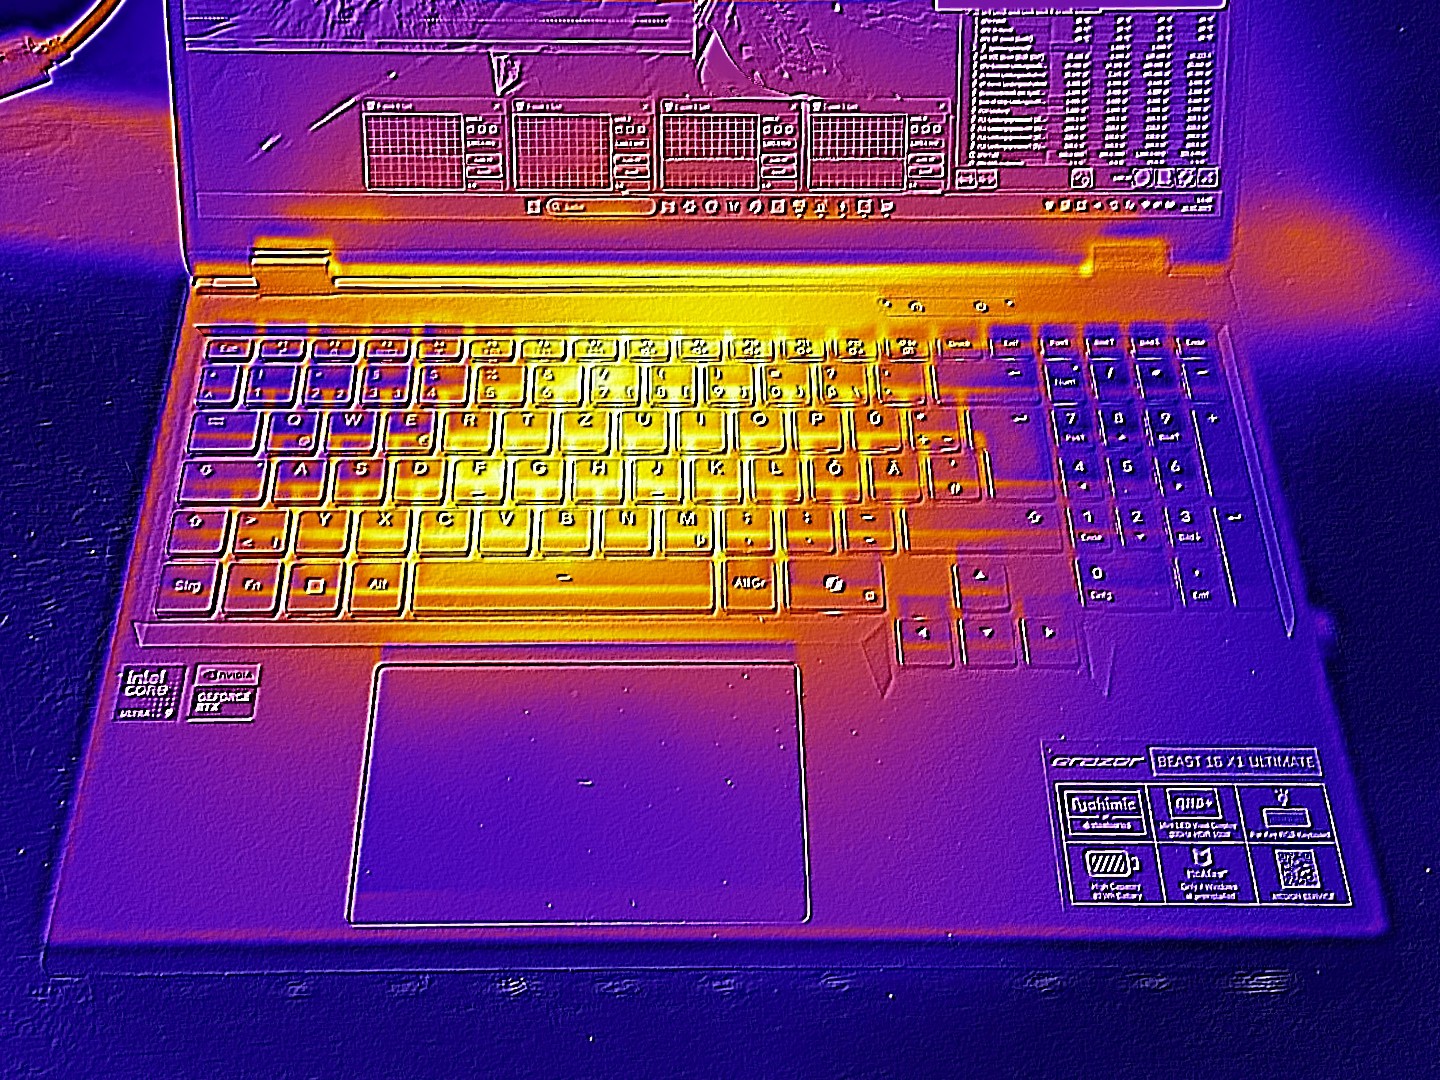
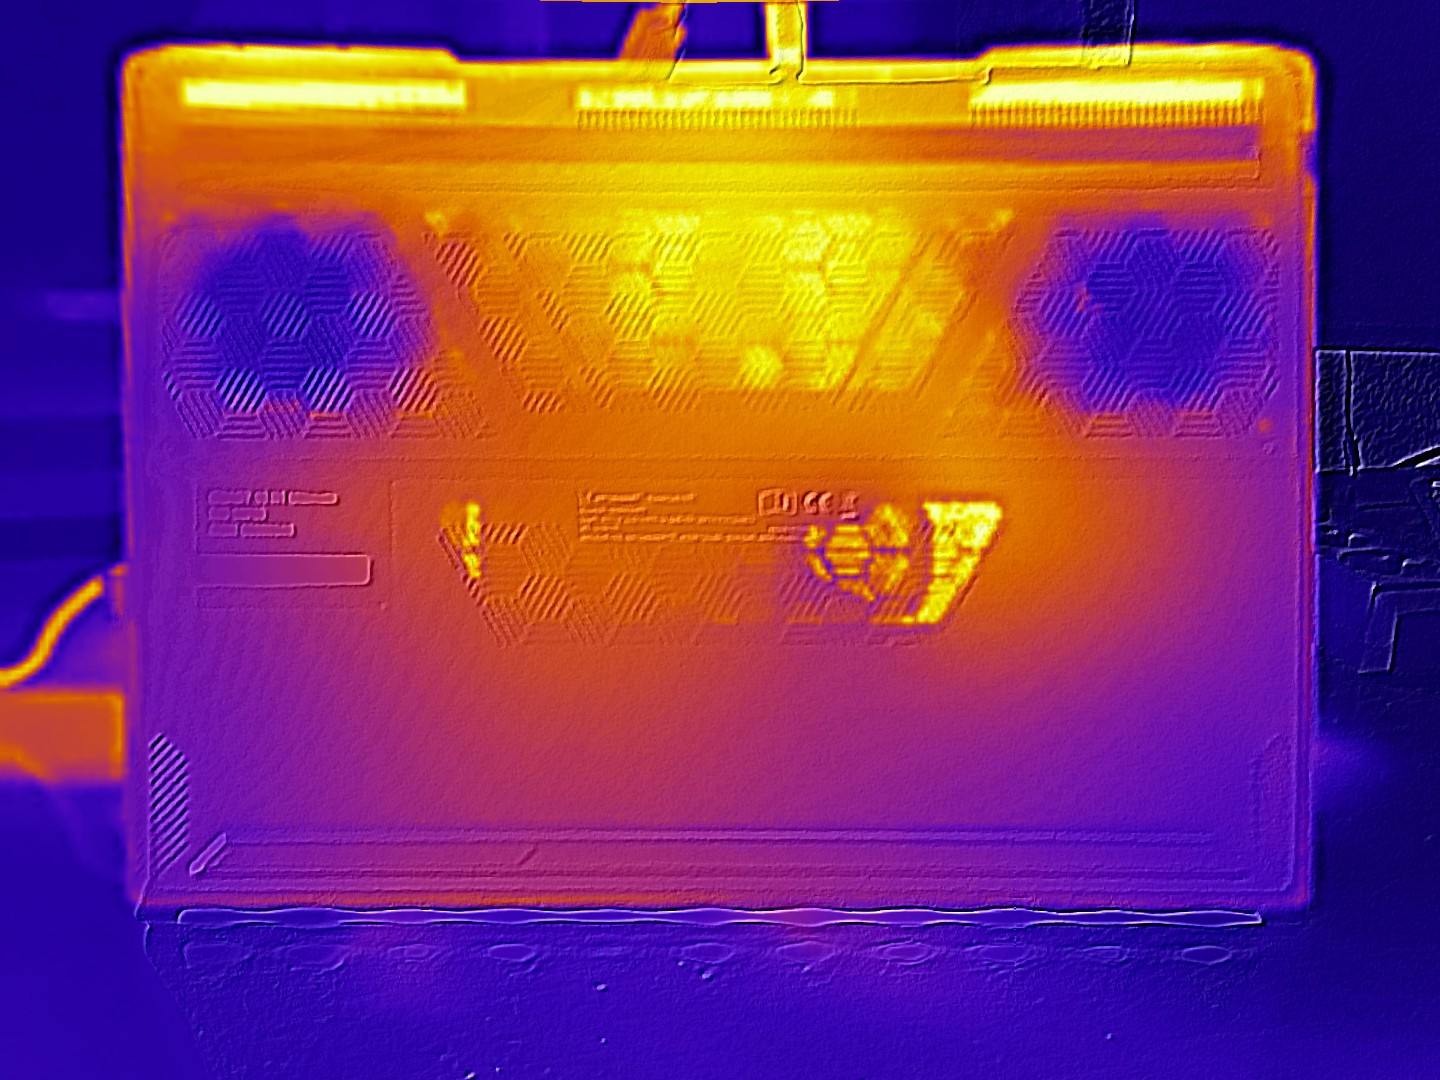
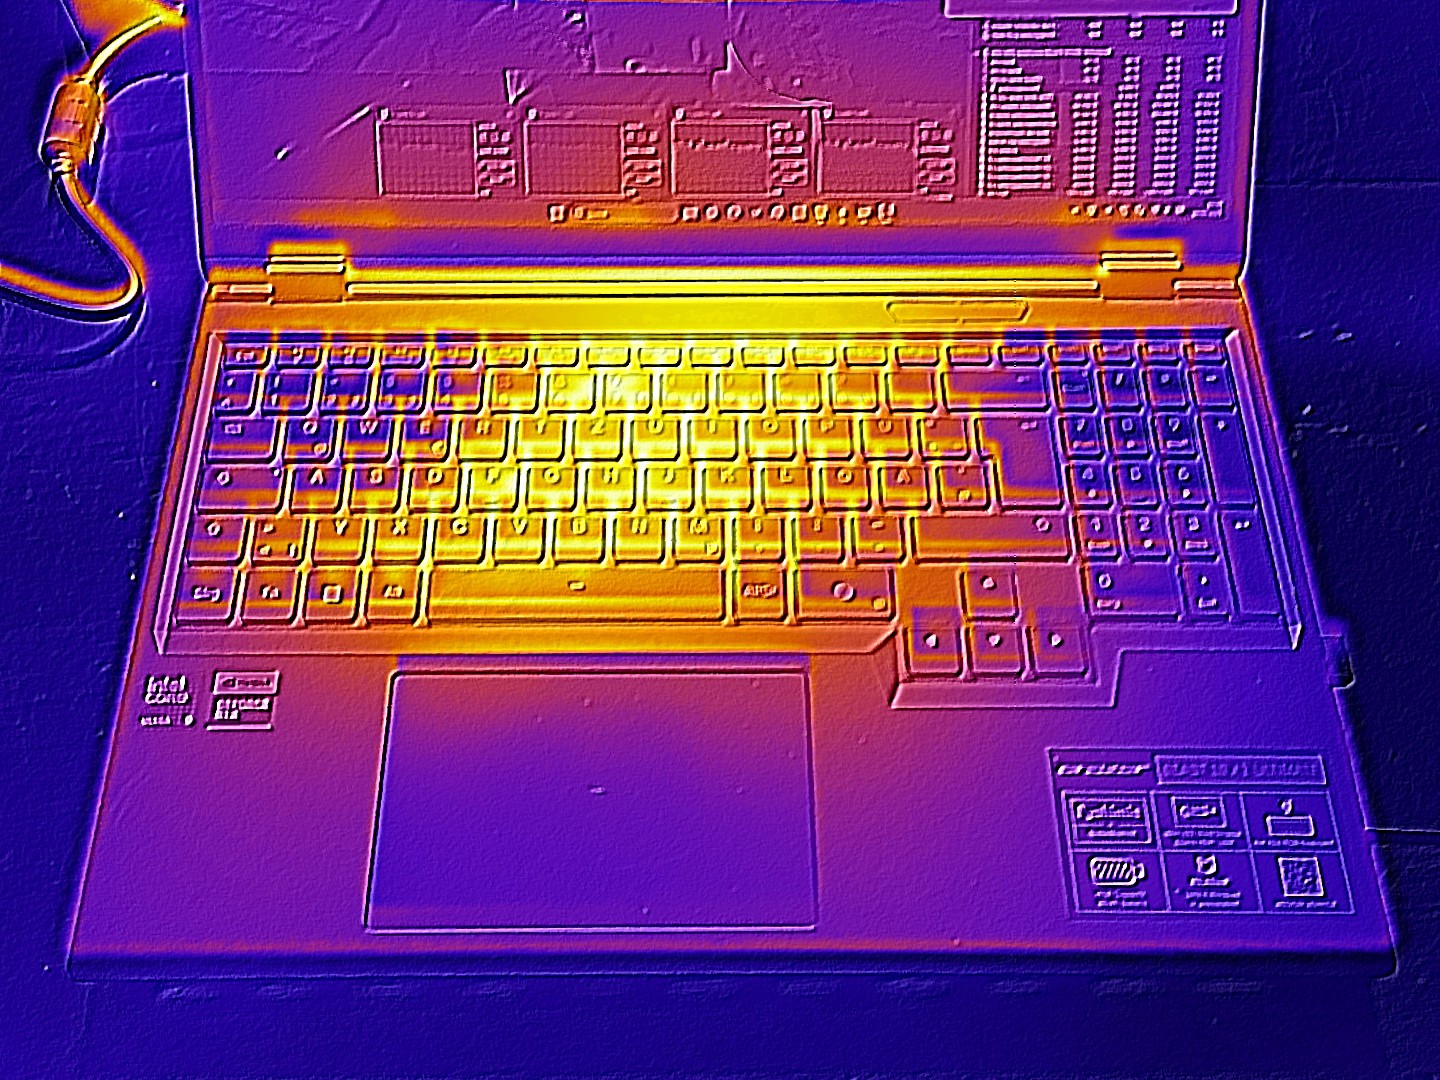
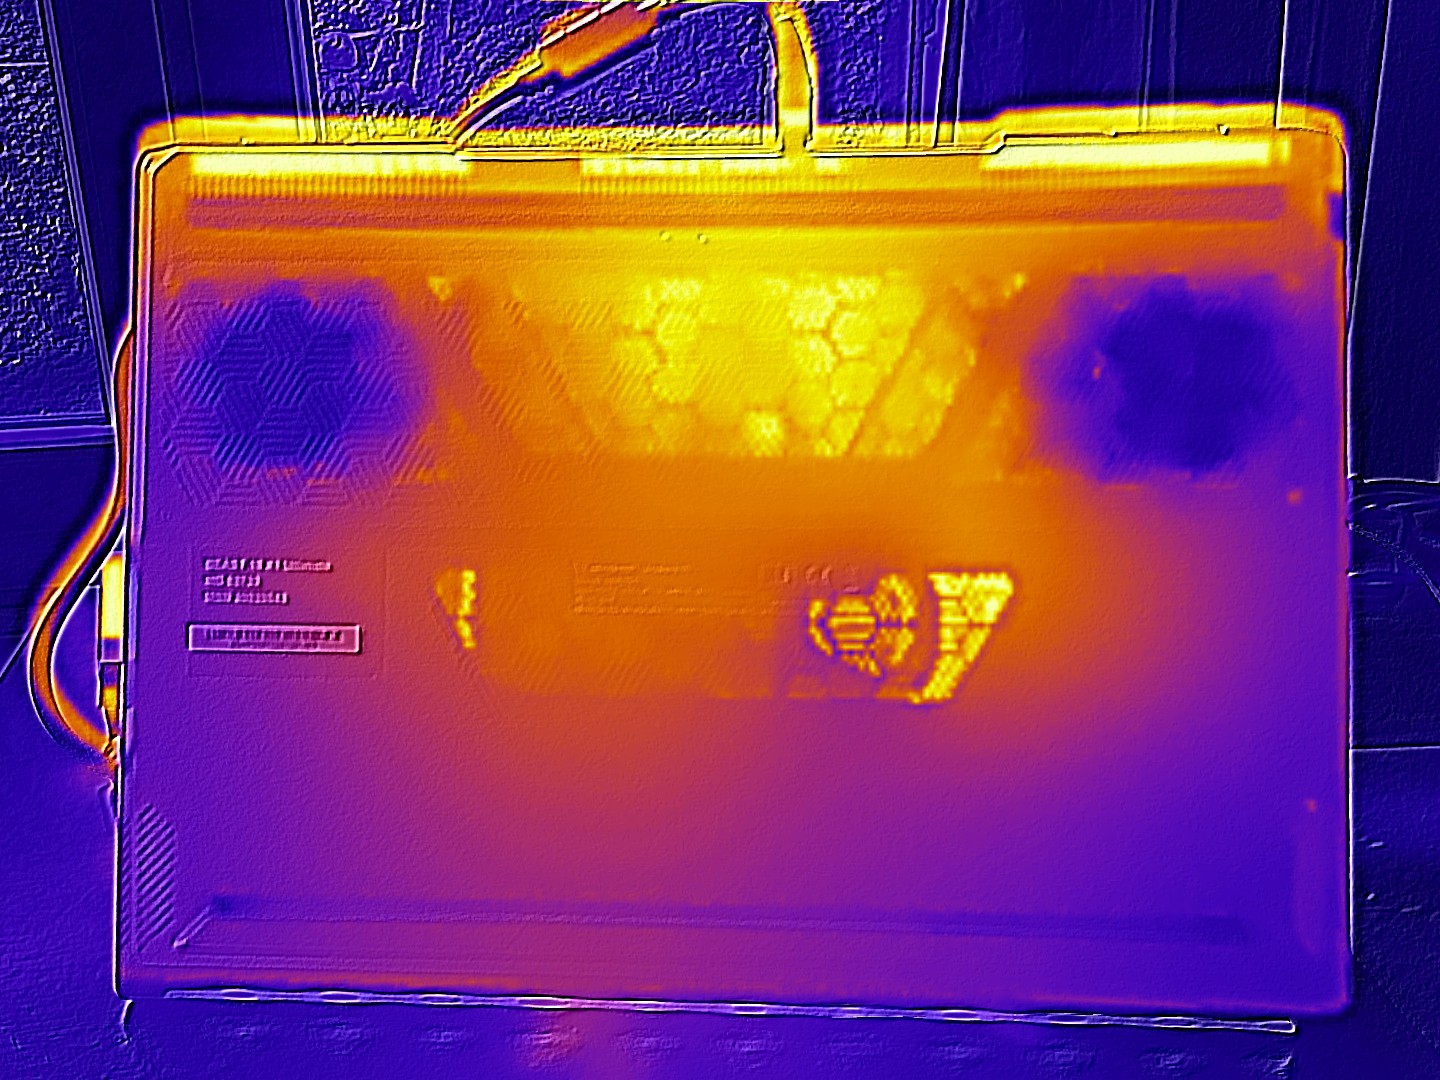
Temperatura
Mientras que la Beast 16 X1 se mantiene agradablemente fría en modo de reposo (máximo 30 °C/86 °F), las superficies de la carcasa pueden alcanzar hasta 49 °C (120,2 °F/superior) y 45 °C (113 °F/inferior) bajo una carga más pesada, que no son valores ni especialmente altos ni bajos en comparación con la competencia.
(-) La temperatura máxima en la parte superior es de 49 °C / 120 F, frente a la media de 40.4 °C / 105 F, que oscila entre 21.2 y 68.8 °C para la clase Gaming.
(±) El fondo se calienta hasta un máximo de 45 °C / 113 F, frente a la media de 43.2 °C / 110 F
(+) En reposo, la temperatura media de la parte superior es de 29.1 °C / 84# F, frente a la media del dispositivo de 33.9 °C / 93 F.
(-) 3: The average temperature for the upper side is 40.2 °C / 104 F, compared to the average of 33.9 °C / 93 F for the class Gaming.
(±) El reposamanos y el touchpad pueden calentarse mucho al tacto con un máximo de 37 °C / 98.6 F.
(-) La temperatura media de la zona del reposamanos de dispositivos similares fue de 28.8 °C / 83.8 F (-8.2 °C / -14.8 F).
| Medion Erazer Beast 16 X1 Ultimate GeForce RTX 5090 Laptop, Ultra 9 275HX | Schenker XMG Neo 16 E25 RTX 5090 Laptop GeForce RTX 5090 Laptop, Ultra 9 275HX | HP Omen Max 16 ah000 GeForce RTX 5090 Laptop, Ultra 9 275HX | Asus ROG Strix Scar 16 2025 GeForce RTX 5090 Laptop, Ultra 9 275HX | Lenovo Legion Pro 7i 16 Gen 10 GeForce RTX 5080 Laptop, Ultra 9 275HX | Asus ROG Strix G16 G615 GeForce RTX 5080 Laptop, Ultra 9 275HX | |
|---|---|---|---|---|---|---|
| Heat | 2% | 6% | -7% | 1% | 8% | |
| Maximum Upper Side * (°C) | 49 | 47.8 2% | 42.8 13% | 44.2 10% | 42.6 13% | 39.6 19% |
| Maximum Bottom * (°C) | 45 | 46.7 -4% | 50.2 -12% | 48.1 -7% | 41.2 8% | 49.7 -10% |
| Idle Upper Side * (°C) | 30 | 28.4 5% | 27.6 8% | 33 -10% | 32.6 -9% | 26.3 12% |
| Idle Bottom * (°C) | 30 | 28.9 4% | 26.2 13% | 36.1 -20% | 32.4 -8% | 27.3 9% |
* ... más pequeño es mejor
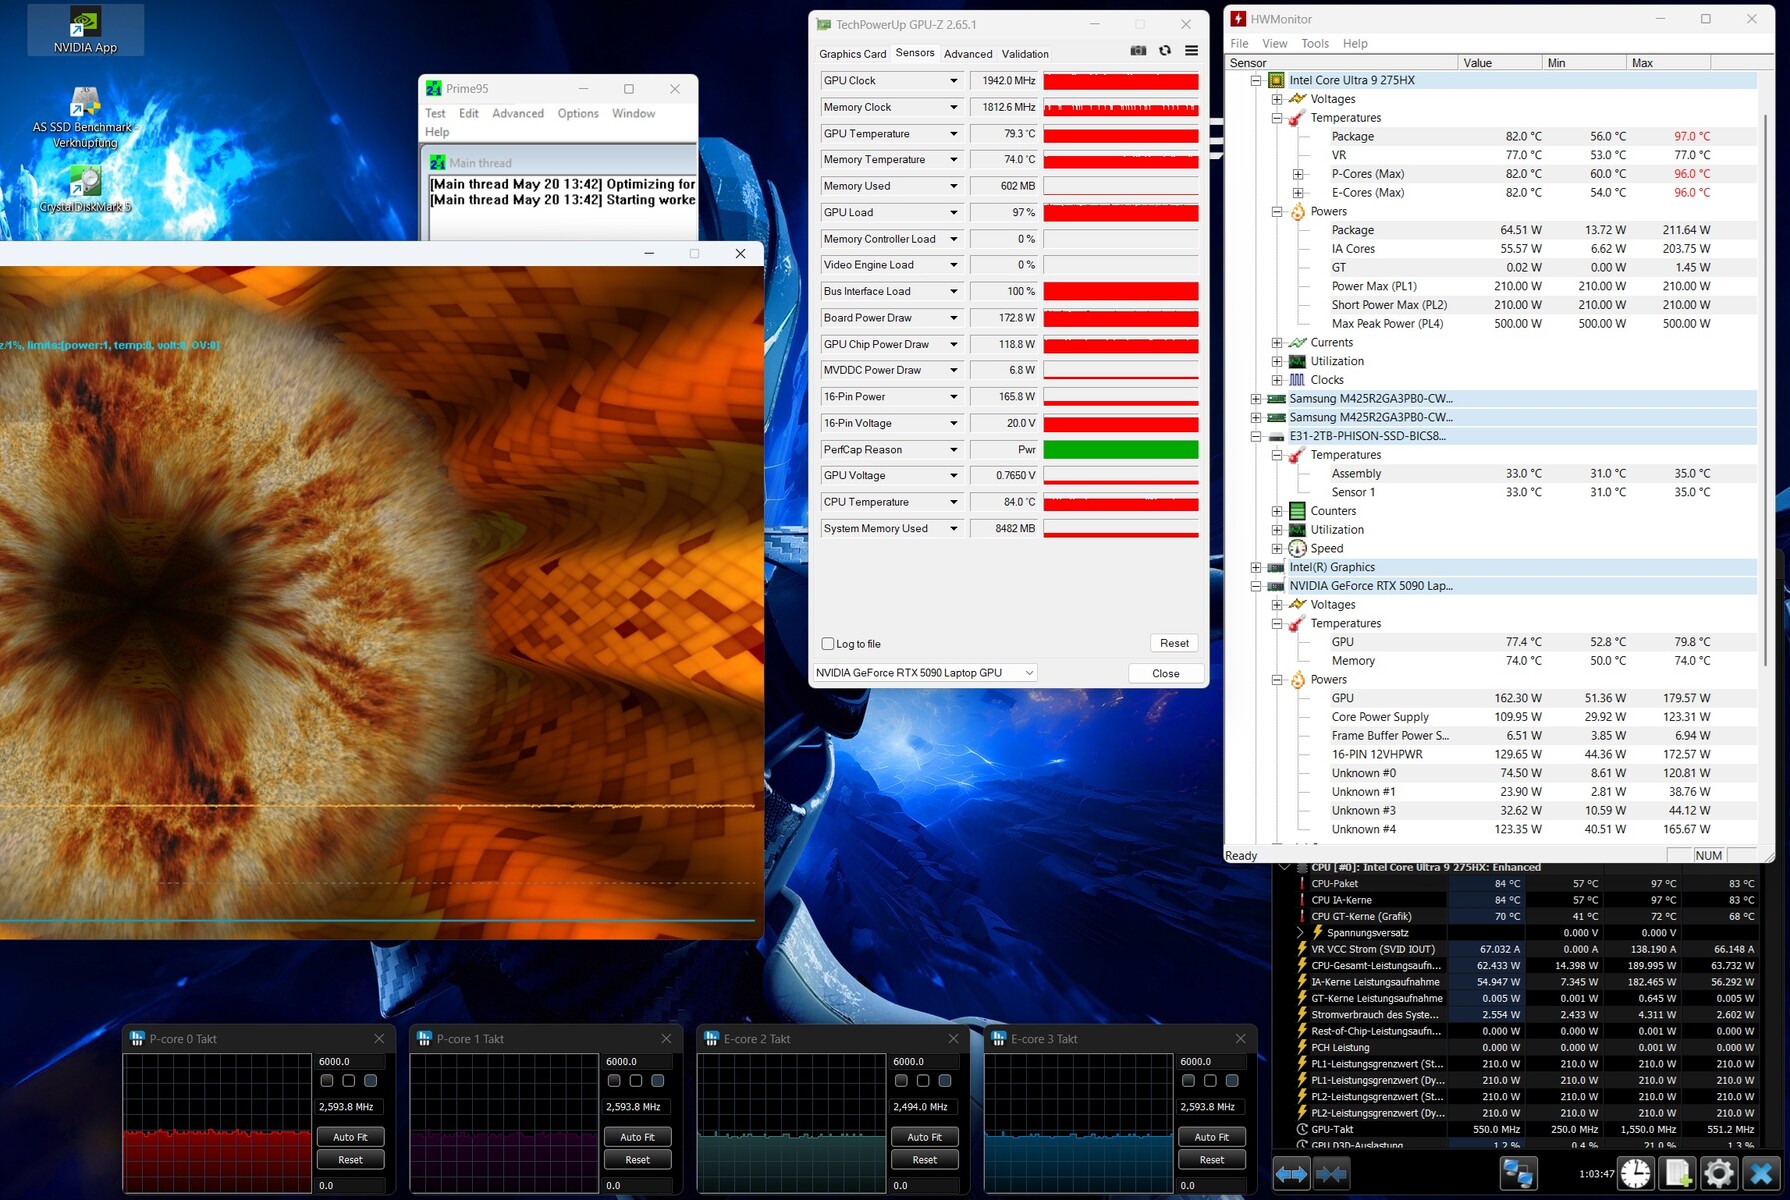
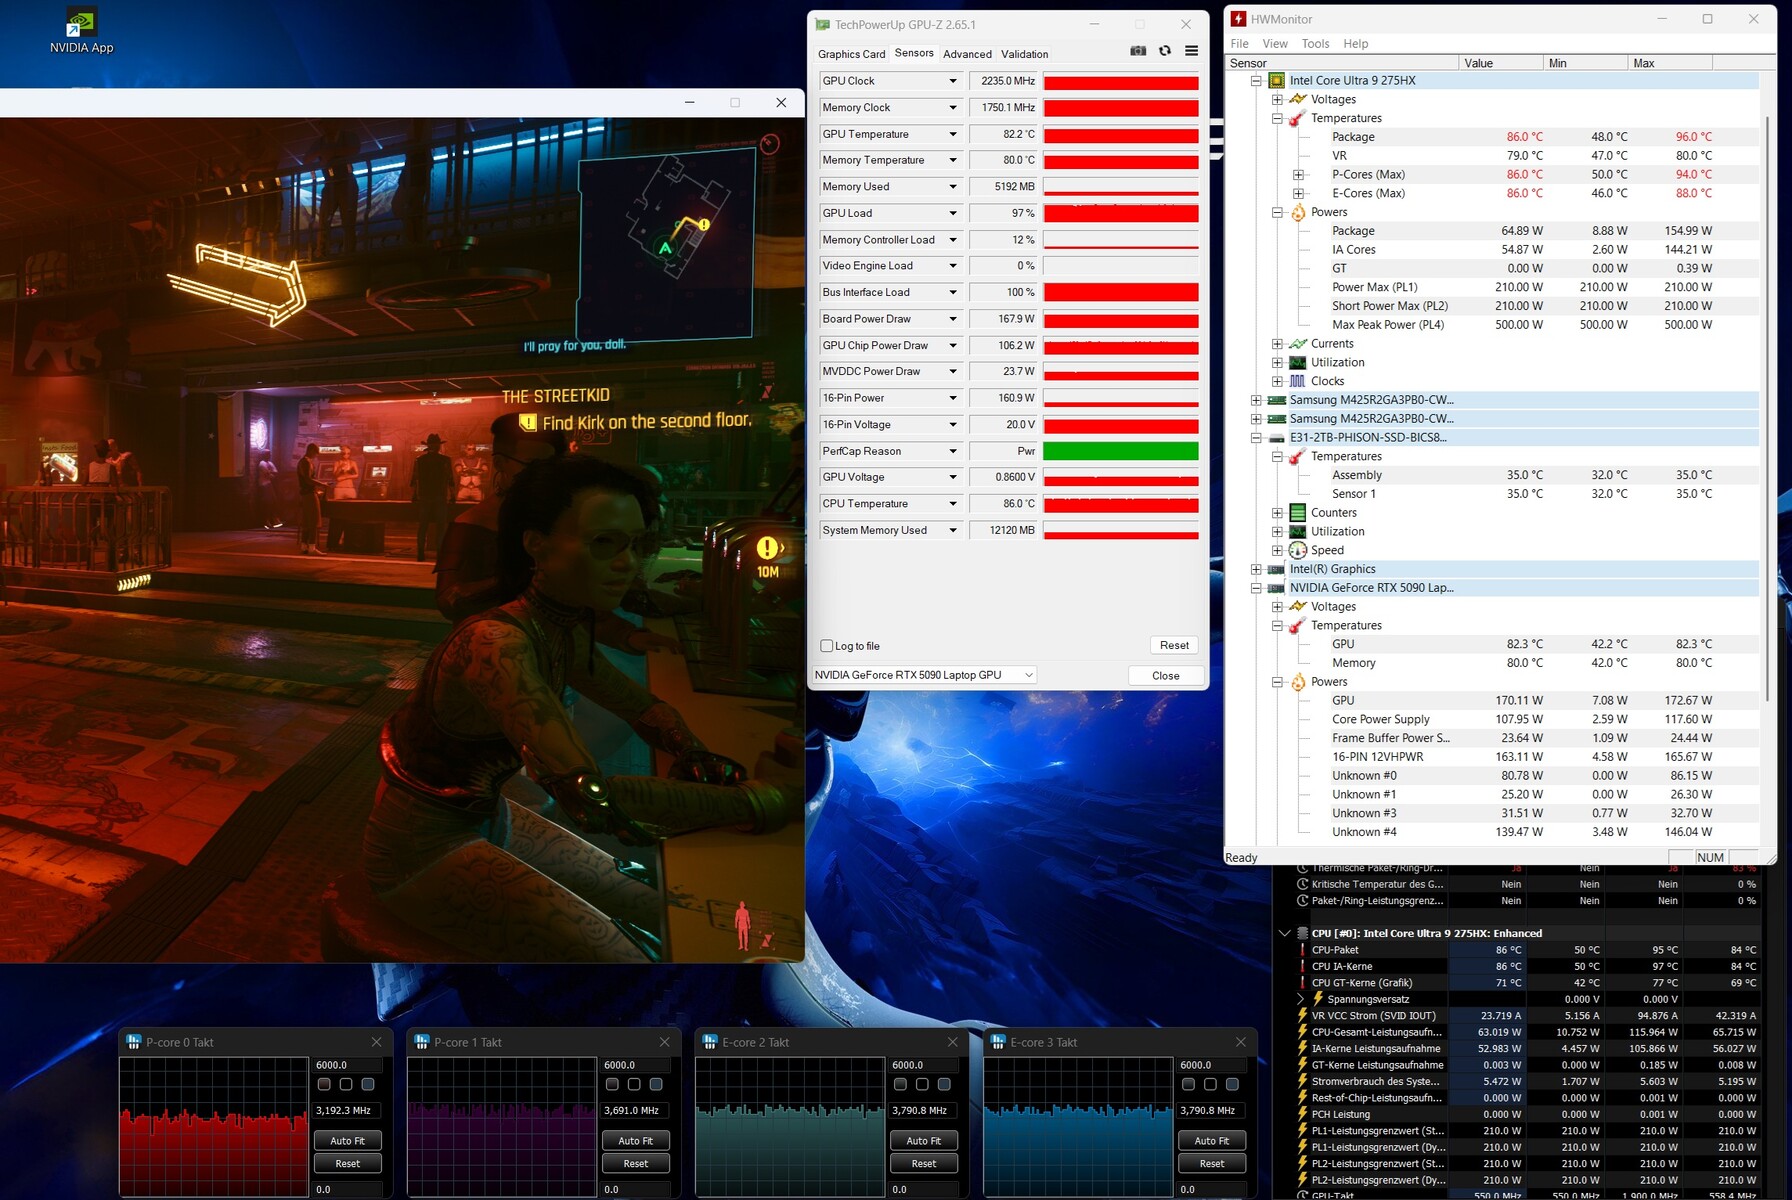
Prueba de esfuerzo
Nuestra prueba de estrés con las herramientas FurMark y Prime95 fue gestionada aceptablemente por la CPU y la GPU a unos 80 °C (176 °F). Las temperaturas fueron ligeramente superiores en Cyberpunk 2077 debido a las mayores velocidades de reloj.
Altavoz
El sistema de sonido del Beast 16 X1 es sorprendentemente bueno para los estándares de los portátiles y de ninguna manera tiene que esconderse detrás de sus competidores. En comparación con el HP Omen Max 16, el volumen máximo también es superior.
Medion Erazer Beast 16 X1 Ultimate análisis de audio
(+) | los altavoces pueden reproducir a un volumen relativamente alto (#85 dB)
Graves 100 - 315 Hz
(±) | lubina reducida - en promedio 11.2% inferior a la mediana
(+) | el bajo es lineal (6.8% delta a la frecuencia anterior)
Medios 400 - 2000 Hz
(+) | medios equilibrados - a sólo 4.7% de la mediana
(+) | los medios son lineales (4.6% delta a la frecuencia anterior)
Altos 2 - 16 kHz
(+) | máximos equilibrados - a sólo 3.6% de la mediana
(±) | la linealidad de los máximos es media (8% delta a frecuencia anterior)
Total 100 - 16.000 Hz
(+) | el sonido global es lineal (10.8% de diferencia con la mediana)
En comparación con la misma clase
» 7% de todos los dispositivos probados de esta clase eran mejores, 3% similares, 90% peores
» El mejor tuvo un delta de 6%, la media fue 18%, el peor fue ###max##%
En comparación con todos los dispositivos probados
» 6% de todos los dispositivos probados eran mejores, 2% similares, 92% peores
» El mejor tuvo un delta de 4%, la media fue 23%, el peor fue ###max##%
HP Omen Max 16 ah000 análisis de audio
(±) | la sonoridad del altavoz es media pero buena (77.9 dB)
Graves 100 - 315 Hz
(±) | lubina reducida - en promedio 9.9% inferior a la mediana
(±) | la linealidad de los graves es media (13.4% delta a frecuencia anterior)
Medios 400 - 2000 Hz
(+) | medios equilibrados - a sólo 2.3% de la mediana
(+) | los medios son lineales (4.3% delta a la frecuencia anterior)
Altos 2 - 16 kHz
(+) | máximos equilibrados - a sólo 1.9% de la mediana
(+) | los máximos son lineales (4.8% delta a la frecuencia anterior)
Total 100 - 16.000 Hz
(+) | el sonido global es lineal (11.4% de diferencia con la mediana)
En comparación con la misma clase
» 9% de todos los dispositivos probados de esta clase eran mejores, 3% similares, 88% peores
» El mejor tuvo un delta de 6%, la media fue 18%, el peor fue ###max##%
En comparación con todos los dispositivos probados
» 7% de todos los dispositivos probados eran mejores, 2% similares, 90% peores
» El mejor tuvo un delta de 4%, la media fue 23%, el peor fue ###max##%
Gestión de la energía
Consumo de energía
La conclusión respecto al consumo de energía es ambivalente. Mientras que el Beast 16 X1 tiende a ser más económico que la competencia en modo inactivo, el consumo en modo 3D está ligeramente por encima de la media. Nota: La dGPU se activa automáticamente cuando se conecta un monitor externo.
| Off / Standby | |
| Ocioso | |
| Carga |
|
Clave:
min: | |
| Medion Erazer Beast 16 X1 Ultimate GeForce RTX 5090 Laptop, Ultra 9 275HX | Schenker XMG Neo 16 E25 RTX 5090 Laptop GeForce RTX 5090 Laptop, Ultra 9 275HX | HP Omen Max 16 ah000 GeForce RTX 5090 Laptop, Ultra 9 275HX | Asus ROG Strix Scar 16 2025 GeForce RTX 5090 Laptop, Ultra 9 275HX | Lenovo Legion Pro 7i 16 Gen 10 GeForce RTX 5080 Laptop, Ultra 9 275HX | Asus ROG Strix G16 G615 GeForce RTX 5080 Laptop, Ultra 9 275HX | Media de la clase Gaming | |
|---|---|---|---|---|---|---|---|
| Power Consumption | -4% | -17% | -40% | -56% | -1% | 1% | |
| Idle Minimum * (Watt) | 13.1 | 11.8 10% | 9.9 24% | 22.5 -72% | 28.5 -118% | 10.8 18% | 13 ? 1% |
| Idle Average * (Watt) | 17.5 | 15.1 14% | 28.6 -63% | 32.2 -84% | 38.8 -122% | 17.7 -1% | 18.7 ? -7% |
| Idle Maximum * (Watt) | 23 | 15.8 31% | 47.1 -105% | 34.3 -49% | 45.6 -98% | 18.8 18% | 24.3 ? -6% |
| Load Average * (Watt) | 88 | 165.3 -88% | 141.8 -61% | 169.3 -92% | 132.2 -50% | 139.4 -58% | 110.2 ? -25% |
| Cyberpunk 2077 ultra * (Watt) | 299 | 296 1% | 253 15% | 294 2% | 318 -6% | 295 1% | |
| Cyberpunk 2077 ultra external monitor * (Watt) | 297 | 289 3% | 230 23% | 288 3% | 319 -7% | 291 2% | |
| Load Maximum * (Watt) | 428 | 415.5 3% | 233 46% | 371.5 13% | 384 10% | 359.3 16% | 258 ? 40% |
* ... más pequeño es mejor
Power consumption Cyberpunk / Stress test
Power consumption with external Monitor
Duración de las pilas
Medion dota al dispositivo de 16 pulgadas de una potente batería de 99 Wh, que permitió una autonomía de algo menos de 8 horas en nuestra prueba WLAN (brillo reducido a 150 cd/m²), un resultado relativamente bueno que está casi a la par con el ROG Strix G16 (90 Wh).
| Medion Erazer Beast 16 X1 Ultimate Ultra 9 275HX, GeForce RTX 5090 Laptop, 99 Wh | Schenker XMG Neo 16 E25 RTX 5090 Laptop Ultra 9 275HX, GeForce RTX 5090 Laptop, 99.8 Wh | HP Omen Max 16 ah000 Ultra 9 275HX, GeForce RTX 5090 Laptop, 83 Wh | Asus ROG Strix Scar 16 2025 Ultra 9 275HX, GeForce RTX 5090 Laptop, 90 Wh | Lenovo Legion Pro 7i 16 Gen 10 Ultra 9 275HX, GeForce RTX 5080 Laptop, 99 Wh | Asus ROG Strix G16 G615 Ultra 9 275HX, GeForce RTX 5080 Laptop, 90 Wh | Media de la clase Gaming | |
|---|---|---|---|---|---|---|---|
| Duración de Batería | 20% | -27% | -18% | -32% | -1% | -9% | |
| WiFi v1.3 (h) | 7.9 | 9.5 20% | 5.8 -27% | 6.5 -18% | 5.4 -32% | 7.8 -1% | 7.15 ? -9% |
| H.264 (h) | 7.7 | 11 | 8.64 ? | ||||
| Load (h) | 2 | 1.2 | 0.8 | 1.5 | 1.502 ? | ||
| Reader / Idle (h) | 8.7 | 8.71 ? | |||||
| Cyberpunk 2077 ultra 150cd (h) | 0.8 |
Valoración general de Notebookcheck
El Medion Erazer Beast 16 X1 es un portátil para juegos y creadores de alta calidad con una pantalla brillante y un gran rendimiento, pero también con altos niveles de ruido.
Medion Erazer Beast 16 X1 Ultimate
- 05/30/2025 v8
Florian Glaser
 Total Sustainability Score:
 Posibles alternativas en comparación
Imagen | Modelo | Precio | Peso | Altura | Pantalla |
|---|---|---|---|---|---|
1. 88.5%  | Medion Erazer Beast 16 X1 Ultimate Intel Core Ultra 9 275HX ⎘ NVIDIA GeForce RTX 5090 Laptop ⎘ 32 GB Memoría, SSD | Amazon: Precio de catálogo: 4300 EUR | 2.8 kg | 30 mm | 16.00" 2560x1600 189 PPI Mini-LED |
2. 81.9%  | HP Omen Max 16 ah000 Intel Core Ultra 9 275HX ⎘ NVIDIA GeForce RTX 5090 Laptop ⎘ 32 GB Memoría, 2048 GB SSD | Amazon: Precio de catálogo: 3800 USD | 2.8 kg | 24.9 mm | 16.00" 2560x1600 189 PPI OLED |
3. 88.4%  | Asus ROG Strix Scar 16 2025 Intel Core Ultra 9 275HX ⎘ NVIDIA GeForce RTX 5090 Laptop ⎘ 64 GB Memoría, 2048 GB SSD | Amazon: Precio de catálogo: 4999€ | 2.8 kg | 30.8 mm | 16.00" 2560x1600 189 PPI Mini-LED |
4. 87.5%  | Lenovo Legion Pro 7i 16 Gen 10 Intel Core Ultra 9 275HX ⎘ NVIDIA GeForce RTX 5080 Laptop ⎘ 32 GB Memoría, 1024 GB SSD | Amazon: Precio de catálogo: 4200 USD | 2.6 kg | 26.65 mm | 16.00" 2560x1600 189 PPI OLED |
5. 87.3%  | Asus ROG Strix G16 G615 Intel Core Ultra 9 275HX ⎘ NVIDIA GeForce RTX 5080 Laptop ⎘ 32 GB Memoría, 1024 GB SSD | Amazon: 1. $1,251.72 ASUS ROG Strix G16 (2025) Ga... 2. $2,369.00 ASUS ROG Strix G16 (2025) Ga... 3. $2,232.55 ASUS ROG Strix G16 (2025) Ga... Precio de catálogo: 3299€ | 2.6 kg | 30.8 mm | 16.00" 2560x1600 189 PPI IPS |
Transparencia
La selección de los dispositivos que se van a reseñar corre a cargo de nuestro equipo editorial. La muestra de prueba fue proporcionada al autor en calidad de préstamo por el fabricante o el minorista a los efectos de esta reseña. El prestamista no tuvo ninguna influencia en esta reseña, ni el fabricante recibió una copia de la misma antes de su publicación. No había ninguna obligación de publicar esta reseña. Como empresa de medios independiente, Notebookcheck no está sujeta a la autoridad de fabricantes, minoristas o editores.
Así es como prueba Notebookcheck
Cada año, Notebookcheck revisa de forma independiente cientos de portátiles y smartphones utilizando procedimientos estandarizados para asegurar que todos los resultados son comparables. Hemos desarrollado continuamente nuestros métodos de prueba durante unos 20 años y hemos establecido los estándares de la industria en el proceso. En nuestros laboratorios de pruebas, técnicos y editores experimentados utilizan equipos de medición de alta calidad. Estas pruebas implican un proceso de validación en varias fases. Nuestro complejo sistema de clasificación se basa en cientos de mediciones y puntos de referencia bien fundamentados, lo que mantiene la objetividad.