Análisis del XMG Apex 15 Max (Clevo NH57VR): Portátil para juegos con una CPU de sobremesa

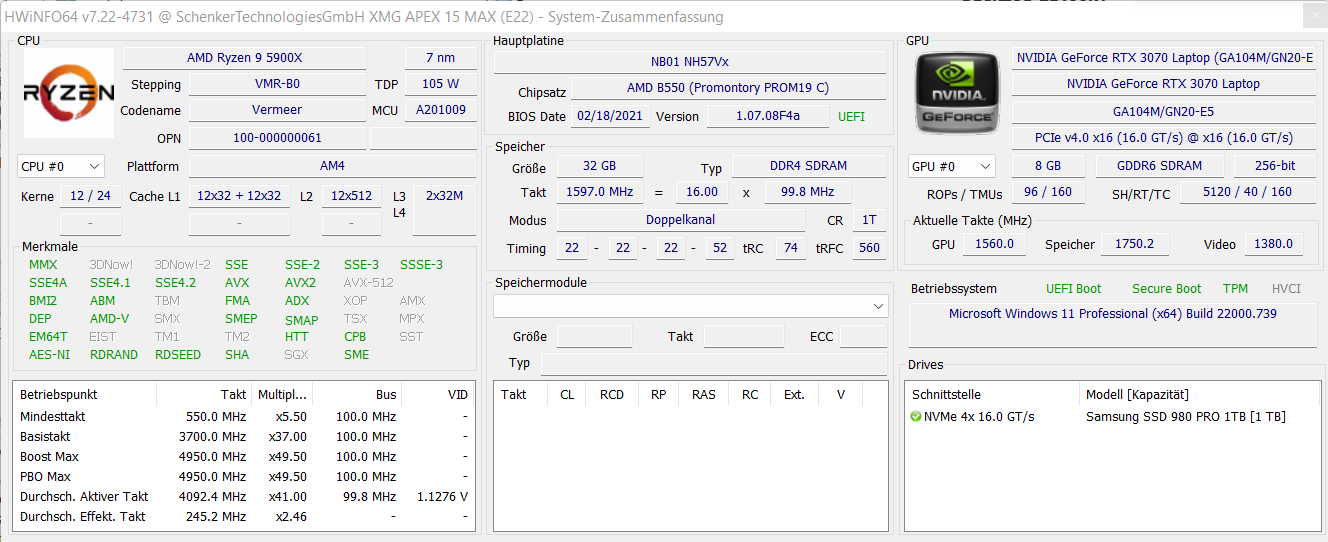
Aunque el Schenker XMG Apex 15 Max se anuncia principalmente como un portátil para juegos, también se dirige al área de estaciones de trabajo y DTR. Dentro del Clevo Barebone (NH57VR) utilizado aquí hay un Ryzen 9-5900XcPU de sobremesa y una GeForce RTX 3070 para portátilgPU.
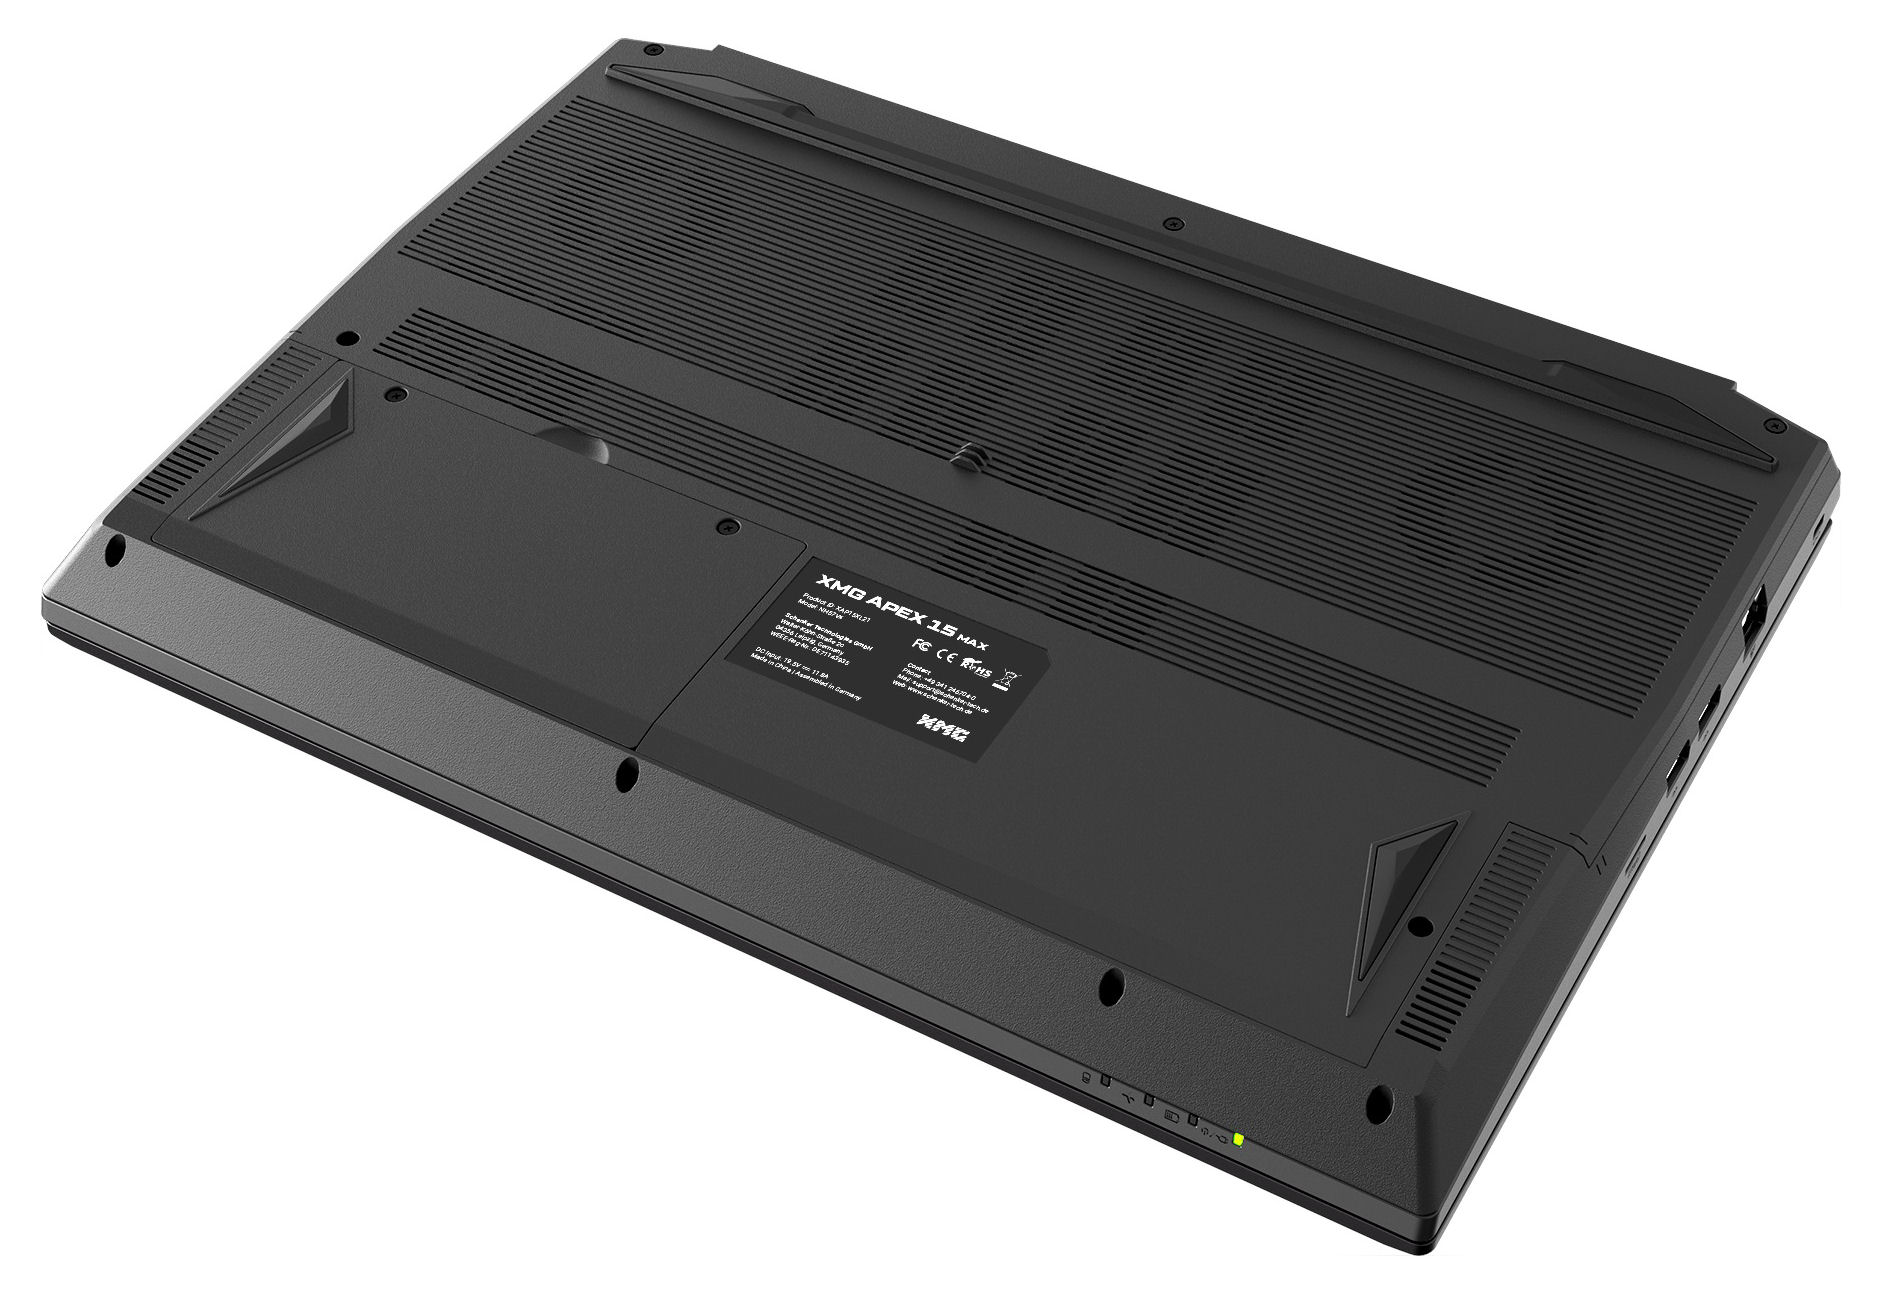
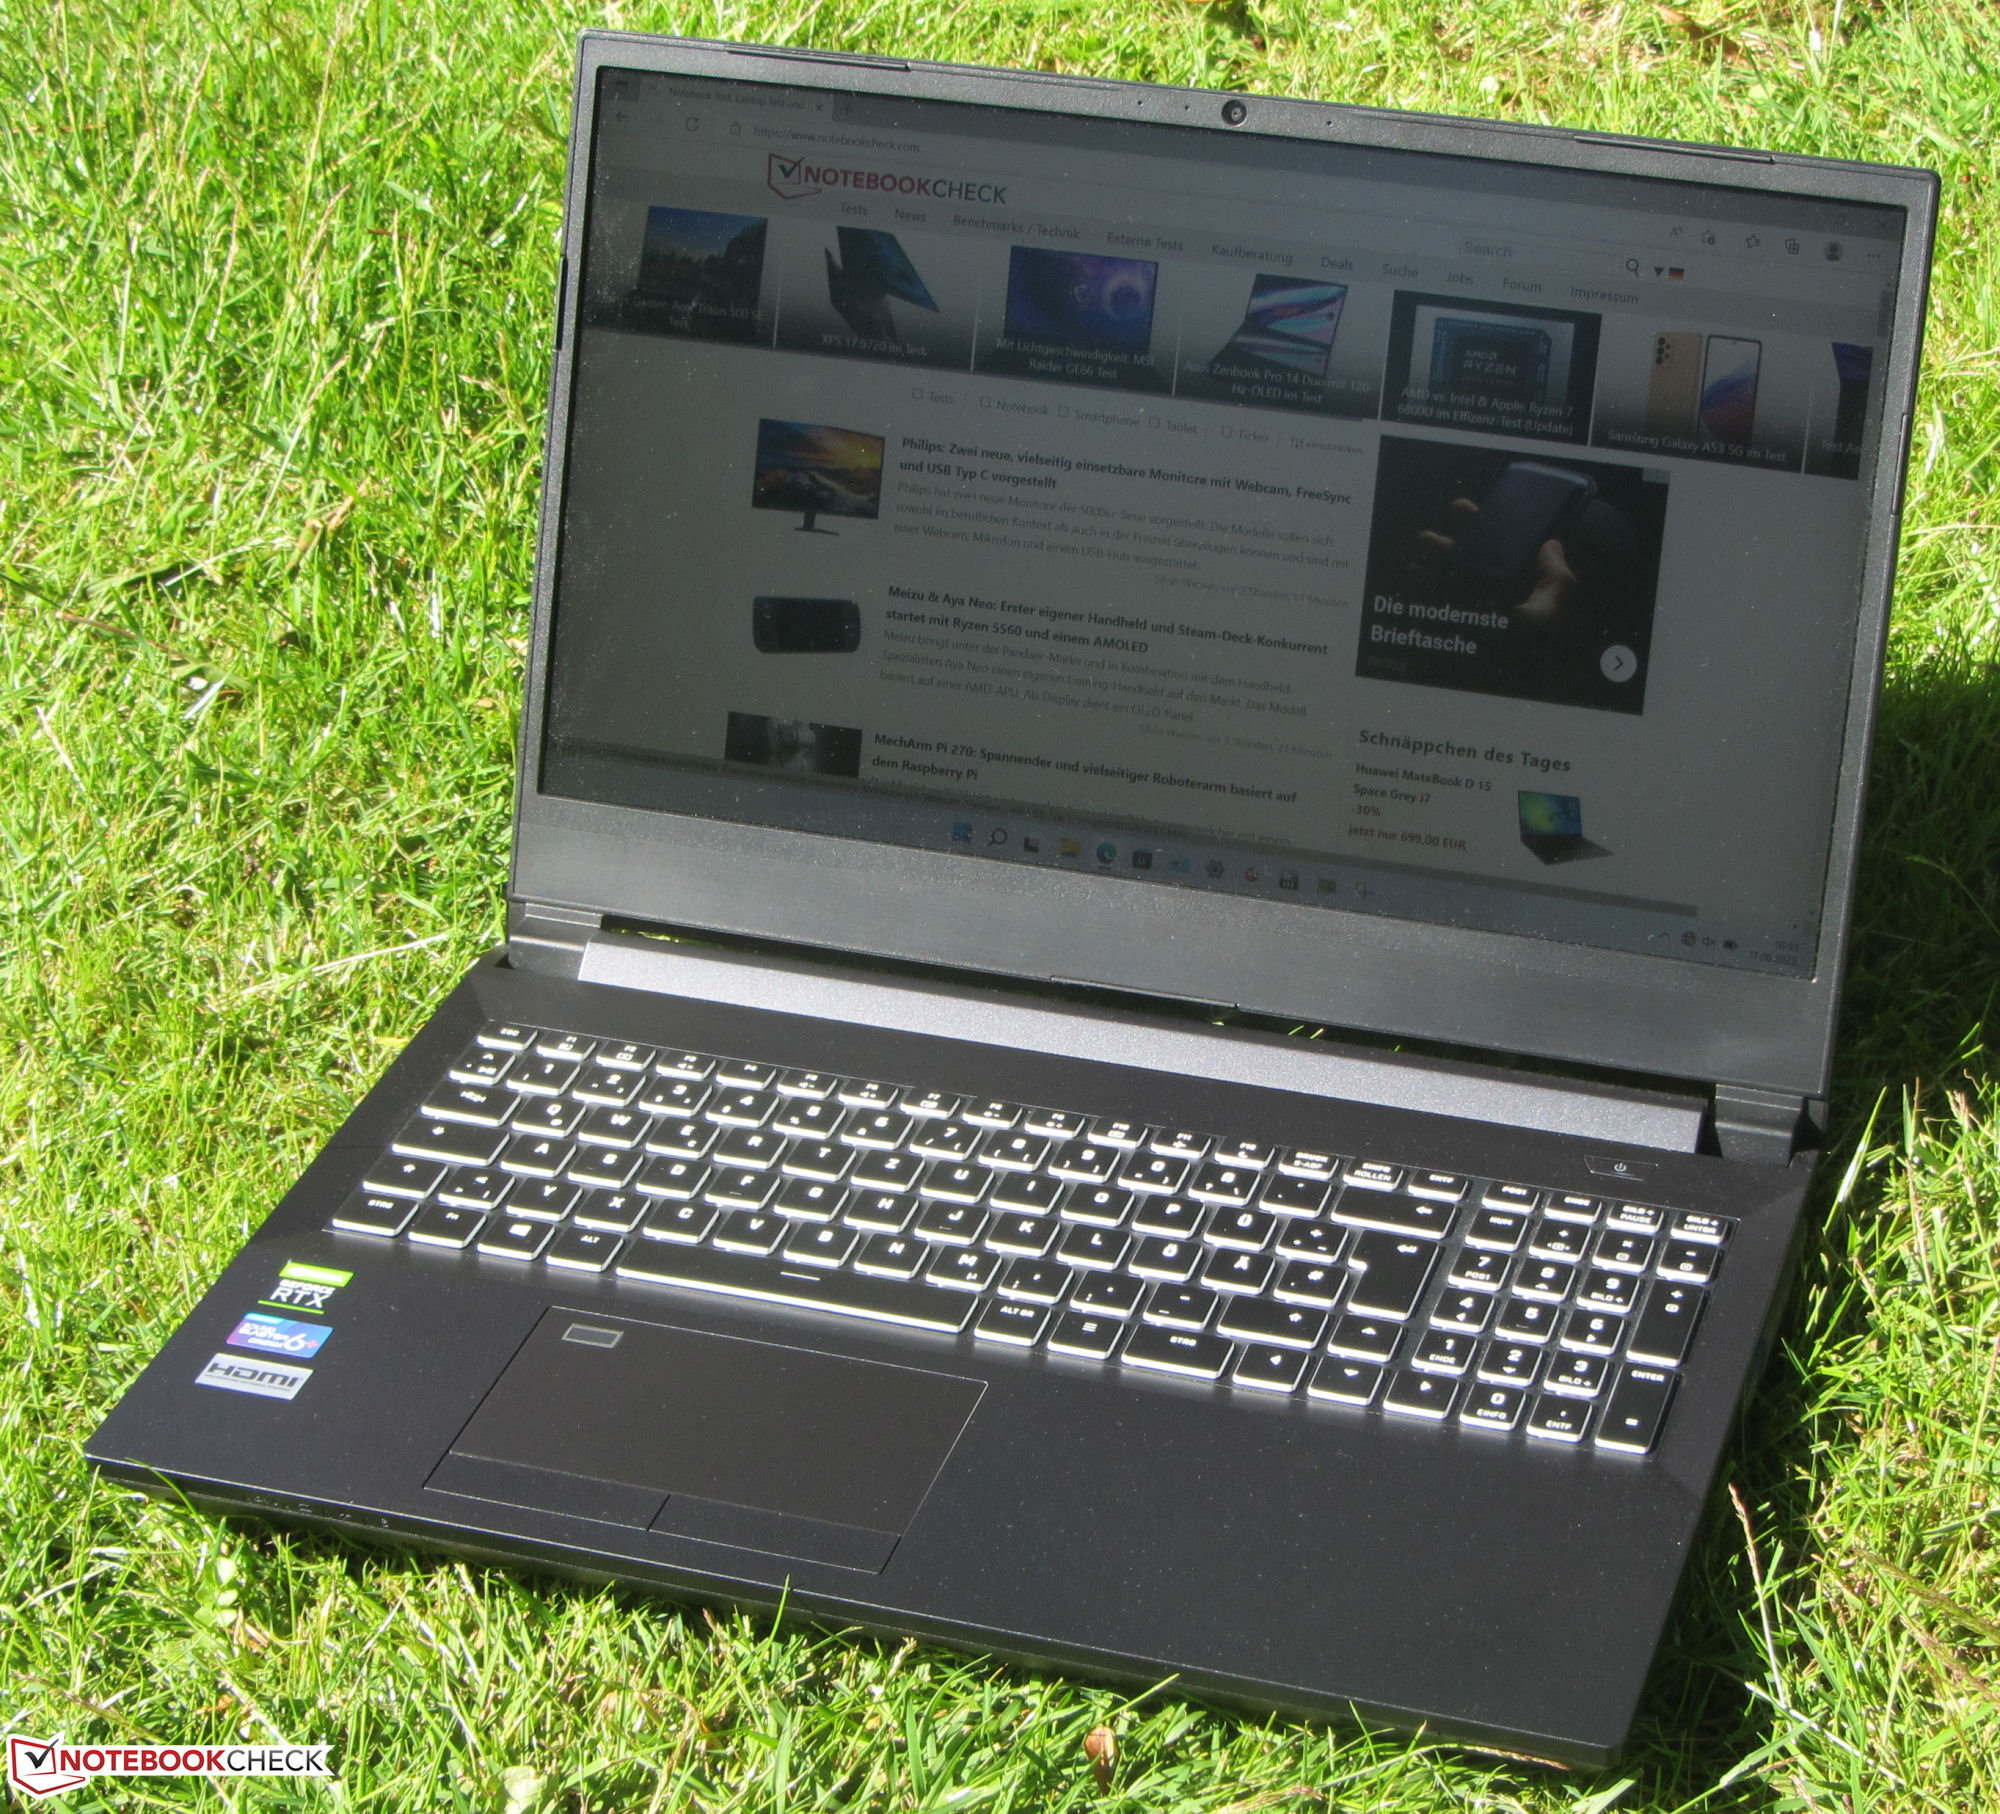
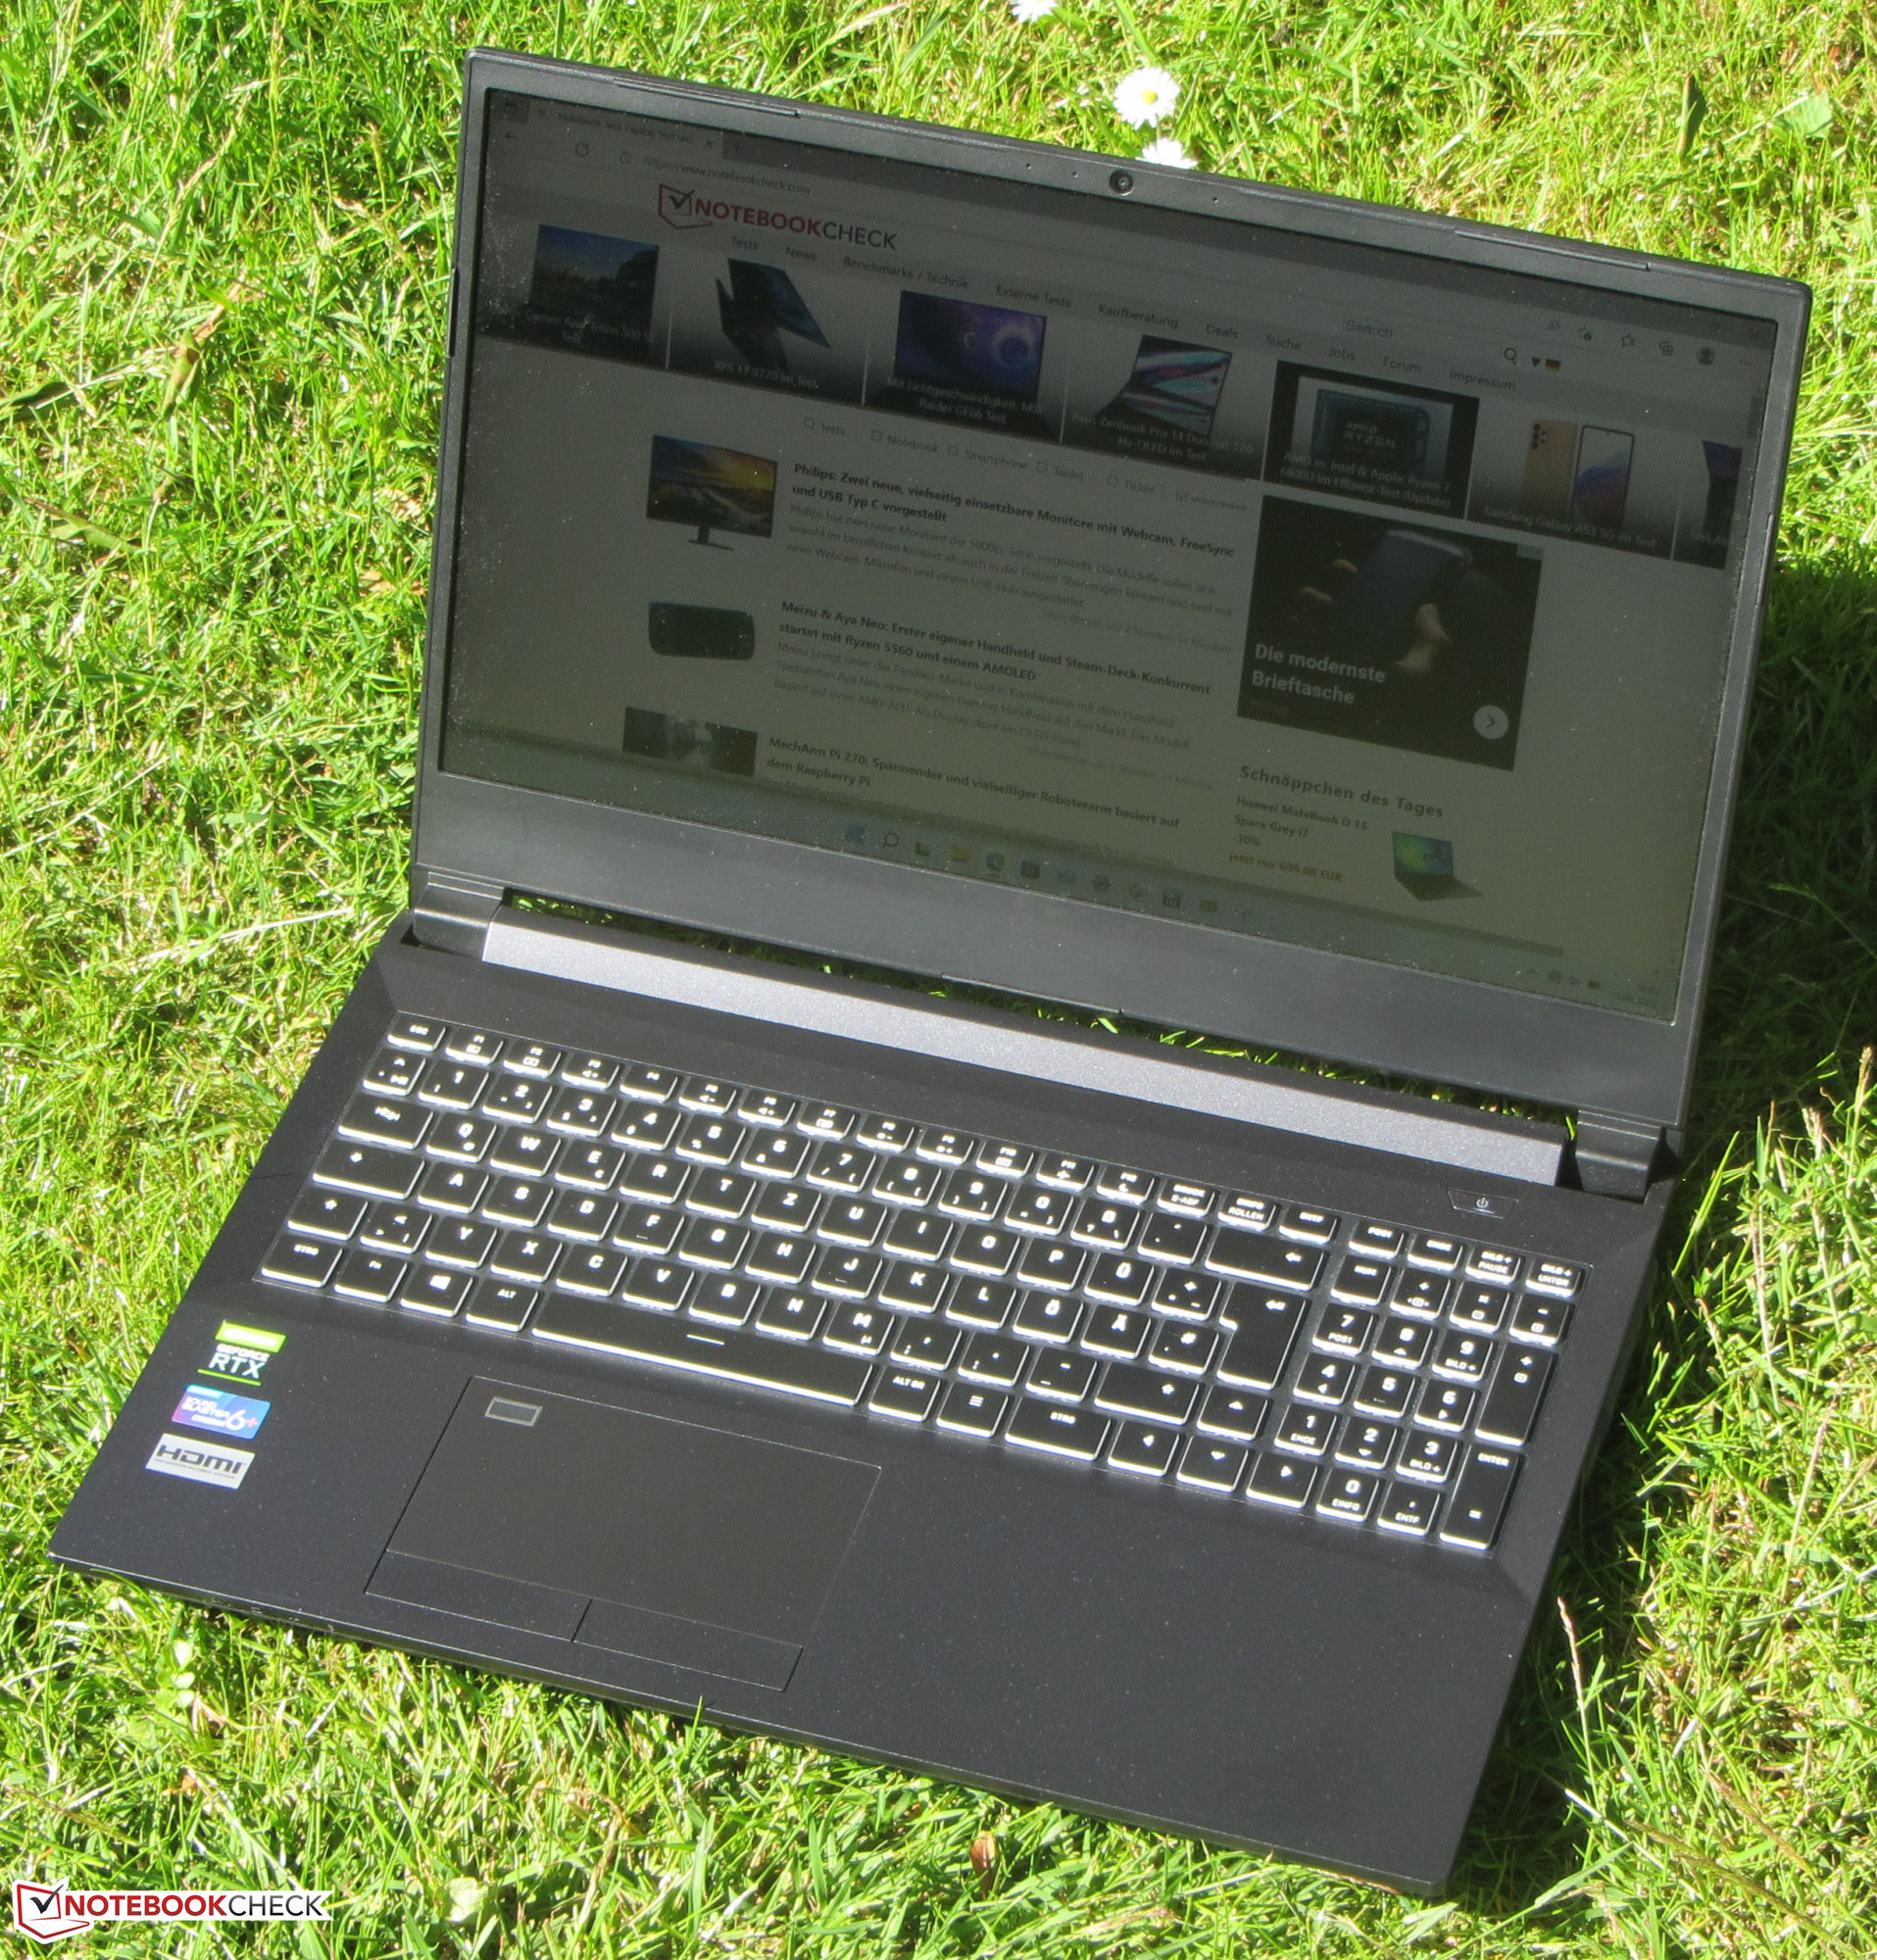
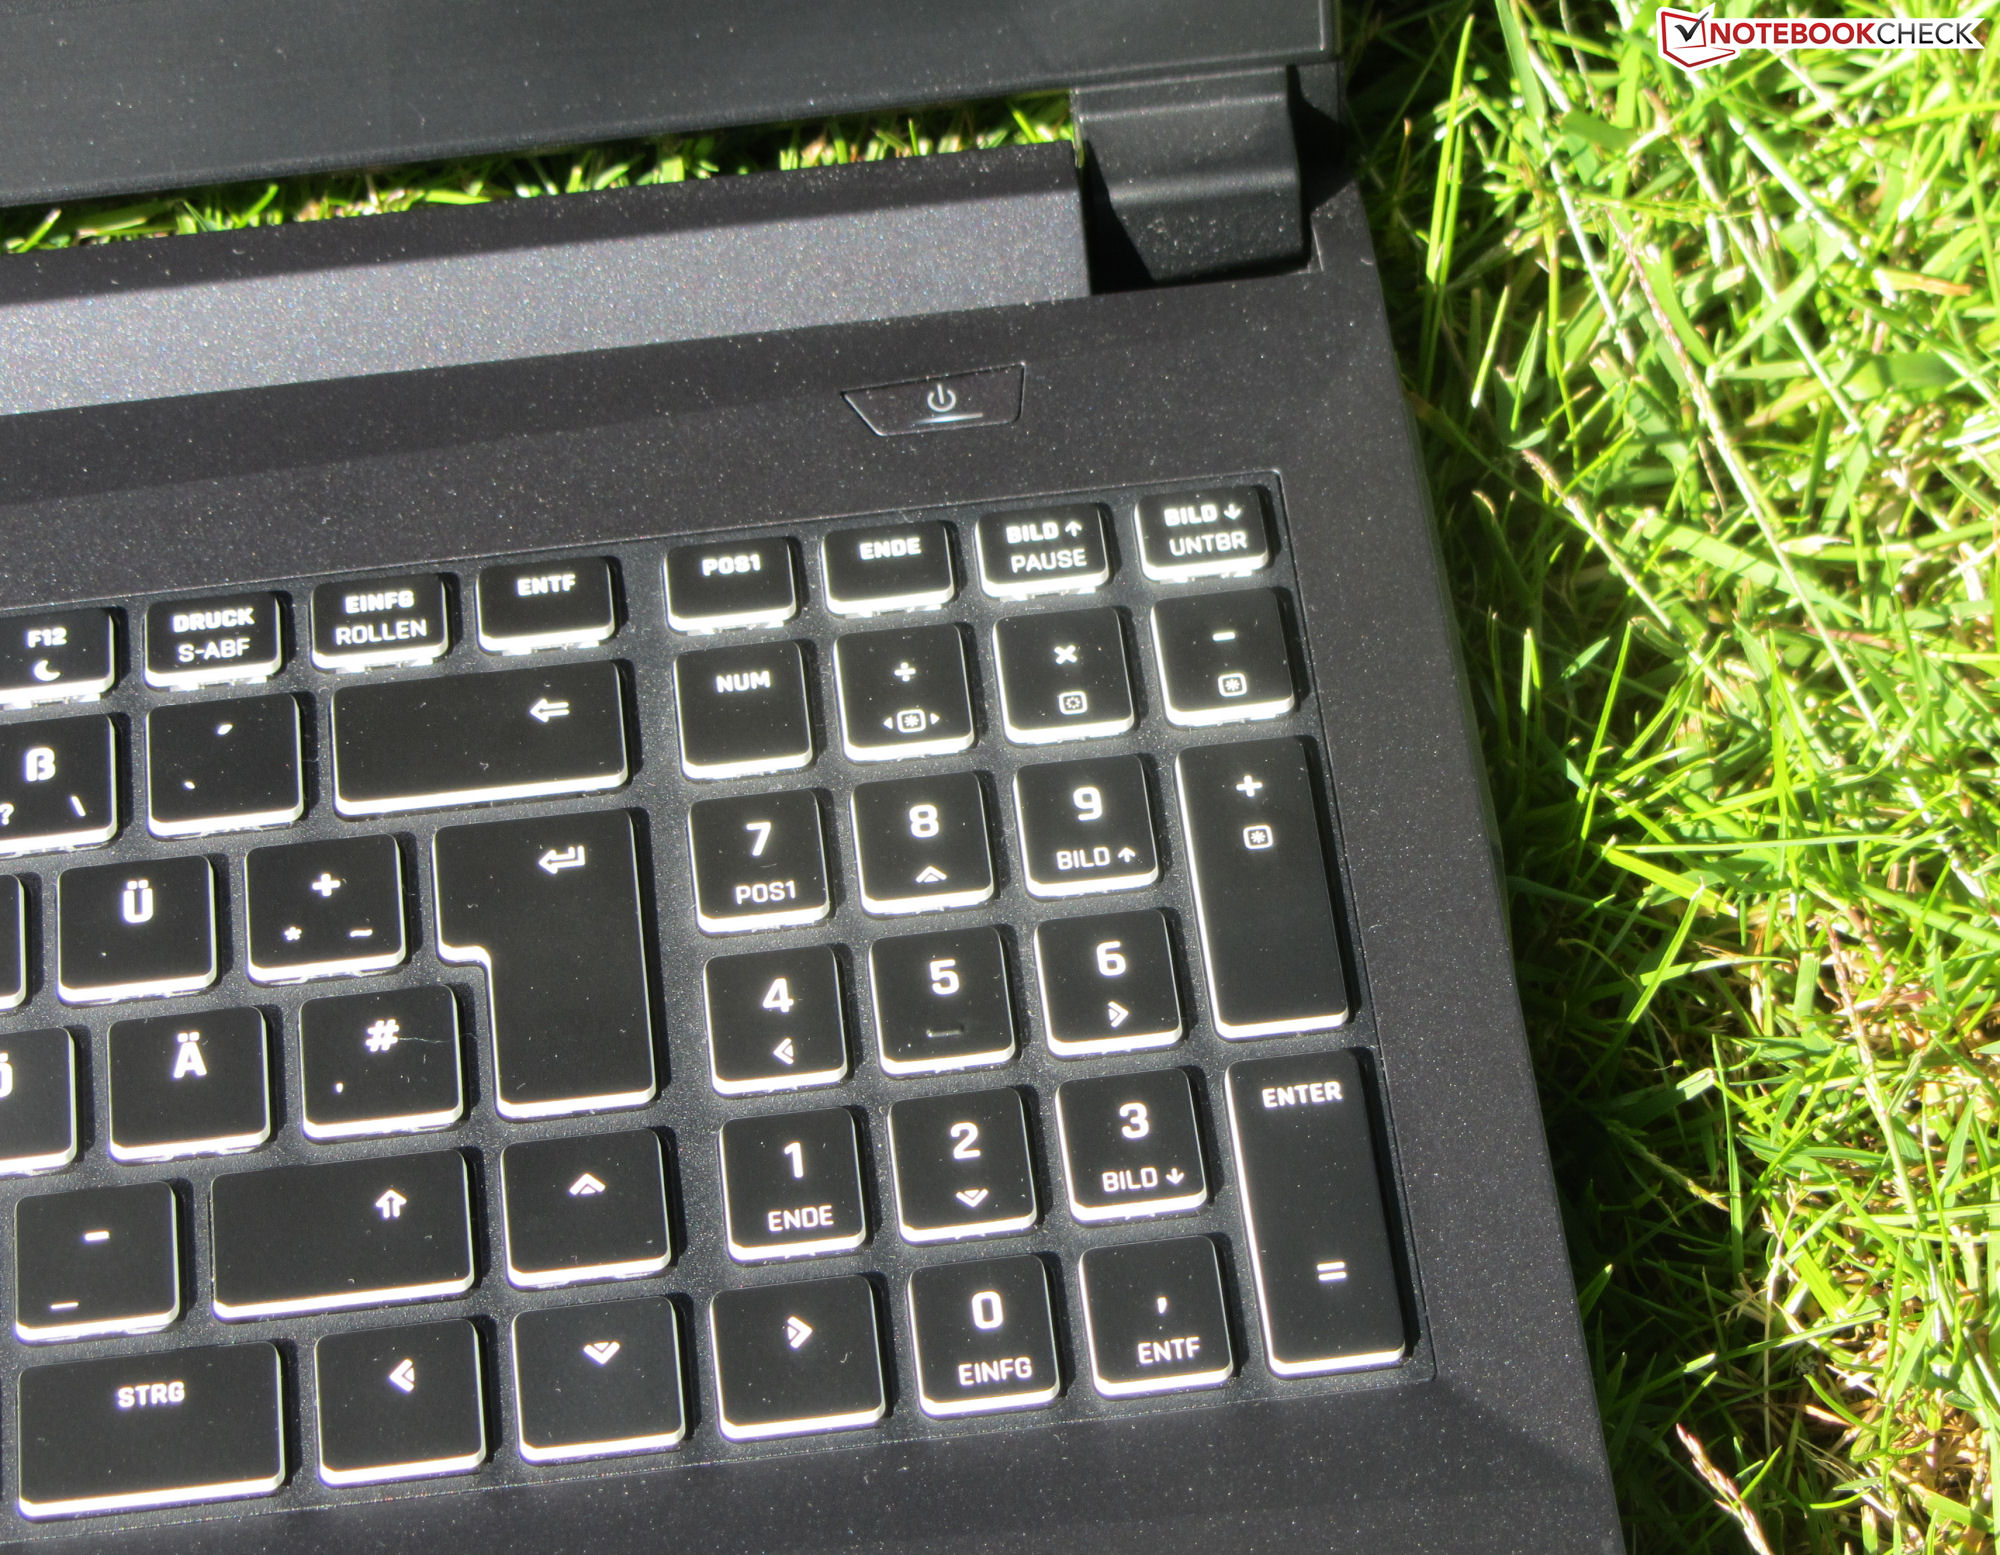
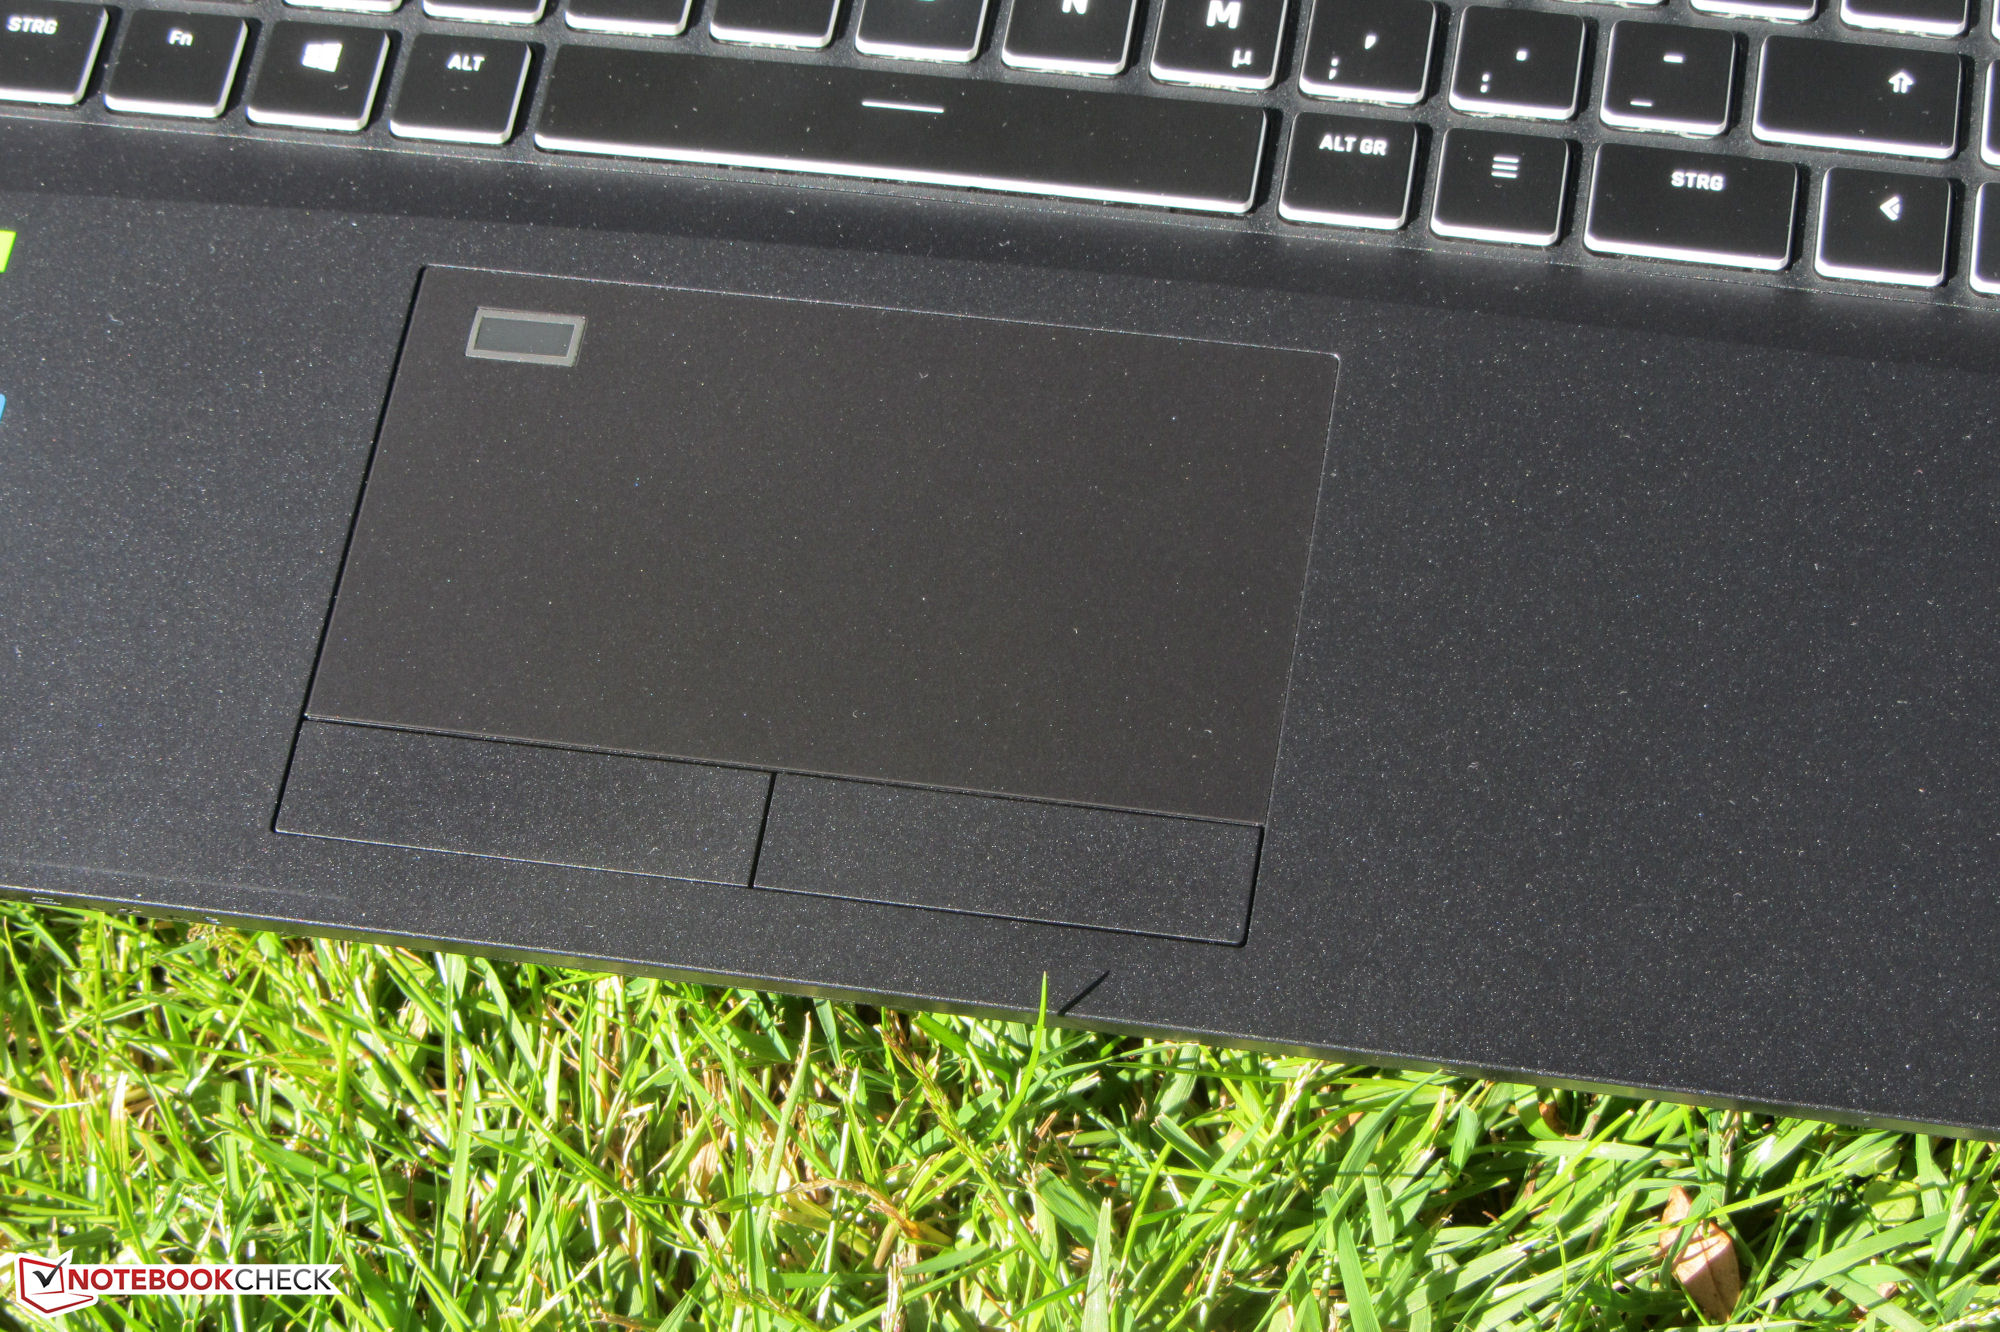
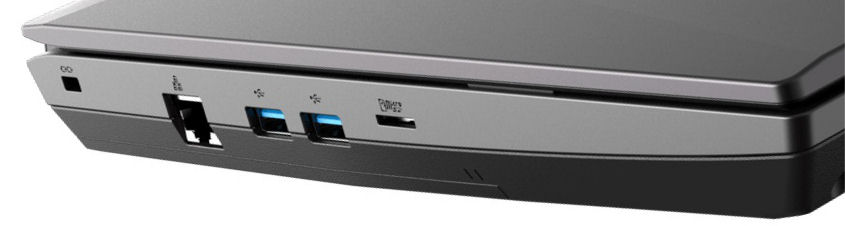
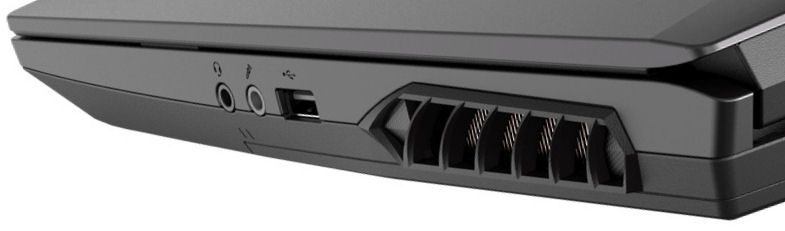
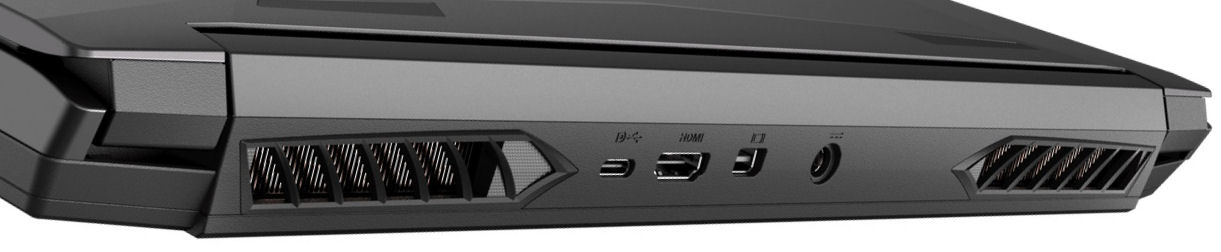
Se trata del sucesor de idéntica construcción del Schenker XMG Apex 15 (2020). Por lo tanto, no hablaremos aquí de nuevo de la carcasa, el equipo, los dispositivos de entrada y los altavoces. Puede encontrar la información correspondiente en la reseña del antiguo Apex 15.
Posibles contendientes en la comparación
Valoración | Fecha | Modelo | Peso | Altura | Tamaño | Resolución | Precio |
|---|---|---|---|---|---|---|---|
| 83.4 % v7 (old) | 06/2022 | Schenker XMG Apex 15 Max R9 5900X, GeForce RTX 3070 Laptop GPU | 2.6 kg | 32.5 mm | 15.60" | 1920x1080 | |
| 83 % v7 (old) | 01/2022 | Eurocom Nightsky ARX315 R9 5900X, GeForce RTX 3070 Laptop GPU | 2.6 kg | 32.5 mm | 15.60" | 1920x1080 | |
| 86.9 % v7 (old) | 03/2022 | MSI Vector GP66 12UGS i9-12900H, GeForce RTX 3070 Ti Laptop GPU | 2.3 kg | 23.4 mm | 15.60" | 1920x1080 | |
| 85.5 % v7 (old) | 05/2022 | HP Omen 16-b1090ng i7-12700H, GeForce RTX 3070 Ti Laptop GPU | 2.3 kg | 23 mm | 16.10" | 2560x1440 | |
| 84.1 % v7 (old) | 01/2022 | Gigabyte A5 X1 R9 5900HX, GeForce RTX 3070 Laptop GPU | 2.2 kg | 25.3 mm | 15.60" | 1920x1080 |

| SD Card Reader | |
| average JPG Copy Test (av. of 3 runs) | |
| Media de la clase Gaming (20.9 - 210, n=54, últimos 2 años) | |
| Schenker XMG Apex 15 Max (AV PRO microSD 128 GB V60) | |
| Eurocom Nightsky ARX315 (AV Pro V60) | |
| HP Omen 16-b1090ng (AV PRO microSD 128 GB V60) | |
| maximum AS SSD Seq Read Test (1GB) | |
| Media de la clase Gaming (25.5 - 261, n=51, últimos 2 años) | |
| Schenker XMG Apex 15 Max (AV PRO microSD 128 GB V60) | |
| Eurocom Nightsky ARX315 (AV Pro V60) | |


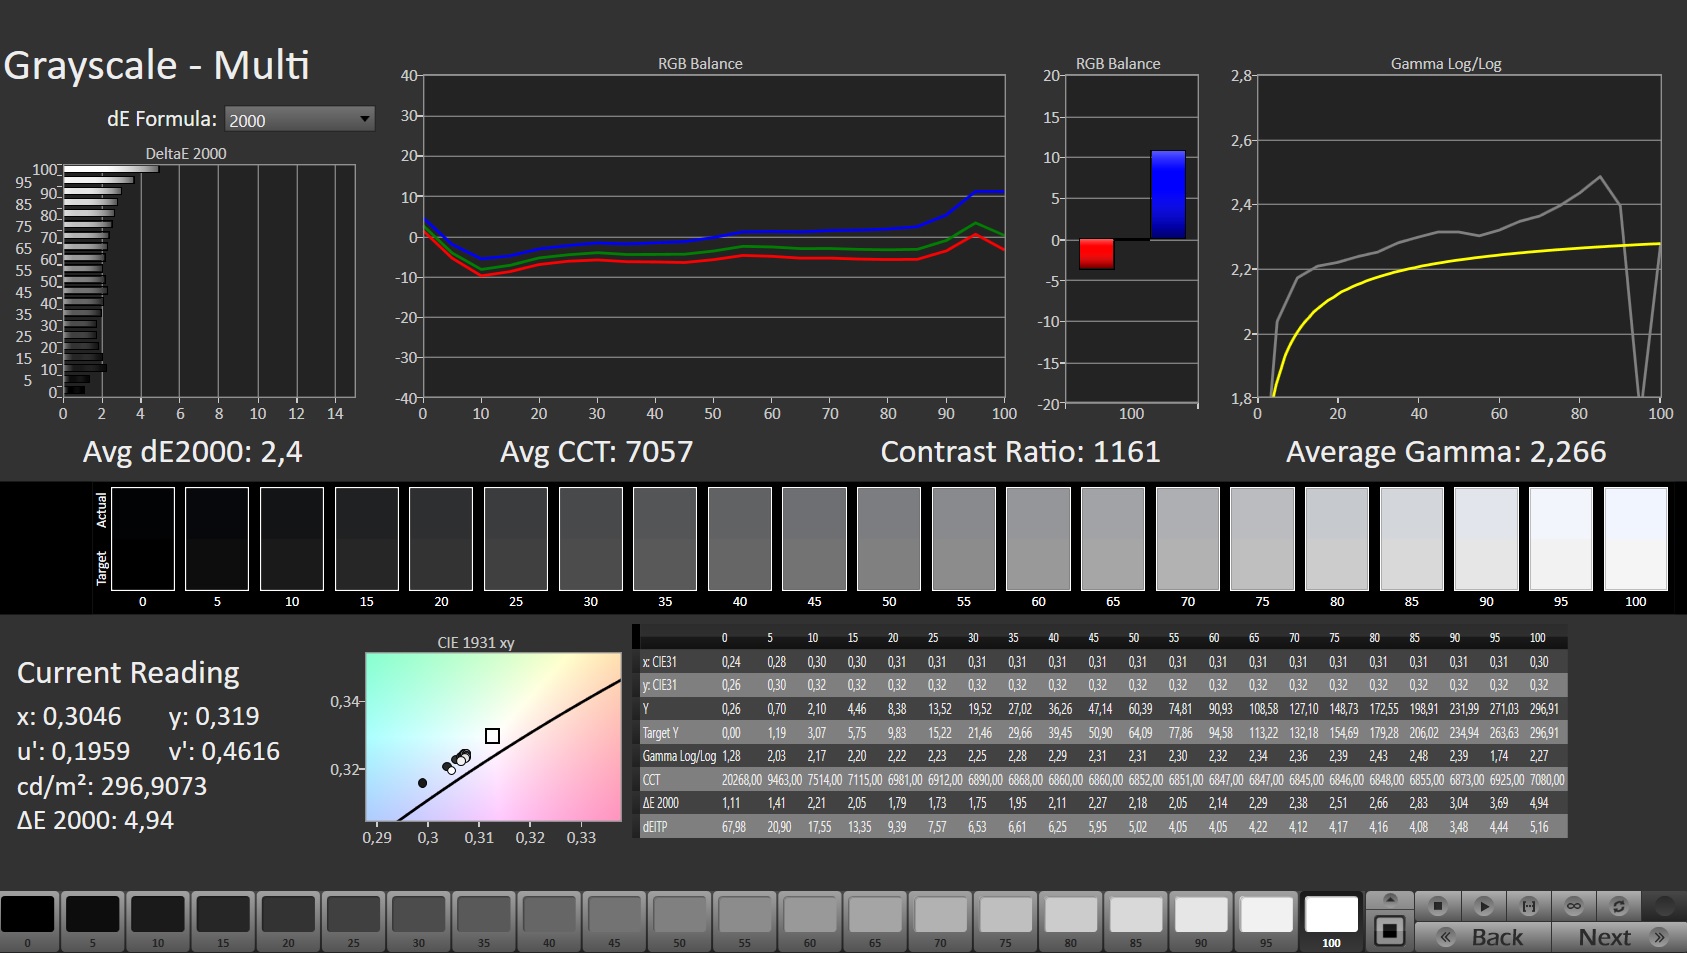
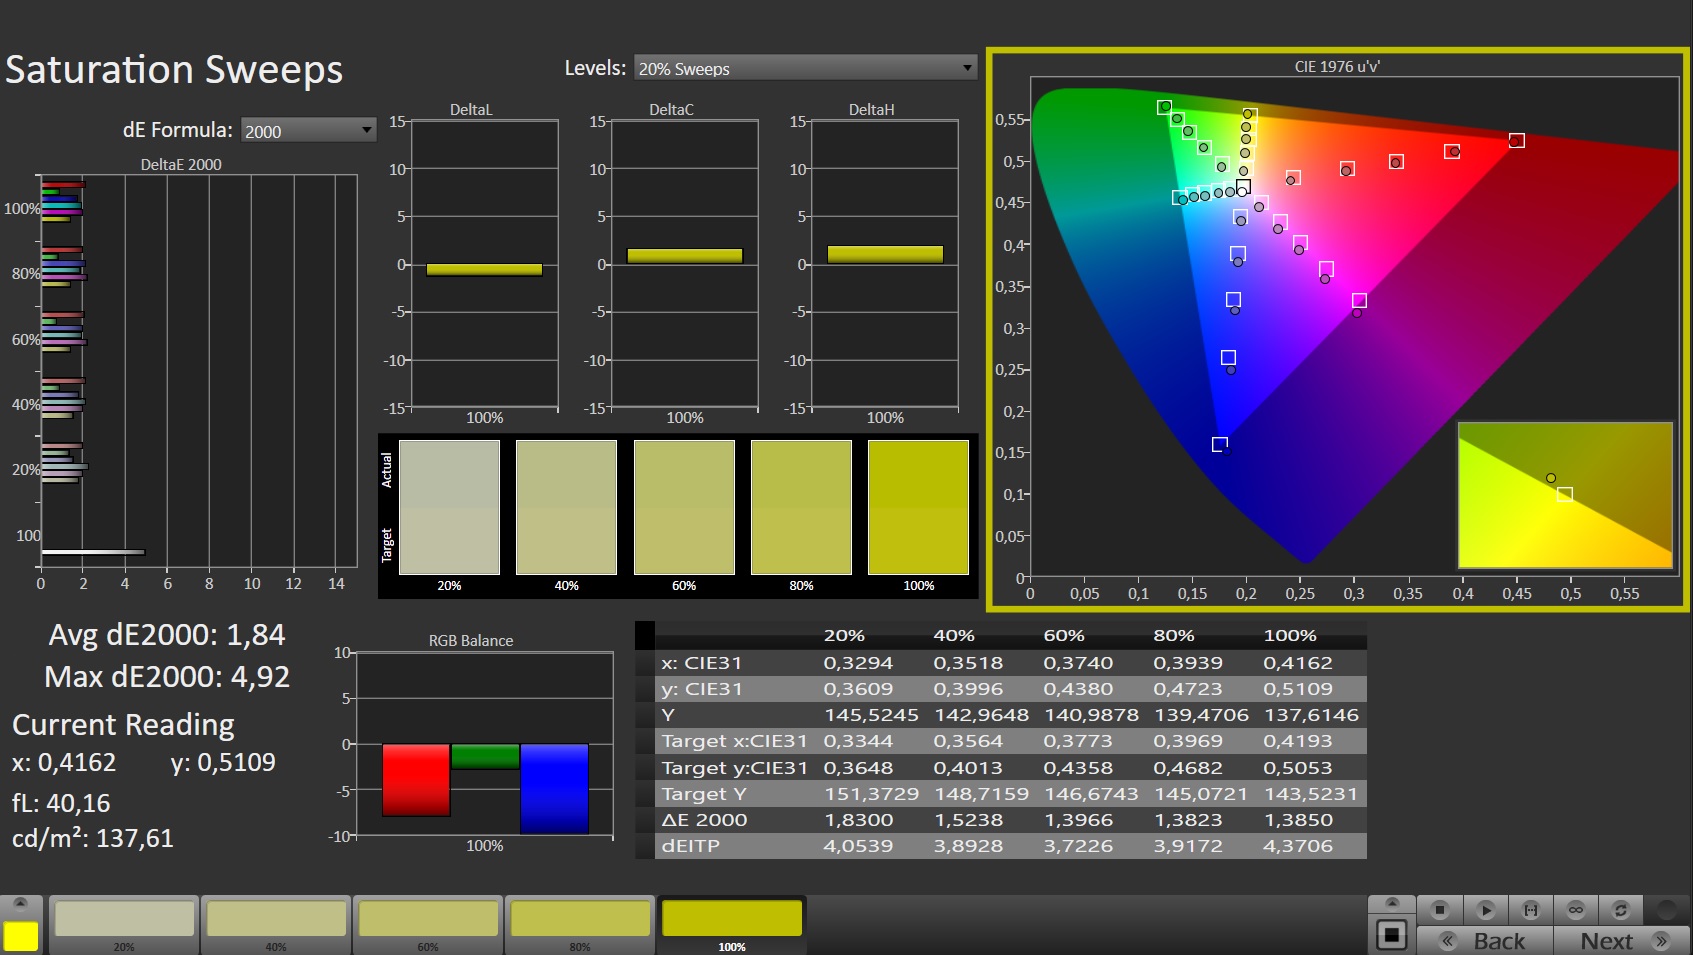
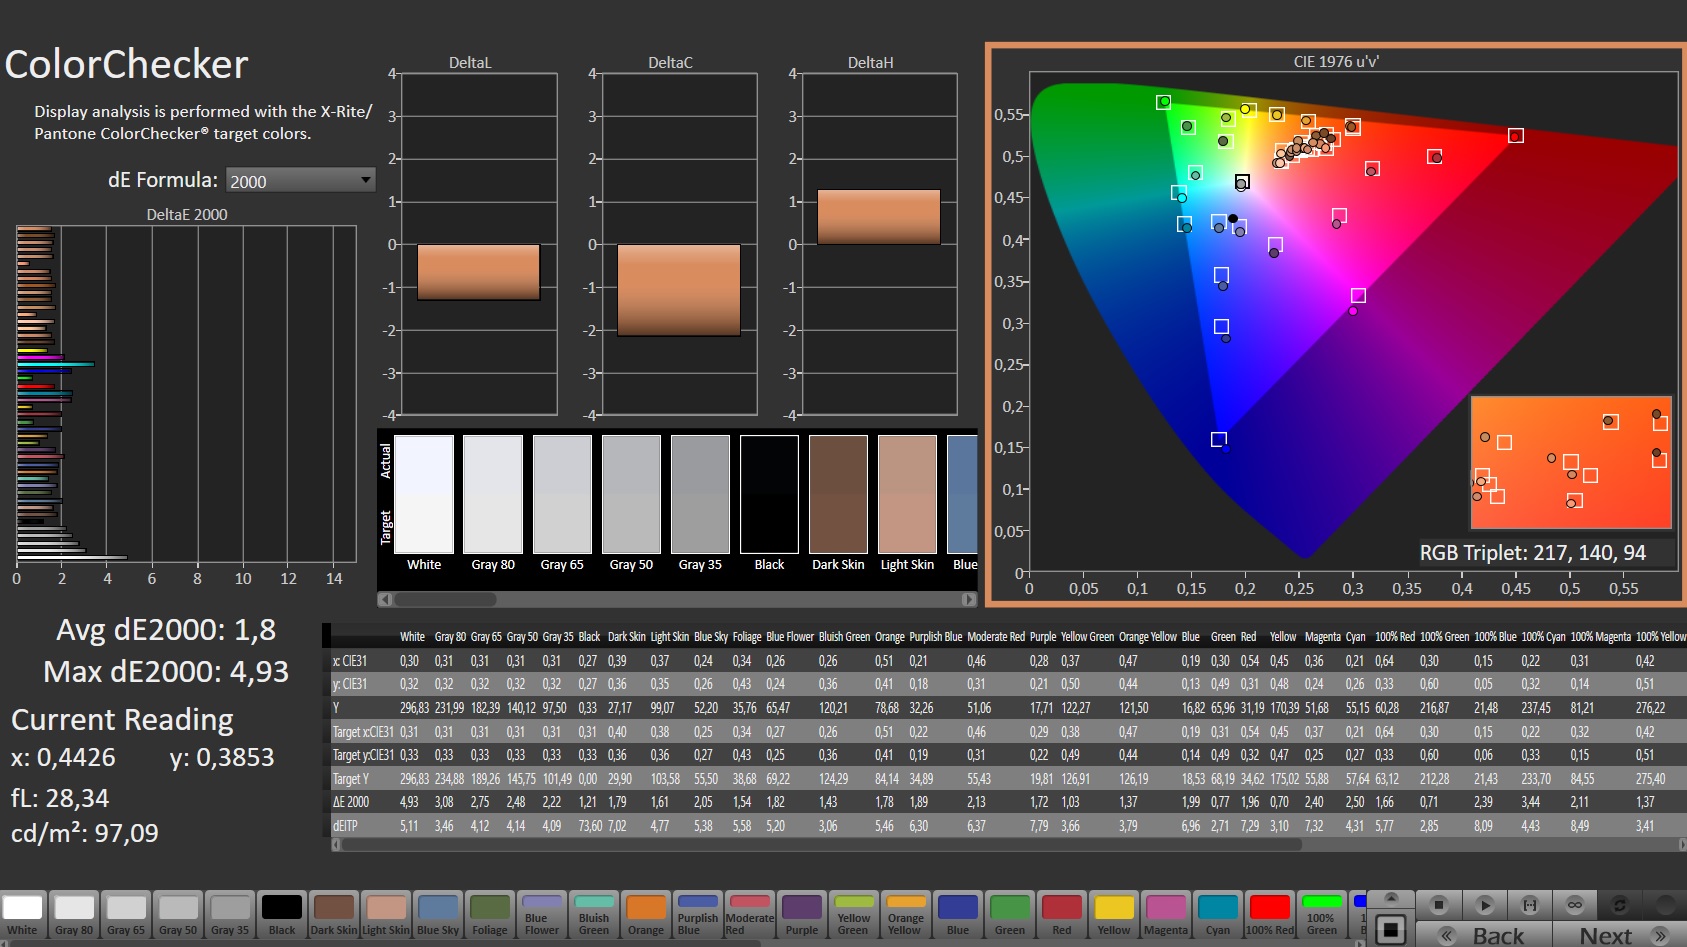
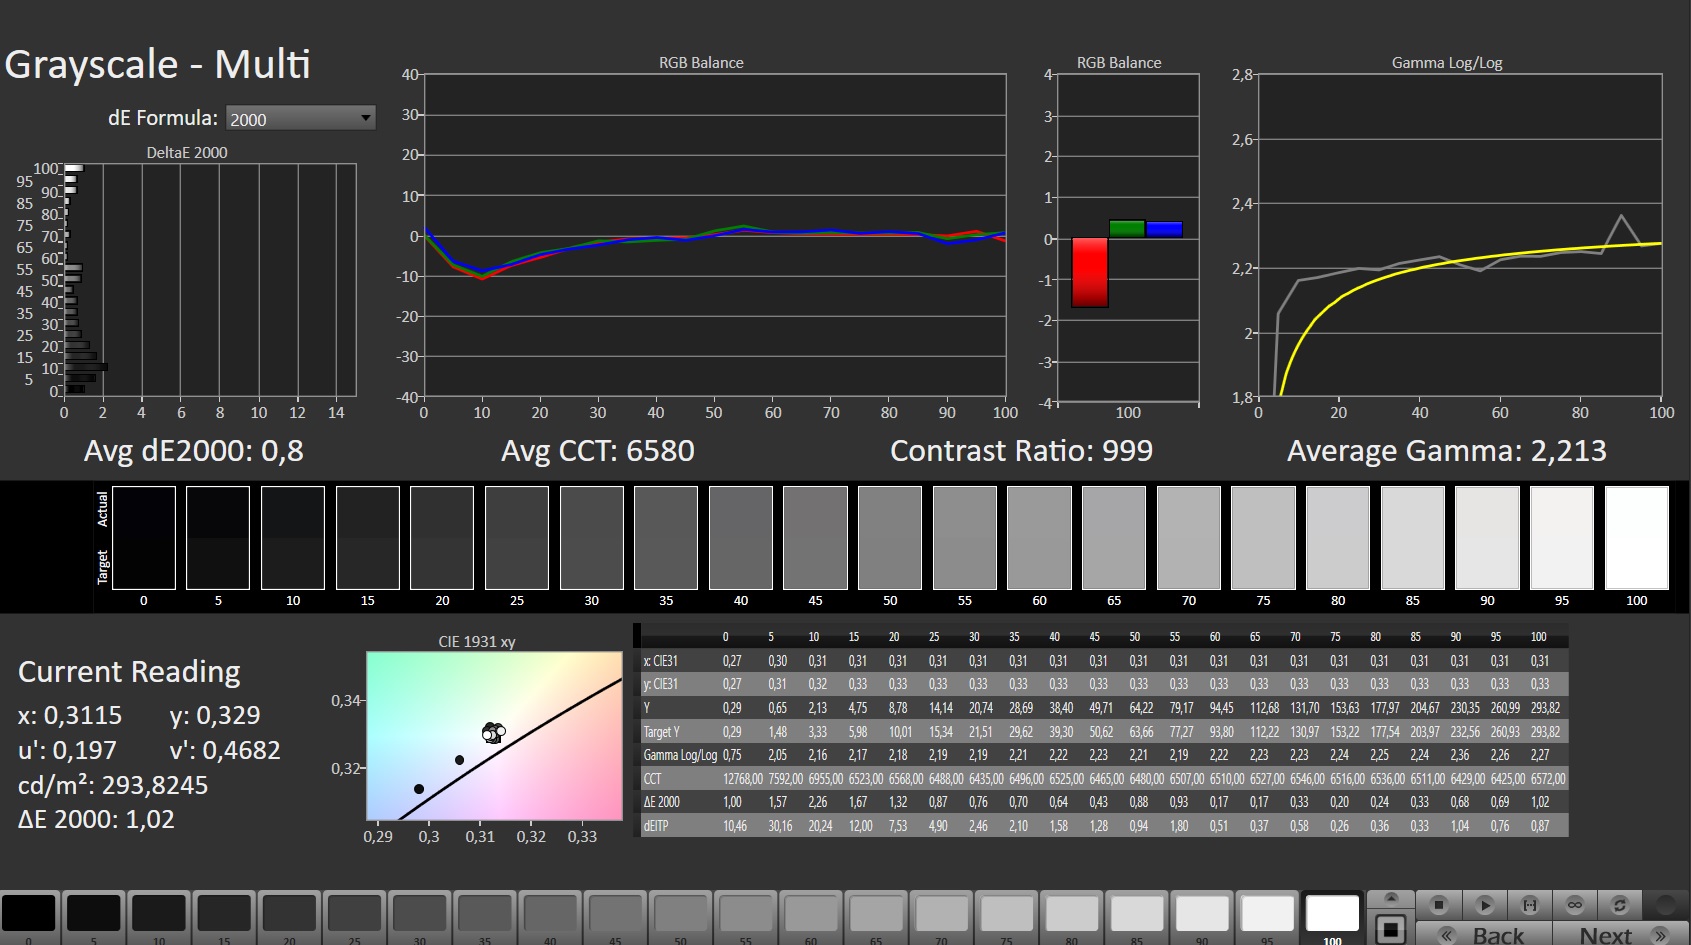
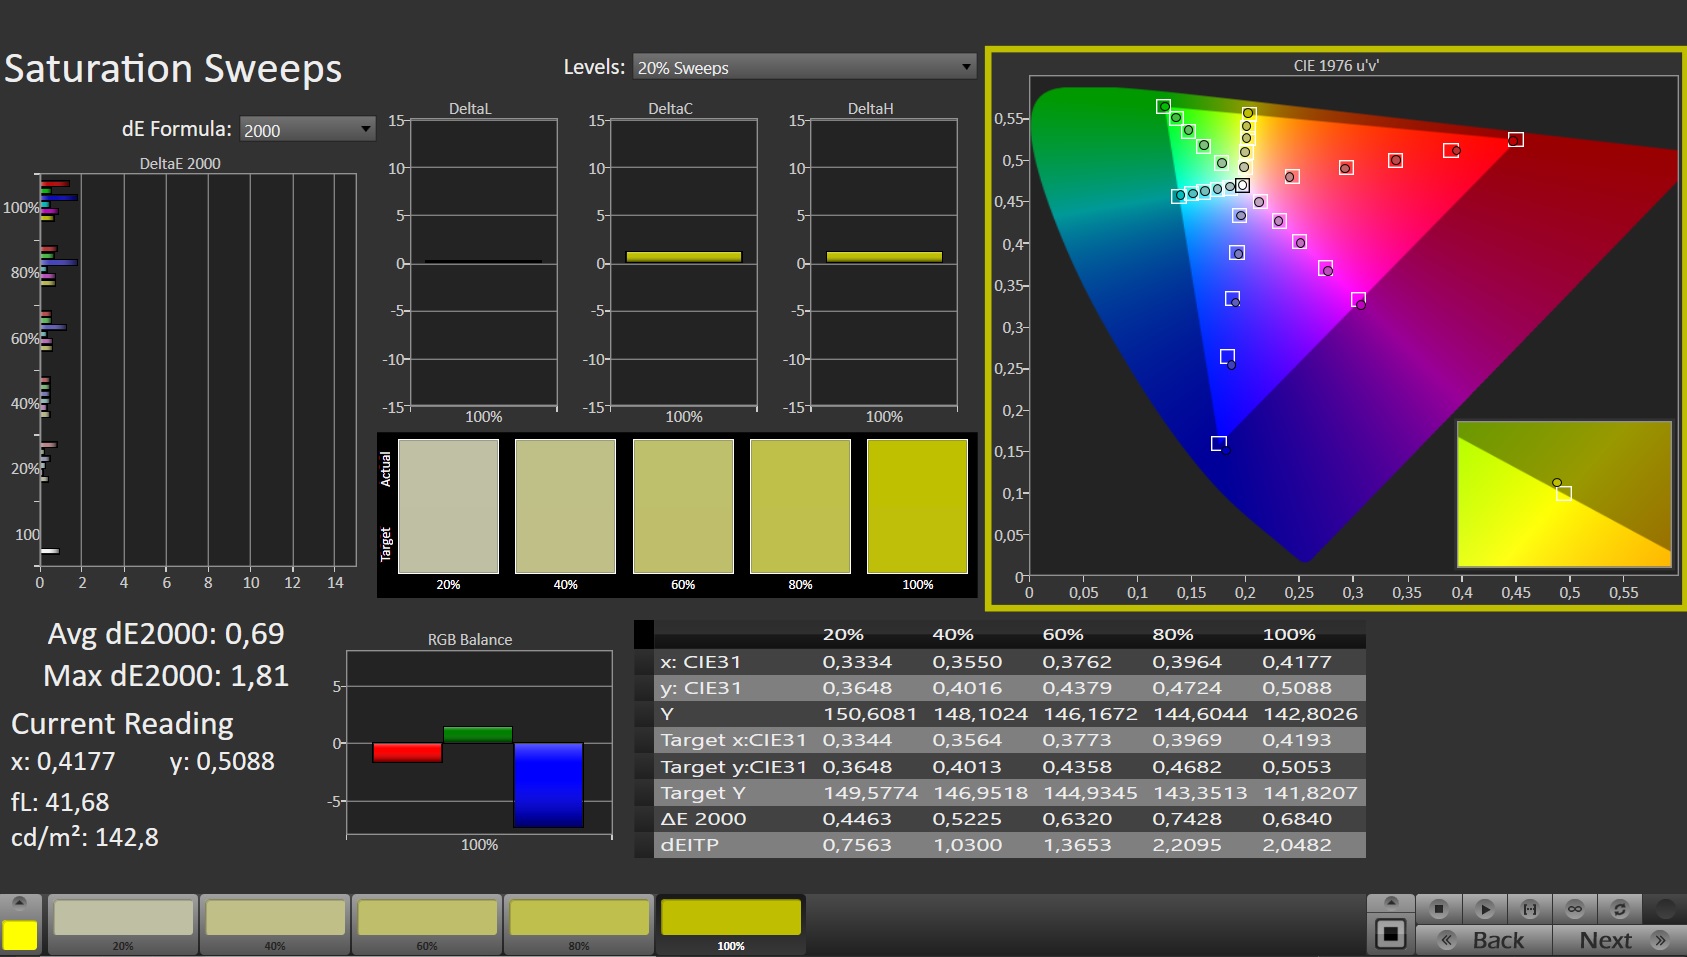
Pantalla - IPS de 240 Hz
Mientras que el contraste (1096:1) de la pantalla mate de 15,6 pulgadas (1920 x 1080 píxeles) cumple los requisitos (> 1000:1), el brillo (264,2 cd/m²) resulta demasiado bajo. Consideramos buenos los valores por encima de 300 cd/m². El panel de 240 Hz ofrece tiempos de respuesta cortos.
Las herramientas de medición registran un parpadeo de alta frecuencia (23.545 Hz) a niveles de brillo del 35% e inferiores. Esto significa que los usuarios sensibles no deberían sufrir dolores de cabeza ni problemas oculares.

| |||||||||||||||||||||||||
iluminación: 86 %
Brillo con batería: 285 cd/m²
Contraste: 1096:1 (Negro: 0.26 cd/m²)
ΔE ColorChecker Calman: 1.8 | ∀{0.5-29.43 Ø4.72}
calibrated: 0.96
ΔE Greyscale Calman: 2.4 | ∀{0.09-98 Ø4.97}
66.8% AdobeRGB 1998 (Argyll 3D)
97% sRGB (Argyll 3D)
65.4% Display P3 (Argyll 3D)
Gamma: 2.266
CCT: 7057 K
| Schenker XMG Apex 15 Max Sharp LQ156M1JW03, IPS, 1920x1080, 15.6" | Eurocom Nightsky ARX315 Sharp LQ156M1JW03, IPS, 1920x1080, 15.6" | MSI Vector GP66 12UGS BOE NE156FHM-NZ3, IPS, 1920x1080, 15.6" | HP Omen 16-b1090ng BOE09E5, IPS, 2560x1440, 16.1" | Schenker XMG Apex 15 NH57AF1 AU Optronics B156HAN (AUO80ED), IPS, 1920x1080, 15.6" | Gigabyte A5 X1 AU Optronics B156HAN12.0, IPS, 1920x1080, 15.6" | |
|---|---|---|---|---|---|---|
| Display | 6% | 6% | 7% | -1% | 5% | |
| Display P3 Coverage (%) | 65.4 | 67.9 4% | 70.1 7% | 71 9% | 67.3 3% | 69.6 6% |
| sRGB Coverage (%) | 97 | 99.7 3% | 99.5 3% | 97.9 1% | 91.3 -6% | 98.6 2% |
| AdobeRGB 1998 Coverage (%) | 66.8 | 73.7 10% | 72.1 8% | 73.3 10% | 66.8 0% | 70.8 6% |
| Response Times | -50% | 11% | -36% | -63% | 6% | |
| Response Time Grey 50% / Grey 80% * (ms) | 9.3 ? | 15.2 ? -63% | 5.8 ? 38% | 14.5 ? -56% | 17.6 ? -89% | 4.8 ? 48% |
| Response Time Black / White * (ms) | 8.2 ? | 11.2 ? -37% | 9.6 ? -17% | 9.4 ? -15% | 11.2 ? -37% | 11.2 ? -37% |
| PWM Frequency (Hz) | 23545 ? | 23150 ? | ||||
| Screen | -18% | -13% | -47% | -32% | -22% | |
| Brightness middle (cd/m²) | 285 | 312.8 10% | 353.1 24% | 335 18% | 317 11% | 335 18% |
| Brightness (cd/m²) | 264 | 294 11% | 325 23% | 319 21% | 316 20% | 325 23% |
| Brightness Distribution (%) | 86 | 90 5% | 85 -1% | 90 5% | 84 -2% | 90 5% |
| Black Level * (cd/m²) | 0.26 | 0.28 -8% | 0.38 -46% | 0.28 -8% | 0.28 -8% | 0.4 -54% |
| Contrast (:1) | 1096 | 1117 2% | 929 -15% | 1196 9% | 1132 3% | 838 -24% |
| Colorchecker dE 2000 * | 1.8 | 2.96 -64% | 2.24 -24% | 4.38 -143% | 3.52 -96% | 2.63 -46% |
| Colorchecker dE 2000 max. * | 4.93 | 6.23 -26% | 5 -1% | 9.48 -92% | 6.93 -41% | 7.71 -56% |
| Colorchecker dE 2000 calibrated * | 0.96 | 1.02 -6% | 1.33 -39% | 2.49 -159% | 0.97 -1% | |
| Greyscale dE 2000 * | 2.4 | 4.2 -75% | 4 -67% | 7 -192% | 2.81 -17% | 4 -67% |
| Gamma | 2.266 97% | 2.32 95% | 2.24 98% | 2.103 105% | 2.54 87% | 2.129 103% |
| CCT | 7057 92% | 7145 91% | 6864 95% | 6244 104% | 6877 95% | 7434 87% |
| Color Space (Percent of AdobeRGB 1998) (%) | 67 | |||||
| Color Space (Percent of sRGB) (%) | 91 | |||||
| Media total (Programa/Opciones) | -21% /
-18% | 1% /
-5% | -25% /
-34% | -32% /
-30% | -4% /
-13% |
* ... más pequeño es mejor
La pantalla muestra una buena reproducción del color ya en el estado de entrega, y las desviaciones de color se mantienen dentro del rango objetivo. Sin embargo, una calibración aún aporta algunas mejoras. La pantalla no puede cubrir los espacios de color AdobeRGB (67%) y DCI-P3 (65%), pero se muestra al menos el 97% del espacio de color sRGB.
Tiempos de respuesta del display
| ↔ Tiempo de respuesta de Negro a Blanco | ||
|---|---|---|
| 8.2 ms ... subida ↗ y bajada ↘ combinada | ↗ 4.3 ms subida | 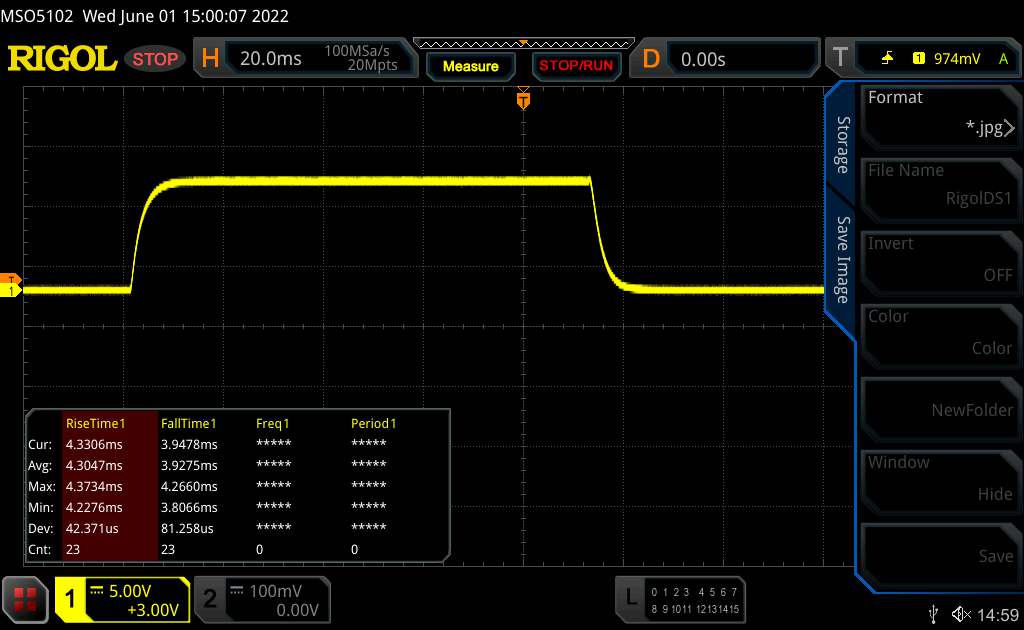 |
| ↘ 3.9 ms bajada | ||
| La pantalla mostró tiempos de respuesta rápidos en nuestros tests y debería ser adecuada para juegos. En comparación, todos los dispositivos de prueba van de ##min### (mínimo) a 240 (máximo) ms. » 24 % de todos los dispositivos son mejores. Esto quiere decir que el tiempo de respuesta medido es mejor que la media (19.8 ms) de todos los dispositivos testados. | ||
| ↔ Tiempo de respuesta 50% Gris a 80% Gris | ||
| 9.3 ms ... subida ↗ y bajada ↘ combinada | ↗ 4.5 ms subida | 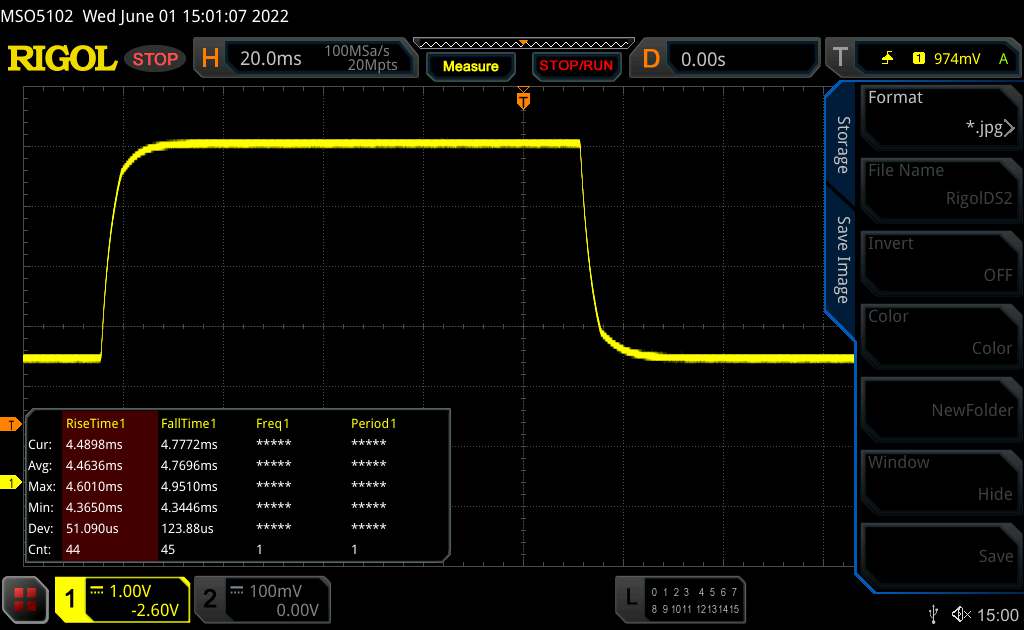 |
| ↘ 4.8 ms bajada | ||
| La pantalla mostró tiempos de respuesta rápidos en nuestros tests y debería ser adecuada para juegos. En comparación, todos los dispositivos de prueba van de ##min### (mínimo) a 636 (máximo) ms. » 23 % de todos los dispositivos son mejores. Esto quiere decir que el tiempo de respuesta medido es mejor que la media (31 ms) de todos los dispositivos testados. | ||
Parpadeo de Pantalla / PWM (Pulse-Width Modulation)
| Parpadeo de Pantalla / PWM detectado | 23545 Hz | ≤ 35 % de brillo | 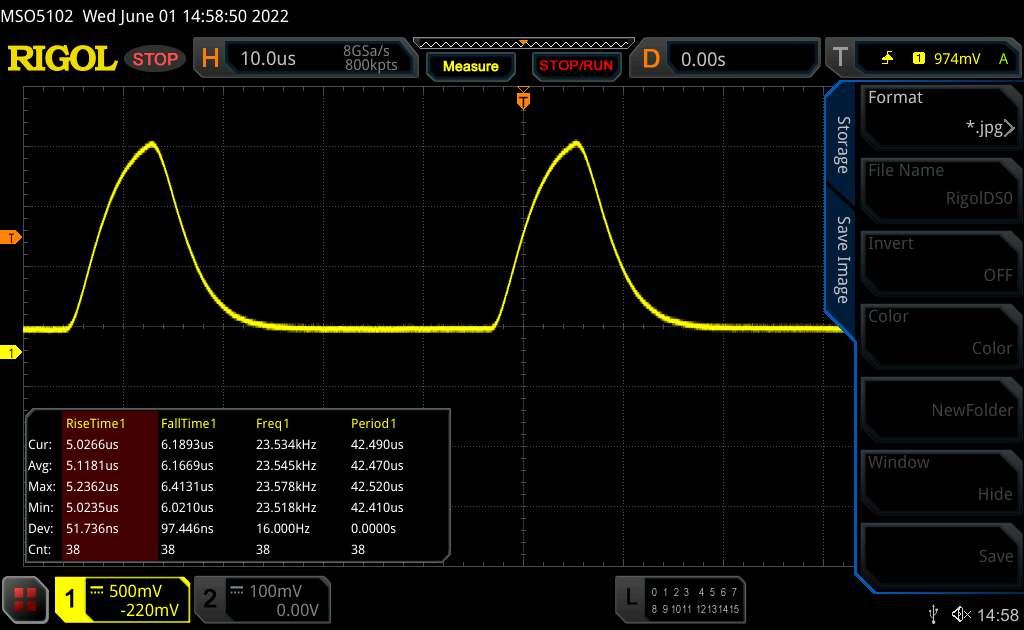 |
La retroiluminación del display parpadea a 23545 Hz (seguramente usa PWM - Pulse-Width Modulation) a un brillo del 35 % e inferior. Sobre este nivel de brillo no debería darse parpadeo / PWM. La frecuencia de 23545 Hz es bastante alta, por lo que la mayoría de gente sensible al parpadeo no debería ver parpadeo o tener fatiga visual. Comparación: 52 % de todos los dispositivos testados no usaron PWM para atenuar el display. Si se usó, medimos una media de 7763 (mínimo: 5 - máxmo: 343500) Hz. | |||
El panel IPS ofrece ángulos de visión estables y se puede leer desde cualquier ángulo. En exteriores, el contenido de la pantalla puede leerse si el sol no es demasiado brillante.

Rendimiento - La CPU de escritorio del XMG Apex no desarrolla todo su potencial
El potente portátil de 15,6 pulgadas da la talla en escenarios de aplicación que requieren mucha potencia de cálculo, ya sea en juegos, procesamiento de vídeo o renderizado. El portátil puede configurarse de forma muy individualizada en la tienda online de Schenker (bestware.com).
Condiciones de la prueba
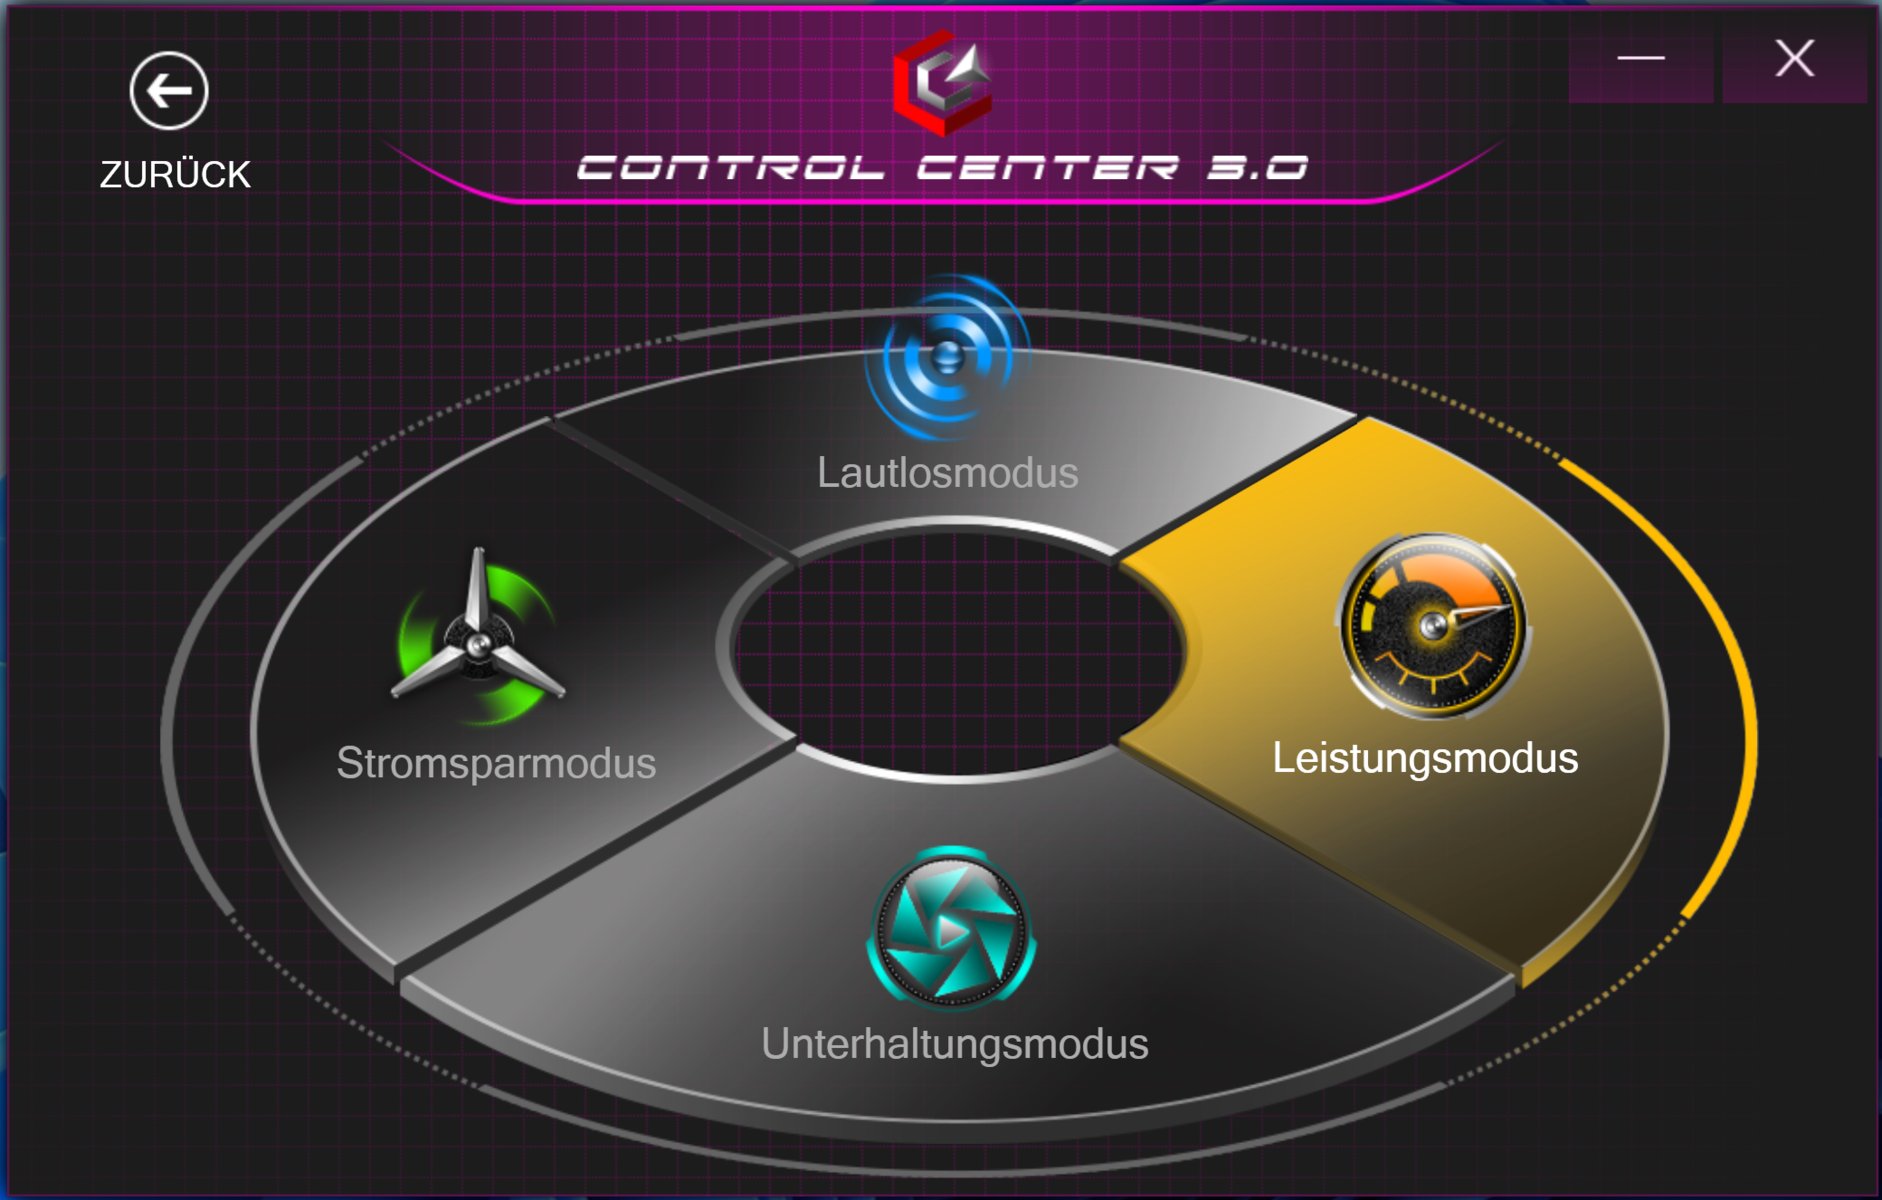
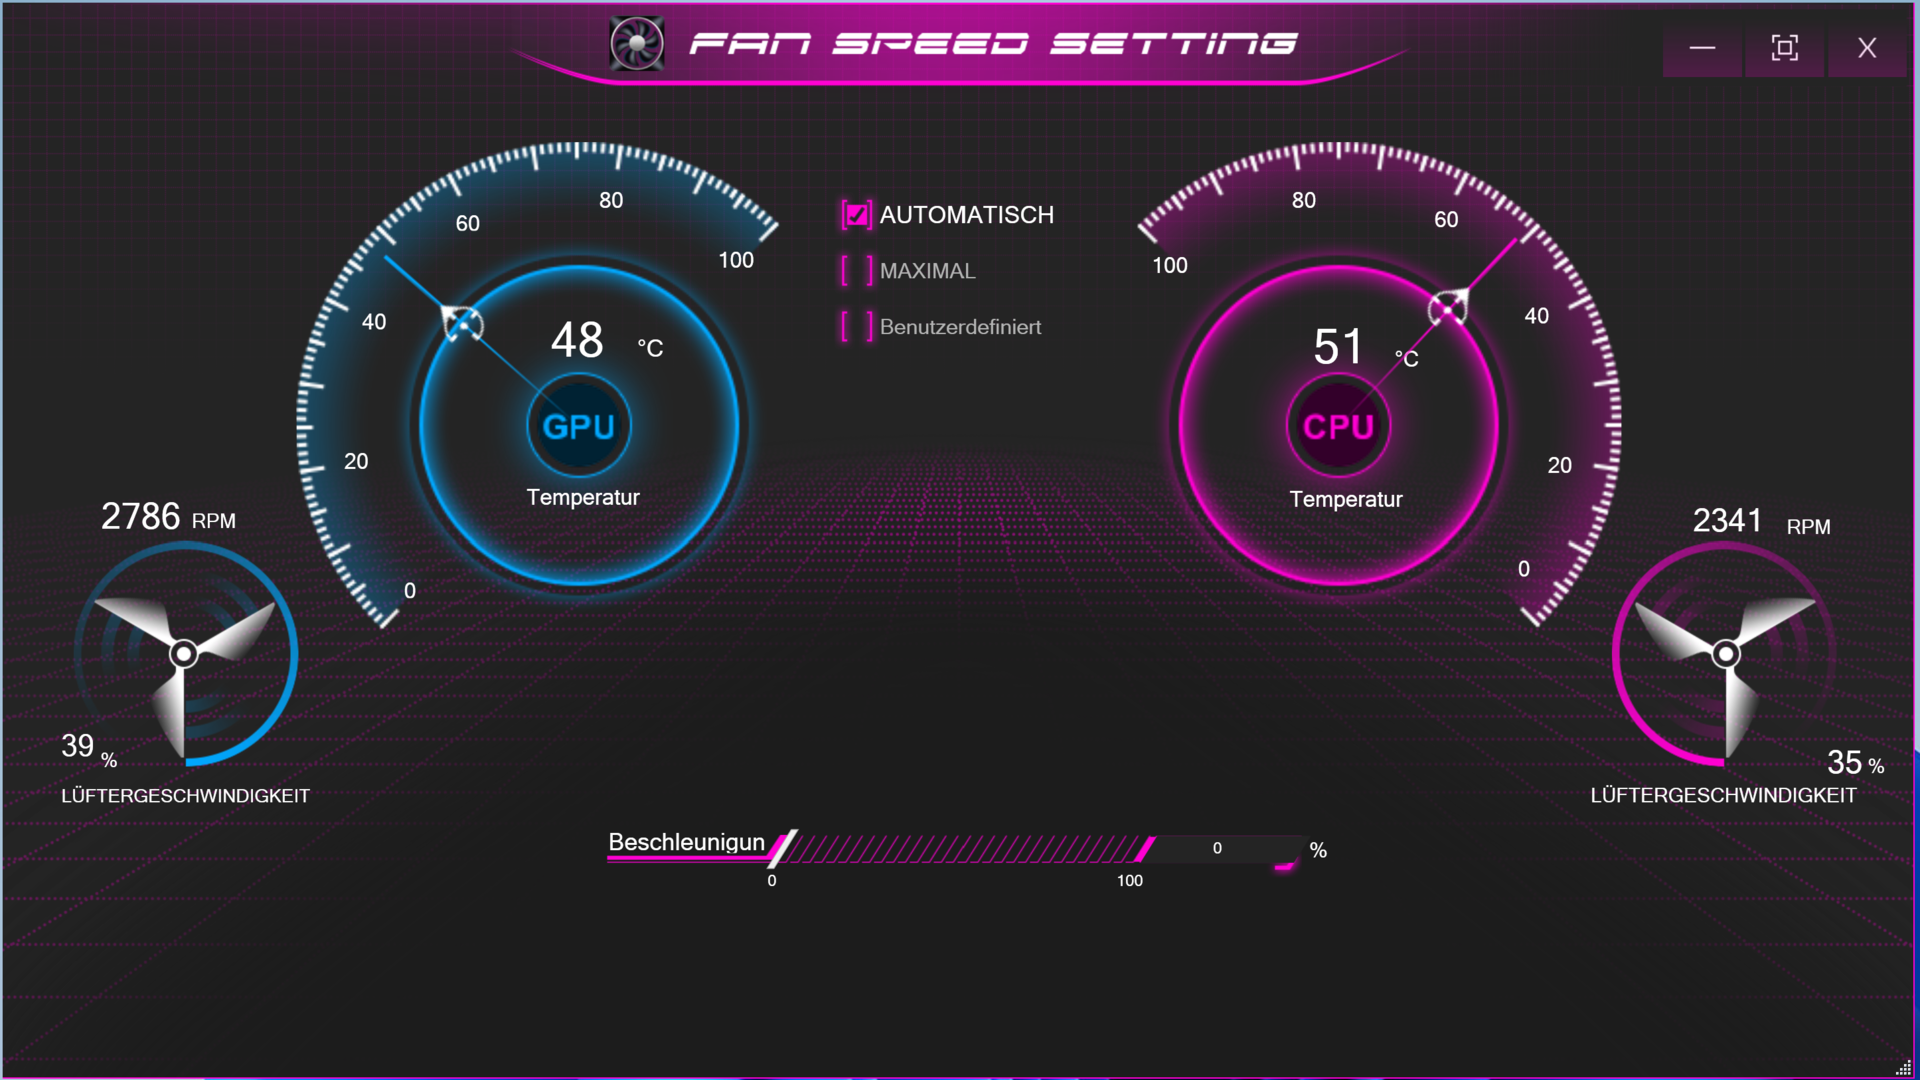
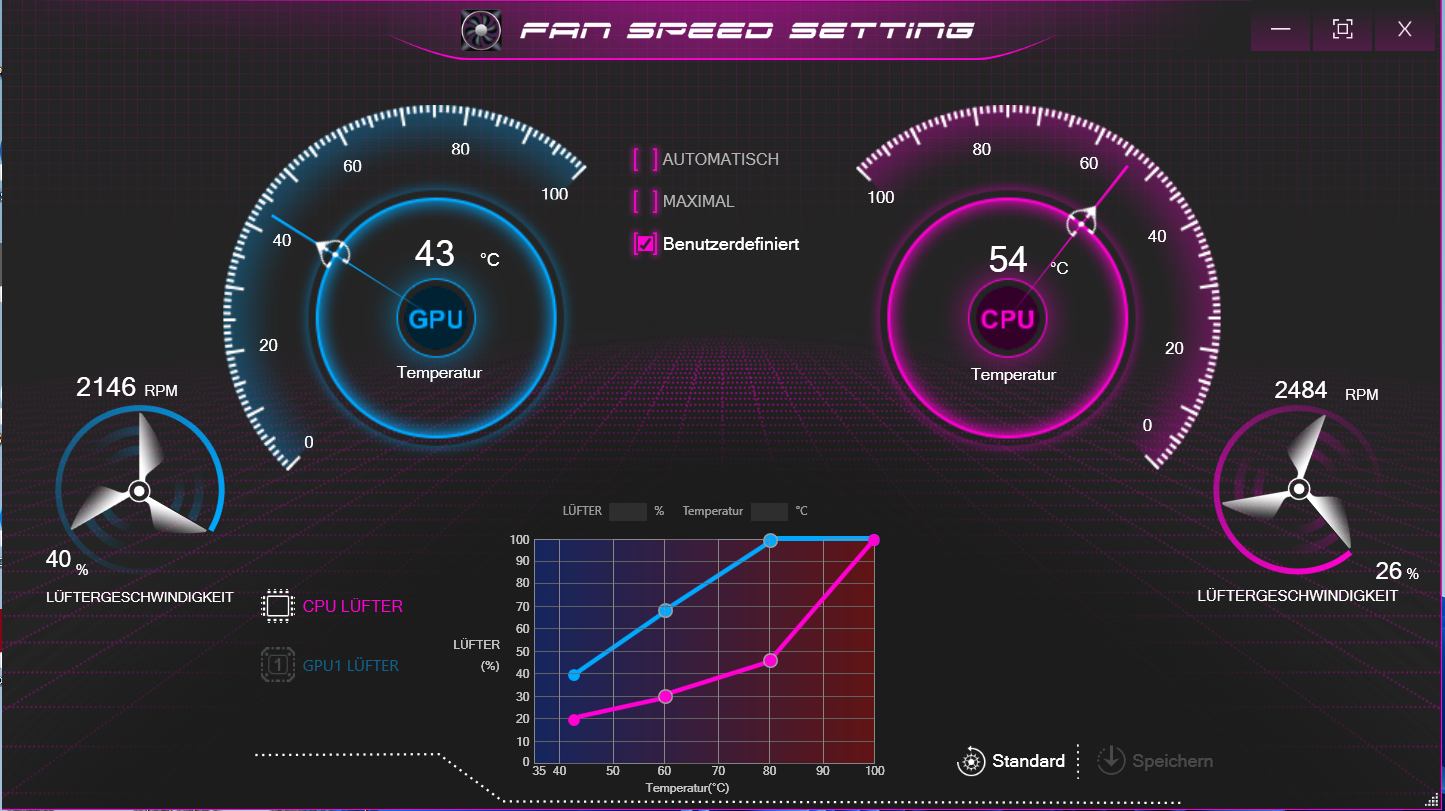
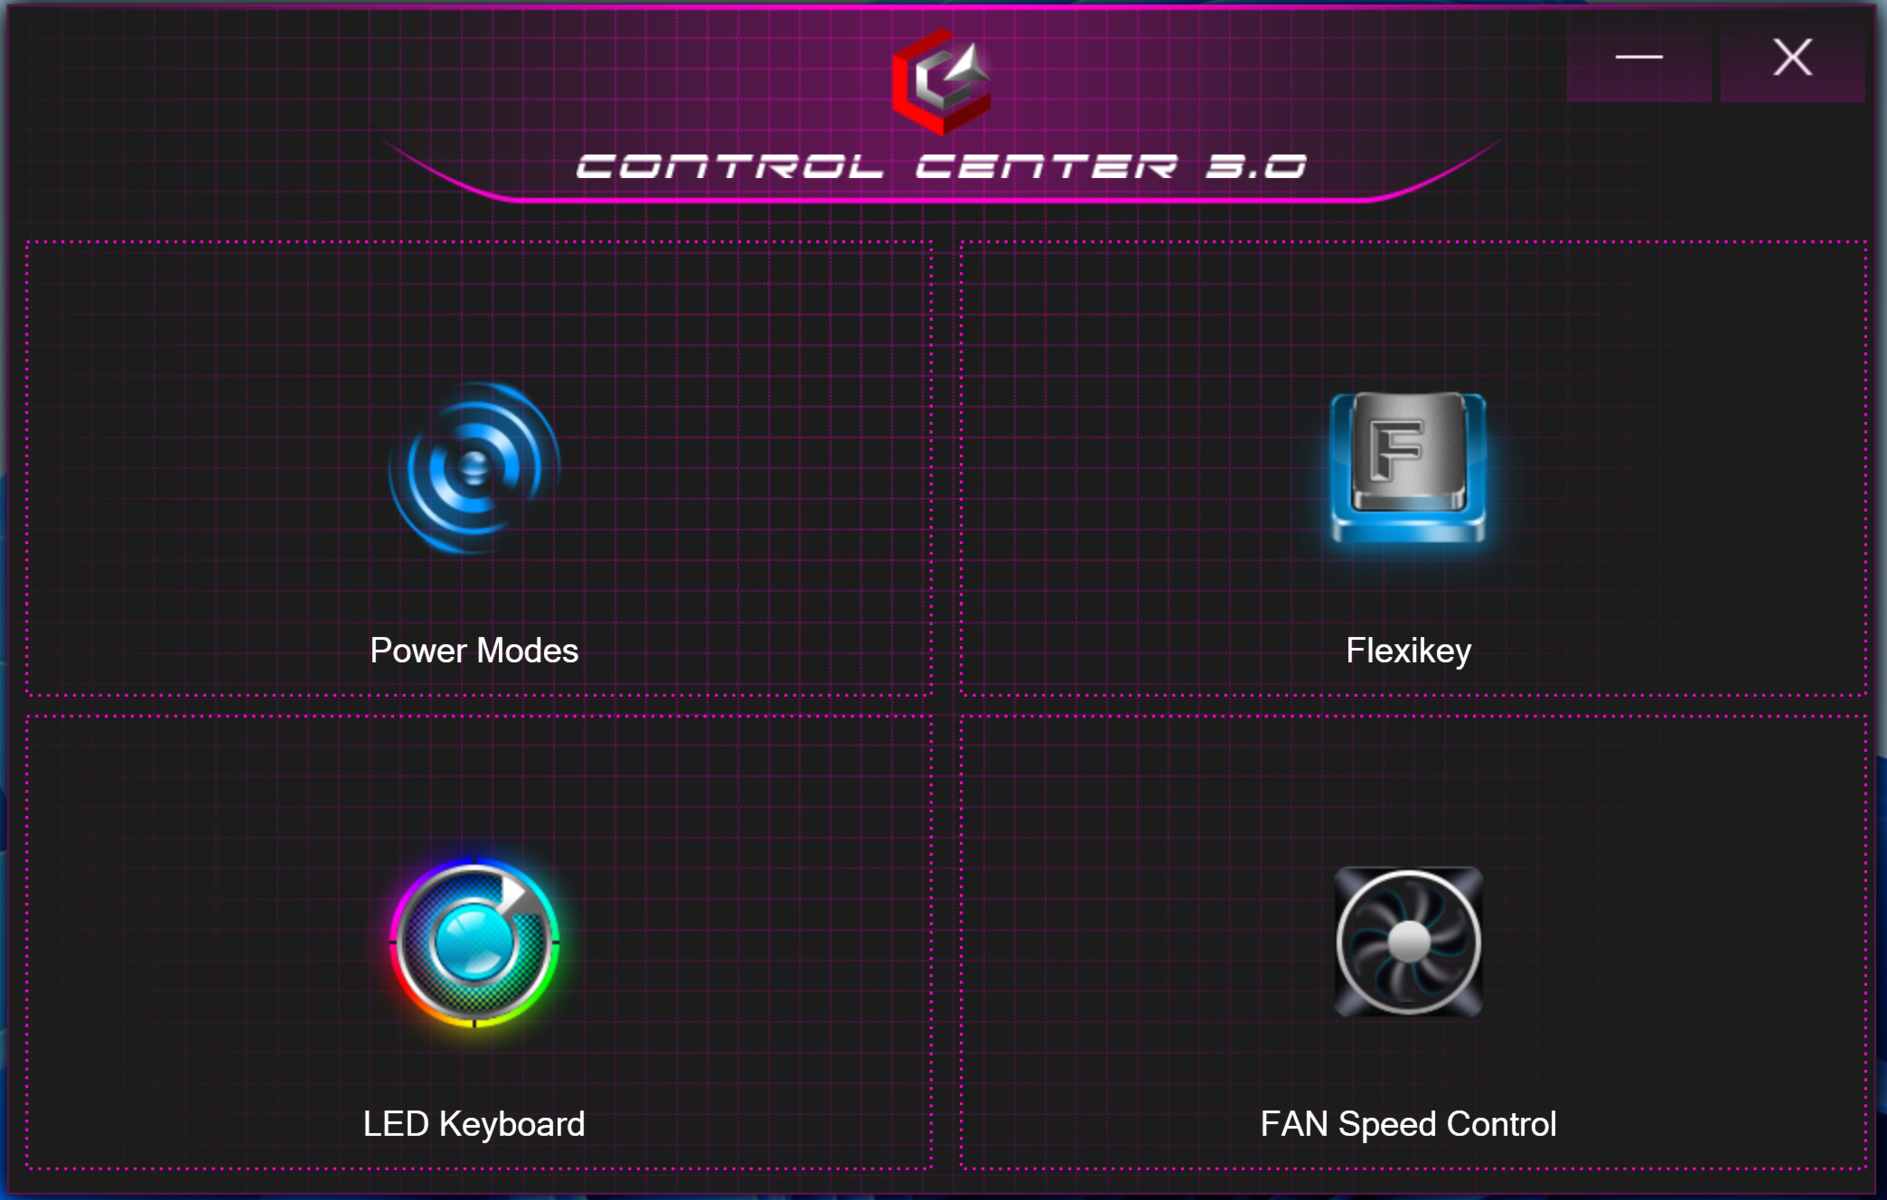
Entre otras opciones, el Centro de Control preinstalado también permite seleccionar un perfil de rendimiento (modo de rendimiento, modo de entretenimiento, modo de ahorro de energía, modo silencioso). Los benchmarks y las pruebas de batería se realizaron utilizando el modo Entretenimiento, que incluye el control automático del ventilador.
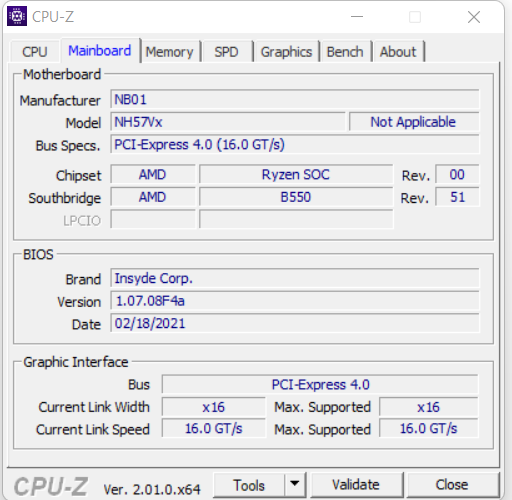
BIOS
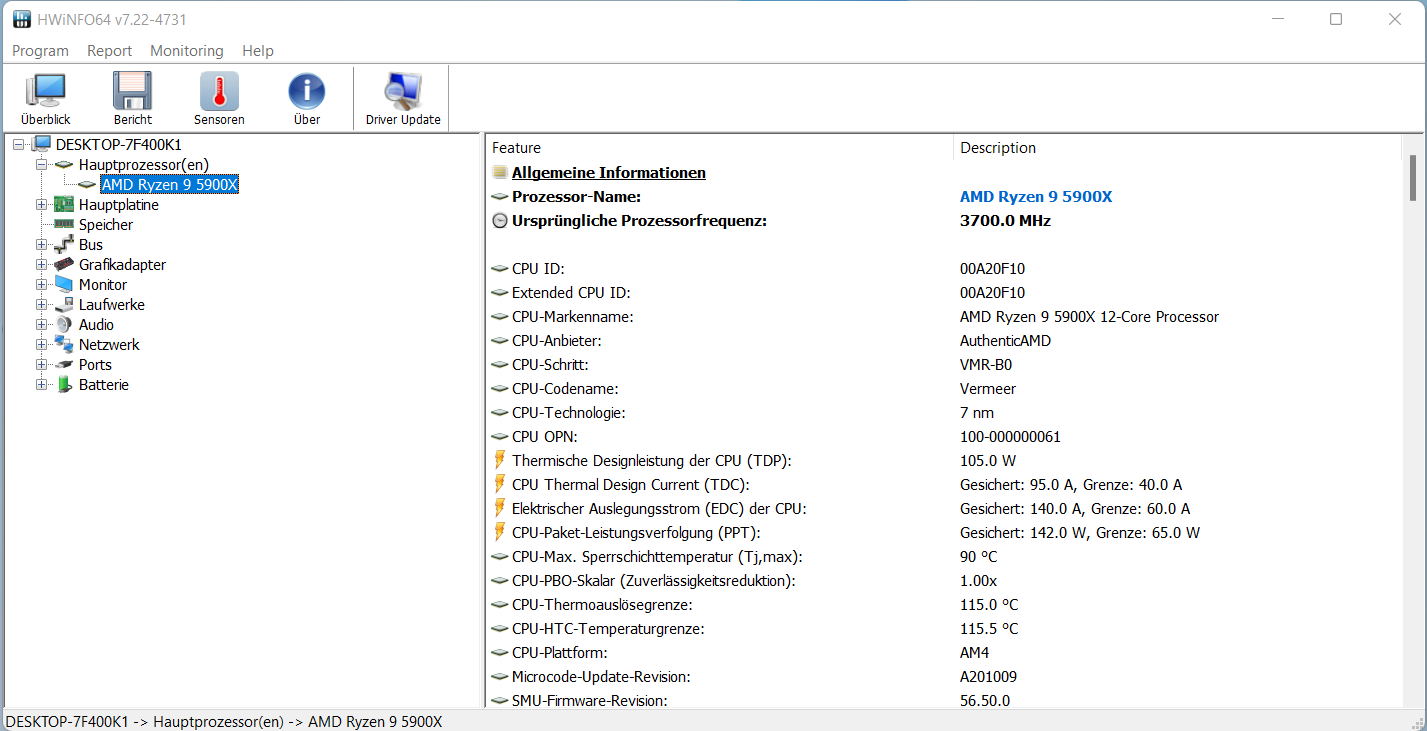
Según Schenker, la BIOS del Apex 15 Max representa un desarrollo propio. Así, la compañía quiere garantizar el funcionamiento estable de las CPUs Ryzen 9 ofrecidas en todo momento. También podemos confirmarlo al menos en nuestra unidad de pruebas.
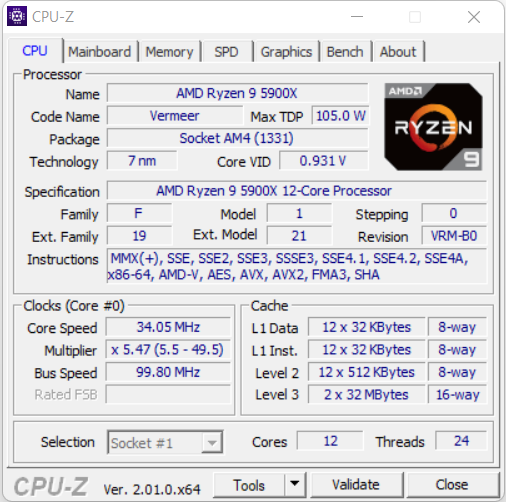
Procesador
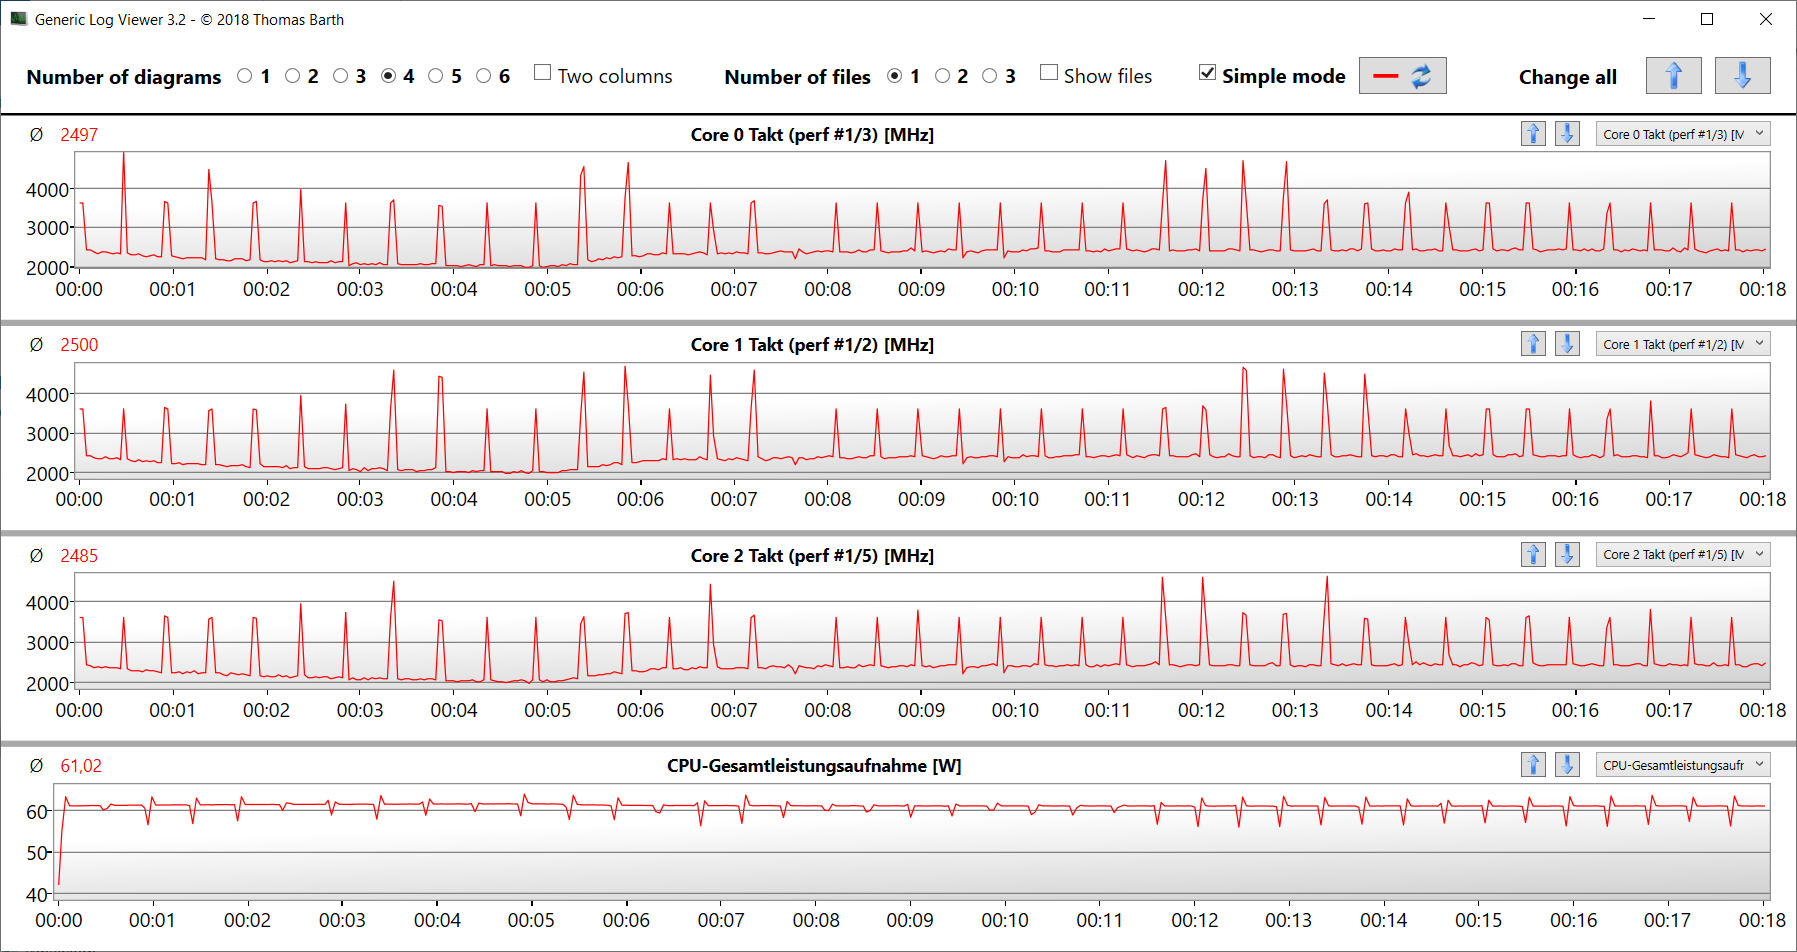
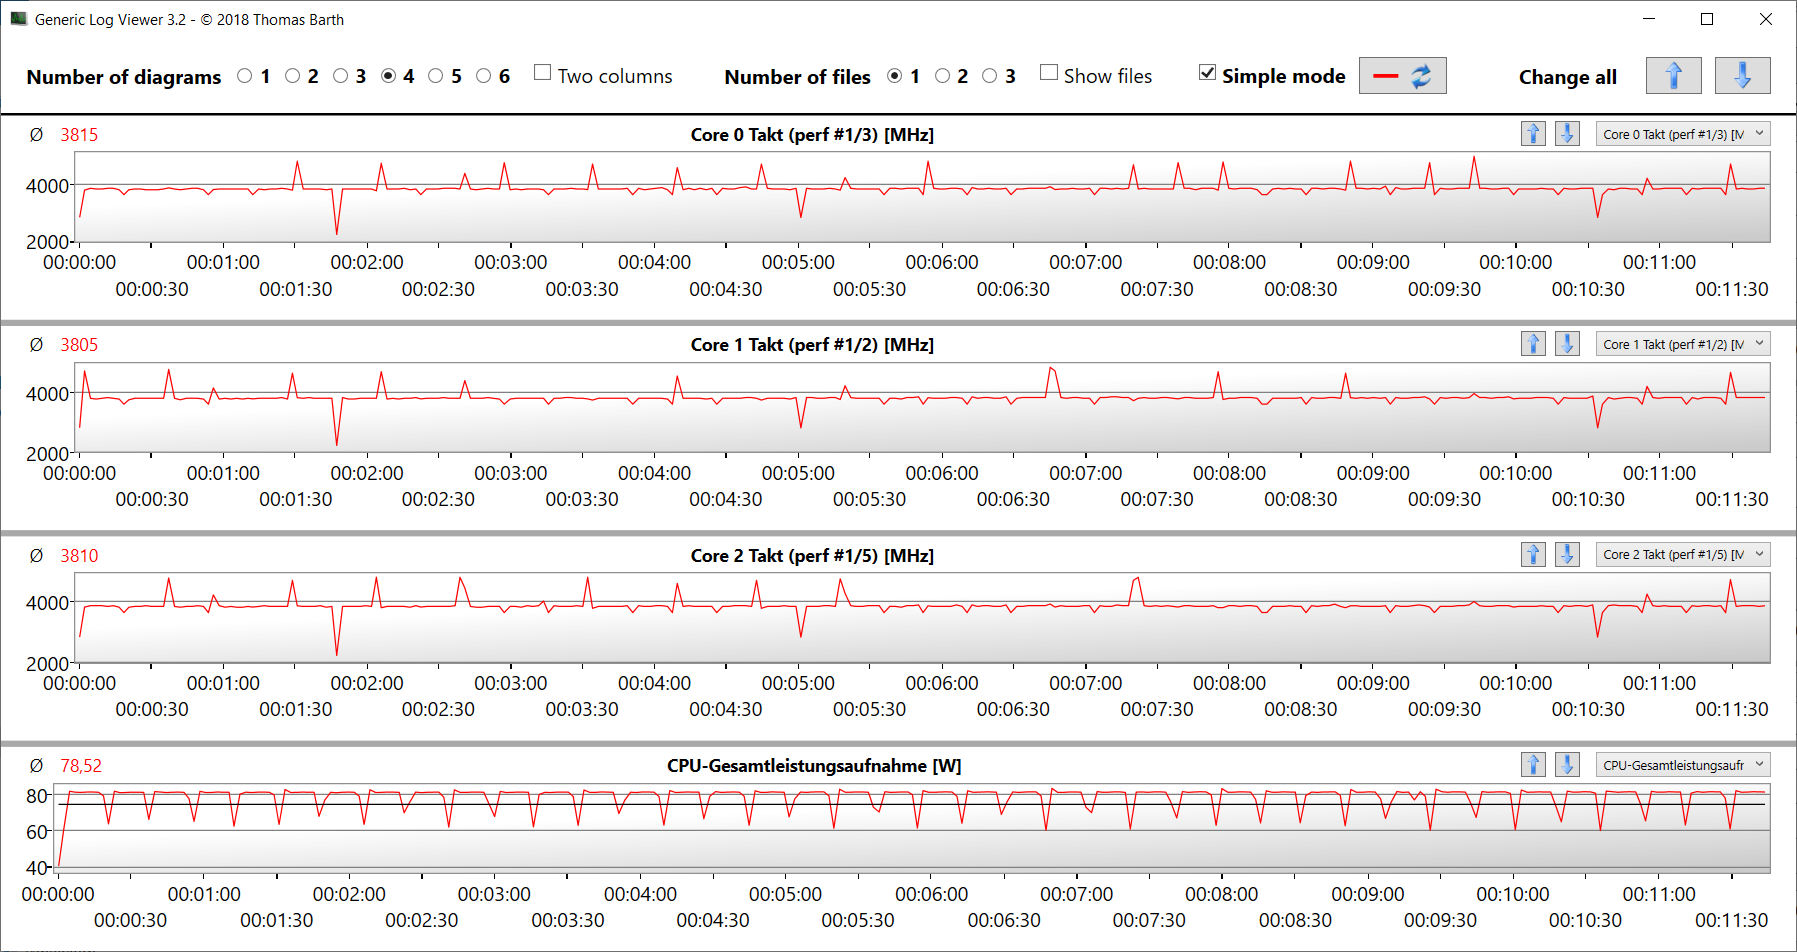
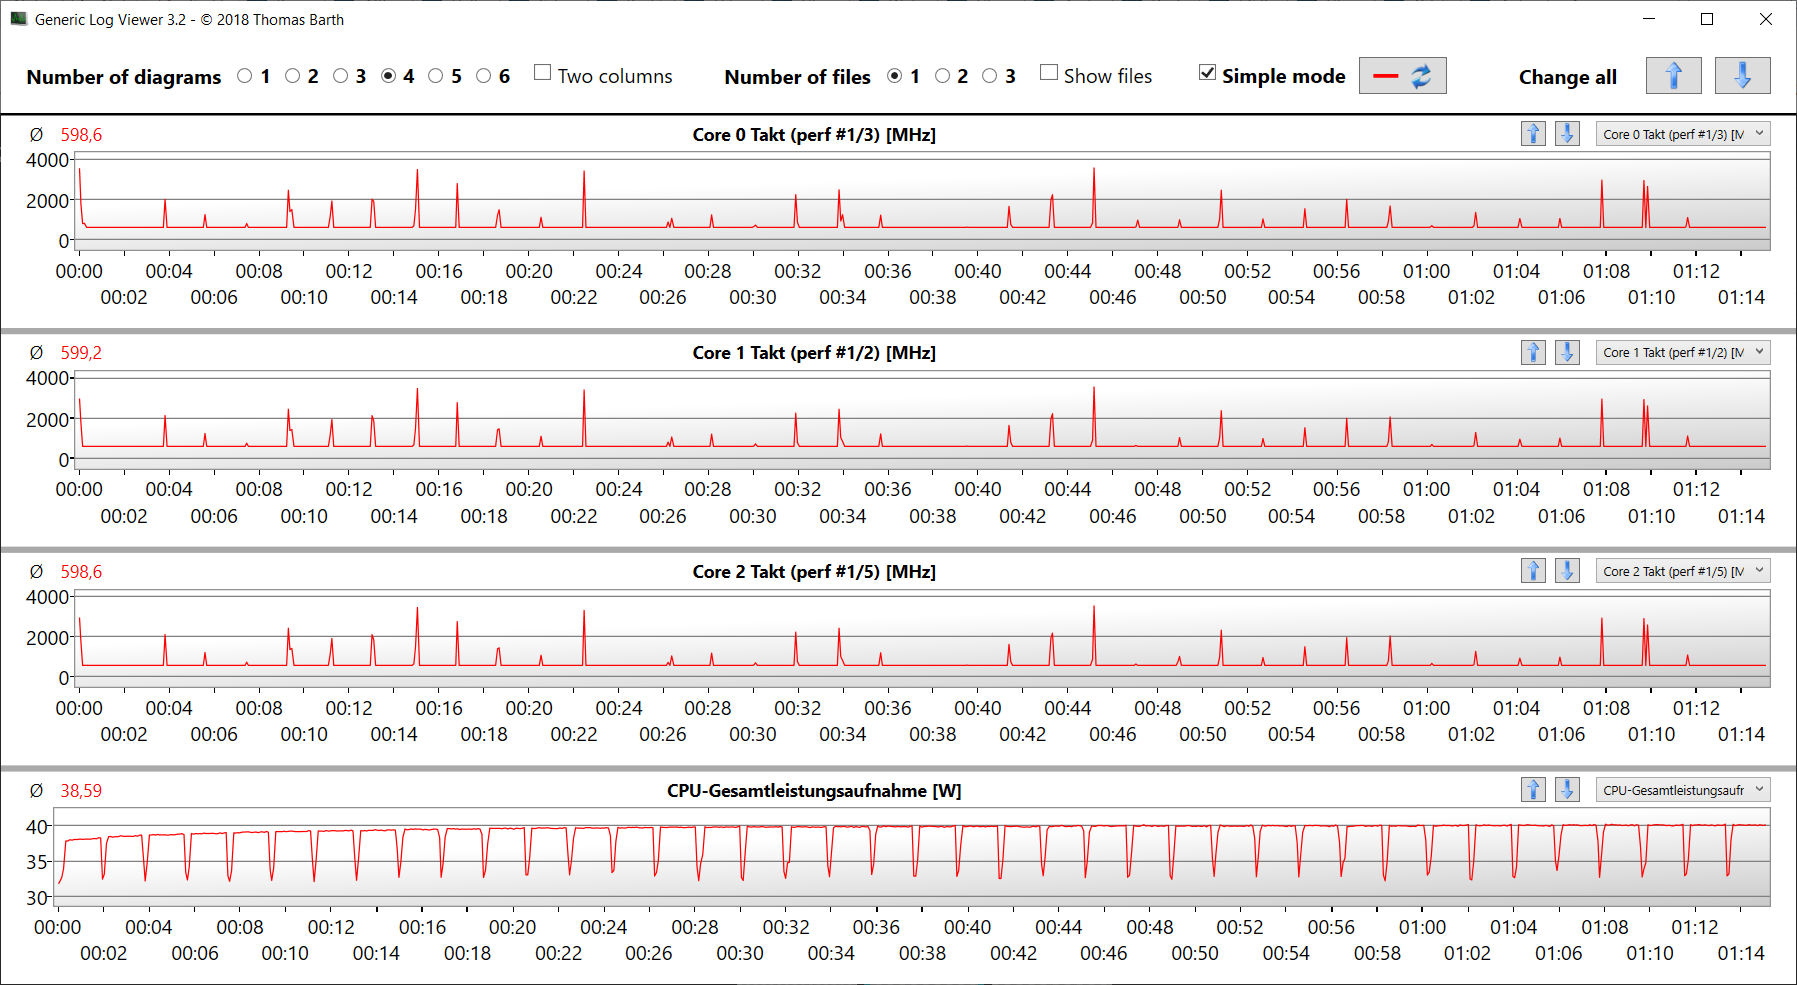
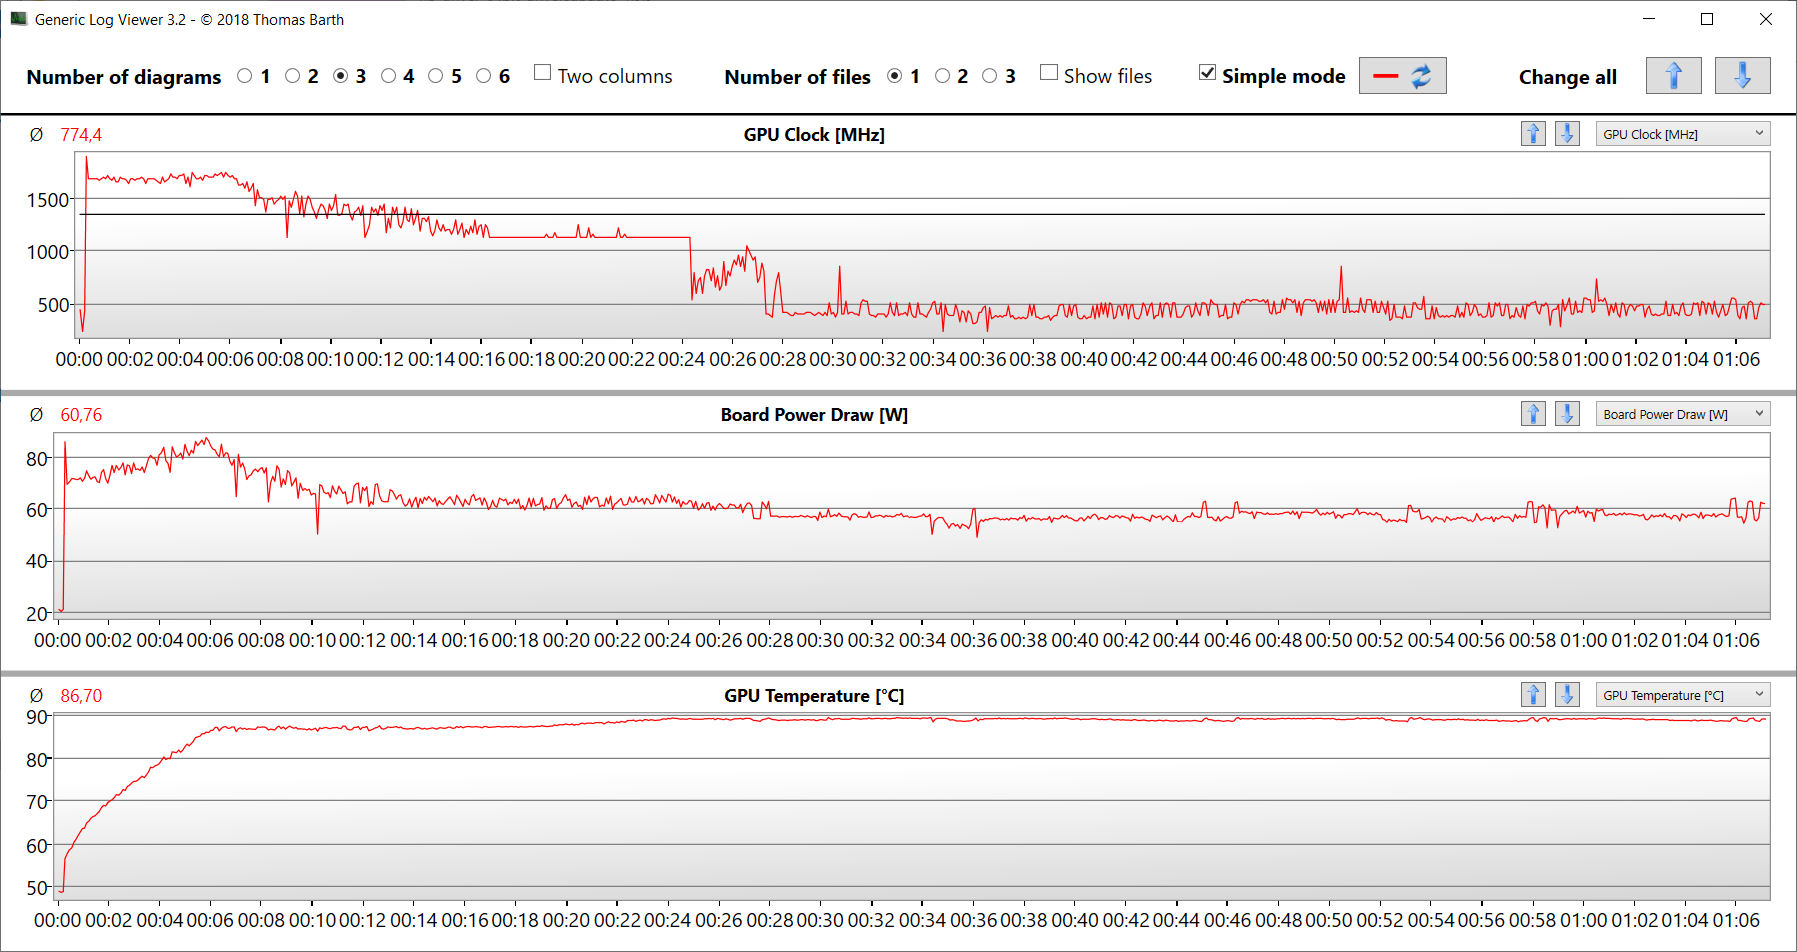
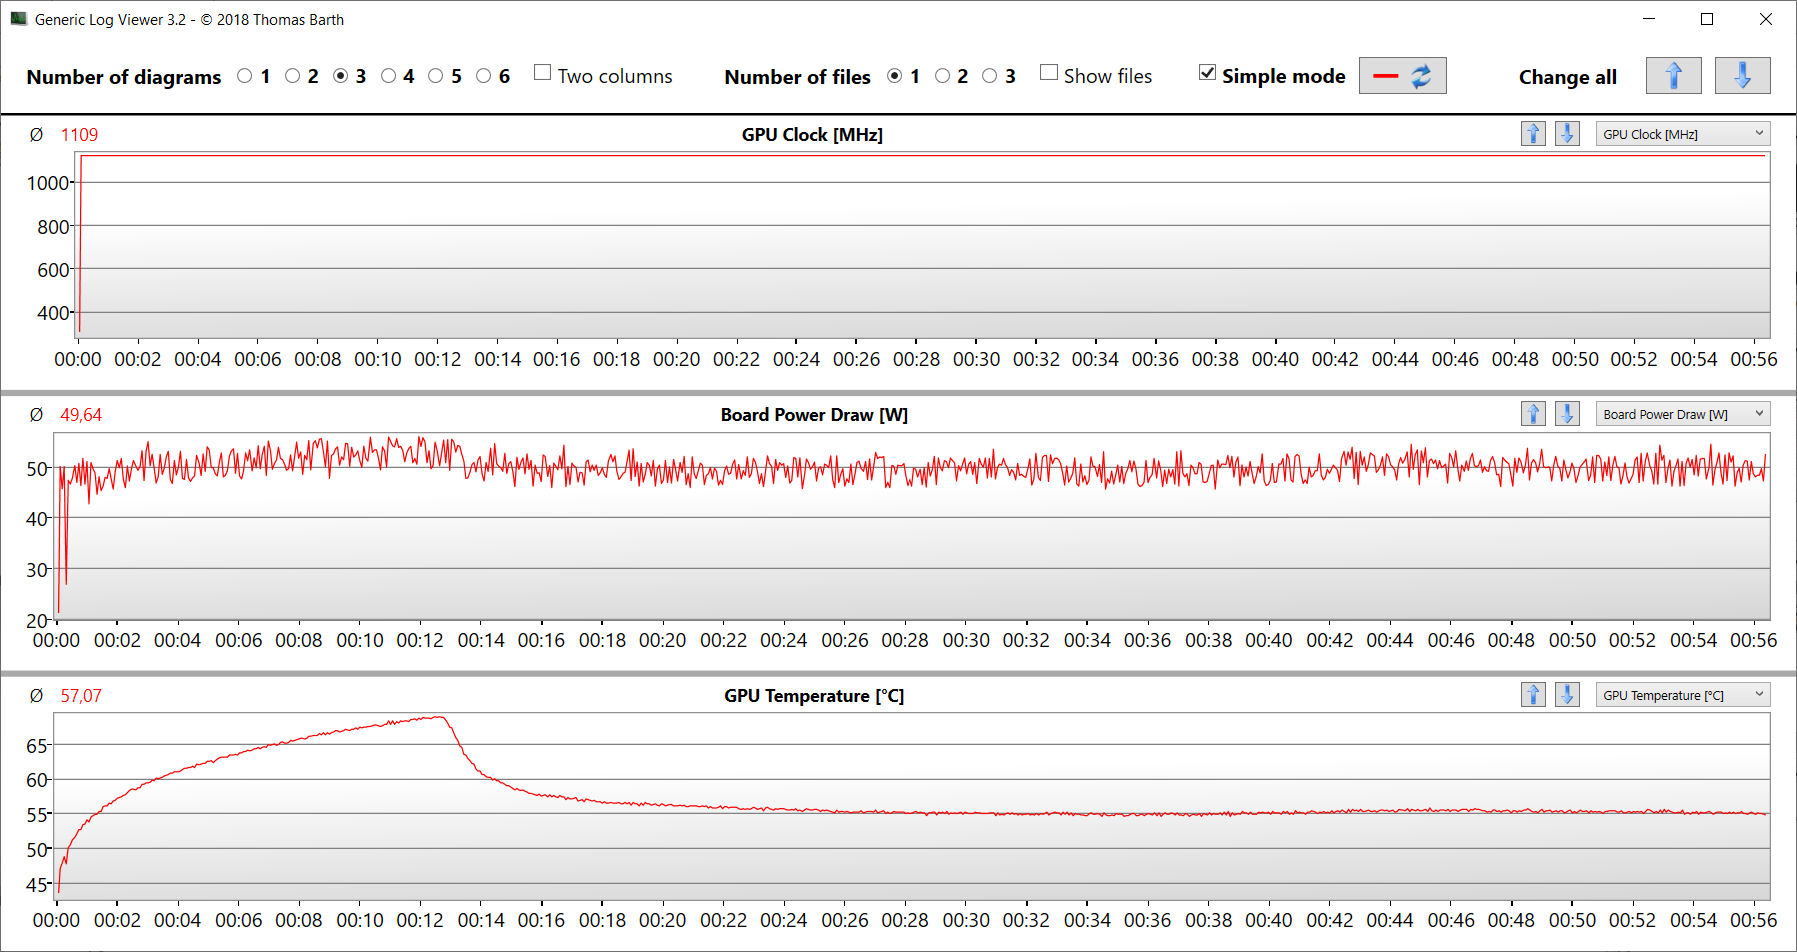
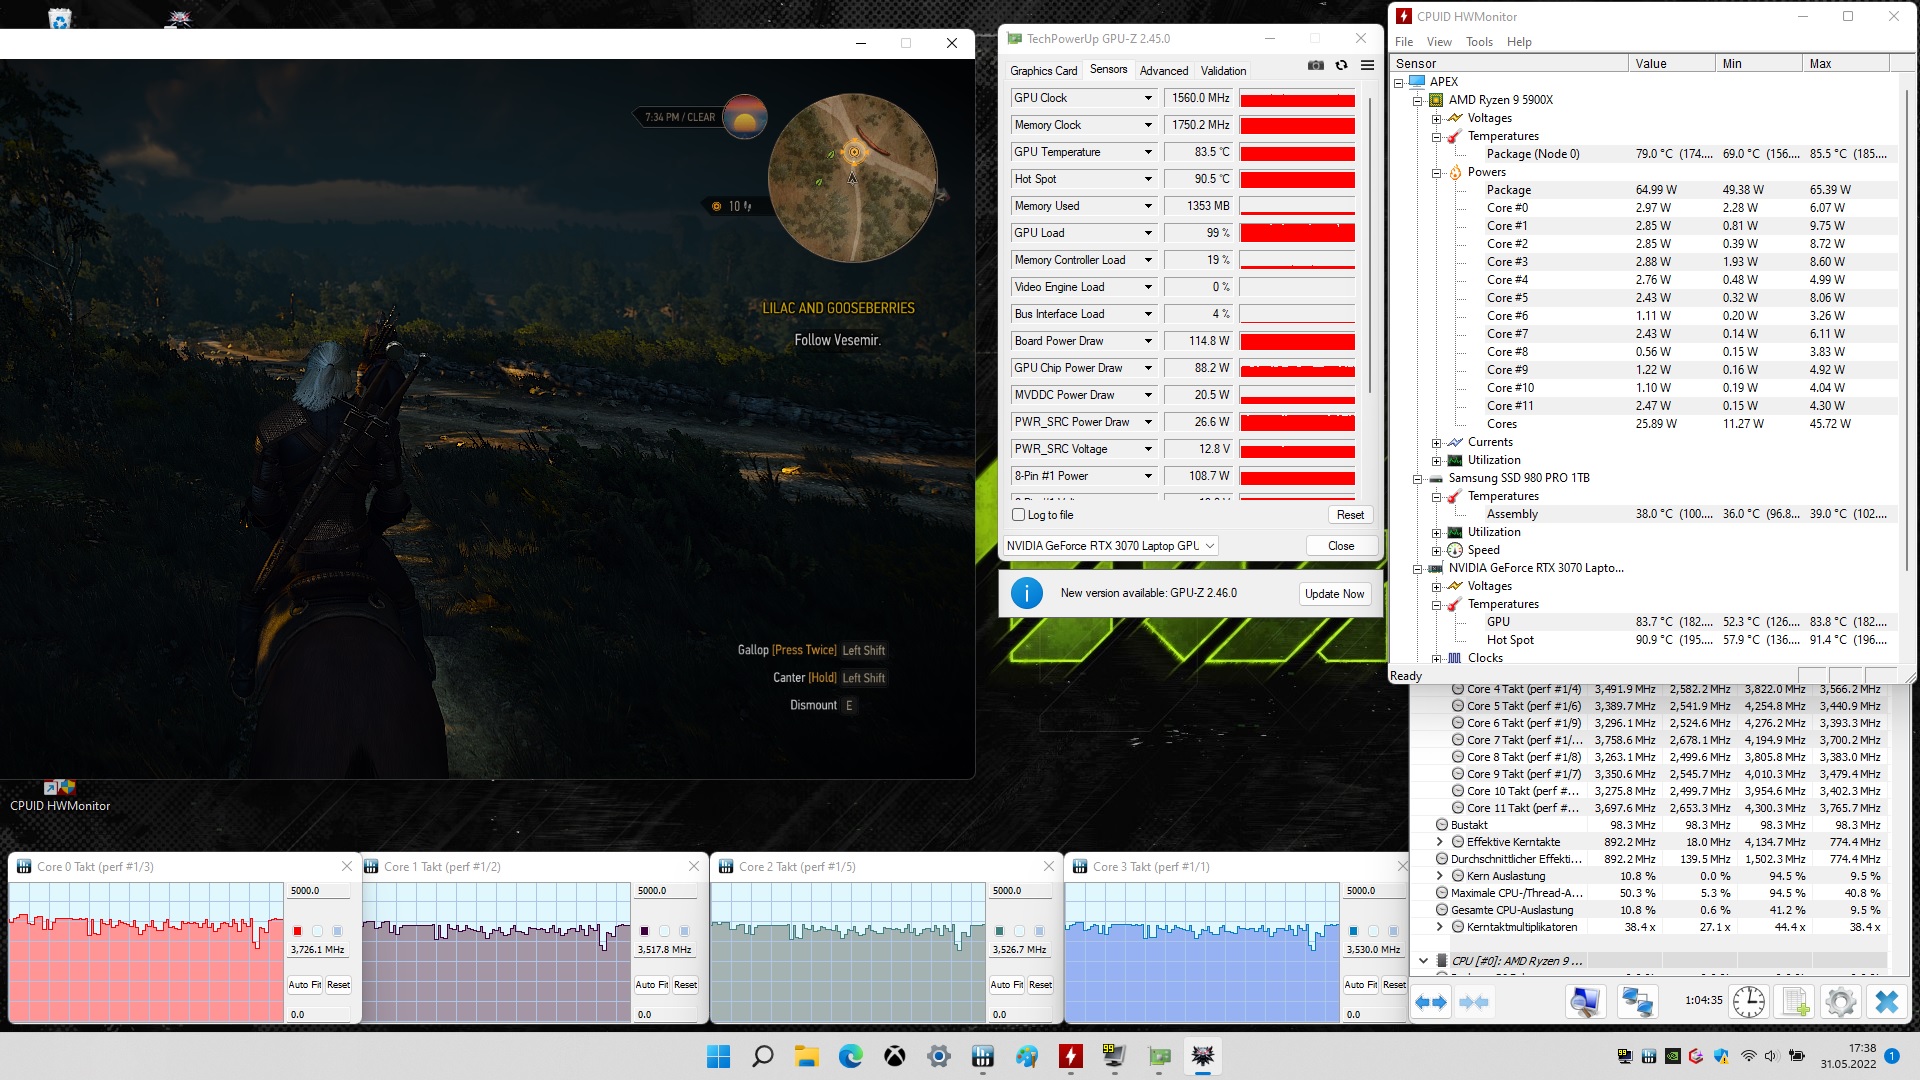
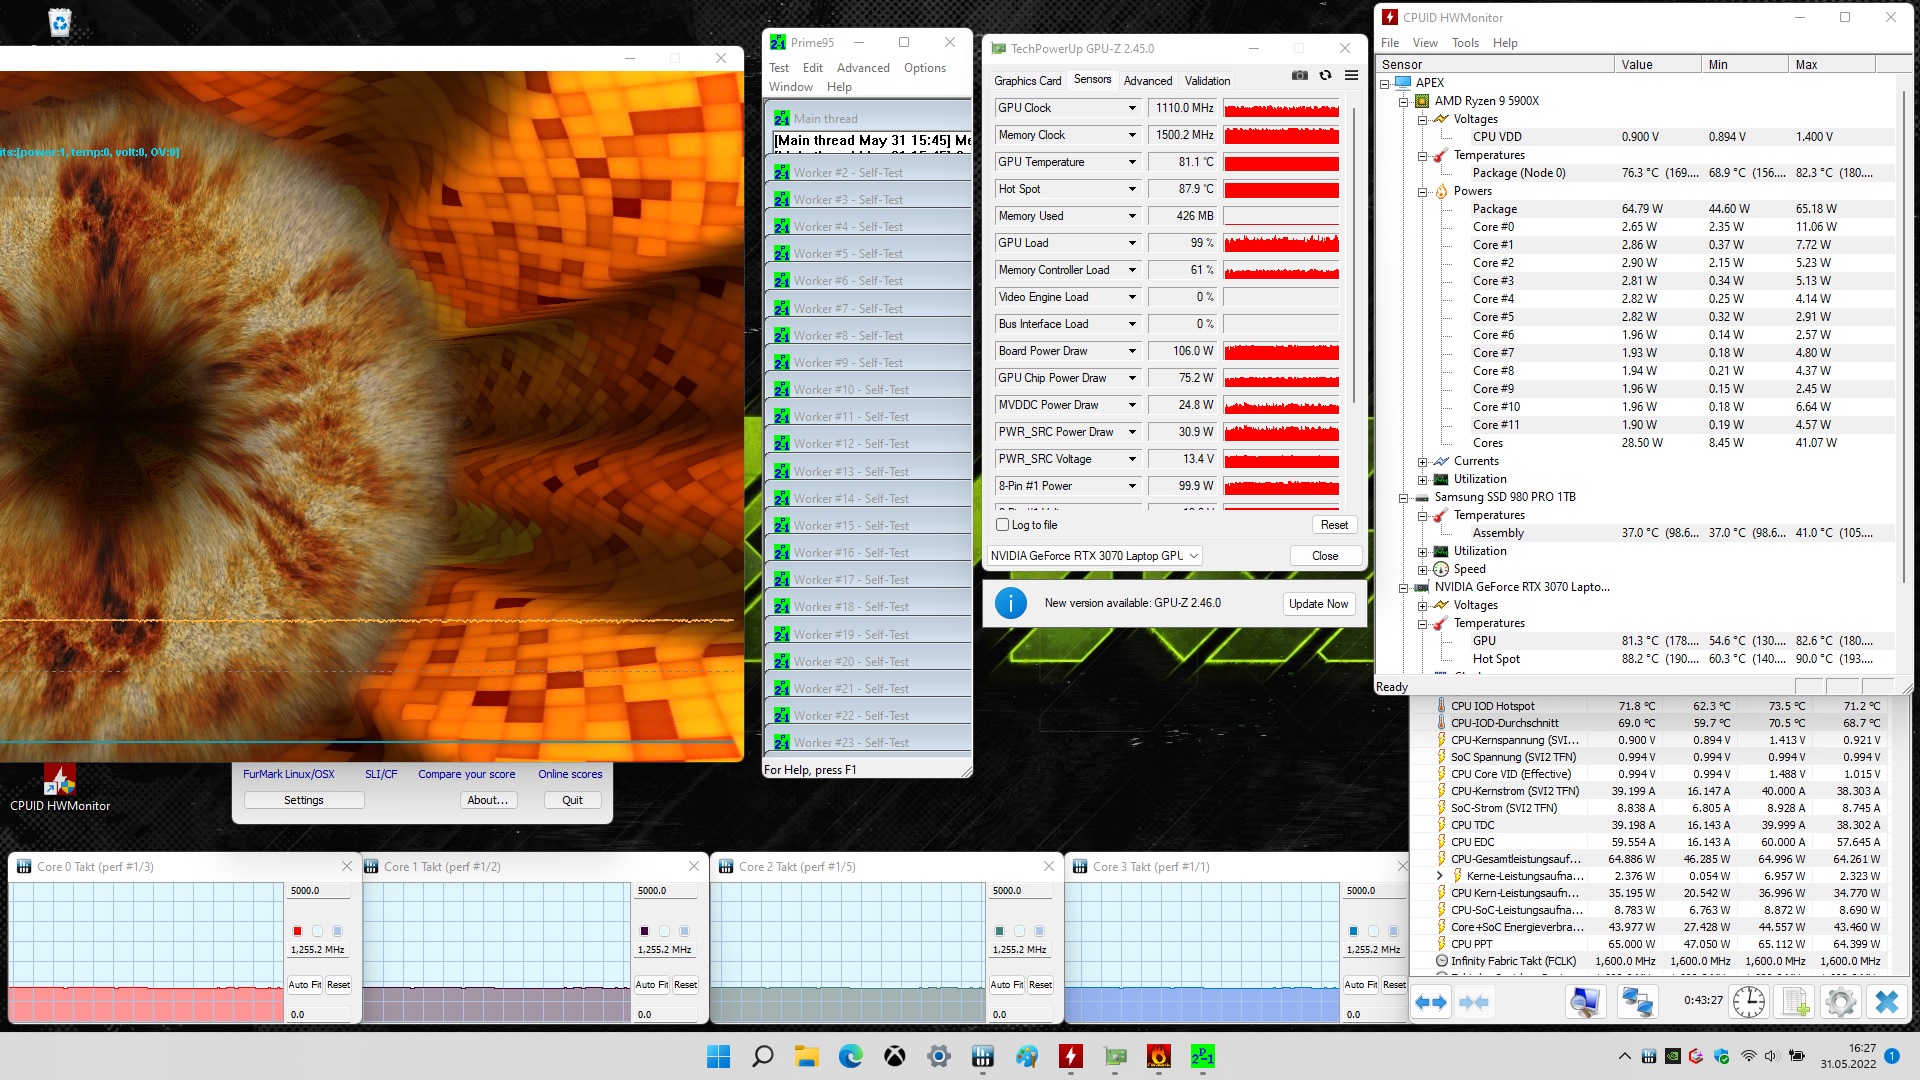
El sustituto Ryzen 9 5900Xde doce núcleos (Vermeer) funciona con una velocidad de reloj básica de 3,7 GHz. A través de Turbo, se puede aumentar hasta 4,5 GHz (doce núcleos) y 4,8 GHz (un solo núcleo). Se admite el multithreading simultáneo (con dos hilos por núcleo). Las velocidades de reloj durante las pruebas de Cinebench R15 varían significativamente, dependiendo del perfil de potencia seleccionado. En todos los casos, la CPU es capaz de funcionar constantemente a una velocidad de reloj estable, lo que se demuestra en nuestra prueba de bucle CB15.
| Modo de entretenimiento | Modo de rendimiento | Modo de rendimiento Max. Ventilador | Modo silencioso | Modo de ahorro de energía | |
|---|---|---|---|---|---|
| Single Thread | 3,6 a 4,7 GHz | 3,4 a 4,8 GHz | 3,6 a 4,8 GHz | 600 MHz a 3,6 GHz | 550 a 650 MHz |
| Multihilo | 2,3 GHz | 3,8 GHz | 3,8 a 3,9 GHz | 550 MHz | 550 MHz |
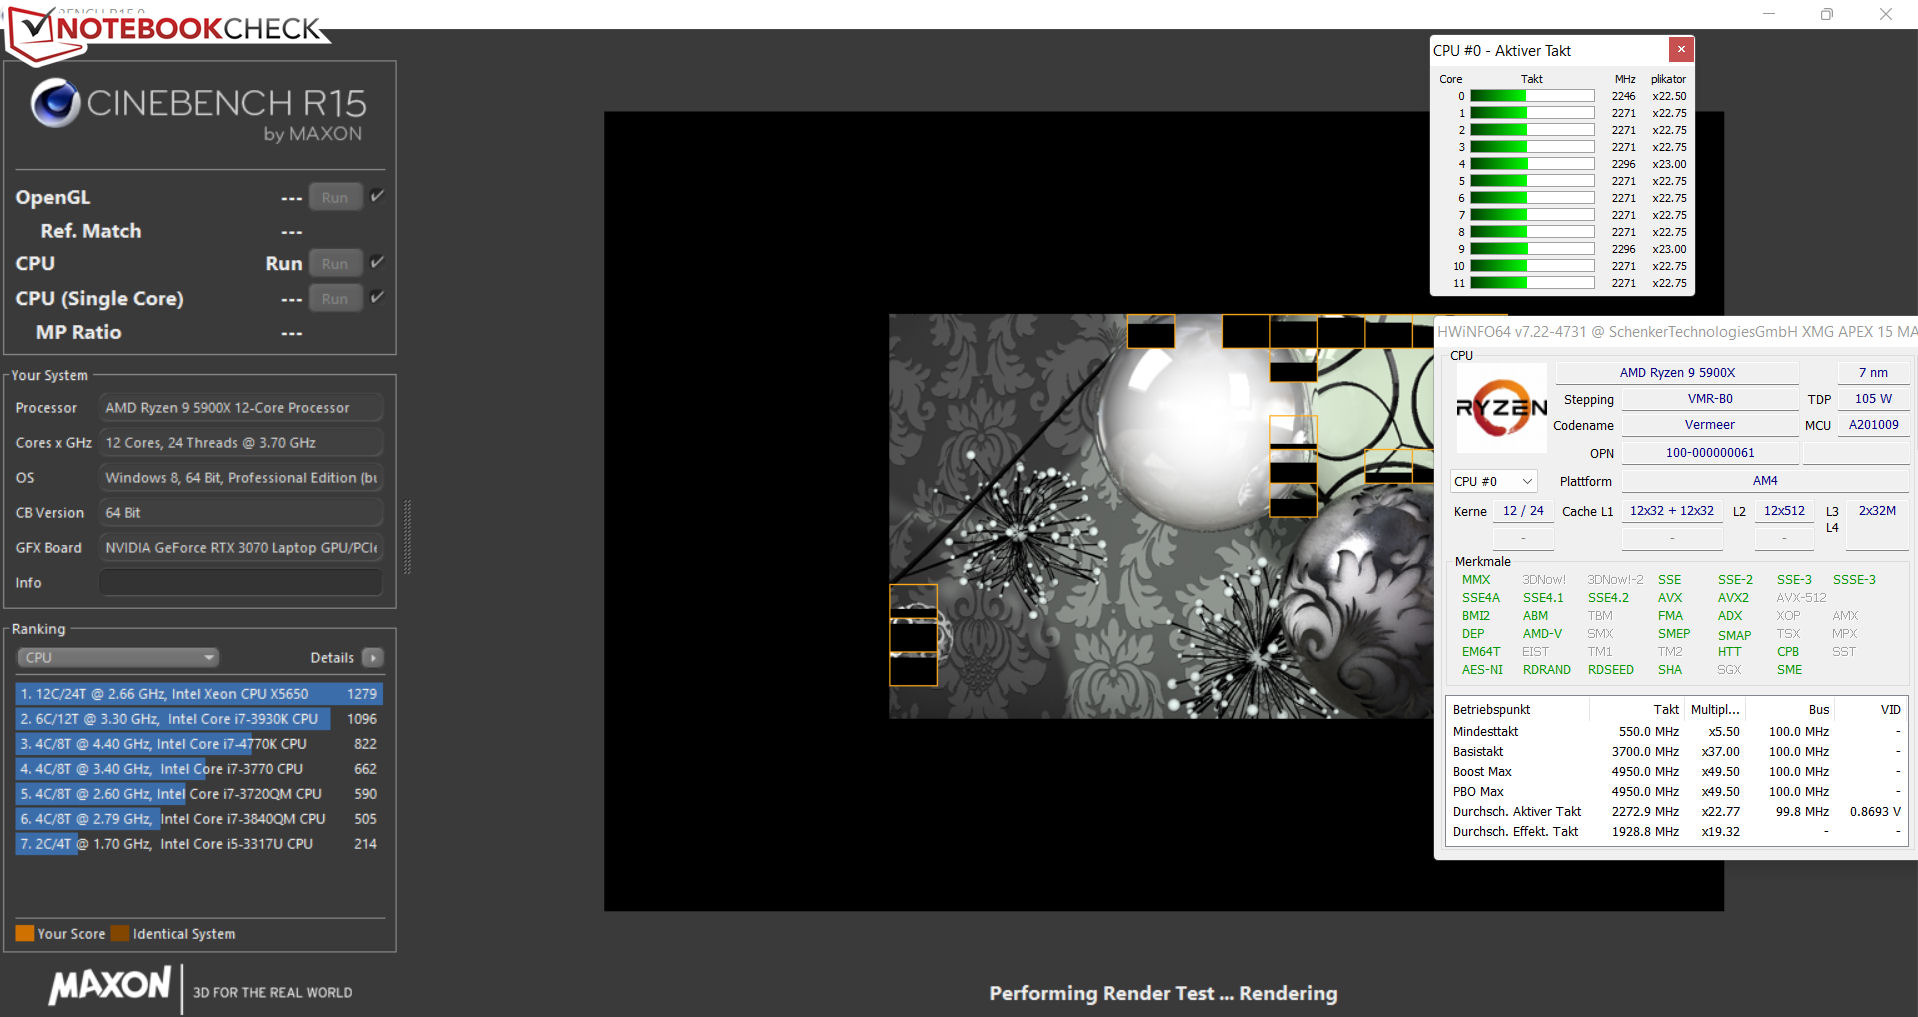
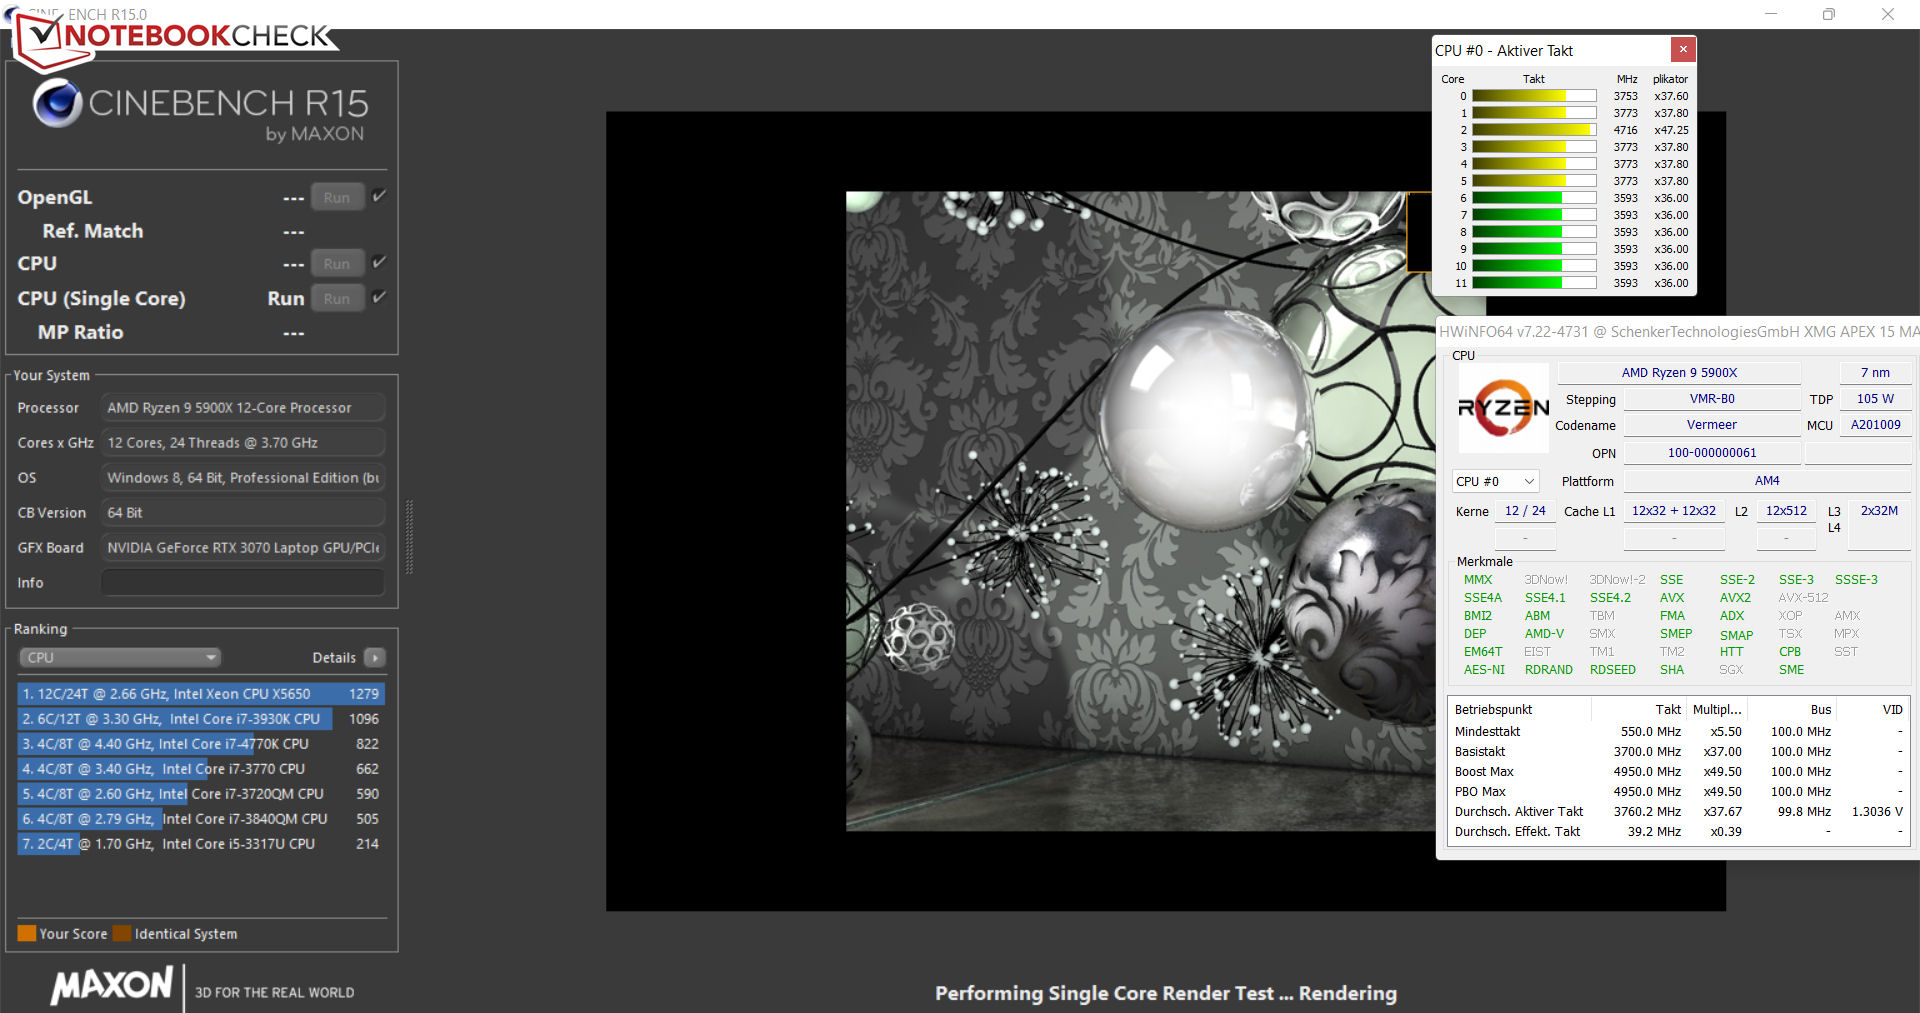
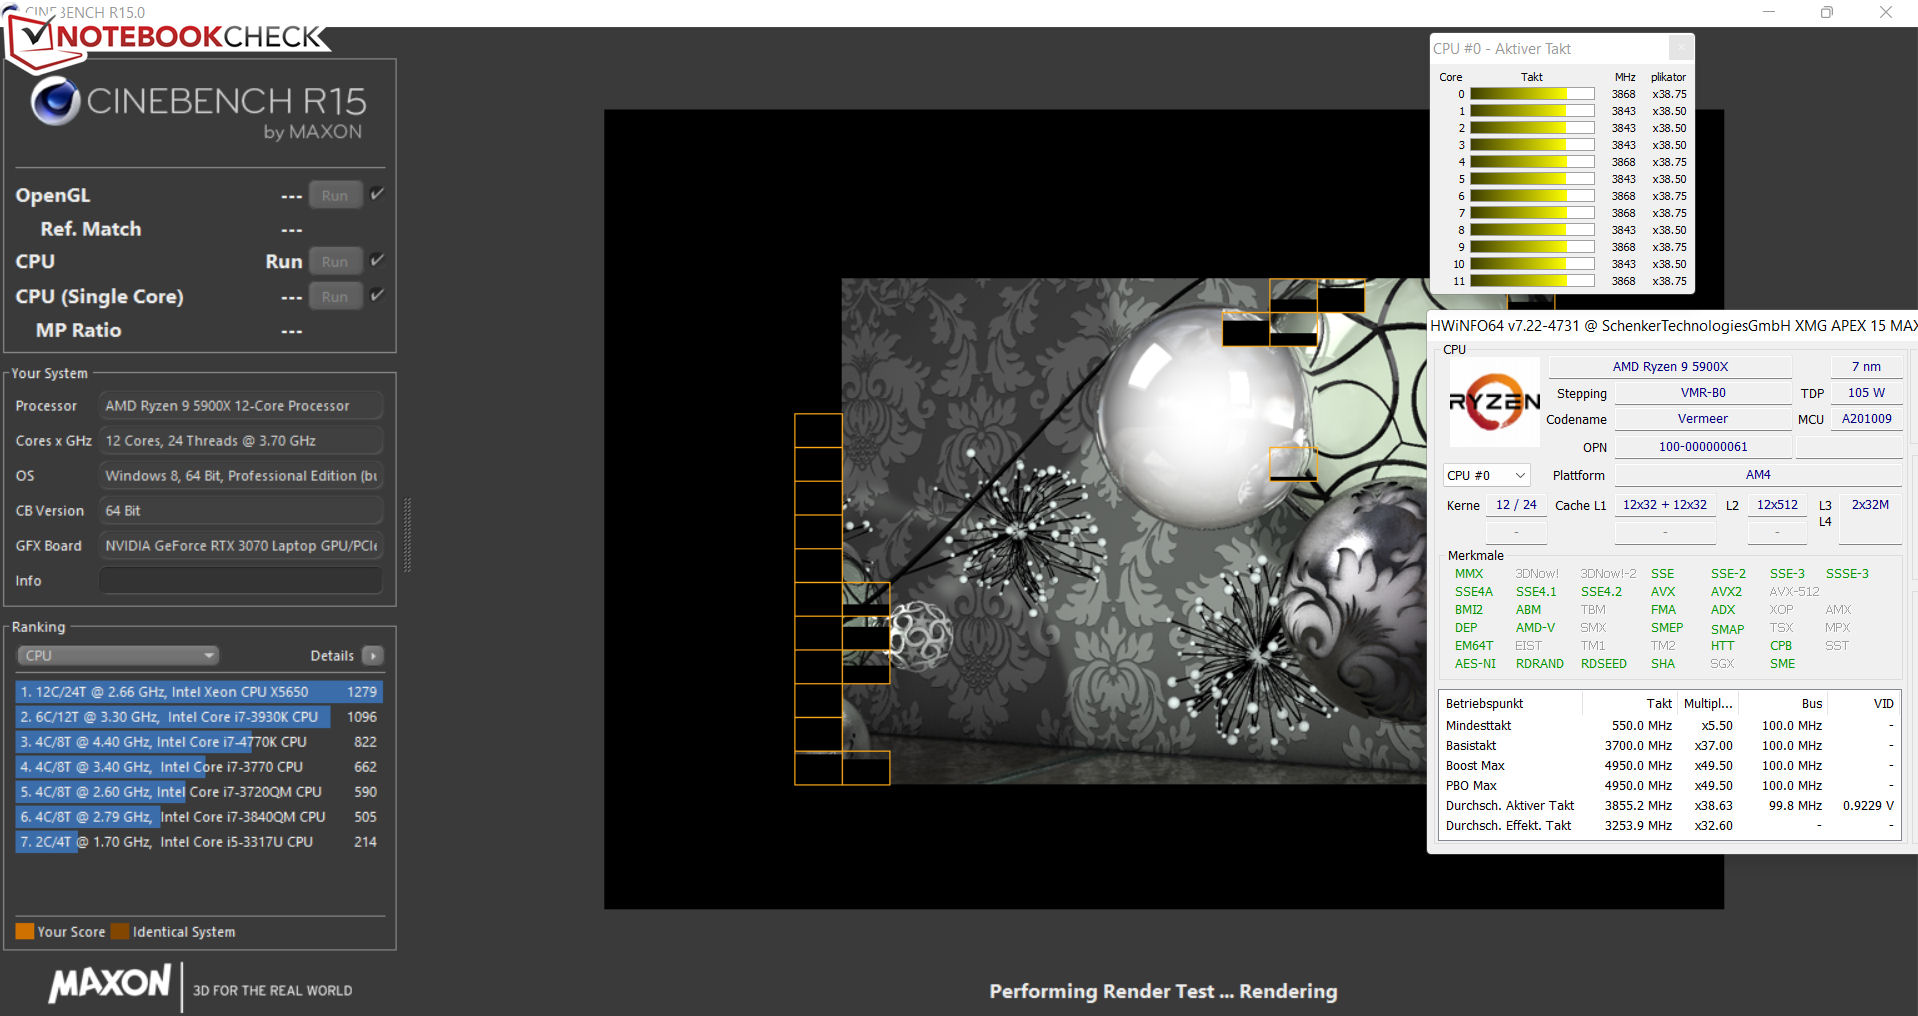
En funcionamiento multihilo, la CPU 5900X se queda muy por debajo de su potencial: sólo alcanza brevemente la velocidad Turbo, si se activa el perfil Rendimiento. En funcionamiento de un solo hilo, la distancia entre el ordenador de sobremesa y el portátil resulta ser menor (ver tabla de comparación). Las opciones de refrigeración de un portátil podrían ser simplemente insuficientes en general para hacer funcionar la CPU de sobremesa a plena potencia.
Es curioso que con los mismos ajustes de rendimiento (modo Performance, ventilador máximo), el Apex se comporta mucho mejor en funcionamiento multihilo que el Eurocom Nightsky ARX315que también está equipado con una CPU Ryzen 9 5900X. Tal vez la BIOS optimizada de Schenker le saque más rendimiento a la CPU.
Cinebench R15 Multi Constant Load Test

| CPU Performance rating - Percent | |
| Media de la clase Gaming | |
| AMD Ryzen 9 5900X | |
| MSI Vector GP66 12UGS | |
| HP Omen 16-b1090ng | |
| Schenker XMG Apex 15 Max | |
| Schenker XMG Apex 15 Max | |
| Eurocom Nightsky ARX315 | |
| Schenker XMG Apex 15 NH57AF1 -2! | |
| Medio AMD Ryzen 9 5900X | |
| Gigabyte A5 X1 | |
| Schenker XMG Apex 15 Max | |
| Schenker XMG Apex 15 Max | |
| Schenker XMG Apex 15 Max | |
| Cinebench R23 | |
| Multi Core | |
| Media de la clase Gaming (10488 - 40970, n=110, últimos 2 años) | |
| AMD Ryzen 9 5900X | |
| MSI Vector GP66 12UGS | |
| Schenker XMG Apex 15 Max (Leistungsmodus, max. Fan) | |
| Schenker XMG Apex 15 Max (Leistungsmodus) | |
| HP Omen 16-b1090ng | |
| Gigabyte A5 X1 | |
| Eurocom Nightsky ARX315 | |
| Medio AMD Ryzen 9 5900X (2435 - 20634, n=7) | |
| Schenker XMG Apex 15 Max | |
| Schenker XMG Apex 15 Max (Stromsparmodus) | |
| Schenker XMG Apex 15 Max (Lautlosmodus) | |
| Single Core | |
| Media de la clase Gaming (1166 - 2356, n=110, últimos 2 años) | |
| MSI Vector GP66 12UGS | |
| HP Omen 16-b1090ng | |
| AMD Ryzen 9 5900X | |
| Eurocom Nightsky ARX315 | |
| Schenker XMG Apex 15 Max (Leistungsmodus) | |
| Schenker XMG Apex 15 Max (Leistungsmodus, max. Fan) | |
| Gigabyte A5 X1 | |
| Schenker XMG Apex 15 Max | |
| Medio AMD Ryzen 9 5900X (527 - 1568, n=7) | |
| Schenker XMG Apex 15 Max (Lautlosmodus) | |
| Schenker XMG Apex 15 Max (Stromsparmodus) | |
| Cinebench R20 | |
| CPU (Multi Core) | |
| Media de la clase Gaming (4029 - 16108, n=109, últimos 2 años) | |
| AMD Ryzen 9 5900X | |
| MSI Vector GP66 12UGS | |
| Schenker XMG Apex 15 Max (Leistungsmodus, max. Fan) | |
| Schenker XMG Apex 15 NH57AF1 | |
| Schenker XMG Apex 15 Max (Leistungsmodus) | |
| HP Omen 16-b1090ng | |
| Gigabyte A5 X1 | |
| Eurocom Nightsky ARX315 | |
| Medio AMD Ryzen 9 5900X (930 - 8629, n=7) | |
| Schenker XMG Apex 15 Max | |
| Schenker XMG Apex 15 Max (Stromsparmodus) | |
| Schenker XMG Apex 15 Max (Lautlosmodus) | |
| CPU (Single Core) | |
| Media de la clase Gaming (442 - 895, n=109, últimos 2 años) | |
| MSI Vector GP66 12UGS | |
| HP Omen 16-b1090ng | |
| AMD Ryzen 9 5900X | |
| Schenker XMG Apex 15 Max (Leistungsmodus) | |
| Eurocom Nightsky ARX315 | |
| Schenker XMG Apex 15 Max (Leistungsmodus, max. Fan) | |
| Gigabyte A5 X1 | |
| Schenker XMG Apex 15 Max | |
| Medio AMD Ryzen 9 5900X (169 - 639, n=7) | |
| Schenker XMG Apex 15 NH57AF1 | |
| Schenker XMG Apex 15 Max (Lautlosmodus) | |
| Schenker XMG Apex 15 Max (Stromsparmodus) | |
| Cinebench R15 | |
| CPU Multi 64Bit | |
| Media de la clase Gaming (1578 - 6271, n=108, últimos 2 años) | |
| AMD Ryzen 9 5900X | |
| HP Omen 16-b1090ng | |
| Schenker XMG Apex 15 NH57AF1 | |
| Schenker XMG Apex 15 Max (Leistungsmodus, max. Fan) | |
| Schenker XMG Apex 15 Max (Leistungsmodus) | |
| MSI Vector GP66 12UGS | |
| Eurocom Nightsky ARX315 | |
| Gigabyte A5 X1 | |
| Medio AMD Ryzen 9 5900X (400 - 3717, n=7) | |
| Schenker XMG Apex 15 Max (Unterhaltungsmodus) | |
| Schenker XMG Apex 15 Max (Lautlosmodus) | |
| Schenker XMG Apex 15 Max (Stromsparmodus) | |
| CPU Single 64Bit | |
| Media de la clase Gaming (188.8 - 343, n=109, últimos 2 años) | |
| MSI Vector GP66 12UGS | |
| AMD Ryzen 9 5900X | |
| HP Omen 16-b1090ng | |
| Schenker XMG Apex 15 Max (Leistungsmodus, max. Fan) | |
| Eurocom Nightsky ARX315 | |
| Schenker XMG Apex 15 Max (Leistungsmodus) | |
| Schenker XMG Apex 15 Max | |
| Gigabyte A5 X1 | |
| Medio AMD Ryzen 9 5900X (79.2 - 271, n=7) | |
| Schenker XMG Apex 15 NH57AF1 | |
| Schenker XMG Apex 15 Max (Lautlosmodus) | |
| Schenker XMG Apex 15 Max (Stromsparmodus) | |
| Blender - v2.79 BMW27 CPU | |
| Schenker XMG Apex 15 Max (Stromsparmodus) | |
| Schenker XMG Apex 15 Max (Lautlosmodus) | |
| Schenker XMG Apex 15 Max | |
| Medio AMD Ryzen 9 5900X (138 - 1259, n=25) | |
| Gigabyte A5 X1 | |
| Eurocom Nightsky ARX315 | |
| MSI Vector GP66 12UGS | |
| Schenker XMG Apex 15 Max (Leistungsmodus) | |
| Schenker XMG Apex 15 Max (Leistungsmodus, max. Fan) | |
| HP Omen 16-b1090ng | |
| Schenker XMG Apex 15 NH57AF1 | |
| Media de la clase Gaming (80 - 330, n=107, últimos 2 años) | |
| AMD Ryzen 9 5900X | |
| 7-Zip 18.03 | |
| 7z b 4 | |
| AMD Ryzen 9 5900X | |
| Media de la clase Gaming (33491 - 148086, n=108, últimos 2 años) | |
| Schenker XMG Apex 15 Max (Leistungsmodus, max. Fan) | |
| Schenker XMG Apex 15 Max (Leistungsmodus) | |
| Medio AMD Ryzen 9 5900X (11386 - 103095, n=25) | |
| Eurocom Nightsky ARX315 | |
| Schenker XMG Apex 15 NH57AF1 | |
| HP Omen 16-b1090ng | |
| MSI Vector GP66 12UGS | |
| Schenker XMG Apex 15 Max | |
| Gigabyte A5 X1 | |
| Schenker XMG Apex 15 Max (Lautlosmodus) | |
| Schenker XMG Apex 15 Max (Stromsparmodus) | |
| 7z b 4 -mmt1 | |
| AMD Ryzen 9 5900X | |
| Schenker XMG Apex 15 Max (Leistungsmodus, max. Fan) | |
| Eurocom Nightsky ARX315 | |
| Media de la clase Gaming (4199 - 7436, n=108, últimos 2 años) | |
| Schenker XMG Apex 15 Max | |
| Schenker XMG Apex 15 Max (Leistungsmodus) | |
| Medio AMD Ryzen 9 5900X (2685 - 6930, n=25) | |
| MSI Vector GP66 12UGS | |
| HP Omen 16-b1090ng | |
| Gigabyte A5 X1 | |
| Schenker XMG Apex 15 Max (Lautlosmodus) | |
| Schenker XMG Apex 15 NH57AF1 | |
| Schenker XMG Apex 15 Max (Stromsparmodus) | |
| Geekbench 5.5 | |
| Multi-Core | |
| Media de la clase Gaming (6460 - 27010, n=108, últimos 2 años) | |
| HP Omen 16-b1090ng | |
| AMD Ryzen 9 5900X | |
| MSI Vector GP66 12UGS | |
| Schenker XMG Apex 15 Max (Leistungsmodus, max. Fan) | |
| Schenker XMG Apex 15 Max (Leistungsmodus) | |
| Medio AMD Ryzen 9 5900X (1946 - 15119, n=27) | |
| Schenker XMG Apex 15 NH57AF1 | |
| Eurocom Nightsky ARX315 | |
| Schenker XMG Apex 15 Max | |
| Gigabyte A5 X1 | |
| Schenker XMG Apex 15 Max (Lautlosmodus) | |
| Schenker XMG Apex 15 Max (Stromsparmodus) | |
| Single-Core | |
| Media de la clase Gaming (986 - 2474, n=108, últimos 2 años) | |
| MSI Vector GP66 12UGS | |
| HP Omen 16-b1090ng | |
| AMD Ryzen 9 5900X | |
| Schenker XMG Apex 15 Max (Leistungsmodus) | |
| Schenker XMG Apex 15 Max (Leistungsmodus, max. Fan) | |
| Eurocom Nightsky ARX315 | |
| Schenker XMG Apex 15 Max | |
| Gigabyte A5 X1 | |
| Medio AMD Ryzen 9 5900X (158 - 1737, n=27) | |
| Schenker XMG Apex 15 NH57AF1 | |
| Schenker XMG Apex 15 Max (Lautlosmodus) | |
| Schenker XMG Apex 15 Max (Stromsparmodus) | |
| HWBOT x265 Benchmark v2.2 - 4k Preset | |
| Media de la clase Gaming (11.5 - 44.3, n=108, últimos 2 años) | |
| AMD Ryzen 9 5900X | |
| Medio AMD Ryzen 9 5900X (3 - 27.4, n=24) | |
| Schenker XMG Apex 15 Max (Leistungsmodus, max. Fan) | |
| Schenker XMG Apex 15 Max (Leistungsmodus) | |
| HP Omen 16-b1090ng | |
| MSI Vector GP66 12UGS | |
| Schenker XMG Apex 15 NH57AF1 | |
| Eurocom Nightsky ARX315 | |
| Gigabyte A5 X1 | |
| Schenker XMG Apex 15 Max | |
| Schenker XMG Apex 15 Max (Lautlosmodus) | |
| Schenker XMG Apex 15 Max (Stromsparmodus) | |
| LibreOffice - 20 Documents To PDF | |
| Schenker XMG Apex 15 Max (Stromsparmodus) | |
| Schenker XMG Apex 15 Max (Lautlosmodus) | |
| Gigabyte A5 X1 | |
| Medio AMD Ryzen 9 5900X (47.4 - 332, n=25) | |
| Schenker XMG Apex 15 NH57AF1 | |
| Schenker XMG Apex 15 Max | |
| Media de la clase Gaming (19 - 88.8, n=108, últimos 2 años) | |
| Schenker XMG Apex 15 Max (Leistungsmodus) | |
| AMD Ryzen 9 5900X | |
| Schenker XMG Apex 15 Max (Leistungsmodus, max. Fan) | |
| Eurocom Nightsky ARX315 | |
| HP Omen 16-b1090ng | |
| MSI Vector GP66 12UGS | |
| R Benchmark 2.5 - Overall mean | |
| Schenker XMG Apex 15 Max (Stromsparmodus) | |
| Schenker XMG Apex 15 Max (Lautlosmodus) | |
| Medio AMD Ryzen 9 5900X (0.4457 - 4.47, n=25) | |
| Schenker XMG Apex 15 NH57AF1 | |
| Schenker XMG Apex 15 Max | |
| Gigabyte A5 X1 | |
| Eurocom Nightsky ARX315 | |
| Schenker XMG Apex 15 Max (Leistungsmodus, max. Fan) | |
| Schenker XMG Apex 15 Max (Leistungsmodus) | |
| AMD Ryzen 9 5900X | |
| HP Omen 16-b1090ng | |
| Media de la clase Gaming (0.3439 - 0.759, n=109, últimos 2 años) | |
| MSI Vector GP66 12UGS | |
* ... más pequeño es mejor
AIDA64: FP32 Ray-Trace | FPU Julia | CPU SHA3 | CPU Queen | FPU SinJulia | FPU Mandel | CPU AES | CPU ZLib | FP64 Ray-Trace | CPU PhotoWorxx
| Performance rating | |
| Media de la clase Gaming | |
| AMD Ryzen 9 5900X | |
| Schenker XMG Apex 15 Max | |
| Schenker XMG Apex 15 Max | |
| Medio AMD Ryzen 9 5900X | |
| Schenker XMG Apex 15 NH57AF1 | |
| Eurocom Nightsky ARX315 | |
| Gigabyte A5 X1 | |
| Schenker XMG Apex 15 Max | |
| MSI Vector GP66 12UGS | |
| HP Omen 16-b1090ng | |
| Schenker XMG Apex 15 Max | |
| Schenker XMG Apex 15 Max | |
| AIDA64 / FP32 Ray-Trace | |
| Media de la clase Gaming (10227 - 85542, n=107, últimos 2 años) | |
| AMD Ryzen 9 5900X (v6.25.5400) | |
| Medio AMD Ryzen 9 5900X (3069 - 24659, n=15) | |
| Schenker XMG Apex 15 Max (v6.50.5800, Leistungsmodus, max. Fan) | |
| Schenker XMG Apex 15 NH57AF1 | |
| Schenker XMG Apex 15 Max (v6.50.5800, Leistungsmodus) | |
| Gigabyte A5 X1 (v6.50.5800) | |
| Eurocom Nightsky ARX315 (v6.50.5800) | |
| Schenker XMG Apex 15 Max (v6.50.5800) | |
| MSI Vector GP66 12UGS (v6.50.5800) | |
| HP Omen 16-b1090ng (v6.50.5800) | |
| Schenker XMG Apex 15 Max (v6.50.5800, Lautlosmodus) | |
| Schenker XMG Apex 15 Max (v6.50.5800, Stromsparmodus) | |
| AIDA64 / FPU Julia | |
| Media de la clase Gaming (51376 - 238426, n=107, últimos 2 años) | |
| Schenker XMG Apex 15 Max (v6.50.5800, Leistungsmodus, max. Fan) | |
| AMD Ryzen 9 5900X (v6.25.5400) | |
| Schenker XMG Apex 15 Max (v6.50.5800, Leistungsmodus) | |
| Medio AMD Ryzen 9 5900X (18567 - 155529, n=15) | |
| Schenker XMG Apex 15 NH57AF1 | |
| Gigabyte A5 X1 (v6.50.5800) | |
| Eurocom Nightsky ARX315 (v6.50.5800) | |
| Schenker XMG Apex 15 Max (v6.50.5800) | |
| MSI Vector GP66 12UGS (v6.50.5800) | |
| HP Omen 16-b1090ng (v6.50.5800) | |
| Schenker XMG Apex 15 Max (v6.50.5800, Stromsparmodus) | |
| Schenker XMG Apex 15 Max (v6.50.5800, Lautlosmodus) | |
| AIDA64 / CPU SHA3 | |
| Media de la clase Gaming (2180 - 9817, n=107, últimos 2 años) | |
| Schenker XMG Apex 15 Max (v6.50.5800, Leistungsmodus, max. Fan) | |
| Schenker XMG Apex 15 Max (v6.50.5800, Leistungsmodus) | |
| Medio AMD Ryzen 9 5900X (629 - 5329, n=15) | |
| AMD Ryzen 9 5900X (v6.25.5400) | |
| Gigabyte A5 X1 (v6.50.5800) | |
| Schenker XMG Apex 15 NH57AF1 | |
| Eurocom Nightsky ARX315 (v6.50.5800) | |
| MSI Vector GP66 12UGS (v6.50.5800) | |
| HP Omen 16-b1090ng (v6.50.5800) | |
| Schenker XMG Apex 15 Max | |
| Schenker XMG Apex 15 Max (v6.50.5800, Lautlosmodus) | |
| Schenker XMG Apex 15 Max (v6.50.5800, Stromsparmodus) | |
| AIDA64 / CPU Queen | |
| AMD Ryzen 9 5900X (v6.25.5400) | |
| Schenker XMG Apex 15 NH57AF1 | |
| Schenker XMG Apex 15 Max (v6.50.5800, Leistungsmodus, max. Fan) | |
| Eurocom Nightsky ARX315 (v6.50.5800) | |
| Media de la clase Gaming (49785 - 173351, n=94, últimos 2 años) | |
| Medio AMD Ryzen 9 5900X (15371 - 138889, n=15) | |
| Schenker XMG Apex 15 Max (v6.50.5800, Leistungsmodus) | |
| MSI Vector GP66 12UGS (v6.50.5800) | |
| Gigabyte A5 X1 (v6.50.5800) | |
| HP Omen 16-b1090ng (v6.50.5800) | |
| Schenker XMG Apex 15 Max (v6.50.5800) | |
| Schenker XMG Apex 15 Max (v6.50.5800, Lautlosmodus) | |
| Schenker XMG Apex 15 Max (v6.50.5800, Stromsparmodus) | |
| AIDA64 / FPU SinJulia | |
| Schenker XMG Apex 15 NH57AF1 | |
| AMD Ryzen 9 5900X (v6.25.5400) | |
| Eurocom Nightsky ARX315 (v6.50.5800) | |
| Schenker XMG Apex 15 Max (v6.50.5800, Leistungsmodus, max. Fan) | |
| Schenker XMG Apex 15 Max (v6.50.5800, Leistungsmodus) | |
| Medio AMD Ryzen 9 5900X (2137 - 19465, n=15) | |
| Schenker XMG Apex 15 Max (v6.50.5800) | |
| Media de la clase Gaming (4424 - 33636, n=107, últimos 2 años) | |
| Gigabyte A5 X1 (v6.50.5800) | |
| MSI Vector GP66 12UGS (v6.50.5800) | |
| HP Omen 16-b1090ng (v6.50.5800) | |
| Schenker XMG Apex 15 Max (v6.50.5800, Stromsparmodus) | |
| Schenker XMG Apex 15 Max (v6.50.5800, Lautlosmodus) | |
| AIDA64 / FPU Mandel | |
| Media de la clase Gaming (25115 - 128721, n=107, últimos 2 años) | |
| Schenker XMG Apex 15 Max (v6.50.5800, Leistungsmodus, max. Fan) | |
| AMD Ryzen 9 5900X (v6.25.5400) | |
| Schenker XMG Apex 15 Max (v6.50.5800, Leistungsmodus) | |
| Medio AMD Ryzen 9 5900X (10291 - 85469, n=15) | |
| Gigabyte A5 X1 (v6.50.5800) | |
| Schenker XMG Apex 15 NH57AF1 | |
| Eurocom Nightsky ARX315 (v6.50.5800) | |
| Schenker XMG Apex 15 Max | |
| MSI Vector GP66 12UGS (v6.50.5800) | |
| HP Omen 16-b1090ng (v6.50.5800) | |
| Schenker XMG Apex 15 Max (v6.50.5800, Lautlosmodus) | |
| Schenker XMG Apex 15 Max (v6.50.5800, Stromsparmodus) | |
| AIDA64 / CPU AES | |
| Schenker XMG Apex 15 Max (v6.50.5800, Leistungsmodus, max. Fan) | |
| Schenker XMG Apex 15 Max (v6.50.5800, Leistungsmodus) | |
| Medio AMD Ryzen 9 5900X (24327 - 212390, n=15) | |
| Eurocom Nightsky ARX315 (v6.50.5800) | |
| Gigabyte A5 X1 (v6.50.5800) | |
| AMD Ryzen 9 5900X (v6.25.5400) | |
| Schenker XMG Apex 15 Max (v6.50.5800) | |
| Media de la clase Gaming (39258 - 247074, n=107, últimos 2 años) | |
| Schenker XMG Apex 15 NH57AF1 | |
| MSI Vector GP66 12UGS (v6.50.5800) | |
| HP Omen 16-b1090ng (v6.50.5800) | |
| Schenker XMG Apex 15 Max (v6.50.5800, Stromsparmodus) | |
| Schenker XMG Apex 15 Max (v6.50.5800, Lautlosmodus) | |
| AIDA64 / CPU ZLib | |
| Media de la clase Gaming (574 - 2531, n=107, últimos 2 años) | |
| AMD Ryzen 9 5900X (v6.25.5400) | |
| Schenker XMG Apex 15 NH57AF1 | |
| MSI Vector GP66 12UGS (v6.50.5800) | |
| Medio AMD Ryzen 9 5900X (150.9 - 1345, n=15) | |
| Schenker XMG Apex 15 Max (v6.50.5800, Leistungsmodus, max. Fan) | |
| Schenker XMG Apex 15 Max (v6.50.5800, Leistungsmodus) | |
| HP Omen 16-b1090ng (v6.50.5800) | |
| Eurocom Nightsky ARX315 (v6.50.5800) | |
| Gigabyte A5 X1 (v6.50.5800) | |
| Schenker XMG Apex 15 Max (v6.50.5800) | |
| Schenker XMG Apex 15 Max (v6.50.5800, Stromsparmodus) | |
| Schenker XMG Apex 15 Max (v6.50.5800, Lautlosmodus) | |
| AIDA64 / FP64 Ray-Trace | |
| Media de la clase Gaming (5509 - 45446, n=107, últimos 2 años) | |
| AMD Ryzen 9 5900X (v6.25.5400) | |
| Medio AMD Ryzen 9 5900X (1518 - 13196, n=15) | |
| Schenker XMG Apex 15 Max (v6.50.5800, Leistungsmodus, max. Fan) | |
| Schenker XMG Apex 15 NH57AF1 | |
| Schenker XMG Apex 15 Max (v6.50.5800, Leistungsmodus) | |
| Gigabyte A5 X1 (v6.50.5800) | |
| Eurocom Nightsky ARX315 (v6.50.5800) | |
| Schenker XMG Apex 15 Max (v6.50.5800) | |
| MSI Vector GP66 12UGS (v6.50.5800) | |
| HP Omen 16-b1090ng (v6.50.5800) | |
| Schenker XMG Apex 15 Max (v6.50.5800, Stromsparmodus) | |
| Schenker XMG Apex 15 Max (v6.50.5800, Lautlosmodus) | |
| AIDA64 / CPU PhotoWorxx | |
| Media de la clase Gaming (12271 - 89891, n=107, últimos 2 años) | |
| HP Omen 16-b1090ng (v6.50.5800) | |
| Schenker XMG Apex 15 Max (v6.50.5800, Leistungsmodus) | |
| Schenker XMG Apex 15 Max (v6.50.5800, Leistungsmodus, max. Fan) | |
| Schenker XMG Apex 15 Max (v6.50.5800) | |
| MSI Vector GP66 12UGS (v6.50.5800) | |
| Medio AMD Ryzen 9 5900X (11451 - 32849, n=15) | |
| Eurocom Nightsky ARX315 (v6.50.5800) | |
| Schenker XMG Apex 15 NH57AF1 | |
| AMD Ryzen 9 5900X (v6.25.5400) | |
| Gigabyte A5 X1 (v6.50.5800) | |
| Schenker XMG Apex 15 Max (v6.50.5800, Stromsparmodus) | |
| Schenker XMG Apex 15 Max (v6.50.5800, Lautlosmodus) | |
Rendimiento del sistema
El portátil es capaz de dominar escenarios de aplicaciones que exigen mucho rendimiento sin problemas, lo que también confirman los muy buenos resultados de PC-Mark. Las tasas de transferencia de la memoria de trabajo integrada se sitúan en un nivel normal para el almacenamiento DDR4 3200.
Siempre que se seleccione el modo Rendimiento o Entretenimiento, el sistema funciona rápidamente y sin problemas. Si se utilizan los otros dos perfiles, el sistema tiende a sufrir cierta lentitud, ya que el rendimiento informático se ralentiza considerablemente.
CrossMark: Overall | Productivity | Creativity | Responsiveness
| PCMark 10 / Score | |
| Media de la clase Gaming (5828 - 11574, n=95, últimos 2 años) | |
| MSI Vector GP66 12UGS | |
| Schenker XMG Apex 15 Max (Leistungsmodus) | |
| Medio AMD Ryzen 9 5900X, NVIDIA GeForce RTX 3070 Laptop GPU (7087 - 7688, n=3) | |
| HP Omen 16-b1090ng | |
| Eurocom Nightsky ARX315 | |
| Schenker XMG Apex 15 Max | |
| Schenker XMG Apex 15 NH57AF1 | |
| Gigabyte A5 X1 | |
| PCMark 10 / Essentials | |
| MSI Vector GP66 12UGS | |
| Media de la clase Gaming (8810 - 12600, n=99, últimos 2 años) | |
| Eurocom Nightsky ARX315 | |
| Schenker XMG Apex 15 NH57AF1 | |
| Medio AMD Ryzen 9 5900X, NVIDIA GeForce RTX 3070 Laptop GPU (10286 - 10613, n=3) | |
| Schenker XMG Apex 15 Max (Leistungsmodus) | |
| Schenker XMG Apex 15 Max | |
| HP Omen 16-b1090ng | |
| Gigabyte A5 X1 | |
| PCMark 10 / Productivity | |
| Media de la clase Gaming (6845 - 21327, n=97, últimos 2 años) | |
| MSI Vector GP66 12UGS | |
| Schenker XMG Apex 15 Max (Leistungsmodus) | |
| HP Omen 16-b1090ng | |
| Medio AMD Ryzen 9 5900X, NVIDIA GeForce RTX 3070 Laptop GPU (9042 - 9959, n=3) | |
| Eurocom Nightsky ARX315 | |
| Gigabyte A5 X1 | |
| Schenker XMG Apex 15 Max | |
| Schenker XMG Apex 15 NH57AF1 | |
| PCMark 10 / Digital Content Creation | |
| Media de la clase Gaming (7602 - 19657, n=97, últimos 2 años) | |
| MSI Vector GP66 12UGS | |
| Schenker XMG Apex 15 Max (Leistungsmodus) | |
| Medio AMD Ryzen 9 5900X, NVIDIA GeForce RTX 3070 Laptop GPU (10387 - 11892, n=3) | |
| HP Omen 16-b1090ng | |
| Eurocom Nightsky ARX315 | |
| Schenker XMG Apex 15 Max | |
| Schenker XMG Apex 15 NH57AF1 | |
| Gigabyte A5 X1 | |
| CrossMark / Overall | |
| Media de la clase Gaming (1366 - 2409, n=96, últimos 2 años) | |
| Schenker XMG Apex 15 Max | |
| Medio AMD Ryzen 9 5900X, NVIDIA GeForce RTX 3070 Laptop GPU (n=1) | |
| CrossMark / Productivity | |
| Media de la clase Gaming (1386 - 2254, n=96, últimos 2 años) | |
| Schenker XMG Apex 15 Max | |
| Medio AMD Ryzen 9 5900X, NVIDIA GeForce RTX 3070 Laptop GPU (n=1) | |
| CrossMark / Creativity | |
| Media de la clase Gaming (1343 - 2729, n=96, últimos 2 años) | |
| Schenker XMG Apex 15 Max | |
| Medio AMD Ryzen 9 5900X, NVIDIA GeForce RTX 3070 Laptop GPU (n=1) | |
| CrossMark / Responsiveness | |
| Media de la clase Gaming (1226 - 2334, n=96, últimos 2 años) | |
| Schenker XMG Apex 15 Max | |
| Medio AMD Ryzen 9 5900X, NVIDIA GeForce RTX 3070 Laptop GPU (n=1) | |
| PCMark 8 Home Score Accelerated v2 | 5278 puntos | |
| PCMark 8 Creative Score Accelerated v2 | 6049 puntos | |
| PCMark 8 Work Score Accelerated v2 | 6196 puntos | |
| PCMark 10 Score | 7087 puntos | |
ayuda | ||
| AIDA64 / Memory Copy | |
| Media de la clase Gaming (21750 - 129946, n=107, últimos 2 años) | |
| HP Omen 16-b1090ng | |
| Medio AMD Ryzen 9 5900X (31315 - 72008, n=15) | |
| Schenker XMG Apex 15 NH57AF1 | |
| Schenker XMG Apex 15 Max | |
| MSI Vector GP66 12UGS | |
| Gigabyte A5 X1 | |
| Eurocom Nightsky ARX315 | |
| AIDA64 / Memory Read | |
| Media de la clase Gaming (22956 - 118858, n=107, últimos 2 años) | |
| HP Omen 16-b1090ng | |
| Medio AMD Ryzen 9 5900X (32972 - 70692, n=15) | |
| MSI Vector GP66 12UGS | |
| Schenker XMG Apex 15 Max | |
| Schenker XMG Apex 15 NH57AF1 | |
| Gigabyte A5 X1 | |
| Eurocom Nightsky ARX315 | |
| AIDA64 / Memory Write | |
| Media de la clase Gaming (22297 - 135096, n=107, últimos 2 años) | |
| HP Omen 16-b1090ng | |
| Medio AMD Ryzen 9 5900X (21619 - 57070, n=15) | |
| Schenker XMG Apex 15 Max | |
| MSI Vector GP66 12UGS | |
| Schenker XMG Apex 15 NH57AF1 | |
| Eurocom Nightsky ARX315 | |
| Gigabyte A5 X1 | |
| AIDA64 / Memory Latency | |
| Media de la clase Gaming (75.3 - 259, n=107, últimos 2 años) | |
| MSI Vector GP66 12UGS | |
| HP Omen 16-b1090ng | |
| Schenker XMG Apex 15 NH57AF1 | |
| Gigabyte A5 X1 | |
| Medio AMD Ryzen 9 5900X (58.4 - 107.6, n=15) | |
| Schenker XMG Apex 15 Max | |
| Eurocom Nightsky ARX315 | |
* ... más pequeño es mejor
Latencias del CPD
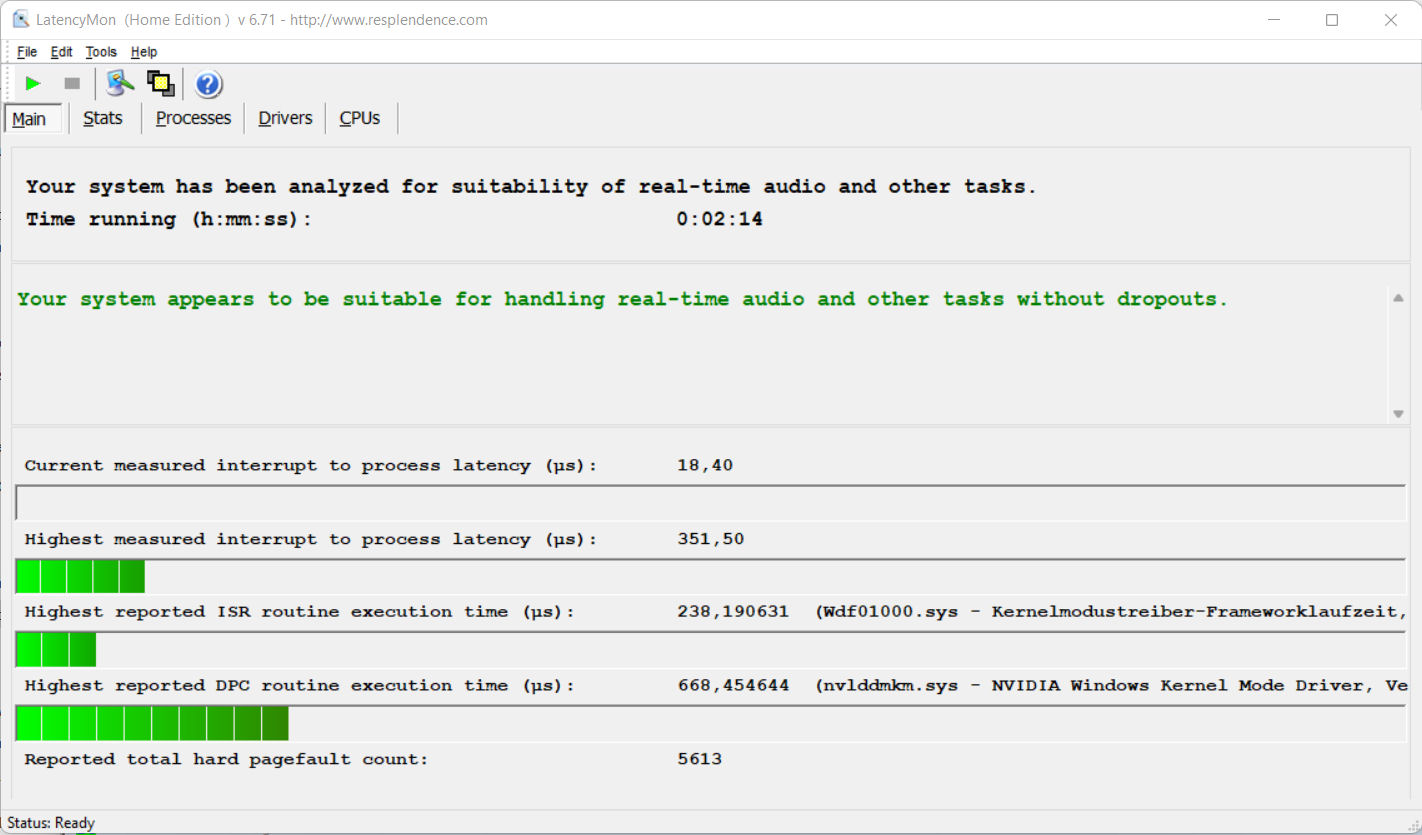
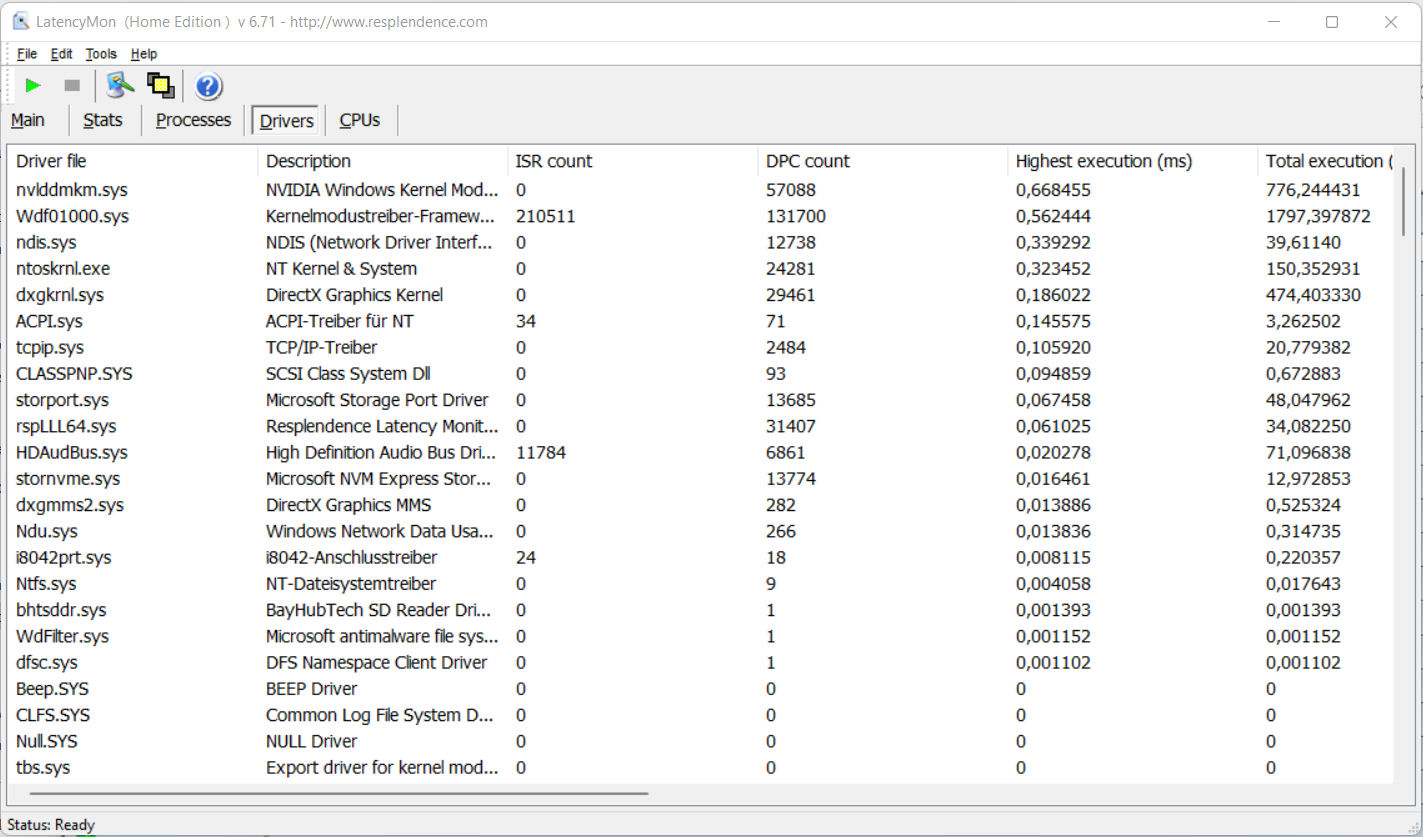
La prueba estandarizada de Latency Monitor (navegación web, reproducción de vídeo 4k, Prime95 de alta carga) no revela nada llamativo en las latencias del CPD. El sistema parece adecuado para el procesamiento de vídeo y audio en tiempo real. Las futuras actualizaciones de software podrían suponer mejoras o incluso empeorar las cosas.
| DPC Latencies / LatencyMon - interrupt to process latency (max), Web, Youtube, Prime95 | |
| MSI Vector GP66 12UGS | |
| Schenker XMG Apex 15 NH57AF1 | |
| HP Omen 16-b1090ng | |
| Gigabyte A5 X1 | |
| Eurocom Nightsky ARX315 | |
| Schenker XMG Apex 15 Max | |
* ... más pequeño es mejor
Solución de almacenamiento
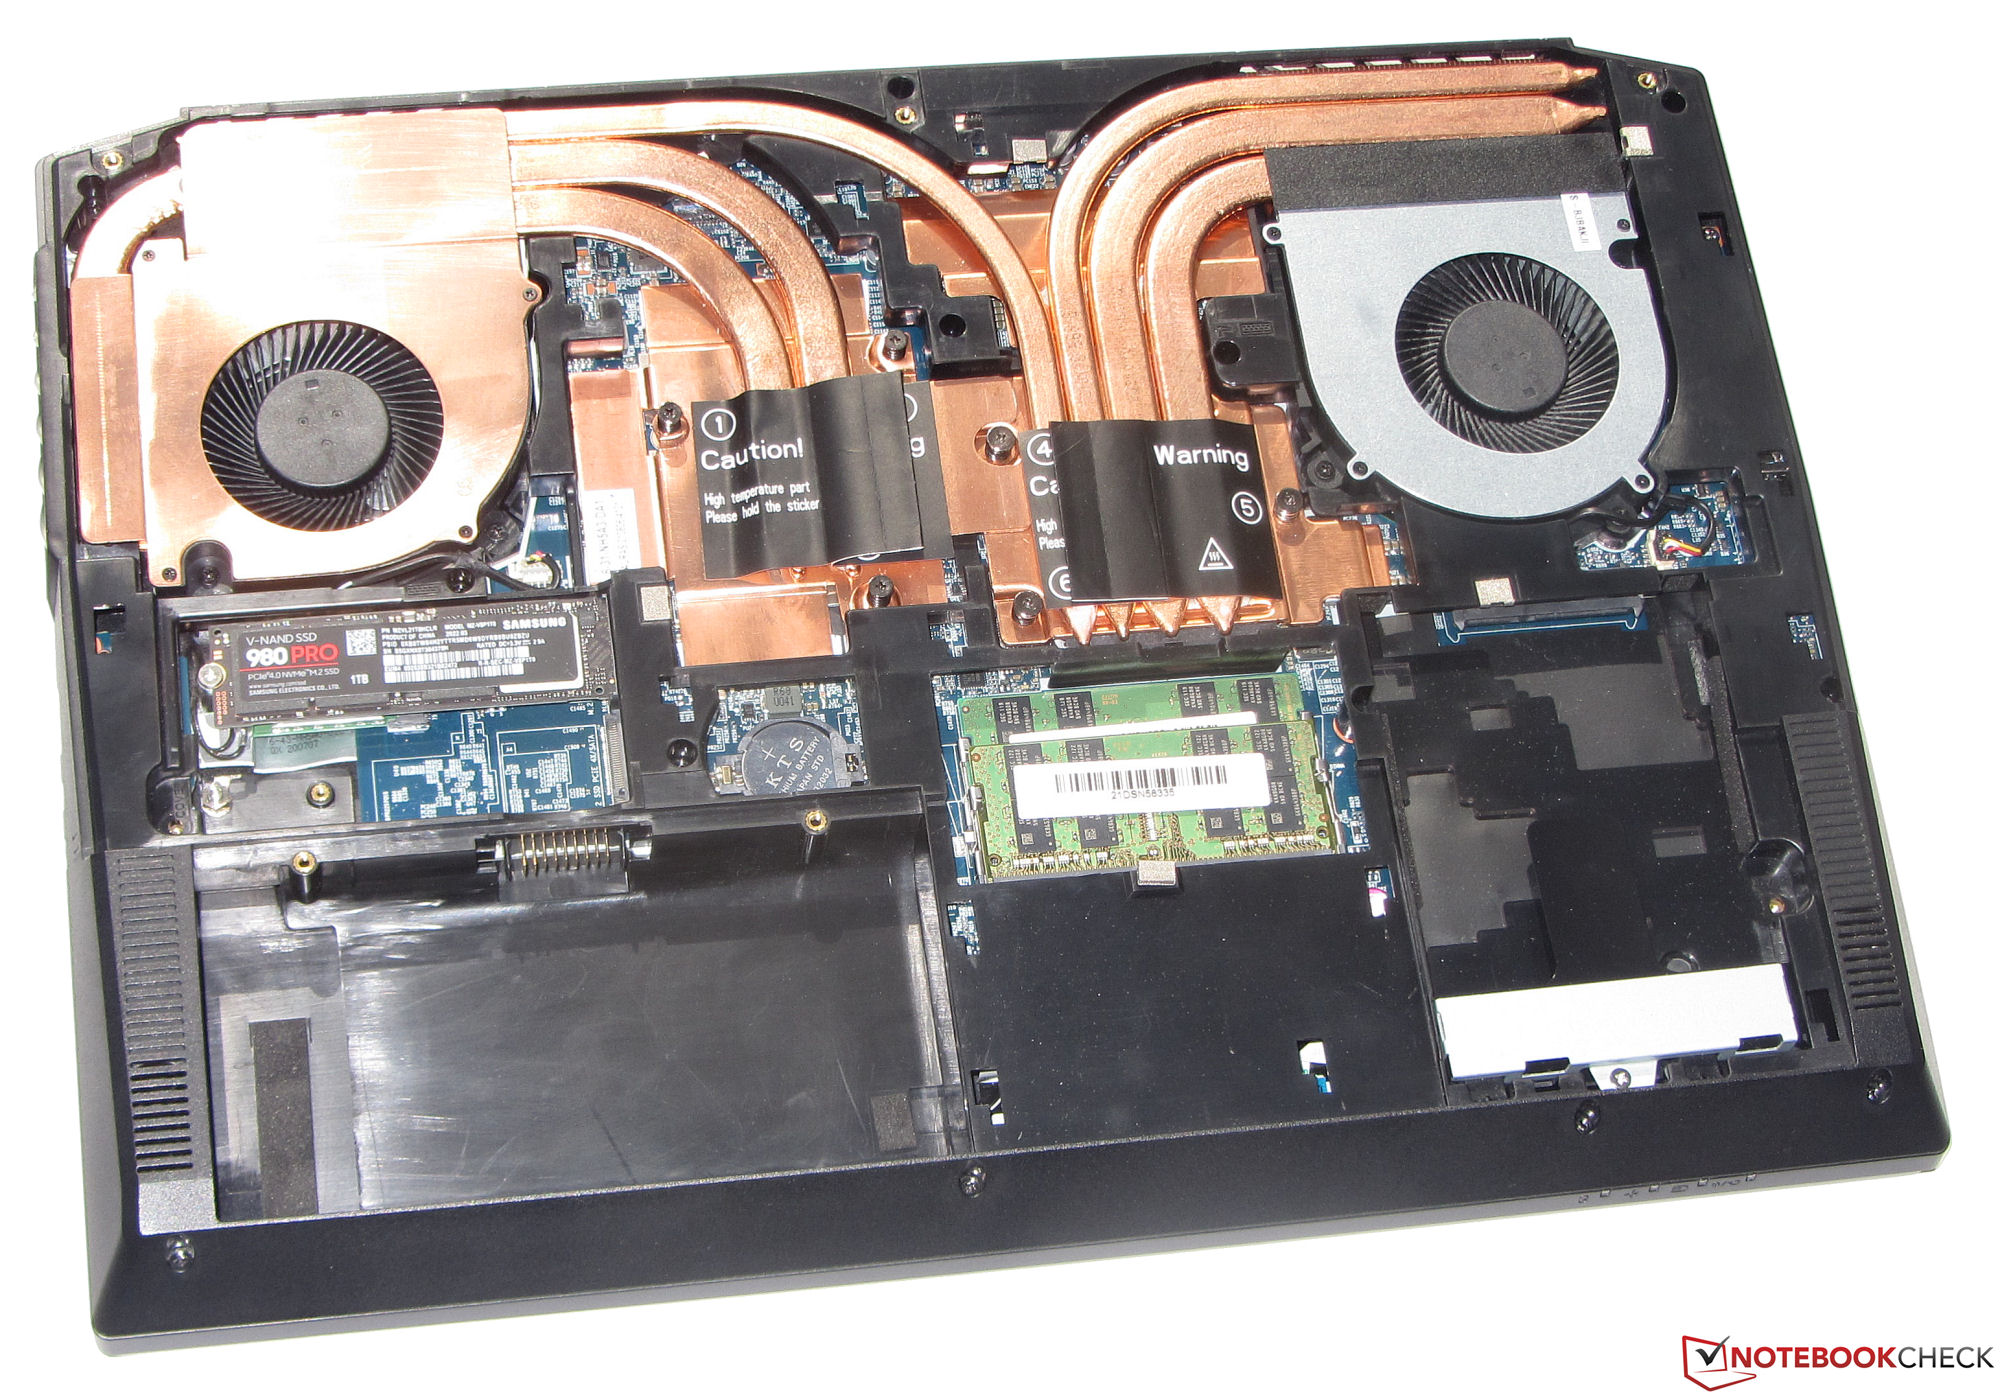
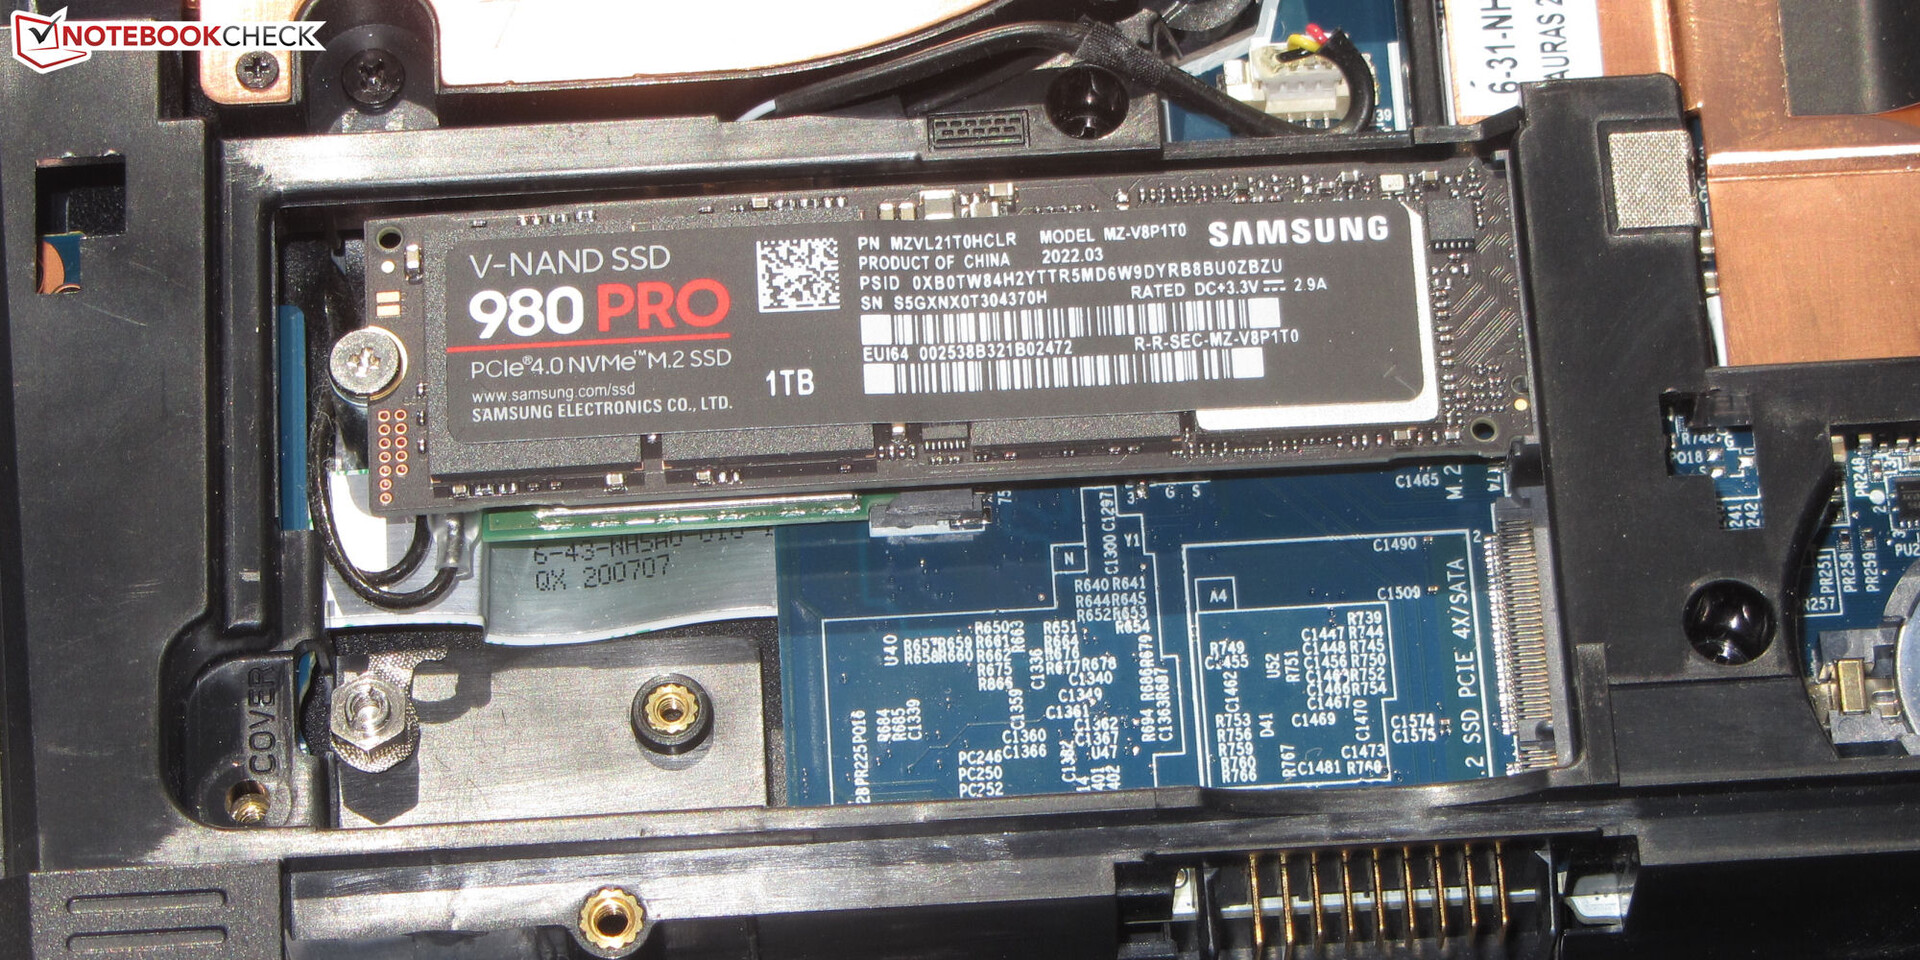
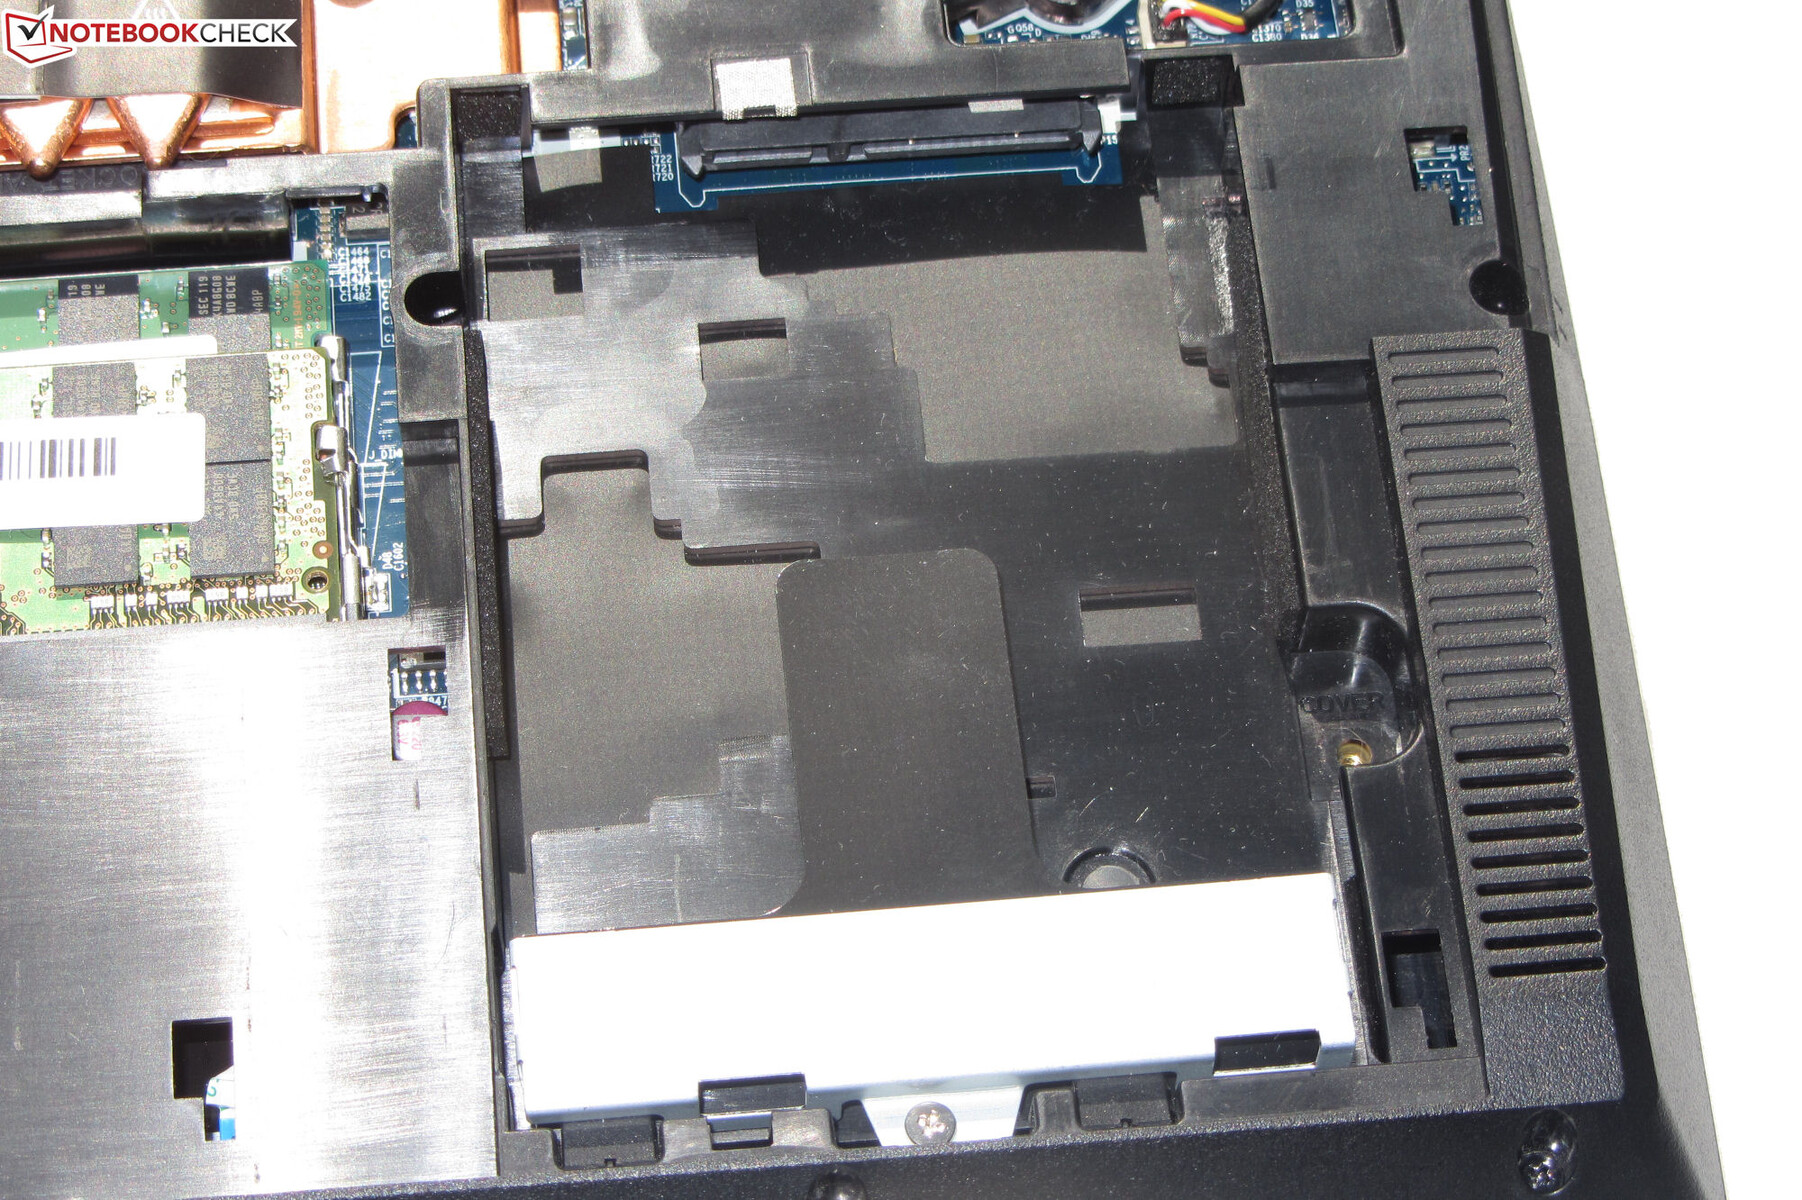
Como unidad del sistema se utiliza un SSD de 1 TB (PCIe 4, M.2-2280) de Samsung, que ofrece excelentes tasas de transferencia. El portátil también ofrece espacio adicional para un segundo SSD (PCIe 3) y un medio de almacenamiento de 2,5 pulgadas.

* ... más pequeño es mejor
Constant Performance Reading: DiskSpd Read Loop, Queue Depth 8
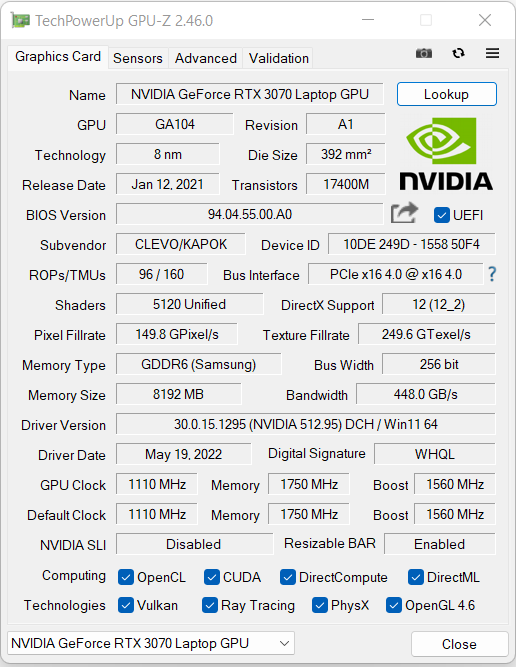
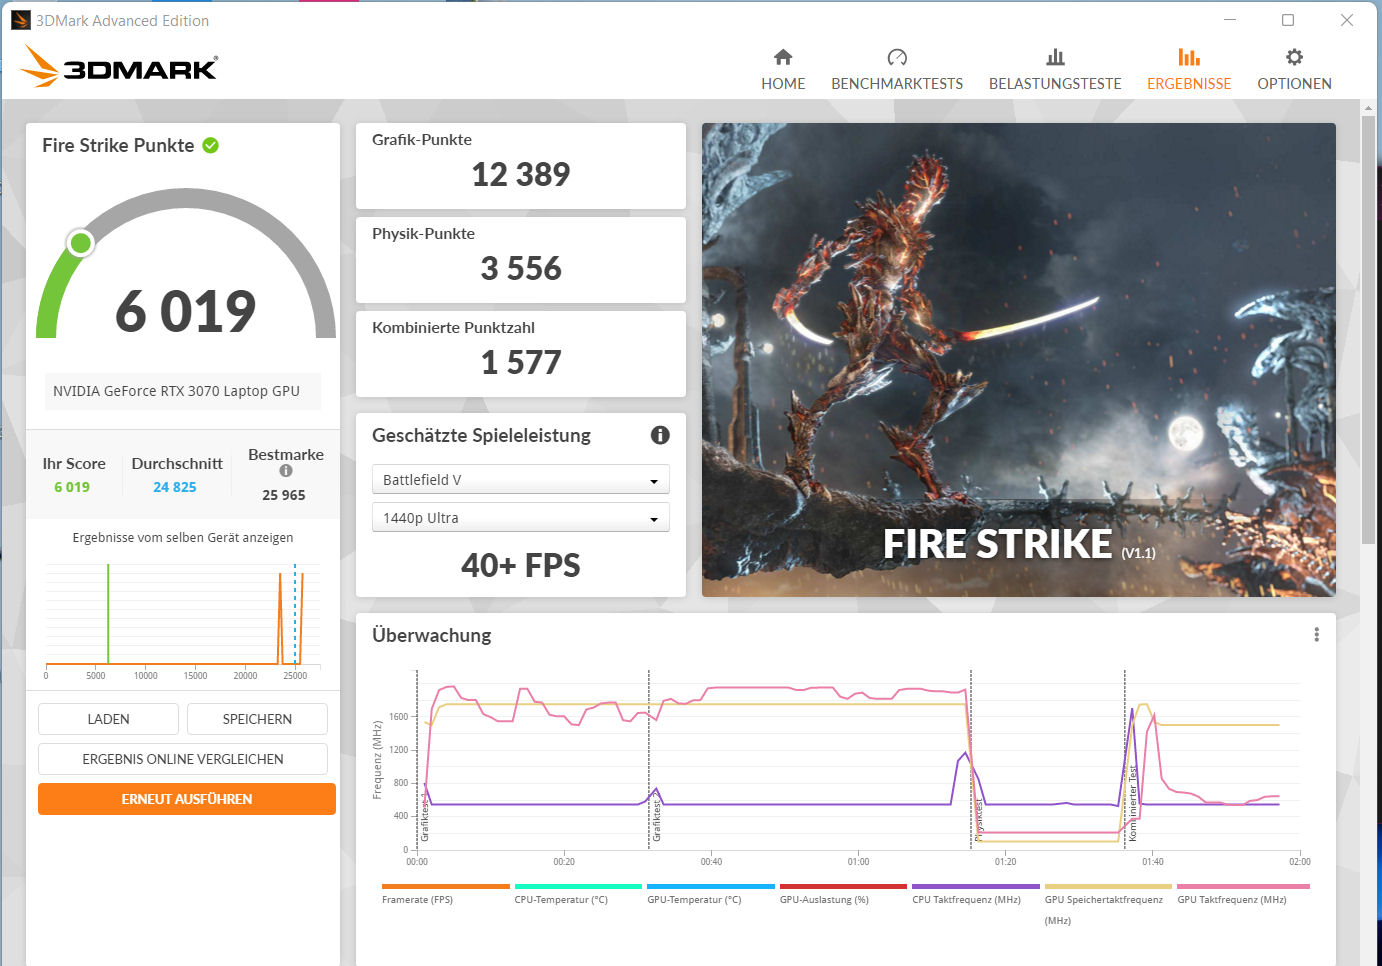
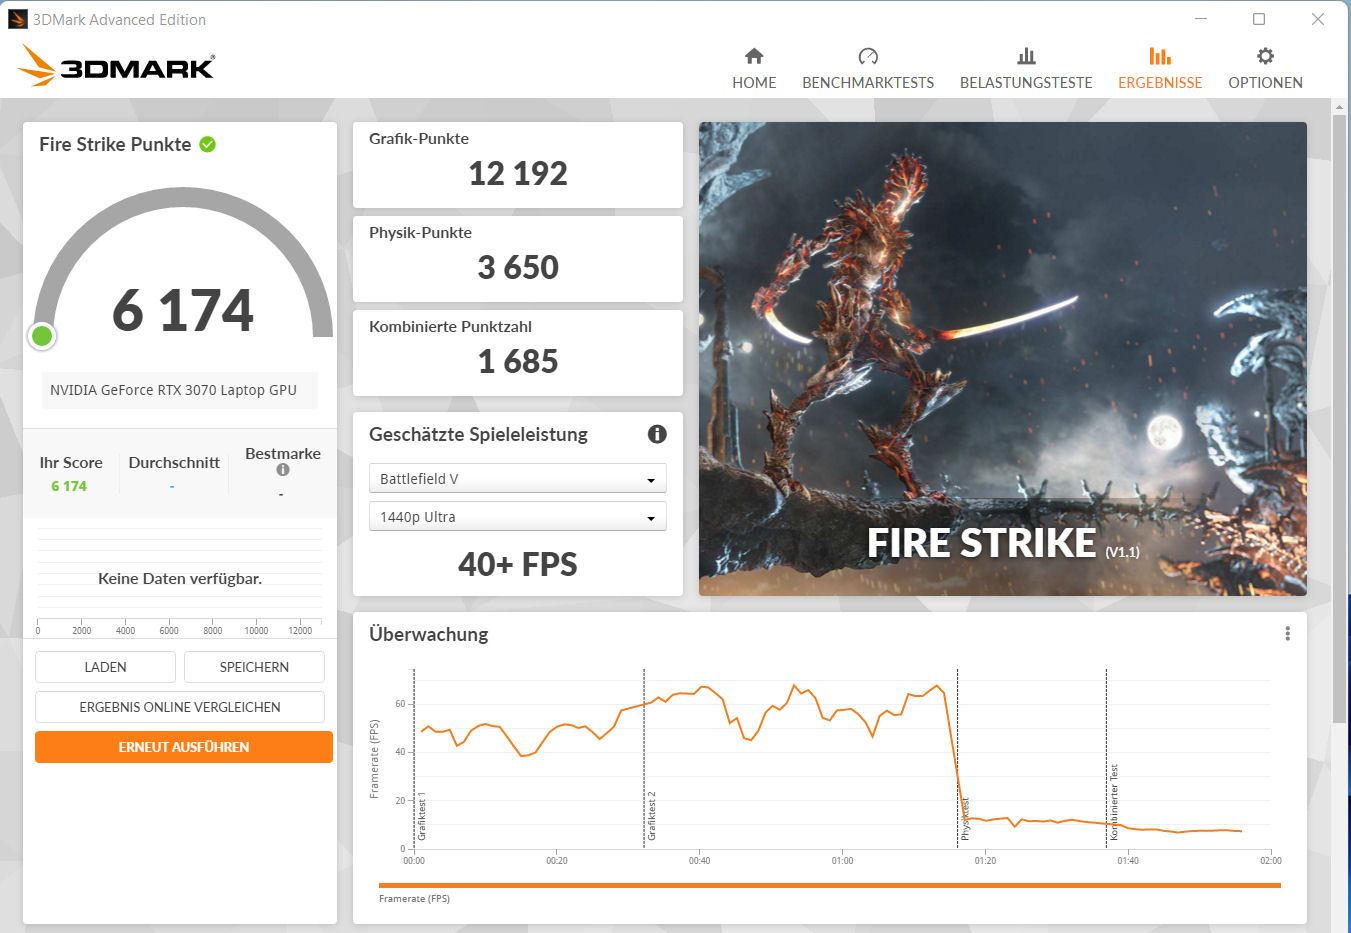
Tarjeta gráfica
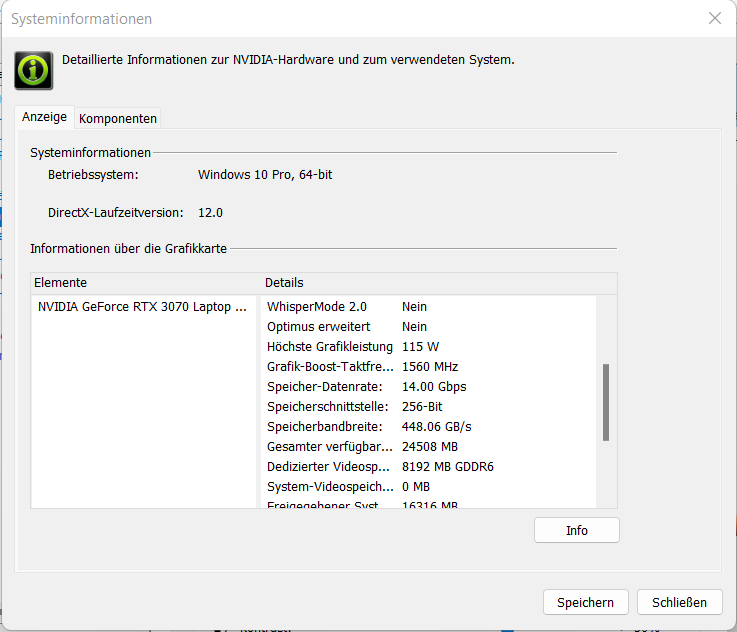
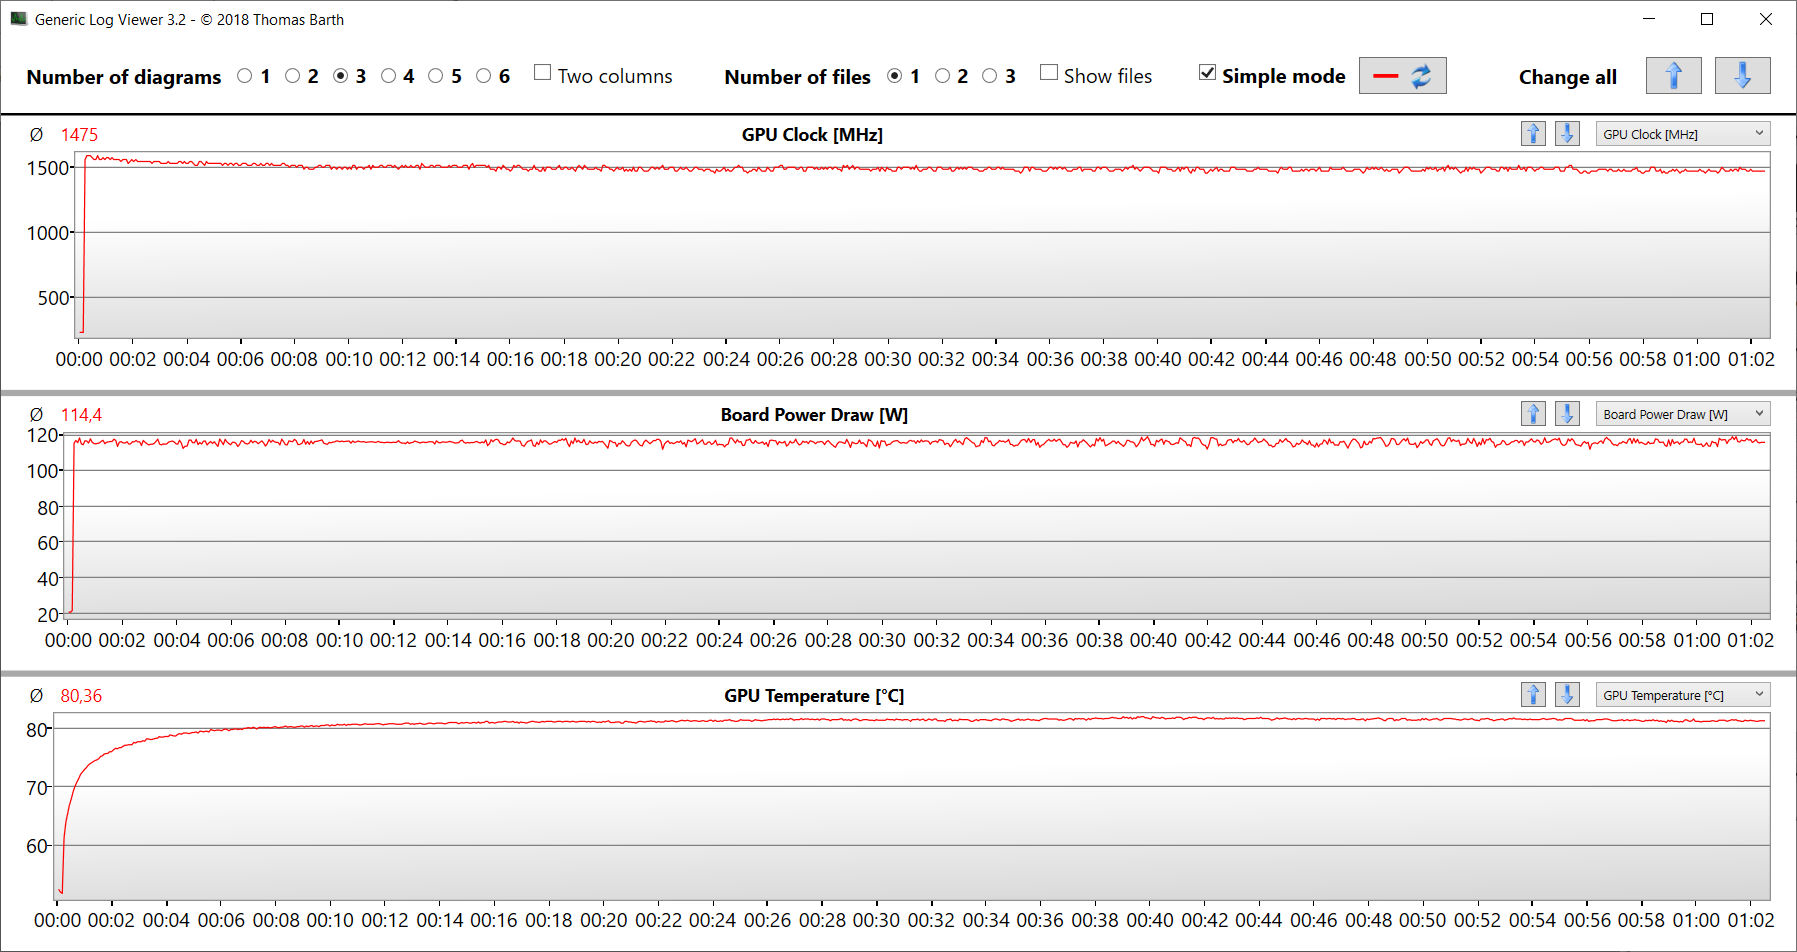
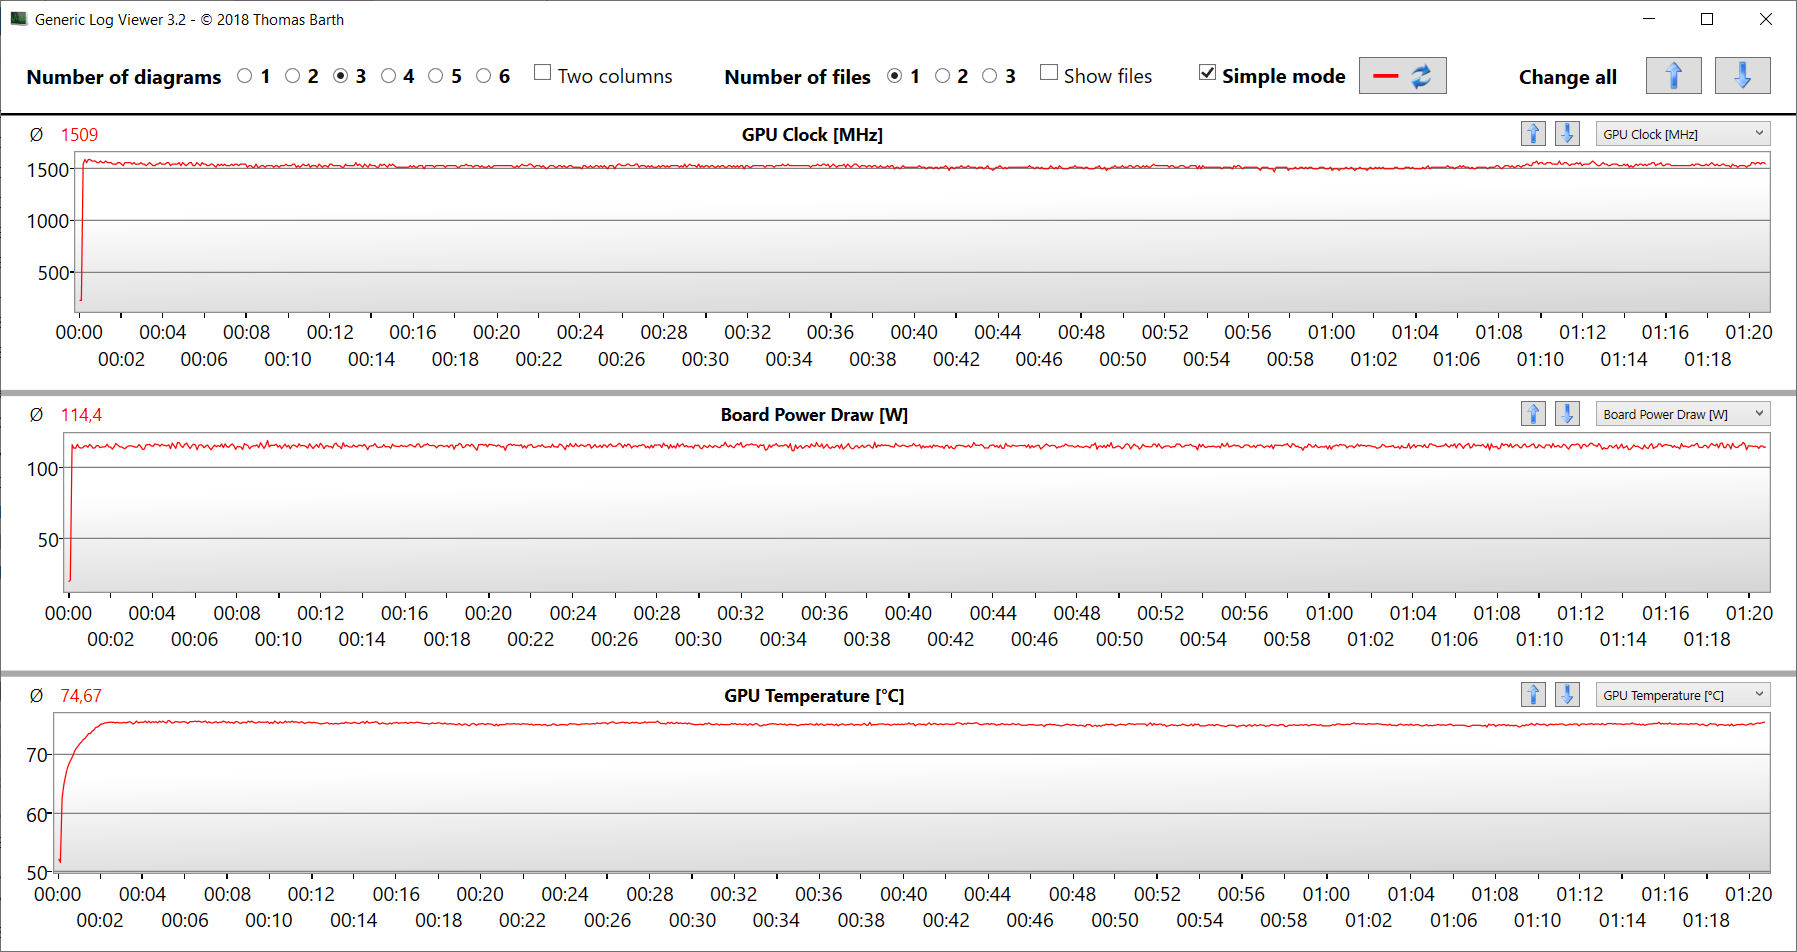
El rendimiento real de la GPU RTX 3000 depende de varios factores: la refrigeración, el equipo de almacenamiento y el TGP máximo que elija el fabricante del portátil dentro de los límites definidos por Nvidia. Schenker selecciona un TGP máximo de 115 vatios para elGeForce Portátil RTX 3070gPU. La GPU puede utilizar el rápido almacenamiento gráfico GDDR6 (8.192 MB).
Los resultados del benchmark están por encima del promedio que determinamos para la RTX 3070 hasta ahora. El TGP se utiliza completamente, lo que se muestra en nuestra prueba The Witcher 3. No hay GPU integrada en la placa, y la RTX 3070 funciona permanentemente.
| 3DMark Performance rating - Percent | |
| Schenker XMG Apex 15 Max | |
| Schenker XMG Apex 15 Max | |
| Media de la clase Gaming | |
| Medio NVIDIA GeForce RTX 3070 Laptop GPU | |
| MSI Vector GP66 12UGS -15! | |
| Gigabyte A5 X1 -16! | |
| Schenker XMG Apex 15 Max -15! | |
| HP Omen 16-b1090ng -15! | |
| Eurocom Nightsky ARX315 -15! | |
| Schenker XMG Apex 15 NH57AF1 -15! | |
| Schenker XMG Apex 15 Max -15! | |
| Schenker XMG Apex 15 Max -18! | |
| 3DMark 11 - 1280x720 Performance GPU | |
| Media de la clase Gaming (21841 - 80022, n=106, últimos 2 años) | |
| MSI Vector GP66 12UGS | |
| Eurocom Nightsky ARX315 | |
| Gigabyte A5 X1 | |
| Schenker XMG Apex 15 Max (Leistungsmodus, max. Fan) | |
| Schenker XMG Apex 15 Max (Leistungsmodus) | |
| Schenker XMG Apex 15 Max | |
| HP Omen 16-b1090ng | |
| Medio NVIDIA GeForce RTX 3070 Laptop GPU (12535 - 38275, n=54) | |
| Schenker XMG Apex 15 NH57AF1 | |
| Schenker XMG Apex 15 Max (Lautlosmodus) | |
| Schenker XMG Apex 15 Max (Stromsparmodus) | |
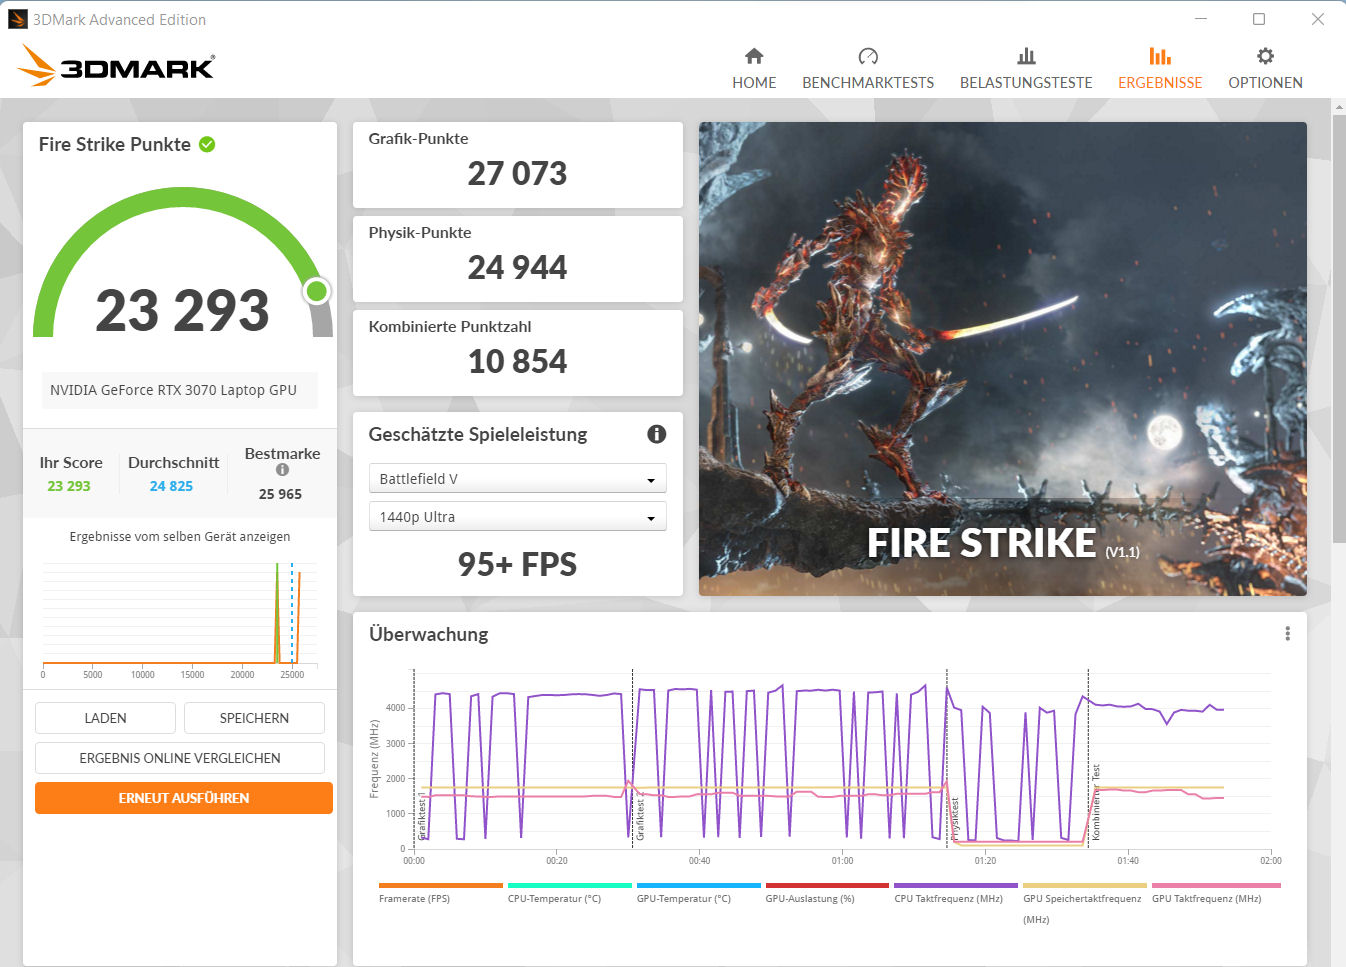
| 3DMark 11 Performance | 27648 puntos | |
| 3DMark Cloud Gate Standard Score | 56629 puntos | |
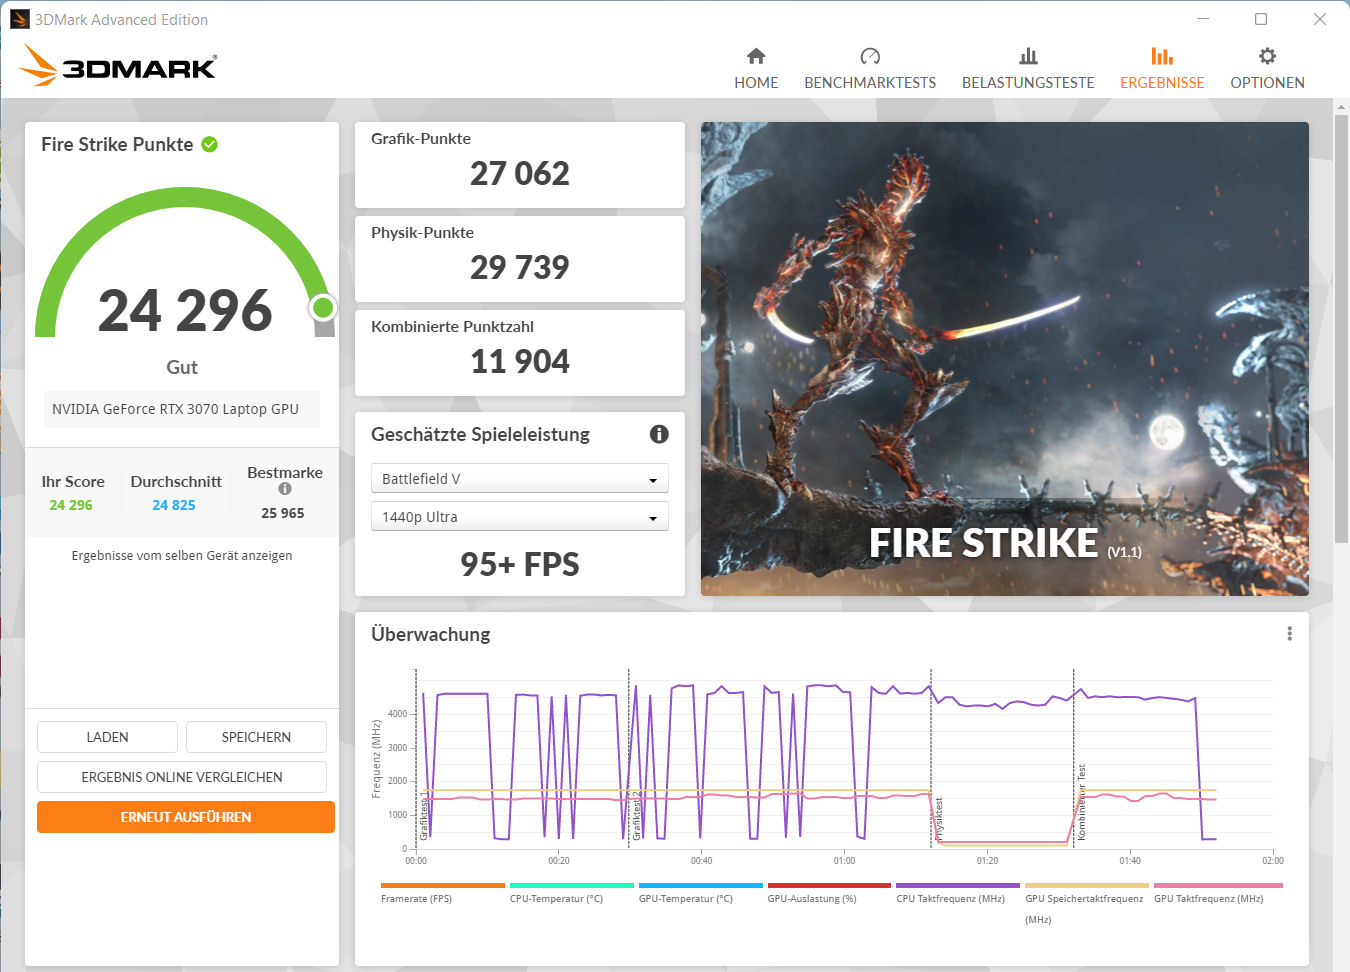
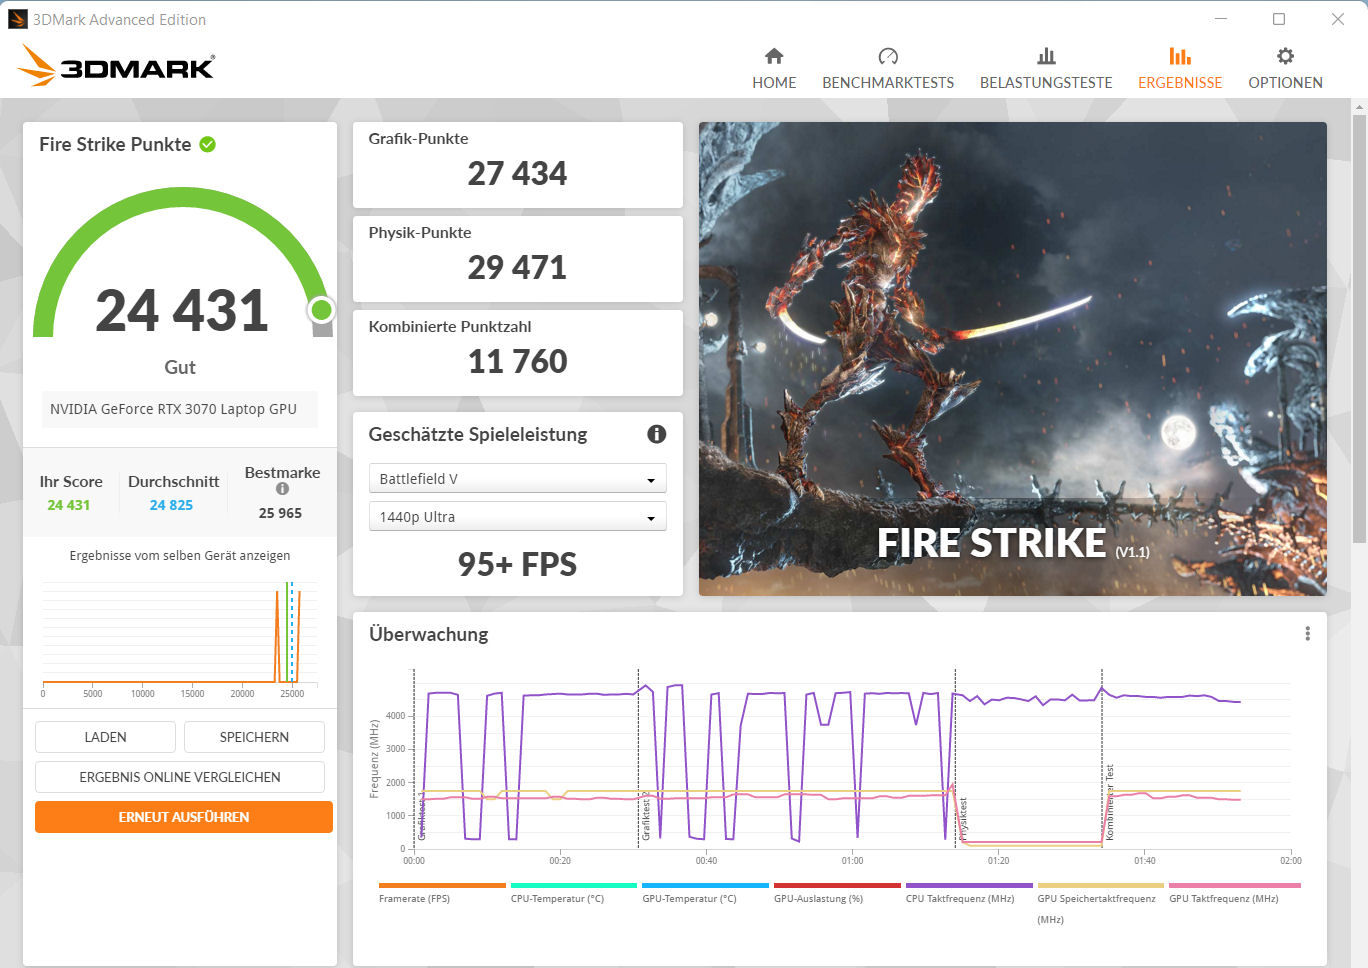
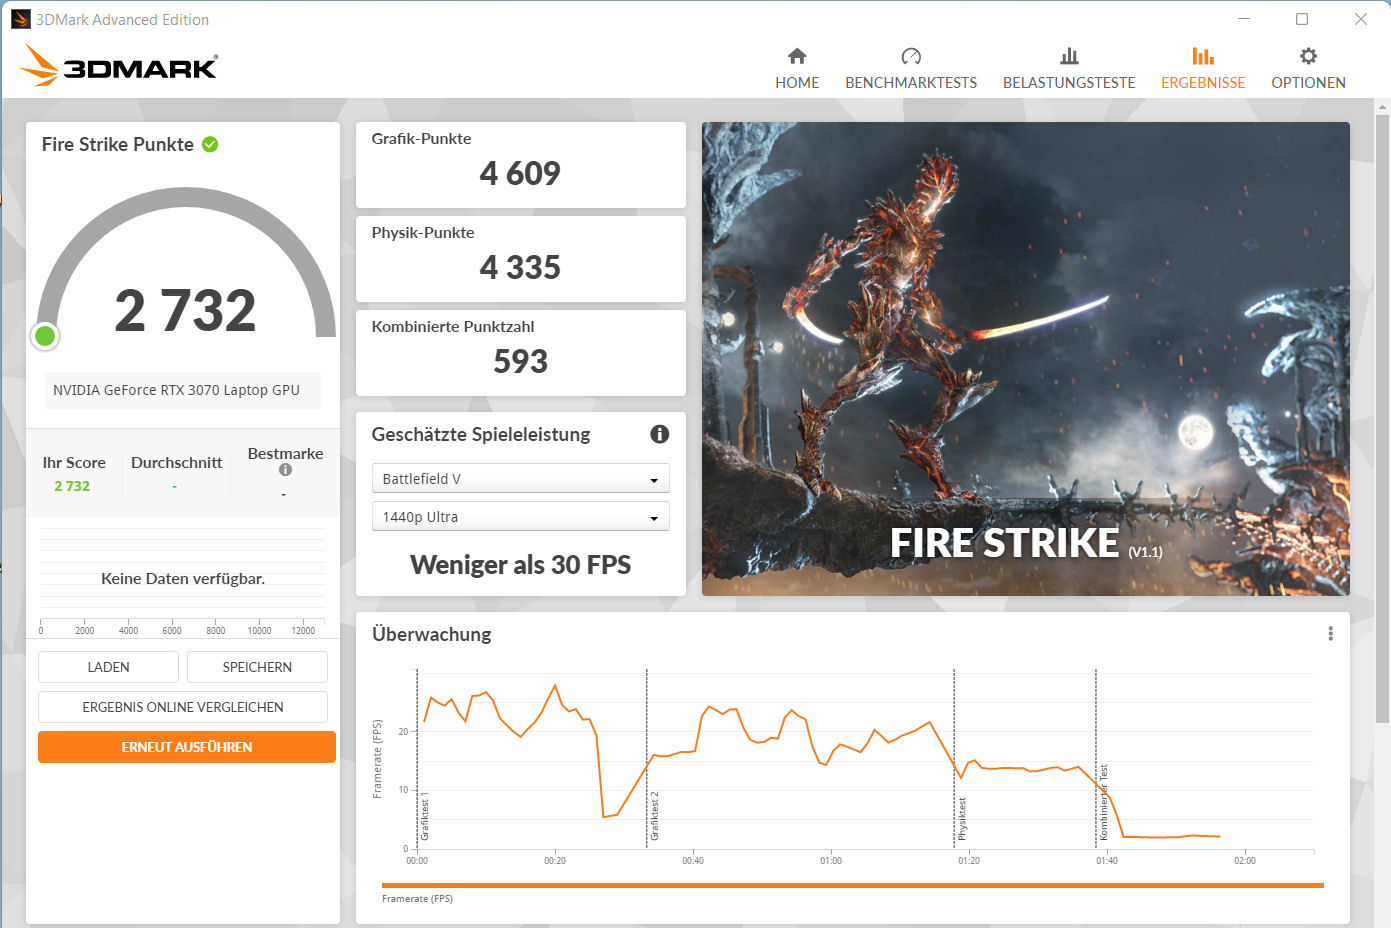
| 3DMark Fire Strike Score | 23293 puntos | |
| 3DMark Time Spy Score | 9891 puntos | |
ayuda | ||
Rendimiento de los juegos
El hardware utilizado es capaz de llevar todos los juegos actuales sin problemas a la pantalla con resolución FHD y ajustes máximos. Las resoluciones más altas con una conexión del monitor externo correspondiente podrían requerir algunos ajustes de calidad reducidos. Las velocidades de fotogramas están por encima de la media que determinamos para la RTX 3070 y también se mantienen constantes durante un periodo de tiempo más largo, lo que se demuestra en nuestra prueba The Witcher 3 (FHD, ajustes máximos, 60 min. de duración). El perfil de Rendimiento resulta en un pequeño aumento de las tasas de fotogramas en los juegos con uso intensivo de la CPU.
| The Witcher 3 - 1920x1080 Ultra Graphics & Postprocessing (HBAO+) | |
| Media de la clase Gaming (95 - 240, n=7, últimos 2 años) | |
| MSI Vector GP66 12UGS | |
| Schenker XMG Apex 15 Max (Leistungsmodus, max. Fan) | |
| Schenker XMG Apex 15 Max | |
| Schenker XMG Apex 15 Max (Leistungsmodus) | |
| Gigabyte A5 X1 | |
| HP Omen 16-b1090ng | |
| Eurocom Nightsky ARX315 | |
| Medio NVIDIA GeForce RTX 3070 Laptop GPU (34.9 - 109, n=52) | |
| Schenker XMG Apex 15 NH57AF1 | |
| Schenker XMG Apex 15 Max (Lautlosmodus) | |
| Schenker XMG Apex 15 Max (Stromsparmodus) | |
| Dota 2 Reborn - 1920x1080 ultra (3/3) best looking | |
| Schenker XMG Apex 15 Max (Leistungsmodus) | |
| Eurocom Nightsky ARX315 | |
| MSI Vector GP66 12UGS | |
| Schenker XMG Apex 15 Max (Leistungsmodus, max. Fan) | |
| Media de la clase Gaming (84.8 - 248, n=110, últimos 2 años) | |
| Schenker XMG Apex 15 Max | |
| HP Omen 16-b1090ng | |
| Schenker XMG Apex 15 NH57AF1 | |
| Gigabyte A5 X1 | |
| Medio NVIDIA GeForce RTX 3070 Laptop GPU (26.9 - 163.9, n=58) | |
| Schenker XMG Apex 15 Max (Lautlosmodus) | |
| Schenker XMG Apex 15 Max (Stromsparmodus) | |
| X-Plane 11.11 - 1920x1080 high (fps_test=3) | |
| Schenker XMG Apex 15 Max (Leistungsmodus) | |
| Schenker XMG Apex 15 Max (Leistungsmodus, max. Fan) | |
| HP Omen 16-b1090ng | |
| MSI Vector GP66 12UGS | |
| Schenker XMG Apex 15 Max | |
| Eurocom Nightsky ARX315 | |
| Media de la clase Gaming (52.1 - 143.5, n=113, últimos 2 años) | |
| Schenker XMG Apex 15 NH57AF1 | |
| Medio NVIDIA GeForce RTX 3070 Laptop GPU (12.4 - 118.8, n=61) | |
| Gigabyte A5 X1 | |
| Schenker XMG Apex 15 Max (Lautlosmodus) | |
| Schenker XMG Apex 15 Max (Stromsparmodus) | |
| Final Fantasy XV Benchmark - 1920x1080 High Quality | |
| Media de la clase Gaming (41 - 215, n=98, últimos 2 años) | |
| MSI Vector GP66 12UGS (1.3) | |
| Eurocom Nightsky ARX315 (1.3) | |
| Schenker XMG Apex 15 Max (1.3, Leistungsmodus, max. Fan) | |
| Schenker XMG Apex 15 Max (1.3) | |
| Schenker XMG Apex 15 Max (1.3, Leistungsmodus) | |
| HP Omen 16-b1090ng | |
| Gigabyte A5 X1 (1.3) | |
| Medio NVIDIA GeForce RTX 3070 Laptop GPU (27.9 - 107, n=49) | |
| Schenker XMG Apex 15 Max (1.3, Lautlosmodus) | |
| Schenker XMG Apex 15 Max (1.3, Stromsparmodus) | |
| GTA V - 1920x1080 Highest AA:4xMSAA + FX AF:16x | |
| Media de la clase Gaming (48.3 - 186.9, n=97, últimos 2 años) | |
| Schenker XMG Apex 15 Max (Leistungsmodus) | |
| Schenker XMG Apex 15 Max (Leistungsmodus, max. Fan) | |
| Schenker XMG Apex 15 Max | |
| MSI Vector GP66 12UGS | |
| Eurocom Nightsky ARX315 | |
| HP Omen 16-b1090ng | |
| Gigabyte A5 X1 | |
| Medio NVIDIA GeForce RTX 3070 Laptop GPU (21.7 - 125.8, n=50) | |
| Schenker XMG Apex 15 NH57AF1 | |
| Schenker XMG Apex 15 Max (Lautlosmodus) | |
| Schenker XMG Apex 15 Max (Stromsparmodus) | |
| Strange Brigade - 1920x1080 ultra AA:ultra AF:16 | |
| Media de la clase Gaming (76.3 - 456, n=88, últimos 2 años) | |
| MSI Vector GP66 12UGS (1.47.22.14 D3D12) | |
| Eurocom Nightsky ARX315 (1.47.22.14 D3D12) | |
| Schenker XMG Apex 15 Max (1.47.22.14 D3D12, Leistungsmodus, max. Fan) | |
| Schenker XMG Apex 15 Max (1.47.22.14 D3D12) | |
| Schenker XMG Apex 15 Max (1.47.22.14 D3D12, Leistungsmodus) | |
| Gigabyte A5 X1 (1.47.22.14 D3D12) | |
| Medio NVIDIA GeForce RTX 3070 Laptop GPU (36.2 - 194, n=46) | |
| HP Omen 16-b1090ng (1.47.22.14 D3D12) | |
| Schenker XMG Apex 15 Max (1.47.22.14 D3D12, Lautlosmodus) | |
| Schenker XMG Apex 15 Max (1.47.22.14 D3D12, Stromsparmodus) | |
| F1 2021 - 1920x1080 Ultra High Preset + Raytracing AA:T AF:16x | |
| Schenker XMG Apex 15 Max (874931) | |
| Schenker XMG Apex 15 Max (874931, Leistungsmodus) | |
| Schenker XMG Apex 15 Max (874931, Leistungsmodus, max. Fan) | |
| Gigabyte A5 X1 (831795) | |
| Medio NVIDIA GeForce RTX 3070 Laptop GPU (33.1 - 123.1, n=23) | |
| Schenker XMG Apex 15 Max (874931, Lautlosmodus) | |
| Schenker XMG Apex 15 Max (874931, Stromsparmodus) | |
| Far Cry 5 - 1920x1080 Ultra Preset AA:T | |
| Schenker XMG Apex 15 Max (Leistungsmodus) | |
| MSI Vector GP66 12UGS | |
| Schenker XMG Apex 15 Max | |
| Eurocom Nightsky ARX315 | |
| Media de la clase Gaming (70 - 151, n=8, últimos 2 años) | |
| Medio NVIDIA GeForce RTX 3070 Laptop GPU (89 - 140, n=36) | |
| Gigabyte A5 X1 | |
The Witcher 3 FPS Chart
| bajo | medio | alto | ultra | |
|---|---|---|---|---|
| GTA V (2015) | 186.4 | 183.4 | 181.4 | 123.6 |
| The Witcher 3 (2015) | 468 | 339 | 189.4 | 101.7 |
| Dota 2 Reborn (2015) | 196.2 | 173.3 | 165.1 | 150.9 |
| Final Fantasy XV Benchmark (2018) | 207 | 138.4 | 103.1 | |
| X-Plane 11.11 (2018) | 142.2 | 131.7 | 110.7 | |
| Far Cry 5 (2018) | 176 | 143 | 137 | 128 |
| Strange Brigade (2018) | 474 | 270 | 217 | 188.3 |
| F1 2021 (2021) | 460 | 324 | 256 | 122.8 |
| Forza Horizon 5 (2021) | 235 | 155 | 142 | 86 |
| Rainbow Six Extraction (2022) | 266 | 206 | 201 | 155 |
| Dying Light 2 (2022) | 111.6 | 88.8 | 75.3 | |
| GRID Legends (2022) | 197.6 | 169.2 | 153 | 124.2 |
| Ghostwire Tokyo (2022) | 164.5 | 162.5 | 160.4 | 159.3 |
| Tiny Tina's Wonderlands (2022) | 210.5 | 170.2 | 115.9 | 90.1 |
| The Quarry (2022) | 155.9 | 114.3 | 95.9 | 75.2 |
Emisiones - El portátil Schenker hace mucho ruido
Emisiones acústicas
En el funcionamiento cotidiano con Office e Internet, los dos ventiladores están atenuados en gran medida, pero siempre se oyen. Nunca se apagan. Bajo carga, se vuelven muy ruidosos con niveles máximos de ruido de hasta 52 dB(A) en nuestra prueba The Witcher 3 ) y 56 dB (A) en la prueba de estrés. Para un menor nivel de ruido durante el funcionamiento, puedes seleccionar el modo silencioso. Aunque el portátil funciona entonces de forma más silenciosa, no lo es, y el rendimiento informático se reduce considerablemente.
Ruido
| Ocioso |
| 30 / 33 / 34 dB(A) |
| Carga |
| 52 / 56 dB(A) |
 | ||
30 dB silencioso 40 dB(A) audible 50 dB(A) ruidosamente alto |
||
min: | ||
| Schenker XMG Apex 15 Max R9 5900X, GeForce RTX 3070 Laptop GPU | Eurocom Nightsky ARX315 R9 5900X, GeForce RTX 3070 Laptop GPU | MSI Vector GP66 12UGS i9-12900H, GeForce RTX 3070 Ti Laptop GPU | HP Omen 16-b1090ng i7-12700H, GeForce RTX 3070 Ti Laptop GPU | Schenker XMG Apex 15 NH57AF1 R9 3900, GeForce RTX 2070 Mobile | Gigabyte A5 X1 R9 5900HX, GeForce RTX 3070 Laptop GPU | |
|---|---|---|---|---|---|---|
| Noise | -0% | 14% | 2% | -14% | 1% | |
| apagado / medio ambiente * (dB) | 26 | 25.3 3% | 22.9 12% | 26 -0% | 30 -15% | 25 4% |
| Idle Minimum * (dB) | 30 | 25.9 14% | 23.4 22% | 30 -0% | 35 -17% | 27 10% |
| Idle Average * (dB) | 33 | 27.9 15% | 23.4 29% | 31 6% | 36 -9% | 29 12% |
| Idle Maximum * (dB) | 34 | 40.8 -20% | 27.4 19% | 33 3% | 39 -15% | 32 6% |
| Load Average * (dB) | 52 | 55.2 -6% | 36 31% | 49 6% | 59 -13% | 57 -10% |
| Witcher 3 ultra * (dB) | 52 | 52.4 -1% | 58.2 -12% | 53 -2% | 62 -19% | 56 -8% |
| Load Maximum * (dB) | 56 | 60.3 -8% | 58 -4% | 57 -2% | 63 -13% | 58 -4% |
* ... más pequeño es mejor
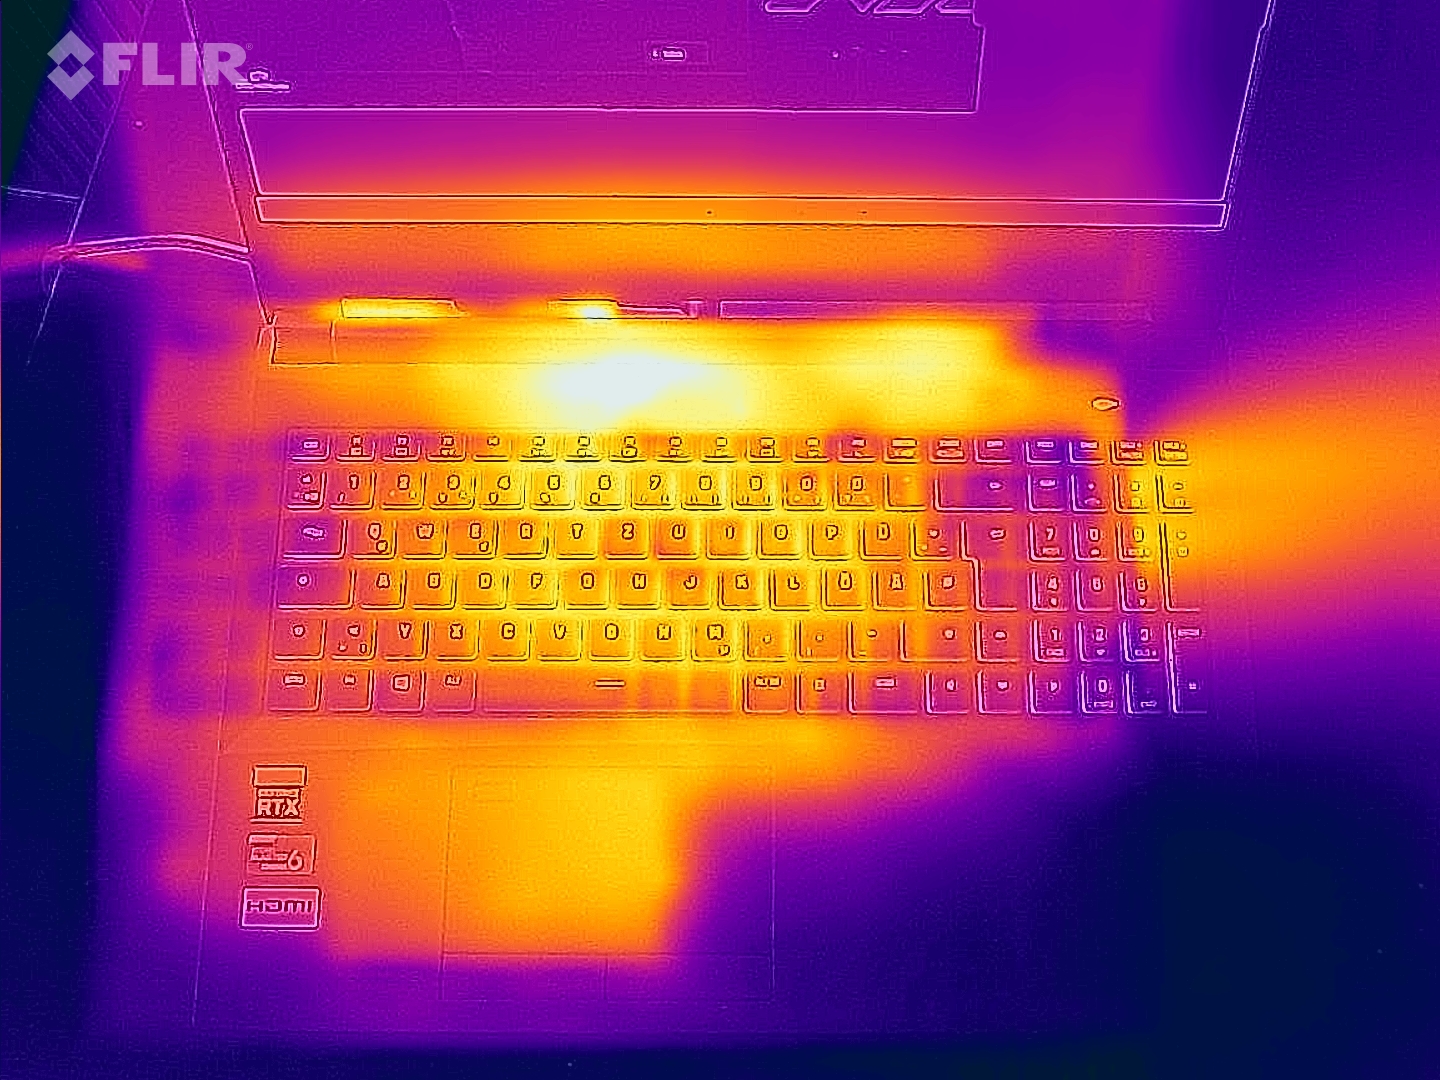
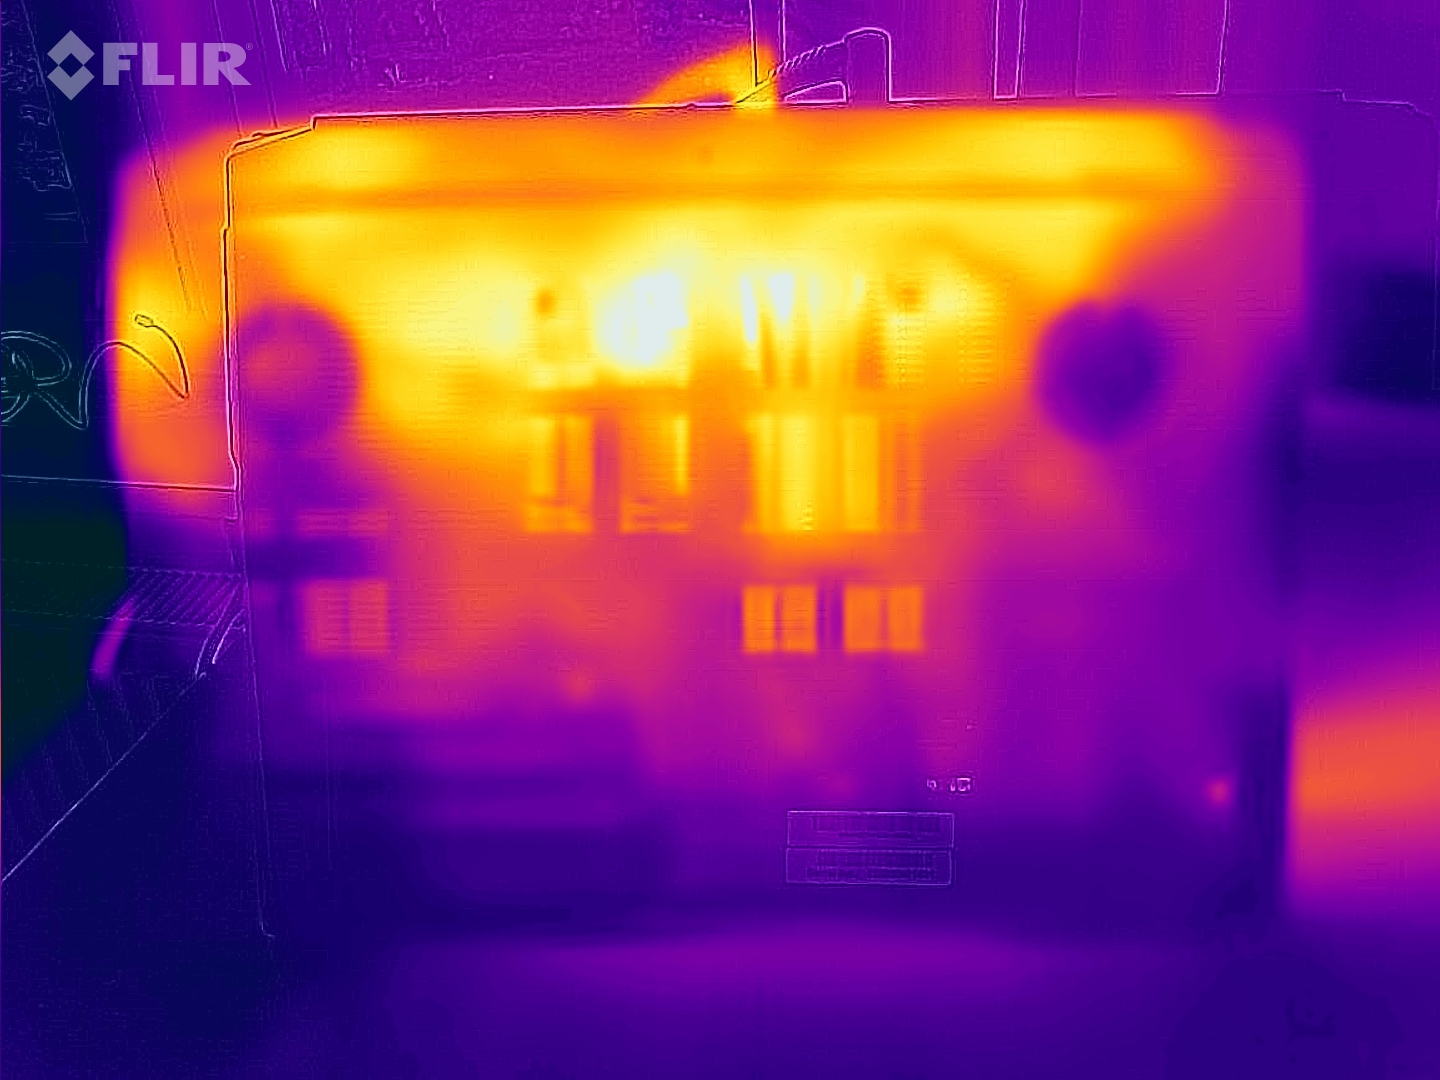
Temperaturas
El portátil se calienta notablemente en todo el espectro de carga, pero no es extremo. Esta es la ventaja de los ventiladores que giran con fuerza. Las temperaturas de la CPU no son motivo de preocupación.
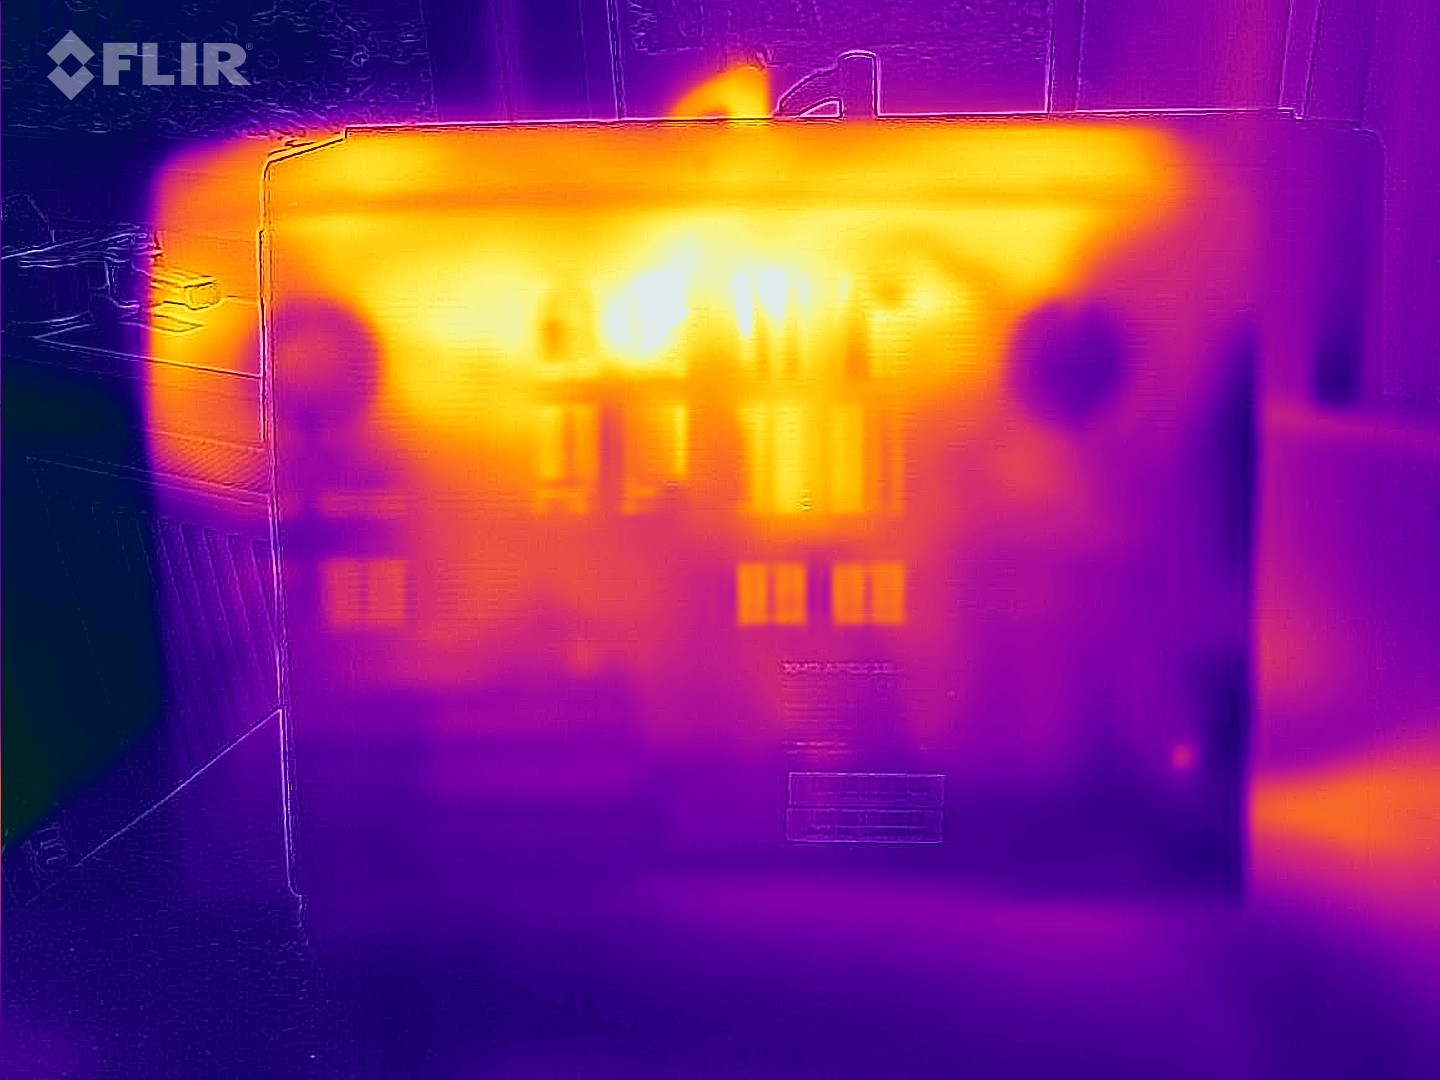
(-) La temperatura máxima en la parte superior es de 49 °C / 120 F, frente a la media de 40.4 °C / 105 F, que oscila entre 21.2 y 68.8 °C para la clase Gaming.
(-) El fondo se calienta hasta un máximo de 54 °C / 129 F, frente a la media de 43.2 °C / 110 F
(±) En reposo, la temperatura media de la parte superior es de 35.1 °C / 95# F, frente a la media del dispositivo de 33.9 °C / 93 F.
(-) Jugando a The Witcher 3, la temperatura media de la parte superior es de 39.8 °C / 104 F, frente a la media del dispositivo de 33.9 °C / 93 F.
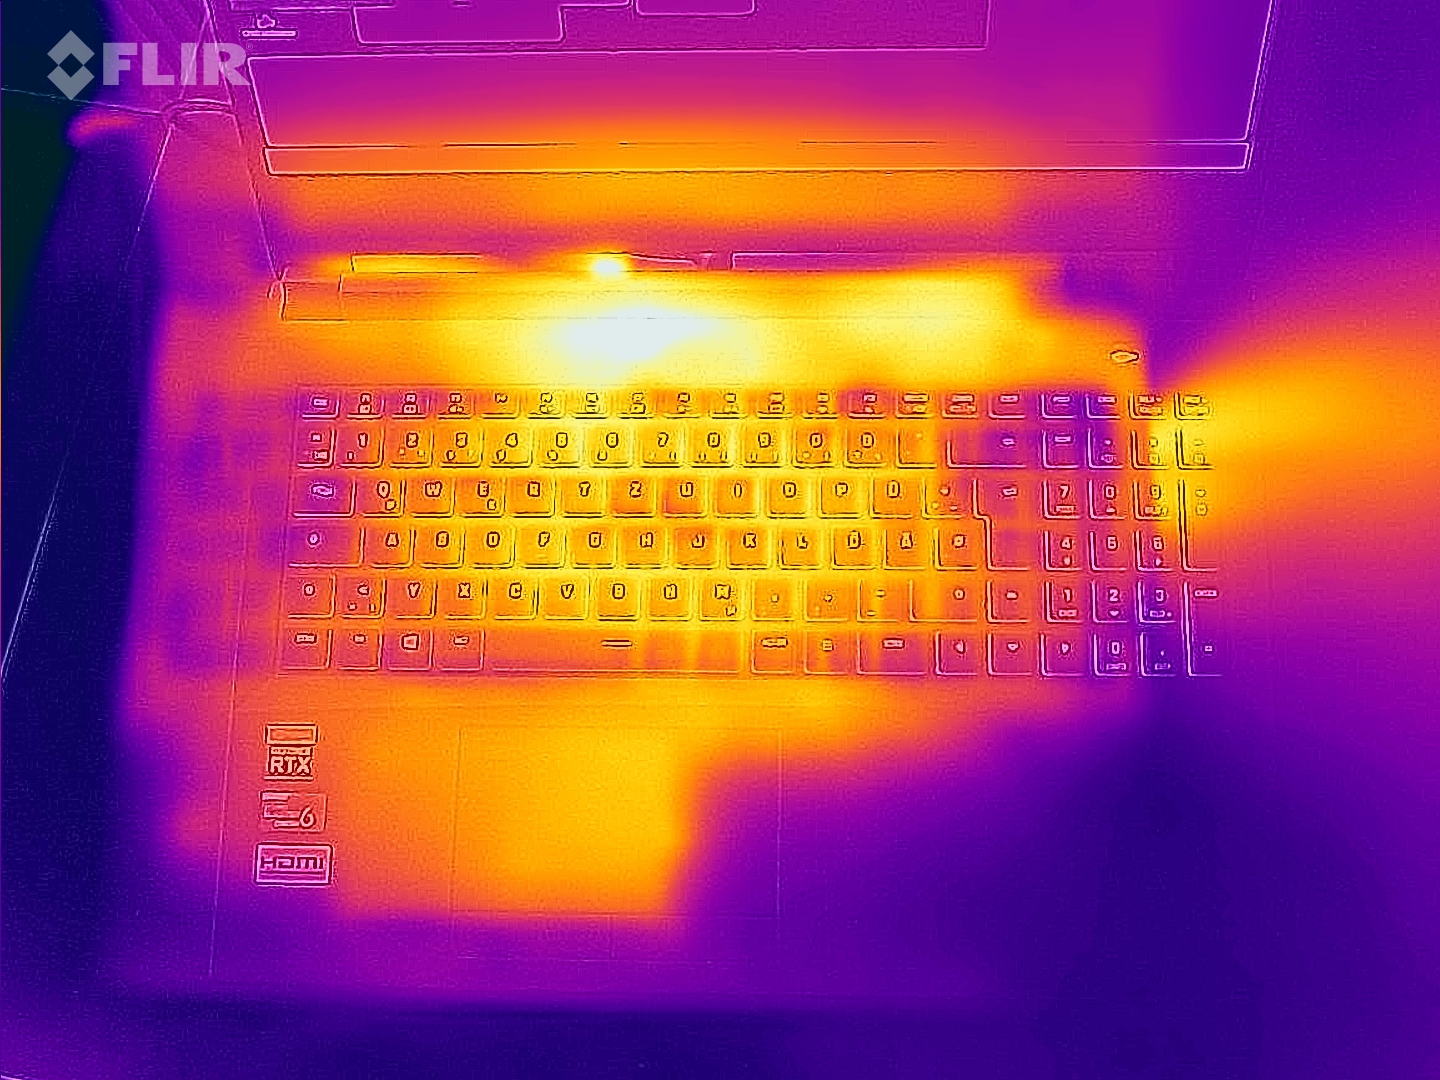
(±) El reposamanos y el touchpad pueden calentarse mucho al tacto con un máximo de 39 °C / 102.2 F.
(-) La temperatura media de la zona del reposamanos de dispositivos similares fue de 28.8 °C / 83.8 F (-10.2 °C / -18.4 F).
| Schenker XMG Apex 15 Max R9 5900X, GeForce RTX 3070 Laptop GPU | Eurocom Nightsky ARX315 R9 5900X, GeForce RTX 3070 Laptop GPU | MSI Vector GP66 12UGS i9-12900H, GeForce RTX 3070 Ti Laptop GPU | HP Omen 16-b1090ng i7-12700H, GeForce RTX 3070 Ti Laptop GPU | Schenker XMG Apex 15 NH57AF1 R9 3900, GeForce RTX 2070 Mobile | Gigabyte A5 X1 R9 5900HX, GeForce RTX 3070 Laptop GPU | |
|---|---|---|---|---|---|---|
| Heat | 13% | 16% | 19% | 11% | 18% | |
| Maximum Upper Side * (°C) | 49 | 36.2 26% | 40.2 18% | 41 16% | 44 10% | 47 4% |
| Maximum Bottom * (°C) | 54 | 49.6 8% | 43.8 19% | 62 -15% | 48 11% | 51 6% |
| Idle Upper Side * (°C) | 38 | 32.6 14% | 34.8 8% | 25 34% | 33 13% | 27 29% |
| Idle Bottom * (°C) | 45 | 43.2 4% | 37 18% | 26 42% | 41 9% | 30 33% |
* ... más pequeño es mejor
Prueba de esfuerzo
La CPU se somete a nuestra prueba de estrés con Prime95 y Furmark funcionando durante al menos una hora a una velocidad de entre 1,2 y 1,3 GHz, y el núcleo gráfico tiene velocidades de entre 1100 y 1200 MHz. La prueba de estrés representa un escenario extremo, y la utilizamos para evaluar si el sistema se mantiene estable a plena carga.
Altavoces
Los altavoces estéreo producen un sonido aceptable, pero apenas hay graves.
Schenker XMG Apex 15 Max análisis de audio
(±) | la sonoridad del altavoz es media pero buena (79 dB)
Graves 100 - 315 Hz
(-) | casi sin bajos - de media 29.1% inferior a la mediana
(±) | la linealidad de los graves es media (12.3% delta a frecuencia anterior)
Medios 400 - 2000 Hz
(+) | medios equilibrados - a sólo 3% de la mediana
(+) | los medios son lineales (5.1% delta a la frecuencia anterior)
Altos 2 - 16 kHz
(+) | máximos equilibrados - a sólo 2.8% de la mediana
(+) | los máximos son lineales (6.6% delta a la frecuencia anterior)
Total 100 - 16.000 Hz
(±) | la linealidad del sonido global es media (20.1% de diferencia con la mediana)
En comparación con la misma clase
» 71% de todos los dispositivos probados de esta clase eran mejores, 6% similares, 23% peores
» El mejor tuvo un delta de 6%, la media fue 18%, el peor fue ###max##%
En comparación con todos los dispositivos probados
» 52% de todos los dispositivos probados eran mejores, 8% similares, 40% peores
» El mejor tuvo un delta de 4%, la media fue 24%, el peor fue ###max##%
MSI Vector GP66 12UGS análisis de audio
(+) | los altavoces pueden reproducir a un volumen relativamente alto (#86.4 dB)
Graves 100 - 315 Hz
(-) | casi sin bajos - de media 19.2% inferior a la mediana
(±) | la linealidad de los graves es media (9.1% delta a frecuencia anterior)
Medios 400 - 2000 Hz
(±) | medias más altas - de media 6.5% más altas que la mediana
(+) | los medios son lineales (5.8% delta a la frecuencia anterior)
Altos 2 - 16 kHz
(+) | máximos equilibrados - a sólo 3.7% de la mediana
(+) | los máximos son lineales (6.5% delta a la frecuencia anterior)
Total 100 - 16.000 Hz
(±) | la linealidad del sonido global es media (18.1% de diferencia con la mediana)
En comparación con la misma clase
» 57% de todos los dispositivos probados de esta clase eran mejores, 8% similares, 35% peores
» El mejor tuvo un delta de 6%, la media fue 18%, el peor fue ###max##%
En comparación con todos los dispositivos probados
» 38% de todos los dispositivos probados eran mejores, 8% similares, 54% peores
» El mejor tuvo un delta de 4%, la media fue 24%, el peor fue ###max##%
Gestión de la energía - El Apex Max consume mucha energía
Consumo de energía
El consumo de energía durante el funcionamiento en reposo resulta muy elevado, con valores de hasta 76 vatios. Durante la prueba de estrés y la prueba Witcher 3, el consumo aumenta hasta 233 vatios o una media de 230 vatios. Durante ambas pruebas, el consumo de energía se mantiene constante. La fuente de alimentación tiene una potencia nominal de 230 vatios.
| Off / Standby | |
| Ocioso | |
| Carga |
|
Clave:
min: | |
| Schenker XMG Apex 15 Max R9 5900X, GeForce RTX 3070 Laptop GPU | Eurocom Nightsky ARX315 R9 5900X, GeForce RTX 3070 Laptop GPU | MSI Vector GP66 12UGS i9-12900H, GeForce RTX 3070 Ti Laptop GPU | HP Omen 16-b1090ng i7-12700H, GeForce RTX 3070 Ti Laptop GPU | Schenker XMG Apex 15 NH57AF1 R9 3900, GeForce RTX 2070 Mobile | Gigabyte A5 X1 R9 5900HX, GeForce RTX 3070 Laptop GPU | Media de la clase Gaming | |
|---|---|---|---|---|---|---|---|
| Power Consumption | -0% | 31% | 49% | 5% | 42% | 47% | |
| Idle Minimum * (Watt) | 64 | 55 14% | 17.5 73% | 4 94% | 55 14% | 10 84% | 13 ? 80% |
| Idle Average * (Watt) | 67 | 68.2 -2% | 20.1 70% | 10 85% | 59 12% | 12 82% | 18.7 ? 72% |
| Idle Maximum * (Watt) | 76 | 72.5 5% | 47.3 38% | 19 75% | 63 17% | 16 79% | 24.3 ? 68% |
| Load Average * (Watt) | 138 | 149.2 -8% | 107.3 22% | 114 17% | 141 -2% | 124 10% | 108.2 ? 22% |
| Witcher 3 ultra * (Watt) | 230 | 233 -1% | 225 2% | 183.2 20% | 238 -3% | 204 11% | |
| Load Maximum * (Watt) | 233 | 255.8 -10% | 277.7 -19% | 221 5% | 259 -11% | 272 -17% | 254 ? -9% |
* ... más pequeño es mejor
Power Consumption The Witcher 3 / Stress Test
Power Consumption With External Monitor
Duración de la batería
El elevado consumo de energía del portátil hace que la duración de la batería sea escasa. En el test WLAN cargando webs a través de un script y el test de vídeo reproduciendo el corto Big Buck Bunny (codificación H.264, FHD) en bucle, el portátil de 15.6 pulgadas dura 0:57 h y 0:56 h respectivamente. El perfil de Ahorro de Energía sólo trae una pequeña mejora de la duración de la WLAN a 1:14 h. La batería sirve más como un respaldo de emergencia aquí.
| Schenker XMG Apex 15 Max R9 5900X, GeForce RTX 3070 Laptop GPU, 62 Wh | Eurocom Nightsky ARX315 R9 5900X, GeForce RTX 3070 Laptop GPU, 62 Wh | MSI Vector GP66 12UGS i9-12900H, GeForce RTX 3070 Ti Laptop GPU, 65 Wh | HP Omen 16-b1090ng i7-12700H, GeForce RTX 3070 Ti Laptop GPU, 83 Wh | Schenker XMG Apex 15 NH57AF1 R9 3900, GeForce RTX 2070 Mobile, 62 Wh | Gigabyte A5 X1 R9 5900HX, GeForce RTX 3070 Laptop GPU, 48.96 Wh | Media de la clase Gaming | |
|---|---|---|---|---|---|---|---|
| Duración de Batería | 0% | 395% | 502% | -6% | 556% | 587% | |
| Reader / Idle (h) | 1 | 7.9 690% | 10.1 910% | 1.2 20% | 10.1 910% | 8.71 ? 771% | |
| H.264 (h) | 0.9 | 7.3 711% | 8.9 ? 889% | ||||
| WiFi v1.3 (h) | 1 | 1 0% | 5.7 470% | 5.6 460% | 1 0% | 6.4 540% | 7 ? 600% |
| Load (h) | 0.8 | 1 25% | 1.9 137% | 0.5 -37% | 1.3 63% | 1.51 ? 89% |
Pro
Contra
Veredicto - Un portátil para juegos para un grupo de usuarios limitado
El Schenker XMG Apex 15 Max tiene que ser visto como un híbrido de portátil para juegos, portátil DTR y estación de trabajo. El portátil está diseñado para ser capaz de producir un alto rendimiento constante - y el Apex no decepciona en este sentido. El portátil puede manejar los juegos FHD en la configuración máxima sin ningún problema.
El Schenker XMG Apex 15 Max ofrece un gran rendimiento informático, pero también consume mucha energía.
Por otro lado, mientras que el GeForce RTX 3070 para portátilesfunciona constantemente a máxima velocidad, la GPU permanente Ryzen 9 5900Xde sobremesa (con zócalo, reemplazable) sólo alcanza su velocidad Turbo brevemente en funcionamiento multihilo. Las opciones de refrigeración alcanzan sus límites aquí.
El portátil se calienta notablemente, pero no se calienta en exceso. El desarrollo de ruido está en el nivel habitual para la clase - es decir, se vuelve muy ruidoso. Esto va acompañado de una pésima duración de la batería y una enorme demanda de energía durante el funcionamiento en reposo. Especialmente esto último es difícil de explicar hoy en día.
No hay demasiados portátiles con una CPU de sobremesa reemplazable y sin una GPU integrada en nuestra base de datos. Entre los portátiles para juegos "normales", el MSI Vector GP66 12UGSsería una alternativa. Mientras que puede ofrecer incluso un poco más de rendimiento que el Apex en ocasiones, también es capaz de aportar una duración de batería significativamente mayor al mismo tiempo.
Precio y disponibilidad
El Schenker XMG Apex 15 Max (principios de 2022) se puede configurar individualmente en la tienda online de Schenker. La configuración de equipamiento que se nos facilitó está disponible por casi 2300 euros (~2433 dólares), y los modelos de entrada están disponibles a partir de unos 1400 euros (~1481 dólares).
Schenker XMG Apex 15 Max
- 06/22/2022 v7 (old)
Sascha Mölck
Price comparison

