Análisis del portátil Schenker XMG Pro 15 (RTX 3080 Ti): El Mike Tyson de los portátiles todoterreno
A principios de año, revisamos el predecesor con la CPU Tiger Lake y RTX 3080. Ahora Schenker ha creado una nueva carcasa y ha actualizado el hardware a Alder Lake y RTX 3080 Ti. Esta vez, estamos revisando la variante con una pantalla IPS QHD en lugar de una pantalla OLED 4K.
Además del predecesor, se usan otros portátiles de 15 pulgadas con hardware similar para comparar, incluyendo elMSI Raider GE66 12UHS así como el Razer Blade 15también comparamos el rendimiento con el del propio XMG Neo 15 con y sin su sistema de refrigeración líquida XMG Oasis.
Posibles contendientes en la comparación
Valoración | Fecha | Modelo | Peso | Altura | Tamaño | Resolución | Precio |
|---|---|---|---|---|---|---|---|
| 86.9 % v7 (old) | 07/2022 | Schenker XMG Pro 15 (i7-12700H, RTX 3080 Ti) i7-12700H, GeForce RTX 3080 Ti Laptop GPU | 2.4 kg | 25 mm | 15.60" | 2560x1440 | |
| 84.6 % v7 (old) | 01/2022 | Schenker XMG Pro 15 (Late 2021) i7-11800H, GeForce RTX 3080 Laptop GPU | 2 kg | 19.8 mm | 15.60" | 3840x2160 | |
| 88.4 % v7 (old) | 07/2022 | Schenker XMG Neo 15 (i7-12700H, RTX 3080 Ti) i7-12700H, GeForce RTX 3080 Ti Laptop GPU | 2.3 kg | 26.6 mm | 15.60" | 2560x1440 | |
| 87.4 % v7 (old) | 06/2022 | MSI Raider GE66 12UHS i9-12900HK, GeForce RTX 3080 Ti Laptop GPU | 2.4 kg | 23.4 mm | 15.60" | 3840x2160 | |
| 89.1 % v7 (old) | 03/2022 | Razer Blade 15 2022 i7-12800H, GeForce RTX 3080 Ti Laptop GPU | 2.1 kg | 16.99 mm | 15.60" | 2560x1440 |
Caja: Más gruesa y pesada de nuevo
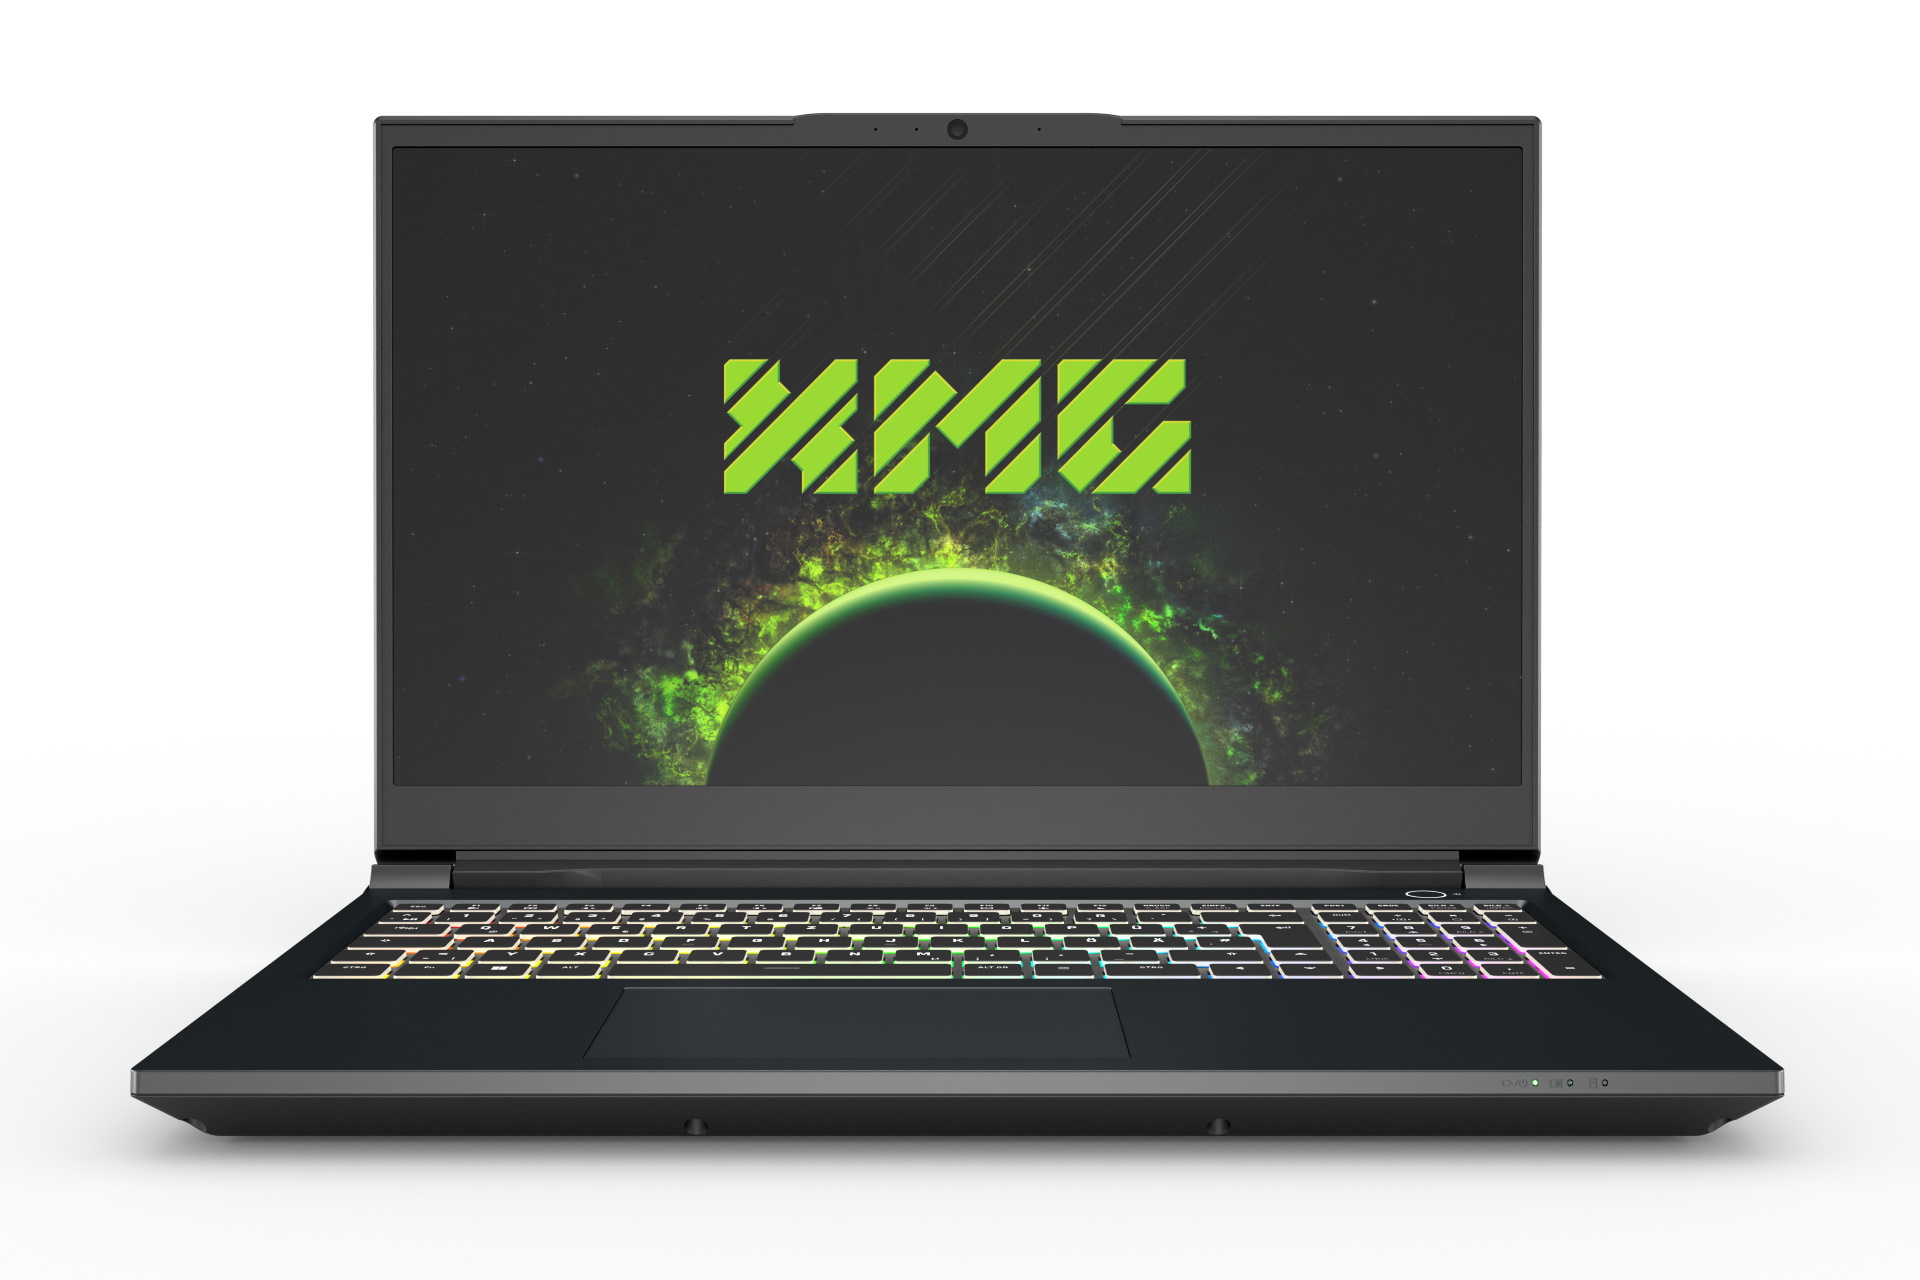
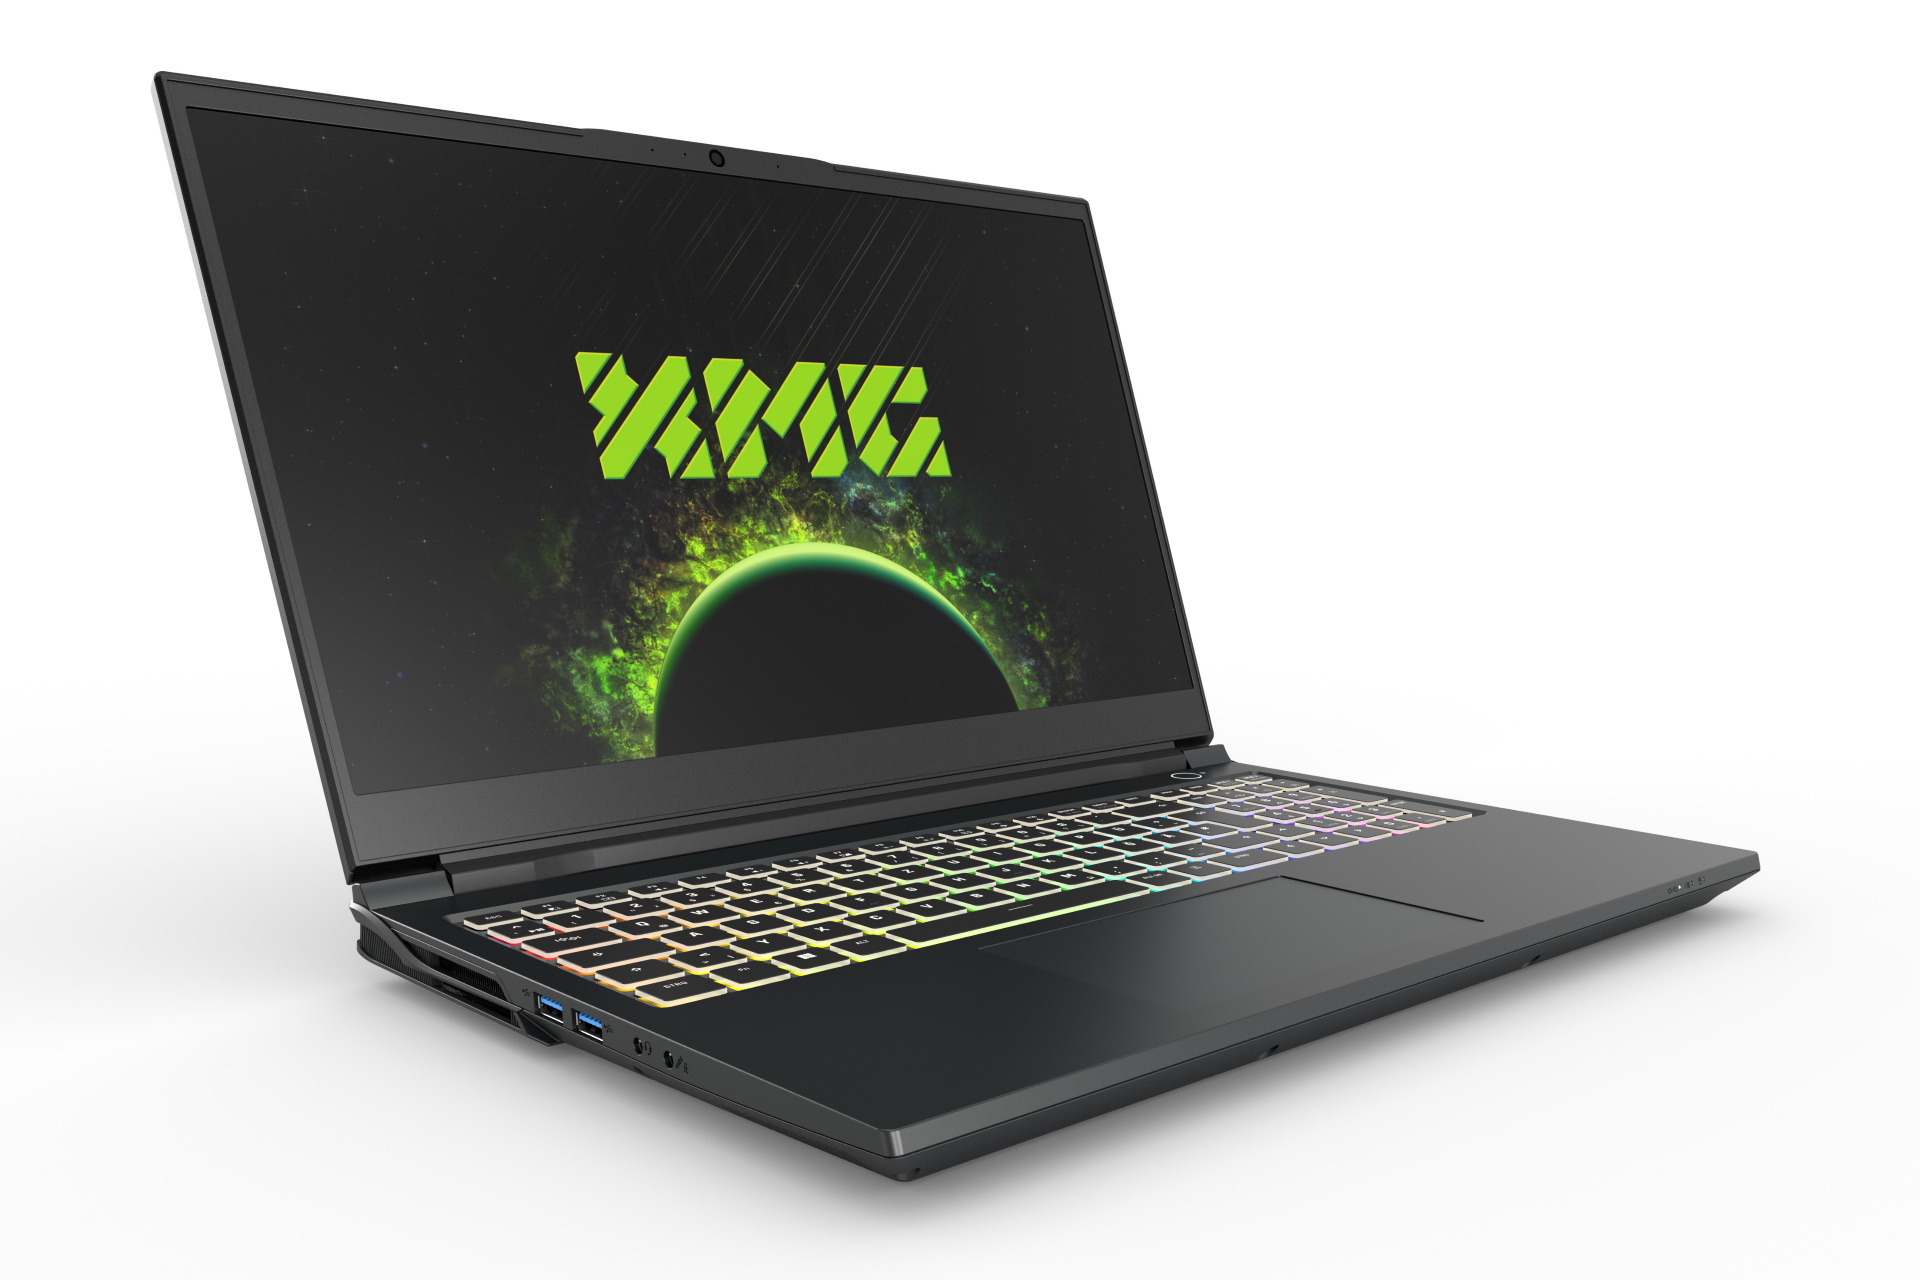
Schenker utiliza una nueva carcasa, la Clevo PD50PNT. La tapa de la pantalla y la carcasa inferior siguen siendo de aluminio, mientras que el bisel de la pantalla y la carcasa superior son de plástico. La tapa de la pantalla y la base hacen ligeros crujidos bajo torsión, pero aún así dan una impresión suficientemente robusta, especialmente la base. No se encontraron huecos desiguales, y la mano de obra está a buen nivel.
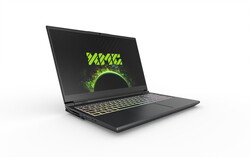
El diseño es relativamente sencillo y se mantiene en negro, lo que también debería atraer a los creadores de contenidos. El logotipo de XMG apenas es visible en la tapa porque también es oscuro. Las superficies son un imán para las huellas dactilares y las marcas de grasa
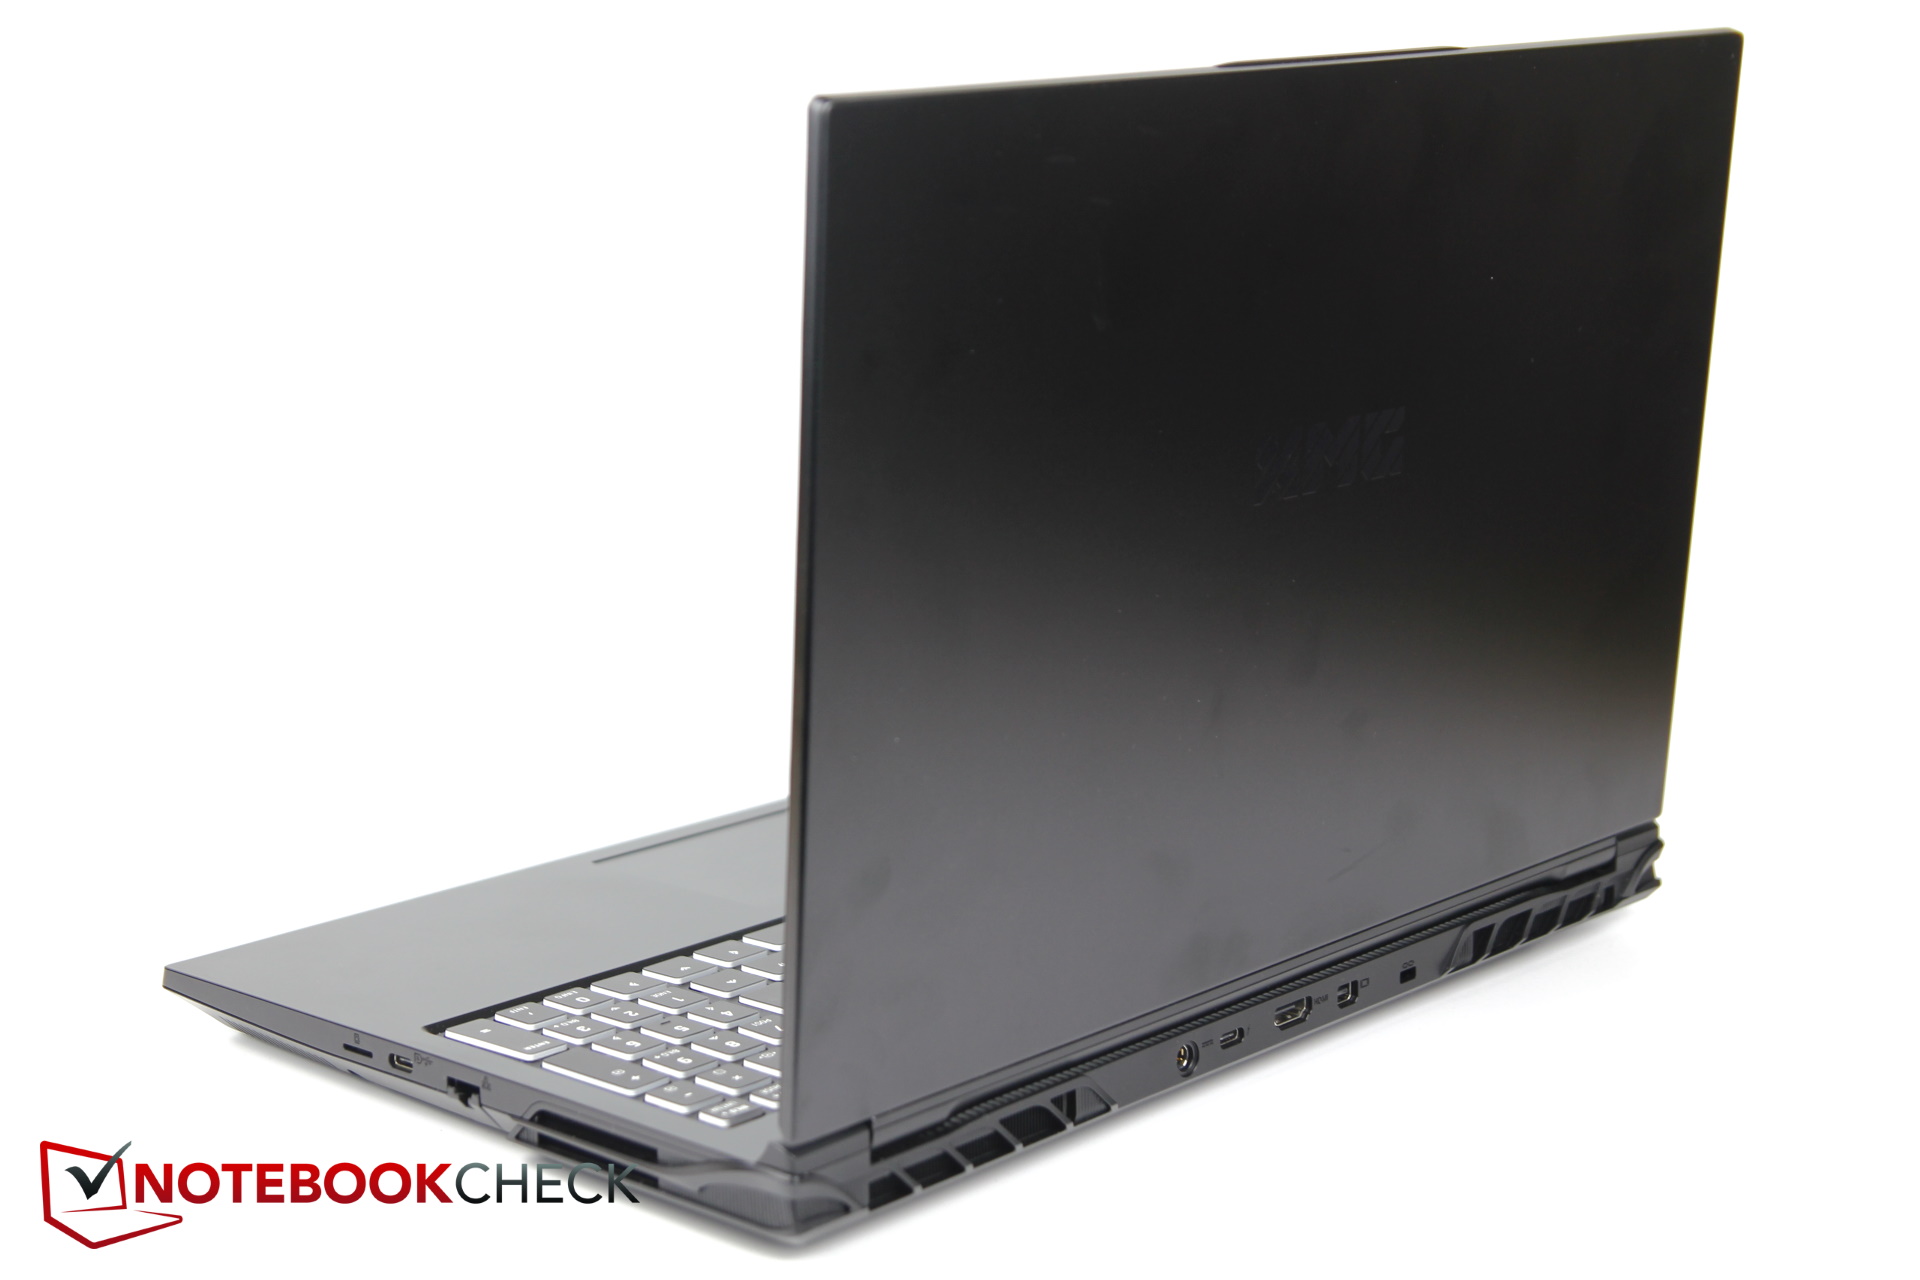
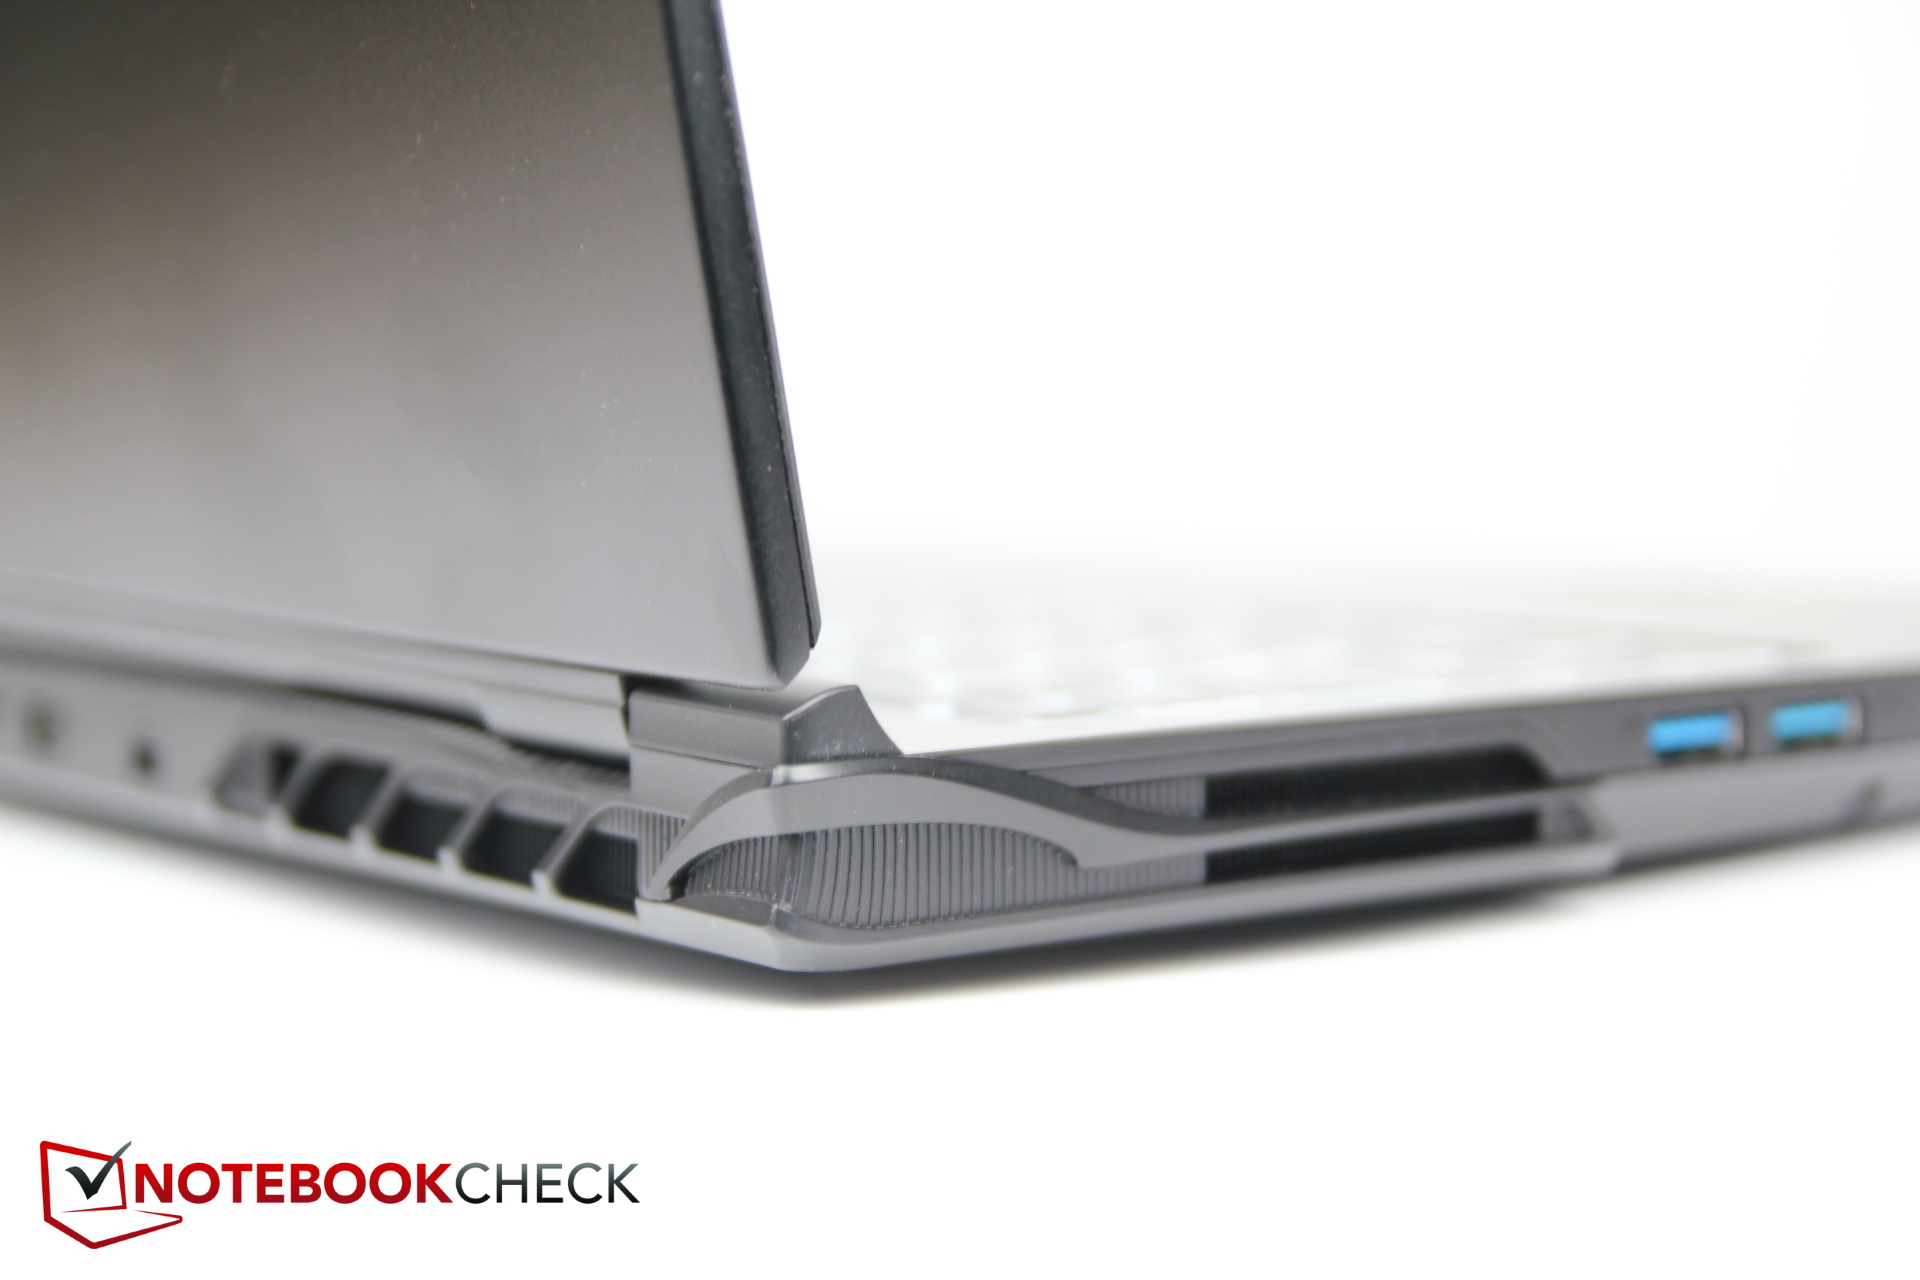
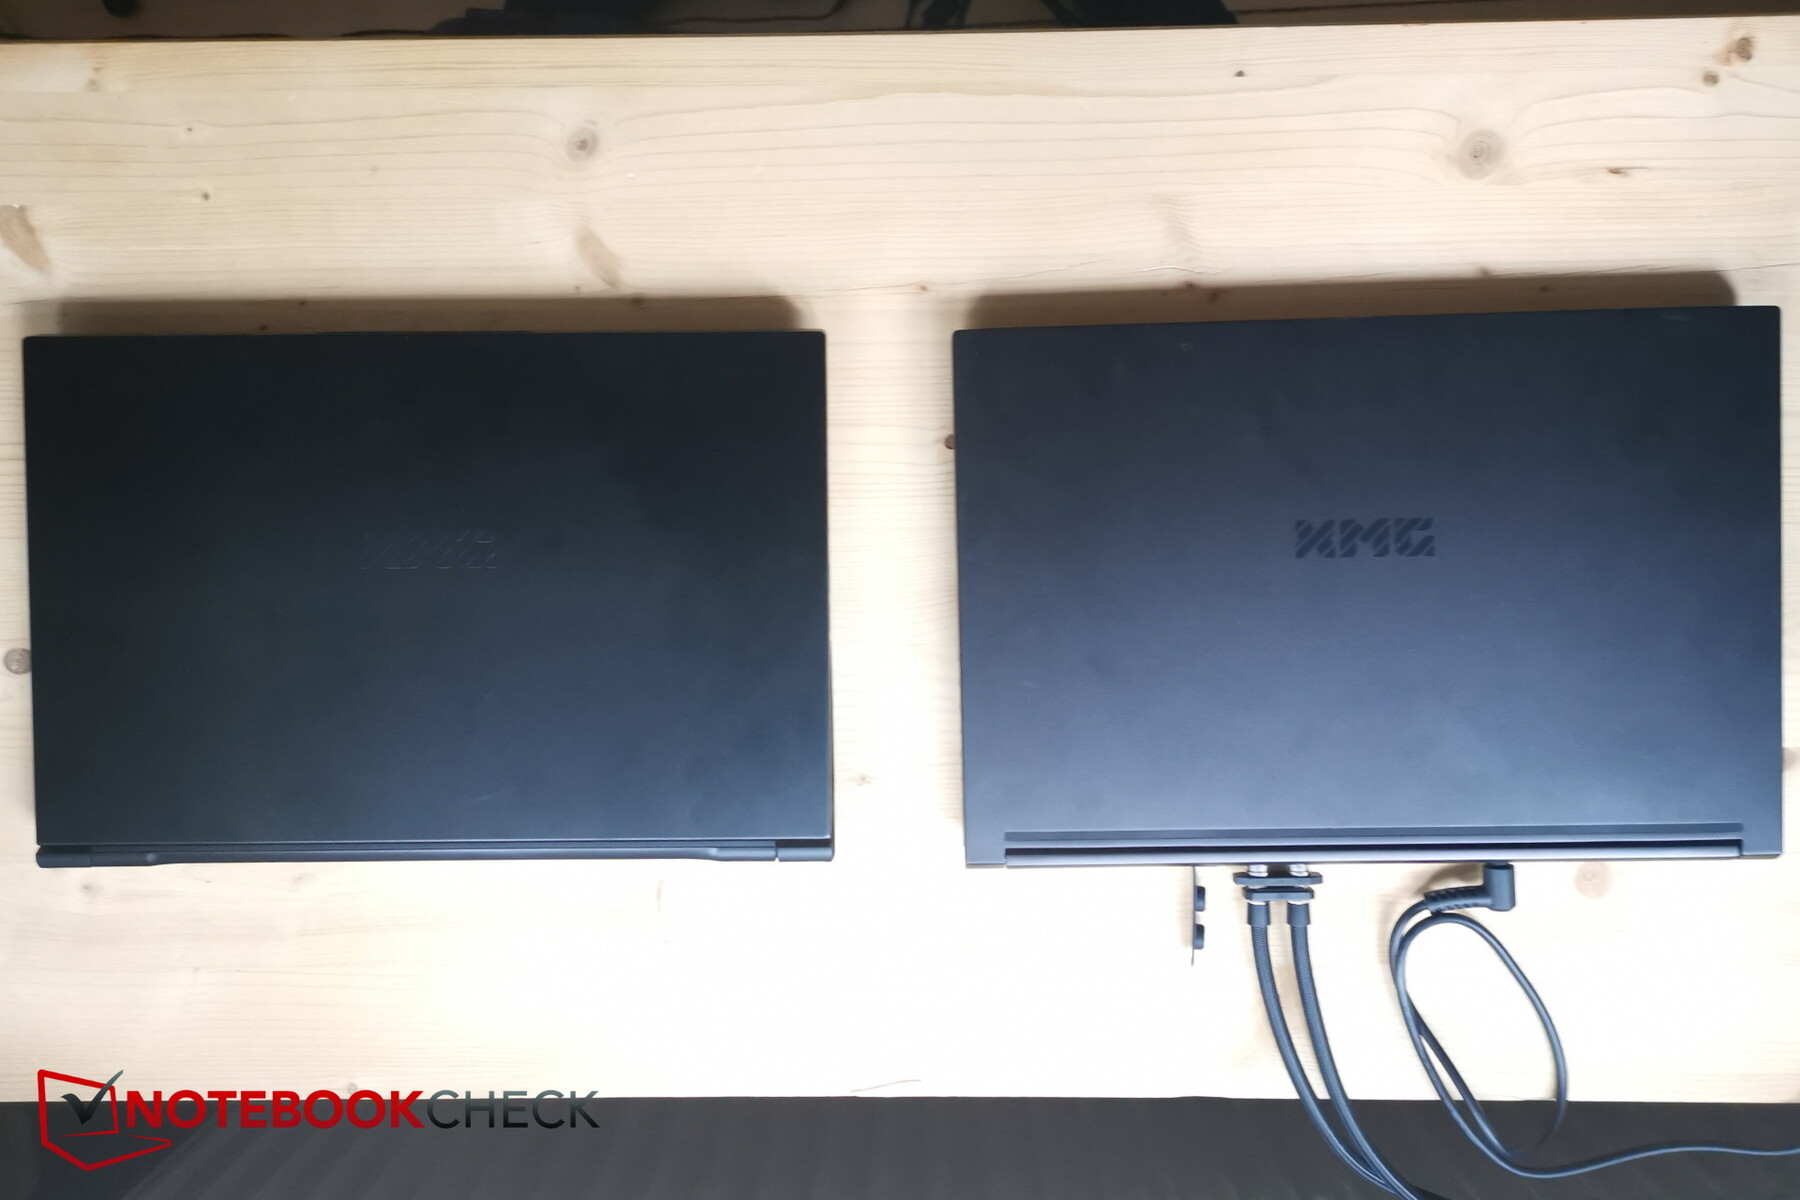
Curiosamente, el nuevo Pro 15 es ligeramente más grueso (~25 mm) y más pesado que su predecesor directo (19,8 mm). La anchura y la profundidad, por otra parte, se han mantenido casi iguales, pero el peso ha aumentado en unos 300 g.
Esto lo acerca al XMG Neo 15 (26.6 mm), por lo que ya no se encuentra entre los dispositivos muy delgados que intentan alcanzar las dimensiones de un Razer Blade 15 (~17 mm).
Equipo: VR ready y MicroSD
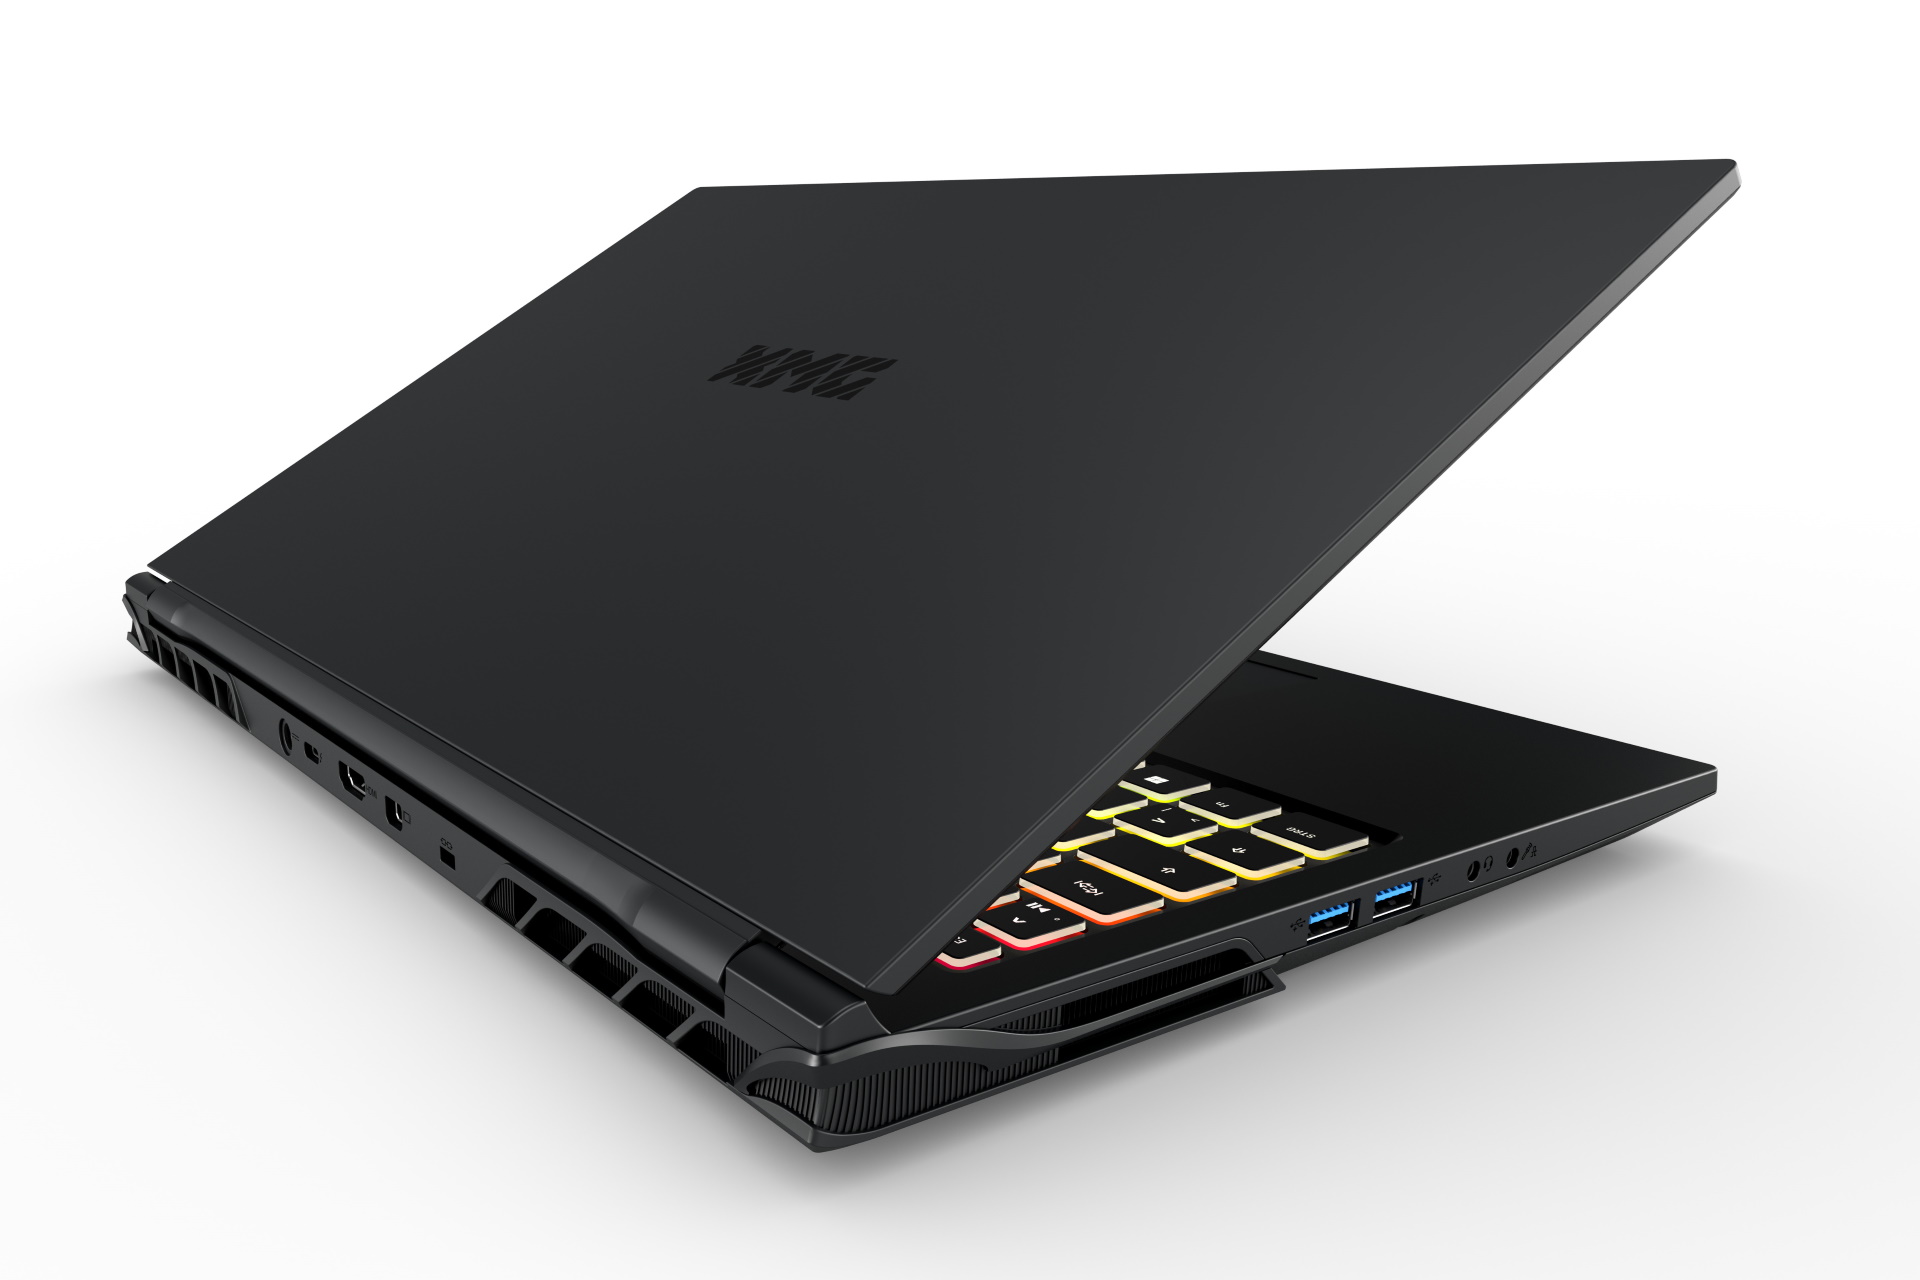
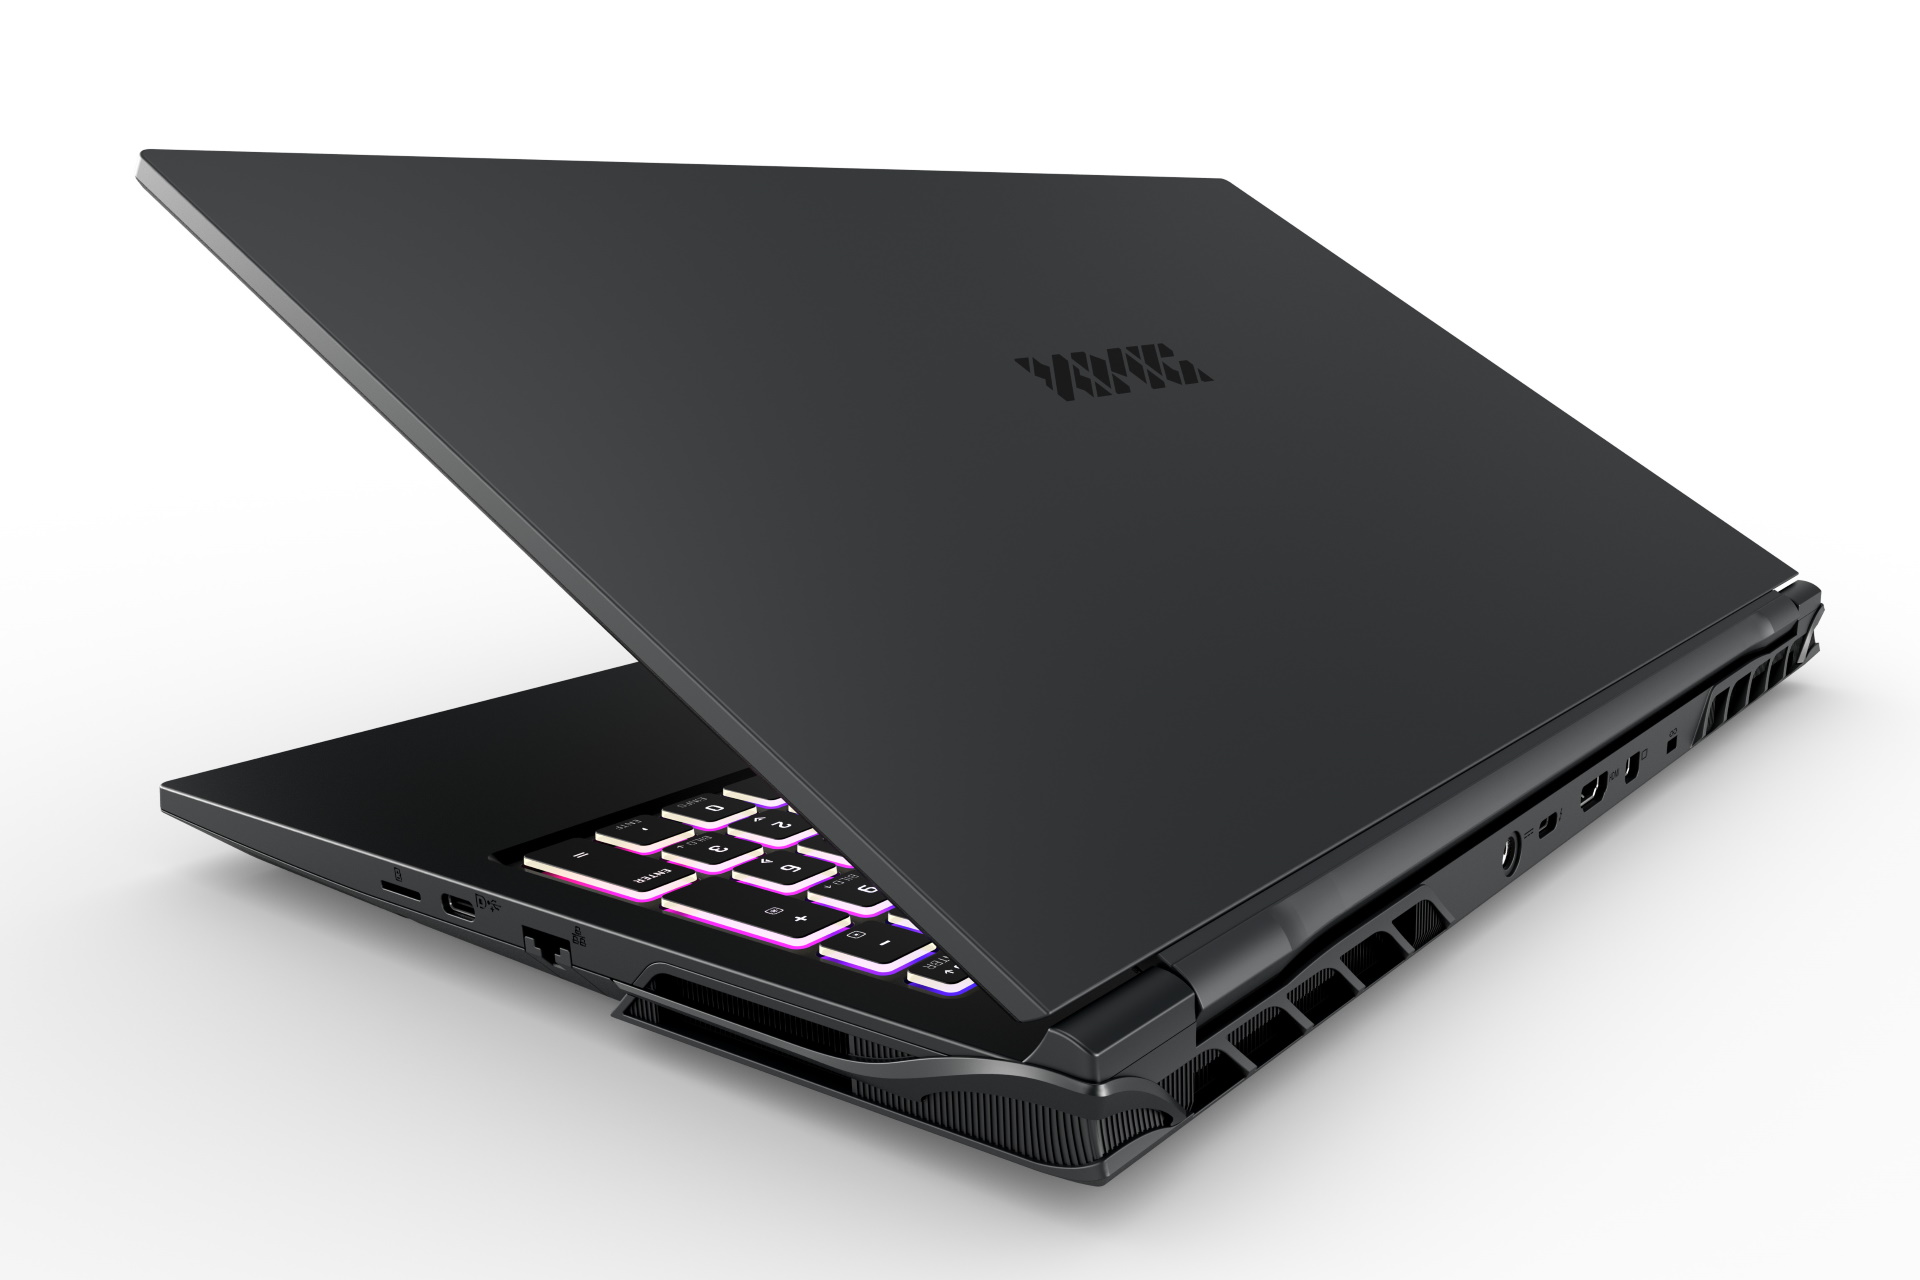
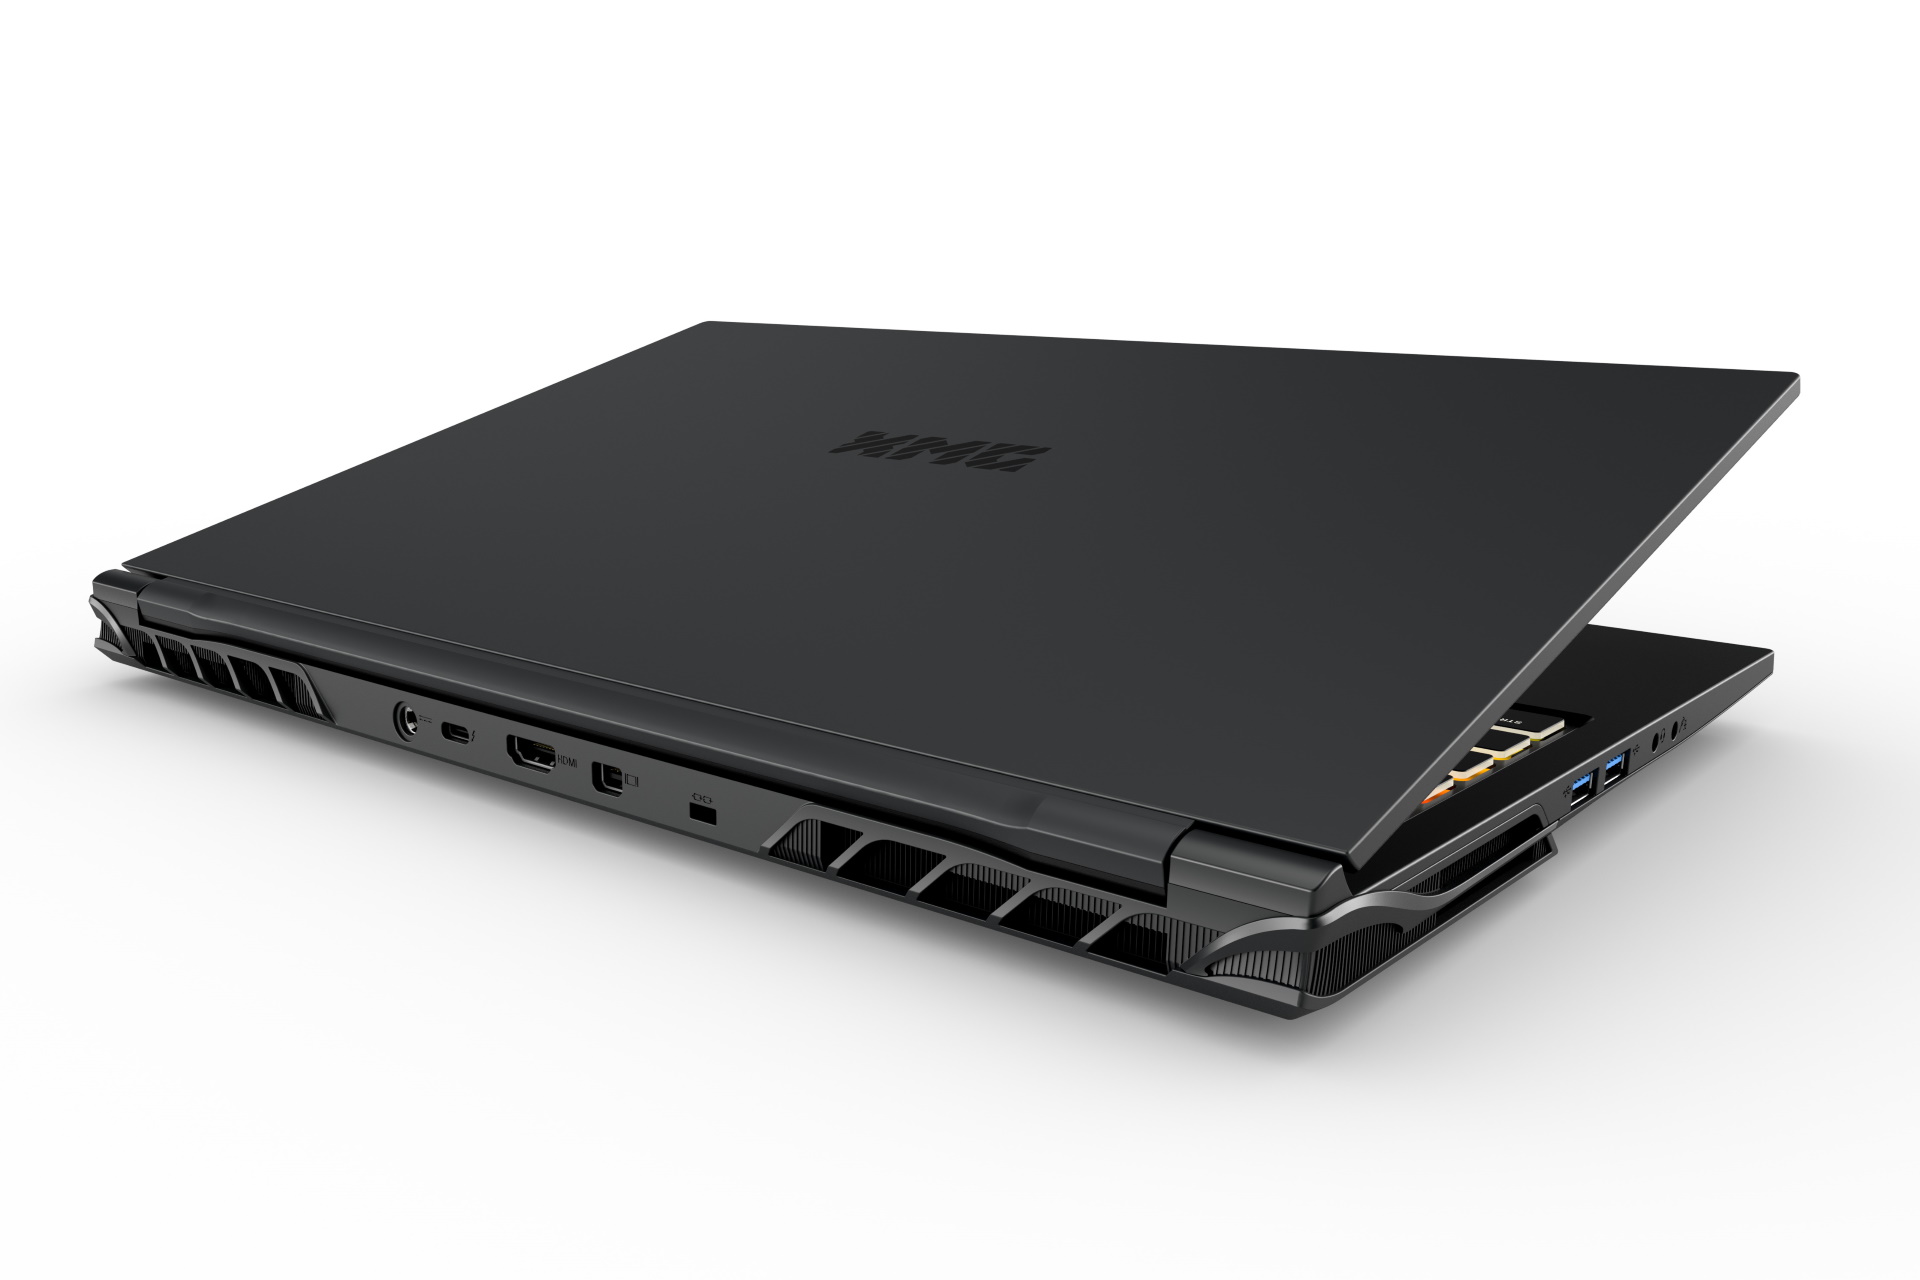
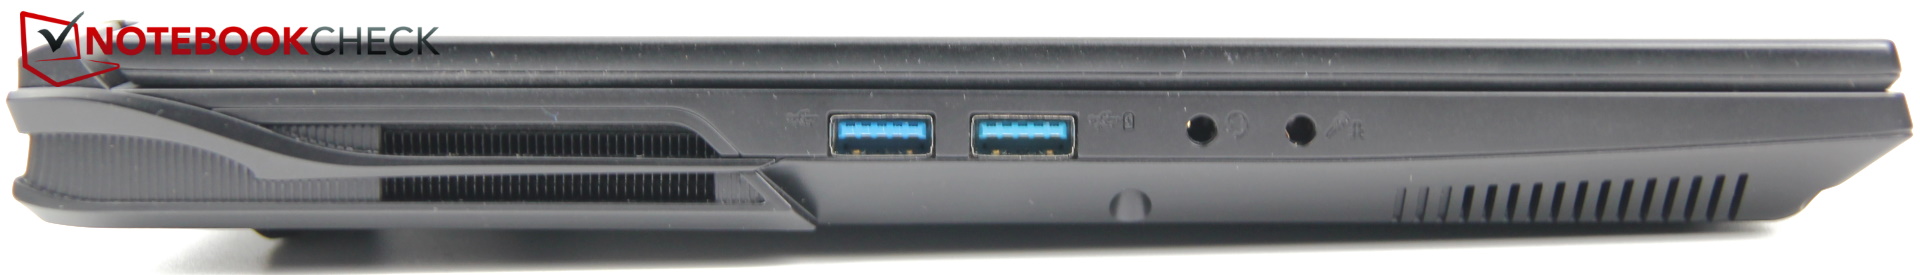
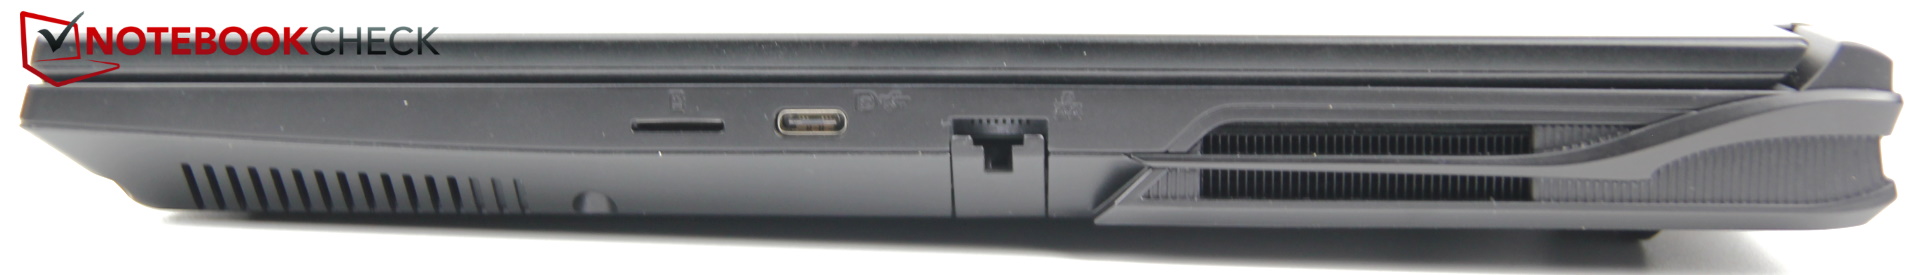
Schenker ha vuelto a introducir un lector de tarjetas, pero sólo en formato MicroSD; el predecesor no tenía lector SD. También cambia la distribución de los puertos USB: Los dos puertos USB-A están ahora a la izquierda, mientras que un puerto USB-C se encuentra a la derecha, además del lector de microSD.
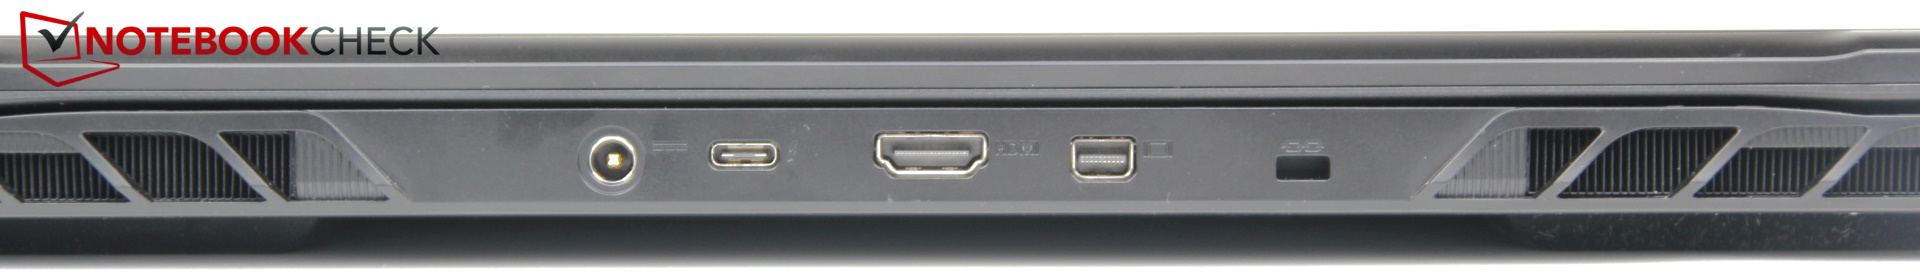
Junto con un MiniDP en la parte trasera, esto hace que el Pro 15 tenga capacidad de RV.
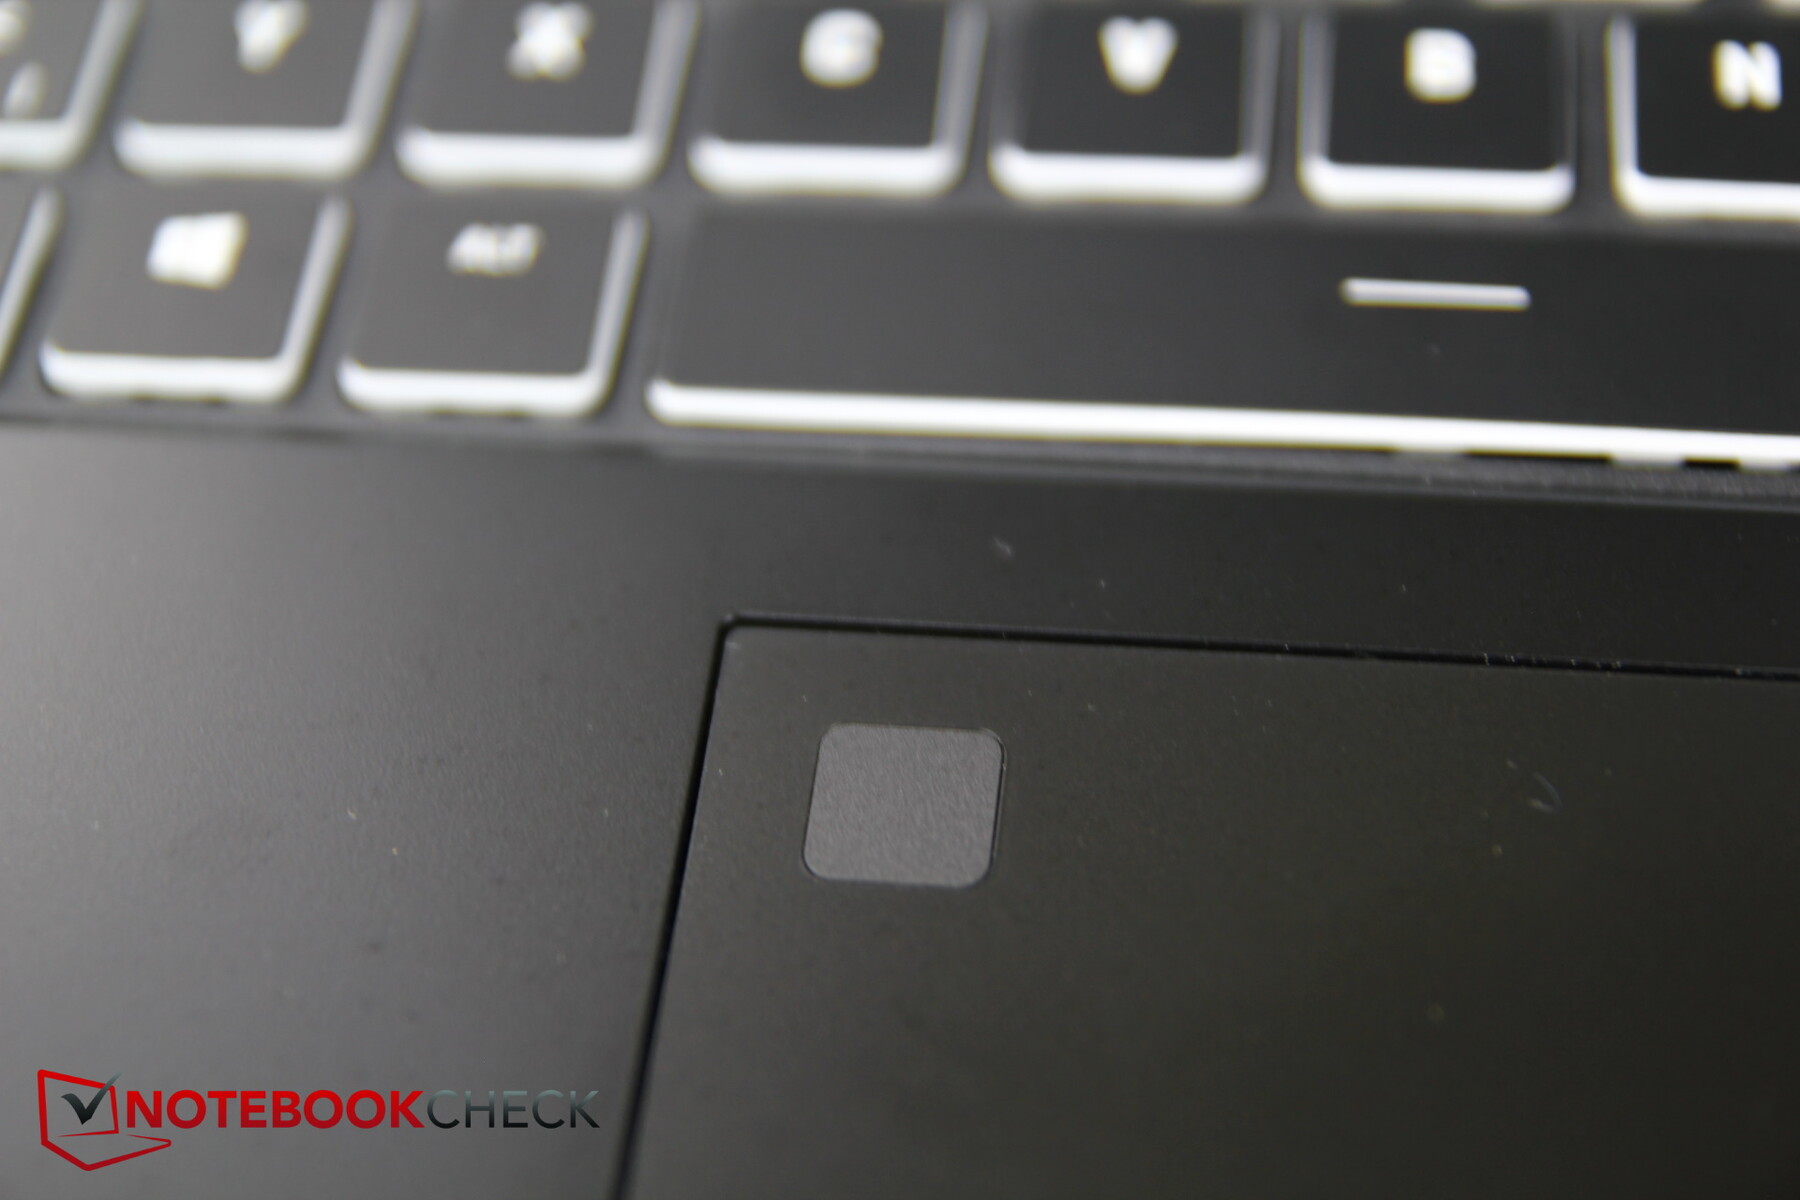
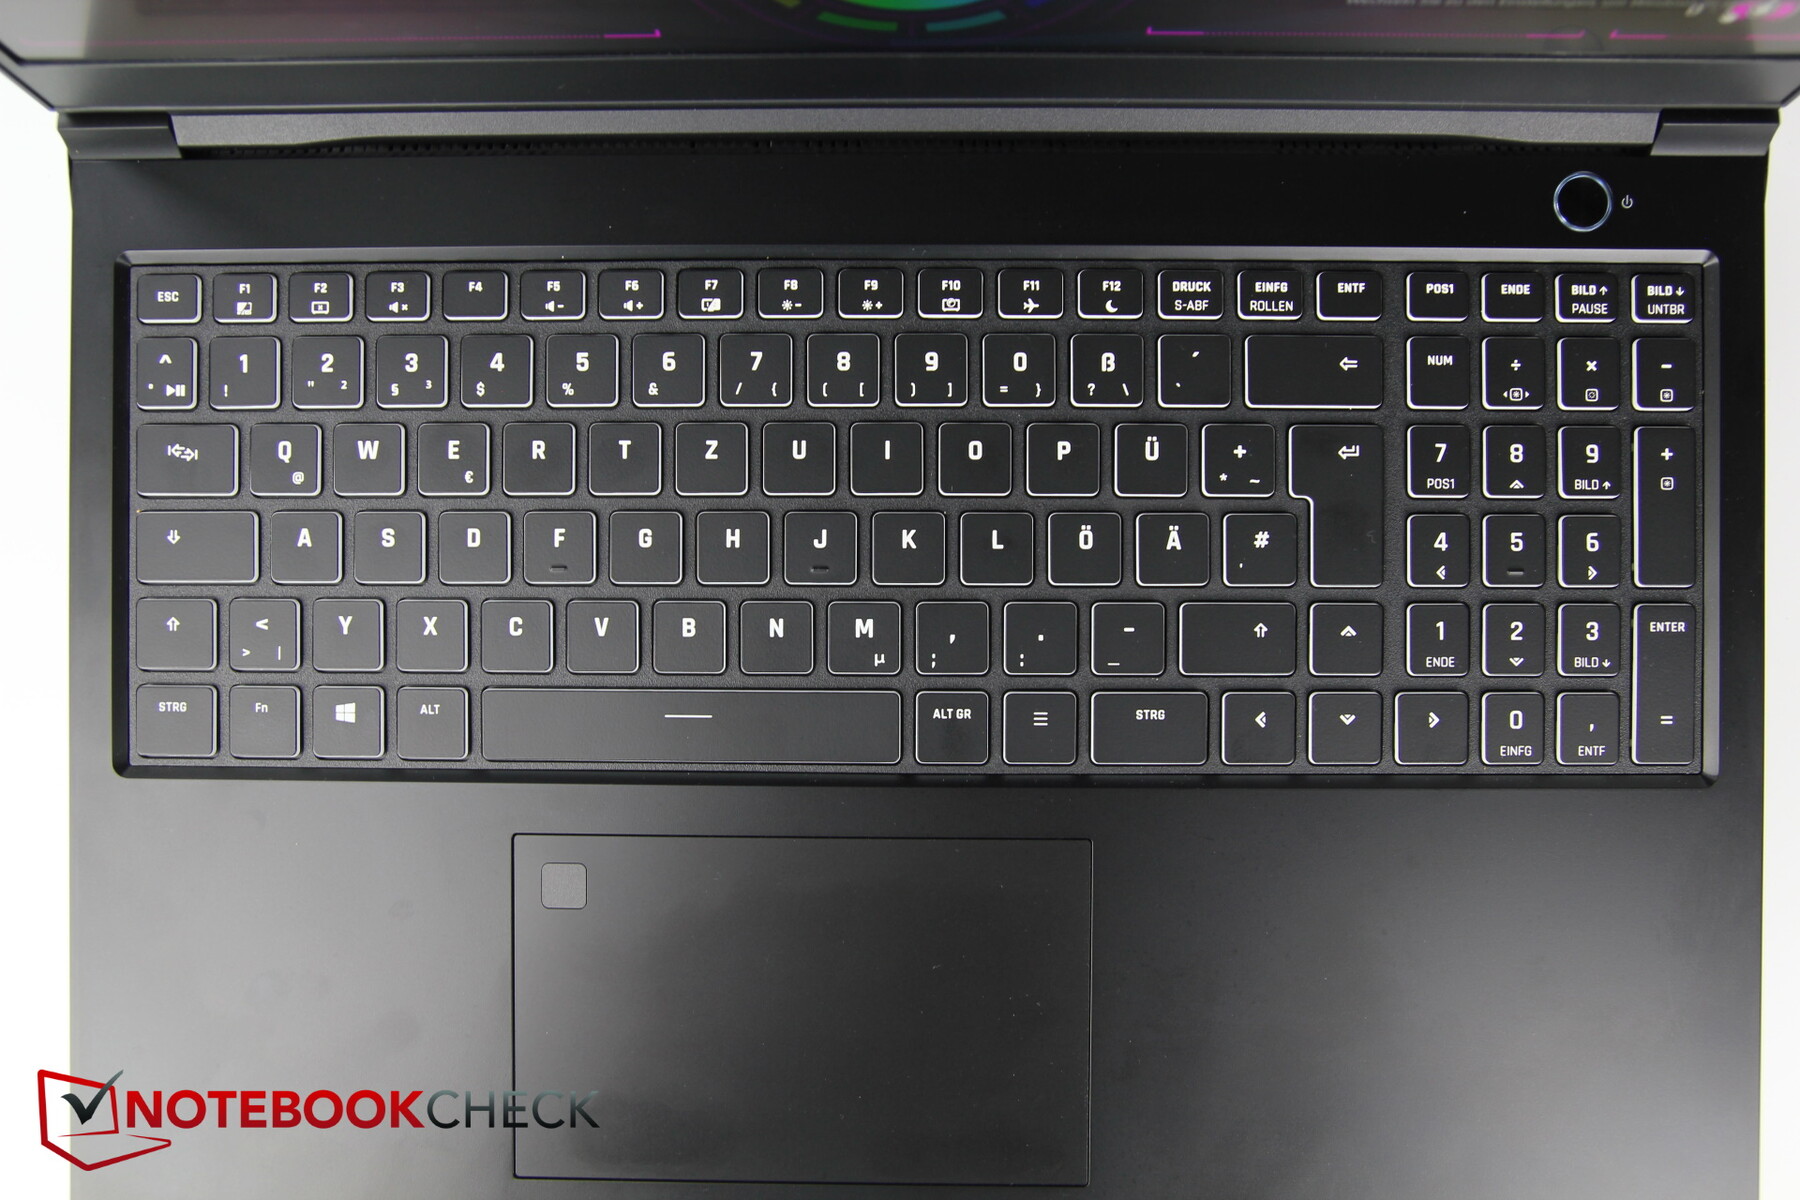
Se ha integrado un sensor de huellas dactilares en la esquina superior izquierda del touchpad.
La distribución de los puertos es aceptable, pero un grueso cable de red puede estorbar a la mano derecha del ratón
Lector de tarjetas SD
El lector de MicroSD tiene un mecanismo de encaje para que la tarjeta apenas sobresalga. Sin embargo, las velocidades con nuestra tarjeta de prueba AV PRO microSD 128 GB V60 están por debajo de la media. El lector del Razer Blade es el doble de rápido.
| SD Card Reader | |
| average JPG Copy Test (av. of 3 runs) | |
| Razer Blade 15 2022 (Toshiba Exceria Pro SDXC 64 GB UHS-II) | |
| Media de la clase Gaming (20.9 - 210, n=54, últimos 2 años) | |
| Schenker XMG Neo 15 (i7-12700H, RTX 3080 Ti) | |
| MSI Raider GE66 12UHS (AV PRO microSD 128 GB V60) | |
| Schenker XMG Pro 15 (i7-12700H, RTX 3080 Ti) | |
| maximum AS SSD Seq Read Test (1GB) | |
| Razer Blade 15 2022 (Toshiba Exceria Pro SDXC 64 GB UHS-II) | |
| Media de la clase Gaming (25.5 - 261, n=51, últimos 2 años) | |
| Schenker XMG Pro 15 (i7-12700H, RTX 3080 Ti) | |
| Schenker XMG Neo 15 (i7-12700H, RTX 3080 Ti) | |
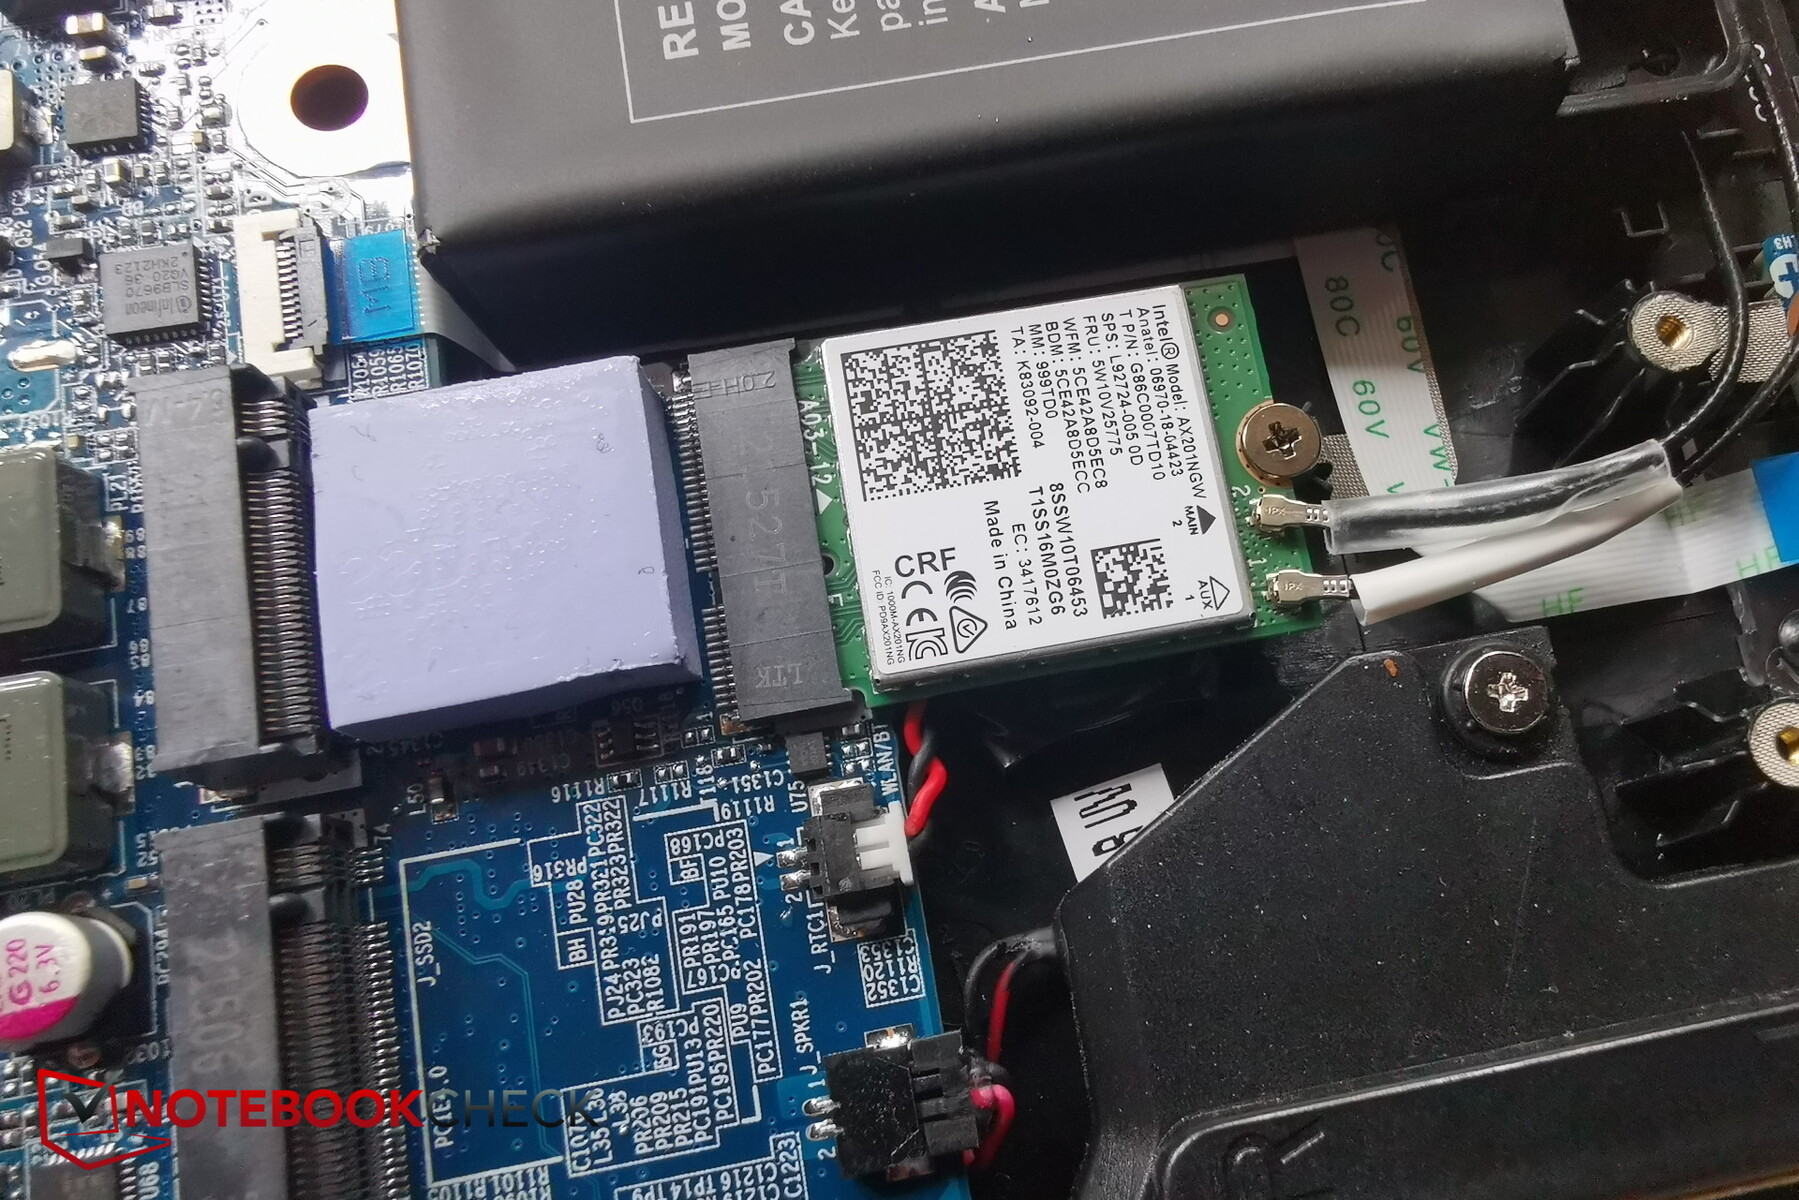
Comunicación
El fabricante ha optado por el popular módulo WiFi Intel AX201, que aún no soporta Wi-Fi 6e, pero se conecta a redes de 5 GHz.
Las tasas de transferencia del Pro 15 están constantemente en la gama alta.
Cámara web
La webcam también recibe una actualización, concretamente de 720p a 1080p, que es Full HD. Medimos desviaciones de color aceptables, pero la imagen parece un poco granulada (en exteriores, sombras) y pálida a pesar del Full HD

 GeForce RTX 3080 Ti Laptop GPU, i7-12700H, Samsung SSD 980 Pro 1TB MZ-V8P1T0BW")
 GeForce RTX 3080 Ti Laptop GPU, i7-12700H, Samsung SSD 980 Pro 1TB MZ-V8P1T0BW")
Seguridad
El Pro 15 ofrece un puerto Kensington, TPM y un sensor de huellas dactilares.
La integración del sensor en Windows Hello funciona con fiabilidad, y el inicio de sesión es muy rápido.
Accesorios y garantía
Los accesorios típicos de Schenker, como una memoria USB con controladores o una alfombrilla de ratón, se echan en falta en el Pro, que sólo viene con un controlador en CD.
Schenker ofrece una garantía de 24 meses en Alemania
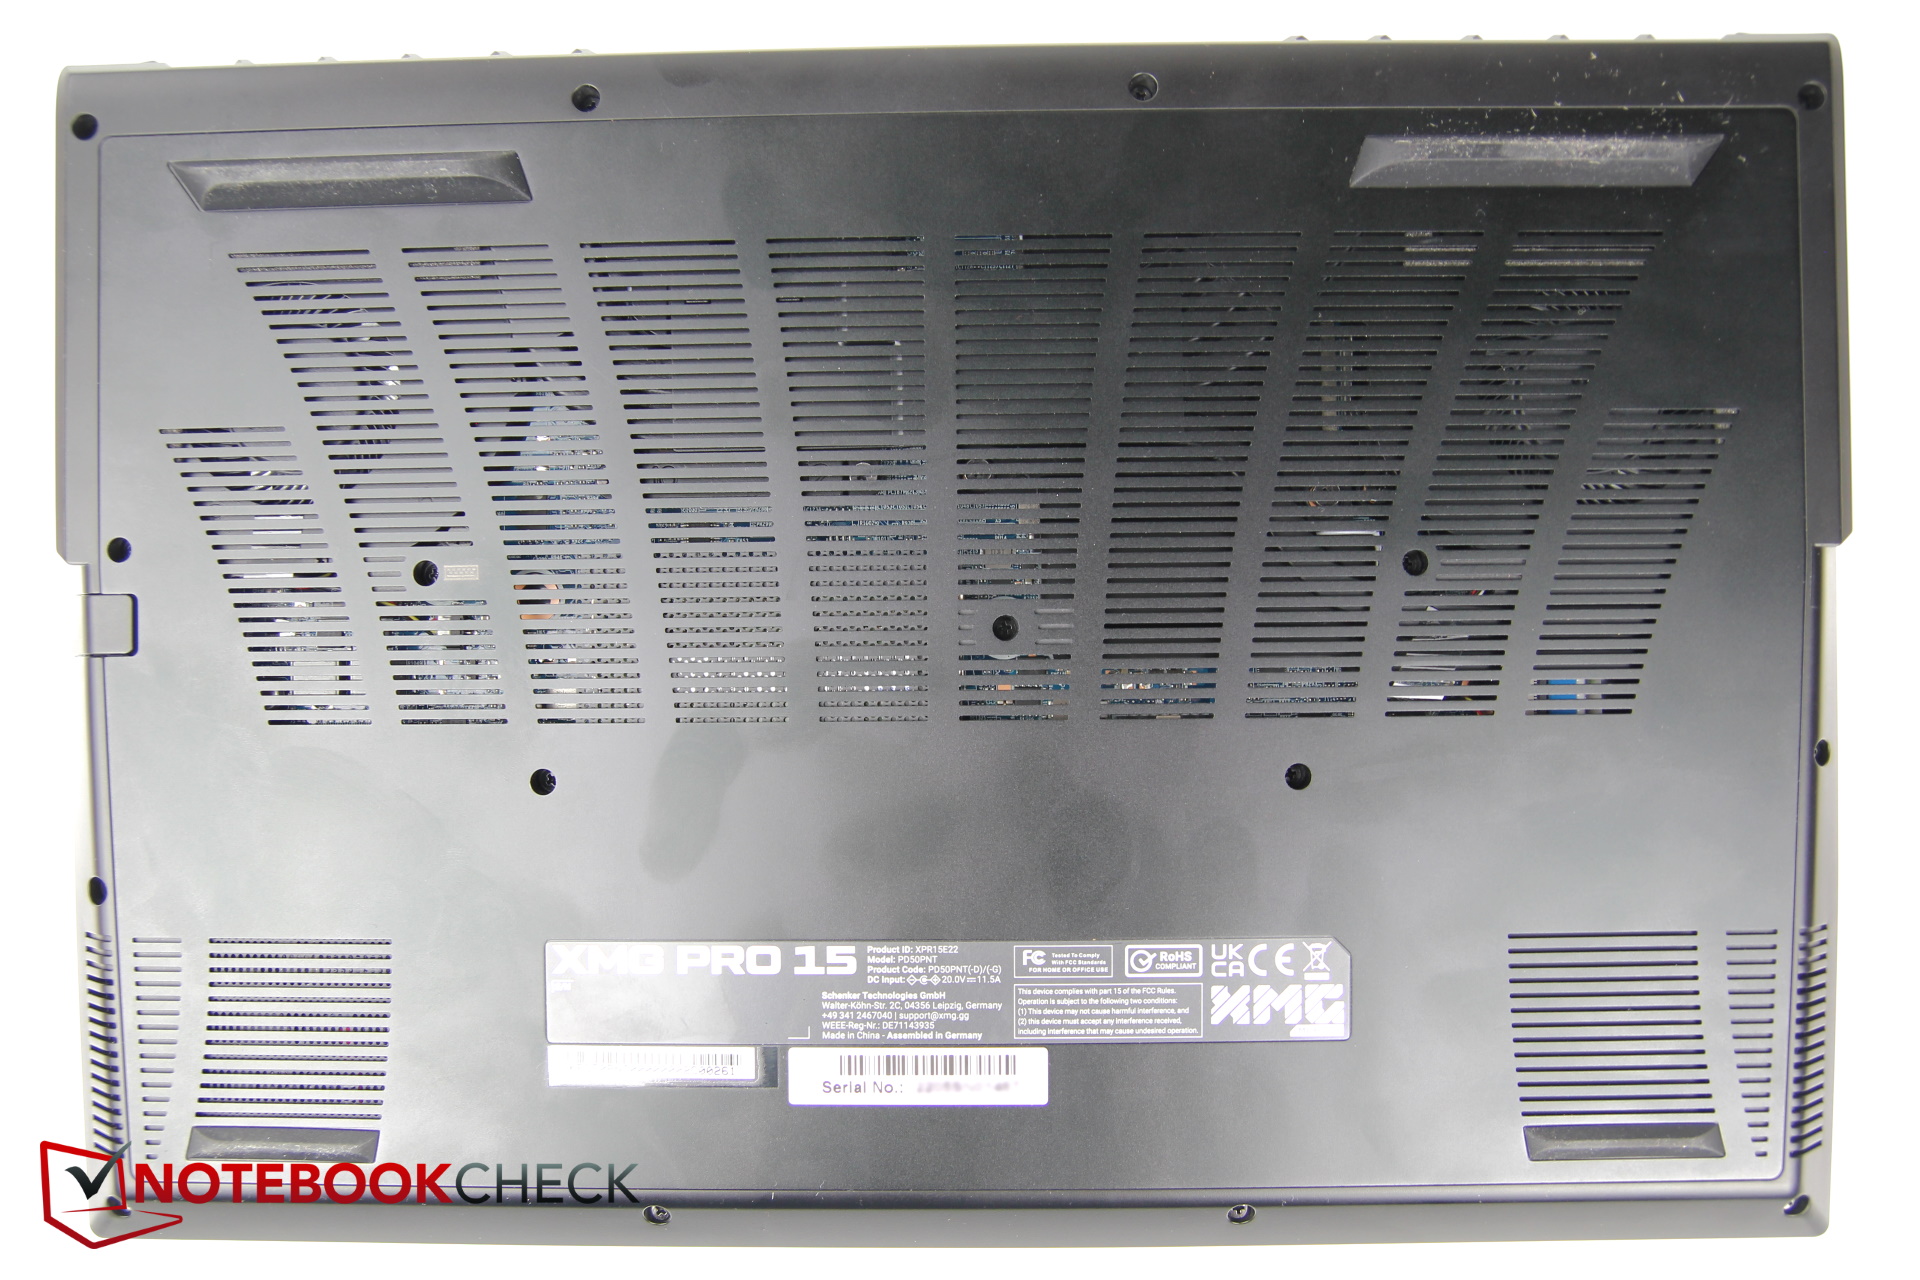
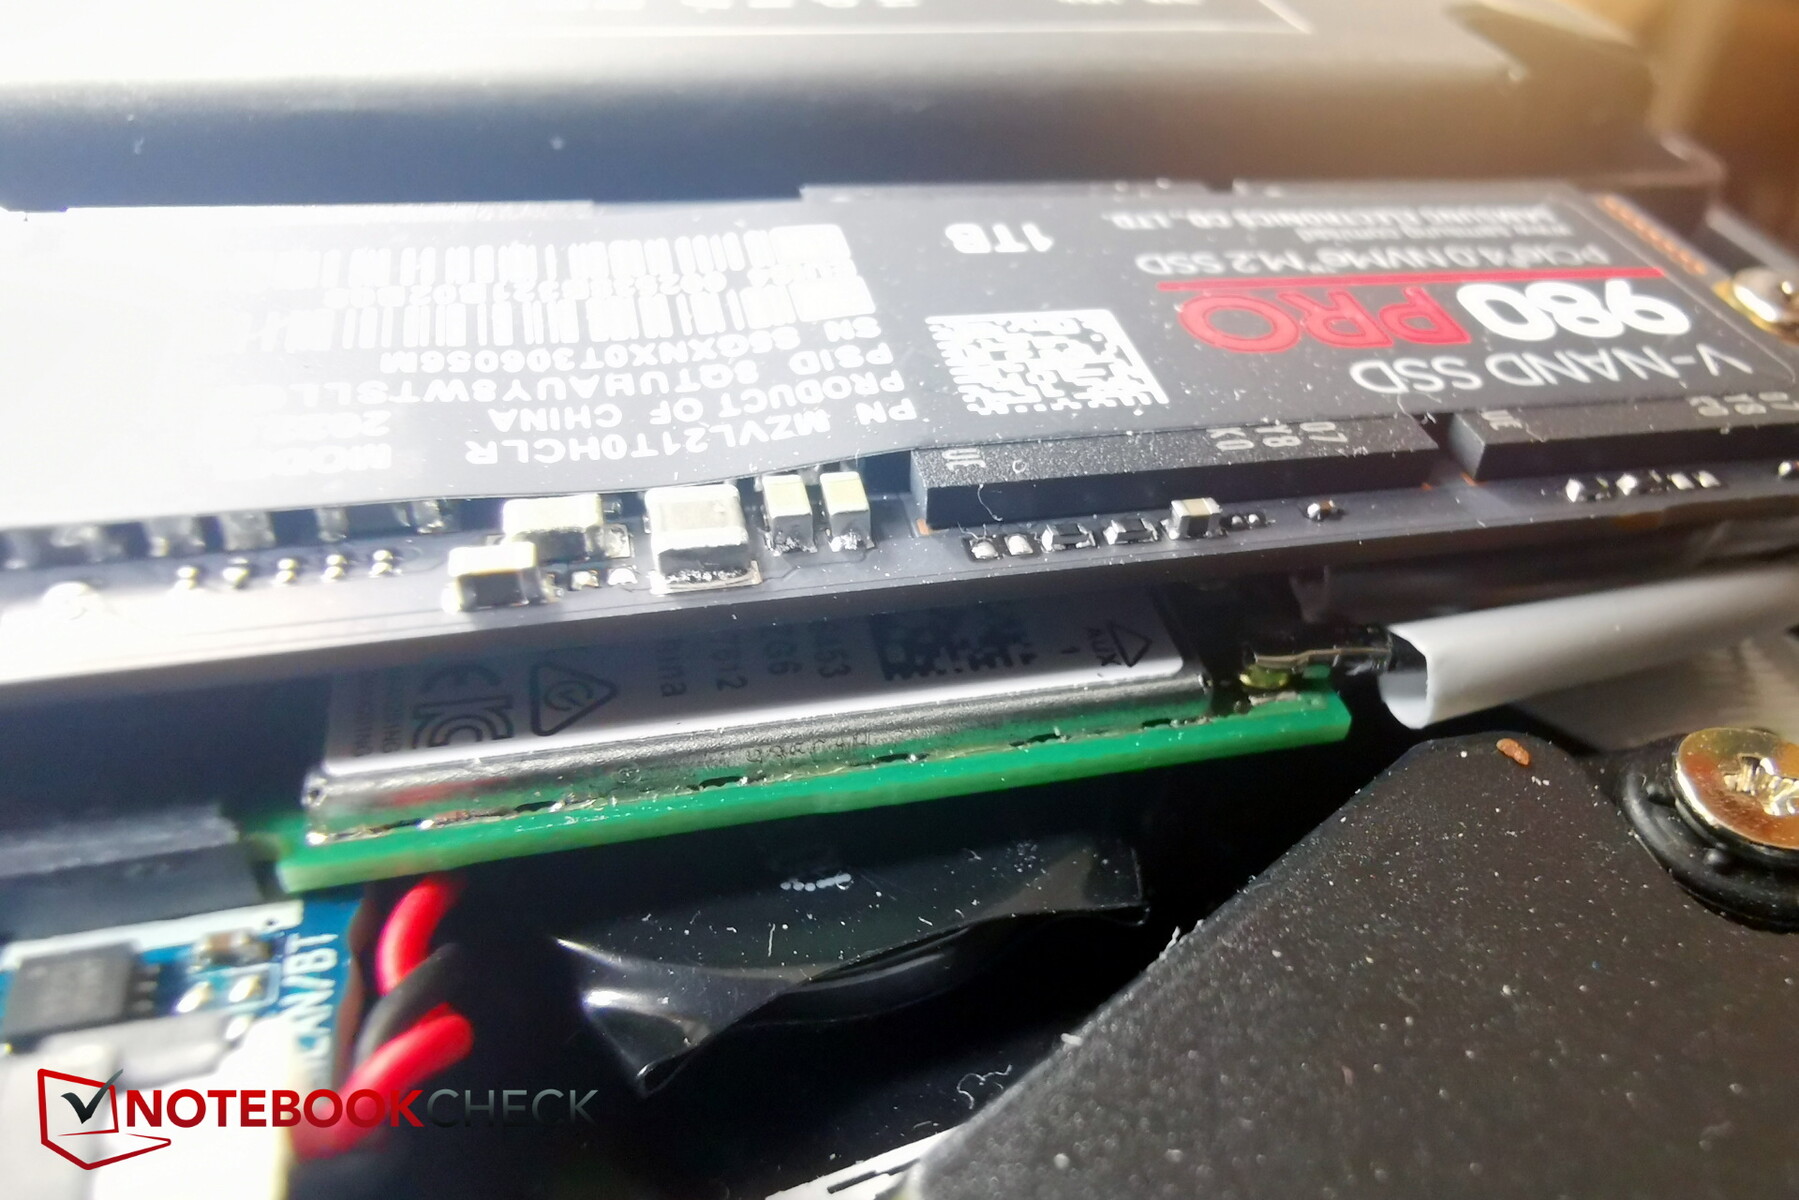
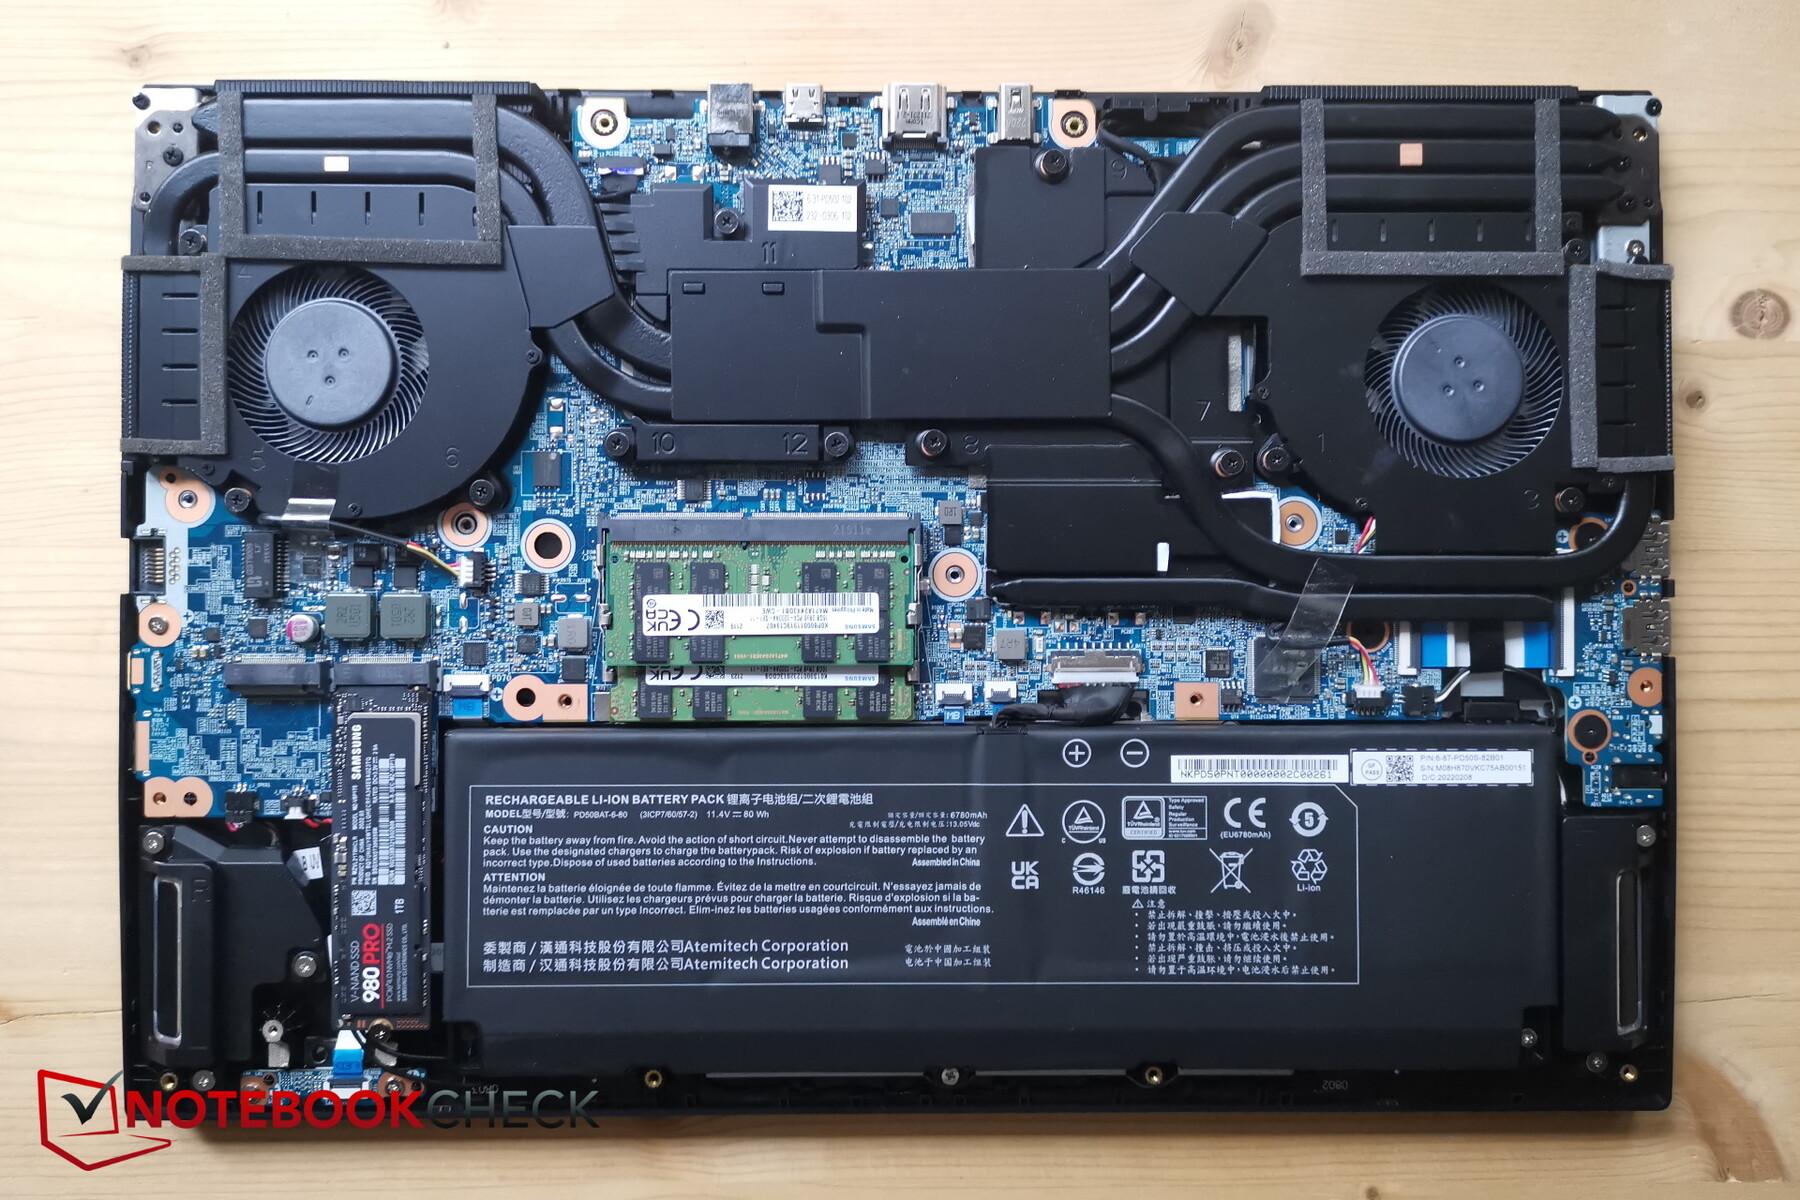
Mantenimiento
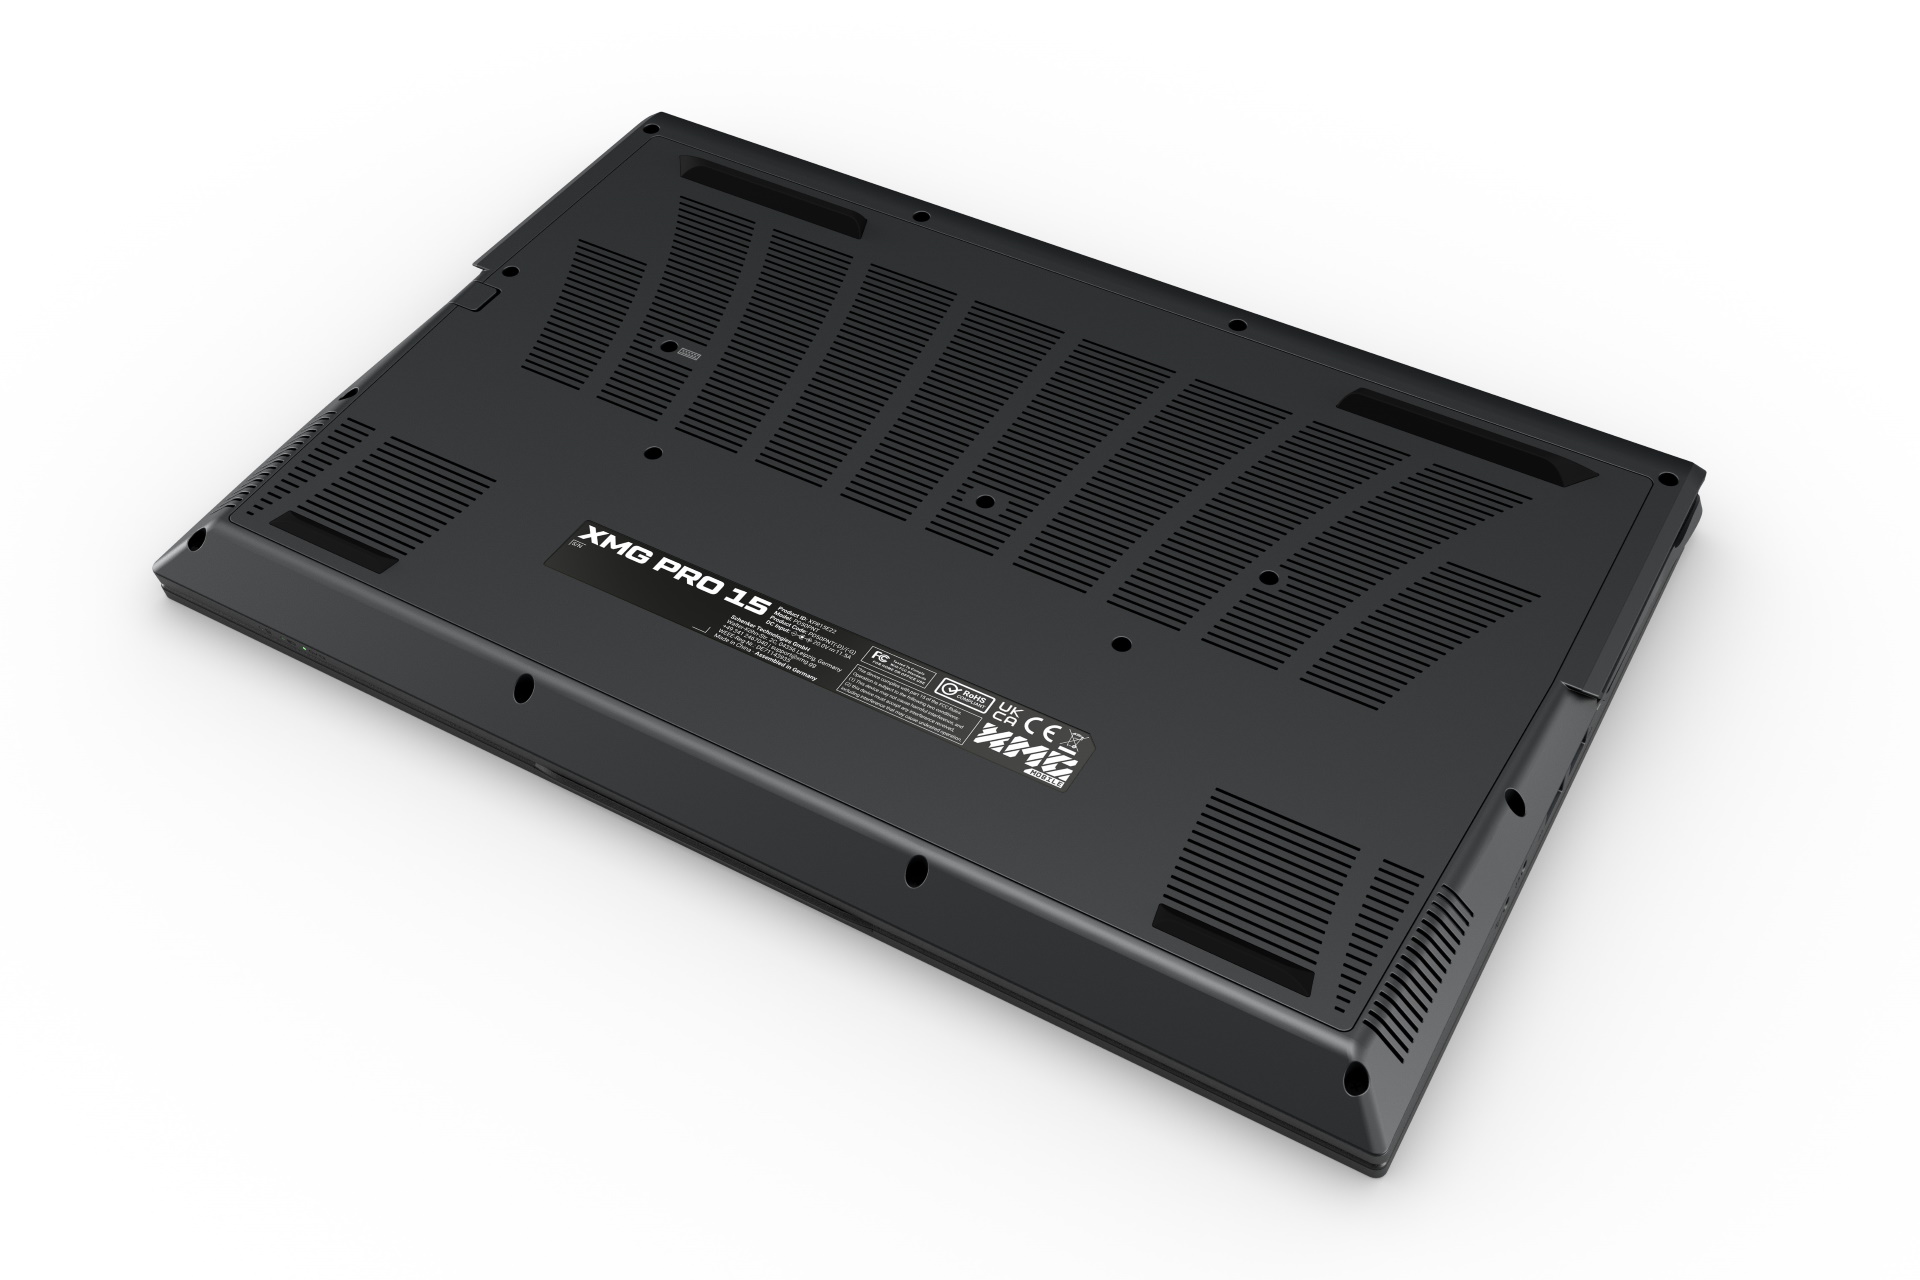
La parte inferior de aluminio está asegurada por 16 tornillos Phillips. Ni siquiera el Neo con sus puertos de agua tiene tantos (14). Afortunadamente, todos los tornillos tienen la misma longitud, por lo que no hay confusión.
La placa base se puede quitar muy fácilmente sin herramientas adicionales, y tienes acceso a la batería, los ventiladores, las dos ranuras M.2 y la RAM. Sólo el módulo WiFi está oculto, concretamente debajo del SSD, lo que quizá no sea tan óptimo en términos de refrigeración.
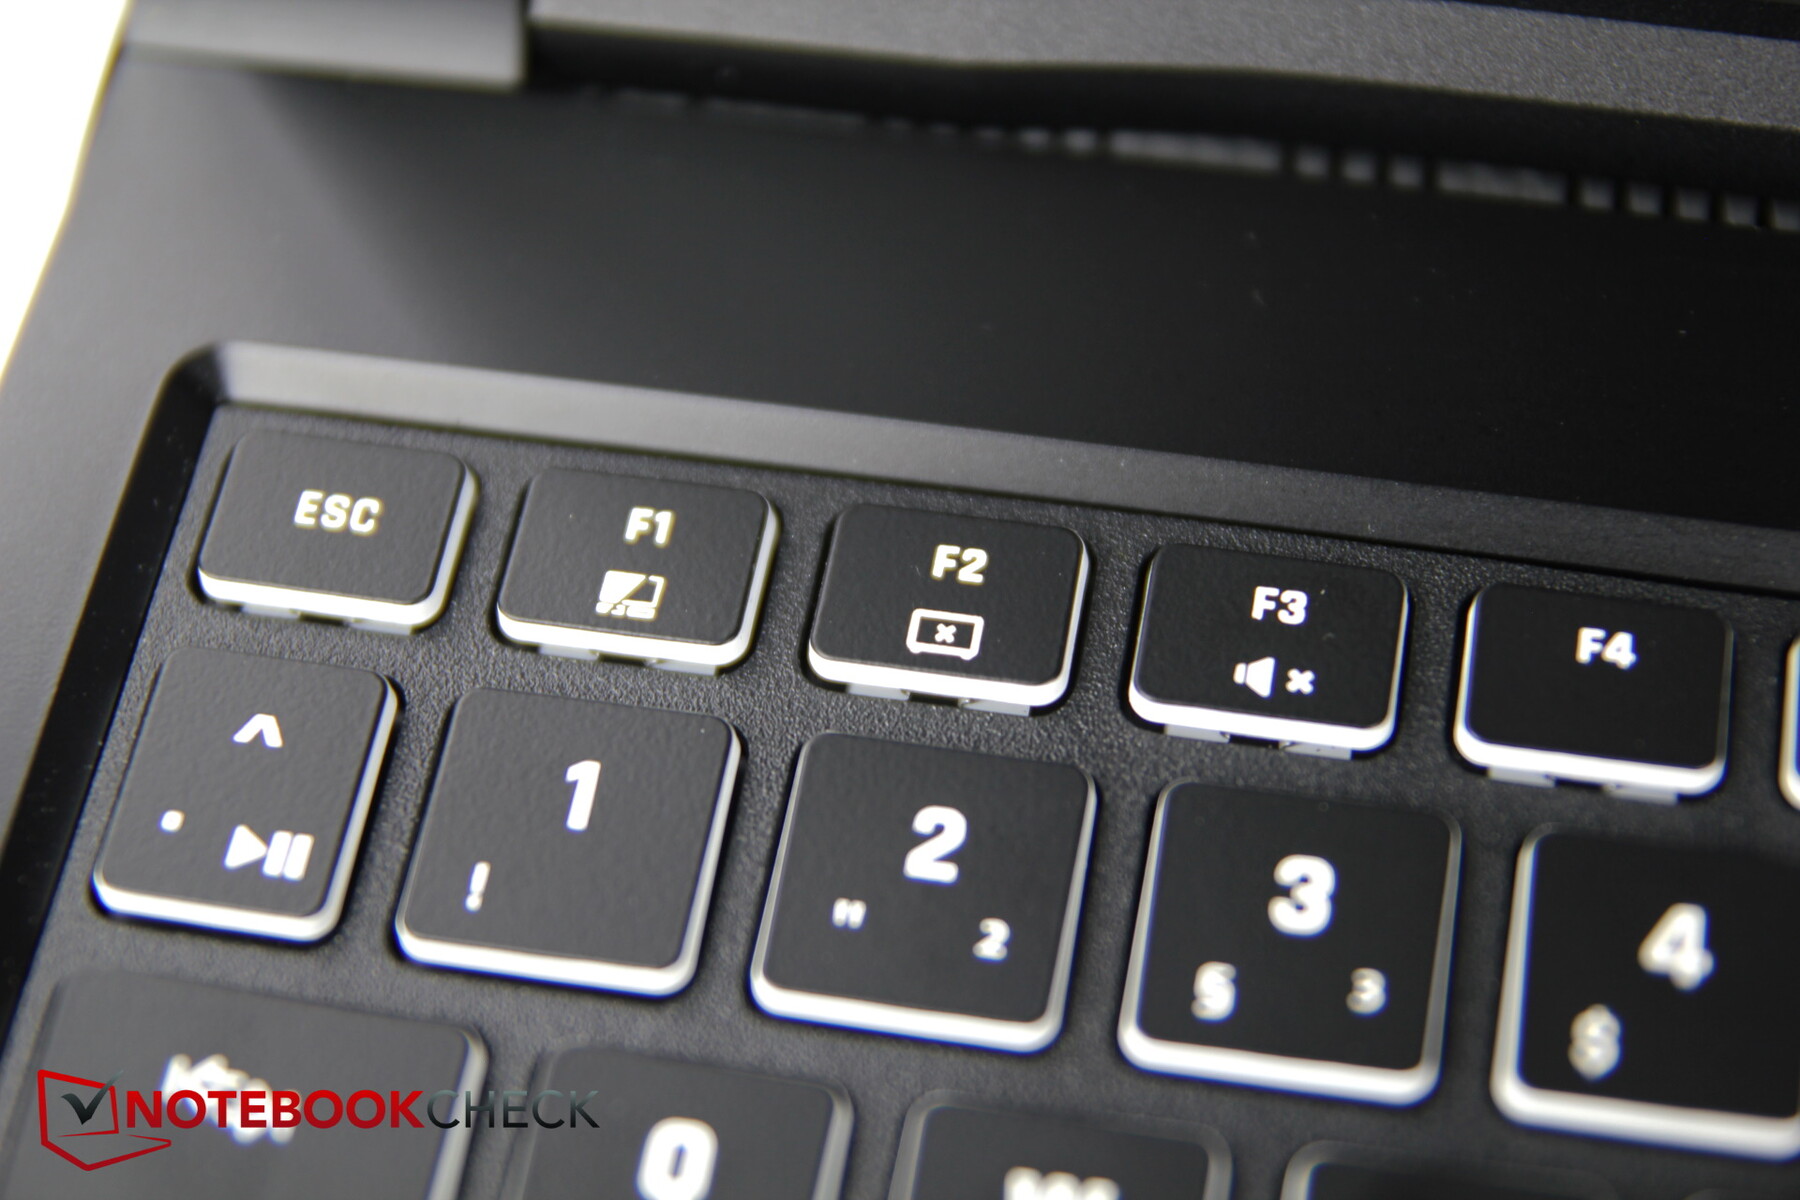
Dispositivos de entrada: RGB por tecla
Teclado
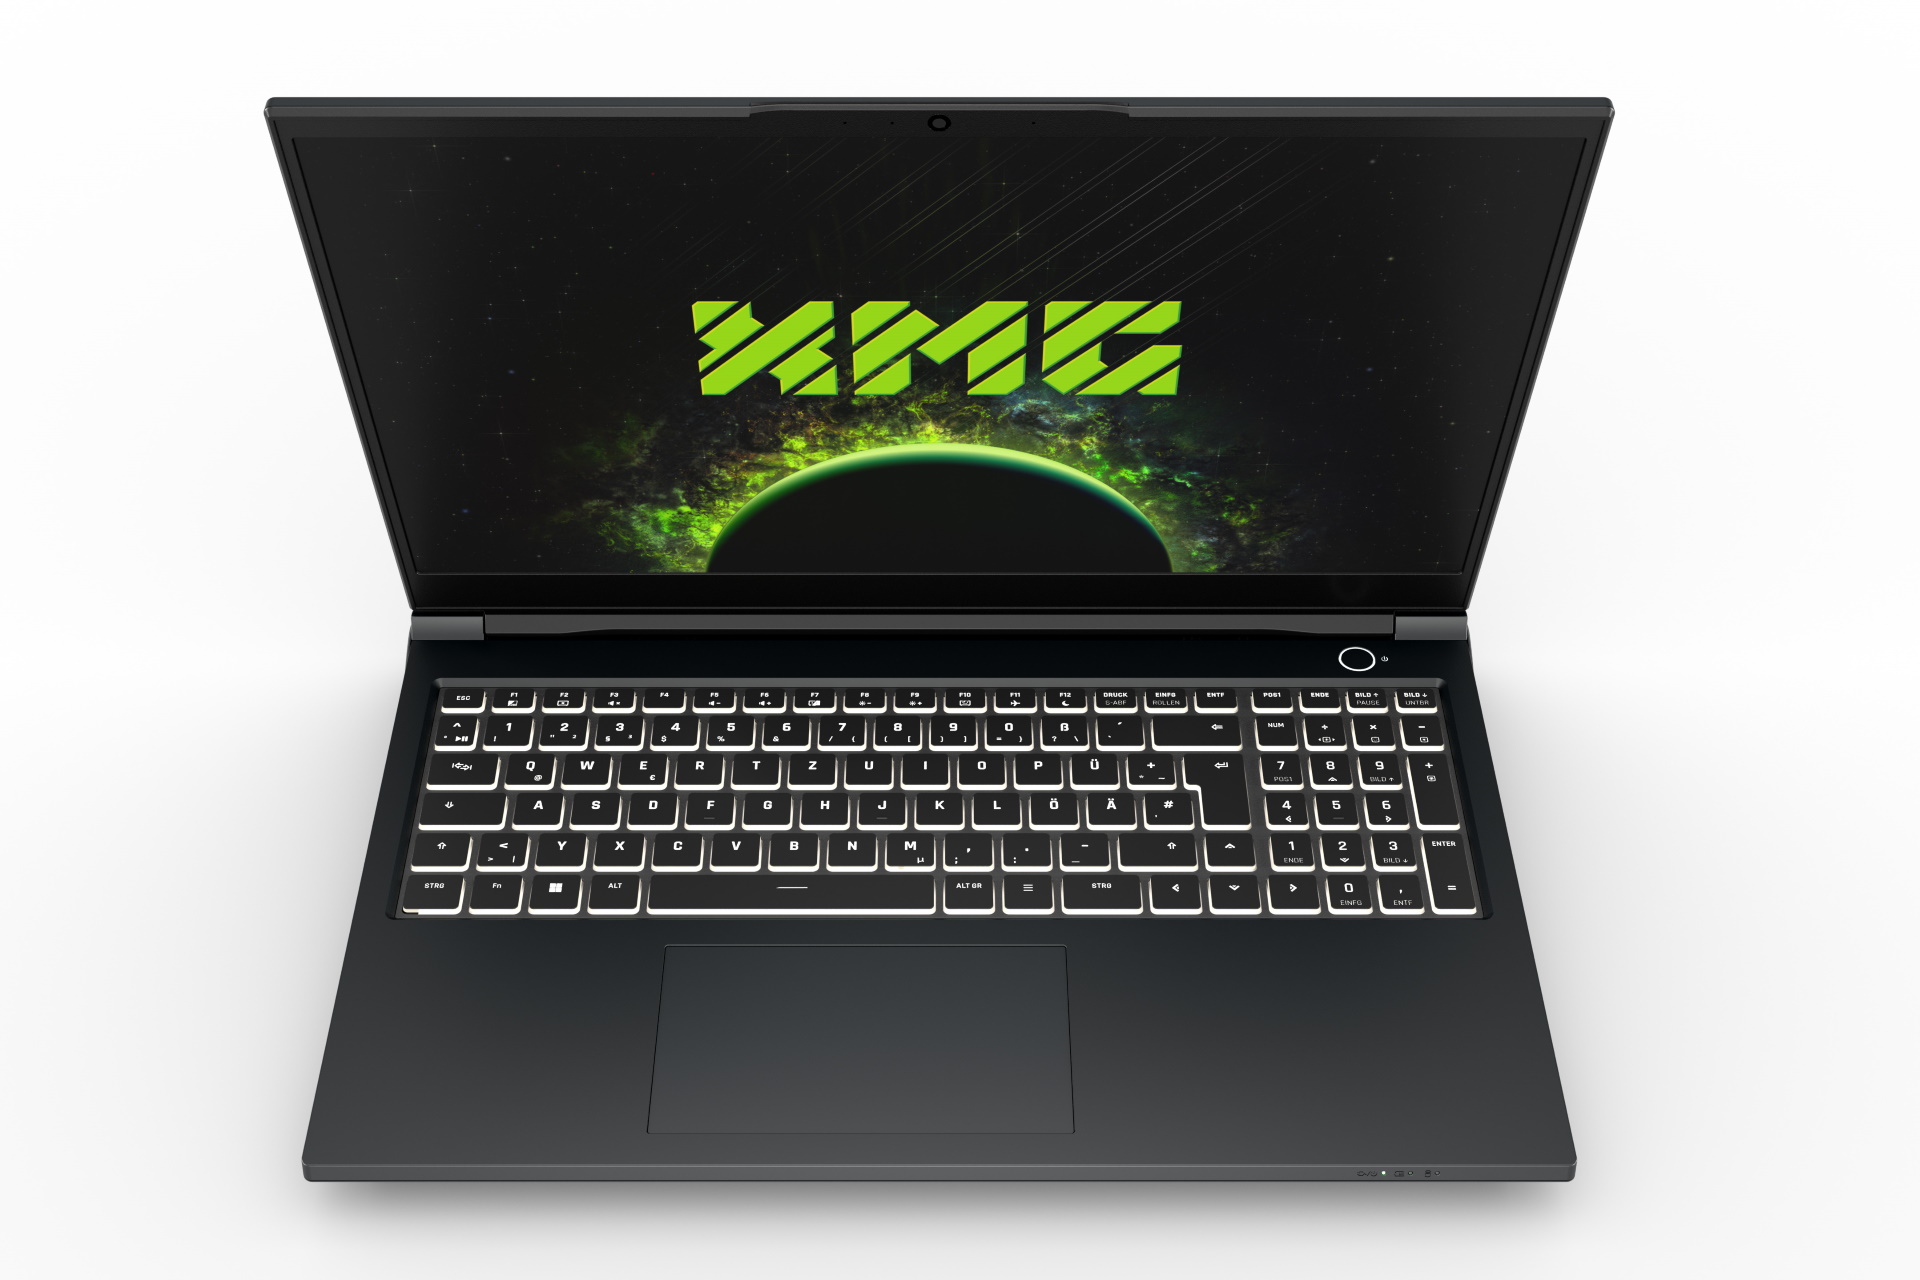
En lugar del teclado optomecánico como en el Neo 15, Schenker utiliza un teclado chiclet "normal" con retroiluminación RGB para cada tecla en el Pro 15.
La distribución es muy ordenada. Aunque las teclas tienen un diseño pequeño, están bien espaciadas y todavía hay espacio para un teclado numérico a la derecha.
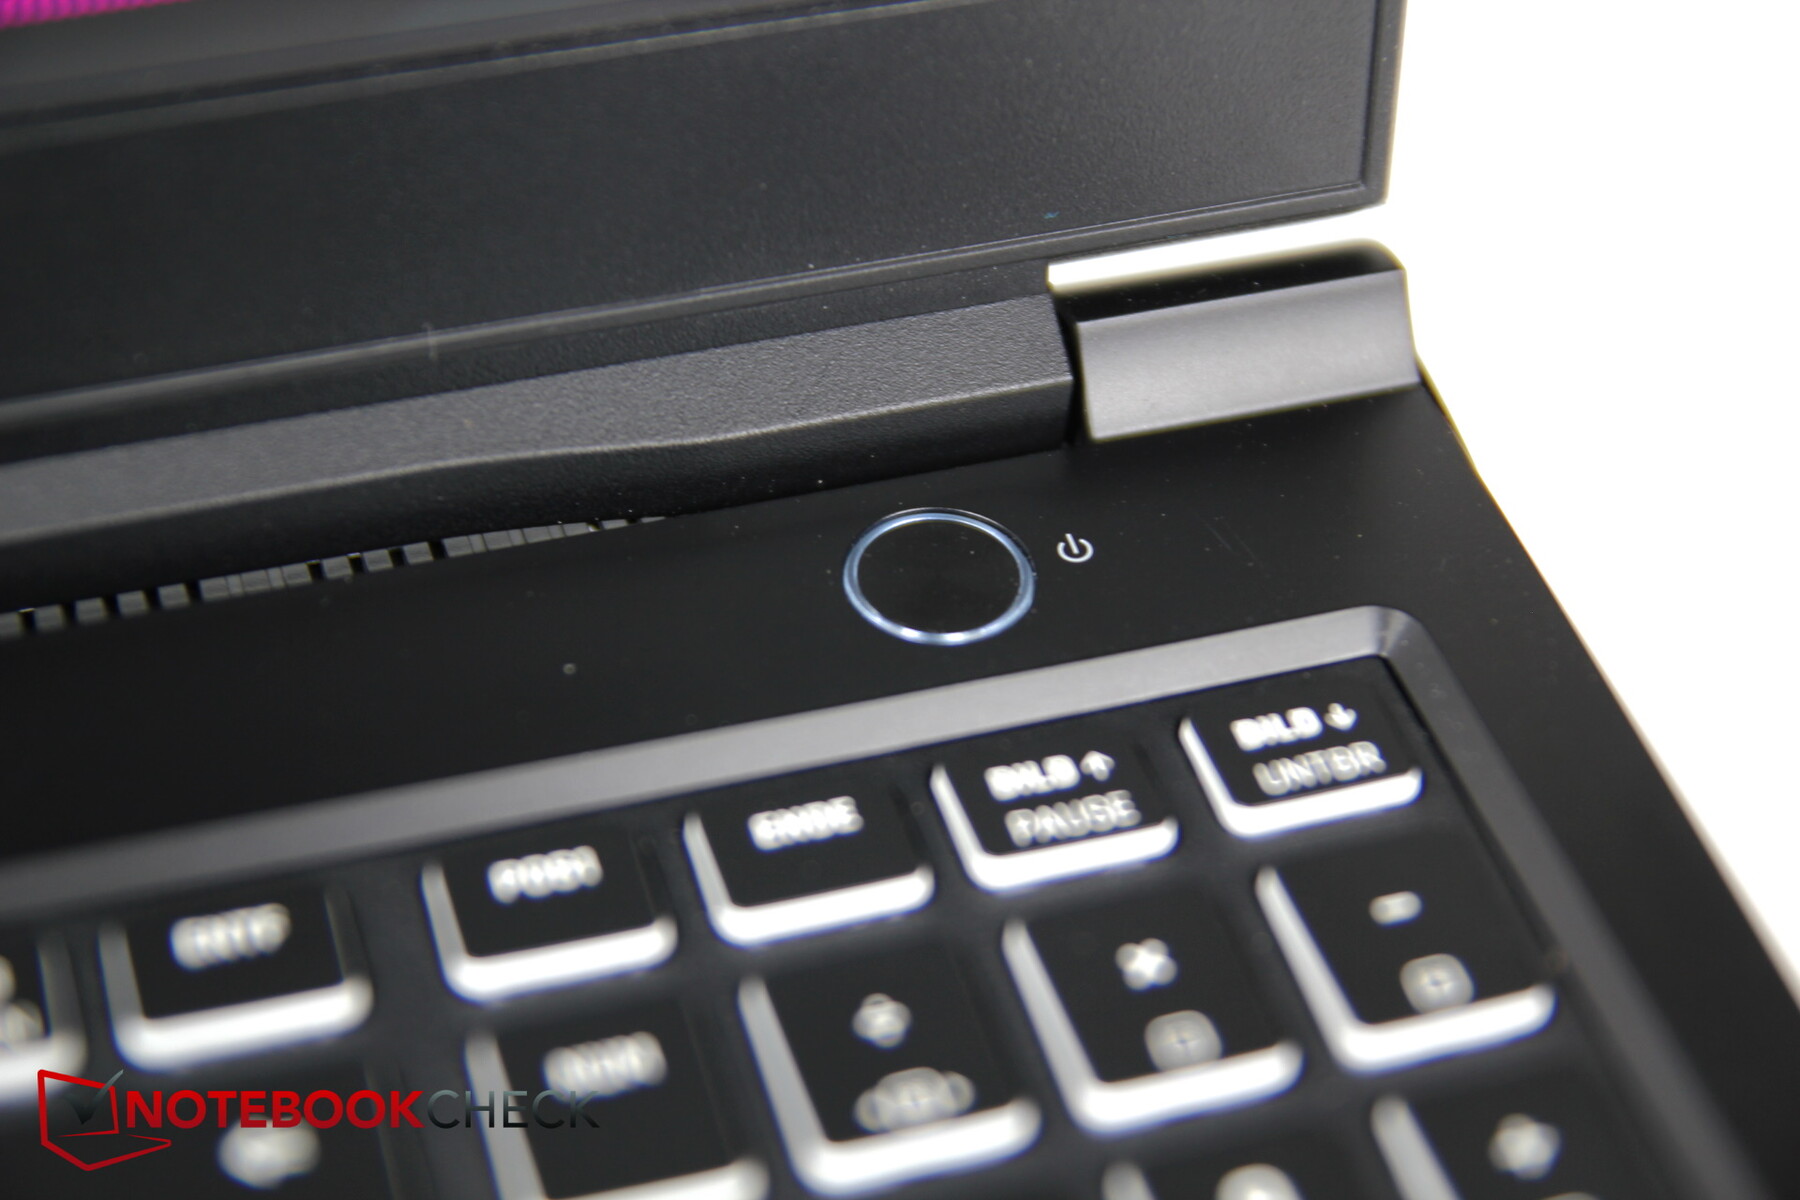
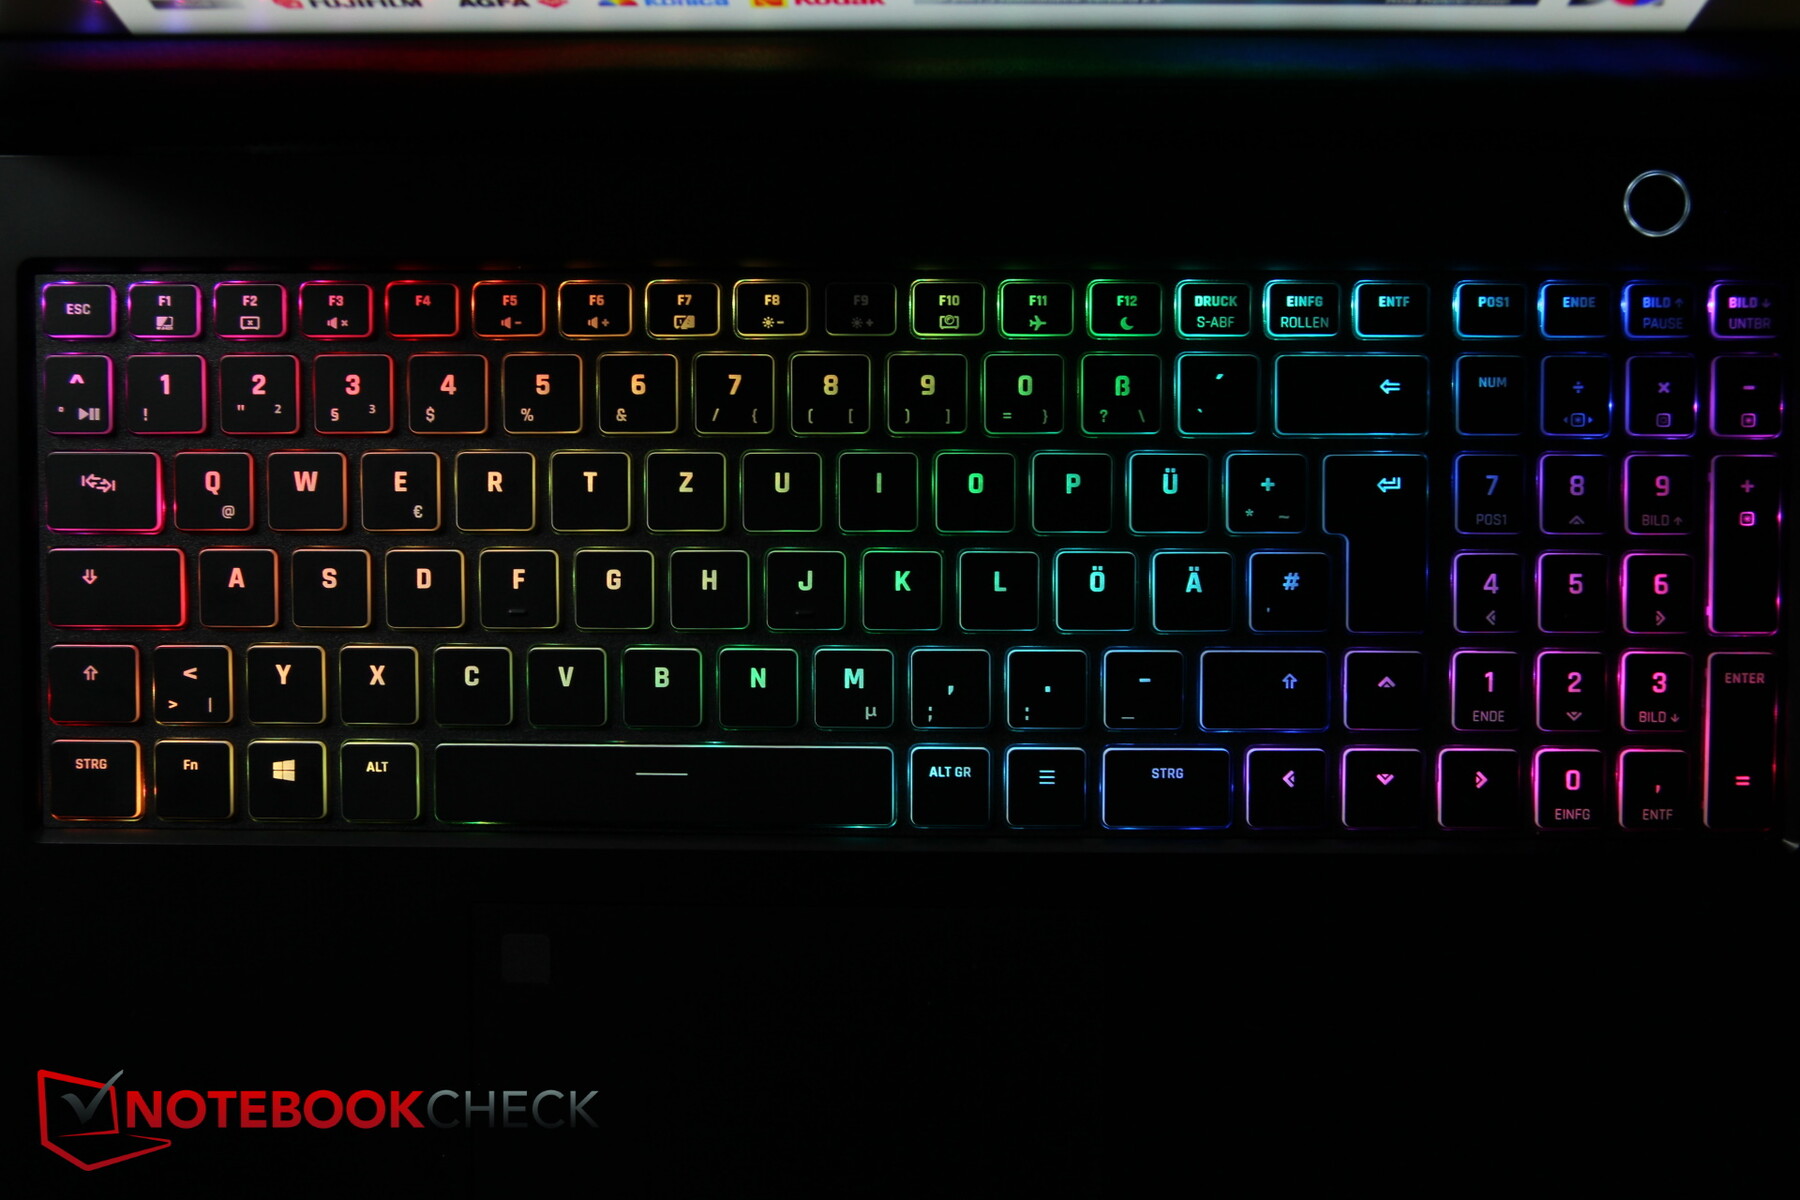
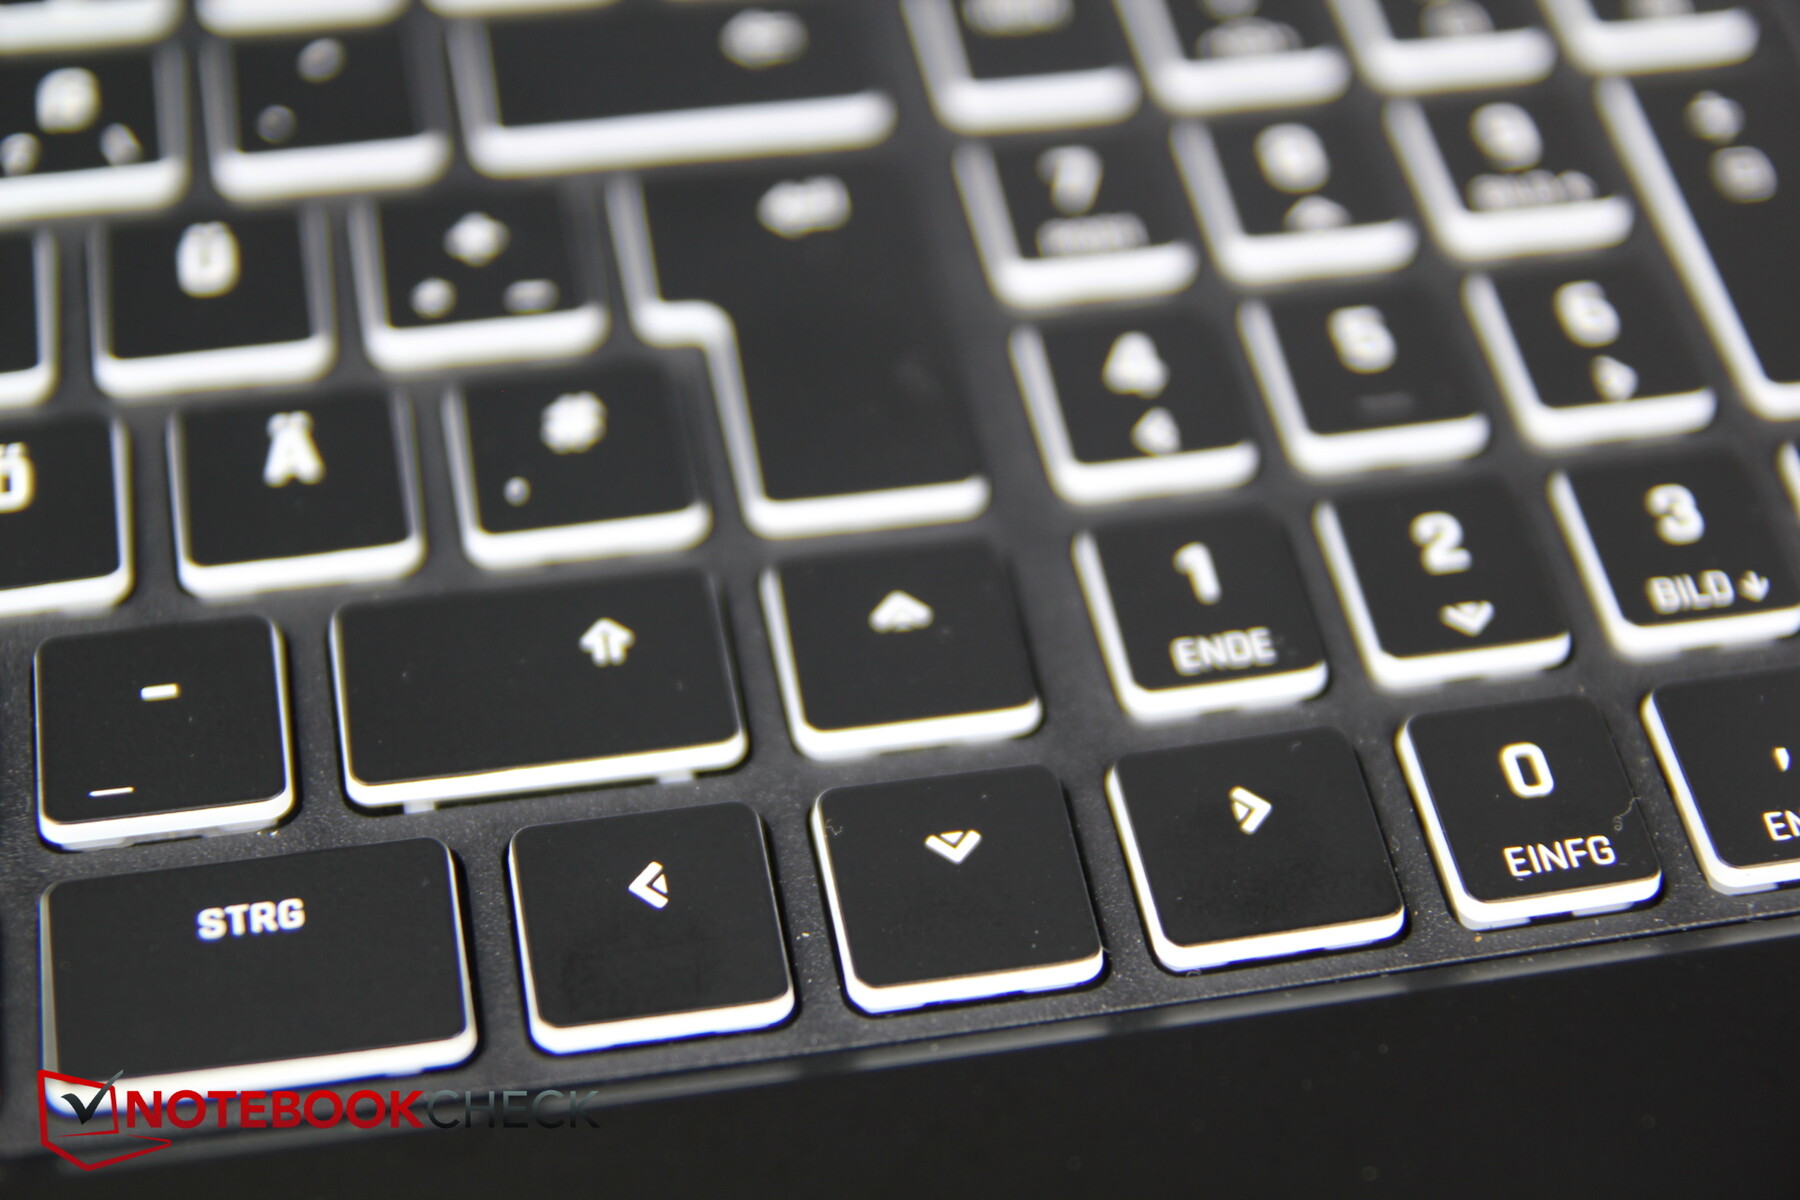
El botón de encendido se ha instalado como una tecla más encima del teclado, y las teclas de dirección tienen un tamaño normal. Sólo las teclas F se han reducido a la mitad en altura. La letra no es muy grande, pero es fácil de leer gracias al blanco claro.
La escritura es sencilla y rápida, el recorrido de las teclas es aceptable y la respuesta de las teclas es palpable. El ruido de pulsación es moderado.
Teclado táctil

El amplio touchpad (~12,1 x 7,3 cm) tiene buenas propiedades de deslizamiento; sólo durante los movimientos muy lentos puede flaquear ligeramente. Los botones de ratón dedicados del predecesor ya son historia, por desgracia. Los clics de los botones integrados son cortos, nítidos y fiables, y el ruido de moderado a medio.
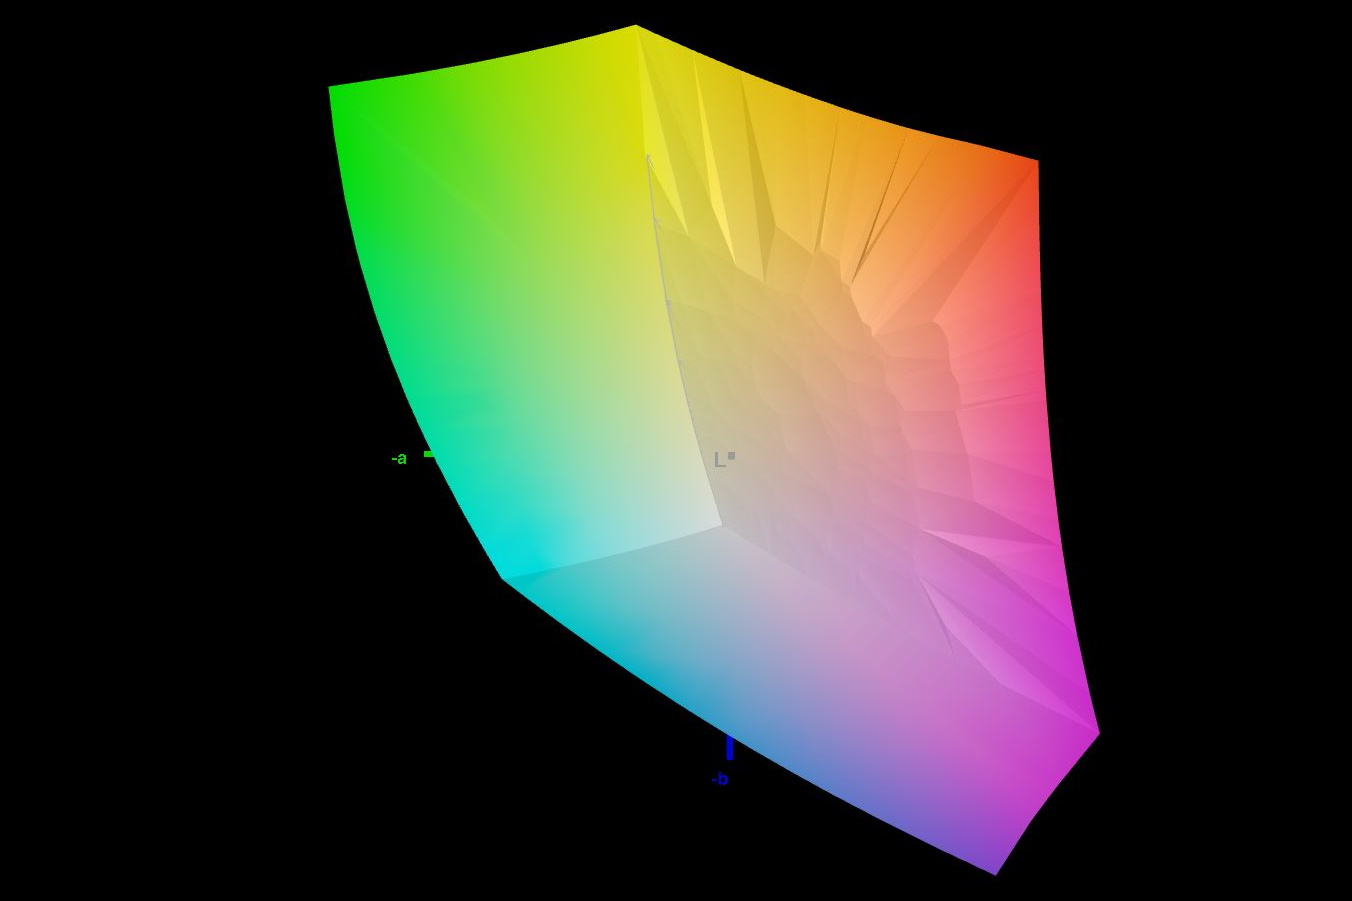
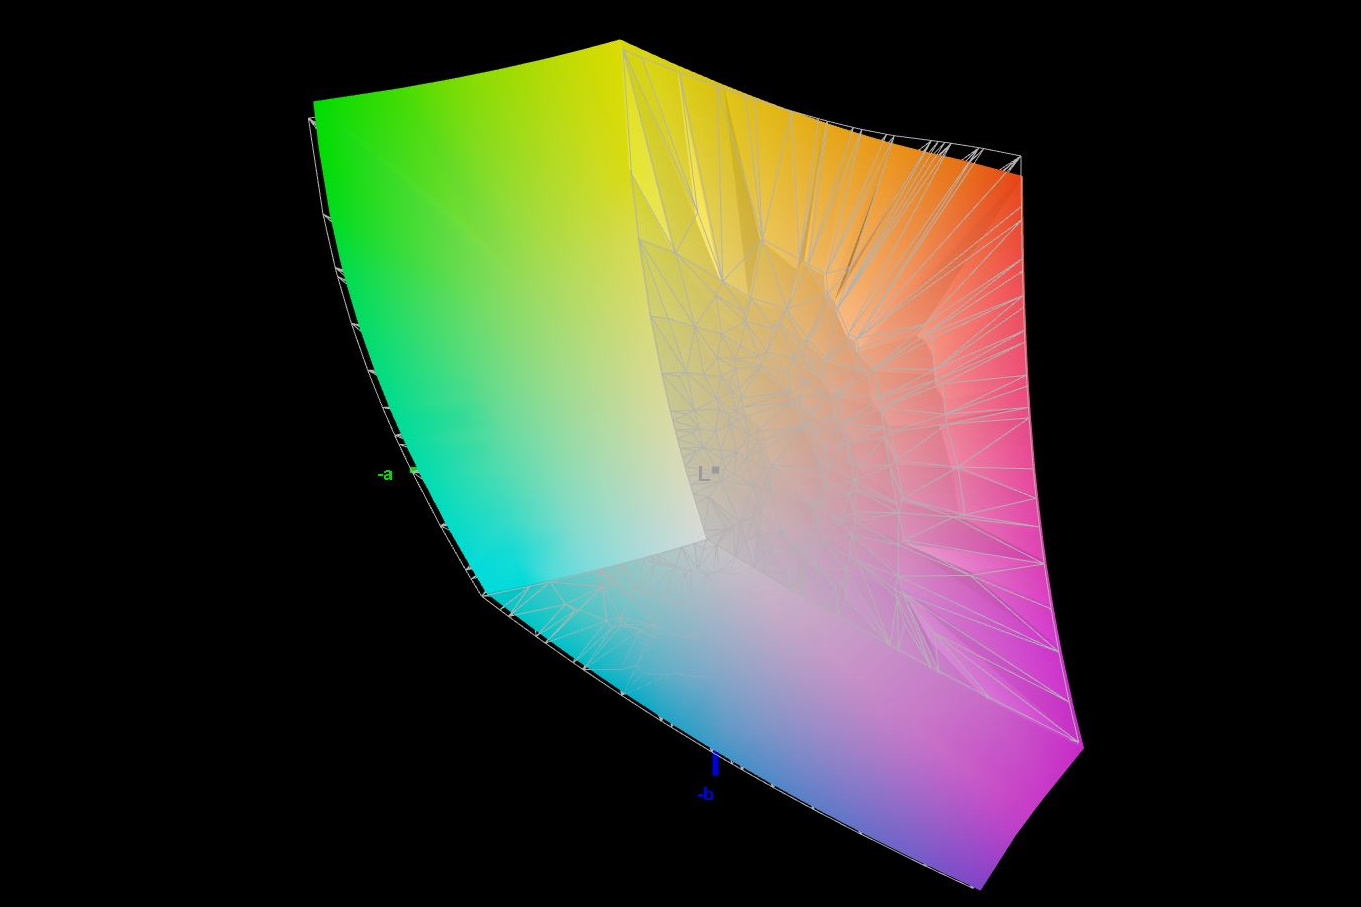
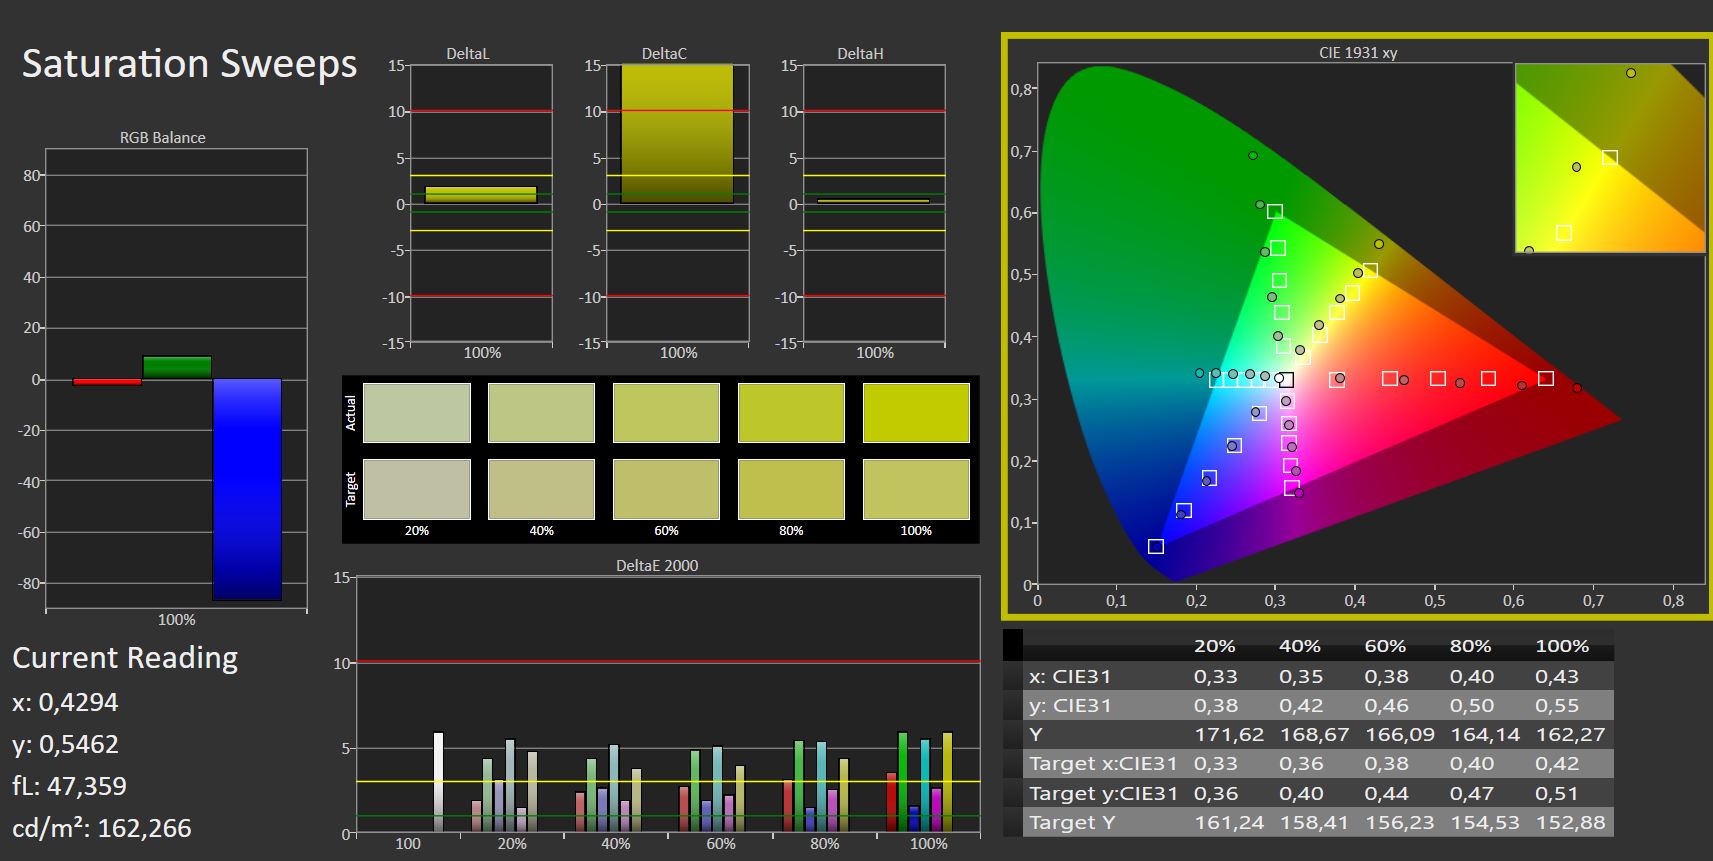
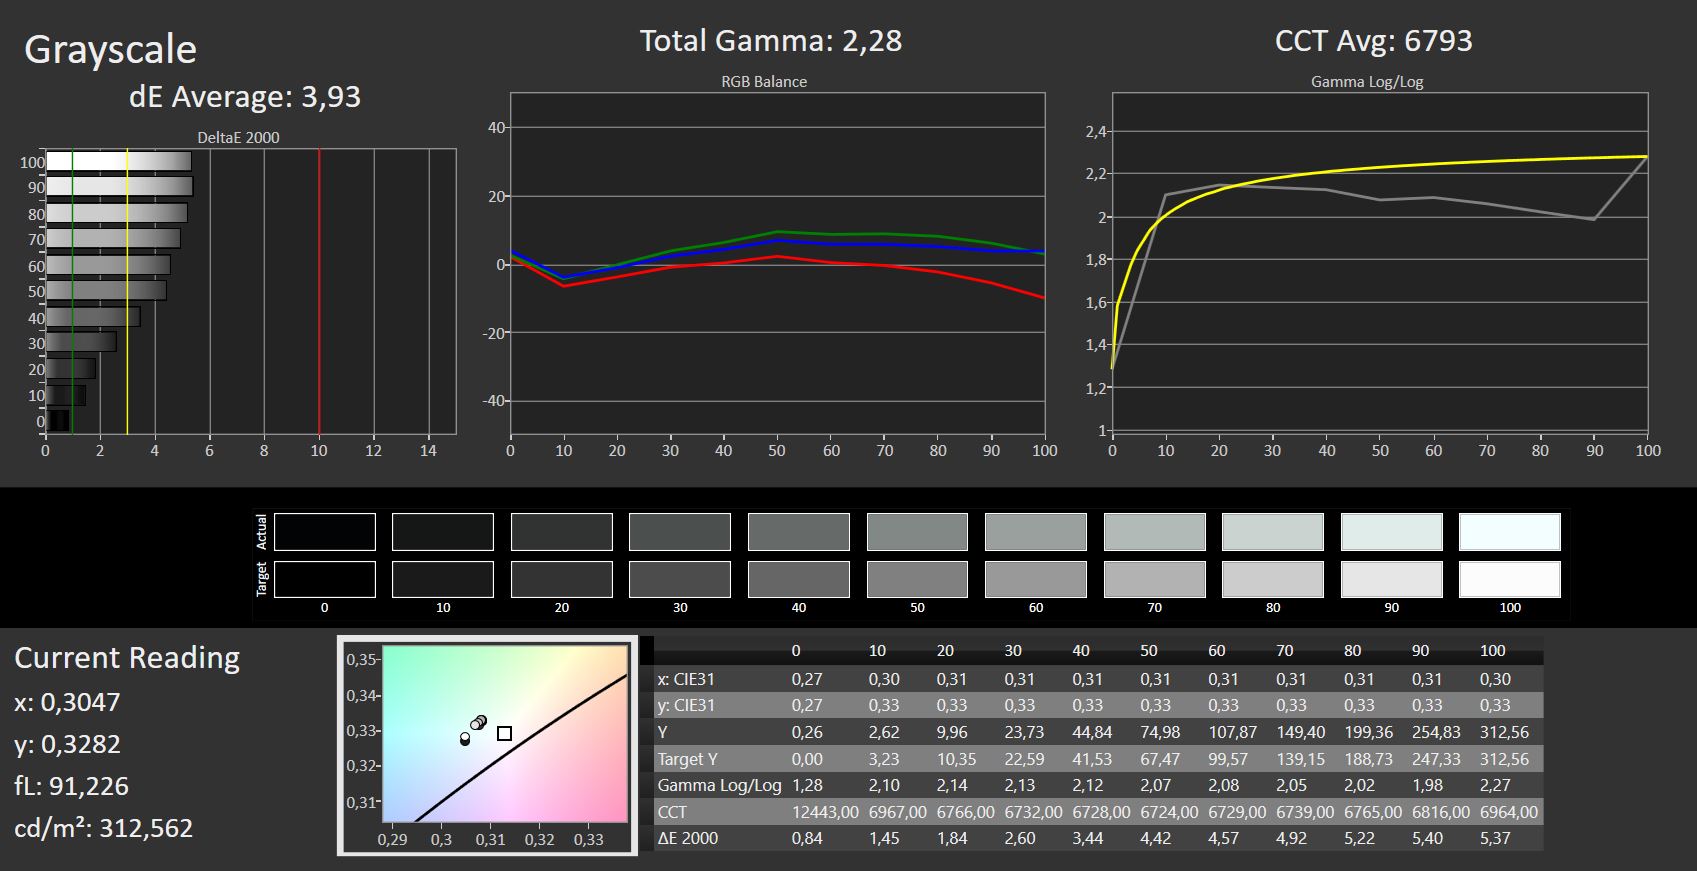
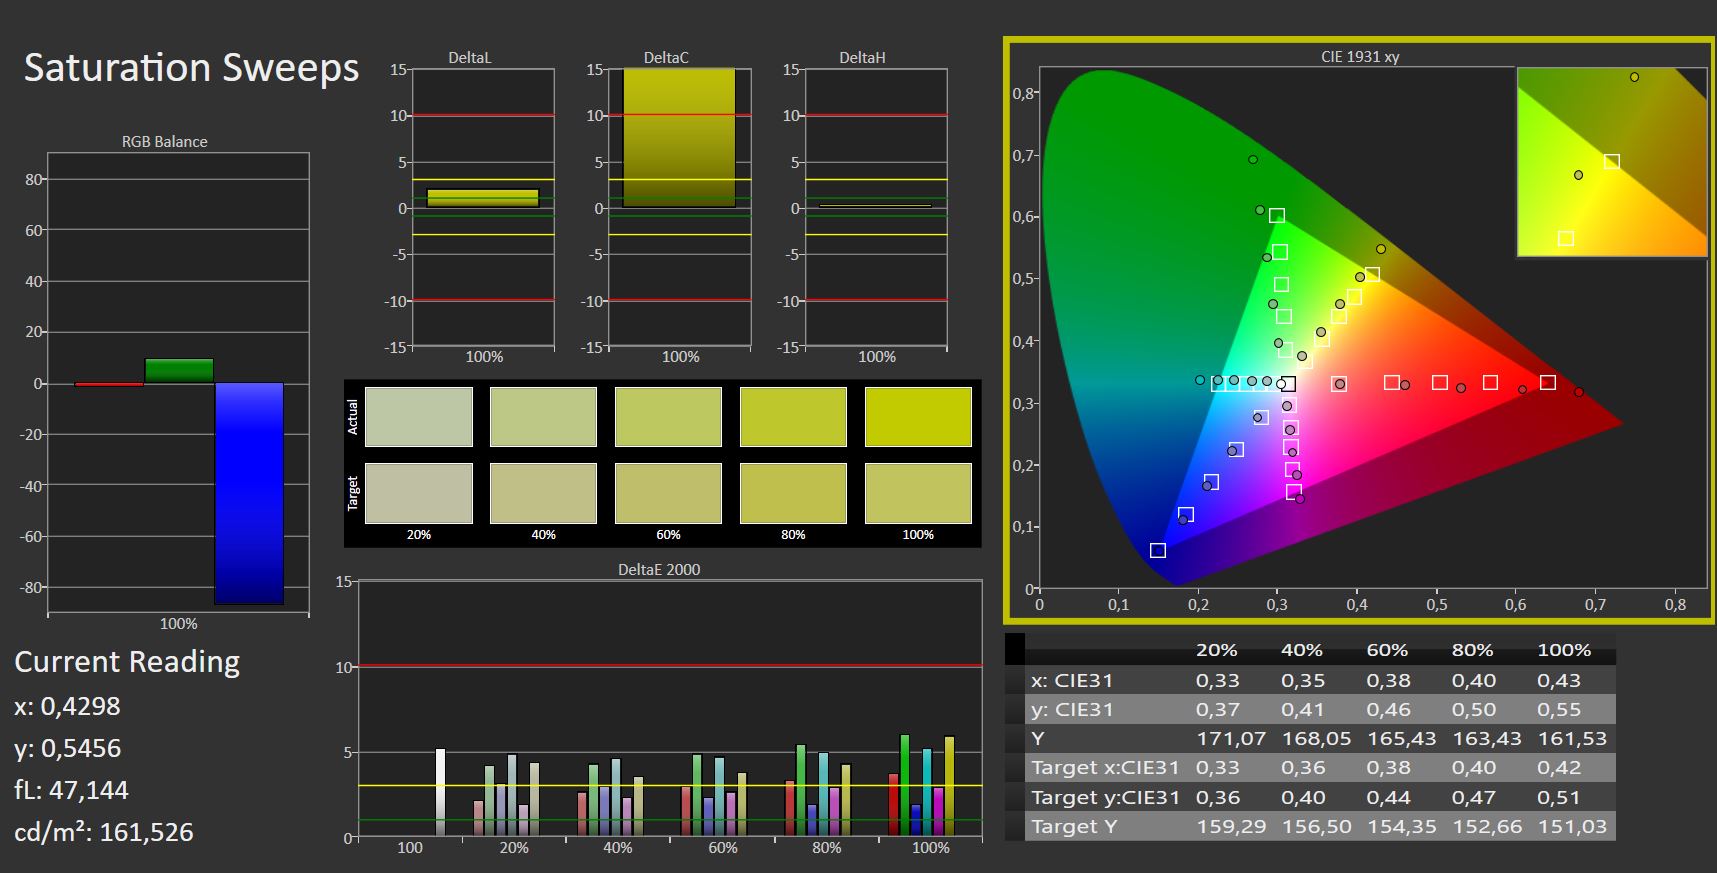
Pantalla: Buena cobertura del espacio de color
Schenker utiliza un panel IPS QHD mate (2560 x 1440) de BOE con 165 Hz. Como alternativa, vuelve a estar disponible la opción 4K OLED de alta calidad del predecesor, así como un panel Full HD con una cobertura de espacio de color más pobre.
El brillo está justo por debajo de los 300 nits debido a una iluminación poco uniforme. El ratio de contraste también podría ser algo mayor, pero está bien. En general, la pantalla no ofrece los mejores valores, pero es muy completa: buenos tiempos de respuesta, brillo aceptable y buena cobertura del espacio de color.
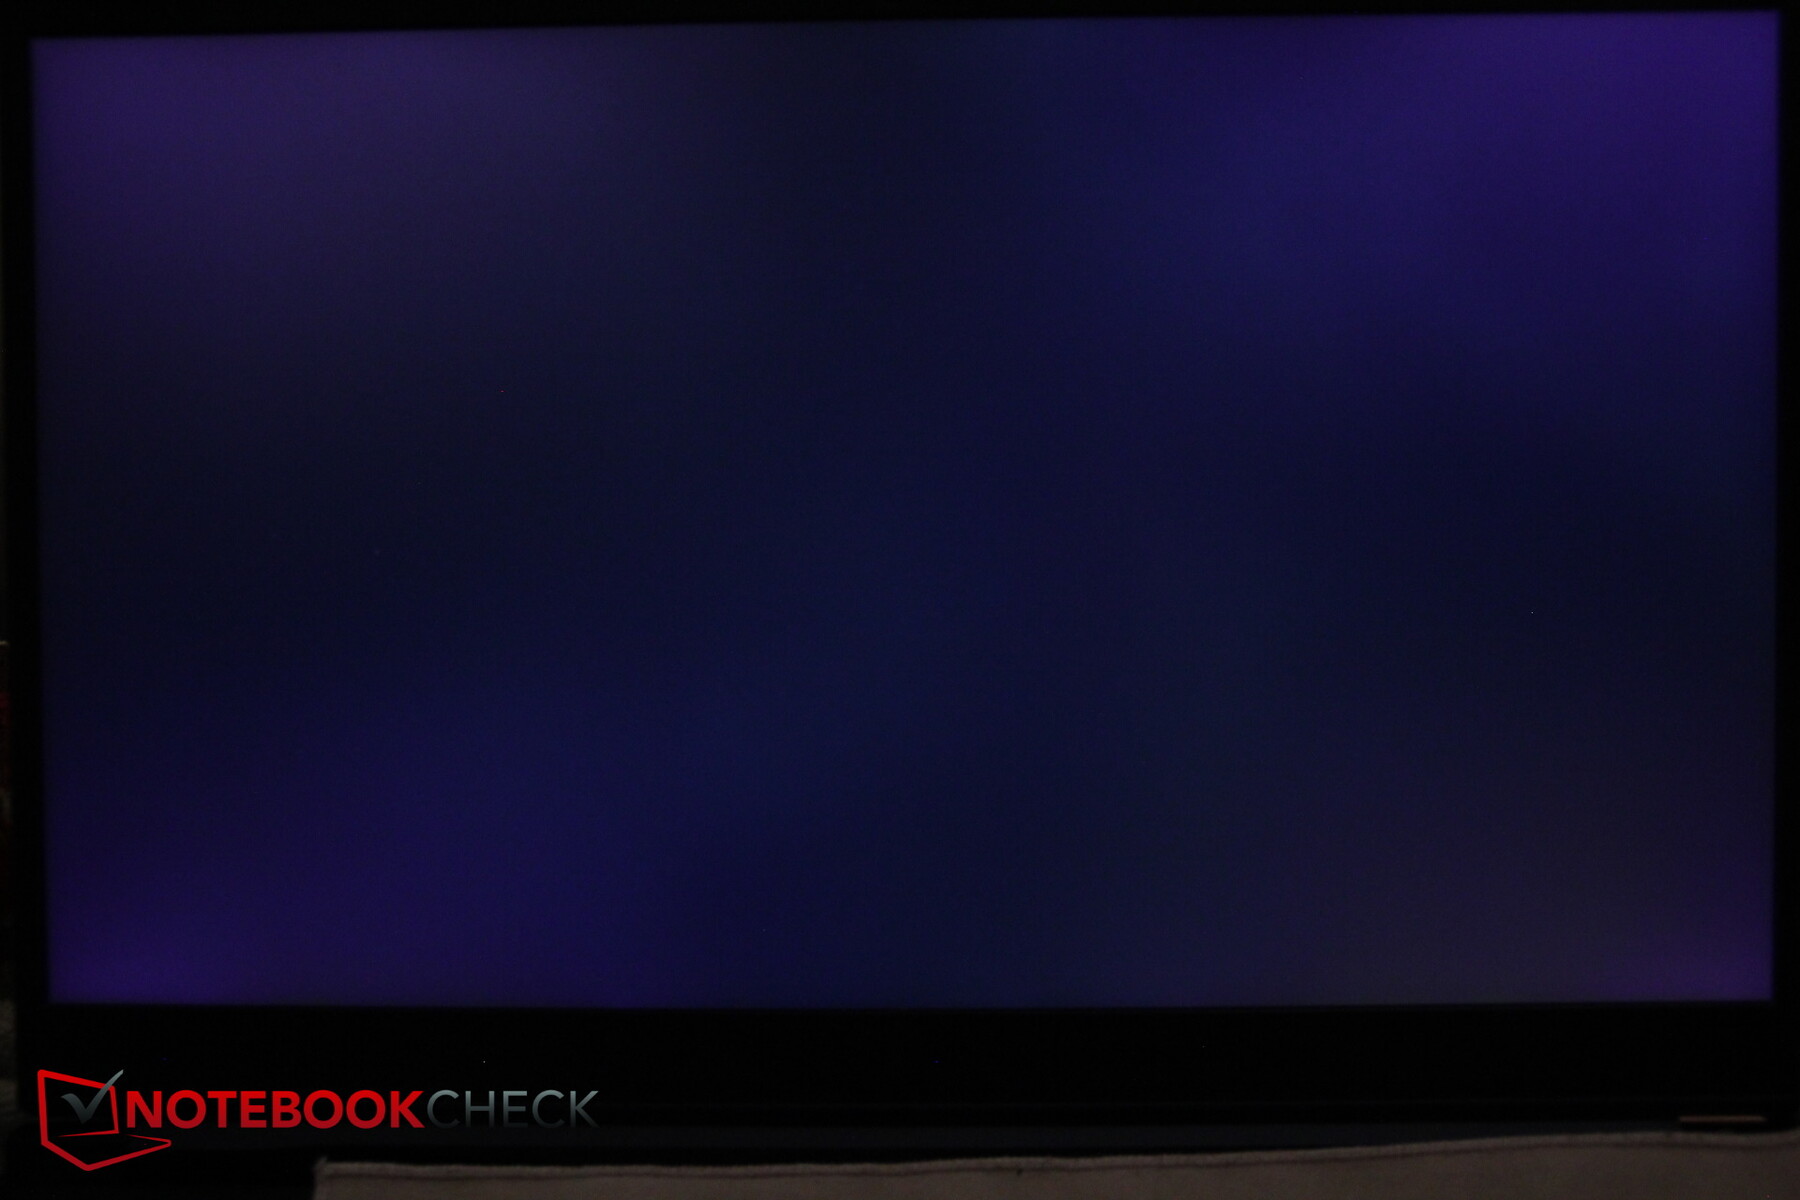
No se utiliza PWM para controlar el brillo. El sangrado de la pantalla es extremadamente mínimo y apenas se nota incluso en entornos oscuros.
| |||||||||||||||||||||||||
iluminación: 83 %
Brillo con batería: 319 cd/m²
Contraste: 991:1 (Negro: 0.32 cd/m²)
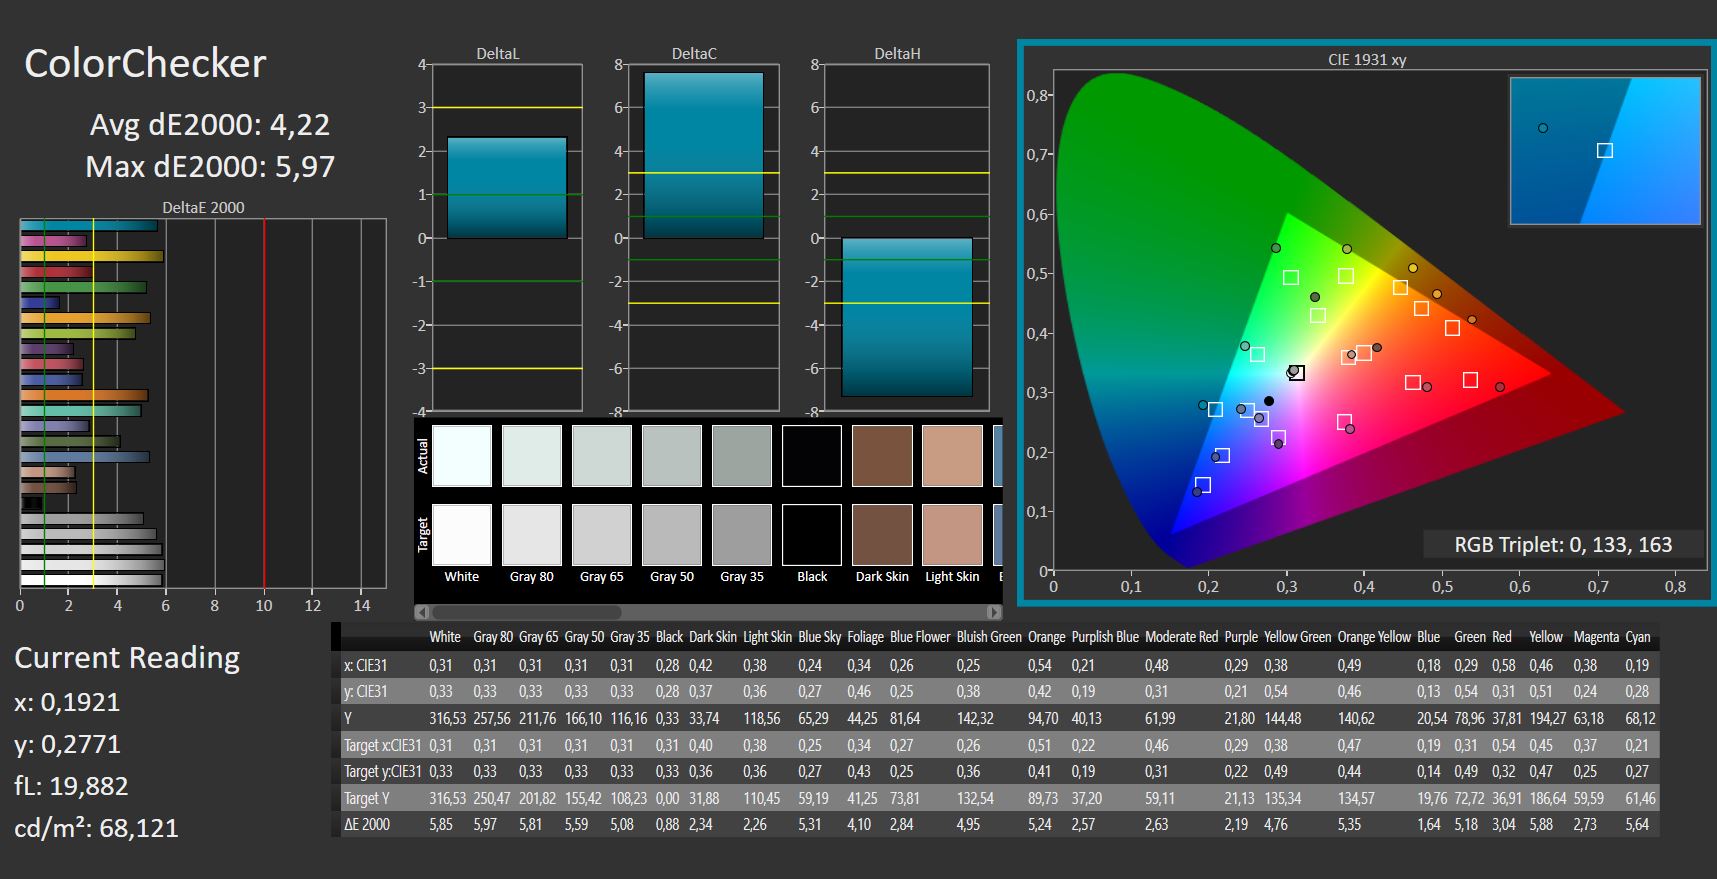
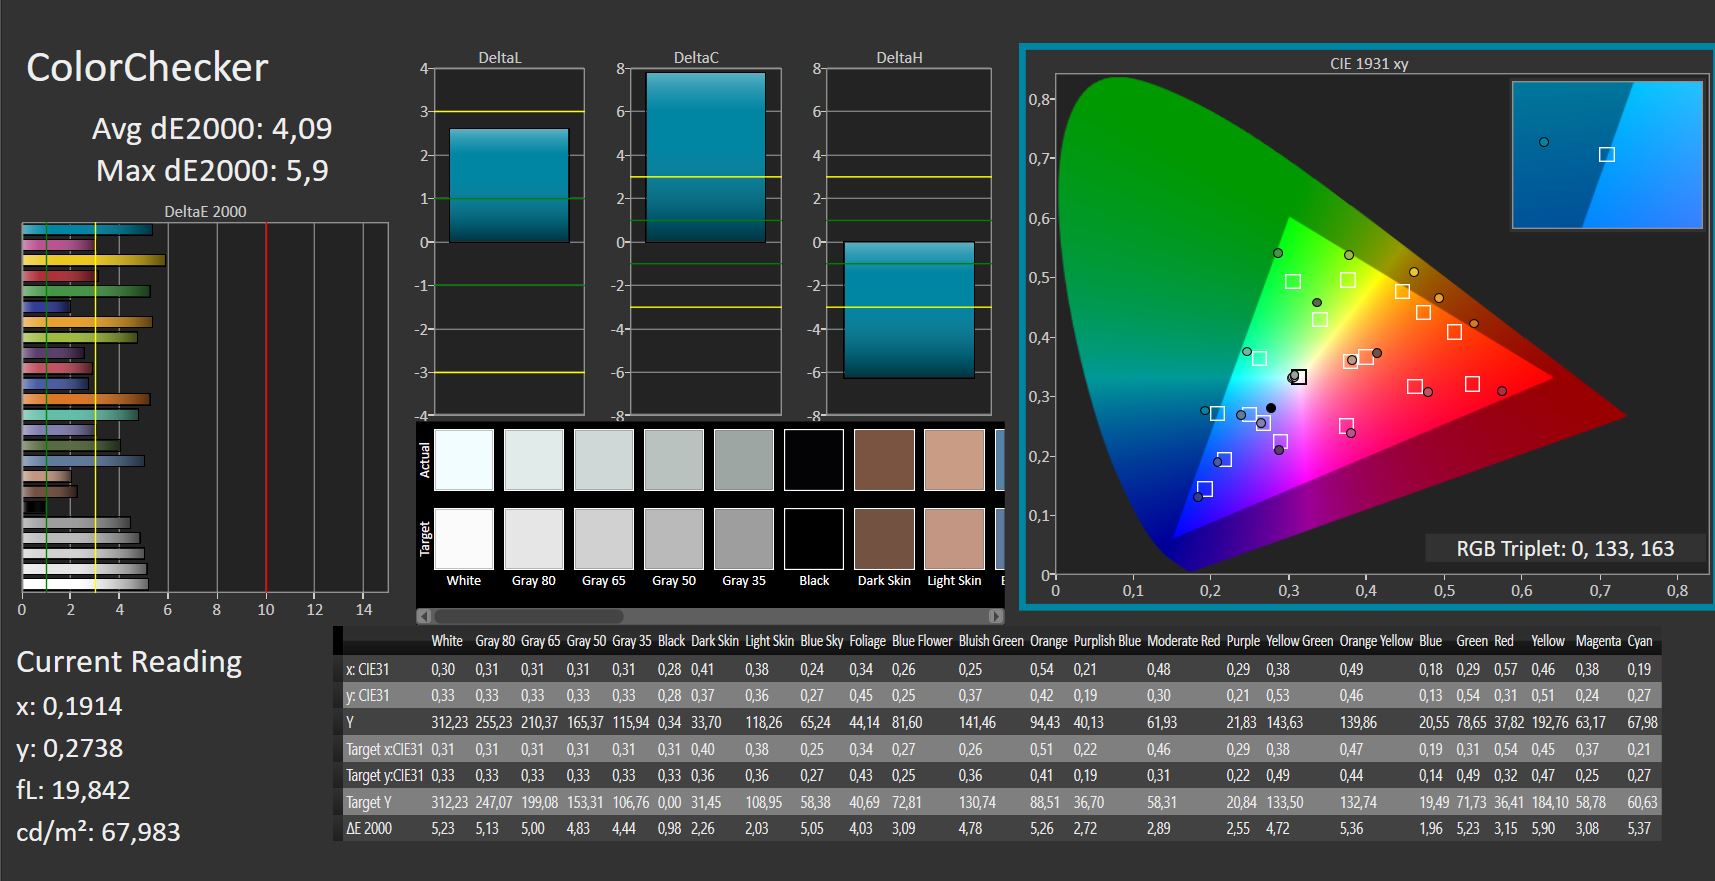
ΔE ColorChecker Calman: 4.22 | ∀{0.5-29.43 Ø4.71}
calibrated: 4.09
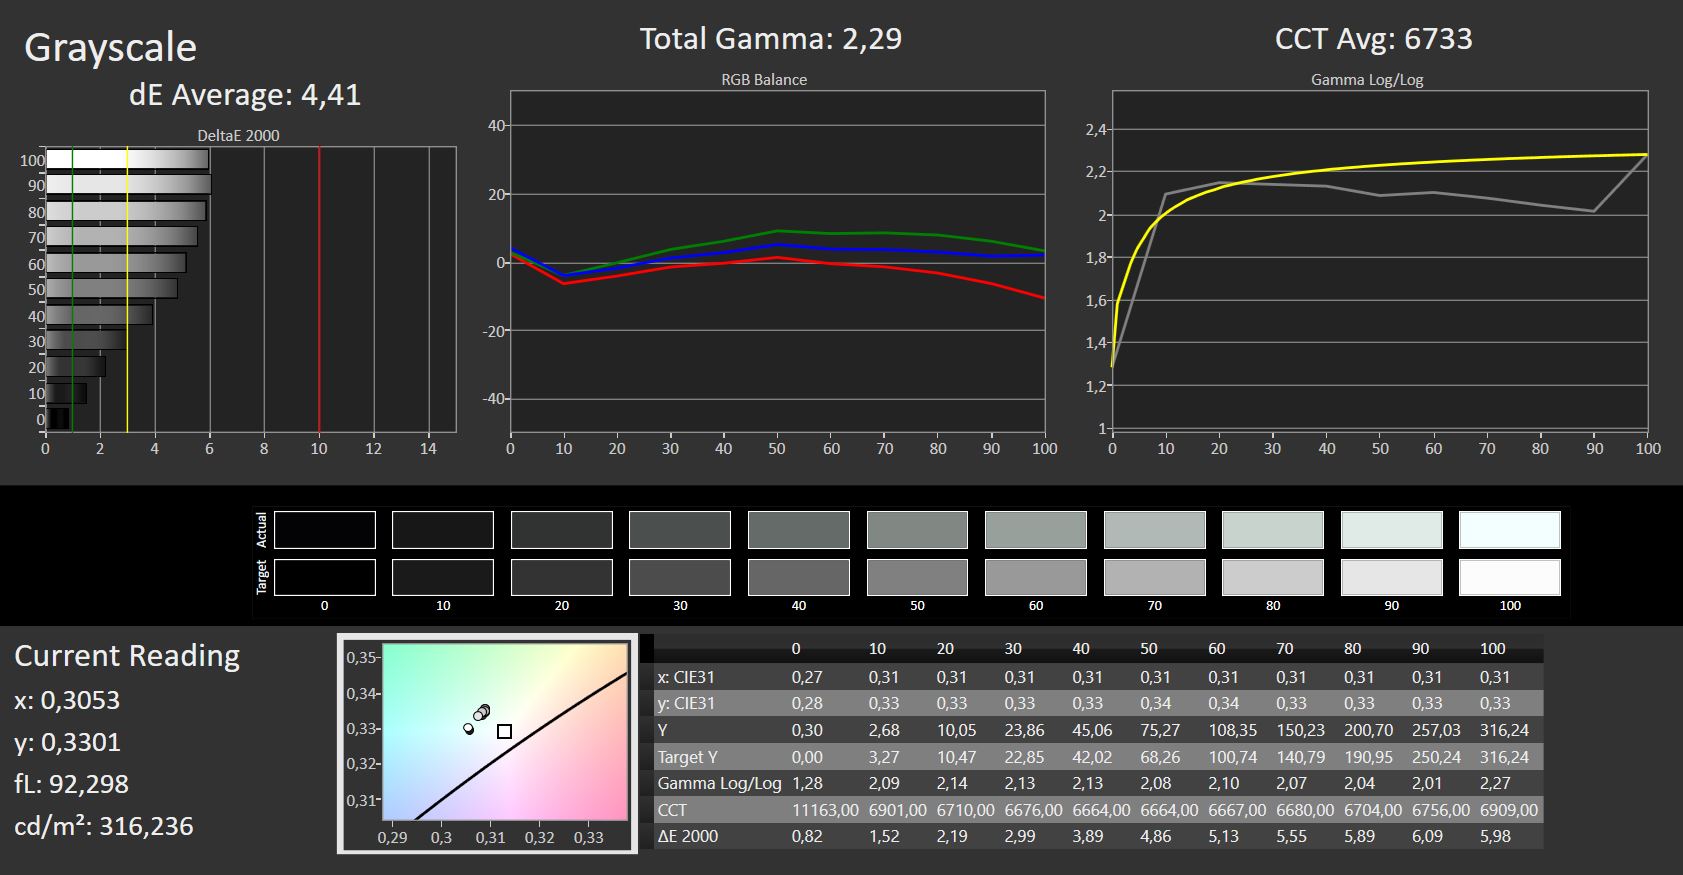
ΔE Greyscale Calman: 4.41 | ∀{0.09-98 Ø4.96}
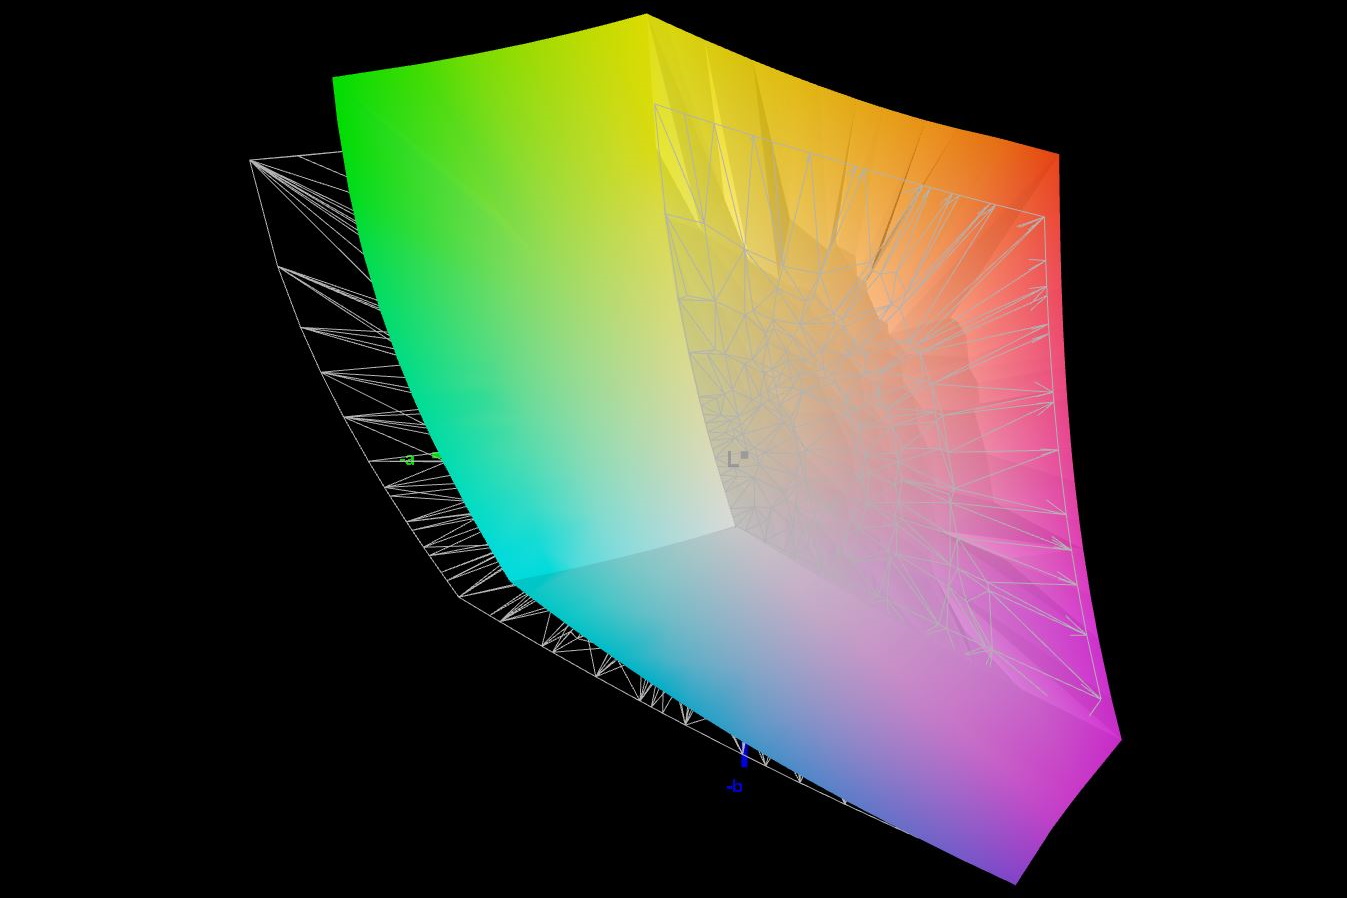
85.2% AdobeRGB 1998 (Argyll 3D)
99.9% sRGB (Argyll 3D)
97.5% Display P3 (Argyll 3D)
Gamma: 2.29
CCT: 6733 K
| Schenker XMG Pro 15 (i7-12700H, RTX 3080 Ti) BOE09C2 (BOE CQ NE156QHM-NY1), IPS, 2560x1440, 15.6" | Schenker XMG Pro 15 (Late 2021) Samsung ATNA56WR14-0, OLED, 3840x2160, 15.6" | Schenker XMG Neo 15 (i7-12700H, RTX 3080 Ti) BOE0A67, IPS, 2560x1440, 15.6" | MSI Raider GE66 12UHS AUO51EB, IPS, 3840x2160, 15.6" | Razer Blade 15 2022 Sharp LQ156T1JW03, IPS, 2560x1440, 15.6" | |
|---|---|---|---|---|---|
| Display | -5% | -17% | -3% | 1% | |
| Display P3 Coverage (%) | 97.5 | 81.2 -17% | 68.2 -30% | 80.4 -18% | 99.1 2% |
| sRGB Coverage (%) | 99.9 | 97.7 -2% | 97.2 -3% | 98.4 -2% | 99.9 0% |
| AdobeRGB 1998 Coverage (%) | 85.2 | 89.1 5% | 69.4 -19% | 94.7 11% | 86.8 2% |
| Response Times | 79% | 3% | -44% | -21% | |
| Response Time Grey 50% / Grey 80% * (ms) | 13.2 ? | 3.2 ? 76% | 12.4 ? 6% | 18.8 ? -42% | 14.4 ? -9% |
| Response Time Black / White * (ms) | 8.8 ? | 1.6 ? 82% | 8.8 ? -0% | 12.8 ? -45% | 11.6 ? -32% |
| PWM Frequency (Hz) | 60 ? | ||||
| Screen | 294% | 35% | 13% | 21% | |
| Brightness middle (cd/m²) | 317 | 443 40% | 365 15% | 351 11% | 286 -10% |
| Brightness (cd/m²) | 294 | 434 48% | 335 14% | 347 18% | 271 -8% |
| Brightness Distribution (%) | 83 | 94 13% | 81 -2% | 90 8% | 89 7% |
| Black Level * (cd/m²) | 0.32 | 0.02 94% | 0.32 -0% | 0.35 -9% | 0.25 22% |
| Contrast (:1) | 991 | 22150 2135% | 1141 15% | 1003 1% | 1144 15% |
| Colorchecker dE 2000 * | 4.22 | 3.73 12% | 1.38 67% | 2.54 40% | 2.74 35% |
| Colorchecker dE 2000 max. * | 5.97 | 8.12 -36% | 2.01 66% | 8.36 -40% | 5.21 13% |
| Colorchecker dE 2000 calibrated * | 4.09 | 1.22 70% | 0.67 84% | 2.52 38% | |
| Greyscale dE 2000 * | 4.41 | 2.5 43% | 1.36 69% | 4.1 7% | 1.1 75% |
| Gamma | 2.29 96% | 2.001 110% | 2.48 89% | 2.089 105% | 2.2 100% |
| CCT | 6733 97% | 6522 100% | 6412 101% | 7036 92% | 6408 101% |
| Media total (Programa/Opciones) | 123% /
192% | 7% /
19% | -11% /
2% | 0% /
11% |
* ... más pequeño es mejor
El panel del Pro 15 cubre completamente el sRGB y el DCI-P3 en más de un 97%, y el AdobeRGB en un 85%. A diferencia del Neo, el panel es por tanto adecuado para la edición de fotos y vídeos.
La pantalla está correctamente calibrada de fábrica; la calibración manual apenas modifica los valores medios de desviación del color
Tiempos de respuesta del display
| ↔ Tiempo de respuesta de Negro a Blanco | ||
|---|---|---|
| 8.8 ms ... subida ↗ y bajada ↘ combinada | ↗ 4.2 ms subida | 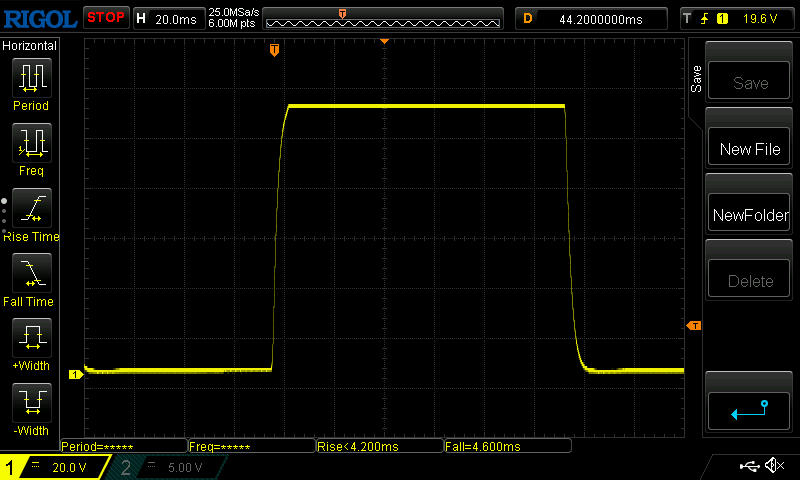 |
| ↘ 4.6 ms bajada | ||
| La pantalla mostró tiempos de respuesta rápidos en nuestros tests y debería ser adecuada para juegos. En comparación, todos los dispositivos de prueba van de ##min### (mínimo) a 240 (máximo) ms. » 25 % de todos los dispositivos son mejores. Esto quiere decir que el tiempo de respuesta medido es mejor que la media (19.8 ms) de todos los dispositivos testados. | ||
| ↔ Tiempo de respuesta 50% Gris a 80% Gris | ||
| 13.2 ms ... subida ↗ y bajada ↘ combinada | ↗ 6.2 ms subida | 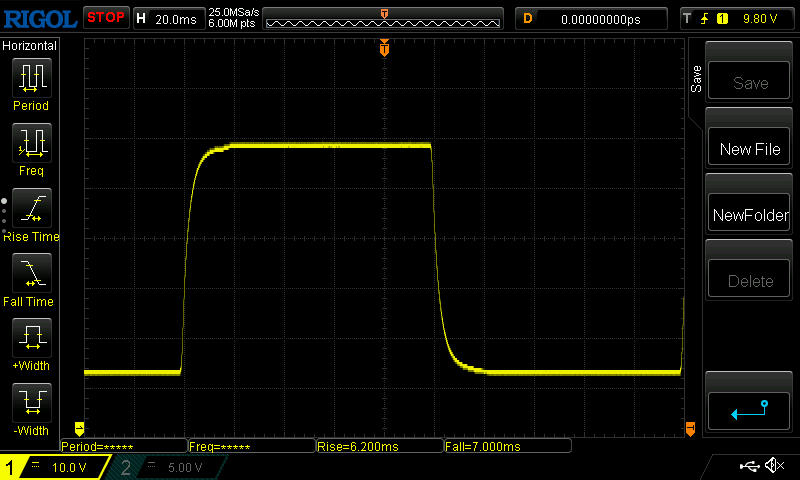 |
| ↘ 7 ms bajada | ||
| La pantalla mostró buenos tiempos de respuesta en nuestros tests pero podría ser demasiado lenta para los jugones competitivos. En comparación, todos los dispositivos de prueba van de ##min### (mínimo) a 636 (máximo) ms. » 27 % de todos los dispositivos son mejores. Esto quiere decir que el tiempo de respuesta medido es mejor que la media (31 ms) de todos los dispositivos testados. | ||
Parpadeo de Pantalla / PWM (Pulse-Width Modulation)
| Parpadeo de Pantalla / PWM no detectado | 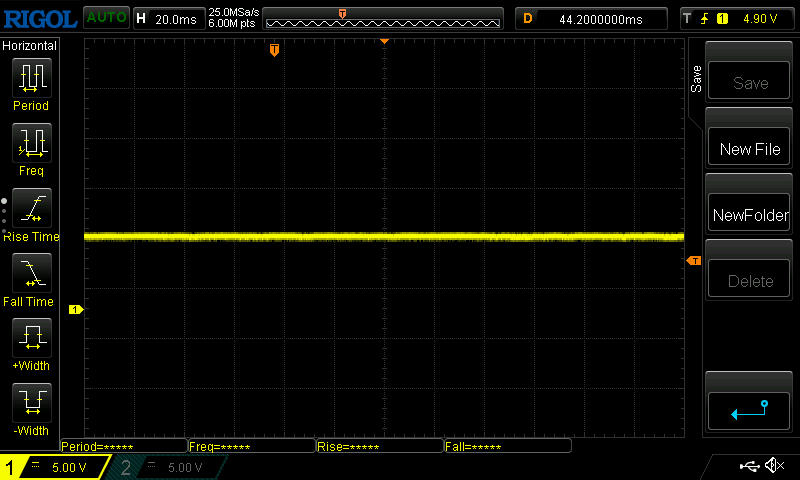 | ||
Comparación: 52 % de todos los dispositivos testados no usaron PWM para atenuar el display. Si se usó, medimos una media de 7754 (mínimo: 5 - máxmo: 343500) Hz. | |||
La superficie mate elimina muchos reflejos en exteriores. Sin embargo, debido a la luminosidad más bien media y a un contraste no demasiado elevado, conviene permanecer a la sombra y asegurarse una visión frontal directa.
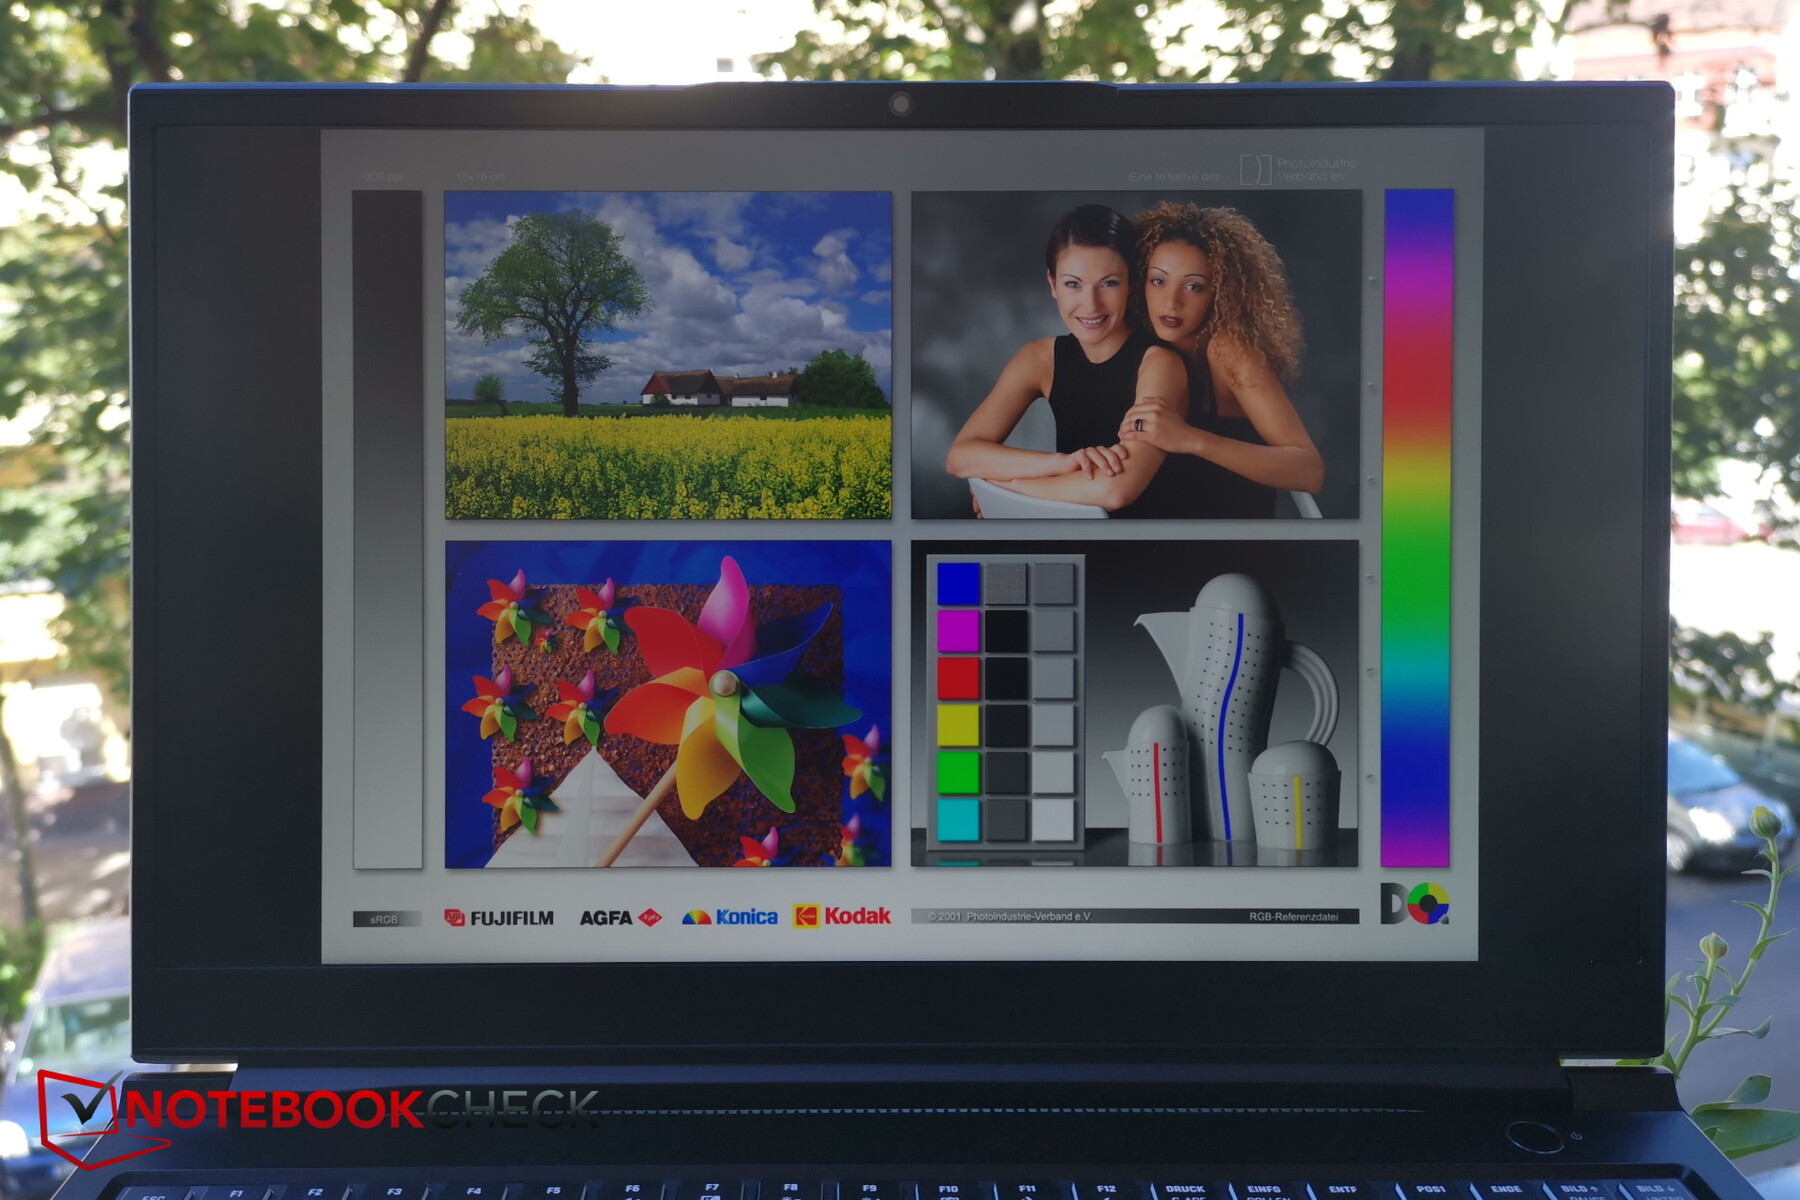
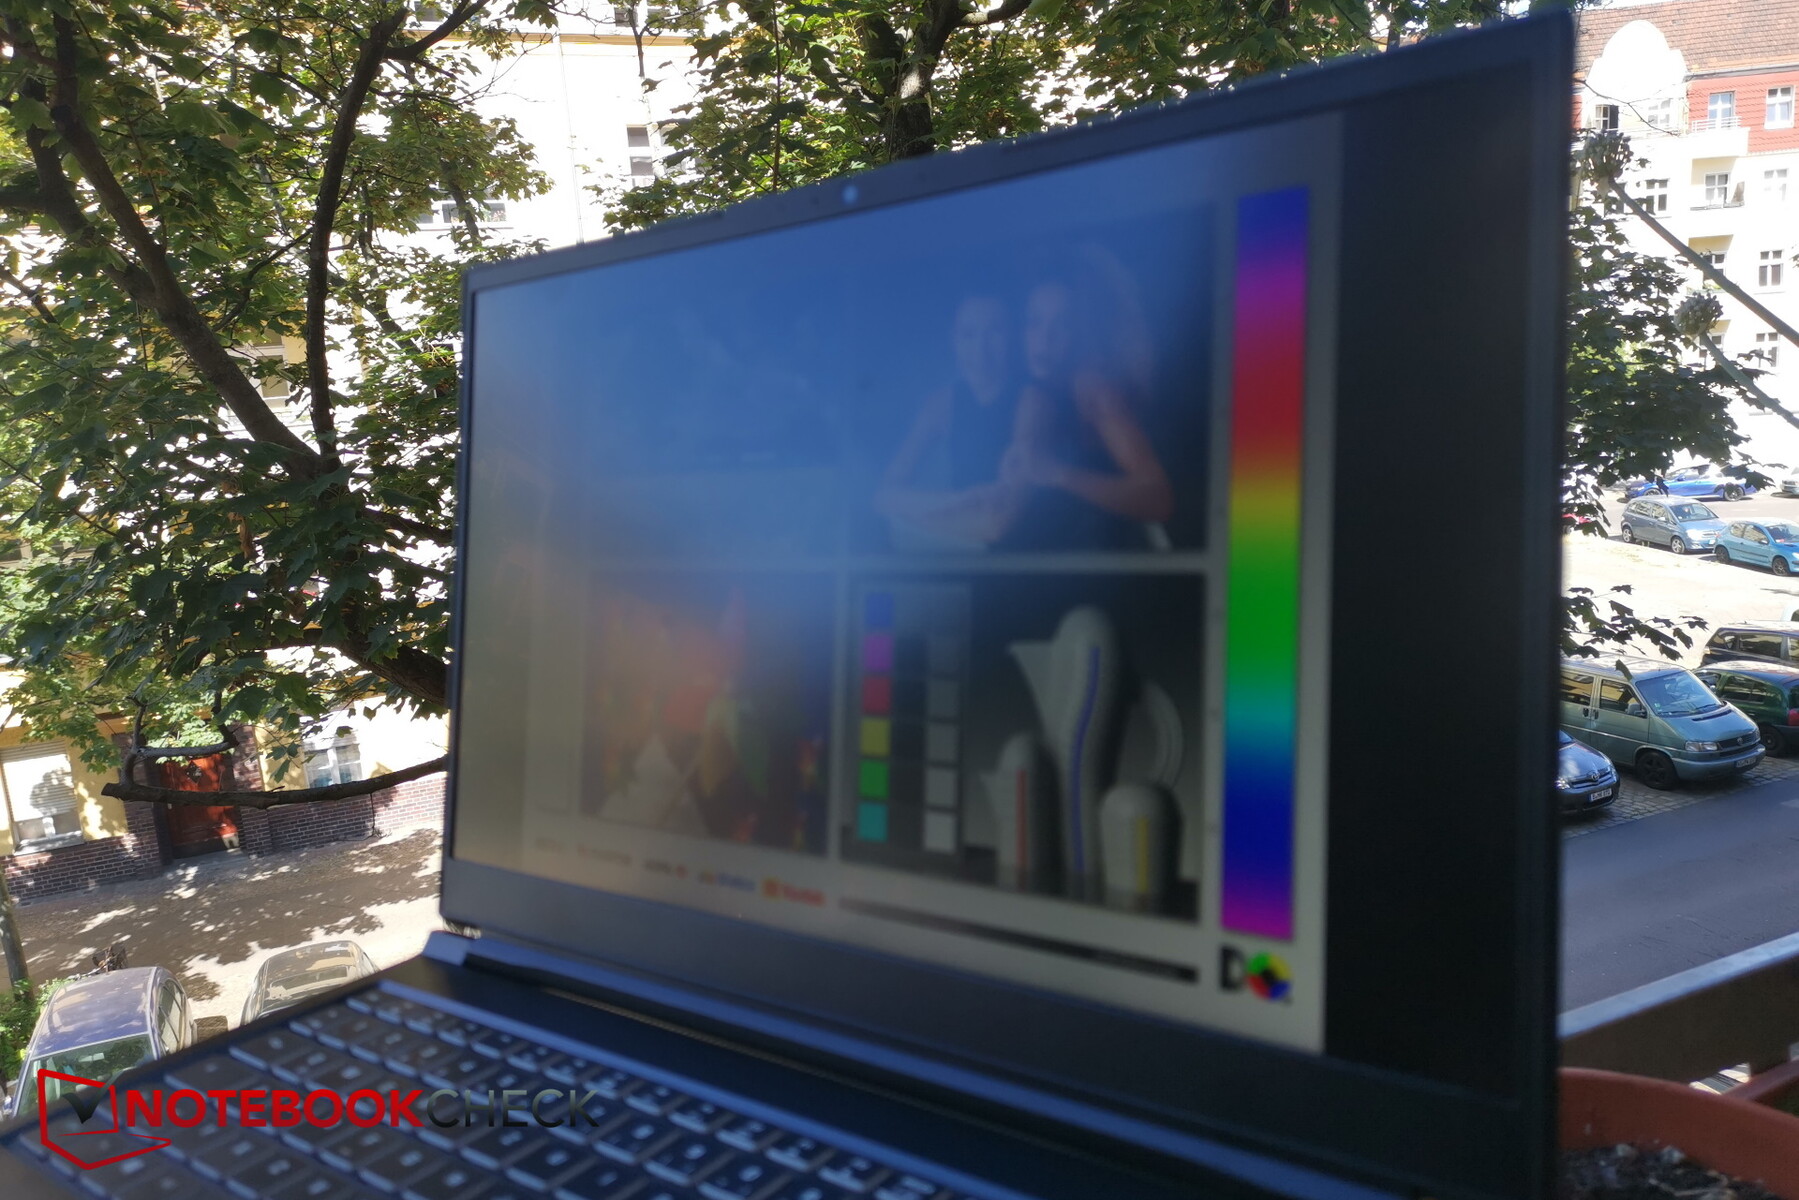
Como es típico de los IPS, la estabilidad del ángulo de visión es muy buena. Sólo bajo ángulos de visión extremos el brillo y los colores se resienten un poco.

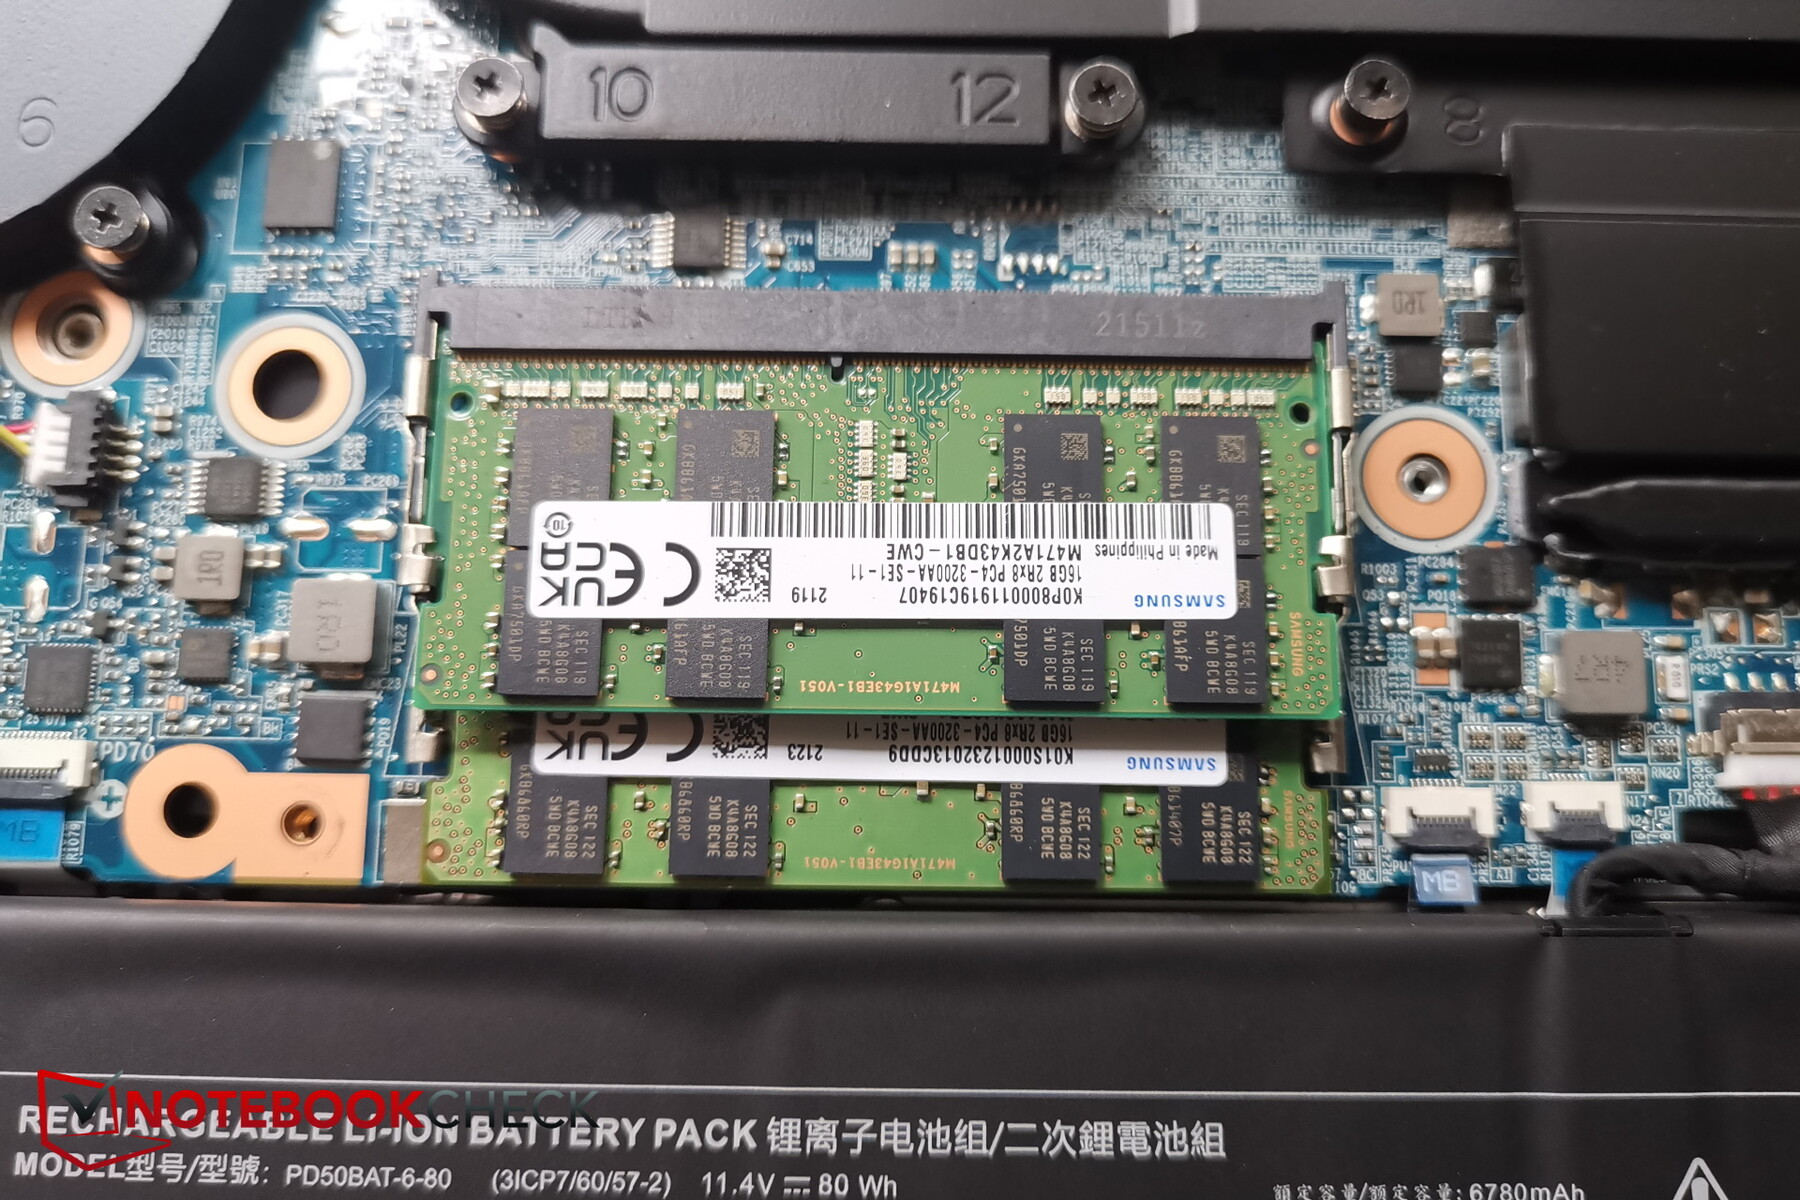
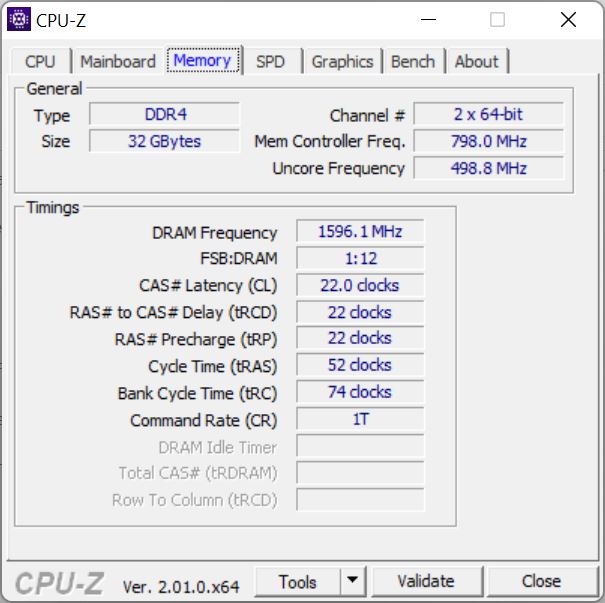
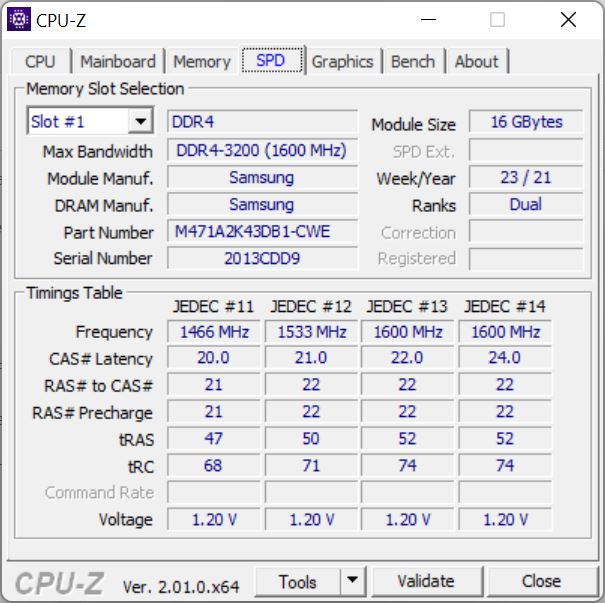
Rendimiento: Alto rendimiento, sin DDR5
El XMG Pro 15 está dirigido a los jugadores así como a los creadores de contenido, lo que se refleja en el elegante diseño y el potente hardware (i7-12700H y RTX 3080 Ti) por un lado, y en el display QHD con su buena cobertura del espacio de color por otro. Unos generosos 32 GB de RAM también benefician a ambas partes, pero por desgracia aquí sólo está disponible en la versión DDR4, a diferencia del Neo.
Condiciones de la prueba
Todos los ajustes importantes de rendimiento se ajustan en el Centro de Control XMG; Schenker utiliza aquí un software diferente al del XMG Neo. Los ajustes manuales de los valores de offset o del Dynamic Boost están prácticamente ausentes. Sólo la curva del ventilador se puede ajustar manualmente.
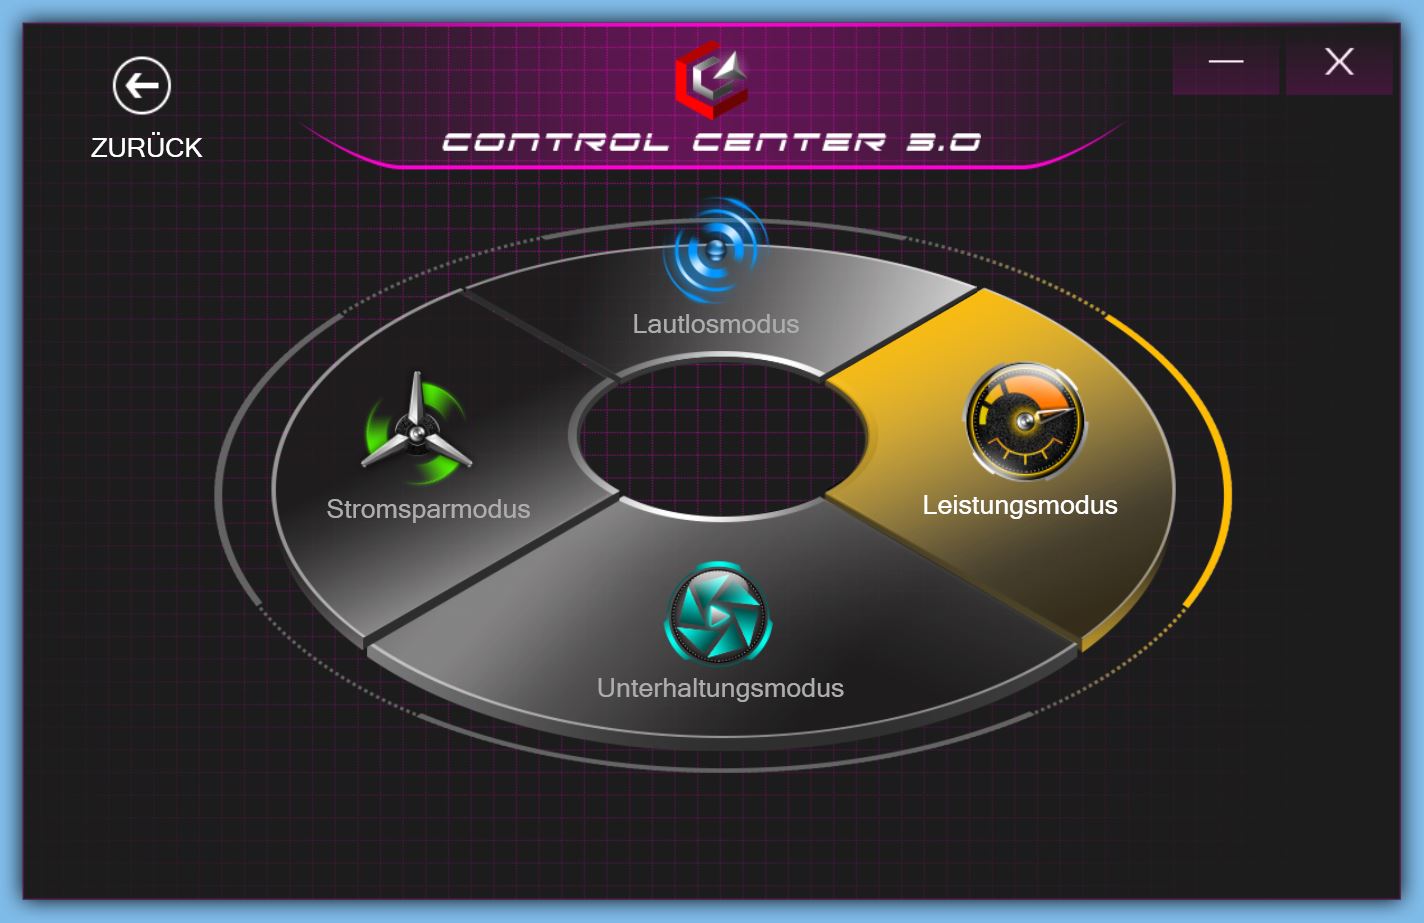
Por otro lado, se pueden seleccionar cuatro modos de rendimiento: Silencio, Ahorro de Energía, Entretenimiento y Rendimiento. Para obtener los mejores resultados del benchmark, realizamos nuestras pruebas en el modo más potente, que es el modo Rendimiento. Sin embargo, Schenker recomienda el modo Entretenimiento, que pretende ser un buen compromiso entre rendimiento y ruido
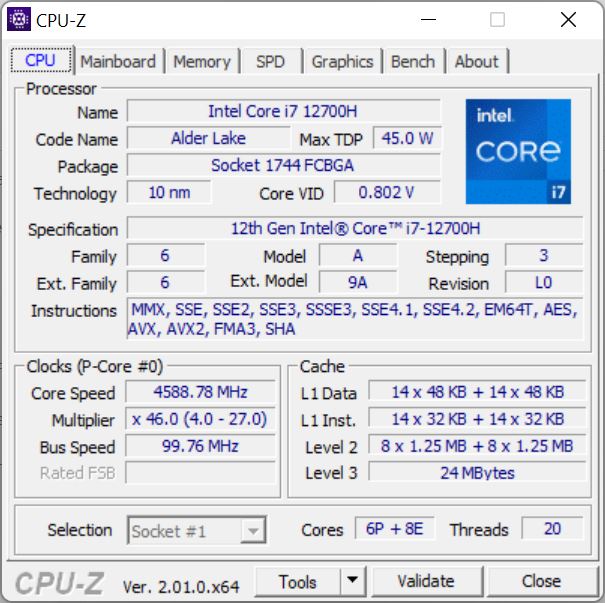
Procesador
Un Intel Core i7-12700H (14 núcleos, 20 hilos). Los núcleos E y P combinados van de 1,8 a 4,7 GHz. La CPU es muy potente y se utiliza en muchos portátiles para juegos de Intel.
En el bucle de Cinebench, el rendimiento cae ligeramente en periodos de tiempo más largos. No obstante, la curva es comparable a la del MSI Raider GE66 con su i9-12900Hpero el mismo i7-12700H es aún más rápido en el Neo 15.
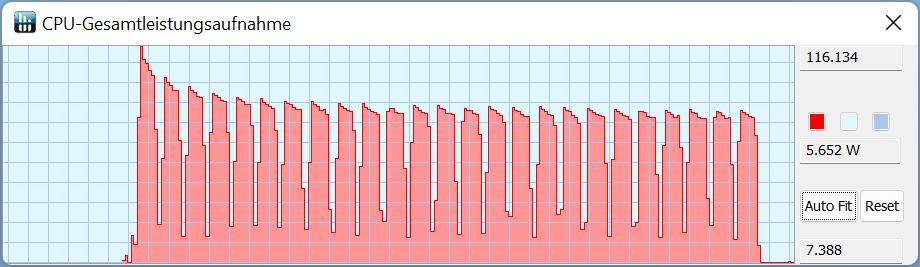
El TDP sólo extrae brevemente 116 W en la primera ejecución, tras lo cual baja y se estabiliza en torno a los 80 a 85 W.
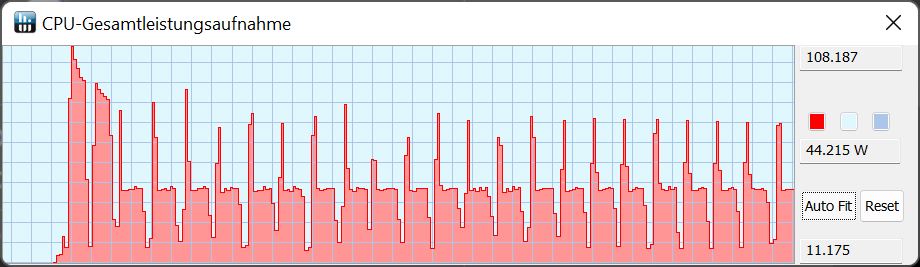
En el modo Entretenimiento (en lugar del modo de rendimiento), el TDP extrae brevemente 108 W en la primera ejecución antes de caer también y estabilizarse en 45 W con picos iniciales muy breves de 55 a 80 W.
El Pro 15 supera al i7-11800H del predecesor en alrededor de un 30%. En general, el rendimiento de la CPU en el Neo 15 y el MSI Raider es unos pocos puntos porcentuales mejor, pero el Pro 15 sigue estando a muy buen nivel, concretamente ligeramente por encima de los índices esperados.
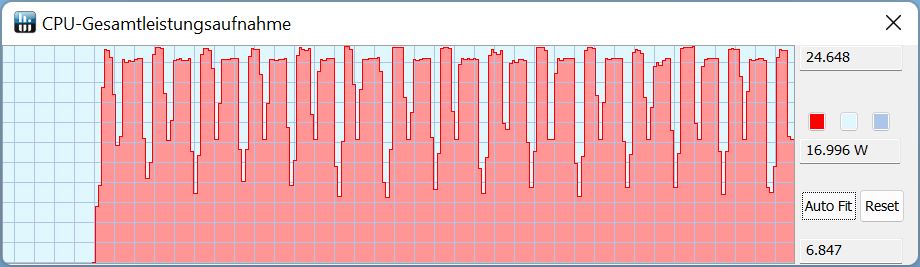
En el modo batería, el consumo máximo es de sólo 25 W, y el TDP cae a veces hasta 16 W durante las ejecuciones de Cinebench. El rendimiento es correspondientemente menor, viendo reducciones de alrededor del 57% comparado con el modo de Rendimiento conectado.
Cinebench R15 Multi Sustained Load
Cinebench R23: Multi Core | Single Core
Cinebench R20: CPU (Multi Core) | CPU (Single Core)
Cinebench R15: CPU Multi 64Bit | CPU Single 64Bit
Blender: v2.79 BMW27 CPU
7-Zip 18.03: 7z b 4 | 7z b 4 -mmt1
Geekbench 5.5: Multi-Core | Single-Core
HWBOT x265 Benchmark v2.2: 4k Preset
LibreOffice : 20 Documents To PDF
R Benchmark 2.5: Overall mean
| CPU Performance rating | |
| Media de la clase Gaming | |
| MSI Raider GE66 12UHS | |
| Schenker XMG Neo 15 (i7-12700H, RTX 3080 Ti) | |
| Schenker XMG Pro 15 (i7-12700H, RTX 3080 Ti) | |
| Medio Intel Core i7-12700H | |
| Razer Blade 15 2022 | |
| Schenker XMG Pro 15 (Late 2021) | |
| Cinebench R23 / Multi Core | |
| Media de la clase Gaming (10488 - 42661, n=107, últimos 2 años) | |
| Schenker XMG Neo 15 (i7-12700H, RTX 3080 Ti) | |
| MSI Raider GE66 12UHS | |
| Schenker XMG Pro 15 (i7-12700H, RTX 3080 Ti) | |
| Medio Intel Core i7-12700H (4032 - 19330, n=64) | |
| Razer Blade 15 2022 | |
| Schenker XMG Pro 15 (Late 2021) | |
| Cinebench R23 / Single Core | |
| Media de la clase Gaming (1166 - 2415, n=107, últimos 2 años) | |
| MSI Raider GE66 12UHS | |
| Schenker XMG Pro 15 (i7-12700H, RTX 3080 Ti) | |
| Schenker XMG Neo 15 (i7-12700H, RTX 3080 Ti) | |
| Razer Blade 15 2022 | |
| Medio Intel Core i7-12700H (778 - 1826, n=63) | |
| Schenker XMG Pro 15 (Late 2021) | |
| Cinebench R20 / CPU (Multi Core) | |
| Media de la clase Gaming (4029 - 16433, n=106, últimos 2 años) | |
| Schenker XMG Neo 15 (i7-12700H, RTX 3080 Ti) | |
| MSI Raider GE66 12UHS | |
| Schenker XMG Pro 15 (i7-12700H, RTX 3080 Ti) | |
| Medio Intel Core i7-12700H (1576 - 7407, n=64) | |
| Razer Blade 15 2022 | |
| Schenker XMG Pro 15 (Late 2021) | |
| Cinebench R20 / CPU (Single Core) | |
| Media de la clase Gaming (442 - 913, n=106, últimos 2 años) | |
| MSI Raider GE66 12UHS | |
| Schenker XMG Pro 15 (i7-12700H, RTX 3080 Ti) | |
| Razer Blade 15 2022 | |
| Schenker XMG Neo 15 (i7-12700H, RTX 3080 Ti) | |
| Medio Intel Core i7-12700H (300 - 704, n=64) | |
| Schenker XMG Pro 15 (Late 2021) | |
| Cinebench R15 / CPU Multi 64Bit | |
| Media de la clase Gaming (1578 - 6330, n=105, últimos 2 años) | |
| Schenker XMG Neo 15 (i7-12700H, RTX 3080 Ti) | |
| Schenker XMG Pro 15 (i7-12700H, RTX 3080 Ti) | |
| MSI Raider GE66 12UHS | |
| Medio Intel Core i7-12700H (1379 - 2916, n=70) | |
| Razer Blade 15 2022 | |
| Schenker XMG Pro 15 (Late 2021) | |
| Cinebench R15 / CPU Single 64Bit | |
| Media de la clase Gaming (188.8 - 350, n=106, últimos 2 años) | |
| MSI Raider GE66 12UHS | |
| Schenker XMG Pro 15 (i7-12700H, RTX 3080 Ti) | |
| Schenker XMG Neo 15 (i7-12700H, RTX 3080 Ti) | |
| Razer Blade 15 2022 | |
| Medio Intel Core i7-12700H (113 - 263, n=65) | |
| Schenker XMG Pro 15 (Late 2021) | |
| Blender / v2.79 BMW27 CPU | |
| Schenker XMG Pro 15 (Late 2021) | |
| Razer Blade 15 2022 | |
| Medio Intel Core i7-12700H (168 - 732, n=63) | |
| Schenker XMG Pro 15 (i7-12700H, RTX 3080 Ti) | |
| MSI Raider GE66 12UHS | |
| Schenker XMG Neo 15 (i7-12700H, RTX 3080 Ti) | |
| Media de la clase Gaming (79 - 330, n=104, últimos 2 años) | |
| 7-Zip 18.03 / 7z b 4 | |
| Media de la clase Gaming (33491 - 148086, n=105, últimos 2 años) | |
| Schenker XMG Neo 15 (i7-12700H, RTX 3080 Ti) | |
| MSI Raider GE66 12UHS | |
| Schenker XMG Pro 15 (i7-12700H, RTX 3080 Ti) | |
| Razer Blade 15 2022 | |
| Medio Intel Core i7-12700H (22844 - 73067, n=63) | |
| Schenker XMG Pro 15 (Late 2021) | |
| 7-Zip 18.03 / 7z b 4 -mmt1 | |
| Media de la clase Gaming (4199 - 7436, n=105, últimos 2 años) | |
| MSI Raider GE66 12UHS | |
| Schenker XMG Neo 15 (i7-12700H, RTX 3080 Ti) | |
| Schenker XMG Pro 15 (i7-12700H, RTX 3080 Ti) | |
| Razer Blade 15 2022 | |
| Medio Intel Core i7-12700H (2743 - 5972, n=63) | |
| Schenker XMG Pro 15 (Late 2021) | |
| Geekbench 5.5 / Multi-Core | |
| Media de la clase Gaming (6460 - 28263, n=105, últimos 2 años) | |
| MSI Raider GE66 12UHS | |
| Schenker XMG Neo 15 (i7-12700H, RTX 3080 Ti) | |
| Razer Blade 15 2022 | |
| Schenker XMG Pro 15 (i7-12700H, RTX 3080 Ti) | |
| Medio Intel Core i7-12700H (5144 - 13745, n=64) | |
| Schenker XMG Pro 15 (Late 2021) | |
| Geekbench 5.5 / Single-Core | |
| Media de la clase Gaming (986 - 2474, n=105, últimos 2 años) | |
| MSI Raider GE66 12UHS | |
| Schenker XMG Pro 15 (i7-12700H, RTX 3080 Ti) | |
| Razer Blade 15 2022 | |
| Schenker XMG Neo 15 (i7-12700H, RTX 3080 Ti) | |
| Medio Intel Core i7-12700H (803 - 1851, n=64) | |
| Schenker XMG Pro 15 (Late 2021) | |
| HWBOT x265 Benchmark v2.2 / 4k Preset | |
| Media de la clase Gaming (11.5 - 44.4, n=105, últimos 2 años) | |
| Schenker XMG Neo 15 (i7-12700H, RTX 3080 Ti) | |
| MSI Raider GE66 12UHS | |
| Schenker XMG Pro 15 (i7-12700H, RTX 3080 Ti) | |
| Razer Blade 15 2022 | |
| Medio Intel Core i7-12700H (4.67 - 21.8, n=64) | |
| Schenker XMG Pro 15 (Late 2021) | |
| LibreOffice / 20 Documents To PDF | |
| Razer Blade 15 2022 | |
| Media de la clase Gaming (33.2 - 88.8, n=105, últimos 2 años) | |
| Schenker XMG Pro 15 (i7-12700H, RTX 3080 Ti) | |
| Schenker XMG Pro 15 (Late 2021) | |
| Schenker XMG Neo 15 (i7-12700H, RTX 3080 Ti) | |
| Medio Intel Core i7-12700H (34.2 - 95.3, n=63) | |
| MSI Raider GE66 12UHS | |
| R Benchmark 2.5 / Overall mean | |
| Schenker XMG Pro 15 (Late 2021) | |
| Medio Intel Core i7-12700H (0.4441 - 1.052, n=63) | |
| Razer Blade 15 2022 | |
| Schenker XMG Neo 15 (i7-12700H, RTX 3080 Ti) | |
| Schenker XMG Pro 15 (i7-12700H, RTX 3080 Ti) | |
| MSI Raider GE66 12UHS | |
| Media de la clase Gaming (0.3439 - 0.759, n=106, últimos 2 años) | |
* ... más pequeño es mejor
AIDA64: FP32 Ray-Trace | FPU Julia | CPU SHA3 | CPU Queen | FPU SinJulia | FPU Mandel | CPU AES | CPU ZLib | FP64 Ray-Trace | CPU PhotoWorxx
| Performance rating | |
| Media de la clase Gaming | |
| Schenker XMG Pro 15 (Late 2021) | |
| MSI Raider GE66 12UHS | |
| Schenker XMG Neo 15 (i7-12700H, RTX 3080 Ti) | |
| Medio Intel Core i7-12700H | |
| Schenker XMG Pro 15 (i7-12700H, RTX 3080 Ti) | |
| Razer Blade 15 2022 | |
| AIDA64 / FP32 Ray-Trace | |
| Media de la clase Gaming (10227 - 85542, n=105, últimos 2 años) | |
| Schenker XMG Pro 15 (Late 2021) | |
| Medio Intel Core i7-12700H (2585 - 17957, n=64) | |
| Schenker XMG Neo 15 (i7-12700H, RTX 3080 Ti) | |
| Schenker XMG Pro 15 (i7-12700H, RTX 3080 Ti) | |
| MSI Raider GE66 12UHS | |
| Razer Blade 15 2022 | |
| AIDA64 / FPU Julia | |
| Media de la clase Gaming (51376 - 238426, n=105, últimos 2 años) | |
| Schenker XMG Pro 15 (Late 2021) | |
| Medio Intel Core i7-12700H (12439 - 90760, n=64) | |
| Schenker XMG Neo 15 (i7-12700H, RTX 3080 Ti) | |
| Schenker XMG Pro 15 (i7-12700H, RTX 3080 Ti) | |
| MSI Raider GE66 12UHS | |
| Razer Blade 15 2022 | |
| AIDA64 / CPU SHA3 | |
| Media de la clase Gaming (2180 - 10115, n=105, últimos 2 años) | |
| Schenker XMG Pro 15 (Late 2021) | |
| Schenker XMG Neo 15 (i7-12700H, RTX 3080 Ti) | |
| Medio Intel Core i7-12700H (833 - 4242, n=64) | |
| MSI Raider GE66 12UHS | |
| Schenker XMG Pro 15 (i7-12700H, RTX 3080 Ti) | |
| Razer Blade 15 2022 | |
| AIDA64 / CPU Queen | |
| Media de la clase Gaming (49785 - 173351, n=90, últimos 2 años) | |
| MSI Raider GE66 12UHS | |
| Schenker XMG Pro 15 (i7-12700H, RTX 3080 Ti) | |
| Schenker XMG Neo 15 (i7-12700H, RTX 3080 Ti) | |
| Medio Intel Core i7-12700H (57923 - 103202, n=63) | |
| Razer Blade 15 2022 | |
| Schenker XMG Pro 15 (Late 2021) | |
| AIDA64 / FPU SinJulia | |
| Media de la clase Gaming (4424 - 33636, n=105, últimos 2 años) | |
| Schenker XMG Neo 15 (i7-12700H, RTX 3080 Ti) | |
| Schenker XMG Pro 15 (Late 2021) | |
| Schenker XMG Pro 15 (i7-12700H, RTX 3080 Ti) | |
| MSI Raider GE66 12UHS | |
| Razer Blade 15 2022 | |
| Medio Intel Core i7-12700H (3249 - 9939, n=64) | |
| AIDA64 / FPU Mandel | |
| Media de la clase Gaming (25115 - 128721, n=105, últimos 2 años) | |
| Schenker XMG Pro 15 (Late 2021) | |
| Medio Intel Core i7-12700H (7135 - 44760, n=64) | |
| Schenker XMG Neo 15 (i7-12700H, RTX 3080 Ti) | |
| Schenker XMG Pro 15 (i7-12700H, RTX 3080 Ti) | |
| MSI Raider GE66 12UHS | |
| Razer Blade 15 2022 | |
| AIDA64 / CPU AES | |
| Schenker XMG Pro 15 (Late 2021) | |
| Media de la clase Gaming (39258 - 247074, n=105, últimos 2 años) | |
| MSI Raider GE66 12UHS | |
| Medio Intel Core i7-12700H (31839 - 144360, n=64) | |
| Schenker XMG Neo 15 (i7-12700H, RTX 3080 Ti) | |
| Schenker XMG Pro 15 (i7-12700H, RTX 3080 Ti) | |
| Razer Blade 15 2022 | |
| AIDA64 / CPU ZLib | |
| Media de la clase Gaming (574 - 2531, n=105, últimos 2 años) | |
| Schenker XMG Neo 15 (i7-12700H, RTX 3080 Ti) | |
| Schenker XMG Pro 15 (i7-12700H, RTX 3080 Ti) | |
| MSI Raider GE66 12UHS | |
| Medio Intel Core i7-12700H (305 - 1171, n=64) | |
| Razer Blade 15 2022 | |
| Schenker XMG Pro 15 (Late 2021) | |
| AIDA64 / FP64 Ray-Trace | |
| Media de la clase Gaming (5509 - 45446, n=105, últimos 2 años) | |
| Schenker XMG Pro 15 (Late 2021) | |
| Medio Intel Core i7-12700H (1437 - 9692, n=64) | |
| Schenker XMG Neo 15 (i7-12700H, RTX 3080 Ti) | |
| Schenker XMG Pro 15 (i7-12700H, RTX 3080 Ti) | |
| MSI Raider GE66 12UHS | |
| Razer Blade 15 2022 | |
| AIDA64 / CPU PhotoWorxx | |
| Media de la clase Gaming (12271 - 89891, n=105, últimos 2 años) | |
| Razer Blade 15 2022 | |
| MSI Raider GE66 12UHS | |
| Schenker XMG Neo 15 (i7-12700H, RTX 3080 Ti) | |
| Medio Intel Core i7-12700H (12863 - 52207, n=64) | |
| Schenker XMG Pro 15 (i7-12700H, RTX 3080 Ti) | |
| Schenker XMG Pro 15 (Late 2021) | |
Rendimiento del sistema
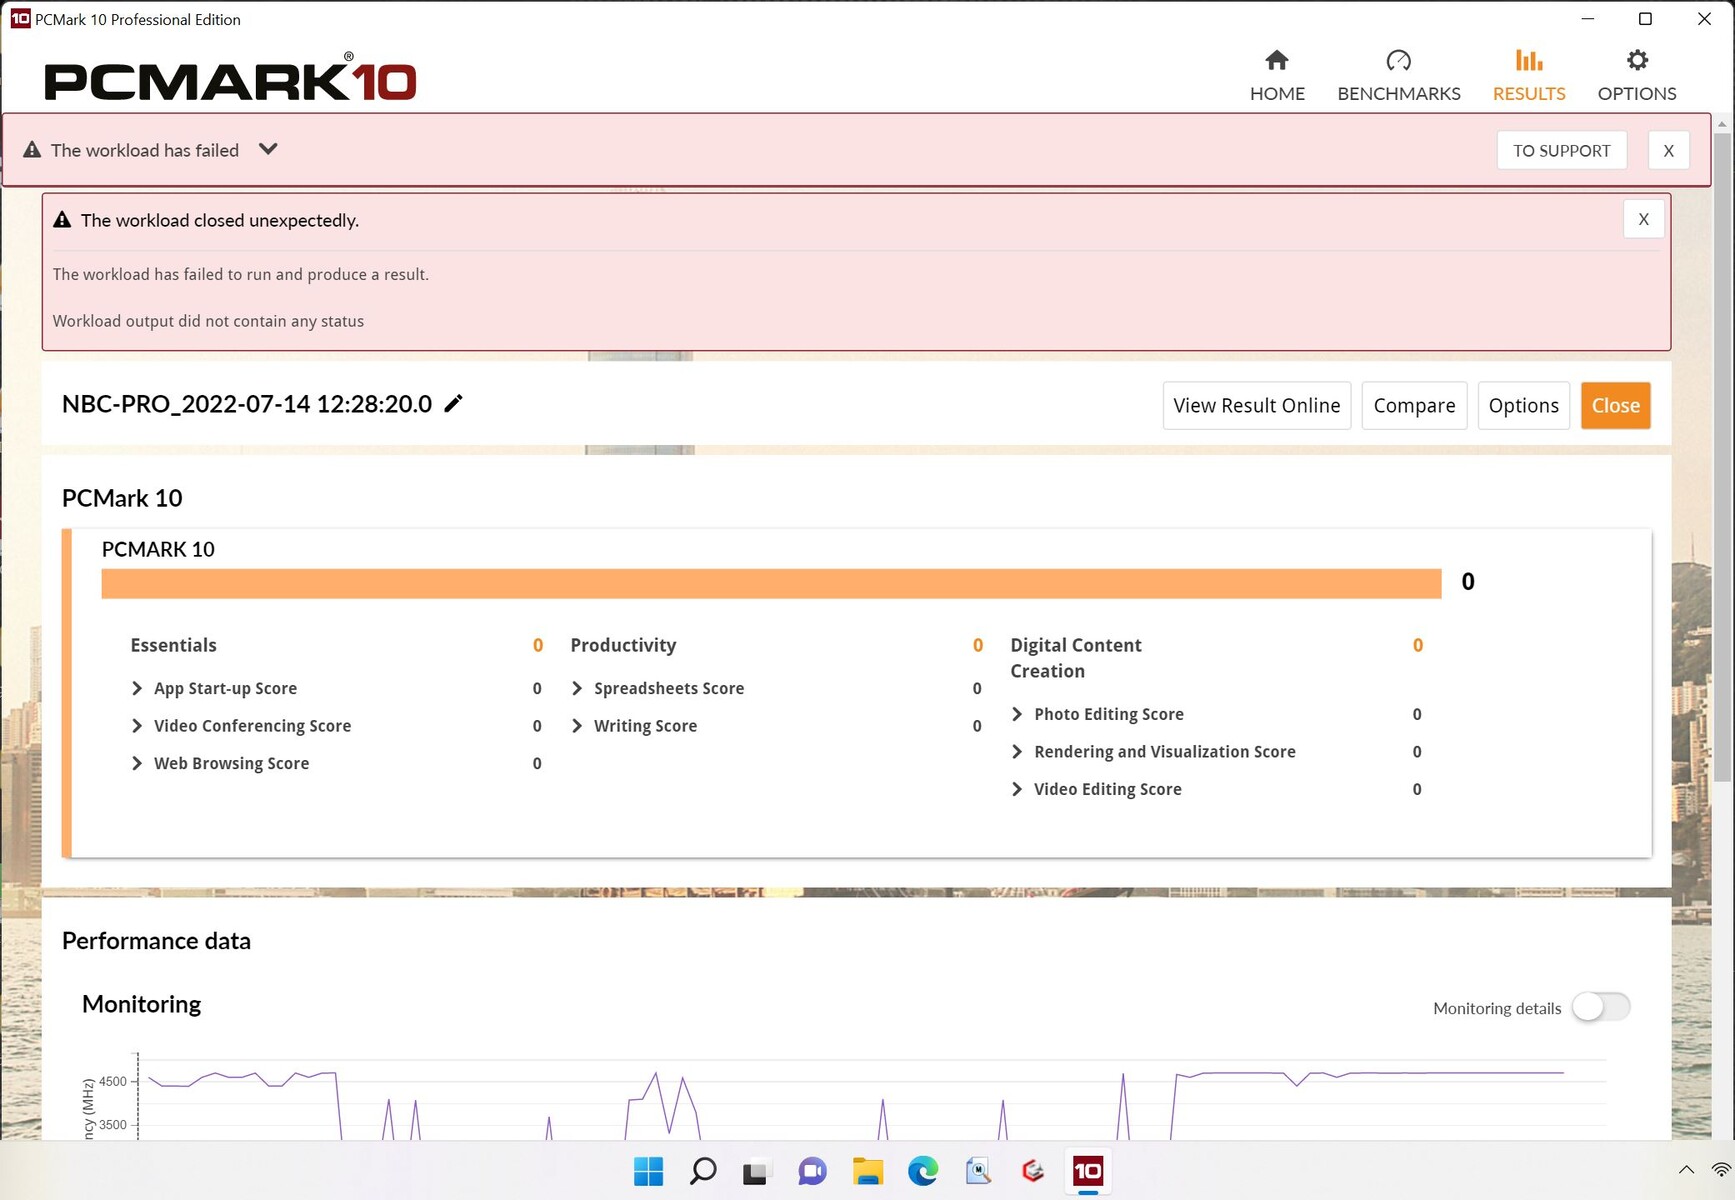
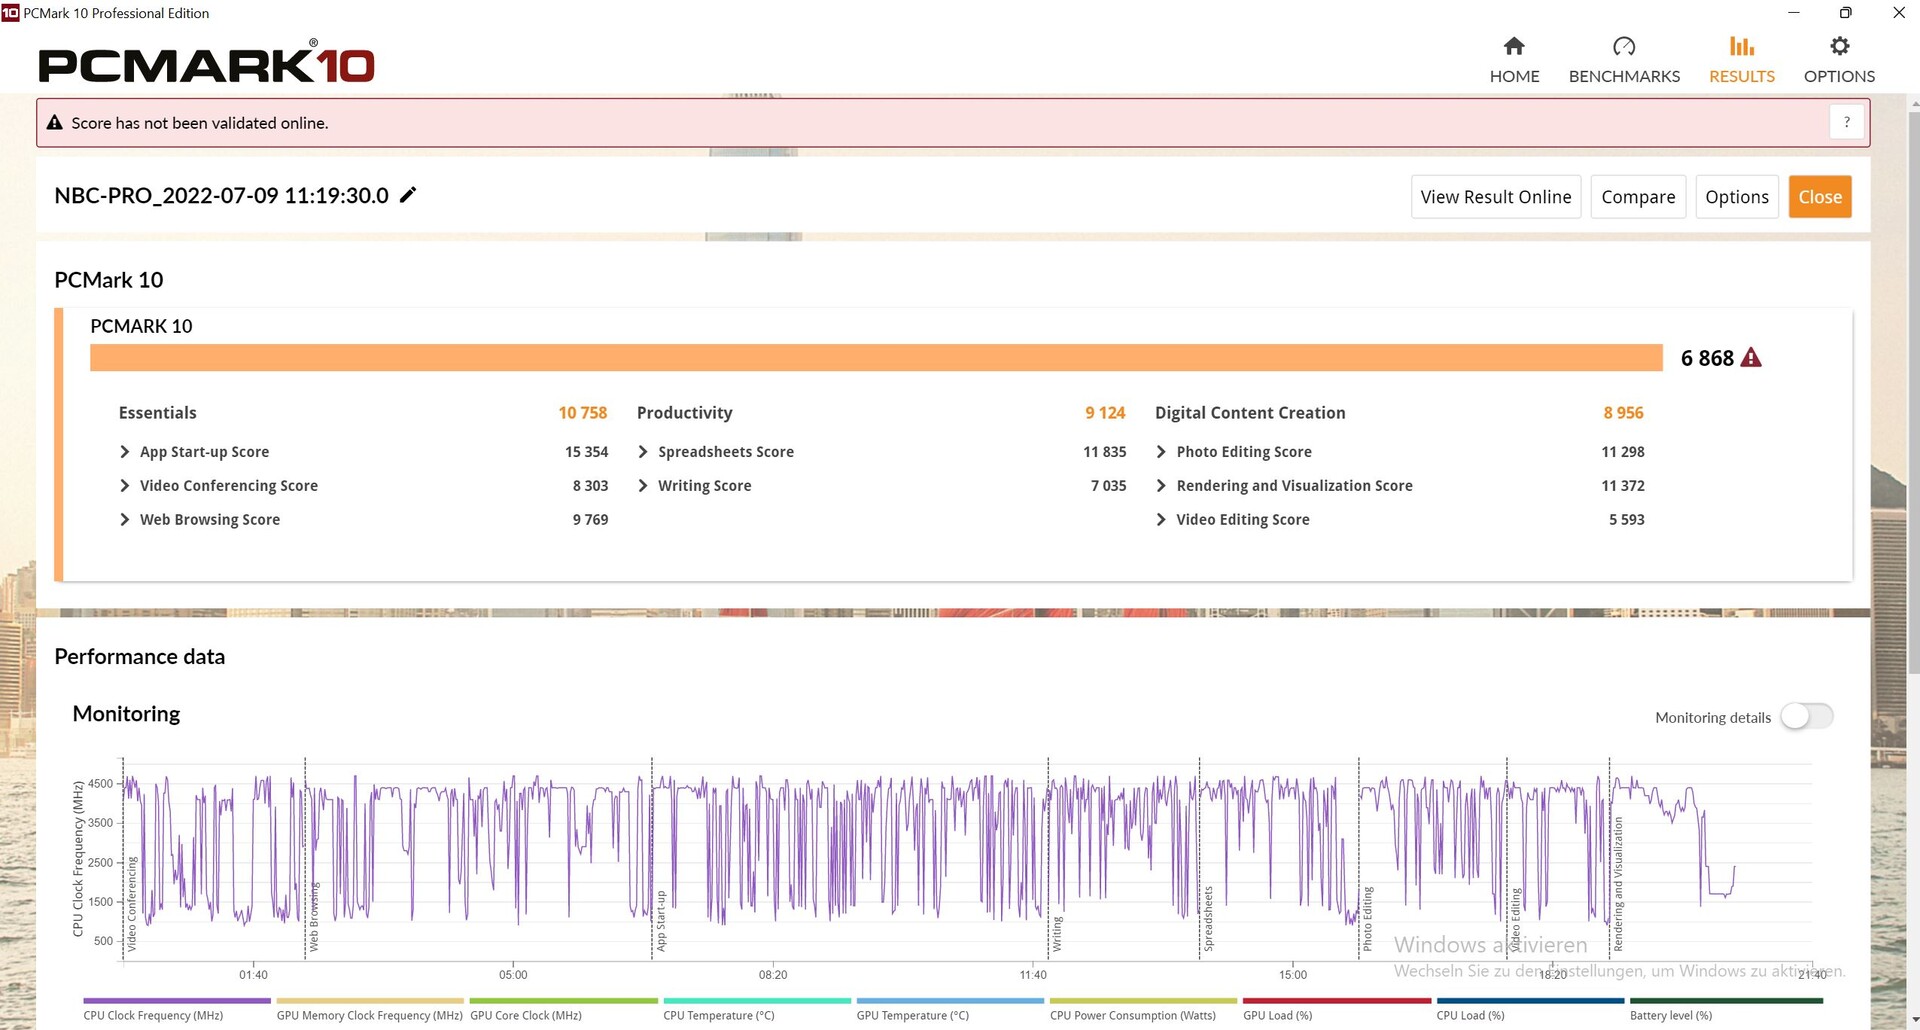
En PCMark 10, los valores de referencia están más o menos a la par con el nivel esperado, pero el rendimiento cae bruscamente en el área de creación de contenidos
CrossMark: Overall | Productivity | Creativity | Responsiveness
| PCMark 10 / Score | |
| Media de la clase Gaming (5828 - 12414, n=93, últimos 2 años) | |
| MSI Raider GE66 12UHS | |
| Razer Blade 15 2022 | |
| Schenker XMG Neo 15 (i7-12700H, RTX 3080 Ti) | |
| Medio Intel Core i7-12700H, NVIDIA GeForce RTX 3080 Ti Laptop GPU (6868 - 7638, n=7) | |
| Schenker XMG Pro 15 (i7-12700H, RTX 3080 Ti) | |
| Schenker XMG Pro 15 (Late 2021) | |
| PCMark 10 / Essentials | |
| MSI Raider GE66 12UHS | |
| Schenker XMG Pro 15 (i7-12700H, RTX 3080 Ti) | |
| Razer Blade 15 2022 | |
| Media de la clase Gaming (8810 - 11935, n=97, últimos 2 años) | |
| Schenker XMG Neo 15 (i7-12700H, RTX 3080 Ti) | |
| Medio Intel Core i7-12700H, NVIDIA GeForce RTX 3080 Ti Laptop GPU (9987 - 11318, n=7) | |
| Schenker XMG Pro 15 (Late 2021) | |
| PCMark 10 / Productivity | |
| Media de la clase Gaming (6845 - 25323, n=95, últimos 2 años) | |
| MSI Raider GE66 12UHS | |
| Razer Blade 15 2022 | |
| Medio Intel Core i7-12700H, NVIDIA GeForce RTX 3080 Ti Laptop GPU (8944 - 10726, n=7) | |
| Schenker XMG Pro 15 (i7-12700H, RTX 3080 Ti) | |
| Schenker XMG Neo 15 (i7-12700H, RTX 3080 Ti) | |
| Schenker XMG Pro 15 (Late 2021) | |
| PCMark 10 / Digital Content Creation | |
| Media de la clase Gaming (7602 - 19954, n=95, últimos 2 años) | |
| MSI Raider GE66 12UHS | |
| Schenker XMG Neo 15 (i7-12700H, RTX 3080 Ti) | |
| Razer Blade 15 2022 | |
| Medio Intel Core i7-12700H, NVIDIA GeForce RTX 3080 Ti Laptop GPU (8956 - 12249, n=7) | |
| Schenker XMG Pro 15 (Late 2021) | |
| Schenker XMG Pro 15 (i7-12700H, RTX 3080 Ti) | |
| CrossMark / Overall | |
| Media de la clase Gaming (1366 - 2409, n=94, últimos 2 años) | |
| Medio Intel Core i7-12700H, NVIDIA GeForce RTX 3080 Ti Laptop GPU (1761 - 1861, n=4) | |
| Schenker XMG Neo 15 (i7-12700H, RTX 3080 Ti) | |
| Schenker XMG Pro 15 (Late 2021) | |
| CrossMark / Productivity | |
| Media de la clase Gaming (1386 - 2254, n=94, últimos 2 años) | |
| Medio Intel Core i7-12700H, NVIDIA GeForce RTX 3080 Ti Laptop GPU (1645 - 1800, n=4) | |
| Schenker XMG Neo 15 (i7-12700H, RTX 3080 Ti) | |
| Schenker XMG Pro 15 (Late 2021) | |
| CrossMark / Creativity | |
| Media de la clase Gaming (1343 - 2786, n=94, últimos 2 años) | |
| Schenker XMG Neo 15 (i7-12700H, RTX 3080 Ti) | |
| Medio Intel Core i7-12700H, NVIDIA GeForce RTX 3080 Ti Laptop GPU (1936 - 2041, n=4) | |
| Schenker XMG Pro 15 (Late 2021) | |
| CrossMark / Responsiveness | |
| Media de la clase Gaming (1226 - 2334, n=94, últimos 2 años) | |
| Medio Intel Core i7-12700H, NVIDIA GeForce RTX 3080 Ti Laptop GPU (1461 - 1868, n=4) | |
| Schenker XMG Pro 15 (Late 2021) | |
| Schenker XMG Neo 15 (i7-12700H, RTX 3080 Ti) | |
| PCMark 10 Score | 6868 puntos | |
ayuda | ||
| AIDA64 / Memory Copy | |
| Media de la clase Gaming (21750 - 129946, n=105, últimos 2 años) | |
| MSI Raider GE66 12UHS | |
| Schenker XMG Neo 15 (i7-12700H, RTX 3080 Ti) | |
| Razer Blade 15 2022 | |
| Medio Intel Core i7-12700H (25615 - 80511, n=64) | |
| Schenker XMG Pro 15 (Late 2021) | |
| Schenker XMG Pro 15 (i7-12700H, RTX 3080 Ti) | |
| AIDA64 / Memory Read | |
| Media de la clase Gaming (22956 - 118858, n=105, últimos 2 años) | |
| MSI Raider GE66 12UHS | |
| Schenker XMG Neo 15 (i7-12700H, RTX 3080 Ti) | |
| Razer Blade 15 2022 | |
| Medio Intel Core i7-12700H (25586 - 79442, n=64) | |
| Schenker XMG Pro 15 (Late 2021) | |
| Schenker XMG Pro 15 (i7-12700H, RTX 3080 Ti) | |
| AIDA64 / Memory Write | |
| Media de la clase Gaming (22297 - 135096, n=105, últimos 2 años) | |
| Razer Blade 15 2022 | |
| Schenker XMG Neo 15 (i7-12700H, RTX 3080 Ti) | |
| MSI Raider GE66 12UHS | |
| Medio Intel Core i7-12700H (23679 - 88660, n=64) | |
| Schenker XMG Pro 15 (Late 2021) | |
| Schenker XMG Pro 15 (i7-12700H, RTX 3080 Ti) | |
| AIDA64 / Memory Latency | |
| Media de la clase Gaming (75.3 - 259, n=105, últimos 2 años) | |
| MSI Raider GE66 12UHS | |
| Schenker XMG Pro 15 (Late 2021) | |
| Medio Intel Core i7-12700H (76.2 - 133.9, n=62) | |
| Razer Blade 15 2022 | |
* ... más pequeño es mejor
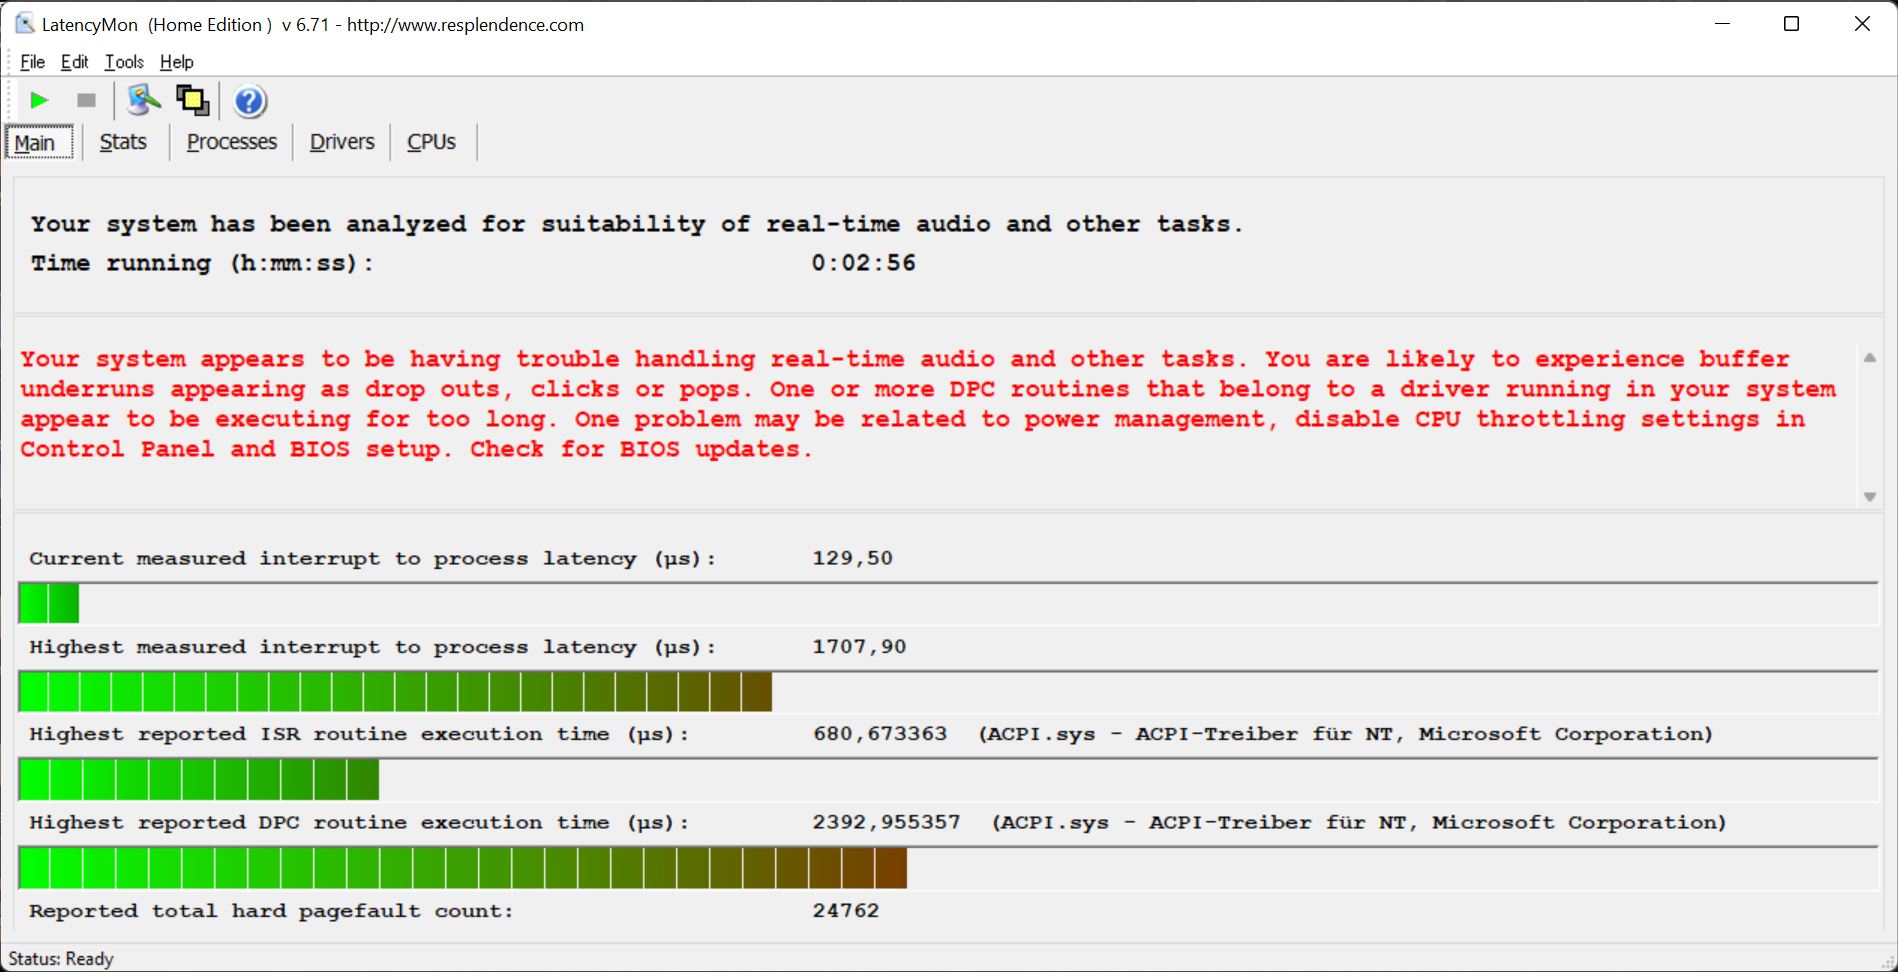
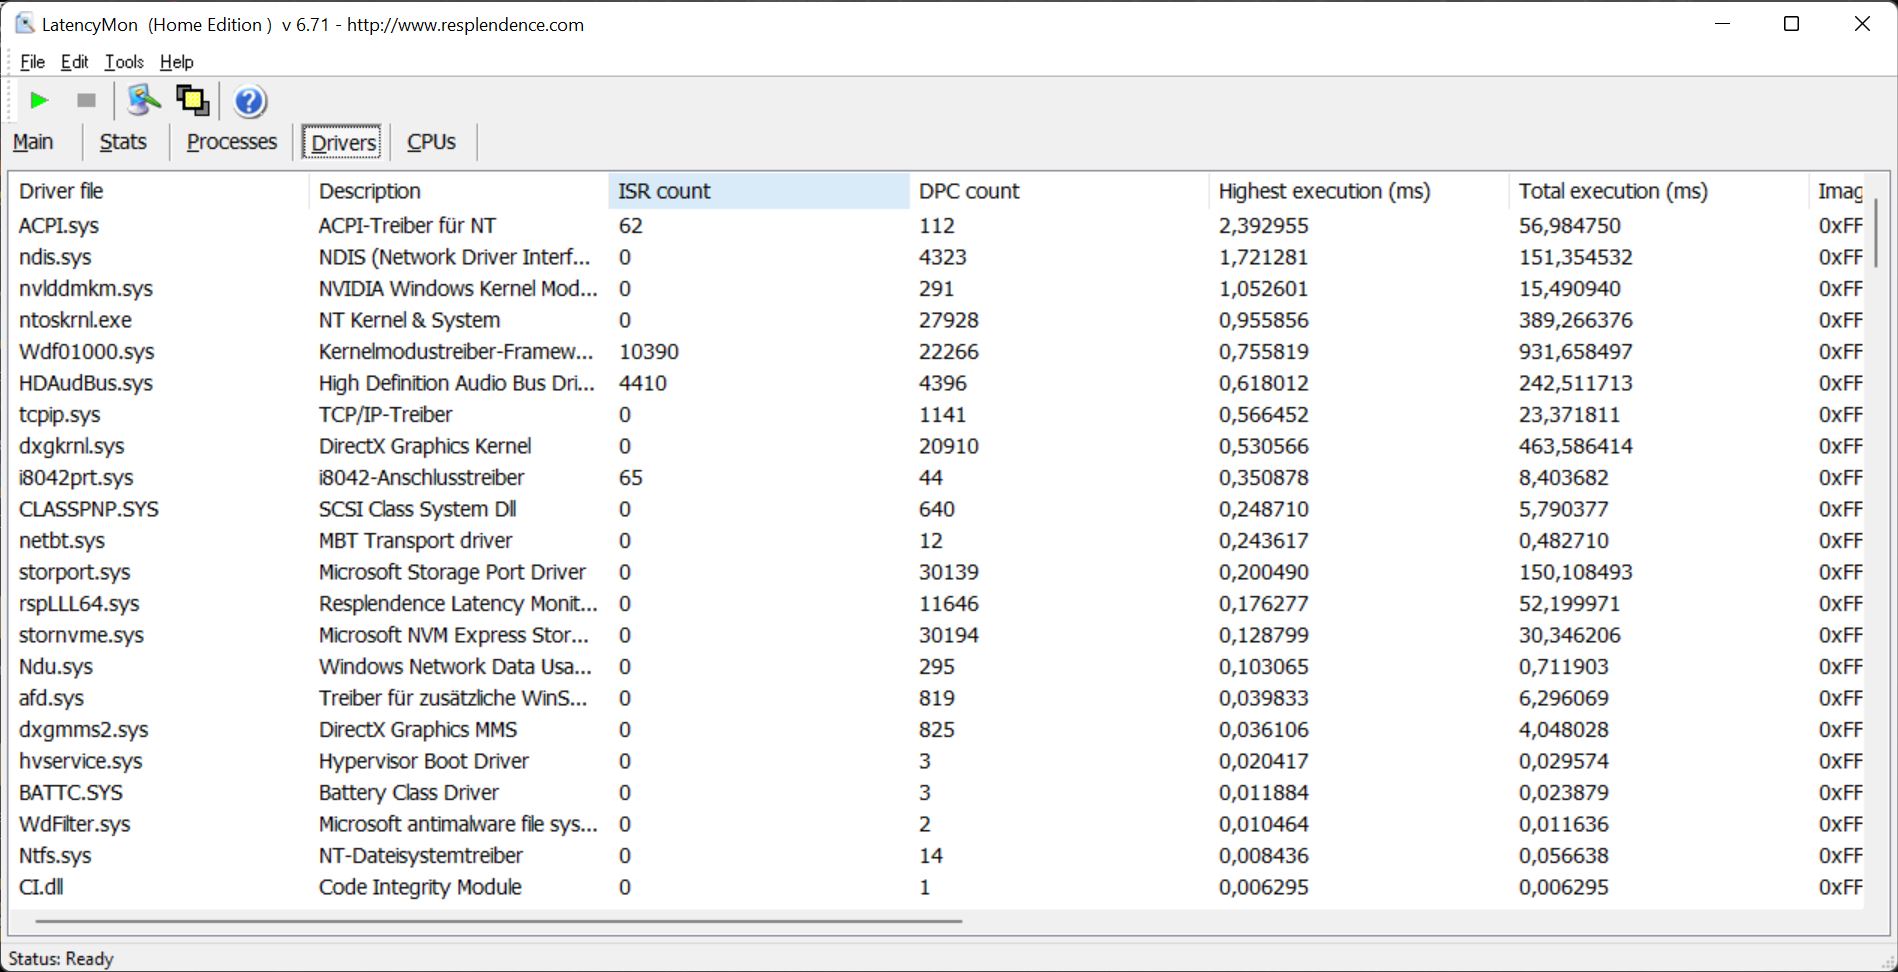
Latencia del CPD
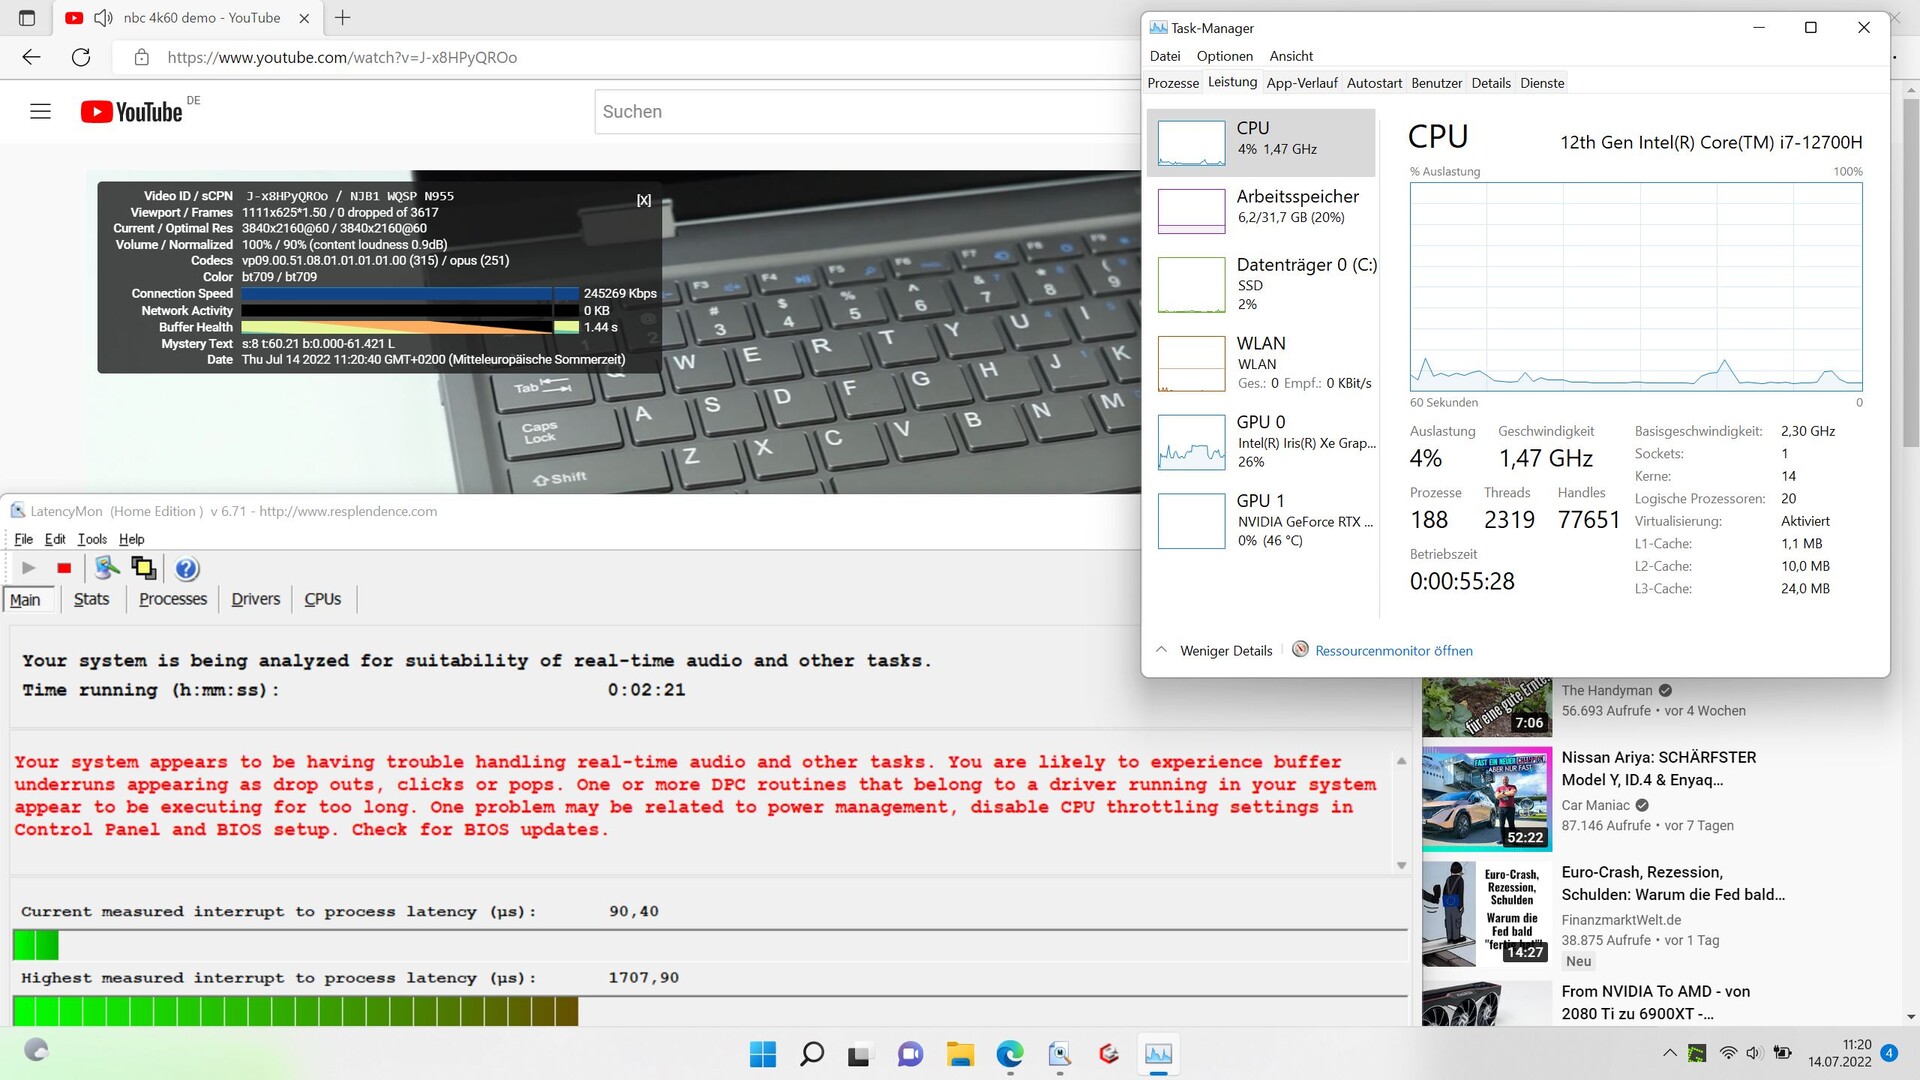
La apertura del navegador no causó ningún problema, pero hubo problemas al cargar nuestro sitio web. La latencia determinada aumentó al abrir varias pestañas y al reproducir nuestro vídeo 4K/60 fps de YouTube. Al menos, el vídeo se ejecutó sin pérdida de fotogramas, pero la latencia sigue siendo relativamente alta.
| DPC Latencies / LatencyMon - interrupt to process latency (max), Web, Youtube, Prime95 | |
| MSI Raider GE66 12UHS | |
| Schenker XMG Neo 15 (i7-12700H, RTX 3080 Ti) | |
| Schenker XMG Pro 15 (i7-12700H, RTX 3080 Ti) | |
| Razer Blade 15 2022 | |
| Schenker XMG Pro 15 (Late 2021) | |
* ... más pequeño es mejor
Dispositivos de almacenamiento
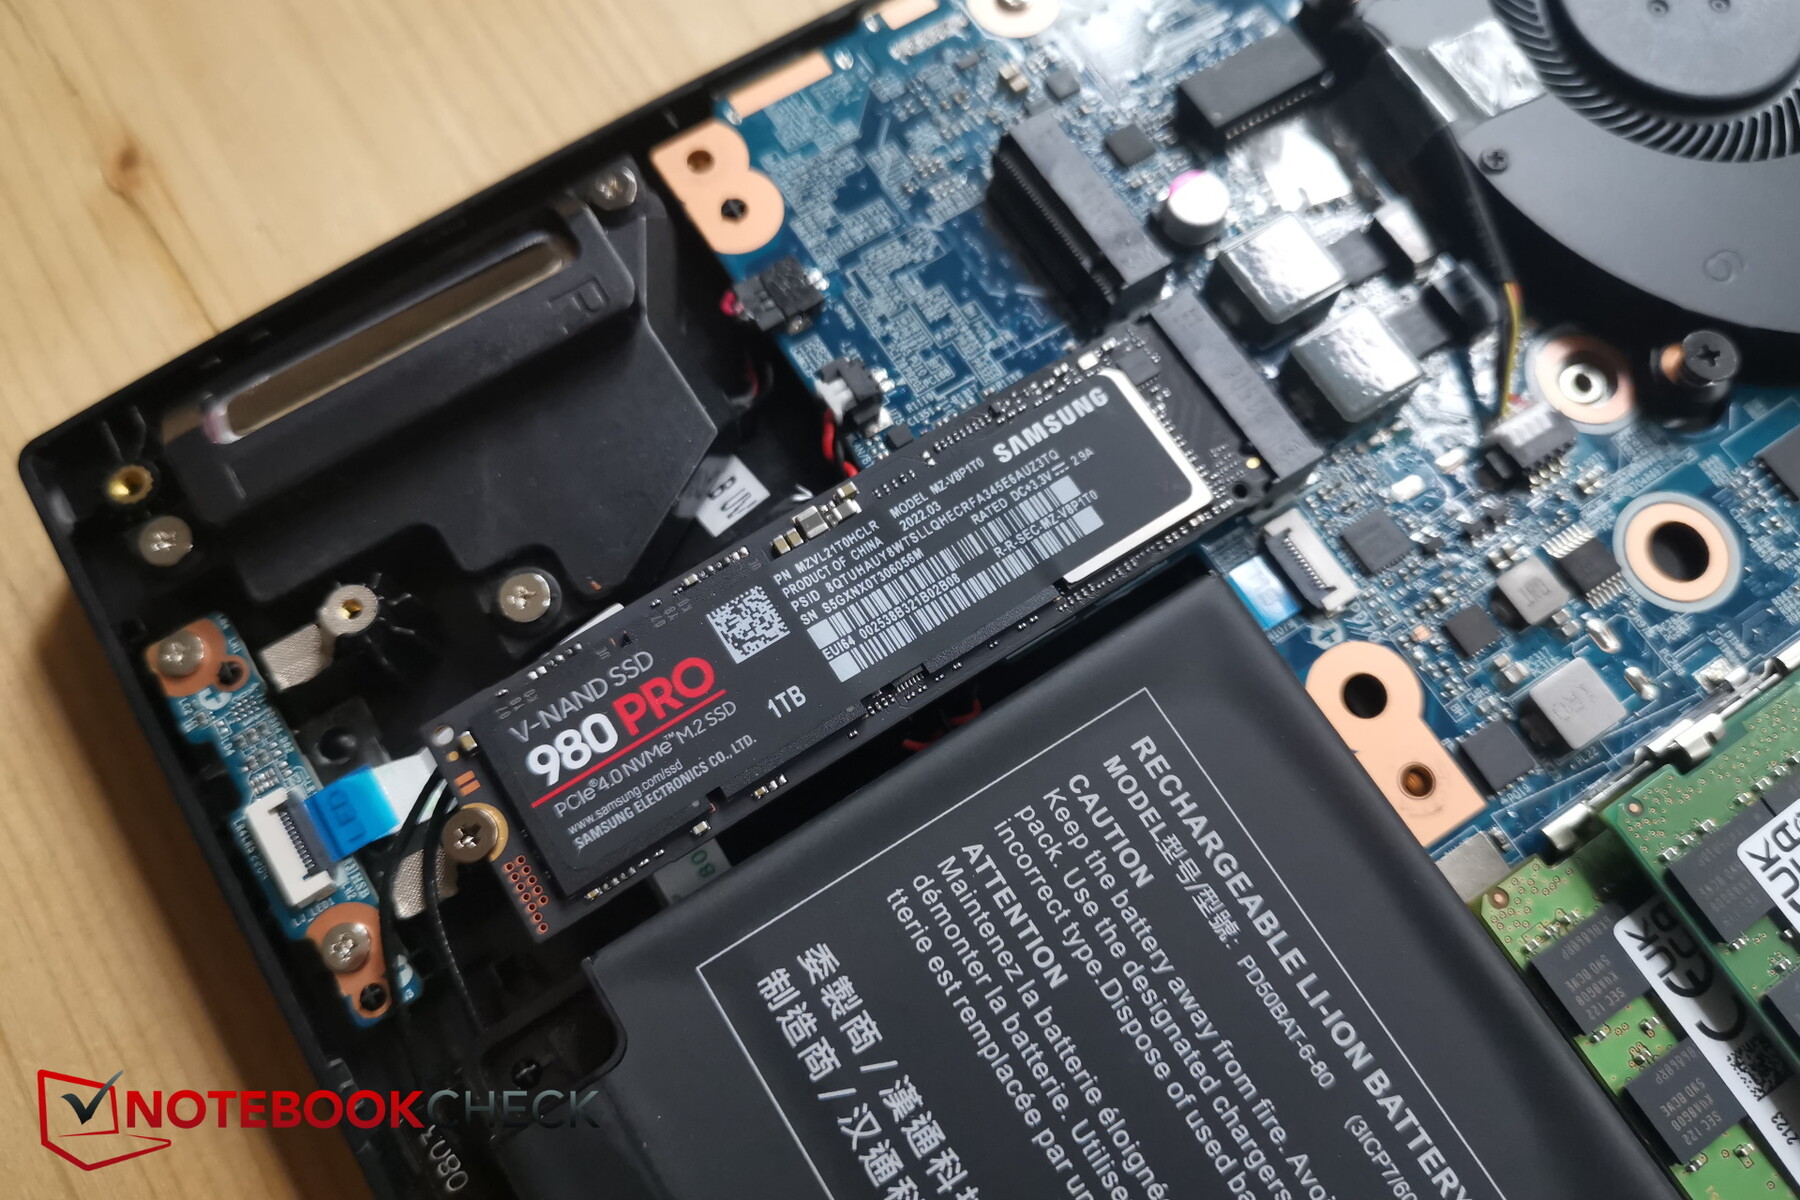
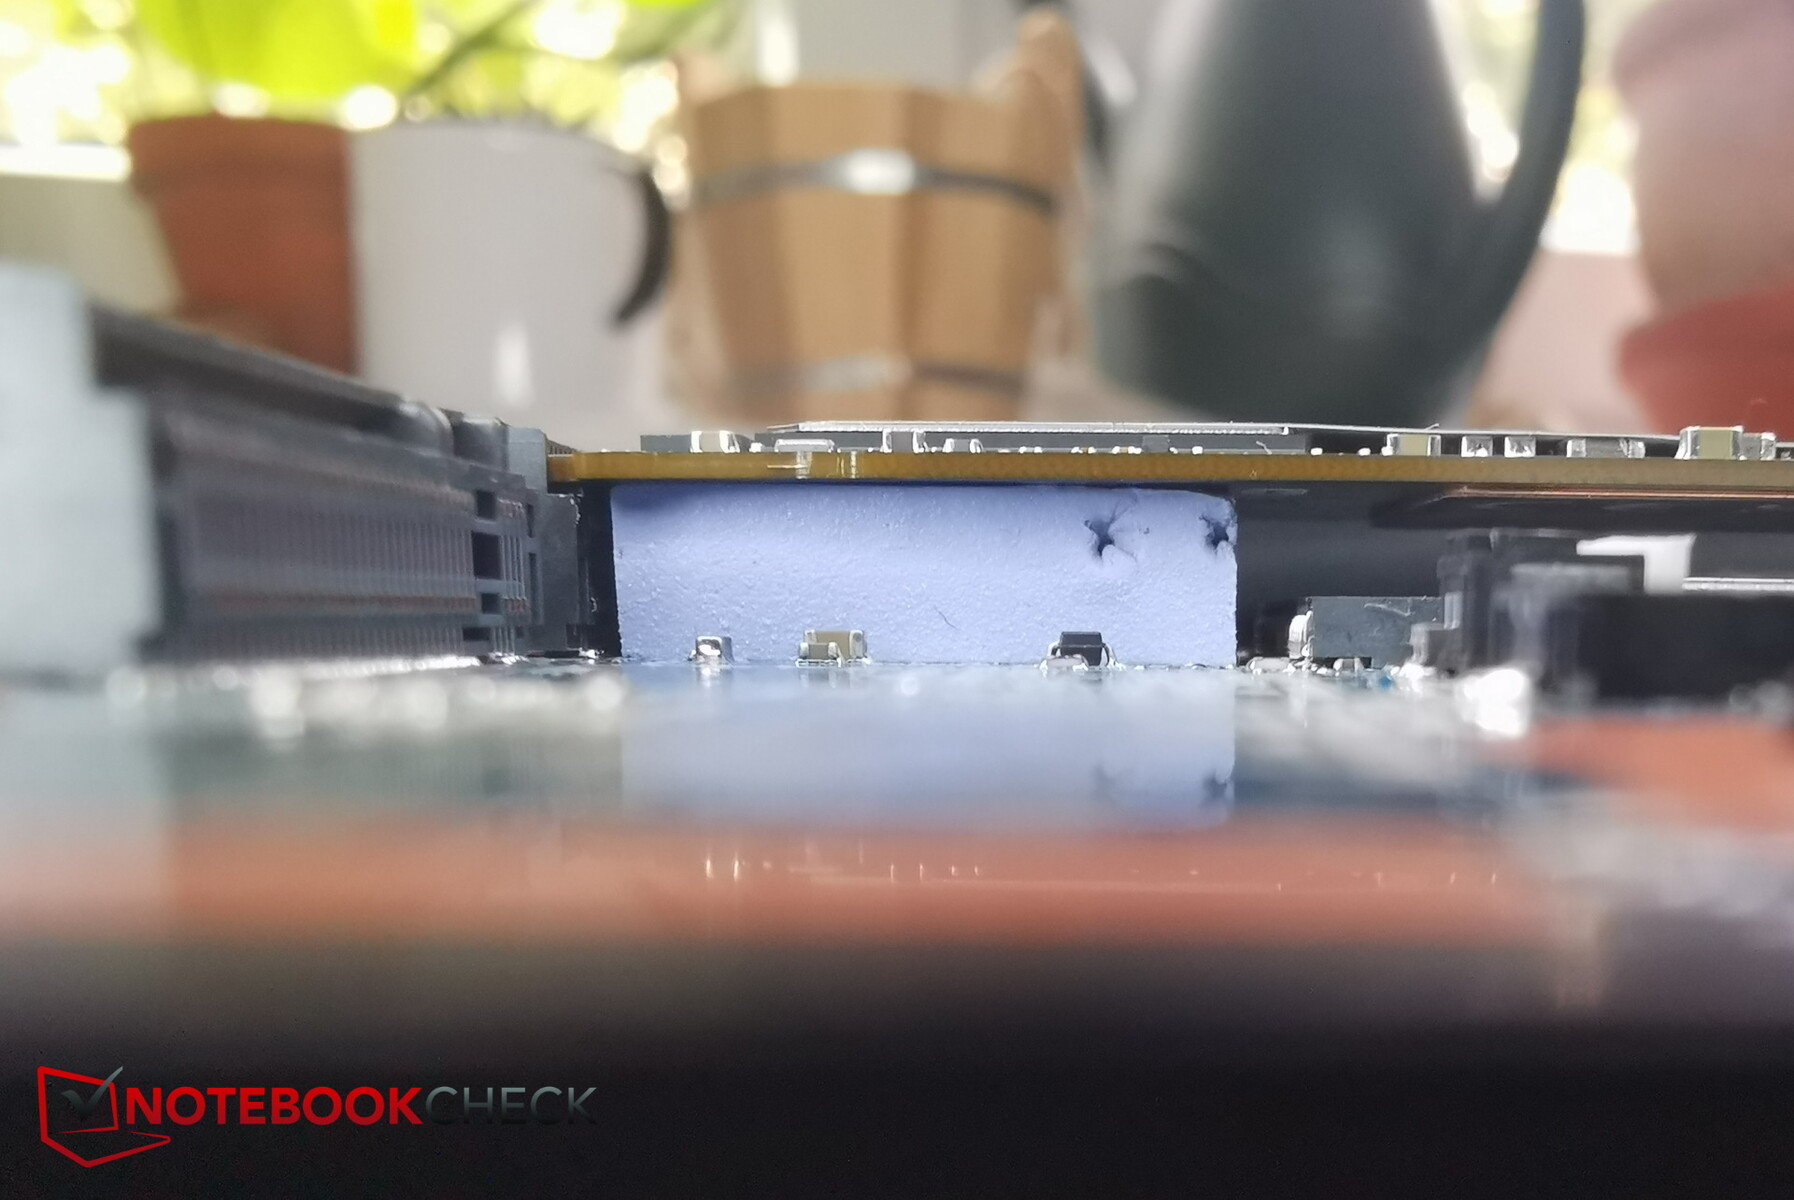
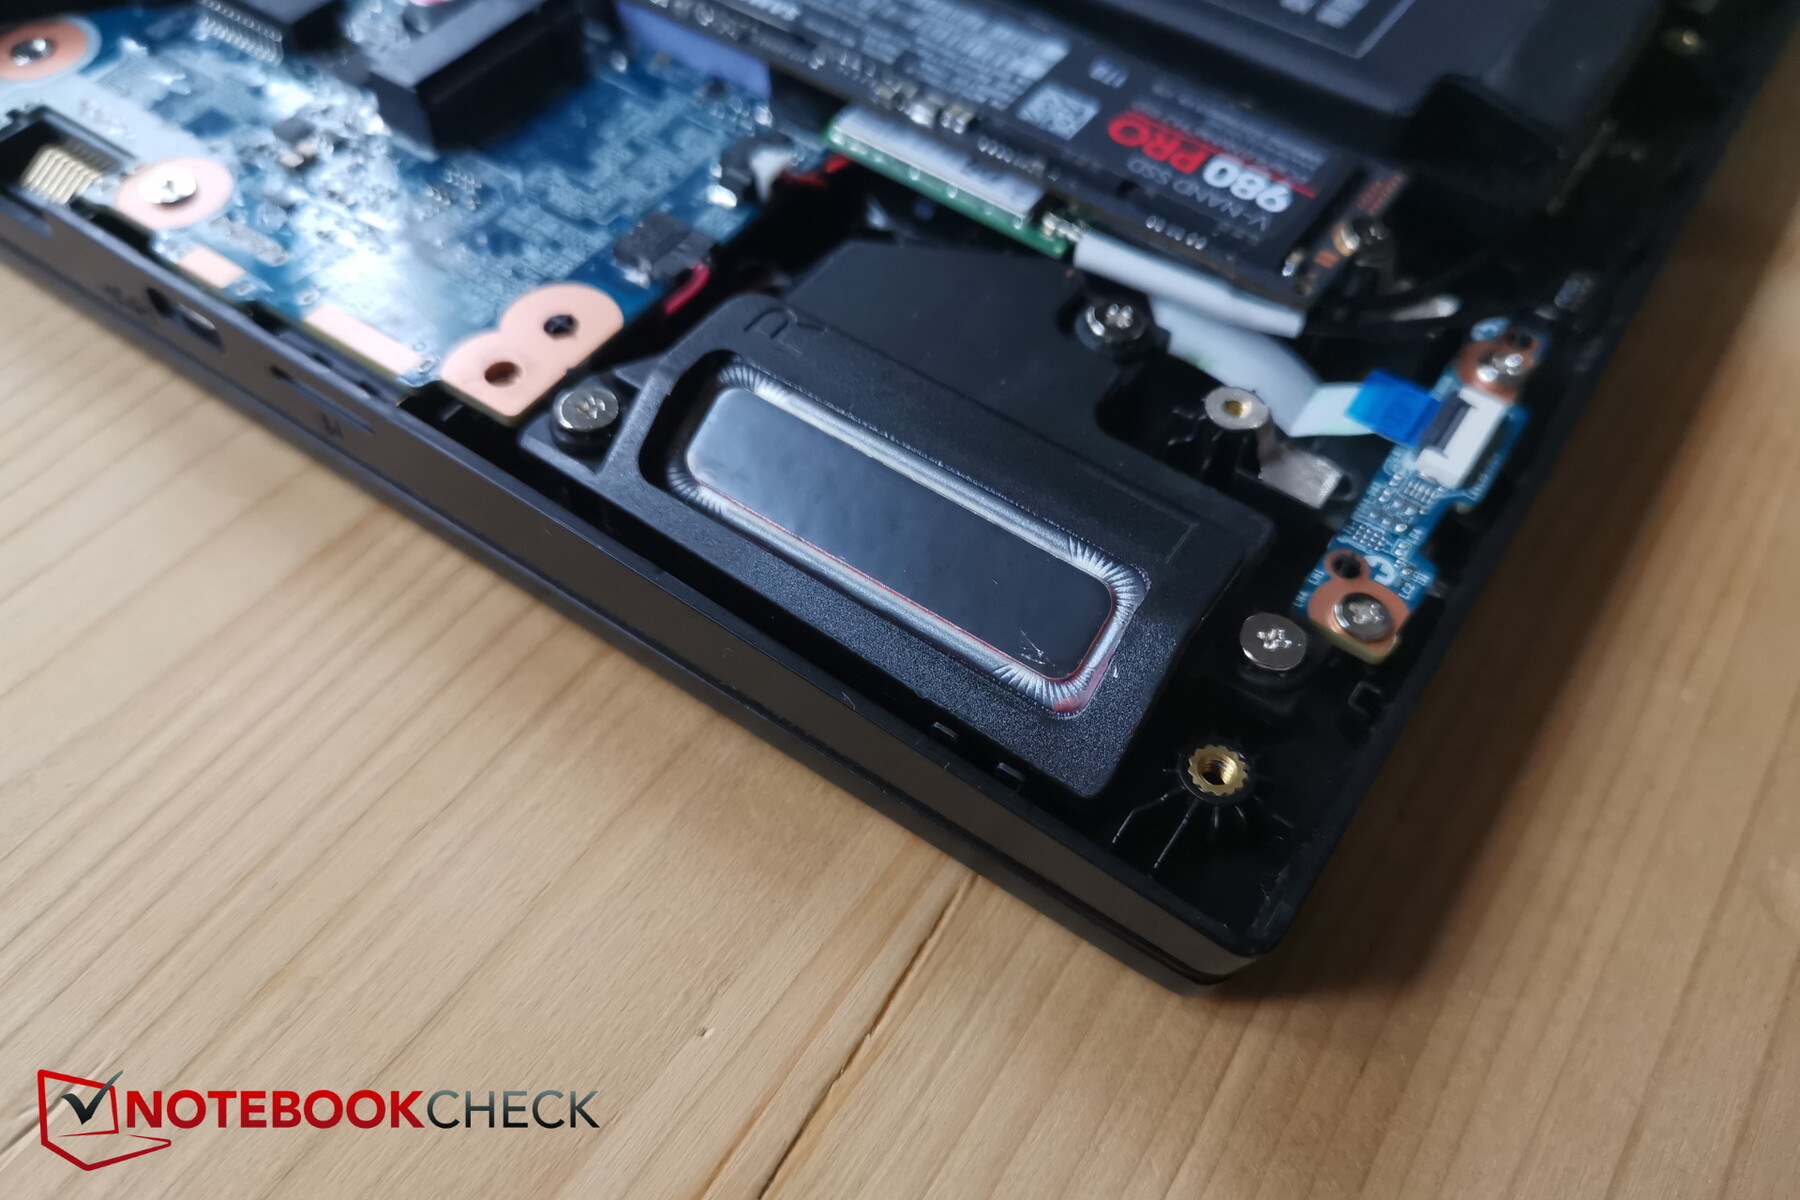
El Samsung SSD 980 Pro instalado con 1 TB y PCIe 4.0 ocupa el puesto 11 en nuestraLista de los mejores SSD/HDDtambién es bastante rápido en el Pro 15, pero el rendimiento sostenido no es constante, lo que significa que el rendimiento puede ser significativamente menor. Esto puede indicar un posible problema de refrigeración, lo que también podría explicar la baja puntuación en PCMark10.
Justo al lado del SSD Samsung hay otra ranura M.2 para una unidad de almacenamiento secundaria.
Al preguntar, el fabricante declaró que la muestra de revisión fue emitida por XMG antes del lanzamiento interno de la serie de modelos y se dice que tiene una almohadilla de refrigeración incorrecta que no se utiliza en el modelo de serie. Sin embargo, aparentemente no hay nada raro en el panel de refrigeración. El XMG Pro 17 también muestra una disminución en el rendimiento a largo plazo del SSD bajo prueba.

* ... más pequeño es mejor
Sustained Performance Read: DiskSpd Read Loop, Queue Depth 8
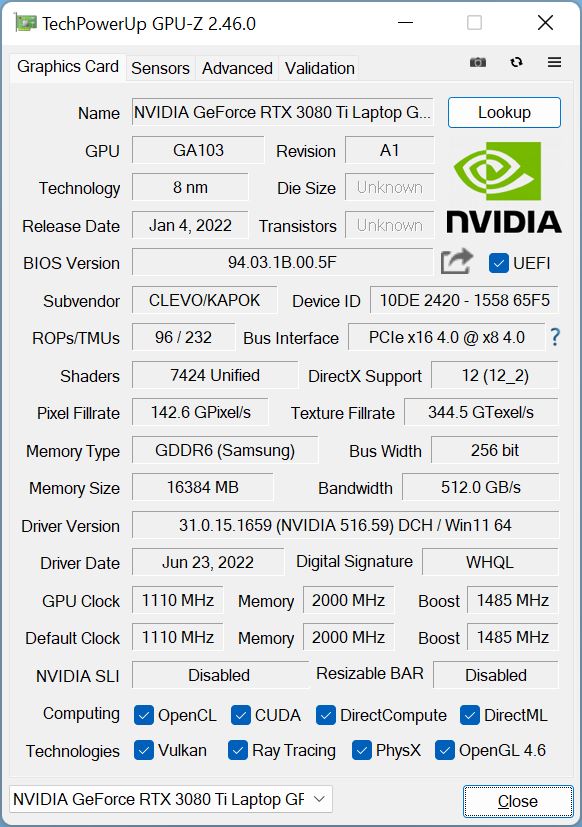
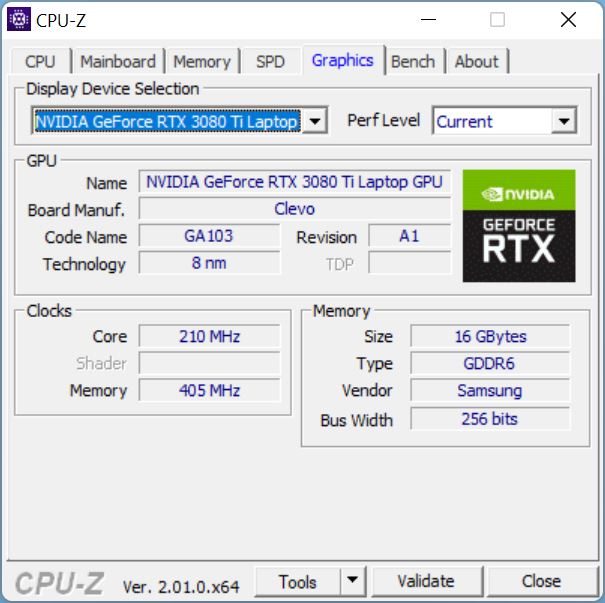
Tarjeta gráfica
El Nvidia Geforce RTX 3080 Ti es actualmente la tarjeta gráfica para portátiles más potente disponible. Sin embargo, su rendimiento depende en gran medida del TGP establecido por el fabricante. En el caso del Pro 15, la GPU puede alcanzar los 155 W (incluyendo Dynamic Boost). Según Nvidia, es posible hasta 175 W. No obstante, el rendimiento 3D debería ser muy alto en todas las aplicaciones.
Sólo el MSI Raider es más rápido en 3DMark 11, y el Neo 15 a veces supera al Pro 15 en las otras 3DMarks, pero las diferencias son más bien pequeñas.
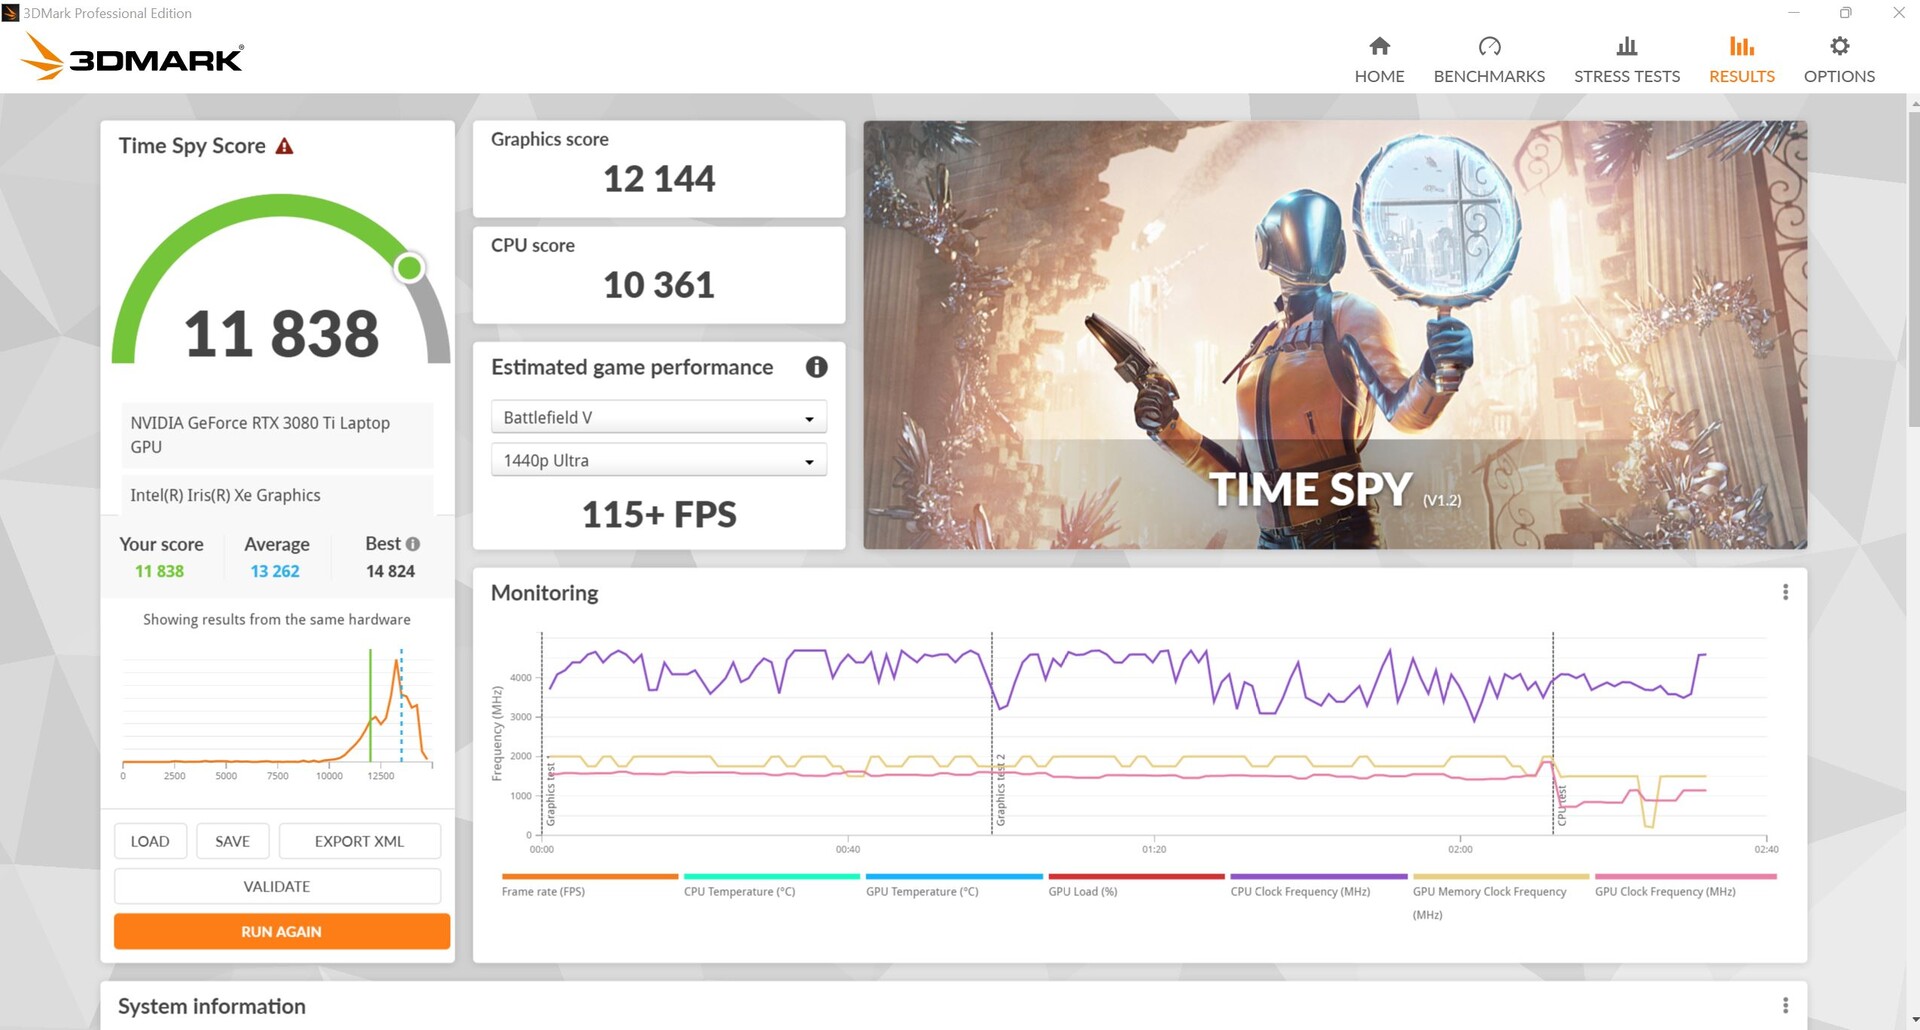
¡En el modo de batería, el rendimiento 3D cae la friolera de un 86% en otra ejecución de Time Spy!
| 3DMark 11 Performance | 33321 puntos | |
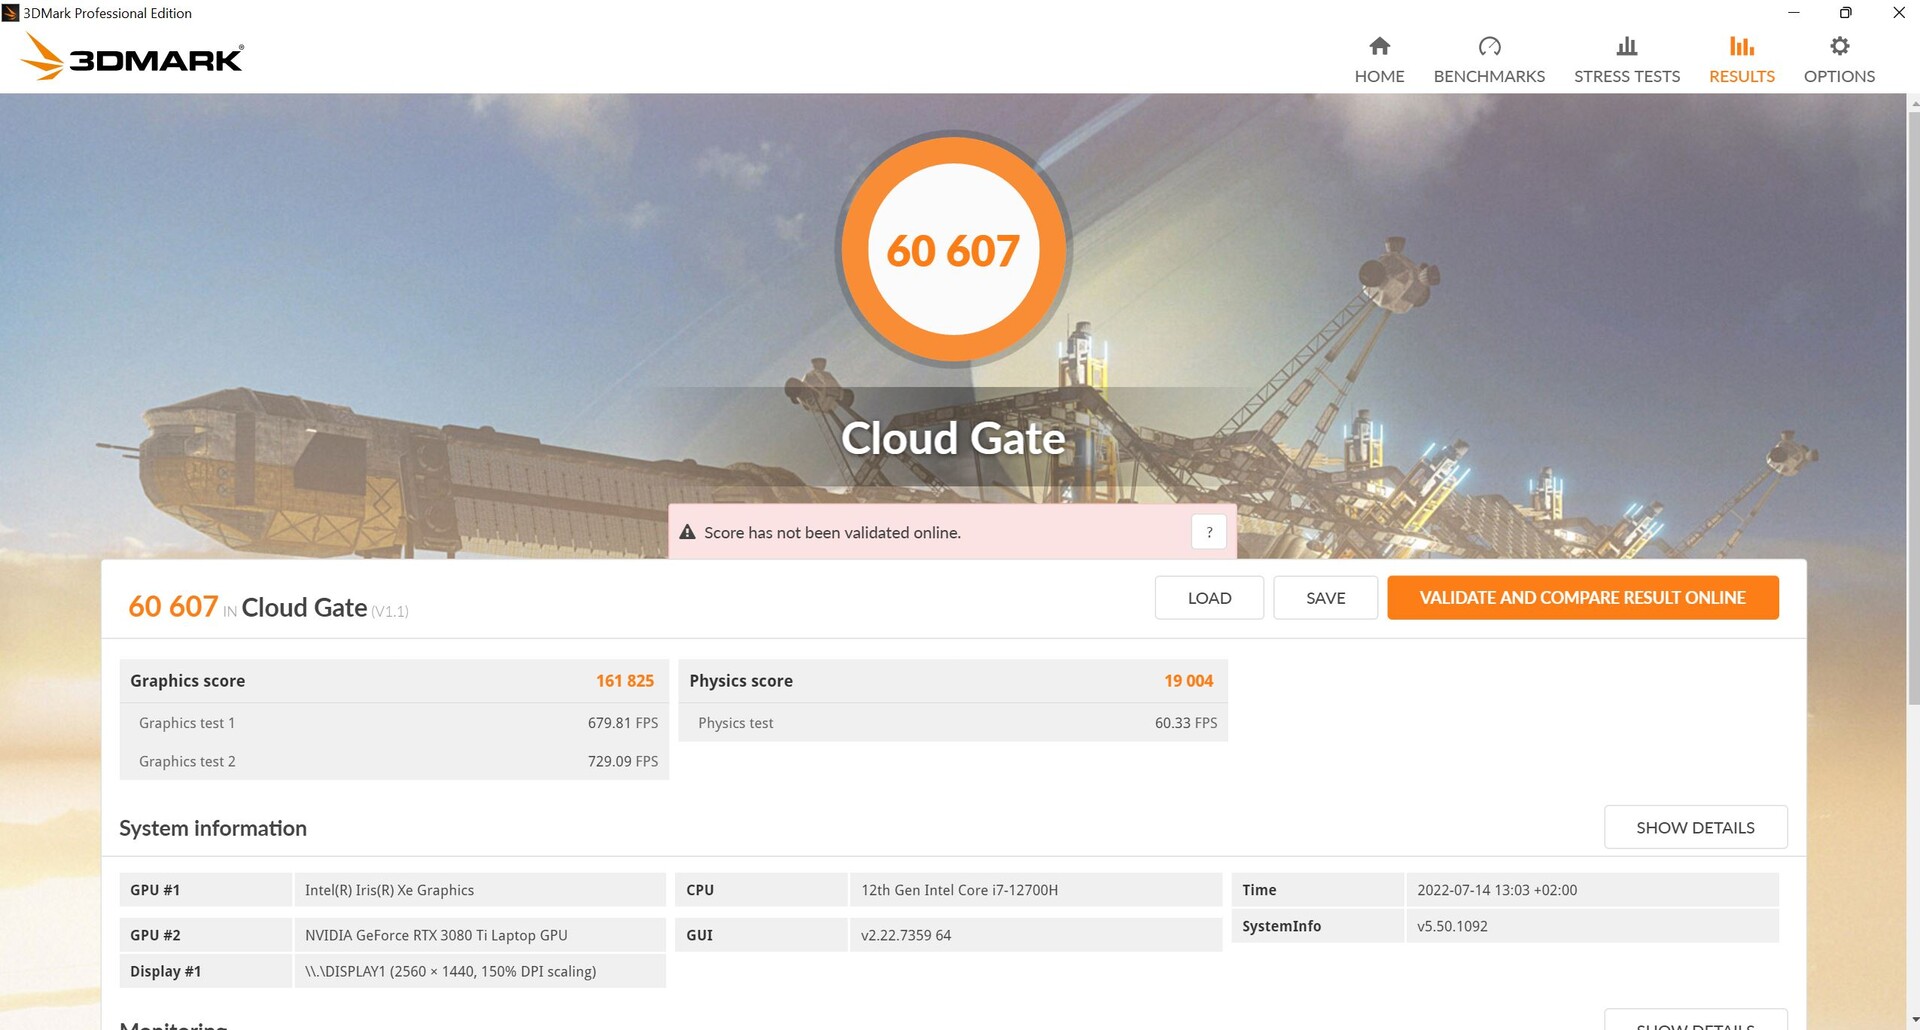
| 3DMark Cloud Gate Standard Score | 60607 puntos | |
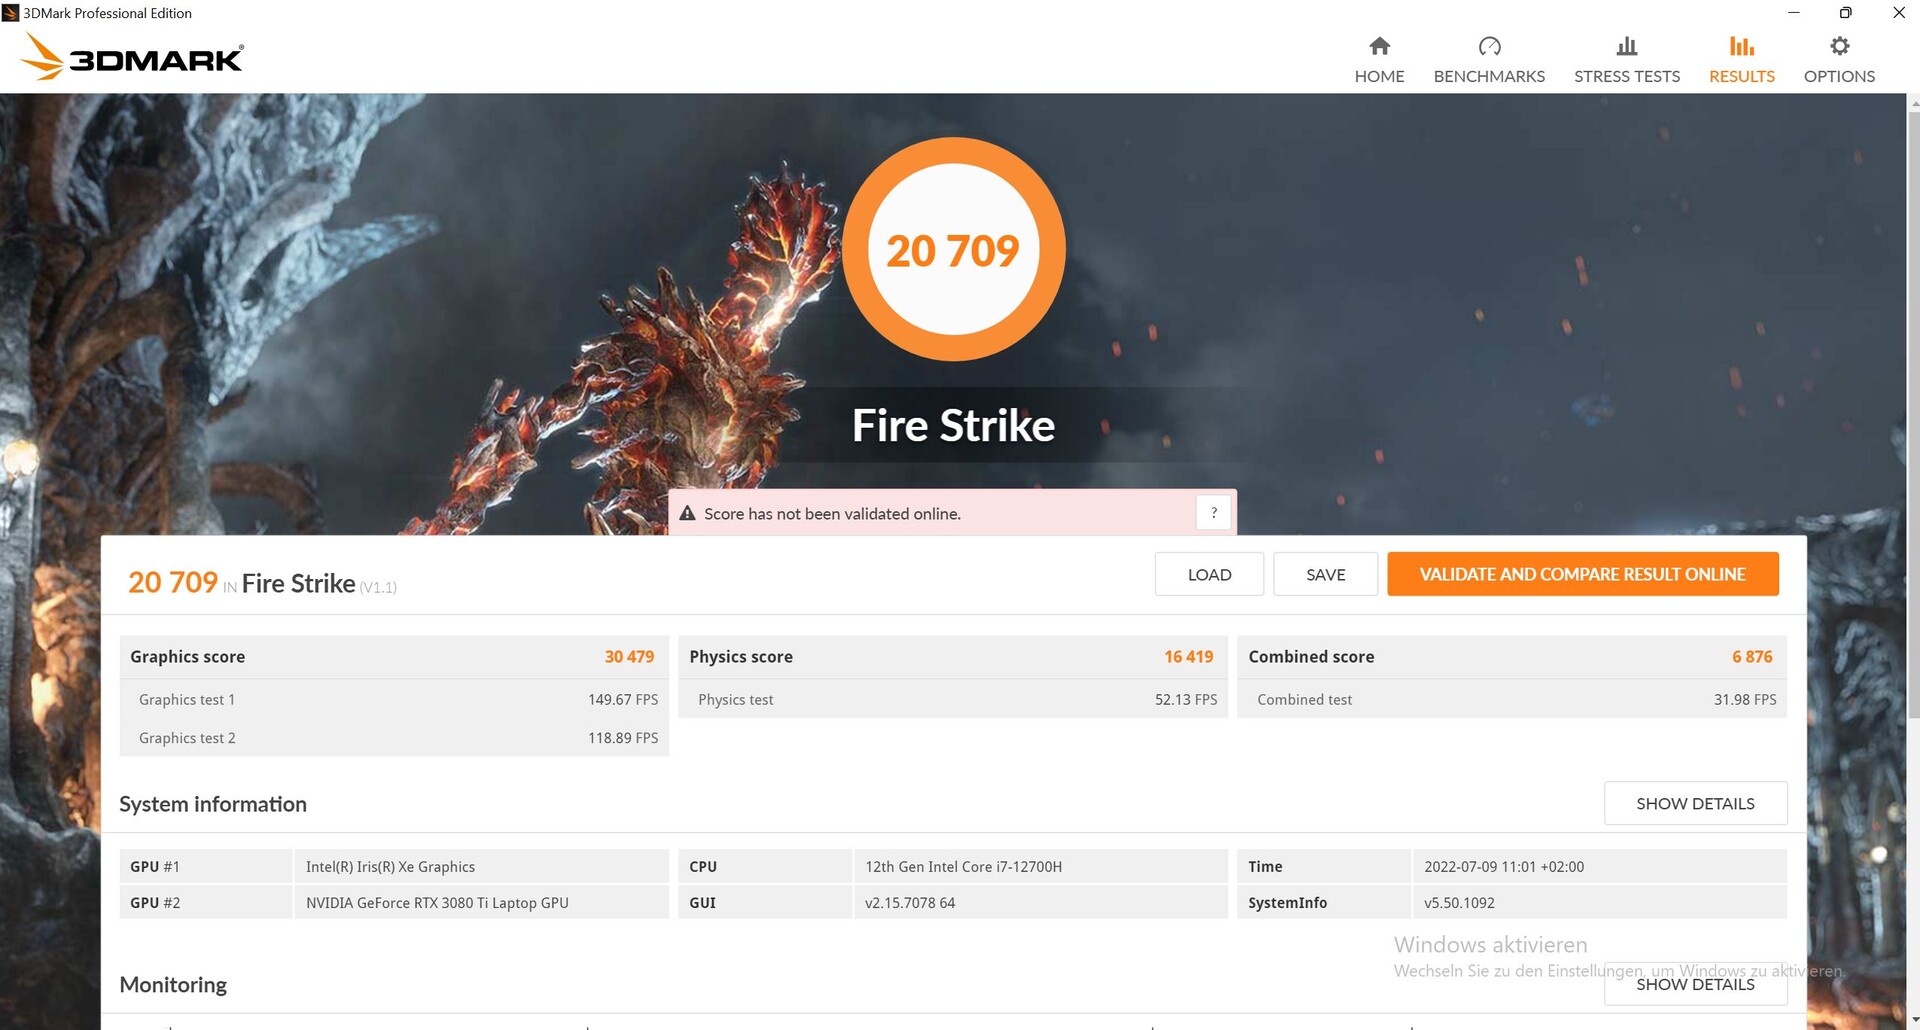
| 3DMark Fire Strike Score | 20709 puntos | |
| 3DMark Time Spy Score | 11838 puntos | |
ayuda | ||
Rendimiento de los juegos
El Pro 15 suele estar justo por debajo de la media en ajustes gráficos bajos, y ligeramente por encima en detalles altos. En general, el rendimiento en juegos está al nivel esperado. Sin embargo, el Neo 15 y el MSI Raider en particular son casi siempre más rápidos, incluso con detalles altos. En Strange Brigade, el Pro 15 es el dispositivo más rápido.
Sin embargo, las cosas se ponen un poco apretadas en términos de trazado de rayos, dependiendo del juego y el nivel de detalle. En Dying Light 2 con ajustes de trazado de rayos altos y Full HD, el Pro 15 logra 38 fps, pero tartamudea en resolución QHD nativa a poco más de 20 fps. Pero esto no es diferente en otros portátiles con la RTX 3080 Ti
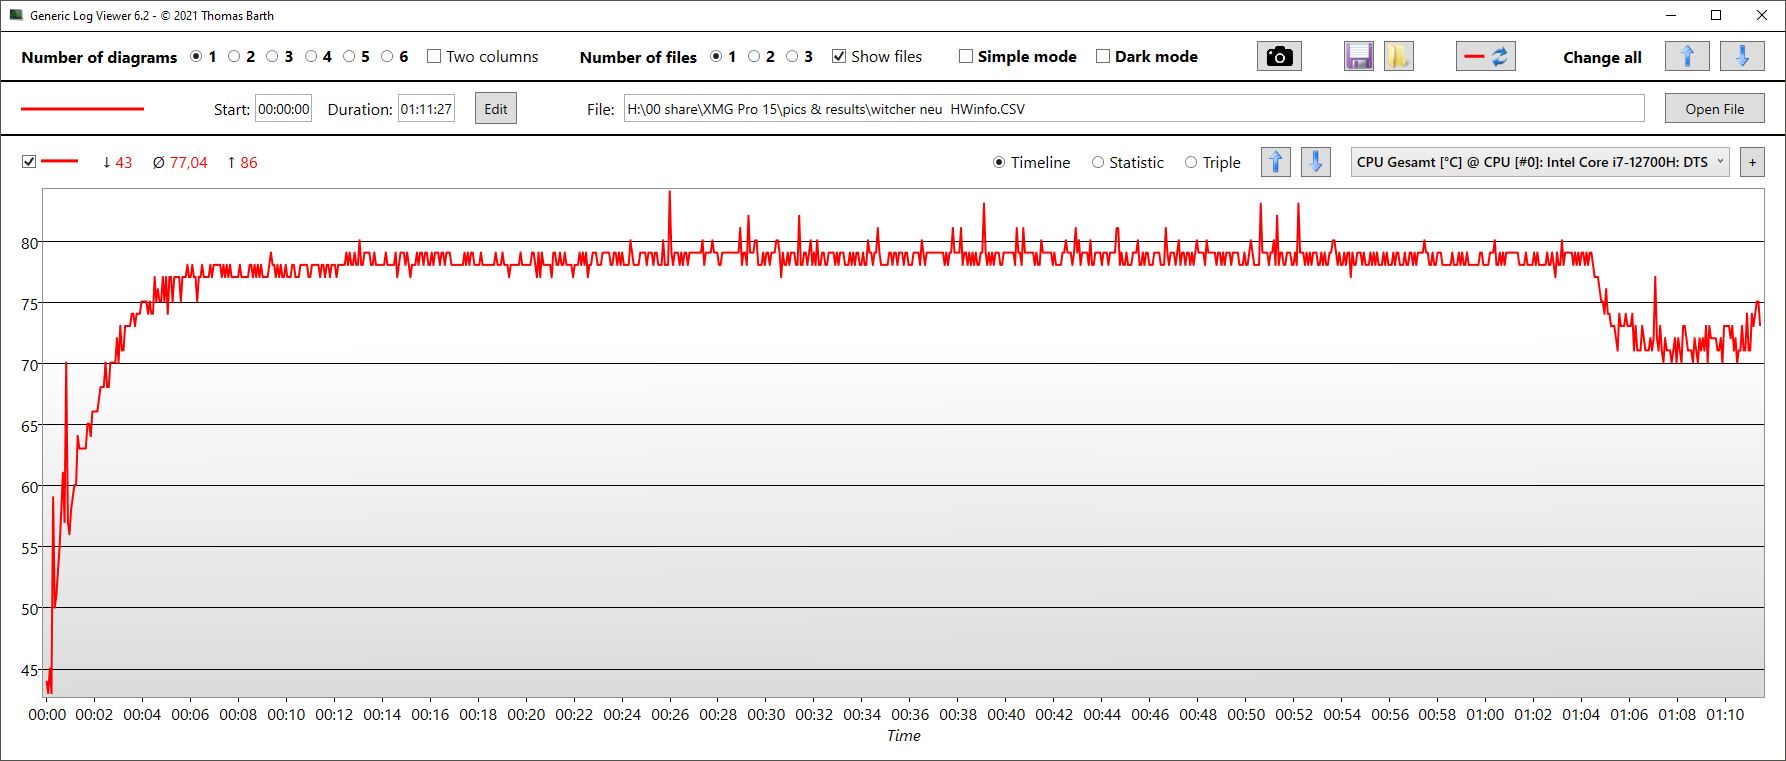
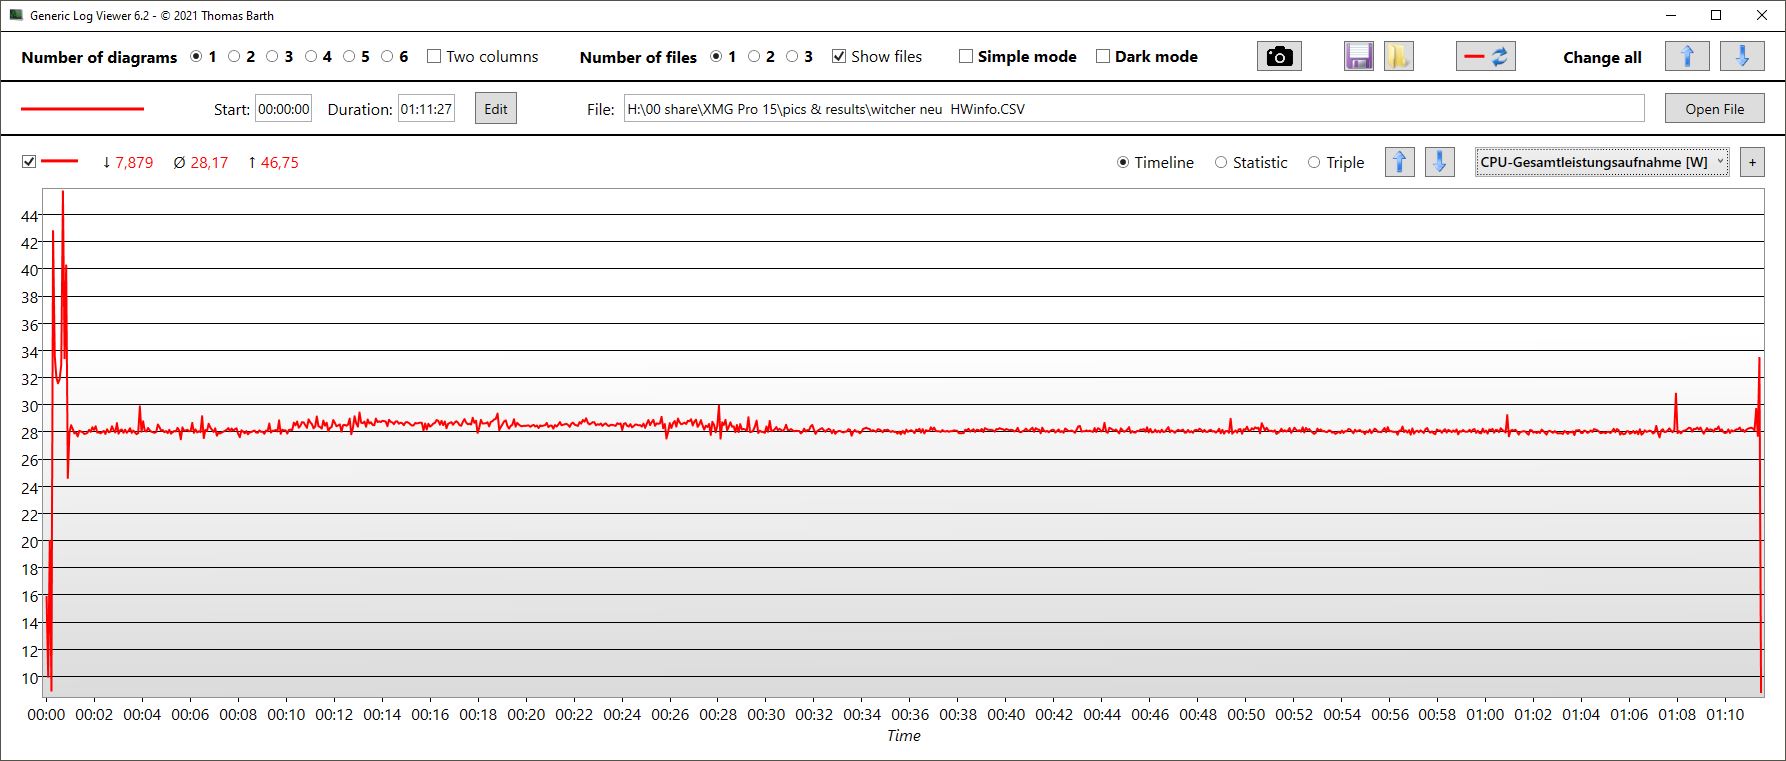
La tasa de fotogramas de Witcher 3 Ultra es bastante constante durante una hora y fluctúa entre 110 y 125 fps.
La CPU se calienta hasta una media de 77 °C y el consumo de energía es de sólo 28 W, también porque Witcher 3 no puede utilizar bien los procesadores más nuevos, especialmente los nuevos núcleos E y P de las CPU de Intel.
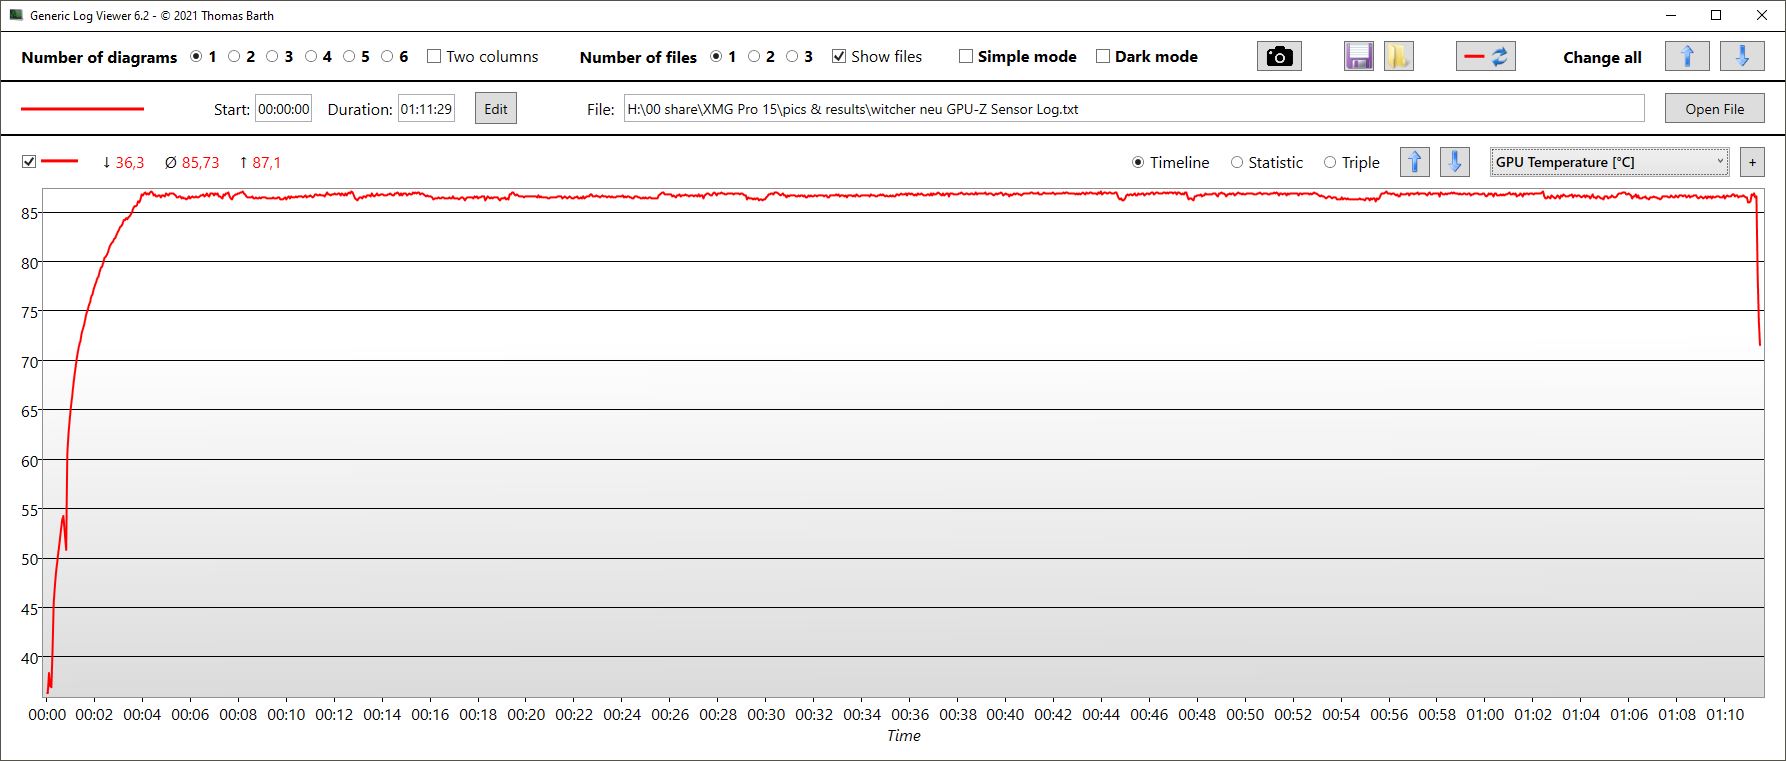
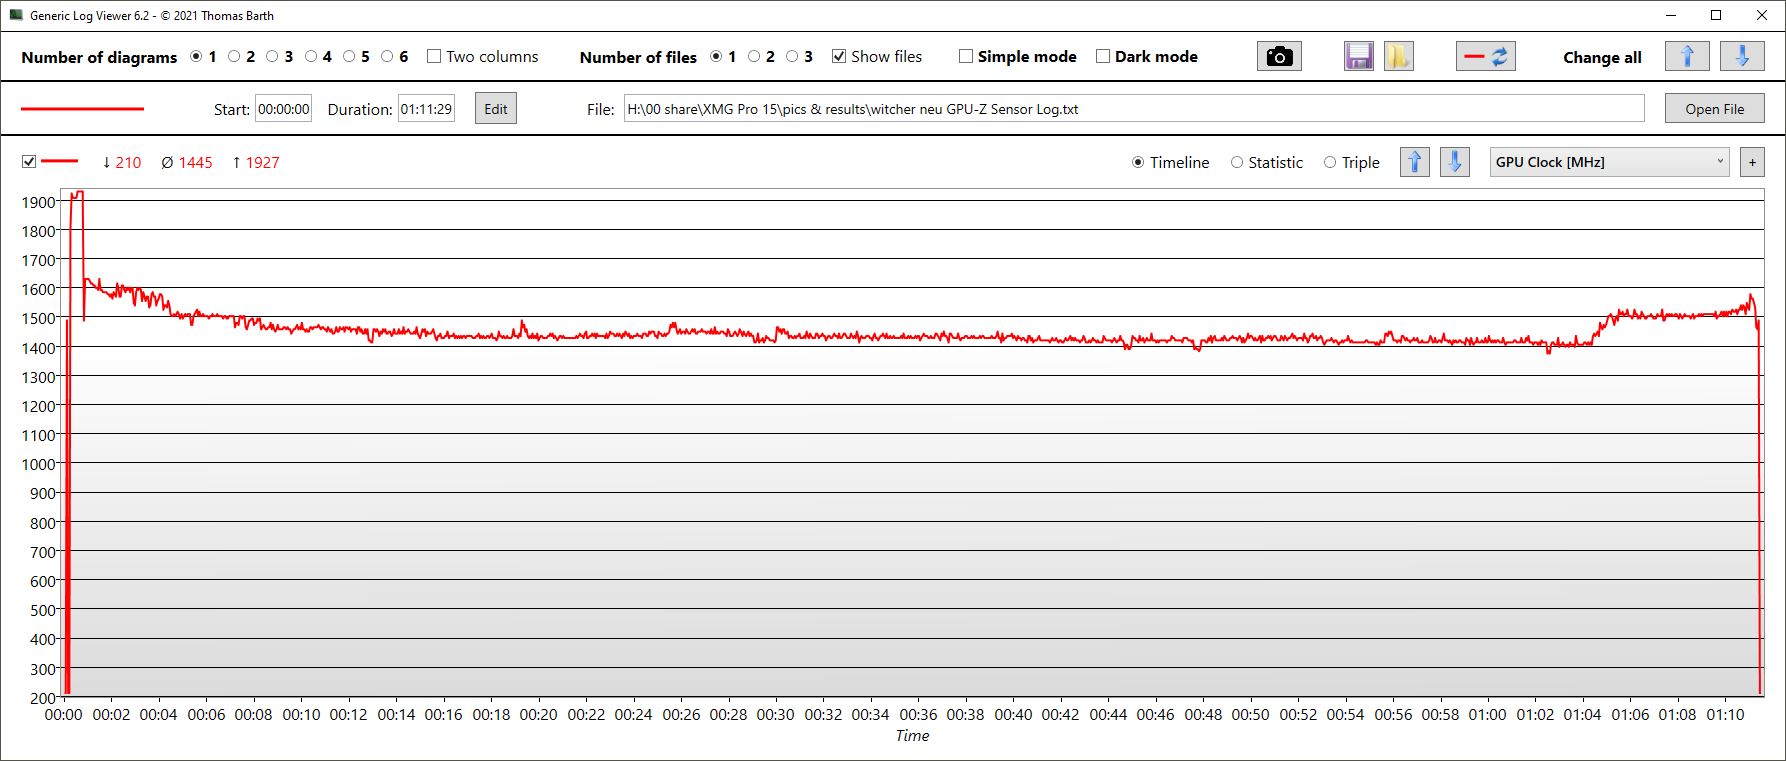
La GPU se calienta hasta una media de 86 °C. No puede mantener la tasa de Turbo y se sincroniza a una media de 1,4 GHz
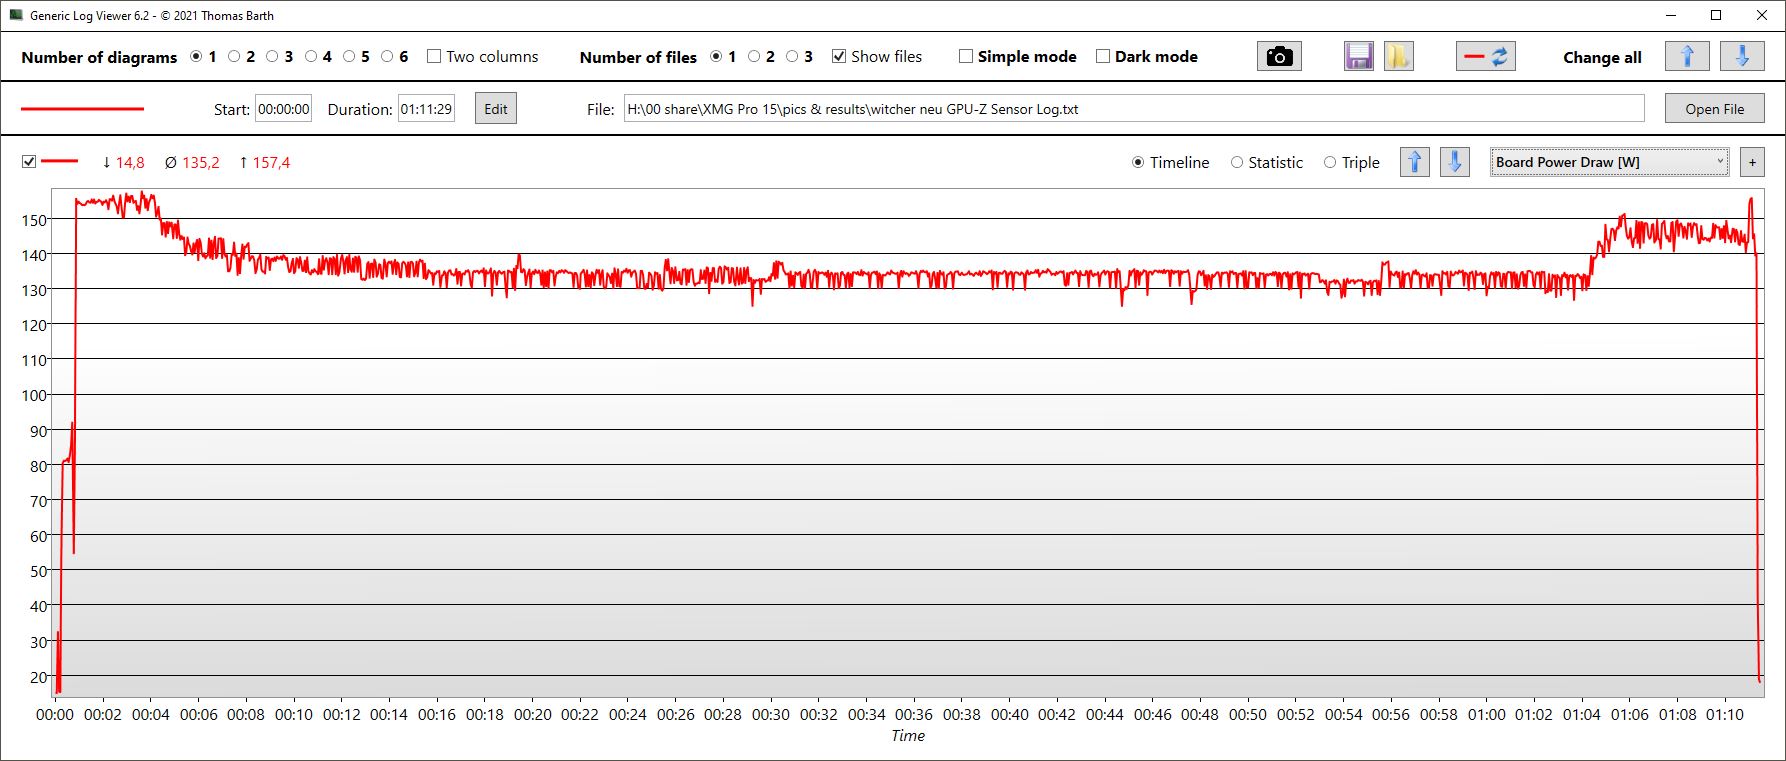
Witcher 3 FPS Chart
| bajo | medio | alto | ultra | QHD | |
|---|---|---|---|---|---|
| GTA V (2015) | 185 | 175.8 | 175.7 | 119.2 | 105.7 |
| The Witcher 3 (2015) | 366 | 319 | 211 | 119 | |
| Dota 2 Reborn (2015) | 161.1 | 148.4 | 138.9 | 131.7 | |
| Final Fantasy XV Benchmark (2018) | 177.5 | 148.3 | 110.4 | 88.8 | |
| X-Plane 11.11 (2018) | 140.2 | 125.2 | 100.1 | ||
| Far Cry 5 (2018) | 164 | 134 | 130 | 120 | 116 |
| Strange Brigade (2018) | 415.8 | 274 | 232 | 200 | 153.8 |
| Dying Light 2 (2022) | 123 | 99 | 84.4 | 59 |
Emisiones: Los ventiladores alcanzan rápidamente su límite
Ruido del sistema
Puede ocurrir que los ventiladores del Pro 15 se queden parados, pero es raro, incluso en modo Silencioso (inactivo). A veces el segundo ventilador también funciona silenciosamente en modo Entretenimiento o Rendimiento. No obstante, este comportamiento de los ventiladores ya es una mejora respecto a su predecesor, aún más ruidoso.
En general, los ventiladores del Pro 15 se aceleran bastante fuerte y muy rápido, y también les cuesta volver a reducir la velocidad. Por ejemplo, los ventiladores giran tras sólo 16 segundos en 3DMark06 y alcanzan su máximo tras 40 segundos. Otros portátiles permanecen en silencio durante más tiempo y no necesariamente alcanzan el volumen máximo bajo cargas medias. Este fue también el caso en el modo Entretenimiento, pero el volumen máximo aquí fue de 54.5 dB en vez de 56.5 dB. El Razer Blade e incluso el MSI Raider son significativamente más silenciosos bajo carga.
Al lanzar programas 3D como Witcher 3 o 3DMark06, oímos un zumbido electrónico que probablemente provenga de la GPU
Ruido
| Ocioso |
| 23 / 31.22 / 33.09 dB(A) |
| Carga |
| 56.35 / 56.89 dB(A) |
 | ||
30 dB silencioso 40 dB(A) audible 50 dB(A) ruidosamente alto |
||
min: | ||
| Schenker XMG Pro 15 (i7-12700H, RTX 3080 Ti) GeForce RTX 3080 Ti Laptop GPU, i7-12700H, Samsung SSD 980 Pro 1TB MZ-V8P1T0BW | Schenker XMG Pro 15 (Late 2021) GeForce RTX 3080 Laptop GPU, i7-11800H, Samsung SSD 980 Pro 1TB MZ-V8P1T0BW | Schenker XMG Neo 15 (i7-12700H, RTX 3080 Ti) GeForce RTX 3080 Ti Laptop GPU, i7-12700H, Samsung SSD 980 Pro 1TB MZ-V8P1T0BW | MSI Raider GE66 12UHS GeForce RTX 3080 Ti Laptop GPU, i9-12900HK, Samsung PM9A1 MZVL22T0HBLB | Razer Blade 15 2022 GeForce RTX 3080 Ti Laptop GPU, i7-12800H, SSSTC CA6-8D1024 | |
|---|---|---|---|---|---|
| Noise | -11% | 8% | 2% | 8% | |
| apagado / medio ambiente * (dB) | 23 | 24 -4% | 23 -0% | 26 -13% | 25.4 -10% |
| Idle Minimum * (dB) | 23 | 31 -35% | 23 -0% | 27 -17% | 26.2 -14% |
| Idle Average * (dB) | 31.22 | 37 -19% | 26.39 15% | 30 4% | 26.2 16% |
| Idle Maximum * (dB) | 33.09 | 41 -24% | 26.39 20% | 39 -18% | 28.4 14% |
| Load Average * (dB) | 56.35 | 56 1% | 45.52 19% | 45 20% | 44.7 21% |
| Witcher 3 ultra * (dB) | 56.89 | 53 7% | 55.89 2% | 45 21% | 44.7 21% |
| Load Maximum * (dB) | 56.89 | 58 -2% | 55.89 2% | 47 17% | 51.9 9% |
* ... más pequeño es mejor
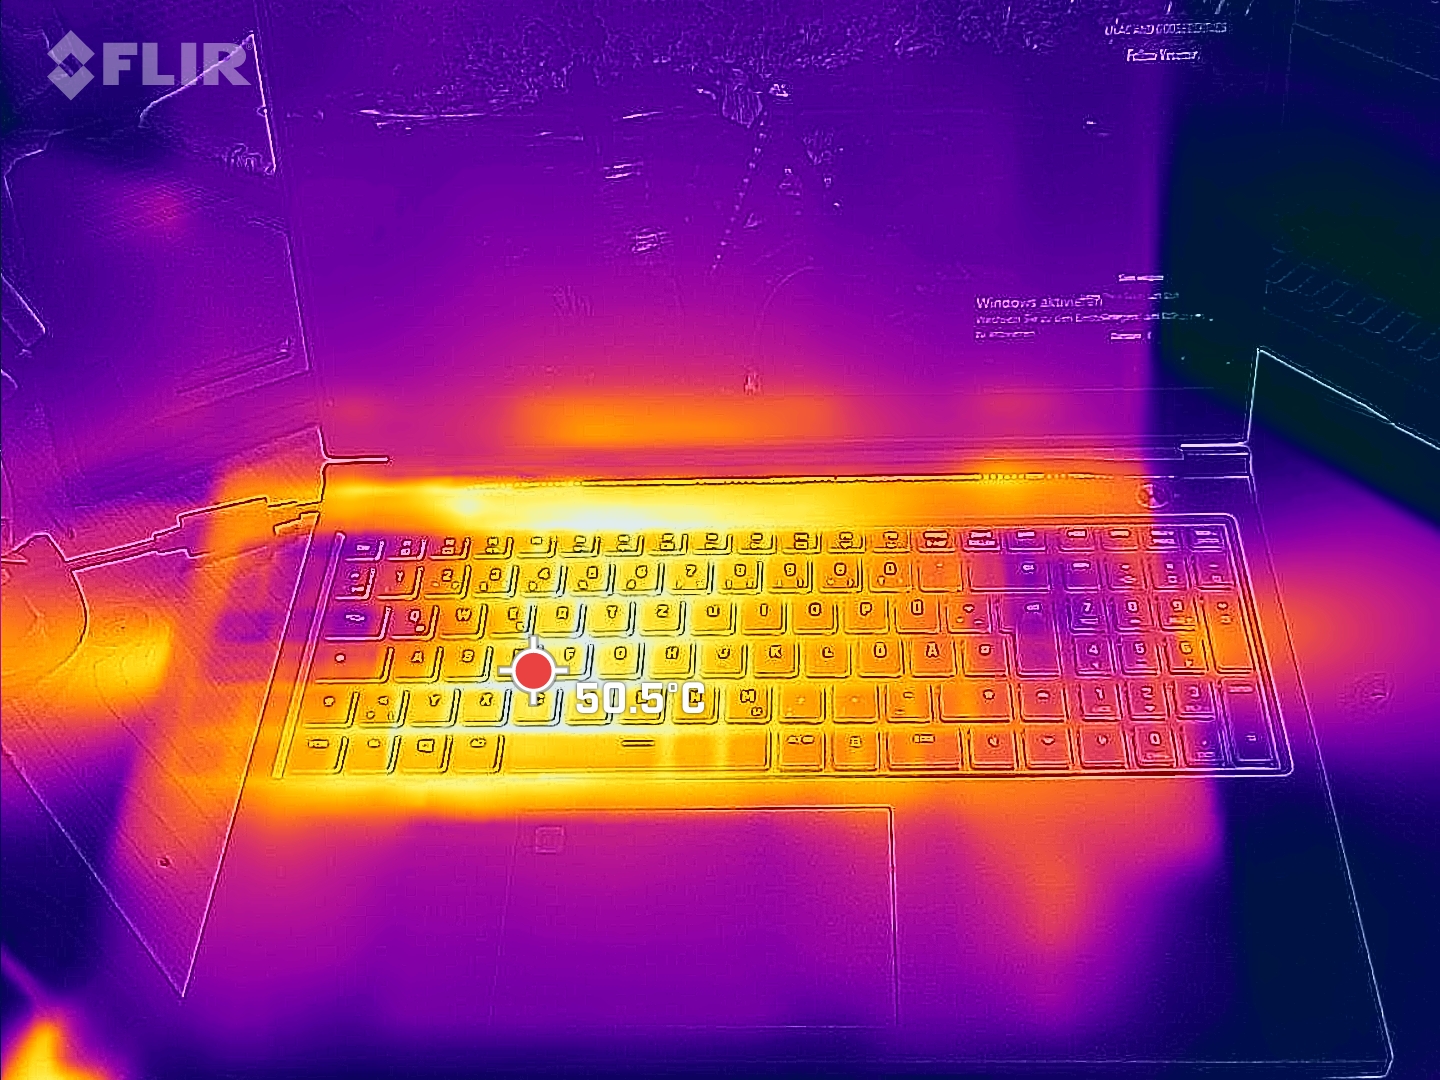
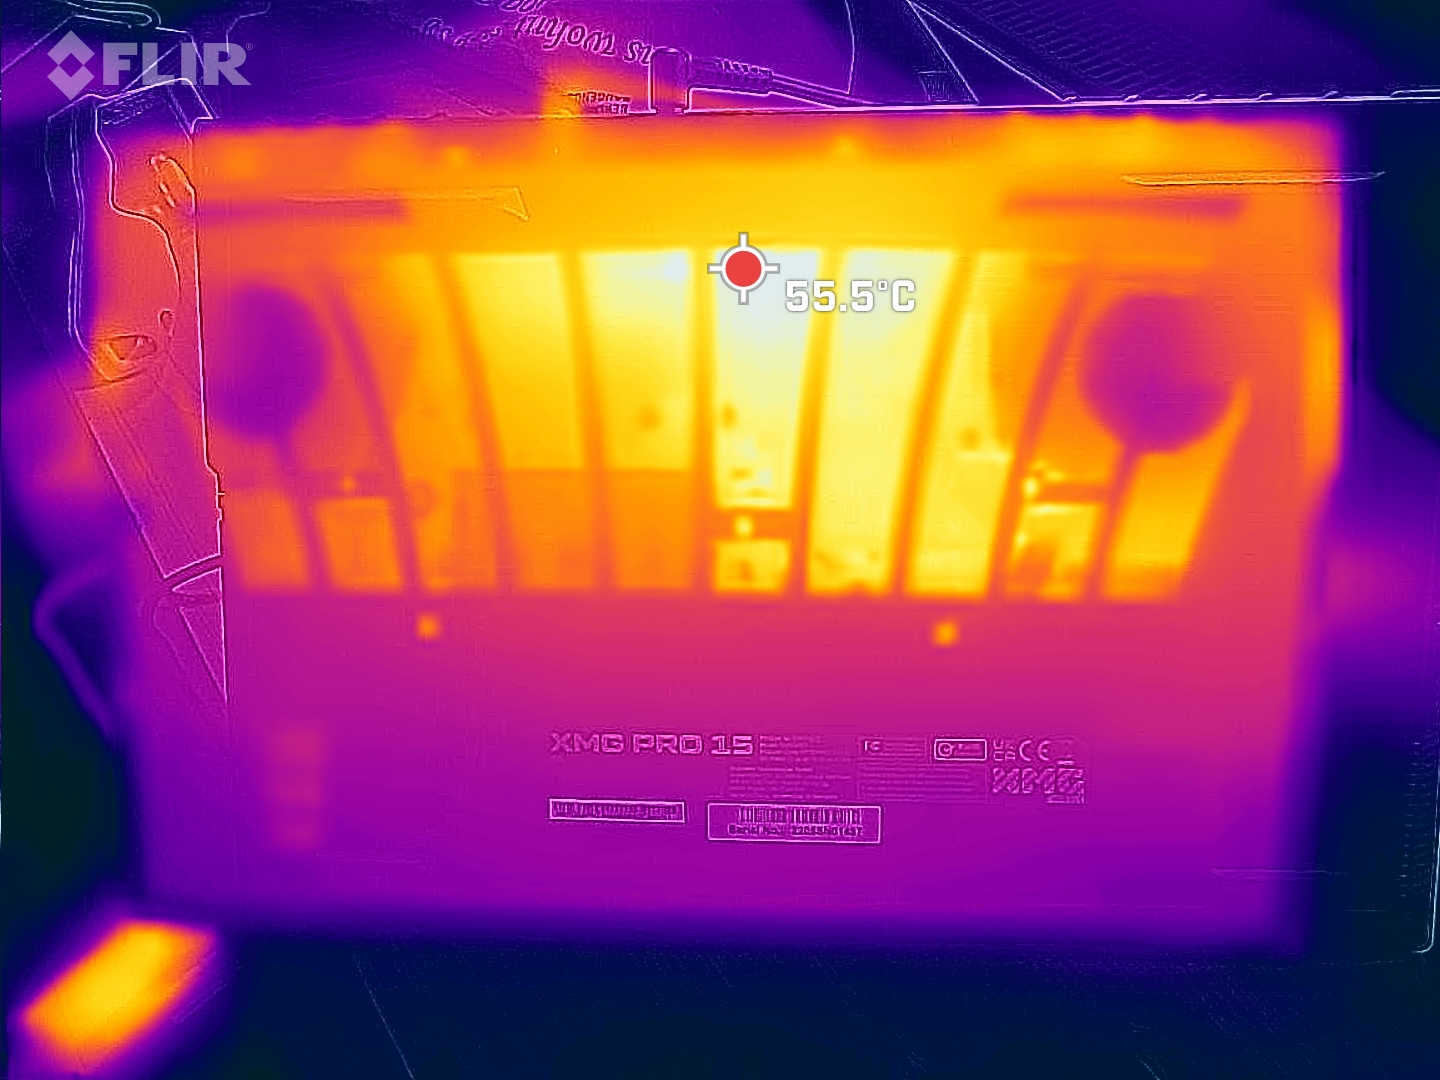
Temperatura
La parte inferior puede calentarse hasta 60 °C durante el juego, y no es mucho más fría la parte superior en el centro. El área de la tecla WASD registra unos 52 °C. El Razer Blade es significativamente más fresco, y el fuerte MSI Raider se calienta de forma similar.
Al menos los reposamanos se mantienen en un rango cómodo.
(-) La temperatura máxima en la parte superior es de 57 °C / 135 F, frente a la media de 40.4 °C / 105 F, que oscila entre 21.2 y 68.8 °C para la clase Gaming.
(-) El fondo se calienta hasta un máximo de 52 °C / 126 F, frente a la media de 43.2 °C / 110 F
(+) En reposo, la temperatura media de la parte superior es de 30 °C / 86# F, frente a la media del dispositivo de 33.9 °C / 93 F.
(-) Jugando a The Witcher 3, la temperatura media de la parte superior es de 44.7 °C / 112 F, frente a la media del dispositivo de 33.9 °C / 93 F.
(+) Los reposamanos y el panel táctil alcanzan como máximo la temperatura de la piel (34 °C / 93.2 F) y, por tanto, no están calientes.
(-) La temperatura media de la zona del reposamanos de dispositivos similares fue de 28.8 °C / 83.8 F (-5.2 °C / -9.4 F).
| Schenker XMG Pro 15 (i7-12700H, RTX 3080 Ti) Intel Core i7-12700H, NVIDIA GeForce RTX 3080 Ti Laptop GPU | Schenker XMG Pro 15 (Late 2021) Intel Core i7-11800H, NVIDIA GeForce RTX 3080 Laptop GPU | Schenker XMG Neo 15 (i7-12700H, RTX 3080 Ti) Intel Core i7-12700H, NVIDIA GeForce RTX 3080 Ti Laptop GPU | MSI Raider GE66 12UHS Intel Core i9-12900HK, NVIDIA GeForce RTX 3080 Ti Laptop GPU | Razer Blade 15 2022 Intel Core i7-12800H, NVIDIA GeForce RTX 3080 Ti Laptop GPU | |
|---|---|---|---|---|---|
| Heat | 4% | -6% | -4% | -2% | |
| Maximum Upper Side * (°C) | 57 | 44 23% | 44 23% | 54 5% | 50 12% |
| Maximum Bottom * (°C) | 52 | 60 -15% | 56 -8% | 65 -25% | 47 10% |
| Idle Upper Side * (°C) | 32 | 30 6% | 38 -19% | 30 6% | 37.4 -17% |
| Idle Bottom * (°C) | 34 | 34 -0% | 41 -21% | 35 -3% | 38.4 -13% |
* ... más pequeño es mejor
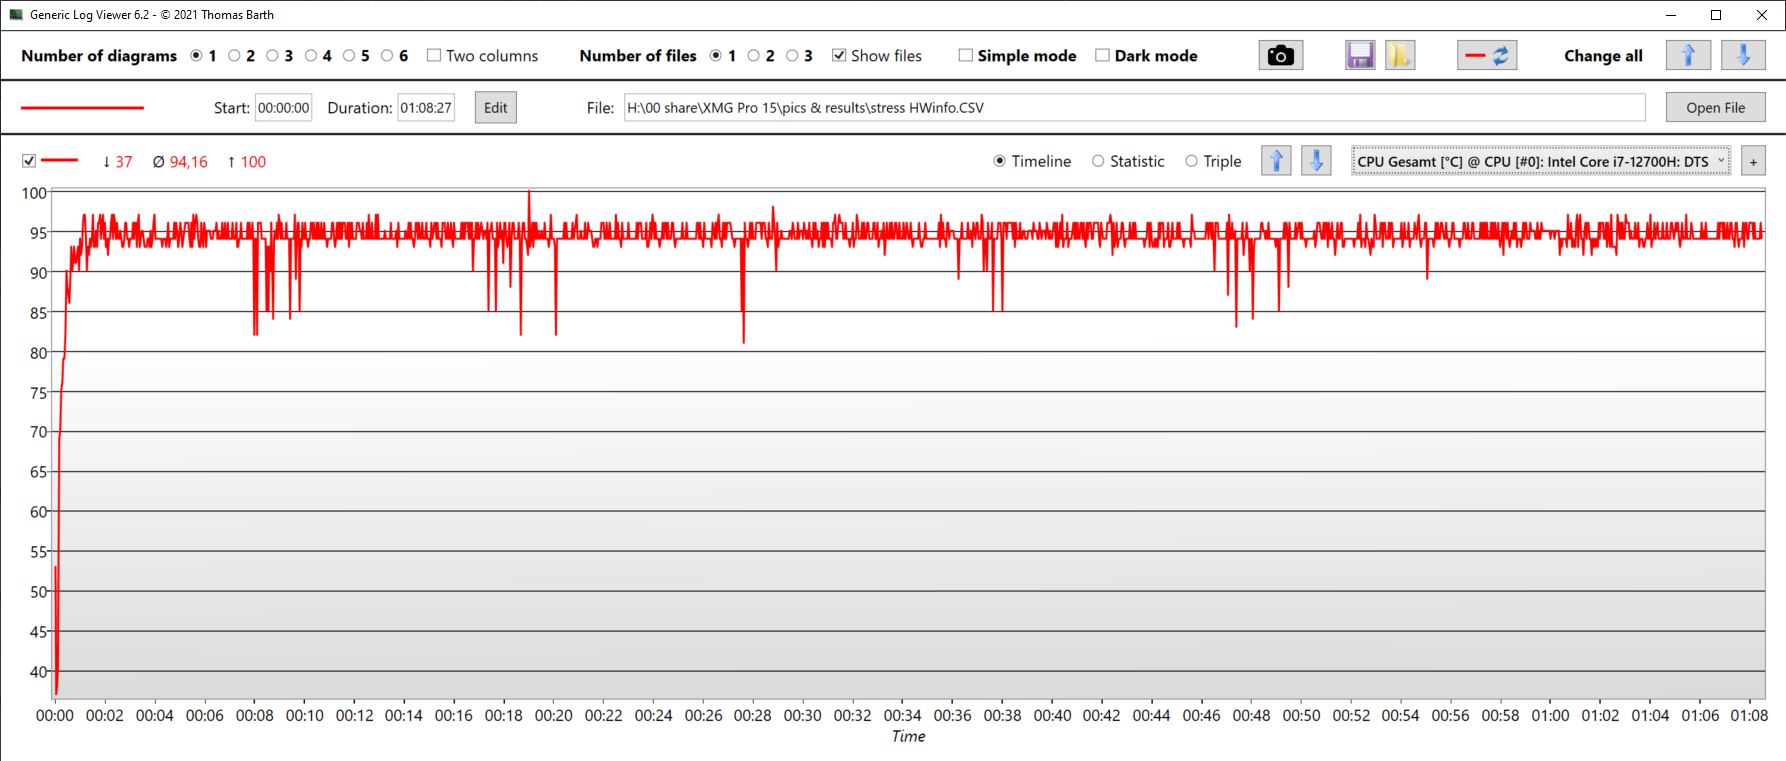
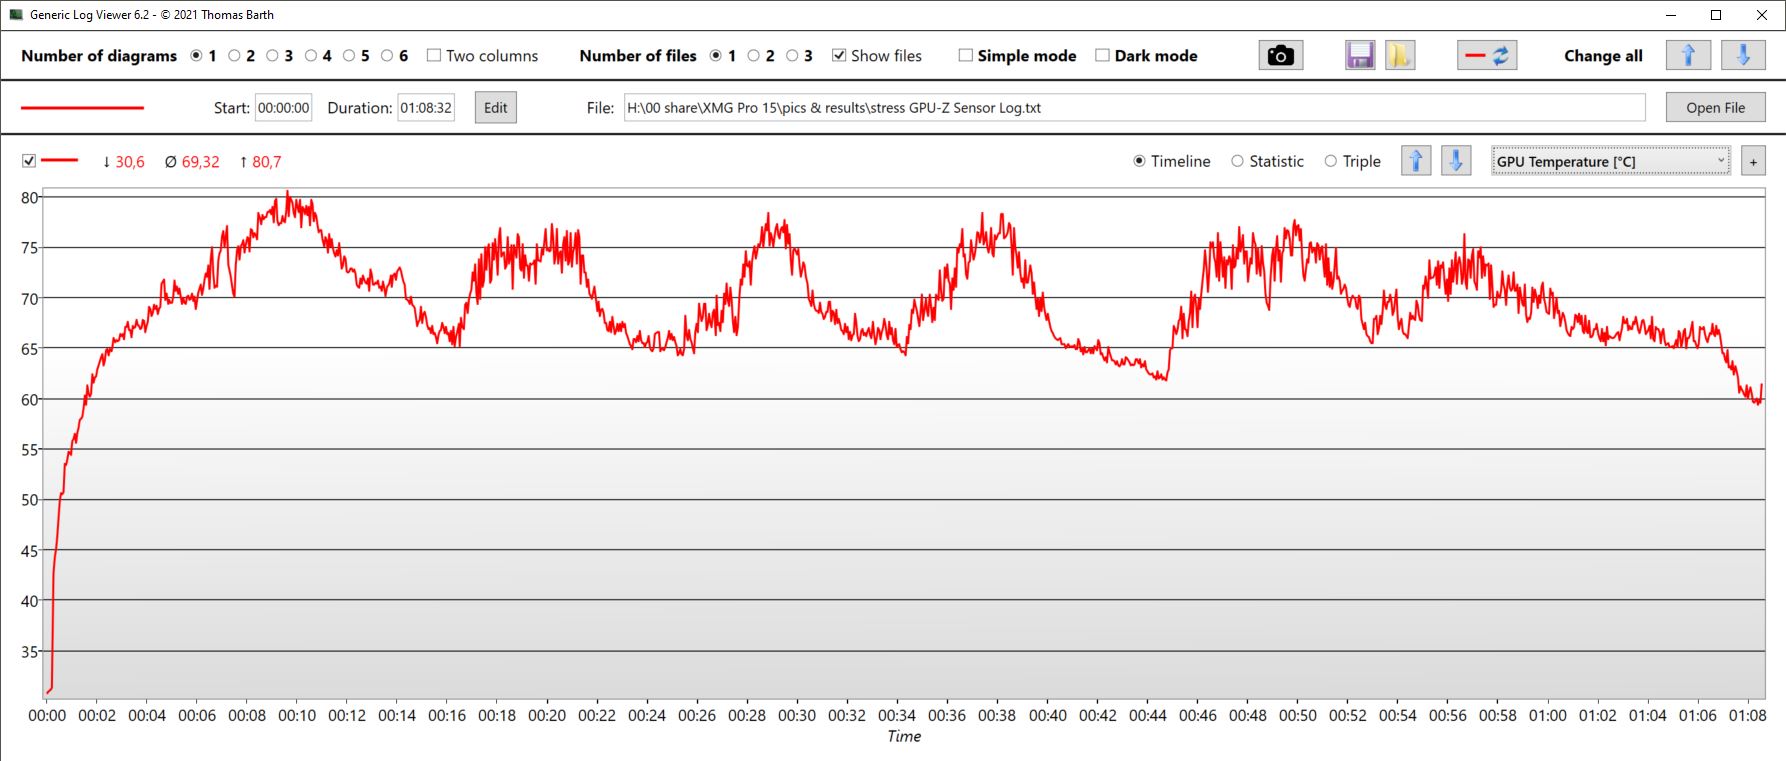
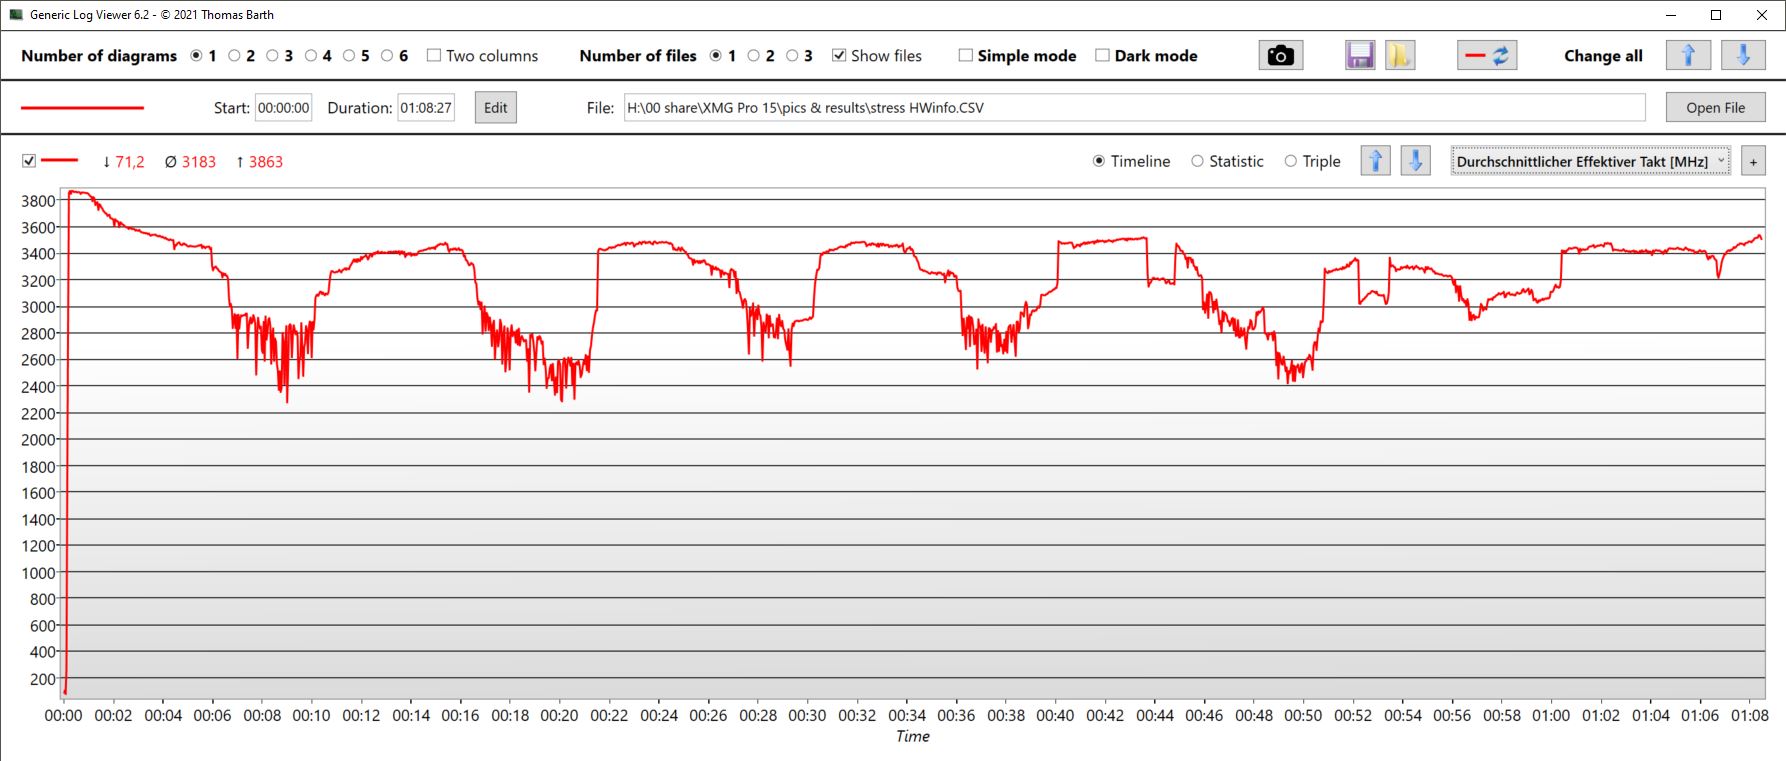
Prueba de esfuerzo
Los núcleos comienzan nuestra prueba de estrés a más de 3,8 GHz. Las frecuencias caen lentamente y hay pequeñas caídas periódicas, por lo que el límite térmico del Pro 15 aparentemente sólo entra en acción muy tarde. Así, la temperatura media del núcleo es de unos elevados 95 °C Al mismo tiempo, es posible una velocidad media bastante alta de unos 3.2 GHz.
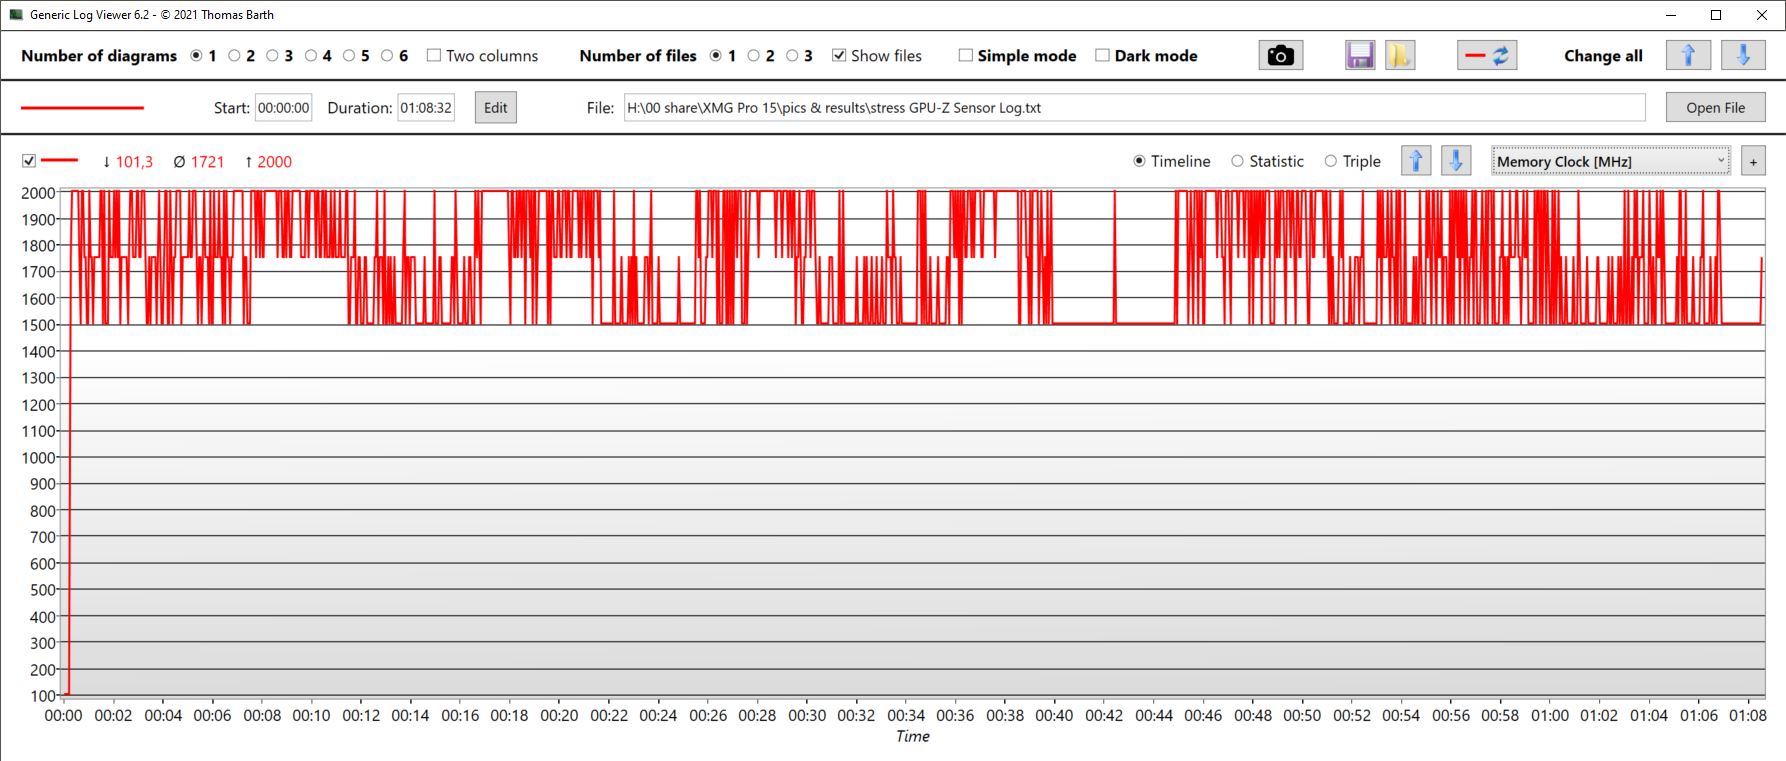
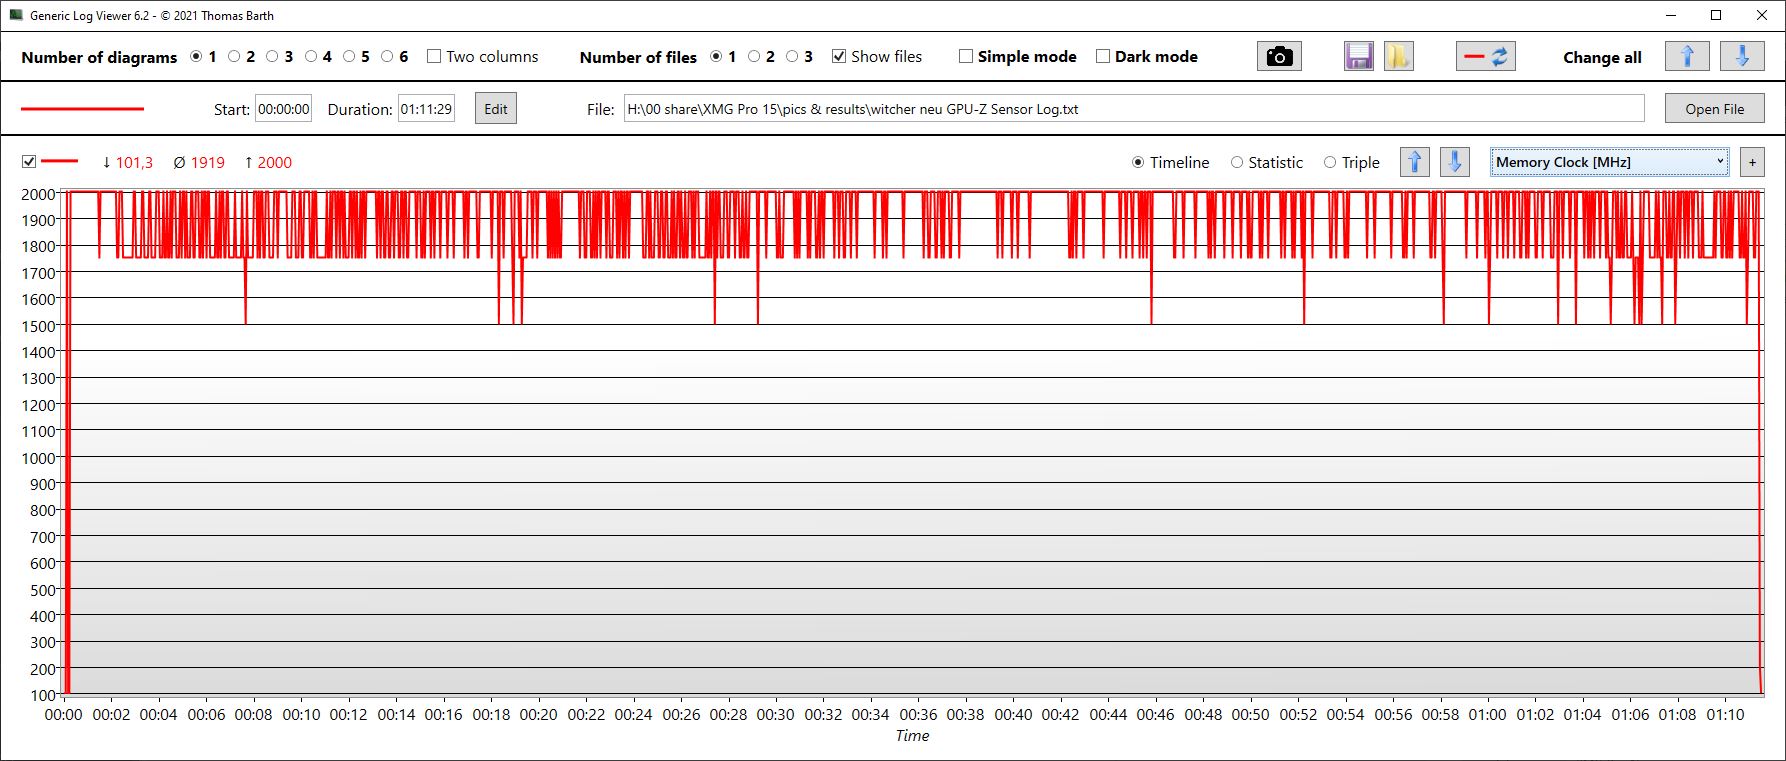
La GPU se calienta menos (en torno a los 69 °C), pero el reloj fluctúa mucho (la media es de 1,2 GHz). El reloj de la memoria también varía entre 1,5 y 2 GHz. La tarjeta consume una media de 69 W de la fuente de alimentación, y sólo ocasionalmente alcanza los 150 W y sólo muy brevemente
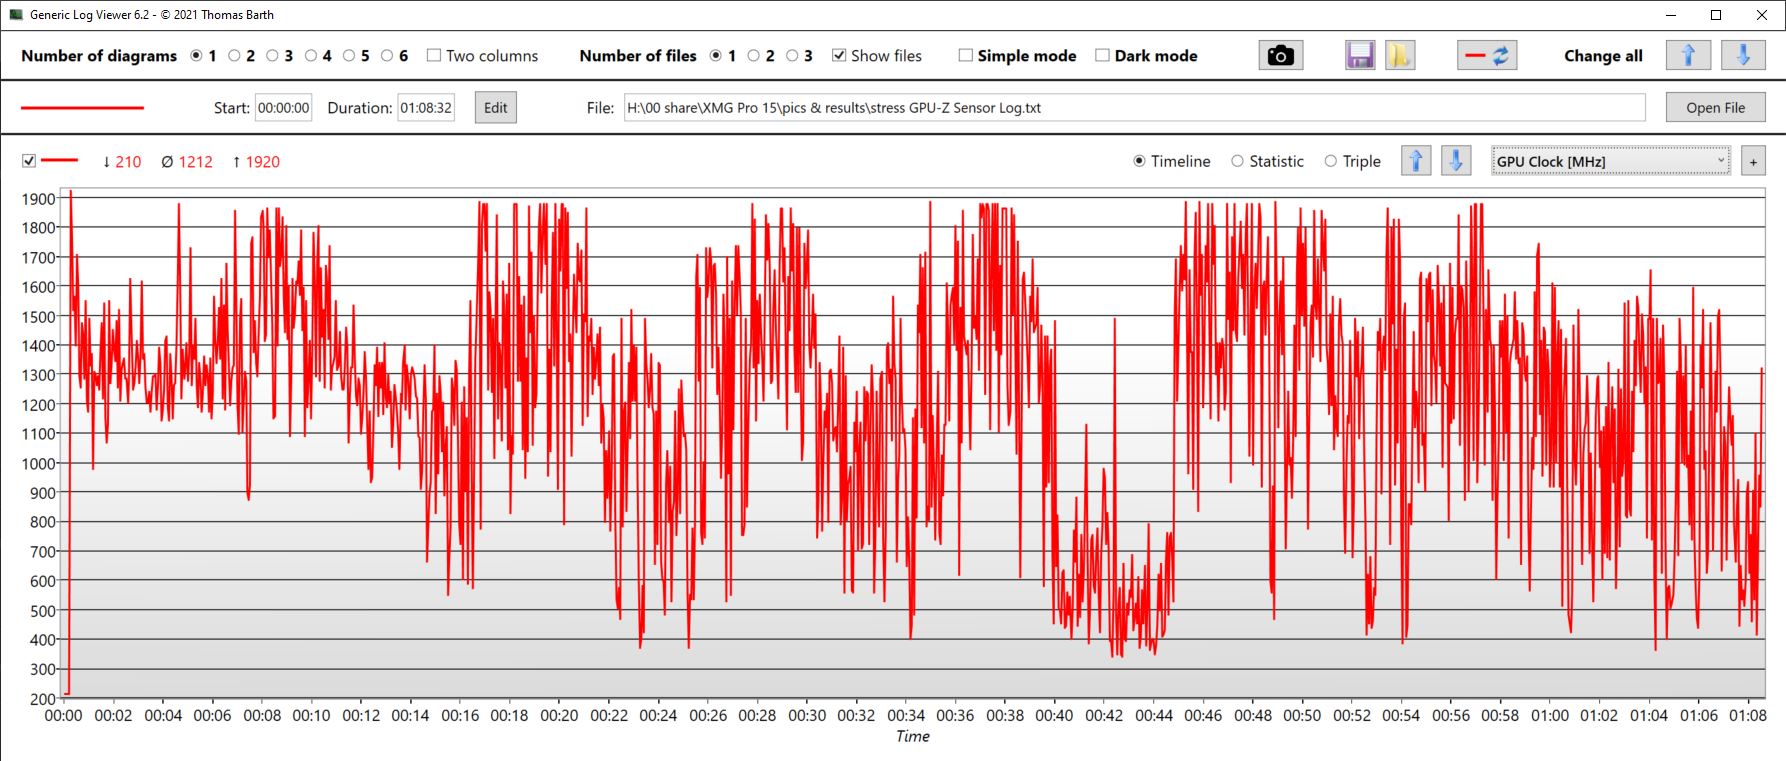
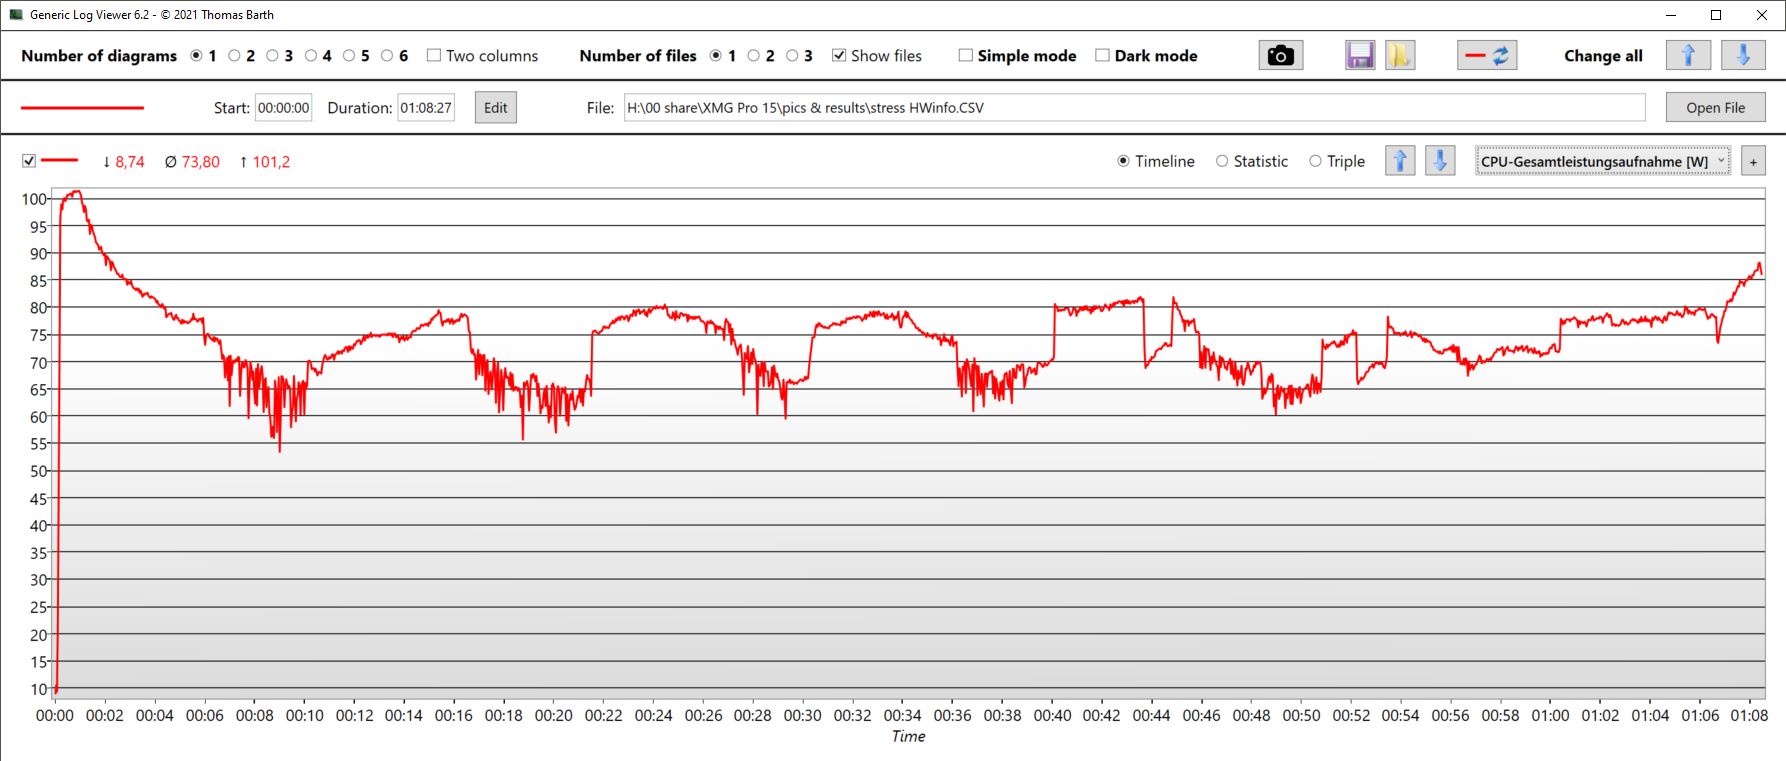
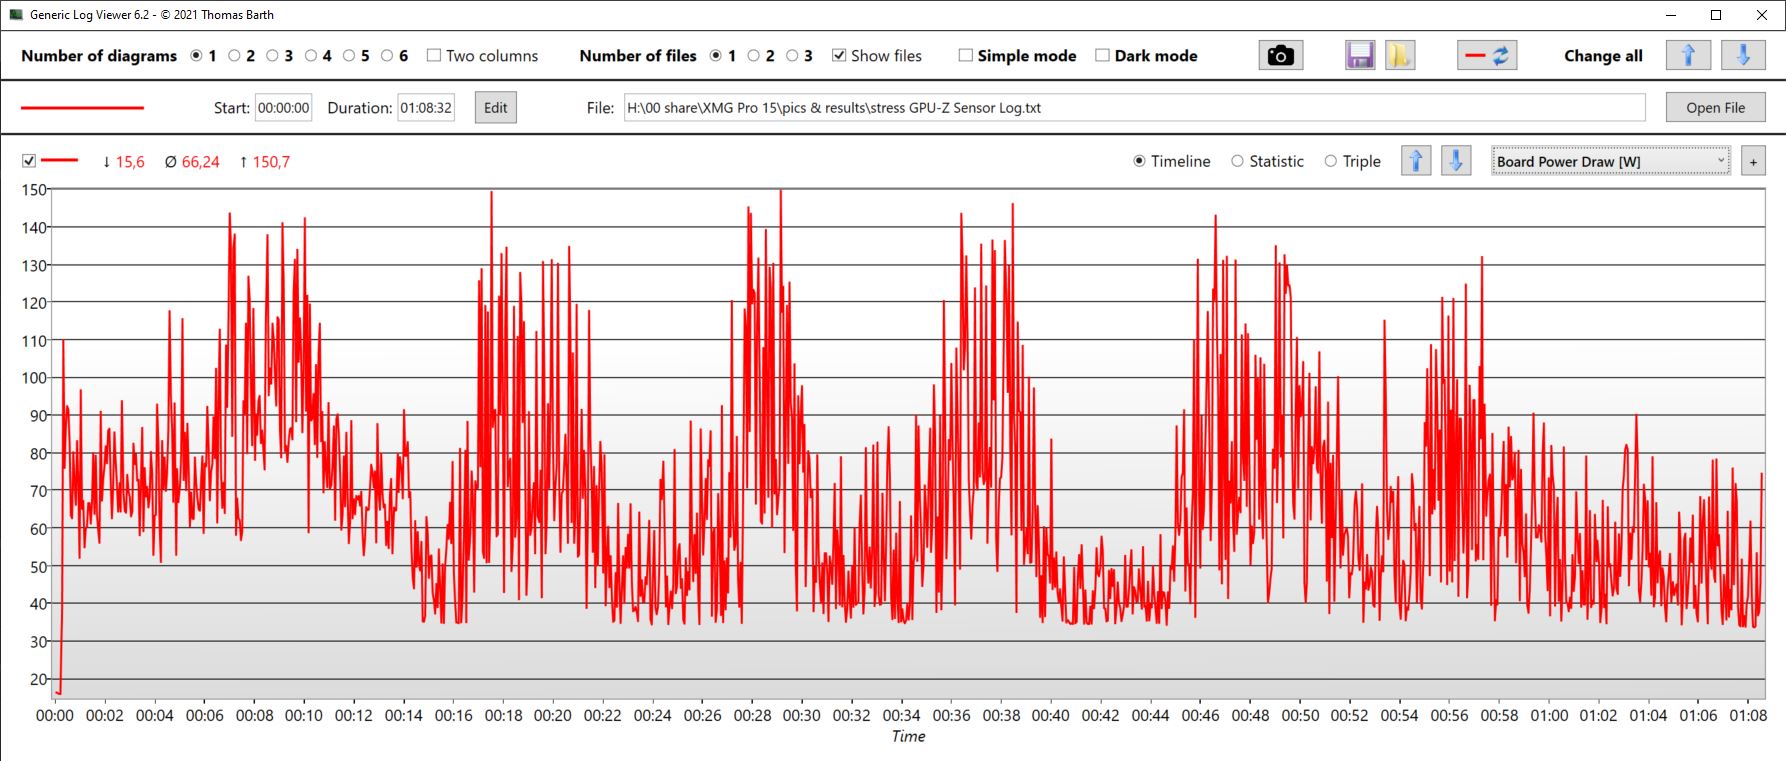
| Reloj dela CPU (GHz) | Reloj de la GPU (MHz) | Temperatura media dela CPU (°C) | Temperatura media de la GPU (°C) | |
| Prime95 + FurMark Stress | 3,2 GHz | 1.212 | 95 | 69 |
| Witcher 3 Estrés | 3,4 | 1.445 | 77 | 86 |
Altavoces
Los altavoces no son especialmente fuertes. Al menos los graves son medios en lugar de estar completamente subrepresentados, mientras que los agudos están equilibrados.
Los dispositivos de audio analógicos externos pueden conectarse a través de dos ranuras de jack.
Schenker XMG Pro 15 (i7-12700H, RTX 3080 Ti) análisis de audio
(±) | la sonoridad del altavoz es media pero buena (75.82 dB)
Graves 100 - 315 Hz
(±) | lubina reducida - en promedio 13% inferior a la mediana
(±) | la linealidad de los graves es media (14.1% delta a frecuencia anterior)
Medios 400 - 2000 Hz
(+) | medios equilibrados - a sólo 4.5% de la mediana
(+) | los medios son lineales (5.3% delta a la frecuencia anterior)
Altos 2 - 16 kHz
(+) | máximos equilibrados - a sólo 3% de la mediana
(+) | los máximos son lineales (5.6% delta a la frecuencia anterior)
Total 100 - 16.000 Hz
(±) | la linealidad del sonido global es media (16.3% de diferencia con la mediana)
En comparación con la misma clase
» 41% de todos los dispositivos probados de esta clase eran mejores, 6% similares, 53% peores
» El mejor tuvo un delta de 6%, la media fue 18%, el peor fue ###max##%
En comparación con todos los dispositivos probados
» 27% de todos los dispositivos probados eran mejores, 6% similares, 68% peores
» El mejor tuvo un delta de 4%, la media fue 23%, el peor fue ###max##%
MSI Raider GE66 12UHS análisis de audio
(+) | los altavoces pueden reproducir a un volumen relativamente alto (#84 dB)
Graves 100 - 315 Hz
(-) | casi sin bajos - de media 17% inferior a la mediana
(±) | la linealidad de los graves es media (11% delta a frecuencia anterior)
Medios 400 - 2000 Hz
(±) | medias más altas - de media 5.6% más altas que la mediana
(+) | los medios son lineales (3.9% delta a la frecuencia anterior)
Altos 2 - 16 kHz
(+) | máximos equilibrados - a sólo 4.6% de la mediana
(+) | los máximos son lineales (6.3% delta a la frecuencia anterior)
Total 100 - 16.000 Hz
(±) | la linealidad del sonido global es media (17.1% de diferencia con la mediana)
En comparación con la misma clase
» 46% de todos los dispositivos probados de esta clase eran mejores, 12% similares, 43% peores
» El mejor tuvo un delta de 6%, la media fue 18%, el peor fue ###max##%
En comparación con todos los dispositivos probados
» 31% de todos los dispositivos probados eran mejores, 8% similares, 61% peores
» El mejor tuvo un delta de 4%, la media fue 23%, el peor fue ###max##%
Gestión de la energía: Asombroso comportamiento energético en reposo
Consumo de energía
Uno tiene la impresión de que los modos de rendimiento del Pro 15 no están totalmente optimizados. La medición del consumo no fue sencilla en inactivo. El consumo más bajo con el brillo minimizado en el modo de vuelo fue difícil de alcanzar en el modo de ahorro de energía; los 40 W medidos son extremadamente altos. Si se cambia al modo de entretenimiento, nominalmente más alto, con la misma configuración, el consumo baja a unos 10 W en unos pocos segundos. Si se vuelve a cambiar al modo de ahorro de energía, el consumo vuelve a ser de 40 W sin ninguna ralentización perceptible después de más de un minuto. No se detectaron procesos de fondo molestos. Sólo se abrió y cerró el Centro de Control en el medio. E incluso en el modo Rendimiento, el consumo en reposo es bastante alto, con 35 W.
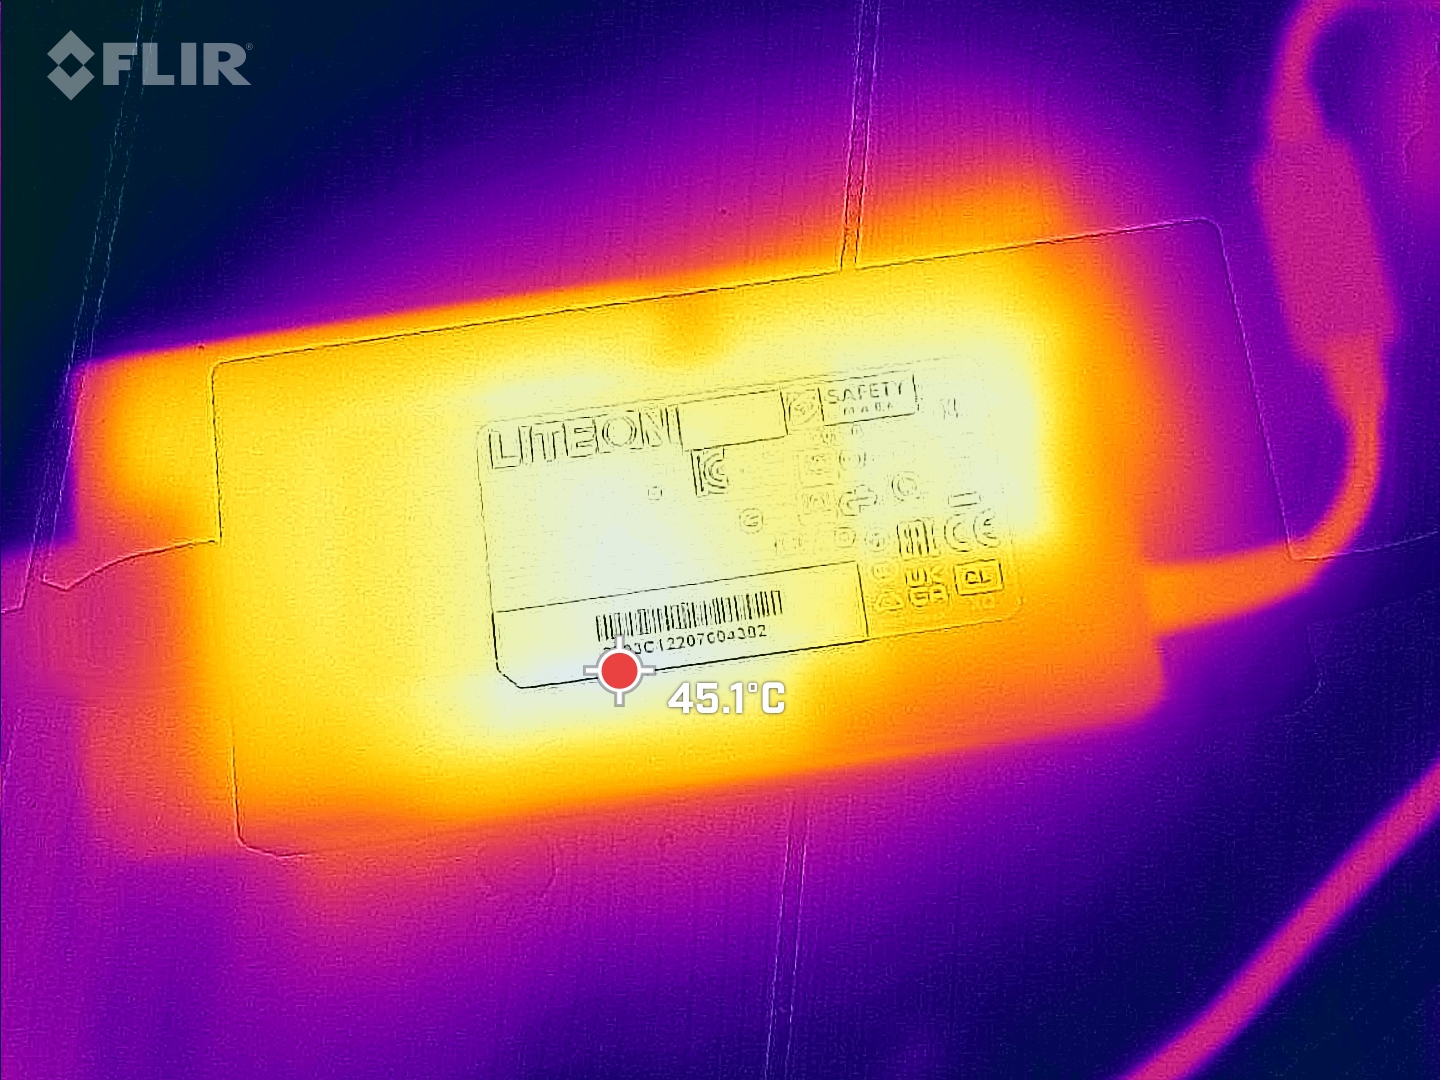
Los juegos exigen una media de 235 W (potencia de entrada en la toma de corriente), y también medimos picos de carga muy cortos de un máximo de 273 W en el test de estrés. La fuente de alimentación de 230 W (potencia de salida, tamaño aprox. 15,4 x 7,5 cm) debería ser suficiente aquí.
| Ocioso | |
| Carga |
|
Clave:
min: | |
| Schenker XMG Pro 15 (i7-12700H, RTX 3080 Ti) i7-12700H, GeForce RTX 3080 Ti Laptop GPU, Samsung SSD 980 Pro 1TB MZ-V8P1T0BW, IPS, 2560x1440, 15.6" | Schenker XMG Pro 15 (Late 2021) i7-11800H, GeForce RTX 3080 Laptop GPU, Samsung SSD 980 Pro 1TB MZ-V8P1T0BW, OLED, 3840x2160, 15.6" | Schenker XMG Neo 15 (i7-12700H, RTX 3080 Ti) i7-12700H, GeForce RTX 3080 Ti Laptop GPU, Samsung SSD 980 Pro 1TB MZ-V8P1T0BW, IPS, 2560x1440, 15.6" | MSI Raider GE66 12UHS i9-12900HK, GeForce RTX 3080 Ti Laptop GPU, Samsung PM9A1 MZVL22T0HBLB, IPS, 3840x2160, 15.6" | Razer Blade 15 2022 i7-12800H, GeForce RTX 3080 Ti Laptop GPU, SSSTC CA6-8D1024, IPS, 2560x1440, 15.6" | Medio NVIDIA GeForce RTX 3080 Ti Laptop GPU | Media de la clase Gaming | |
|---|---|---|---|---|---|---|---|
| Power Consumption | -11% | -6% | -5% | -56% | -24% | -3% | |
| Idle Minimum * (Watt) | 10 | 20 -100% | 15 -50% | 16 -60% | 33.2 -232% | 17.2 ? -72% | 13 ? -30% |
| Idle Average * (Watt) | 15.2 | 22 -45% | 18 -18% | 19 -25% | 36.4 -139% | 23.3 ? -53% | 19 ? -25% |
| Idle Maximum * (Watt) | 35 | 26 26% | 18 49% | 26 26% | 37.6 -7% | 30.8 ? 12% | 24.6 ? 30% |
| Load Average * (Watt) | 116 | 103 11% | 123 -6% | 110 5% | 116.7 -1% | 121.2 ? -4% | 110.7 ? 5% |
| Witcher 3 ultra * (Watt) | 235 | 186 21% | 234 -0% | 202 14% | 172 27% | ||
| Load Maximum * (Watt) | 273 | 218 20% | 301 -10% | 242 11% | 228.6 16% | 276 ? -1% | 259 ? 5% |
* ... más pequeño es mejor
{
{
Duración de la batería
Schenker instala una batería de 80 Wh, la misma que en el Razer. El MSI Raider tiene bastantes más reservas con 99 Wh
La navegación dura entre 5,5 y 6 horas dependiendo del brillo, y ver vídeos dura unas 5 horas. Las duraciones no son particularmente largas en comparación; los dispositivos de la competencia duran más, especialmente al ver vídeos. El Pro podría aprender algo del Neo, que tiene más aguante con su batería de 93 Wh
| Schenker XMG Pro 15 (i7-12700H, RTX 3080 Ti) i7-12700H, GeForce RTX 3080 Ti Laptop GPU, 80 Wh | Schenker XMG Pro 15 (Late 2021) i7-11800H, GeForce RTX 3080 Laptop GPU, 73 Wh | Schenker XMG Neo 15 (i7-12700H, RTX 3080 Ti) i7-12700H, GeForce RTX 3080 Ti Laptop GPU, 93 Wh | MSI Raider GE66 12UHS i9-12900HK, GeForce RTX 3080 Ti Laptop GPU, 99 Wh | Razer Blade 15 2022 i7-12800H, GeForce RTX 3080 Ti Laptop GPU, 80 Wh | Media de la clase Gaming | |
|---|---|---|---|---|---|---|
| Duración de Batería | -5% | 17% | 9% | -16% | 21% | |
| H.264 (h) | 5.3 | 6.5 23% | 7.1 34% | 7.1 34% | 8.32 ? 57% | |
| WiFi v1.3 (h) | 5.8 | 5.2 -10% | 7.7 33% | 5.7 -2% | 4.9 -16% | 7.11 ? 23% |
| Load (h) | 1.8 | 1.3 -28% | 1.5 -17% | 1.7 -6% | 1.502 ? -17% | |
| Reader / Idle (h) | 10.6 | 8.27 ? |
Pro
Contra
Veredicto: Pero, pero, mi querido Pro 15
El XMG Pro 15 trae un montón de características que constituyen un buen jugador o un buen portátil de trabajo para los creadores de contenidos. Lo primero y más importante es la pantalla QHD con sus rápidos tiempos de respuesta y su buena cobertura del espacio de color. El hardware también es impresionante, los dispositivos de entrada son decentes como mínimo, el WiFi es muy rápido, y el rendimiento general es alto.
Schenker intenta contrarrestar las típicas desventajas de los portátiles con hardware fuerte con una carcasa más gruesa, pero esto sólo funciona hasta cierto punto. Sí, el nuevo Pro 15 es un poco más silencioso que el antiguo Pro 15, más delgado, pero sigue siendo uno de los dispositivos más ruidosos en el campo de la comparación, y los ventiladores alcanzan rápidamente sus límites. Al mismo tiempo, las temperaturas no han mejorado realmente.
Y así, las muchas ventajas del Pro 15 van acompañadas de algunos pequeños "peros": La pantalla QHD es fundamentalmente decente, pero la iluminación es desigual. Schenker ha instalado un rápido SSD Samsung 980 Pro, pero se ralentiza bajo carga constante (calor). El rendimiento es muy alto, pero el dispositivo se vuelve muy ruidoso y se calienta rápidamente. Vuelve a haber un lector SD, pero sólo lee tarjetas MicroSD y es lento.
El XMG Pro 15 es un ordenador de juego y trabajo muy rápido con muchas buenas características que, sin embargo, a menudo parecen estar desequilibradas.
Precio y disponibilidad
El Pro 15 no está disponible actualmente en Alemania, la patria del fabricante. Sólo la propia tienda de Schenker bestware.com lista el dispositivo, pero no en nuestra configuración de análisis; el display correspondiente o la RTX 3080 Ti no pueden elegirse actualmente.
Los precios empiezan en 1.978,99 euros (algo menos de 2.000 dólares) para el modelo con pantalla OLED, pero una RTX 3060 más débil, 16 de GB de RAM y un SSD de 500 GB. Con una RTX 3070 Ti, 32 GB y un SSD de 1 TB, el modelo cuesta 2.510 euros (US$ ~2520)
Schenker XMG Pro 15 (i7-12700H, RTX 3080 Ti)
- 07/21/2022 v7 (old)
Christian Hintze
Price comparison

