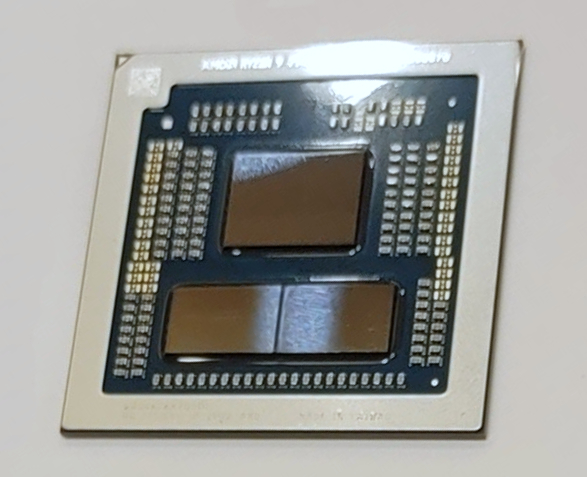
La serie Dragon Range sigue utilizando un diseño de chiplet con dos CCD-clusters (cada uno con 8 posibles núcleos, el 7745HX sólo utiliza un CCD) en 5nm y un IO-die (incluyendo el controlador de memoria y la IGPU Radeon 610M ) en 6nm. El chip integra 4 puertos USB 3.2 Gen2 (10 Gbps) (no USB4), 28 carriles PCIe 5.0 (para GPU y SSD) y un controlador de memoria DDR5-5200 de doble canal.
El R7 7745HX tiene un TDP de 55 vatios y puede configurarse hasta 75 vatios (cTDP).
Nombre código Dragon Range (Zen 4) Serie AMD Dragon Range Velocidad de reloj 3600 - 5100 MHz Caché de Nivel 1 512 KB Caché de Nivel 2 8 MB Caché de Nivel 3 32 MB Número de Núcleos/Subprocesos 8 / 16 Consumo de Corriente (TDP = Thermal Design Power) 55 Watt Conteo de Transistores 9900 Millón Tecnología de producción CCD = 5 nm, I/O = 6 nm Temperatura Máx. 100 °C Conector FL1 Recursos DDR5-5200 RAM, PCIe 5, MMX, SSE, SSE2, SSE3, SSSE3, SSE4A, SSE4.1, SSE4.2, AVX, AVX2, AVX-512, BMI2, ABM, FMA, ADX, SMEP, SMAP, SMT, CPB, AES-NI, RDRAND, RDSEED, SHA, SME GPU AMD Radeon 610M (400 - 2200 MHz)64 Bit soporte para 64 Bit Architecture x86 Fecha de anuncio 01/05/2023 Enlace de Producto (externo) www.amd.com
Performance Rating - CB R15 + R20 + 7-Zip + X265 + Blender + 3DM11 CPU
...
...
AMD Ryzen 9 9955HX
max:
Cinebench 2024 - Cinebench 2024 CPU Single Core
...
...
Apple M5 Pro 18-Core
Cinebench 2024 - Cinebench 2024 CPU Multi Core
...
Apple M5 10-Core
...
Apple M5 Pro 18-Core
max:
Cinebench R23 - Cinebench R23 Multi Core
min: 18060 de promedio: 18453 mediana: 18452.5 (17%) max: 18845 Points
CPU TDP 75 W TDP 97 W 100% 96%
...
...
AMD Ryzen 9 9955HX3D
max:
Cinebench R23 - Cinebench R23 Single Core
min: 1846 de promedio: 1850 mediana: 1850 (75%) max: 1854 Points
CPU TDP 75 W TDP 97 W 100% 100%
Cinebench R20 - Cinebench R20 CPU (Single Core)
min: 717 de promedio: 718 mediana: 718 (78%) max: 719 Points
CPU TDP 75 W TDP 97 W 100% 100%
...
...
max:
Intel Core Ultra 7 270K Plus
Cinebench R20 - Cinebench R20 CPU (Multi Core)
min: 7072 de promedio: 7236 mediana: 7235.5 (18%) max: 7399 Points
CPU TDP 75 W TDP 97 W 100% 96%
...
...
AMD Ryzen 9 9955HX3D
max:
Cinebench R15 - Cinebench R15 CPU Multi 64 Bit
min: 2978 de promedio: 2986 mediana: 2986 (19%) max: 2994 Points
CPU TDP 75 W TDP 97 W 100% 99%
...
...
AMD Ryzen 9 9955HX3D
max:
0 60 120 180 240 300 360 420 480 540 600 660 720 780 840 900 960 1020 1080 1140 1200 1260 1320 1380 1440 1500 1560 1620 1680 1740 1800 1860 1920 1980 2040 2100 2160 2220 2280 2340 2400 2460 2520 2580 2640 2700 2760 2820 2880 2940 Tooltip Lenovo Legion Pro 5 16ARX8: Ø2918 (2861.03-2977.96)
Minisforum BD770i: Ø2867 (2818.49-2955.3)
Cinebench R15 - Cinebench R15 CPU Single 64 Bit
min: 294 de promedio: 294.5 mediana: 294.5 (82%) max: 295 Points
CPU TDP 75 W TDP 97 W 100% 100%
...
...
max:
Intel Core Ultra 9 285K
Cinebench R11.5 - Cinebench R11.5 CPU Multi 64 Bit
...
...
AMD Ryzen 9 9955HX3D
max:
Intel Core Ultra 7 270K Plus
Cinebench R11.5 - Cinebench R11.5 CPU Single 64 Bit
...
...
max:
Intel Core Ultra 9 285K
Cinebench R10 - Cinebench R10 Rend. Single (32bit)
AMD Geode LX 800
...
Intel Core i5-1140G7
...
max:
Cinebench R10 - Cinebench R10 Rend. Multi (32bit)
Cinebench R10 - Cinebench R10 Rend. Multi (64bit)
...
...
max:
Intel Core Ultra 7 270K Plus
Cinebench R10 - Cinebench R10 Rend. Single (64bit)
...
...
max:
Intel Core Ultra 7 270K Plus
wPrime 2.10 - wPrime 2.0 1024m *
wPrime 2.10 - wPrime 2.0 32m *
7-Zip 18.03 - 7-Zip 18.03 Multi Thread 4 runs
min: 75557 de promedio: 79413 mediana: 79412.5 (46%) max: 83268 MIPS
CPU TDP 75 W TDP 97 W 100% 91%
...
...
AMD Ryzen 9 9955HX3D
max:
7-Zip 18.03 - 7-Zip 18.03 Single Thread 4 runs
min: 7244 de promedio: 7260 mediana: 7259.5 (83%) max: 7275 MIPS
CPU TDP 75 W TDP 97 W 100% 100%
...
AMD Ryzen 9 9955HX3D
AMD Ryzen 9 9955HX
max:
AMD Ryzen 7 9850X3D
X264 HD Benchmark 4.0 - x264 Pass 2
X264 HD Benchmark 4.0 - x264 Pass 1
...
AMD Ryzen 9 9955HX
AMD Ryzen 9 9955HX3D
...
HWBOT x265 Benchmark v2.2 - HWBOT x265 4k Preset
min: 23.2 de promedio: 23.7 mediana: 23.7 (42%) max: 24.1 fps
CPU TDP 75 W TDP 97 W 100% 96%
...
...
AMD Ryzen 9 9955HX3D
max:
0 5 10 15 20 25 Tooltip Lenovo Legion Pro 5 16ARX8: Ø22.6 (0.73-27.1)
Minisforum BD770i: Ø23.6 (0.76-28.3)
TrueCrypt - TrueCrypt Serpent
...
...
AMD Ryzen 9 9955HX3D
max:
TrueCrypt - TrueCrypt Twofish
TrueCrypt - TrueCrypt AES
Blender - Blender 3.3 Classroom CPU *
min: 272 de promedio: 274.5 mediana: 274.5 (3%) max: 277 Seconds
AMD Ryzen 9 9955HX3D
...
...
Blender - Blender 2.79 BMW27 CPU *
min: 169 de promedio: 171.5 mediana: 171.5 (1%) max: 174 Seconds
CPU TDP 75 W TDP 97 W 100% 100%
Intel Core i5-1038NG7
...
...
R Benchmark 2.5 - R Benchmark 2.5 *
min: 0.4141 de promedio: 0.4 mediana: 0.4 (9%) max: 0.421 sec
CPU TDP 75 W TDP 97 W 100% 100%
AMD Ryzen 9 9955HX3D
...
...
3DMark 06 - CPU - 3DMark 06 - CPU
VIA C7-M C7-M-1200
...
...
max:
Super Pi mod 1.5 XS 1M - Super Pi mod 1.5 XS 1M *
Super Pi mod 1.5 XS 2M - Super Pi mod 1.5 XS 2M *
...
Intel Core i5-1230U
...
Super Pi Mod 1.5 XS 32M - Super Pi mod 1.5 XS 32M *
...
Intel Core i5-1230U
...
VIA C3-M C3-M-1200
3DMark Vantage - 3DM Vant. Perf. CPU no Physx
min: 97894 de promedio: 99684 mediana: 99683.5 (73%) max: 101473 Points
CPU TDP ? TDP 75 W 100% 96%
...
AMD Ryzen 9 9955HX
max:
Intel Core Ultra 7 270K Plus
3DMark 11 - 3DM11 Performance Physics
min: 25054 de promedio: 25688 mediana: 25687.5 (63%) max: 26321 Points
CPU TDP 75 W TDP 97 W 100% 95%
AMD E-240
...
AMD Ryzen 9 9955HX
AMD Ryzen 9 9955HX3D
max:
AMD Ryzen 9 9950X3D
3DMark - 3DMark Ice Storm Physics
...
Intel Core i7-1265U
Intel Core i5-1245U
...
max:
3DMark - 3DMark Ice Storm Extreme Physics
3DMark - 3DMark Ice Storm Unlimited Physics
...
Intel Core i5-6267U
Intel Core i5-7200U
Intel Core i3-8121U
Intel Core i7-6560U
Intel Core i5-7267U
...
max:
Intel Core Ultra 5 250K Plus
3DMark - 3DMark Cloud Gate Physics
...
...
max:
Intel Core Ultra 7 270K Plus
3DMark - 3DMark Fire Strike Standard Physics
min: 19932 de promedio: 25710 mediana: 25709.5 (46%) max: 31487 Points
CPU TDP 75 W TDP 97 W 63% 100%
...
...
max:
Intel Core Ultra 7 270K Plus
3DMark - 3DMark Time Spy CPU
min: 11051 de promedio: 11264 mediana: 11264 (47%) max: 11477 Points
CPU TDP 75 W TDP 97 W 96% 100%
...
...
max:
Intel Core Ultra 7 270K Plus
Geekbench 6.7 - Geekbench 6.7.1 Single-Core
...
...
Apple M5 Pro 15-Core
Geekbench 6.7 - Geekbench 6.7.1 Multi-Core
Geekbench 6.0 - Geekbench 6.0 Single-Core
...
...
max:
Intel Core Ultra 7 270K Plus
Geekbench 6.0 - Geekbench 6.0 Multi-Core
Geekbench 5.5 - Geekbench 5.1 - 5.5 64 Bit Single-Core
min: 2040 de promedio: 2054 mediana: 2053.5 (69%) max: 2067 puntos
CPU TDP 75 W TDP 97 W 100% 99%
Geekbench 5.5 - Geekbench 5.1 - 5.5 64 Bit Multi-Core
min: 12378 de promedio: 12920 mediana: 12920 (23%) max: 13462 puntos
CPU TDP 75 W TDP 97 W 100% 92%
Geekbench 5.0 - Geekbench 5.0 64 Bit Single-Core
min: 1971 de promedio: 1980 mediana: 1980 (9%) max: 1989 puntos
CPU TDP 75 W TDP 97 W 100% 99%
...
...
AMD Ryzen 9 9955HX3D
max:
AMD Ryzen 7 9850X3D
Geekbench 5.0 - Geekbench 5.0 64 Bit Multi-Core
min: 12179 de promedio: 12761 mediana: 12760.5 (40%) max: 13342 puntos
CPU TDP 75 W TDP 97 W 100% 91%
...
...
AMD Ryzen 9 9955HX3D
max:
AMD Ryzen Threadripper PRO 3995WX
Geekbench 4.4 - Geekbench 4.1 - 4.4 64 Bit Single-Core
...
...
AMD Ryzen 9 9955HX3D
max:
Samsung Exynos 2600
Geekbench 4.4 - Geekbench 4.1 - 4.4 64 Bit Multi-Core
...
...
AMD Ryzen 9 9955HX3D
max:
Intel Core Ultra 7 270K Plus
Mozilla Kraken 1.1 - Kraken 1.1 Total Score *
min: 471 de promedio: 476 mediana: 476 (1%) max: 481 ms
Apple M5 Pro 18-Core
...
Apple M1
...
max:
WebXPRT 4 - WebXPRT 4 Score
min: 280 de promedio: 281.5 mediana: 281.5 (70%) max: 283 Points
...
...
Apple M5 Pro 18-Core
WebXPRT 3 - WebXPRT 3 Score
min: 345 de promedio: 347 mediana: 347 (58%) max: 349 Points
...
AMD Ryzen 9 9955HX3D
...
Apple M5 Pro 18-Core
CrossMark - CrossMark Overall
min: 2027 de promedio: 2103 mediana: 2103 (74%) max: 2179 Points
CPU TDP 75 W TDP 97 W 100% 93%
...
AMD Ryzen 9 9955HX
AMD Ryzen 9 9955HX3D
...
Apple M5 Max
Power Consumption - Prime95 Power Consumption - external Monitor *
min: 130.1 de promedio: 138.7 mediana: 138.7 (24%) max: 147.3 Watt
CPU TDP 75 W TDP 97 W 104% 100%
...
...
AMD Ryzen 9 9955HX3D
max:
AMD Ryzen Threadripper PRO 3975WX
0 5 10 15 20 25 30 35 40 45 50 55 60 65 70 75 80 85 90 95 100 105 110 115 120 125 130 135 140 145 150 155 Tooltip Minisforum BD770i: Ø130.1 (125.2-132.3)
Lenovo Legion Pro 5 16ARX8: Ø147.3 (143.4-160)
Power Consumption - Cinebench R15 Multi Power Consumption - external Monitor *
min: 127.5 de promedio: 136.9 mediana: 136.9 (25%) max: 146.3 Watt
CPU TDP 75 W TDP 97 W 105% 100%
...
...
AMD Ryzen 9 9955HX3D
max:
0 5 10 15 20 25 30 35 40 45 50 55 60 65 70 75 80 85 90 95 100 105 110 115 120 125 130 135 140 145 150 Tooltip Minisforum BD770i: Ø127.5 (126.9-127.9)
Lenovo Legion Pro 5 16ARX8: Ø146.3 (139.7-154.4)
Power Consumption - Idle Power Consumption - external Monitor *
min: 12.5 de promedio: 31.6 mediana: 16.3 (11%) max: 65.9 Watt
CPU TDP ? TDP 75 W TDP 97 W 100% 158% 163%
...
AMD Ryzen 9 9955HX3D
max:
0 5 10 15 20 25 30 35 40 45 50 55 60 65 70 Tooltip Lenovo Legion Pro 5 16ARX8: Ø12.5 (7.11-23.4)
Minisforum BD770i: Ø16.3 (15.4-24.1)
Minisforum BD770i, RTX 4090: Ø65.9 (64.8-71.2)
Power Consumption - Idle Power Consumption 150cd 1min *
0 5 10 15 20 Tooltip Lenovo Legion Pro 5 16ARX8: Ø13.6 (8.19-21.9)
Power Consumption - Power Efficiency - Cinebench R15 Multi external Monitor
min: 20.4 de promedio: 22 mediana: 22 (16%) max: 23.5 Points per Watt
CPU TDP 75 W TDP 97 W 100% 87%
- Gama de valores de las pruebas para esta tarjeta gráfica
- Valores medios de las pruebas para esta tarjeta gráfica
* A menor número, mayor rendimiento
log 01. 08:57:42
#0 ran 0s before starting gpusingle class +0s ... 0s
#1 no ids found in url (should be separated by "_") +0s ... 0s
#2 not redirecting to Ajax server +0s ... 0s
#3 did not recreate cache, as it is less than 5 days old! Created at Wed, 01 Jul 2026 05:28:54 +0200 +0.006s ... 0.006s
#4 composed specs +0.021s ... 0.027s
#5 did output specs +0s ... 0.027s
#6 getting avg benchmarks for device 14940 +0.059s ... 0.087s
#7 got single benchmarks 14940 +0.014s ... 0.101s
#8 got avg benchmarks for devices +0s ... 0.101s
#9 min, max, avg, median took s +3.145s ... 3.246s
#10 no comparison url found in template nbc.compare_page_2 needed +0.607s ... 3.853s
#11 return log +0s ... 3.853s