Análises de portátiles con NVIDIA GeForce GTX 1650 Max-Q tarjeta gráfica
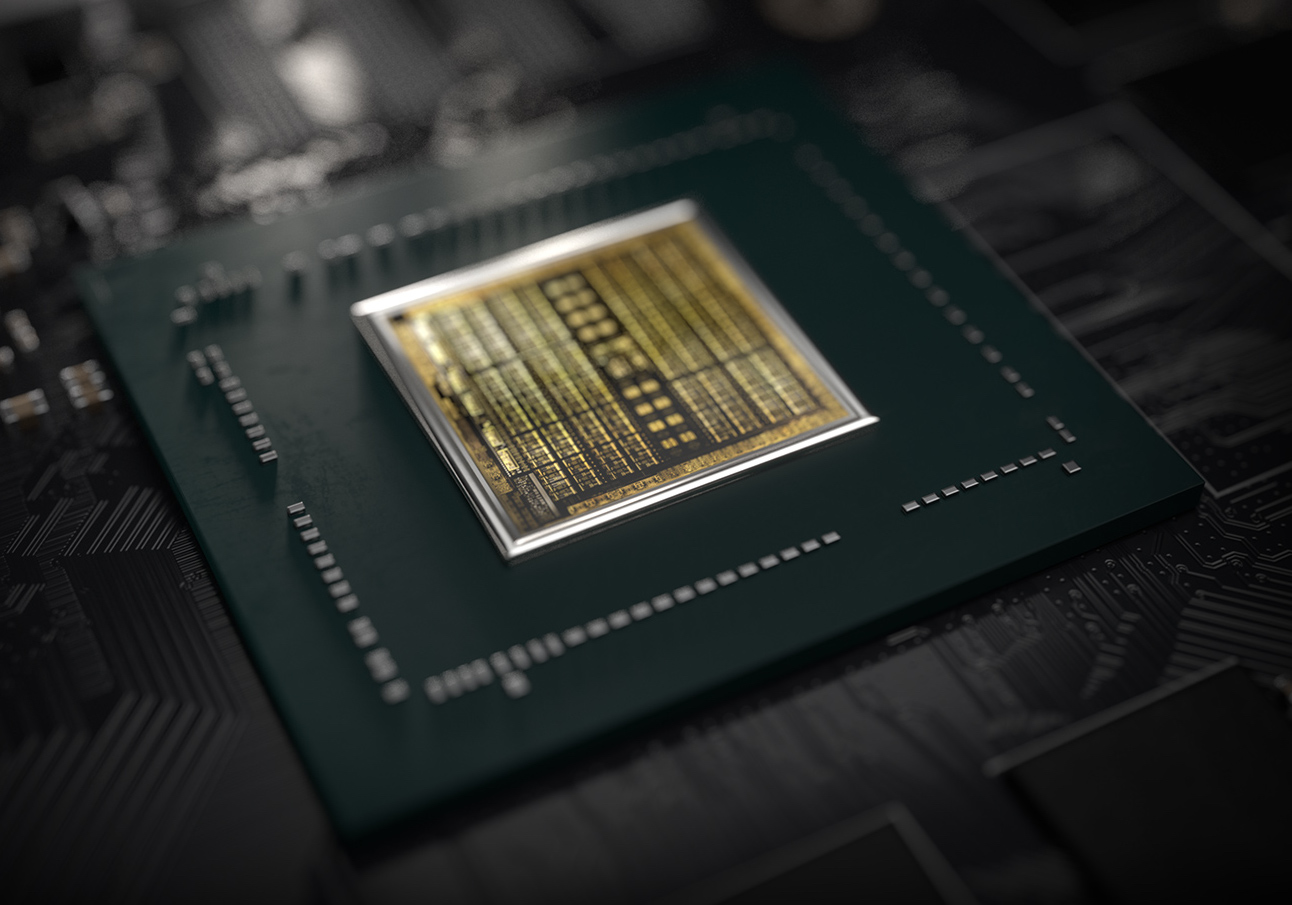
Análisis del Asus ROG Flow X13: Convertible para juegos con un AMD Ryzen 9 5980H y una RTX 3080 opcional
El Asus Flow X13 es un convertible ultracompacto de 13 pulgadas con una pantalla de alta resolución. Con la base de visualización opcional, equipada con una GPU Nvidia Geforce RTX 3080, el Flow X13, junto con la CPU AMD Ryzen 9 5980H integrada en el portátil, teóricamente incluso haría que los ordenadores de sobremesa parecieran viejos. Debido a la falta de disponibilidad, por ahora solo analizaremos el Flow X13 sin la eGPU.
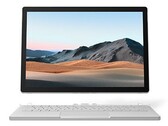
AMD Ryzen 9 5980HS, NVIDIA GeForce GTX 1650 Max-Q, 13.4", 1.4 kgReview del Surface Book 3 13.5: El convertible de Microsoft está envejeciendo lentamente
Con la última edición del Surface Book 3, Microsoft actualiza su multi-talento a la generación de Lago de Hielo de Intel. Obtenemos una imagen general de la variante i7 con Nvidia GeForce GTX 1650 y aclaramos lo que los usuarios pueden esperar de ella en nuestra revisión.
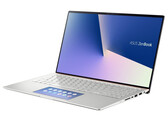
Intel Core i7-1065G7, NVIDIA GeForce GTX 1650 Max-Q, 13.5", 1.6 kgReview del Asus ZenBook 15 UX534FTC: Matte, el poderoso rey de la vida de la batería
Asus ha equipado la delgada laptop con un procesador de cuatro núcleos y una tarjeta gráfica dedicada. Por lo demás, las características son excelentes: pantalla IPS mate, NVMe SSD, 16 GB de RAM (en modo de doble canal), teclado retroiluminado. Además, la excelente duración de la batería completa el paquete completo.
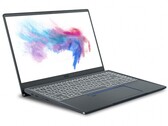
Intel Core i7-10510U, NVIDIA GeForce GTX 1650 Max-Q, 15.6", 1.6 kgReview del portátil MSI Prestige 14 A10SC-009: Comet Lake para los creadores de contenidos
El MSI Prestige 14 es una pequeña central eléctrica con un diseño y un equipo que son convincentes. También nos gusta mucho el teclado con sus teclas de flecha de tamaño normal. Nuestra detallada revisión aclara cómo funciona el portátil de 14 pulgadas para los creativos.
Intel Core i7-10710U, NVIDIA GeForce GTX 1650 Max-Q, 14", 1.3 kgReview del portátil MSI GF63 Thin 9SC: Jugador ligero por poco menos de $1000
Mientras que los portátiles para juegos económicos suelen tener dificultades para mostrar los juegos actuales con el máximo detalle, la relación precio-rendimiento es buena en la mayoría de los casos. El GF63 Thin 9SC de MSI es un representante bastante asequible de esta especie.
Intel Core i5-9300H, NVIDIA GeForce GTX 1650 Max-Q, 15.6", 1.8 kgLenovo Yoga C940-15IRH: Intel Core i7-9750H, 15.60", 2 kg
análise » Review del convertible Lenovo Yoga C940-15IRH: El XPS 15 2 en 1 que Dell debería haber hecho
Razer Blade Stealth 13, Core i7-1065G7: Intel Core i7-1065G7, 13.30", 1.5 kg
análise » Review de la Razer Blade Stealth (GTX 1650 Max-Q): Pantalla de 4K, duración de la batería y rendimiento de la CPU decepcionan
MSI Prestige 15 A10SC: Intel Core i7-10710U, 15.60", 1.7 kg
análise » Review de portátiles MSI Prestige 15 A10SC: Una de las mejores alternativas del Dell XPS 15
Lenovo IdeaPad S540-15IWL 81SW0015GE: Intel Core i7-8565U, 15.60", 1.9 kg
análise » Review de Lenovo IdeaPad S540-15IWL: Un gran todoterreno con una sola debilidad real
Asus ZenBook 15 UX534FT-DB77: Intel Core i7-8565U, 15.60", 1.7 kg
análise » Review del portátil Asus ZenBook 15 UX534F: Parece un Ultrabook, juega como un gamer
MSI Prestige 14 i7-10710U: Intel Core i7-10710U, 14.00", 1.3 kg
análise » Review de MSI Prestige 14 Hands-On Laptop: Más rápido que nunca y aún así ideal para los creadores de contenido
MSI PS63 Modern 8SC: Intel Core i7-8565U, 15.60", 1.7 kg
análise » Un verdadero todoterreno: Review del portátil MSI PS63 Modern 8SC
Asus VivoBook Pro 15 K3500PH: Intel Core i7-11370H, 15.60", 1.7 kg
análise externo » Asus VivoBook Pro 15 K3500PH
MSI GV15 Thin 11SC-633: Intel Core i5-11400H, 15.60", 1.9 kg
análise externo » MSI GV15 Thin 11SC-633
Acer Swift X SFX14-41G-R6BZ: AMD Ryzen 5 5500U, 14.00", 1.5 kg
análise externo » Acer Swift X SFX14-41G-R6BZ
Acer Swift X SFX14-41G-R9Q5: AMD Ryzen 5 5500U, 14.00", 1.5 kg
análise externo » Acer Swift X SFX14-41G-R9Q5
Asus ROG Flow X13 GV301QH-K6069T: AMD Ryzen 7 5800HS, 13.40", 1.3 kg
análise externo » Asus ROG Flow X13 GV301QH-K6069T
Asus ZenBook Pro 15 UX535LH-BN150T : Intel Core i7-10870H, 15.60", 1.8 kg
análise externo » Asus ZenBook Pro 15 UX535LH-BN150T
Asus ZenBook Pro 15 UX535LH-BN024T: Intel Core i5-10300H, 15.60", 1.8 kg
análise externo » Asus ZenBook Pro 15 UX535LH-BN024T
Lenovo ThinkBook 15p IMH-20V30007GE: Intel Core i5-10300H, 15.60", 1.9 kg
análise externo » Lenovo ThinkBook 15p IMH-20V30007GE
Asus ZenBook Flip 15 UX564PH-EZ007R: Intel Core i7-11370H, 15.60", 1.9 kg
análise externo » Asus ZenBook Flip 15 UX564PH-EZ007R
MSI GF63 Thin 10SC-206: Intel Core i5-10300H, 15.60", 1.9 kg
análise externo » MSI GF63 Thin 10SC-206
Asus ROG Flow X13 GV301QH-K6034T-BE: AMD Ryzen 7 5800HS, 13.40", 1.3 kg
análise externo » Asus ROG Flow X13 GV301QH-K6034T-BE
MSI Prestige 15 A11SCX-019XES: Intel Core i7-1185G7, 15.60", 1.7 kg
análise externo » MSI Prestige 15 A11SCX-019XES
MSI Prestige 15 A10SC-014: Intel Core i7-10710U, 15.60", 1.7 kg
análise externo » MSI Prestige 15 A10SC-014
Asus ROG Flow X13 GV301QH: AMD Ryzen 9 5980HS, 13.40", 1.4 kg
análise externo » Asus ROG Flow X13 GV301QH
Lenovo ThinkPad X1 Extreme-20QV000WGE: Intel Core i7-9750H, 15.60", 1.7 kg
análise externo » Lenovo ThinkPad X1 Extreme-20QV000WGE
Microsoft Surface Book 3 13.5: Intel Core i7-1065G7, 13.50", 1.6 kg
análise externo » Microsoft Surface Book 3 13.5
MSI Prestige 14 A10SC-009: Intel Core i7-10710U, 14.00", 1.3 kg
análise externo » MSI Prestige 14 A10SC-009
Lenovo ThinkPad X1 Extreme G2-20QV000KUS: Intel Core i7-9850H, 15.60", 1.8 kg
análise externo » Lenovo ThinkPad X1 Extreme G2-20QV000KUS
Razer Blade Stealth i7-1065G7, GTX 1650 Max-Q: Intel Core i7-1065G7, 13.30", 1.5 kg
análise externo » Razer Blade Stealth i7-1065G7, GTX 1650 Max-Q
Lenovo ThinkPad X1 Extreme G2-20QV00CEGE: Intel Core i9-9880H, 15.60", 1.8 kg
análise externo » Lenovo ThinkPad X1 Extreme G2-20QV00CEGE
Lenovo ThinkPad X1 Extreme G2-20QV00CMGE: Intel Core i7-9750H, 15.60", 1.7 kg
análise externo » Lenovo ThinkPad X1 Extreme G2-20QV00CMGE
Lenovo Yoga C940-15IRH: Intel Core i7-9750H, 15.60", 2 kg
análise externo » Lenovo Yoga C940-15IRH
MSI Prestige 15 A10SC-029NL: Intel Core i7-10710U, 15.60", 1.6 kg
análise externo » MSI Prestige 15 A10SC-029NL
MSI Prestige 15 A10SC-044XES: Intel Core i7-10710U, 15.60", 1.7 kg
análise externo » MSI Prestige 15 A10SC-044XES
MSI Prestige 14 A10SC-004NL: Intel Core i7-10710U, 14.00", 1.3 kg
análise externo » MSI Prestige 14 A10SC-004NL
MSI Prestige 15 A10SC-060XES: Intel Core i7-10710U, 15.60", 1.7 kg
análise externo » MSI Prestige 15 A10SC-060XES
Lenovo ThinkPad X1 Extreme G2-20QV000UGE: Intel Core i5-9300H, 15.60", 1.7 kg
análise externo » Lenovo ThinkPad X1 Extreme G2-20QV000UGE
Asus ZenBook 15 UX534FT-DB77: Intel Core i7-8565U, 15.60", 1.7 kg
análise externo » Asus ZenBook 15 UX534FT-DB77
Asus ZenBook 15 UX534FTC-A8078R: Intel Core i7-10510U, 15.60", 1.7 kg
análise externo » Asus ZenBook 15 UX534FTC-A8078R
MSI Prestige 15 A10SC: Intel Core i7-10710U, 15.60", 1.7 kg
análise externo » MSI Prestige 15 A10SC
Asus ZenBook 15 UX534FT-A8145T: Intel Core i7-8565U, 15.60", 1.7 kg
análise externo » Asus ZenBook 15 UX534FT-A8145T
MSI Prestige 15 A10SC-011: Intel Core i7-10710U, 15.60", 1.6 kg
análise externo » MSI Prestige 15 A10SC-011
Lenovo ThinkPad X1 Extreme G2-20QV000WGE: Intel Core i7-9750H, 15.60", 1.7 kg
análise externo » Lenovo ThinkPad X1 Extreme G2-20QV000WGE
MSI GF63 9SC-662: Intel Core i5-9300H, 15.60", 1.9 kg
análise externo » MSI GF63 9SC-662
MSI Prestige 14 i7-10710U: Intel Core i7-10710U, 14.00", 1.3 kg
análise externo » MSI Prestige 14 i7-10710U
Lenovo Ideapad S540-15IWL 81SW001SMH: Intel Core i5-8265U, 15.60", 1.8 kg
análise externo » Lenovo Ideapad S540-15IWL 81SW001SMH
MSI GF75 Thin 9SC-039XES: Intel Core i7-9750H, 15.60", 2.2 kg
análise externo » MSI GF75 Thin 9SC-039XES
Asus ZenBook 15 UX534FT, i7-8565U: Intel Core i7-8565U, 15.60", 1.7 kg
análise externo » Asus ZenBook 15 UX534FT, i7-8565U
MSI PS63 8SC-003NL: Intel Core i7-8565U, 15.60", 1.6 kg
análise externo » MSI PS63 8SC-003NL
Microsoft Surface Book 3 13.5: Intel Core i7-1065G7, 13.50", 1.6 kg
» Microsoft Surface Book 3 13.5: ¿Vale la pena cambiar del modelo anterior?