Review del portátil Dell Precision 3551: Debut del Intel Core i9-10885H
A diferencia de la Precision 3550, que se ejecuta en CPU de la serie U de Intel más lentas con gráficos Quadro P520 opcionales, la Precision 3551 aumenta el factor de rendimiento con CPU de clase H y la GPU Quadro P620 opcional. El portátil es una estación de trabajo móvil de nivel básico que se sitúa por debajo de las series Precision 5000 de gama media y Precision 7000 de gama alta.
Más reviews de Dell:
Valoración | Fecha | Modelo | Peso | Altura | Tamaño | Resolución | Precio |
|---|---|---|---|---|---|---|---|
| 81.2 % v7 (old) | 10/2020 | Dell Precision 3000 3551 i9-10885H, Quadro P620 | 2.2 kg | 24.92 mm | 15.60" | 1920x1080 | |
| 82.7 % v7 (old) | 10/2020 | HP ZBook Firefly 15 G7 i7-10610U, Quadro P520 | 1.8 kg | 19.2 mm | 15.60" | 3840x2160 | |
| 86.3 % v7 (old) | 08/2020 | Dell Precision 5550 P91F i7-10875H, Quadro T2000 Max-Q | 2 kg | 18 mm | 15.60" | 3840x2400 | |
| 81.2 % v7 (old) | 11/2019 | Lenovo ThinkPad P53s-20N6001NGE i7-8565U, Quadro P520 | 1.9 kg | 19.95 mm | 15.60" | 1920x1080 | |
| 76 % v7 (old) | 10/2019 | MSI WP65 i7-9750H, Quadro P620 | 1.9 kg | 21.7 mm | 15.60" | 1920x1080 | |
| 84.3 % v6 (old) | 08/2018 | Dell Precision 3530 E-2176M, Quadro P600 | 2.3 kg | 24.3 mm | 15.60" | 1920x1080 |
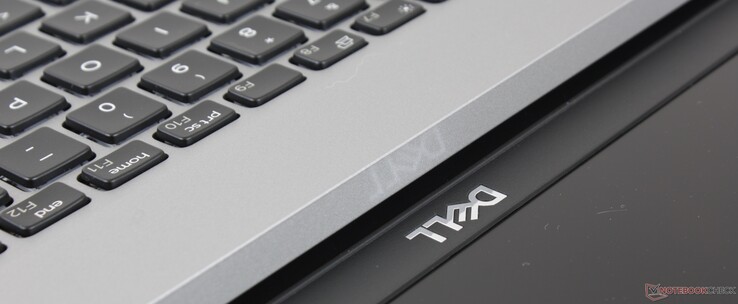
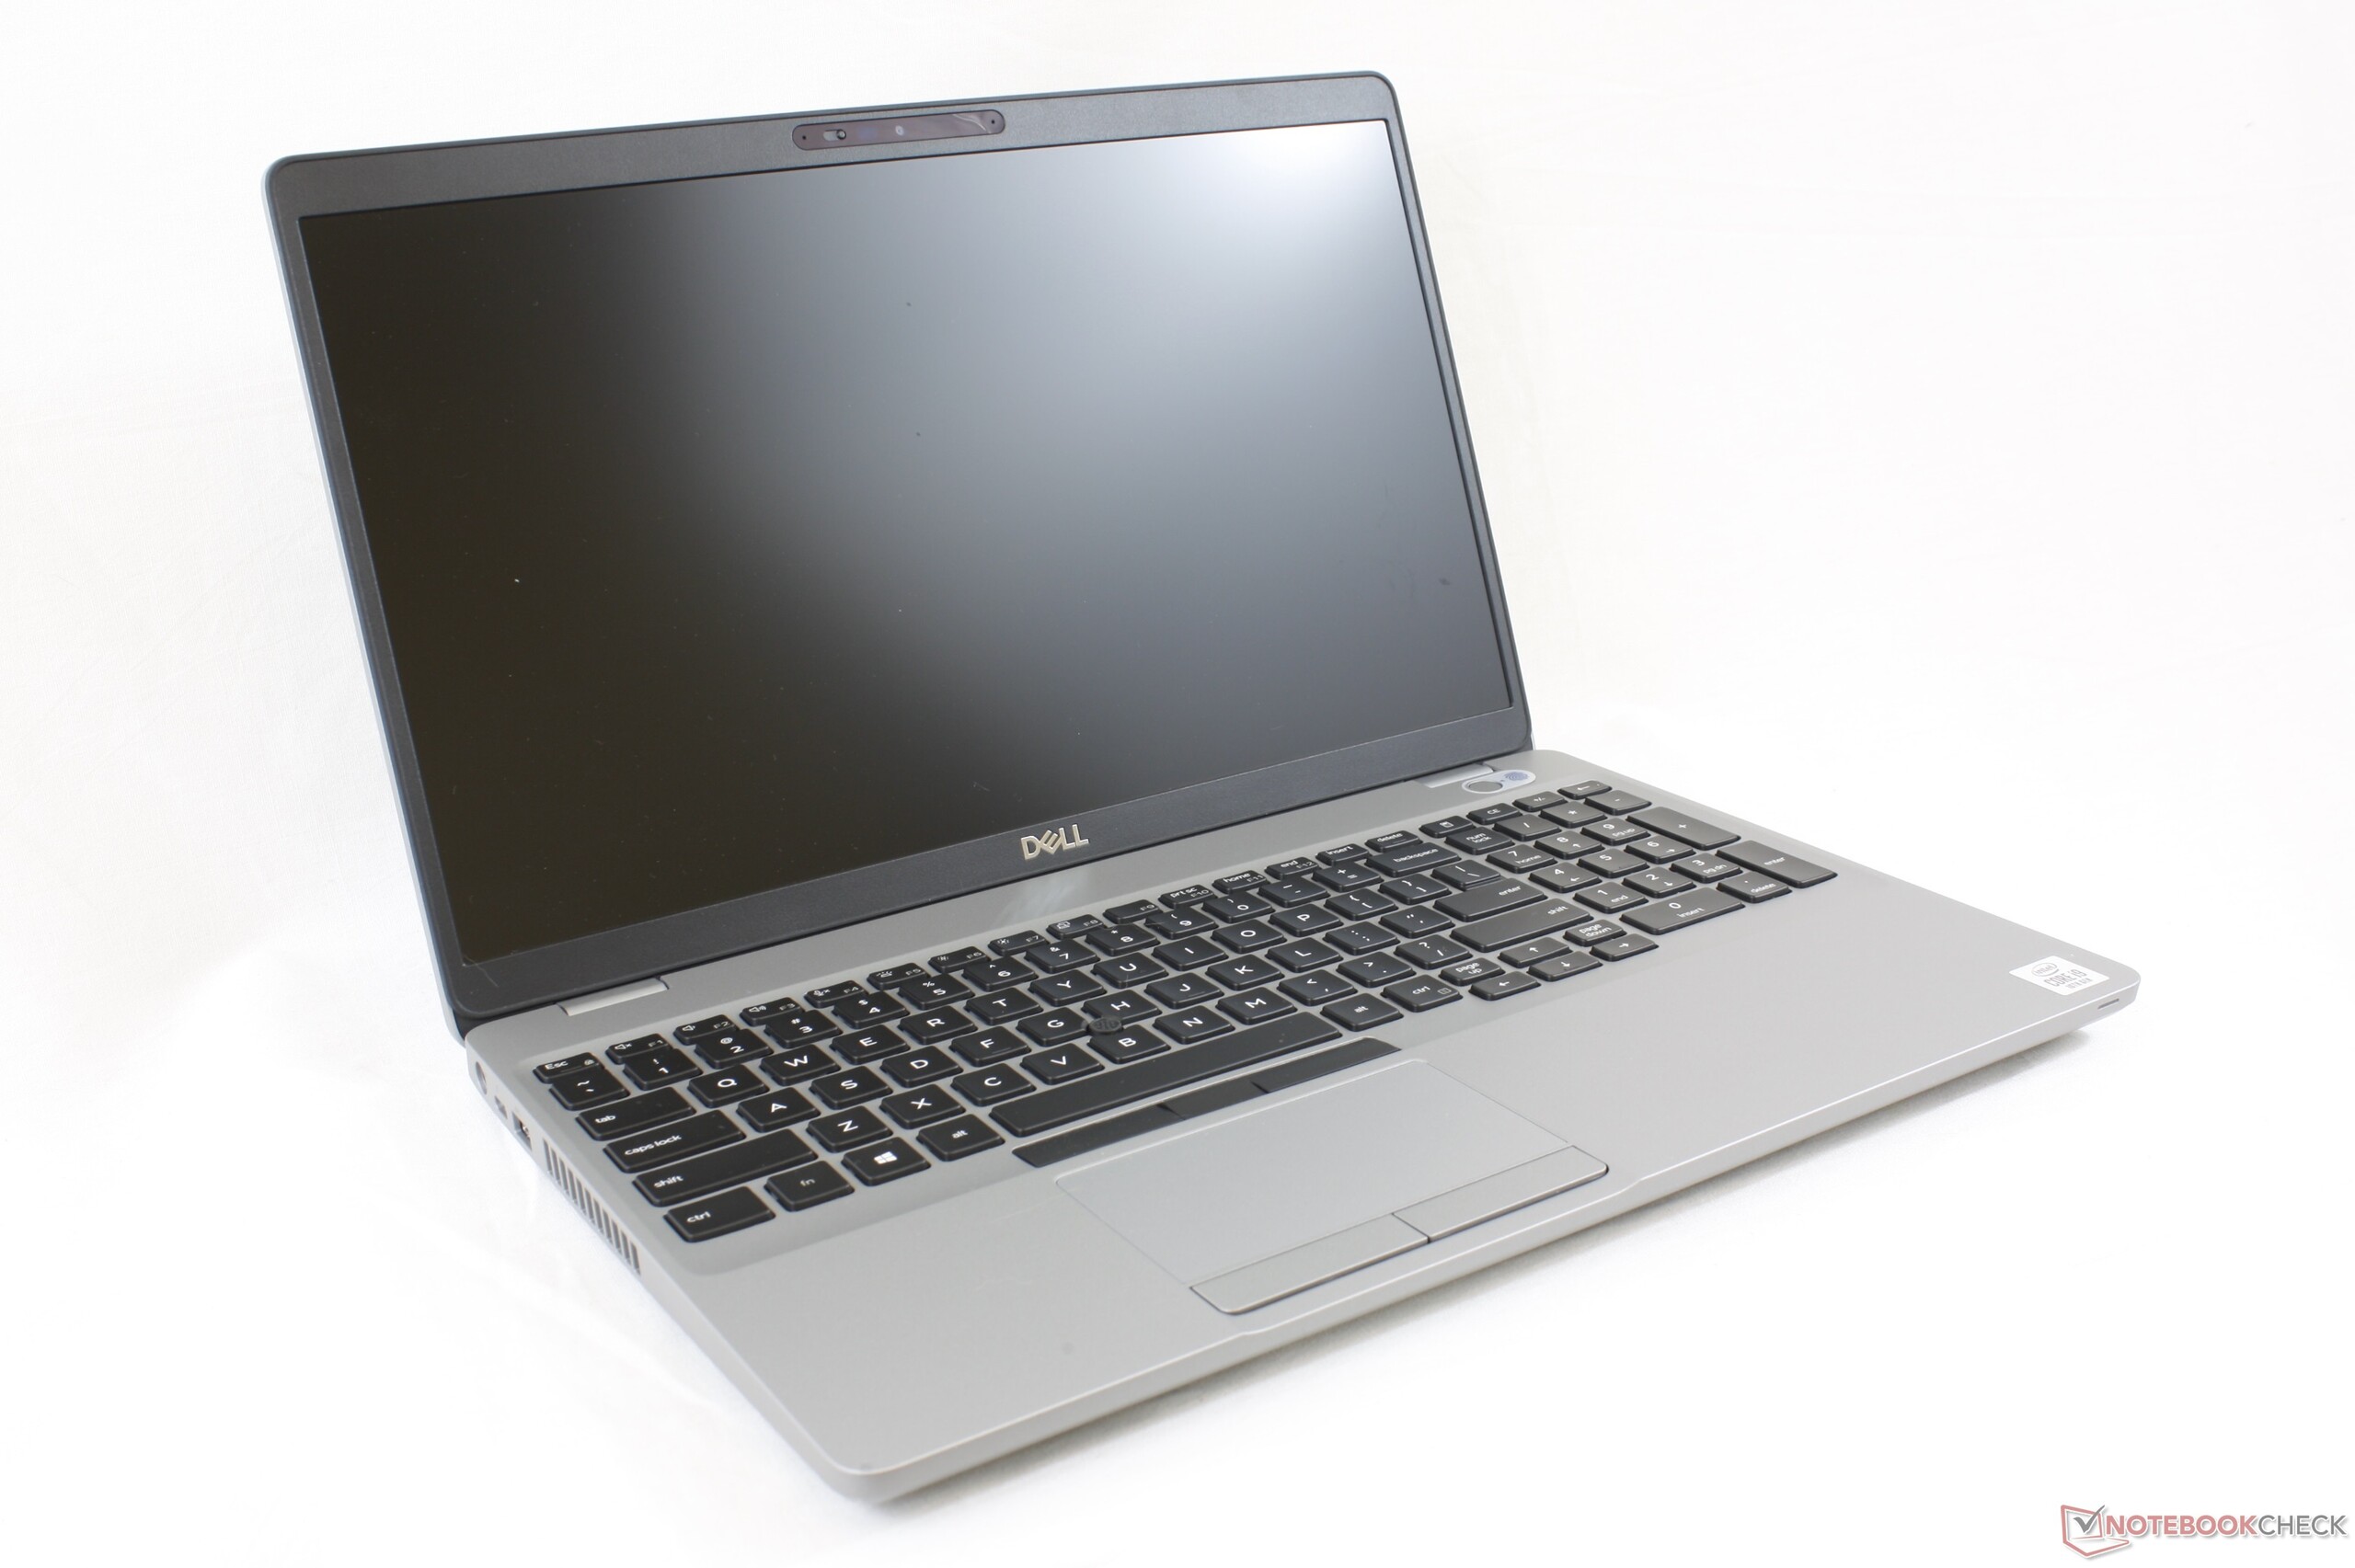
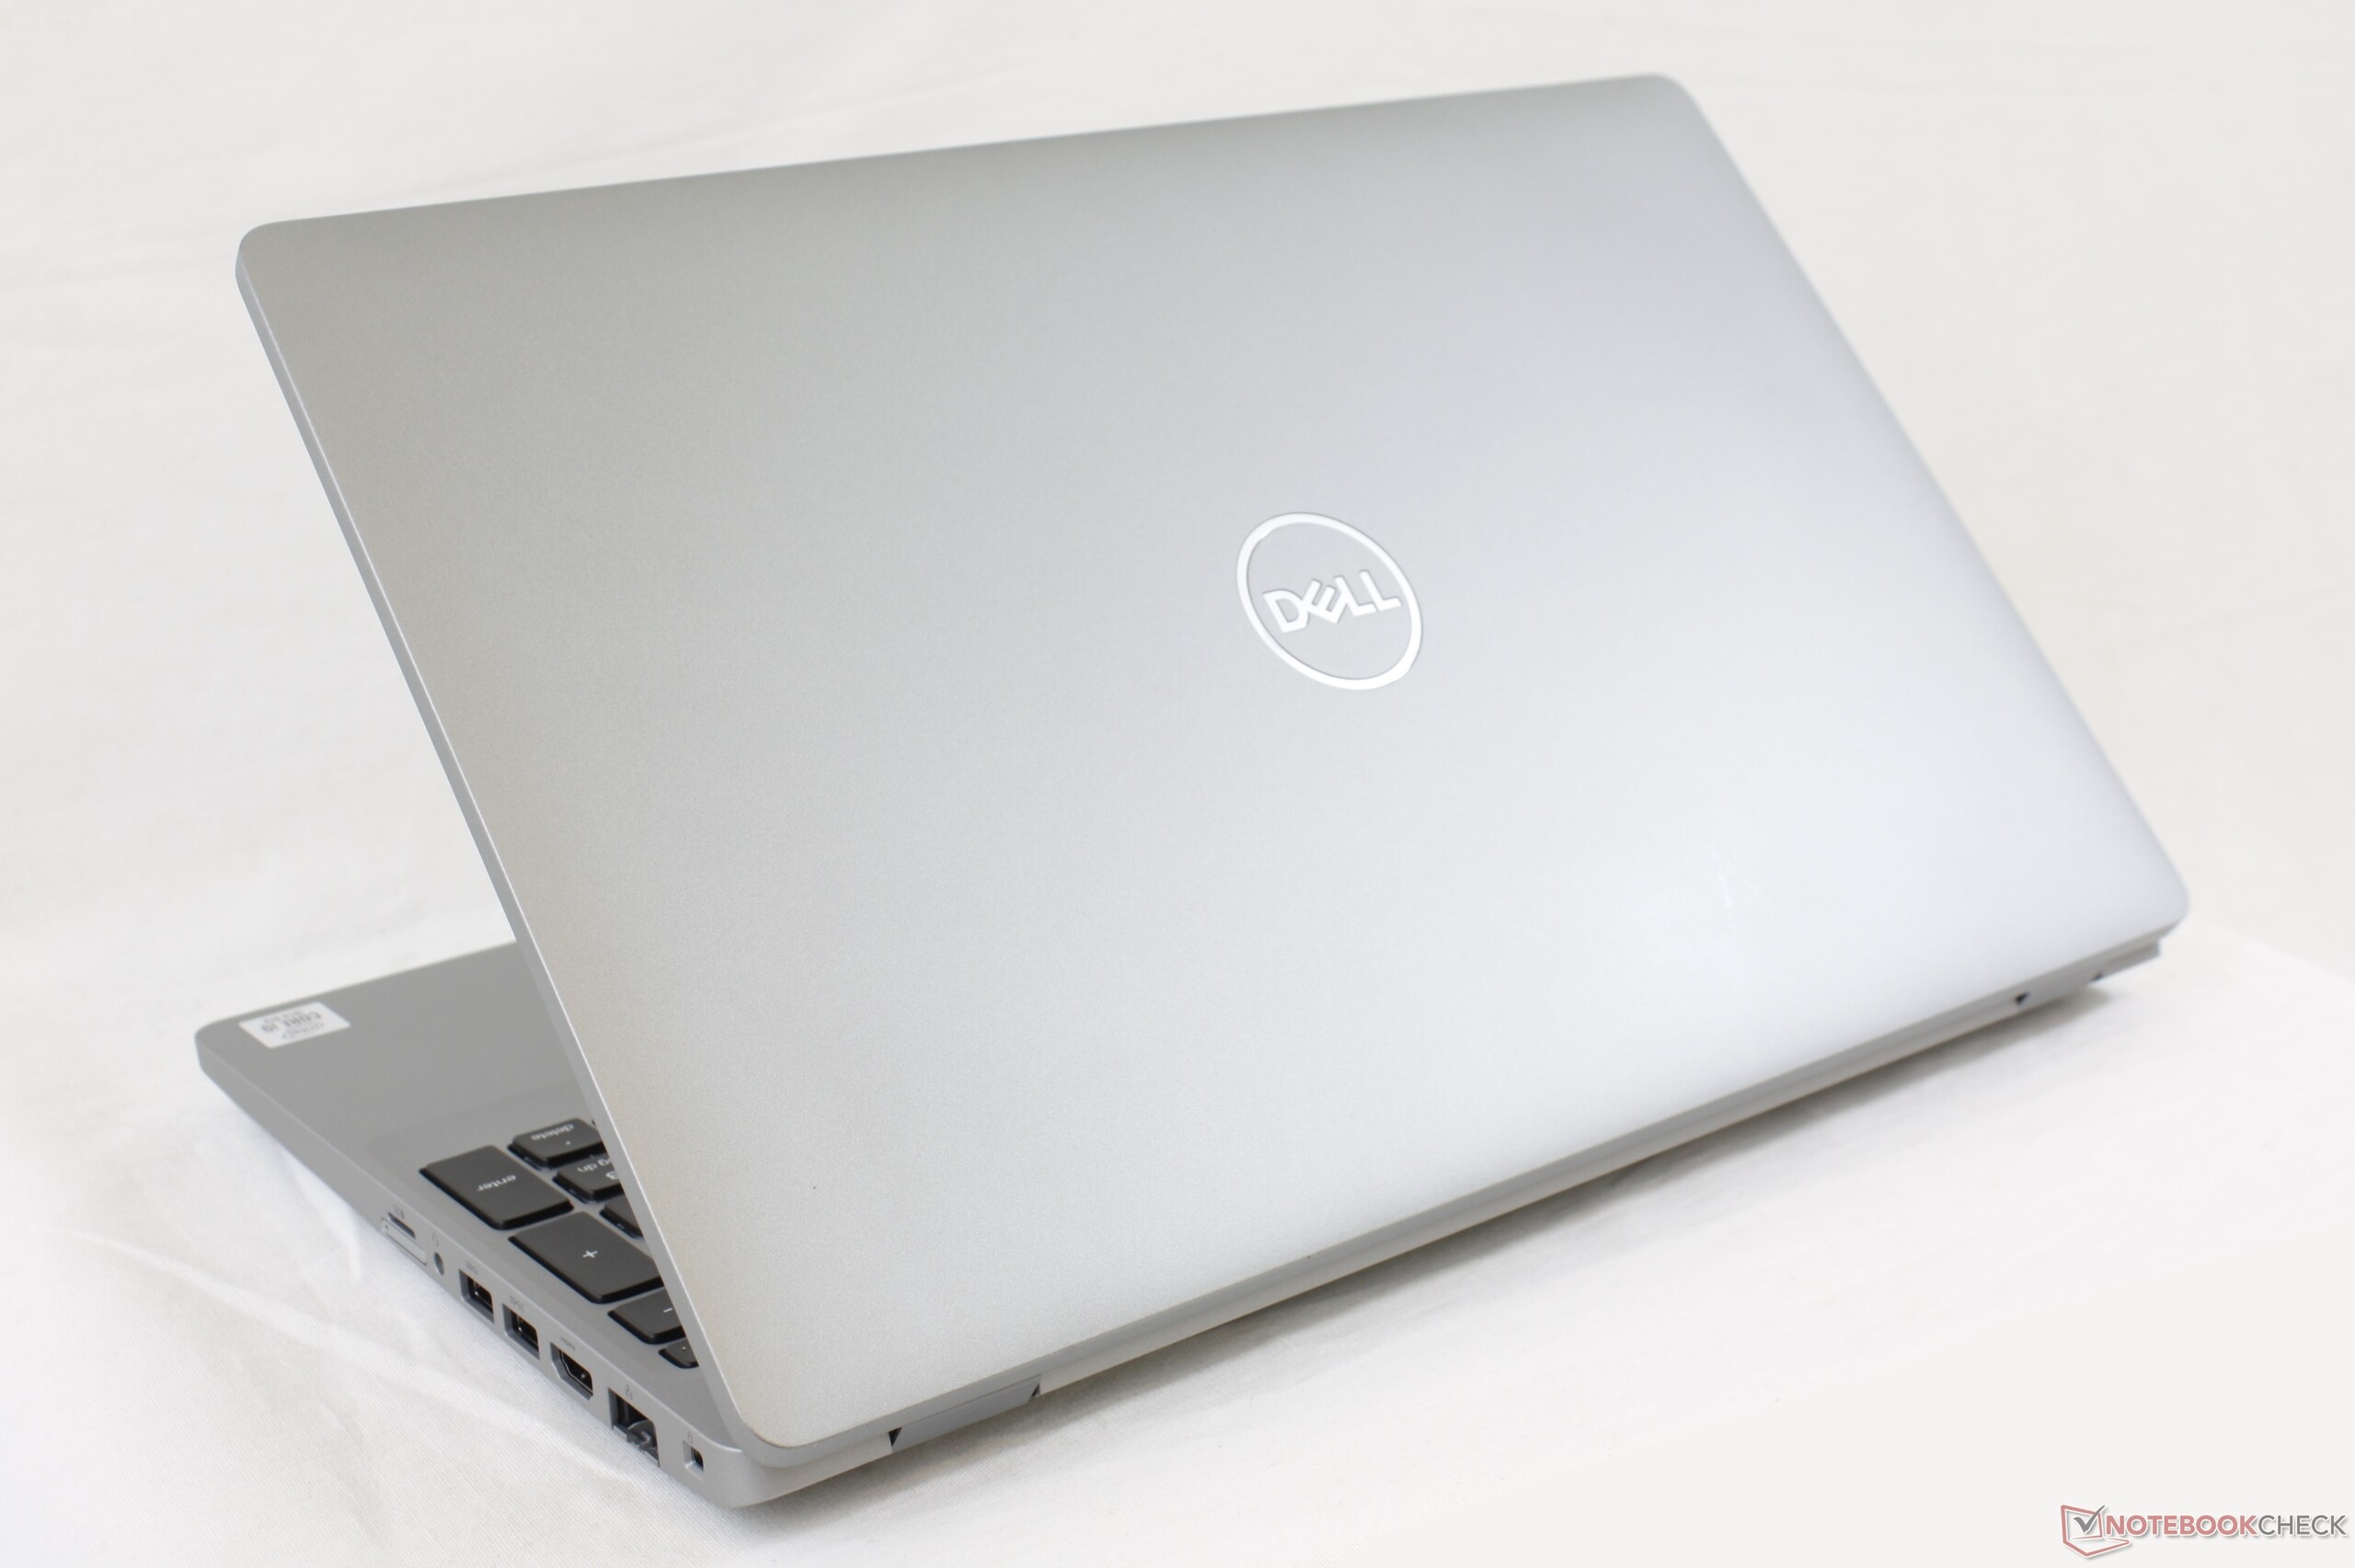
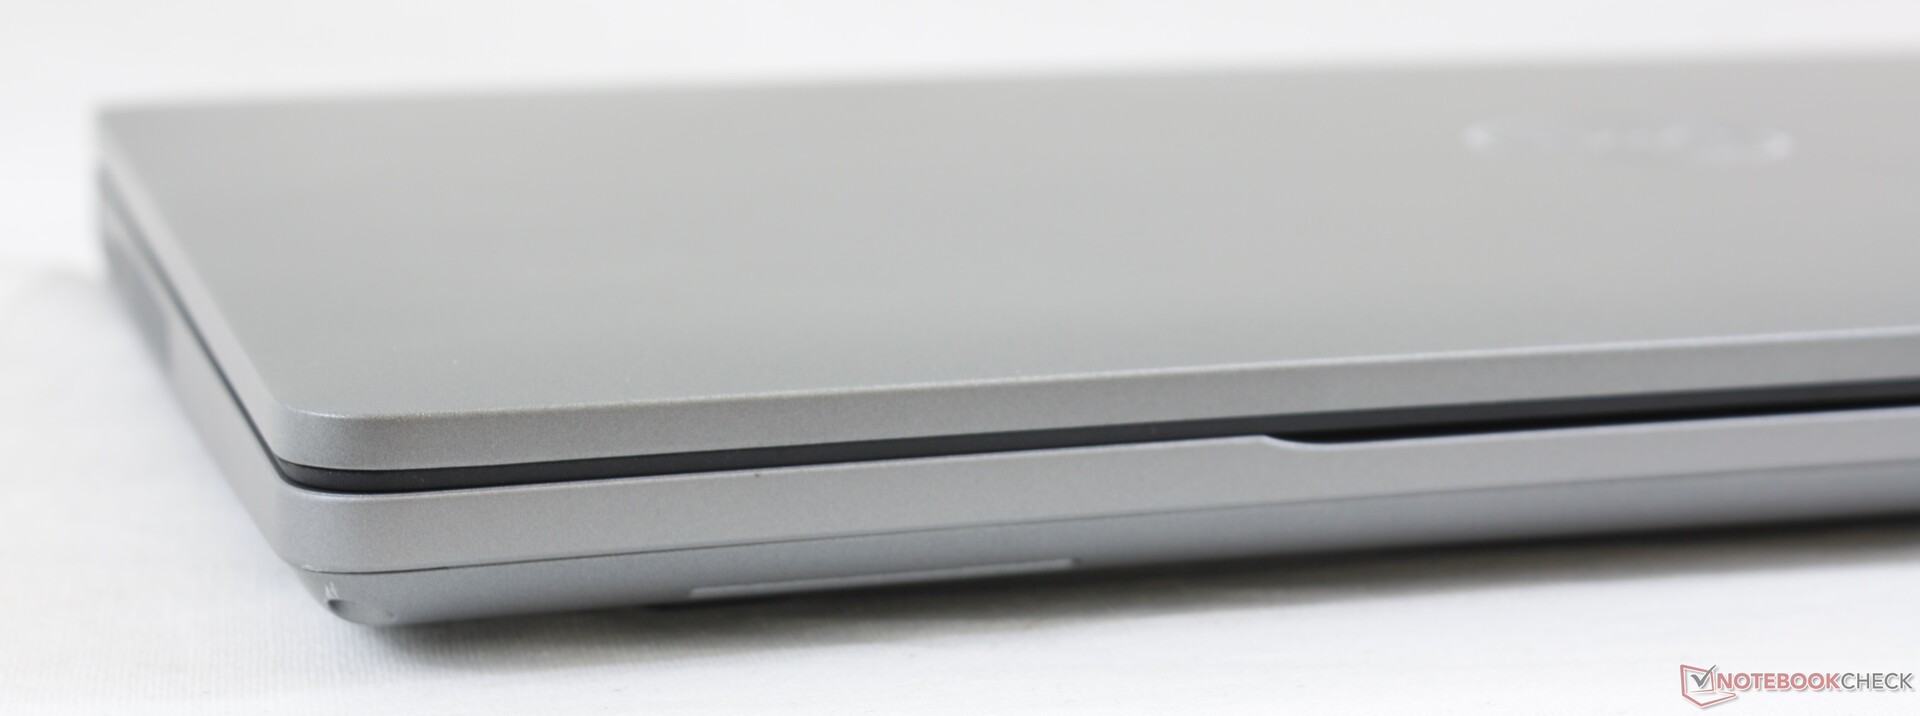
Carcasa
El chasis es rotundo para los estándares de hoy en día donde los diseños afilados y elegantes son comunes. Los bordes y las esquinas son redondeados para un aspecto de la vieja escuela a pesar de los estrechos biseles laterales y la reducción de tamaño en comparación con el antiguo Precision 3530. Todo esto es intencionado, por supuesto, ya que los usuarios tendrán que considerar las series más caras de Precision 5000 o 7000 si quieren estaciones de trabajo más atractivas visualmente.
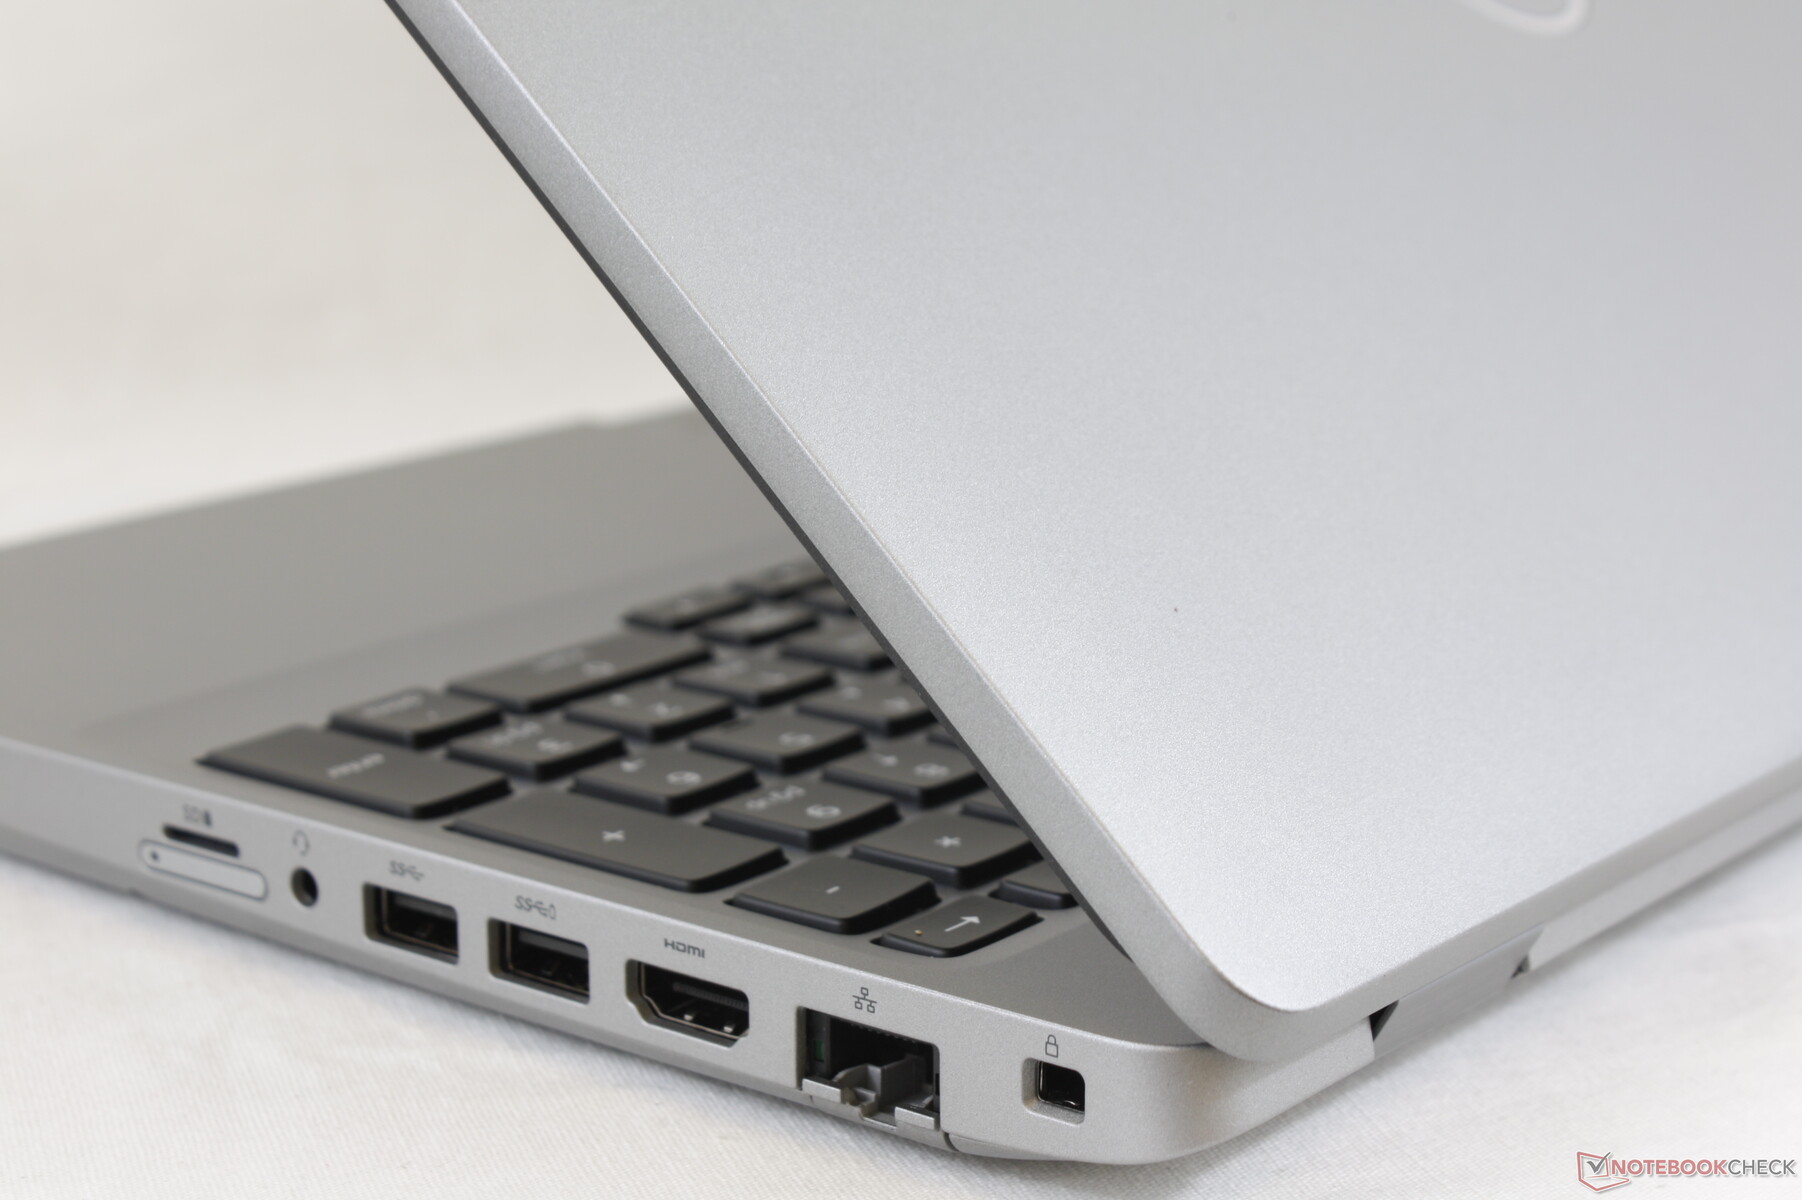
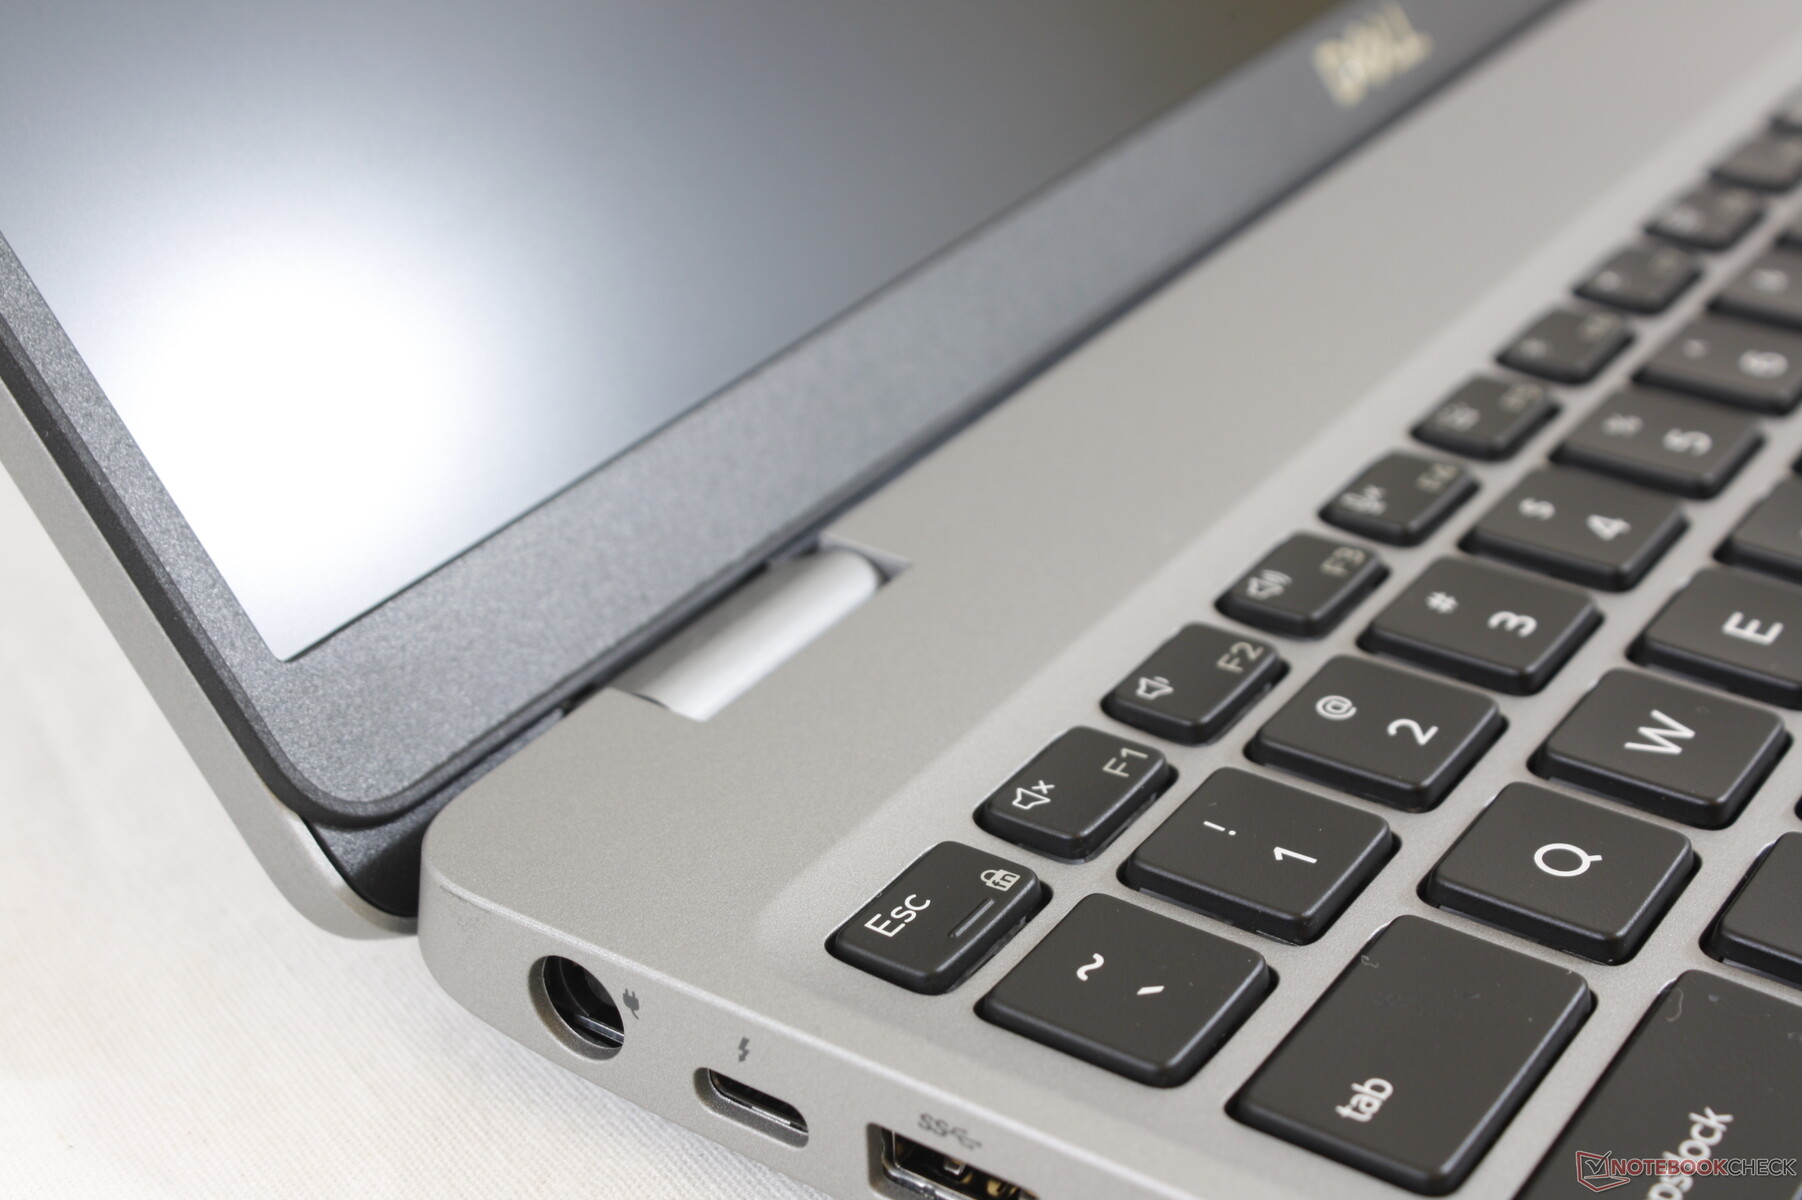
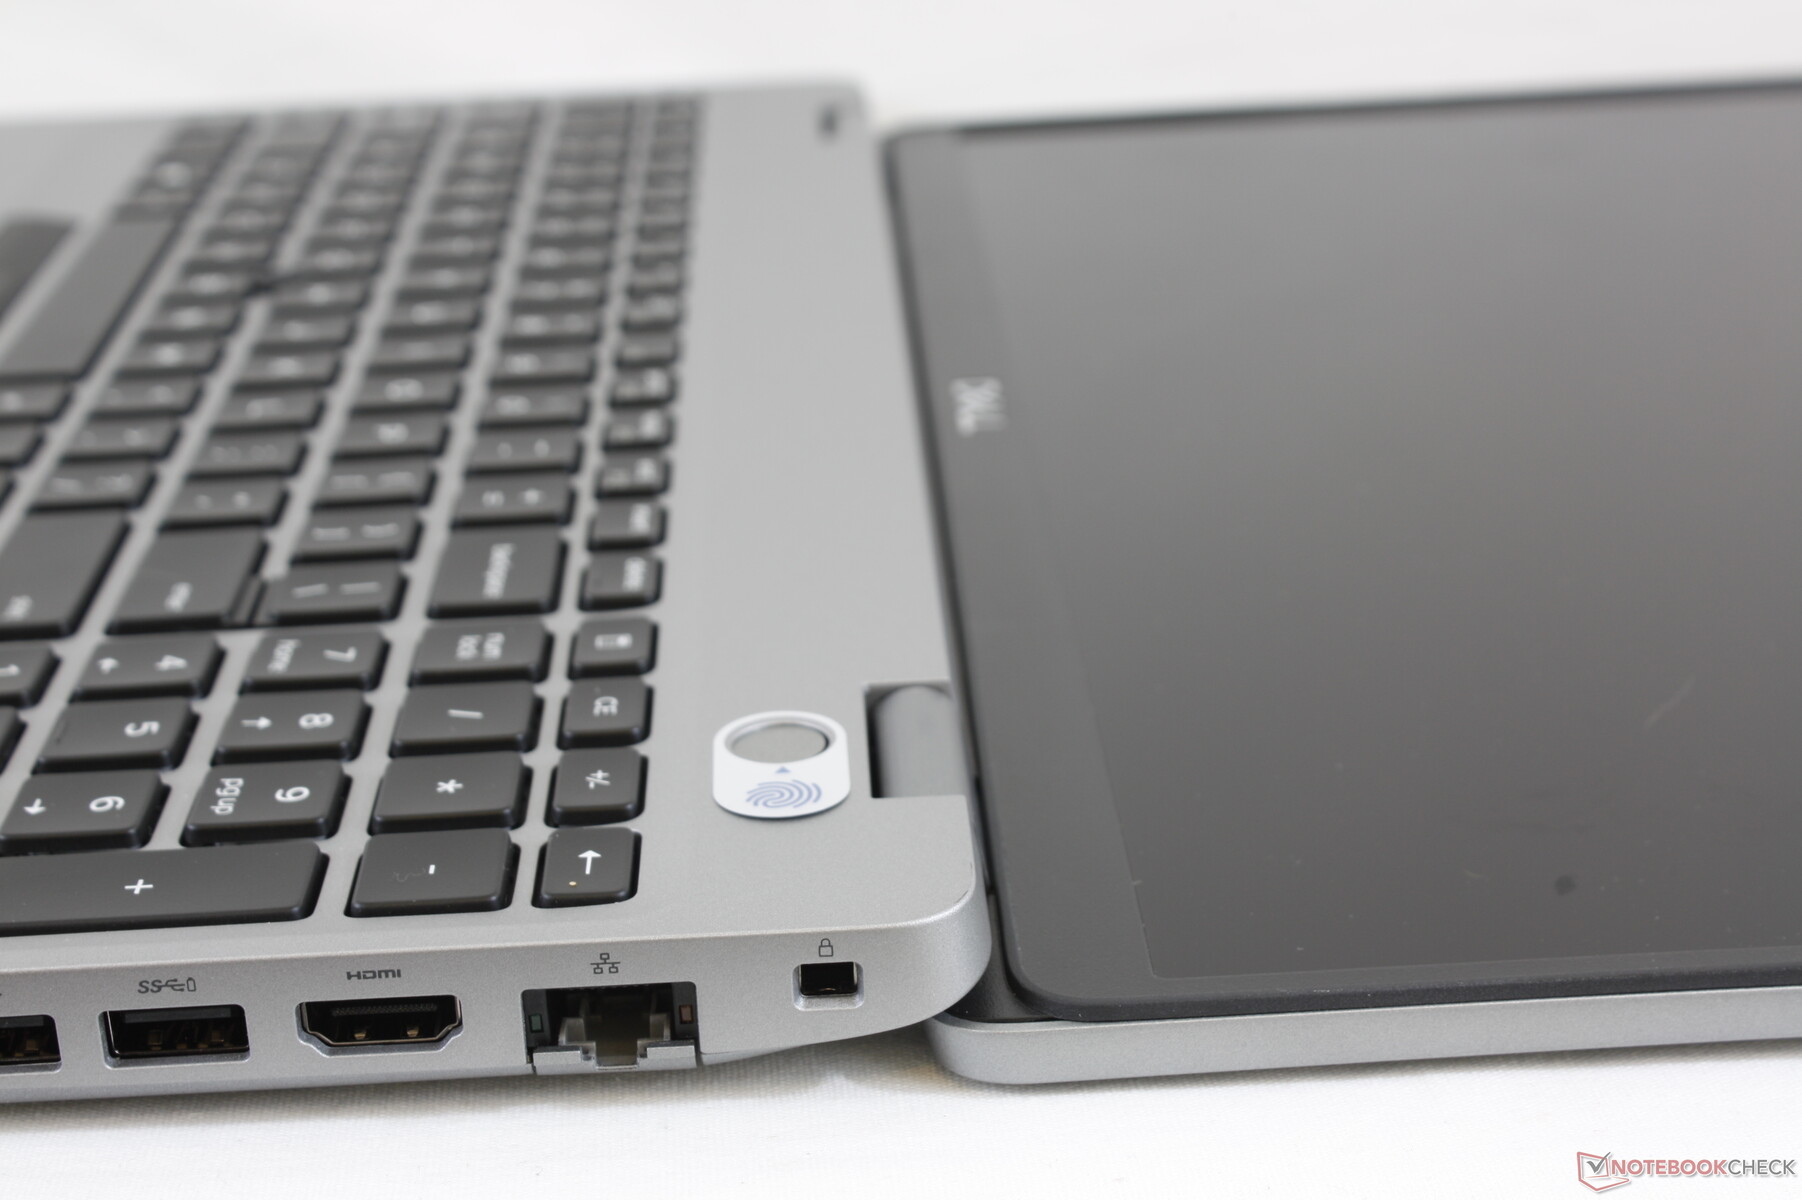
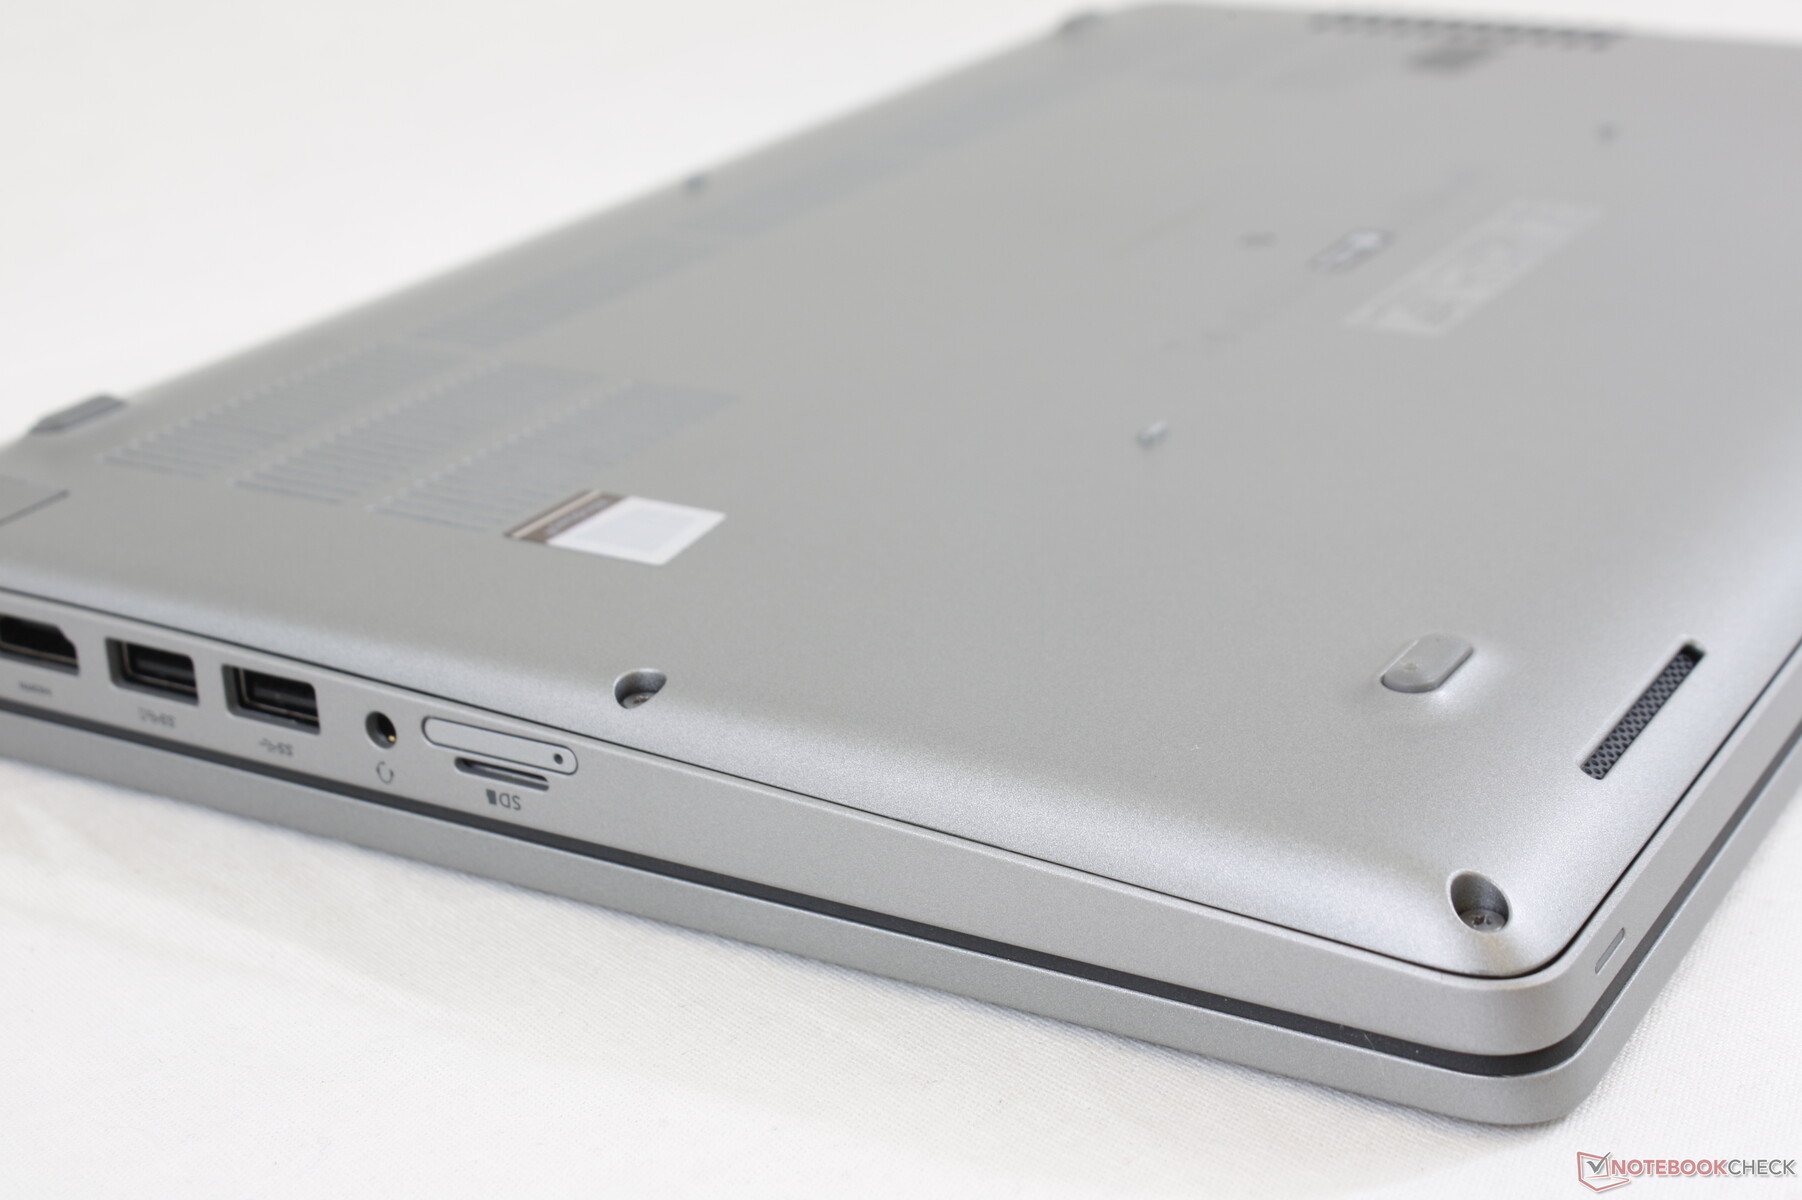
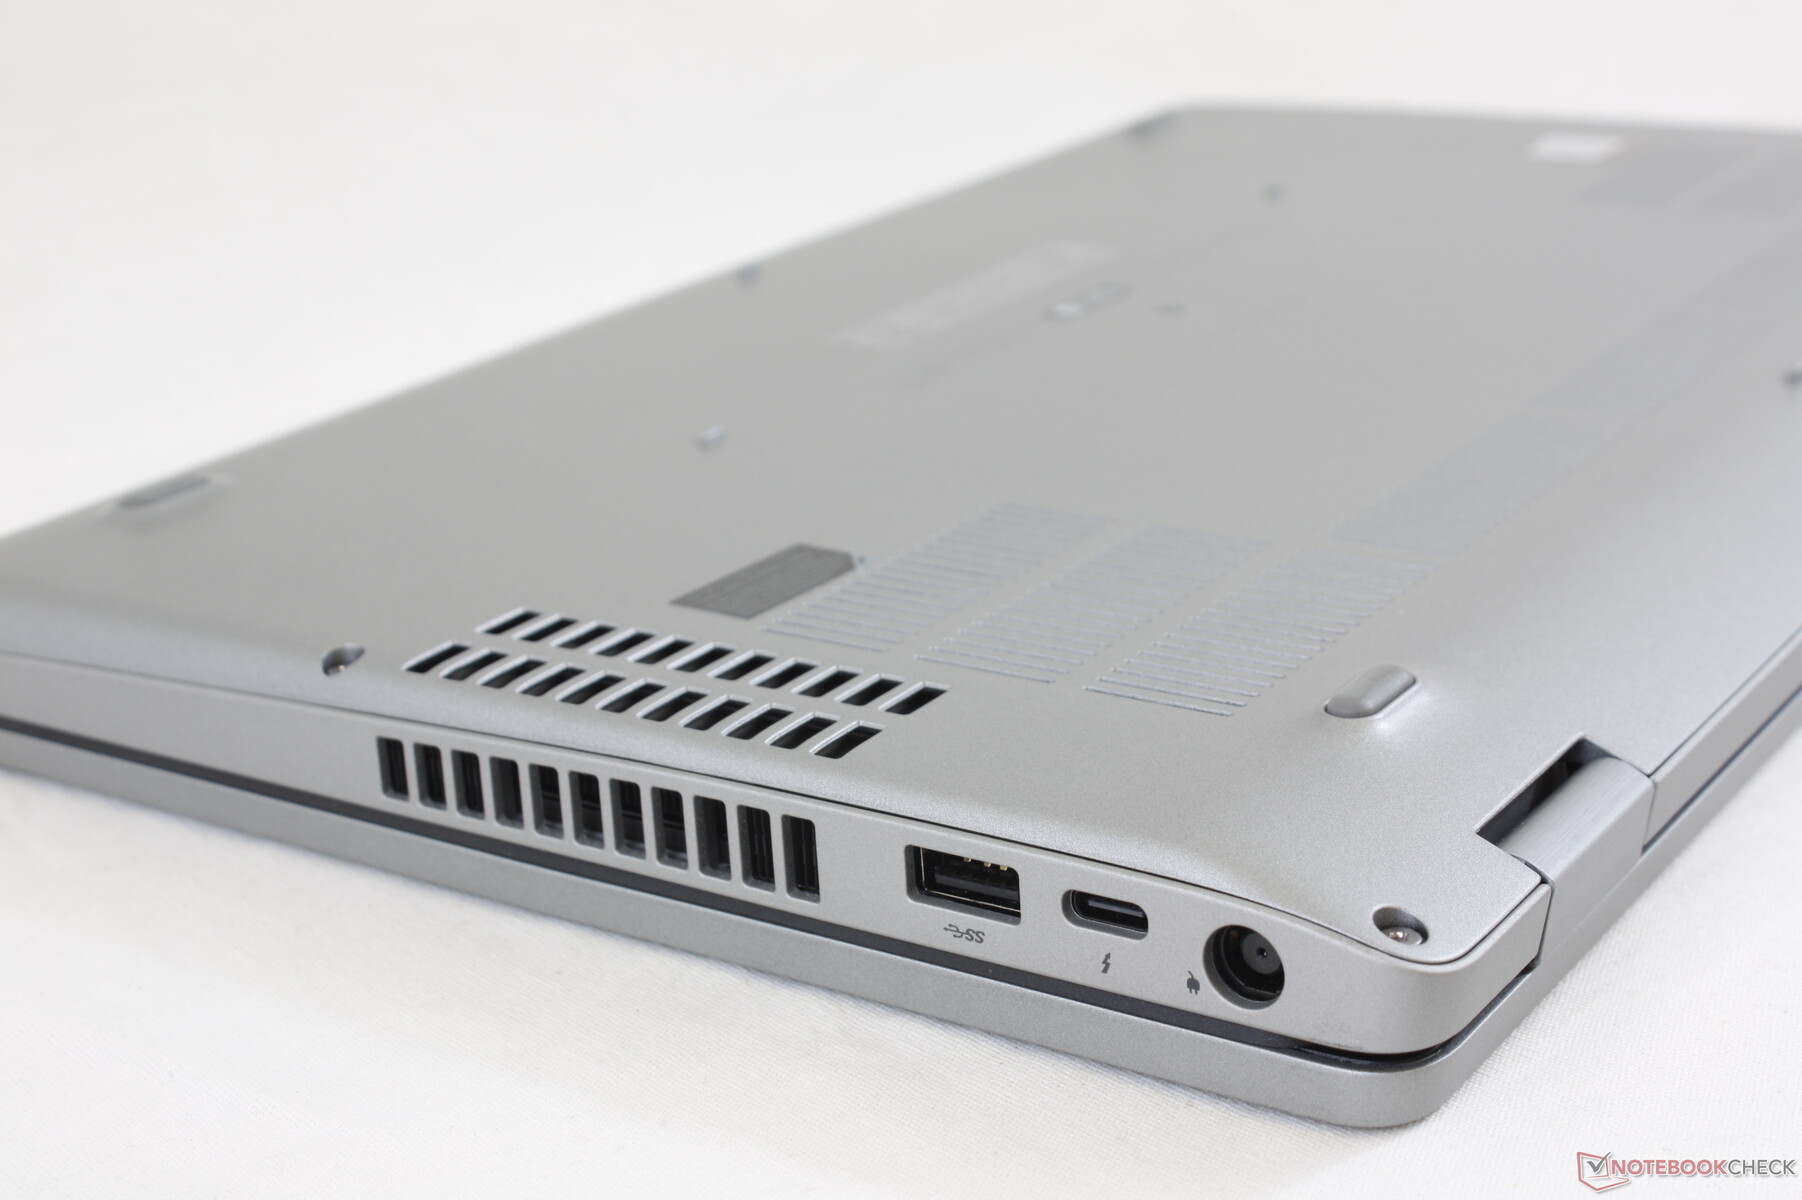
Conectividad
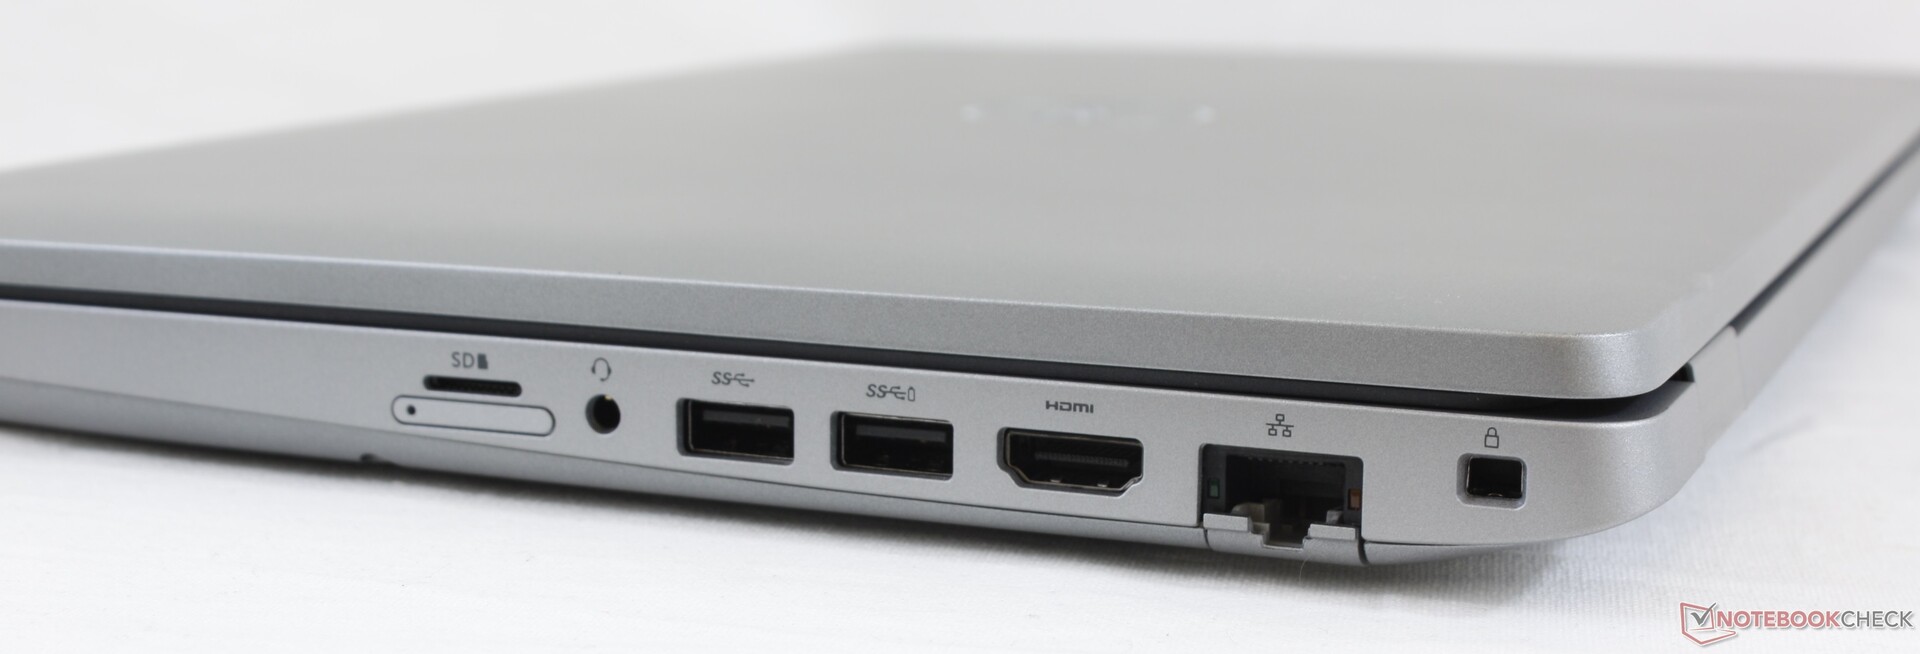
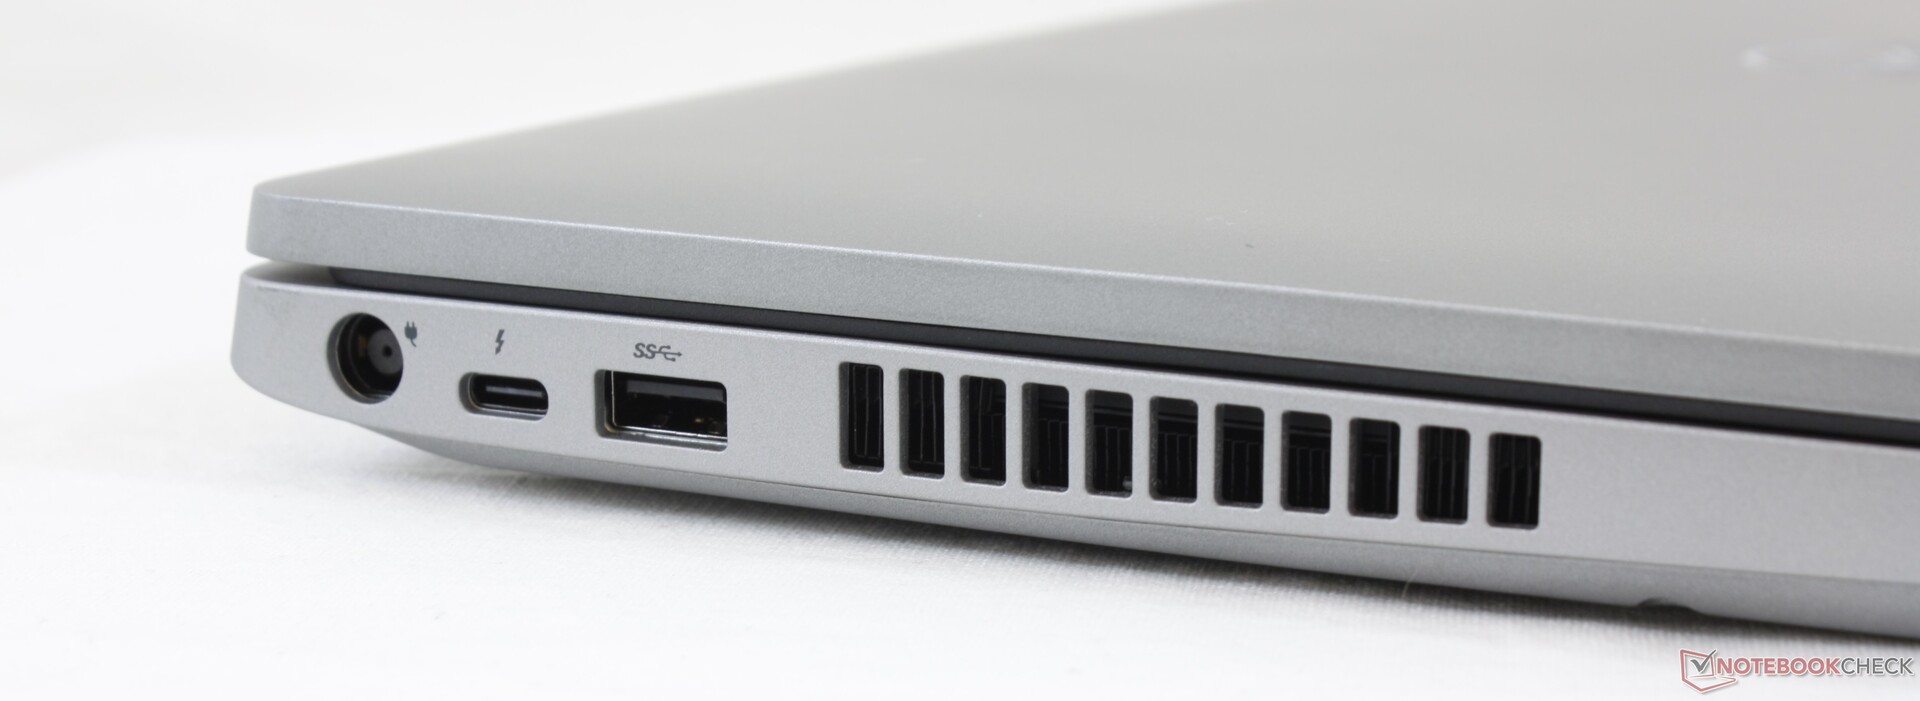
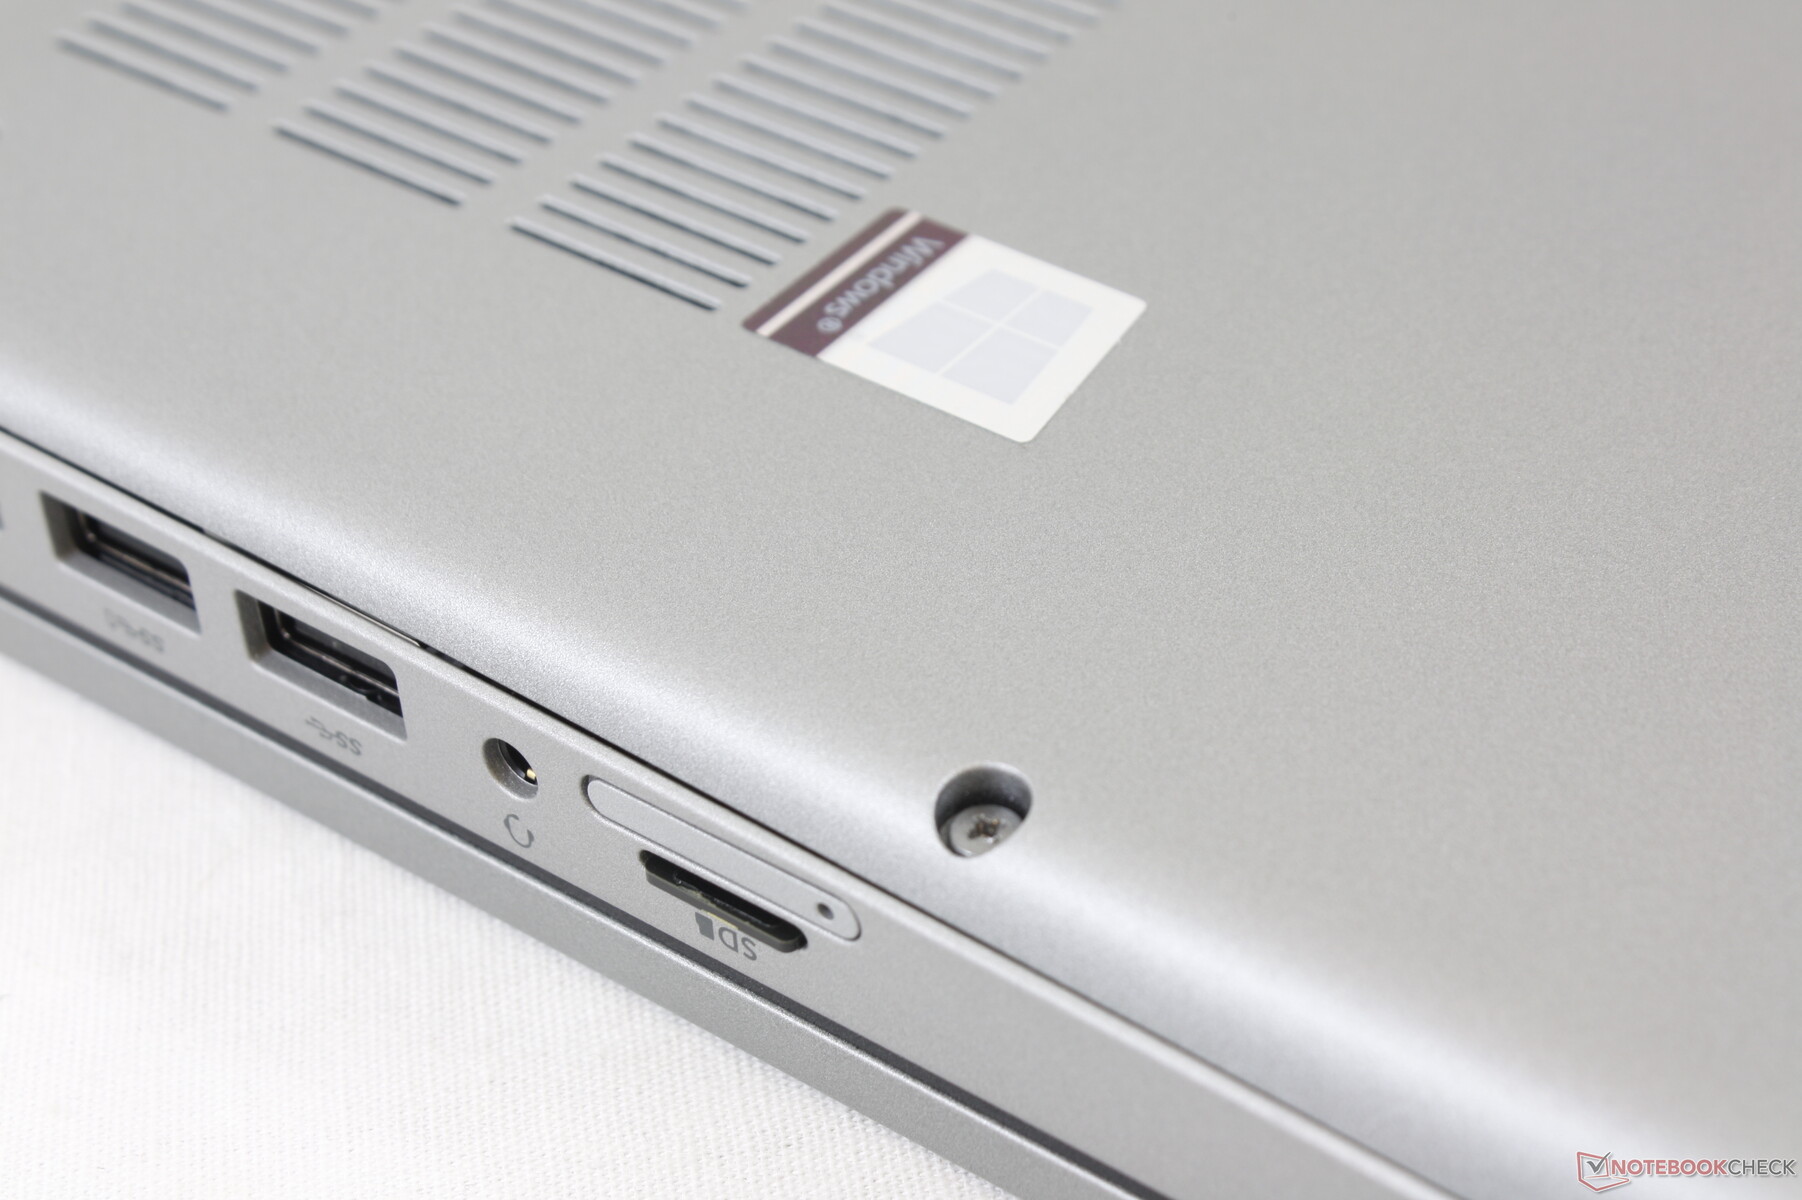
Lector de tarjetas SD
| SD Card Reader | |
| average JPG Copy Test (av. of 3 runs) | |
| Dell Precision 5550 P91F (Toshiba Exceria Pro SDXC 64 GB UHS-II) | |
| Dell Precision 3530 (Toshiba Exceria Pro SDXC 64 GB UHS-II) | |
| Dell Precision 3000 3551 (Toshiba Exceria Pro M501 64 GB UHS-II) | |
| Lenovo ThinkPad P53s-20N6001NGE (Toshiba Exceria Pro M501 64 GB UHS-II) | |
| maximum AS SSD Seq Read Test (1GB) | |
| Dell Precision 3530 (Toshiba Exceria Pro SDXC 64 GB UHS-II) | |
| Dell Precision 5550 P91F (Toshiba Exceria Pro SDXC 64 GB UHS-II) | |
| Dell Precision 3000 3551 (Toshiba Exceria Pro M501 64 GB UHS-II) | |
| Lenovo ThinkPad P53s-20N6001NGE (Toshiba Exceria Pro M501 64 GB UHS-II) | |
Comunicación
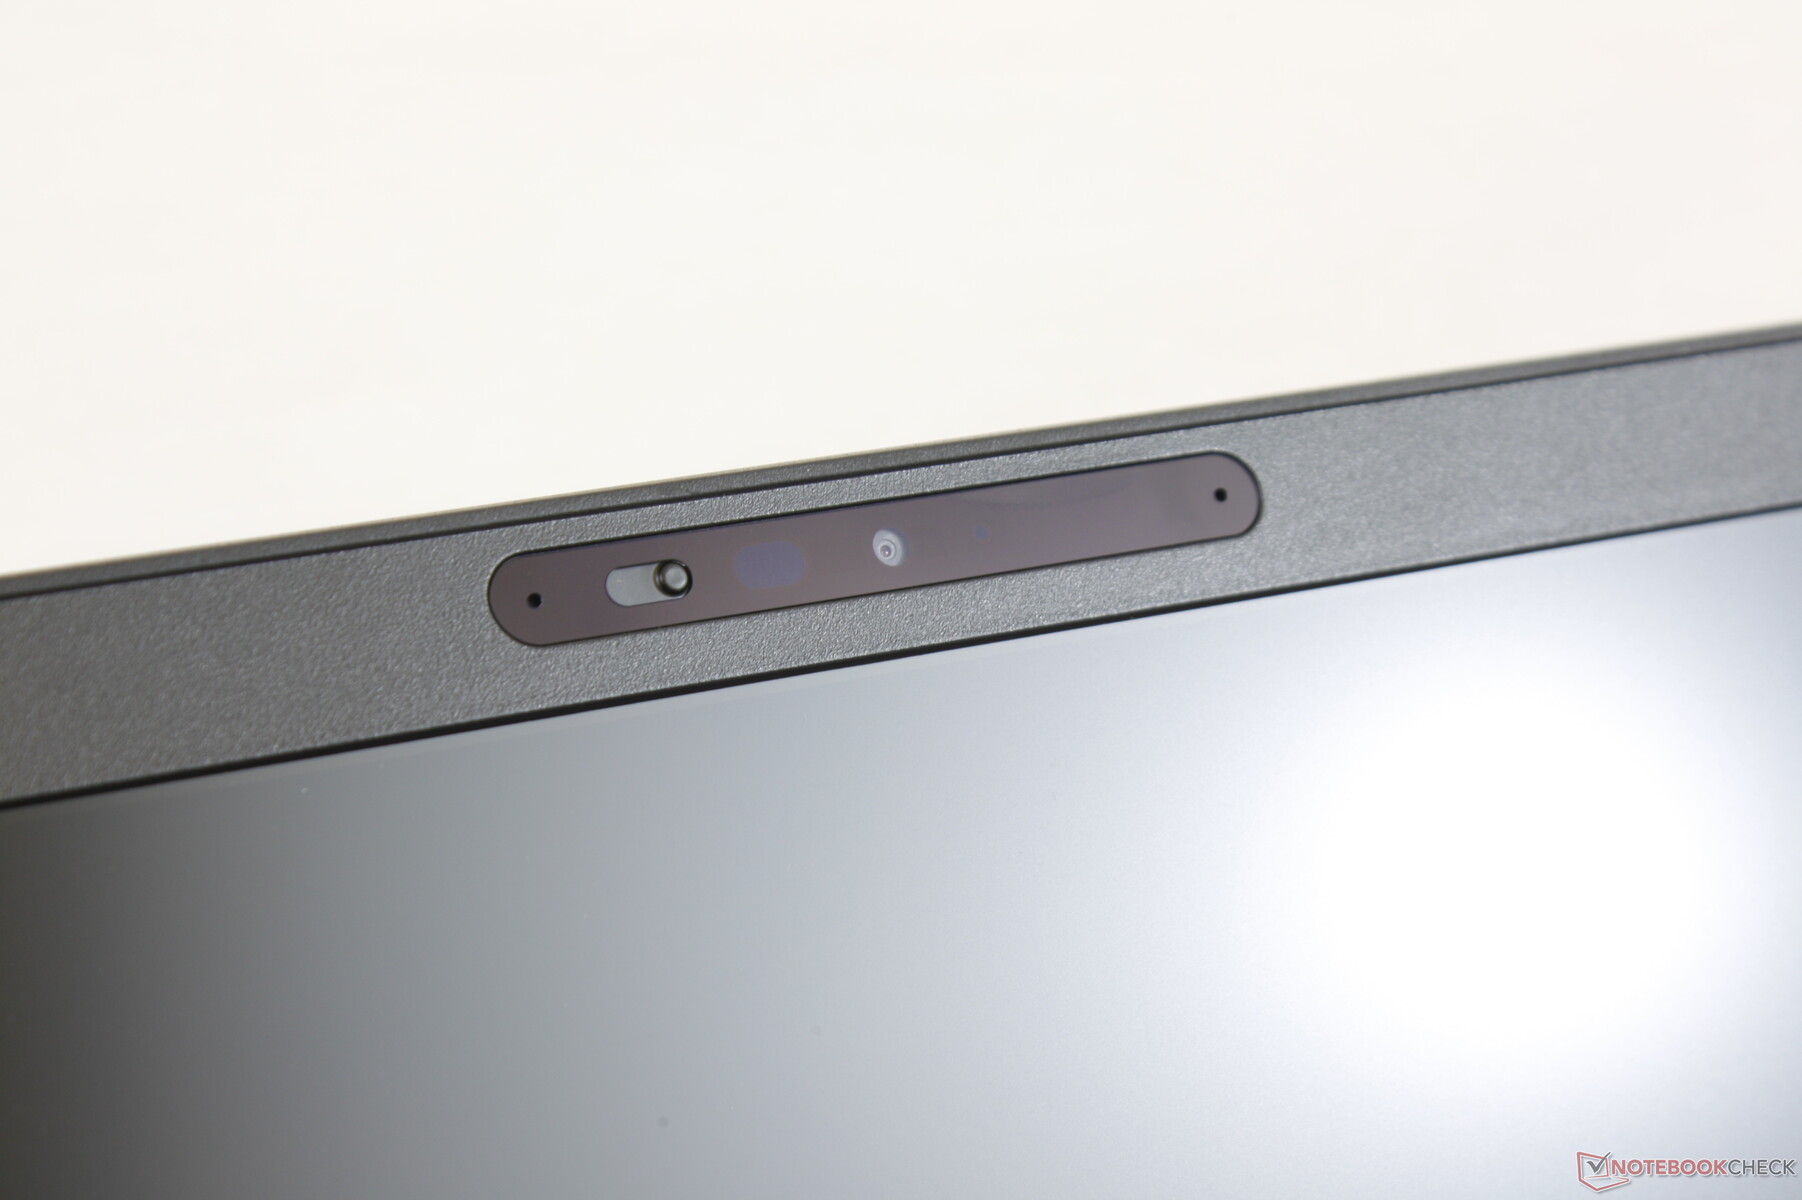
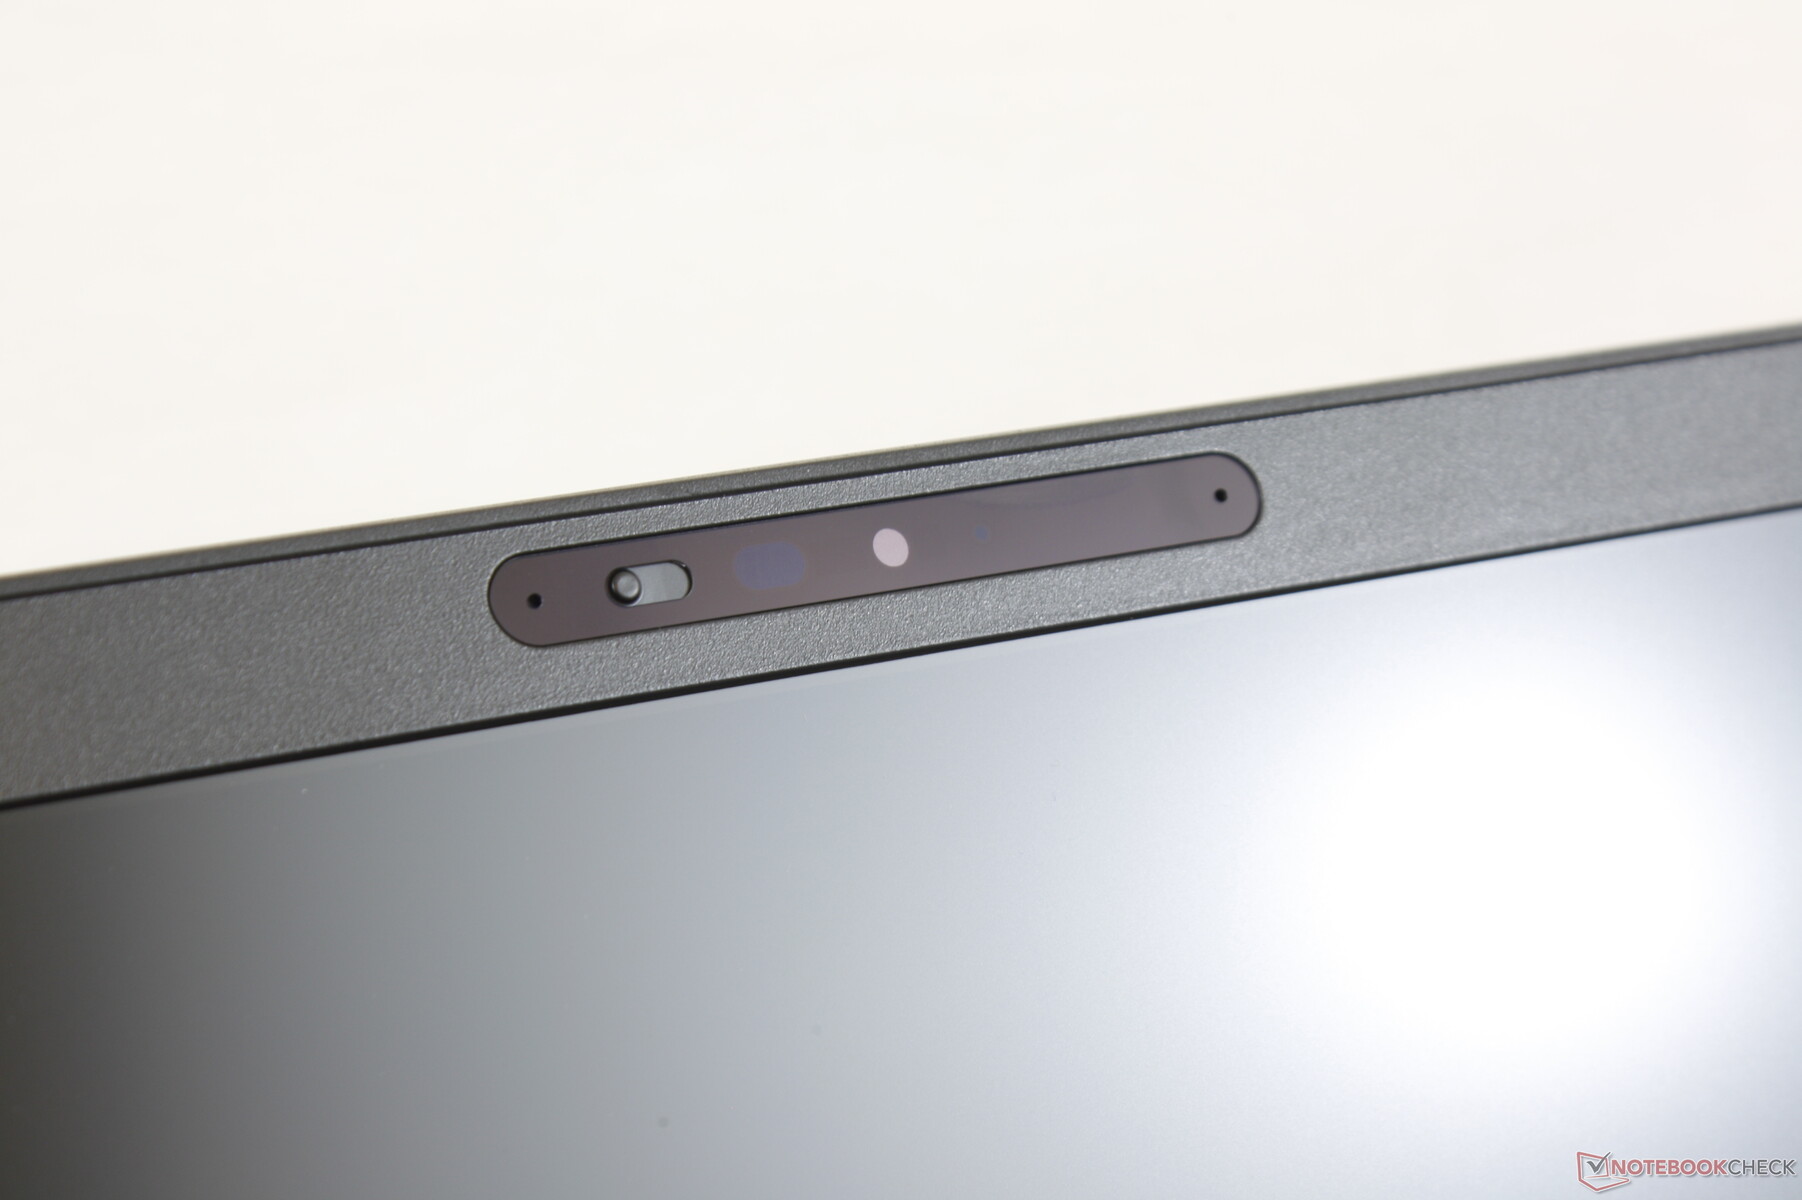
Webcam


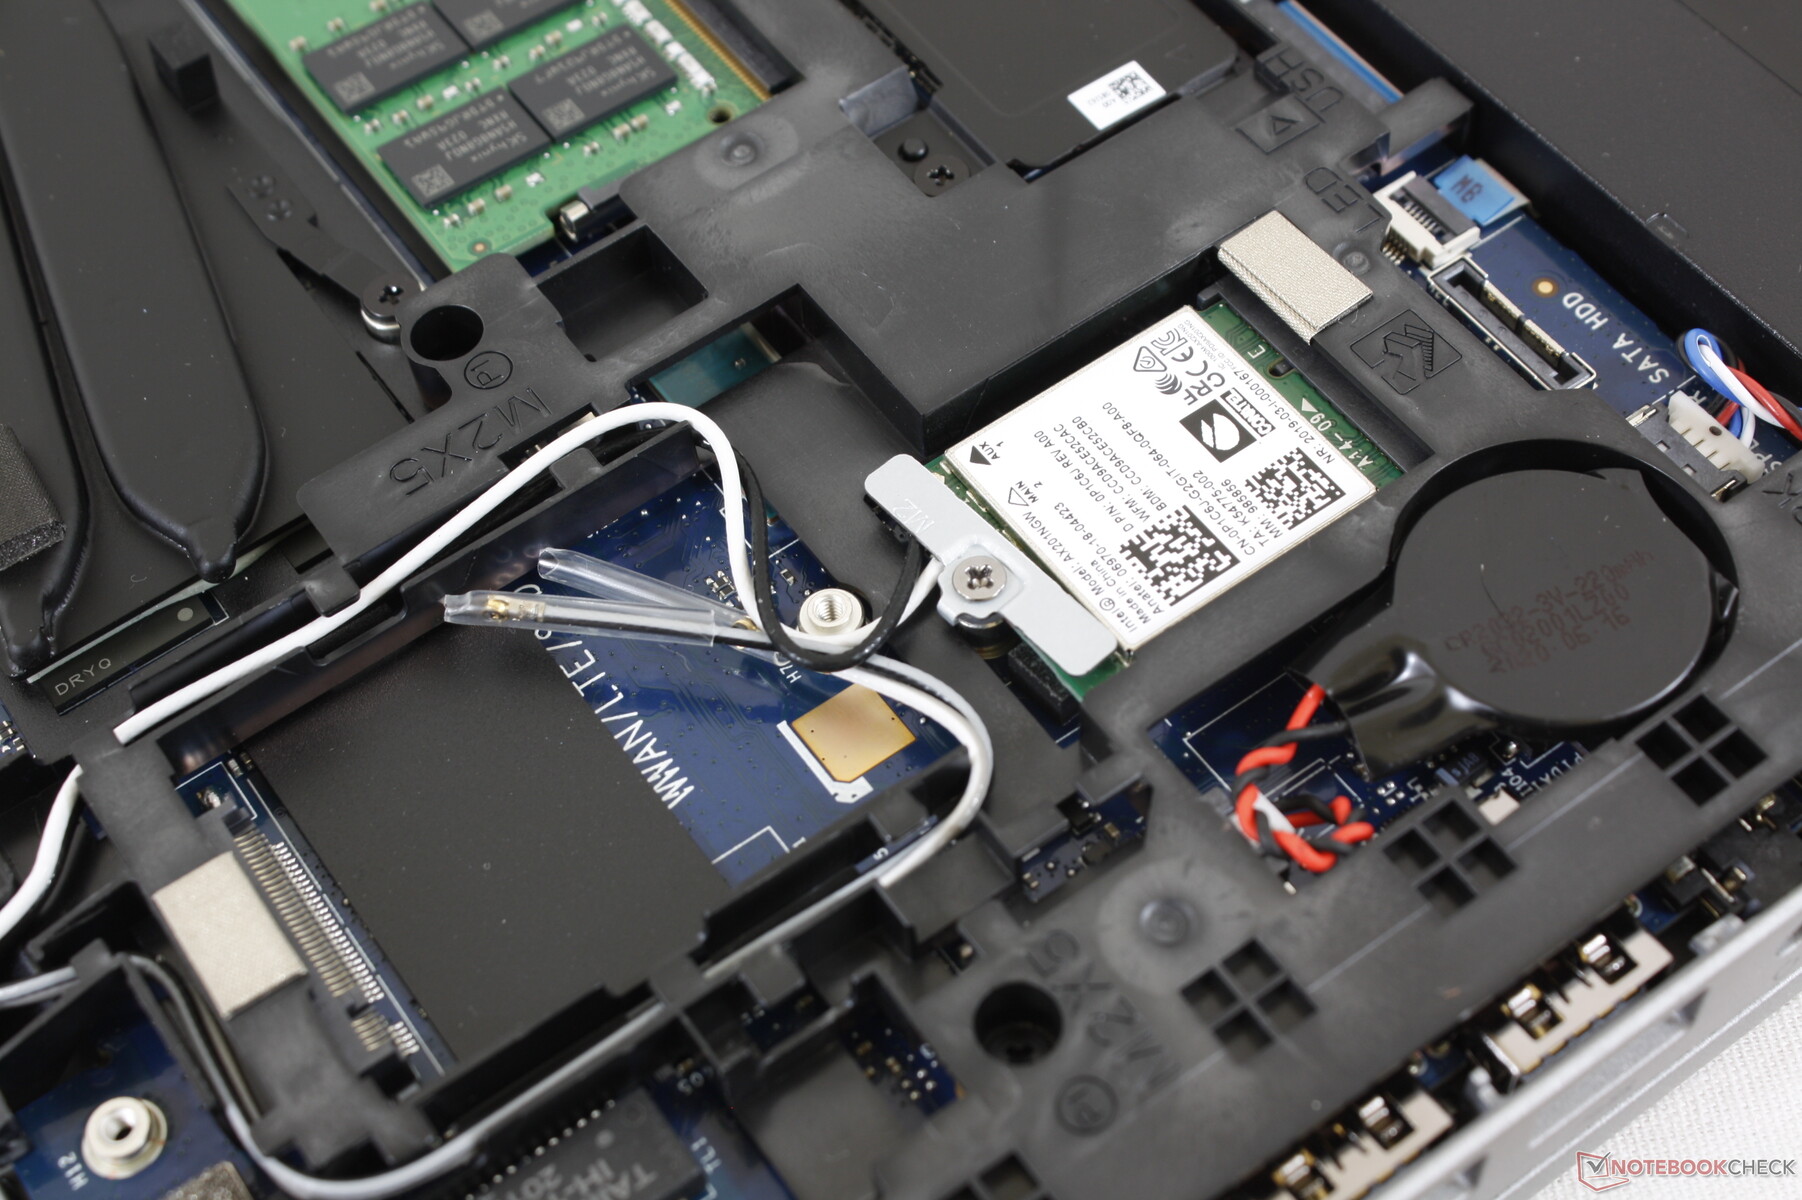
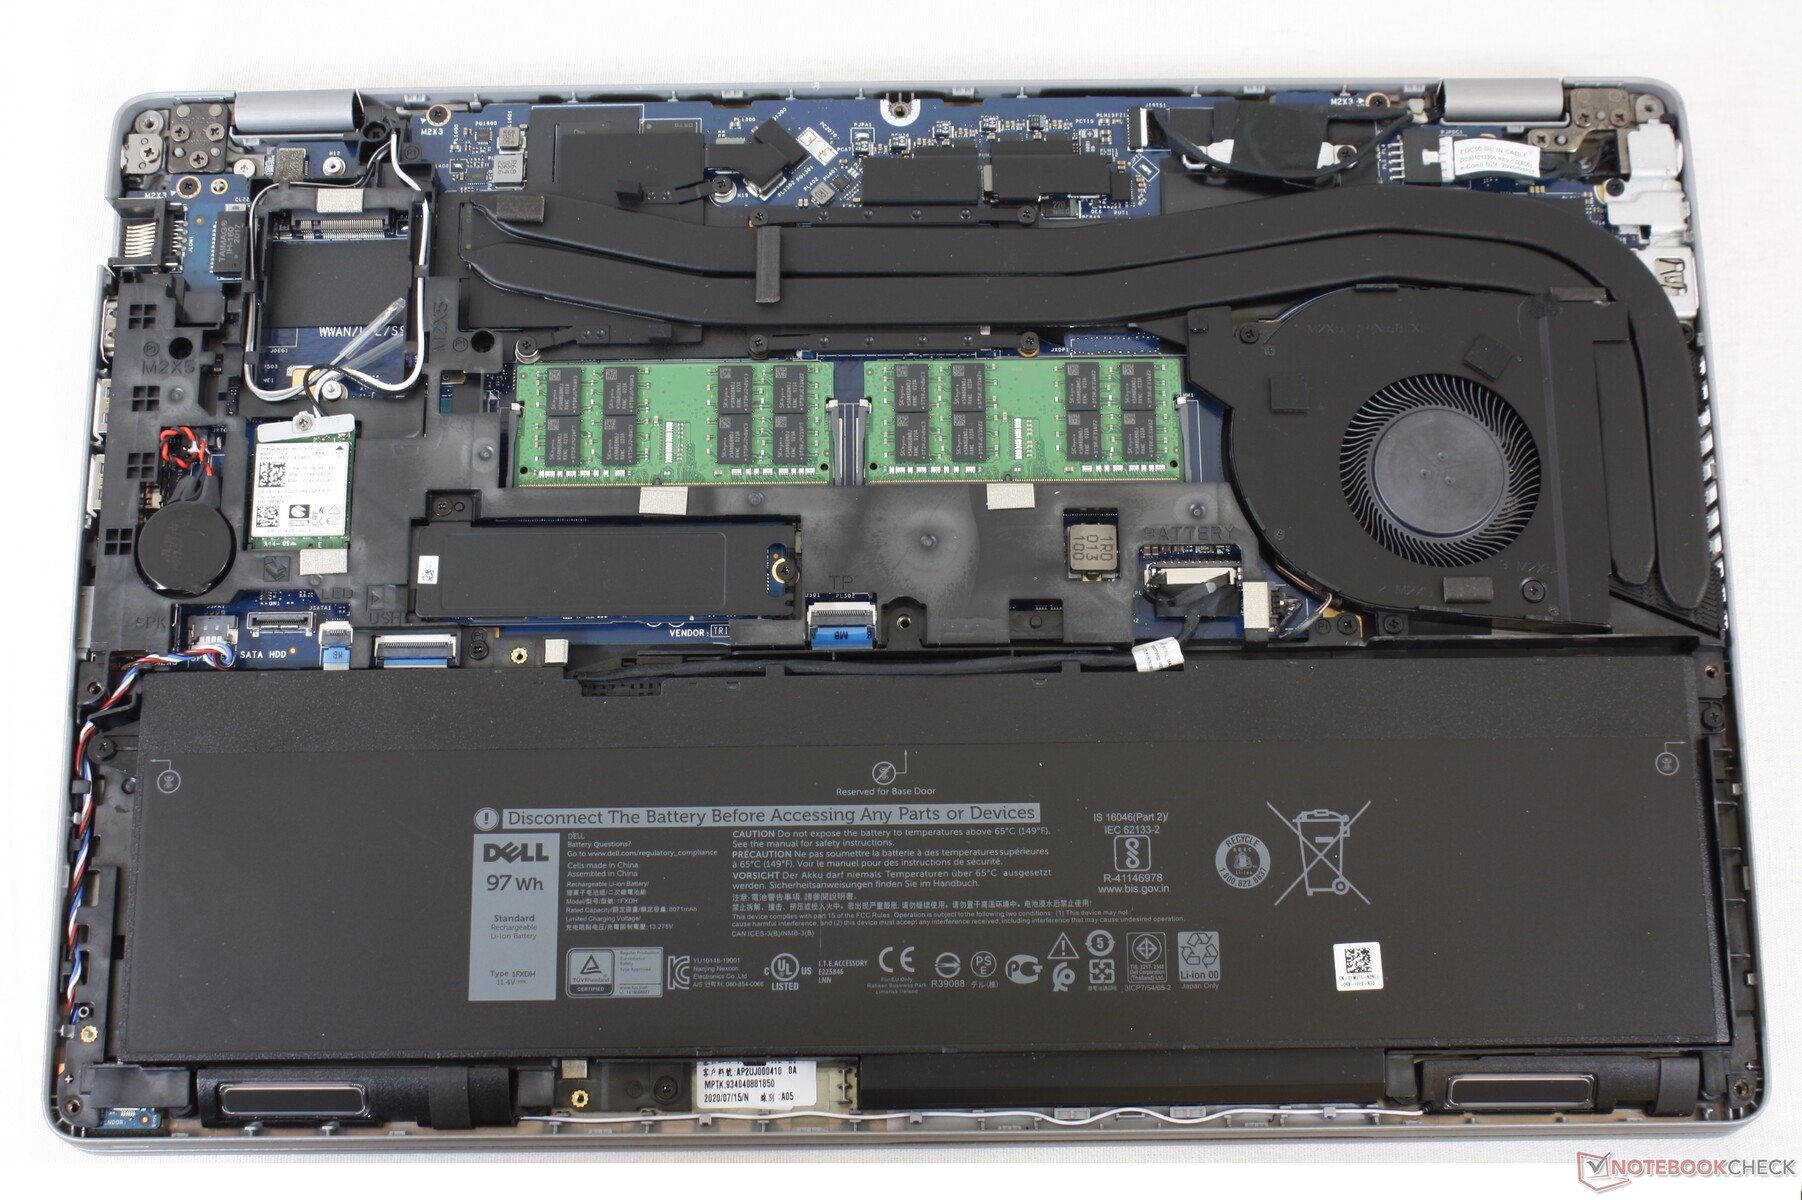
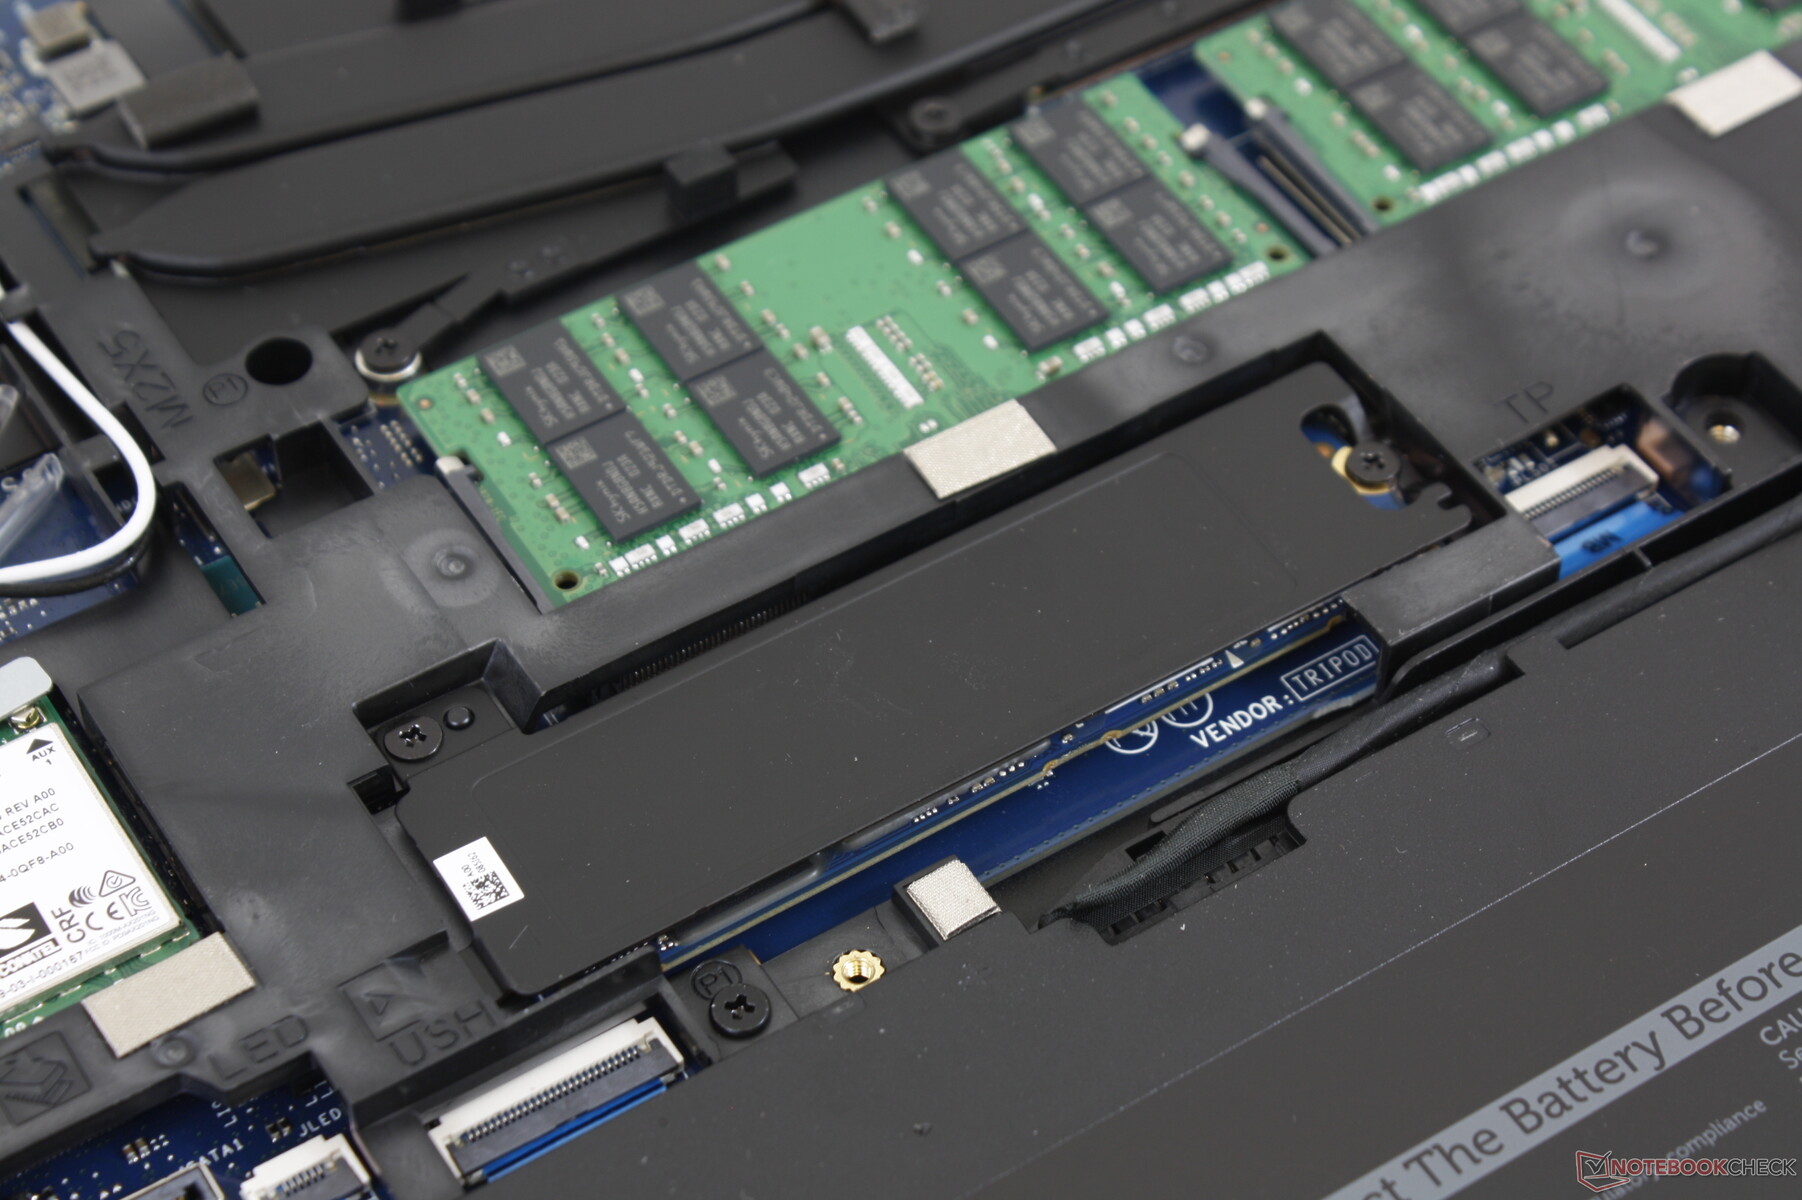
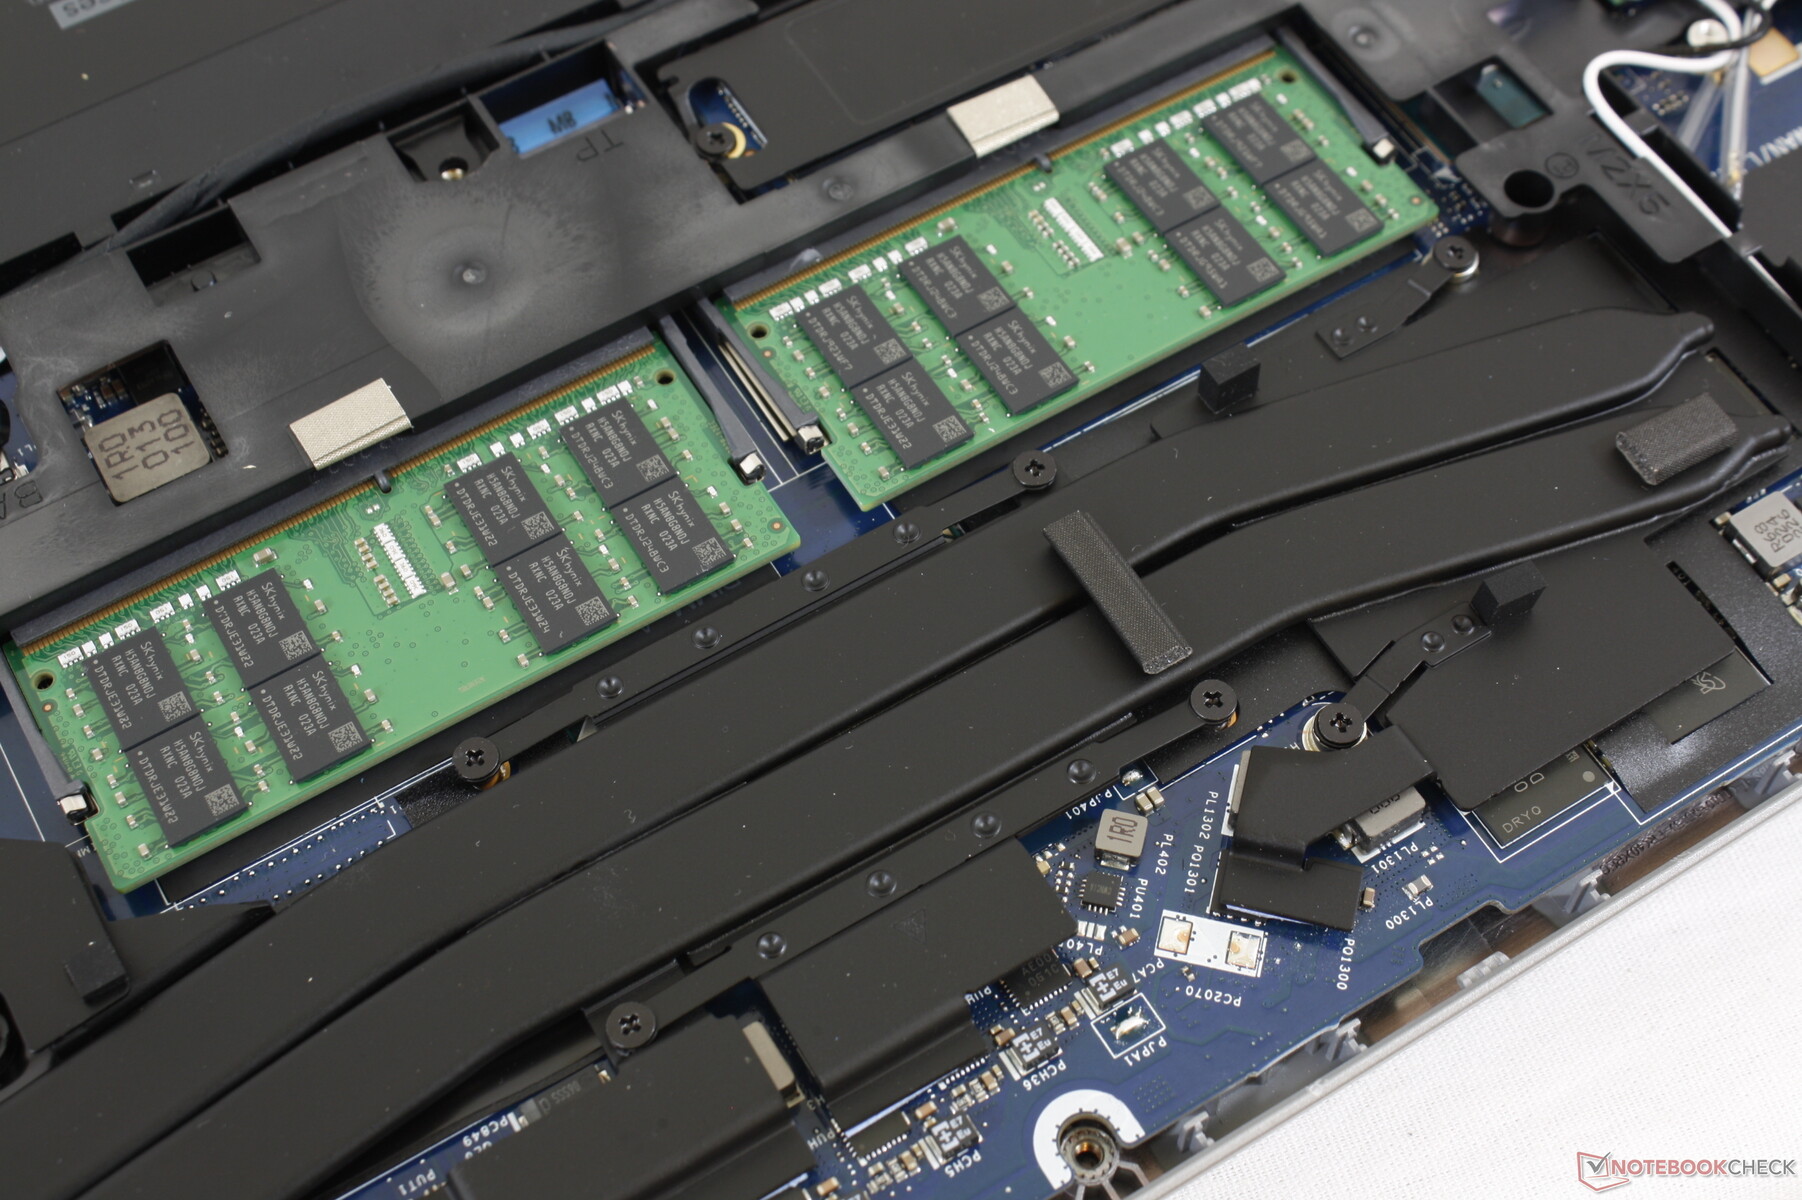
Mantenimiento
Accesorios y garantía
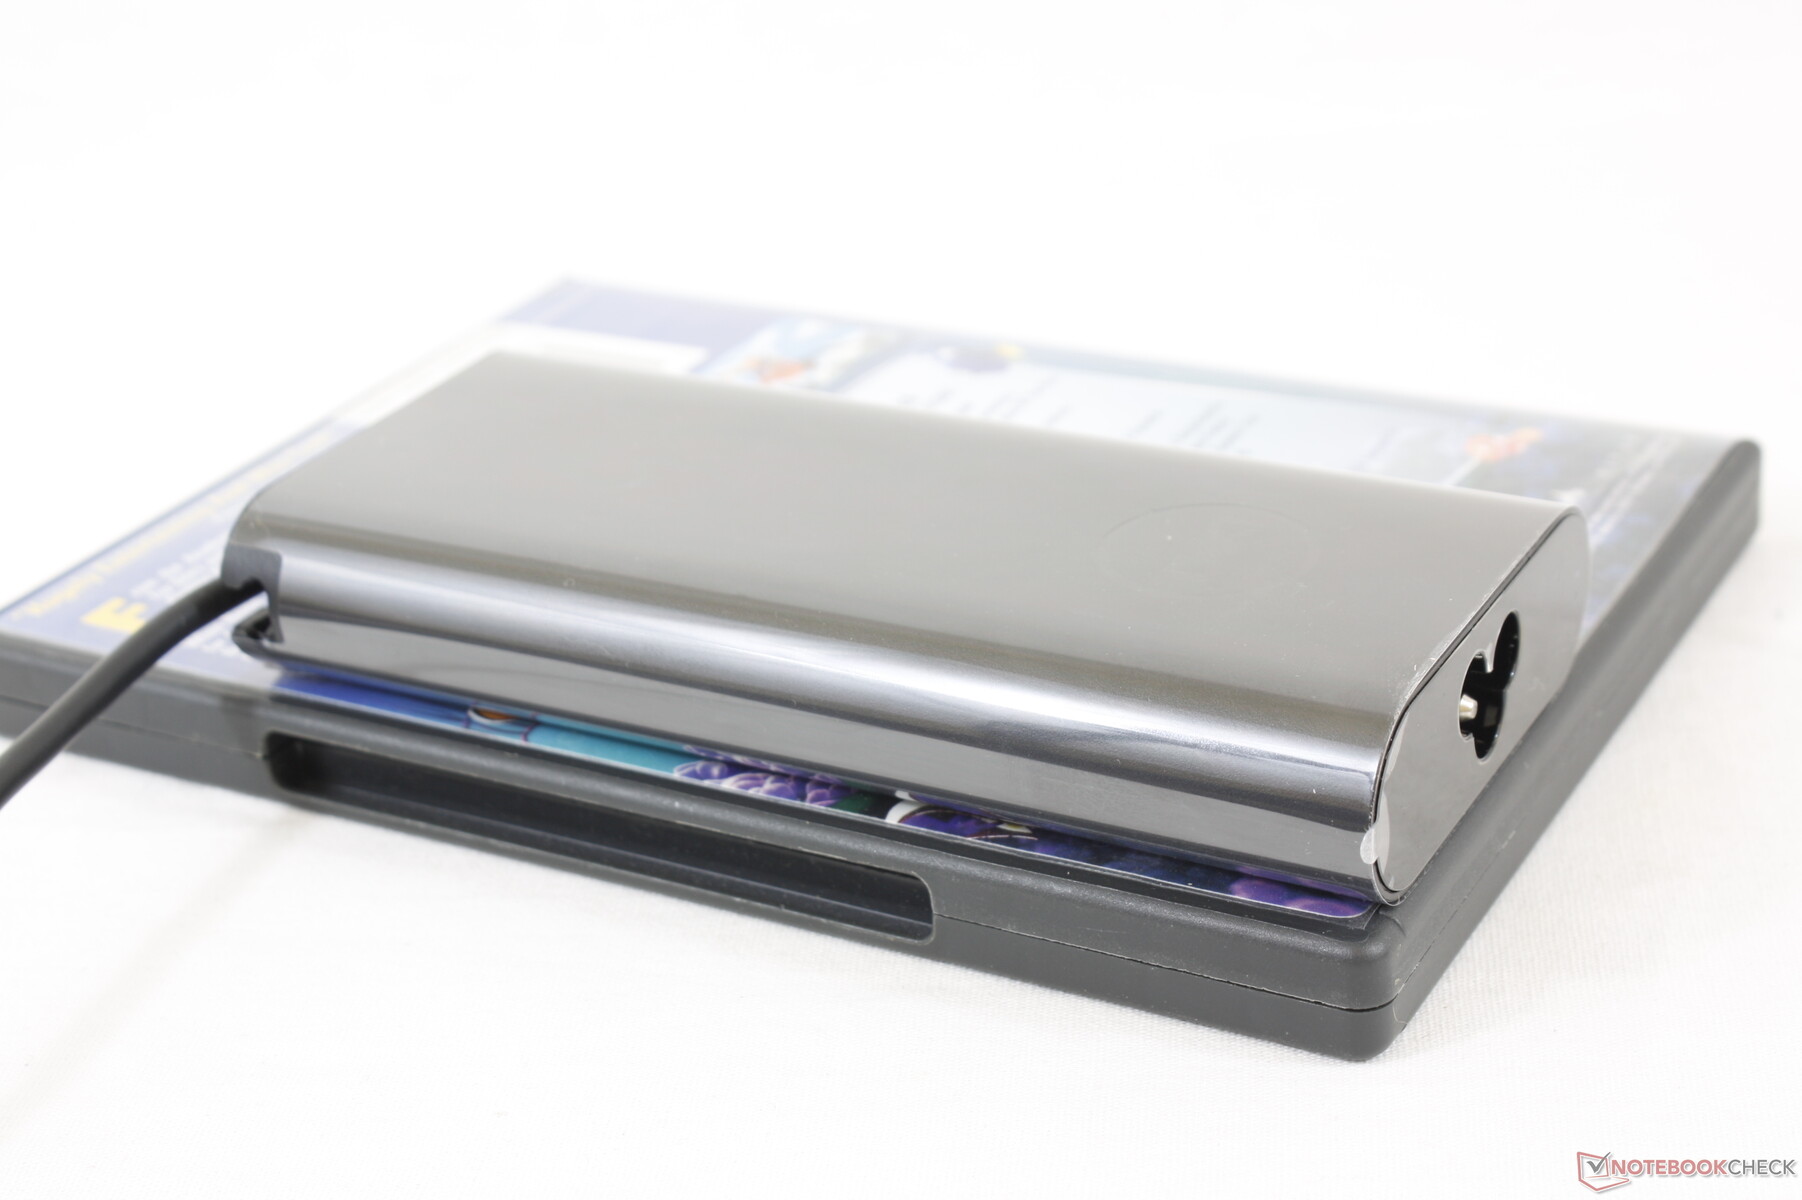
No hay más accesorios en la caja que el adaptador de CA y el papeleo. Los usuarios pueden elegir entre un USB-C o el cargador de barril si lo compran directamente a Dell.
La garantía limitada estándar es de sólo un año, en comparación con los tres años de la serie Precision 7000. Esta es definitivamente una medida de ahorro de costos ya que la serie Precision 3000 está dirigida a usuarios con presupuesto limitado.
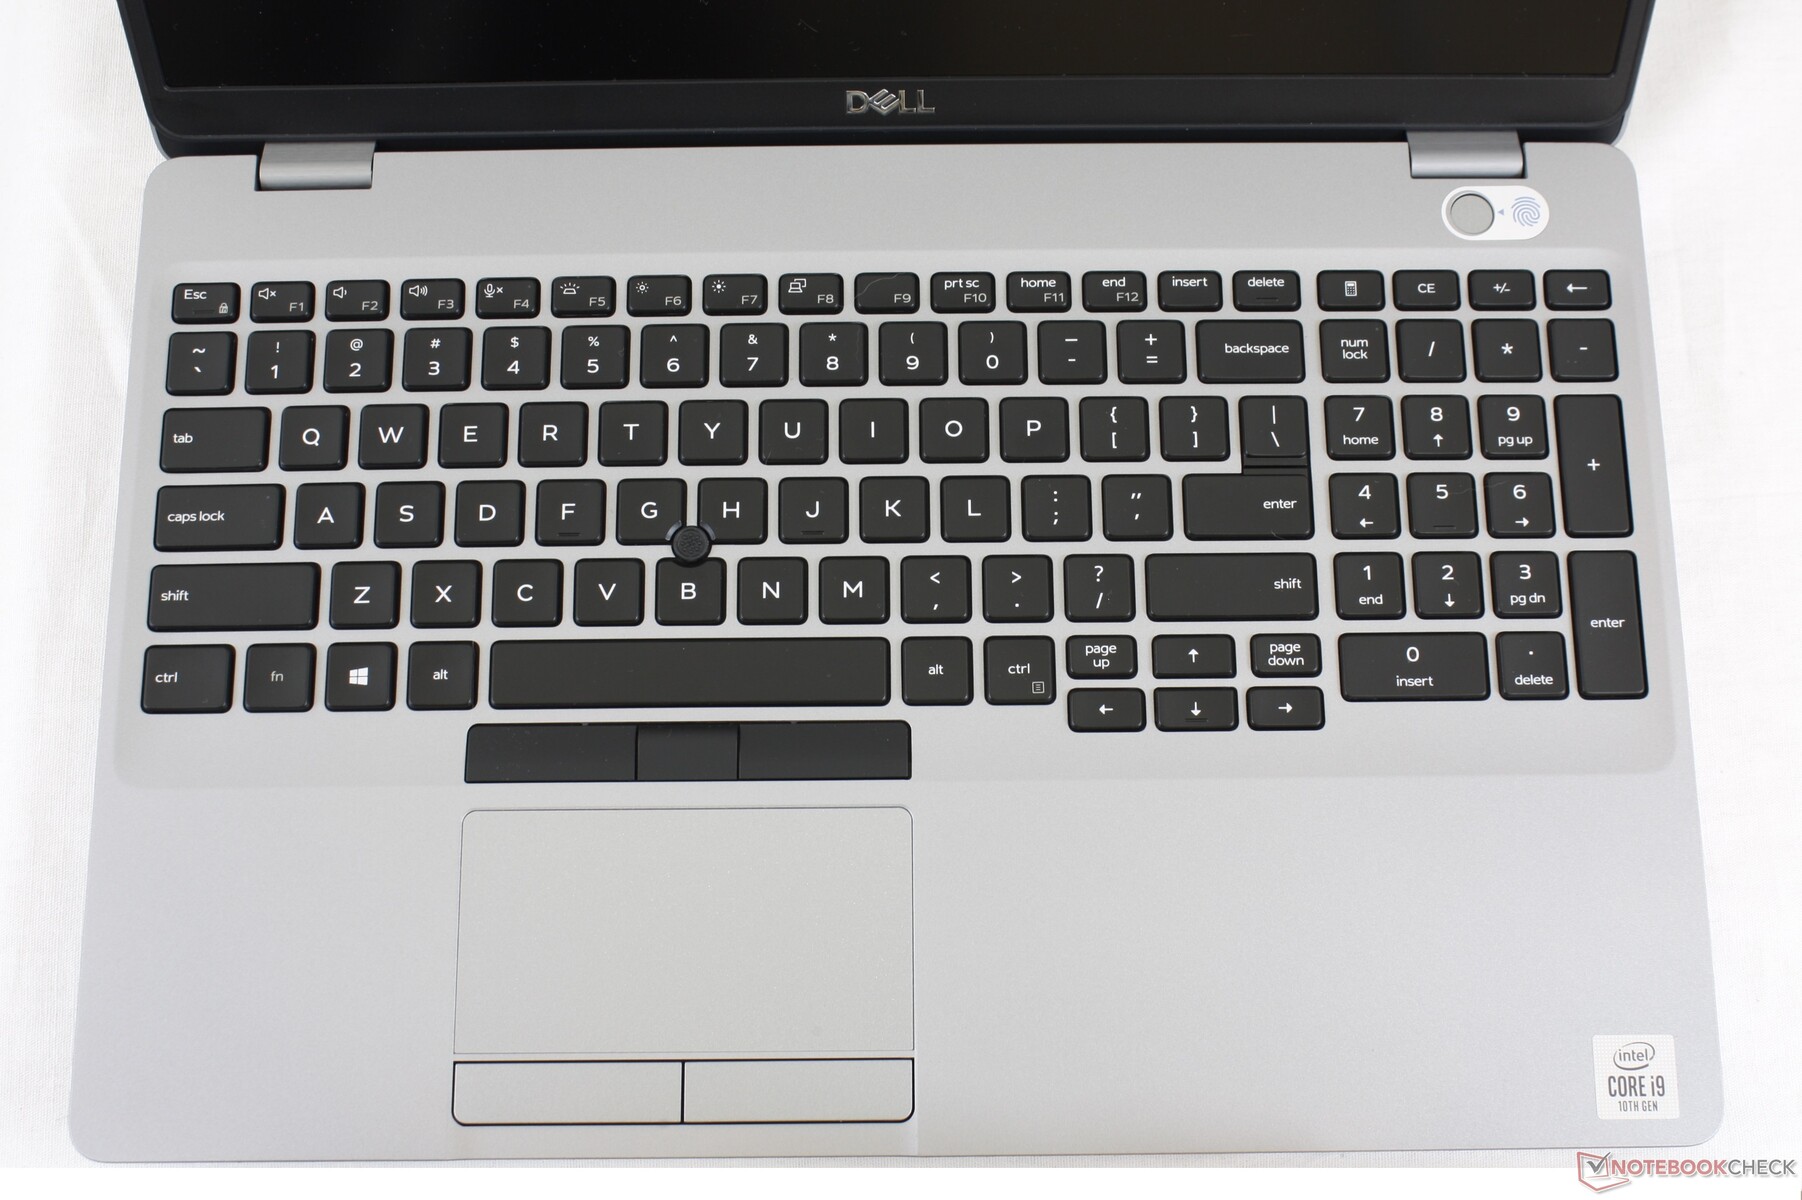
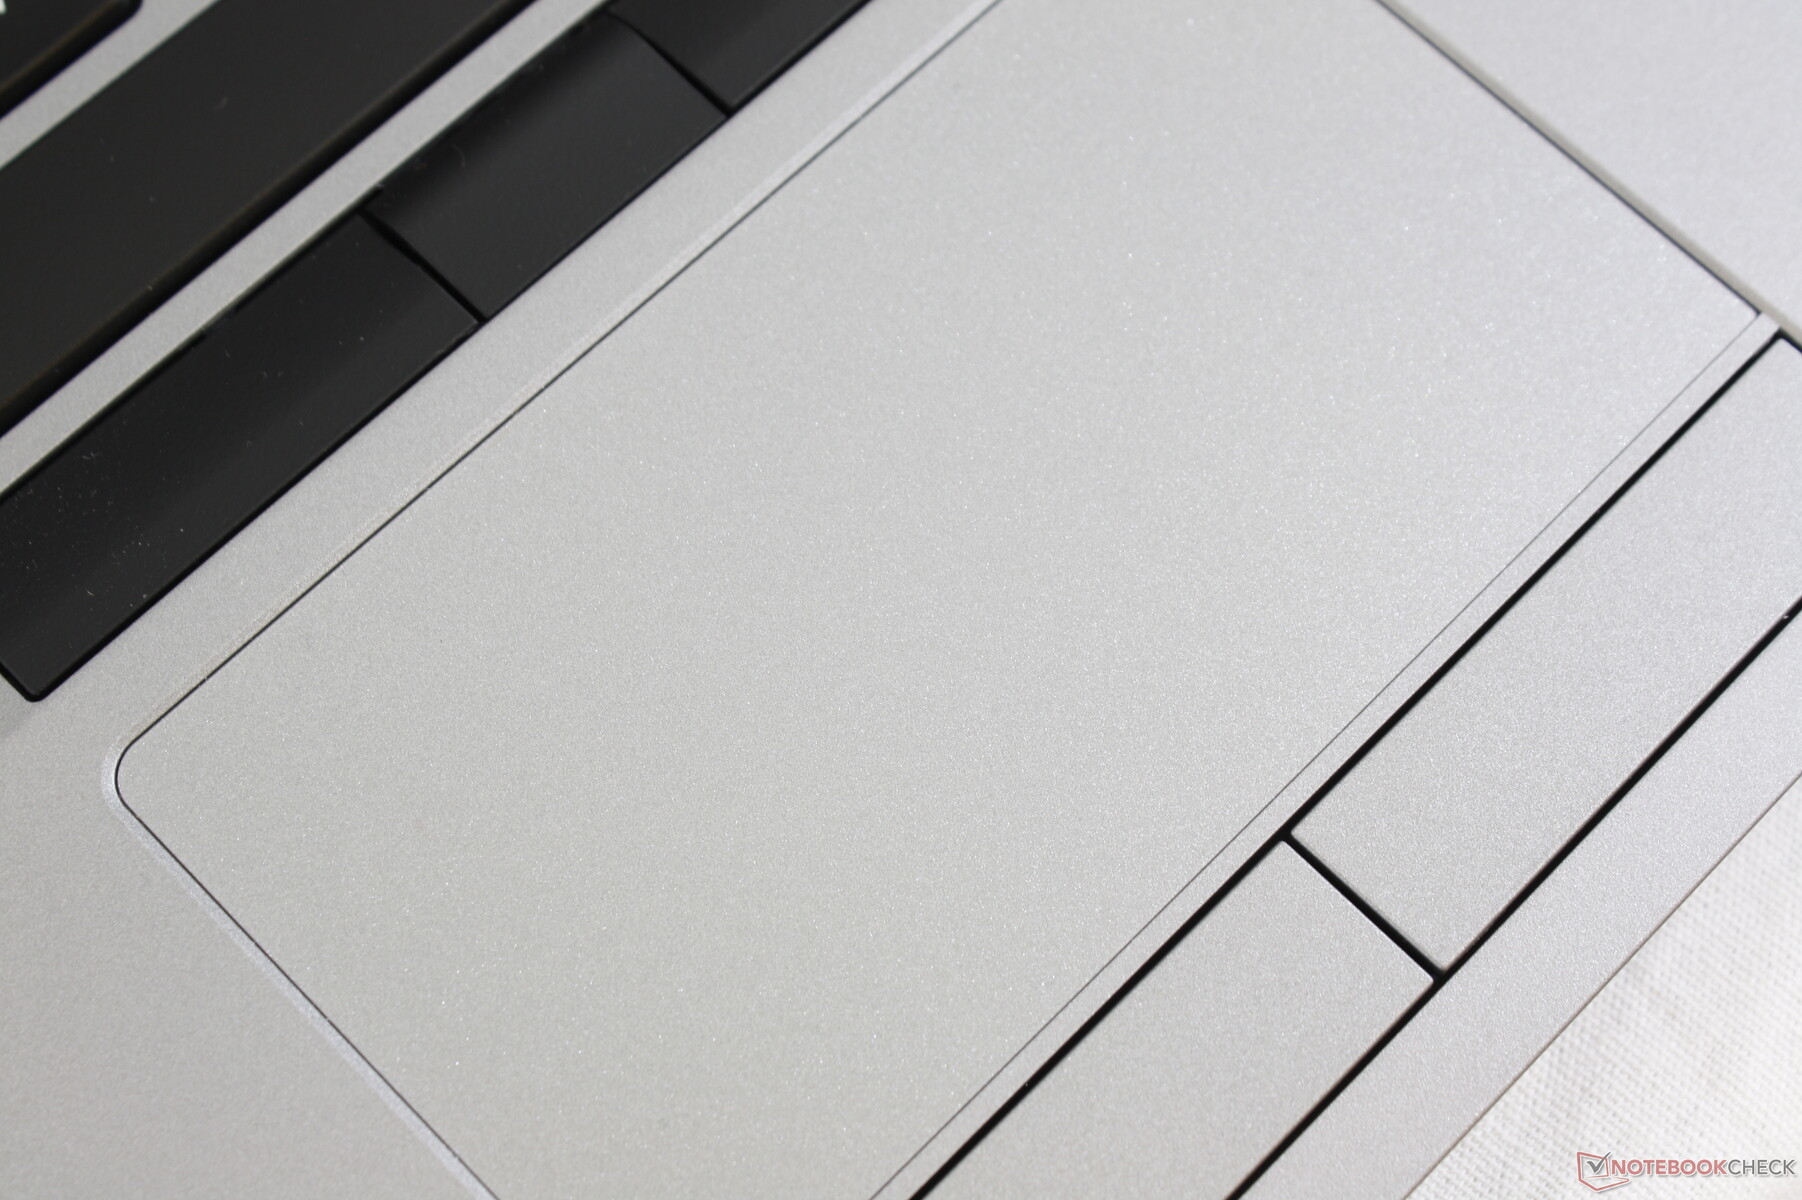
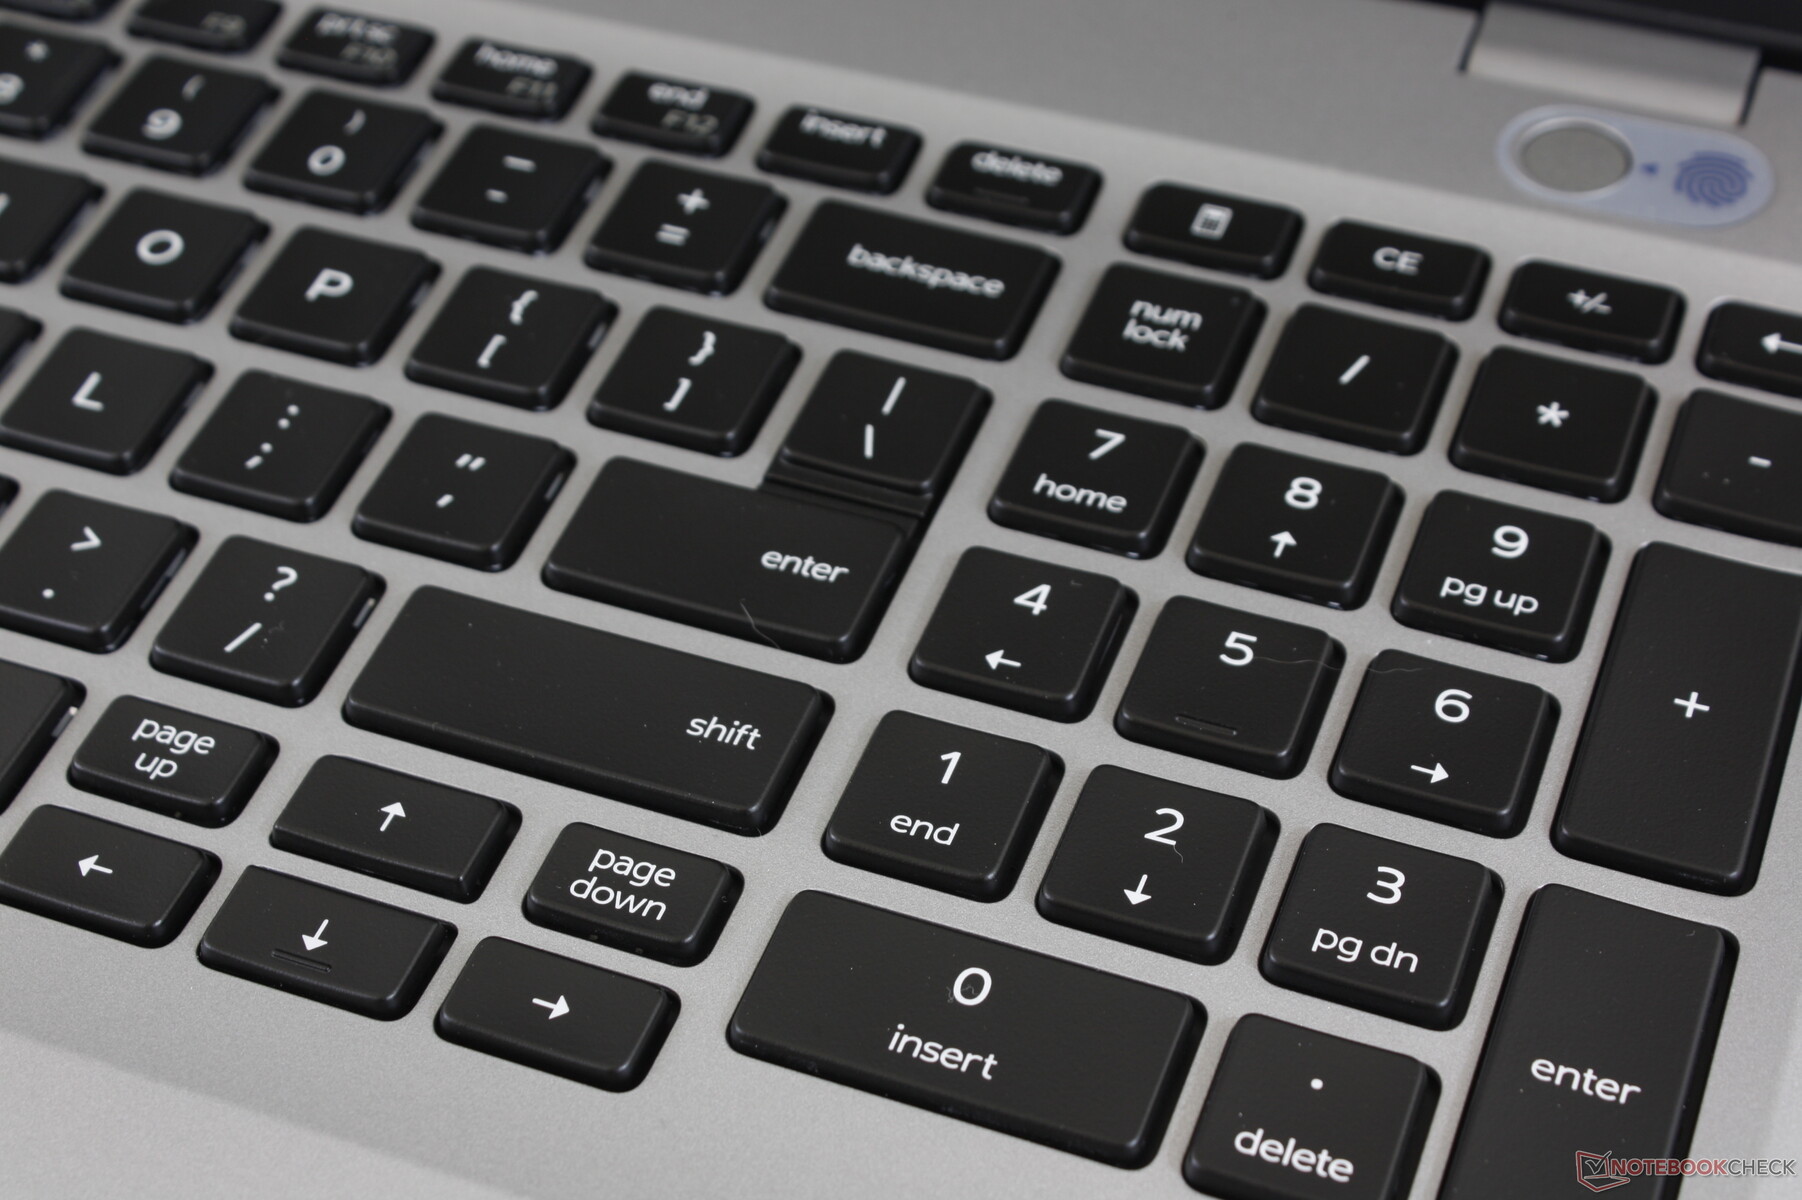
Dispositivos de entrada

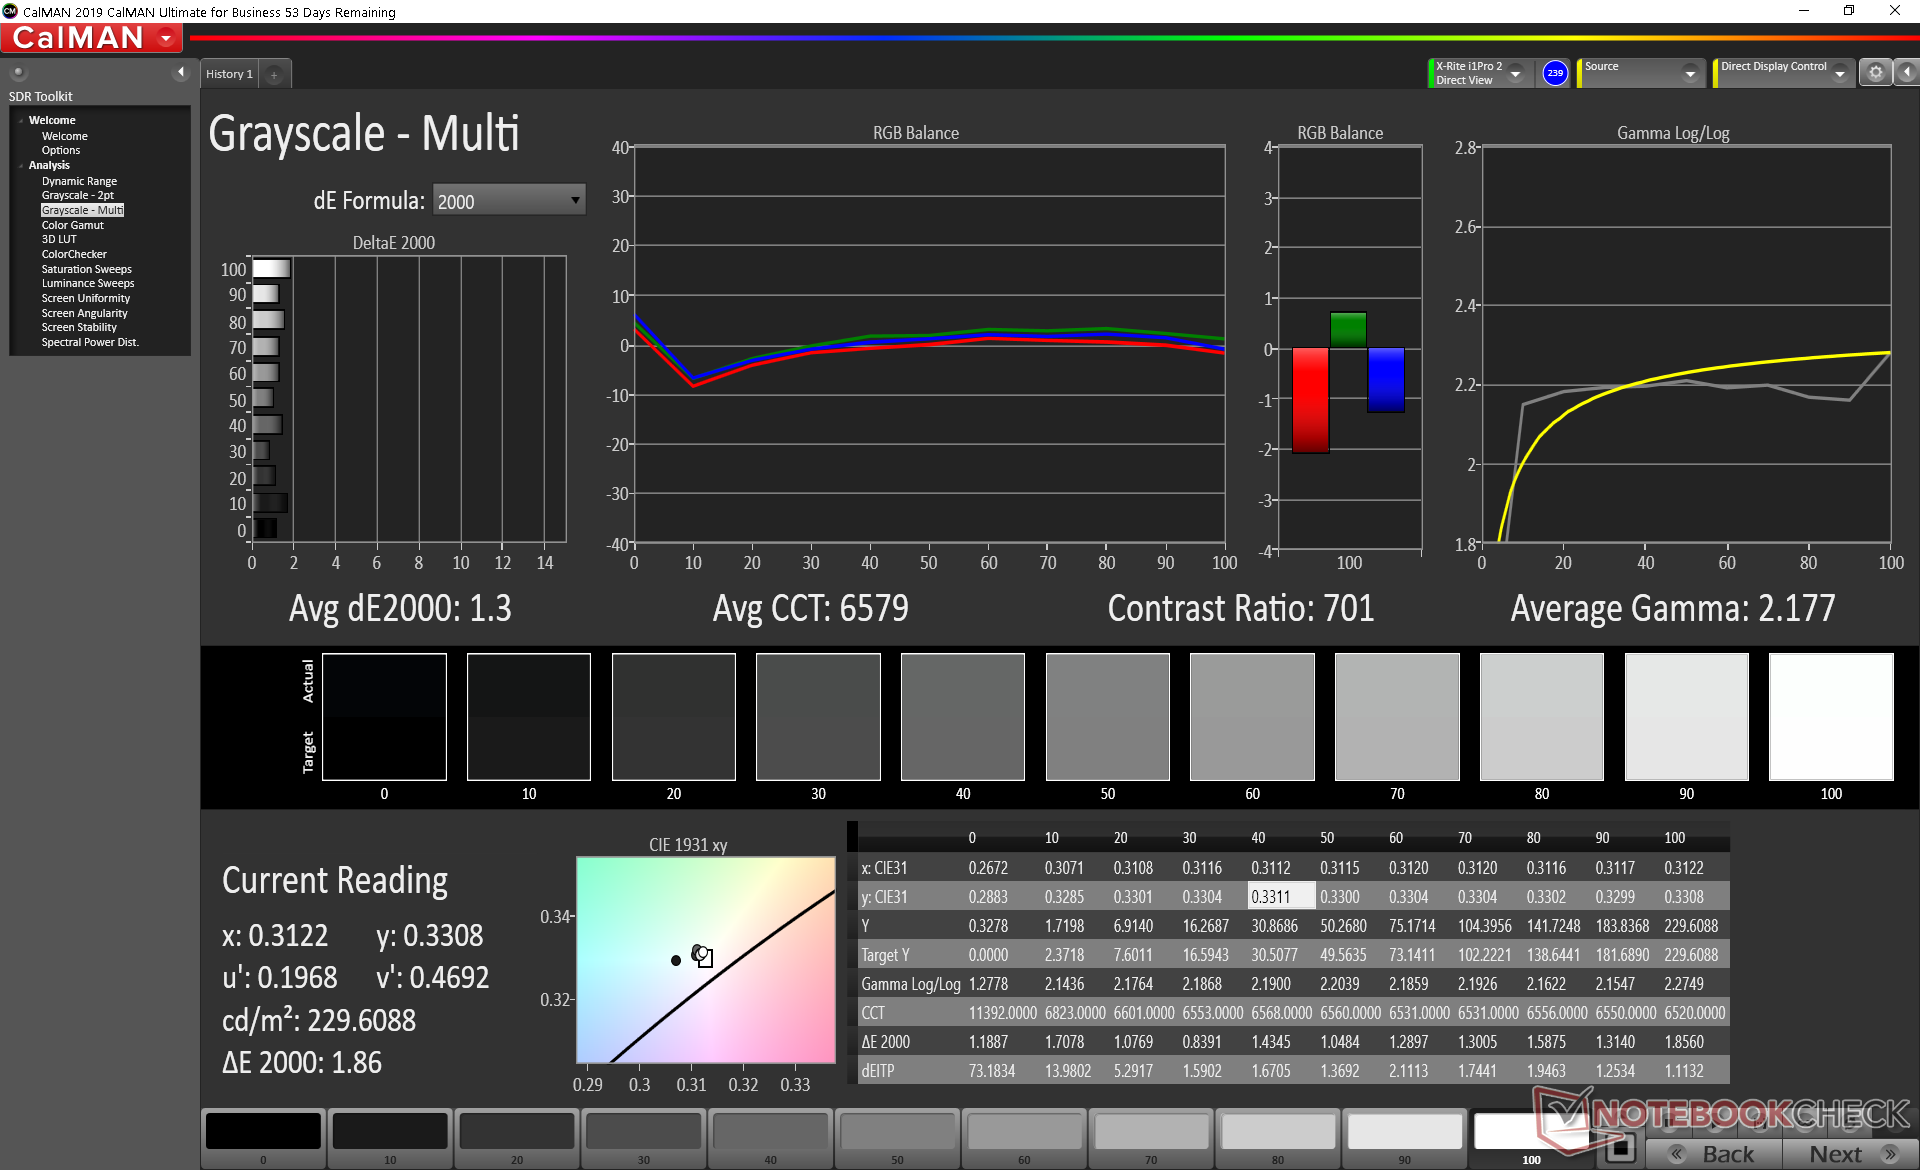
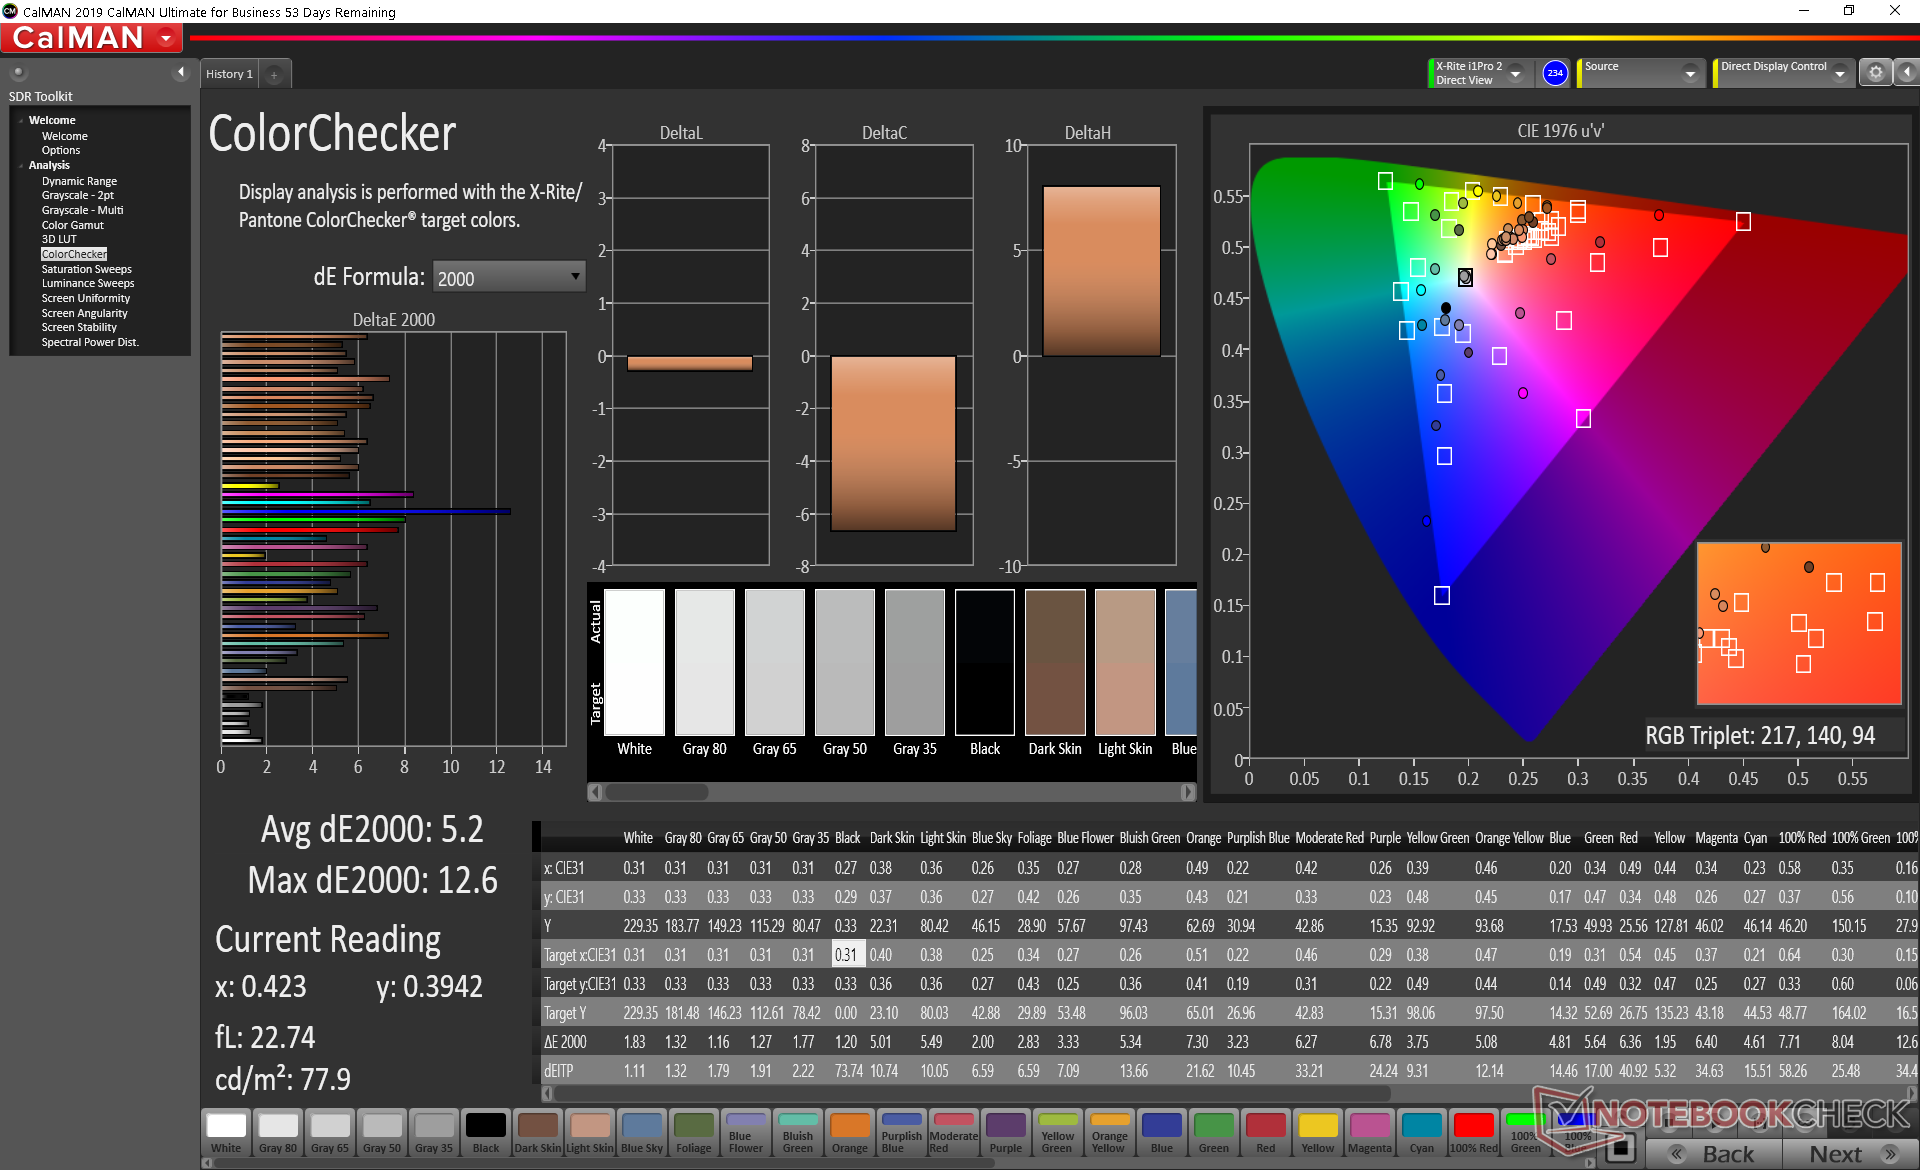
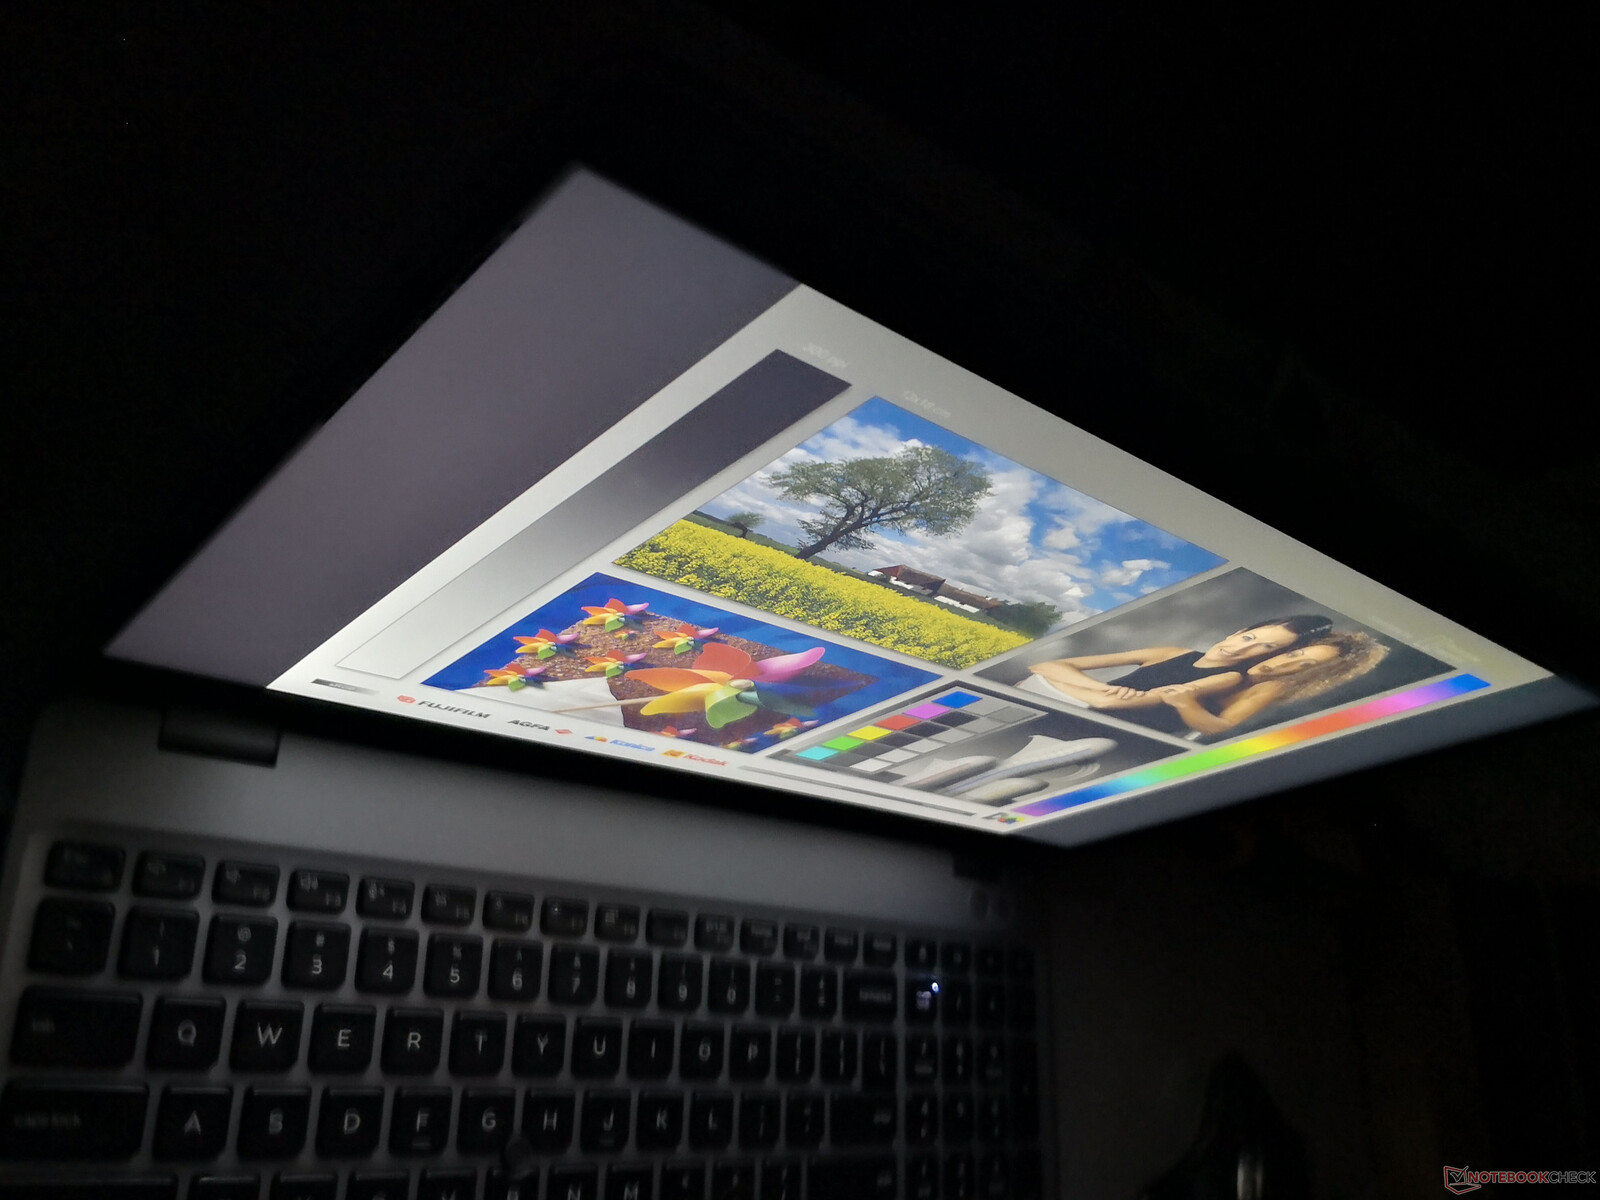
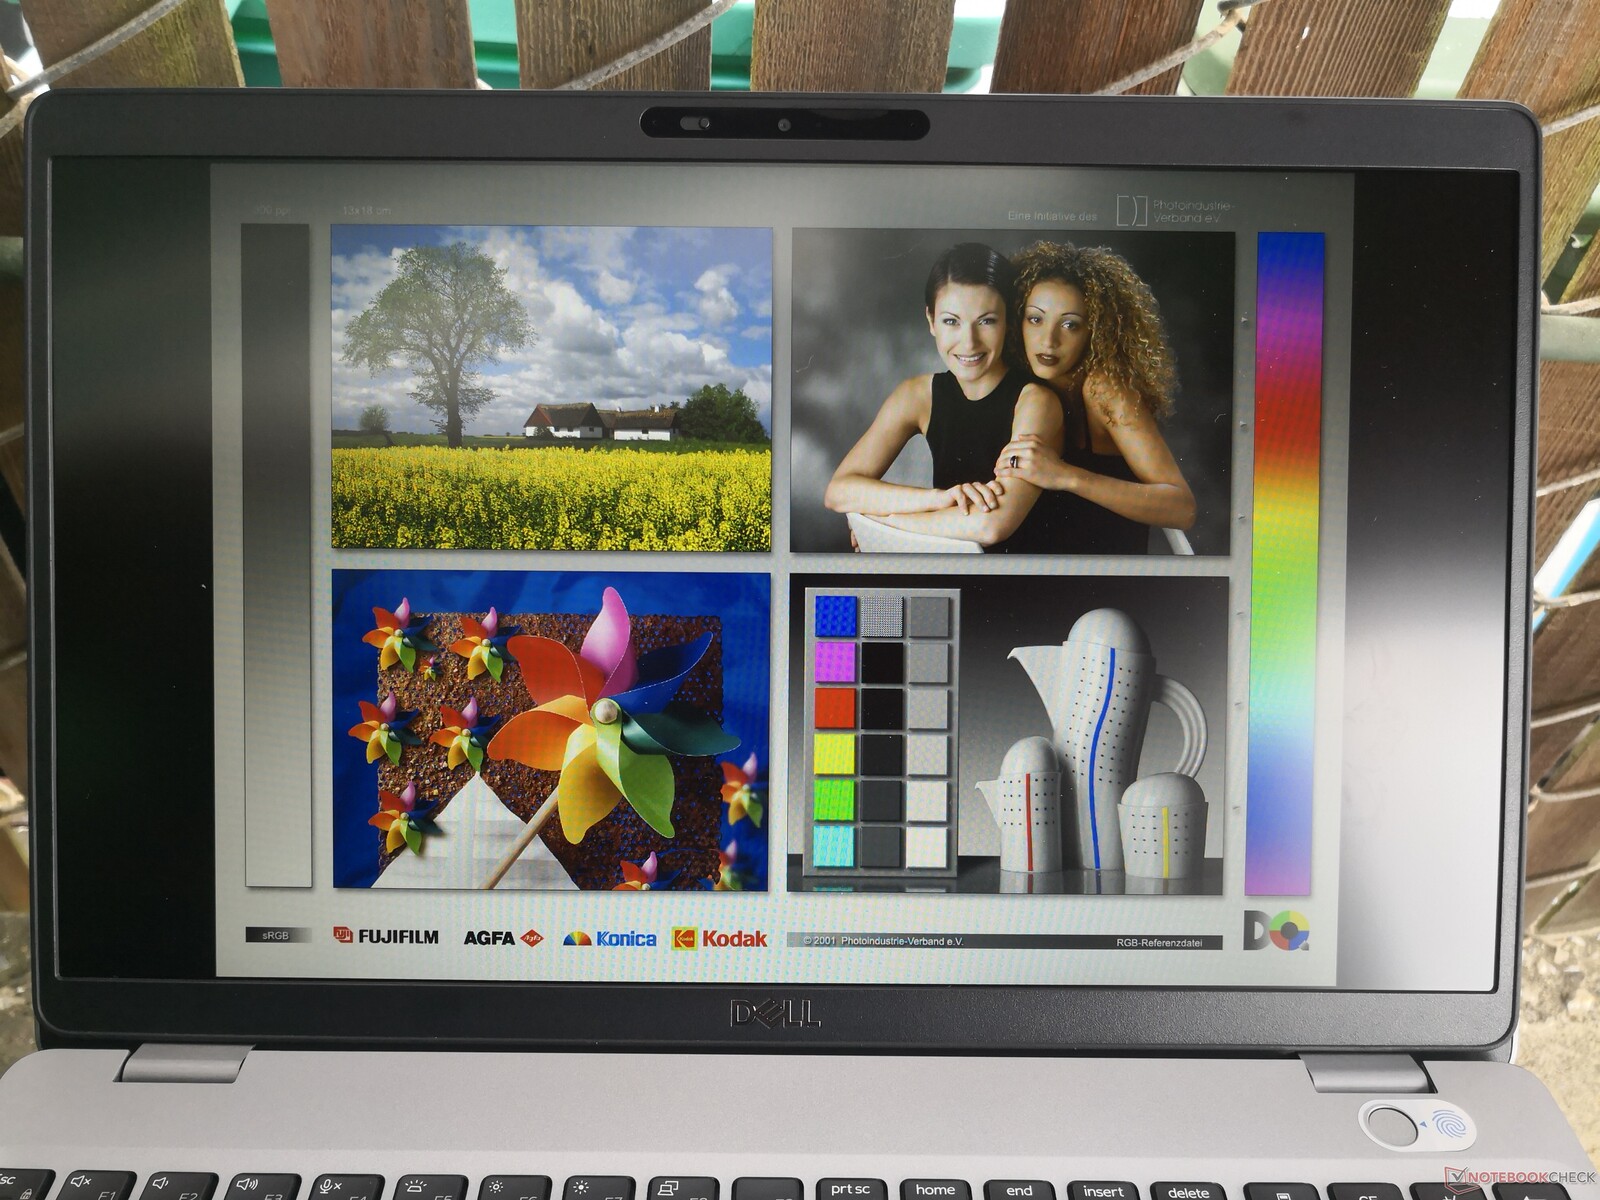
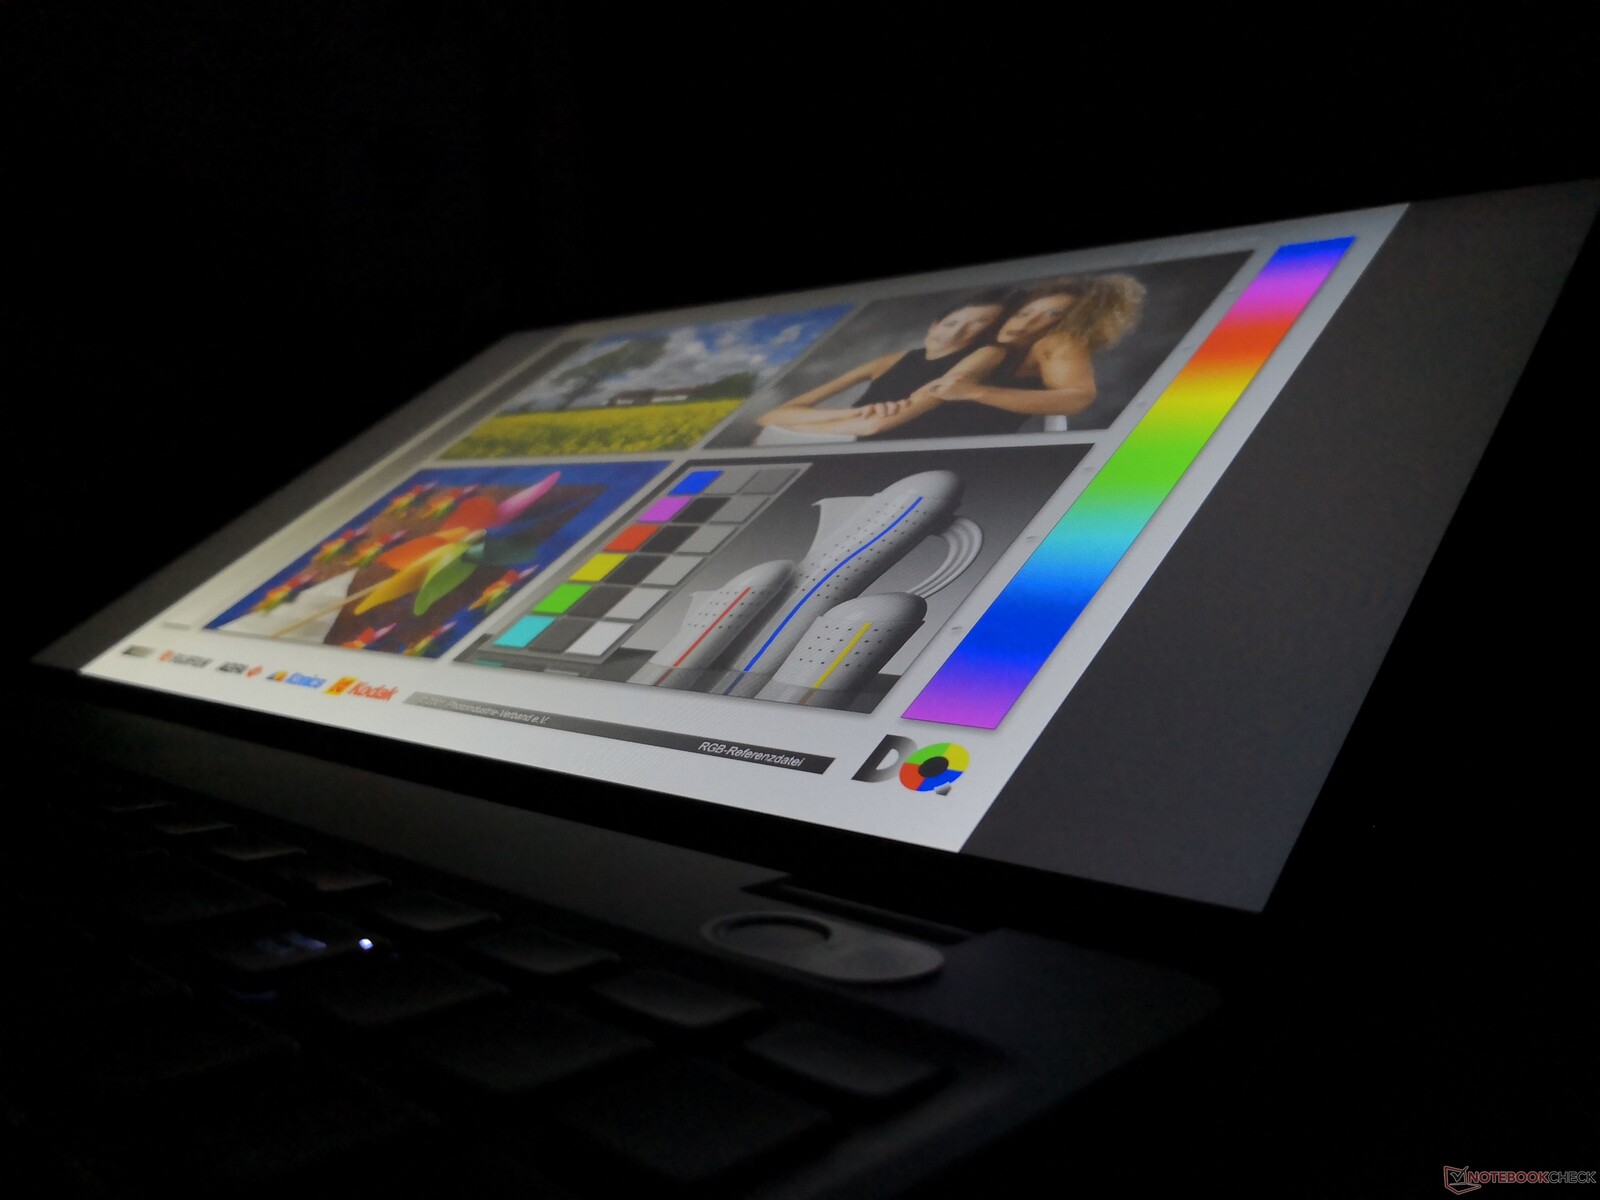
Display
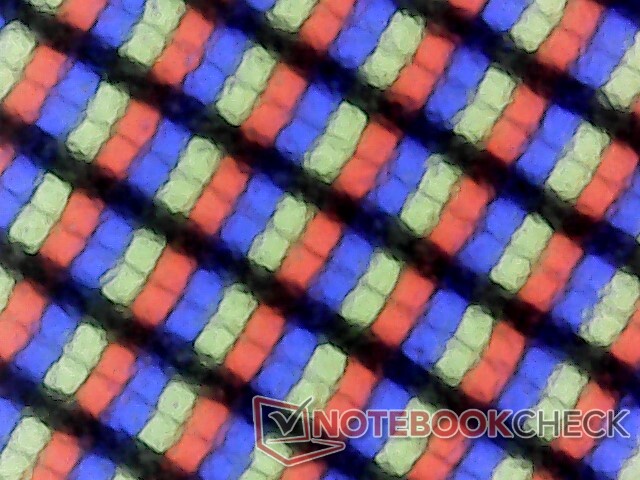
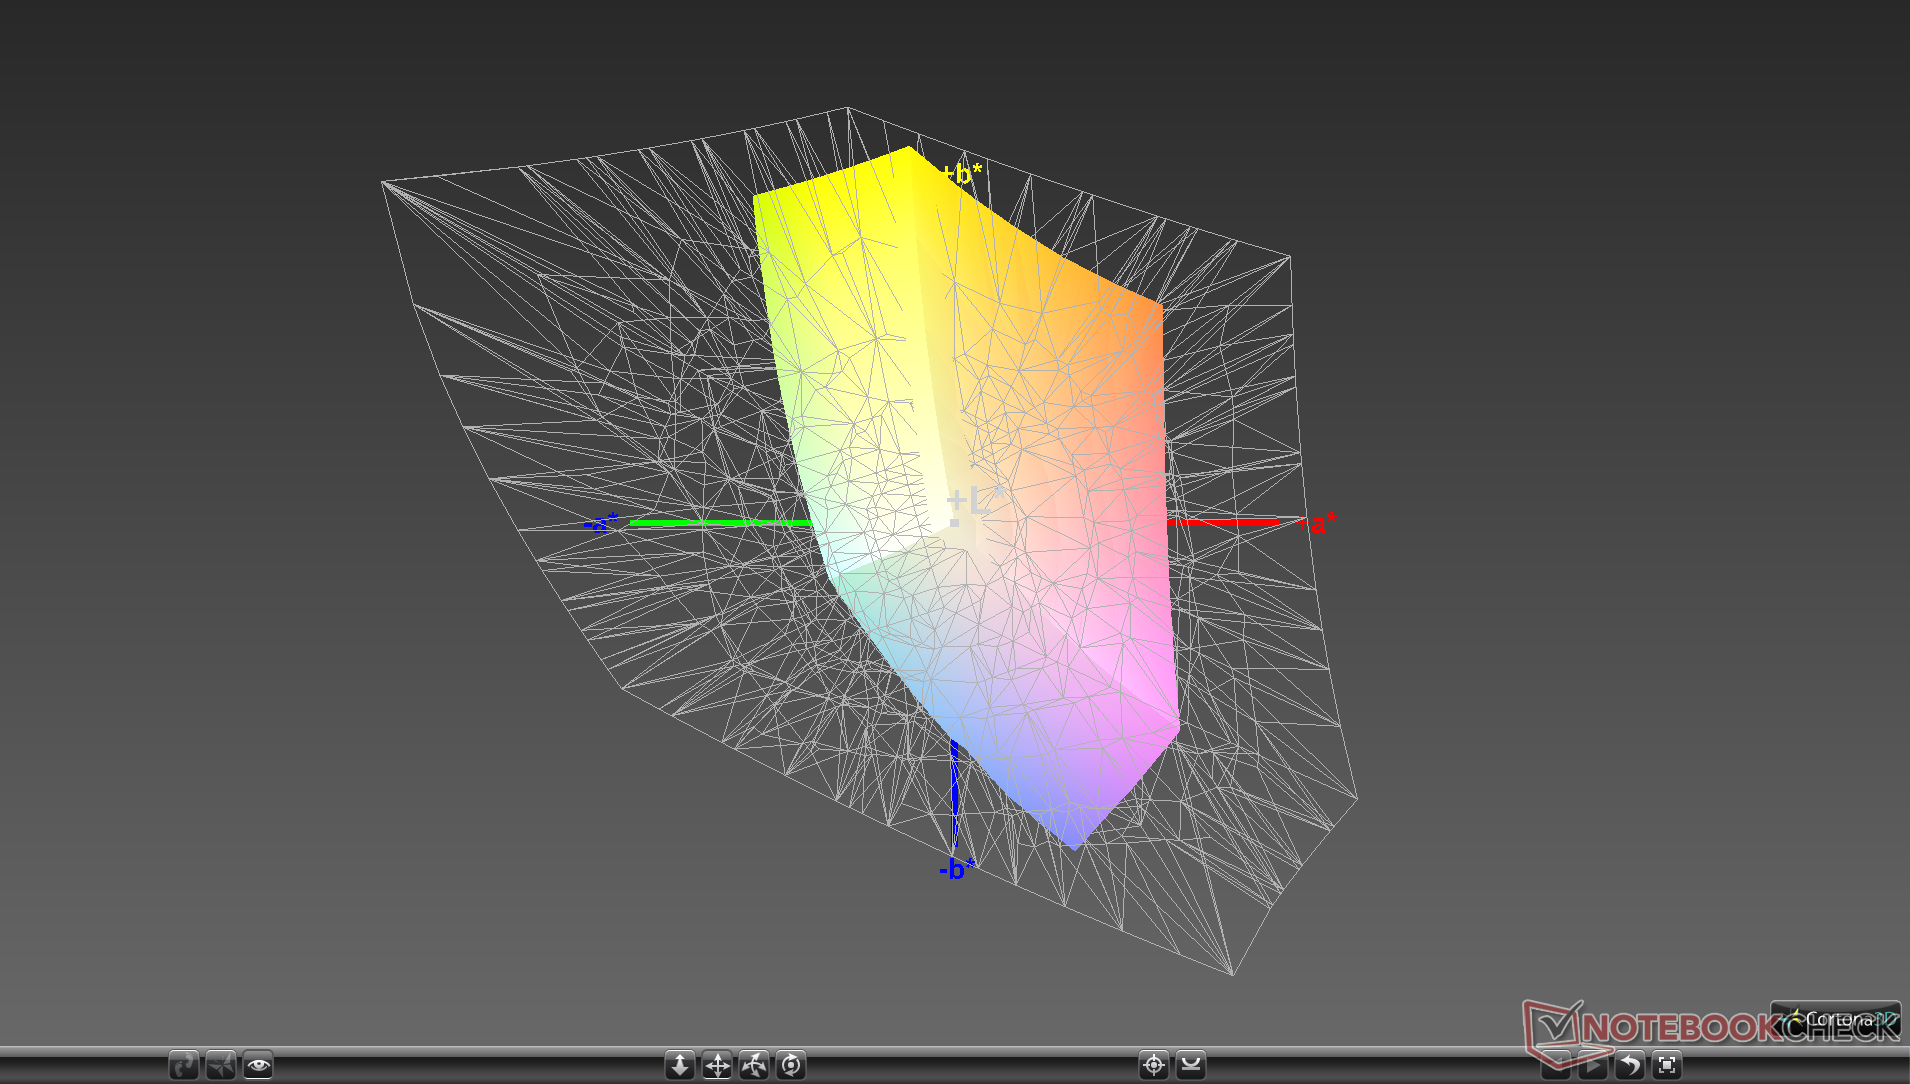
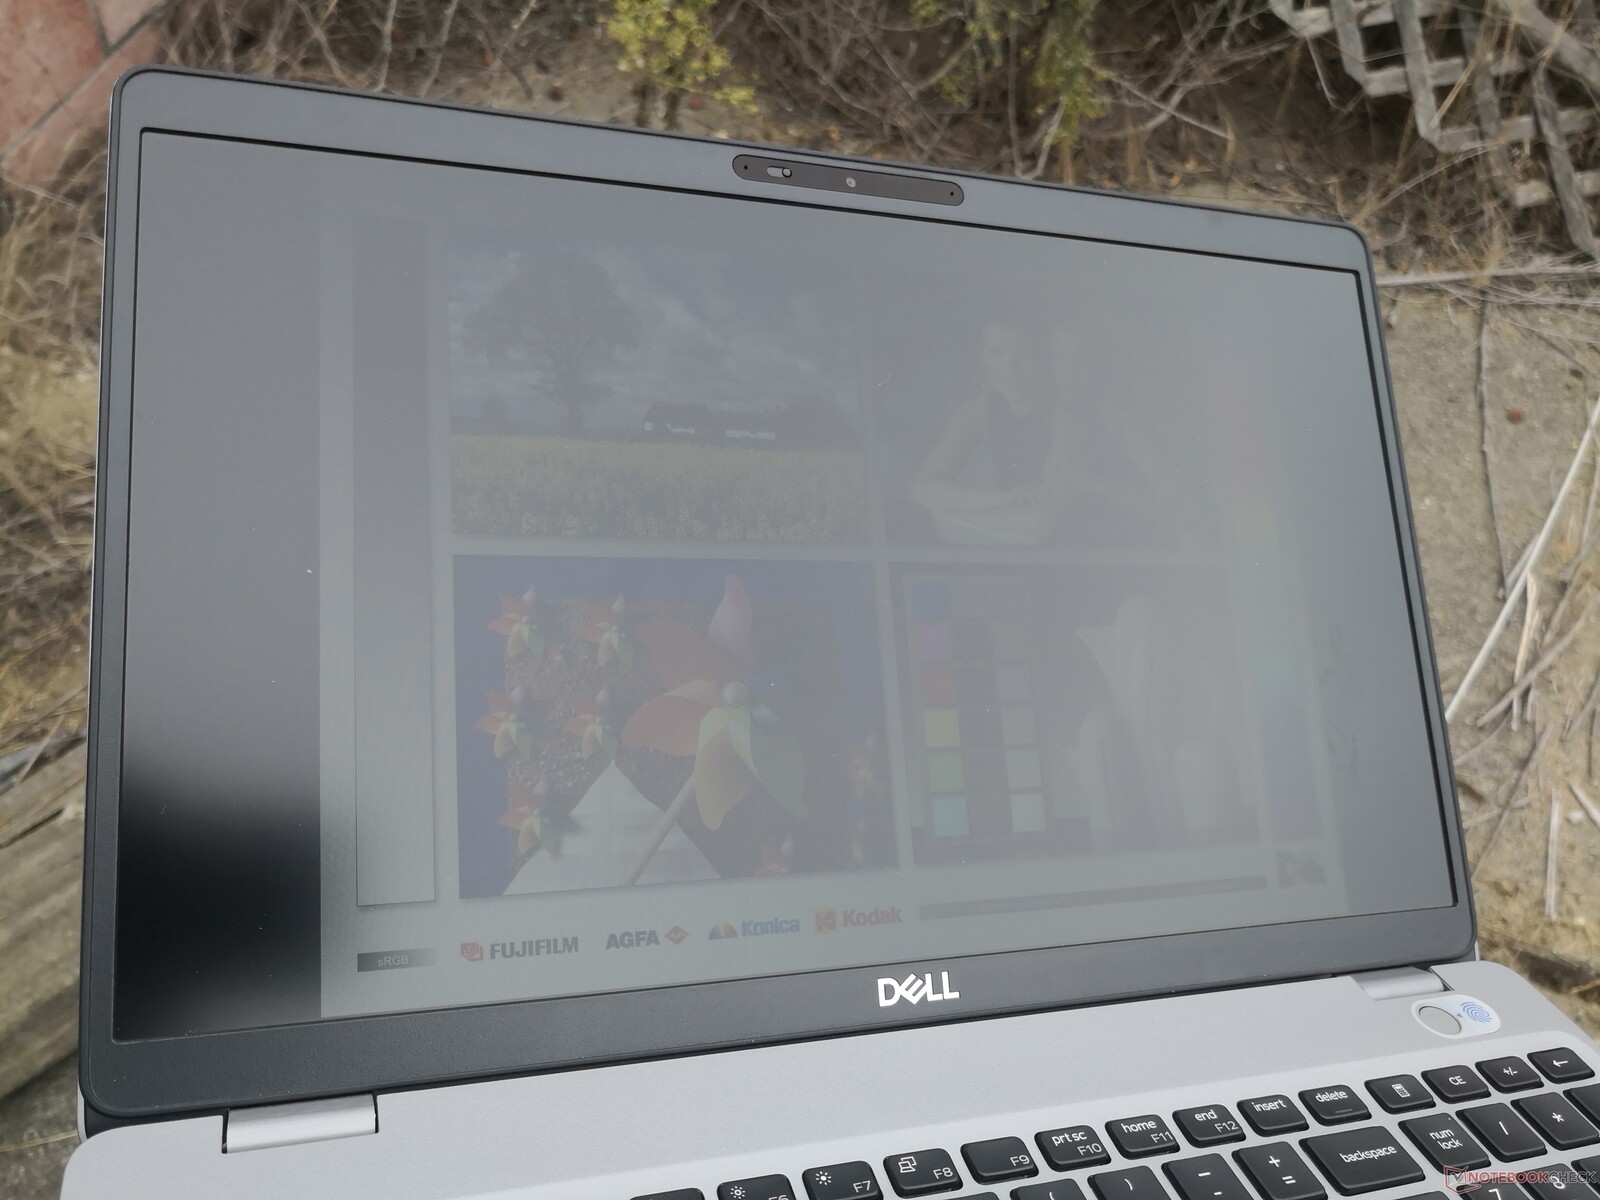
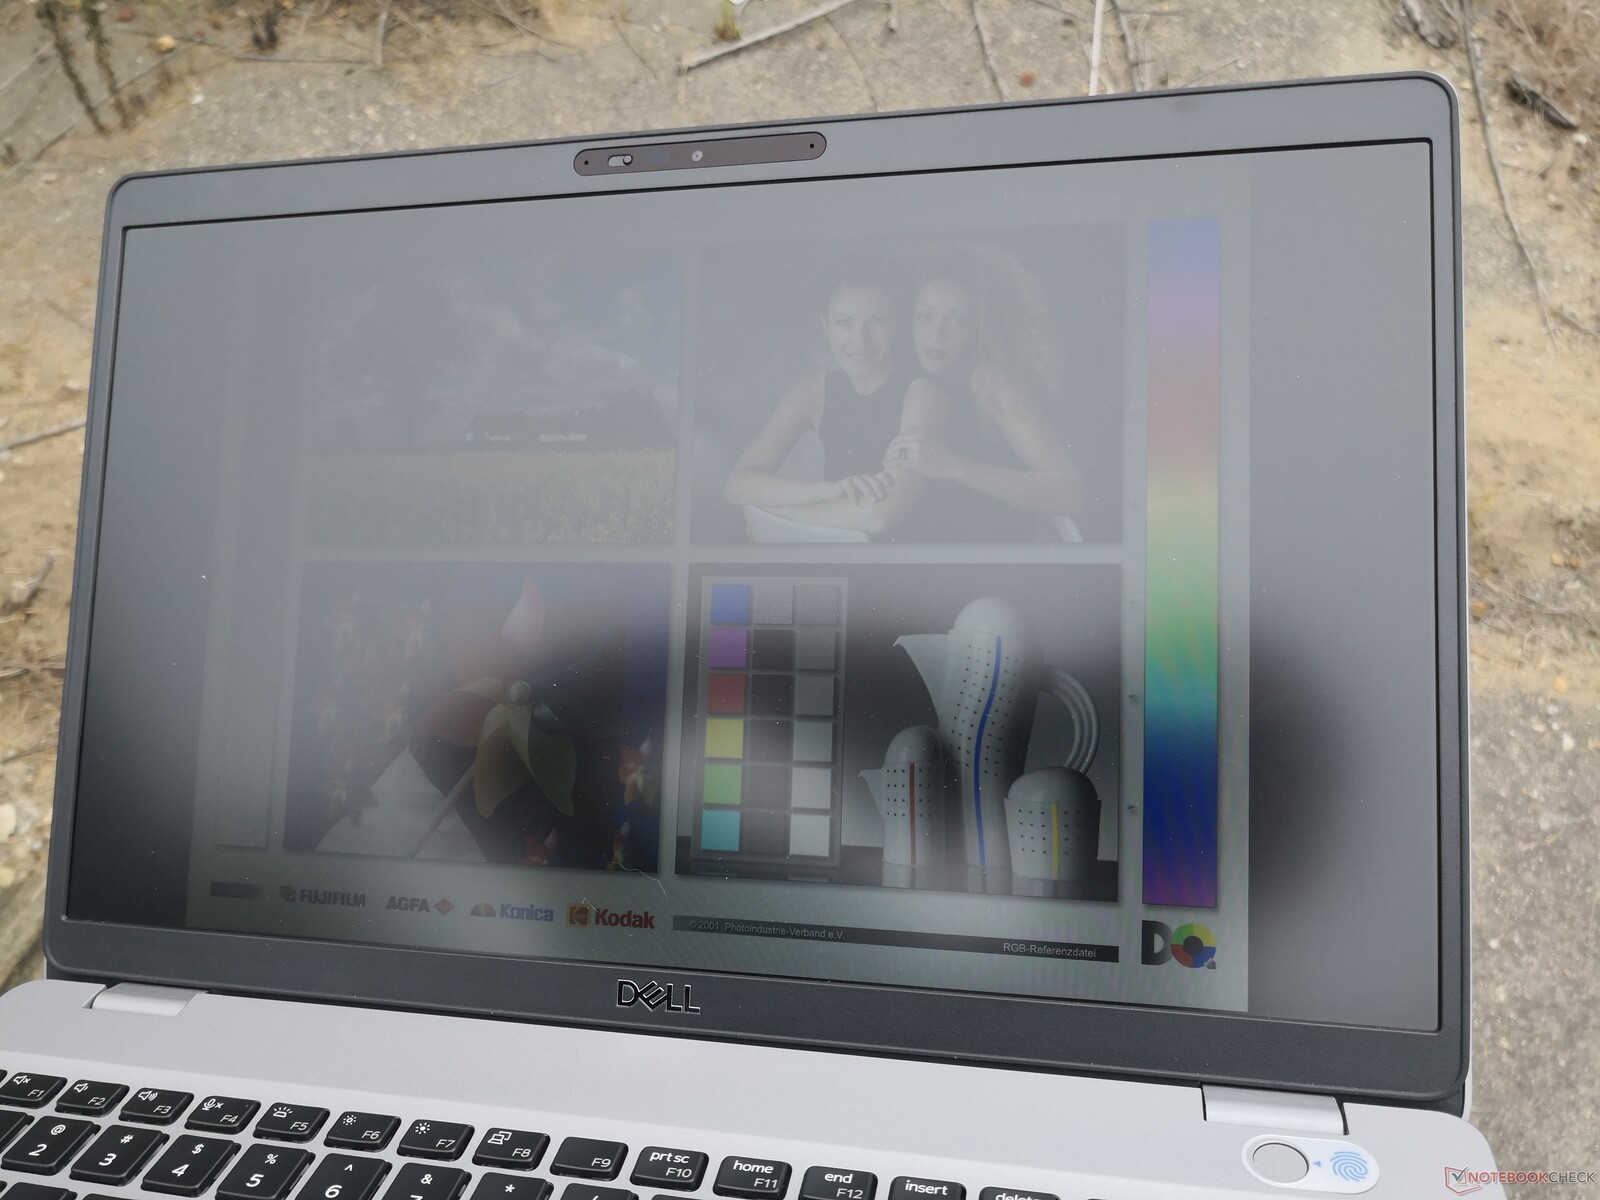
Dell utiliza el mismo panel IPS LG Philips 156WFD 1080p para su Precision 3551 y Latitude 5500. Aunque el contraste es bueno en casi 1000:1, otras características como el brillo, los tiempos de respuesta y los colores son promedio en el mejor de los casos para representar una pantalla de presupuesto. Definitivamente esta no es la opción de panel que quieres si la precisión del color es vital. Afortunadamente, el sistema puede ser configurado con opciones de pantalla de gama alta que prometen una cobertura sRGB completa si se desea.
| |||||||||||||||||||||||||
iluminación: 89 %
Brillo con batería: 235.5 cd/m²
Contraste: 942:1 (Negro: 0.25 cd/m²)
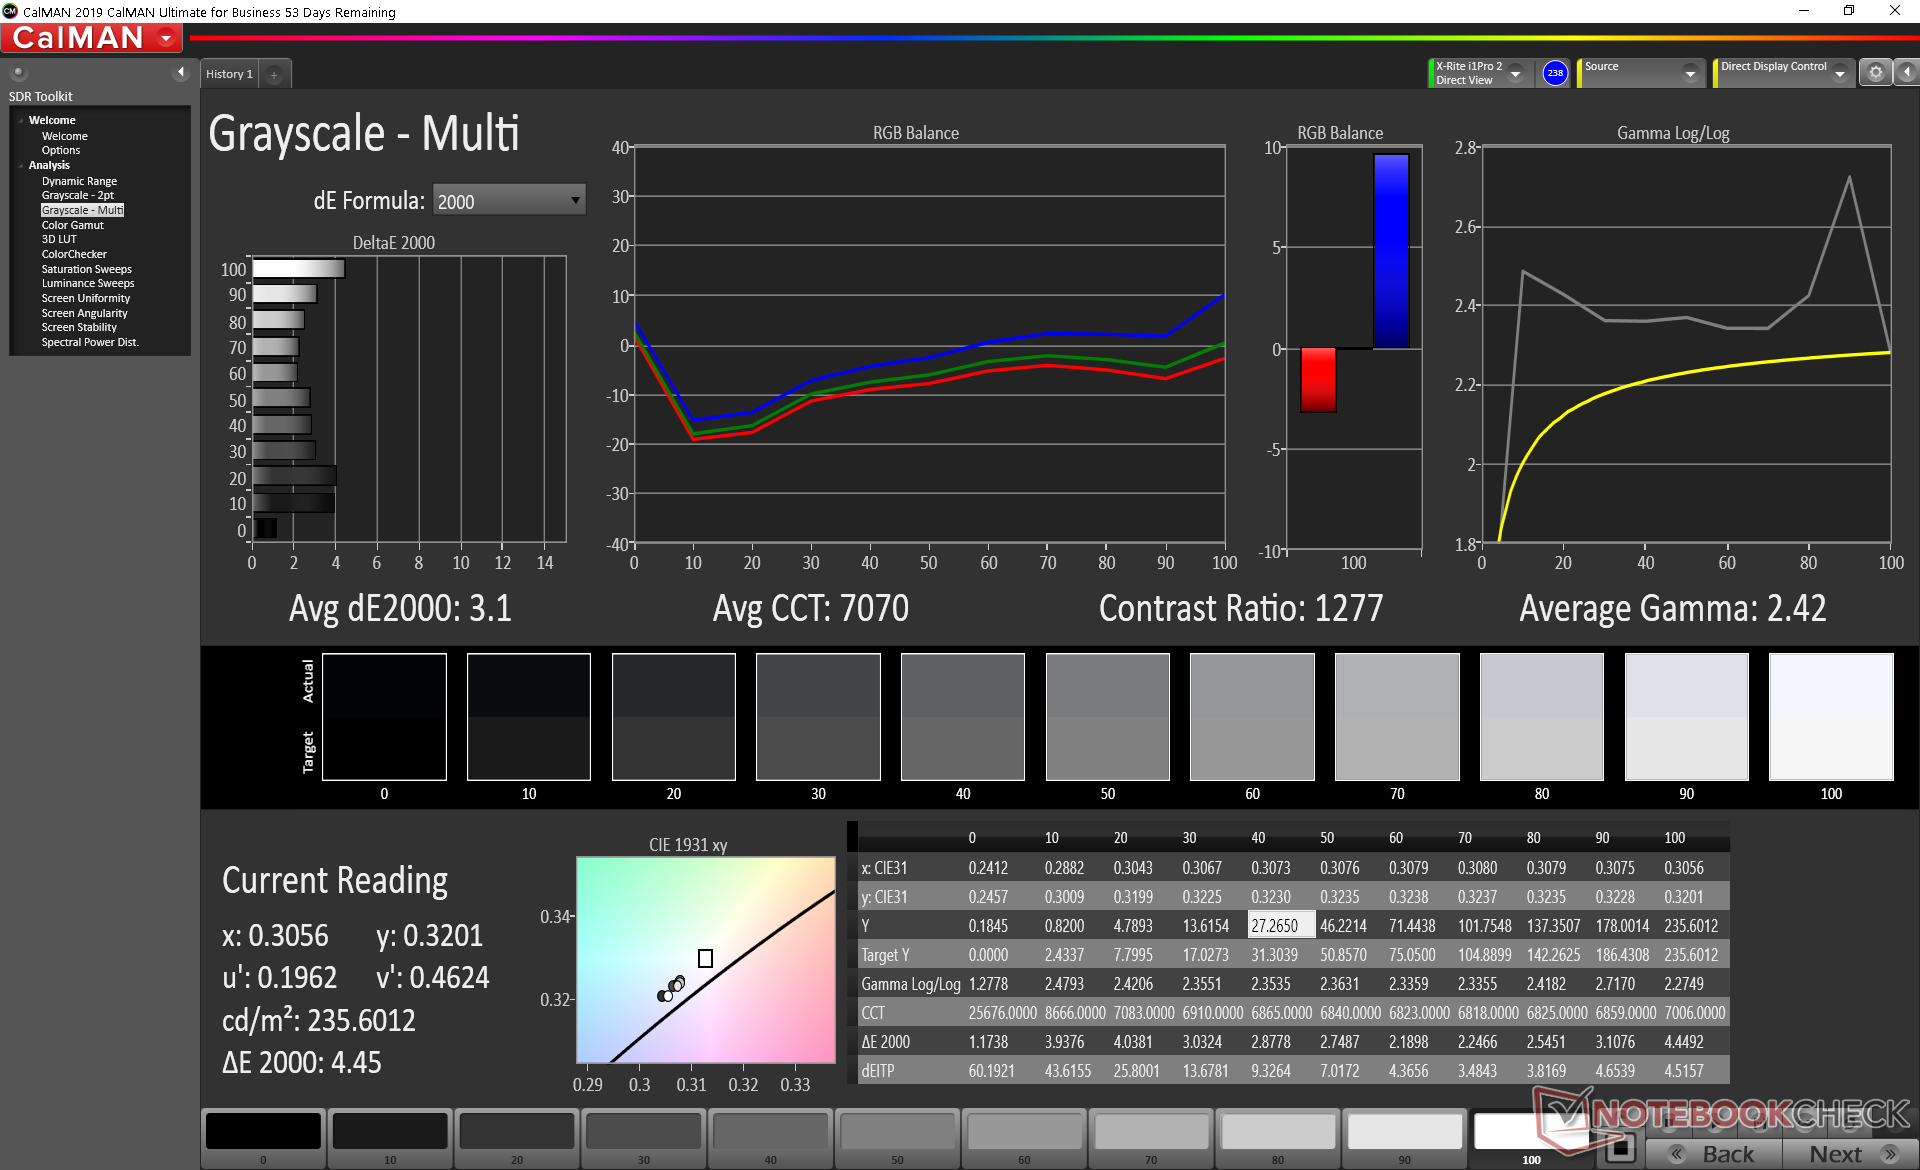
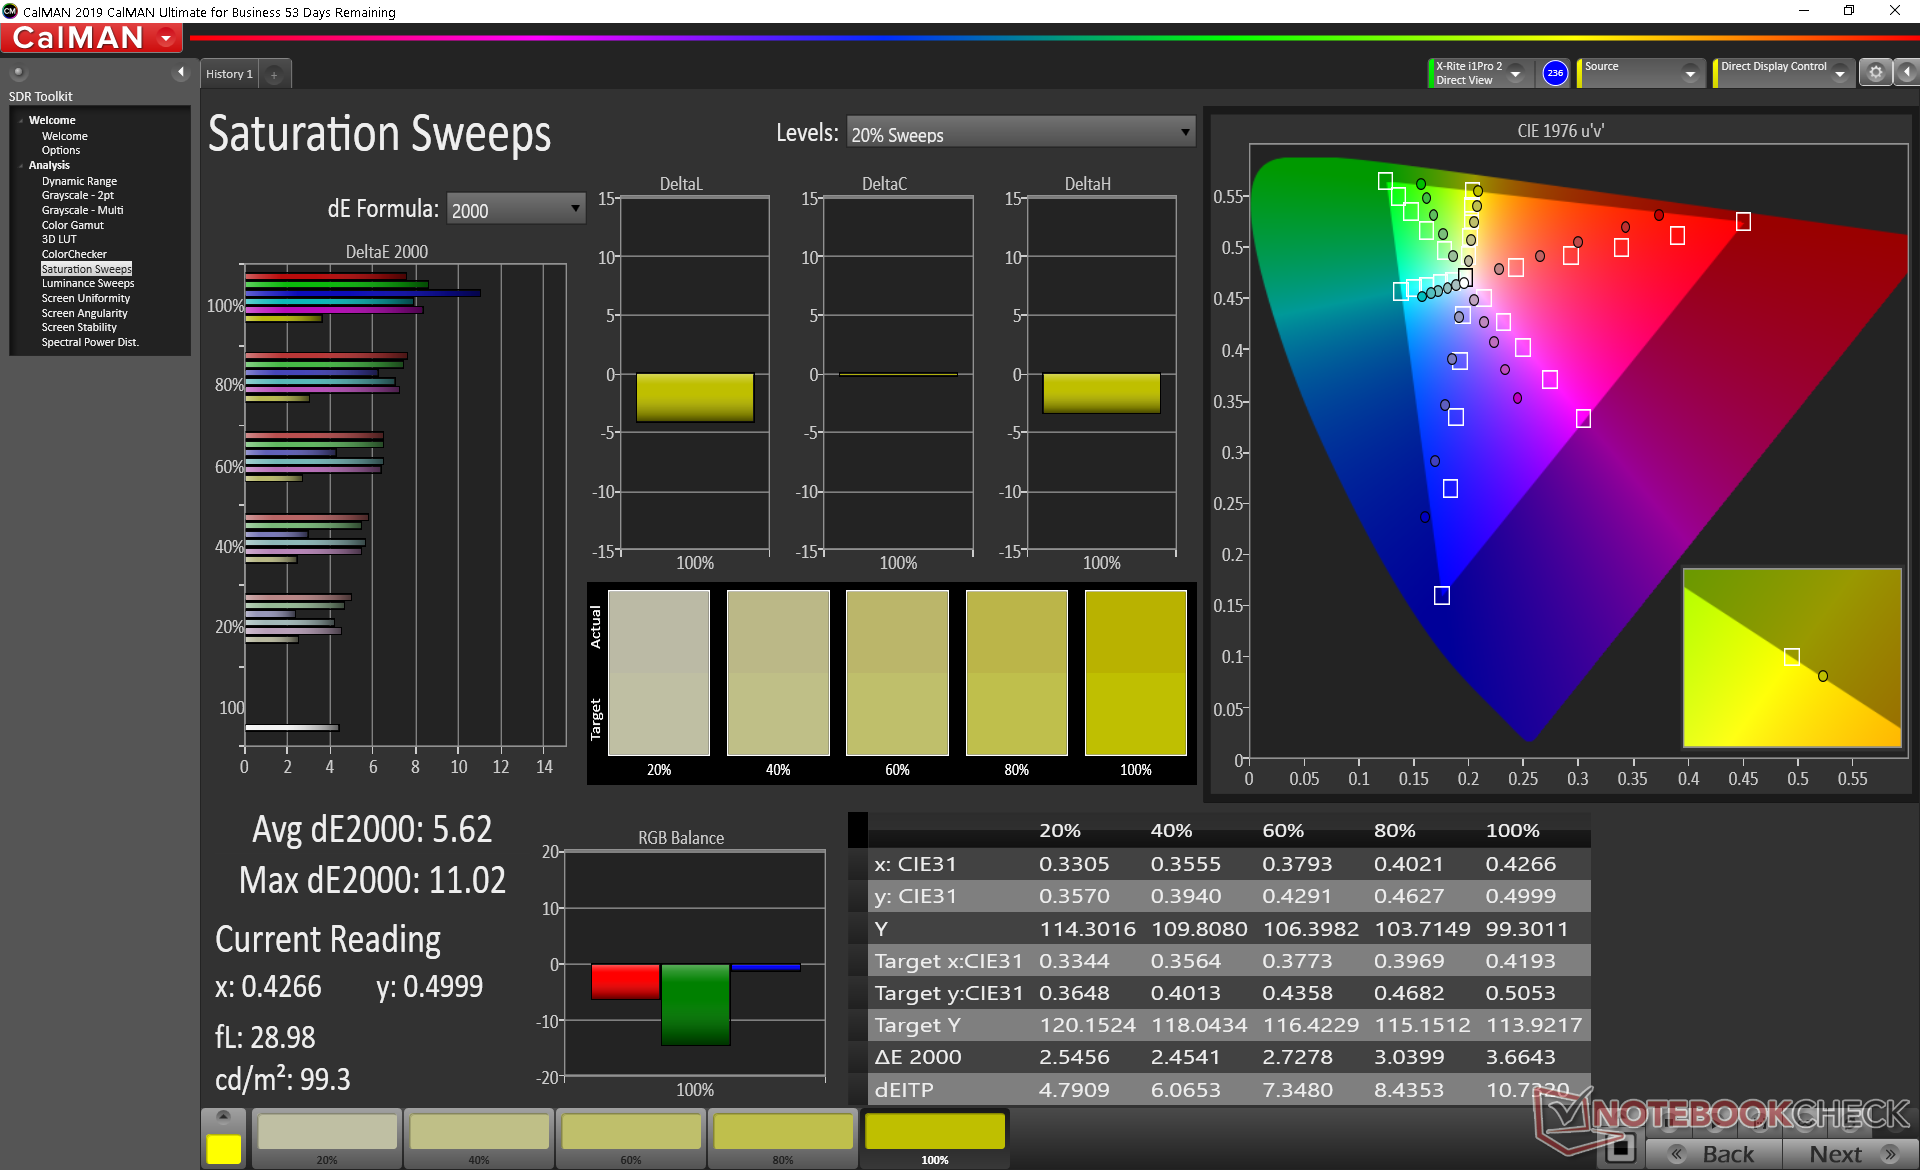
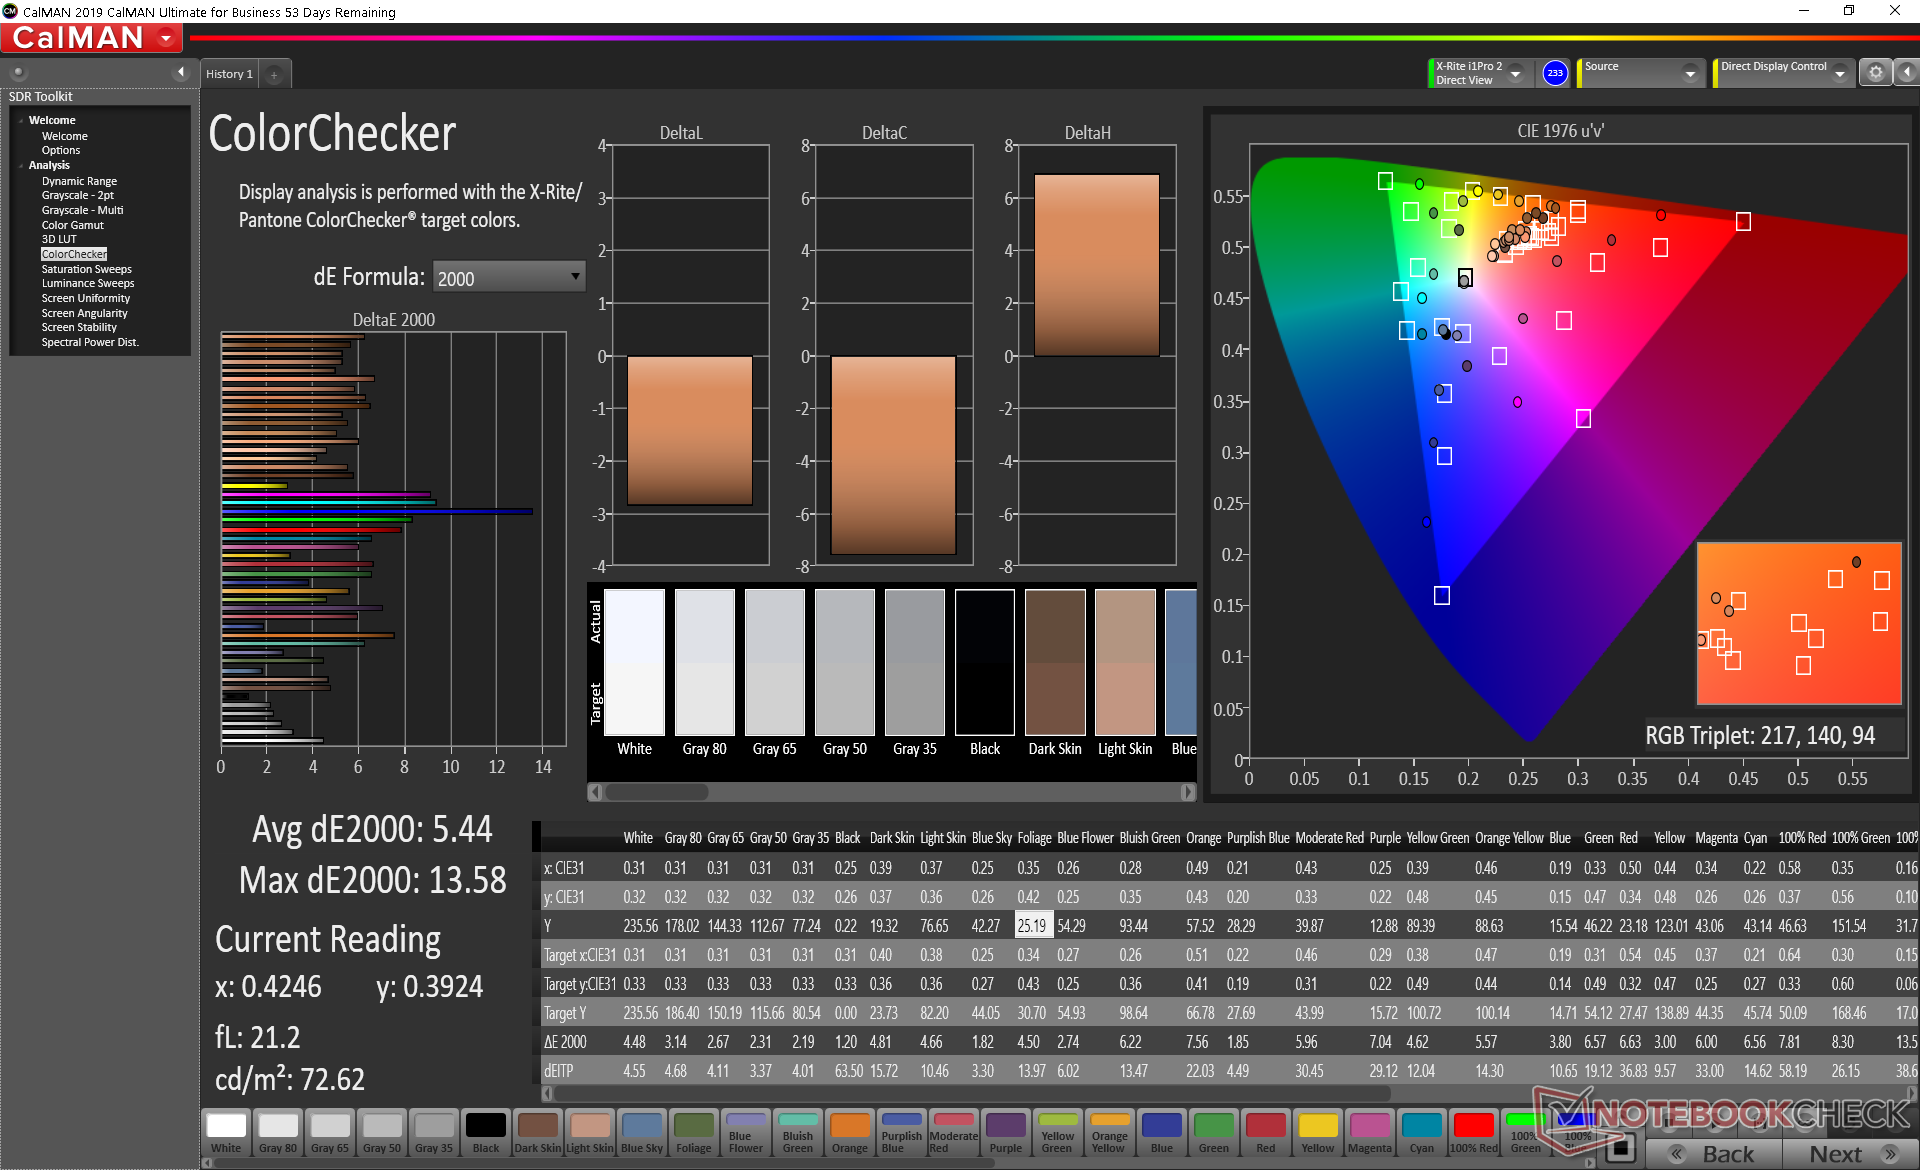
ΔE ColorChecker Calman: 5.44 | ∀{0.5-29.43 Ø4.71}
calibrated: 5.2
ΔE Greyscale Calman: 3.1 | ∀{0.09-98 Ø4.96}
56.1% sRGB (Argyll 1.6.3 3D)
35.5% AdobeRGB 1998 (Argyll 1.6.3 3D)
38.74% AdobeRGB 1998 (Argyll 3D)
56.5% sRGB (Argyll 3D)
37.5% Display P3 (Argyll 3D)
Gamma: 2.42
CCT: 7070 K
| Dell Precision 3000 3551 LG Philips 156WFD, IPS, 15.6", 1920x1080 | HP ZBook Firefly 15 G7 LGD064F, IPS LED, 15.6", 3840x2160 | Dell Precision 5550 P91F Sharp LQ156R1, IPS, 15.6", 3840x2400 | Lenovo ThinkPad P53s-20N6001NGE Lenovo LEN40BA, IPS, 15.6", 1920x1080 | MSI WP65 AU Optronics B156HAN02.1, IPS, 15.6", 1920x1080 | Dell Precision 3530 BOE BOE06F1, IPS, 15.6", 1920x1080 | |
|---|---|---|---|---|---|---|
| Display | 79% | 125% | 5% | 5% | 80% | |
| Display P3 Coverage (%) | 37.5 | 68.8 83% | 89.9 140% | 39.58 6% | 39.46 5% | 72.8 94% |
| sRGB Coverage (%) | 56.5 | 97.7 73% | 100 77% | 57.6 2% | 58.8 4% | 94.6 67% |
| AdobeRGB 1998 Coverage (%) | 38.74 | 69.8 80% | 99.9 158% | 40.89 6% | 40.69 5% | 69.3 79% |
| Response Times | -33% | -42% | -50% | -16% | -34% | |
| Response Time Grey 50% / Grey 80% * (ms) | 29.6 ? | 44 ? -49% | 46 ? -55% | 51.2 ? -73% | 37.6 ? -27% | 40.4 ? -36% |
| Response Time Black / White * (ms) | 26.4 ? | 30.8 ? -17% | 34 ? -29% | 33.6 ? -27% | 27.6 ? -5% | 34.8 ? -32% |
| PWM Frequency (Hz) | 1053 ? | |||||
| Screen | 51% | 33% | 4% | -2% | 10% | |
| Brightness middle (cd/m²) | 235.5 | 381 62% | 469.8 99% | 260 10% | 267.4 14% | 285.7 21% |
| Brightness (cd/m²) | 228 | 382 68% | 464 104% | 243 7% | 259 14% | 275 21% |
| Brightness Distribution (%) | 89 | 92 3% | 85 -4% | 88 -1% | 86 -3% | 85 -4% |
| Black Level * (cd/m²) | 0.25 | 0.21 16% | 0.42 -68% | 0.18 28% | 0.37 -48% | 0.31 -24% |
| Contrast (:1) | 942 | 1814 93% | 1119 19% | 1444 53% | 723 -23% | 922 -2% |
| Colorchecker dE 2000 * | 5.44 | 3 45% | 5.16 5% | 6 -10% | 4.21 23% | 5.84 -7% |
| Colorchecker dE 2000 max. * | 13.58 | 5.2 62% | 9.33 31% | 19.2 -41% | 21.1 -55% | 8.76 35% |
| Colorchecker dE 2000 calibrated * | 5.2 | 1.5 71% | 3.75 28% | 4.3 17% | 4.27 18% | 3.14 40% |
| Greyscale dE 2000 * | 3.1 | 3.5 -13% | 5.5 -77% | 4.2 -35% | 2.3 26% | 6.5 -110% |
| Gamma | 2.42 91% | 2.26 97% | 2 110% | 2.49 88% | 2.2 100% | 2.383 92% |
| CCT | 7070 92% | 7254 90% | 6198 105% | 6865 95% | 6578 99% | 7176 91% |
| Color Space (Percent of AdobeRGB 1998) (%) | 35.5 | 64.3 81% | 89.2 151% | 37.6 6% | 37.2 5% | 62 75% |
| Color Space (Percent of sRGB) (%) | 56.1 | 97.5 74% | 100 78% | 59.2 6% | 58.5 4% | 94 68% |
| Media total (Programa/Opciones) | 32% /
46% | 39% /
41% | -14% /
-3% | -4% /
-3% | 19% /
18% |
* ... más pequeño es mejor
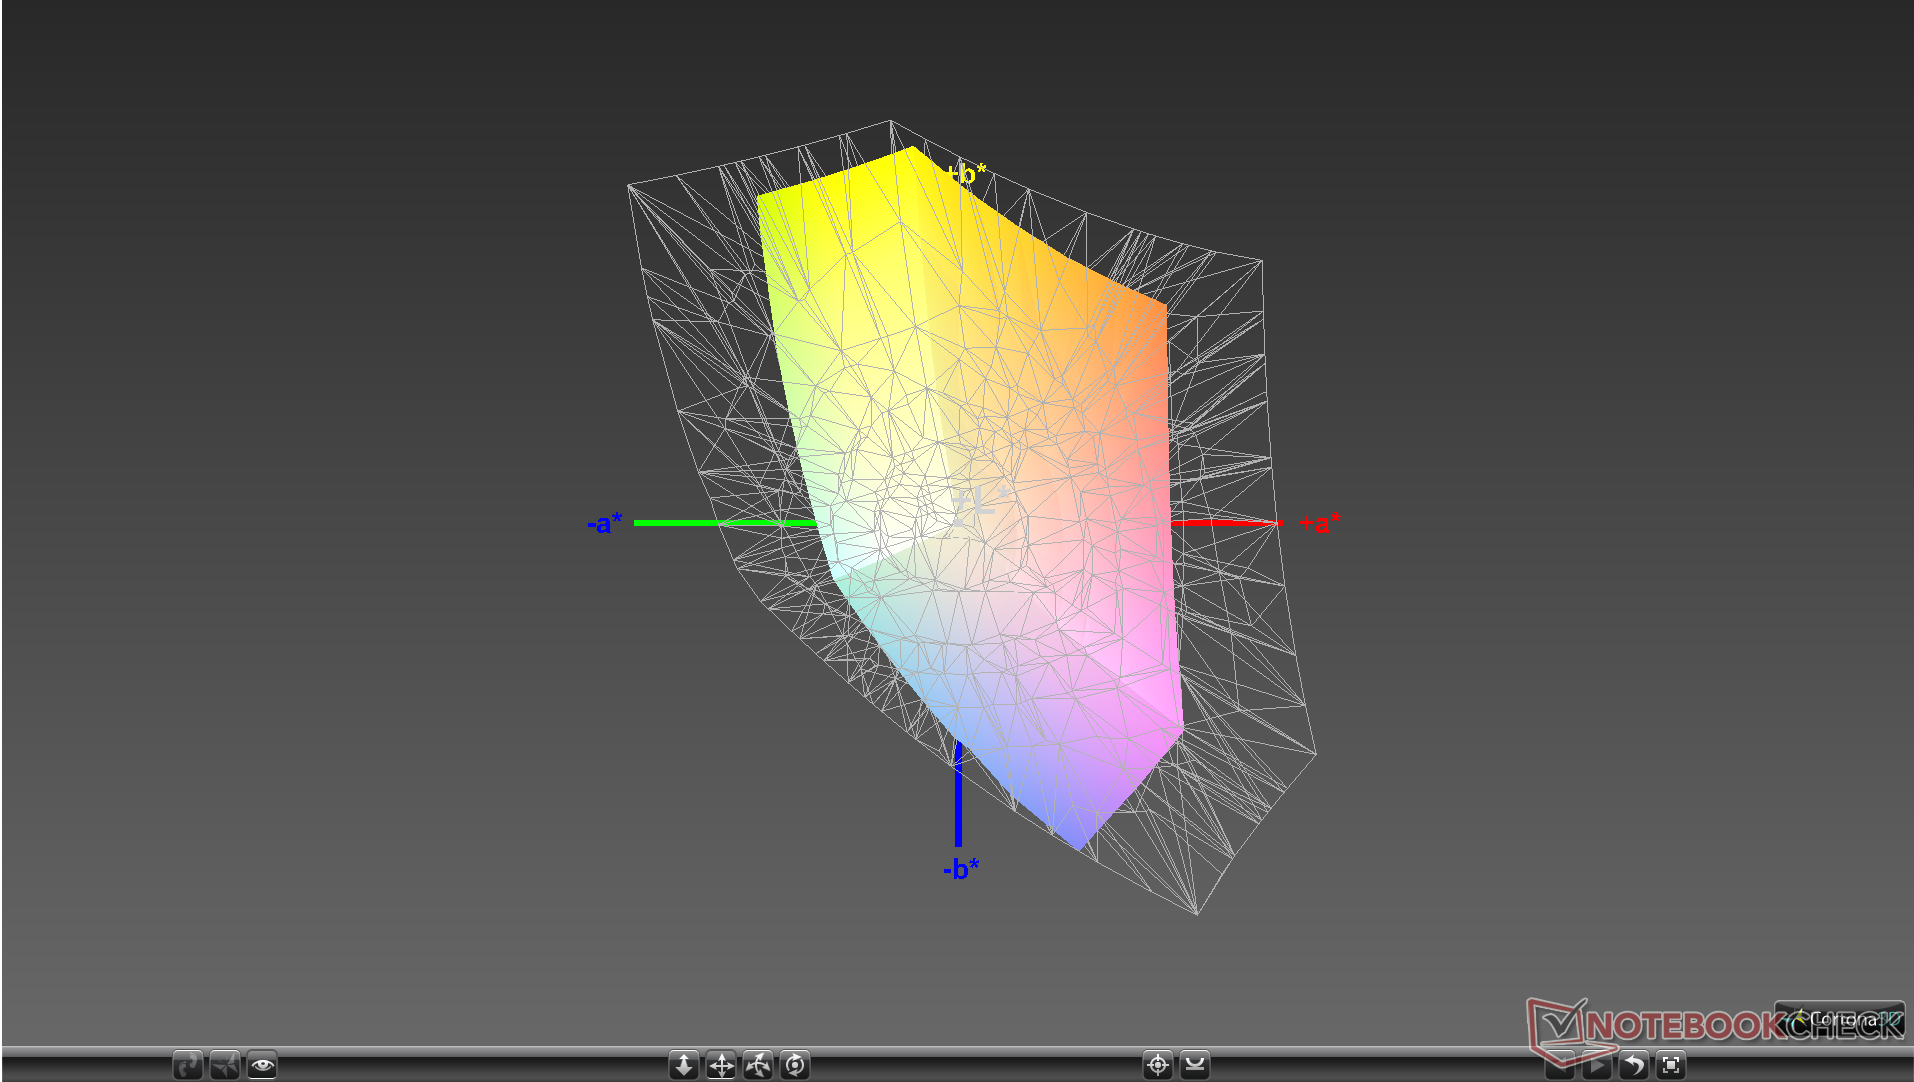
La pantalla está calibrada decentemente fuera de la caja con una temperatura de color que se apoya en el lado frío. Nuestra calibración fija esto, pero los colores permanecen en promedio en el mejor de los casos debido al limitado espacio de color mencionado anteriormente.

Tiempos de respuesta del display
| ↔ Tiempo de respuesta de Negro a Blanco | ||
|---|---|---|
| 26.4 ms ... subida ↗ y bajada ↘ combinada | ↗ 14 ms subida | 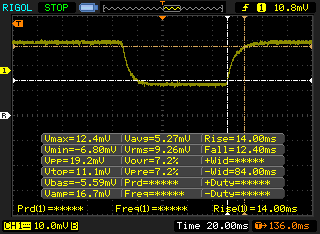 |
| ↘ 12.4 ms bajada | ||
| La pantalla mostró tiempos de respuesta relativamente lentos en nuestros tests pero podría ser demasiado lenta para los jugones. En comparación, todos los dispositivos de prueba van de ##min### (mínimo) a 240 (máximo) ms. » 66 % de todos los dispositivos son mejores. Eso quiere decir que el tiempo de respuesta es peor que la media (19.8 ms) de todos los dispositivos testados. | ||
| ↔ Tiempo de respuesta 50% Gris a 80% Gris | ||
| 29.6 ms ... subida ↗ y bajada ↘ combinada | ↗ 16.4 ms subida | 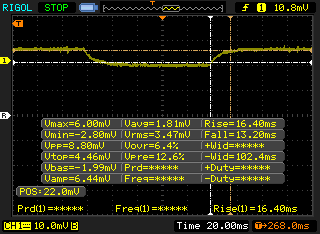 |
| ↘ 13.2 ms bajada | ||
| La pantalla mostró tiempos de respuesta relativamente lentos en nuestros tests pero podría ser demasiado lenta para los jugones. En comparación, todos los dispositivos de prueba van de ##min### (mínimo) a 636 (máximo) ms. » 40 % de todos los dispositivos son mejores. Eso quiere decir que el tiempo de respuesta es similar al dispositivo testado medio (31 ms). | ||
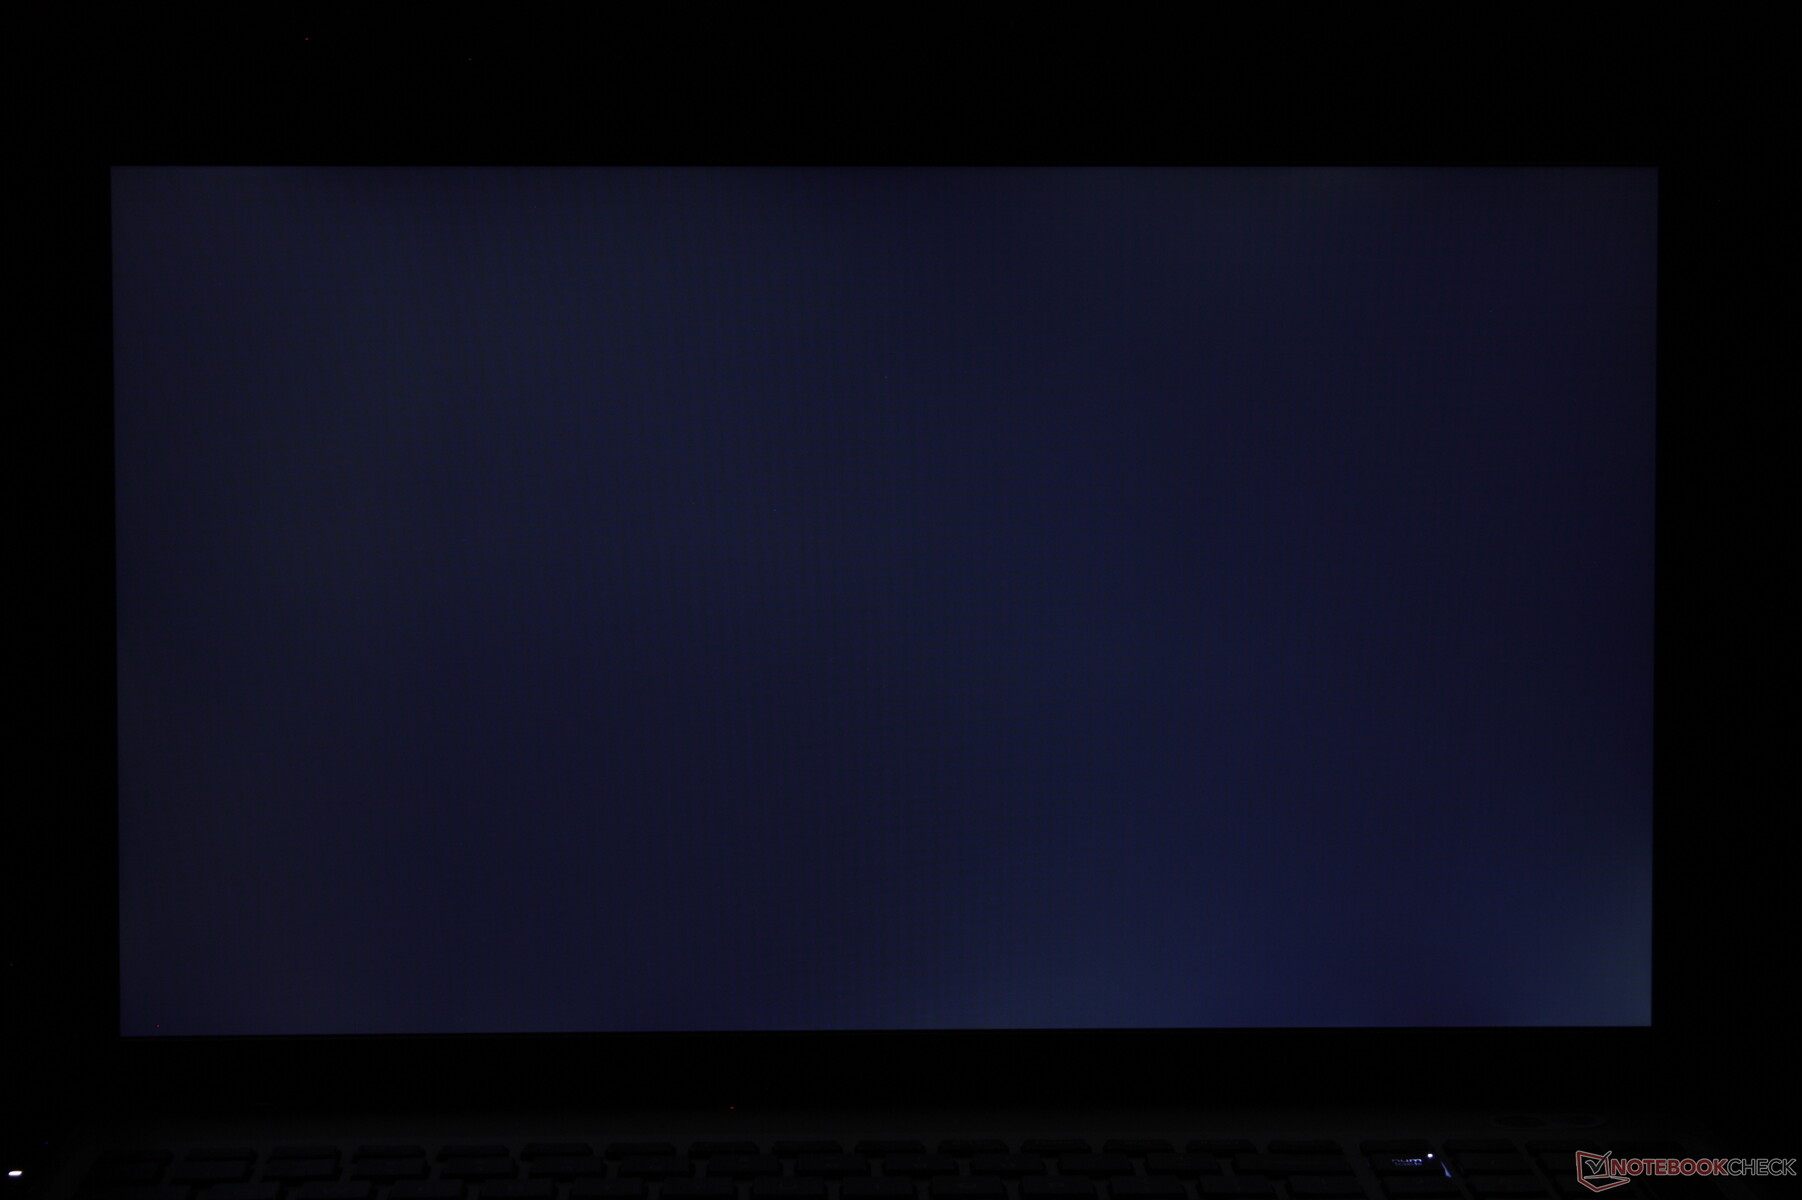
Parpadeo de Pantalla / PWM (Pulse-Width Modulation)
| Parpadeo de Pantalla / PWM no detectado | 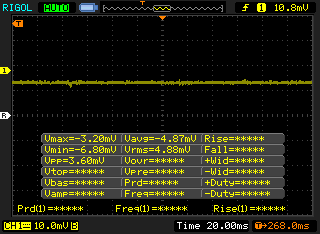 | ||
Comparación: 52 % de todos los dispositivos testados no usaron PWM para atenuar el display. Si se usó, medimos una media de 7754 (mínimo: 5 - máxmo: 343500) Hz. | |||
Rendimiento
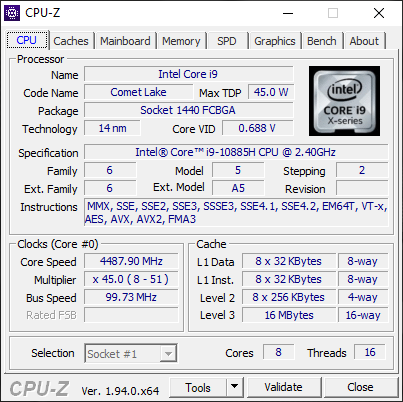
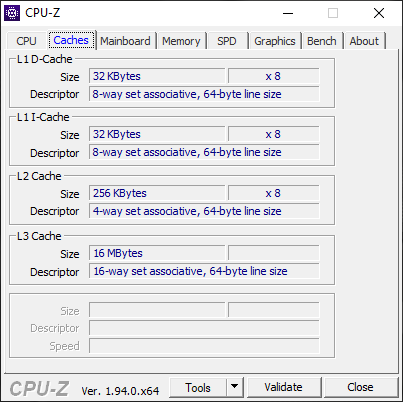
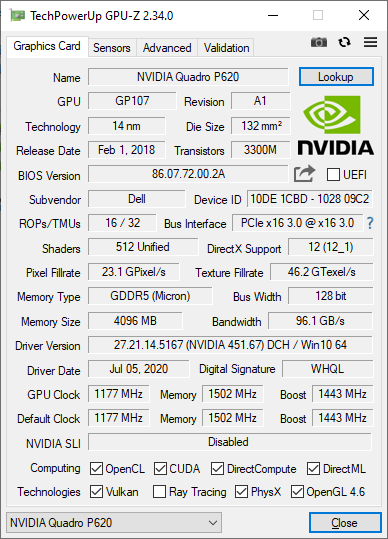
Procesador
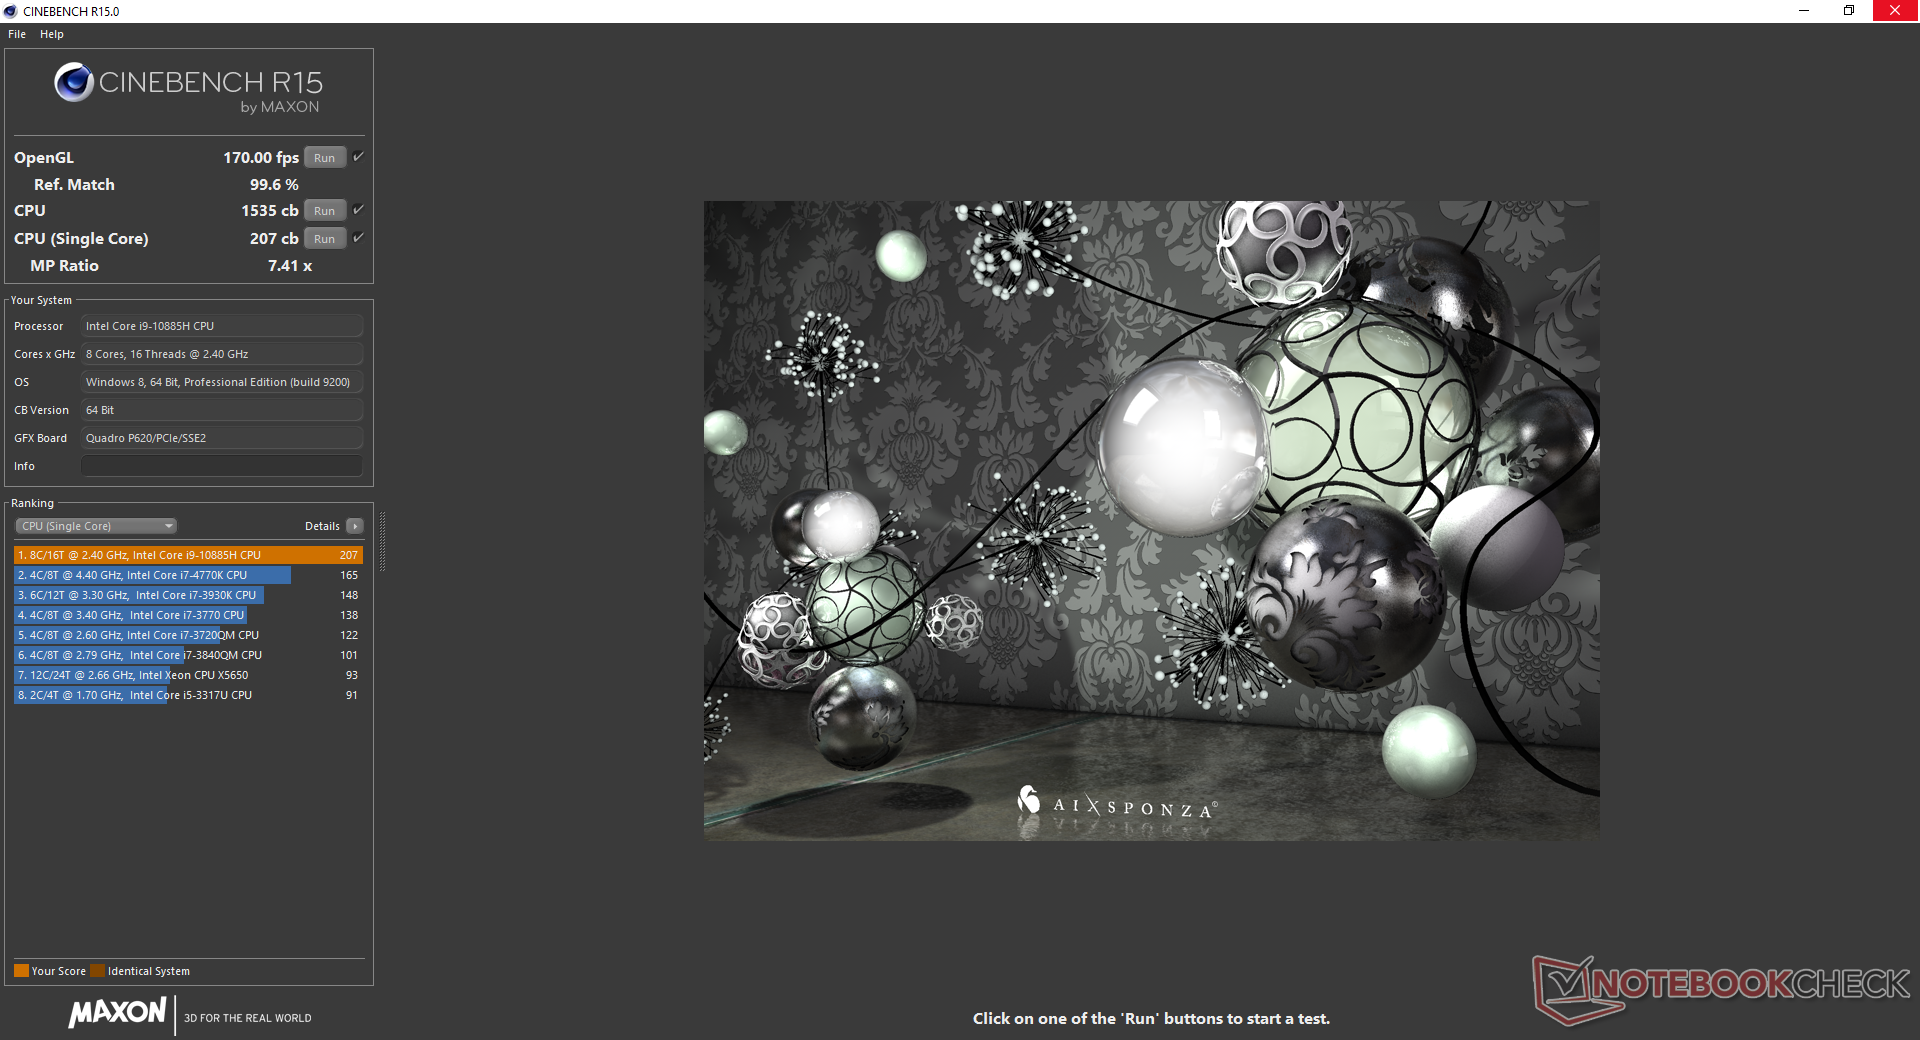
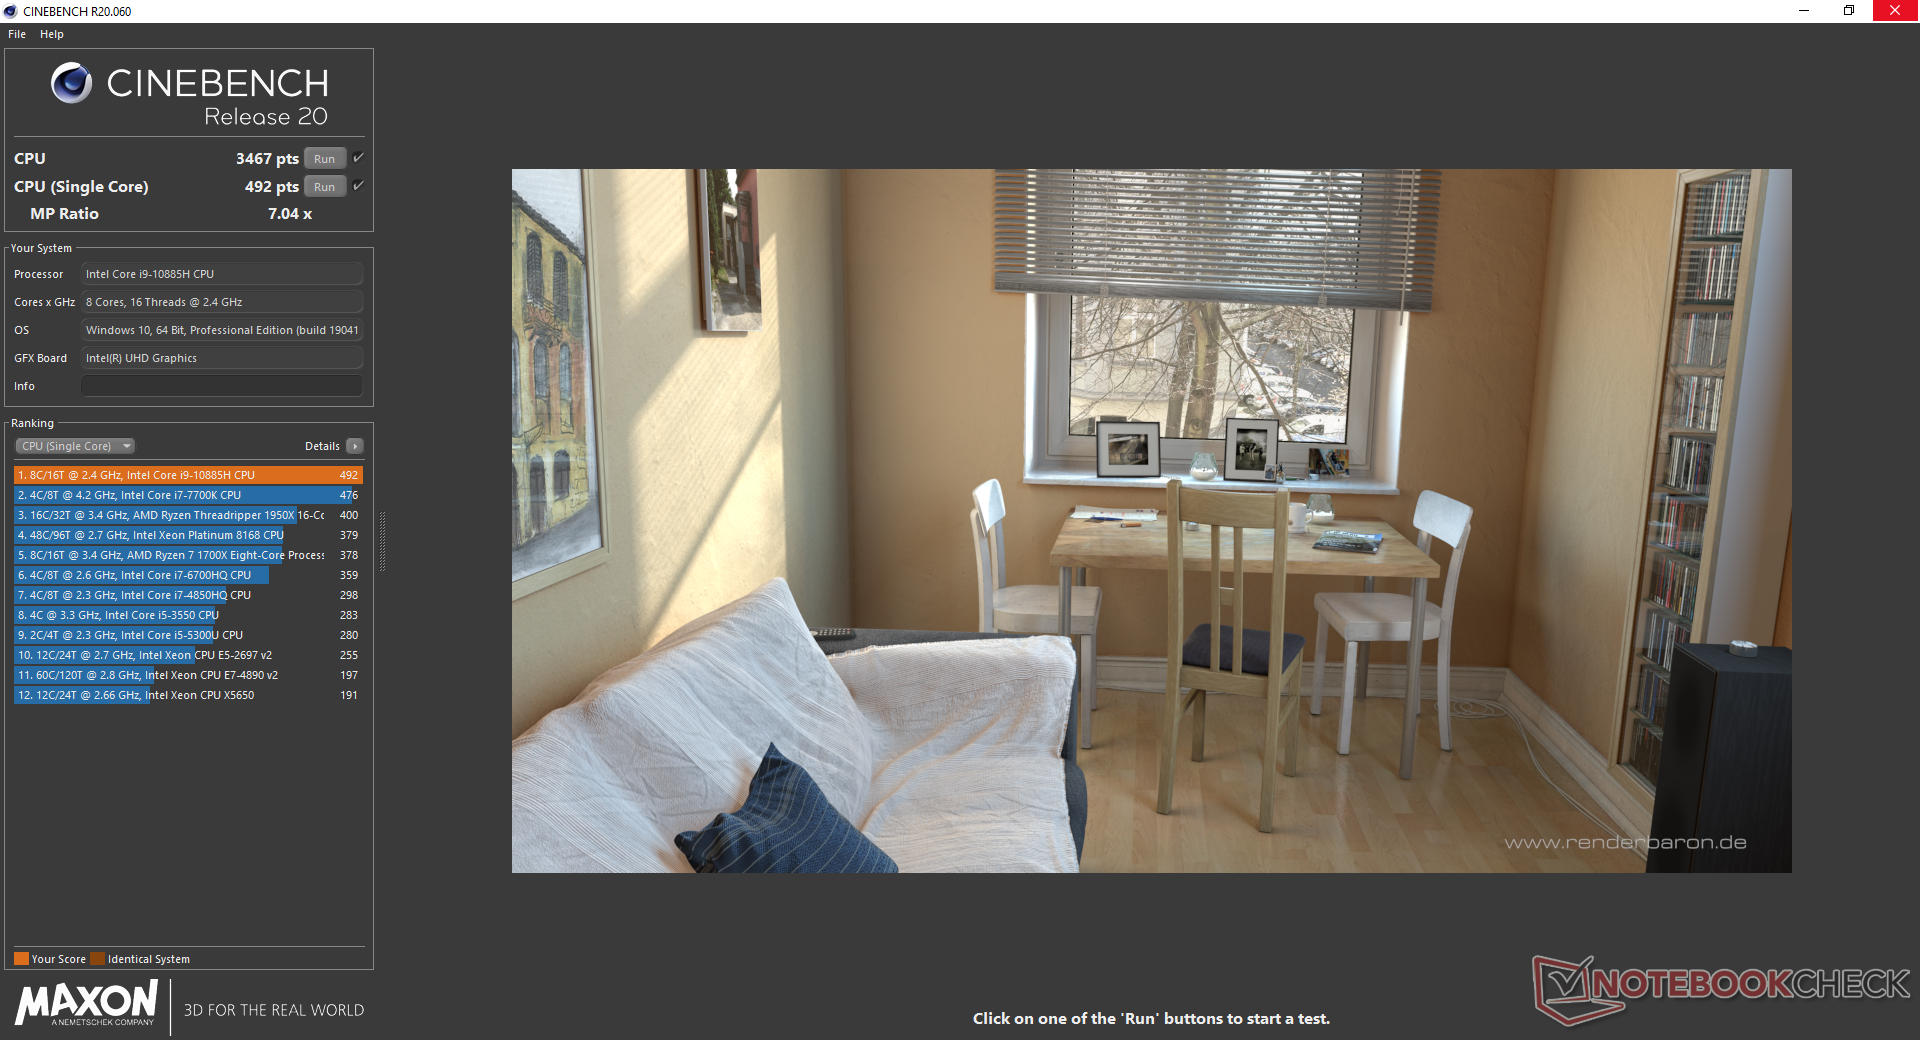
El rendimiento de la CPU es casi un 20 por ciento más lento que el del Core i7-10875H no habilitado para vPro en el Precision 5550, según los puntos de referencia de CineBench. No obstante, el rendimiento bruto es casi 1,5 veces más rápido que el del Precision 3550 si se configurara con el Core i7-10510U.
Consulta nuestra página dedicada al Core i9-10885H para obtener más información técnica y puntos de referencia. Nuestra unidad fue configurada en modo de ultra rendimiento a través del software Dell Power Manager antes de ejecutar estos benchmarks.
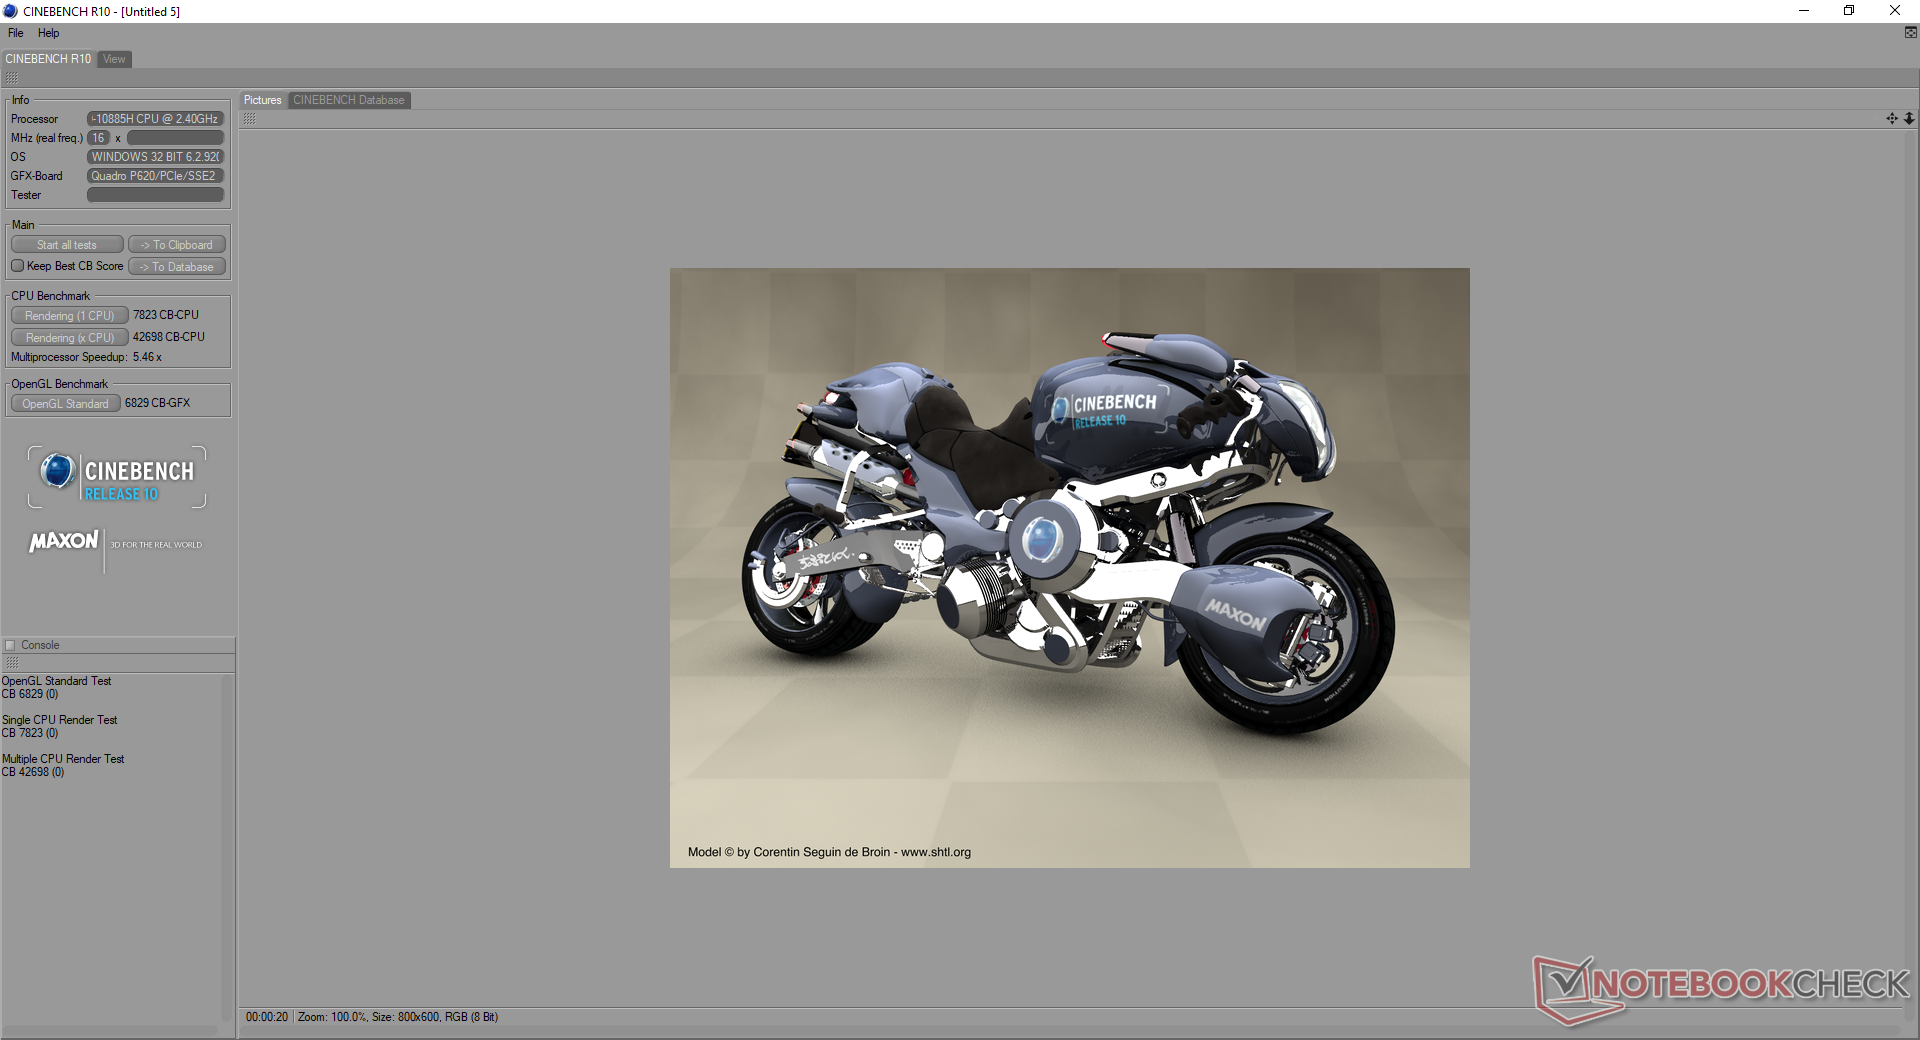
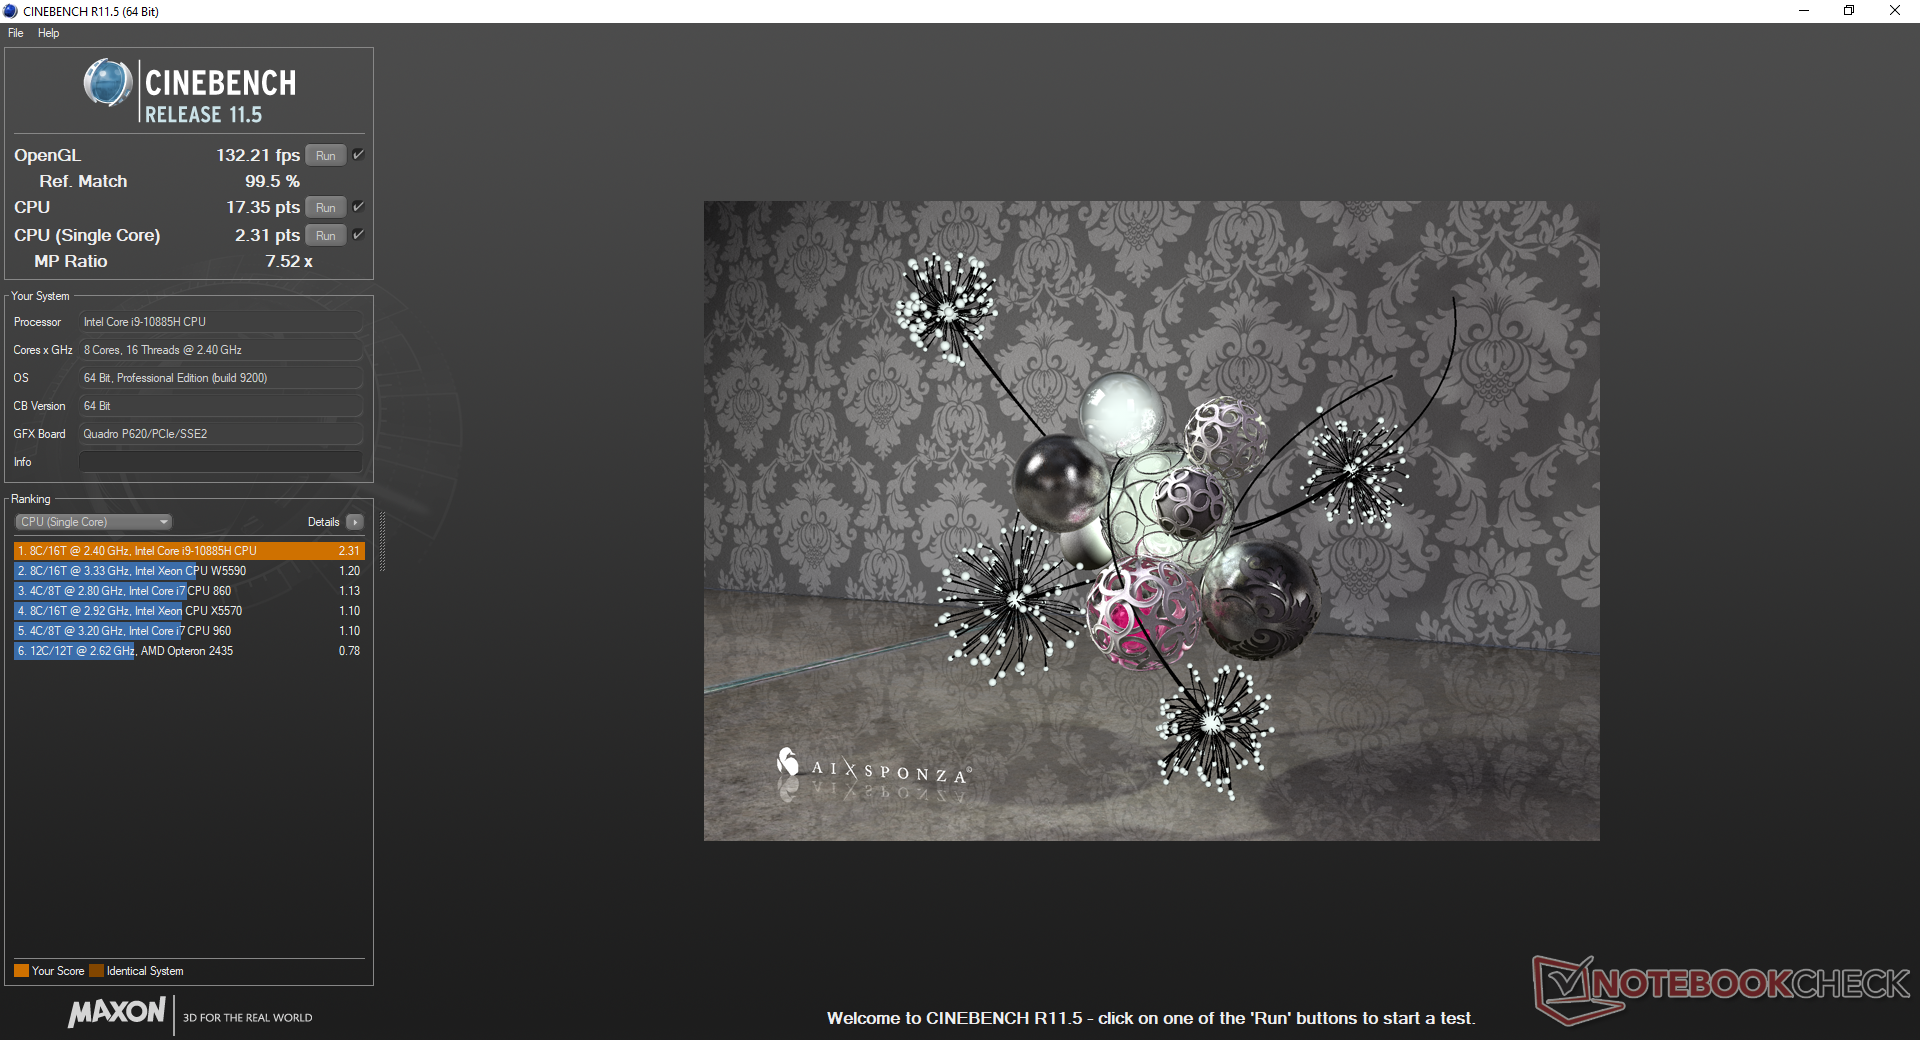
Cinebench R15: CPU Multi 64Bit | CPU Single 64Bit
Blender: v2.79 BMW27 CPU
7-Zip 18.03: 7z b 4 -mmt1 | 7z b 4
Geekbench 5.5: Single-Core | Multi-Core
HWBOT x265 Benchmark v2.2: 4k Preset
LibreOffice : 20 Documents To PDF
R Benchmark 2.5: Overall mean
| Cinebench R20 / CPU (Multi Core) | |
| MSI WS66 10TMT-207US | |
| Dell Precision 7550 | |
| Dell Precision 5550 P91F | |
| Medio Intel Core i9-10885H (2798 - 3762, n=3) | |
| Dell Precision 3000 3551 | |
| Acer ConceptD 3 Pro CN315-71P-73W1 | |
| Lenovo ThinkPad P1 2019-20QT000RGE | |
| HP ZBook Firefly 15 G7 | |
| Acer TravelMate P215-52 | |
| Cinebench R20 / CPU (Single Core) | |
| MSI WS66 10TMT-207US | |
| Dell Precision 5550 P91F | |
| Dell Precision 7550 | |
| Medio Intel Core i9-10885H (460 - 513, n=3) | |
| HP ZBook Firefly 15 G7 | |
| Dell Precision 3000 3551 | |
| Acer ConceptD 3 Pro CN315-71P-73W1 | |
| Lenovo ThinkPad P1 2019-20QT000RGE | |
| Acer TravelMate P215-52 | |
| Geekbench 5.5 / Single-Core | |
| MSI WS66 10TMT-207US | |
| Dell Precision 7550 | |
| Dell Precision 5550 P91F | |
| Medio Intel Core i9-10885H (1216 - 1376, n=3) | |
| HP ZBook Firefly 15 G7 | |
| Dell Precision 3000 3551 | |
| Acer ConceptD 3 Pro CN315-71P-73W1 | |
| Acer TravelMate P215-52 | |
| Geekbench 5.5 / Multi-Core | |
| Dell Precision 5550 P91F | |
| Dell Precision 7550 | |
| MSI WS66 10TMT-207US | |
| Medio Intel Core i9-10885H (6529 - 7693, n=3) | |
| Dell Precision 3000 3551 | |
| Acer ConceptD 3 Pro CN315-71P-73W1 | |
| HP ZBook Firefly 15 G7 | |
| Acer TravelMate P215-52 | |
| LibreOffice / 20 Documents To PDF | |
| HP ZBook Firefly 15 G7 | |
| Acer ConceptD 3 Pro CN315-71P-73W1 | |
| Acer TravelMate P215-52 | |
| Medio Intel Core i9-10885H (45.9 - 59.6, n=3) | |
| Dell Precision 7550 | |
| Dell Precision 3000 3551 | |
| MSI WS66 10TMT-207US | |
| Dell Precision 5550 P91F | |
| R Benchmark 2.5 / Overall mean | |
| Acer TravelMate P215-52 | |
| Acer ConceptD 3 Pro CN315-71P-73W1 | |
| HP ZBook Firefly 15 G7 | |
| Dell Precision 5550 P91F | |
| MSI WS66 10TMT-207US | |
| Dell Precision 3000 3551 | |
| Dell Precision 7550 | |
| Medio Intel Core i9-10885H (0.564 - 0.572, n=3) | |
Cinebench R15: CPU Multi 64Bit | CPU Single 64Bit
Blender: v2.79 BMW27 CPU
7-Zip 18.03: 7z b 4 -mmt1 | 7z b 4
Geekbench 5.5: Single-Core | Multi-Core
HWBOT x265 Benchmark v2.2: 4k Preset
LibreOffice : 20 Documents To PDF
R Benchmark 2.5: Overall mean
* ... más pequeño es mejor
Rendimiento del sistema
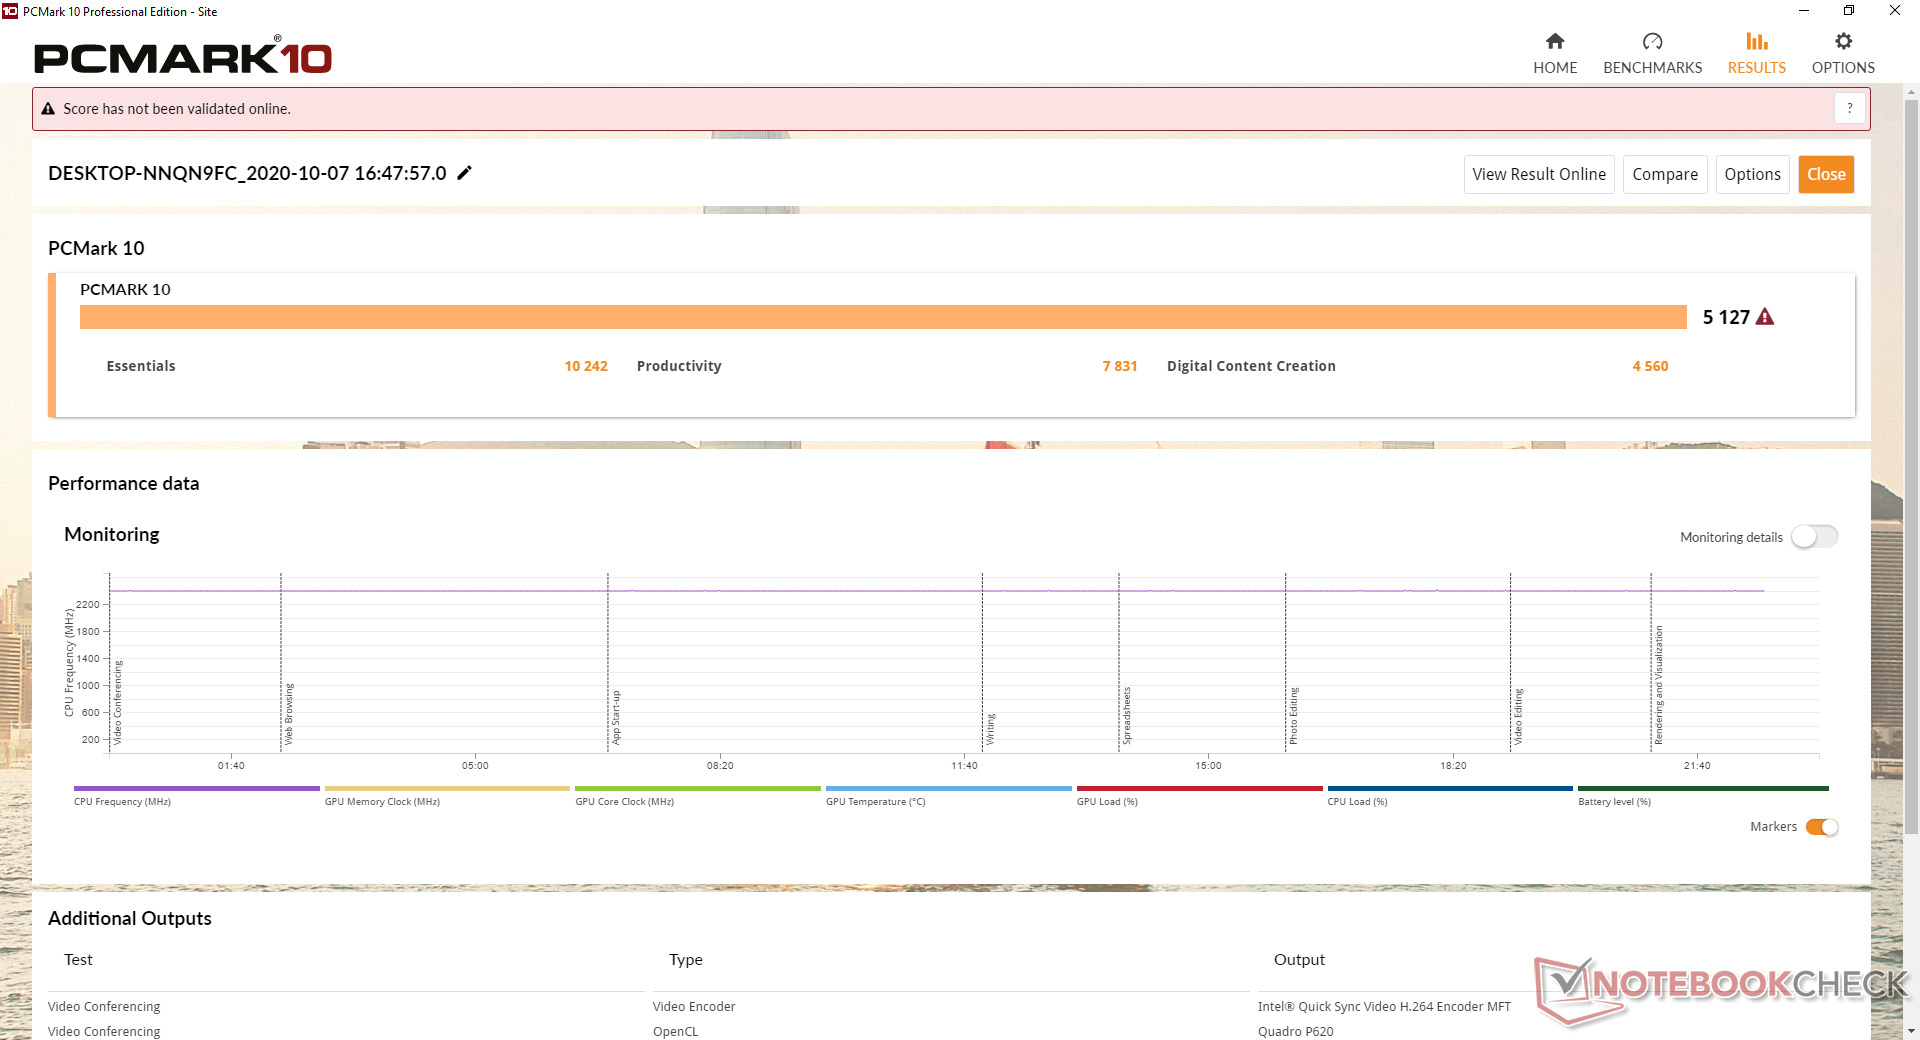
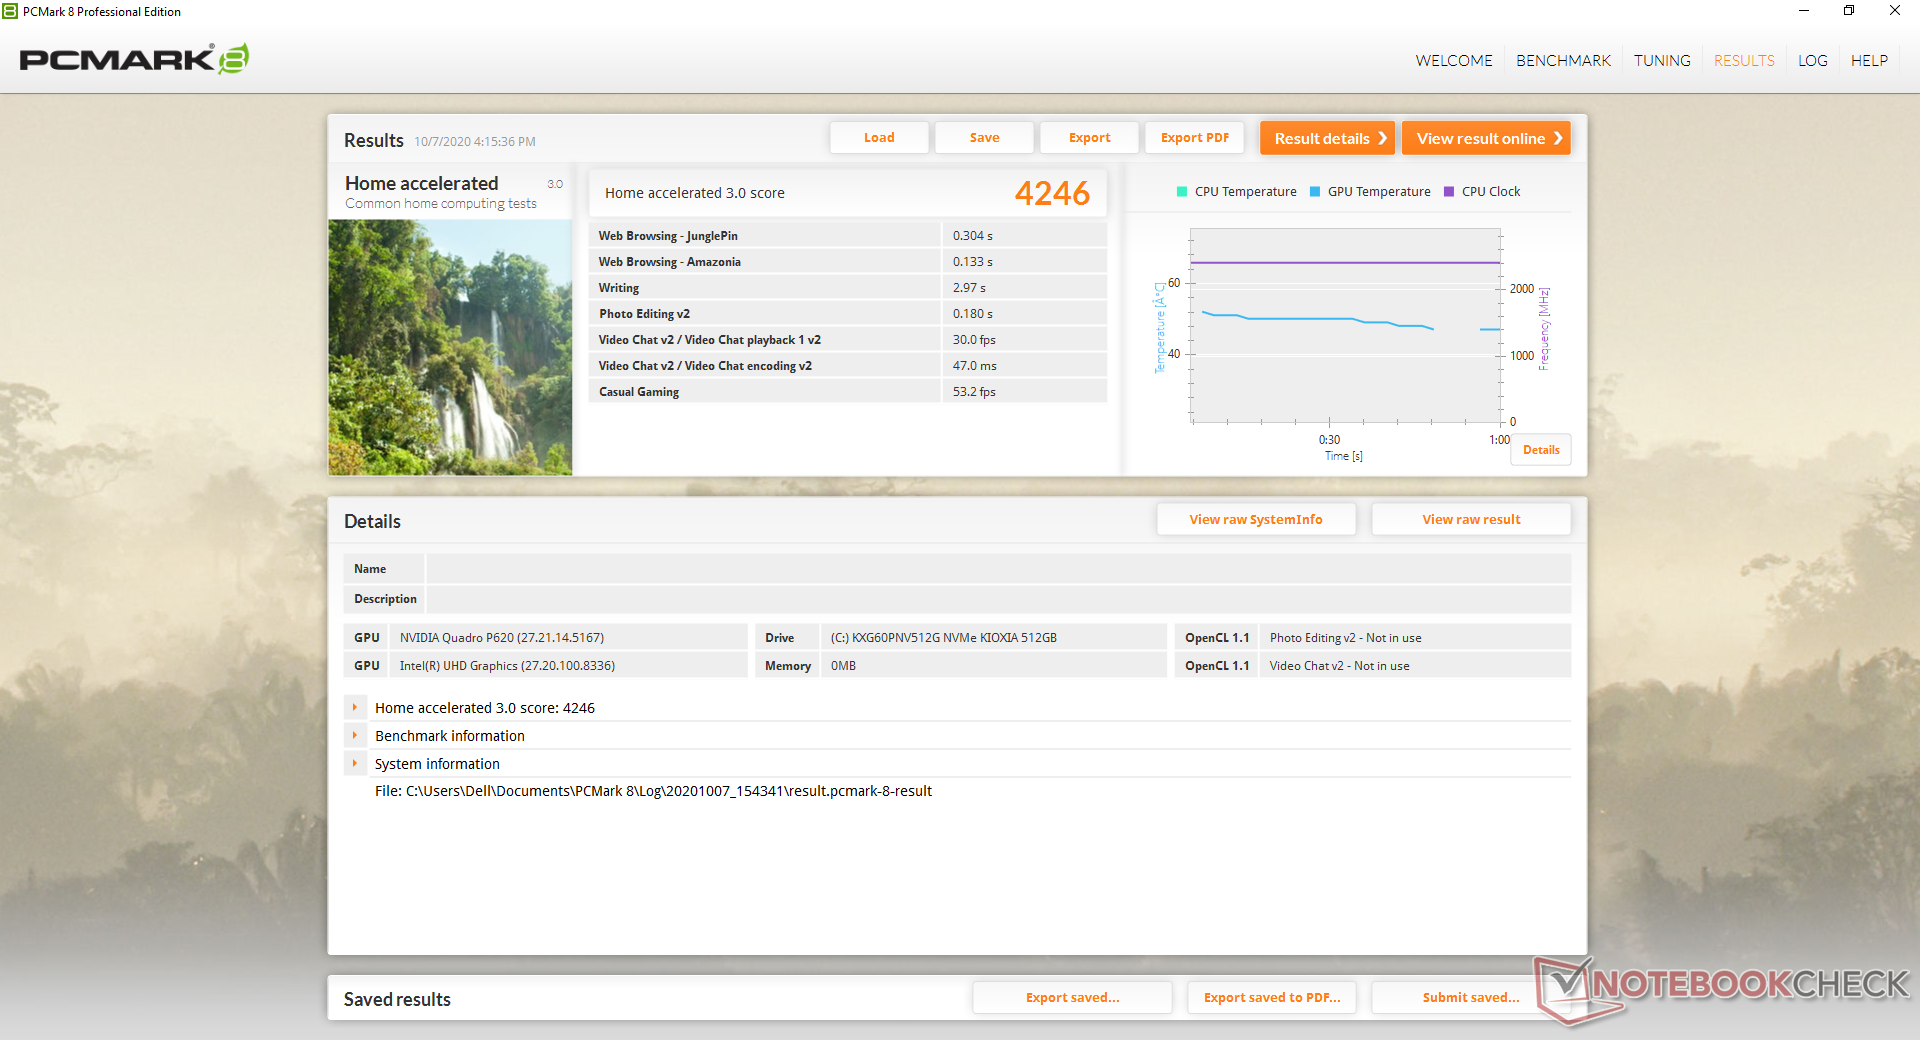
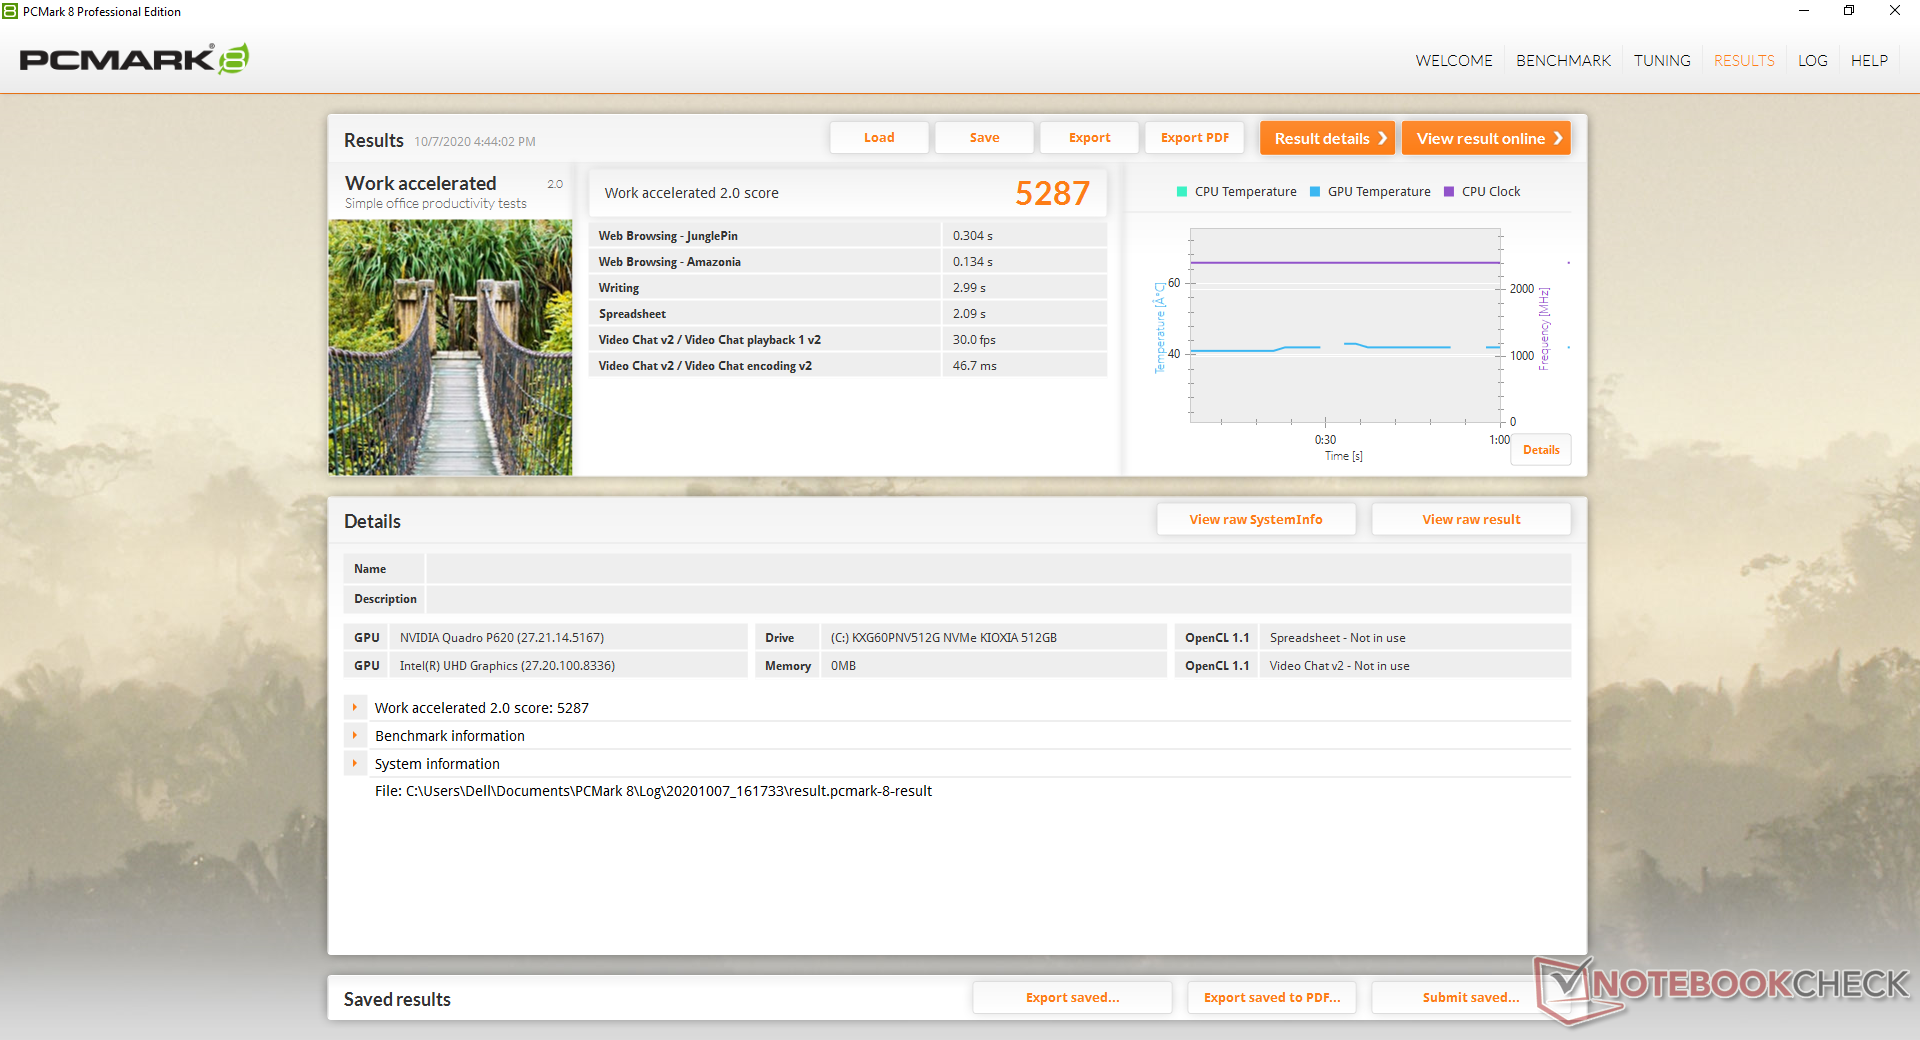
| PCMark 8 Home Score Accelerated v2 | 4246 puntos | |
| PCMark 8 Work Score Accelerated v2 | 5287 puntos | |
| PCMark 10 Score | 5127 puntos | |
ayuda | ||
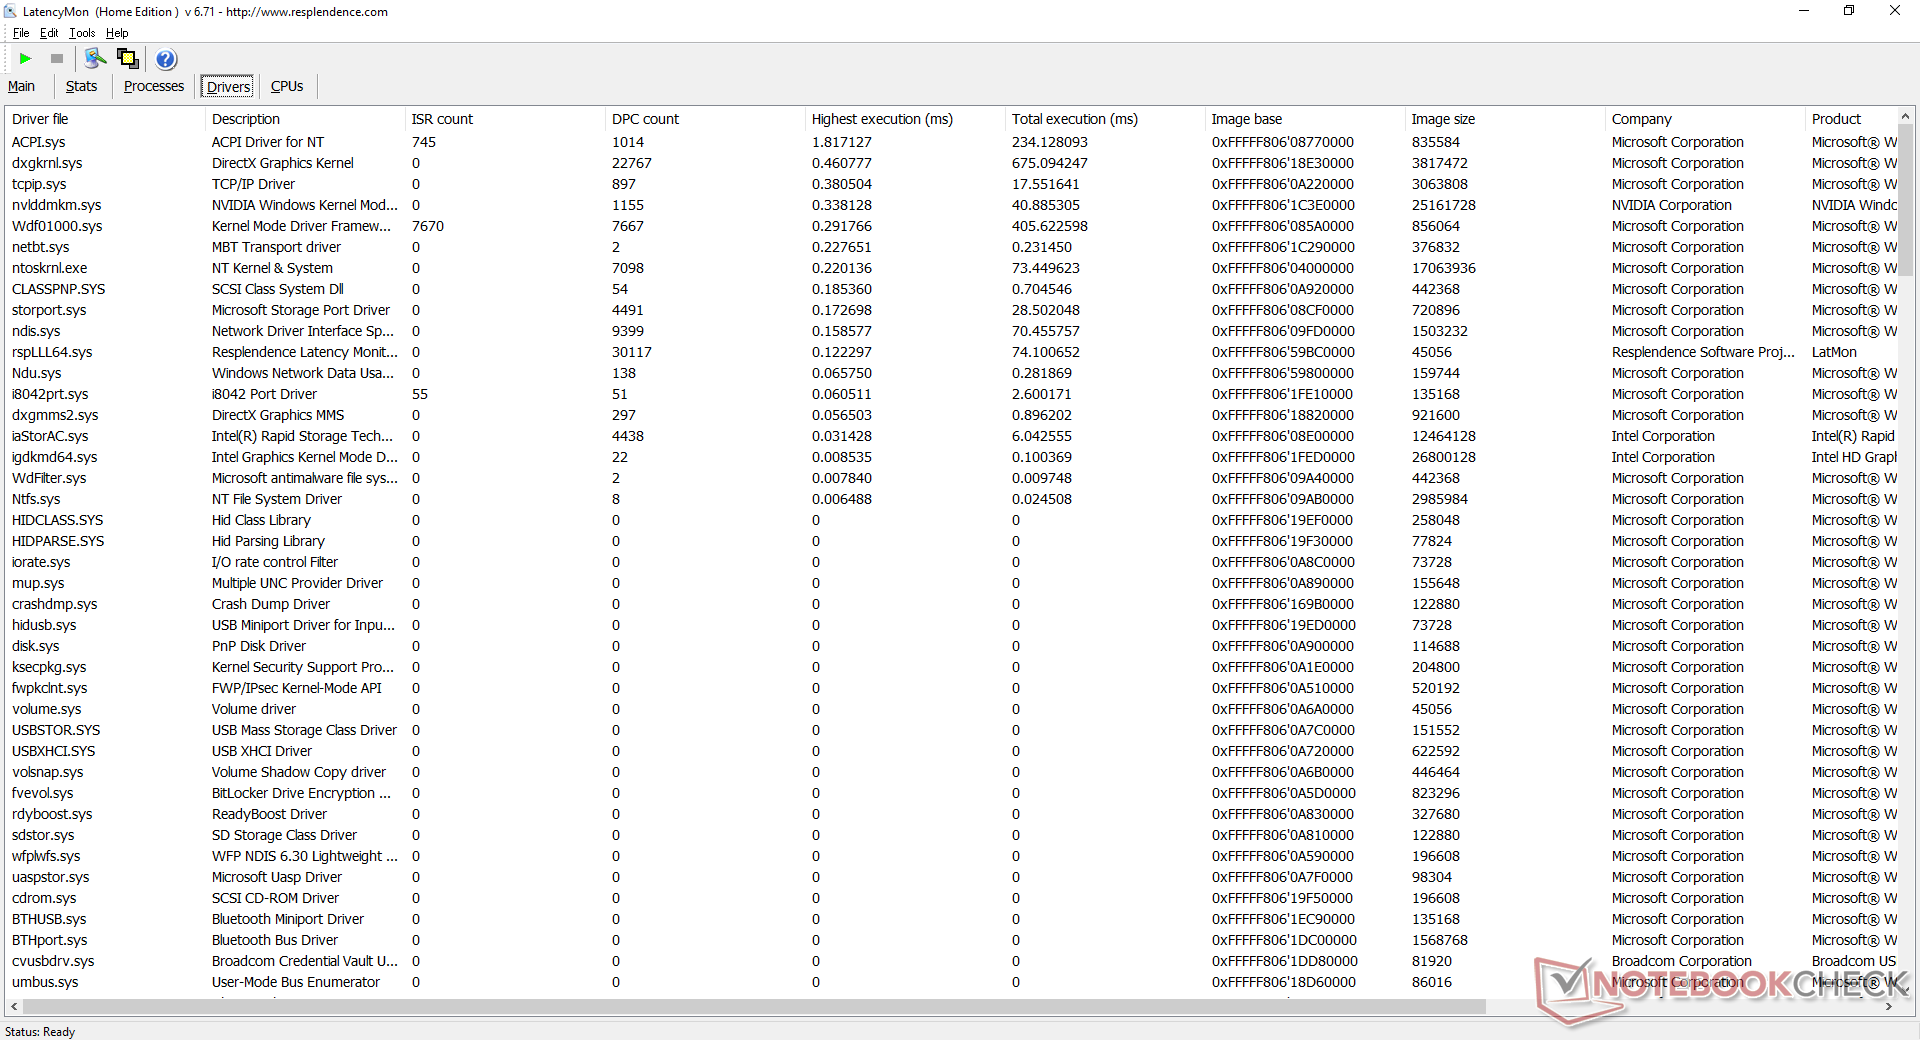
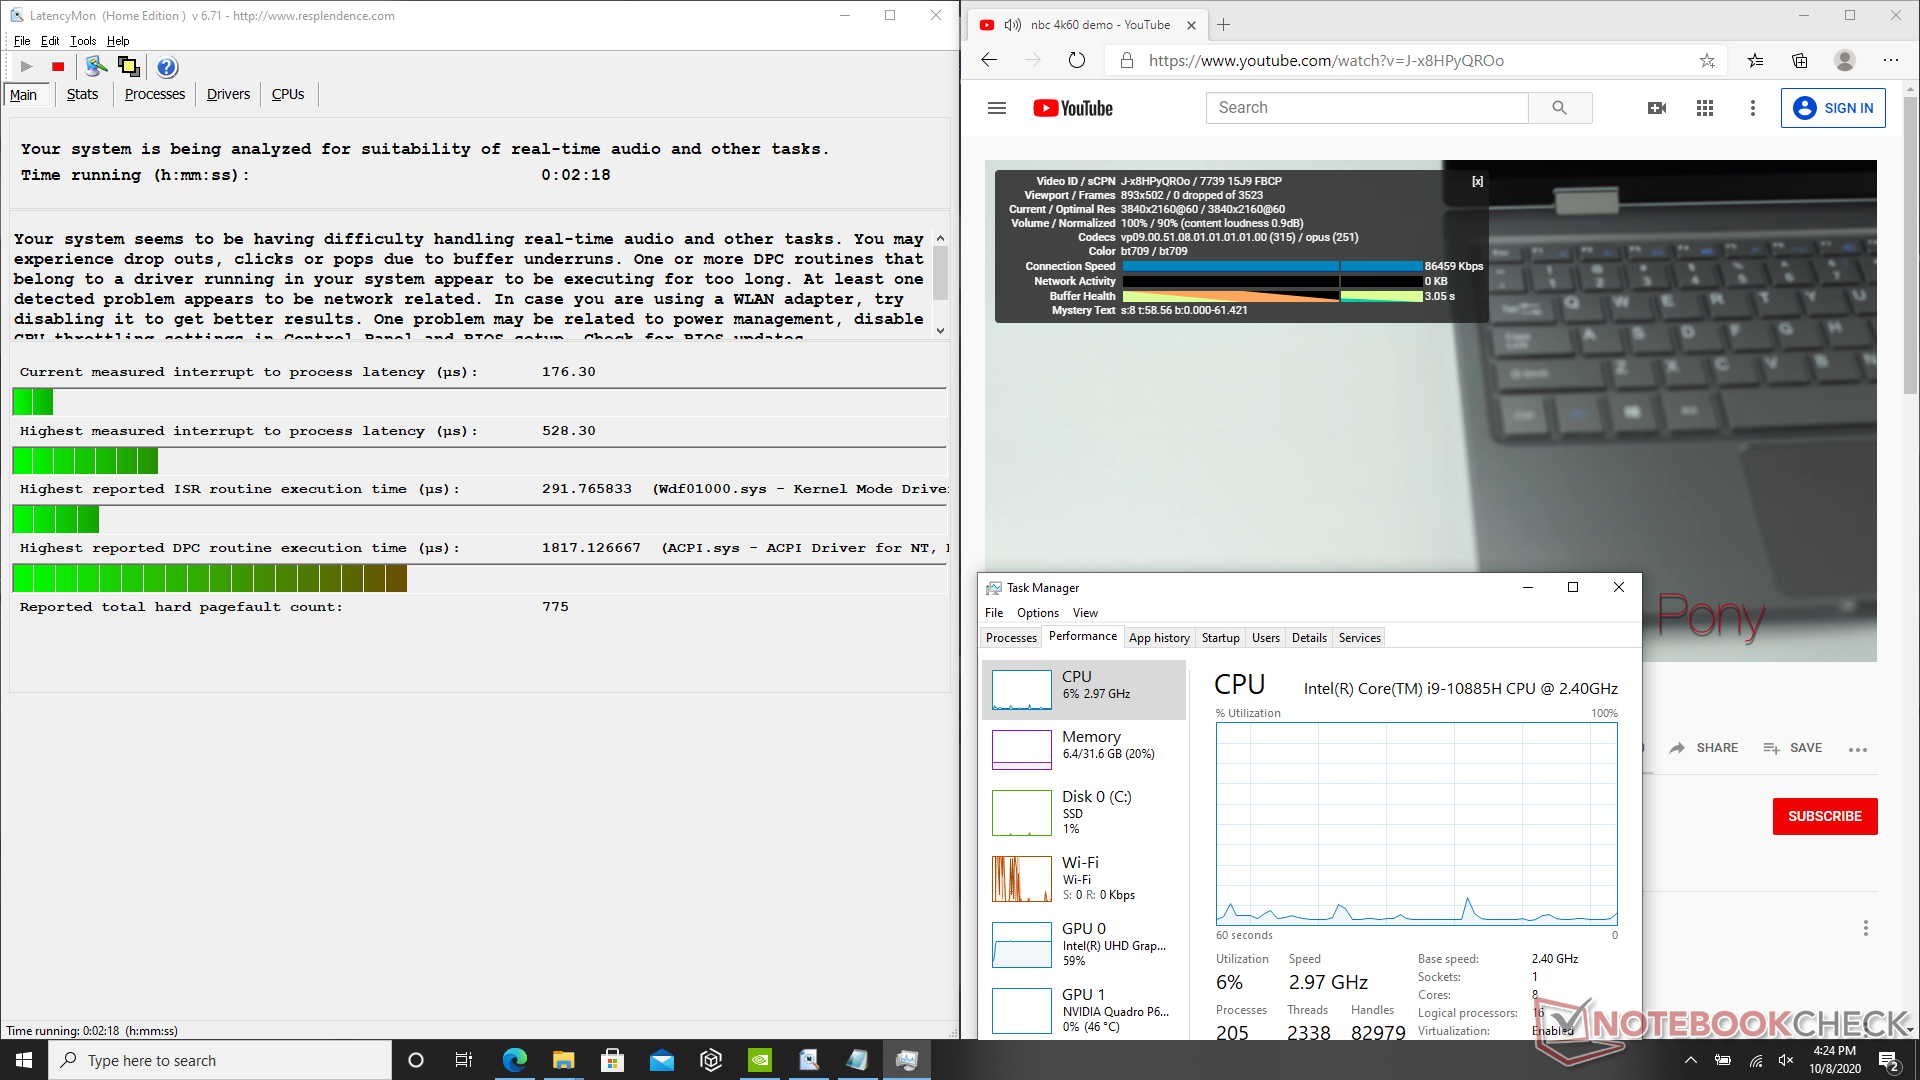
Latencia del DPC
| DPC Latencies / LatencyMon - interrupt to process latency (max), Web, Youtube, Prime95 | |
| Dell Precision 7550 | |
| HP ZBook Firefly 15 G7 | |
| MSI WS66 10TMT-207US | |
| Dell Precision 3000 3551 | |
| Dell Precision 5000 5750 P92F | |
| Dell Precision 5550 P91F | |
* ... más pequeño es mejor
Dispositivos de almacenamiento
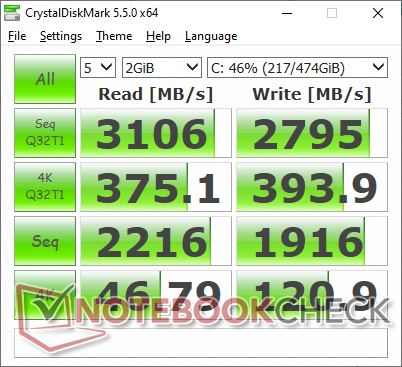
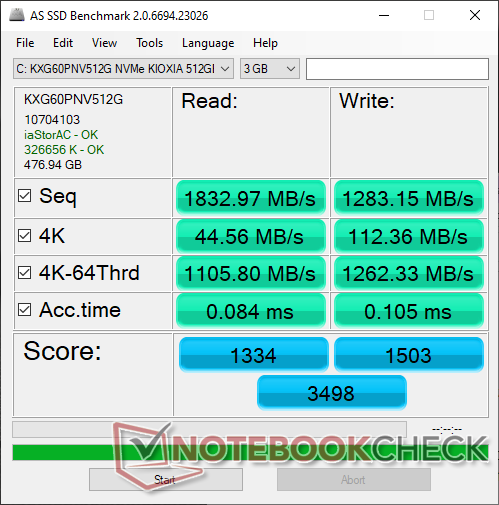
| Dell Precision 3000 3551 Toshiba Kioxia XG6 KXG60PNV512G | HP ZBook Firefly 15 G7 Toshiba XG6 KXG60ZNV1T02 | Dell Precision 5550 P91F SK Hynix PC601A NVMe 1TB | Lenovo ThinkPad P53s-20N6001NGE Intel SSD 760p SSDPEKKW256G8 | MSI WP65 Samsung SSD PM981 MZVLB512HAJQ | Dell Precision 3530 SK hynix PC400 512 GB | |
|---|---|---|---|---|---|---|
| AS SSD | 13% | -53% | 4% | 10% | -13% | |
| Seq Read (MB/s) | 1833 | 2666 45% | 2039 11% | 2283 25% | 1097 -40% | 2682 46% |
| Seq Write (MB/s) | 1283 | 1257 -2% | 1376 7% | 1042 -19% | 1838 43% | 1272 -1% |
| 4K Read (MB/s) | 44.56 | 48.04 8% | 44.11 -1% | 46.62 5% | 52.9 19% | 25.98 -42% |
| 4K Write (MB/s) | 112.4 | 137.5 22% | 113.3 1% | 172.6 54% | 108.4 -4% | 102.8 -9% |
| 4K-64 Read (MB/s) | 1106 | 977 -12% | 1094 -1% | 759 -31% | 1509 36% | 994 -10% |
| 4K-64 Write (MB/s) | 1262 | 1142 -10% | 1630 29% | 916 -27% | 1695 34% | 908 -28% |
| Access Time Read * (ms) | 0.084 | 0.053 37% | 0.059 30% | 0.06 29% | 0.067 20% | 0.099 -18% |
| Access Time Write * (ms) | 0.105 | 0.03 71% | 0.99 -843% | 0.022 79% | 0.103 2% | 0.053 50% |
| Score Read (Points) | 1334 | 1292 -3% | 1342 1% | 1034 -22% | 1671 25% | 1288 -3% |
| Score Write (Points) | 1503 | 1406 -6% | 1881 25% | 1192 -21% | 1988 32% | 1138 -24% |
| Score Total (Points) | 3498 | 3297 -6% | 3883 11% | 2705 -23% | 4558 30% | 3013 -14% |
| Copy ISO MB/s (MB/s) | 2940 | 2489 -15% | 1800 -39% | 1701 -42% | ||
| Copy Program MB/s (MB/s) | 733 | 682 -7% | 569 -22% | 346.1 -53% | ||
| Copy Game MB/s (MB/s) | 1442 | 1515 5% | 1409 -2% | 1050 -27% | ||
| CrystalDiskMark 5.2 / 6 | 8% | -2% | 16% | 3% | -14% | |
| Write 4K (MB/s) | 120.9 | 133.1 10% | 122.6 1% | 195.9 62% | 126.9 5% | 113.6 -6% |
| Read 4K (MB/s) | 46.79 | 51.6 10% | 42.4 -9% | 74.9 60% | 44.91 -4% | 41.18 -12% |
| Write Seq (MB/s) | 1916 | 1986 4% | 2167 13% | 1194 -38% | 1944 1% | 1417 -26% |
| Read Seq (MB/s) | 2216 | 2208 0% | 1747 -21% | 2309 4% | 1449 -35% | 1896 -14% |
| Write 4K Q32T1 (MB/s) | 393.9 | 462.3 17% | 388.8 -1% | 507 29% | 531 35% | 355 -10% |
| Read 4K Q32T1 (MB/s) | 375.1 | 400.2 7% | 367.3 -2% | 624 66% | 579 54% | 404.3 8% |
| Write Seq Q32T1 (MB/s) | 2795 | 3074 10% | 2629 -6% | 1206 -57% | 1970 -30% | 1411 -50% |
| Read Seq Q32T1 (MB/s) | 3106 | 3268 5% | 3460 11% | 3091 0% | 2990 -4% | 3095 0% |
| Media total (Programa/Opciones) | 11% /
11% | -28% /
-35% | 10% /
9% | 7% /
7% | -14% /
-13% |
* ... más pequeño es mejor

Estrangulamiento del disco: DiskSpd Read Loop, Queue Depth 8
Rendimiento de la GPU
El rendimiento gráfico bruto es ligeramente inferior al de los nuevos Quadro T1000 Max-Q y sin las ventajas de mayor rendimiento por vatio de la nueva arquitectura de Turing. La Quadro P620 está una generación atrasada en este aspecto y no está diseñada para aplicaciones gráficas intensivas.
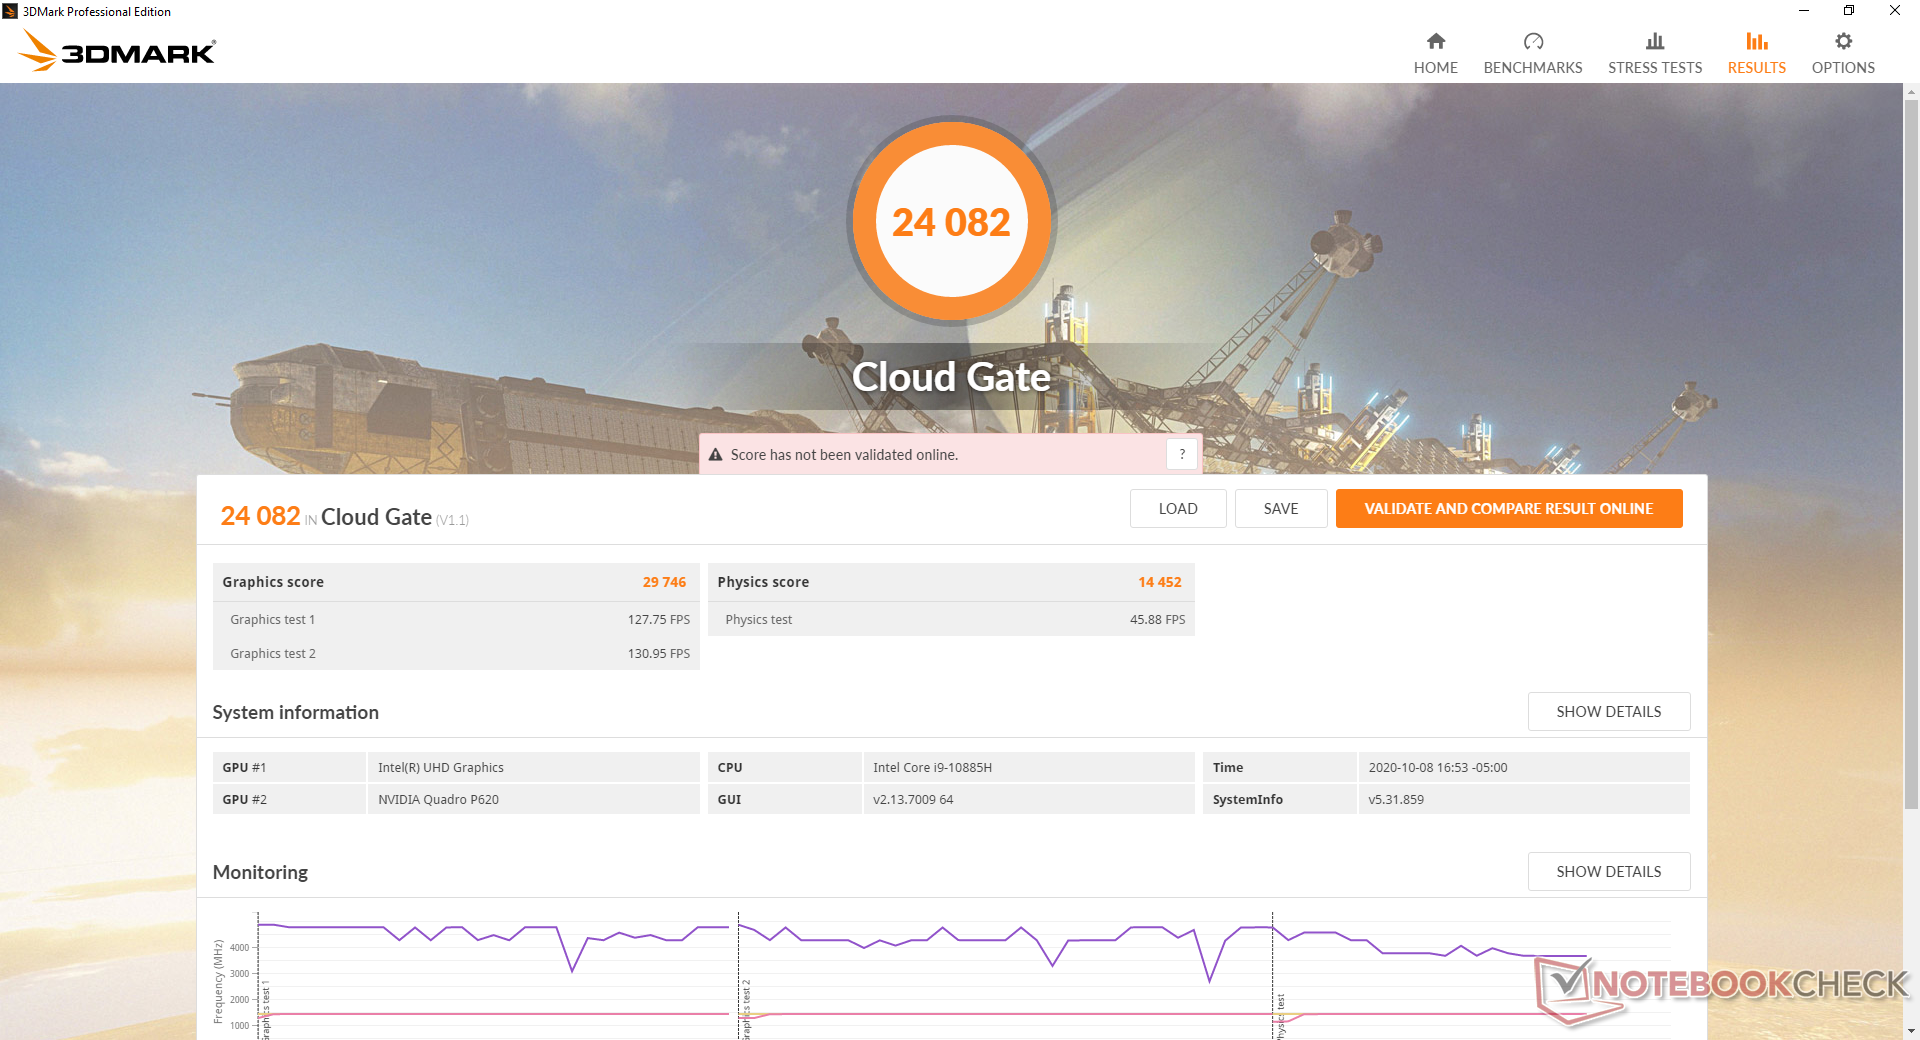
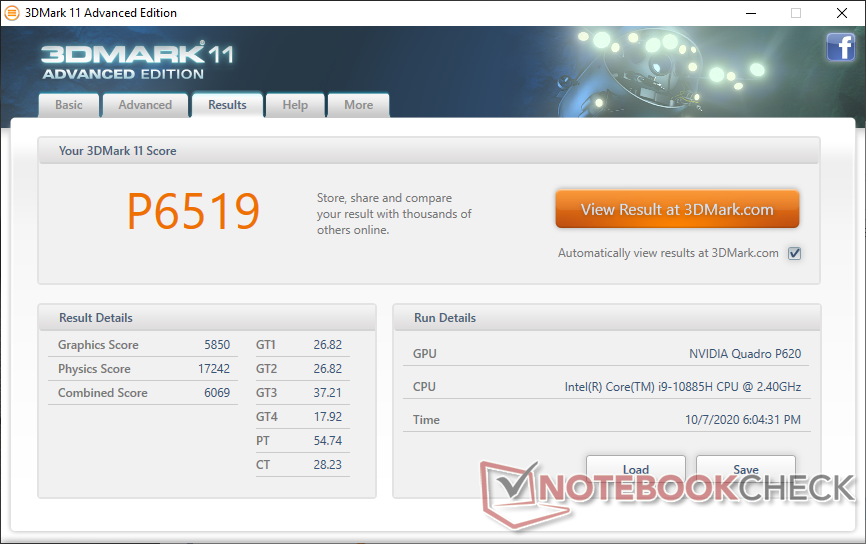
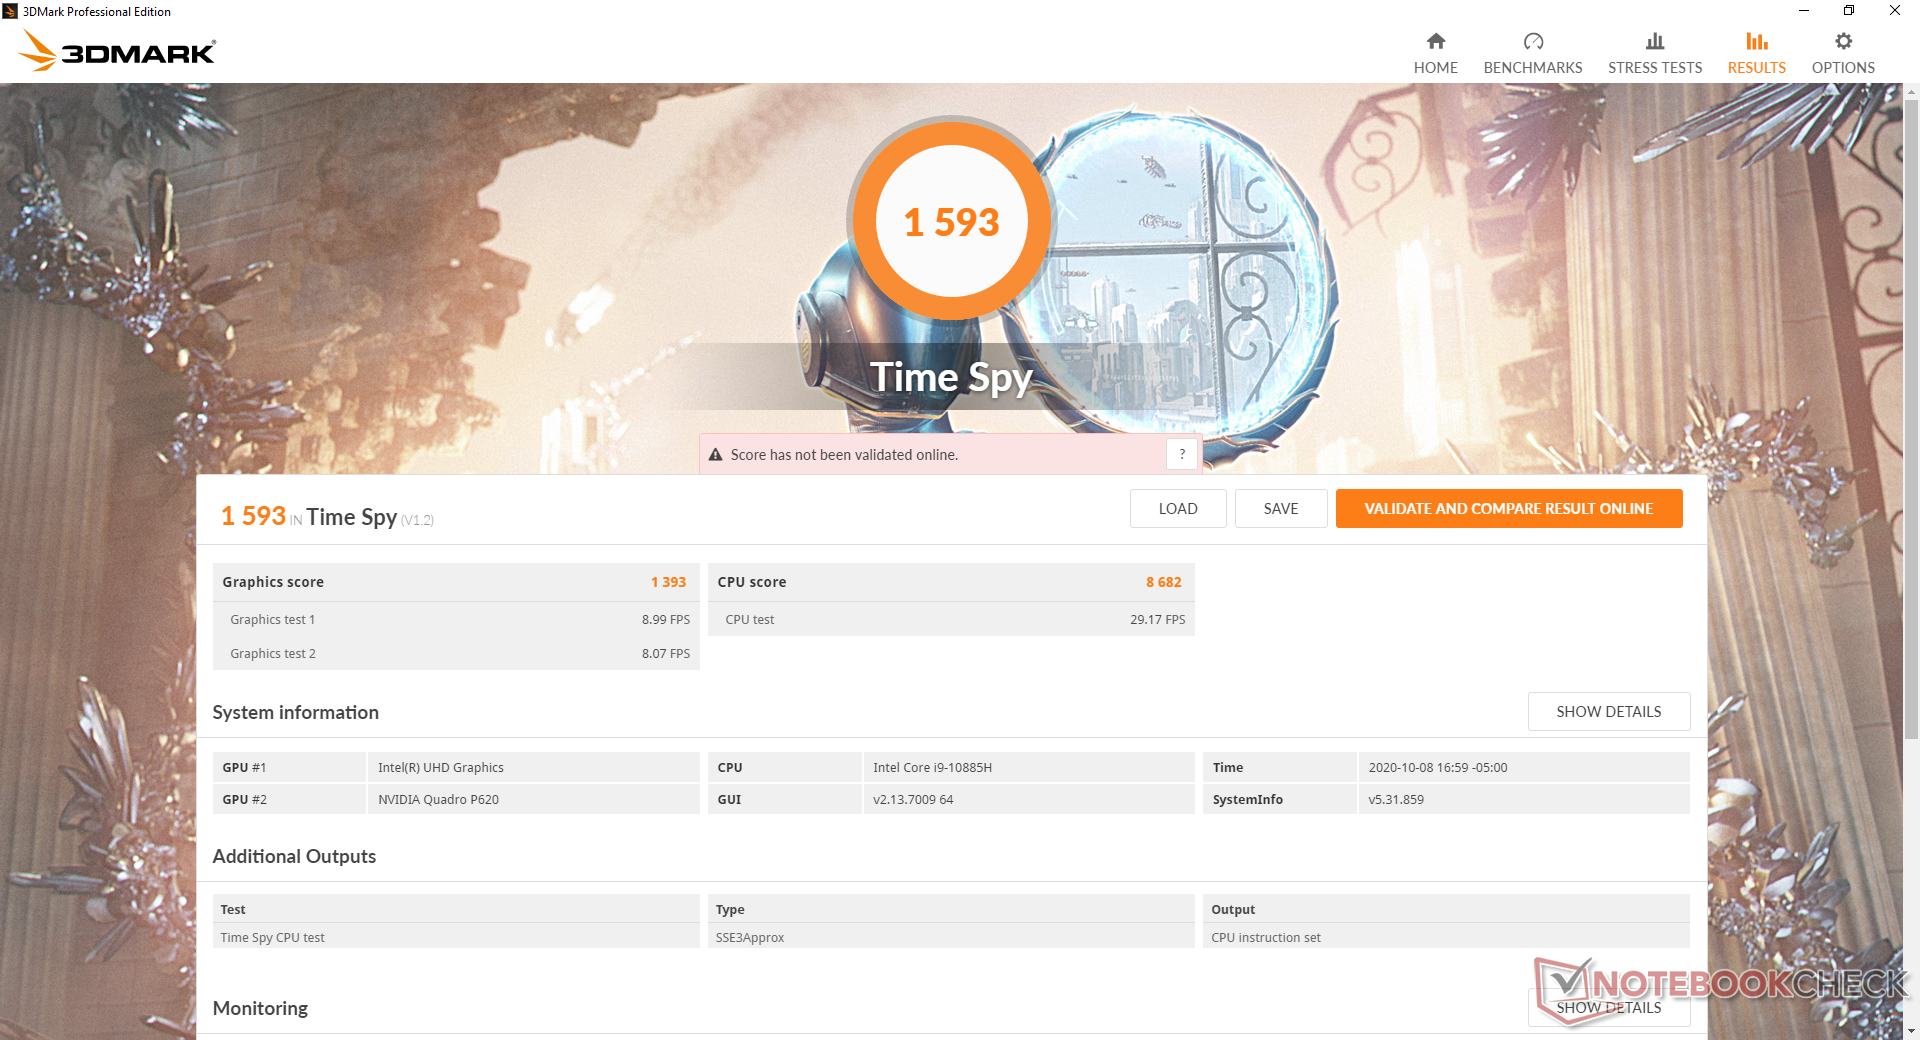
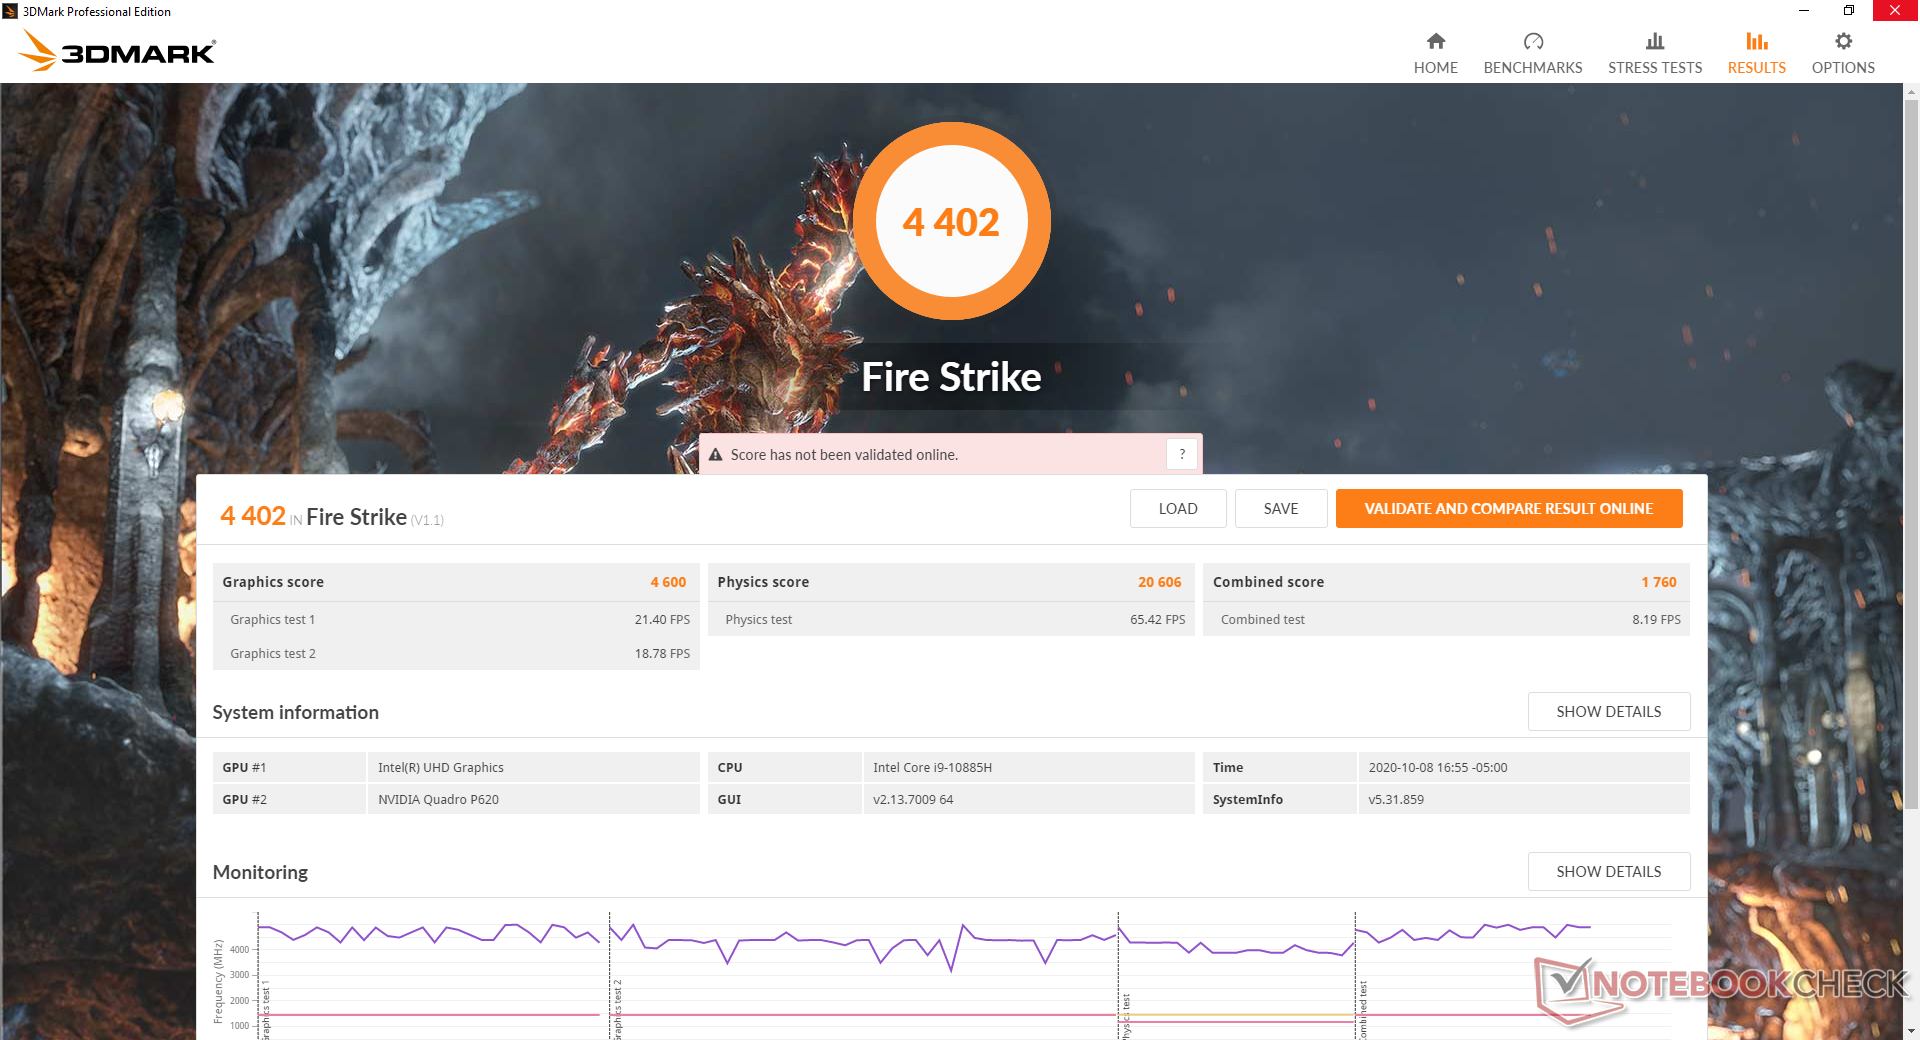
| 3DMark 06 Standard Score | 35322 puntos | |
| 3DMark 11 Performance | 6519 puntos | |
| 3DMark Cloud Gate Standard Score | 24082 puntos | |
| 3DMark Fire Strike Score | 4402 puntos | |
| 3DMark Time Spy Score | 1593 puntos | |
ayuda | ||
| bajo | medio | alto | ultra | |
|---|---|---|---|---|
| The Witcher 3 (2015) | 90.7 | 51.7 | 31.5 | 16.5 |
| Dota 2 Reborn (2015) | 156 | 139 | 90.2 | 82.8 |
| Final Fantasy XV Benchmark (2018) | 51.7 | 25.8 | 18.5 | |
| X-Plane 11.11 (2018) | 104 | 71.3 | 63.9 |
Emisiones
Ruido de sistema
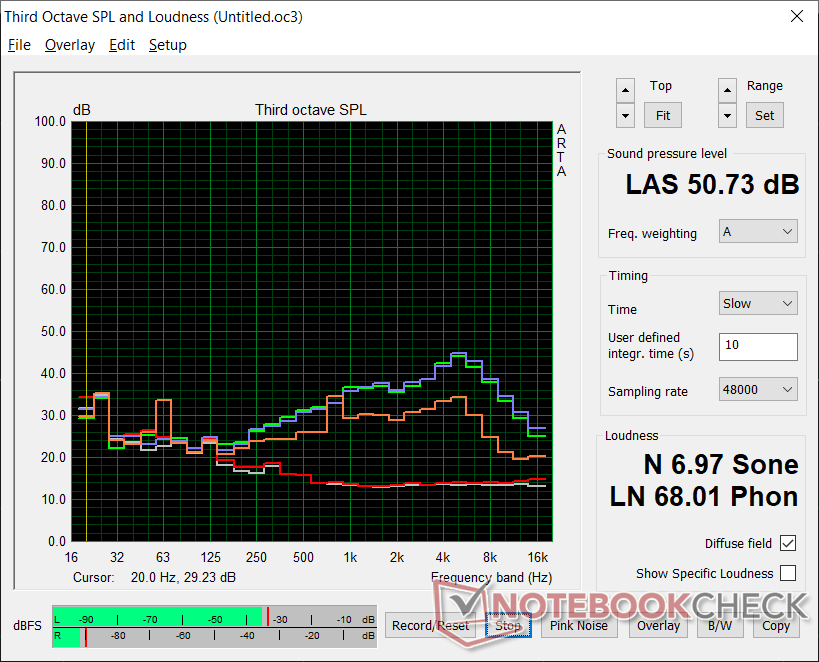
El ventilador es silencioso cuando simplemente navega por la web o transmite un video. Con cargas más altas, comenzará a acelerar casi al máximo sin dudar cuando se ejecuten cargas más altas. Espere un ruido del ventilador fuerte y ligeramente agudo entre 42 dB(A) y 51 dB(A) cuando el sistema esté estresado.
| Dell Precision 3000 3551 Quadro P620, i9-10885H, Toshiba Kioxia XG6 KXG60PNV512G | HP ZBook Firefly 15 G7 Quadro P520, i7-10610U, Toshiba XG6 KXG60ZNV1T02 | Dell Precision 5550 P91F Quadro T2000 Max-Q, i7-10875H, SK Hynix PC601A NVMe 1TB | Lenovo ThinkPad P53s-20N6001NGE Quadro P520, i7-8565U, Intel SSD 760p SSDPEKKW256G8 | MSI WP65 Quadro P620, i7-9750H, Samsung SSD PM981 MZVLB512HAJQ | Dell Precision 3530 Quadro P600, E-2176M, SK hynix PC400 512 GB | |
|---|---|---|---|---|---|---|
| Noise | 6% | 4% | 3% | -11% | -3% | |
| apagado / medio ambiente * (dB) | 25.8 | 29.3 -14% | 26.2 -2% | 29.2 -13% | 28.7 -11% | 28.1 -9% |
| Idle Minimum * (dB) | 26.2 | 29.3 -12% | 26.2 -0% | 29.2 -11% | 33.4 -27% | 28.3 -8% |
| Idle Average * (dB) | 26.2 | 29.3 -12% | 26.2 -0% | 29.2 -11% | 33.5 -28% | 28.3 -8% |
| Idle Maximum * (dB) | 26.2 | 30 -15% | 26.2 -0% | 30.8 -18% | 33.5 -28% | 28.4 -8% |
| Load Average * (dB) | 51.2 | 32.8 36% | 39.2 23% | 32.6 36% | 37 28% | 46.2 10% |
| Witcher 3 ultra * (dB) | 42.7 | 32.8 23% | 39 9% | 38.7 9% | ||
| Load Maximum * (dB) | 50.7 | 32.8 35% | 50.6 -0% | 33.8 33% | 59.5 -17% | 48.6 4% |
* ... más pequeño es mejor
Ruido
| Ocioso |
| 26.2 / 26.2 / 26.2 dB(A) |
| Carga |
| 51.2 / 50.7 dB(A) |
 | ||
30 dB silencioso 40 dB(A) audible 50 dB(A) ruidosamente alto |
||
min: | ||
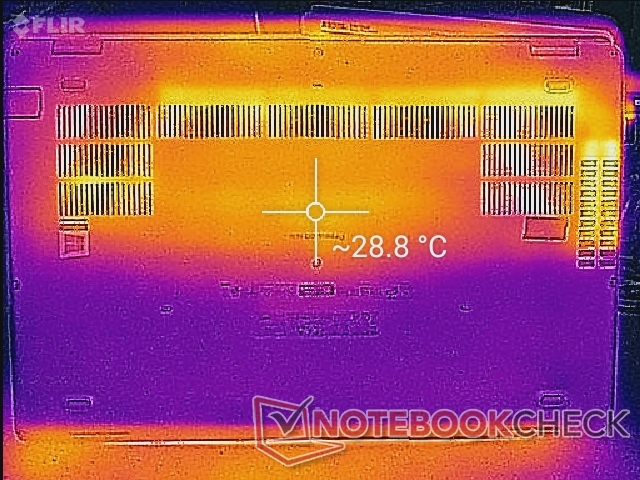
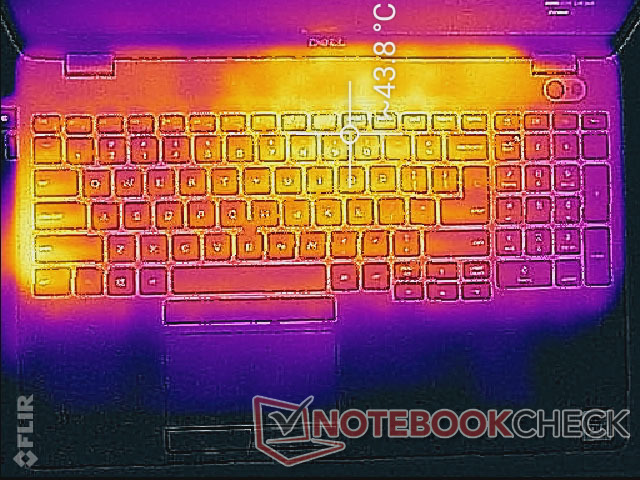
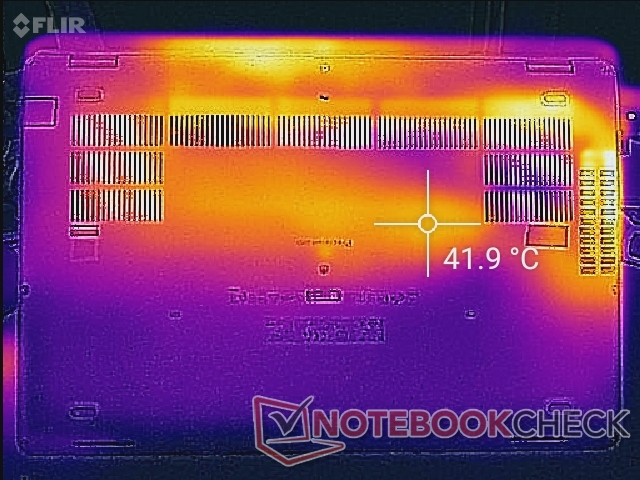
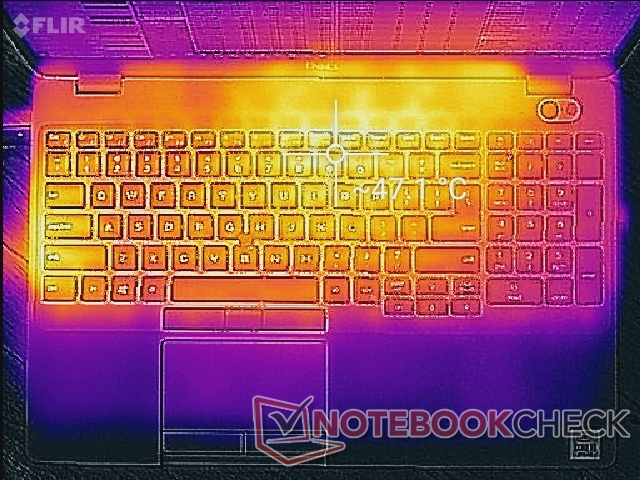
Temperatura
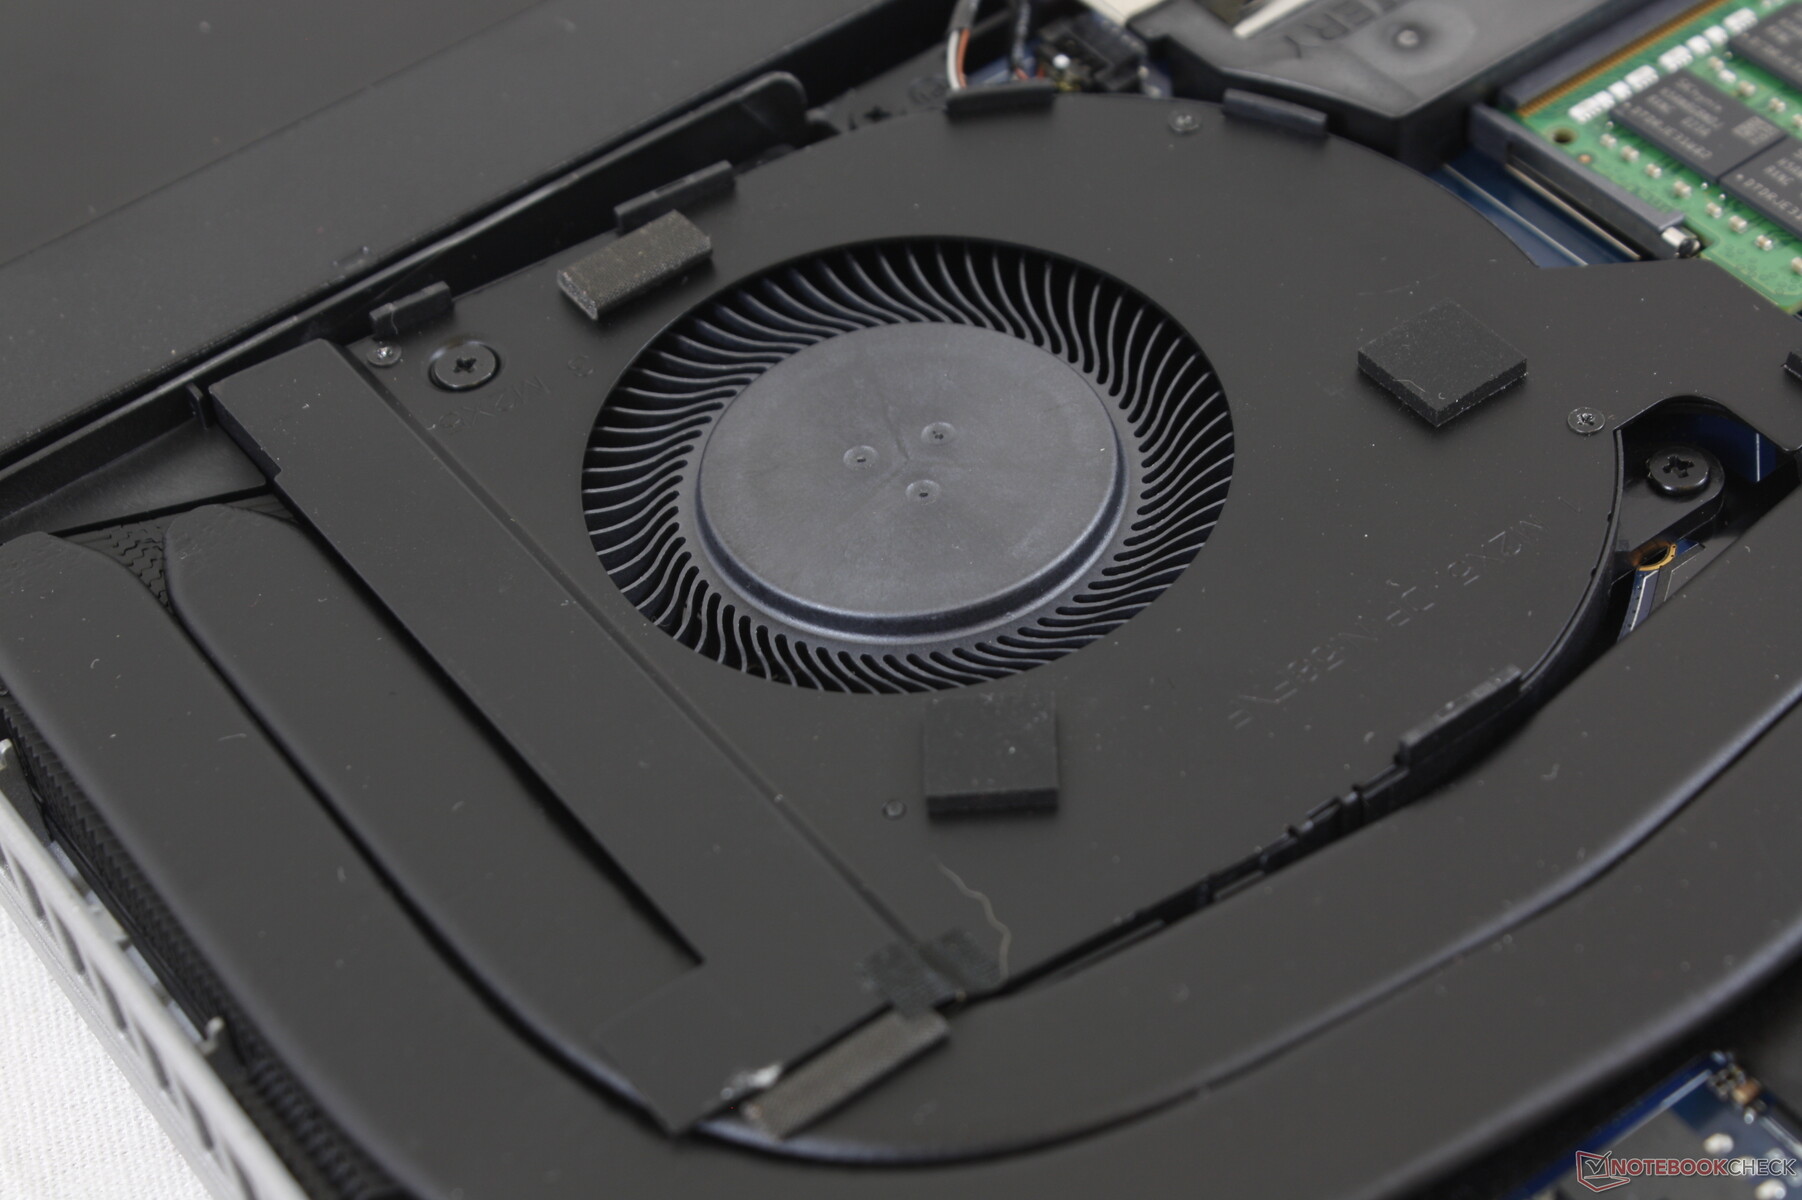
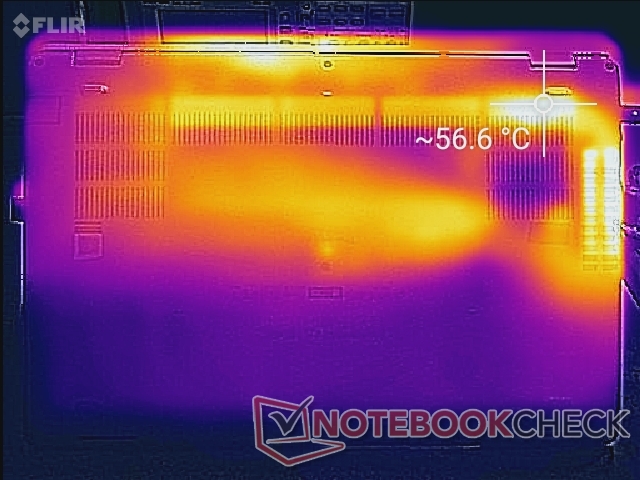
Las temperaturas de la superficie son más cálidas hacia el centro del teclado y a lo largo del borde izquierdo debido a los tubos de calor en forma de L que hay en el interior. Los apoyos de las palmas de las manos permanecen frescos y nunca encontramos que los puntos calientes sean incómodos durante el uso.
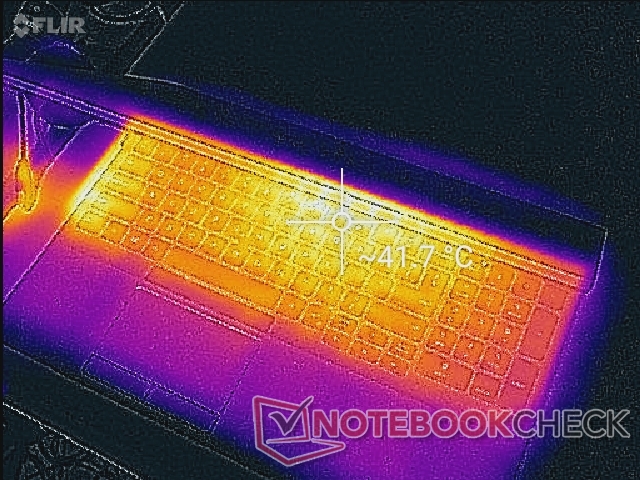
(-) La temperatura máxima en la parte superior es de 47 °C / 117 F, frente a la media de 38.2 °C / 101 F, que oscila entre 22.2 y 69.8 °C para la clase Workstation.
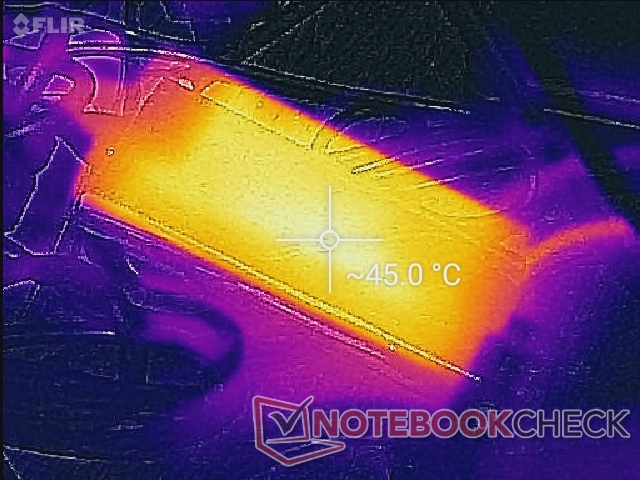
(-) El fondo se calienta hasta un máximo de 54.6 °C / 130 F, frente a la media de 41.1 °C / 106 F
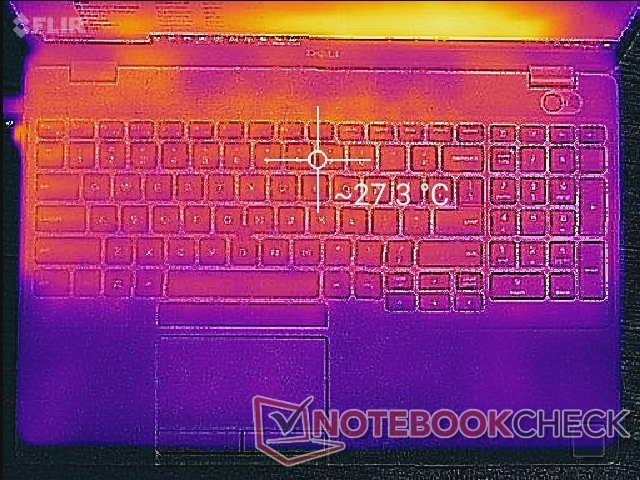
(+) En reposo, la temperatura media de la parte superior es de 26.3 °C / 79# F, frente a la media del dispositivo de 32 °C / 90 F.
(±) Jugando a The Witcher 3, la temperatura media de la parte superior es de 35.1 °C / 95 F, frente a la media del dispositivo de 32 °C / 90 F.
(+) El reposamanos y el panel táctil están a una temperatura inferior a la de la piel, con un máximo de 27.4 °C / 81.3 F y, por tanto, son fríos al tacto.
(±) La temperatura media de la zona del reposamanos de dispositivos similares fue de 27.8 °C / 82 F (+0.4 °C / 0.7 F).
Prueba de estrés
Cuando se ejecuta el Prime95, las velocidades se elevan a 4 Ghz durante los primeros segundos hasta alcanzar una temperatura central de 98 C. Las velocidades se estabilizan entonces en 2,7 a 2,8 GHz y 80 C a partir de entonces. Las velocidades máximas de Turbo Boost no son sostenibles en este sistema incluso cuando se está en el modo de Ultra Rendimiento y estos resultados reflejan nuestro CineBench y las lecturas de consumo de energía también.
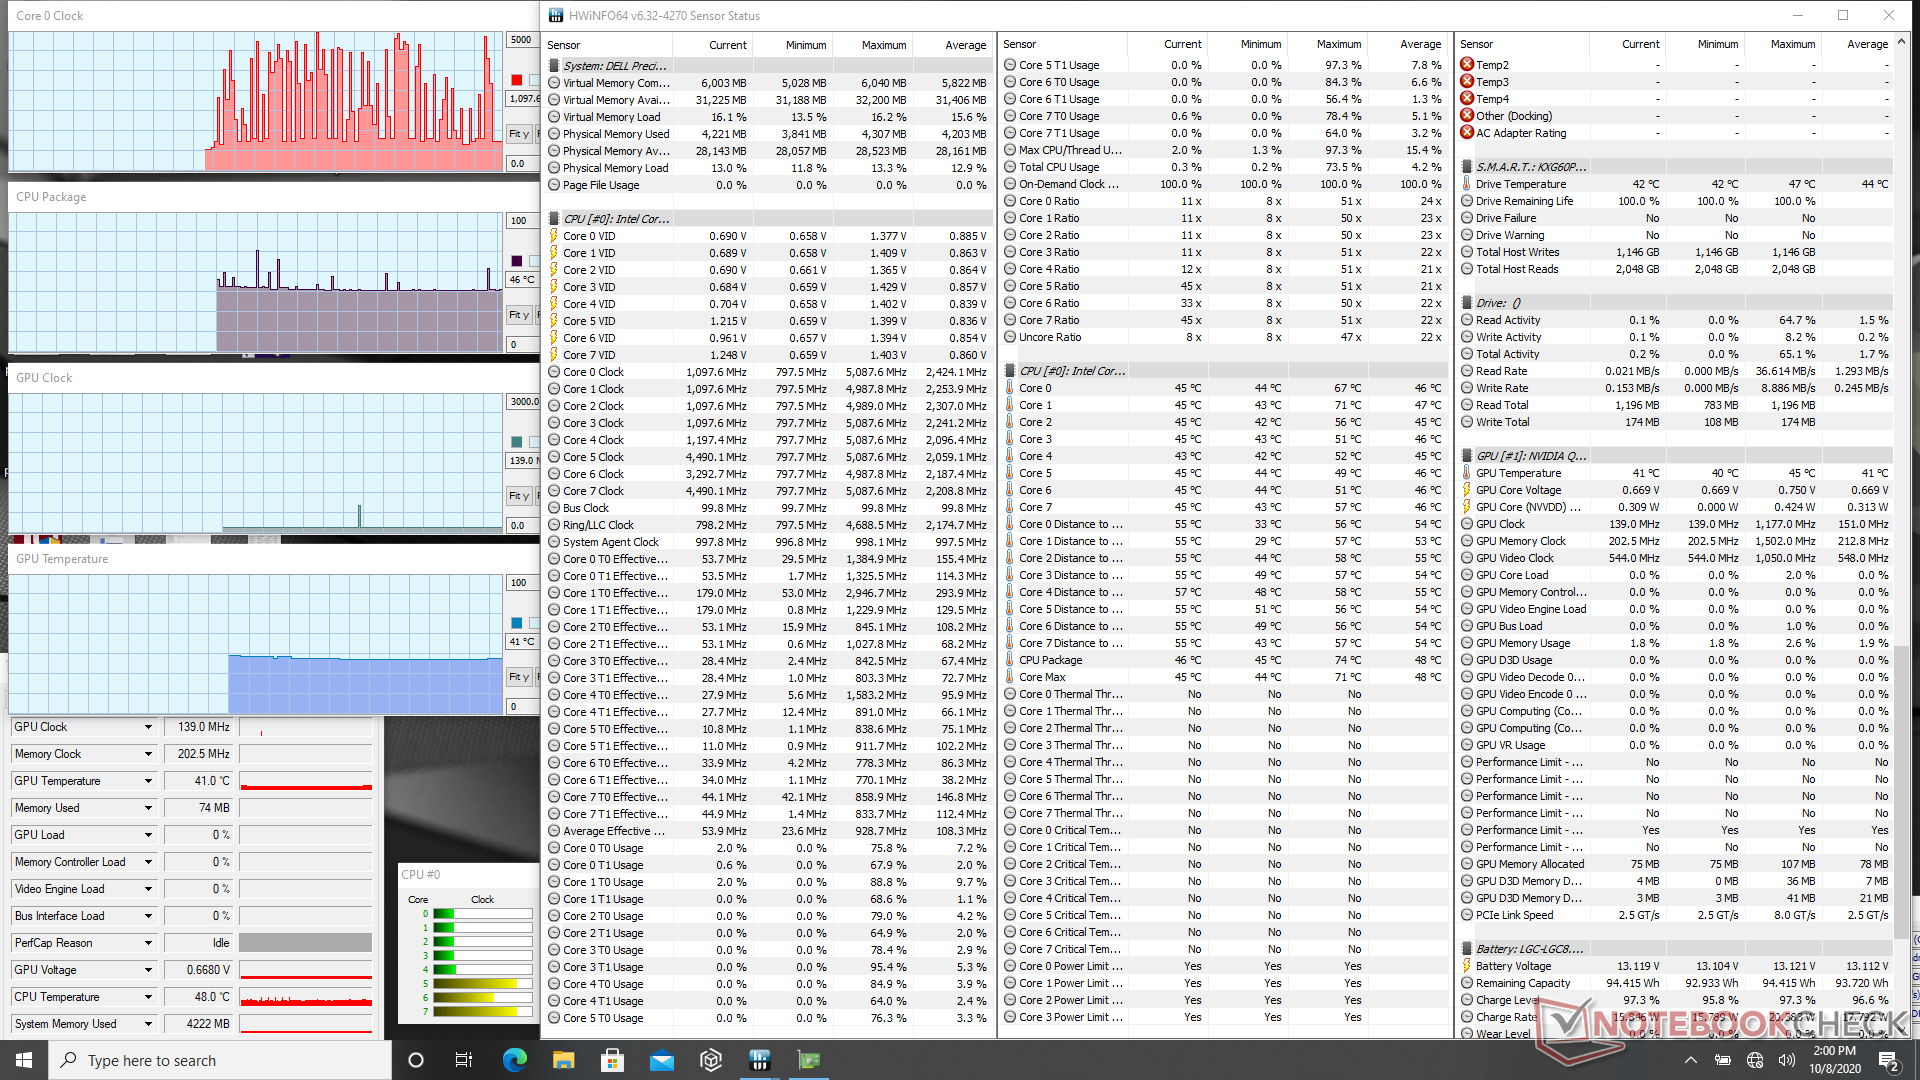
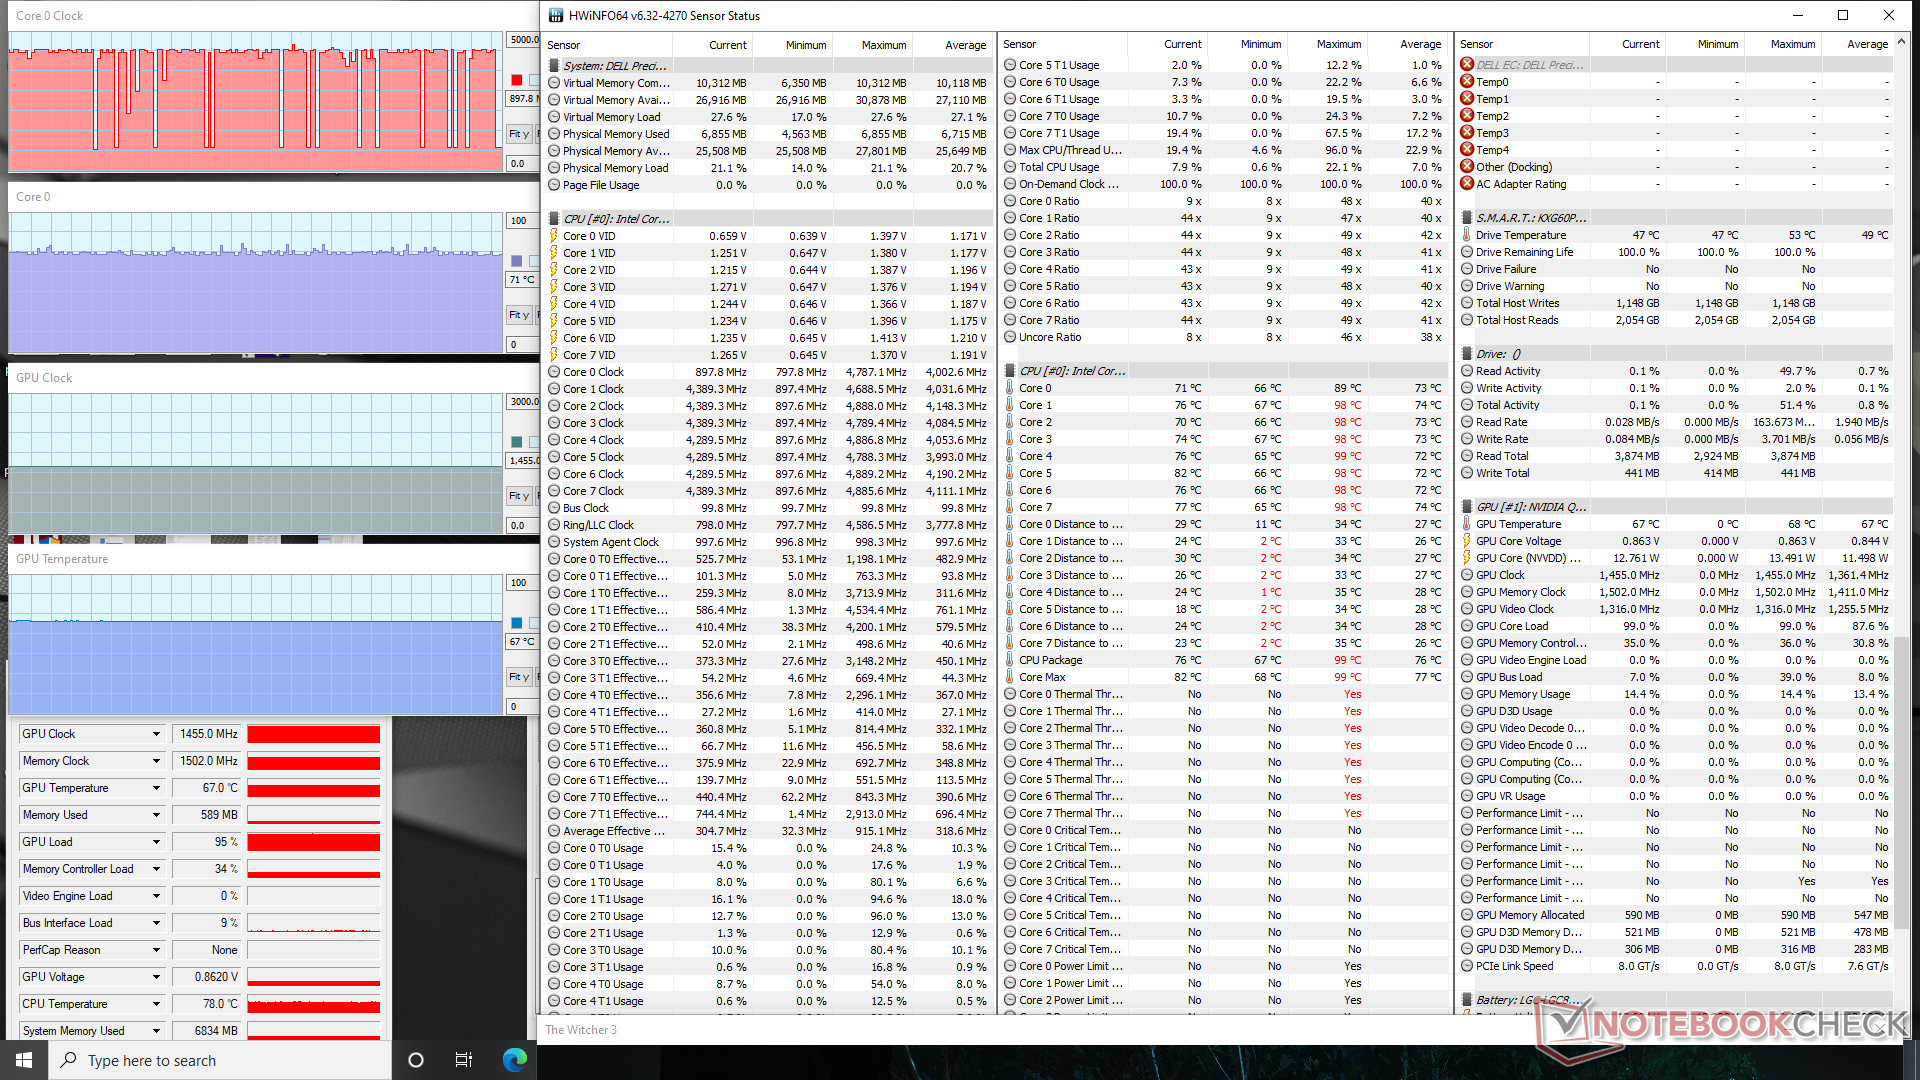
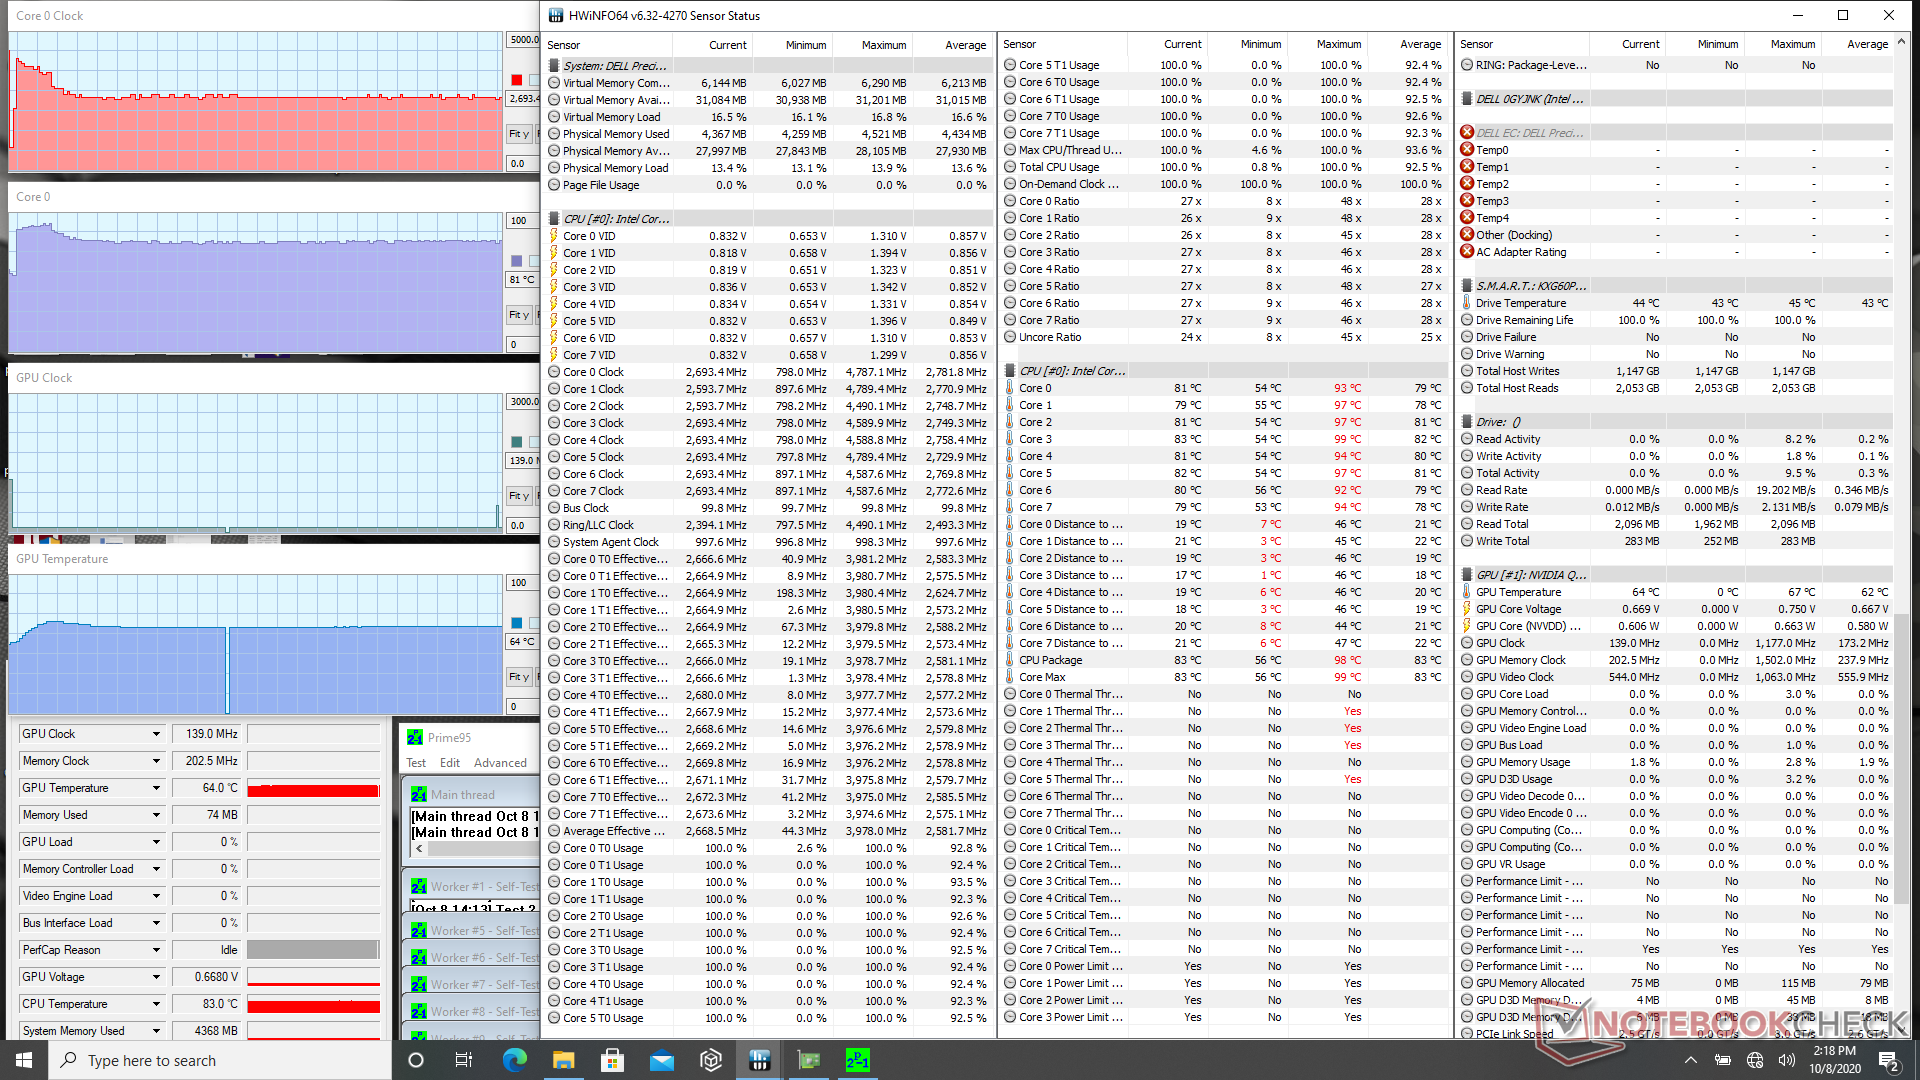
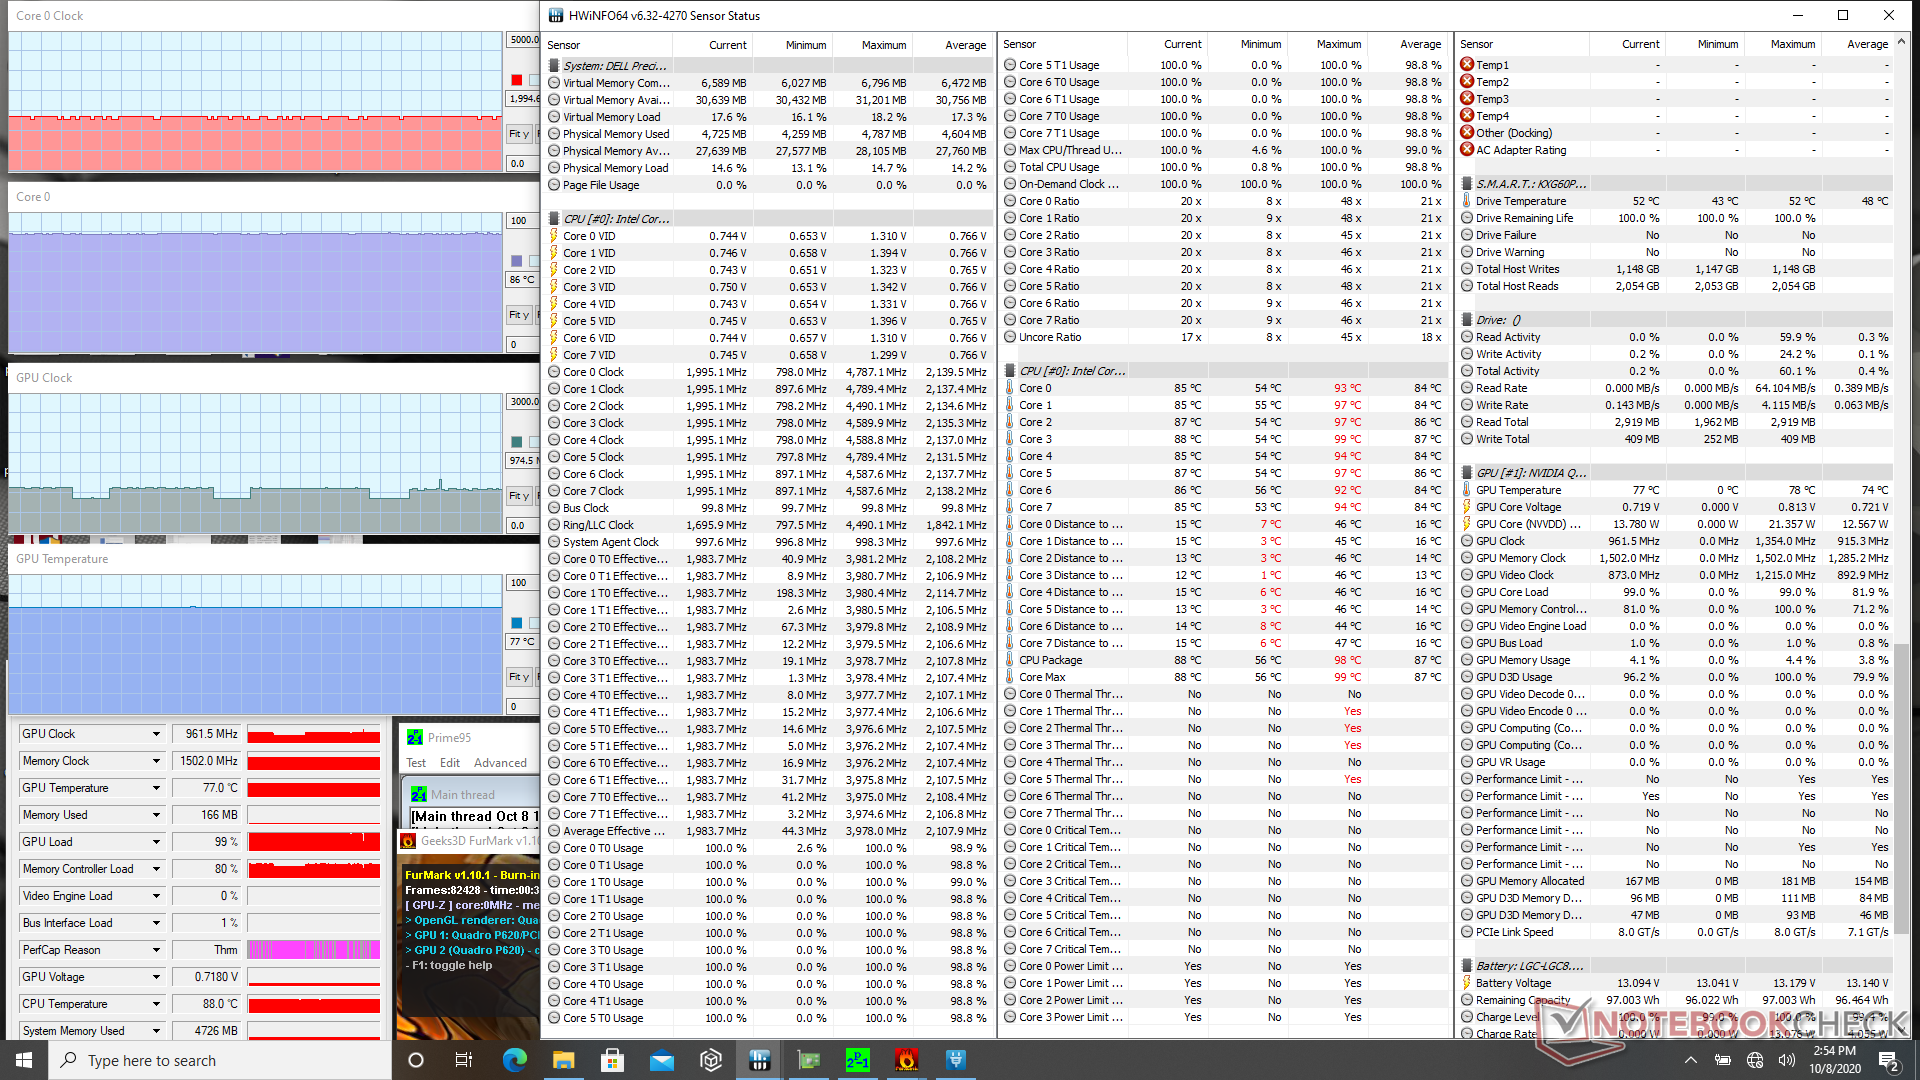
| CPU Clock (GHz) | GPU Clock (MHz) | Average CPU Temperature (°C) | Average GPU Temperature (°C) | |
| System Idle | -- | -- | 46 | 41 |
| Prime95 Stress | 2.7 | -- | 81 | 64 |
| Prime95 + FurMark Stress | 1.9 - 2.0 | ~660 - 975 | 86 | 77 |
| Witcher 3 Stress | 0.9 - 4.2 | 1455 | 71 | 67 |
Altavoces


Dell Precision 3000 3551 análisis de audio
(+) | los altavoces pueden reproducir a un volumen relativamente alto (#84.5 dB)
Graves 100 - 315 Hz
(-) | casi sin bajos - de media 19.8% inferior a la mediana
(±) | la linealidad de los graves es media (10.1% delta a frecuencia anterior)
Medios 400 - 2000 Hz
(+) | medios equilibrados - a sólo 4% de la mediana
(+) | los medios son lineales (5.4% delta a la frecuencia anterior)
Altos 2 - 16 kHz
(+) | máximos equilibrados - a sólo 3.4% de la mediana
(+) | los máximos son lineales (2.9% delta a la frecuencia anterior)
Total 100 - 16.000 Hz
(±) | la linealidad del sonido global es media (15.5% de diferencia con la mediana)
En comparación con la misma clase
» 35% de todos los dispositivos probados de esta clase eran mejores, 10% similares, 55% peores
» El mejor tuvo un delta de 7%, la media fue 17%, el peor fue ###max##%
En comparación con todos los dispositivos probados
» 23% de todos los dispositivos probados eran mejores, 4% similares, 73% peores
» El mejor tuvo un delta de 4%, la media fue 23%, el peor fue ###max##%
Apple MacBook 12 (Early 2016) 1.1 GHz análisis de audio
(+) | los altavoces pueden reproducir a un volumen relativamente alto (#83.6 dB)
Graves 100 - 315 Hz
(±) | lubina reducida - en promedio 11.3% inferior a la mediana
(±) | la linealidad de los graves es media (14.2% delta a frecuencia anterior)
Medios 400 - 2000 Hz
(+) | medios equilibrados - a sólo 2.4% de la mediana
(+) | los medios son lineales (5.5% delta a la frecuencia anterior)
Altos 2 - 16 kHz
(+) | máximos equilibrados - a sólo 2% de la mediana
(+) | los máximos son lineales (4.5% delta a la frecuencia anterior)
Total 100 - 16.000 Hz
(+) | el sonido global es lineal (10.2% de diferencia con la mediana)
En comparación con la misma clase
» 7% de todos los dispositivos probados de esta clase eran mejores, 2% similares, 90% peores
» El mejor tuvo un delta de 5%, la media fue 18%, el peor fue ###max##%
En comparación con todos los dispositivos probados
» 5% de todos los dispositivos probados eran mejores, 1% similares, 94% peores
» El mejor tuvo un delta de 4%, la media fue 23%, el peor fue ###max##%
Gestión de la energía
Consumo de energía
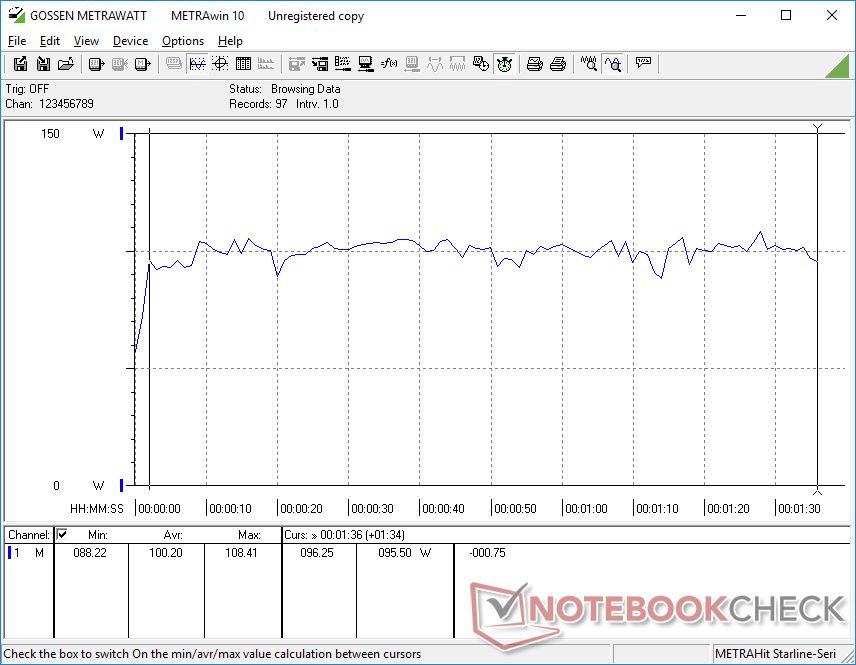
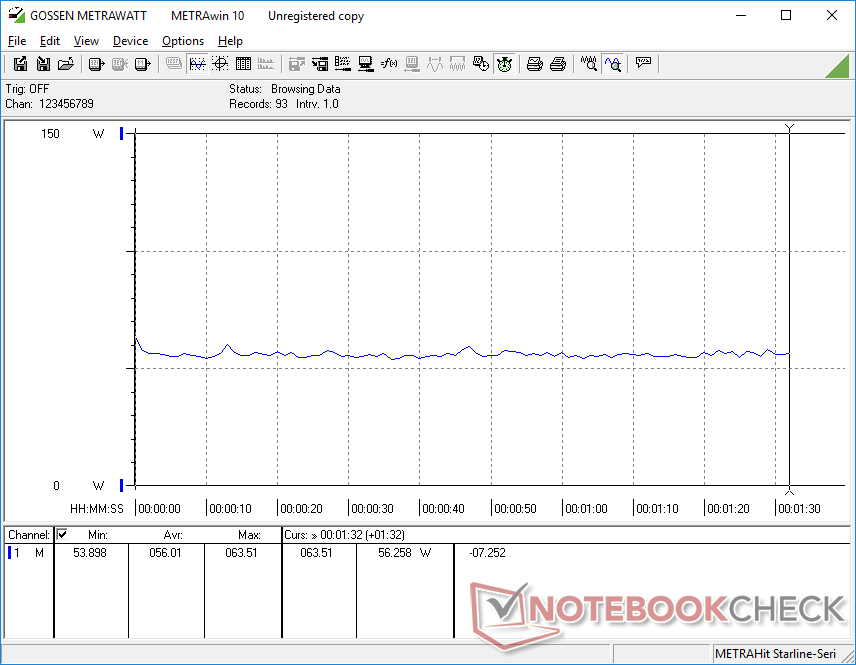
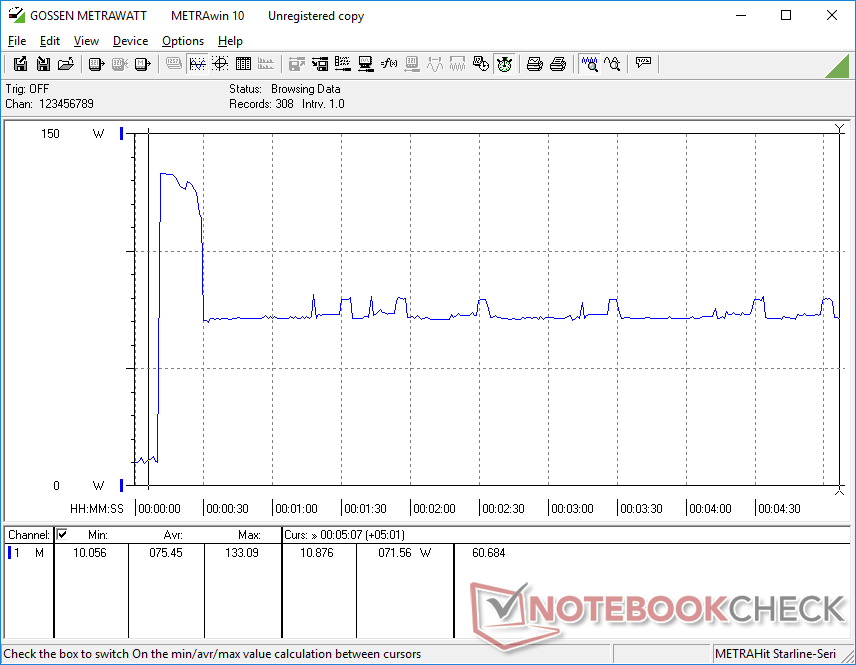
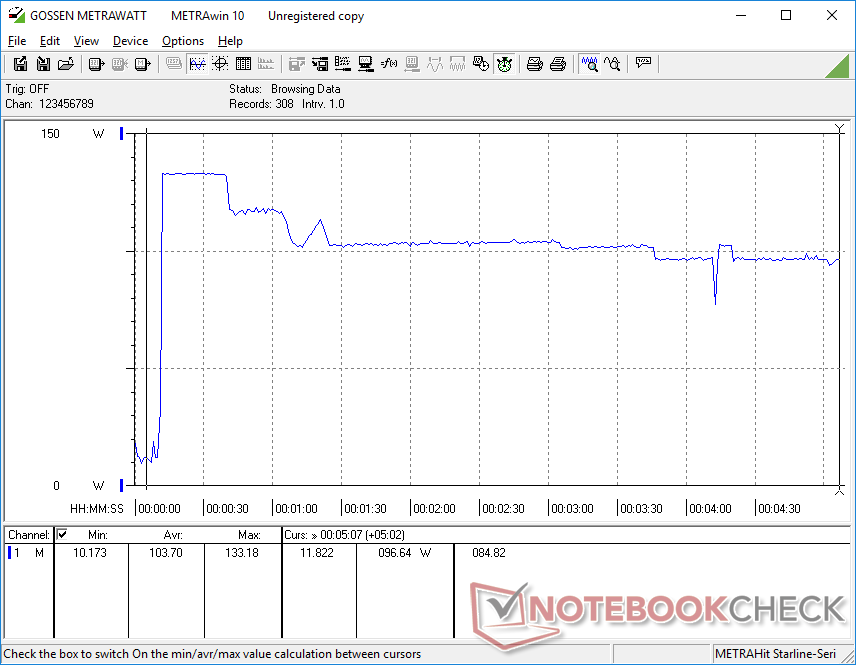
Cuando se encuentre bajo altas cargas de procesamiento, el sistema utilizará la mayor parte de su adaptador de CA de 130 W a casi 100 W. Afortunadamente, la batería no se agotará lentamente, a diferencia de algunas de las primeras unidades de producción del XPS 17 o del Precision 5750. El consumo nunca se estabiliza cerca de 130 W debido a las limitaciones térmicas del sistema.
| Off / Standby | |
| Ocioso | |
| Carga |
|
Clave:
min: | |
| Dell Precision 3000 3551 i9-10885H, Quadro P620, Toshiba Kioxia XG6 KXG60PNV512G, IPS, 1920x1080, 15.6" | HP ZBook Firefly 15 G7 i7-10610U, Quadro P520, Toshiba XG6 KXG60ZNV1T02, IPS LED, 3840x2160, 15.6" | Dell Precision 5550 P91F i7-10875H, Quadro T2000 Max-Q, SK Hynix PC601A NVMe 1TB, IPS, 3840x2400, 15.6" | Lenovo ThinkPad P53s-20N6001NGE i7-8565U, Quadro P520, Intel SSD 760p SSDPEKKW256G8, IPS, 1920x1080, 15.6" | MSI WP65 i7-9750H, Quadro P620, Samsung SSD PM981 MZVLB512HAJQ, IPS, 1920x1080, 15.6" | Dell Precision 3530 E-2176M, Quadro P600, SK hynix PC400 512 GB, IPS, 1920x1080, 15.6" | |
|---|---|---|---|---|---|---|
| Power Consumption | 26% | -31% | 33% | -43% | -10% | |
| Idle Minimum * (Watt) | 5.7 | 3.5 39% | 5.6 2% | 2.74 52% | 5.6 2% | 5.3 7% |
| Idle Average * (Watt) | 8.7 | 6.7 23% | 11.2 -29% | 6.4 26% | 8.6 1% | 10.7 -23% |
| Idle Maximum * (Watt) | 9 | 9.6 -7% | 18.4 -104% | 9.7 -8% | 30.7 -241% | 14.1 -57% |
| Load Average * (Watt) | 100.2 | 60 40% | 114 -14% | 55.2 45% | 78 22% | 85.4 15% |
| Witcher 3 ultra * (Watt) | 56 | 49.3 12% | 76.7 -37% | 63.5 -13% | 75.5 -35% | |
| Load Maximum * (Watt) | 133.2 | 68.6 48% | 134.2 -1% | 69.4 48% | 170.2 -28% | 91.9 31% |
* ... más pequeño es mejor
Duración de la batería
El tiempo de funcionamiento es muy largo, más de 13,5 horas de uso de la WLAN en el mundo real con nuestra batería de 97 Wh. Dell ofrece opciones más pequeñas de 68 Wh y 51 Wh para reducir el peso total del sistema.
La recarga desde la capacidad vacía a la plena capacidad toma alrededor de 2 horas. El sistema puede ser recargado a través de USB-C o el adaptador de CA propietario a diferencia de la mayoría de los otros portátiles.
| Dell Precision 3000 3551 i9-10885H, Quadro P620, 97 Wh | HP ZBook Firefly 15 G7 i7-10610U, Quadro P520, 53 Wh | Dell Precision 5550 P91F i7-10875H, Quadro T2000 Max-Q, 86 Wh | Lenovo ThinkPad P53s-20N6001NGE i7-8565U, Quadro P520, 57 Wh | MSI WP65 i7-9750H, Quadro P620, 51 Wh | Dell Precision 3530 E-2176M, Quadro P600, 92 Wh | |
|---|---|---|---|---|---|---|
| Duración de Batería | -33% | -34% | -37% | -56% | -32% | |
| WiFi v1.3 (h) | 13.6 | 9.1 -33% | 9 -34% | 8.6 -37% | 6 -56% | 9.3 -32% |
| Load (h) | 2 | 1.4 | 2.5 | 0.6 | 1.6 | |
| Reader / Idle (h) | 22.6 | 25.2 | 10.1 | 18.8 |
Pro
Contra
Veredicto
La Precision 3551 tiene todos los fundamentos de una estación de trabajo móvil clásica. TrackPoint, botones de ratón reales, tarjeta inteligente, WWAN, capacidad de servicio y muchas otras opciones de hardware, incluyendo doble almacenamiento. Thunderbolt 3 es un buen toque, especialmente para lo que se considera una estación de trabajo "de gama baja". Si la conectividad y la facilidad de uso están en lo más alto de su lista, entonces el no-frills Precision 3551 marcará esas casillas sin arruinar tu presupuesto.
La estación de trabajo se vuelve menos impresionante cuando se habla de rendimiento y diseño visual. Los gráficos se limitan al antiguo Quadro P620 y el Core i9-109880H podría haber sido mejor cuando se trata de la sostenibilidad del Turbo Boost. El aspecto del sistema es funcional, pero también aburrido. Tendrás que buscar un poco más arriba en la pila a través de las series más caras Precision 5000 o 7000 para encontrar sistemas más elegantes con un rendimiento más rápido.
Gran selección de puertos y características de usabilidad aunque el rendimiento de los gráficos es limitado y el diseño del chasis es anticuado.
Dell Precision 3000 3551
- 10/09/2020 v7 (old)
Allen Ngo
Price comparison
