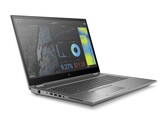
Intel Core i9-10885H
El Intel Core i9-10885H es un procesador de gama alta para portátiles con ocho núcleos basado en la arquitectura Comet Lake (CML-H, cuarta generación de Skylake). El procesador alcanza una frecuencia de entre 2,4 y 5,3 GHz y puede ejecutar hasta dieciséis hilos simultáneamente gracias a Hyper-Threading. El procesador se sigue fabricando en el antiguo proceso de 14nm (14nm++).
La arquitectura Comet Lake es similar a la de Coffee Lake y ofrece las mismas características y se fabrica en el mismo proceso de 14nm. Aparte de las mejoras en la velocidad de reloj, el controlador de memoria ahora también admite una memoria RAM DDR4-2933 más rápida. Puede encontrar más información sobre Comet Lake y todos los modelos y artículos sobre él aquí.
El Core i9-10855H es compatible con las funciones de gestión vPro, TXT y SIPP.
El rendimiento del Core i9-10885H debería estar ligeramente por encima del antiguo modelo superior Core i9-9980HK, gracias al potencial mayor turbo de un solo núcleo. Gracias a los 8 núcleos y las altas velocidades Turbo, incluso las aplicaciones exigentes deberían funcionar muy bien en la CPU. Sin embargo, el rendimiento a largo plazo depende siempre del sistema de refrigeración del portátil y de la configuración del sistema. En el momento del anuncio, el i9-10885H es la segunda CPU Comet Lake-H más rápida por detrás del Core i9-10980HK.
Se supone que la iGPU integrada Intel UHD Graphics 630 ofrece un rendimiento similar a la UHD630 del Core i7-9880H. Como solución de gama baja, sólo ejecutará los juegos actuales con fluidez y a detalles reducidos, si es que lo hace.
Intel especifica el TDP con 45 vatios y, por tanto, el i9 sólo es adecuado para grandes portátiles con buenas soluciones de refrigeración. Usando cTDP-down, la CPU también puede configurarse a 35 vatios, lo que resulta en un rendimiento reducido.
Serie Intel Comet Lake Nombre código Comet Lake-H Serie: Comet Lake Comet Lake-H Velocidad de reloj 2400 - 5300 MHz Caché de Nivel 1 512 KB Caché de Nivel 2 2 MB Caché de Nivel 3 16 MB Número de Núcleos/Subprocesos 8 / 16 Consumo de Corriente (TDP = Thermal Design Power) 45 Watt Tecnología de producción 14 nm Temperatura Máx. 100 °C Conector FCBGA1440 Recursos Dual-Channel DDR4 Memory Controller, HyperThreading, AVX, AVX2, Quick Sync, Virtualization, AES-NI GPU Intel UHD Graphics 630 (350 - 1200 MHz)64 Bit soporte para 64 Bit Architecture x86 Precio inicial $556 U.S. Fecha de anuncio 04/02/2020 Enlace de Producto (externo) Intel Comet Lake i9-10885H
Benchmarks Performance Rating - CB R15 + R20 + 7-Zip + X265 + Blender + 3DM11 CPU
45.4 pt (51%)
...
Intel Core i7-1265U 1%
...
Intel Core i9-12900HX 46%
Cinebench R23 - Cinebench R23 Multi Core
min: 8802 de promedio: 9438 mediana: 9438 (15%) max: 10074 Points
CPU TDP 70 W TDP 74 W 100% 87%
...
Apple M2 -8%
...
Intel Core i9-13980HX 222%
Cinebench R23 - Cinebench R23 Single Core
min: 1284 de promedio: 1290 mediana: 1289.5 (57%) max: 1295 Points
CPU TDP 70 W TDP 74 W 100% 99%
...
Intel Core i5-1140G7 -3%
Intel Core i7-1180G7 -1%
...
Intel Core i9-12900HX 49%
Cinebench R20 - Cinebench R20 CPU (Single Core)
min: 460 de promedio: 487.3 mediana: 489 (56%) max: 513 Points
CPU TDP ? TDP 70 W TDP 74 W 90% 100% 95%
...
Intel Core i7-1180G7 1%
...
Intel Core i9-12900HX 51%
Cinebench R20 - Cinebench R20 CPU (Multi Core)
min: 2798 de promedio: 3400 mediana: 3639 (15%) max: 3762 Points
CPU TDP ? TDP 70 W TDP 74 W 74% 100% 97%
...
Intel Core i5-1245U -7%
...
Intel Core i7-12800HX 152%
Cinebench R15 - Cinebench R15 CPU Multi 64 Bit
min: 1264 de promedio: 1502 mediana: 1517 (16%) max: 1726 Points
CPU TDP ? TDP 70 W TDP 74 W 73% 100% 88%
...
...
Intel Core i7-12800HX 125%
0 90 180 270 360 450 540 630 720 810 900 990 1080 1170 1260 1350 1440 1530 1620 1710 Tooltip Dell Precision 3000 3551: Ø1152 (1113.77-1263.86)
HP ZBook Fury 17 G7 119W5EA: Ø1456 (1429.34-1516.82)
HP ZBook Studio G7: Ø1601 (1574.8-1726.44)
Cinebench R15 - Cinebench R15 CPU Single 64 Bit
min: 197 de promedio: 206.7 mediana: 211 (64%) max: 212 Points
CPU TDP ? TDP 70 W TDP 74 W 93% 100% 100%
...
Intel Core i5-1230U -1%
Apple M1 0%
...
Intel Core i9-12900HX 34%
wPrime 2.10 - wPrime 2.0 1024m *
131.2 s (2%)
...
AMD Ryzen 9 5980HS -16%
Intel Core i7-9750H 18%
Intel Xeon E-2176M 24%
...
VIA C3-M C3-M-1200 6348%
wPrime 2.10 - wPrime 2.0 32m *
3.9 s (1%)
...
Intel Core i3-1215U -12%
AMD Ryzen 9 5980HS -10%
Intel Core i7-9750H 28%
Intel Core i7-1265U 36%
Intel Xeon E-2176M 38%
...
6420 puntos (37%)
...
Intel Core i5-1245U -4%
Intel Core i7-9750H 0%
Intel Core i7-8559U 4%
...
7-Zip 18.03 - 7-Zip 18.03 Multli Thread 4 runs
min: 36740 de promedio: 40519 mediana: 41823 (26%) max: 42993 MIPS
CPU TDP ? TDP 70 W TDP 74 W 85% 100% 97%
...
Intel Core i5-1245U -11%
...
Intel Core i7-12800HX 90%
7-Zip 18.03 - 7-Zip 18.03 Single Thread 4 runs
min: 5397 de promedio: 5551 mediana: 5589 (67%) max: 5668 MIPS
CPU TDP ? TDP 70 W TDP 74 W 95% 100% 99%
...
Apple M1 -2%
Intel Core i7-8559U -1%
AMD Ryzen 9 PRO 6950HS -1%
AMD Ryzen 9 5980HS 1%
Intel Core i7-12800HX 1%
...
Intel Core i9-12900HX 13%
X264 HD Benchmark 4.0 - x264 Pass 2
80.5 fps (29%)
...
Intel Core i5-1245U -3%
Intel Core i7-1265U 1%
...
Intel Core i9-12900HX 130%
X264 HD Benchmark 4.0 - x264 Pass 1
217.8 fps (51%)
...
Intel Core i7-9750H -1%
AMD Ryzen 9 PRO 6950HS 2%
...
Intel Core i9-12900HX 44%
HWBOT x265 Benchmark v2.2 - HWBOT x265 4k Preset
min: 10.6 de promedio: 11.5 mediana: 11.3 (24%) max: 12.5 fps
CPU TDP ? TDP 70 W TDP 74 W 85% 100% 90%
...
...
Intel Core i7-12800HX 117%
0 5 10 15 20 Tooltip Dell Precision 3000 3551: Ø12 (1.25-21.9)
HP ZBook Fury 17 G7 119W5EA: Ø11.5 (0.87-16.2)
HP ZBook Studio G7: Ø13 (1.15-20.8)
TrueCrypt - TrueCrypt Serpent
1 GB/s (0%)
...
Intel Core i5-1245U -13%
Intel Core i7-1265U -10%
AMD Ryzen 9 PRO 6950HS 2%
Intel Core i3-1215U 10%
...
Intel Core i9-12900HX 70%
TrueCrypt - TrueCrypt Twofish
1.8 GB/s (0%)
...
Intel Core i3-1215U -6%
...
Intel Core i9-12900HX 78%
TrueCrypt - TrueCrypt AES
9.9 GB/s (0%)
...
Intel Core i5-1245U -7%
Intel Core i7-1265U -2%
...
Intel Core i9-12900HX 76%
Blender - Blender 2.79 BMW27 CPU *
min: 283 de promedio: 311 mediana: 302 (2%) max: 348 Seconds
CPU TDP ? TDP 70 W TDP 74 W 100% 100% 100%
Intel Core i5-1038NG7 -99%
...
...
R Benchmark 2.5 - R Benchmark 2.5 *
min: 0.564 de promedio: 0.6 mediana: 0.6 (12%) max: 0.572 sec
CPU TDP ? TDP 70 W TDP 74 W 100% 100% 100%
Intel Core i9-12900HX -26%
...
Intel Core i3-1215U -4%
...
3DMark 06 - CPU - 3DMark 06 - CPU
12101 Points (26%)
...
Intel Core i5-1245U 1%
...
Intel Core i9-12900HX 46%
Super Pi mod 1.5 XS 1M - Super Pi mod 1.5 XS 1M *
7.3 s (2%)
...
AMD Ryzen 9 PRO 6950HS -2%
Intel Core i9-12900HX -1%
Intel Core i3-1215U -1%
...
VIA C3-M C3-M-1200 6215%
Super Pi mod 1.5 XS 2M - Super Pi mod 1.5 XS 2M *
16.3 s (1%)
...
Intel Core i3-1215U -3%
Intel Core i9-12900HX -1%
...
Super Pi Mod 1.5 XS 32M - Super Pi mod 1.5 XS 32M *
433.9 s (2%)
...
Intel Core i7-1265U -1%
Intel Core i5-1140G7 0%
Intel Core i5-1245U 2%
Intel Core i5-1035G7 5%
Intel Core i5-1035G4 6%
...
VIA C3-M C3-M-1200 5089%
3DMark 11 - 3DM11 Performance Physics
min: 12279 de promedio: 14604 mediana: 14291 (39%) max: 17242 Points
CPU TDP ? TDP 70 W TDP 74 W 100% 83% 71%
...
AMD Ryzen 9 PRO 6950HS -4%
Intel Xeon W-2145 -4%
AMD Ryzen 9 5980HS 4%
...
Intel Core i7-12800HX 53%
3DMark - 3DMark Ice Storm Physics
31296 Points (20%)
...
Intel Core i5-4200H -4%
...
3DMark - 3DMark Ice Storm Extreme Physics
30997 Points (26%)
...
AMD Ryzen Embedded R1505G -2%
...
Intel Core i9-12900HX 229%
3DMark - 3DMark Cloud Gate Physics
min: 11176 de promedio: 12814 mediana: 12814 (32%) max: 14452 Points
CPU TDP ? TDP 74 W 100% 77%
...
...
Intel Core i9-12950HX 78%
3DMark - 3DMark Fire Strike Standard Physics
min: 17249 de promedio: 19483 mediana: 20594 (38%) max: 20606 Points
CPU TDP ? TDP 70 W TDP 74 W 100% 100% 84%
...
Intel Core i5-1245U -5%
Intel Xeon W-2145 1%
...
Intel Core i7-12800HX 77%
3DMark - 3DMark Time Spy CPU
min: 6510 de promedio: 7798 mediana: 8203 (40%) max: 8682 Points
CPU TDP ? TDP 70 W TDP 74 W 100% 94% 75%
...
AMD Ryzen 9 PRO 6950HS -9%
...
Intel Core i7-12800HX 83%
Geekbench 5.4 - Geekbench 5.1 - 5.4 64 Bit Single-Core
min: 1216 de promedio: 1303 mediana: 1317 (57%) max: 1376 puntos
CPU TDP ? TDP 70 W TDP 74 W 88% 100% 96%
...
Intel Xeon E-2186M -4%
Intel Core i5-1038NG7 -3%
Intel Core i7-1065G7 -2%
Intel Core i5-1140G7 4%
...
Apple M2 Max 51%
Geekbench 5.4 - Geekbench 5.1 - 5.4 64 Bit Multi-Core
min: 6529 de promedio: 7045 mediana: 6914 (24%) max: 7693 puntos
CPU TDP ? TDP 70 W TDP 74 W 90% 100% 85%
...
Intel Core i7-11600H -10%
Intel Core i5-11500H -1%
Intel Core i7-1250U 0%
Intel Core i5-1230U 0%
Intel Core i7-1260U 0%
Intel Xeon W-11855M 2%
...
Apple M2 Max 118%
Geekbench 5.0 - Geekbench 5.0 64 Bit Single-Core
min: 1234 de promedio: 1281 mediana: 1280.5 (6%) max: 1327 puntos
CPU TDP ? TDP 74 W 93% 100%
...
Intel Core i7-1065G7 1%
Intel Core i5-1140G7 6%
...
Geekbench 5.0 - Geekbench 5.0 64 Bit Multi-Core
min: 6598 de promedio: 7172 mediana: 7172 (23%) max: 7746 puntos
CPU TDP ? TDP 74 W 100% 85%
...
Intel Core i7-1250U -1%
Intel Core i7-1260U -1%
Intel Core i5-1230U 0%
...
Intel Core i9-12900HX 130%
Geekbench 4.1 - 4.4 - Geekbench 4.1 - 4.4 64 Bit Single-Core
min: 5672 de promedio: 5676 mediana: 5675.5 (59%) max: 5679 puntos
CPU TDP ? TDP 74 W 100% 100%
...
Intel Core i7-1065G7 -2%
...
Intel Core i9-13900HX 57%
Geekbench 4.1 - 4.4 - Geekbench 4.1 - 4.4 64 Bit Multi-Core
min: 26114 de promedio: 29009 mediana: 29009 (32%) max: 31904 puntos
CPU TDP ? TDP 74 W 100% 82%
...
...
Intel Core i9-13900HX 145%
Mozilla Kraken 1.1 - Kraken 1.1 Total Score *
min: 730 de promedio: 738 mediana: 734 (1%) max: 749 ms
CPU TDP ? TDP 70 W TDP 74 W 100% 100% 100%
...
Intel Core i5-1140G7 2%
Intel Core i5-1038NG7 2%
...
Octane V2 - Octane V2 Total Score
58398 Points (60%)
...
Intel Core i5-1140G7 -1%
Apple M1 8%
...
Intel Core i9-12900HX 63%
WebXPRT 3 - WebXPRT 3 Score
min: 233 de promedio: 234.3 mediana: 234 (59%) max: 236 Points
CPU TDP ? TDP 70 W TDP 74 W 99% 100% 99%
...
Intel Core i7-1260U 1%
Intel Core i7-1180G7 3%
...
Power Consumption - Prime95 Power Consumption - external Monitor *
min: 78.1 de promedio: 103.7 mediana: 116.4 (20%) max: 116.6 Watt
CPU TDP ? TDP 70 W TDP 74 W 108% 100% 100%
...
...
Intel Core i7-12800HX 71%
Power Consumption - Cinebench R15 Multi Power Consumption - external Monitor *
min: 125.2 de promedio: 131.2 mediana: 126 (26%) max: 142.4 Watt
CPU TDP ? TDP 70 W TDP 74 W 105% 105% 100%
...
Intel Core i7-12850HX -2%
Intel Core i9-12900HX 43%
...
Intel Core i9-12950HX 51%
Power Consumption - Cinebench R15 Multi Power Efficiency - external Monitor
min: 10.1 de promedio: 11.5 mediana: 10.7 (12%) max: 13.7 Points per Watt
CPU TDP ? TDP 70 W TDP 74 W 74% 100% 78%
...
Intel Core i7-8559U -6%
Intel Core i7-7700HQ -2%
Intel Atom x7-E3950 8%
Intel Xeon E-2176M 10%
...
- Gama de valores de las pruebas para esta tarjeta gráfica
- Valores medios de las pruebas para esta tarjeta gráfica
* Smaller numbers mean a higher performance
v1.22
log 27. 12:31:57
#0 no ids found in url (should be separated by "_") +0s ... 0s
#1 not redirecting to Ajax server +0s ... 0s
#2 did not recreate cache, as it is less than 5 days old! Created at Wed, 25 Jan 2023 08:57:11 +0100 +0.001s ... 0.001s
#3 no comparison url found in template nbc.compare_page_2 needed +0.008s ... 0.009s
#4 no comparison url found in template nbc.compare_page_2 needed +0s ... 0.009s
#5 no comparison url found in template nbc.compare_page_2 needed +0s ... 0.009s
#6 no comparison url found in template nbc.compare_page_2 needed +0s ... 0.009s
#7 no comparison url found in template nbc.compare_page_2 needed +0s ... 0.01s
#8 no comparison url found in template nbc.compare_page_2 needed +0s ... 0.01s
#9 no comparison url found in template nbc.compare_page_2 needed +0s ... 0.01s
#10 no comparison url found in template nbc.compare_page_2 needed +0s ... 0.01s
#11 no comparison url found in template nbc.compare_page_2 needed +0s ... 0.011s
#12 no comparison url found in template nbc.compare_page_2 needed +0s ... 0.011s
#13 no comparison url found in template nbc.compare_page_2 needed +0s ... 0.011s
#14 no comparison url found in template nbc.compare_page_2 needed +0s ... 0.011s
#15 composed specs +0s ... 0.012s
#16 did output specs +0s ... 0.012s
#17 getting avg benchmarks for device 11962 +0.011s ... 0.023s
#18 got single benchmarks 11962 +0.022s ... 0.045s
#19 got avg benchmarks for devices +0s ... 0.045s
#20 min, max, avg, median took s +0.462s ... 0.507s
#21 no comparison url found in template nbc.compare_page_2 needed +0s ... 0.507s
#22 return log +0s ... 0.507s
Análisis para el Intel Core i9-10885H procesador
Análisis del HP ZBook Fury 17 G7: Mucha potencia y una gran pantalla 4K en un paquete más compacto En su estación de trabajo móvil HP ZBook Fury 17 G7, HP metió más rendimiento en una carcasa más compacta. La configuración 119W5EA ofrece mucha potencia en la ...
Intel Core i9-10885H | NVIDIA Quadro RTX 4000 Max-Q | 17.30" | 2.9 kg
Análisis del portátil HP ZBook Studio G7: la mejor estación de trabajo móvil gracias a la cámara de vapor y a DreamColor? Casi todos los fabricantes ofrecen estaciones de trabajo delgadas, pero no suelen tener GPUs muy potentes. HP, por otro lado, equipa su ZBook Studio G7 con pote...
Intel Core i9-10885H | NVIDIA Quadro RTX 3000 Max-Q | 15.60" | 2 kg
Review del portátil Dell Precision 3551: Debut del Intel Core i9-10885H La Precision 3551 es una de las estaciones de trabajo móviles más baratas que se pueden encontrar con un CPU Intel Core i9 de 10ª generación habilitado para vPr...
Intel Core i9-10885H | NVIDIA Quadro P620 | 15.60" | 2.2 kg
HP ZBook Fury 17 G7 119W5EA : NVIDIA Quadro RTX 4000 Max-Q, 17.30", 2.9 kg
análise externo » HP ZBook Fury 17 G7 119W5EA
Fujitsu Celsius H7510, i9-10885H RTX 3000 : NVIDIA Quadro RTX 3000 (Laptop), 15.60", 2.7 kg
análise externo » Fujitsu Celsius H7510, i9-10885H RTX 3000
Lenovo ThinkPad P15 G1-20ST001HGE : NVIDIA Quadro RTX 5000 Max-Q, 15.60", 2.7 kg
análise externo » Lenovo ThinkPad P15 G1-20ST001HGE
Dell XPS 15 9500-XHR6F : NVIDIA GeForce GTX 1650 Ti Mobile, 15.60", 2.1 kg
análise externo » Dell XPS 15 9500-XHR6F
HP ZBook Studio G7 : NVIDIA Quadro RTX 3000 Max-Q, 15.60", 2 kg
análise externo » HP ZBook Studio G7
Lenovo ThinkPad P1 G3-20TH001AGE : NVIDIA Quadro T2000 Max-Q, 15.60", 1.7 kg
análise externo » Lenovo ThinkPad P1 G3-20TH001AGE
HP ZBook Create G7, Core i9 RTX 2070 Max-Q : NVIDIA GeForce RTX 2070 Max-Q, 15.60", 1.9 kg
análise externo » HP ZBook Create G7, Core i9 RTX 2070 Max-Q
Lenovo ThinkPad X1 Extreme G3-20TK000NGE : NVIDIA GeForce GTX 1650 Ti Max-Q, 15.60", 1.7 kg
análise externo » Lenovo ThinkPad X1 Extreme G3-20TK000NGE
Dell Precision 3000 3551 : NVIDIA Quadro P620, 15.60", 2.2 kg
análise externo » Dell Precision 3000 3551
HP Envy 15-ep0190nd : NVIDIA GeForce RTX 2060 Max-Q, 15.60", 2.2 kg
análise externo » HP Envy 15-ep0190nd
Dell XPS 17 9700-C9T5T : NVIDIA GeForce RTX 2060 Max-Q, 17.30", 2.5 kg
análise externo » Dell XPS 17 9700-C9T5T
Dell Precision 3000 3551 : NVIDIA Quadro P620, 15.60", 2.2 kg
» El Core i9-10885H de Intel es casi un 20 por ciento más lento que el Core i7-10875H
Please share our article, every link counts!
.170
Otras CPUs de la serie Comet Lake » Intel Core i9-10910 10x 3.6 GHz - 5 GHz
» Intel Core i7-10700K 8x 3.8 GHz - 5.1 GHz
» Intel Core i7-10700 8x 2.9 GHz - 4.8 GHz
» Intel Core i9-10880H 8x 2.3 GHz - 5.1 GHz
» Intel Core i3-10320 4x 3.8 GHz - 4.6 GHz
» Intel Core i7-10510Y 4x 1.2 GHz - 4.5 GHz
» Intel Core i5-10310Y 4x 1.1 GHz - 4.1 GHz
» Intel Core i5-10210Y 4x 1 GHz - 4 GHz
» Intel Core i3-10110Y 2x 1 GHz - 4 GHz
CPUs de alrededor + Intel Core i7-11600H 6x 2.9 GHz - 4.6 GHz
- AMD Ryzen 7 7735U 8x 2.7 GHz - 4.75 GHz
- AMD Ryzen 7 7736U 8x 2.7 GHz - 4.7 GHz
Klaus Hinum (Update: 2021-08- 8)