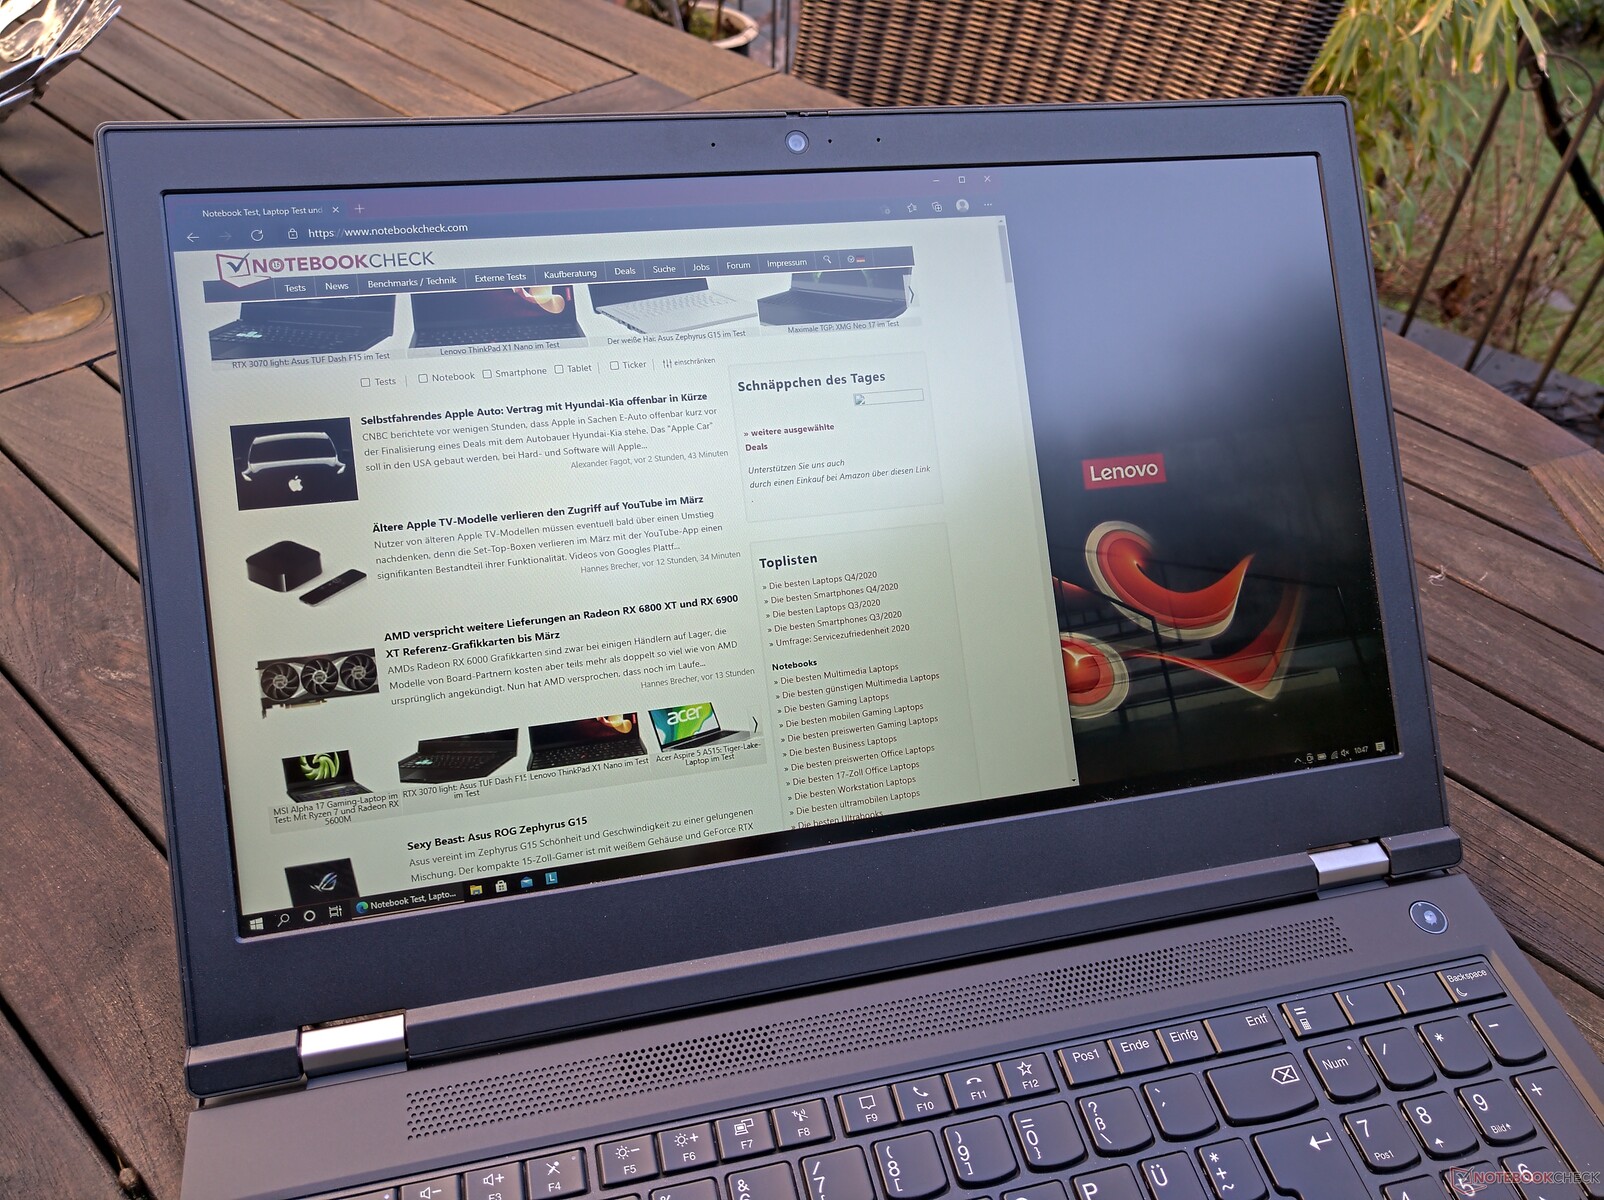
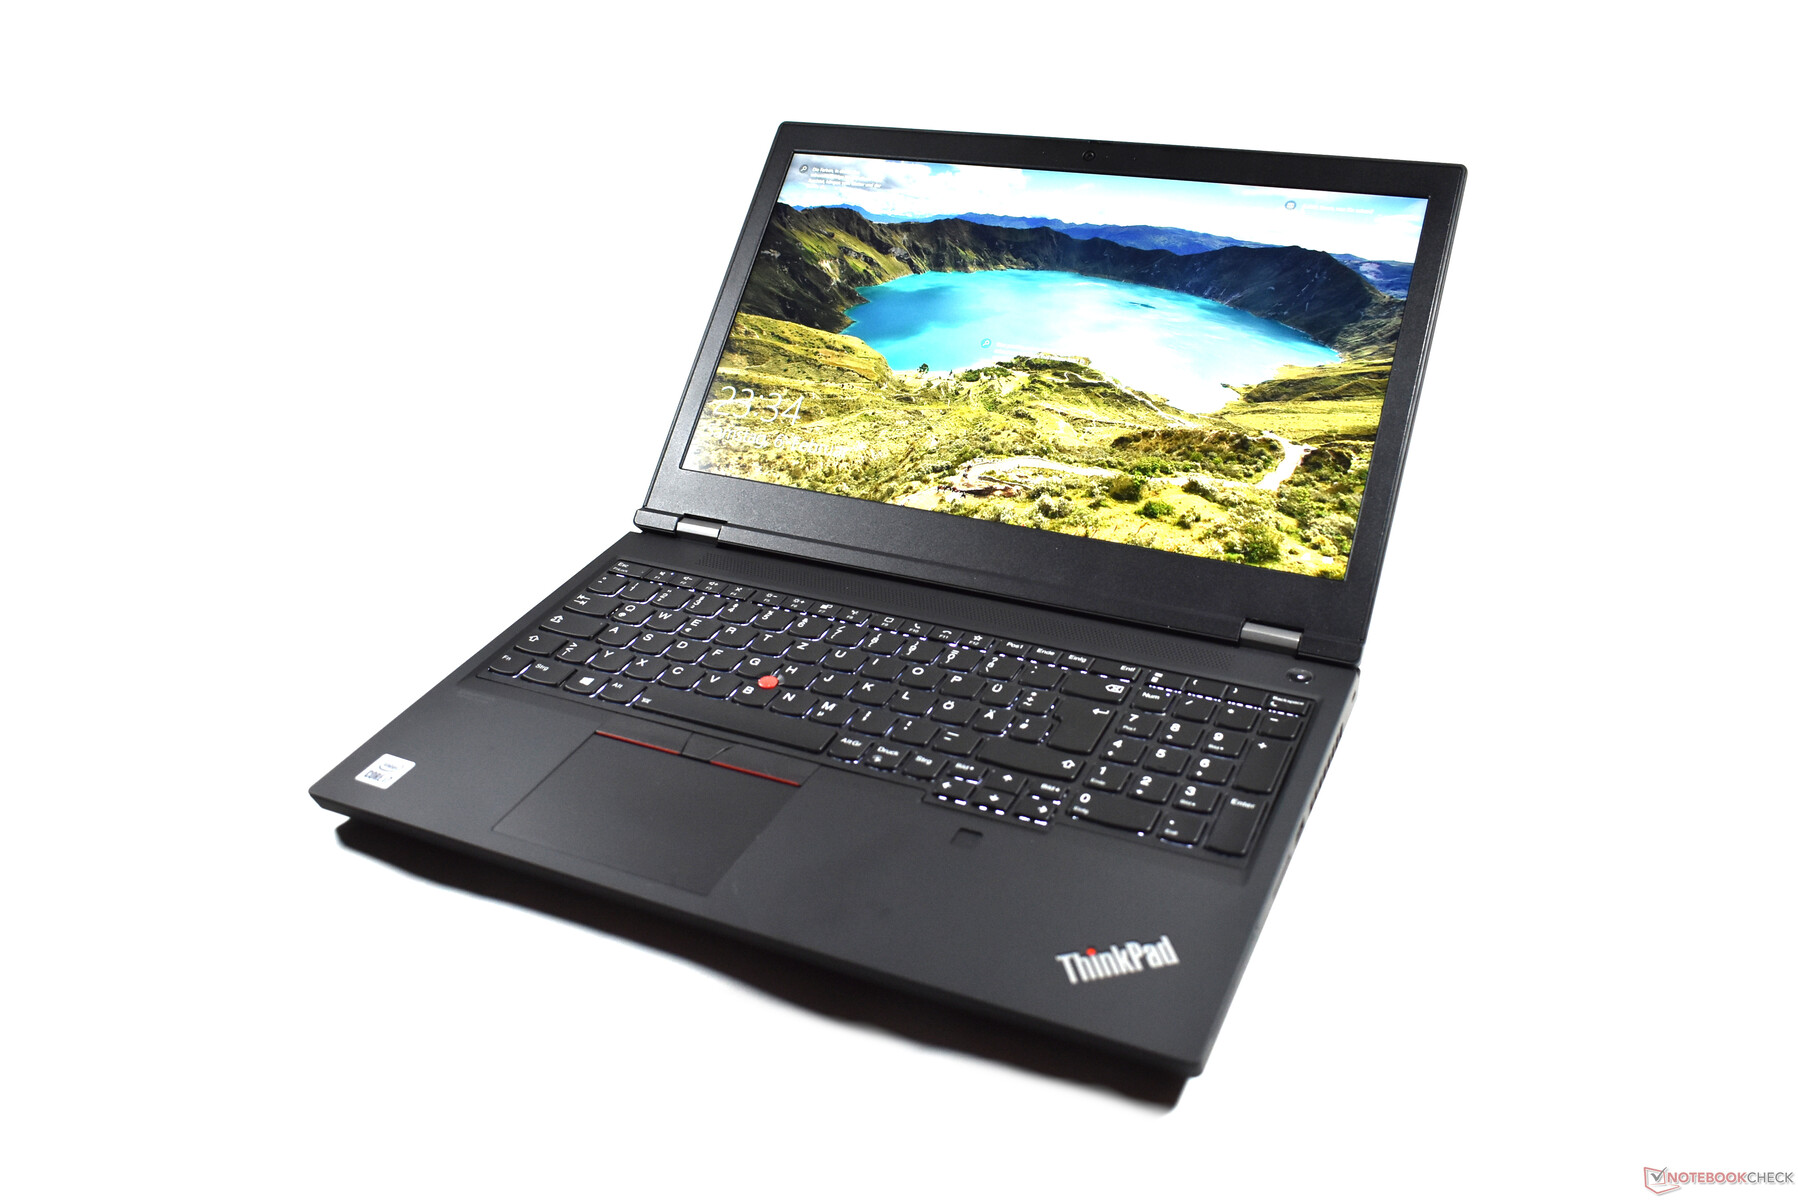
Análisis del portátil Lenovo ThinkPad P15 Gen 1: Estación de trabajo móvil con un punto débil en el teclado
Cuando Lenovo introdujo el ThinkPad P50 en el mercado en 2015, fue el primer modelo de la nueva serie ThinkPad P, que debía formar la rama de estaciones de trabajo en lugar de la serie W. Desde entonces, Lenovo ha ampliado la serie, pero las estaciones de trabajo clásicas siguen representando el núcleo de la cartera de estaciones de trabajo. El año pasado, el modelo de 15 pulgadas de esta rama se llamaba Lenovo ThinkPad P53. El sucesor actual no se llama ThinkPad P54, sino LenovoThinkPad P15 Gen 1, siguiendo el nuevo esquema de denominación de ThinkPad.
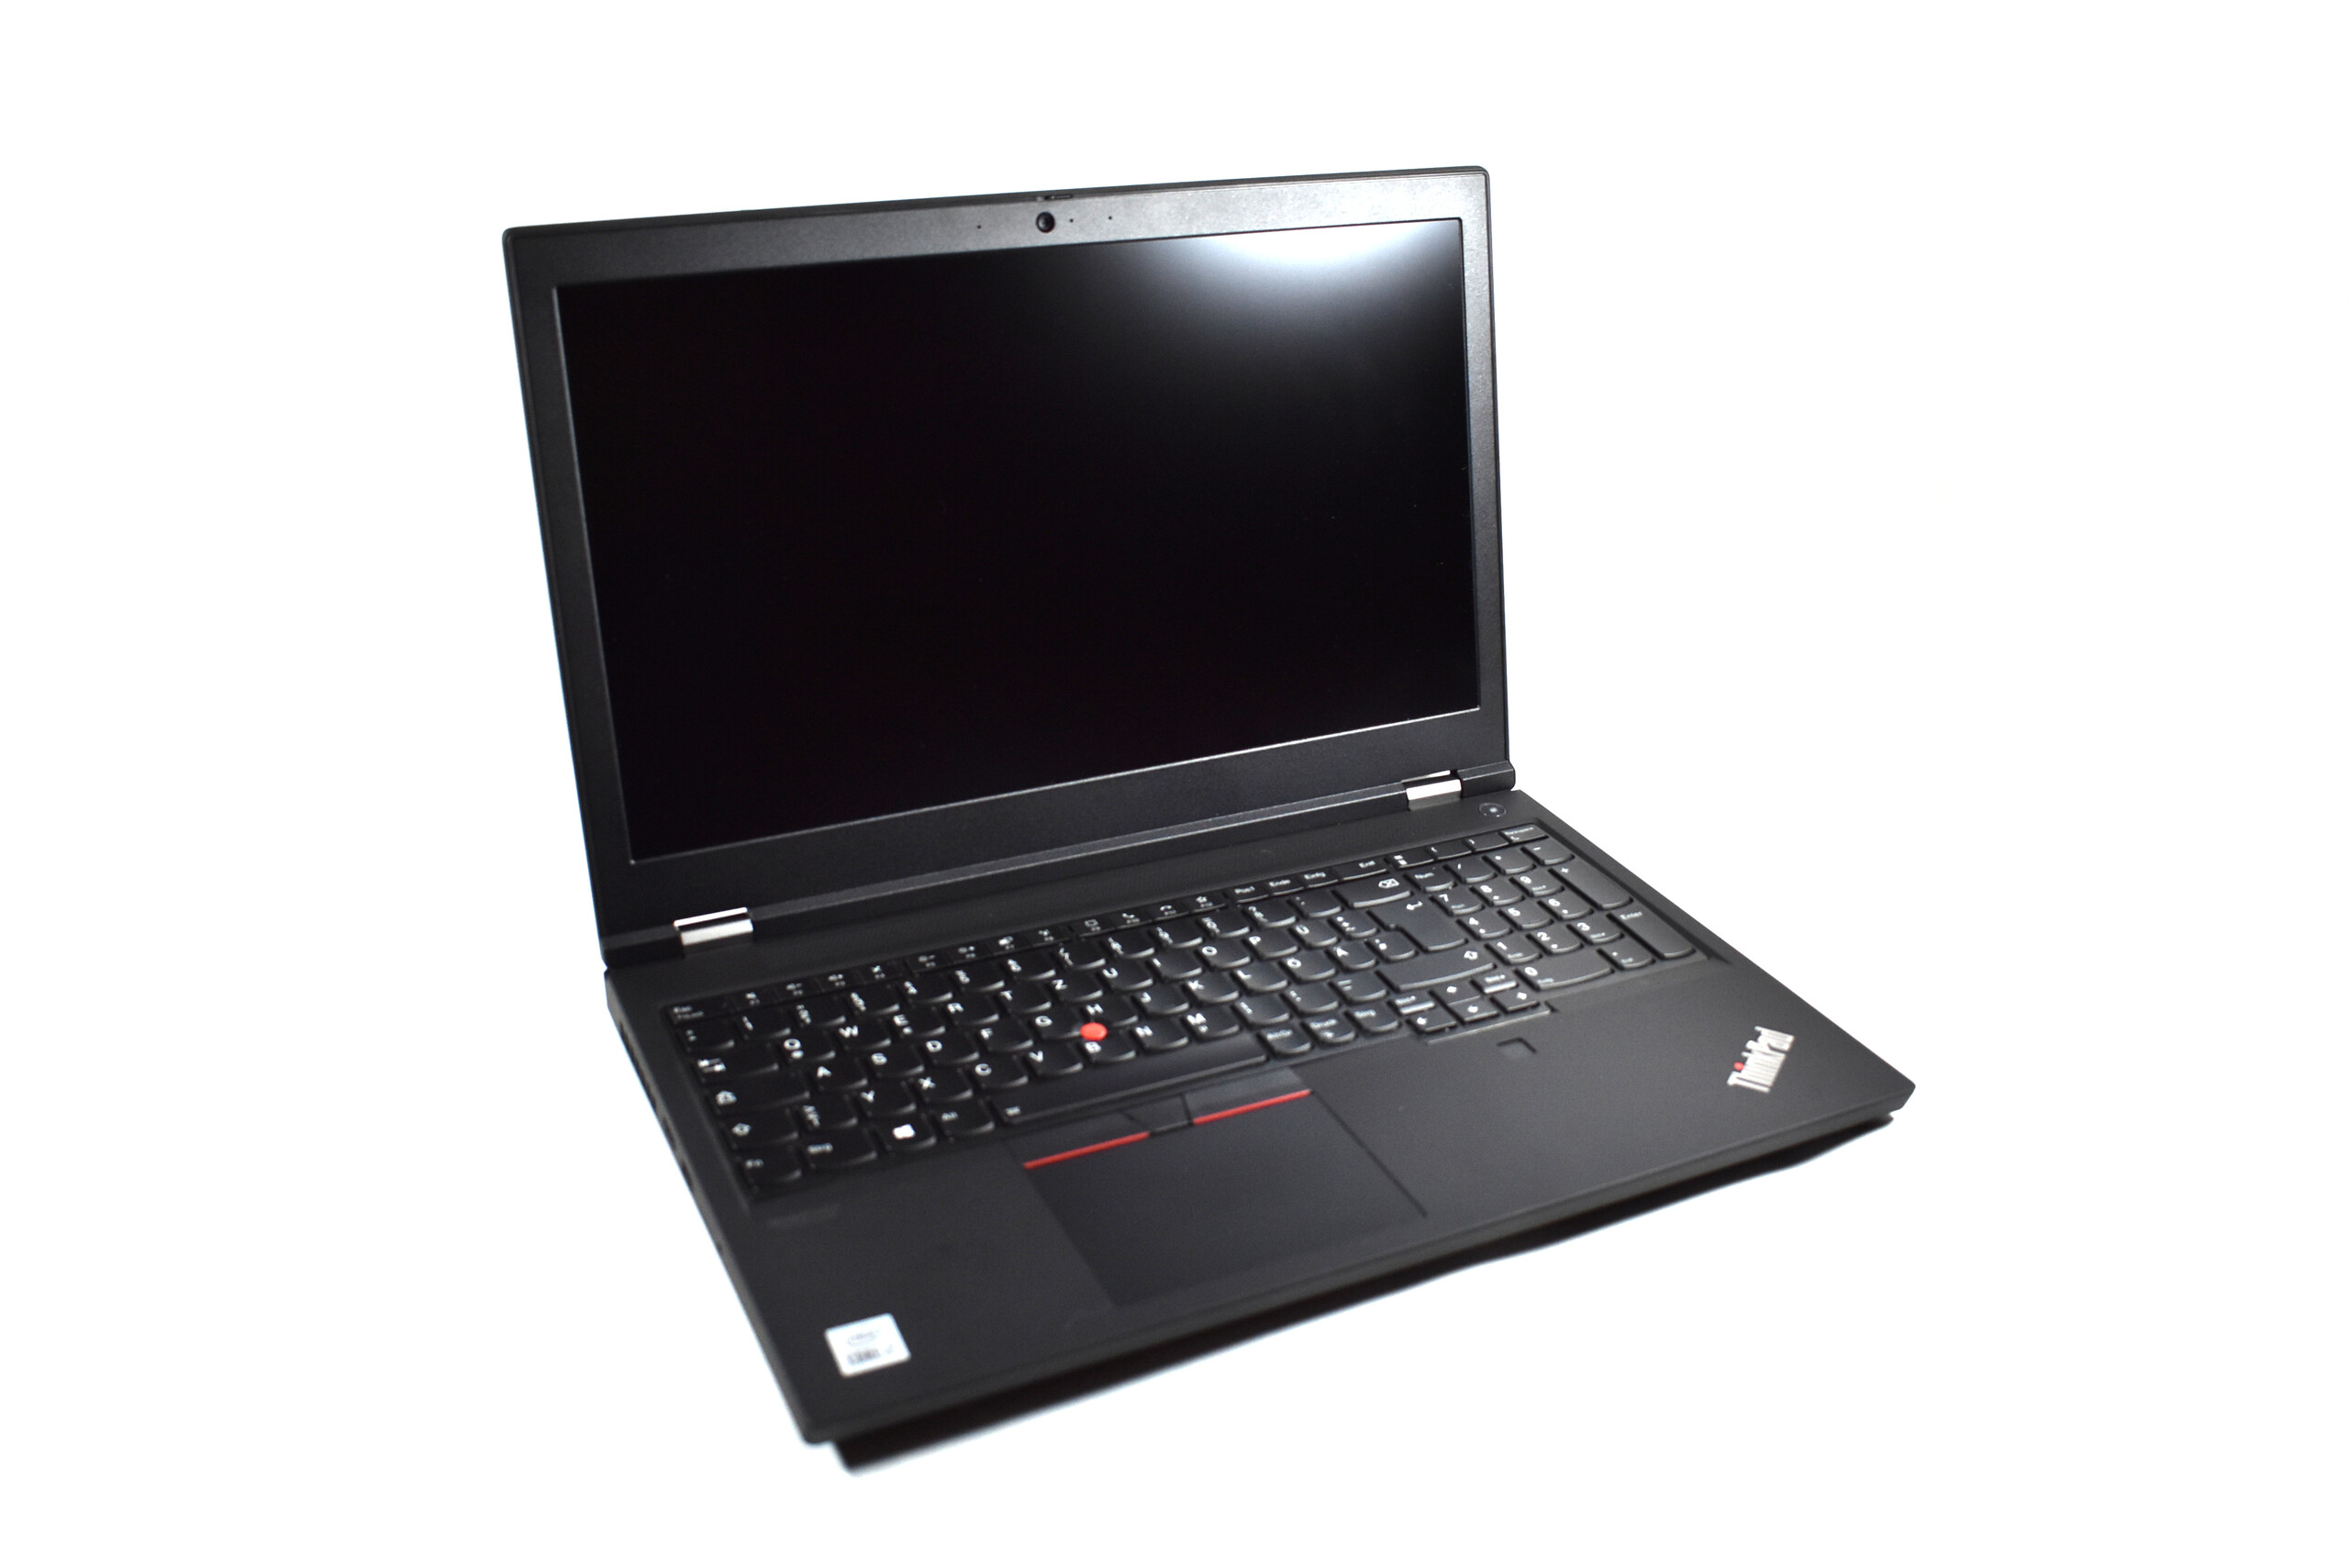
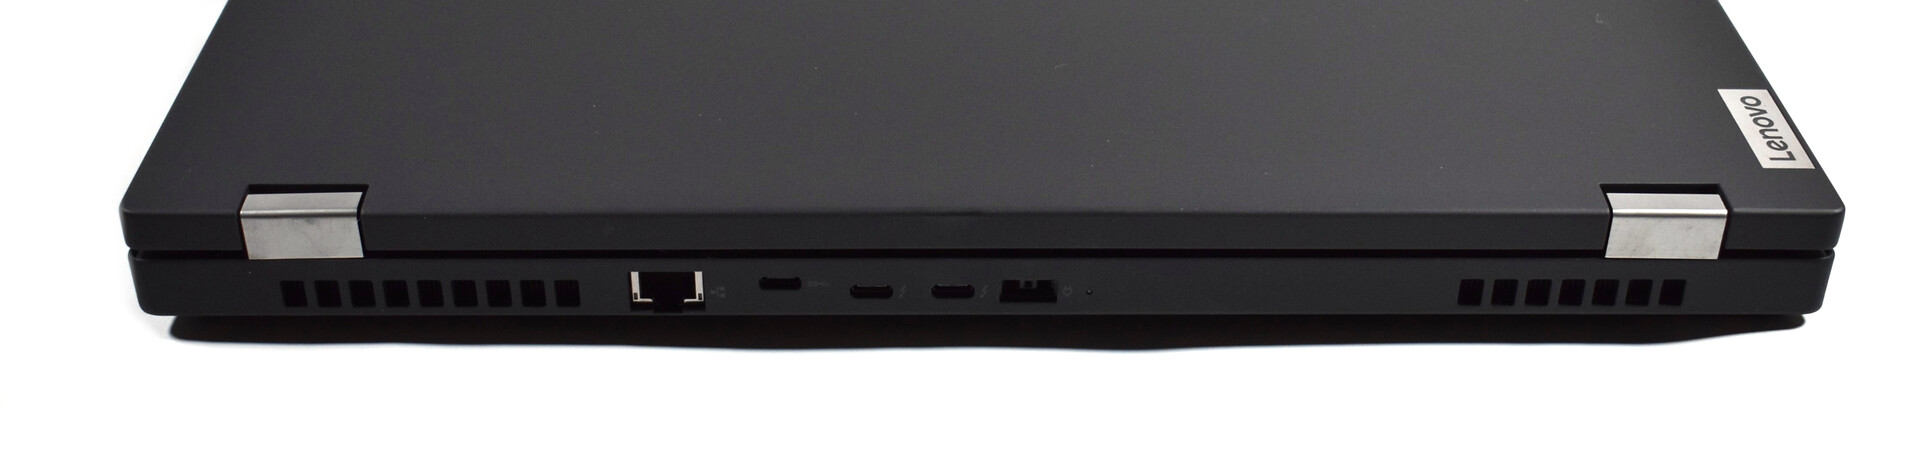
Lenovo no sólo introduce un nuevo esquema de nomenclatura con el ThinkPad P15, sino también un nuevo diseño de carcasa. Pero ya que comparte la misma construcción con el Lenovo ThinkPad T15g Gen 1, no informaremos aquí sobre los aspectos del diseño, características, y dispositivos de entrada en detalle. Puedes encontrar más información sobre estas áreas en nuestroanálisis del ThinkPad T15g
Possible competitors in our comparison
Valoración | Fecha | Modelo | Peso | Altura | Tamaño | Resolución | Precio |
|---|---|---|---|---|---|---|---|
| 85.6 % v7 (old) | 03/2021 | Lenovo ThinkPad P15 Gen1-20ST000DGE i7-10750H, Quadro T1000 (Laptop) | 2.7 kg | 31.45 mm | 15.60" | 1920x1080 | |
| 89.8 % v7 (old) | 11/2019 | Lenovo ThinkPad P53-20QN000YGE i7-9850H, Quadro RTX 5000 Max-Q | 2.7 kg | 29.4 mm | 15.60" | 1920x1080 | |
| 86.3 % v7 (old) | 03/2021 | Lenovo ThinkPad T15g-20UR000GGE i7-10750H, GeForce RTX 2070 Super Max-Q | 2.8 kg | 31.45 mm | 15.60" | 1920x1080 | |
| 86.6 % v7 (old) | 02/2021 | Lenovo ThinkPad T15p-20TN0006GE i7-10750H, GeForce GTX 1050 Mobile | 2.2 kg | 22.7 mm | 15.60" | 3840x2160 | |
| 87.8 % v7 (old) | 08/2020 | Dell Precision 7550 W-10885M, Quadro RTX 5000 Max-Q | 2.8 kg | 27.36 mm | 15.60" | 3840x2160 | |
| 90.2 % v7 (old) | 01/2021 | HP ZBook Fury 15 G7 W-10885M, Quadro RTX 5000 Max-Q | 2.4 kg | 25.9 mm | 15.60" | 3840x2160 |
Cambios más importantes del Lenovo ThinkPad P53
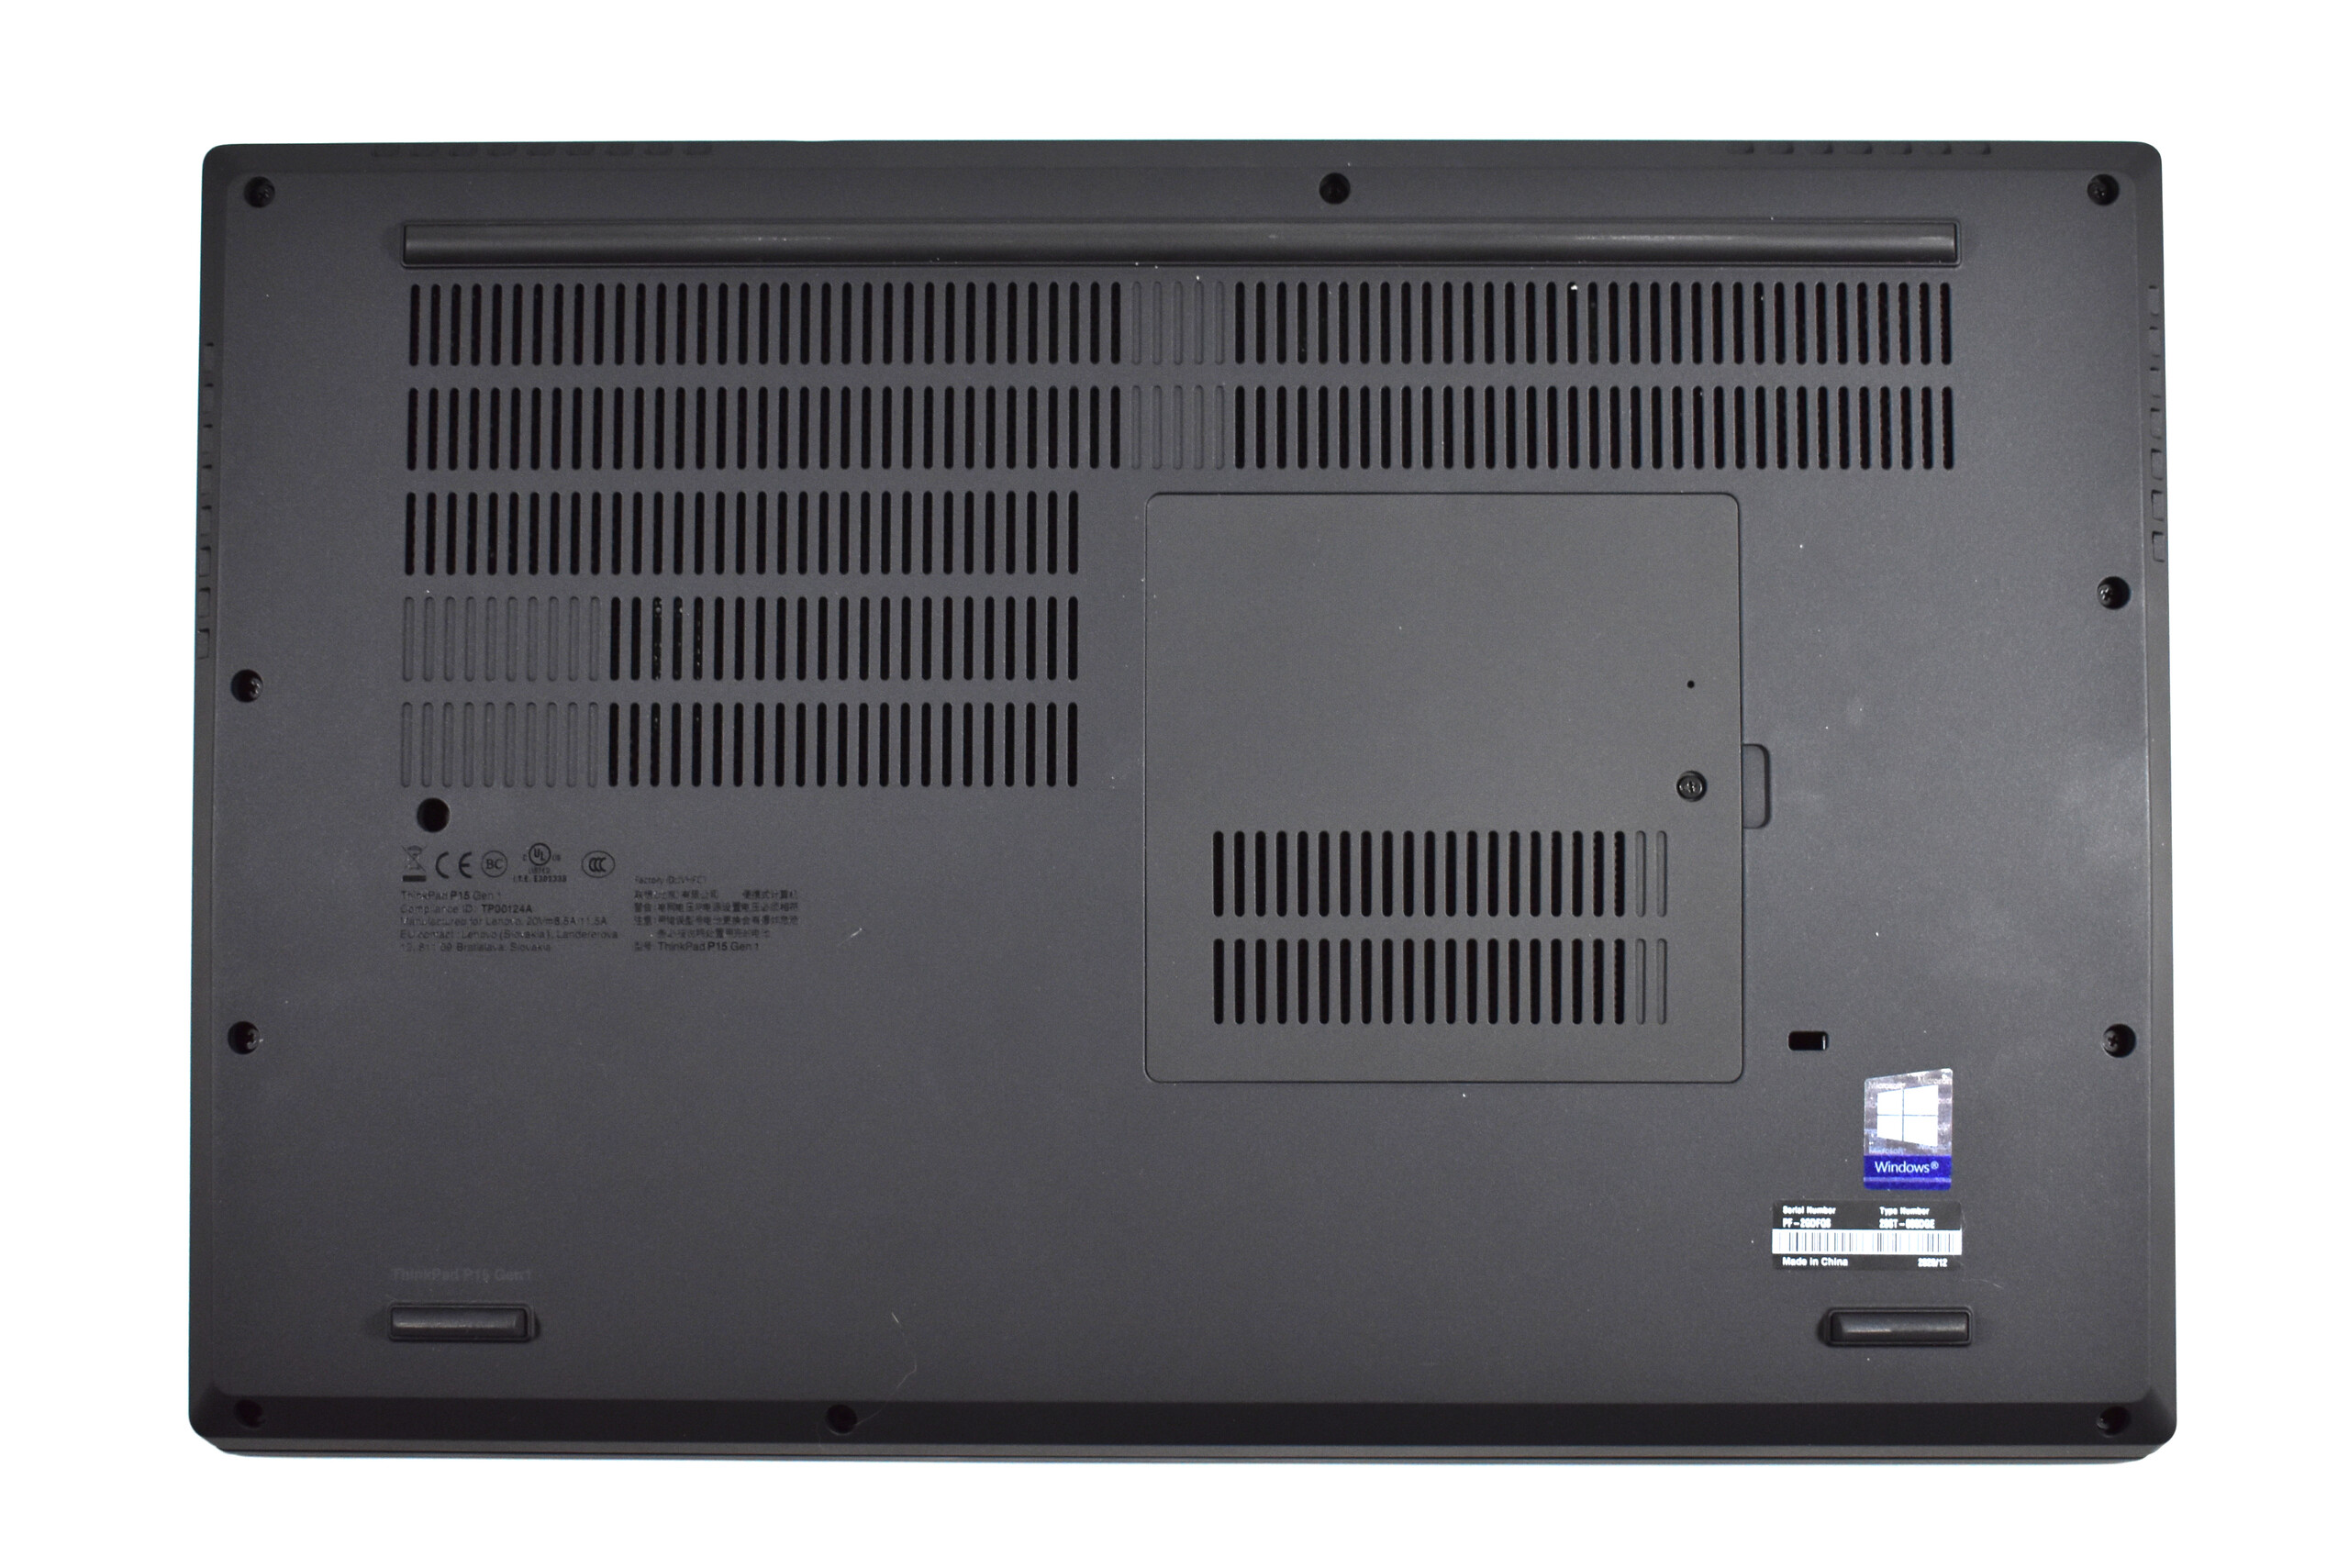
Externamente, el Lenovo ThinkPad P15 Gen 1 se parece mucho a su predecesor. Sin embargo, bajo el capó y en la carcasa negra, muchas cosas han cambiado respecto al ThinkPad P53. A excepción del marco de magnesio en el interior, la carcasa delThinkPad P15está ahora completamente hecha de plástico de fibra de vidrio, mientras que el fondo de la carcasa seguía estando hecho de una aleación de magnesio y aluminio en el P53. Mientras que la estabilidad general no sufre de esto, la háptica en cierto sentido sí, ya que puedes sentir la diferencia entre metal y plástico.
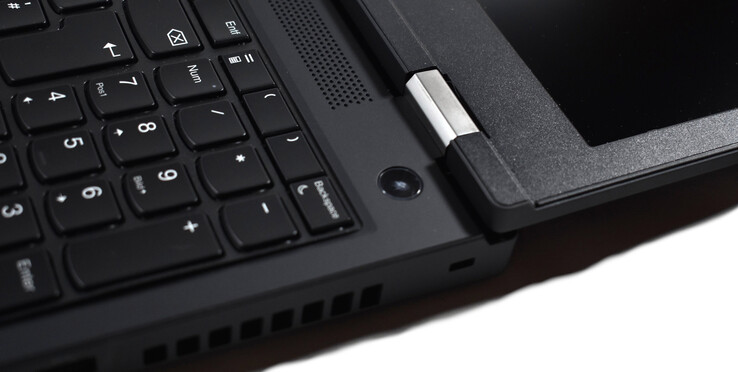
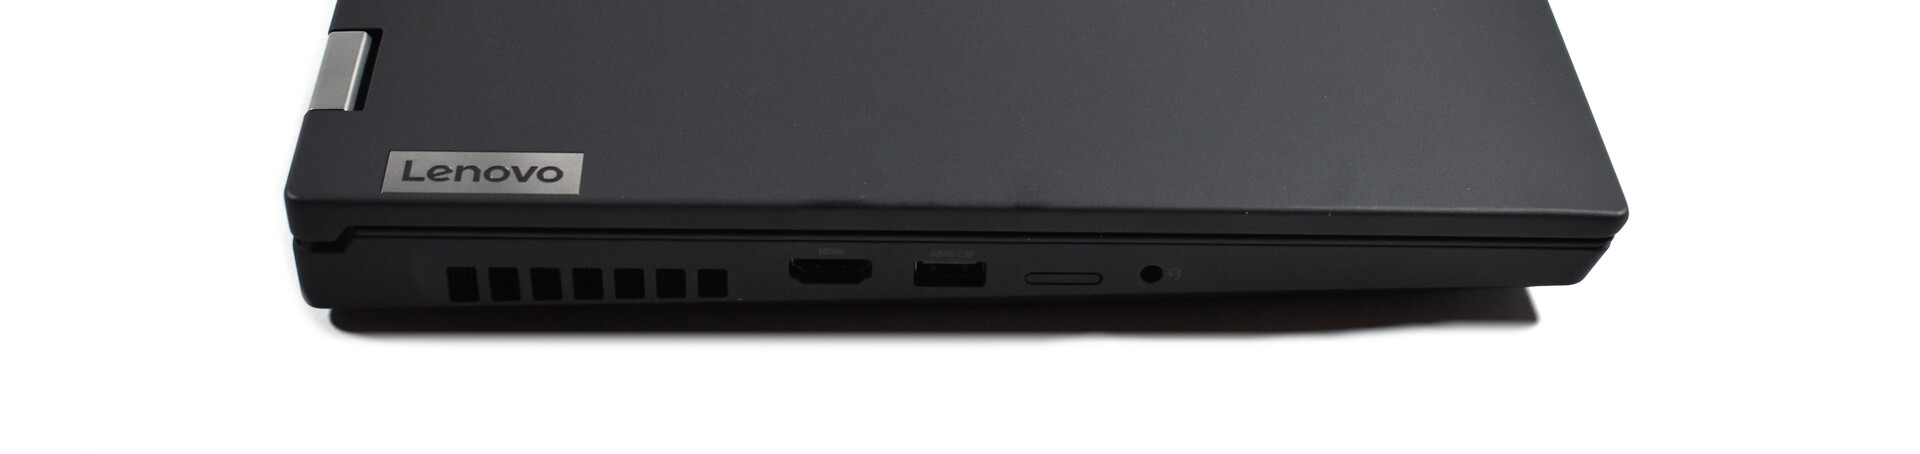
Sorprendentemente, Lenovo comete un gran error en términos de fabricación: Al igual que en el ThinkPad T15g, el teclado tiene una notable cesión en la esquina inferior izquierda. Además, no todos los cambios de diseño son positivos: los dos LEDs de estado bajo la pantalla han sido eliminados, al igual que las teclas dedicadas del touchpad.
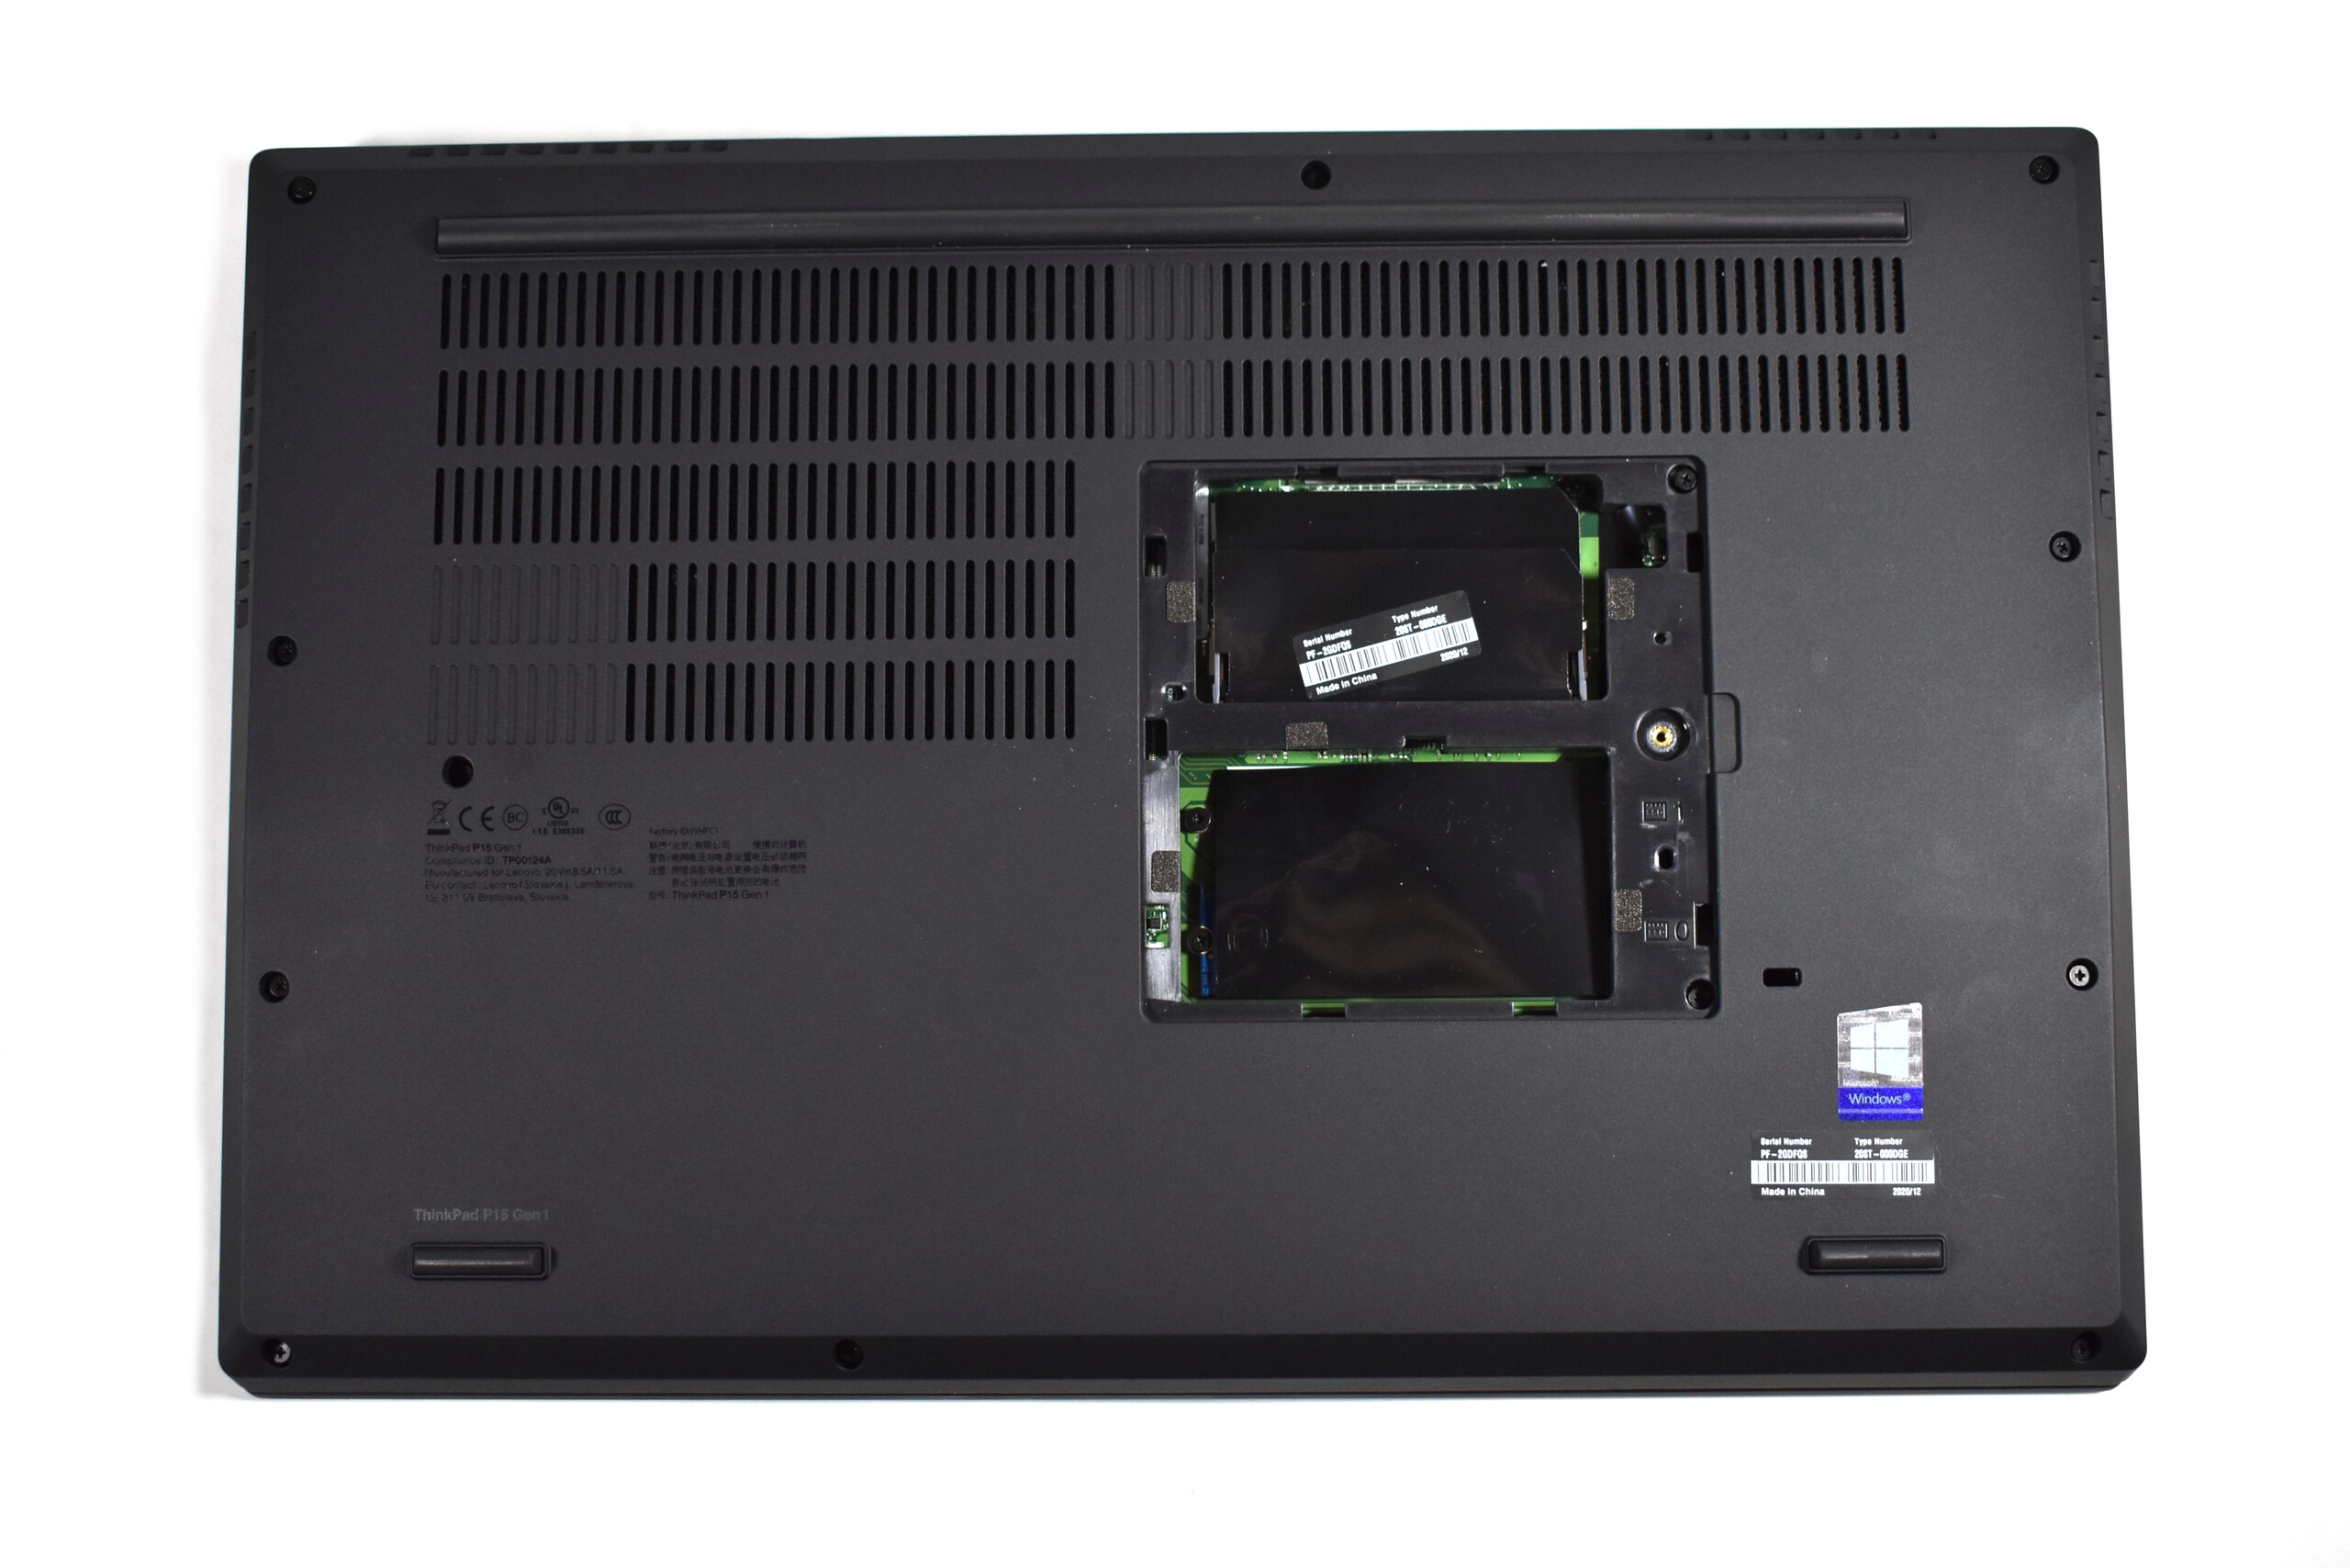
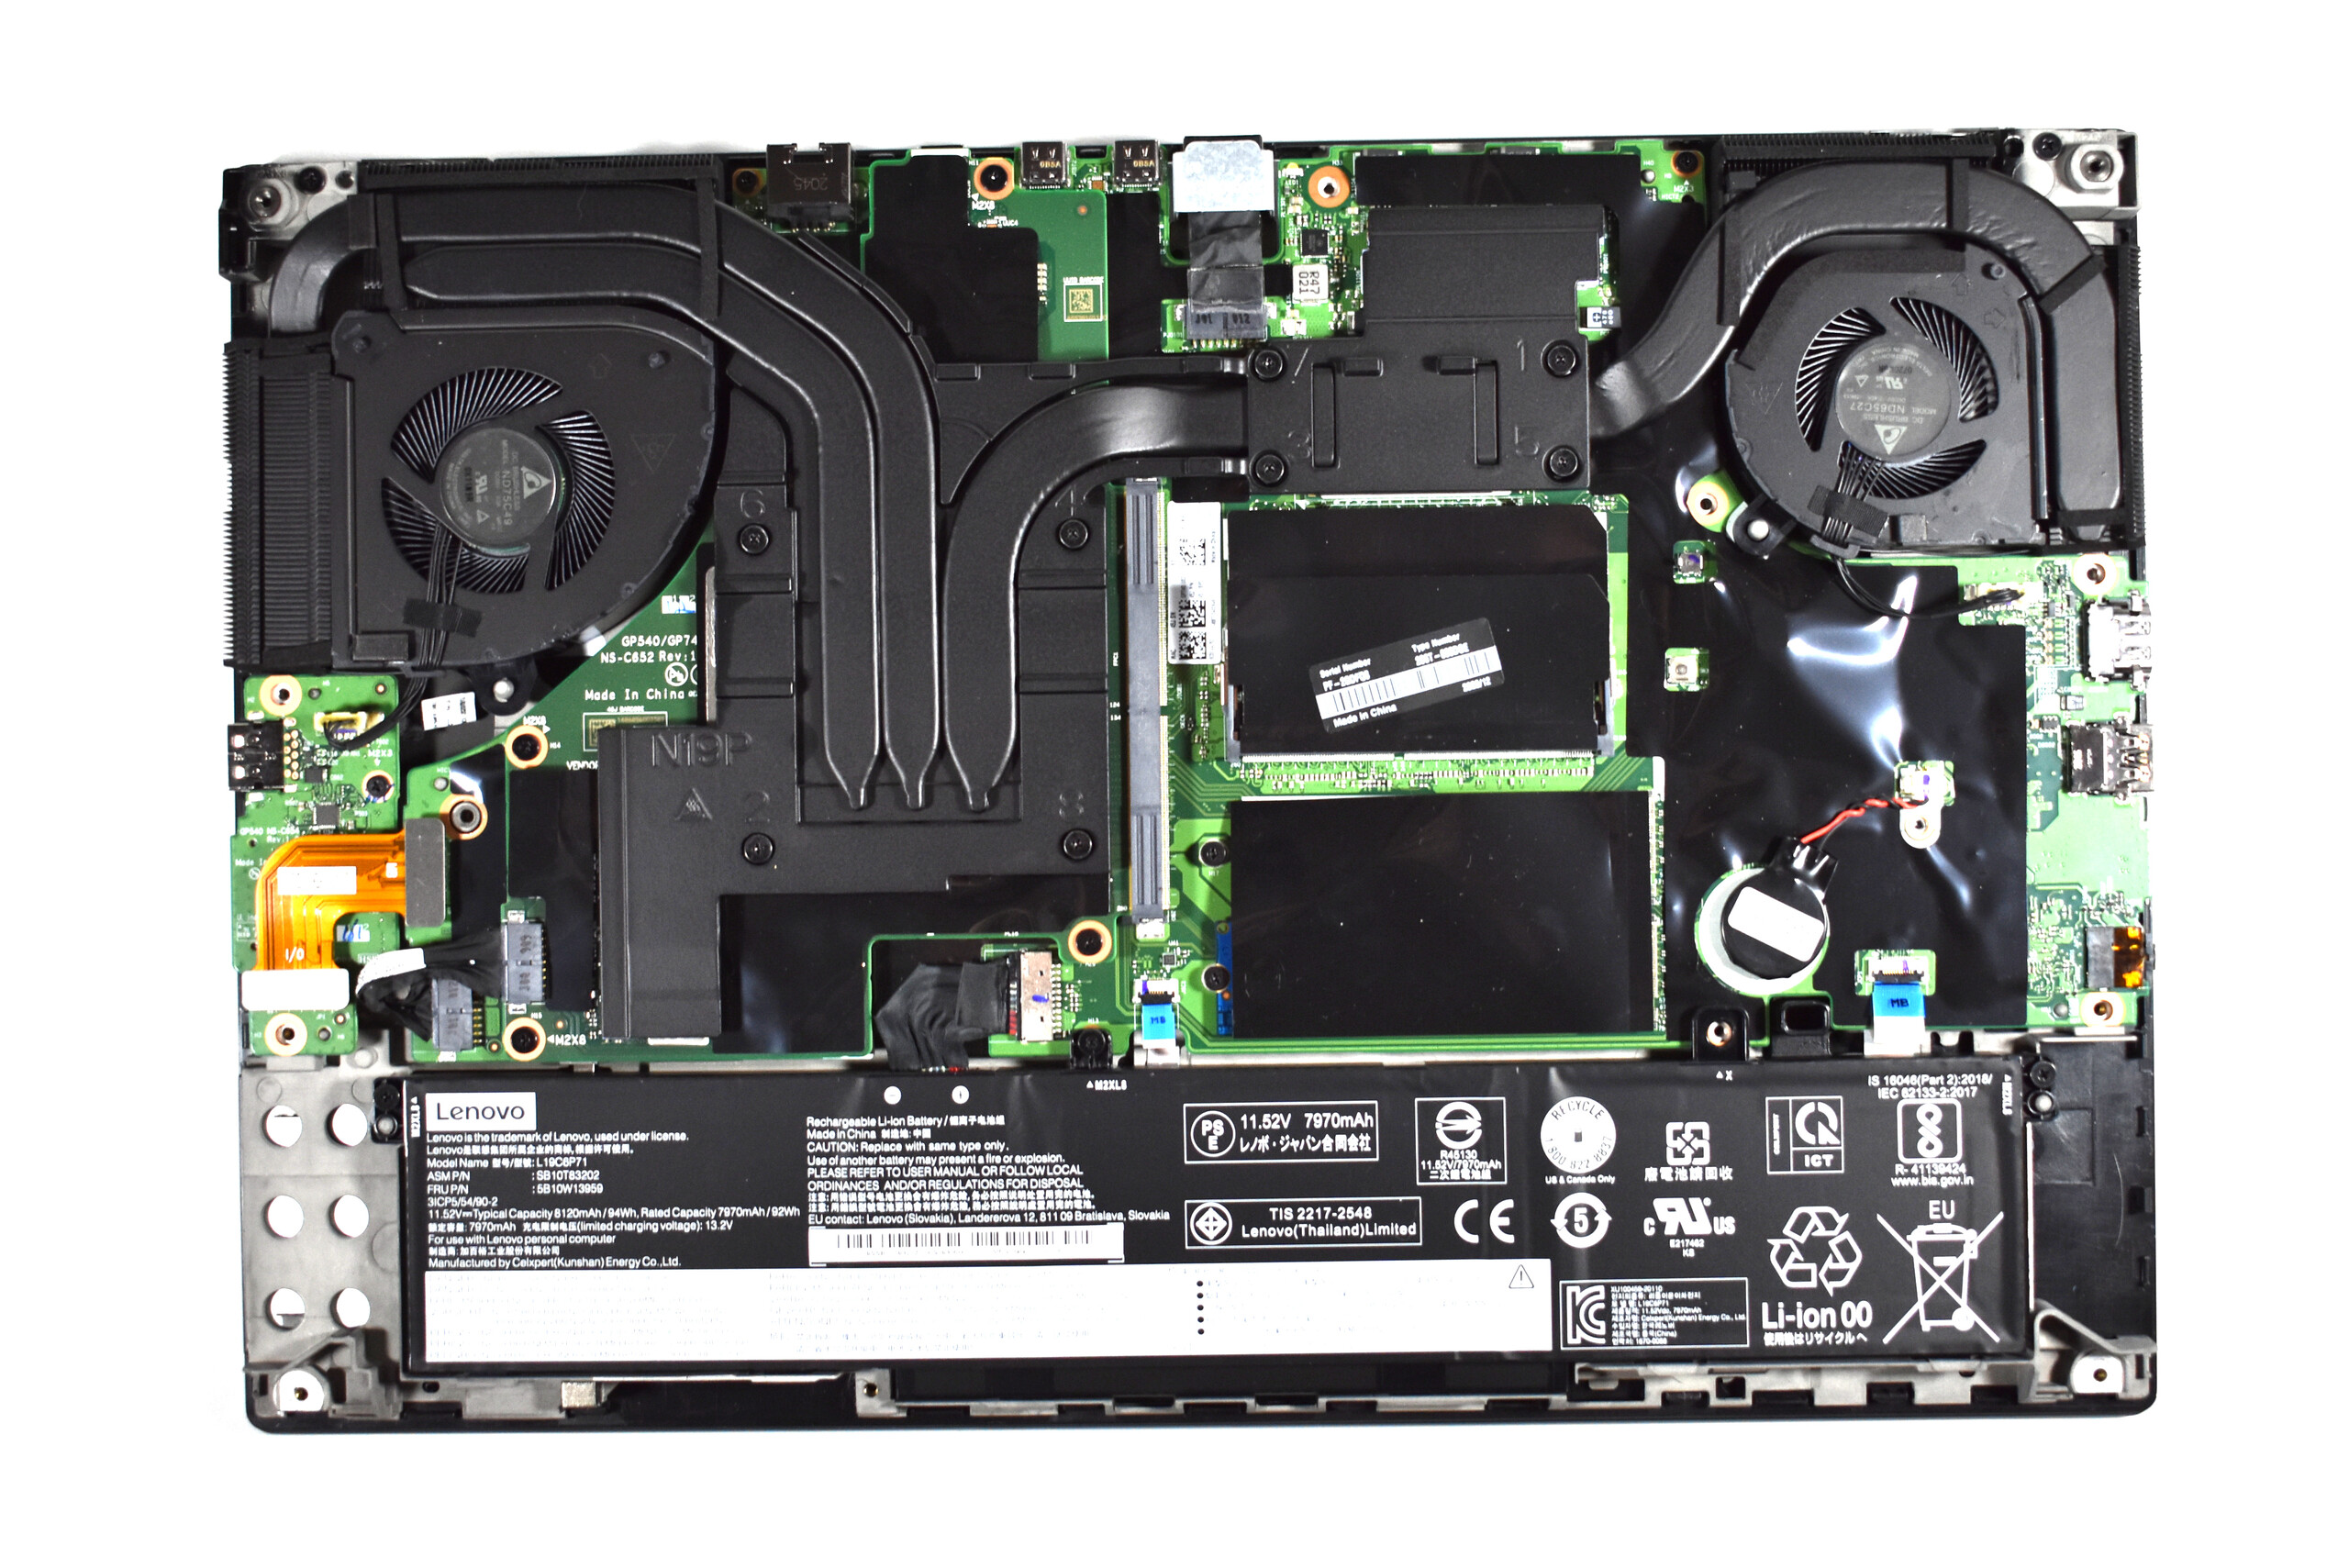
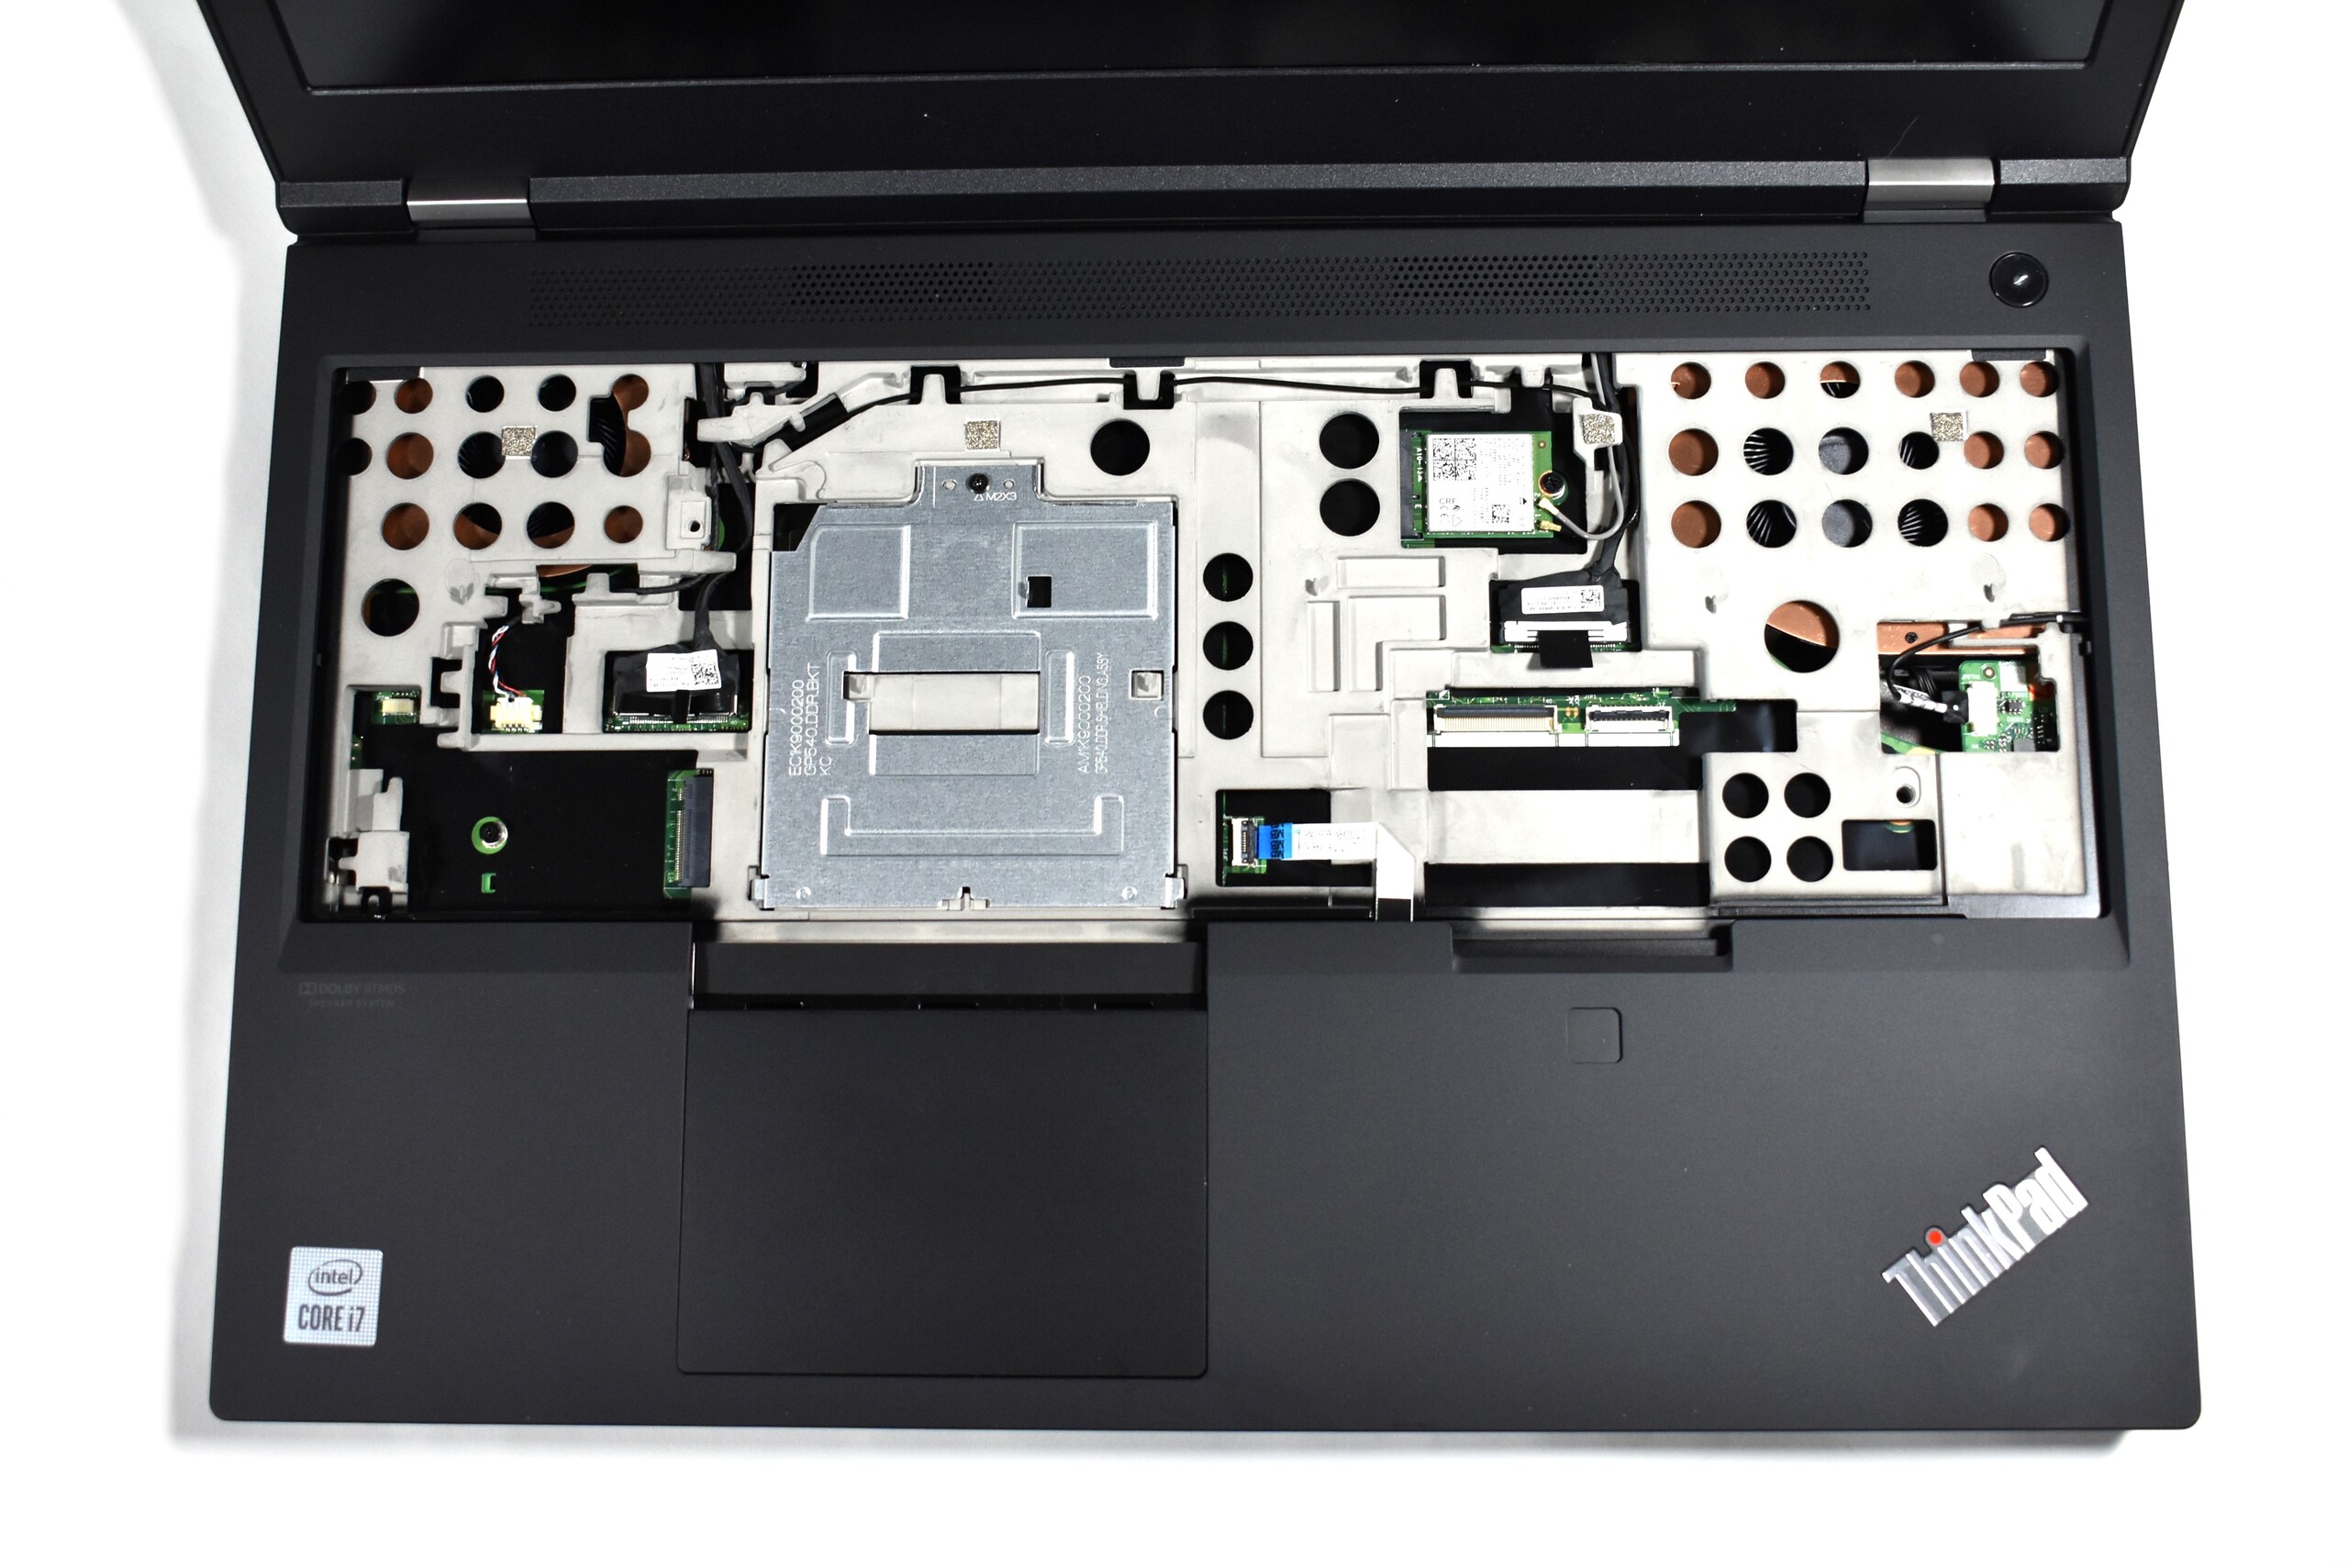
Aunque algunos de estos cambios nos preocupan, nos gustan las opciones de mantenimiento mejoradas y la mayor modularidad. En el predecesor, todavía había que desmontar toda la carcasa para acceder al sistema de refrigeración, pero en el ThinkPad P15 basta con quitar la placa inferior. Quitar el teclado con teclado numérico es igualmente fácil, y da acceso a dos de las cuatro ranuras de RAM
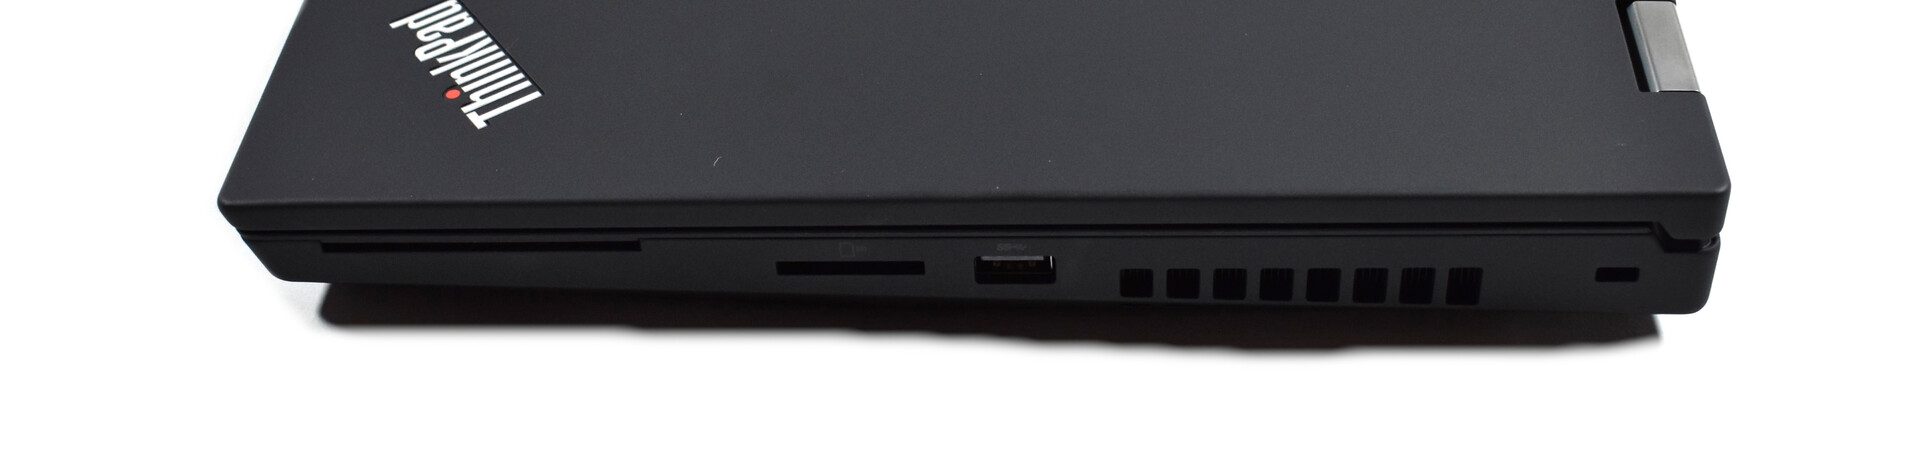
| SD Card Reader | |
| average JPG Copy Test (av. of 3 runs) | |
| Dell Precision 7550 (Toshiba Exceria Pro SDXC 64 GB UHS-II) | |
| Lenovo ThinkPad P53-20QN000YGE (Toshiba Exceria Pro SDXC 64 GB UHS-II) | |
| HP ZBook Fury 15 G7 (Toshiba Exceria Pro SDXC 64 GB UHS-II) | |
| Media de la clase Workstation (49.6 - 681, n=14, últimos 2 años) | |
| Lenovo ThinkPad T15p-20TN0006GE (Toshiba Exceria Pro SDXC 64 GB UHS-II) | |
| Lenovo ThinkPad P15 Gen1-20ST000DGE (Toshiba Exceria Pro SDXC 64 GB UHS-II) | |
| maximum AS SSD Seq Read Test (1GB) | |
| Media de la clase Workstation (87.6 - 1455, n=14, últimos 2 años) | |
| HP ZBook Fury 15 G7 (Toshiba Exceria Pro SDXC 64 GB UHS-II) | |
| Lenovo ThinkPad P53-20QN000YGE (Toshiba Exceria Pro SDXC 64 GB UHS-II) | |
| Dell Precision 7550 (Toshiba Exceria Pro SDXC 64 GB UHS-II) | |
| Lenovo ThinkPad T15p-20TN0006GE (Toshiba Exceria Pro SDXC 64 GB UHS-II) | |
| Lenovo ThinkPad P15 Gen1-20ST000DGE (Toshiba Exceria Pro SDXC 64 GB UHS-II) | |
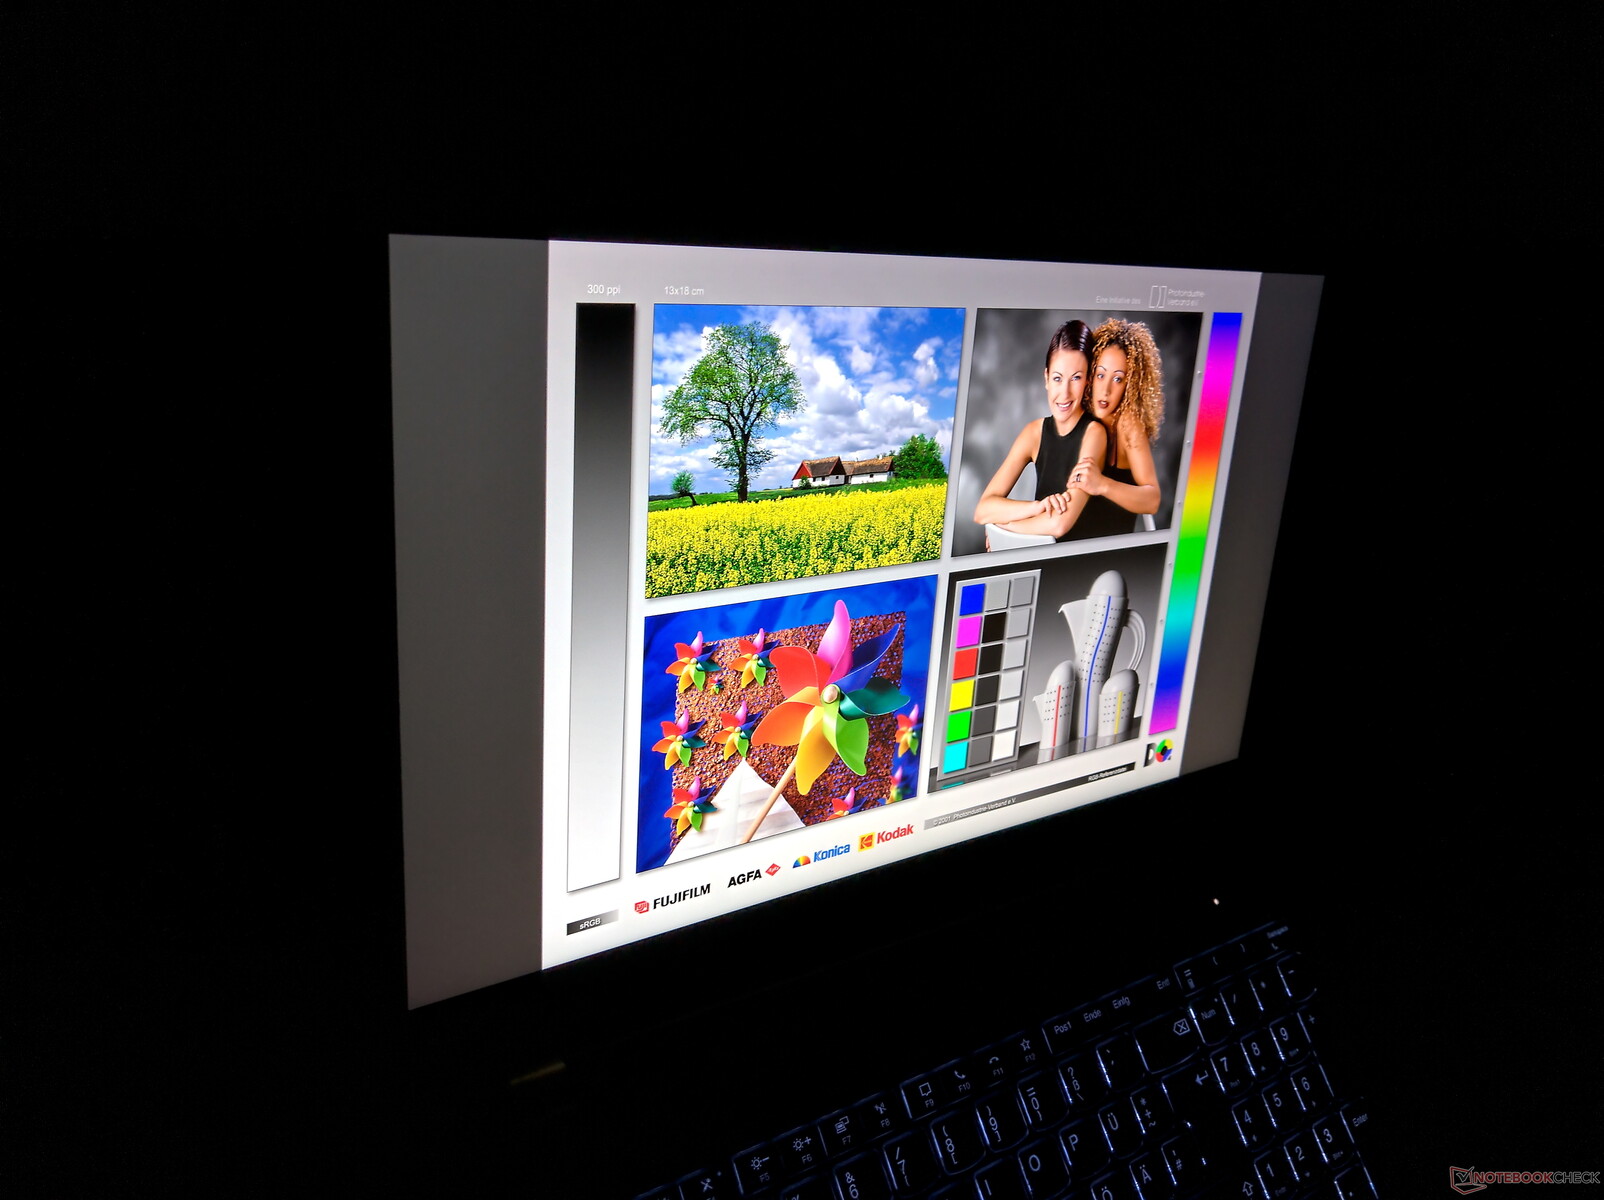
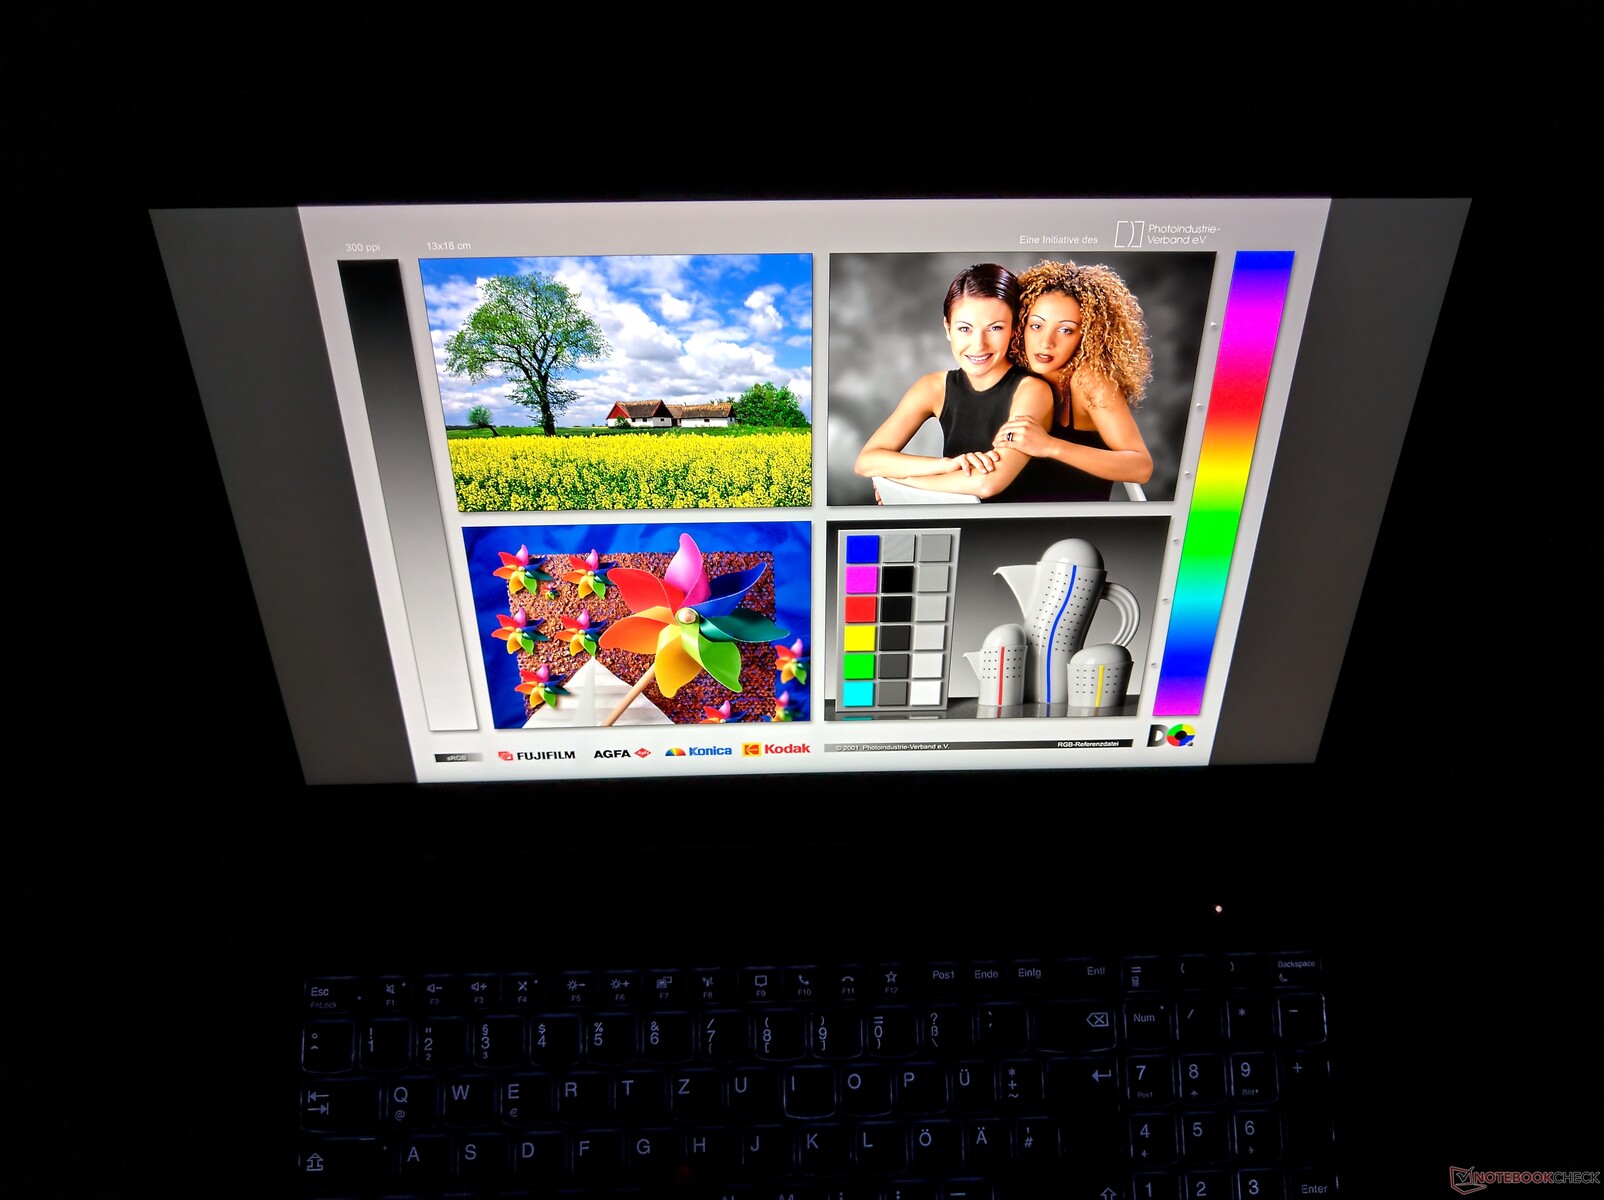
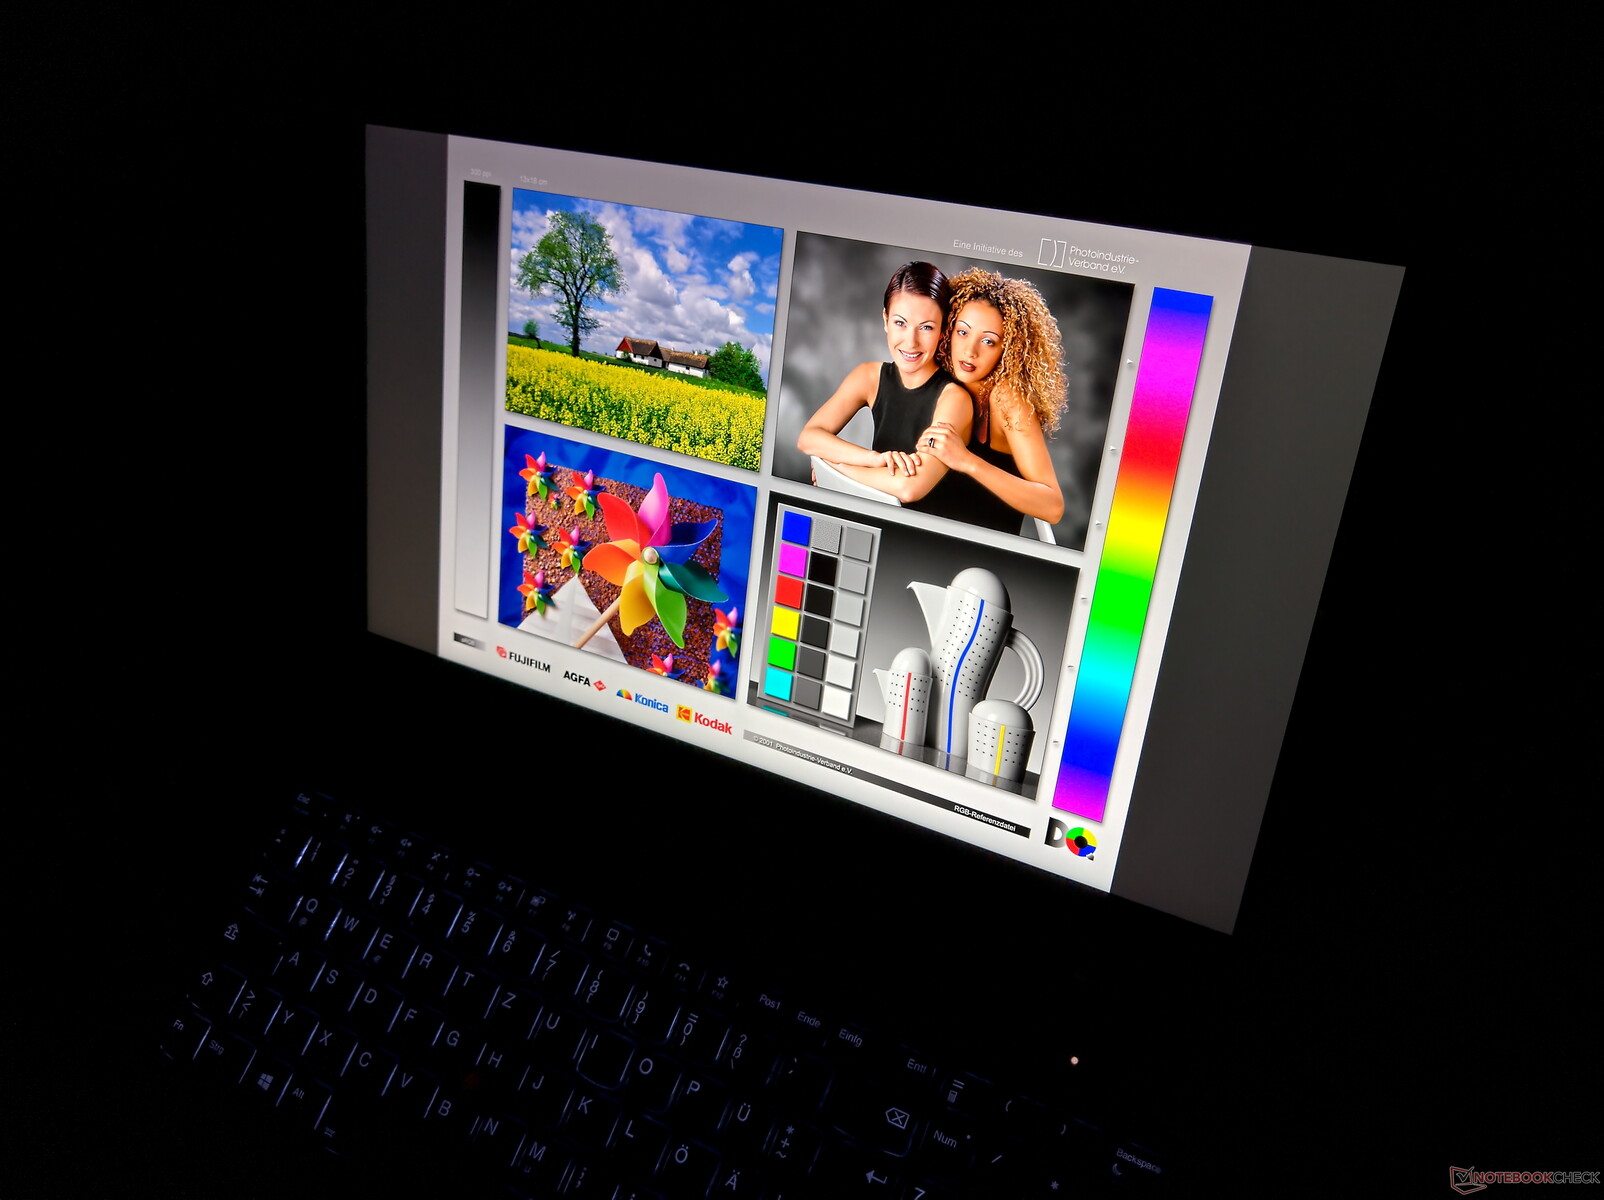
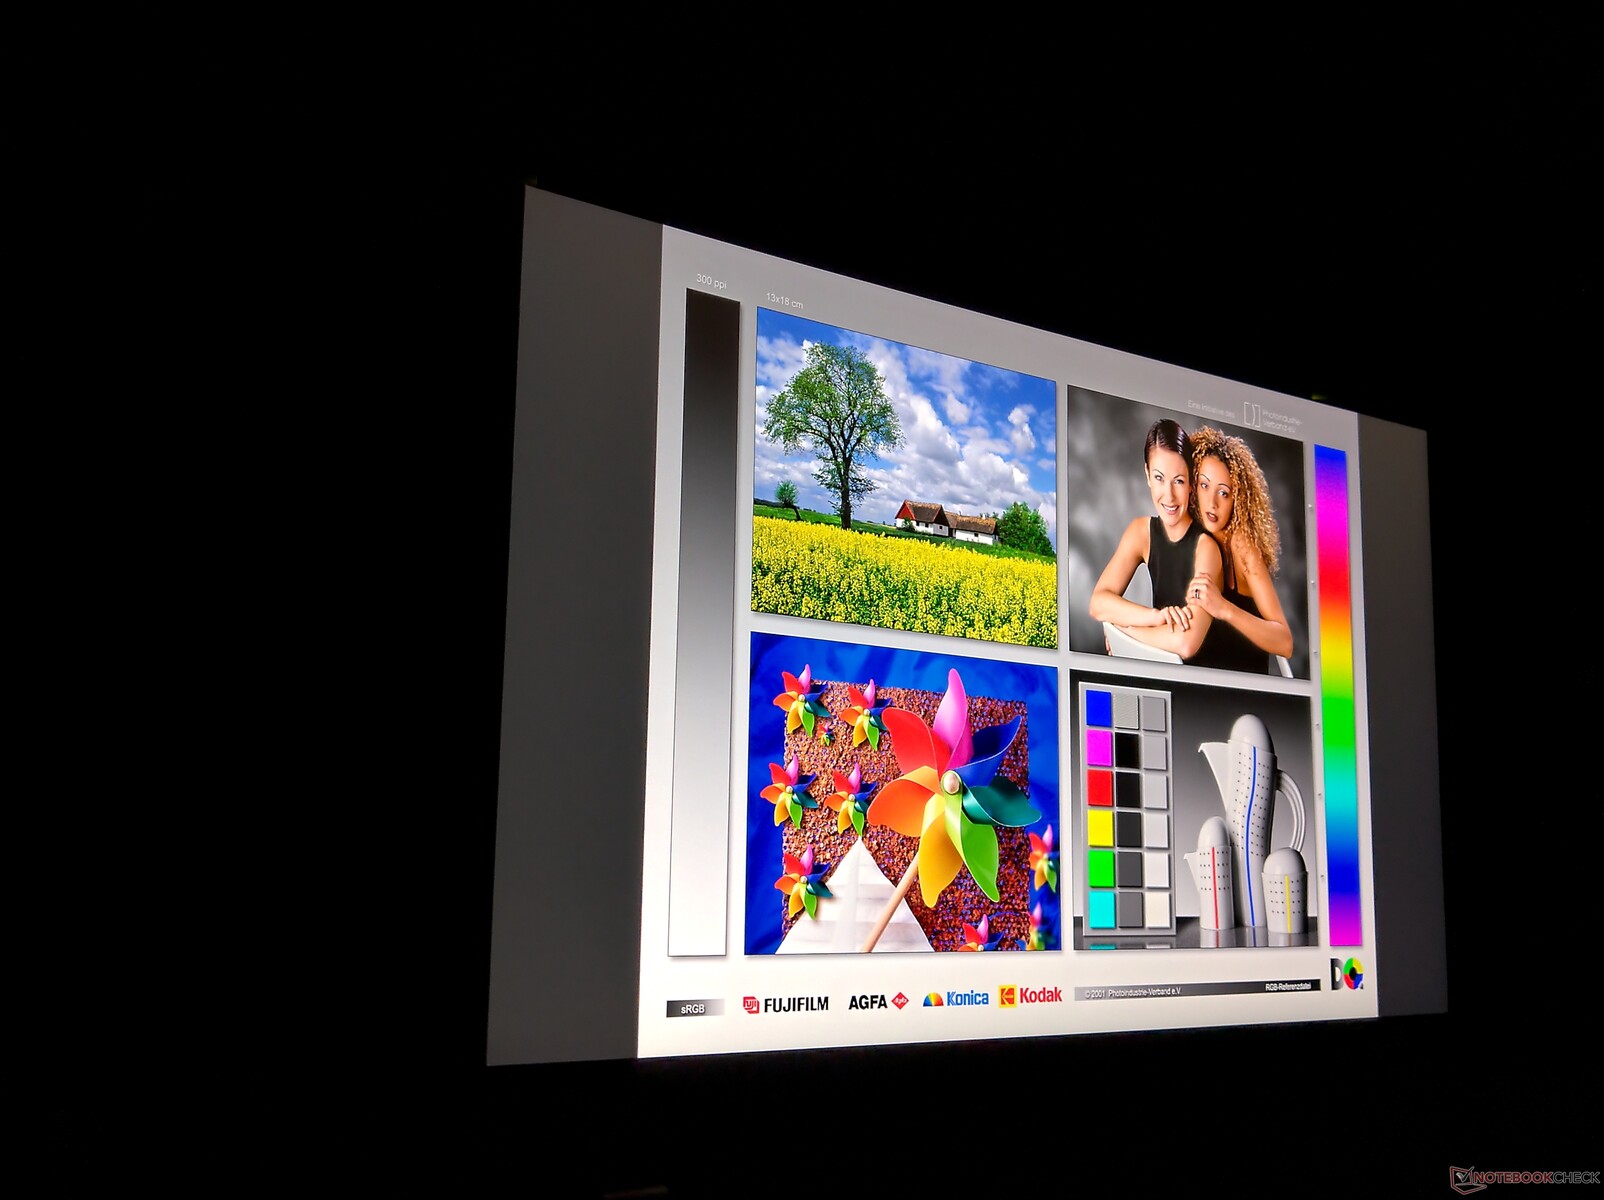
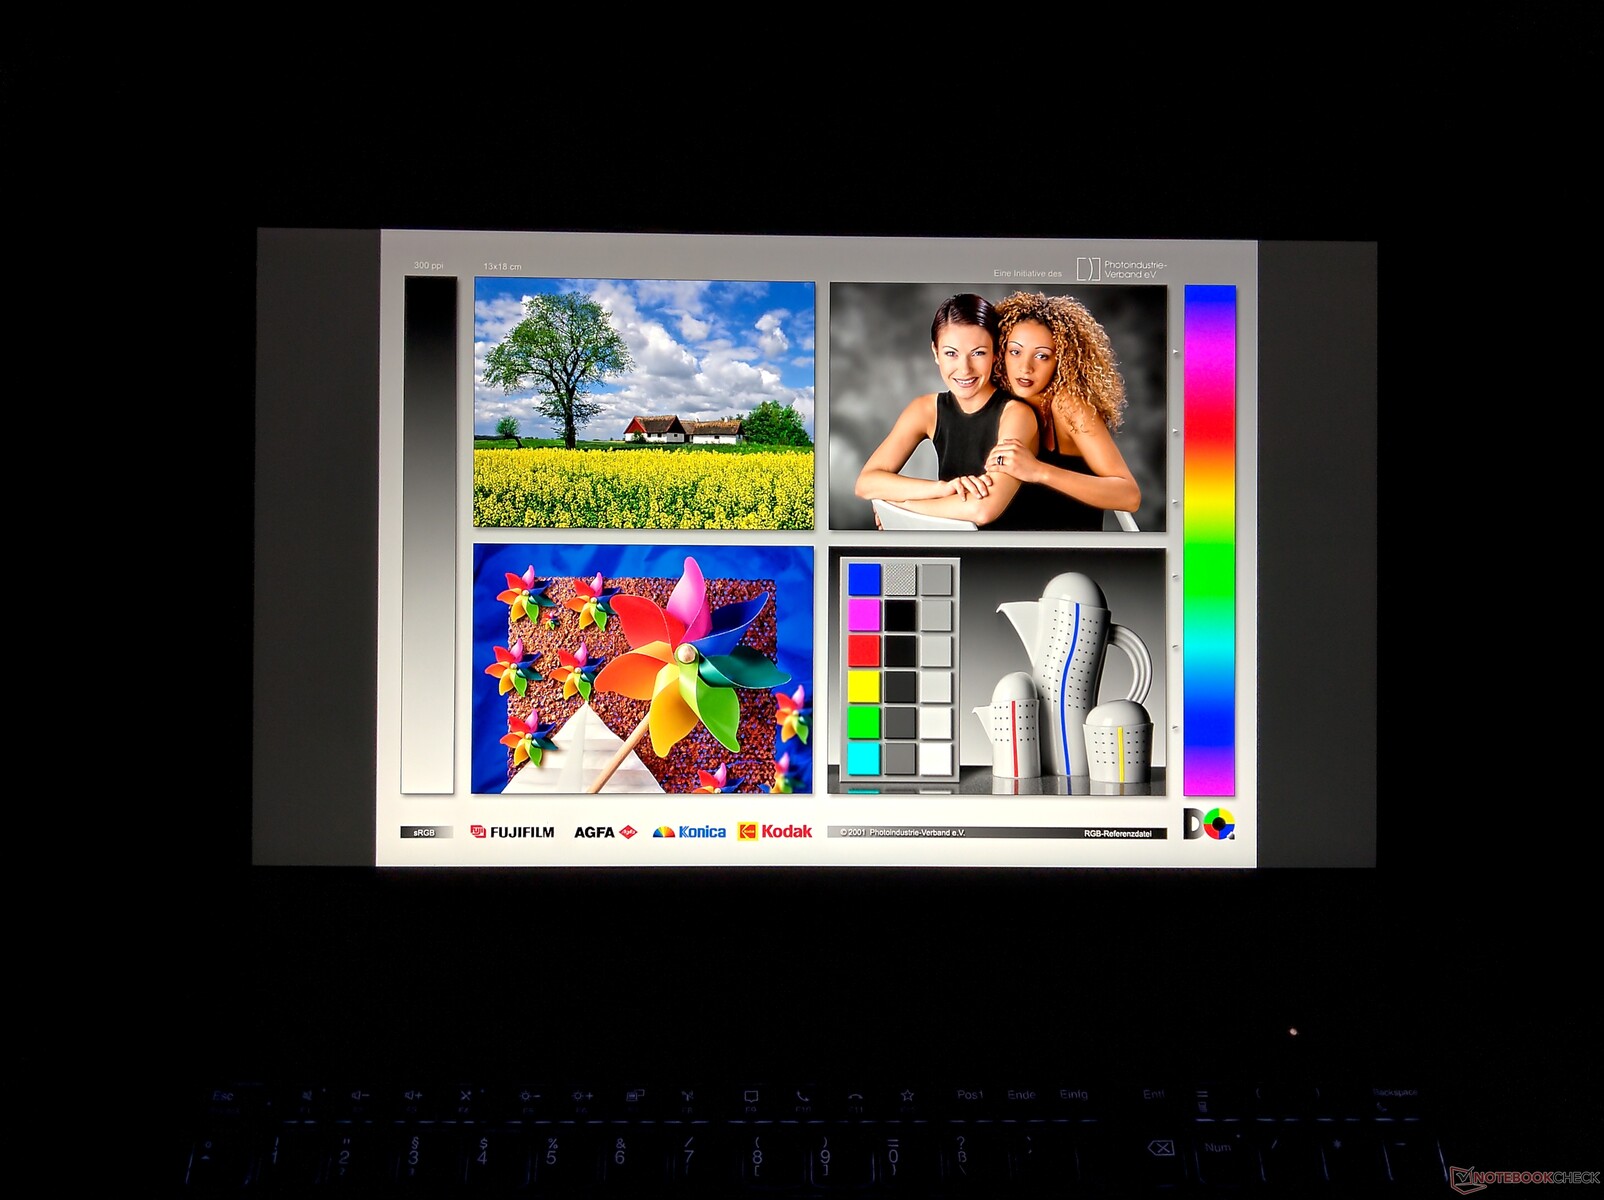
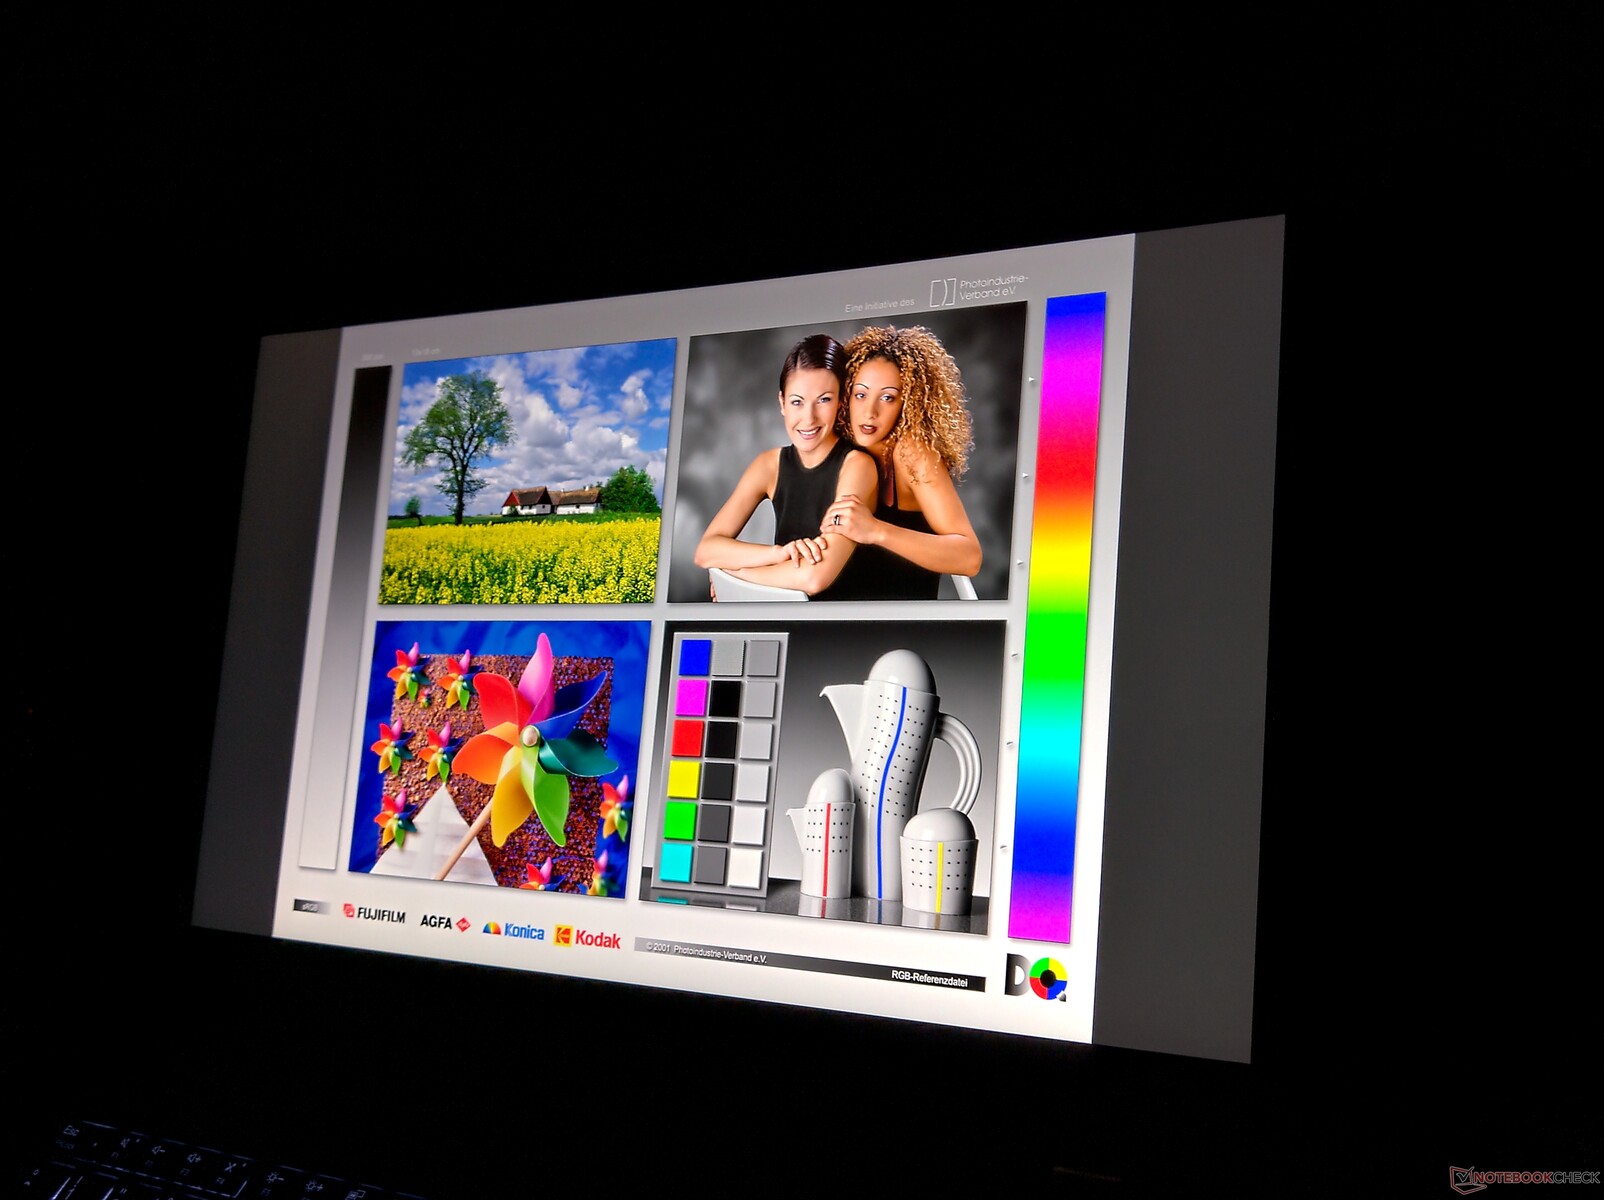
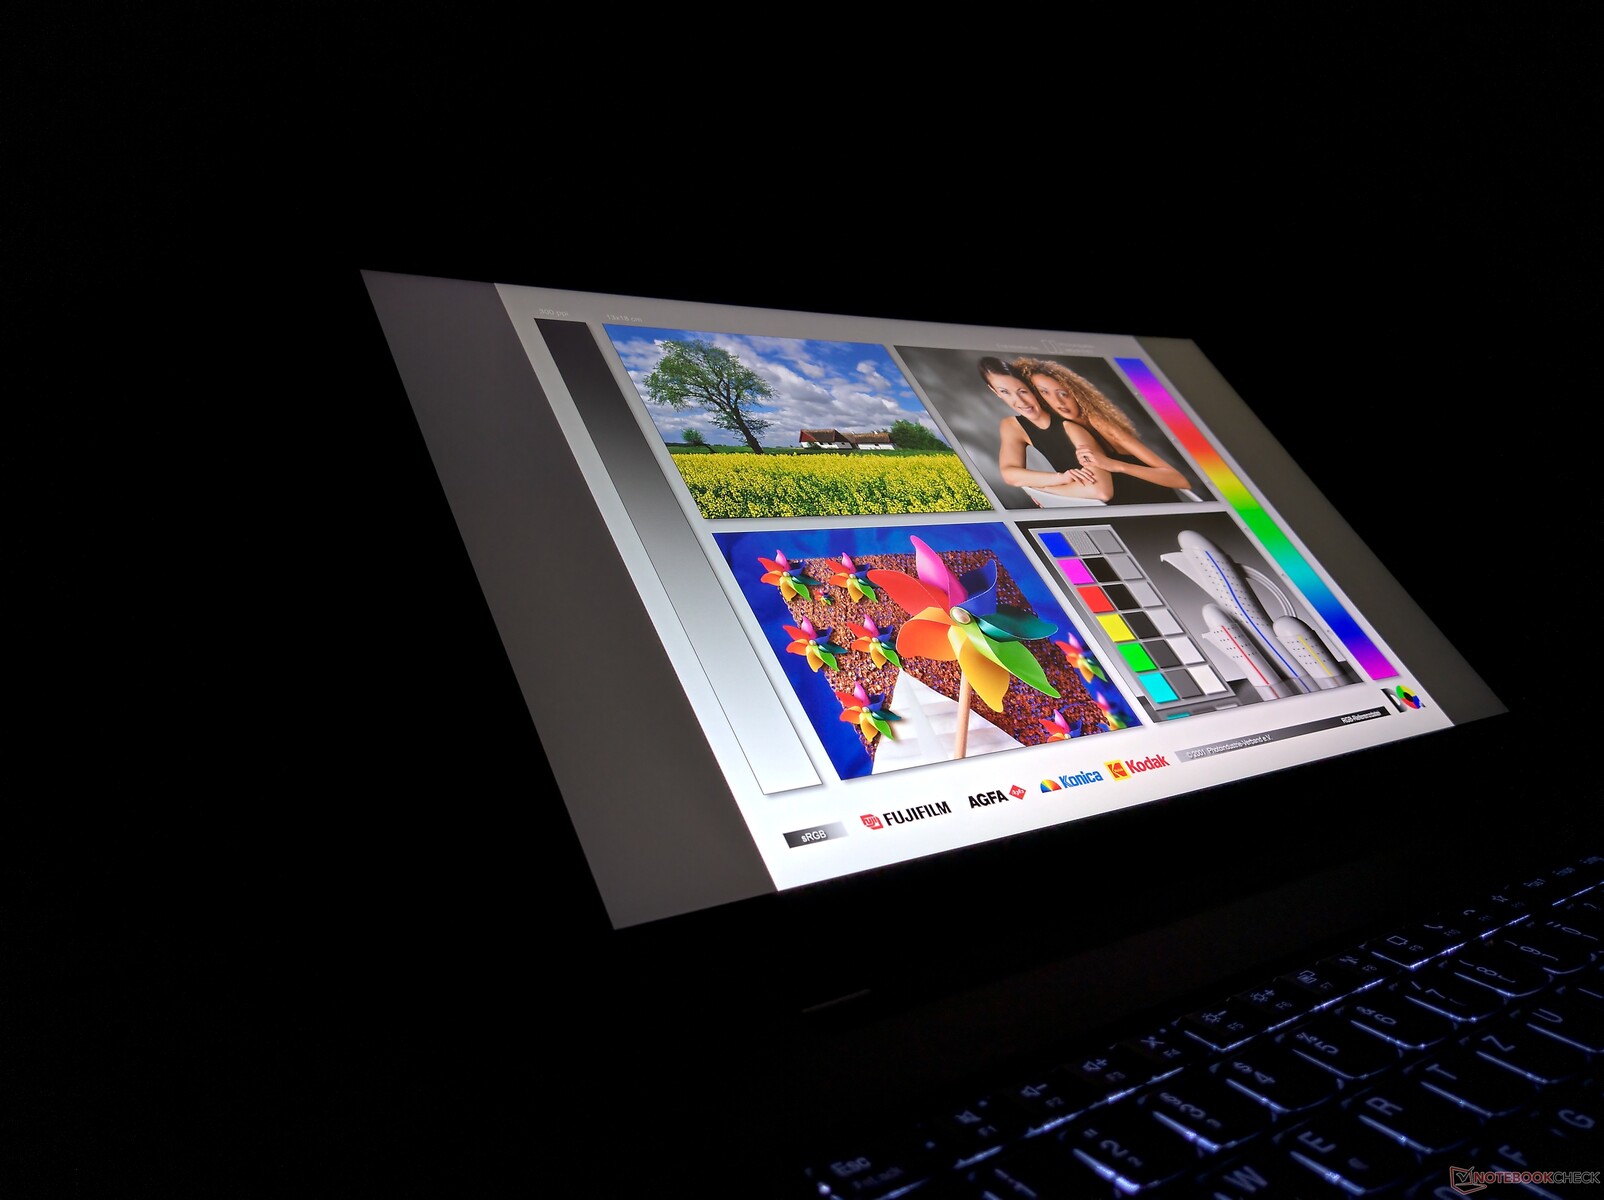
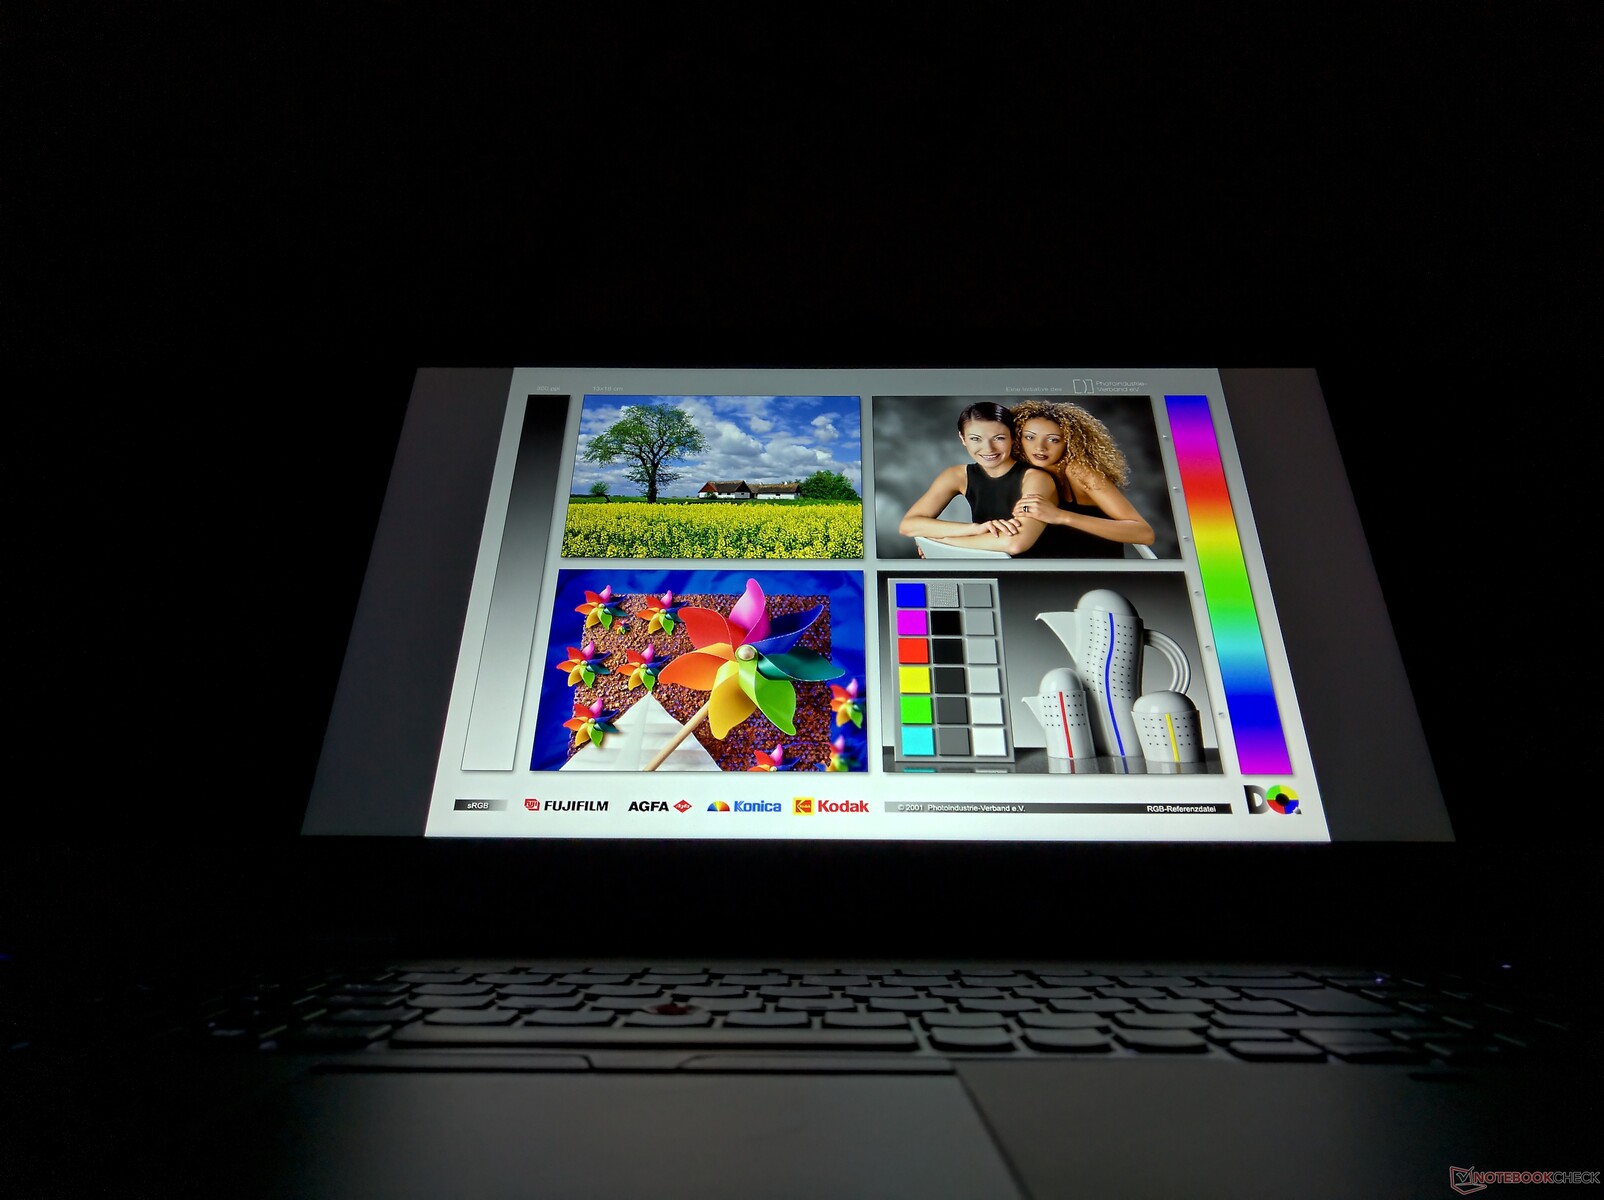
Pantalla: Probando el panel básico del Lenovo ThinkPad P15

Como muchos otros portátiles ThinkPad, el Lenovo ThinkPad P15 Gen 1 también ofrece una selección de pantallas disponibles que tienen en común la diagonal de 15,6 pulgadas y el formato 16:9
- Full-HD (1920 x 1080), IPS LCD, 300 cd/m², 72% NTSC, mate
- Full-HD (1920 x 1080), IPS LCD, 500 cd/m², 72% NTSC, mate, Dolby Vision
- 4K-UHD (3840 x 2160), LCD IPS, 600 cd/m², 100% AdobeRGB, mate, Dolby Vision
- 4K-UHD (3840 x 2160), OLED, 400 cd/m² (pico de 500 cd/m²), 100% DCI-P3, brillante, Dolby Vision, pantalla táctil
Con un brillo medio medido de 304 cd/m², la pantalla básica de nuestra unidad de pruebas alcanza el valor de brillo prometido. Aunque esto hace que el display sea el más oscuro de nuestra comparación, no es sorprendente, ya que las otras estaciones de trabajo están equipadas con displays 4K UHD y el ThinkPad P53 tenía el LCD Full-HD más brillante.
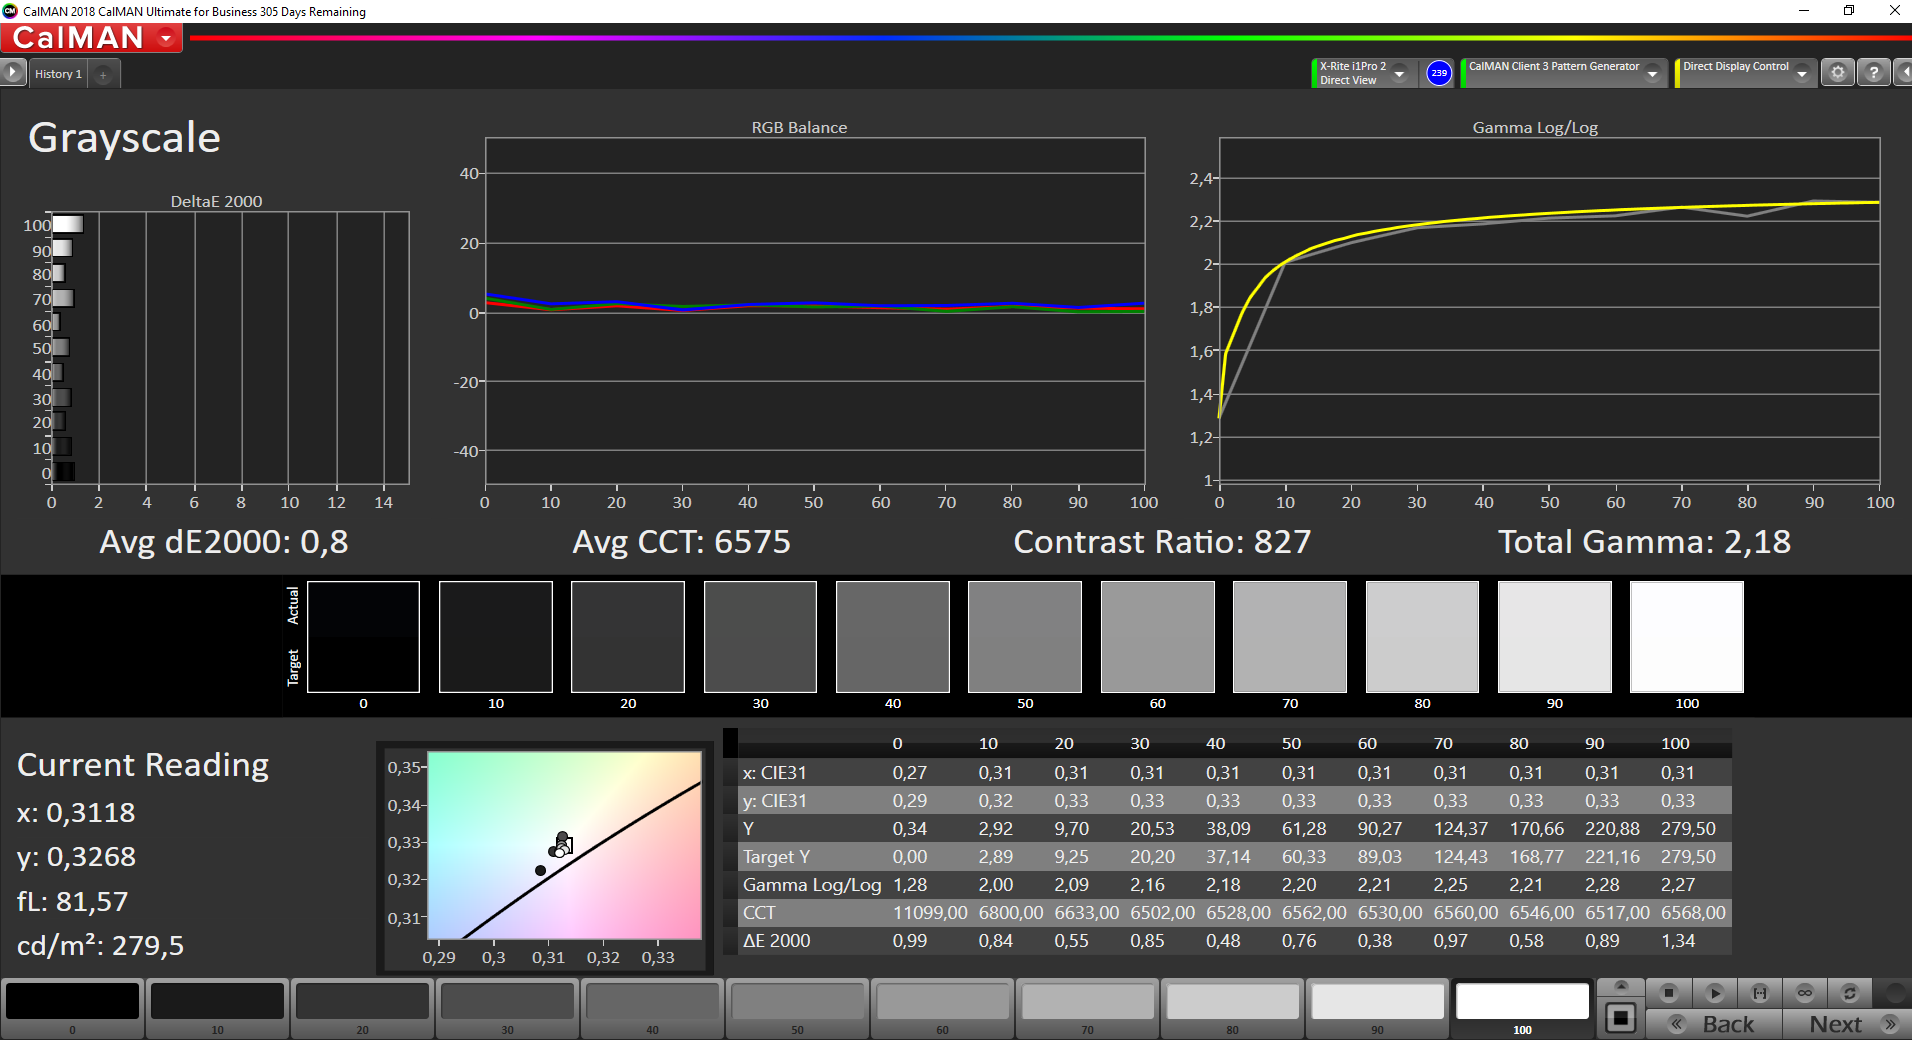
La distribución de brillo por debajo de la media destaca, pero no hay sombreado perceptible mirando a simple vista
| |||||||||||||||||||||||||
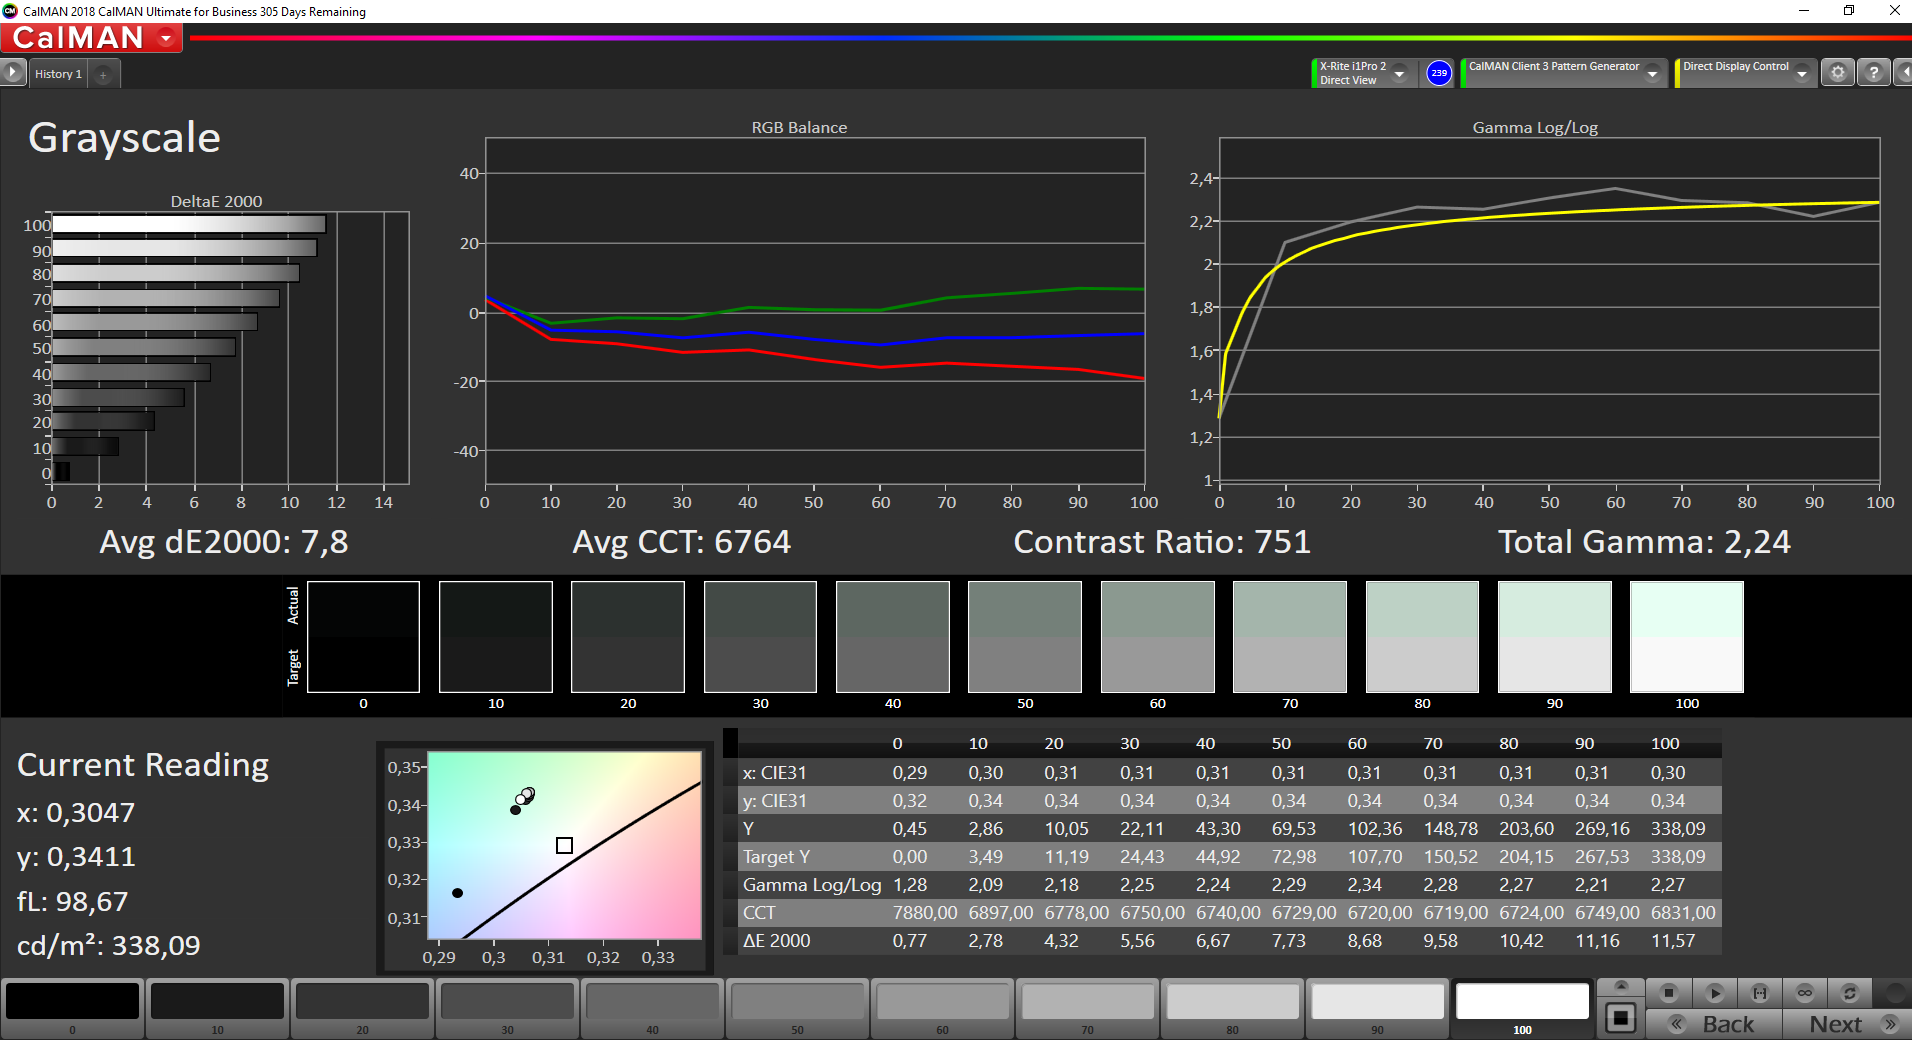
iluminación: 81 %
Brillo con batería: 336 cd/m²
Contraste: 751:1 (Negro: 0.45 cd/m²)
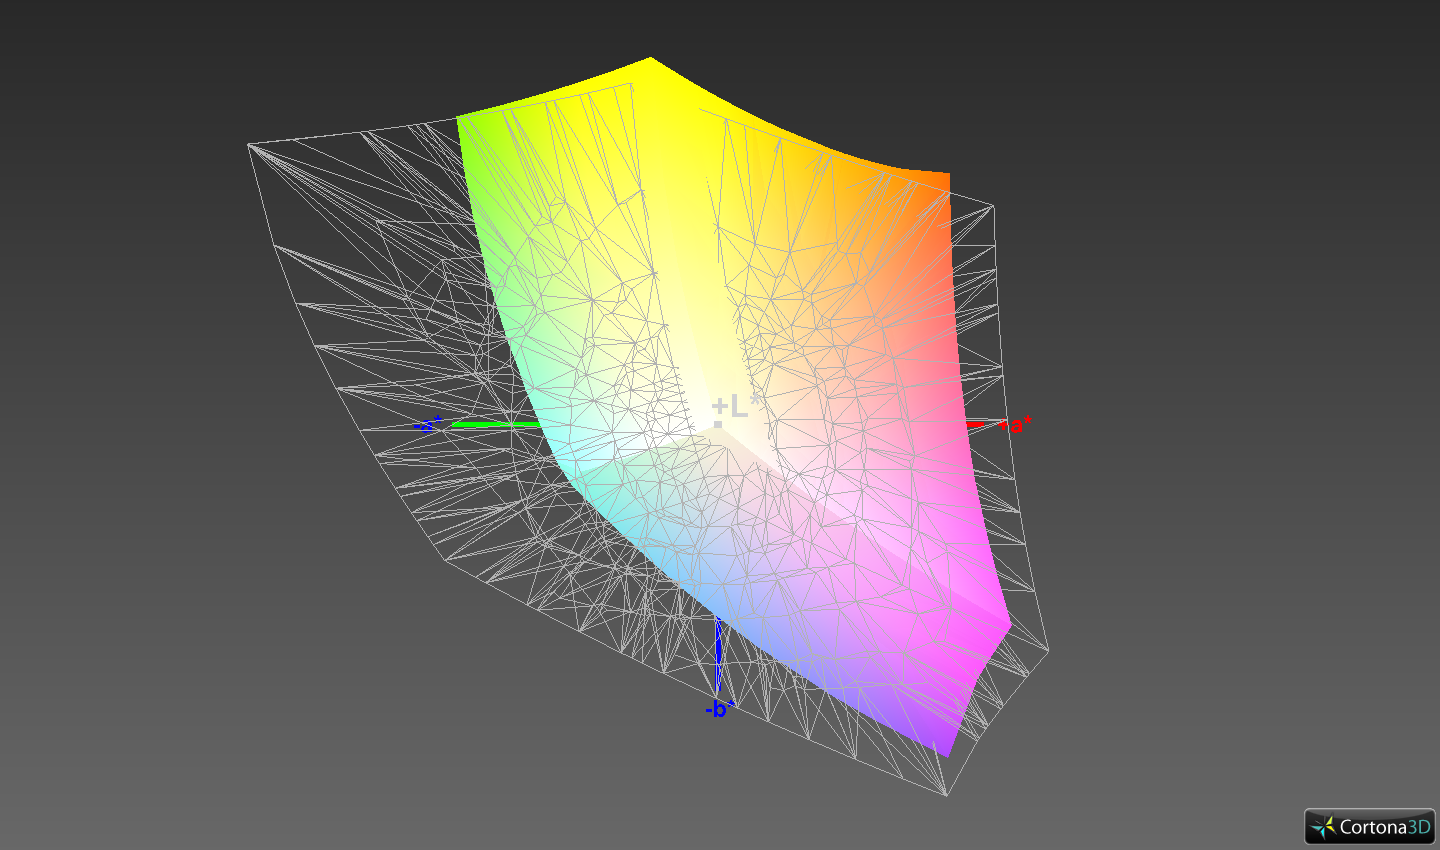
ΔE ColorChecker Calman: 5.5 | ∀{0.5-29.43 Ø4.72}
calibrated: 1.9
ΔE Greyscale Calman: 7.8 | ∀{0.09-98 Ø4.97}
92.1% sRGB (Argyll 1.6.3 3D)
60% AdobeRGB 1998 (Argyll 1.6.3 3D)
67.1% AdobeRGB 1998 (Argyll 3D)
92.3% sRGB (Argyll 3D)
66.6% Display P3 (Argyll 3D)
Gamma: 2.24
CCT: 6764 K
| Lenovo ThinkPad P15 Gen1-20ST000DGE N156HCE-EN1, a-Si IPS LED, 1920x1080, 15.6" | Lenovo ThinkPad P53-20QN000YGE N156HCE-GN1, IPS, 1920x1080, 15.6" | Lenovo ThinkPad T15p-20TN0006GE MNF601EA1-1, IPS LED, 3840x2160, 15.6" | Dell Precision 7550 AU Optronics B156ZAN, IPS, 3840x2160, 15.6" | HP ZBook Fury 15 G7 LG Philips LGD0661, IPS, 3840x2160, 15.6" | |
|---|---|---|---|---|---|
| Display | -3% | 28% | 25% | 26% | |
| Display P3 Coverage (%) | 66.6 | 63.2 -5% | 86.8 30% | 82.1 23% | 95.6 44% |
| sRGB Coverage (%) | 92.3 | 92.9 1% | 99.3 8% | 99.6 8% | 99.8 8% |
| AdobeRGB 1998 Coverage (%) | 67.1 | 64.3 -4% | 98.5 47% | 96.8 44% | 84.5 26% |
| Response Times | 15% | 17% | -14% | -23% | |
| Response Time Grey 50% / Grey 80% * (ms) | 41.2 ? | 38.4 ? 7% | 41.6 ? -1% | 51.2 ? -24% | 56 ? -36% |
| Response Time Black / White * (ms) | 32.8 ? | 25.2 ? 23% | 21.2 ? 35% | 34 ? -4% | 36 ? -10% |
| PWM Frequency (Hz) | 24270 | 26040 ? | |||
| Screen | 39% | 64% | 14% | 35% | |
| Brightness middle (cd/m²) | 338 | 510 51% | 595 76% | 473.5 40% | 672.8 99% |
| Brightness (cd/m²) | 304 | 468 54% | 594 95% | 461 52% | 674 122% |
| Brightness Distribution (%) | 81 | 89 10% | 94 16% | 90 11% | 89 10% |
| Black Level * (cd/m²) | 0.45 | 0.36 20% | 0.32 29% | 0.55 -22% | 0.5 -11% |
| Contrast (:1) | 751 | 1417 89% | 1859 148% | 861 15% | 1346 79% |
| Colorchecker dE 2000 * | 5.5 | 2.3 58% | 1.2 78% | 4.8 13% | 3.48 37% |
| Colorchecker dE 2000 max. * | 11.5 | 5.5 52% | 2.5 78% | 8.73 24% | 9.44 18% |
| Colorchecker dE 2000 calibrated * | 1.9 | 1.2 37% | 1 47% | 3.08 -62% | 3.03 -59% |
| Greyscale dE 2000 * | 7.8 | 3.2 59% | 1.4 82% | 5.6 28% | 3.1 60% |
| Gamma | 2.24 98% | 2.34 94% | 2.1 105% | 2.34 94% | 2.04 108% |
| CCT | 6764 96% | 7036 92% | 6492 100% | 7549 86% | 6380 102% |
| Color Space (Percent of AdobeRGB 1998) (%) | 60 | 59.4 -1% | 85.3 42% | 86.4 44% | 75.2 25% |
| Color Space (Percent of sRGB) (%) | 92.1 | 93.1 1% | 99.2 8% | 99.7 8% | 100 9% |
| Media total (Programa/Opciones) | 17% /
28% | 36% /
51% | 8% /
12% | 13% /
26% |
* ... más pequeño es mejor
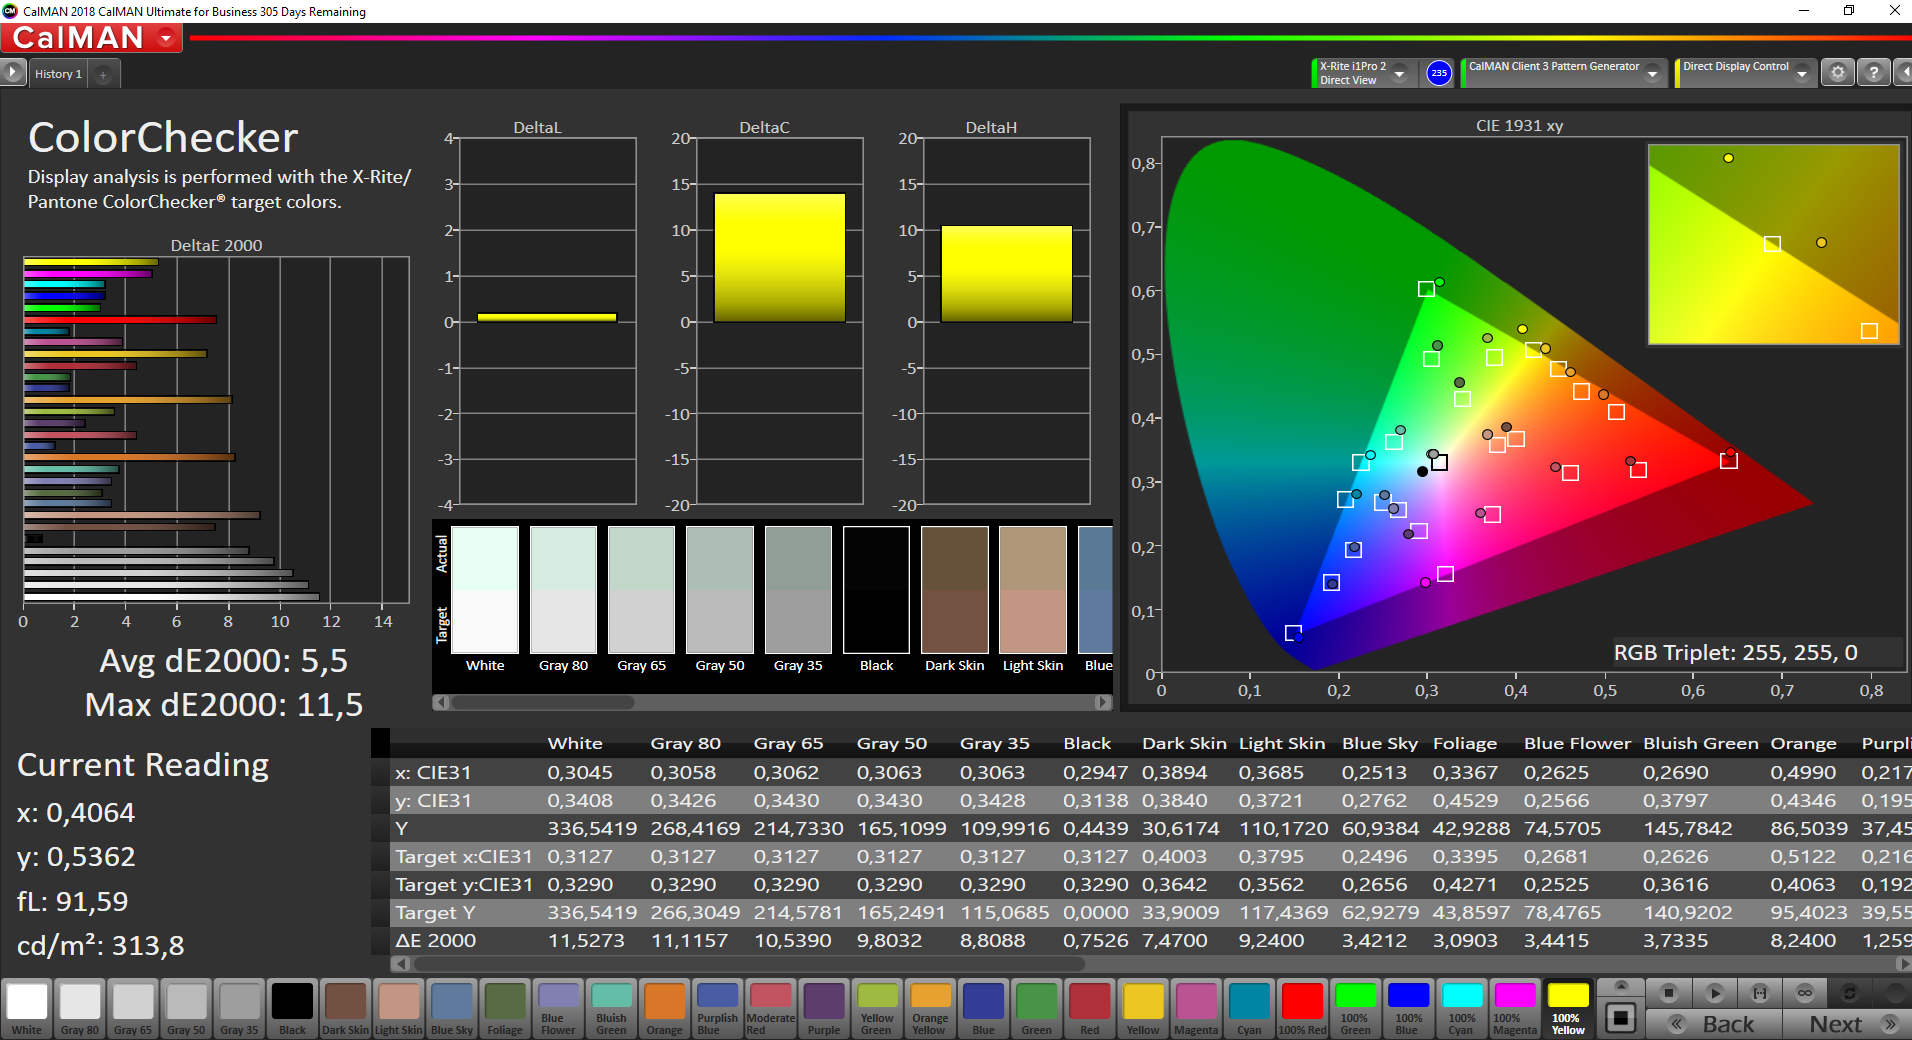
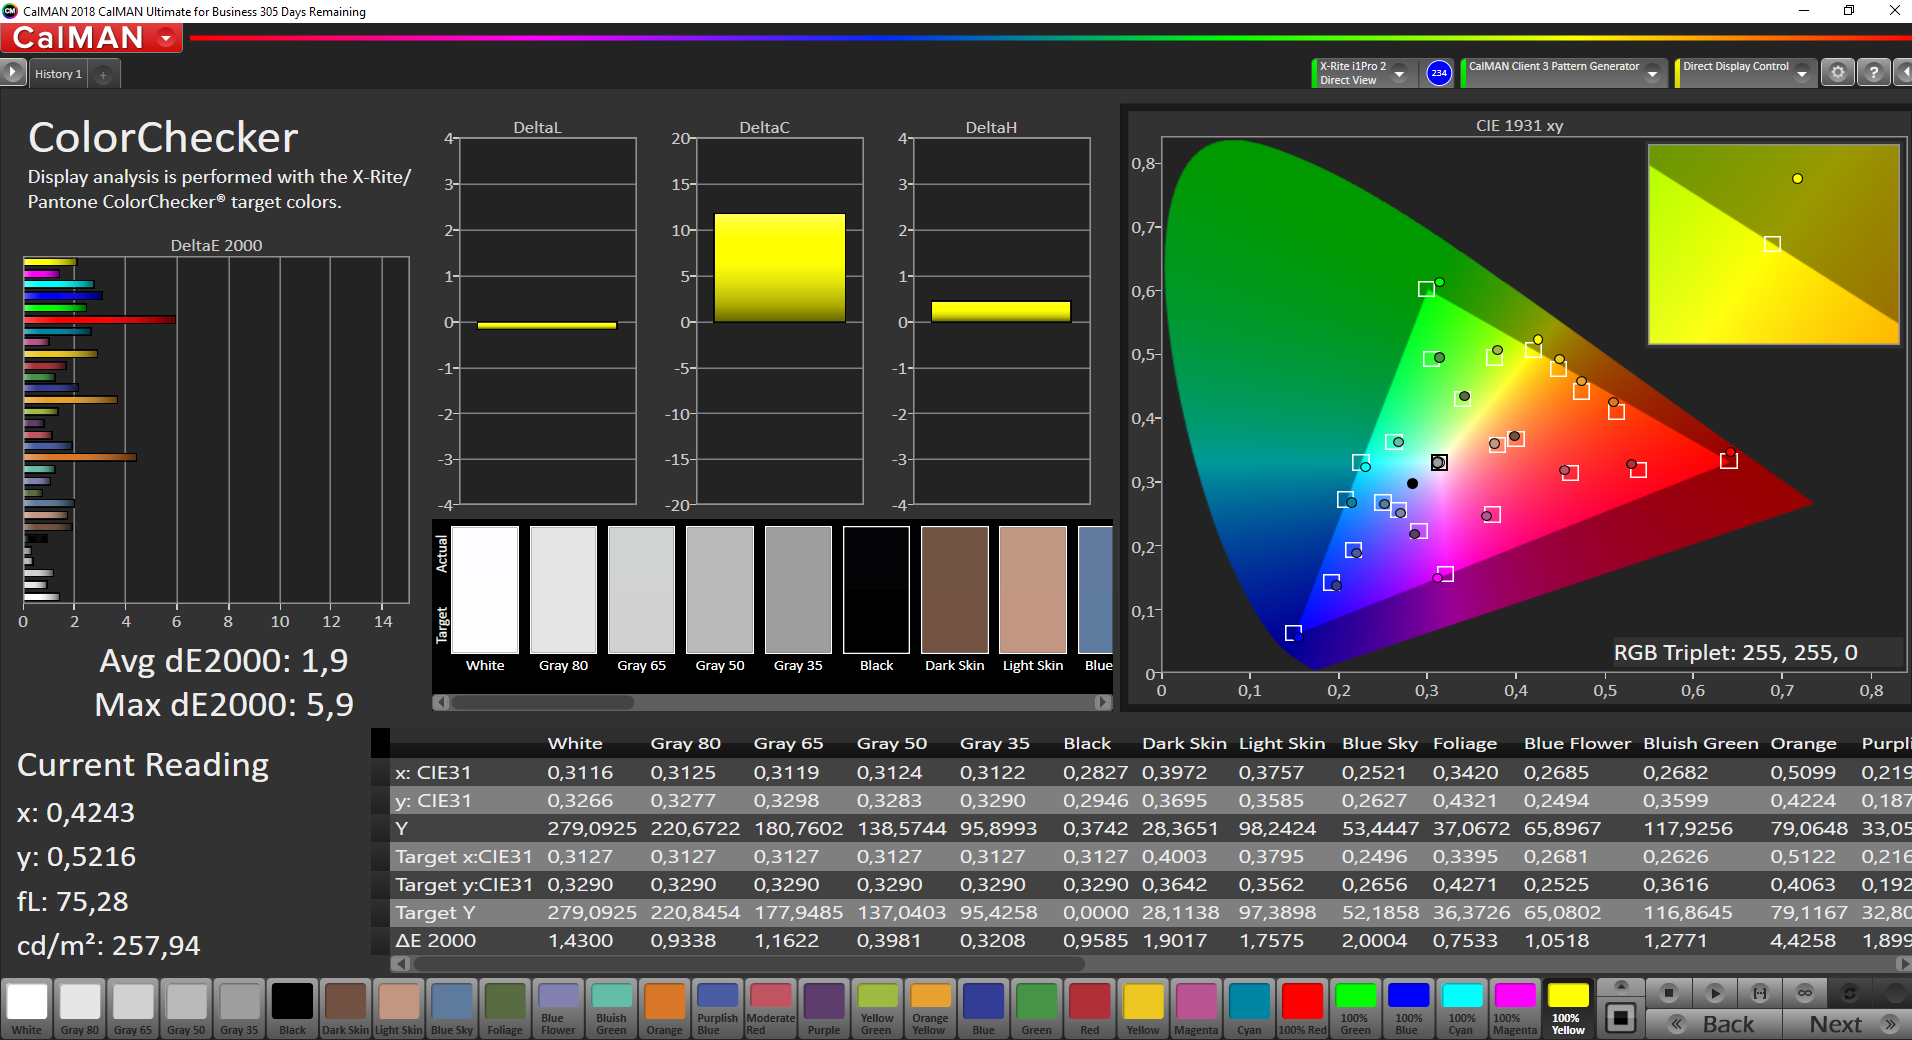
En el estado de entrega, la pantalla no está bien calibrada, lo que puede verse claramente en los valores que medimos con CalMan y el medidor de color X-Rite i1 Pro 2: La pantalla LCD del ThinkPad tiene un tinte verde. Una calibración decente lo solucionará, y ofrecemos el perfil de color correspondiente como descarga gratuita. Sin embargo, debido a la calibración, el brillo máximo en el centro del panel LCD caerá unos 60 cd/m².
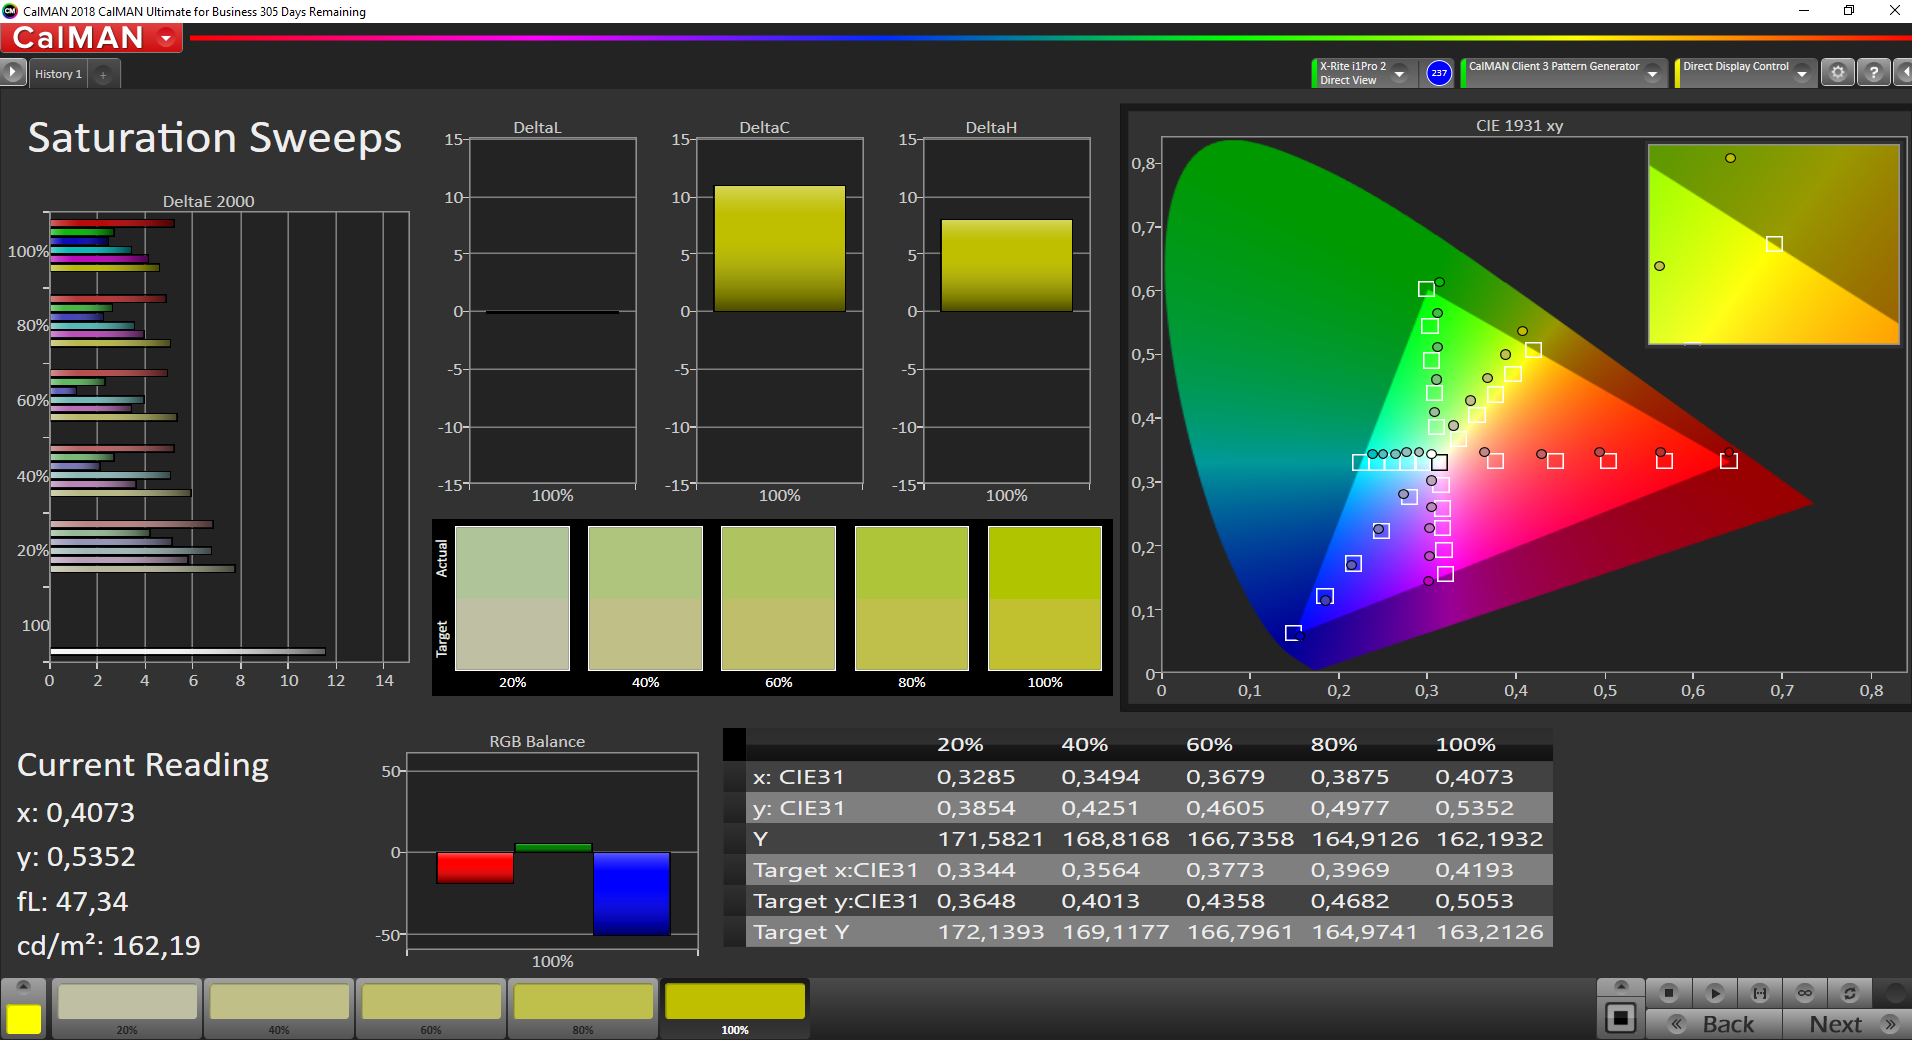
Estamos un poco decepcionados con el valor de contraste. Aunque 751:1 no es extremadamente malo, tampoco es un buen valor. También faltan algunos puntos porcentuales para cubrir completamente el espacio de color sRGB, pero esto también fue el caso del ThinkPad P53 con la pantalla de 500 cd/m²
Aunque en general también se puede usar el Lenovo ThinkPad P15 Gen 1 en exteriores, sólo es el caso a la sombra o en días nublados. Para la luz solar directa, necesitaría un brillo mayor
Tiempos de respuesta del display
| ↔ Tiempo de respuesta de Negro a Blanco | ||
|---|---|---|
| 32.8 ms ... subida ↗ y bajada ↘ combinada | ↗ 18.8 ms subida | 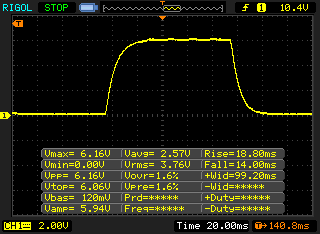 |
| ↘ 14 ms bajada | ||
| La pantalla mostró tiempos de respuesta lentos en nuestros tests y podría ser demasiado lenta para los jugones. En comparación, todos los dispositivos de prueba van de ##min### (mínimo) a 240 (máximo) ms. » 88 % de todos los dispositivos son mejores. Eso quiere decir que el tiempo de respuesta es peor que la media (19.8 ms) de todos los dispositivos testados. | ||
| ↔ Tiempo de respuesta 50% Gris a 80% Gris | ||
| 41.2 ms ... subida ↗ y bajada ↘ combinada | ↗ 22 ms subida | 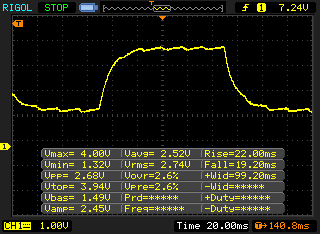 |
| ↘ 19.2 ms bajada | ||
| La pantalla mostró tiempos de respuesta lentos en nuestros tests y podría ser demasiado lenta para los jugones. En comparación, todos los dispositivos de prueba van de ##min### (mínimo) a 636 (máximo) ms. » 66 % de todos los dispositivos son mejores. Eso quiere decir que el tiempo de respuesta es peor que la media (31 ms) de todos los dispositivos testados. | ||
Parpadeo de Pantalla / PWM (Pulse-Width Modulation)
| Parpadeo de Pantalla / PWM detectado | 24270 Hz | 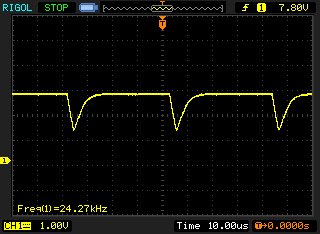 | |
La retroiluminación del display parpadea a 24270 Hz (seguramente usa PWM - Pulse-Width Modulation) . La frecuencia de 24270 Hz es bastante alta, por lo que la mayoría de gente sensible al parpadeo no debería ver parpadeo o tener fatiga visual. Comparación: 52 % de todos los dispositivos testados no usaron PWM para atenuar el display. Si se usó, medimos una media de 7765 (mínimo: 5 - máxmo: 343500) Hz. | |||
La estabilidad del ángulo de visión de la pantalla IPS no ofrece ningún motivo de queja.
Rendimiento: La CPU del portátil Lenovo puede consumir más de 100 vatios
Una mejora central comparada con el ThinkPad P53 es el hecho de que las opciones de GPU ya no están ligadas a las CPUs, porque los chips gráficos no están soldados a la placa base sino que ahora están integrados a través de una placa hija separada. Esto significa que cualquiera de las GPU profesionales de la generación Nvidia Turing(Quadro T1000, T2000, RTX 3000, RTX 4000 Max-Q, RTX 5000 Max-Q) puede combinarse con todas las CPUs Intel disponibles de la serie "Comet Lake H"(Core i5-10400H, i7-10750H, i7-10850H, i7-10875H, i9-10885H, i9-10980HK, Xeon W-10855M, W-10885M).
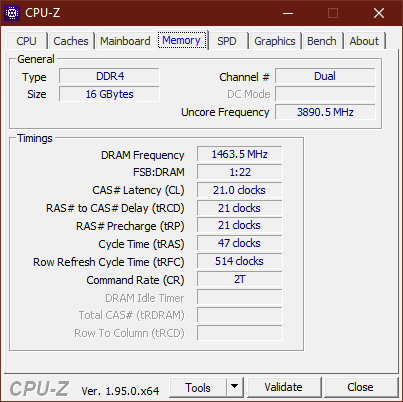
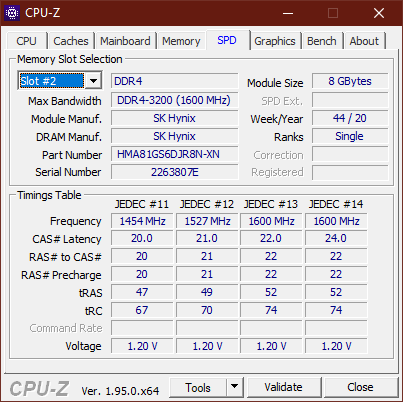
La memoria RAM es completamente ampliable, y las cuatro ranuras DDR4-2933 SO-DIMM permiten un máximo de 128 GB, en los modelos Xeon incluso como almacenamiento ECC. En cuanto a la solución de almacenamiento, sólo quedan dos SSD M.2-2280, mientras que el predecesor aún permitía tres, además de ofrecer algunas opciones de HDD para algunos modelos
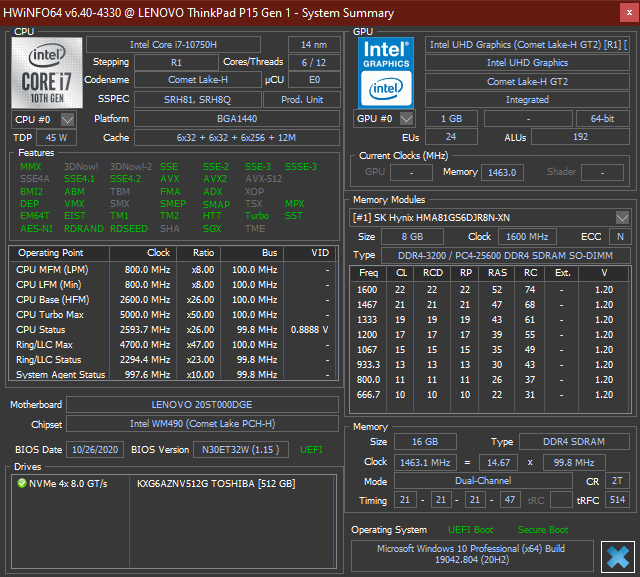
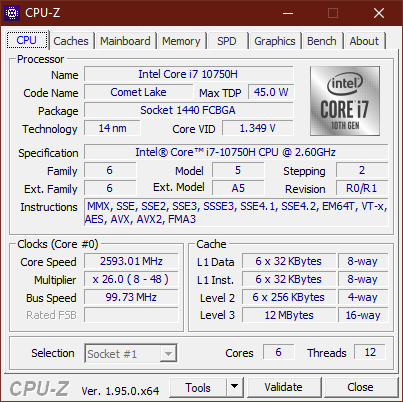
Procesador
El IntelCore i7-10750H pertenece a la serie "Comet Lake H" de Intel y es probablemente uno de los últimos chips de 14 nanómetros en un portátil. Los seis núcleos con un TDP nominal de 45 vatios tienen una velocidad de reloj máxima teórica de 5 GHz (velocidad de reloj básica: 2,6 GHz). Nuestra lista de CPUs puede ayudarte a comparar otros puntos de referencia
Con casi 130 vatios (short boost) y 75 vatios (constante) bajo carga multinúcleo, el procesador del ThinkPad P15 puede consumir bastante más que 45 vatios. Aunque esto contribuye a un buen rendimiento de la CPU, todavía no puede competir con las CPUs octa-core. Además, la CPU es bastante ineficiente, y el considerablemente más eficiente AMD Ryzen 7 Pro 4750U del asequible ThinkPad L15 es más rápido bajo carga en todos los núcleos.
En funcionamiento en batería, el rendimiento de la CPU se ralentiza con un consumo máximo de 65 vatios. Con 1172 puntos, el resultado multinúcleo del CB15 resulta un 10% inferior
Cinebench R15: CPU Single 64Bit | CPU Multi 64Bit
Blender: v2.79 BMW27 CPU
7-Zip 18.03: 7z b 4 -mmt1 | 7z b 4
Geekbench 5.5: Single-Core | Multi-Core
HWBOT x265 Benchmark v2.2: 4k Preset
LibreOffice : 20 Documents To PDF
R Benchmark 2.5: Overall mean
| Cinebench R20 / CPU (Single Core) | |
| Media de la clase Workstation (671 - 857, n=24, últimos 2 años) | |
| HP ZBook Fury 15 G7 | |
| HP ZBook Fury 15 G7 | |
| Lenovo ThinkPad P15 Gen1-20ST000DGE | |
| Dell Precision 7550 | |
| Lenovo ThinkPad T15g-20UR000GGE | |
| Medio Intel Core i7-10750H (431 - 504, n=43) | |
| Lenovo ThinkPad T15p-20TN0006GE | |
| Cinebench R20 / CPU (Multi Core) | |
| Media de la clase Workstation (5760 - 15043, n=24, últimos 2 años) | |
| Dell Precision 7550 | |
| HP ZBook Fury 15 G7 | |
| HP ZBook Fury 15 G7 | |
| Lenovo ThinkPad P15 Gen1-20ST000DGE | |
| Lenovo ThinkPad T15p-20TN0006GE | |
| Lenovo ThinkPad T15g-20UR000GGE | |
| Medio Intel Core i7-10750H (1749 - 3325, n=43) | |
| Cinebench R15 / CPU Single 64Bit | |
| Media de la clase Workstation (191.4 - 328, n=24, últimos 2 años) | |
| HP ZBook Fury 15 G7 | |
| HP ZBook Fury 15 G7 | |
| Dell Precision 7550 | |
| Lenovo ThinkPad P15 Gen1-20ST000DGE | |
| Lenovo ThinkPad T15g-20UR000GGE | |
| Lenovo ThinkPad T15p-20TN0006GE | |
| Medio Intel Core i7-10750H (184 - 213, n=45) | |
| Lenovo ThinkPad P53-20QN000YGE | |
| Cinebench R15 / CPU Multi 64Bit | |
| Media de la clase Workstation (2489 - 5810, n=24, últimos 2 años) | |
| Dell Precision 7550 | |
| HP ZBook Fury 15 G7 | |
| HP ZBook Fury 15 G7 | |
| Lenovo ThinkPad P15 Gen1-20ST000DGE | |
| Lenovo ThinkPad T15g-20UR000GGE | |
| Lenovo ThinkPad T15p-20TN0006GE | |
| Medio Intel Core i7-10750H (804 - 1418, n=50) | |
| Lenovo ThinkPad P53-20QN000YGE | |
| Blender / v2.79 BMW27 CPU | |
| Lenovo ThinkPad P53-20QN000YGE | |
| HP ZBook Fury 15 G7 | |
| Medio Intel Core i7-10750H (322 - 587, n=43) | |
| Lenovo ThinkPad T15p-20TN0006GE | |
| Lenovo ThinkPad P15 Gen1-20ST000DGE | |
| Lenovo ThinkPad T15g-20UR000GGE | |
| Dell Precision 7550 | |
| Media de la clase Workstation (91 - 222, n=24, últimos 2 años) | |
| 7-Zip 18.03 / 7z b 4 -mmt1 | |
| Media de la clase Workstation (5126 - 6960, n=24, últimos 2 años) | |
| HP ZBook Fury 15 G7 | |
| Dell Precision 7550 | |
| Lenovo ThinkPad T15g-20UR000GGE | |
| Lenovo ThinkPad P15 Gen1-20ST000DGE | |
| Medio Intel Core i7-10750H (4504 - 5470, n=43) | |
| Lenovo ThinkPad P53-20QN000YGE | |
| Lenovo ThinkPad T15p-20TN0006GE | |
| 7-Zip 18.03 / 7z b 4 | |
| Media de la clase Workstation (60489 - 116969, n=24, últimos 2 años) | |
| Dell Precision 7550 | |
| Lenovo ThinkPad T15g-20UR000GGE | |
| Lenovo ThinkPad P15 Gen1-20ST000DGE | |
| HP ZBook Fury 15 G7 | |
| Lenovo ThinkPad T15p-20TN0006GE | |
| Medio Intel Core i7-10750H (26040 - 37345, n=43) | |
| Lenovo ThinkPad P53-20QN000YGE | |
| Geekbench 5.5 / Single-Core | |
| Media de la clase Workstation (1783 - 2183, n=24, últimos 2 años) | |
| HP ZBook Fury 15 G7 | |
| Dell Precision 7550 | |
| Lenovo ThinkPad T15g-20UR000GGE | |
| Lenovo ThinkPad P15 Gen1-20ST000DGE | |
| Medio Intel Core i7-10750H (1114 - 1333, n=43) | |
| Lenovo ThinkPad T15p-20TN0006GE | |
| Geekbench 5.5 / Multi-Core | |
| Media de la clase Workstation (11542 - 25554, n=24, últimos 2 años) | |
| Dell Precision 7550 | |
| HP ZBook Fury 15 G7 | |
| Lenovo ThinkPad T15g-20UR000GGE | |
| Lenovo ThinkPad P15 Gen1-20ST000DGE | |
| Medio Intel Core i7-10750H (4443 - 6674, n=43) | |
| Lenovo ThinkPad T15p-20TN0006GE | |
| HWBOT x265 Benchmark v2.2 / 4k Preset | |
| Media de la clase Workstation (17.8 - 40.5, n=24, últimos 2 años) | |
| Dell Precision 7550 | |
| Lenovo ThinkPad T15g-20UR000GGE | |
| Lenovo ThinkPad P15 Gen1-20ST000DGE | |
| Medio Intel Core i7-10750H (5.54 - 11.6, n=43) | |
| Lenovo ThinkPad T15p-20TN0006GE | |
| Lenovo ThinkPad P53-20QN000YGE | |
| HP ZBook Fury 15 G7 | |
| LibreOffice / 20 Documents To PDF | |
| HP ZBook Fury 15 G7 | |
| Lenovo ThinkPad P15 Gen1-20ST000DGE | |
| Medio Intel Core i7-10750H (43.1 - 99.2, n=43) | |
| Lenovo ThinkPad T15g-20UR000GGE | |
| Media de la clase Workstation (37.1 - 74.7, n=24, últimos 2 años) | |
| Dell Precision 7550 | |
| Lenovo ThinkPad T15p-20TN0006GE | |
| R Benchmark 2.5 / Overall mean | |
| Lenovo ThinkPad T15p-20TN0006GE | |
| Lenovo ThinkPad P15 Gen1-20ST000DGE | |
| Medio Intel Core i7-10750H (0.578 - 0.708, n=42) | |
| Lenovo ThinkPad T15g-20UR000GGE | |
| Dell Precision 7550 | |
| HP ZBook Fury 15 G7 | |
| Media de la clase Workstation (0.3825 - 0.603, n=24, últimos 2 años) | |
* ... más pequeño es mejor
Rendimiento del sistema
Con sus potentes componentes, el ThinkPad P15 no muestra ninguna debilidad en el rendimiento del sistema.
| PCMark 10 Score | 5620 puntos | |
ayuda | ||
Latencias del CPD
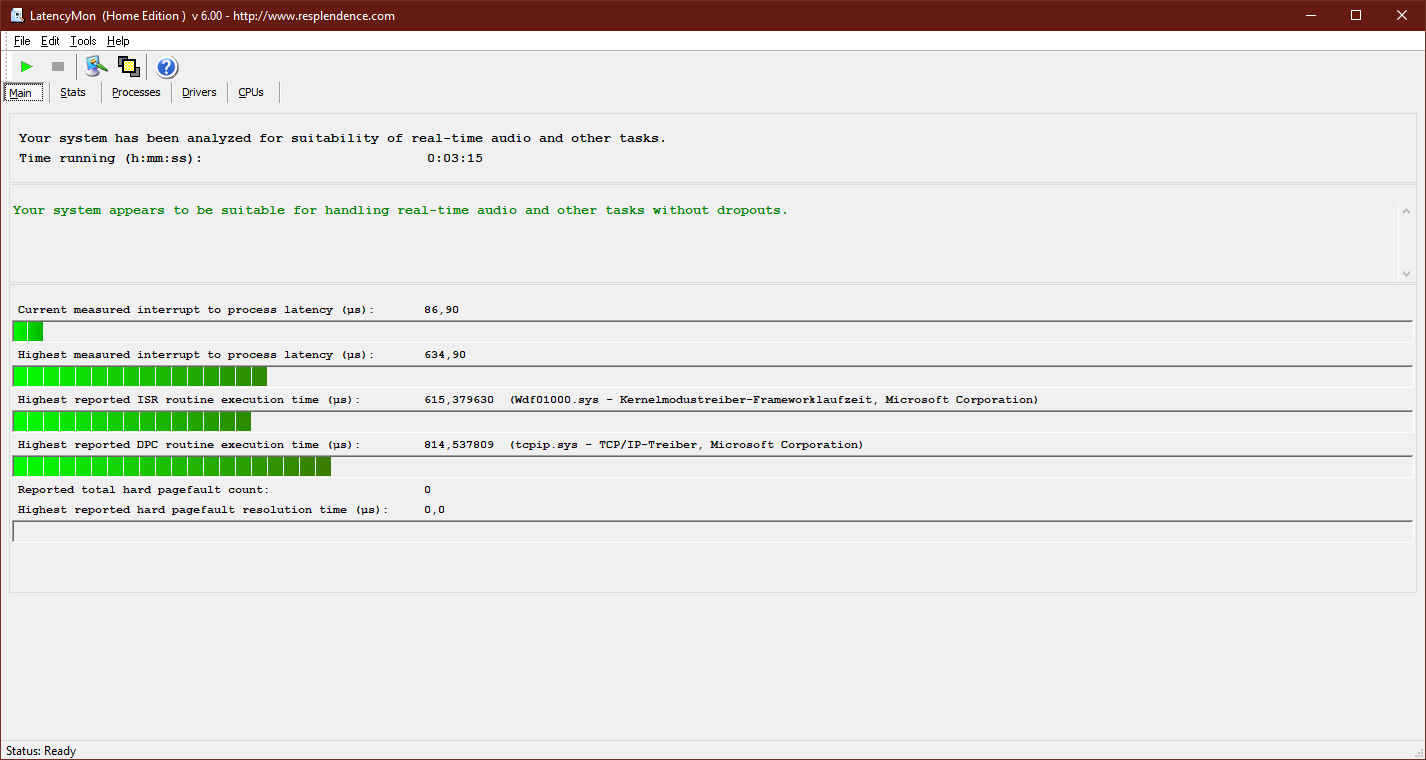
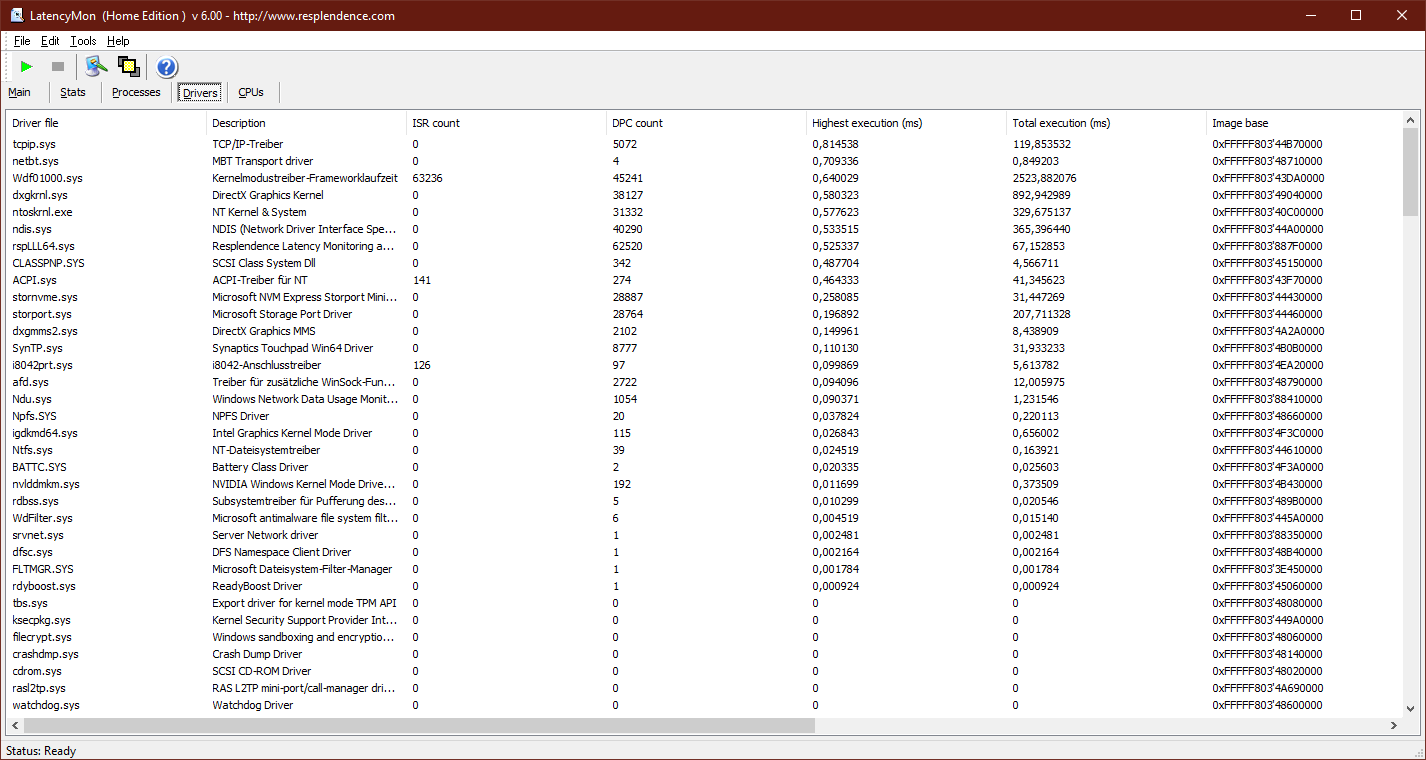
| DPC Latencies / LatencyMon - interrupt to process latency (max), Web, Youtube, Prime95 | |
| Lenovo ThinkPad P15 Gen1-20ST000DGE | |
* ... más pequeño es mejor
Solución de almacenamiento
El SSD M.2 2280 ofrece muy buenos resultados en las pruebas. Está fabricado por Toshiba, ofrece una capacidad de 512 GB y se conecta por PCIe NVMe
| Lenovo ThinkPad P15 Gen1-20ST000DGE Toshiba XG6 KXG6AZNV512G | Lenovo ThinkPad P53-20QN000YGE Samsung PM981a MZVLB1T0HBLR | Lenovo ThinkPad T15g-20UR000GGE SK Hynix PC401 512GB M.2 (HFS512GD9TNG) | Lenovo ThinkPad T15p-20TN0006GE WDC PC SN730 SDBQNTY-512GB | Dell Precision 7550 SK Hynix PC601A NVMe 1TB | HP ZBook Fury 15 G7 Samsung PM981a MZVLB1T0HBLR | Medio Toshiba XG6 KXG6AZNV512G | |
|---|---|---|---|---|---|---|---|
| CrystalDiskMark 5.2 / 6 | -4% | 2% | 0% | -12% | -1% | -12% | |
| Write 4K (MB/s) | 129.5 | 147 14% | 154 19% | 141.8 9% | 121 -7% | 114.1 -12% | 139 ? 7% |
| Read 4K (MB/s) | 49.54 | 48.3 -3% | 46.01 -7% | 47.39 -4% | 42.16 -15% | 57.2 15% | 45.8 ? -8% |
| Write Seq (MB/s) | 2379 | 1402 -41% | 2561 8% | 2404 1% | 2150 -10% | 2580 8% | 1628 ? -32% |
| Read Seq (MB/s) | 1989 | 1503 -24% | 1799 -10% | 2124 7% | 1755 -12% | 2527 27% | 1647 ? -17% |
| Write 4K Q32T1 (MB/s) | 663 | 475.2 -28% | 452.2 -32% | 637 -4% | 395.3 -40% | 480.2 -28% | 547 ? -17% |
| Read 4K Q32T1 (MB/s) | 425.2 | 581 37% | 570 34% | 414.8 -2% | 381.8 -10% | 387.6 -9% | 436 ? 3% |
| Write Seq Q32T1 (MB/s) | 2960 | 2936 -1% | 2736 -8% | 2706 -9% | 2730 -8% | 2996 1% | 2522 ? -15% |
| Read Seq Q32T1 (MB/s) | 3182 | 3539 11% | 3468 9% | 3319 4% | 3468 9% | 2853 -10% | 2739 ? -14% |

Constant Performance Reads: DiskSpd Read Loop, Queue Depth 8
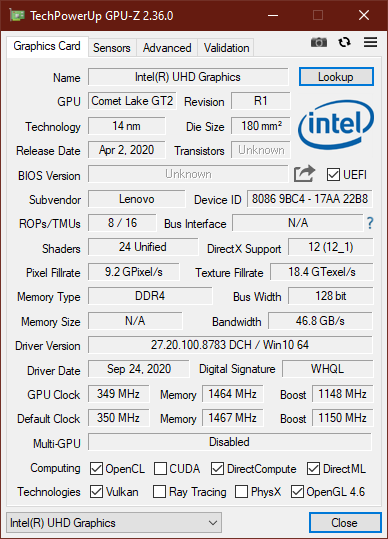
Tarjeta gráfica
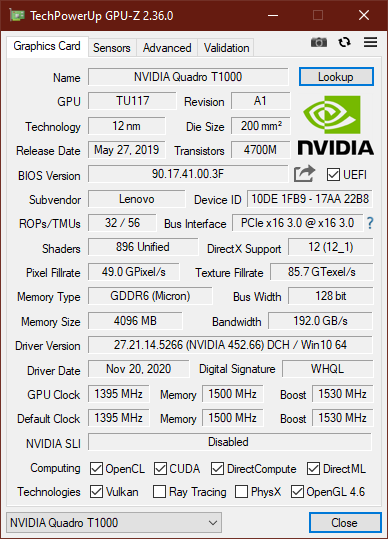
La NvidiaQuadro T1000 representa la opción básica del Lenovo ThinkPad P15. Por supuesto, la Nvidia Quadro RTX 5000 Max-Q del predecesor del ThinkPad P53 es considerablemente más rápida, pero no es ninguna sorpresa. Una comparación más interesante es la Nvidia GeForce GTX 1050 del LenovoThinkPad T15p. Dependiendo de la prueba, el T1000 tiene una ventaja de entre 50 y 75%, aquí. Así que si quieres mucho rendimiento gráfico, incluso la configuración básica del ThinkPad P15 es una mejor opción que el ThinkPad T15p. Hay más comparaciones disponibles en nuestra lista de comparación de GPUs.
Como en el procesador, una ligera reducción de rendimiento en el modo de batería también puede ser determinada aquí. Con 9654 puntos en la prueba GPU 3DMark 11, el rendimiento resultó cerca de 15% menor
| 3DMark 11 Performance | 11592 puntos | |
| 3DMark Fire Strike Score | 8173 puntos | |
| 3DMark Time Spy Score | 3565 puntos | |
ayuda | ||
Rendimiento de los juegos
Por lo general, las estaciones de trabajo no están pensadas para los juegos, pero no son completamente inadecuadas. El P15 también es capaz de mostrar juegos modernos con fluidez en resolución Full-HD y con ajustes de detalle altos. Sin embargo, para los juegos 4K, el ThinkPad T15g con una GeForce RTX sería más adecuado
| The Witcher 3 - 1920x1080 High Graphics & Postprocessing (Nvidia HairWorks Off) | |
| Lenovo ThinkPad T15g-20UR000GGE | |
| Media de la clase Workstation (91 - 156.4, n=2, últimos 2 años) | |
| Lenovo ThinkPad P15 Gen1-20ST000DGE | |
| Medio NVIDIA Quadro T1000 (Laptop) (52.7 - 62.9, n=3) | |
| Lenovo ThinkPad T15p-20TN0006GE | |
| bajo | medio | alto | ultra | |
|---|---|---|---|---|
| The Witcher 3 (2015) | 189 | 114 | 62.9 | 35 |
| Dota 2 Reborn (2015) | 151 | 136 | 123 | 115 |
| X-Plane 11.11 (2018) | 108 | 96 | 80.1 | |
| Shadow of the Tomb Raider (2018) | 111 | 56.7 | 54.1 | 46 |
| Total War: Three Kingdoms (2019) | 189 | 60.4 | 39.1 | 24.7 |
Emisiones: Los ventiladores pueden ser más ruidosos en el ThinkPad P15
Emisiones acústicas
En funcionamiento en vacío, Lenovo consigue dejar los ventiladores apagados la mayor parte del tiempo, y si funcionan, son apenas audibles con 28,8 dB(a). Bajo carga, la situación cambia: Un nivel de ruido de 37,7 dB(a) puede notarse fácilmente, y el nivel máximo de ruido de 44,6 dB(a) puede llegar a ser molesto. Comparado con el ThinkPad P53, los dos ventiladores pueden ser significativamente más ruidosos aquí.
No notamos ningún ruido de bobina
Ruido
| Ocioso |
| 24.9 / 24.9 / 28.8 dB(A) |
| Carga |
| 37.7 / 44.6 dB(A) |
 | ||
30 dB silencioso 40 dB(A) audible 50 dB(A) ruidosamente alto |
||
min: | ||
Temperatura
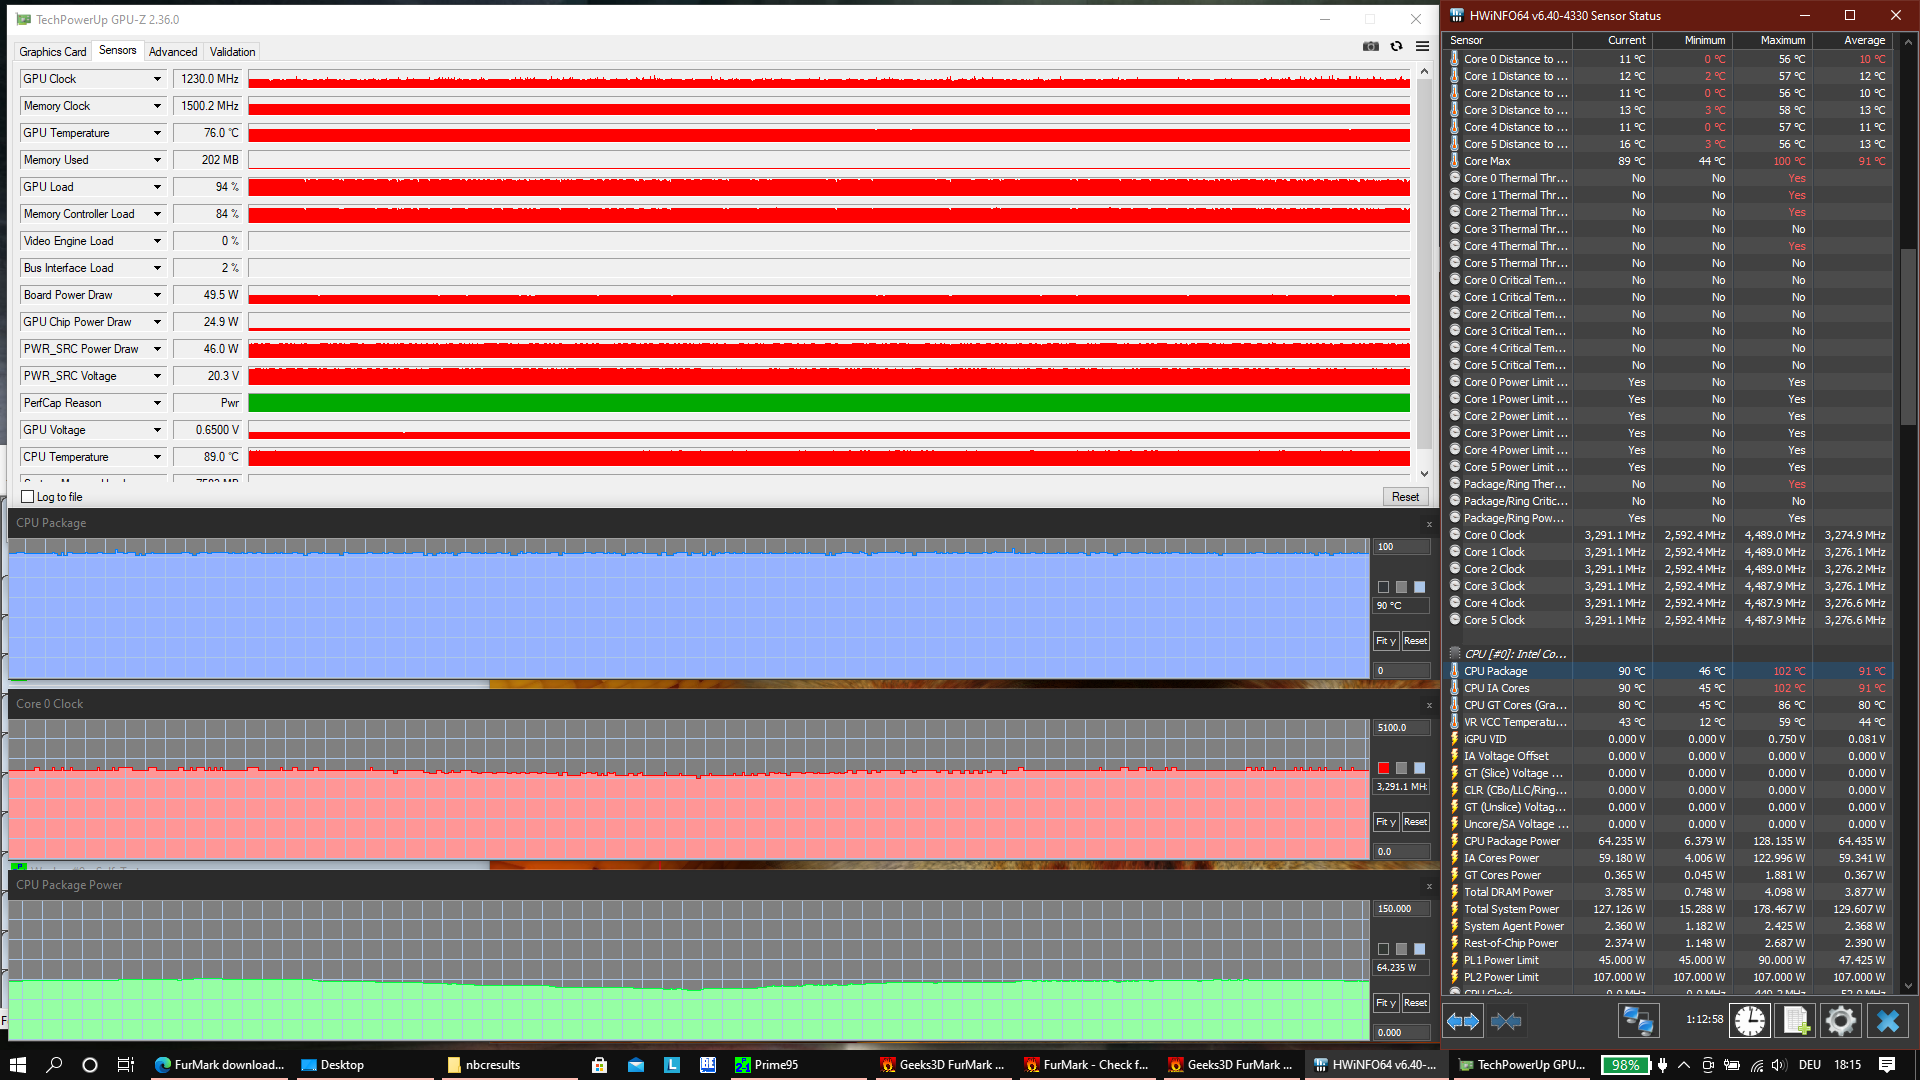
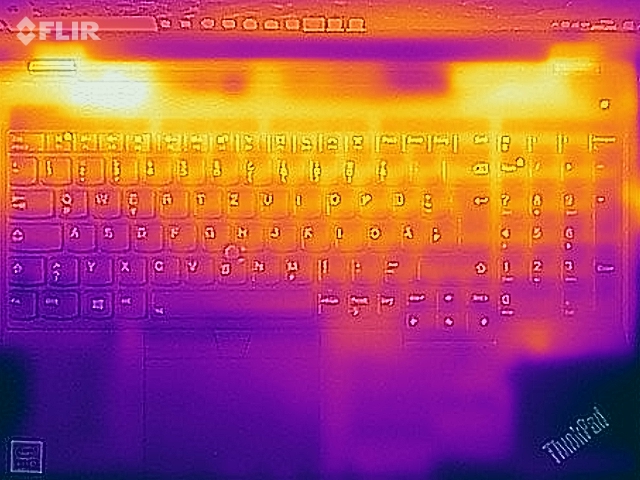
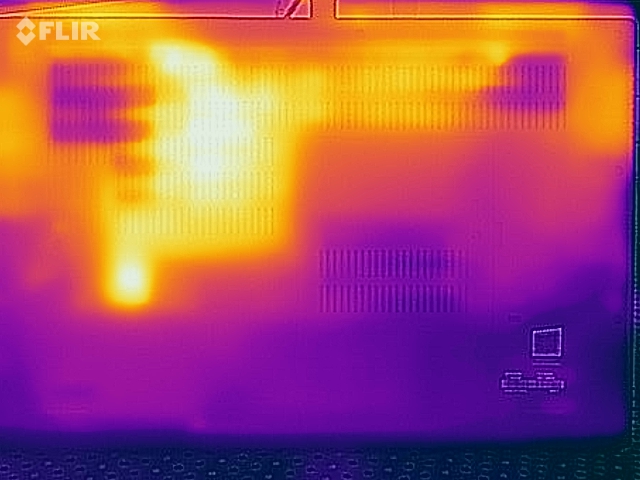
Los altos valores de consumo de la CPU tienen un precio: las temperaturas externas suben hasta 60 °Cen la parte inferior, ¡y eso en un modelo básico! Con CPUs y GPUs más potentes, las temperaturas podrían subir aún más
Por supuesto, la prueba de estrés representa un escenario extremo. Después de una hora en la prueba de estrés, ni la CPU ni la GPU muestran ninguna ralentización debido a las altas temperaturas. El chip gráfico es capaz de consumir 50 vatios, y la CPU 65 vatios - el rendimiento de refrigeración parece haber mejorado en comparación con el portátil Lenovo ThinkPad P53
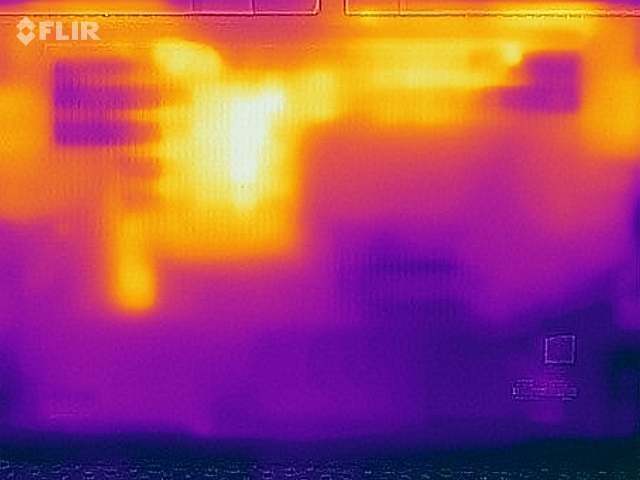
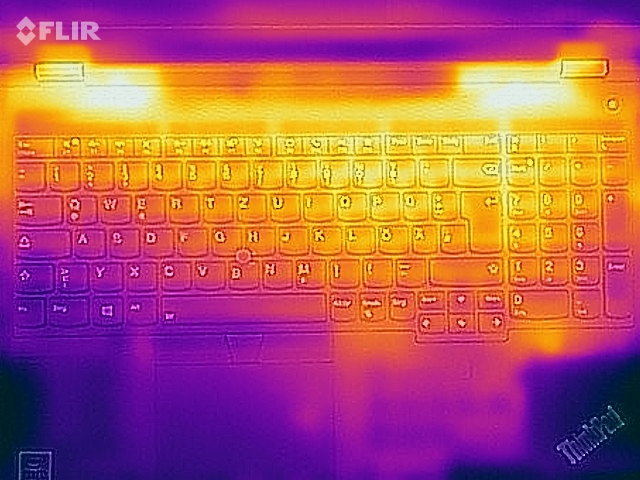
(-) La temperatura máxima en la parte superior es de 45.4 °C / 114 F, frente a la media de 38.2 °C / 101 F, que oscila entre 22.2 y 69.8 °C para la clase Workstation.
(-) El fondo se calienta hasta un máximo de 60.6 °C / 141 F, frente a la media de 41.1 °C / 106 F
(+) En reposo, la temperatura media de la parte superior es de 25.8 °C / 78# F, frente a la media del dispositivo de 32 °C / 90 F.
(±) Jugando a The Witcher 3, la temperatura media de la parte superior es de 36.1 °C / 97 F, frente a la media del dispositivo de 32 °C / 90 F.
(+) Los reposamanos y el panel táctil alcanzan como máximo la temperatura de la piel (32.5 °C / 90.5 F) y, por tanto, no están calientes.
(-) La temperatura media de la zona del reposamanos de dispositivos similares fue de 27.8 °C / 82 F (-4.7 °C / -8.5 F).
Altavoces
Lenovo ThinkPad P15 Gen1-20ST000DGE análisis de audio
(±) | la sonoridad del altavoz es media pero buena (80.7 dB)
Graves 100 - 315 Hz
(-) | casi sin bajos - de media 15.1% inferior a la mediana
(±) | la linealidad de los graves es media (11.4% delta a frecuencia anterior)
Medios 400 - 2000 Hz
(±) | medias más altas - de media 7.6% más altas que la mediana
(+) | los medios son lineales (5.4% delta a la frecuencia anterior)
Altos 2 - 16 kHz
(+) | máximos equilibrados - a sólo 3.4% de la mediana
(+) | los máximos son lineales (6.9% delta a la frecuencia anterior)
Total 100 - 16.000 Hz
(±) | la linealidad del sonido global es media (18.2% de diferencia con la mediana)
En comparación con la misma clase
» 59% de todos los dispositivos probados de esta clase eran mejores, 10% similares, 31% peores
» El mejor tuvo un delta de 7%, la media fue 17%, el peor fue ###max##%
En comparación con todos los dispositivos probados
» 39% de todos los dispositivos probados eran mejores, 8% similares, 53% peores
» El mejor tuvo un delta de 4%, la media fue 24%, el peor fue ###max##%
Lenovo ThinkPad T15p-20TN0006GE análisis de audio
(±) | la sonoridad del altavoz es media pero buena (74.7 dB)
Graves 100 - 315 Hz
(-) | casi sin bajos - de media 22.8% inferior a la mediana
(±) | la linealidad de los graves es media (12.2% delta a frecuencia anterior)
Medios 400 - 2000 Hz
(±) | medias más altas - de media 6.4% más altas que la mediana
(±) | la linealidad de los medios es media (8.5% delta respecto a la frecuencia anterior)
Altos 2 - 16 kHz
(+) | máximos equilibrados - a sólo 3.6% de la mediana
(+) | los máximos son lineales (6.3% delta a la frecuencia anterior)
Total 100 - 16.000 Hz
(±) | la linealidad del sonido global es media (29.3% de diferencia con la mediana)
En comparación con la misma clase
» 95% de todos los dispositivos probados de esta clase eran mejores, 2% similares, 3% peores
» El mejor tuvo un delta de 5%, la media fue 17%, el peor fue ###max##%
En comparación con todos los dispositivos probados
» 87% de todos los dispositivos probados eran mejores, 3% similares, 10% peores
» El mejor tuvo un delta de 4%, la media fue 24%, el peor fue ###max##%
Gestión de la energía: Una estación de trabajo ThinkPad con una gran batería
Consumo de energía
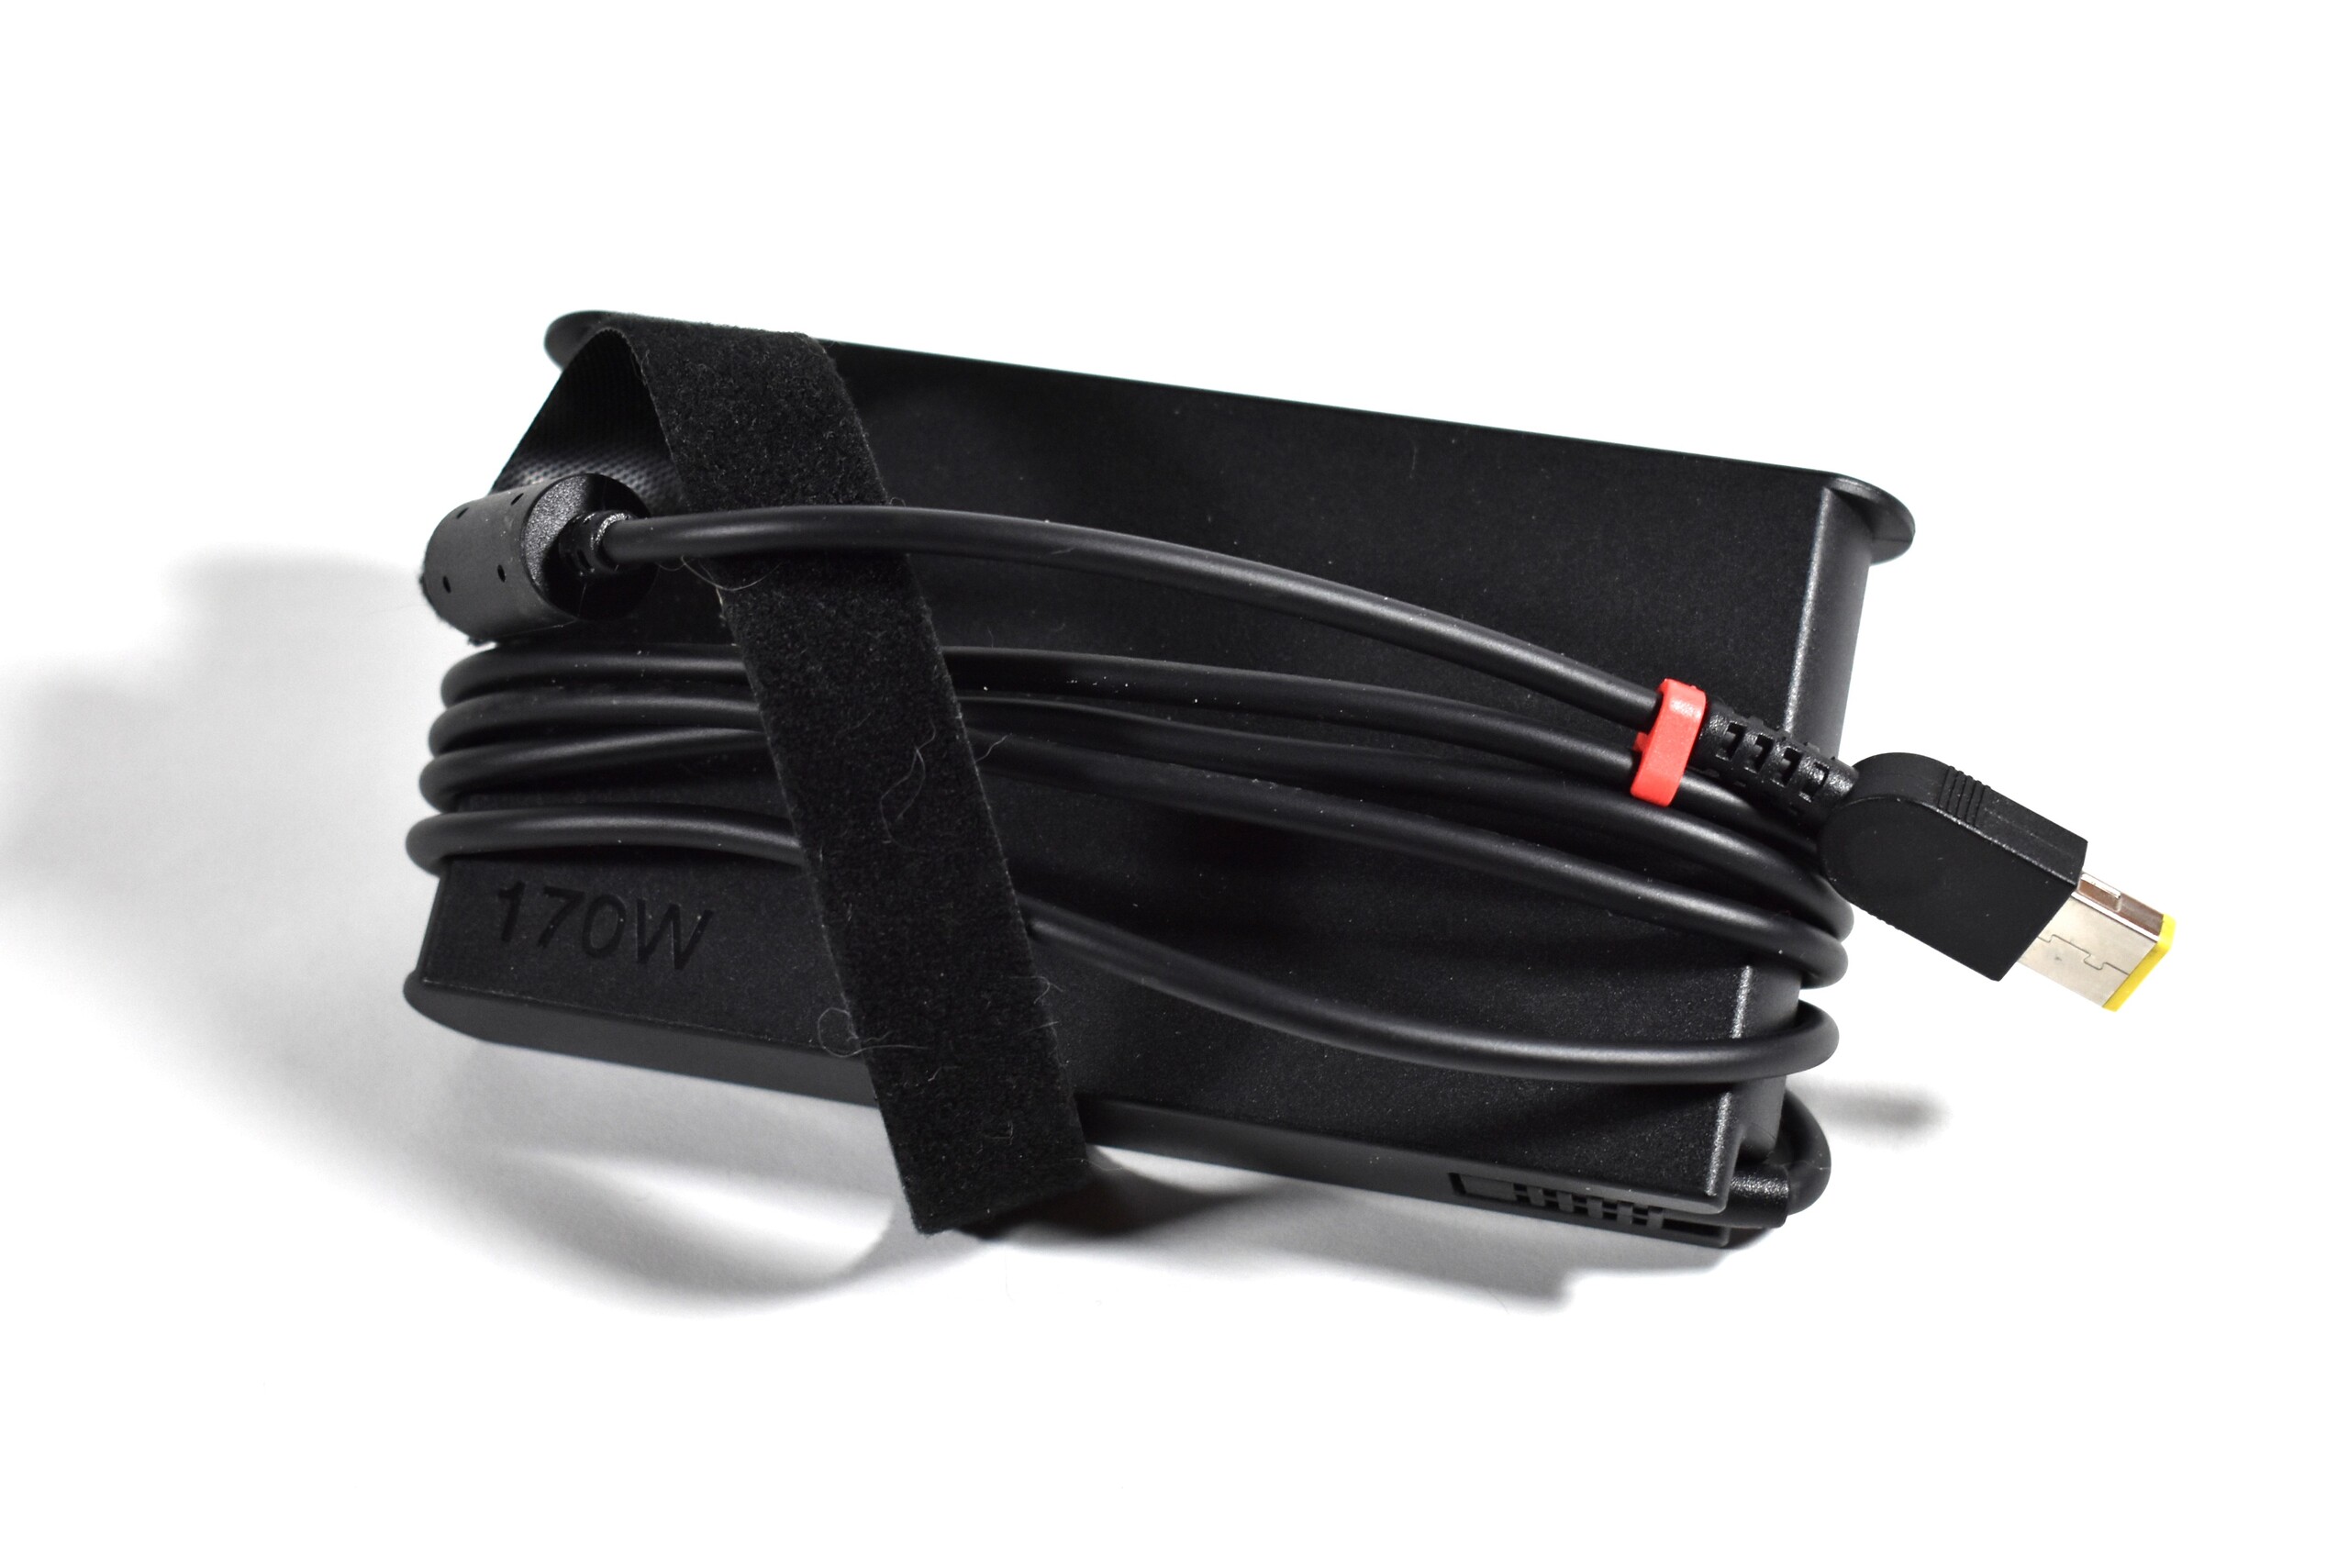
No ha cambiado mucho en comparación con el Lenovo ThinkPad P53 en términos de consumo de energía, al menos en funcionamiento inactivo. Bajo carga, el consumo es significativamente menor, lo que puede atribuirse a la GPU más débil. El consumo máximo es un juego de niños para la fuente de alimentación de 170 vatios
| Off / Standby | |
| Ocioso | |
| Carga |
|
Clave:
min: | |
| Lenovo ThinkPad P15 Gen1-20ST000DGE i7-10750H, Quadro T1000 (Laptop), Toshiba XG6 KXG6AZNV512G, a-Si IPS LED, 1920x1080, 15.6" | Lenovo ThinkPad P53-20QN000YGE i7-9850H, Quadro RTX 5000 Max-Q, Samsung PM981a MZVLB1T0HBLR, IPS, 1920x1080, 15.6" | Lenovo ThinkPad T15g-20UR000GGE i7-10750H, GeForce RTX 2070 Super Max-Q, SK Hynix PC401 512GB M.2 (HFS512GD9TNG), IPS, 1920x1080, 15.6" | Lenovo ThinkPad T15p-20TN0006GE i7-10750H, GeForce GTX 1050 Mobile, WDC PC SN730 SDBQNTY-512GB, IPS LED, 3840x2160, 15.6" | Dell Precision 7550 W-10885M, Quadro RTX 5000 Max-Q, SK Hynix PC601A NVMe 1TB, IPS, 3840x2160, 15.6" | HP ZBook Fury 15 G7 W-10885M, Quadro RTX 5000 Max-Q, Samsung PM981a MZVLB1T0HBLR, IPS, 3840x2160, 15.6" | Medio NVIDIA Quadro T1000 (Laptop) | Media de la clase Workstation | |
|---|---|---|---|---|---|---|---|---|
| Power Consumption | -13% | -8% | 8% | -38% | -20% | 6% | -10% | |
| Idle Minimum * (Watt) | 8.4 | 7.9 6% | 5.8 31% | 6 29% | 8.2 2% | 4.6 45% | 8.33 ? 1% | 9.04 ? -8% |
| Idle Average * (Watt) | 12.3 | 11.8 4% | 11.4 7% | 12.8 -4% | 16.8 -37% | 13.6 -11% | 11.8 ? 4% | 13.8 ? -12% |
| Idle Maximum * (Watt) | 14.2 | 14.9 -5% | 13.9 2% | 16.1 -13% | 24.4 -72% | 21.5 -51% | 15.2 ? -7% | 17.7 ? -25% |
| Load Average * (Watt) | 96 | 96 -0% | 93.2 3% | 95.6 -0% | 131 -36% | 113.1 -18% | 86.4 ? 10% | 96.2 ? -0% |
| Witcher 3 ultra * (Watt) | 95 | 149 -57% | 145 -53% | 84 12% | 156.6 -65% | 157.5 -66% | ||
| Load Maximum * (Watt) | 168.8 | 207.8 -23% | 234 -39% | 131.1 22% | 201.8 -20% | 199 -18% | 131.1 ? 22% | 178.5 ? -6% |
* ... más pequeño es mejor
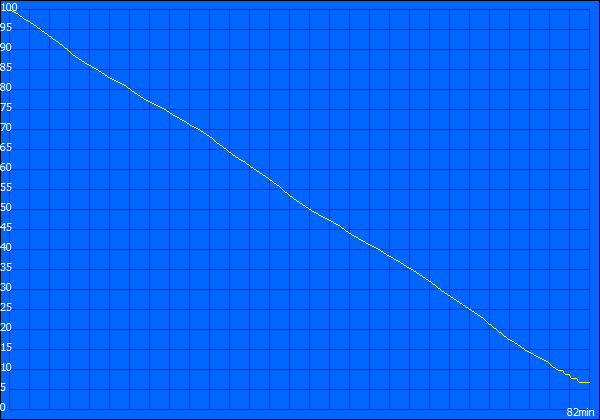
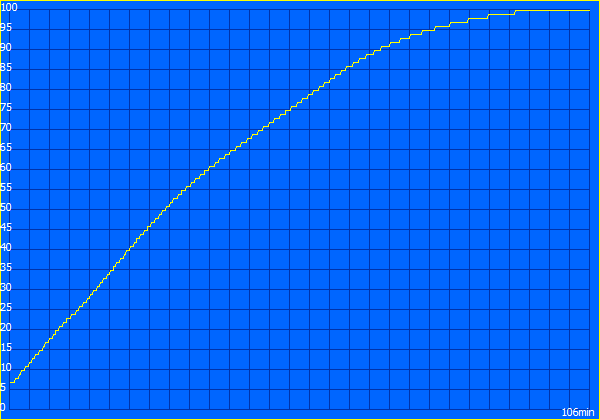
Duración de la batería
Con 94 Wh, el Lenovo ThinkPad P15 Gen 1 tiene la mayor batería actual de un ThinkPad de 15 pulgadas. Es incluso 4 Wh mayor que la del predecesor ThinkPad P53. Con el bajo consumo de la pantalla Full-HD, Lenovo logra una larga duración de la batería, durando casi 14 horas en el test Wi-Fi (150 cd/m²), lo que es excelente. Y casi 10 horas en la misma prueba con el brillo máximo también son un logro
| Lenovo ThinkPad P15 Gen1-20ST000DGE i7-10750H, Quadro T1000 (Laptop), 94 Wh | Lenovo ThinkPad P53-20QN000YGE i7-9850H, Quadro RTX 5000 Max-Q, 90 Wh | Lenovo ThinkPad T15g-20UR000GGE i7-10750H, GeForce RTX 2070 Super Max-Q, 94 Wh | Lenovo ThinkPad T15p-20TN0006GE i7-10750H, GeForce GTX 1050 Mobile, 68 Wh | Dell Precision 7550 W-10885M, Quadro RTX 5000 Max-Q, 95 Wh | HP ZBook Fury 15 G7 W-10885M, Quadro RTX 5000 Max-Q, 94 Wh | Media de la clase Workstation | |
|---|---|---|---|---|---|---|---|
| Duración de Batería | 6% | -10% | -34% | -27% | -16% | -18% | |
| H.264 (h) | 13.9 | 9.8 -29% | 12.7 -9% | 7.7 -45% | 9.51 ? -32% | ||
| WiFi v1.3 (h) | 14.1 | 11.1 -21% | 11.2 -21% | 7.3 -48% | 8.9 -37% | 8.6 -39% | 8.52 ? -40% |
| Load (h) | 1.2 | 2 67% | 1.2 0% | 1.1 -8% | 1 -17% | 1.3 8% | 1.429 ? 19% |
Pro
Contra
Veredicto: Una impresión mixta para el Lenovo ThinkPad P15 Gen 1
Aunque no lo parezca a primera vista, Lenovo ha cambiado algunas cosas en el ThinkPad P15 Gen 1 en comparación con el modelopredecesor ThinkPad P53. Aunque hay varias mejoras, el nuevo portátil ThinkPad es peor en otros aspectos.
Un aspecto es la carcasa, que no se siente tan bien al tacto. Esto también incluye un problema de estabilidad en el área del teclado, que repiquetea en la parte inferior izquierda. También nos disgusta que se hayan eliminado algunas características como las teclas dedicadas del touchpad. No vemos ninguna razón válida para que Lenove tenga que hacer algunos recortes en un dispositivo profesional tan caro. El contraste de la opción de pantalla básica del P15 también podría ser mayor. Y también hay una ranura M.2 menos que en el predecesor.
Los cambios positivos tienen que ver con la construcción y la refrigeración. El ThinkPad P15 Gen 1 es más fácil de mantener, porque el sistema de refrigeración es más accesible. Este último también ha mejorado en comparación con el predecesor y no hay ralentización, aunque los ventiladores pueden ser más ruidosos. El resultado es una mejora del rendimiento de la CPU. En comparación con el P53, el tamaño de la batería también ha aumentado, lo que resulta en una mejor duración de la misma.
En general, el ThinkPad P15 Gen 1 es una estación de trabajo bien equipada con varios puntos débiles que Lenovo quizá podría remediar en el sucesor (palabra clave: teclado ruidoso).
Tendríamos algunas dificultades para recomendar el Lenovo ThinkPad P15 Gen 1. Por un lado, debido al punto débil del teclado, y por otro lado porque las CPUs utilizadas son simplemente ineficientes. Un ThinkPad P15 Gen 2 con CPUs de 10-nm de Intel podría funcionar significativamente más fresco y silencioso con las mismas capacidades de rendimiento.
Precio y disponibilidad
En la configuración probada, el Lenovo ThinkPad P15 Gen 1 cuesta unos 1980 euros en Alemania. En EE.UU., el ThinkPad P15 Gen 1 está disponible en Amazon a partir de $1545.
Lenovo ThinkPad P15 Gen1-20ST000DGE
- 03/04/2021 v7 (old)
Benjamin Herzig
Price comparison

