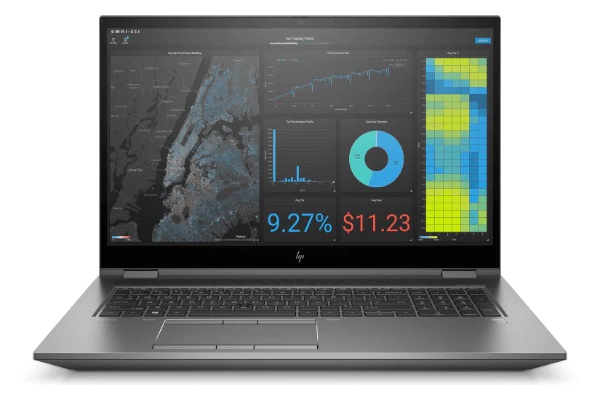
Revisión de la estación de trabajo HP ZBook Fury 15 G7: Cámara de vapor para un máximo rendimiento
El HP ZBook Fury 15 G7 es la estación de trabajo móvil de 15,6 pulgadas más importante de la compañía, diseñada para usuarios y profesionales de CAD de alto rendimiento. A diferencia del más delgado ZBook 15u o de la serie Firefly, el ZBook Fury 15 utiliza CPU de la serie H de Intel mucho más rápidas con opciones de GPU RTX de gama alta GeForce en lugar de las más lentas de la serie U de Intel con GPU Quadro P.
Hay disponible una amplia gama de configuraciones que van desde la CPU Core i5-10300H hasta el Xeon W-10885M, 16 GB de RAM hasta 128 GB, pantalla de 1080p 250 nits hasta 4K UHD 600 nits, y la GPU Quadro T2000 Max-Q hasta el RTX 5000 Max-Q. La lista completa de especificaciones se puede encontrar en la hoja de datos oficial de HP aquí. La unidad que tenemos a mano en una configuración de gama alta con la CPU Xeon, pantalla de 4K y GPU Quadr RTX 5000 Max-Q por aproximadamente $6100 USD.
Las alternativas al ZBook Fury 15 G7 incluyen otras estaciones de trabajo de alta gama de 15,6 pulgadas como la Dell Precision 7550, la serie ThinkPad P de Lenovo, el Asus ProArt StudioBook Pro 15, o el MSI WS66.
Más reseñas de HP:
potential competitors in comparison
Valoración | Fecha | Modelo | Peso | Altura | Tamaño | Resolución | Precio |
|---|---|---|---|---|---|---|---|
| 90.2 % v7 (old) | 01/2021 | HP ZBook Fury 15 G7 W-10885M, Quadro RTX 5000 Max-Q | 2.4 kg | 25.9 mm | 15.60" | 3840x2160 | |
| 83.1 % v7 (old) | 11/2020 | Asus ProArt StudioBook Pro 15 W500G5T i7-9750H, Quadro RTX 5000 Max-Q | 2 kg | 18.9 mm | 15.60" | 3840x2160 | |
| 83.4 % v7 (old) | 08/2020 | MSI WS66 10TMT-207US i9-10980HK, Quadro RTX 5000 Max-Q | 2.3 kg | 19.8 mm | 15.60" | 1920x1080 | |
| 87.8 % v7 (old) | 08/2020 | Dell Precision 7550 W-10885M, Quadro RTX 5000 Max-Q | 2.8 kg | 27.36 mm | 15.60" | 3840x2160 | |
| 87 % v7 (old) | 08/2020 | Razer Blade 15 Studio Edition 2020 i7-10875H, Quadro RTX 5000 Max-Q | 2.2 kg | 13.98 mm | 15.60" | 3840x2160 | |
| 87.8 % v7 (old) | 08/2019 | Lenovo ThinkPad P1 2019-20QT000RGE i7-9850H, Quadro T1000 (Laptop) | 1.7 kg | 18.4 mm | 15.60" | 1920x1080 |
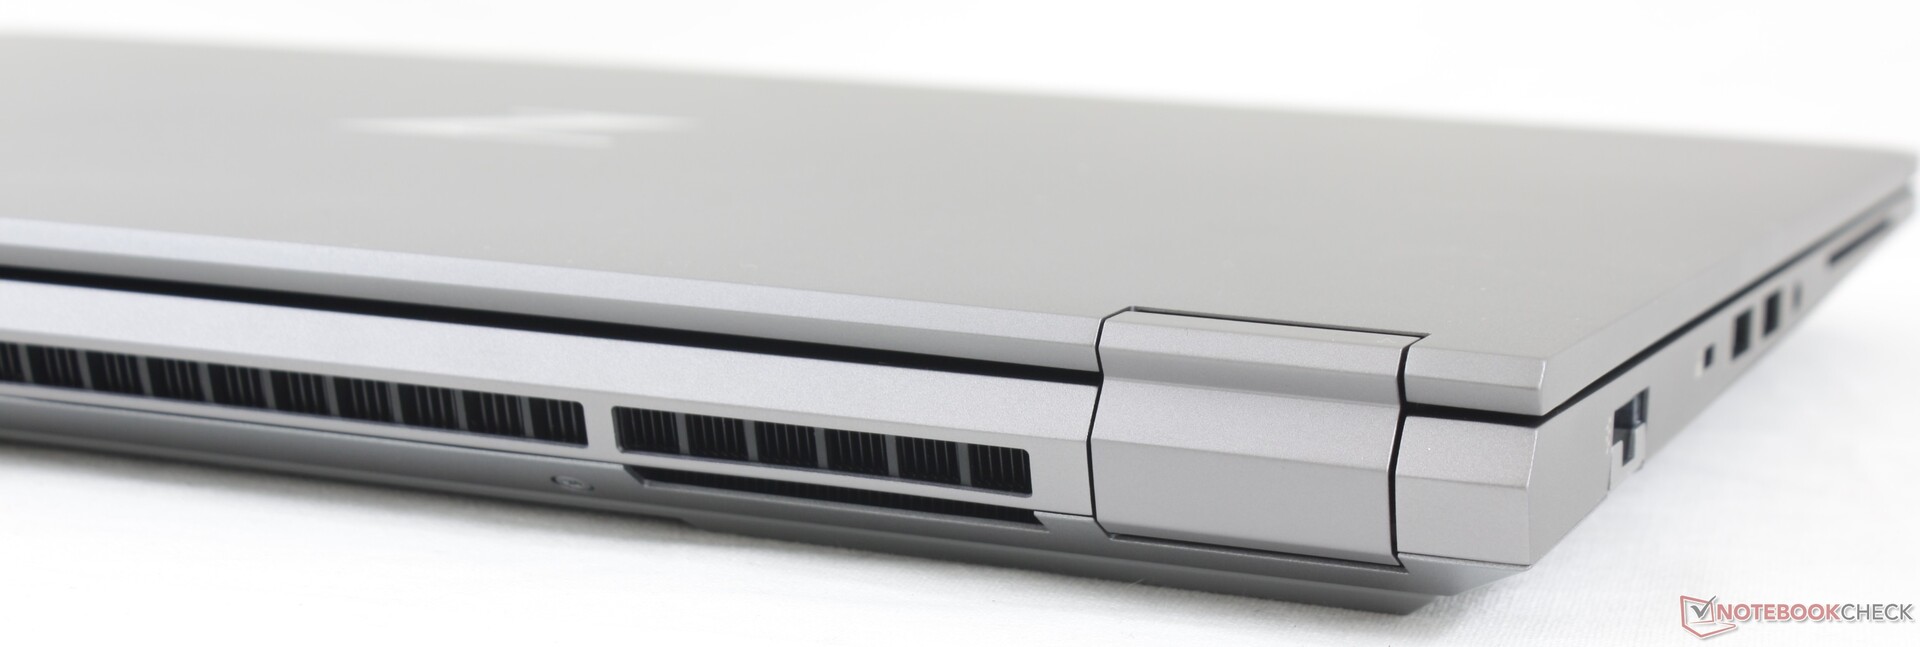
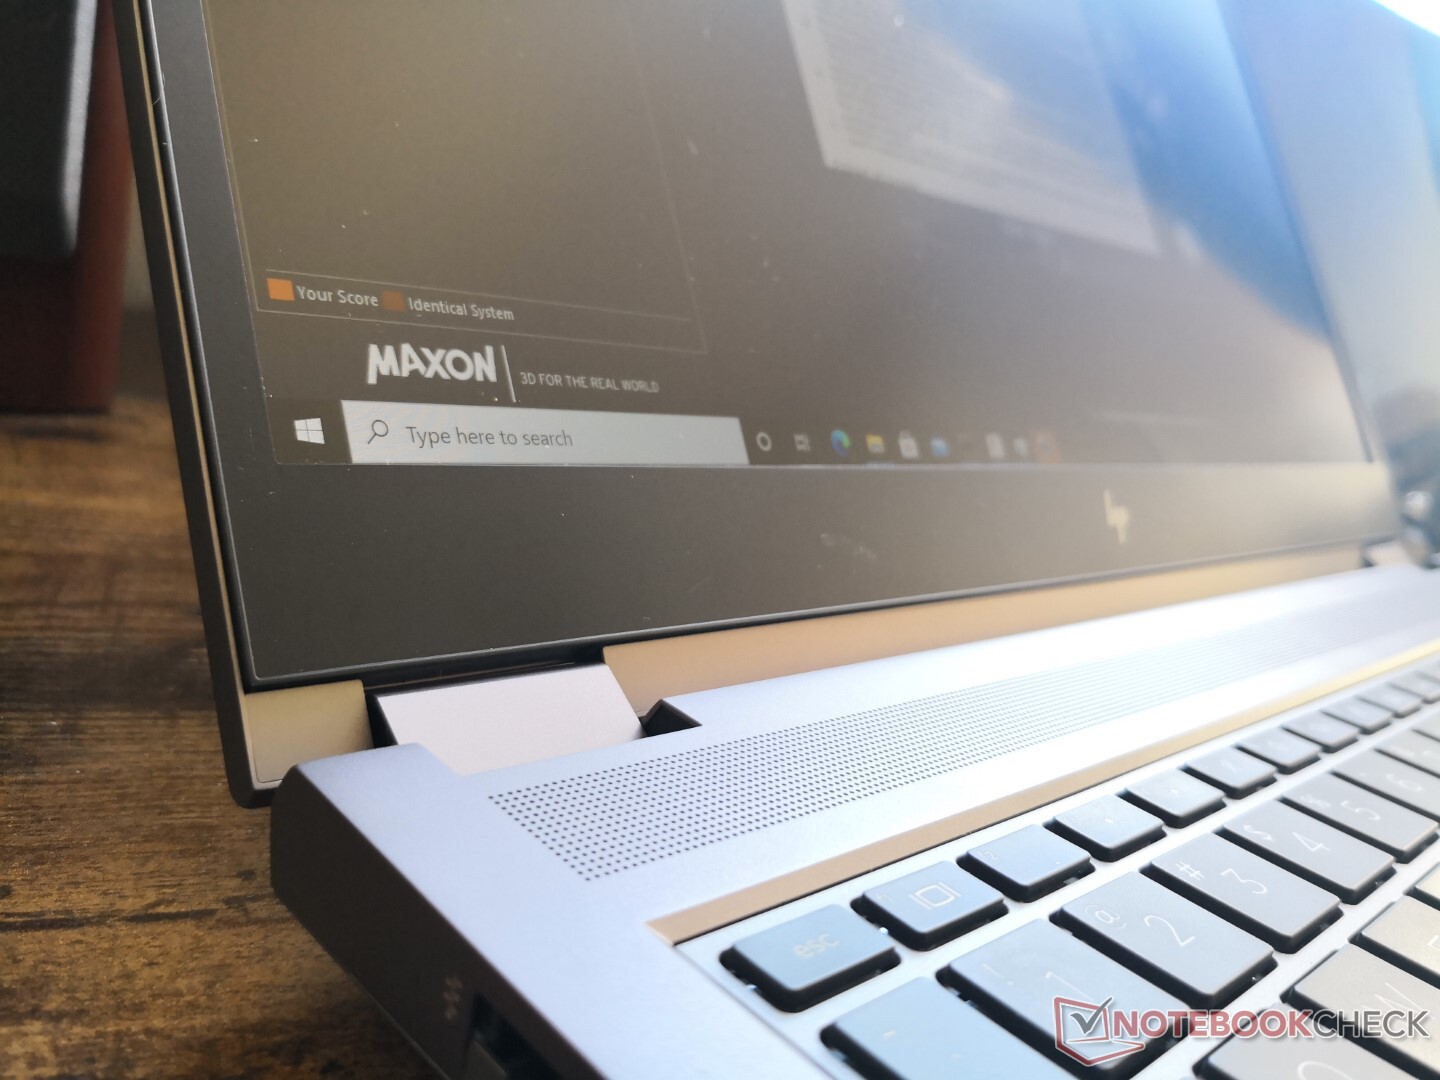
Caso
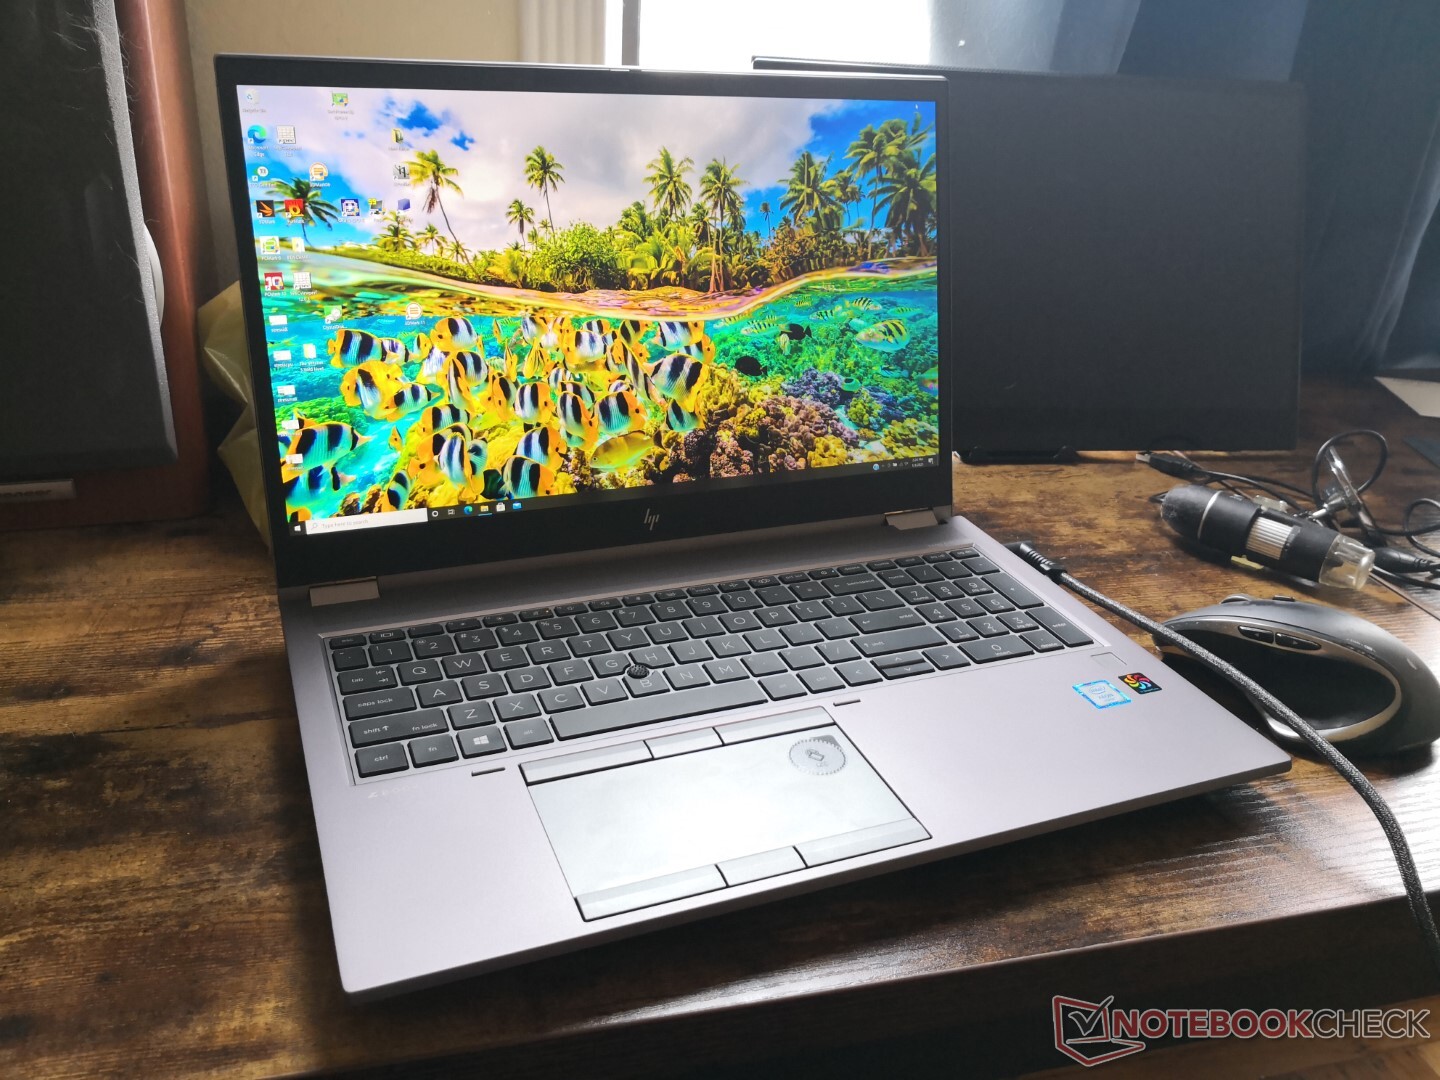
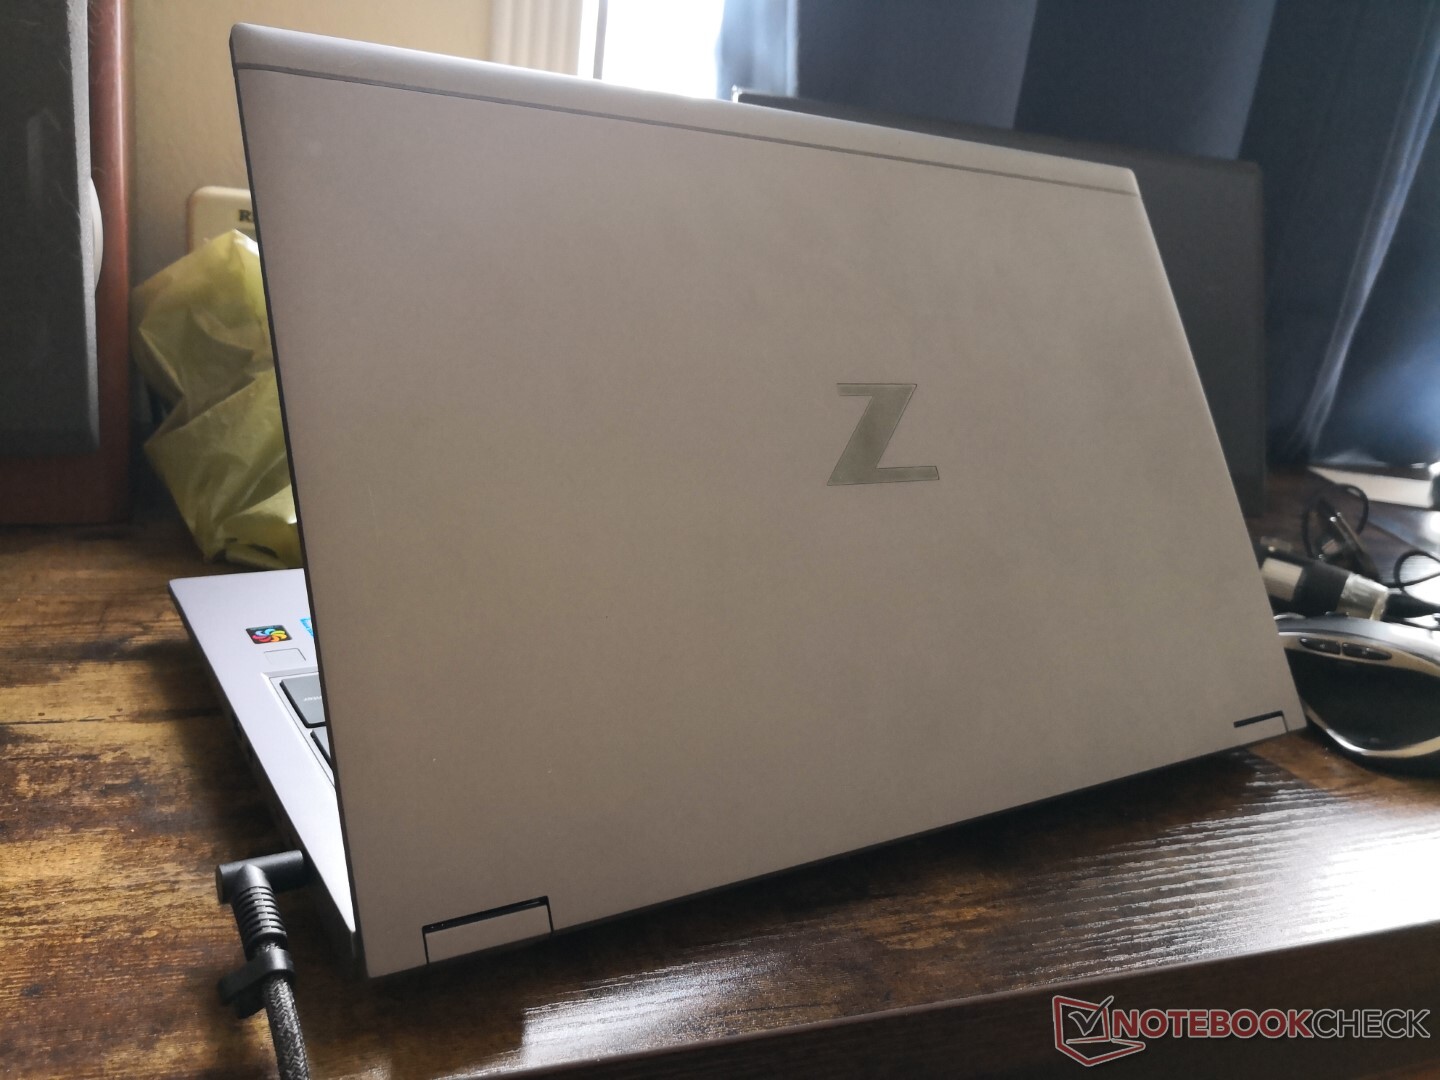
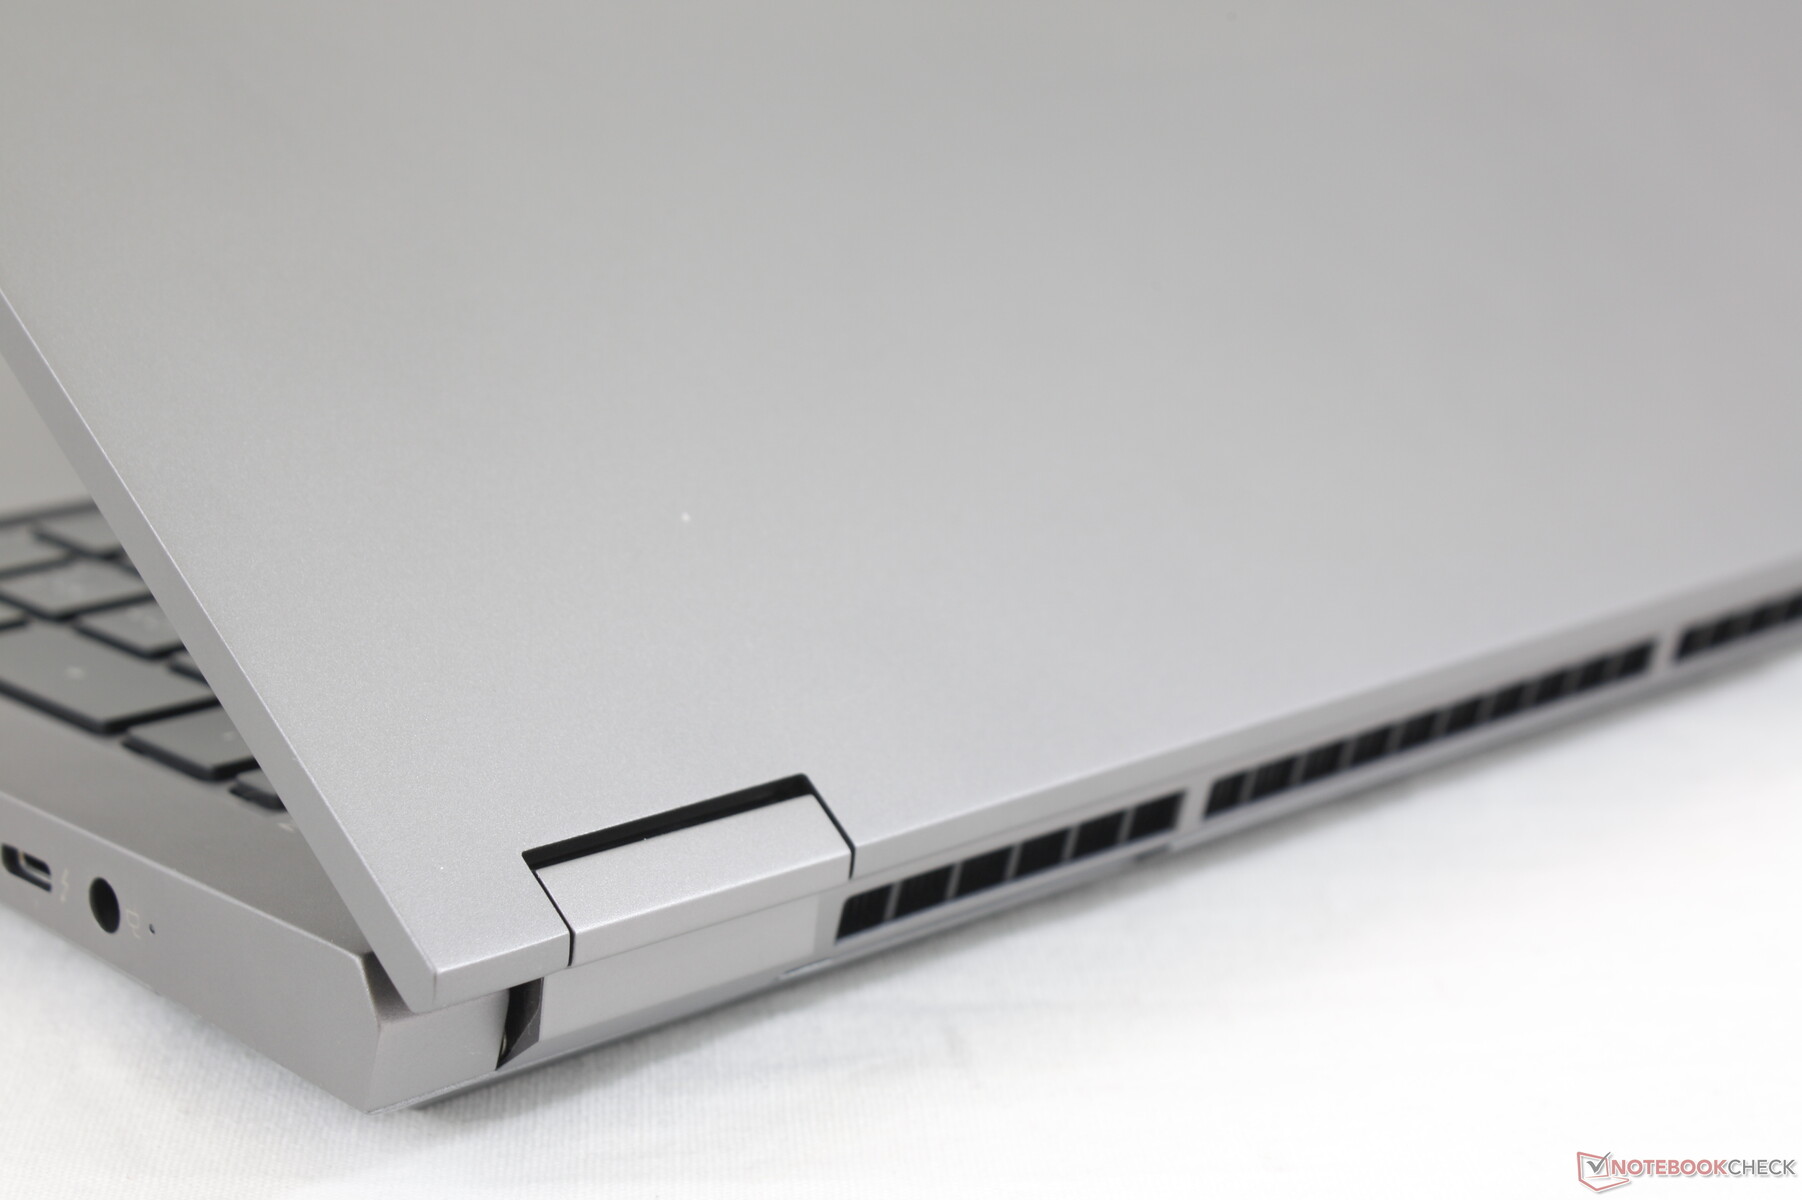
Han pasado unos años desde la última vez que vimos un ZBook 15 de tamaño completo y muchas cosas han cambiado. HP ha rediseñado el chasis de pies a cabeza con un aspecto más afilado sin sacrificar muchas de las características que las estaciones de trabajo más delgadas tienden a omitir, como lectores de tarjetas inteligentes, nubes de palos de apuntar y botones dedicados al ratón. HP dice que los biseles superior, lateral e inferior son 59,7 por ciento, 53,1 por ciento y 10,6 por ciento más pequeños, respectivamente, que el ZBook 15 G6 saliente. La base es firme, con poco o nada de deformaciones o crujidos, incluyendo el centro del teclado, que es donde la mayoría de los portátiles son más débiles. La tapa se flexiona un poco más pero no lo suficiente como para preocuparse.
El HP es notablemente más ligero que el Precision 7550 por unos 400 g a pesar de sus dimensiones similares. El sistema Dell se siente más sólido, sin embargo, probablemente debido a su peso más masivo. Hay muchas estaciones de trabajo ultrafinas Nvidia Studio como la Razer Blade o la MSI WS66 que están diseñadas para ser aún más delgadas y ligeras si los usuarios quieren algo más portátil.
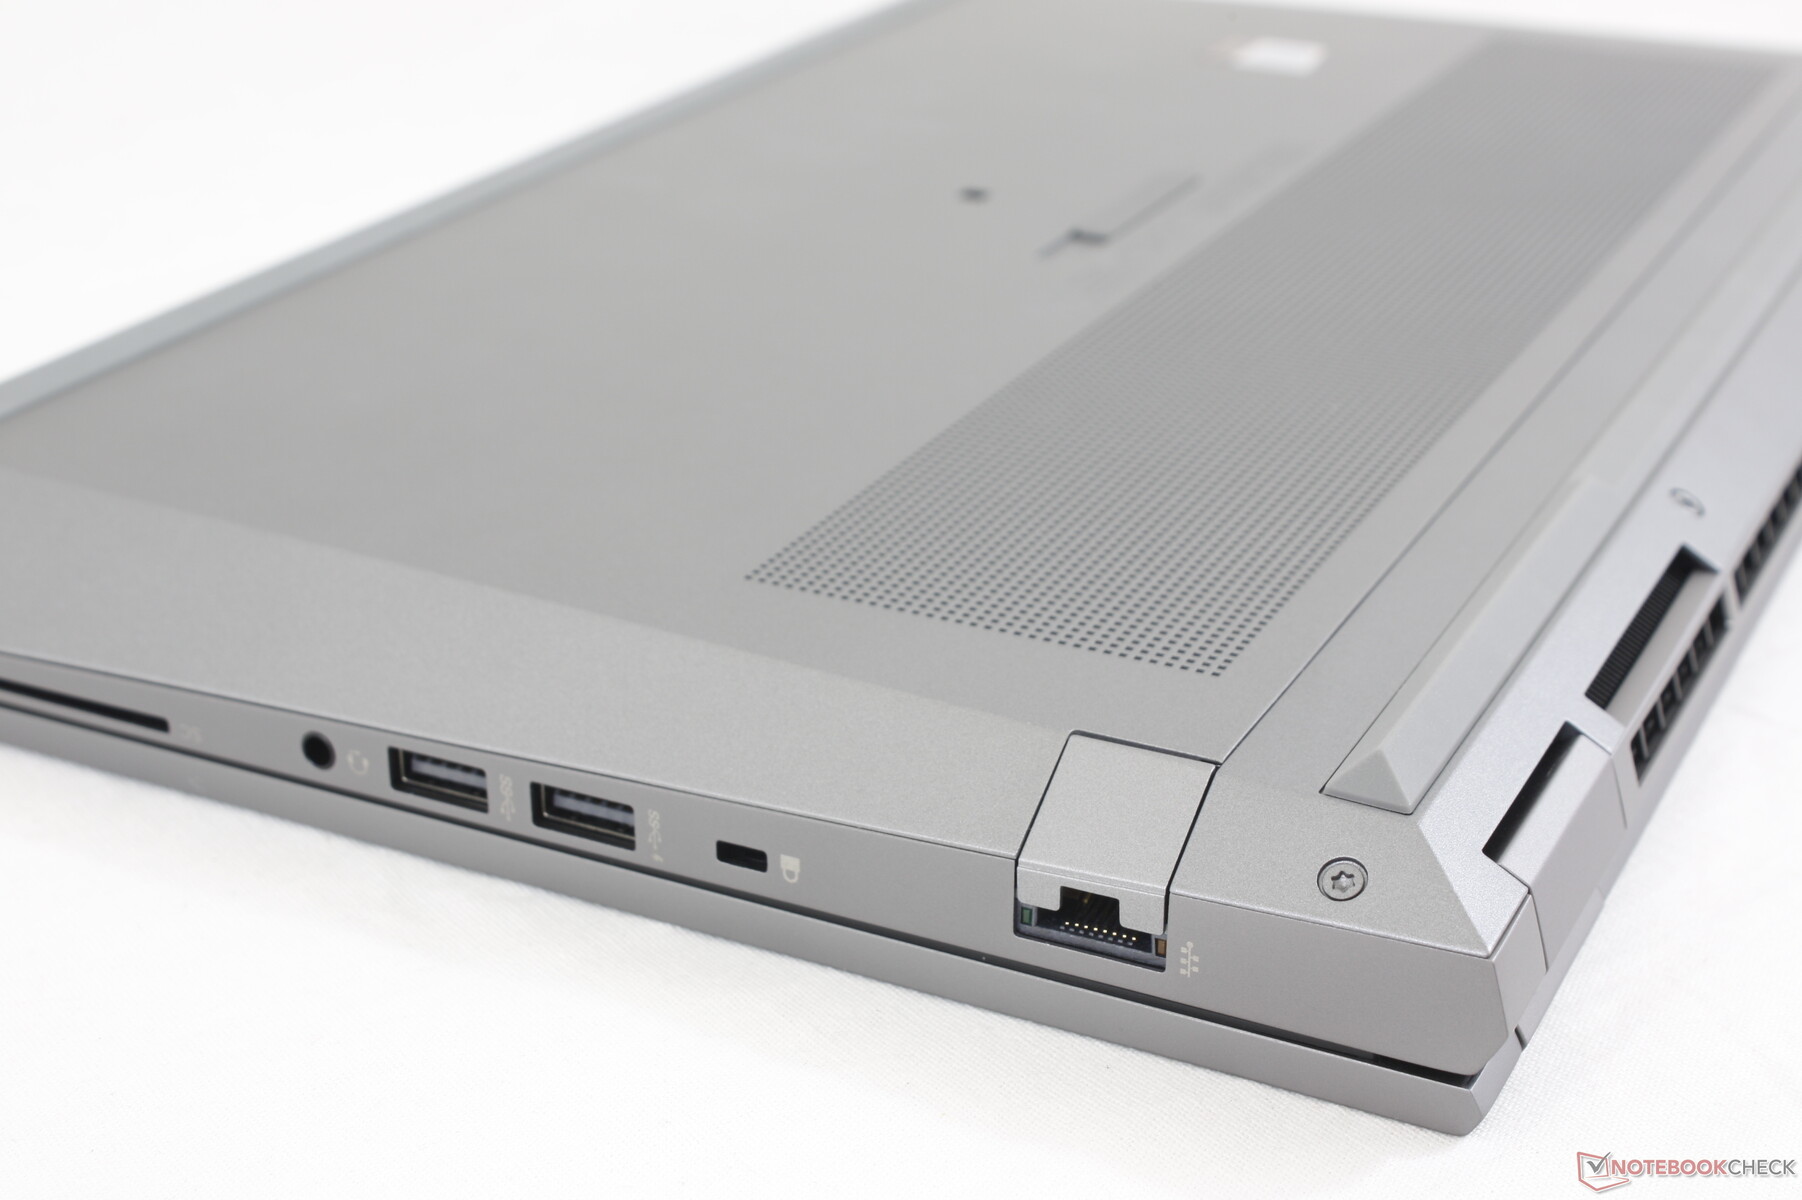
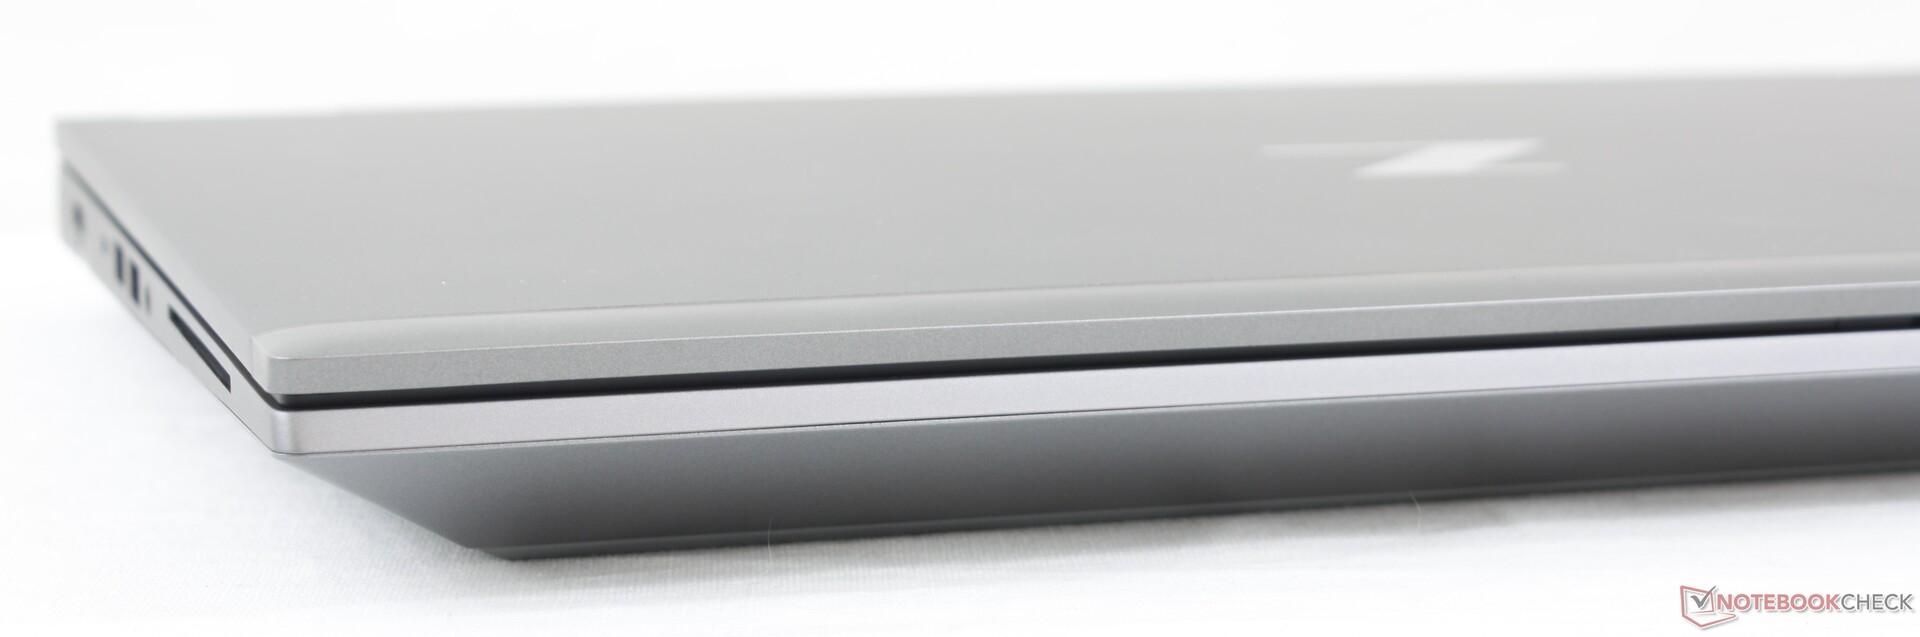
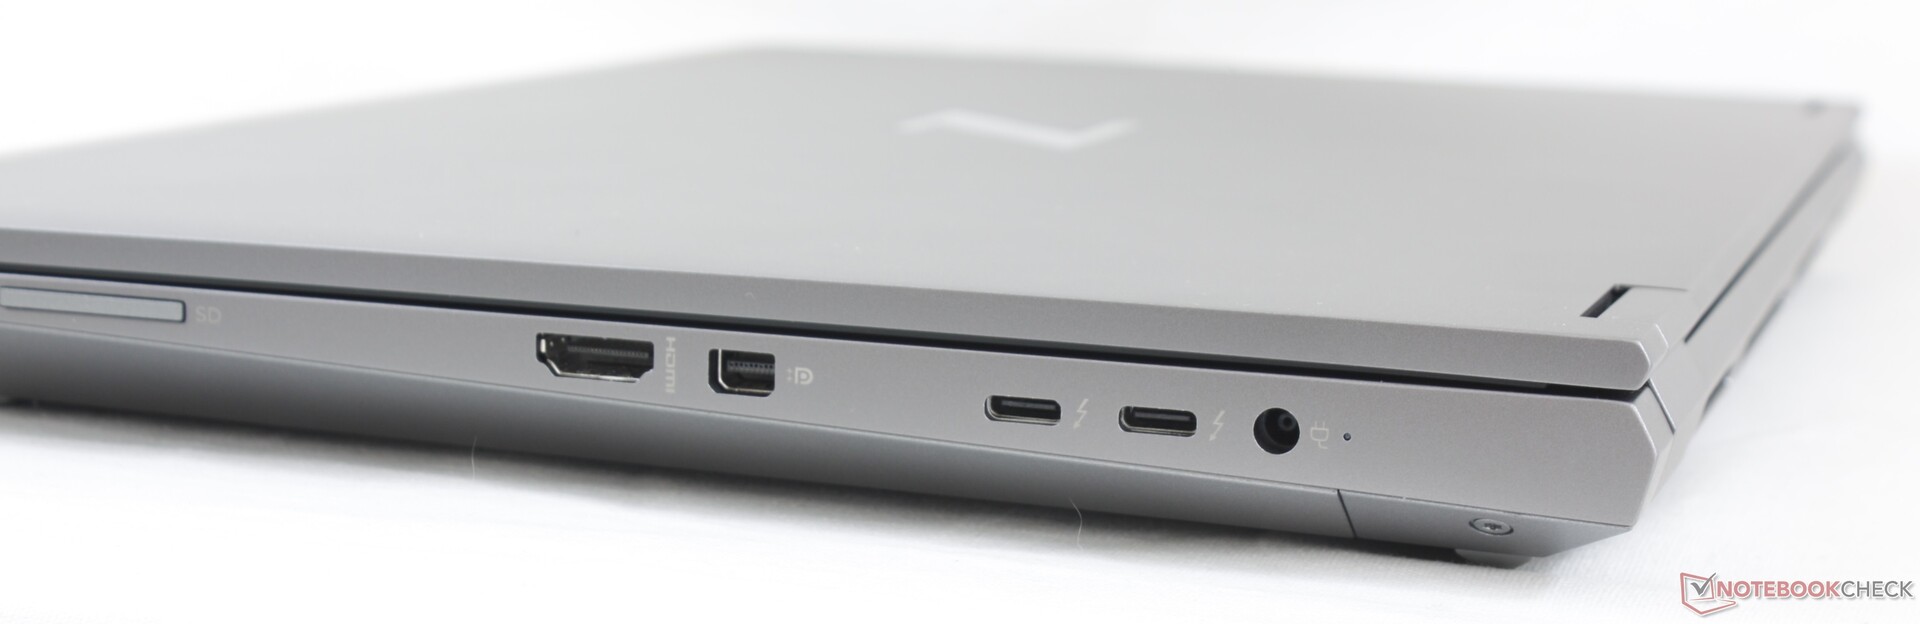
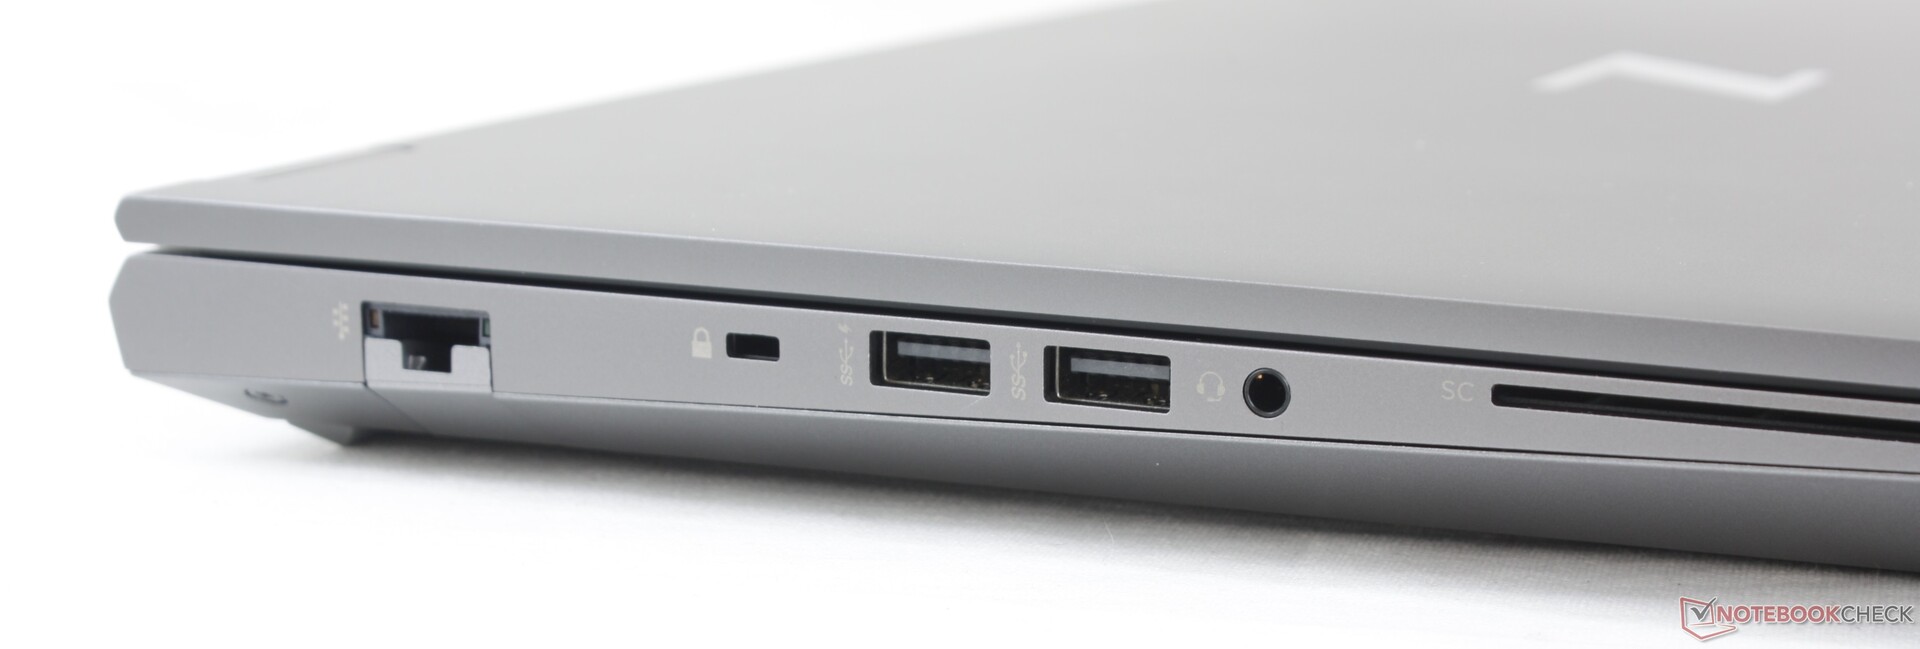
Conectividad
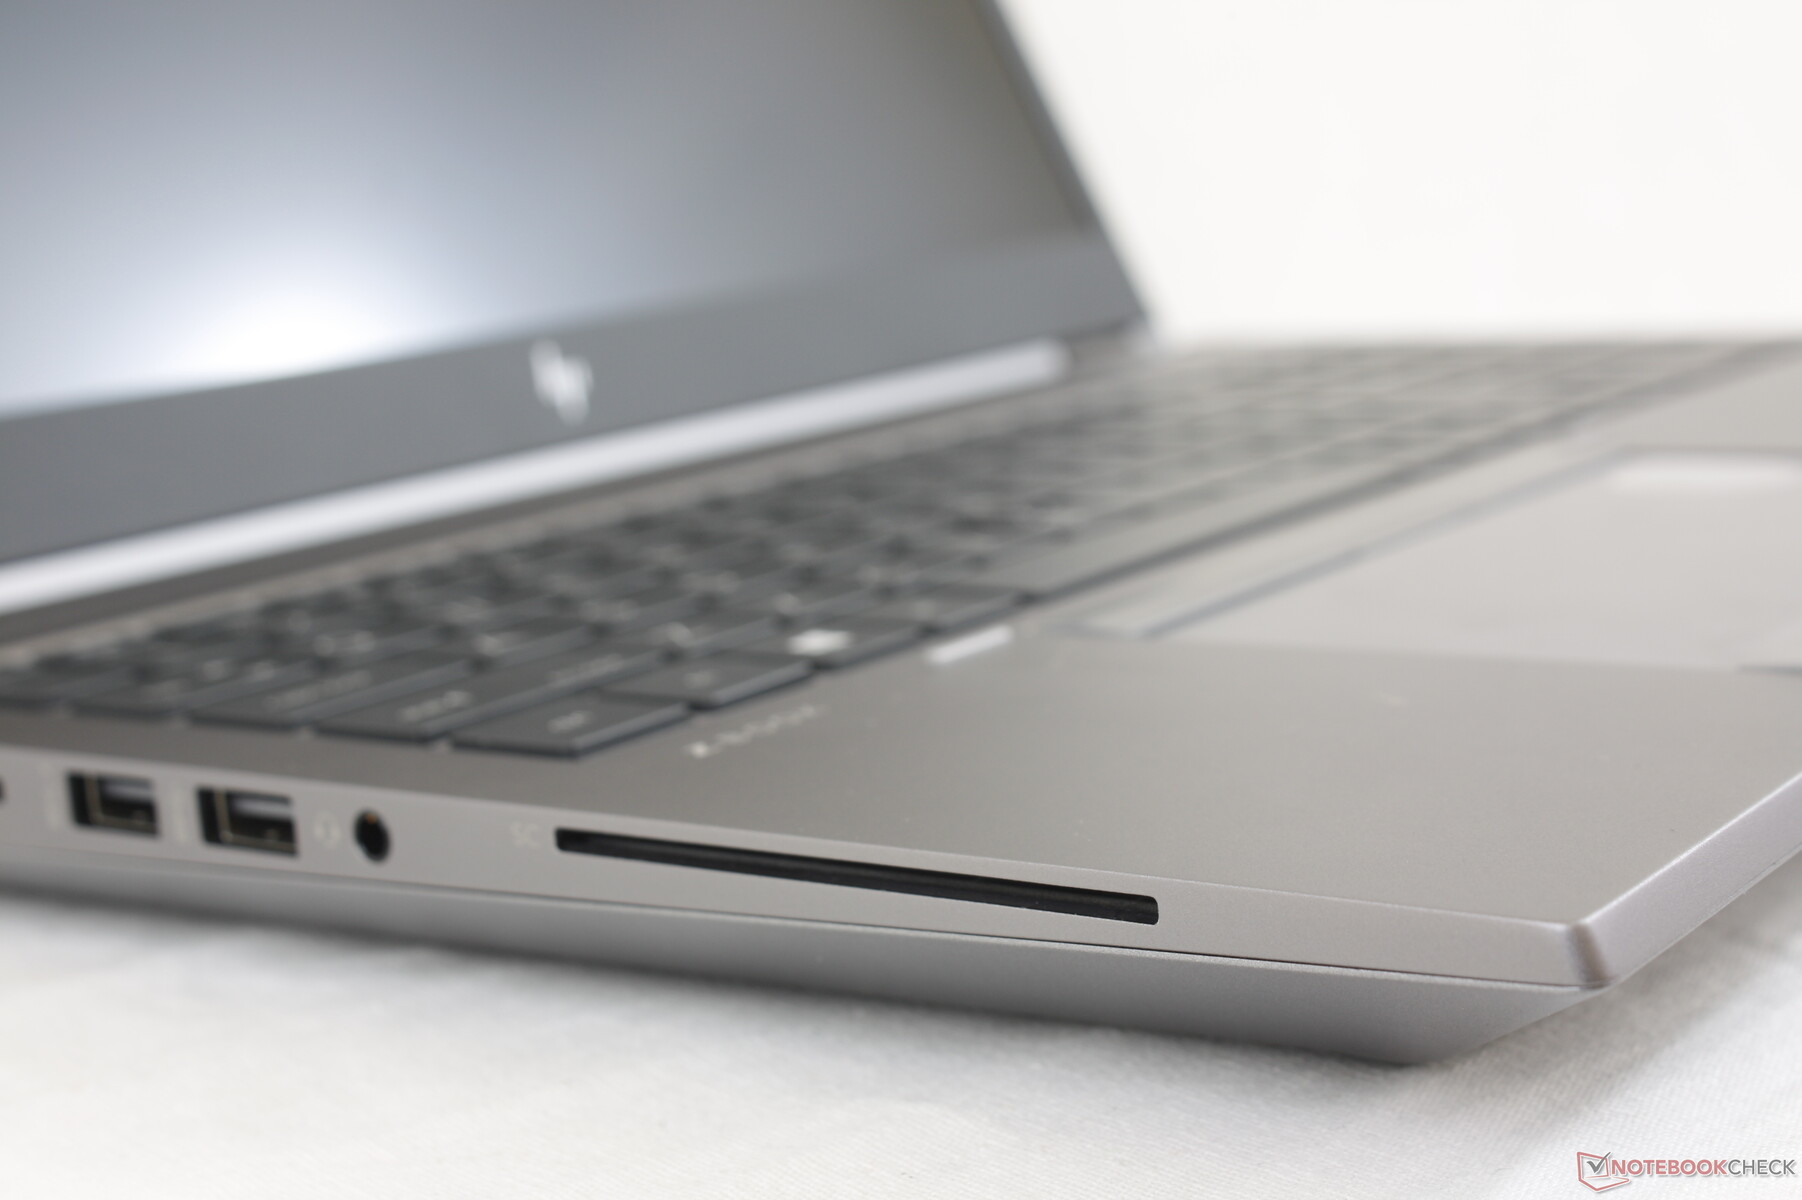
Las opciones de puerto son abundantes e idénticas a las del Dell Precision 7550. El posicionamiento de puerto es más accesible en el HP ya que no hay ninguno a lo largo del borde trasero.
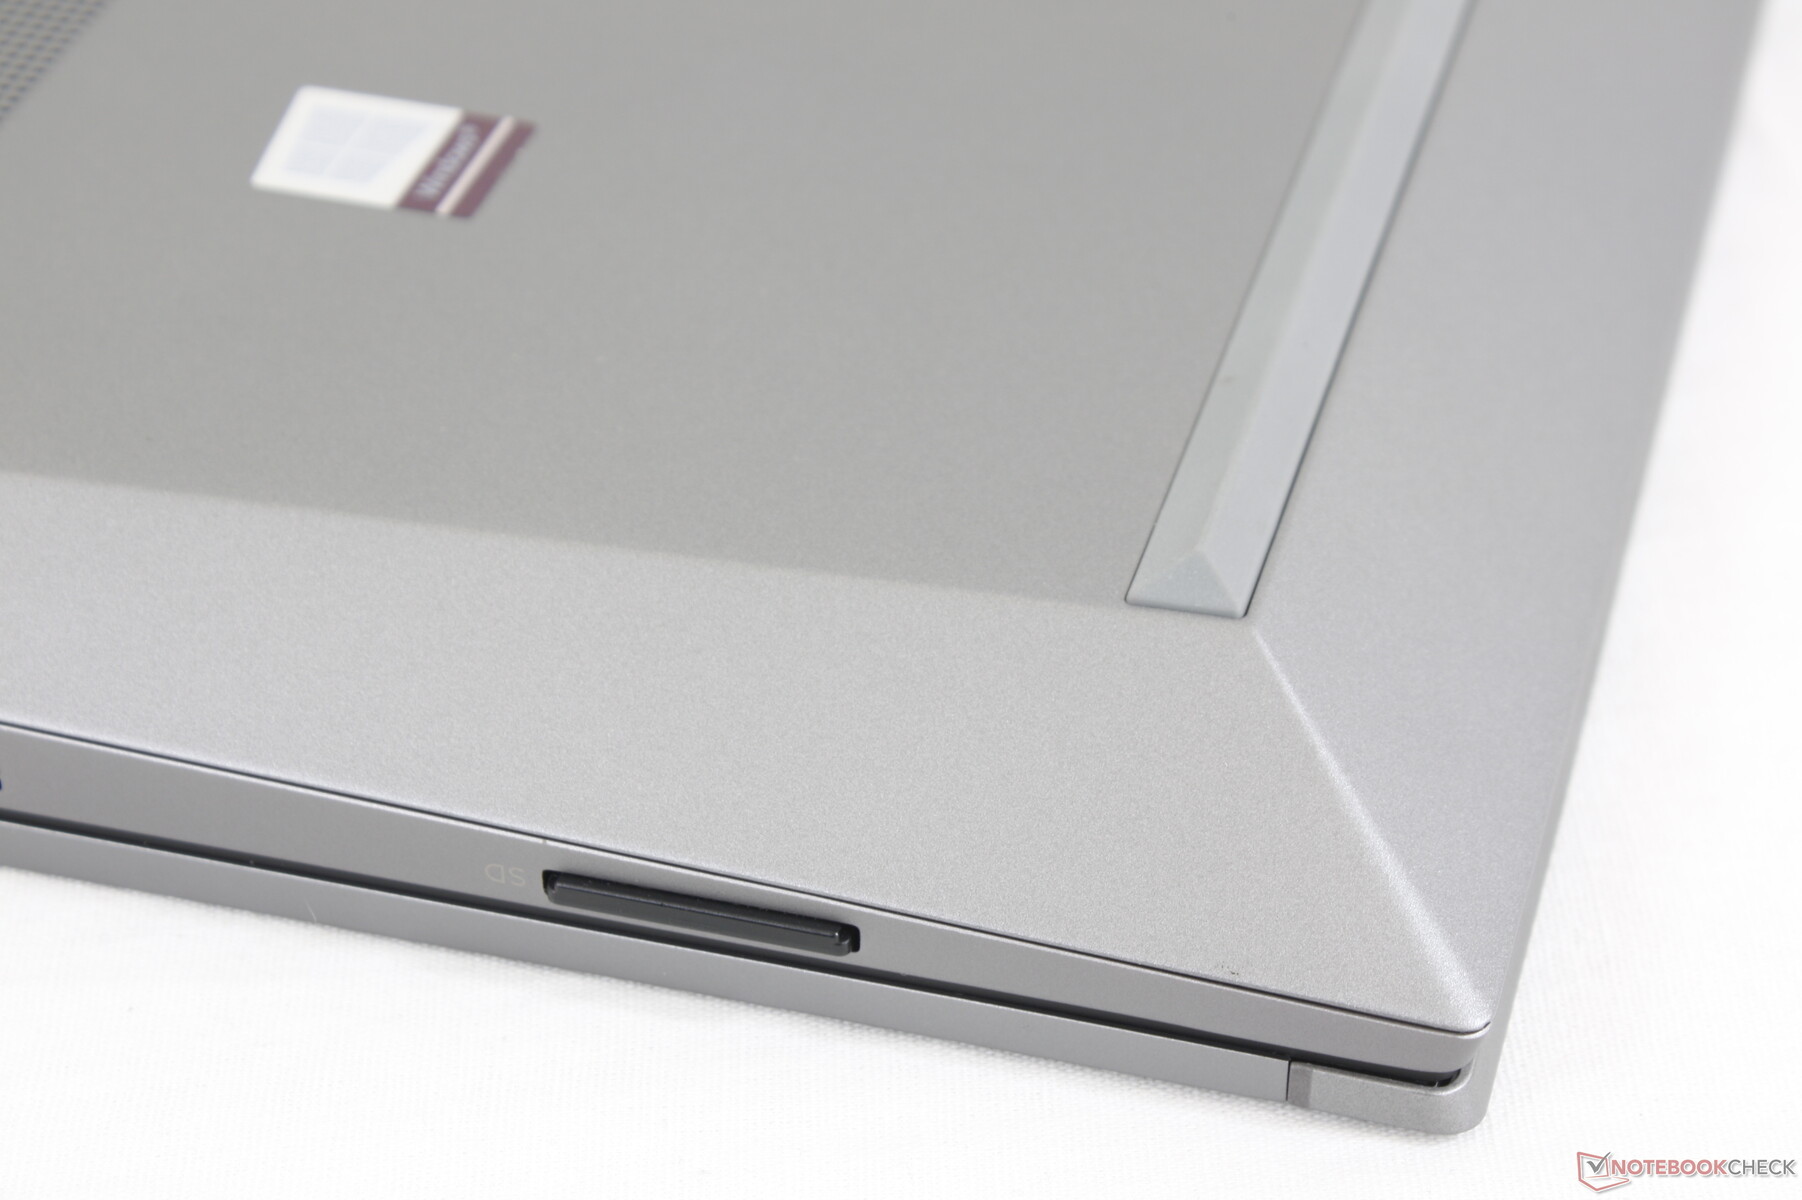
Lector de tarjetas SD
El lector de tarjetas SD integrado ofrece una rápida velocidad de transferencia. Mover 1 GB de imágenes de nuestra tarjeta UHS-II al escritorio toma cerca de 6 segundos para estar en línea con la mayoría de las otras estaciones de trabajo de alta gama.
| SD Card Reader | |
| average JPG Copy Test (av. of 3 runs) | |
| MSI WS66 10TMT-207US (Toshiba Exceria Pro SDXC 64 GB UHS-II) | |
| Dell Precision 7550 (Toshiba Exceria Pro SDXC 64 GB UHS-II) | |
| Lenovo ThinkPad P1 2019-20QT000RGE (Toshiba Exceria Pro SDXC 64 GB UHS-II) | |
| HP ZBook Fury 15 G7 (Toshiba Exceria Pro SDXC 64 GB UHS-II) | |
| Razer Blade 15 Studio Edition 2020 (Toshiba Exceria Pro SDXC 64 GB UHS-II) | |
| maximum AS SSD Seq Read Test (1GB) | |
| MSI WS66 10TMT-207US (Toshiba Exceria Pro SDXC 64 GB UHS-II) | |
| HP ZBook Fury 15 G7 (Toshiba Exceria Pro SDXC 64 GB UHS-II) | |
| Lenovo ThinkPad P1 2019-20QT000RGE (Toshiba Exceria Pro SDXC 64 GB UHS-II) | |
| Dell Precision 7550 (Toshiba Exceria Pro SDXC 64 GB UHS-II) | |
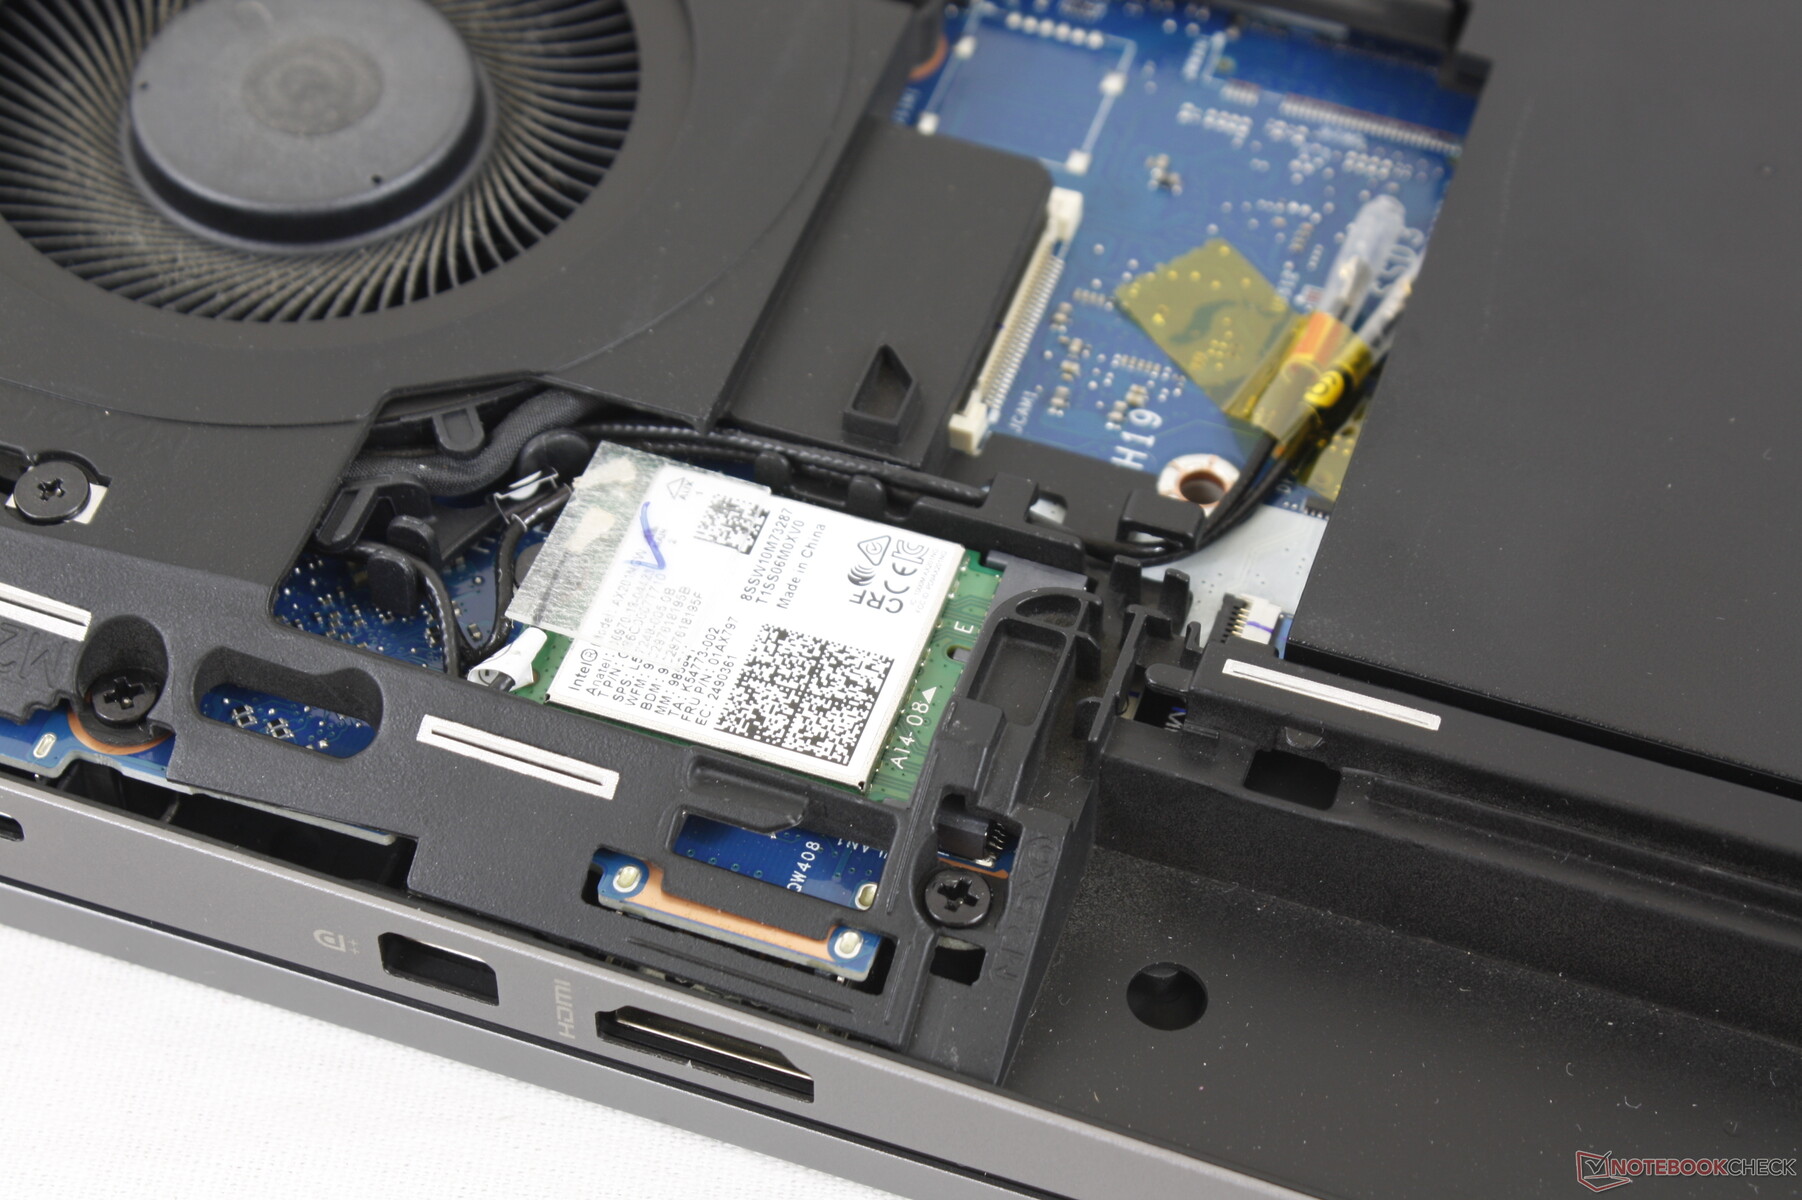
Comunicación
El Intel AX201 viene de serie para la conexión Wi-Fi 6 y Bluetooth 5.1. No tuvimos ningún problema cuando lo emparejamos con nuestro enrutador de prueba Netgear RAX200. Las velocidades de transferencia promedio varían según el entorno.
Webcam

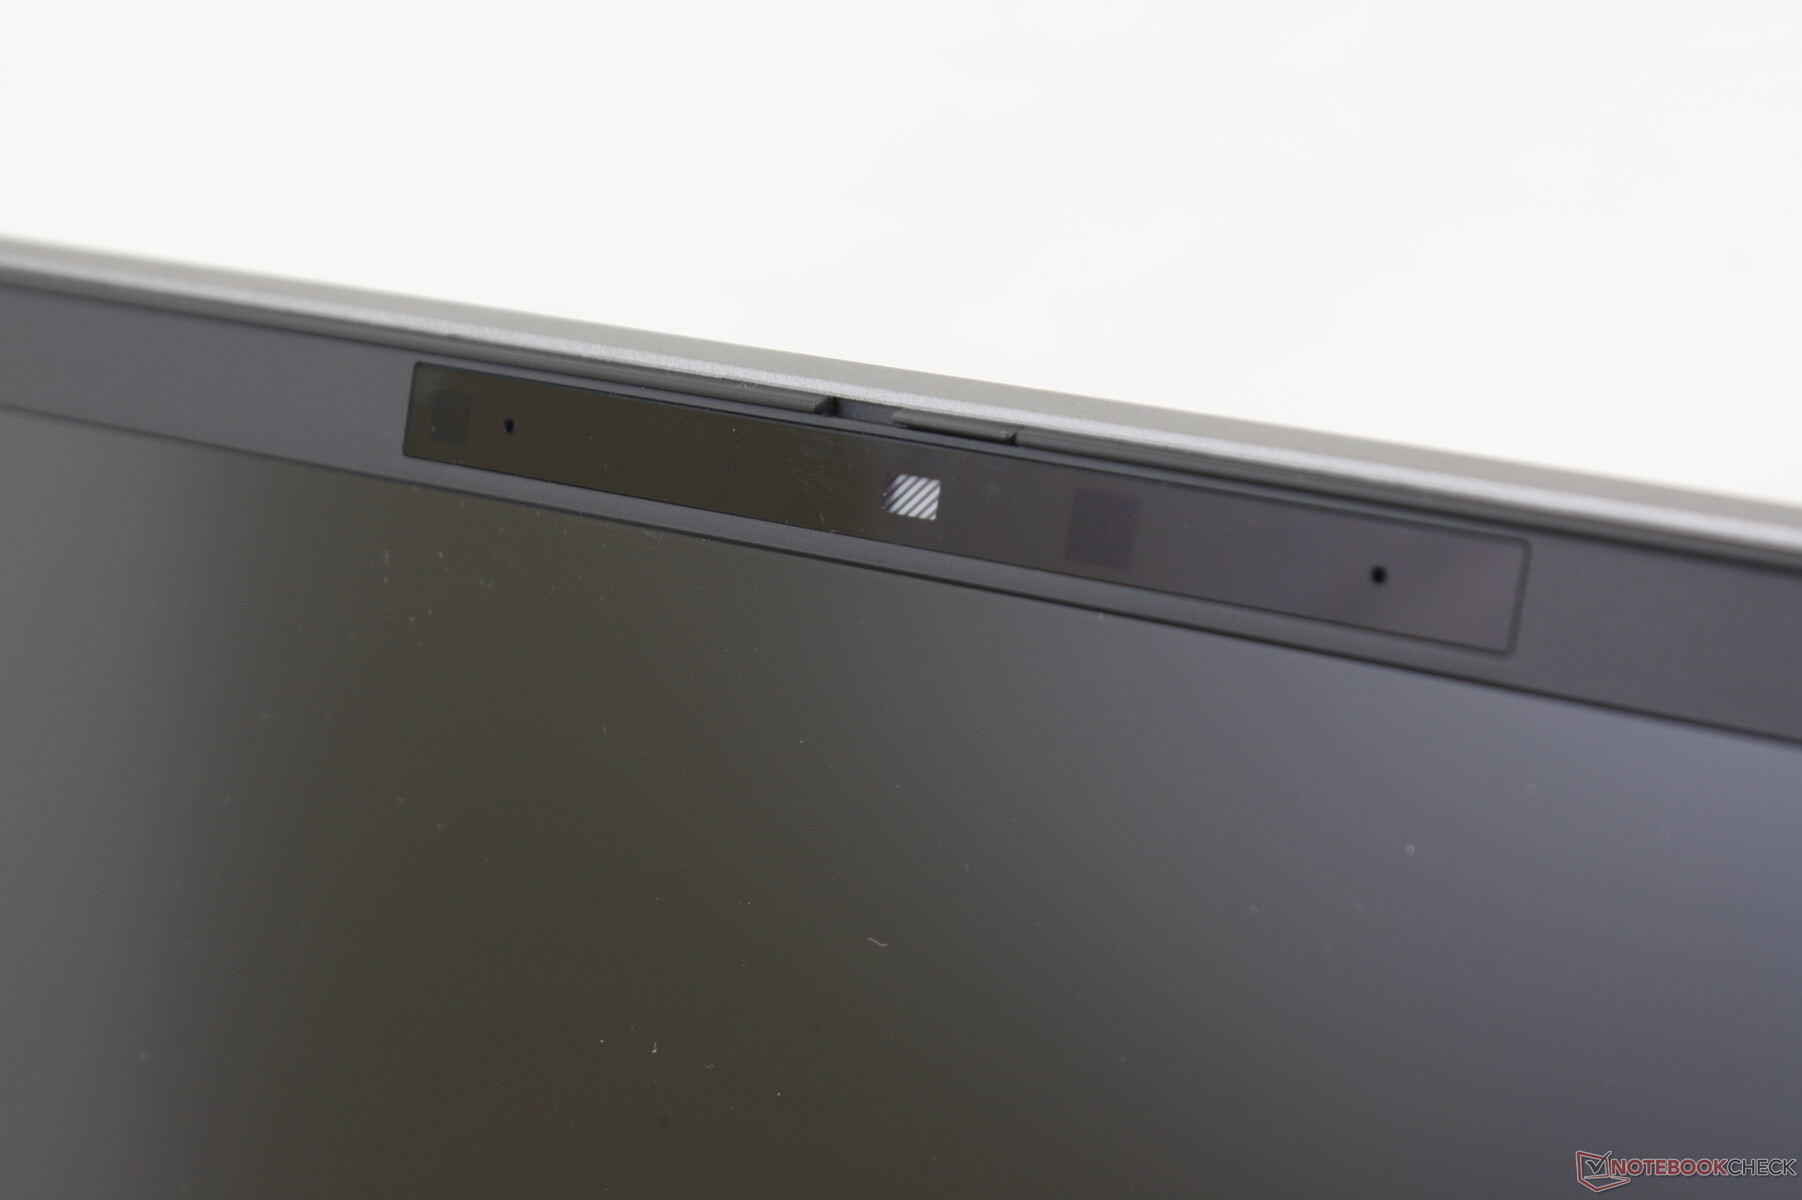


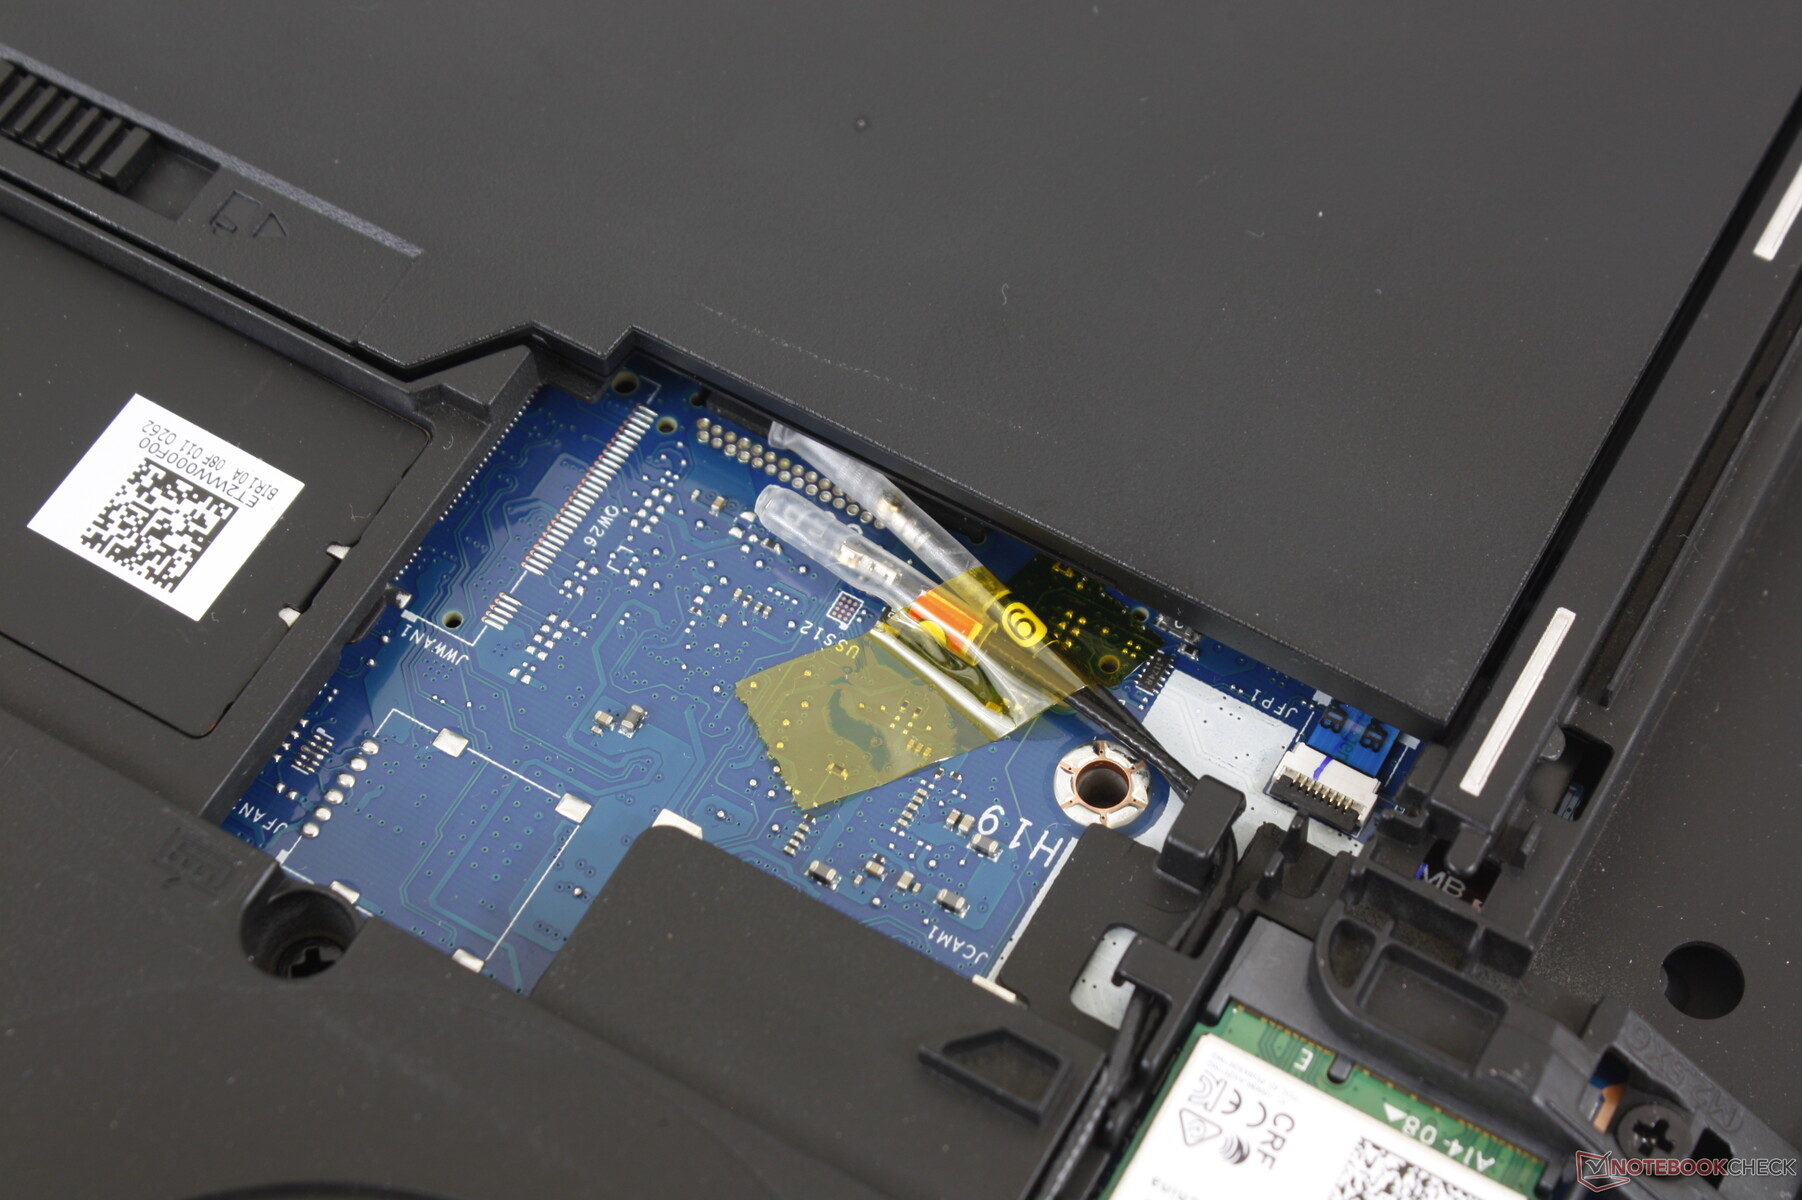
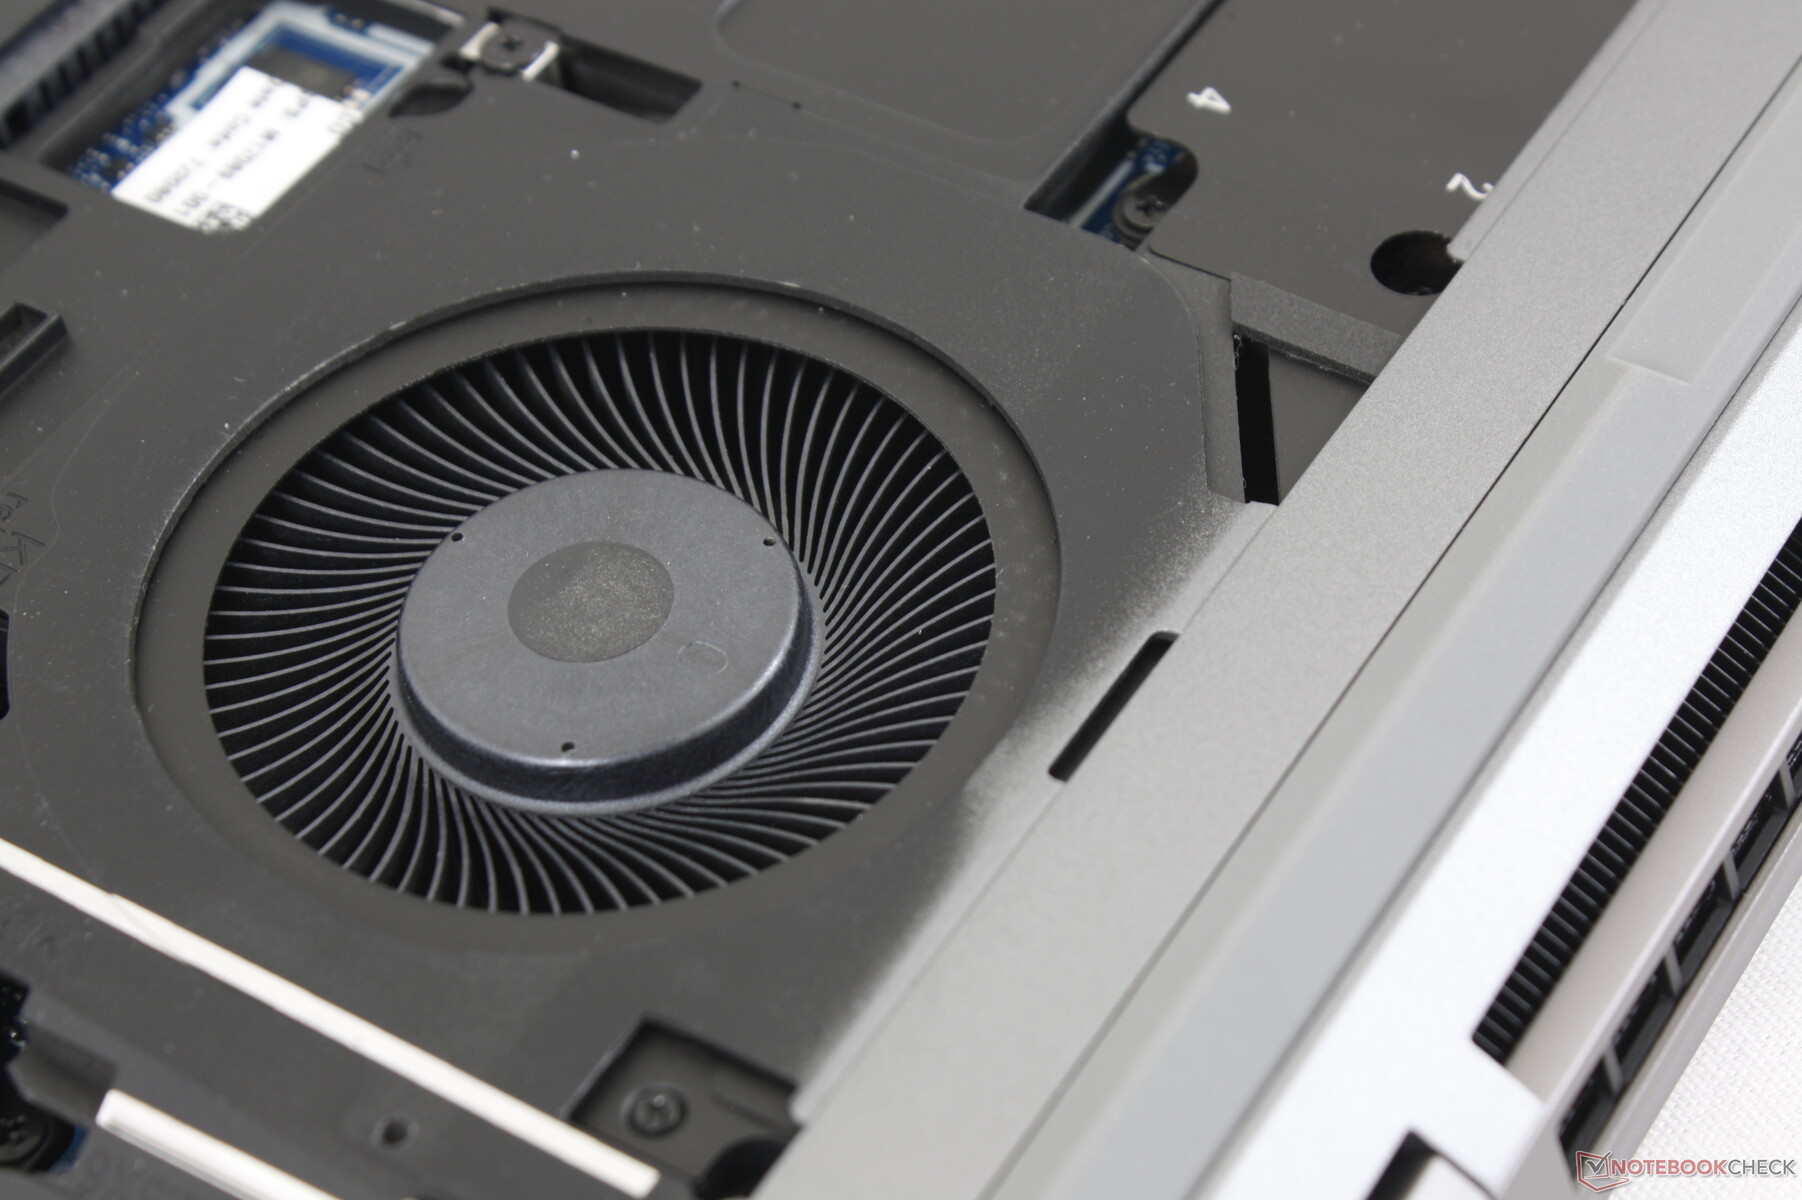
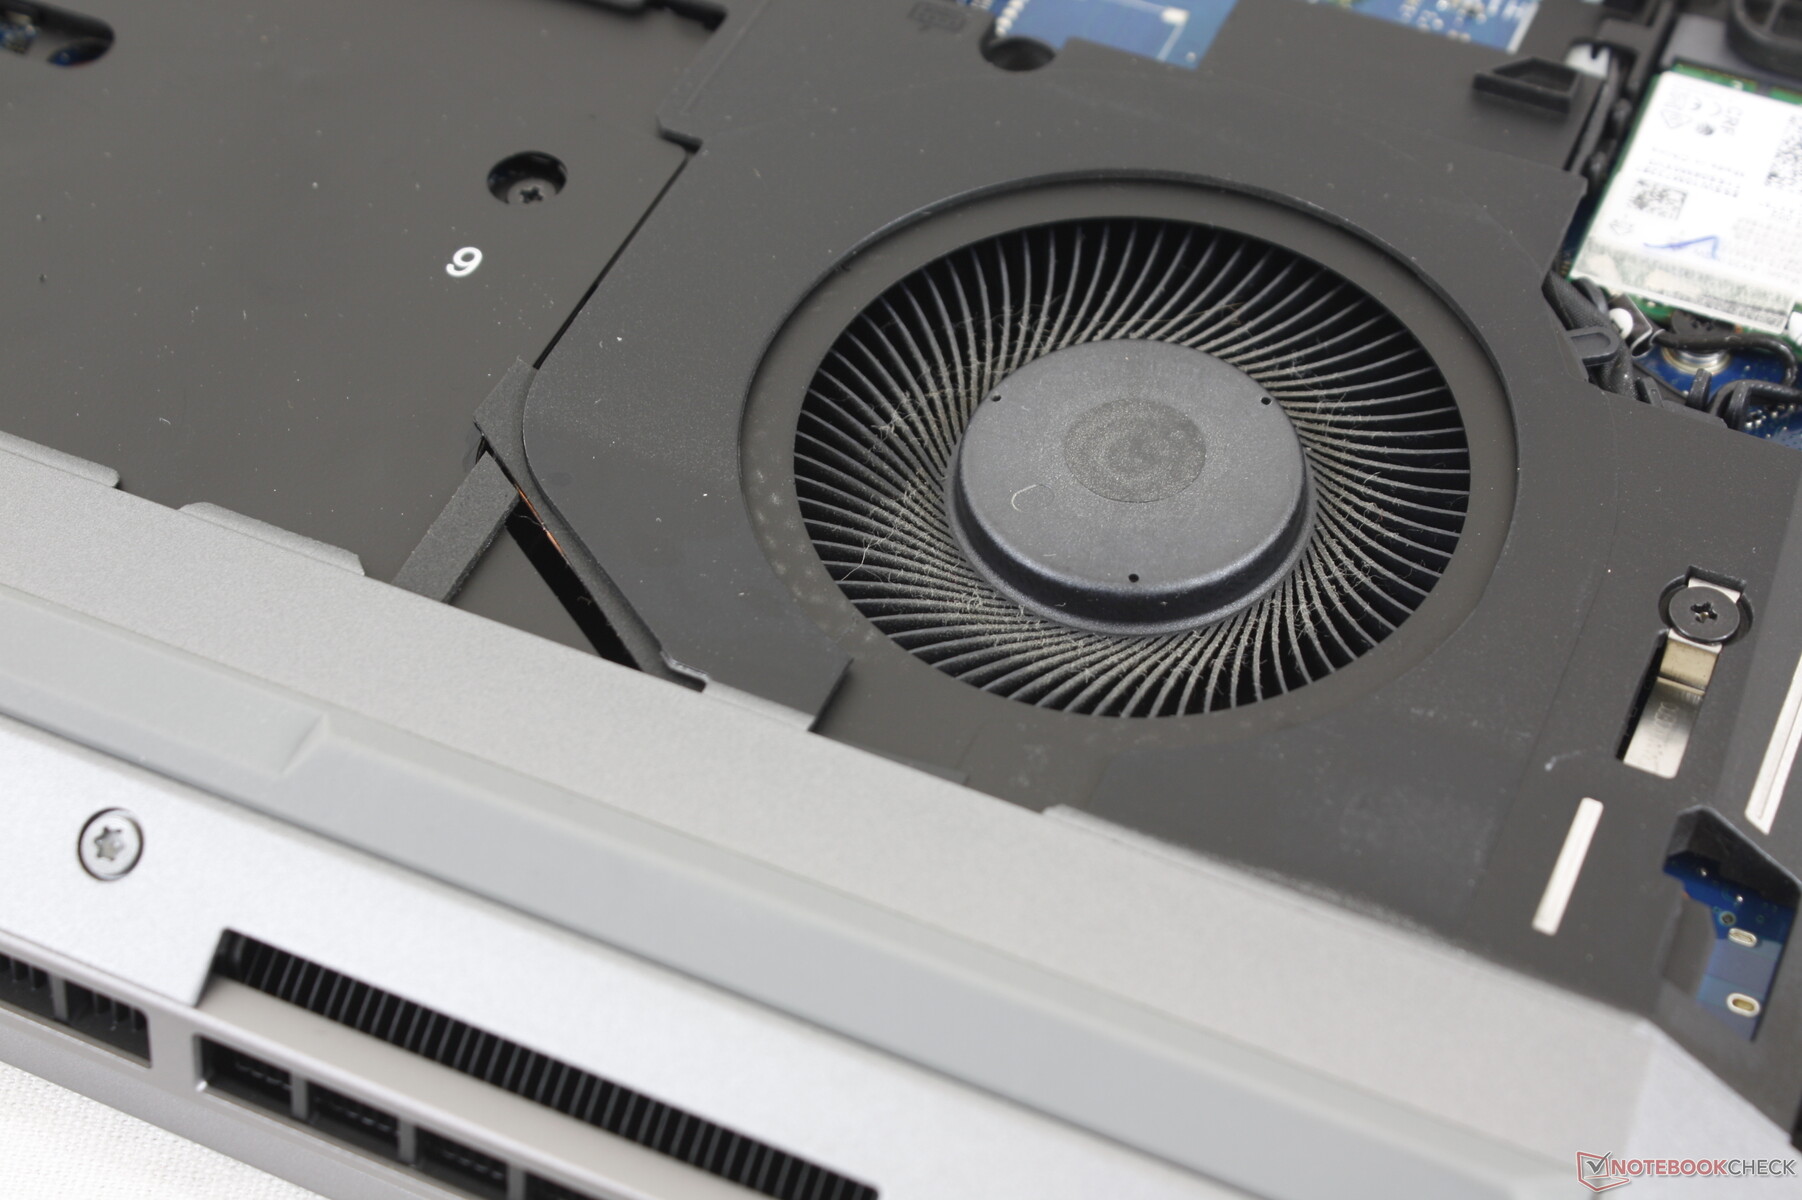
Mantenimiento
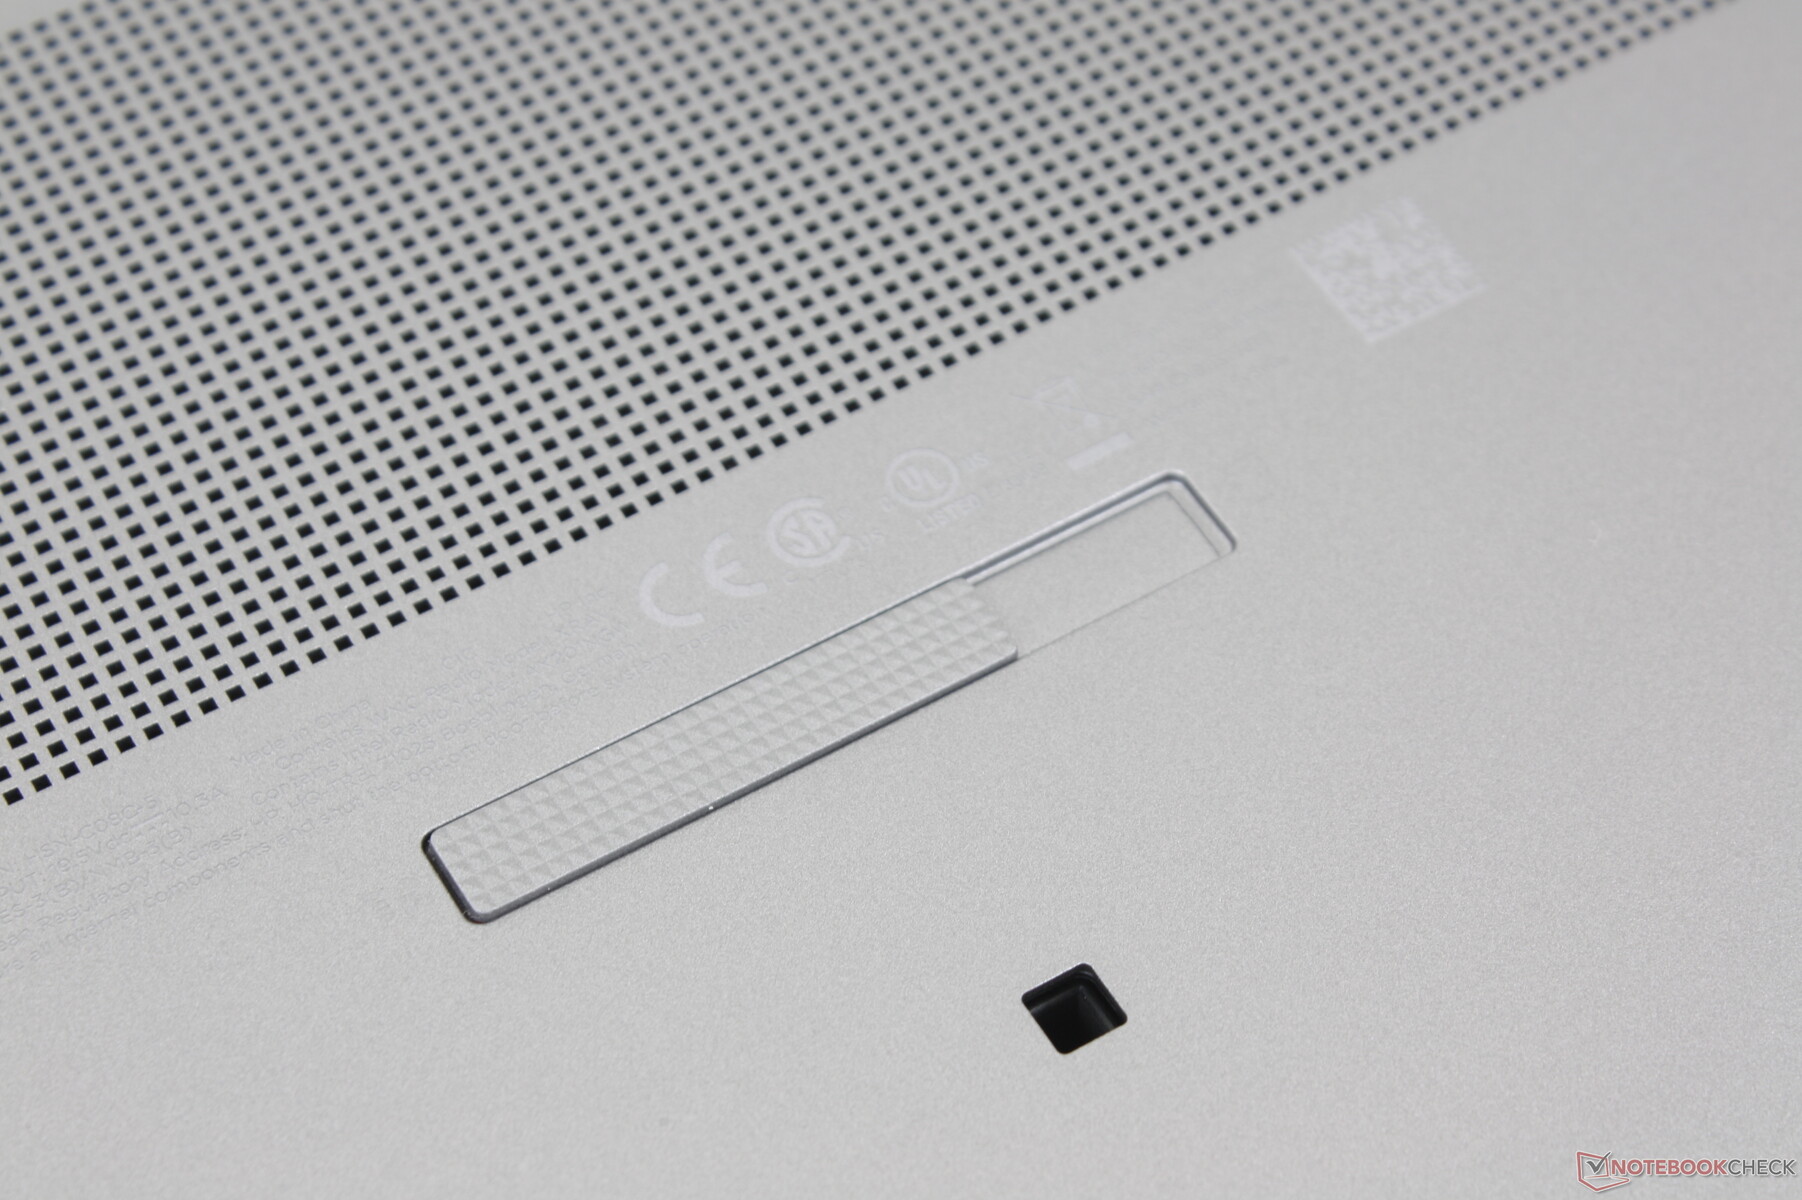
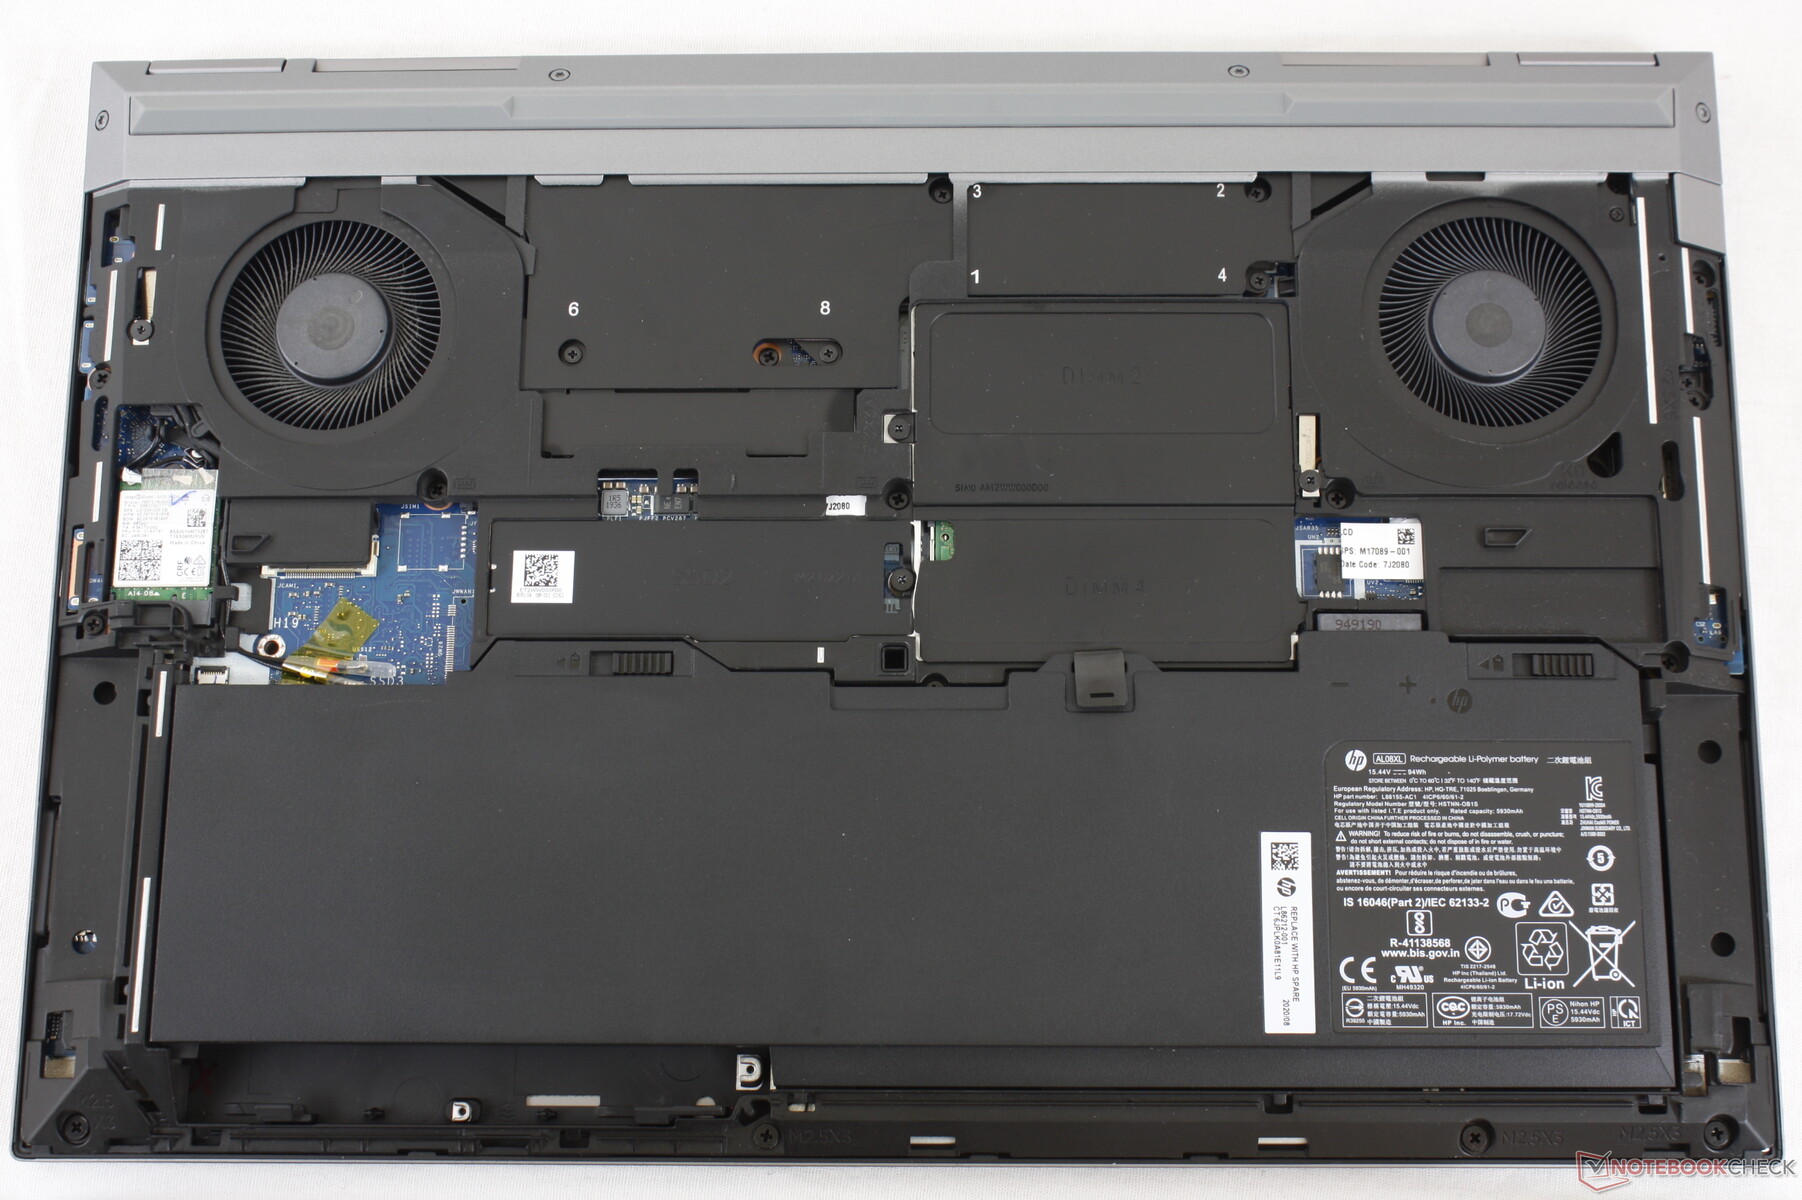
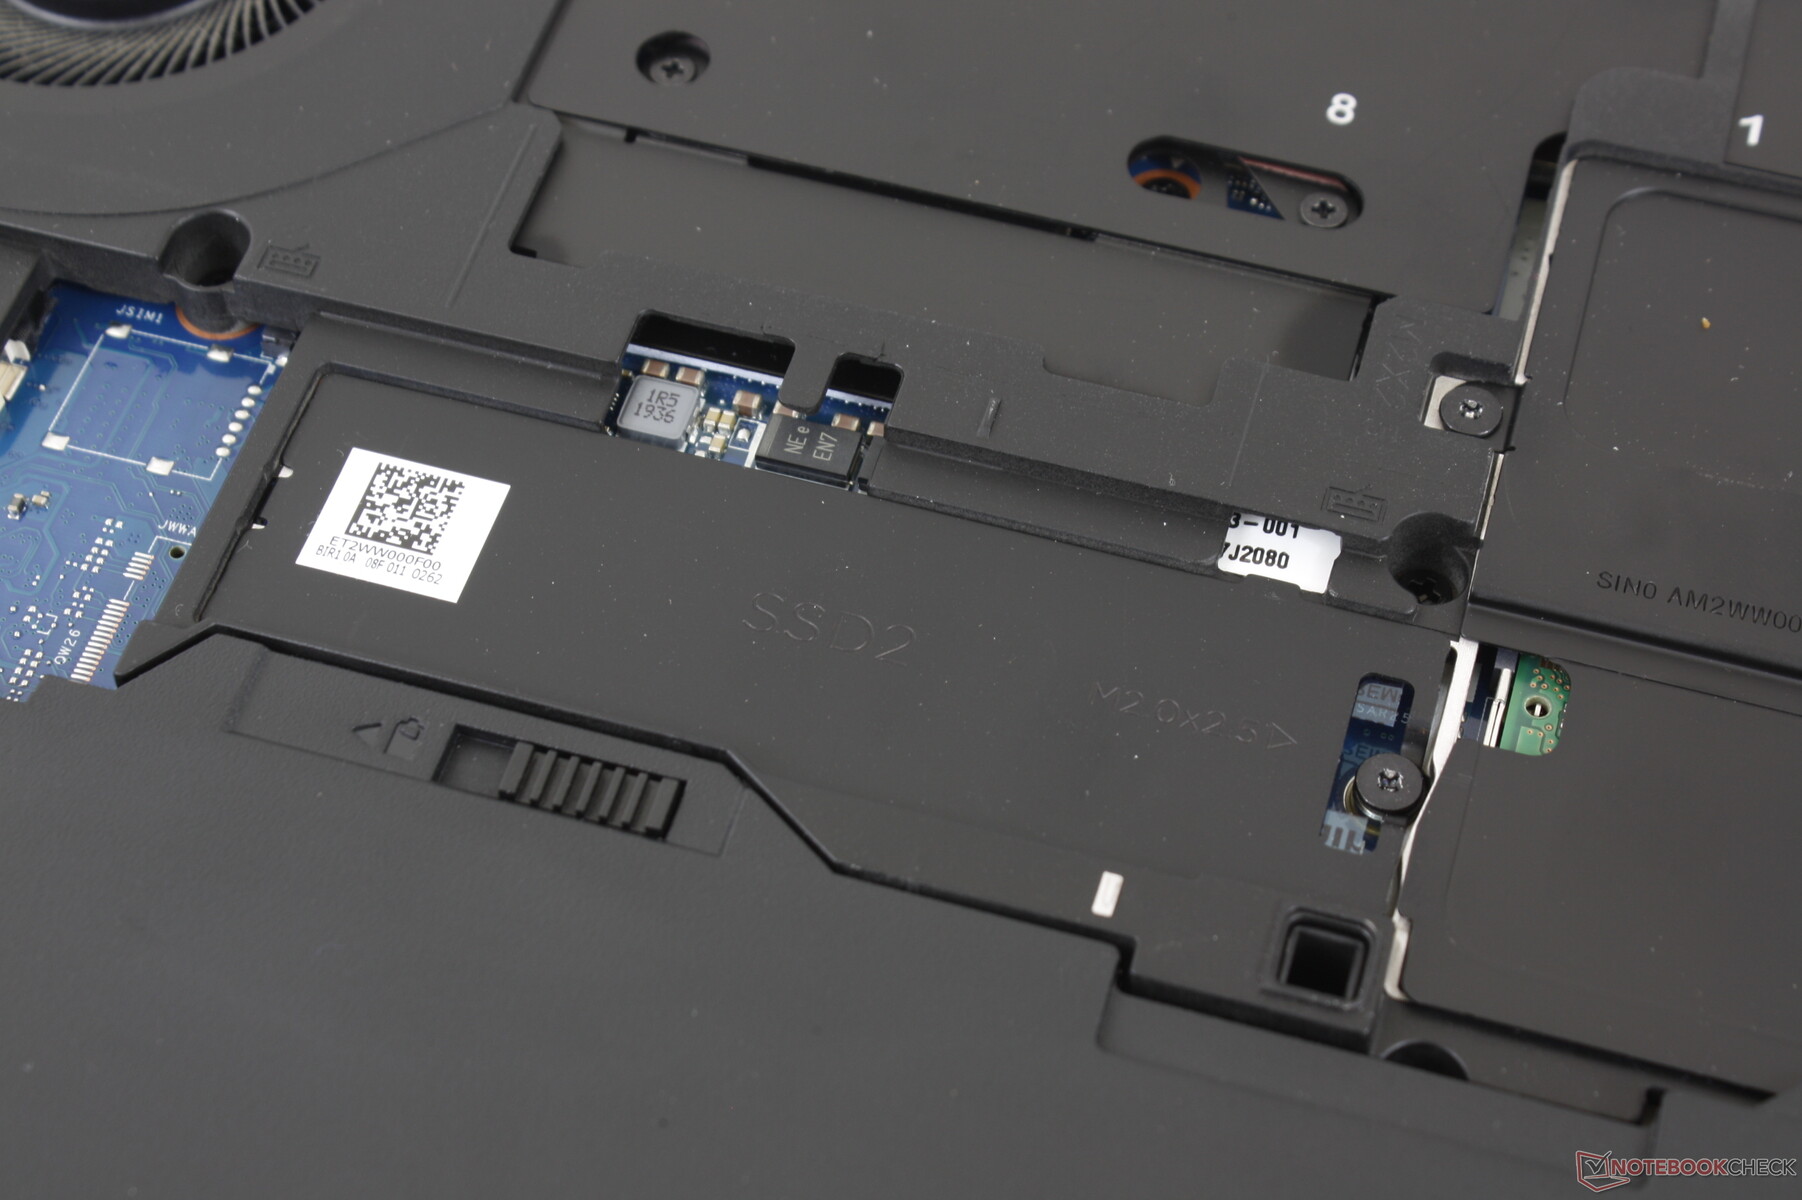
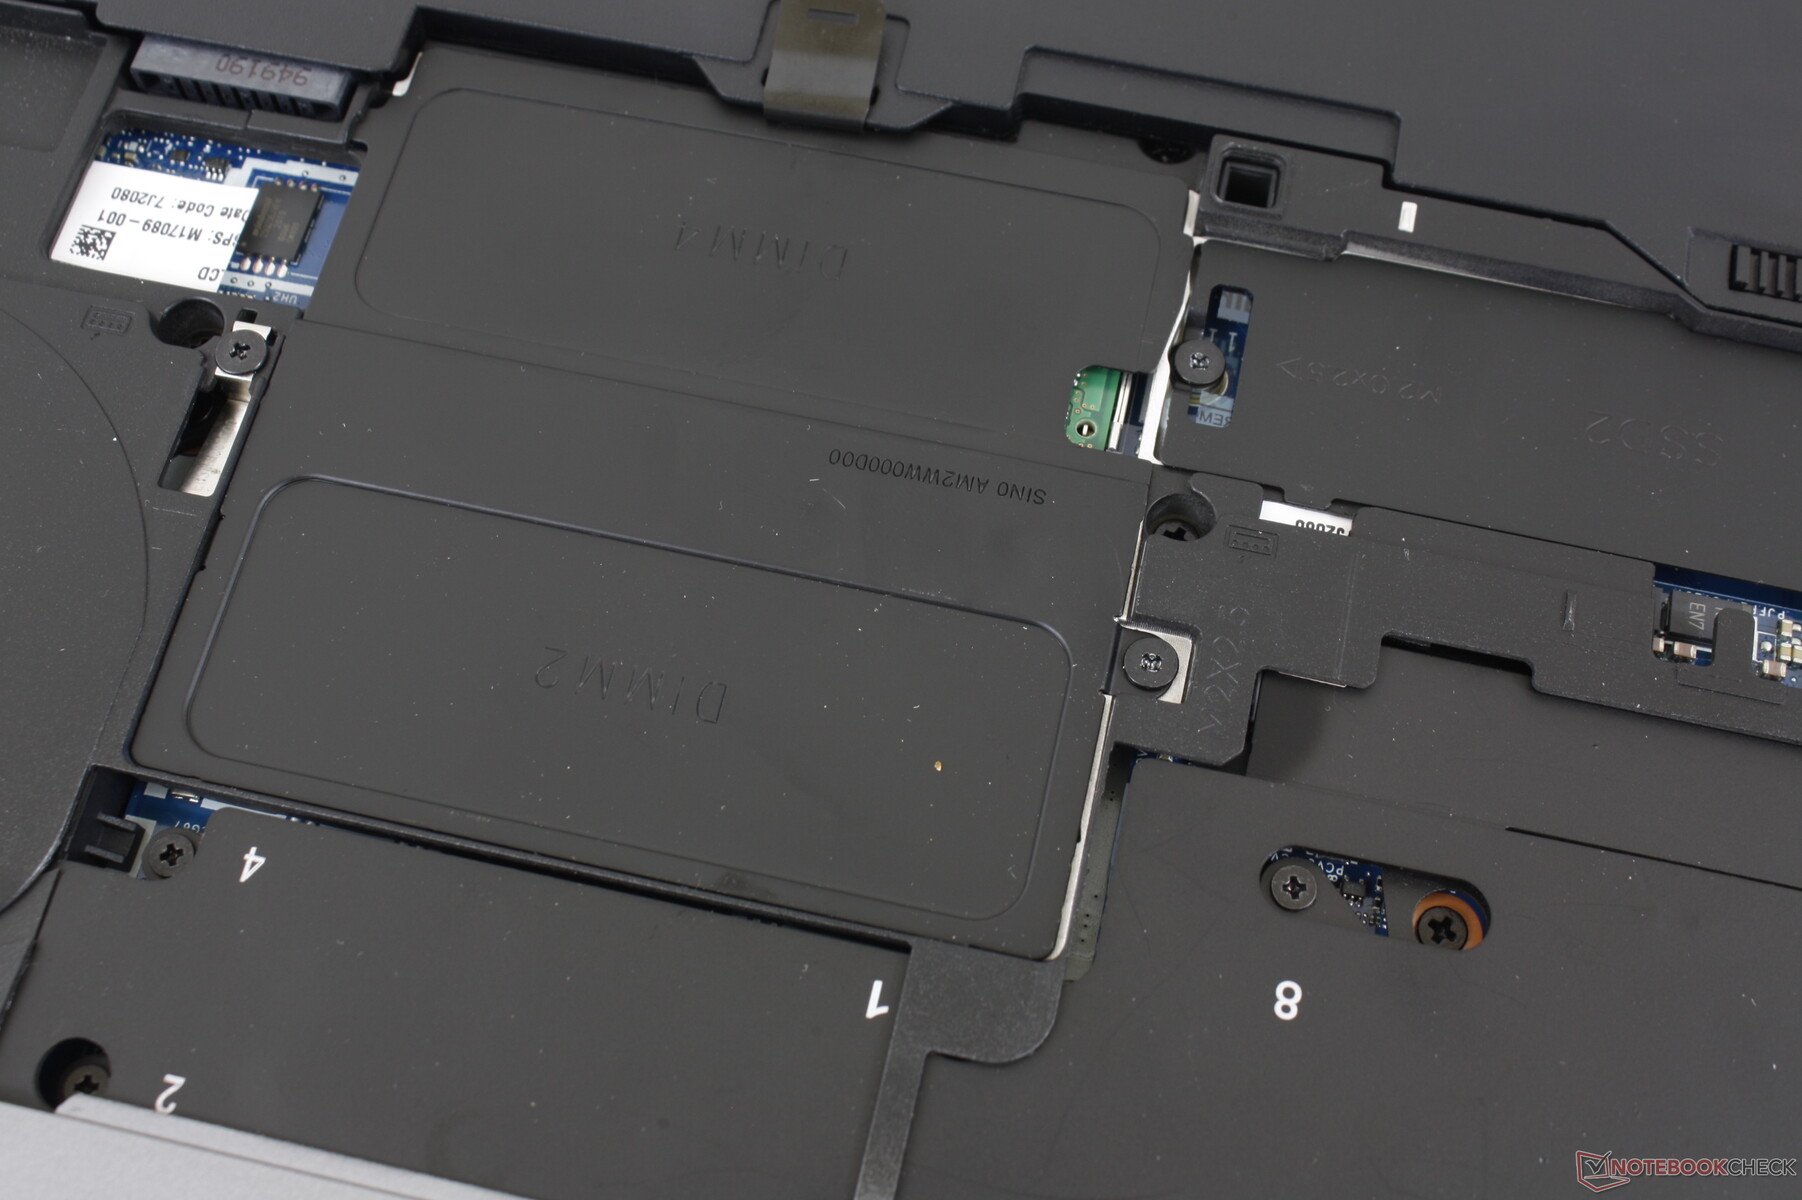
HP anuncia un servicio "sin herramientas" porque el panel inferior y la batería principal se pueden quitar fácilmente desenganchando un par de cierres. Nos encanta este enfoque y creemos que más fabricantes de equipos originales deberían implementar algo similar para sus portátiles profesionales. Desafortunadamente, hay una gran advertencia: se sigue necesitando un destornillador para acceder a casi todo lo demás. La memoria RAM y el almacenamiento están detrás de un blindaje adicional, lo que significa que el diseño "sin herramientas" no es del todo exacto.
Además, los tornillos que aseguran las ranuras de la RAM y la SSD están apretados y son blandos, lo que significa que pueden salir más fácilmente. Hemos desmontado muchos portátiles en nuestros laboratorios y los tornillos de este HP son más difíciles de quitar
Accesorios y garantía
No hay más extras en la caja que el papeleo habitual y el adaptador de CA. Sin embargo, hay un montón de estaciones de acoplamiento y accesorios opcionales, incluyendo el HP Thunderbolt Dock.
Una garantía limitada de tres años viene de serie con opciones de ampliación si se pide directamente a HP.
Dispositivos de entrada
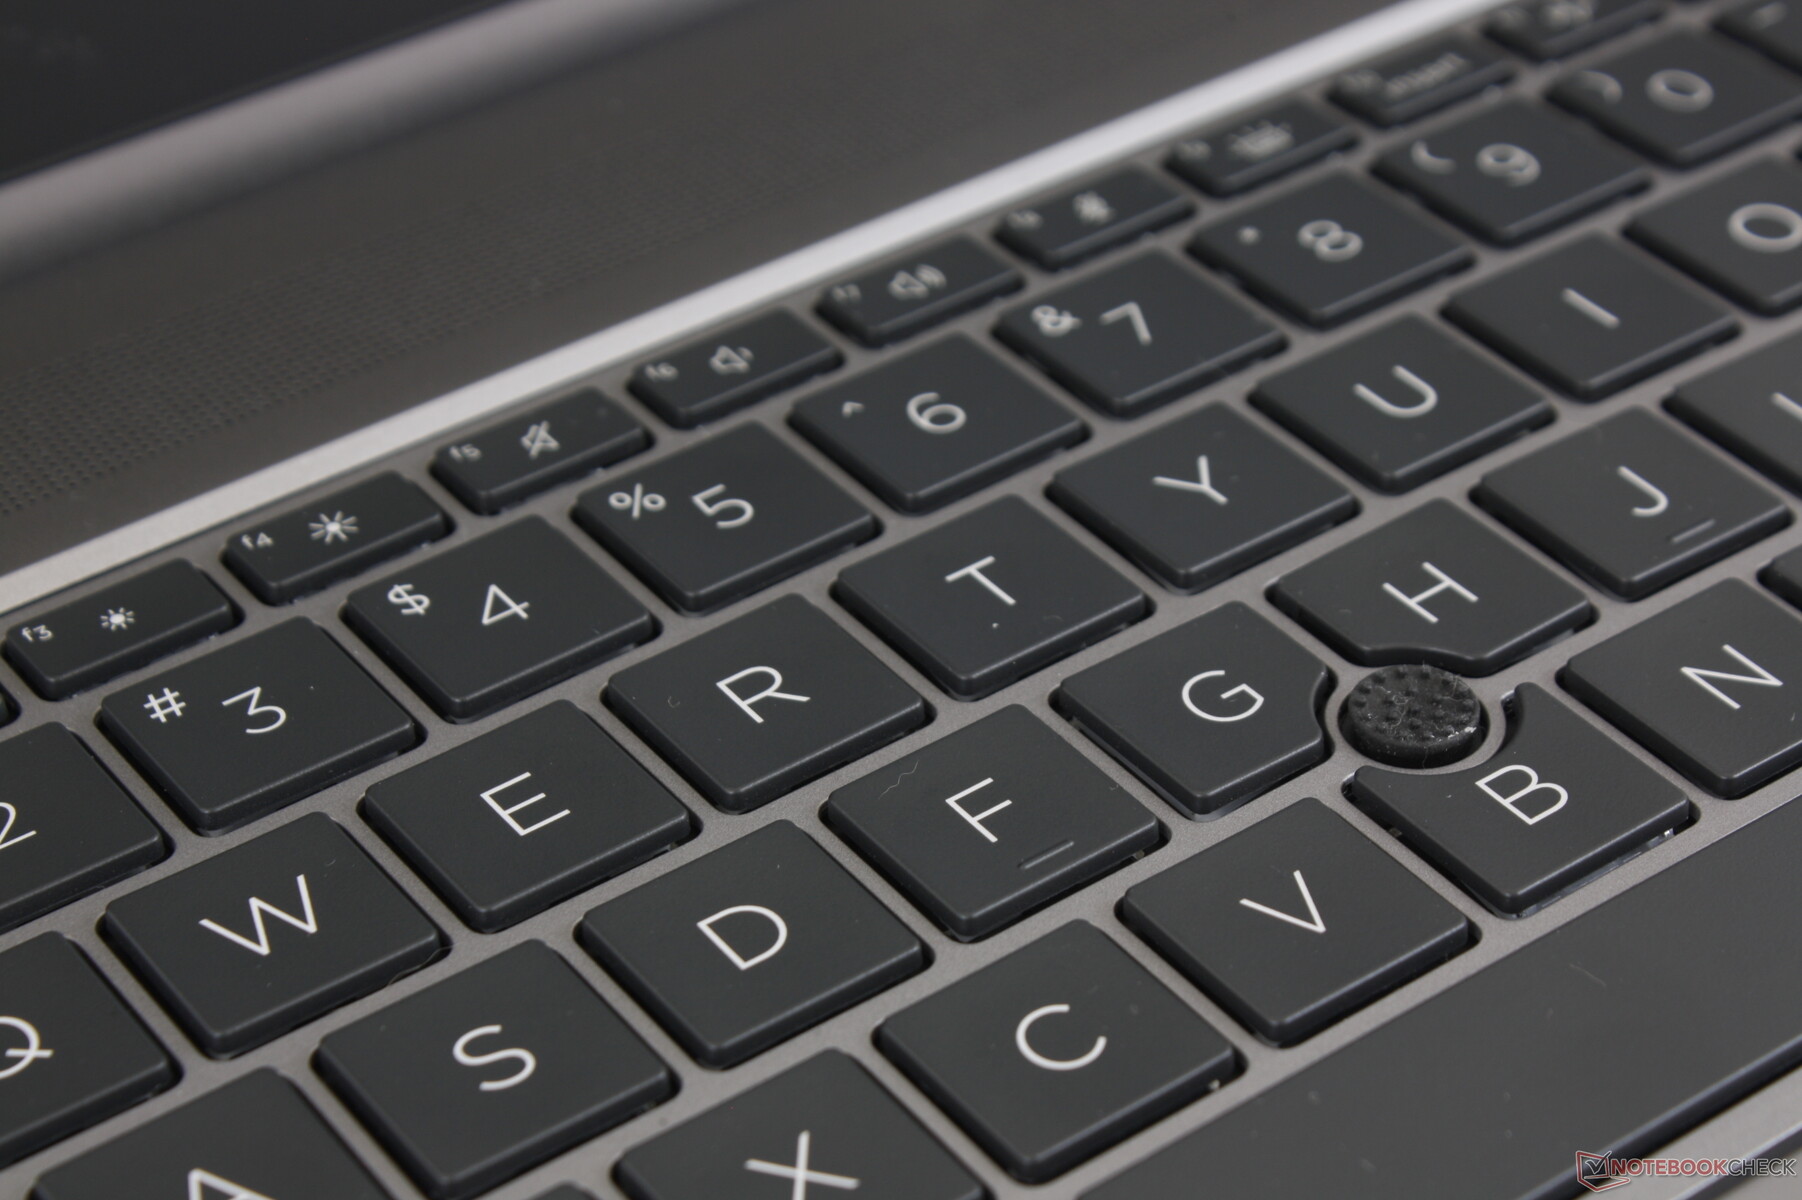
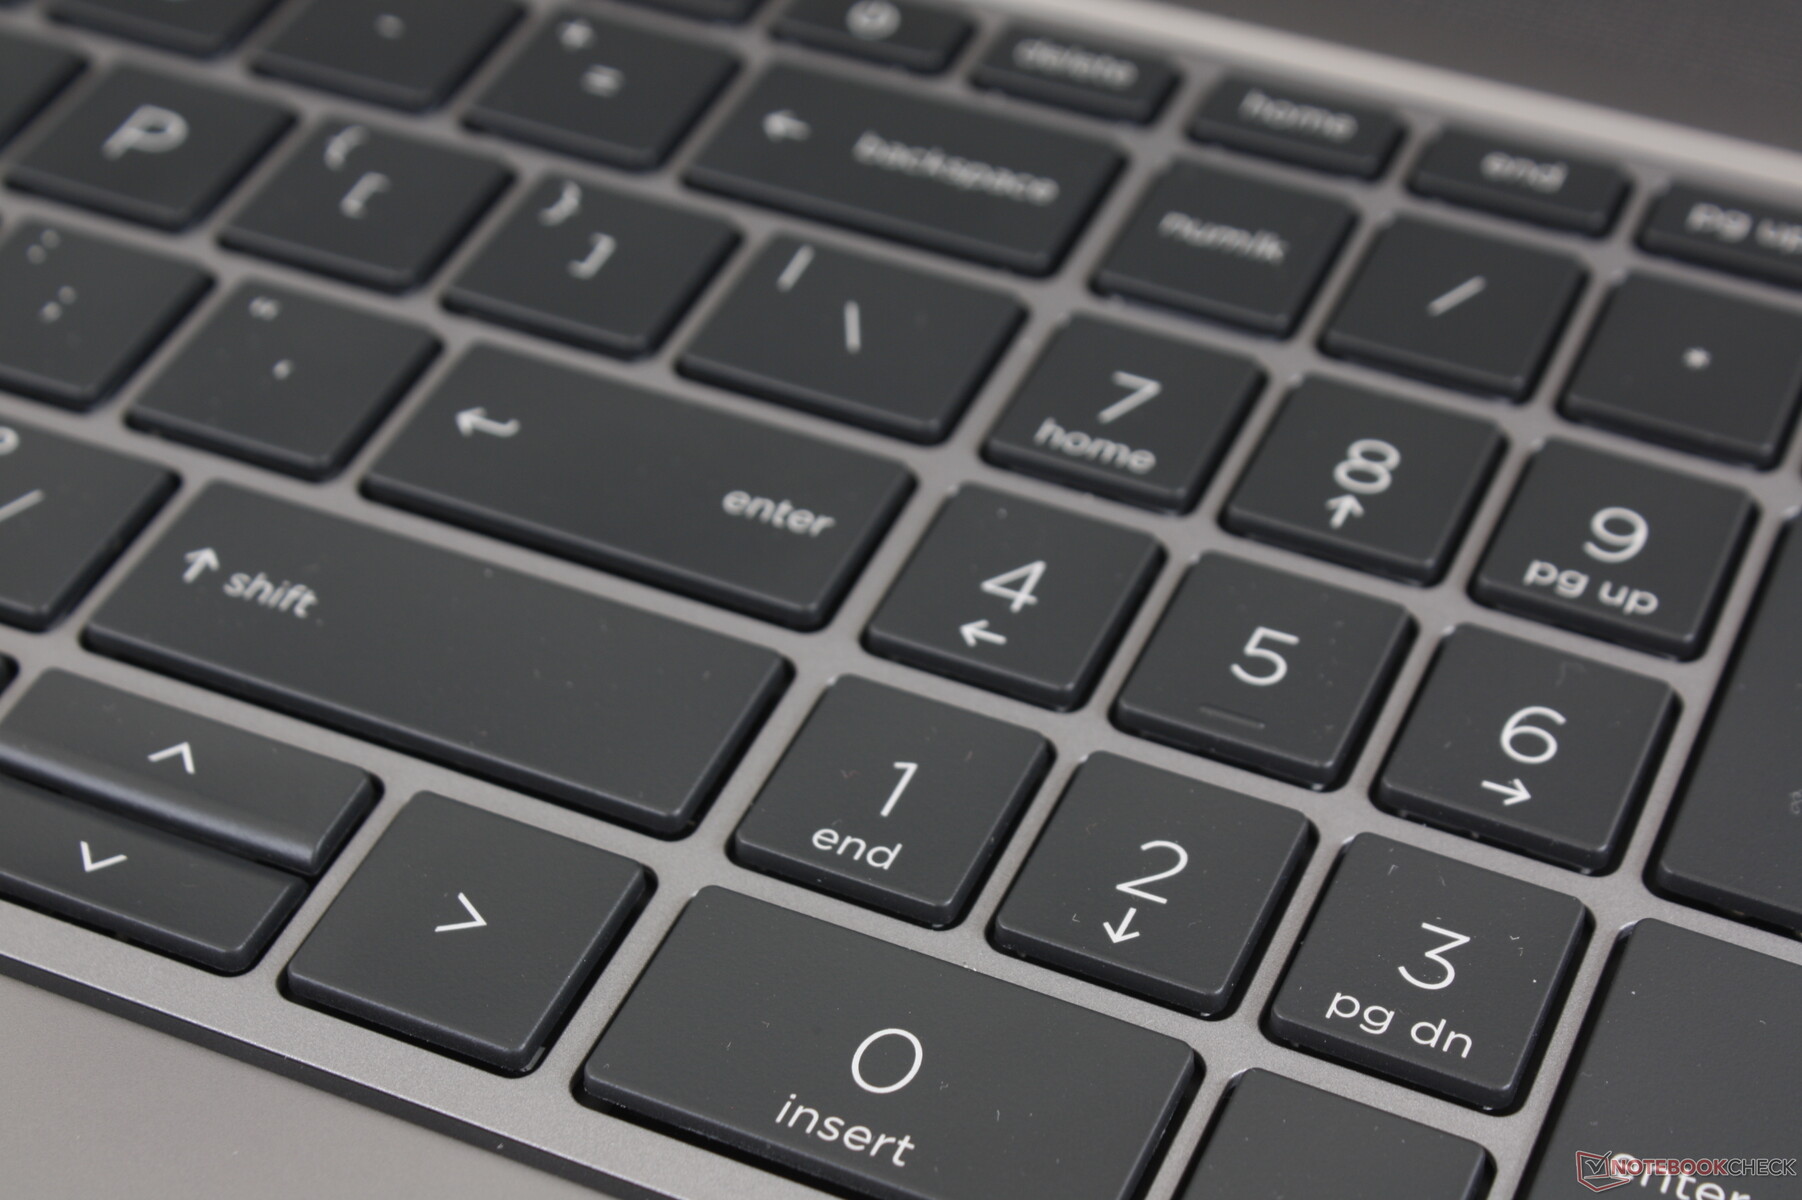
Teclado
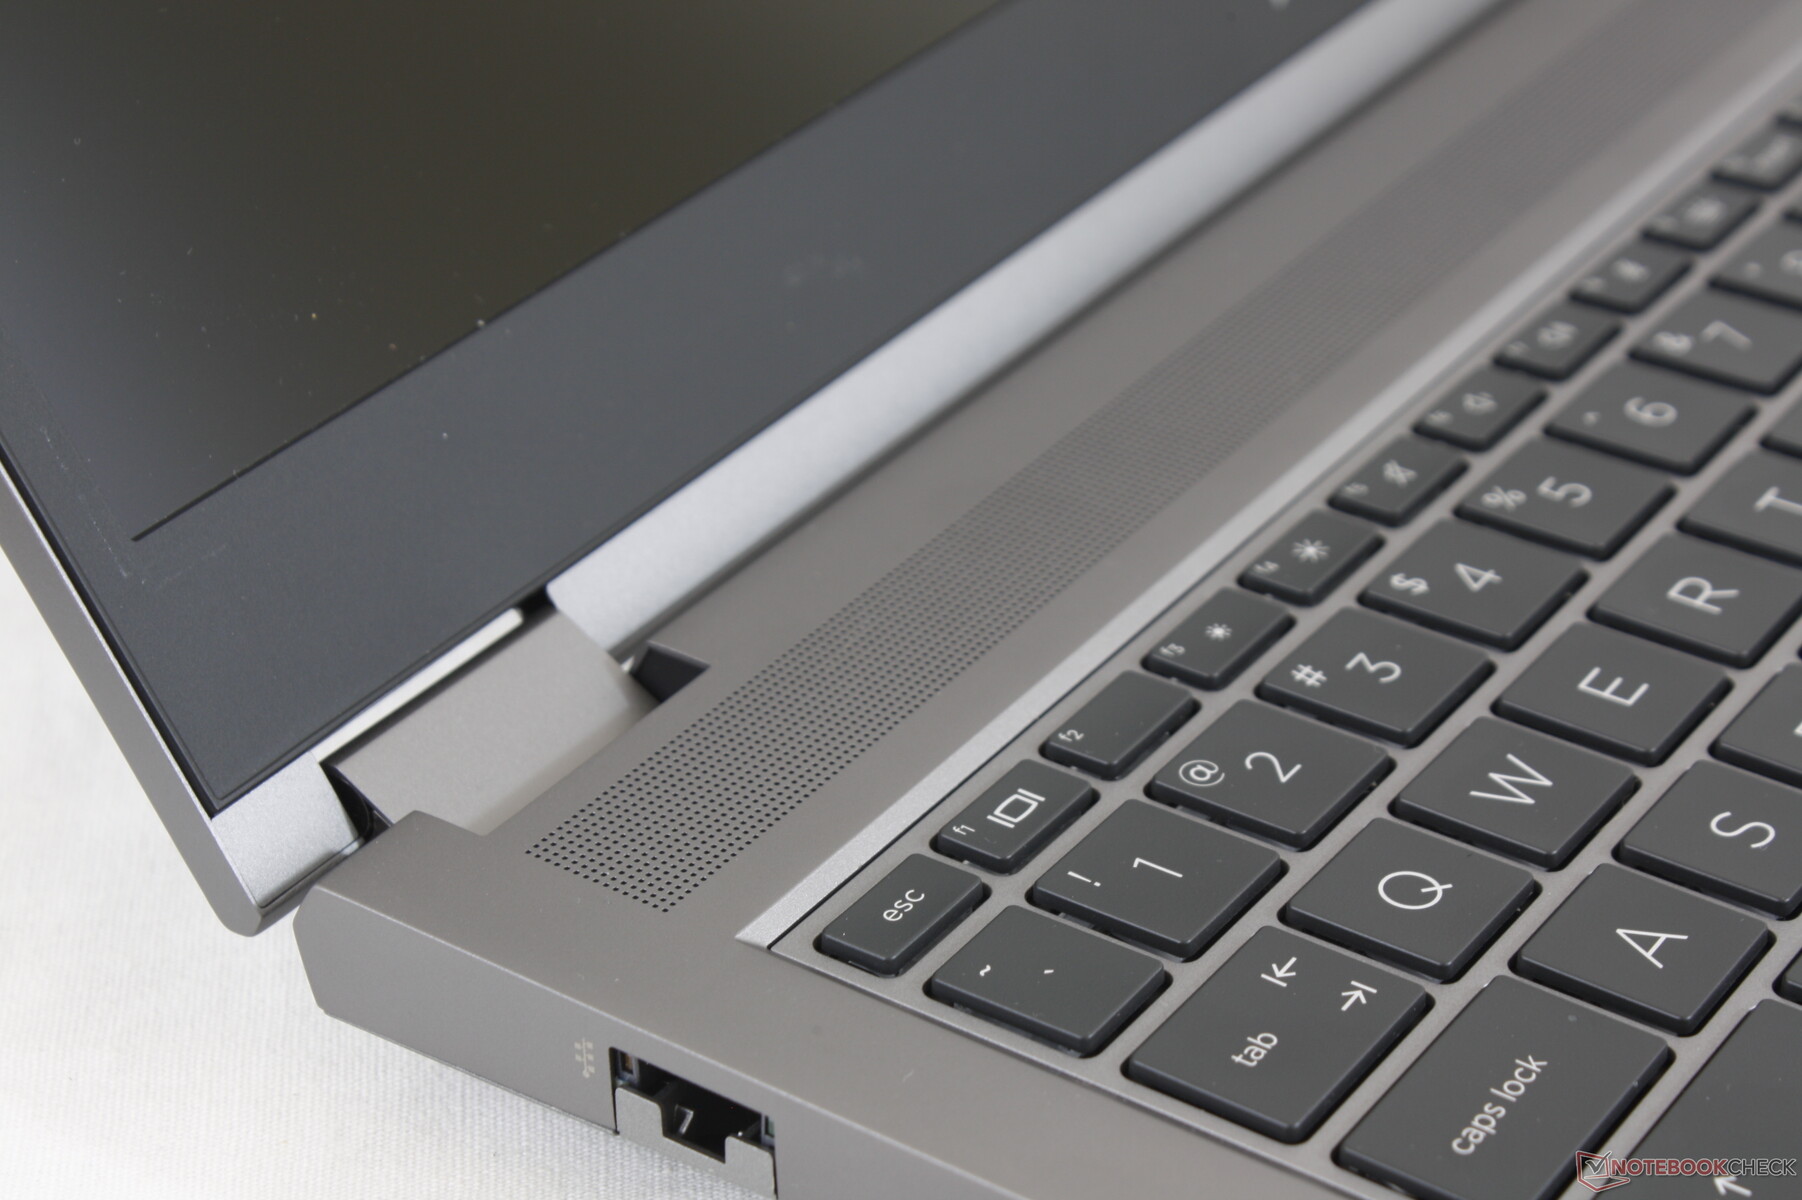
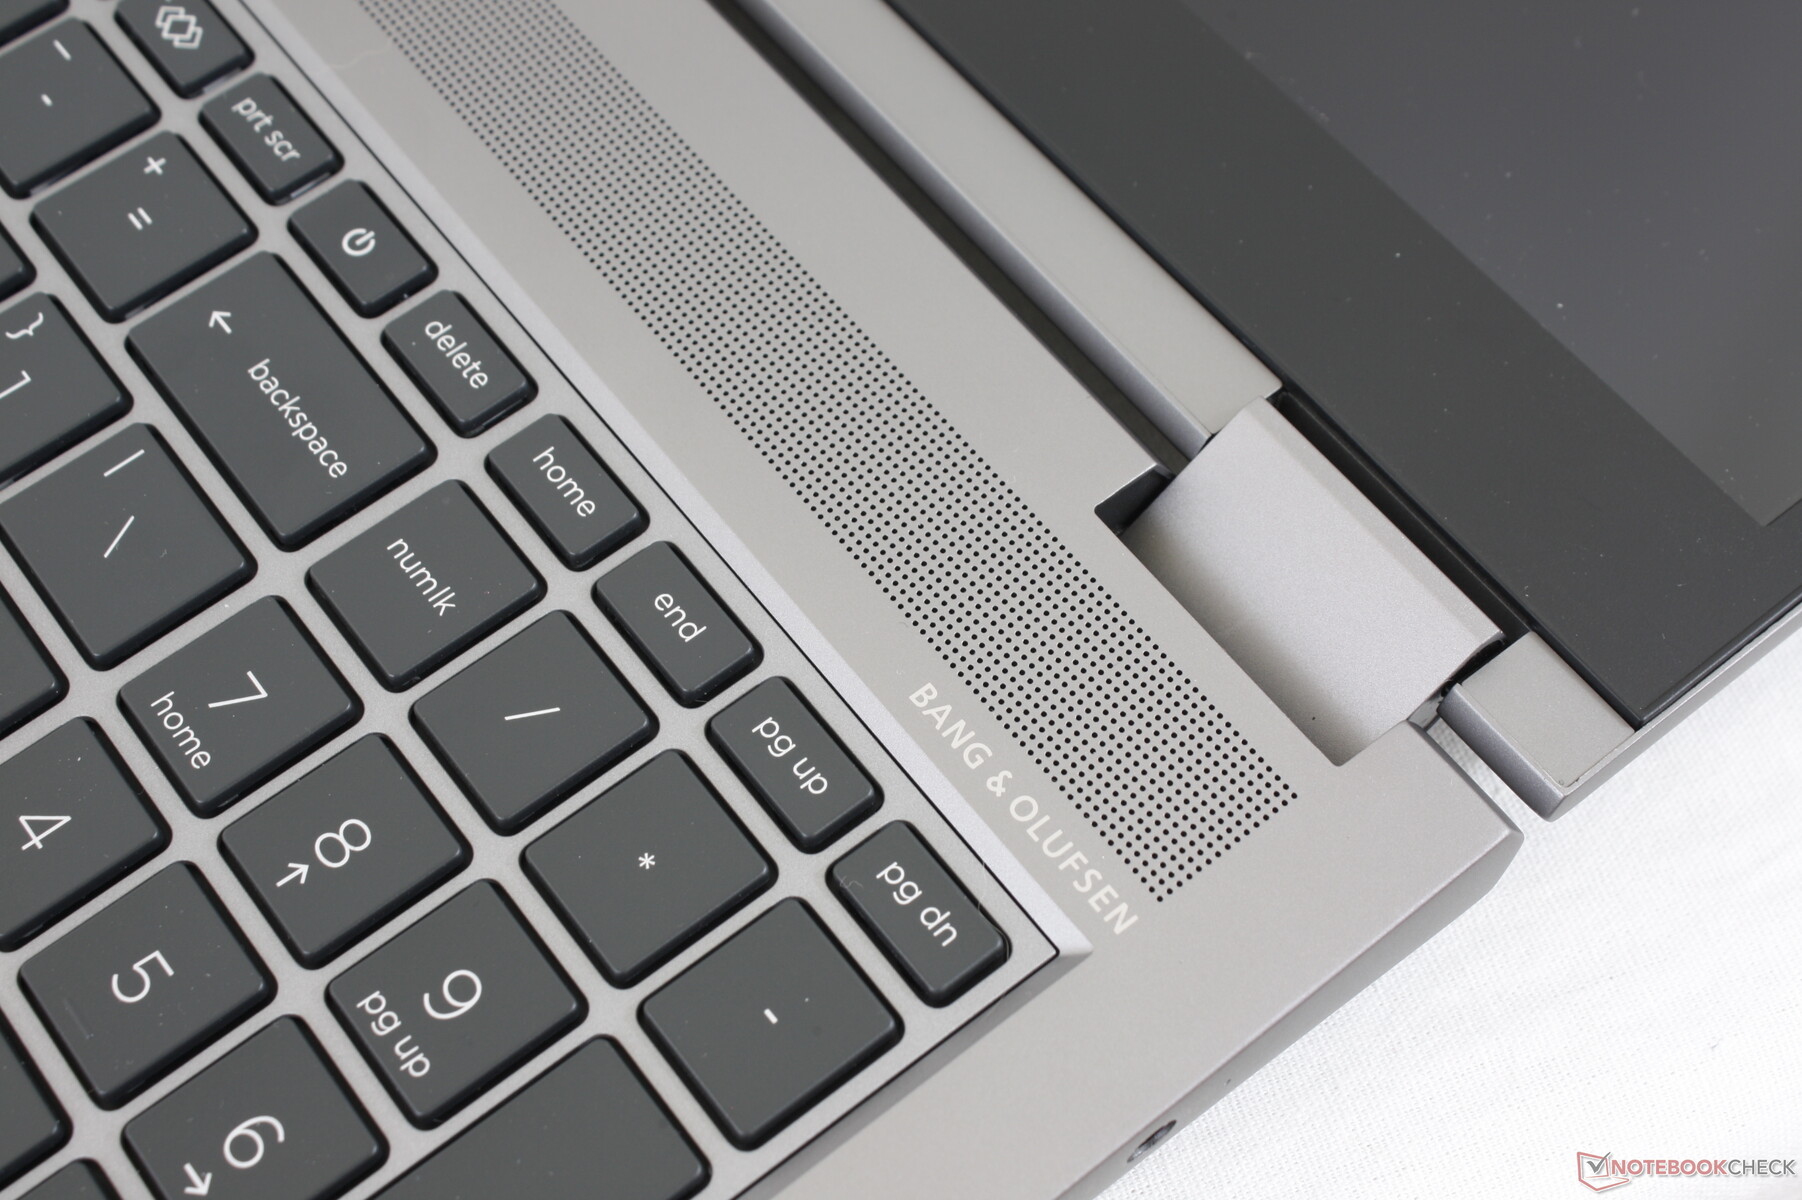
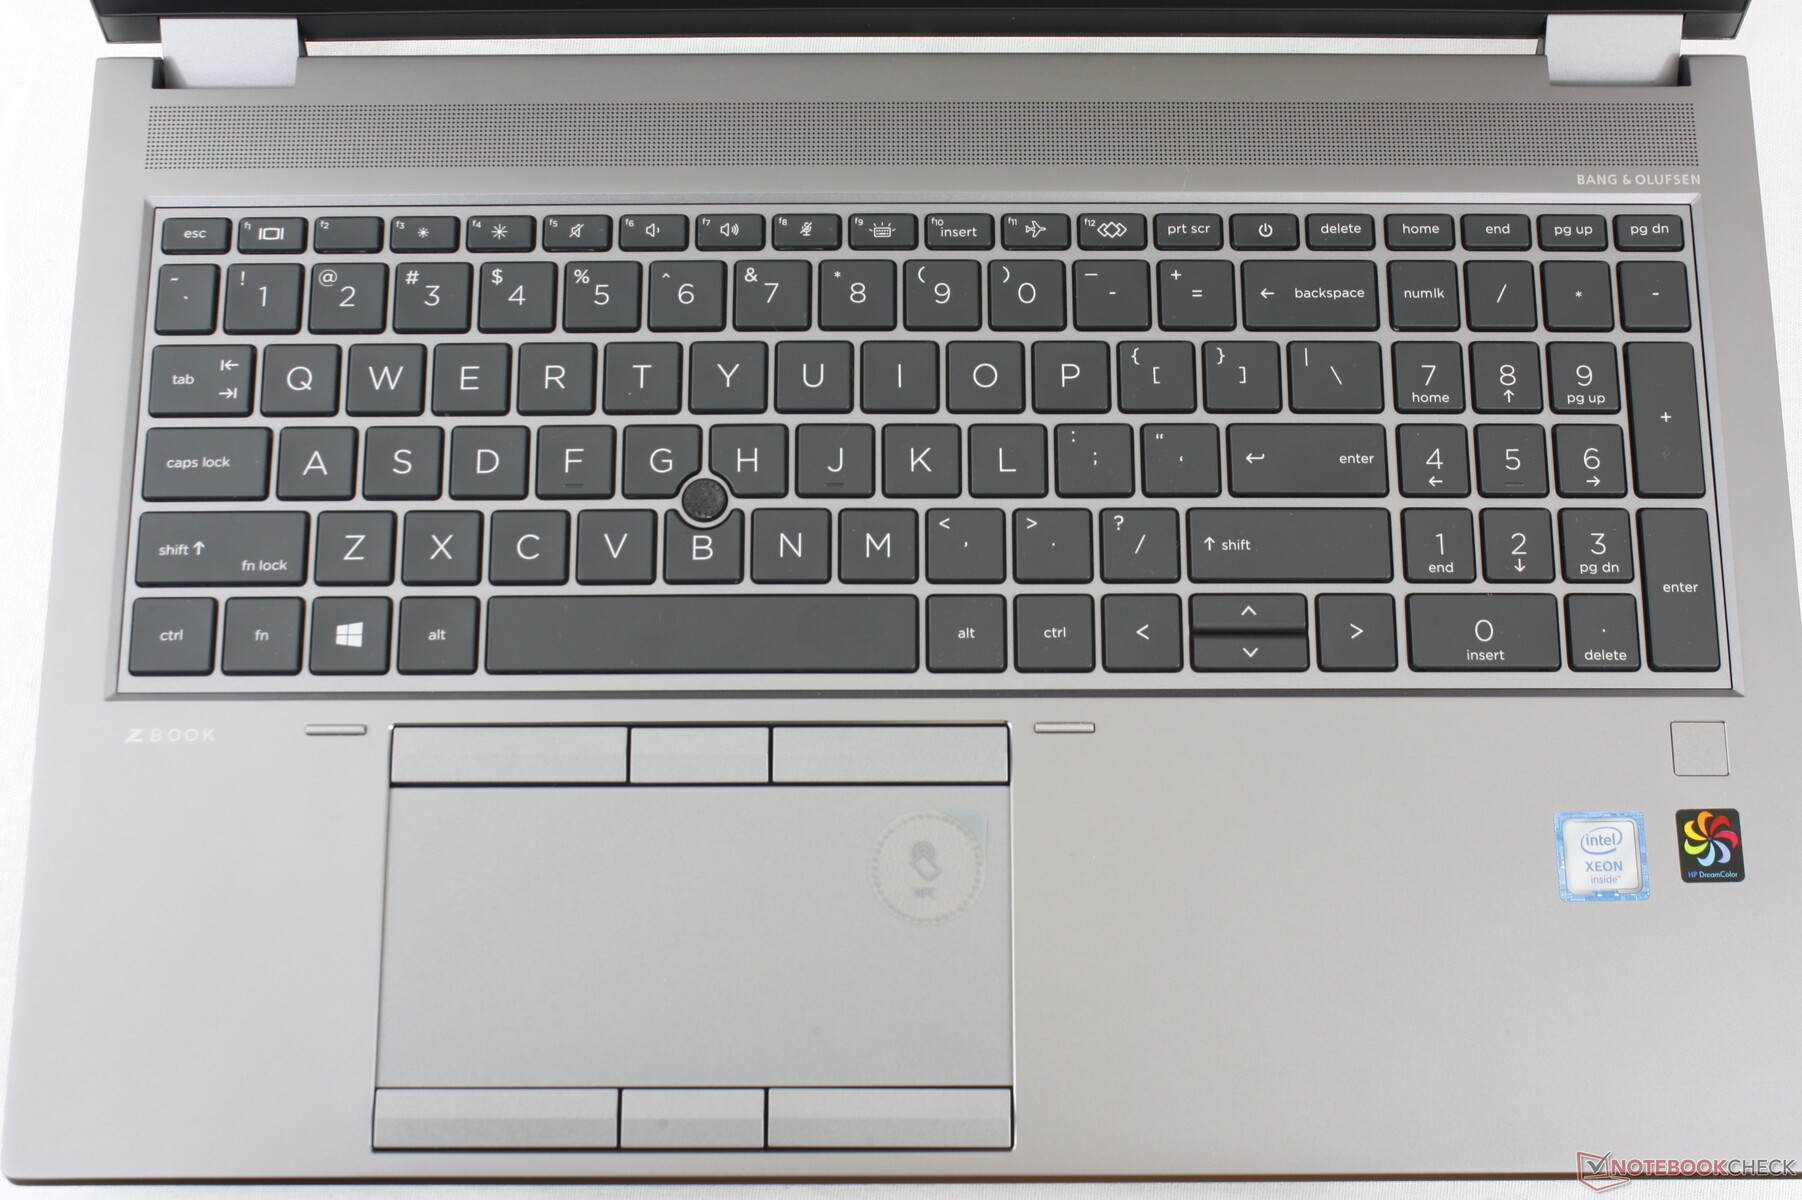
Los teclados de los portátiles HP Spectre, EliteBook y ZBook son de los mejores en sus respectivas categorías. La retroalimentación es nítida con un recorrido relativamente profundo, así que no parece que estés escribiendo en un fino Ultrabook con teclas poco profundas. El ruido también es relativamente silencioso, excepto por la tecla Space, que es más ruidosa. El hecho de que la base sea tan densa ayuda a que cada tecla se sienta uniforme de esquina a esquina.
Una nueva característica del teclado es su tecla F12 personalizable que también se puede encontrar en los últimos portátiles Envy y Spectre. Los usuarios pueden configurar la tecla para lanzar rápidamente programas, archivos, carpetas o sitios web. Sin embargo, no soporta macros, lo que creemos que es un gran descuido.
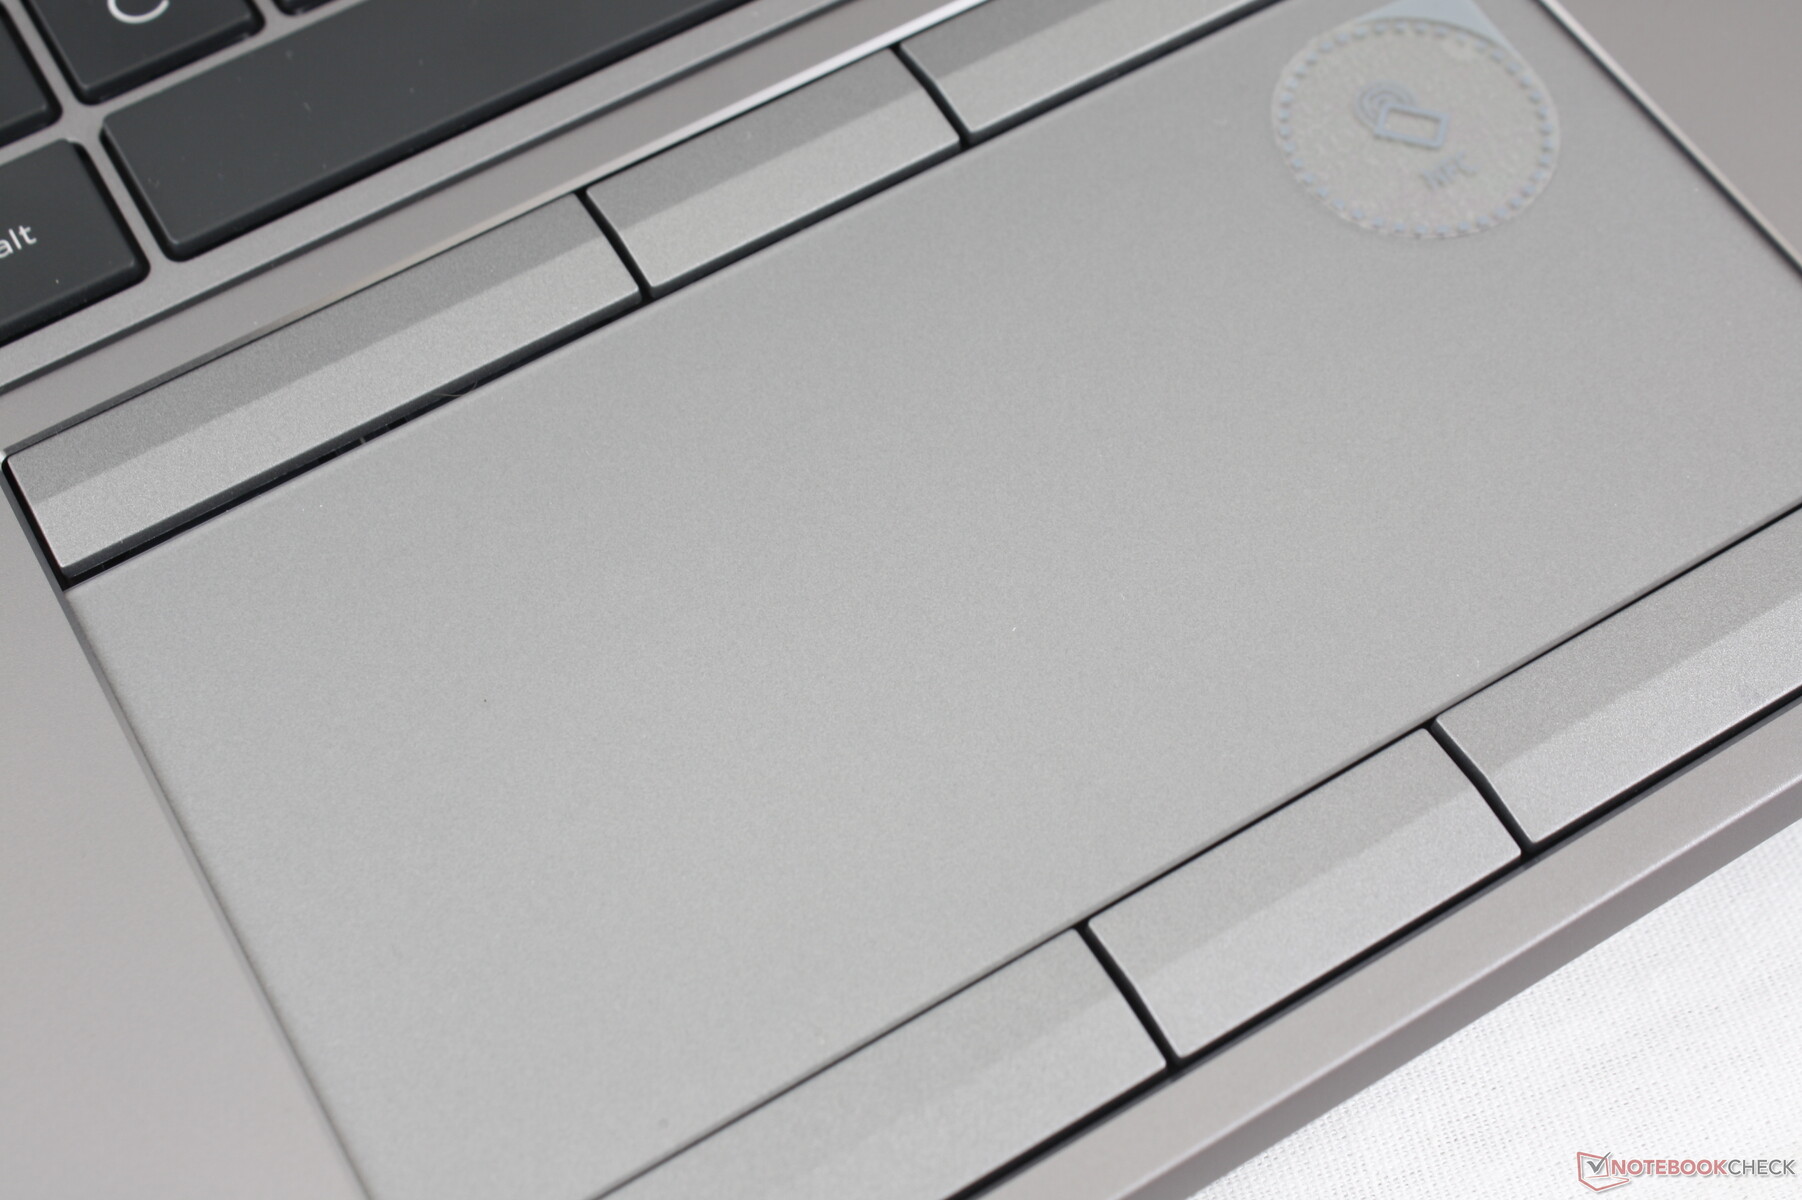
Touchpad
El panel táctil aquí es uno de los mejores que hemos usado en cualquier estación de trabajo de 15.6 pulgadas. Es firme con propiedades de deslizamiento suave y sólo se adhiere un poco a velocidades más lentas. La superficie también es mayor que en la Precision 7550 (12,5 x 6 cm vs. 10 x 6,5 cm) y ofrece más botones de ratón dedicados.
La retroalimentación de los botones dedicados también es satisfactoria con los viajes más profundos que en la mayoría de las computadoras portátiles. El estruendo es moderado pero no lo suficientemente fuerte como para ser molesto. La retroalimentación no se siente uniforme entre cada tecla, sin embargo, como la tecla inferior derecha se siente un poco más suave que el resto de las teclas.
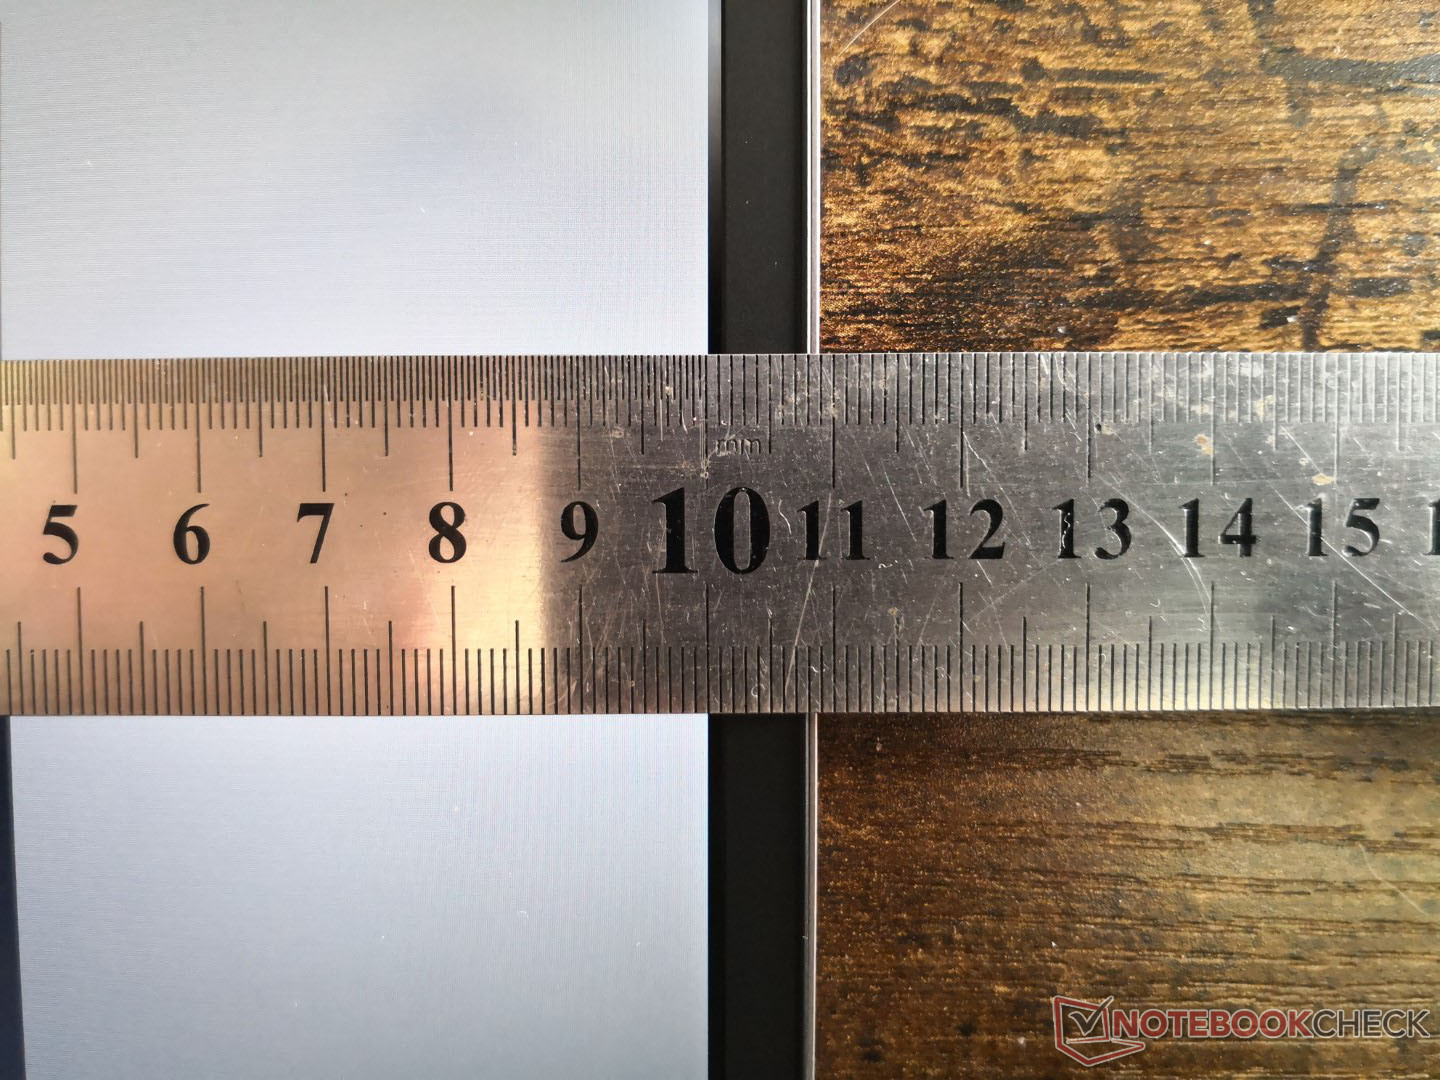
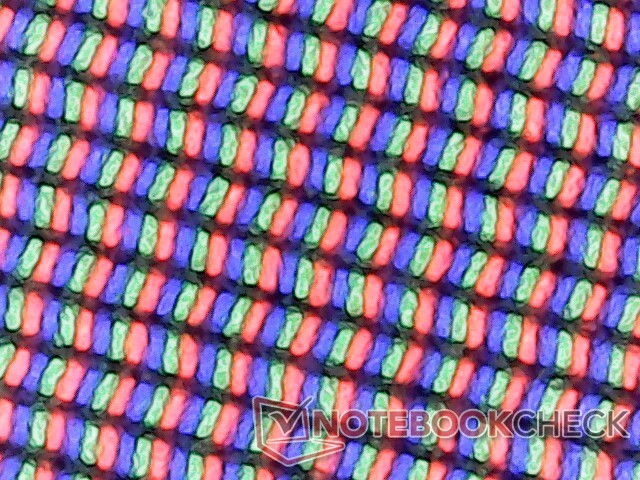
Pantalla
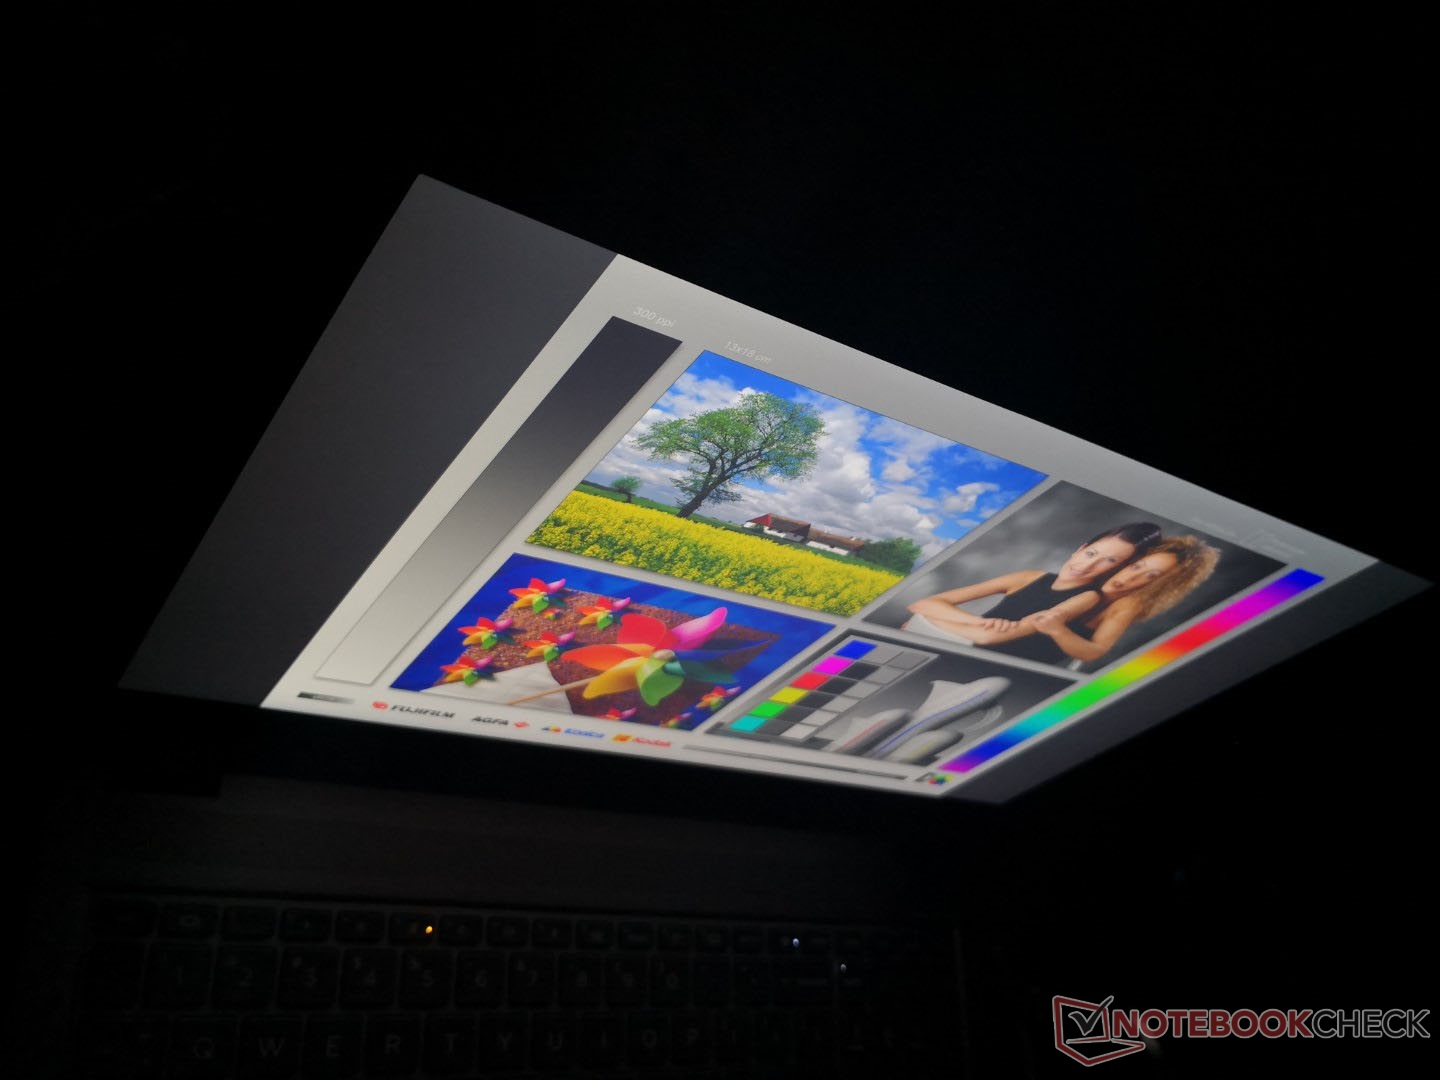
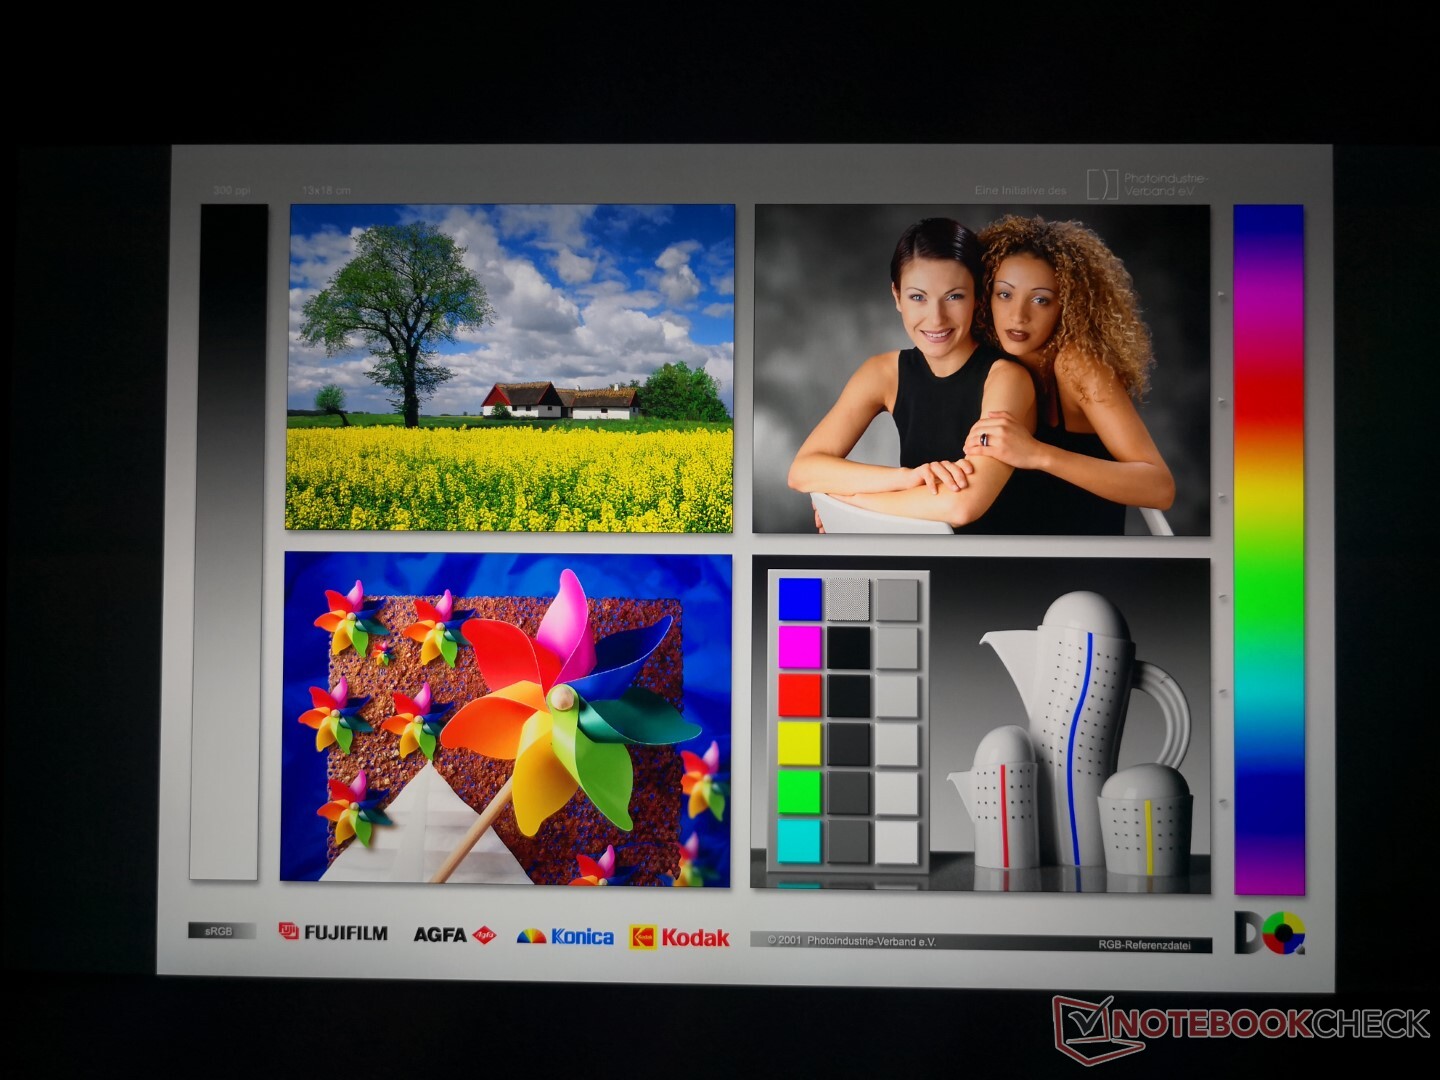
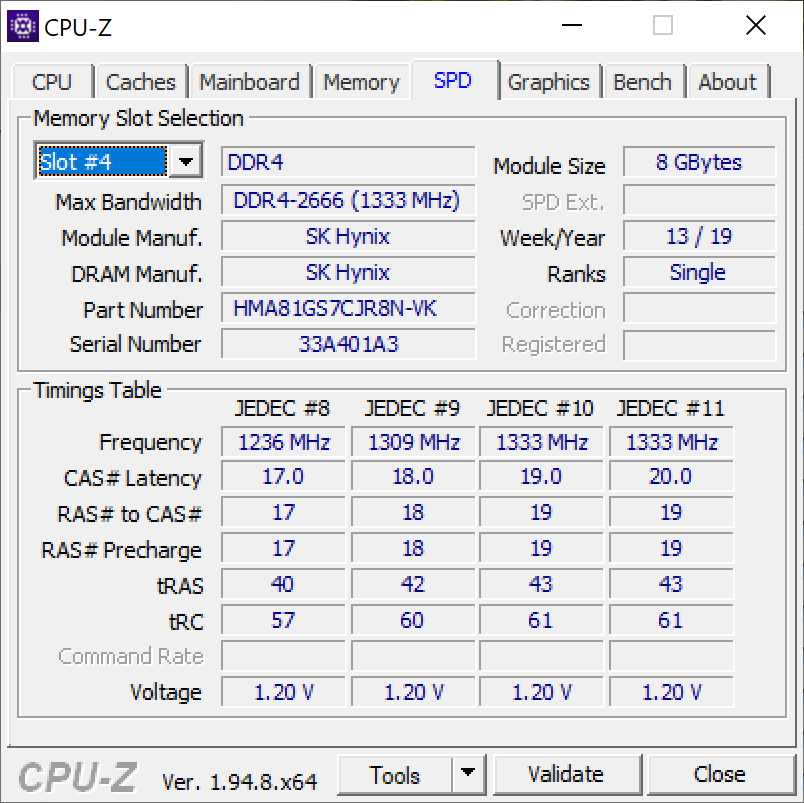
HP ofrece un diluvio de opciones de visualización - 13, de hecho - que van desde FHD a 4K, 250 nits a 1000 nits, pantalla táctil y sin pantalla táctil, y todo lo demás. Nuestras mediciones e impresiones a continuación reflejan sólo el panel sin pantalla táctil 4K UHD HDR400 DreamColor, ya que los otros paneles tendrán casi seguro atributos diferentes.
HWiNFO no puede obtener el nombre exacto del panel de nuestra unidad y sólo puede devolver el controlador LG Philips LGD0661. Sin embargo, podemos confirmar que la alta relación de contraste y la pantalla de 600 nit es más brillante que la mayoría de las otras estaciones de trabajo.
| |||||||||||||||||||||||||
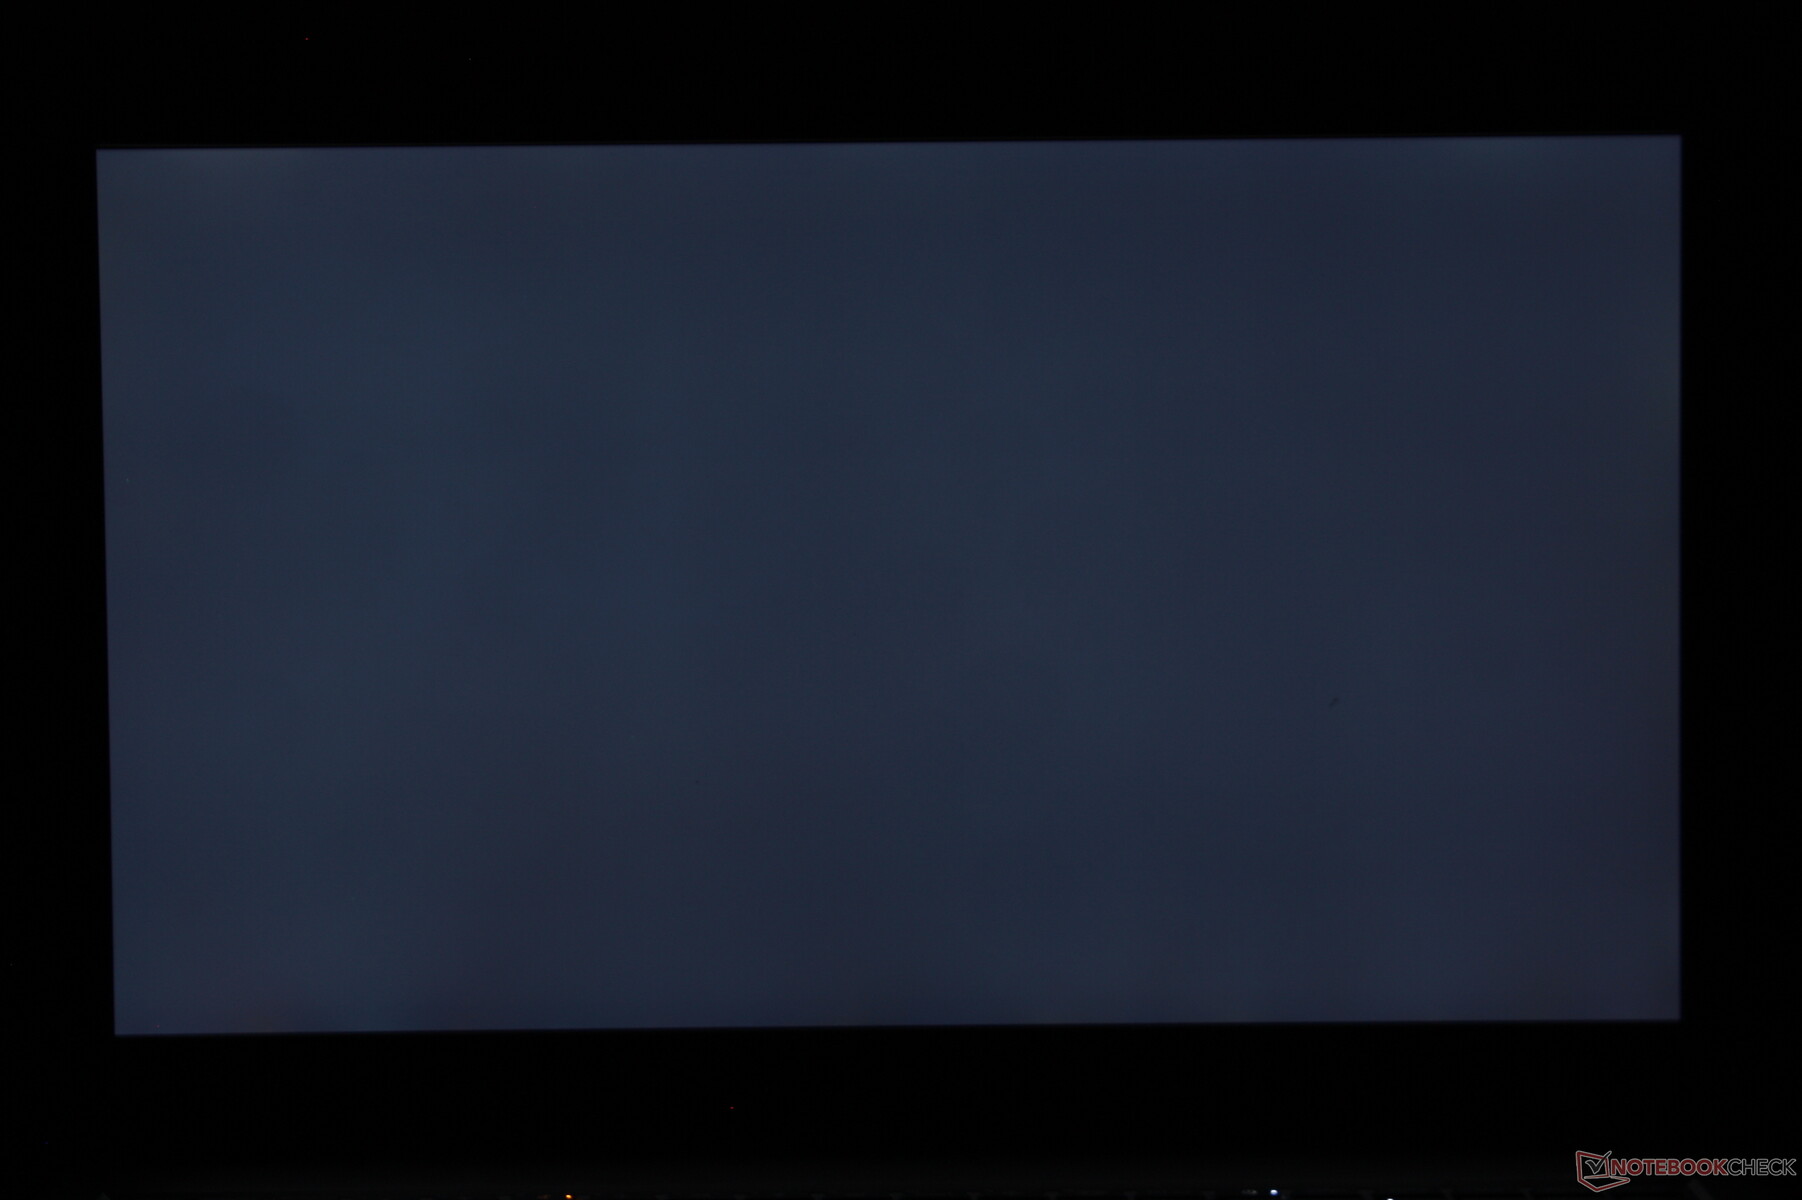
iluminación: 89 %
Brillo con batería: 672.8 cd/m²
Contraste: 1346:1 (Negro: 0.5 cd/m²)
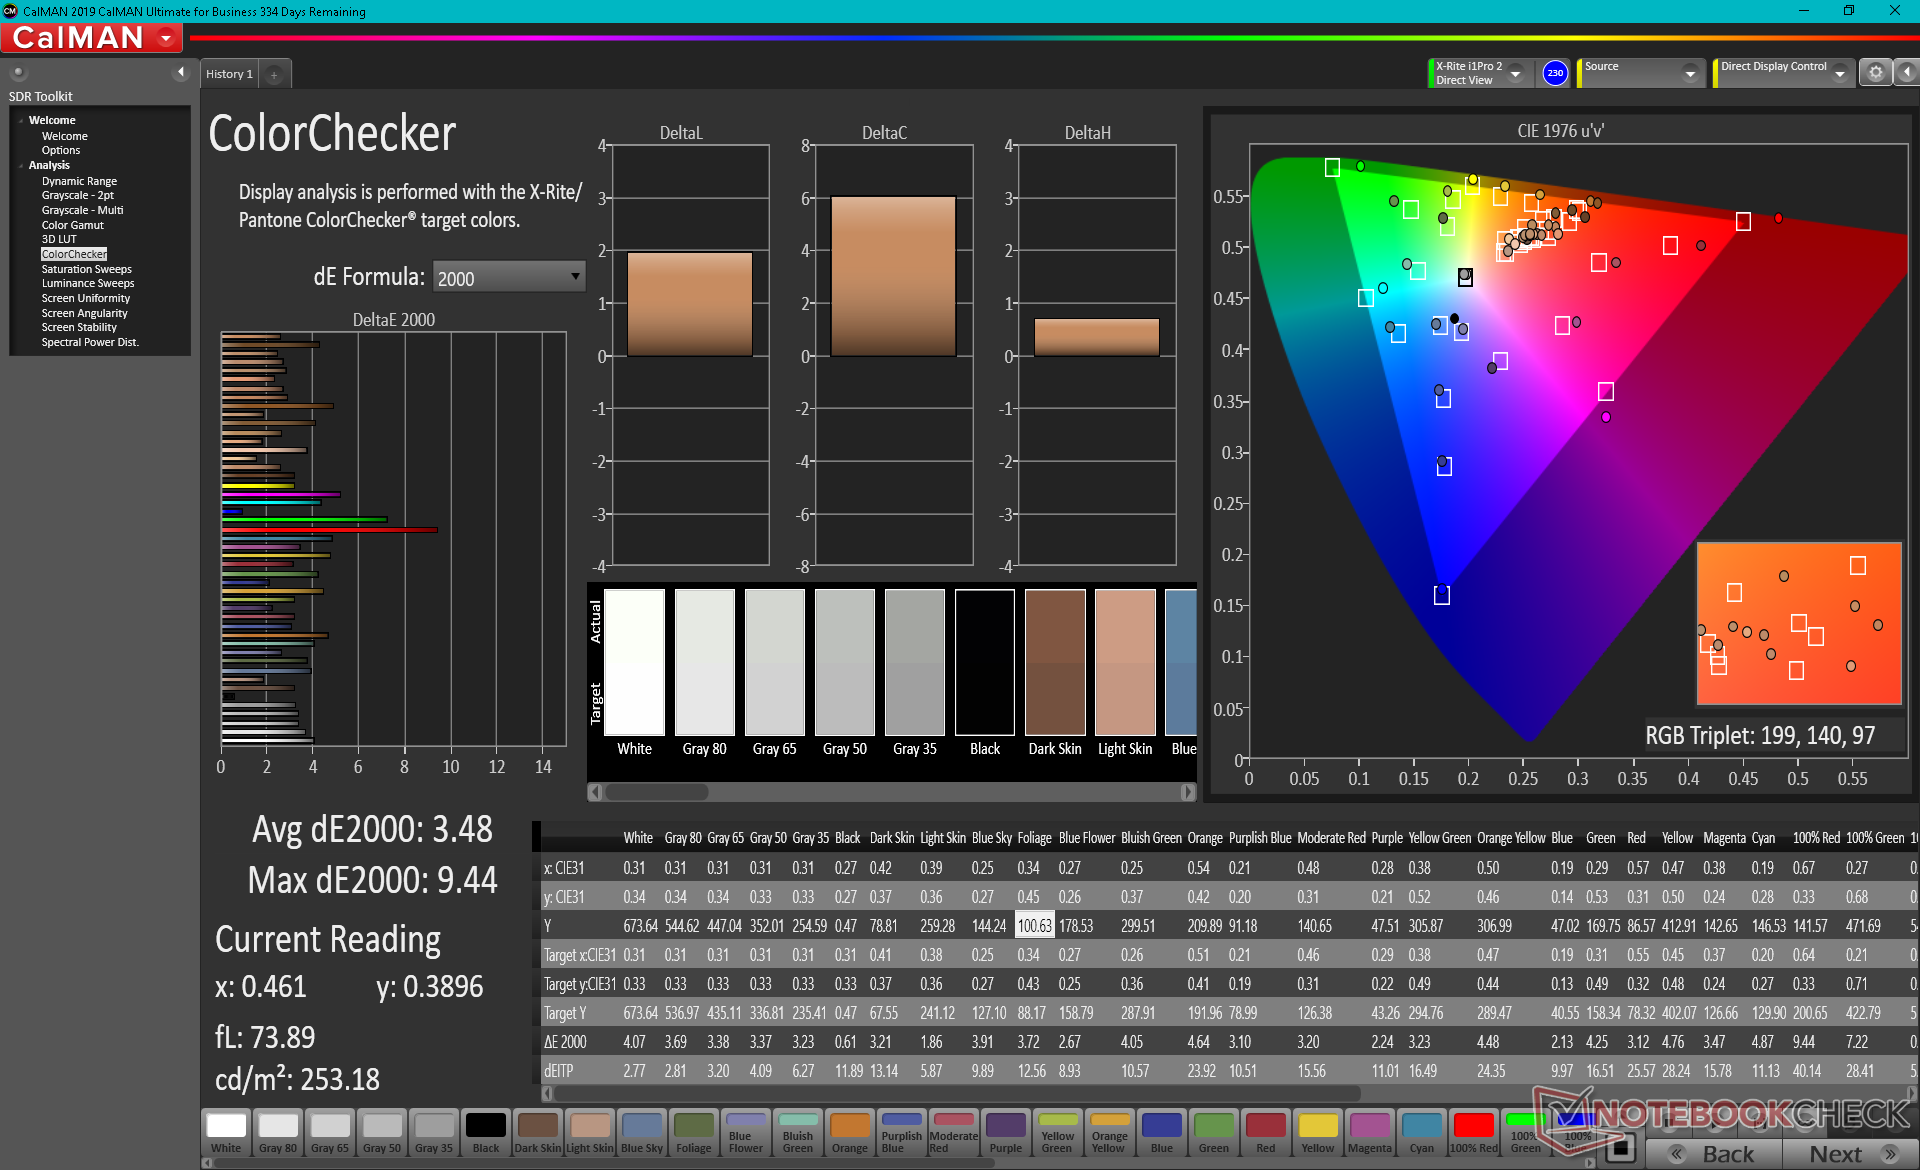
ΔE ColorChecker Calman: 3.48 | ∀{0.5-29.43 Ø4.72}
calibrated: 3.03
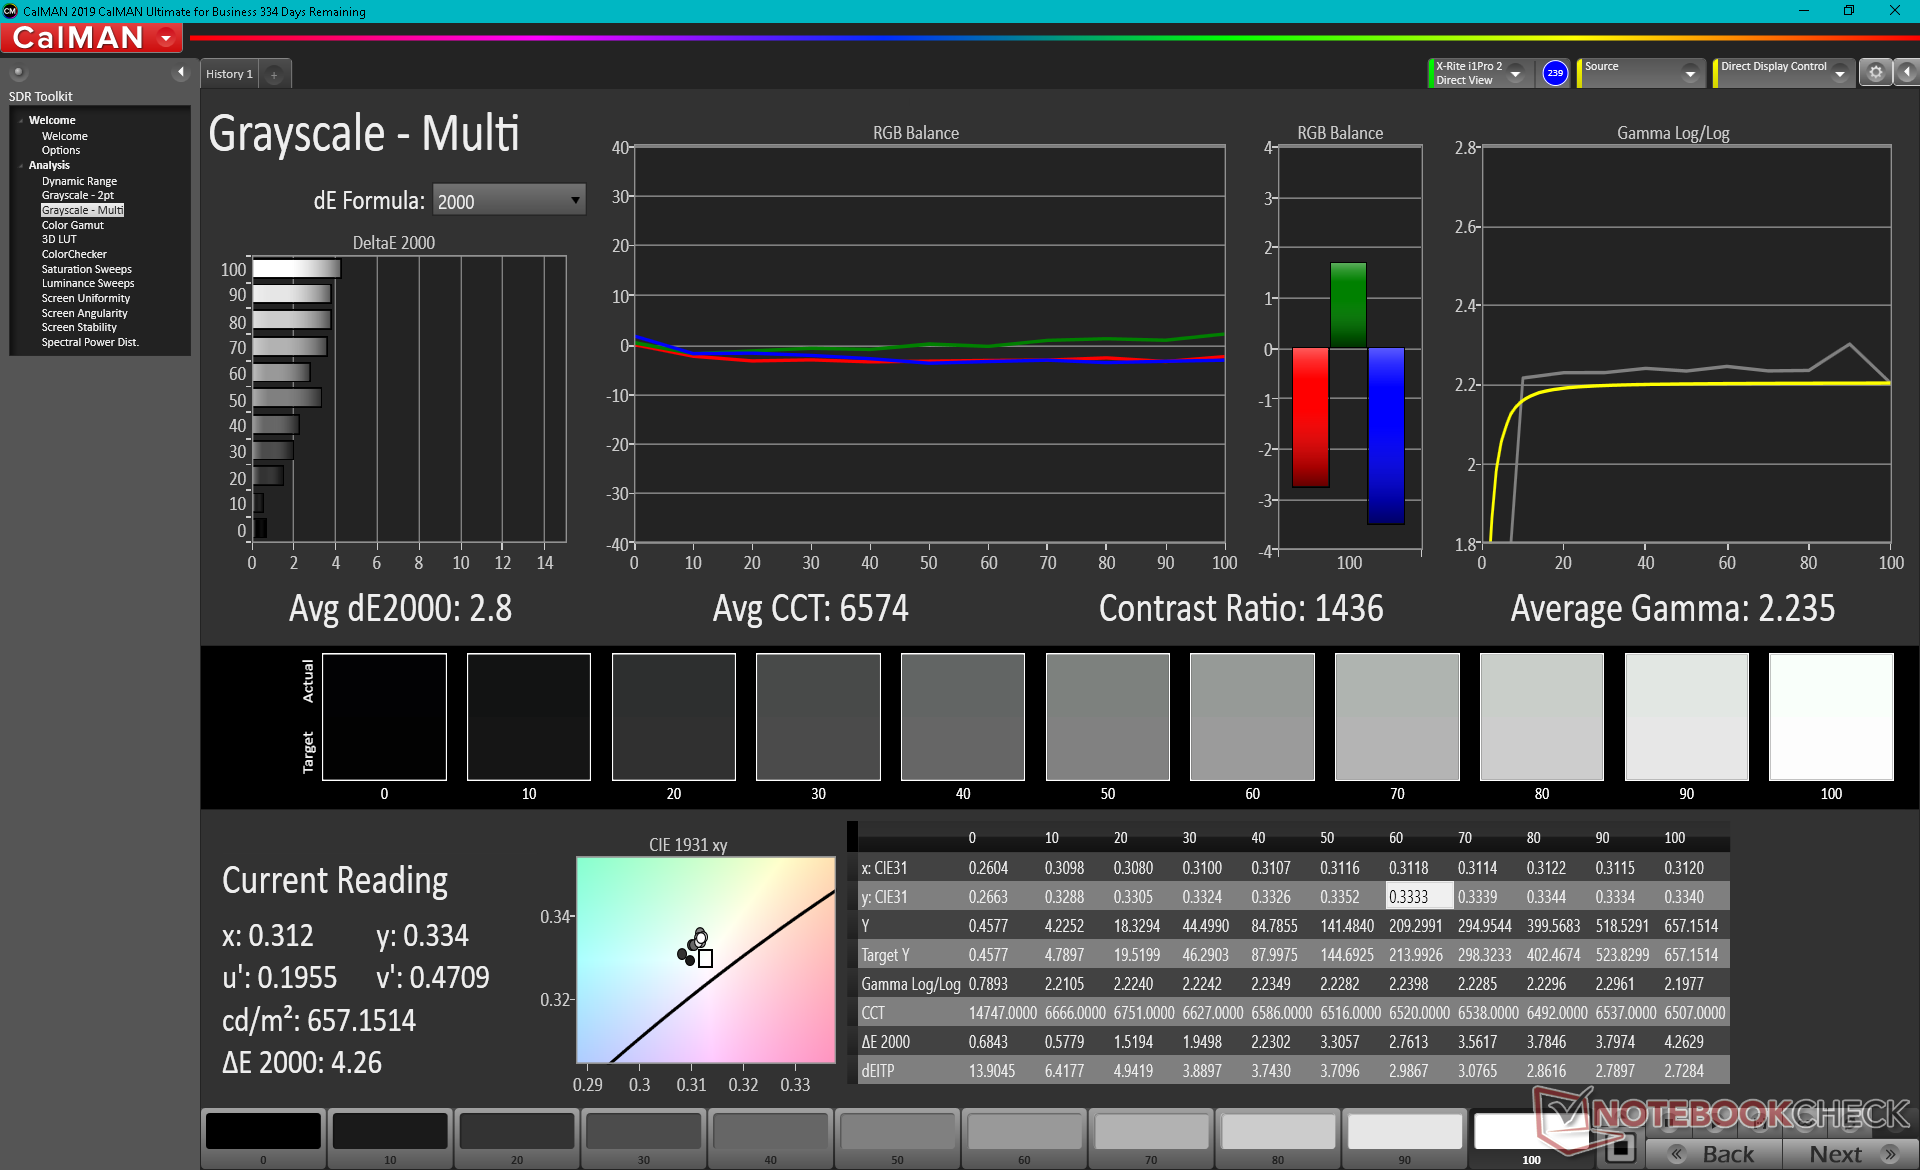
ΔE Greyscale Calman: 3.1 | ∀{0.09-98 Ø4.97}
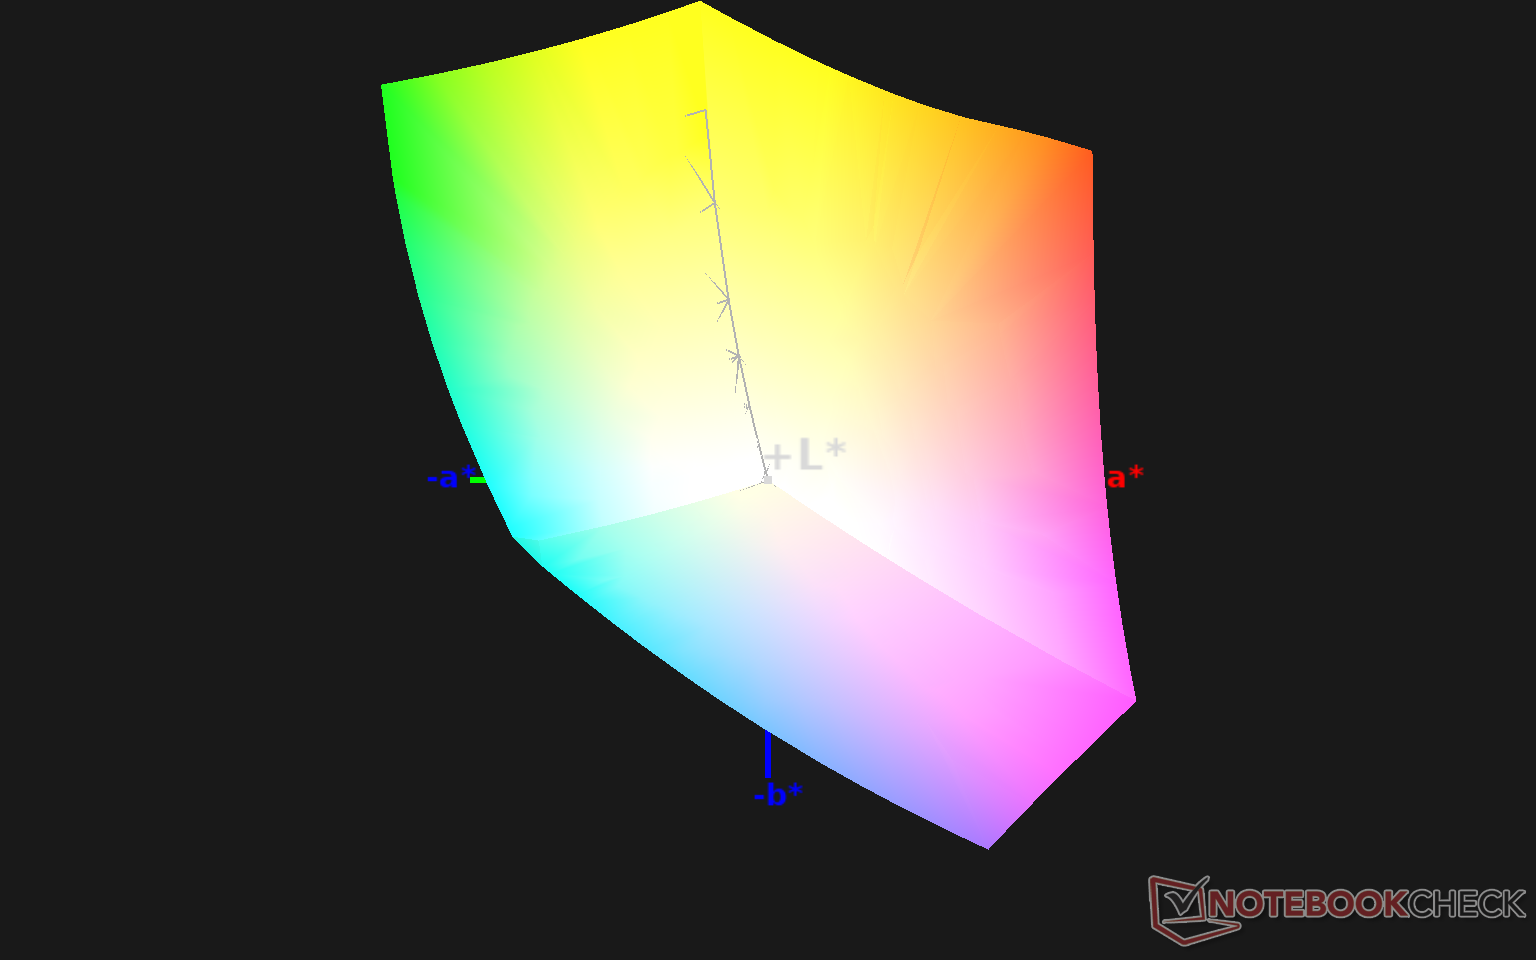
100% sRGB (Argyll 1.6.3 3D)
75.2% AdobeRGB 1998 (Argyll 1.6.3 3D)
84.5% AdobeRGB 1998 (Argyll 3D)
99.8% sRGB (Argyll 3D)
95.6% Display P3 (Argyll 3D)
Gamma: 2.04
CCT: 6380 K
| HP ZBook Fury 15 G7 LG Philips LGD0661, IPS, 15.6", 3840x2160 | Asus ProArt StudioBook Pro 15 W500G5T AU Optronics B156ZAN03.1, IPS, 15.6", 3840x2160 | MSI WS66 10TMT-207US AU Optronics B156HAB03.0, IPS, 15.6", 1920x1080 | Dell Precision 7550 AU Optronics B156ZAN, IPS, 15.6", 3840x2160 | Razer Blade 15 Studio Edition 2020 Samsung SDCA029, OLED, 15.6", 3840x2160 | Lenovo ThinkPad P1 2019-20QT000RGE N156HCE-GN1, IPS LED, 15.6", 1920x1080 | |
|---|---|---|---|---|---|---|
| Display | -1% | -24% | 0% | 6% | -23% | |
| Display P3 Coverage (%) | 95.6 | 82.1 -14% | 62.8 -34% | 82.1 -14% | 99.9 4% | 62.4 -35% |
| sRGB Coverage (%) | 99.8 | 97.6 -2% | 86.9 -13% | 99.6 0% | 100 0% | 91.5 -8% |
| AdobeRGB 1998 Coverage (%) | 84.5 | 95 12% | 63.6 -25% | 96.8 15% | 97.3 15% | 63.4 -25% |
| Response Times | -1% | 20% | 8% | 91% | 50% | |
| Response Time Grey 50% / Grey 80% * (ms) | 56 ? | 58 ? -4% | 44.8 ? 20% | 51.2 ? 9% | 4 ? 93% | 34.4 ? 39% |
| Response Time Black / White * (ms) | 36 ? | 35 ? 3% | 28.8 ? 20% | 34 ? 6% | 4 ? 89% | 14 ? 61% |
| PWM Frequency (Hz) | 26040 ? | |||||
| Screen | 1% | -16% | -19% | 126% | -4% | |
| Brightness middle (cd/m²) | 672.8 | 344 -49% | 374.5 -44% | 473.5 -30% | 380 -44% | 542 -19% |
| Brightness (cd/m²) | 674 | 335 -50% | 363 -46% | 461 -32% | 388 -42% | 528 -22% |
| Brightness Distribution (%) | 89 | 93 4% | 91 2% | 90 1% | 93 4% | 84 -6% |
| Black Level * (cd/m²) | 0.5 | 0.37 26% | 0.42 16% | 0.55 -10% | 0.018 96% | 0.41 18% |
| Contrast (:1) | 1346 | 930 -31% | 892 -34% | 861 -36% | 21111 1468% | 1322 -2% |
| Colorchecker dE 2000 * | 3.48 | 1.76 49% | 4.05 -16% | 4.8 -38% | 5.47 -57% | 3.5 -1% |
| Colorchecker dE 2000 max. * | 9.44 | 4.31 54% | 8.17 13% | 8.73 8% | 8.19 13% | 7.8 17% |
| Colorchecker dE 2000 calibrated * | 3.03 | 4.36 -44% | 3.08 -2% | 3.04 -0% | 1.3 57% | |
| Greyscale dE 2000 * | 3.1 | 3.12 -1% | 2.6 16% | 5.6 -81% | 5.3 -71% | 4.8 -55% |
| Gamma | 2.04 108% | 2.2 100% | 2.21 100% | 2.34 94% | 2.15 102% | 2.33 94% |
| CCT | 6380 102% | 6563 99% | 7027 93% | 7549 86% | 6128 106% | 7690 85% |
| Color Space (Percent of AdobeRGB 1998) (%) | 75.2 | 85 13% | 56.4 -25% | 86.4 15% | 86 14% | 58.8 -22% |
| Color Space (Percent of sRGB) (%) | 100 | 98 -2% | 86.3 -14% | 99.7 0% | 100 0% | 91.1 -9% |
| Media total (Programa/Opciones) | -0% /
1% | -7% /
-13% | -4% /
-12% | 74% /
99% | 8% /
-1% |
* ... más pequeño es mejor
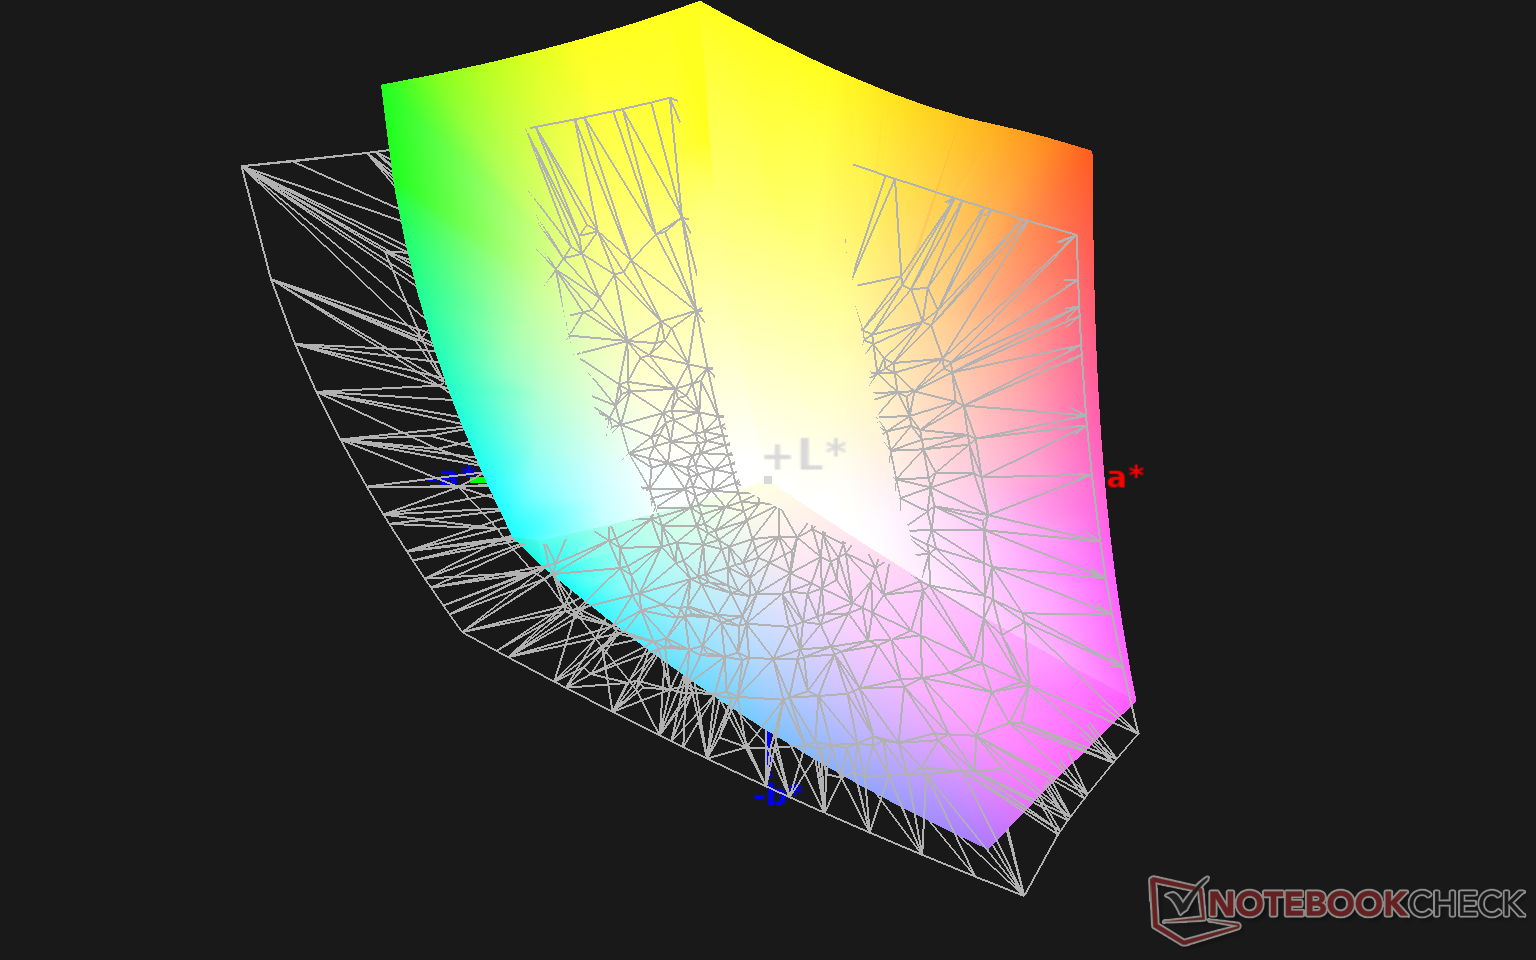
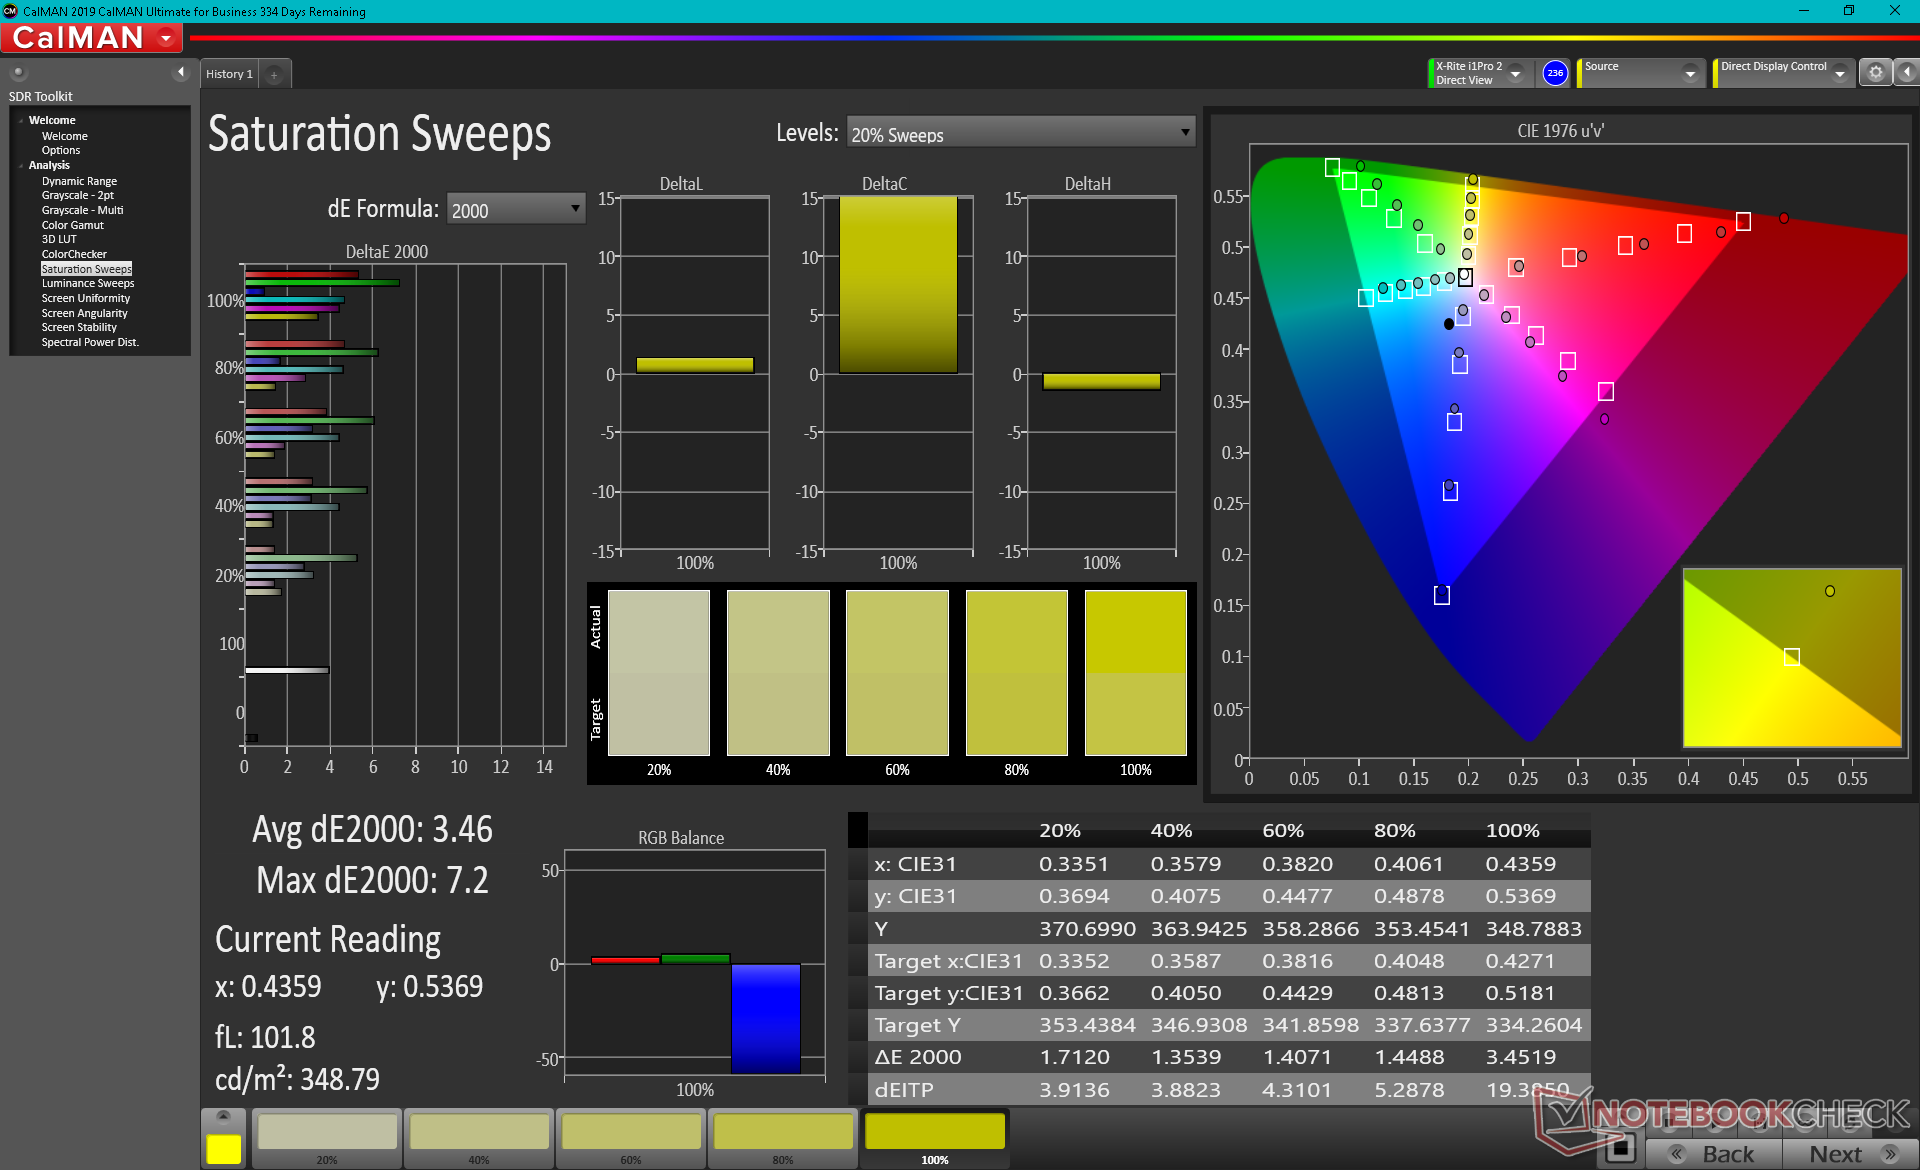
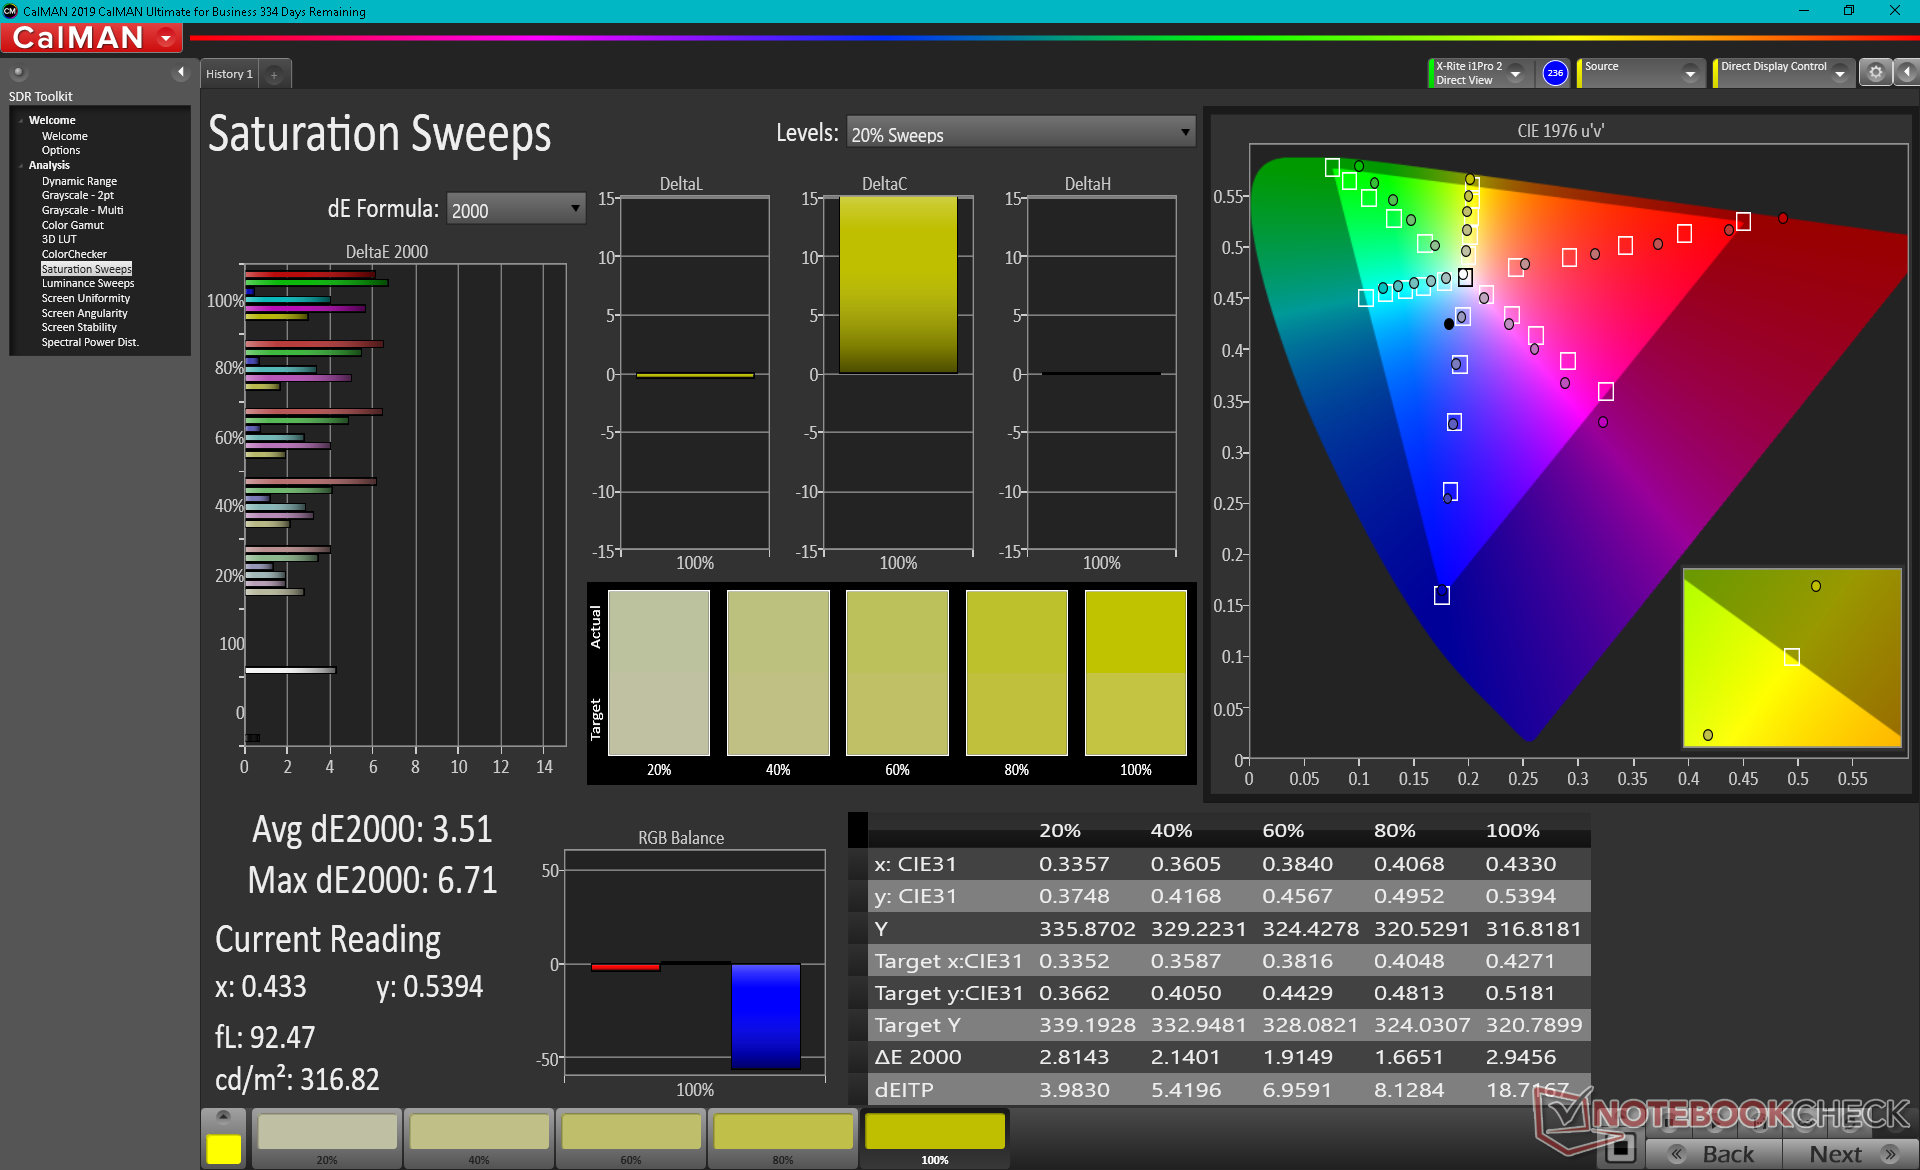
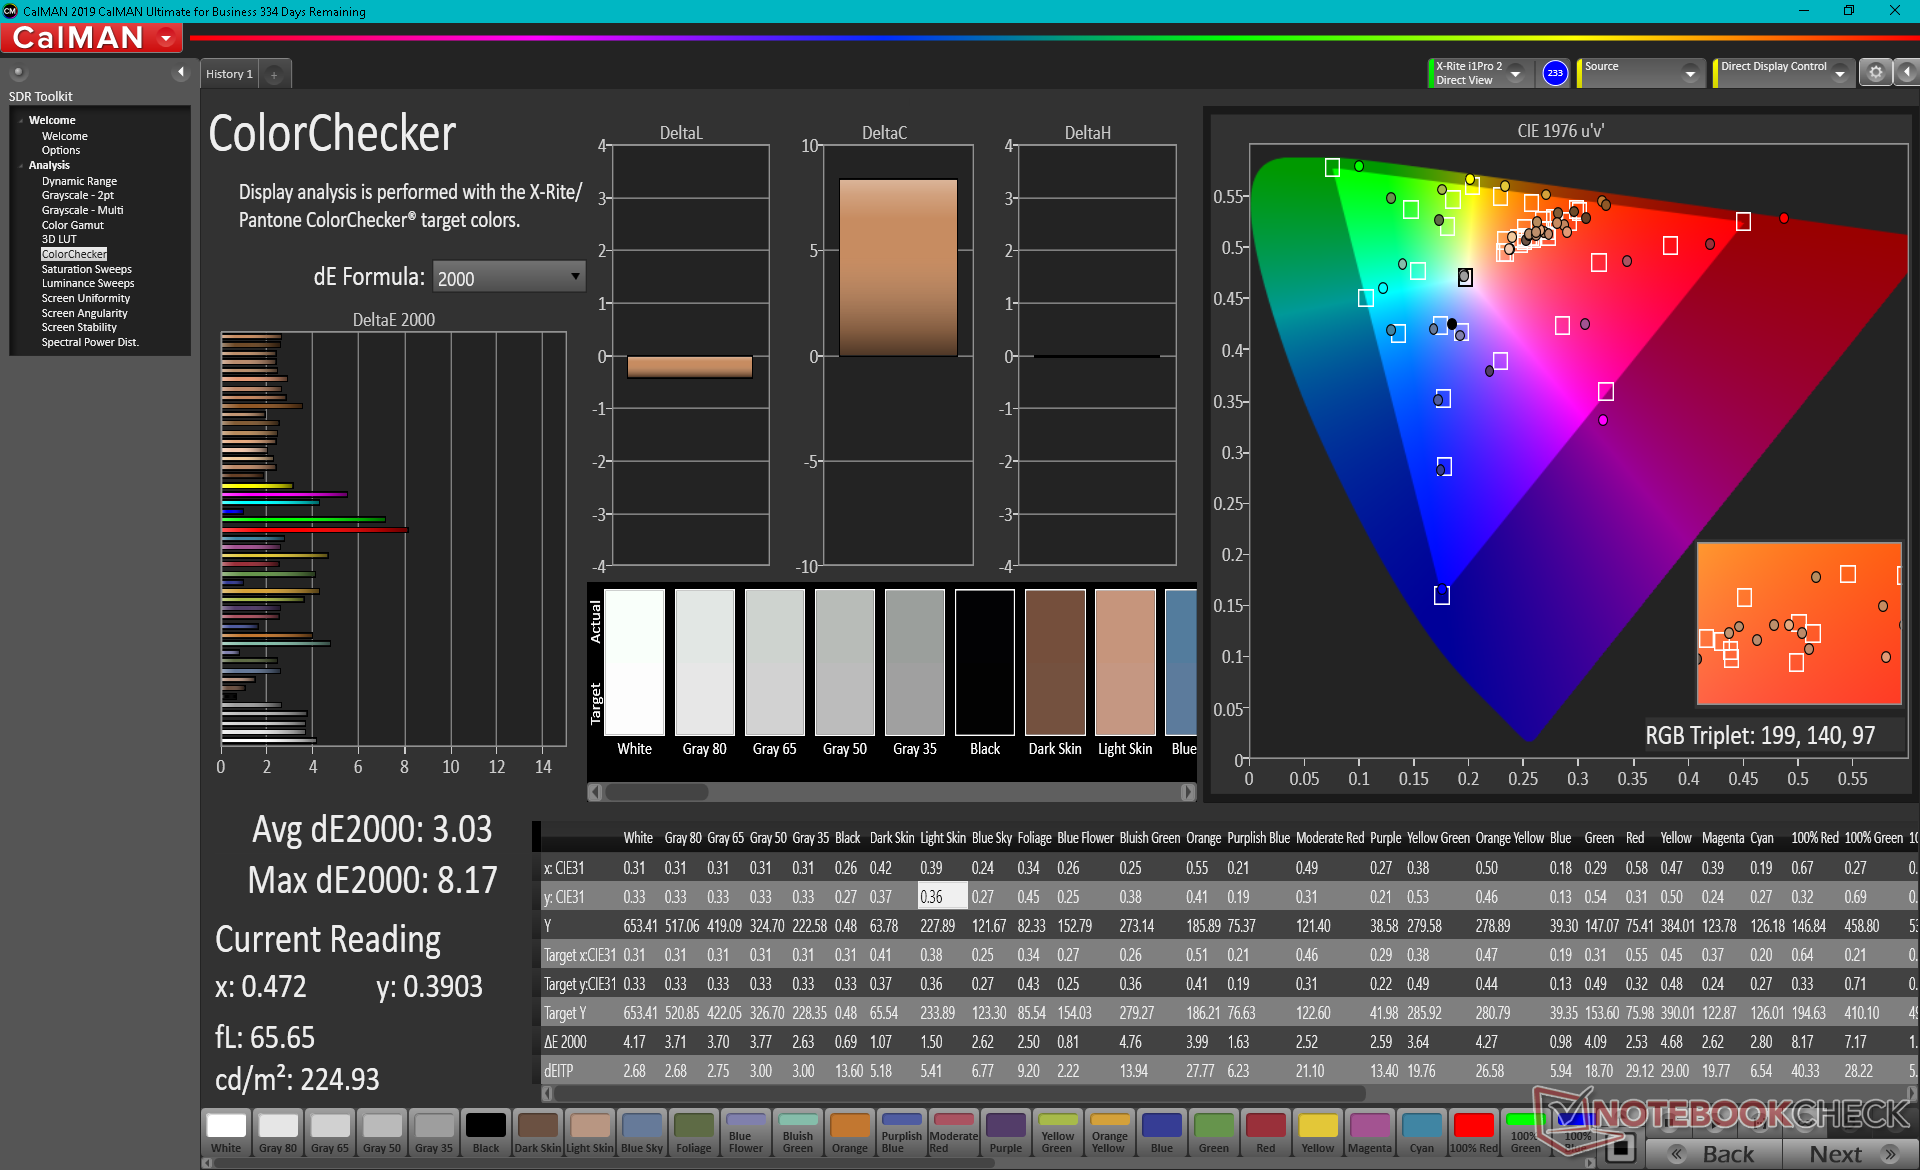
El espacio de color cubre todo el sRGB y el DCI-P3. Cuando se compara con el AdobeRGB, el DCI-P3 cubre más amarillo y rojo, lo que nuestras imágenes de abajo pueden confirmar para nuestro ZBook.
Las mediciones del colorímetro de X-Rite muestran que la temperatura del color está ligeramente en el lado caliente. Calibrar la pantalla nosotros mismos resuelve el pequeño problema del equilibrio RGB y las curvas gamma más planas. HP no ofrece ningún software de gestión del color preinstalado, a diferencia de Dell y su software Premier Color.

Tiempos de respuesta del display
| ↔ Tiempo de respuesta de Negro a Blanco | ||
|---|---|---|
| 36 ms ... subida ↗ y bajada ↘ combinada | ↗ 20.4 ms subida | 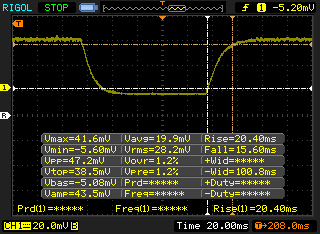 |
| ↘ 15.6 ms bajada | ||
| La pantalla mostró tiempos de respuesta lentos en nuestros tests y podría ser demasiado lenta para los jugones. En comparación, todos los dispositivos de prueba van de ##min### (mínimo) a 240 (máximo) ms. » 94 % de todos los dispositivos son mejores. Eso quiere decir que el tiempo de respuesta es peor que la media (19.9 ms) de todos los dispositivos testados. | ||
| ↔ Tiempo de respuesta 50% Gris a 80% Gris | ||
| 56 ms ... subida ↗ y bajada ↘ combinada | ↗ 27.6 ms subida | 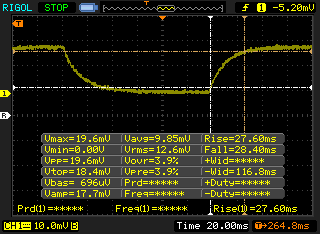 |
| ↘ 28.4 ms bajada | ||
| La pantalla mostró tiempos de respuesta lentos en nuestros tests y podría ser demasiado lenta para los jugones. En comparación, todos los dispositivos de prueba van de ##min### (mínimo) a 636 (máximo) ms. » 93 % de todos los dispositivos son mejores. Eso quiere decir que el tiempo de respuesta es peor que la media (31.1 ms) de todos los dispositivos testados. | ||
Parpadeo de Pantalla / PWM (Pulse-Width Modulation)
| Parpadeo de Pantalla / PWM no detectado |  | ||
Comparación: 52 % de todos los dispositivos testados no usaron PWM para atenuar el display. Si se usó, medimos una media de 7784 (mínimo: 5 - máxmo: 343500) Hz. | |||
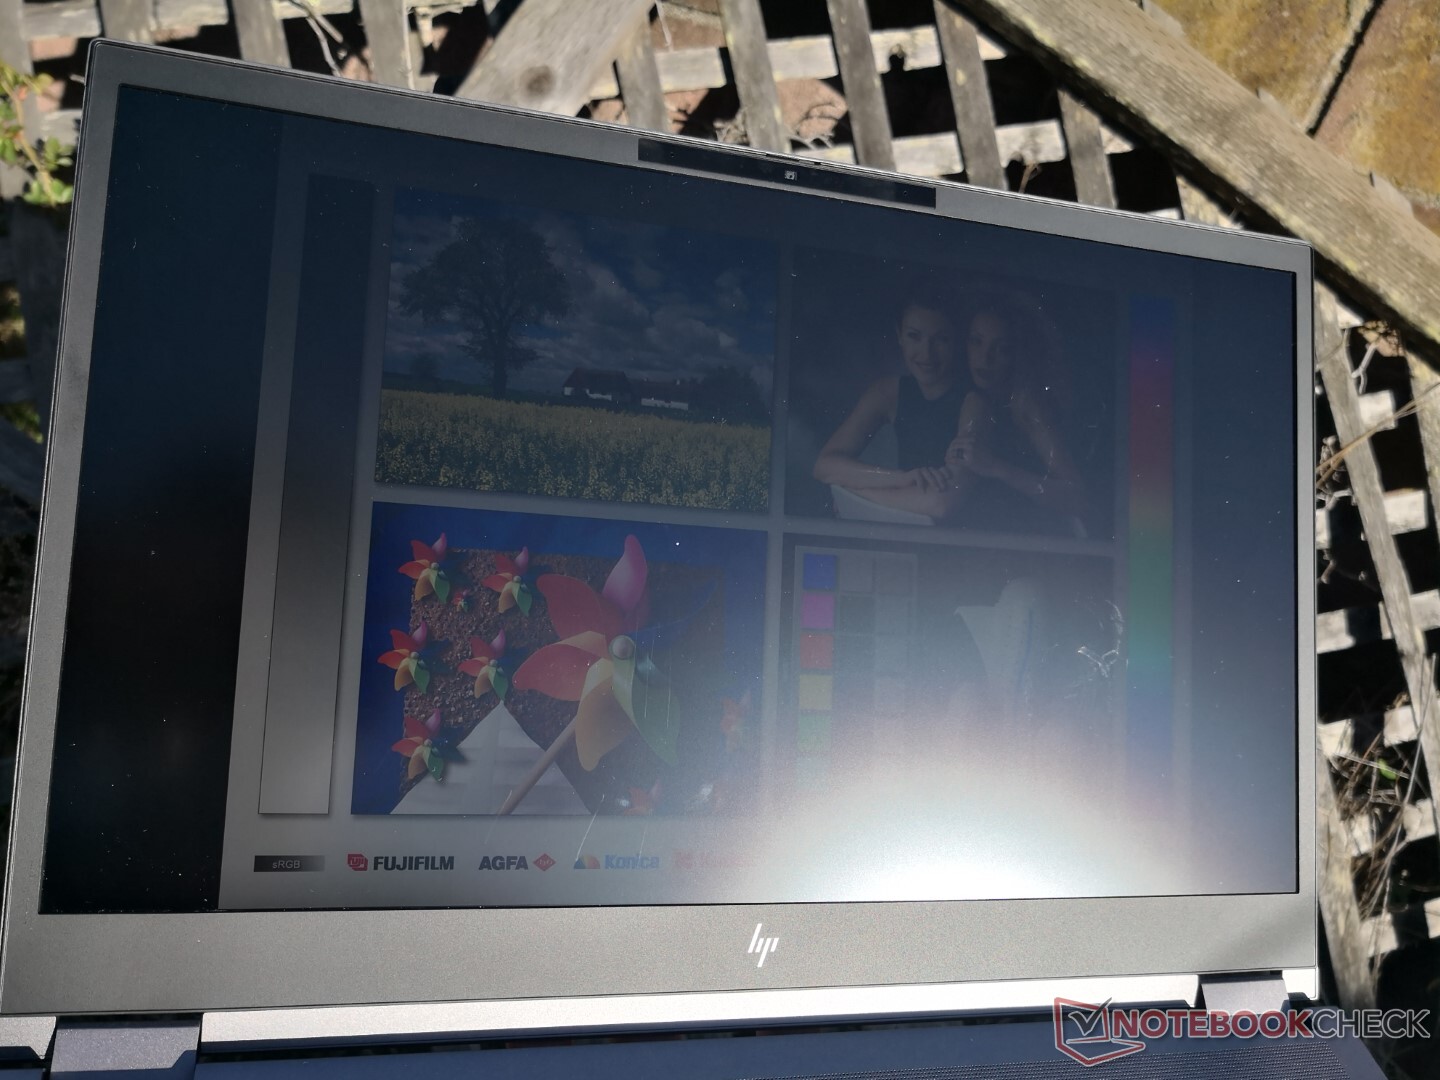
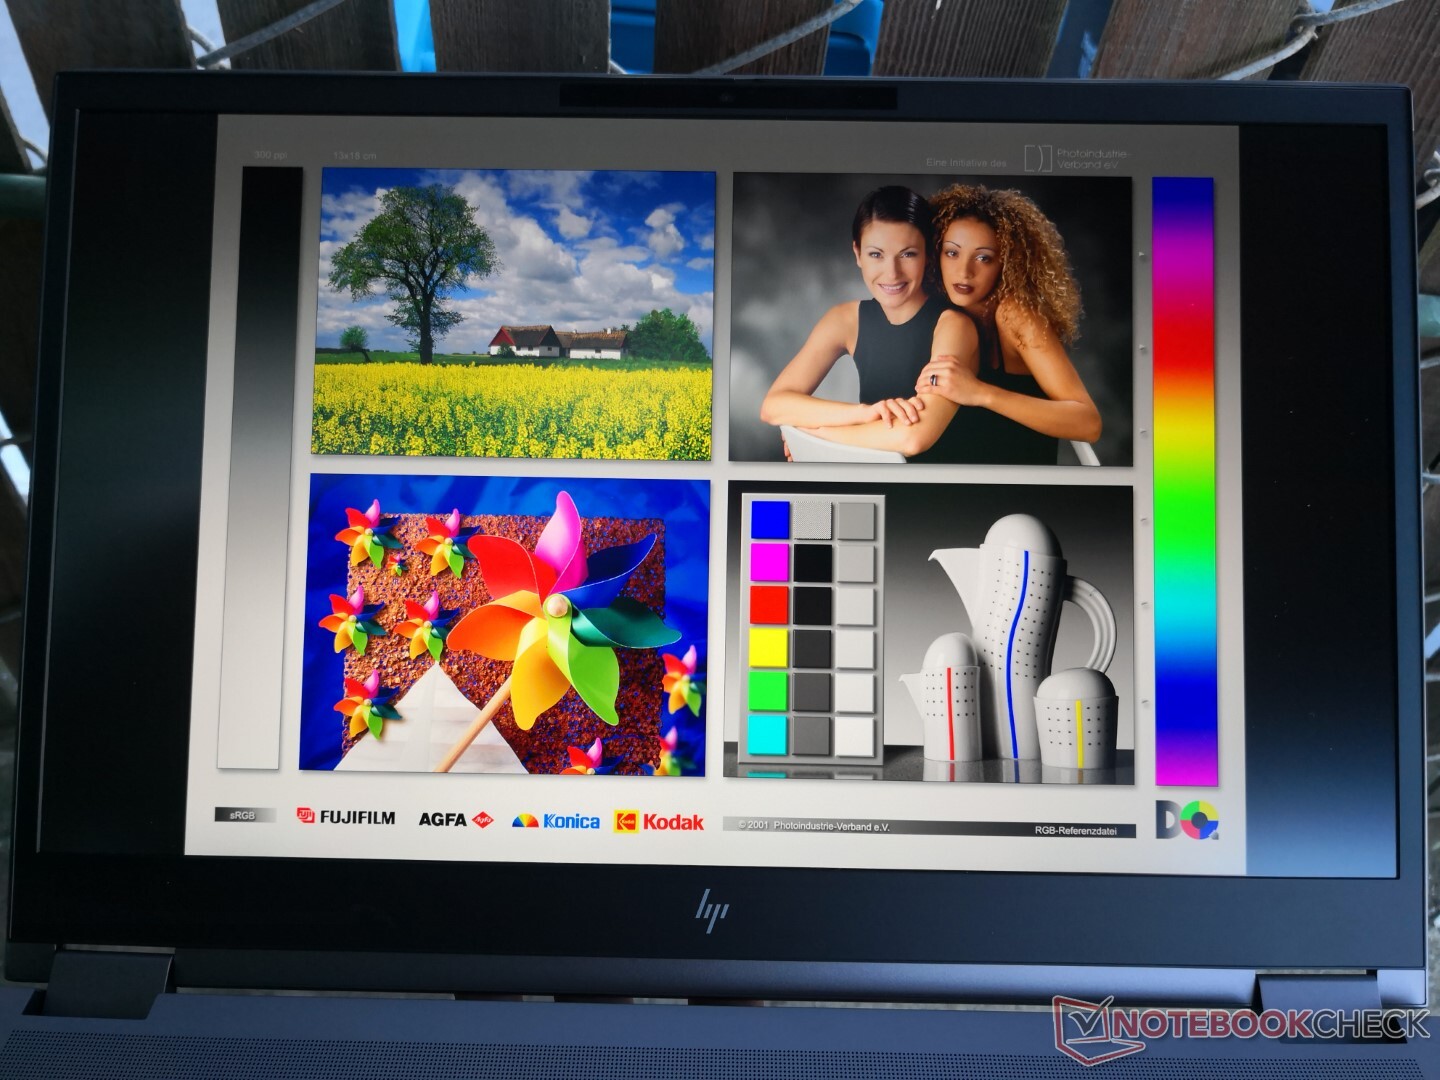
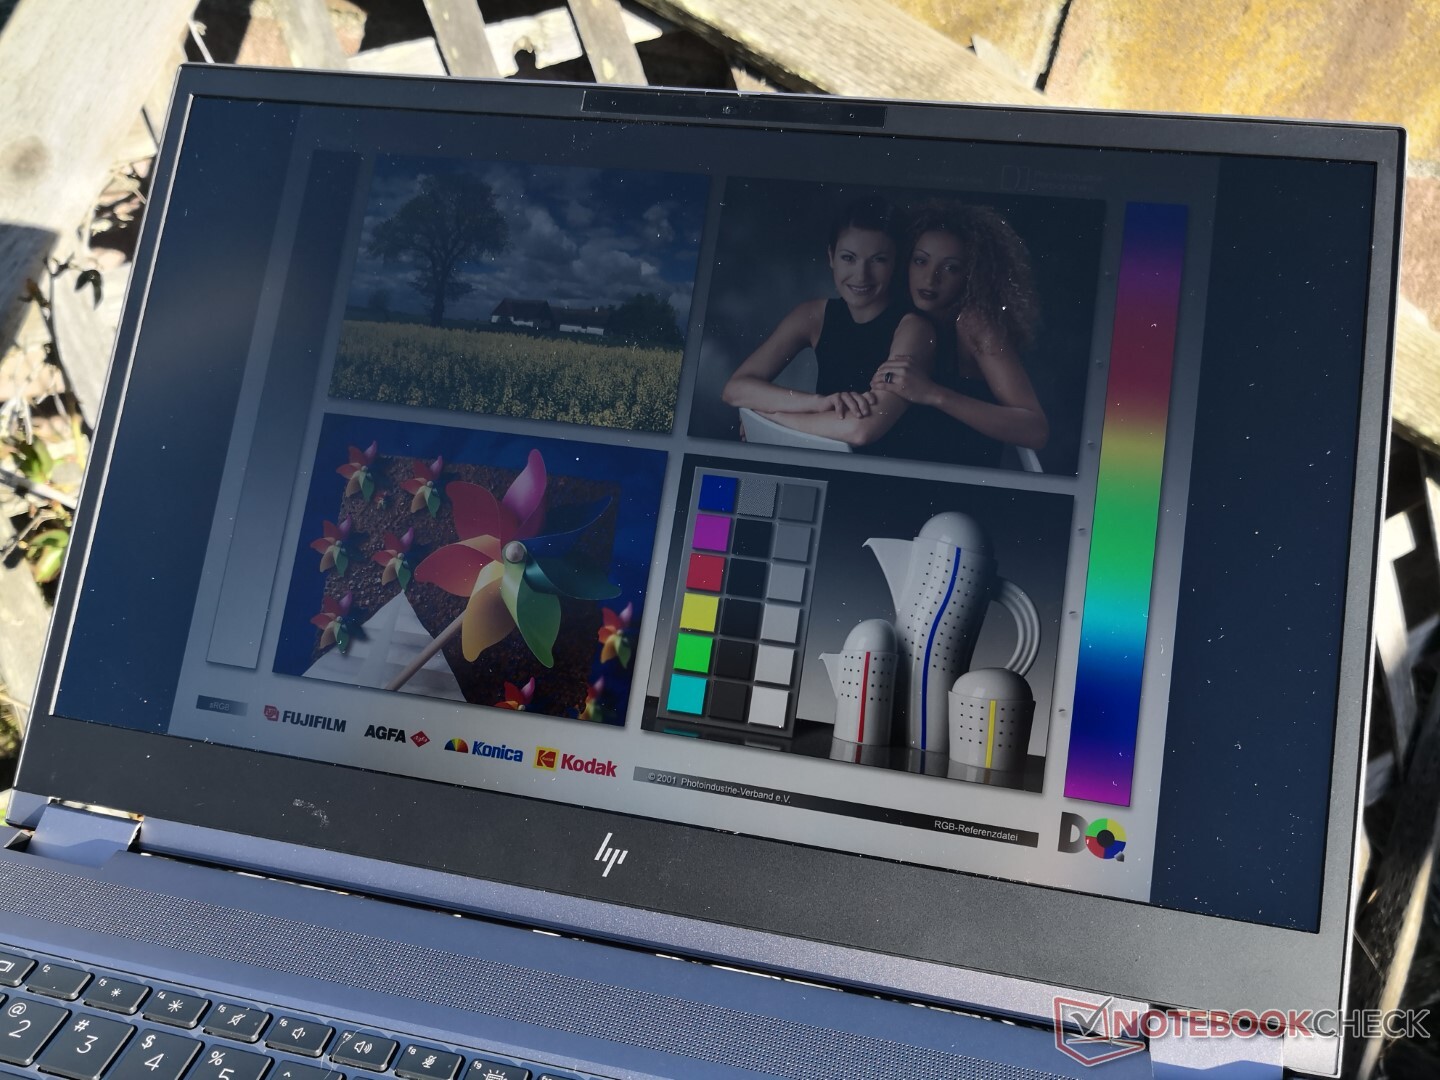
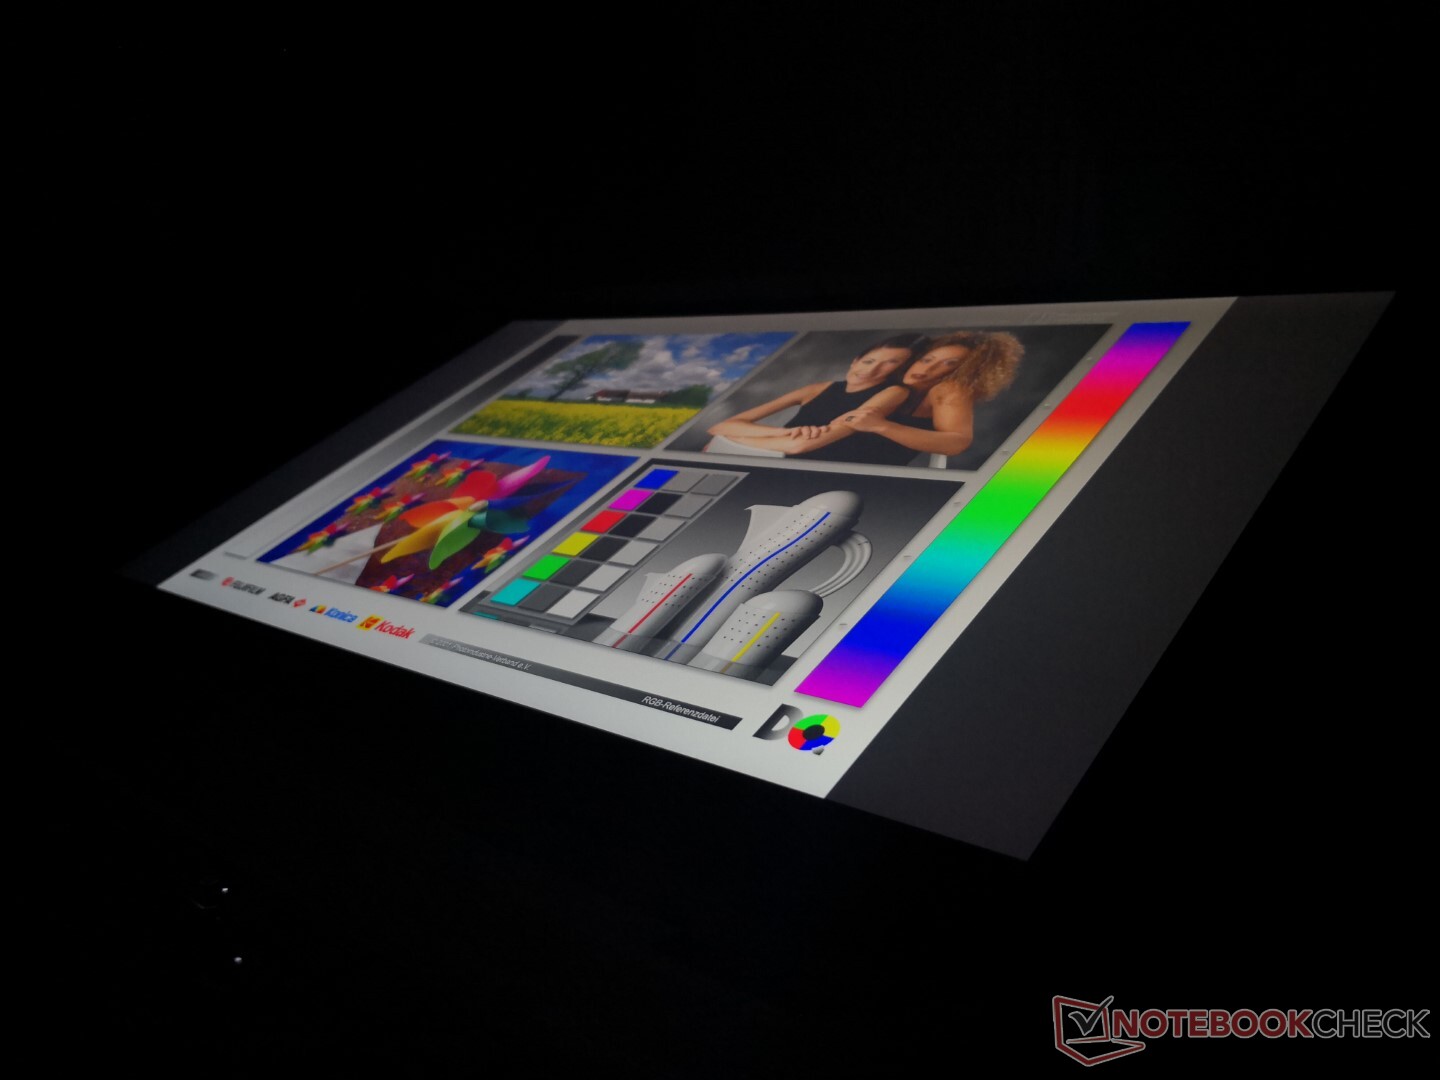
La visibilidad en el exterior es buena si está a la sombra, especialmente porque la pantalla es significativamente más brillante que el promedio de una laptop o estación de trabajo de 15.6 pulgadas. Sin embargo, la luz directa del sol todavía lavará la pantalla.
Actuación
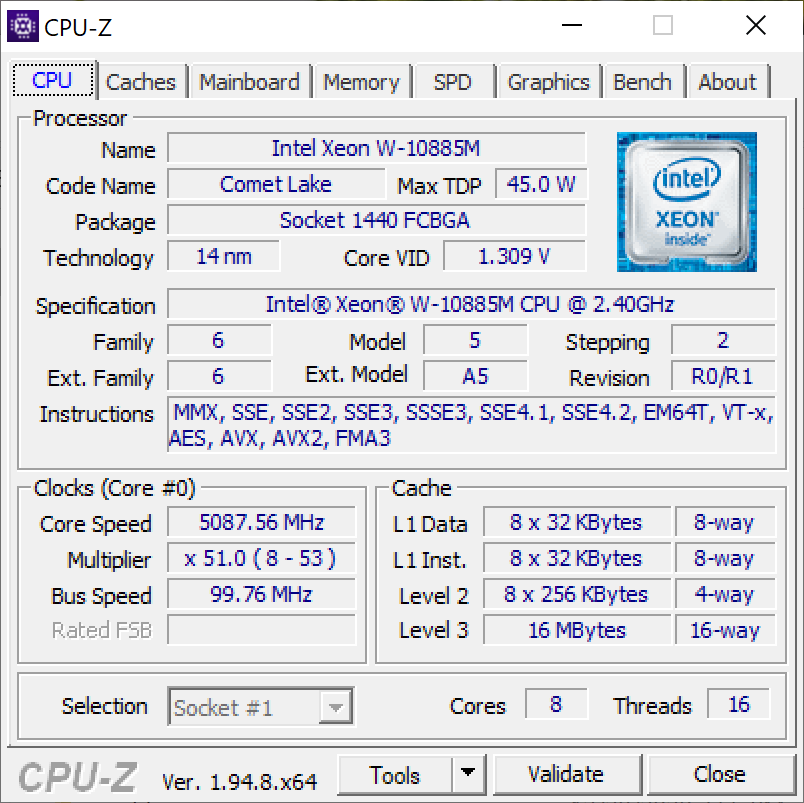
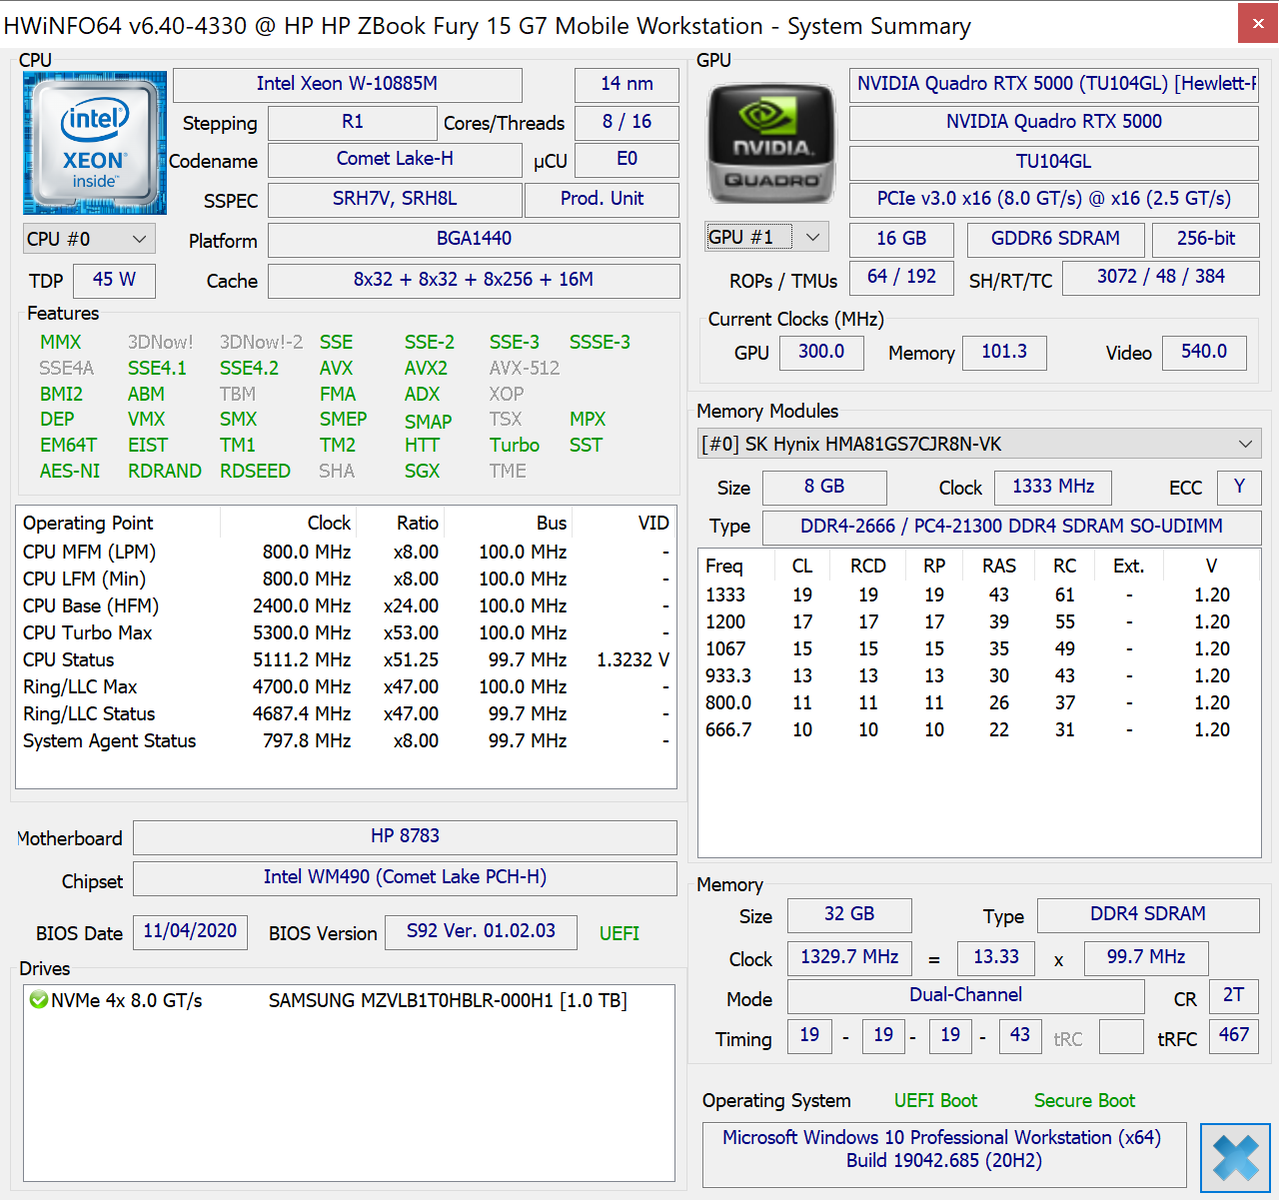
Como estación de trabajo móvil con todas las funciones, el ZBook Fury 15 puede estar equipado con el Core i9-10885H o Xeon W-10885M para soporte de RAM ECC. Cabe señalar que los usuarios pueden configurar hasta 128 GB de RAM no ECC, mientras que el ECC se limitará a 64 GB. Los profesionales que no son usuarios de energía pueden preferir el HP ZBook Firefly, más pequeño y portátil.
Nuestra unidad se configuró en el modo de alto rendimiento a través de Windows antes de ejecutar todos los puntos de referencia que se indican a continuación para obtener las puntuaciones más altas posibles.
Procesador
El rendimiento de los multi-hilos crudos es más lento de lo esperado, un 30 por ciento más lento que el Precision 7550 equipado con el mismo CPU de Xeon. Los beneficios del Turbo Boost son mínimos como se muestra en los resultados de la prueba de bucle de CineBench R15 xT a continuación.
El rendimiento mejora significativamente después de actualizar la BIOS a 1.04.01, probablemente debido a un fallo en nuestra versión anterior de la BIOS. El rendimiento de los multi-hilos brutos saltaría casi un 50 por ciento para estar más en línea con el ya mencionado Dell. Sin embargo, esto tiene un costo, el cual será detallado en nuestra sección de Prueba de Estrés
Cinebench R15: CPU Multi 64Bit | CPU Single 64Bit
Blender: v2.79 BMW27 CPU
7-Zip 18.03: 7z b 4 -mmt1 | 7z b 4
Geekbench 5.5: Single-Core | Multi-Core
HWBOT x265 Benchmark v2.2: 4k Preset
LibreOffice : 20 Documents To PDF
R Benchmark 2.5: Overall mean
| HWBOT x265 Benchmark v2.2 / 4k Preset | |
| MSI WS66 10TMT-207US | |
| Medio Intel Xeon W-10885M (8.89 - 13.6, n=3) | |
| Dell Precision 5540 | |
| Dell Precision 3000 3551 | |
| Dell Precision 5550 P91F | |
| Lenovo ThinkPad X1 Extreme Gen3-20TLS0UV00 | |
| Acer Nitro 5 AN515-44-R5FT | |
| HP ZBook Fury 15 G7 | |
| Asus ProArt StudioBook Pro 15 W500G5T | |
| Dell XPS 15 9500 Core i5 | |
| LibreOffice / 20 Documents To PDF | |
| Acer Nitro 5 AN515-44-R5FT | |
| Dell XPS 15 9500 Core i5 | |
| Asus ProArt StudioBook Pro 15 W500G5T | |
| HP ZBook Fury 15 G7 | |
| Medio Intel Xeon W-10885M (44.4 - 58.1, n=3) | |
| Lenovo ThinkPad X1 Extreme Gen3-20TLS0UV00 | |
| Dell Precision 3000 3551 | |
| MSI WS66 10TMT-207US | |
| Dell Precision 5550 P91F | |
| R Benchmark 2.5 / Overall mean | |
| Dell XPS 15 9500 Core i5 | |
| Asus ProArt StudioBook Pro 15 W500G5T | |
| Acer Nitro 5 AN515-44-R5FT | |
| Lenovo ThinkPad X1 Extreme Gen3-20TLS0UV00 | |
| Dell Precision 5550 P91F | |
| MSI WS66 10TMT-207US | |
| Dell Precision 3000 3551 | |
| Medio Intel Xeon W-10885M (0.551 - 0.57, n=3) | |
| HP ZBook Fury 15 G7 | |
* ... más pequeño es mejor
Rendimiento del sistema
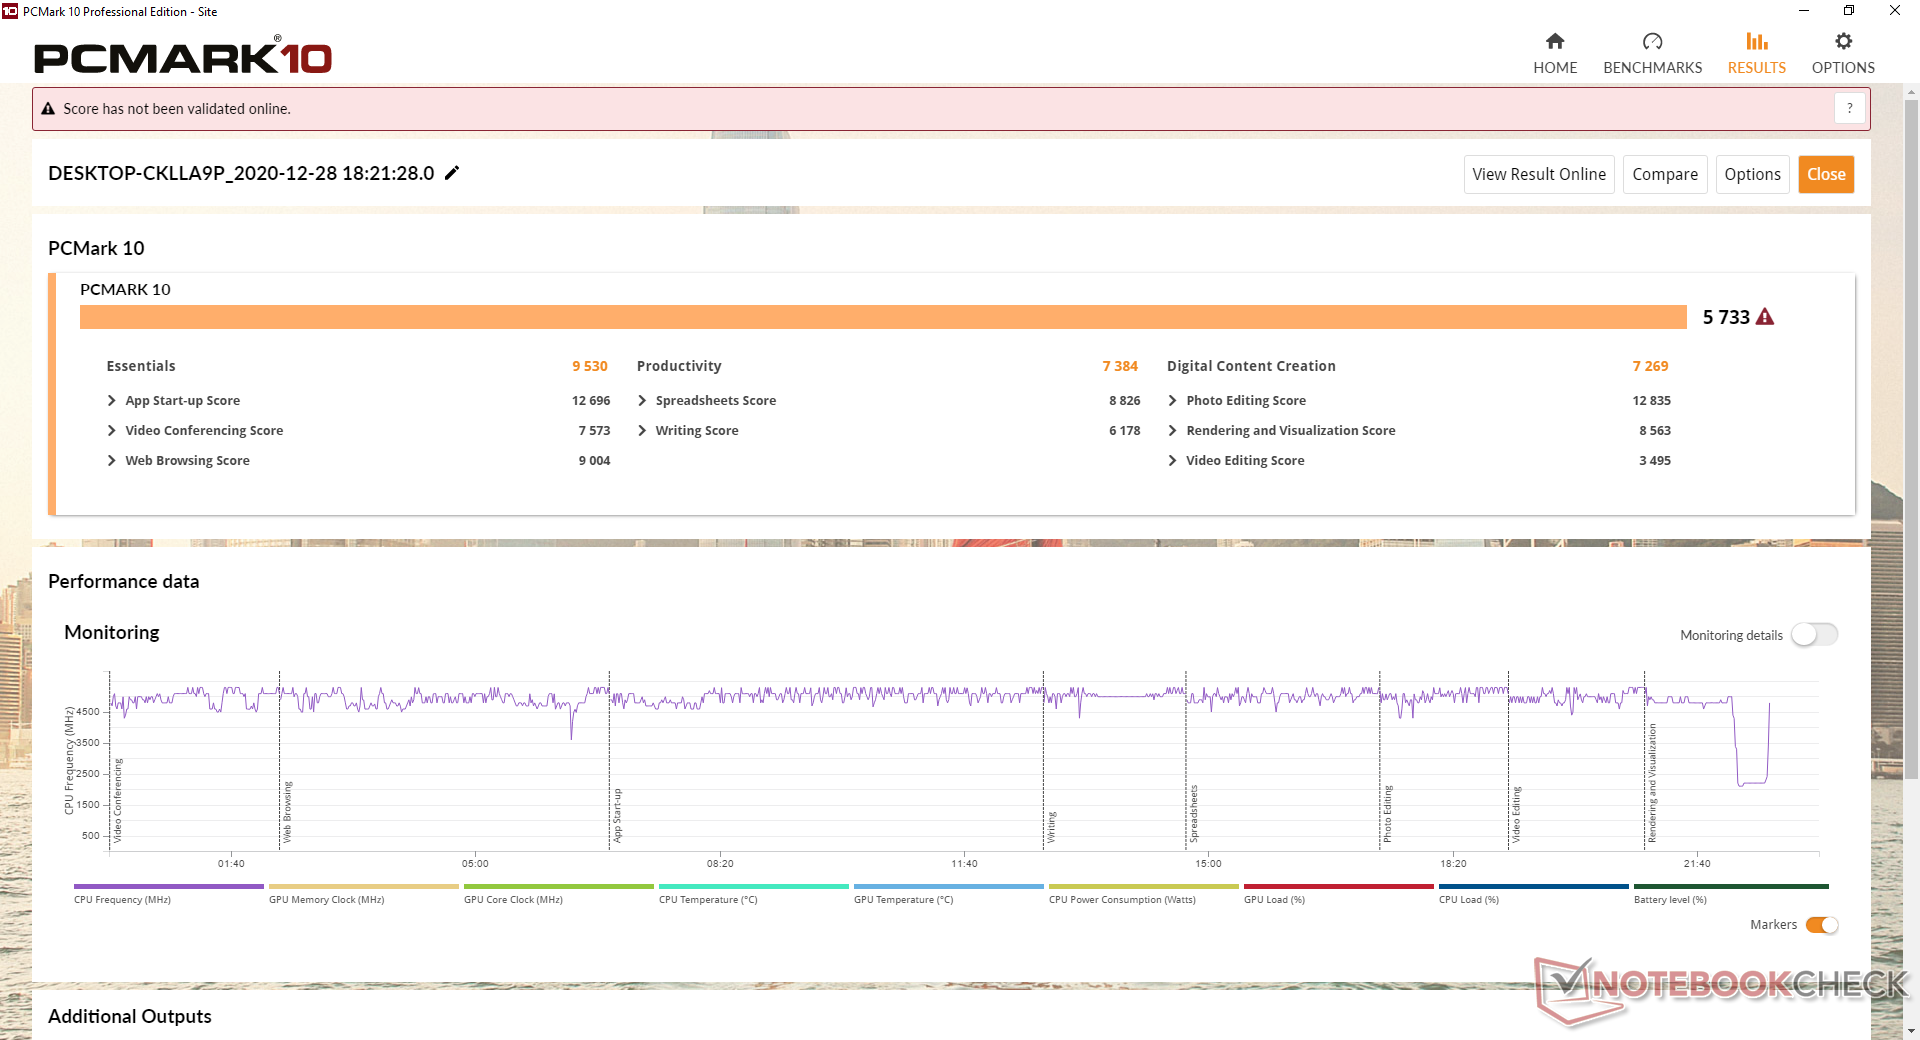
Los puntos de referencia de PCMark están donde esperamos que estén en relación con otras estaciones de trabajo móviles. La Precision 7550, que viene con la misma CPU y GPU que nuestra HP, es capaz de superar a nuestro sistema por meros puntos porcentuales.
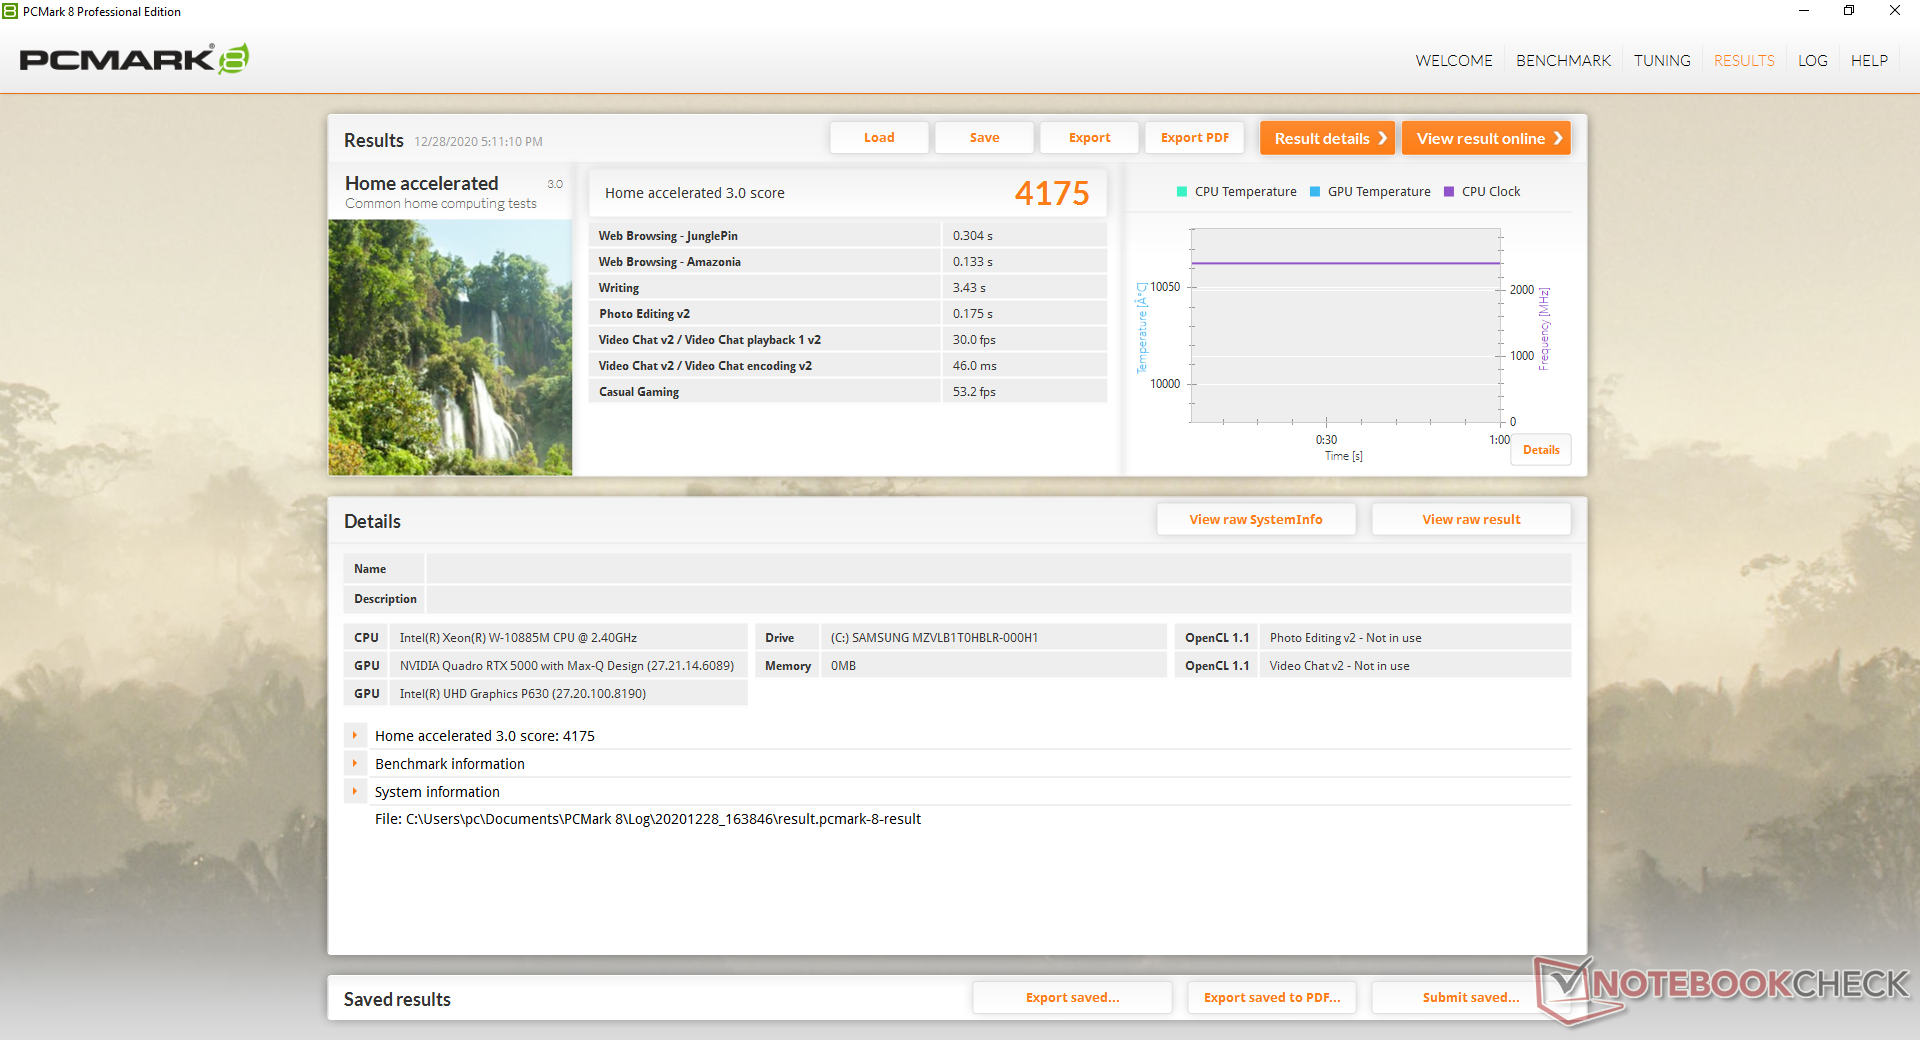
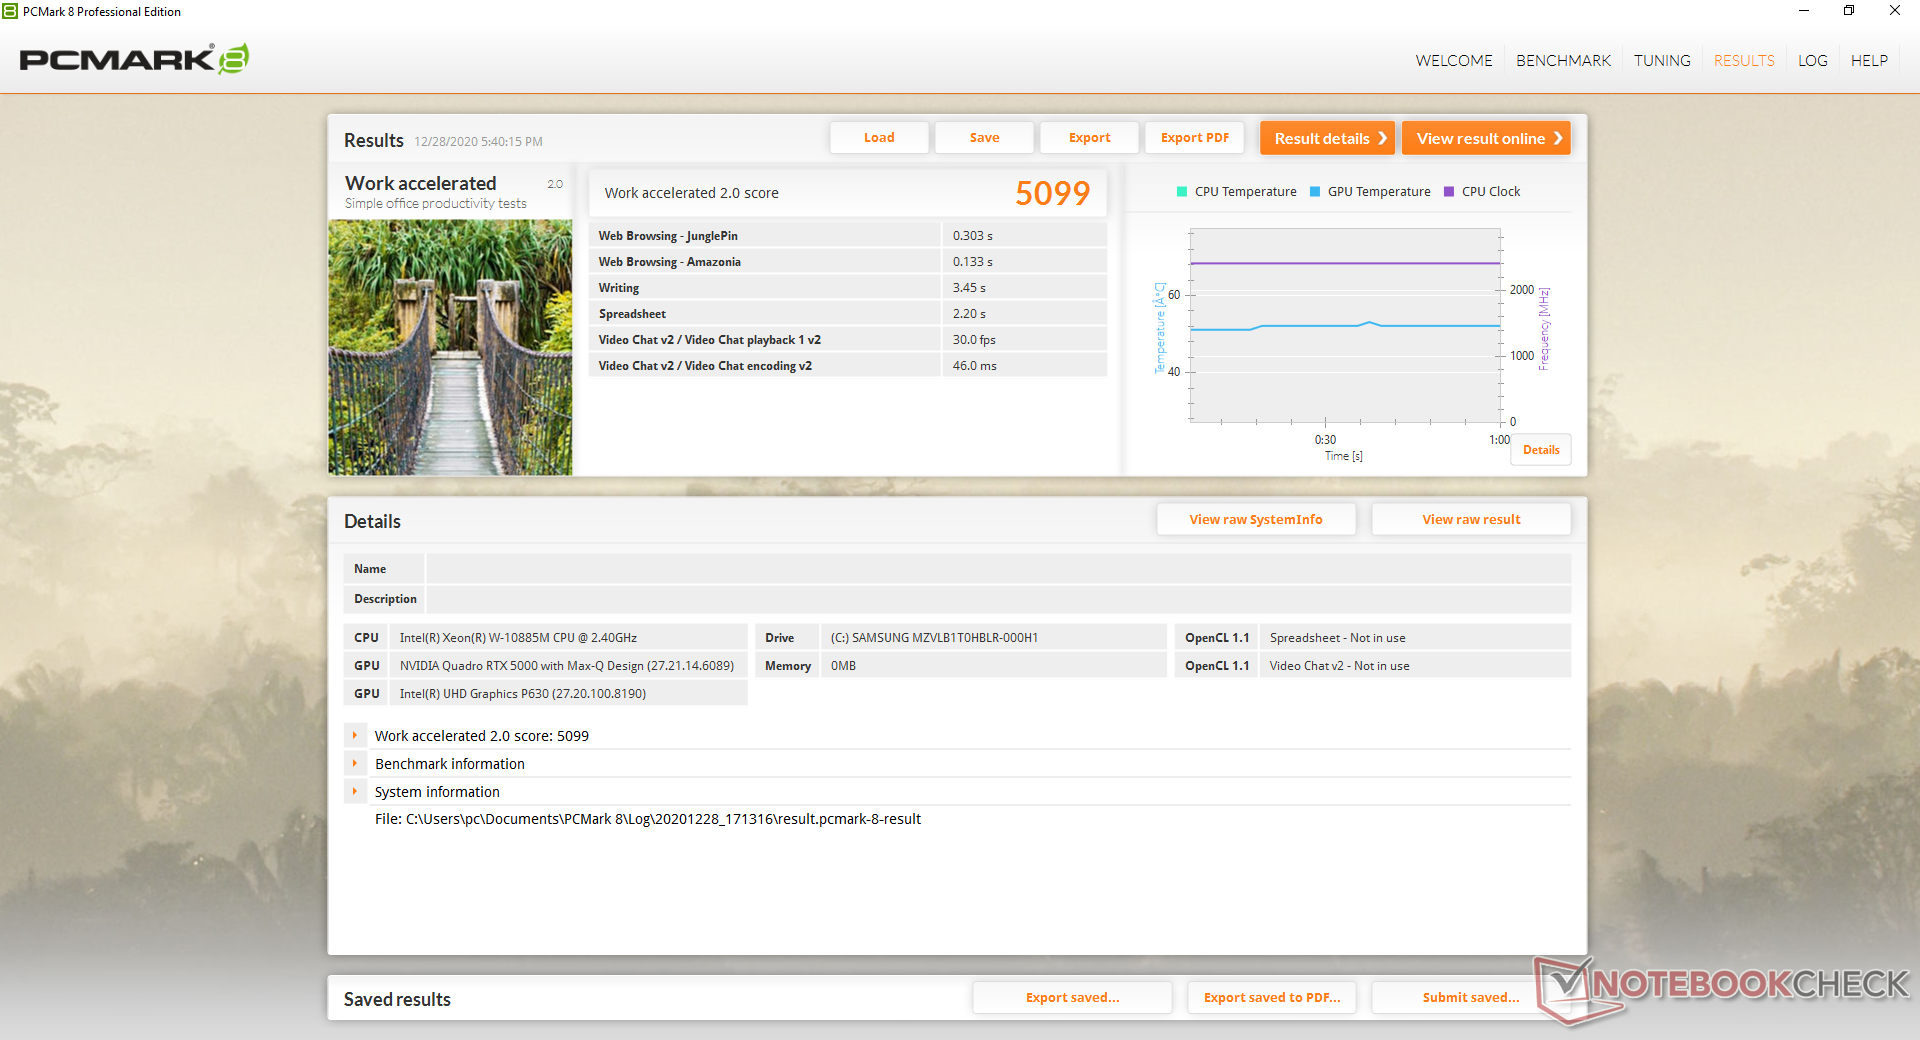
| PCMark 8 Home Score Accelerated v2 | 4175 puntos | |
| PCMark 8 Work Score Accelerated v2 | 5099 puntos | |
| PCMark 10 Score | 5733 puntos | |
ayuda | ||
Latencia DPC
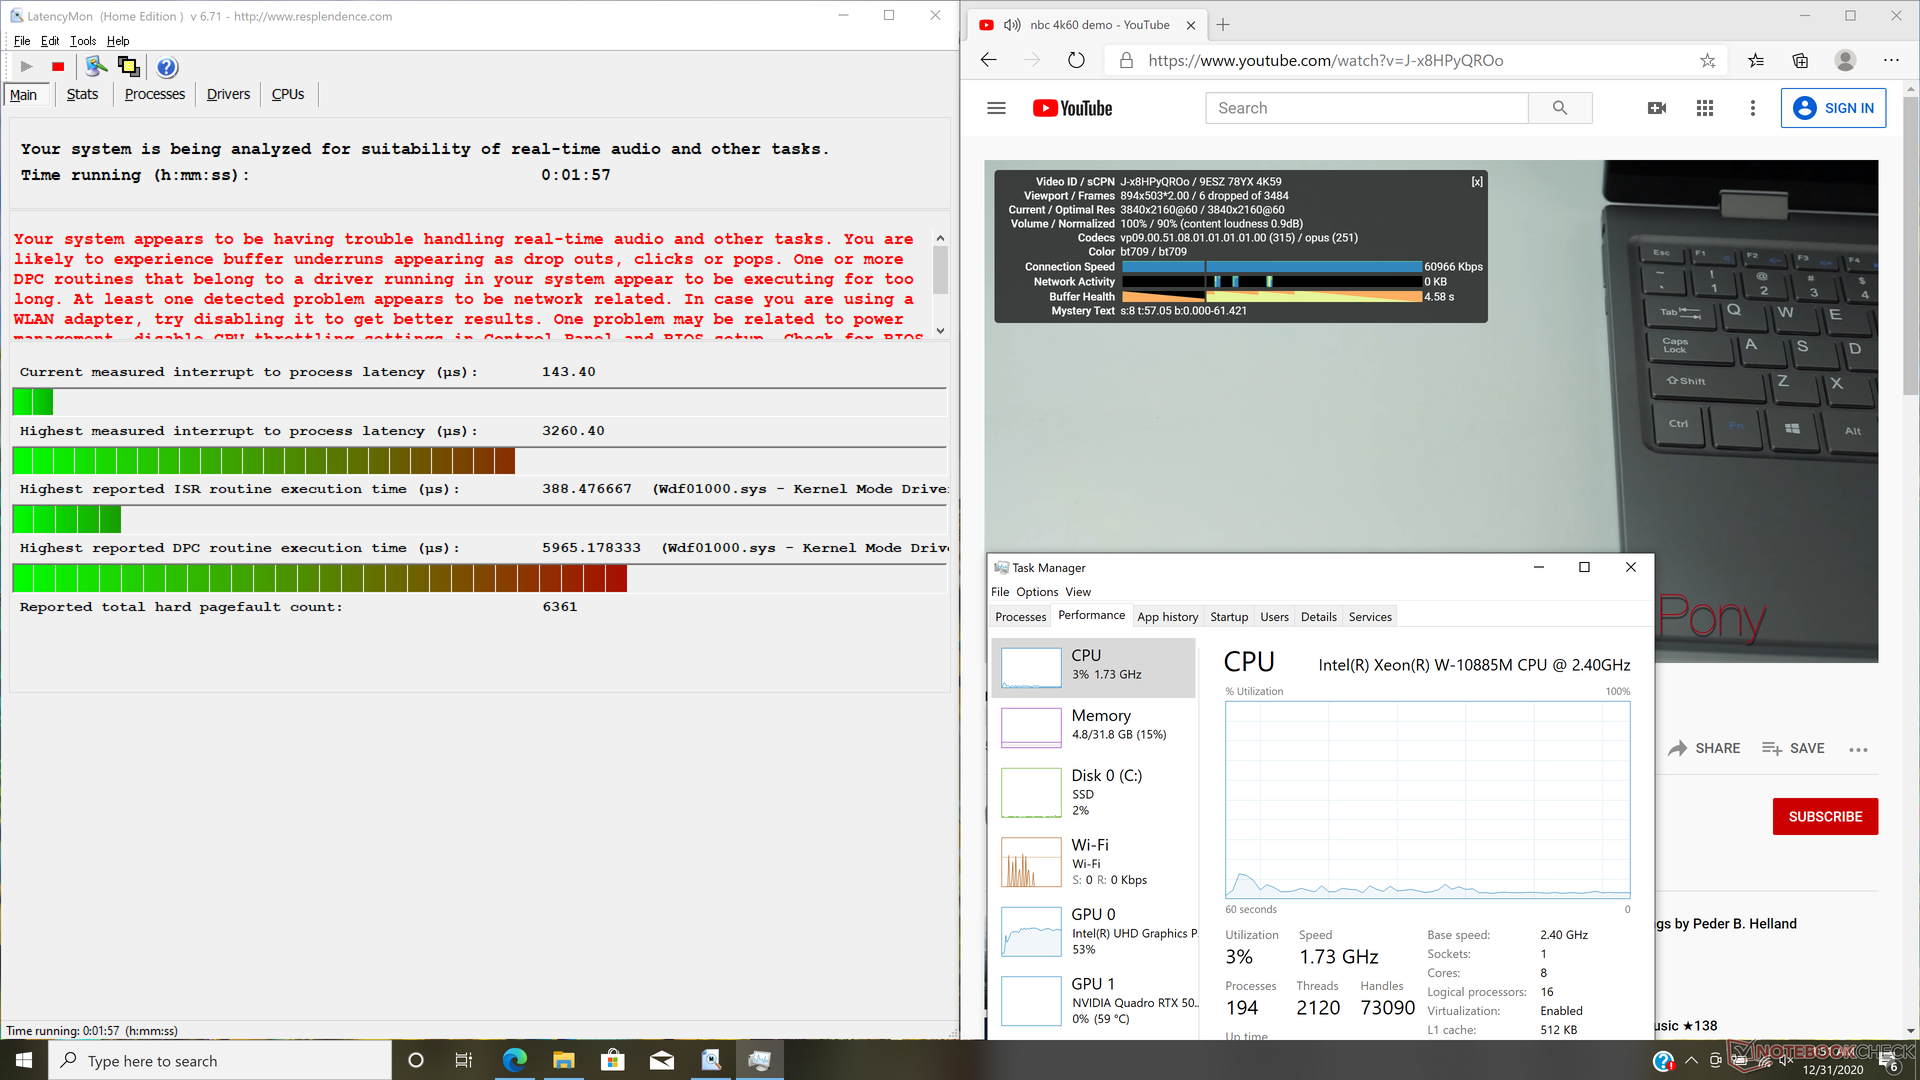
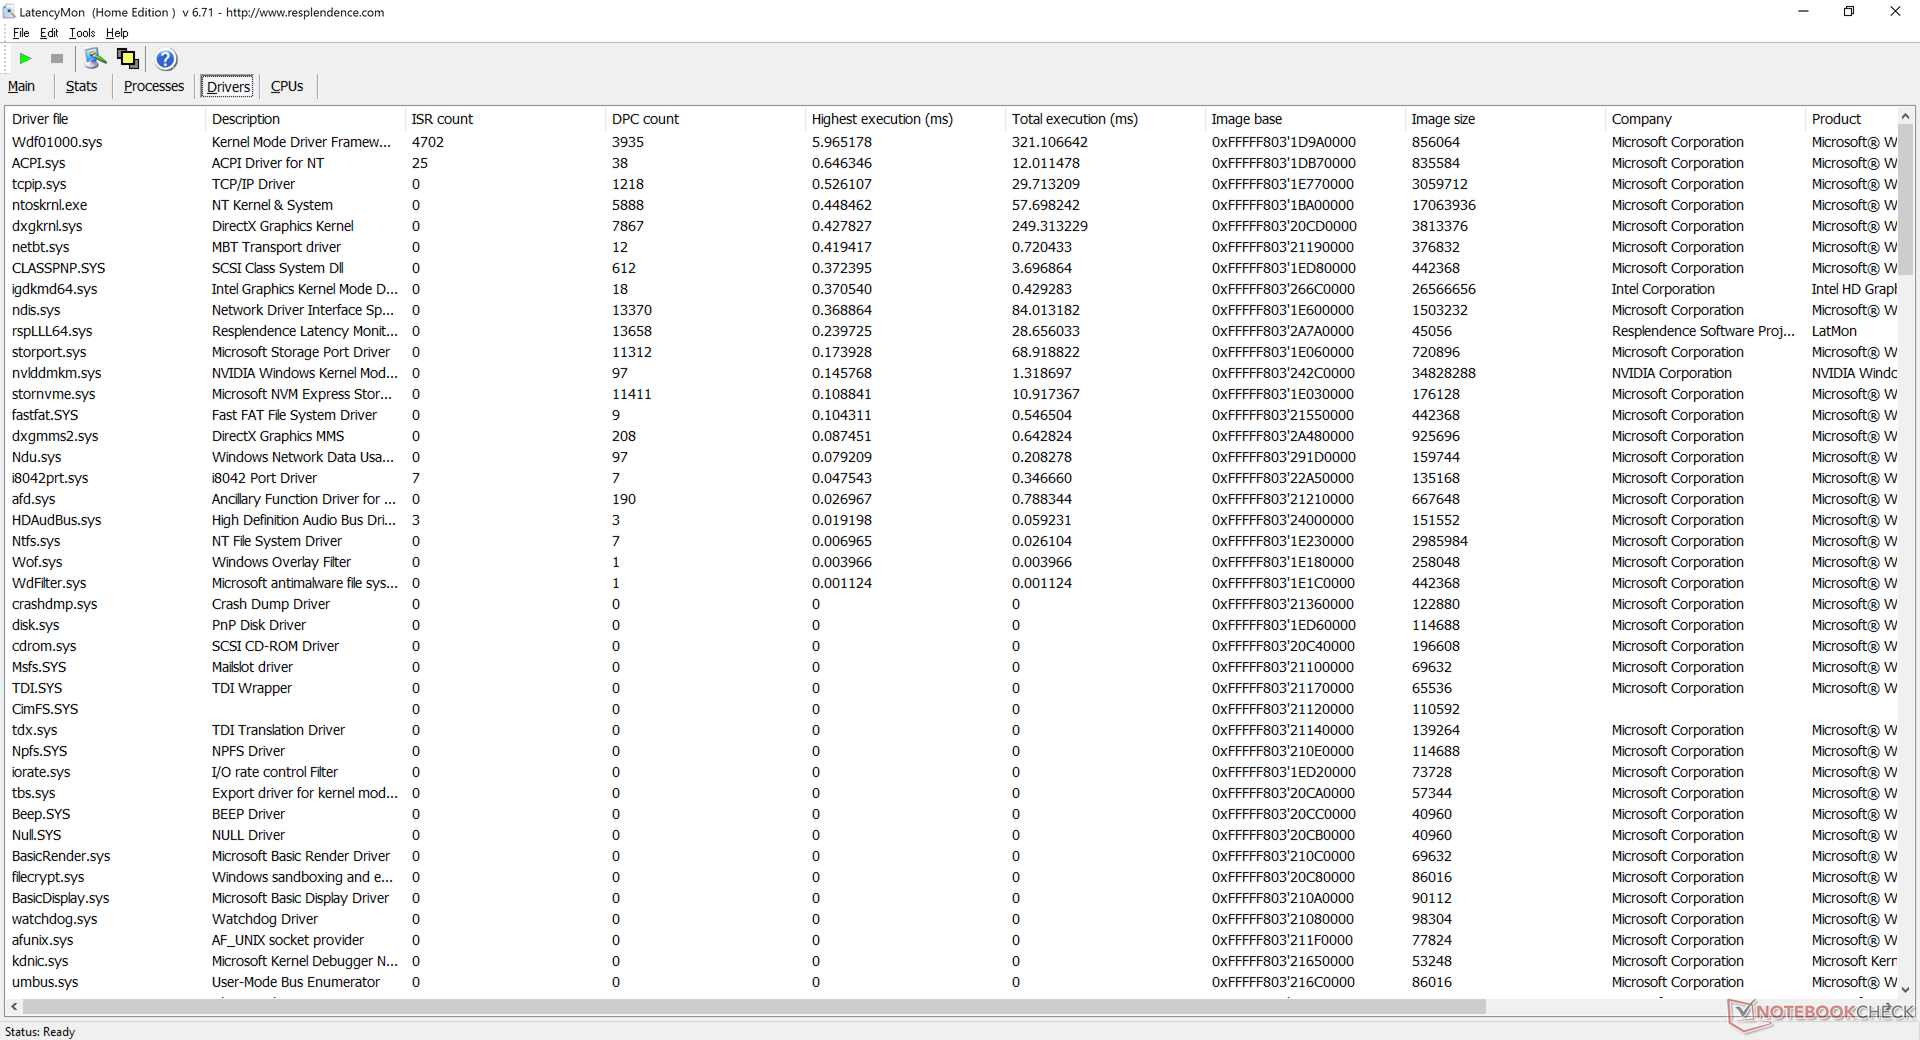
LatencyMon revela problemas de latencia DPC al abrir varias pestañas del navegador de nuestra página de inicio, incluso después de varias pruebas repetidas. La reproducción de video de 4K a 60 FPS es suave pero no perfecta ya que grabamos 6 cuadros caídos durante un video de un minuto en YouTube.
| DPC Latencies / LatencyMon - interrupt to process latency (max), Web, Youtube, Prime95 | |
| Dell Precision 7550 | |
| MSI WS66 10TMT-207US | |
| HP ZBook Fury 15 G7 | |
| Asus ProArt StudioBook Pro 15 W500G5T | |
| Razer Blade 15 Studio Edition 2020 | |
* ... más pequeño es mejor
Dispositivos de almacenamiento
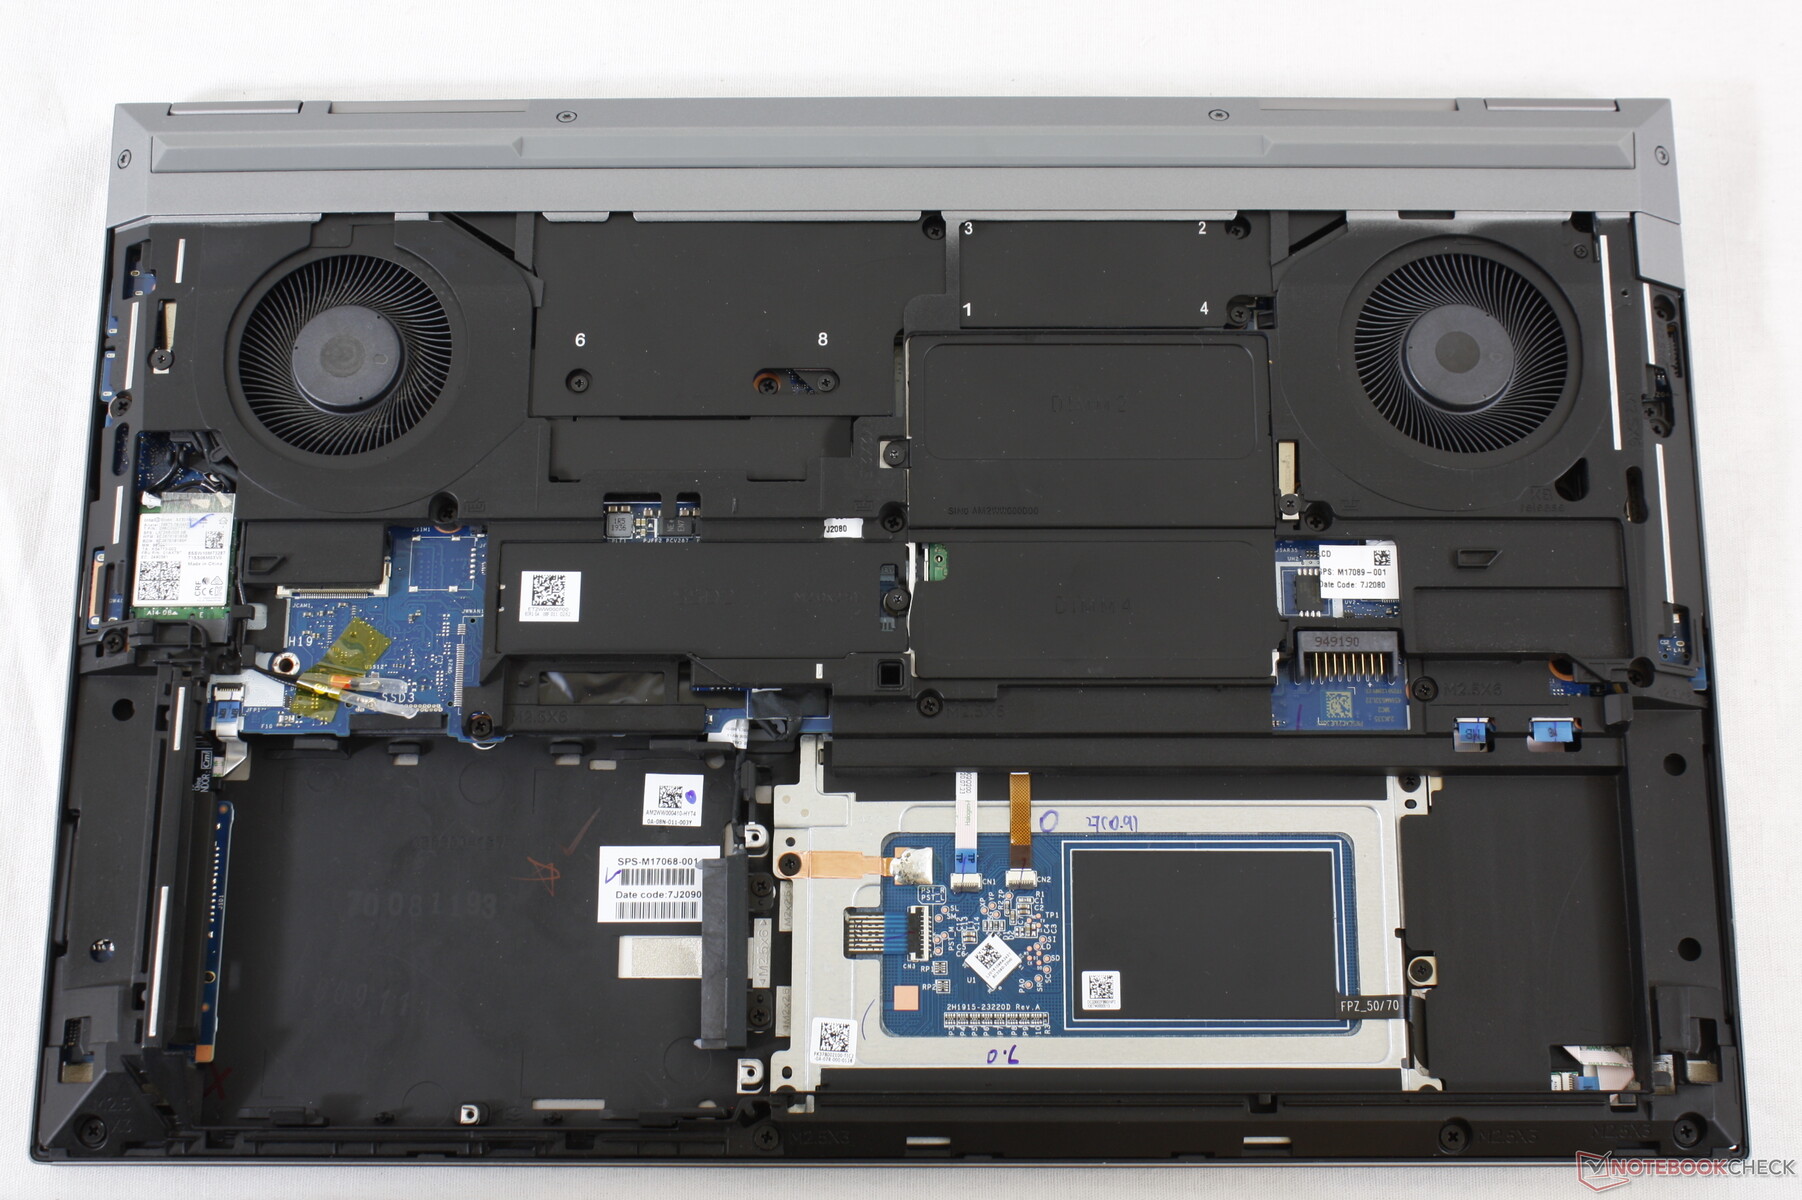
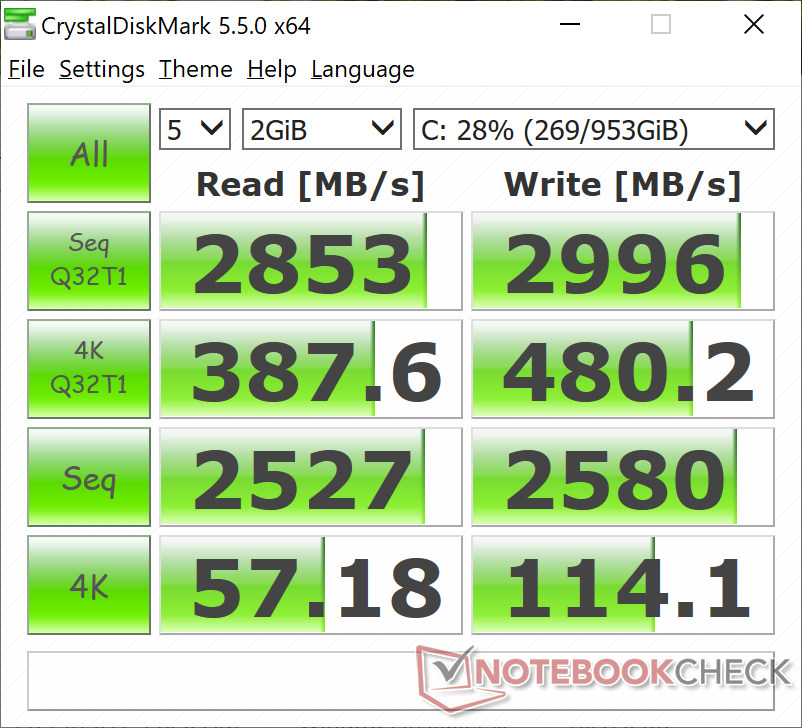
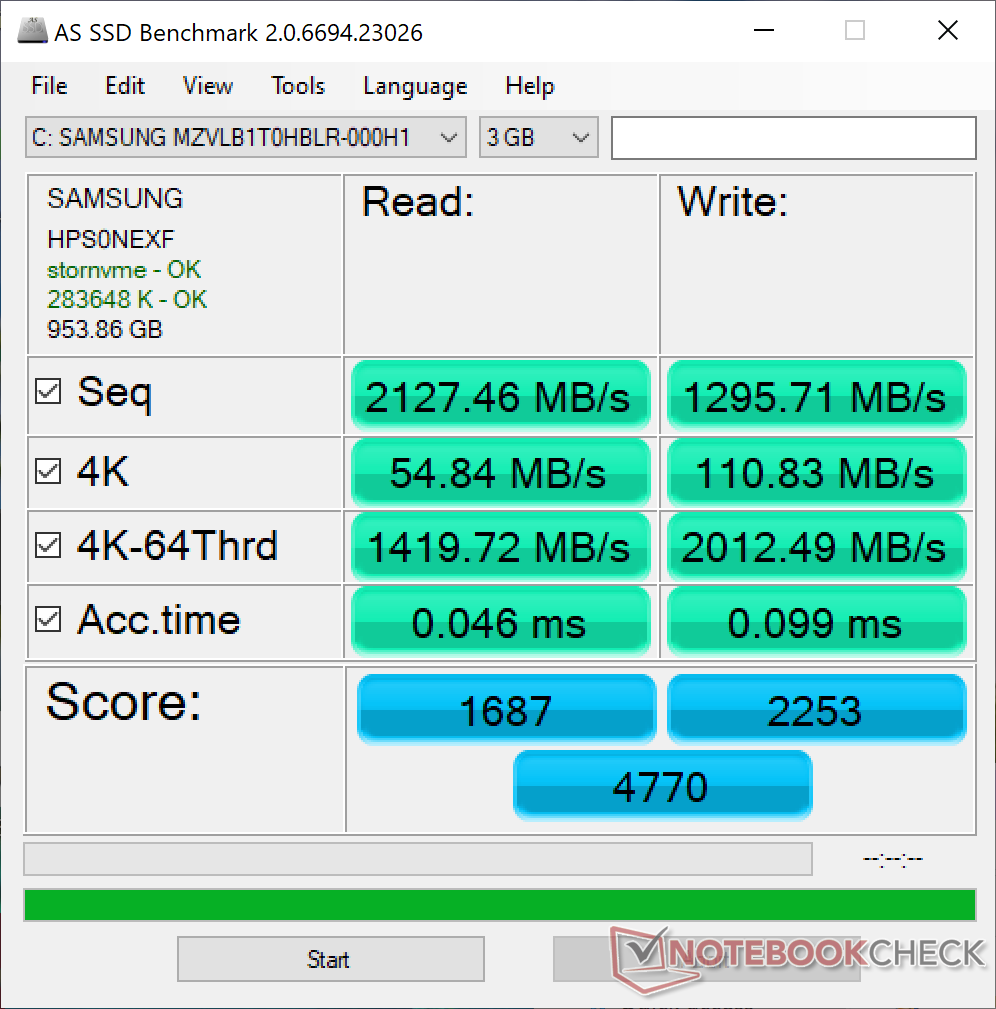
Nuestra unidad de prueba viene con un Samsung PM981a de 1 TB que es uno de los SSDs PCIe 3 x4 NVMe más rápidos orientados al consumidor disponibles. Los usuarios pueden configurar con otros tamaños o modelos con seguridad SED si lo desean.
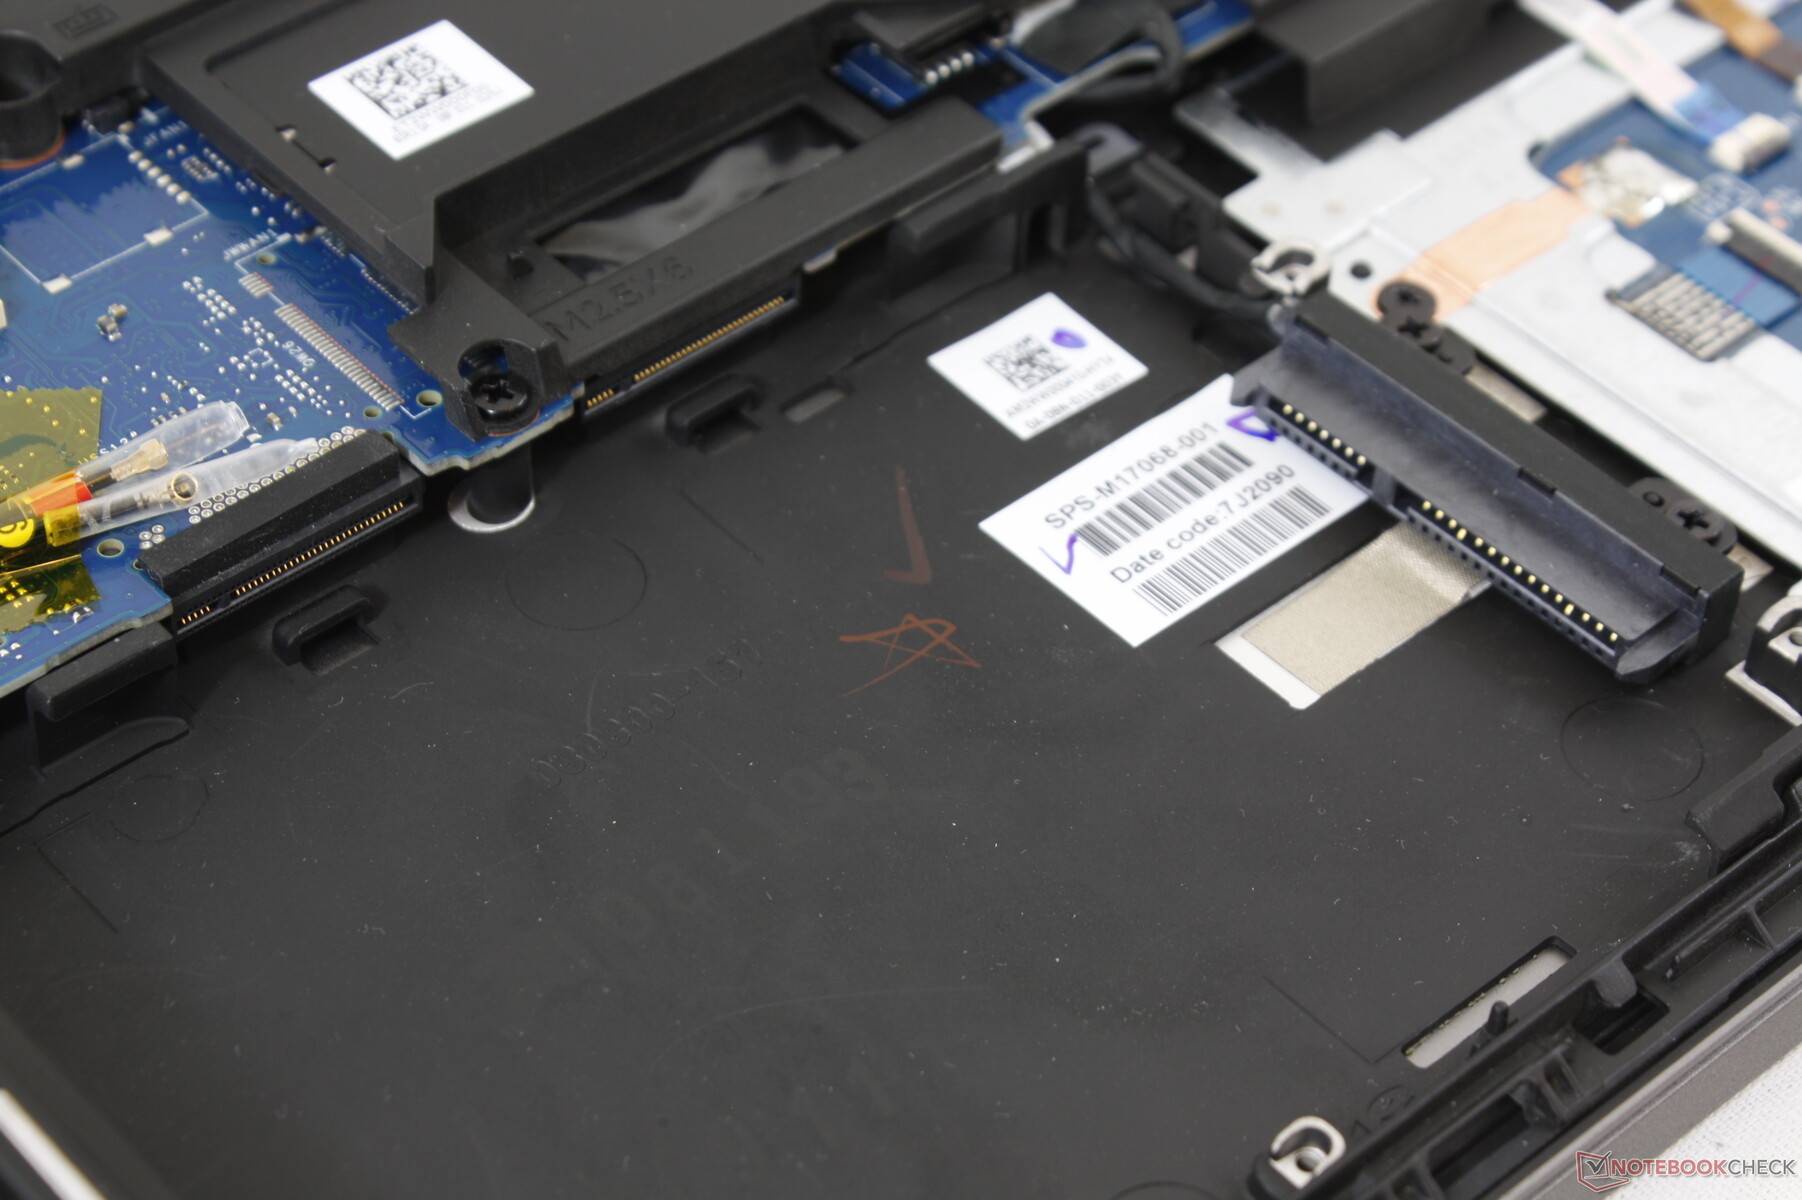
Un total de cuatro ranuras de almacenamiento están disponibles (3x M.2 2280 + 1x 2.5 pulgadas SATA III). Sin embargo, la bahía de 2,5 pulgadas comparte el mismo espacio que dos de las ranuras M.2, lo que significa que no hay suficiente espacio para instalar cuatro unidades. Los usuarios pueden instalar hasta tres unidades M.2 o una unidad M.2 más una unidad de 2,5 pulgadas.
Algunos SKU omiten el conector de 2,5 pulgadas para una ranura M.2 adicional para admitir hasta cuatro unidades M.2 simultáneamente.
| HP ZBook Fury 15 G7 Samsung PM981a MZVLB1T0HBLR | MSI WS66 10TMT-207US WDC PC SN730 SDBPNTY-1T00 | Dell Precision 7550 SK Hynix PC601A NVMe 1TB | Razer Blade 15 Studio Edition 2020 Samsung PM981a MZVLB1T0HBLR | Lenovo ThinkPad P1 2019-20QT000RGE WDC PC SN720 SDAQNTW-512G | |
|---|---|---|---|---|---|
| AS SSD | 74% | 29% | 31% | 49% | |
| Seq Read (MB/s) | 2127 | 2321 9% | 2028 -5% | 1982 -7% | 2980 40% |
| Seq Write (MB/s) | 1296 | 2620 102% | 1193 -8% | 2252 74% | 2094 62% |
| 4K Read (MB/s) | 54.8 | 48.57 -11% | 42.31 -23% | 47.13 -14% | 45.05 -18% |
| 4K Write (MB/s) | 110.8 | 165.1 49% | 105.5 -5% | 88.2 -20% | 155.4 40% |
| 4K-64 Read (MB/s) | 1420 | 1712 21% | 1128 -21% | 1481 4% | 1291 -9% |
| 4K-64 Write (MB/s) | 2012 | 2174 8% | 1537 -24% | 1842 -8% | 1506 -25% |
| Access Time Read * (ms) | 0.046 | 0.057 -24% | 0.069 -50% | 0.087 -89% | 0.064 -39% |
| Access Time Write * (ms) | 0.099 | 0.068 31% | 0.106 -7% | 0.04 60% | 0.024 76% |
| Score Read (Points) | 1687 | 1993 18% | 1373 -19% | 1726 2% | 1634 -3% |
| Score Write (Points) | 2253 | 2601 15% | 1762 -22% | 2155 -4% | 1871 -17% |
| Score Total (Points) | 4770 | 5630 18% | 3801 -20% | 4781 0% | 4300 -10% |
| Copy ISO MB/s (MB/s) | 2779 | 2589 -7% | 1768 -36% | 1982 -29% | 2015 -27% |
| Copy Program MB/s (MB/s) | 123.3 | 791 542% | 627 409% | 501 306% | 597 384% |
| Copy Game MB/s (MB/s) | 440.8 | 1625 269% | 1477 235% | 1140 159% | 1449 229% |
| CrystalDiskMark 5.2 / 6 | 12% | -9% | 2% | 1% | |
| Write 4K (MB/s) | 114.1 | 185.8 63% | 121 6% | 132.9 16% | 162.2 42% |
| Read 4K (MB/s) | 57.2 | 47.21 -17% | 42.16 -26% | 46.73 -18% | 43.71 -24% |
| Write Seq (MB/s) | 2580 | 2874 11% | 2150 -17% | 2214 -14% | 2441 -5% |
| Read Seq (MB/s) | 2527 | 1786 -29% | 1755 -31% | 2018 -20% | 1753 -31% |
| Write 4K Q32T1 (MB/s) | 480.2 | 466.8 -3% | 395.3 -18% | 478.9 0% | 397.6 -17% |
| Read 4K Q32T1 (MB/s) | 387.6 | 563 45% | 381.8 -1% | 540 39% | 520 34% |
| Write Seq Q32T1 (MB/s) | 2996 | 3091 3% | 2730 -9% | 2975 -1% | 2519 -16% |
| Read Seq Q32T1 (MB/s) | 2853 | 3395 19% | 3468 22% | 3195 12% | 3448 21% |
| Write 4K Q8T8 (MB/s) | 1381 | ||||
| Read 4K Q8T8 (MB/s) | 1371 | ||||
| Media total (Programa/Opciones) | 43% /
51% | 10% /
15% | 17% /
20% | 25% /
31% |
* ... más pequeño es mejor

Disk Throttling: DiskSpd Read Loop, Queue Depth 8
Rendimiento de la GPU
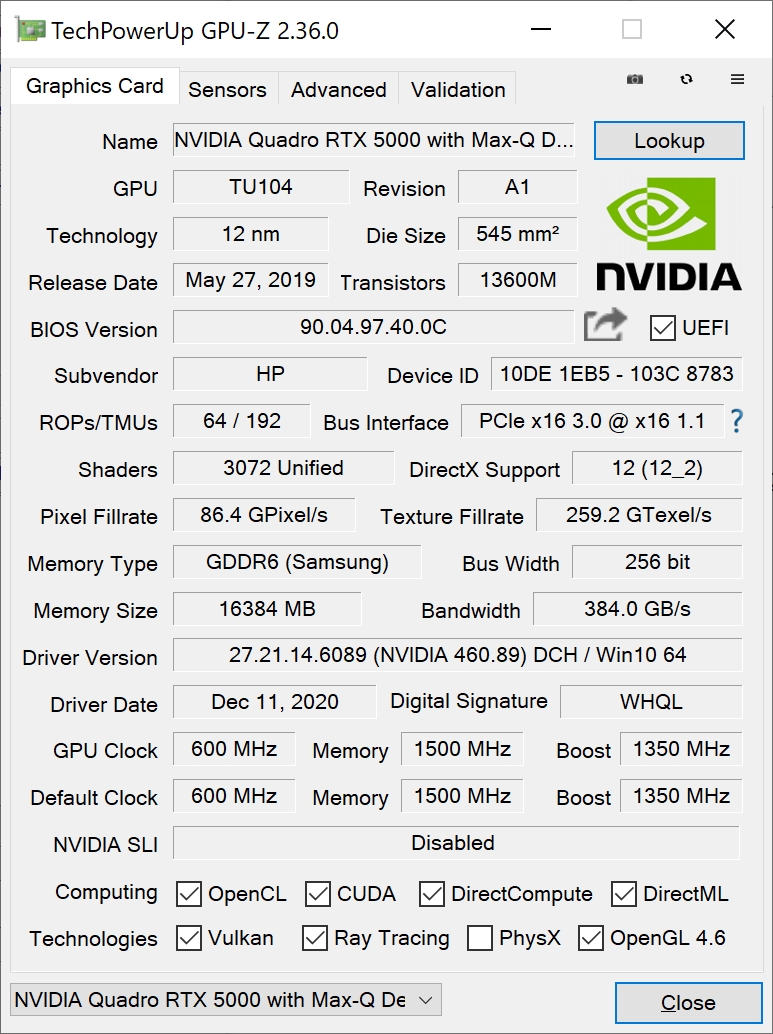
El sistema utiliza una GPU Quadro RTX 5000 Max-Q en lugar de la más rápida Quadro RTX 5000 Max-P, que es capaz de ofrecer hasta un 30 a 35 por ciento más de rendimiento que nuestra variante Max-Q. Los usuarios que deseen el máximo rendimiento de la RTX 5000 deben buscar en el Acer ConceptD 9 Pro más grande.
El rendimiento de los gráficos en bruto sigue siendo excelente, con resultados de referencia que se acercan a los de una Quadro RTX 4000 Max-P.
| 3DMark 11 Performance | 20890 puntos | |
| 3DMark Cloud Gate Standard Score | 30434 puntos | |
| 3DMark Fire Strike Score | 16005 puntos | |
| 3DMark Time Spy Score | 7276 puntos | |
ayuda | ||
| bajo | medio | alto | ultra | QHD | 4K | |
|---|---|---|---|---|---|---|
| The Witcher 3 (2015) | 298.9 | 235.8 | 149.8 | 79.5 | 55.4 | |
| Dota 2 Reborn (2015) | 142 | 126 | 119 | 112 | 96.7 | |
| Final Fantasy XV Benchmark (2018) | 132 | 101 | 79.4 | 58.4 | 33.9 | |
| X-Plane 11.11 (2018) | 96.1 | 86.9 | 73.4 | 60.6 |
Emissions
Ruido del sistema
El ruido del ventilador nunca es un problema cuando se trata de cargas bajas o medias. La primera escena de referencia de 90 segundos de 3DMark 06, por ejemplo, induce un ruido del ventilador de sólo 31,7 dB(A) a ser mucho más silencioso que lo que hemos observado en el Precision 7550 o MSI WS66. El ruido del ventilador alcanza un máximo de 47 dB(A) cuando se ejecutan cargas más altas.
No podemos notar ningún ruido electrónico o quejido de la bobina en nuestra unidad de prueba.
| HP ZBook Fury 15 G7 Quadro RTX 5000 Max-Q, W-10885M, Samsung PM981a MZVLB1T0HBLR | Asus ProArt StudioBook Pro 15 W500G5T Quadro RTX 5000 Max-Q, i7-9750H, Samsung SSD PM981 MZVLB1T0HALR | MSI WS66 10TMT-207US Quadro RTX 5000 Max-Q, i9-10980HK, WDC PC SN730 SDBPNTY-1T00 | Dell Precision 7550 Quadro RTX 5000 Max-Q, W-10885M, SK Hynix PC601A NVMe 1TB | Razer Blade 15 Studio Edition 2020 Quadro RTX 5000 Max-Q, i7-10875H, Samsung PM981a MZVLB1T0HBLR | Lenovo ThinkPad P1 2019-20QT000RGE Quadro T1000 (Laptop), i7-9850H, WDC PC SN720 SDAQNTW-512G | |
|---|---|---|---|---|---|---|
| Noise | -10% | -17% | -11% | -12% | -5% | |
| apagado / medio ambiente * (dB) | 26.4 | 25.2 5% | 26 2% | 25.8 2% | 30.1 -14% | 28.8 -9% |
| Idle Minimum * (dB) | 26.4 | 27.9 -6% | 32 -21% | 25.8 2% | 30.1 -14% | 28.8 -9% |
| Idle Average * (dB) | 26.4 | 27.9 -6% | 32 -21% | 25.8 2% | 30.1 -14% | 28.8 -9% |
| Idle Maximum * (dB) | 26.4 | 27.9 -6% | 32 -21% | 25.9 2% | 30.1 -14% | 28.8 -9% |
| Load Average * (dB) | 31.7 | 47 -48% | 42 -32% | 51.2 -62% | 42.3 -33% | 36.1 -14% |
| Witcher 3 ultra * (dB) | 47 | 47.4 -1% | 51.9 -10% | 48.2 -3% | ||
| Load Maximum * (dB) | 47 | 46.9 -0% | 59.7 -27% | 51.9 -10% | 42.1 10% | 36.7 22% |
* ... más pequeño es mejor
Ruido
| Ocioso |
| 26.4 / 26.4 / 26.4 dB(A) |
| Carga |
| 31.7 / 47 dB(A) |
 | ||
30 dB silencioso 40 dB(A) audible 50 dB(A) ruidosamente alto |
||
min: | ||
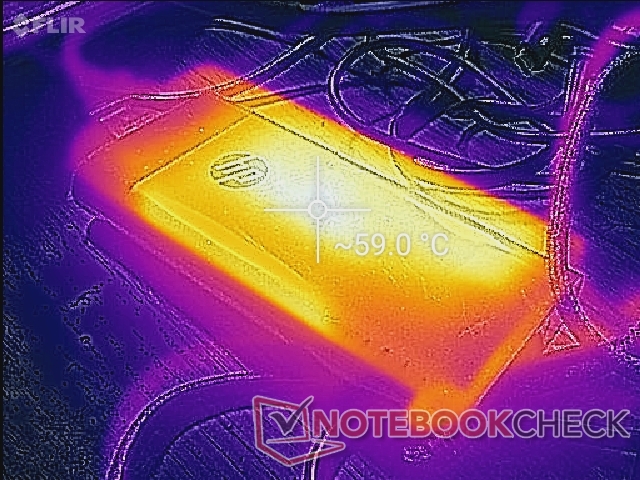
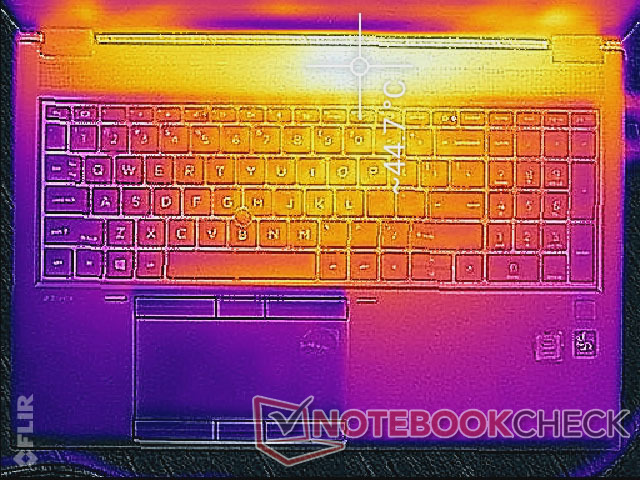
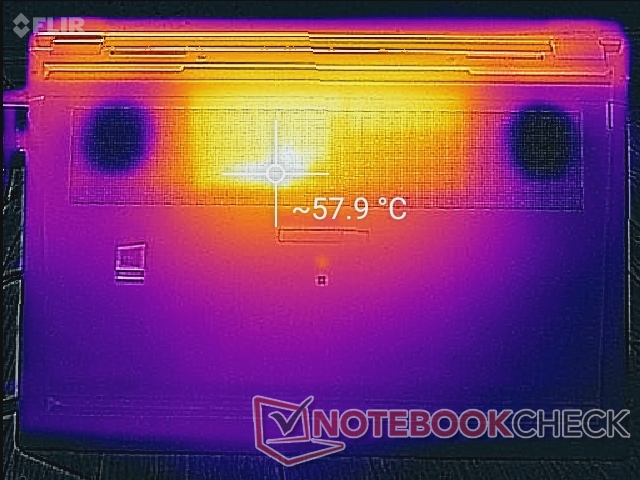
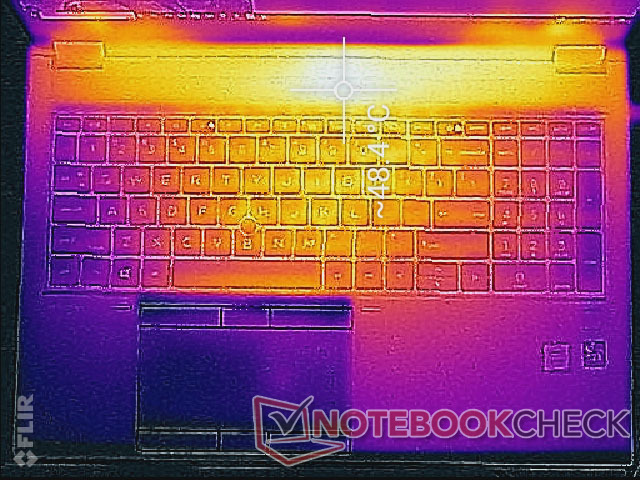
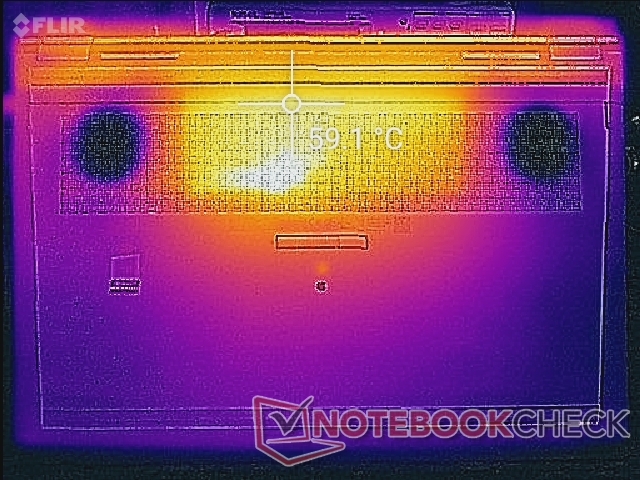
Temperatura
Los puntos calientes pueden llegar a ser tan calientes como 49 C a 60 C en la parte superior e inferior del portátil, respectivamente. Afortunadamente, estas áreas están hacia la parte trasera de la laptop donde los usuarios son menos propensos a tocar. El AsusProArt StudioBook Pro 15, que viene con la misma GPU RTX 5000 Max-Q, funciona incluso más caliente hasta 66 C cuando está en condiciones similares.
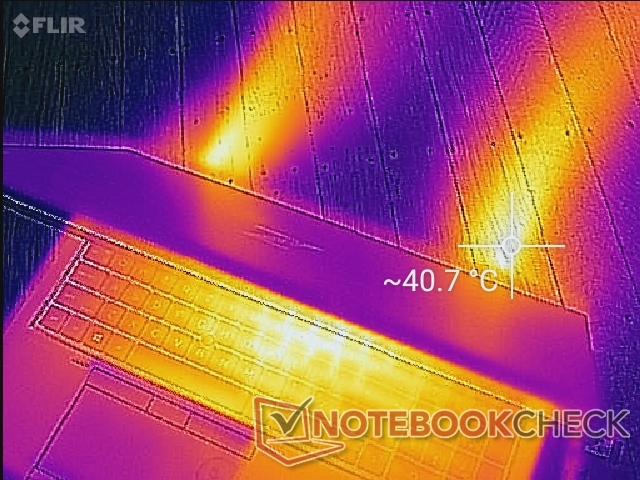
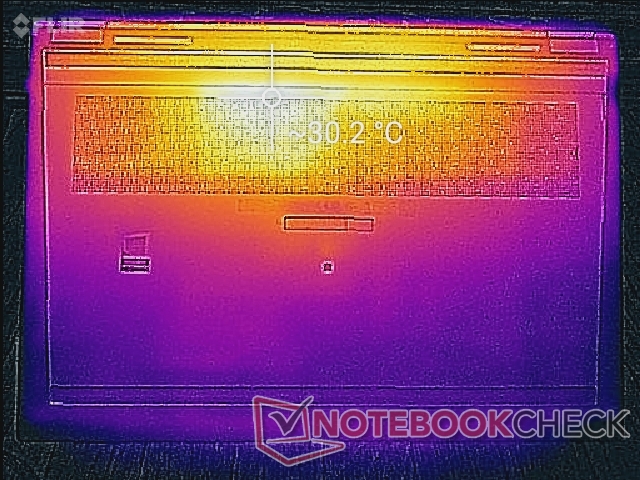
(-) La temperatura máxima en la parte superior es de 48.8 °C / 120 F, frente a la media de 38.2 °C / 101 F, que oscila entre 22.2 y 69.8 °C para la clase Workstation.
(-) El fondo se calienta hasta un máximo de 62.6 °C / 145 F, frente a la media de 41.1 °C / 106 F
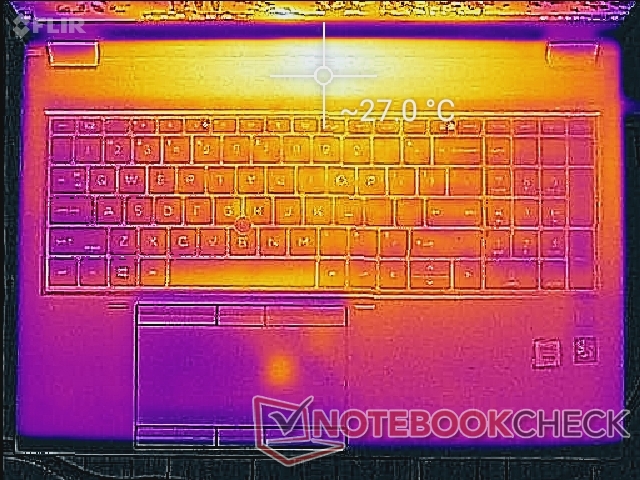
(+) En reposo, la temperatura media de la parte superior es de 24.5 °C / 76# F, frente a la media del dispositivo de 32 °C / 90 F.
(±) Jugando a The Witcher 3, la temperatura media de la parte superior es de 33.9 °C / 93 F, frente a la media del dispositivo de 32 °C / 90 F.
(+) Los reposamanos y el panel táctil alcanzan como máximo la temperatura de la piel (33 °C / 91.4 F) y, por tanto, no están calientes.
(-) La temperatura media de la zona del reposamanos de dispositivos similares fue de 27.8 °C / 82 F (-5.2 °C / -9.4 F).
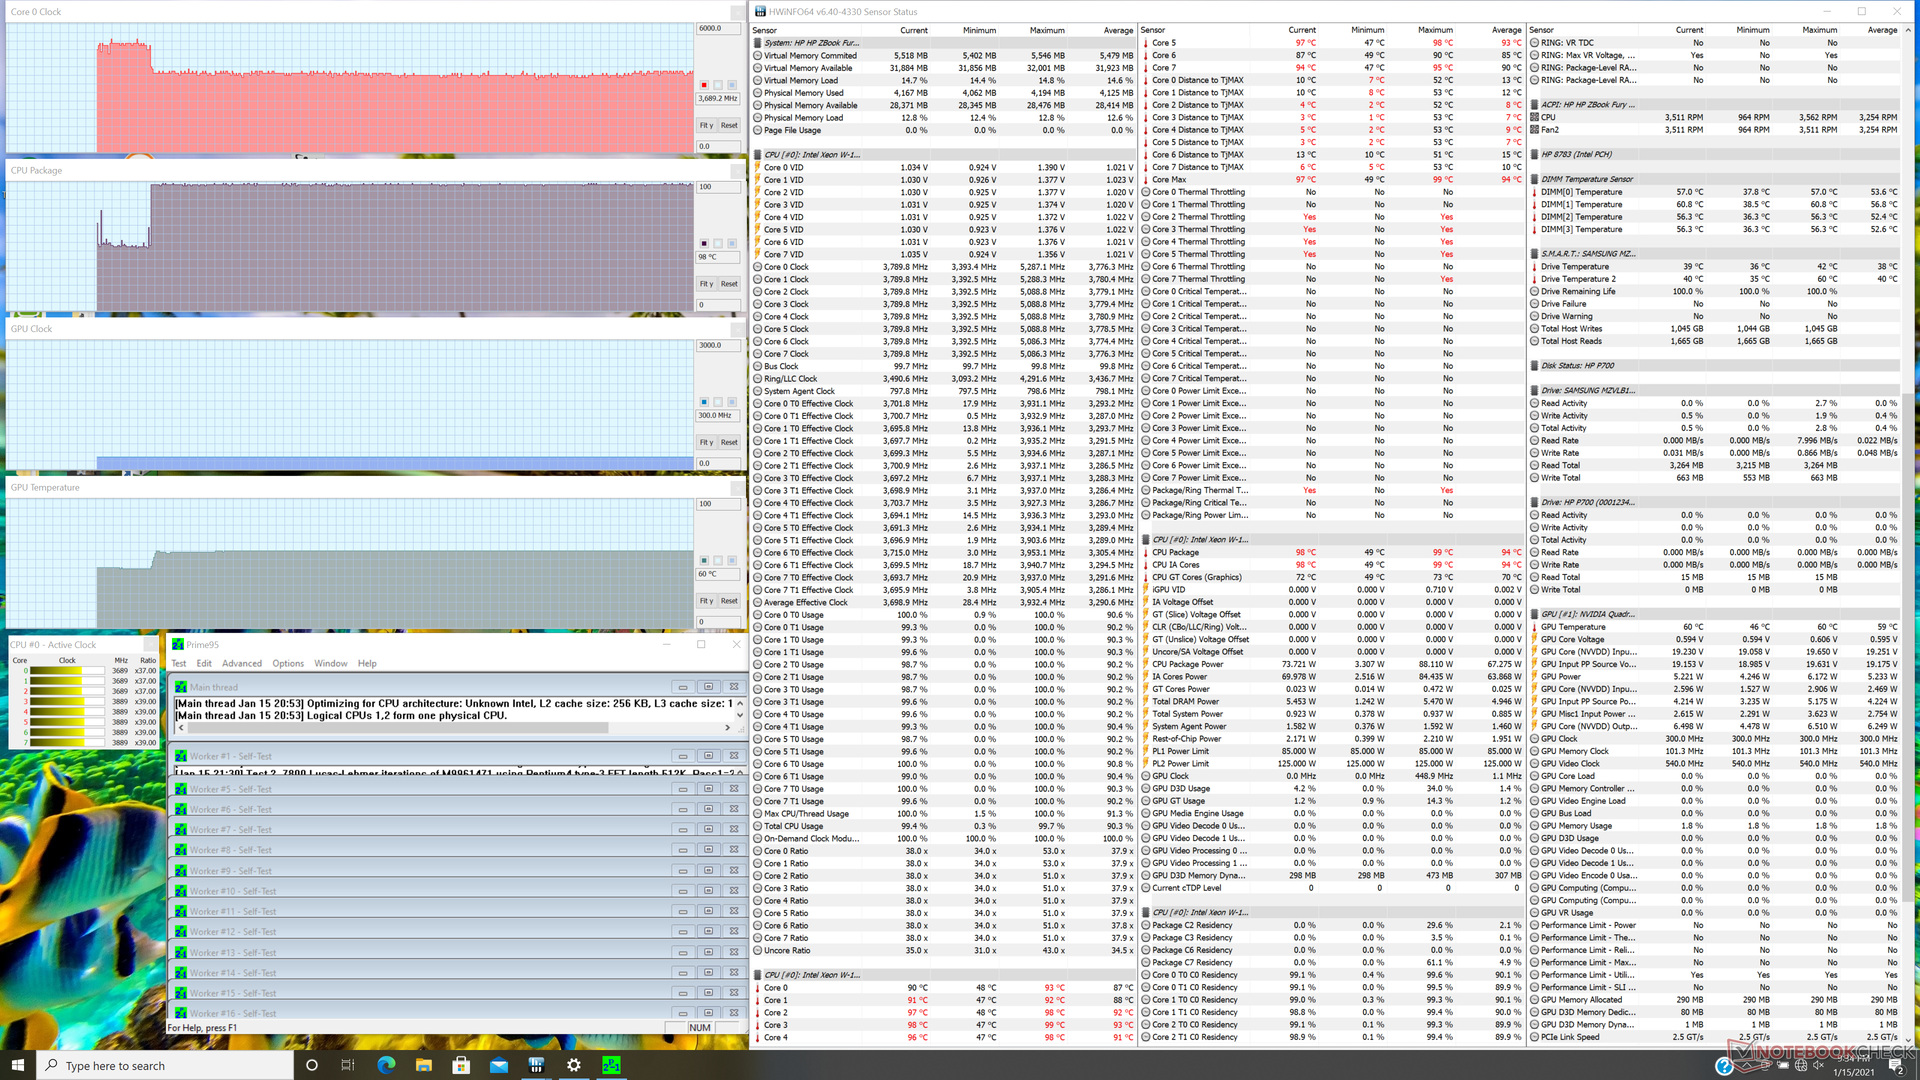
Prueba de estrés
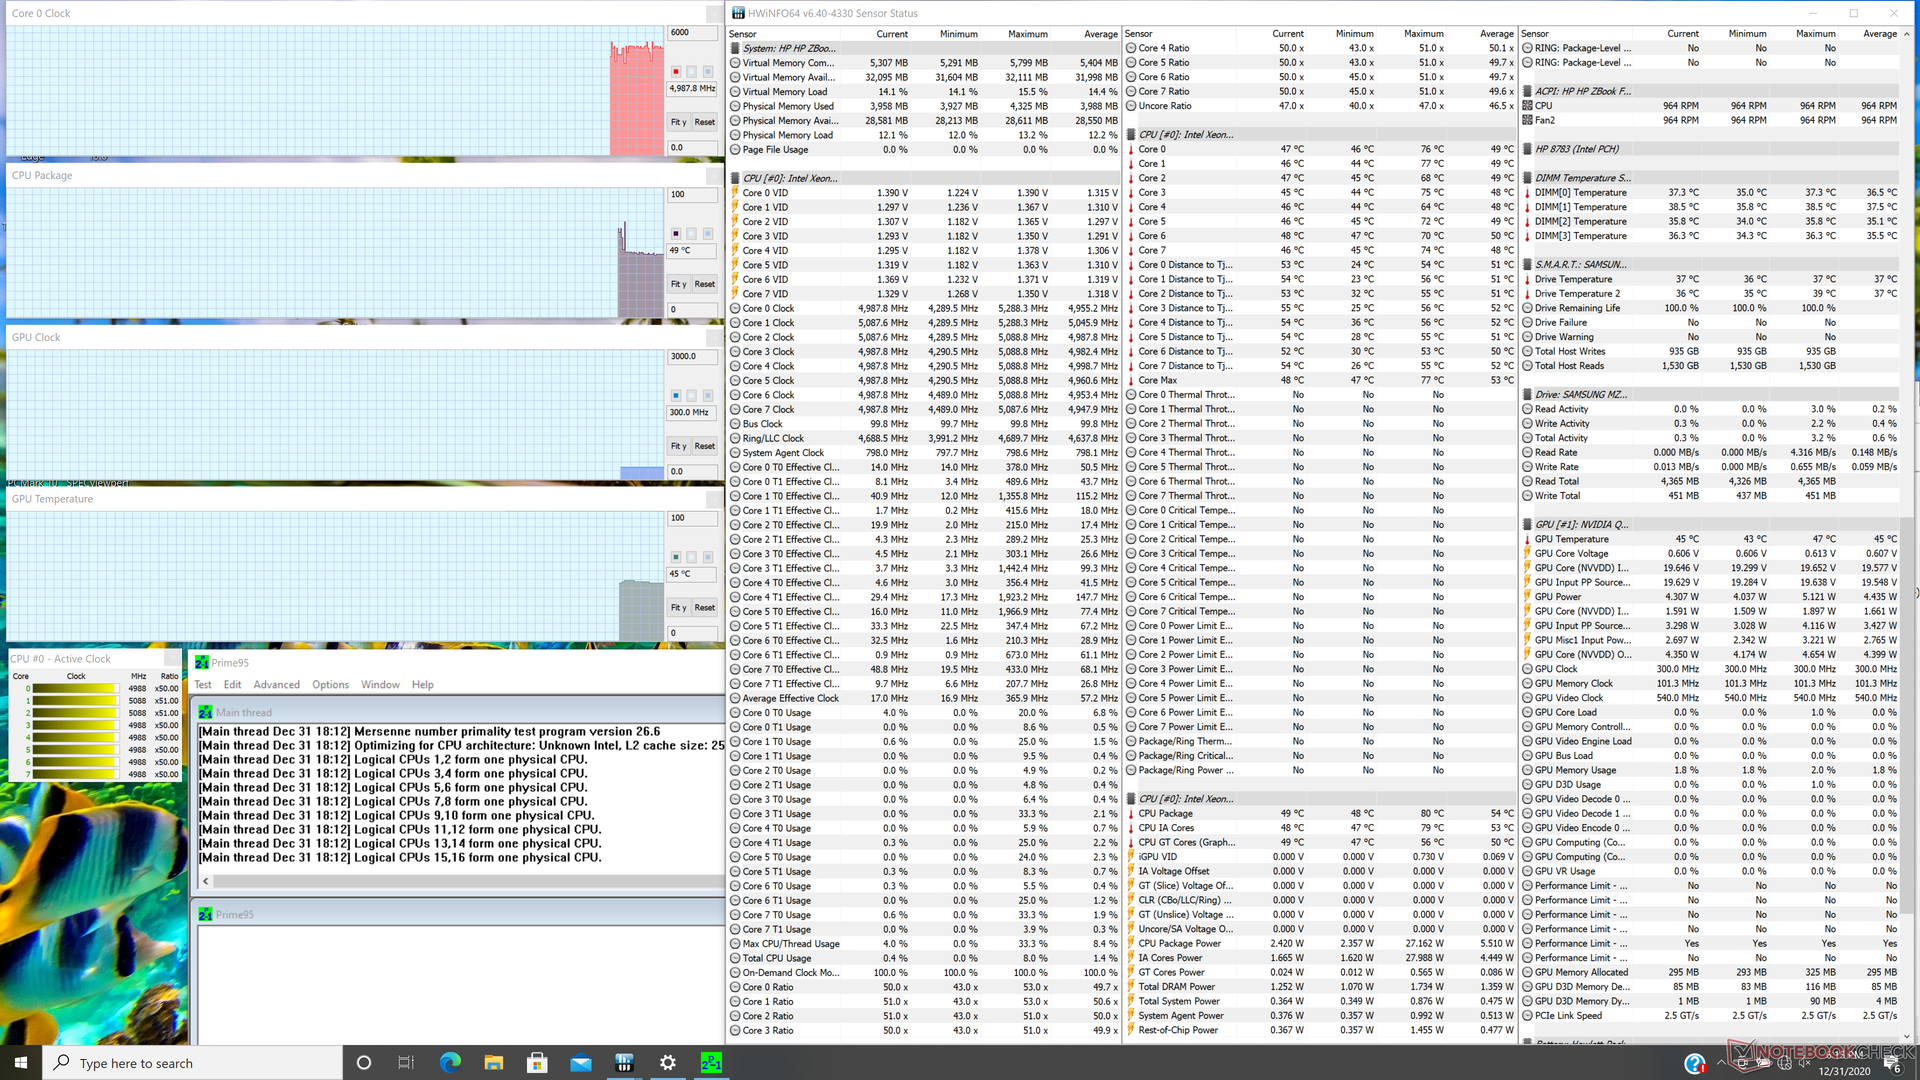
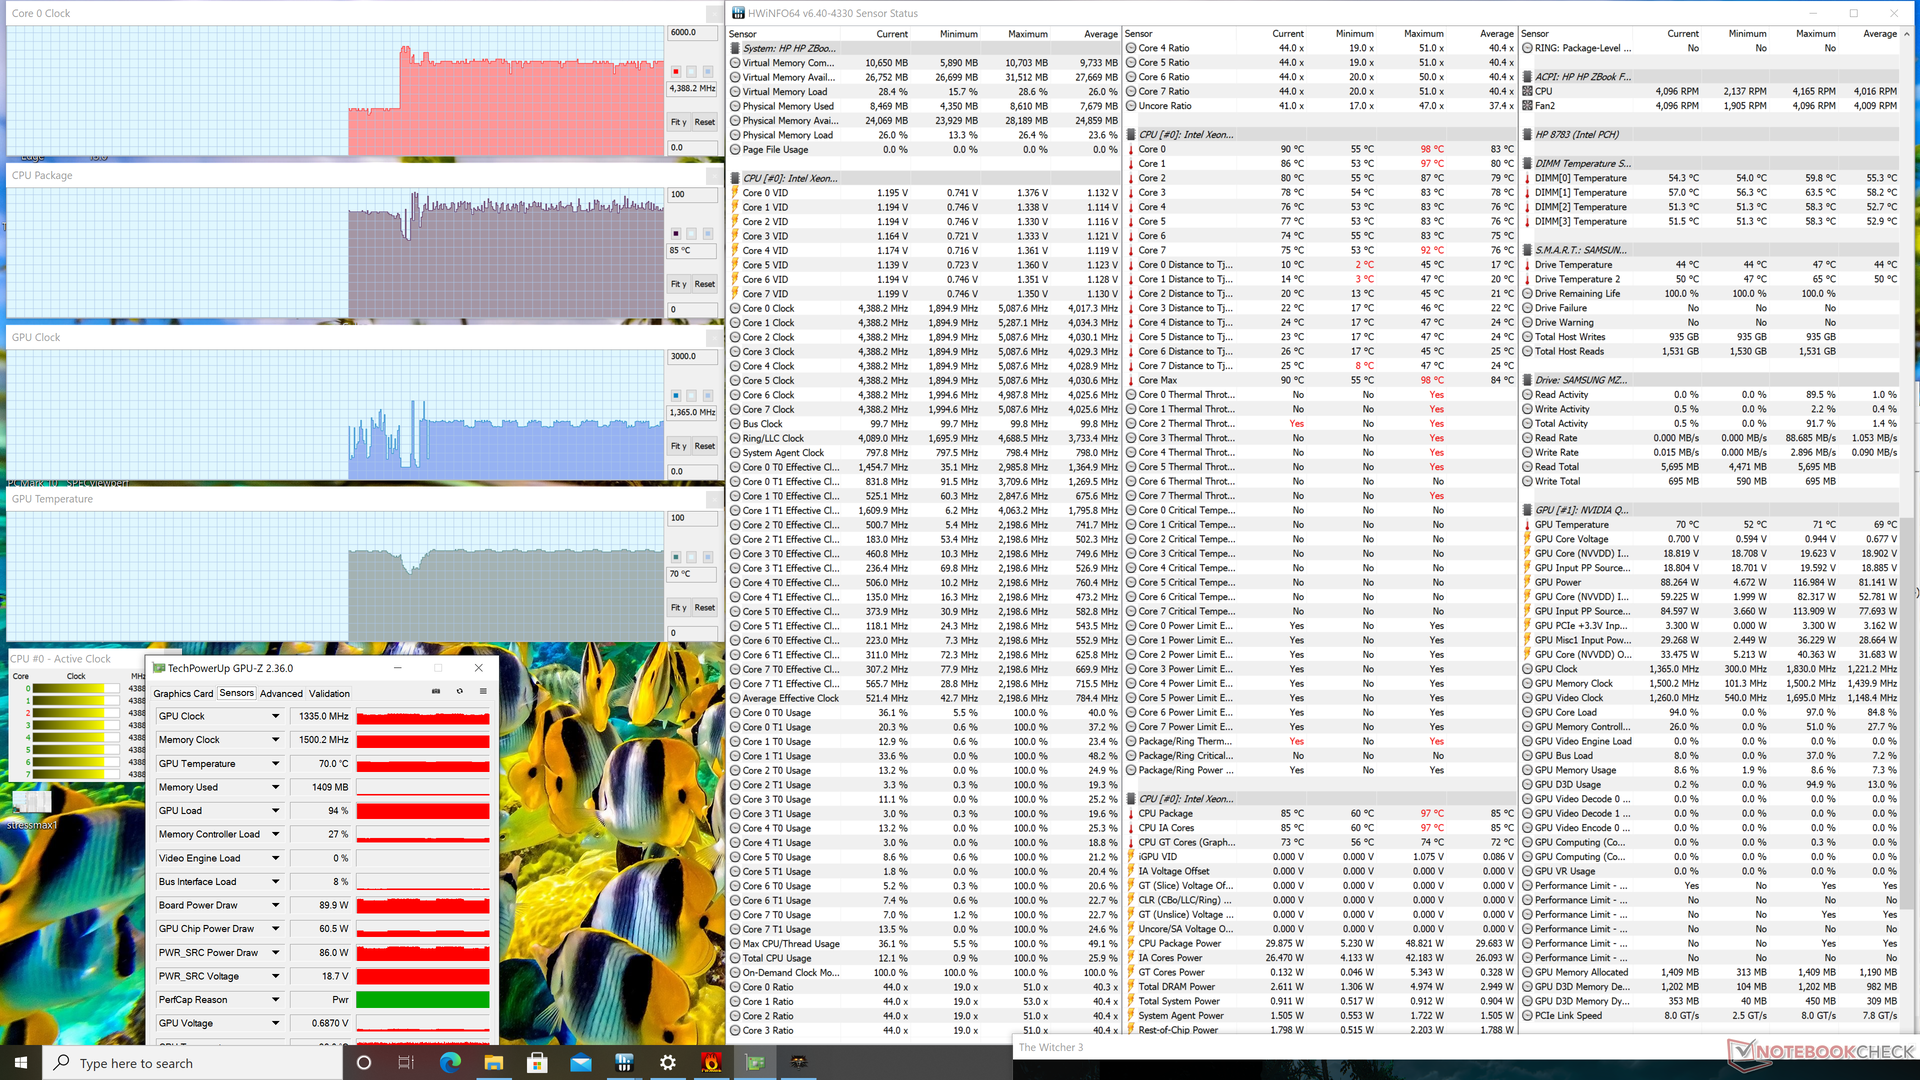
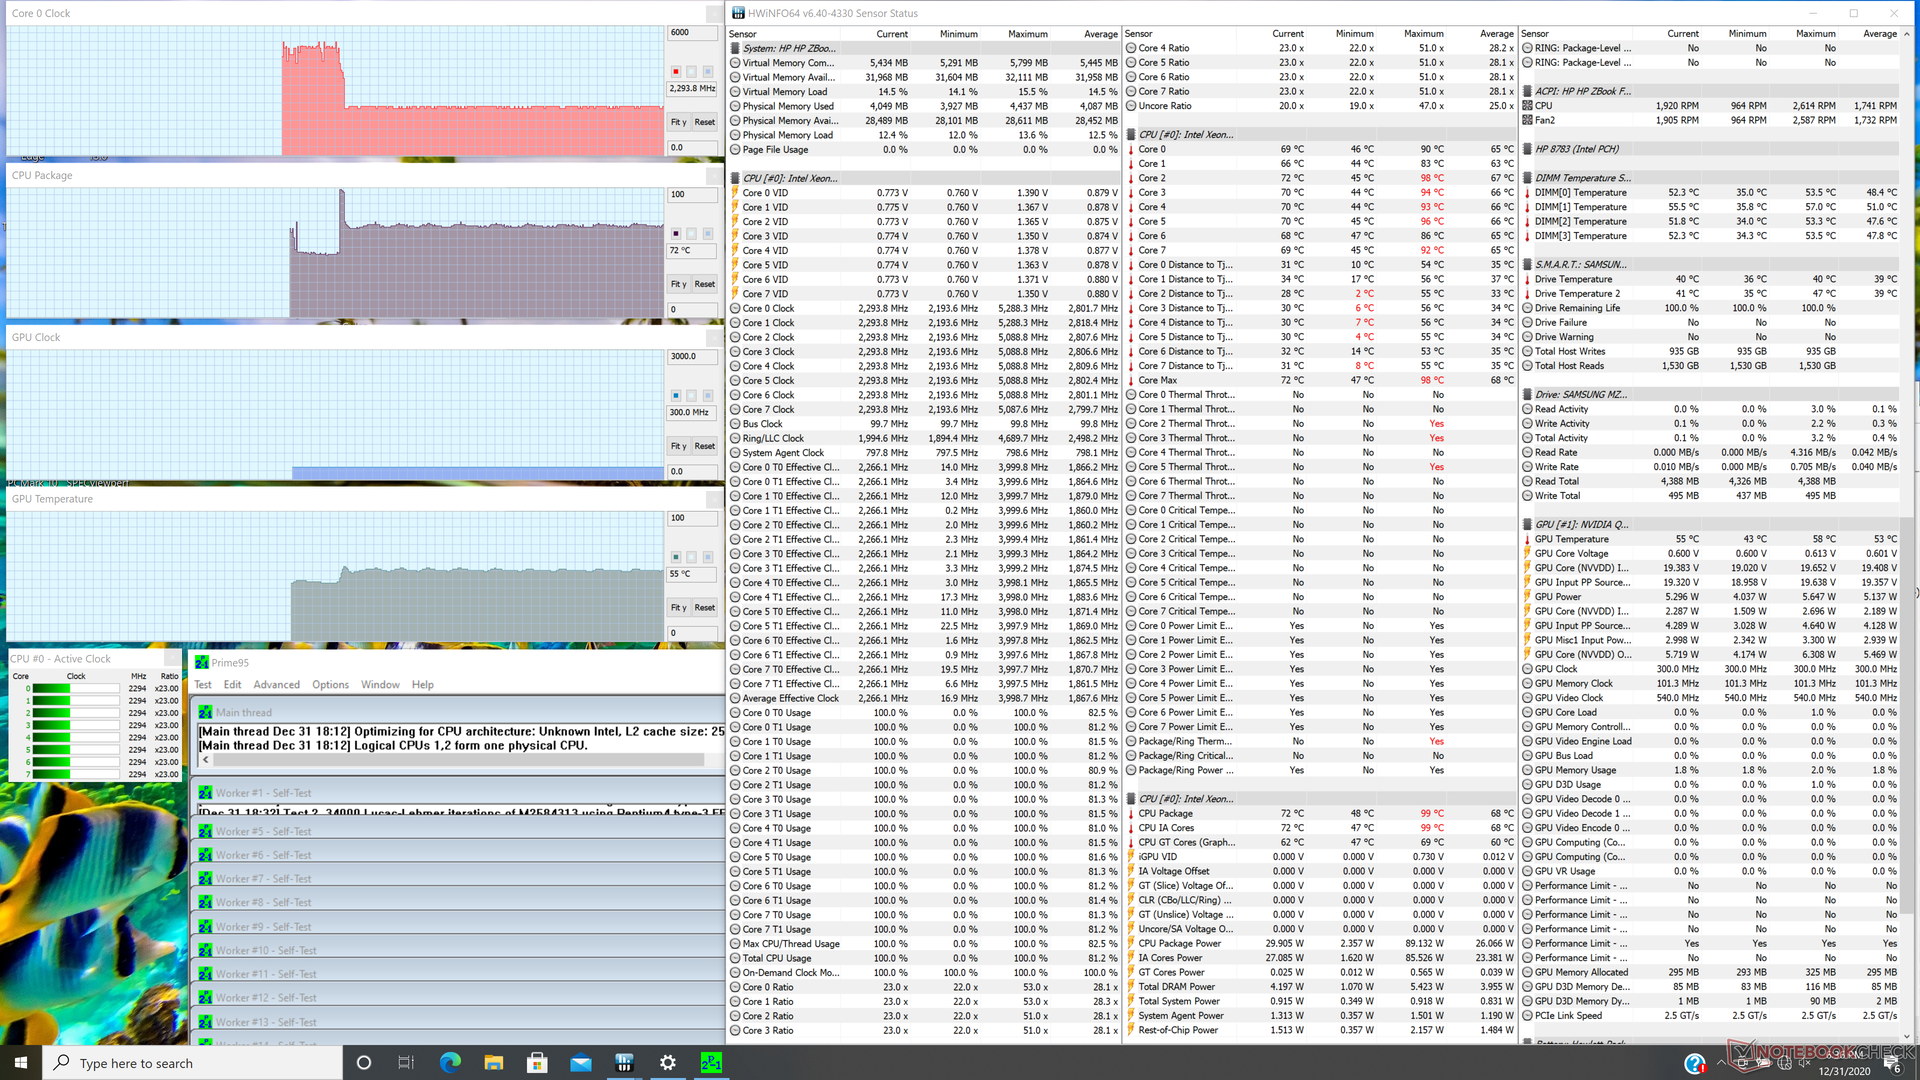
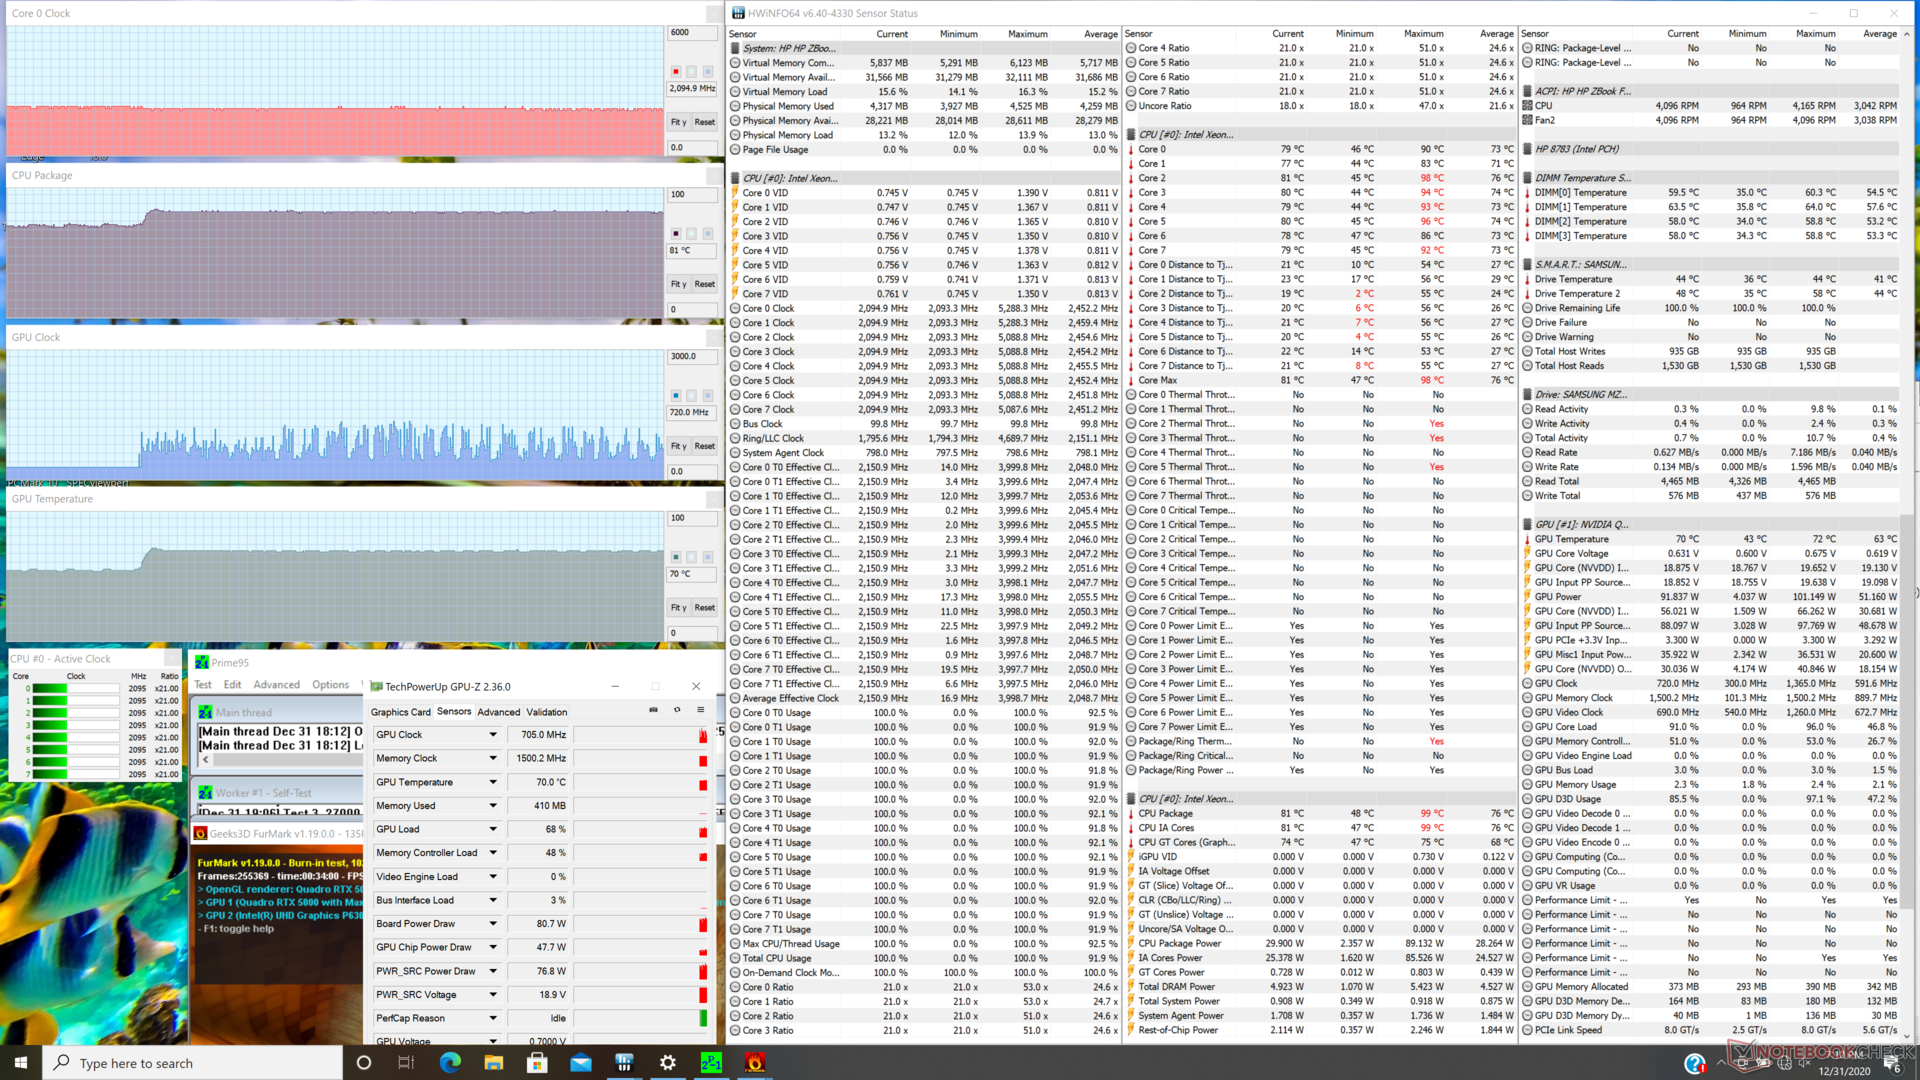
Enfatizamos el sistema con cargas sintéticas para identificar cualquier posible estrangulamiento o problemas de estabilidad. Cuando se ejecuta Prime95, la CPU se elevaría hasta el rango de 3,6 a 4 GHz durante unos pocos segundos y a una temperatura del núcleo de 99 C. Luego bajaría inmediatamente a sólo 2,3 GHz para una temperatura del núcleo mucho más fría de 72 C. Sin embargo, después de actualizar nuestro BIOS, la CPU se estabilizaría en cambio a unos 3,6 GHz y 98 C para un rendimiento drásticamente más rápido, aunque a costa de temperaturas del núcleo mucho más cálidas. Los resultados generales después de la actualización son similares a los que observamos en el Precision 7550.
El funcionamiento con batería afecta al rendimiento de los gráficos. Un Fire Strike que funcione con pilas daría como resultado unos resultados de Física y Gráficos de 15724 y 9428 puntos, respectivamente, en comparación con los 15118 y 19759 puntos cuando está en la red eléctrica.
| Reloj de laCPU(GHz) Reloj de la GPU(MHz) Temperatura promedio de laCPU (°C) Temperatura promedio de laGPU(°C) | |
| Elsistema está inactivo.. | |
| Prime95 Stress 2.2 - 2.3.. | |
| Prime95 Stress (BIOS 1.04.01) | 3.5 - 3.6 |
| Prime95 + FurMark Stress | 2.0 - 2.1 |
| Prime95 + FurMark Stress (BIOS 1.04.01) | 2.9 - 3.5 |
| Witcher 3 Estrés | ~4.4 |
Oradores

HP ZBook Fury 15 G7 análisis de audio
(±) | la sonoridad del altavoz es media pero buena (80.1 dB)
Graves 100 - 315 Hz
(±) | lubina reducida - en promedio 8% inferior a la mediana
(±) | la linealidad de los graves es media (9.5% delta a frecuencia anterior)
Medios 400 - 2000 Hz
(+) | medios equilibrados - a sólo 3.3% de la mediana
(+) | los medios son lineales (4.8% delta a la frecuencia anterior)
Altos 2 - 16 kHz
(+) | máximos equilibrados - a sólo 2.2% de la mediana
(+) | los máximos son lineales (3.5% delta a la frecuencia anterior)
Total 100 - 16.000 Hz
(+) | el sonido global es lineal (10.1% de diferencia con la mediana)
En comparación con la misma clase
» 6% de todos los dispositivos probados de esta clase eran mejores, 4% similares, 90% peores
» El mejor tuvo un delta de 7%, la media fue 17%, el peor fue ###max##%
En comparación con todos los dispositivos probados
» 5% de todos los dispositivos probados eran mejores, 1% similares, 94% peores
» El mejor tuvo un delta de 4%, la media fue 24%, el peor fue ###max##%
Apple MacBook 12 (Early 2016) 1.1 GHz análisis de audio
(+) | los altavoces pueden reproducir a un volumen relativamente alto (#83.6 dB)
Graves 100 - 315 Hz
(±) | lubina reducida - en promedio 11.3% inferior a la mediana
(±) | la linealidad de los graves es media (14.2% delta a frecuencia anterior)
Medios 400 - 2000 Hz
(+) | medios equilibrados - a sólo 2.4% de la mediana
(+) | los medios son lineales (5.5% delta a la frecuencia anterior)
Altos 2 - 16 kHz
(+) | máximos equilibrados - a sólo 2% de la mediana
(+) | los máximos son lineales (4.5% delta a la frecuencia anterior)
Total 100 - 16.000 Hz
(+) | el sonido global es lineal (10.2% de diferencia con la mediana)
En comparación con la misma clase
» 7% de todos los dispositivos probados de esta clase eran mejores, 2% similares, 91% peores
» El mejor tuvo un delta de 5%, la media fue 18%, el peor fue ###max##%
En comparación con todos los dispositivos probados
» 5% de todos los dispositivos probados eran mejores, 1% similares, 94% peores
» El mejor tuvo un delta de 4%, la media fue 24%, el peor fue ###max##%
Energy Management
Consumo de energía
El ralentí en el escritorio demanda entre 4 W y 22 W dependiendo del nivel de brillo y si la GPU discreta está activa. La diferencia entre el brillo mínimo y máximo es de hasta 9 W, ya que la pantalla es más brillante que la mayoría de los demás portátiles.
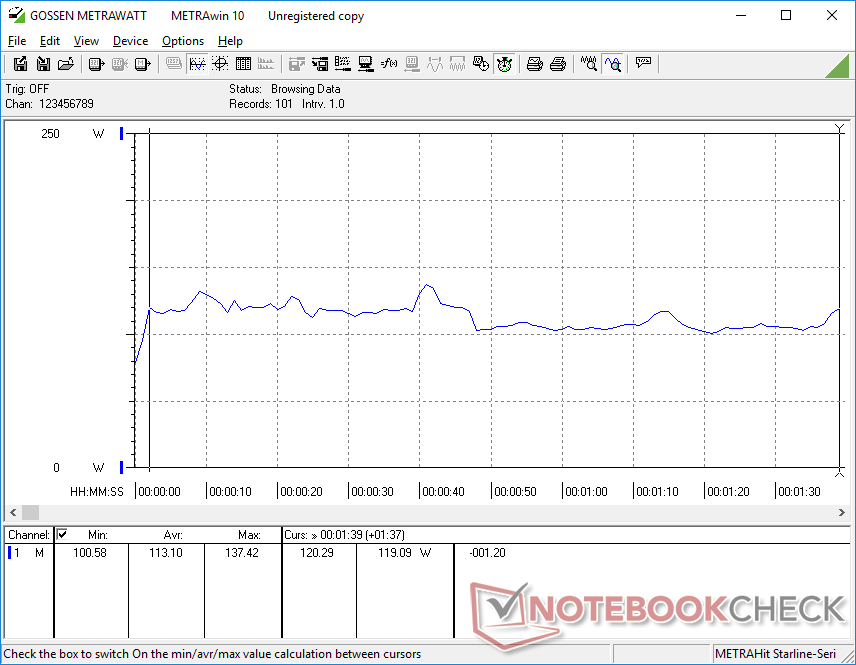
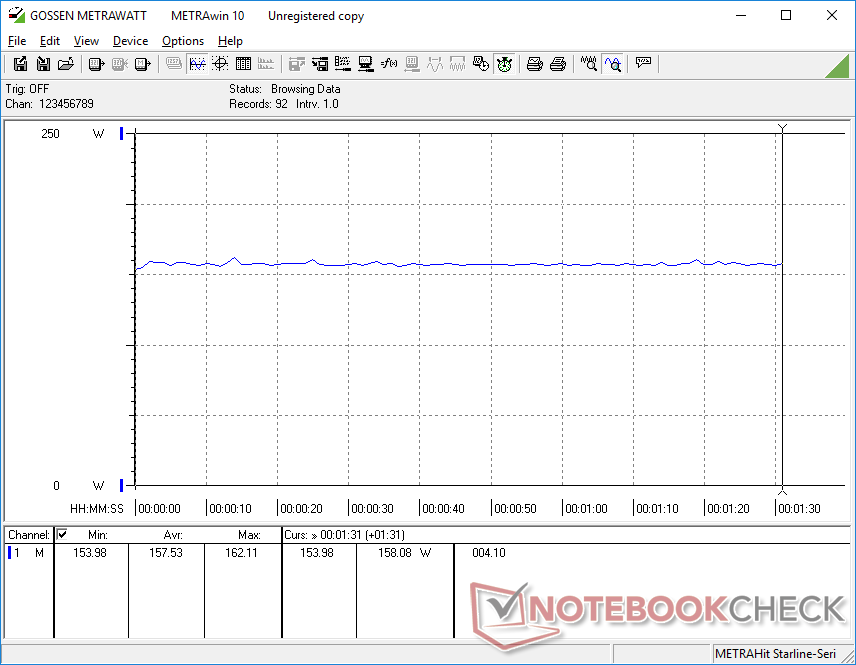
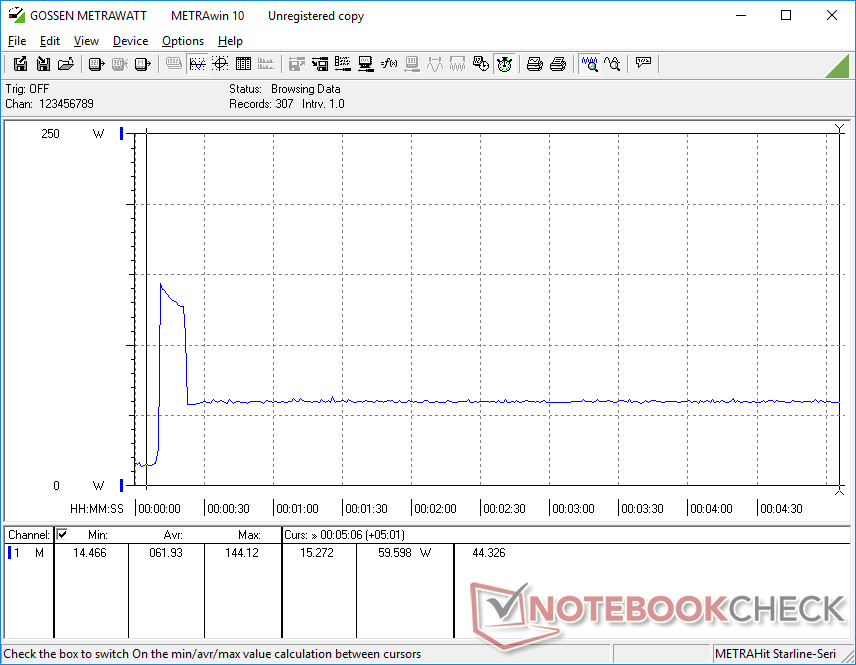
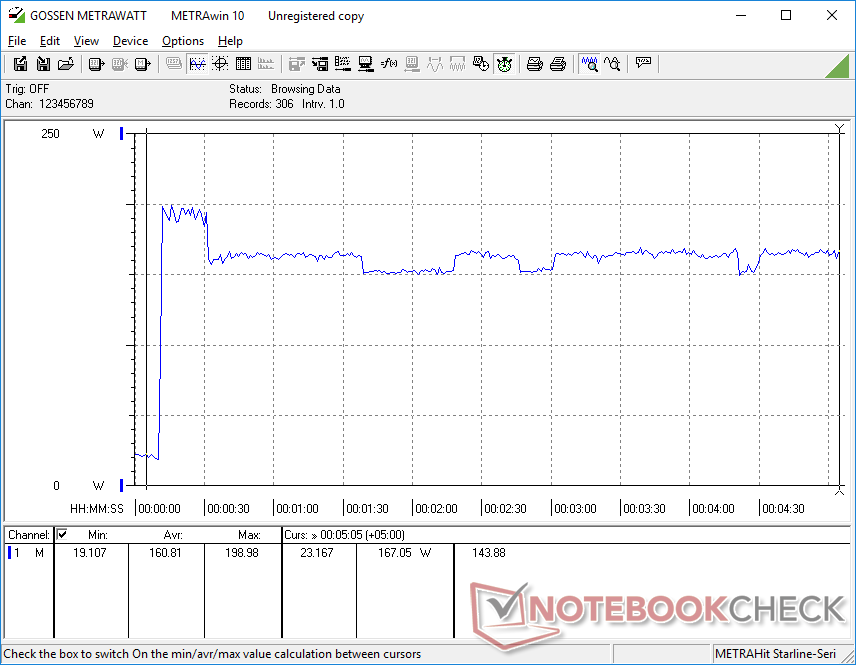
Cargas más altas equivalentes a los juegos pueden dibujar entre 113 W a 158 W que es casi exactamente lo que medimos en el Precision 7550 o MSI WS66 así como cada uno equipado con el mismo CPU y GPU. Sin embargo, se puede observar una gran diferencia cuando se ejecuta Prime95. El consumo de energía se estabilizaría en sólo 59,6 W en nuestro HP comparado con 135,3 W en nuestro Dell. Esto también explicaría el notable déficit de rendimiento de nuestro HP durante las secciones de prueba de bucle de CineBench y prueba de estrés anteriores.
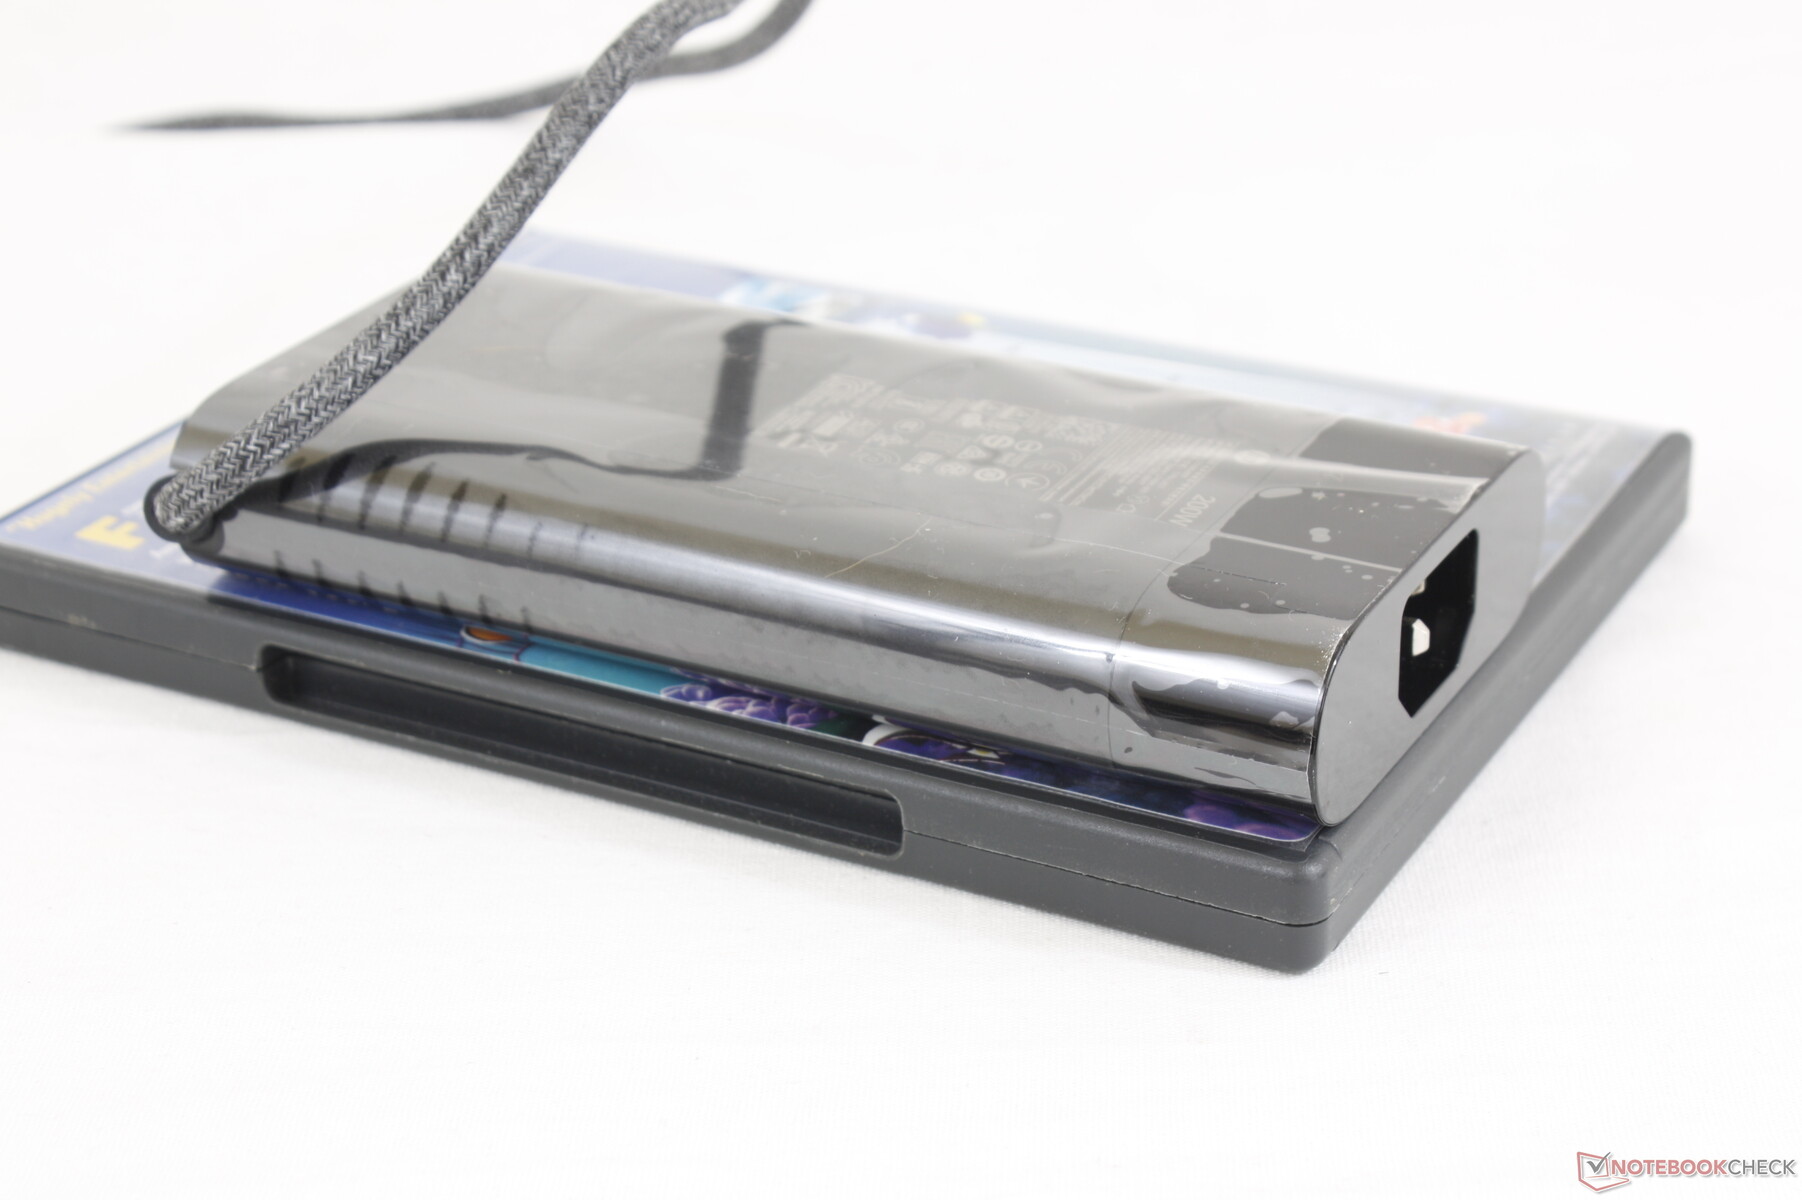
Podemos registrar un consumo máximo de 199 W del adaptador de CA de 200 W de tamaño medio (~15 x 7,2 x 2,4 cm). Esta tasa es sólo temporal, como se muestra en nuestros gráficos a continuación, probablemente debido a razones térmicas. Ejecutar cargas extremas disminuirá la velocidad de carga pero no agotará la batería, a diferencia dealgunos de los primeros modelos de Dell Precision.
| Off / Standby | |
| Ocioso | |
| Carga |
|
Clave:
min: | |
| HP ZBook Fury 15 G7 W-10885M, Quadro RTX 5000 Max-Q, Samsung PM981a MZVLB1T0HBLR, IPS, 3840x2160, 15.6" | Asus ProArt StudioBook Pro 15 W500G5T i7-9750H, Quadro RTX 5000 Max-Q, Samsung SSD PM981 MZVLB1T0HALR, IPS, 3840x2160, 15.6" | MSI WS66 10TMT-207US i9-10980HK, Quadro RTX 5000 Max-Q, WDC PC SN730 SDBPNTY-1T00, IPS, 1920x1080, 15.6" | Dell Precision 7550 W-10885M, Quadro RTX 5000 Max-Q, SK Hynix PC601A NVMe 1TB, IPS, 3840x2160, 15.6" | Razer Blade 15 Studio Edition 2020 i7-10875H, Quadro RTX 5000 Max-Q, Samsung PM981a MZVLB1T0HBLR, OLED, 3840x2160, 15.6" | Lenovo ThinkPad P1 2019-20QT000RGE i7-9850H, Quadro T1000 (Laptop), WDC PC SN720 SDAQNTW-512G, IPS LED, 1920x1080, 15.6" | |
|---|---|---|---|---|---|---|
| Power Consumption | -33% | -56% | -22% | -37% | -31% | |
| Idle Minimum * (Watt) | 4.6 | 11.6 -152% | 13.8 -200% | 8.2 -78% | 13.4 -191% | 13.7 -198% |
| Idle Average * (Watt) | 13.6 | 19 -40% | 18.4 -35% | 16.8 -24% | 18 -32% | 17.5 -29% |
| Idle Maximum * (Watt) | 21.5 | 20.6 4% | 41.5 -93% | 24.4 -13% | 26.1 -21% | 20.9 3% |
| Load Average * (Watt) | 113.1 | 102 10% | 110.5 2% | 131 -16% | 115 -2% | 77.2 32% |
| Witcher 3 ultra * (Watt) | 157.5 | 151.6 4% | 156.6 1% | 145 8% | ||
| Load Maximum * (Watt) | 199 | 178 11% | 227.1 -14% | 201.8 -1% | 165 17% | 123.7 38% |
* ... más pequeño es mejor
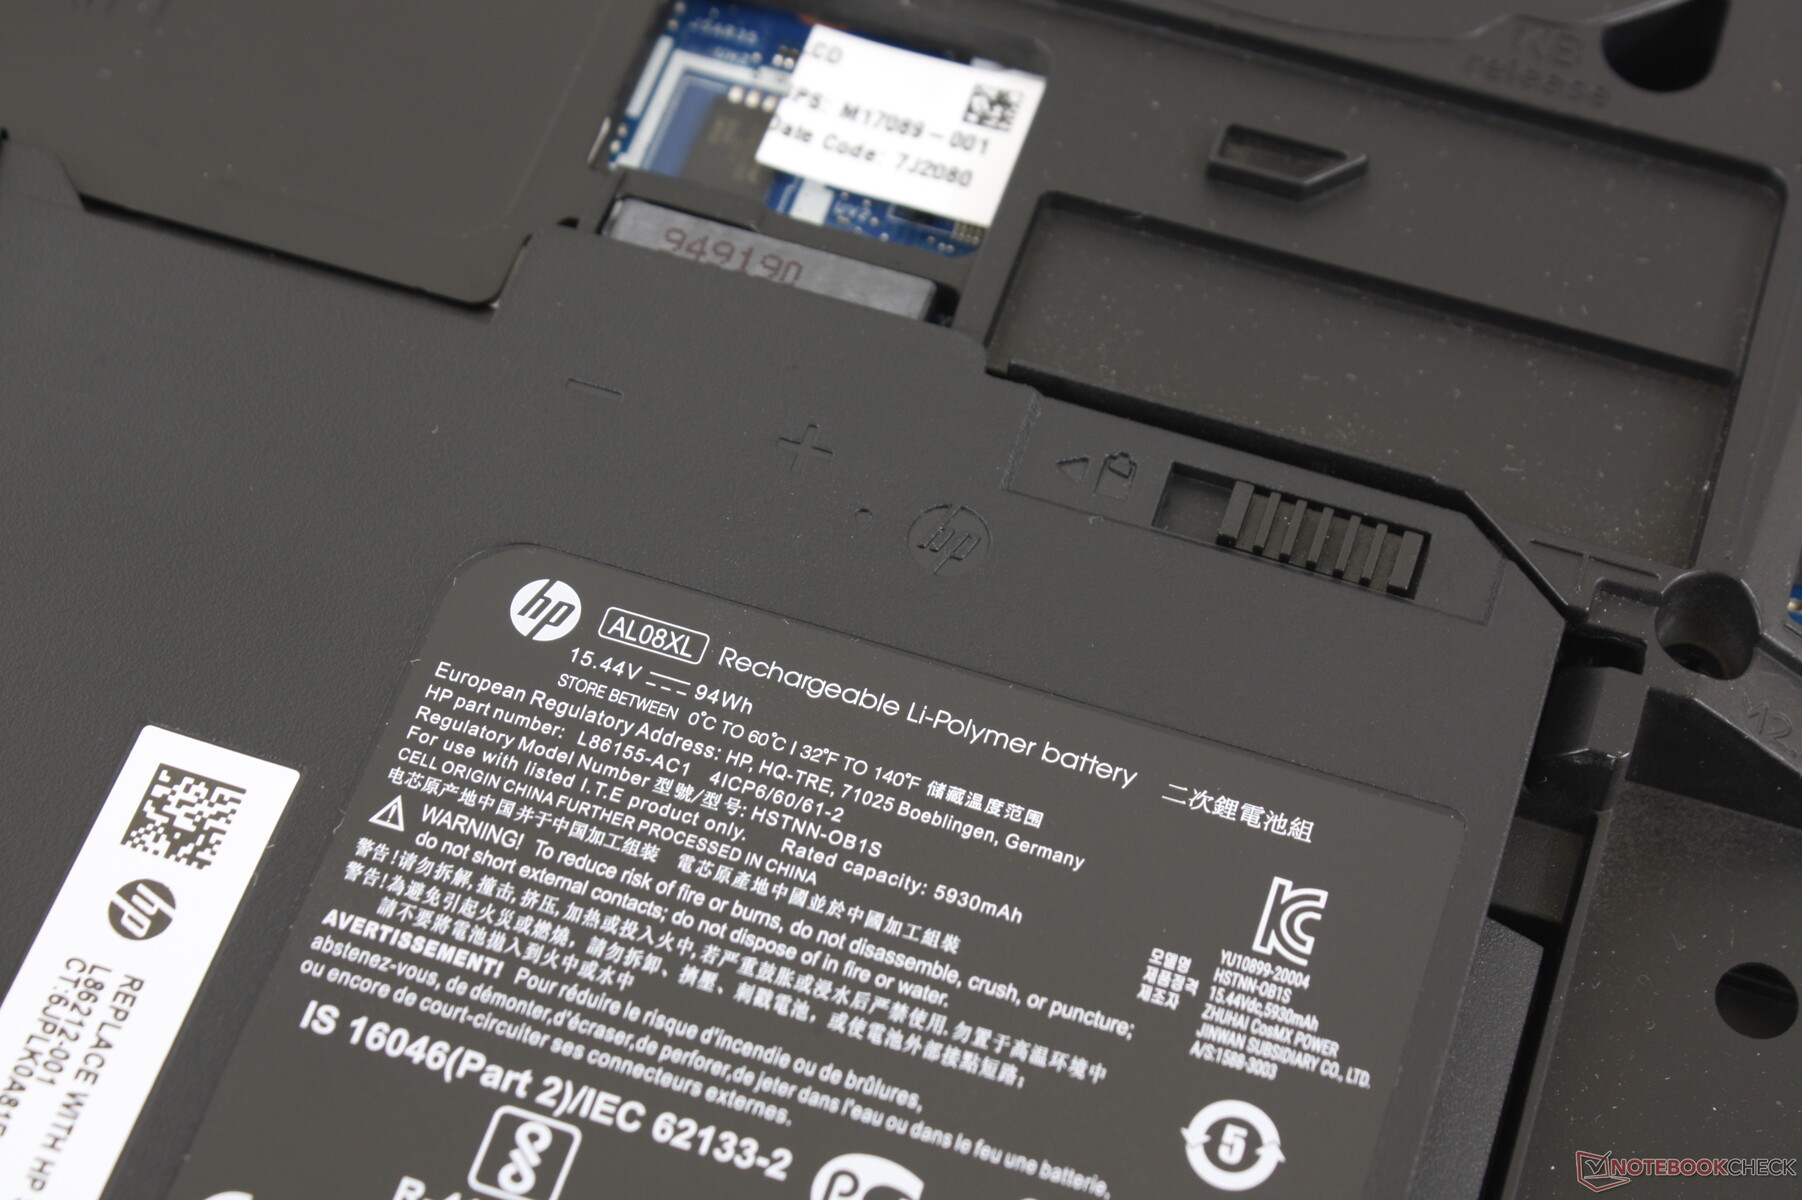
La vida de la batería
Espere 8 horas y media de uso de la red WLAN en el mundo real. La carga de vacío a lleno también es rápida a pesar de la gran capacidad de la batería de 94 Wh. El sistema puede ser cargado a través de USB-C, aunque a un ritmo más lento.
| HP ZBook Fury 15 G7 W-10885M, Quadro RTX 5000 Max-Q, 94 Wh | Asus ProArt StudioBook Pro 15 W500G5T i7-9750H, Quadro RTX 5000 Max-Q, 76 Wh | MSI WS66 10TMT-207US i9-10980HK, Quadro RTX 5000 Max-Q, 99.99 Wh | Dell Precision 7550 W-10885M, Quadro RTX 5000 Max-Q, 95 Wh | Razer Blade 15 Studio Edition 2020 i7-10875H, Quadro RTX 5000 Max-Q, 80 Wh | Lenovo ThinkPad P1 2019-20QT000RGE i7-9850H, Quadro T1000 (Laptop), 80 Wh | |
|---|---|---|---|---|---|---|
| Duración de Batería | -45% | -18% | -12% | -4% | 2% | |
| Reader / Idle (h) | 13.2 | 8.3 -37% | 11.1 -16% | 8.8 -33% | ||
| WiFi v1.3 (h) | 8.6 | 4.7 -45% | 7.8 -9% | 8.9 3% | 5.7 -34% | 8.9 3% |
| Load (h) | 1.3 | 1.2 -8% | 1 -23% | 2 54% | 1.3 0% |
Pro
Contra
Veredicto
El aspecto más notable del ZBook Fury 15 es su capacidad de ofrecer esencialmente todas las características y opciones de rendimiento del Dell Precision 7550 pero en un paquete notablemente más ligero. Esto hace que el HP sea una buena solución intermedia para los usuarios que quieren una estación de trabajo móvil sin sacrificar muchas de las características auxiliares que los modelos más delgados y ligeros como el Razer Blade Studio, el MSI WS66 o el Asus ProArt omiten con frecuencia. También es una de las pocas estaciones de trabajo que incluye opciones de panel de 1000 nits para los ocasionales escenarios de exterior.
Expandible y cómoda con muchas opciones de configuración para elegir. El ZBook Fury 15 se las arregla para incluir muchas de las características de las estaciones de trabajo clásicas a pesar de su peso moderado.
La experiencia de teclear y el trackpad merece elogios por ser una de las más cómodas que hemos experimentado en una estación de trabajo móvil. Es genial que HP no haya encontrado la necesidad de "simplificar" el teclado o el panel táctil para adaptarse a las tendencias actuales de los portátiles ultrafinos o los diseños minimalistas. Este es un sistema diseñado desde el principio para profesionales y no sólo un portátil para juegos de colores.
A los usuarios avanzados no les gustará el hecho de que el procesador se estabilice a 98 C cuando esté a plena carga y que la GPU Quadro RTX 5000 sea de la variedad Max-Q. La WAN y ciertas opciones de almacenamiento pueden ser excluidas dependiendo de la SKU, lo que significa que no se puede comprar una configuración más barata y luego actualizar ciertos componentes por sí mismo porque faltarán los conectores. Bisagras más firmes para minimizar el tambaleo al ajustar los ángulos harían que el chasis se sintiera aún mejor.
Precio y disponibilidad
El ZBook Fury 15 viene en una multitud de configuraciones que son todas muy diferentes de lo que hemos revisado. Tanto Amazon como Walmart tienen SKU de gama baja por unos $1999 USD en el momento de escribir este artículo.
Notebookcheck puede recibir una comisión por las compras hechas a través de nuestros enlaces de afiliados
HP ZBook Fury 15 G7
- 01/16/2021 v7 (old)
Allen Ngo
Price comparison

