Análisis del Lenovo ThinkPad X1 Nano Gen 2: El portátil X1 más pequeño de la historia
")
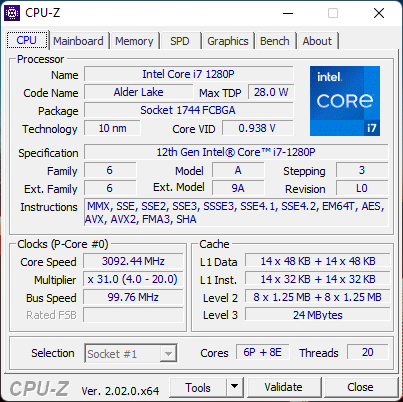
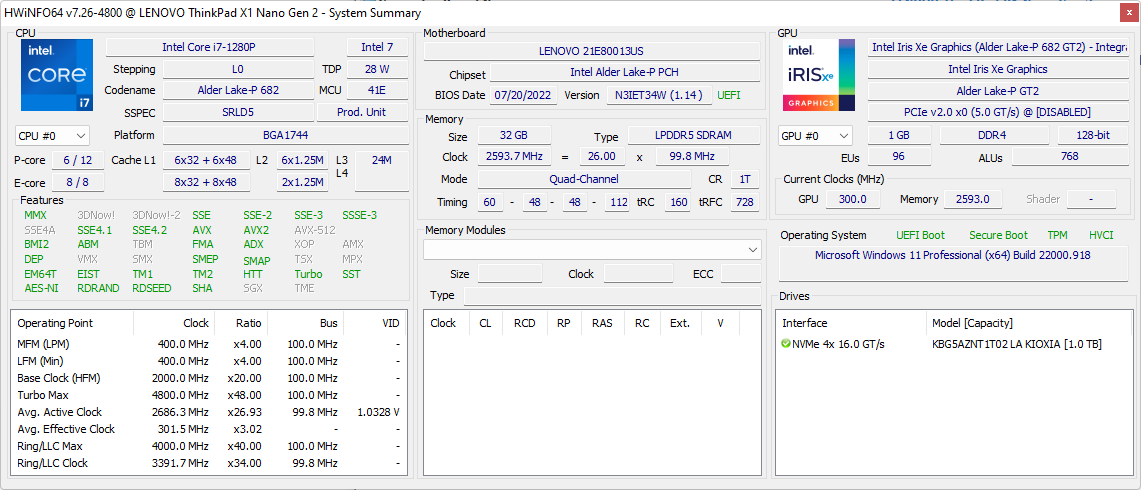
Una de las mayores quejas sobre el ThinkPad X1 Nano Gen 1 era su lento procesador. Mientras que la mayoría de los otros subportátiles funcionaban con CPUs Core i5-1135G7 o i7-1165G7 de 11ª generación de 28 W, el Nano Gen 1 se quedó con el i7-1160G7 de 15 W. Puede que el modelo fuera súper ligero, pero daba la sensación de que el bajo peso tenía un impacto directo en los niveles de rendimiento. El nuevo ThinkPad X1 Nano Gen 2 aborda este problema cambiando el i7-1160G7 por una opción adecuada de 28 W i7-1280P vPro de 12ª generación que debería convertir al X1 Nano Gen 2 en uno de los portátiles empresariales de 13,0 pulgadas más rápidos, al menos sobre el papel.
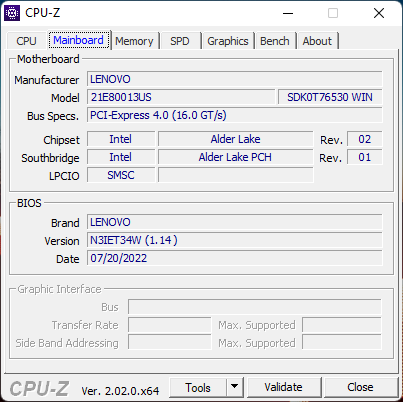
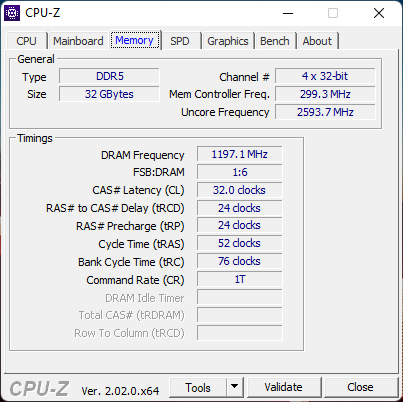
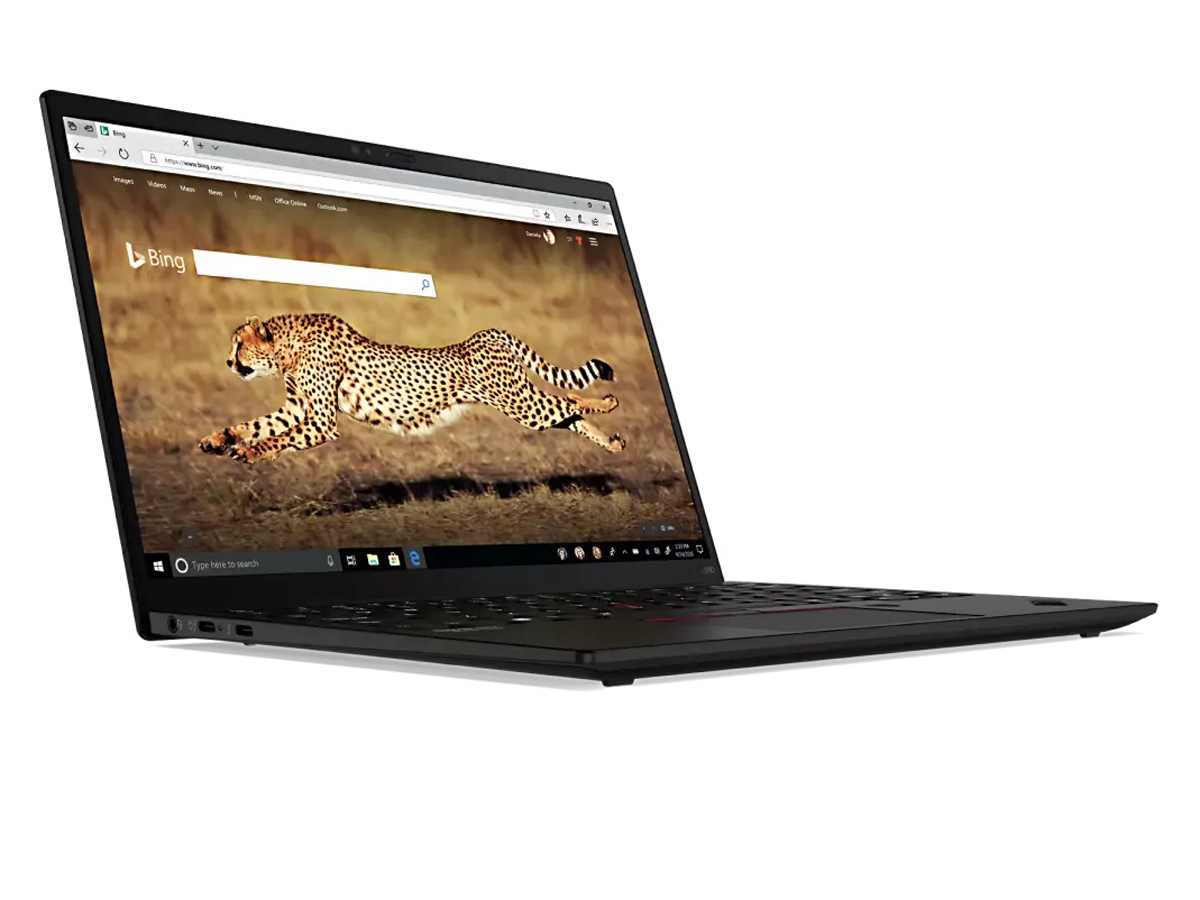
Aparte de la actualización de la CPU, el modelo Gen 2 trae algunos otros cambios, como una cámara web de mayor resolución, una Wi-Fi más rápida y soporte WAN 5G. Por lo demás, el diseño exterior es idéntico al del modelo Gen 1 de 2021, por lo que recomendamos consultar nuestra reseña existente en para saber más sobre las características físicas del portátil.
Los competidores en este espacio incluyen otros portátiles empresariales superligeros de 13 pulgadas como el HP Elite Dragonfly G3, Dell Latitude 13 7330, la serie LG Gram, o el Dynabook Portege X30L.
Más opiniones de Lenovo
Posibles contendientes en la comparación
Valoración | Fecha | Modelo | Peso | Altura | Tamaño | Resolución | Precio |
|---|---|---|---|---|---|---|---|
| 88.9 % v7 (old) | 09/2022 | Lenovo ThinkPad X1 Nano Gen 2 Core i7-1280P i7-1280P, Iris Xe G7 96EUs | 958 g | 14.4 mm | 13.00" | 2160x1350 | |
| 89.8 % v7 (old) | 02/2021 | Lenovo ThinkPad X1 Nano-20UN002UGE i7-1160G7, Iris Xe G7 96EUs | 946 g | 16 mm | 13.00" | 2160x1350 | |
| 91 % v7 (old) | 08/2022 | HP Elite Dragonfly G3 i7-1265U, Iris Xe G7 96EUs | 1.2 kg | 16.3 mm | 13.50" | 1920x1280 | |
| 89 % v7 (old) | 07/2022 | Dell Latitude 13 7330 i7-1265U, Iris Xe G7 96EUs | 1 kg | 16.96 mm | 13.30" | 1920x1080 | |
| 85.1 % v7 (old) | 07/2022 | Framework Laptop 13.5 12th Gen Intel i7-1260P, Iris Xe G7 96EUs | 1.3 kg | 15.85 mm | 13.50" | 2256x1504 | |
| 87.8 % v7 (old) | 03/2021 | Huawei MateBook X Pro 2021 i7-1165G7, Iris Xe G7 96EUs | 1.3 kg | 14.6 mm | 13.90" | 3000x2000 |
Caso

Comunicación
El módulo WLAN ha sido actualizado del Intel AX201 al AX211 para soportar Wi-Fi 6E. No experimentamos ningún problema de conectividad cuando lo emparejamos con nuestra red de 6 GHz
LTE 5G Cat 20 o 4G CAT 9 son actualizaciones WWAN opcionales. Habrá una ranura Nano-SIM si se configura con la función.
| Networking | |
| iperf3 transmit AX12 | |
| Lenovo ThinkPad X1 Nano-20UN002UGE | |
| Huawei MateBook X Pro 2021 | |
| iperf3 receive AX12 | |
| Huawei MateBook X Pro 2021 | |
| Lenovo ThinkPad X1 Nano-20UN002UGE | |
| iperf3 receive AXE11000 6GHz | |
| Framework Laptop 13.5 12th Gen Intel | |
| Lenovo ThinkPad X1 Nano Gen 2 Core i7-1280P | |
| HP Elite Dragonfly G3 | |
| Dell Latitude 13 7330 | |
| iperf3 transmit AXE11000 6GHz | |
| Dell Latitude 13 7330 | |
| Framework Laptop 13.5 12th Gen Intel | |
| HP Elite Dragonfly G3 | |
| Lenovo ThinkPad X1 Nano Gen 2 Core i7-1280P | |
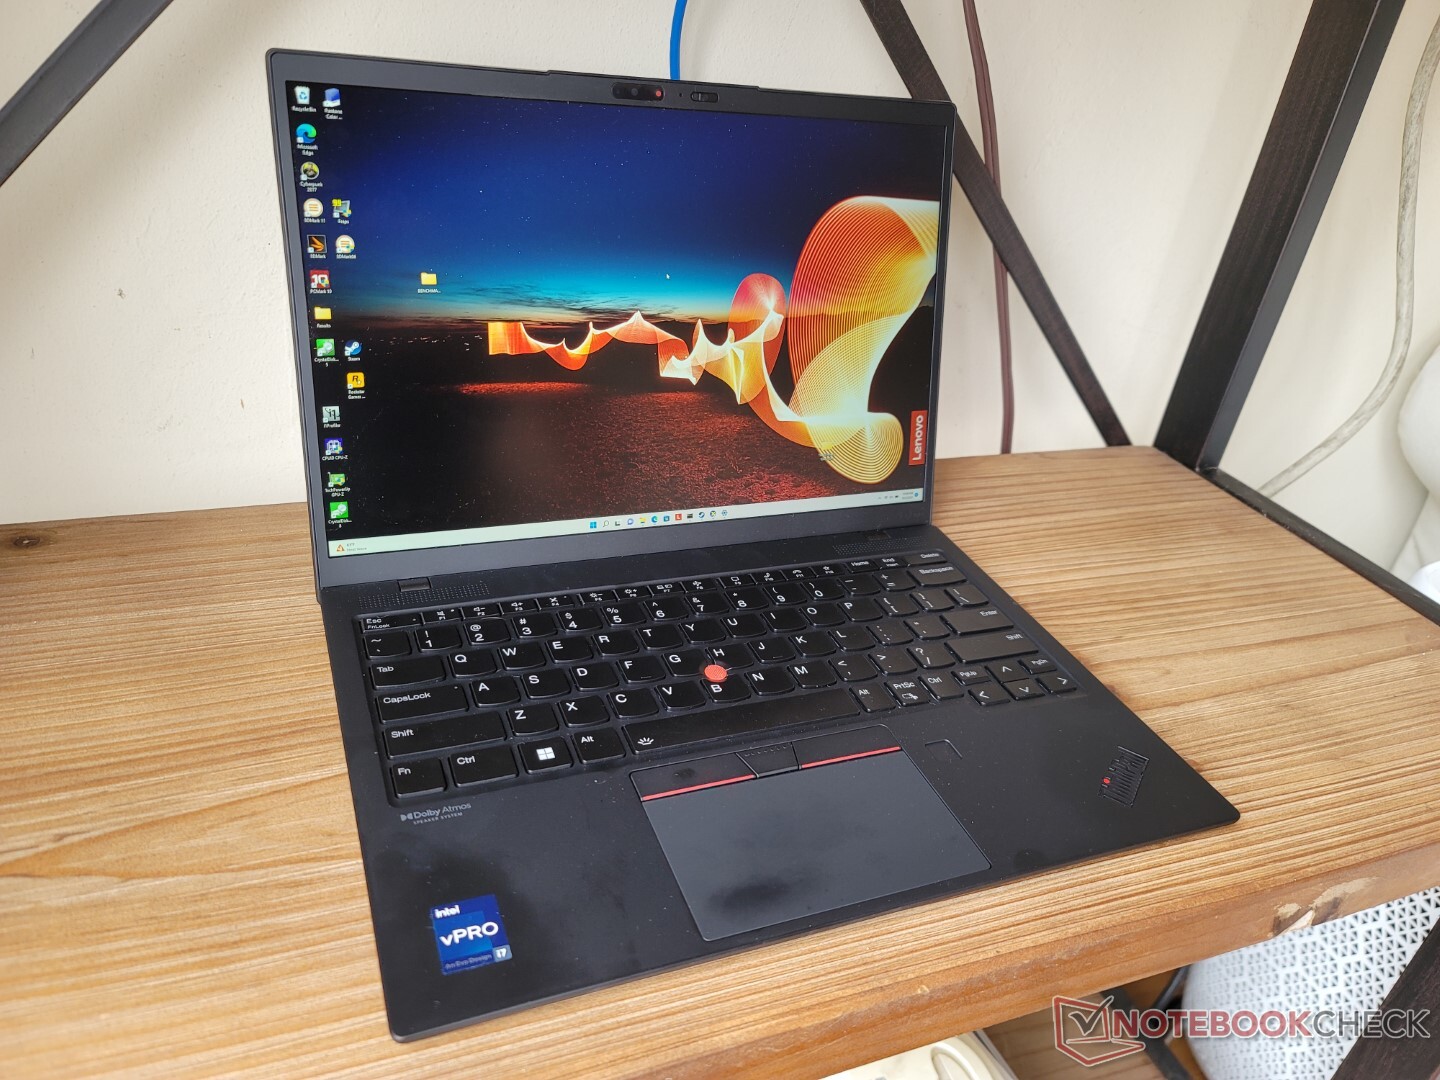
Cámara web
Dell ha actualizado la webcam de 720p en el modelo Gen 1 a 1080p para la versión Gen 2 de este año. La imagen no es tan turbia como resultado, pero los colores siguen siendo inferiores
Tanto el IR como el obturador físico de la webcam vienen de serie para la privacidad.


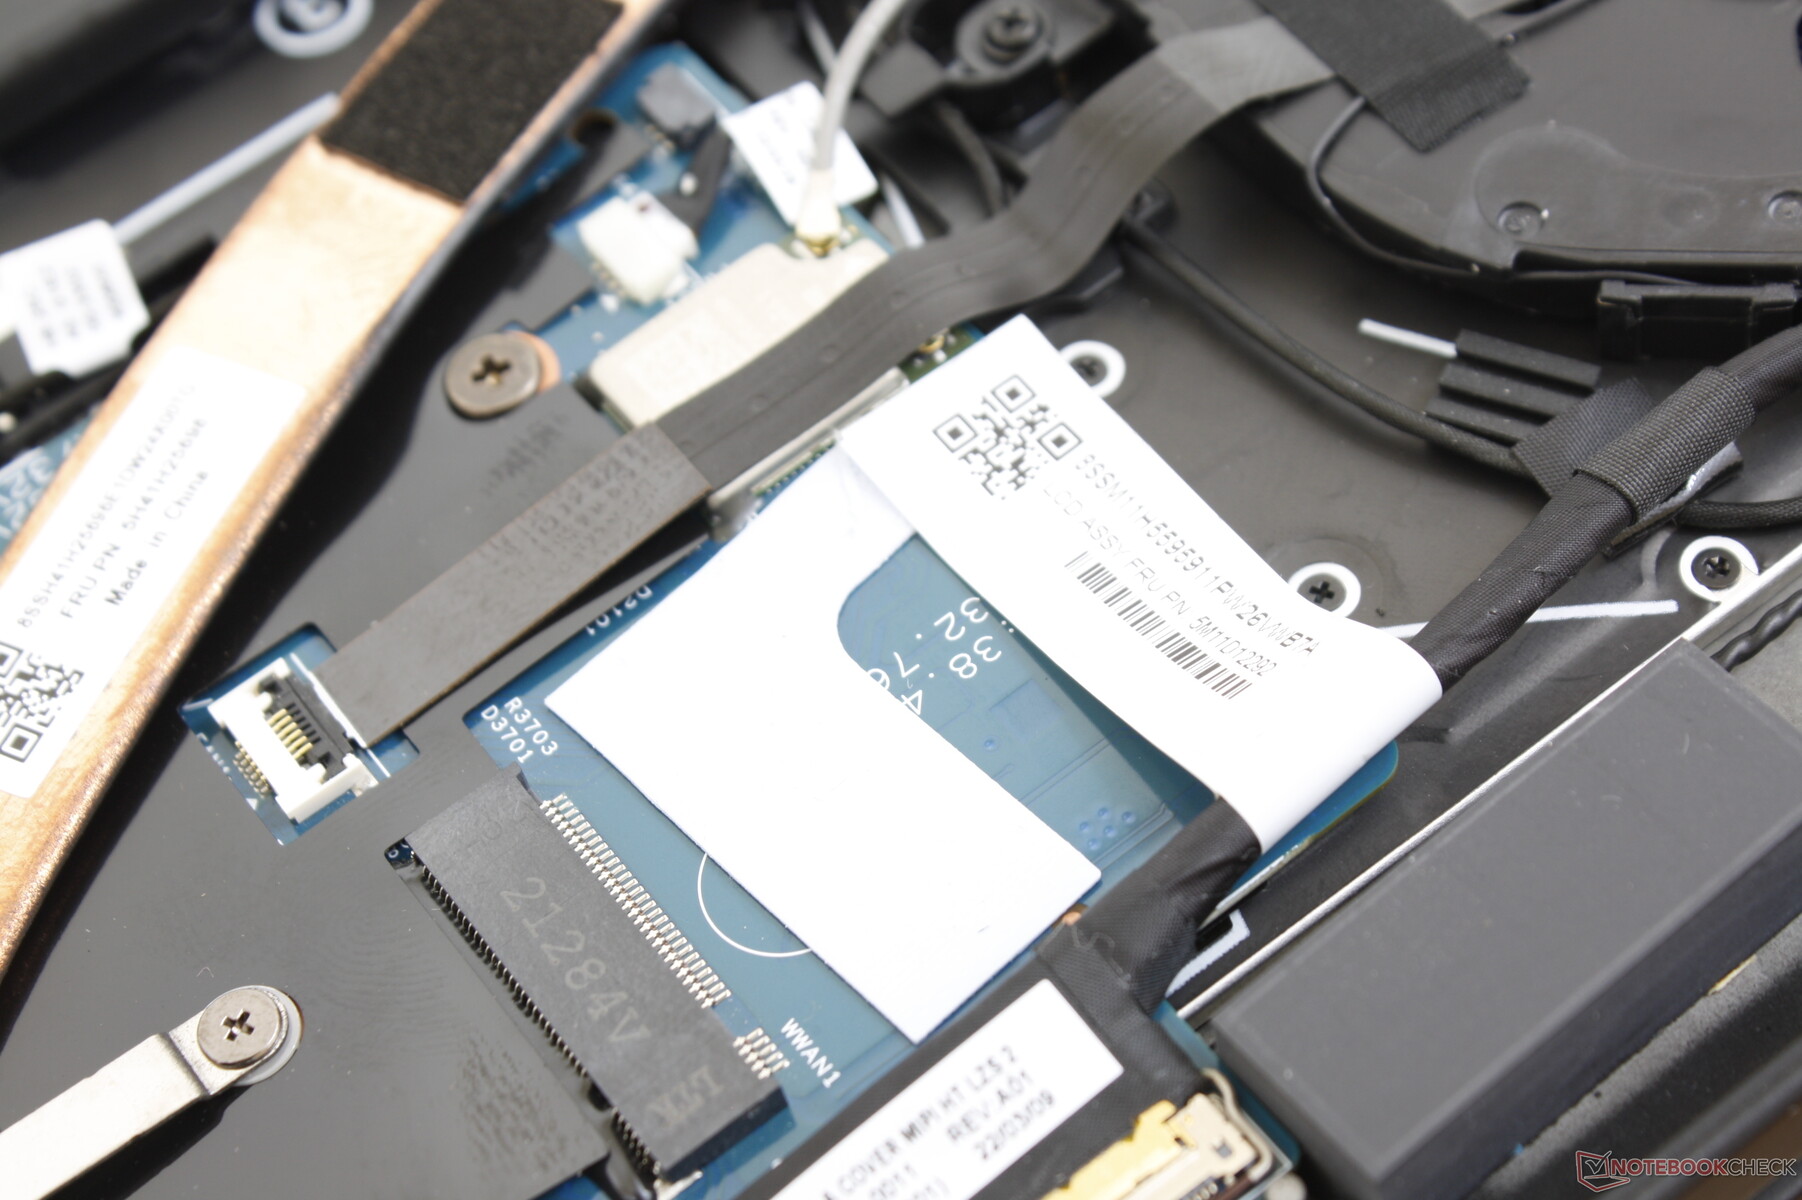
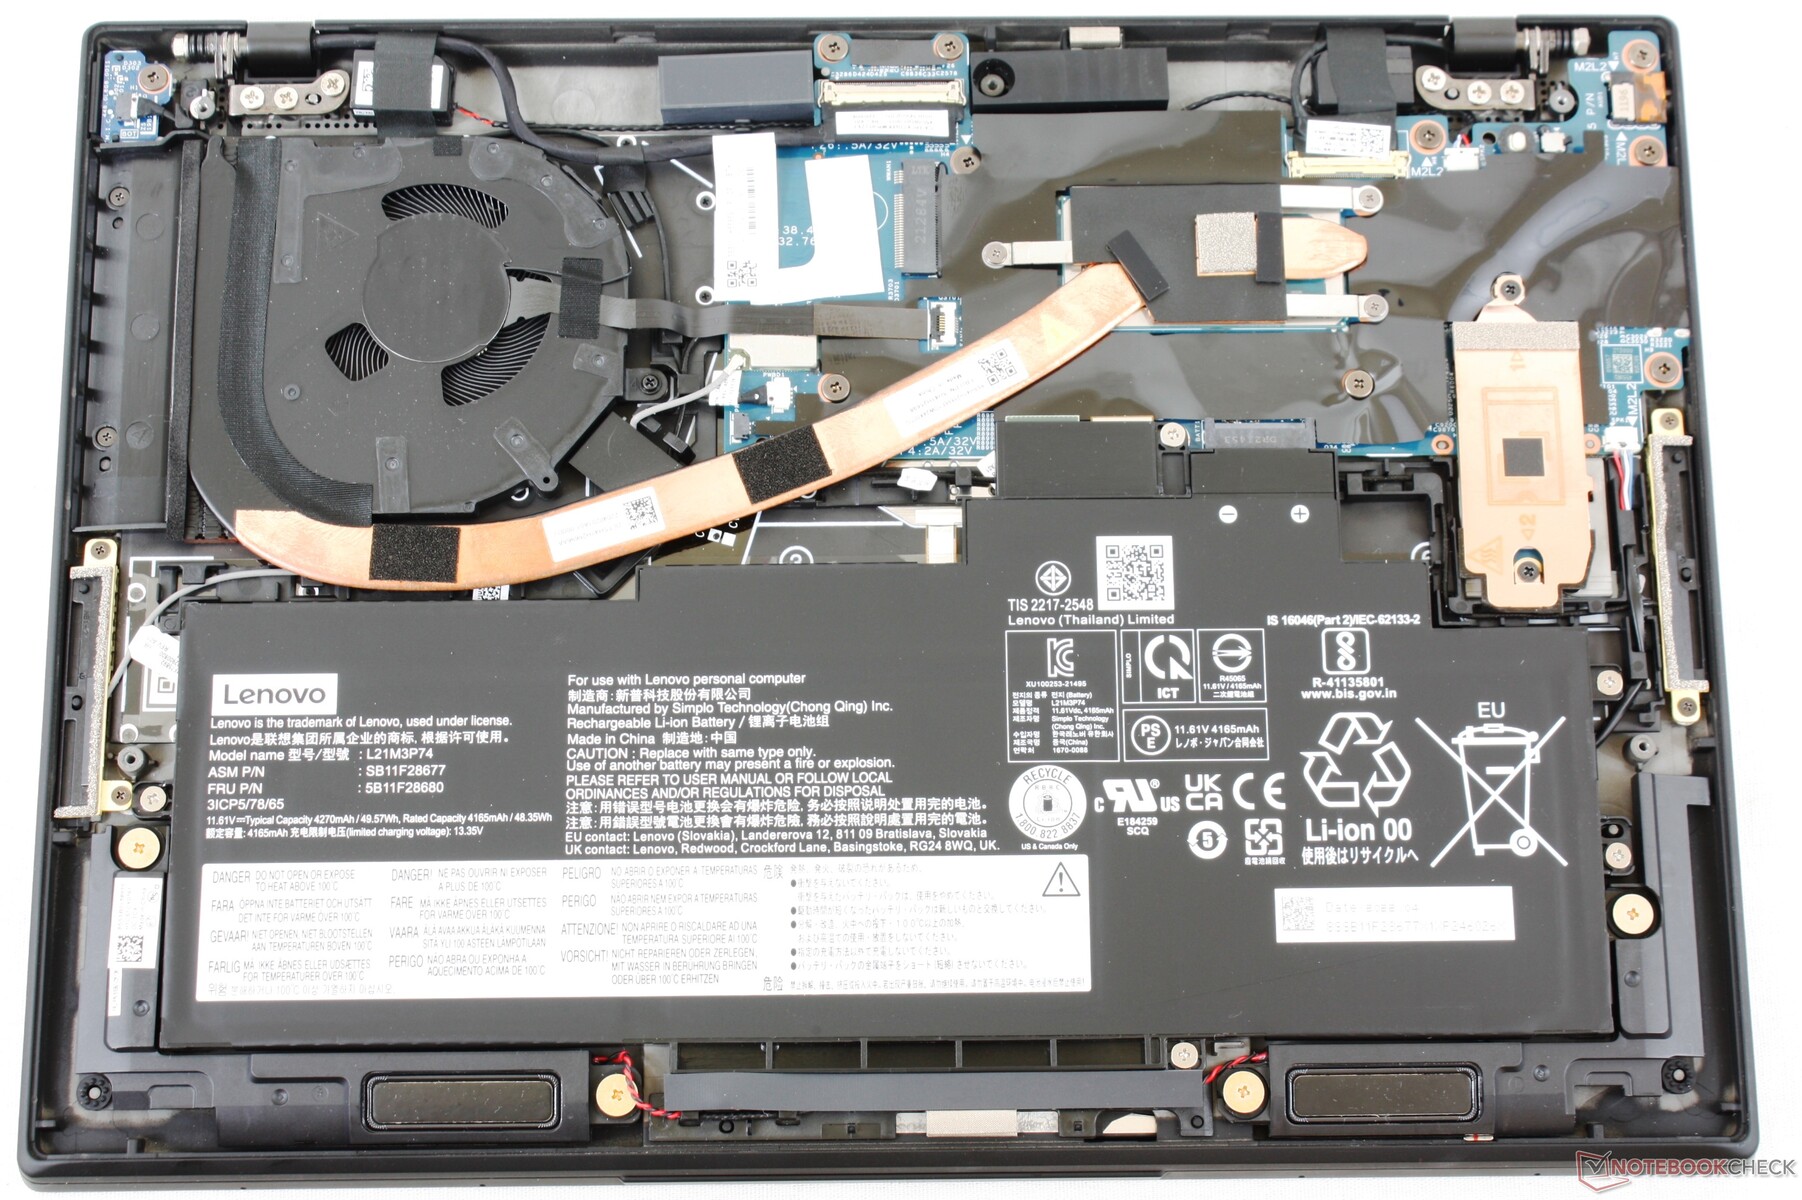
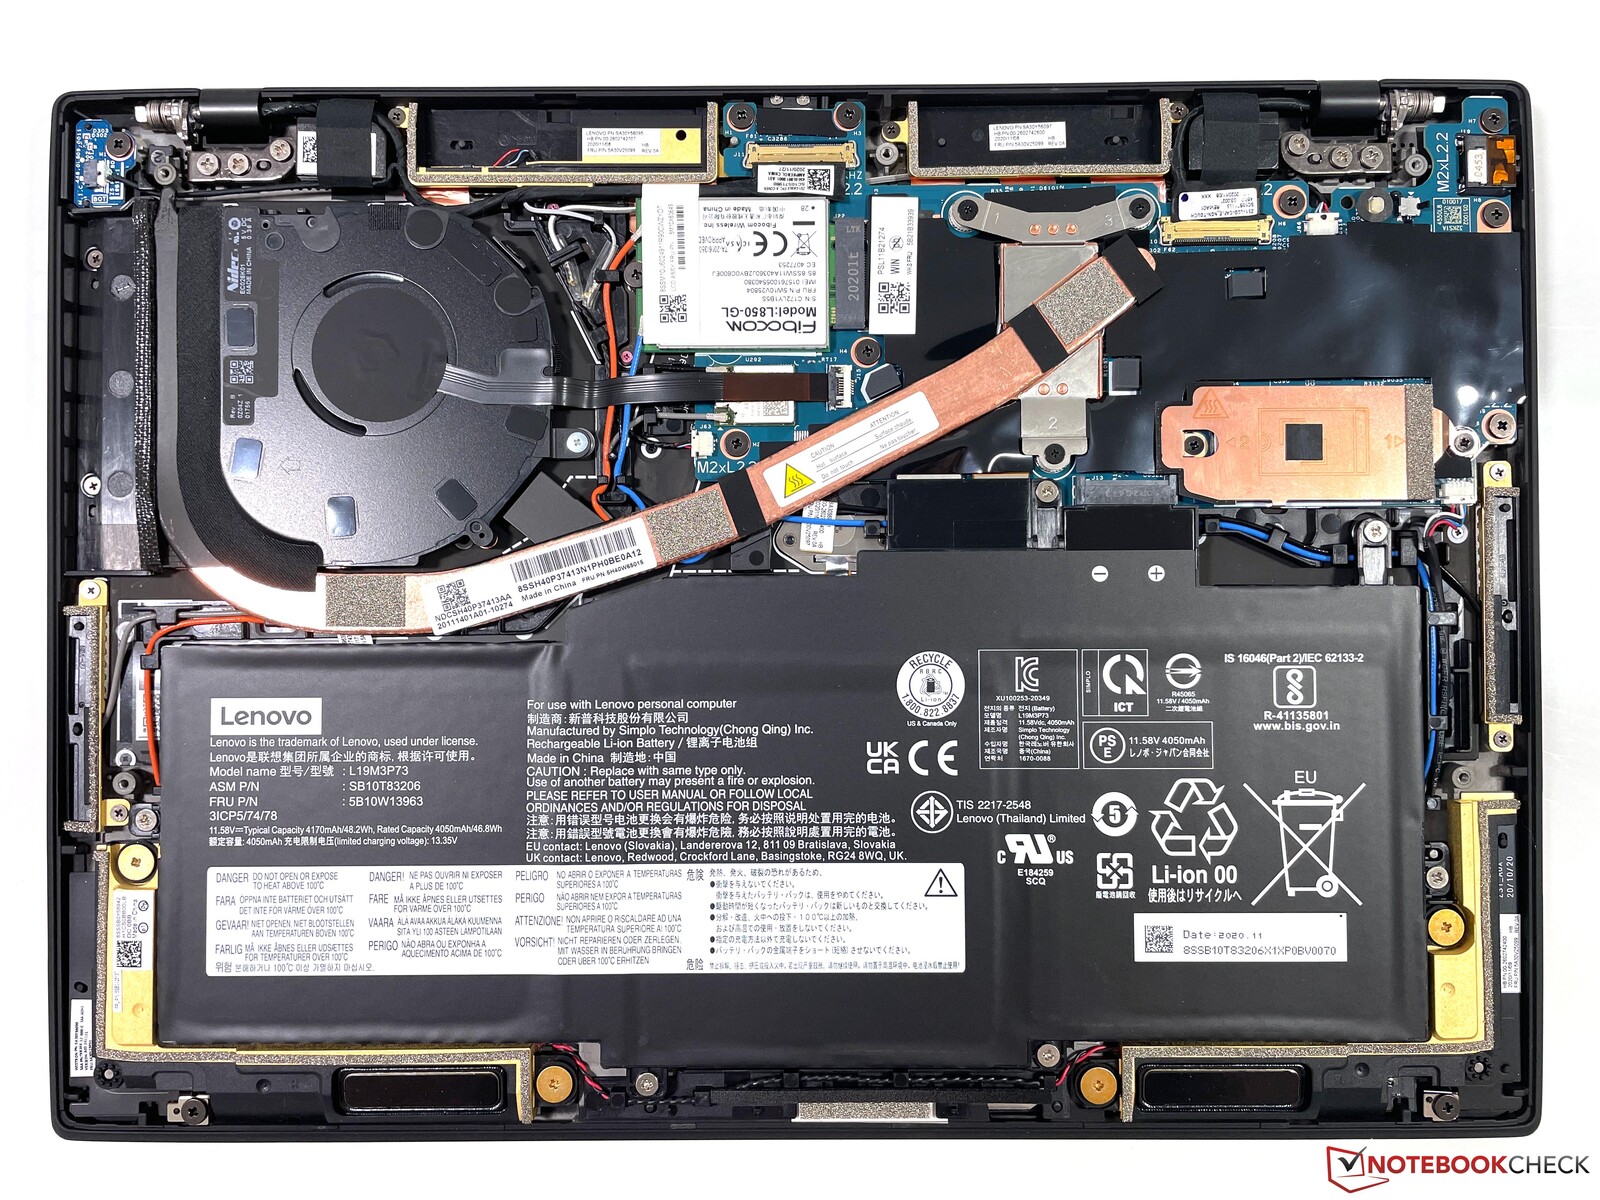
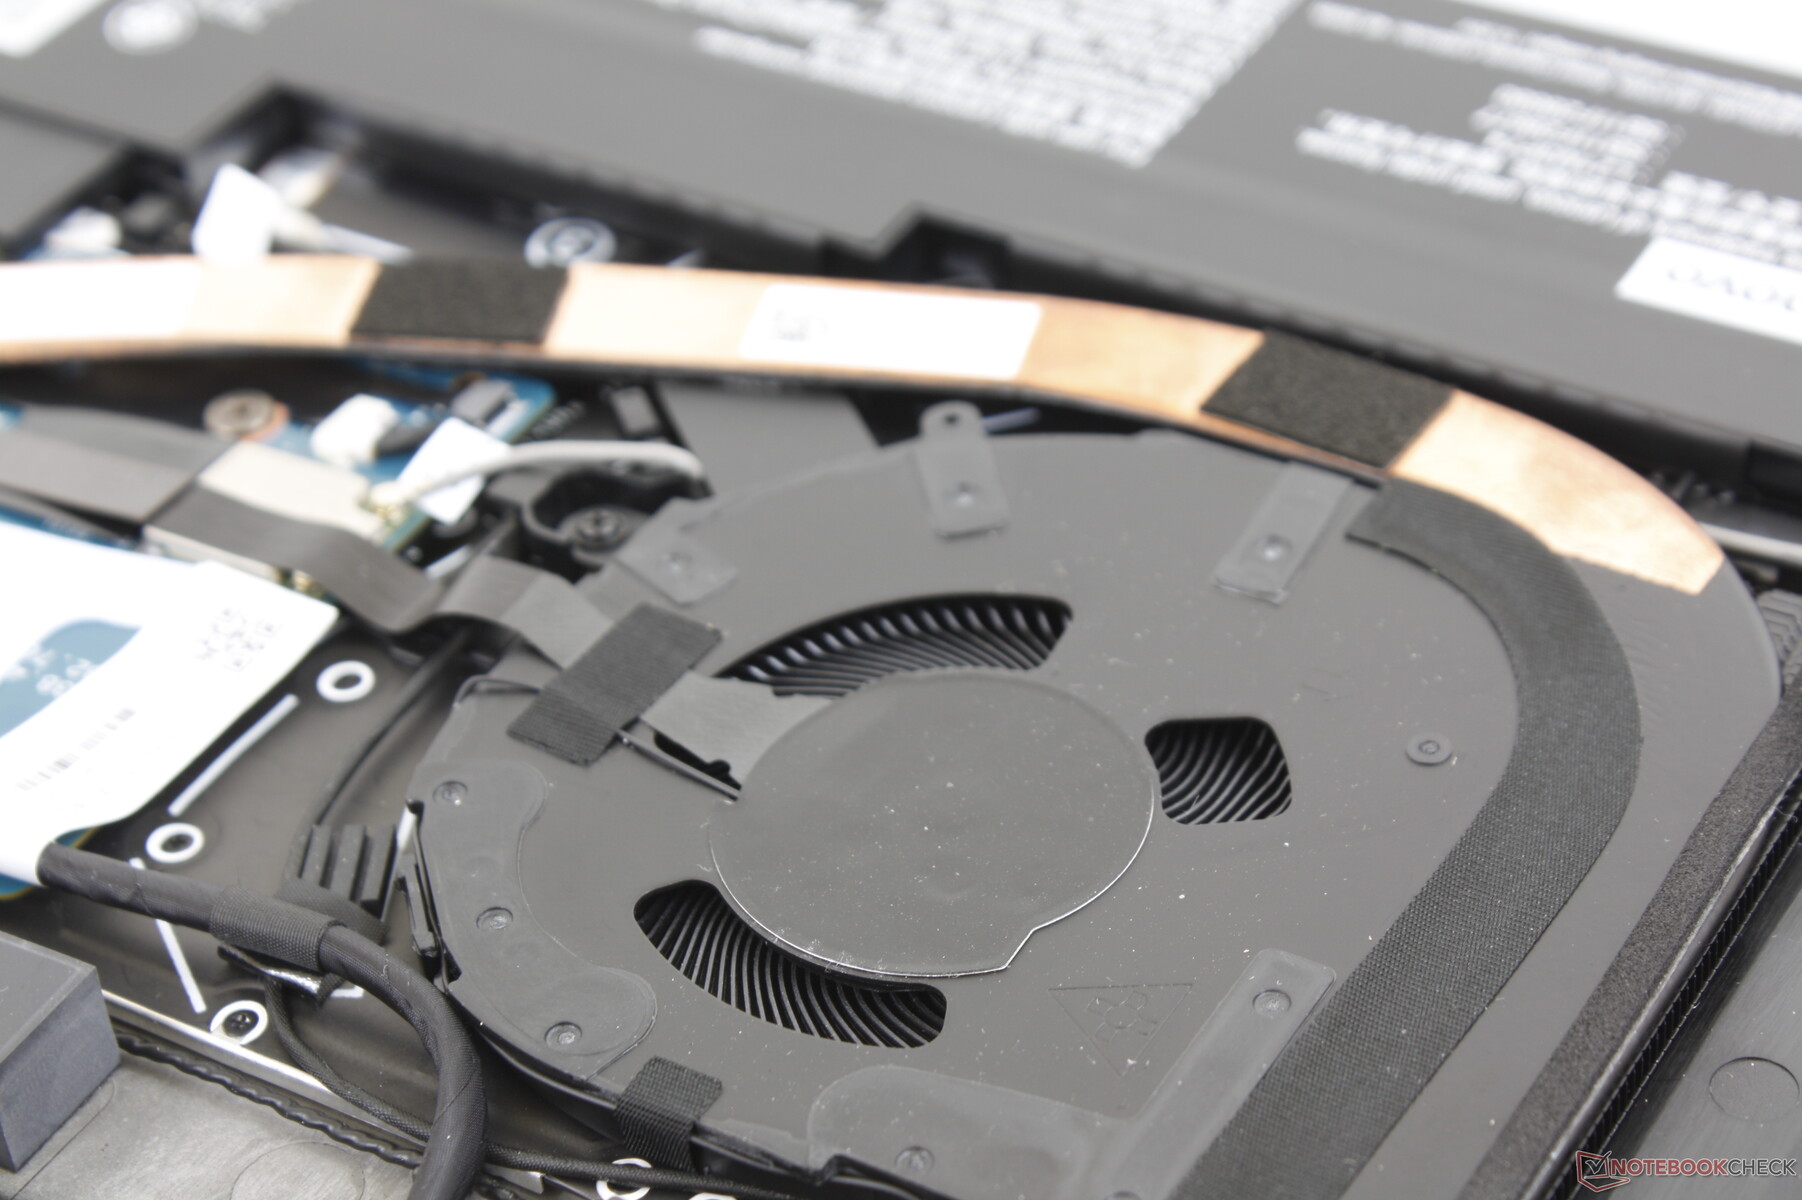
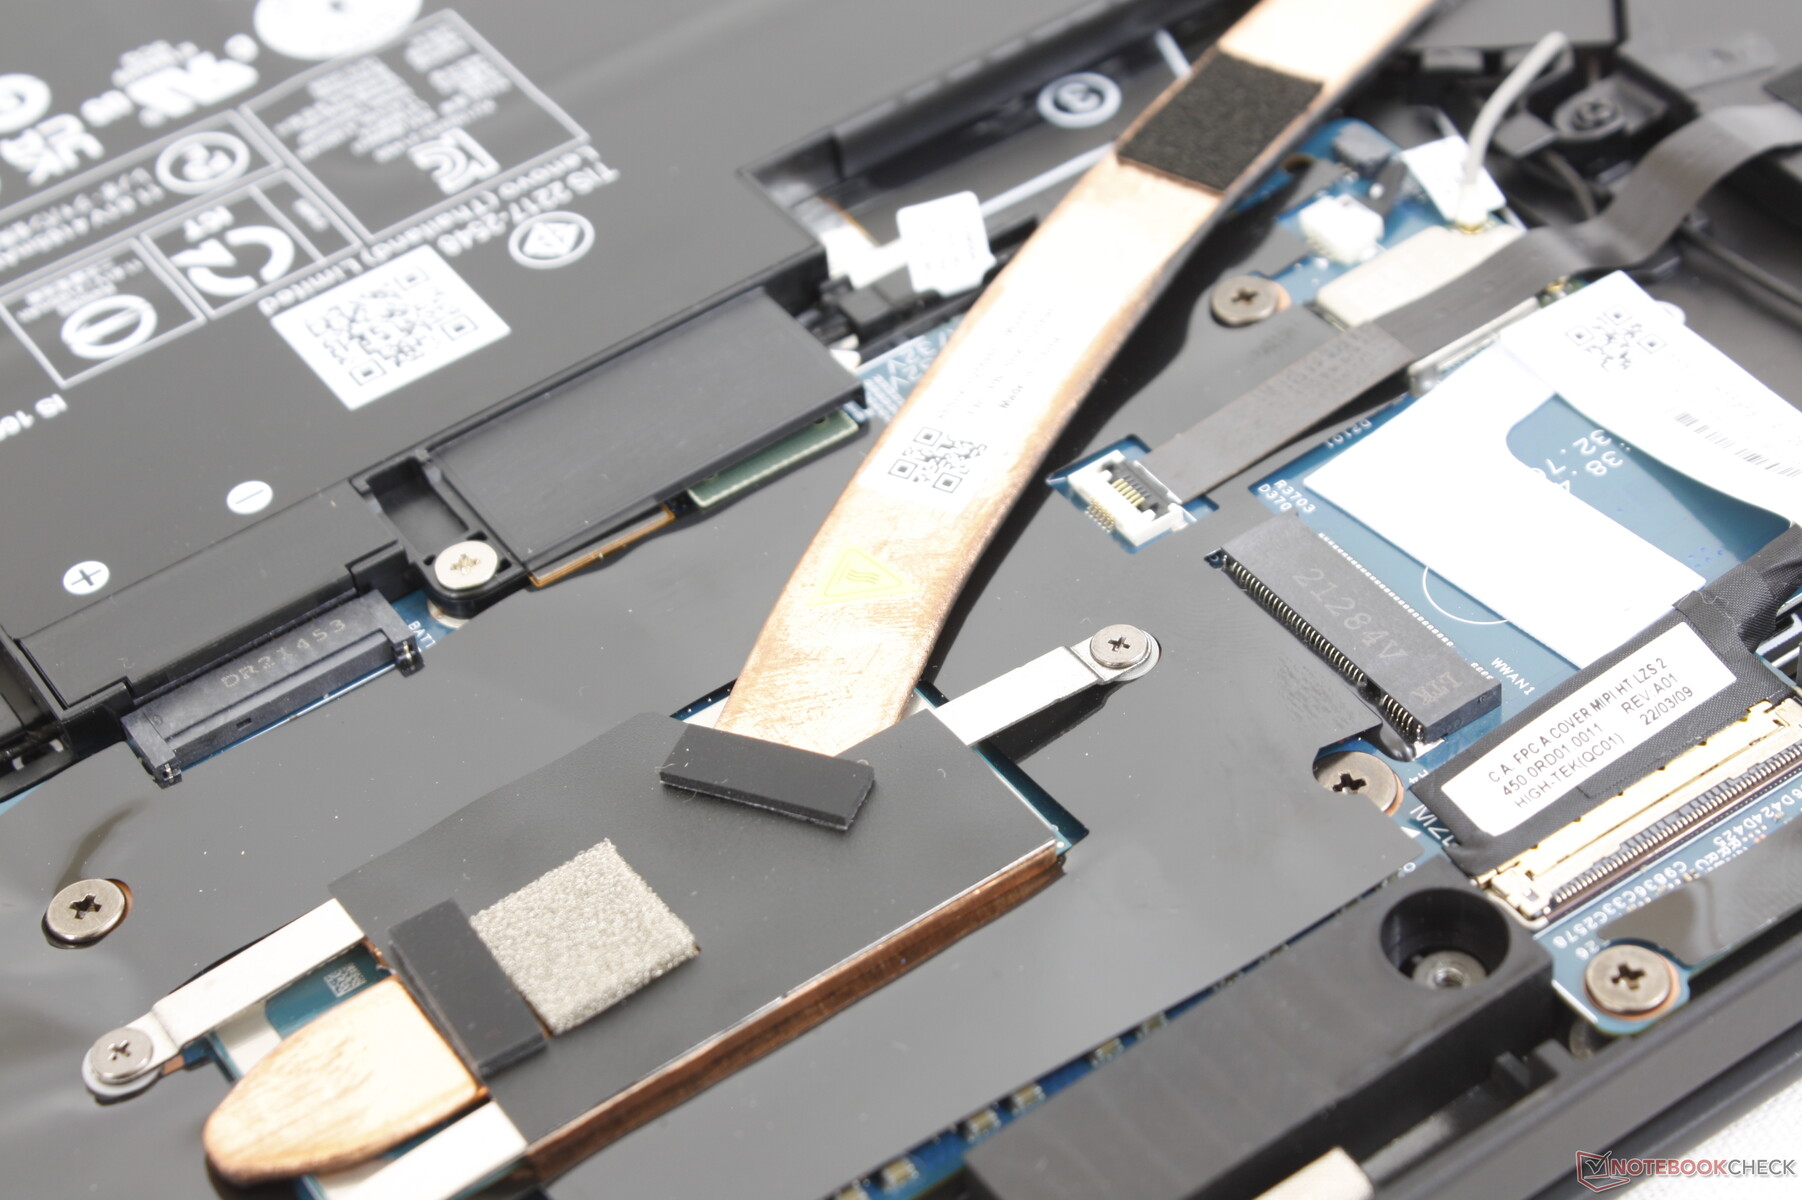
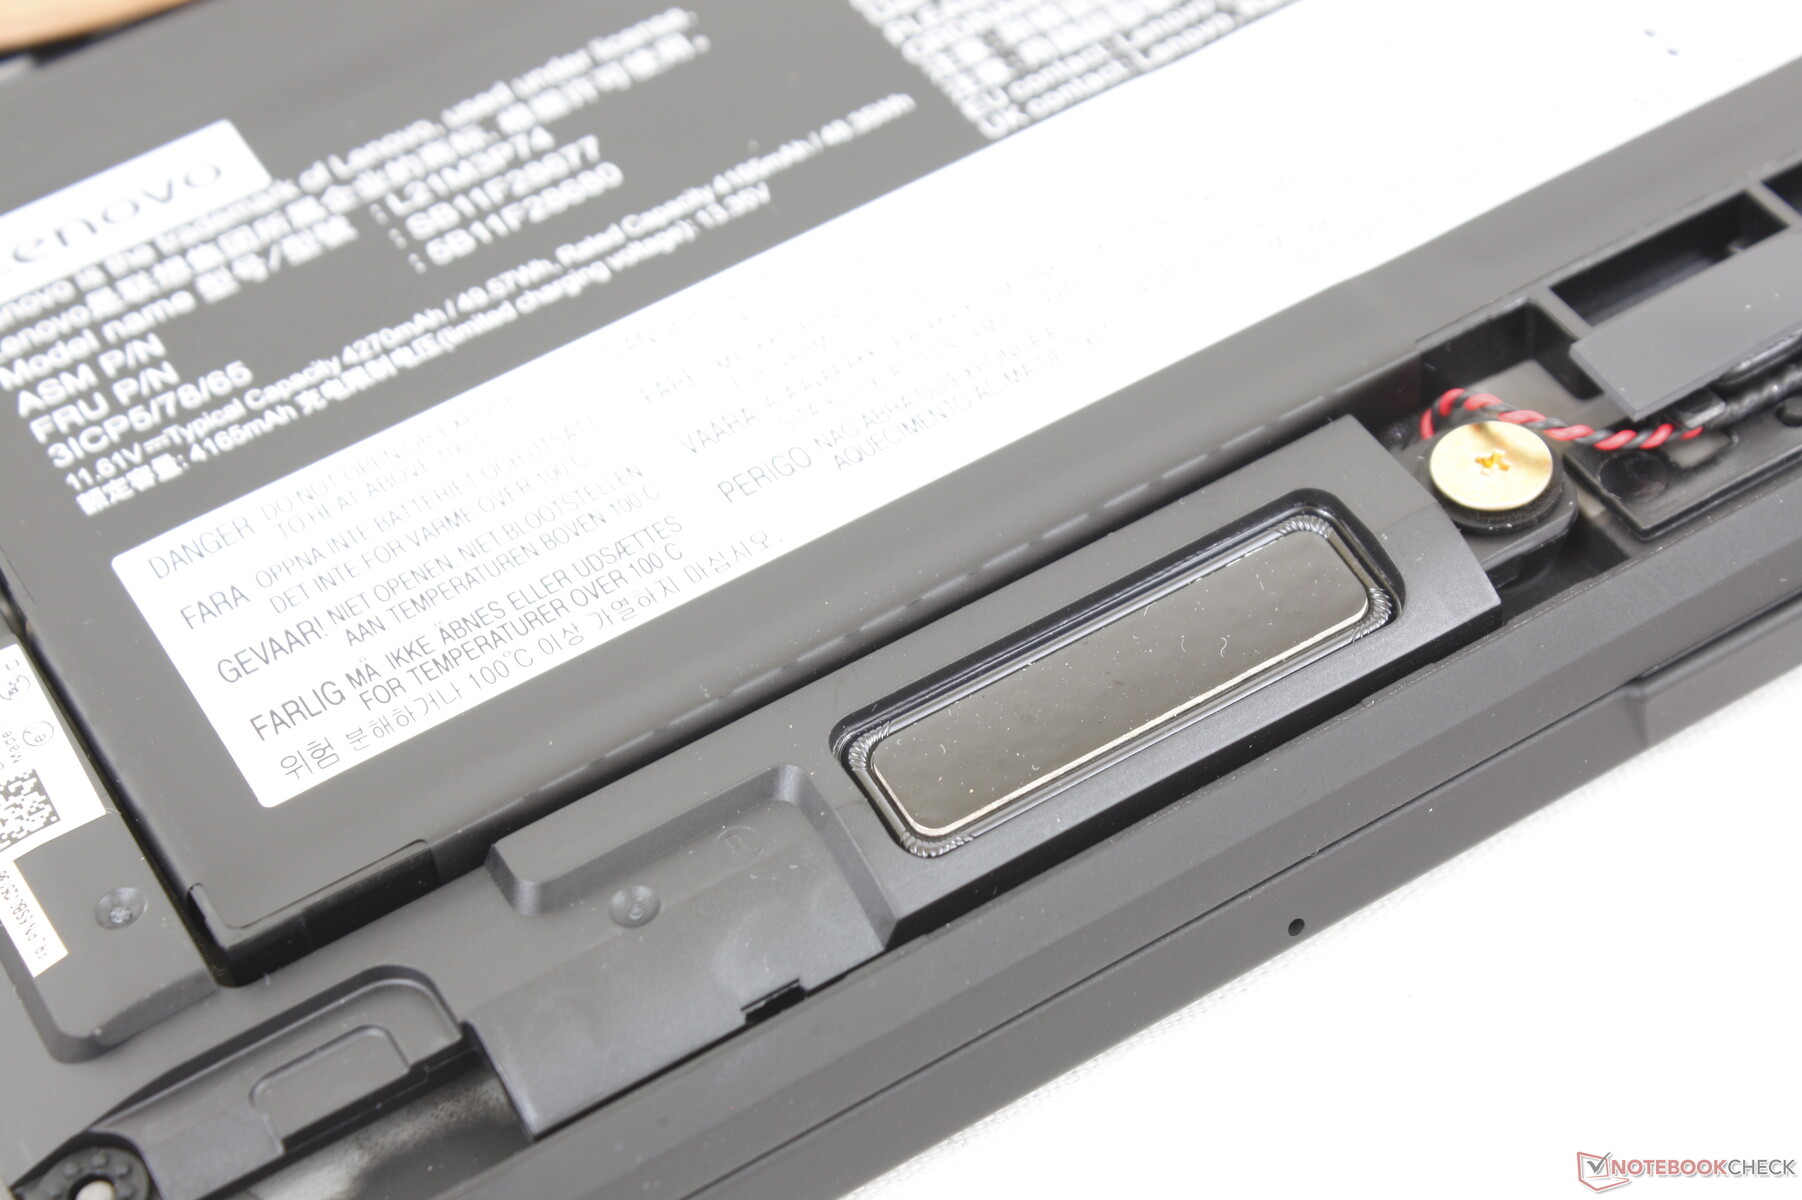
Mantenimiento
El panel inferior se quita fácilmente con un destornillador Philips. Las partes internas son en su mayoría las mismas que las del modelo Gen 1, salvo por el SSD M.2 2242 reposicionado y otros ajustes menores, como muestran las imágenes siguientes.
Accesorios y garantía
No hay extras en la caja más allá del adaptador de CA y la documentación. Se aplica una garantía limitada del fabricante de un año, lo que resulta decepcionante teniendo en cuenta el elevado precio de partida del modelo. Una cobertura de 3 años debería haber sido estándar.
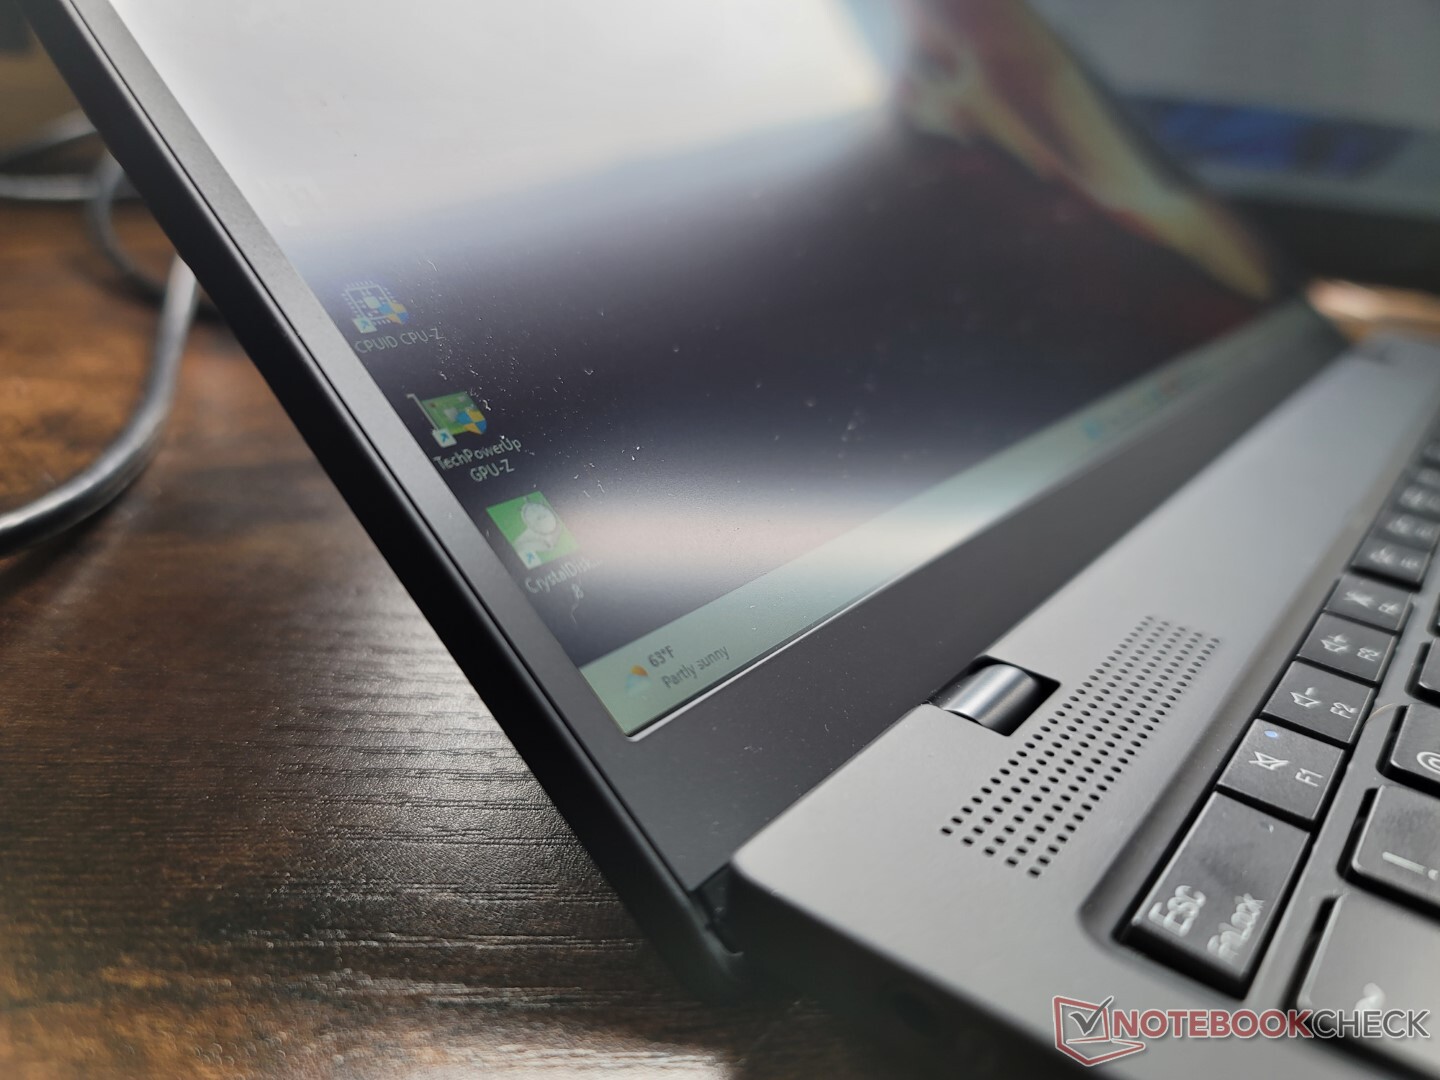
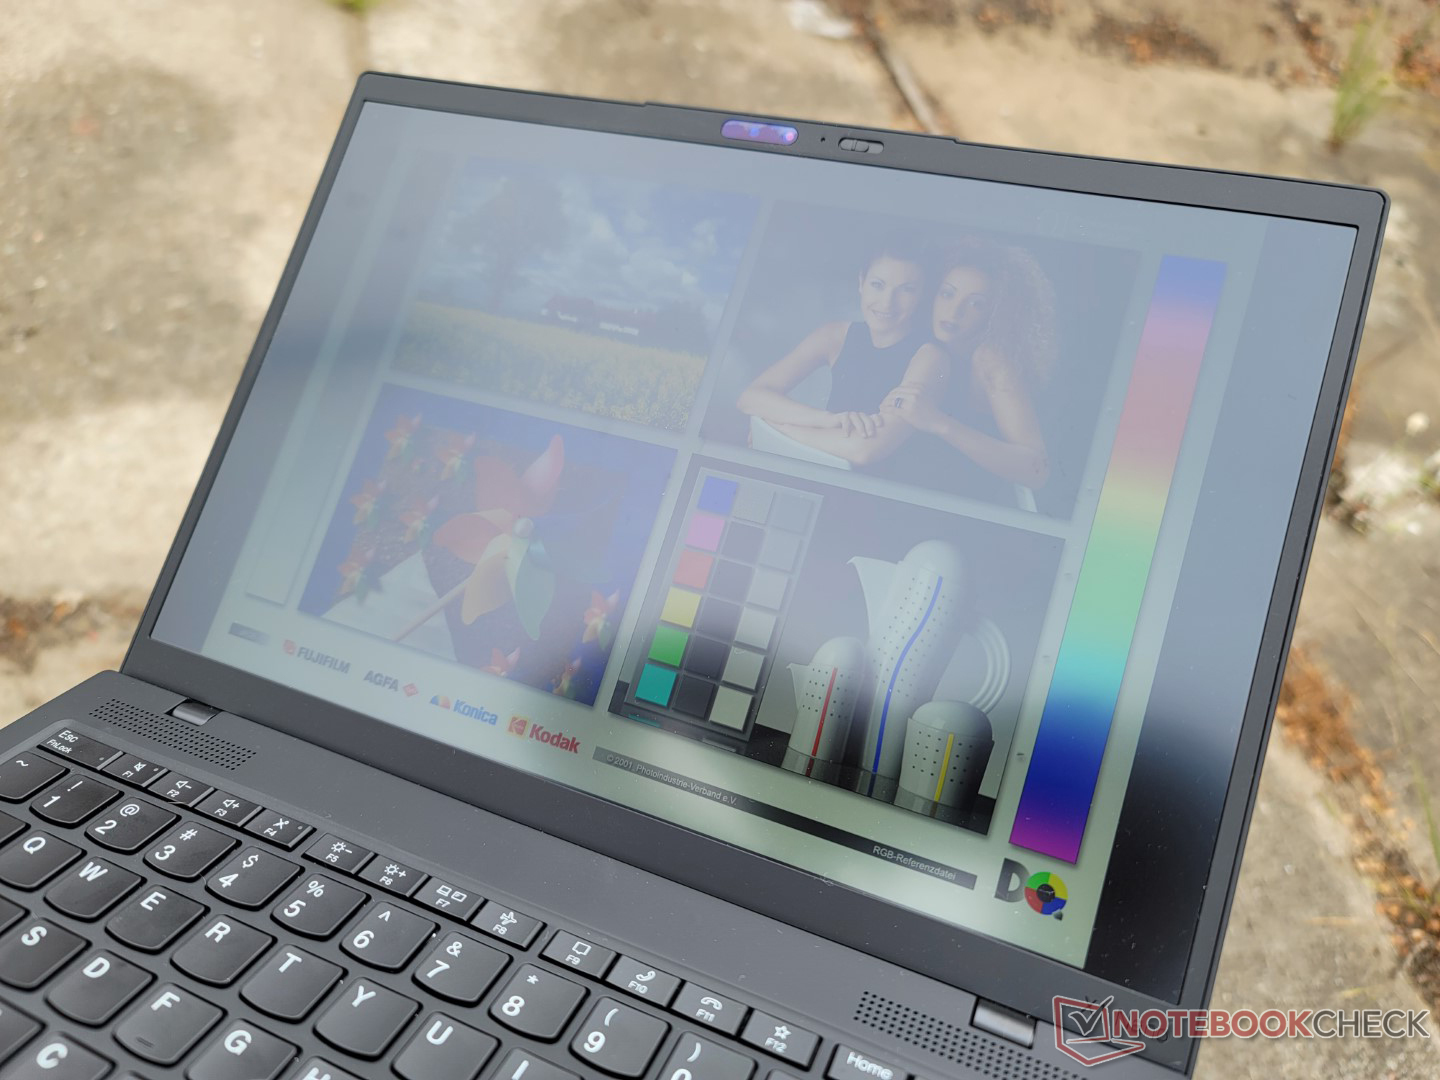
Mostrar
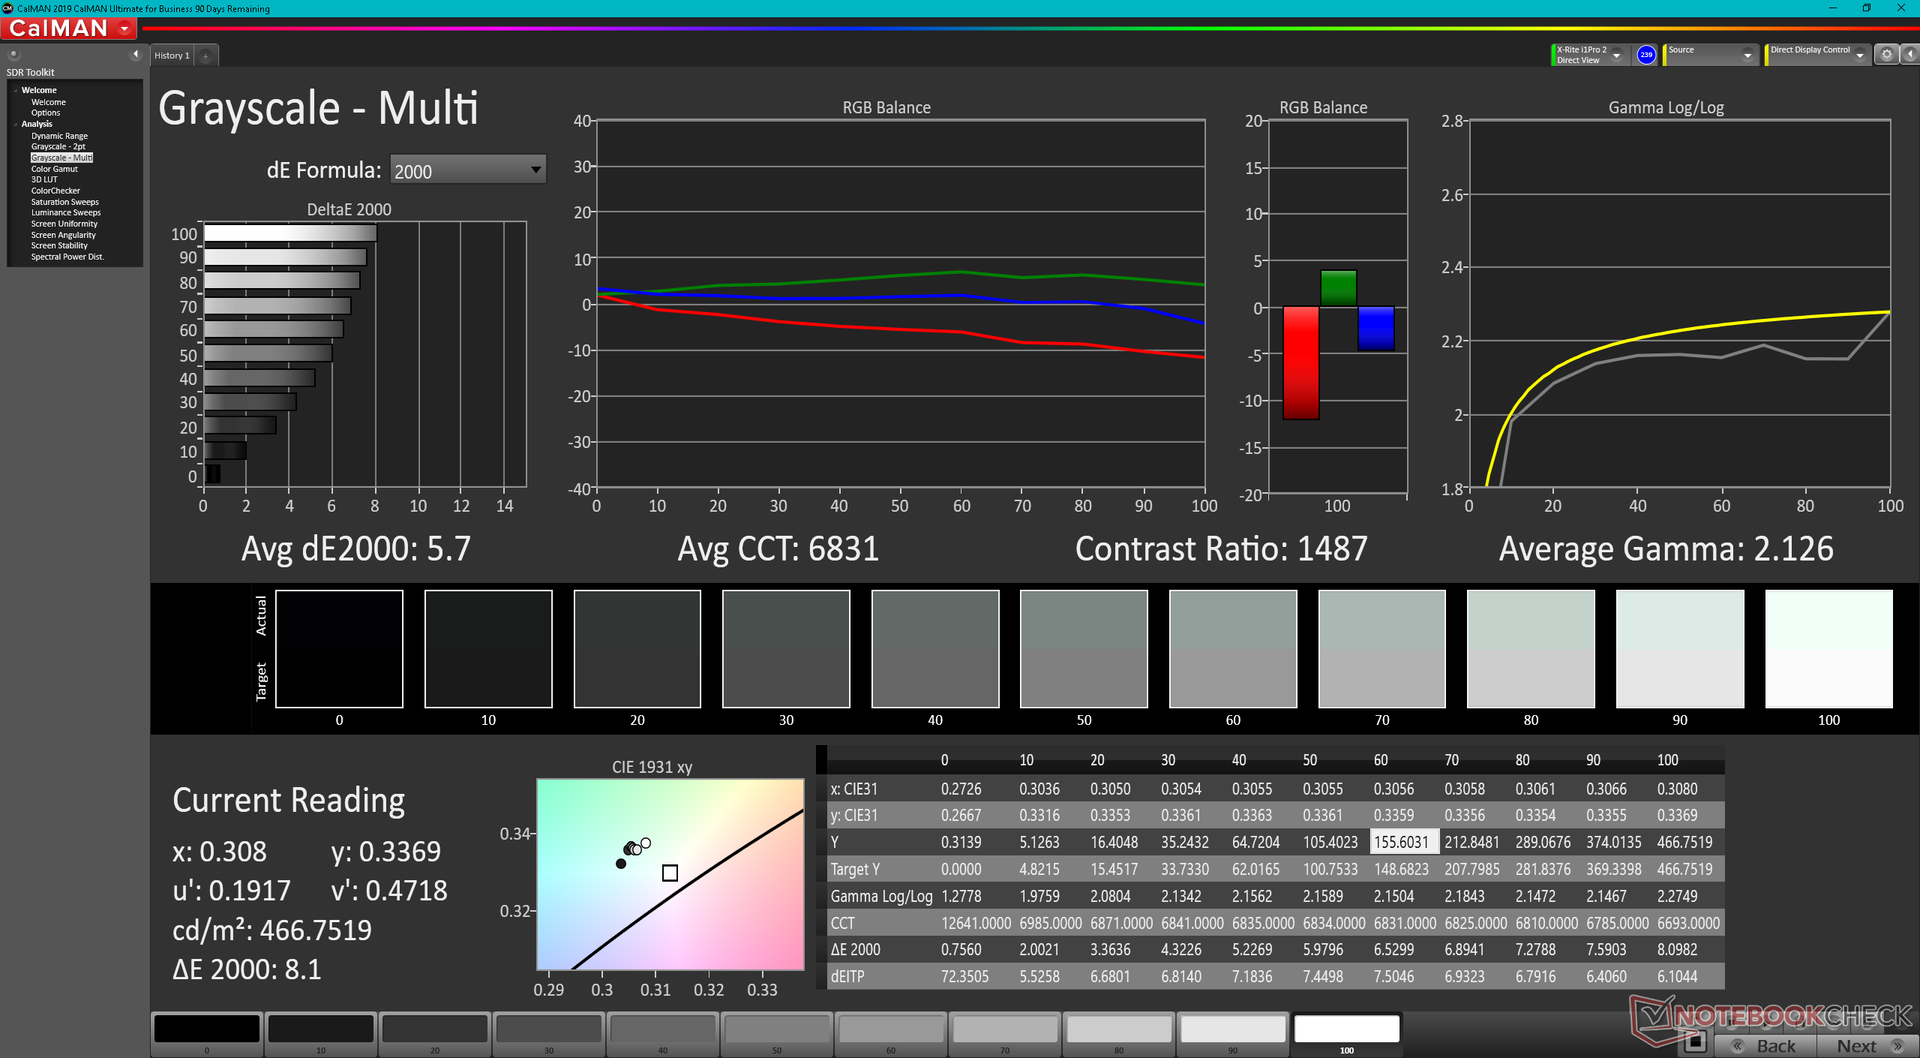
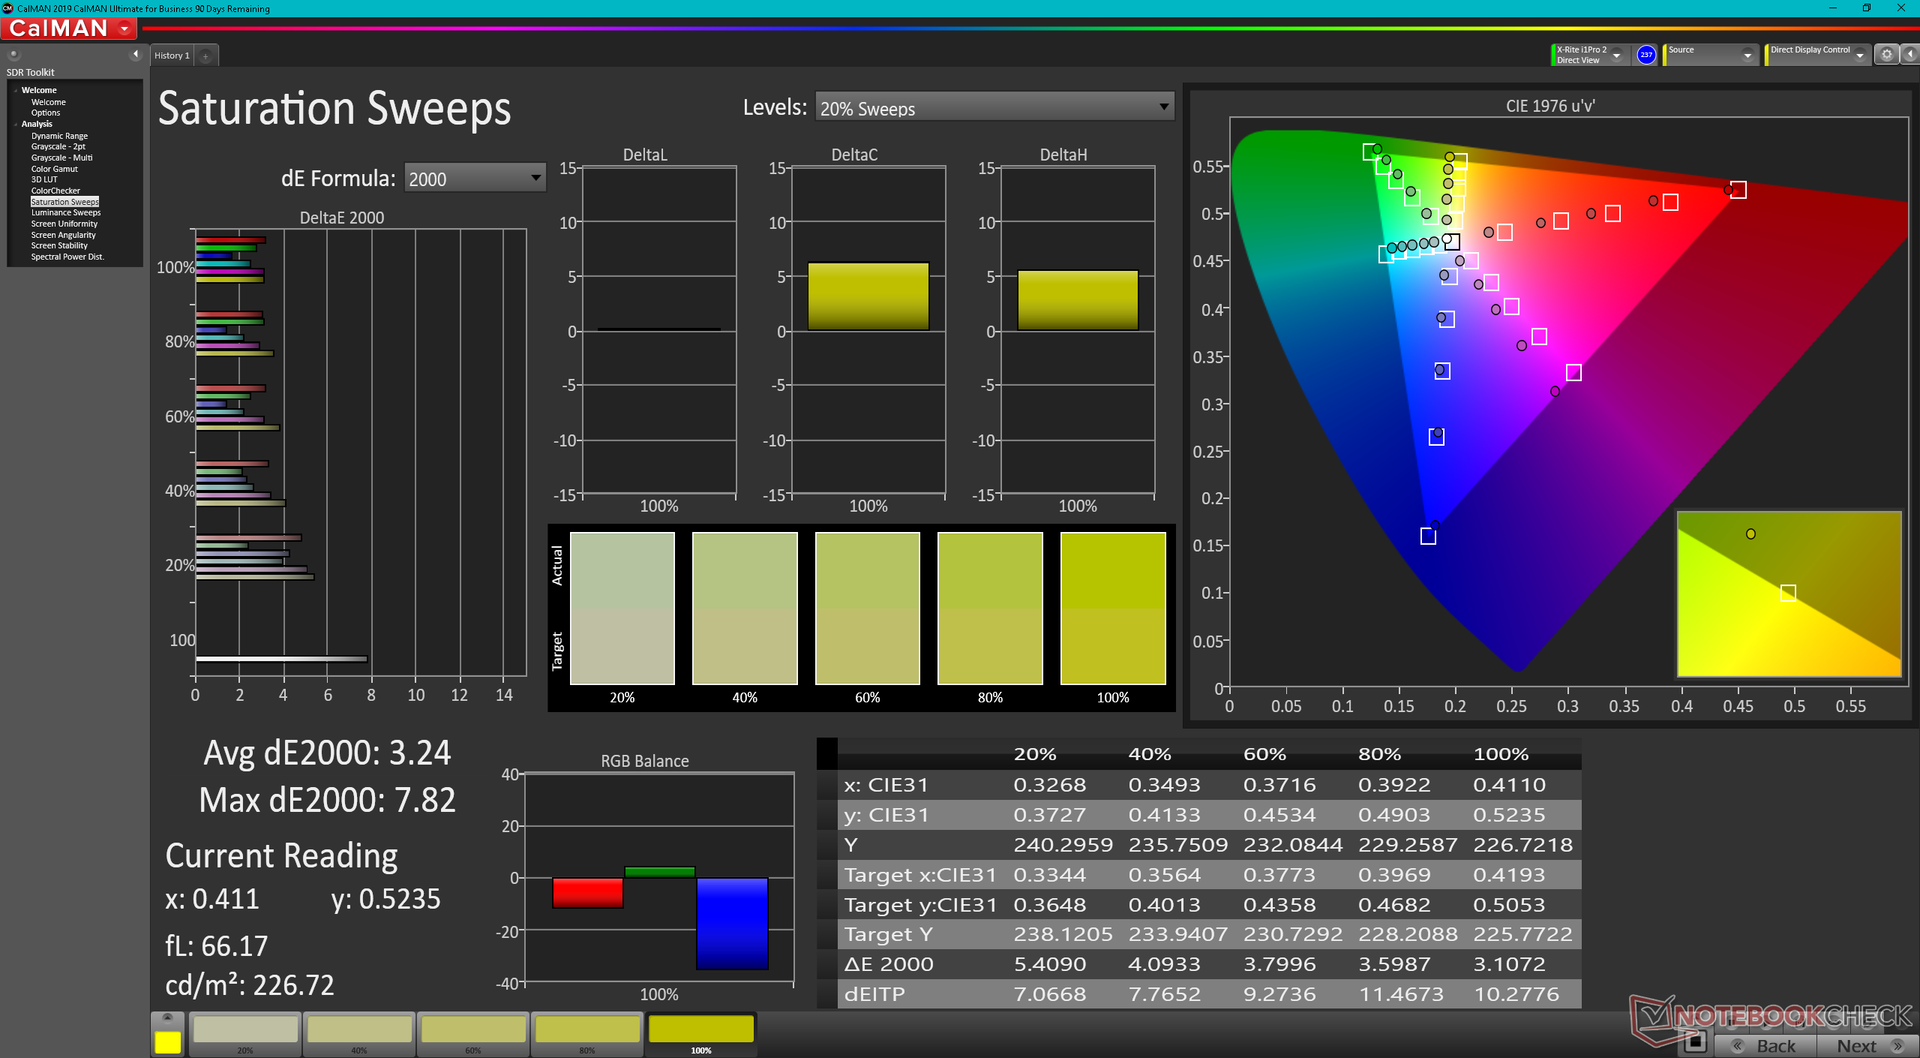
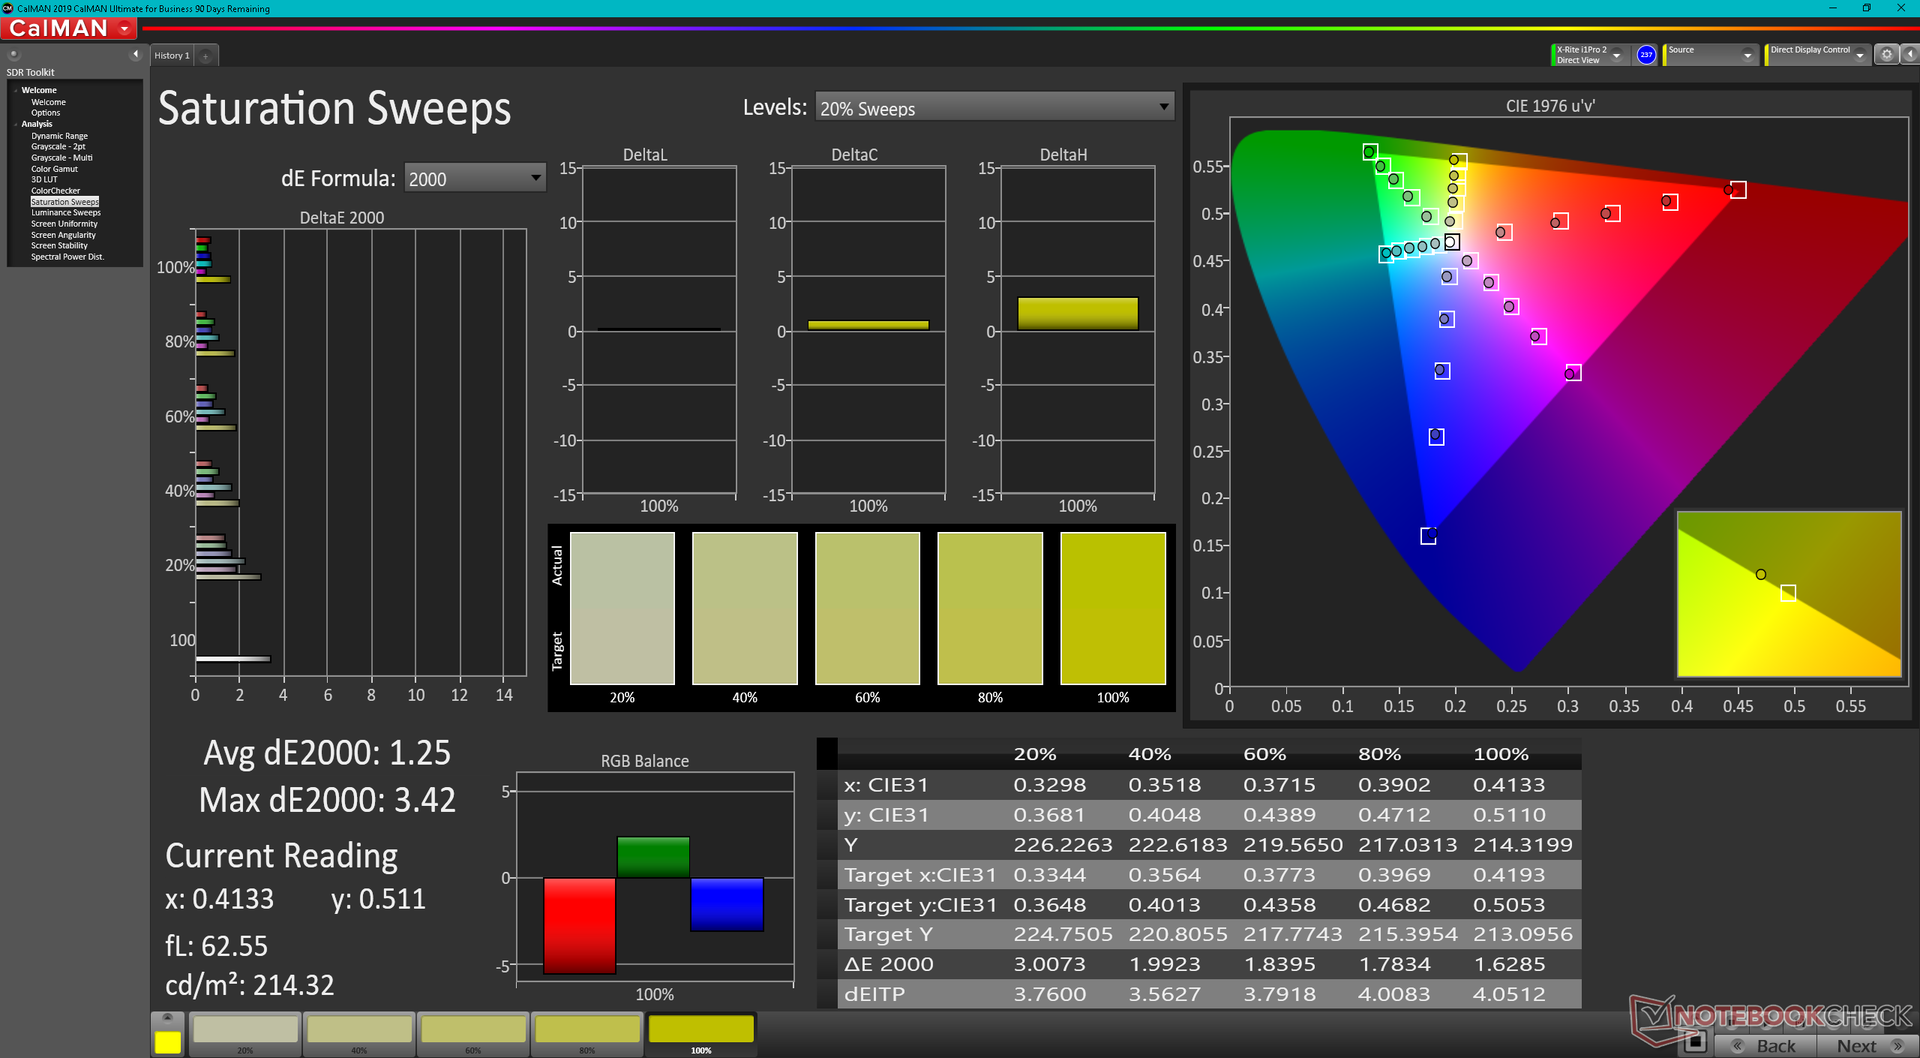
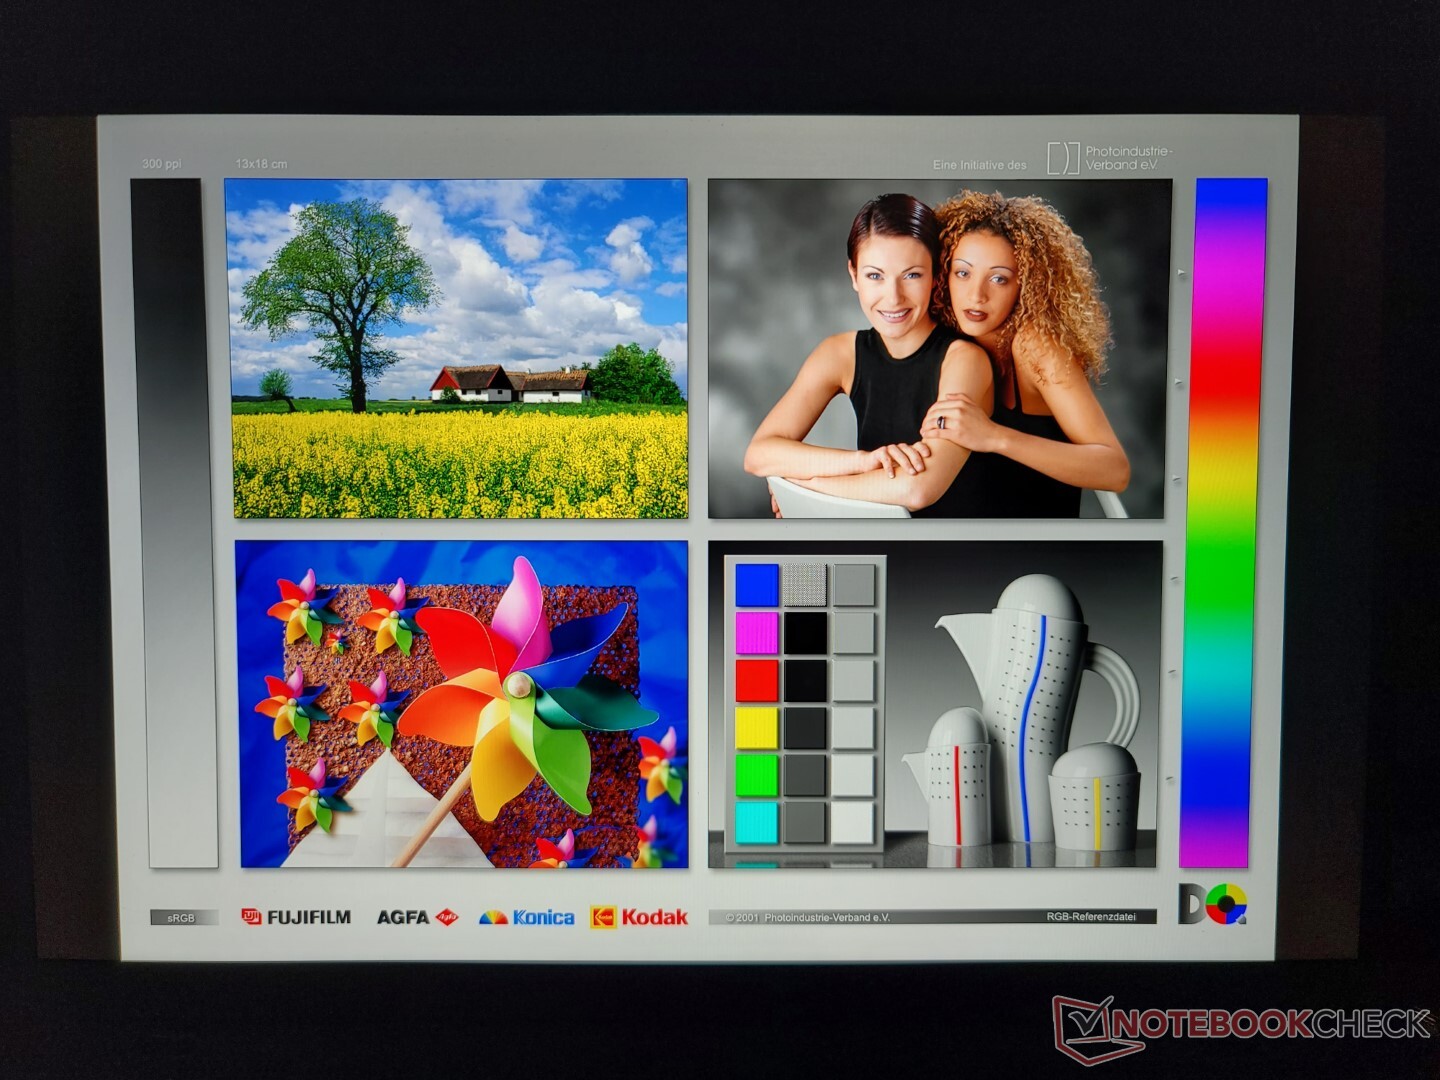
Nuestra unidad de prueba Gen 2 utiliza un panel IPS diferente al de la versión Gen 1 original (P101ZFZ-BH2 frente a MND007ZA1-2). No obstante, sus atributos principales siguen siendo casi idénticos para una experiencia visual esencialmente igual. Los usuarios siguen obteniendo un panel de 450 nits con cobertura sRGB completa y una relación de contraste de >1000:1. Los tiempos de respuesta en blanco y negro y gris podrían ser mejores, pero esto no es un problema para la navegación o las cargas de trabajo de tipo ofimático.


| |||||||||||||||||||||||||
iluminación: 94 %
Brillo con batería: 469.6 cd/m²
Contraste: 1269:1 (Negro: 0.37 cd/m²)
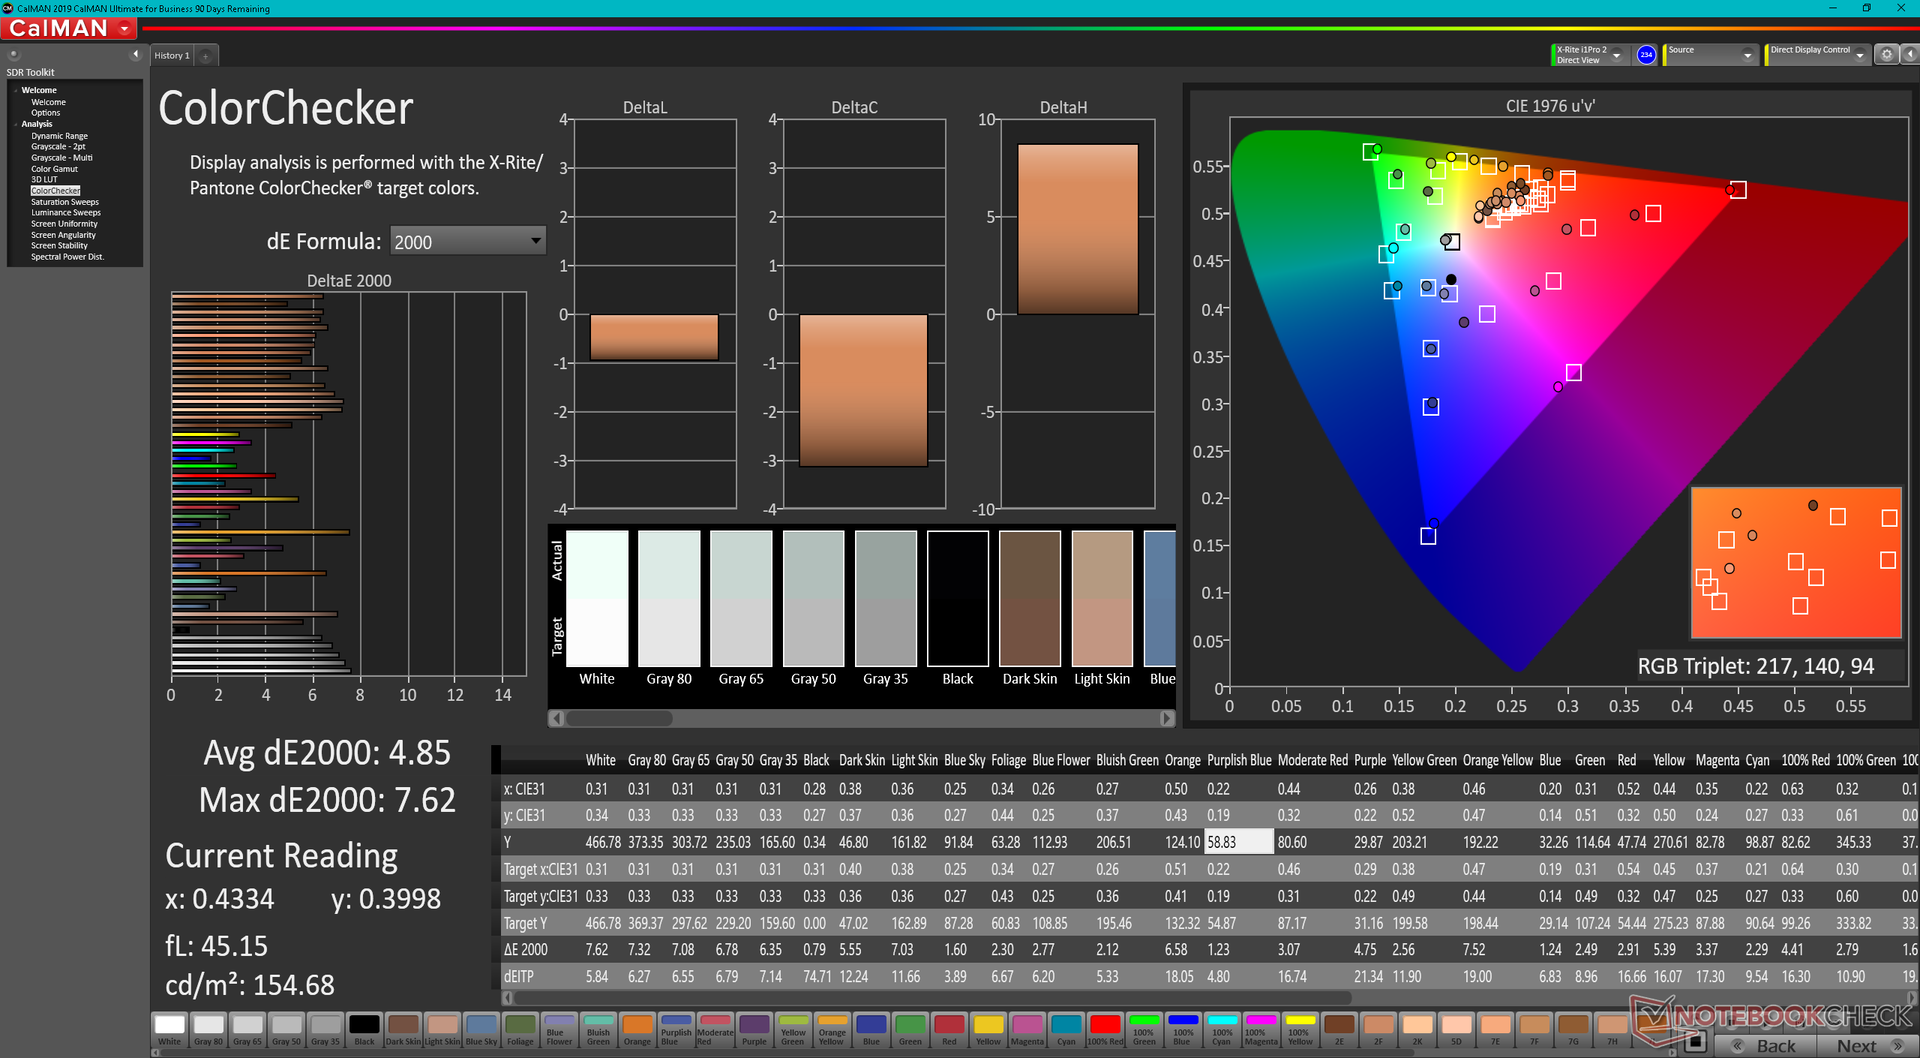
ΔE ColorChecker Calman: 4.85 | ∀{0.5-29.43 Ø4.71}
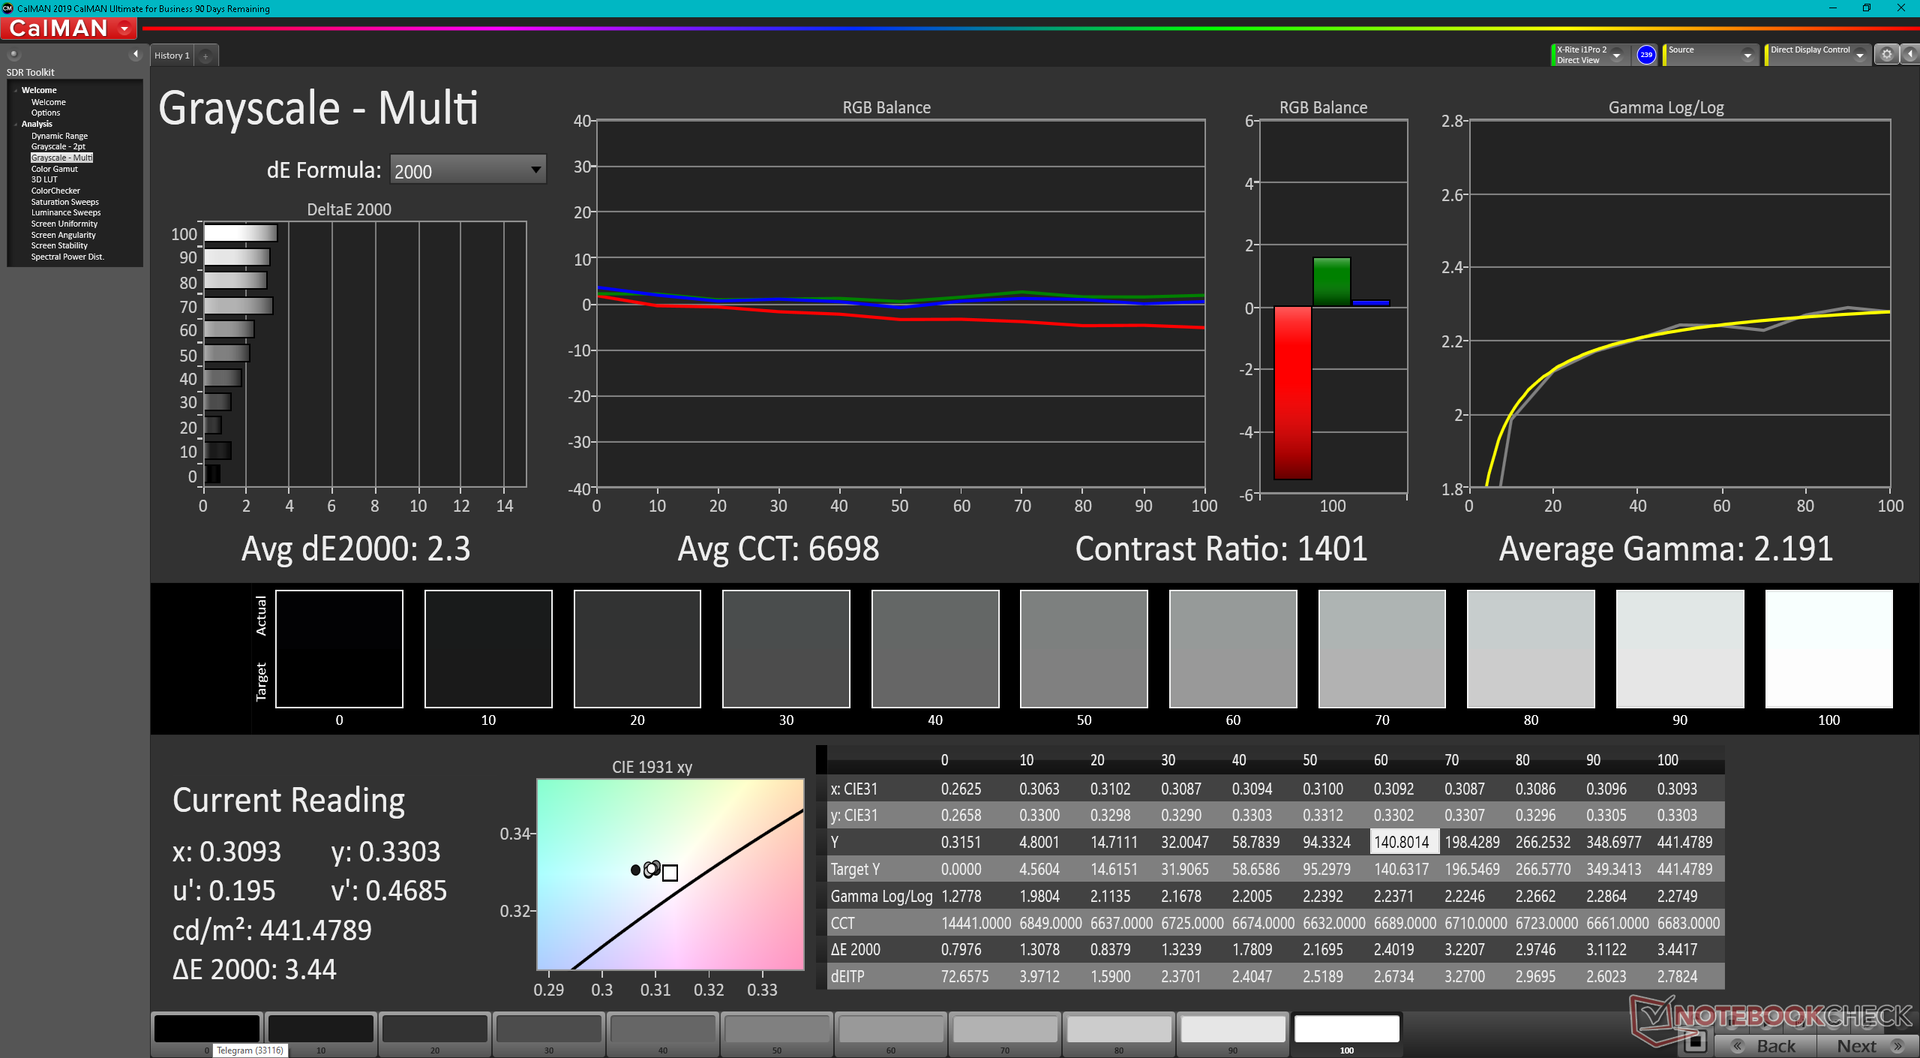
calibrated: 1.22
ΔE Greyscale Calman: 5.7 | ∀{0.09-98 Ø4.96}
68.3% AdobeRGB 1998 (Argyll 3D)
96.1% sRGB (Argyll 3D)
66.2% Display P3 (Argyll 3D)
Gamma: 2.13
CCT: 6931 K
| Lenovo ThinkPad X1 Nano Gen 2 Core i7-1280P P101ZFZ-BH2, IPS, 2160x1350, 13" | Lenovo ThinkPad X1 Nano-20UN002UGE MND007ZA1-2, IPS, 2160x1350, 13" | HP Elite Dragonfly G3 Chi Mei CMN13C0, IPS, 1920x1280, 13.5" | Dell Latitude 13 7330 LG Philips 133WF9, IPS, 1920x1080, 13.3" | Framework Laptop 13.5 12th Gen Intel BOE CQ NE135FBM-N41, IPS, 2256x1504, 13.5" | Huawei MateBook X Pro 2021 TIANMA XM, IPS, 3000x2000, 13.9" | |
|---|---|---|---|---|---|---|
| Display | 5% | 2% | -1% | 4% | -2% | |
| Display P3 Coverage (%) | 66.2 | 70.4 6% | 68 3% | 66.1 0% | 69.9 6% | 64.9 -2% |
| sRGB Coverage (%) | 96.1 | 99.9 4% | 98.3 2% | 93.5 -3% | 99.4 3% | 94.4 -2% |
| AdobeRGB 1998 Coverage (%) | 68.3 | 72 5% | 69.9 2% | 68.2 0% | 71.1 4% | 66.3 -3% |
| Response Times | -8% | -28% | -14% | 7% | 6% | |
| Response Time Grey 50% / Grey 80% * (ms) | 43.6 ? | 46.8 ? -7% | 50.8 ? -17% | 48.4 ? -11% | 34.7 ? 20% | 37.6 ? 14% |
| Response Time Black / White * (ms) | 25.6 ? | 28 ? -9% | 35.2 ? -38% | 29.6 ? -16% | 27.5 ? -7% | 26.4 ? -3% |
| PWM Frequency (Hz) | ||||||
| Screen | 29% | 19% | 24% | 13% | 26% | |
| Brightness middle (cd/m²) | 469.6 | 460 -2% | 387.2 -18% | 460.1 -2% | 449.6 -4% | 502 7% |
| Brightness (cd/m²) | 460 | 434 -6% | 360 -22% | 445 -3% | 431 -6% | 474 3% |
| Brightness Distribution (%) | 94 | 92 -2% | 80 -15% | 89 -5% | 90 -4% | 89 -5% |
| Black Level * (cd/m²) | 0.37 | 0.27 27% | 0.26 30% | 0.31 16% | 0.31 16% | 0.33 11% |
| Contrast (:1) | 1269 | 1704 34% | 1489 17% | 1484 17% | 1450 14% | 1521 20% |
| Colorchecker dE 2000 * | 4.85 | 1.1 77% | 2.36 51% | 2.42 50% | 2.76 43% | 1.35 72% |
| Colorchecker dE 2000 max. * | 7.62 | 4.5 41% | 4.79 37% | 3.97 48% | 7.96 -4% | 3.67 52% |
| Colorchecker dE 2000 calibrated * | 1.22 | 1 18% | 0.63 48% | 0.77 37% | 0.58 52% | 1.2 2% |
| Greyscale dE 2000 * | 5.7 | 1.6 72% | 3 47% | 2.3 60% | 5.2 9% | 1.7 70% |
| Gamma | 2.13 103% | 2.2 100% | 2.17 101% | 2.23 99% | 2.23 99% | 2.24 98% |
| CCT | 6931 94% | 6475 100% | 6137 106% | 6262 104% | 6475 100% | 6440 101% |
| Color Space (Percent of AdobeRGB 1998) (%) | 65.7 | 61.1 | ||||
| Color Space (Percent of sRGB) (%) | 99.9 | 94.3 | ||||
| Media total (Programa/Opciones) | 9% /
18% | -2% /
9% | 3% /
13% | 8% /
10% | 10% /
17% |
* ... más pequeño es mejor
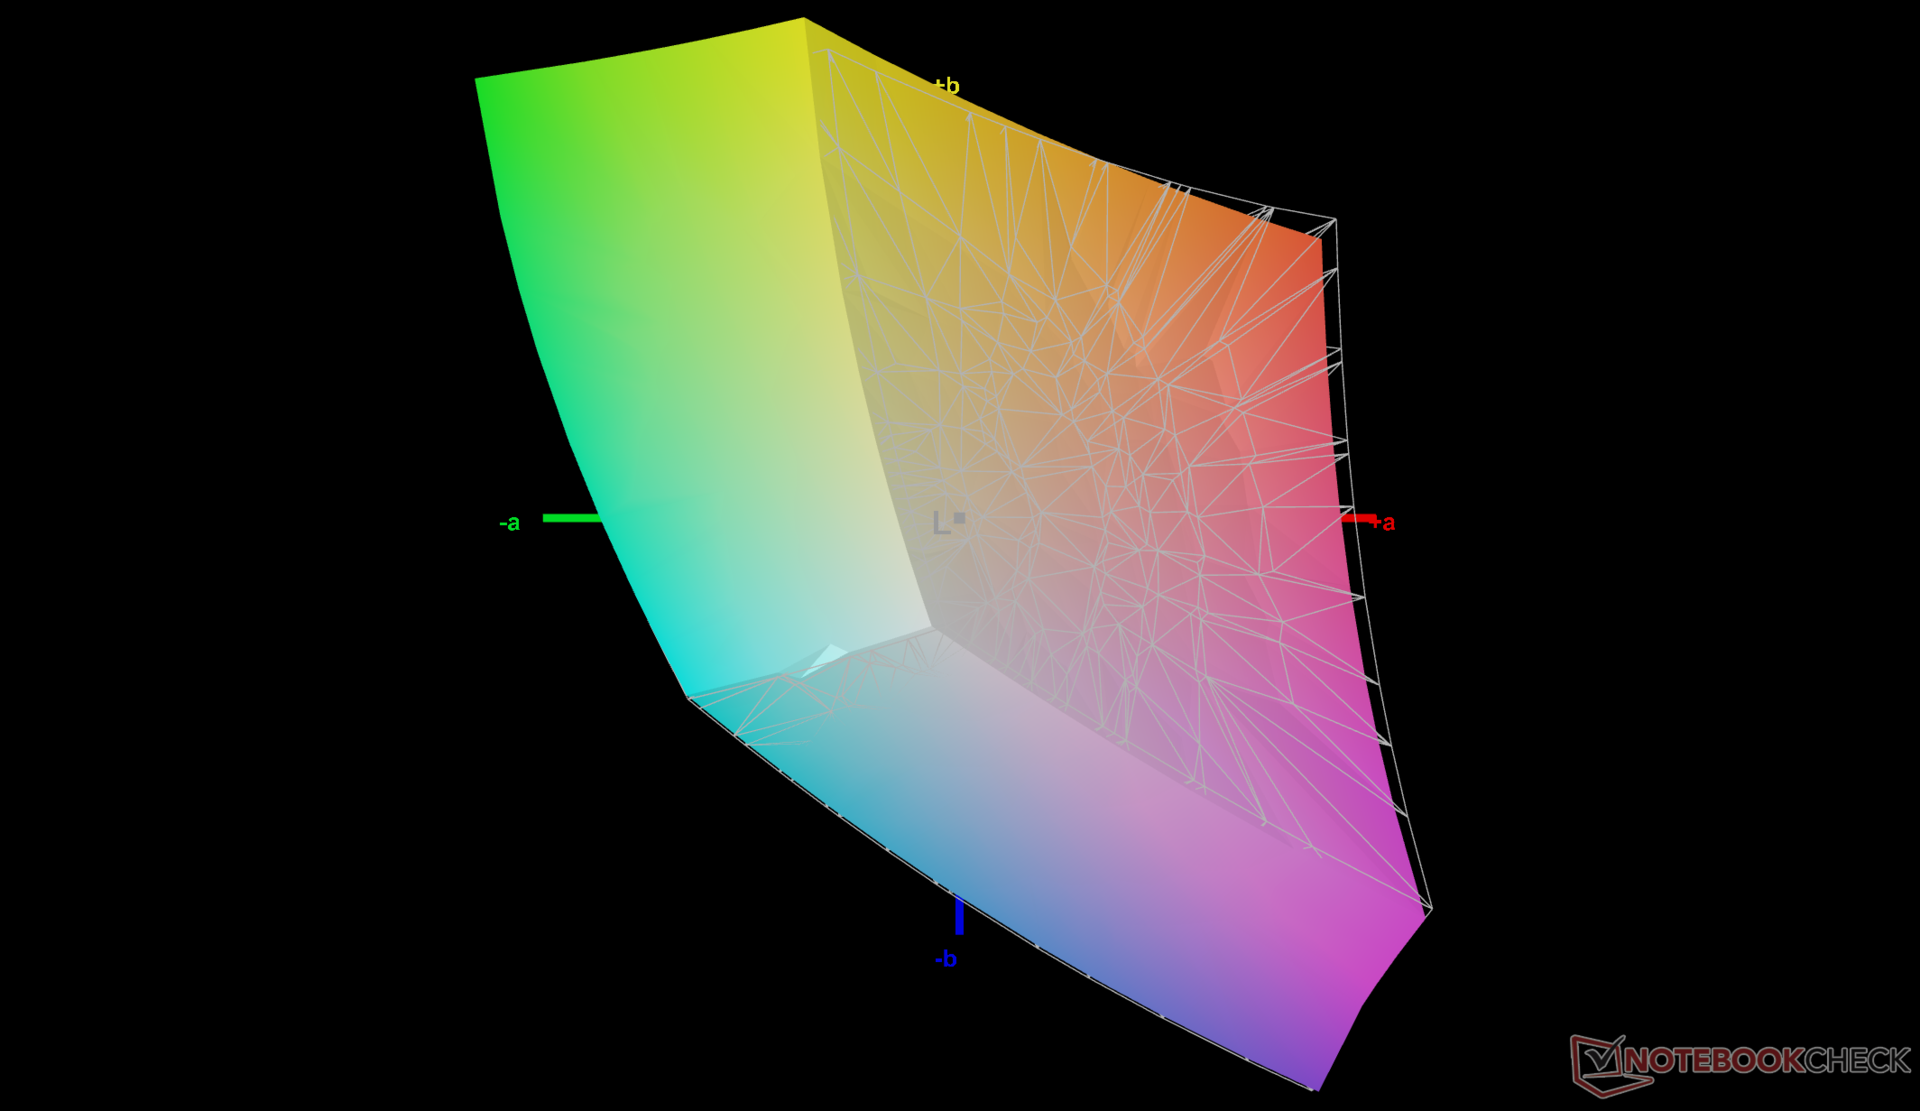
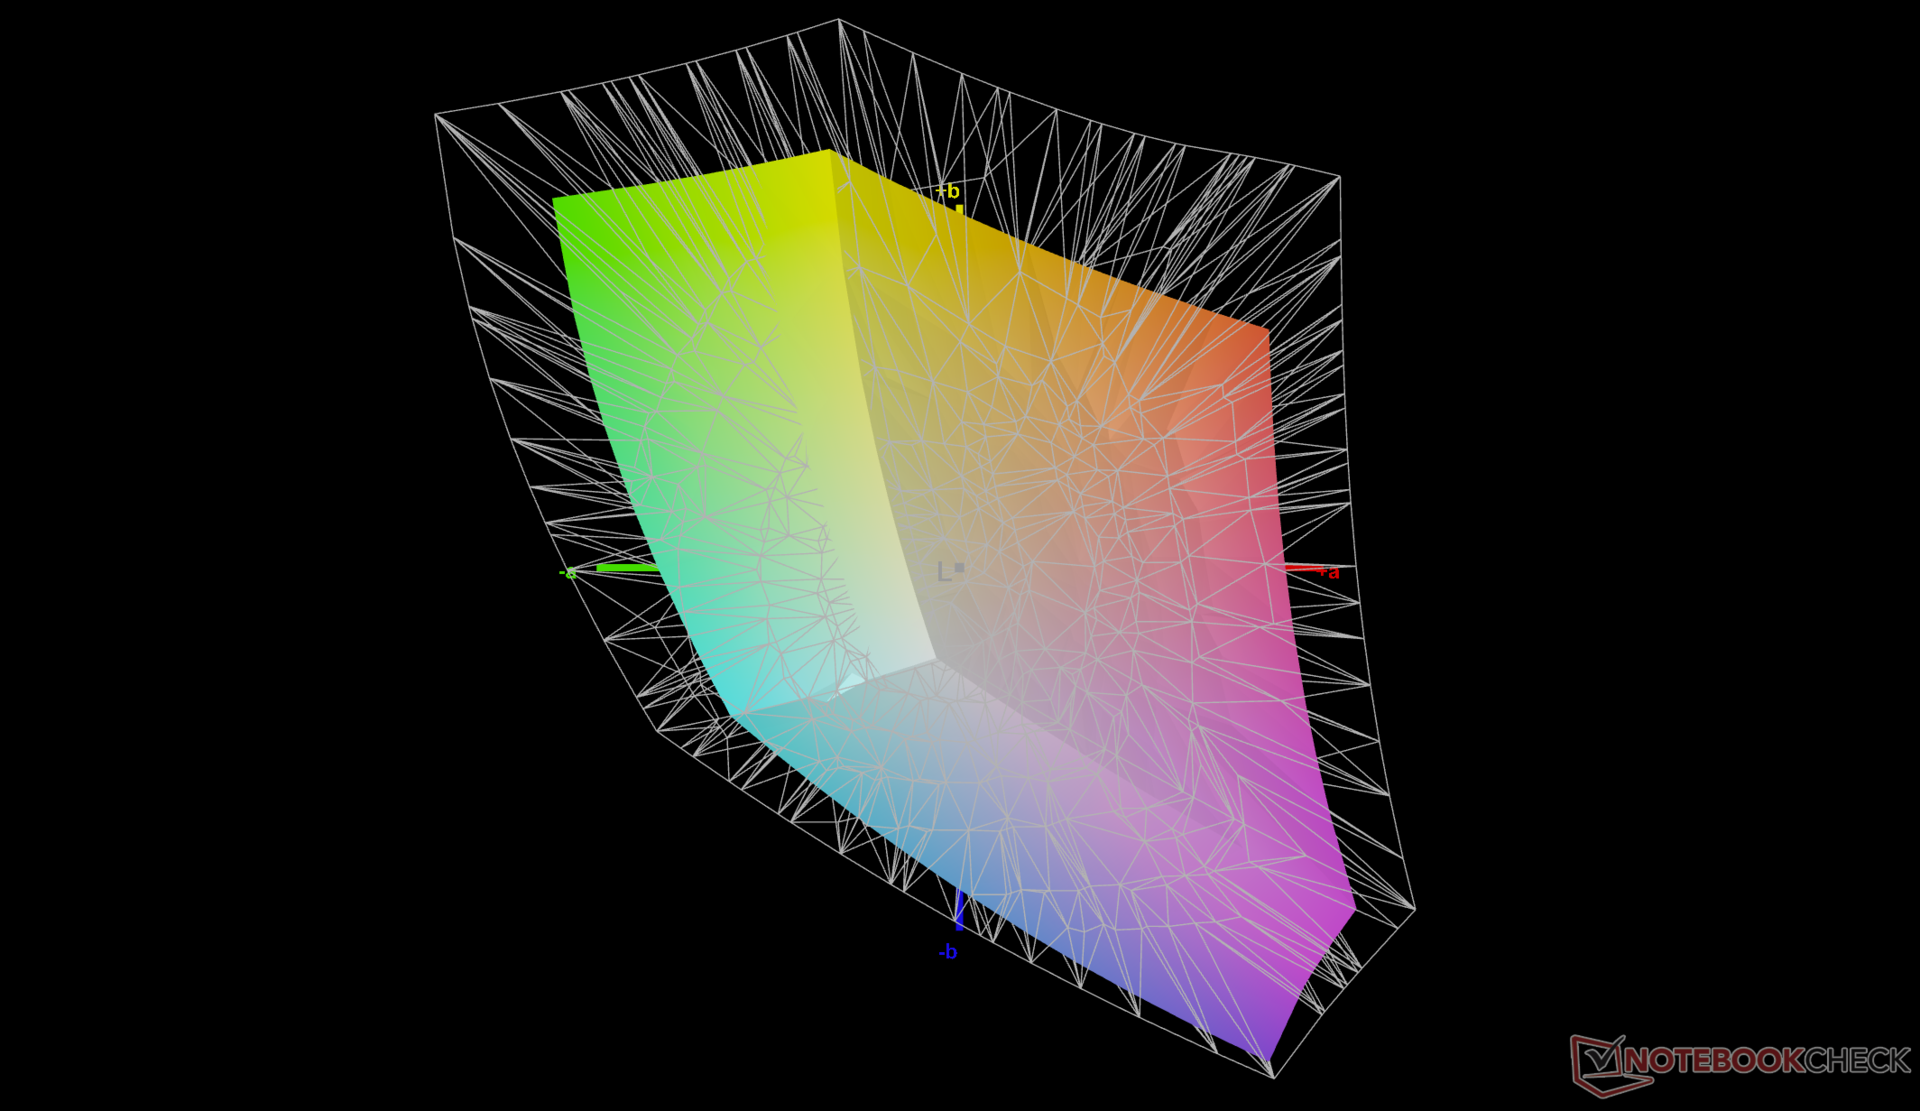
El panel no está bien calibrado al sacarlo de la caja. Calibrarlo nosotros mismos mejoraría mucho los valores medios de escala de grises y color deltaE de 5,7 y 4,85 a sólo 2,3 y 1,22, respectivamente. Recomendamos una calibración por parte del usuario final para aprovechar mejor la cobertura sRGB completa del panel.

Tiempos de respuesta del display
| ↔ Tiempo de respuesta de Negro a Blanco | ||
|---|---|---|
| 25.6 ms ... subida ↗ y bajada ↘ combinada | ↗ 13.2 ms subida | 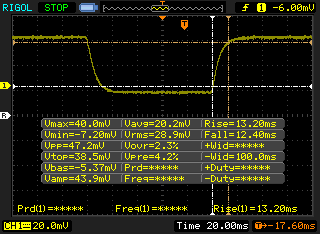 |
| ↘ 12.4 ms bajada | ||
| La pantalla mostró tiempos de respuesta relativamente lentos en nuestros tests pero podría ser demasiado lenta para los jugones. En comparación, todos los dispositivos de prueba van de ##min### (mínimo) a 240 (máximo) ms. » 61 % de todos los dispositivos son mejores. Eso quiere decir que el tiempo de respuesta es peor que la media (19.8 ms) de todos los dispositivos testados. | ||
| ↔ Tiempo de respuesta 50% Gris a 80% Gris | ||
| 43.6 ms ... subida ↗ y bajada ↘ combinada | ↗ 22 ms subida | 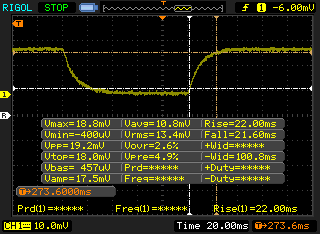 |
| ↘ 21.6 ms bajada | ||
| La pantalla mostró tiempos de respuesta lentos en nuestros tests y podría ser demasiado lenta para los jugones. En comparación, todos los dispositivos de prueba van de ##min### (mínimo) a 636 (máximo) ms. » 73 % de todos los dispositivos son mejores. Eso quiere decir que el tiempo de respuesta es peor que la media (31 ms) de todos los dispositivos testados. | ||
Parpadeo de Pantalla / PWM (Pulse-Width Modulation)
| Parpadeo de Pantalla / PWM no detectado | 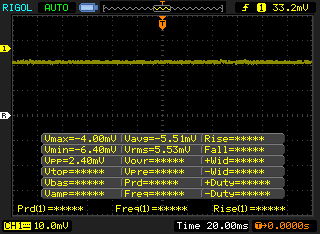 | ||
Comparación: 52 % de todos los dispositivos testados no usaron PWM para atenuar el display. Si se usó, medimos una media de 7754 (mínimo: 5 - máxmo: 343500) Hz. | |||
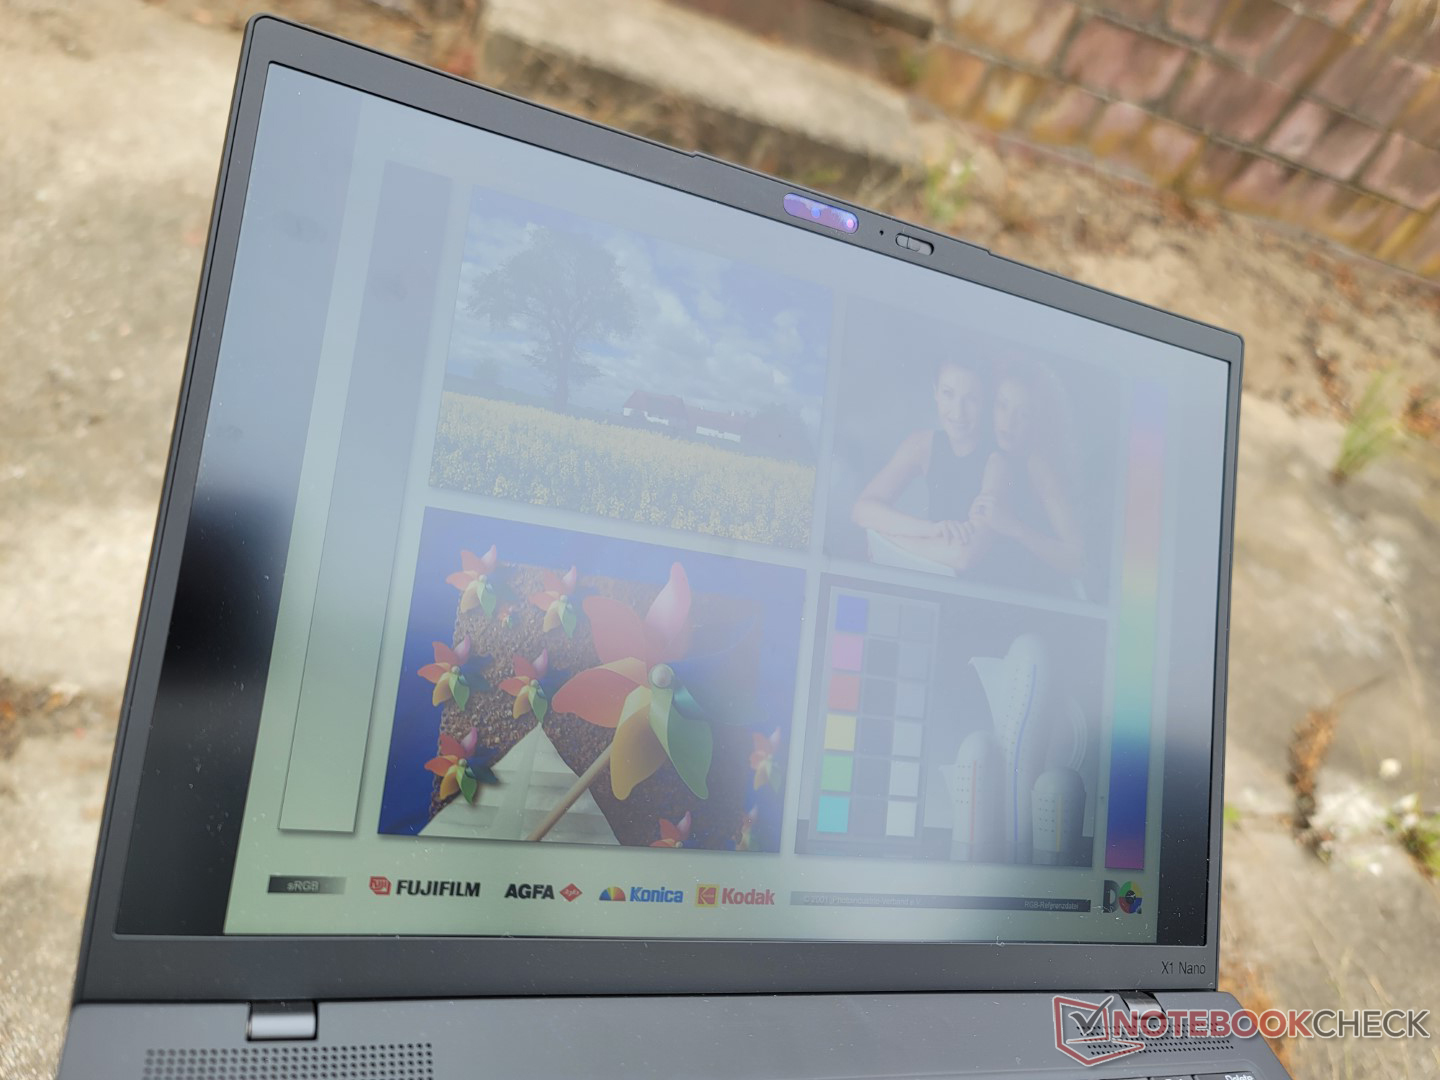
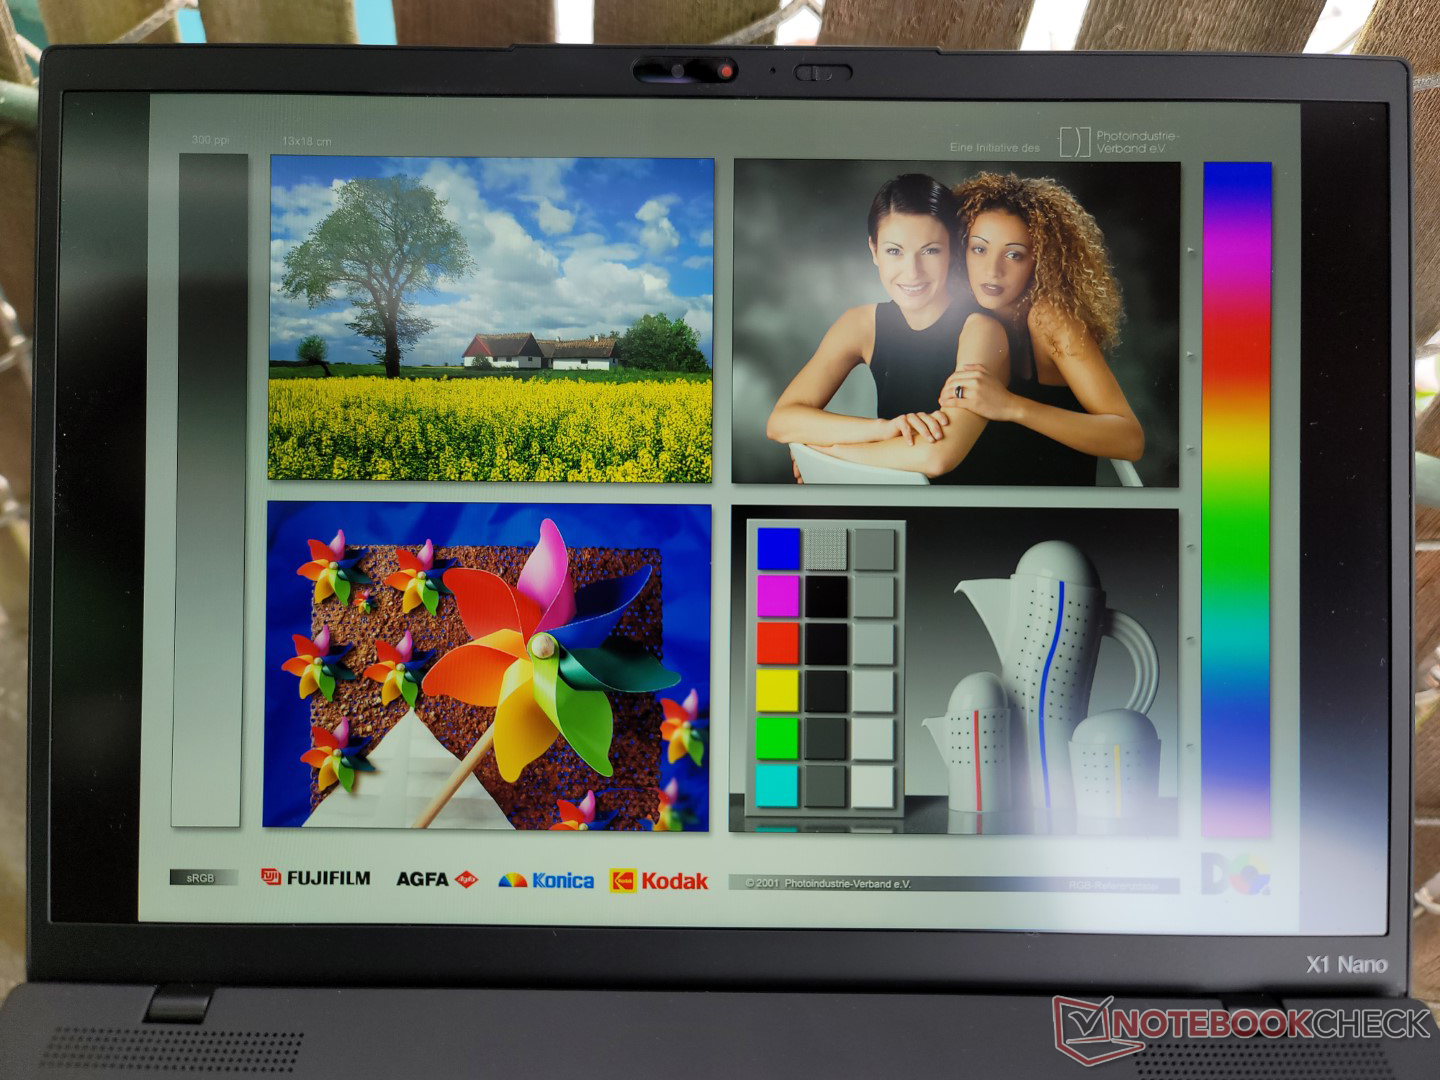
La visibilidad en exteriores y los ángulos de visión siguen siendo prácticamente los mismos que en el modelo Gen 1, ya que Lenovo no ha aumentado el brillo ni el contraste de la pantalla en el modelo de este año.

Rendimiento
Condiciones de la prueba
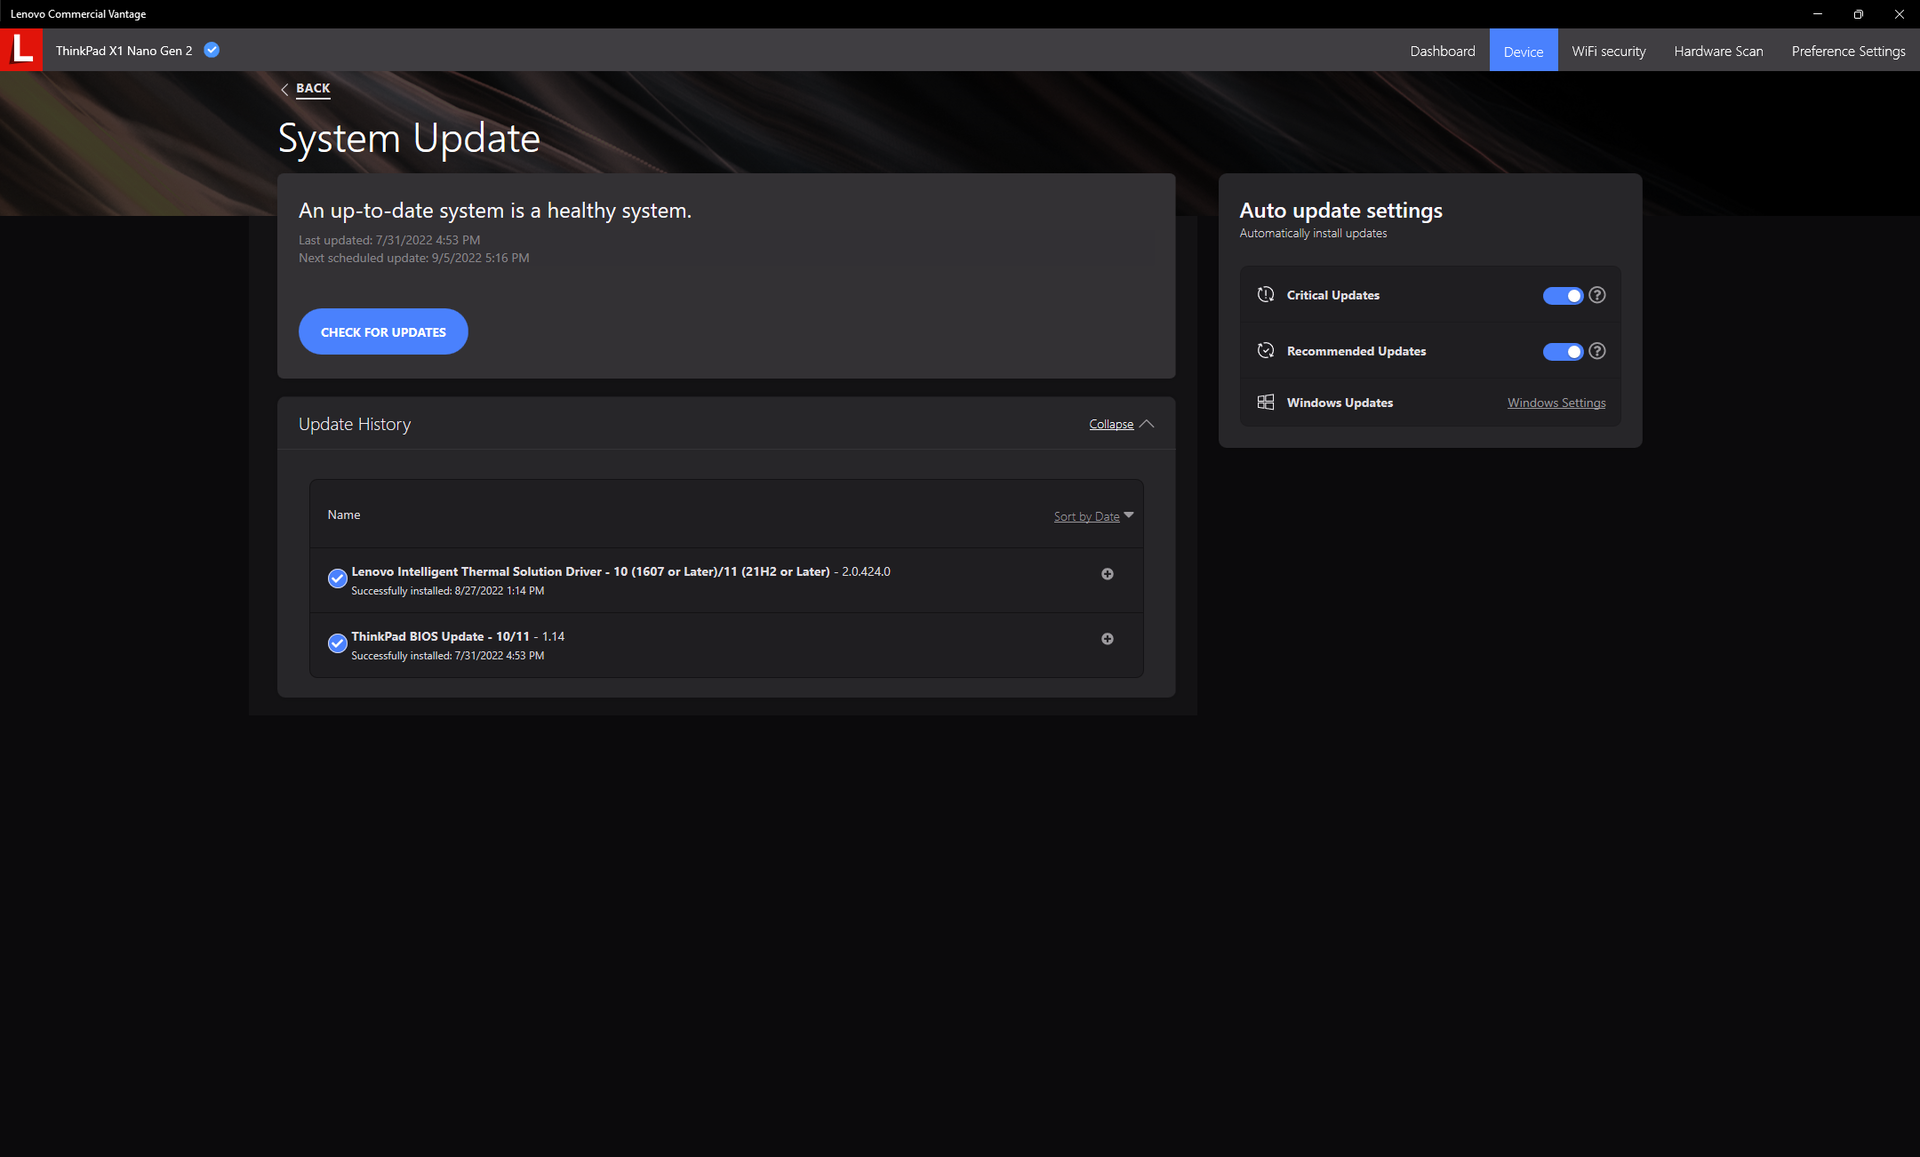
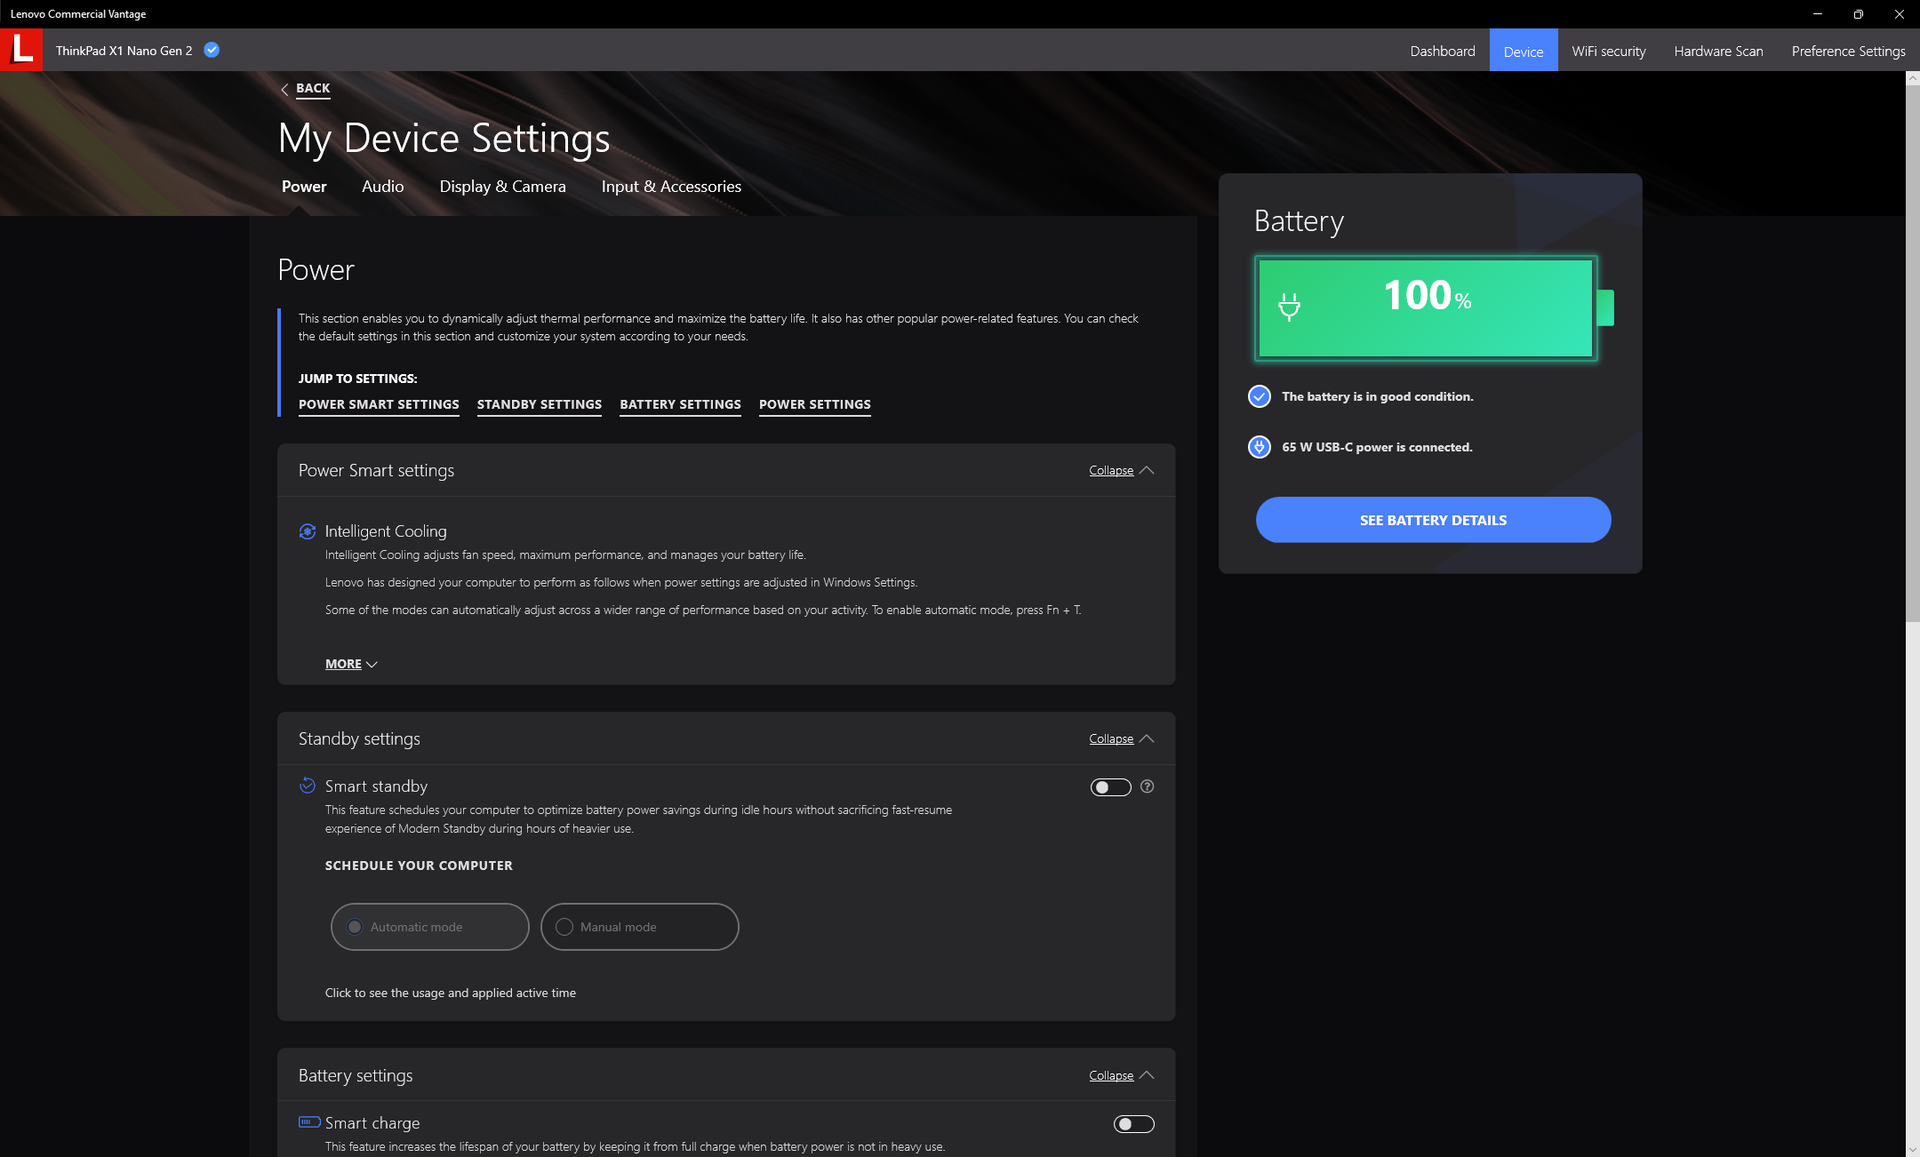
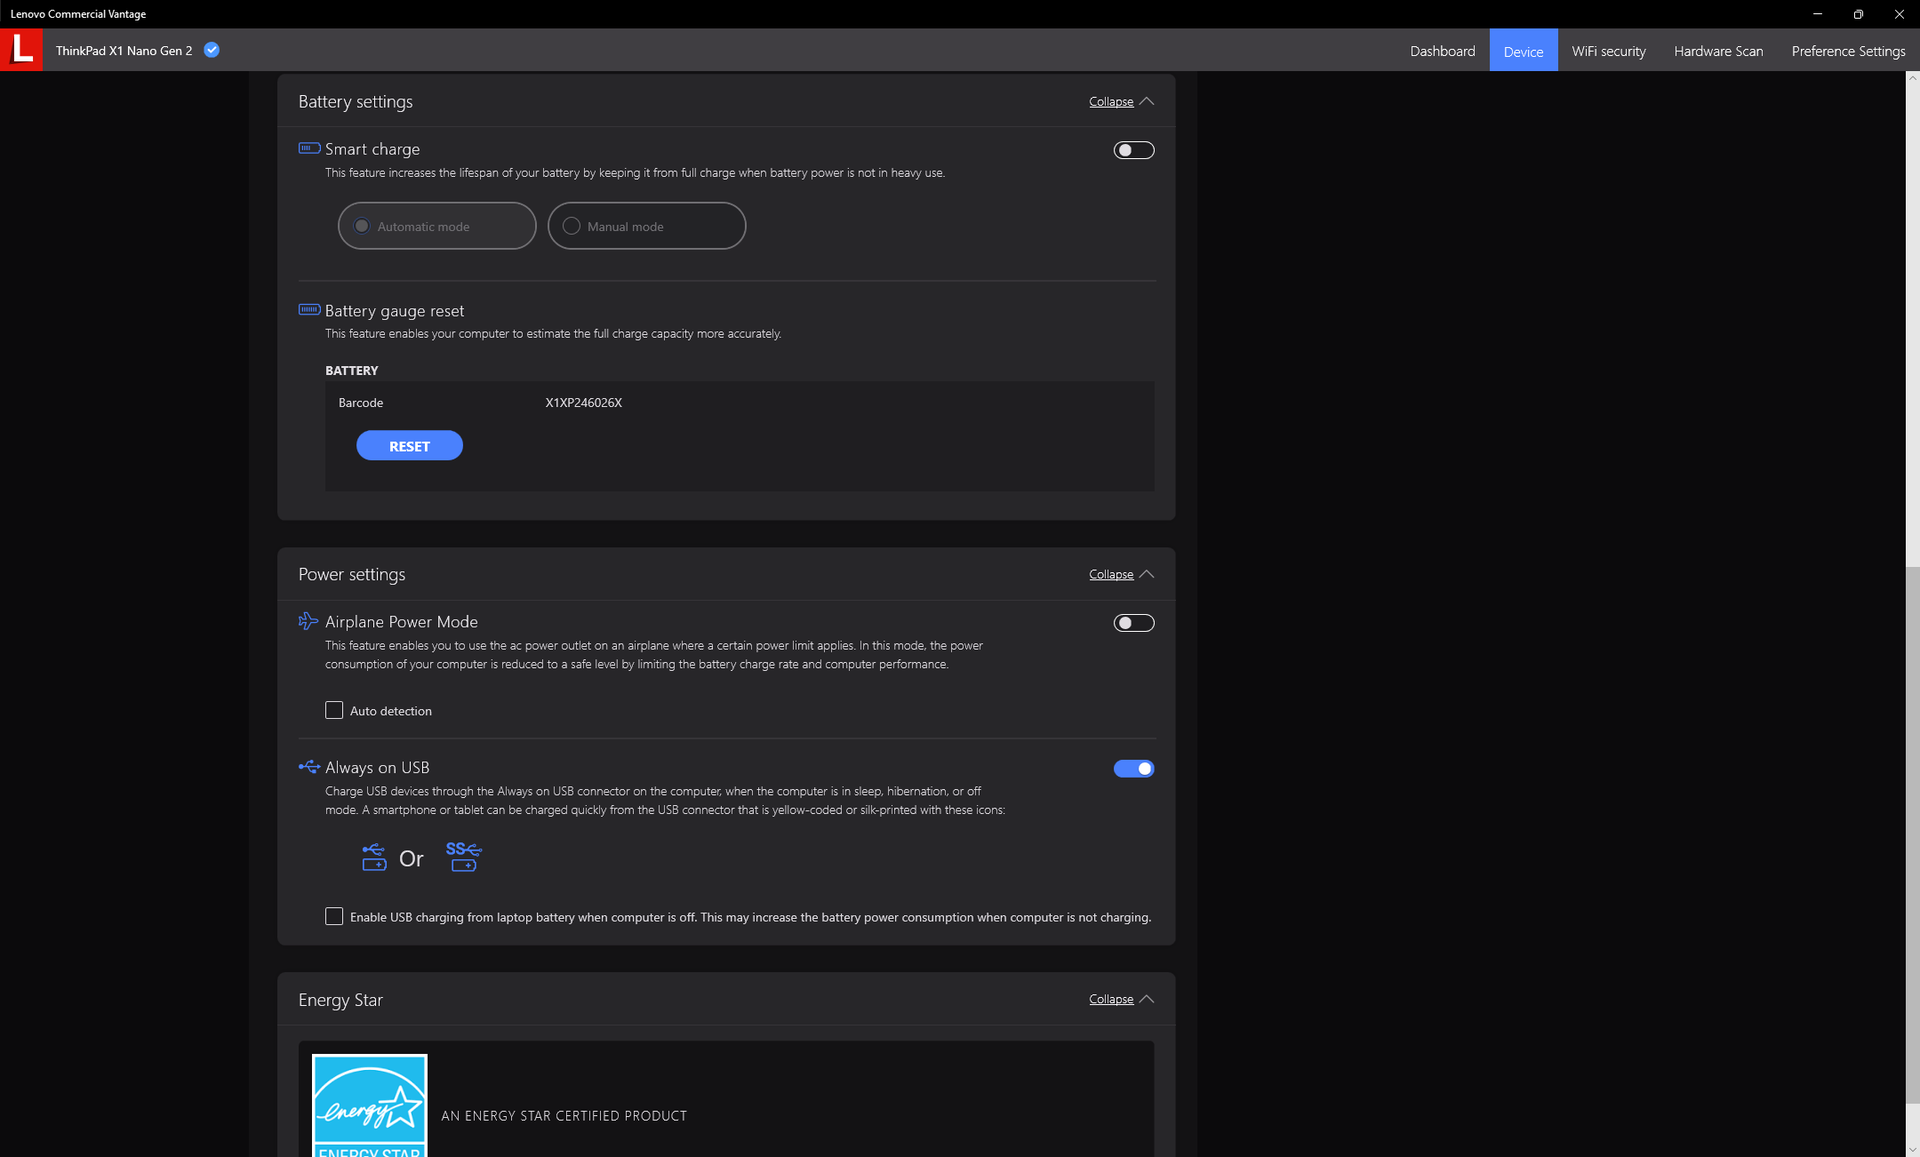
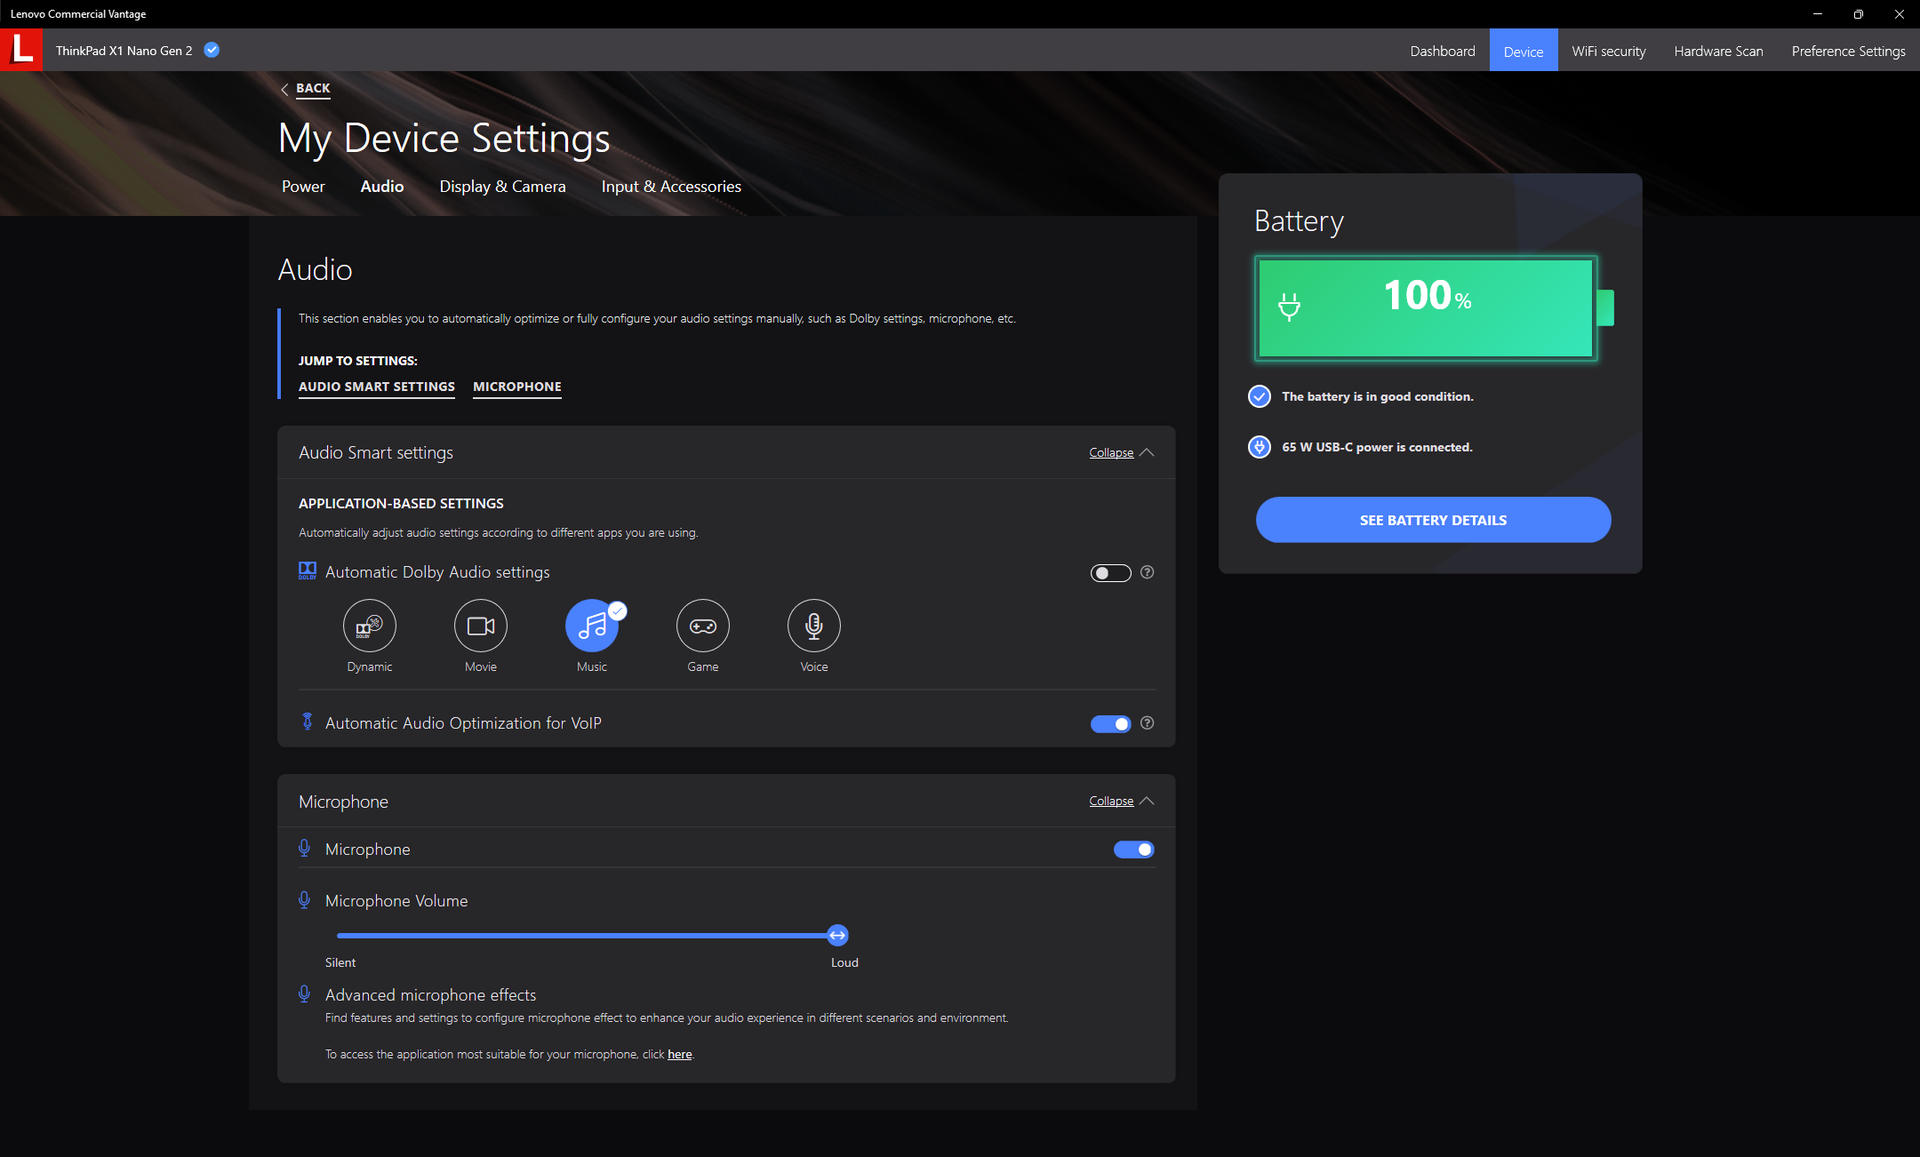
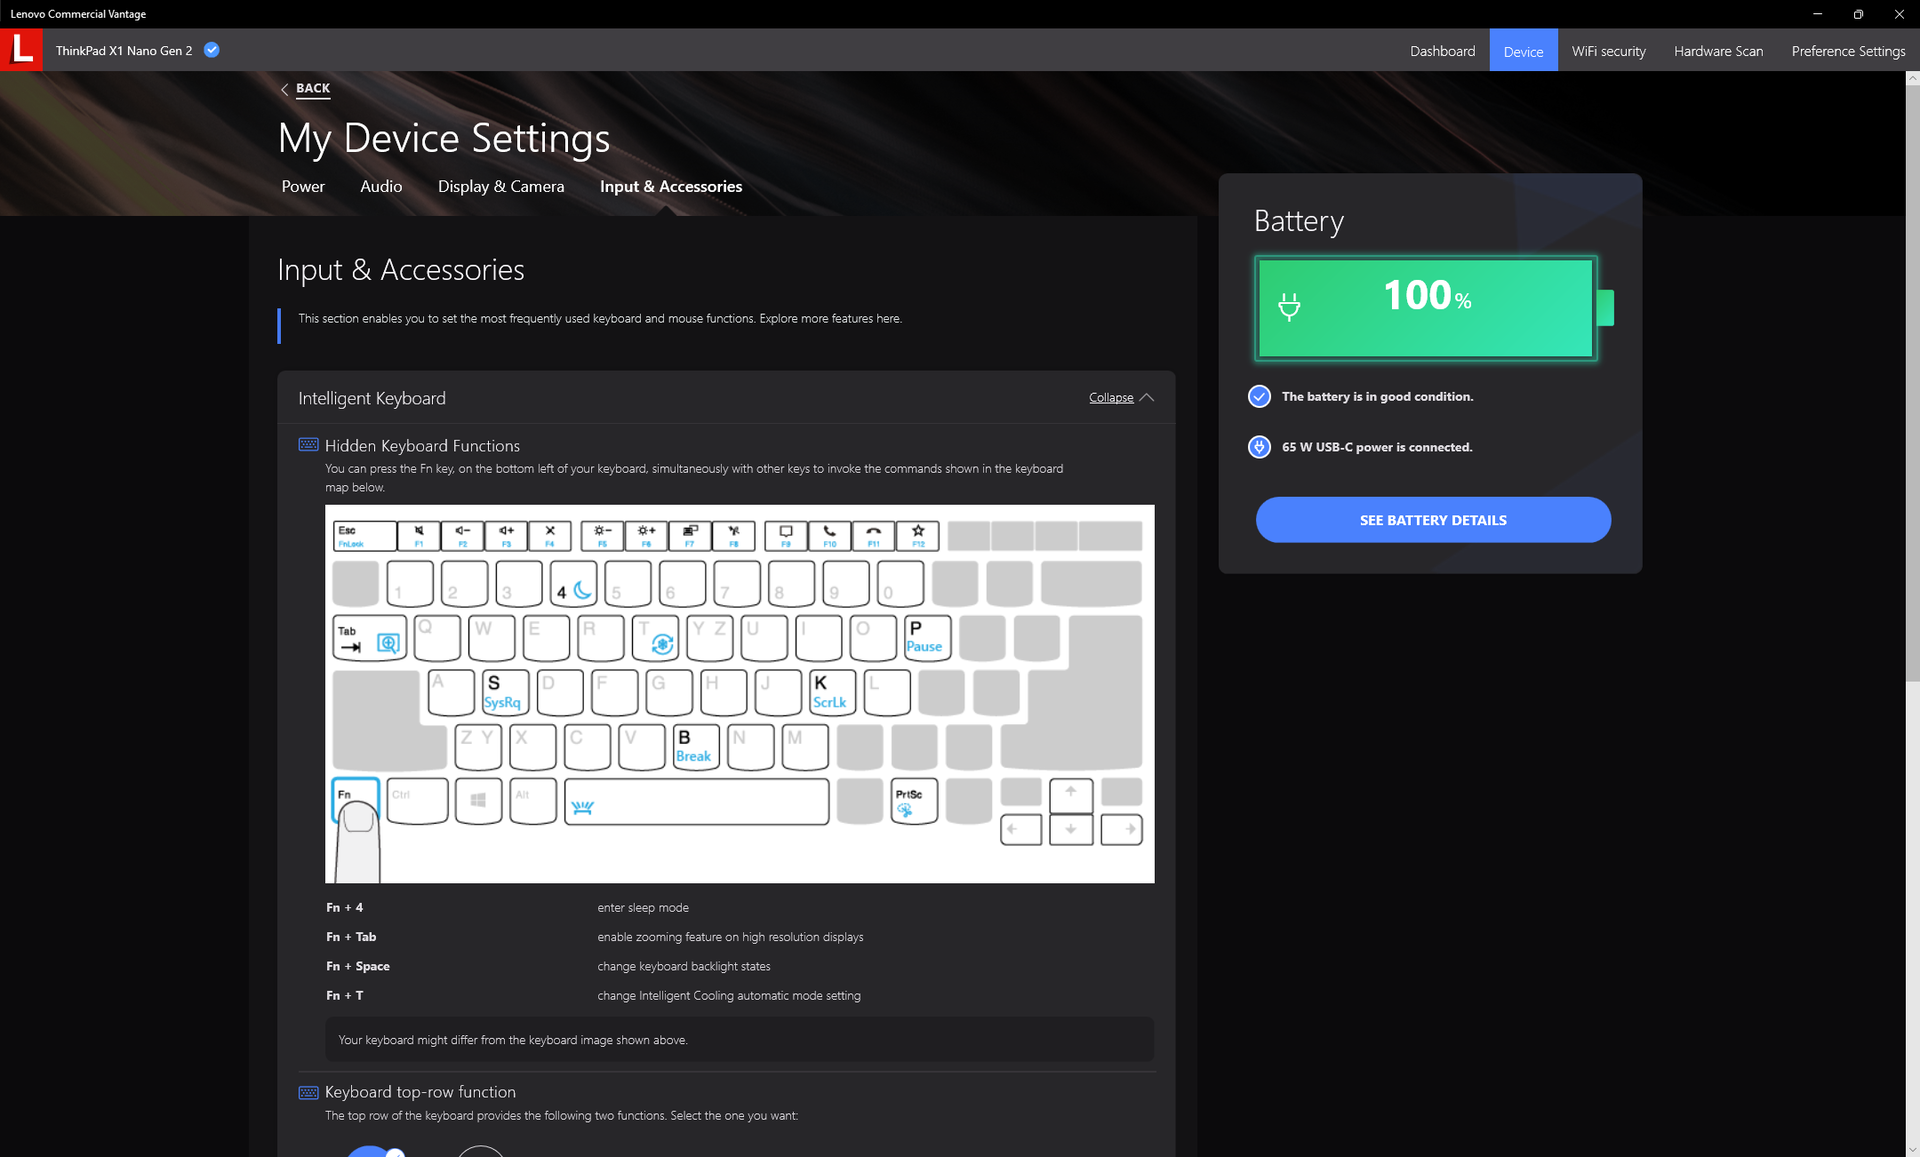
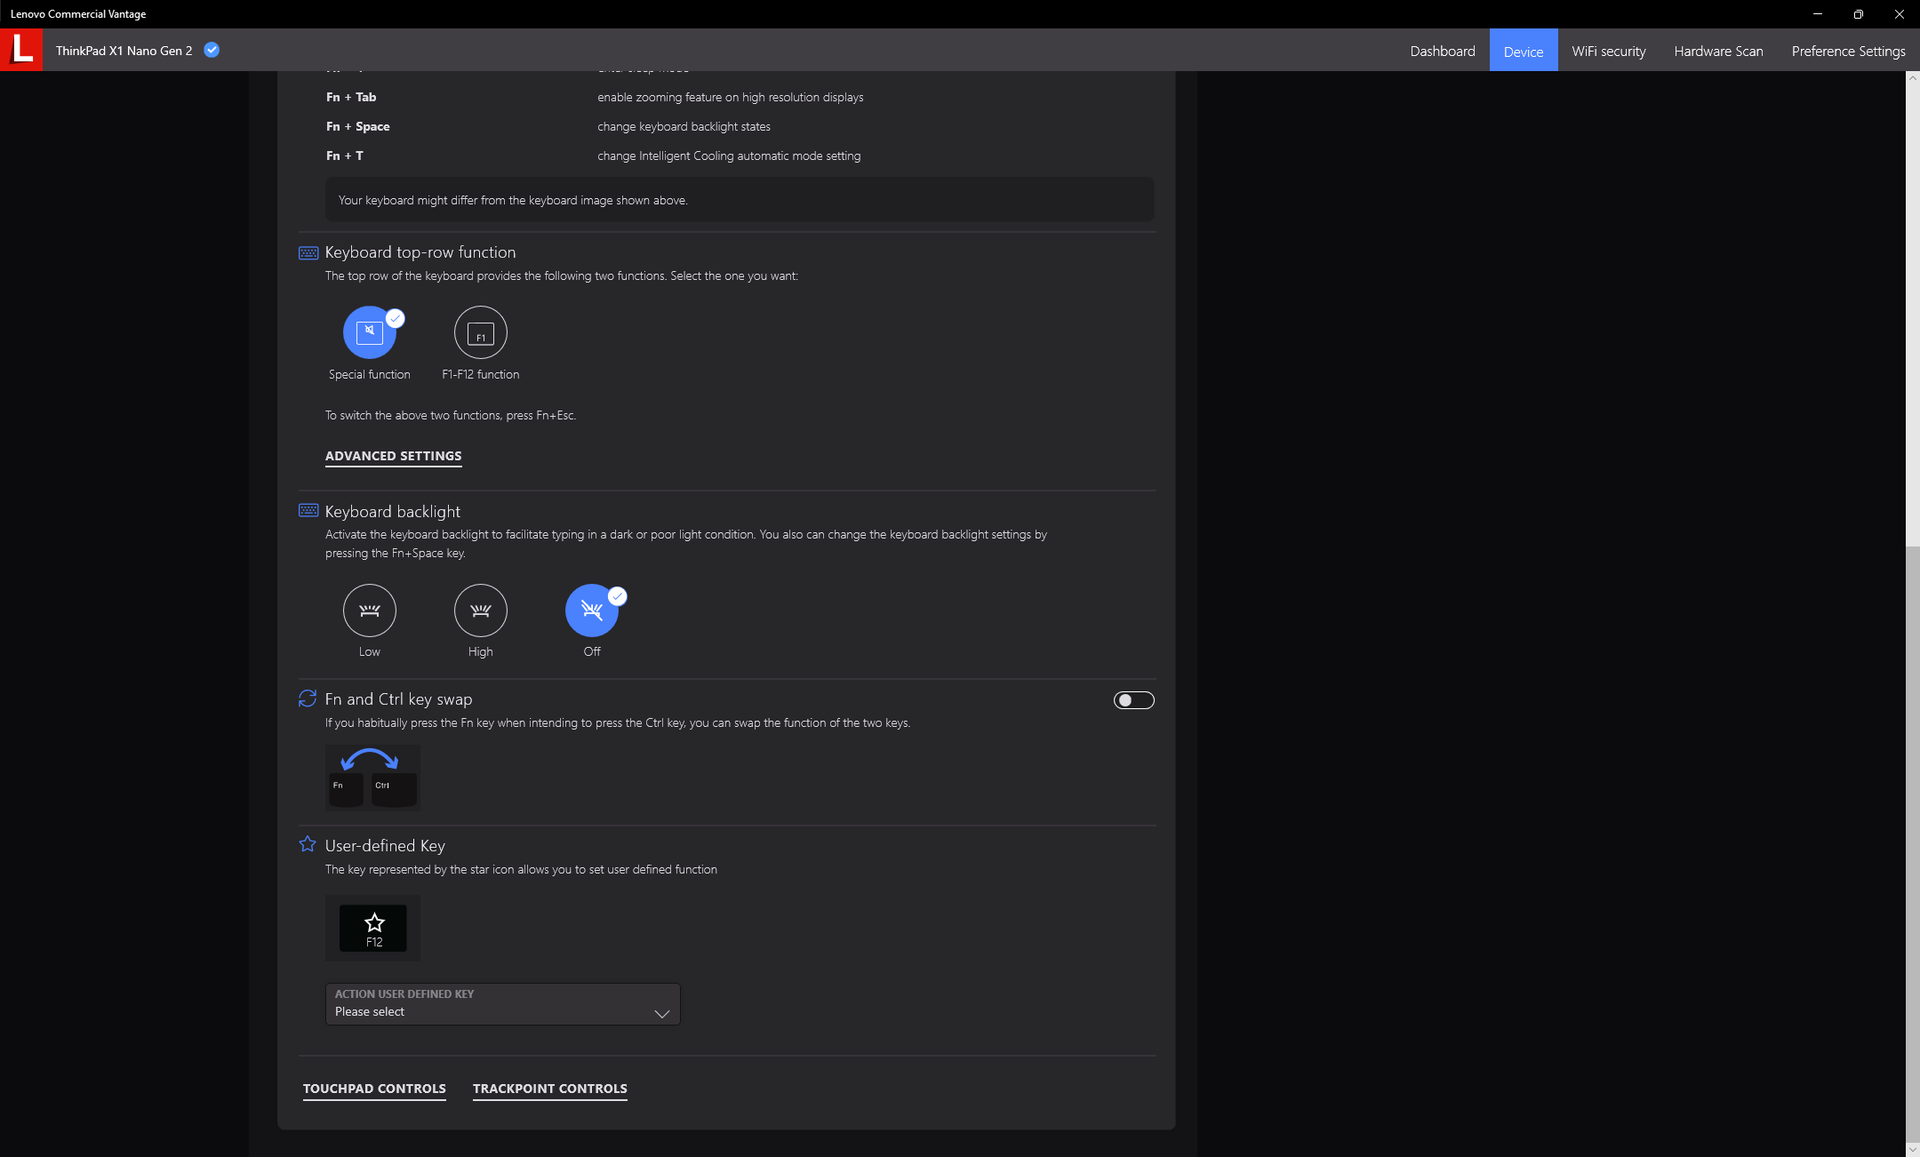
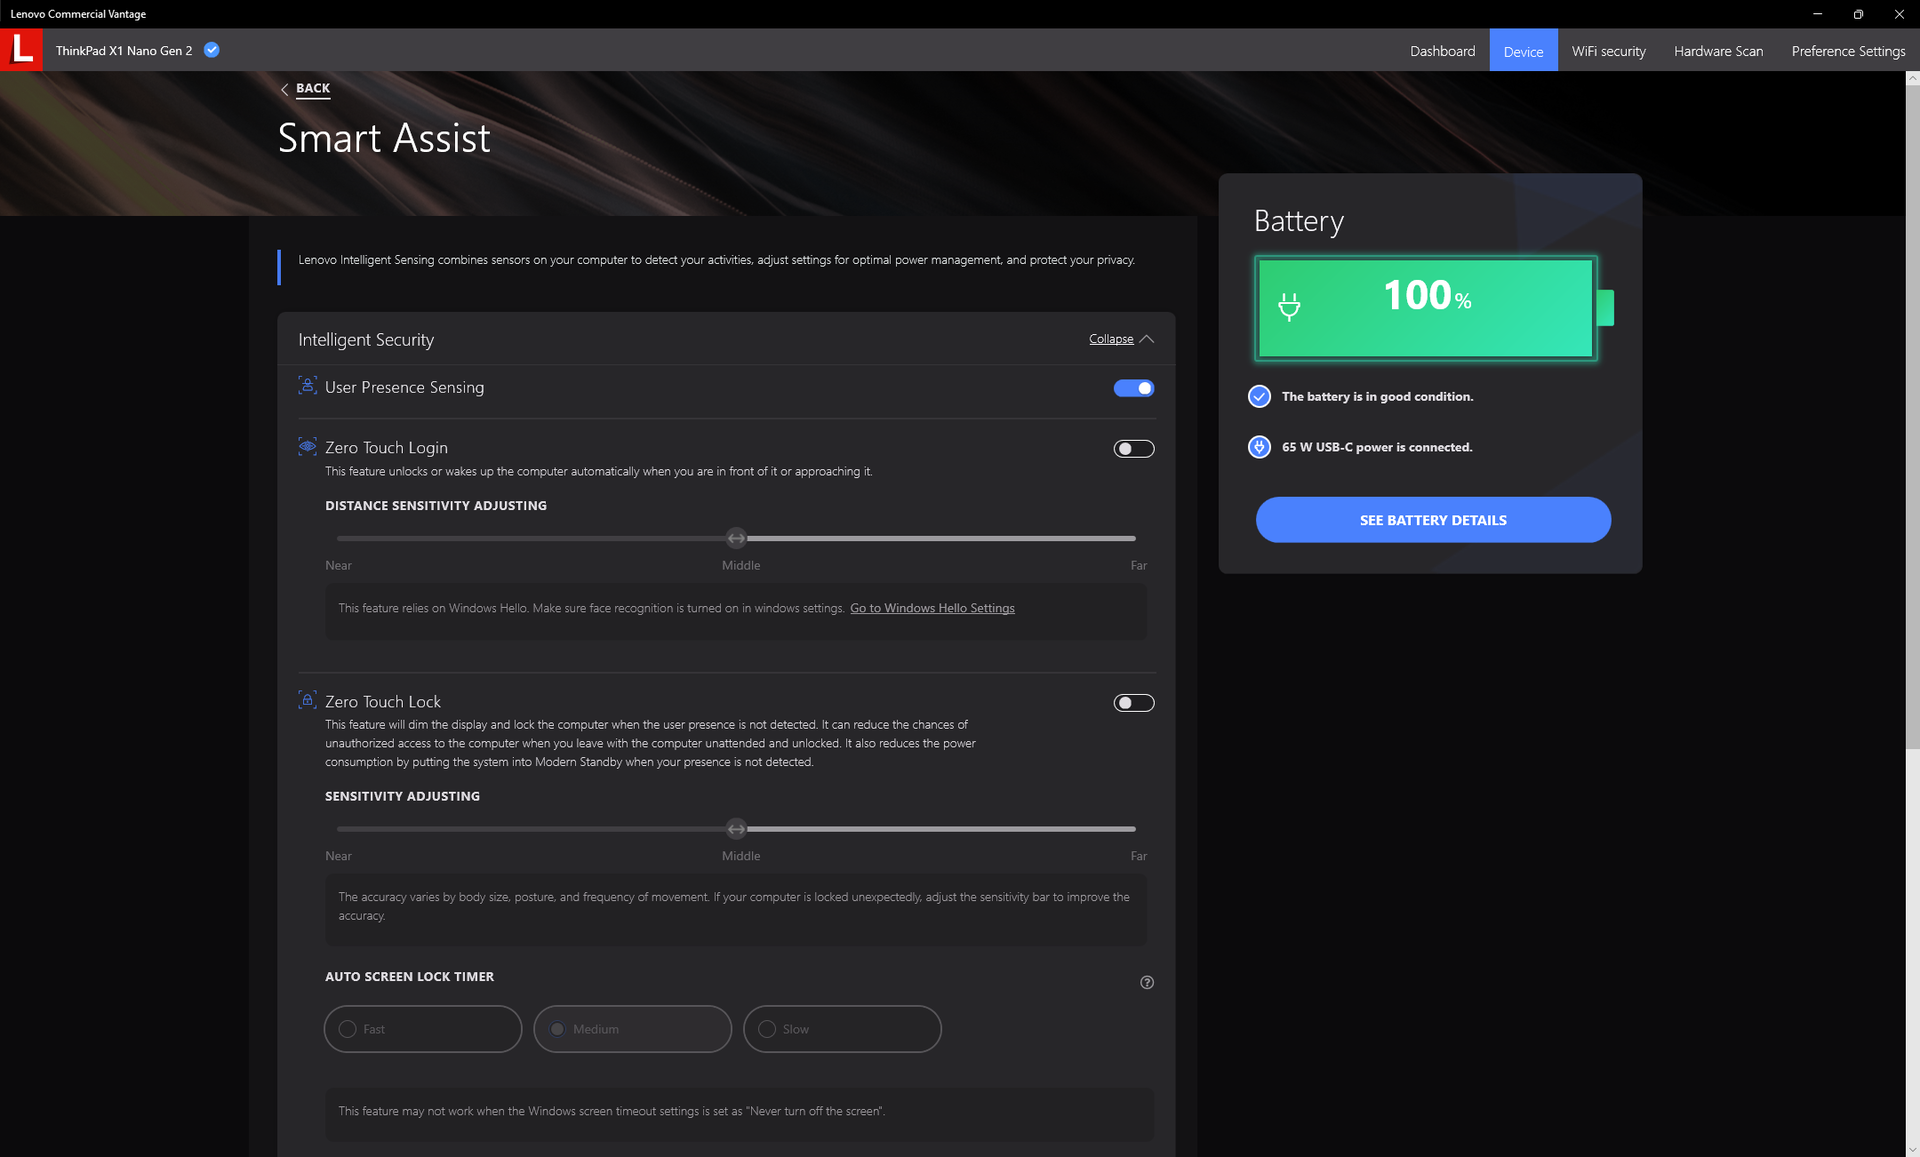
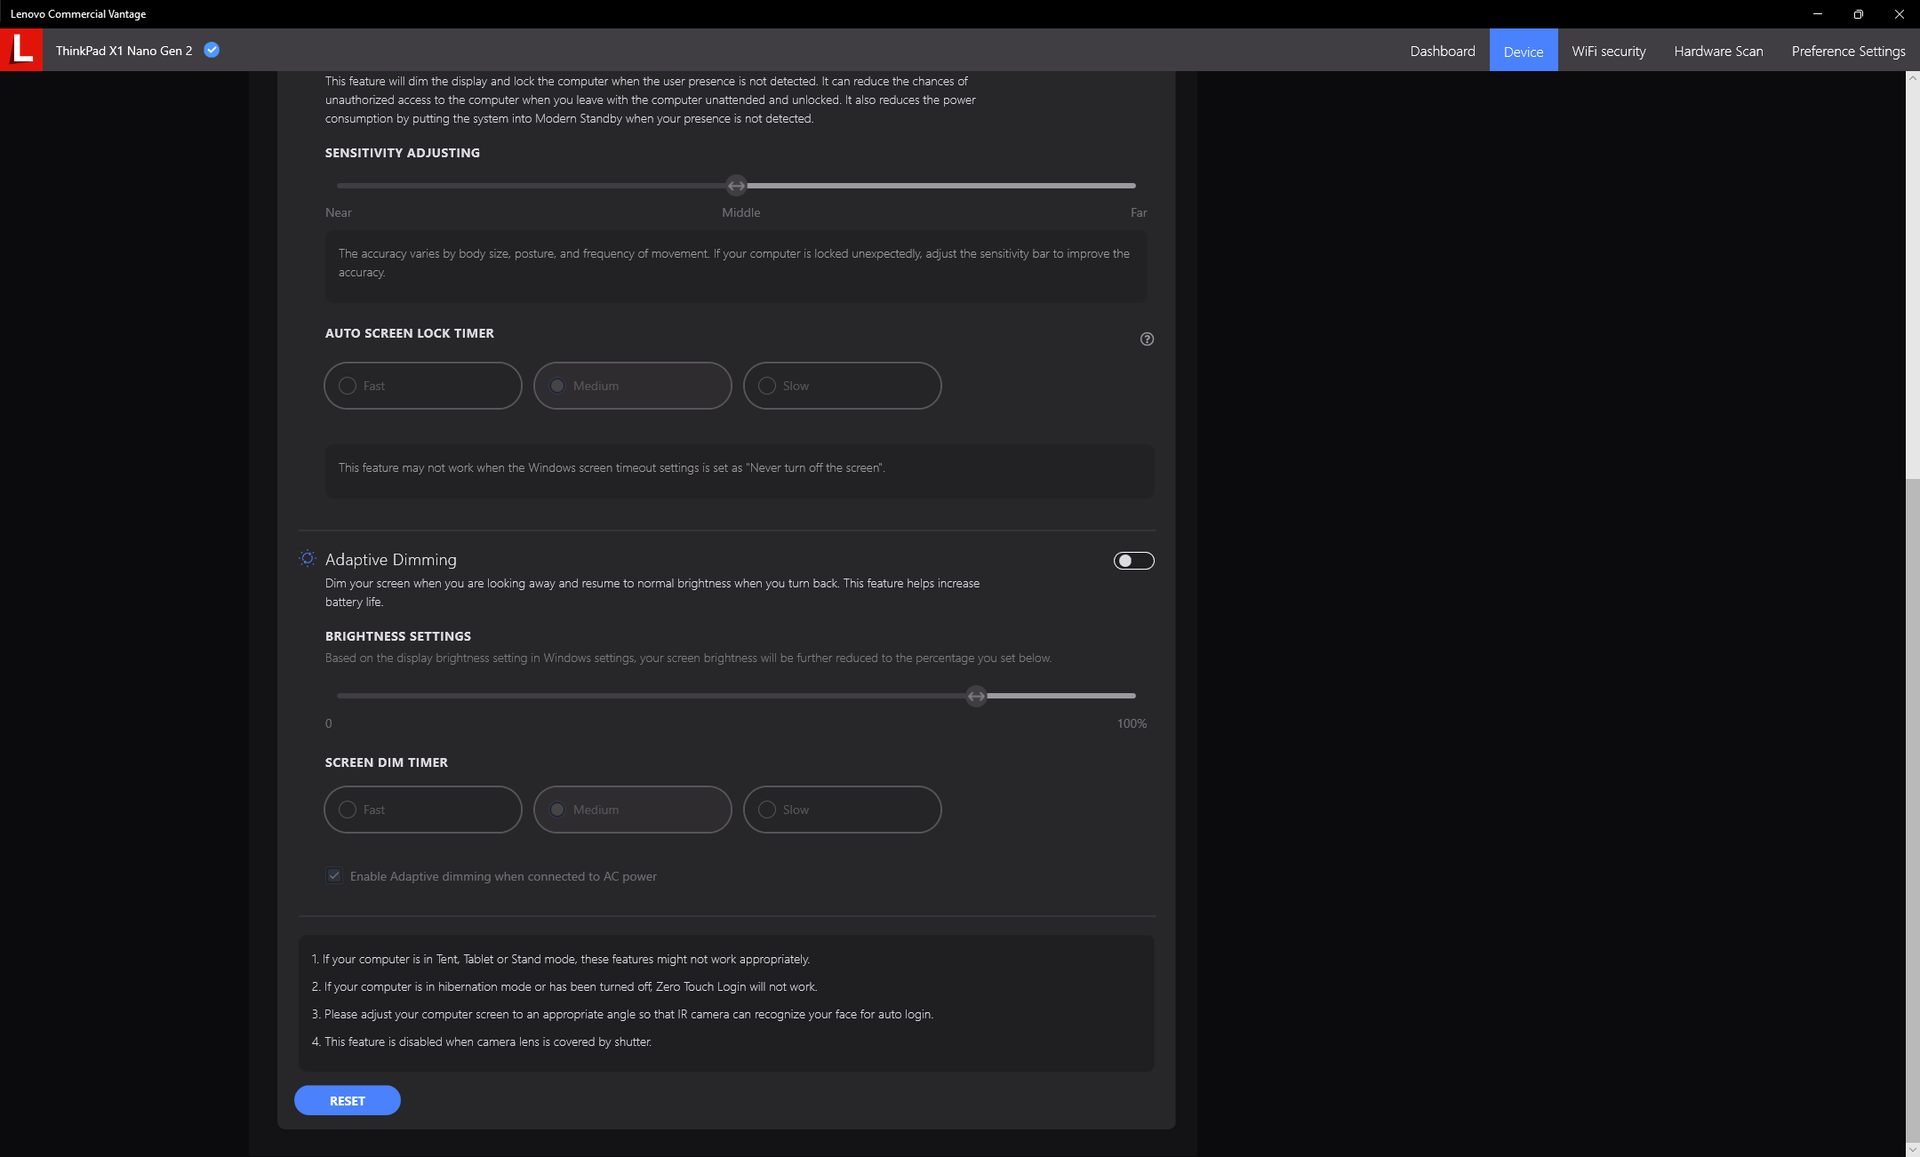
Configuramos nuestra unidad en el modo "Mejor rendimiento" a través de Windows antes de ejecutar cualquier prueba de rendimiento a continuación. Se recomienda que los usuarios se familiaricen con el software Vantage preinstalado, ya que muchas actualizaciones de software y funciones específicas de Lenovo, como la detección de la presencia del usuario, se activan aquí, como se muestra en las capturas de pantalla siguientes.
Procesador
El rendimiento de la CPU es mixto. La alta puntuación inicial de CineBench R15 en multihilo de 2118 puntos es excelente, pero cae drásticamente a 1485 puntos tras la siguiente ejecución consecutiva, lo que representa una pobre sostenibilidad de Turbo Boost y una ralentización más pronunciada que la de la mayoría de los portátiles. De hecho, el rendimiento multihilo puede caer hasta un 48 por ciento cuando se estresa, como se muestra en nuestra prueba de bucle CineBench R15 xT a continuación. El Framework Laptop con el supuestamente más lento Core i7-1260P es capaz de superar a nuestro i7-1280P durante periodos más largos. En otras palabras, los usuarios pueden disfrutar de la breve ráfaga inicial de velocidad del i7-1280P en el Lenovo antes de que caiga por un precipicio.
A pesar de su rendimiento algo decepcionante, nuestra CPU i7-1280P en el X1 Nano Gen 2 sigue siendo bastante más rápida que el Core i7-1160G7 del X1 Nano Gen 1 en un 80 por ciento, incluso teniendo en cuenta los problemas de ralentización.
Cinebench R15 Multi Loop
Cinebench R23: Multi Core | Single Core
Cinebench R15: CPU Multi 64Bit | CPU Single 64Bit
Blender: v2.79 BMW27 CPU
7-Zip 18.03: 7z b 4 | 7z b 4 -mmt1
Geekbench 5.5: Multi-Core | Single-Core
HWBOT x265 Benchmark v2.2: 4k Preset
LibreOffice : 20 Documents To PDF
R Benchmark 2.5: Overall mean
| Cinebench R20 / CPU (Multi Core) | |
| Medio Intel Core i7-1280P (3283 - 5415, n=8) | |
| Asus Zenbook S 13 OLED | |
| Framework Laptop 13.5 12th Gen Intel | |
| Lenovo ThinkPad Z13 21D2CTO1WW | |
| Lenovo ThinkPad X1 Nano Gen 2 Core i7-1280P | |
| HP Spectre x360 13.5 14t-ef000 | |
| Lenovo Yoga 6 13ALC6 | |
| HP Elite Dragonfly G3 | |
| Dynabook Portégé X30L-K-139 | |
| Lenovo ThinkPad X1 Nano-20UN002UGE | |
| Lenovo Yoga Slim 7-14IIL05 | |
| Dell Inspiron 13 7306-6TYH5 | |
| Lenovo ThinkPad X1 Titanium Yoga G1 20QB0016GE | |
| Cinebench R20 / CPU (Single Core) | |
| Framework Laptop 13.5 12th Gen Intel | |
| HP Spectre x360 13.5 14t-ef000 | |
| Medio Intel Core i7-1280P (615 - 701, n=8) | |
| Lenovo ThinkPad X1 Nano Gen 2 Core i7-1280P | |
| HP Elite Dragonfly G3 | |
| Dynabook Portégé X30L-K-139 | |
| Dell Inspiron 13 7306-6TYH5 | |
| Lenovo ThinkPad Z13 21D2CTO1WW | |
| Asus Zenbook S 13 OLED | |
| Lenovo ThinkPad X1 Nano-20UN002UGE | |
| Lenovo Yoga 6 13ALC6 | |
| Lenovo Yoga Slim 7-14IIL05 | |
| Lenovo ThinkPad X1 Titanium Yoga G1 20QB0016GE | |
| Cinebench R23 / Multi Core | |
| Medio Intel Core i7-1280P (8632 - 14803, n=8) | |
| Asus Zenbook S 13 OLED | |
| Framework Laptop 13.5 12th Gen Intel | |
| Lenovo ThinkPad Z13 21D2CTO1WW | |
| Lenovo ThinkPad X1 Nano Gen 2 Core i7-1280P | |
| HP Spectre x360 13.5 14t-ef000 | |
| Lenovo Yoga 6 13ALC6 | |
| HP Elite Dragonfly G3 | |
| Dynabook Portégé X30L-K-139 | |
| Lenovo ThinkPad X1 Nano-20UN002UGE | |
| Dell Inspiron 13 7306-6TYH5 | |
| Lenovo ThinkPad X1 Titanium Yoga G1 20QB0016GE | |
| Cinebench R23 / Single Core | |
| HP Spectre x360 13.5 14t-ef000 | |
| Lenovo ThinkPad X1 Nano Gen 2 Core i7-1280P | |
| Medio Intel Core i7-1280P (1609 - 1787, n=7) | |
| Framework Laptop 13.5 12th Gen Intel | |
| HP Elite Dragonfly G3 | |
| Asus Zenbook S 13 OLED | |
| Dell Inspiron 13 7306-6TYH5 | |
| Lenovo ThinkPad Z13 21D2CTO1WW | |
| Dynabook Portégé X30L-K-139 | |
| Lenovo Yoga 6 13ALC6 | |
| Lenovo ThinkPad X1 Titanium Yoga G1 20QB0016GE | |
| Cinebench R15 / CPU Multi 64Bit | |
| Medio Intel Core i7-1280P (1905 - 2332, n=7) | |
| Lenovo ThinkPad X1 Nano Gen 2 Core i7-1280P | |
| Asus Zenbook S 13 OLED | |
| Framework Laptop 13.5 12th Gen Intel | |
| Lenovo ThinkPad Z13 21D2CTO1WW | |
| HP Spectre x360 13.5 14t-ef000 | |
| HP Elite Dragonfly G3 | |
| Lenovo Yoga 6 13ALC6 | |
| Dynabook Portégé X30L-K-139 | |
| Lenovo ThinkPad X1 Nano-20UN002UGE | |
| Dell Inspiron 13 7306-6TYH5 | |
| Dell Inspiron 13 7306-6TYH5 | |
| Lenovo Yoga Slim 7-14IIL05 | |
| Lenovo ThinkPad X1 Titanium Yoga G1 20QB0016GE | |
| Cinebench R15 / CPU Single 64Bit | |
| Framework Laptop 13.5 12th Gen Intel | |
| HP Spectre x360 13.5 14t-ef000 | |
| Lenovo ThinkPad X1 Nano Gen 2 Core i7-1280P | |
| Asus Zenbook S 13 OLED | |
| Medio Intel Core i7-1280P (203 - 258, n=7) | |
| Lenovo ThinkPad Z13 21D2CTO1WW | |
| Dell Inspiron 13 7306-6TYH5 | |
| Dell Inspiron 13 7306-6TYH5 | |
| HP Elite Dragonfly G3 | |
| Lenovo ThinkPad X1 Nano-20UN002UGE | |
| Lenovo Yoga 6 13ALC6 | |
| Lenovo Yoga Slim 7-14IIL05 | |
| Lenovo ThinkPad X1 Titanium Yoga G1 20QB0016GE | |
| Dynabook Portégé X30L-K-139 | |
| Blender / v2.79 BMW27 CPU | |
| Lenovo ThinkPad X1 Titanium Yoga G1 20QB0016GE | |
| Lenovo Yoga Slim 7-14IIL05 | |
| Dell Inspiron 13 7306-6TYH5 | |
| Lenovo ThinkPad X1 Nano-20UN002UGE | |
| Dynabook Portégé X30L-K-139 | |
| HP Elite Dragonfly G3 | |
| Lenovo ThinkPad Z13 21D2CTO1WW | |
| HP Spectre x360 13.5 14t-ef000 | |
| Lenovo Yoga 6 13ALC6 | |
| Asus Zenbook S 13 OLED | |
| Framework Laptop 13.5 12th Gen Intel | |
| Lenovo ThinkPad X1 Nano Gen 2 Core i7-1280P | |
| Medio Intel Core i7-1280P (259 - 309, n=7) | |
| 7-Zip 18.03 / 7z b 4 | |
| Medio Intel Core i7-1280P (45292 - 53710, n=7) | |
| Asus Zenbook S 13 OLED | |
| Lenovo ThinkPad X1 Nano Gen 2 Core i7-1280P | |
| Framework Laptop 13.5 12th Gen Intel | |
| Lenovo Yoga 6 13ALC6 | |
| HP Spectre x360 13.5 14t-ef000 | |
| Lenovo ThinkPad Z13 21D2CTO1WW | |
| HP Elite Dragonfly G3 | |
| Dynabook Portégé X30L-K-139 | |
| Lenovo ThinkPad X1 Nano-20UN002UGE | |
| Dell Inspiron 13 7306-6TYH5 | |
| Lenovo Yoga Slim 7-14IIL05 | |
| Lenovo ThinkPad X1 Titanium Yoga G1 20QB0016GE | |
| 7-Zip 18.03 / 7z b 4 -mmt1 | |
| Framework Laptop 13.5 12th Gen Intel | |
| Lenovo ThinkPad X1 Nano Gen 2 Core i7-1280P | |
| Medio Intel Core i7-1280P (4995 - 5874, n=7) | |
| HP Spectre x360 13.5 14t-ef000 | |
| Asus Zenbook S 13 OLED | |
| Lenovo ThinkPad Z13 21D2CTO1WW | |
| Dell Inspiron 13 7306-6TYH5 | |
| HP Elite Dragonfly G3 | |
| Lenovo ThinkPad X1 Nano-20UN002UGE | |
| Lenovo Yoga 6 13ALC6 | |
| Dynabook Portégé X30L-K-139 | |
| Lenovo Yoga Slim 7-14IIL05 | |
| Lenovo ThinkPad X1 Titanium Yoga G1 20QB0016GE | |
| Geekbench 5.5 / Multi-Core | |
| Medio Intel Core i7-1280P (9623 - 11811, n=7) | |
| Lenovo ThinkPad X1 Nano Gen 2 Core i7-1280P | |
| Framework Laptop 13.5 12th Gen Intel | |
| HP Spectre x360 13.5 14t-ef000 | |
| HP Elite Dragonfly G3 | |
| Asus Zenbook S 13 OLED | |
| Dynabook Portégé X30L-K-139 | |
| Lenovo ThinkPad Z13 21D2CTO1WW | |
| Dell Inspiron 13 7306-6TYH5 | |
| Lenovo ThinkPad X1 Nano-20UN002UGE | |
| Lenovo Yoga Slim 7-14IIL05 | |
| Lenovo ThinkPad X1 Titanium Yoga G1 20QB0016GE | |
| Geekbench 5.5 / Single-Core | |
| Lenovo ThinkPad X1 Nano Gen 2 Core i7-1280P | |
| Framework Laptop 13.5 12th Gen Intel | |
| HP Spectre x360 13.5 14t-ef000 | |
| Medio Intel Core i7-1280P (1571 - 1802, n=7) | |
| Dynabook Portégé X30L-K-139 | |
| Dell Inspiron 13 7306-6TYH5 | |
| HP Elite Dragonfly G3 | |
| Asus Zenbook S 13 OLED | |
| Lenovo ThinkPad Z13 21D2CTO1WW | |
| Lenovo ThinkPad X1 Nano-20UN002UGE | |
| Lenovo ThinkPad X1 Titanium Yoga G1 20QB0016GE | |
| Lenovo Yoga Slim 7-14IIL05 | |
| HWBOT x265 Benchmark v2.2 / 4k Preset | |
| Asus Zenbook S 13 OLED | |
| Medio Intel Core i7-1280P (9.62 - 14.5, n=5) | |
| Framework Laptop 13.5 12th Gen Intel | |
| HP Spectre x360 13.5 14t-ef000 | |
| Lenovo ThinkPad X1 Nano Gen 2 Core i7-1280P | |
| Lenovo Yoga 6 13ALC6 | |
| Lenovo ThinkPad Z13 21D2CTO1WW | |
| HP Elite Dragonfly G3 | |
| Dynabook Portégé X30L-K-139 | |
| Lenovo ThinkPad X1 Nano-20UN002UGE | |
| Dell Inspiron 13 7306-6TYH5 | |
| Lenovo Yoga Slim 7-14IIL05 | |
| Lenovo ThinkPad X1 Titanium Yoga G1 20QB0016GE | |
| LibreOffice / 20 Documents To PDF | |
| Lenovo Yoga 6 13ALC6 | |
| HP Elite Dragonfly G3 | |
| Lenovo ThinkPad Z13 21D2CTO1WW | |
| Lenovo Yoga Slim 7-14IIL05 | |
| Asus Zenbook S 13 OLED | |
| Lenovo ThinkPad X1 Nano-20UN002UGE | |
| Lenovo ThinkPad X1 Titanium Yoga G1 20QB0016GE | |
| Medio Intel Core i7-1280P (41 - 61.6, n=8) | |
| Dynabook Portégé X30L-K-139 | |
| Dell Inspiron 13 7306-6TYH5 | |
| Lenovo ThinkPad X1 Nano Gen 2 Core i7-1280P | |
| HP Spectre x360 13.5 14t-ef000 | |
| Framework Laptop 13.5 12th Gen Intel | |
| R Benchmark 2.5 / Overall mean | |
| Lenovo ThinkPad X1 Titanium Yoga G1 20QB0016GE | |
| Lenovo Yoga Slim 7-14IIL05 | |
| Lenovo ThinkPad X1 Nano-20UN002UGE | |
| Lenovo Yoga 6 13ALC6 | |
| Dell Inspiron 13 7306-6TYH5 | |
| Lenovo ThinkPad Z13 21D2CTO1WW | |
| Dynabook Portégé X30L-K-139 | |
| HP Elite Dragonfly G3 | |
| Asus Zenbook S 13 OLED | |
| HP Spectre x360 13.5 14t-ef000 | |
| Medio Intel Core i7-1280P (0.4505 - 0.512, n=7) | |
| Lenovo ThinkPad X1 Nano Gen 2 Core i7-1280P | |
| Framework Laptop 13.5 12th Gen Intel | |
Cinebench R23: Multi Core | Single Core
Cinebench R15: CPU Multi 64Bit | CPU Single 64Bit
Blender: v2.79 BMW27 CPU
7-Zip 18.03: 7z b 4 | 7z b 4 -mmt1
Geekbench 5.5: Multi-Core | Single-Core
HWBOT x265 Benchmark v2.2: 4k Preset
LibreOffice : 20 Documents To PDF
R Benchmark 2.5: Overall mean
* ... más pequeño es mejor
AIDA64: FP32 Ray-Trace | FPU Julia | CPU SHA3 | CPU Queen | FPU SinJulia | FPU Mandel | CPU AES | CPU ZLib | FP64 Ray-Trace | CPU PhotoWorxx
| AIDA64 / FP32 Ray-Trace | |
| Medio Intel Core i7-1280P (7466 - 13068, n=6) | |
| Lenovo ThinkPad X1 Nano Gen 2 Core i7-1280P | |
| Lenovo ThinkPad X1 Nano-20UN002UGE | |
| Dell Latitude 13 7330 | |
| HP Elite Dragonfly G3 | |
| Framework Laptop 13.5 12th Gen Intel | |
| Huawei MateBook X Pro 2021 | |
| AIDA64 / FPU SinJulia | |
| Medio Intel Core i7-1280P (5880 - 8571, n=6) | |
| Framework Laptop 13.5 12th Gen Intel | |
| Lenovo ThinkPad X1 Nano Gen 2 Core i7-1280P | |
| Dell Latitude 13 7330 | |
| HP Elite Dragonfly G3 | |
| Lenovo ThinkPad X1 Nano-20UN002UGE | |
| Huawei MateBook X Pro 2021 | |
| AIDA64 / FP64 Ray-Trace | |
| Medio Intel Core i7-1280P (4006 - 7184, n=6) | |
| Lenovo ThinkPad X1 Nano Gen 2 Core i7-1280P | |
| Lenovo ThinkPad X1 Nano-20UN002UGE | |
| Dell Latitude 13 7330 | |
| HP Elite Dragonfly G3 | |
| Framework Laptop 13.5 12th Gen Intel | |
| Huawei MateBook X Pro 2021 | |
| AIDA64 / CPU PhotoWorxx | |
| Medio Intel Core i7-1280P (36663 - 48416, n=6) | |
| Huawei MateBook X Pro 2021 | |
| Lenovo ThinkPad X1 Nano Gen 2 Core i7-1280P | |
| HP Elite Dragonfly G3 | |
| Lenovo ThinkPad X1 Nano-20UN002UGE | |
| Framework Laptop 13.5 12th Gen Intel | |
| Dell Latitude 13 7330 | |
Rendimiento del sistema
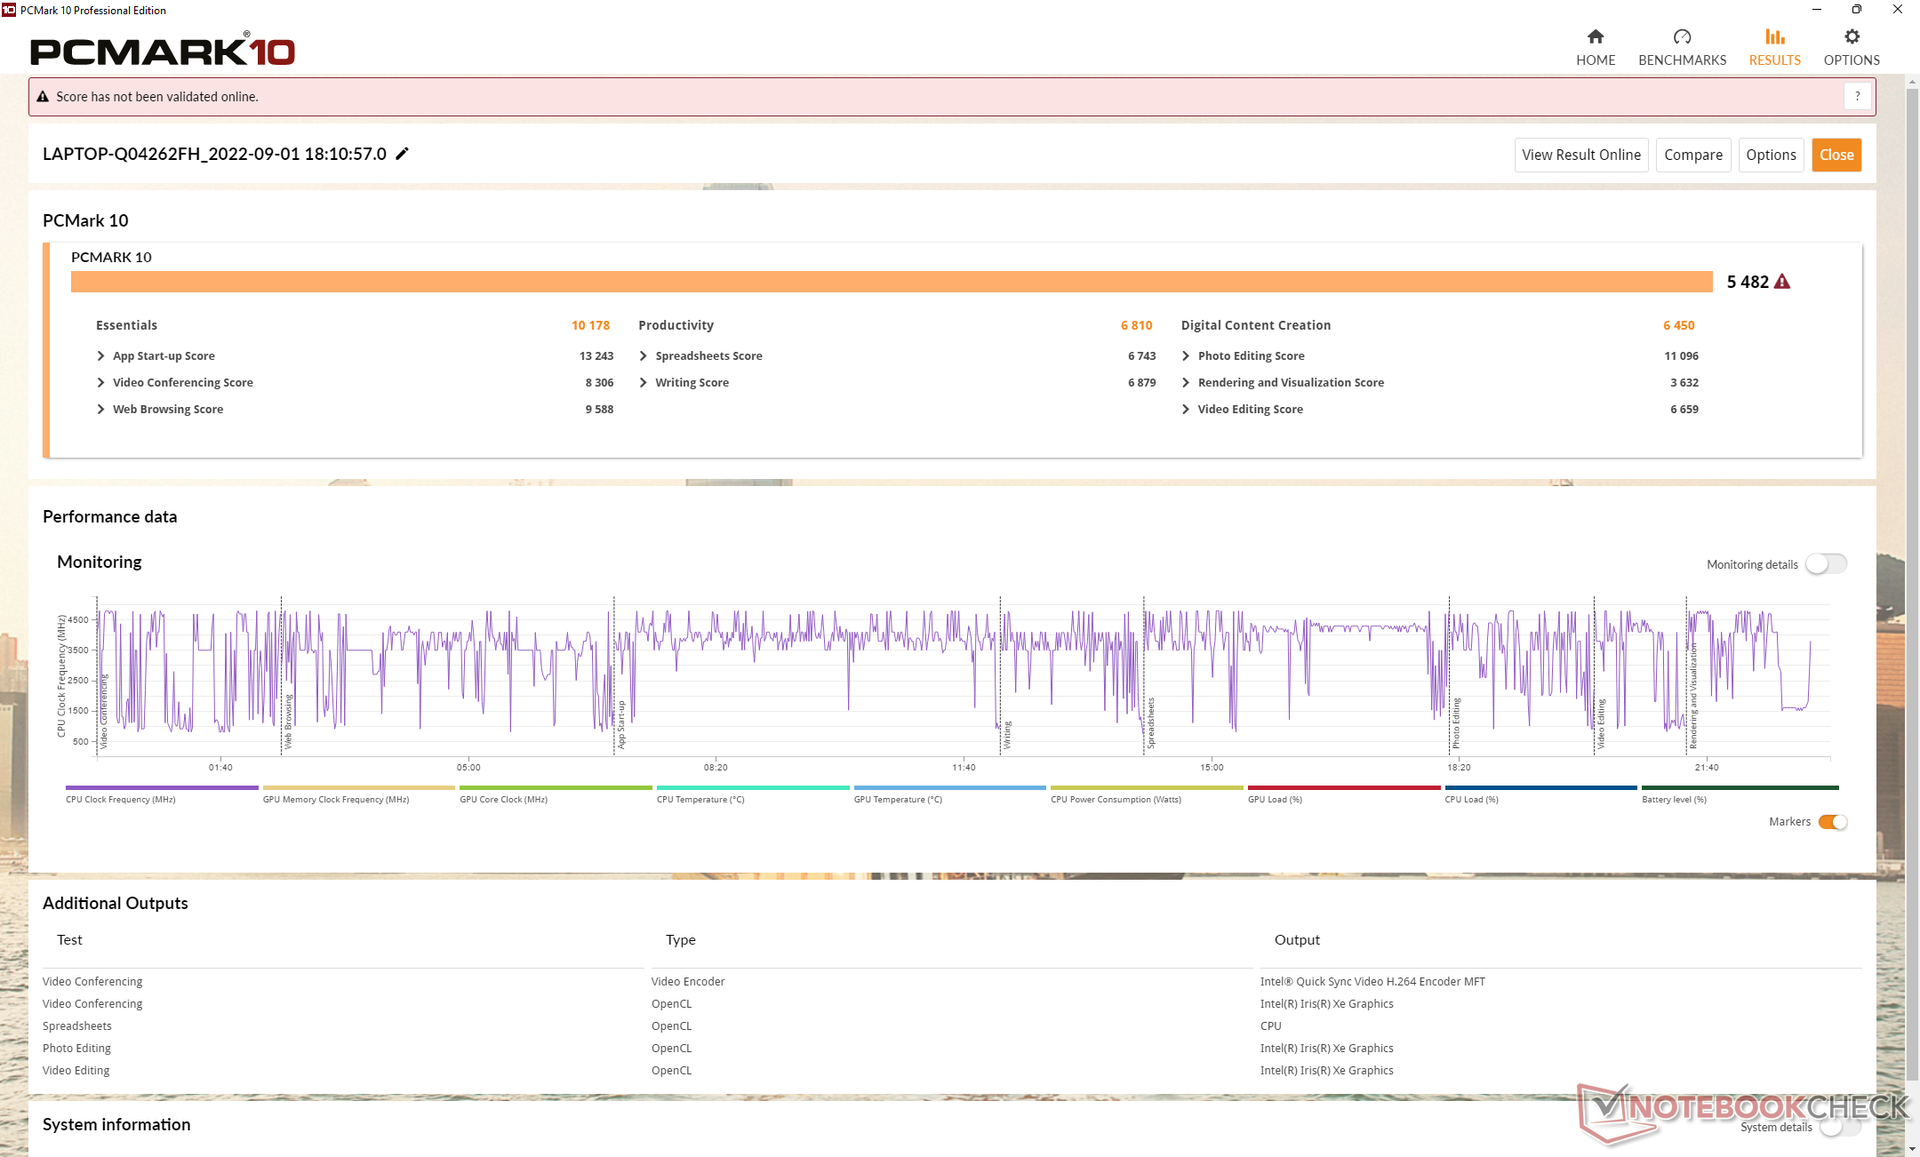
Los resultados de PCMark 10 son sistemáticamente superiores a los del modelo Gen 1 y a los de la mayoría de portátiles de 13,0 pulgadas debido a la CPU de la serie Core P. La diferencia es mayor en la subprueba de Creación de Contenido Digital.
CrossMark: Overall | Productivity | Creativity | Responsiveness
| PCMark 10 / Score | |
| Framework Laptop 13.5 12th Gen Intel | |
| Medio Intel Core i7-1280P, Intel Iris Xe Graphics G7 96EUs (5410 - 5994, n=4) | |
| Lenovo ThinkPad X1 Nano Gen 2 Core i7-1280P | |
| Dell Latitude 13 7330 | |
| Huawei MateBook X Pro 2021 | |
| HP Elite Dragonfly G3 | |
| Lenovo ThinkPad X1 Nano-20UN002UGE | |
| PCMark 10 / Essentials | |
| Framework Laptop 13.5 12th Gen Intel | |
| Dell Latitude 13 7330 | |
| Medio Intel Core i7-1280P, Intel Iris Xe Graphics G7 96EUs (9719 - 10920, n=4) | |
| Huawei MateBook X Pro 2021 | |
| Lenovo ThinkPad X1 Nano Gen 2 Core i7-1280P | |
| Lenovo ThinkPad X1 Nano-20UN002UGE | |
| HP Elite Dragonfly G3 | |
| PCMark 10 / Productivity | |
| Framework Laptop 13.5 12th Gen Intel | |
| Dell Latitude 13 7330 | |
| Medio Intel Core i7-1280P, Intel Iris Xe Graphics G7 96EUs (6301 - 7453, n=4) | |
| Lenovo ThinkPad X1 Nano Gen 2 Core i7-1280P | |
| Huawei MateBook X Pro 2021 | |
| Lenovo ThinkPad X1 Nano-20UN002UGE | |
| HP Elite Dragonfly G3 | |
| PCMark 10 / Digital Content Creation | |
| Medio Intel Core i7-1280P, Intel Iris Xe Graphics G7 96EUs (6450 - 7180, n=4) | |
| Framework Laptop 13.5 12th Gen Intel | |
| Lenovo ThinkPad X1 Nano Gen 2 Core i7-1280P | |
| HP Elite Dragonfly G3 | |
| Dell Latitude 13 7330 | |
| Huawei MateBook X Pro 2021 | |
| Lenovo ThinkPad X1 Nano-20UN002UGE | |
| CrossMark / Overall | |
| Medio Intel Core i7-1280P, Intel Iris Xe Graphics G7 96EUs (1677 - 1773, n=4) | |
| Lenovo ThinkPad X1 Nano Gen 2 Core i7-1280P | |
| Framework Laptop 13.5 12th Gen Intel | |
| Dell Latitude 13 7330 | |
| HP Elite Dragonfly G3 | |
| CrossMark / Productivity | |
| Medio Intel Core i7-1280P, Intel Iris Xe Graphics G7 96EUs (1585 - 1709, n=4) | |
| Framework Laptop 13.5 12th Gen Intel | |
| Lenovo ThinkPad X1 Nano Gen 2 Core i7-1280P | |
| Dell Latitude 13 7330 | |
| HP Elite Dragonfly G3 | |
| CrossMark / Creativity | |
| Lenovo ThinkPad X1 Nano Gen 2 Core i7-1280P | |
| Medio Intel Core i7-1280P, Intel Iris Xe Graphics G7 96EUs (1849 - 1928, n=4) | |
| Framework Laptop 13.5 12th Gen Intel | |
| HP Elite Dragonfly G3 | |
| Dell Latitude 13 7330 | |
| CrossMark / Responsiveness | |
| Medio Intel Core i7-1280P, Intel Iris Xe Graphics G7 96EUs (1394 - 1746, n=4) | |
| Framework Laptop 13.5 12th Gen Intel | |
| Lenovo ThinkPad X1 Nano Gen 2 Core i7-1280P | |
| Dell Latitude 13 7330 | |
| HP Elite Dragonfly G3 | |
| PCMark 10 Score | 5482 puntos | |
ayuda | ||
| AIDA64 / Memory Write | |
| Huawei MateBook X Pro 2021 | |
| Lenovo ThinkPad X1 Nano Gen 2 Core i7-1280P | |
| Medio Intel Core i7-1280P (58729 - 68247, n=6) | |
| HP Elite Dragonfly G3 | |
| Lenovo ThinkPad X1 Nano-20UN002UGE | |
| Framework Laptop 13.5 12th Gen Intel | |
| Dell Latitude 13 7330 | |
| AIDA64 / Memory Latency | |
| Medio Intel Core i7-1280P (93.1 - 153.3, n=6) | |
| HP Elite Dragonfly G3 | |
| Lenovo ThinkPad X1 Nano-20UN002UGE | |
| Lenovo ThinkPad X1 Nano Gen 2 Core i7-1280P | |
| Huawei MateBook X Pro 2021 | |
| Framework Laptop 13.5 12th Gen Intel | |
| Dell Latitude 13 7330 | |
* ... más pequeño es mejor
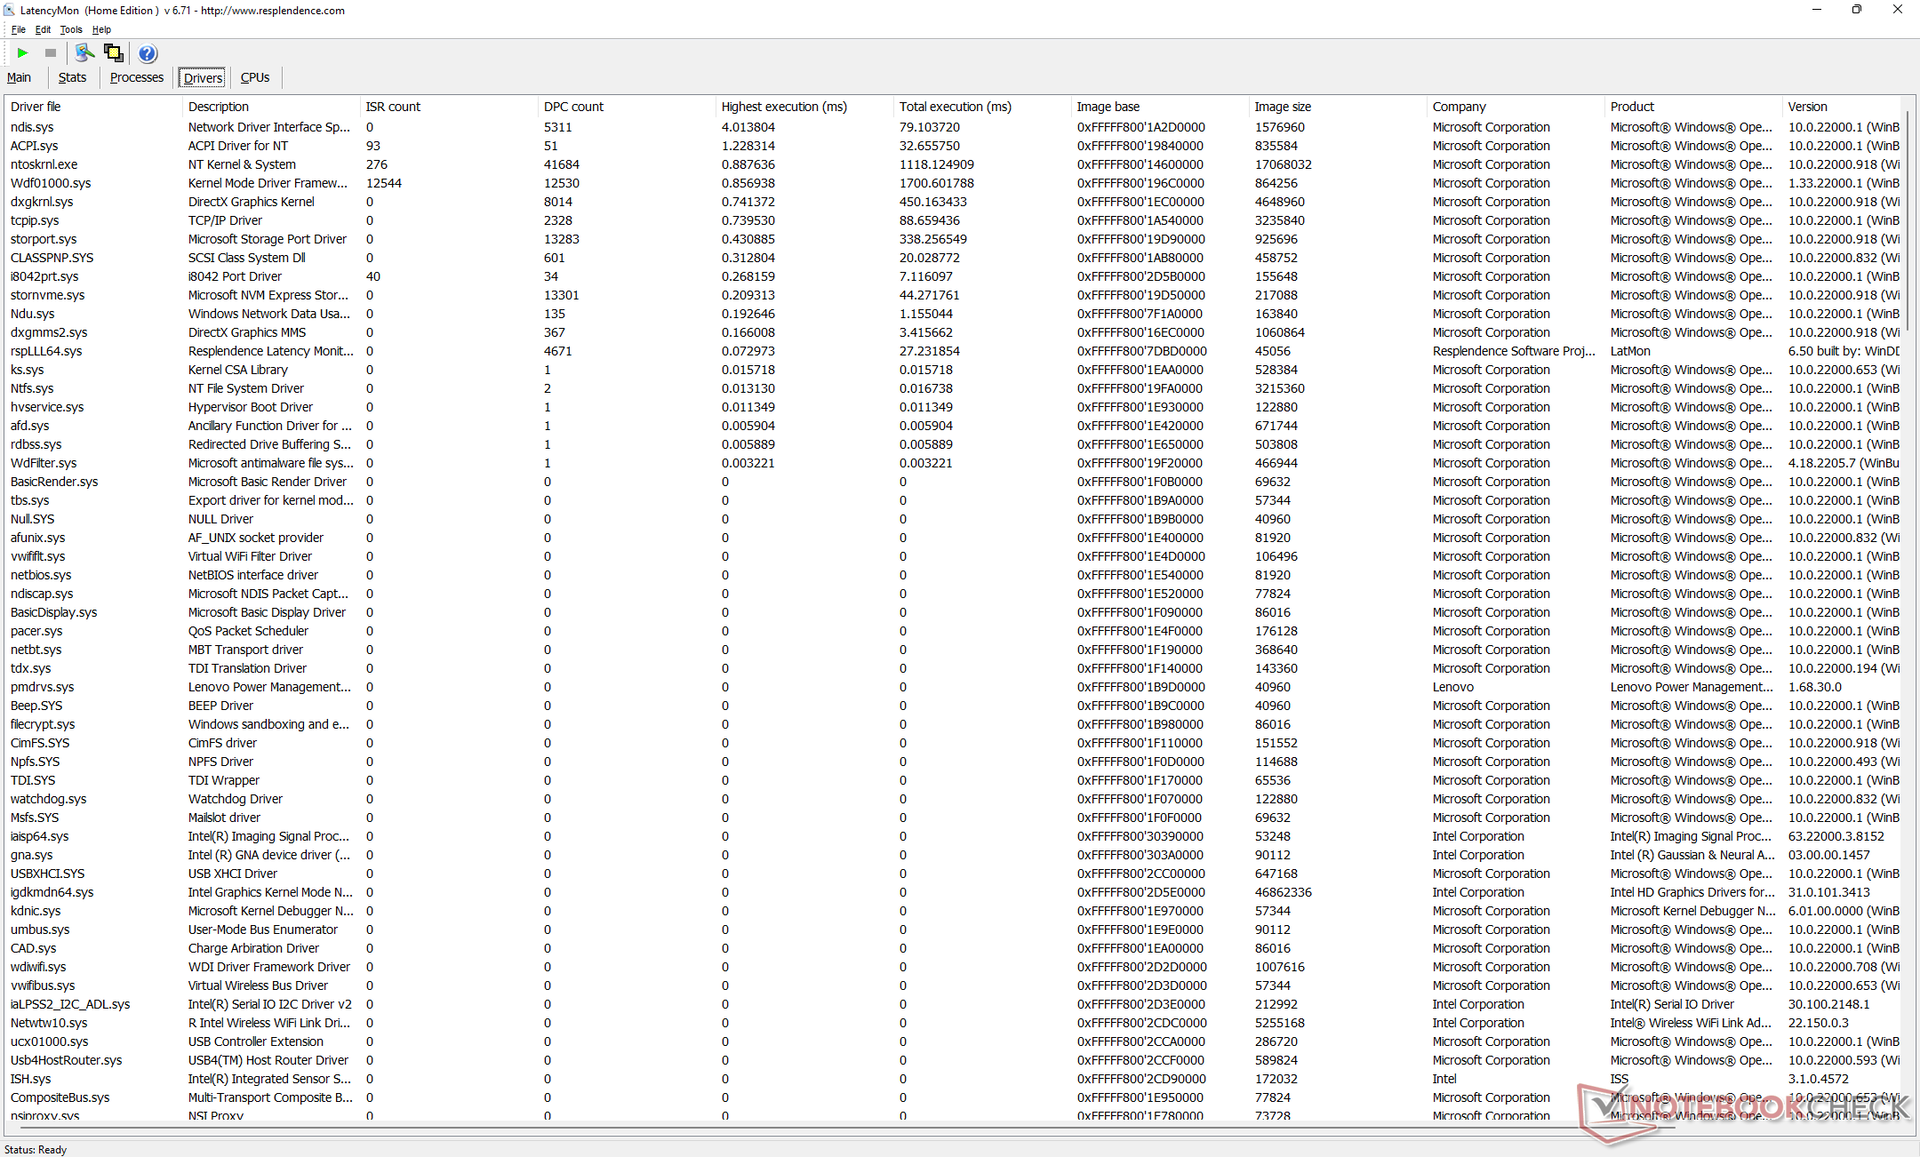
Latencia del CPD
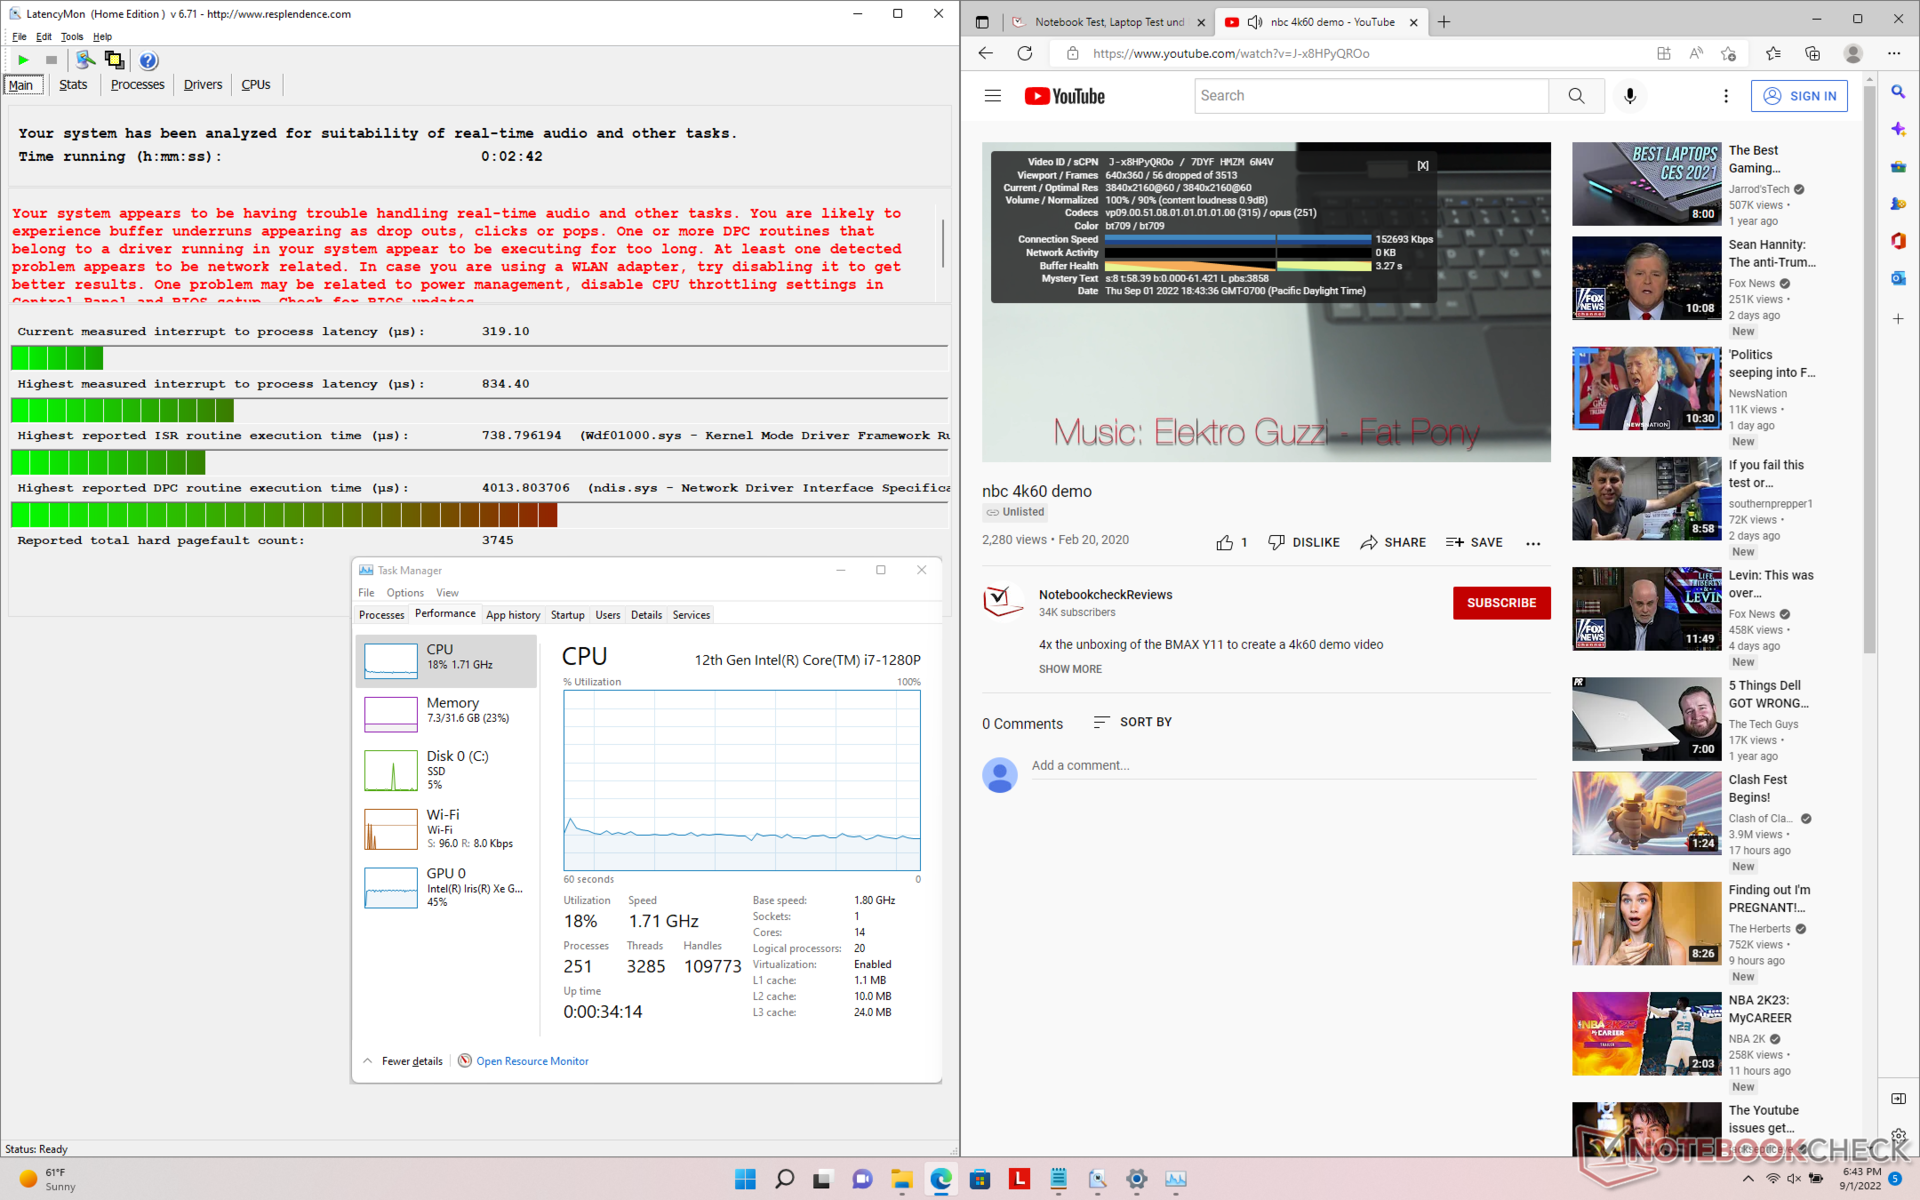
LatencyMon revela problemas de CPD al abrir varias pestañas del navegador en nuestra página de inicio. la reproducción de vídeo 4K a 60 FPS también podría haber sido mejor, ya que pudimos registrar 56 fotogramas perdidos durante nuestra prueba de vídeo de un minuto de duración incluso con los últimos controladores gráficos a fecha de publicación.
| DPC Latencies / LatencyMon - interrupt to process latency (max), Web, Youtube, Prime95 | |
| Lenovo ThinkPad X1 Nano-20UN002UGE | |
| Huawei MateBook X Pro 2021 | |
| Framework Laptop 13.5 12th Gen Intel | |
| Lenovo ThinkPad X1 Nano Gen 2 Core i7-1280P | |
| Dell Latitude 13 7330 | |
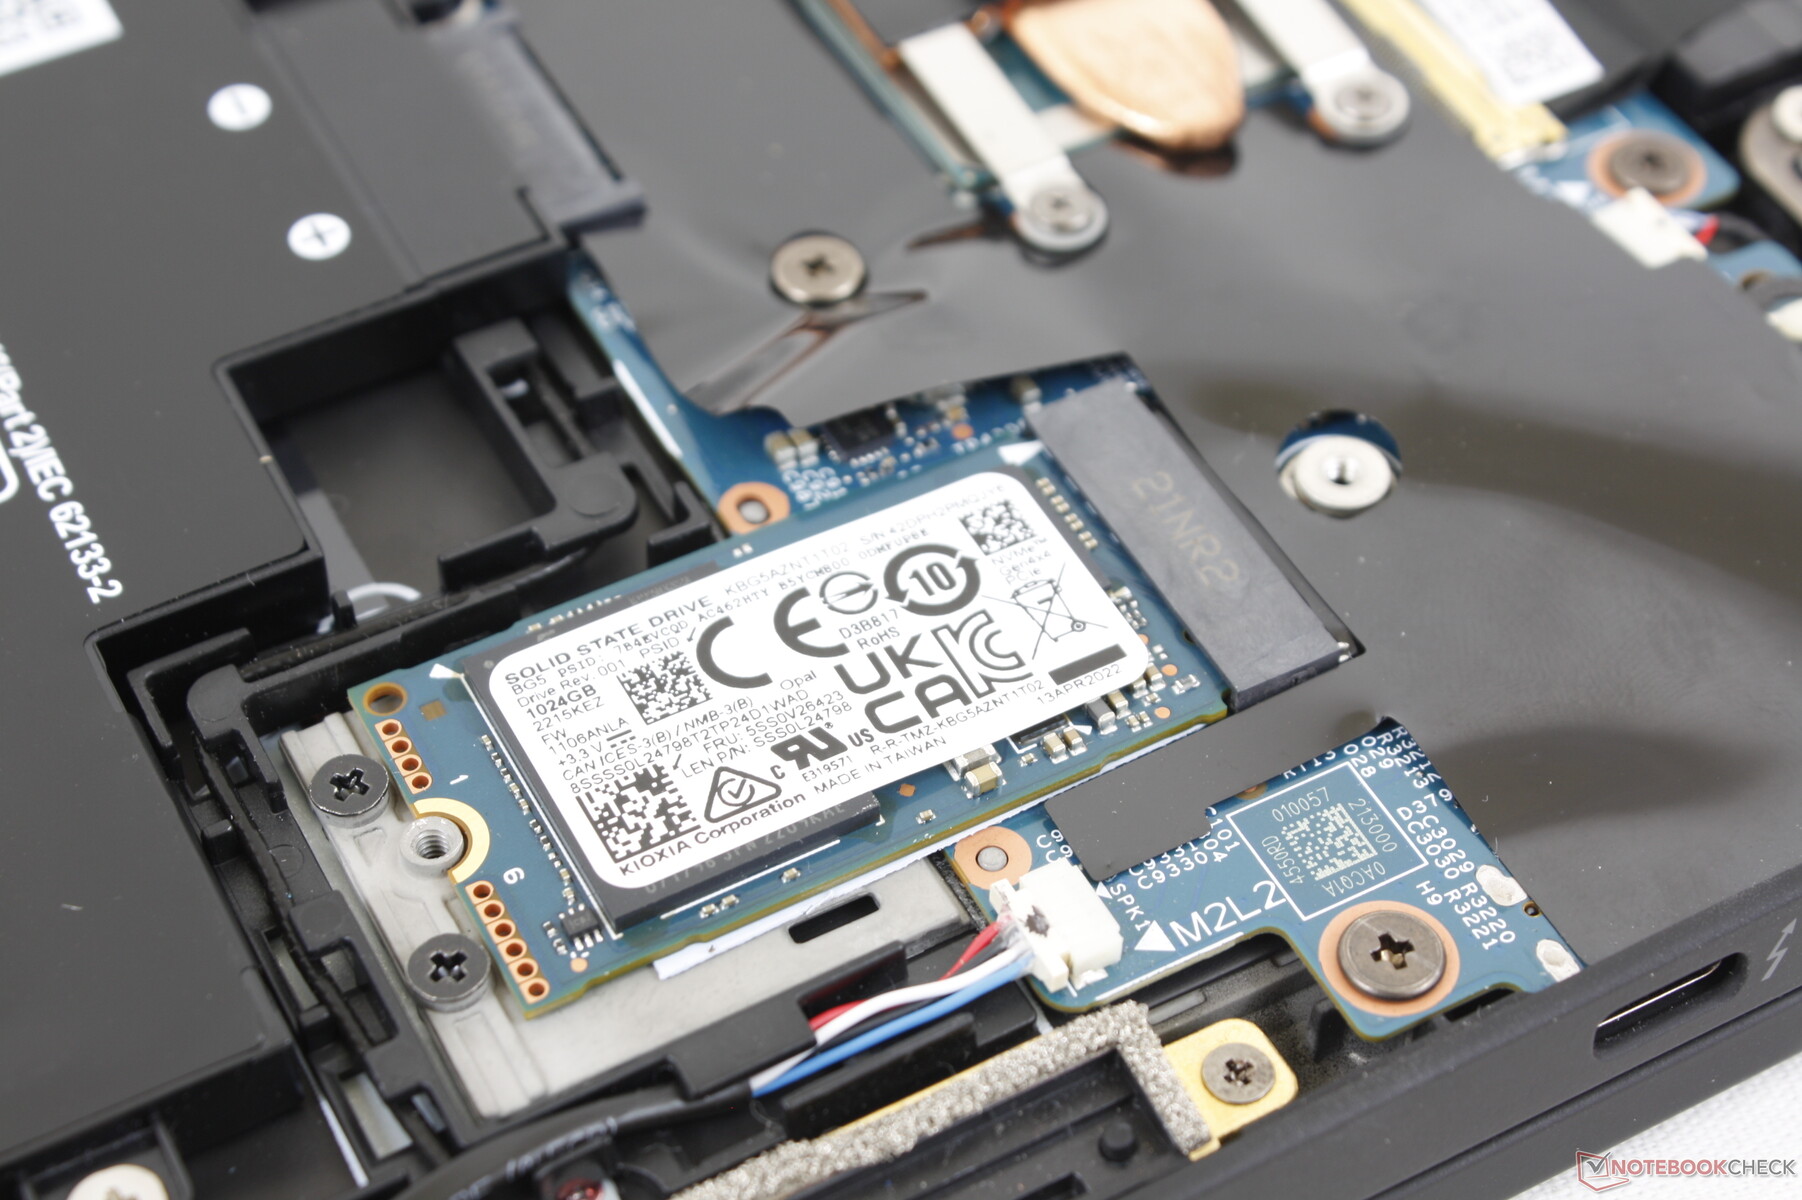
| HP Elite Dragonfly G3 | |
* ... más pequeño es mejor
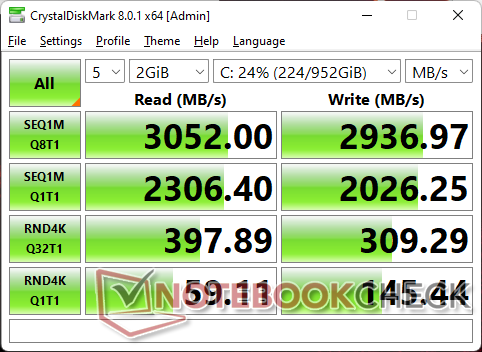
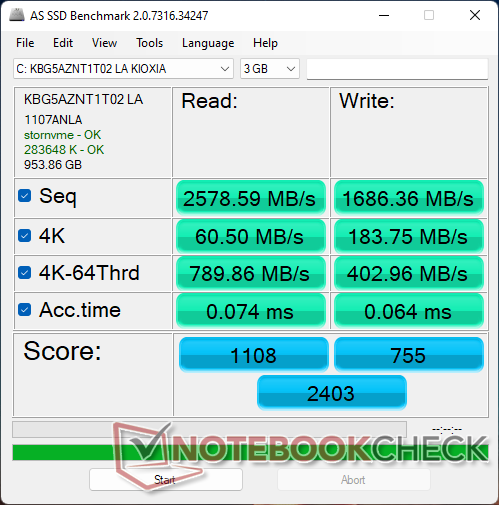
Dispositivos de almacenamiento
Nuestra unidad de prueba viene equipada con el Kioxia KBG5AZNT1T02 PCIe3 NVMe SSD para velocidades máximas de lectura sostenida de hasta 2700 MB/s. Es decepcionante que no haya opciones PCIe4 en la caja teniendo en cuenta el elevado precio del ThinkPad X1 Nano, pero al menos el modelo viene con una placa de cobre sobre la SSD para ayudar a la disipación del calor
Hay que tener en cuenta que las unidades M.2 2280 de longitud completa no son compatibles.

* ... más pequeño es mejor
Disk Throttling: DiskSpd Read Loop, Queue Depth 8
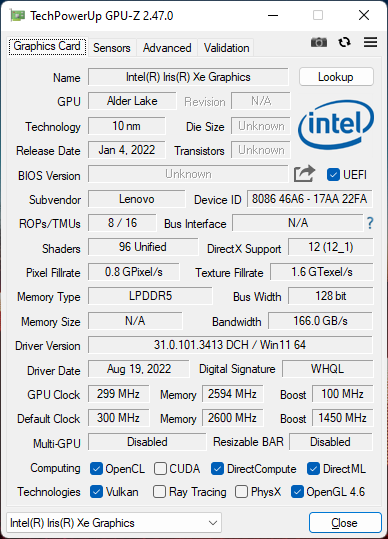
Rendimiento de la GPU
El rendimiento gráfico es decente a pesar de la fuerte ralentización del rendimiento de la CPU mencionada anteriormente. las puntuaciones de 3DMark están donde deberían estar en relación con otros portátiles con las mismas Iris Xe 96 EUs Pero la ralentización aparece cuando se ejecutan juegos reales. Por ejemplo, las tasas de fotogramas cuando está en reposo en Witcher 3 en la configuración más baja de 768p puede llegar a 106 FPS durante el inicio de la prueba antes de caer rápidamente a sólo 80 FPS un par de minutos más tarde, como se muestra en nuestro gráfico a continuación
El rendimiento gráfico general sigue siendo más rápido que en el modelo Gen 1 del año pasado, en un 30 por ciento aproximadamente, antes de tener en cuenta cualquier estrangulamiento del rendimiento.
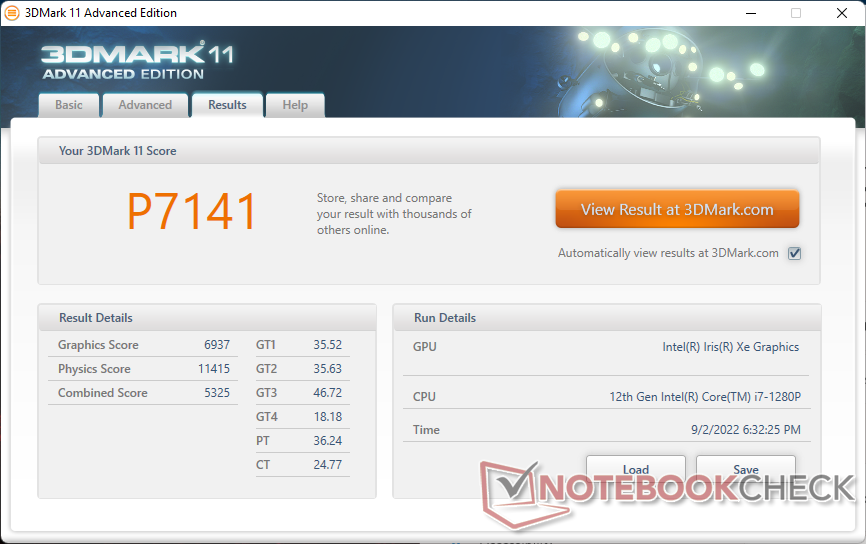
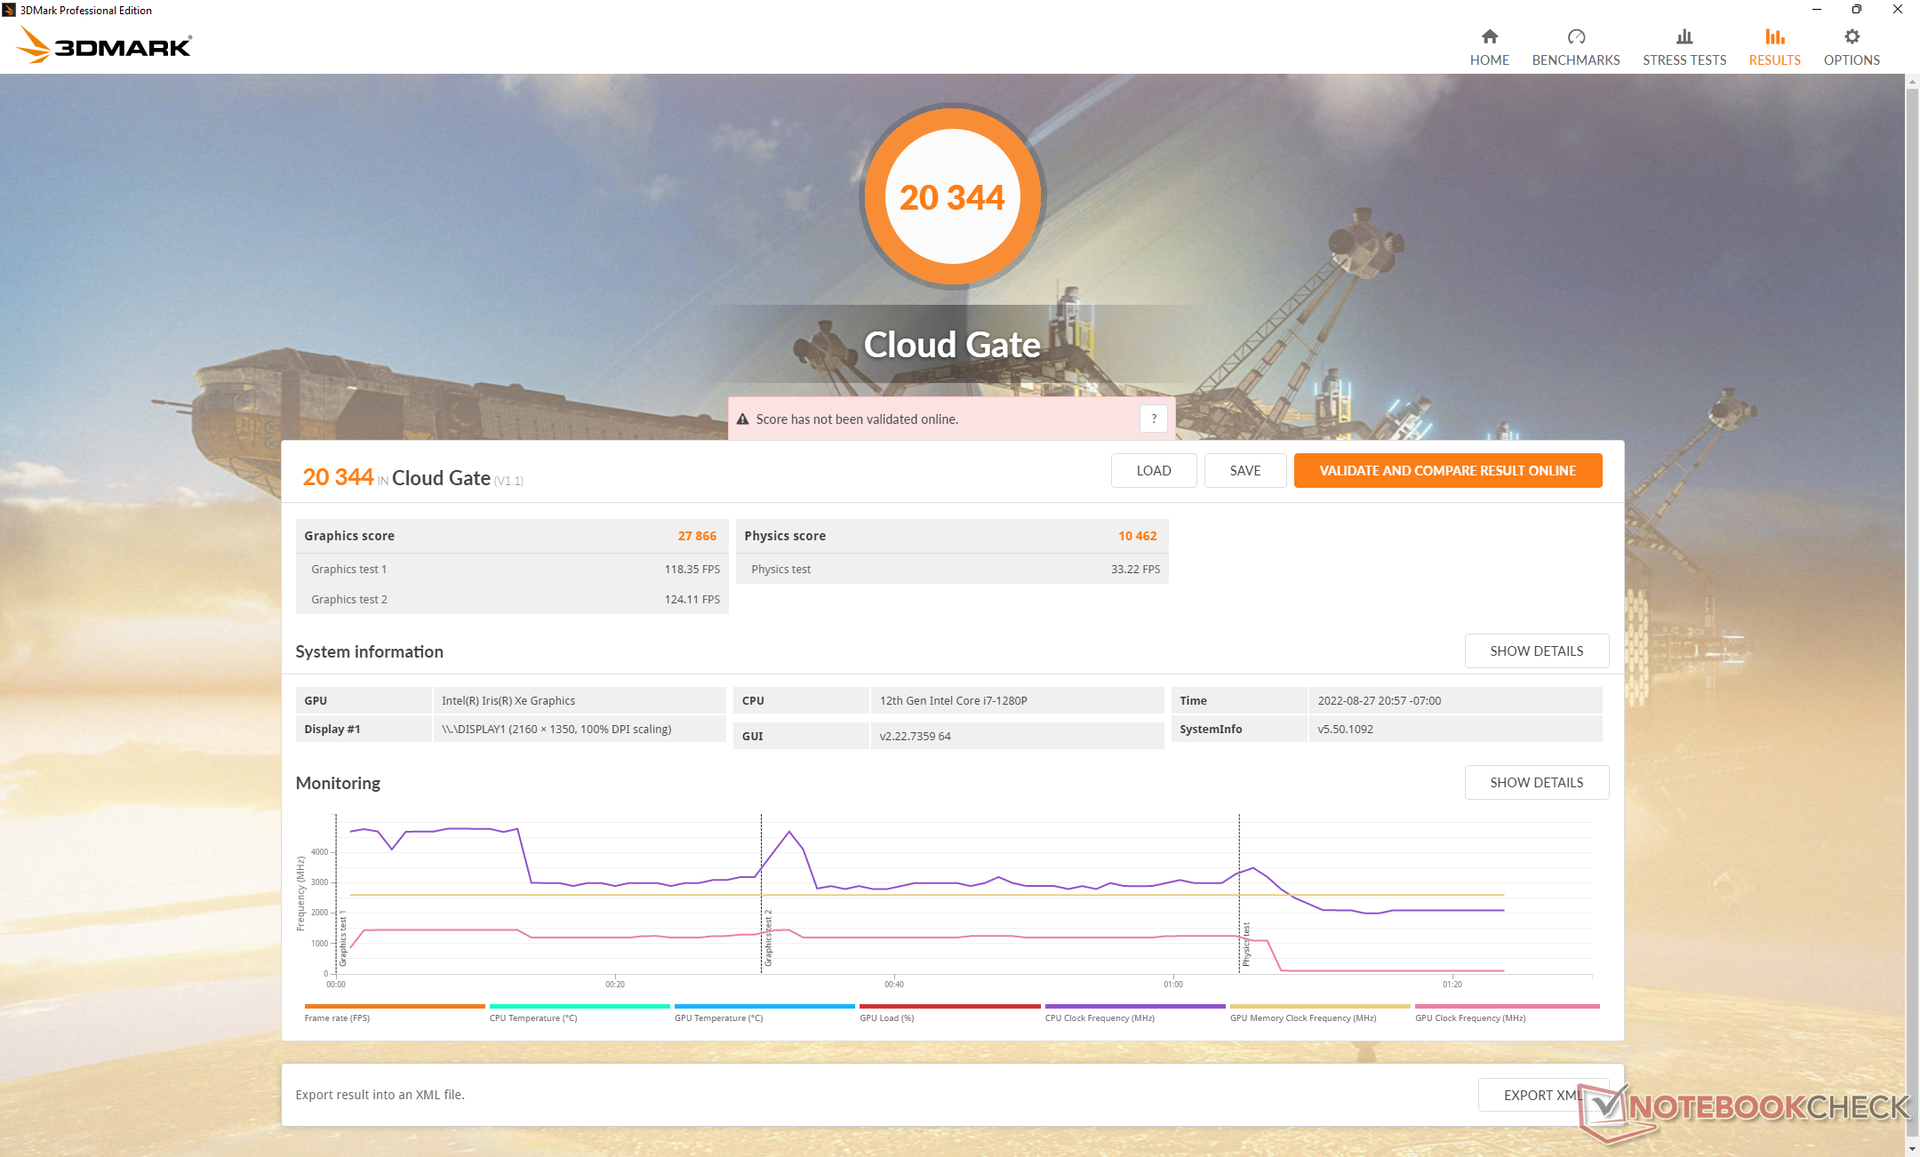
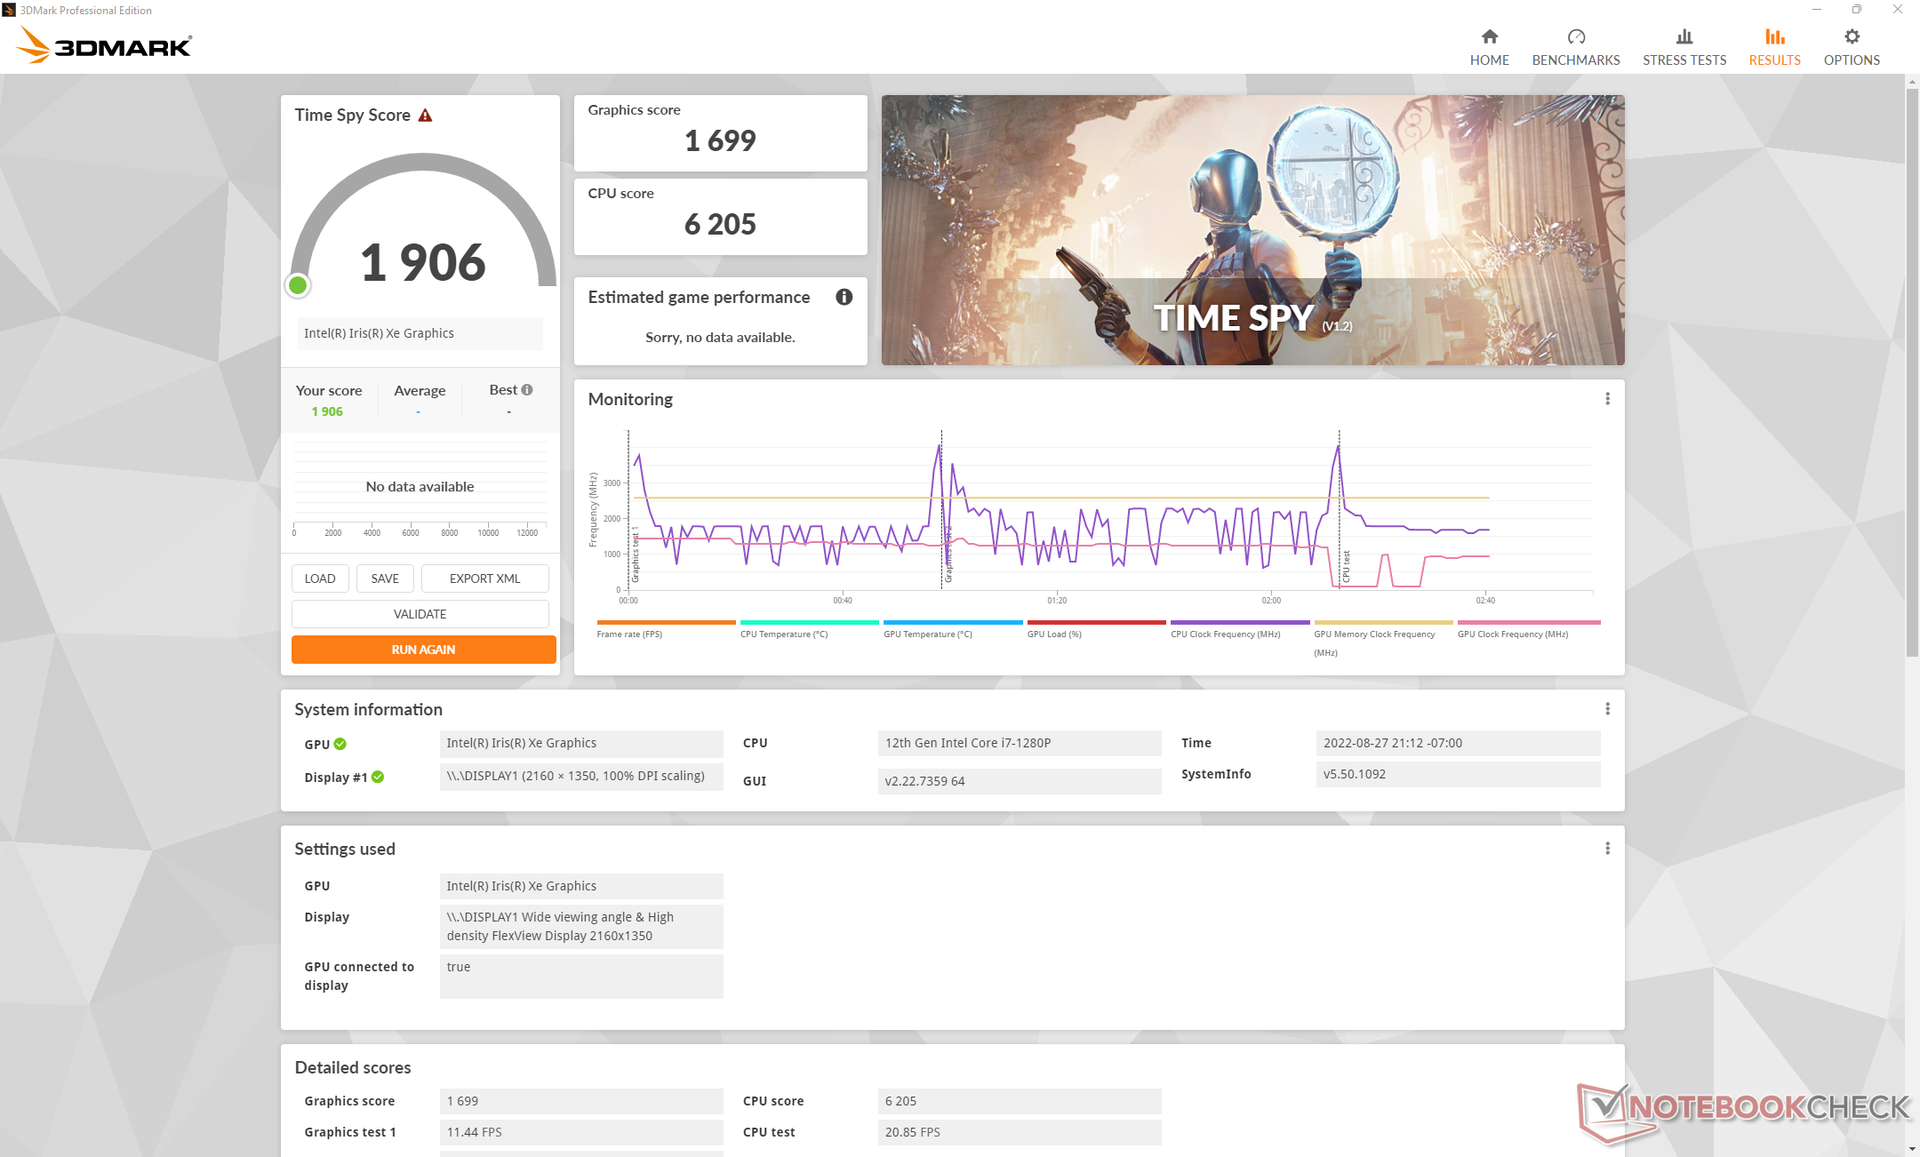
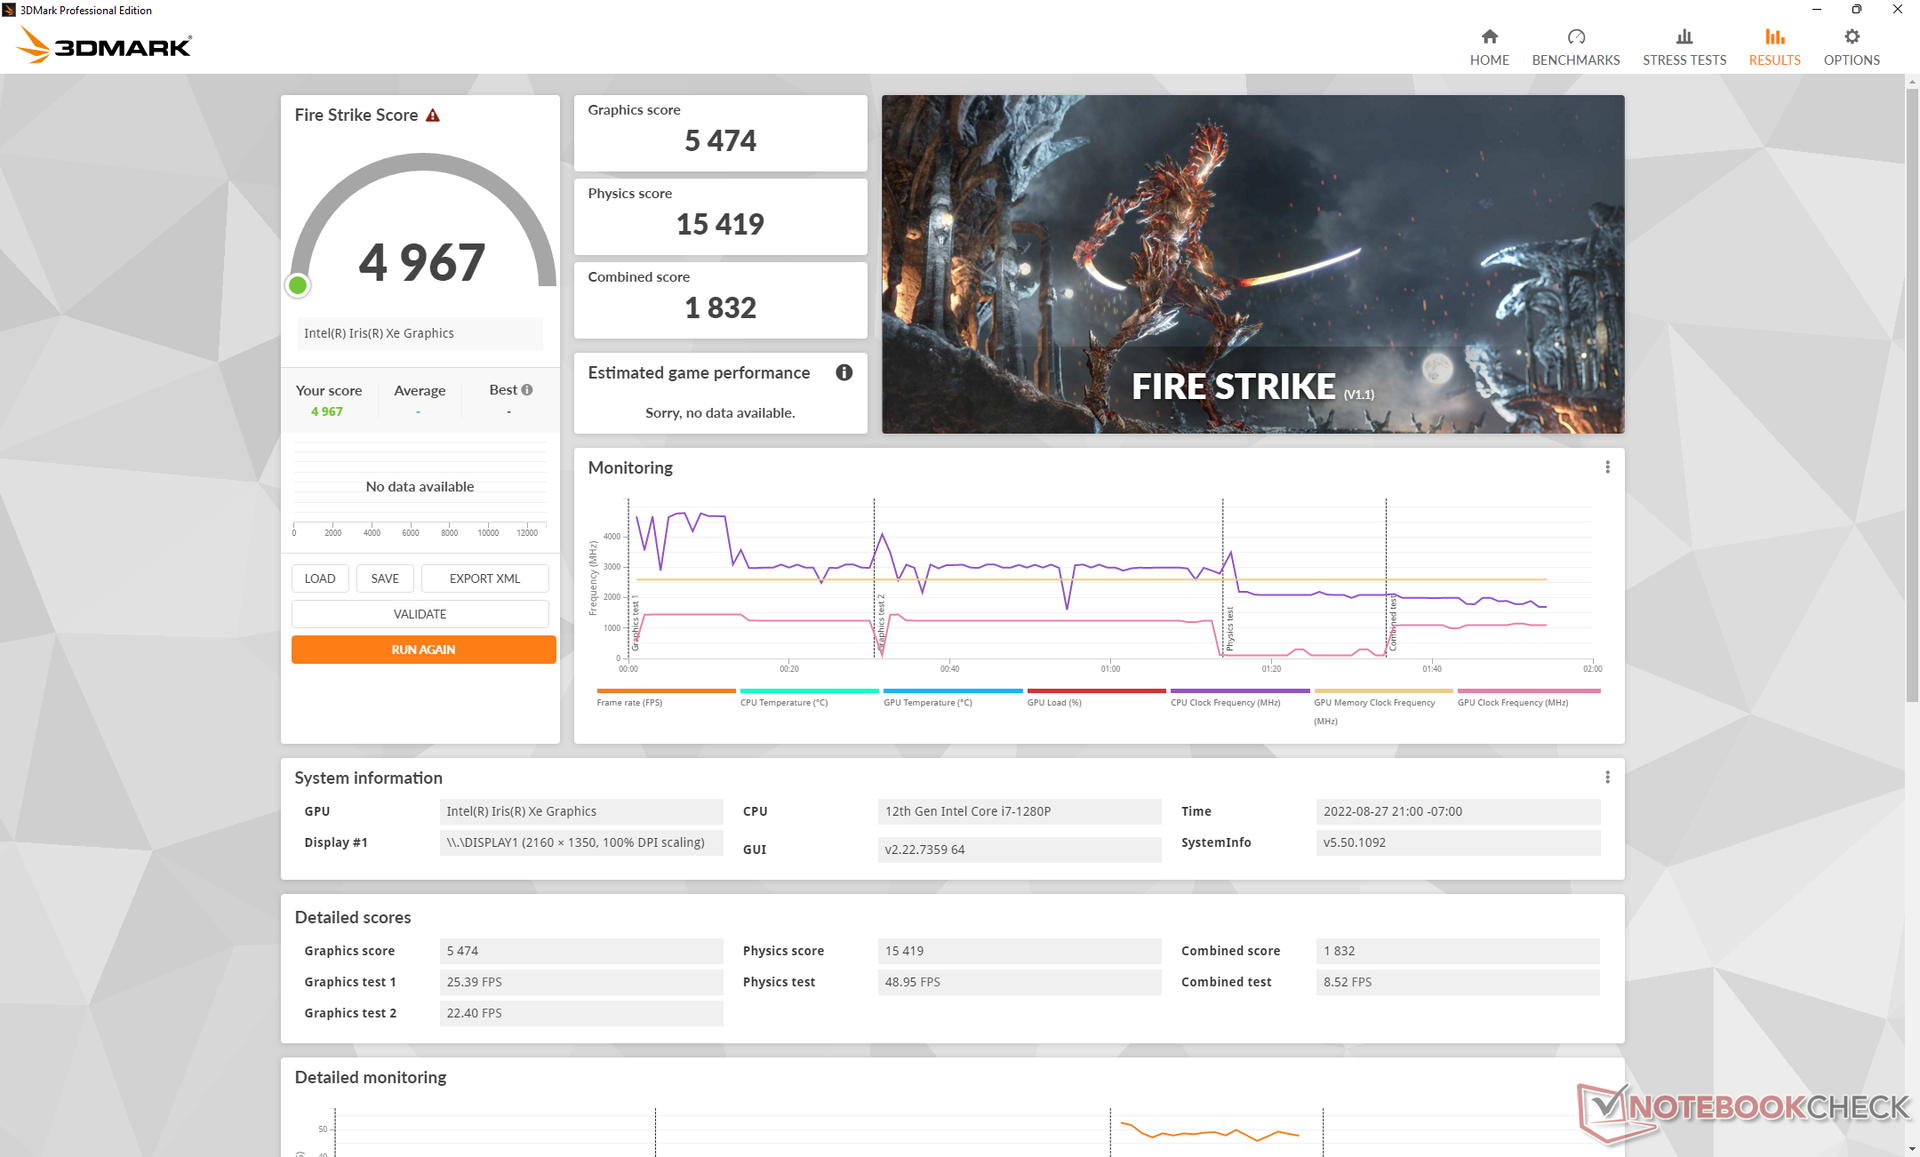
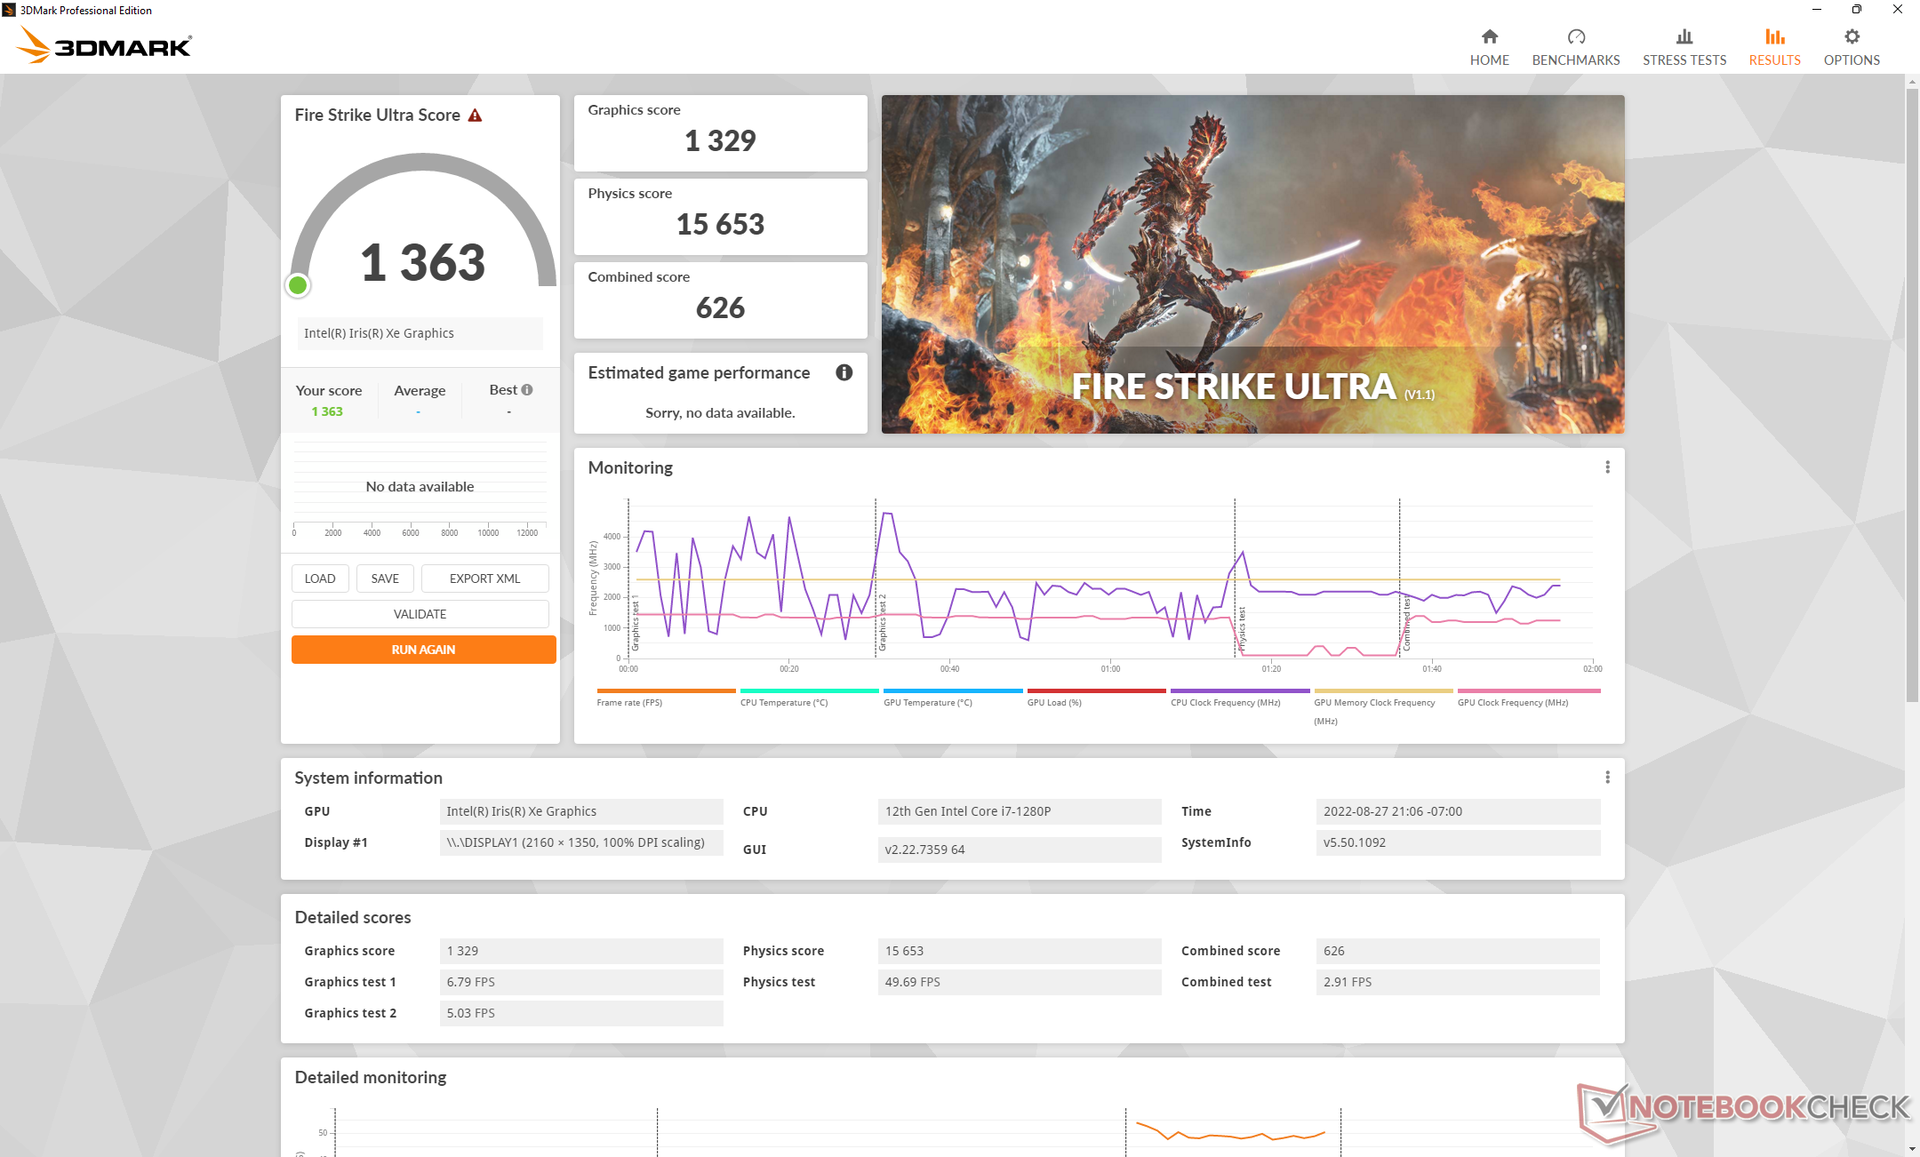
| 3DMark 11 Performance | 7141 puntos | |
| 3DMark Cloud Gate Standard Score | 20344 puntos | |
| 3DMark Fire Strike Score | 4967 puntos | |
| 3DMark Time Spy Score | 1906 puntos | |
ayuda | ||
Witcher 3 FPS Chart
| bajo | medio | alto | ultra | |
|---|---|---|---|---|
| GTA V (2015) | 97.2 | 82.3 | 21.9 | 9.84 |
| The Witcher 3 (2015) | 107.2 | 67.3 | 35 | 15.1 |
| Dota 2 Reborn (2015) | 106.1 | 76 | 55.6 | 49 |
| Final Fantasy XV Benchmark (2018) | 35.8 | 20.7 | 20.7 | |
| X-Plane 11.11 (2018) | 38.8 | 39.9 | 35.4 | |
| Strange Brigade (2018) | 88.1 | 41 | 32 | 25.1 |
| Cyberpunk 2077 1.6 (2022) | 18.3 | 16.1 | 12.3 | 9.5 |
Emisiones
Ruido del sistema
El ruido del ventilador está vinculado a los tres perfiles de energía de Lenovo Vantage: Silencioso, Refrigeración Equilibrada o Inteligente, y Mejor Rendimiento. El sistema es más silencioso de lo esperado incluso con el perfil de refrigeración inteligente por defecto. Cuando se ejecuta la primera escena de prueba de 3DMark 06, por ejemplo, el ventilador interno permanece muy silencioso durante toda la escena, como lo que observamos en el Dragonfly G3 oMateBook X Pro bajo condiciones similares. Sin embargo, cuando se ajusta al Mejor Rendimiento, se espera que el ventilador lata con más frecuencia, hasta 40 dB(A), cuando se ejecutan cargas más altas como los juegos. Por lo demás, recomendamos mantener la refrigeración inteligente para la mayoría de los escenarios.
Vale la pena notar que nuestra unidad de prueba mostraba un ruido electrónico o silbido de la bobina cuando estaba en reposo en el escritorio. El ruido desaparece temporalmente cuando se ejecuta 3DMark 06, lo que explica por qué nuestras mediciones de ruido cuando se ejecuta el benchmark es menor que nuestra medición de ruido cuando está en reposo en el escritorio (23,9 vs. 23,3 dB(A)).
Ruido
| Ocioso |
| 23.9 / 23.9 / 23.9 dB(A) |
| Carga |
| 23.3 / 40.9 dB(A) |
 | ||
30 dB silencioso 40 dB(A) audible 50 dB(A) ruidosamente alto |
||
min: | ||
| Lenovo ThinkPad X1 Nano Gen 2 Core i7-1280P Iris Xe G7 96EUs, i7-1280P, Kioxia BG5 KBG5AZNT1T02 | Lenovo ThinkPad X1 Nano-20UN002UGE Iris Xe G7 96EUs, i7-1160G7, WDC PC SN530 SDBPNPZ-512G | HP Elite Dragonfly G3 Iris Xe G7 96EUs, i7-1265U, Micron 3400 MTFDKBA512TFH 512GB | Dell Latitude 13 7330 Iris Xe G7 96EUs, i7-1265U, Toshiba KBG40ZNS512G NVMe | Framework Laptop 13.5 12th Gen Intel Iris Xe G7 96EUs, i7-1260P, WDC PC SN730 SDBPNTY-512G | Huawei MateBook X Pro 2021 Iris Xe G7 96EUs, i7-1165G7, Samsung PM981a MZVLB1T0HBLR | |
|---|---|---|---|---|---|---|
| Noise | -11% | 6% | -8% | -18% | -3% | |
| apagado / medio ambiente * (dB) | 23.3 | 24.9 -7% | 22.8 2% | 23.4 -0% | 22.8 2% | 25.4 -9% |
| Idle Minimum * (dB) | 23.9 | 24.9 -4% | 23.2 3% | 23.4 2% | 23 4% | 25.6 -7% |
| Idle Average * (dB) | 23.9 | 26.3 -10% | 23.2 3% | 23.4 2% | 23 4% | 25.6 -7% |
| Idle Maximum * (dB) | 23.9 | 31.8 -33% | 23.2 3% | 23.4 2% | 23 4% | 25.6 -7% |
| Load Average * (dB) | 23.3 | 34.3 -47% | 25.1 -8% | 37.8 -62% | 47.3 -103% | 28.7 -23% |
| Witcher 3 ultra * (dB) | 40.9 | 34.3 16% | 32 22% | 39.2 4% | 47.3 -16% | 32 22% |
| Load Maximum * (dB) | 40.9 | 37.5 8% | 35.2 14% | 43 -5% | 49.8 -22% | 38.2 7% |
* ... más pequeño es mejor
Temperatura
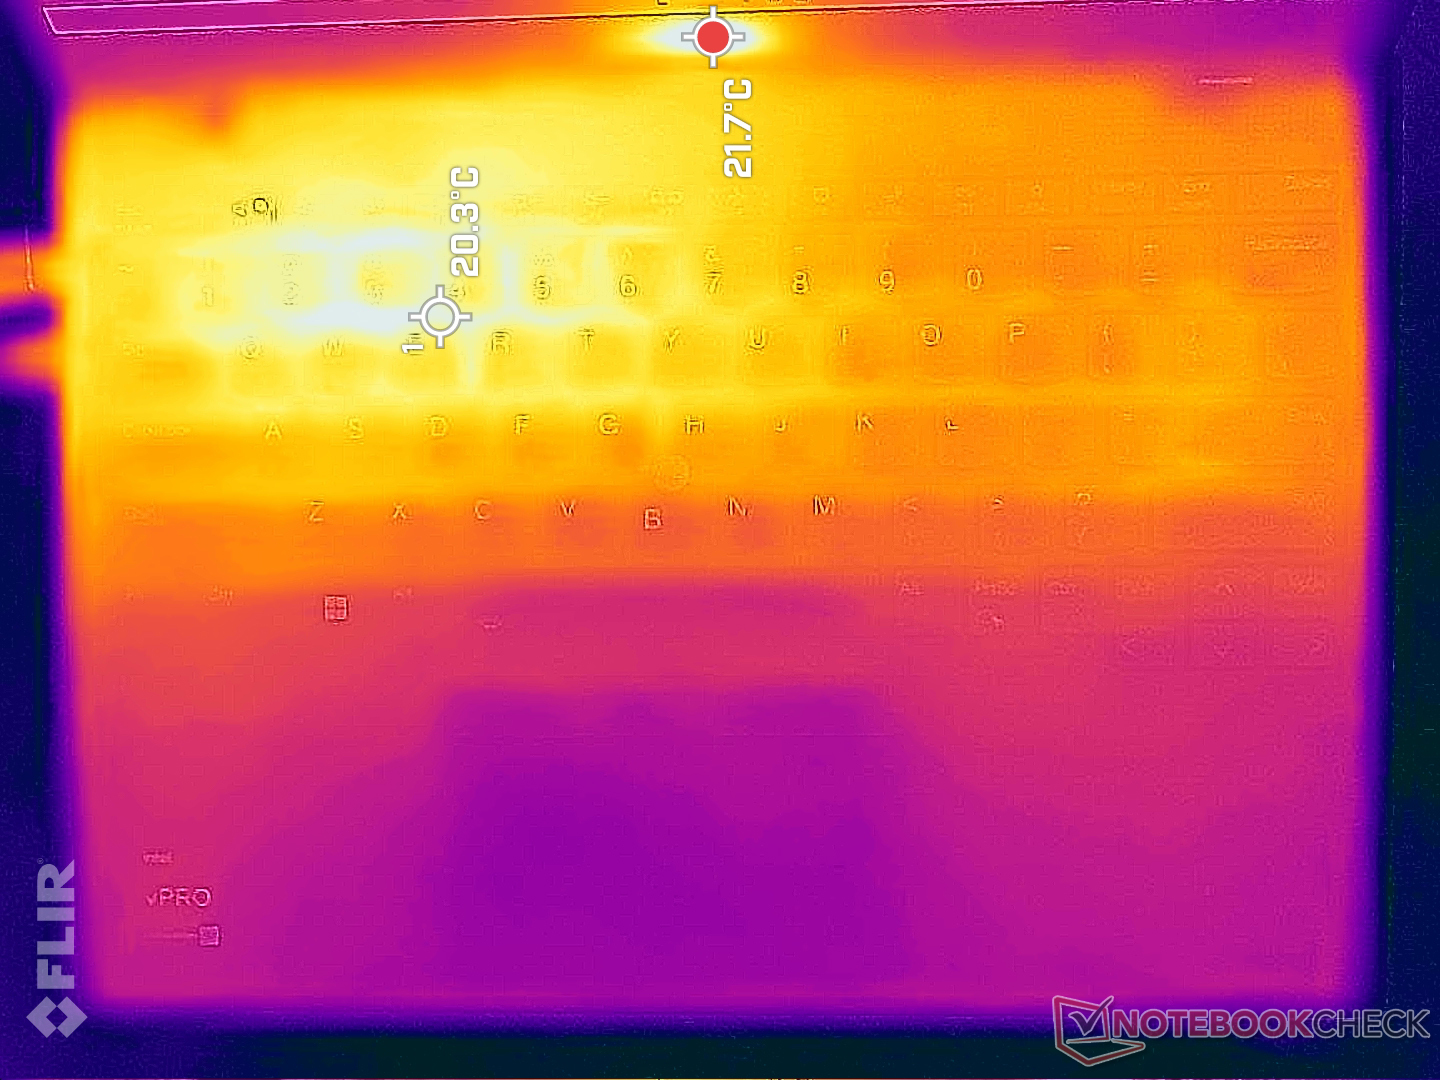
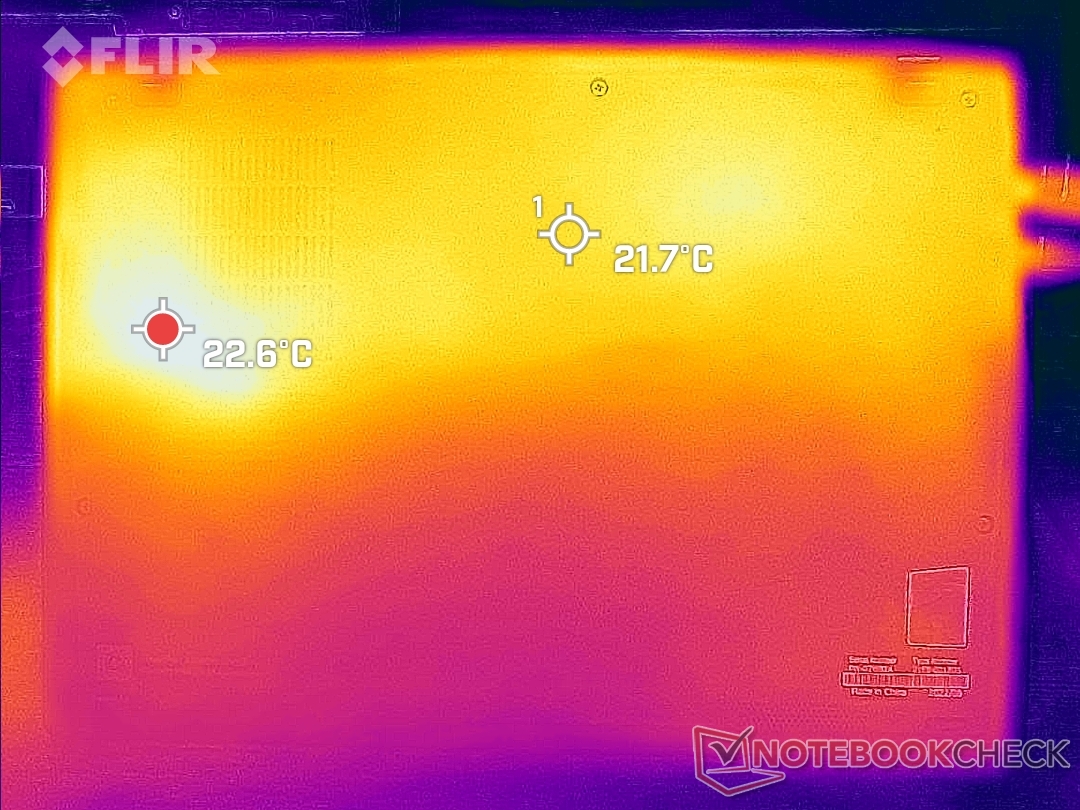
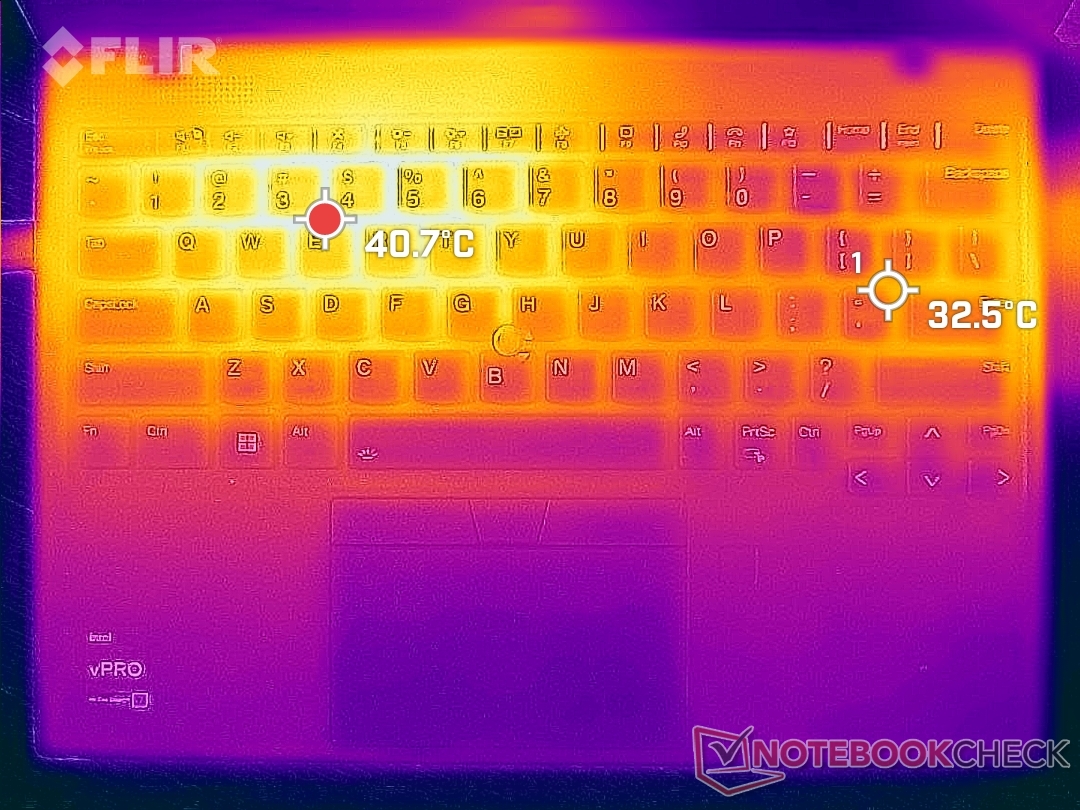
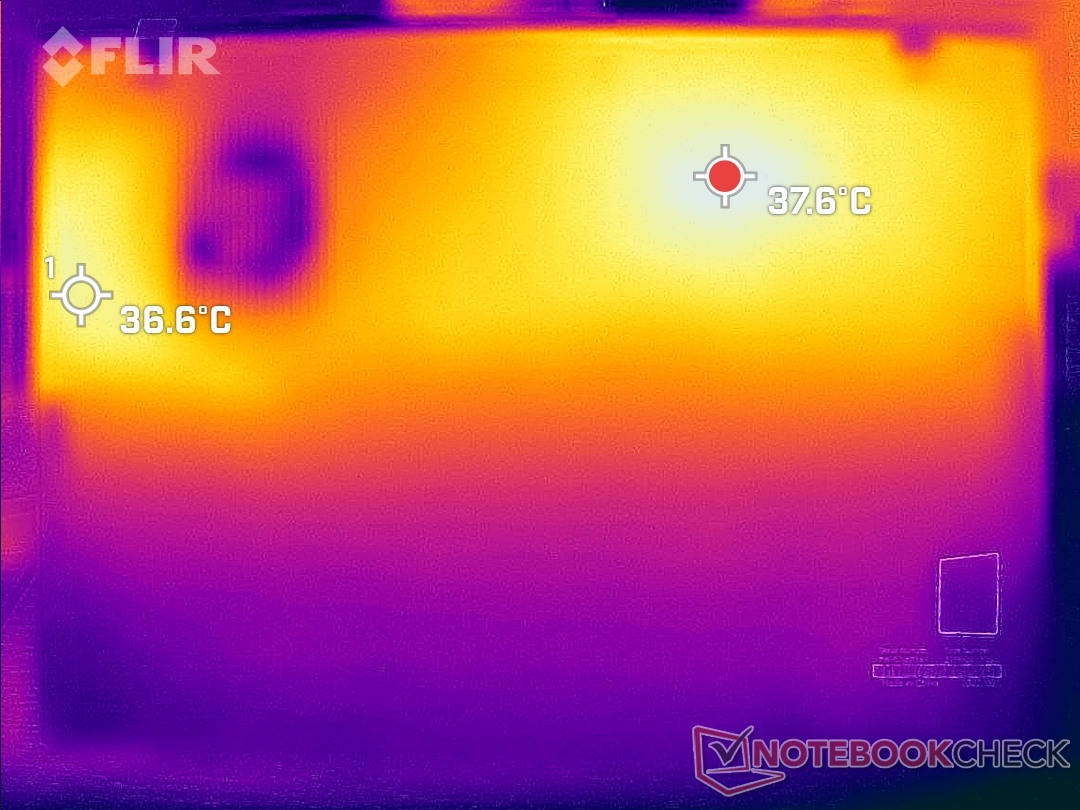
Las temperaturas de la superficie no son más cálidas en nuestra unidad Gen 2 más reciente en comparación con la Gen 1. De hecho, el punto caliente de la parte inferior es más frío, con sólo 40 C en comparación con los 48 C del modelo del año pasado, posiblemente debido a la fuerte ralentización del rendimiento mencionada anteriormente. Es de esperar que la mitad izquierda del teclado esté siempre más caliente que la derecha, como muestran los mapas de temperatura de abajo, ya que la CPU está situada en el lado izquierdo del chasis.

(±) La temperatura máxima en la parte superior es de 42.4 °C / 108 F, frente a la media de 35.9 °C / 97 F, que oscila entre 21.4 y 59 °C para la clase Subnotebook.
(±) El fondo se calienta hasta un máximo de 40.2 °C / 104 F, frente a la media de 39.2 °C / 103 F
(+) En reposo, la temperatura media de la parte superior es de 25.3 °C / 78# F, frente a la media del dispositivo de 30.8 °C / 87 F.
(+) El reposamanos y el panel táctil están a una temperatura inferior a la de la piel, con un máximo de 30.2 °C / 86.4 F y, por tanto, son fríos al tacto.
(±) La temperatura media de la zona del reposamanos de dispositivos similares fue de 28.2 °C / 82.8 F (-2 °C / -3.6 F).
| Lenovo ThinkPad X1 Nano Gen 2 Core i7-1280P Intel Core i7-1280P, Intel Iris Xe Graphics G7 96EUs | Lenovo ThinkPad X1 Nano-20UN002UGE Intel Core i7-1160G7, Intel Iris Xe Graphics G7 96EUs | HP Elite Dragonfly G3 Intel Core i7-1265U, Intel Iris Xe Graphics G7 96EUs | Dell Latitude 13 7330 Intel Core i7-1265U, Intel Iris Xe Graphics G7 96EUs | Framework Laptop 13.5 12th Gen Intel Intel Core i7-1260P, Intel Iris Xe Graphics G7 96EUs | Huawei MateBook X Pro 2021 Intel Core i7-1165G7, Intel Iris Xe Graphics G7 96EUs | |
|---|---|---|---|---|---|---|
| Heat | 1% | 2% | 8% | 4% | -7% | |
| Maximum Upper Side * (°C) | 42.4 | 42.2 -0% | 39 8% | 38.6 9% | 36.8 13% | 42.2 -0% |
| Maximum Bottom * (°C) | 40.2 | 47.5 -18% | 42.2 -5% | 42 -4% | 42.4 -5% | 40.4 -0% |
| Idle Upper Side * (°C) | 27.8 | 24.3 13% | 26.8 4% | 23.8 14% | 24.2 13% | 31.2 -12% |
| Idle Bottom * (°C) | 27.8 | 25.3 9% | 28.2 -1% | 24.6 12% | 29 -4% | 32.2 -16% |
* ... más pequeño es mejor
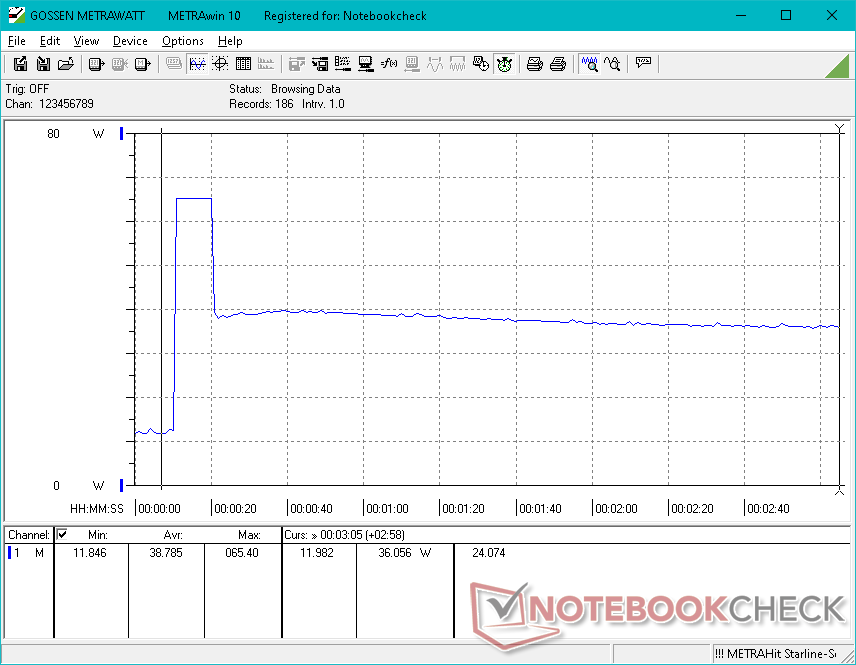
Prueba de esfuerzo
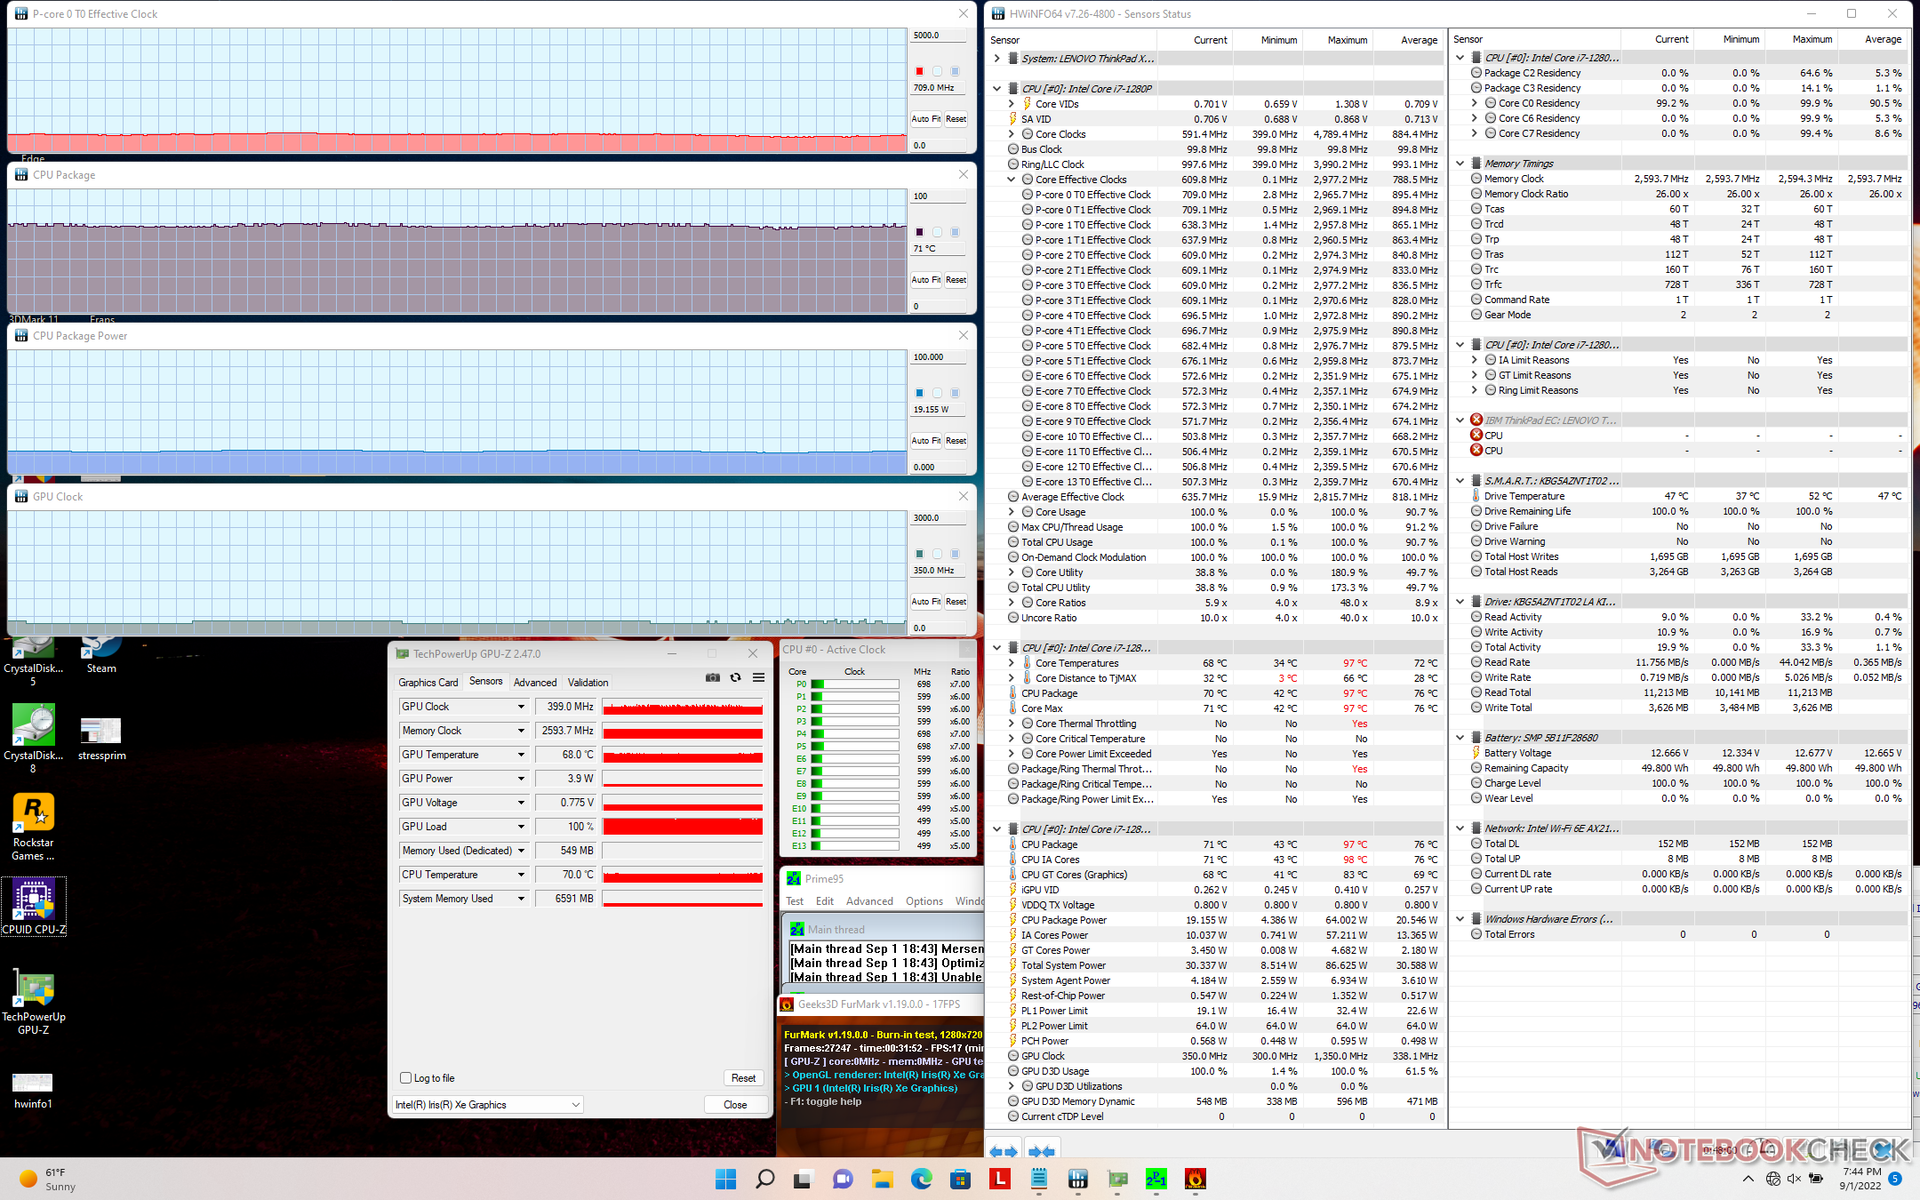
Cuando se estresa con Prime95, la velocidad de reloj de la CPU y el consumo de energía de la placa se disparan a 3 GHz y 64 W, respectivamente. Sin embargo, la temperatura también se dispara hasta unos alarmantes 97 C, por lo que este Turbo Boost máximo sólo dura unos segundos como máximo antes de que las velocidades de reloj y el consumo de energía de la placa caigan a sólo 1,3 GHz y 23 W, respectivamente, para una temperatura del núcleo ligeramente más fría de 85 C. Al ejecutar esta misma prueba en el más grande y pesado Portátil Framework equipado con la CPU i7-1260P resultaría en velocidades de reloj estables más altas de alrededor de 2,5 GHz en comparación.
Las frecuencias de reloj de la GPU y la temperatura cuando se ejecuta Witcher 3 se estabilizarían en 948 MHz y 69 C, respectivamente, en comparación con los 1396 MHz y 83 C del mencionado Framework.
El rendimiento no se reduce si funciona con batería. Una prueba 3DMark 11 con baterías arrojaría unas puntuaciones de Física y Gráficos de 13122 y 6668 puntos, respectivamente, frente a los 11415 y 6937 puntos con la red eléctrica.
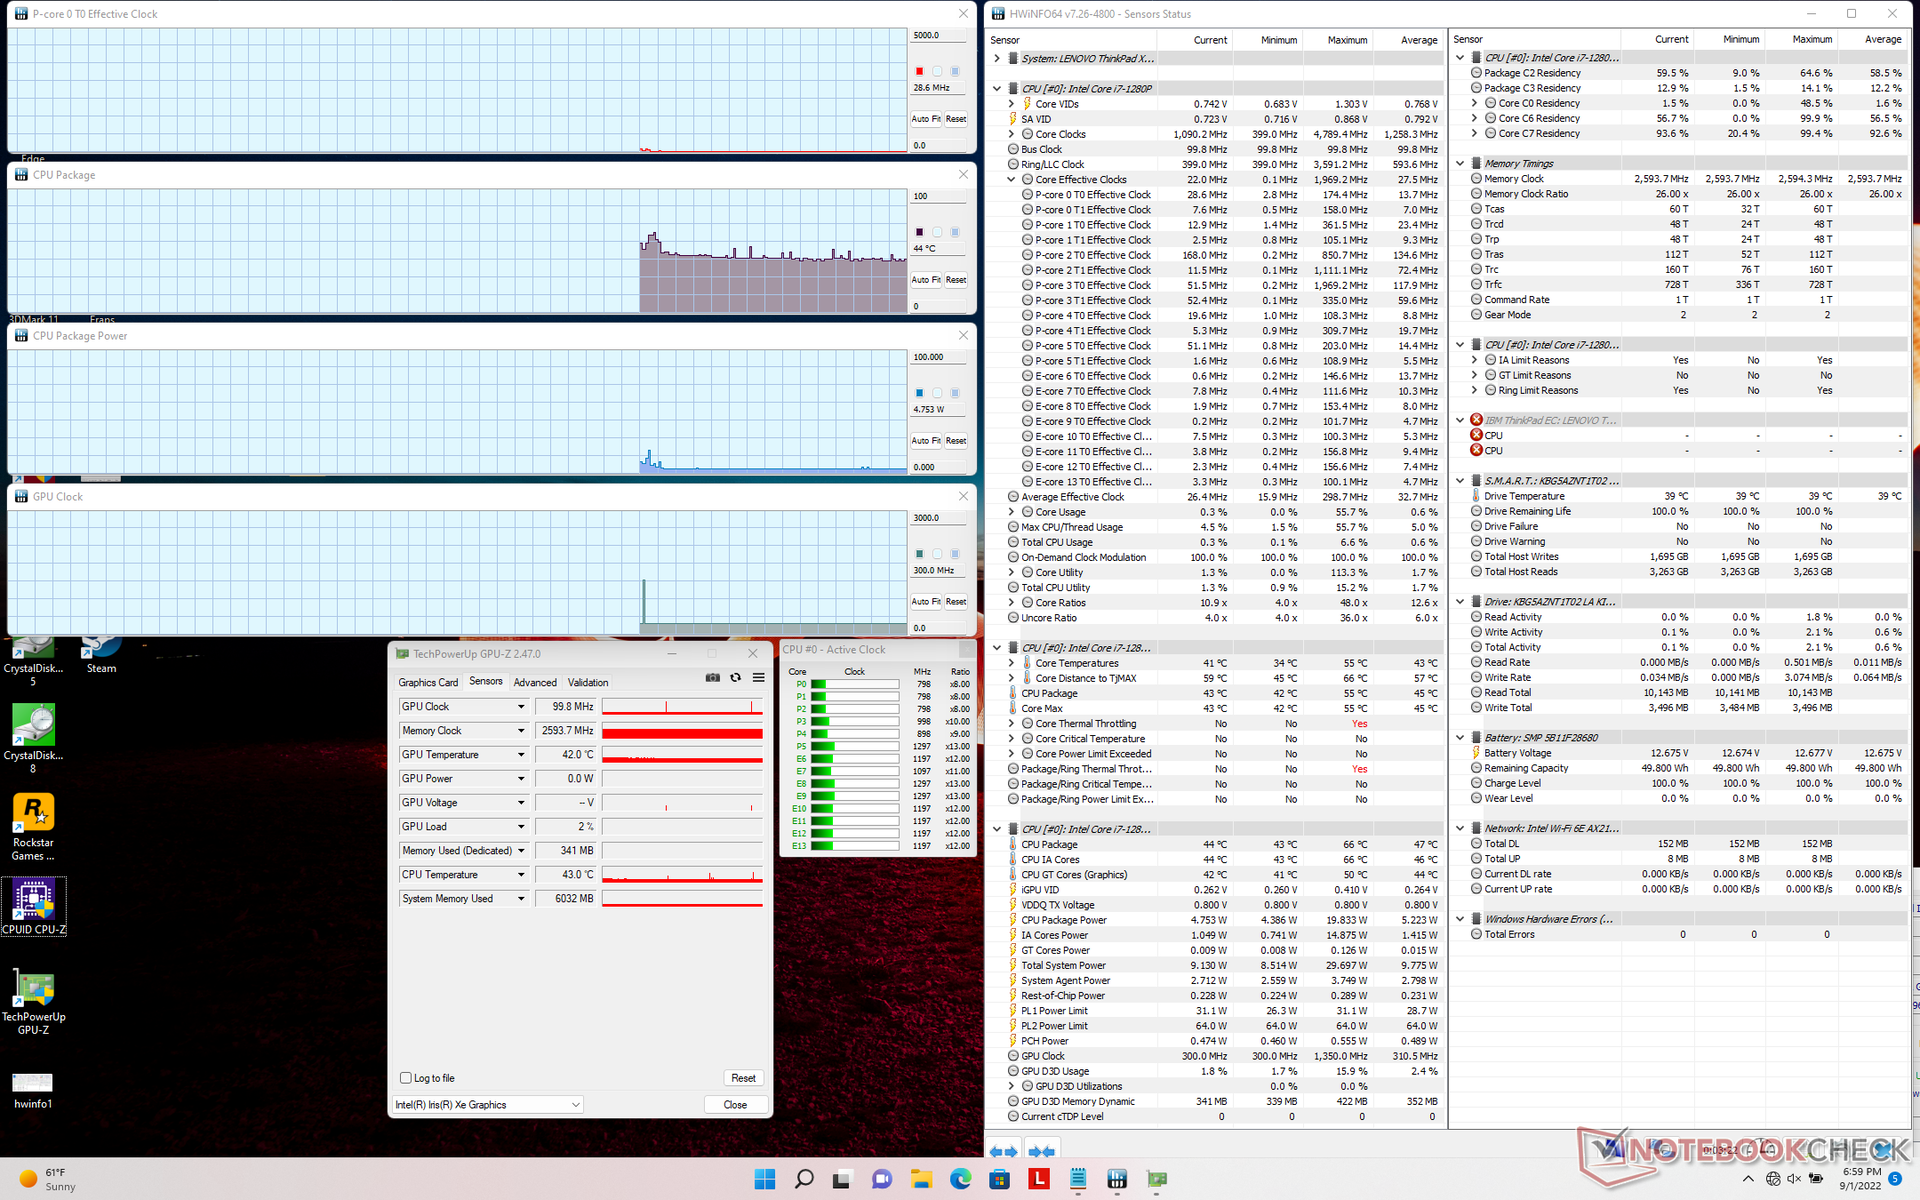
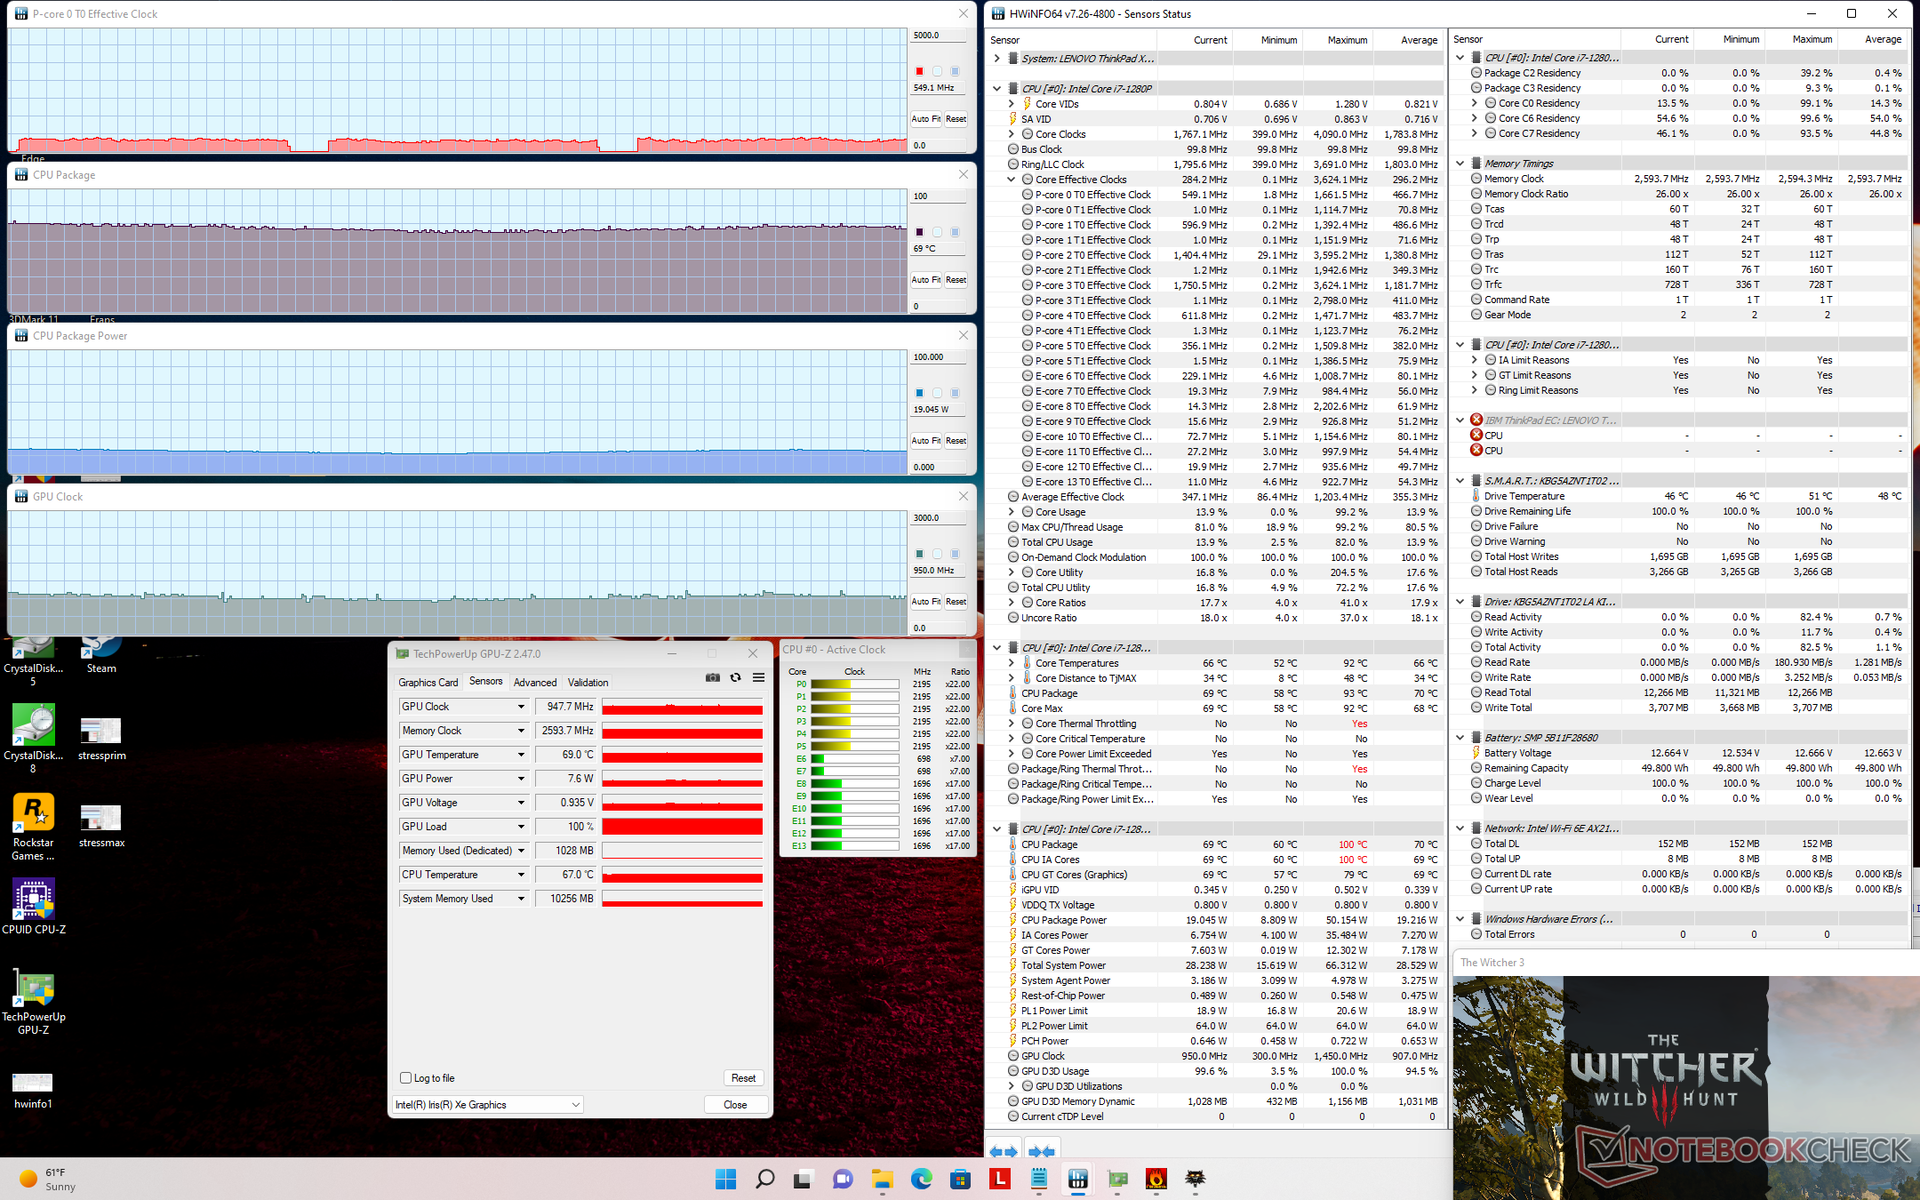
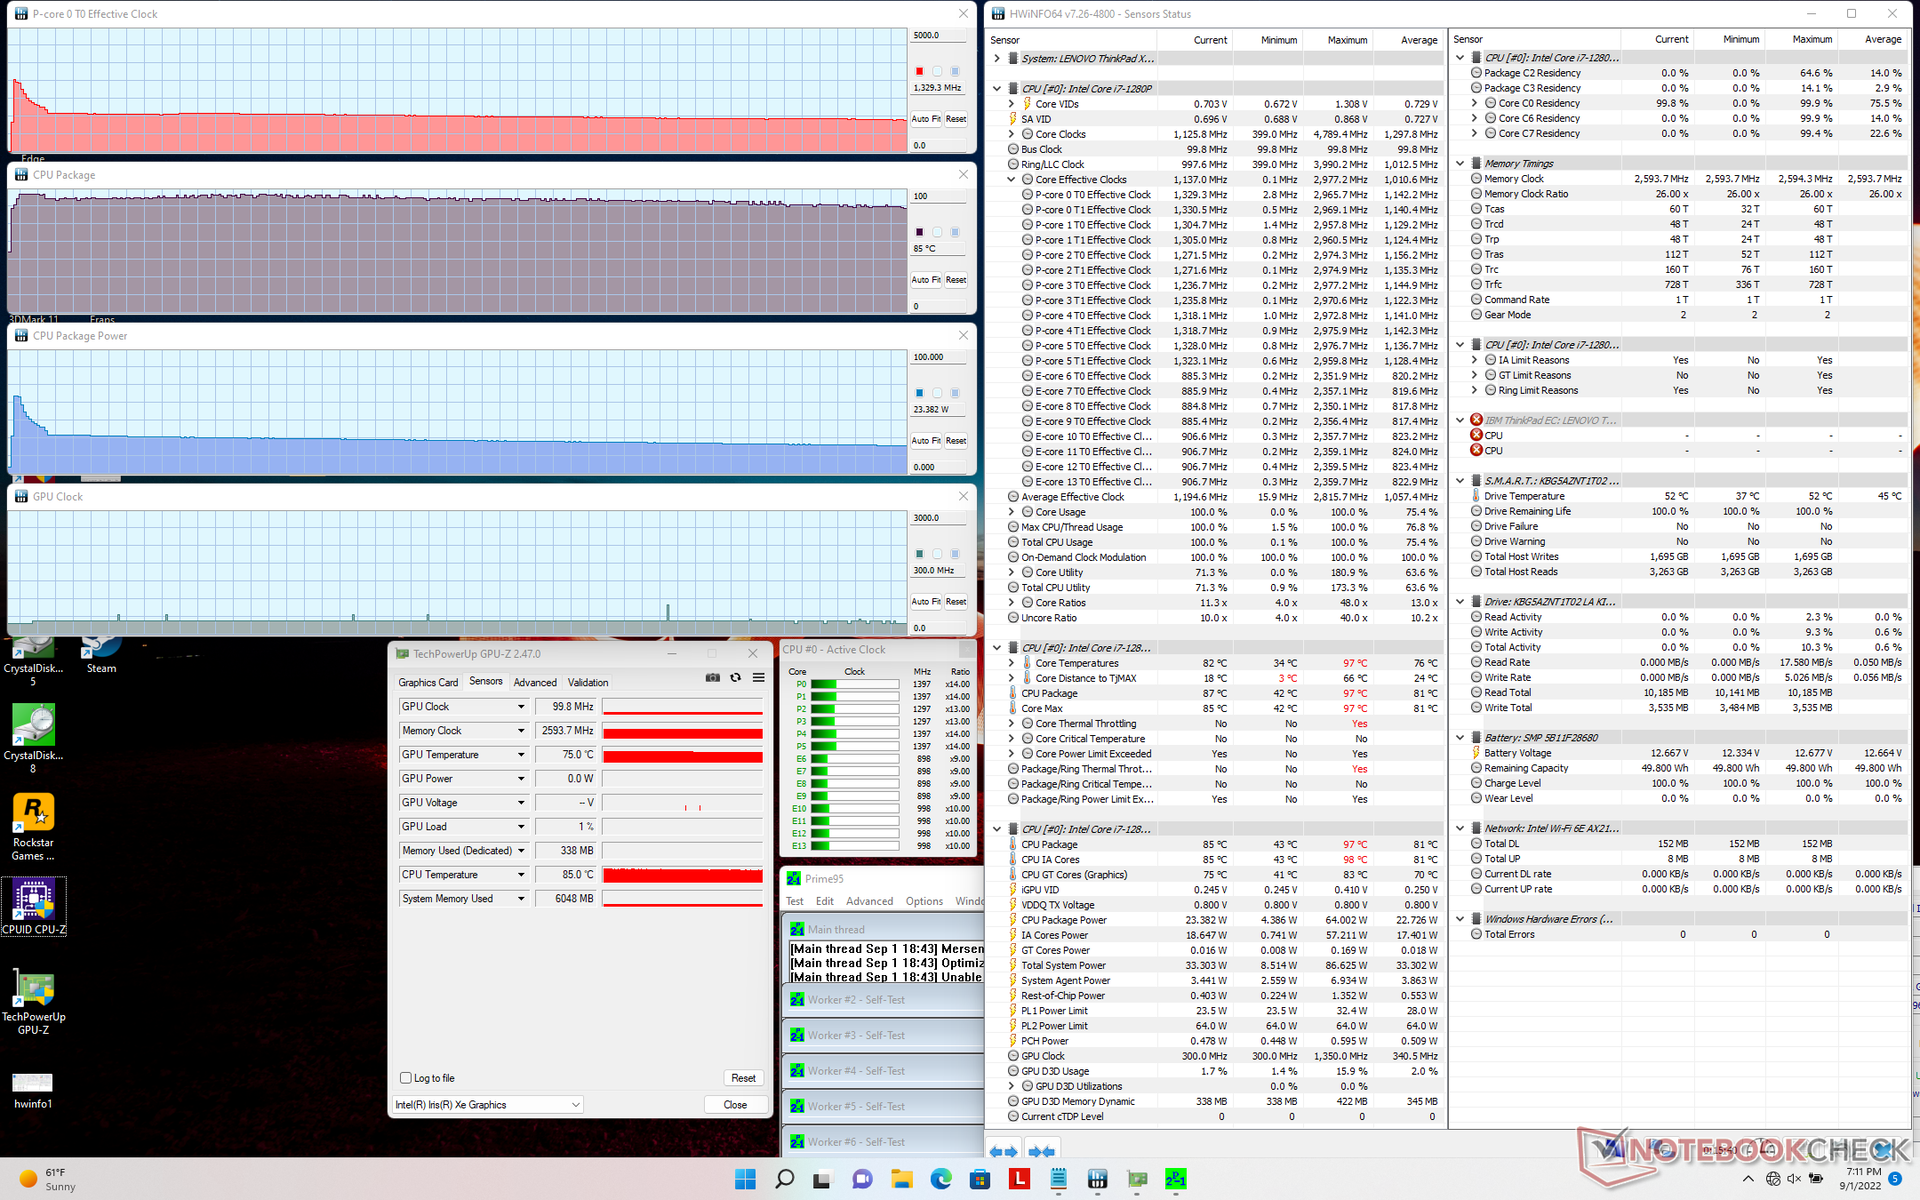
| Reloj dela CPU (GHz) | Reloj de la GPU (MHz) | Temperatura media de la CPU (°C) | |
| Sistema en reposo | -- | -- | 44 |
| Prime95 Stress | 1.3 | -- | 85 |
| Prime95+ FurMark Stress | 0,7 | 399 | 71 |
| Witcher 3 Estrés | ~0,5 | 948 | 69 |
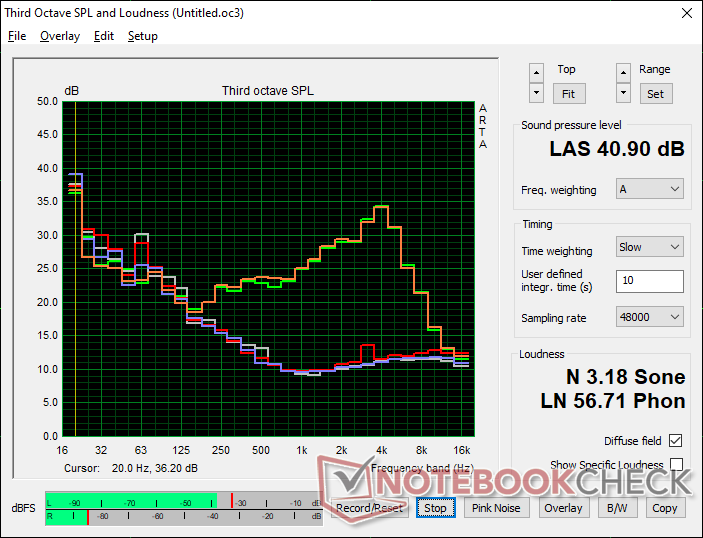
Altavoces
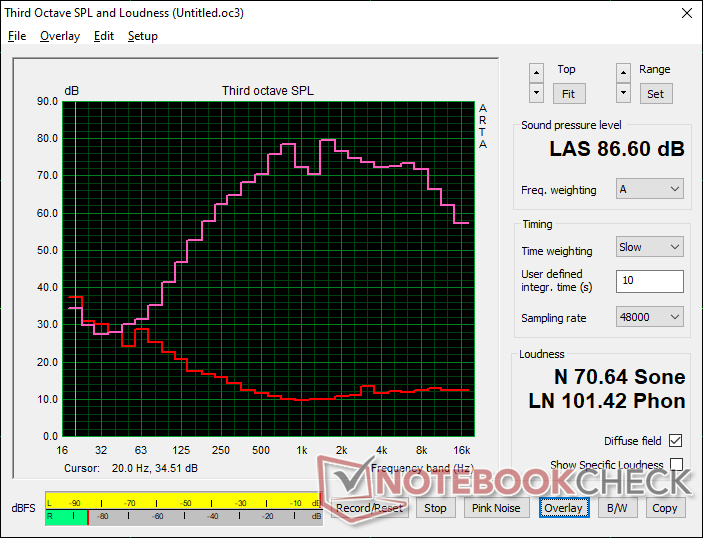
Lenovo ThinkPad X1 Nano Gen 2 Core i7-1280P análisis de audio
(+) | los altavoces pueden reproducir a un volumen relativamente alto (#86.6 dB)
Graves 100 - 315 Hz
(-) | casi sin bajos - de media 16.3% inferior a la mediana
(±) | la linealidad de los graves es media (8.4% delta a frecuencia anterior)
Medios 400 - 2000 Hz
(+) | medios equilibrados - a sólo 4% de la mediana
(±) | la linealidad de los medios es media (7.3% delta respecto a la frecuencia anterior)
Altos 2 - 16 kHz
(+) | máximos equilibrados - a sólo 2.7% de la mediana
(+) | los máximos son lineales (3% delta a la frecuencia anterior)
Total 100 - 16.000 Hz
(+) | el sonido global es lineal (12.8% de diferencia con la mediana)
En comparación con la misma clase
» 19% de todos los dispositivos probados de esta clase eran mejores, 4% similares, 76% peores
» El mejor tuvo un delta de 5%, la media fue 18%, el peor fue ###max##%
En comparación con todos los dispositivos probados
» 12% de todos los dispositivos probados eran mejores, 3% similares, 85% peores
» El mejor tuvo un delta de 4%, la media fue 23%, el peor fue ###max##%
Apple MacBook Pro 16 2021 M1 Pro análisis de audio
(+) | los altavoces pueden reproducir a un volumen relativamente alto (#84.7 dB)
Graves 100 - 315 Hz
(+) | buen bajo - sólo 3.8% lejos de la mediana
(+) | el bajo es lineal (5.2% delta a la frecuencia anterior)
Medios 400 - 2000 Hz
(+) | medios equilibrados - a sólo 1.3% de la mediana
(+) | los medios son lineales (2.1% delta a la frecuencia anterior)
Altos 2 - 16 kHz
(+) | máximos equilibrados - a sólo 1.9% de la mediana
(+) | los máximos son lineales (2.7% delta a la frecuencia anterior)
Total 100 - 16.000 Hz
(+) | el sonido global es lineal (4.6% de diferencia con la mediana)
En comparación con la misma clase
» 0% de todos los dispositivos probados de esta clase eran mejores, 0% similares, 100% peores
» El mejor tuvo un delta de 5%, la media fue 17%, el peor fue ###max##%
En comparación con todos los dispositivos probados
» 0% de todos los dispositivos probados eran mejores, 0% similares, 100% peores
» El mejor tuvo un delta de 4%, la media fue 23%, el peor fue ###max##%
Gestión de la energía
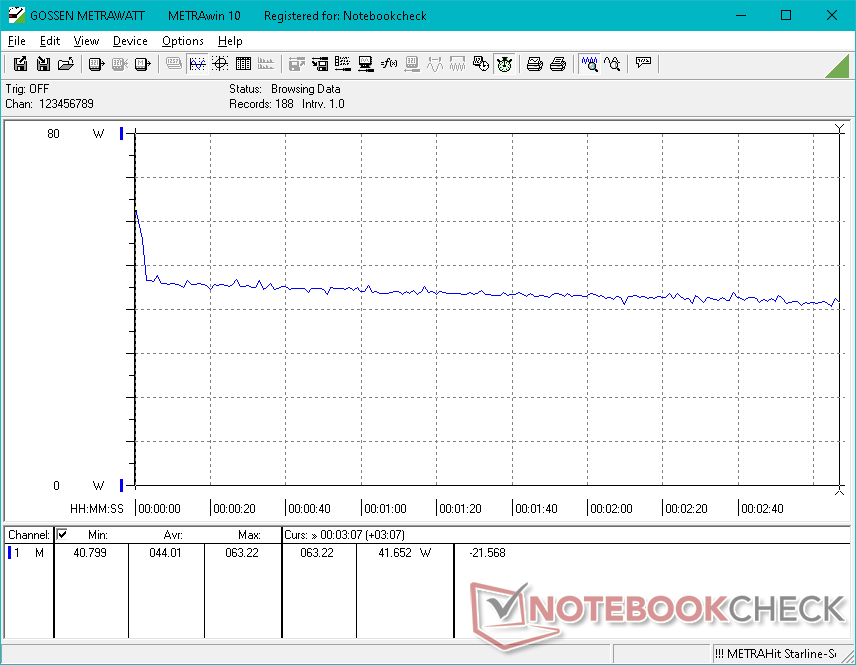
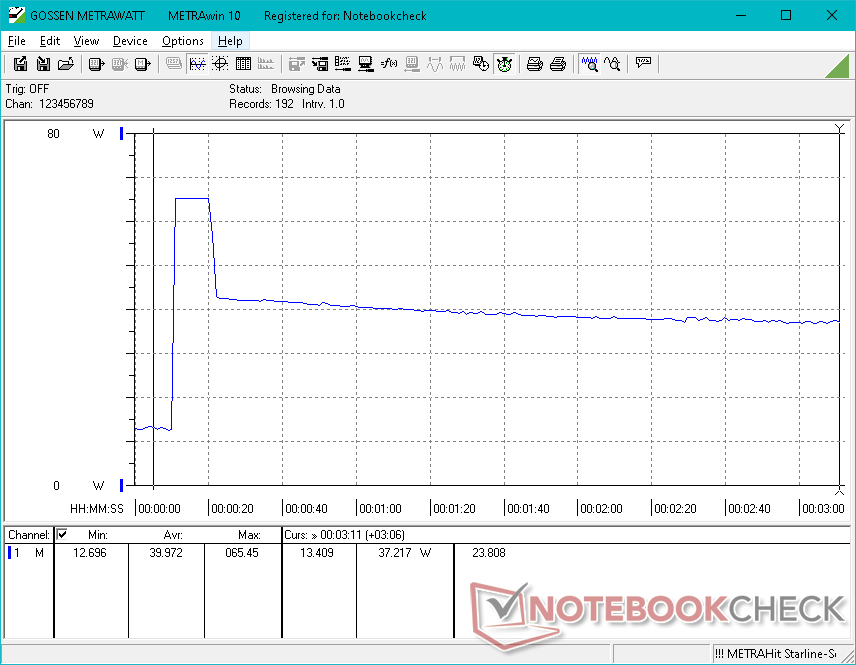
Consumo de energía
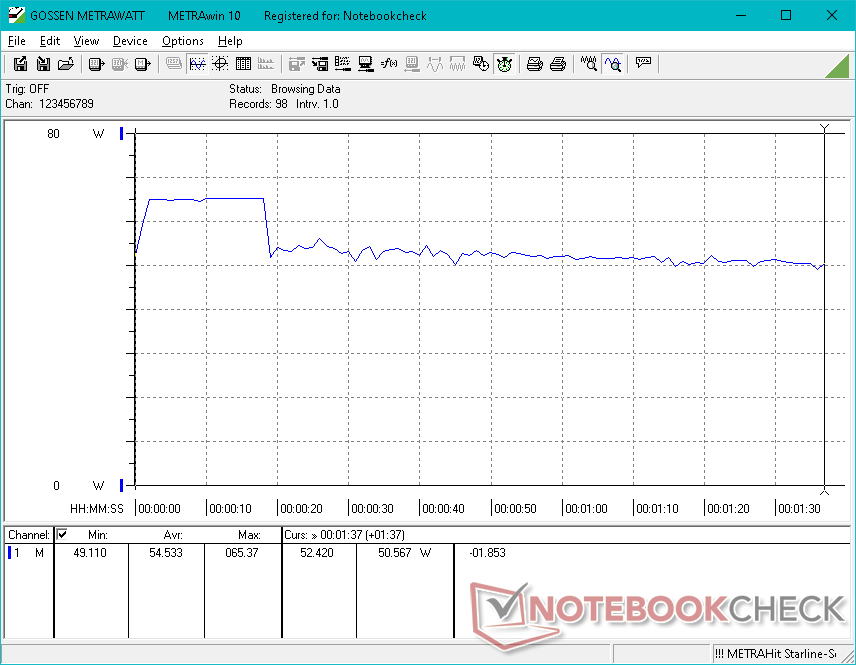
El sistema es en general más exigente que otros subportátiles de 13 pulgadas, ya que es uno de los pocos con una CPU de la serie Core P. Simplemente en reposo en el escritorio consume entre 3 W y 15 W mientras que el HP Dragonfly G3, Latitude 7330o el ThinkPad X1 Nano original alcanzarían un máximo de 7 W o 9 W en condiciones similares
Las diferencias de consumo energético se disparan aún más cuando se ejecutan cargas más exigentes. 3DMark 06 o Witcher 3, por ejemplo, demandarían entre 44 W y 55 W para ser significativamente más que los mencionados HP, Dell, o el X1 Nano original. La CPU Core i7-1280P puede ser más rápida, pero ciertamente tiene un coste
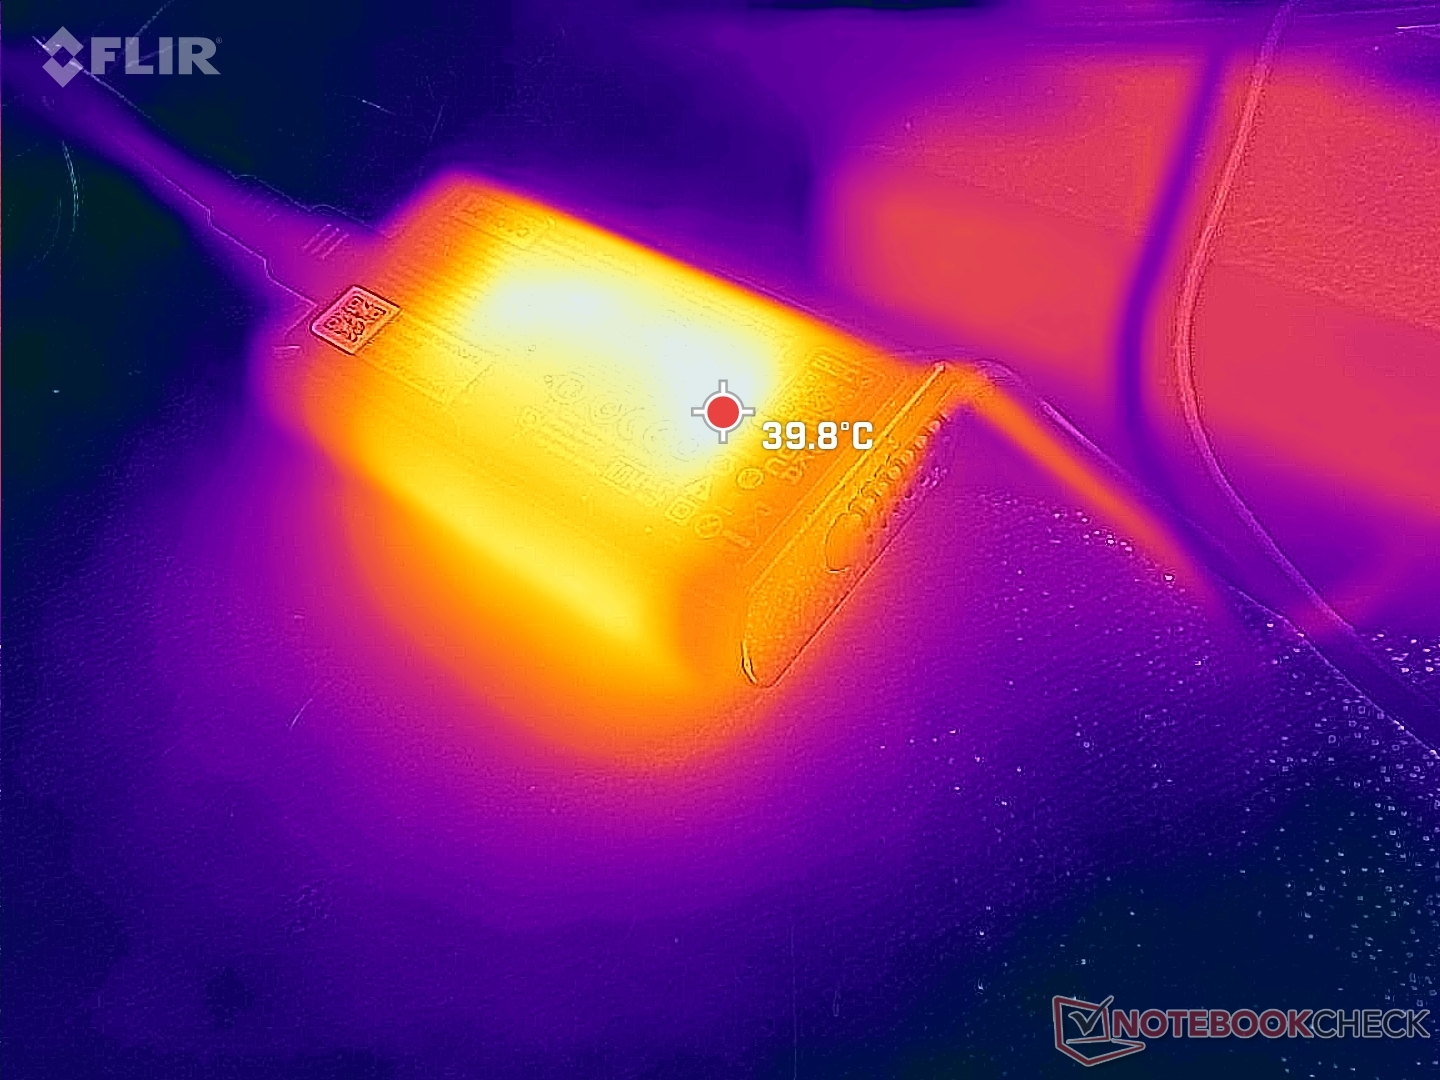
Pudimos registrar un consumo máximo temporal de 65.4 W desde el pequeño (~8.7 x 5.2 x 2.2 cm) adaptador de CA de 65 W antes de que la ralentización se active como muestran nuestras capturas de pantalla.
| Off / Standby | |
| Ocioso | |
| Carga |
|
Clave:
min: | |
| Lenovo ThinkPad X1 Nano Gen 2 Core i7-1280P i7-1280P, Iris Xe G7 96EUs, Kioxia BG5 KBG5AZNT1T02, IPS, 2160x1350, 13" | Lenovo ThinkPad X1 Nano-20UN002UGE i7-1160G7, Iris Xe G7 96EUs, WDC PC SN530 SDBPNPZ-512G, IPS, 2160x1350, 13" | HP Elite Dragonfly G3 i7-1265U, Iris Xe G7 96EUs, Micron 3400 MTFDKBA512TFH 512GB, IPS, 1920x1280, 13.5" | Dell Latitude 13 7330 i7-1265U, Iris Xe G7 96EUs, Toshiba KBG40ZNS512G NVMe, IPS, 1920x1080, 13.3" | Framework Laptop 13.5 12th Gen Intel i7-1260P, Iris Xe G7 96EUs, WDC PC SN730 SDBPNTY-512G, IPS, 2256x1504, 13.5" | Huawei MateBook X Pro 2021 i7-1165G7, Iris Xe G7 96EUs, Samsung PM981a MZVLB1T0HBLR, IPS, 3000x2000, 13.9" | |
|---|---|---|---|---|---|---|
| Power Consumption | 25% | 16% | 21% | -11% | -11% | |
| Idle Minimum * (Watt) | 3.4 | 3.3 3% | 3.4 -0% | 2.8 18% | 5.3 -56% | 6.7 -97% |
| Idle Average * (Watt) | 6.5 | 5.7 12% | 5.6 14% | 4.8 26% | 8.4 -29% | 10 -54% |
| Idle Maximum * (Watt) | 14.4 | 9.1 37% | 8.4 42% | 7.3 49% | 11.2 22% | 10.3 28% |
| Load Average * (Watt) | 54.5 | 29.6 46% | 40.8 25% | 48.1 12% | 57.4 -5% | 35.7 34% |
| Witcher 3 ultra * (Watt) | 44 | 27.7 37% | 35.5 19% | 35.4 20% | 46.7 -6% | 32.7 26% |
| Load Maximum * (Watt) | 65.4 | 55.1 16% | 68.4 -5% | 63.6 3% | 61.2 6% | 67.6 -3% |
* ... más pequeño es mejor
Power Consumption Witcher 3 / Stresstest
Power Consumption external Monitor
Duración de la batería
Los tiempos de ejecución son mucho más cortos que en el modelo del año pasado, casi la mitad (¡!), incluso con el perfil de energía equilibrado, probablemente debido a la CPU más exigente de la serie Core P. Con sólo 5 horas de uso real de WLAN, el X1 Nano Gen 2 no va a durar tanto como la mayoría de subportátiles.
| Lenovo ThinkPad X1 Nano Gen 2 Core i7-1280P i7-1280P, Iris Xe G7 96EUs, 49.5 Wh | Lenovo ThinkPad X1 Nano-20UN002UGE i7-1160G7, Iris Xe G7 96EUs, 48.2 Wh | HP Elite Dragonfly G3 i7-1265U, Iris Xe G7 96EUs, 68 Wh | Dell Latitude 13 7330 i7-1265U, Iris Xe G7 96EUs, 41 Wh | Framework Laptop 13.5 12th Gen Intel i7-1260P, Iris Xe G7 96EUs, 55 Wh | Huawei MateBook X Pro 2021 i7-1165G7, Iris Xe G7 96EUs, 56 Wh | |
|---|---|---|---|---|---|---|
| Duración de Batería | 94% | 131% | 63% | 47% | 106% | |
| WiFi v1.3 (h) | 5.1 | 9.9 94% | 11.8 131% | 8.3 63% | 7.5 47% | 10.5 106% |
| H.264 (h) | 15.4 | |||||
| Load (h) | 1.6 | 3.5 | 1.4 | 3 | ||
| Reader / Idle (h) | 37.8 | 21.9 | 19.5 |
Pro
Contra
Veredicto - Un velocista ligero, pero no un maratonista
El ThinkPad X1 Nano Gen 2 es el ejemplo perfecto de lo que ocurre cuando se cambia una CPU de 15 W por una de 28 W en un portátil diseñado originalmente para funcionar con una CPU de 15 W. Vas a ver un rendimiento más rápido, pero ese aumento de rendimiento sólo será en ráfagas cortas debido a las limitaciones de la solución de refrigeración. Por lo tanto, el sistema está en su mejor momento cuando las ráfagas cortas de alto rendimiento pueden ser útiles, como al lanzar aplicaciones, la edición ocasional de imágenes o la descompresión de archivos pequeños. Sin embargo, si pretendes utilizar el portátil para cargas de trabajo intensivas de la CPU durante periodos de tiempo más largos, entonces la CPU aquí puede no ser tan rápida como podrías estar esperando. Ten en cuenta que este es un inconveniente común en la mayoría, si no en todos los portátiles superligeros (<1 kg) hasta ahora, como el Dragonfly G3, Latitude 7330o el LG Gram.
Otro aspecto importante a tener en cuenta es que la duración de la batería se ha reducido significativamente, ya que la capacidad de la misma permanece esencialmente inalterada a pesar de que la CPU es más nueva y exige más energía. Es posible que tenga que ser más consciente de la carga cuando viaje como resultado.
El ThinkPad X1 Nano Gen 2 es innegablemente más rápido que el modelo original Gen 1, pero tiene el coste de una menor duración y una posible ralentización del rendimiento.
A pesar de la limitada sostenibilidad de Turbo Boost de la CPU, el X1 Nano Gen 2 sigue siendo un sistema mucho más rápido que el antiguo modelo Gen 1 sin necesidad de cambiar nada del chasis, la pantalla o el peso. Los usuarios que buscan maximizar el rendimiento del procesador pueden considerar portátiles más pesados con soluciones de refrigeración más potentes como la Serie ThinkPad T en su lugar.
Precio y disponibilidad
El ThinkPad X1 Nano Gen 2 ya está disponible a través de distribuidores como Amazon y Newegg por 1700 USD si se configura con el Core i5 y la pantalla FHD hasta 2300 USD si se configura con el Core i7 y la pantalla 2K. Como alternativa, los usuarios pueden comprar directamente a Lenovo.
Lenovo ThinkPad X1 Nano Gen 2 Core i7-1280P
- 09/04/2022 v7 (old)
Allen Ngo
Price comparison

