Schenker XMG NEO 17 con RTX 3080 en la revisión del portátil: Los usuarios pueden dar rienda suelta a la RTX 3080 por sí mismos
A principios de año, analizamos el Schenker XMG Neo 17 con CPU AMD y RTX 3070, y ahora le sigue uno de los modelos superiores con RTX 3080 y CPU Intel Tiger Lake, y el teclado mecánico también está a bordo de nuevo. Como en el modelo hermano, el TGP de la tarjeta gráfica se puede configurar completamente por software, y se pueden asignar los 165 W completos a la GPU de esta forma. Sin embargo, el modelo hermano ya era muy ruidoso bajo carga con una RTX 3070, así que ¿los desarrolladores siguieron ajustando el sistema de refrigeración mientras tanto?
Los principales competidores son el Aorus 17G YDcon la misma CPU y GPU, el Medion Erazer Beast X25y el más caro Asus ROG Zephyrus S17 y el Asus Strix Scar 17. Además, comparamos con el predecesor
Dado que prácticamente nada ha cambiado en el caso desde 2019, nos remitimos a la revisión de del Schenker XMG Neo 17 (Tongfang GK7CP7S) para las secciones de chasis, equipo y dispositivos de entrada
Possible competitors in comparison
Valoración | Fecha | Modelo | Peso | Altura | Tamaño | Resolución | Precio |
|---|---|---|---|---|---|---|---|
| 87.4 % v7 (old) | 09/2021 | Schenker XMG NEO 17 GM7TG8S i7-11800H, GeForce RTX 3080 Laptop GPU | 2.6 kg | 27.45 mm | 17.30" | 2560x1440 | |
| 85.1 % v7 (old) | 01/2021 | Schenker XMG Neo 17 (Early 2021, RTX 3070, 5800H) R7 5800H, GeForce RTX 3070 Laptop GPU | 2.5 kg | 27 mm | 17.30" | 2560x1440 | |
| 86 % v7 (old) | 06/2021 | Aorus 17G YD i7-11800H, GeForce RTX 3080 Laptop GPU | 2.8 kg | 26 mm | 17.30" | 1920x1080 | |
| 85 % v7 (old) | 07/2021 | Medion Erazer Beast X25 R9 5900HX, GeForce RTX 3080 Laptop GPU | 2.3 kg | 23 mm | 17.30" | 1920x1080 | |
| 90.1 % v7 (old) | 07/2021 | Asus ROG Zephyrus S17 GX703HSD i9-11900H, GeForce RTX 3080 Laptop GPU | 2.8 kg | 19.9 mm | 17.30" | 2560x1440 | |
| 86.6 % v7 (old) | 05/2021 | Asus Strix Scar 17 G733QSA-XS99 R9 5900HX, GeForce RTX 3080 Laptop GPU | 2.8 kg | 28.3 mm | 17.30" | 1920x1080 |
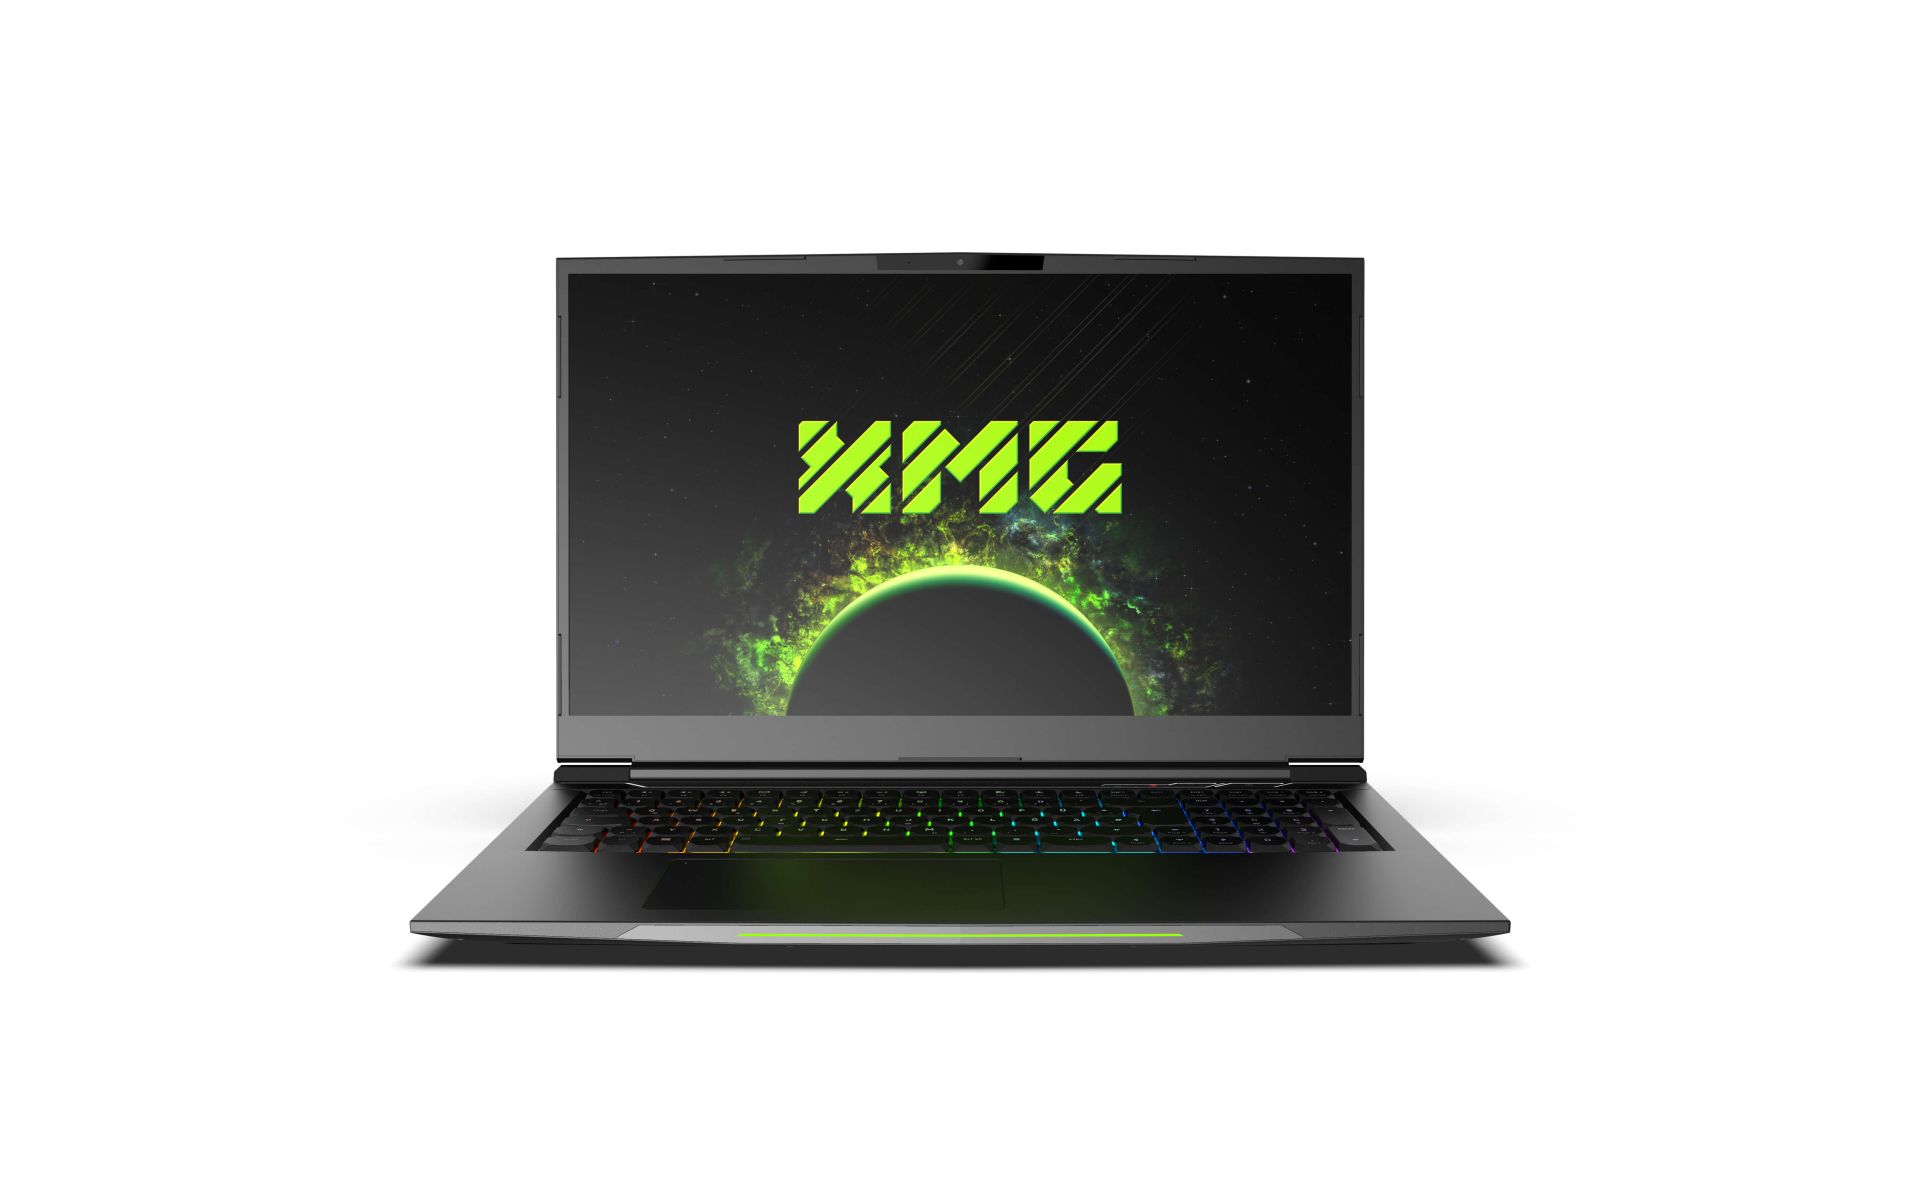
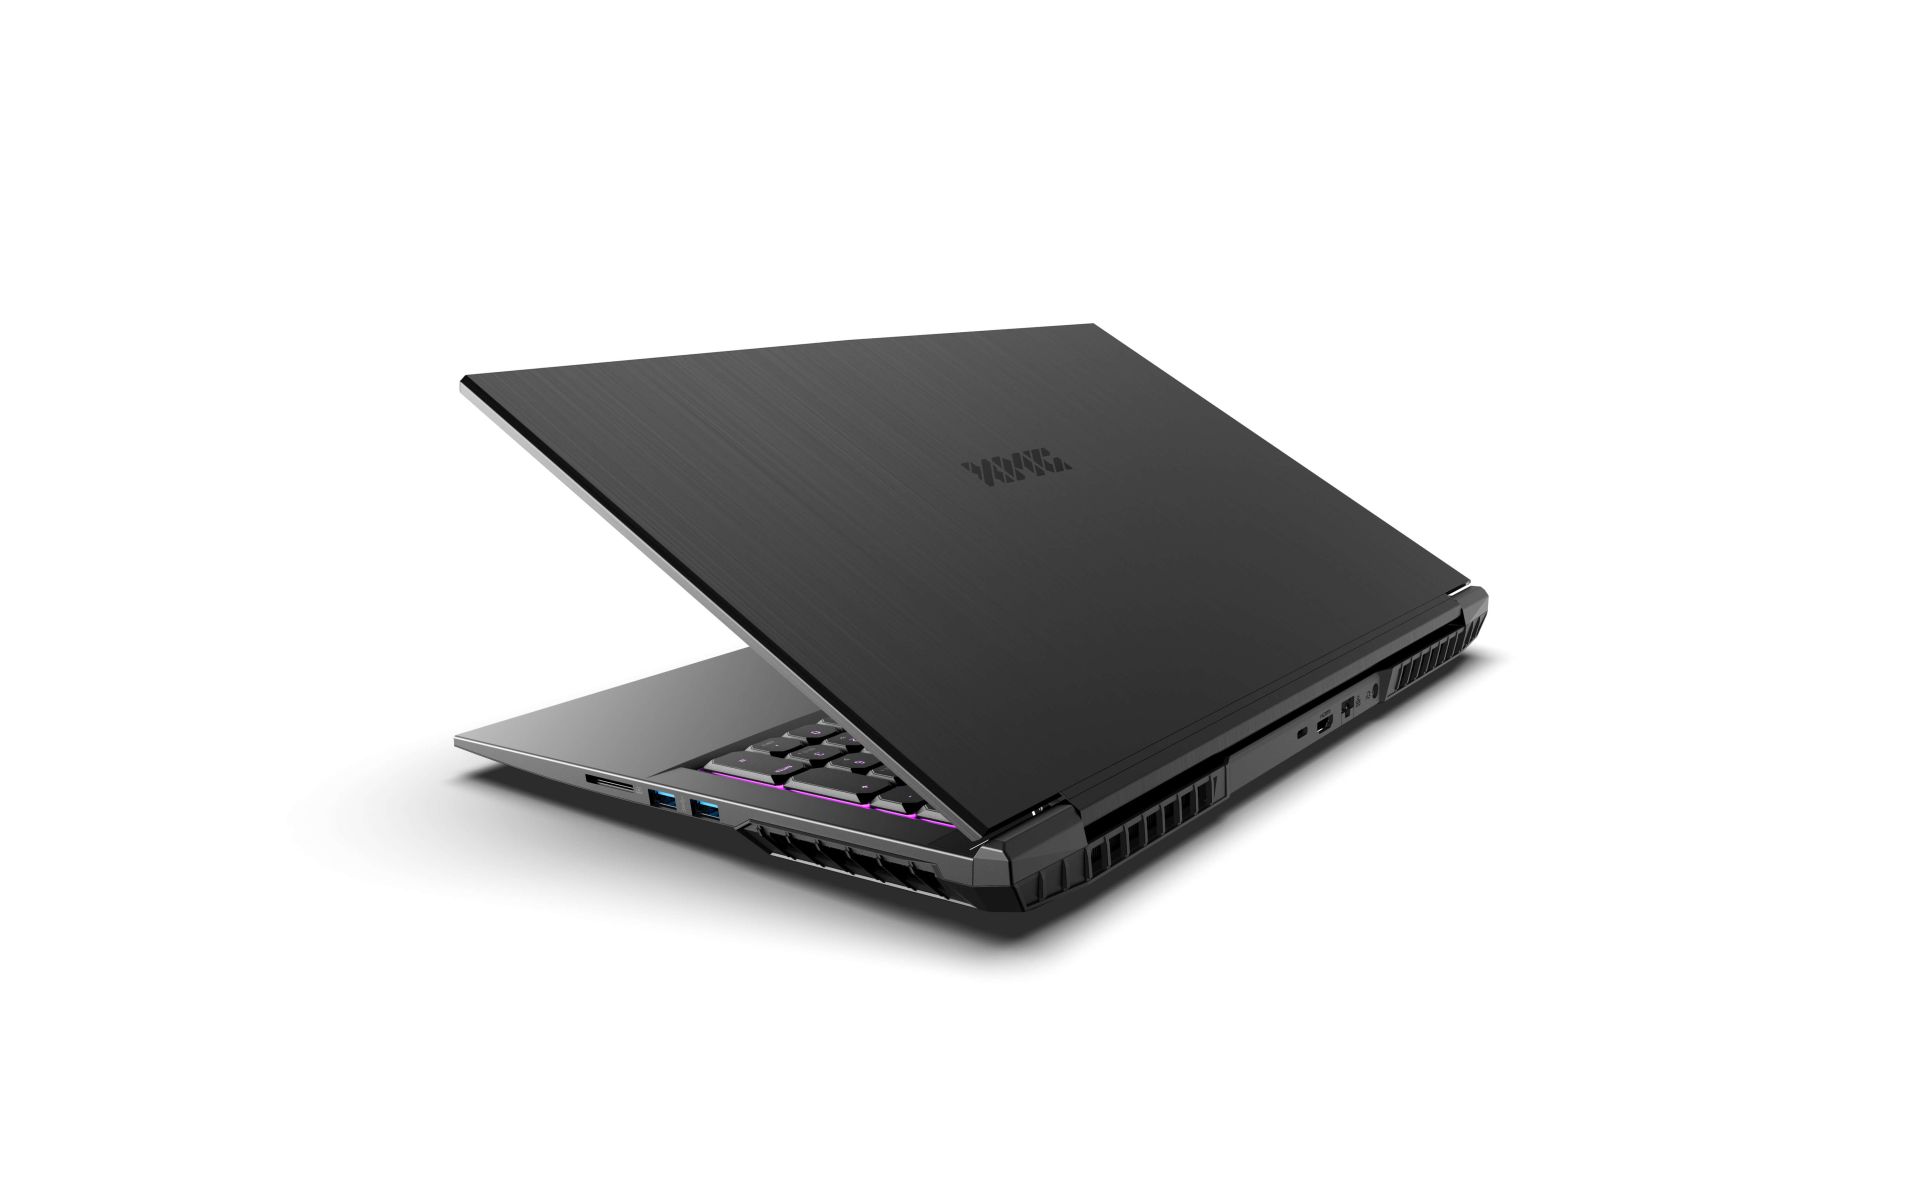
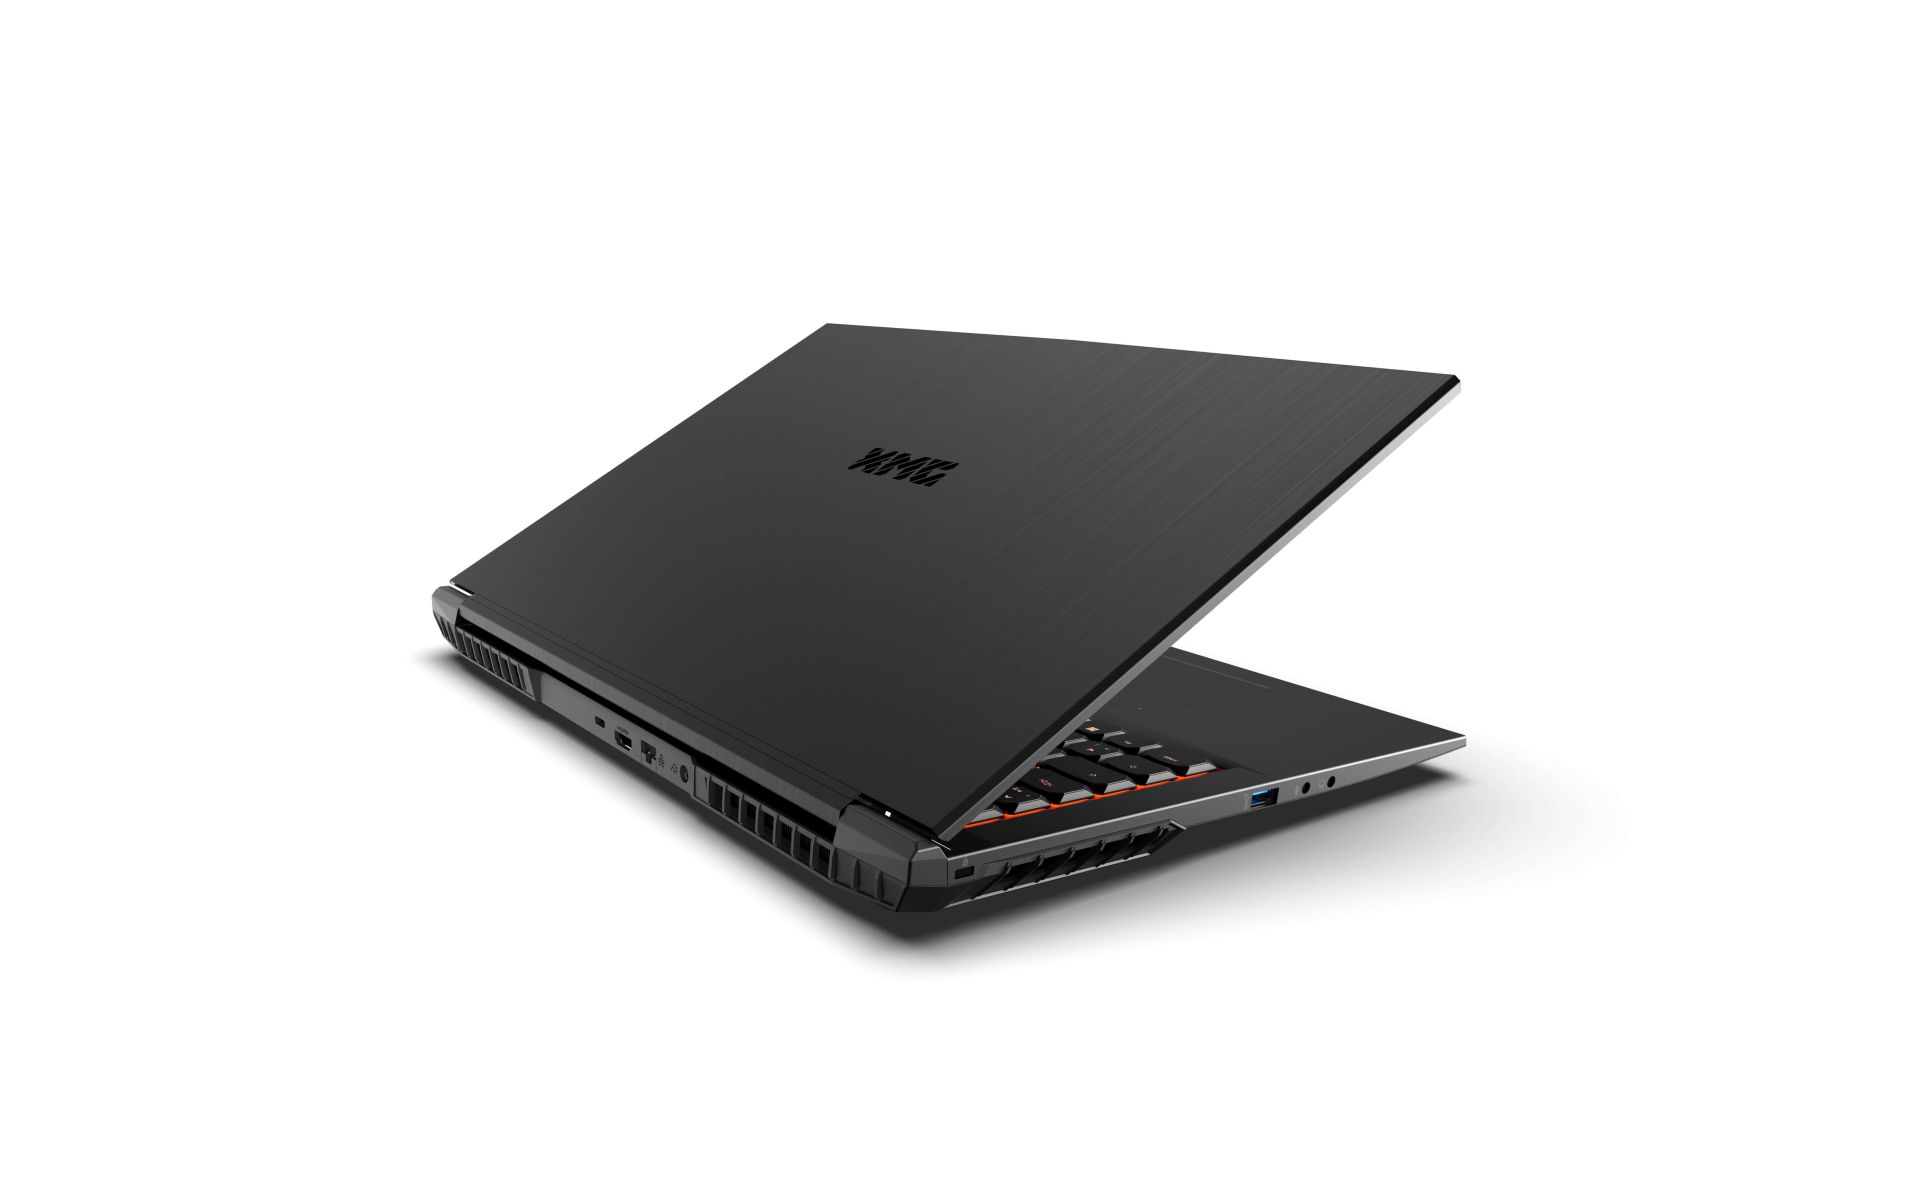
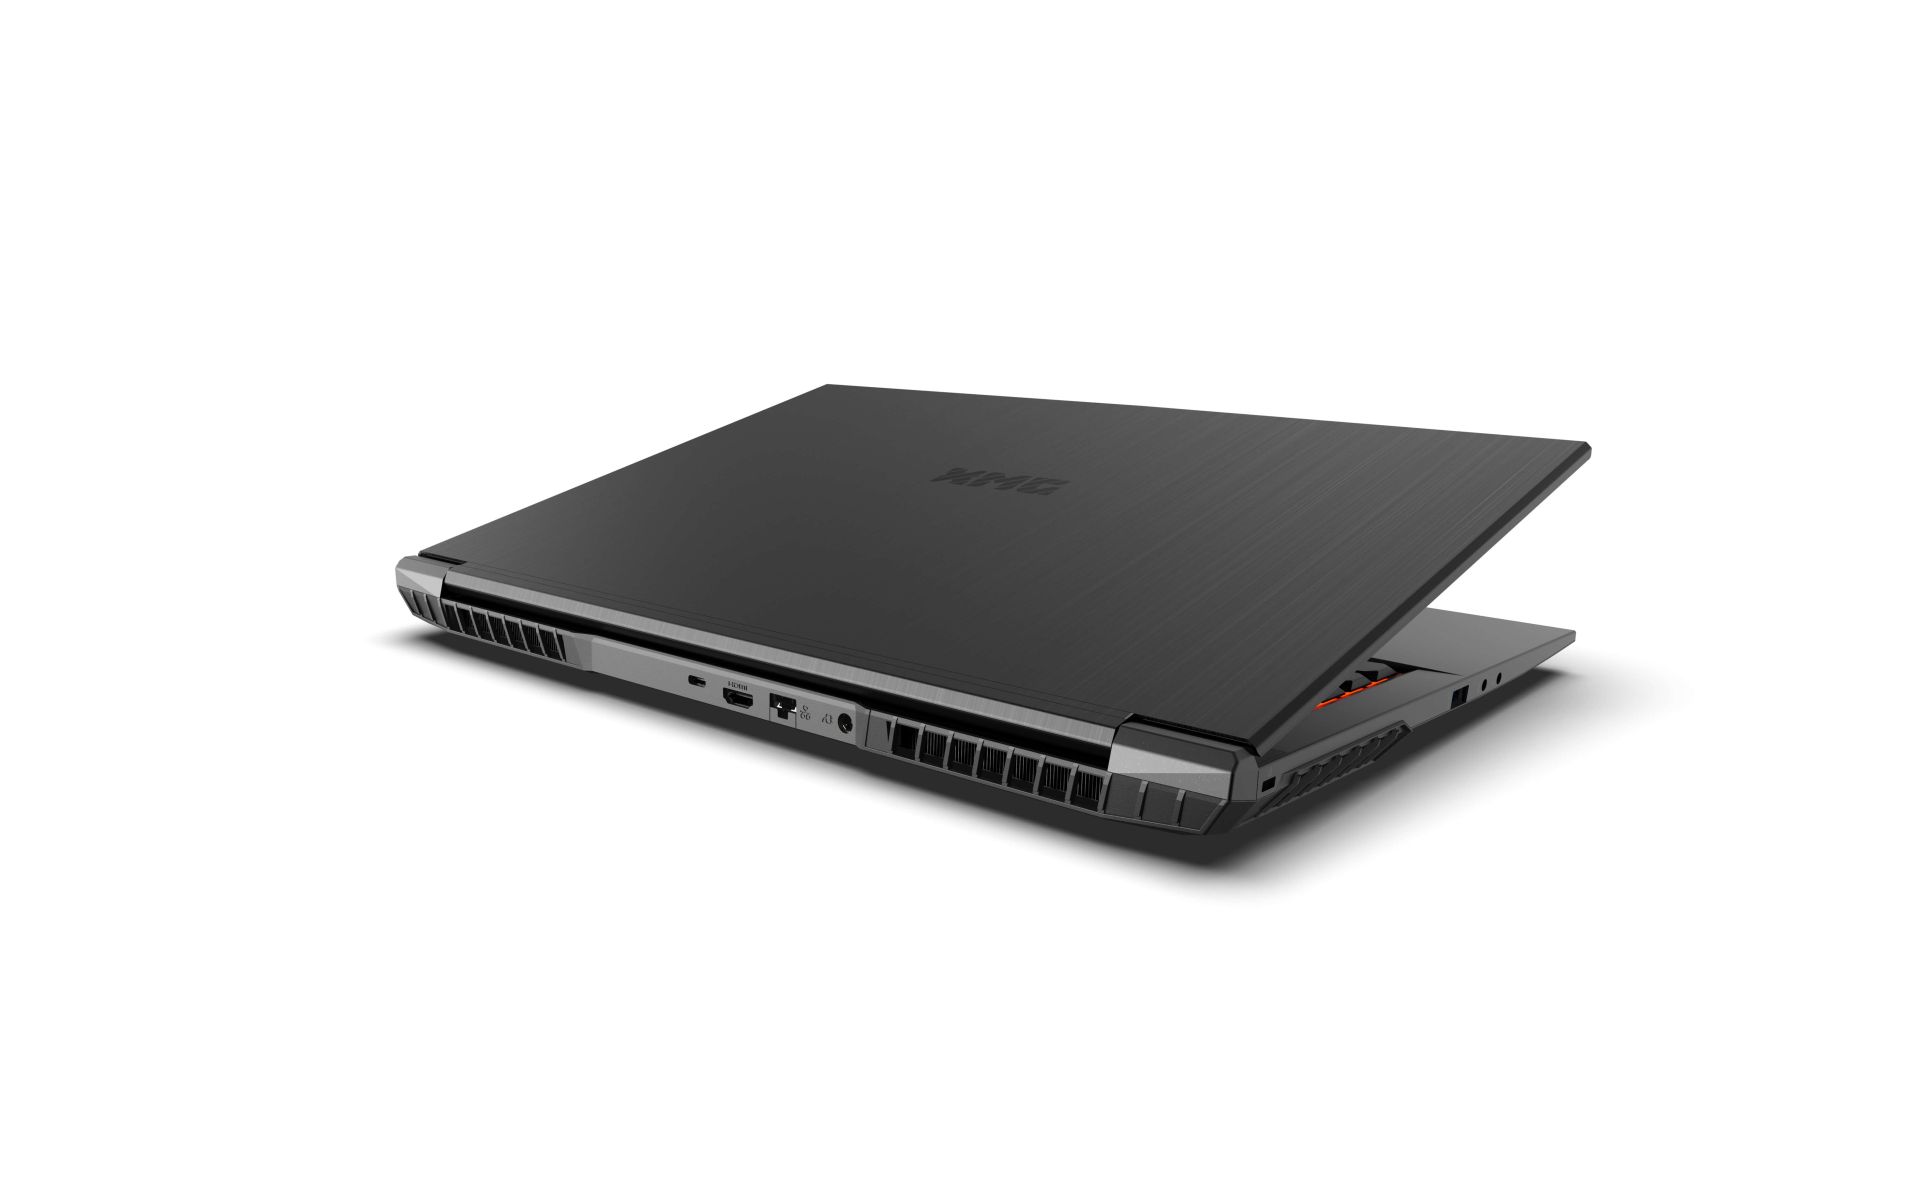
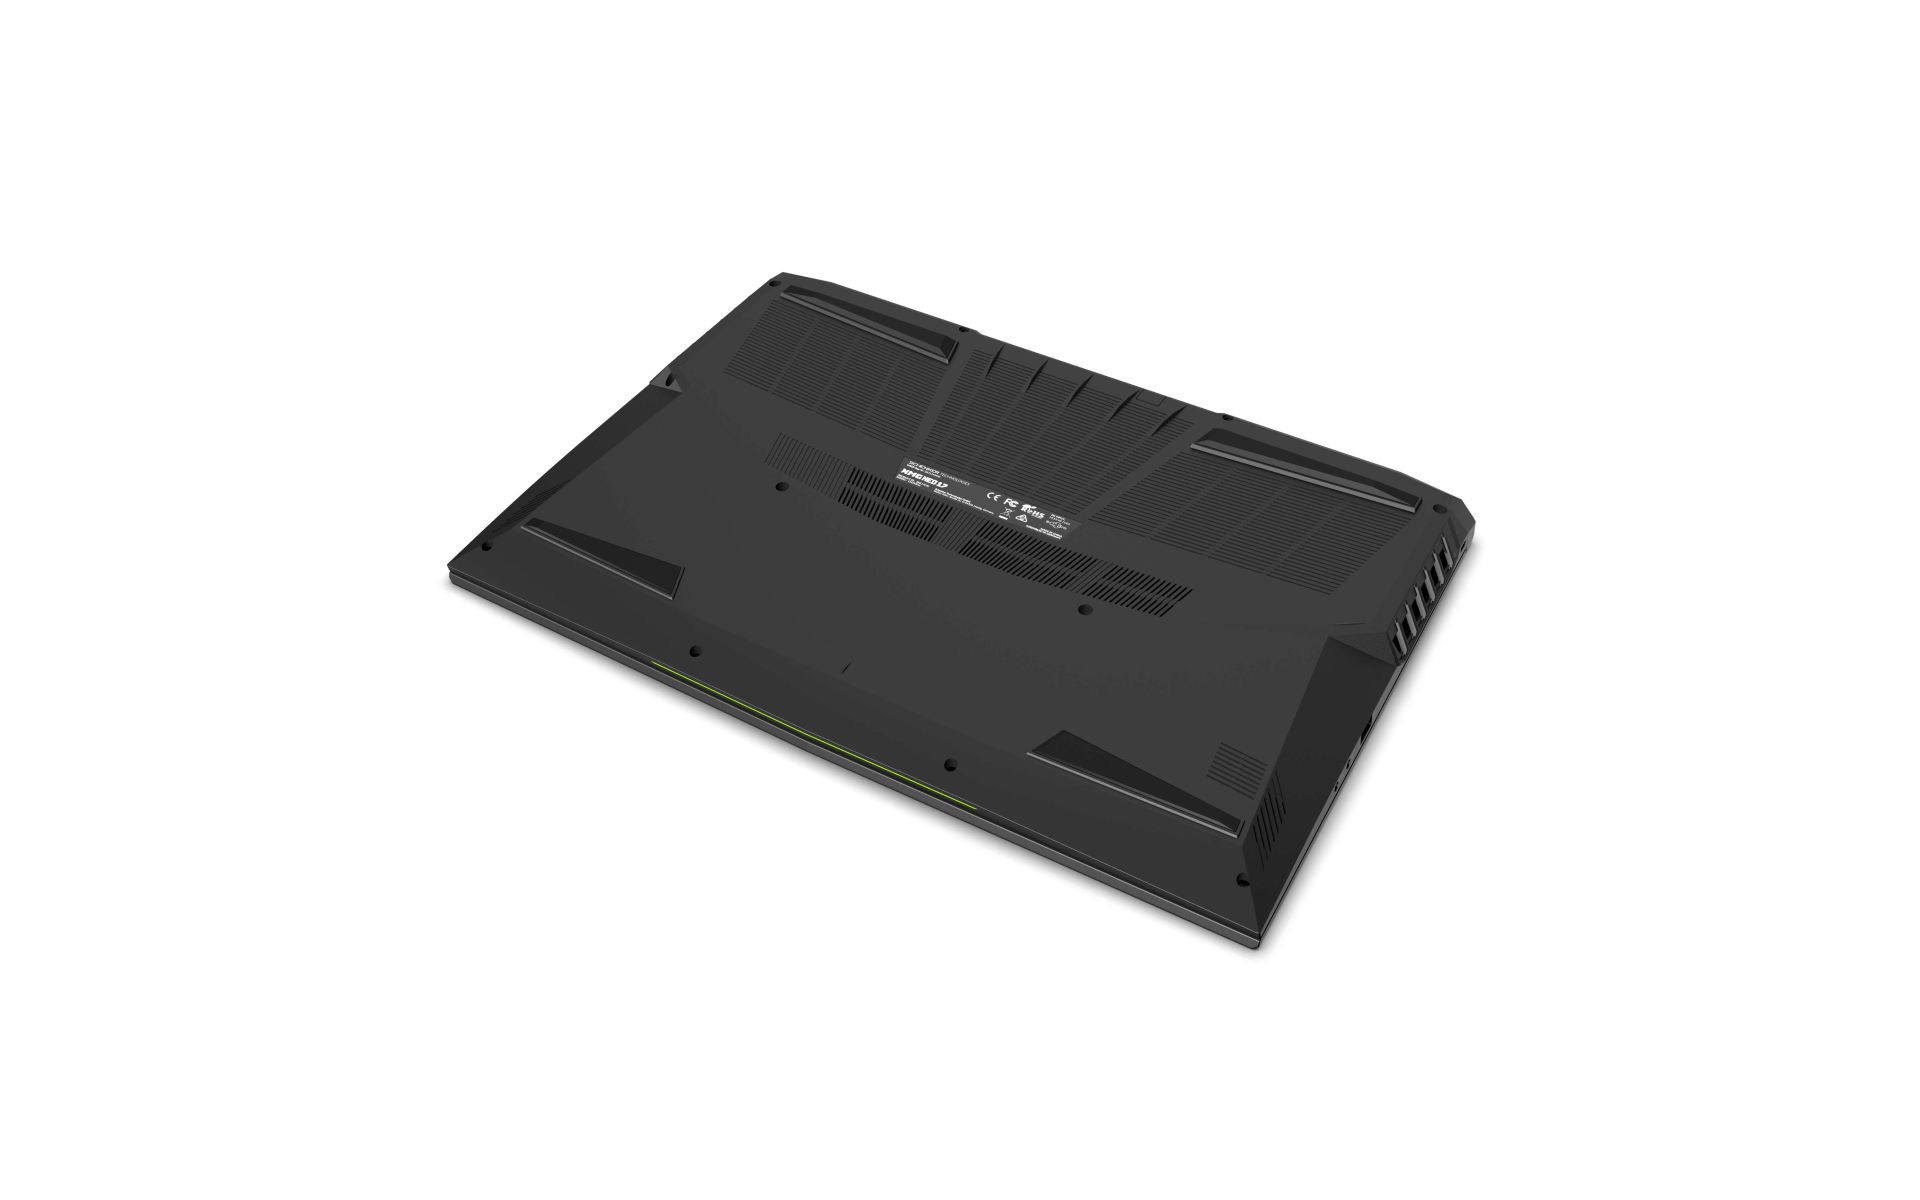
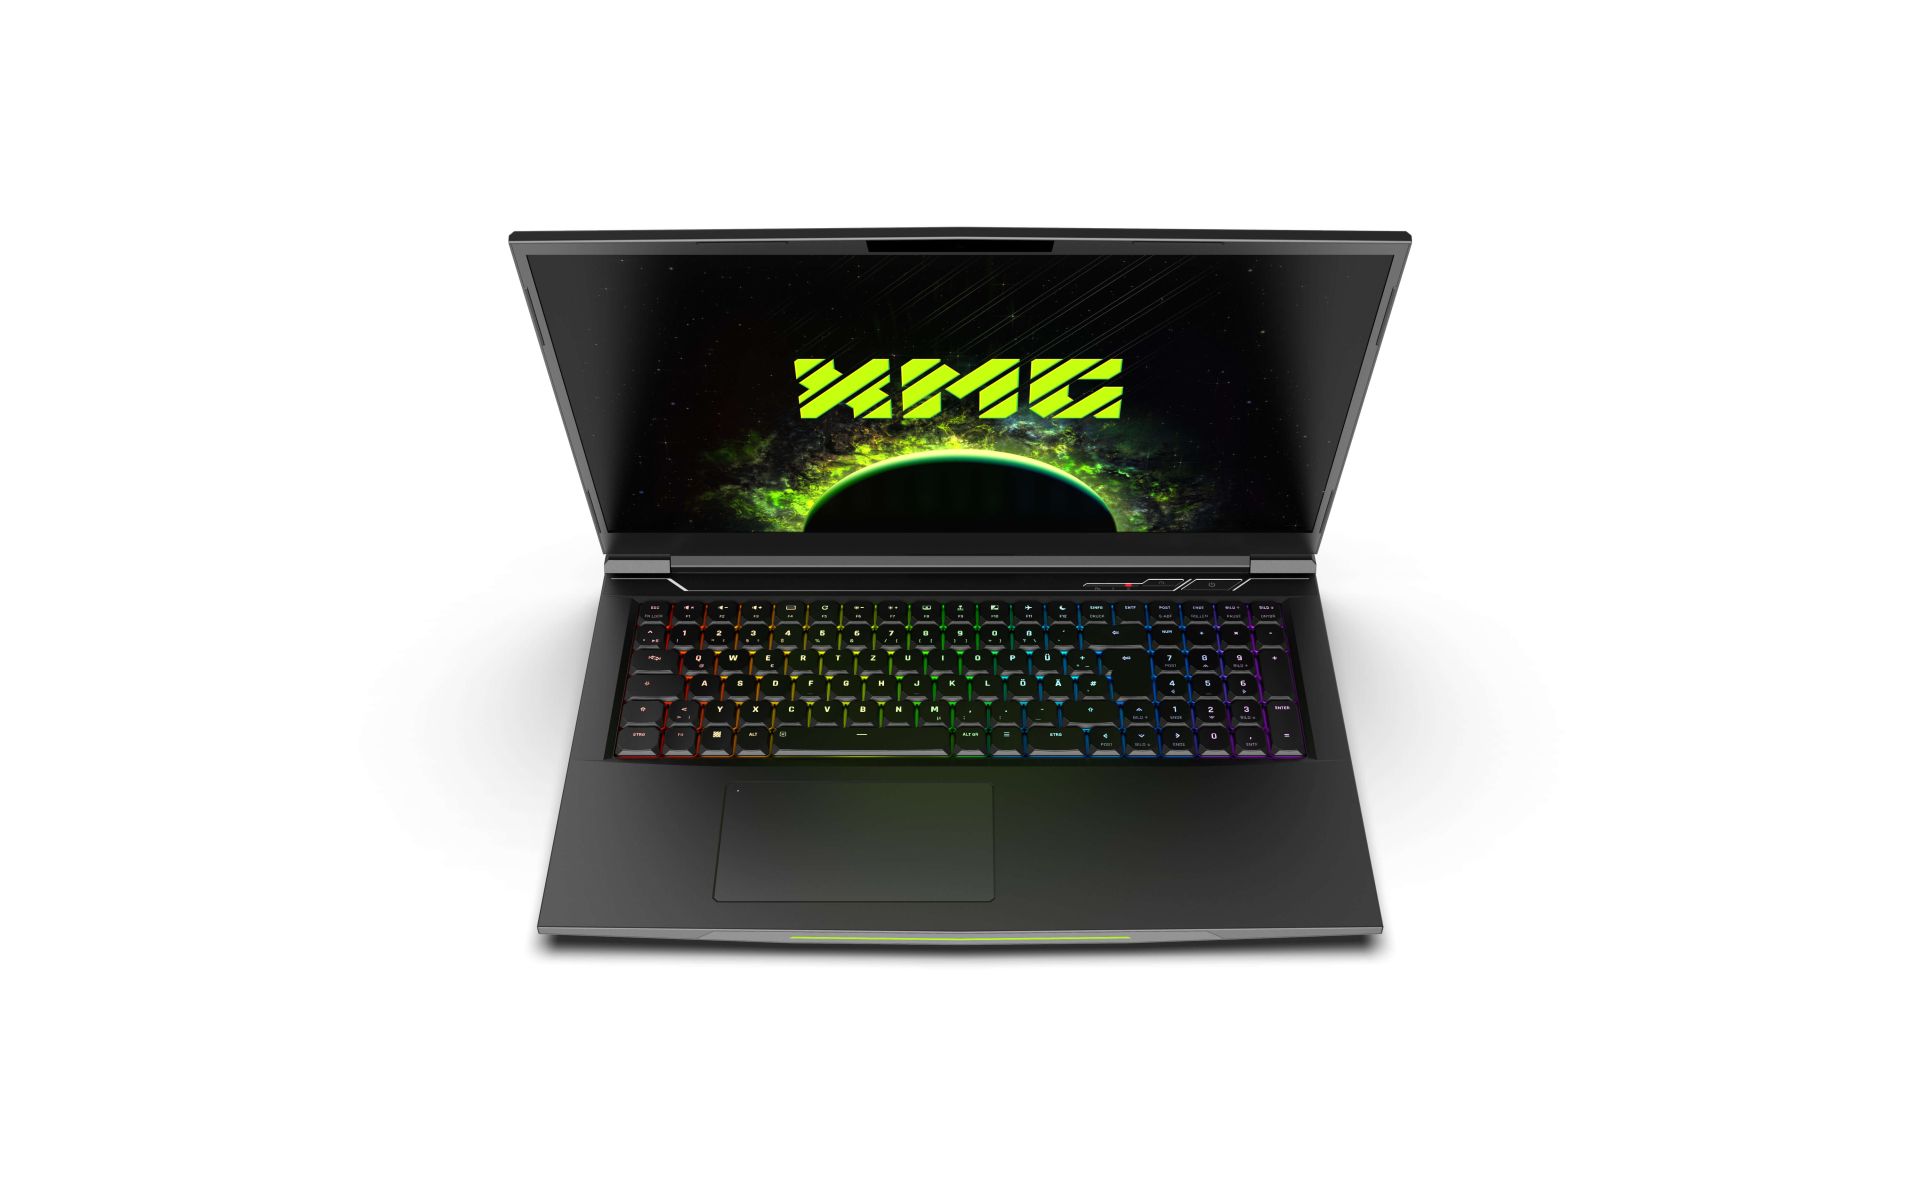
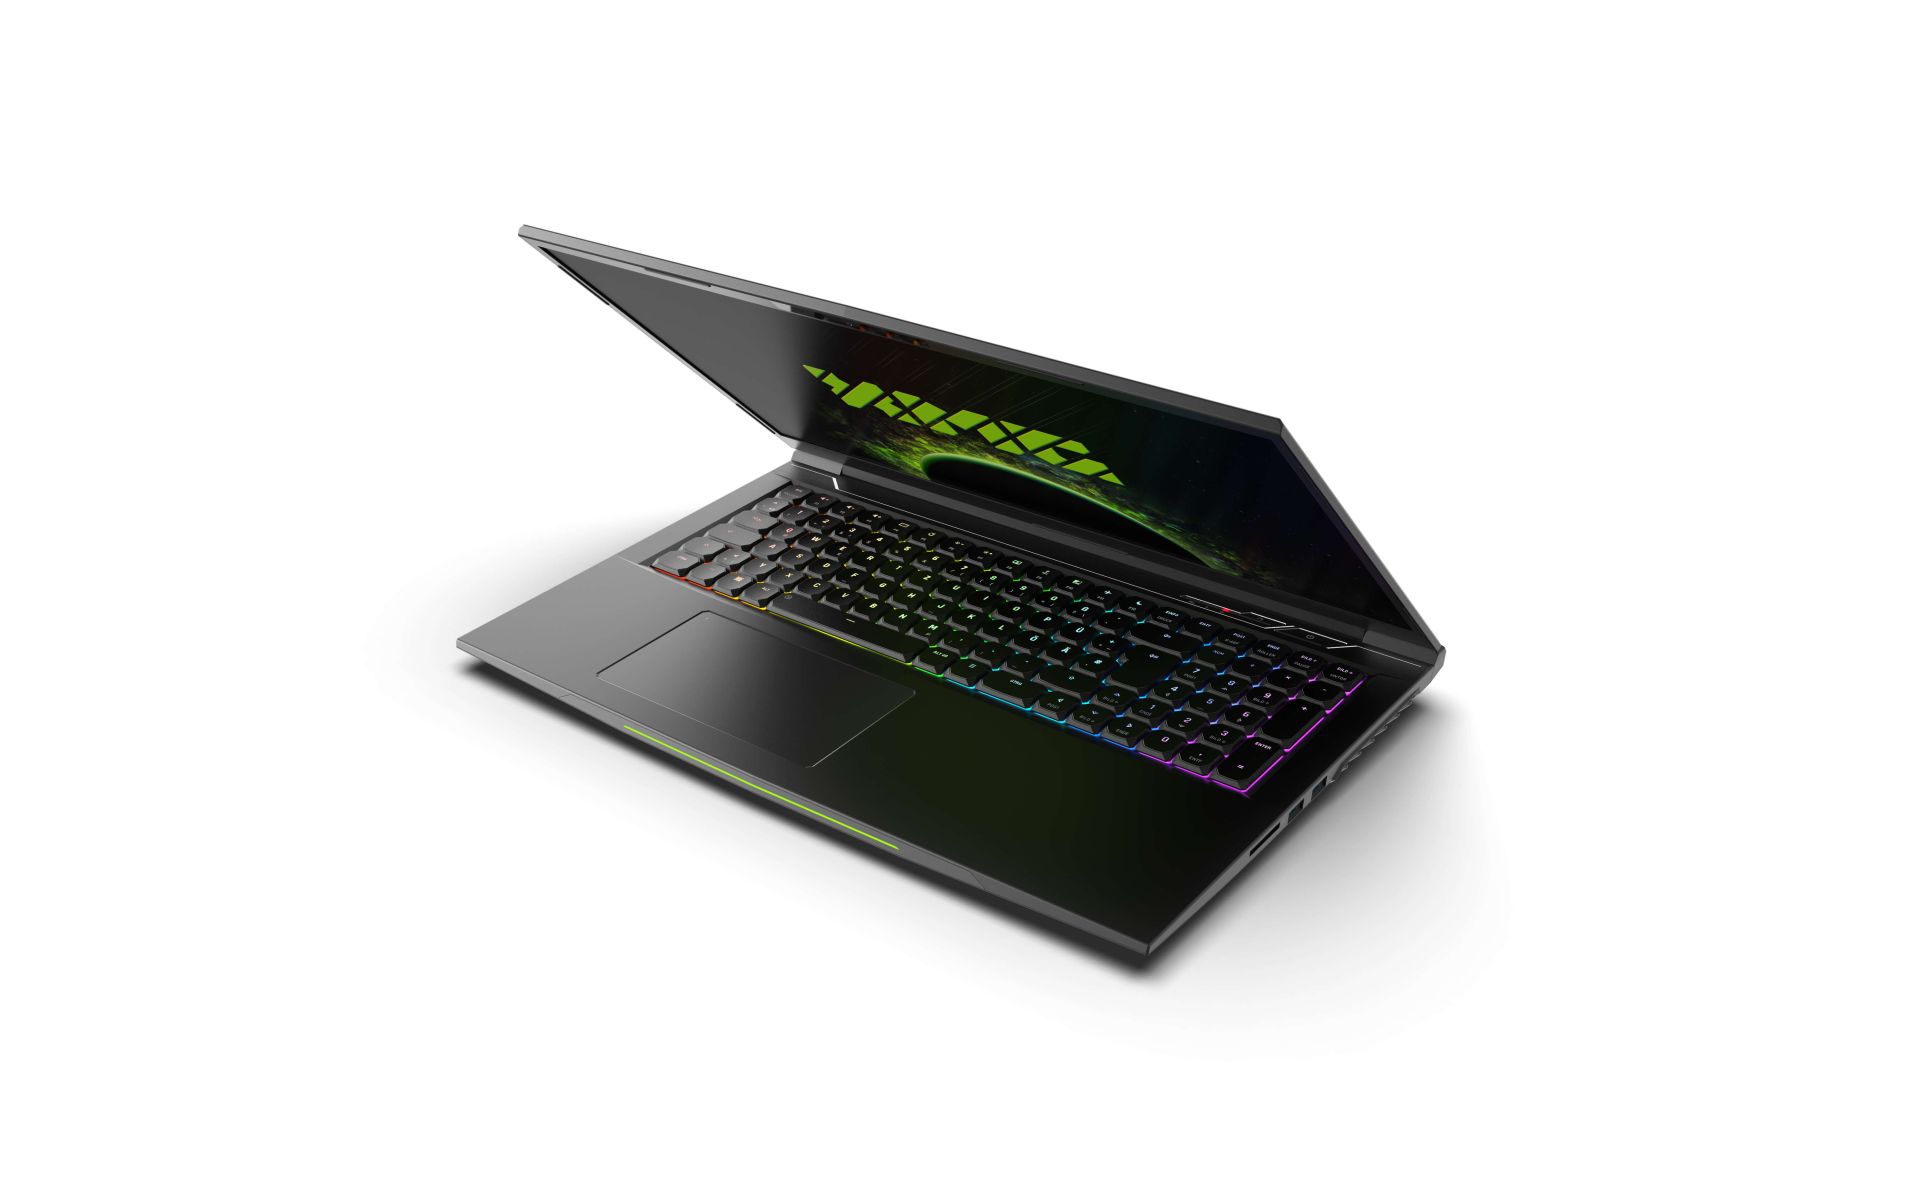
Caja - Estable y relativamente delgada
(Fuente de la imagen: Schenker)
Equipo - Cura de broma con actualización de velocidad
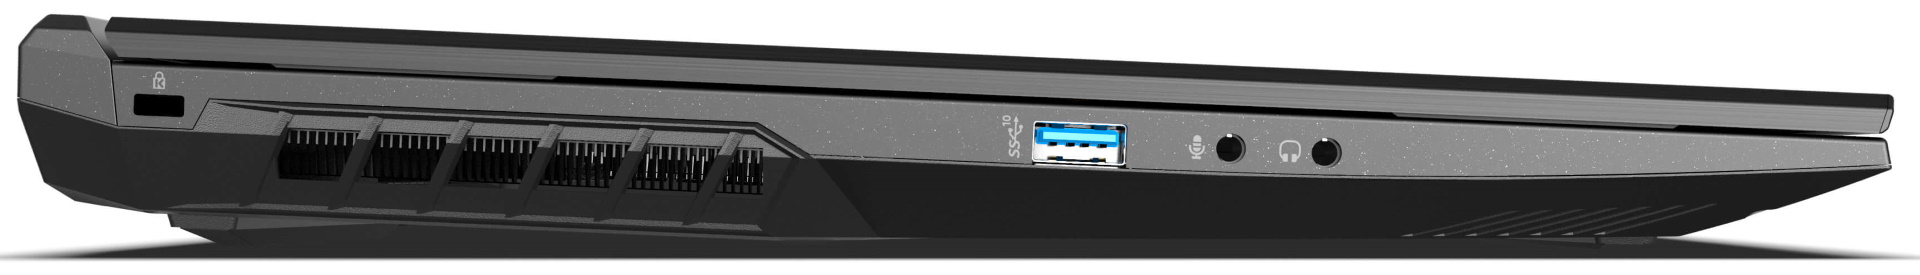
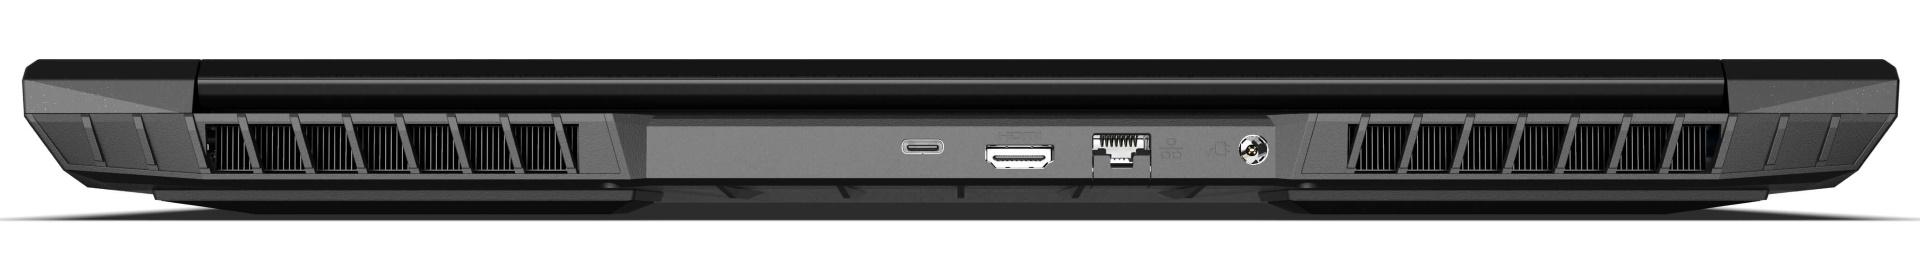
Por supuesto, algunas cosas ya han cambiado aquí desde 2019, pero no necesariamente sólo para mejor. Por ejemplo, los dos puertos miniDP se han caído, lo que no se compensa con nada. Por lo demás, algunos puertos cambian de posición: Por ejemplo, el puerto LAN ahora se mueve a la parte trasera. Los dos puertos USB-A de la derecha sólo soportan 3.0, mientras que el puerto USB-A de la izquierda soporta 3.2 Gen2. El puerto USB-C 4.0 de la parte trasera soporta Thunderbolt 4, incluyendo DisplayPort 1.4 y compatibilidad con G-SYNC, pero sin Power Delivery; el gamer no puede cargar por USB-C
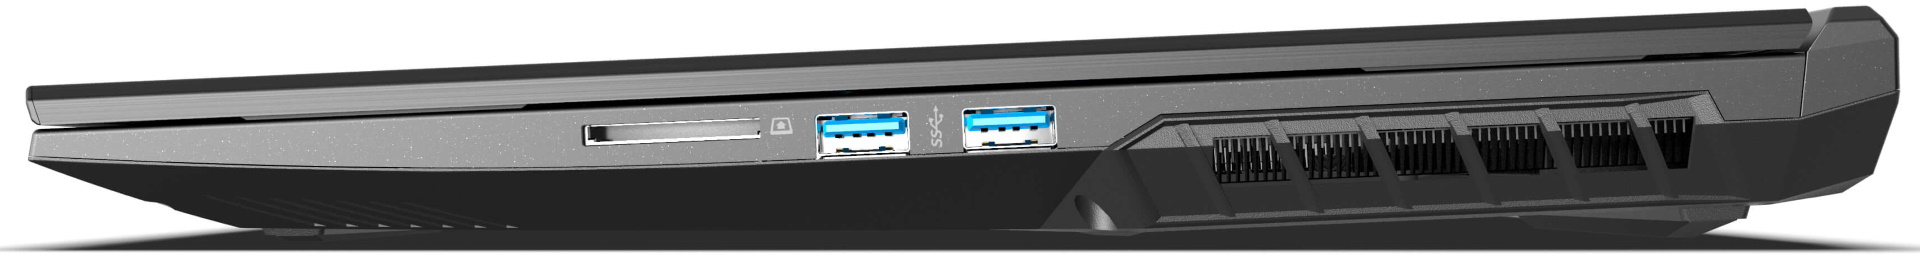
Lector de tarjetas SD
El lector SD acepta tarjetas SD de tamaño estándar, que no encajan en su sitio y sobresalen hasta la mitad. La prueba de velocidad con nuestra tarjeta de memoria de referencia AV PRO microSD 128 GB V60 da como resultado tasas medias. Los lectores del Zephyrus y del Aorus son significativamente más rápidos, mientras que el Medion tiene tasas similares. En general, las tasas están claramente por debajo de la media para el sector de los juegos, especialmente teniendo en cuenta el precio
| SD Card Reader | |
| average JPG Copy Test (av. of 3 runs) | |
| Aorus 17G YD (AV PRO microSD 128 GB V60) | |
| Asus ROG Zephyrus S17 GX703HSD | |
| Media de la clase Gaming (20.9 - 210, n=55, últimos 2 años) | |
| Schenker XMG Neo 17 (Early 2021, RTX 3070, 5800H) (Toshiba Exceria Pro SDXC 64 GB UHS-II) | |
| Medion Erazer Beast X25 (AV PRO microSD 128 GB V60) | |
| Schenker XMG NEO 17 GM7TG8S | |
| maximum AS SSD Seq Read Test (1GB) | |
| Asus ROG Zephyrus S17 GX703HSD | |
| Aorus 17G YD (AV PRO microSD 128 GB V60) | |
| Media de la clase Gaming (25.5 - 261, n=52, últimos 2 años) | |
| Schenker XMG NEO 17 GM7TG8S | |
| Schenker XMG Neo 17 (Early 2021, RTX 3070, 5800H) (Toshiba Exceria Pro SDXC 64 GB UHS-II) | |
| Medion Erazer Beast X25 (AV PRO microSD 128 GB V60) | |
Comunicación
El puerto LAN soporta 2,5 Gbit/s. En cuanto a las tasas de transferencia WLAN, el NEO tiene asegurado un lugar en el medio campo inferior, pero la mayoría de los competidores son ligeramente más rápidos. El rendimiento de transmisión, en particular, fluctúa mucho y tiene valores atípicos hacia la parte inferior
Cámara web
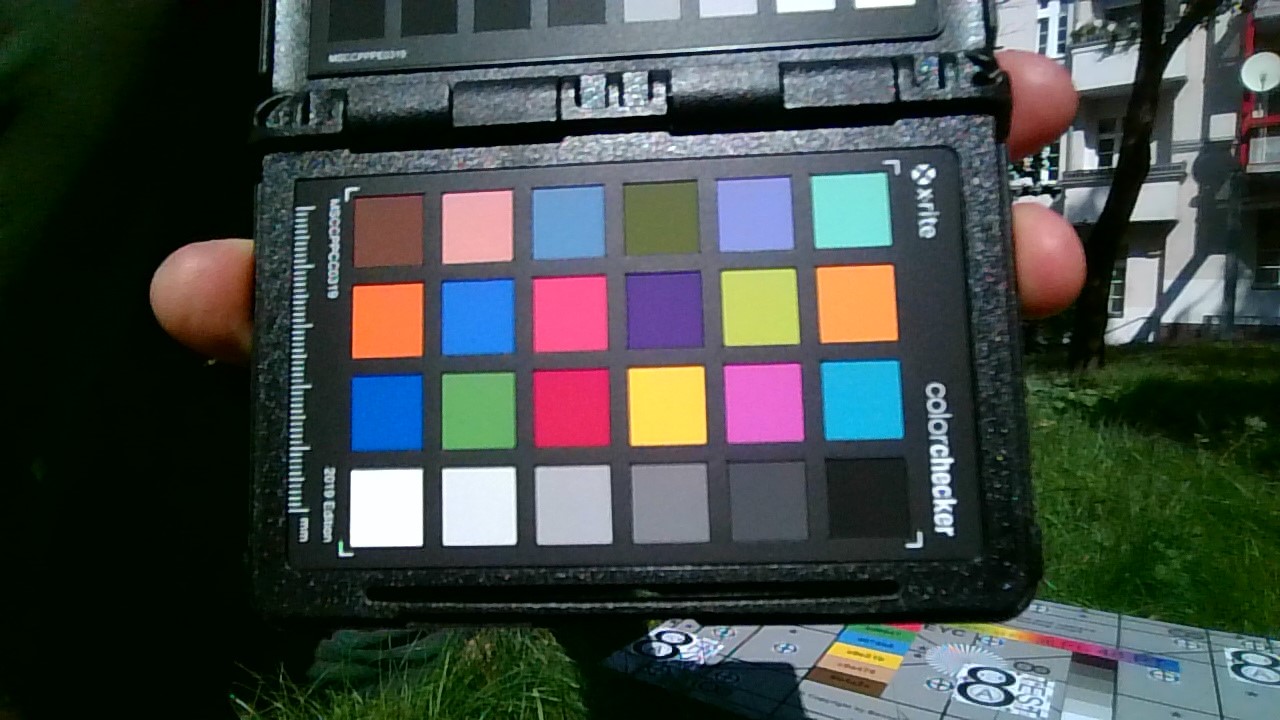
La webcam es pésima incluso para las cámaras estándar de 720p. Aunque las desviaciones de color son sorprendentemente bajas, las imágenes son demasiado oscuras, borrosas y deslavadas incluso a la luz del sol, por lo que la webcam sólo es utilizable en caso de emergencia. Si no quieres quedar como un gótico en tus videoconferencias, deberías confiar en una solución externa e ignorar la cámara interna


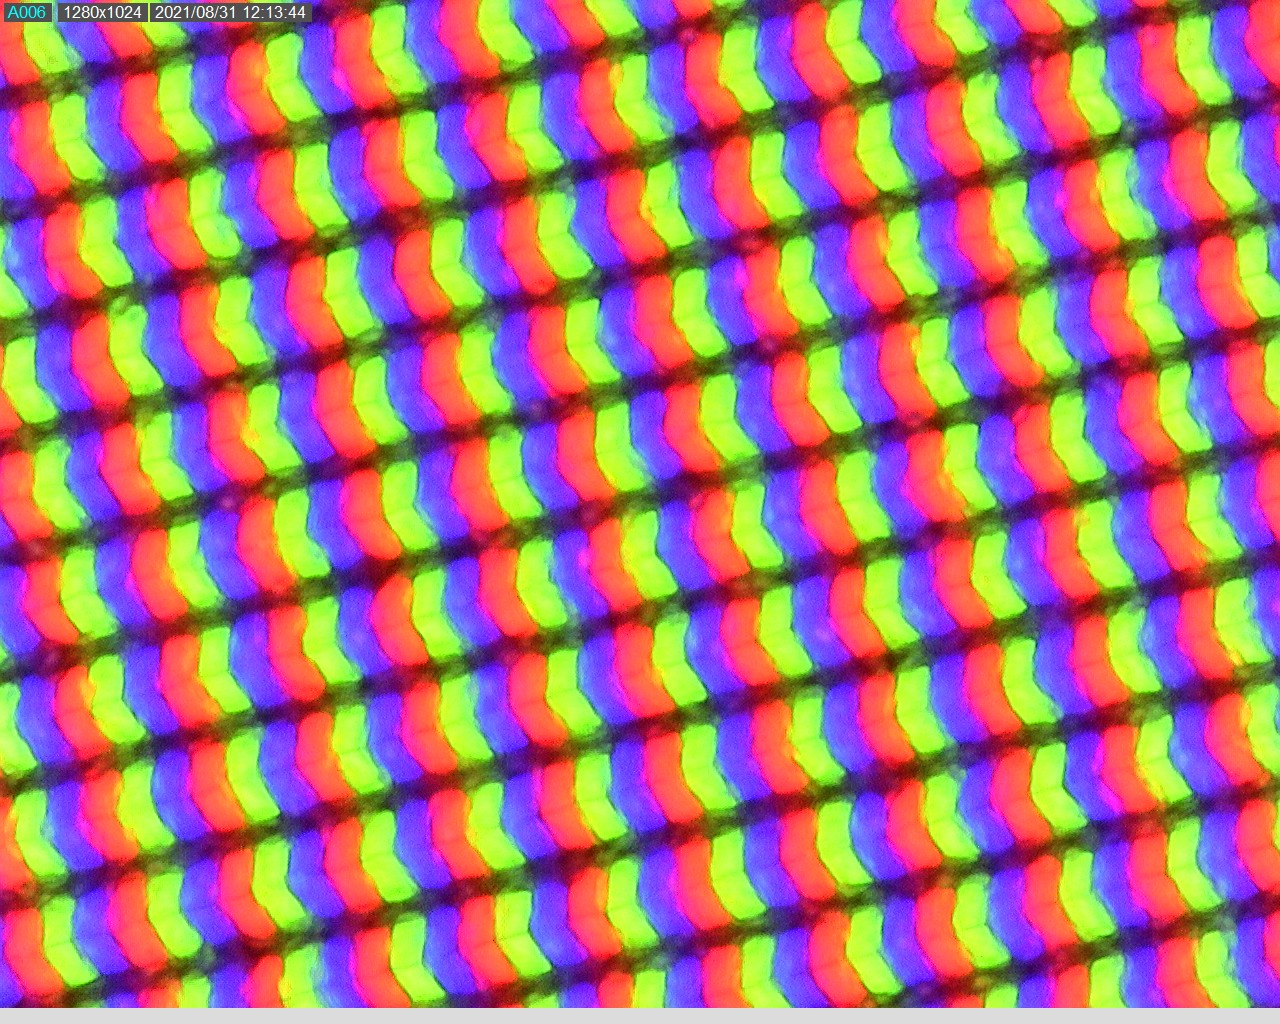
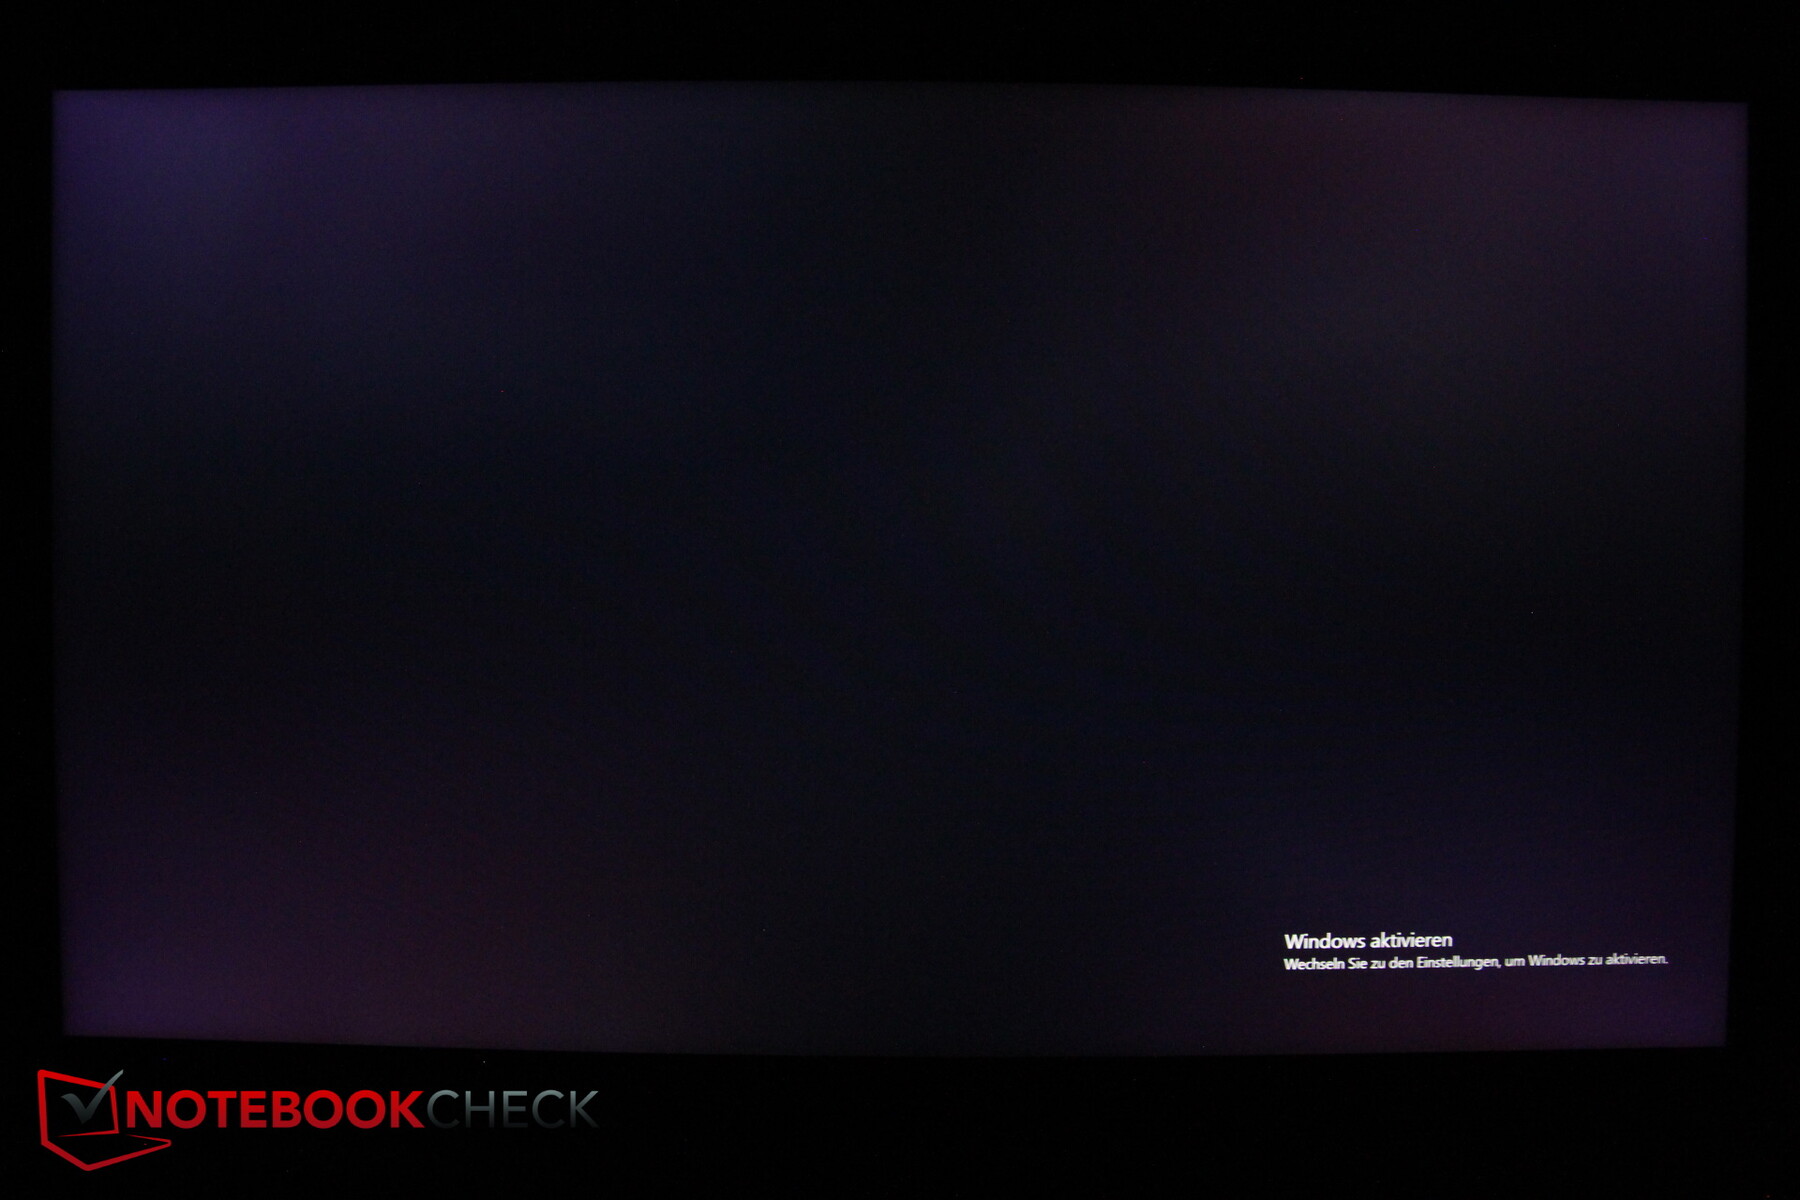
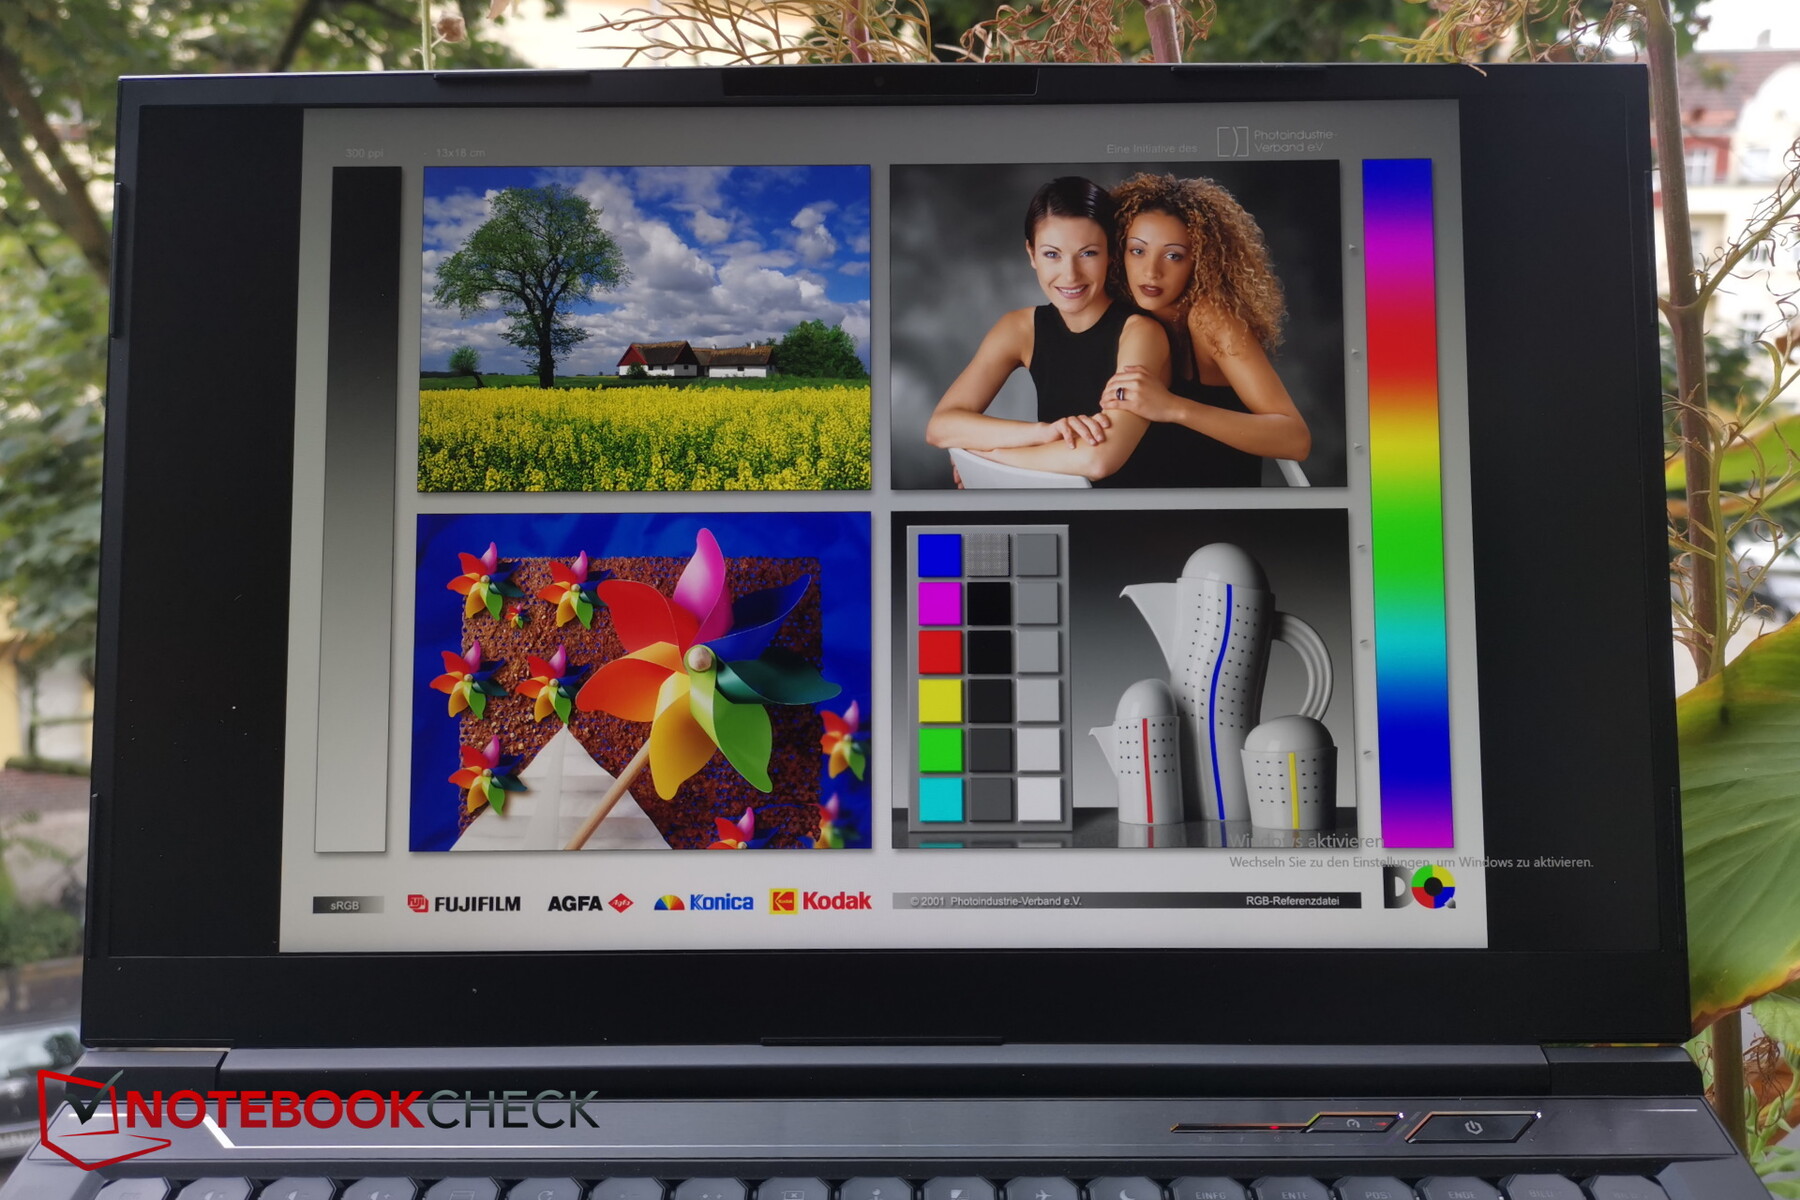
Pantalla - Panel WQHD bien calibrado
Schenker confía en una pantalla IPS mate de 17,3 pulgadas de BOE con una resolución 16:9 de 2.560 x 1.440 píxeles y una tasa de refresco de 165 Hz. Así, la pantalla es la misma que en el NEO 17 con CPU AMD y RTX 3060
El brillo medio de 366 nits está bien, y la iluminación del 82% es aceptable
| |||||||||||||||||||||||||
iluminación: 82 %
Brillo con batería: 397 cd/m²
Contraste: 880:1 (Negro: 0.45 cd/m²)
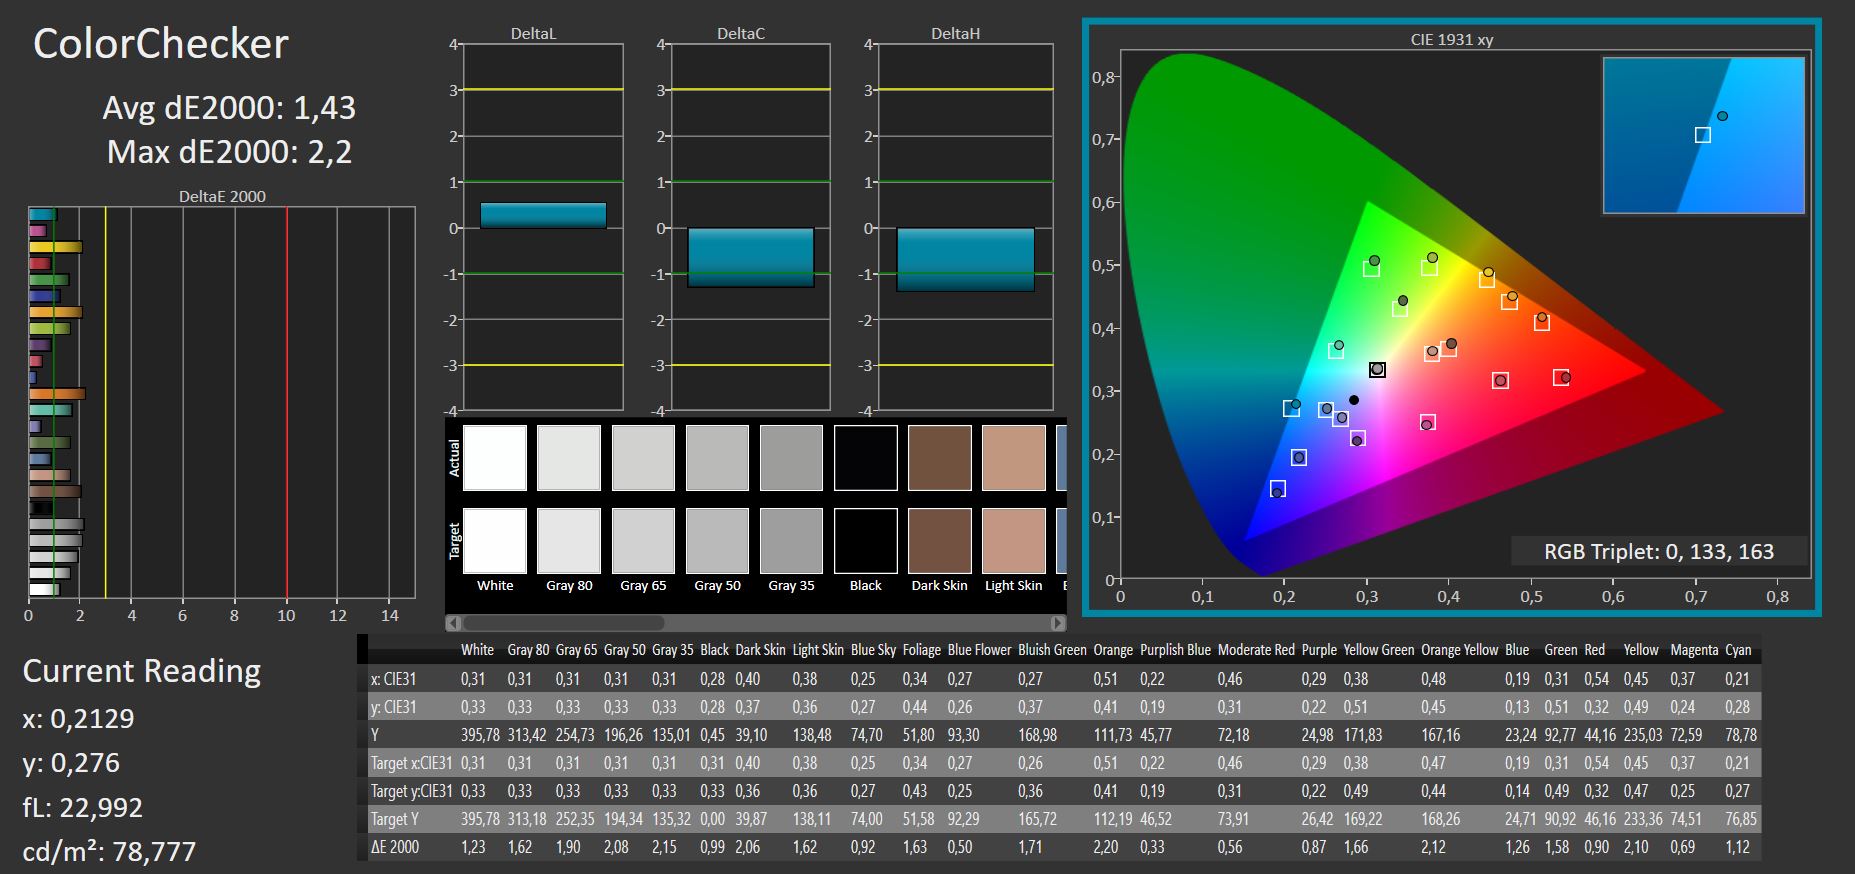
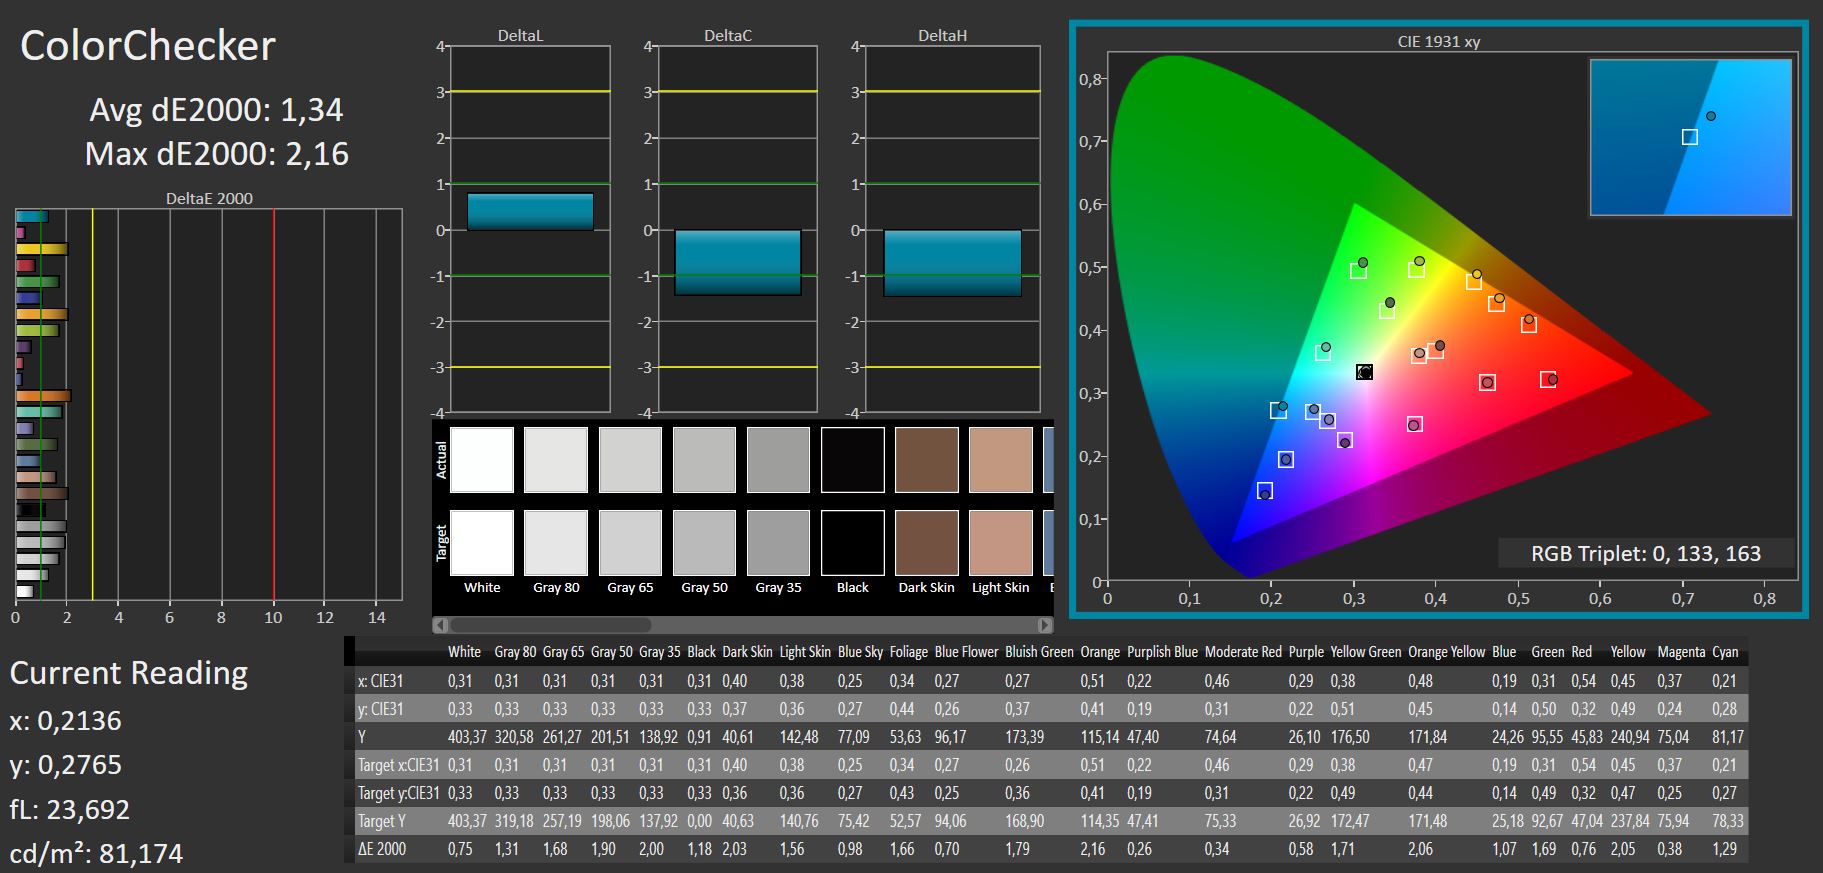
ΔE ColorChecker Calman: 1.43 | ∀{0.5-29.43 Ø4.73}
calibrated: 1.34
ΔE Greyscale Calman: 1.8 | ∀{0.09-98 Ø4.97}
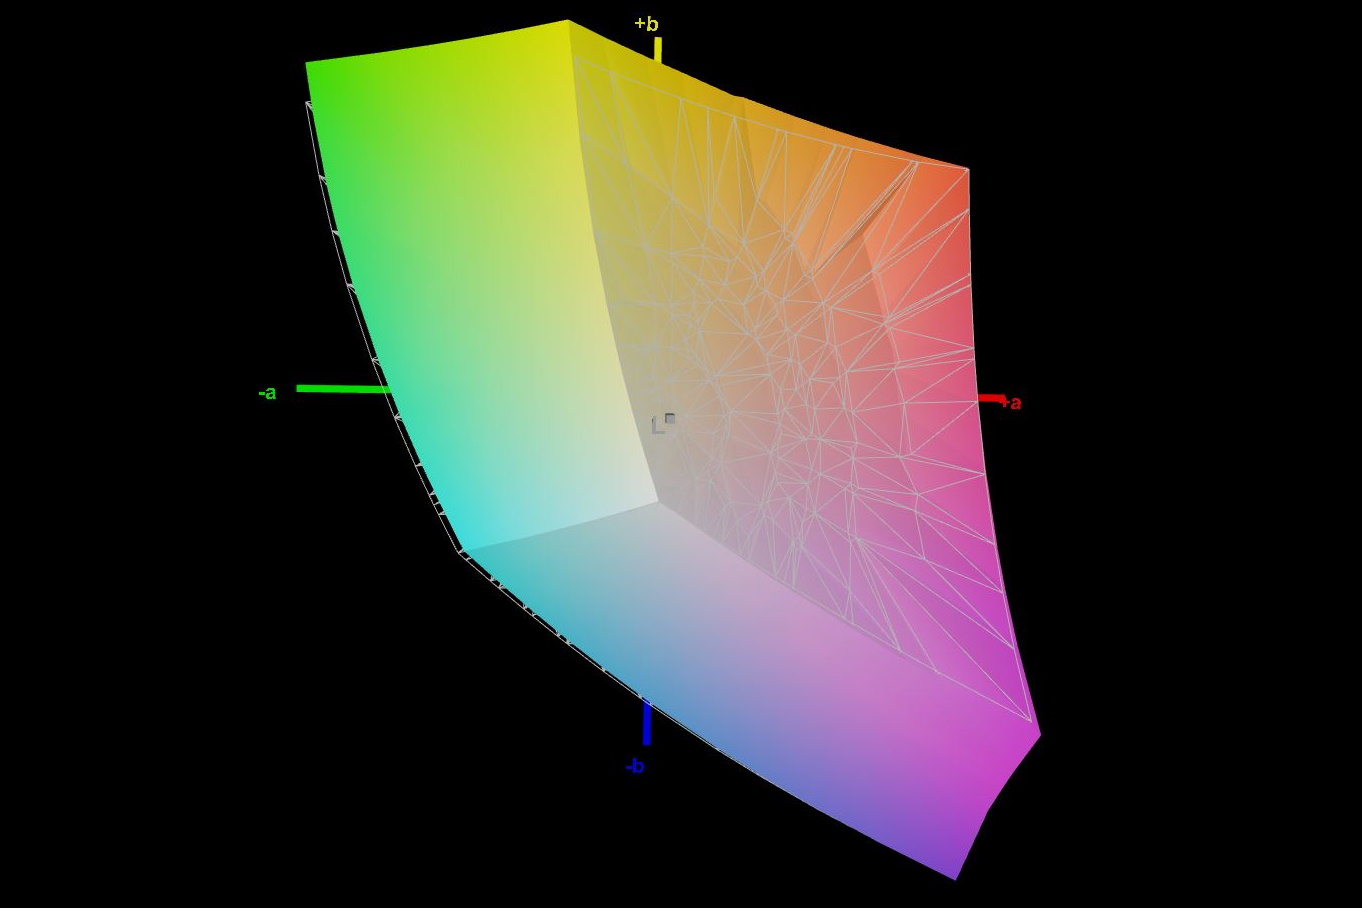
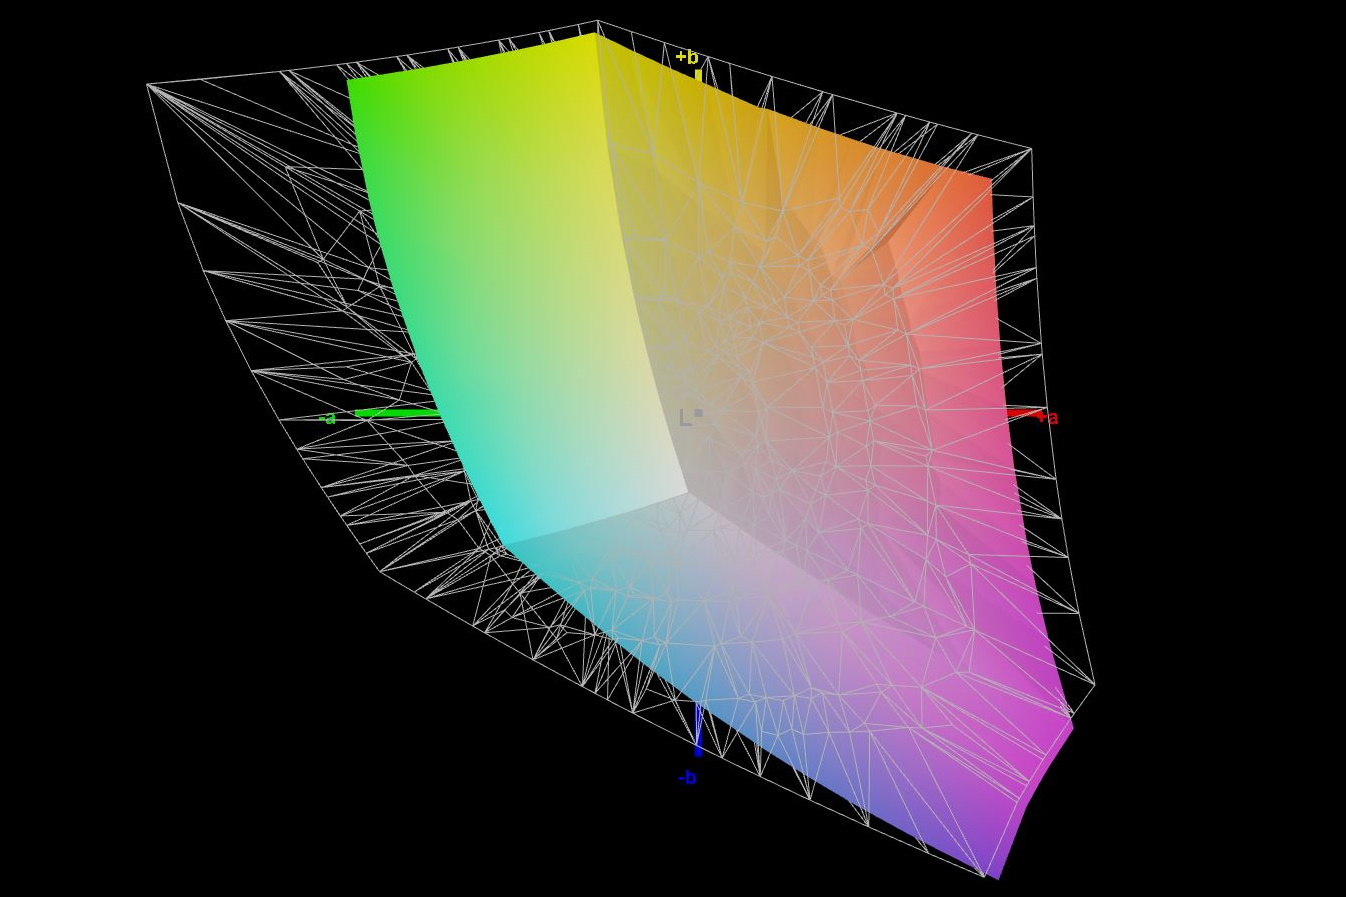
68.6% AdobeRGB 1998 (Argyll 3D)
96.3% sRGB (Argyll 3D)
67.1% Display P3 (Argyll 3D)
Gamma: 2.4
CCT: 6489 K
| Schenker XMG NEO 17 GM7TG8S BOE0977 (NE173QHM-NY2), IPS, 2560x1440, 17.3" | Schenker XMG Neo 17 (Early 2021, RTX 3070, 5800H) BOE NE173QHM-NY2 (BOE0977), IPS, 2560x1440, 17.3" | Aorus 17G YD Sharp LQ173M1JW04, IPS, 1920x1080, 17.3" | Medion Erazer Beast X25 BOE NE173FHM-NZ1 (BOE0884), IPS, 1920x1080, 17.3" | Asus ROG Zephyrus S17 GX703HSD BOE099D (BOE CQ NE173QHM-NY3), IPS, 2560x1440, 17.3" | Asus Strix Scar 17 G733QSA-XS99 AU Optronics B173HAN05.4, IPS, 1920x1080, 17.3" | |
|---|---|---|---|---|---|---|
| Display | 4% | 6% | 4% | 22% | 5% | |
| Display P3 Coverage (%) | 67.1 | 70.5 5% | 72.3 8% | 70.4 5% | 94.2 40% | 71 6% |
| sRGB Coverage (%) | 96.3 | 99.5 3% | 100 4% | 99.8 4% | 98.7 2% | 99.4 3% |
| AdobeRGB 1998 Coverage (%) | 68.6 | 71.8 5% | 73.7 7% | 71.6 4% | 84.4 23% | 72.2 5% |
| Response Times | -13% | 3% | 38% | 39% | 17% | |
| Response Time Grey 50% / Grey 80% * (ms) | 15.2 | 16.8 ? -11% | 13.6 ? 11% | 9.2 ? 39% | 4.8 68% | 6.6 ? 57% |
| Response Time Black / White * (ms) | 8.8 | 10 ? -14% | 9.2 ? -5% | 5.6 ? 36% | 8 9% | 10.8 ? -23% |
| PWM Frequency (Hz) | ||||||
| Screen | -22% | -35% | -26% | -40% | -9% | |
| Brightness middle (cd/m²) | 396 | 410 4% | 286 -28% | 329 -17% | 322 -19% | 303.8 -23% |
| Brightness (cd/m²) | 366 | 381 4% | 282 -23% | 315 -14% | 288 -21% | 292 -20% |
| Brightness Distribution (%) | 82 | 88 7% | 73 -11% | 88 7% | 72 -12% | 85 4% |
| Black Level * (cd/m²) | 0.45 | 0.37 18% | 0.24 47% | 0.33 27% | 0.3 33% | 0.23 49% |
| Contrast (:1) | 880 | 1108 26% | 1192 35% | 997 13% | 1073 22% | 1321 50% |
| Colorchecker dE 2000 * | 1.43 | 2.55 -78% | 2.79 -95% | 2.03 -42% | 3.05 -113% | 1.87 -31% |
| Colorchecker dE 2000 max. * | 2.2 | 4.33 -97% | 6.23 -183% | 5.5 -150% | 5.23 -138% | 3.26 -48% |
| Colorchecker dE 2000 calibrated * | 1.34 | 1.28 4% | 0.82 39% | 0.82 39% | 1.92 -43% | 1.45 -8% |
| Greyscale dE 2000 * | 1.8 | 3.4 -89% | 3.5 -94% | 3.5 -94% | 3.11 -73% | 2.7 -50% |
| Gamma | 2.4 92% | 2.275 97% | 2.358 93% | 2.223 99% | 2.13 103% | 2.26 97% |
| CCT | 6489 100% | 6637 98% | 6147 106% | 6526 100% | 6553 99% | 6436 101% |
| Color Space (Percent of AdobeRGB 1998) (%) | 72 | 74 | 84 | 65.6 | ||
| Color Space (Percent of sRGB) (%) | 95 | 96 | 99 | 99.4 | ||
| Media total (Programa/Opciones) | -10% /
-15% | -9% /
-21% | 5% /
-10% | 7% /
-16% | 4% /
-2% |
* ... más pequeño es mejor
El nivel de negro y el contraste son ligeramente peores que en el AMD NEO, pero a cambio la pantalla parece estar mejor calibrada. Las desviaciones de color son mínimas, un calibrado manual sólo aporta pequeñas mejoras
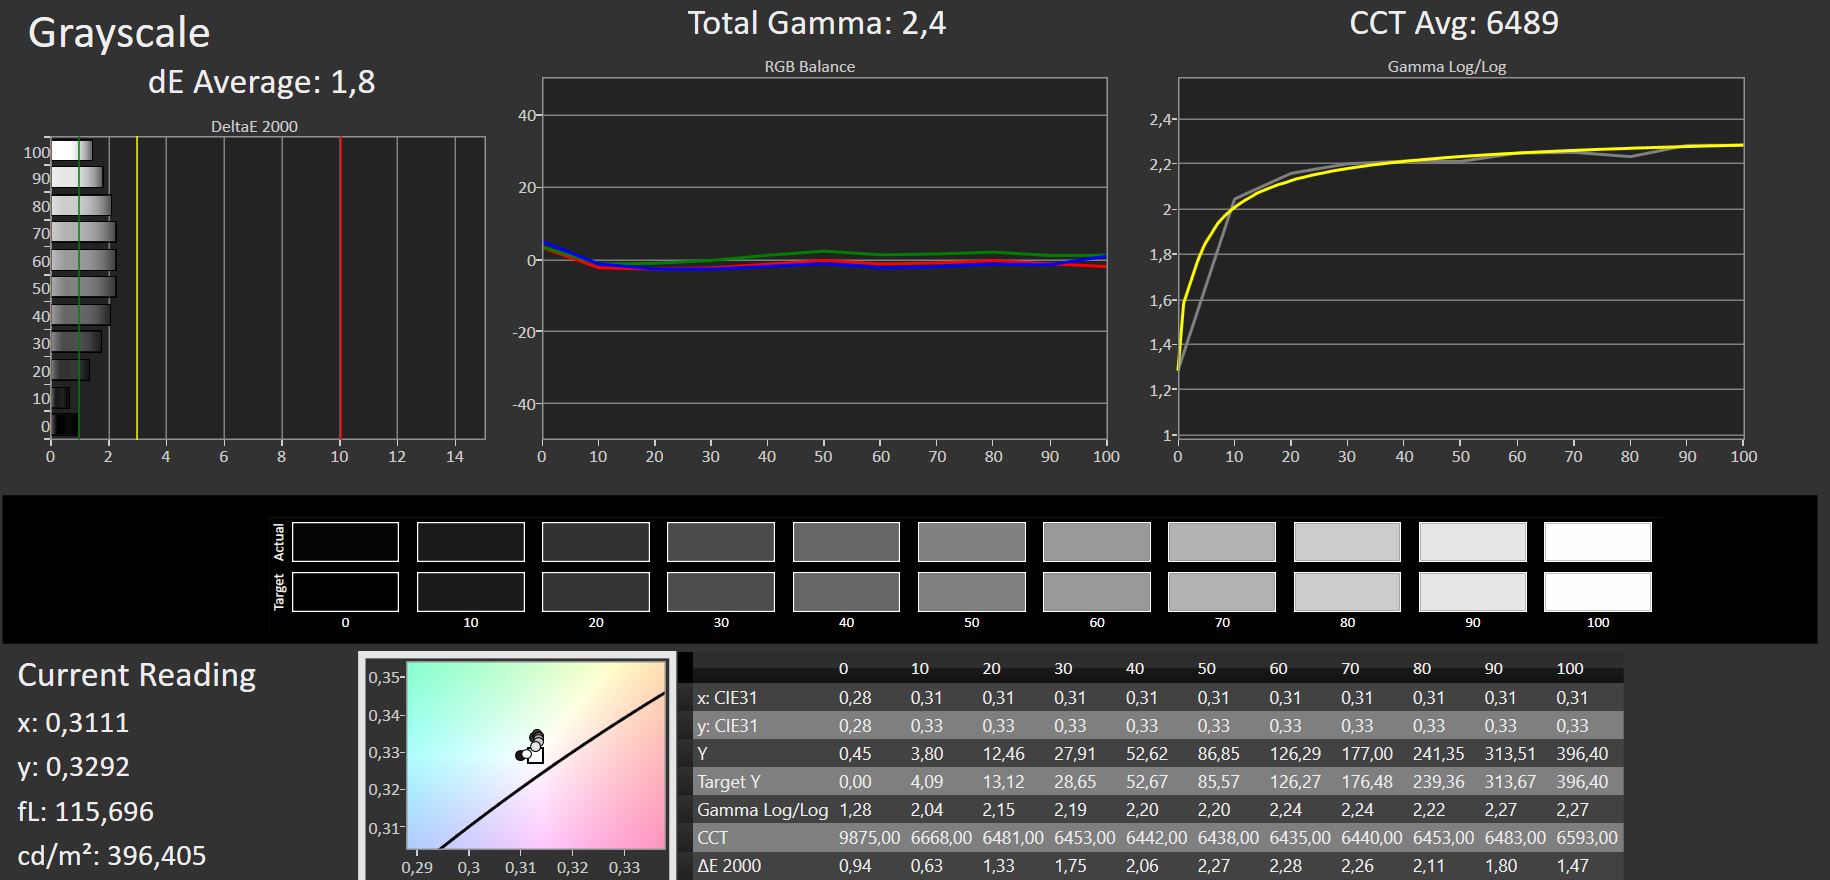
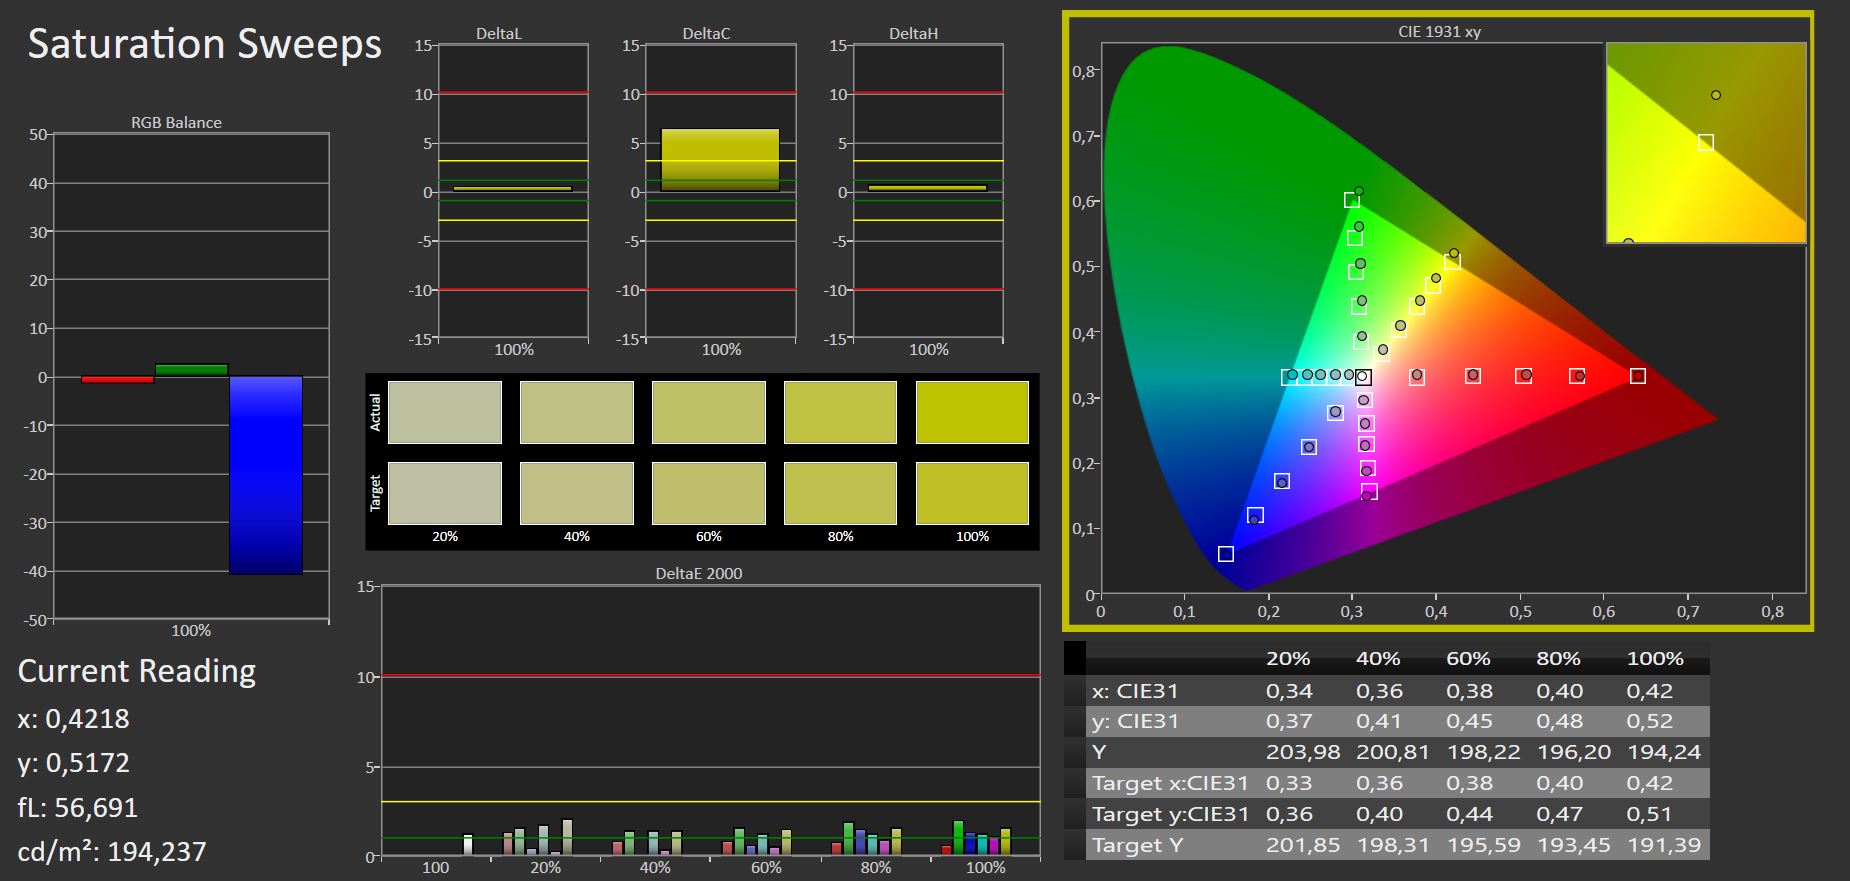
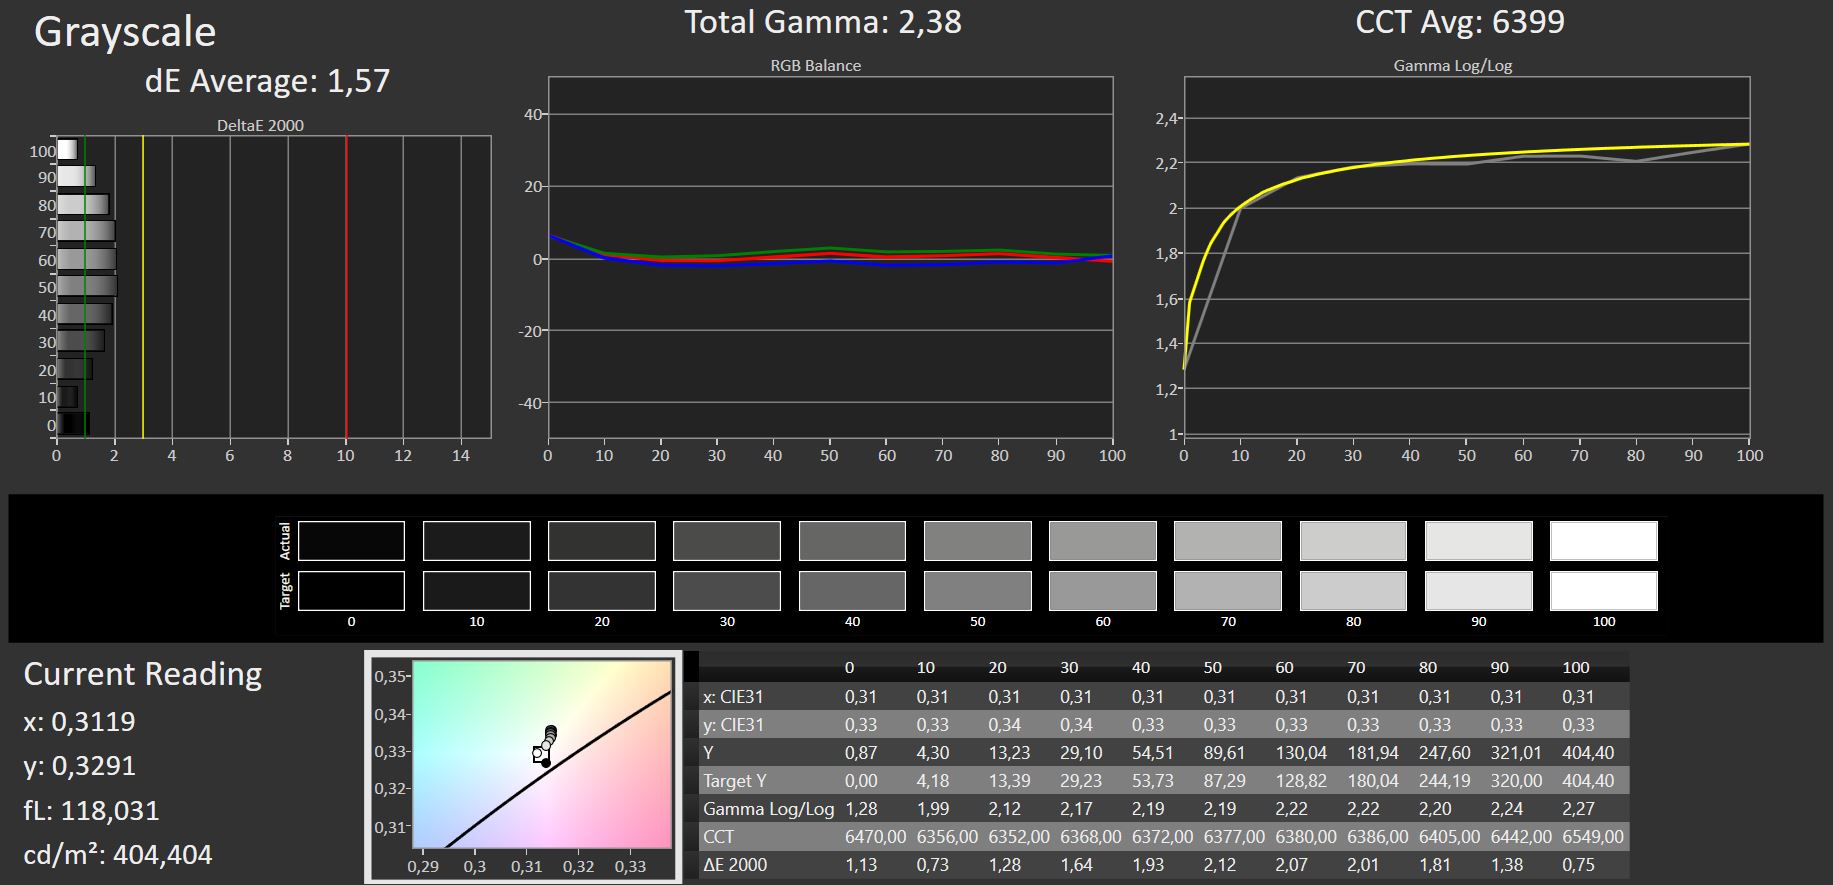
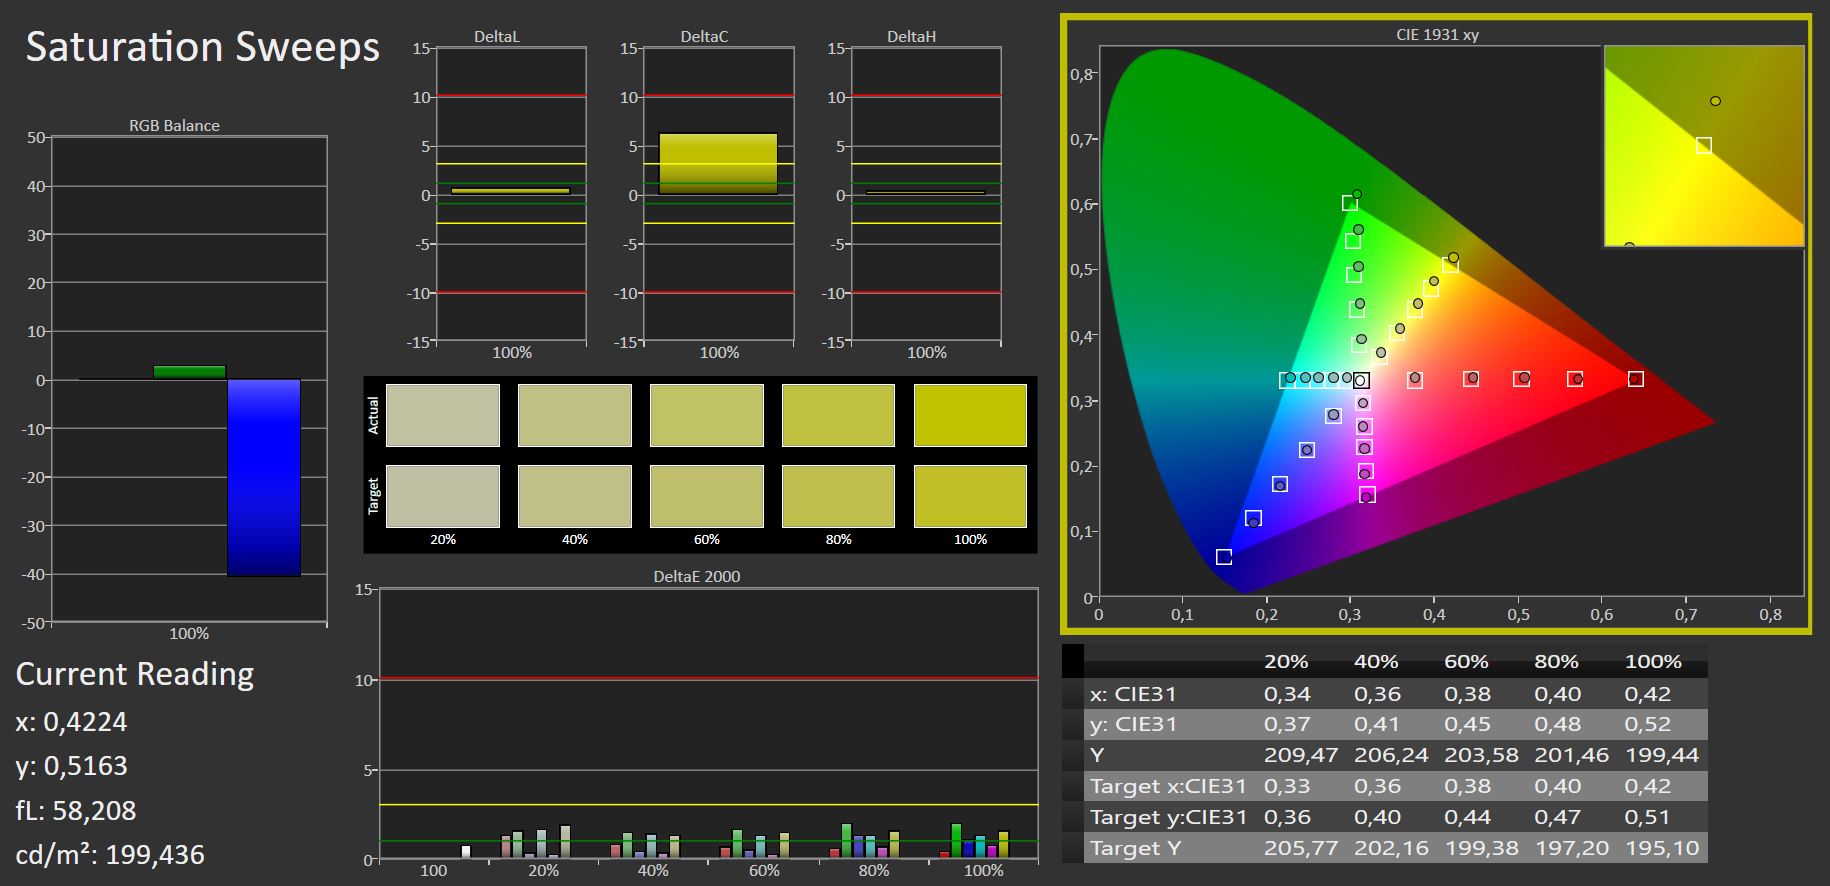
AdobeRGB todavía está cubierto en un 69%, sRGB casi por completo.
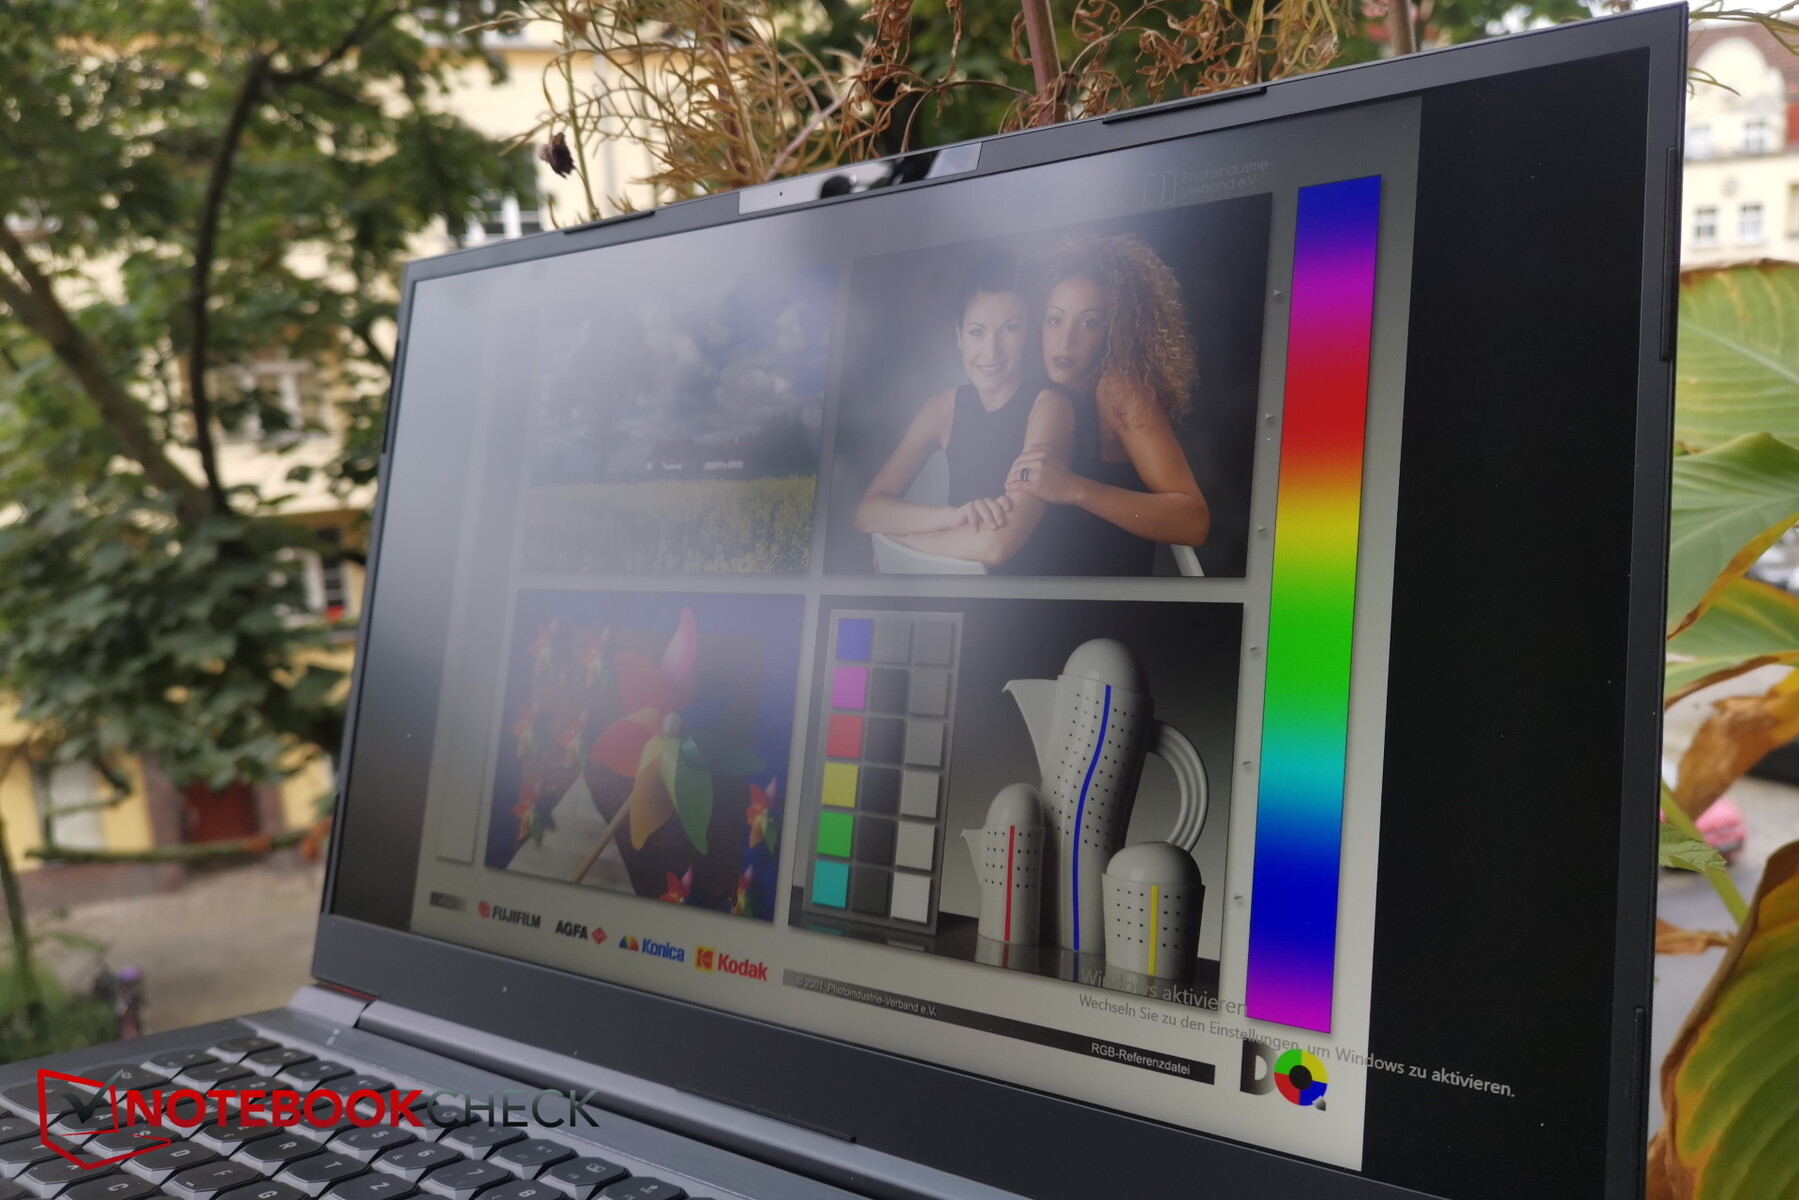
Debido a la superficie mate y al brillo bastante bueno, el NEO 17 también puede usarse bastante bien en exteriores, al menos en la sombra
Los tiempos de respuesta no son excepcionales para un jugador, pero son suficientes. No notamos ningún PWM
Tiempos de respuesta del display
| ↔ Tiempo de respuesta de Negro a Blanco | ||
|---|---|---|
| 8.8 ms ... subida ↗ y bajada ↘ combinada | ↗ ms subida | |
| ↘ ms bajada | ||
| La pantalla mostró tiempos de respuesta rápidos en nuestros tests y debería ser adecuada para juegos. En comparación, todos los dispositivos de prueba van de ##min### (mínimo) a 240 (máximo) ms. » 24 % de todos los dispositivos son mejores. Esto quiere decir que el tiempo de respuesta medido es mejor que la media (19.9 ms) de todos los dispositivos testados. | ||
| ↔ Tiempo de respuesta 50% Gris a 80% Gris | ||
| 15.2 ms ... subida ↗ y bajada ↘ combinada | ↗ ms subida | |
| ↘ ms bajada | ||
| La pantalla mostró buenos tiempos de respuesta en nuestros tests pero podría ser demasiado lenta para los jugones competitivos. En comparación, todos los dispositivos de prueba van de ##min### (mínimo) a 636 (máximo) ms. » 29 % de todos los dispositivos son mejores. Esto quiere decir que el tiempo de respuesta medido es mejor que la media (31.1 ms) de todos los dispositivos testados. | ||
Parpadeo de Pantalla / PWM (Pulse-Width Modulation)
| Parpadeo de Pantalla / PWM no detectado | ||
Comparación: 52 % de todos los dispositivos testados no usaron PWM para atenuar el display. Si se usó, medimos una media de 7798 (mínimo: 5 - máxmo: 343500) Hz. | ||
Se pierde un poco de brillo cuando se ve desde ángulos extremos, pero la pérdida es muy limitada, como es típico de los IPS

Rendimiento - Unbridled RTX 3080
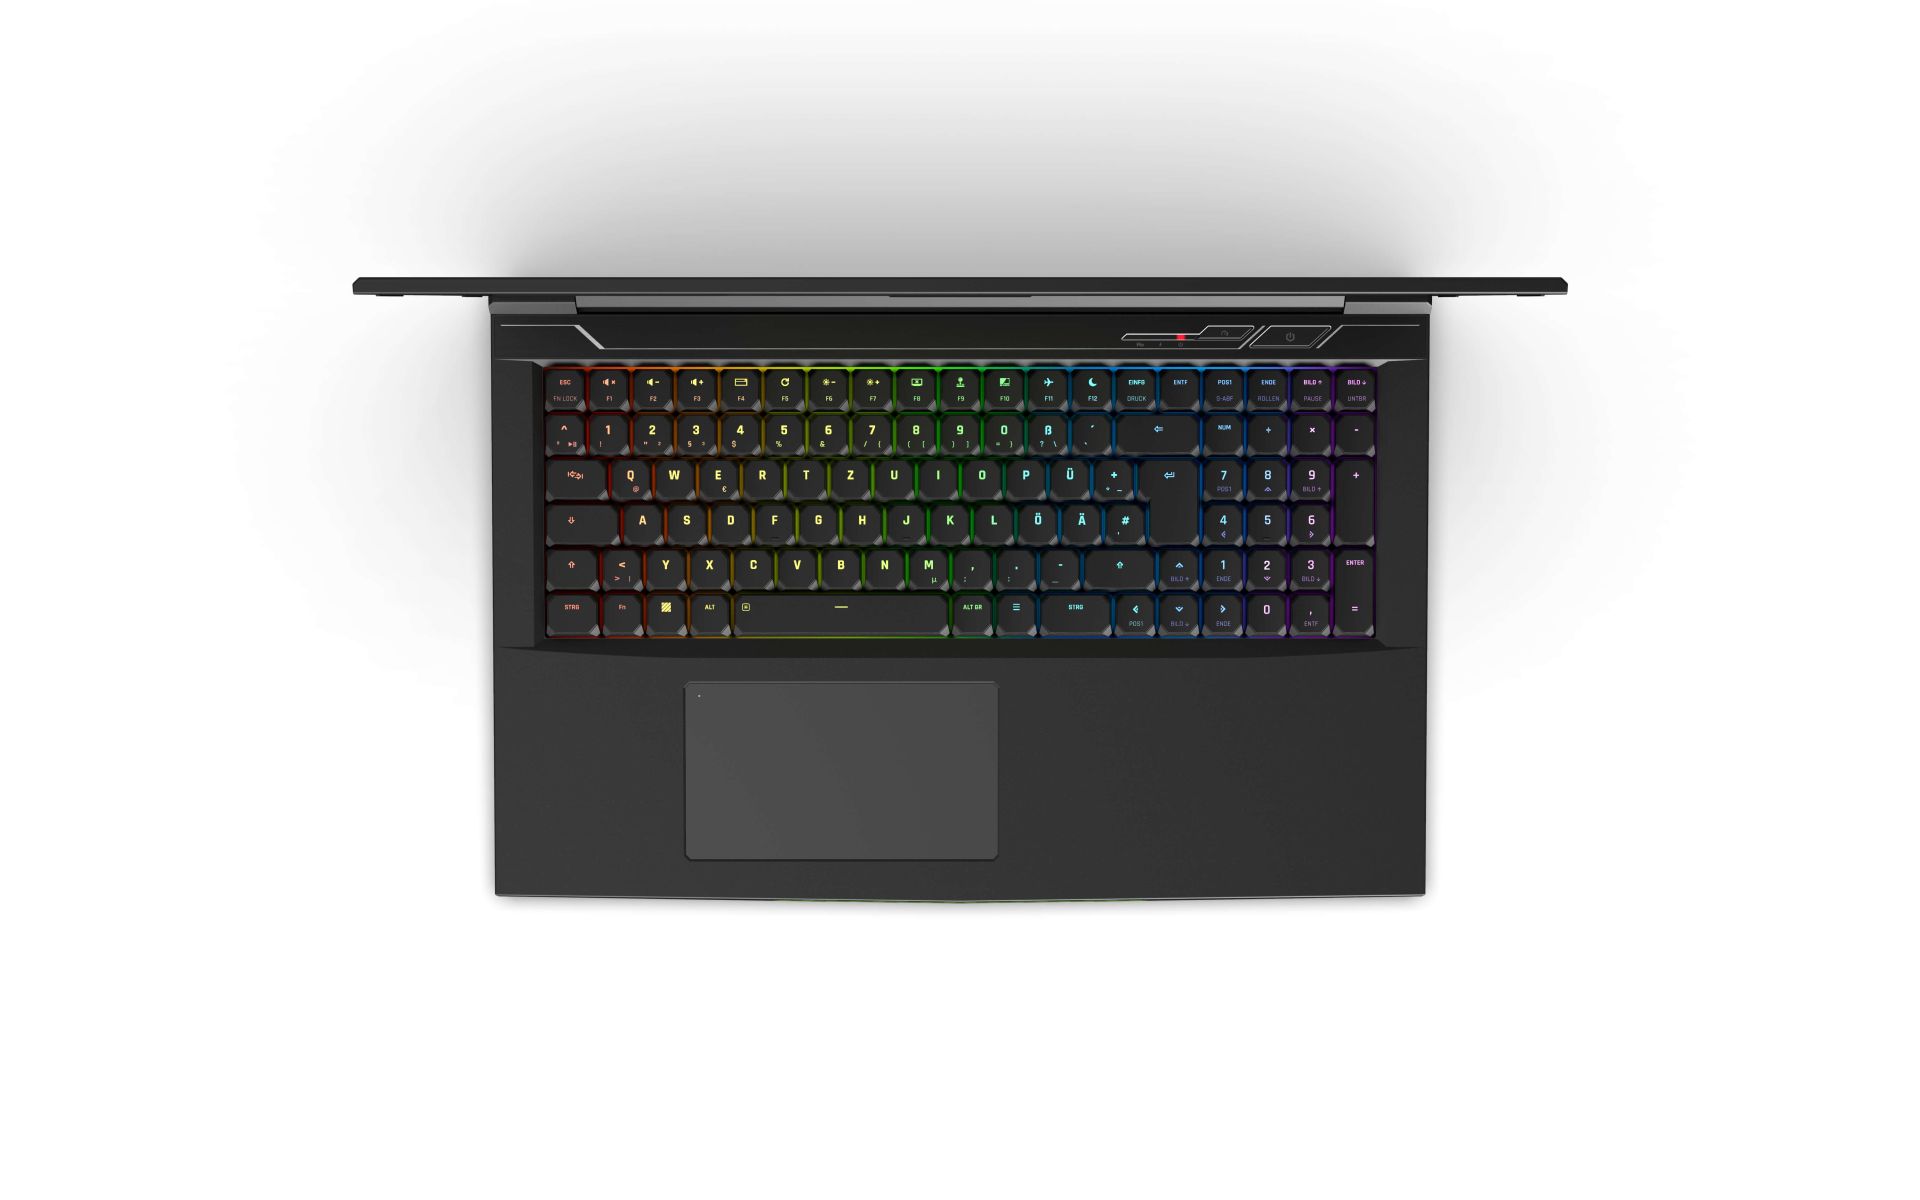
El NEO 17 es claramente un gamer, no sólo por la GPU Nvidia GeForce RTX 3080 para portátiles o la CPU Intel Core i7-11800H de 8 núcleos. La iluminación RGB del teclado también da algunas pistas. Con esta combinación de hardware, incluso los juegos más recientes y exigentes deberían poder jugarse sin problemas en la resolución nativa, y hay suficientes reservas para el juego 4K en monitores externos.
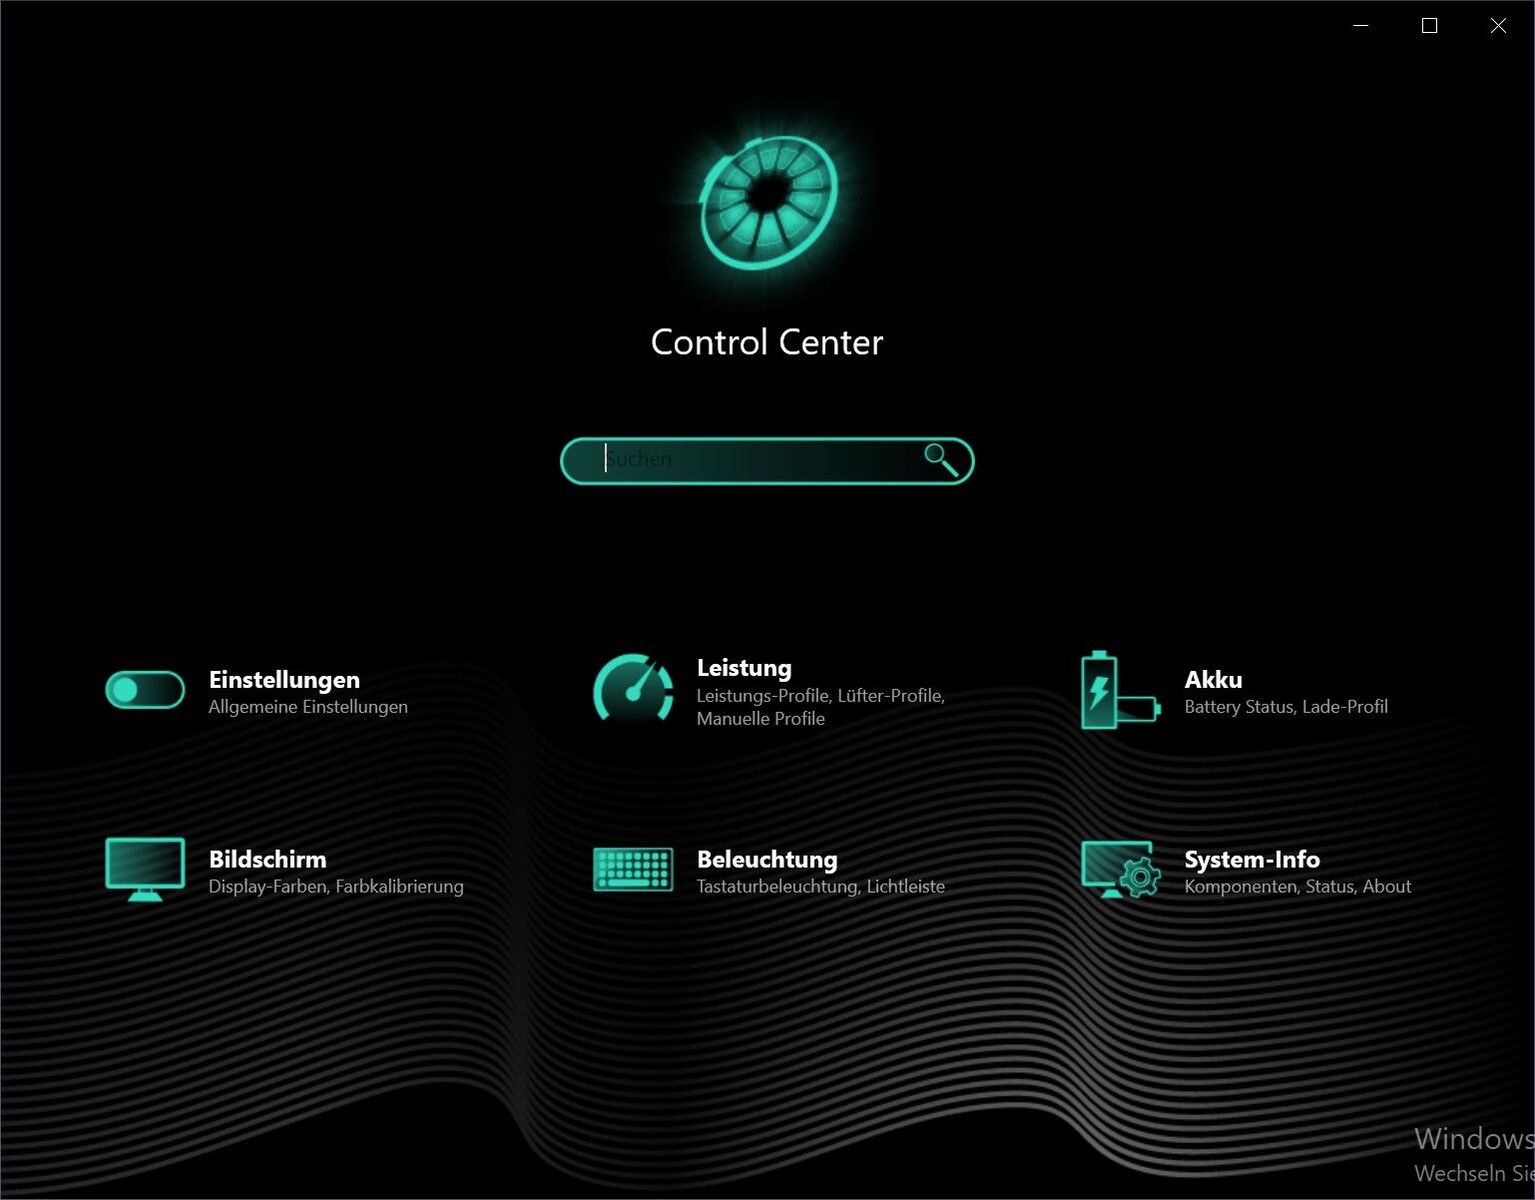
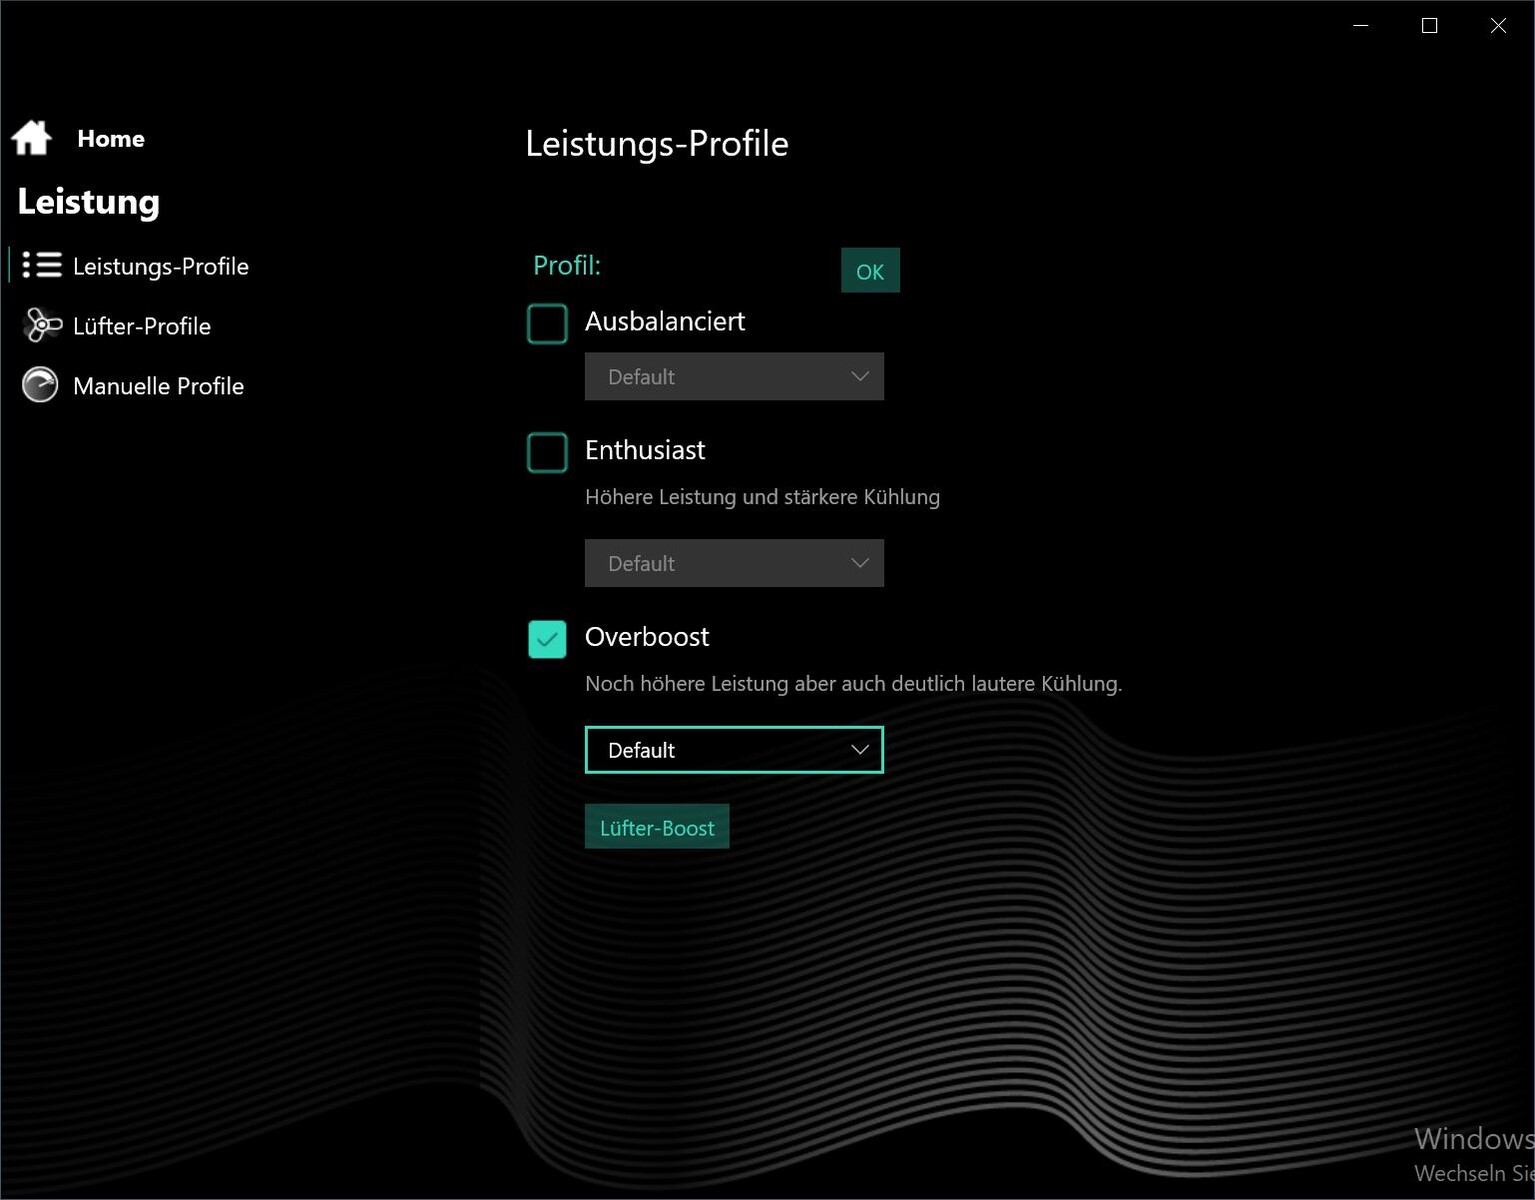
Para obtener los mejores resultados en los benchmarks, desactivamos la GPU interna en el Centro de Control y activamos el modo Overboost
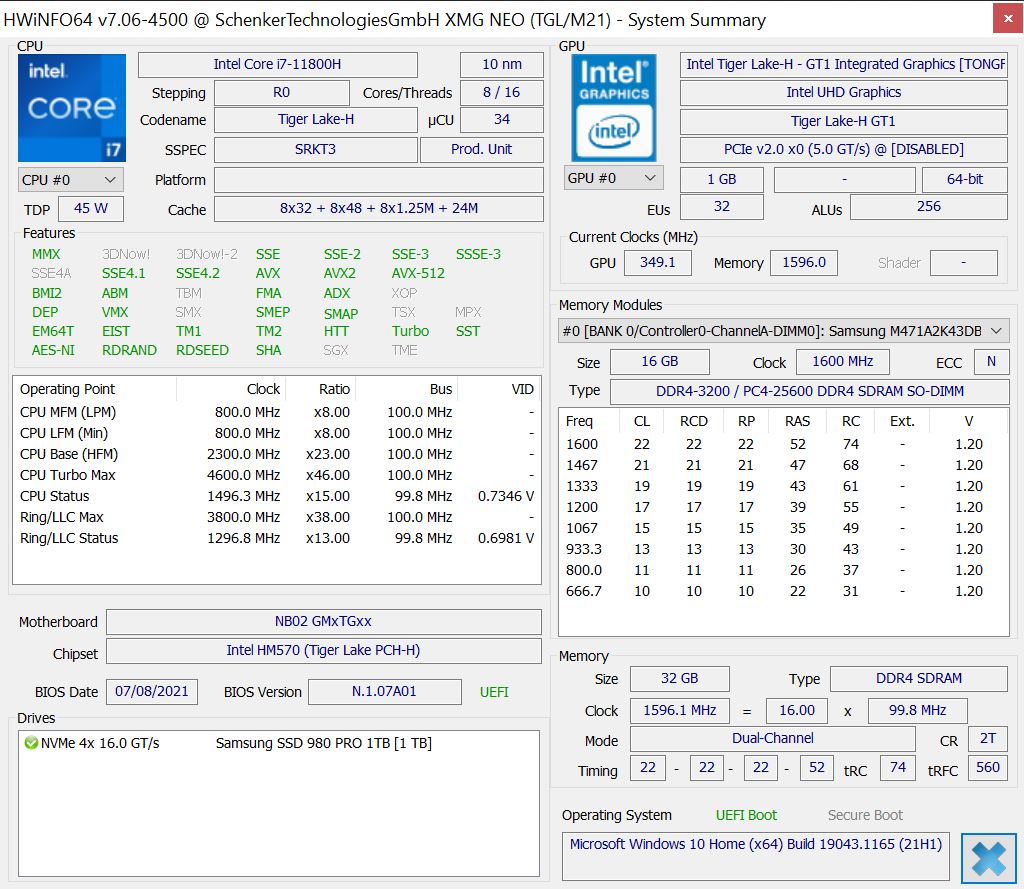
Procesador
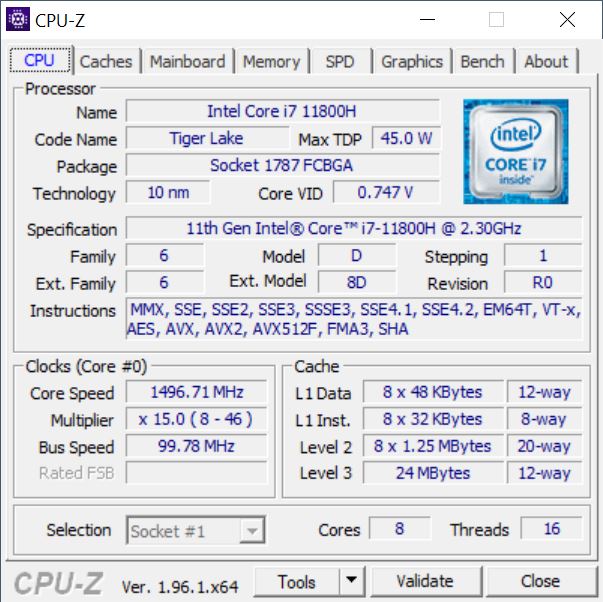
Los 8 núcleos del Intel Core i7-11800H se mueven entre 2,3 y 4,6 GHz
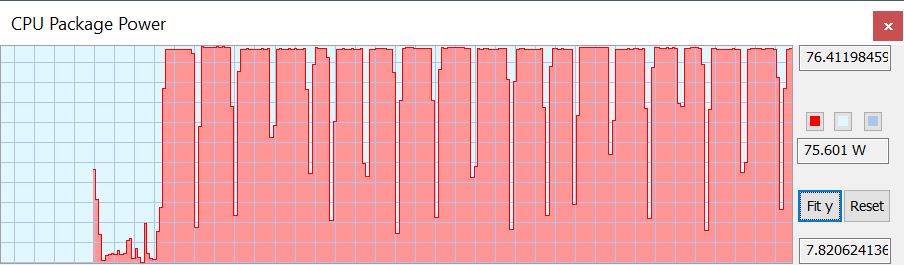
El NEO 17 rinde algo por debajo de la media en el bucle continuo de Cinebench R15 a pesar del modo overboost, pero la diferencia es pequeña. Por ejemplo, el Aorus con la misma CPU es un poco más rápido. El TDP siempre es de 75 W en las ejecuciones individuales. Sin embargo, puedes aumentar manualmente el TDP en el Centro de Control, pero lo dejamos en la configuración por defecto del modo overboost
El NEO 17 pierde alrededor de un 20% en modo batería y sólo puntúa 1,420 en lugar de 1,767 puntos en Cinebench R15 Multi.
Cinebench R15 Multi Endurance test
Cinebench R20: CPU (Single Core) | CPU (Multi Core)
Cinebench R15: CPU Single 64Bit | CPU Multi 64Bit
Blender: v2.79 BMW27 CPU
7-Zip 18.03: 7z b 4 -mmt1 | 7z b 4
Geekbench 5.5: Single-Core | Multi-Core
HWBOT x265 Benchmark v2.2: 4k Preset
LibreOffice : 20 Documents To PDF
R Benchmark 2.5: Overall mean
| Cinebench R23 / Single Core | |
| Media de la clase Gaming (1166 - 2356, n=113, últimos 2 años) | |
| Asus ROG Zephyrus S17 GX703HSD | |
| Aorus 17G YD | |
| Asus Strix Scar 17 G733QSA-XS99 | |
| Medio Intel Core i7-11800H (1386 - 1522, n=45) | |
| Schenker XMG NEO 17 GM7TG8S | |
| Medion Erazer Beast X25 | |
| Schenker XMG Neo 17 (Early 2021, RTX 3070, 5800H) | |
| Cinebench R23 / Multi Core | |
| Media de la clase Gaming (10488 - 40970, n=113, últimos 2 años) | |
| Asus Strix Scar 17 G733QSA-XS99 | |
| Aorus 17G YD | |
| Asus ROG Zephyrus S17 GX703HSD | |
| Medion Erazer Beast X25 | |
| Schenker XMG Neo 17 (Early 2021, RTX 3070, 5800H) | |
| Medio Intel Core i7-11800H (6508 - 14088, n=48) | |
| Schenker XMG NEO 17 GM7TG8S | |
| Cinebench R20 / CPU (Single Core) | |
| Media de la clase Gaming (442 - 895, n=112, últimos 2 años) | |
| Asus ROG Zephyrus S17 GX703HSD | |
| Schenker XMG NEO 17 GM7TG8S | |
| Medion Erazer Beast X25 | |
| Medio Intel Core i7-11800H (520 - 586, n=47) | |
| Asus Strix Scar 17 G733QSA-XS99 | |
| Aorus 17G YD | |
| Schenker XMG Neo 17 (Early 2021, RTX 3070, 5800H) | |
| Cinebench R20 / CPU (Multi Core) | |
| Media de la clase Gaming (4029 - 16108, n=112, últimos 2 años) | |
| Asus Strix Scar 17 G733QSA-XS99 | |
| Asus ROG Zephyrus S17 GX703HSD | |
| Aorus 17G YD | |
| Medion Erazer Beast X25 | |
| Schenker XMG Neo 17 (Early 2021, RTX 3070, 5800H) | |
| Medio Intel Core i7-11800H (2498 - 5408, n=50) | |
| Schenker XMG NEO 17 GM7TG8S | |
| Cinebench R15 / CPU Single 64Bit | |
| Media de la clase Gaming (188.8 - 343, n=112, últimos 2 años) | |
| Asus ROG Zephyrus S17 GX703HSD | |
| Asus Strix Scar 17 G733QSA-XS99 | |
| Medion Erazer Beast X25 | |
| Schenker XMG Neo 17 (Early 2021, RTX 3070, 5800H) | |
| Schenker XMG NEO 17 GM7TG8S | |
| Aorus 17G YD | |
| Medio Intel Core i7-11800H (201 - 231, n=46) | |
| Cinebench R15 / CPU Multi 64Bit | |
| Media de la clase Gaming (1578 - 6271, n=113, últimos 2 años) | |
| Asus Strix Scar 17 G733QSA-XS99 | |
| Asus ROG Zephyrus S17 GX703HSD | |
| Schenker XMG Neo 17 (Early 2021, RTX 3070, 5800H) | |
| Aorus 17G YD | |
| Medion Erazer Beast X25 | |
| Medio Intel Core i7-11800H (1342 - 2173, n=50) | |
| Schenker XMG NEO 17 GM7TG8S | |
| Blender / v2.79 BMW27 CPU | |
| Aorus 17G YD | |
| Medio Intel Core i7-11800H (217 - 454, n=46) | |
| Schenker XMG NEO 17 GM7TG8S | |
| Medion Erazer Beast X25 | |
| Schenker XMG Neo 17 (Early 2021, RTX 3070, 5800H) | |
| Asus ROG Zephyrus S17 GX703HSD | |
| Asus Strix Scar 17 G733QSA-XS99 | |
| Media de la clase Gaming (80 - 330, n=110, últimos 2 años) | |
| 7-Zip 18.03 / 7z b 4 -mmt1 | |
| Media de la clase Gaming (4199 - 7436, n=111, últimos 2 años) | |
| Asus ROG Zephyrus S17 GX703HSD | |
| Asus Strix Scar 17 G733QSA-XS99 | |
| Medion Erazer Beast X25 | |
| Schenker XMG Neo 17 (Early 2021, RTX 3070, 5800H) | |
| Aorus 17G YD | |
| Schenker XMG NEO 17 GM7TG8S | |
| Medio Intel Core i7-11800H (5138 - 5732, n=46) | |
| 7-Zip 18.03 / 7z b 4 | |
| Media de la clase Gaming (33491 - 148086, n=111, últimos 2 años) | |
| Asus Strix Scar 17 G733QSA-XS99 | |
| Medion Erazer Beast X25 | |
| Schenker XMG Neo 17 (Early 2021, RTX 3070, 5800H) | |
| Asus ROG Zephyrus S17 GX703HSD | |
| Medio Intel Core i7-11800H (33718 - 56758, n=46) | |
| Aorus 17G YD | |
| Schenker XMG NEO 17 GM7TG8S | |
| Geekbench 5.5 / Single-Core | |
| Media de la clase Gaming (986 - 2474, n=111, últimos 2 años) | |
| Asus ROG Zephyrus S17 GX703HSD | |
| Schenker XMG NEO 17 GM7TG8S | |
| Aorus 17G YD | |
| Medio Intel Core i7-11800H (1429 - 1625, n=40) | |
| Asus Strix Scar 17 G733QSA-XS99 | |
| Medion Erazer Beast X25 | |
| Schenker XMG Neo 17 (Early 2021, RTX 3070, 5800H) | |
| Geekbench 5.5 / Multi-Core | |
| Media de la clase Gaming (6460 - 27010, n=111, últimos 2 años) | |
| Asus ROG Zephyrus S17 GX703HSD | |
| Aorus 17G YD | |
| Medion Erazer Beast X25 | |
| Schenker XMG NEO 17 GM7TG8S | |
| Asus Strix Scar 17 G733QSA-XS99 | |
| Medio Intel Core i7-11800H (4655 - 9851, n=40) | |
| Schenker XMG Neo 17 (Early 2021, RTX 3070, 5800H) | |
| HWBOT x265 Benchmark v2.2 / 4k Preset | |
| Media de la clase Gaming (11.5 - 44.3, n=111, últimos 2 años) | |
| Asus Strix Scar 17 G733QSA-XS99 | |
| Asus ROG Zephyrus S17 GX703HSD | |
| Aorus 17G YD | |
| Medion Erazer Beast X25 | |
| Schenker XMG Neo 17 (Early 2021, RTX 3070, 5800H) | |
| Medio Intel Core i7-11800H (7.38 - 17.4, n=46) | |
| Schenker XMG NEO 17 GM7TG8S | |
| LibreOffice / 20 Documents To PDF | |
| Schenker XMG Neo 17 (Early 2021, RTX 3070, 5800H) | |
| Medion Erazer Beast X25 | |
| Media de la clase Gaming (19 - 88.8, n=111, últimos 2 años) | |
| Medio Intel Core i7-11800H (38.6 - 59.9, n=45) | |
| Asus Strix Scar 17 G733QSA-XS99 | |
| Asus ROG Zephyrus S17 GX703HSD | |
| Schenker XMG NEO 17 GM7TG8S | |
| Aorus 17G YD | |
| R Benchmark 2.5 / Overall mean | |
| Schenker XMG NEO 17 GM7TG8S | |
| Medio Intel Core i7-11800H (0.548 - 0.615, n=46) | |
| Aorus 17G YD | |
| Asus ROG Zephyrus S17 GX703HSD | |
| Schenker XMG Neo 17 (Early 2021, RTX 3070, 5800H) | |
| Asus Strix Scar 17 G733QSA-XS99 | |
| Medion Erazer Beast X25 | |
| Media de la clase Gaming (0.3439 - 0.759, n=112, últimos 2 años) | |
* ... más pequeño es mejor
Rendimiento del sistema
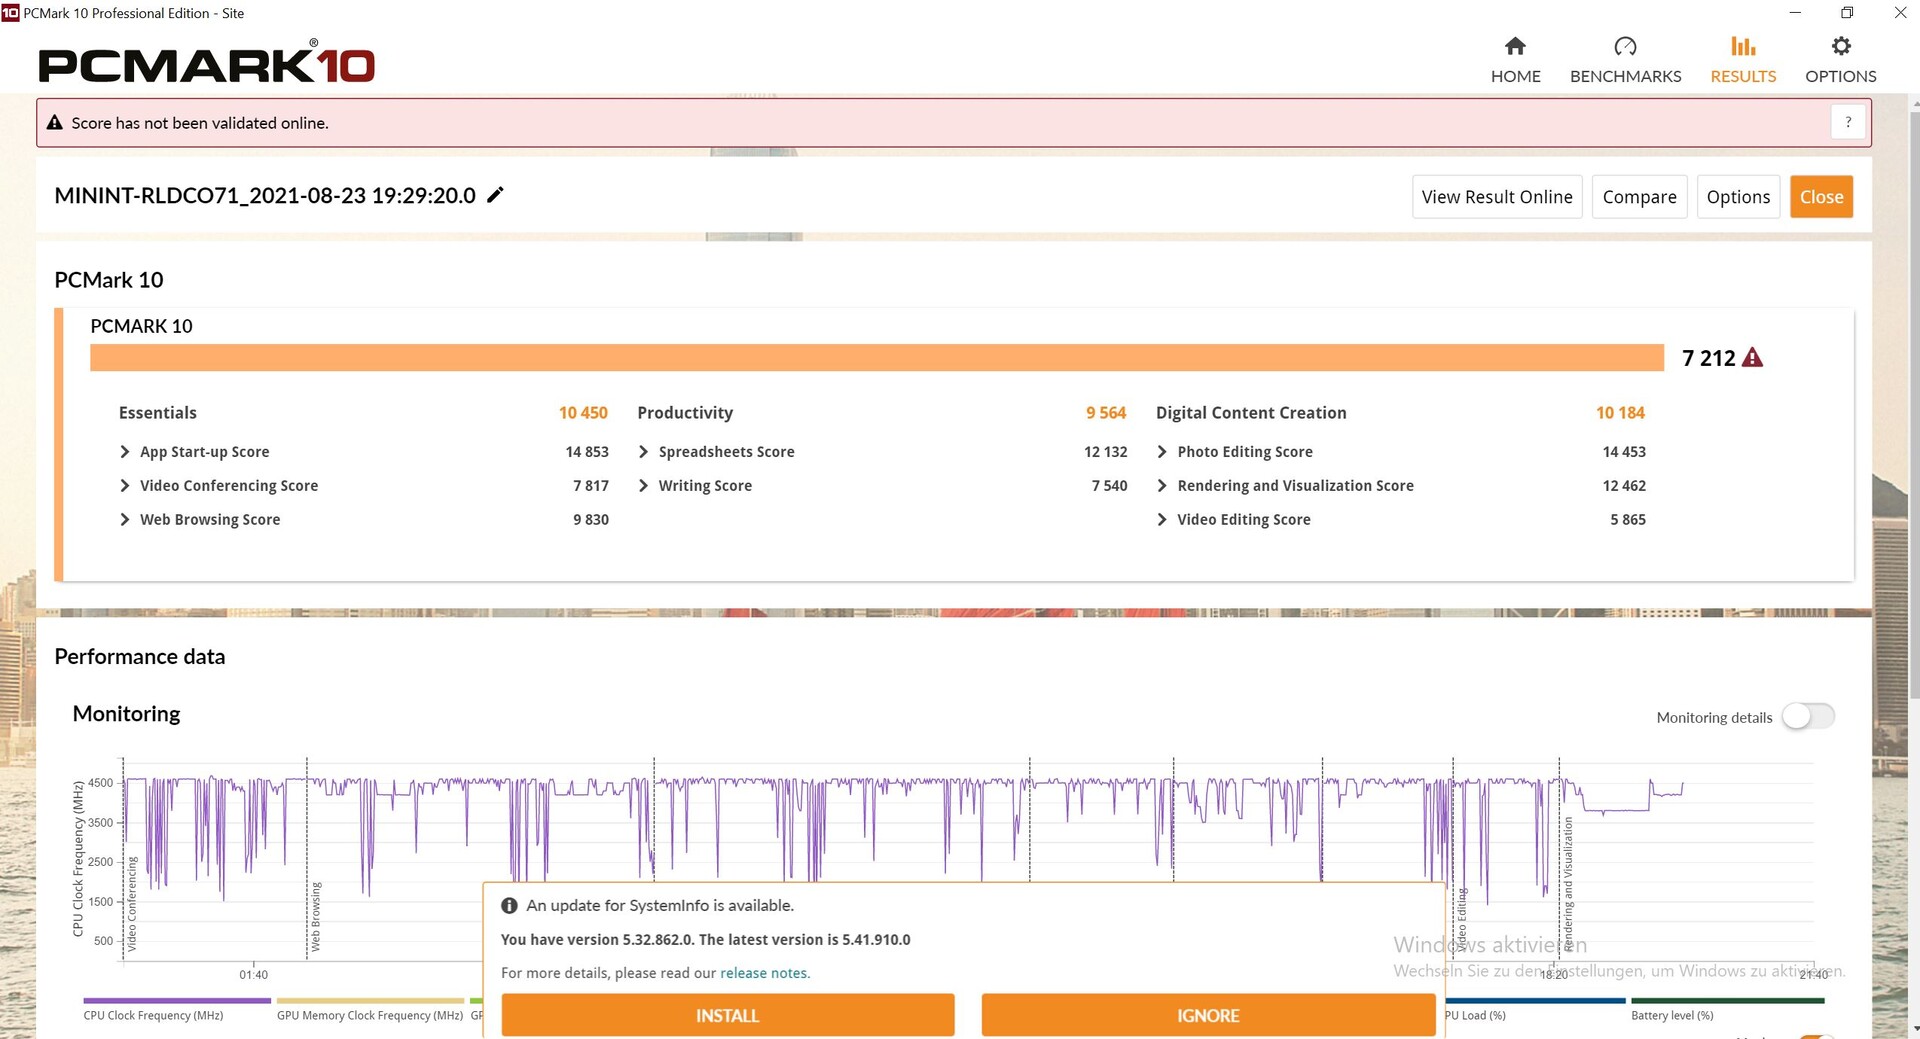
No obstante, el rendimiento del sistema está en el nivel esperado, y el NEO 17 incluso ocupa uno de los primeros puestos
| PCMark 10 / Score | |
| Media de la clase Gaming (5828 - 11574, n=96, últimos 2 años) | |
| Asus ROG Zephyrus S17 GX703HSD | |
| Schenker XMG NEO 17 GM7TG8S | |
| Asus Strix Scar 17 G733QSA-XS99 | |
| Medio Intel Core i7-11800H, NVIDIA GeForce RTX 3080 Laptop GPU (6673 - 7470, n=11) | |
| Aorus 17G YD | |
| Schenker XMG Neo 17 (Early 2021, RTX 3070, 5800H) | |
| Medion Erazer Beast X25 | |
| PCMark 10 / Essentials | |
| Media de la clase Gaming (8810 - 12600, n=100, últimos 2 años) | |
| Asus ROG Zephyrus S17 GX703HSD | |
| Asus Strix Scar 17 G733QSA-XS99 | |
| Schenker XMG NEO 17 GM7TG8S | |
| Medio Intel Core i7-11800H, NVIDIA GeForce RTX 3080 Laptop GPU (9862 - 11064, n=11) | |
| Aorus 17G YD | |
| Schenker XMG Neo 17 (Early 2021, RTX 3070, 5800H) | |
| Medion Erazer Beast X25 | |
| PCMark 10 / Productivity | |
| Media de la clase Gaming (6845 - 18766, n=98, últimos 2 años) | |
| Asus Strix Scar 17 G733QSA-XS99 | |
| Schenker XMG NEO 17 GM7TG8S | |
| Aorus 17G YD | |
| Medion Erazer Beast X25 | |
| Asus ROG Zephyrus S17 GX703HSD | |
| Medio Intel Core i7-11800H, NVIDIA GeForce RTX 3080 Laptop GPU (8278 - 9803, n=11) | |
| Schenker XMG Neo 17 (Early 2021, RTX 3070, 5800H) | |
| PCMark 10 / Digital Content Creation | |
| Media de la clase Gaming (7602 - 19657, n=98, últimos 2 años) | |
| Asus ROG Zephyrus S17 GX703HSD | |
| Medio Intel Core i7-11800H, NVIDIA GeForce RTX 3080 Laptop GPU (9881 - 11323, n=11) | |
| Schenker XMG Neo 17 (Early 2021, RTX 3070, 5800H) | |
| Schenker XMG NEO 17 GM7TG8S | |
| Aorus 17G YD | |
| Asus Strix Scar 17 G733QSA-XS99 | |
| Medion Erazer Beast X25 | |
| PCMark 10 Score | 7212 puntos | |
ayuda | ||
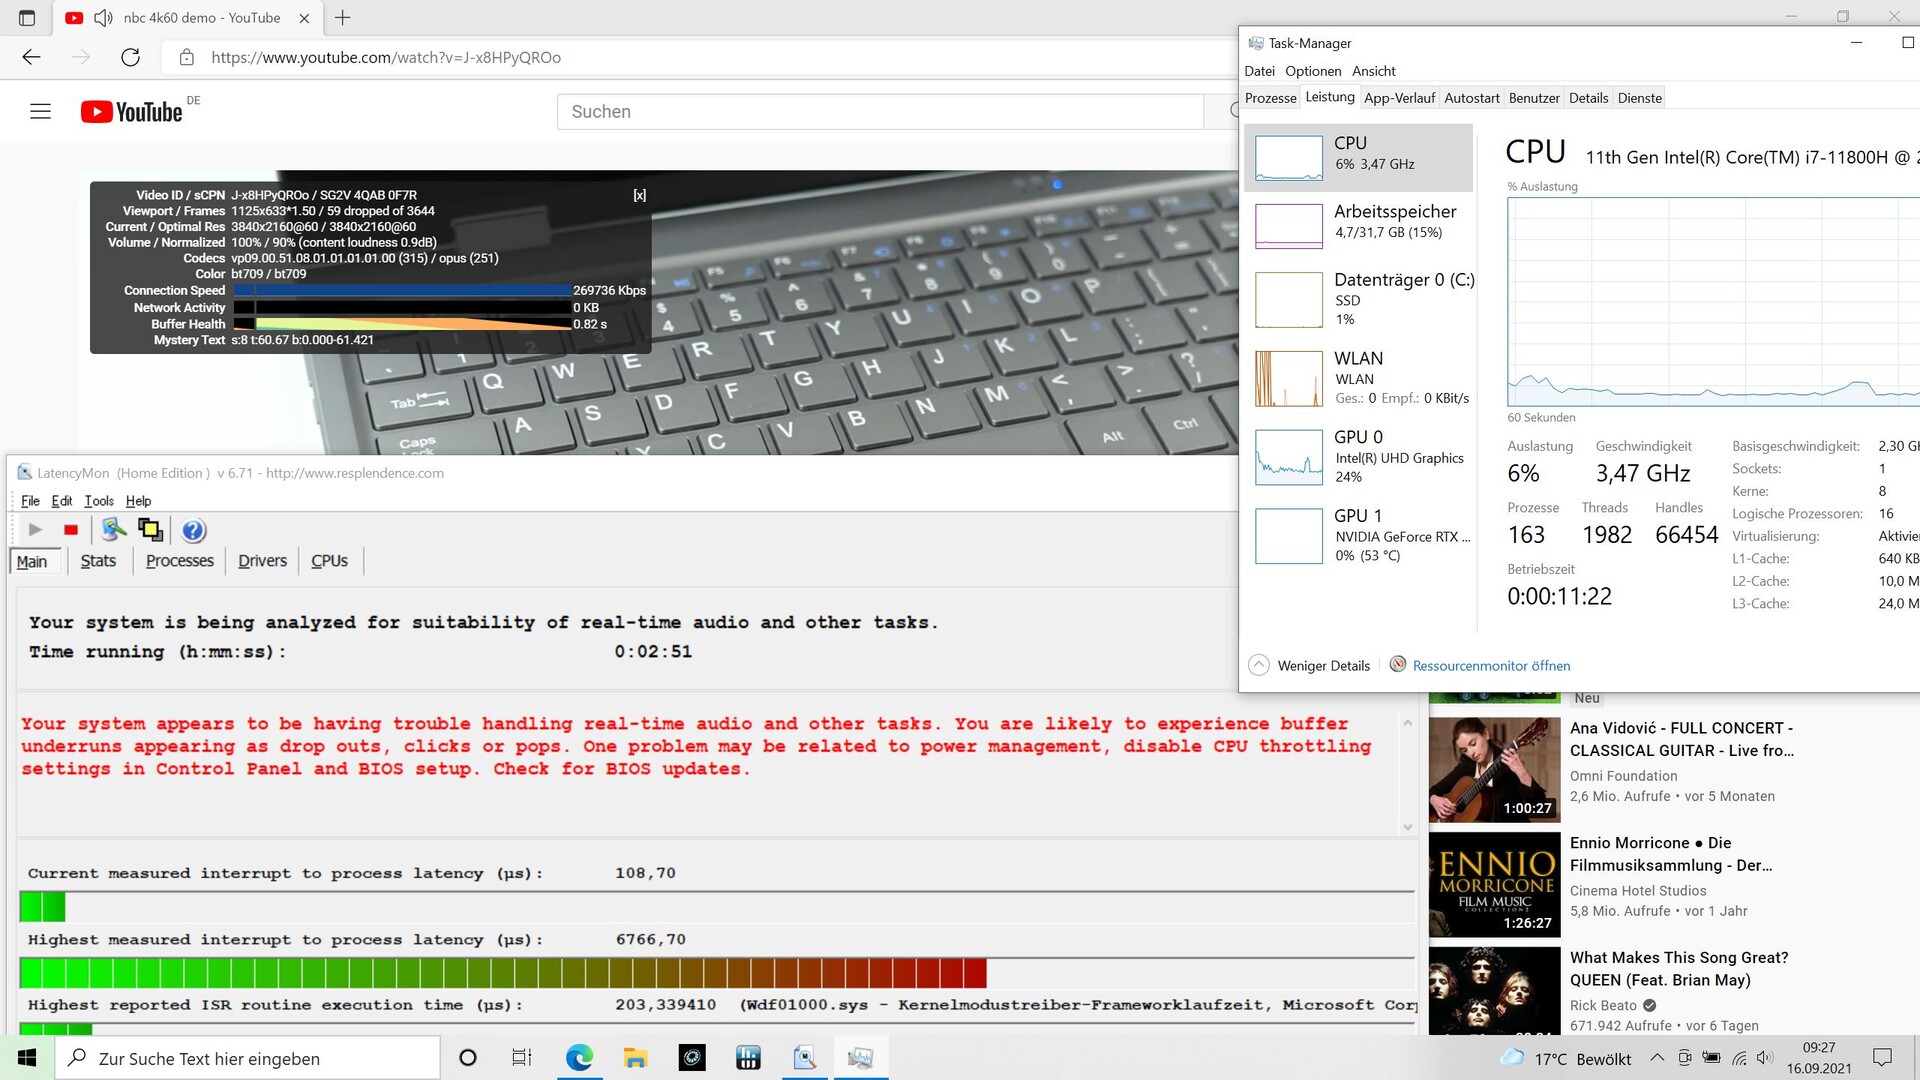
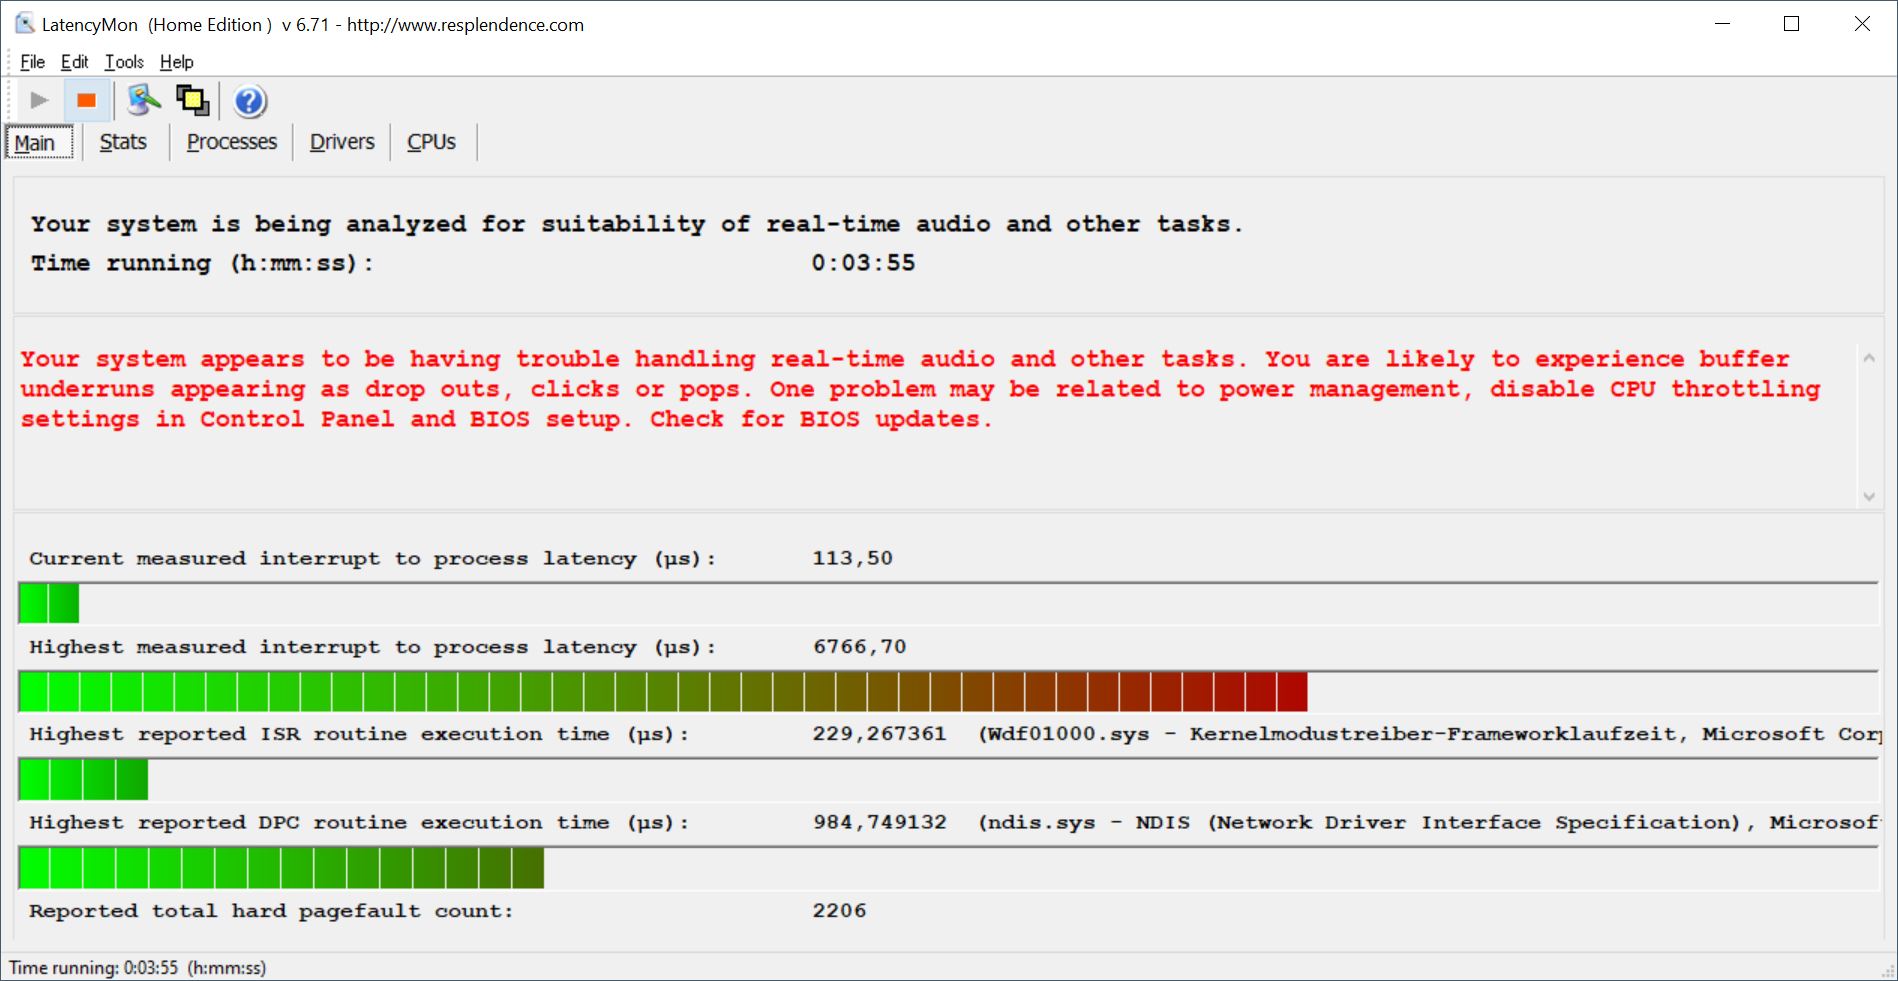
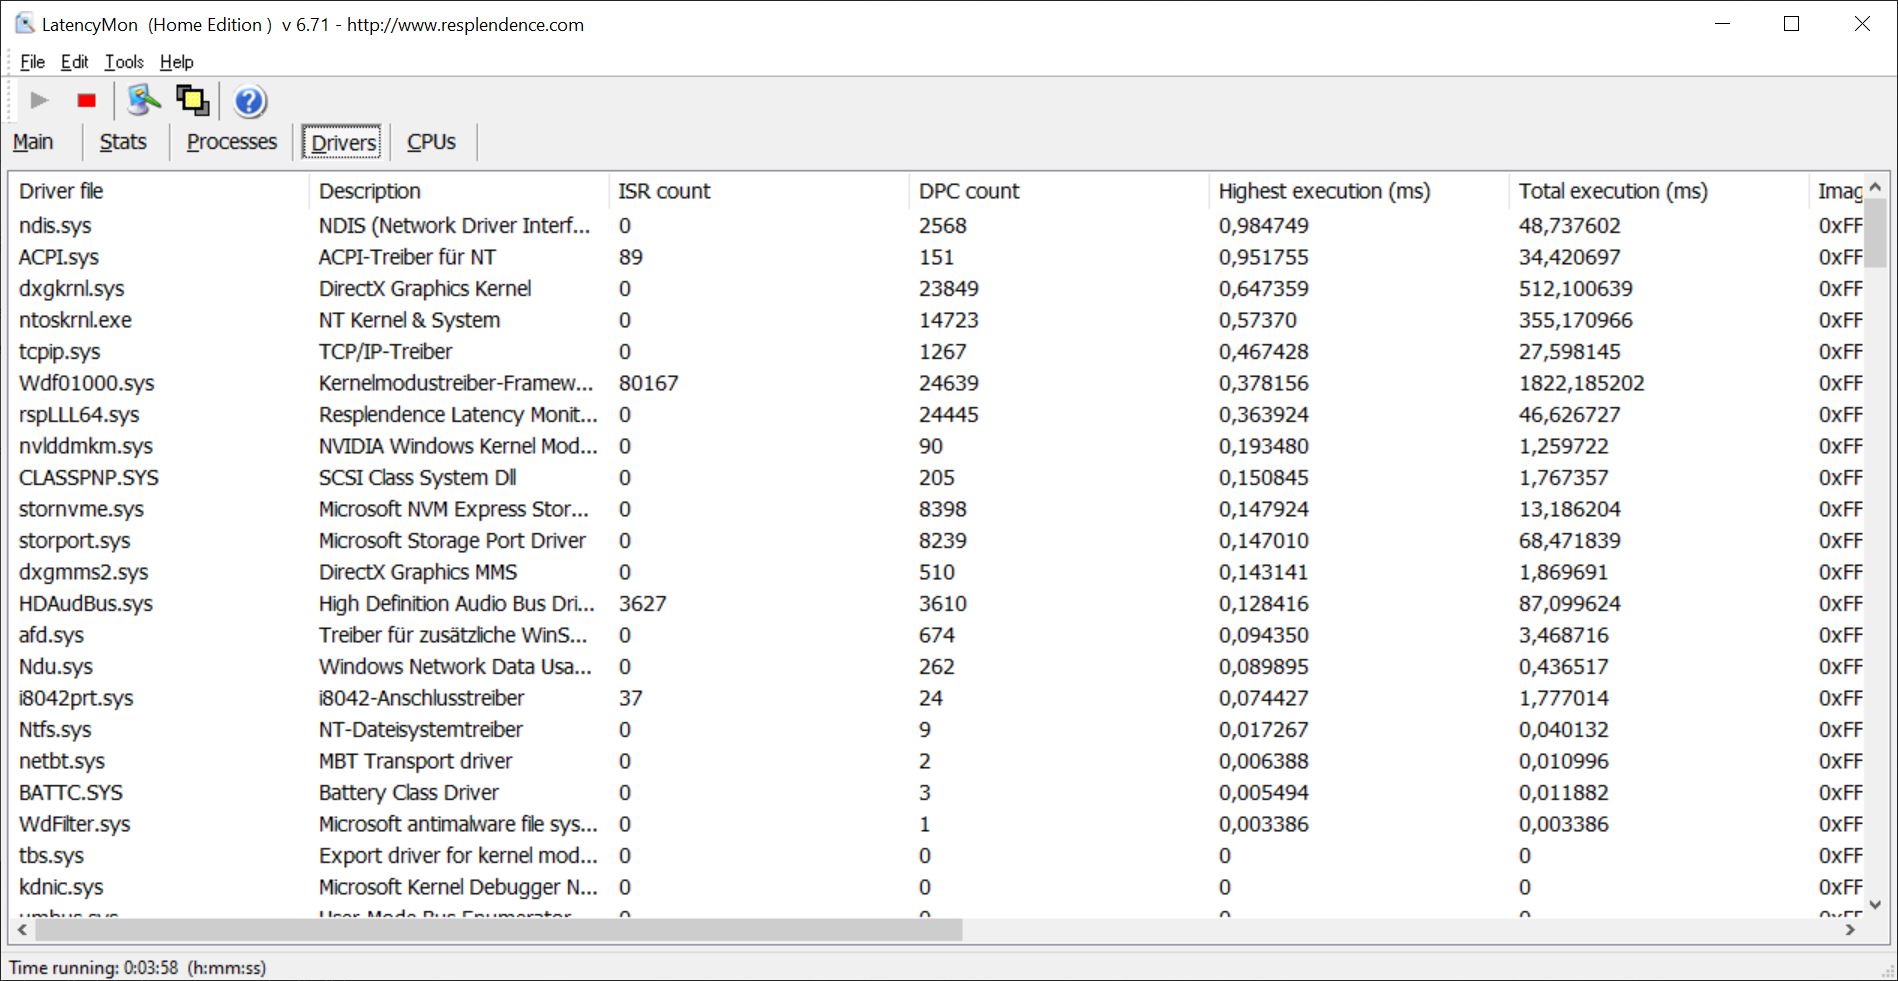
Latencias del CPD
Si abrimos varios artículos de Notebookcheck.com en sus propias pestañas, el NEO 17 se las arregla bien. La situación es diferente cuando reproducimos nuestro vídeo de prueba 4K/60 fps en YouTube. El resultado son unos tristes 59 fotogramas caídos, así como un retardo bastante alto en el renderizado en tiempo real, lo que hace que el Schenker tenga los peores índices en comparación. La culpa la tienen varios drivers; Schenker debería mejorar esto con una actualización de la BIOS
| DPC Latencies / LatencyMon - interrupt to process latency (max), Web, Youtube, Prime95 | |
| Schenker XMG NEO 17 GM7TG8S | |
| Schenker XMG Neo 17 (Early 2021, RTX 3070, 5800H) | |
| Asus ROG Zephyrus S17 GX703HSD | |
| Aorus 17G YD | |
| Medion Erazer Beast X25 | |
| Asus Strix Scar 17 G733QSA-XS99 | |
* ... más pequeño es mejor
Almacenamiento masivo
Schenker instala un Samsung SSD 980 Pro con 1 TB de espacio de almacenamiento, que está en la parte superior de nuestra Tabla de HDD/SSD. En consecuencia, también supera a la mayoría de los competidores en términos de velocidad. Sólo el Samsung PM9A1 en el Asus ROG Zephyrus es incluso un poco más rápido
| Schenker XMG NEO 17 GM7TG8S Samsung SSD 980 Pro 1TB MZ-V8P1T0BW | Schenker XMG Neo 17 (Early 2021, RTX 3070, 5800H) Samsung SSD 970 EVO Plus 500GB | Aorus 17G YD Samsung PM9A1 MZVL2512HCJQ | Medion Erazer Beast X25 Samsung PM9A1 MZVL22T0HBLB | Asus ROG Zephyrus S17 GX703HSD Samsung PM9A1 MZVL22T0HBLB | Asus Strix Scar 17 G733QSA-XS99 2x Samsung PM981a MZVLB1T0HBLR (RAID 0) | Medio Samsung SSD 980 Pro 1TB MZ-V8P1T0BW | |
|---|---|---|---|---|---|---|---|
| CrystalDiskMark 5.2 / 6 | -29% | -13% | -37% | 0% | -6% | 0% | |
| Write 4K (MB/s) | 225.9 | 206.1 -9% | 227.4 1% | 129.7 -43% | 244.2 8% | 235.9 4% | 220 ? -3% |
| Read 4K (MB/s) | 90.3 | 53 -41% | 91.3 1% | 62.4 -31% | 89.8 -1% | 48.02 -47% | 85.1 ? -6% |
| Write Seq (MB/s) | 4289 | 3018 -30% | 2241 -48% | 2436 -43% | 4822 12% | 3911 ? -9% | |
| Read Seq (MB/s) | 4228 | 2575 -39% | 4496 6% | 2354 -44% | 5043 19% | 3999 ? -5% | |
| Write 4K Q32T1 (MB/s) | 626 | 535 -15% | 661 6% | 512 -18% | 607 -3% | 625 0% | 551 ? -12% |
| Read 4K Q32T1 (MB/s) | 685 | 608 -11% | 712 4% | 436.2 -36% | 658 -4% | 392.3 -43% | 977 ? 43% |
| Write Seq Q32T1 (MB/s) | 5184 | 3242 -37% | 1540 -70% | 3541 -32% | 5270 2% | 5350 3% | 4932 ? -5% |
| Read Seq Q32T1 (MB/s) | 7088 | 3617 -49% | 6806 -4% | 3568 -50% | 7091 0% | 7130 1% | 6842 ? -3% |
| Write 4K Q8T8 (MB/s) | 2270 | 1390 ? | |||||
| Read 4K Q8T8 (MB/s) | 2490 | 2134 ? | |||||
| AS SSD | -34% | -23% | -39% | 10% | -26% | -19% | |
| Seq Read (MB/s) | 5223 | 3020 -42% | 5150 -1% | 2591 -50% | 5085 -3% | 4981 -5% | 4838 ? -7% |
| Seq Write (MB/s) | 3922 | 2631 -33% | 3920 0% | 1900 -52% | 4434 13% | 3050 -22% | 3490 ? -11% |
| 4K Read (MB/s) | 82.2 | 60.3 -27% | 46.6 -43% | 53.9 -34% | 80.3 -2% | 57 -31% | 72 ? -12% |
| 4K Write (MB/s) | 207.6 | 171.6 -17% | 145.8 -30% | 112.6 -46% | 214.7 3% | 261.3 26% | 188.8 ? -9% |
| 4K-64 Read (MB/s) | 2439 | 1410 -42% | 2071 -15% | 1335 -45% | 2573 5% | 1205 -51% | 2234 ? -8% |
| 4K-64 Write (MB/s) | 2652 | 2324 -12% | 3267 23% | 2966 12% | 2972 12% | 1290 -51% | 2622 ? -1% |
| Access Time Read * (ms) | 0.022 | 0.045 -105% | 0.078 -255% | 0.038 -73% | 0.018 18% | 0.032 -45% | 0.04075 ? -85% |
| Access Time Write * (ms) | 0.021 | 0.024 -14% | 0.029 -38% | 0.036 -71% | 0.02 5% | 0.044 -110% | 0.03363 ? -60% |
| Score Read (Points) | 3044 | 1773 -42% | 2633 -14% | 1648 -46% | 3161 4% | 1760 -42% | 2811 ? -8% |
| Score Write (Points) | 3252 | 2759 -15% | 2805 -14% | 3269 1% | 3631 12% | 1857 -43% | 3159 ? -3% |
| Score Total (Points) | 7794 | 5429 -30% | 7716 -1% | 5733 -26% | 8380 8% | 4428 -43% | 7334 ? -6% |
| Copy ISO MB/s (MB/s) | 3221 | 3190 -1% | 3239 1% | 3357 4% | 2688 ? -17% | ||
| Copy Program MB/s (MB/s) | 1151 | 987 -14% | 899 -22% | 966 -16% | 568 ? -51% | ||
| Copy Game MB/s (MB/s) | 1194 | 2096 76% | 2171 82% | 2051 72% | 1346 ? 13% | ||
| Media total (Programa/Opciones) | -32% /
-32% | -18% /
-20% | -38% /
-38% | 5% /
7% | -16% /
-19% | -10% /
-12% |
* ... más pequeño es mejor

Continuous load read: DiskSpd Read Loop, Queue Depth 8
Tarjeta gráfica
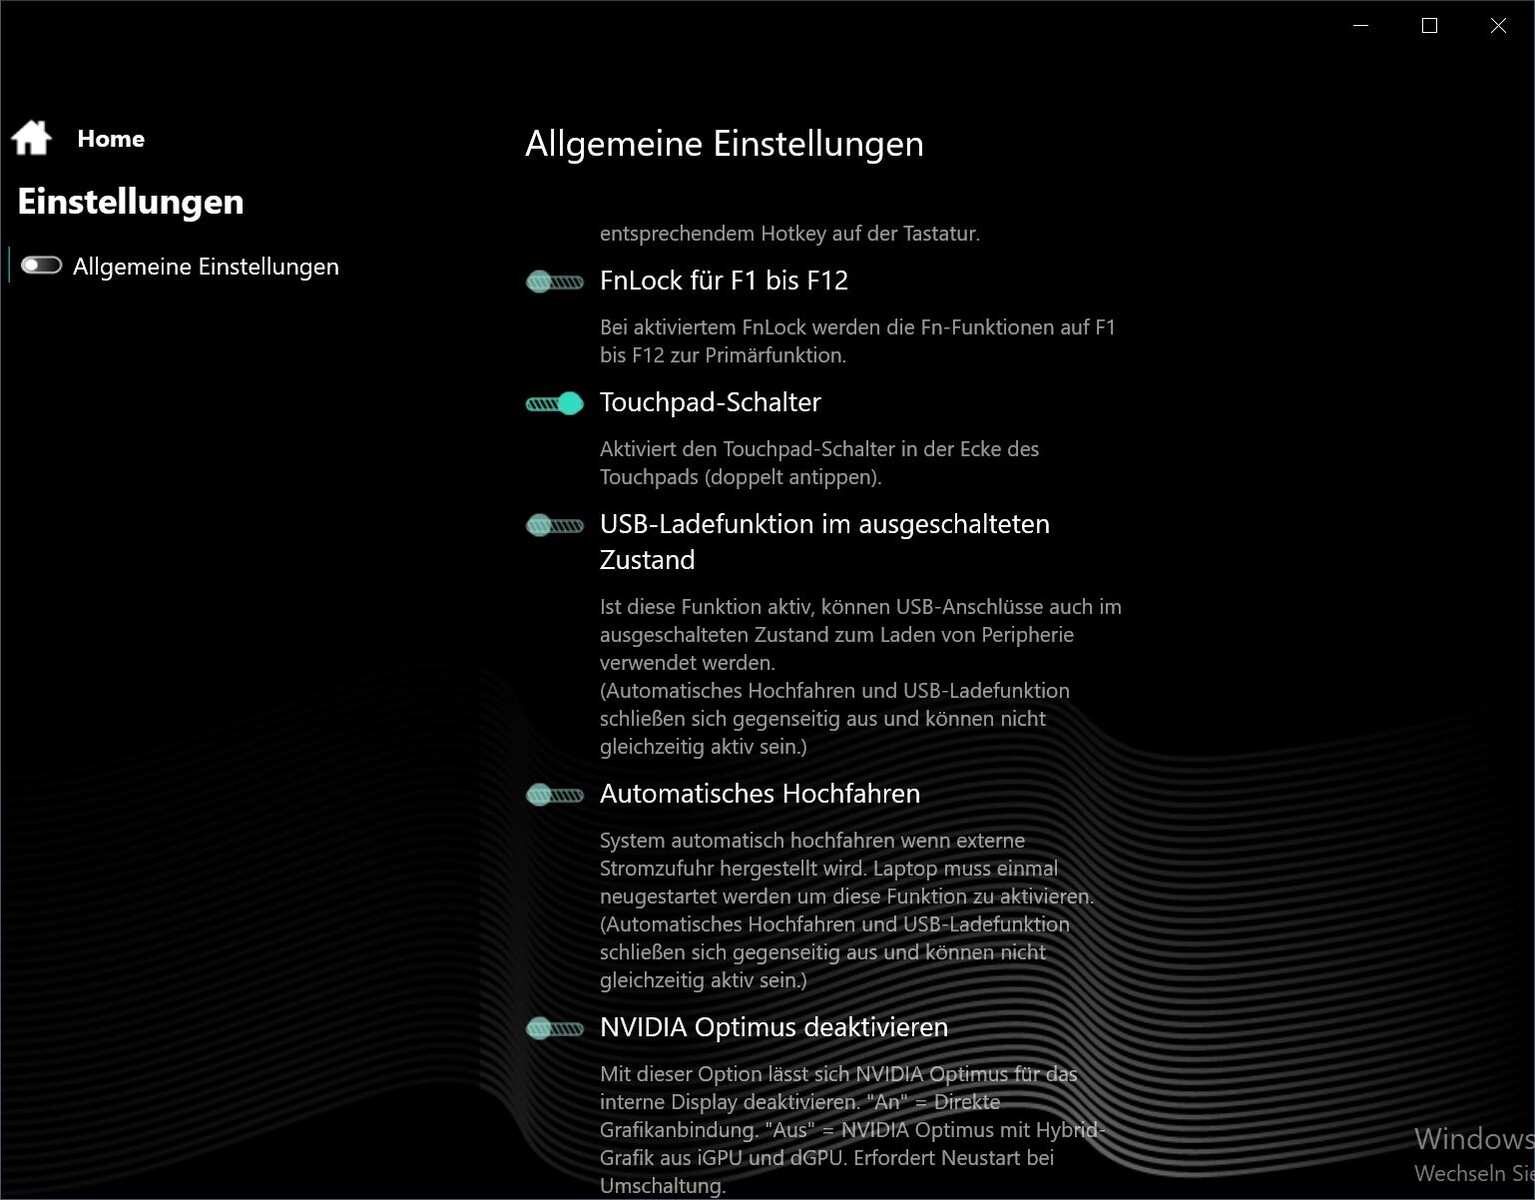
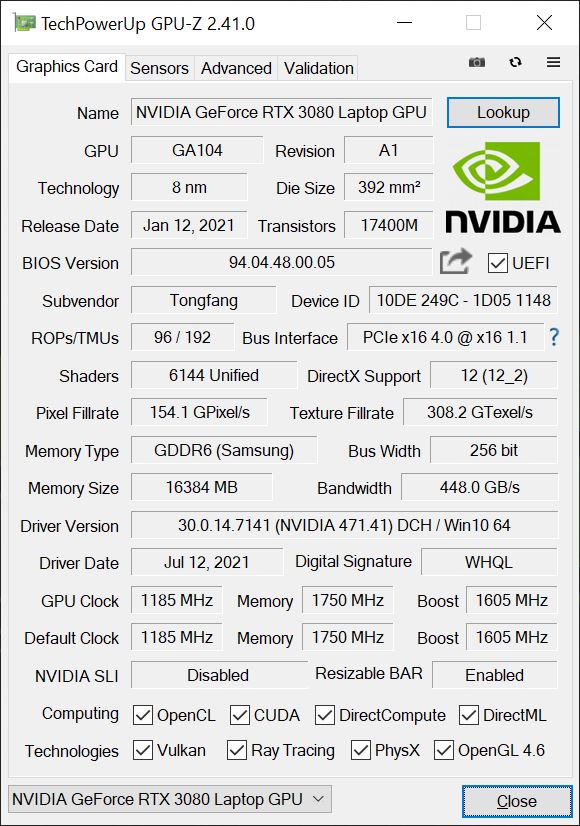
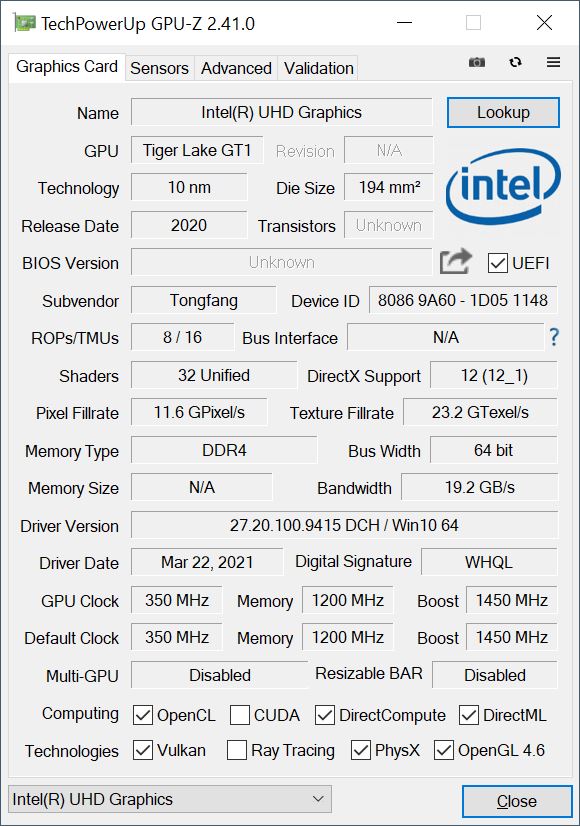
En el Neo, la gráfica integrada Intel Xe funciona primero, mientras que la fuerteGPU Nvidia GeForce RTX 3080 para portátiles espera para las tareas más exigentes. Puedes desactivar Nvidia Optimus y, por tanto, la GPU integrada en el Centro de Control, lo que podría resultar en unos cuantos fps más debido a la conexión directa sin redirección de señal a la iGPU. Encomiable: Schenker transmite al cliente la elección de TGP de la GPU publicada por Nvidia. Esto significa que los usuarios pueden asignar el TGP máximo de 165 W (incluyendo 15 W de Turbo Boost) a su NEO en el Centro de Control.
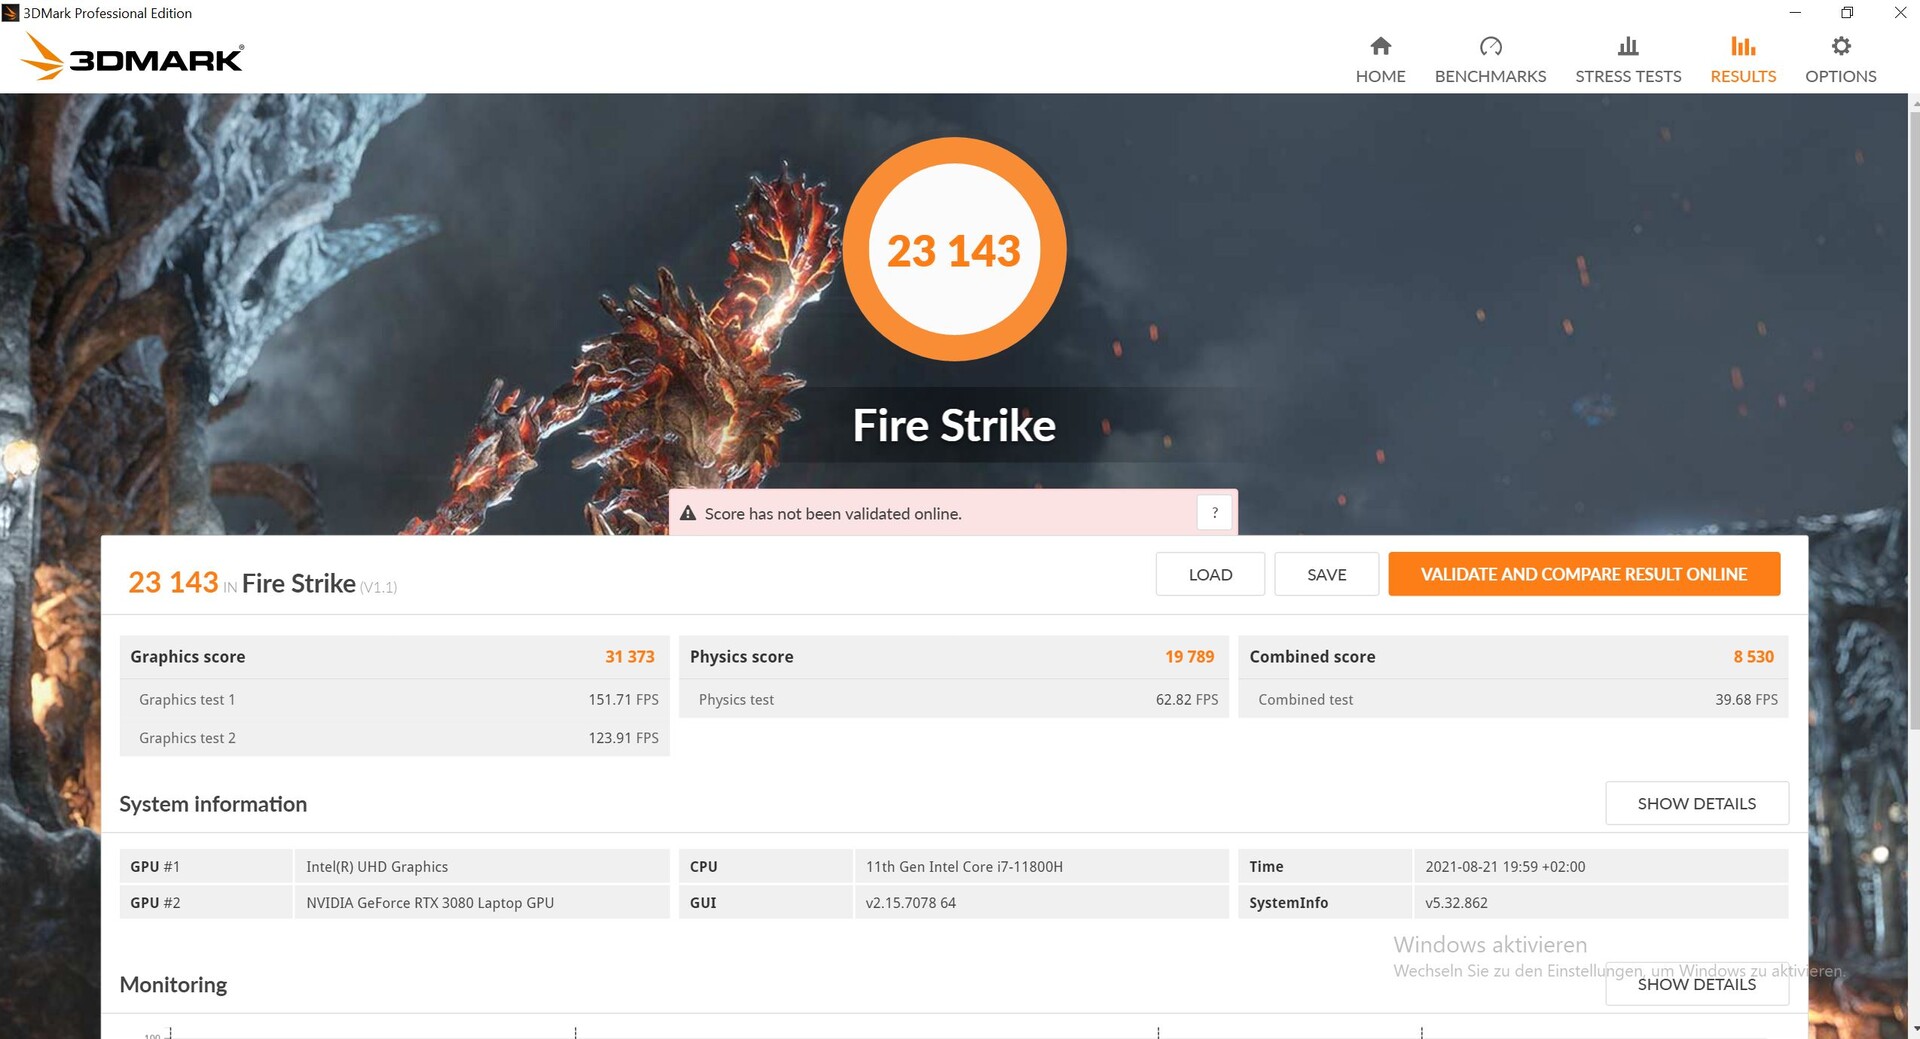
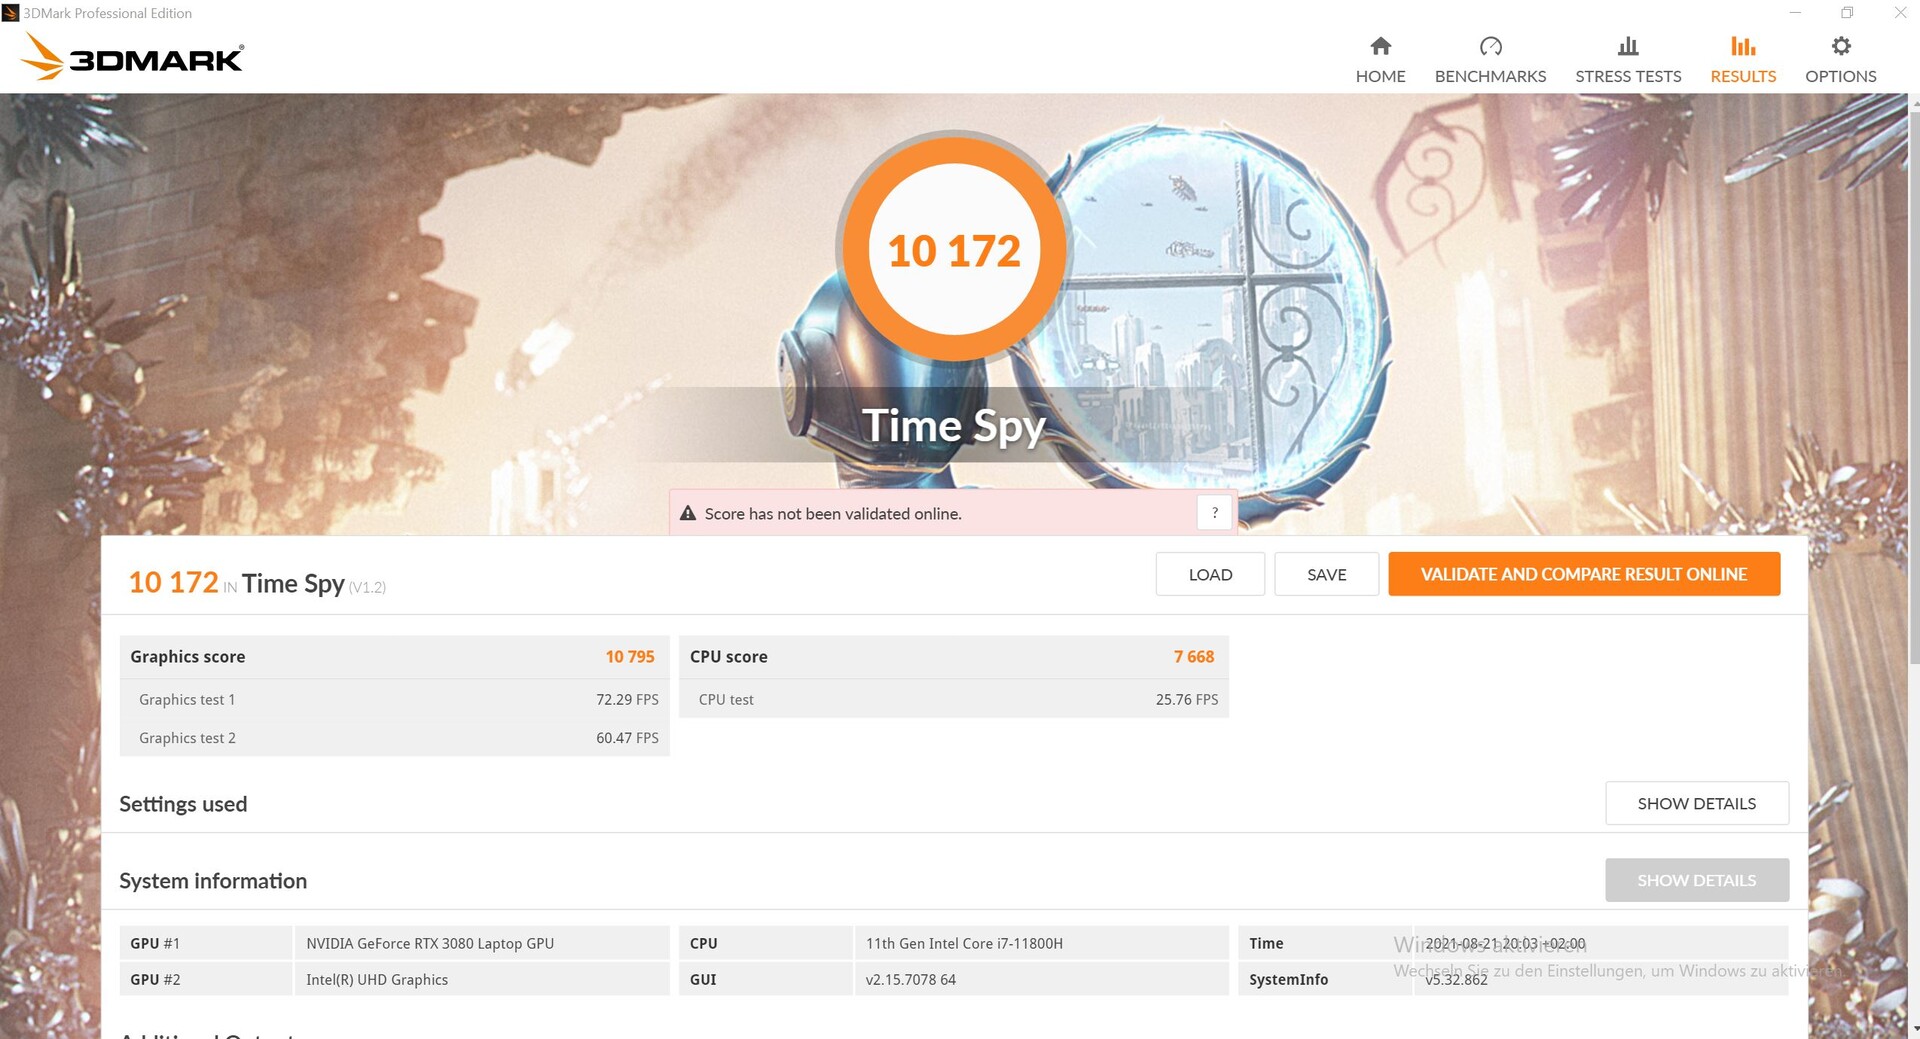
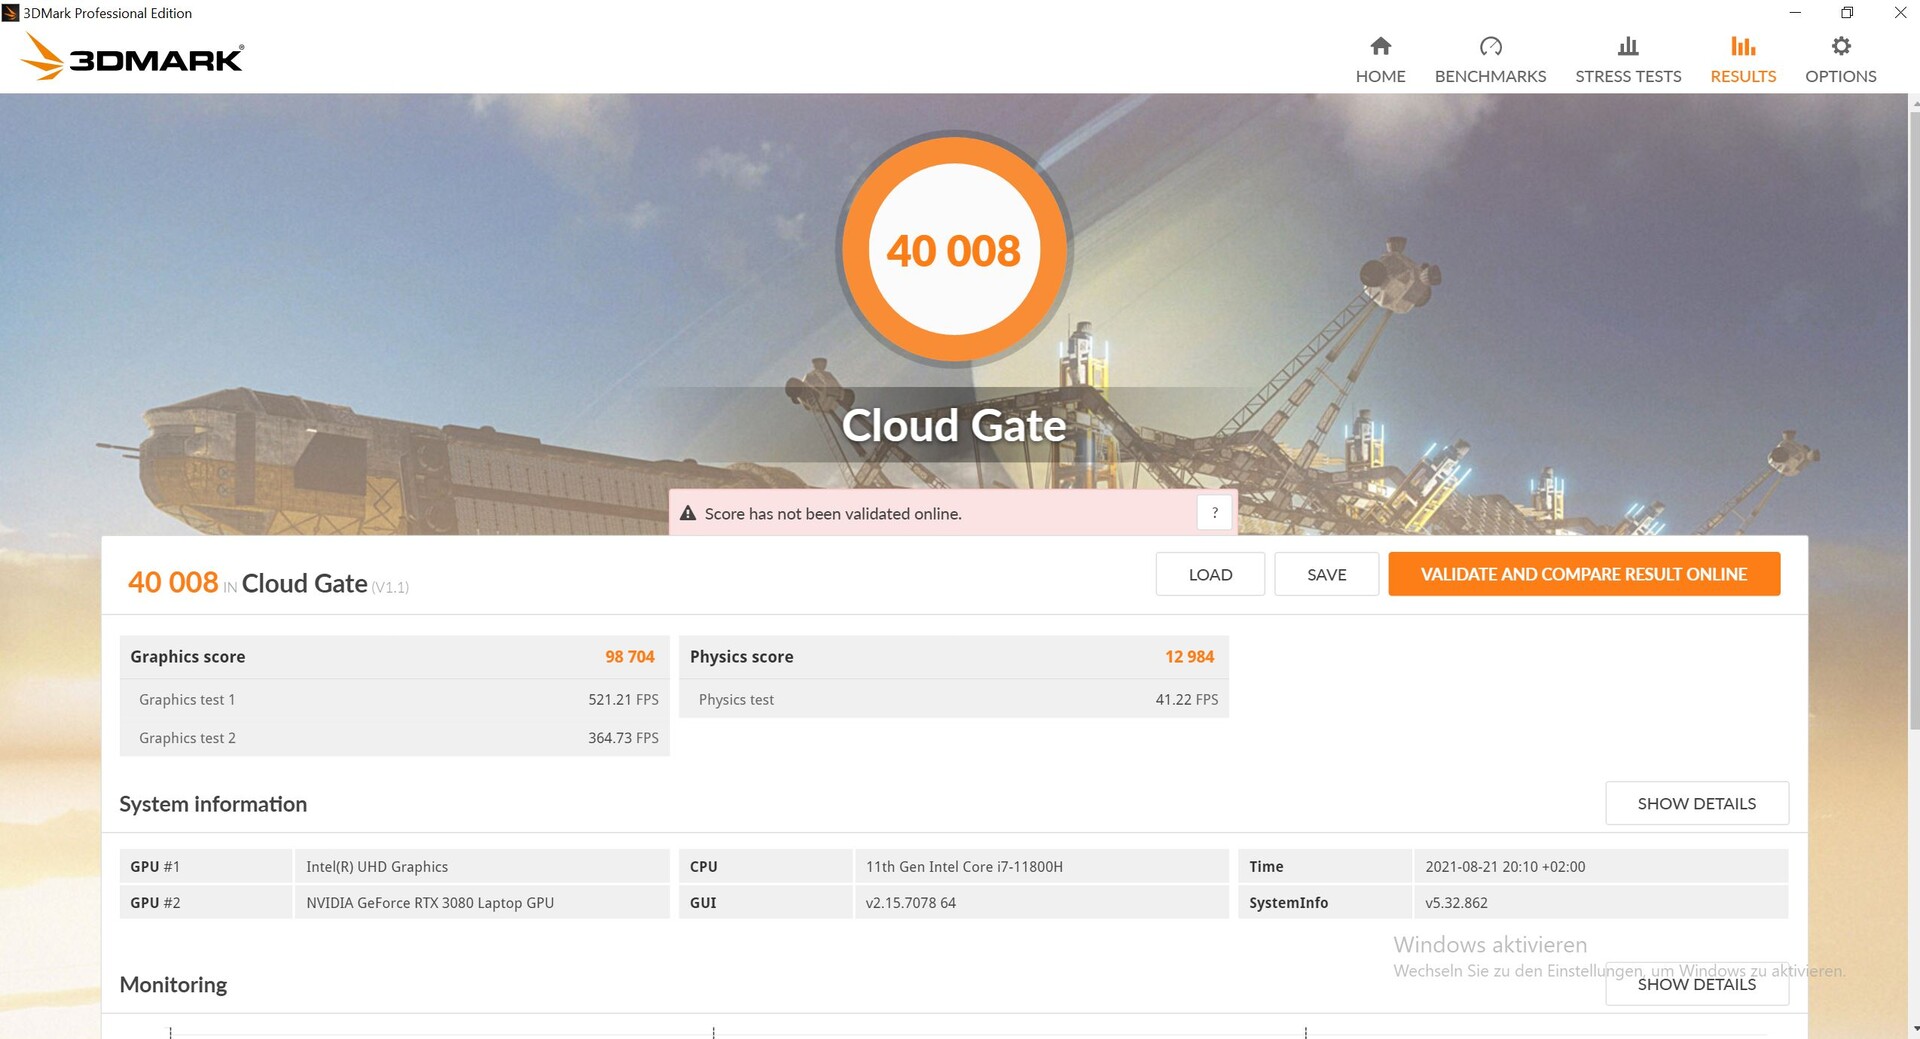
Nuestro NEO también se lleva la palma en 3DMark 11, por ejemplo, así como en la prueba Fire Strike de 3DMark. Sin embargo, el portátil rinde algo por debajo de la media en Time Spy y Cloud Gate. En general, podemos ver que el rendimiento de la RTX 3080 es muy alto
Otra ejecución de 3DMark 11 en modo batería revela una pérdida de rendimiento de alrededor del 64%

| 3DMark 11 Performance | 29046 puntos | |
| 3DMark Cloud Gate Standard Score | 40008 puntos | |
| 3DMark Fire Strike Score | 23143 puntos | |
| 3DMark Time Spy Score | 10172 puntos | |
ayuda | ||
Rendimiento de los juegos
En los distintos benchmarks de juegos, el NEO se lleva la palma casi siempre gracias a su potente GPU, y la RTX 3080 rinde un 10% más que todos los modelos que probamos. El Zephyrus es su competidor más fuerte y a menudo se acerca mucho al NEO, aunque la RTX 3080 del Zephyrus sólo tiene un TGP de 140W. Así que, aunque el NEO suele estar a la cabeza, el rendimiento podría ser un poco mejor.
| Shadow of the Tomb Raider | |
| 1920x1080 Lowest Preset | |
| Schenker XMG NEO 17 GM7TG8S | |
| Medio NVIDIA GeForce RTX 3080 Laptop GPU (117 - 178.7, n=8) | |
| Asus ROG Zephyrus S17 GX703HSD | |
| 1920x1080 Medium Preset | |
| Schenker XMG NEO 17 GM7TG8S | |
| Asus ROG Zephyrus S17 GX703HSD | |
| Medio NVIDIA GeForce RTX 3080 Laptop GPU (81.6 - 164, n=12) | |
| 1920x1080 High Preset AA:SM | |
| Asus ROG Zephyrus S17 GX703HSD | |
| Schenker XMG NEO 17 GM7TG8S | |
| Medio NVIDIA GeForce RTX 3080 Laptop GPU (79.4 - 160, n=13) | |
| Media de la clase Gaming (107 - 127, n=2, últimos 2 años) | |
| 1920x1080 Highest Preset AA:T | |
| Schenker XMG NEO 17 GM7TG8S | |
| Asus ROG Zephyrus S17 GX703HSD | |
| Medio NVIDIA GeForce RTX 3080 Laptop GPU (76.6 - 151, n=13) | |
| Media de la clase Gaming (96 - 116, n=2, últimos 2 años) | |
| 2560x1440 Highest Preset AA:T | |
| Schenker XMG NEO 17 GM7TG8S | |
| Asus ROG Zephyrus S17 GX703HSD | |
| Medio NVIDIA GeForce RTX 3080 Laptop GPU (79 - 113, n=7) | |
Al analizar la Witcher 3 velocidad de fotogramas durante un periodo de una hora, se observa que los fps descienden ligeramente pero de forma continua a lo largo del tiempo. Por lo tanto, la ralentización se observa definitivamente durante una carga prolongada
Witcher 3 FPS-Diagram
| bajo | medio | alto | ultra | QHD | |
|---|---|---|---|---|---|
| GTA V (2015) | 185 | 182 | 176 | 112 | |
| The Witcher 3 (2015) | 418 | 329 | 210 | 113 | |
| Dota 2 Reborn (2015) | 179 | 157 | 141.5 | 134.7 | |
| X-Plane 11.11 (2018) | 132 | 118 | 88.9 | ||
| Far Cry 5 (2018) | 168 | 143 | 137 | 127 | 112 |
| Strange Brigade (2018) | 535 | 305 | 247 | 218 | |
| Shadow of the Tomb Raider (2018) | 170 | 150 | 131 | 132 | 113 |
Emisiones - Ruido molesto
Emisiones acústicas
Incluso en el modo overboost, los ventiladores suelen permanecer en silencio durante el ralentí. Sin embargo, si se aplica una carga de antemano, los ventiladores siguen rugiendo silenciosamente durante bastante tiempo en el ralentí posterior. Bajo carga, el desarrollo del ruido es comparable al de la competencia, pero 55 dB(A) es claramente molesto para todos ellos, sólo el Zephyrus se mantiene un poco más silencioso bajo carga completa.
Sin embargo, hay ruidos molestos temporales. Un chirrido electrónico algo más fuerte y un zumbido aparecen temporalmente cuando se aplican ciertas cargas, como 3DMark o juegos, pero luego desaparecen de nuevo. Estos ruidos eran más flagrantes en el Zephyrus, pero son molestos aquí también porque parecen innecesarios
Ruido
| Ocioso |
| 23 / 23 / 23 dB(A) |
| Carga |
| 39.5 / 55.09 dB(A) |
 | ||
30 dB silencioso 40 dB(A) audible 50 dB(A) ruidosamente alto |
||
min: | ||
| Schenker XMG NEO 17 GM7TG8S GeForce RTX 3080 Laptop GPU, i7-11800H, Samsung SSD 980 Pro 1TB MZ-V8P1T0BW | Schenker XMG Neo 17 (Early 2021, RTX 3070, 5800H) GeForce RTX 3070 Laptop GPU, R7 5800H, Samsung SSD 970 EVO Plus 500GB | Aorus 17G YD GeForce RTX 3080 Laptop GPU, i7-11800H, Samsung PM9A1 MZVL2512HCJQ | Medion Erazer Beast X25 GeForce RTX 3080 Laptop GPU, R9 5900HX, Samsung PM9A1 MZVL22T0HBLB | Asus ROG Zephyrus S17 GX703HSD GeForce RTX 3080 Laptop GPU, i9-11900H, Samsung PM9A1 MZVL22T0HBLB | Asus Strix Scar 17 G733QSA-XS99 GeForce RTX 3080 Laptop GPU, R9 5900HX, 2x Samsung PM981a MZVLB1T0HBLR (RAID 0) | |
|---|---|---|---|---|---|---|
| Noise | -22% | -25% | -24% | 3% | -1% | |
| apagado / medio ambiente * (dB) | 23 | 24 -4% | 25 -9% | 25 -9% | 23 -0% | 25 -9% |
| Idle Minimum * (dB) | 23 | 29 -26% | 32 -39% | 26 -13% | 23 -0% | 25.2 -10% |
| Idle Average * (dB) | 23 | 32 -39% | 33 -43% | 30 -30% | 23 -0% | 25.2 -10% |
| Idle Maximum * (dB) | 23 | 38 -65% | 39 -70% | 43 -87% | 23 -0% | 25.2 -10% |
| Load Average * (dB) | 39.5 | 49 -24% | 43 -9% | 54 -37% | 41 -4% | 30.7 22% |
| Witcher 3 ultra * (dB) | 54.5 | 53 3% | 52 5% | 52 5% | 45 17% | 51.3 6% |
| Load Maximum * (dB) | 55.09 | 55 -0% | 61 -11% | 55 -0% | 52 6% | 51.3 7% |
* ... más pequeño es mejor
Temperatura
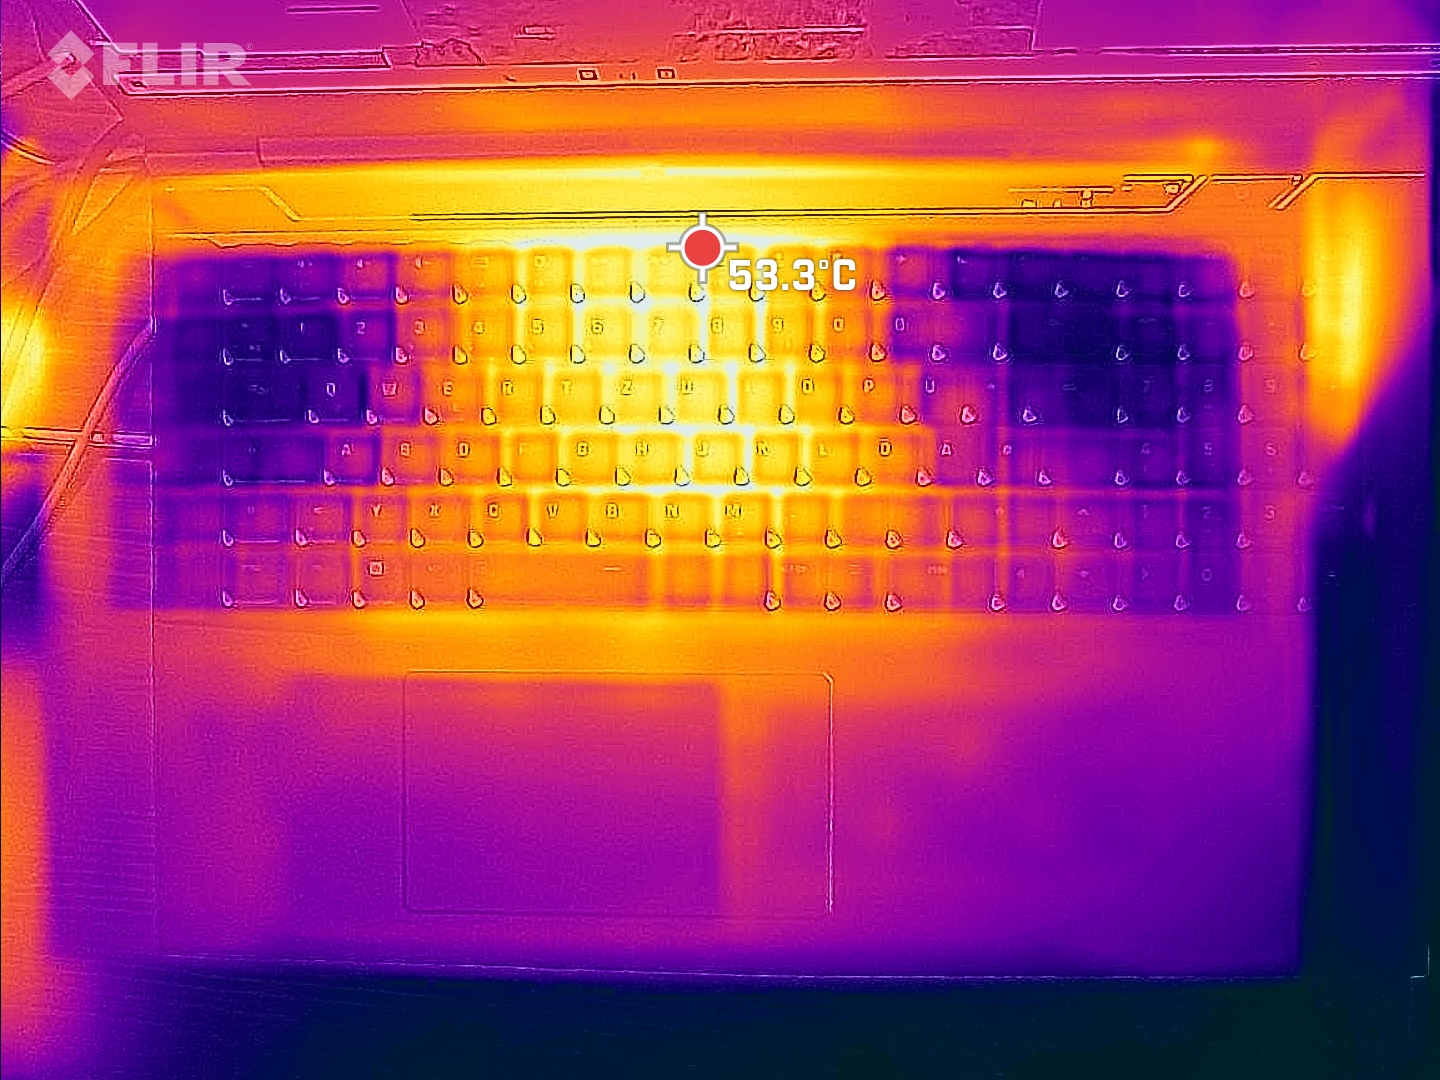
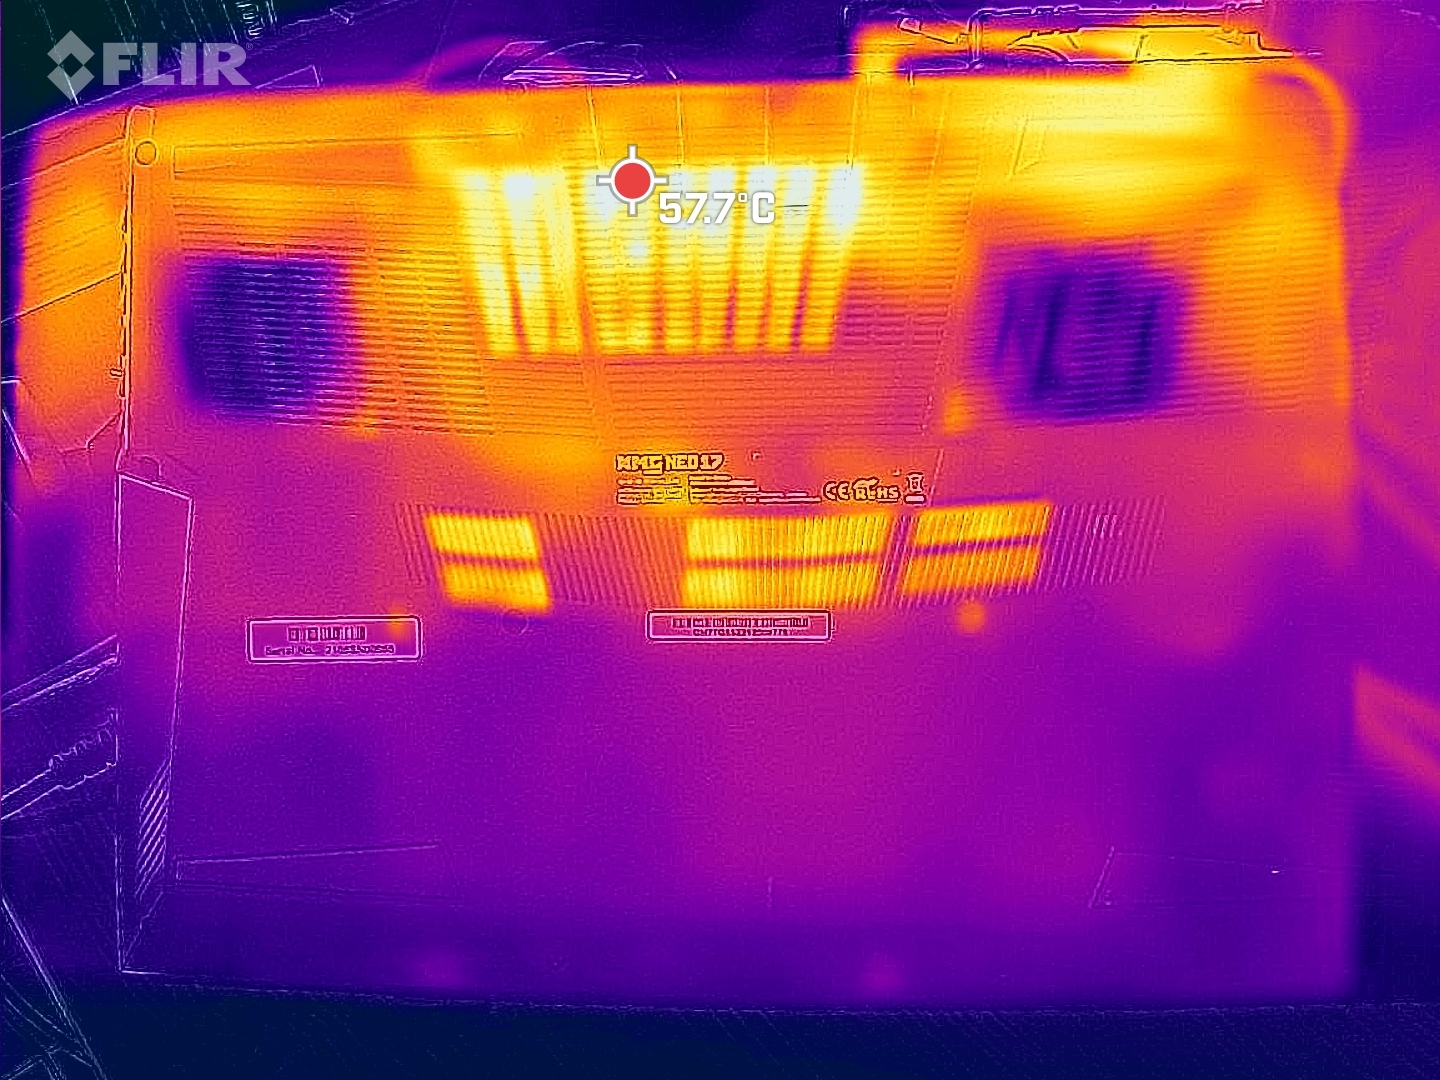
Pueden aparecer puntos calientes de más de 60 °C en la parte inferior bajo carga completa, lo que hace que el NEO sea un poco más caliente que la mayoría de sus rivales. Se calienta especialmente en el centro y hacia la pantalla, pero afortunadamente los reposamanos siempre se mantienen frescos.La zona de las teclas WASD se calienta hasta unos41 °C cuando se juega Witcher 3. Especialmente el Aorus o el Asus Strix Scar se mantienen más frescos bajo carga
(-) La temperatura máxima en la parte superior es de 51 °C / 124 F, frente a la media de 40.4 °C / 105 F, que oscila entre 21.2 y 68.8 °C para la clase Gaming.
(-) El fondo se calienta hasta un máximo de 62 °C / 144 F, frente a la media de 43.2 °C / 110 F
(+) En reposo, la temperatura media de la parte superior es de 30.9 °C / 88# F, frente a la media del dispositivo de 33.9 °C / 93 F.
(-) Jugando a The Witcher 3, la temperatura media de la parte superior es de 39.6 °C / 103 F, frente a la media del dispositivo de 33.9 °C / 93 F.
(±) El reposamanos y el touchpad pueden calentarse mucho al tacto con un máximo de 37 °C / 98.6 F.
(-) La temperatura media de la zona del reposamanos de dispositivos similares fue de 28.8 °C / 83.8 F (-8.2 °C / -14.8 F).
| Schenker XMG NEO 17 GM7TG8S GeForce RTX 3080 Laptop GPU, i7-11800H, Samsung SSD 980 Pro 1TB MZ-V8P1T0BW | Schenker XMG Neo 17 (Early 2021, RTX 3070, 5800H) GeForce RTX 3070 Laptop GPU, R7 5800H, Samsung SSD 970 EVO Plus 500GB | Aorus 17G YD GeForce RTX 3080 Laptop GPU, i7-11800H, Samsung PM9A1 MZVL2512HCJQ | Medion Erazer Beast X25 GeForce RTX 3080 Laptop GPU, R9 5900HX, Samsung PM9A1 MZVL22T0HBLB | Asus ROG Zephyrus S17 GX703HSD GeForce RTX 3080 Laptop GPU, i9-11900H, Samsung PM9A1 MZVL22T0HBLB | Asus Strix Scar 17 G733QSA-XS99 GeForce RTX 3080 Laptop GPU, R9 5900HX, 2x Samsung PM981a MZVLB1T0HBLR (RAID 0) | |
|---|---|---|---|---|---|---|
| Heat | 10% | 19% | 3% | 2% | 15% | |
| Maximum Upper Side * (°C) | 51 | 47 8% | 36 29% | 54 -6% | 59 -16% | 40 22% |
| Maximum Bottom * (°C) | 62 | 51 18% | 52 16% | 57 8% | 53 15% | 39.8 36% |
| Idle Upper Side * (°C) | 35 | 32 9% | 29 17% | 34 3% | 35 -0% | 34.6 1% |
| Idle Bottom * (°C) | 38 | 37 3% | 33 13% | 35 8% | 35 8% | 38.4 -1% |
* ... más pequeño es mejor
Los núcleos de la CPU comienzan nuestra prueba de estrés con unos 4,2 GHz. El reloj fluctúa fuertemente y sólo llega a 2.3 GHz al final, que es el reloj base. La ralentización térmica es, por tanto, bastante pronunciada a lo largo del tiempo en el NEO, lo que probablemente también se deba al hecho de que concedemos a la RTX 3080 el máximo TGP. Aquí, los usuarios deberían probar un buen compromiso entre el TDP de la CPU, el TGP de la GPU y el desarrollo del calor. Esta necesidad de probar es uno de los inconvenientes de las, por otra parte, buenas libertades del NEO 17.
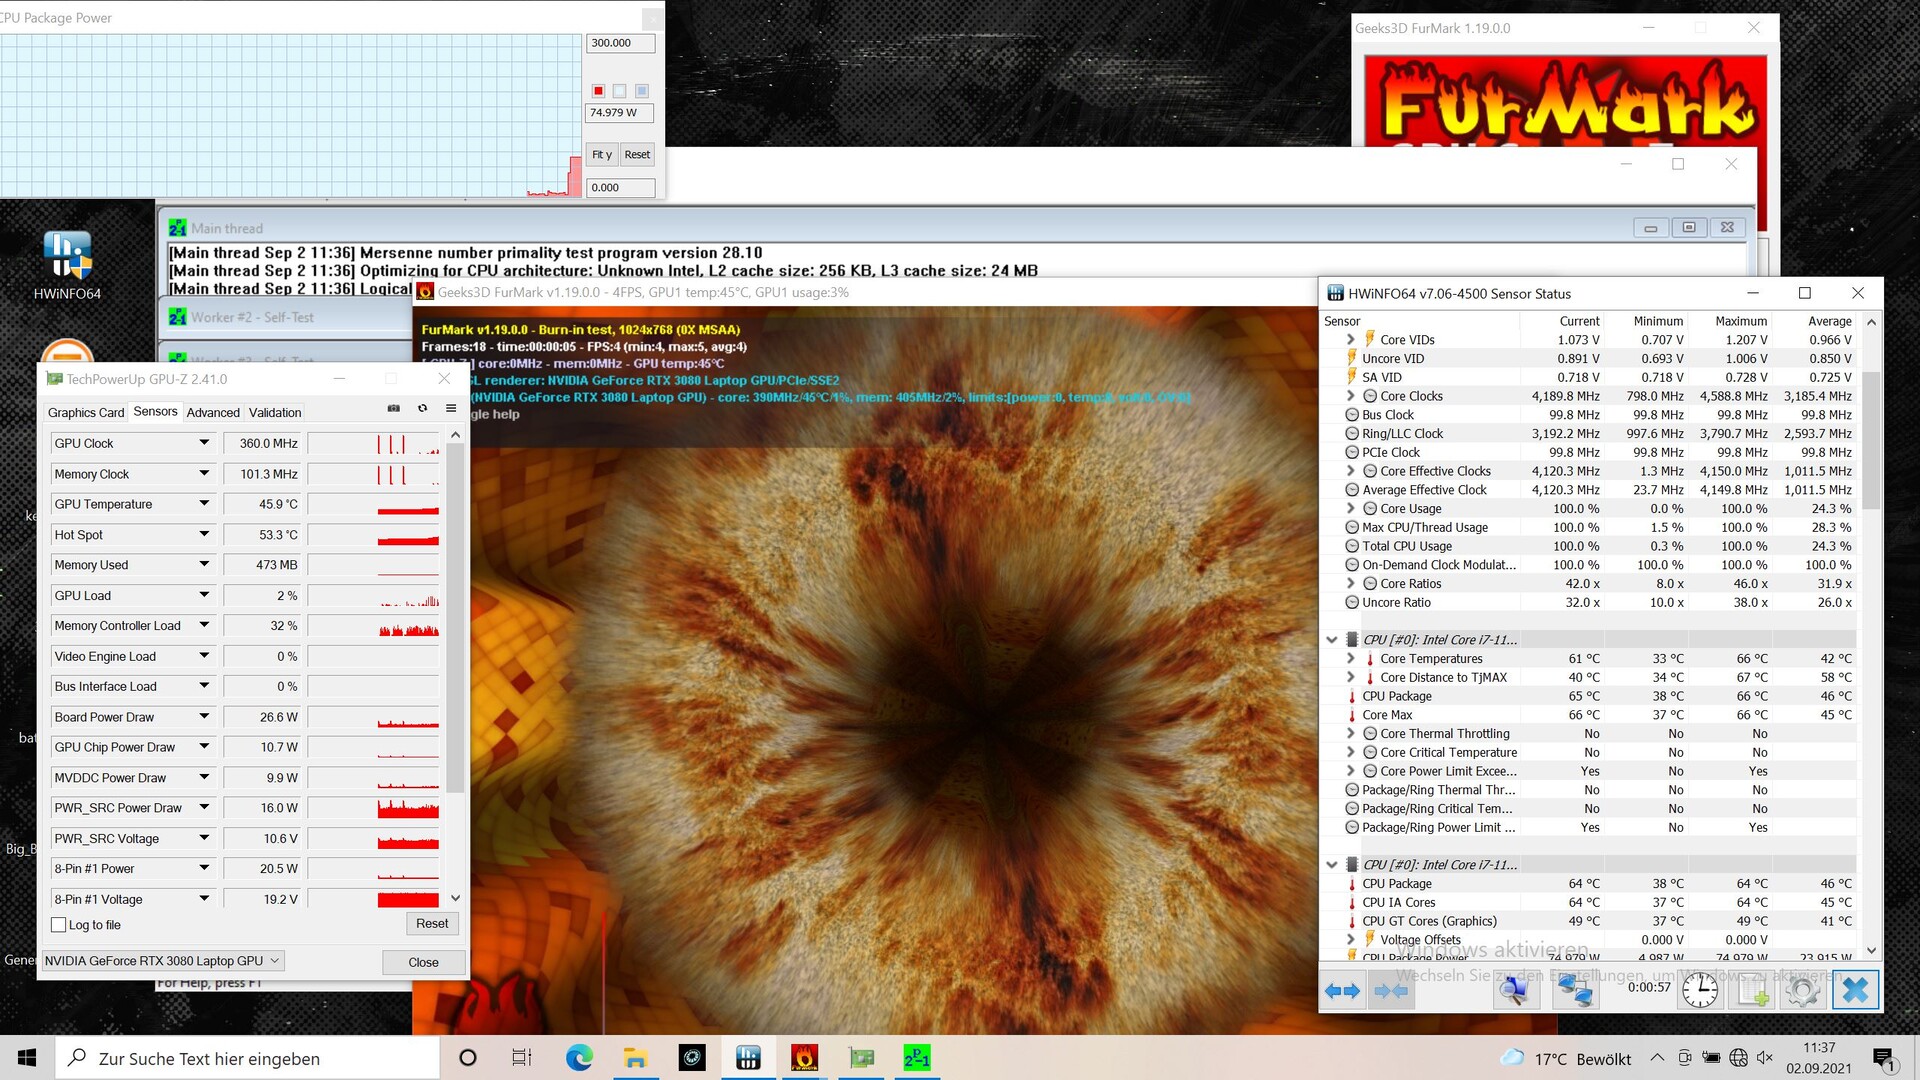
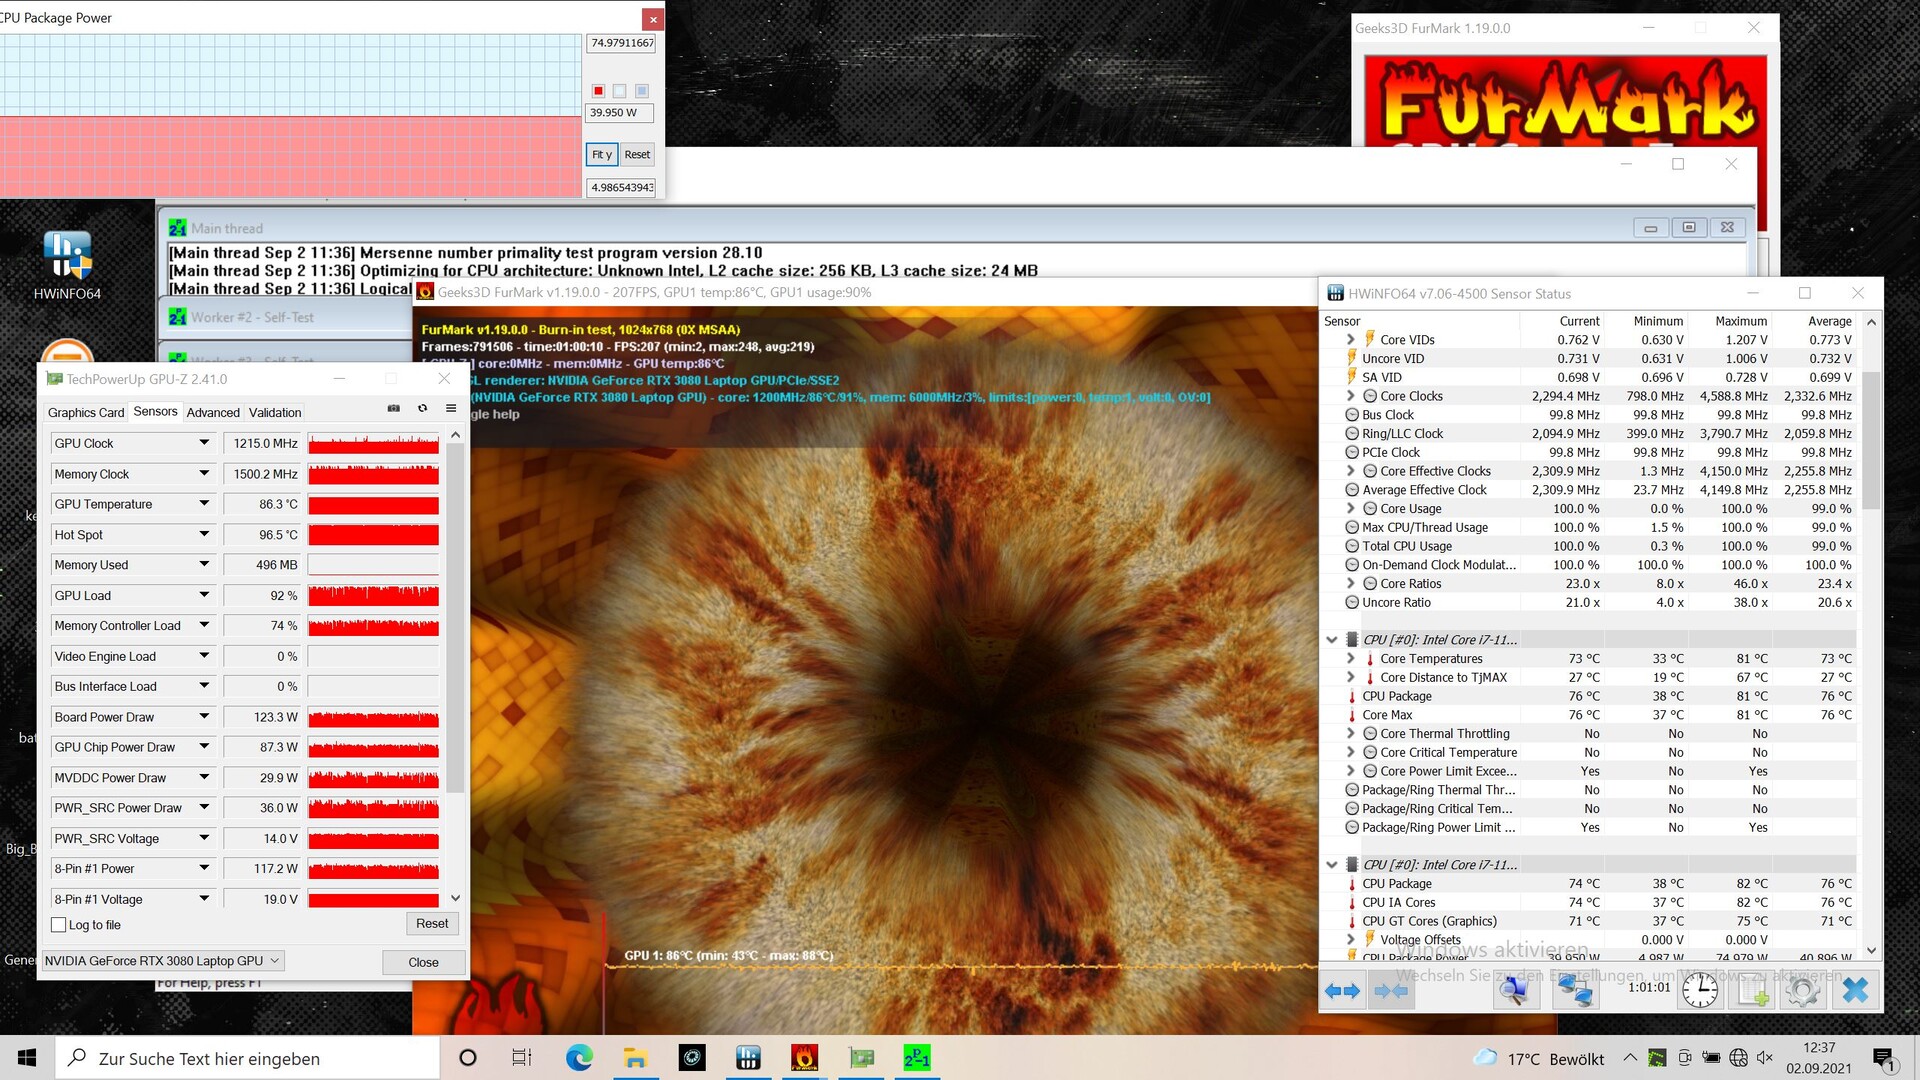
El NEO aún tiene margen de mejora en cuanto a las temperaturas del núcleo, que sólo sonde 73 °C tras una hora de pruebas, con un máximo de sólo 81°C
El reloj de la GPU baja de 1.485 MHz al principio a 1.215 MHz al final. El núcleo se calienta hasta unos 86 °C (186,8 °F), y el límite térmico se alcanza a los 87 °C(188,6°F).
Altavoz
Los altavoces ya están entre los mejores en el campo de los altavoces para portátiles. Son bastante fuertes y producen unos medios y agudos equilibrados. Por supuesto, los bajos son un poco más bajos, pero en comparación con muchos otros altavoces, los bajos llegan. En general, la impresión auditiva es positiva en comparación. Sin embargo, hay que utilizar un equipo externo para disfrutar realmente del audio. Dispone de una entrada de micrófono independiente y una salida de auriculares para las conexiones analógicas
Schenker XMG NEO 17 GM7TG8S análisis de audio
(±) | la sonoridad del altavoz es media pero buena (78.4 dB)
Graves 100 - 315 Hz
(±) | lubina reducida - en promedio 13.7% inferior a la mediana
(±) | la linealidad de los graves es media (12.5% delta a frecuencia anterior)
Medios 400 - 2000 Hz
(±) | medias más altas - de media 5.3% más altas que la mediana
(+) | los medios son lineales (6.2% delta a la frecuencia anterior)
Altos 2 - 16 kHz
(+) | máximos equilibrados - a sólo 2.8% de la mediana
(+) | los máximos son lineales (5.7% delta a la frecuencia anterior)
Total 100 - 16.000 Hz
(+) | el sonido global es lineal (14.8% de diferencia con la mediana)
En comparación con la misma clase
» 29% de todos los dispositivos probados de esta clase eran mejores, 7% similares, 64% peores
» El mejor tuvo un delta de 6%, la media fue 18%, el peor fue ###max##%
En comparación con todos los dispositivos probados
» 20% de todos los dispositivos probados eran mejores, 4% similares, 76% peores
» El mejor tuvo un delta de 4%, la media fue 24%, el peor fue ###max##%
Apple MacBook 12 (Early 2016) 1.1 GHz análisis de audio
(+) | los altavoces pueden reproducir a un volumen relativamente alto (#83.6 dB)
Graves 100 - 315 Hz
(±) | lubina reducida - en promedio 11.3% inferior a la mediana
(±) | la linealidad de los graves es media (14.2% delta a frecuencia anterior)
Medios 400 - 2000 Hz
(+) | medios equilibrados - a sólo 2.4% de la mediana
(+) | los medios son lineales (5.5% delta a la frecuencia anterior)
Altos 2 - 16 kHz
(+) | máximos equilibrados - a sólo 2% de la mediana
(+) | los máximos son lineales (4.5% delta a la frecuencia anterior)
Total 100 - 16.000 Hz
(+) | el sonido global es lineal (10.2% de diferencia con la mediana)
En comparación con la misma clase
» 7% de todos los dispositivos probados de esta clase eran mejores, 2% similares, 91% peores
» El mejor tuvo un delta de 5%, la media fue 18%, el peor fue ###max##%
En comparación con todos los dispositivos probados
» 5% de todos los dispositivos probados eran mejores, 1% similares, 94% peores
» El mejor tuvo un delta de 4%, la media fue 24%, el peor fue ###max##%
Gestión de la energía: frugal en reposo, derrochadora durante el juego
Consumo de energía
En todos los escenarios, el NEO 17 es relativamente frugal, sólo el Asus Strix consume menos. Sin embargo, el consumo es relativamente alto en juegos, lo que probablemente se deba a la RTX desatada y suele poner al NEO en primer lugar en términos de fps.
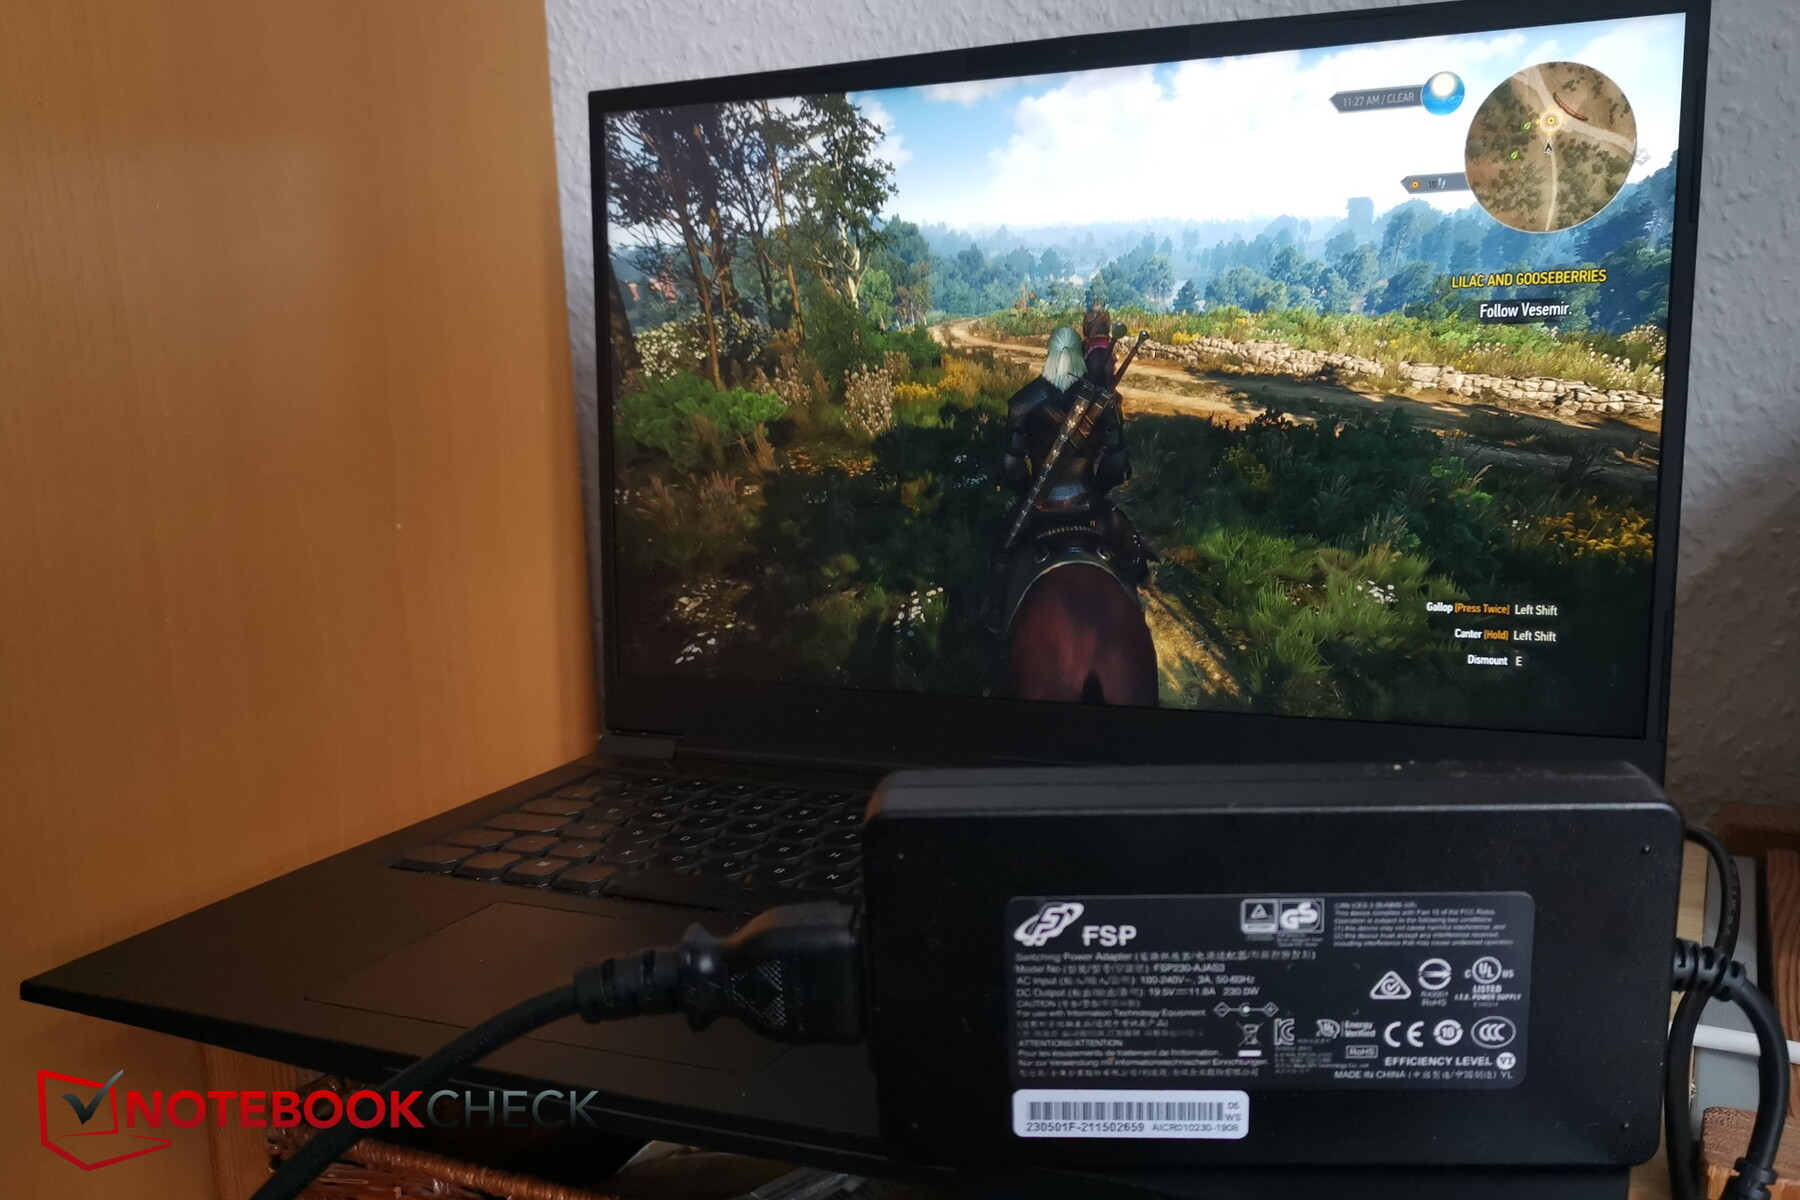
Medimos picos de consumo muy cortos de algo más de 230 W en el test de estrés. Sin embargo, dado que el consumo medio es de 226 W incluso en este escenario de carga extrema, la fuente de alimentación de 230 W debería tener un tamaño suficiente
| Ocioso | |
| Carga |
|
Clave:
min: | |
| Schenker XMG NEO 17 GM7TG8S i7-11800H, GeForce RTX 3080 Laptop GPU, Samsung SSD 980 Pro 1TB MZ-V8P1T0BW, IPS, 2560x1440, 17.3" | Schenker XMG Neo 17 (Early 2021, RTX 3070, 5800H) R7 5800H, GeForce RTX 3070 Laptop GPU, Samsung SSD 970 EVO Plus 500GB, IPS, 2560x1440, 17.3" | Aorus 17G YD i7-11800H, GeForce RTX 3080 Laptop GPU, Samsung PM9A1 MZVL2512HCJQ, IPS, 1920x1080, 17.3" | Medion Erazer Beast X25 R9 5900HX, GeForce RTX 3080 Laptop GPU, Samsung PM9A1 MZVL22T0HBLB, IPS, 1920x1080, 17.3" | Asus ROG Zephyrus S17 GX703HSD i9-11900H, GeForce RTX 3080 Laptop GPU, Samsung PM9A1 MZVL22T0HBLB, IPS, 2560x1440, 17.3" | Asus Strix Scar 17 G733QSA-XS99 R9 5900HX, GeForce RTX 3080 Laptop GPU, 2x Samsung PM981a MZVLB1T0HBLR (RAID 0), IPS, 1920x1080, 17.3" | Medio NVIDIA GeForce RTX 3080 Laptop GPU | Media de la clase Gaming | |
|---|---|---|---|---|---|---|---|---|
| Power Consumption | 10% | -6% | -7% | -4% | 17% | -5% | 10% | |
| Idle Minimum * (Watt) | 19 | 13 32% | 24 -26% | 22 -16% | 21.7 -14% | 10.9 43% | 19.8 ? -4% | 13.3 ? 30% |
| Idle Average * (Watt) | 25 | 16 36% | 26 -4% | 26 -4% | 27 -8% | 14.7 41% | 24.3 ? 3% | 19 ? 24% |
| Idle Maximum * (Watt) | 28 | 26 7% | 38 -36% | 34 -21% | 33 -18% | 26.8 4% | 33.3 ? -19% | 24.5 ? 12% |
| Load Average * (Watt) | 105 | 125 -19% | 101 4% | 120 -14% | 108 -3% | 106.7 -2% | 108.1 ? -3% | 108.1 ? -3% |
| Witcher 3 ultra * (Watt) | 223 | 187 16% | 164 26% | 189 15% | 195 13% | 192.4 14% | ||
| Load Maximum * (Watt) | 226 | 259 -15% | 230 -2% | 231 -2% | 210 7% | 228.4 -1% | 230 ? -2% | 254 ? -12% |
* ... más pequeño es mejor
Energy consumption Witcher 3 / Stress test
Duración de la batería
Schenker ahorra en batería y sólo instala una capacidad de 62 Wh. Eso es demasiado poco para un jugador tan ávido de rendimiento. La competencia usa al menos 90 Wh, y eso también se nota en las duraciones. Los rivales duran casi el doble en la prueba de Wi-Fi y vídeo El NEO sólo dura 3 horas y 45 minutos. A diferencia de las pruebas de rendimiento, volvimos a activar Optimus y cambiamos al modo equilibrado en el Centro de Control en lugar de Overboost
| Schenker XMG NEO 17 GM7TG8S i7-11800H, GeForce RTX 3080 Laptop GPU, 62 Wh | Schenker XMG Neo 17 (Early 2021, RTX 3070, 5800H) R7 5800H, GeForce RTX 3070 Laptop GPU, 62 Wh | Aorus 17G YD i7-11800H, GeForce RTX 3080 Laptop GPU, 99 Wh | Medion Erazer Beast X25 R9 5900HX, GeForce RTX 3080 Laptop GPU, 91 Wh | Asus ROG Zephyrus S17 GX703HSD i9-11900H, GeForce RTX 3080 Laptop GPU, 90 Wh | Asus Strix Scar 17 G733QSA-XS99 R9 5900HX, GeForce RTX 3080 Laptop GPU, 90 Wh | Media de la clase Gaming | |
|---|---|---|---|---|---|---|---|
| Duración de Batería | -31% | 43% | 36% | 89% | 69% | 68% | |
| H.264 (h) | 3.7 | 6.2 68% | 7.2 95% | 8.26 ? 123% | |||
| WiFi v1.3 (h) | 3.7 | 3.5 -5% | 6 62% | 6.8 84% | 7.5 103% | 9.3 151% | 7.01 ? 89% |
| Load (h) | 1.6 | 0.7 -56% | 1.6 0% | 1.4 -13% | 2.7 69% | 1.4 -13% | 1.47 ? -8% |
| Reader / Idle (h) | 4.7 | 9 | 9.9 | 13.3 | 8.71 ? | ||
| Witcher 3 ultra (h) | 1 |
Pro
Contra
Veredicto - Configure usted mismo
La ventaja del NEO es a la vez una maldición y una bendición: Casi todos los parámetros de rendimiento pueden ajustarse manualmente en el software. Esto permite dar rienda suelta a la RTX 3080, por ejemplo, asignándole el máximo TGP. Los entusiastas de los juegos probablemente disfrutarán personalizando el NEO 17 según sus necesidades y exprimiendo cada fotograma extra. Los no jugadores pueden al menos usar perfiles predefinidos, pero podrían verse abrumados por el equilibrio manual del rendimiento de la CPU y la GPU en la delgada carcasa.
Como a menudo, la versión AMD tiene el mejor rendimiento de la CPU, pero se omite el Thunderbolt. Por desgracia, la duración de la batería no es muy competitiva para todas las configuraciones del NEO-17, especialmente a este precio.
Sin embargo, no hay nada de lo que quejarse en el resto del hardware. Además de la CPU y la GPU, el SSD, por ejemplo, también está en lo más alto.
El NEO 17 cuenta con muchas opciones de ajuste; casi todos los parámetros de rendimiento se pueden ajustar manualmente en el software. Hay críticas por la escasa duración de la batería.
Precio y disponibilidad
Schenker ofrece un enlace a bestware.com donde nuestro modelo de prueba está actualmente disponible en el configurador por 2.721,98 euros (~3.196 dólares)
Schenker XMG NEO 17 GM7TG8S
- 09/30/2021 v7 (old)
Christian Hintze
Price comparison
