Análisis del portátil Alienware x17 R1 RTX 3080: Un nuevo comienzo

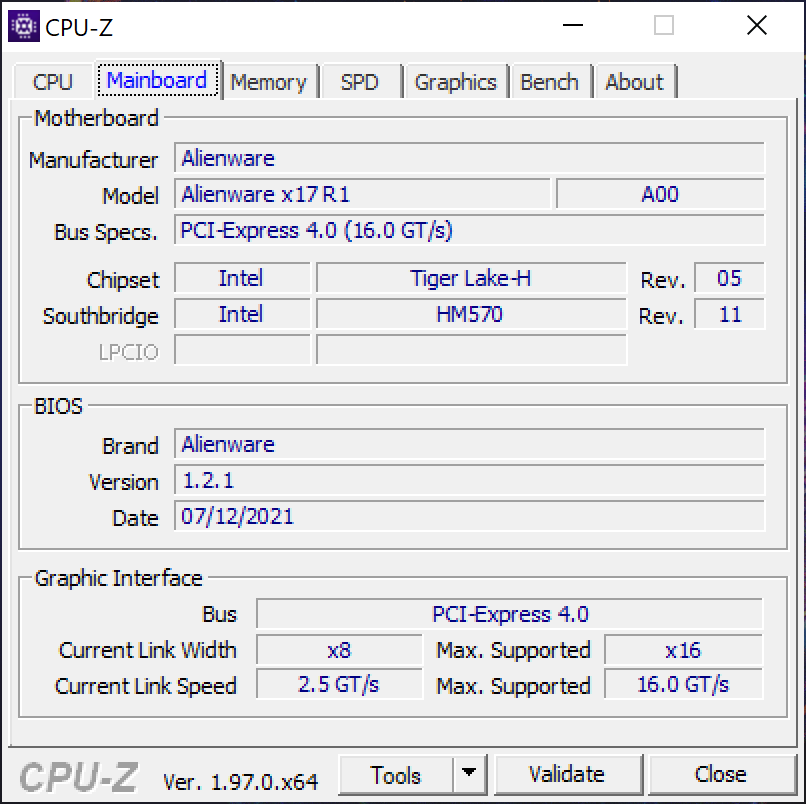
La serie de portátiles Alienware de 17,3 pulgadas ha tenido una avalancha de cambios estos últimos años. Dell presentó un chasis Alienware m17 R1 completamente nuevo en 2019 solo para reemplazarlo con un chasis m17 R2 completamente rediseñado solo un año después en 2020. Para 2021, el fabricante ha introducido otro rediseño completo del chasis para reemplazar la serie m17 por completo, llamado Alienware x17
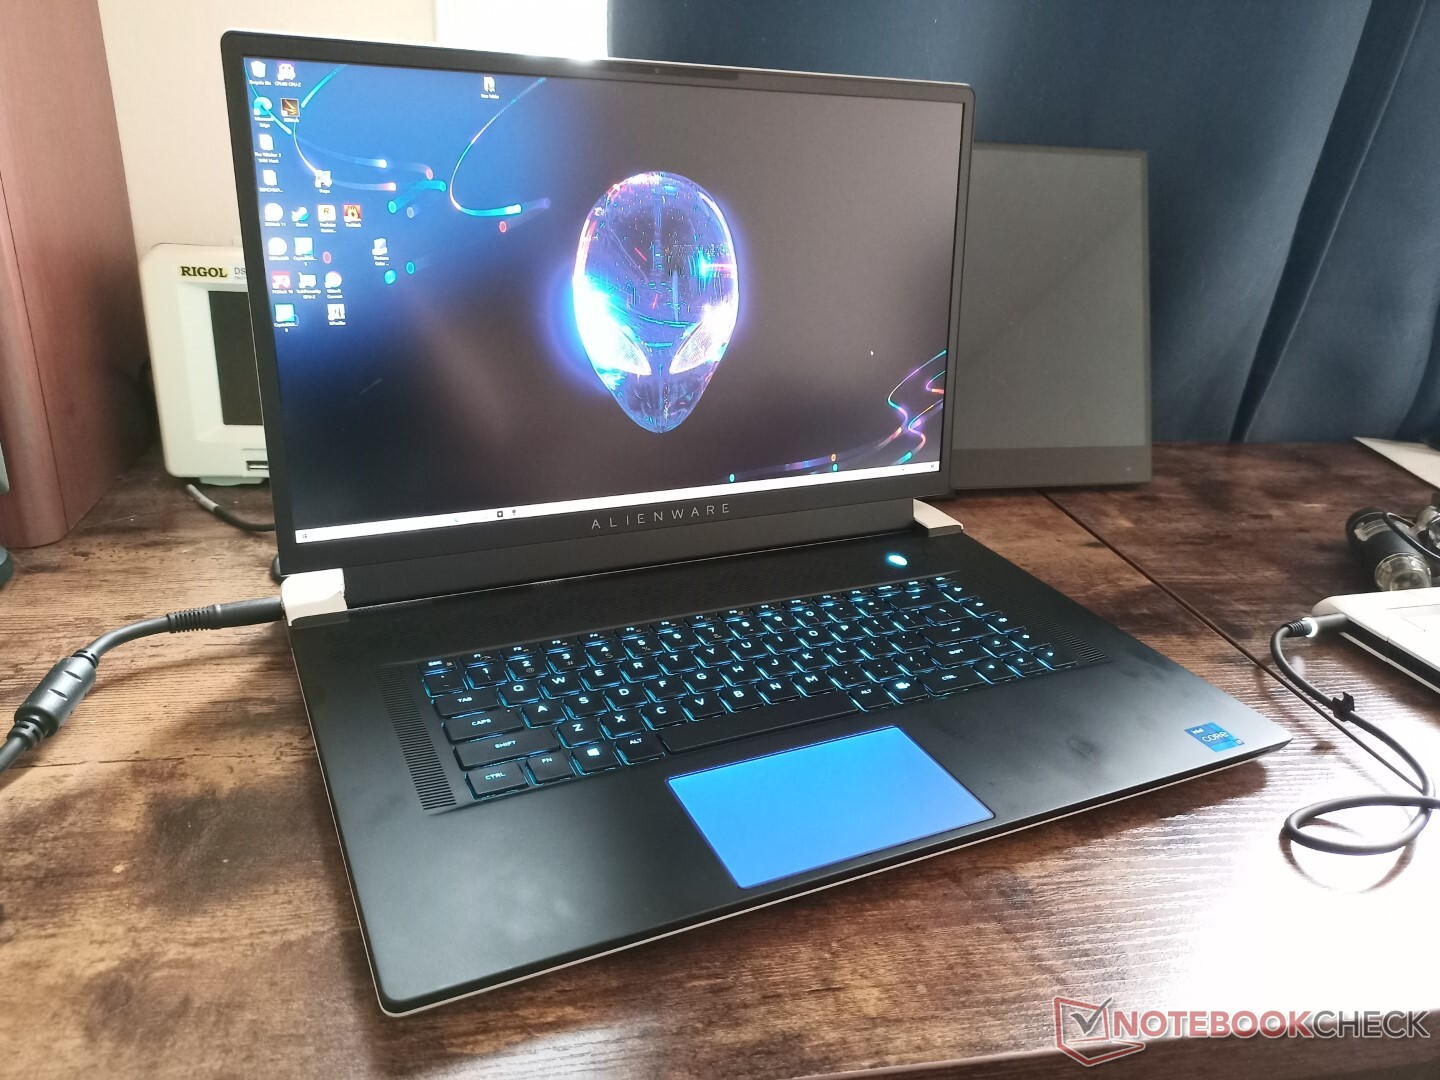
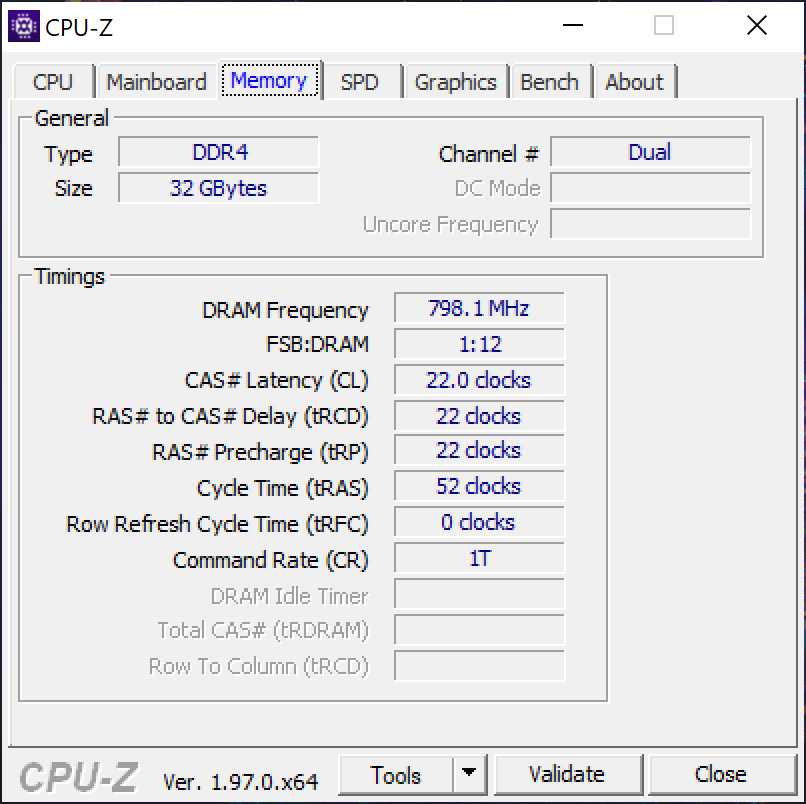
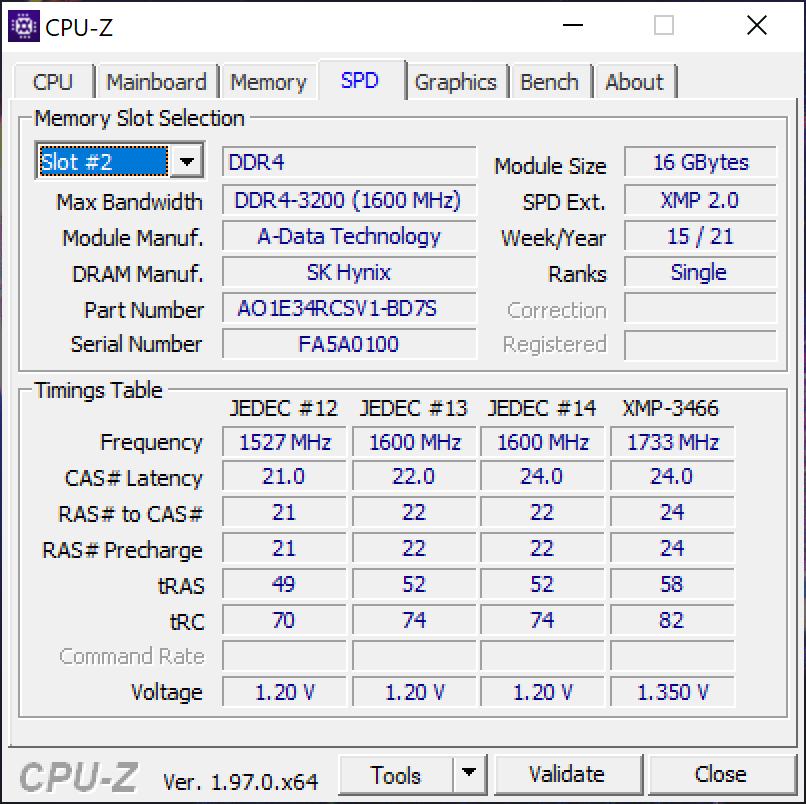
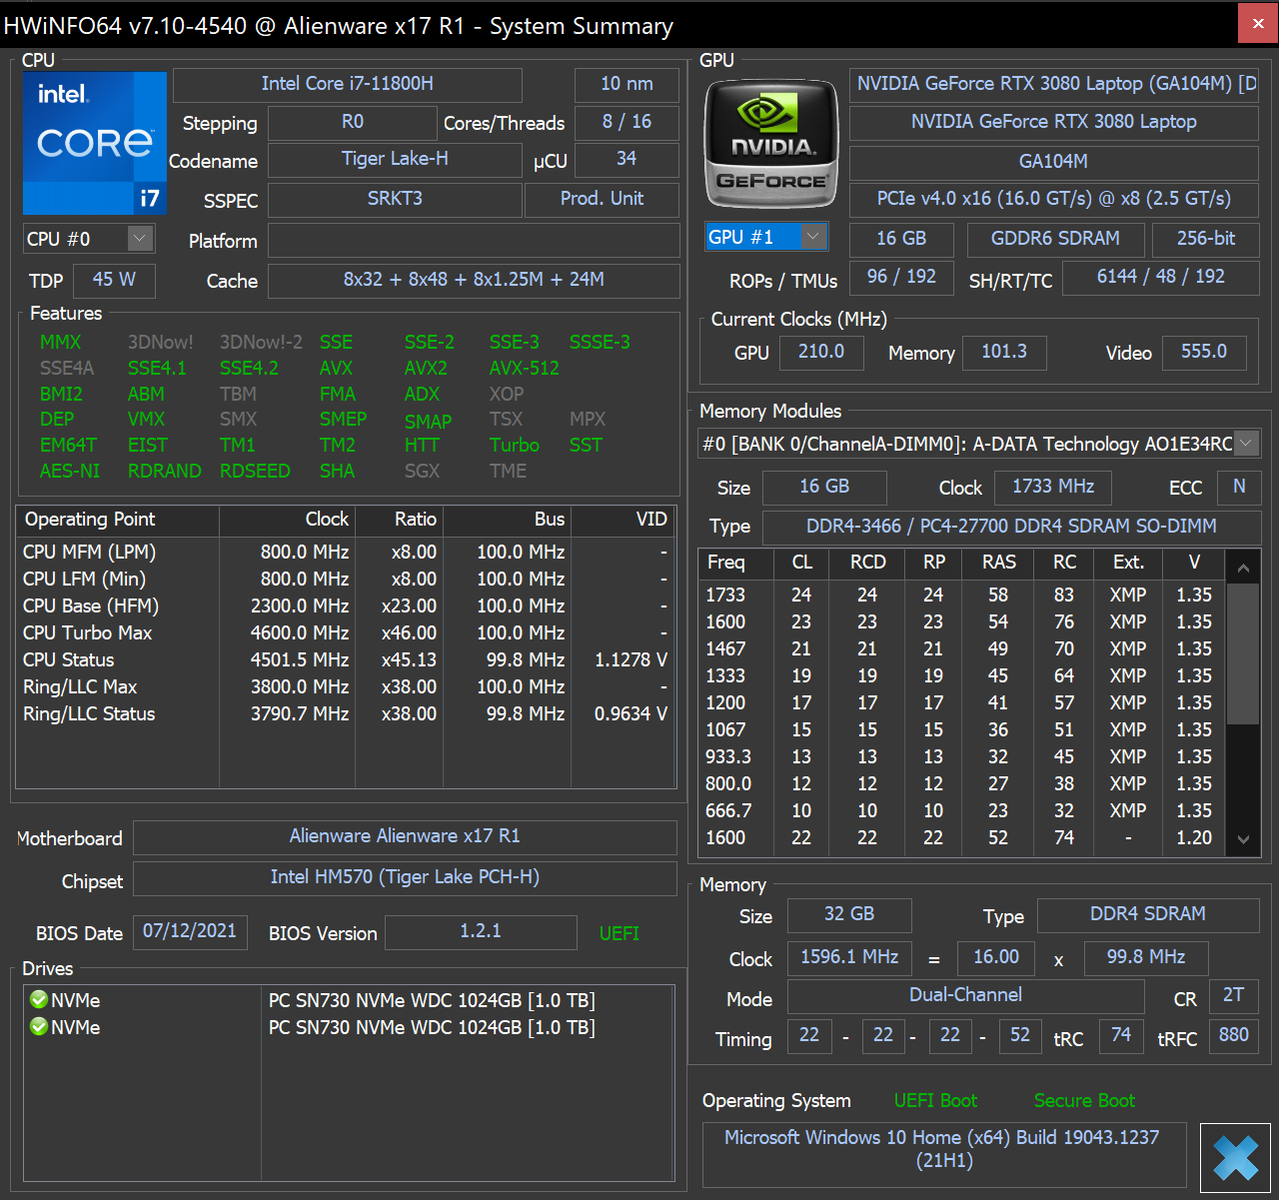
Nuestra unidad de prueba es una configuración de gama alta equipada con la CPU Core i7-11800H, la GPU GeForce RTX 3080, la pantalla UHD 4K de 120 Hz, las teclas mecánicas CherryMX y 32 GB de RAM por unos 3200 dólares. Hay opciones menores y mayores con la RTX 3060 o Core i9-11980HKrespectivamente. Quizás la característica más importante del nuevo chasis es su solución de refrigeración rediseñada que incluye más ventiladores que antes y una nueva pasta térmica basada en silicona de galio sobre la CPU. También está disponible una versión de 15,6 pulgadas llamada Alienware x15 R1
Entre los competidores del Alienware x17 R1 se encuentran otros portátiles de juego ultrafinos de 17,3 pulgadas como el MSI GS76, Razer Blade 17,Asus ROG Zephyrus S17y el modelo basado en TongfangMaingear Vector Pro.
Más reseñas de Dell:
potential competitors in comparison
Valoración | Fecha | Modelo | Peso | Altura | Tamaño | Resolución | Precio |
|---|---|---|---|---|---|---|---|
| 89 % v7 (old) | 09/2021 | Alienware x17 RTX 3080 P48E i7-11800H, GeForce RTX 3080 Laptop GPU | 3.2 kg | 21.4 mm | 17.30" | 3840x2160 | |
| 85.3 % v7 (old) | 04/2021 | Alienware m17 R4 i9-10980HK, GeForce RTX 3080 Laptop GPU | 3 kg | 22 mm | 17.30" | 1920x1080 | |
| 89.4 % v7 (old) | 09/2021 | Razer Blade 17 RTX 3070 i7-11800H, GeForce RTX 3070 Laptop GPU | 2.8 kg | 19.9 mm | 17.30" | 1920x1080 | |
| 90.1 % v7 (old) | 07/2021 | Asus ROG Zephyrus S17 GX703HSD i9-11900H, GeForce RTX 3080 Laptop GPU | 2.8 kg | 19.9 mm | 17.30" | 2560x1440 | |
| 86.2 % v7 (old) | 09/2021 | MSI GS76 Stealth 11UH i9-11900H, GeForce RTX 3080 Laptop GPU | 2.4 kg | 20 mm | 17.30" | 3840x2160 | |
| 88 % v7 (old) | 05/2021 | Gigabyte Aero 17 HDR YD i9-11980HK, GeForce RTX 3080 Laptop GPU | 2.8 kg | 22 mm | 17.30" | 3840x2160 |
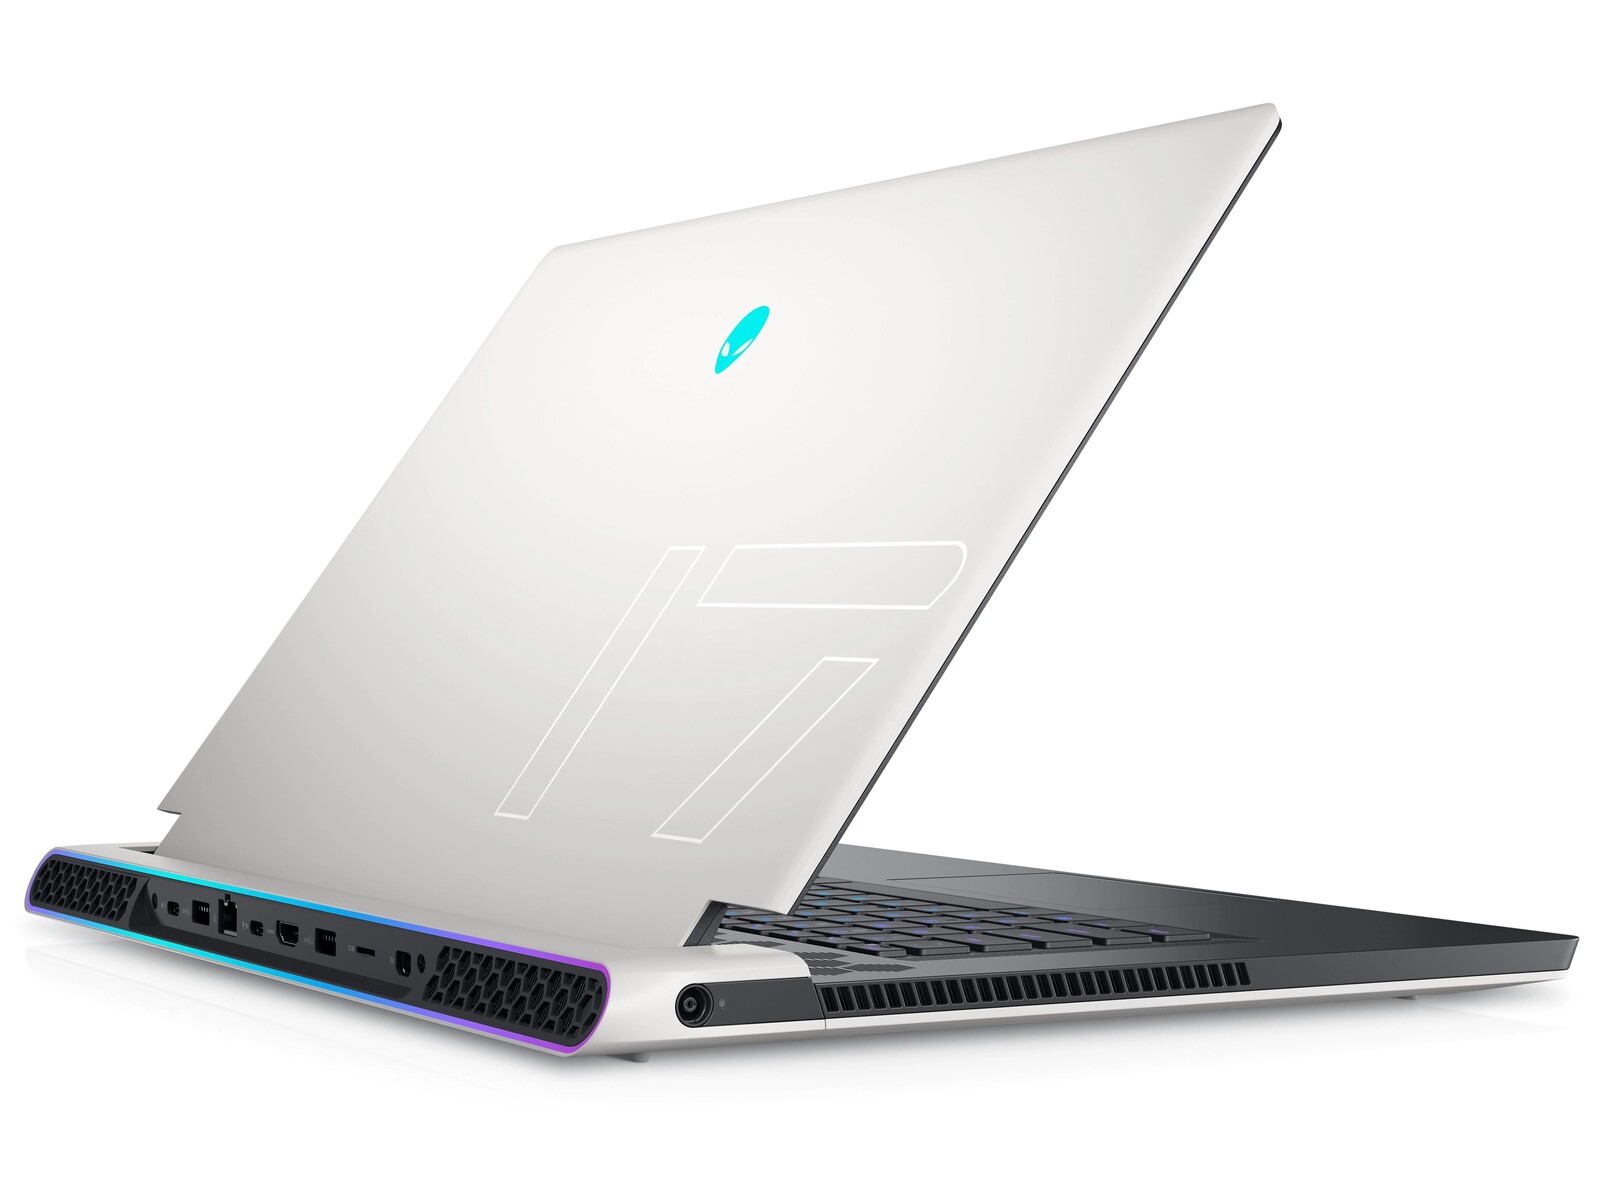
Caso - La leyenda renace
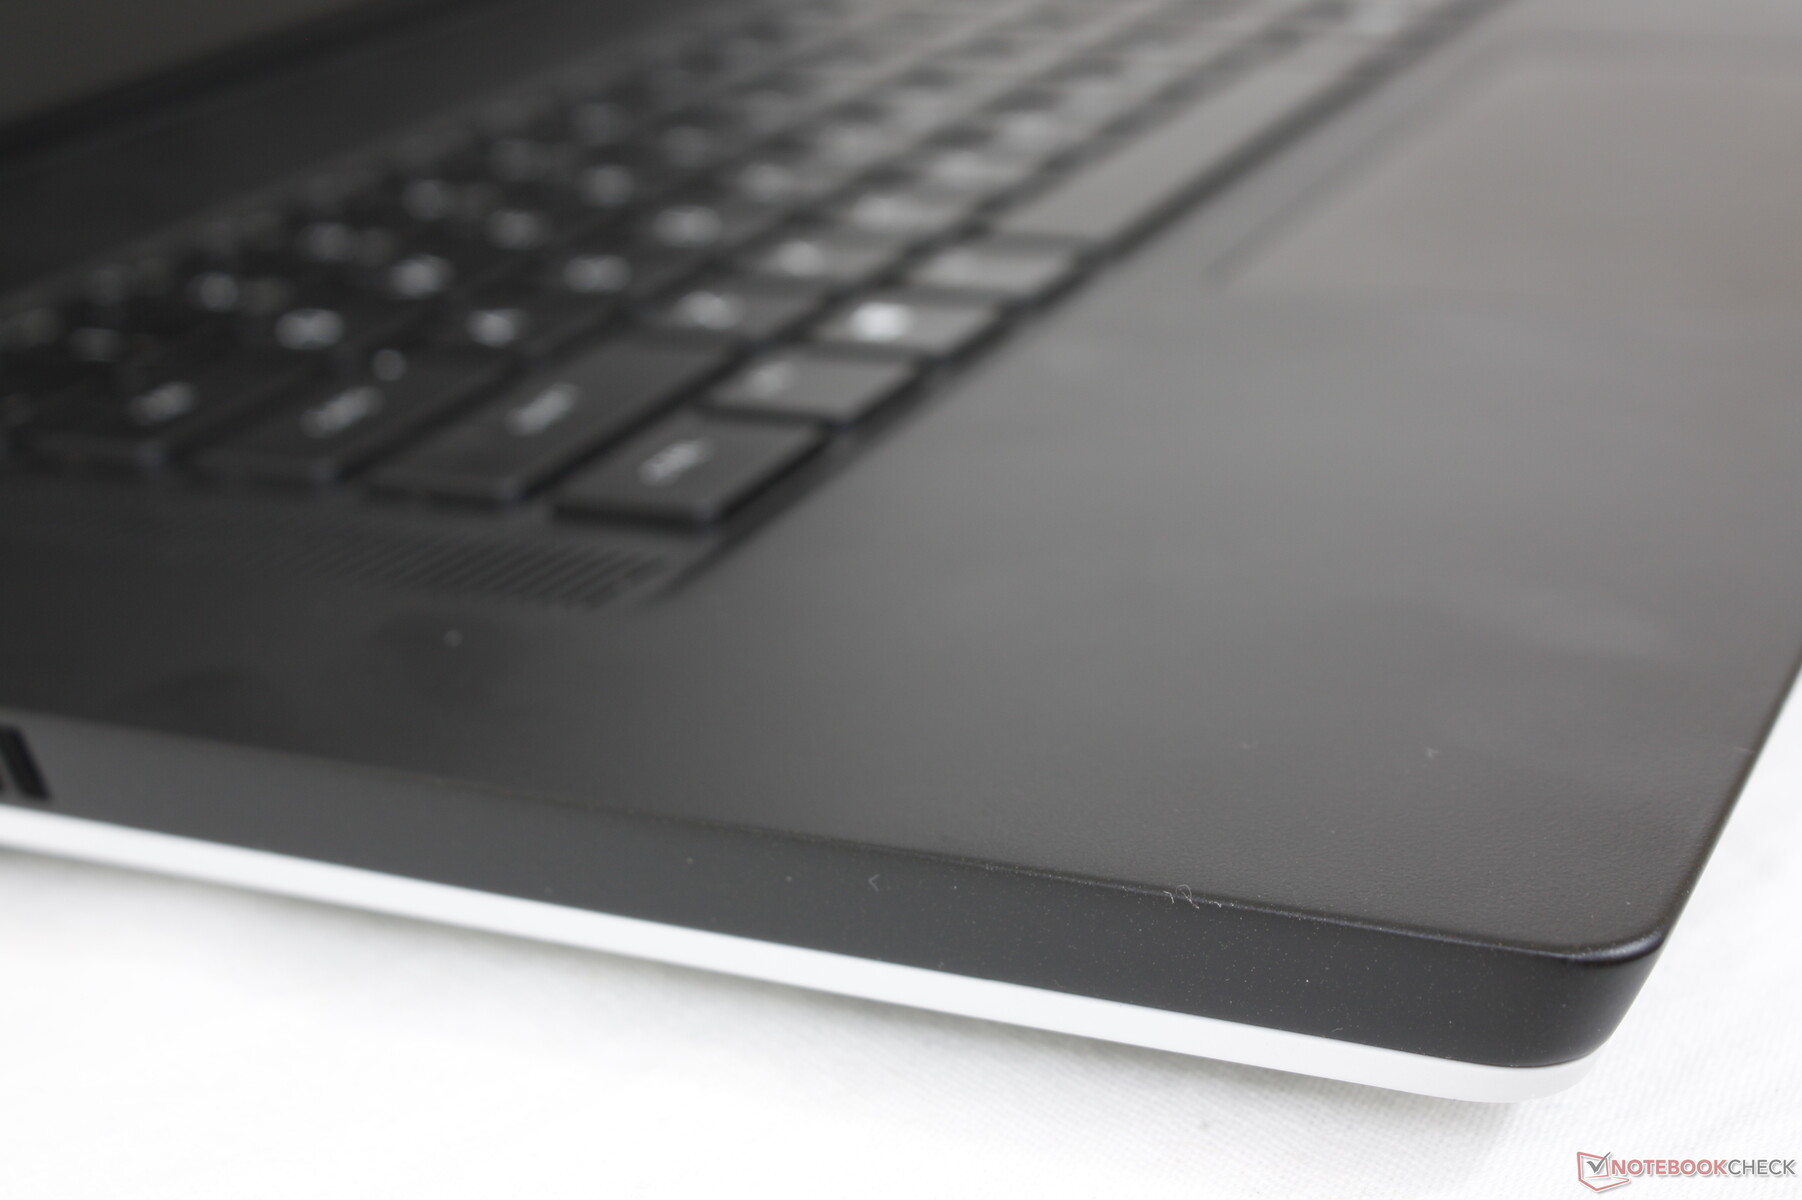
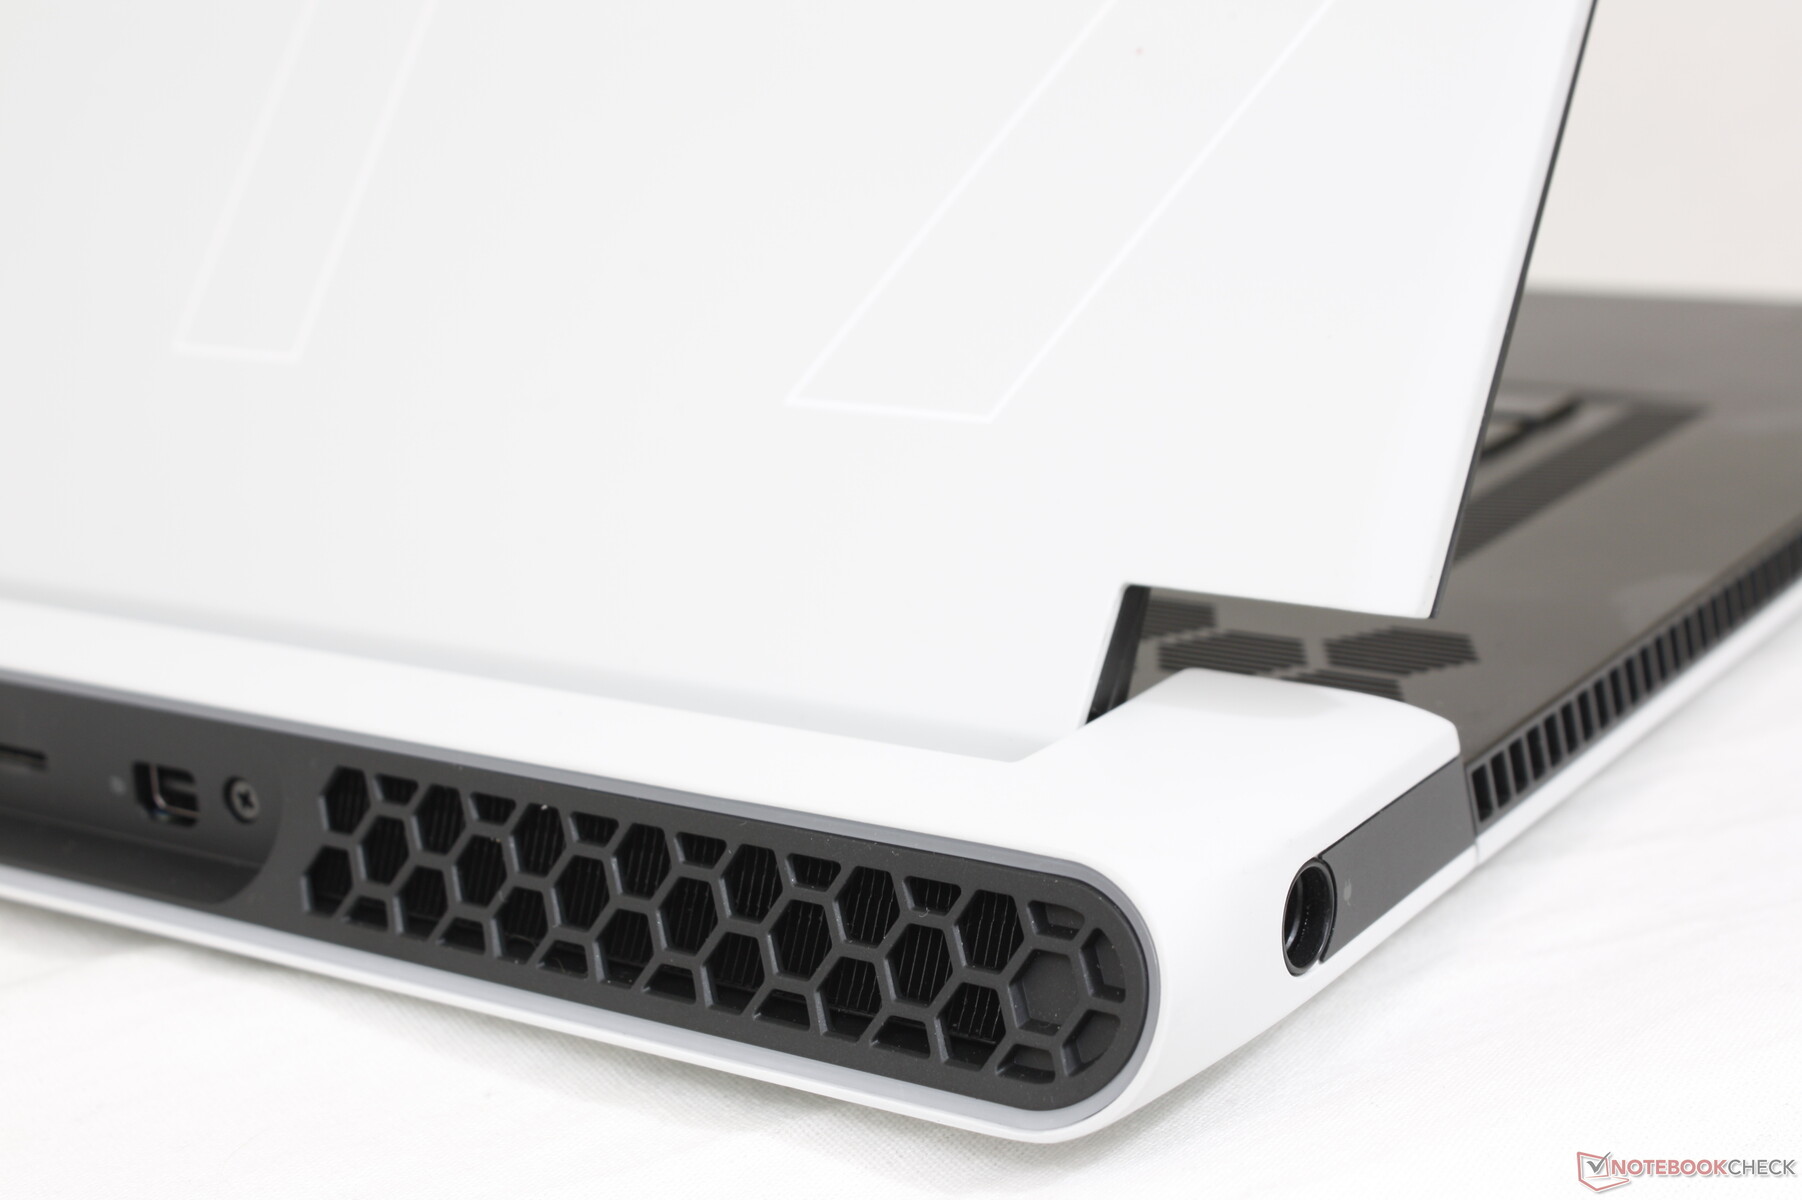
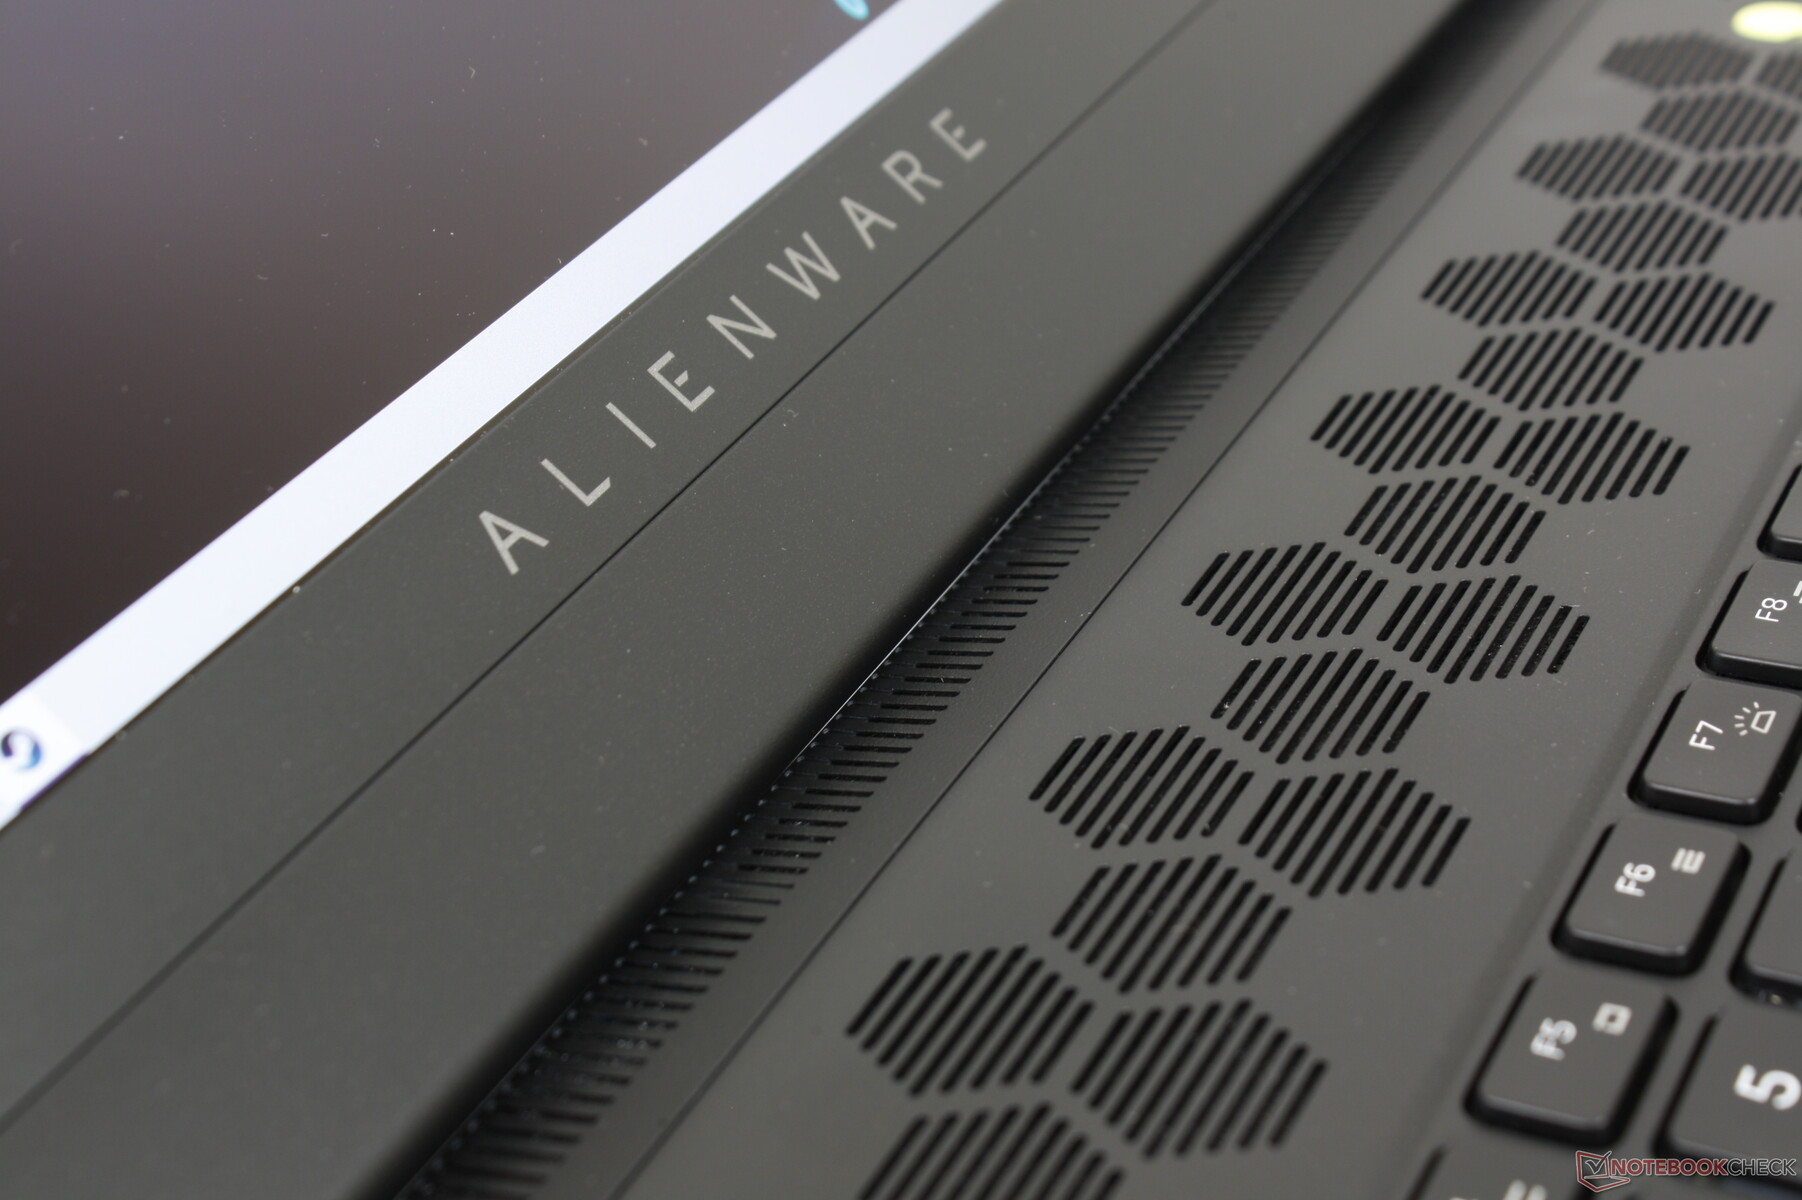
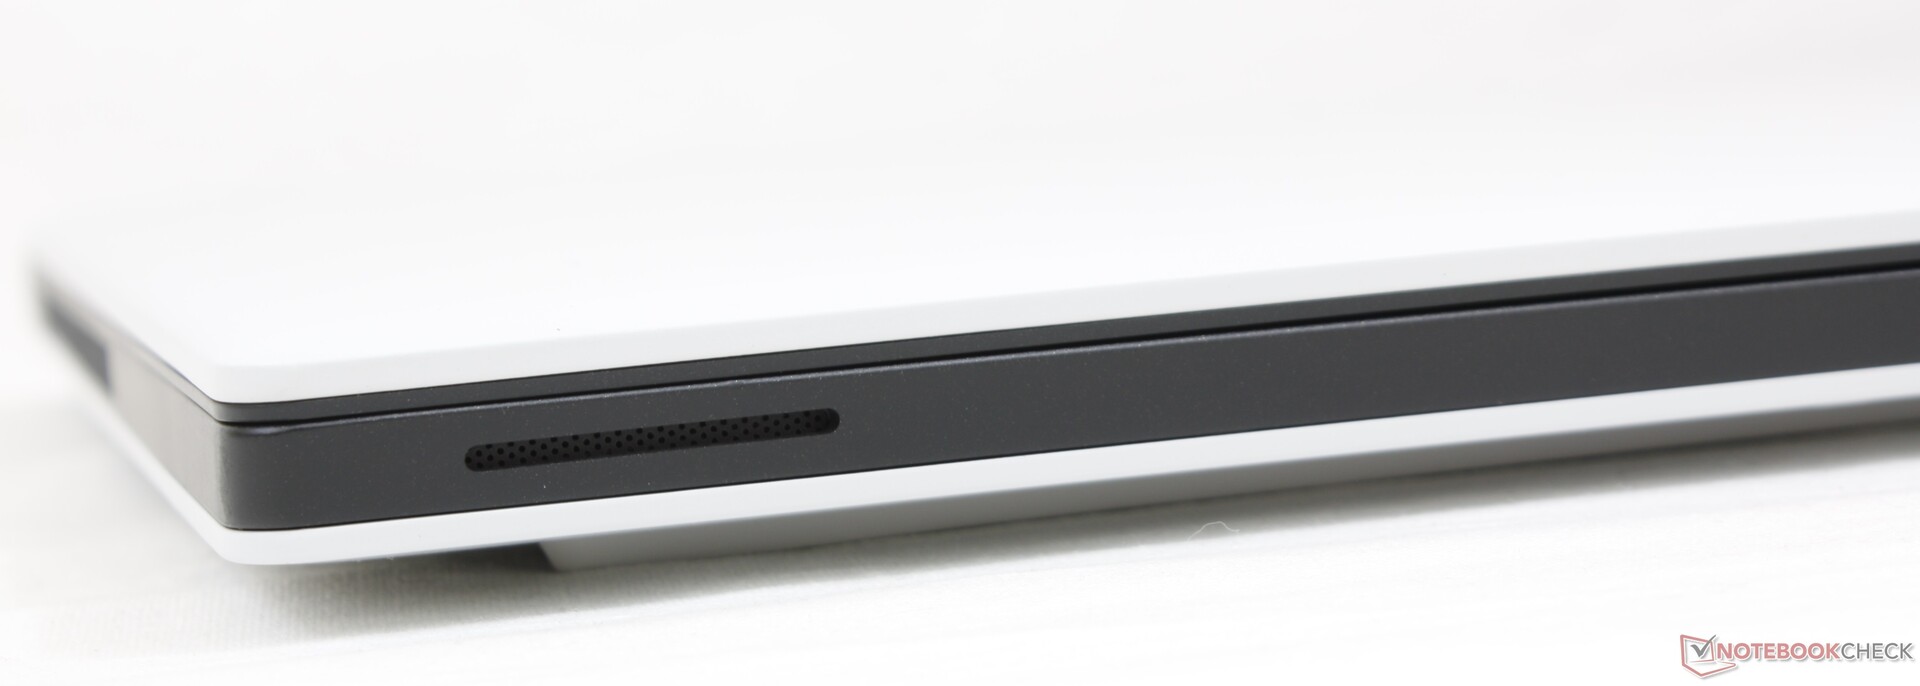
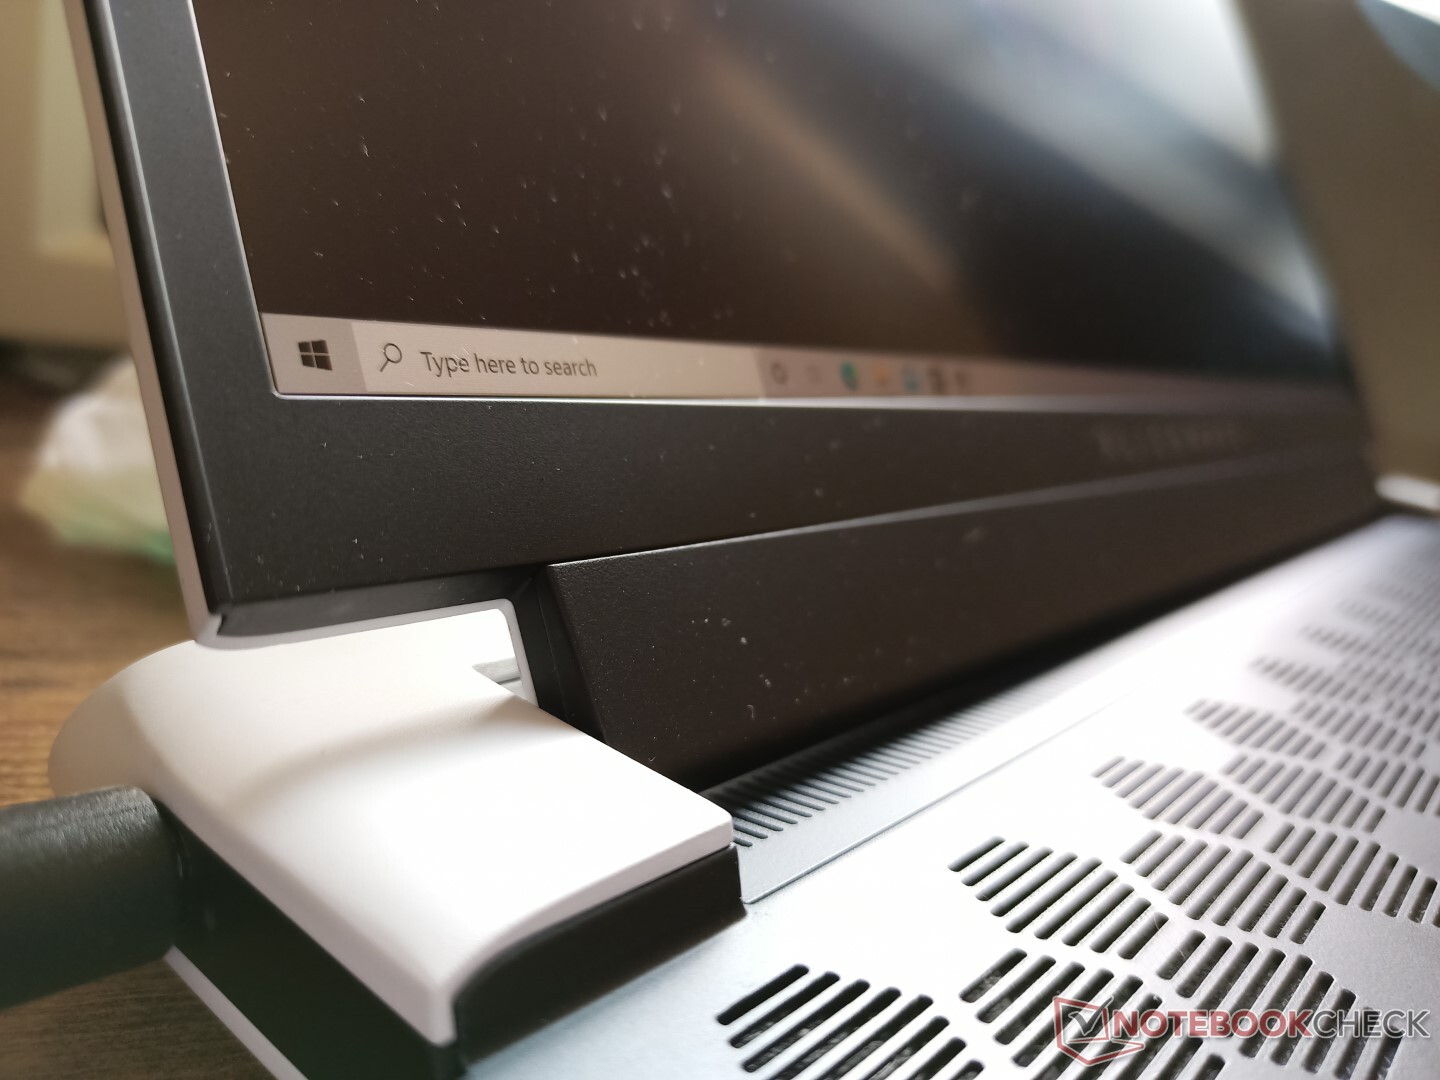
El renovado diseño del chasis "Legend" de https://ifworlddesignguide.com/entry/281017-alienware-legend-design-language utiliza plásticos suaves al tacto similares a los del m17 R2, pero en proporciones diferentes y generalmente más planas para acentuar un aspecto más delgado. La tapa exterior blanca y las rejillas en forma de panal se mantienen, por ejemplo, mientras que la cubierta del teclado es ahora negra y más afilada en los bordes. La rigidez sigue siendo excelente, especialmente alrededor de la base, con muy poca deformación y sin crujidos.
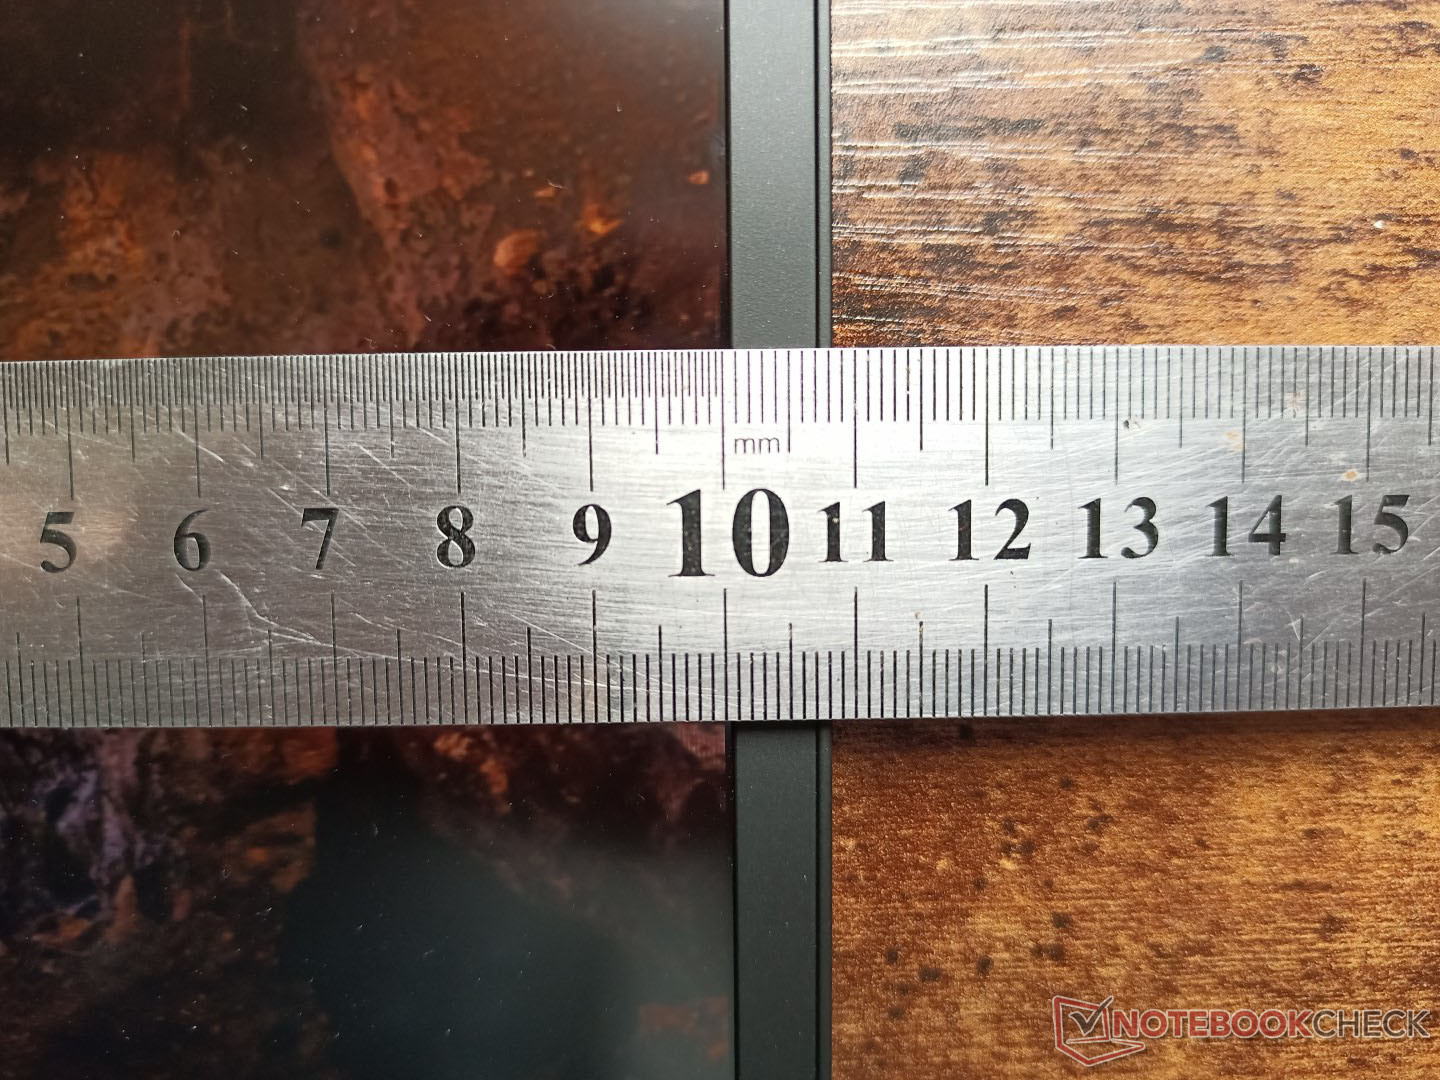
La tapa se flexiona más que la del Blade 17 pero no tanto como la del MSI GS75. También tiene algunos de los biseles más gruesos a lo largo del borde inferior para cualquier portátil de juego de 17.3 pulgadas que hayamos visto, lo que es en parte responsable de la huella extra grande.
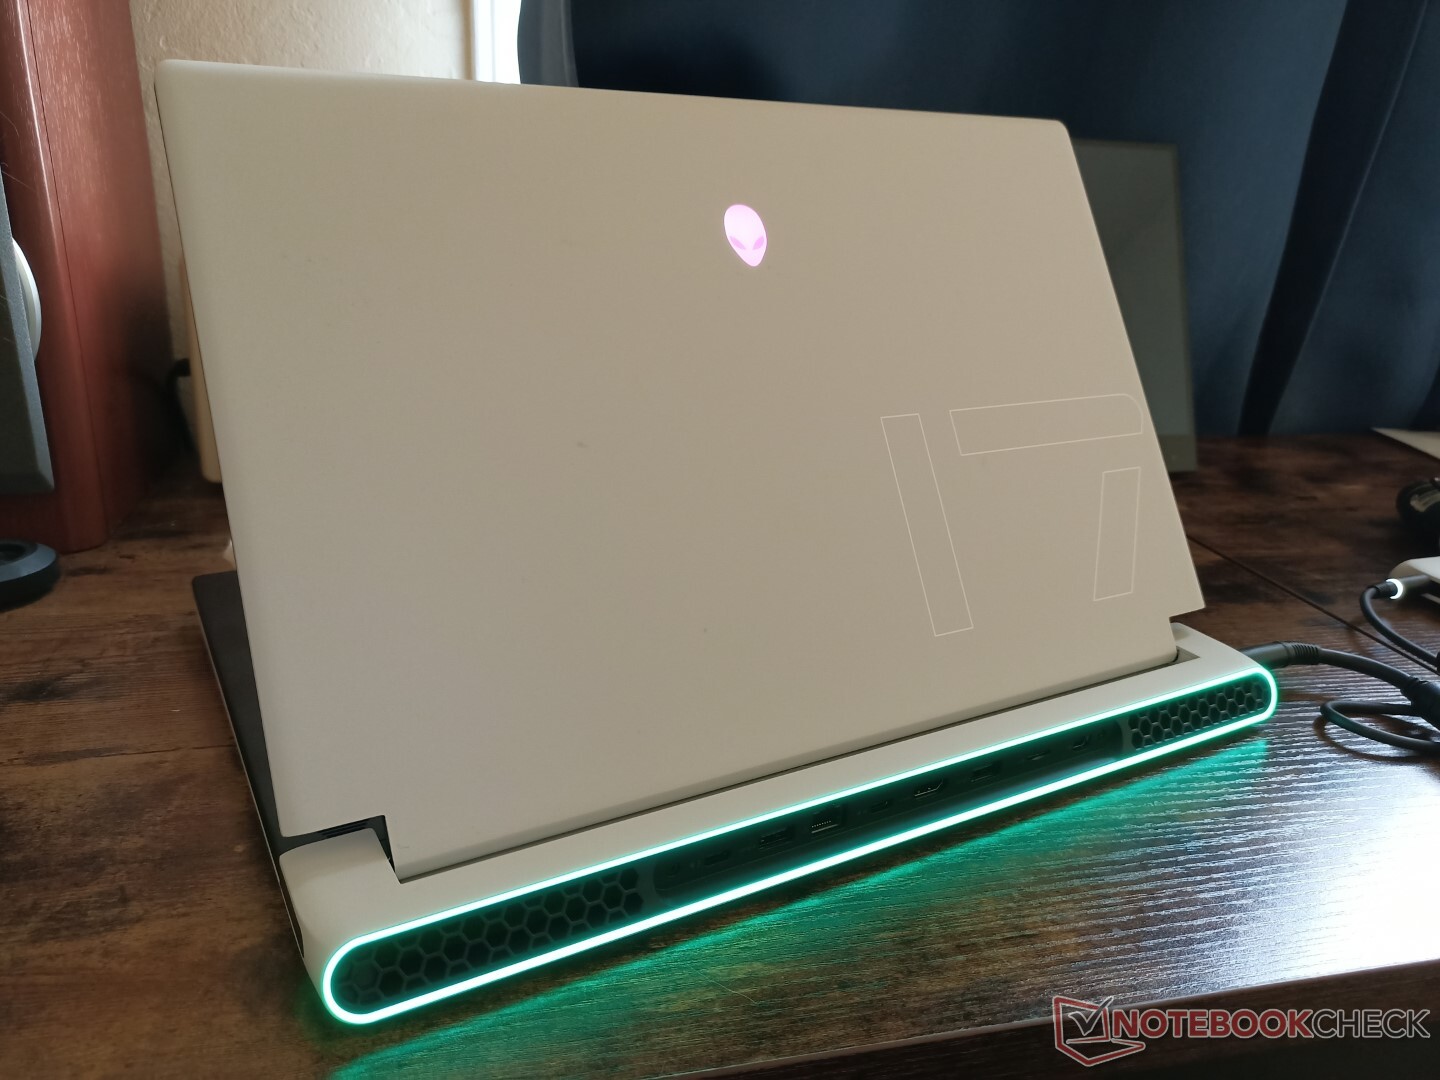
Los portátiles Alienware no tienen miedo de ser grandes y el x17 R1 sigue siendo un sistema grande a pesar de lo "delgado" que a Dell le gusta comercializar el modelo. La verdad es que el sistema es notablemente más grande y pesado que la mayoría de los modelos de la competencia, como el MSI GS76, el Blade 17 o el Zephyrus S17. Incluso el antiguo Alienware m17 R4 es más ligero que el x17 R1 por unos 200 gramos a pesar de sus volúmenes casi idénticos. Sin embargo, el peso añadido contribuye a una base más fuerte y rígida.
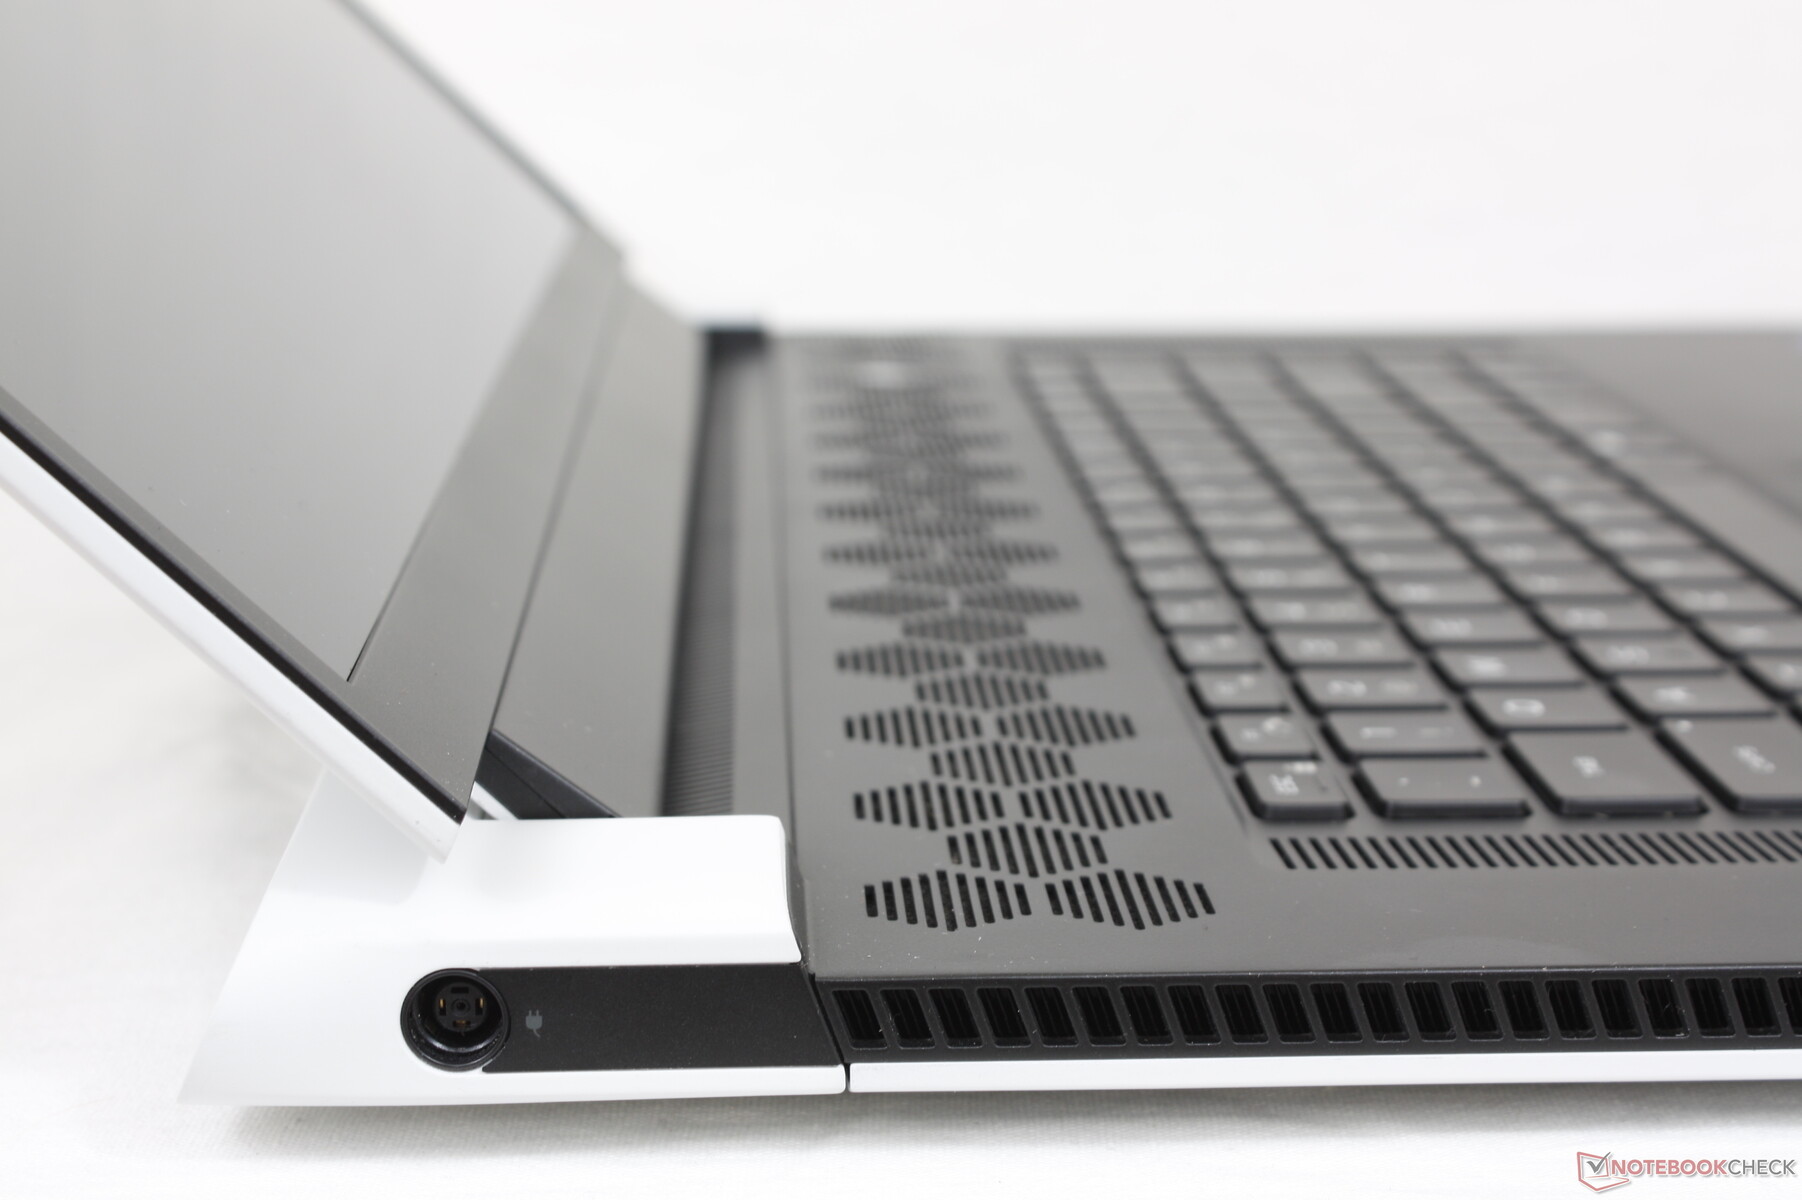
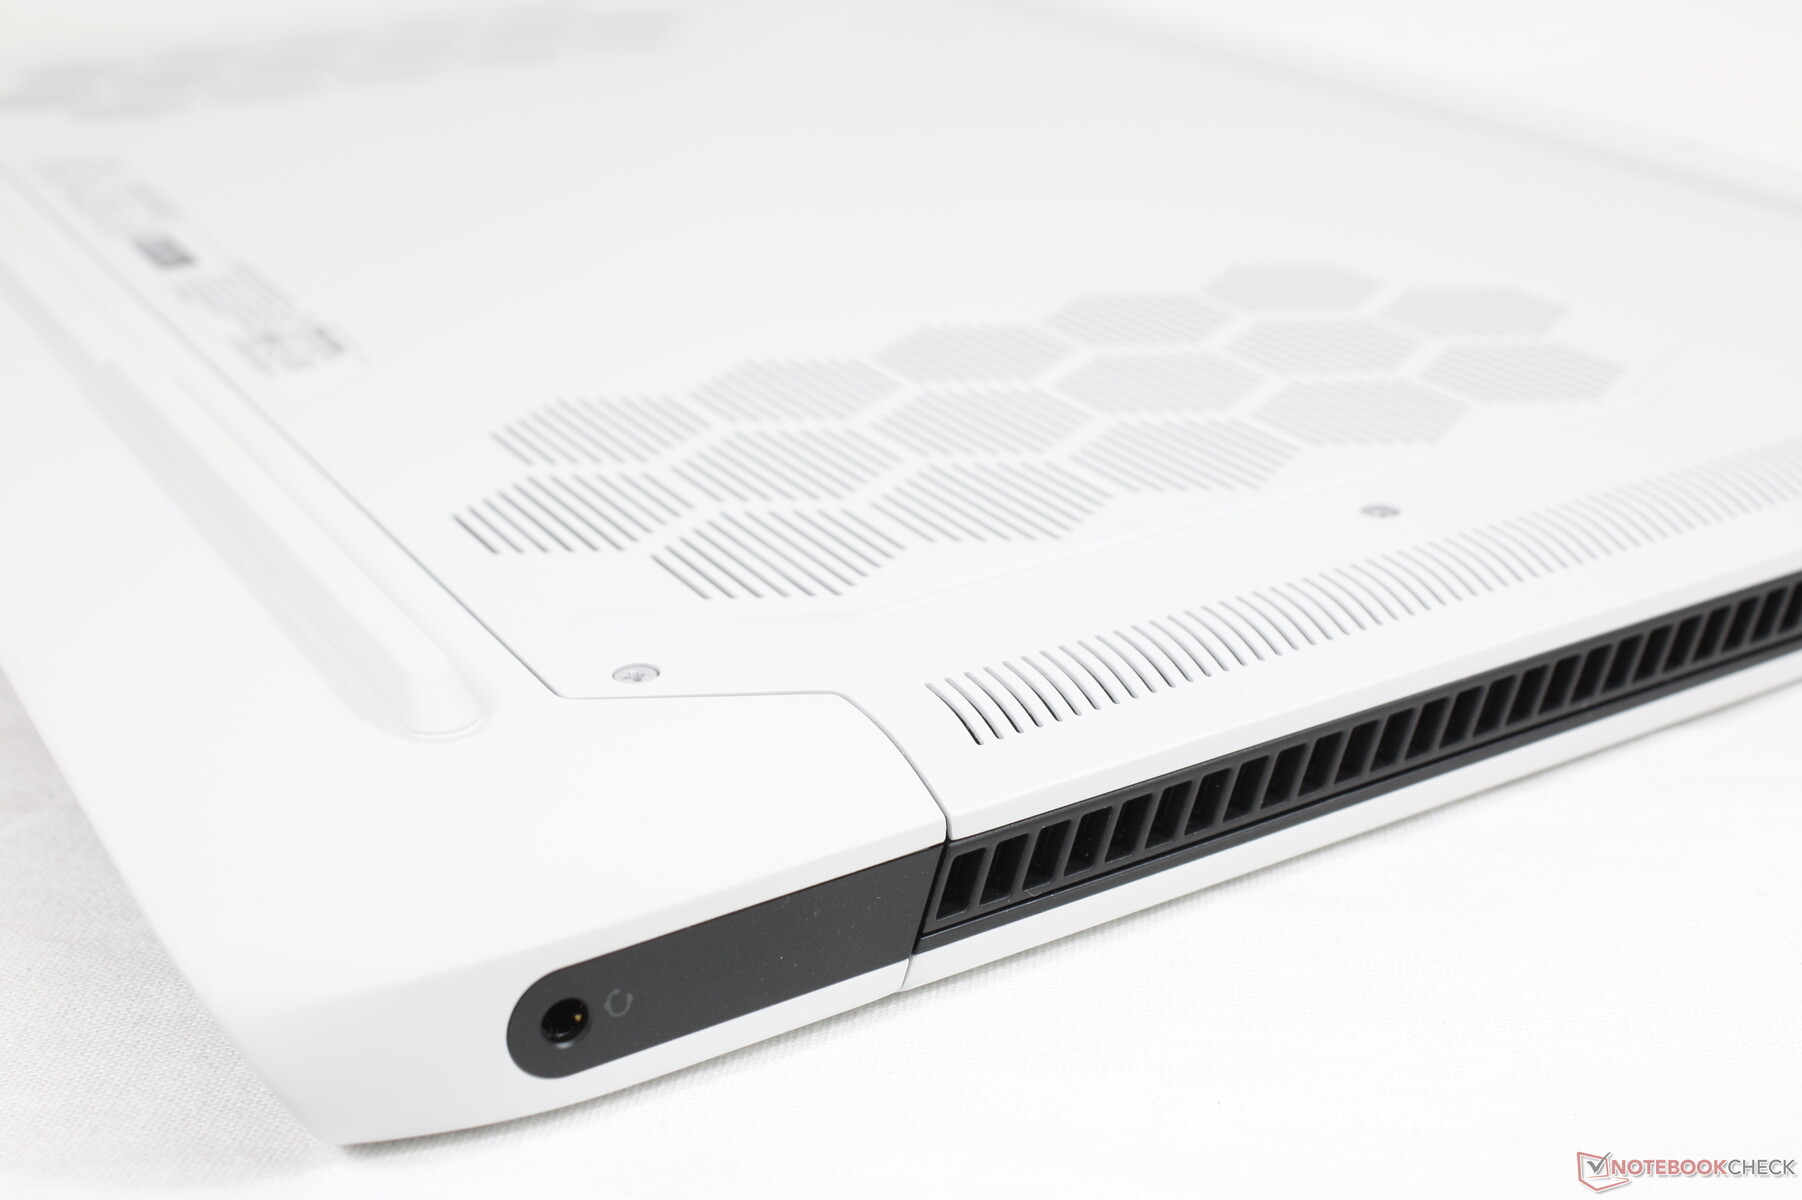
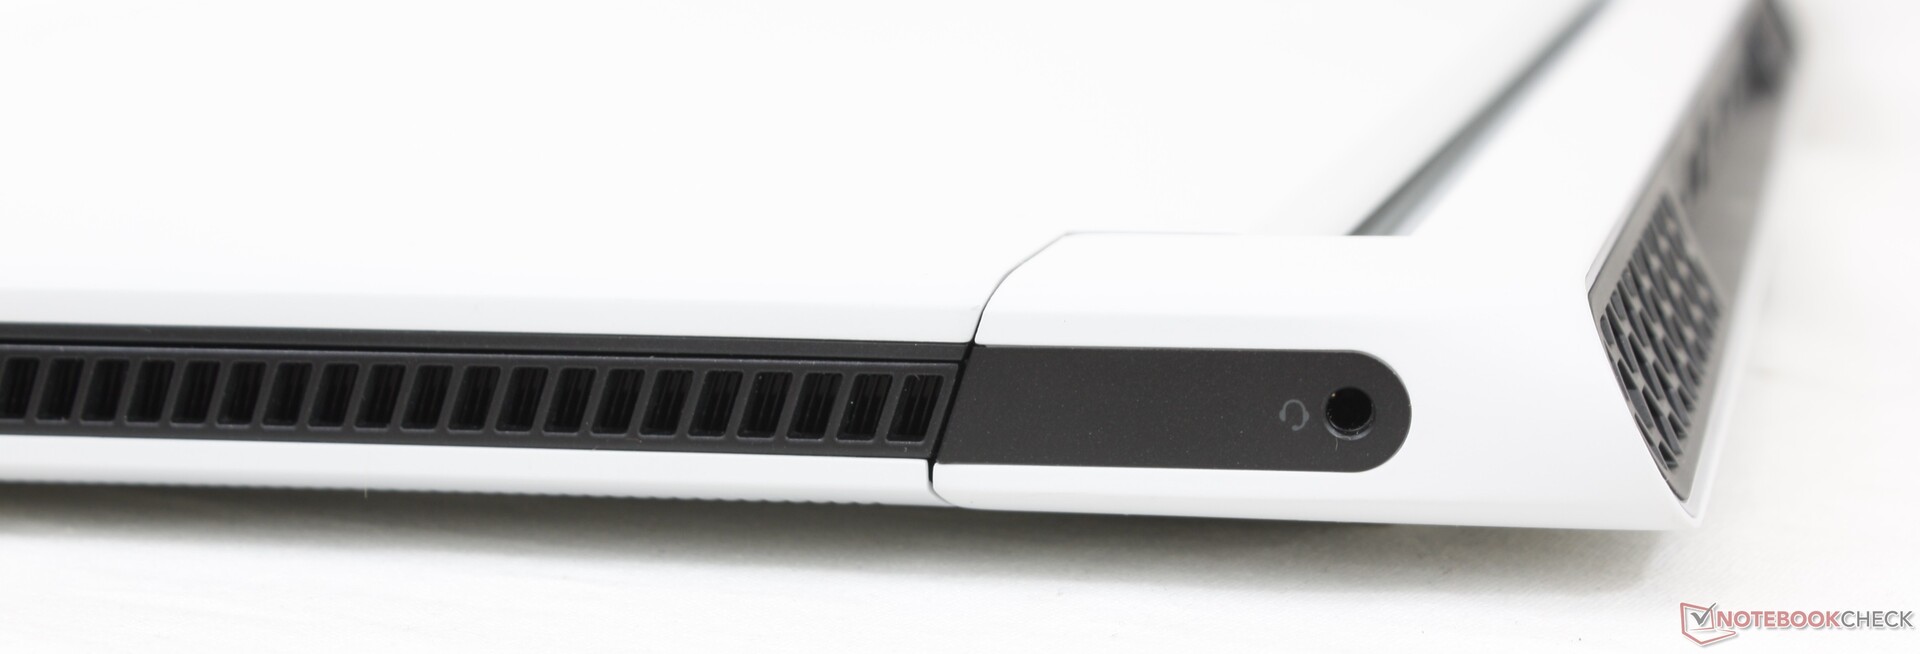
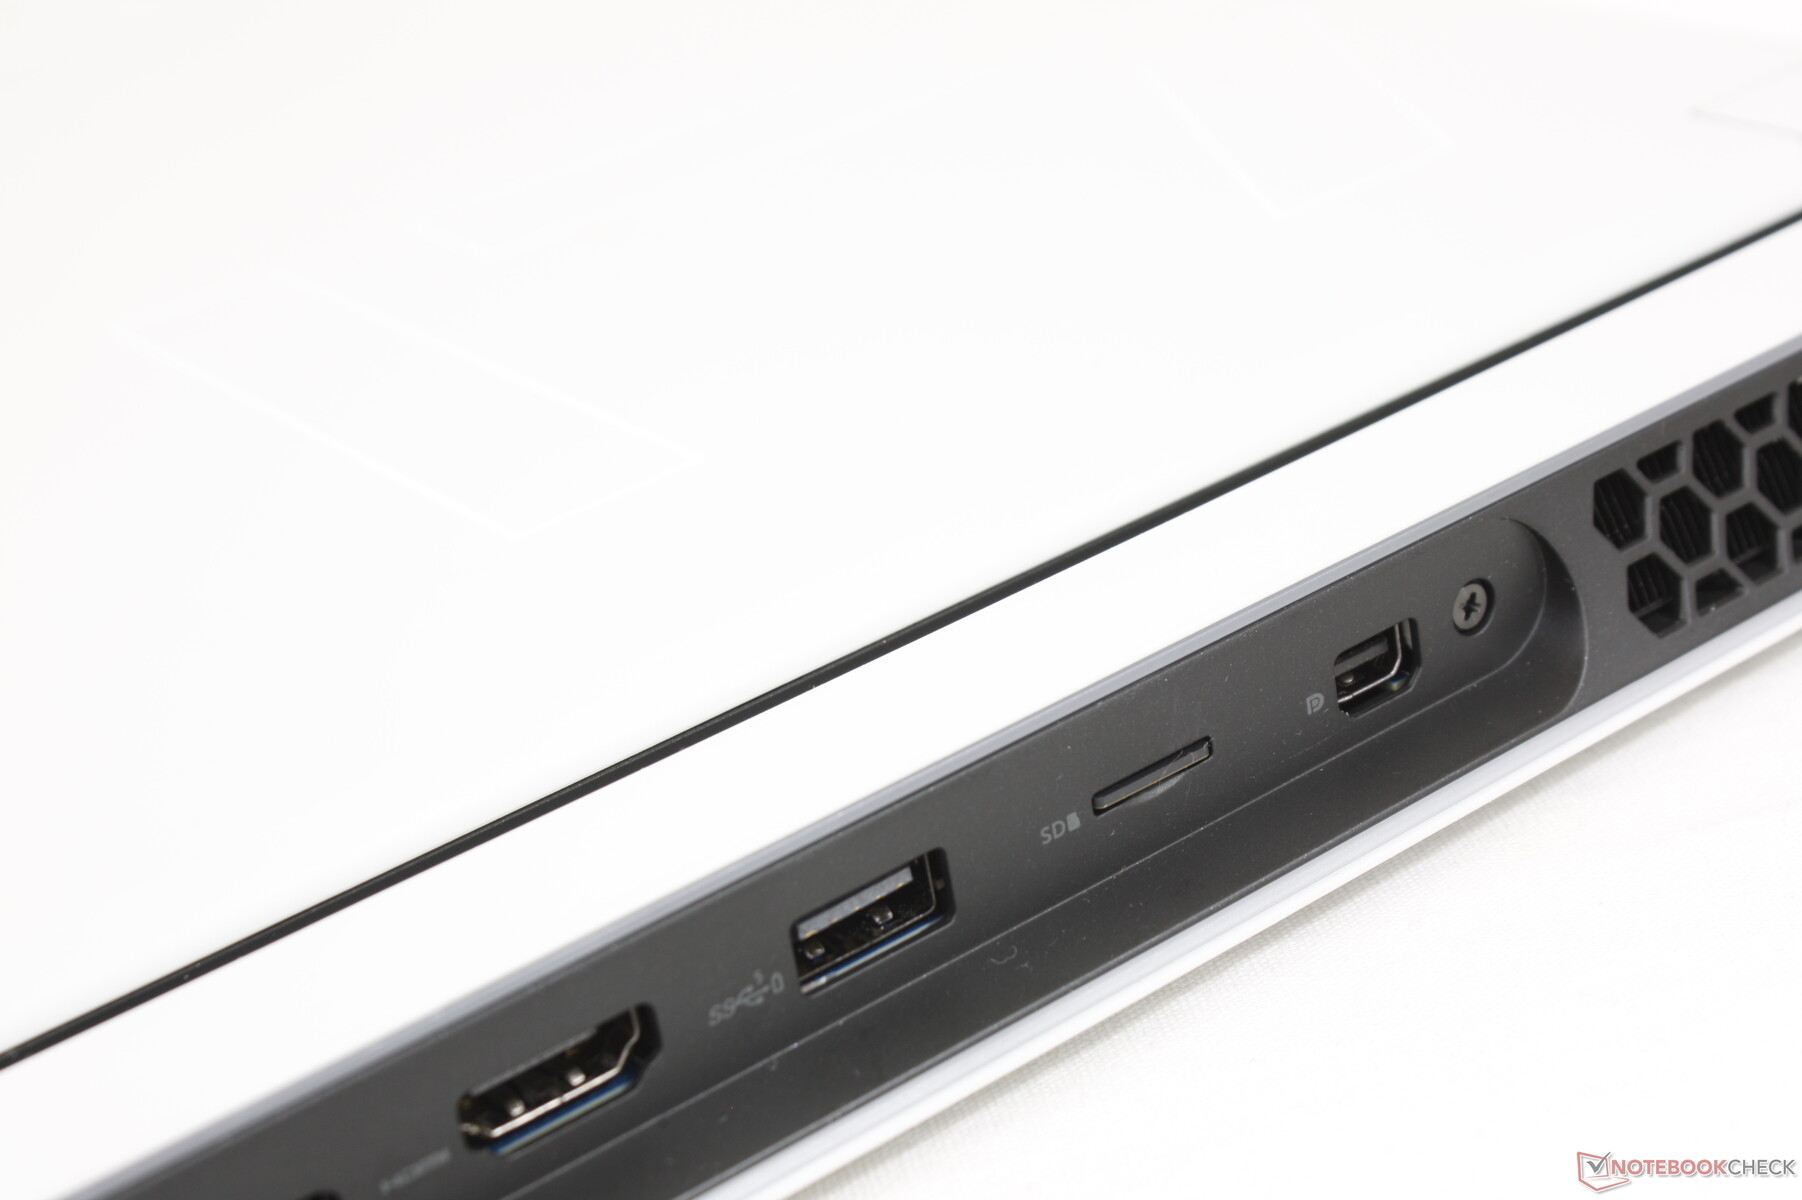
Conectividad - A lo largo de la espalda
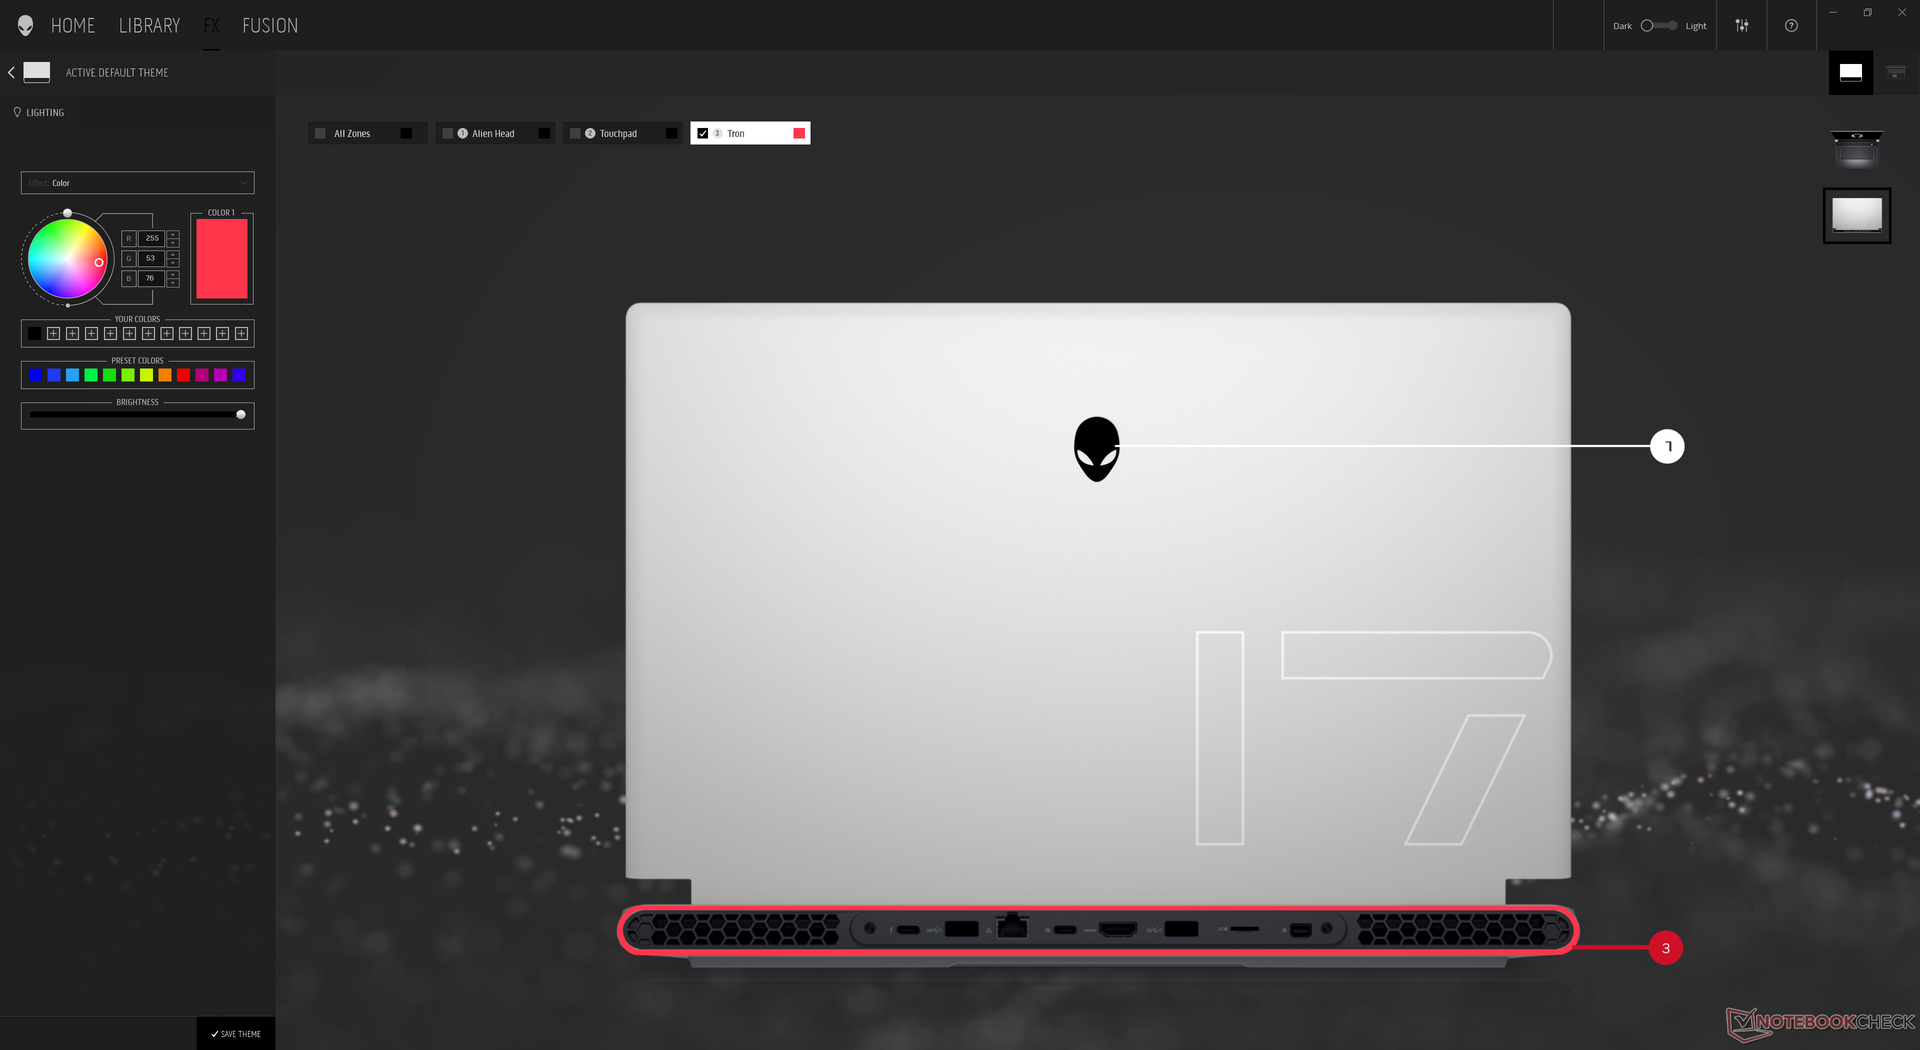
Las opciones de puerto son mayormente las mismas que en el Alienware m17 R4 del año pasado, pero con algunos cambios importantes. El raramente usado puerto de Amplificador Gráfico propietario, por ejemplo, se ha dejado de lado en favor de un segundo puerto USB-C más práctico. También hay un puerto USB-A menos con el que trabajar esta vez. Por lo demás, todos los demás puertos han vuelto, aunque reorganizados en la parte trasera del chasis para que sean más difíciles de alcanzar y ver que en la mayoría de portátiles
Hay que tener en cuenta que ambos puertos USB-C soportan DisplayPort y Power Delivery, pero sólo uno es compatible con Thunderbolt 4.


Lector de tarjetas SD
Las velocidades de transferencia del lector MicroSD integrado son muy rápidas, casi 250 MB/s con nuestra tarjeta de prueba UHS-II. La ranura es un poco difícil de acceder ya que está en la parte trasera, pero definitivamente es mejor que no tenerla.
| SD Card Reader | |
| average JPG Copy Test (av. of 3 runs) | |
| Razer Blade 17 RTX 3070 (AV Pro V60) | |
| MSI GS76 Stealth 11UH (AV PRO microSD 128 GB V60) | |
| Alienware m17 R4 (AV PRO microSD 128 GB V60) | |
| Gigabyte Aero 17 HDR YD (AV PRO microSD 128 GB V60) | |
| Asus ROG Zephyrus S17 GX703HSD | |
| Alienware x17 RTX 3080 P48E (AV Pro V60) | |
| maximum AS SSD Seq Read Test (1GB) | |
| Asus ROG Zephyrus S17 GX703HSD | |
| Alienware x17 RTX 3080 P48E (AV Pro V60) | |
| Alienware m17 R4 (AV PRO microSD 128 GB V60) | |
| MSI GS76 Stealth 11UH (AV PRO microSD 128 GB V60) | |
| Razer Blade 17 RTX 3070 (AV Pro V60) | |
| Gigabyte Aero 17 HDR YD (AV PRO microSD 128 GB V60) | |
Comunicación
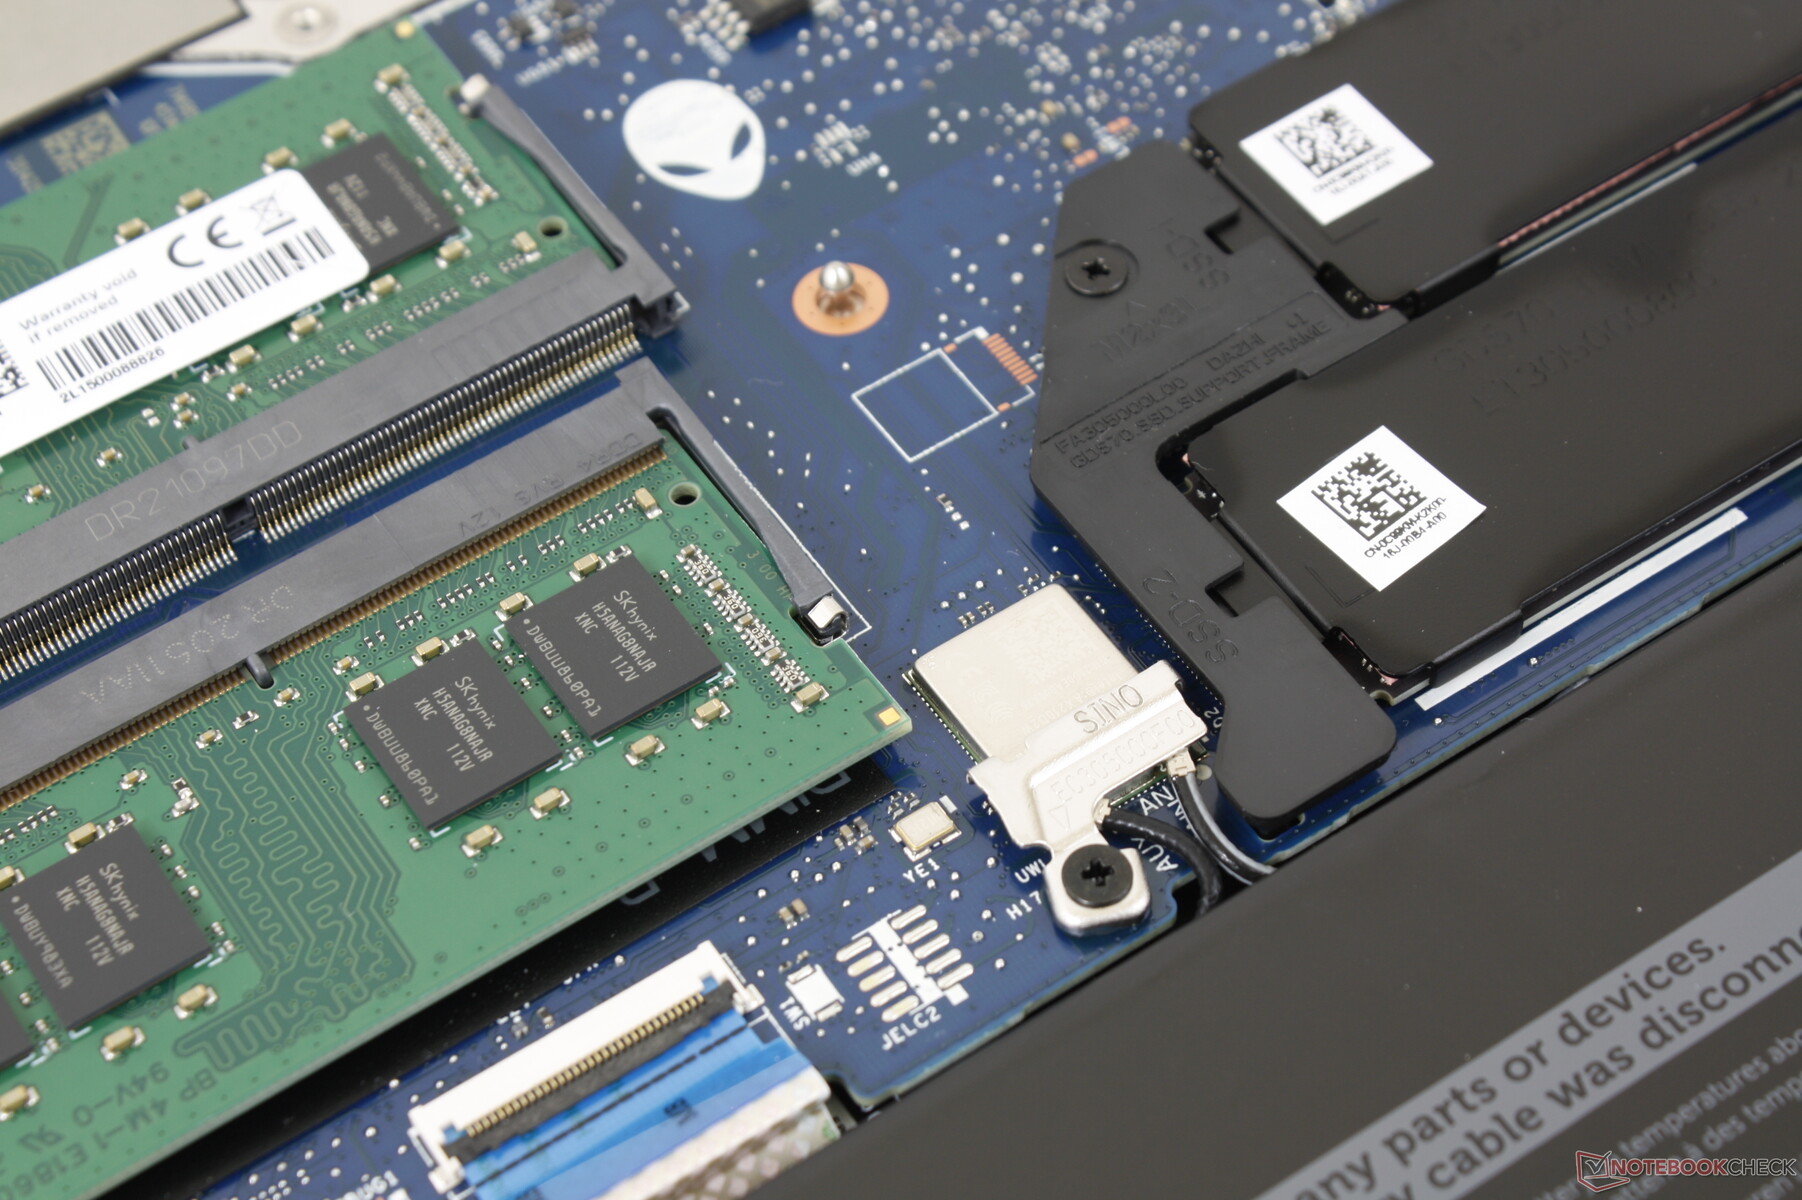
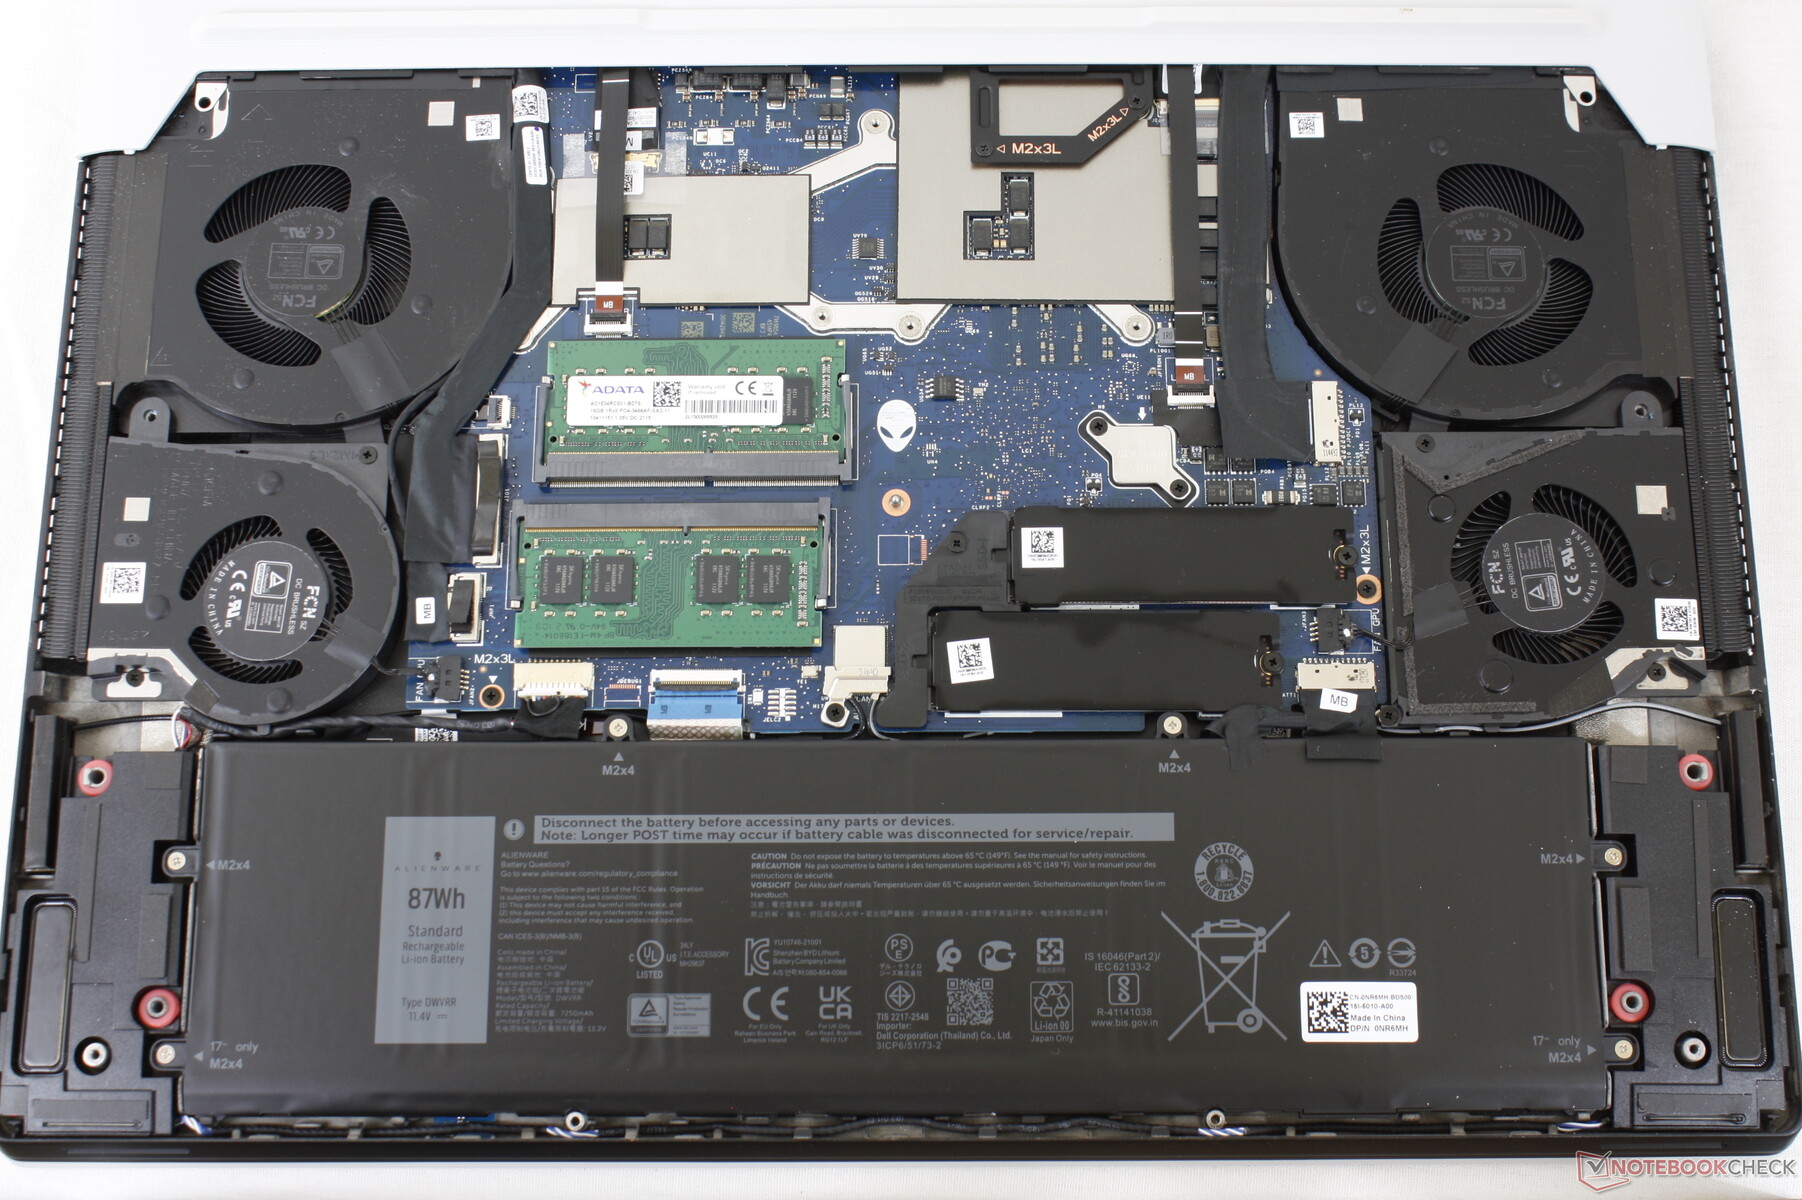
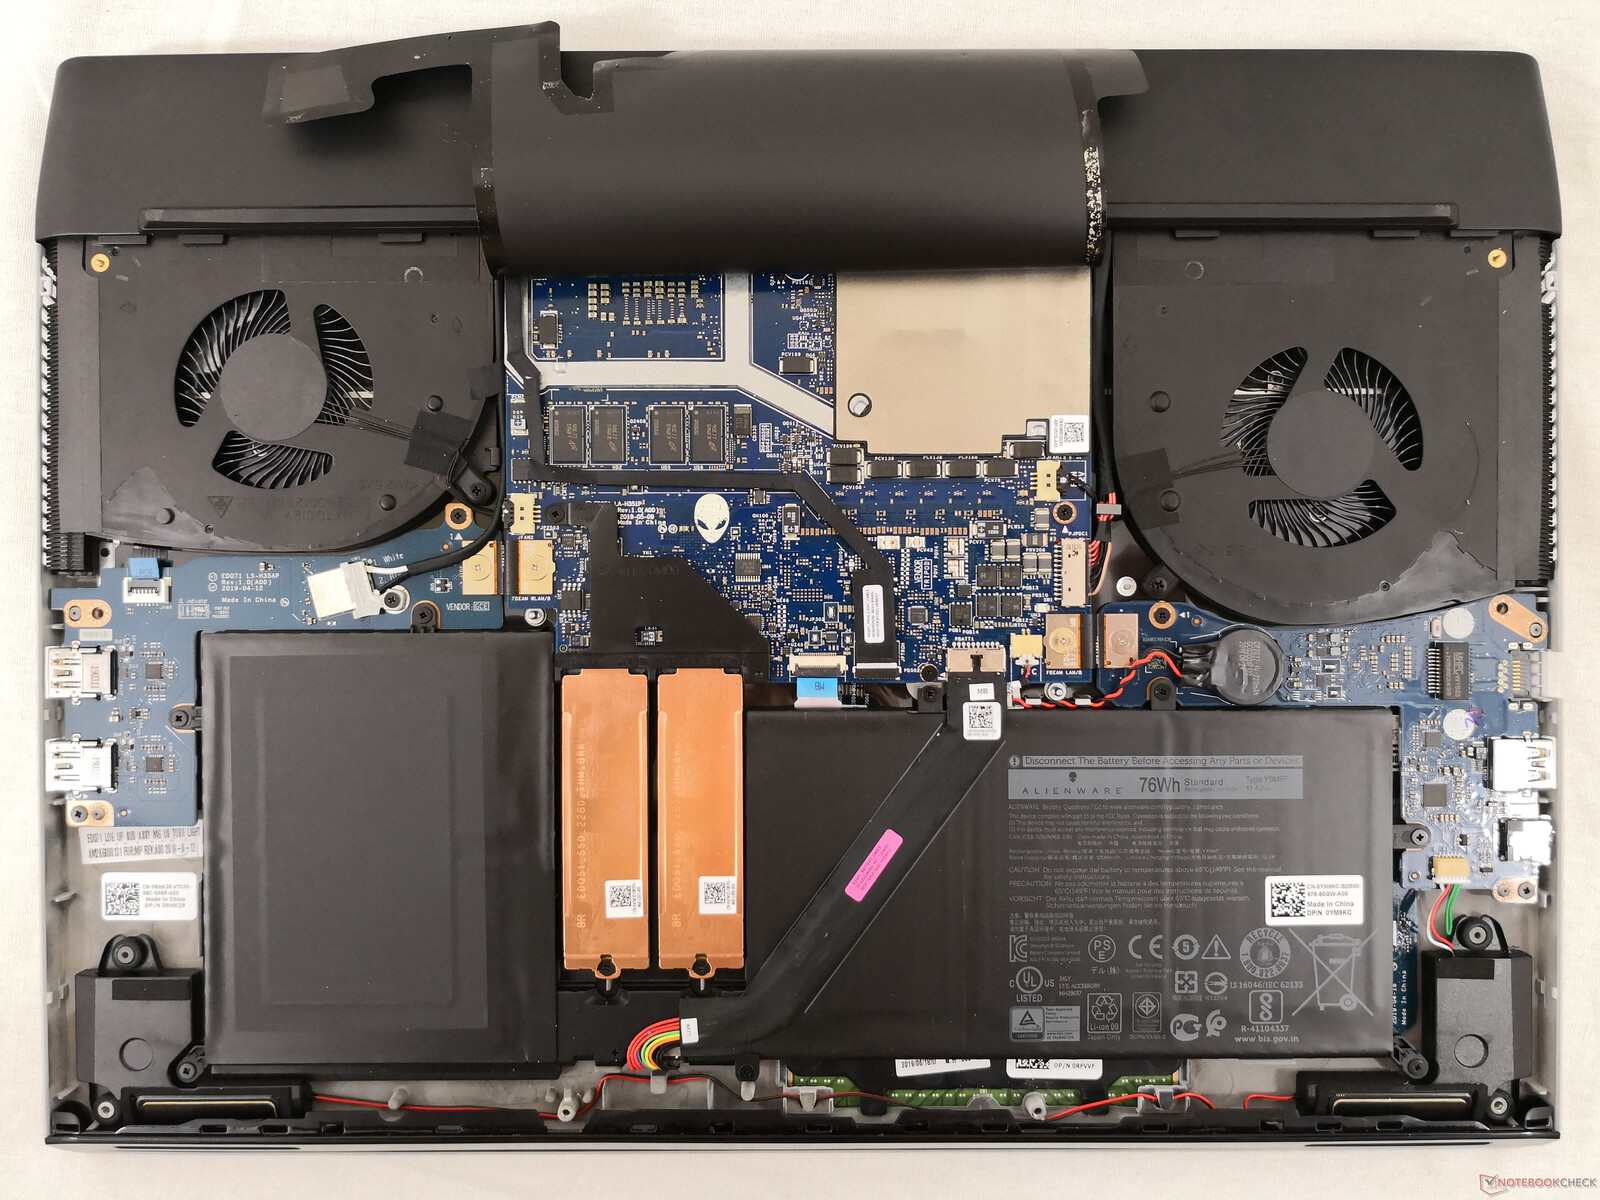
El módulo Killer AX1675x habilitado para Wi-Fi viene soldado de forma muy parecida a como estaba en el diseño de la última generación del m17. Curiosamente, el módulo WLAN es extraíble en el Alienware x15 a pesar de que es un factor de forma más pequeño de 15,6 pulgadas.
Webcam - IR, pero sin obturador
La calidad de la cámara no ha mejorado realmente de una generación a otra, ya que el sistema sólo viene con un sensor de 720p. Otros portátiles como el Razer Blade 17 se han actualizado a 1080p. También se echa en falta un obturador de cámara web.

")
")
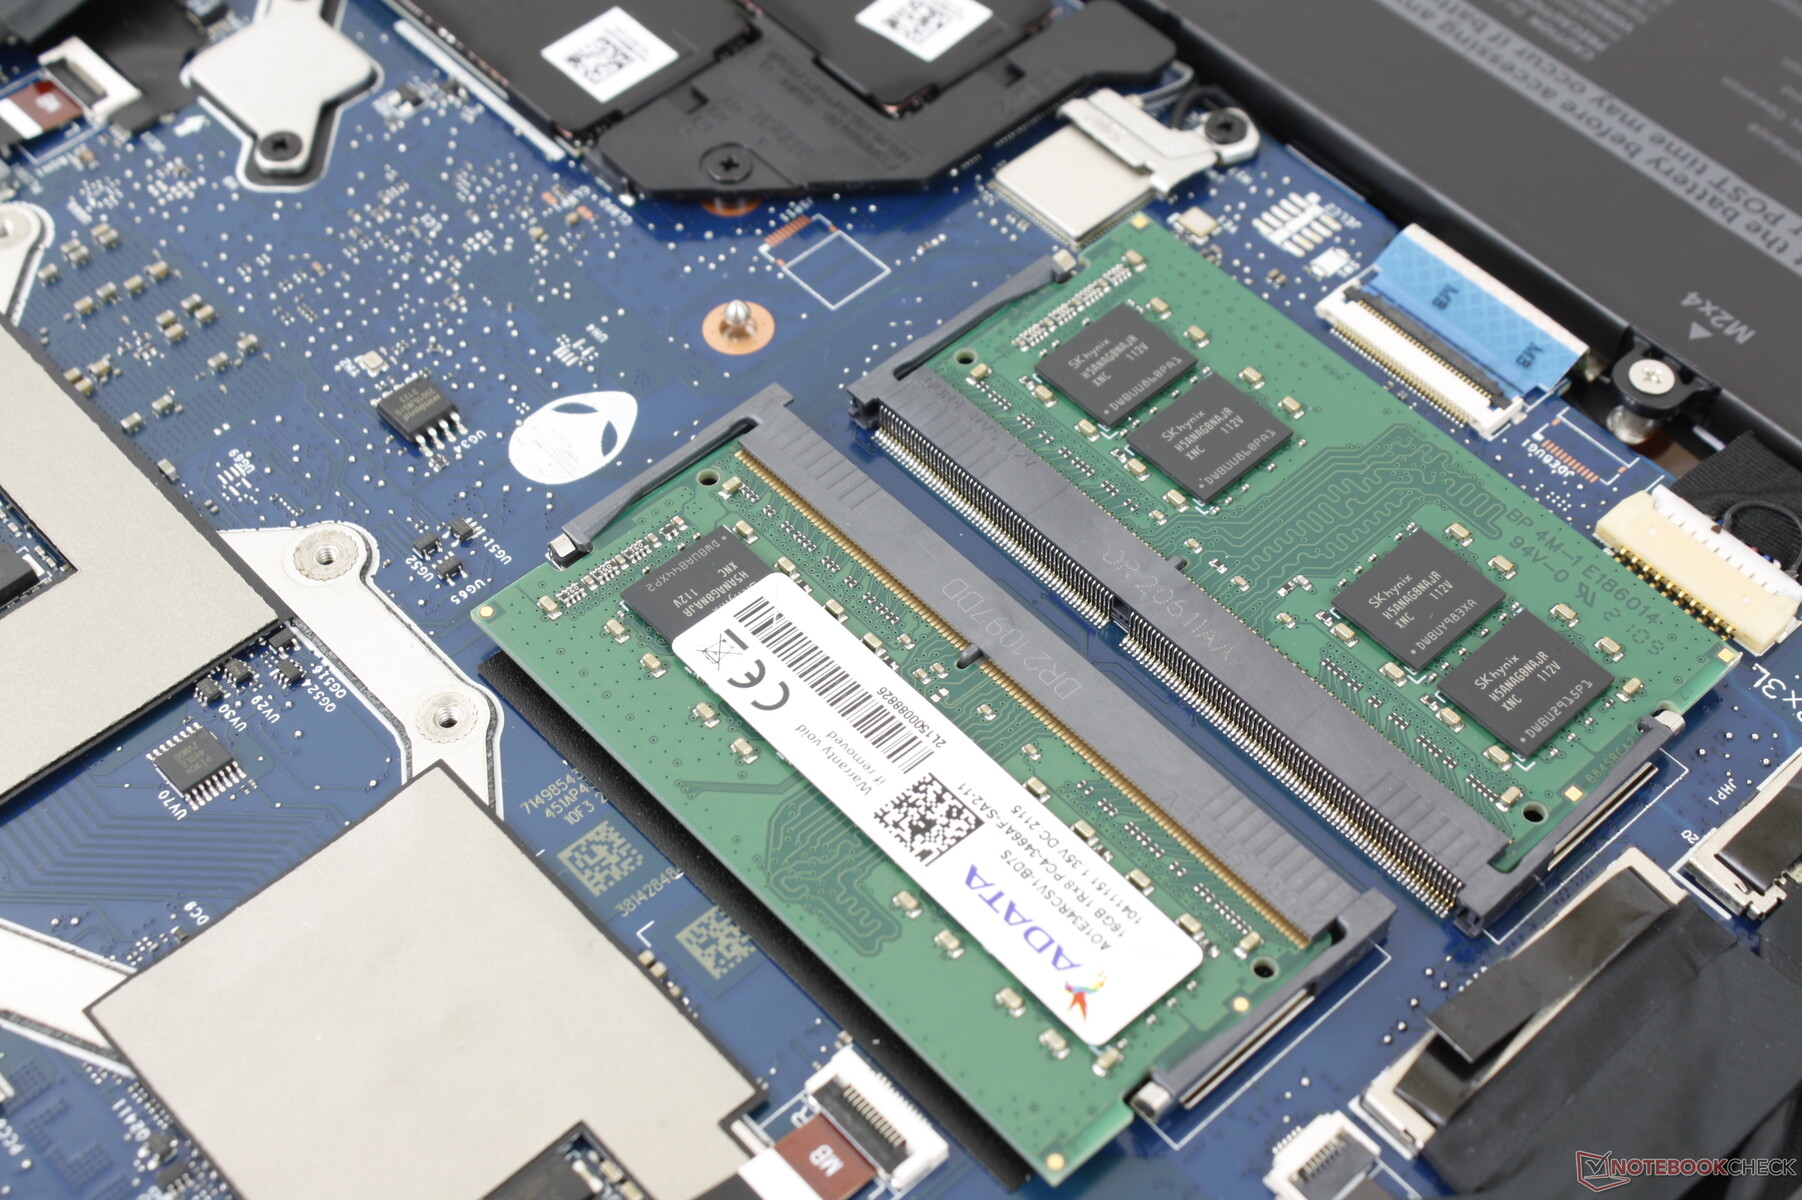
Mantenimiento
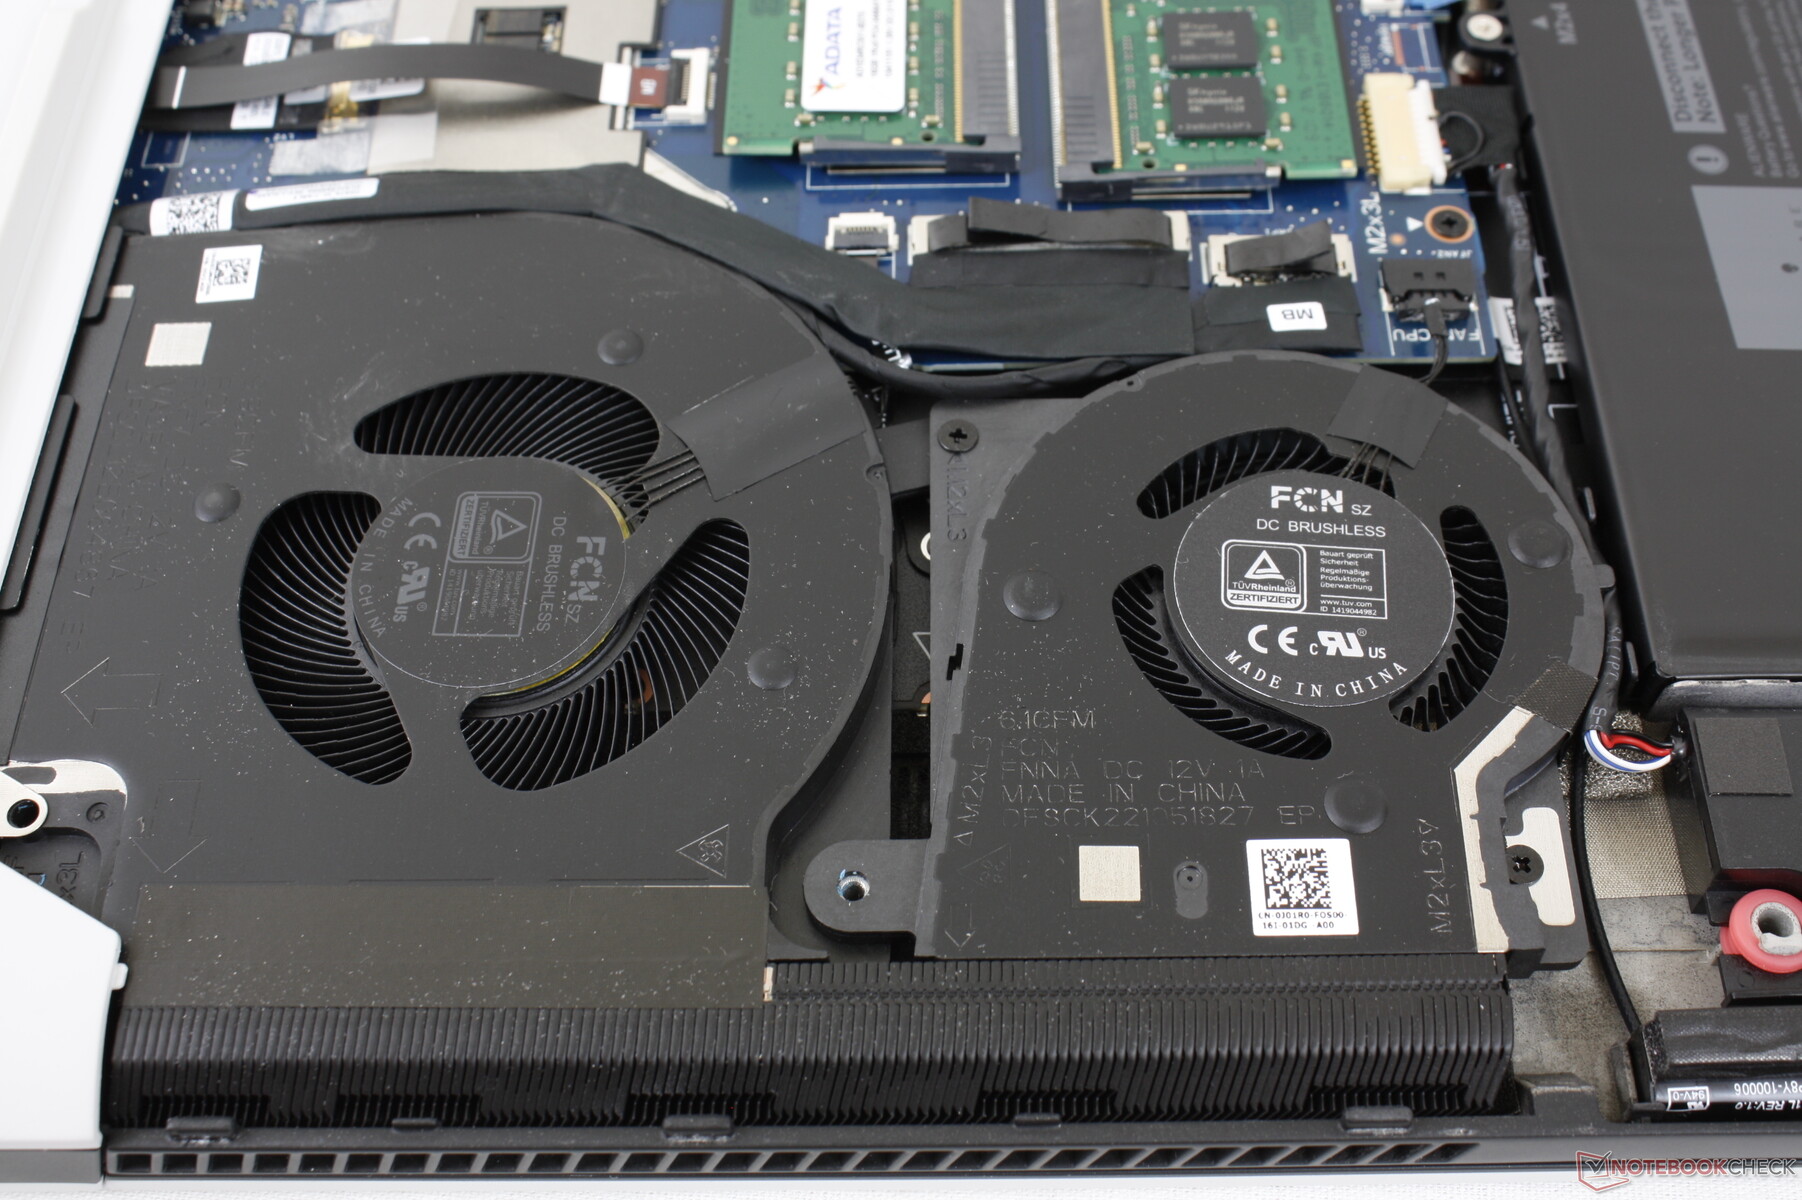
El panel inferior se quita fácilmente con un destornillador Philips y un borde afilado. La RAM es ahora ampliable a través de 2 ranuras SODIMM mientras que en el antiguo diseño m17 R2 están soldadas.
Accesorios y garantía
No hay extras en la caja fuera del adaptador de CA y la documentación. Se aplica la garantía limitada estándar de un año con opciones de ampliación si se compra directamente a Dell.
Dispositivos de entrada - CherryMX al rescate
Teclado
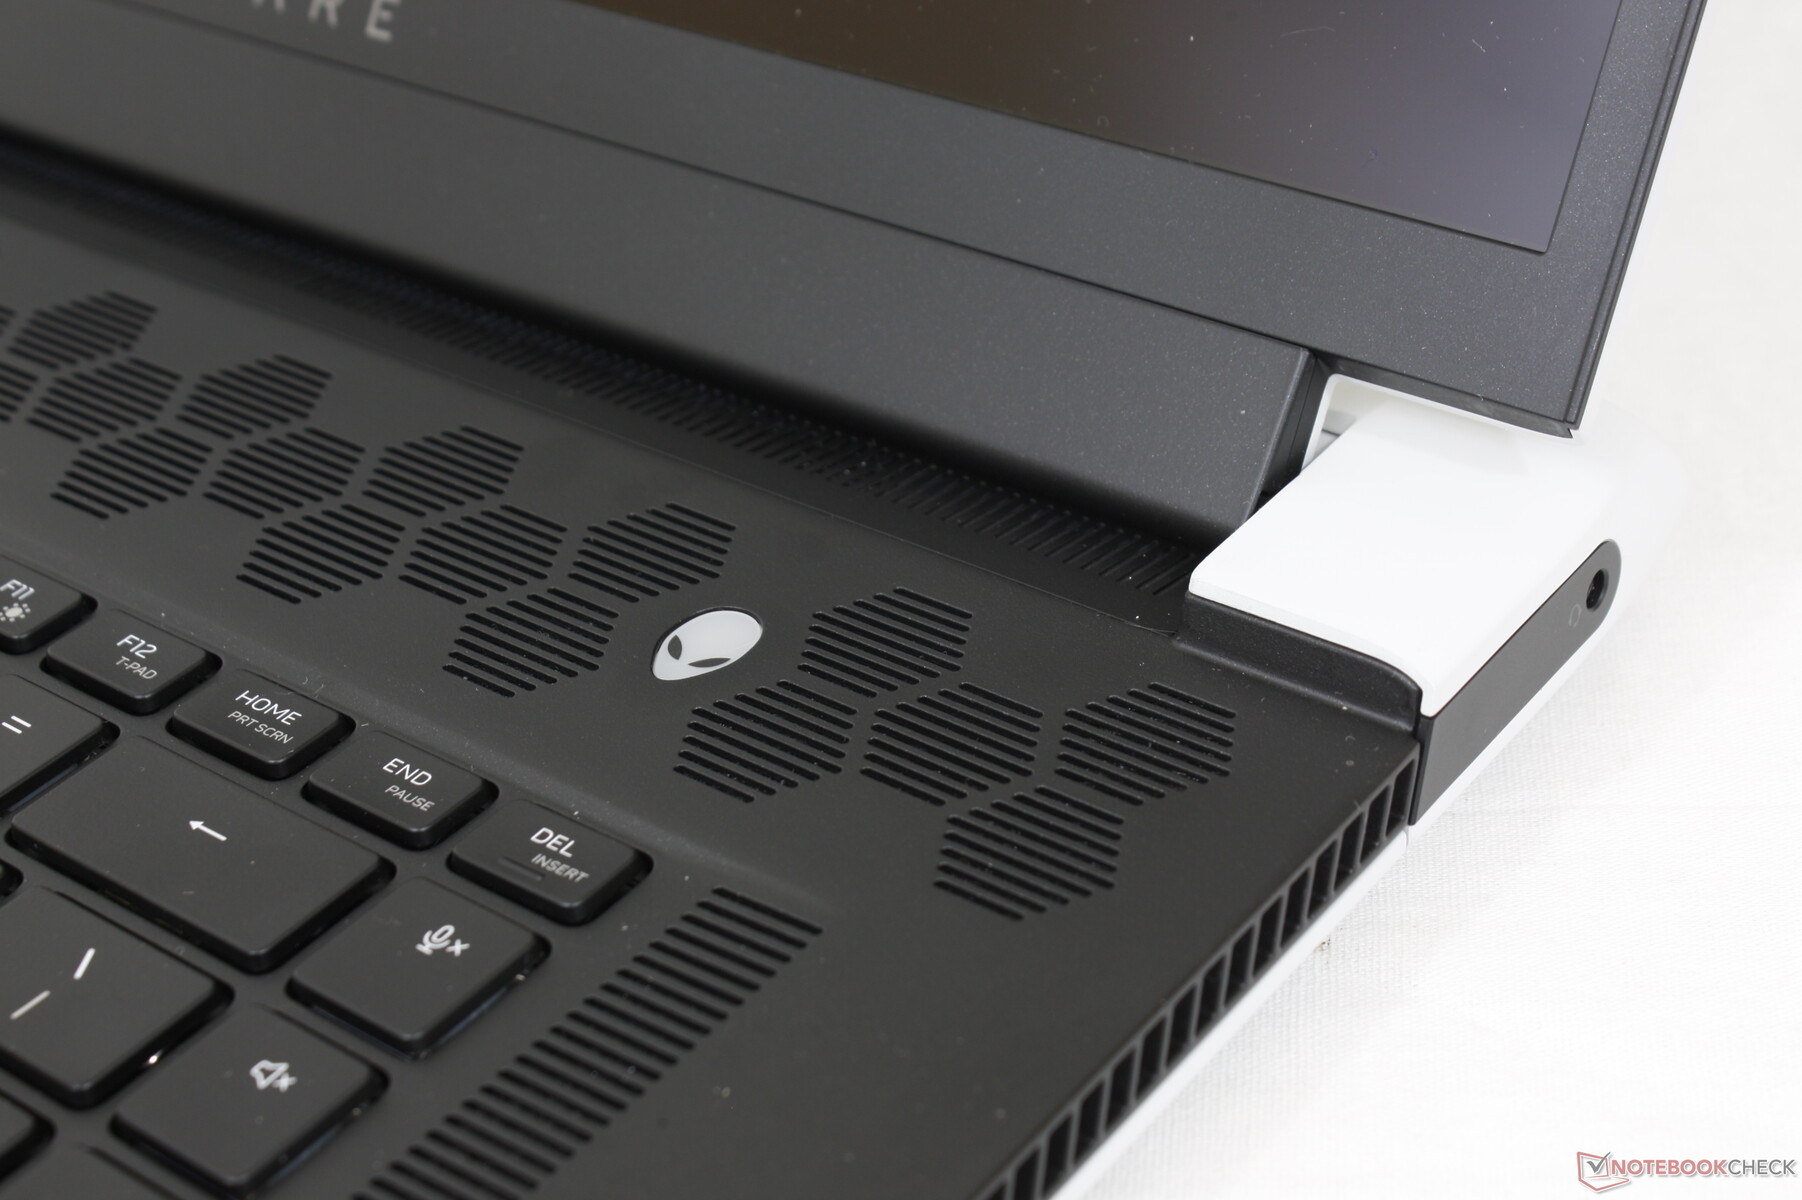
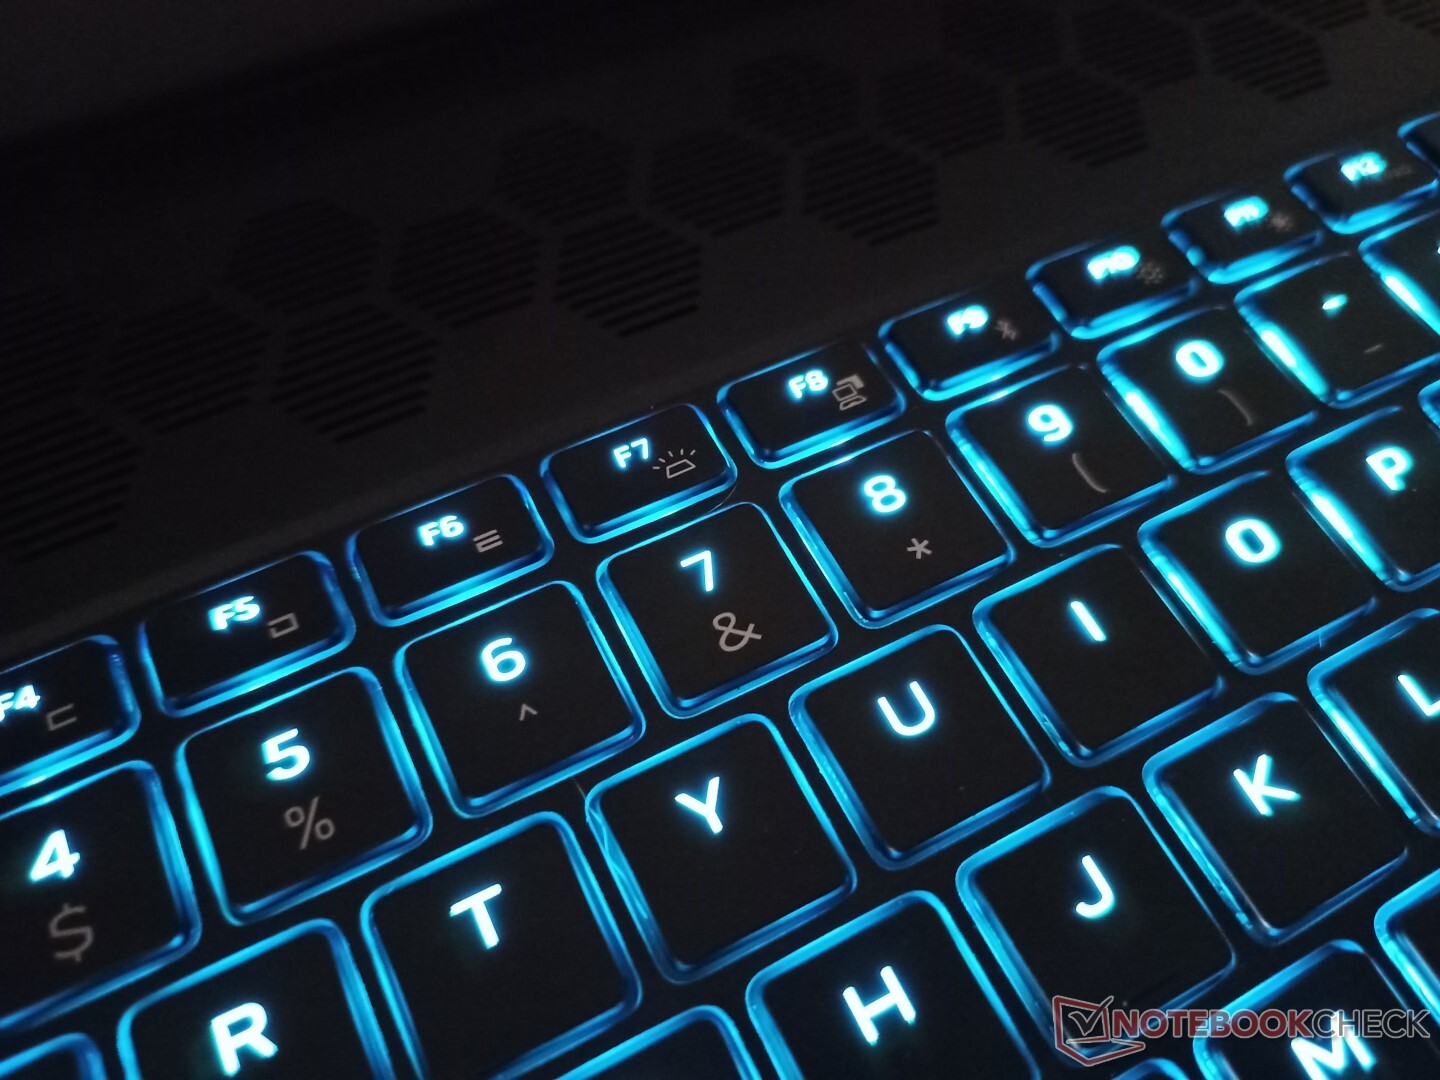
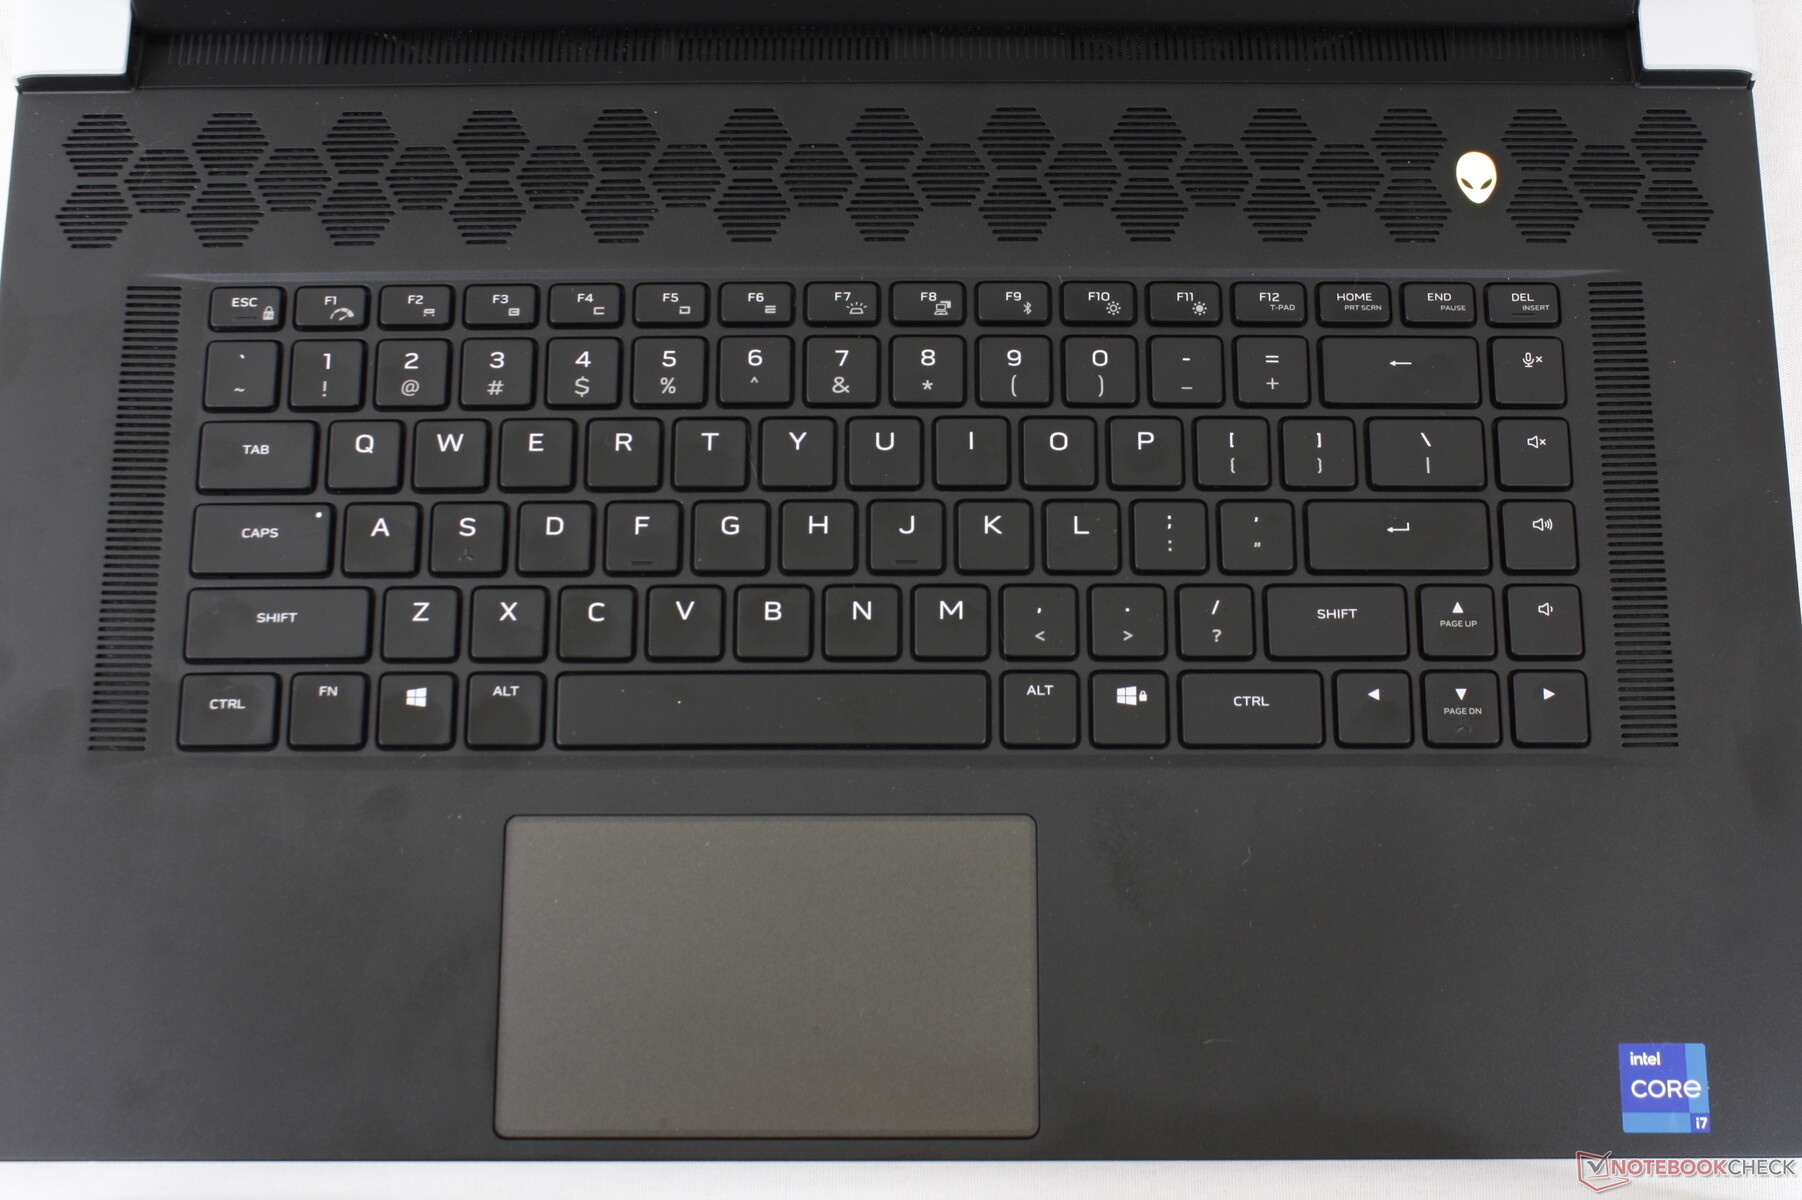
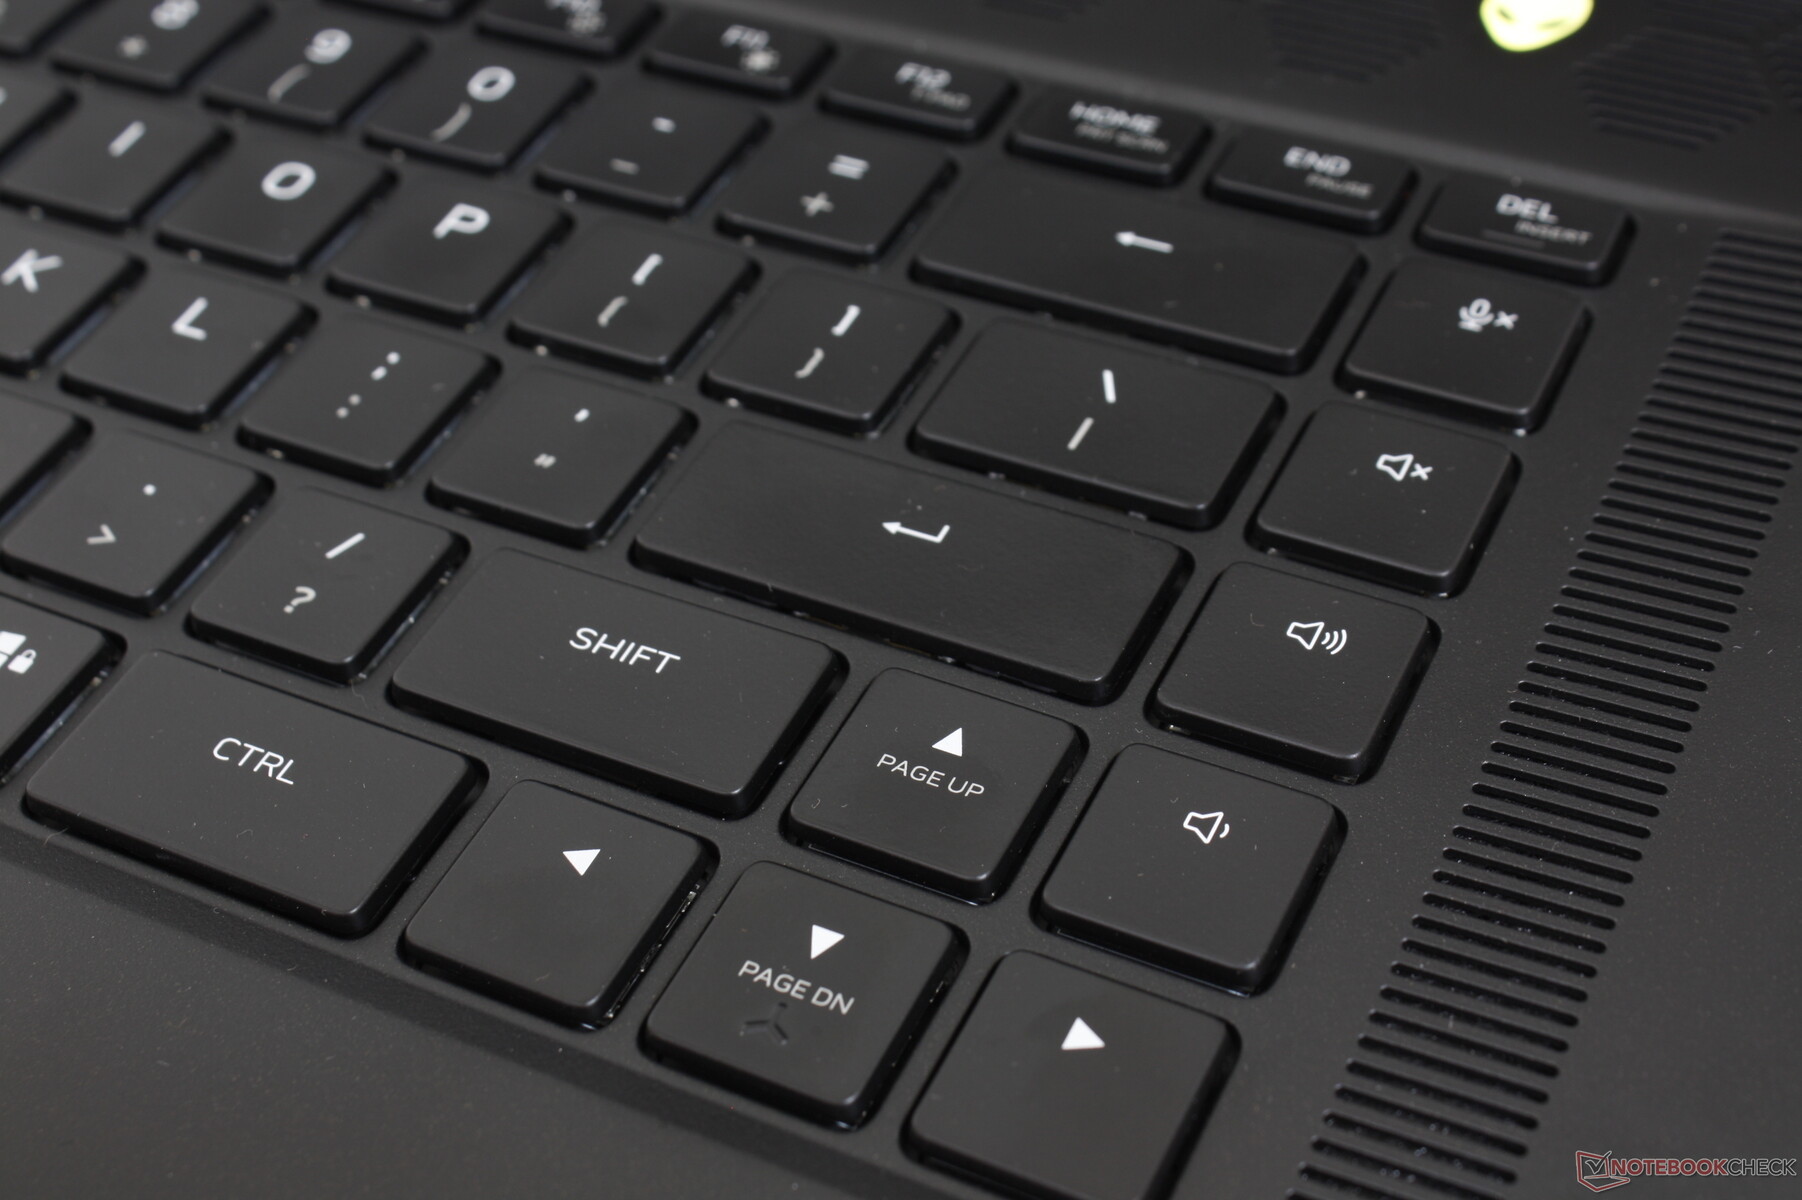
Introducido en en el Alienware m17 R4 del año pasado, las teclas mecánicas CherryMX de perfil ultrabajo han regresado en el x17 R1 como una característica opcional. Al principio teníamos dudas sobre las teclas, ya que los interruptores mecánicos u ópticos han sido mayormente extraños en portátiles como el MSI GT80 Titan, el Razer Blade 15 de 2019, o el Lenovo Legion Y920. Sin embargo, estas nuevas teclas CherryMX se están convirtiendo rápidamente en nuestras favoritas en cualquier portátil para juegos. La respuesta es uniforme, más nítida y con un recorrido más profundo y un clic más satisfactorio en comparación con portátiles como el Razer Blade 17 o el MSI GS76. Las teclas RGB por tecla funcionan bien tanto para el procesamiento de textos como para los juegos, aunque a costa de un estruendo agudo que los compañeros de habitación o de clase pueden no apreciar. En estos casos, recomendamos optar por los modelos con interruptores de membrana tradicionales.
Quizá nuestra mayor queja con el teclado es que los símbolos secundarios de la mayoría de las teclas no están retroiluminados. Así, las teclas de control de brillo, pantalla de impresión, pausa, inserción, etc., son casi imposibles de ver si se trabaja o se juega con poca luz ambiental. Todas las teclas y símbolos están iluminados en el Blade 17 en comparación. Tenga en cuenta que la primera fila de teclas de función tampoco son mecánicas.
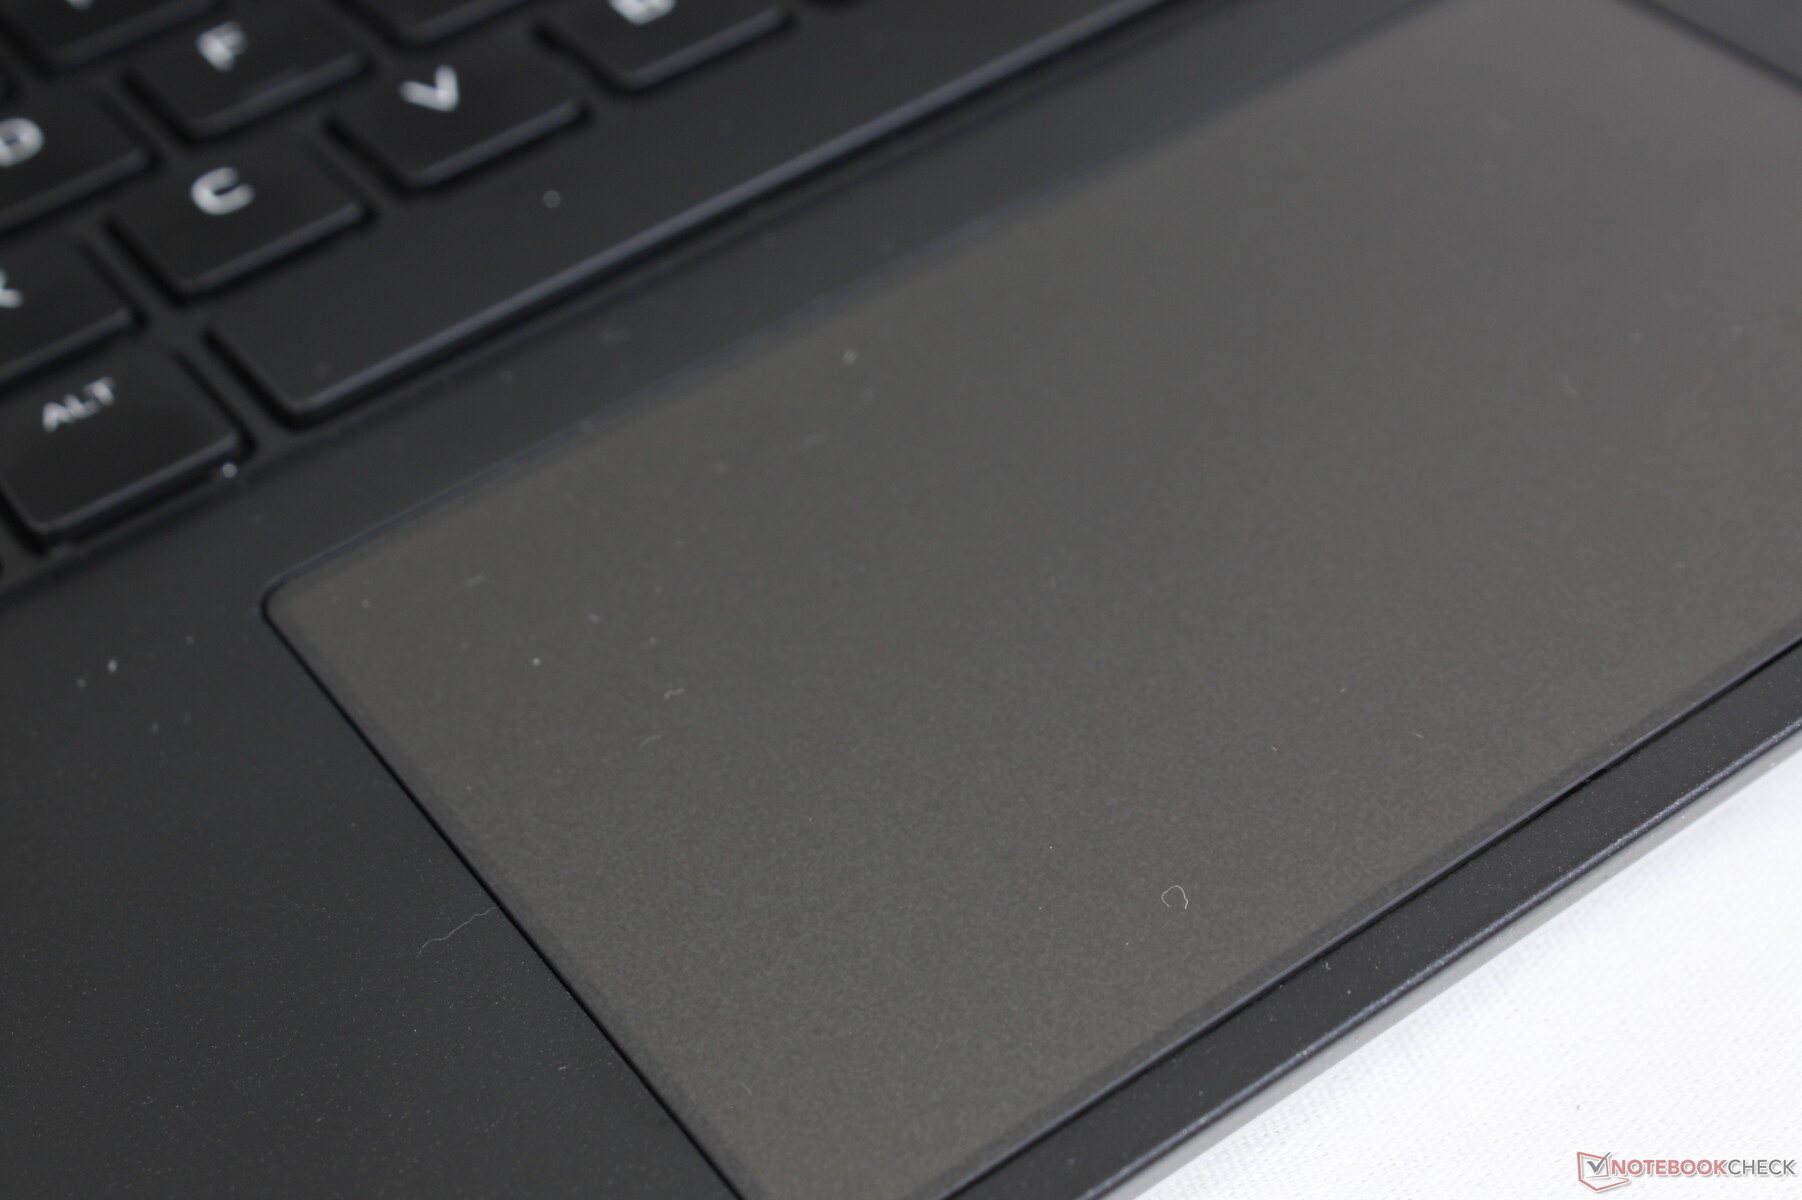
Panel táctil
El clickpad de Precision es relativamente pequeño con 11,3 x 6,8 cm comparado con los 14 x 6,5 cm del MSI GS75. Su superficie es, por lo demás, suave cuando se desliza a velocidades medias, con sólo un poco de adherencia a velocidades más lentas para clics más precisos. El recorrido es muy poco profundo y la respuesta es más suave al presionar. Aunque una mayor superficie habría facilitado las entradas multitáctiles, al menos el clickpad no es tan esponjoso como el de la serie Razer Blade.
Dell ofrece una retroiluminación RGB para el clickpad en ciertas referencias, lo que es una opción superficial que regresa de los antiguos portátiles Alienware. Esta característica no está disponible en el Alienware x15 R1 más pequeño de 15,6 pulgadas.

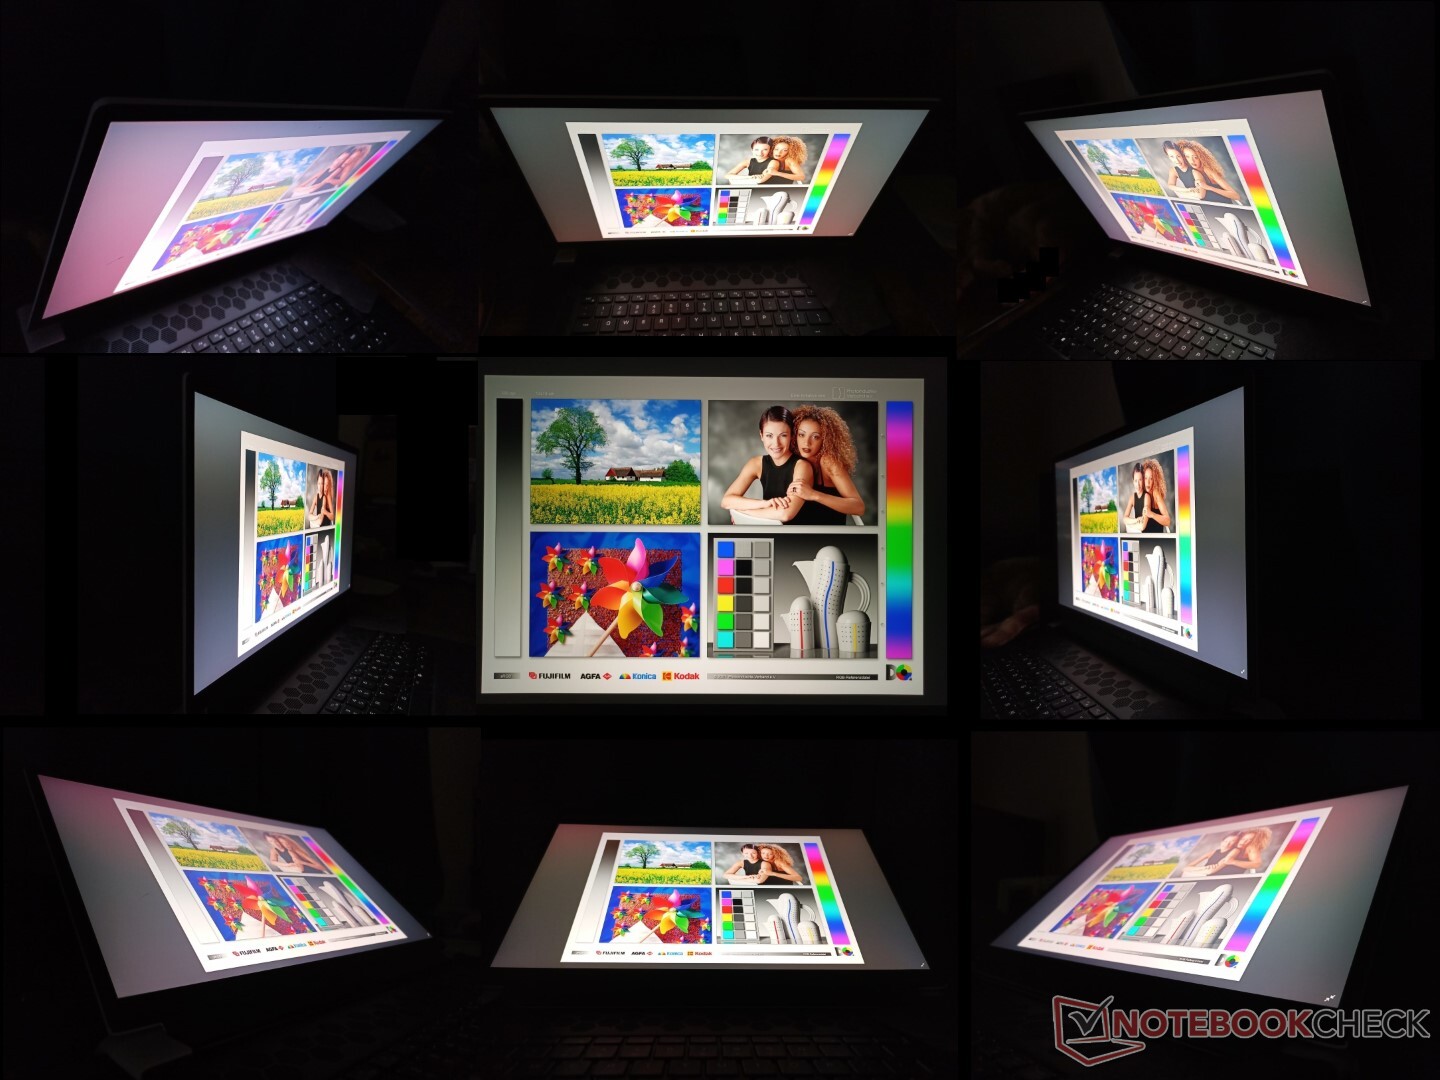
Pantalla - 4K, 120 Hz, 100% AdobeRGB, 5 ms
Mientras que el panel AU Optronics B173ZAN puede encontrarse en otros portátiles como elSchenker XMG Ultra 17el de nuestro Alienware tiene una tasa de refresco nativa de 120 Hz en lugar de 60 Hz. Además, los tiempos de respuesta blanco-negro y gris-gris son muy rápidos en los rangos de un dígito y el brillo máximo también es notablemente más brillante que en la mayoría de otros portátiles para juegos. El MSI GS76 lleva un panel 4K similar con tiempos de respuesta aún más rápidos que nuestro Alienware aunque a costa de una gama más estrecha. Esto hace que la pantalla del Alienware sea una de las pocas que hemos visto que aparentemente cumple todos los requisitos en cuanto a frecuencia de actualización, resolución, tiempos de respuesta, cobertura de color y brillo.
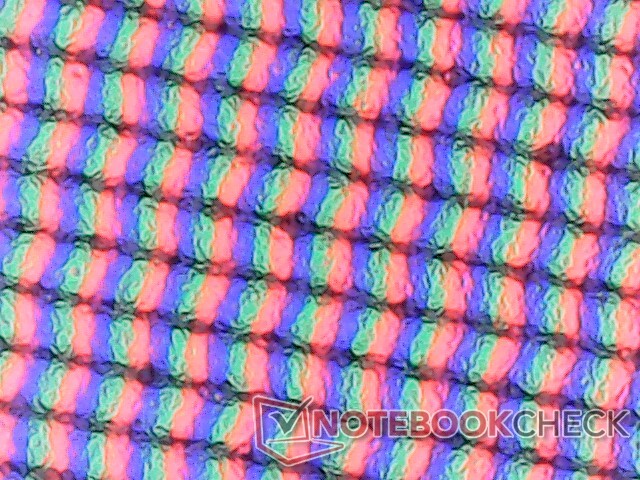
El recubrimiento mate es ligeramente más granulado que una alternativa brillante y el sangrado de la luz de fondo podría haber sido mejor en nuestra unidad específica. Nuestras mediciones reflejan sólo el panel 4K 120 Hz y no ninguna de las otras opciones de pantalla disponibles para el Alienware x17 que se espera que tengan diferentes atributos.
Nótese que Advanced Optimus sólo está disponible en las unidades FHD de 360 Hz. Otras unidades como la nuestra tienen Optimus 1.0 con una opción manual de GPU discreta en la BIOS.

| |||||||||||||||||||||||||
iluminación: 91 %
Brillo con batería: 438.7 cd/m²
Contraste: 914:1 (Negro: 0.48 cd/m²)
ΔE ColorChecker Calman: 4.34 | ∀{0.5-29.43 Ø4.71}
calibrated: 0.72
ΔE Greyscale Calman: 2.4 | ∀{0.09-98 Ø4.96}
100% AdobeRGB 1998 (Argyll 3D)
100% sRGB (Argyll 3D)
88.3% Display P3 (Argyll 3D)
Gamma: 2.09
CCT: 6413 K
| Alienware x17 RTX 3080 P48E AU Optronics B173ZAN, IPS, 17.3", 3840x2160 | Alienware m17 R4 AU Optronics AUOEC91, IPS, 17.3", 1920x1080 | Razer Blade 17 RTX 3070 AU Optronics B173HAN05.4, IPS, 17.3", 1920x1080 | Asus ROG Zephyrus S17 GX703HSD BOE099D (BOE CQ NE173QHM-NY3), IPS, 17.3", 2560x1440 | MSI GS76 Stealth 11UH AUO B173ZAN06.1 (AUODE95), IPS, 17.3", 3840x2160 | Gigabyte Aero 17 HDR YD AU Optronics AUO329B, IPS, 17.3", 3840x2160 | |
|---|---|---|---|---|---|---|
| Display | -16% | -15% | -3% | -23% | -1% | |
| Display P3 Coverage (%) | 88.3 | 69.8 -21% | 71.7 -19% | 94.2 7% | 63 -29% | 86.9 -2% |
| sRGB Coverage (%) | 100 | 99.7 0% | 98.8 -1% | 98.7 -1% | 94.8 -5% | 100 0% |
| AdobeRGB 1998 Coverage (%) | 100 | 71.6 -28% | 73.6 -26% | 84.4 -16% | 65 -35% | 99.6 0% |
| Response Times | 10% | 43% | 45% | 39% | -206% | |
| Response Time Grey 50% / Grey 80% * (ms) | 14.4 ? | 13.2 ? 8% | 4.2 ? 71% | 4.8 67% | 8.8 ? 39% | 52 ? -261% |
| Response Time Black / White * (ms) | 10.4 ? | 9.2 ? 12% | 8.8 ? 15% | 8 23% | 6.4 ? 38% | 26 ? -150% |
| PWM Frequency (Hz) | ||||||
| Screen | 21% | -44% | -19% | 9% | 30% | |
| Brightness middle (cd/m²) | 438.7 | 305 -30% | 323.3 -26% | 322 -27% | 474 8% | 488 11% |
| Brightness (cd/m²) | 435 | 301 -31% | 315 -28% | 288 -34% | 454 4% | 467 7% |
| Brightness Distribution (%) | 91 | 93 2% | 91 0% | 72 -21% | 88 -3% | 86 -5% |
| Black Level * (cd/m²) | 0.48 | 0.19 60% | 0.33 31% | 0.3 37% | 0.46 4% | 0.33 31% |
| Contrast (:1) | 914 | 1605 76% | 980 7% | 1073 17% | 1030 13% | 1479 62% |
| Colorchecker dE 2000 * | 4.34 | 1.31 70% | 4.59 -6% | 3.05 30% | 1.5 65% | 1.23 72% |
| Colorchecker dE 2000 max. * | 7.3 | 2.32 68% | 10.82 -48% | 5.23 28% | 5.59 23% | 2.94 60% |
| Colorchecker dE 2000 calibrated * | 0.72 | 0.91 -26% | 1.4 -94% | 1.92 -167% | 0.86 -19% | 0.77 -7% |
| Greyscale dE 2000 * | 2.4 | 2.3 4% | 7.9 -229% | 3.11 -30% | 2.8 -17% | 1.5 37% |
| Gamma | 2.09 105% | 2.281 96% | 2.28 96% | 2.13 103% | 2.158 102% | 2.169 101% |
| CCT | 6413 101% | 6449 101% | 5941 109% | 6553 99% | 6597 99% | 6614 98% |
| Color Space (Percent of AdobeRGB 1998) (%) | 72 | 84 | 99 | |||
| Color Space (Percent of sRGB) (%) | 94 | 99 | 99 | |||
| Media total (Programa/Opciones) | 5% /
12% | -5% /
-25% | 8% /
-6% | 8% /
6% | -59% /
-10% |
* ... más pequeño es mejor
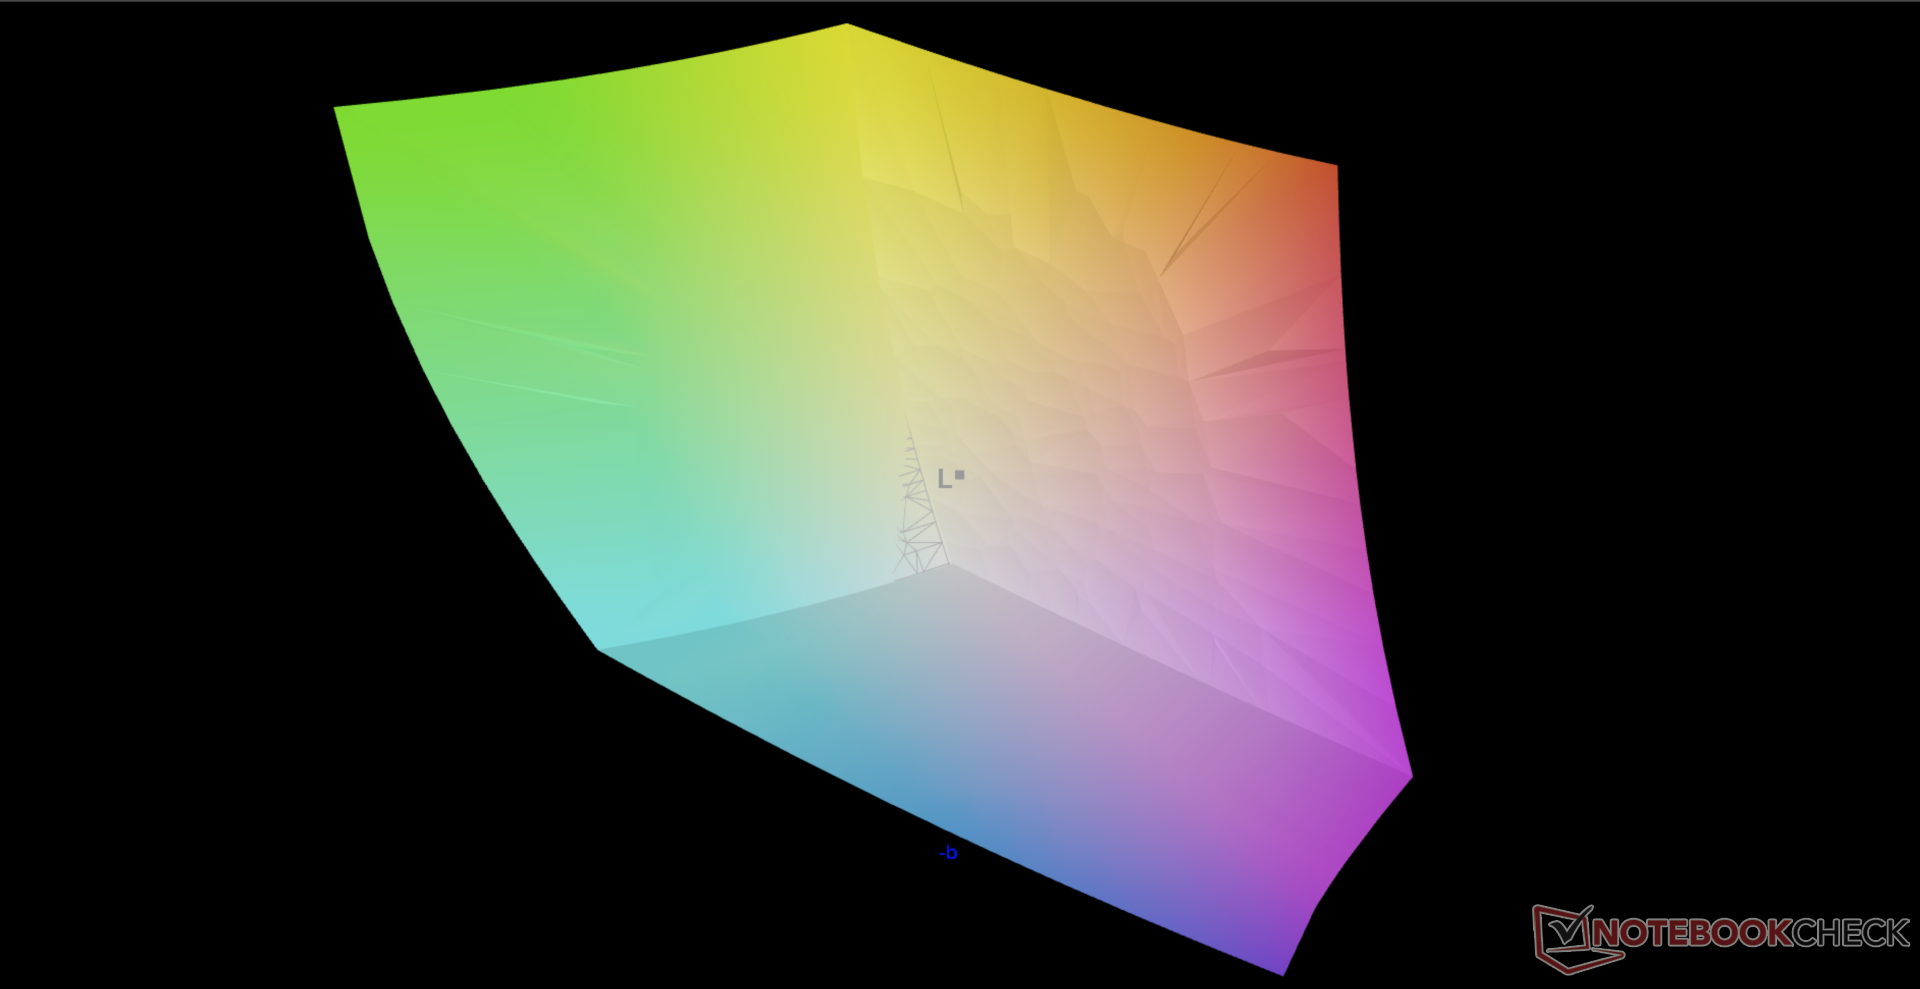
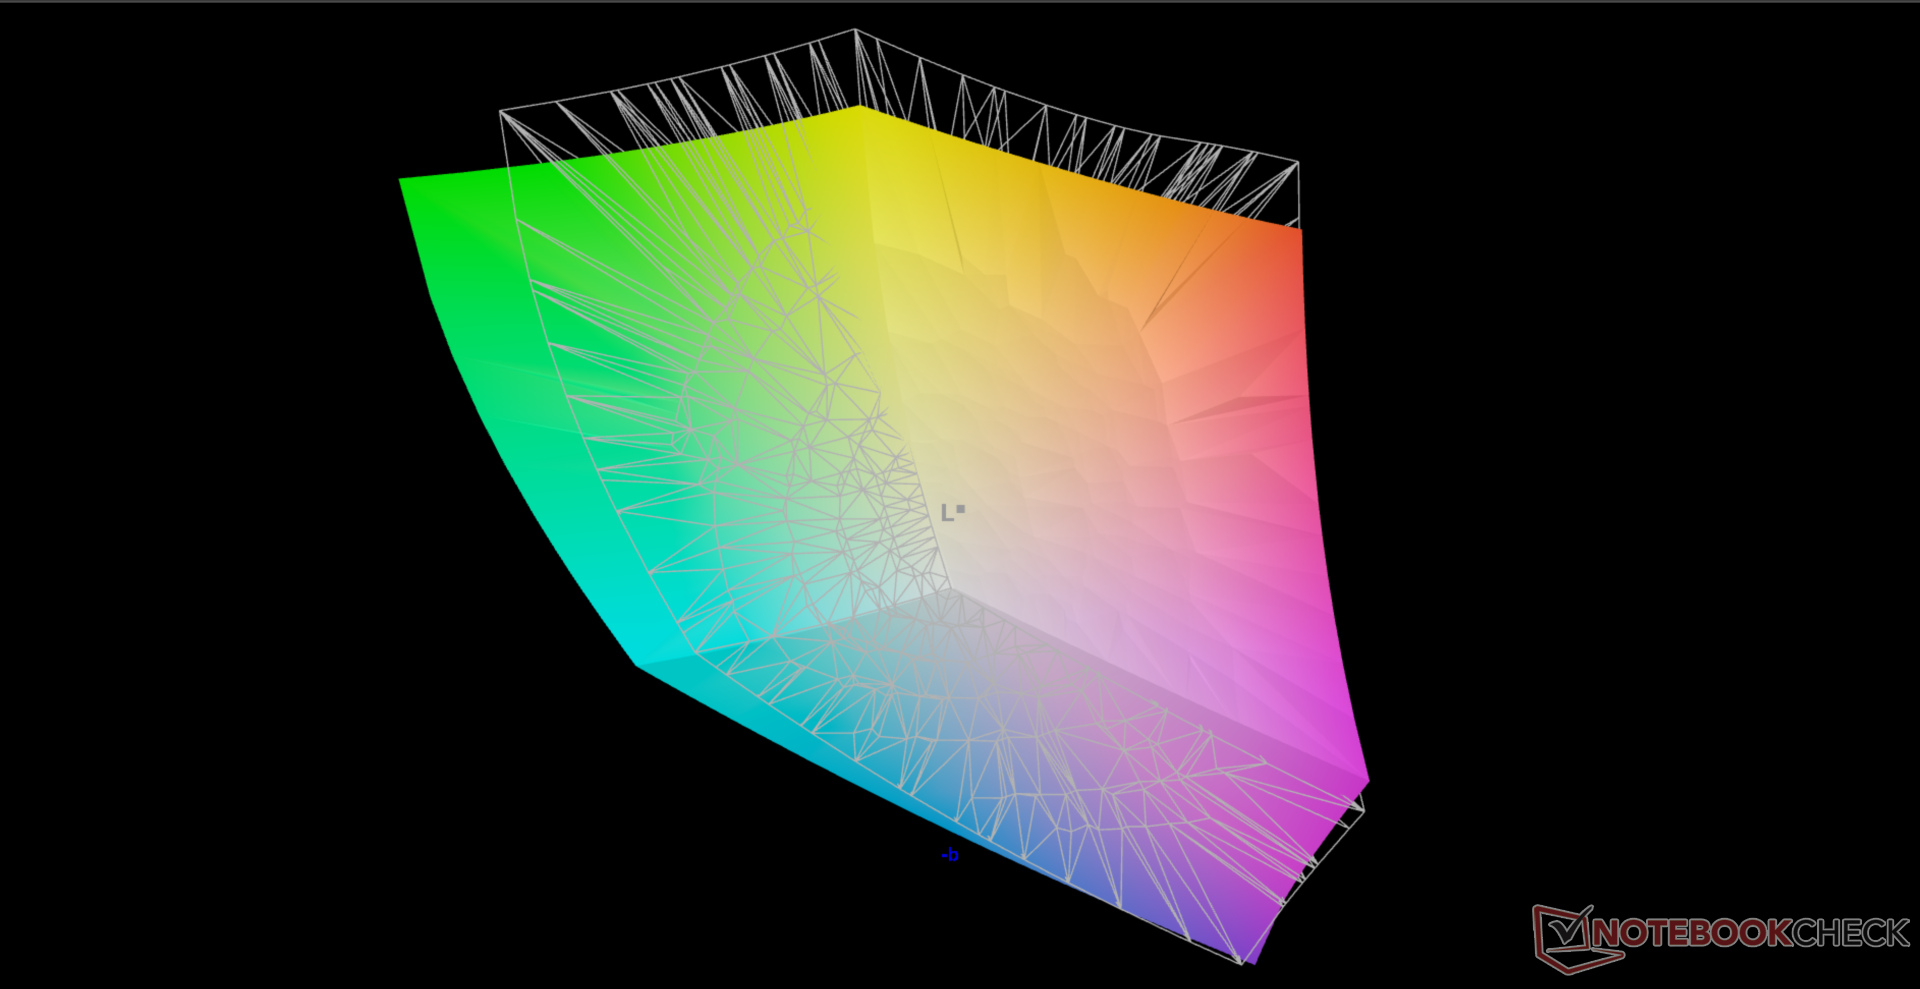
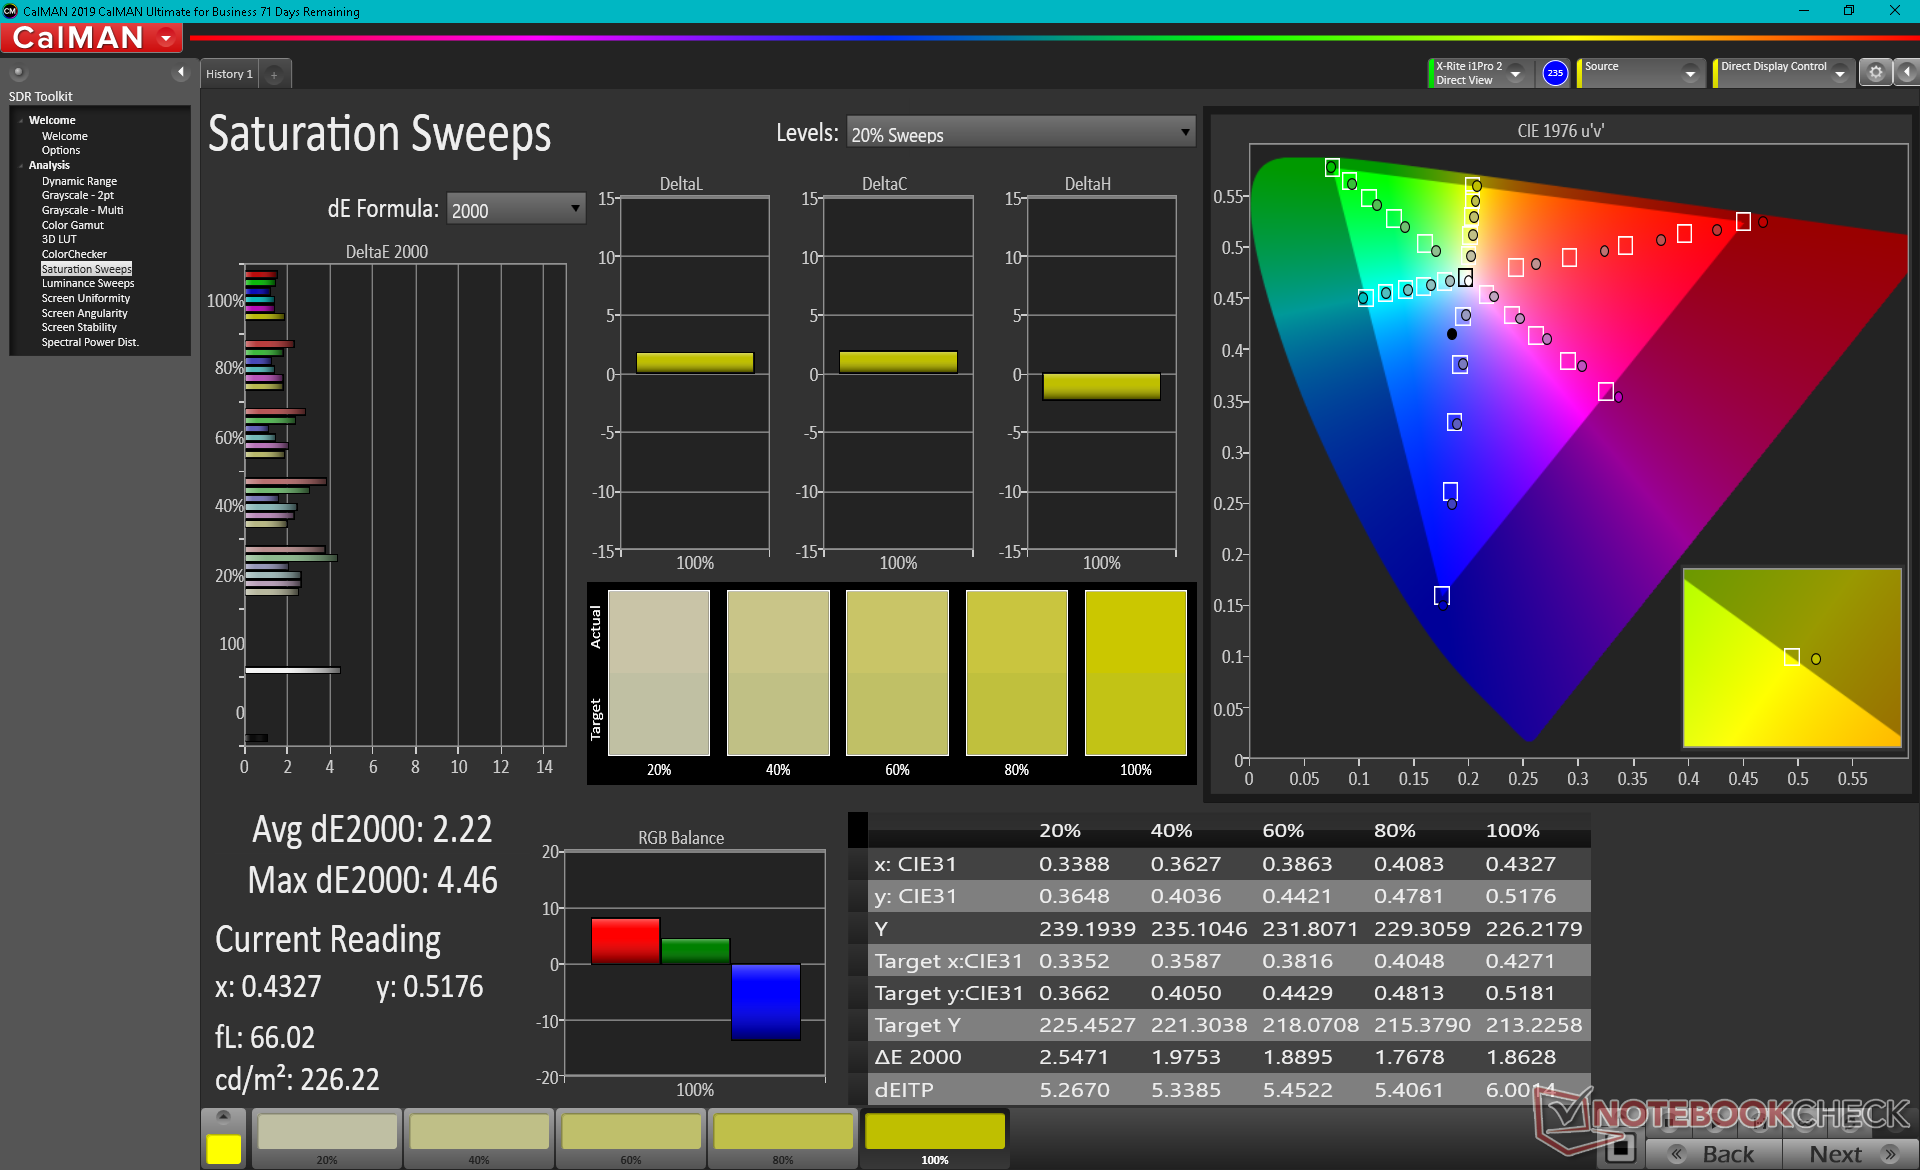
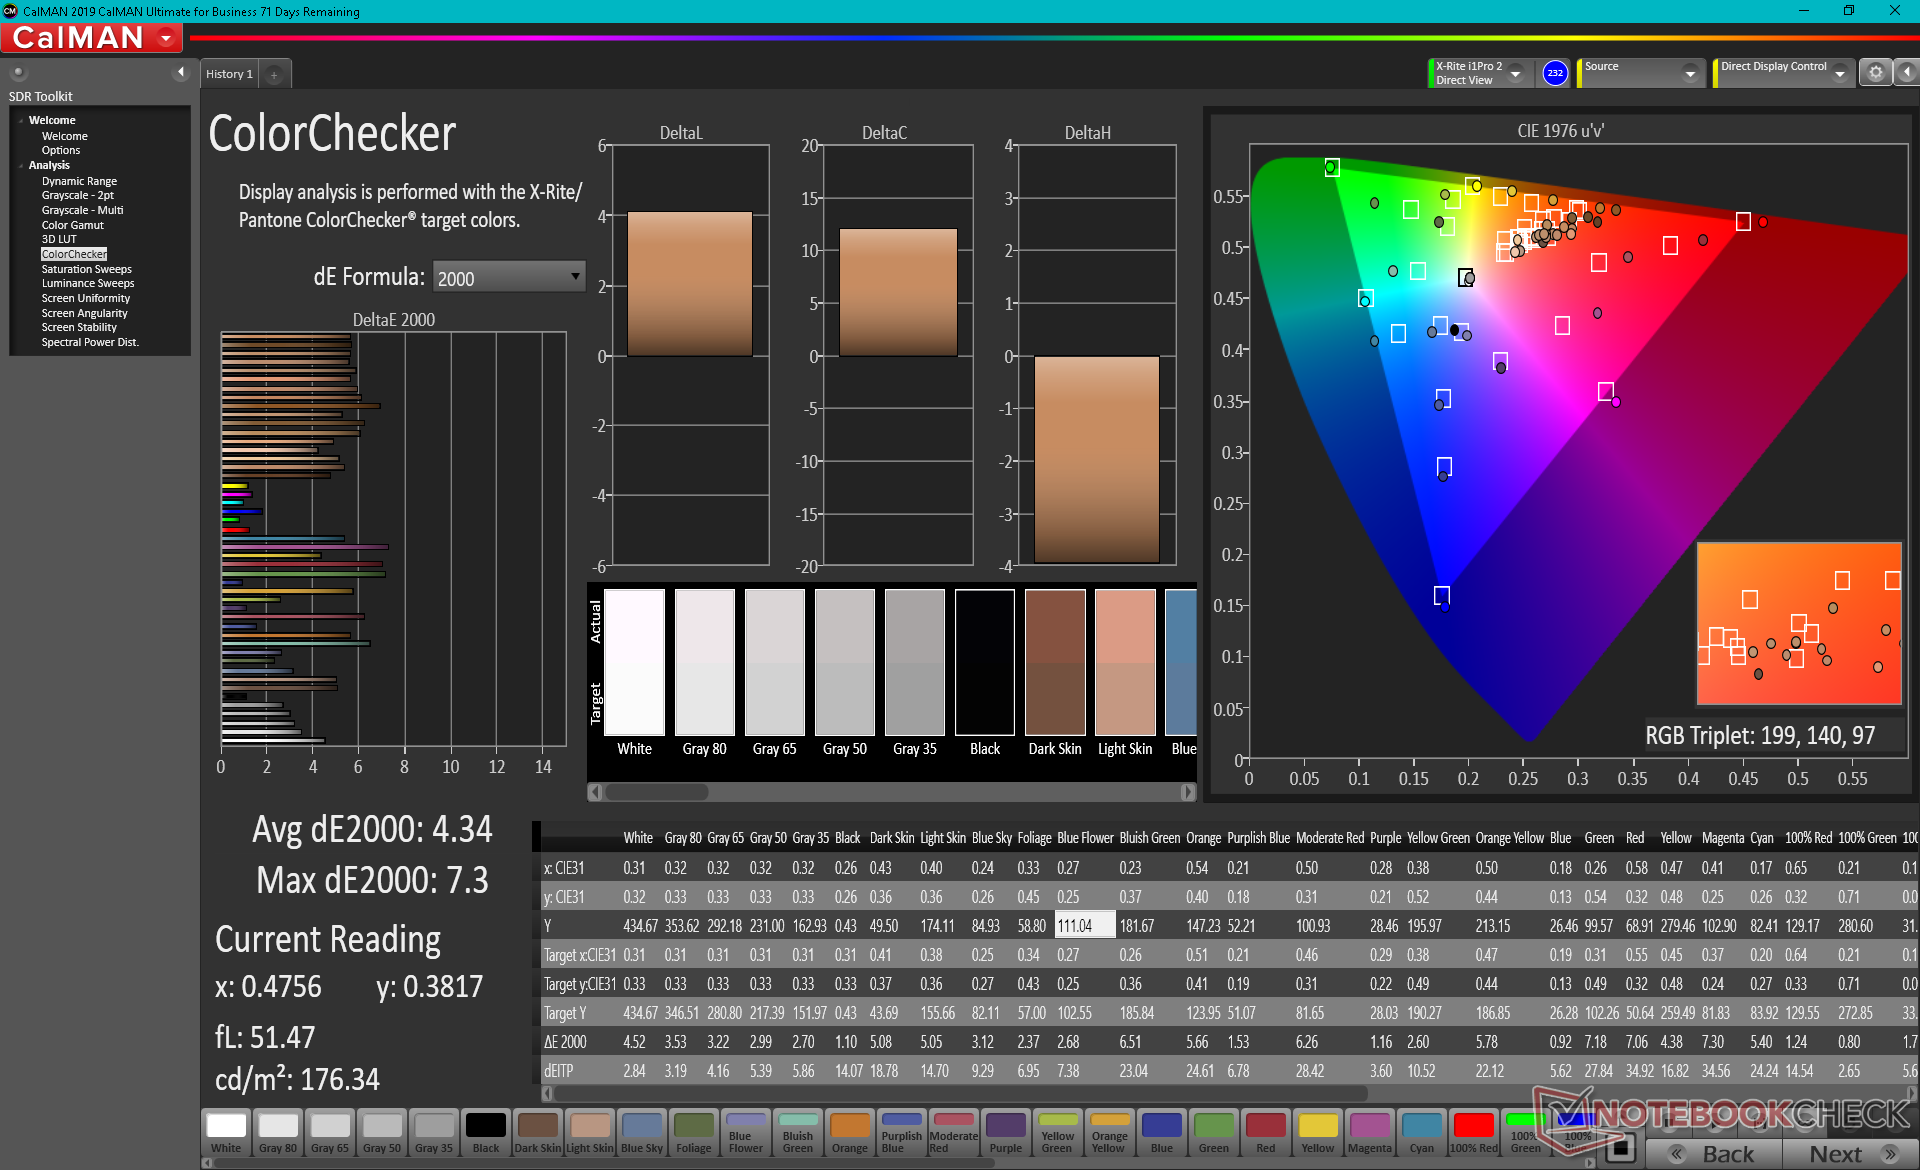
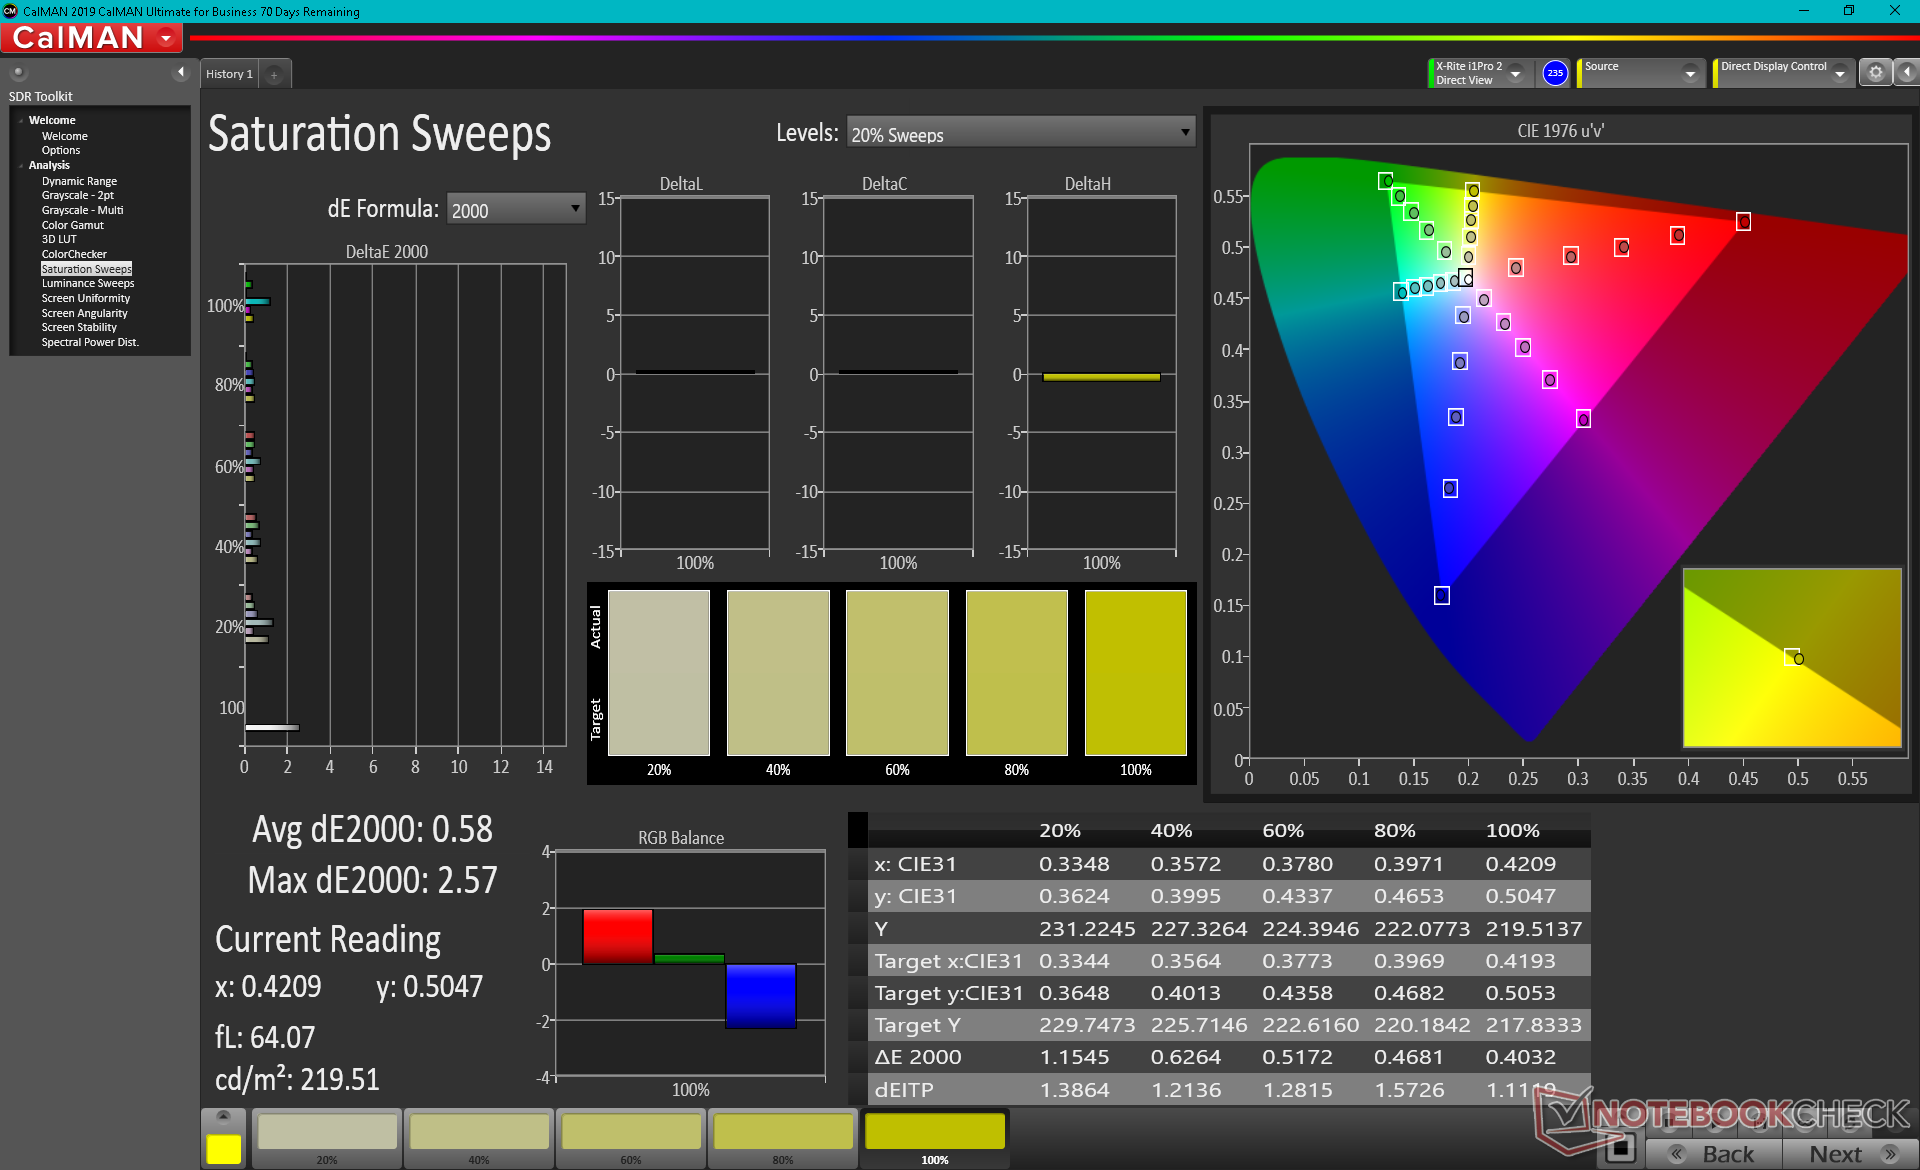
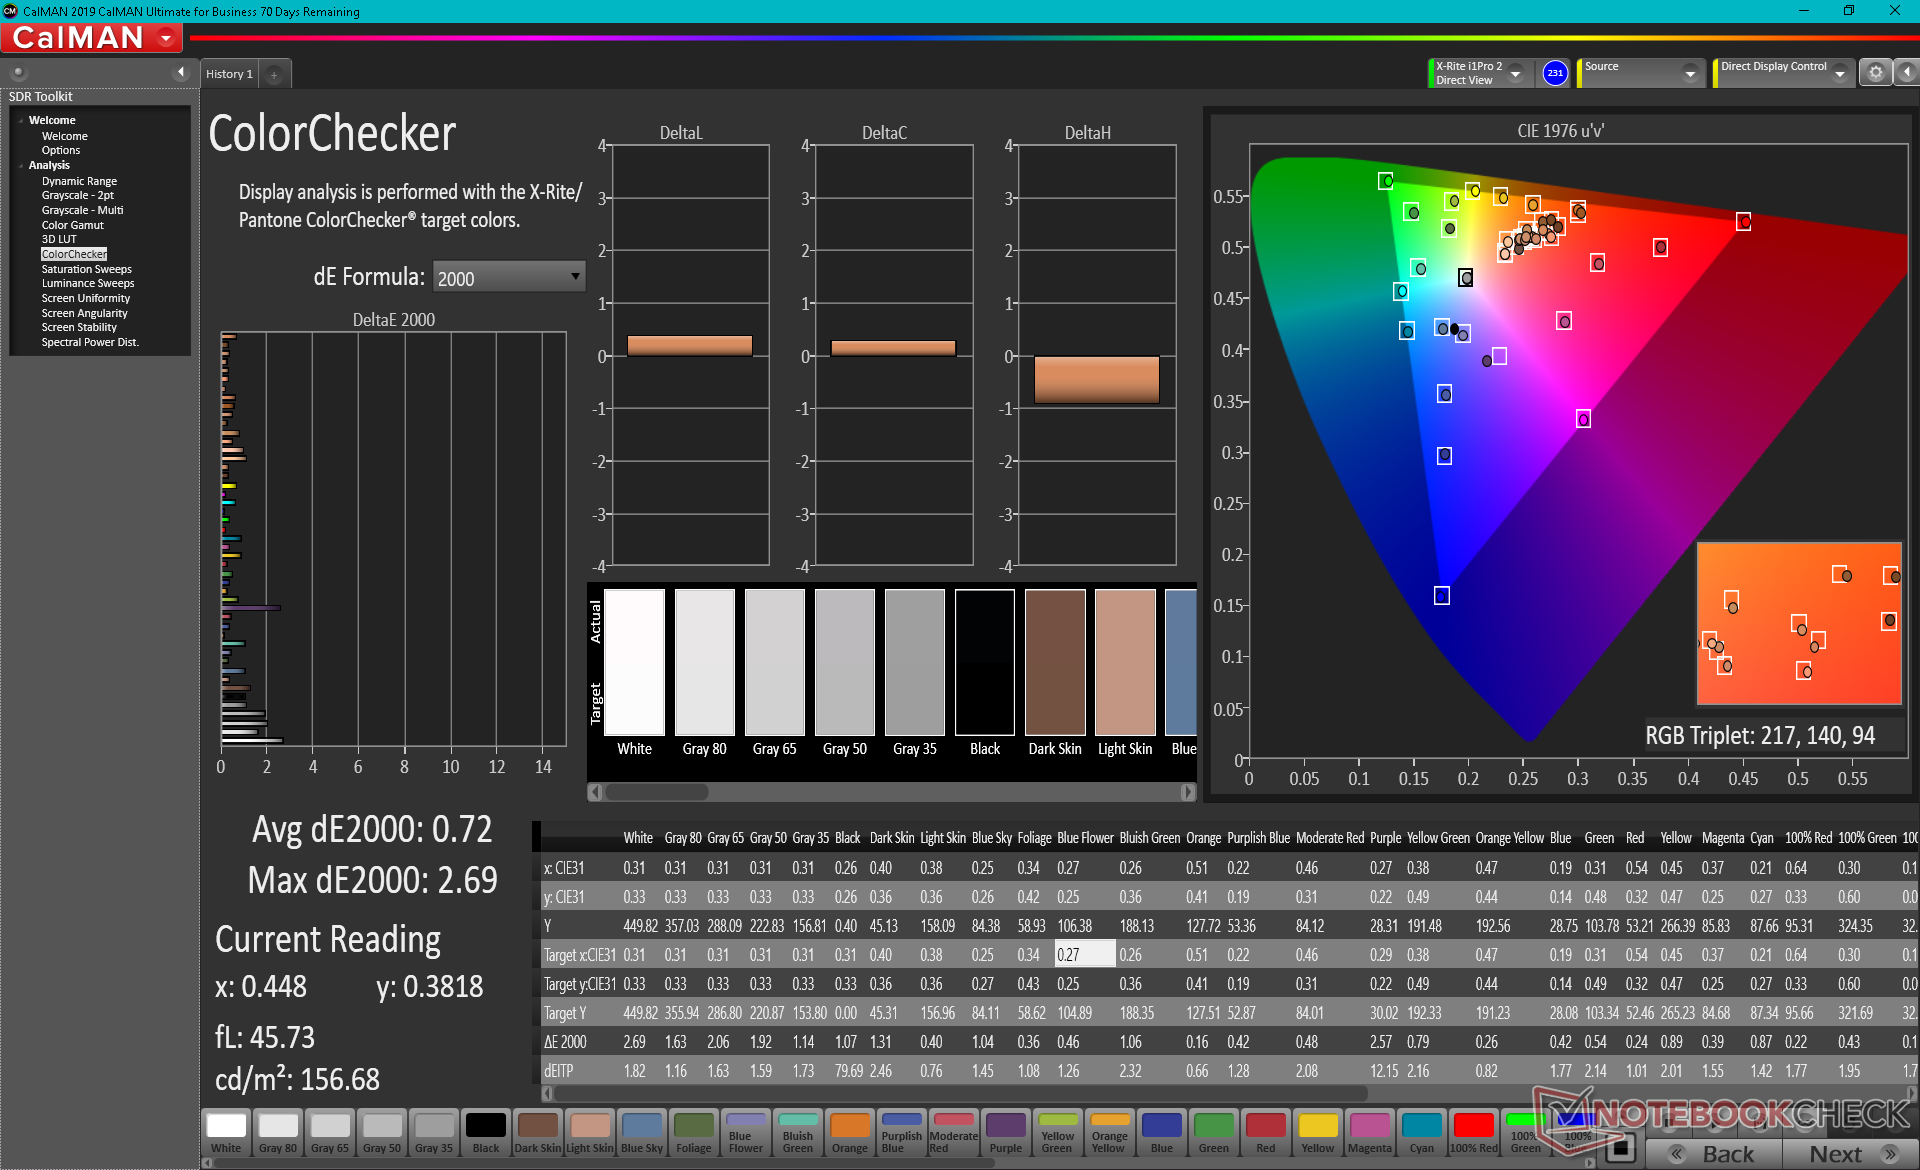
El espacio de color abarca todo el sRGB y el AdobeRGB, como anuncia el fabricante, mientras que la cobertura del DCI-P3 es de aproximadamente el 88%. Los colores profundos, los tiempos de respuesta rápidos y la rápida tasa de refresco hacen que este panel 4K sea adecuado tanto para los juegos como para la edición de gráficos.
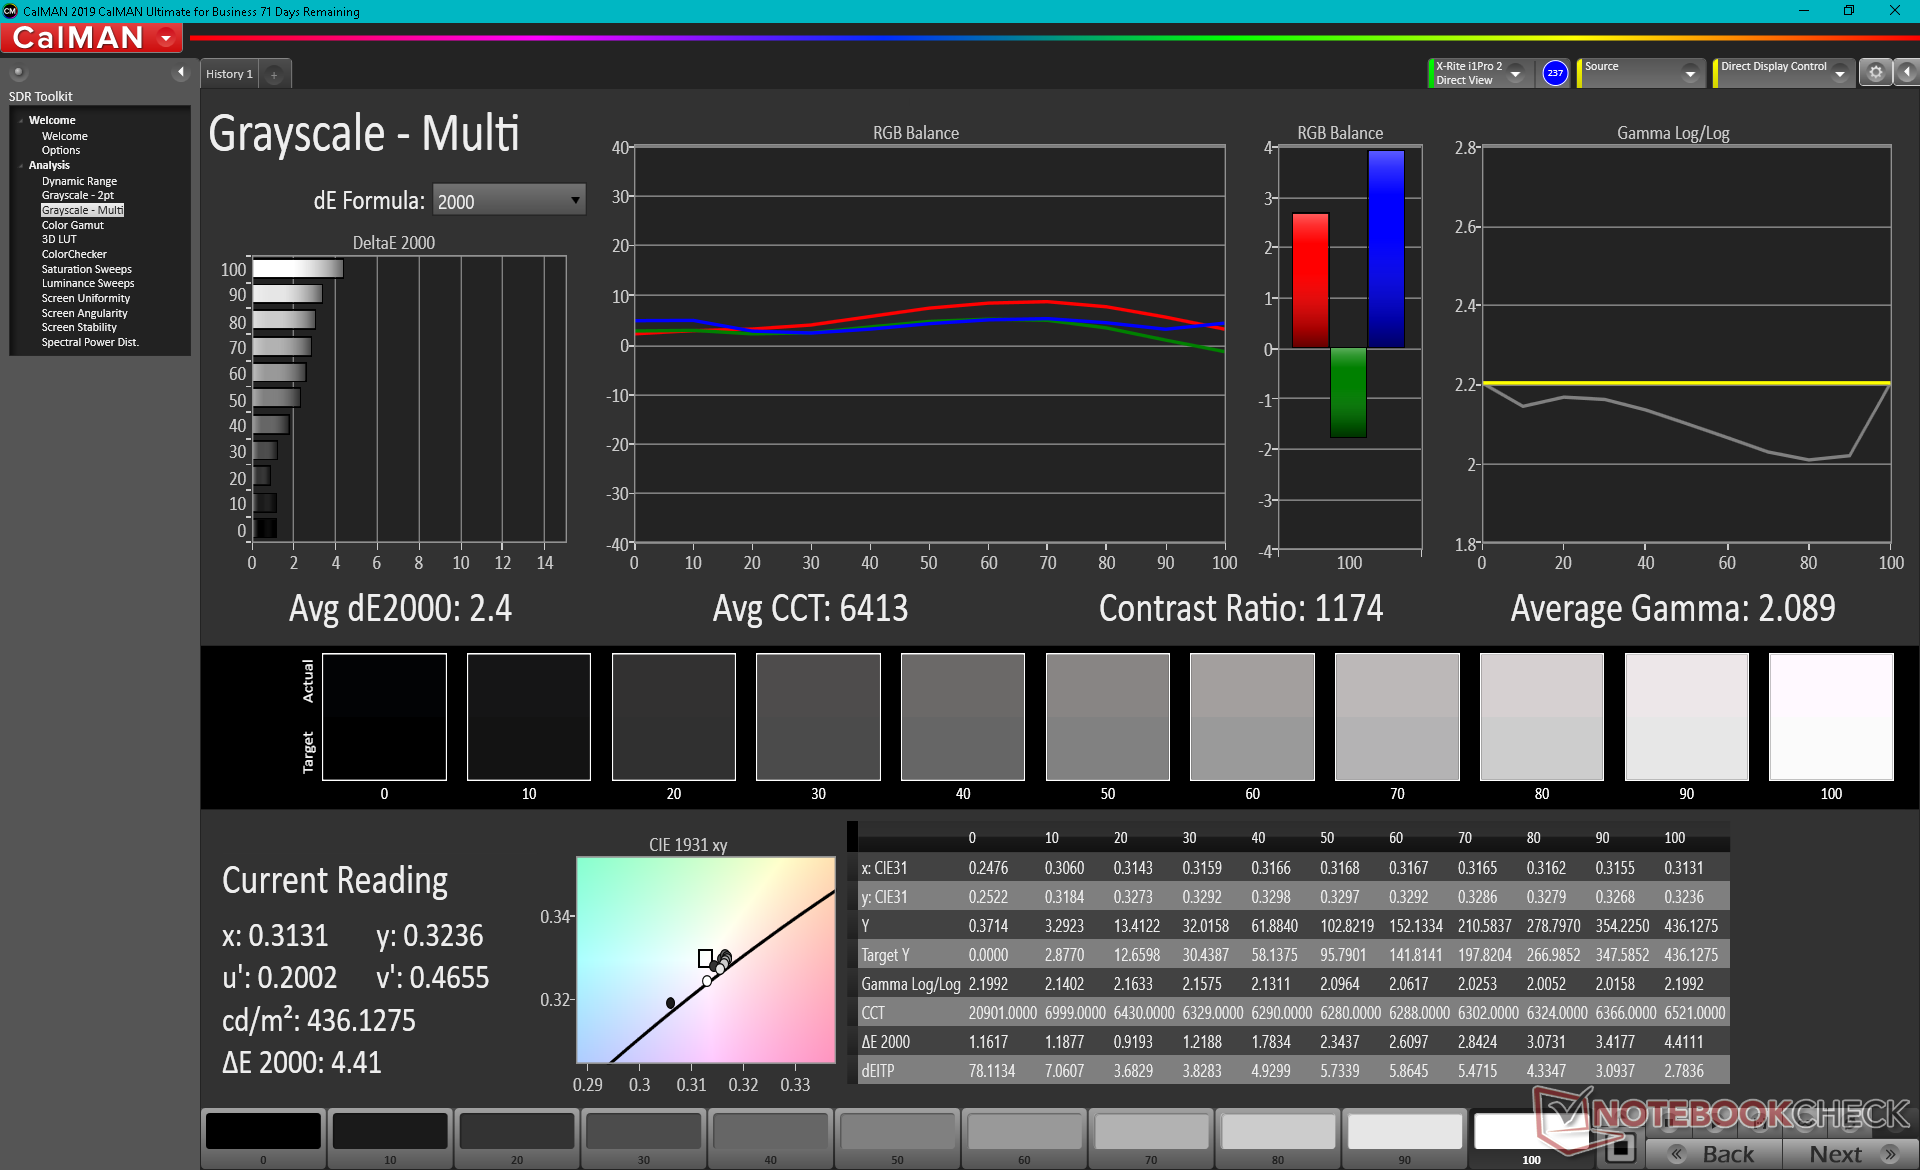
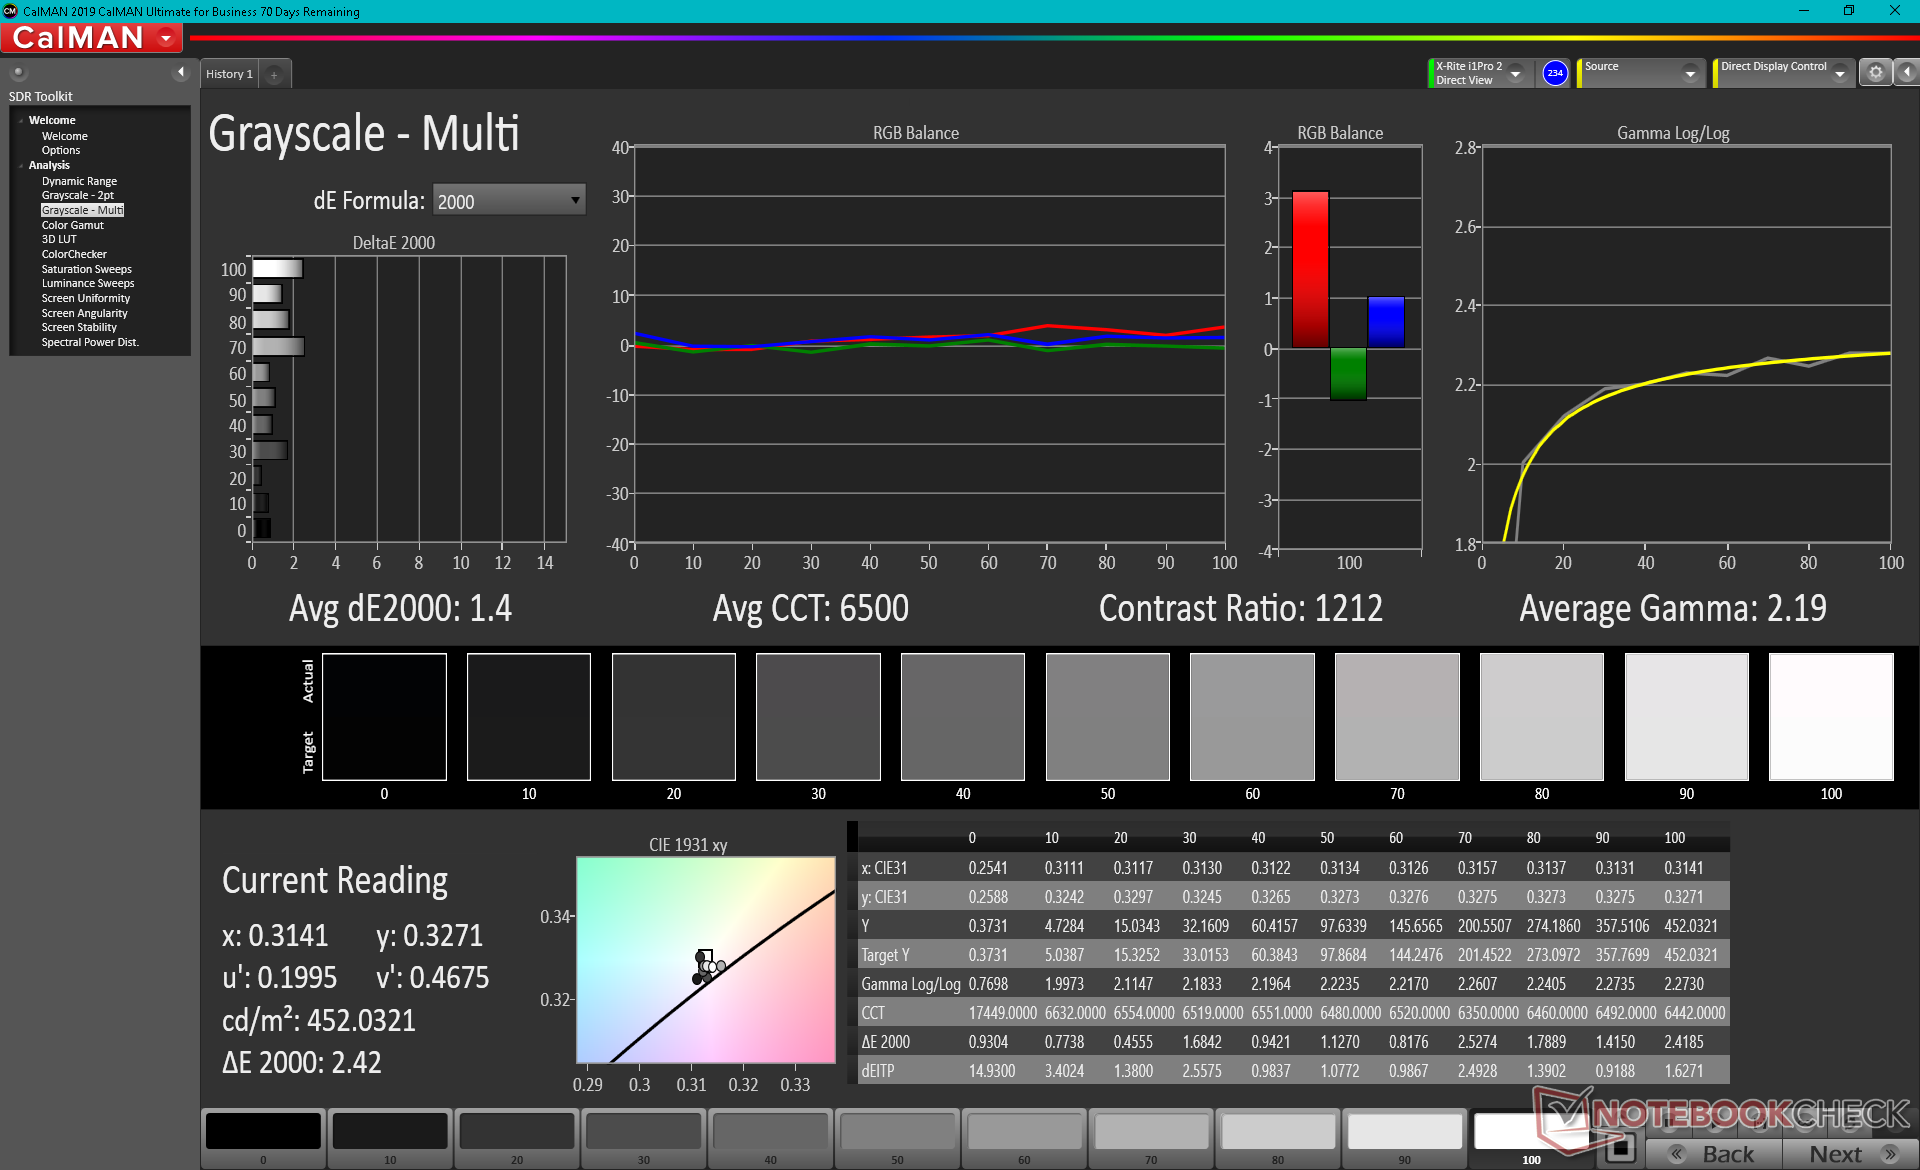
Las mediciones del colorímetro X-Rite muestran que la pantalla está decentemente calibrada desde el principio, con valores DeltaE medios de escala de grises y de color de sólo 2,4 y 4,34, respectivamente, cuando se compara con el estándar AdobeRGB. Si se ajusta la pantalla a sRGB y luego se calibran sus colores, se obtendrían excelentes valores DeltaE de menos de 2 en todos los ámbitos.
Tiempos de respuesta del display
| ↔ Tiempo de respuesta de Negro a Blanco | ||
|---|---|---|
| 10.4 ms ... subida ↗ y bajada ↘ combinada | ↗ 5.2 ms subida | 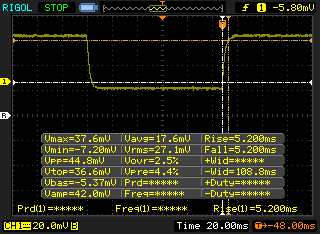 |
| ↘ 5.2 ms bajada | ||
| La pantalla mostró buenos tiempos de respuesta en nuestros tests pero podría ser demasiado lenta para los jugones competitivos. En comparación, todos los dispositivos de prueba van de ##min### (mínimo) a 240 (máximo) ms. » 28 % de todos los dispositivos son mejores. Esto quiere decir que el tiempo de respuesta medido es mejor que la media (19.8 ms) de todos los dispositivos testados. | ||
| ↔ Tiempo de respuesta 50% Gris a 80% Gris | ||
| 14.4 ms ... subida ↗ y bajada ↘ combinada | ↗ 7.6 ms subida | 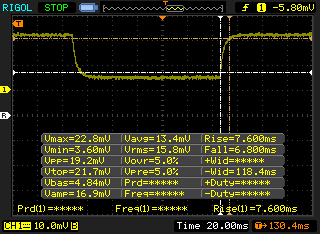 |
| ↘ 6.8 ms bajada | ||
| La pantalla mostró buenos tiempos de respuesta en nuestros tests pero podría ser demasiado lenta para los jugones competitivos. En comparación, todos los dispositivos de prueba van de ##min### (mínimo) a 636 (máximo) ms. » 28 % de todos los dispositivos son mejores. Esto quiere decir que el tiempo de respuesta medido es mejor que la media (31 ms) de todos los dispositivos testados. | ||
Parpadeo de Pantalla / PWM (Pulse-Width Modulation)
| Parpadeo de Pantalla / PWM no detectado | 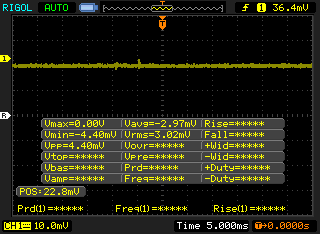 | ||
Comparación: 52 % de todos los dispositivos testados no usaron PWM para atenuar el display. Si se usó, medimos una media de 7754 (mínimo: 5 - máxmo: 343500) Hz. | |||
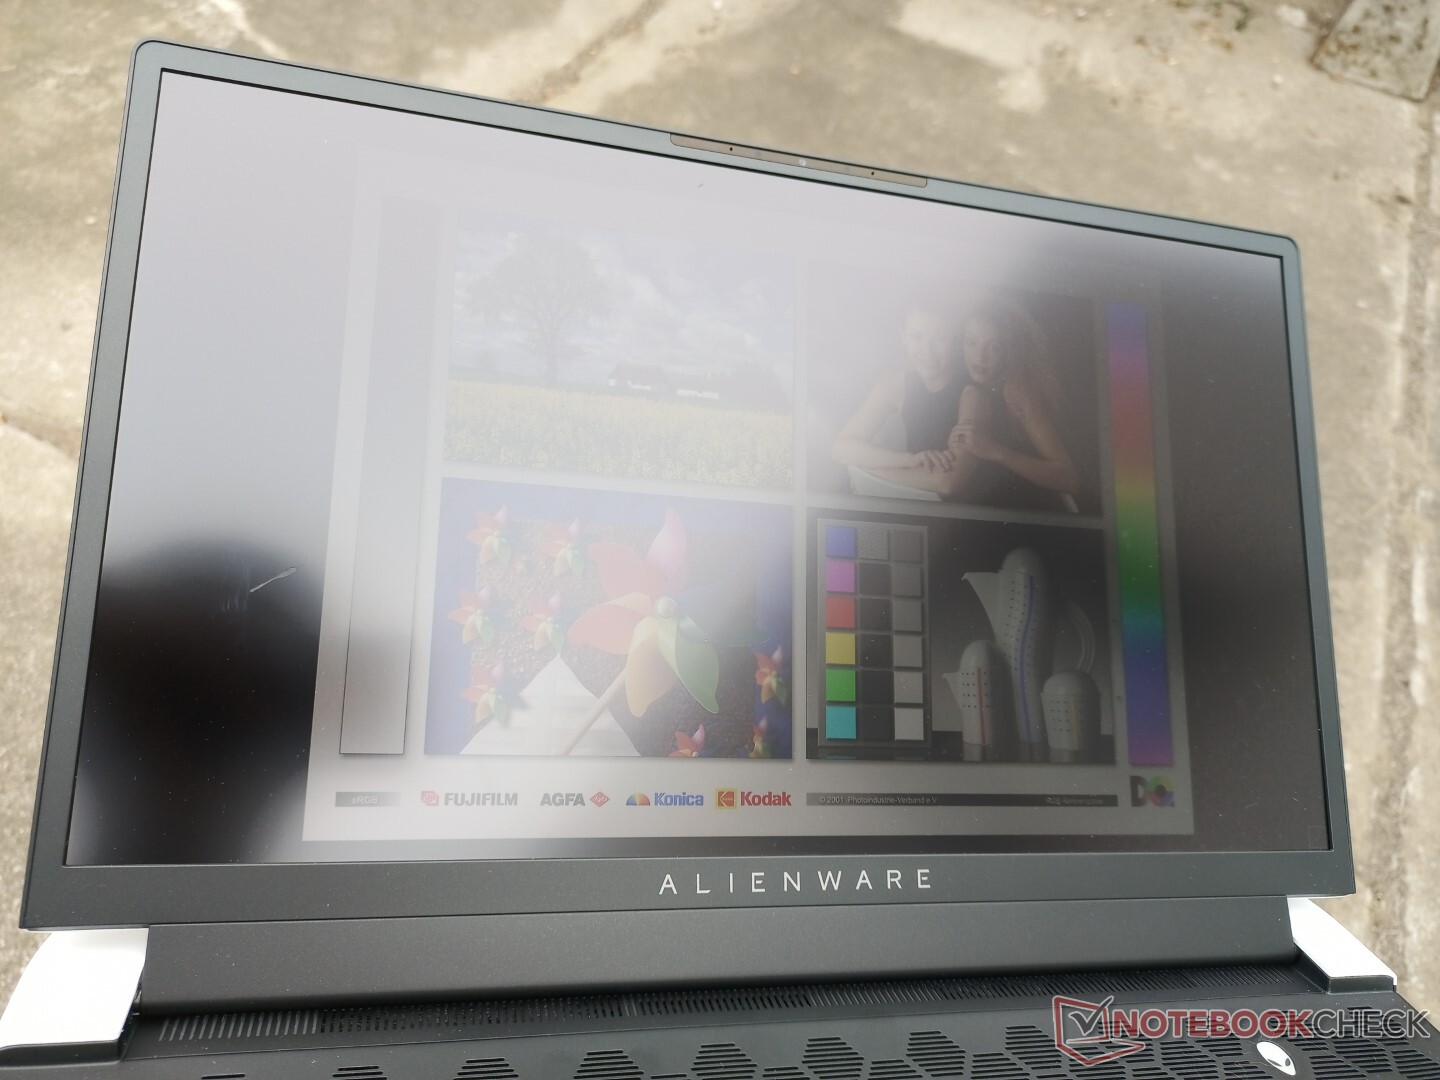
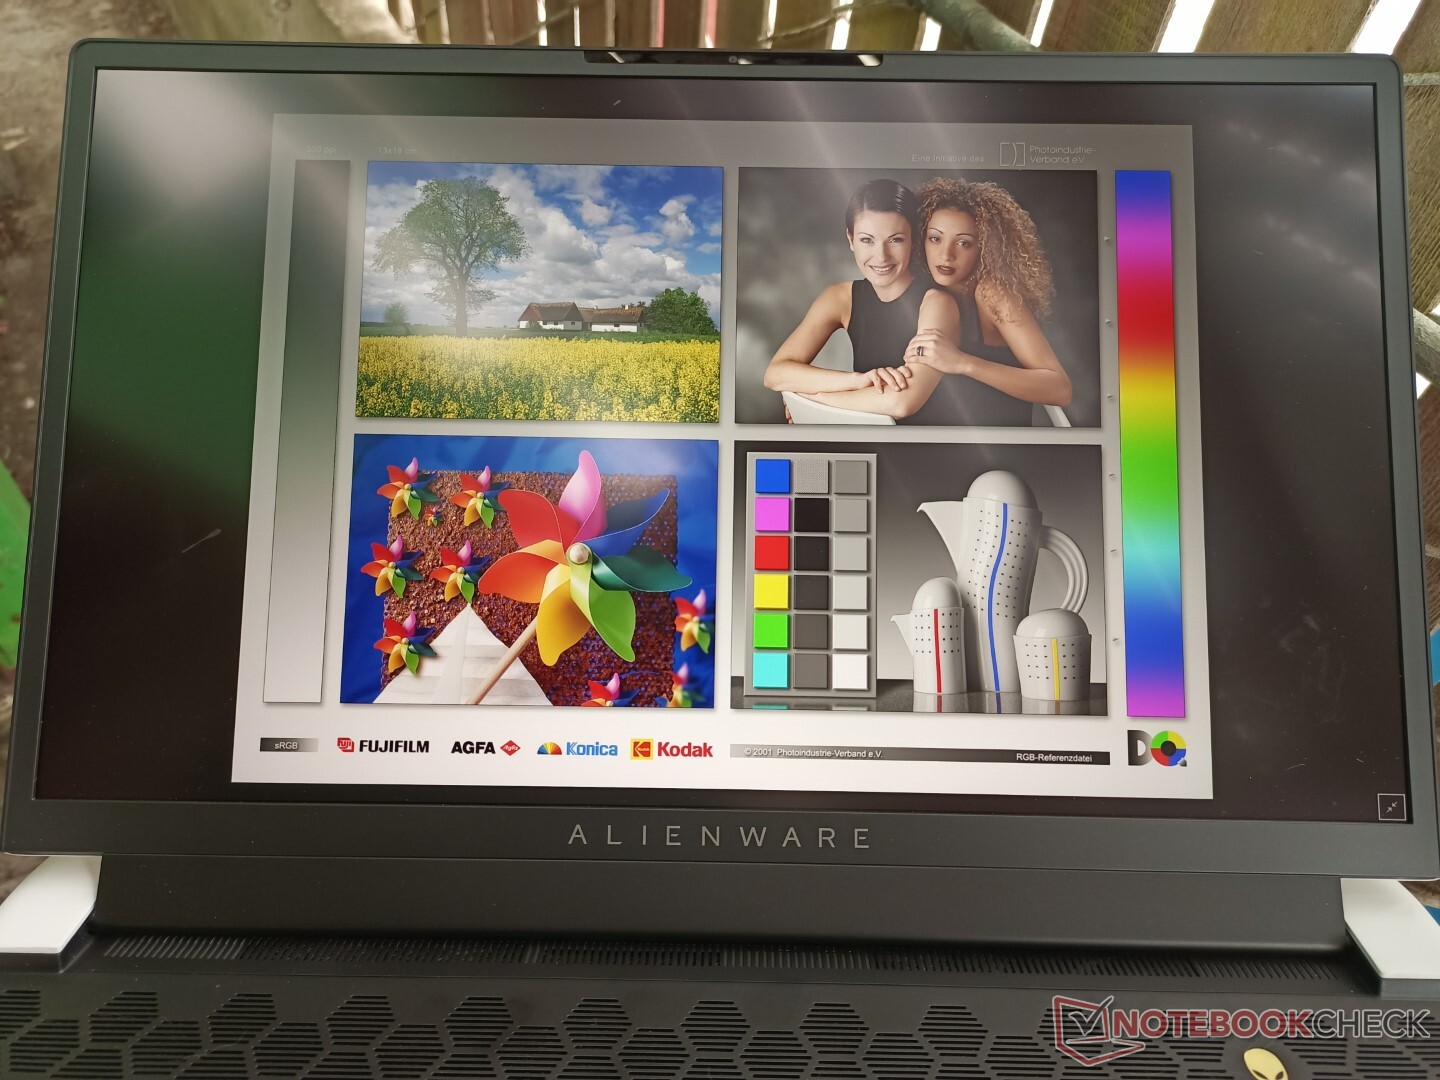
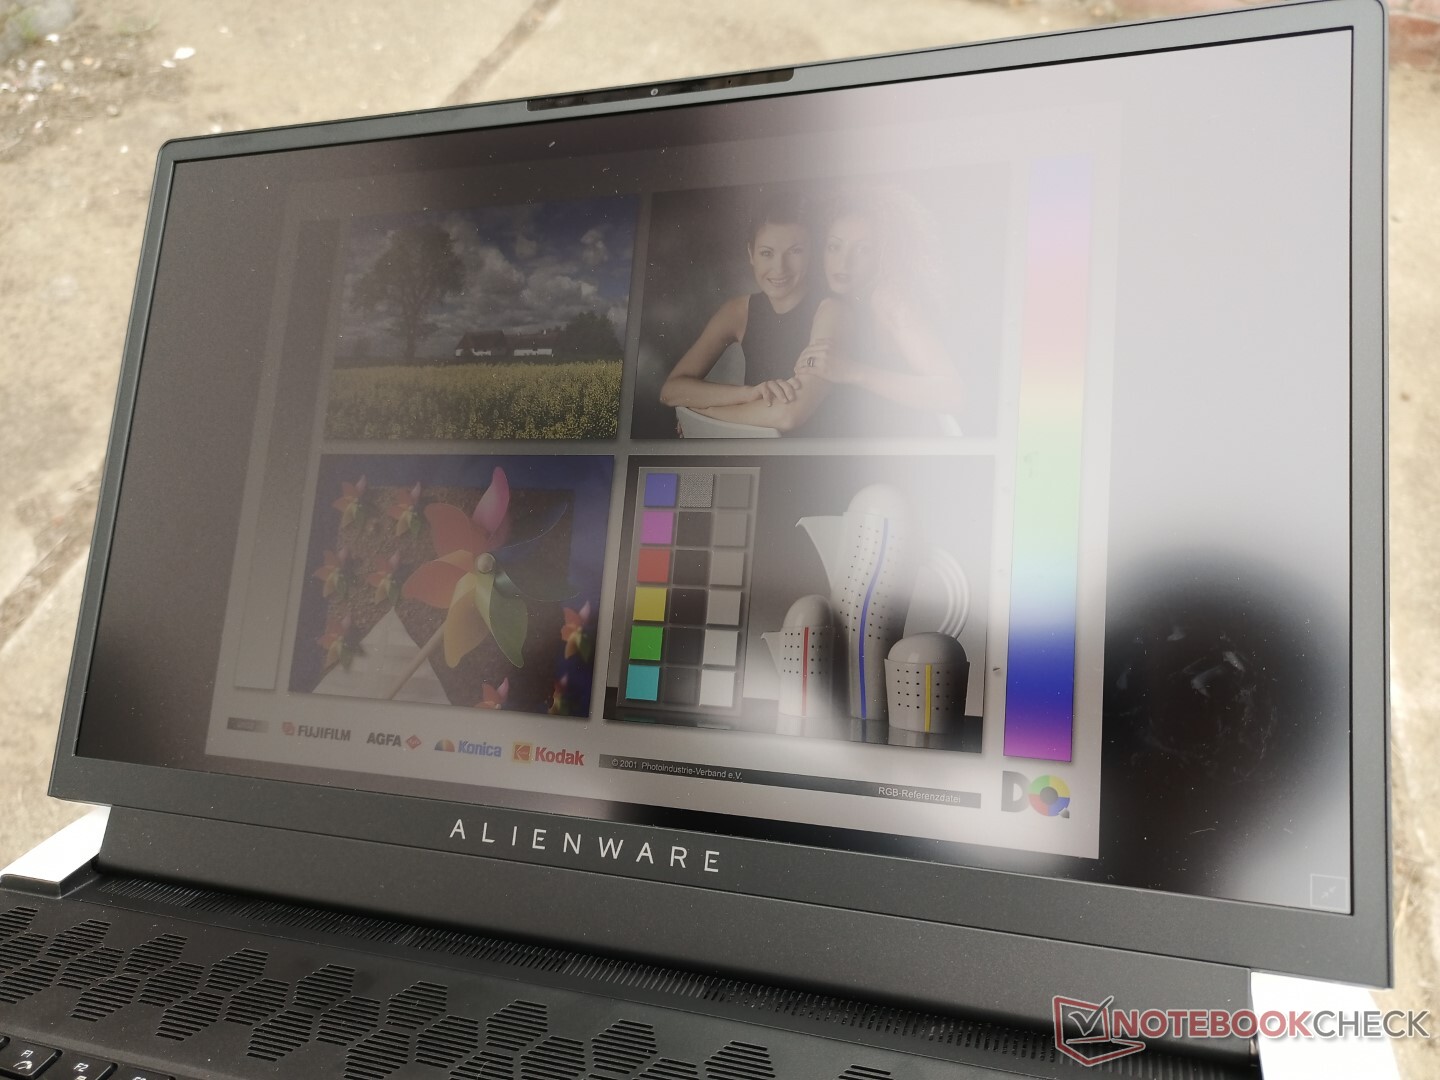
La visibilidad en exteriores es ligeramente mejor que en muchos otros portátiles de juego de 17,3 pulgadas, ya que la pantalla mate de 400 nits es más brillante que el típico objetivo de 300 nits. Sin embargo, el gran peso y el tamaño son difíciles de ignorar, por lo que probablemente querrás trabajar en un escritorio plano independientemente del entorno.
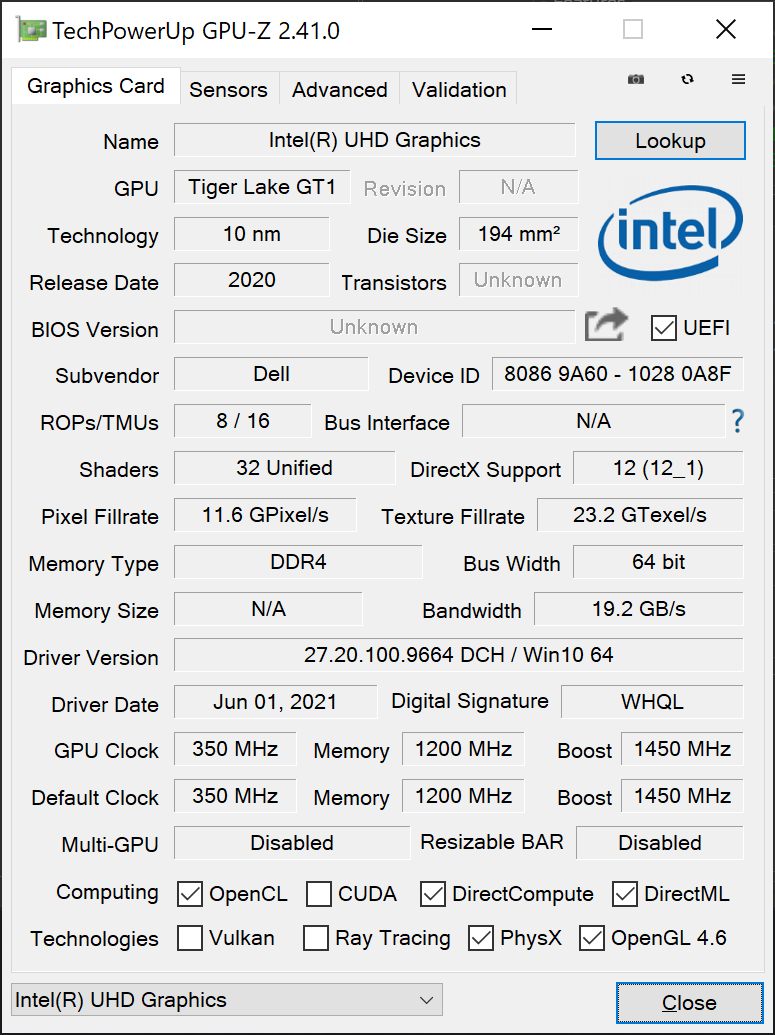
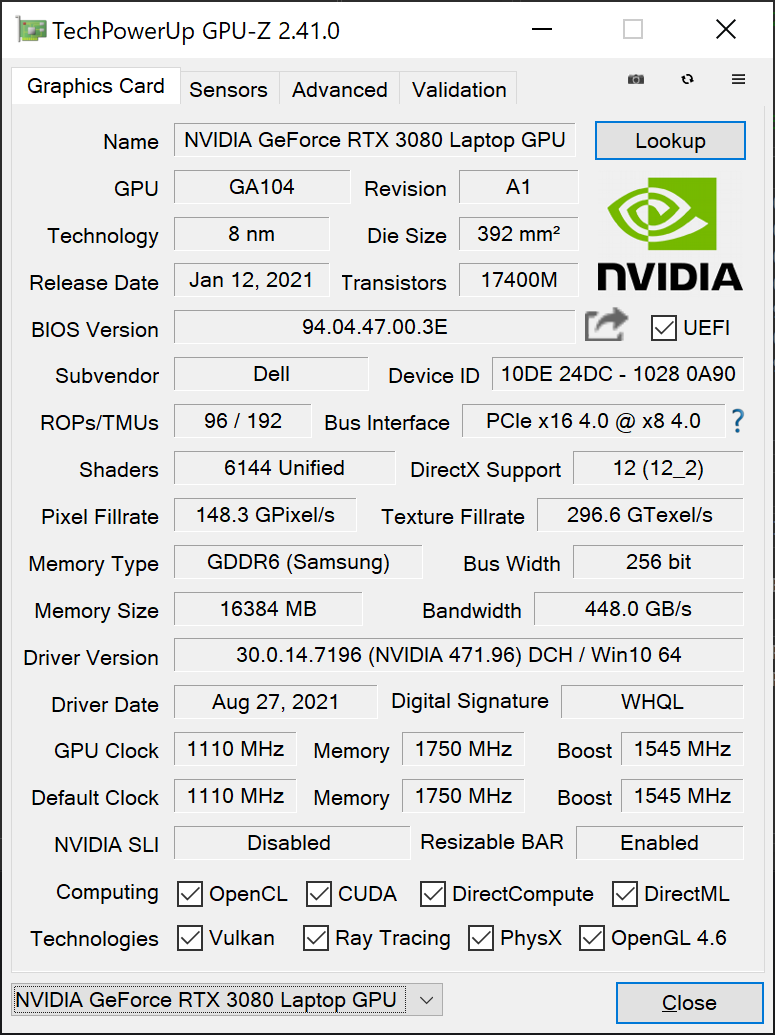
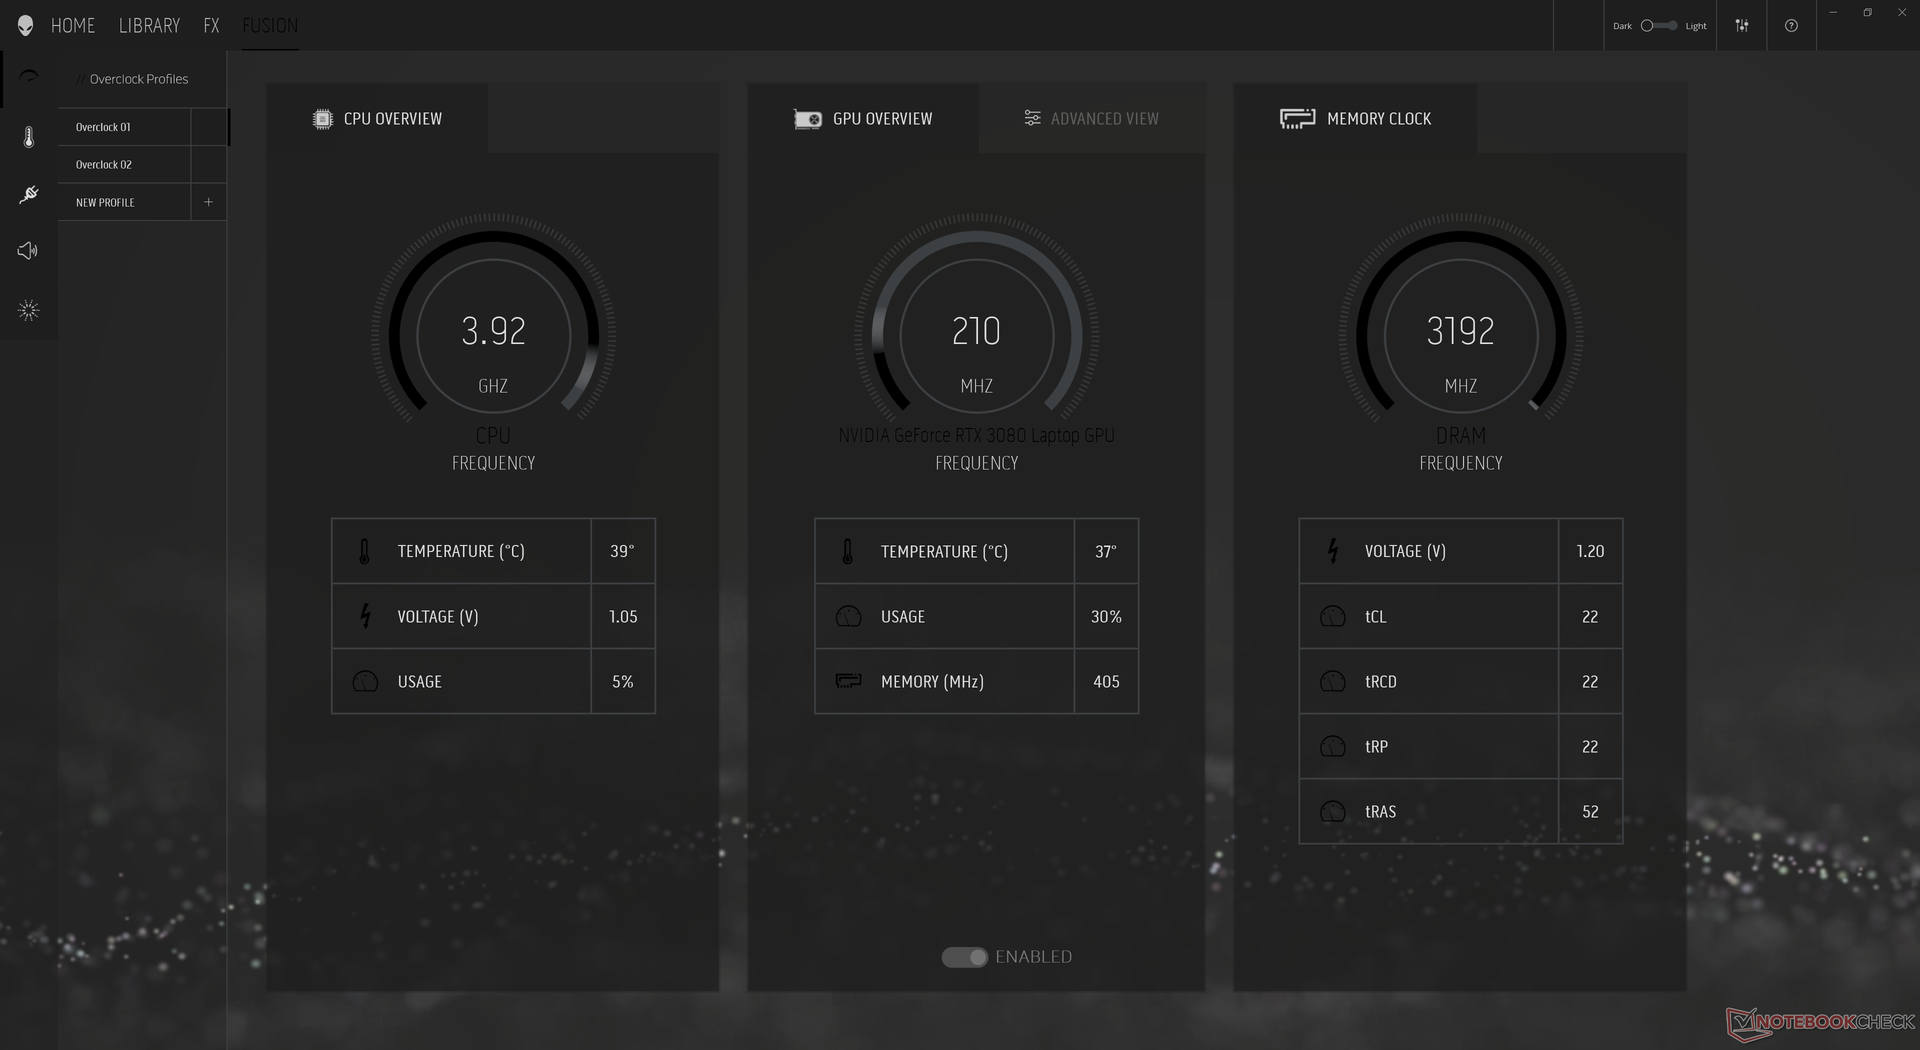
Rendimiento: impresionante velocidad de reloj del procesador
Dos opciones de CPU (Core i7-11800H, Core i9-11980HK) y tres opciones de gráficos GeForce (RTX 3060, RTX 3070RTX 3080). No esperamos grandes diferencias entre las dos CPUs ya que nuestro i7-11800H ya está funcionando muy por encima de los 90 C cuando está bajo carga, pero las tres GPUs están funcionando cada una con diferentes objetivos TGP de 130 W, 140 W y 165 W, respectivamente. En comparación, la RTX 3080 del Razer Blade 17 tiene un objetivo de "sólo" 130 W
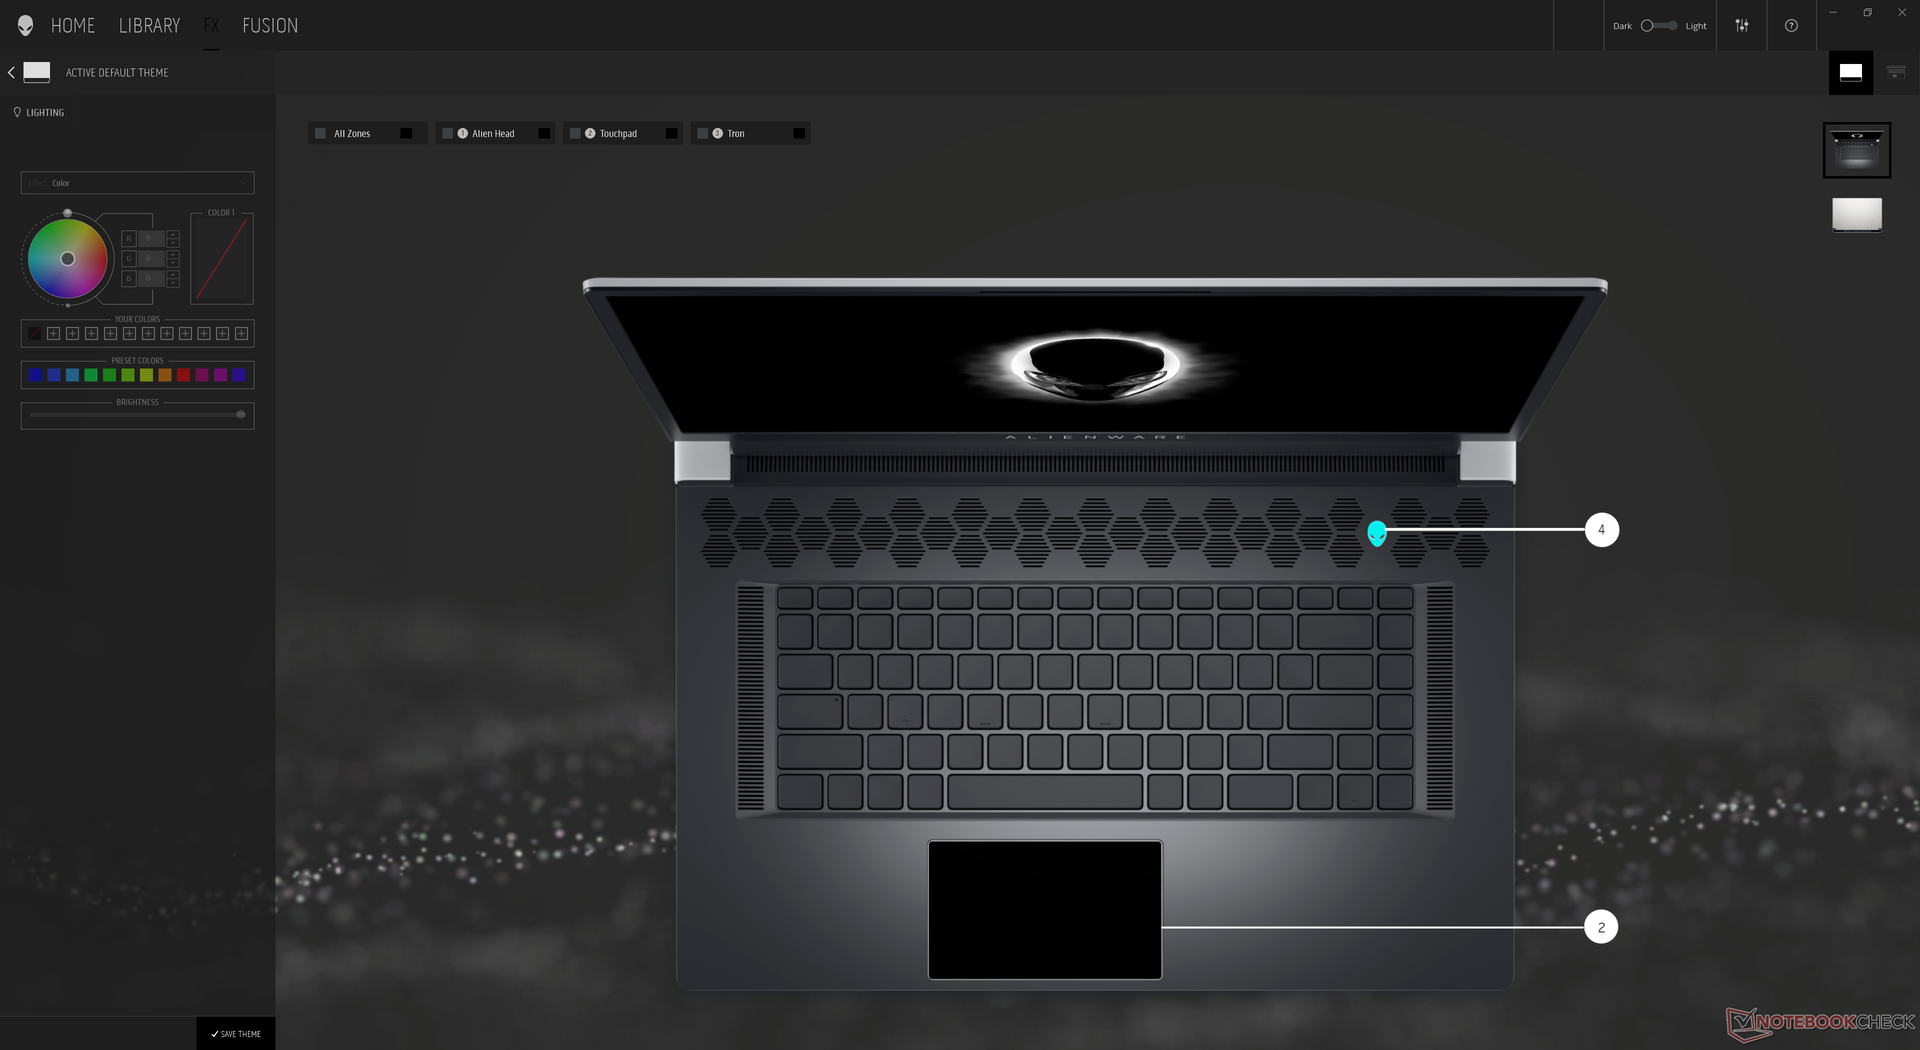
Nuestro sistema se configuró en modo de alto rendimiento a través del software Alienware Command Center antes de ejecutar nuestros benchmarks para obtener las puntuaciones más altas posibles. Recomendamos a los usuarios que se familiaricen con este software, ya que aquí se encuentran todas las funciones de iluminación y rendimiento. Además, los usuarios pueden configurar el sistema en modo Optimus o GPU discreta a través de la BIOS.
Optimus avanzado y, por tanto, G-Sync sólo son compatibles con los modelos FHD de 360 Hz.
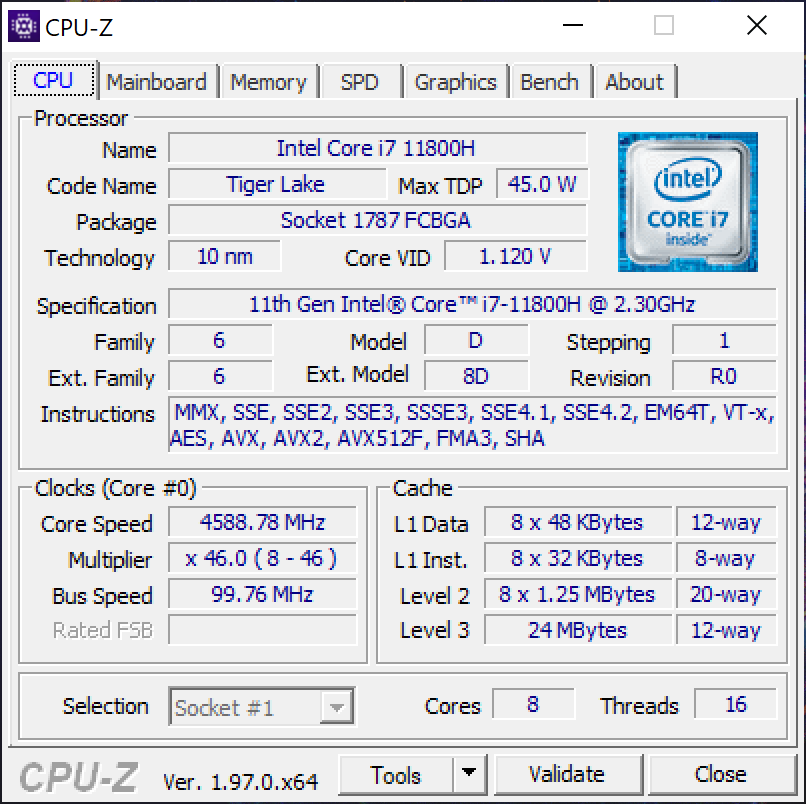
Procesador
El rendimiento de la CPU es excepcional, con puntuaciones en CineBench xT que son hasta un 20 por ciento más rápidas que la media de los portátiles de nuestra base de datos con el mismo Core i7-11800H CPU. De hecho, el Alienware x17 es uno de los portátiles más rápidos que se pueden conseguir en el mercado con este procesador específico. El rendimiento más rápido de lo esperado de nuestro sistema lo sitúa ligeramente por delante del Ryzen 9 5900HX o del Core i9-11900K en cargas multihilo aunque el i7-11800H suele estar por detrás en la mayoría de portátiles
El alto rendimiento de la CPU del Alienware puede atribuirse a los altísimos objetivos PL1 y PL2 de 165 W cada uno comparados con los 65 W y 90 W, respectivamente, de otros portátiles como el Razer Blade 17. El sistema también es excelente a la hora de mantener altas velocidades de reloj Turbo Boost durante periodos prolongados, como muestra nuestra prueba de bucle CineBench R15 xT que aparece a continuación. Sin embargo, estos elevados resultados de rendimiento no son gratuitos, como muestran nuestras secciones de Prueba de Estrés y Consumo de Energía.
Cinebench R15 Multi Loop
Cinebench R23: Multi Core | Single Core
Cinebench R15: CPU Multi 64Bit | CPU Single 64Bit
Blender: v2.79 BMW27 CPU
7-Zip 18.03: 7z b 4 -mmt1 | 7z b 4
Geekbench 5.5: Single-Core | Multi-Core
HWBOT x265 Benchmark v2.2: 4k Preset
LibreOffice : 20 Documents To PDF
R Benchmark 2.5: Overall mean
| Cinebench R23 / Multi Core | |
| Schenker XMG Ultra 17 Rocket Lake | |
| Alienware x17 RTX 3080 P48E | |
| Asus Strix Scar 17 G733QSA-XS99 | |
| MSI GS76 Stealth 11UH | |
| Asus ROG Strix G17 G713QE-RB74 | |
| Medio Intel Core i7-11800H (6508 - 14088, n=48) | |
| Alienware m17 R4 | |
| Medion Erazer Beast X20 | |
| Cinebench R23 / Single Core | |
| Schenker XMG Ultra 17 Rocket Lake | |
| MSI GS76 Stealth 11UH | |
| Alienware x17 RTX 3080 P48E | |
| Asus Strix Scar 17 G733QSA-XS99 | |
| Medio Intel Core i7-11800H (1386 - 1522, n=45) | |
| Asus ROG Strix G17 G713QE-RB74 | |
| Alienware m17 R4 | |
| Medion Erazer Beast X20 | |
| Geekbench 5.5 / Single-Core | |
| Schenker XMG Ultra 17 Rocket Lake | |
| MSI GS76 Stealth 11UH | |
| Medio Intel Core i7-11800H (1429 - 1625, n=40) | |
| Asus Strix Scar 17 G733QSA-XS99 | |
| Alienware m17 R4 | |
| MSI GS75 10SF-609US | |
| Medion Erazer Beast X20 | |
| Eluktronics RP-17 | |
| Schenker XMG Pro 17 PB71RD-G | |
| Lenovo Legion 5 17IMH05 | |
* ... más pequeño es mejor
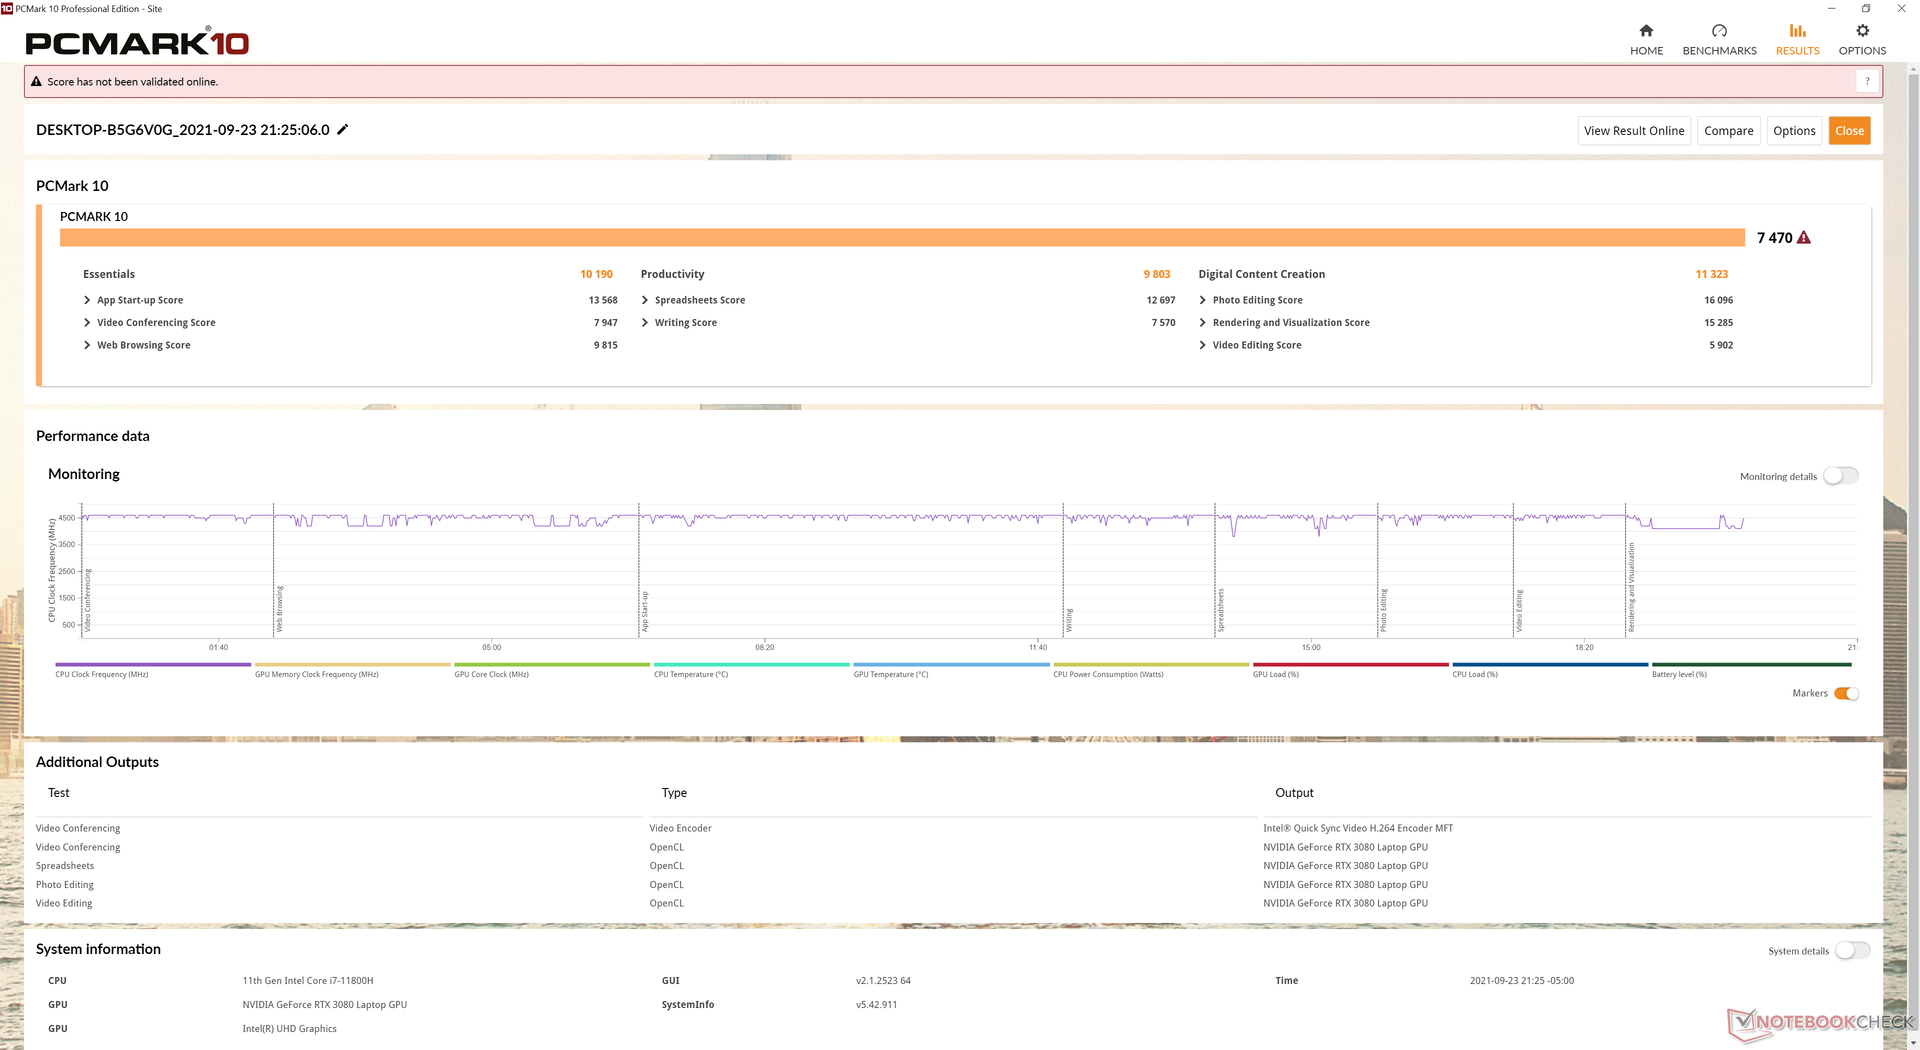
Rendimiento del sistema
Las puntuaciones de PCMark están donde esperamos que estén en relación con otros portátiles de juego de alto rendimiento. Los resultados generales superan ligeramente al Razer Blade 17 equipado con la misma CPU y GPU.
| PCMark 10 / Score | |
| Alienware x17 RTX 3080 P48E | |
| Razer Blade 17 RTX 3070 | |
| Asus ROG Zephyrus S17 GX703HSD | |
| Medio Intel Core i7-11800H, NVIDIA GeForce RTX 3080 Laptop GPU (6673 - 7470, n=11) | |
| Gigabyte Aero 17 HDR YD | |
| MSI GS76 Stealth 11UH | |
| Alienware m17 R4 | |
| PCMark 10 / Essentials | |
| Razer Blade 17 RTX 3070 | |
| Asus ROG Zephyrus S17 GX703HSD | |
| Medio Intel Core i7-11800H, NVIDIA GeForce RTX 3080 Laptop GPU (9862 - 11064, n=11) | |
| Gigabyte Aero 17 HDR YD | |
| Alienware x17 RTX 3080 P48E | |
| MSI GS76 Stealth 11UH | |
| Alienware m17 R4 | |
| PCMark 10 / Productivity | |
| Alienware x17 RTX 3080 P48E | |
| Asus ROG Zephyrus S17 GX703HSD | |
| Razer Blade 17 RTX 3070 | |
| Medio Intel Core i7-11800H, NVIDIA GeForce RTX 3080 Laptop GPU (8278 - 9803, n=11) | |
| Gigabyte Aero 17 HDR YD | |
| MSI GS76 Stealth 11UH | |
| Alienware m17 R4 | |
| PCMark 10 / Digital Content Creation | |
| Alienware x17 RTX 3080 P48E | |
| Razer Blade 17 RTX 3070 | |
| Asus ROG Zephyrus S17 GX703HSD | |
| Medio Intel Core i7-11800H, NVIDIA GeForce RTX 3080 Laptop GPU (9881 - 11323, n=11) | |
| Gigabyte Aero 17 HDR YD | |
| MSI GS76 Stealth 11UH | |
| Alienware m17 R4 | |
| PCMark 10 Score | 7470 puntos | |
ayuda | ||
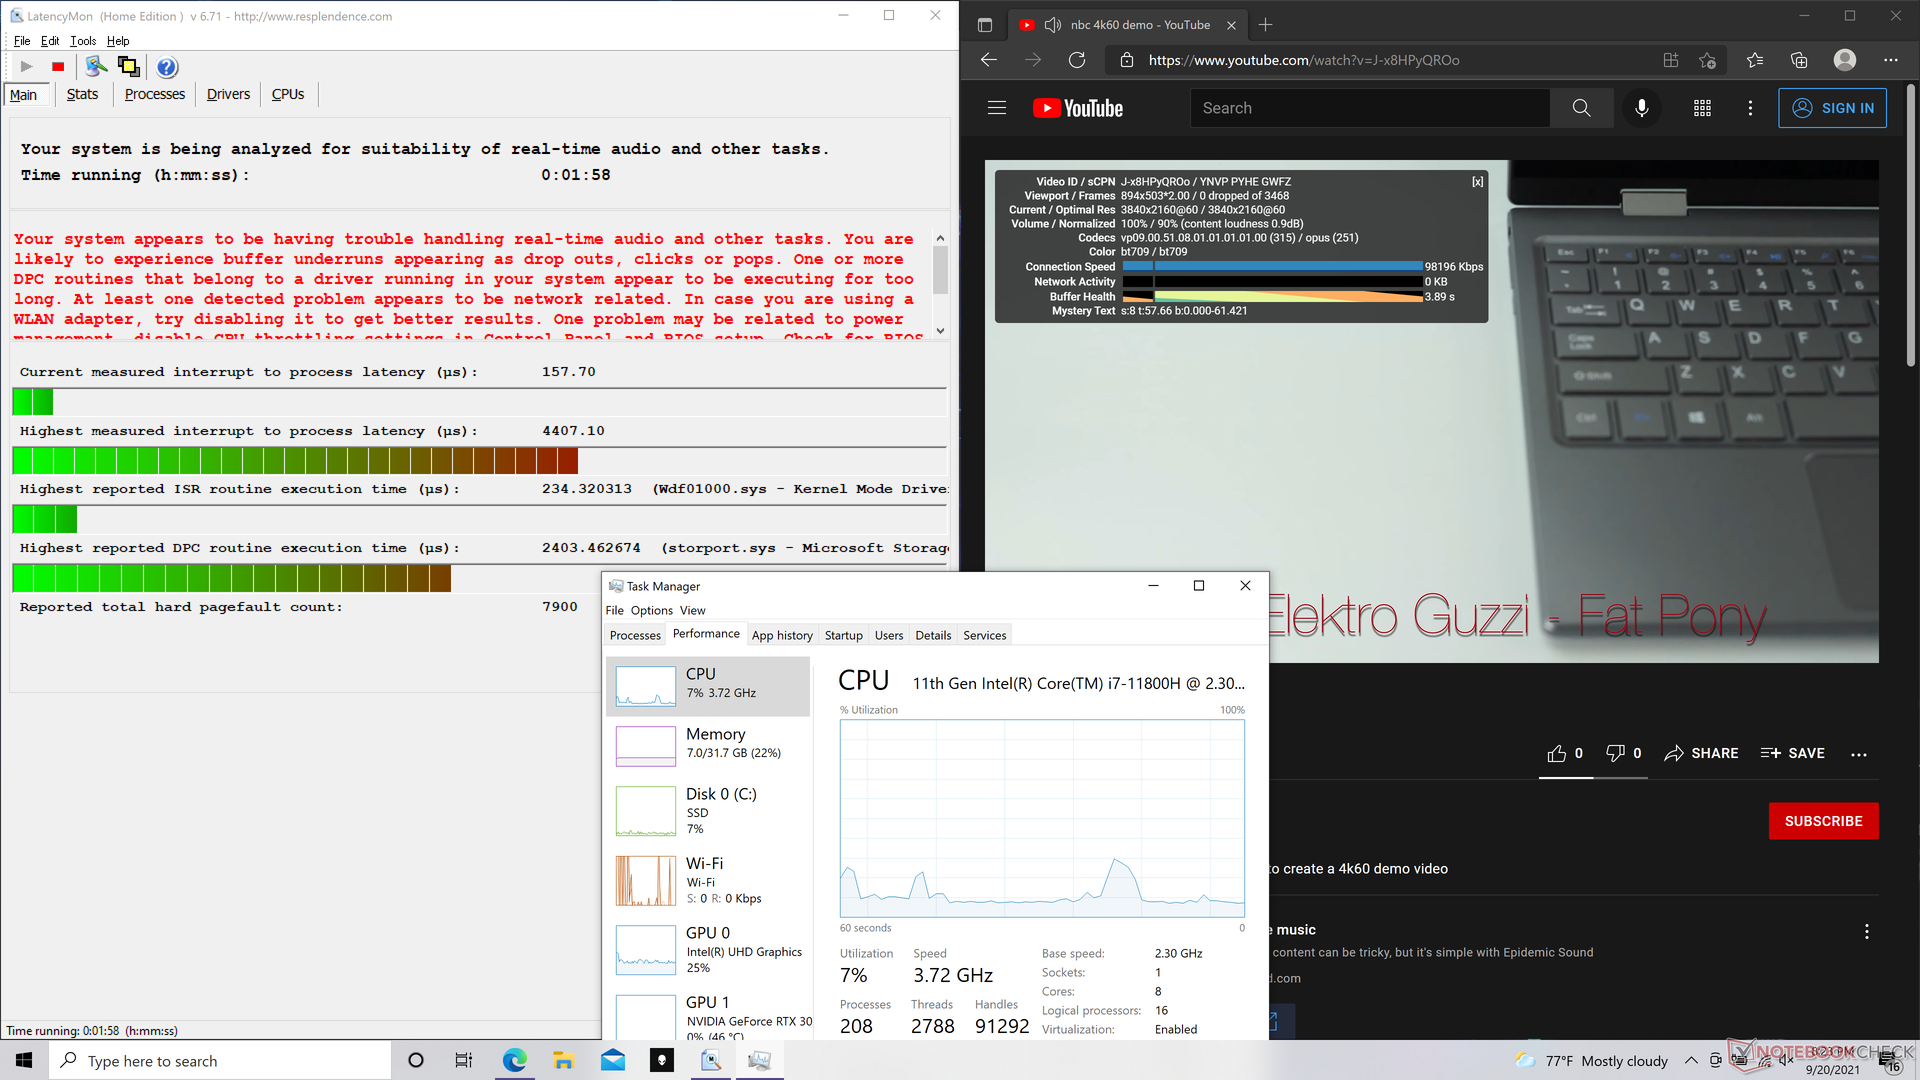
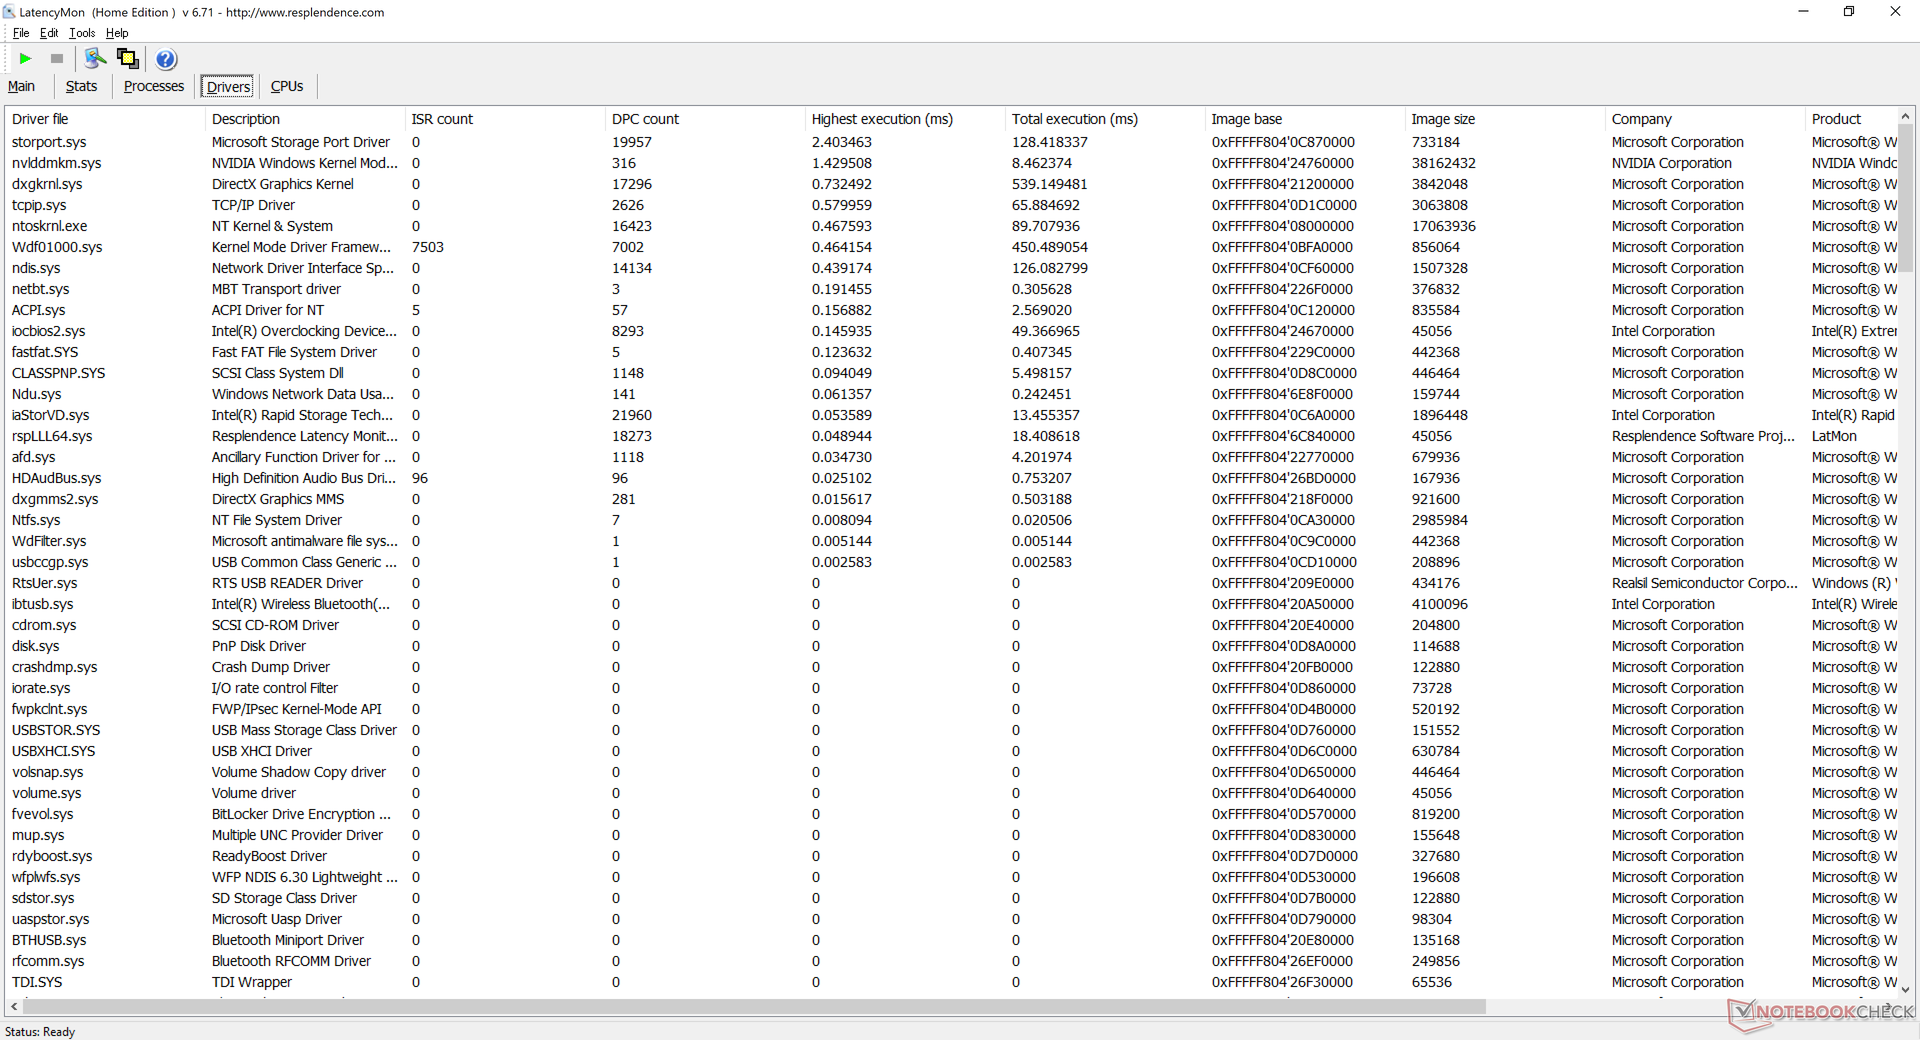
Latencia del CPD
LatencyMon revela problemas de latencia del CPD al abrir varias pestañas del navegador en nuestra página de inicio y al ejecutar el estrés de Prime95. Por lo demás, la reproducción de vídeo 4K a 60 FPS es perfecta, sin pérdida de fotogramas.
| DPC Latencies / LatencyMon - interrupt to process latency (max), Web, Youtube, Prime95 | |
| Alienware x17 RTX 3080 P48E | |
| Gigabyte Aero 17 HDR YD | |
| Asus ROG Zephyrus S17 GX703HSD | |
| MSI GS76 Stealth 11UH | |
| Alienware m17 R4 | |
| Razer Blade 17 RTX 3070 | |
* ... más pequeño es mejor
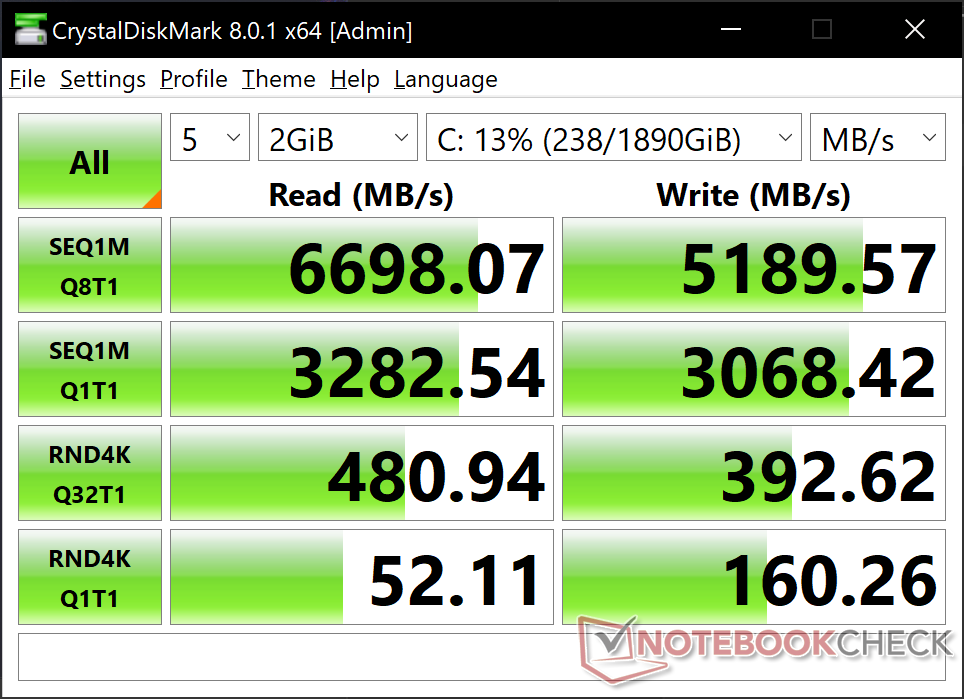
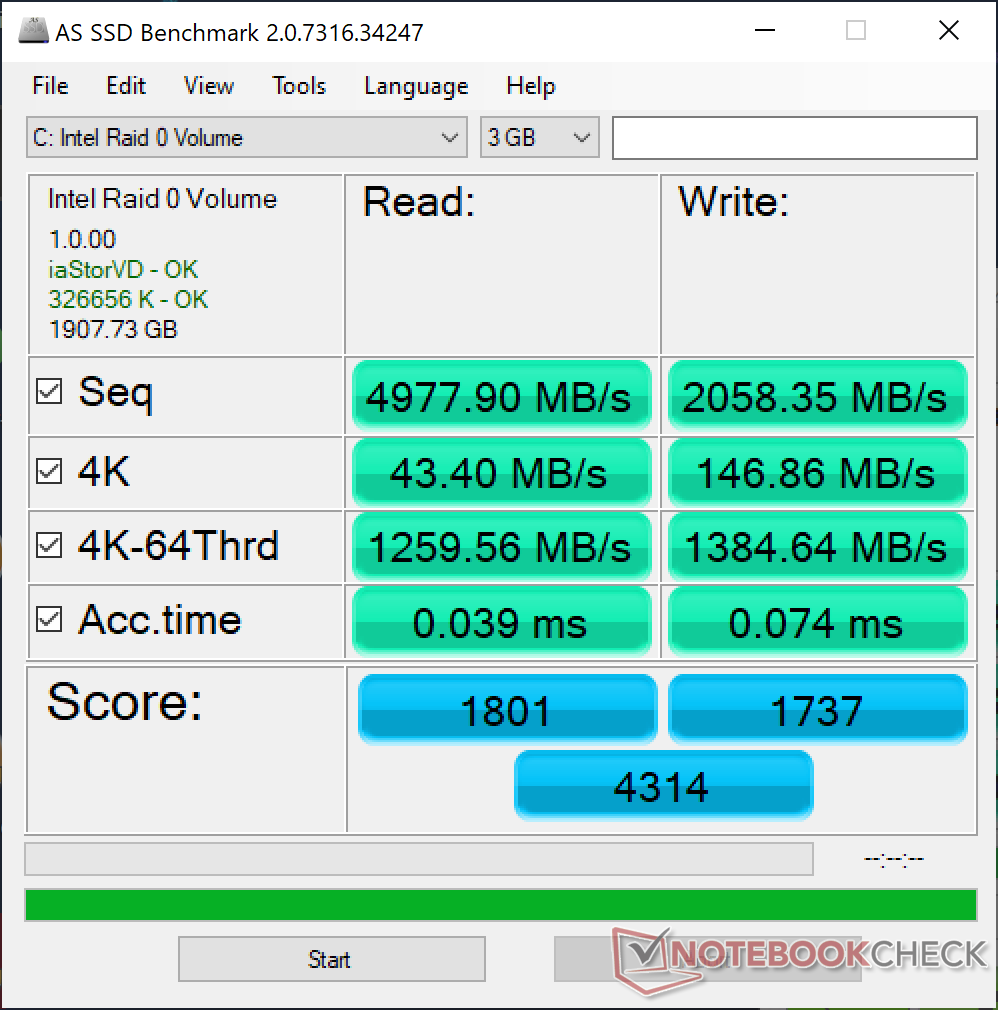
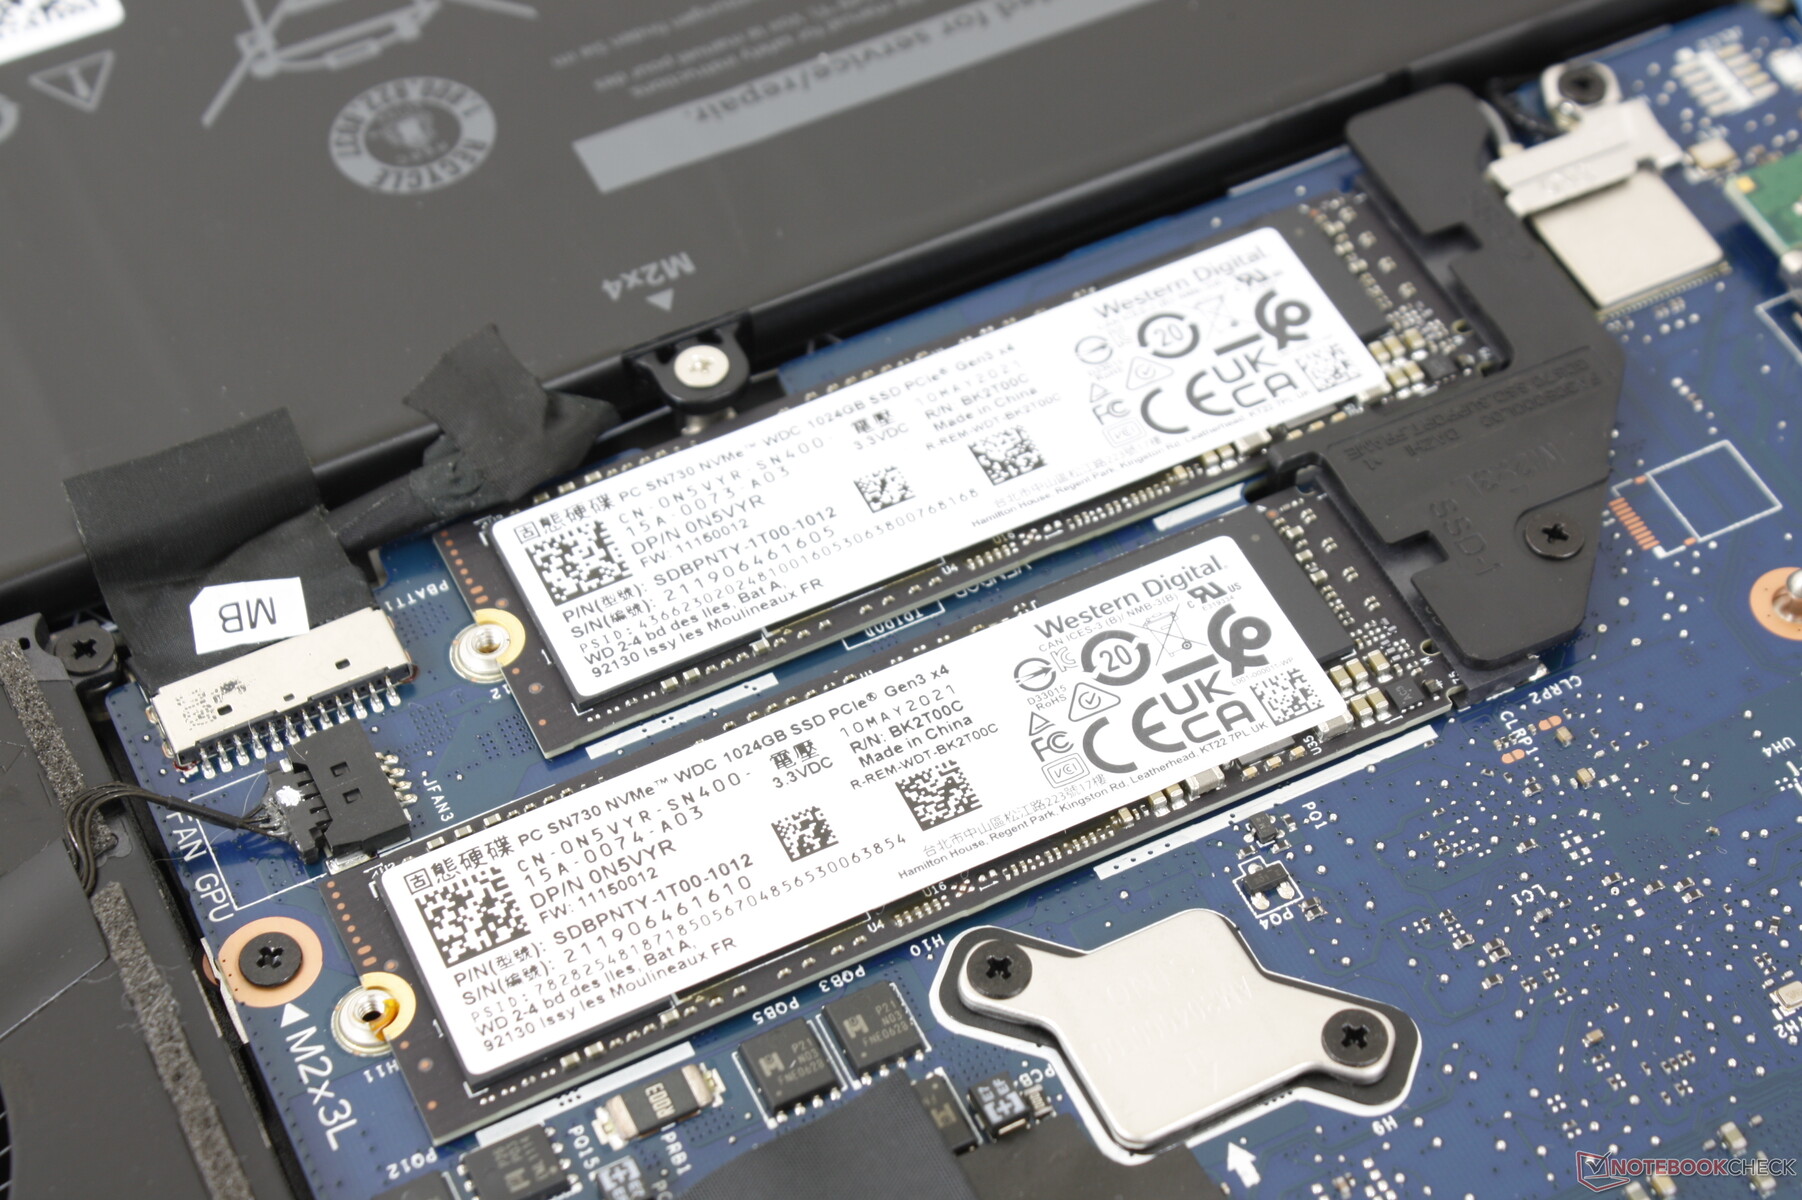
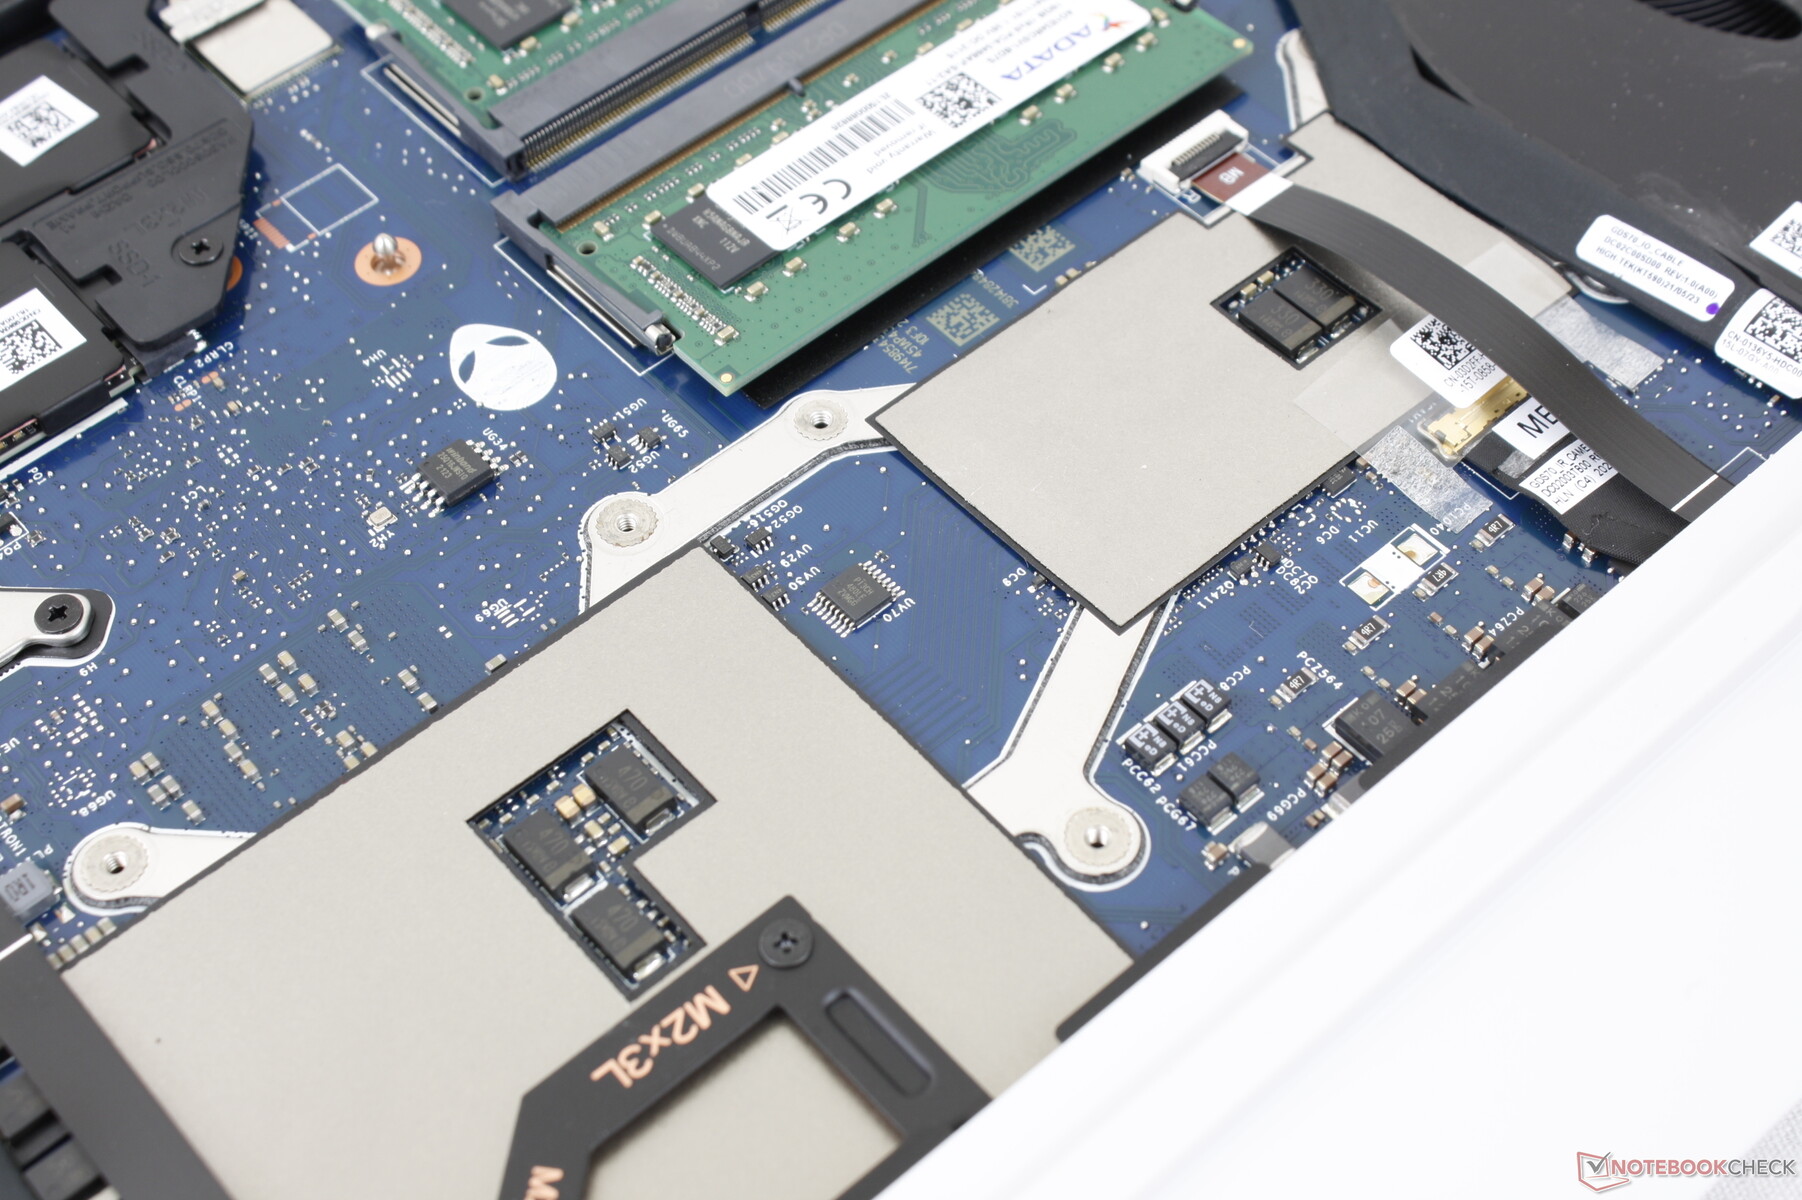
Dispositivos de almacenamiento - Un PCIe4 y un PCIe3
Nuestra unidad de prueba viene con dos unidades SSD WD SN730 NVMe de 1 TB en RAID 0 para velocidades de lectura y escritura secuenciales de hasta 6700 MB/s y 4300 MB/s, respectivamente, para ser más rápida que cualquier unidad SSD PCIe3 individual disponible. Sin embargo, un soloSamsung PM9A1 PCIe4 superará nuestra configuración PCIe3 RAID 0. Dell dice que el sistema puede soportar hasta un SSD PCIe4 si los usuarios quieren instalar uno ellos mismos.
| Alienware x17 RTX 3080 P48E 2x WDC PC SN730 SDBPNTY-1T00 (RAID 0) | Alienware m17 R4 2x Micron 2300 512 GB (RAID 0) | Razer Blade 17 RTX 3070 Samsung PM9A1 MZVL21T0HCLR | Asus ROG Zephyrus S17 GX703HSD Samsung PM9A1 MZVL22T0HBLB | MSI GS76 Stealth 11UH Samsung PM9A1 MZVL22T0HBLB | Gigabyte Aero 17 HDR YD Samsung PM9A1 MZVL2512HCJQ | |
|---|---|---|---|---|---|---|
| AS SSD | -12% | 52% | 67% | 68% | 66% | |
| Seq Read (MB/s) | 4978 | 2733 -45% | 5302 7% | 5085 2% | 5408 9% | 5438 9% |
| Seq Write (MB/s) | 2058 | 2822 37% | 3977 93% | 4434 115% | 3863 88% | 3904 90% |
| 4K Read (MB/s) | 43.4 | 45.04 4% | 55 27% | 80.3 85% | 52.7 21% | 56.2 29% |
| 4K Write (MB/s) | 146.9 | 88.4 -40% | 148.7 1% | 214.7 46% | 153.1 4% | 165.8 13% |
| 4K-64 Read (MB/s) | 1260 | 1388 10% | 2715 115% | 2573 104% | 2692 114% | 2489 98% |
| 4K-64 Write (MB/s) | 1385 | 1227 -11% | 3416 147% | 2972 115% | 3414 146% | 3480 151% |
| Access Time Read * (ms) | 0.039 | 0.079 -103% | 0.044 -13% | 0.018 54% | 0.046 -18% | 0.054 -38% |
| Access Time Write * (ms) | 0.074 | 0.095 -28% | 0.085 -15% | 0.02 73% | 0.027 64% | 0.026 65% |
| Score Read (Points) | 1801 | 1706 -5% | 3300 83% | 3161 76% | 3285 82% | 3089 72% |
| Score Write (Points) | 1737 | 1598 -8% | 3963 128% | 3631 109% | 3953 128% | 4036 132% |
| Score Total (Points) | 4314 | 4184 -3% | 8874 106% | 8380 94% | 8830 105% | 8620 100% |
| Copy ISO MB/s (MB/s) | 2009 | 2414 20% | 2710 35% | 3239 61% | ||
| Copy Program MB/s (MB/s) | 1099 | 1030 -6% | 1114 1% | 899 -18% | ||
| Copy Game MB/s (MB/s) | 1881 | 1991 6% | 2095 11% | 2171 15% | ||
| CrystalDiskMark 5.2 / 6 | -16% | 38% | 41% | 39% | 42% | |
| Write 4K (MB/s) | 159.2 | 93.1 -42% | 233.5 47% | 244.2 53% | 230.7 45% | 230.4 45% |
| Read 4K (MB/s) | 51.9 | 46.79 -10% | 90.1 74% | 89.8 73% | 87.9 69% | 91.6 76% |
| Write Seq (MB/s) | 3115 | 2853 -8% | 4263 37% | 4300 38% | 4216 35% | |
| Read Seq (MB/s) | 3298 | 2556 -22% | 4468 35% | 4392 33% | 4543 38% | |
| Write 4K Q32T1 (MB/s) | 392.6 | 475 21% | 538 37% | 607 55% | 582 48% | 667 70% |
| Read 4K Q32T1 (MB/s) | 474.7 | 529 11% | 703 48% | 658 39% | 730 54% | 728 53% |
| Write Seq Q32T1 (MB/s) | 4331 | 3331 -23% | 5097 18% | 5270 22% | 5152 19% | 5043 16% |
| Read Seq Q32T1 (MB/s) | 6746 | 3319 -51% | 7065 5% | 7091 5% | 7094 5% | 6821 1% |
| Write 4K Q8T8 (MB/s) | 2270 | |||||
| Read 4K Q8T8 (MB/s) | 2490 | |||||
| Media total (Programa/Opciones) | -14% /
-13% | 45% /
47% | 54% /
59% | 54% /
55% | 54% /
56% |
* ... más pequeño es mejor

Disk Throttling: DiskSpd Read Loop, Queue Depth 8
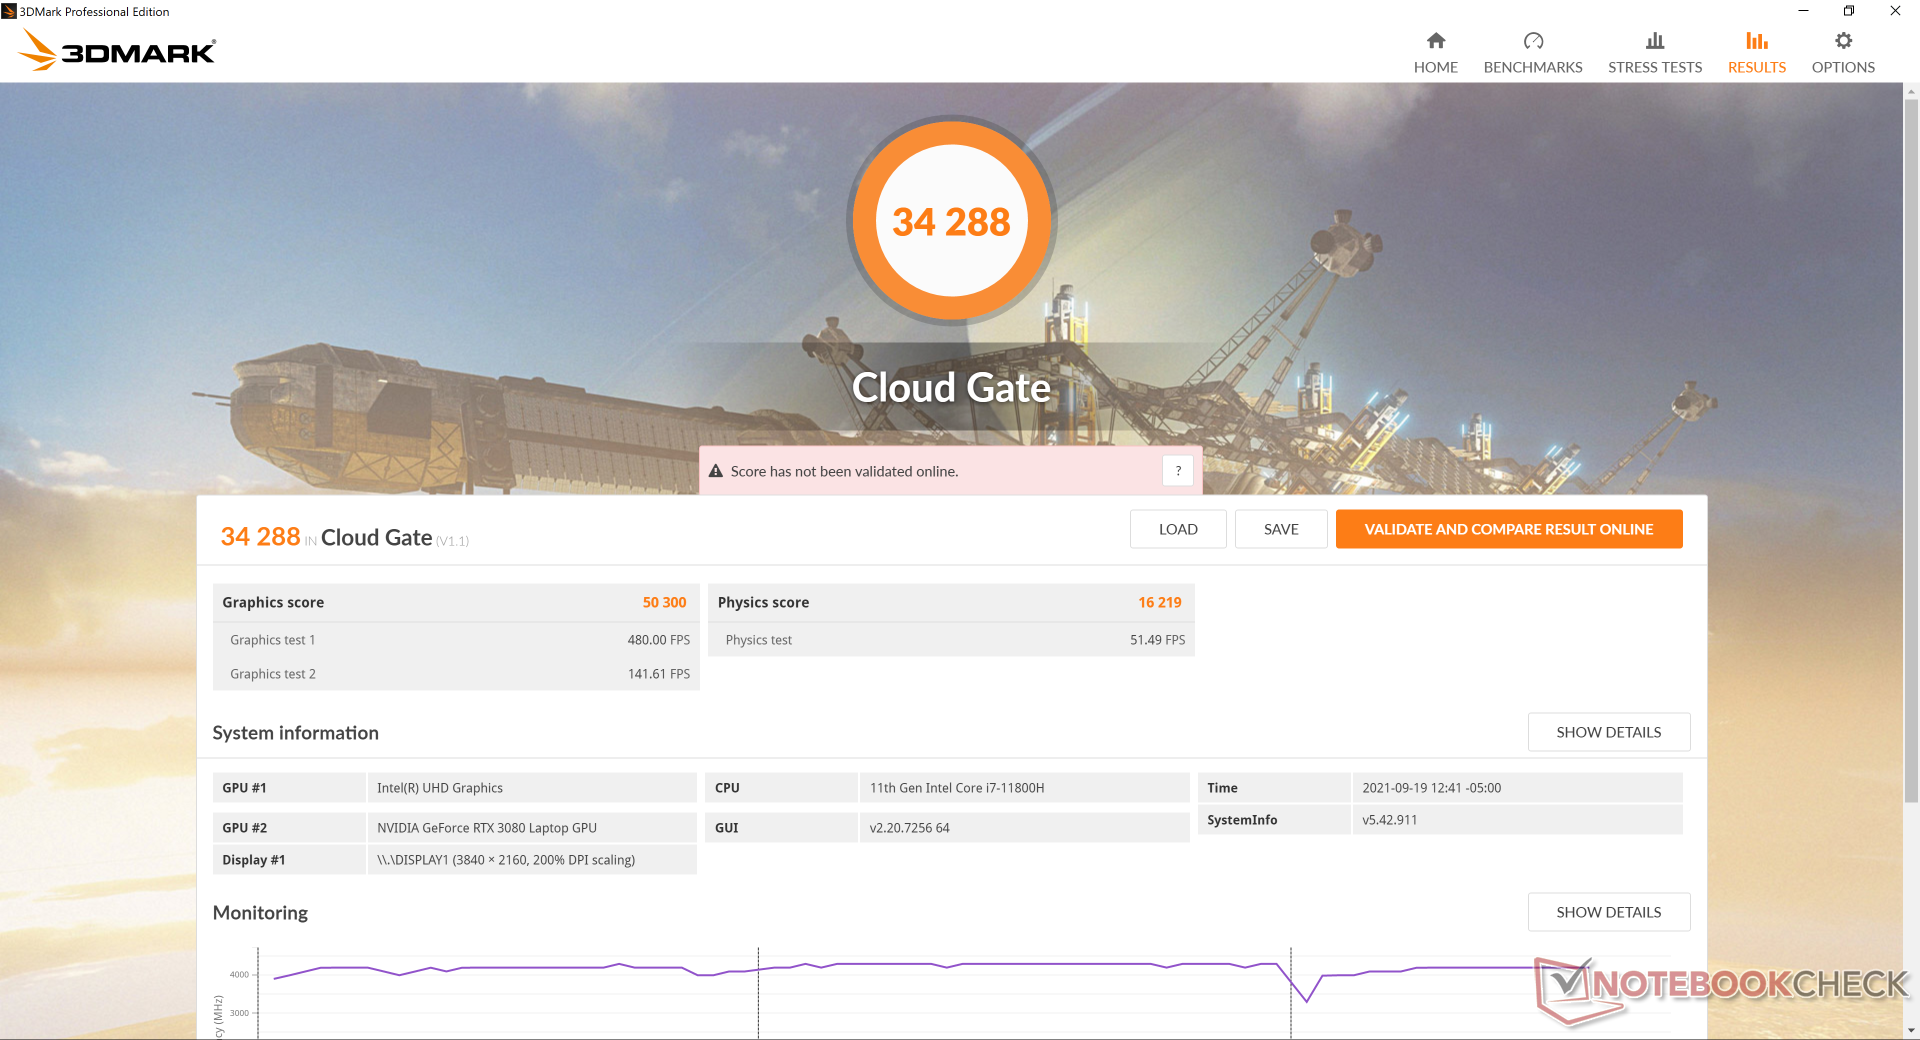
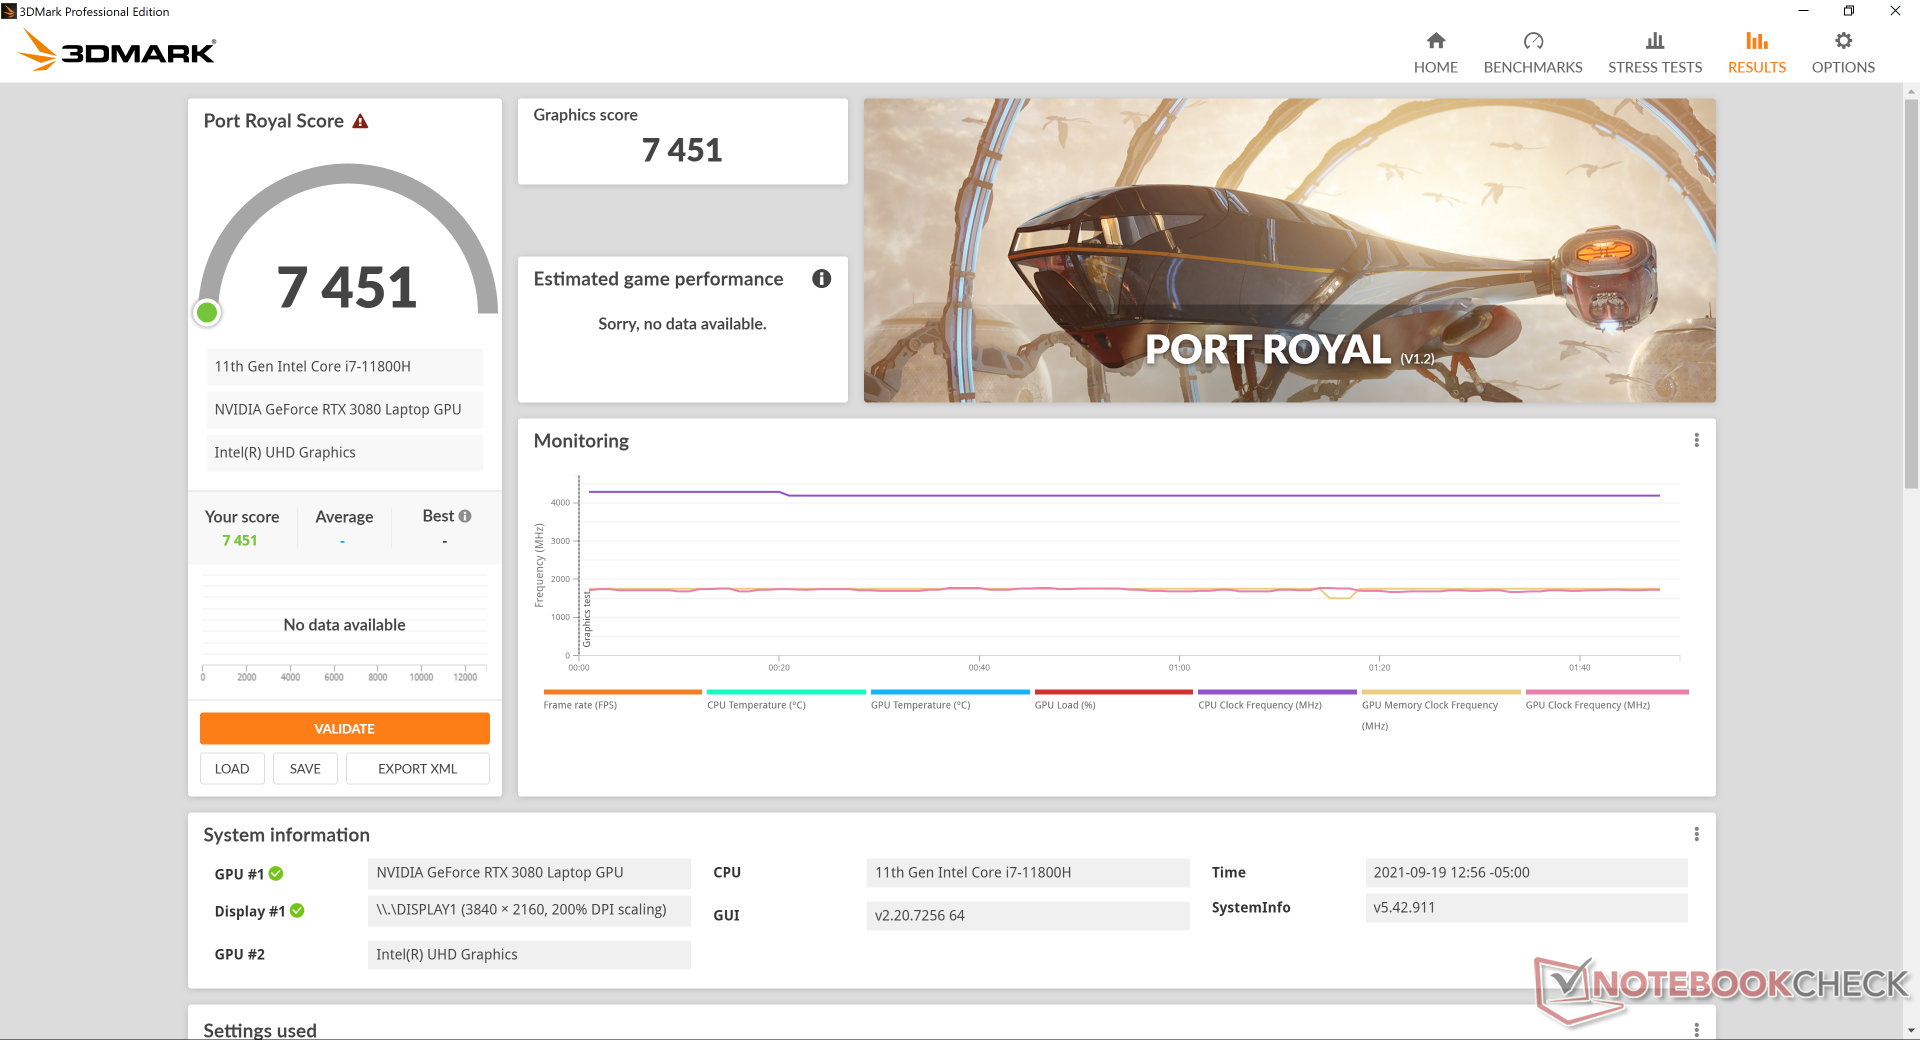
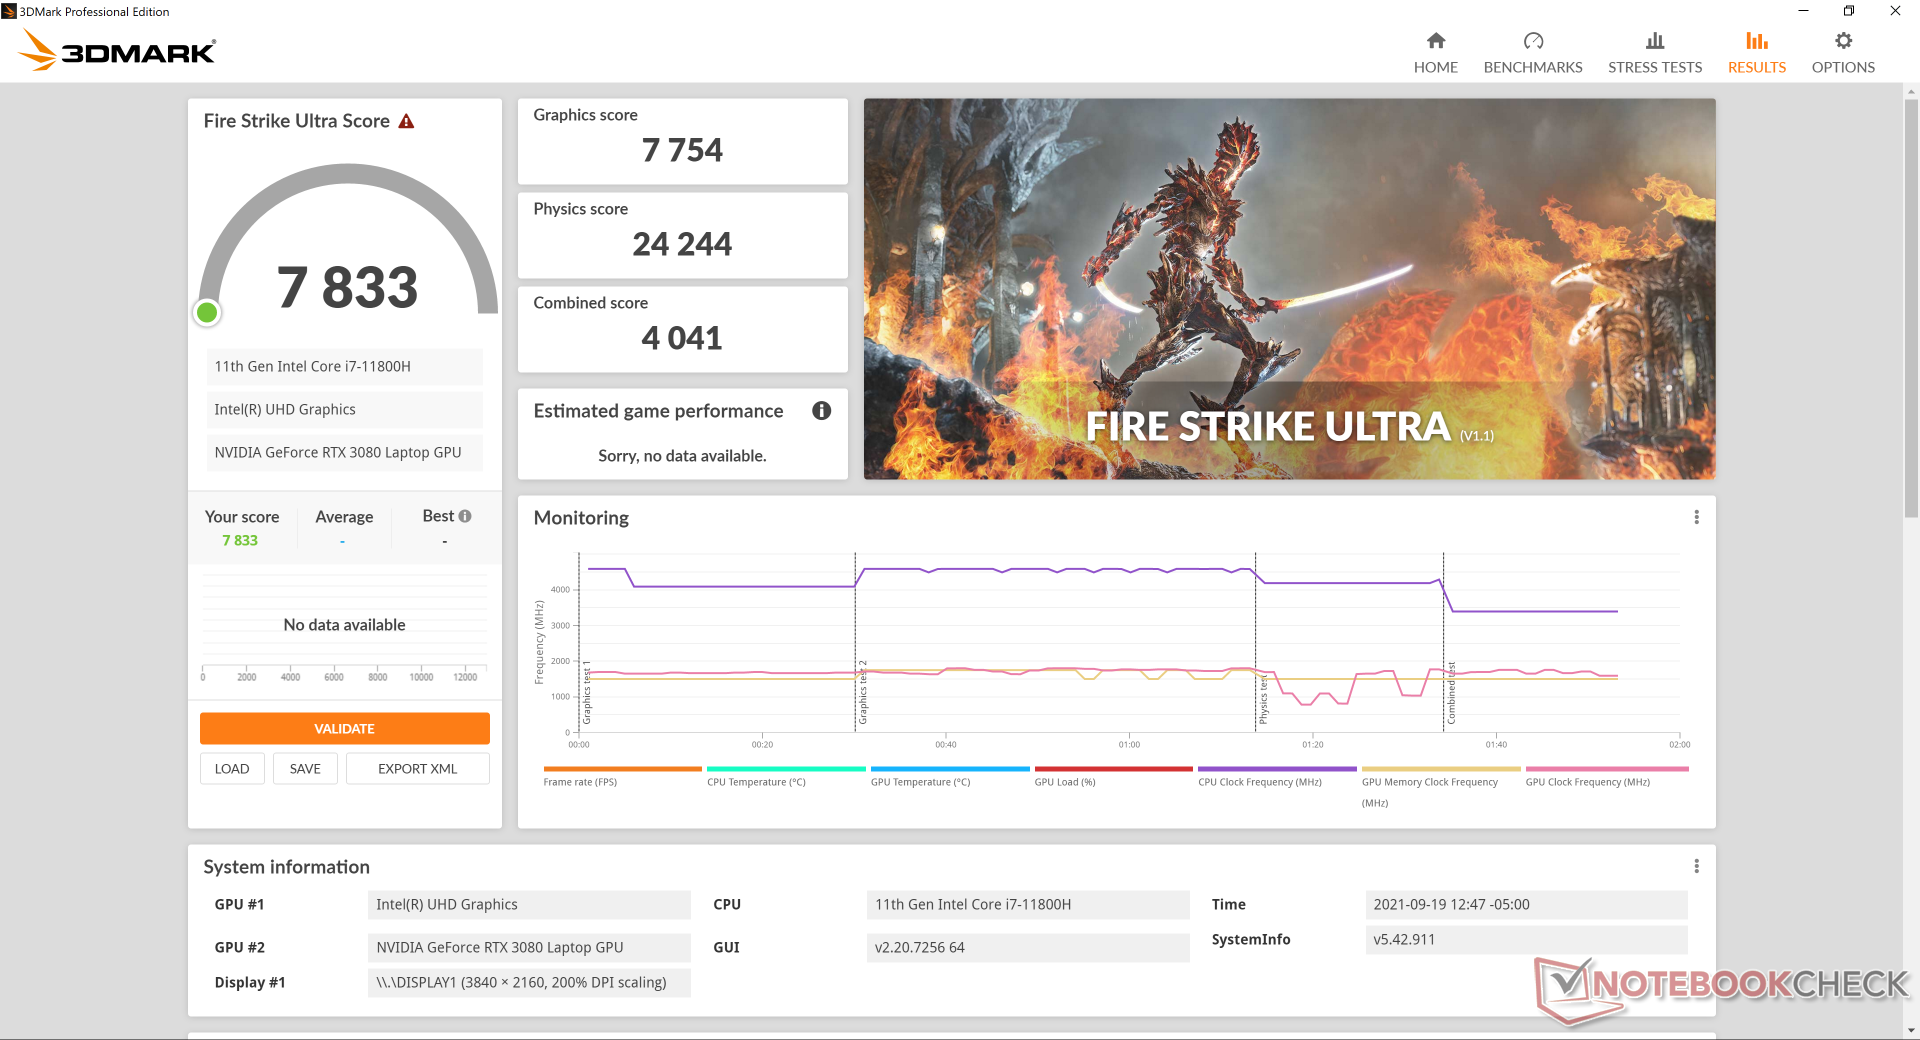
Rendimiento de la GPU: un poco más alto que la media
A pesar de la gráfica RTX 3080 de 165 W, el rendimiento bruto es solo entre un 2 y un 9 por ciento más rápido que el portátil RTX 3080 medio en nuestra base de datos, probablemente debido a la disminución de los rendimientos en objetivos TGP más altos. La pequeña ventaja también se aprecia al ejecutar juegos, ya que las tasas de fotogramas vuelven a ser sólo unos pocos puntos porcentuales más altas de media. Sin embargo, la diferencia de rendimiento se vuelve más pronunciada cuando se compara con la RTX 3080 de 90 W del MSI GS76, donde nuestro Alienware puede ser entre un 15 y un 30 por ciento más rápido en ciertos títulos. A pC de sobremesa con gráficos RTX 3080 seguirá superando a cualquier portátil con RTX 3080 entre un 40 y un 45 por ciento.
Al estar en ralentí durante Witcher 3 durante más de una hora muestra velocidades de fotogramas estables sin caídas aleatorias que sugieren que no se interrumpe la actividad de fondo cuando se juega, en contraste con lo que observamos en algunos modelos antiguos de Alienware m15.
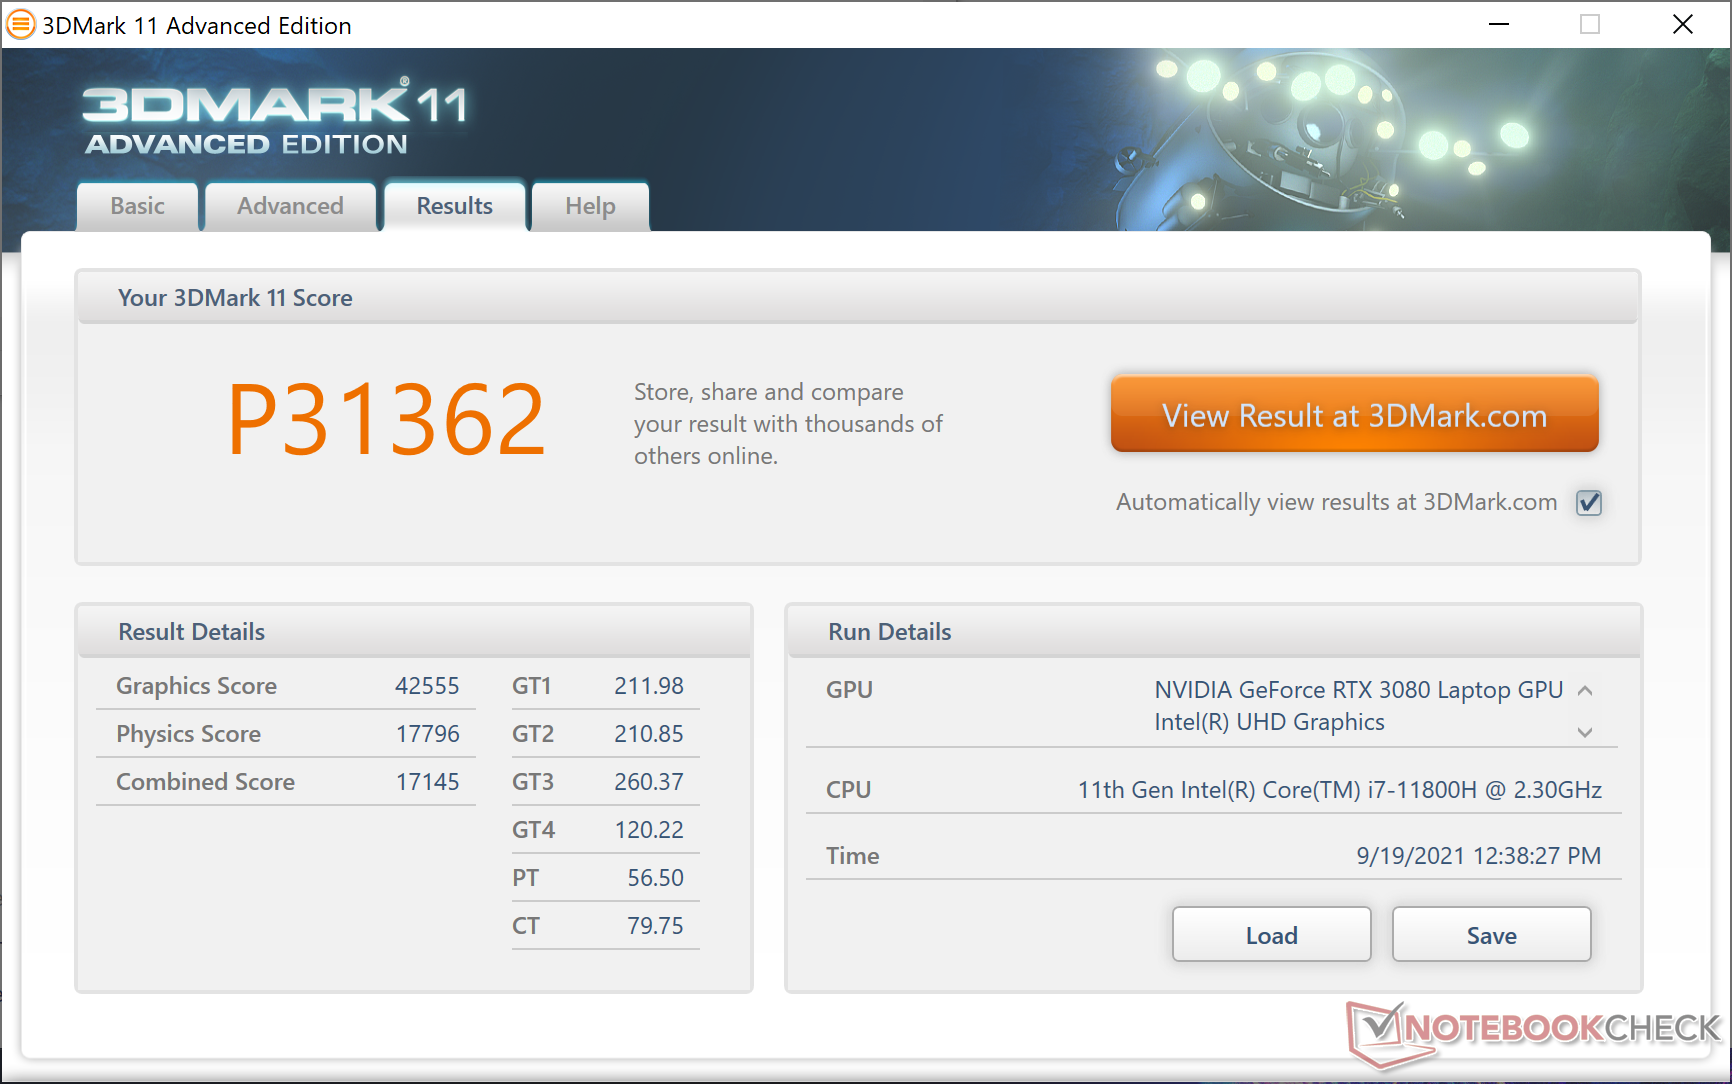
| 3DMark 11 Performance | 31362 puntos | |
| 3DMark Cloud Gate Standard Score | 34288 puntos | |
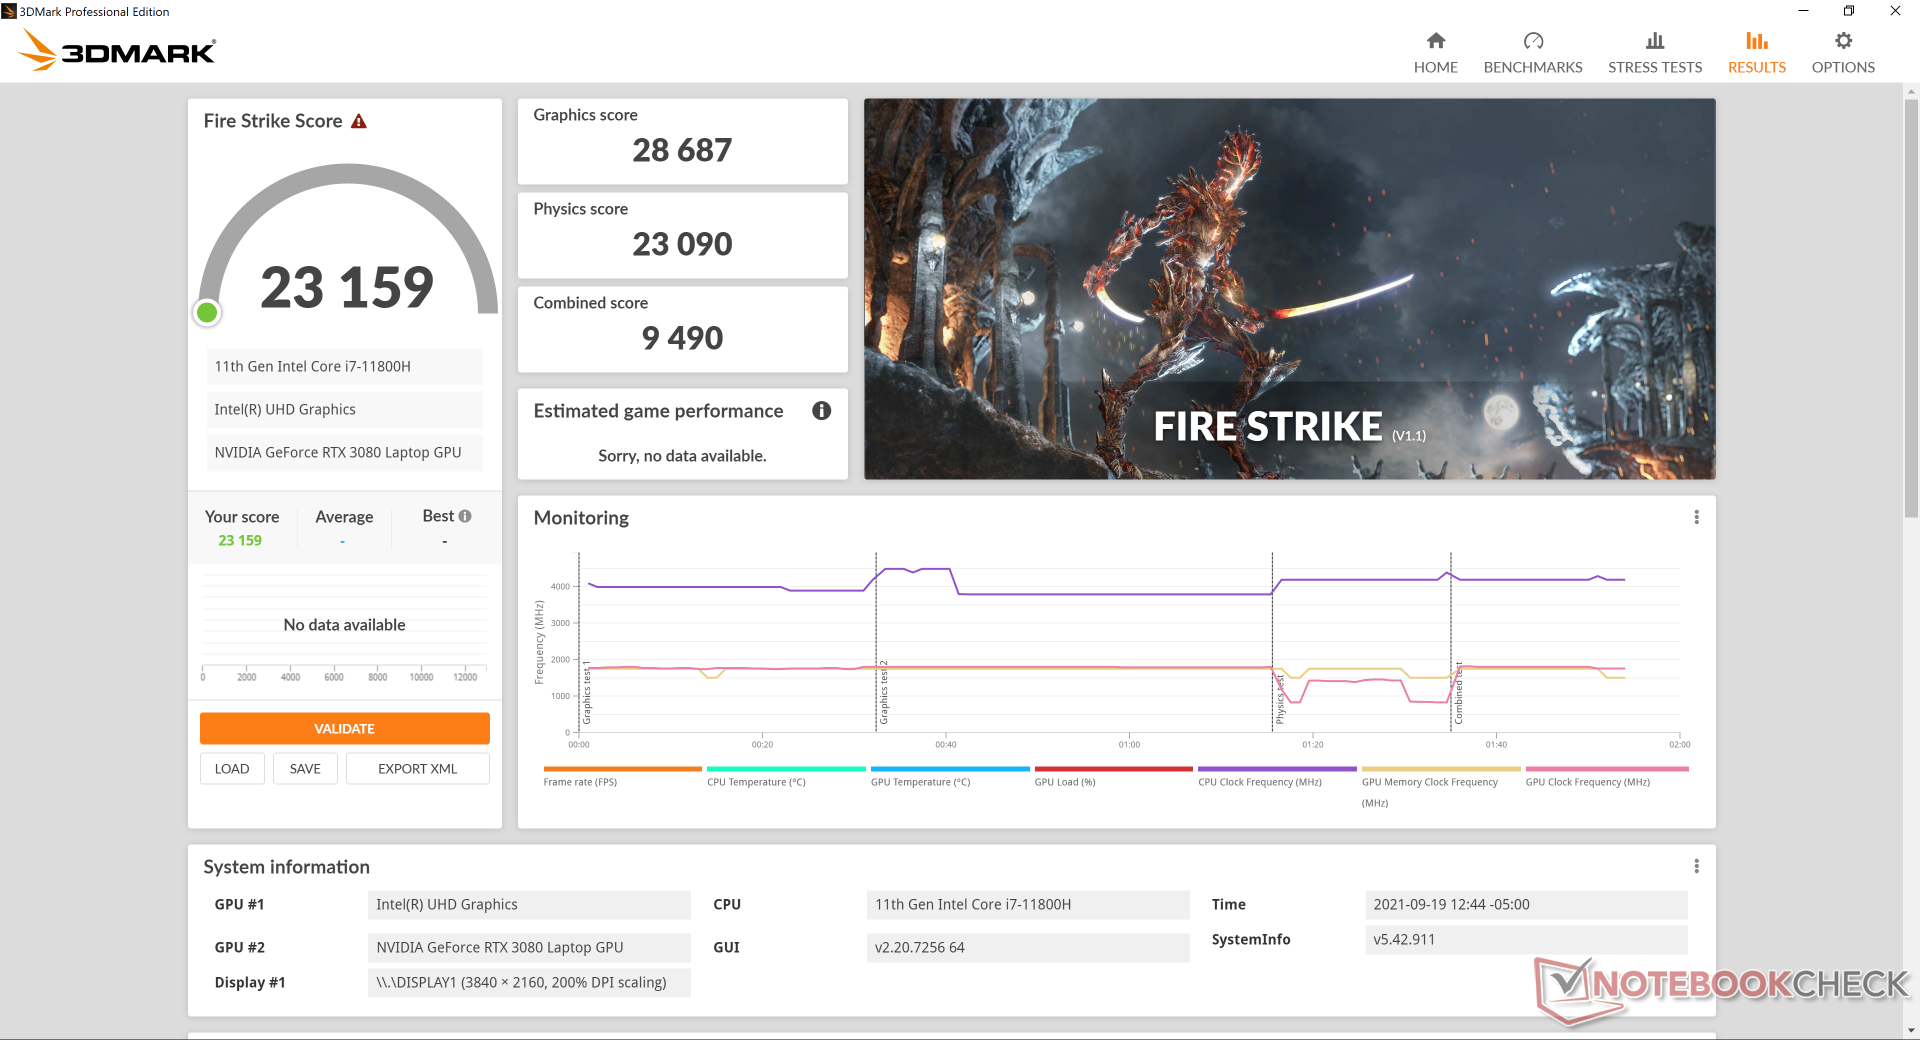
| 3DMark Fire Strike Score | 23159 puntos | |
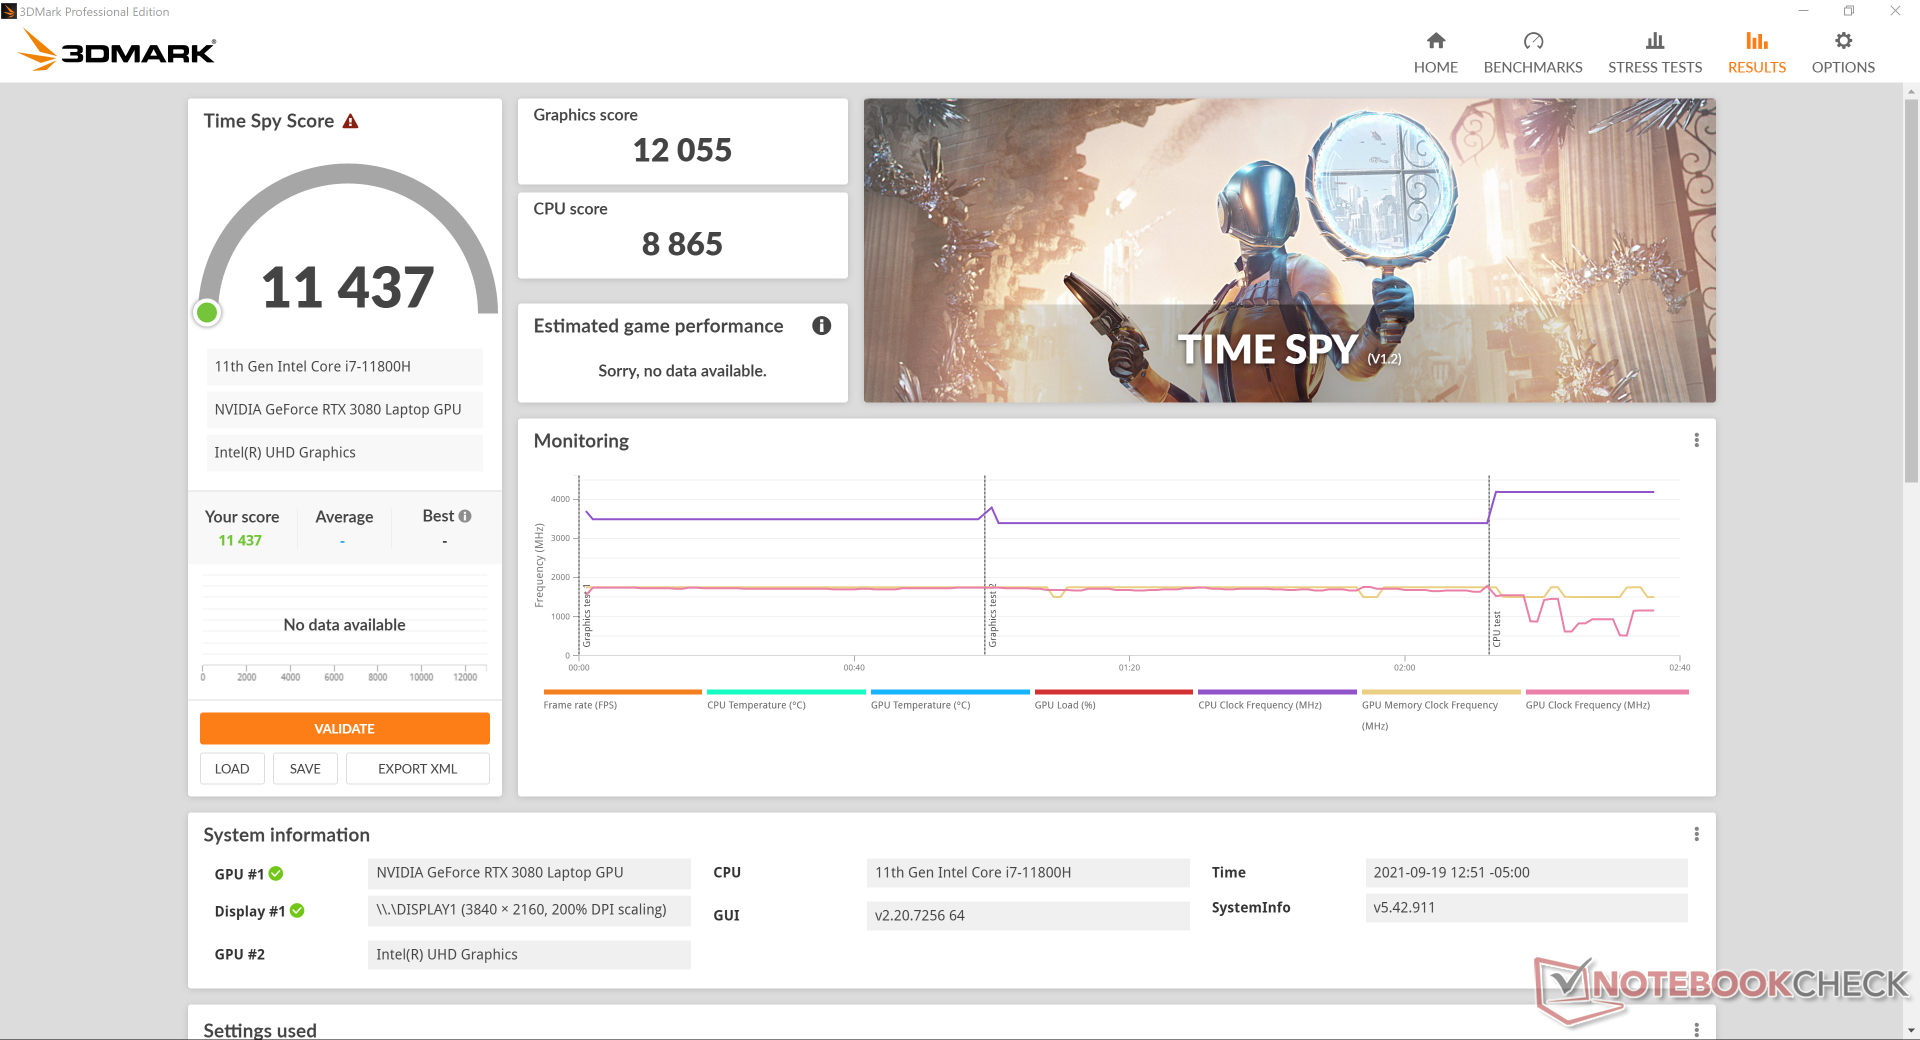
| 3DMark Time Spy Score | 11437 puntos | |
ayuda | ||
Witcher 3 FPS Chart
| bajo | medio | alto | ultra | QHD | 4K | |
|---|---|---|---|---|---|---|
| GTA V (2015) | 183 | 176 | 163 | 98.1 | 89.2 | 98.1 |
| The Witcher 3 (2015) | 370.2 | 294 | 192 | 105.2 | 80.2 | |
| Dota 2 Reborn (2015) | 164 | 148 | 143 | 135 | 111 | |
| Final Fantasy XV Benchmark (2018) | 181 | 134 | 106 | 81.8 | 50.8 | |
| X-Plane 11.11 (2018) | 118 | 99.3 | 79.7 | 56.9 | ||
| Far Cry 5 (2018) | 144 | 125 | 120 | 112 | 98 | 63 |
| Strange Brigade (2018) | 456 | 269 | 225 | 199 | 152 | 91.6 |
Emissions
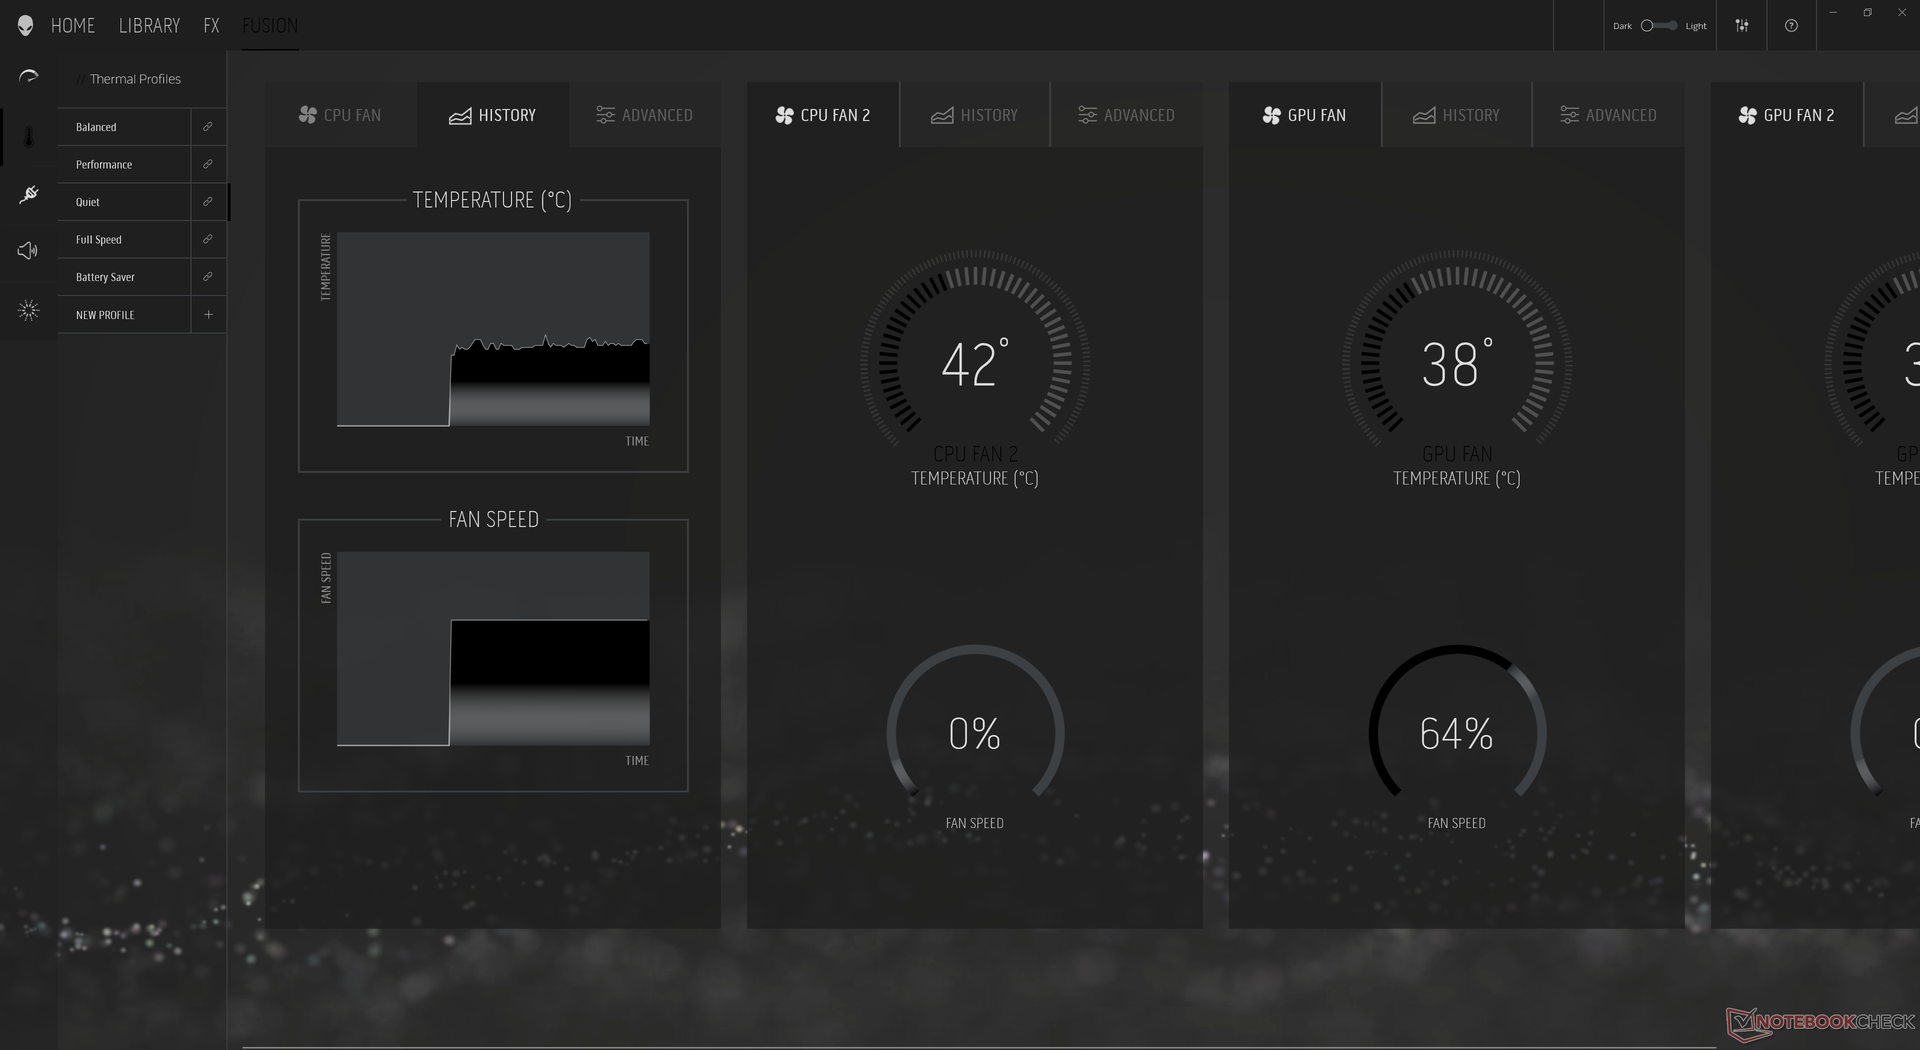
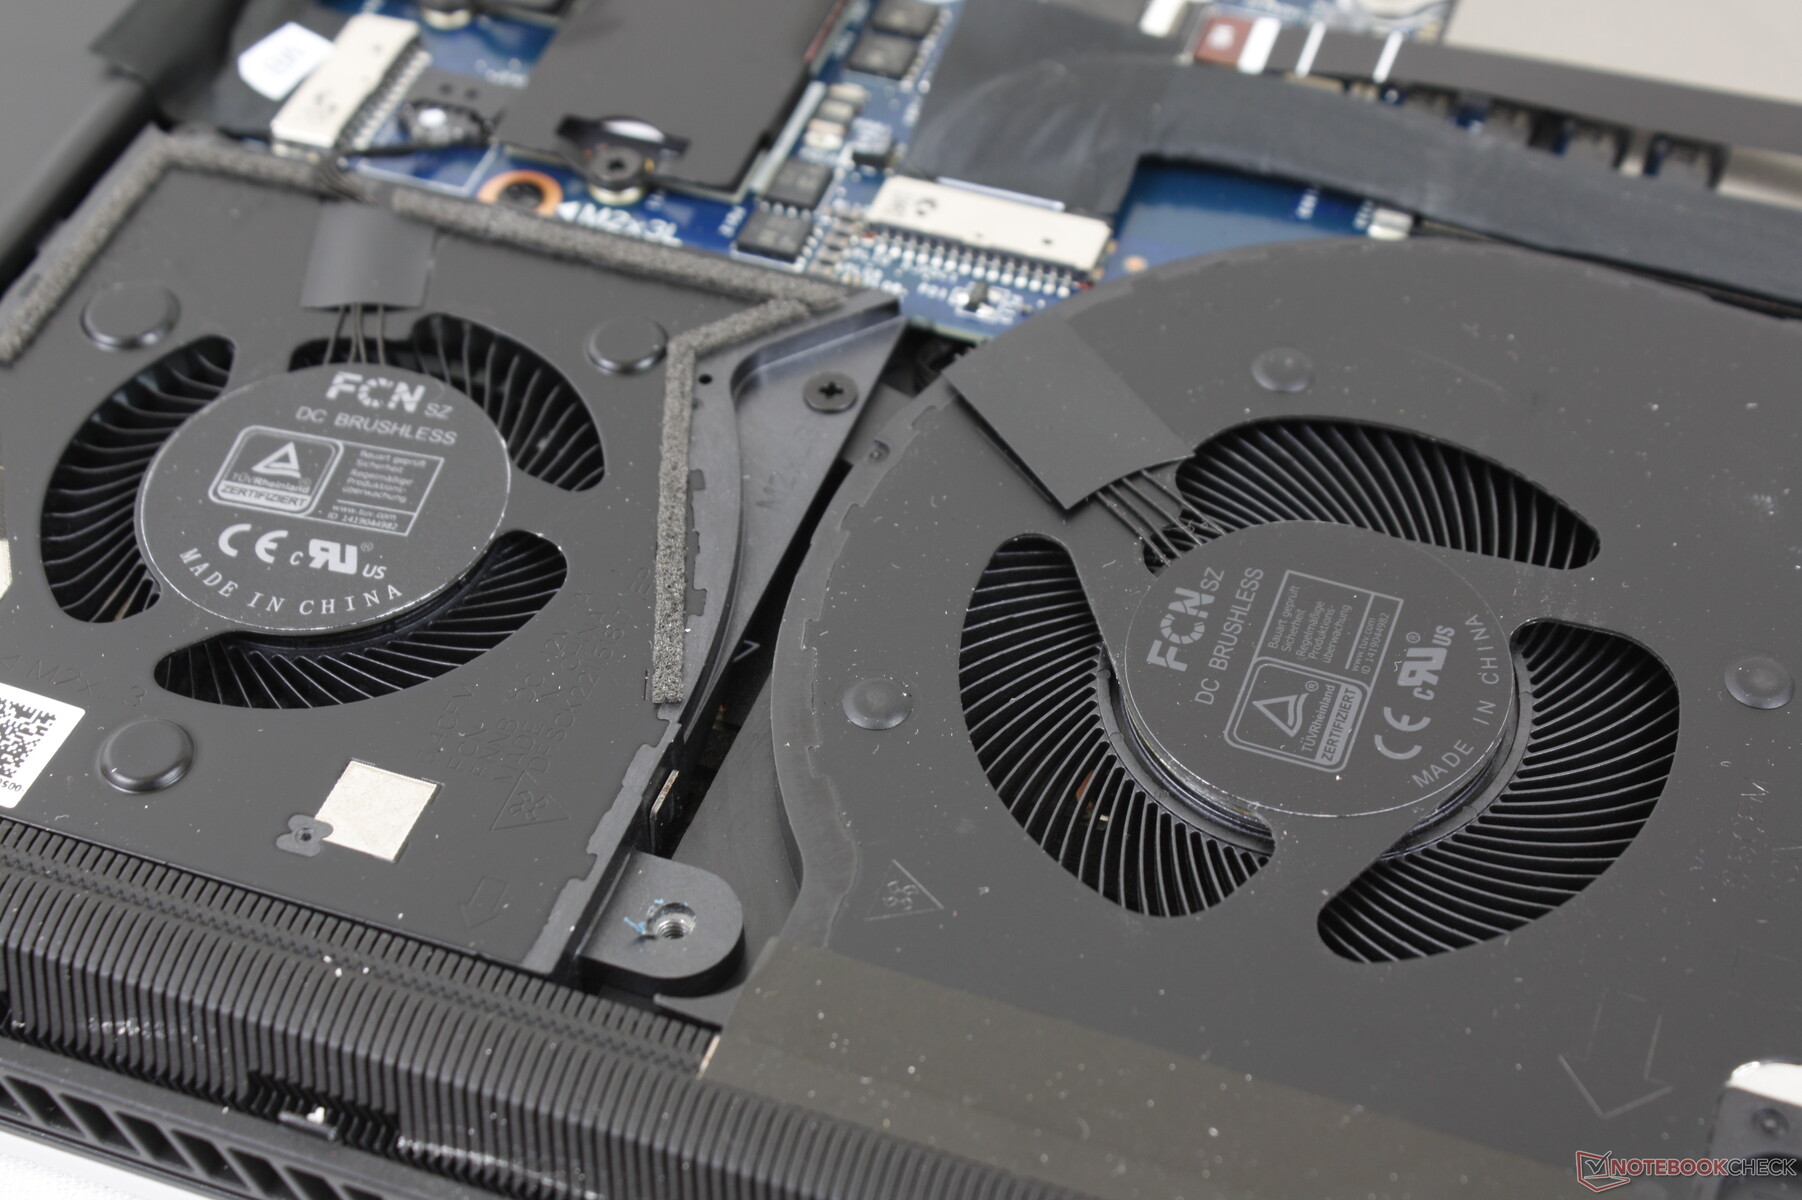
Ruido del sistema - Cámara de vapor + pasta térmica de galio-silicona
El ruido del ventilador depende en gran medida de los ajustes del Centro de Comando Alienware (Silencio, Rendimiento y Velocidad Máxima). A pesar de tener dos veces más ventiladores que en la mayoría de portátiles de juego, el Alienware x17 es generalmente muy silencioso durante cargas bajas como la navegación o el streaming de vídeo incluso cuando se pone en modo Rendimiento. Pudimos registrar un ruido de ventilador de sólo 31,3 dB(A) contra un fondo de 24,9 dB(A) al ejecutar 3DMark 06 durante 90 segundos. Sin embargo, si se prolonga, el ruido del ventilador acabará subiendo a 43,8 dB(A), lo que es similar a lo que hemos registrado en otros portátiles para juegos.
Si se ejecuta Witcher 3 en modo Rendimiento, el ruido del ventilador se mantiene en 49,7 dB(A). Curiosamente, este nivel sigue siendo el mismo incluso en modo equilibrado, por lo que los jugadores deberían poner el sistema en modo Rendimiento siempre que sea posible. Poner los ventiladores en modo Velocidad Máxima aumentará el ruido del ventilador hasta 55 dB(A) sin importar la carga en pantalla. El Alienware x17 es, en general, más silencioso que el Gigabyte Aero 17 o el m17 R4 de última generación durante las cargas bajas, pero son casi iguales una vez que se introducen cargas más altas.
| Alienware x17 RTX 3080 P48E GeForce RTX 3080 Laptop GPU, i7-11800H, 2x WDC PC SN730 SDBPNTY-1T00 (RAID 0) | Alienware m17 R4 GeForce RTX 3080 Laptop GPU, i9-10980HK, 2x Micron 2300 512 GB (RAID 0) | Razer Blade 17 RTX 3070 GeForce RTX 3070 Laptop GPU, i7-11800H, Samsung PM9A1 MZVL21T0HCLR | Asus ROG Zephyrus S17 GX703HSD GeForce RTX 3080 Laptop GPU, i9-11900H, Samsung PM9A1 MZVL22T0HBLB | MSI GS76 Stealth 11UH GeForce RTX 3080 Laptop GPU, i9-11900H, Samsung PM9A1 MZVL22T0HBLB | Gigabyte Aero 17 HDR YD GeForce RTX 3080 Laptop GPU, i9-11980HK, Samsung PM9A1 MZVL2512HCJQ | |
|---|---|---|---|---|---|---|
| Noise | -6% | -3% | 4% | -10% | -20% | |
| apagado / medio ambiente * (dB) | 24.9 | 24 4% | 24.2 3% | 23 8% | 24 4% | 25 -0% |
| Idle Minimum * (dB) | 24.9 | 24 4% | 24.7 1% | 23 8% | 24 4% | 30 -20% |
| Idle Average * (dB) | 24.9 | 25 -0% | 24.7 1% | 23 8% | 25 -0% | 32 -29% |
| Idle Maximum * (dB) | 29.6 | 36 -22% | 24.7 17% | 23 22% | 42 -42% | 41 -39% |
| Load Average * (dB) | 31.1 | 45 -45% | 44.3 -42% | 41 -32% | 46 -48% | 43 -38% |
| Witcher 3 ultra * (dB) | 49.7 | 47 5% | 56.3 -13% | 45 9% | 48 3% | 51 -3% |
| Load Maximum * (dB) | 54.8 | 50 9% | 47.7 13% | 52 5% | 48 12% | 59 -8% |
* ... más pequeño es mejor
Ruido
| Ocioso |
| 24.9 / 24.9 / 29.6 dB(A) |
| Carga |
| 31.1 / 54.8 dB(A) |
 | ||
30 dB silencioso 40 dB(A) audible 50 dB(A) ruidosamente alto |
||
min: | ||
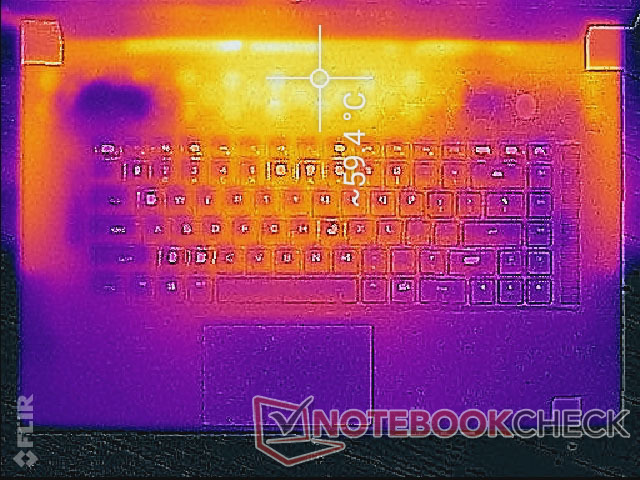
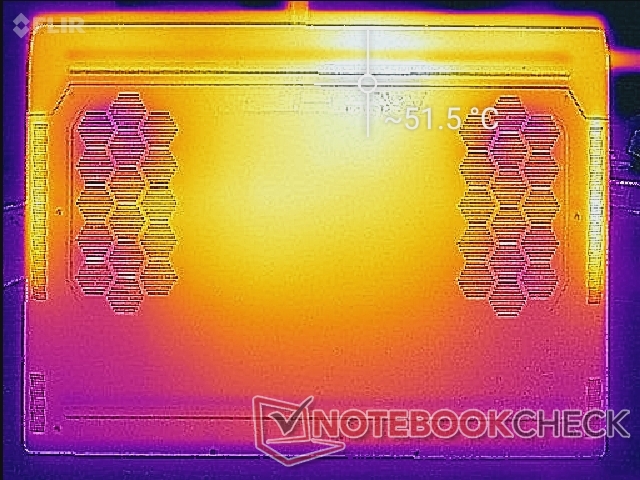
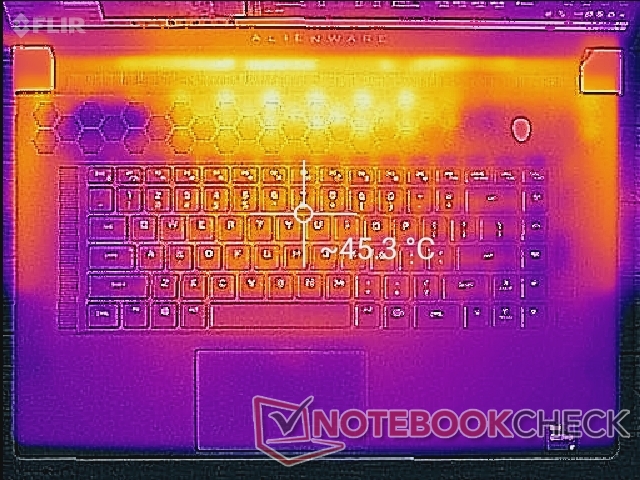
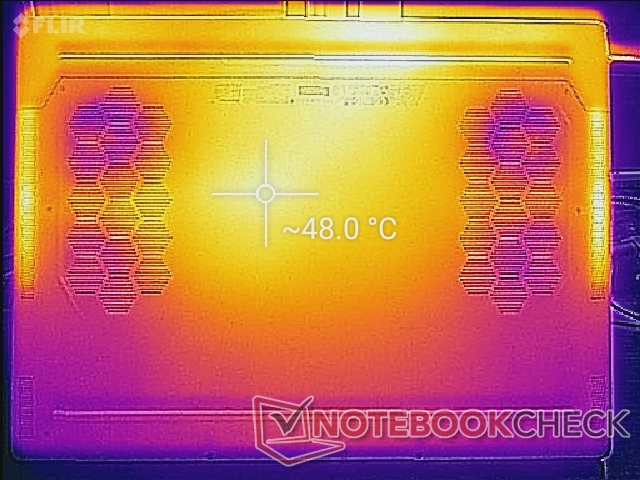
Temperatura
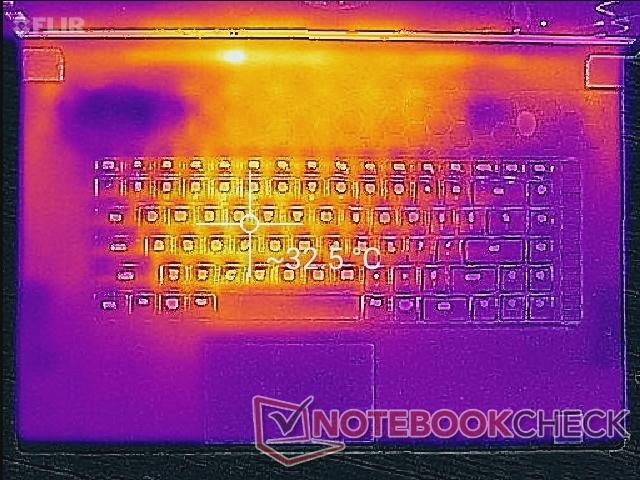
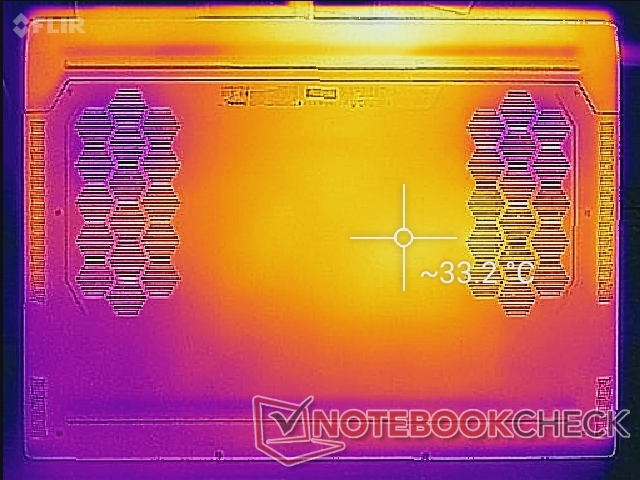
Las temperaturas de la superficie en reposo son relativamente frescas en los reposamanos, mientras que el centro y la parte inferior del teclado pueden ser notablemente más cálidos, a unos 33 C cada uno, ya que los ventiladores están a baja velocidad. Cuando se juega, los puntos calientes pueden llegar a ser tan cálidos como 59 C y 52 C en la parte superior e inferior, respectivamente, o incluso 39 C a lo largo de los bordes laterales del teclado. Estos puntos calientes están generalmente alejados de las palmas y los dedos de los usuarios para que no distraigan durante el juego, pero se recomienda definitivamente no bloquear ninguna de las varias rejillas de ventilación alrededor del sistema
Las temperaturas generales son más frescas que las que observamos en el Asus Zephyrus S17 probablemente debido al mayor grosor y tamaño de nuestro chasis Alienware.
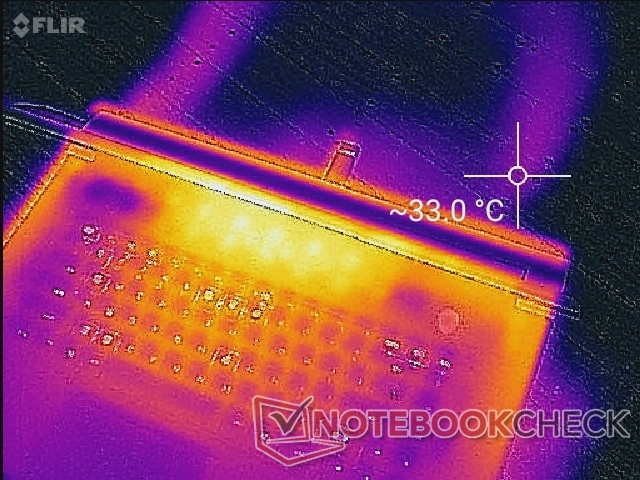
(-) La temperatura máxima en la parte superior es de 58.4 °C / 137 F, frente a la media de 40.4 °C / 105 F, que oscila entre 21.2 y 68.8 °C para la clase Gaming.
(-) El fondo se calienta hasta un máximo de 49 °C / 120 F, frente a la media de 43.2 °C / 110 F
(+) En reposo, la temperatura media de la parte superior es de 29.5 °C / 85# F, frente a la media del dispositivo de 33.9 °C / 93 F.
(-) Jugando a The Witcher 3, la temperatura media de la parte superior es de 41.4 °C / 107 F, frente a la media del dispositivo de 33.9 °C / 93 F.
(+) Los reposamanos y el panel táctil alcanzan como máximo la temperatura de la piel (32.4 °C / 90.3 F) y, por tanto, no están calientes.
(-) La temperatura media de la zona del reposamanos de dispositivos similares fue de 28.8 °C / 83.8 F (-3.6 °C / -6.5 F).
Prueba de esfuerzo
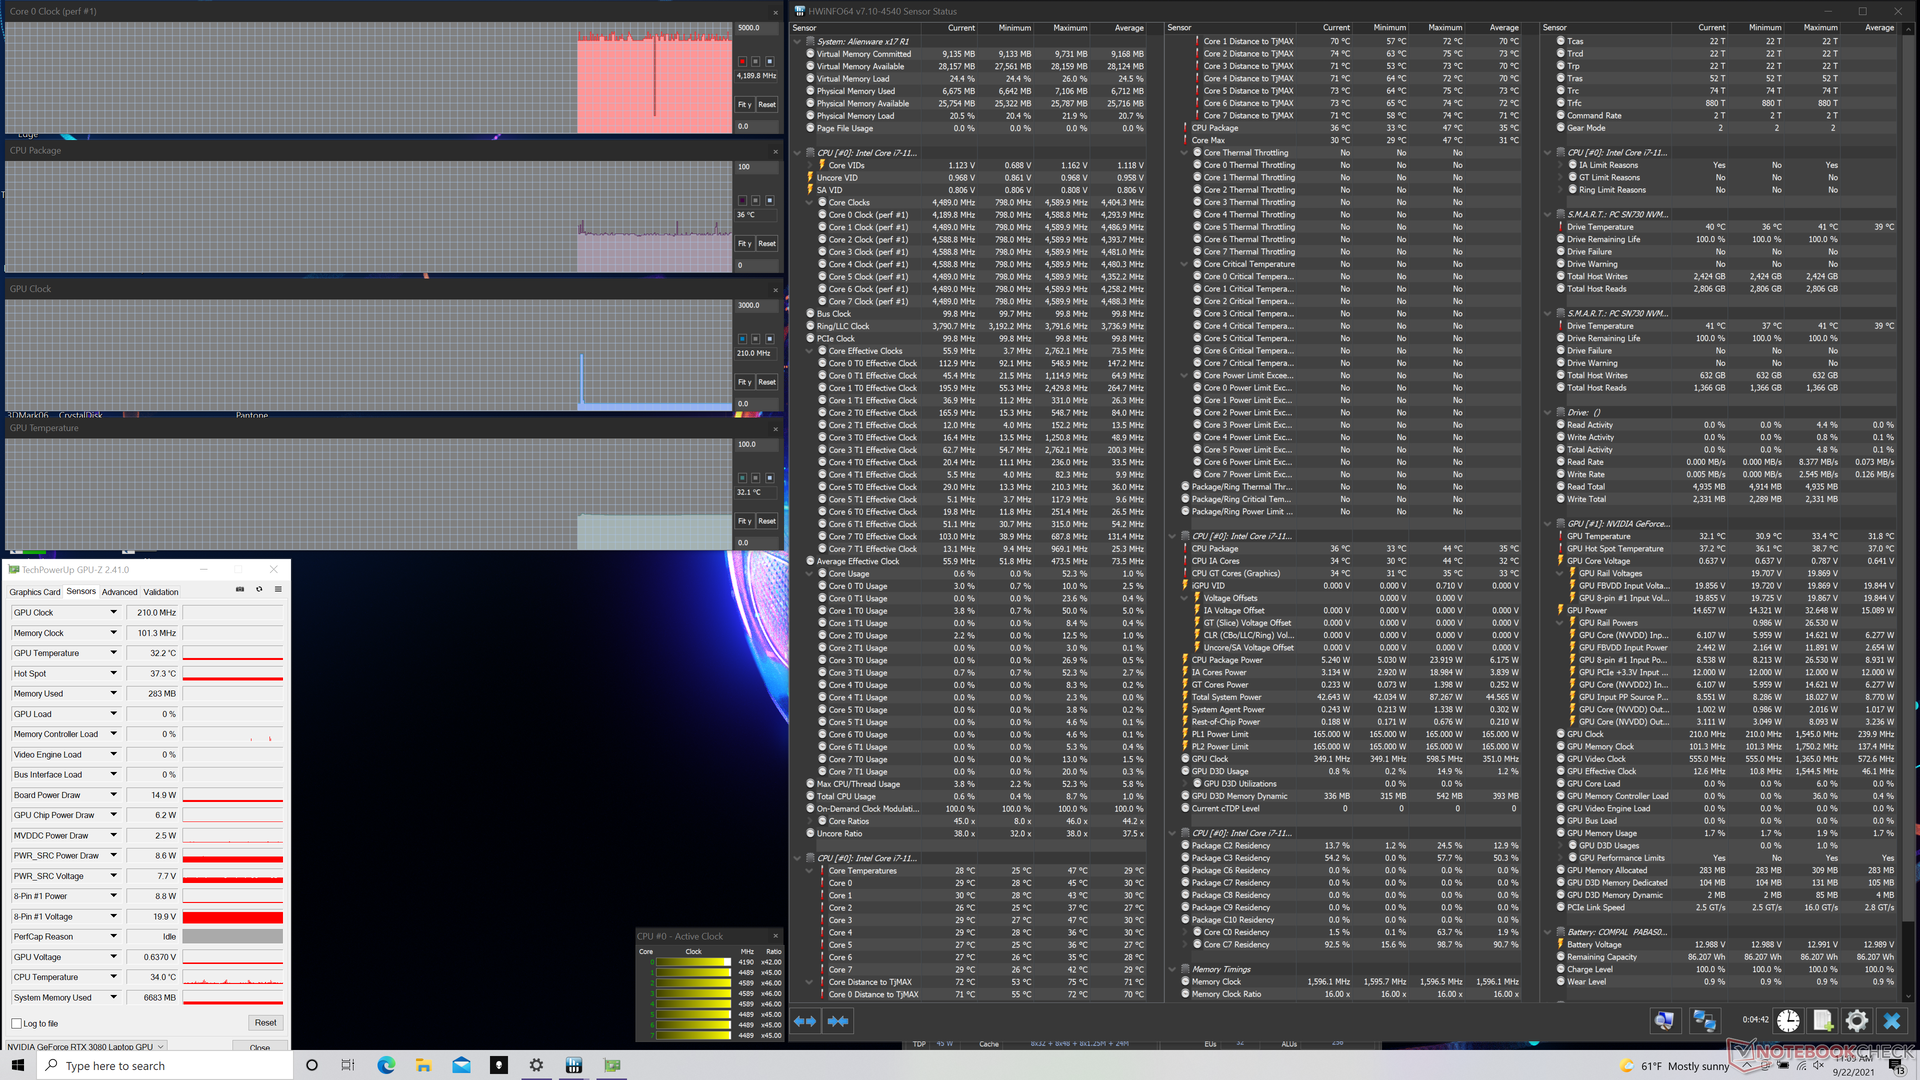
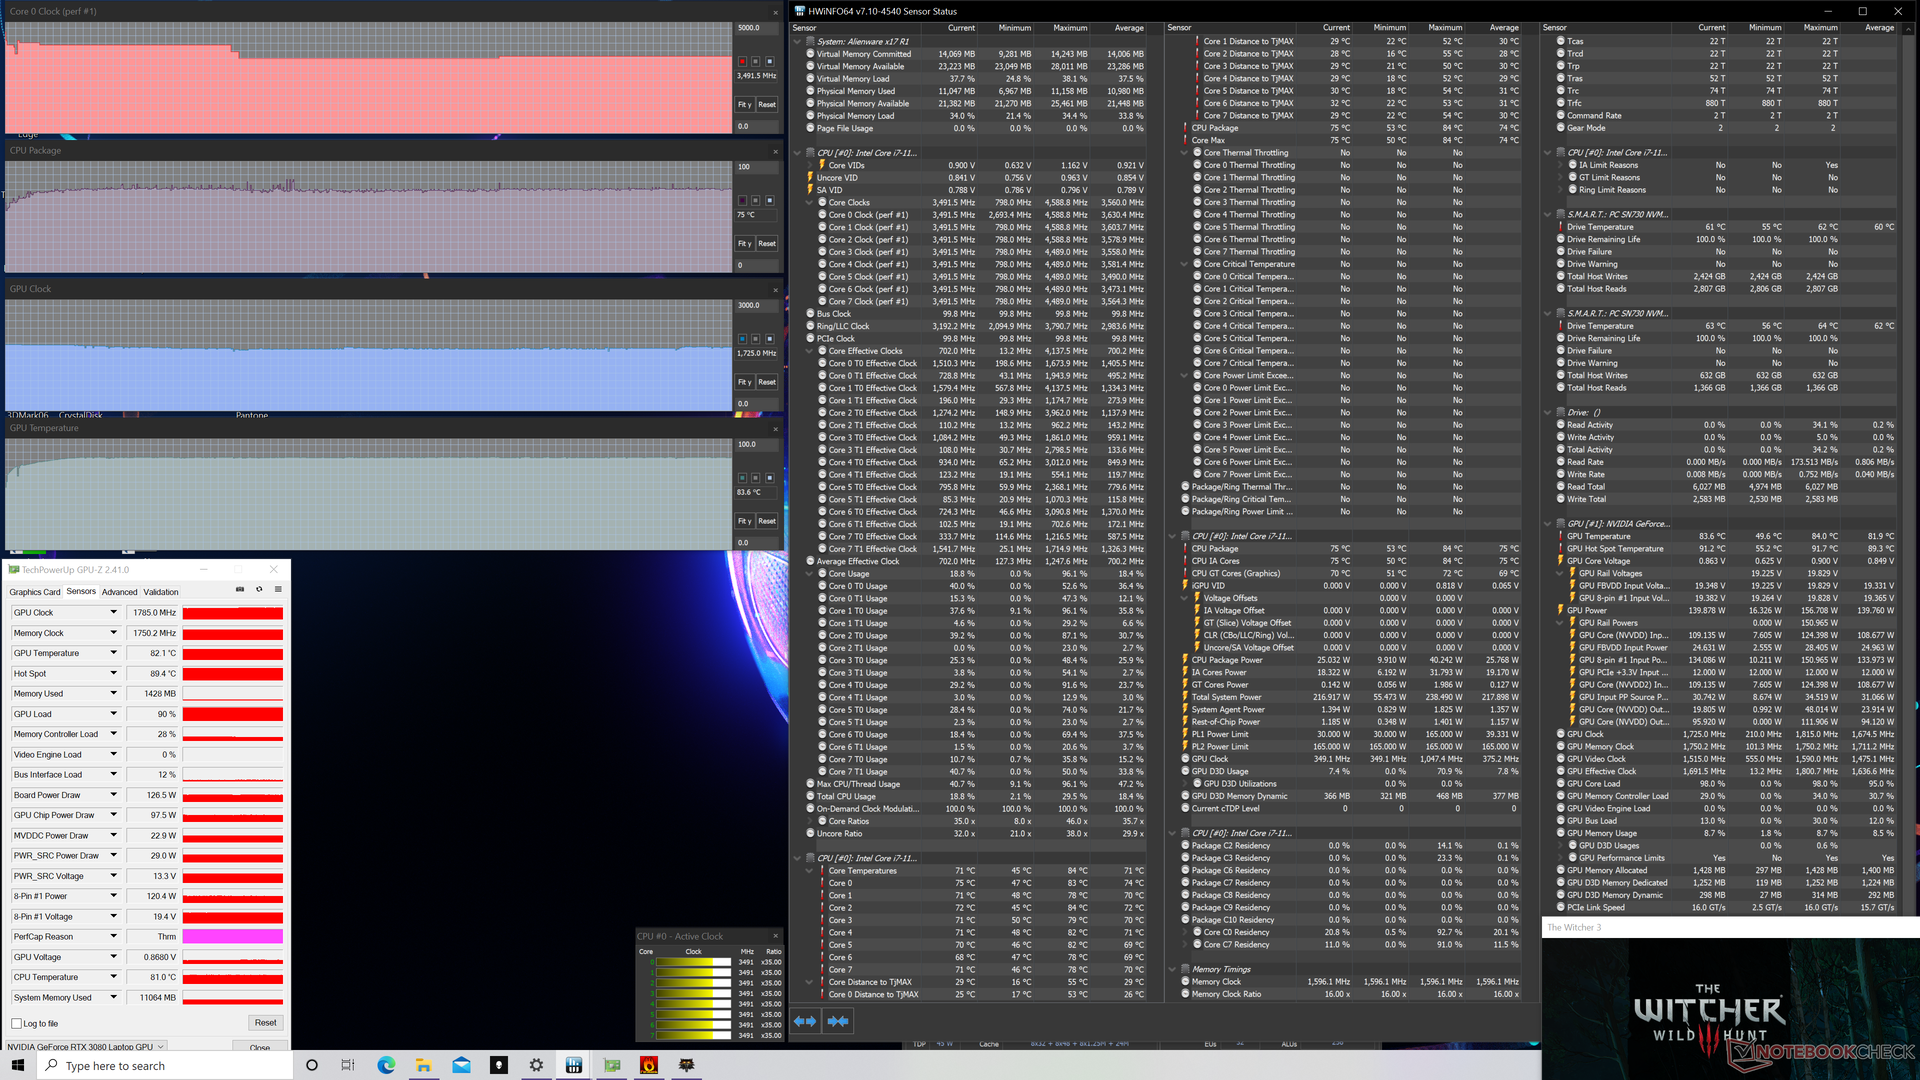
Cuando se estresa con Prime95, las velocidades de reloj de la CPU y la temperatura oscilan entre 3,8 GHz y 4,2 GHz y entre 85 C y 100 C cada par de minutos, lo que son valores muy altos en general. A modo de comparación, el Razer Blade 17 viene con el mismo procesador Core i7-11800H y, sin embargo, se estabiliza a sólo 2,8 GHz y 78 C cuando se somete a las mismas condiciones. Tanto la velocidad de reloj de la CPU como la de la GPU se ralentizan cuando se utilizan al 100% a través de Prime95 y FurMark.
La ejecución de Witcher 3 en modo Alto Rendimiento hace que la CPU y la GPU se estabilicen en 3,5 GHz y 1785 MHz, respectivamente, con un consumo de energía de la placa GPU constante de unos 145 W. Si está en modo Balanceado, las frecuencias de la CPU caen a sólo 2,5 GHz mientras que las frecuencias de la GPU pueden bajar ligeramente a 1680 MHz y un consumo de energía de ~135 W. Si estás jugando y quieres sacar el máximo partido a tu portátil, asegúrate de activar el modo Alto Rendimiento a través del software de Alienware. Las frecuencias de reloj de la GPU son más rápidas de lo esperado en cualquier caso si se comparan con la mayoría de portátiles con la misma GPU como el Maingear Vector Pro.
El uso de la batería limitará el rendimiento de los gráficos. Una prueba de Fire Strike con baterías arrojaría unas puntuaciones de Física y Gráficos de 24602 y 13281 puntos, respectivamente, frente a los 22907 y 29194 puntos de la red eléctrica.
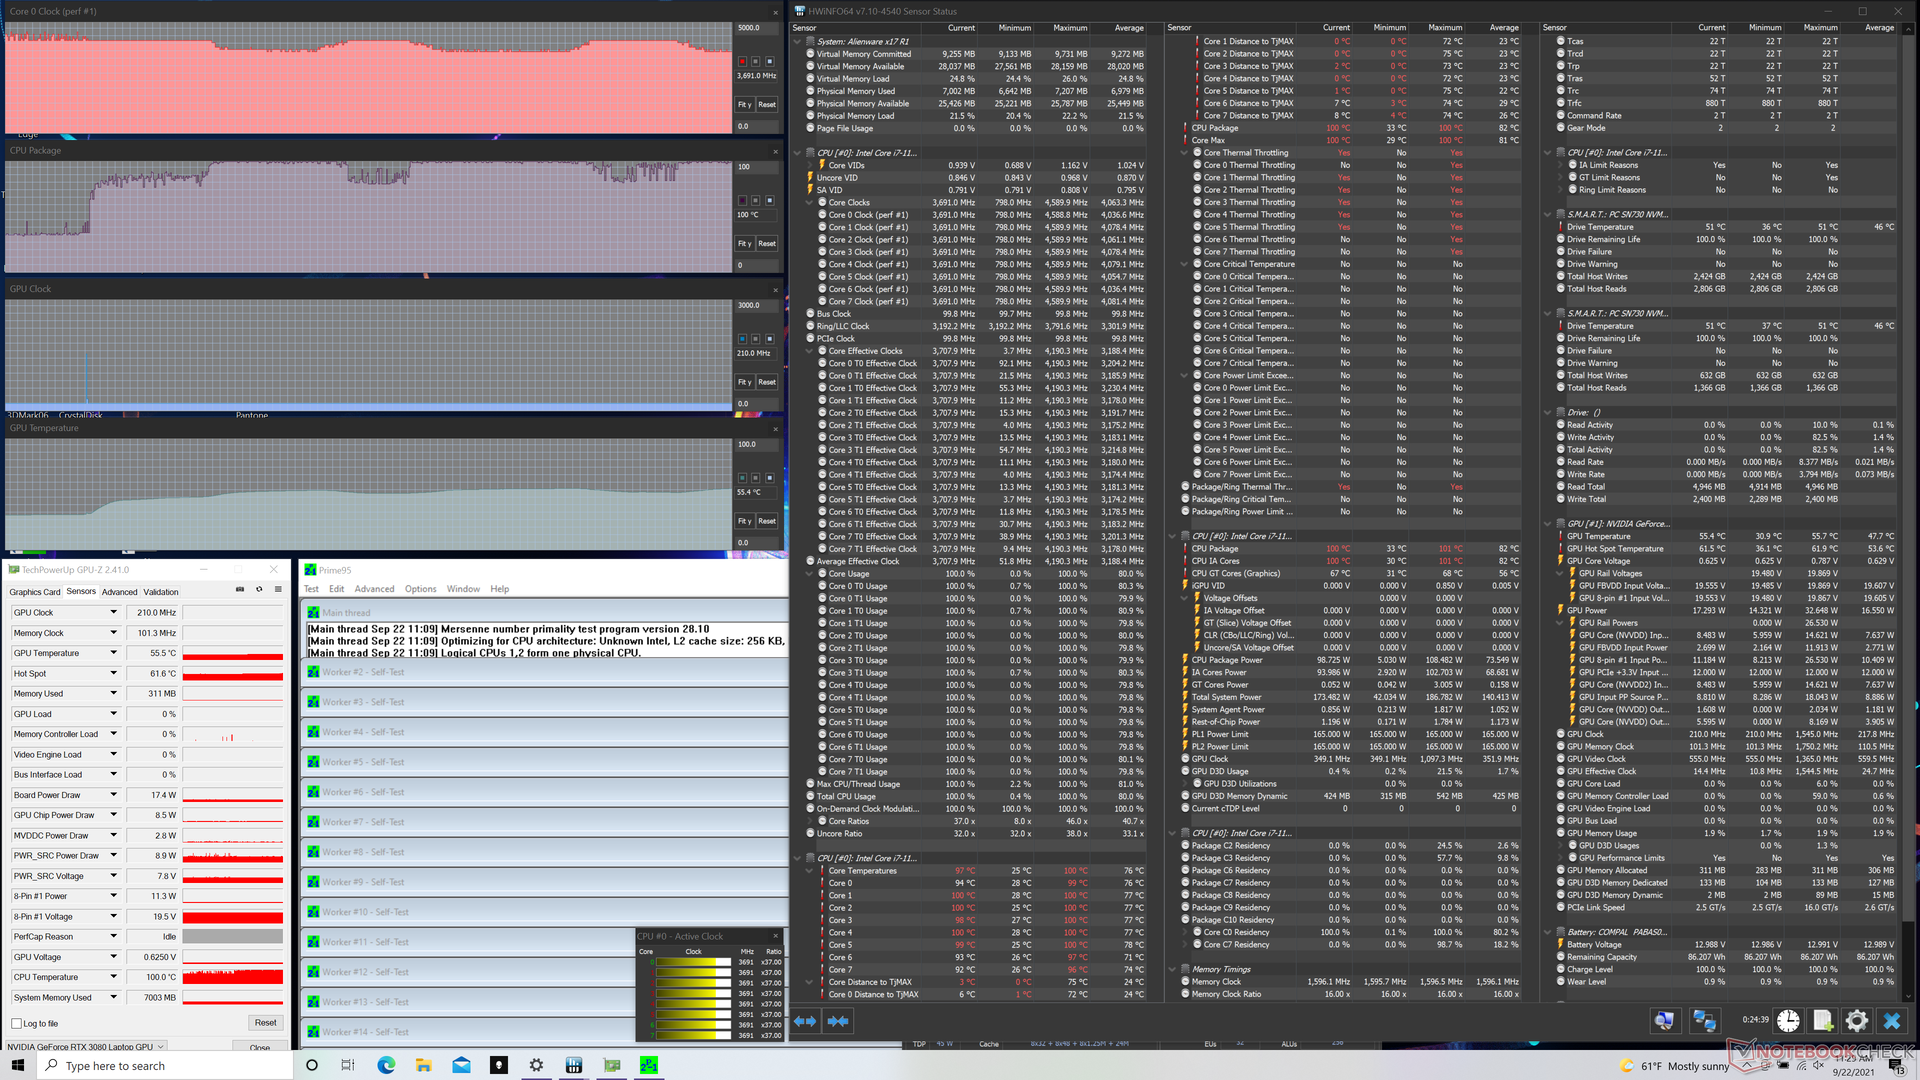
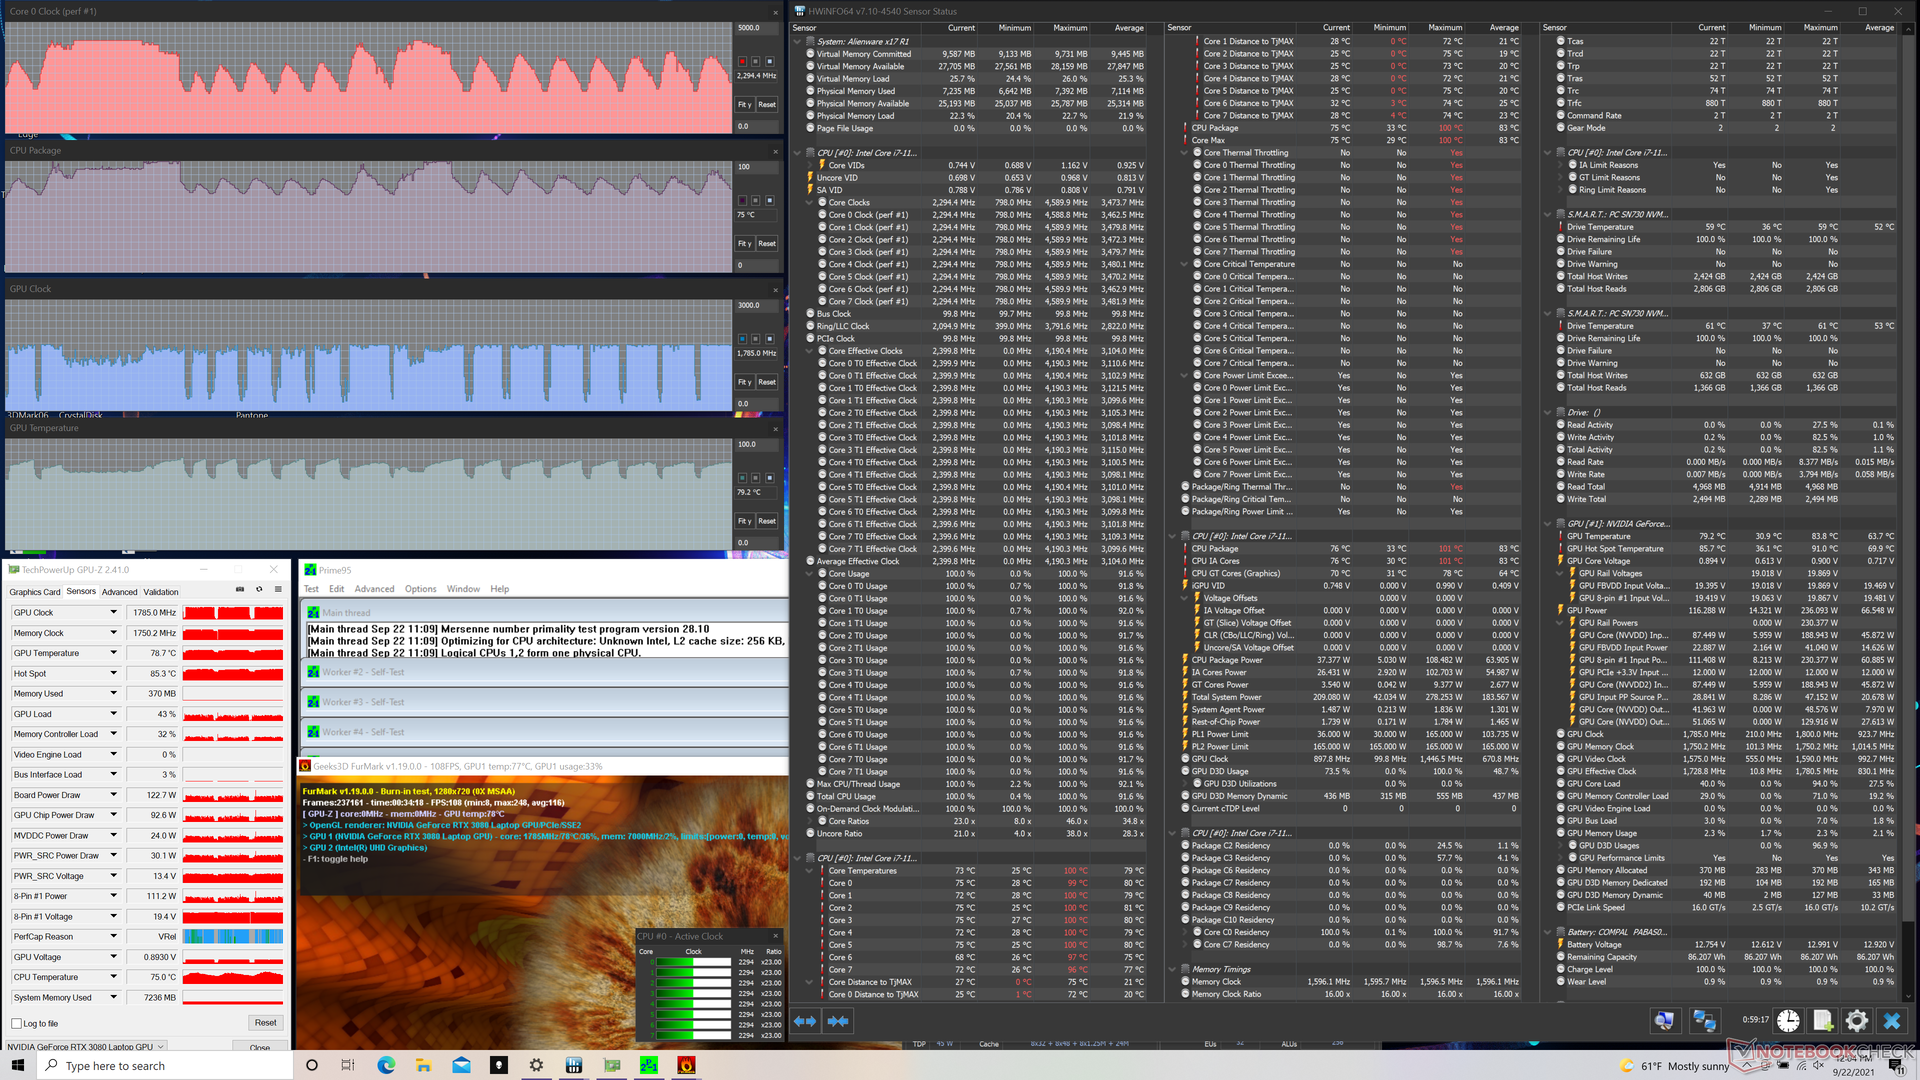
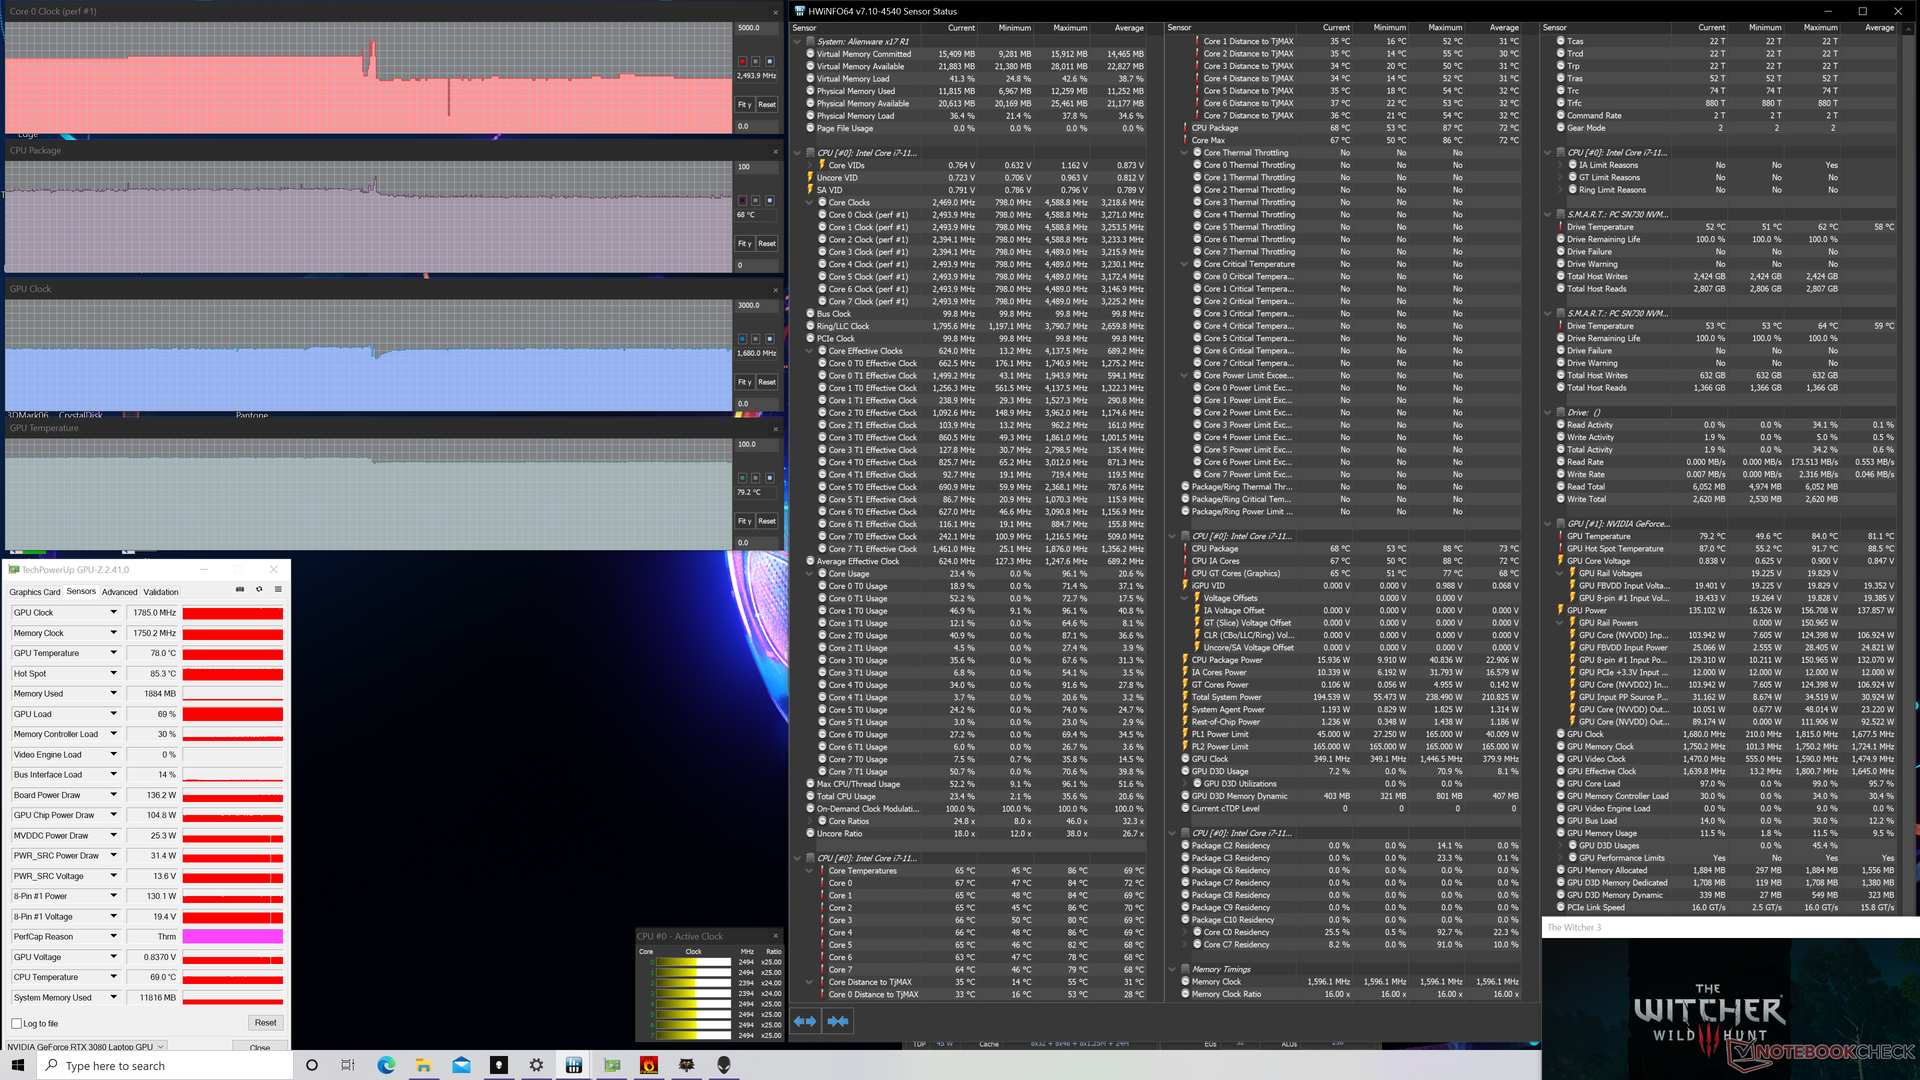
| Relojde la CPU(GHz) | Reloj dela GPU(MHz) | Temperatura media de la CPU (°C) | Temperaturamediade la GPU (°C) | |
| Sistema en reposo | 36 | 32 | ||
| Estrés de Prime95(modo de alto rendimiento) | 3,8 - 4,2 | -- | 85 - 100 | 55 |
| Estrés de Prime95+ FurMark (modo de alto rendimiento) | 1,9 - 3,4 | 300 - 1785 | 71 - 86 | 65 - 79 |
| Witcher 3 Estrés (modo equilibrado) | 2,5 | 1785 | 68 | 79 |
| Witcher 3 Estrés (modo de alto rendimiento) | 3,5 | 1785 | 75 | 84 |
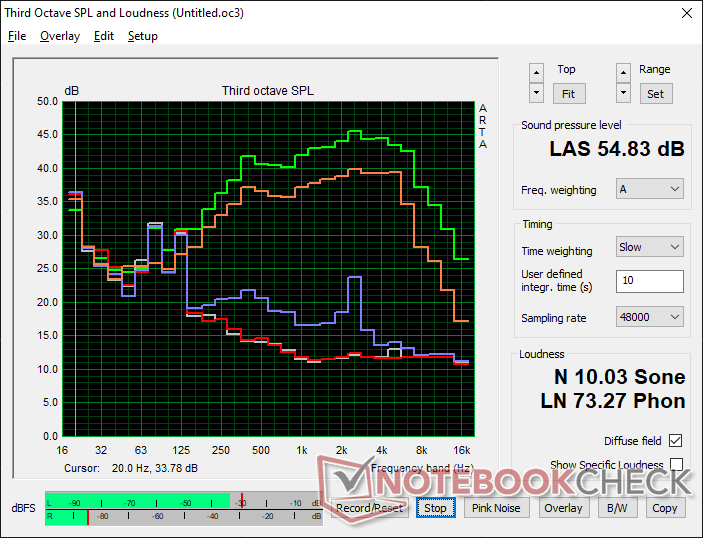
Altavoces


Alienware x17 RTX 3080 P48E análisis de audio
(+) | los altavoces pueden reproducir a un volumen relativamente alto (#88 dB)
Graves 100 - 315 Hz
(-) | casi sin bajos - de media 23% inferior a la mediana
(±) | la linealidad de los graves es media (9.8% delta a frecuencia anterior)
Medios 400 - 2000 Hz
(+) | medios equilibrados - a sólo 2.7% de la mediana
(+) | los medios son lineales (4% delta a la frecuencia anterior)
Altos 2 - 16 kHz
(+) | máximos equilibrados - a sólo 4.4% de la mediana
(±) | la linealidad de los máximos es media (7% delta a frecuencia anterior)
Total 100 - 16.000 Hz
(±) | la linealidad del sonido global es media (17.3% de diferencia con la mediana)
En comparación con la misma clase
» 47% de todos los dispositivos probados de esta clase eran mejores, 12% similares, 41% peores
» El mejor tuvo un delta de 6%, la media fue 18%, el peor fue ###max##%
En comparación con todos los dispositivos probados
» 32% de todos los dispositivos probados eran mejores, 8% similares, 59% peores
» El mejor tuvo un delta de 4%, la media fue 23%, el peor fue ###max##%
Apple MacBook 12 (Early 2016) 1.1 GHz análisis de audio
(+) | los altavoces pueden reproducir a un volumen relativamente alto (#83.6 dB)
Graves 100 - 315 Hz
(±) | lubina reducida - en promedio 11.3% inferior a la mediana
(±) | la linealidad de los graves es media (14.2% delta a frecuencia anterior)
Medios 400 - 2000 Hz
(+) | medios equilibrados - a sólo 2.4% de la mediana
(+) | los medios son lineales (5.5% delta a la frecuencia anterior)
Altos 2 - 16 kHz
(+) | máximos equilibrados - a sólo 2% de la mediana
(+) | los máximos son lineales (4.5% delta a la frecuencia anterior)
Total 100 - 16.000 Hz
(+) | el sonido global es lineal (10.2% de diferencia con la mediana)
En comparación con la misma clase
» 7% de todos los dispositivos probados de esta clase eran mejores, 2% similares, 90% peores
» El mejor tuvo un delta de 5%, la media fue 18%, el peor fue ###max##%
En comparación con todos los dispositivos probados
» 5% de todos los dispositivos probados eran mejores, 1% similares, 94% peores
» El mejor tuvo un delta de 4%, la media fue 23%, el peor fue ###max##%
Energy Management
Consumo de energía - Facturas de energía elevadas
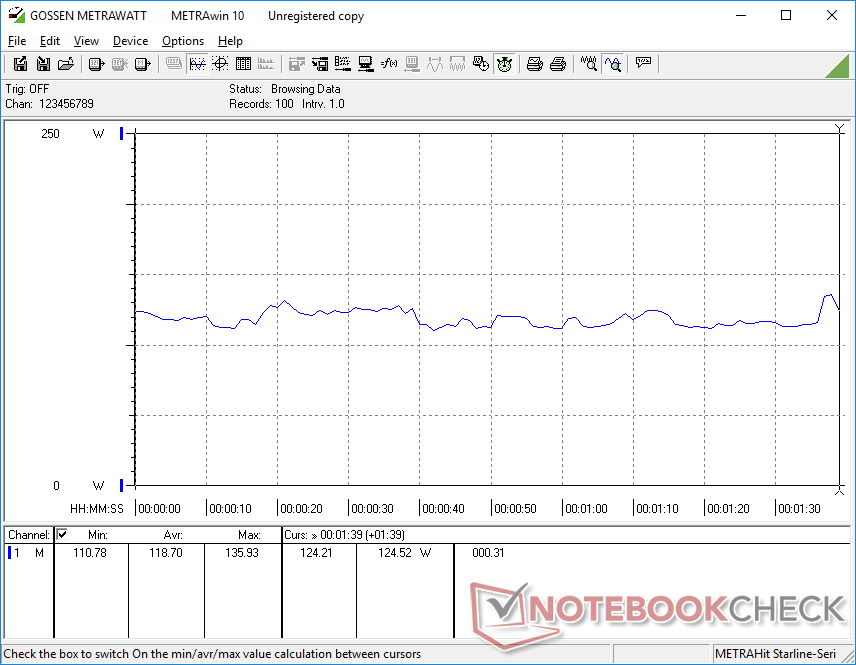
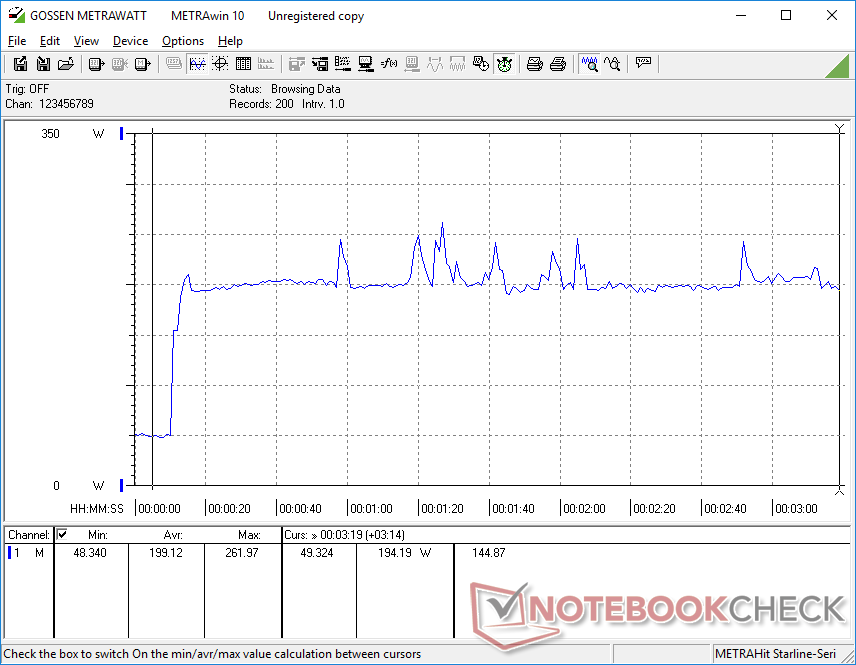
Dell ha mejorado el consumo de energía del sistema durante las cargas bajas en comparación con el m17 R4, lo que puede explicar la mayor duración de la batería en nuestra siguiente sección. Nuestro sistema consumía tan solo 10 W cuando estaba en reposo en el escritorio con el ajuste de brillo mínimo para ser 4 veces más eficiente que lo que registramos en el m17 R4 del año pasado.
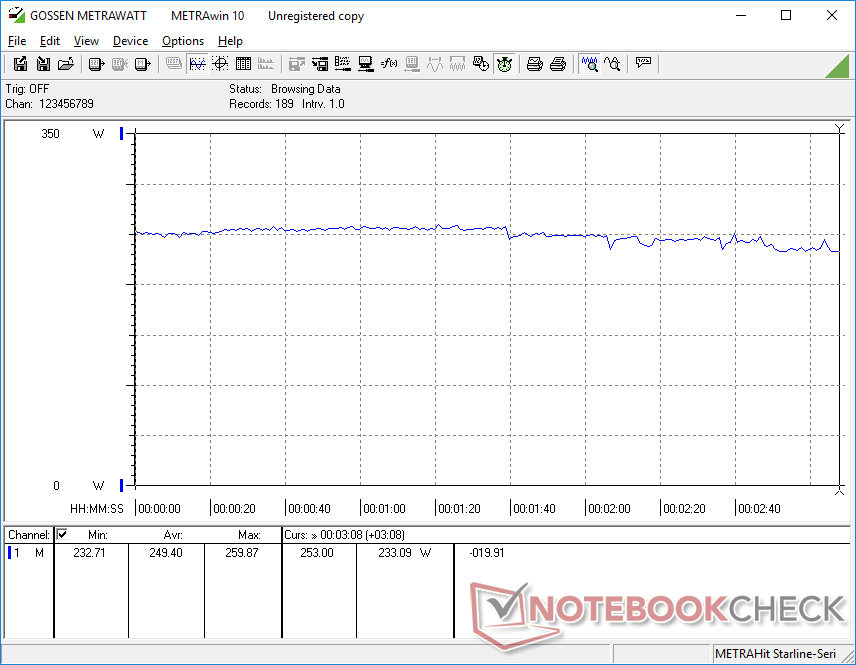
El consumo de energía cuando se juega sigue siendo más alto de lo habitual, al igual que lo que descubrimos en la serie m17. Ejecutando Witcher 3 consumiría una media de 249 W en comparación con sólo 195 W o 156 W en el Asus ROG Zephyrus S17 o el MSI GS76, respectivamente. El mayor TDP de la CPU y los objetivos de TGP de la GPU del sistema Alienware son probablemente los responsables de su mayor demanda de energía.
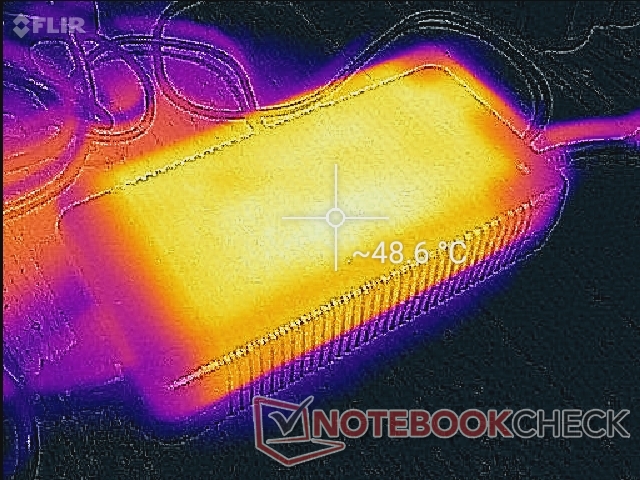
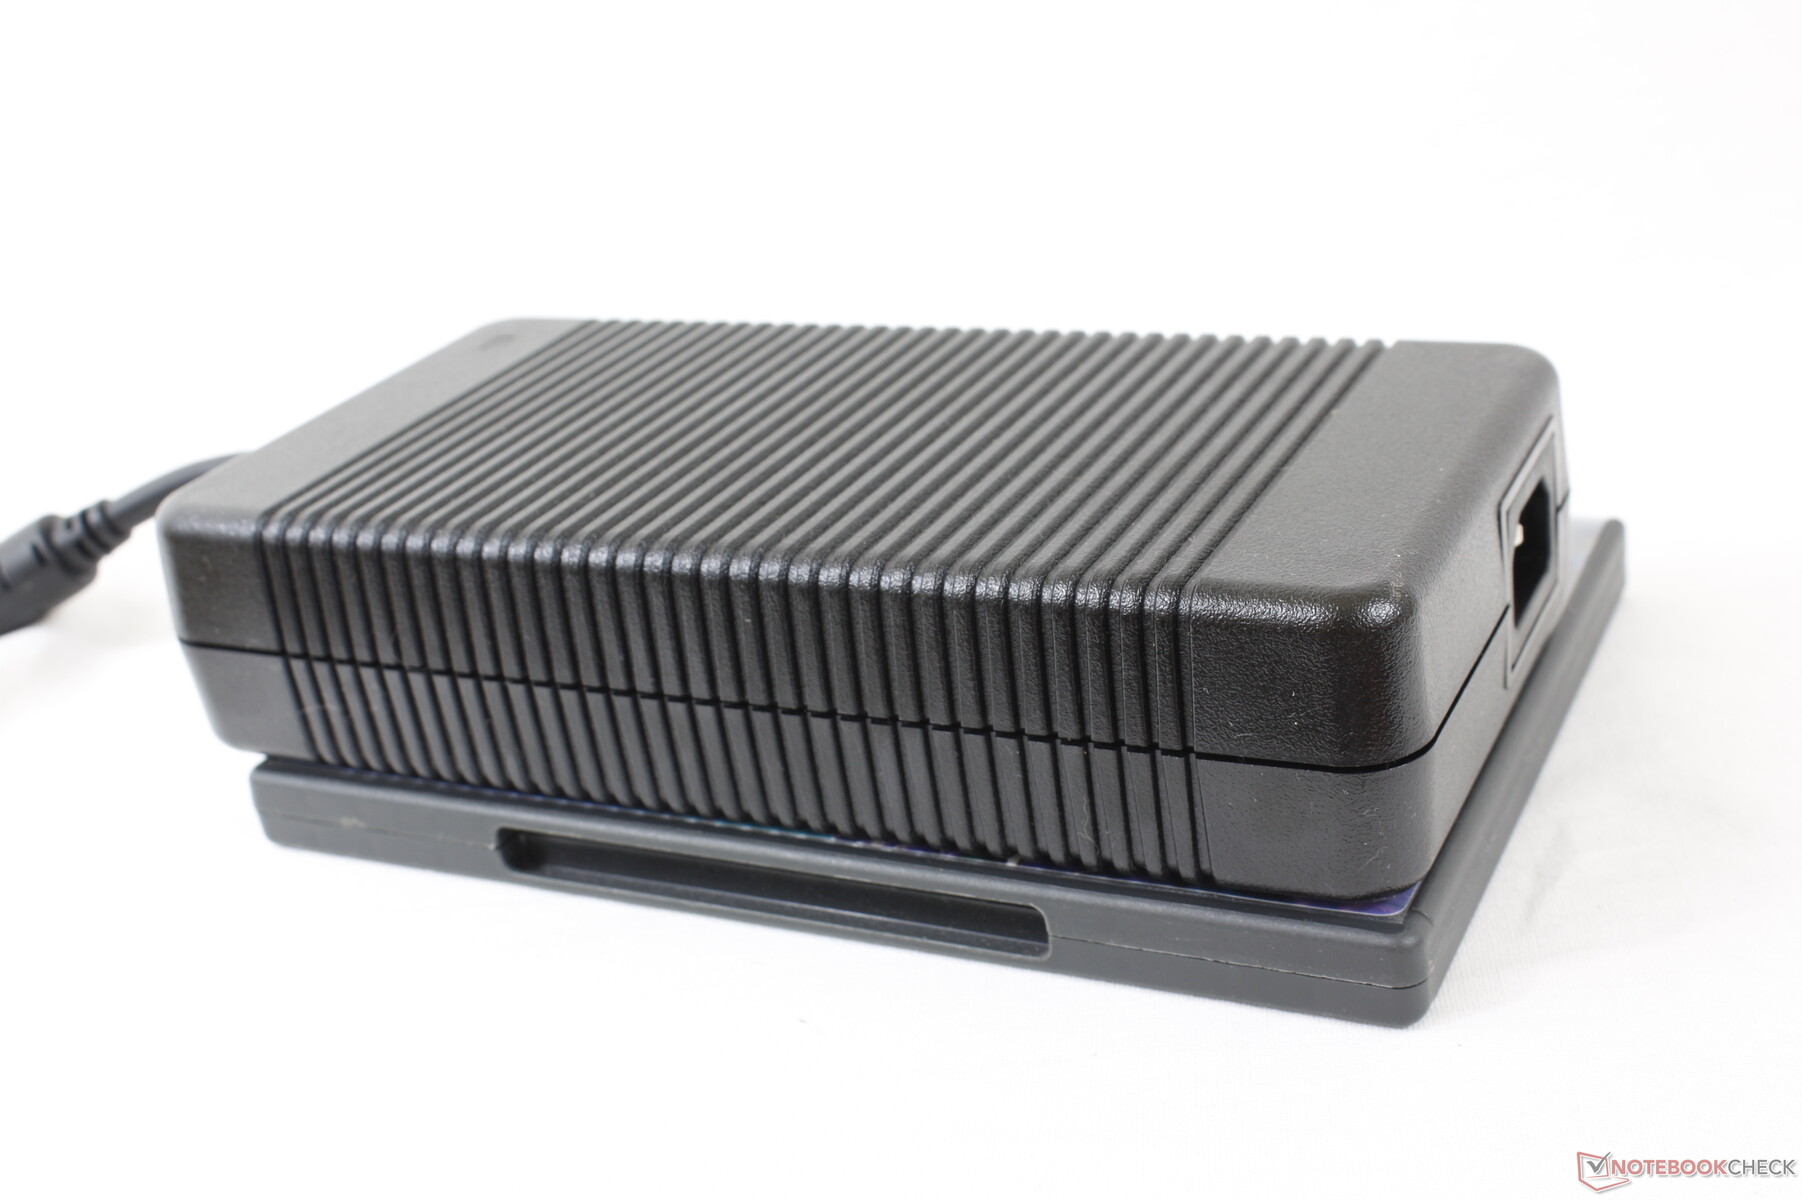
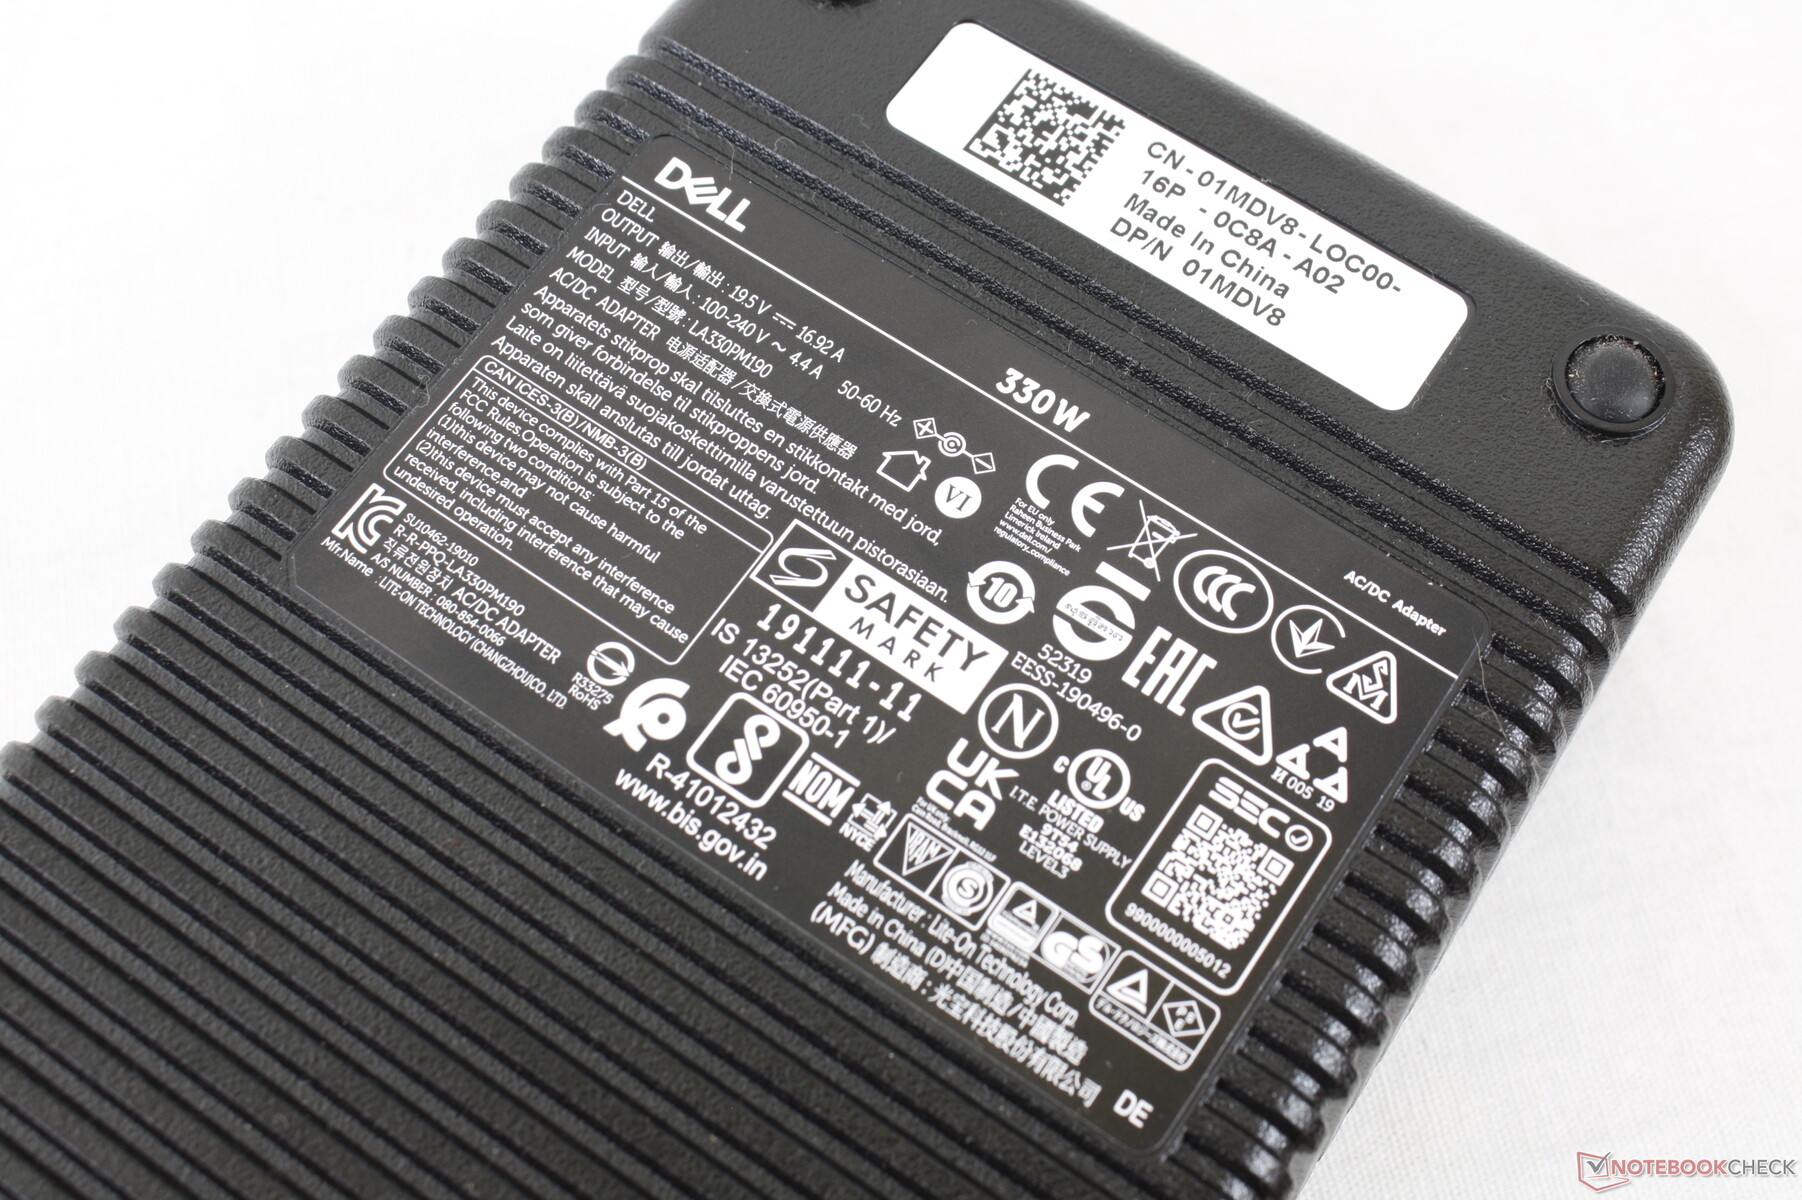
Nuestra unidad de pruebas viene con un adaptador de CA grande y pesado (~20 x 9.9 x 4.3 cm, 1.5 kg) de 330 W comparado con los adaptadores de CA más pequeños de 280 W o 230 W del ROG Zephyrus S17 o el Razer Blade 17, respectivamente. Sospechamos que el adaptador de CA sobredimensionado es para soportar mejor los mencionados objetivos de TDP y TGP más altos del sistema, así como la velocidad de carga de la batería cuando se juega. Dell ofrece un adaptador de CA de 240 W más pequeño para las unidades RTX 3060 de menor tamaño.
| Off / Standby | |
| Ocioso | |
| Carga |
|
Clave:
min: | |
| Alienware x17 RTX 3080 P48E i7-11800H, GeForce RTX 3080 Laptop GPU, 2x WDC PC SN730 SDBPNTY-1T00 (RAID 0), IPS, 3840x2160, 17.3" | Alienware m17 R4 i9-10980HK, GeForce RTX 3080 Laptop GPU, 2x Micron 2300 512 GB (RAID 0), IPS, 1920x1080, 17.3" | Razer Blade 17 RTX 3070 i7-11800H, GeForce RTX 3070 Laptop GPU, Samsung PM9A1 MZVL21T0HCLR, IPS, 1920x1080, 17.3" | Asus ROG Zephyrus S17 GX703HSD i9-11900H, GeForce RTX 3080 Laptop GPU, Samsung PM9A1 MZVL22T0HBLB, IPS, 2560x1440, 17.3" | MSI GS76 Stealth 11UH i9-11900H, GeForce RTX 3080 Laptop GPU, Samsung PM9A1 MZVL22T0HBLB, IPS, 3840x2160, 17.3" | Gigabyte Aero 17 HDR YD i9-11980HK, GeForce RTX 3080 Laptop GPU, Samsung PM9A1 MZVL2512HCJQ, IPS, 3840x2160, 17.3" | |
|---|---|---|---|---|---|---|
| Power Consumption | -80% | -11% | -10% | 13% | -20% | |
| Idle Minimum * (Watt) | 10.2 | 42 -312% | 20.9 -105% | 21.7 -113% | 14 -37% | 25 -145% |
| Idle Average * (Watt) | 21.2 | 48 -126% | 25.1 -18% | 27 -27% | 19 10% | 28 -32% |
| Idle Maximum * (Watt) | 48.4 | 58 -20% | 45 7% | 33 32% | 31 36% | 40 17% |
| Load Average * (Watt) | 118.7 | 124 -4% | 102 14% | 108 9% | 97 18% | 114 4% |
| Witcher 3 ultra * (Watt) | 249 | 219 12% | 189 24% | 195 22% | 156 37% | 176 29% |
| Load Maximum * (Watt) | 262 | 337 -29% | 234.8 10% | 210 20% | 231 12% | 236 10% |
* ... más pequeño es mejor
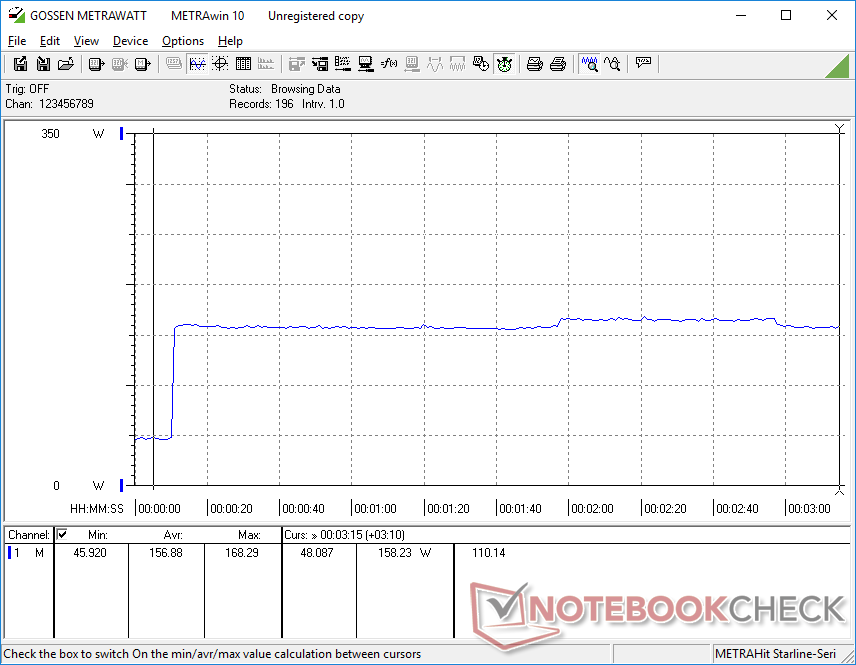
Power Consumption Witcher 3 / Stresstest
Duración de la batería - No está mal para el tamaño
Los tiempos de ejecución eran terribles en la última generación de la serie m17 incluso cuando todos los ajustes de rendimiento estaban al mínimo. Afortunadamente, la duración de la batería ha mejorado significativamente en el x17 sin necesidad de aumentar su capacidad. Los usuarios pueden esperar ahora algo menos de 6 horas de uso real de la WLAN frente a las 2,5 horas del m17 R4, lo que es decente para un portátil de juegos de alto rendimiento. Los resultados son generalmente comparables a los del MSI GS76 o Gigabyte Aero 17 que vienen con baterías más grandes de 99 Wh.
La carga desde el vacío hasta la capacidad total es muy rápida, alrededor de 75 minutos con el adaptador de barril de CA incluido.
| Alienware x17 RTX 3080 P48E i7-11800H, GeForce RTX 3080 Laptop GPU, 87 Wh | Alienware m17 R4 i9-10980HK, GeForce RTX 3080 Laptop GPU, 86 Wh | Razer Blade 17 RTX 3070 i7-11800H, GeForce RTX 3070 Laptop GPU, 70 Wh | Asus ROG Zephyrus S17 GX703HSD i9-11900H, GeForce RTX 3080 Laptop GPU, 90 Wh | MSI GS76 Stealth 11UH i9-11900H, GeForce RTX 3080 Laptop GPU, 99.9 Wh | Gigabyte Aero 17 HDR YD i9-11980HK, GeForce RTX 3080 Laptop GPU, 99 Wh | |
|---|---|---|---|---|---|---|
| Duración de Batería | -5% | 24% | 133% | 37% | 23% | |
| Reader / Idle (h) | 7 | 6.7 -4% | 9.9 41% | |||
| WiFi v1.3 (h) | 5.9 | 2.4 -59% | 5.2 -12% | 7.5 27% | 6.4 8% | 5.6 -5% |
| Load (h) | 0.8 | 1.2 50% | 1.5 88% | 2.7 238% | 1.3 63% | 1.2 50% |
| Witcher 3 ultra (h) | 1 |
Pro
Contra
Veredicto - Más grande y más pesado por todas las razones correctas
Las características más convincentes del Alienware x17 son el rendimiento de su procesador y las teclas mecánicas CherryMX. La CPU Core i7-11800H es notablemente más rápida que la de otros portátiles equipados con el mismo chip, mientras que las teclas mecánicas son de las más cómodas que hemos usado en un portátil para juegos.
El Alienware x17 de Dell no tiene miedo de maximizar el rendimiento incluso si eso significa ser ligeramente más grande y pesado que el resto.
Todo ese rendimiento se produce a costa de la temperatura del núcleo, el consumo de energía, el tamaño y el peso, como ocurre con modelos alternativos como elRazer Blade 17,MSI GS76 Stealtho el Asus ROG Zephyrus S17 son todos más pequeños, más ligeros y más eficientes desde el punto de vista energético, al tiempo que ofrecen opciones similares de Intel y Nvidia. Sin embargo, estos sistemas tienden a ser un poco más lentos, por lo que dependerá de los usuarios equilibrar el rendimiento con sus preferencias personales de portabilidad. Si te conformas con un rendimiento de nivel RTX 3060, entonces el Razer o el MSI, más ligeros, pueden ser la mejor opción, mientras que los cazadores de rendimiento RTX 3080 pueden exprimir mucho más el Alienware x17 y su sistema de refrigeración comparativamente mayor.
Precio y disponibilidad
Ya están disponibles diferentes configuraciones del Alienware x17 R1 en Best Buy y Newegg a partir de 2399 dólares en el momento de escribir este artículo. Como alternativa, los usuarios pueden pedirlo directamente a Dell que naturalmente tendrá más SKUs y opciones.
Alienware x17 RTX 3080 P48E
- 09/24/2021 v7 (old)
Allen Ngo
Price comparison

