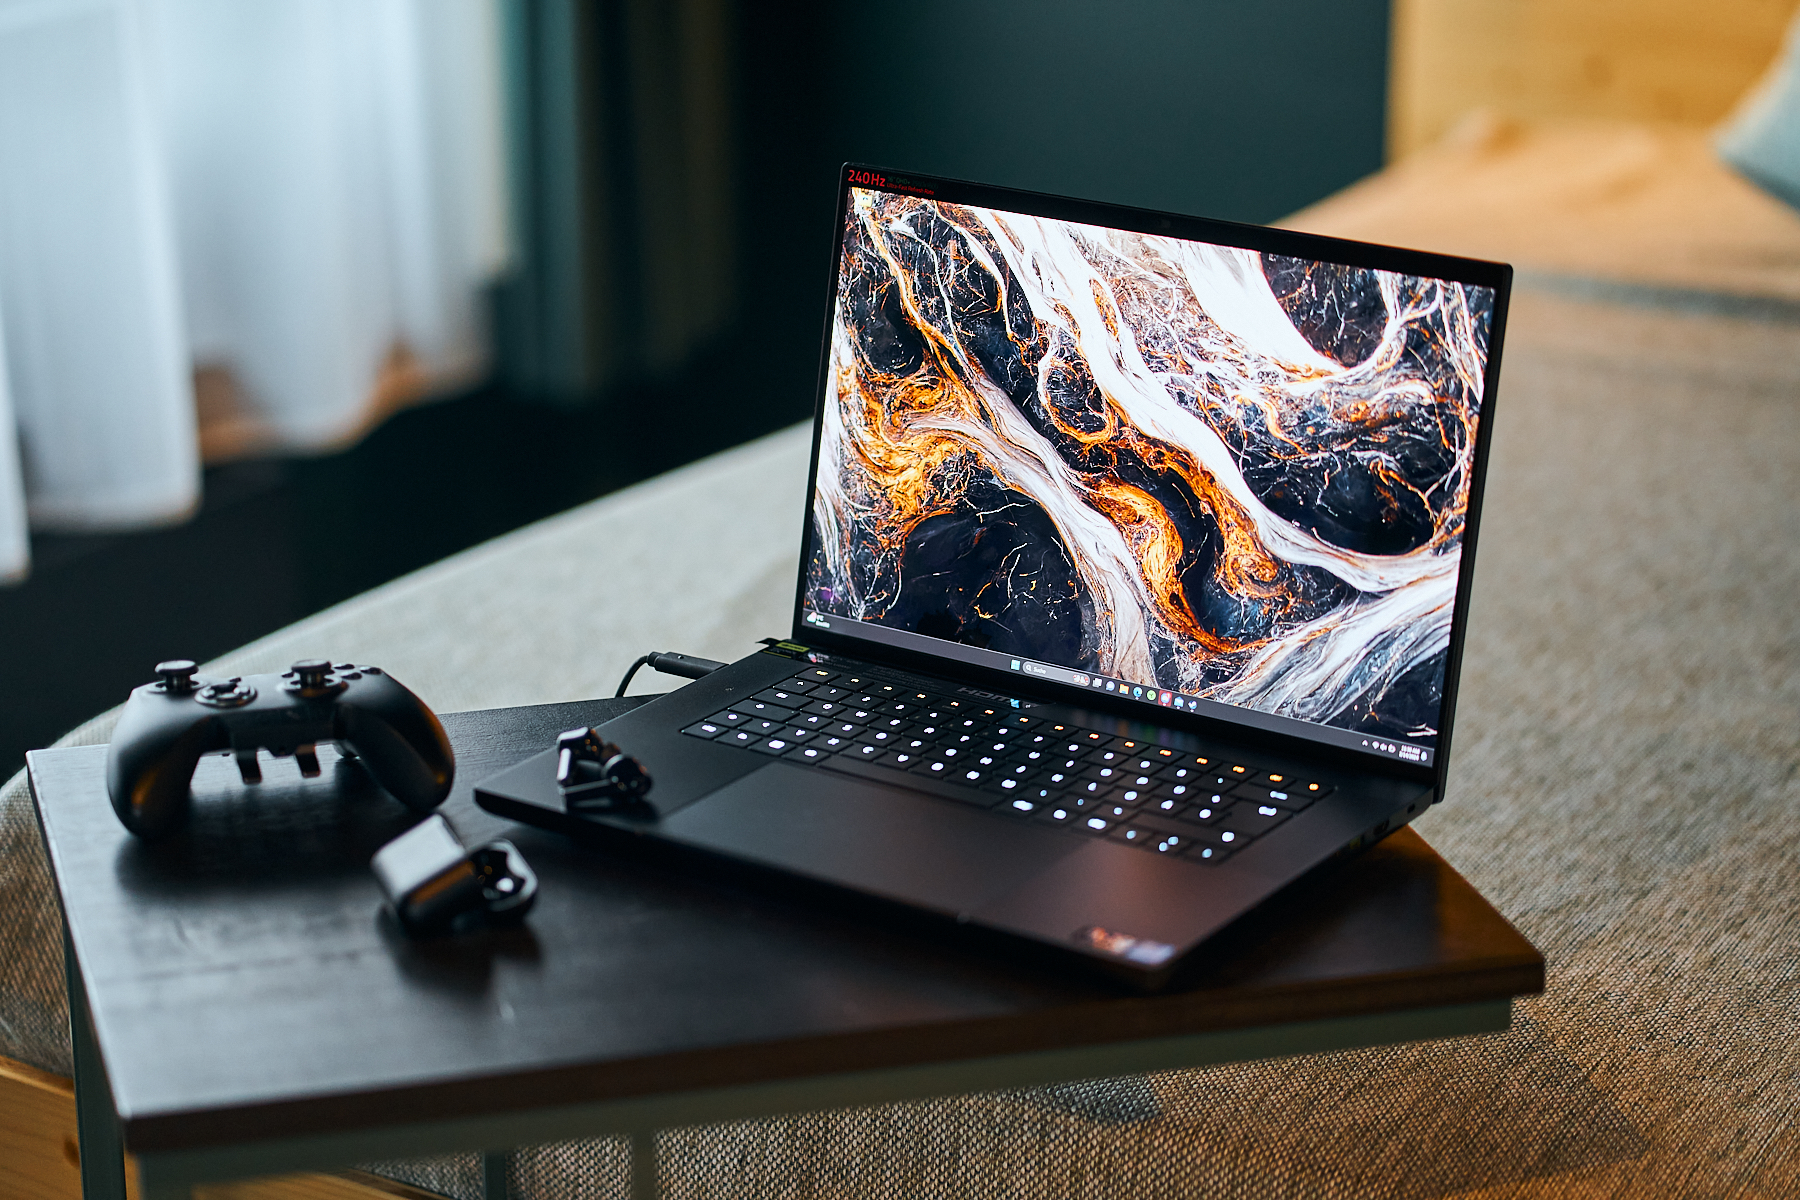
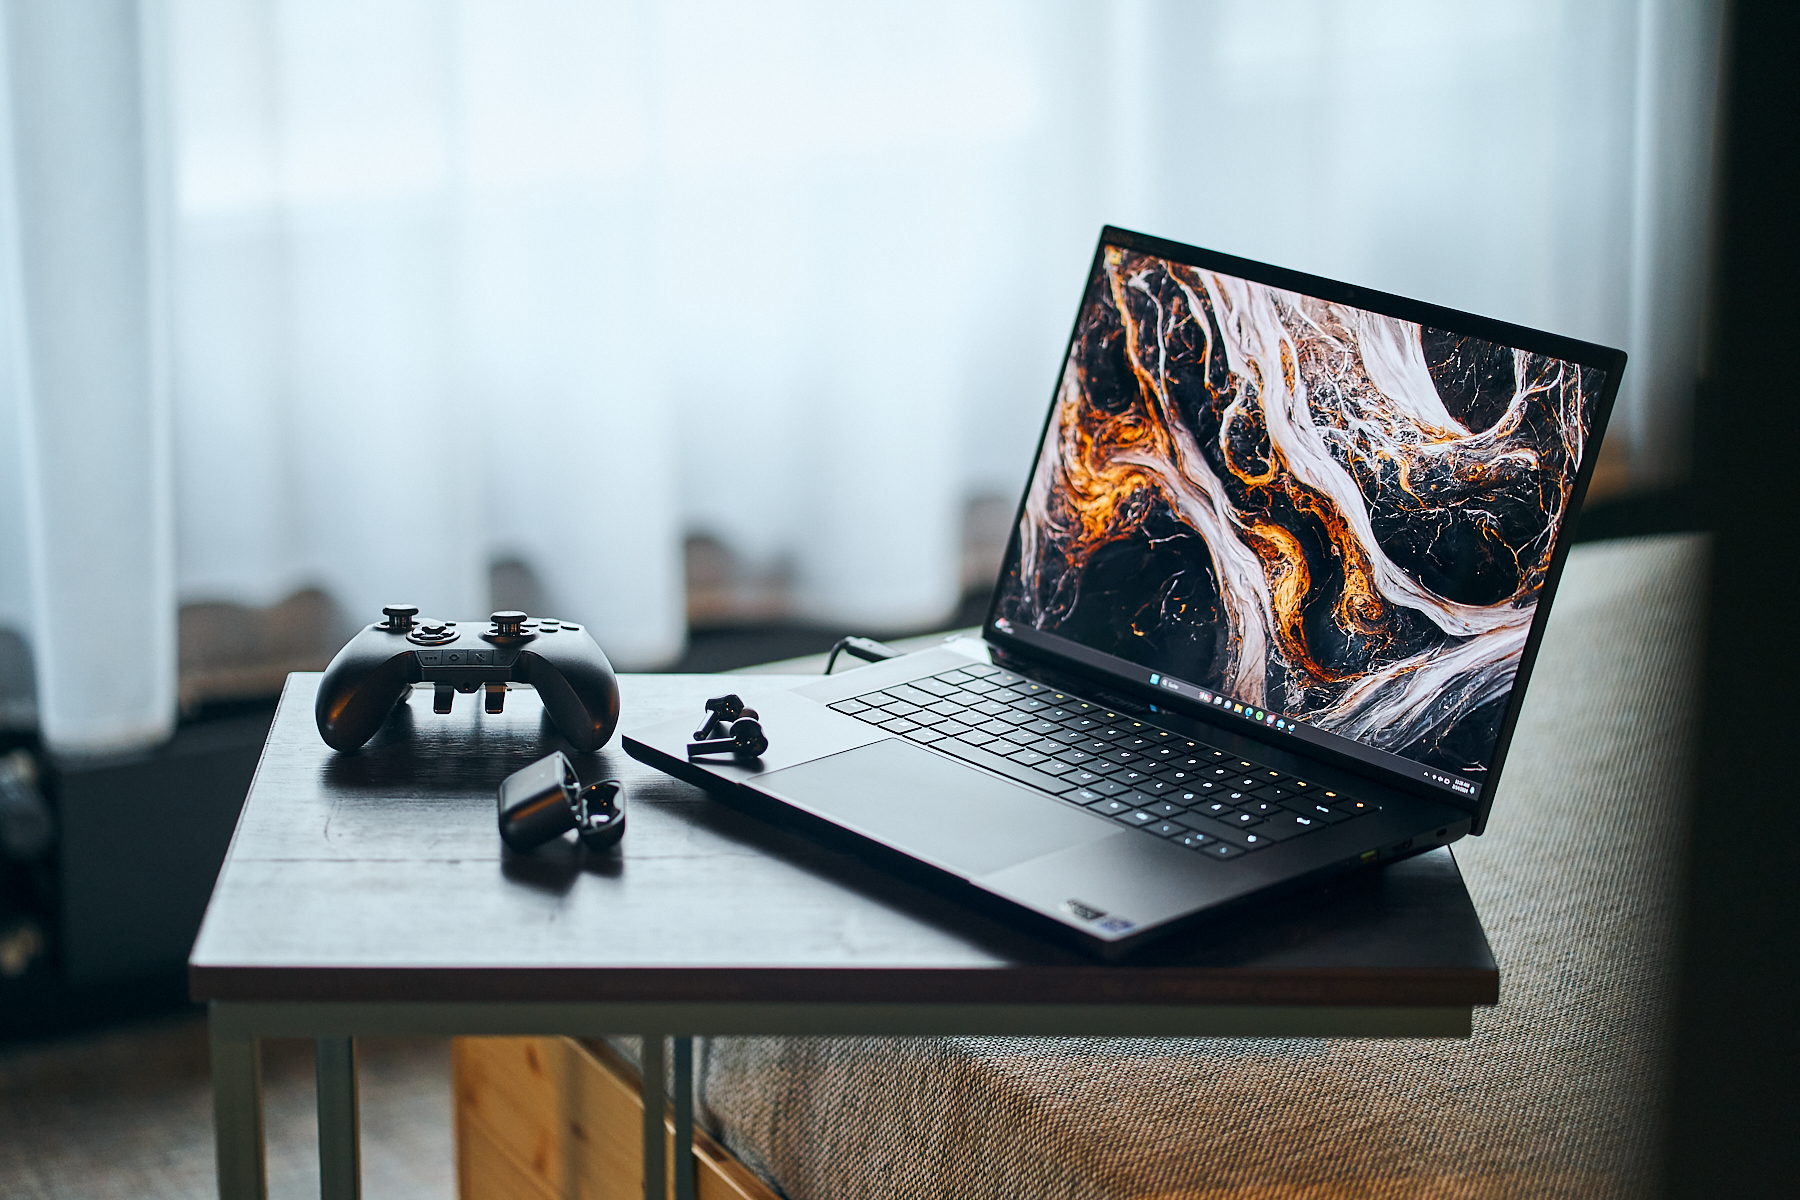
Análisis del portátil Razer Blade 16 (2024): Ahora con Samsung OLED superrápido

¿Qué tiene de nuevo el Razer Blade con respecto a su predecesor del año pasado? En resumen: WiFi 7, Intel Gen 14 y una pantalla OLED. Esta última es la que Razer anuncia como su gran novedad. Aun así, se han mantenido las ya excelentes opciones Mini-LED del modelo predecesor, lo que significa que ahora puede elegir entre OLED y Mini-LED. Así que, en este análisis, examinaremos muy de cerca la pantalla del portátil en particular. Además, comprobaremos qué rendimiento puede ofrecer Intel Gen 14 dentro del Blade 16 en comparación con Gen 13.
Nuestro 2024 Razer Blade 16 competirá contra otros portátiles de 16 pulgadas con una RTX 4090, en primer lugar el buque insignia de Lenovo Legion 9i Gen 8 16IRX8-pero también el Schenker XMG Neo 16 E23 y el Asus ROG Zephyrus M16. Y, por supuesto, también lo compararemos con su predecesor Análisis del Razer Blade 16 Early 2023 RTX 4090: La bestia Core i9-13950HX con la primera pantalla mini-LED UHD+ de modo dual del mundo con la CPU Gen-13-HX y la RTX 4090. Para tener al menos un portátil con una nueva CPU Gen-14 en el campo de comparación, también lo enfrentaremos al Lenovo Legion 5i 16 G9 con el i7-14650HX.
Posibles contendientes en la comparación
Valoración | Fecha | Modelo | Peso | Altura | Tamaño | Resolución | Precio |
|---|---|---|---|---|---|---|---|
| 91.1 % v7 (old) | 02/2024 | Razer Blade 16 2024, RTX 4090 i9-14900HX, GeForce RTX 4090 Laptop GPU | 2.5 kg | 22 mm | 16.00" | 2560x1600 | |
| 89.8 % v7 (old) | 03/2023 | Razer Blade 16 Early 2023 RTX 4090 i9-13950HX, GeForce RTX 4090 Laptop GPU | 2.5 kg | 21.99 mm | 16.00" | 3840x2400 | |
| 90.2 % v7 (old) | 10/2023 | Lenovo Legion 9 16IRX8 i9-13980HX, GeForce RTX 4090 Laptop GPU | 2.6 kg | 22.7 mm | 16.00" | 3200x2000 | |
| 87.7 % v7 (old) | 04/2023 | Schenker XMG Neo 16 E23 i9-13900HX, GeForce RTX 4090 Laptop GPU | 2.5 kg | 29.9 mm | 16.00" | 2560x1600 | |
| 89.1 % v7 (old) | 02/2024 | Lenovo Legion 5 16IRX G9 i7-14650HX, GeForce RTX 4060 Laptop GPU | 2.4 kg | 25.2 mm | 16.00" | 2560x1600 |
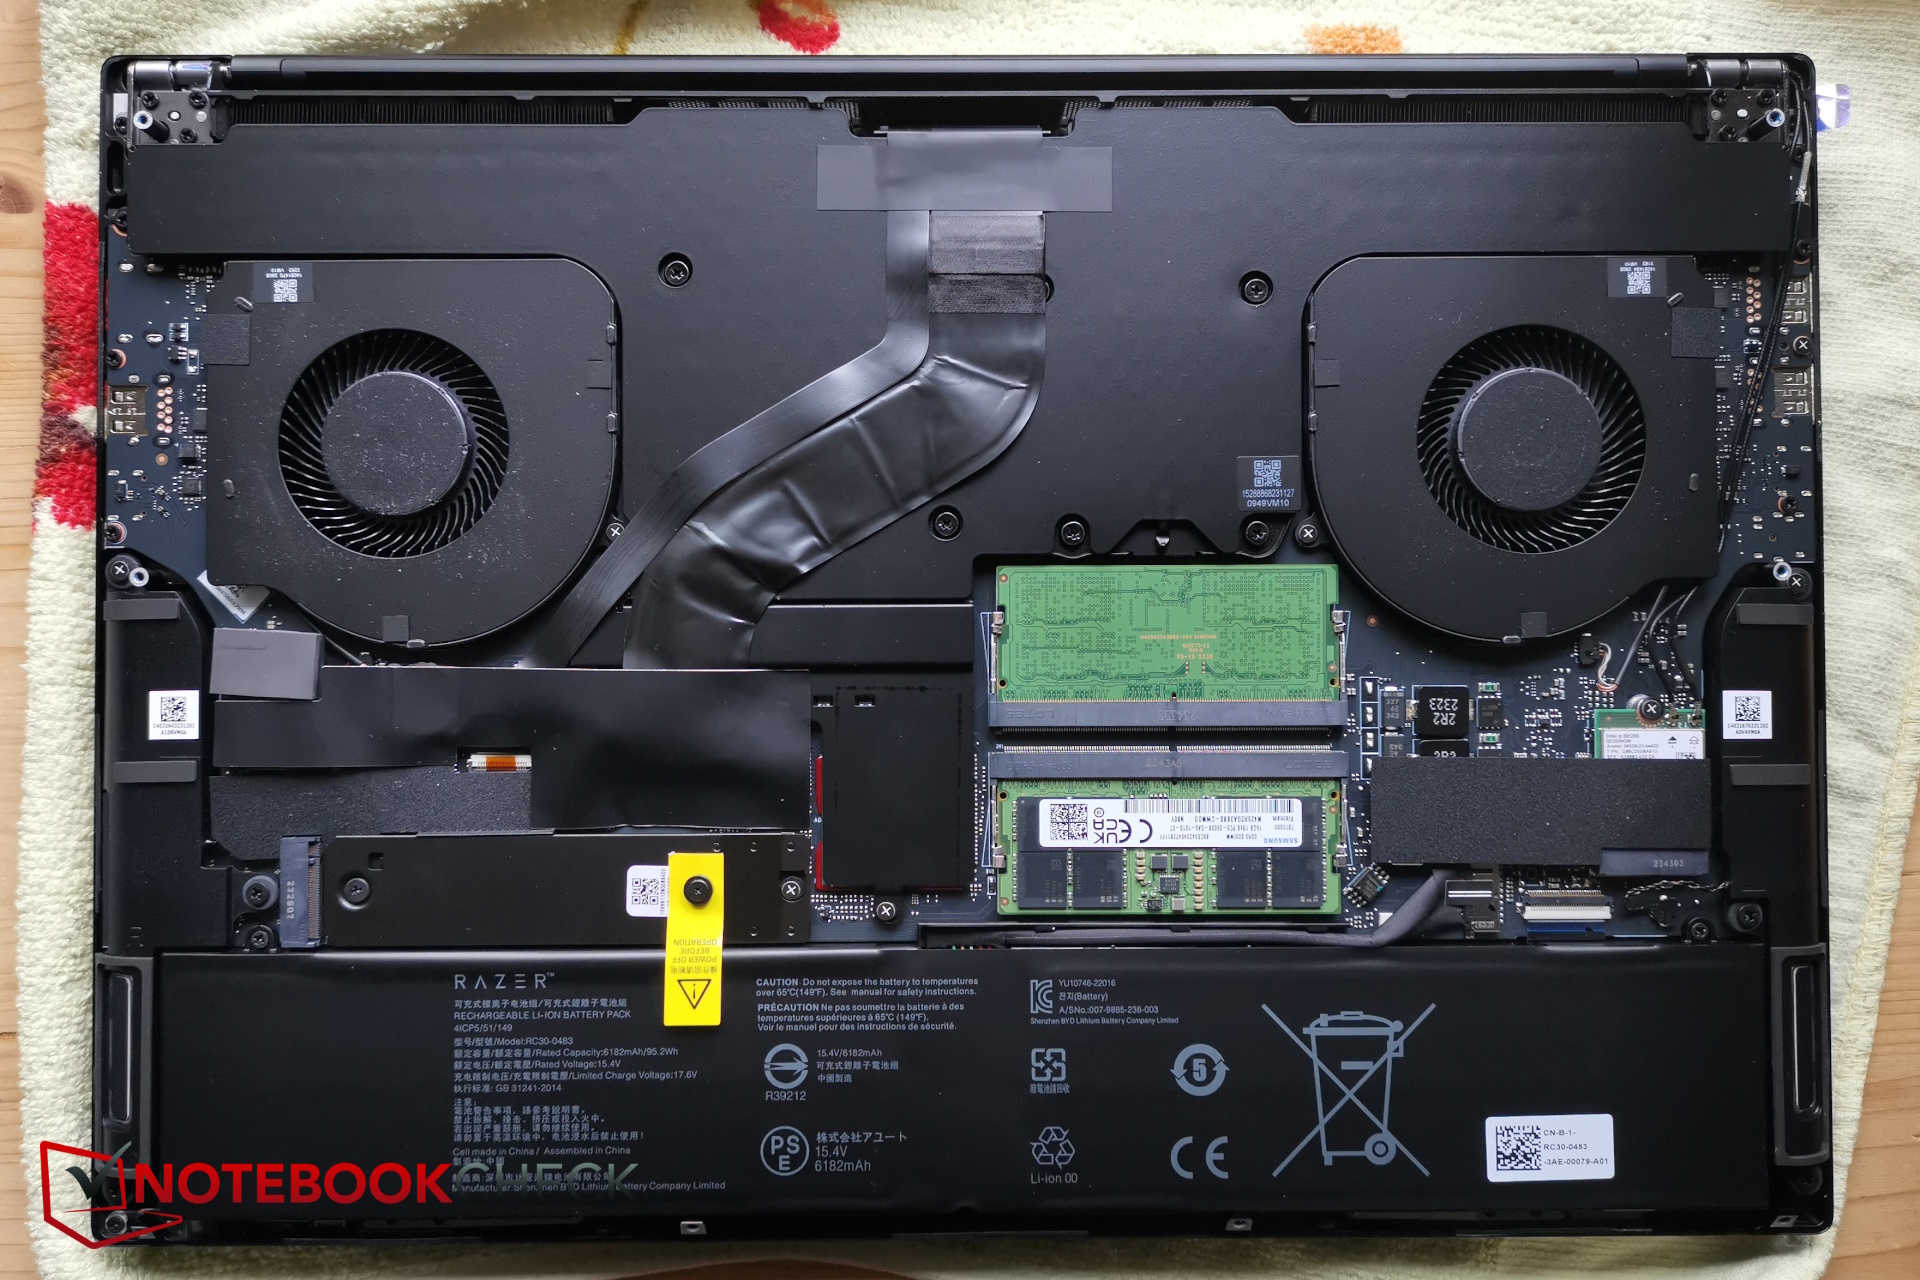
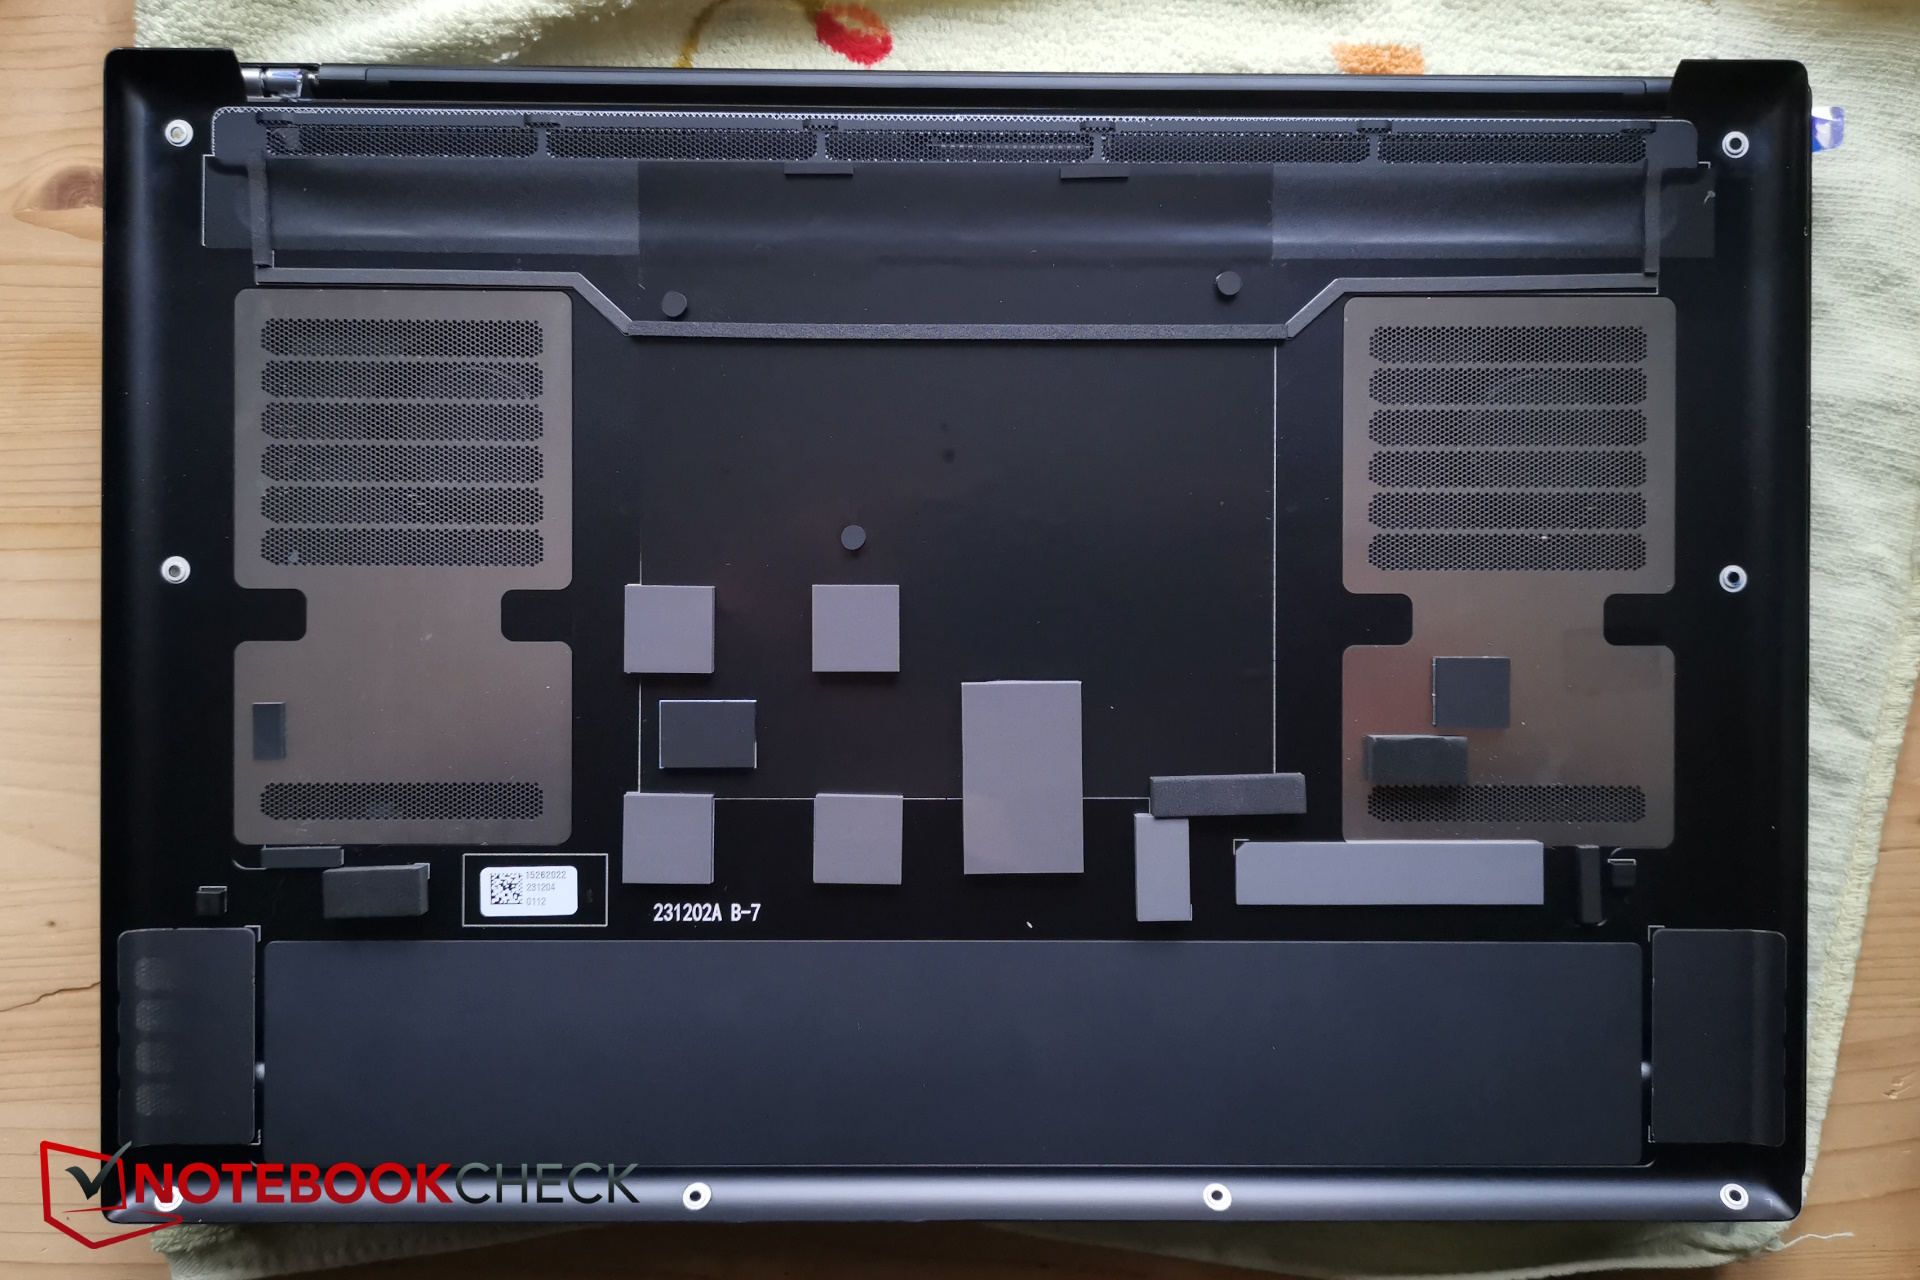
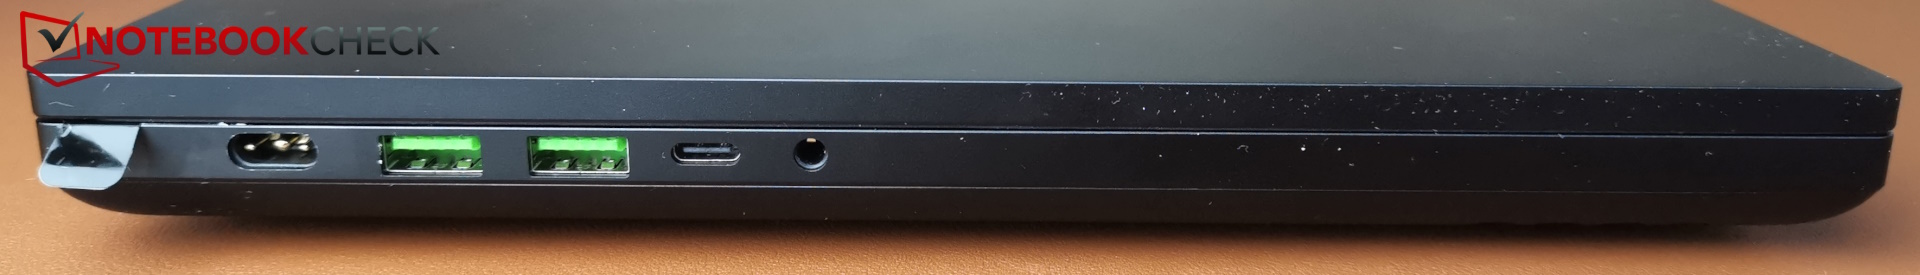
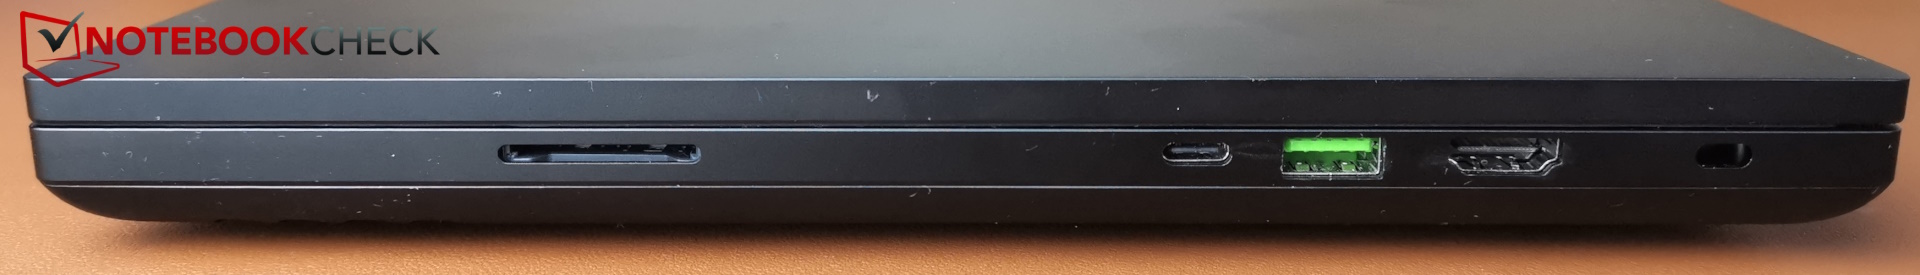
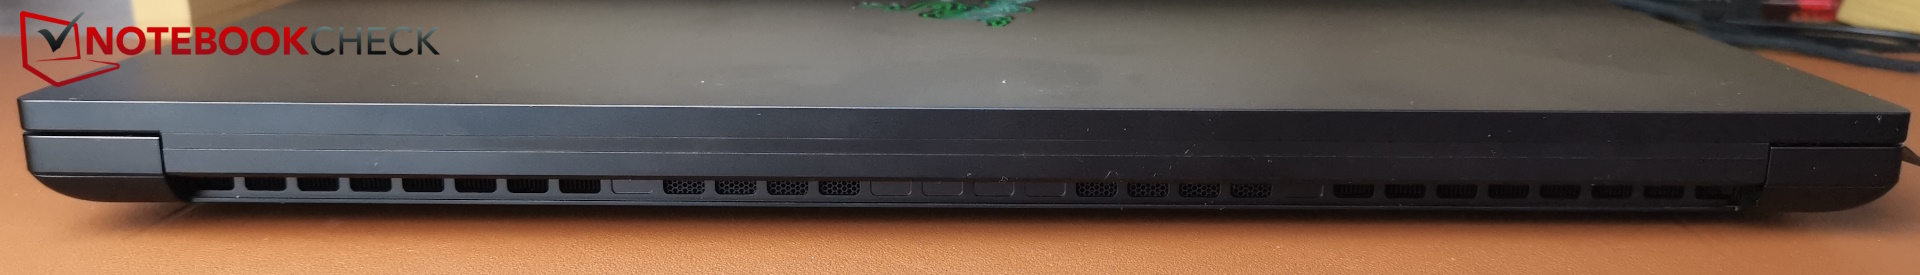
Caja y conectividad - Unibody de metal con una placa de titanio
Prácticamente nada ha cambiado en la carcasa del portátil: el hardware sigue alojado dentro de una carcasa unibody de aluminio y una placa de titanio se asienta en la parte delantera de la base para mejorar su robustez. Tanto la carcasa como el teclado siguen siendo auténticos imanes para las huellas dactilares.
Sin embargo, se ha introducido un cambio: ahora puede optar por la edición "Mercury" del Blade, que presenta un diseño ligero.
Encontrará más información sobre la carcasa, la conectividad y los dispositivos de entrada del dispositivo en nuestros análisis de los modelos 2023.


| SD Card Reader | |
| average JPG Copy Test (av. of 3 runs) | |
| Razer Blade 16 Early 2023 RTX 4090 (Angelbird AV PRO 128 GB V60) | |
| Razer Blade 16 2024, RTX 4090 | |
| Media de la clase Gaming (20.9 - 210, n=54, últimos 2 años) | |
| Lenovo Legion 9 16IRX8 (Toshiba Exceria Pro SDXC 64 GB UHS-II) | |
| Schenker XMG Neo 16 E23 (AV PRO microSD 128 GB V60) | |
| Lenovo Legion 5 16IRX G9 | |
| maximum AS SSD Seq Read Test (1GB) | |
| Razer Blade 16 Early 2023 RTX 4090 (Angelbird AV PRO 128 GB V60) | |
| Razer Blade 16 2024, RTX 4090 | |
| Media de la clase Gaming (25.5 - 261, n=51, últimos 2 años) | |
| Lenovo Legion 9 16IRX8 (Toshiba Exceria Pro SDXC 64 GB UHS-II) | |
| Schenker XMG Neo 16 E23 (AV PRO microSD 128 GB V60) | |
| Lenovo Legion 5 16IRX G9 | |


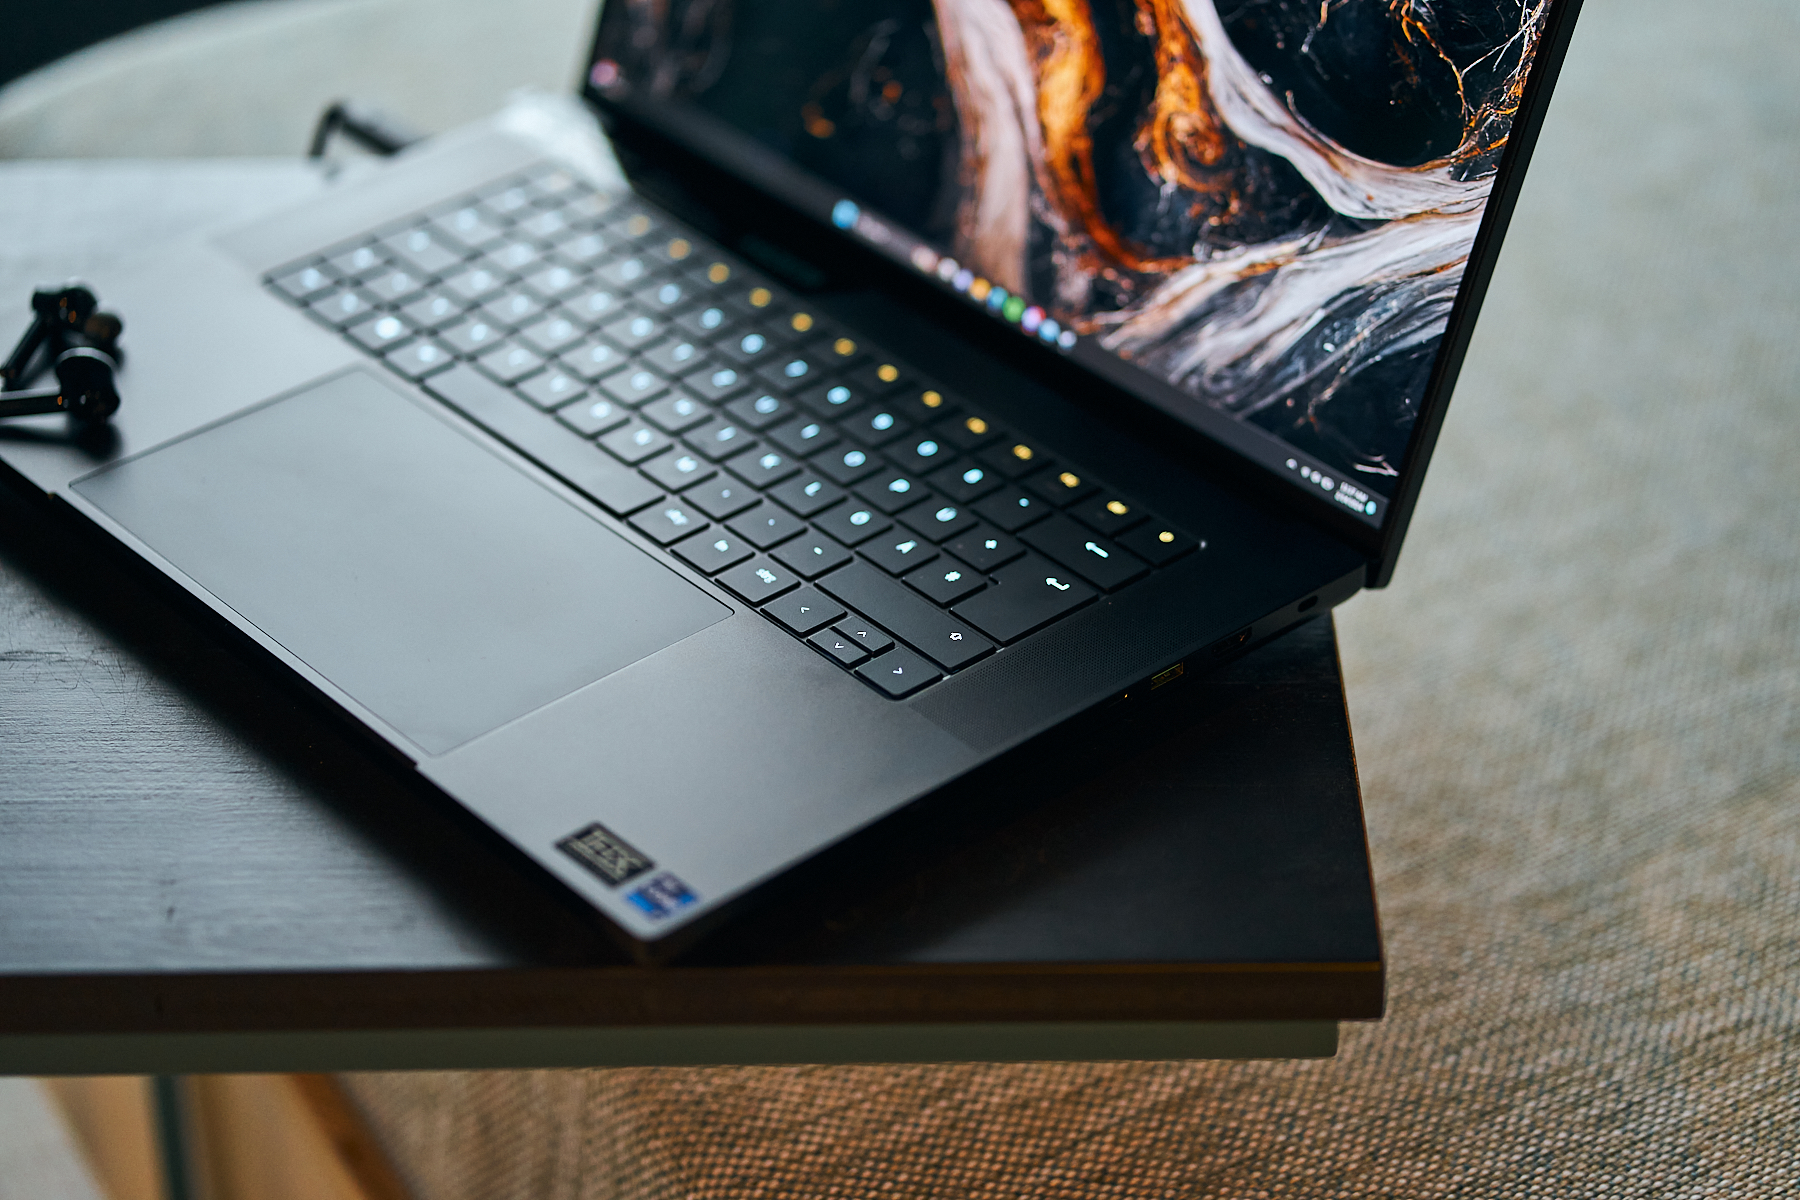
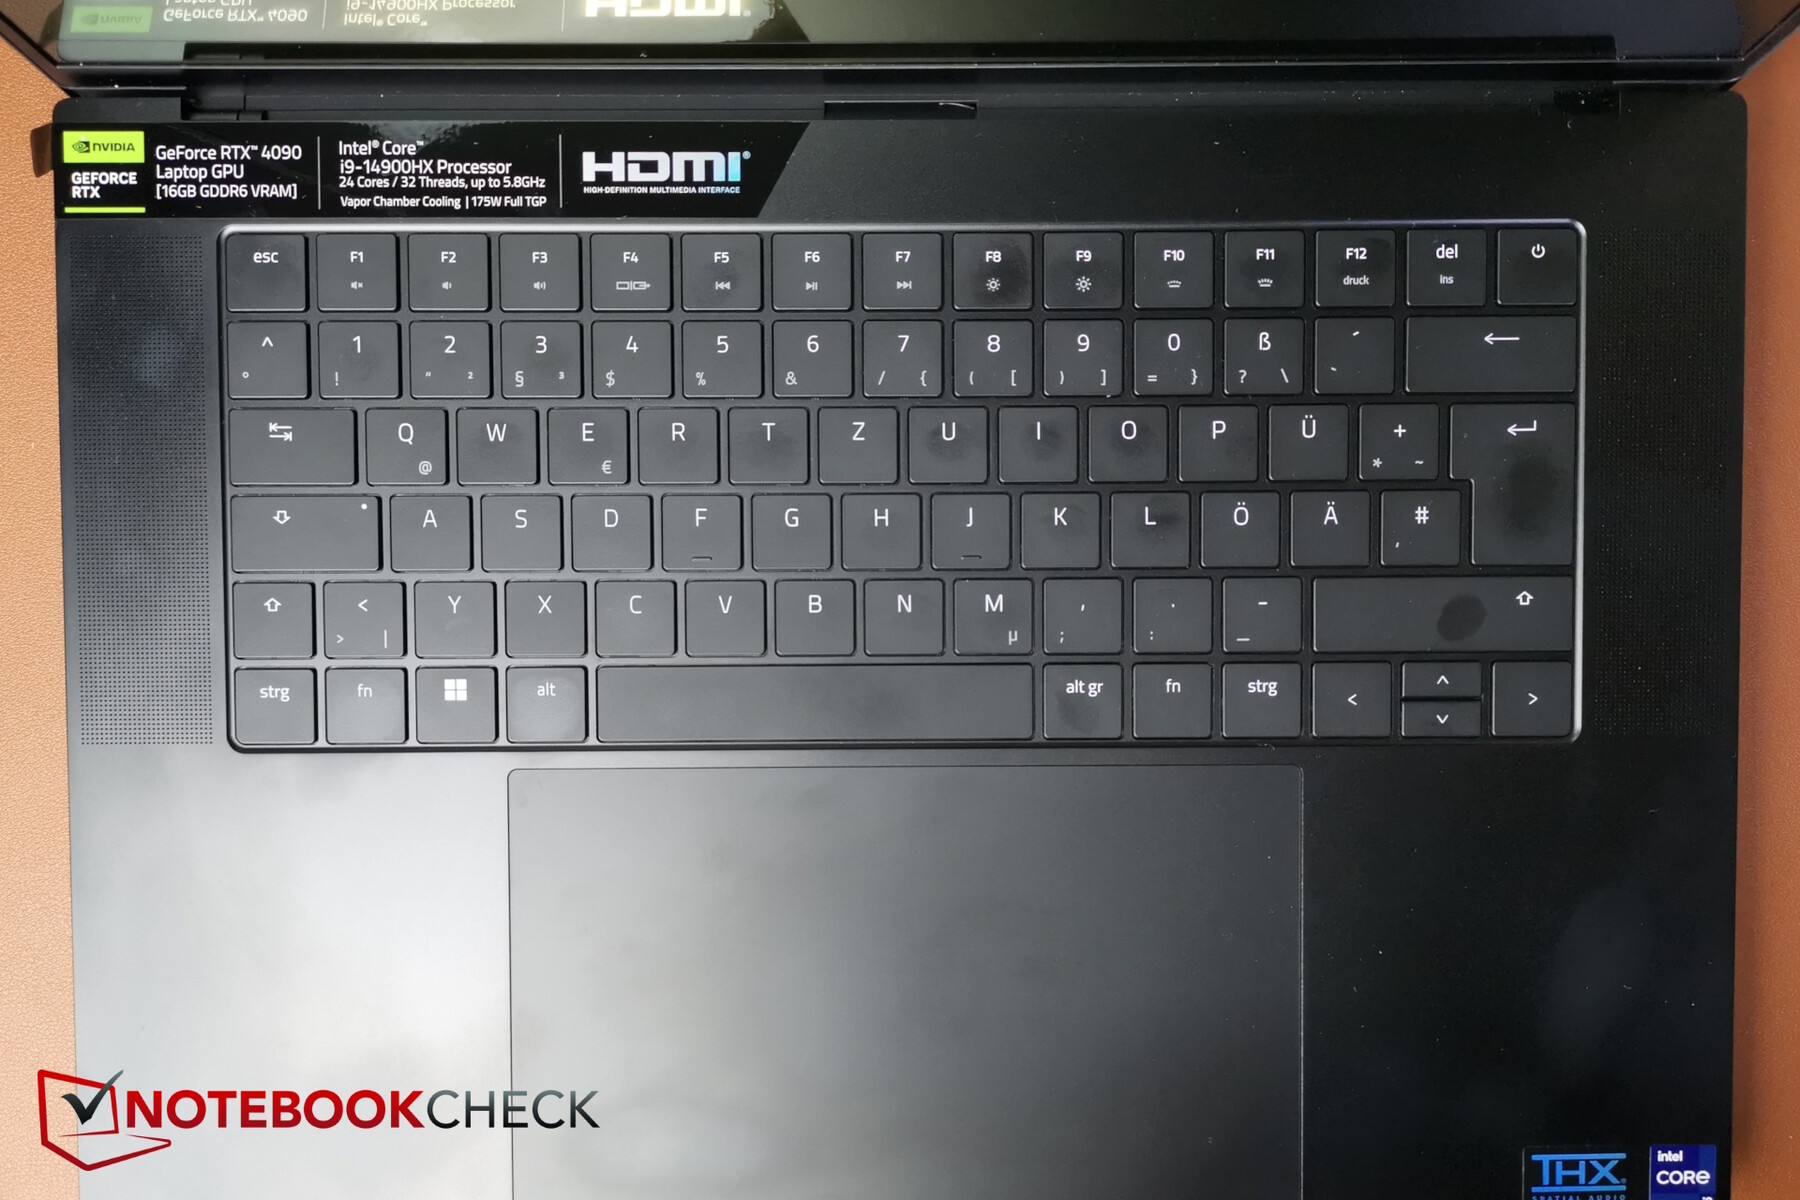
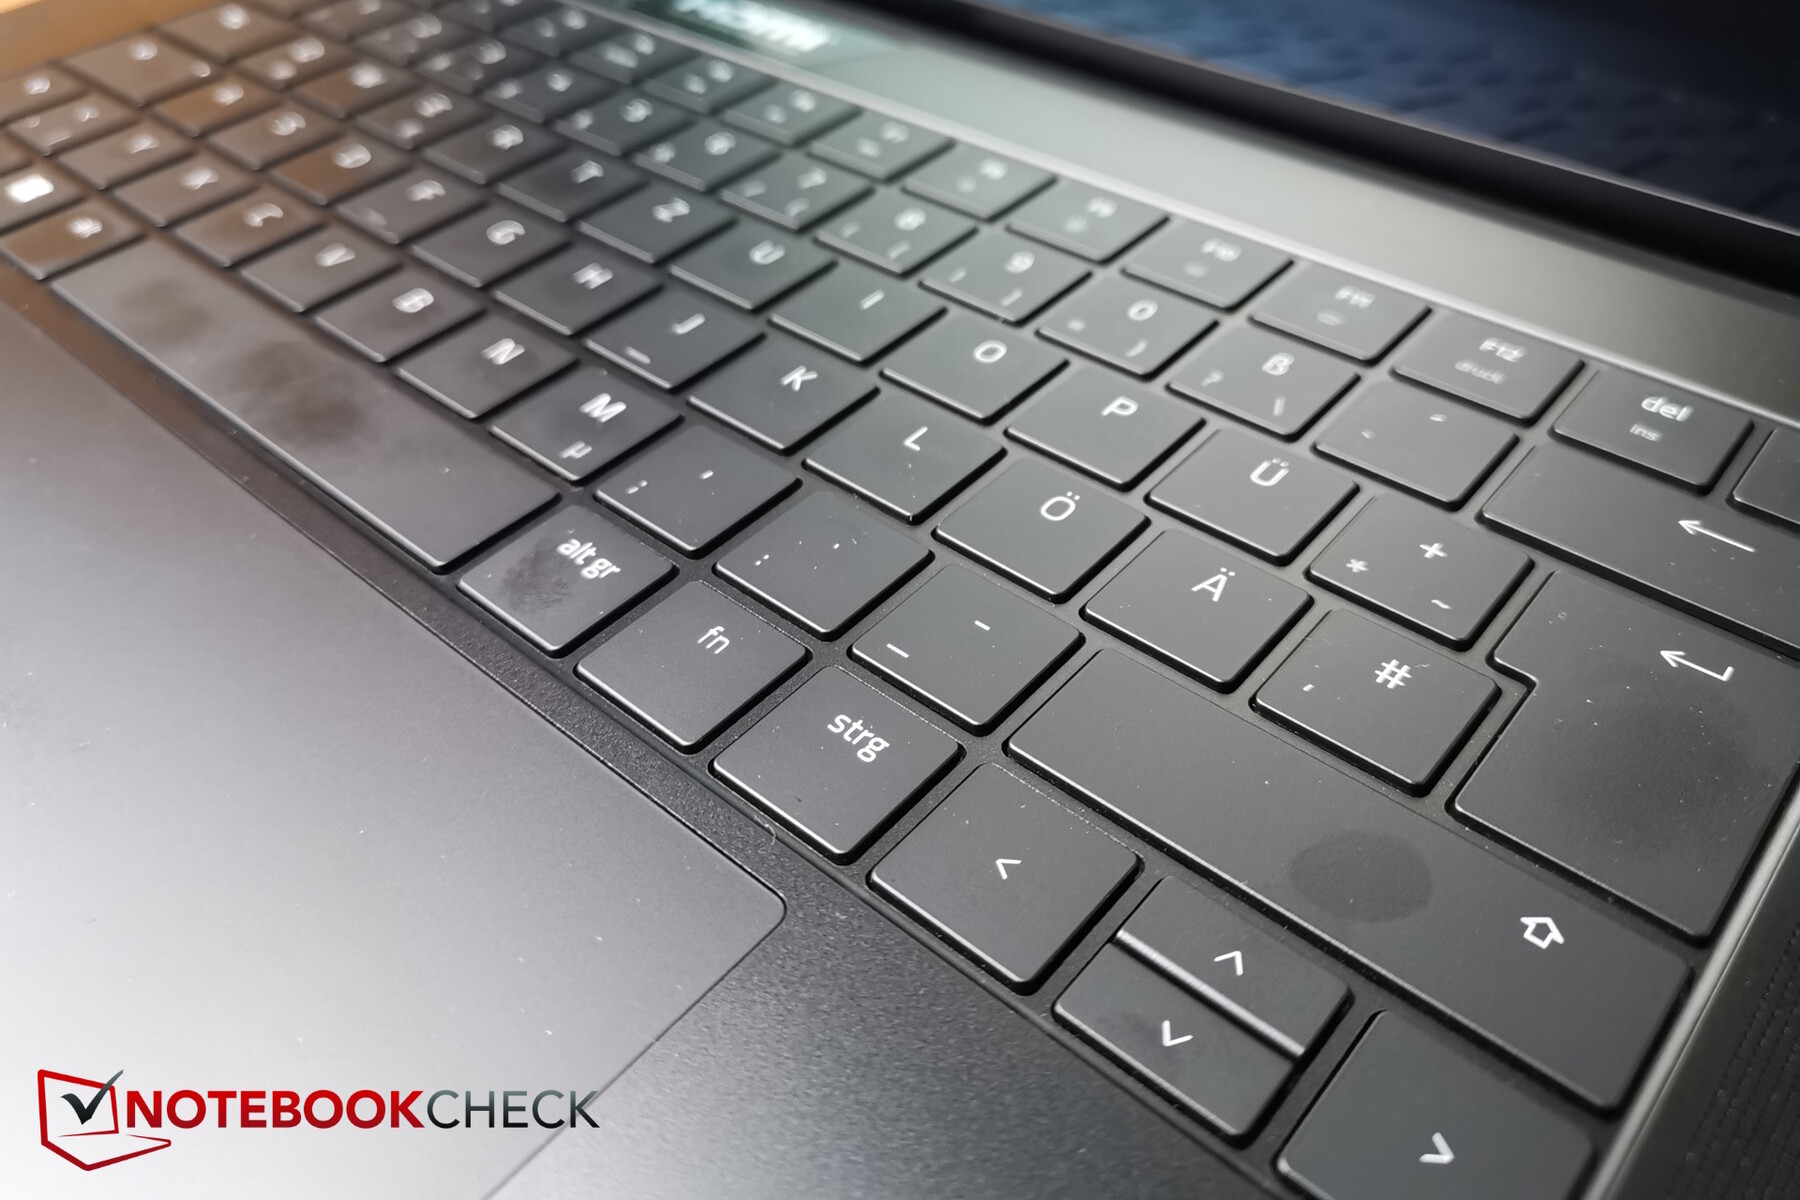
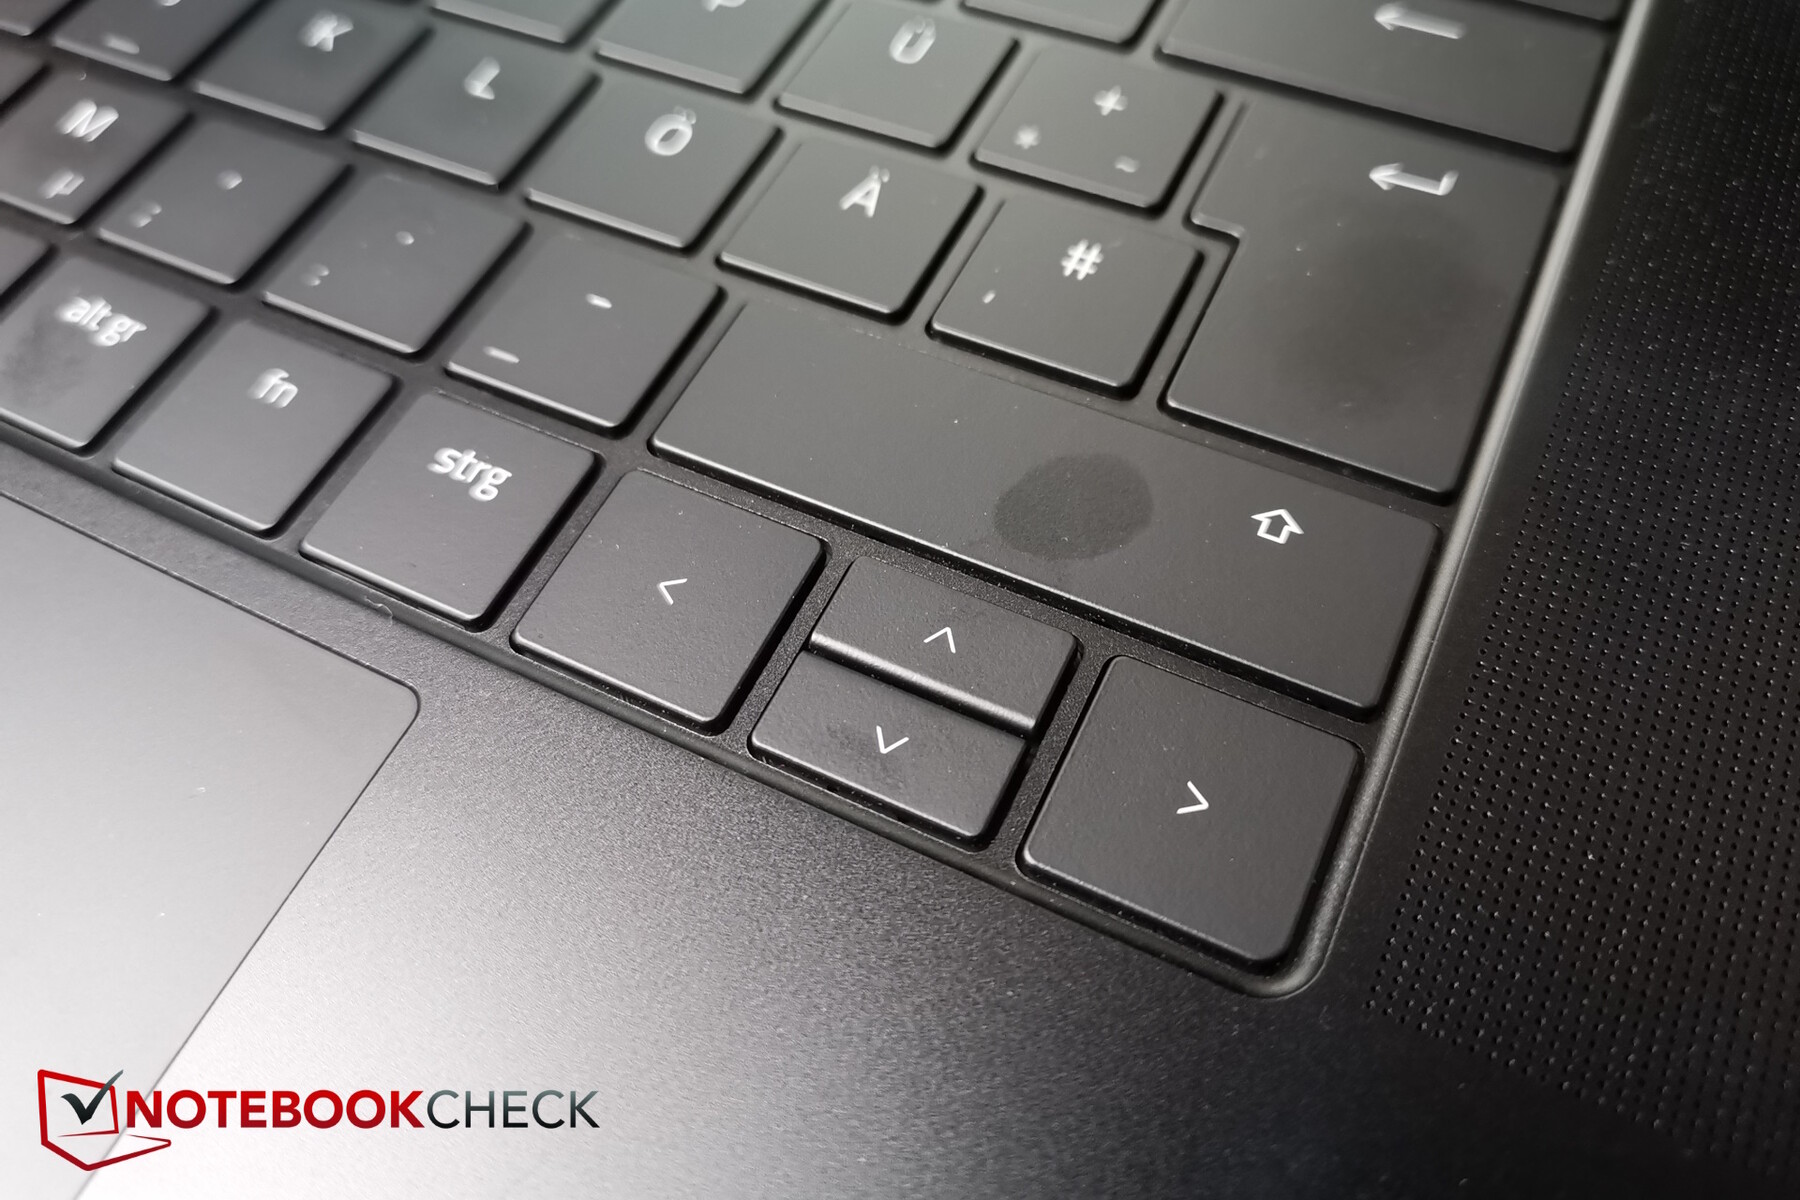
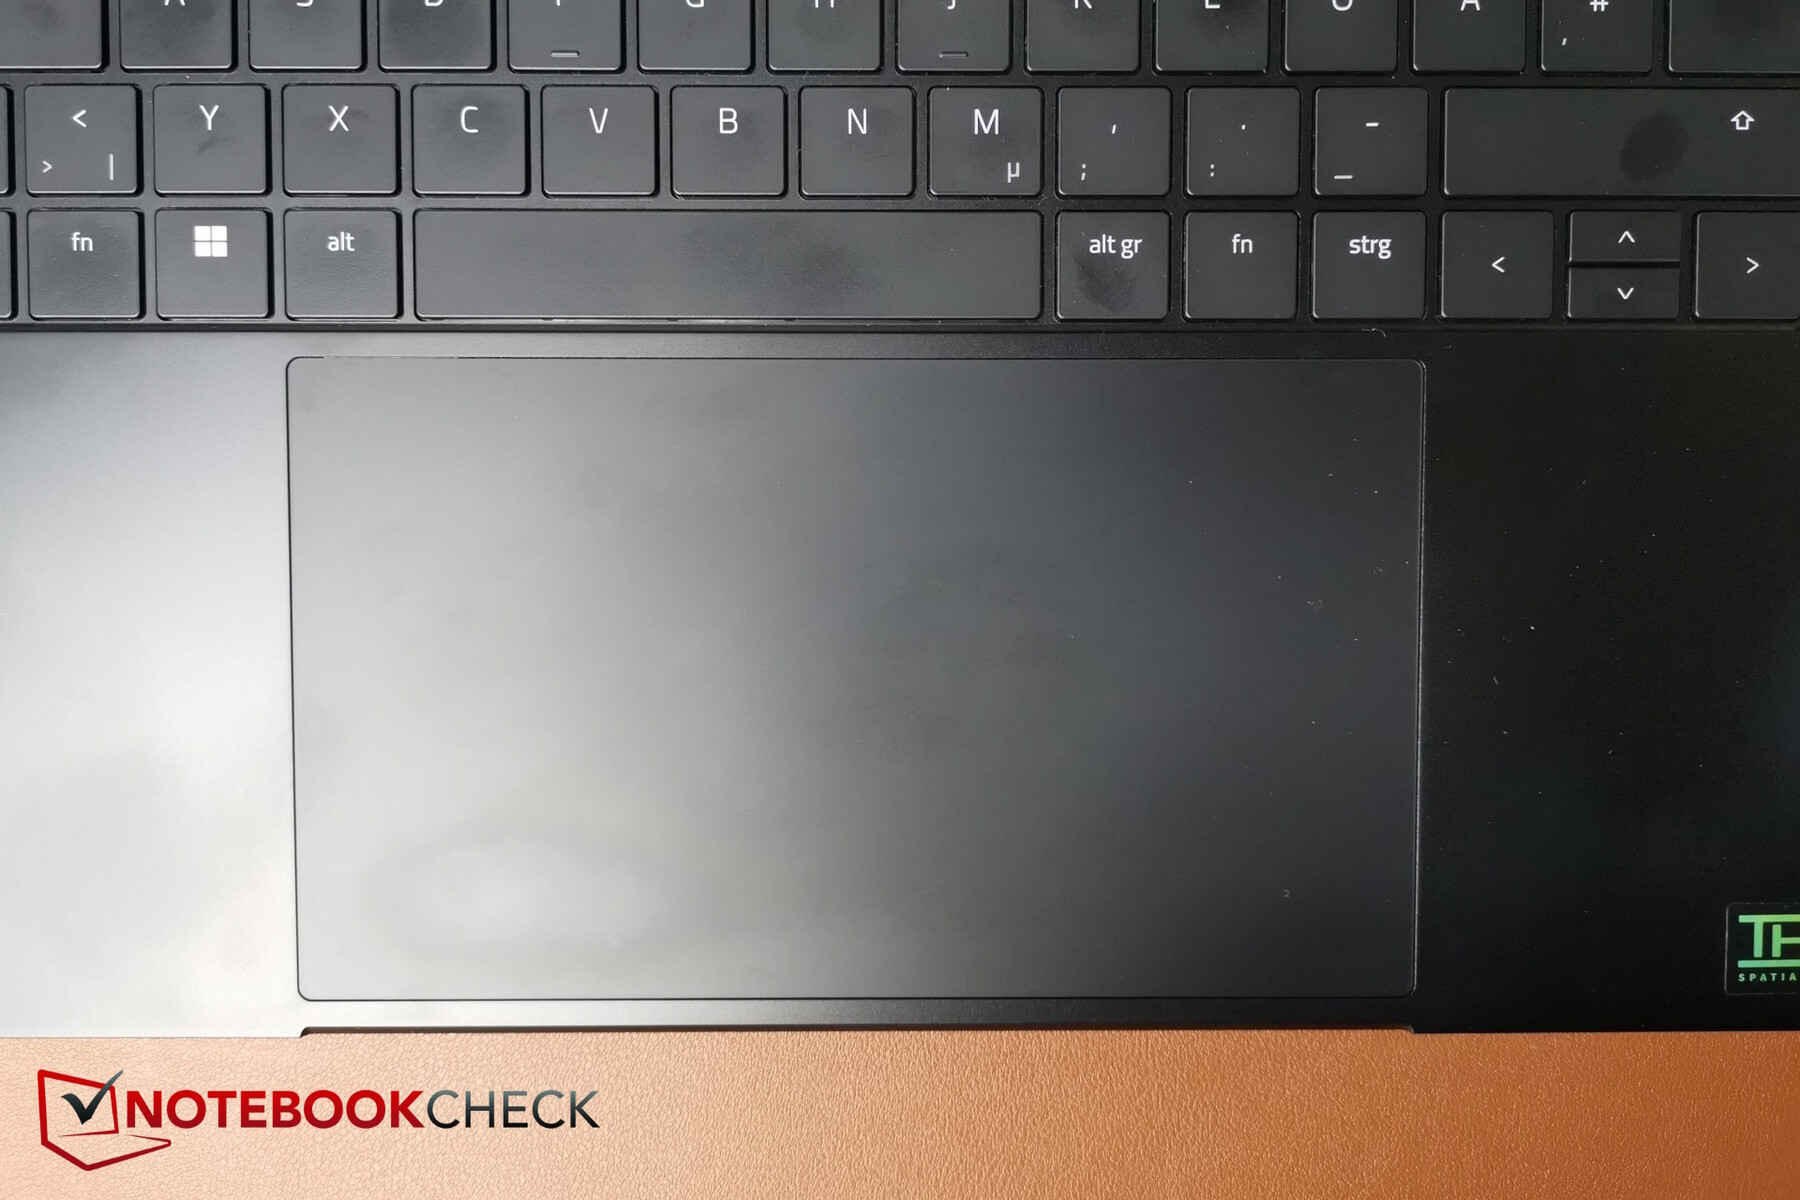
Dispositivos de entrada - ¿El panel táctil es casi demasiado grande?
Las teclas de membrana del portátil son bastante grandes y tienen poco espacio entre ellas. A su vez, Razer ha decidido no instalar un teclado numérico.
La elevación de las teclas es de corta a media y su respuesta es decente. Lamentablemente, las teclas de flecha arriba/abajo están reducidas a la mitad en altura, pero aparte de esto, la disposición se siente agradable y espaciosa.
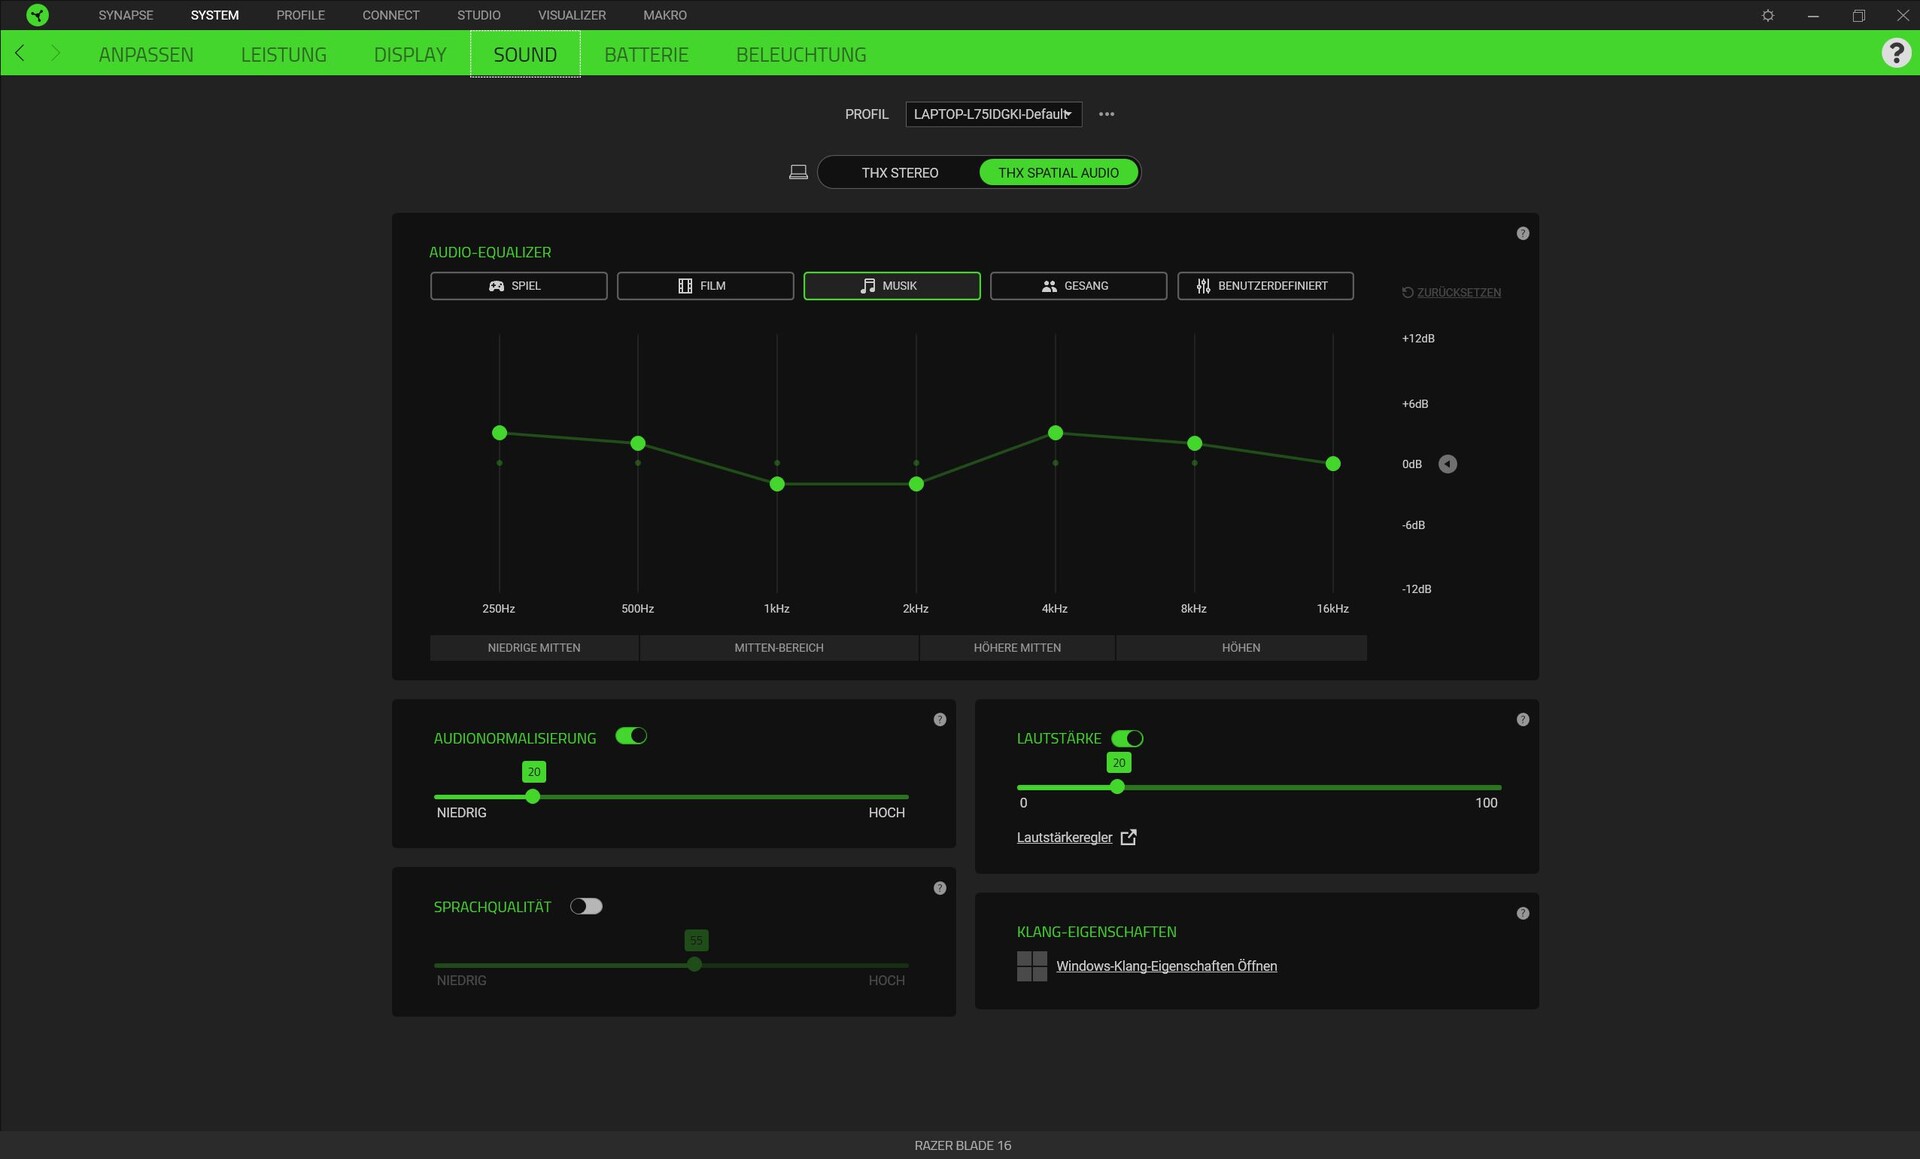
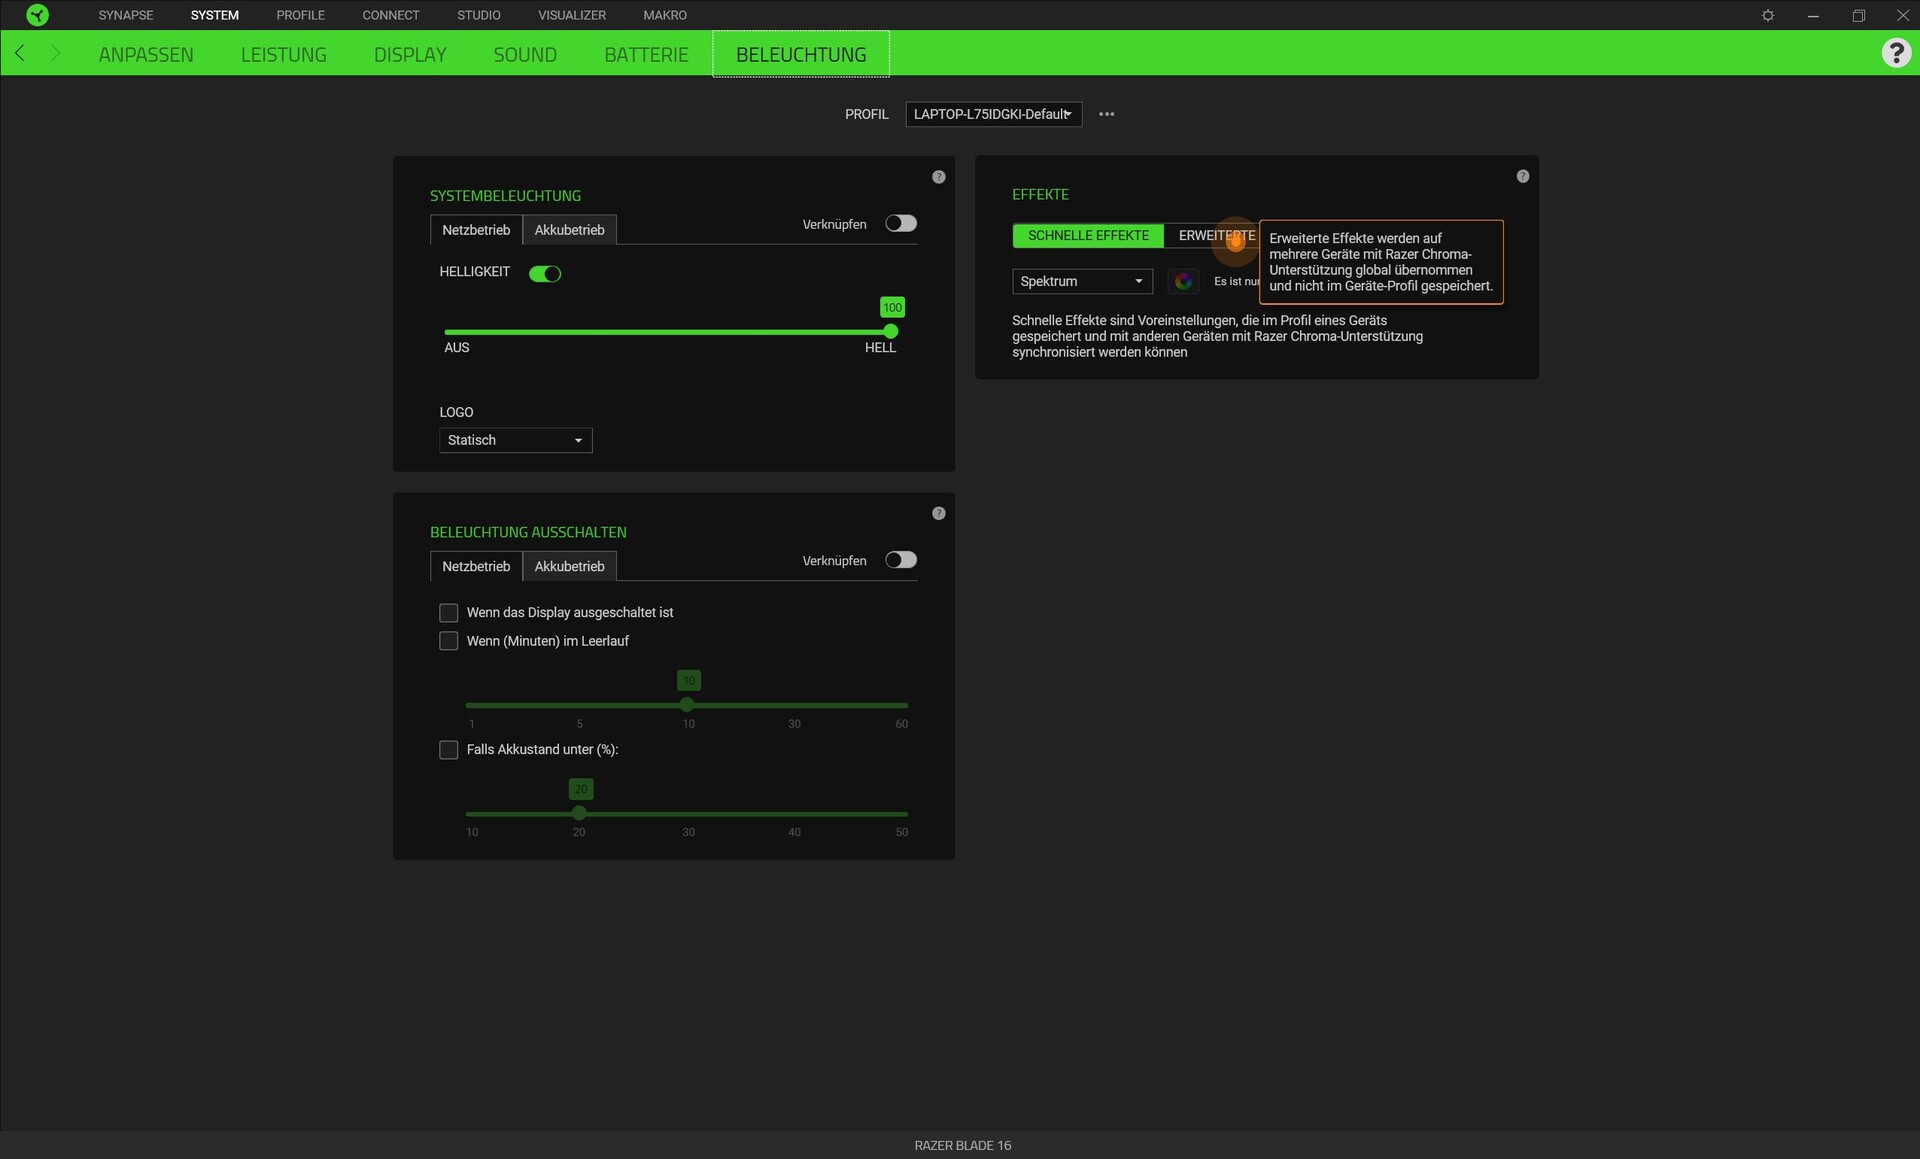
La retroiluminación RGB por botón (Razer Chroma) se puede configurar ampliamente a través de la aplicación Synapse, como es típico en Razer.
El touchpad es enorme Tan grande que los reposamuñecas junto a él casi parecen demasiado pequeños. Esto hace que a veces las entradas del touchpad fallen porque su mano ha tocado accidentalmente el pad cuando simplemente lo estaba apoyando en el lateral. Menos habría sido más en este aspecto.
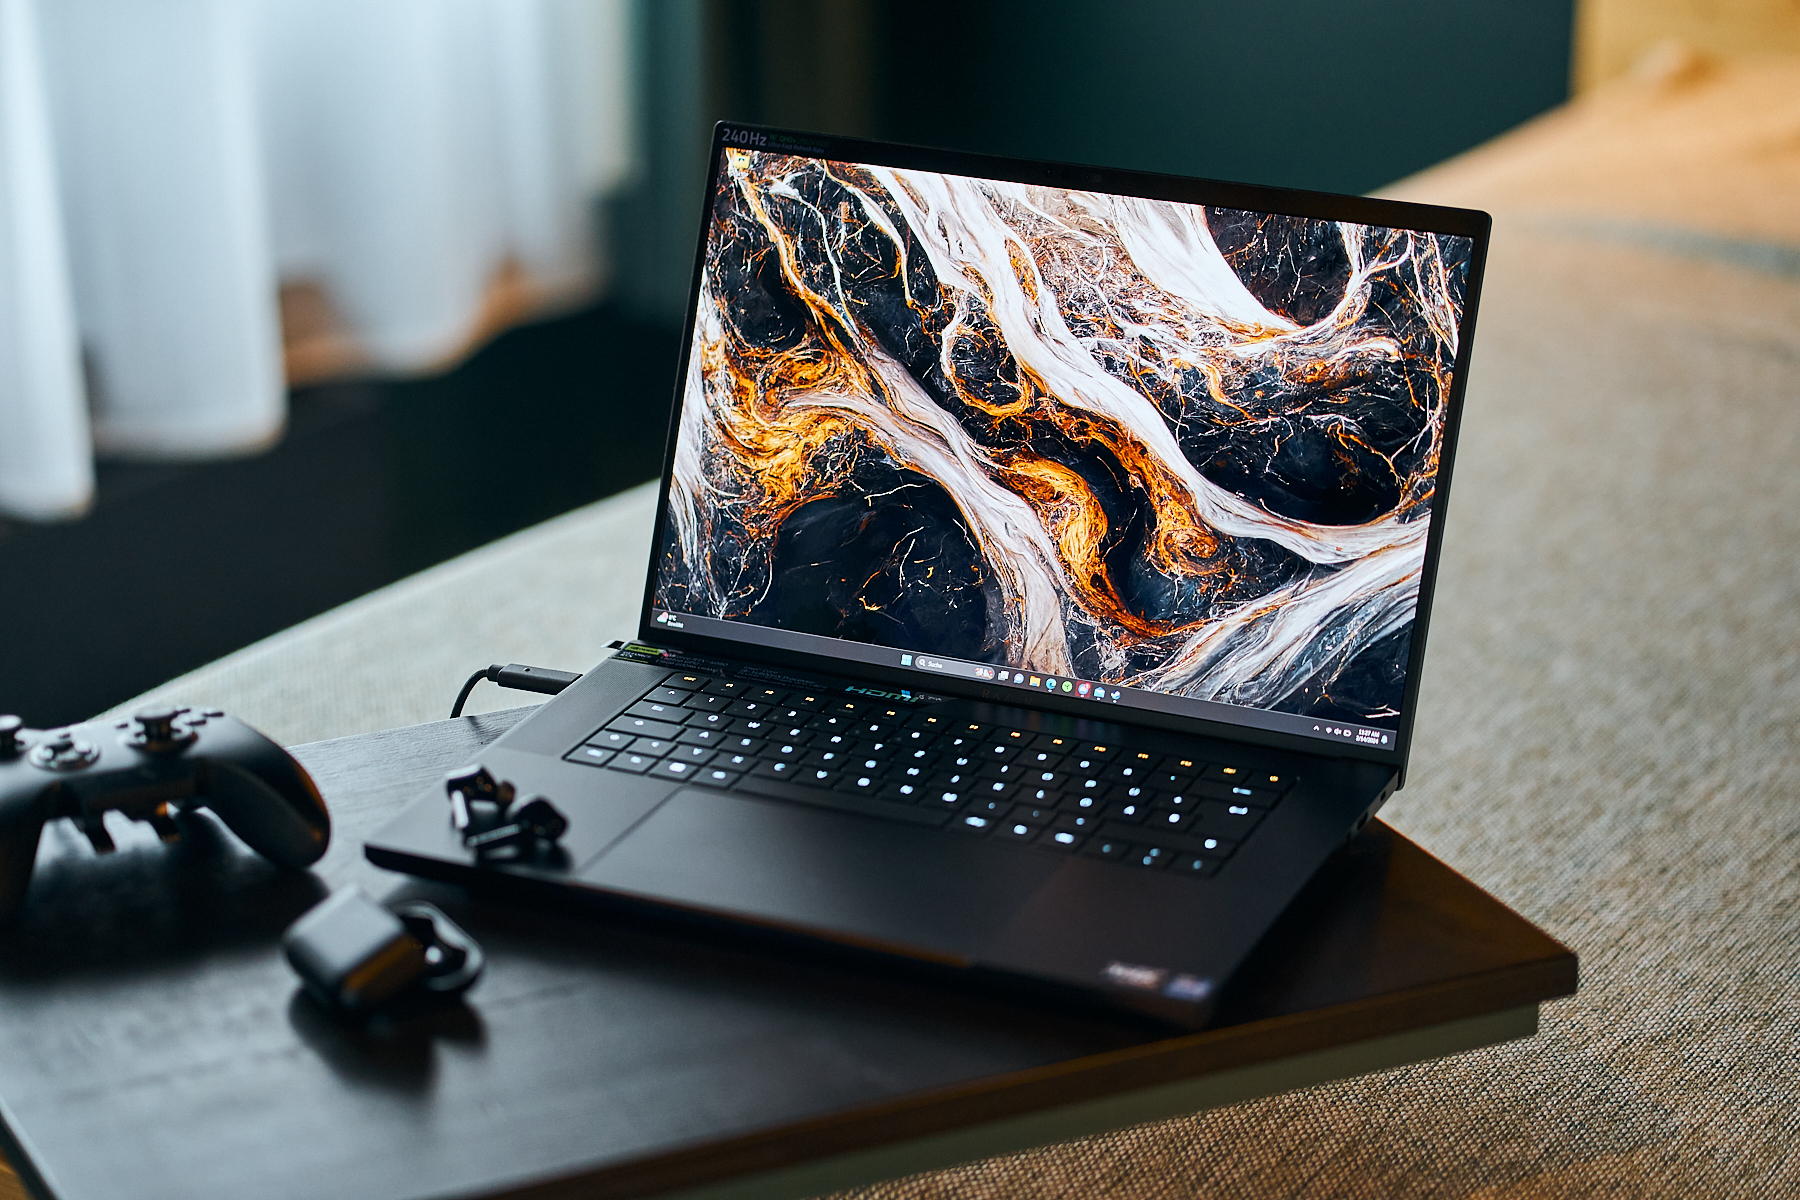
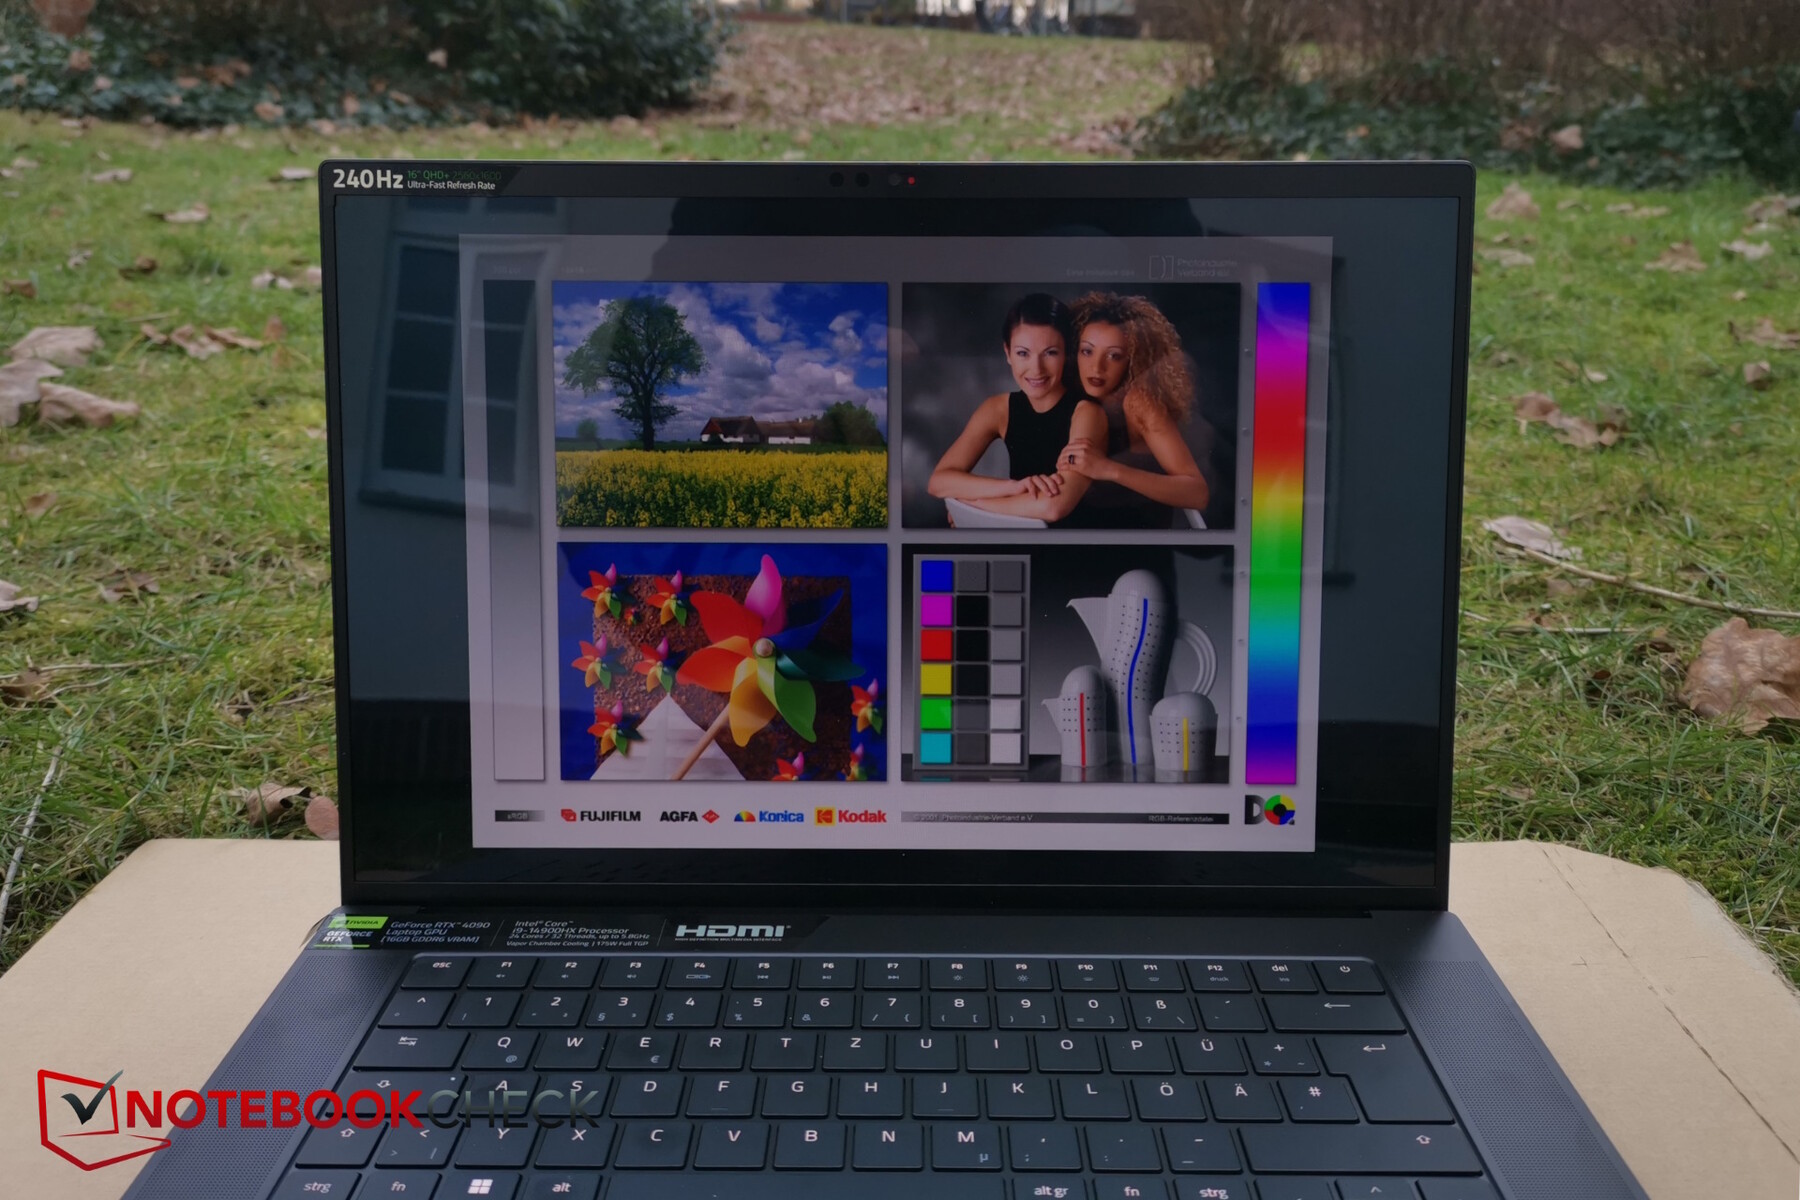
Pantalla - ¿La Blade 16 con OLED o Mini-LED?
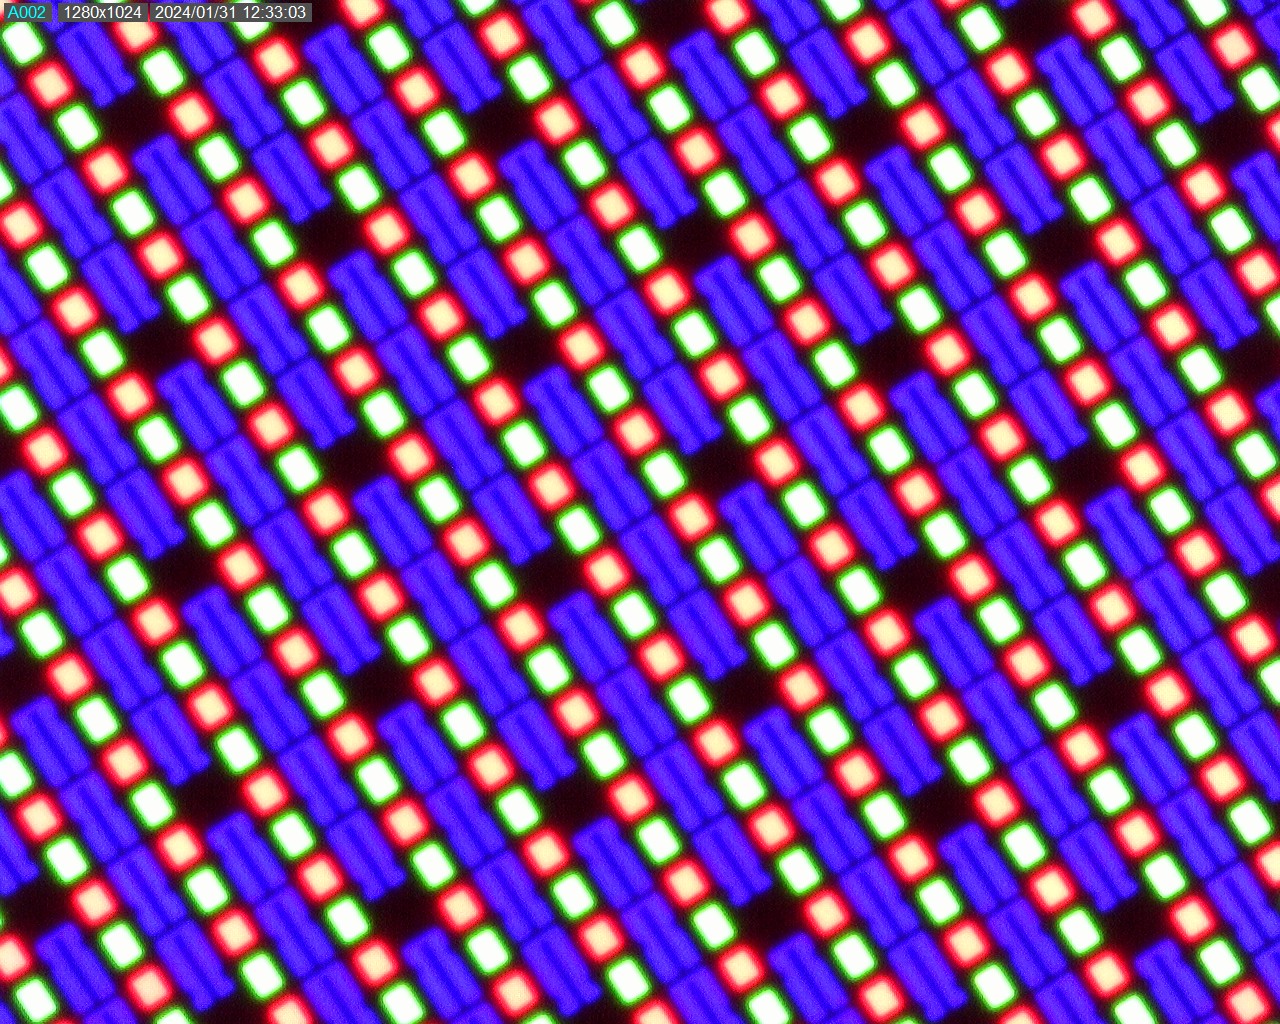
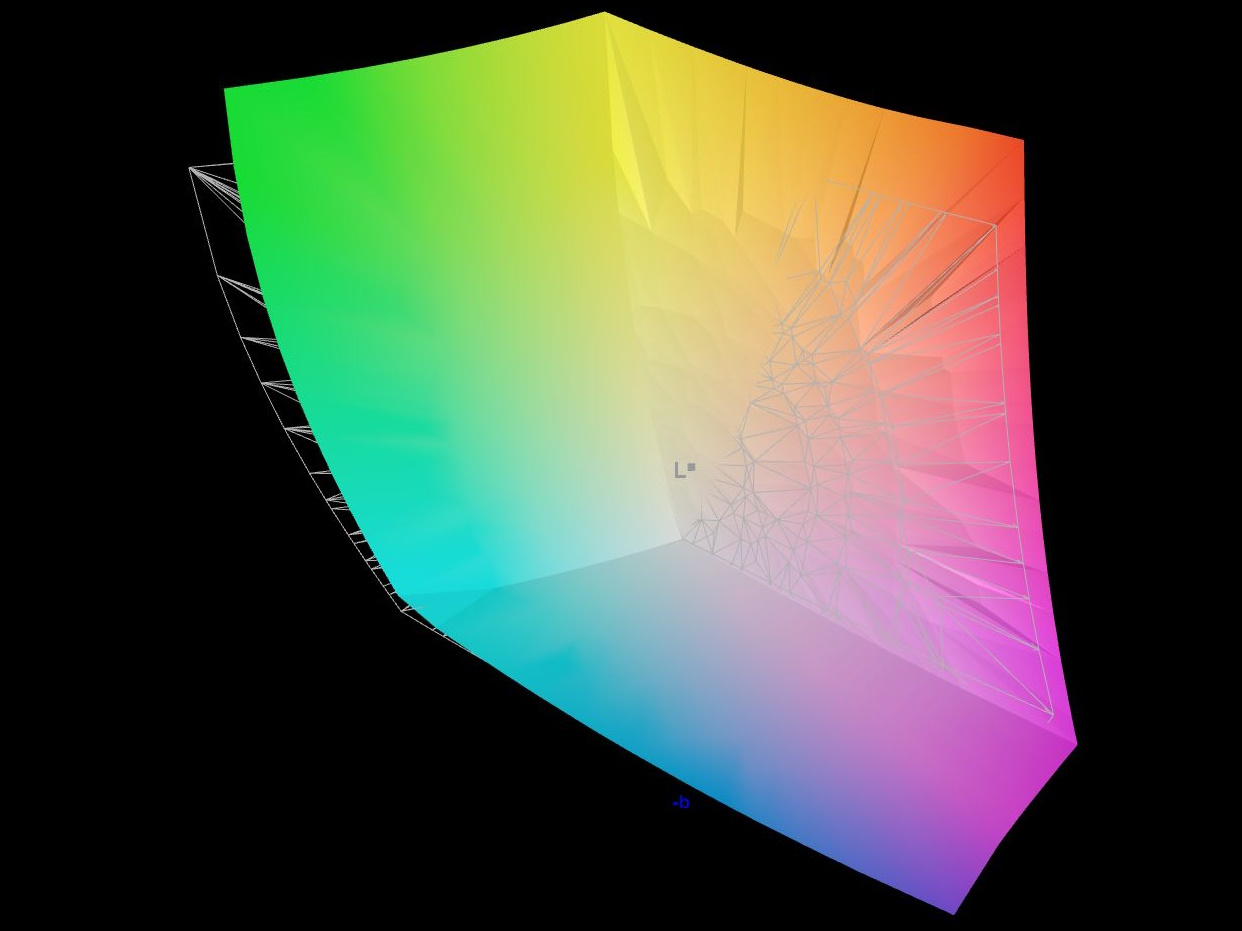
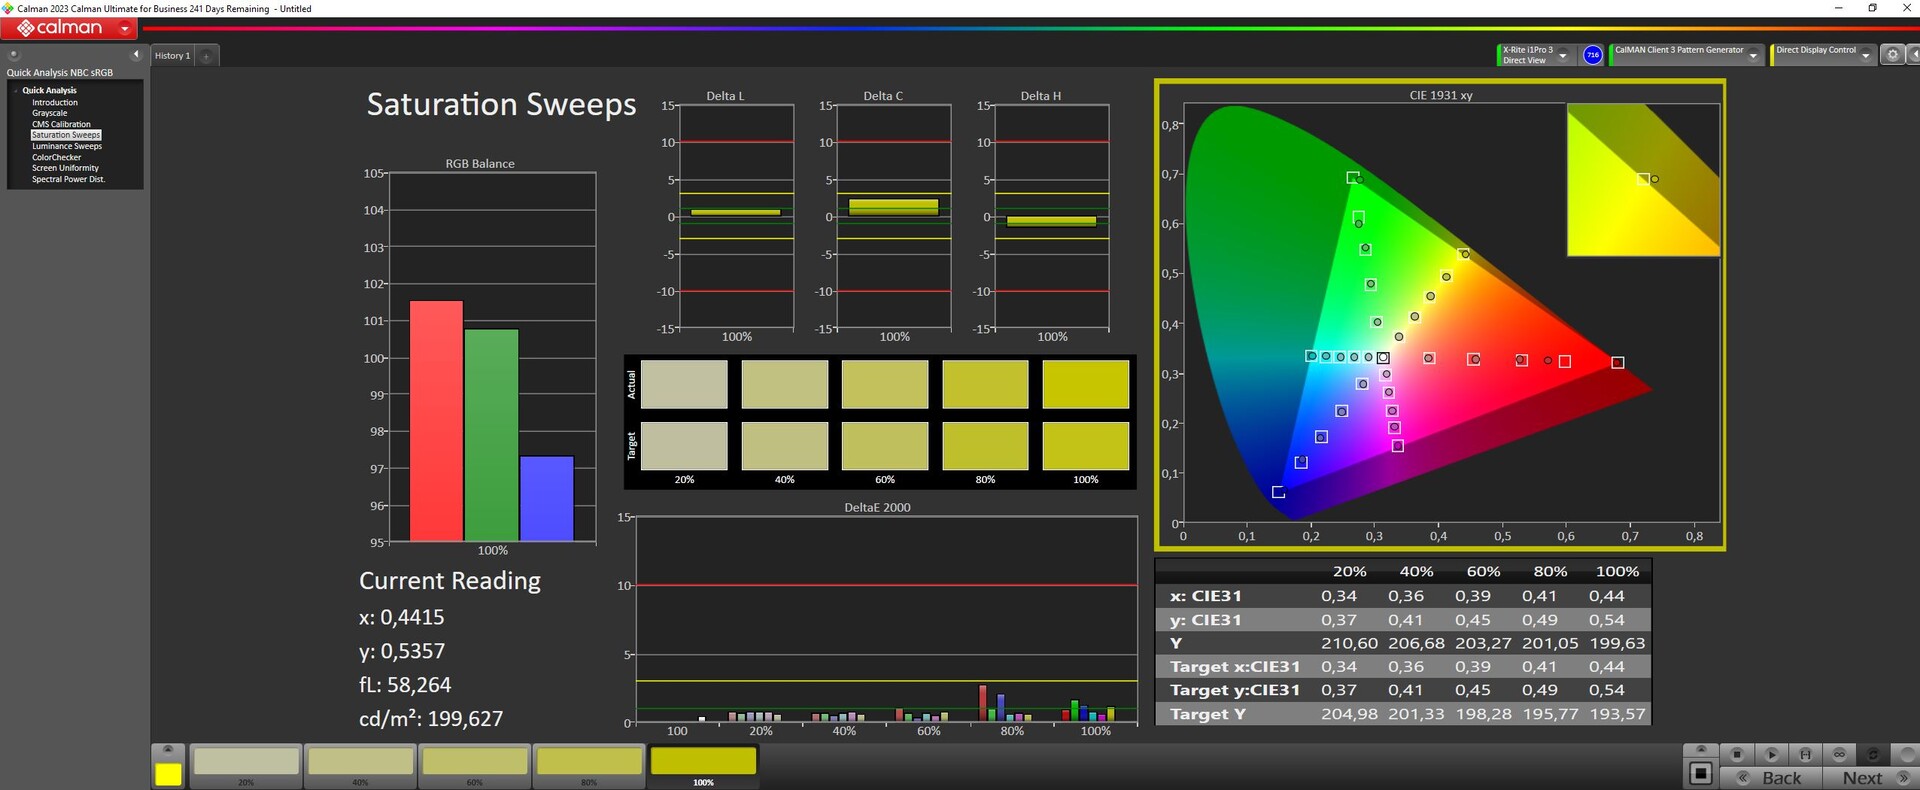
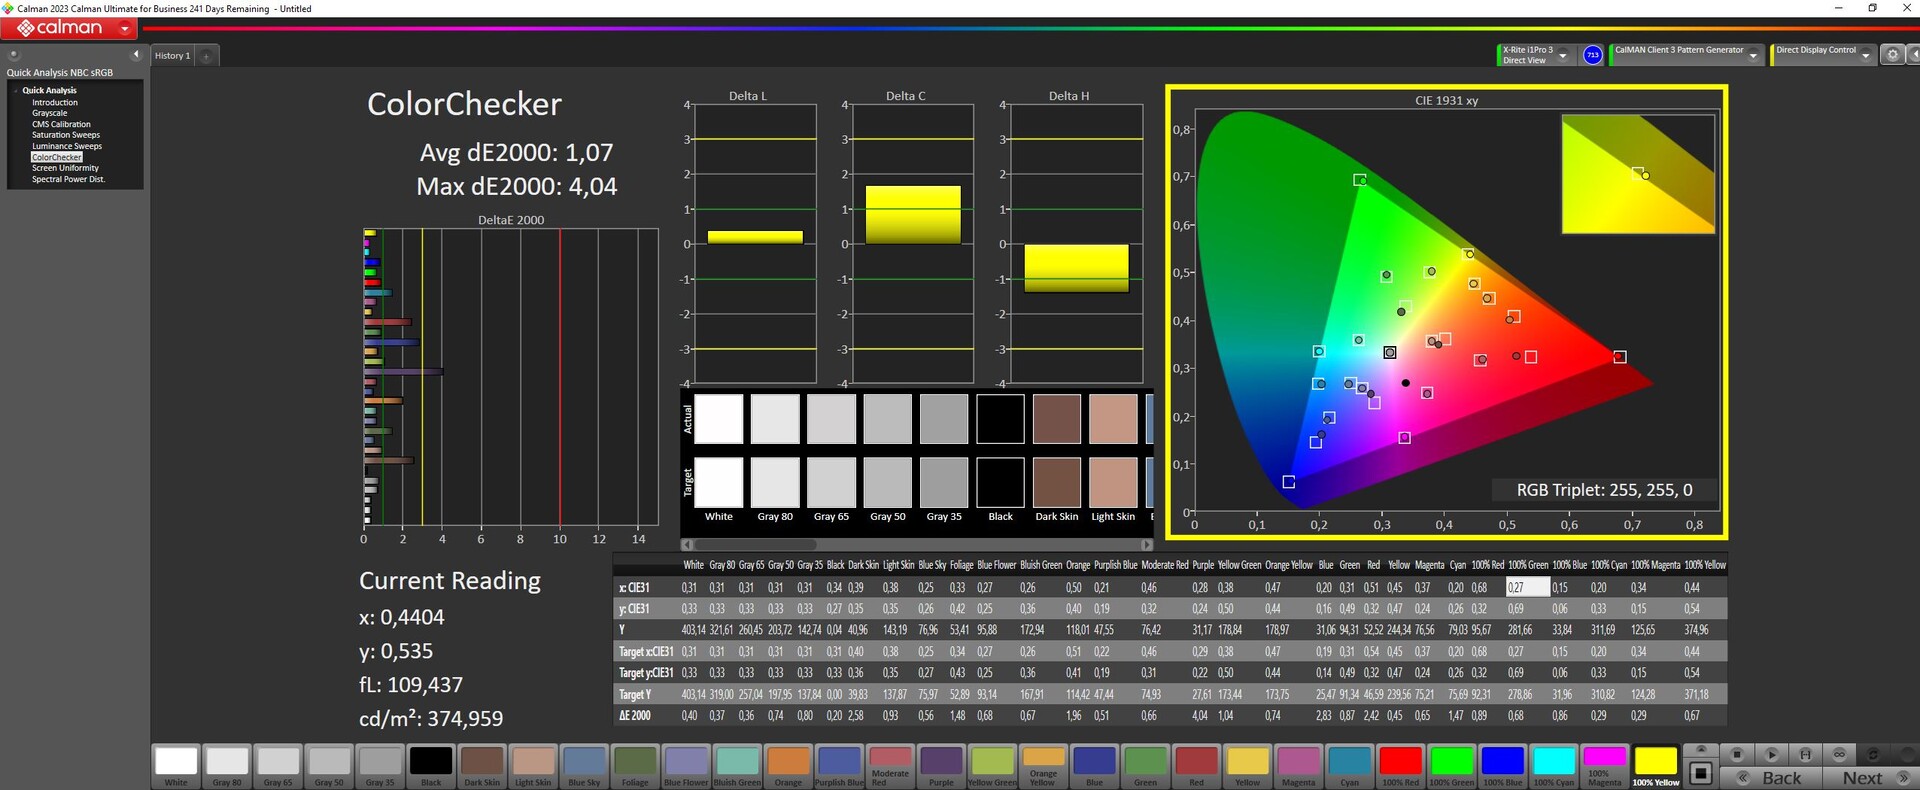
En nuestro modelo de prueba se ha instalado la nueva Samsung OLED, de la que Razer habla tan bien. Sin embargo, también puede optar por adquirir el portátil con las buenas pantallas Mini-LED. El cliente se enfrenta a una decisión difícil, ya que ambos tipos de panel tienen sus propias ventajas y desventajas.
Los Mini-LED pueden alcanzar hasta 1.000 nits (HDR) y el modelo predecesor aún lograba más de 700 nits en modo SDR. Nuestro OLED "sólo" alcanzó una media de 420 nits pero, a cambio, presenta un valor de negro perfecto y, como resultado, altos contrastes. Puede oscurecer perfectamente zonas concretas de la pantalla.
La pantalla Mini-LED presenta dos modos de resolución nativos, a saber, FHD+ y UHD+. La OLED está "limitada" a 1.600p (QHD+) pero tiene unos tiempos de respuesta extremadamente rápidos de entre 0,2 (gris a gris) y 0,4 milisegundos (negro a blanco). Independientemente de la pantalla que acabe eligiendo, seguro que con Razer no tendrá una mala.
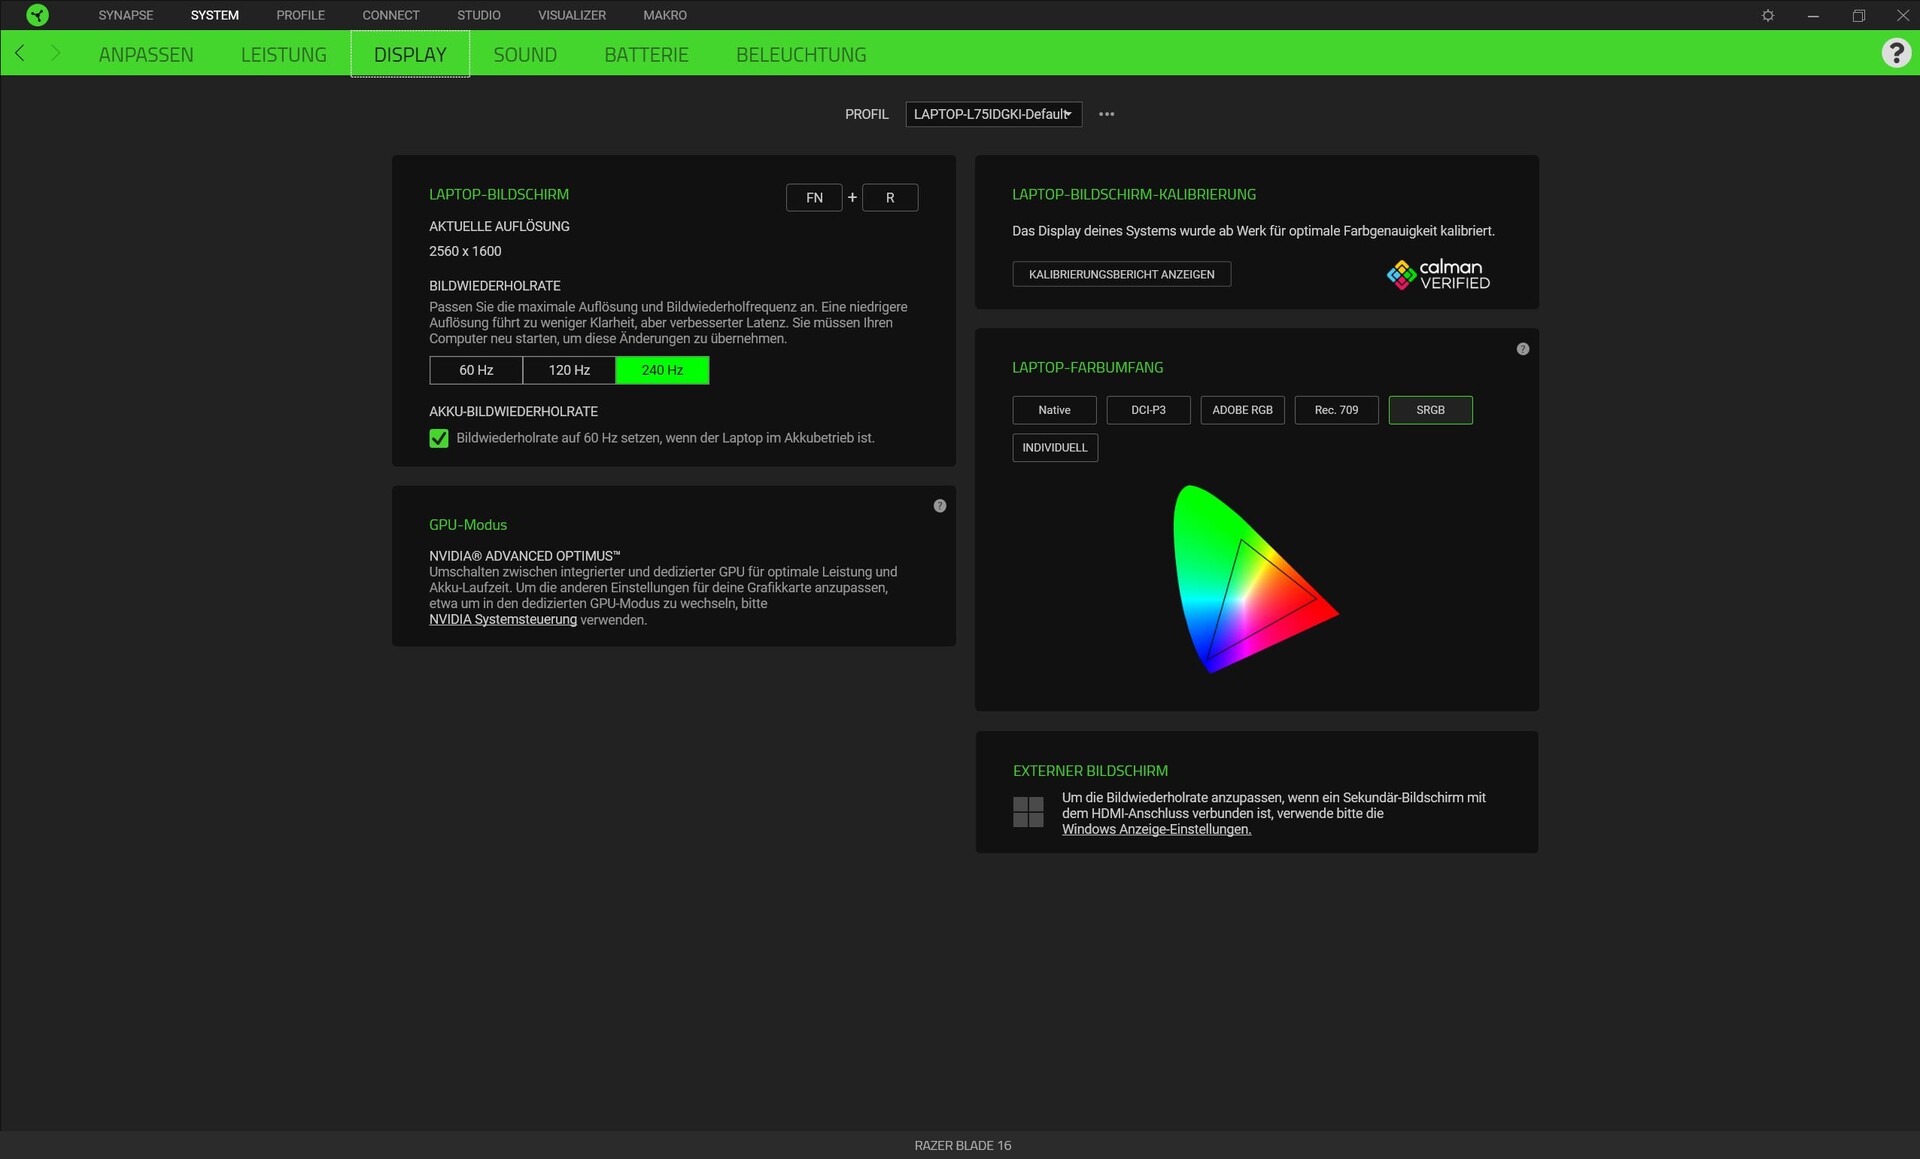
La Samsung OLED de nuestro modelo de prueba Blade tiene una superficie reflectante y clara. Razer publicita el modelo con todo tipo de certificados, incluidos VESA ClearMR 11000 (máxima claridad de visualización con objetos en movimiento en la pantalla a 240 Hz), Calman Verified (calibrado del color) y VESA DisplayHDR True Black 500.
Además de los numerosos certificados, la OLED 16:10 con una resolución de 2.560 x 1.600 píxeles está preparada para G-Sync y viene precalibrada. No hay sangrado de retroiluminación con los OLED.
| |||||||||||||||||||||||||
iluminación: 98 %
Brillo con batería: 416 cd/m²
Contraste: 20900:1 (Negro: 0.02 cd/m²)
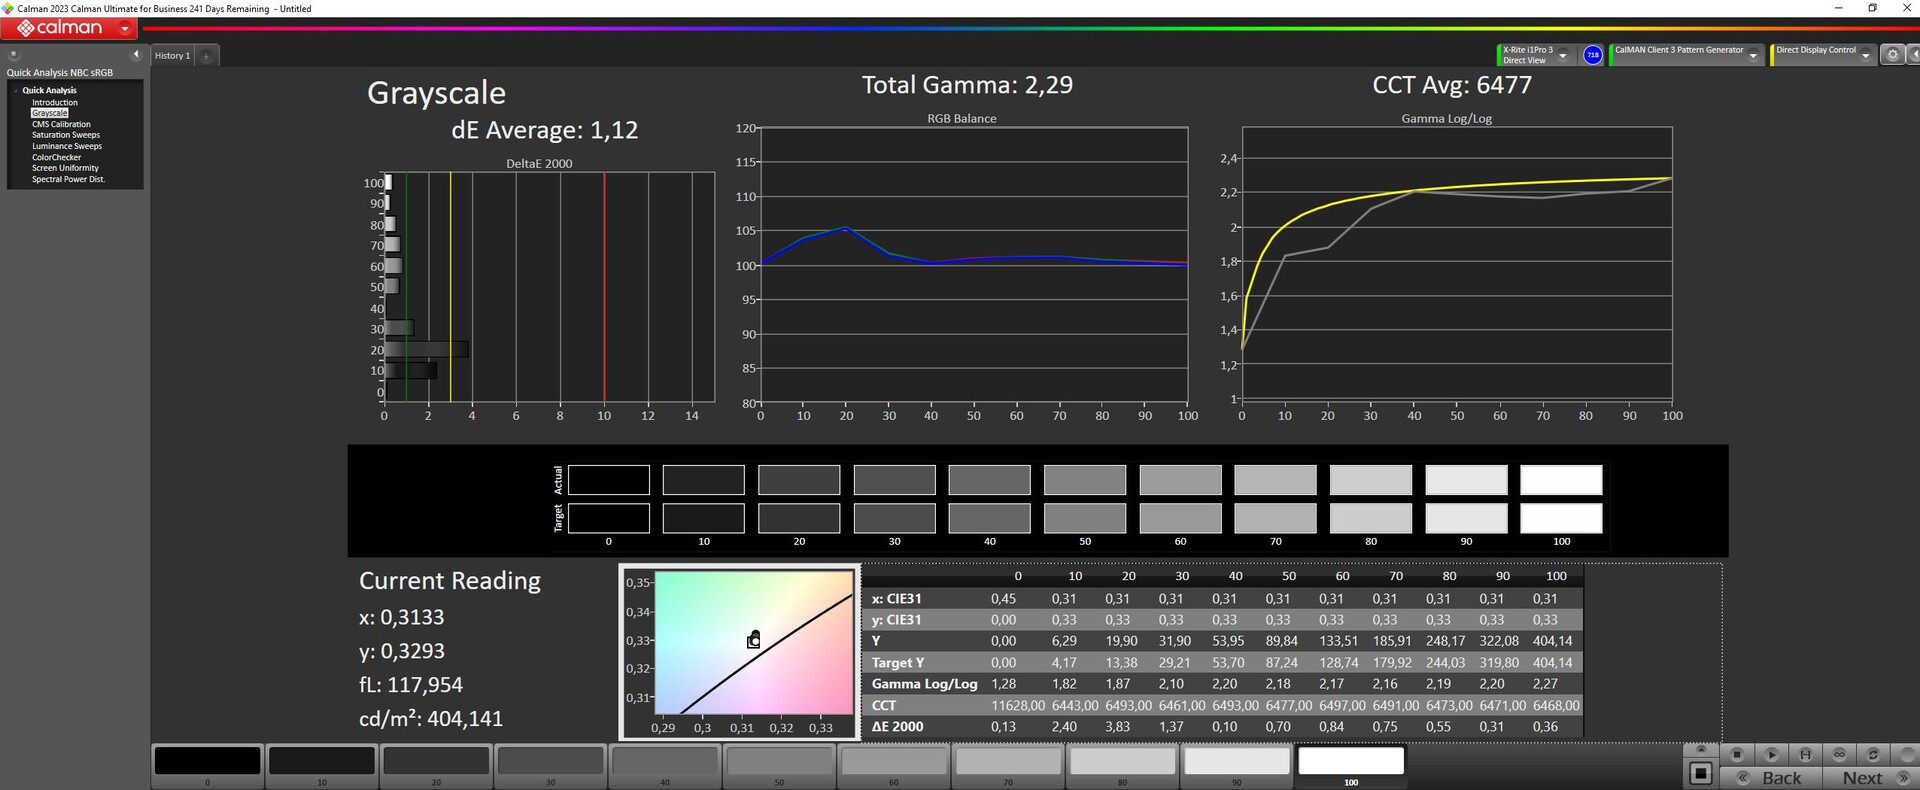
ΔE ColorChecker Calman: 1.07 | ∀{0.5-29.43 Ø4.71}
calibrated: 1.07
ΔE Greyscale Calman: 1.12 | ∀{0.09-98 Ø4.96}
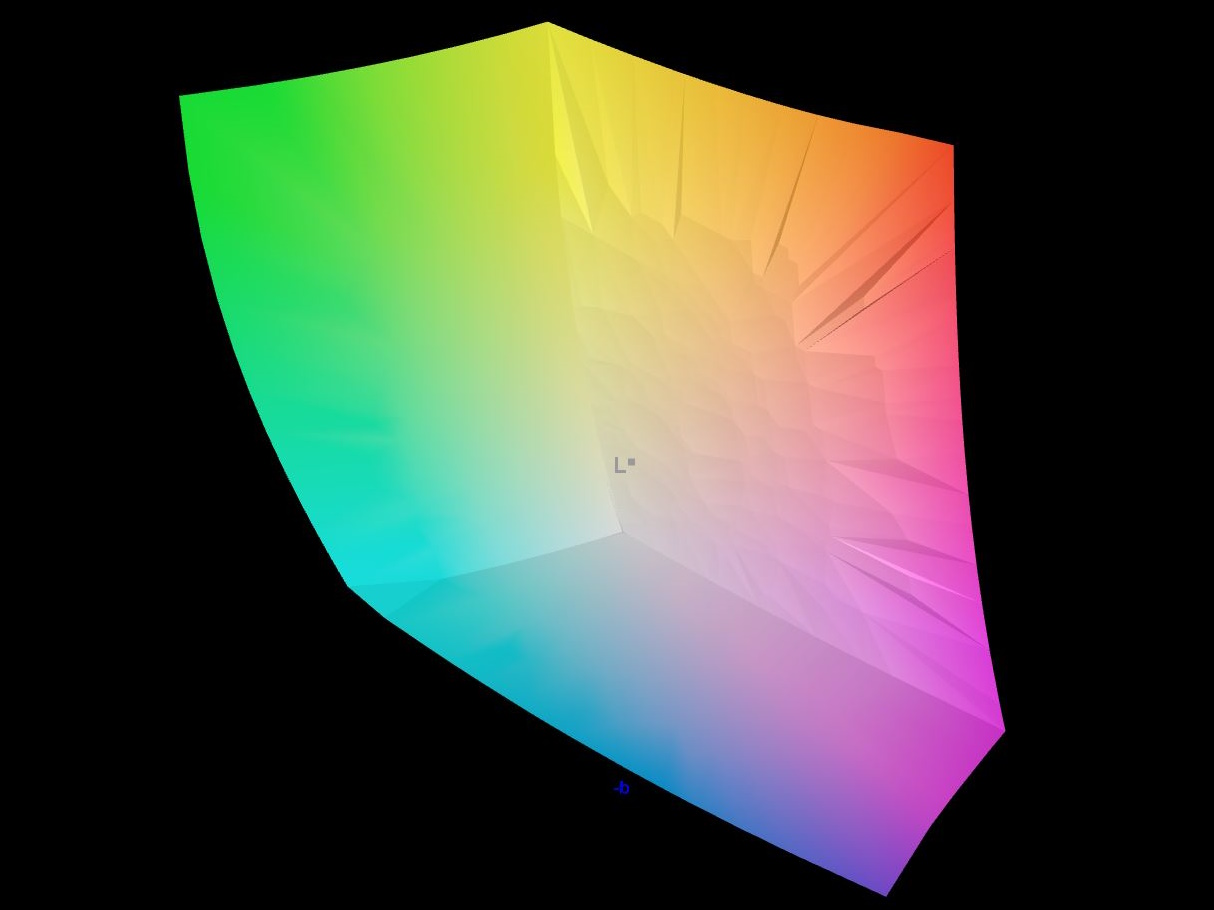
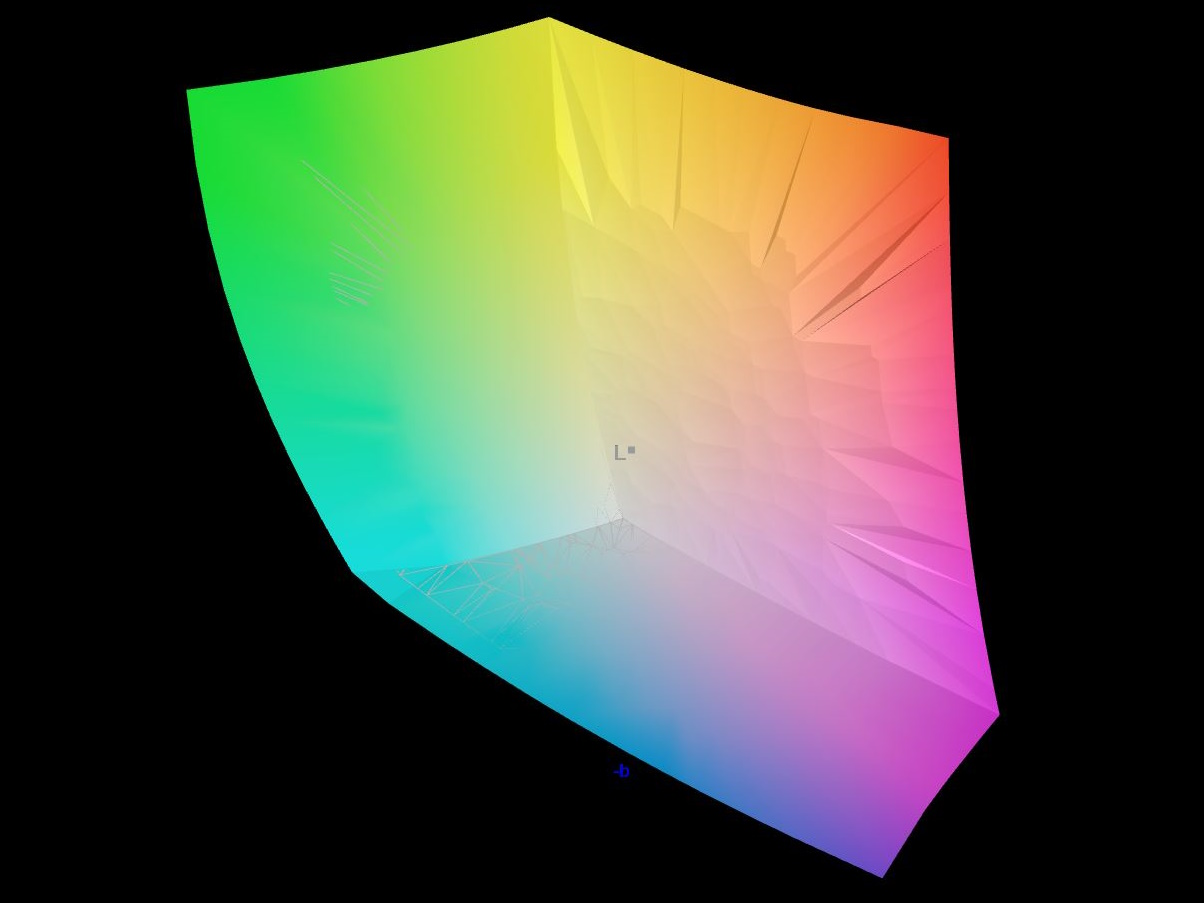
95.6% AdobeRGB 1998 (Argyll 3D)
99.9% sRGB (Argyll 3D)
99.1% Display P3 (Argyll 3D)
Gamma: 2.29
CCT: 6417 K
| Razer Blade 16 2024, RTX 4090 Samsung SDC41AB (ATNA60DL03-0), OLED, 2560x1600, 16" | Razer Blade 16 Early 2023 RTX 4090 AUO B160ZAN01.U, mini-LED, 3840x2400, 16" | Lenovo Legion 9 16IRX8 CSOT T3 MNG007ZA2-2, Mini-LED, 3200x2000, 16" | Schenker XMG Neo 16 E23 BOE0AF0 NE160QDM-NZ1, IPS, 2560x1600, 16" | Lenovo Legion 5 16IRX G9 NE160QDM-NZ3, IPS, 2560x1600, 16" | |
|---|---|---|---|---|---|
| Display | -1% | -4% | -21% | -16% | |
| Display P3 Coverage (%) | 99.1 | 99.9 1% | 97.2 -2% | 67.3 -32% | 72.4 -27% |
| sRGB Coverage (%) | 99.9 | 100 0% | 99.9 0% | 96.7 -3% | 100 0% |
| AdobeRGB 1998 Coverage (%) | 95.6 | 90.9 -5% | 87 -9% | 68.9 -28% | 74.1 -22% |
| Response Times | -9780% | -4121% | -3996% | -3592% | |
| Response Time Grey 50% / Grey 80% * (ms) | 0.24 ? | 10.2 ? -4150% | 13.3 ? -5442% | 14.5 ? -5942% | 12.5 ? -5108% |
| Response Time Black / White * (ms) | 0.4 ? | 62.04 ? -15410% | 11.6 ? -2800% | 8.6 ? -2050% | 8.7 ? -2075% |
| PWM Frequency (Hz) | 960 | 2420 ? | 4742 | ||
| Screen | -42% | -49% | -201% | -176% | |
| Brightness middle (cd/m²) | 418 | 730 75% | 674.9 61% | 372 -11% | 526 26% |
| Brightness (cd/m²) | 420 | 729 74% | 682 62% | 349 -17% | 500 19% |
| Brightness Distribution (%) | 98 | 94 -4% | 96 -2% | 88 -10% | 87 -11% |
| Black Level * (cd/m²) | 0.02 | 0.0045 78% | 0.04 -100% | 0.32 -1500% | 0.33 -1550% |
| Contrast (:1) | 20900 | 162222 676% | 16873 -19% | 1163 -94% | 1594 -92% |
| Colorchecker dE 2000 * | 1.07 | 5.65 -428% | 2.56 -139% | 2.06 -93% | 1.2 -12% |
| Colorchecker dE 2000 max. * | 4.04 | 10.11 -150% | 4.16 -3% | 3 26% | 2.1 48% |
| Colorchecker dE 2000 calibrated * | 1.07 | 1.85 -73% | 2.47 -131% | 1.5 -40% | 1 7% |
| Greyscale dE 2000 * | 1.12 | 8.1 -623% | 3 -168% | 1.9 -70% | 1.3 -16% |
| Gamma | 2.29 96% | 1.98 111% | 2.38 92% | 2.312 95% | 2.23 99% |
| CCT | 6417 101% | 5874 111% | 6799 96% | 6747 96% | 6391 102% |
| Media total (Programa/Opciones) | -3274% /
-1424% | -1391% /
-621% | -1406% /
-705% | -1261% /
-630% |
* ... más pequeño es mejor
Como prometió, el panel cubre DisplayP3 prácticamente en su totalidad y, por supuesto, también sRGB. Además, AdobeRGB está cubierto en un 96% aproximadamente.
Según Razer, todos los modelos Blade de 16 pulgadas vienen precalibrados y nuestras mediciones lo confirmaron. Sus desviaciones de escala de grises y color son muy bajas -sólo alrededor de 1. Esto significa que el Blade 16 es perfecto para editar fotos y vídeos.
El fabricante también configura varios perfiles de color para ello en su software Synapse, a saber, DCI-P3, Adobe RGB, Rec. 709 y sRGB. También existe la opción de ajustar el modo de color individualmente y hay un modo de color nativo. Seleccionamos DCI-P3 para nuestras mediciones.
En total, clasificaríamos el panel OLED como ligeramente superior a la pantalla Mini-LED, lo que tiene que ver especialmente con su excelente cobertura del espacio de color, precisión cromática, negros profundos, altos contrastes y rápidos tiempos de respuesta.
Tiempos de respuesta del display
| ↔ Tiempo de respuesta de Negro a Blanco | ||
|---|---|---|
| 0.4 ms ... subida ↗ y bajada ↘ combinada | ↗ 0.2 ms subida |  |
| ↘ 0.2 ms bajada | ||
| La pantalla mostró tiempos de respuesta muy rápidos en nuestros tests y debería ser adecuada para juegos frenéticos. En comparación, todos los dispositivos de prueba van de ##min### (mínimo) a 240 (máximo) ms. » 0 % de todos los dispositivos son mejores. Esto quiere decir que el tiempo de respuesta medido es mejor que la media (19.8 ms) de todos los dispositivos testados. | ||
| ↔ Tiempo de respuesta 50% Gris a 80% Gris | ||
| 0.24 ms ... subida ↗ y bajada ↘ combinada | ↗ 0.15 ms subida |  |
| ↘ 0.09 ms bajada | ||
| La pantalla mostró tiempos de respuesta muy rápidos en nuestros tests y debería ser adecuada para juegos frenéticos. En comparación, todos los dispositivos de prueba van de ##min### (mínimo) a 636 (máximo) ms. » 0 % de todos los dispositivos son mejores. Esto quiere decir que el tiempo de respuesta medido es mejor que la media (31 ms) de todos los dispositivos testados. | ||
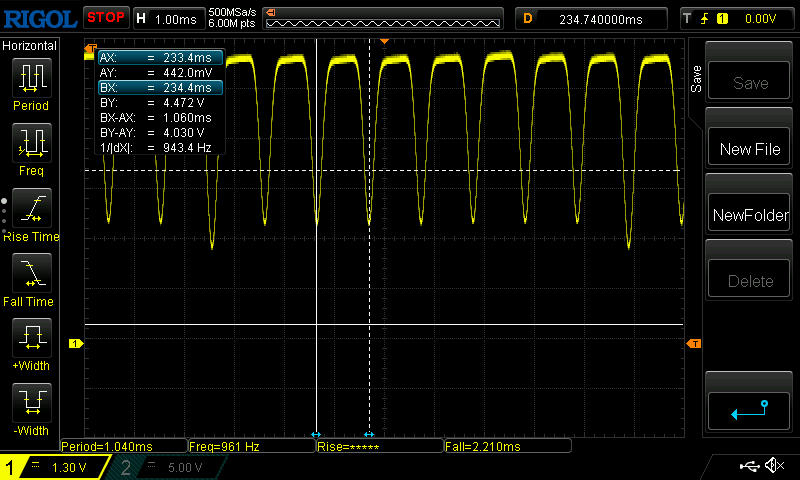
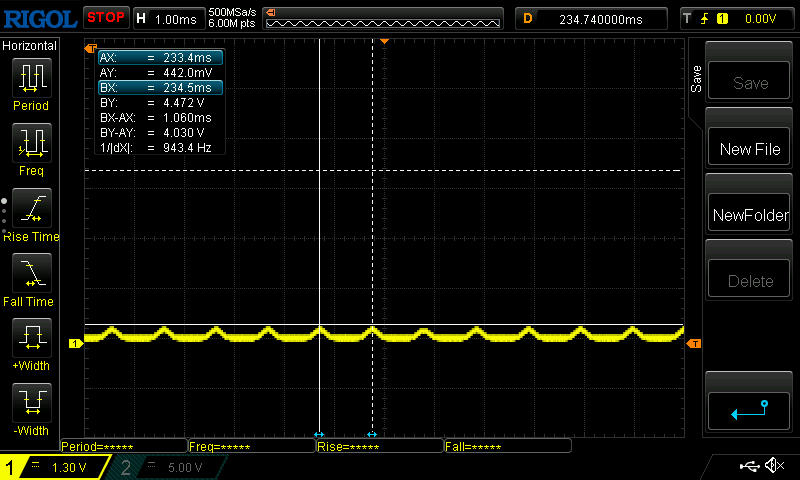
Parpadeo de Pantalla / PWM (Pulse-Width Modulation)
| Parpadeo de Pantalla / PWM detectado | 960 Hz | 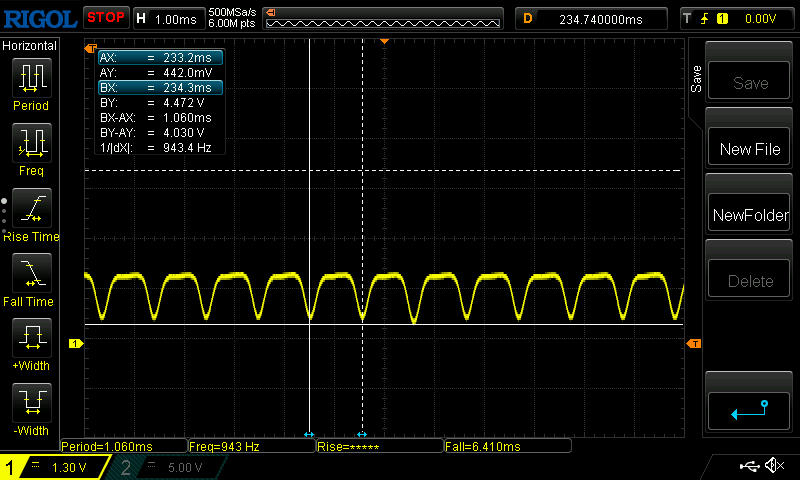 | |
La retroiluminación del display parpadea a 960 Hz (seguramente usa PWM - Pulse-Width Modulation) . La frecuencia de 960 Hz es bastante alta, por lo que la mayoría de gente sensible al parpadeo no debería ver parpadeo o tener fatiga visual. Comparación: 52 % de todos los dispositivos testados no usaron PWM para atenuar el display. Si se usó, medimos una media de 7757 (mínimo: 5 - máxmo: 343500) Hz. | |||
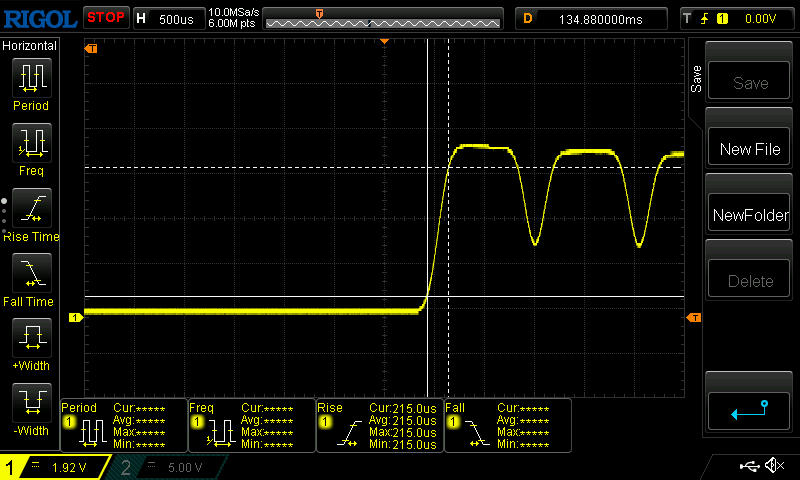
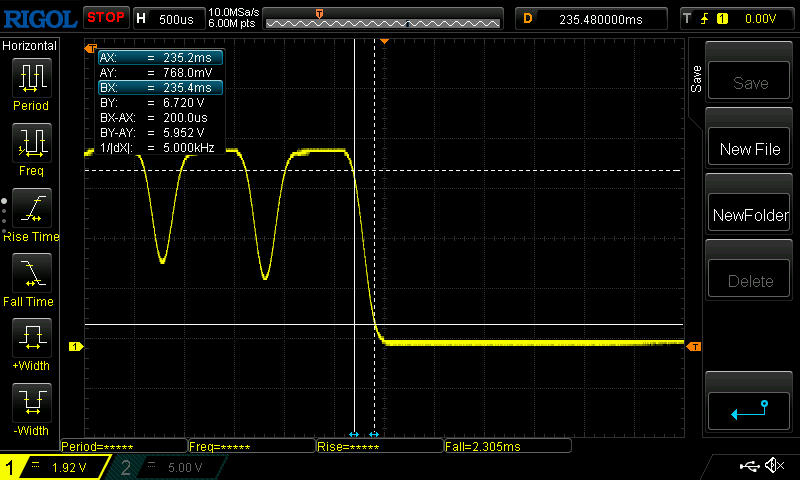
Los tiempos de respuesta del portátil de 0,2 y 0,4 ms son muy rápidos, demasiado rápidos para el modo de registro automático de nuestro dispositivo de prueba. A continuación le mostramos nuestra grabación manual de sus tiempos de subida y bajada.
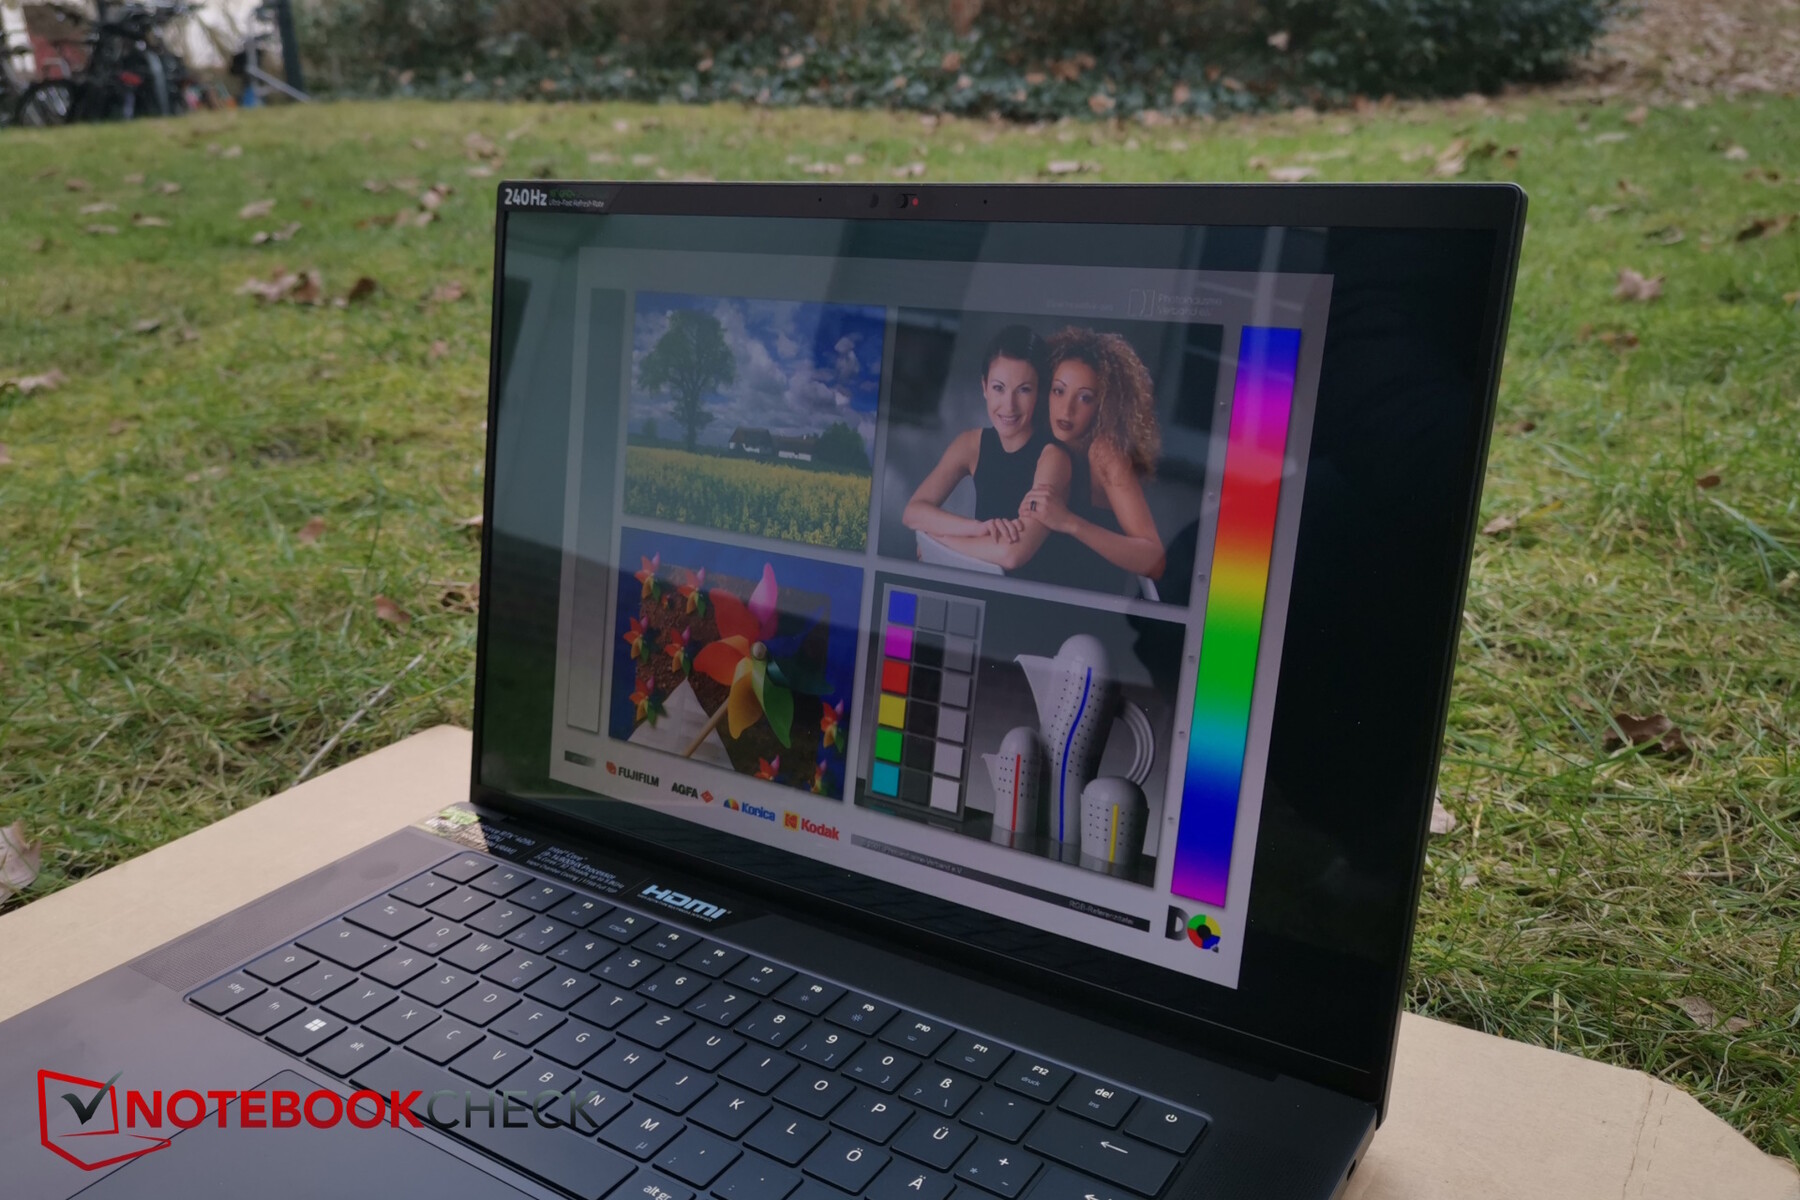
En exteriores, puede resultar un poco difícil utilizar la Blade 16 debido a su superficie reflectante. Aun así, su fuerte contraste lo compensa un poco. A la sombra, debería estar bien para trabajar en exteriores.

Rendimiento - Estancamiento a pesar de la nueva generación de CPUs
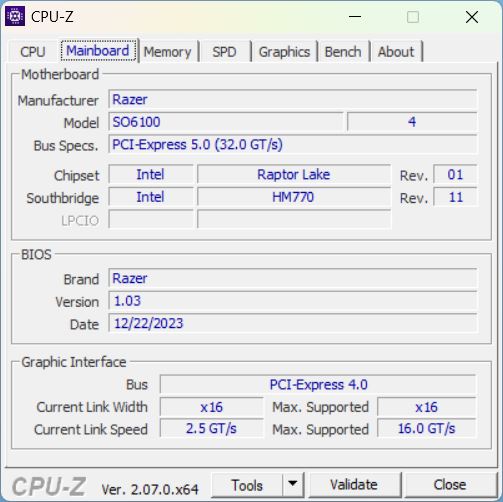
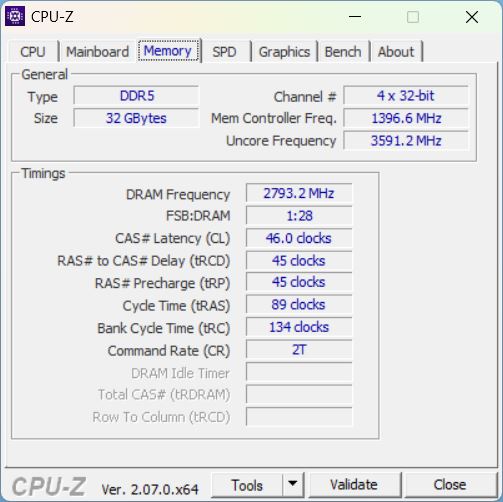
Con su potente RTX 4090 y el no menos potente Intel Core i9-14900HXel Blade 16 está, por supuesto, dirigido principalmente a los jugadores. Pero con su buena pantalla y su diseño elegante y delgado, Razer siempre se ha dirigido deliberadamente también a los profesionales creativos. 32 GB de RAM, WiFi 7 y una unidad SSD de 2 TB completan las características de nuestra muestra de prueba.
Condiciones de prueba
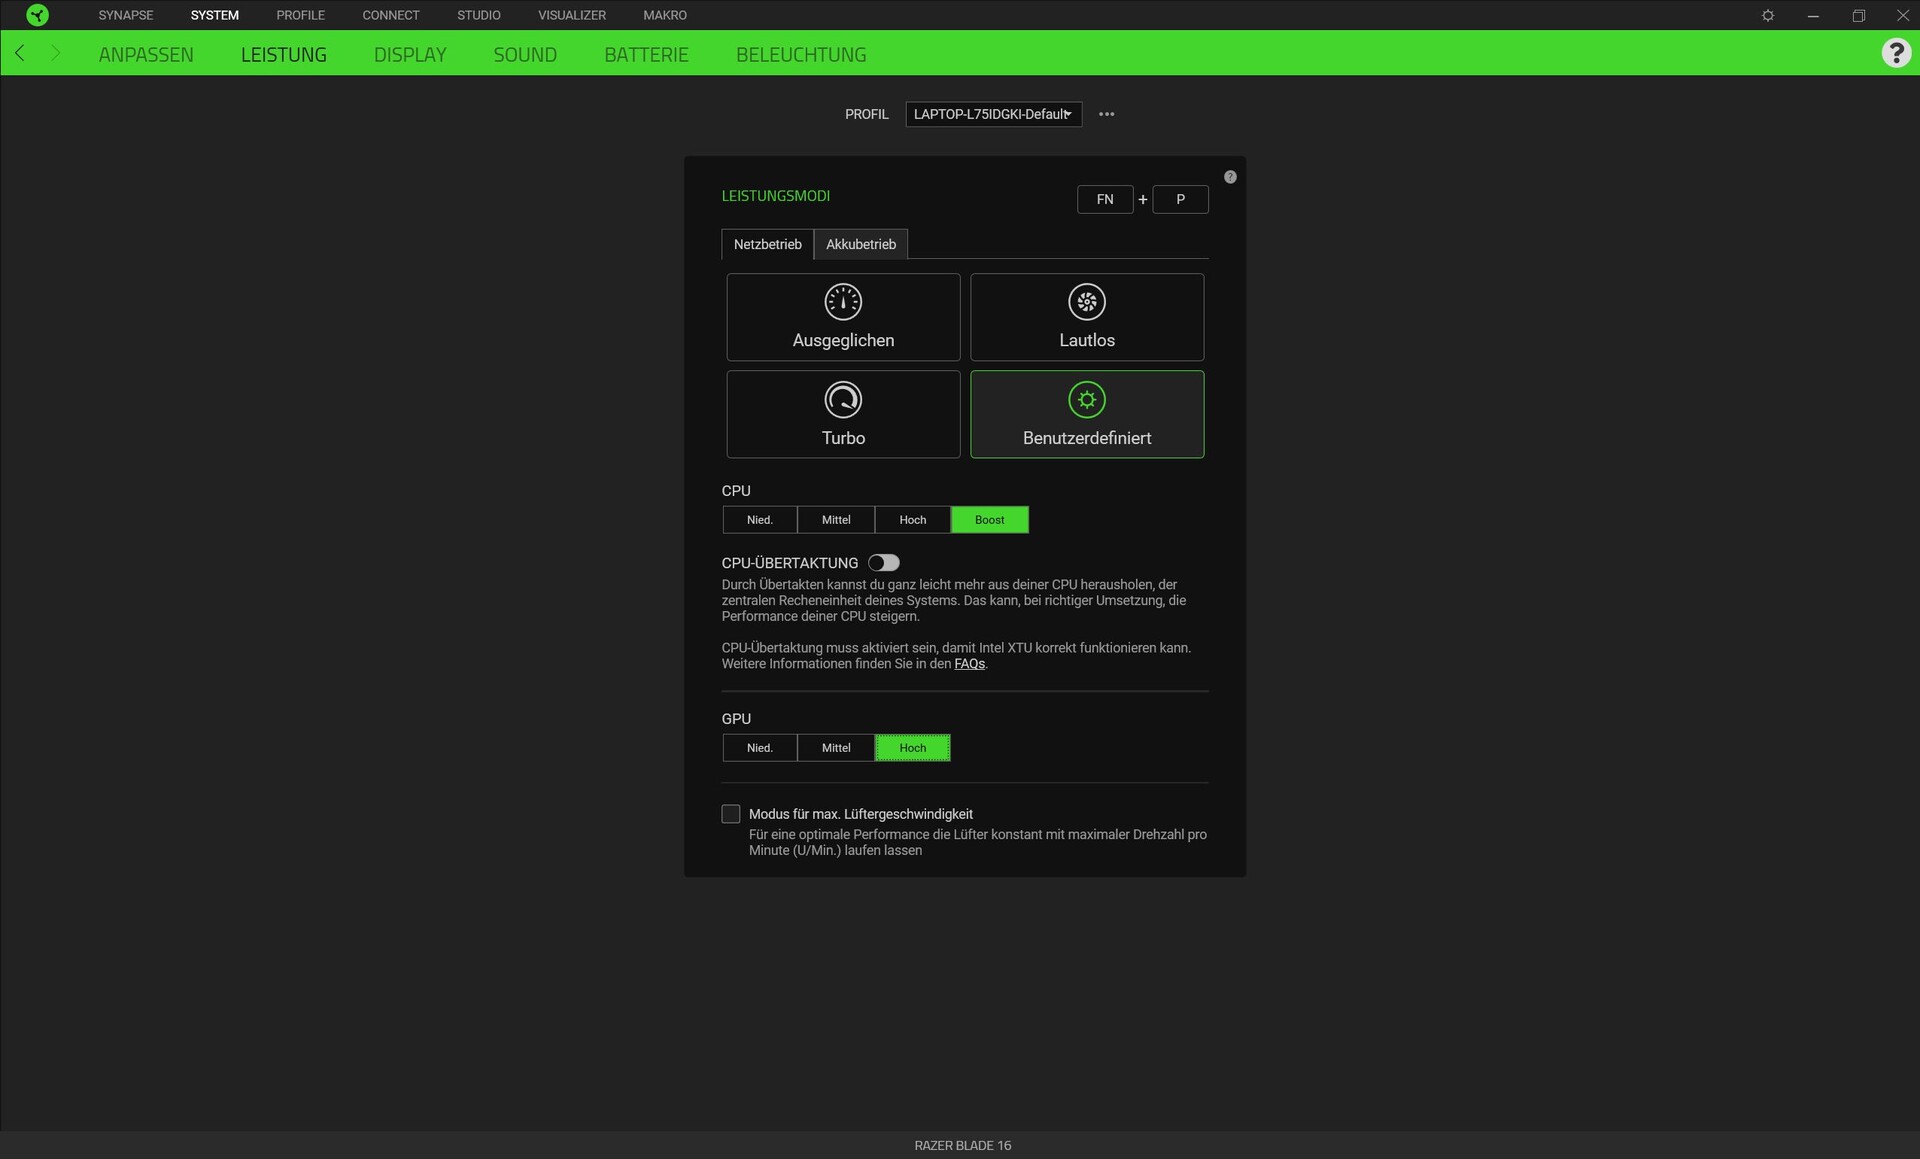
Razer Synapse sirve como centro de mando y control en los modelos Blade. Le permite configurar uno de los cuatro modos de rendimiento(silencioso, equilibrado, turbo, personalizado), así como los efectos de iluminación y realizar más ajustes.
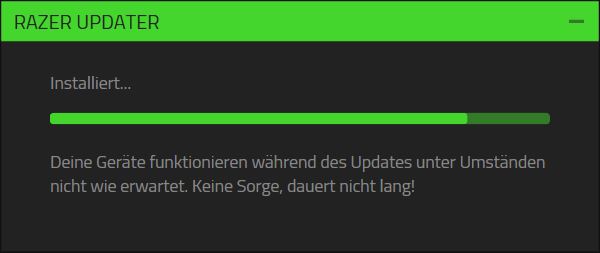
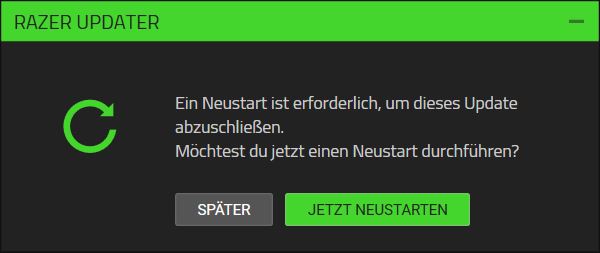
A veces, el software tiene que actualizarse por sí solo, lo que lleva un tiempo inusualmente largo; incluso tuvimos que reiniciar el dispositivo después, lo que resultó un poco molesto. No se puede acceder a las opciones durante la larga actualización no solicitada. La pantalla de inicio tampoco es la mejor. Aunque el software recuerda la última pestaña abierta durante una sesión de Windows (por ejemplo, rendimiento), siempre tenemos que reiniciar antes de poder acceder a la pantalla de inicio. Aquí, primero tenemos que seleccionar nuestro dispositivo (incluso si es nuestro único dispositivo Razer) y luego hacer clic en la pestaña correcta; "personalizar" está seleccionada por defecto (configurar teclas de función), una pestaña que probablemente se utiliza muy poco.
Para nuestras pruebas de rendimiento, utilizamos el modo personalizado para maximizar el rendimiento de la CPU y la GPU. Sin embargo, dejamos los ventiladores en automático, de lo contrario siempre subirían al máximo volumen. A veces se produjeron algunos problemas con el cambio de gráficos, que fallaba en determinadas aplicaciones. Por ejemplo, 3DMark 06 sólo se iniciaba en modo dGPU.
Procesador
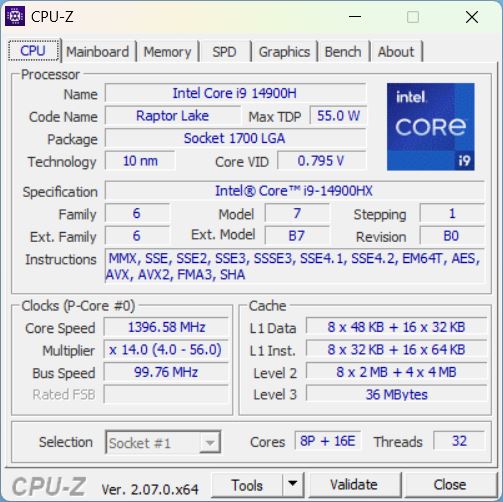
El Core i9-14900HX es el actual perro superior dentro de la serie Raptor-Lake-Refresh para portátiles. Sin embargo, en comparación con el Raptor Lake del año pasado, la arquitectura se ha mantenido igual, sólo que su velocidad de reloj turbo es ahora ligeramente superior. Ahora alcanza hasta 5,8 GHz y, aparte de esto, la CPU insignia de Intel cuenta con 24 núcleos (8 núcleos P, 16 núcleos E; 32 hilos).
Durante el bucle Cinebench R15, la CPU ofreció un rendimiento muy alto y constante sin la habitual caída de rendimiento tras las primeras 1 a 3 ejecuciones. Aun así, el Legion 9 con el modelo superior del año pasado, el Core i9-13980HX, fue igual de rápido y las otras CPU de gama alta de la Gen 13 de Intel sólo se quedaron un poco por detrás. El más débil i7-14650HX dentro de la actual Legion 5 quedó un poco más rezagado. En comparación con su predecesorlos resultados de la CPU actual fueron aproximadamente un 8% mejores. A pesar de este excelente rendimiento, no hay demasiados argumentos que hablen a favor de gastar mucho dinero en el Intel Gen 14, ya que el Gen 13 es casi idénticamente rápido. Eche un vistazo a nuestro análisis de las nuevas CPU Gen-14 para obtener más información.
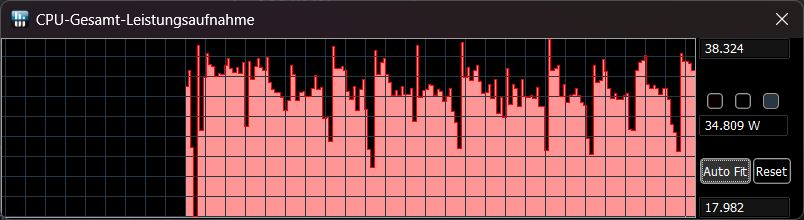
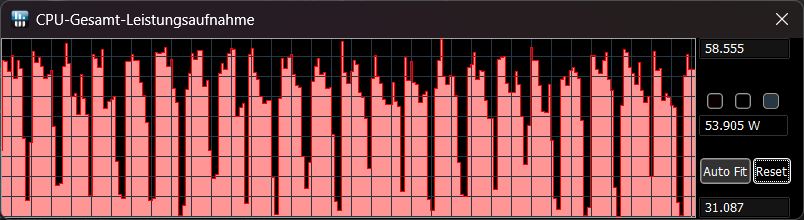
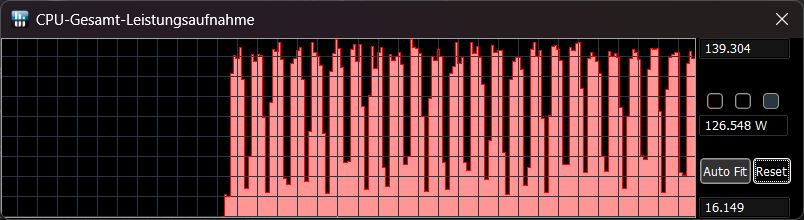
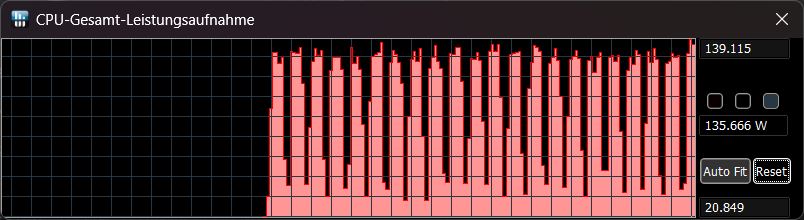
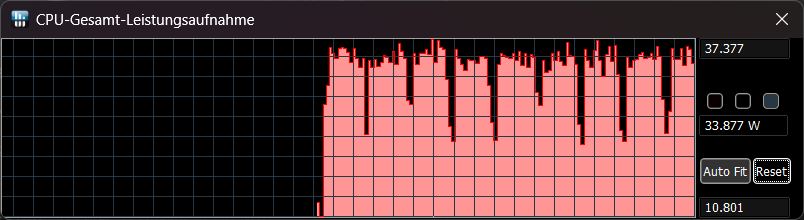
En la tabla siguiente, hemos enumerado el consumo de energía durante Cinebench R15 utilizando los diferentes modos de rendimiento y las capturas de pantalla de la derecha ilustran estos valores. Si desconectábamos la alimentación, Synapse pasaba automáticamente al modo equilibrado, que no se podía cambiar. Sin embargo, los valores de TDP eran aún más bajos que en el mismo modo cuando estaba enchufado; son bastante más parecidos a los valores del modo silencioso.
| Modo/valor de rendimiento | Puntuación Cinebench R15, primera ejecución | TDP al inicio de la ejecución | TDP al final de la ejecución |
|---|---|---|---|
| Definido por el usuario (boost/alto) | 4.456 | 139 | 135 |
| Turbo | 4.305 | 139 | 126 |
| Equilibrado | 2.678 | 58 | 54 |
| Silencioso | 1.888 | 38 | 35 |
| Batería | 1.835 | 37 | 34 |
Cinebench R15 Multi continuous test
Cinebench R23: Multi Core | Single Core
Cinebench R20: CPU (Multi Core) | CPU (Single Core)
Cinebench R15: CPU Multi 64Bit | CPU Single 64Bit
Blender: v2.79 BMW27 CPU
7-Zip 18.03: 7z b 4 | 7z b 4 -mmt1
Geekbench 6.7: Multi-Core | Single-Core
Geekbench 5.5: Multi-Core | Single-Core
HWBOT x265 Benchmark v2.2: 4k Preset
LibreOffice : 20 Documents To PDF
R Benchmark 2.5: Overall mean
| CPU Performance rating | |
| Lenovo Legion 9 16IRX8 | |
| Razer Blade 16 2024, RTX 4090 | |
| Medio Intel Core i9-14900HX | |
| Schenker XMG Neo 16 E23 -2! | |
| Razer Blade 16 Early 2023 RTX 4090 -2! | |
| Media de la clase Gaming | |
| Lenovo Legion 5 16IRX G9 | |
| Cinebench R23 / Multi Core | |
| Lenovo Legion 9 16IRX8 | |
| Schenker XMG Neo 16 E23 | |
| Razer Blade 16 2024, RTX 4090 | |
| Medio Intel Core i9-14900HX (17078 - 36249, n=37) | |
| Razer Blade 16 Early 2023 RTX 4090 | |
| Media de la clase Gaming (10488 - 42661, n=107, últimos 2 años) | |
| Lenovo Legion 5 16IRX G9 | |
| Cinebench R23 / Single Core | |
| Medio Intel Core i9-14900HX (1720 - 2245, n=37) | |
| Lenovo Legion 9 16IRX8 | |
| Razer Blade 16 2024, RTX 4090 | |
| Schenker XMG Neo 16 E23 | |
| Media de la clase Gaming (1166 - 2415, n=107, últimos 2 años) | |
| Lenovo Legion 5 16IRX G9 | |
| Razer Blade 16 Early 2023 RTX 4090 | |
| Cinebench R20 / CPU (Multi Core) | |
| Lenovo Legion 9 16IRX8 | |
| Schenker XMG Neo 16 E23 | |
| Medio Intel Core i9-14900HX (6579 - 13832, n=37) | |
| Razer Blade 16 2024, RTX 4090 | |
| Razer Blade 16 Early 2023 RTX 4090 | |
| Media de la clase Gaming (4029 - 16433, n=106, últimos 2 años) | |
| Lenovo Legion 5 16IRX G9 | |
| Cinebench R20 / CPU (Single Core) | |
| Medio Intel Core i9-14900HX (657 - 859, n=37) | |
| Razer Blade 16 2024, RTX 4090 | |
| Schenker XMG Neo 16 E23 | |
| Media de la clase Gaming (442 - 913, n=106, últimos 2 años) | |
| Razer Blade 16 Early 2023 RTX 4090 | |
| Lenovo Legion 5 16IRX G9 | |
| Lenovo Legion 9 16IRX8 | |
| Cinebench R15 / CPU Multi 64Bit | |
| Schenker XMG Neo 16 E23 | |
| Lenovo Legion 9 16IRX8 | |
| Razer Blade 16 2024, RTX 4090 | |
| Medio Intel Core i9-14900HX (3263 - 5589, n=38) | |
| Razer Blade 16 Early 2023 RTX 4090 | |
| Media de la clase Gaming (1578 - 6330, n=105, últimos 2 años) | |
| Lenovo Legion 5 16IRX G9 | |
| Cinebench R15 / CPU Single 64Bit | |
| Razer Blade 16 2024, RTX 4090 | |
| Medio Intel Core i9-14900HX (247 - 323, n=37) | |
| Lenovo Legion 9 16IRX8 | |
| Schenker XMG Neo 16 E23 | |
| Media de la clase Gaming (188.8 - 350, n=106, últimos 2 años) | |
| Lenovo Legion 5 16IRX G9 | |
| Razer Blade 16 Early 2023 RTX 4090 | |
| Blender / v2.79 BMW27 CPU | |
| Media de la clase Gaming (79 - 330, n=104, últimos 2 años) | |
| Lenovo Legion 5 16IRX G9 | |
| Medio Intel Core i9-14900HX (91 - 206, n=37) | |
| Razer Blade 16 Early 2023 RTX 4090 | |
| Schenker XMG Neo 16 E23 | |
| Razer Blade 16 2024, RTX 4090 | |
| Lenovo Legion 9 16IRX8 | |
| 7-Zip 18.03 / 7z b 4 | |
| Lenovo Legion 9 16IRX8 | |
| Razer Blade 16 2024, RTX 4090 | |
| Schenker XMG Neo 16 E23 | |
| Medio Intel Core i9-14900HX (66769 - 136645, n=37) | |
| Razer Blade 16 Early 2023 RTX 4090 | |
| Lenovo Legion 5 16IRX G9 | |
| Media de la clase Gaming (33491 - 148086, n=105, últimos 2 años) | |
| 7-Zip 18.03 / 7z b 4 -mmt1 | |
| Schenker XMG Neo 16 E23 | |
| Medio Intel Core i9-14900HX (5452 - 7545, n=37) | |
| Razer Blade 16 2024, RTX 4090 | |
| Lenovo Legion 9 16IRX8 | |
| Razer Blade 16 Early 2023 RTX 4090 | |
| Lenovo Legion 5 16IRX G9 | |
| Media de la clase Gaming (4199 - 7436, n=105, últimos 2 años) | |
| Geekbench 6.7 / Multi-Core | |
| Razer Blade 16 2024, RTX 4090 | |
| Lenovo Legion 9 16IRX8 | |
| Medio Intel Core i9-14900HX (13158 - 19665, n=37) | |
| Lenovo Legion 5 16IRX G9 | |
| Media de la clase Gaming (6625 - 22850, n=106, últimos 2 años) | |
| Geekbench 6.7 / Single-Core | |
| Medio Intel Core i9-14900HX (2419 - 3129, n=37) | |
| Razer Blade 16 2024, RTX 4090 | |
| Lenovo Legion 9 16IRX8 | |
| Media de la clase Gaming (1490 - 3259, n=106, últimos 2 años) | |
| Lenovo Legion 5 16IRX G9 | |
| Geekbench 5.5 / Multi-Core | |
| Schenker XMG Neo 16 E23 | |
| Lenovo Legion 9 16IRX8 | |
| Medio Intel Core i9-14900HX (8618 - 23194, n=37) | |
| Razer Blade 16 2024, RTX 4090 | |
| Media de la clase Gaming (6460 - 28263, n=105, últimos 2 años) | |
| Lenovo Legion 5 16IRX G9 | |
| Razer Blade 16 Early 2023 RTX 4090 | |
| Geekbench 5.5 / Single-Core | |
| Lenovo Legion 9 16IRX8 | |
| Razer Blade 16 2024, RTX 4090 | |
| Medio Intel Core i9-14900HX (1669 - 2210, n=37) | |
| Media de la clase Gaming (986 - 2474, n=105, últimos 2 años) | |
| Schenker XMG Neo 16 E23 | |
| Razer Blade 16 Early 2023 RTX 4090 | |
| Lenovo Legion 5 16IRX G9 | |
| HWBOT x265 Benchmark v2.2 / 4k Preset | |
| Lenovo Legion 9 16IRX8 | |
| Schenker XMG Neo 16 E23 | |
| Razer Blade 16 Early 2023 RTX 4090 | |
| Razer Blade 16 2024, RTX 4090 | |
| Medio Intel Core i9-14900HX (16.8 - 38.9, n=37) | |
| Media de la clase Gaming (11.5 - 44.4, n=105, últimos 2 años) | |
| Lenovo Legion 5 16IRX G9 | |
| LibreOffice / 20 Documents To PDF | |
| Razer Blade 16 Early 2023 RTX 4090 | |
| Media de la clase Gaming (33.2 - 88.8, n=105, últimos 2 años) | |
| Razer Blade 16 2024, RTX 4090 | |
| Lenovo Legion 5 16IRX G9 | |
| Medio Intel Core i9-14900HX (19 - 85.1, n=37) | |
| Schenker XMG Neo 16 E23 | |
| Lenovo Legion 9 16IRX8 | |
| R Benchmark 2.5 / Overall mean | |
| Media de la clase Gaming (0.3439 - 0.759, n=106, últimos 2 años) | |
| Lenovo Legion 5 16IRX G9 | |
| Razer Blade 16 Early 2023 RTX 4090 | |
| Medio Intel Core i9-14900HX (0.3604 - 0.4859, n=37) | |
| Lenovo Legion 9 16IRX8 | |
| Razer Blade 16 2024, RTX 4090 | |
| Schenker XMG Neo 16 E23 | |
* ... más pequeño es mejor
AIDA64: FP32 Ray-Trace | FPU Julia | CPU SHA3 | CPU Queen | FPU SinJulia | FPU Mandel | CPU AES | CPU ZLib | FP64 Ray-Trace | CPU PhotoWorxx
| Performance rating | |
| Lenovo Legion 9 16IRX8 | |
| Media de la clase Gaming | |
| Razer Blade 16 2024, RTX 4090 | |
| Schenker XMG Neo 16 E23 | |
| Medio Intel Core i9-14900HX | |
| Razer Blade 16 Early 2023 RTX 4090 | |
| Lenovo Legion 5 16IRX G9 | |
| AIDA64 / FP32 Ray-Trace | |
| Media de la clase Gaming (10227 - 85542, n=105, últimos 2 años) | |
| Lenovo Legion 9 16IRX8 | |
| Razer Blade 16 2024, RTX 4090 | |
| Medio Intel Core i9-14900HX (13098 - 33474, n=36) | |
| Schenker XMG Neo 16 E23 | |
| Lenovo Legion 5 16IRX G9 | |
| Razer Blade 16 Early 2023 RTX 4090 | |
| AIDA64 / FPU Julia | |
| Media de la clase Gaming (51376 - 238426, n=105, últimos 2 años) | |
| Lenovo Legion 9 16IRX8 | |
| Razer Blade 16 2024, RTX 4090 | |
| Medio Intel Core i9-14900HX (67573 - 166040, n=36) | |
| Schenker XMG Neo 16 E23 | |
| Razer Blade 16 Early 2023 RTX 4090 | |
| Lenovo Legion 5 16IRX G9 | |
| AIDA64 / CPU SHA3 | |
| Lenovo Legion 9 16IRX8 | |
| Media de la clase Gaming (2180 - 10115, n=105, últimos 2 años) | |
| Razer Blade 16 2024, RTX 4090 | |
| Medio Intel Core i9-14900HX (3589 - 7979, n=36) | |
| Schenker XMG Neo 16 E23 | |
| Razer Blade 16 Early 2023 RTX 4090 | |
| Lenovo Legion 5 16IRX G9 | |
| AIDA64 / CPU Queen | |
| Razer Blade 16 2024, RTX 4090 | |
| Medio Intel Core i9-14900HX (118405 - 148966, n=36) | |
| Razer Blade 16 Early 2023 RTX 4090 | |
| Schenker XMG Neo 16 E23 | |
| Lenovo Legion 9 16IRX8 | |
| Media de la clase Gaming (49785 - 173351, n=90, últimos 2 años) | |
| Lenovo Legion 5 16IRX G9 | |
| AIDA64 / FPU SinJulia | |
| Razer Blade 16 2024, RTX 4090 | |
| Lenovo Legion 9 16IRX8 | |
| Medio Intel Core i9-14900HX (10475 - 18517, n=36) | |
| Schenker XMG Neo 16 E23 | |
| Media de la clase Gaming (4424 - 33636, n=105, últimos 2 años) | |
| Razer Blade 16 Early 2023 RTX 4090 | |
| Lenovo Legion 5 16IRX G9 | |
| AIDA64 / FPU Mandel | |
| Media de la clase Gaming (25115 - 128721, n=105, últimos 2 años) | |
| Lenovo Legion 9 16IRX8 | |
| Razer Blade 16 2024, RTX 4090 | |
| Medio Intel Core i9-14900HX (32543 - 83662, n=36) | |
| Schenker XMG Neo 16 E23 | |
| Lenovo Legion 5 16IRX G9 | |
| Razer Blade 16 Early 2023 RTX 4090 | |
| AIDA64 / CPU AES | |
| Schenker XMG Neo 16 E23 | |
| Razer Blade 16 Early 2023 RTX 4090 | |
| Medio Intel Core i9-14900HX (86964 - 241777, n=36) | |
| Lenovo Legion 9 16IRX8 | |
| Razer Blade 16 2024, RTX 4090 | |
| Media de la clase Gaming (39258 - 247074, n=105, últimos 2 años) | |
| Lenovo Legion 5 16IRX G9 | |
| AIDA64 / CPU ZLib | |
| Lenovo Legion 9 16IRX8 | |
| Razer Blade 16 2024, RTX 4090 | |
| Medio Intel Core i9-14900HX (1054 - 2292, n=36) | |
| Schenker XMG Neo 16 E23 | |
| Razer Blade 16 Early 2023 RTX 4090 | |
| Media de la clase Gaming (574 - 2531, n=105, últimos 2 años) | |
| Lenovo Legion 5 16IRX G9 | |
| AIDA64 / FP64 Ray-Trace | |
| Media de la clase Gaming (5509 - 45446, n=105, últimos 2 años) | |
| Lenovo Legion 9 16IRX8 | |
| Razer Blade 16 2024, RTX 4090 | |
| Medio Intel Core i9-14900HX (6809 - 18349, n=36) | |
| Schenker XMG Neo 16 E23 | |
| Lenovo Legion 5 16IRX G9 | |
| Razer Blade 16 Early 2023 RTX 4090 | |
| AIDA64 / CPU PhotoWorxx | |
| Razer Blade 16 Early 2023 RTX 4090 | |
| Lenovo Legion 9 16IRX8 | |
| Razer Blade 16 2024, RTX 4090 | |
| Schenker XMG Neo 16 E23 | |
| Medio Intel Core i9-14900HX (23903 - 54702, n=36) | |
| Media de la clase Gaming (12271 - 89891, n=105, últimos 2 años) | |
| Lenovo Legion 5 16IRX G9 | |
Rendimiento del sistema
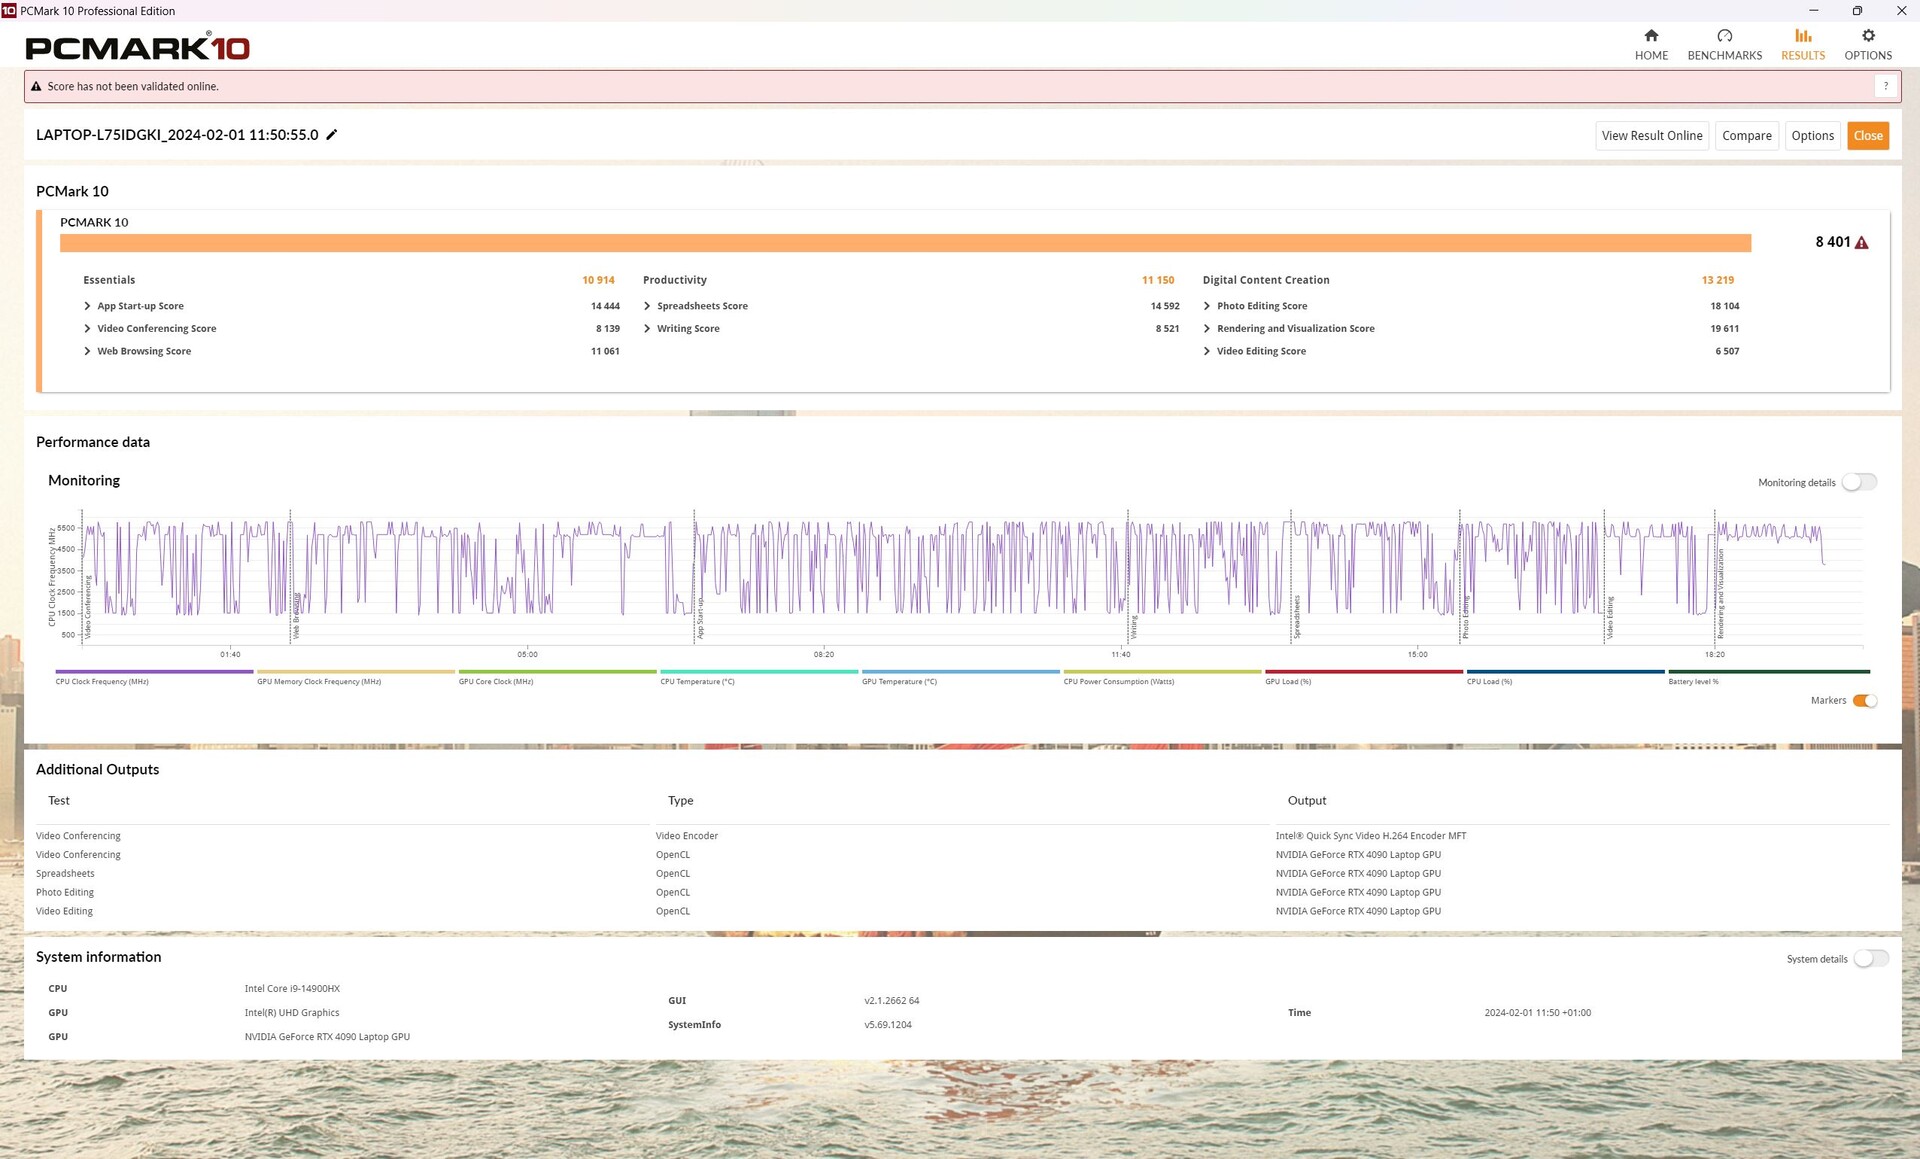
En CrossMark, la Blade 16 tomó la delantera a los dispositivos de comparación, mientras que en PCMark 10, la jugadora se quedó en torno a un 3% por detrás del portátil medio con la misma combinación de CPU/GPU. En total, todos los dispositivos de comparación alcanzaron valores similares.
Subjetivamente, el sistema funciona sin problemas -sólo la conmutación de gráficos hace que se congele durante unos segundos al iniciar las aplicaciones, pero esto también ocurre en muchos otros gamers con dGPU.
CrossMark: Overall | Productivity | Creativity | Responsiveness
WebXPRT 3: Overall
WebXPRT 4: Overall
Mozilla Kraken 1.1: Total
| PCMark 10 / Score | |
| Lenovo Legion 9 16IRX8 | |
| Medio Intel Core i9-14900HX, NVIDIA GeForce RTX 4090 Laptop GPU (8230 - 9234, n=13) | |
| Media de la clase Gaming (5828 - 12414, n=93, últimos 2 años) | |
| Razer Blade 16 2024, RTX 4090 | |
| Schenker XMG Neo 16 E23 | |
| Lenovo Legion 5 16IRX G9 | |
| Razer Blade 16 Early 2023 RTX 4090 | |
| PCMark 10 / Essentials | |
| Lenovo Legion 9 16IRX8 | |
| Medio Intel Core i9-14900HX, NVIDIA GeForce RTX 4090 Laptop GPU (10778 - 11628, n=13) | |
| Schenker XMG Neo 16 E23 | |
| Razer Blade 16 2024, RTX 4090 | |
| Razer Blade 16 Early 2023 RTX 4090 | |
| Lenovo Legion 5 16IRX G9 | |
| Media de la clase Gaming (8810 - 11935, n=97, últimos 2 años) | |
| PCMark 10 / Productivity | |
| Media de la clase Gaming (6845 - 25323, n=95, últimos 2 años) | |
| Razer Blade 16 2024, RTX 4090 | |
| Lenovo Legion 9 16IRX8 | |
| Medio Intel Core i9-14900HX, NVIDIA GeForce RTX 4090 Laptop GPU (9458 - 11759, n=13) | |
| Schenker XMG Neo 16 E23 | |
| Lenovo Legion 5 16IRX G9 | |
| Razer Blade 16 Early 2023 RTX 4090 | |
| PCMark 10 / Digital Content Creation | |
| Lenovo Legion 9 16IRX8 | |
| Medio Intel Core i9-14900HX, NVIDIA GeForce RTX 4090 Laptop GPU (13219 - 16462, n=13) | |
| Schenker XMG Neo 16 E23 | |
| Media de la clase Gaming (7602 - 19954, n=95, últimos 2 años) | |
| Razer Blade 16 2024, RTX 4090 | |
| Razer Blade 16 Early 2023 RTX 4090 | |
| Lenovo Legion 5 16IRX G9 | |
| CrossMark / Overall | |
| Razer Blade 16 2024, RTX 4090 | |
| Medio Intel Core i9-14900HX, NVIDIA GeForce RTX 4090 Laptop GPU (1877 - 2344, n=10) | |
| Schenker XMG Neo 16 E23 | |
| Lenovo Legion 5 16IRX G9 | |
| Razer Blade 16 Early 2023 RTX 4090 | |
| Media de la clase Gaming (1366 - 2409, n=94, últimos 2 años) | |
| Lenovo Legion 9 16IRX8 | |
| CrossMark / Productivity | |
| Razer Blade 16 2024, RTX 4090 | |
| Medio Intel Core i9-14900HX, NVIDIA GeForce RTX 4090 Laptop GPU (1738 - 2162, n=10) | |
| Schenker XMG Neo 16 E23 | |
| Lenovo Legion 5 16IRX G9 | |
| Razer Blade 16 Early 2023 RTX 4090 | |
| Media de la clase Gaming (1386 - 2254, n=94, últimos 2 años) | |
| Lenovo Legion 9 16IRX8 | |
| CrossMark / Creativity | |
| Schenker XMG Neo 16 E23 | |
| Razer Blade 16 2024, RTX 4090 | |
| Medio Intel Core i9-14900HX, NVIDIA GeForce RTX 4090 Laptop GPU (2195 - 2660, n=10) | |
| Lenovo Legion 5 16IRX G9 | |
| Lenovo Legion 9 16IRX8 | |
| Media de la clase Gaming (1343 - 2786, n=94, últimos 2 años) | |
| Razer Blade 16 Early 2023 RTX 4090 | |
| CrossMark / Responsiveness | |
| Lenovo Legion 5 16IRX G9 | |
| Medio Intel Core i9-14900HX, NVIDIA GeForce RTX 4090 Laptop GPU (1478 - 2327, n=10) | |
| Razer Blade 16 2024, RTX 4090 | |
| Razer Blade 16 Early 2023 RTX 4090 | |
| Schenker XMG Neo 16 E23 | |
| Media de la clase Gaming (1226 - 2334, n=94, últimos 2 años) | |
| Lenovo Legion 9 16IRX8 | |
| WebXPRT 3 / Overall | |
| Lenovo Legion 9 16IRX8 | |
| Schenker XMG Neo 16 E23 | |
| Razer Blade 16 2024, RTX 4090 | |
| Medio Intel Core i9-14900HX, NVIDIA GeForce RTX 4090 Laptop GPU (279 - 339, n=10) | |
| Media de la clase Gaming (220 - 532, n=98, últimos 2 años) | |
| Lenovo Legion 5 16IRX G9 | |
| Razer Blade 16 Early 2023 RTX 4090 | |
| Razer Blade 16 Early 2023 RTX 4090 | |
| WebXPRT 4 / Overall | |
| Lenovo Legion 9 16IRX8 | |
| Schenker XMG Neo 16 E23 | |
| Medio Intel Core i9-14900HX, NVIDIA GeForce RTX 4090 Laptop GPU (246 - 309, n=8) | |
| Media de la clase Gaming (165 - 354, n=98, últimos 2 años) | |
| Razer Blade 16 Early 2023 RTX 4090 | |
| Razer Blade 16 Early 2023 RTX 4090 | |
| Razer Blade 16 Early 2023 RTX 4090 | |
| Lenovo Legion 5 16IRX G9 | |
| Mozilla Kraken 1.1 / Total | |
| Lenovo Legion 5 16IRX G9 | |
| Razer Blade 16 Early 2023 RTX 4090 | |
| Razer Blade 16 Early 2023 RTX 4090 | |
| Media de la clase Gaming (391 - 590, n=100, últimos 2 años) | |
| Medio Intel Core i9-14900HX, NVIDIA GeForce RTX 4090 Laptop GPU (428 - 535, n=11) | |
| Schenker XMG Neo 16 E23 | |
| Razer Blade 16 2024, RTX 4090 | |
| Lenovo Legion 9 16IRX8 | |
* ... más pequeño es mejor
| PCMark 10 Score | 8401 puntos | |
ayuda | ||
| AIDA64 / Memory Copy | |
| Razer Blade 16 2024, RTX 4090 | |
| Razer Blade 16 Early 2023 RTX 4090 | |
| Lenovo Legion 9 16IRX8 | |
| Schenker XMG Neo 16 E23 | |
| Medio Intel Core i9-14900HX (38028 - 83392, n=36) | |
| Media de la clase Gaming (21750 - 129946, n=105, últimos 2 años) | |
| Lenovo Legion 5 16IRX G9 | |
| AIDA64 / Memory Read | |
| Razer Blade 16 2024, RTX 4090 | |
| Lenovo Legion 9 16IRX8 | |
| Razer Blade 16 Early 2023 RTX 4090 | |
| Schenker XMG Neo 16 E23 | |
| Medio Intel Core i9-14900HX (43306 - 87568, n=36) | |
| Media de la clase Gaming (22956 - 118858, n=105, últimos 2 años) | |
| Lenovo Legion 5 16IRX G9 | |
| AIDA64 / Memory Write | |
| Razer Blade 16 Early 2023 RTX 4090 | |
| Lenovo Legion 9 16IRX8 | |
| Media de la clase Gaming (22297 - 135096, n=105, últimos 2 años) | |
| Razer Blade 16 2024, RTX 4090 | |
| Medio Intel Core i9-14900HX (37146 - 80589, n=36) | |
| Schenker XMG Neo 16 E23 | |
| Lenovo Legion 5 16IRX G9 | |
| AIDA64 / Memory Latency | |
| Media de la clase Gaming (75.3 - 259, n=105, últimos 2 años) | |
| Lenovo Legion 5 16IRX G9 | |
| Razer Blade 16 Early 2023 RTX 4090 | |
| Schenker XMG Neo 16 E23 | |
| Medio Intel Core i9-14900HX (76.1 - 105, n=36) | |
| Lenovo Legion 9 16IRX8 | |
| Razer Blade 16 2024, RTX 4090 | |
* ... más pequeño es mejor
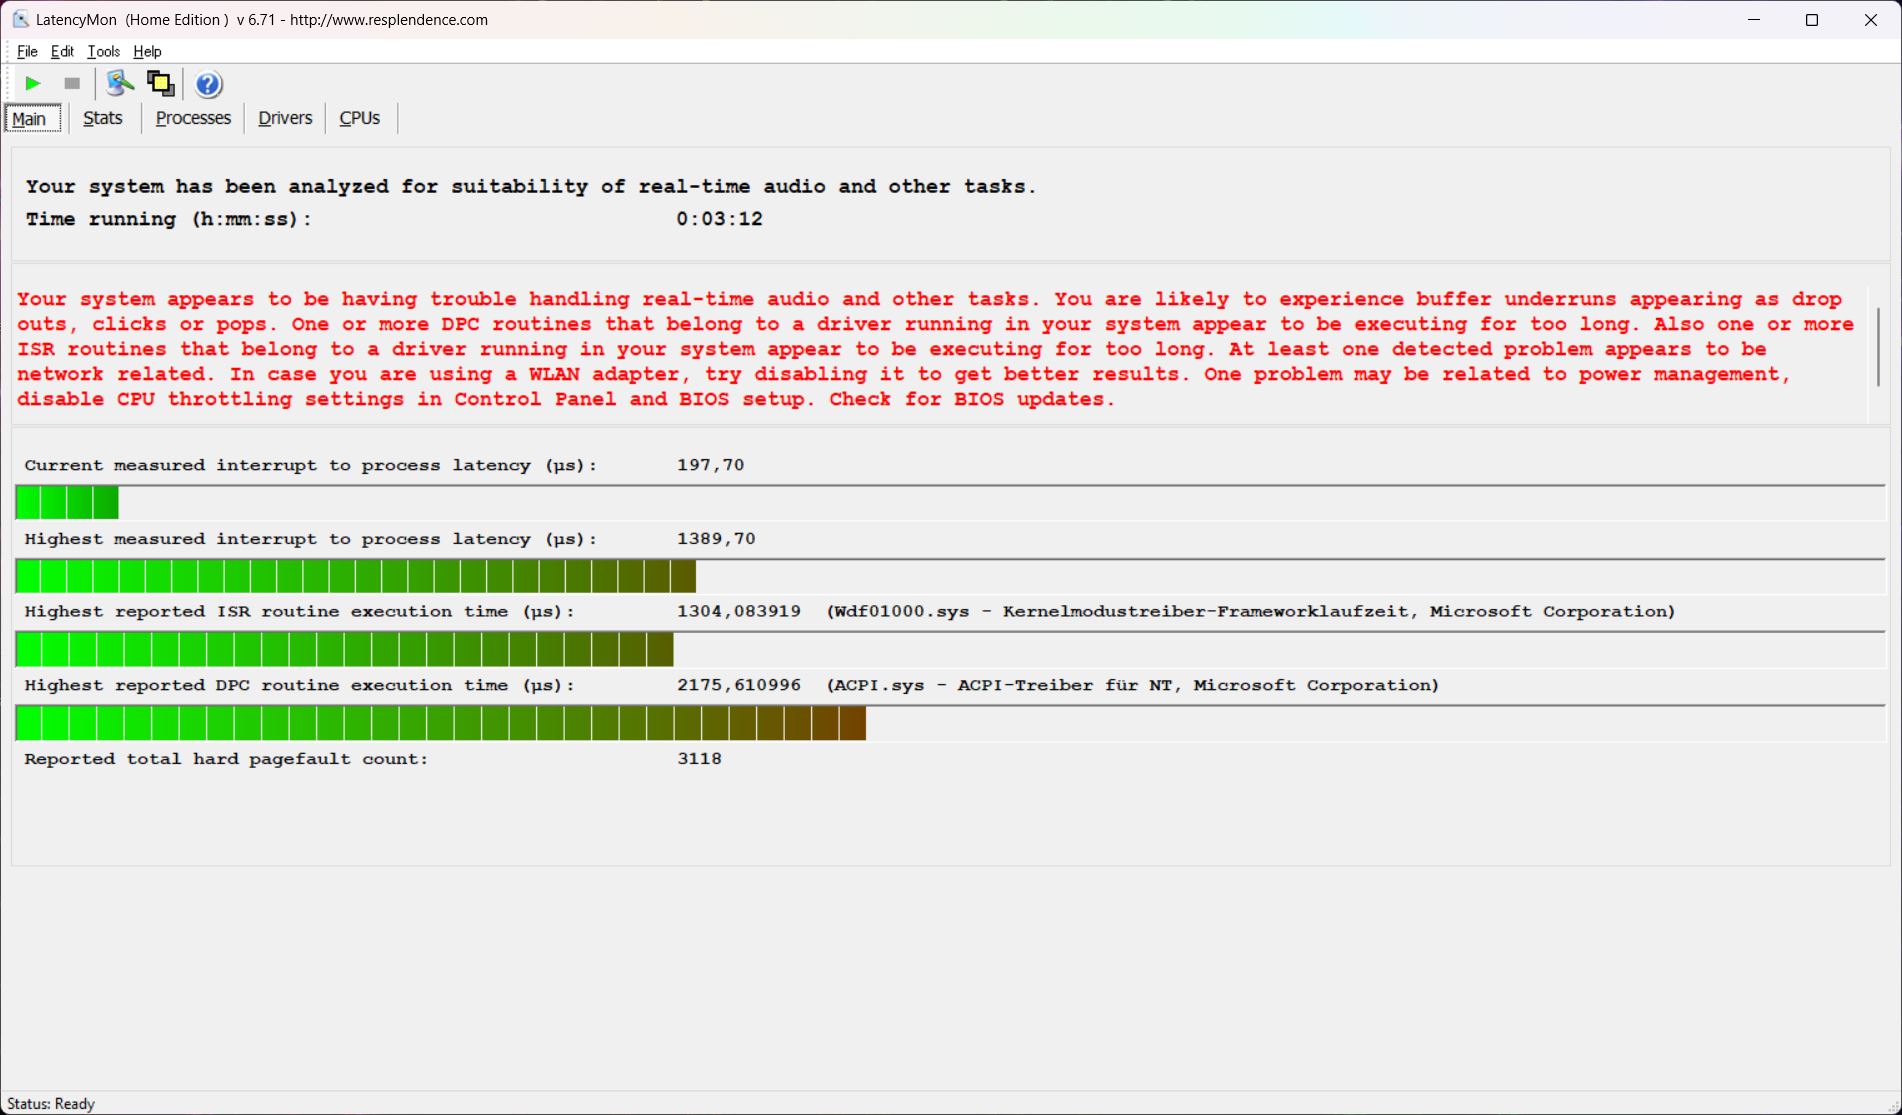
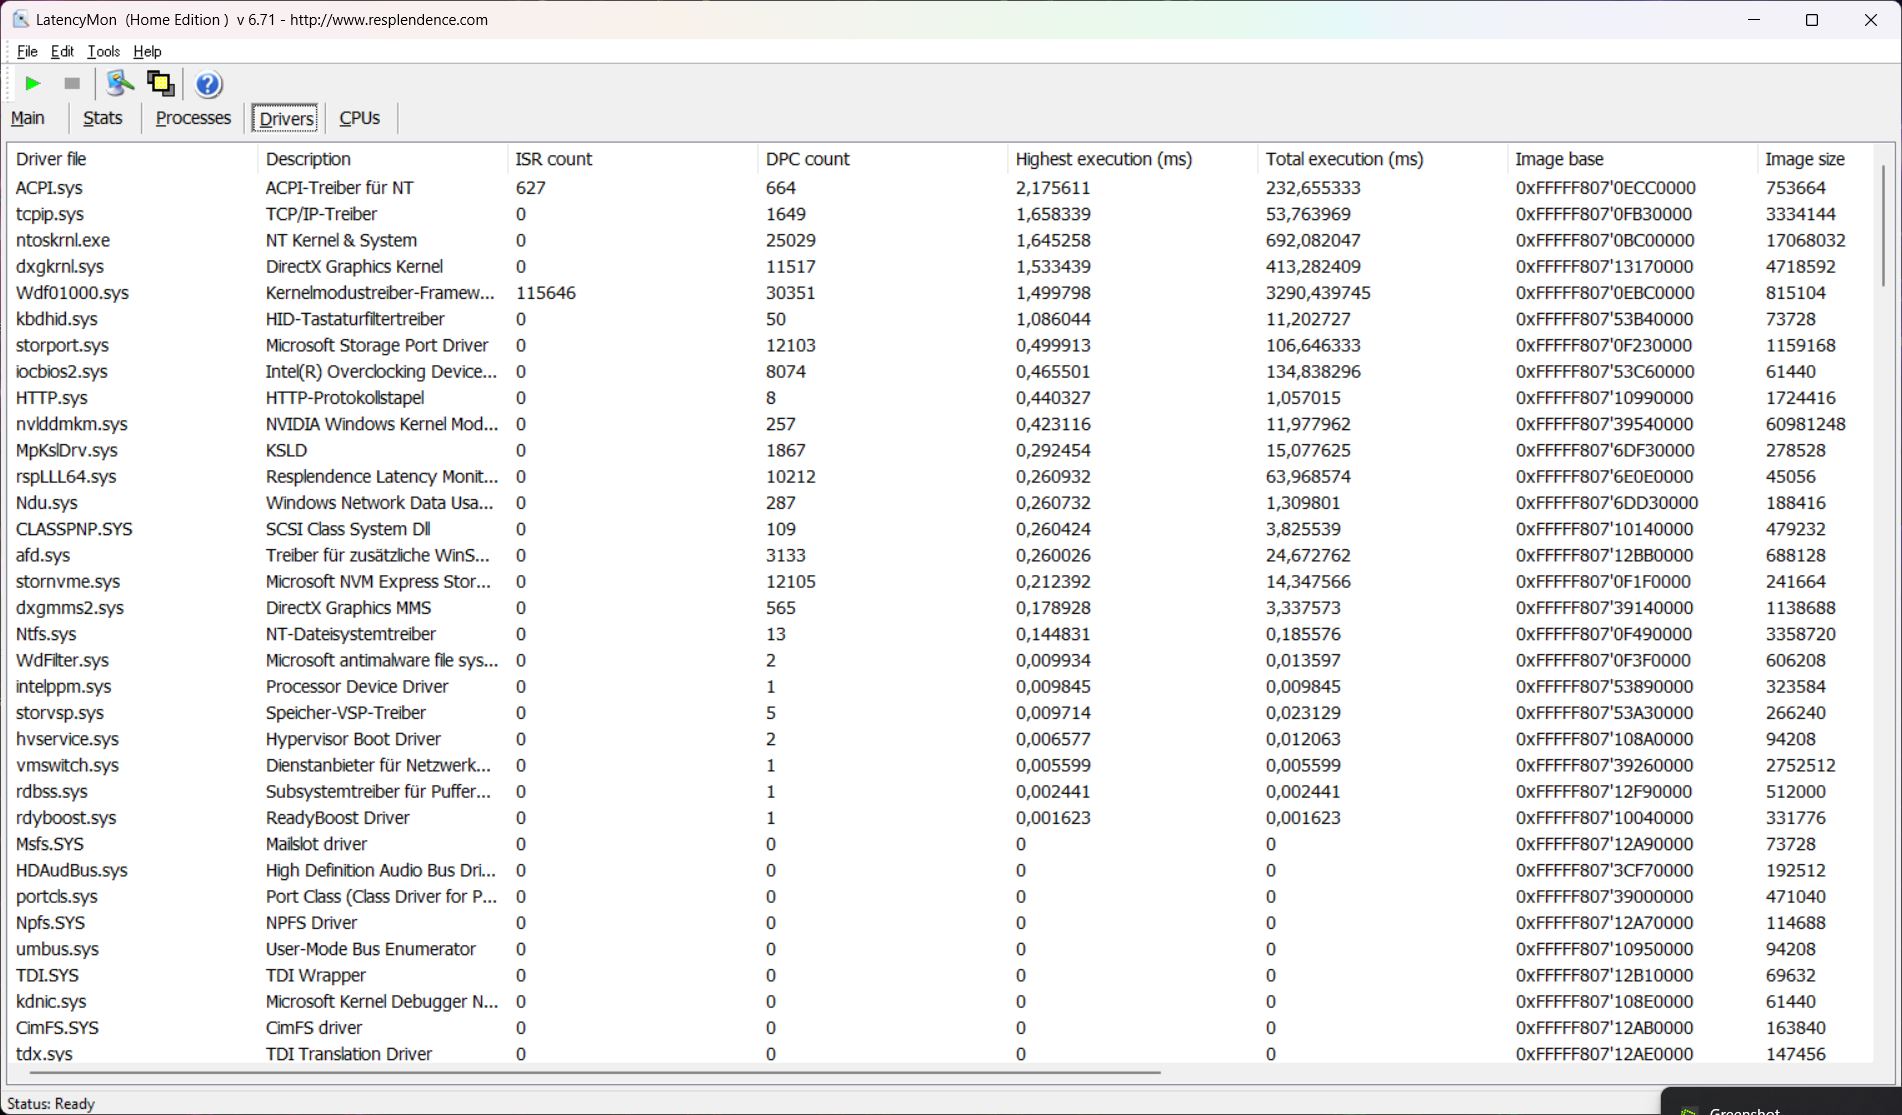
Latencia del CPD
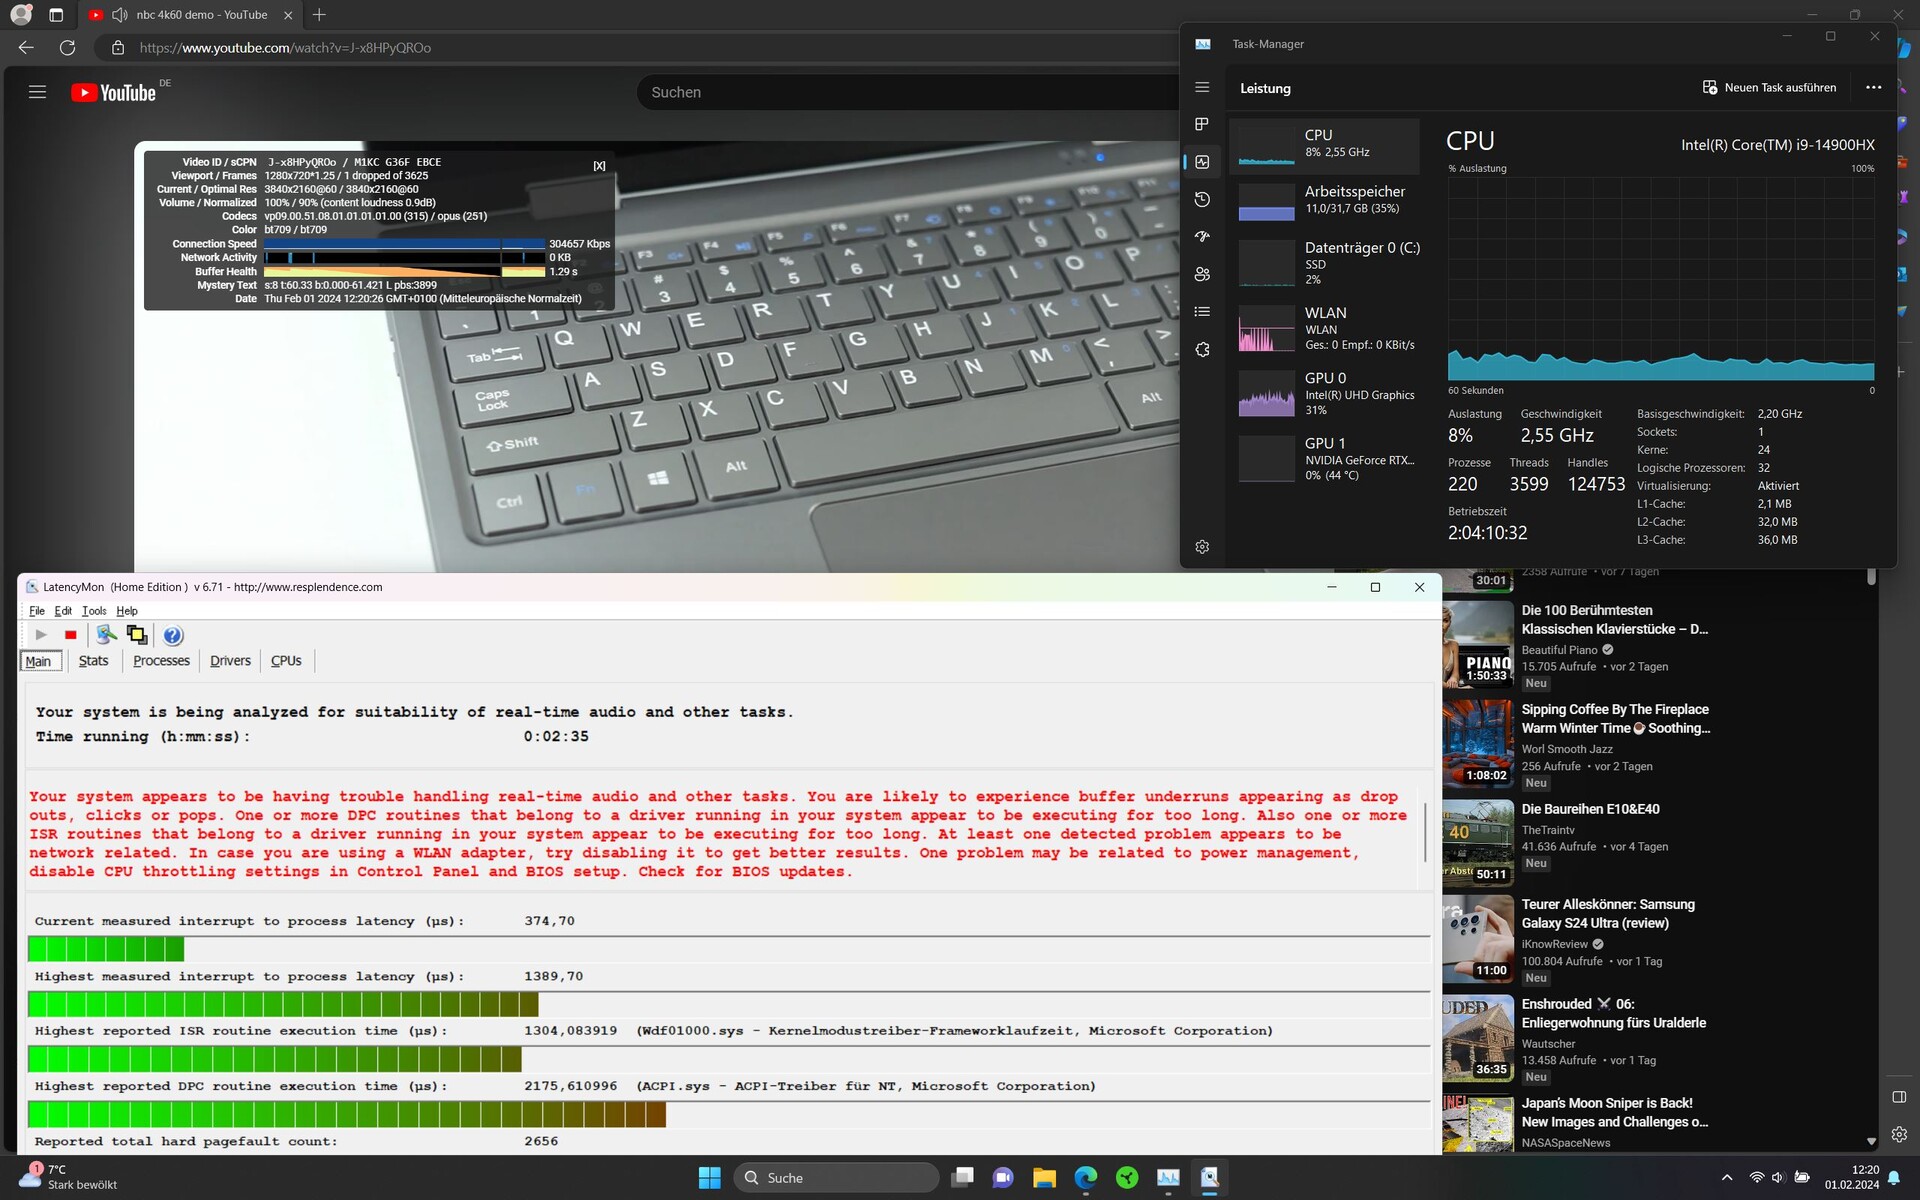
El software LatencyMon detectó ligeras latencias nada más abrir el navegador. Éstas aumentaron al abrir varias pestañas en nuestro sitio web. Nuestro vídeo 4K/60 fps de YouTube se reprodujo sin problemas pero con un fotograma caído.
| DPC Latencies / LatencyMon - interrupt to process latency (max), Web, Youtube, Prime95 | |
| Razer Blade 16 Early 2023 RTX 4090 | |
| Razer Blade 16 Early 2023 RTX 4090 | |
| Schenker XMG Neo 16 E23 | |
| Lenovo Legion 9 16IRX8 | |
| Lenovo Legion 5 16IRX G9 | |
| Razer Blade 16 2024, RTX 4090 | |
* ... más pequeño es mejor
Dispositivos de almacenamiento
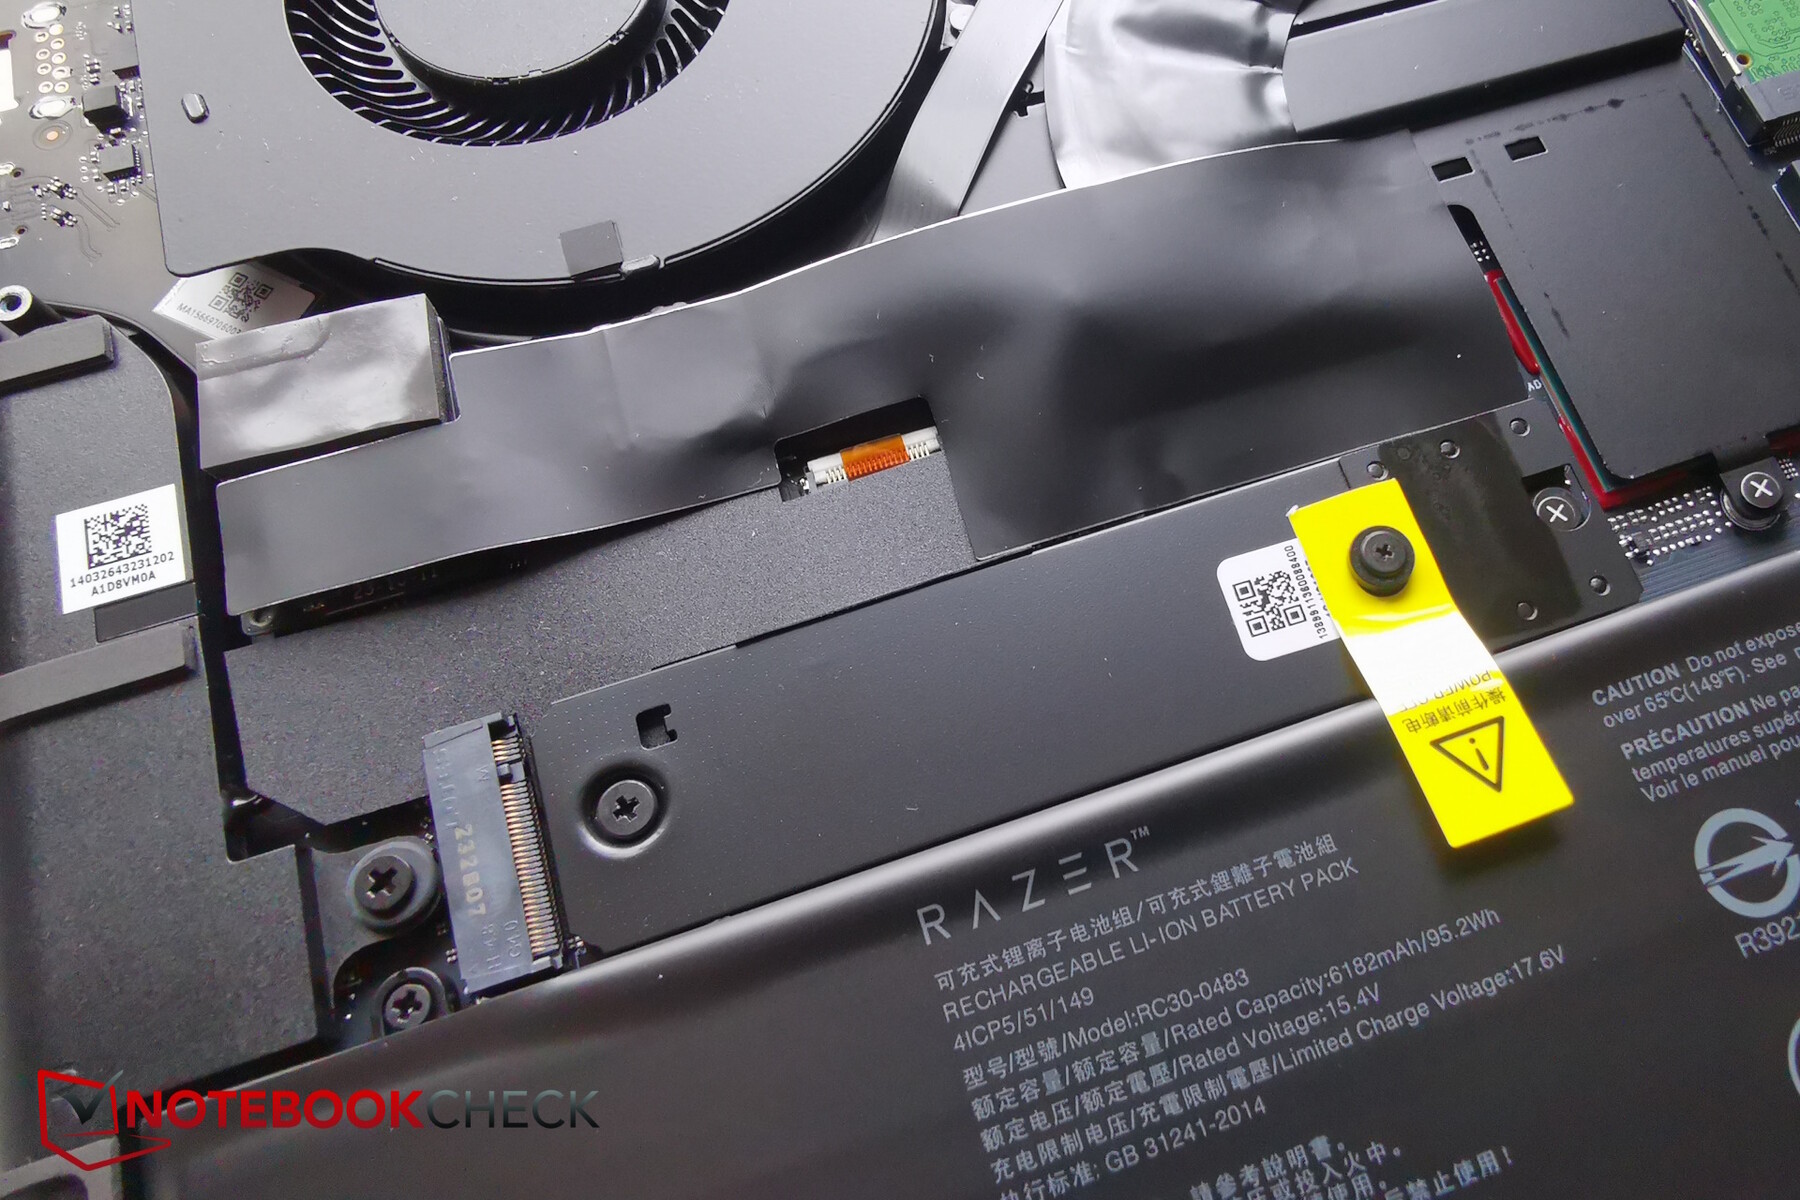
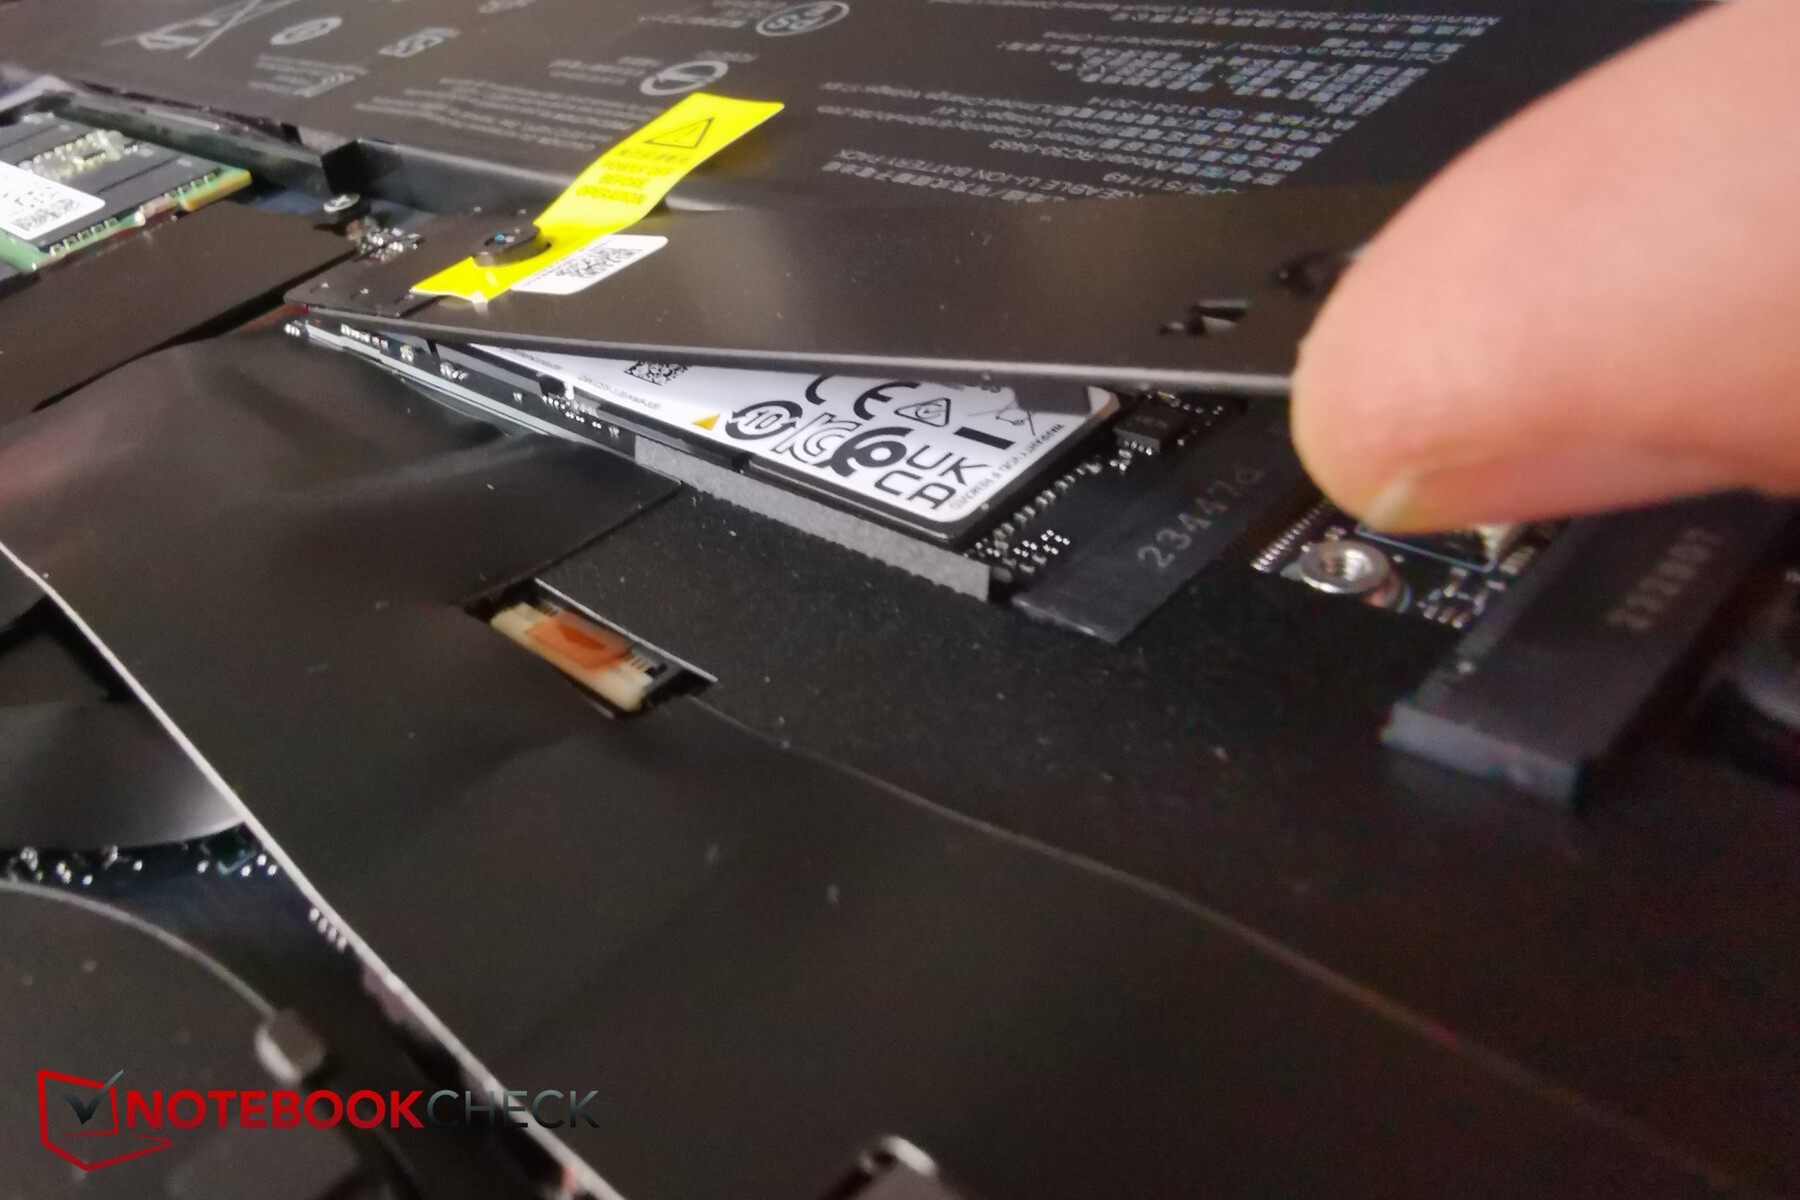
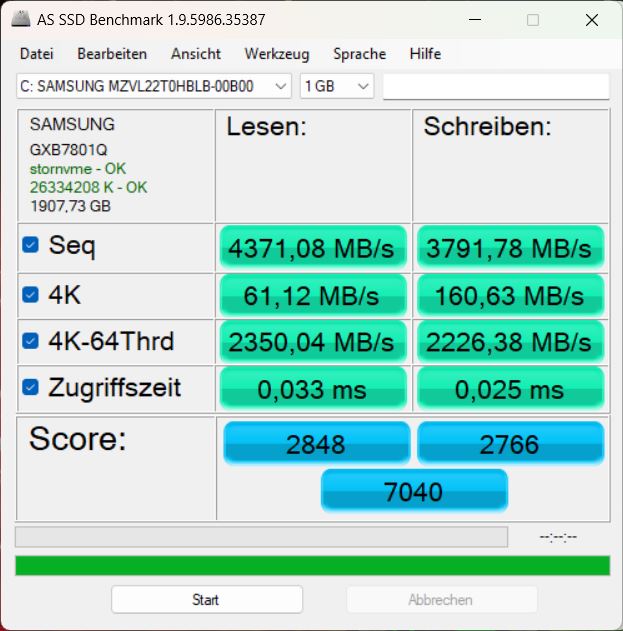
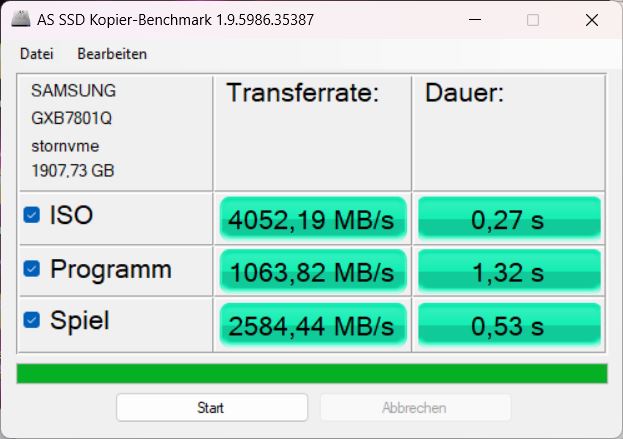
Razer ha instalado una unidad SSD PCIe-4-NVMe de 2 TB de Samsung en nuestro dispositivo de pruebas. El dispositivo de almacenamiento relativamente rápido alcanzó la posición 13 en nuestra mejor lista. En el Blade, la SSD funcionó primero a velocidades óptimas, pero no pudo mantenerlas estables durante periodos más largos: sus tasas de transferencia cayeron alrededor de un 30% al cabo de un rato debido al estrangulamiento térmico. Posteriormente, siguió siendo un modelo rápido, sin embargo, Razer realmente debería tomar medidas para garantizar que el estrangulamiento térmico no se produzca para empezar.

* ... más pequeño es mejor
Reading continuous performance: DiskSpd Read Loop, Queue Depth 8
Tarjeta gráfica
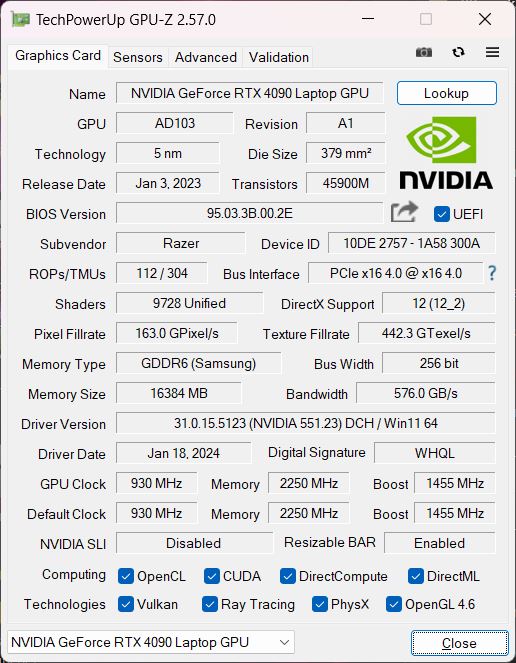
La RTX 4090 es actualmente la GPU más potente para portátiles. En el interior del Blade 16, incluso se le permite hacer uso del máximo de 175 vatios (150 vatios + 25 vatios Dynamic Boost, según el modo). También cuenta con 16 GB de RAM.
Durante los benchmarks sintéticos 3DMark, los competidores RTX-4090 lo hicieron todos similarmente biensólo el XMG Neo 16 E23 fue alrededor de un 7% más rápida. En conjunto, la RTX 4090 de la Blade 16 obtuvo resultados comparables a la media de todos los portátiles de nuestra base de datos que incorporan una RTX 4090. En comparación con el 2023 Blade 16sólo lo hizo un 5% mejor.
Repetir otra ejecución de Fire-Strike en modo batería hizo que la puntuación gráfica del portátil cayera ¡un 85 por ciento!
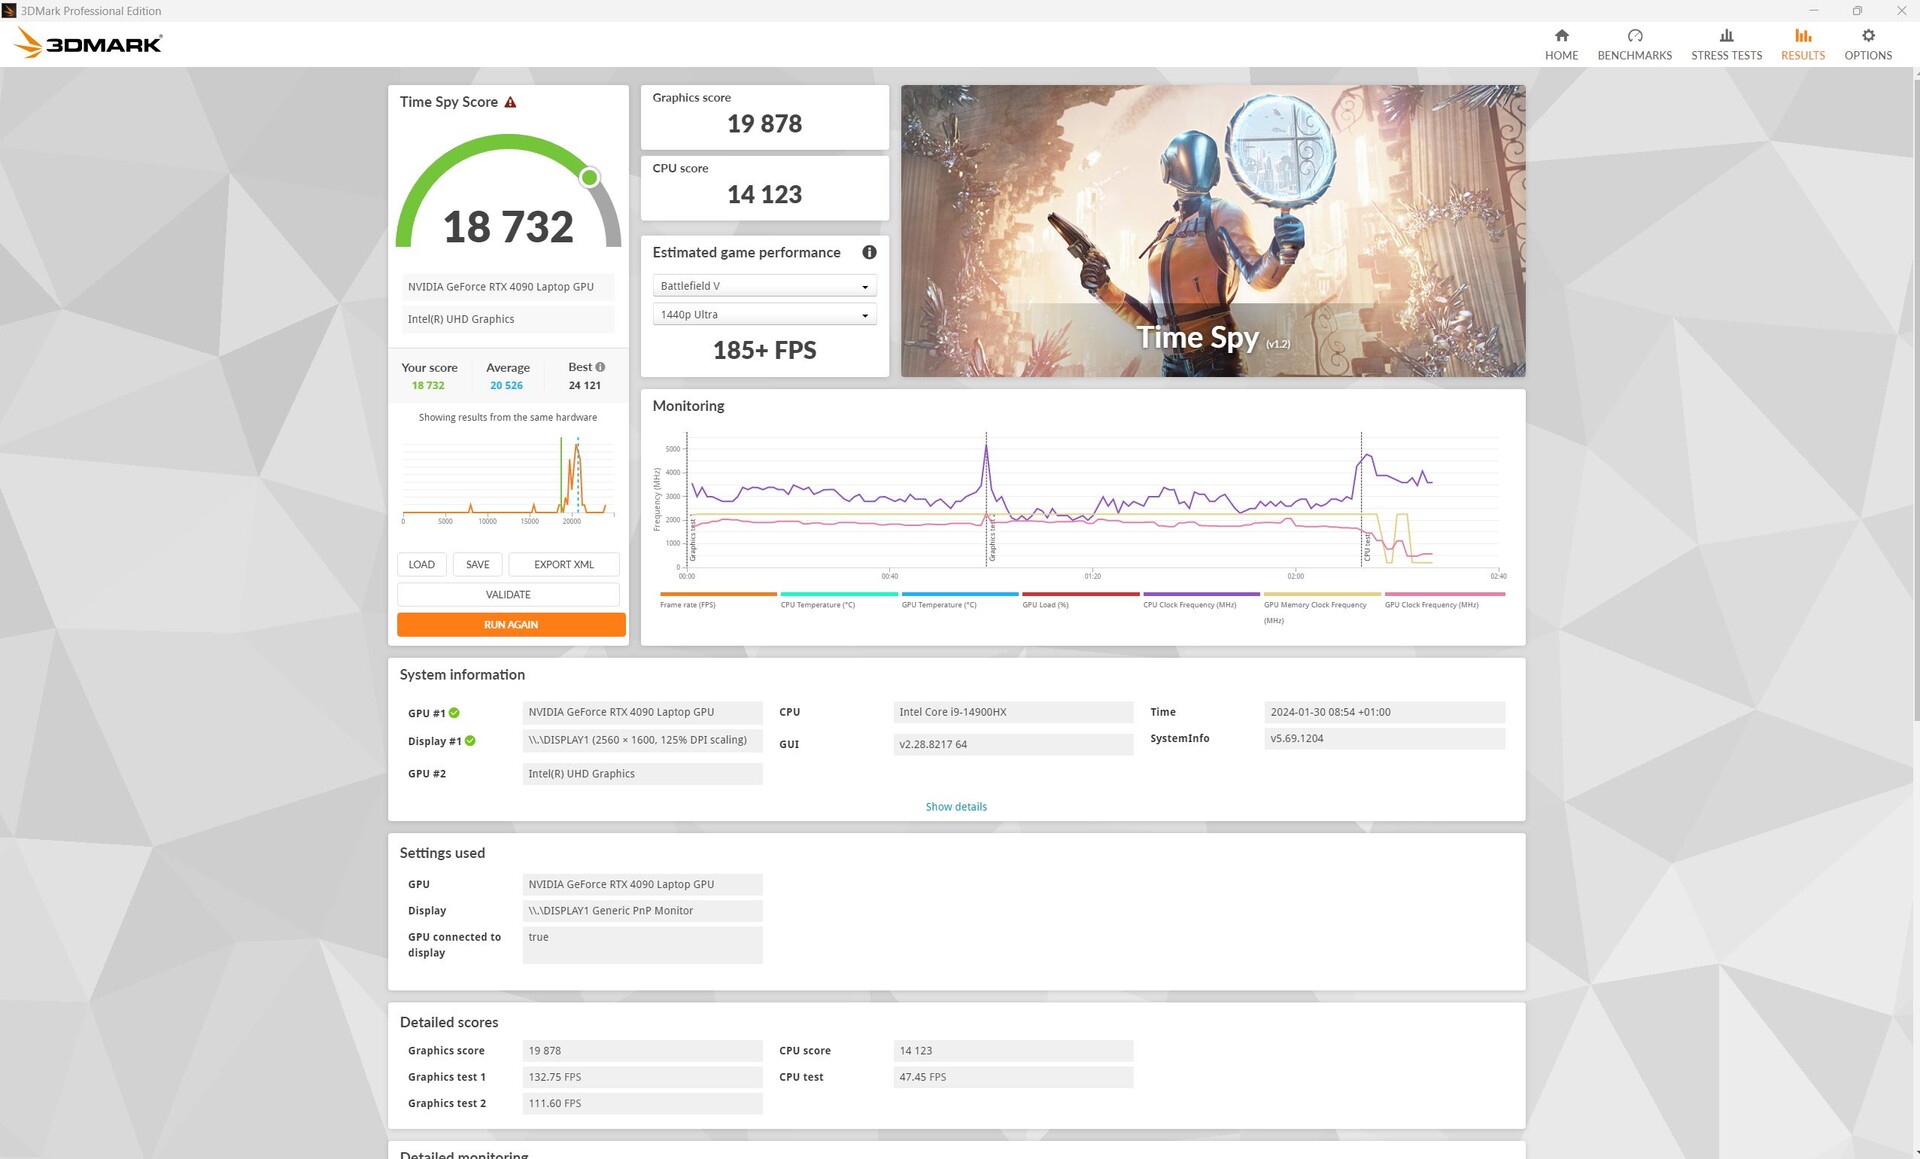
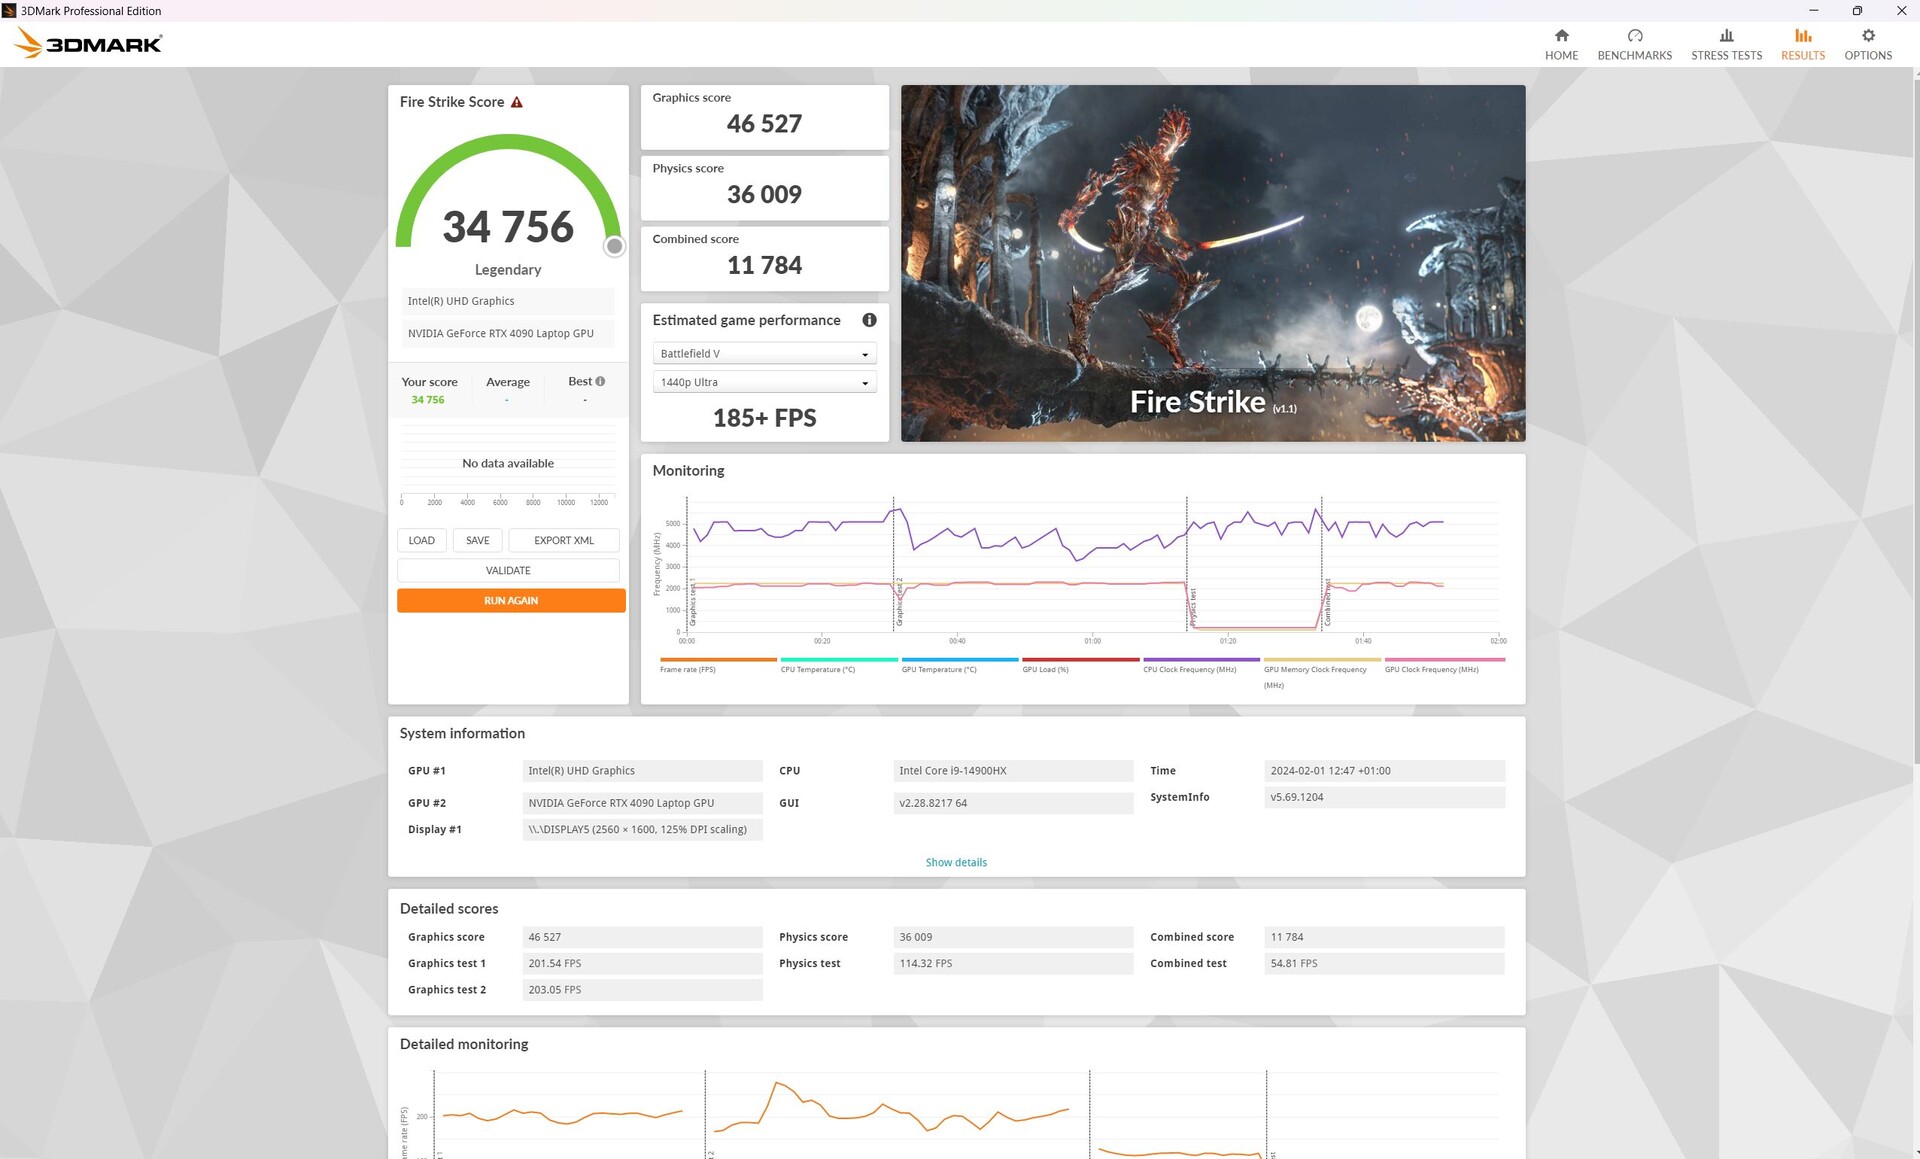
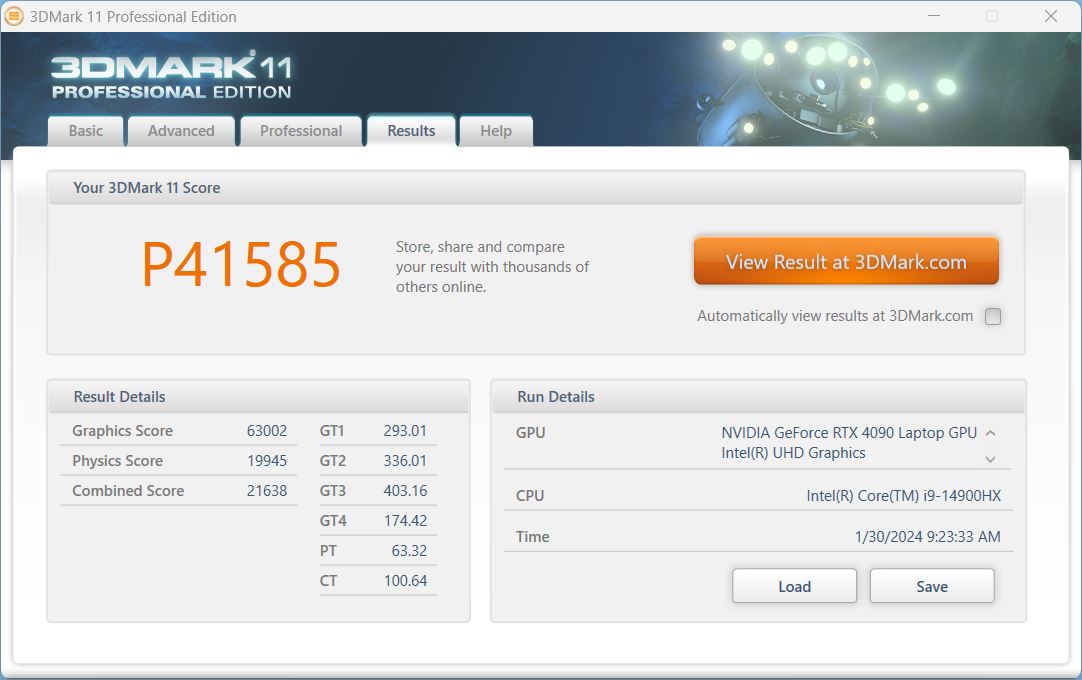
| 3DMark 11 Performance | 44454 puntos | |
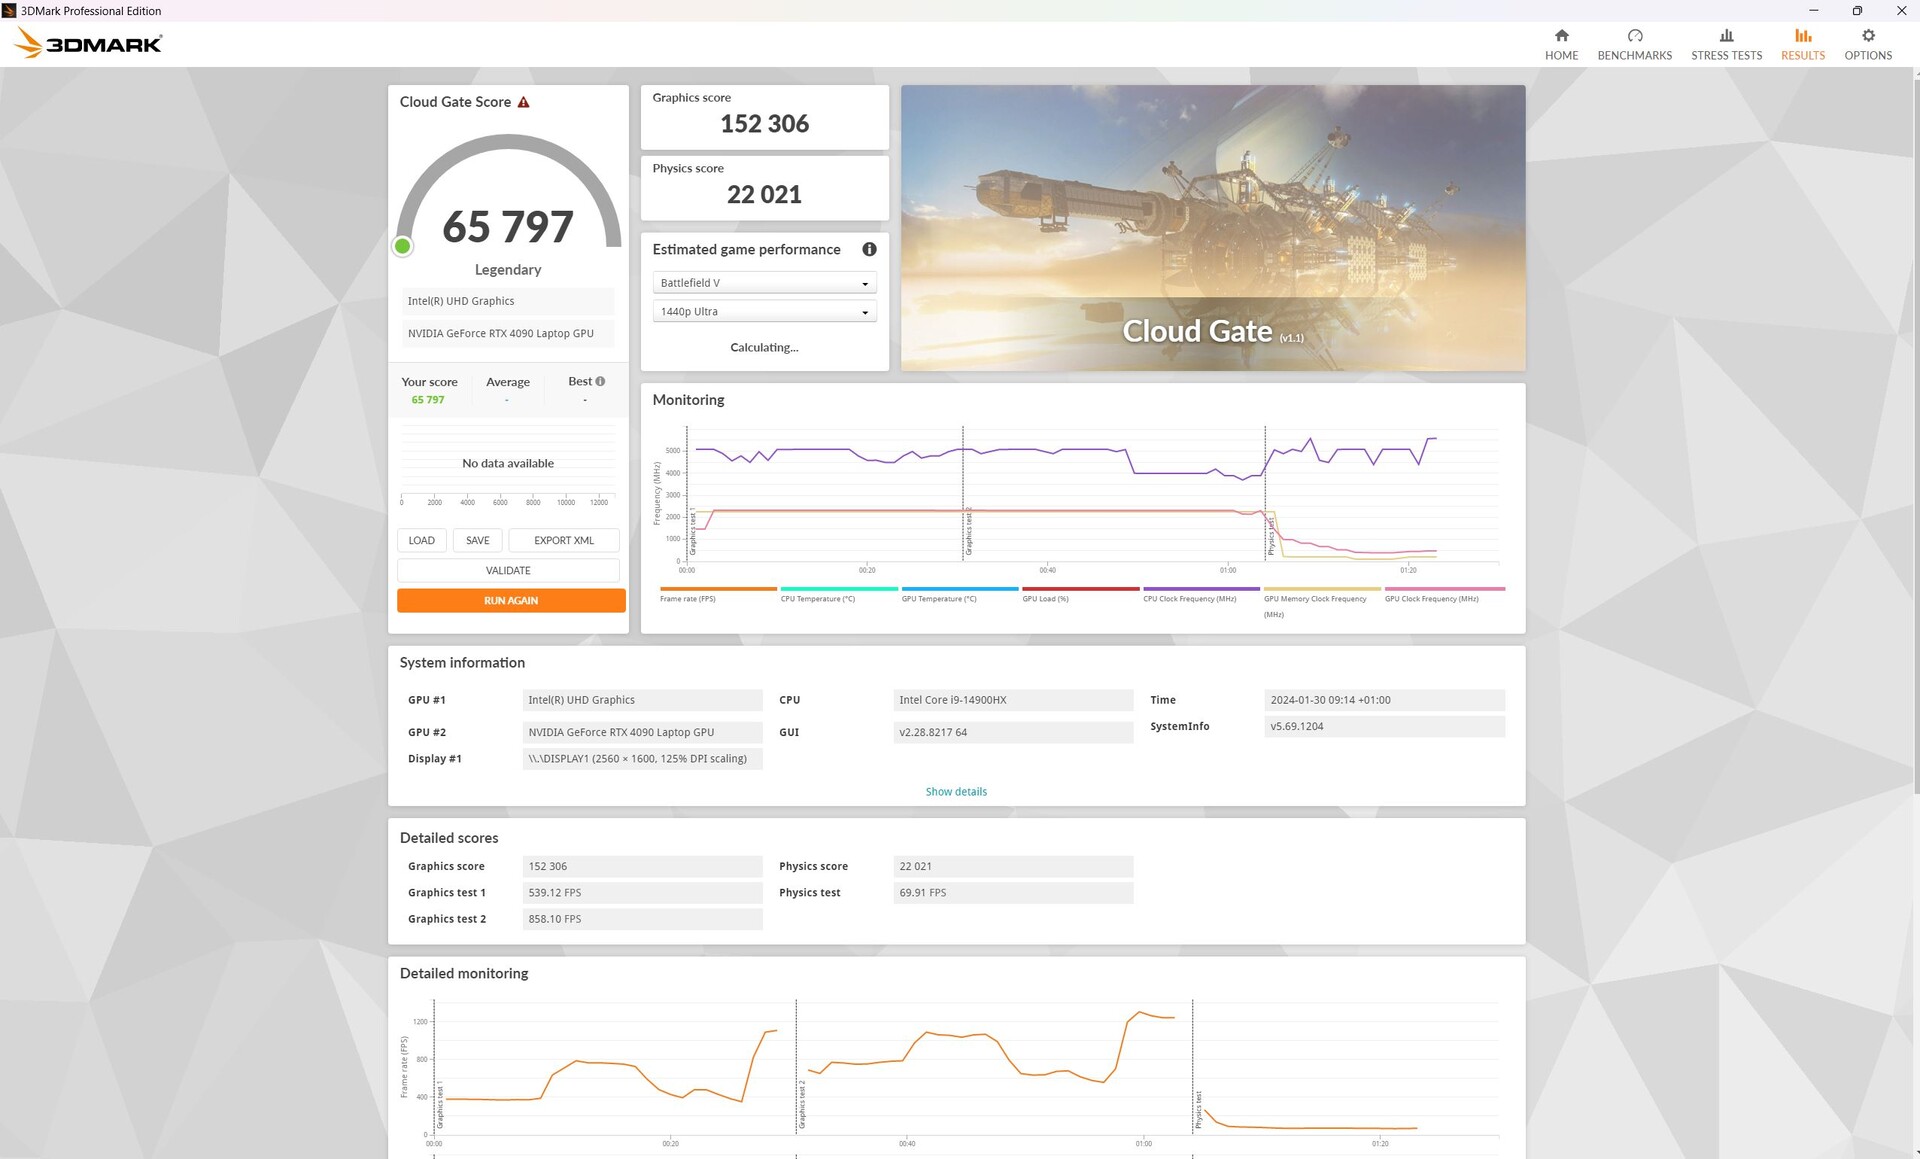
| 3DMark Cloud Gate Standard Score | 65797 puntos | |
| 3DMark Fire Strike Score | 34756 puntos | |
| 3DMark Time Spy Score | 18732 puntos | |
ayuda | ||
* ... más pequeño es mejor
Juegos
A la hora de jugar, el portátil pintó un cuadro similar. De nuevo, el Blade logró una ventaja de alrededor del 7% en comparación con su predecesor. Otros competidores de última generación como el XMG Neo 16 o el Legion 9 incluso llegaron a aventajar a la Blade en juegos.
En conjunto, la Blade 16 cuenta con potencia suficiente para representar todos los juegos en 4K. Sin embargo, su velocidad de fotogramas a veces cayó por debajo de la marca de 60 fps cuando se ejecutaba Dying Light.
Al jugar a Cyberpunk 2077 1.6, la nueva Blade 16 logró alrededor de 52 fps en 4K Ultra. En 4K, sus frecuencias de cuadro cayeron a valores injugables con la máxima calidad RT, con la mejor GPU o sin ella.
Incluso con DLSS o Frame Generation (FG), no se puede igualar la tasa de refresco de la pantalla, al menos en su resolución nativa de 1.600p. En Cyberpunk, medimos 53,42 fps (DLSS) y alrededor de 85 fps (FG). En Call of Duty: Modern Warfare III, el sistema alcanzó 161fps (DLSS) y 183 fps (FG) y en Alan Wake II medimos 73,5 (DLSS) y 112,6 fps (FG).
La siguiente tabla muestra los valores de FPS, consumo y volumen de The Witcher 3 FHD Ultra utilizando los distintos modos de rendimiento.
| Modo/valor de rendimiento | Witcher 3 fps (Max / Avg) | emisiones de ruido en dB | consumo de energía en vatios |
|---|---|---|---|
| Definido por el usuario (boost/high) | 211 / 193 | 46,81 | 243 |
| Turbo | 203 / 191 | 46,81 | 242 |
| Equilibrado | 177 / 169 | 42.99 | 196 |
| Silencioso | 141 / 132 | 32.16 | 141 |
| Performance rating - Percent | |
| Lenovo Legion 9 16IRX8 | |
| Schenker XMG Neo 16 E23 | |
| Razer Blade 16 2024, RTX 4090 | |
| Razer Blade 16 Early 2023 RTX 4090 | |
| Media de la clase Gaming | |
| Lenovo Legion 5 16IRX G9 | |
| The Witcher 3 - 1920x1080 Ultra Graphics & Postprocessing (HBAO+) | |
| Schenker XMG Neo 16 E23 | |
| Lenovo Legion 9 16IRX8 | |
| Razer Blade 16 2024, RTX 4090 | |
| Media de la clase Gaming (104.7 - 240, n=7, últimos 2 años) | |
| Razer Blade 16 Early 2023 RTX 4090 | |
| Lenovo Legion 5 16IRX G9 | |
| GTA V - 1920x1080 Highest AA:4xMSAA + FX AF:16x | |
| Lenovo Legion 9 16IRX8 | |
| Schenker XMG Neo 16 E23 | |
| Razer Blade 16 2024, RTX 4090 | |
| Media de la clase Gaming (48.3 - 186.9, n=94, últimos 2 años) | |
| Razer Blade 16 Early 2023 RTX 4090 | |
| Lenovo Legion 5 16IRX G9 | |
| Final Fantasy XV Benchmark - 1920x1080 High Quality | |
| Schenker XMG Neo 16 E23 | |
| Lenovo Legion 9 16IRX8 | |
| Media de la clase Gaming (41 - 215, n=95, últimos 2 años) | |
| Razer Blade 16 2024, RTX 4090 | |
| Razer Blade 16 Early 2023 RTX 4090 | |
| Lenovo Legion 5 16IRX G9 | |
| Strange Brigade - 1920x1080 ultra AA:ultra AF:16 | |
| Lenovo Legion 9 16IRX8 | |
| Schenker XMG Neo 16 E23 | |
| Razer Blade 16 2024, RTX 4090 | |
| Razer Blade 16 Early 2023 RTX 4090 | |
| Media de la clase Gaming (76.3 - 458, n=87, últimos 2 años) | |
| Lenovo Legion 5 16IRX G9 | |
| Dota 2 Reborn - 1920x1080 ultra (3/3) best looking | |
| Lenovo Legion 9 16IRX8 | |
| Razer Blade 16 2024, RTX 4090 | |
| Razer Blade 16 Early 2023 RTX 4090 | |
| Schenker XMG Neo 16 E23 | |
| Lenovo Legion 5 16IRX G9 | |
| Media de la clase Gaming (84.8 - 248, n=107, últimos 2 años) | |
| Cyberpunk 2077 1.6 | |
| 1920x1080 Ultra Preset | |
| Schenker XMG Neo 16 E23 | |
| Lenovo Legion 9 16IRX8 | |
| Medio NVIDIA GeForce RTX 4090 Laptop GPU (91 - 159.7, n=20) | |
| Razer Blade 16 2024, RTX 4090 | |
| Razer Blade 16 Early 2023 RTX 4090 | |
| 2560x1440 Ultra Preset | |
| Schenker XMG Neo 16 E23 | |
| Lenovo Legion 9 16IRX8 | |
| Medio NVIDIA GeForce RTX 4090 Laptop GPU (75.7 - 116, n=21) | |
| Razer Blade 16 Early 2023 RTX 4090 | |
| Razer Blade 16 2024, RTX 4090 | |
| 3840x2160 Ultra Preset | |
| Medio NVIDIA GeForce RTX 4090 Laptop GPU (38.8 - 56, n=16) | |
| Razer Blade 16 2024, RTX 4090 | |
| Razer Blade 16 Early 2023 RTX 4090 | |
| 1920x1080 Ray Tracing Ultra Preset (DLSS off) | |
| Medio NVIDIA GeForce RTX 4090 Laptop GPU (56.5 - 74, n=8) | |
| Razer Blade 16 Early 2023 RTX 4090 | |
| Razer Blade 16 2024, RTX 4090 | |
| 3840x2160 Ray Tracing Ultra Preset (DLSS off) | |
| Razer Blade 16 Early 2023 RTX 4090 | |
| Medio NVIDIA GeForce RTX 4090 Laptop GPU (16.5 - 22.4, n=7) | |
| Razer Blade 16 2024, RTX 4090 | |
Witcher 3 FPS diagram
| bajo | medio | alto | ultra | QHD DLSS | QHD | 4K DLSS | 4K | |
|---|---|---|---|---|---|---|---|---|
| GTA V (2015) | 184 | 181.9 | 181.6 | 138.1 | 126.9 | 168 | ||
| The Witcher 3 (2015) | 567 | 425 | 354 | 200 | 164 | |||
| Dota 2 Reborn (2015) | 233 | 210 | 201 | 188.1 | 187.3 | |||
| Final Fantasy XV Benchmark (2018) | 171.7 | 155.7 | 137.5 | 126.8 | ||||
| X-Plane 11.11 (2018) | 204 | 182.3 | 146.2 | 145.5 | ||||
| Far Cry 5 (2018) | 173 | 140 | 134 | 127 | 125 | 103 | ||
| Strange Brigade (2018) | 487 | 372 | 368 | 359.8 | 279 | 157 | ||
| Dying Light 2 (2022) | 223.1 | 196.6 | 155.6 | 117.3 | 59.8 | |||
| Cyberpunk 2077 1.6 (2022) | 146.7 | 138.51 | 123.6 | 103.58 | 86.59 | 46.1 | ||
| F1 23 (2023) | 113.2 | 72.4 | 36.9 | |||||
| Baldur's Gate 3 (2023) | 175.8 | 134 | 74 | |||||
| Cyberpunk 2077 (2023) | 95.35 | 83.39 | 39.61 | |||||
| Assassin's Creed Mirage (2023) | 130 | 117 | 74 | |||||
| Alan Wake 2 (2023) | 108.6 | 78.4 | 41.6 | |||||
| Call of Duty Modern Warfare 3 2023 (2023) | 179 | 138 | 91 | |||||
| Avatar Frontiers of Pandora (2023) | 98 | 67 | 34 | |||||
| Black Myth: Wukong (2024) | 53 | 58 | 39 | 23 | ||||
| Call of Duty Black Ops 6 (2024) | 124 | 111 | 103 | 71 | 68 | |||
| Indiana Jones and the Great Circle (2024) | 122.4 | 109.3 | 95.4 | 58 | ||||
| Monster Hunter Wilds (2025) | 70.56 | 70.41 | 63.11 | 40.46 | ||||
| Assassin's Creed Shadows (2025) | 64 | 58 | 52 | 34 |
Emisiones y potencia - La Razer Blade ofrece muchas opciones de personalización
Emisiones sonoras
En el modo personalizado con el rendimiento de la CPU y la GPU maximizado, los ventiladores a veces se quedaban quietos, pero la mayoría de las veces zumbaban a unos 27 dB, incluso en reposo.
En el escenario de carga media (3DMark 06), se aceleraron en dos pasos. En los primeros 30 segundos, subieron lentamente y mantuvieron este nivel de ruido medio durante aproximadamente un minuto antes de volver a subir a más de 43 dB. Aquí, por ejemplo, el significativamente más barato Dell G16 permaneció mucho más silencioso, sin cambiar su volumen de salida de 27 dB durante toda la prueba. El predecesor del portátil también permaneció más silencioso en este escenario.
El modo turbo no aportó ninguna ventaja en términos de rendimiento o emisiones de ruido si se observan los Witcher 3 resultados, pero el Blade se refrigera mejor.
A pesar de tener casi el mismo rendimiento, el nuevo Blade es mínimamente más ruidoso que su predecesor incluso bajo el máximo estrés. Sin embargo, la competencia es aún más ruidosa cuando se juega.
Ruido
| Ocioso |
| 23 / 23 / 27.66 dB(A) |
| Carga |
| 43.76 / 50.37 dB(A) |
 | ||
30 dB silencioso 40 dB(A) audible 50 dB(A) ruidosamente alto |
||
min: | ||
| Razer Blade 16 2024, RTX 4090 GeForce RTX 4090 Laptop GPU, i9-14900HX, Samsung PM9A1 MZVL22T0HBLB | Razer Blade 16 Early 2023 RTX 4090 GeForce RTX 4090 Laptop GPU, i9-13950HX, SSSTC CA6-8D1024 | Lenovo Legion 9 16IRX8 GeForce RTX 4090 Laptop GPU, i9-13980HX, 2x SK Hynix HFS001TEJ9X115N (RAID 0) | Schenker XMG Neo 16 E23 GeForce RTX 4090 Laptop GPU, i9-13900HX, Crucial P5 Plus 1TB CT1000P5PSSD8 | Lenovo Legion 5 16IRX G9 GeForce RTX 4060 Laptop GPU, i7-14650HX, Samsung PM9A1 MZVL21T0HCLR | |
|---|---|---|---|---|---|
| Noise | 4% | -2% | -30% | -11% | |
| apagado / medio ambiente * (dB) | 23 | 20.84 9% | 23.7 -3% | 25 -9% | 24 -4% |
| Idle Minimum * (dB) | 23 | 23.65 -3% | 24 -4% | 31 -35% | 24 -4% |
| Idle Average * (dB) | 23 | 23.65 -3% | 24 -4% | 33 -43% | 28.8 -25% |
| Idle Maximum * (dB) | 27.66 | 23.65 14% | 30.4 -10% | 42 -52% | 32 -16% |
| Load Average * (dB) | 43.76 | 43.35 1% | 30.4 31% | 58 -33% | 45.5 -4% |
| Witcher 3 ultra * (dB) | 46.81 | 46.7 -0% | 52.2 -12% | 57 -22% | 53.1 -13% |
| Load Maximum * (dB) | 50.37 | 46.72 7% | 54.9 -9% | 59 -17% | 55.7 -11% |
* ... más pequeño es mejor
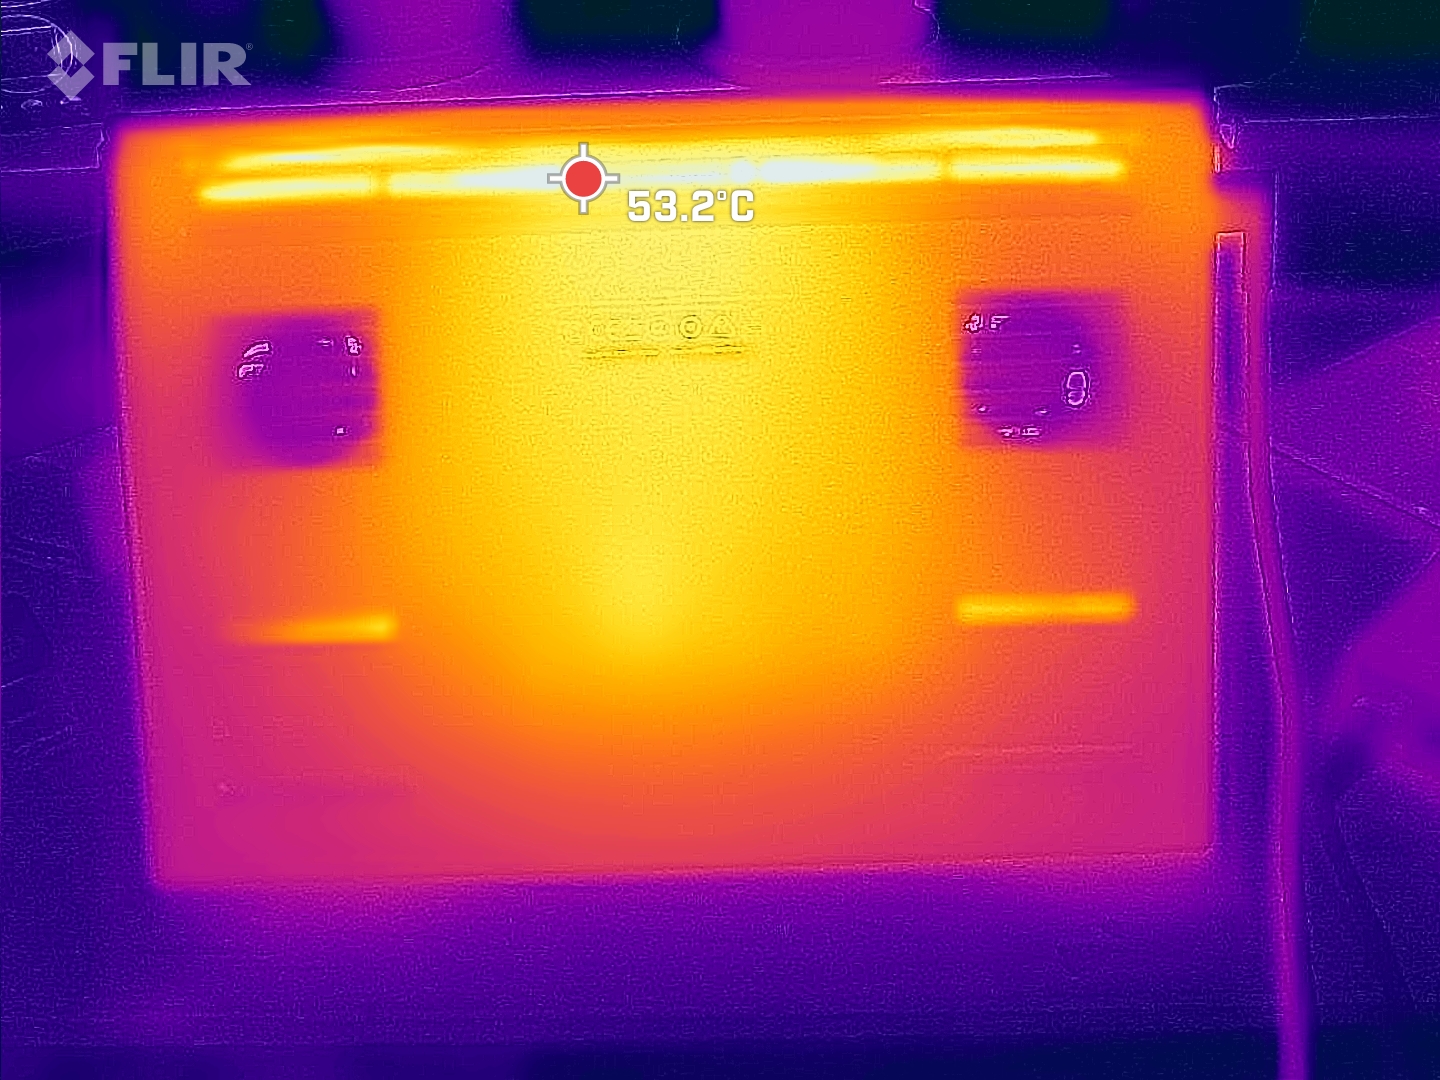
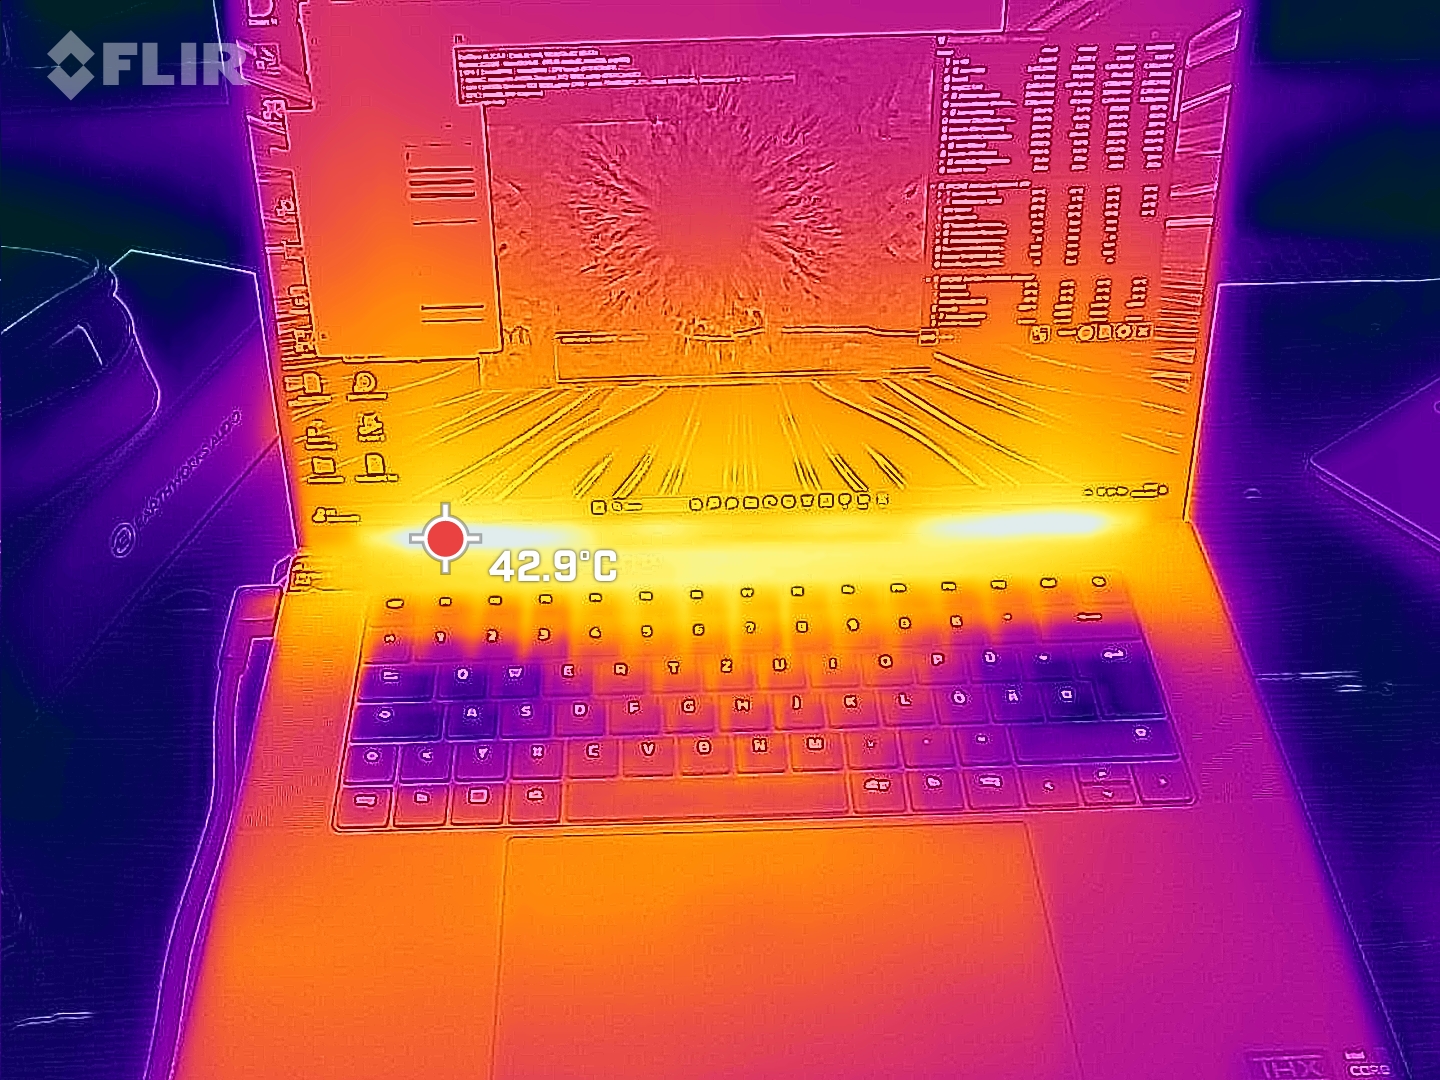
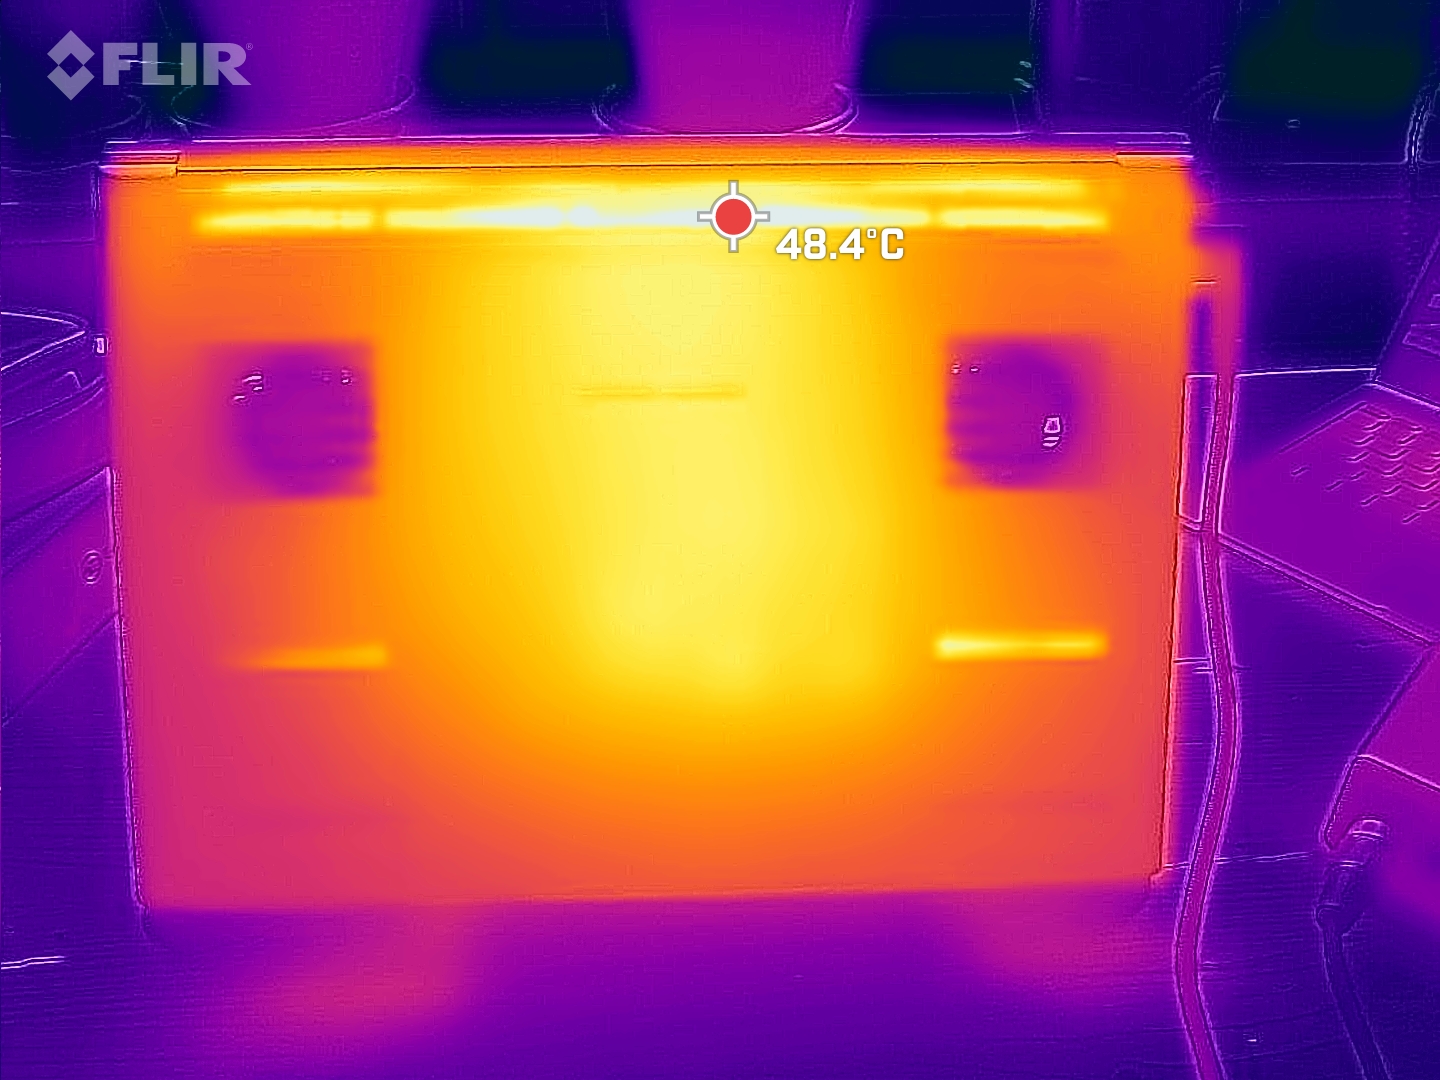
Temperatura
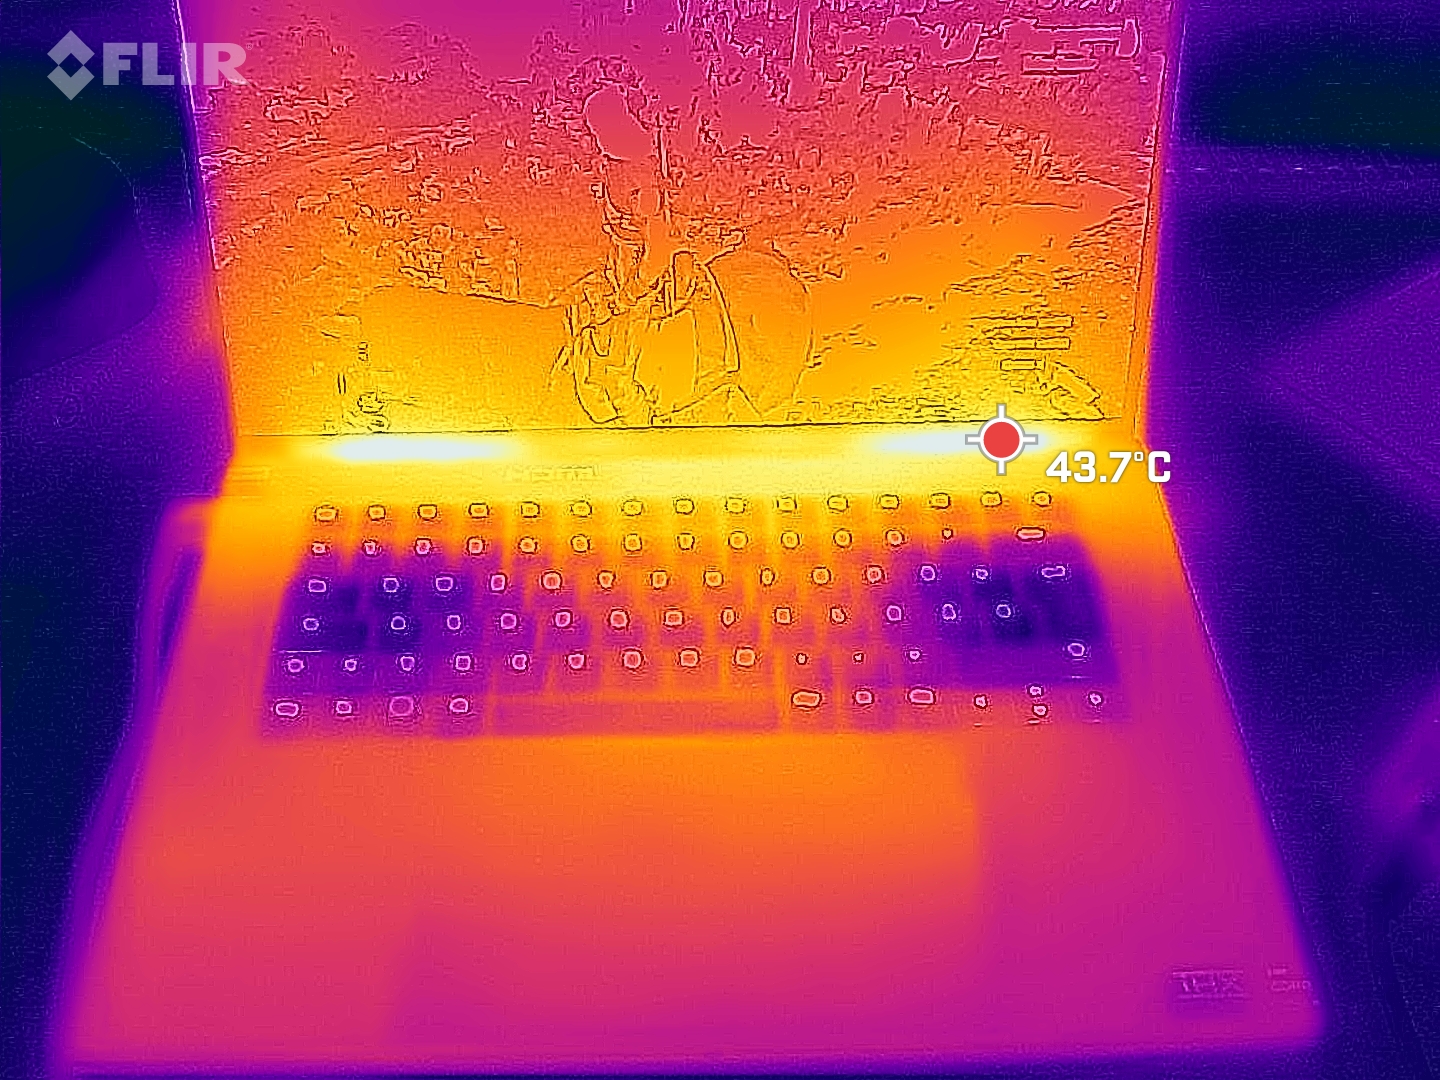
Bajo tensión máxima, medimos puntos calientes de hasta 47 °C. Esto es demasiado caliente para poner el dispositivo en su regazo, pero todavía comparativamente fresco en comparación con la competencia.
(±) La temperatura máxima en la parte superior es de 45 °C / 113 F, frente a la media de 40.4 °C / 105 F, que oscila entre 21.2 y 68.8 °C para la clase Gaming.
(±) El fondo se calienta hasta un máximo de 45 °C / 113 F, frente a la media de 43.2 °C / 110 F
(+) En reposo, la temperatura media de la parte superior es de 26.8 °C / 80# F, frente a la media del dispositivo de 33.9 °C / 93 F.
(±) Jugando a The Witcher 3, la temperatura media de la parte superior es de 35.9 °C / 97 F, frente a la media del dispositivo de 33.9 °C / 93 F.
(+) Los reposamanos y el panel táctil alcanzan como máximo la temperatura de la piel (34 °C / 93.2 F) y, por tanto, no están calientes.
(-) La temperatura media de la zona del reposamanos de dispositivos similares fue de 28.8 °C / 83.8 F (-5.2 °C / -9.4 F).
| Razer Blade 16 2024, RTX 4090 Intel Core i9-14900HX, NVIDIA GeForce RTX 4090 Laptop GPU | Razer Blade 16 Early 2023 RTX 4090 Intel Core i9-13950HX, NVIDIA GeForce RTX 4090 Laptop GPU | Lenovo Legion 9 16IRX8 Intel Core i9-13980HX, NVIDIA GeForce RTX 4090 Laptop GPU | Schenker XMG Neo 16 E23 Intel Core i9-13900HX, NVIDIA GeForce RTX 4090 Laptop GPU | Lenovo Legion 5 16IRX G9 Intel Core i7-14650HX, NVIDIA GeForce RTX 4060 Laptop GPU | |
|---|---|---|---|---|---|
| Heat | -10% | -12% | -2% | -2% | |
| Maximum Upper Side * (°C) | 45 | 52 -16% | 49.6 -10% | 50 -11% | 40.4 10% |
| Maximum Bottom * (°C) | 45 | 47.6 -6% | 48.6 -8% | 51 -13% | 43.8 3% |
| Idle Upper Side * (°C) | 29 | 33 -14% | 33.2 -14% | 28 3% | 30.3 -4% |
| Idle Bottom * (°C) | 30 | 30.6 -2% | 34.2 -14% | 26 13% | 35.3 -18% |
* ... más pequeño es mejor
Altavoces
A diferencia de muchos otros portátiles para juegos, el Blade 16 tiene cuatro altavoces, dos tweeters y dos woofers. Esto proporciona al oyente unos agudos y medios equilibrados y -a diferencia de muchos competidores- los graves son notables.
Sin embargo, esto tiene sus límites y los altavoces no son excesivamente ruidosos. Sólo dispone de una conexión jack de 3,5 mm para conectar dispositivos analógicos.
Razer Blade 16 2024, RTX 4090 análisis de audio
(±) | la sonoridad del altavoz es media pero buena (81.16 dB)
Graves 100 - 315 Hz
(±) | lubina reducida - en promedio 8.2% inferior a la mediana
(±) | la linealidad de los graves es media (7.4% delta a frecuencia anterior)
Medios 400 - 2000 Hz
(+) | medios equilibrados - a sólo 3.3% de la mediana
(+) | los medios son lineales (5.9% delta a la frecuencia anterior)
Altos 2 - 16 kHz
(+) | máximos equilibrados - a sólo 1.6% de la mediana
(+) | los máximos son lineales (3.1% delta a la frecuencia anterior)
Total 100 - 16.000 Hz
(+) | el sonido global es lineal (9.2% de diferencia con la mediana)
En comparación con la misma clase
» 3% de todos los dispositivos probados de esta clase eran mejores, 1% similares, 96% peores
» El mejor tuvo un delta de 6%, la media fue 18%, el peor fue ###max##%
En comparación con todos los dispositivos probados
» 3% de todos los dispositivos probados eran mejores, 1% similares, 96% peores
» El mejor tuvo un delta de 4%, la media fue 23%, el peor fue ###max##%
Lenovo Legion 9 16IRX8 análisis de audio
(+) | los altavoces pueden reproducir a un volumen relativamente alto (#82.8 dB)
Graves 100 - 315 Hz
(±) | lubina reducida - en promedio 13.5% inferior a la mediana
(±) | la linealidad de los graves es media (9% delta a frecuencia anterior)
Medios 400 - 2000 Hz
(+) | medios equilibrados - a sólo 1.5% de la mediana
(+) | los medios son lineales (5.7% delta a la frecuencia anterior)
Altos 2 - 16 kHz
(+) | máximos equilibrados - a sólo 2.4% de la mediana
(+) | los máximos son lineales (3.7% delta a la frecuencia anterior)
Total 100 - 16.000 Hz
(+) | el sonido global es lineal (11% de diferencia con la mediana)
En comparación con la misma clase
» 7% de todos los dispositivos probados de esta clase eran mejores, 3% similares, 89% peores
» El mejor tuvo un delta de 6%, la media fue 18%, el peor fue ###max##%
En comparación con todos los dispositivos probados
» 6% de todos los dispositivos probados eran mejores, 2% similares, 92% peores
» El mejor tuvo un delta de 4%, la media fue 23%, el peor fue ###max##%
Consumo de energía
La nueva Blade ha hecho grandes progresos en cuanto a su consumo de energía. Especialmente en ralentí, su consumo desciende ahora a un nivel esperado; el modelo predecesor era extremadamente hambriento de energía en este escenario.
Incluso al jugar a The Witcher, su consumo descendió ligeramente a pesar de tener el mismo rendimiento, si no ligeramente mejor. Sólo su consumo máximo teórico y temporal de 328 vatios es ahora superior.
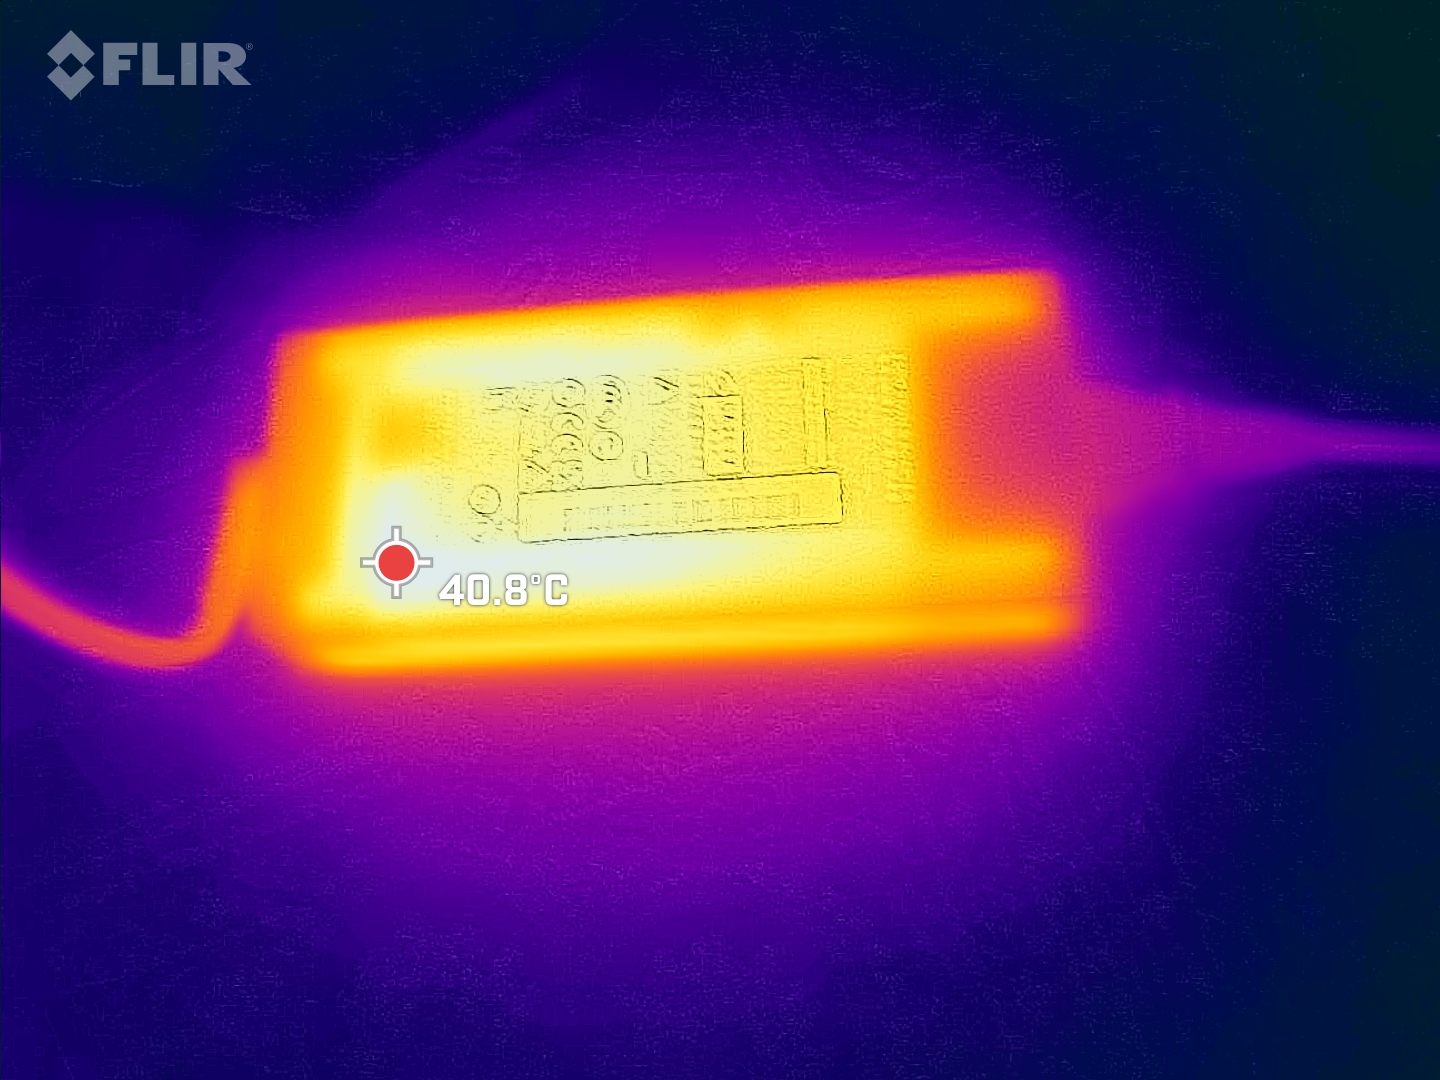
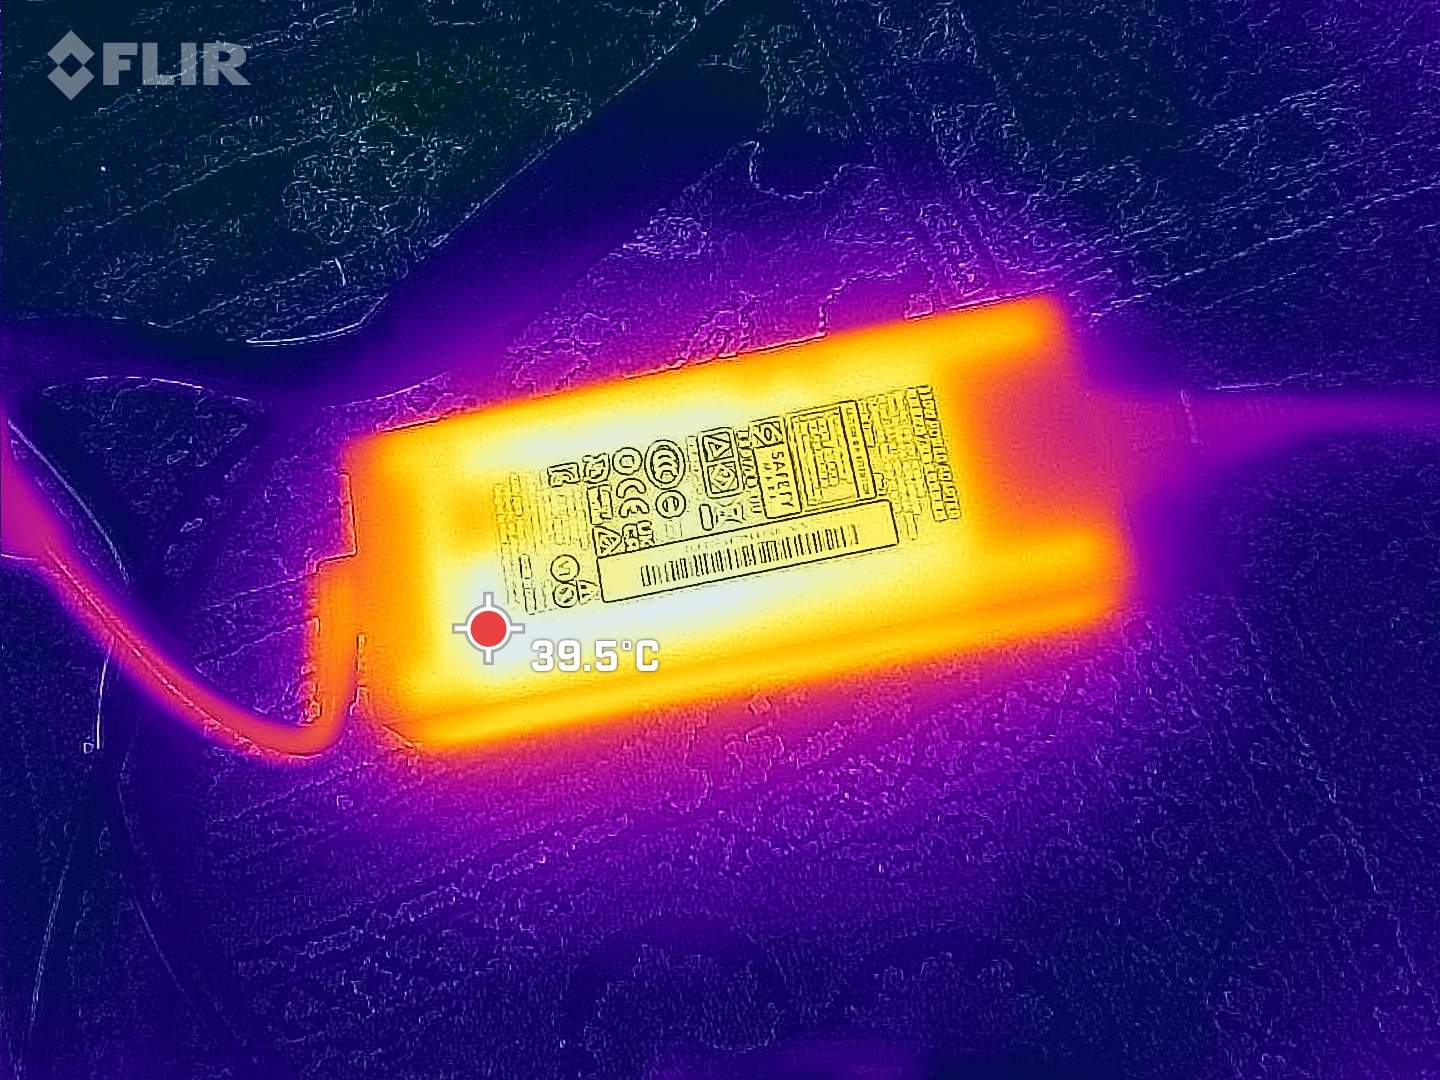
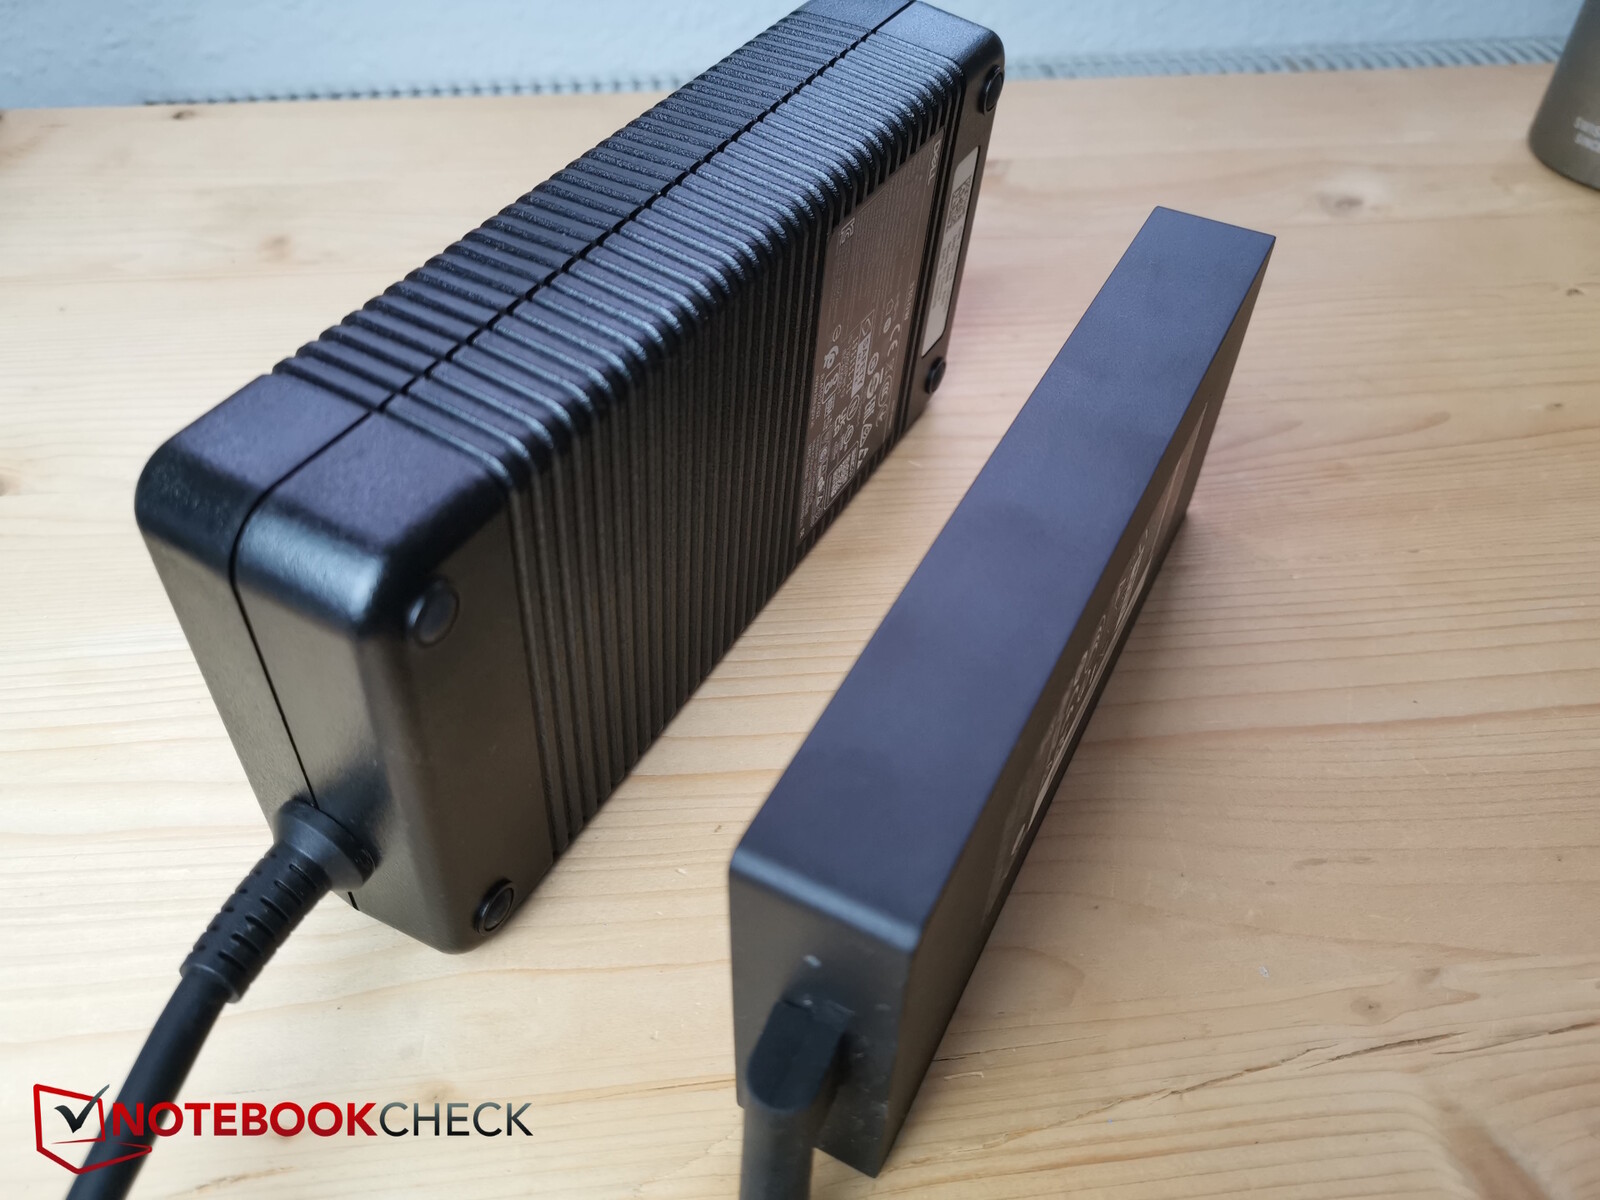
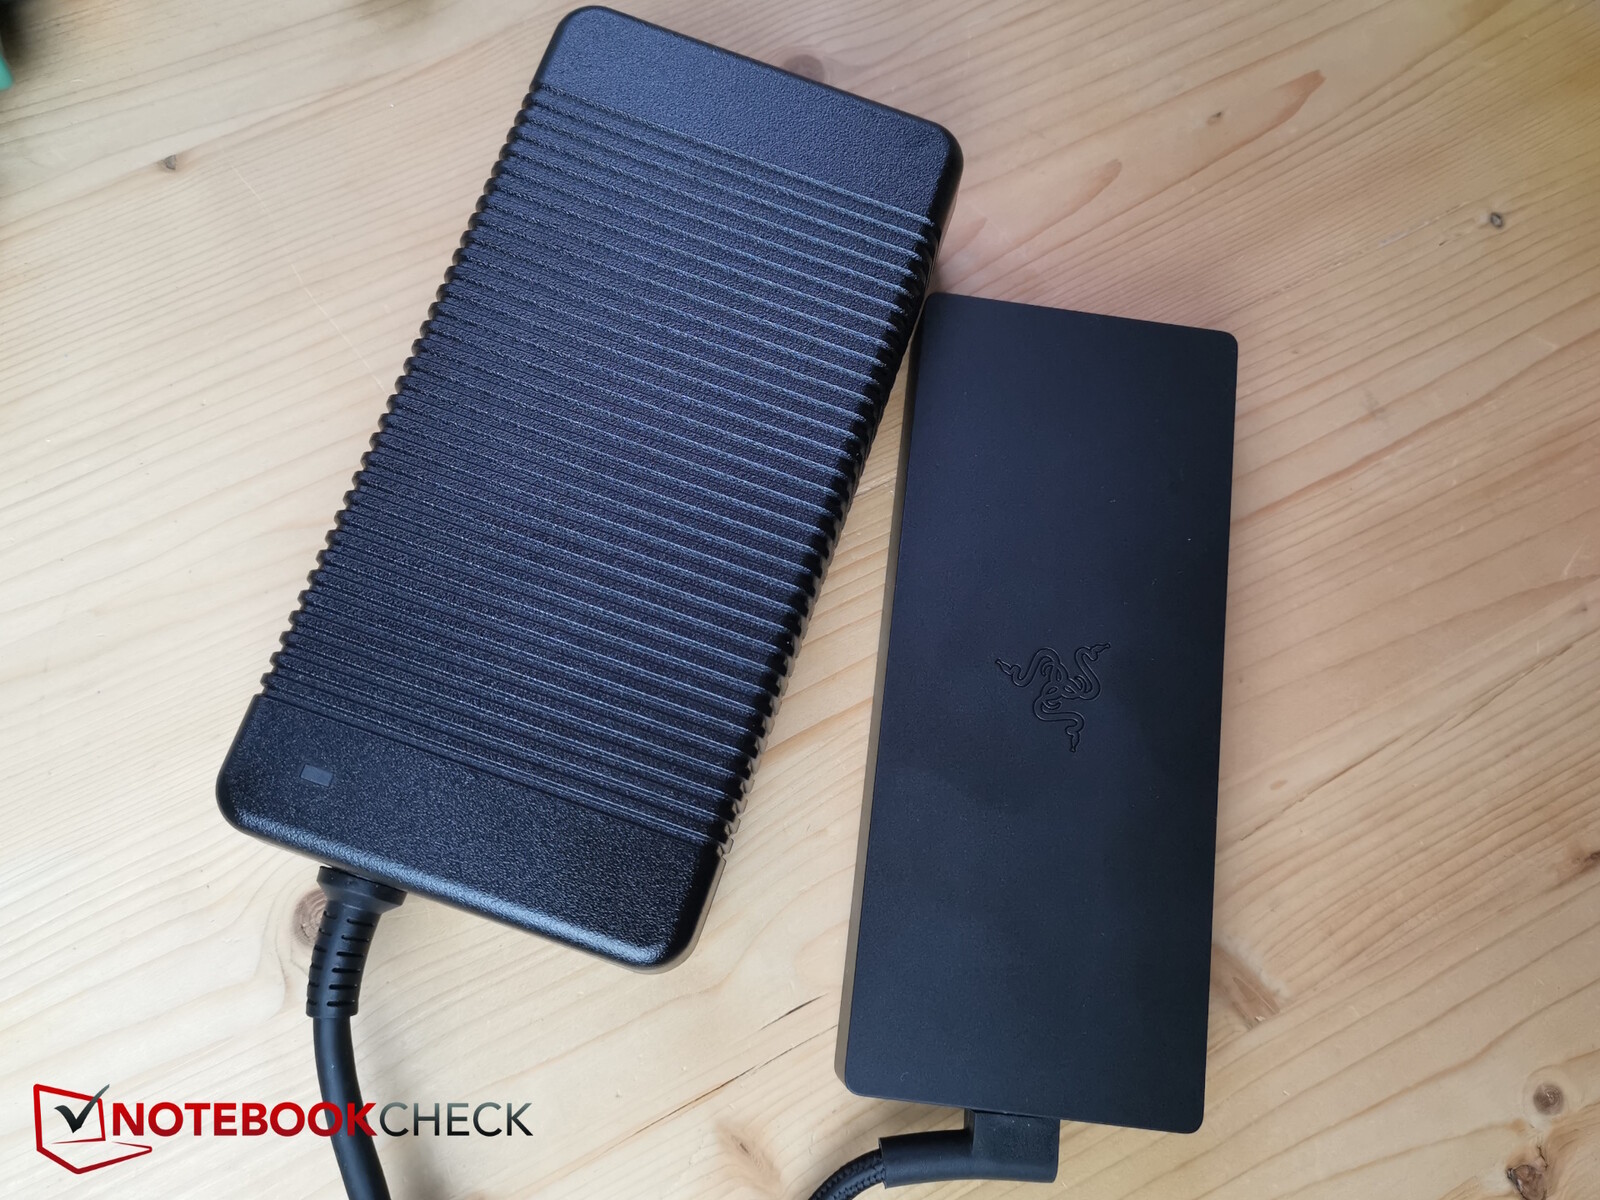
Razer se enorgullece con razón de sus fuentes de alimentación, que a menudo son más pequeñas que las soluciones comparables de fabricantes genéricos de terceros al tiempo que ofrecen el mismo rendimiento. La fuente de alimentación de 330 vatios incluida tiene el tamaño justo para absorber los picos de carga y, según Razer, ha ahorrado alrededor de un 60 por ciento de tamaño en comparación con soluciones comparables. De hecho, la fuente de alimentación Razer es significativamente más pequeña que la de 330 vatios suministrada con el Dell G16 (2024), por ejemplo.
| Off / Standby | |
| Ocioso | |
| Carga |
|
Clave:
min: | |
| Razer Blade 16 2024, RTX 4090 i9-14900HX, GeForce RTX 4090 Laptop GPU, Samsung PM9A1 MZVL22T0HBLB, OLED, 2560x1600, 16" | Razer Blade 16 Early 2023 RTX 4090 i9-13950HX, GeForce RTX 4090 Laptop GPU, SSSTC CA6-8D1024, mini-LED, 3840x2400, 16" | Lenovo Legion 9 16IRX8 i9-13980HX, GeForce RTX 4090 Laptop GPU, 2x SK Hynix HFS001TEJ9X115N (RAID 0), Mini-LED, 3200x2000, 16" | Schenker XMG Neo 16 E23 i9-13900HX, GeForce RTX 4090 Laptop GPU, Crucial P5 Plus 1TB CT1000P5PSSD8, IPS, 2560x1600, 16" | Lenovo Legion 5 16IRX G9 i7-14650HX, GeForce RTX 4060 Laptop GPU, Samsung PM9A1 MZVL21T0HCLR, IPS, 2560x1600, 16" | Medio NVIDIA GeForce RTX 4090 Laptop GPU | Media de la clase Gaming | |
|---|---|---|---|---|---|---|---|
| Power Consumption | -41% | -69% | -6% | 10% | -20% | 5% | |
| Idle Minimum * (Watt) | 16.9 | 27.5 -63% | 32.3 -91% | 8 53% | 15.4 9% | 16.2 ? 4% | 13 ? 23% |
| Idle Average * (Watt) | 17.8 | 34.4 -93% | 42.6 -139% | 18 -1% | 19.7 -11% | 23.1 ? -30% | 19 ? -7% |
| Idle Maximum * (Watt) | 19.6 | 35.4 -81% | 57.9 -195% | 28 -43% | 20.7 -6% | 34.2 ? -74% | 24.6 ? -26% |
| Load Average * (Watt) | 128 | 147.8 -15% | 121 5% | 133 -4% | 102.6 20% | 130.5 ? -2% | 110.7 ? 14% |
| Witcher 3 ultra * (Watt) | 243 | 256 -5% | 254 -5% | 294 -21% | 191.3 21% | ||
| Load Maximum * (Watt) | 328 | 286.7 13% | 297.7 9% | 399 -22% | 246.6 25% | 324 ? 1% | 259 ? 21% |
* ... más pequeño es mejor
Power consumption Witcher 3 / stress test
Power consumption with external monitor
Tiempos de ejecución
La capacidad de la batería del portátil se ha mantenido igual en 95,2 Ah. Lo mismo puede decirse de su autonomía. Hemos medido unas 5,5 horas de navegación y 6,5 horas de visionado de vídeos.
| Razer Blade 16 2024, RTX 4090 i9-14900HX, GeForce RTX 4090 Laptop GPU, 95.2 Wh | Razer Blade 16 Early 2023 RTX 4090 i9-13950HX, GeForce RTX 4090 Laptop GPU, 95.2 Wh | Lenovo Legion 9 16IRX8 i9-13980HX, GeForce RTX 4090 Laptop GPU, 99.9 Wh | Schenker XMG Neo 16 E23 i9-13900HX, GeForce RTX 4090 Laptop GPU, 99 Wh | Lenovo Legion 5 16IRX G9 i7-14650HX, GeForce RTX 4060 Laptop GPU, 80 Wh | Media de la clase Gaming | |
|---|---|---|---|---|---|---|
| Duración de Batería | 8% | -37% | -1% | 8% | 18% | |
| H.264 (h) | 7.6 | 8.4 11% | 5.8 -24% | 9.6 26% | 8.32 ? 9% | |
| WiFi v1.3 (h) | 5.5 | 5.8 5% | 2.7 -51% | 6.7 22% | 7.4 35% | 7.11 ? 29% |
| Load (h) | 1.3 | 1.4 8% | 1 -23% | 0.8 -38% | 1.502 ? 16% | |
| Witcher 3 ultra (h) | 1.6 | 1.4 | ||||
| Reader / Idle (h) | 6.7 | 8.27 ? |
Pro
Contra
Veredicto - Pocos argumentos que hablen a favor de actualizar el modelo 2023

El Razer Blade 16 vuelve a ser un portátil para juegos muy logrado. Es compacto, delgado, pero potente y tiene un acabado de alta calidad. Con su rápida y bonita pantalla OLED, las configuraciones se han enriquecido con una bonita alternativa de pantalla.
Sin embargo, los propietarios de los modelos 2023, que también cuentan con muy buenas pantallas Mini-LED, no tienen realmente ninguna razón para actualizarse: su rendimiento apenas ha mejorado gracias a la actualización Raptor Lake y no se ha añadido ninguna característica imprescindible a este modelo.
Al igual que su predecesor, la versión 2024 del Razer Blade 16 es un gamer de gama alta muy logrado. Sin embargo, apenas hay razones para actualizarlo respecto a su predecesor casi equivalente.
Precio y disponibilidad
La nueva Blade 16 puede encontrarse actualmente en Amazon por 4.699,99 dólares.
Razer Blade 16 2024, RTX 4090
- 02/19/2024 v7 (old)
Christian Hintze
Transparencia
La selección de los dispositivos que se van a reseñar corre a cargo de nuestro equipo editorial. La muestra de prueba fue proporcionada al autor en calidad de préstamo por el fabricante o el minorista a los efectos de esta reseña. El prestamista no tuvo ninguna influencia en esta reseña, ni el fabricante recibió una copia de la misma antes de su publicación. No había ninguna obligación de publicar esta reseña. Como empresa de medios independiente, Notebookcheck no está sujeta a la autoridad de fabricantes, minoristas o editores.
Así es como prueba Notebookcheck
Cada año, Notebookcheck revisa de forma independiente cientos de portátiles y smartphones utilizando procedimientos estandarizados para asegurar que todos los resultados son comparables. Hemos desarrollado continuamente nuestros métodos de prueba durante unos 20 años y hemos establecido los estándares de la industria en el proceso. En nuestros laboratorios de pruebas, técnicos y editores experimentados utilizan equipos de medición de alta calidad. Estas pruebas implican un proceso de validación en varias fases. Nuestro complejo sistema de clasificación se basa en cientos de mediciones y puntos de referencia bien fundamentados, lo que mantiene la objetividad.Price comparison

