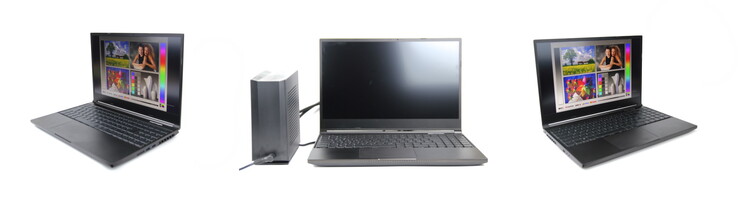
Schenker XMG Neo 15 con XMG Oasis en revisión: RTX 3080 Ti sin límites térmicos
En febrero de este año, pudimos tener en nuestras manos uno de losmodelos de preproducción del XMG Neo 15 (junto con el XMG Oasis) y recopilar los primeros resultados del benchmark. Ahora, tanto el Neo 15 como la unidad de refrigeración líquida externa Oasis están listos para la producción y es el momento de realizar una prueba adecuada y exhaustiva.
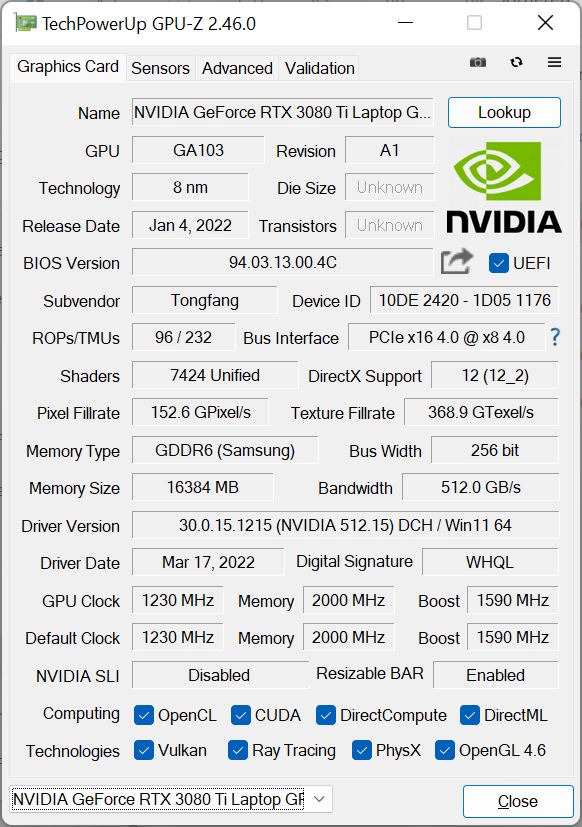
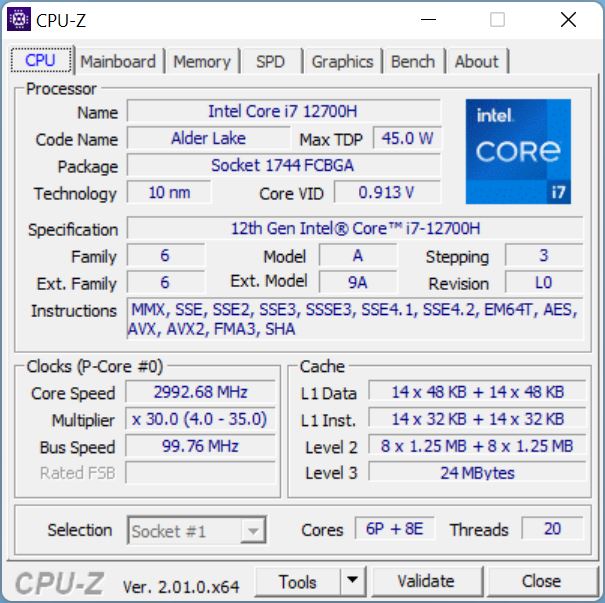
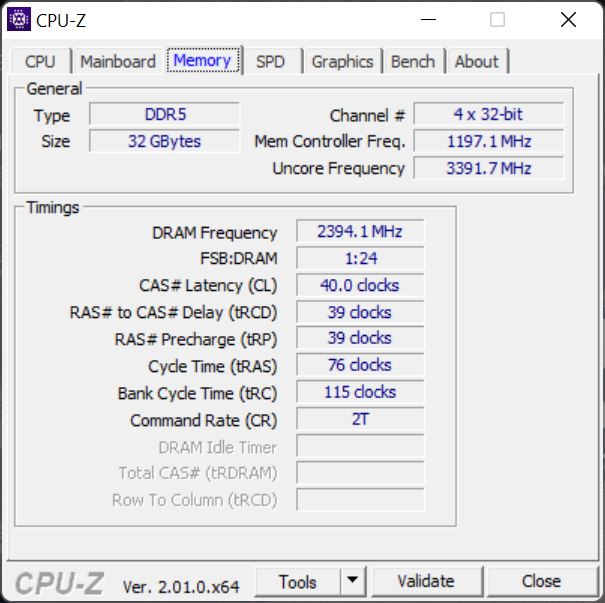
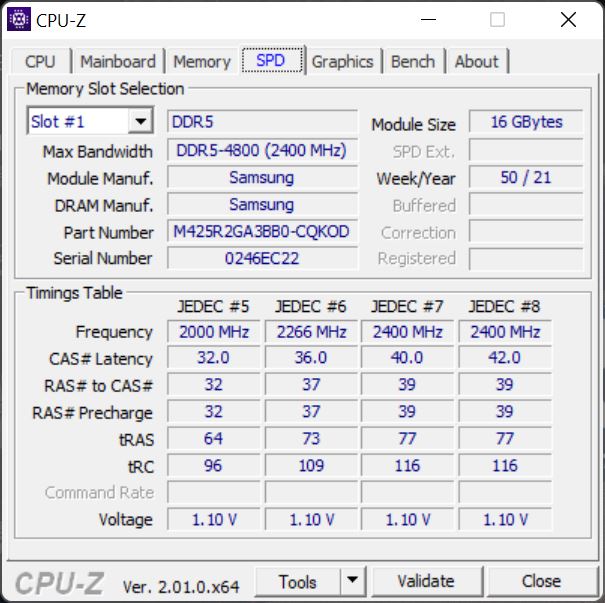
Nuestra muestra de revisión combina uni7-12700H con una RTX 3080 Ti en un chasis de 15,6 pulgadas. A esto se añaden 32 GB de DDR5 y un display QHD con cobertura sRGB casi completa. La carcasa viene de Tongfang/Uniwill con la designación GM5AG8W.
La unidad de refrigeración líquida externa XMG Oasis puede adquirirse por separado por 199 euros y se supone que aumenta el rendimiento y reduce el ruido y la temperatura.
Echamos un vistazo al portátil y al Oasis, y comparamos el Neo 15 con y sin refrigeración líquida en nuestras pruebas. Para la comparación externa, utilizamos otros portátiles con una RTX 3080 Ti junto ael predecesorentre ellos se encuentra el Razer Blade 15pero también el Asus ROG Zephyrus Duo 16, el Gigabyte Aero 16 YE5 y el Alienware x17 R2 debido a la falta de otros portátiles de 15 pulgadas con una RTX 3080 Ti.
Posibles contendientes en la comparación
Valoración | Fecha | Modelo | Peso | Altura | Tamaño | Resolución | Precio |
|---|---|---|---|---|---|---|---|
| 88.4 % v7 (old) | 07/2022 | Schenker XMG Neo 15 (i7-12700H, RTX 3080 Ti) i7-12700H, GeForce RTX 3080 Ti Laptop GPU | 2.3 kg | 26.6 mm | 15.60" | 2560x1440 | |
| 87 % v7 (old) | 06/2021 | Schenker XMG Neo 15 Tiger Lake i7-11800H, GeForce RTX 3080 Laptop GPU | 2.2 kg | 26 mm | 15.60" | 2560x1440 | |
| 89.1 % v7 (old) | 03/2022 | Razer Blade 15 2022 i7-12800H, GeForce RTX 3080 Ti Laptop GPU | 2.1 kg | 16.99 mm | 15.60" | 2560x1440 | |
| 88.2 % v7 (old) | 05/2022 | Asus ROG Zephyrus Duo 16 GX650RX R9 6900HX, GeForce RTX 3080 Ti Laptop GPU | 2.6 kg | 20.5 mm | 16.00" | 3840x2400 | |
| 84.7 % v7 (old) | 03/2022 | Gigabyte Aero 16 YE5 i9-12900HK, GeForce RTX 3080 Ti Laptop GPU | 2.3 kg | 22.4 mm | 16.00" | 3840x2400 | |
| 89.2 % v7 (old) | 05/2022 | Alienware x17 R2 P48E i9-12900HK, GeForce RTX 3080 Ti Laptop GPU | 3.1 kg | 20.9 mm | 17.30" | 1920x1080 |
Caja: Metal arriba, plástico abajo
XMG Neo 15
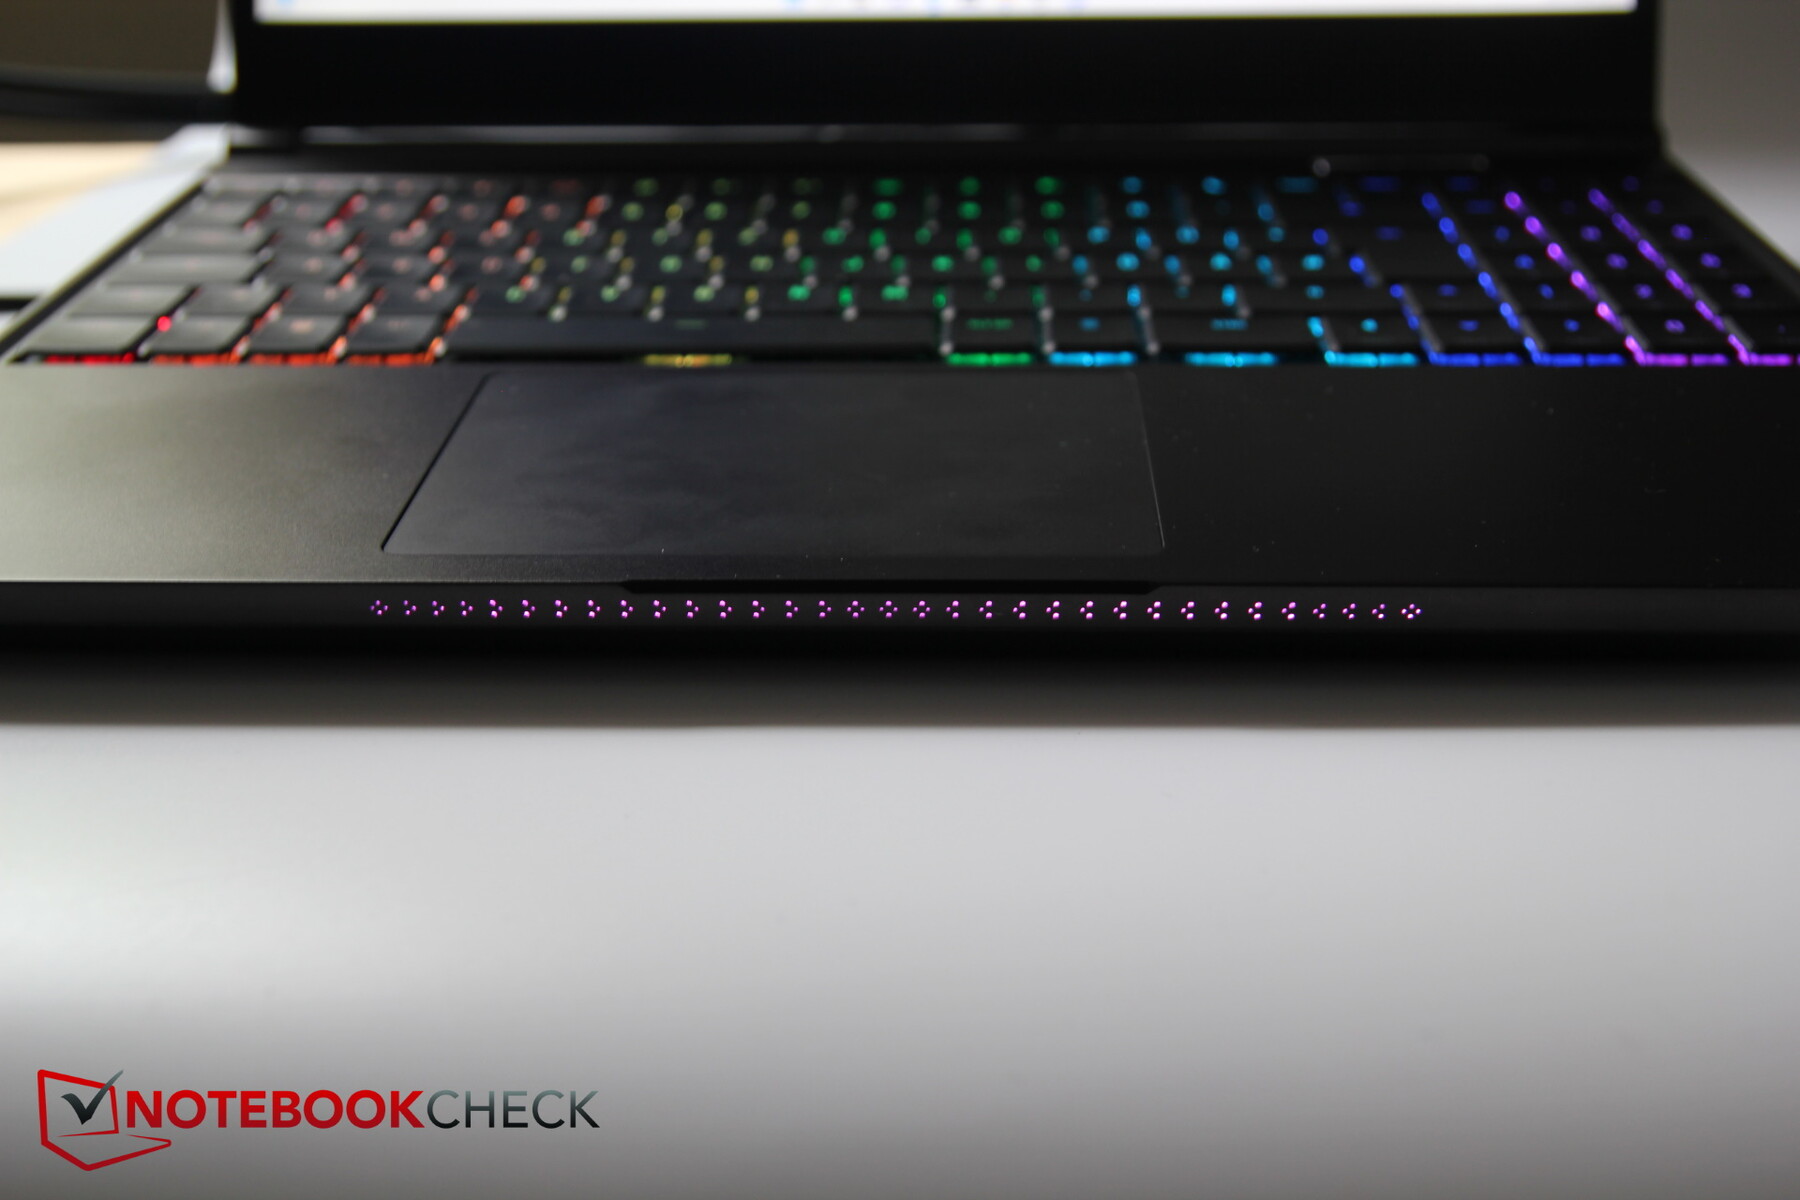
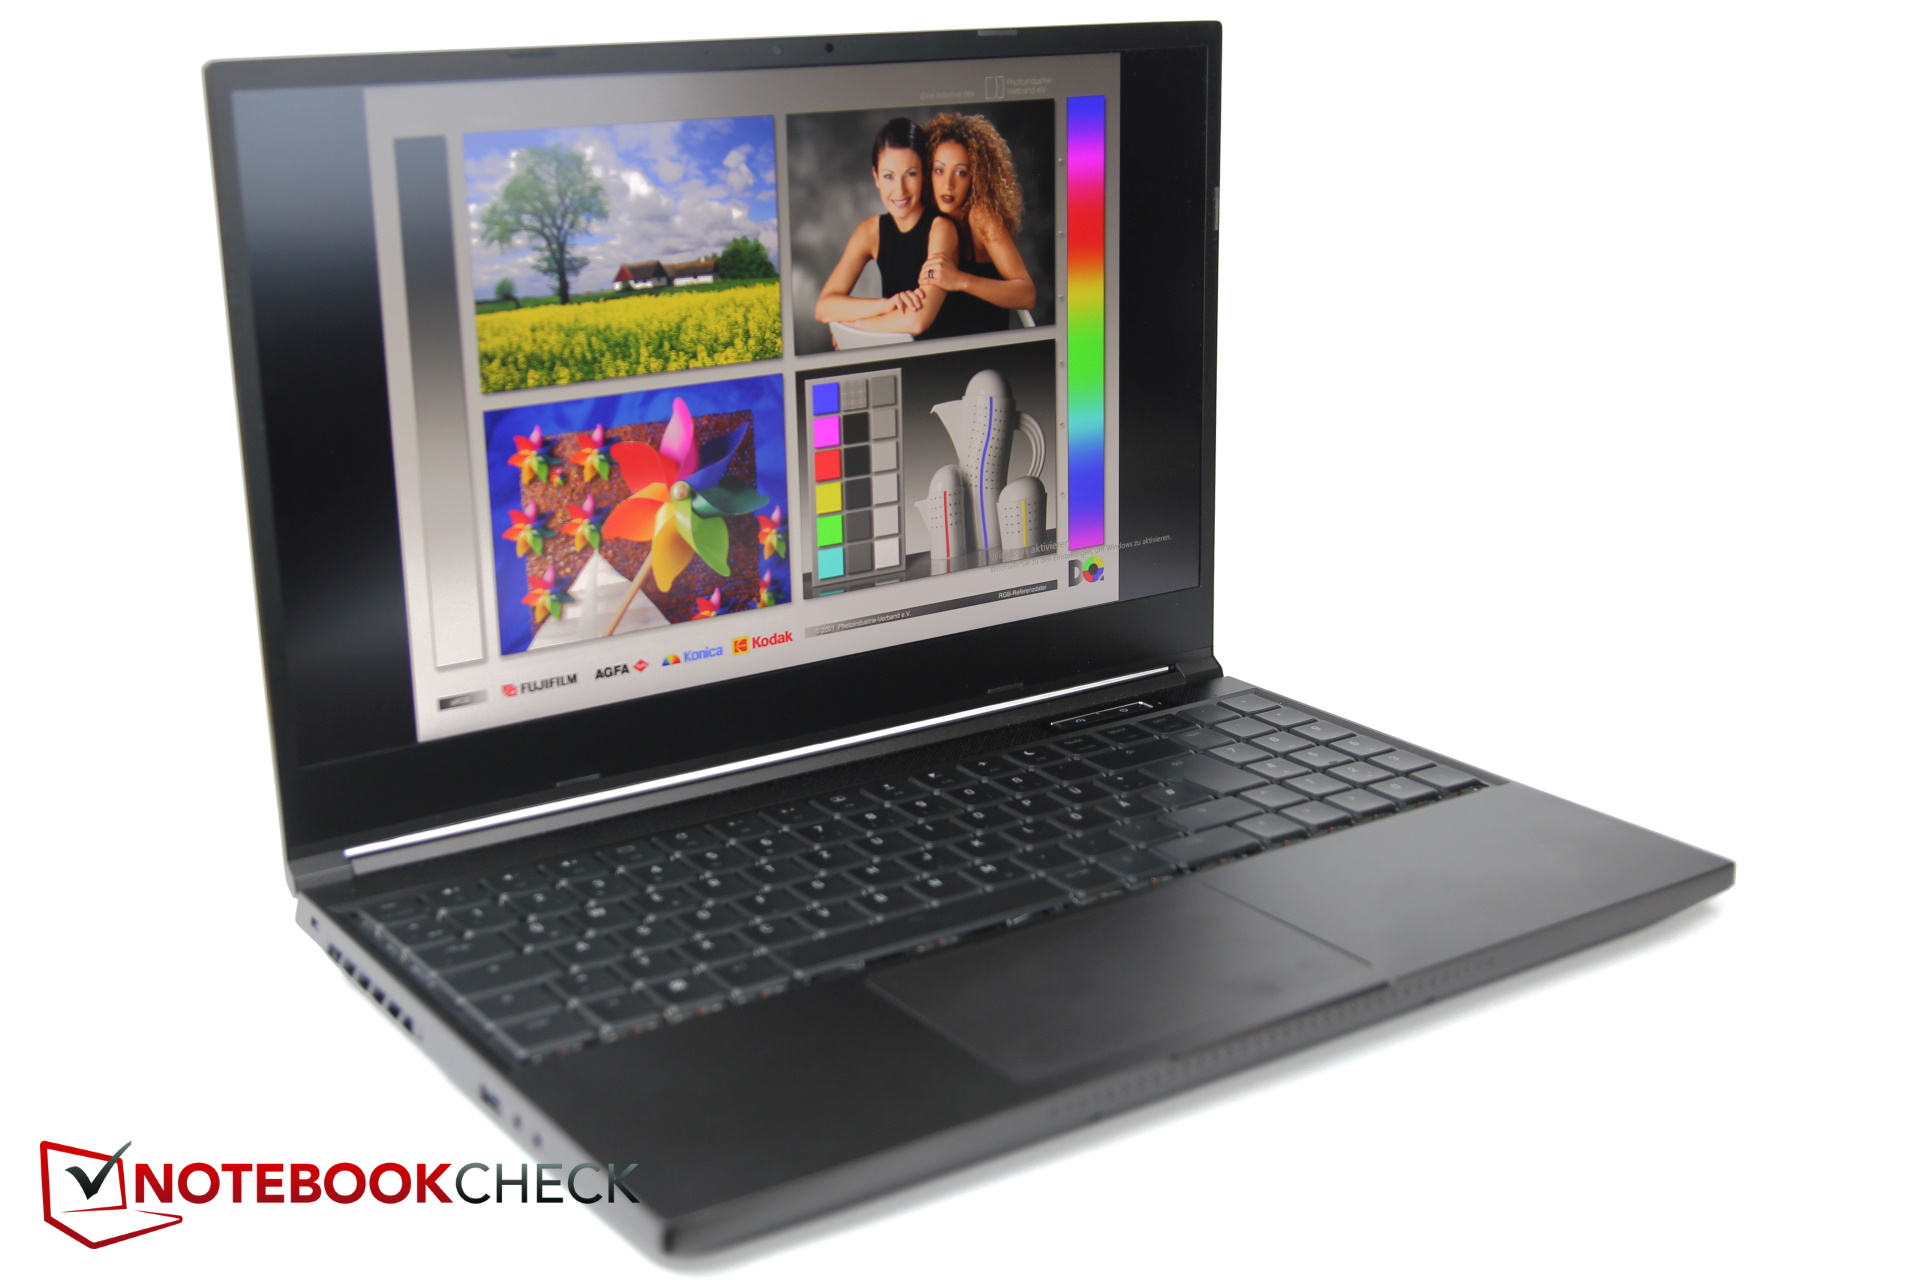
Para un jugador, el Neo resulta bastante sencillo. Aparte del teclado, no hay elementos RGB parpadeantes, e incluso las obligatorias pegatinas de colores de las especificaciones "faltan" en el reposamanos. El diseño negro mate es funcionalmente sencillo y discreto, y resulta agradable precisamente por estas razones. Incluso los profesionales no tienen que avergonzarse de tener el Neo en la mesa de su oficina. Sin embargo, hay una especie de barra con estructura de celosía en la parte delantera, que también permite que la retroiluminación del teclado brille, pero no de forma demasiado molesta.
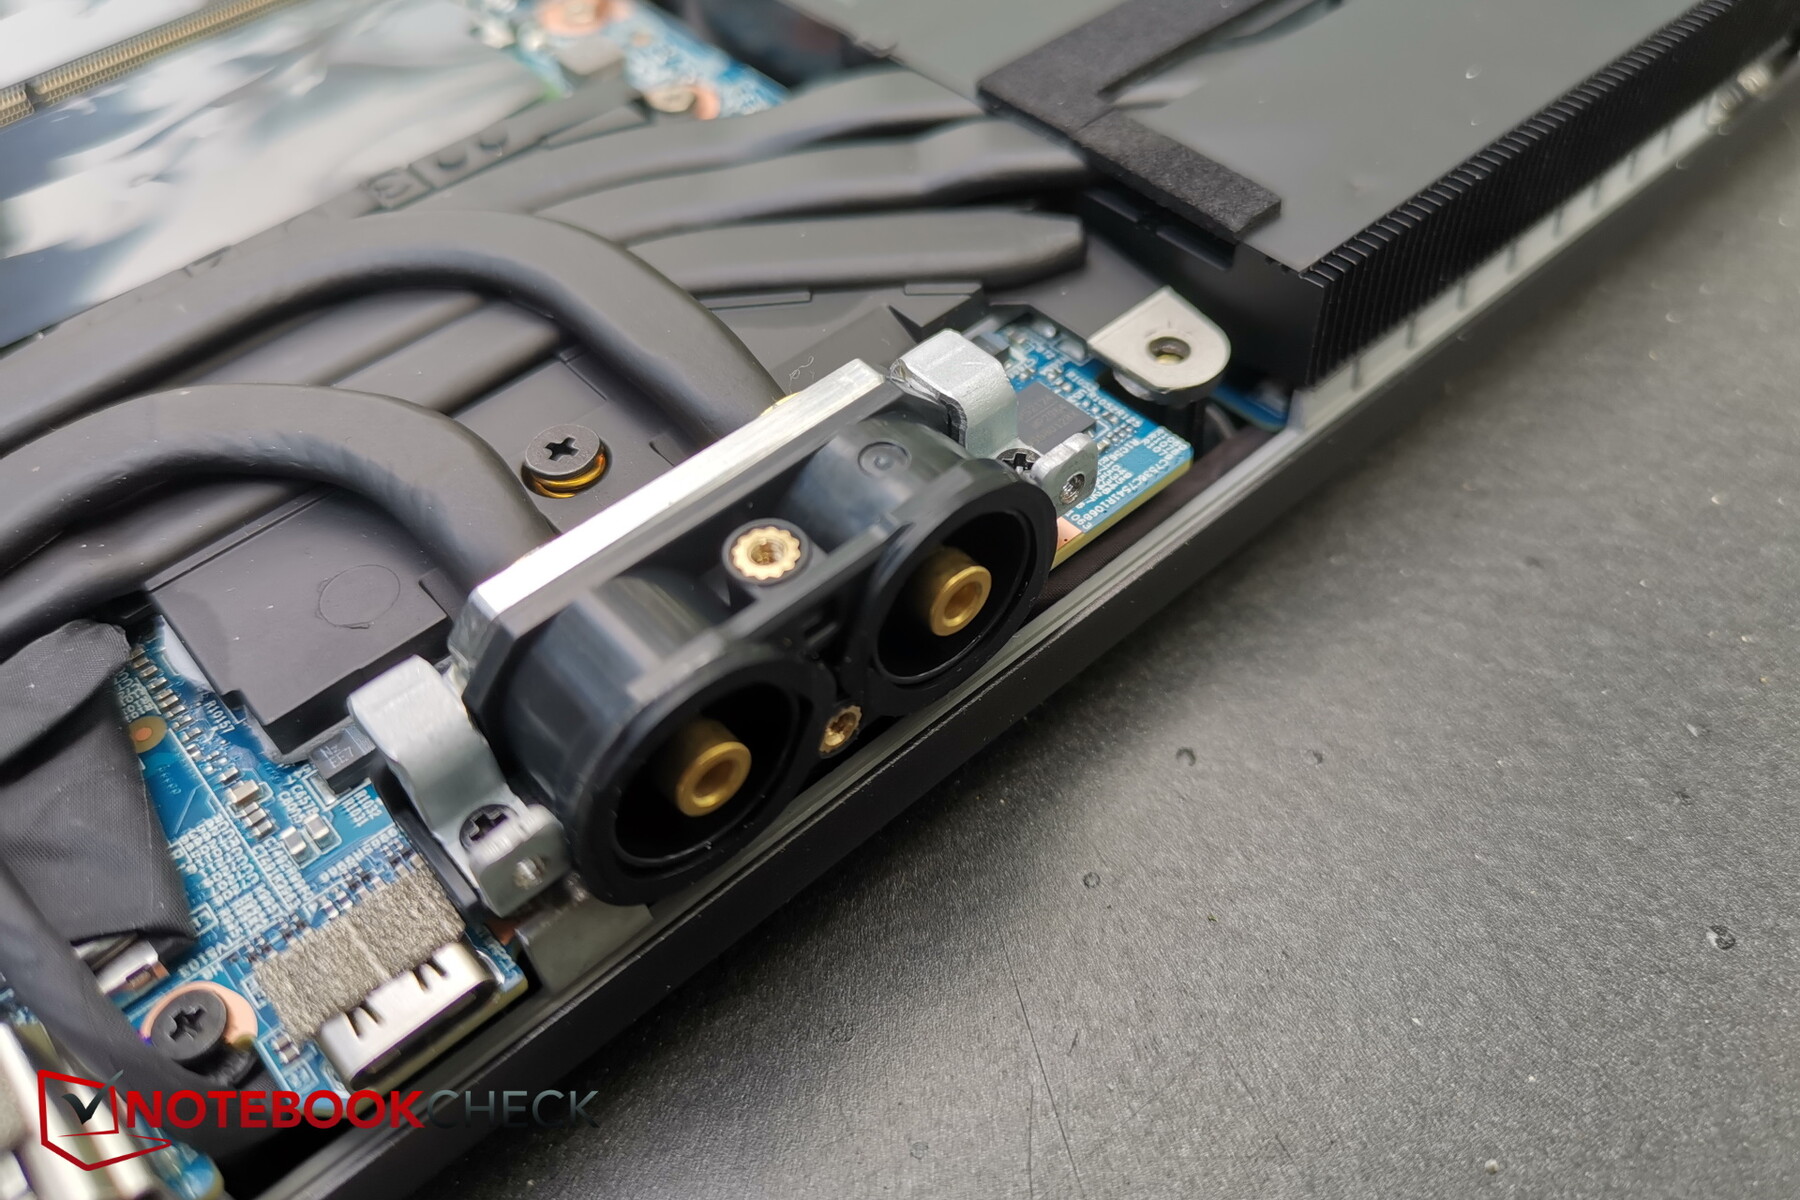
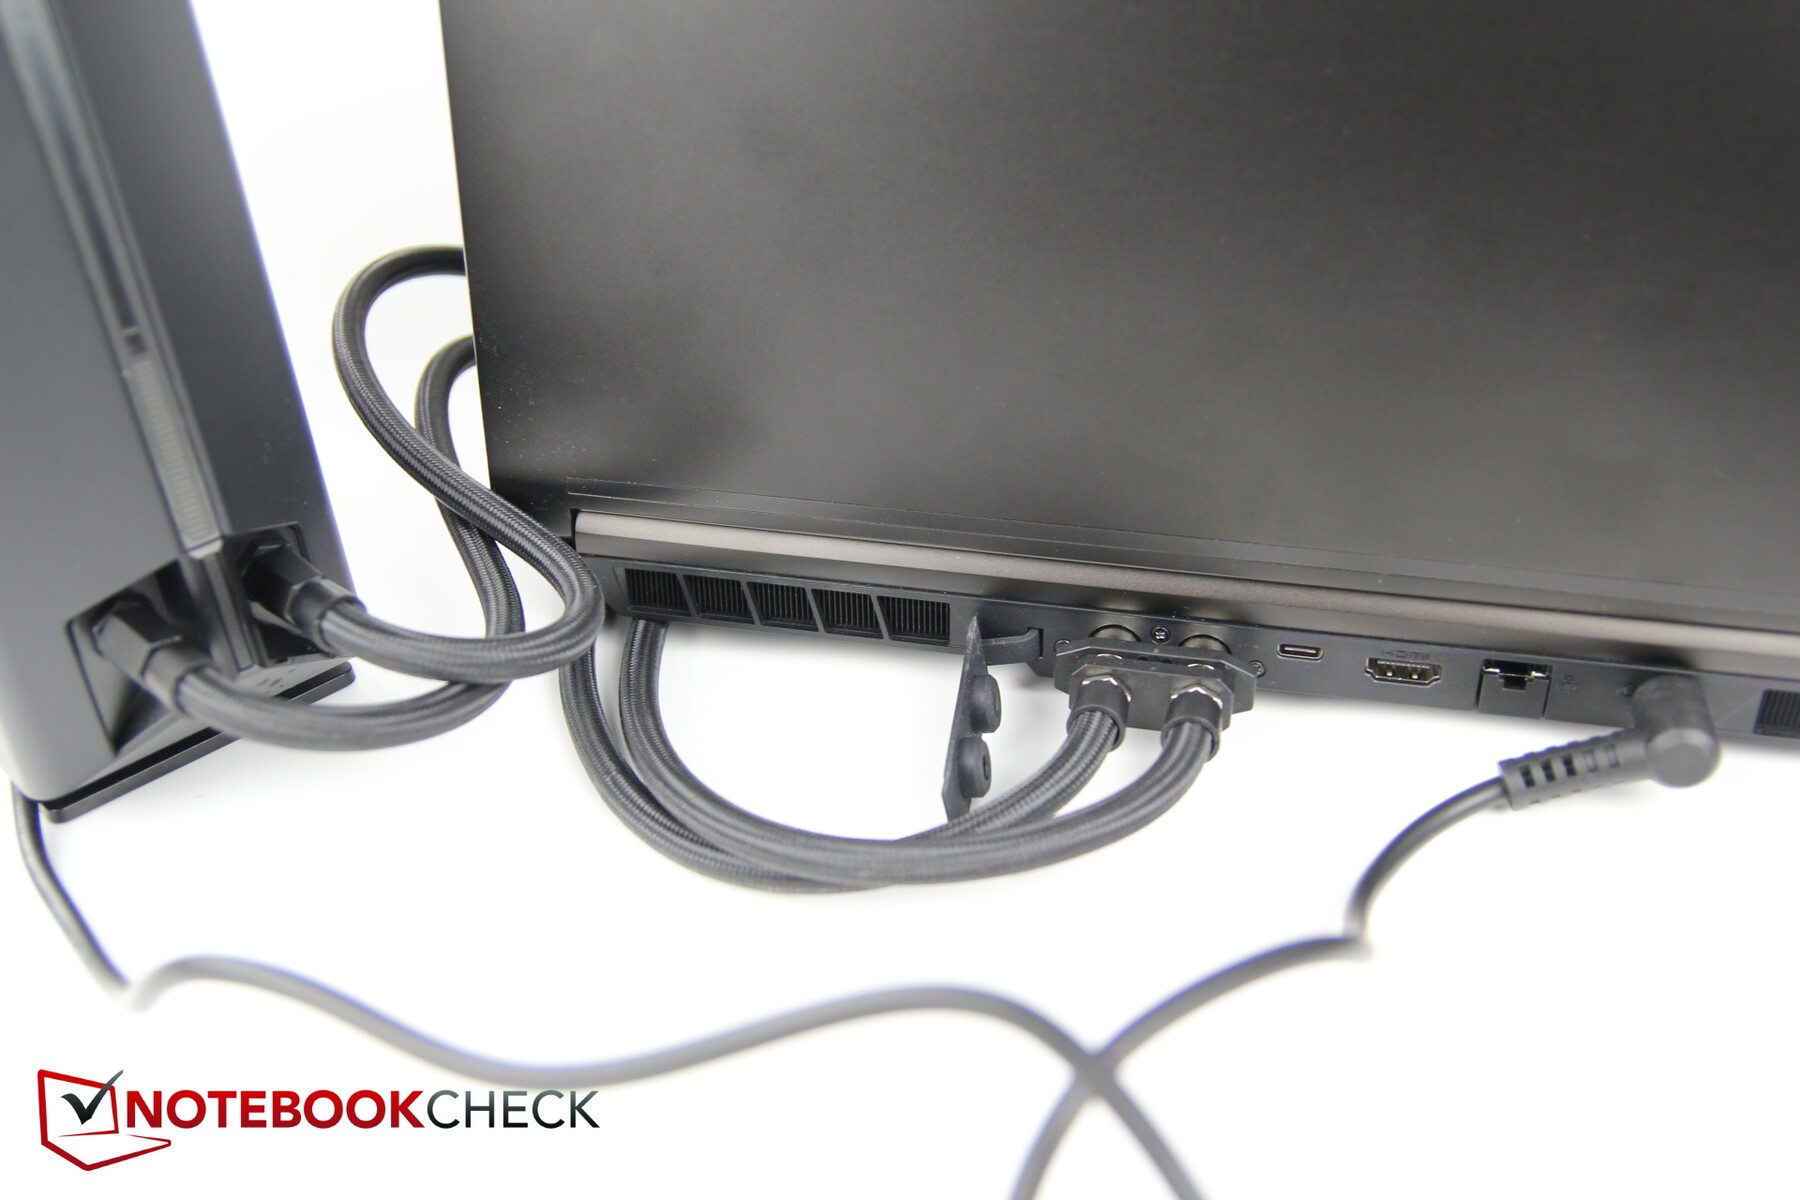
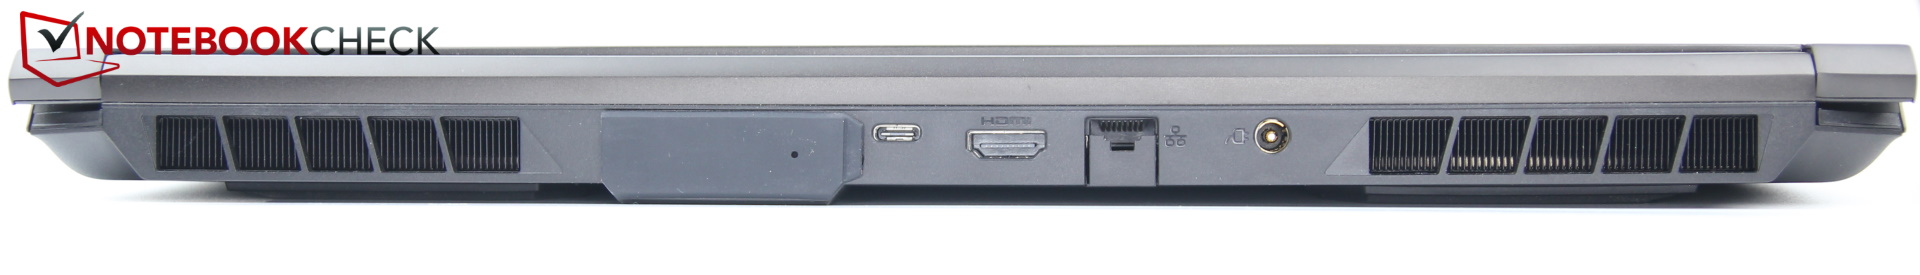
Al examinar por primera vez el NEO, una característica claramente perceptible son los dos puertos de tubo de color dorado para la refrigeración líquida en la parte trasera, protegidos por una tapa de goma.
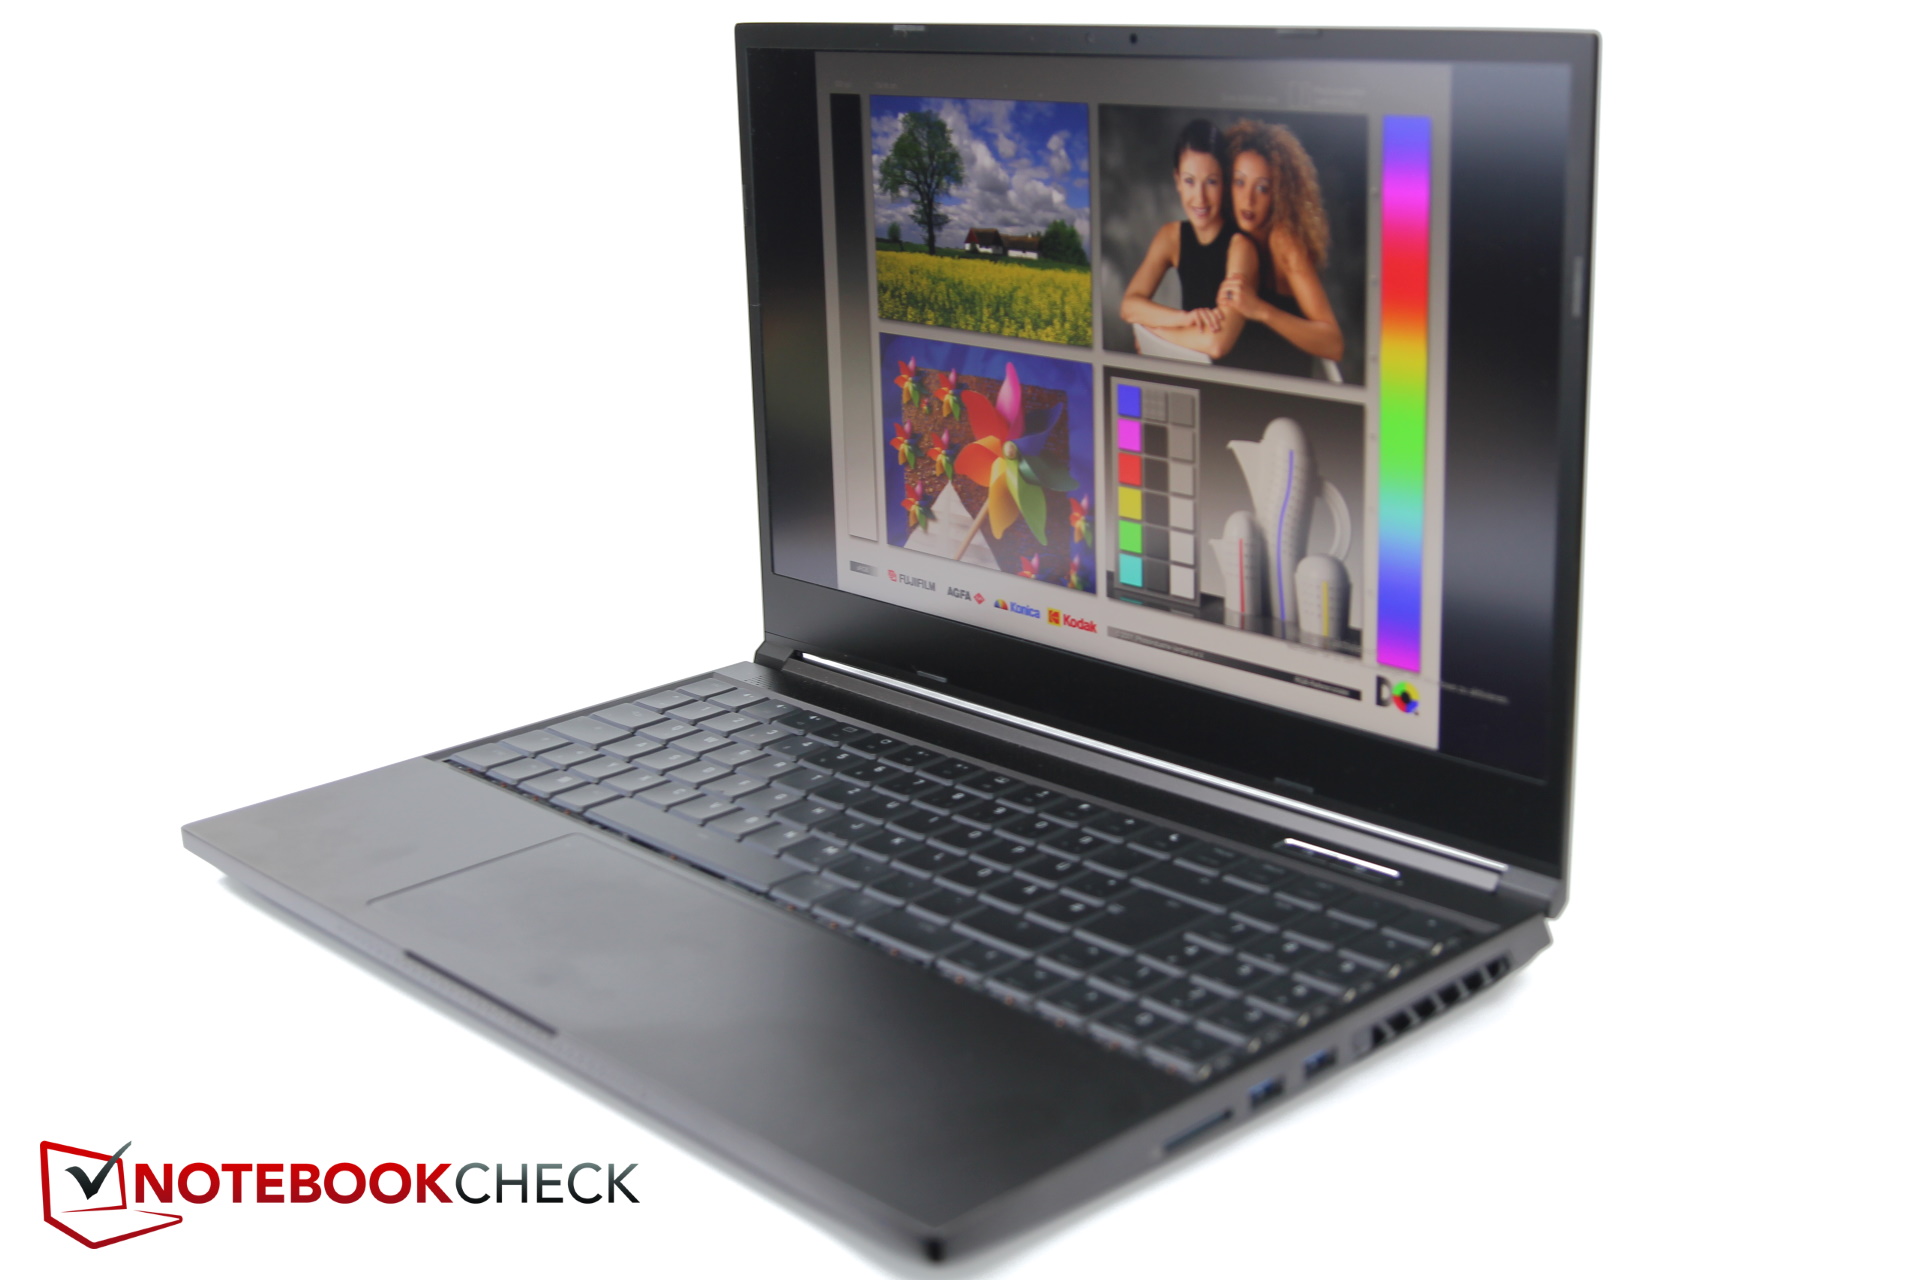
La tapa de la pantalla y la parte superior de la placa base son de metal, mientras que la parte inferior es de plástico. La base es muy estable y no emite ningún crujido o chirrido cuando se somete a torsión. Esto también se aplica a la tapa de la pantalla, pero ésta es naturalmente más fácil de doblar. Las bisagras quizás podrían estar un poco más ajustadas, pero son sólidas.
La superficie metálica es sensible a las huellas dactilares y a las manchas de grasa. La calidad de construcción es muy buena; no descubrimos ningún hueco inusual o desigual.
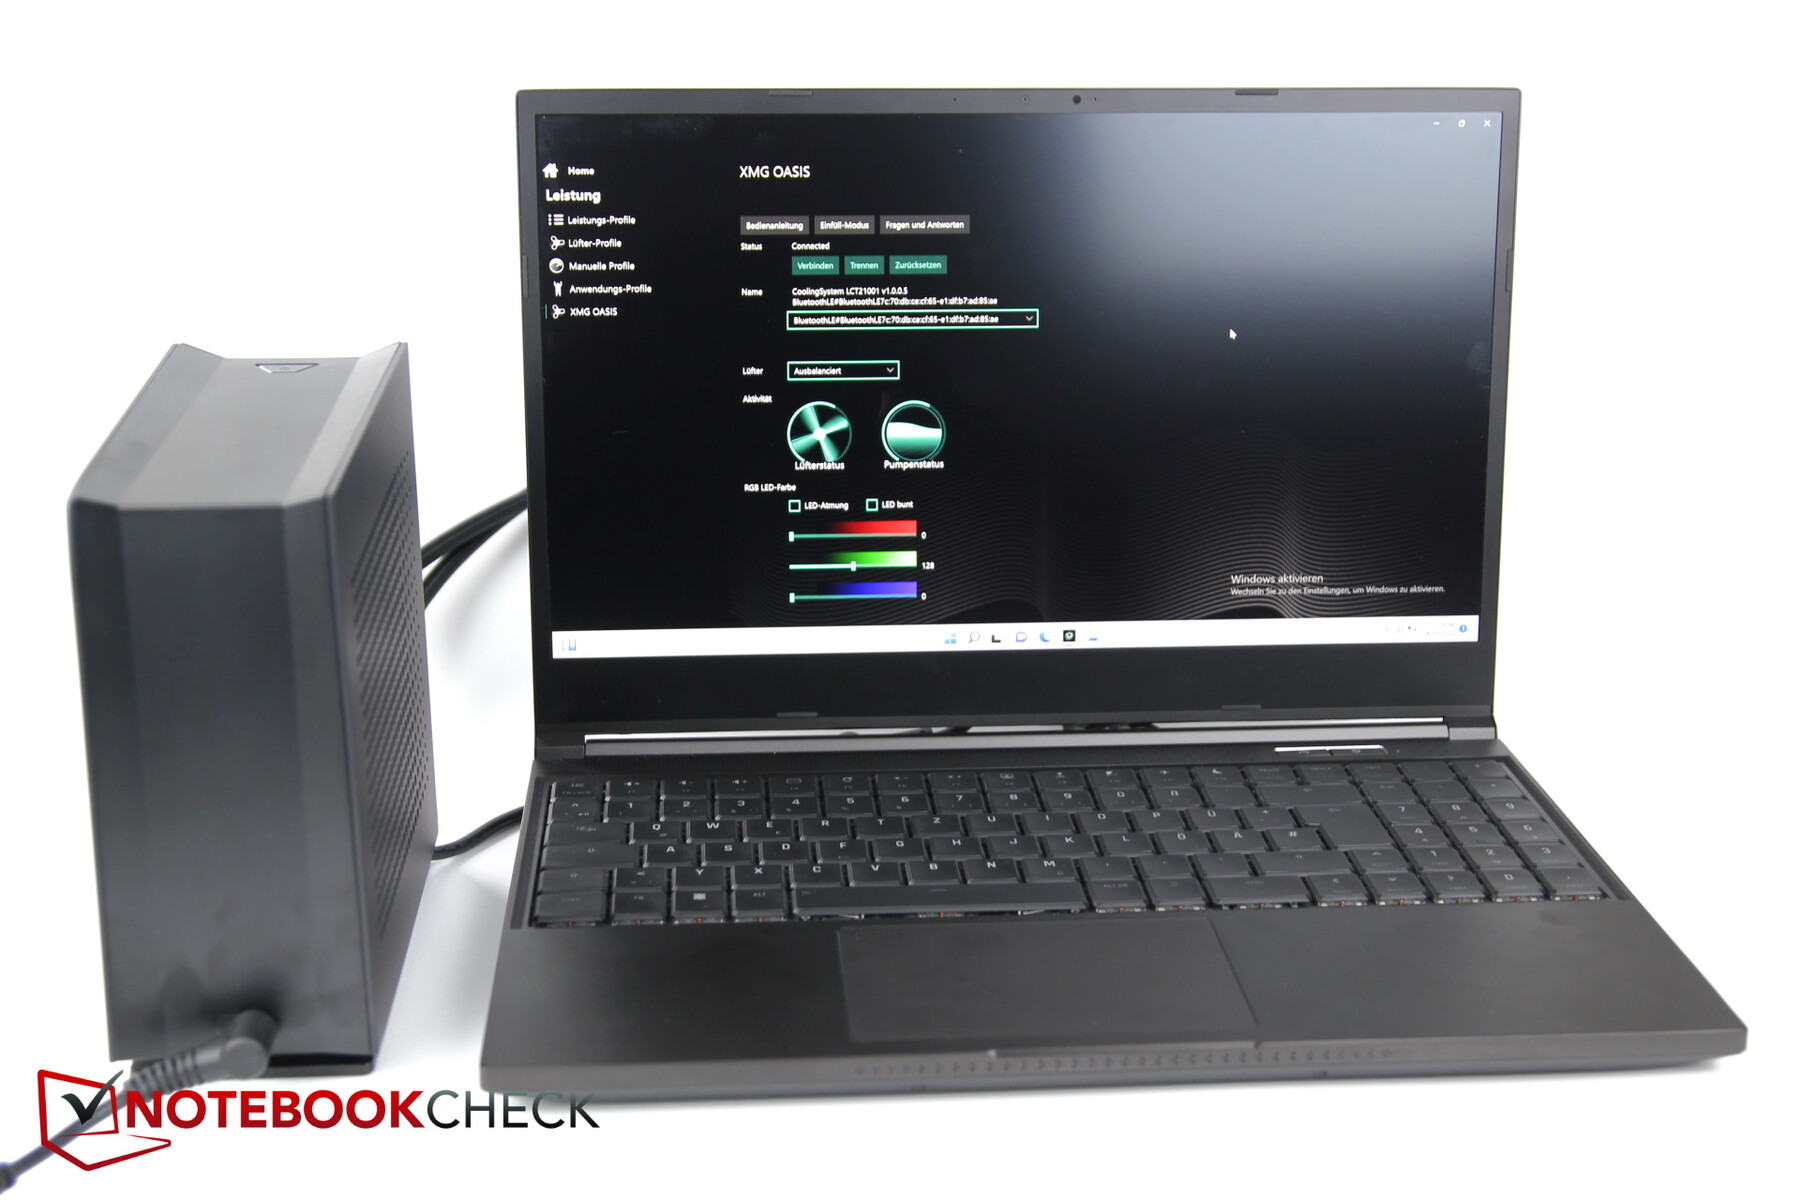
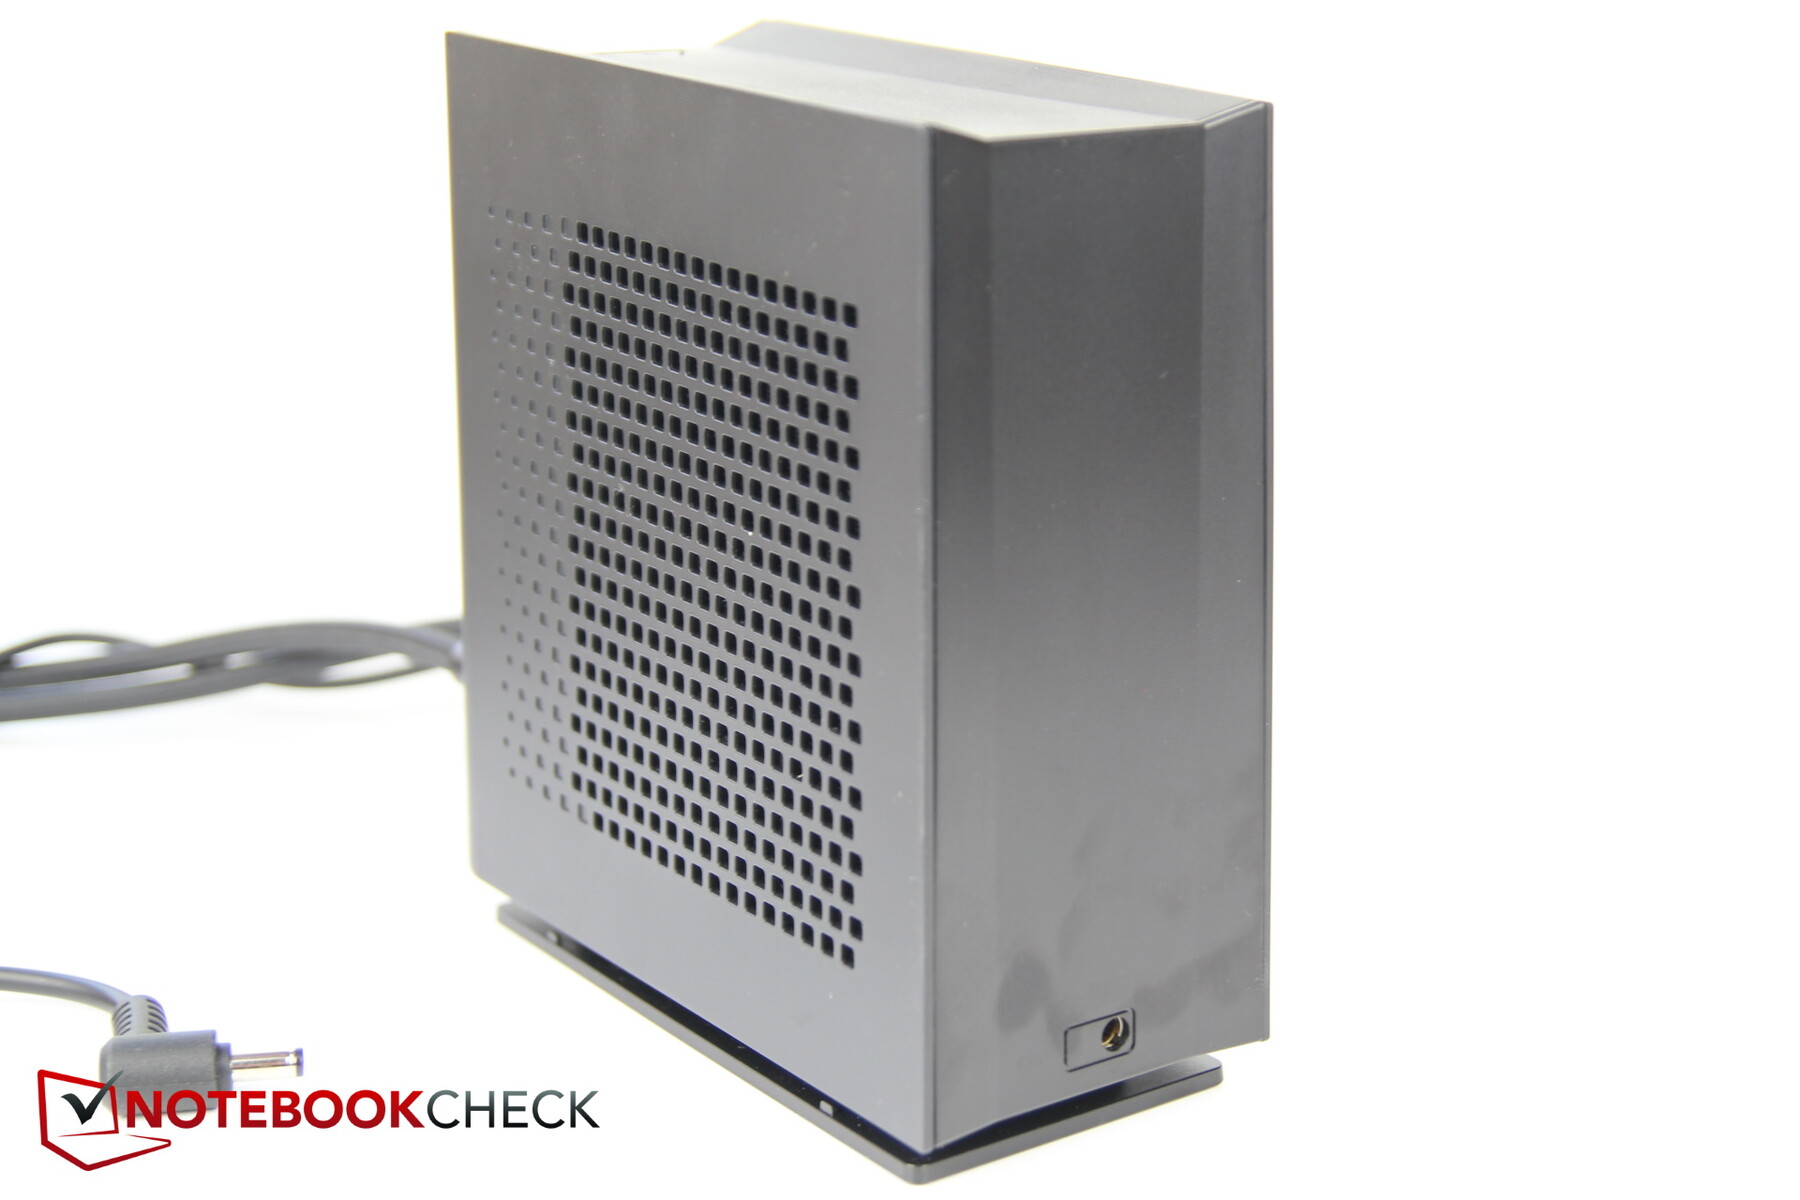
Oasis XMG
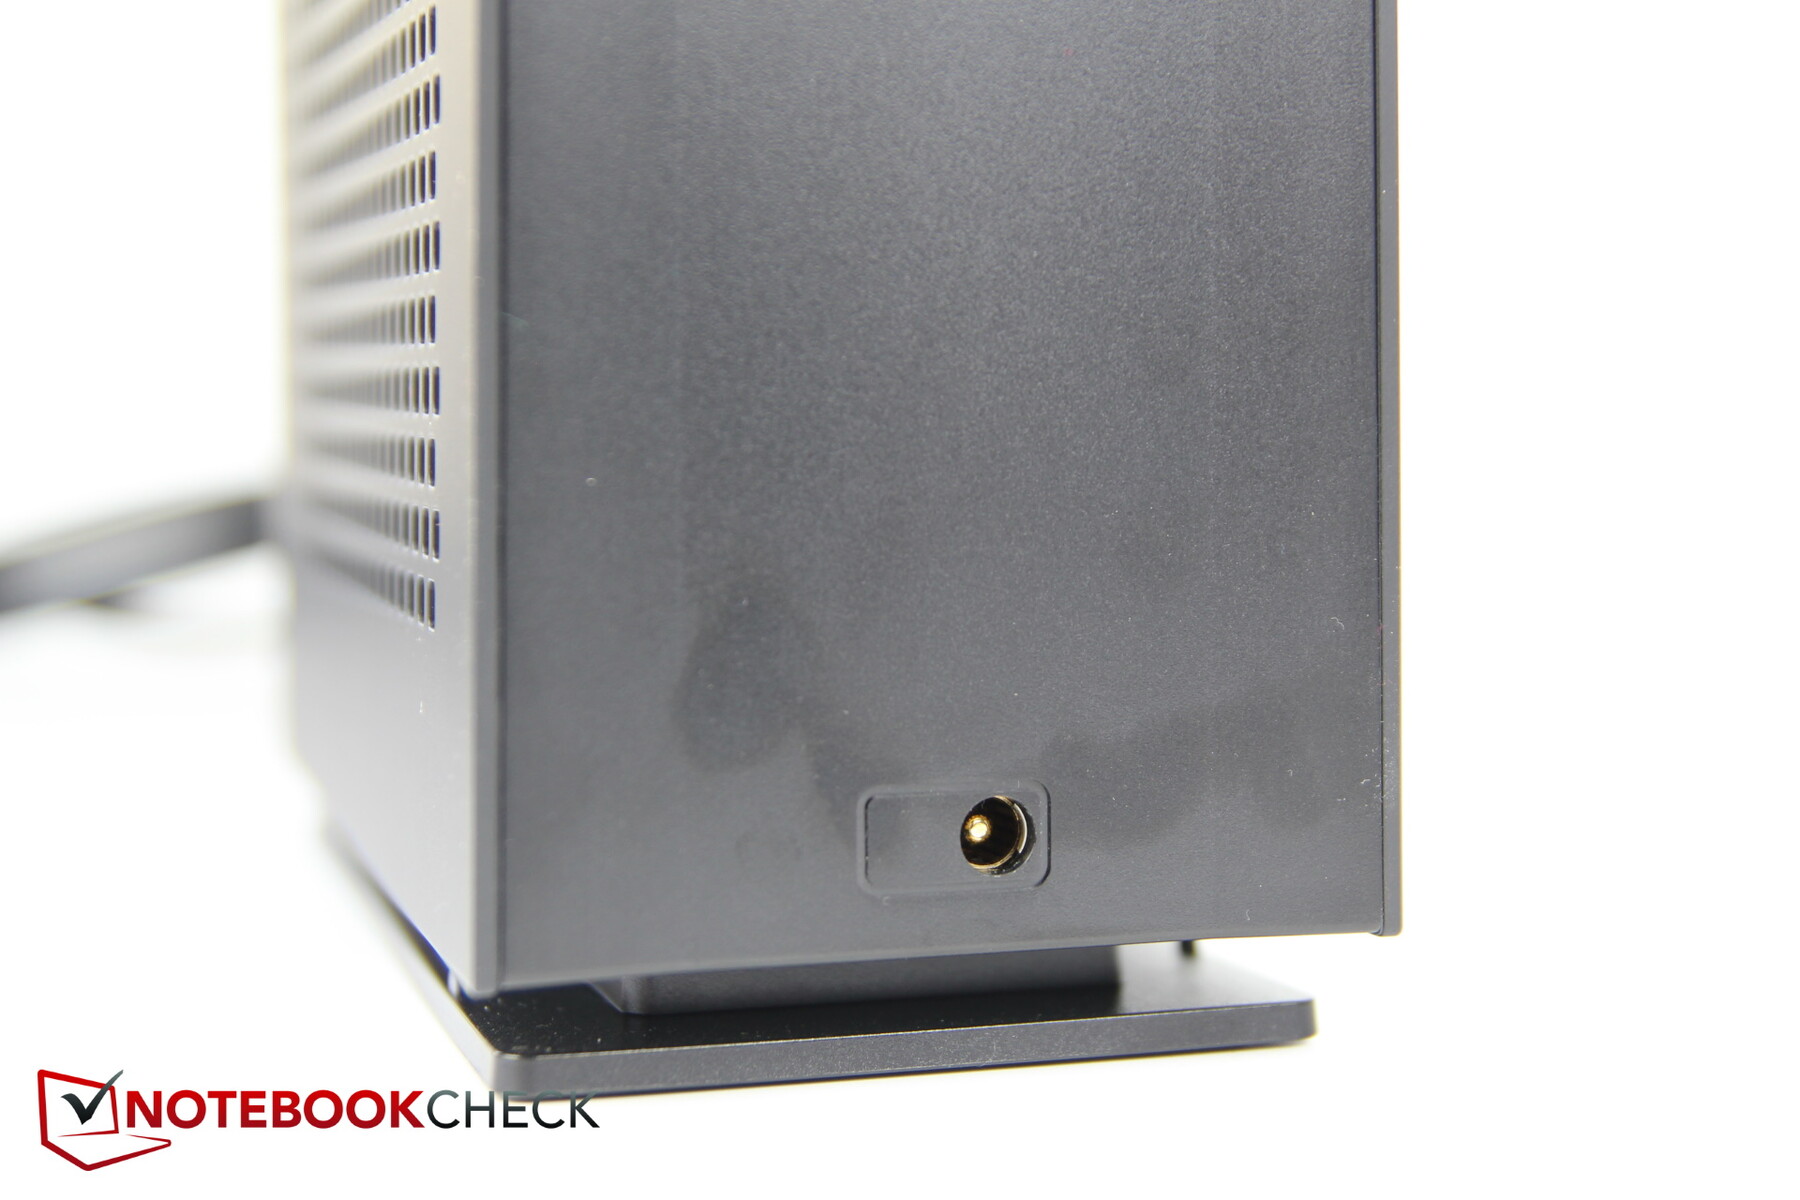
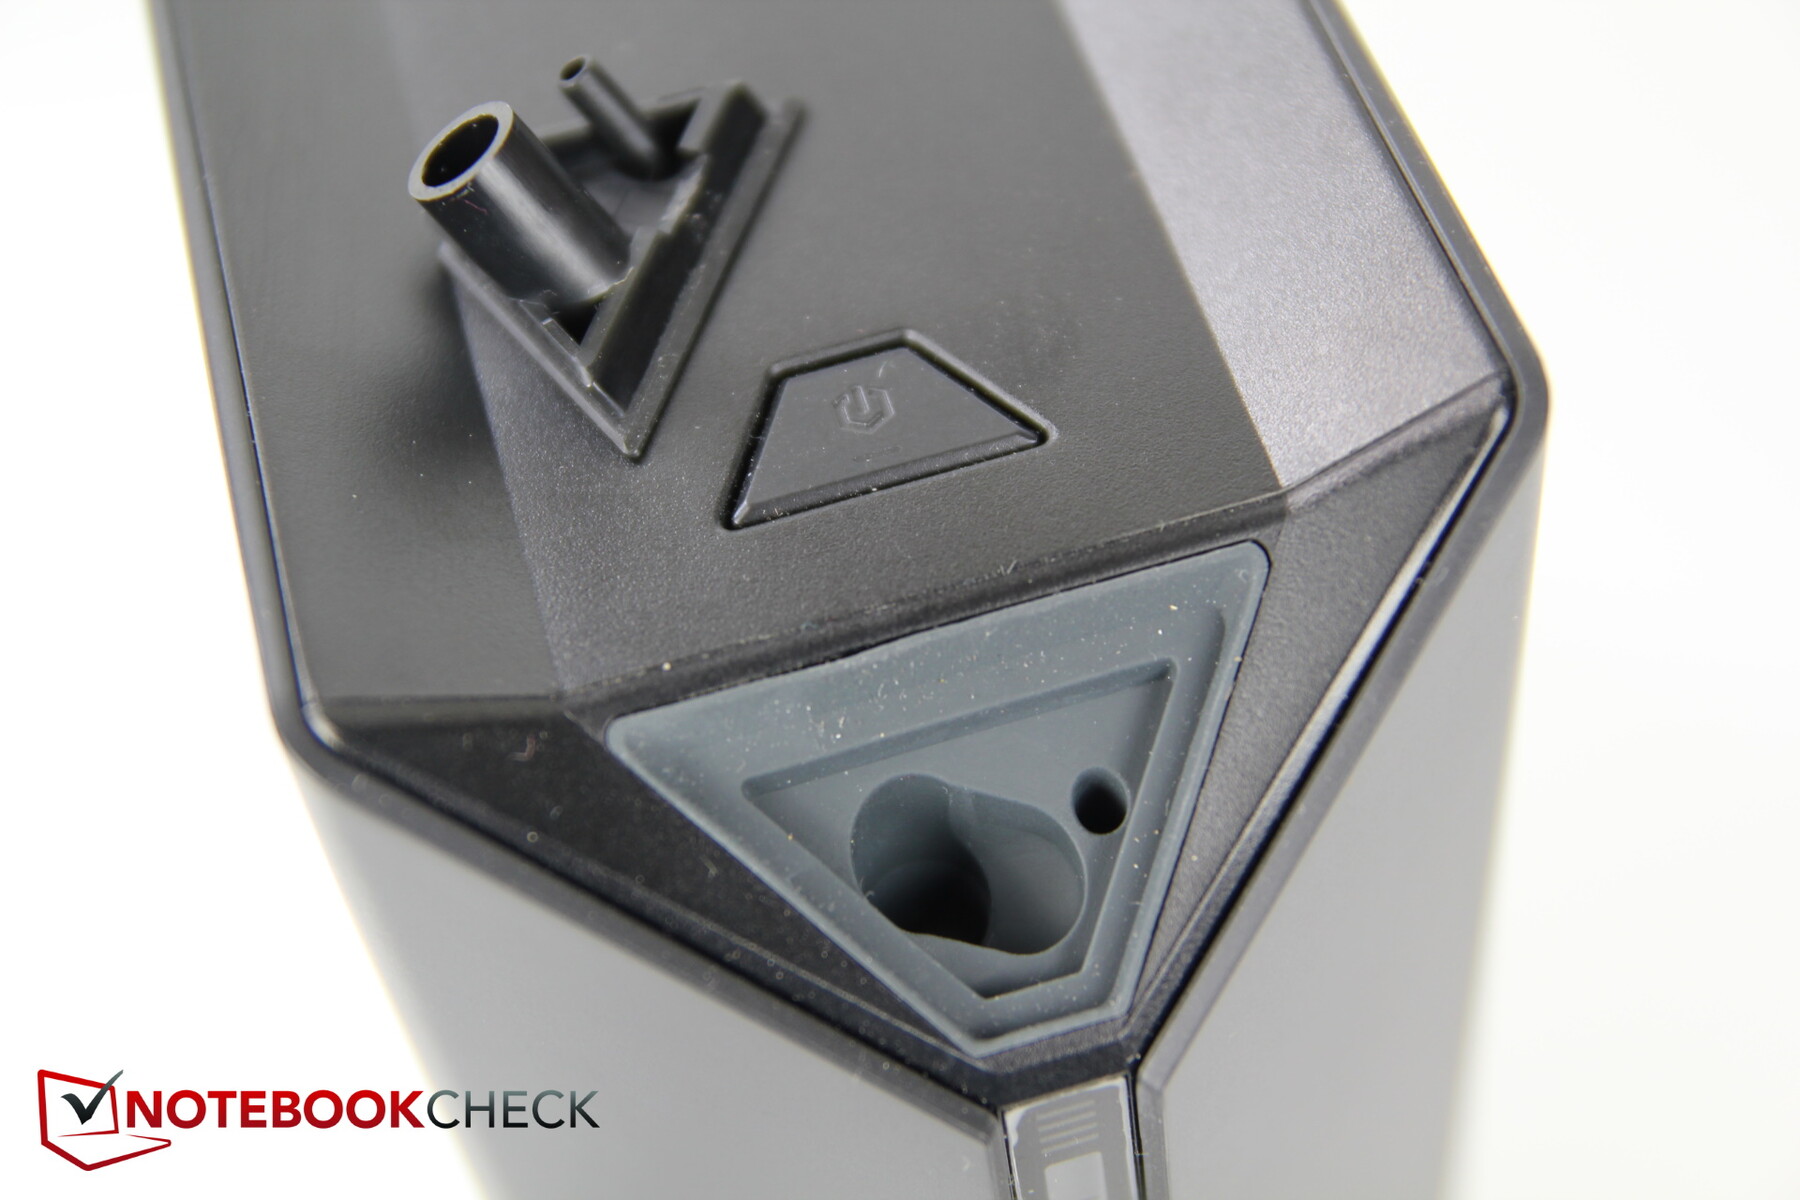
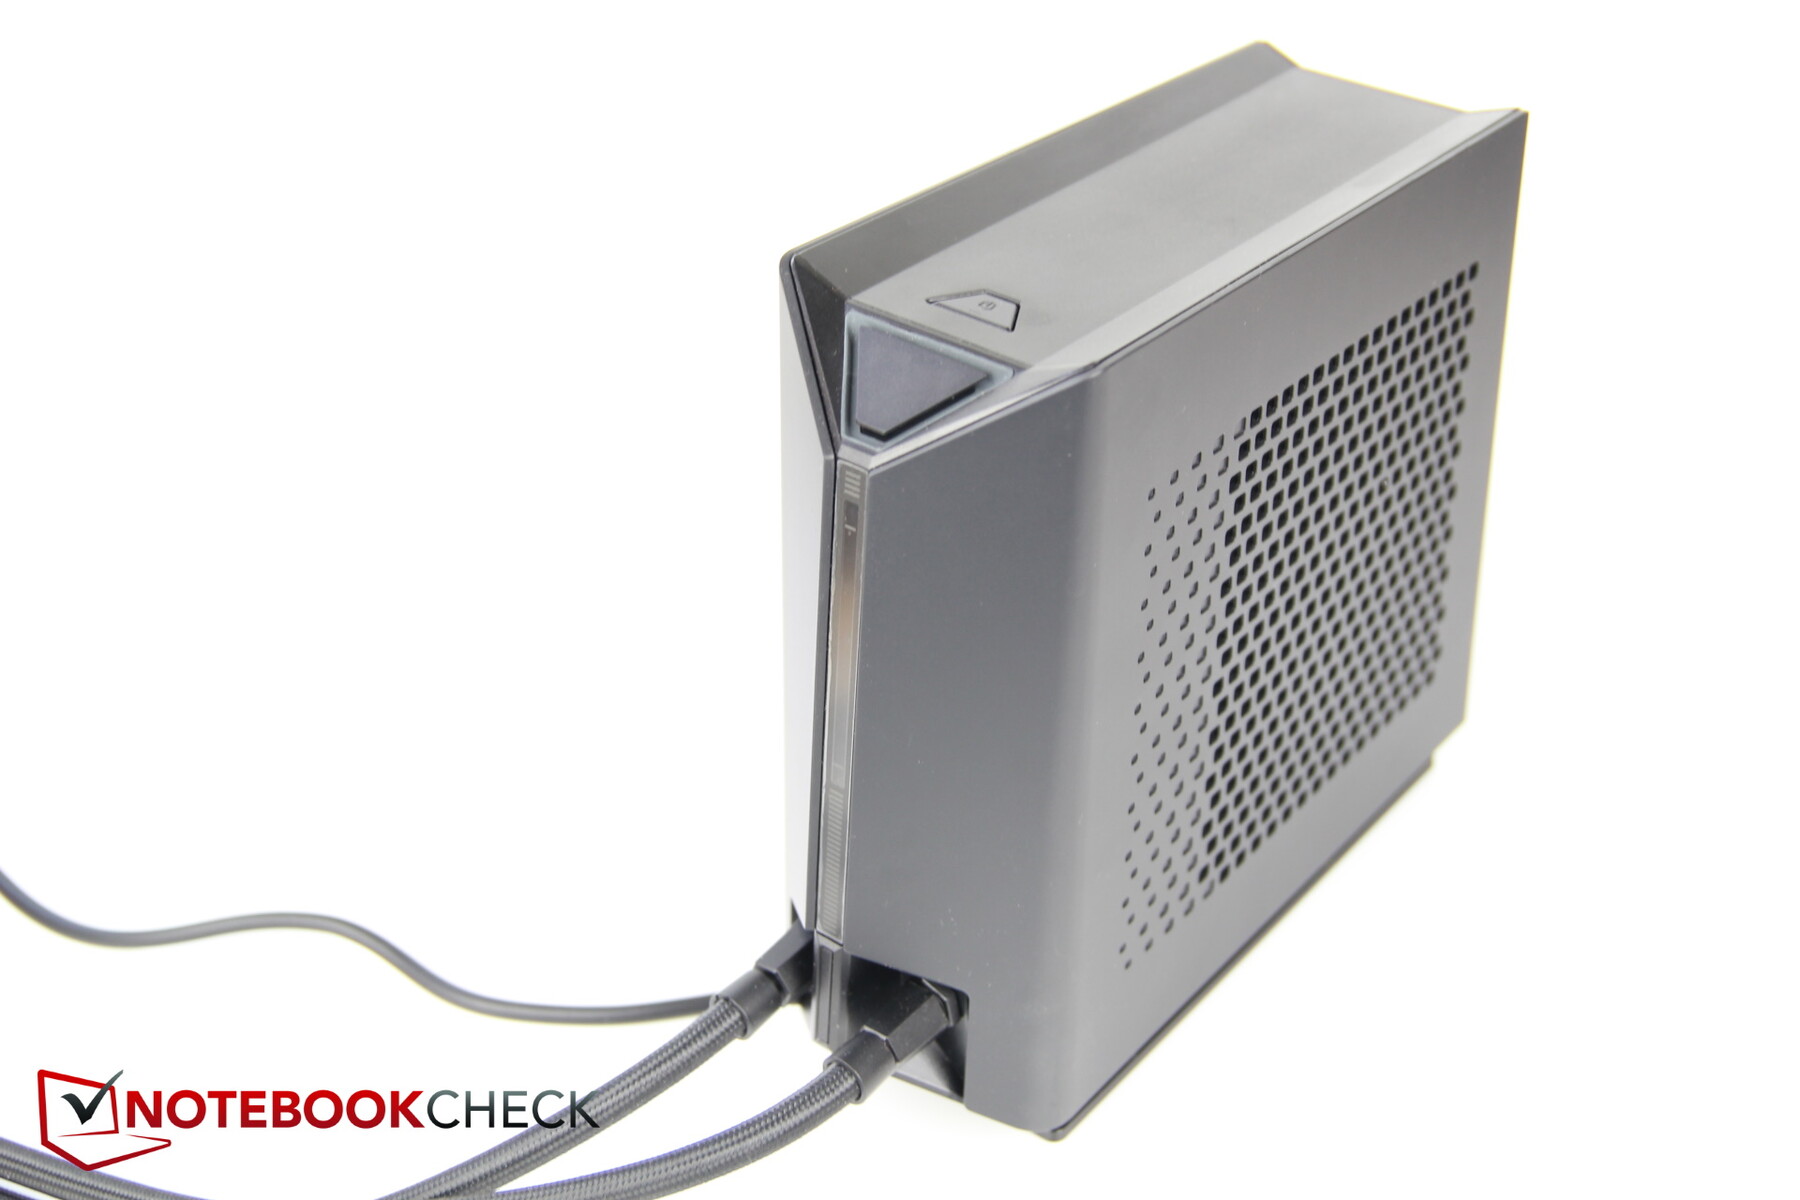
La unidad de refrigeración líquida externa tiene la forma de una caja de plástico negra. El refrigerante o el agua destilada se vierte en la parte superior. Las dos conexiones de manguera están en la parte inferior en un lado y la conexión de alimentación en el lado opuesto. Aquí es donde se conecta la fuente de alimentación del Neo, un cable corto del Oasis va entonces a la ranura de alimentación del Neo como alimentador.
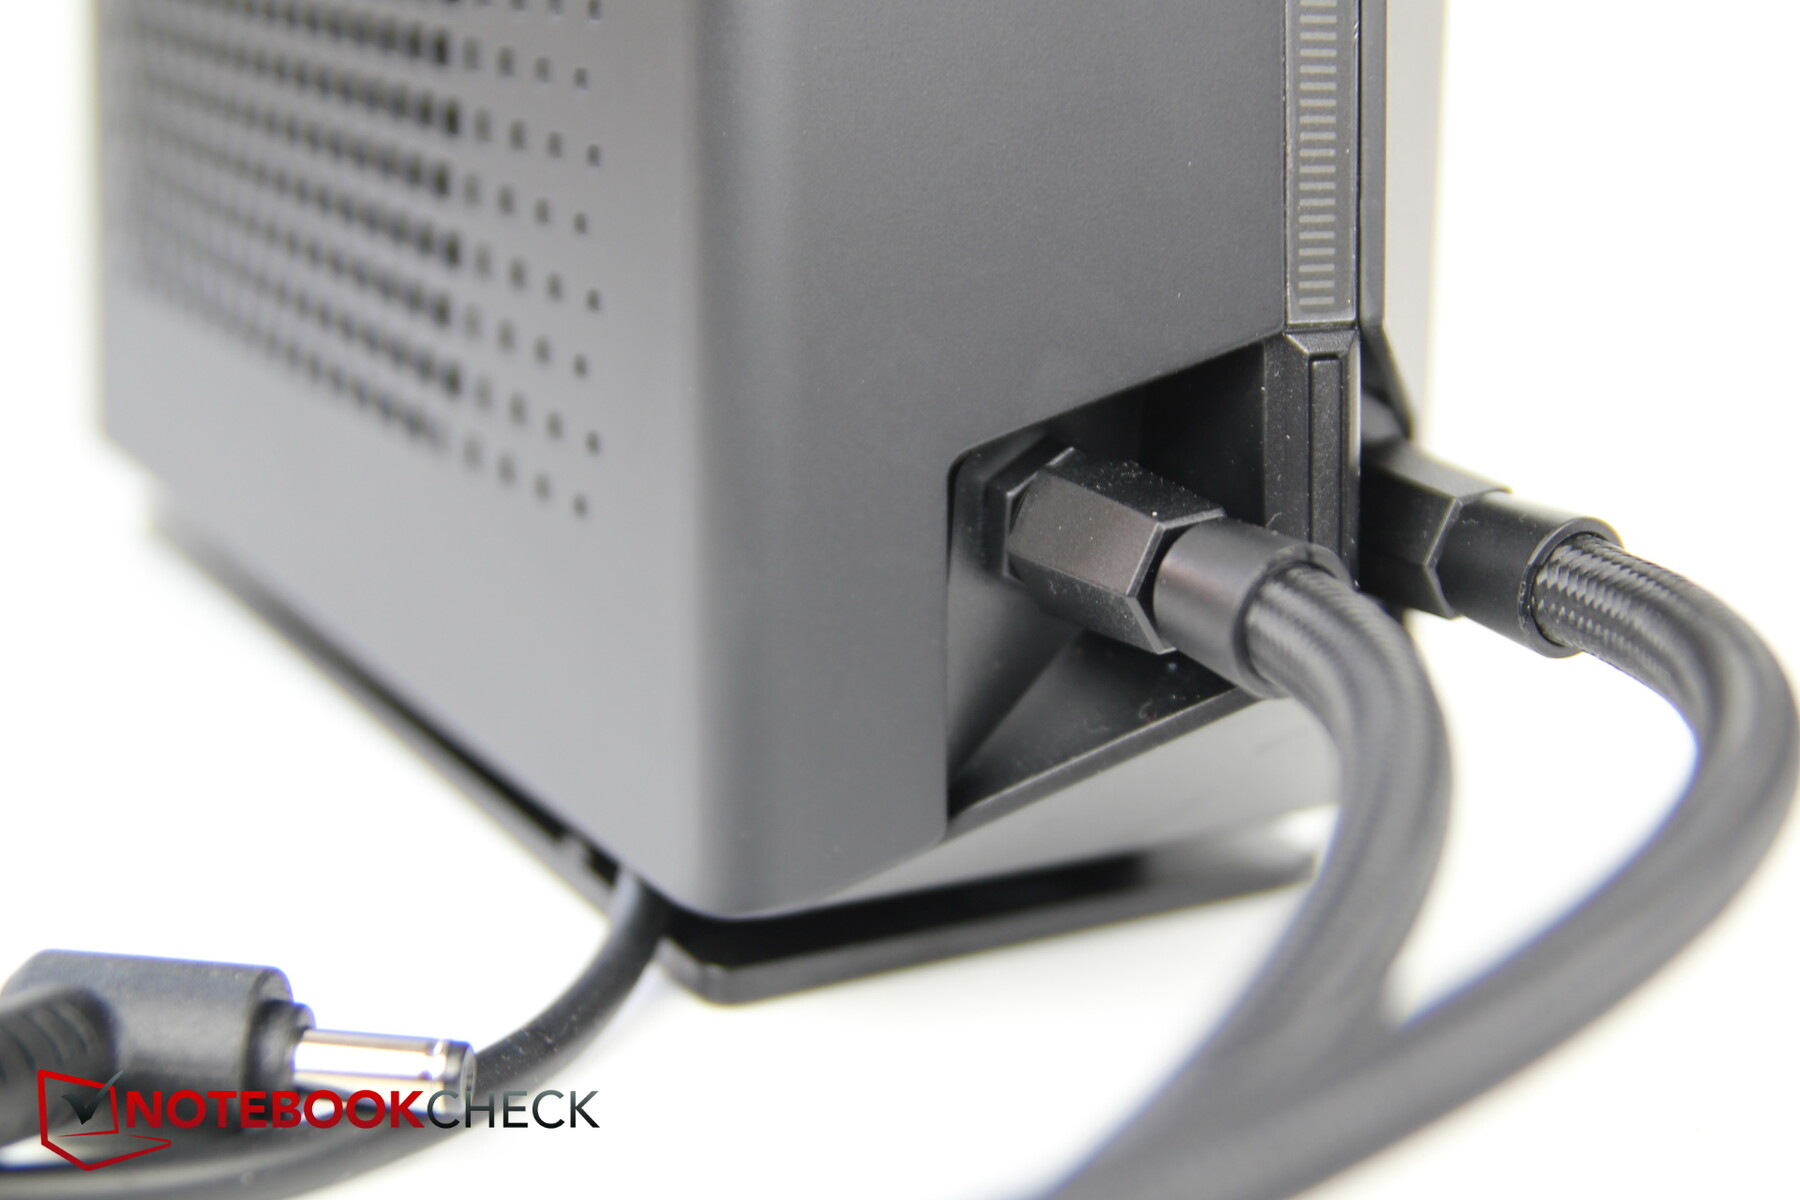
La caja mide unos 18 cm de alto, al menos igual de largo, y unos 7,5 cm de ancho. En la parte superior se encuentra el orificio de llenado, que está asegurado por una pequeña tapa de plástico que se inserta en un tapón de goma para evitar fugas
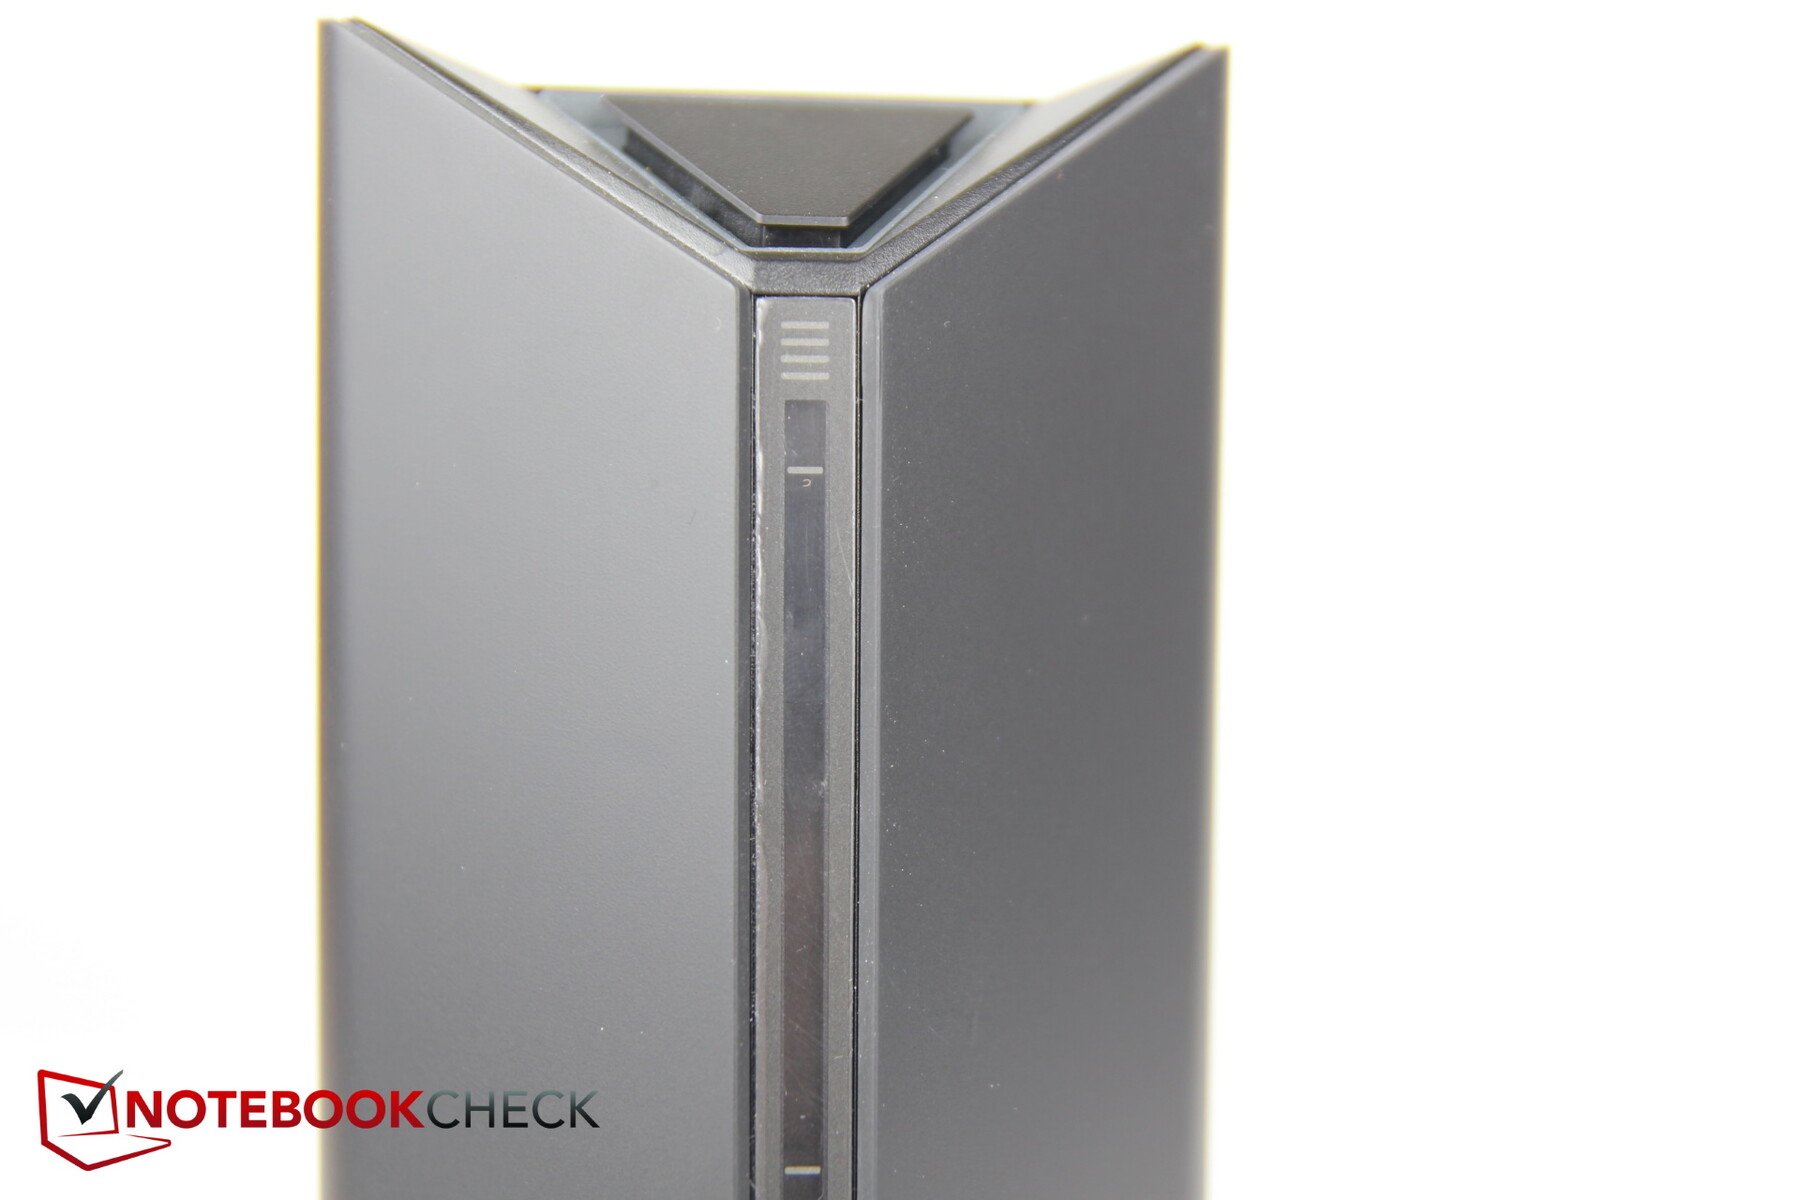
En la parte delantera hay una columna de visualización estrecha y transparente donde se puede leer el nivel de llenado. Desgraciadamente, apenas es visible, al menos cuando se utiliza agua destilada. Una "bola" de color que sea empujada hacia arriba por el agua o algo similar sería útil aquí.
Después de conectar el Oasis al Neo, se llena el Oasis con agua destilada. Cuando se conectan los dos dispositivos, parte del agua se bombea al circuito de refrigeración del Neo y por lo tanto hay que añadir un poco más de agua de nuevo. Después, el nivel de agua debería permanecer constante y no se necesitan más rellenos siempre que no se vacíe el agua del Neo (para usarlo como portátil sin el Oasis, por ejemplo). Por lo tanto, el uso del refrigerante depende de tu propio uso del portátil. Los usuarios móviles a menudo tendrán que drenar el refrigerante y rellenarlo. En el uso estacionario, el Oasis casi nunca necesita ser rellenado, ya que el refrigerante no tiene otro lugar a donde ir
Comparación de tamaños
Como la comparación con los modelos de 16 y 17 pulgadas no tiene mucho sentido, utilizamos aquí otros de 15 pulgadas, también con una GPU diferente.
Nada ha cambiado en comparación con el predecesor. El Razer Blade 15 es ligeramente más pequeño y significativamente más delgado que el Neo, pero los otros competidores tienden a ser ligeramente más grandes. En general, el Neo 15 no es demasiado notable comparado con la competencia en términos de peso o dimensiones.
Equipamiento: Thunderbolt, cámara web FHD y puerto de refrigeración líquida
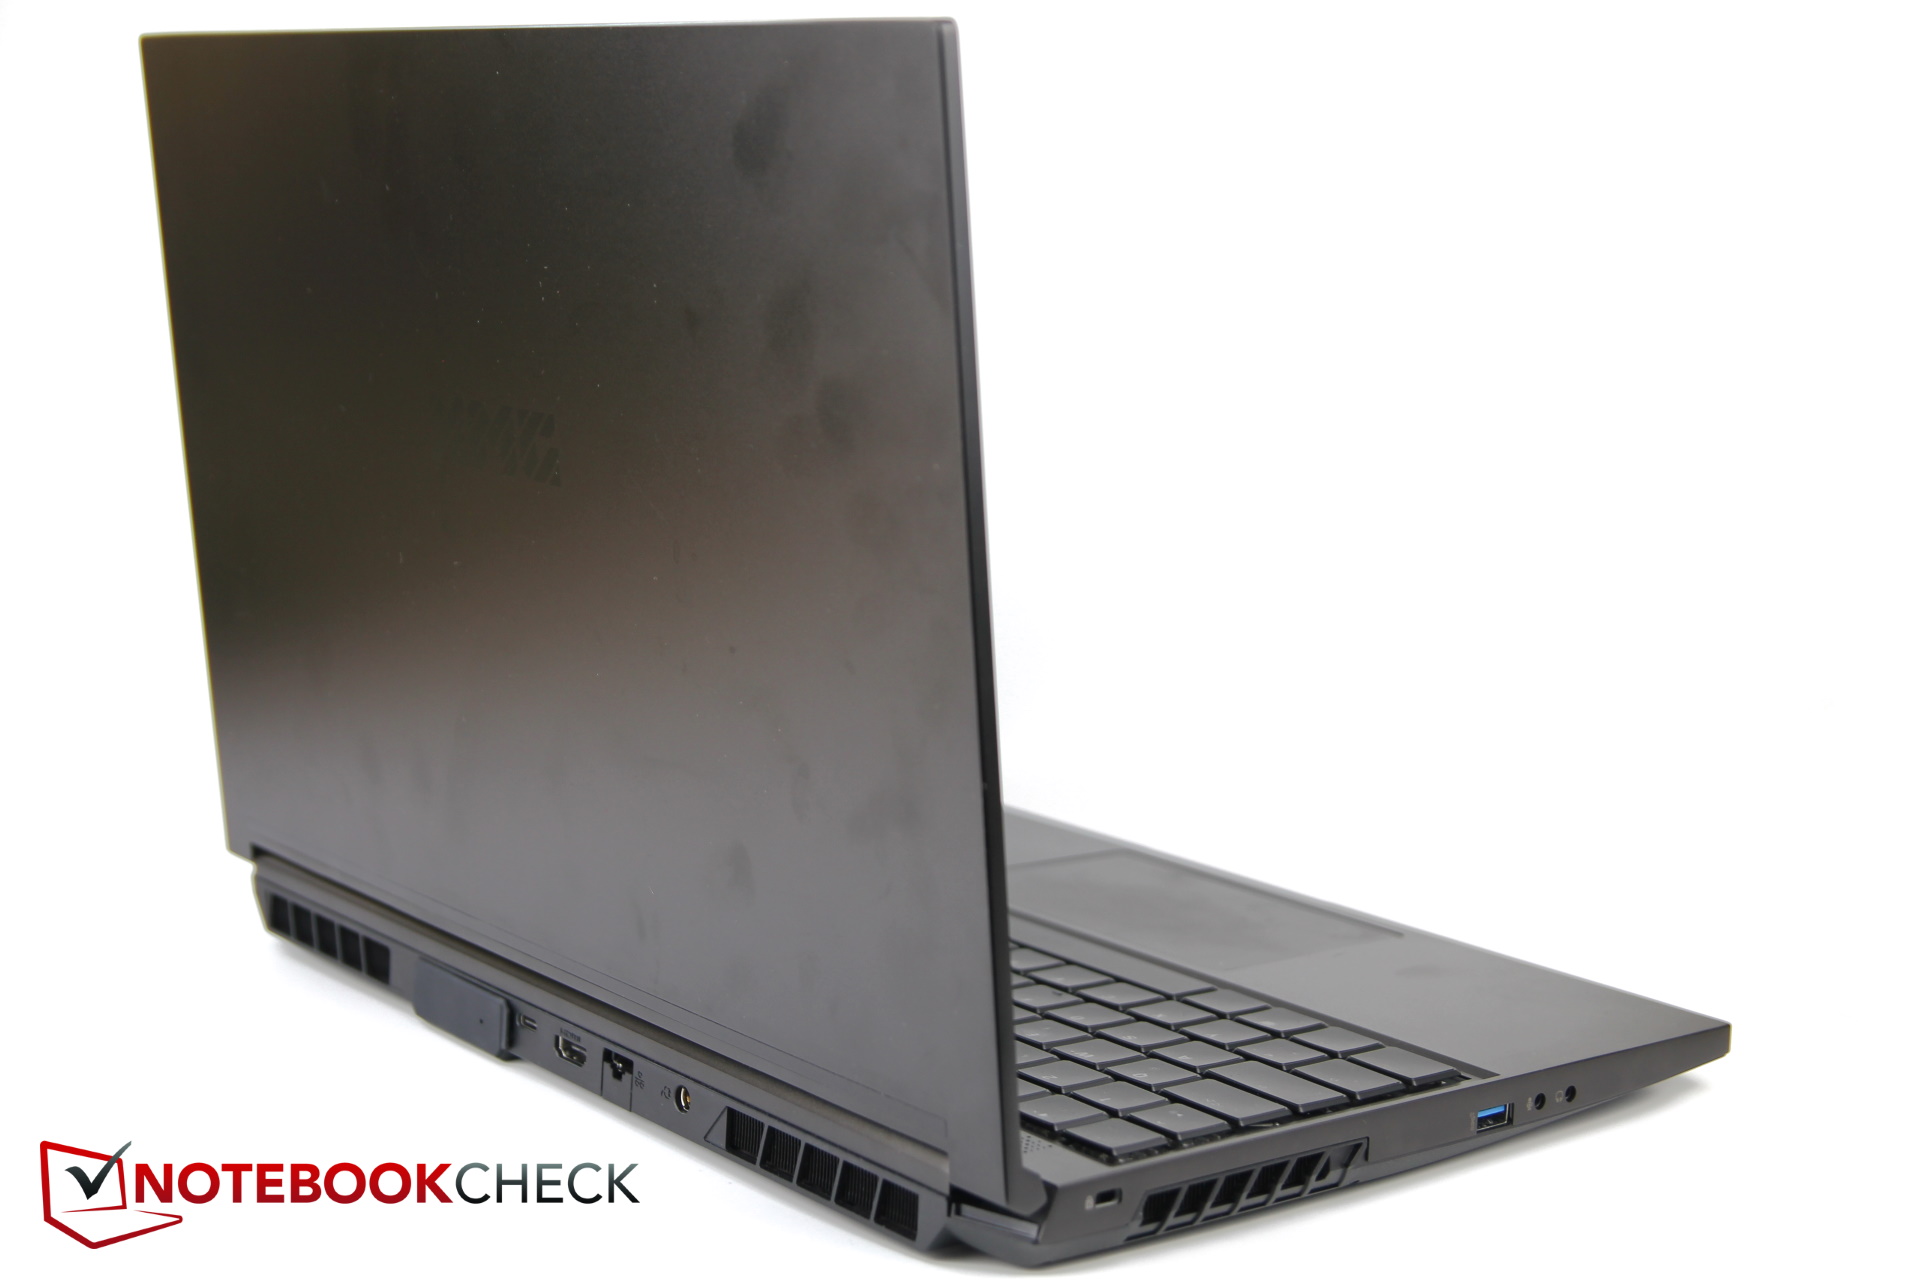
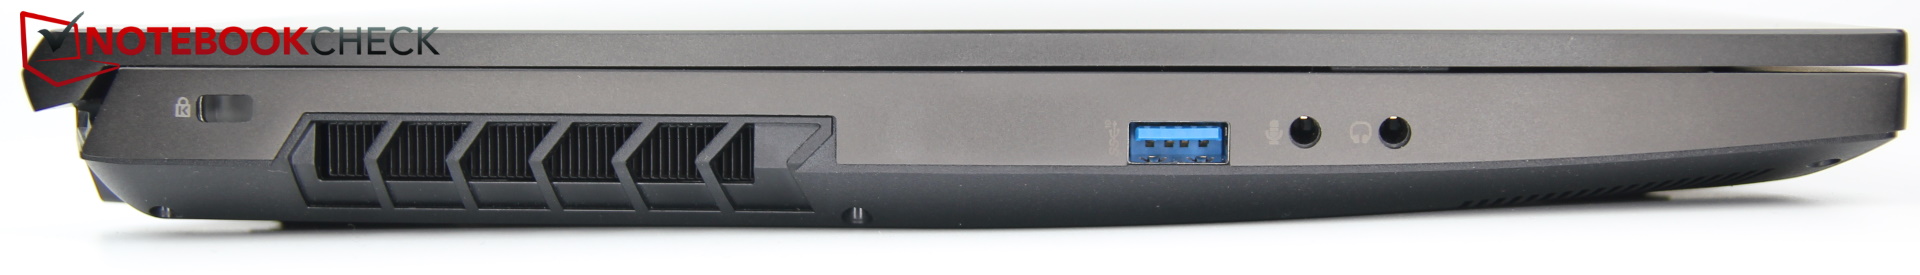
El Neo 15 tiene un total de cuatro puertos USB, tres de ellos tipo A y uno tipo C, que también es un puerto Thunderbolt. Este último soporta DisplayPort, pero desgraciadamente no es apto para VR debido a la conexión con la iGPU, y no soporta PowerDelivery. De los tres puertos USB-A, sólo el de la izquierda es capaz de 10 Gbit/s, los dos de la derecha sólo 5 Gbit/s (USB 3.2 Gen1 corresponde a USB 3.0).
Los dos puertos de audio separados también son una buena característica. Pero la característica especial es sin duda el puerto de refrigeración líquida externa, que está en la parte trasera.
Los puertos están distribuidos en tres lados, y la mayoría de ellos están en la parte trasera. El cable del robusto adaptador de corriente de 280 W al portátil es un poco corto para nuestro gusto.
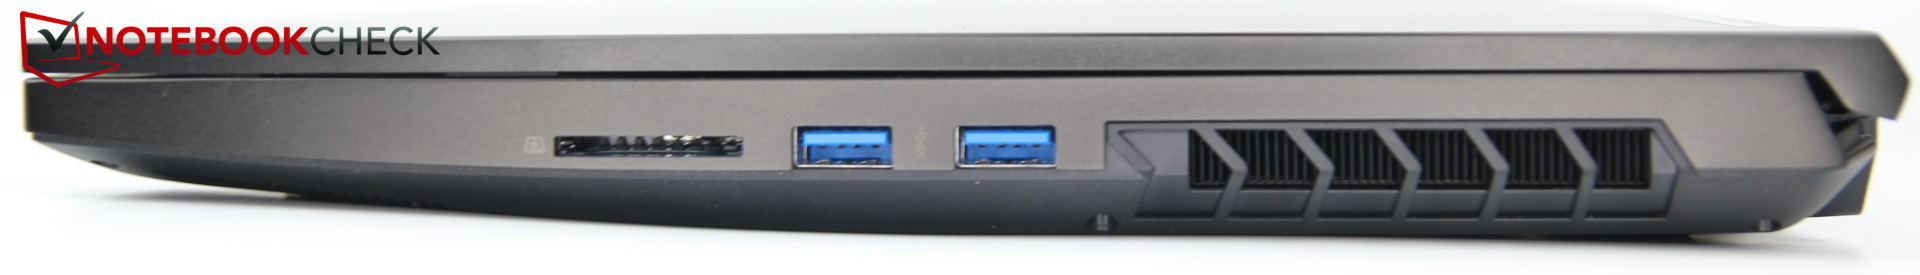
Lector de tarjetas SD
El lector de SD está en el lado derecho y deja sobresaliendo las tarjetas SD que sólo están insertadas y no están bien cerradas por la mitad. Aunque las tasas de transferencia son más funcionales que rápidas, al menos hay un lector de tarjetas.
| SD Card Reader | |
| average JPG Copy Test (av. of 3 runs) | |
| Alienware x17 R2 P48E (AV Pro V60) | |
| Razer Blade 15 2022 (Toshiba Exceria Pro SDXC 64 GB UHS-II) | |
| Asus ROG Zephyrus Duo 16 GX650RX (AV PRO microSD 128 GB V60) | |
| Media de la clase Gaming (20.9 - 210, n=54, últimos 2 años) | |
| Schenker XMG Neo 15 (i7-12700H, RTX 3080 Ti) | |
| Schenker XMG Neo 15 Tiger Lake (AV PRO microSD 128 GB V60) | |
| maximum AS SSD Seq Read Test (1GB) | |
| Alienware x17 R2 P48E (AV Pro V60) | |
| Asus ROG Zephyrus Duo 16 GX650RX (AV PRO microSD 128 GB V60) | |
| Razer Blade 15 2022 (Toshiba Exceria Pro SDXC 64 GB UHS-II) | |
| Media de la clase Gaming (25.5 - 261, n=51, últimos 2 años) | |
| Schenker XMG Neo 15 Tiger Lake (AV PRO microSD 128 GB V60) | |
| Schenker XMG Neo 15 (i7-12700H, RTX 3080 Ti) | |
Comunicación
El módulo Intel AX201 instalado ofrece rápidas velocidades de transmisión en el rango de 2,4 y 5 GHz, pero aún no es capaz de utilizar la nueva red Wifi 6E de 6 GHz. Durante las pruebas, el dispositivo tuvo repetidamente problemas para encontrar la red de 5 GHz de nuestro router de referencia, que a menudo no aparecía en la lista de conexiones Wi-Fi disponibles.
Una vez detectada, la conexión fue estable y también agradablemente rápida, con aproximadamente 1.600 Mbit/s.
Cámara web
Schenker hace uso de una cámara web de 1080p. Una característica fundamentalmente bienvenida, pero la calidad es bastante mediocre a pesar de la resolución FullHD, y las desviaciones de color son bastante altas

 GeForce RTX 3080 Ti Laptop GPU, i7-12700H, Samsung SSD 980 Pro 1TB MZ-V8P1T0BW")
 GeForce RTX 3080 Ti Laptop GPU, i7-12700H, Samsung SSD 980 Pro 1TB MZ-V8P1T0BW")
Seguridad
Dispone de un puerto Kensington, así como de TPM. Sin embargo, el Neo no ofrece características como un sensor de huellas dactilares, cámara IR o similares.
Accesorios y garantía
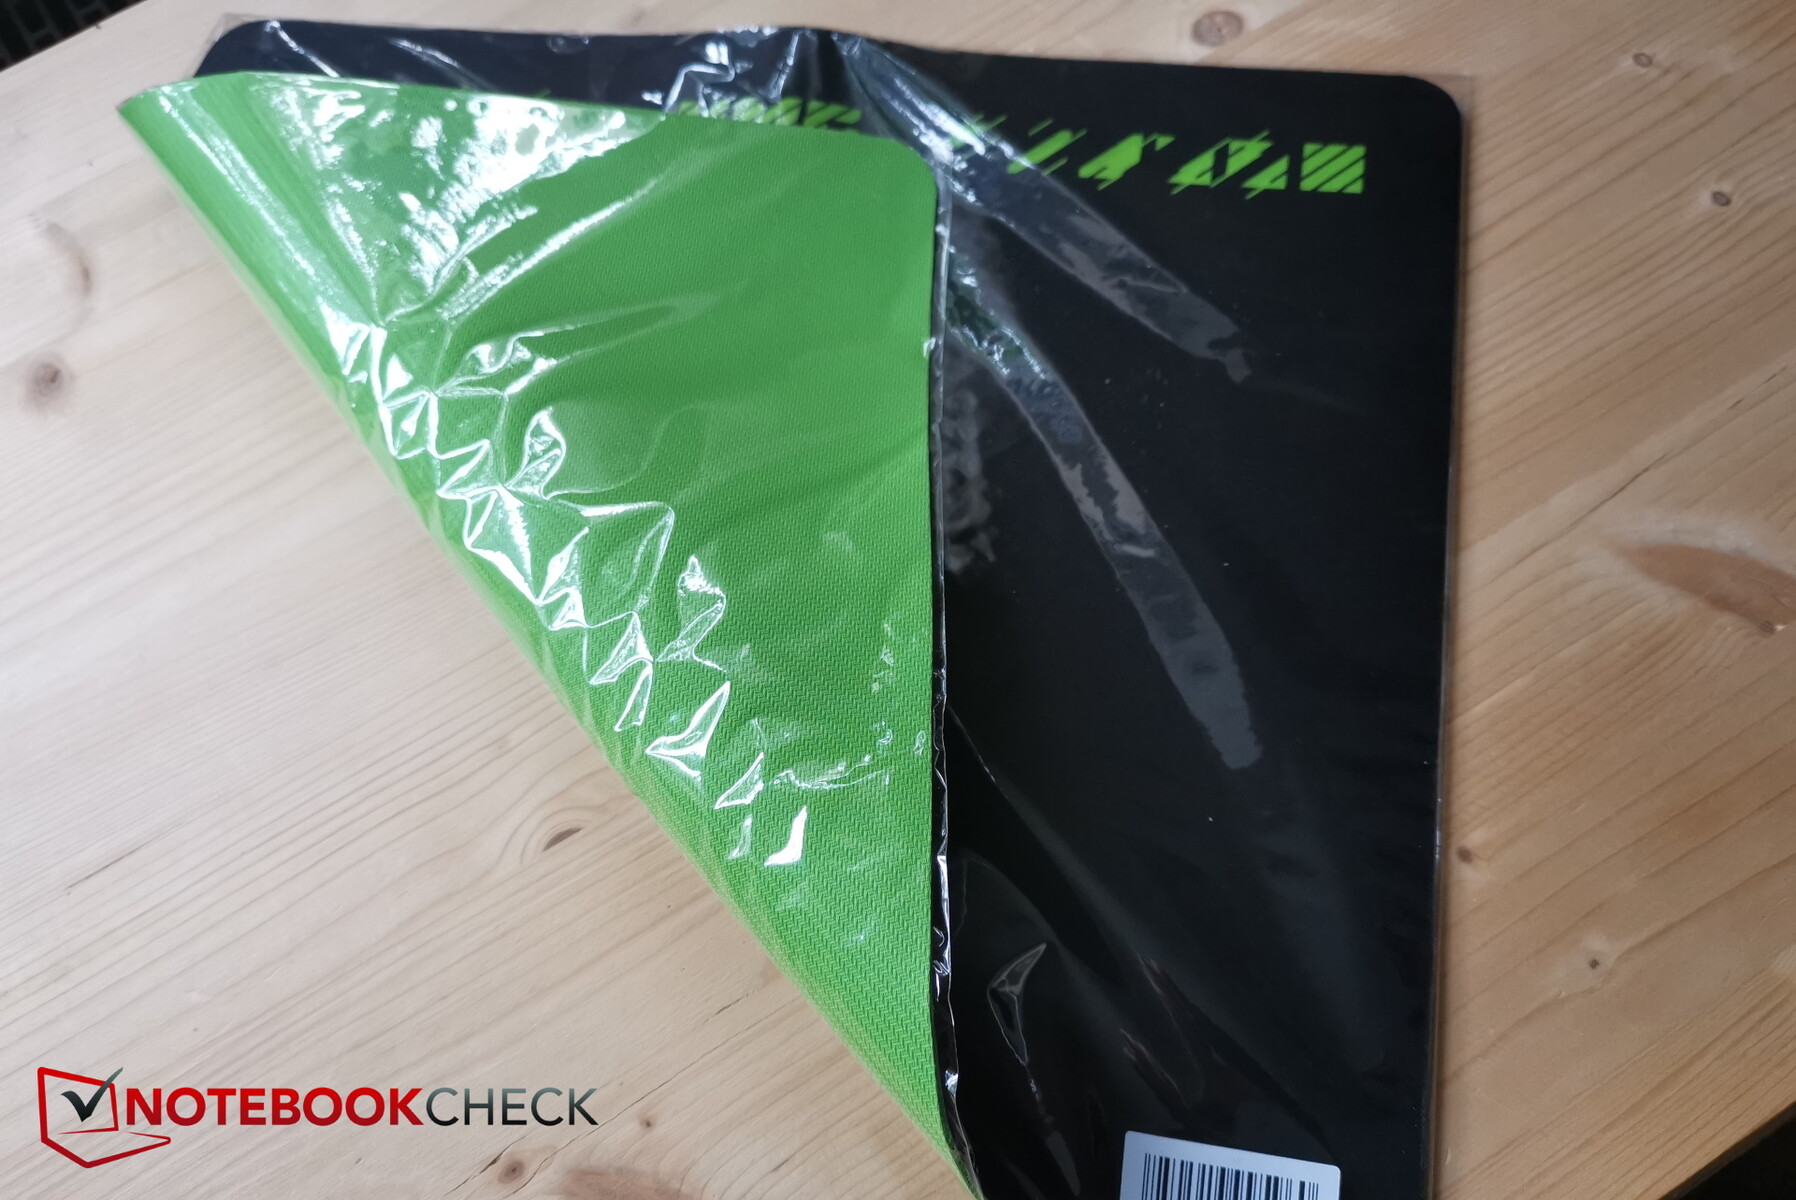
Además de la documentación habitual, el Neo viene con la típica memoria USB de Schenker con los controladores, algo muy práctico. También se incluye una gran alfombrilla de ratón
La garantía en Alemania es de 24 meses, que incluye servicio de recogida y devolución. Esto puede diferir en otros países y regiones, así que asegúrese de consultar con su proveedor antes de comprar
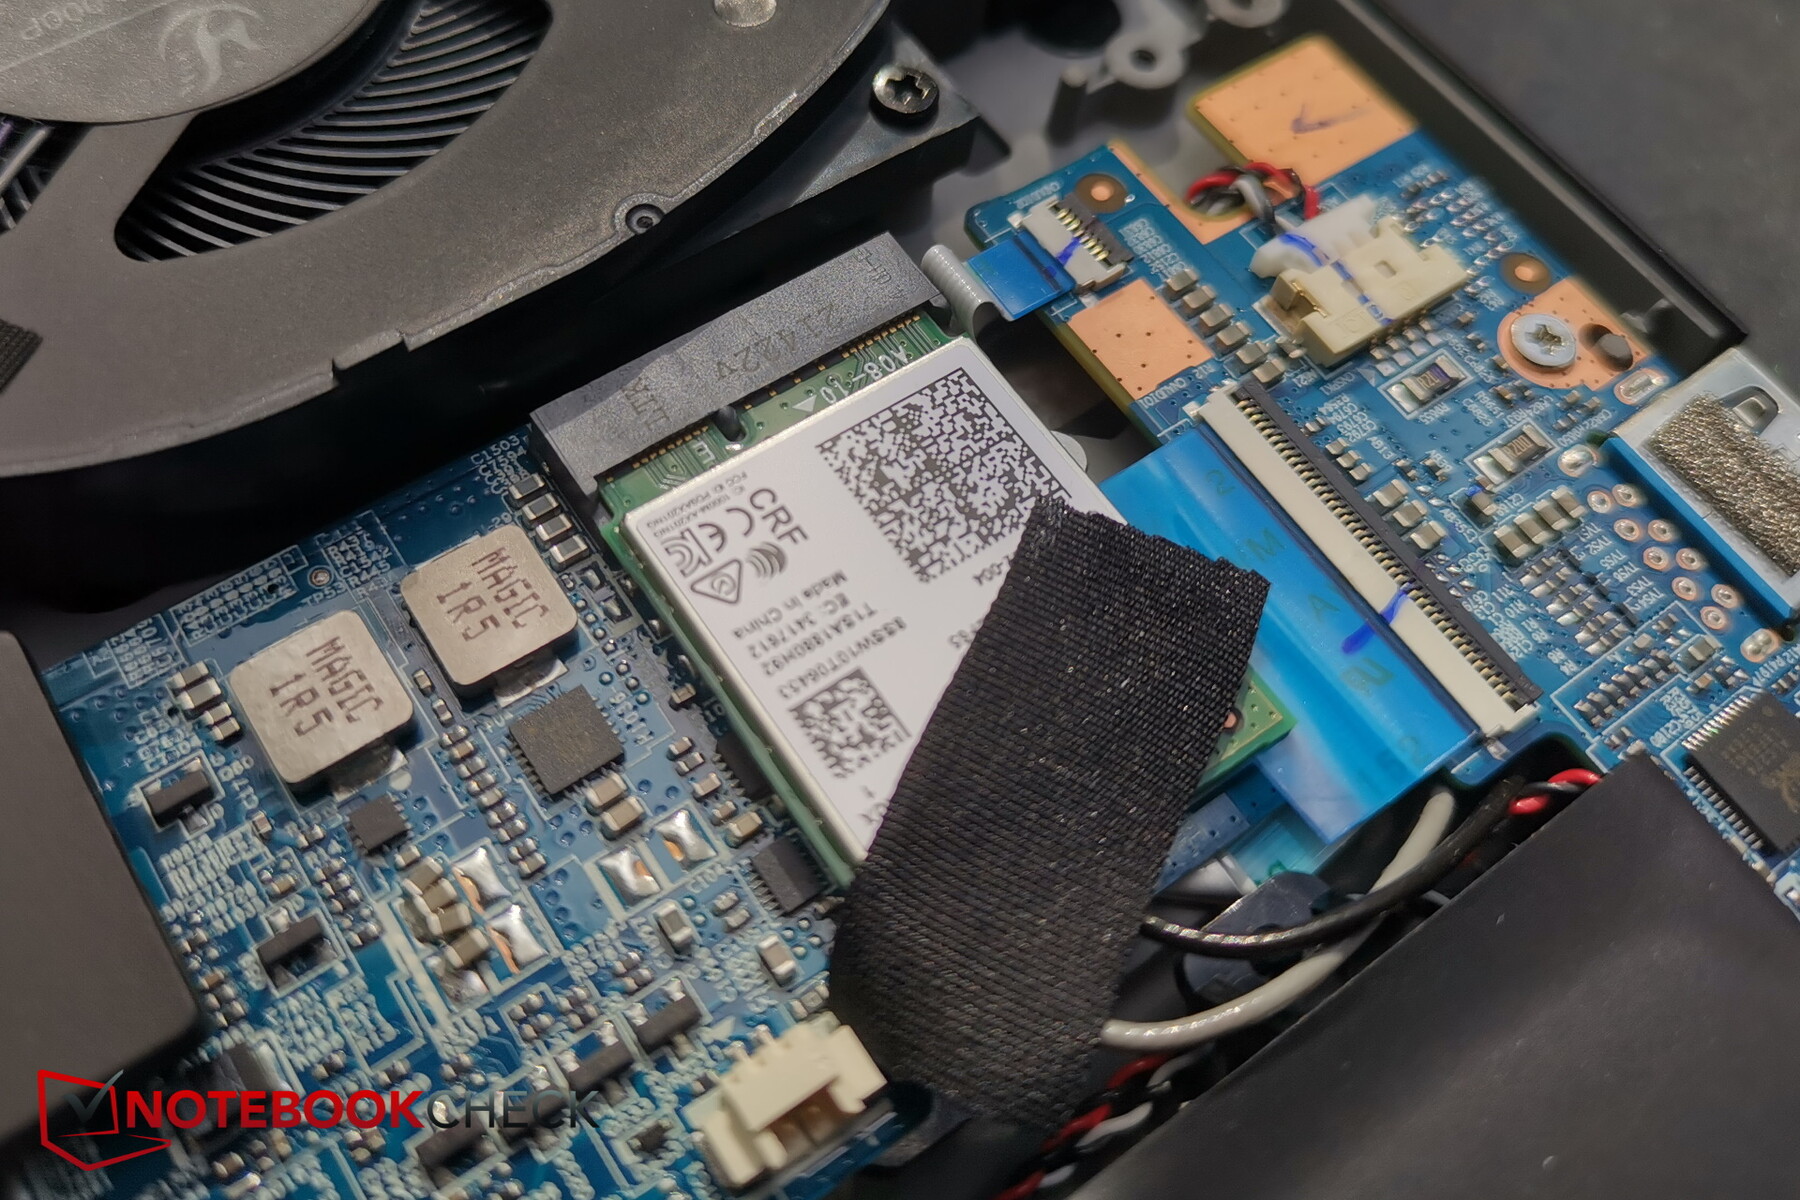
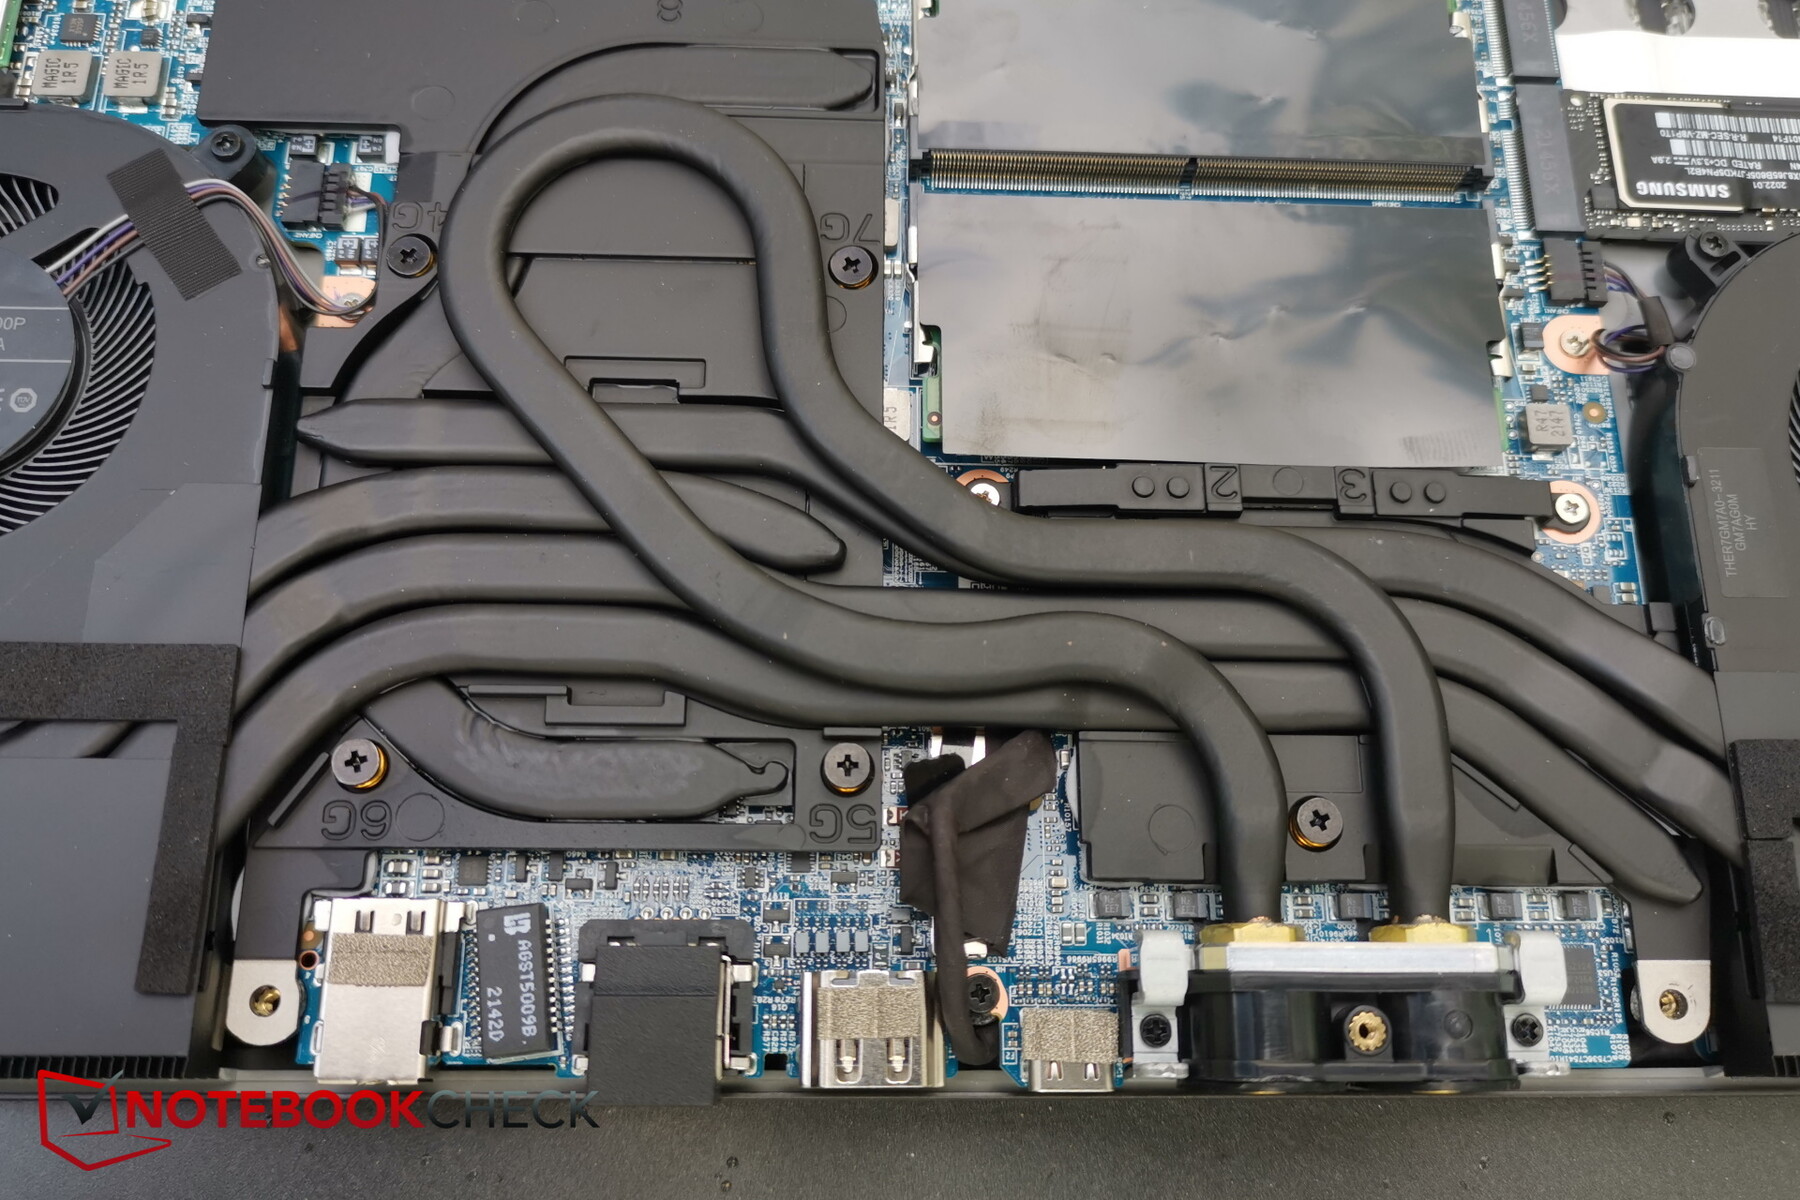
Mantenimiento
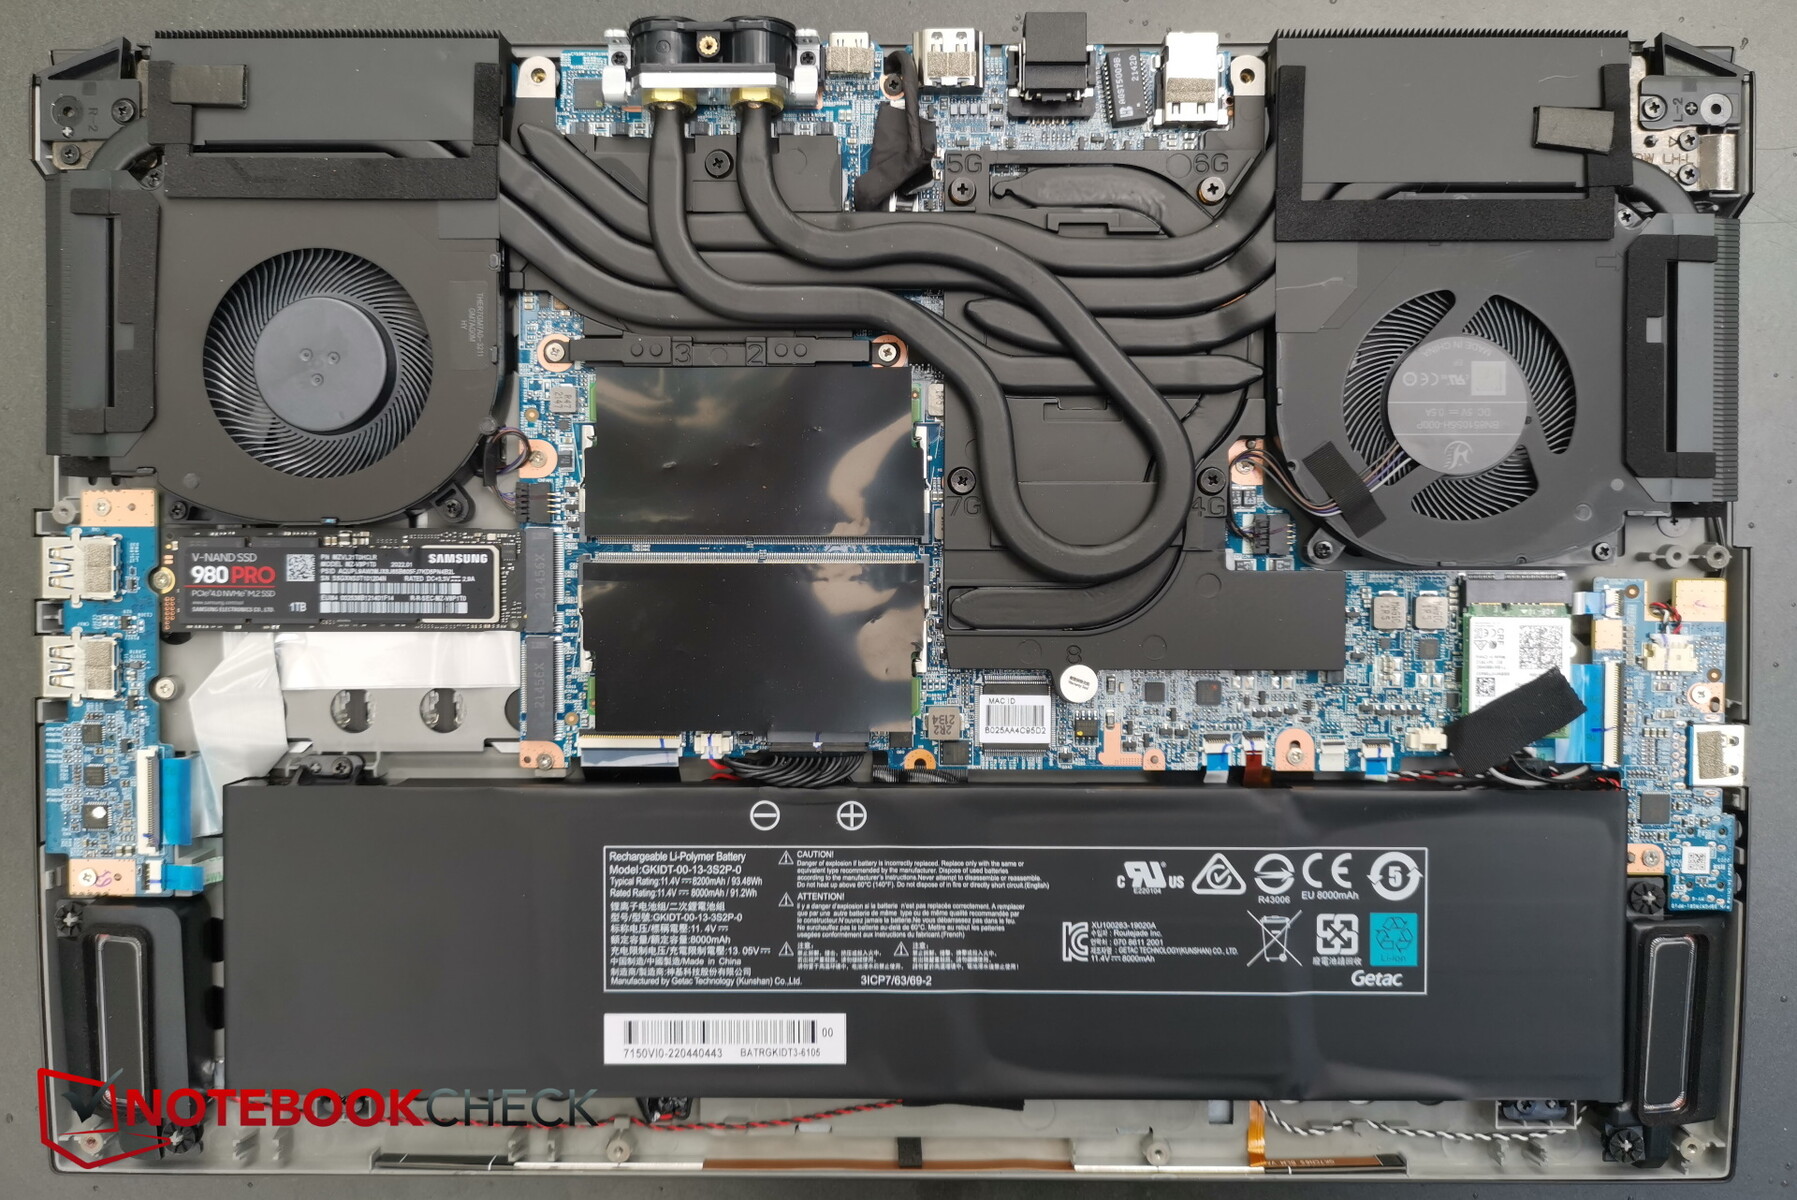
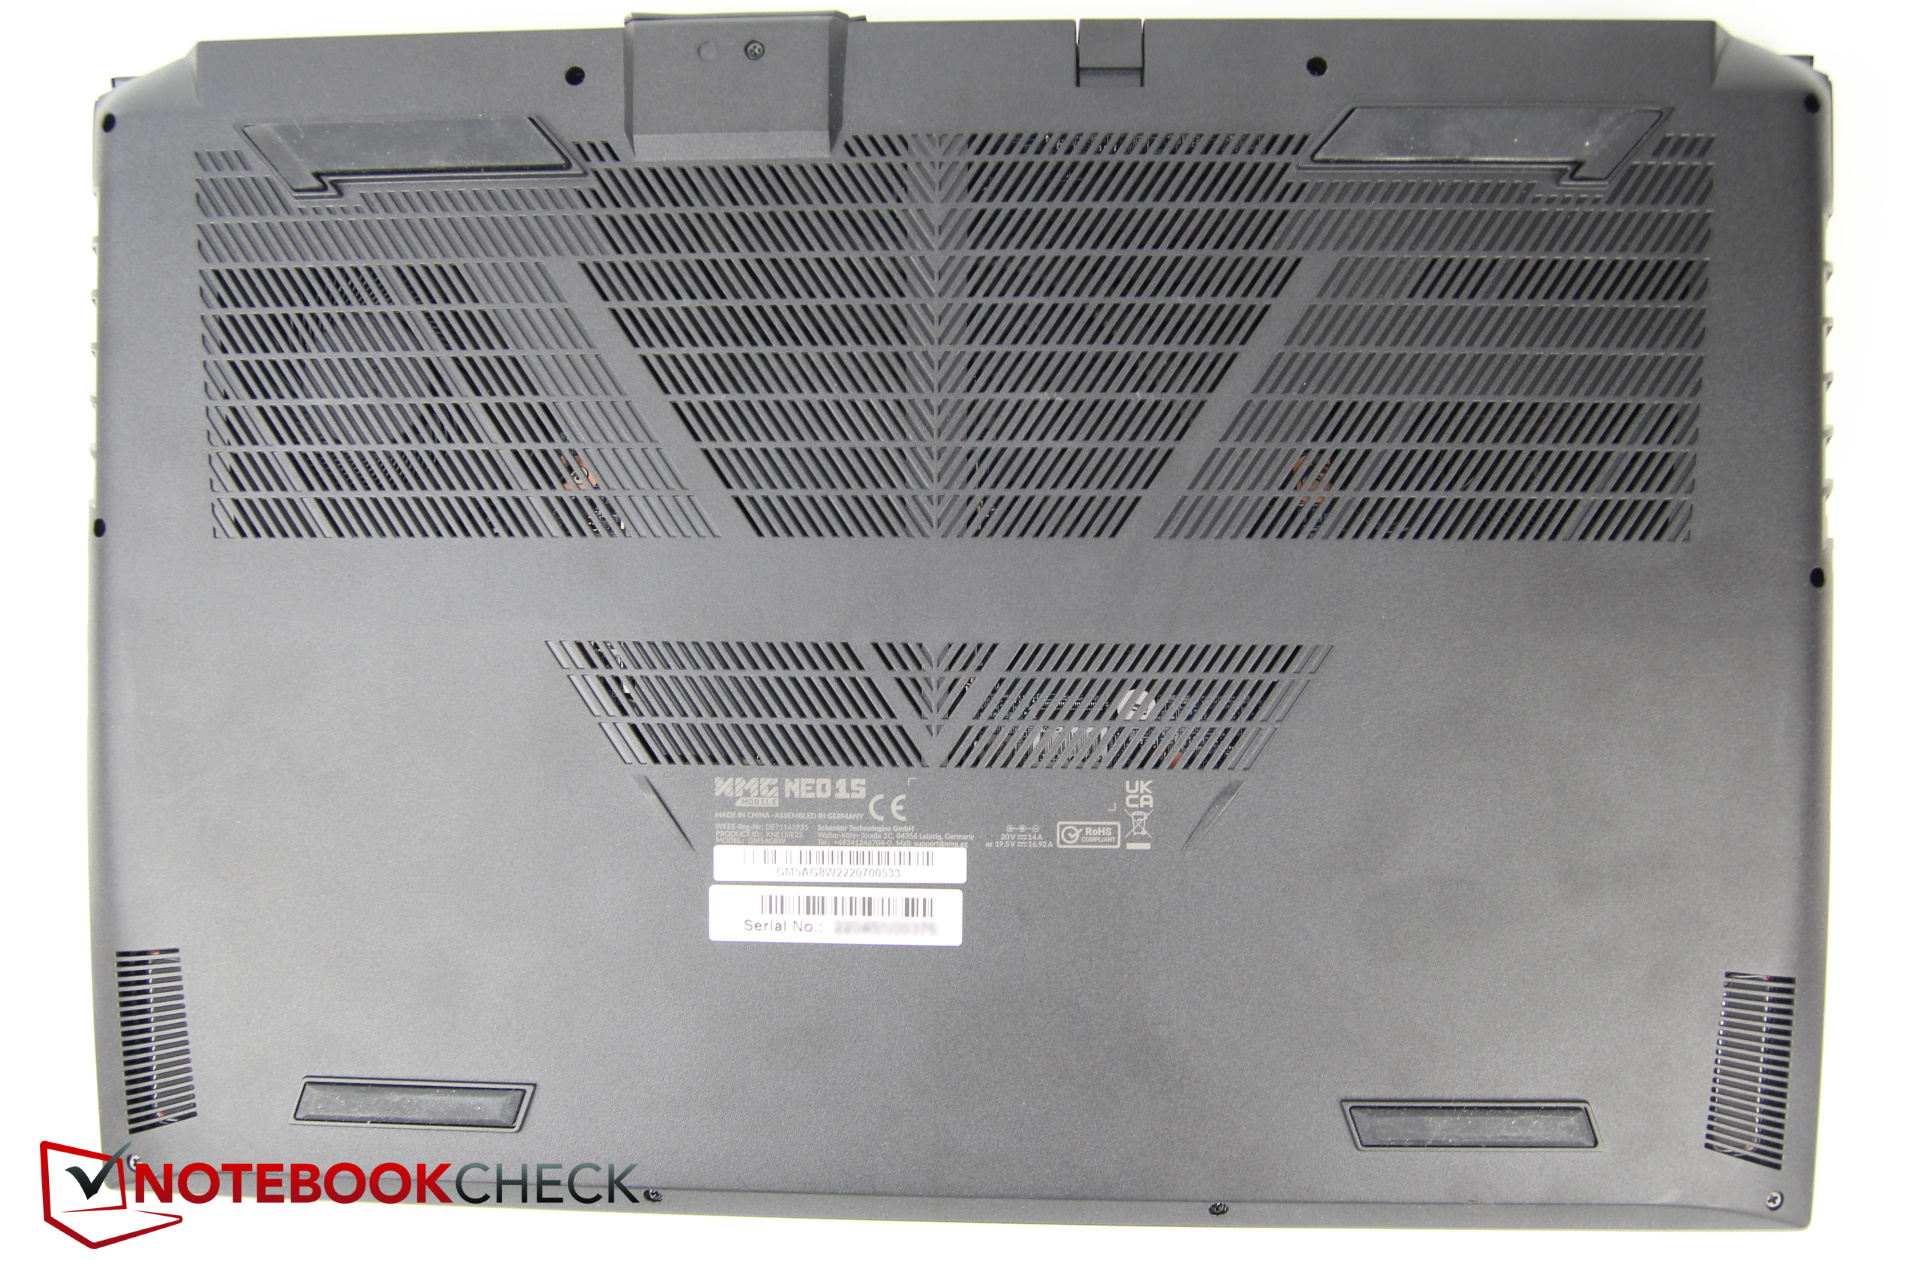
Hay que quitar un total de 14 tornillos Phillips para acceder al interior. Afortunadamente todos tienen la misma longitud, incluyendo los tres del puerto de refrigeración líquida. Después, la parte inferior se puede sacar fácilmente con la mano, preferiblemente desde la parte trasera lateral.
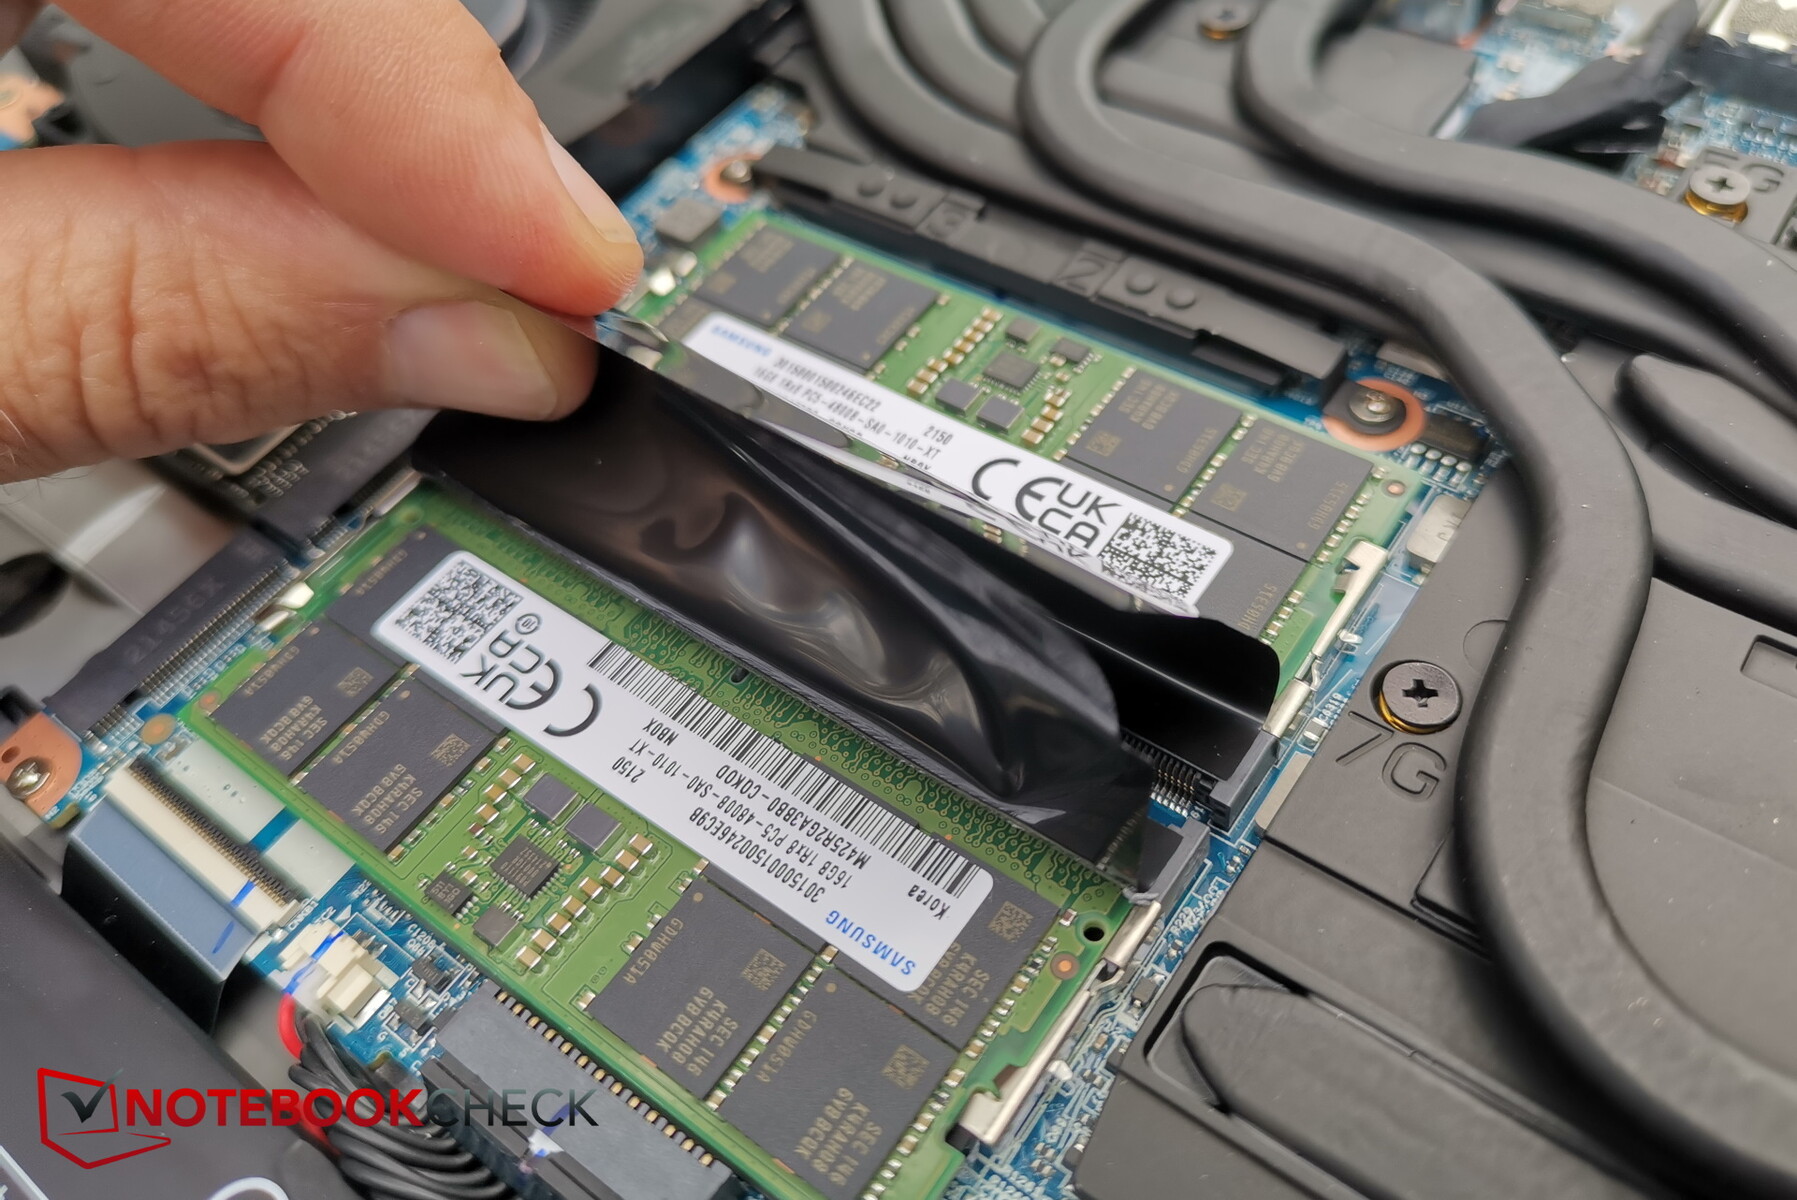
Una vez dentro, tienes acceso a la RAM, el SSD (incluyendo la segunda ranura M.2), los ventiladores, la batería, el circuito de refrigeración líquida y el módulo Wifi reemplazable.
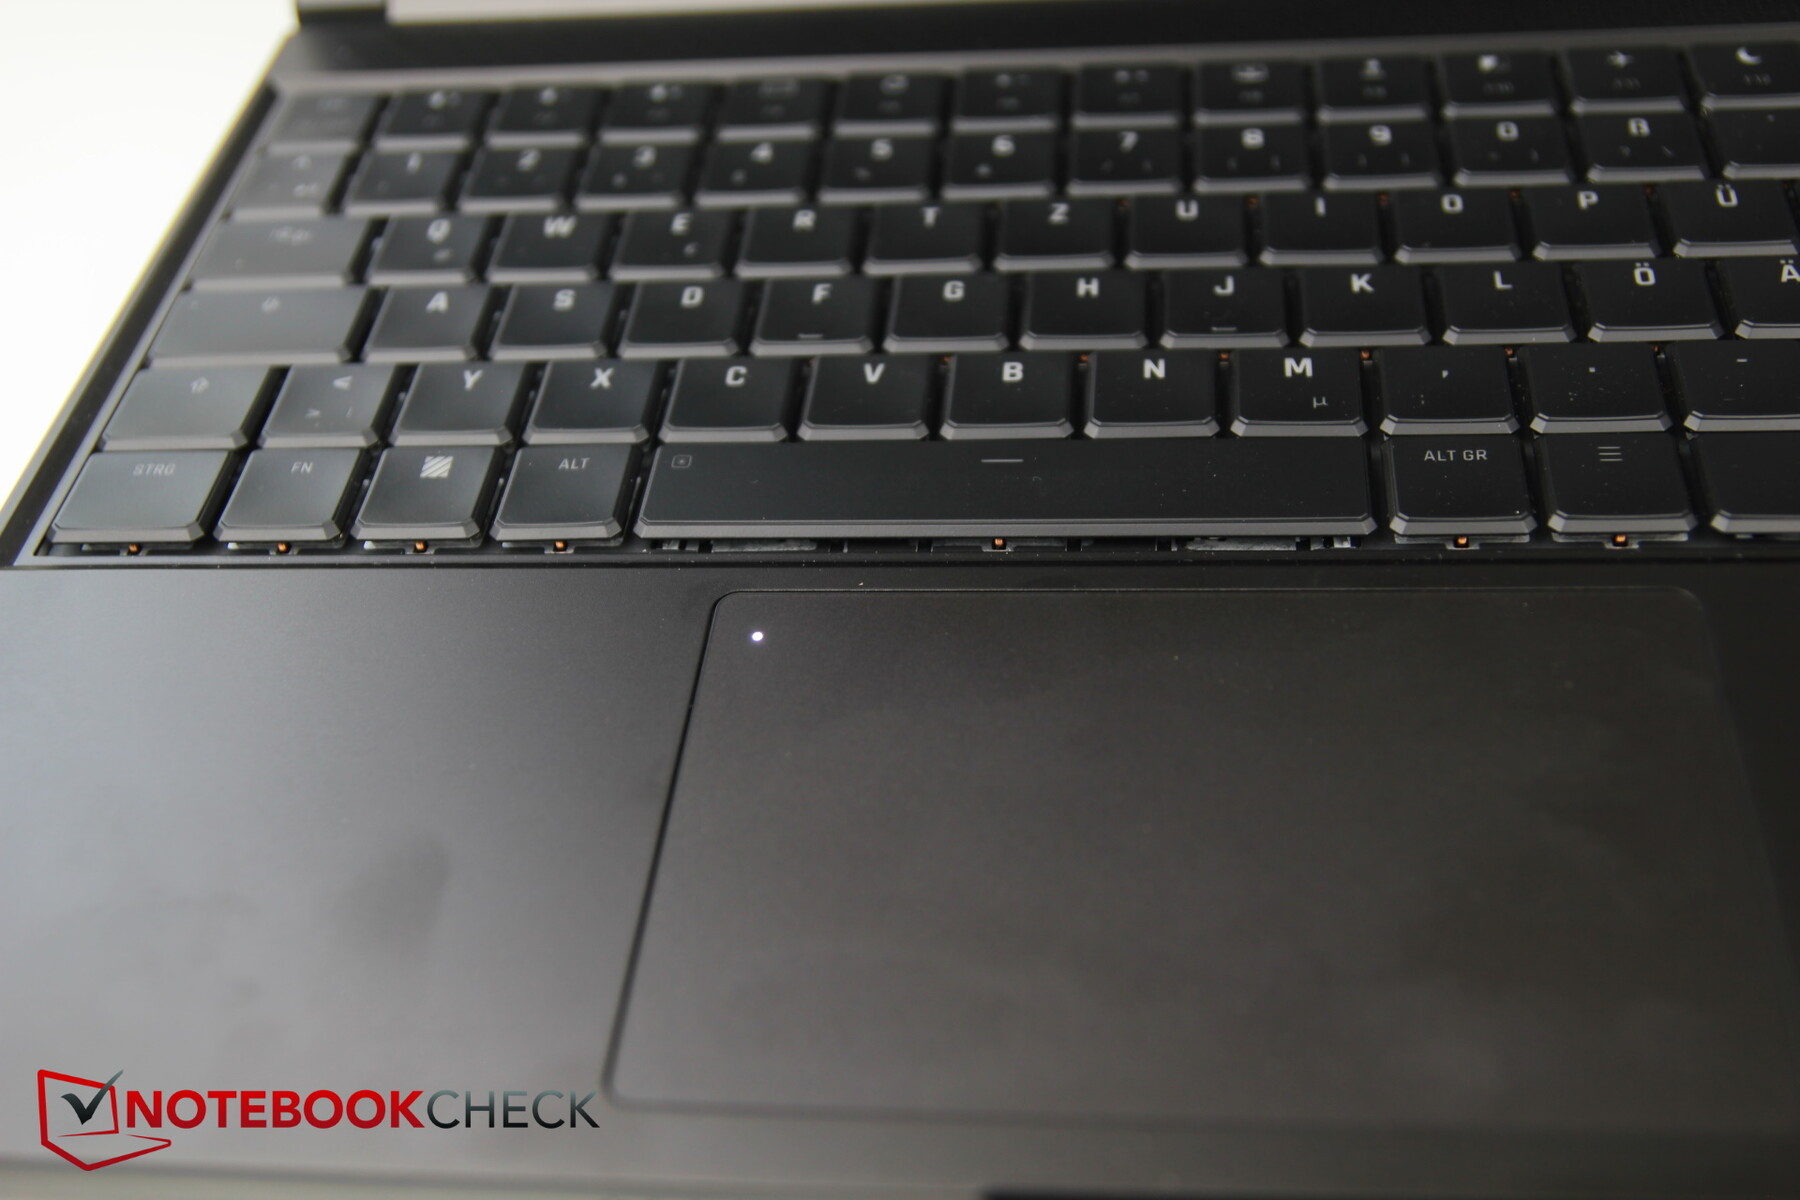
Dispositivos de entrada: Teclado optomecánico
Teclado
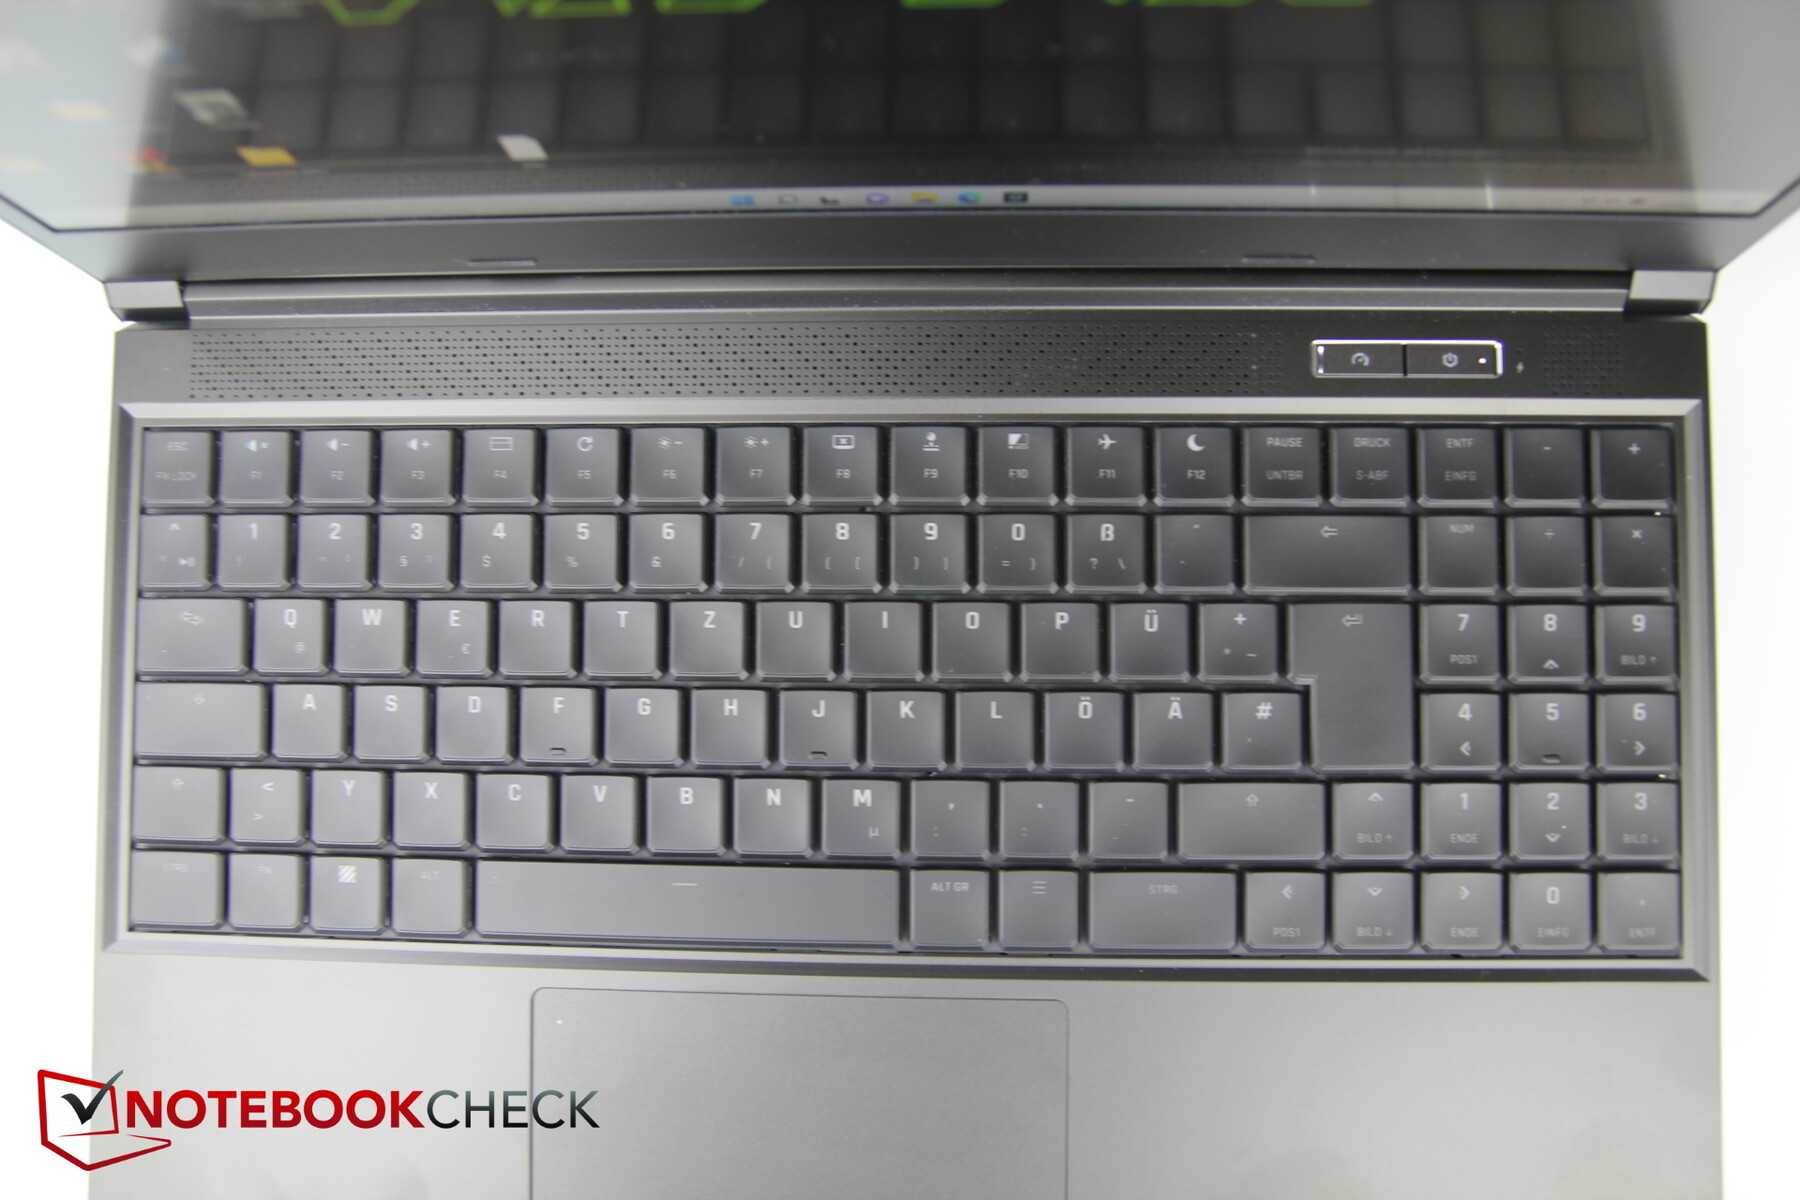
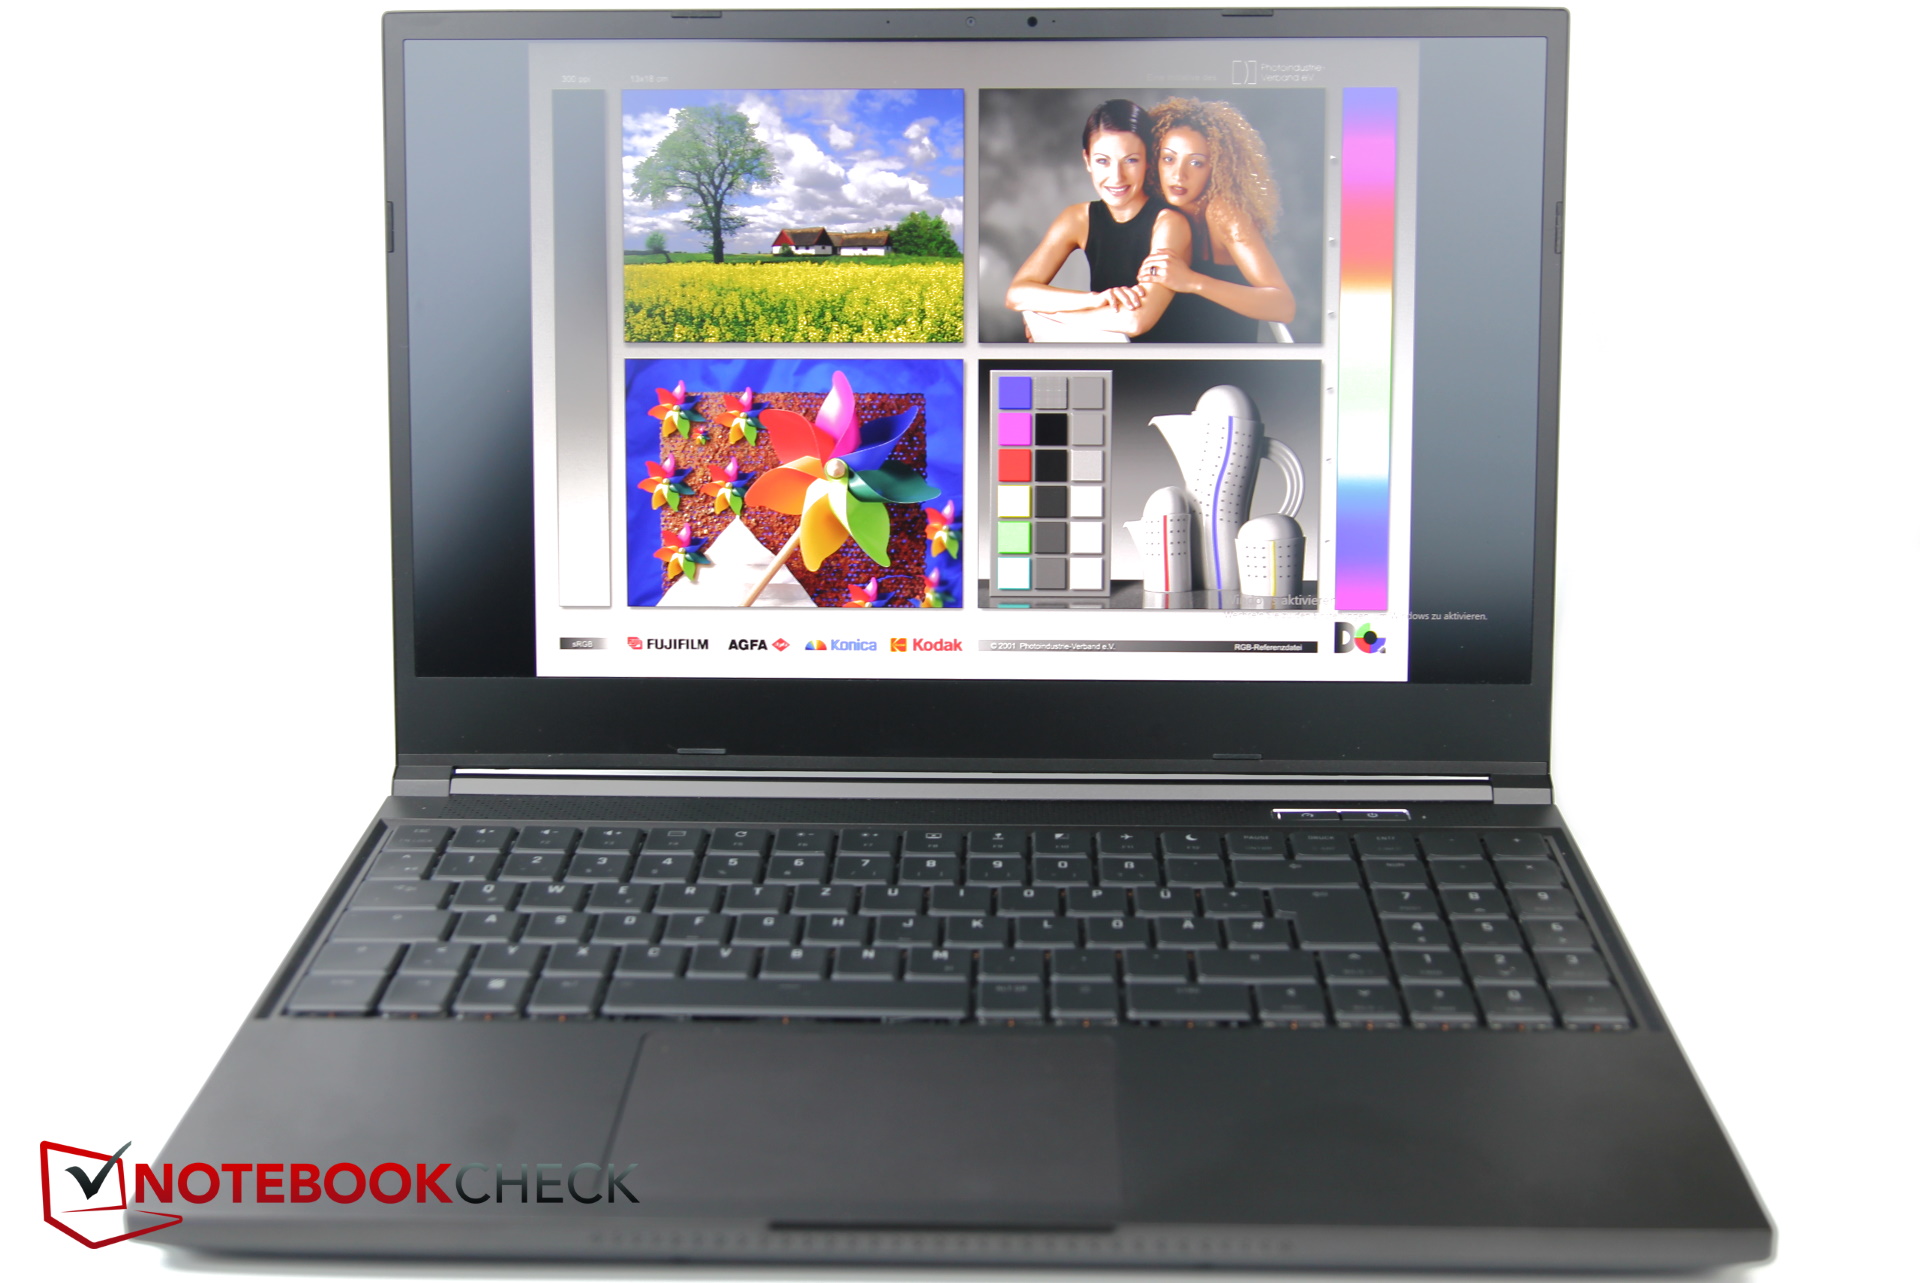
El teclado ocupa todo el espacio de la base de 15 pulgadas, al menos en términos de anchura. Esto hace que el diseño del teclado sea de tamaño normal, con un buen espacio entre las teclas y un teclado numérico a la derecha. La disposición extremadamente ordenada es agradable: incluso las teclas de dirección tienen un tamaño decente y todo parece estar exactamente en el lugar correcto.
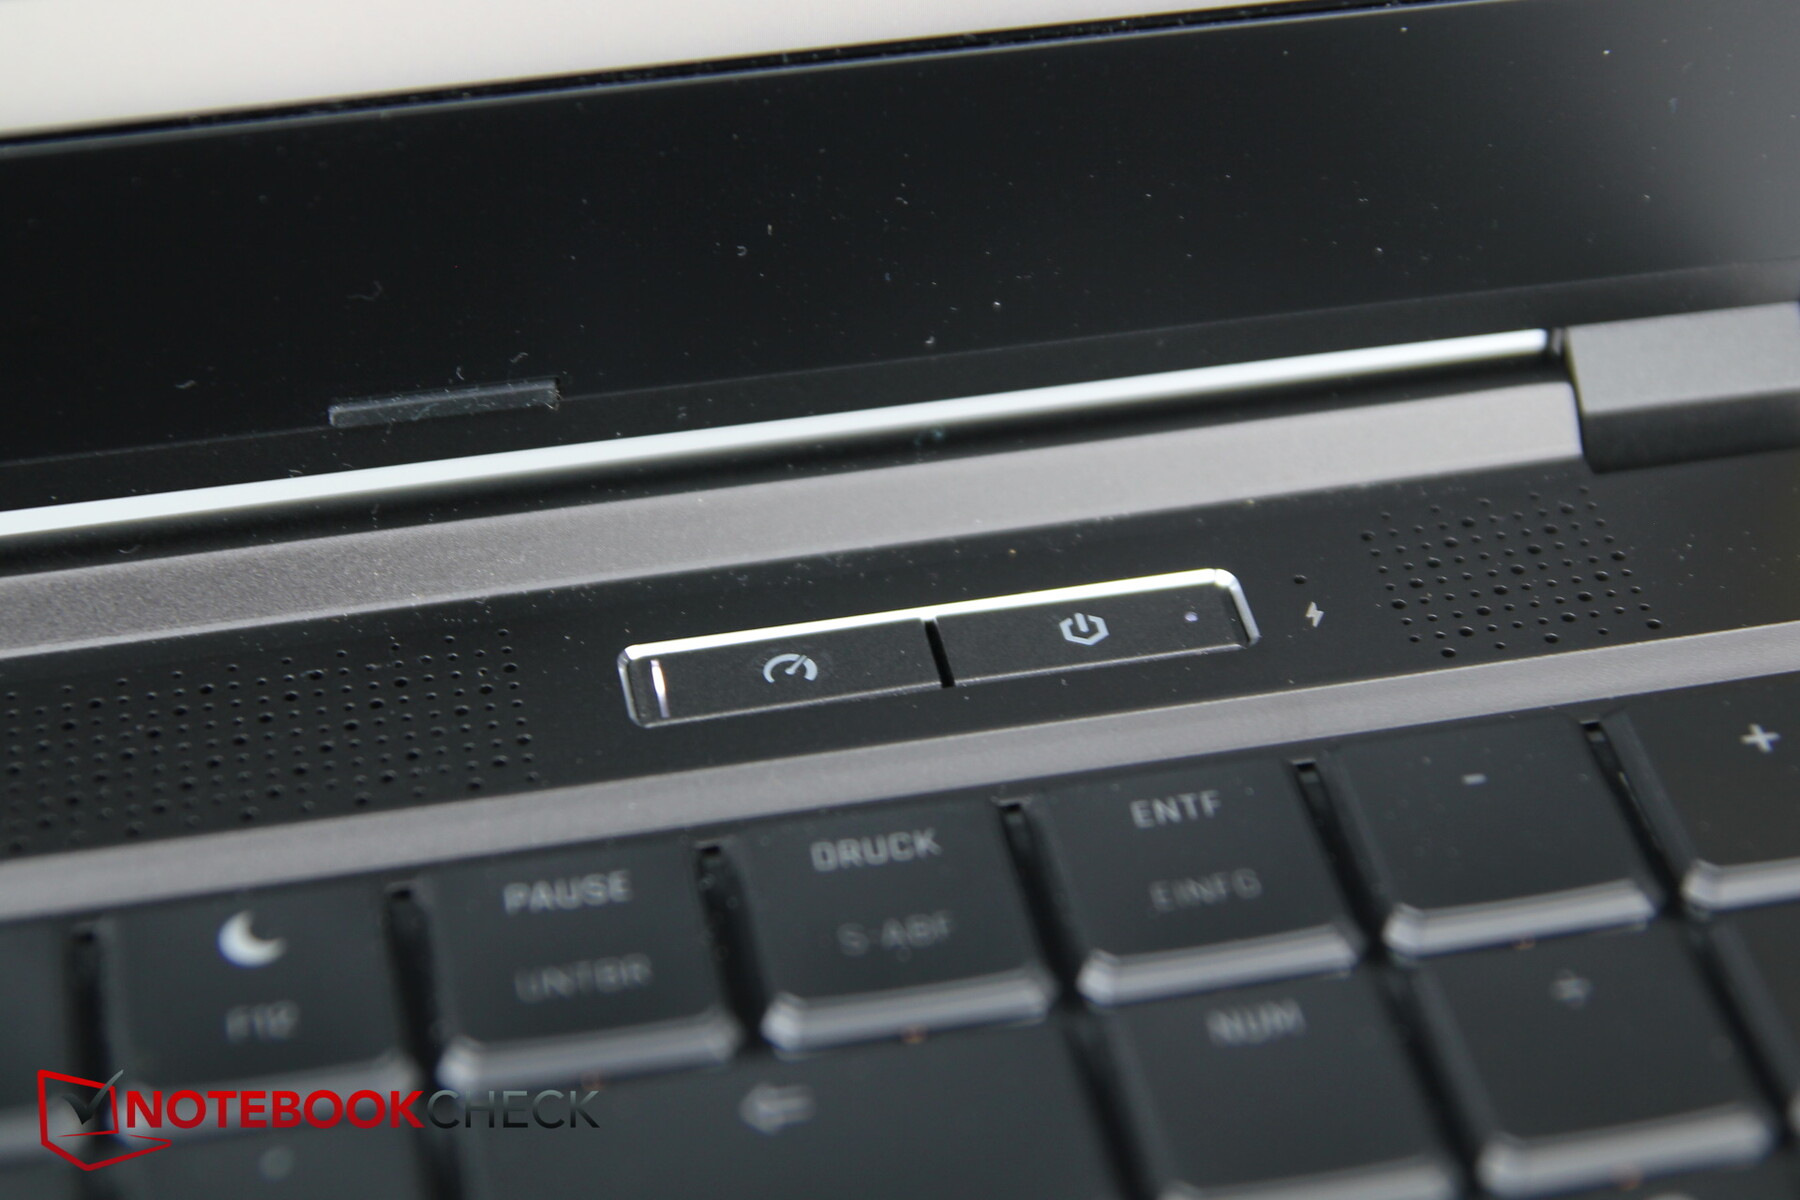
El botón de encendido está diseñado como una tecla adicional sobre el teclado y junto a él hay otra tecla que cambia los modos de rendimiento. Curiosamente, la tecla "Fin" está situada como función secundaria en la tecla de flecha derecha, así como directamente encima de ella en el "1" del teclado numérico, por lo que las dos están directamente encima de la otra. Nos costó un poco encontrar la tecla de la iluminación del teclado, cuyo símbolo es diminuto y está en la esquina superior izquierda de la barra espaciadora.
La letra es relativamente pequeña en general, pero se mantiene principalmente en un tono oscuro, lo que significa que a veces es irreconocible durante el día en condiciones de iluminación subóptimas - una letra más brillante y/o más grande sería útil aquí.
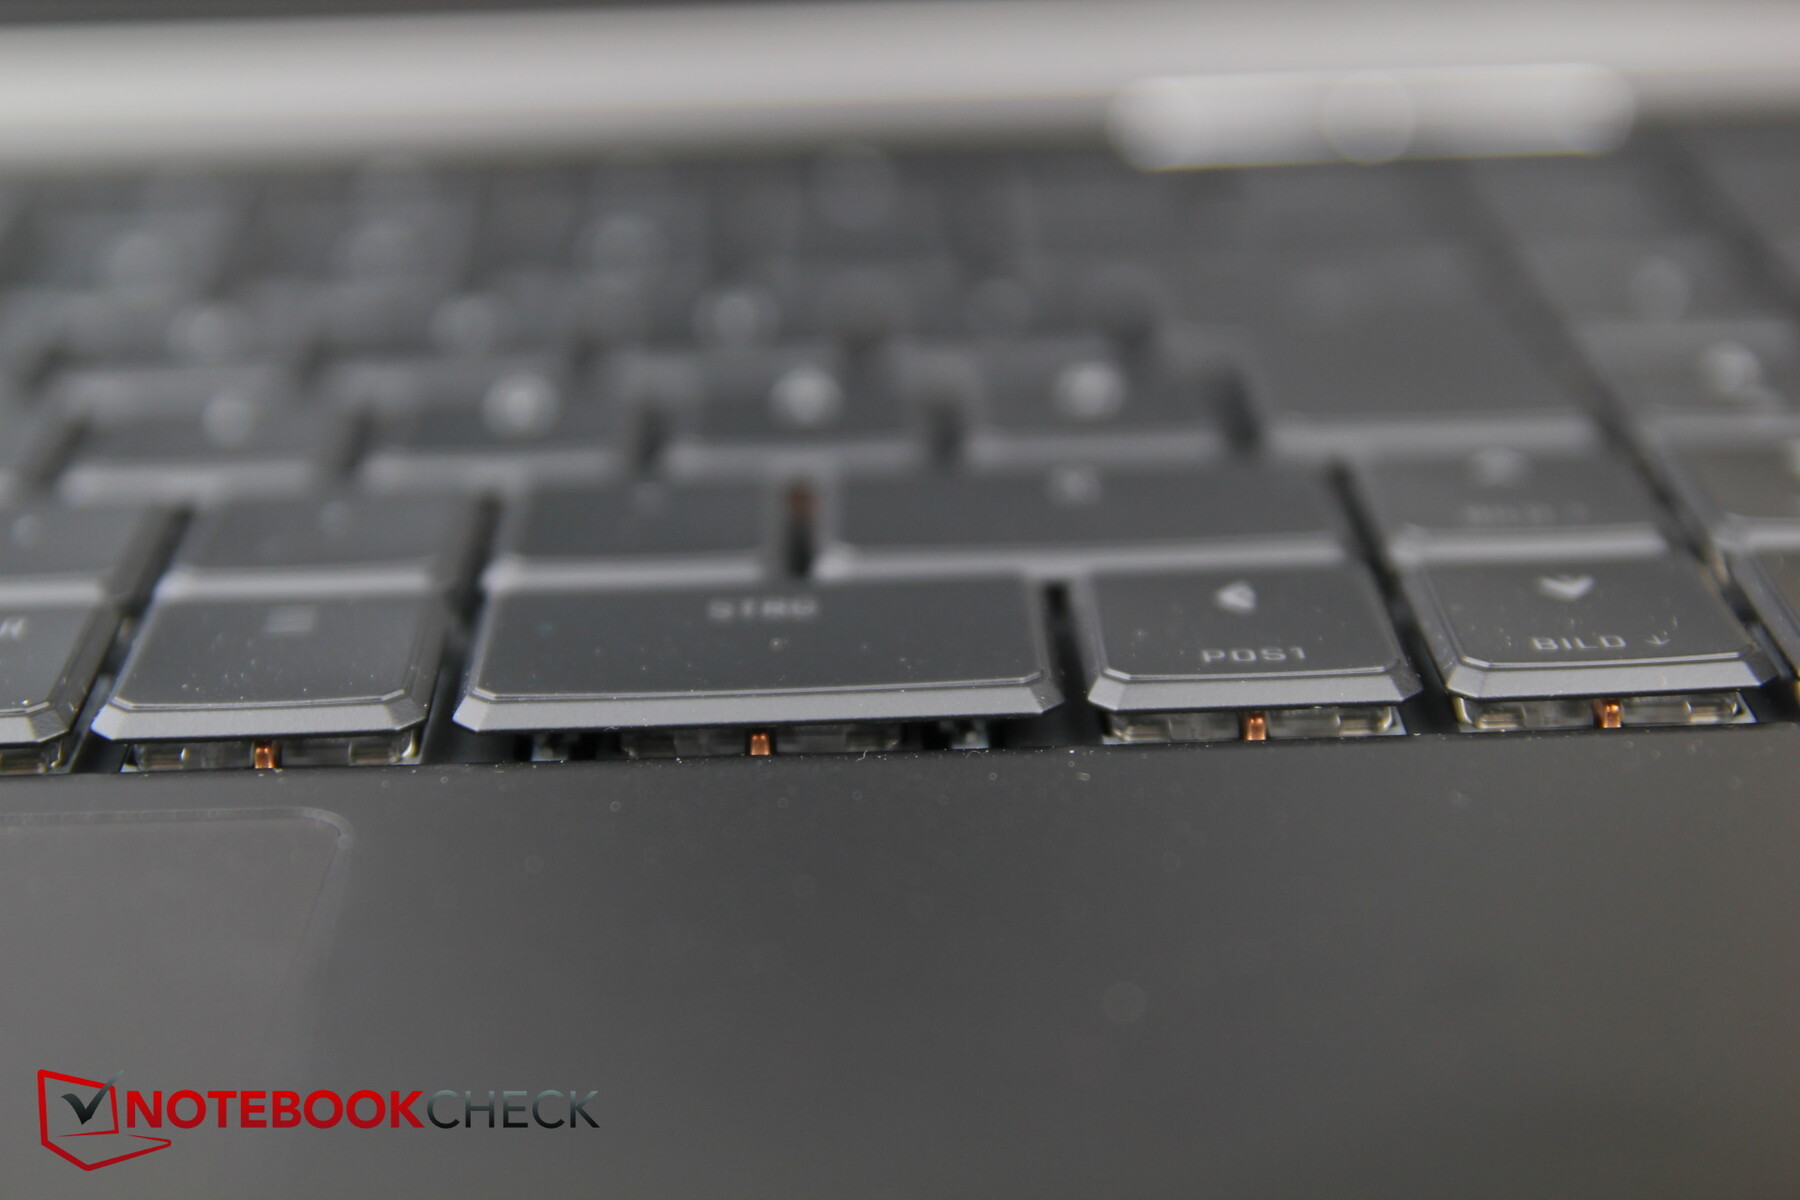
Las teclas optomecánicas tienen un buen tacto al escribir, el recorrido es de 2 mm y la respuesta es agradable. El ruido al teclear es sólo ligeramente superior al de los teclados "normales", pero significativamente inferior al de los teclados puramente mecánicos. Las tapas del teclado son muy finas. Se puede ver por debajo de las tapas y así vislumbrar la mecánica subyacente.
Además, cada tecla se puede iluminar individualmente, y las funciones especiales de una tecla también se iluminan tenuemente.
Teclado táctil
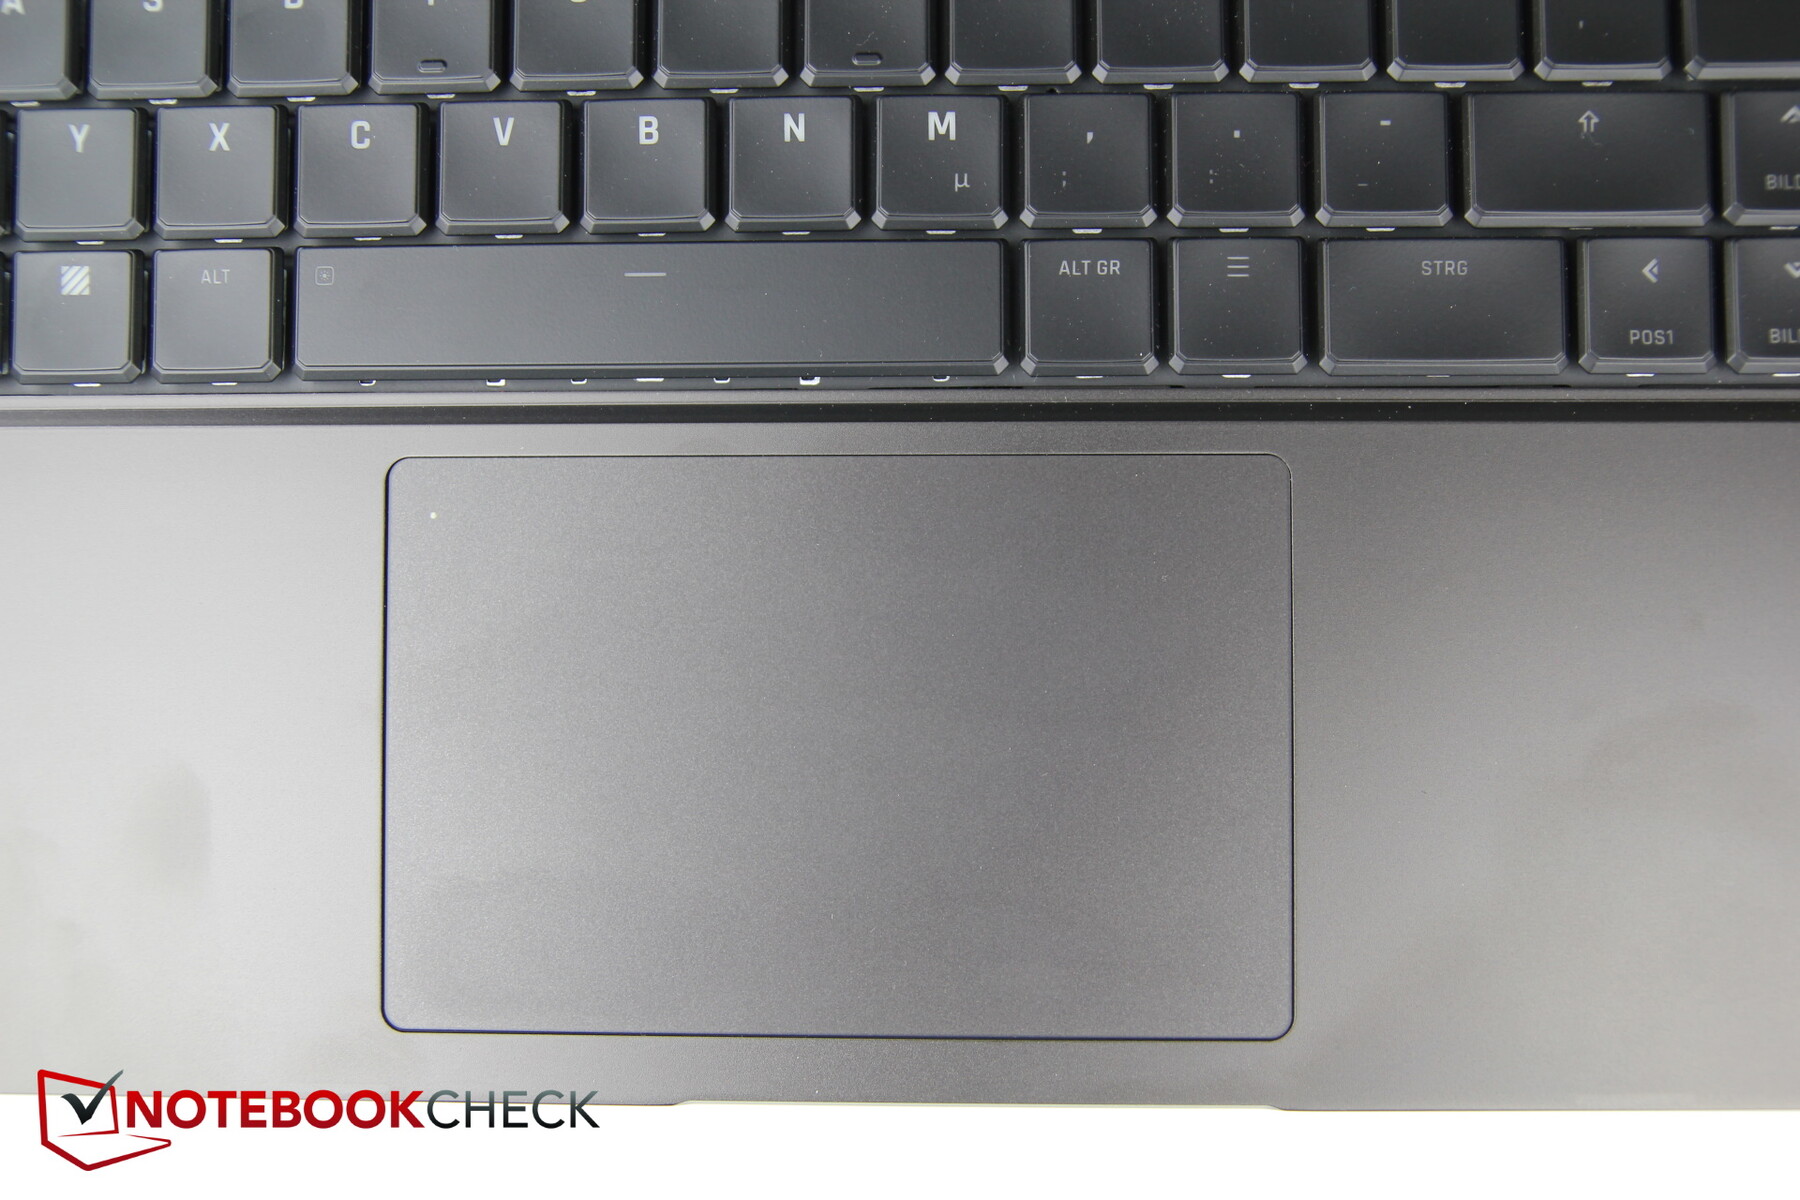
El touchpad mide unos 11,6 x 7,4 cm, por lo que es bastante grande. Un mini-LED blanco en la esquina superior izquierda indica si está (des)activado. La superficie es muy suave y no provoca tartamudeos incluso durante los movimientos lentos.
Schenker confía en las teclas integradas, que quieren ser presionadas con bastante firmeza, dan una respuesta clara, son moderadamente ruidosas, pero a veces simplemente no ejecutan la función deseada. En ocasiones, varios clics seguidos no funcionaron, pero un clic posterior mediante un toque con el dedo en el pad sí lo hizo.
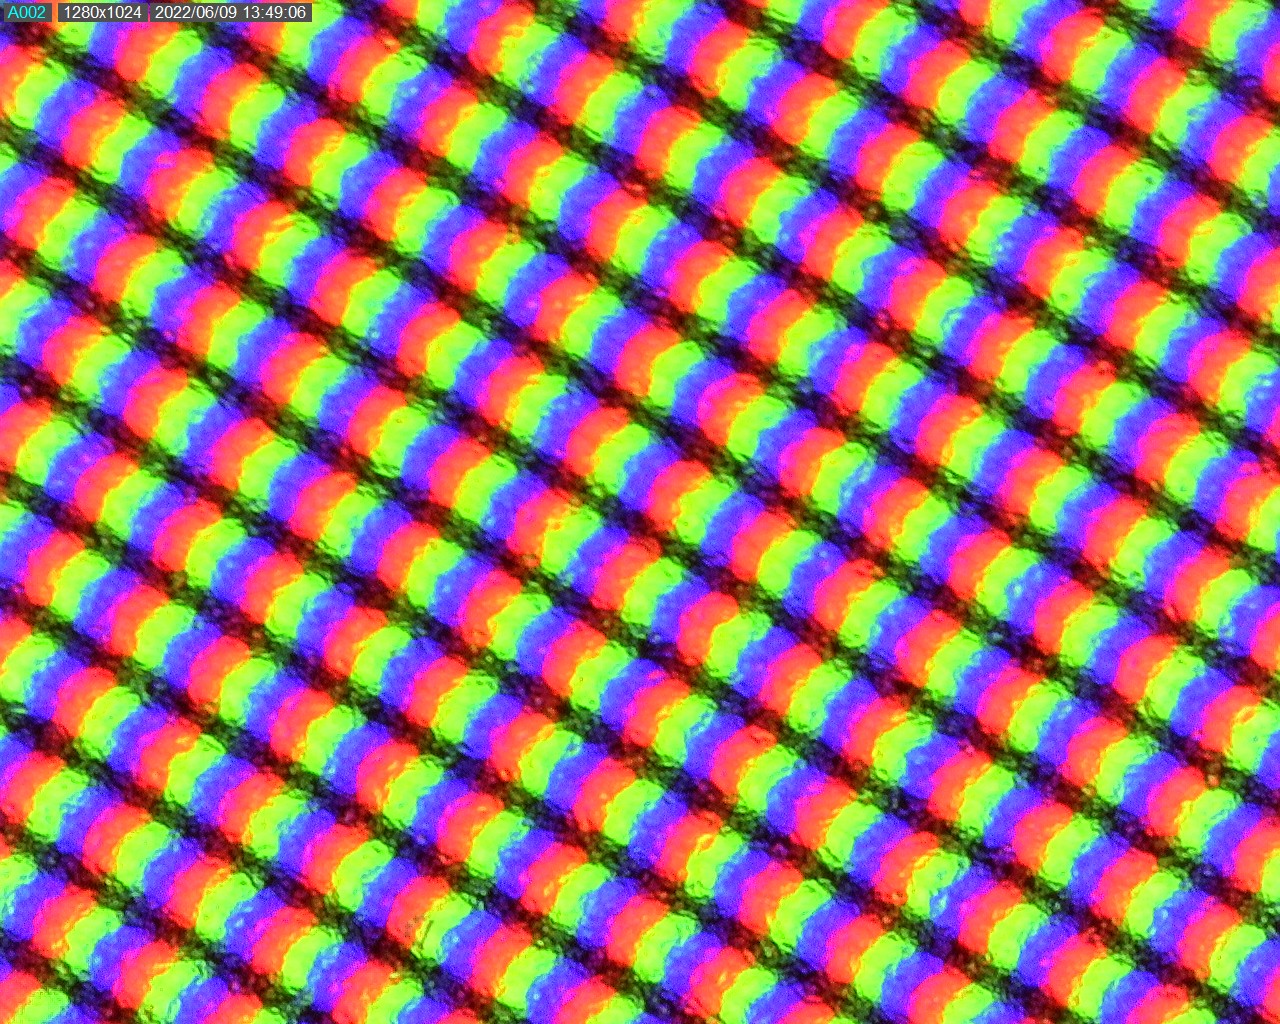
Pantalla: QHD a 240 Hz y cobertura sRGB completa
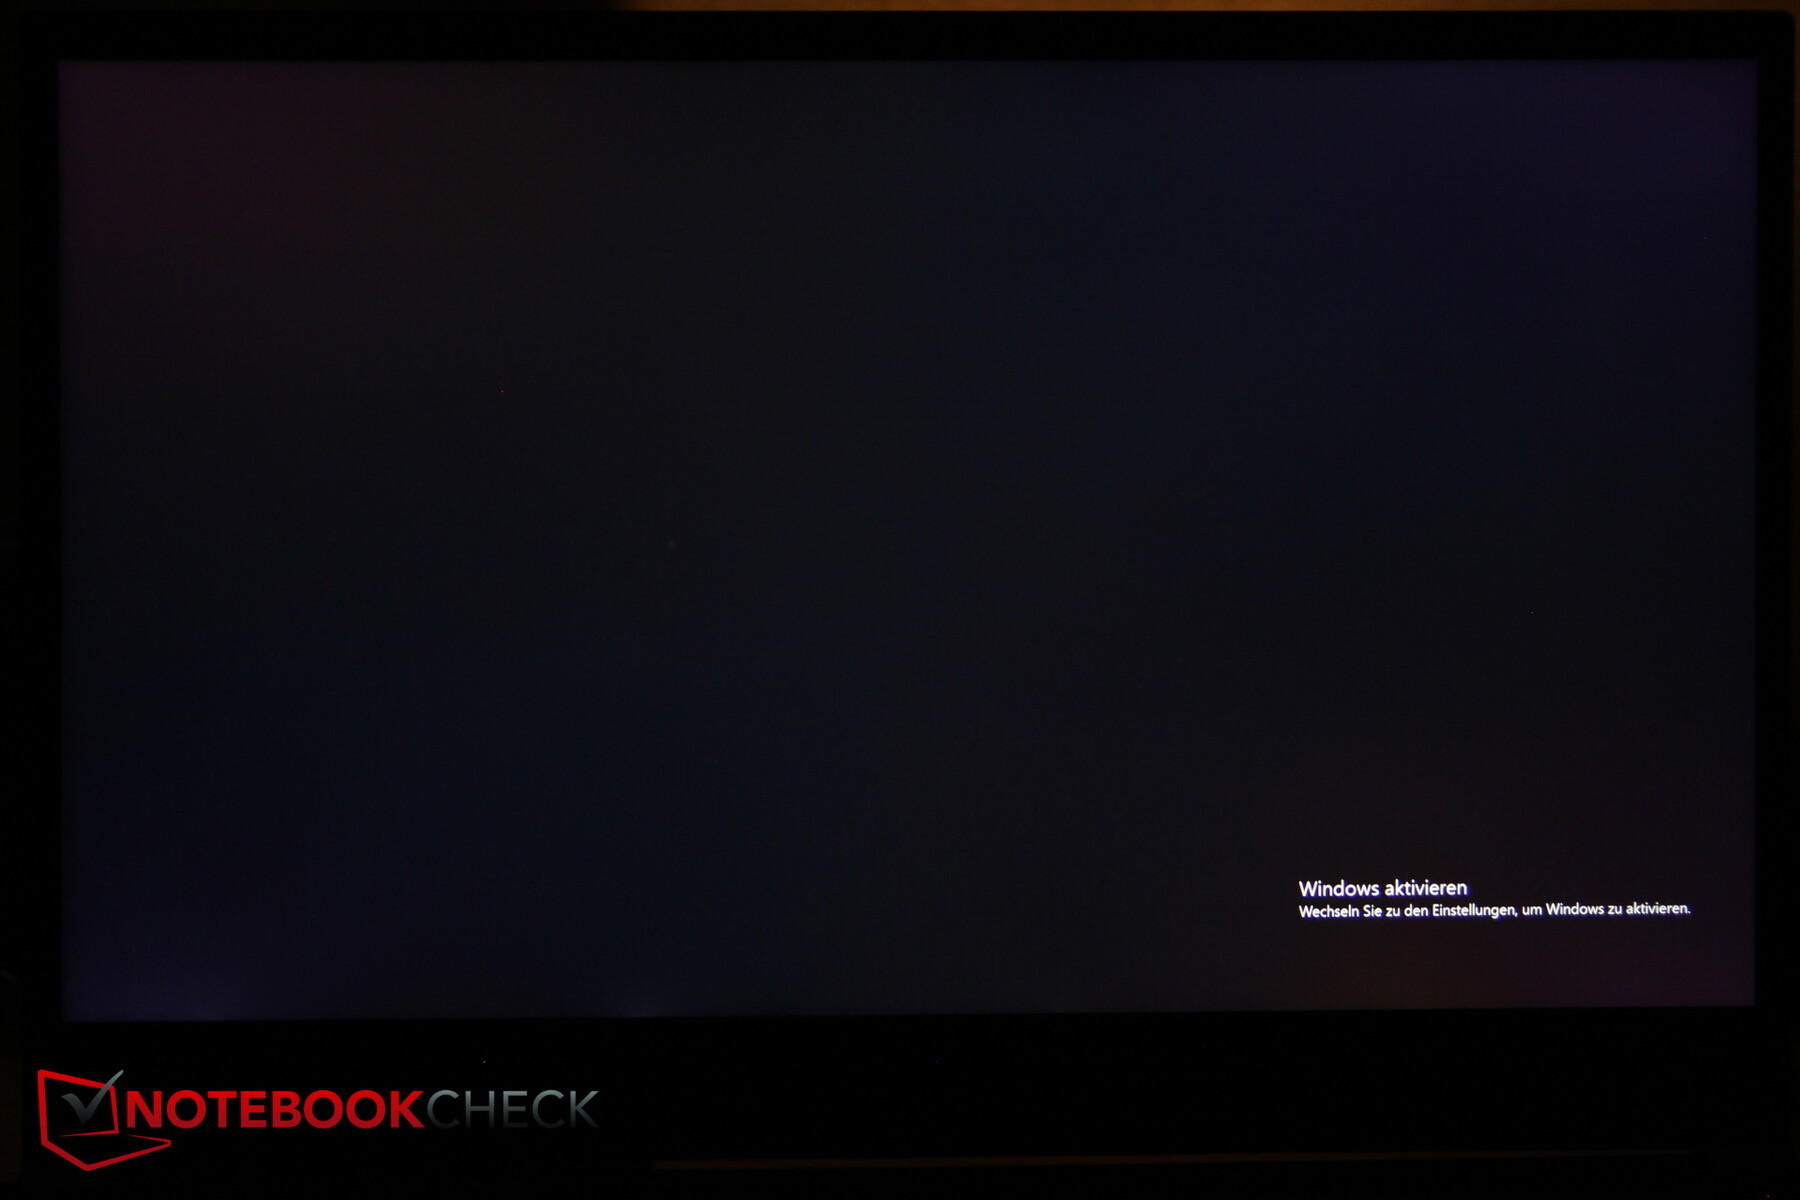
Se ha instalado un panel IPS QHD mate de BOE con una tasa de refresco de 240 Hz. El brillo del panel supera los 300 nits, pero la distribución podría ser mejor, especialmente hacia la esquina inferior izquierda, donde el brillo disminuye con más fuerza. El nivel de negro y el contraste son medios.
El sangrado de pantalla sólo es mínimamente visible en las esquinas inferiores, y el PWM no se usa para controlar el brillo. Los tiempos de respuesta son satisfactorios, alrededor de 10 ms
| |||||||||||||||||||||||||
iluminación: 81 %
Brillo con batería: 365 cd/m²
Contraste: 1141:1 (Negro: 0.32 cd/m²)
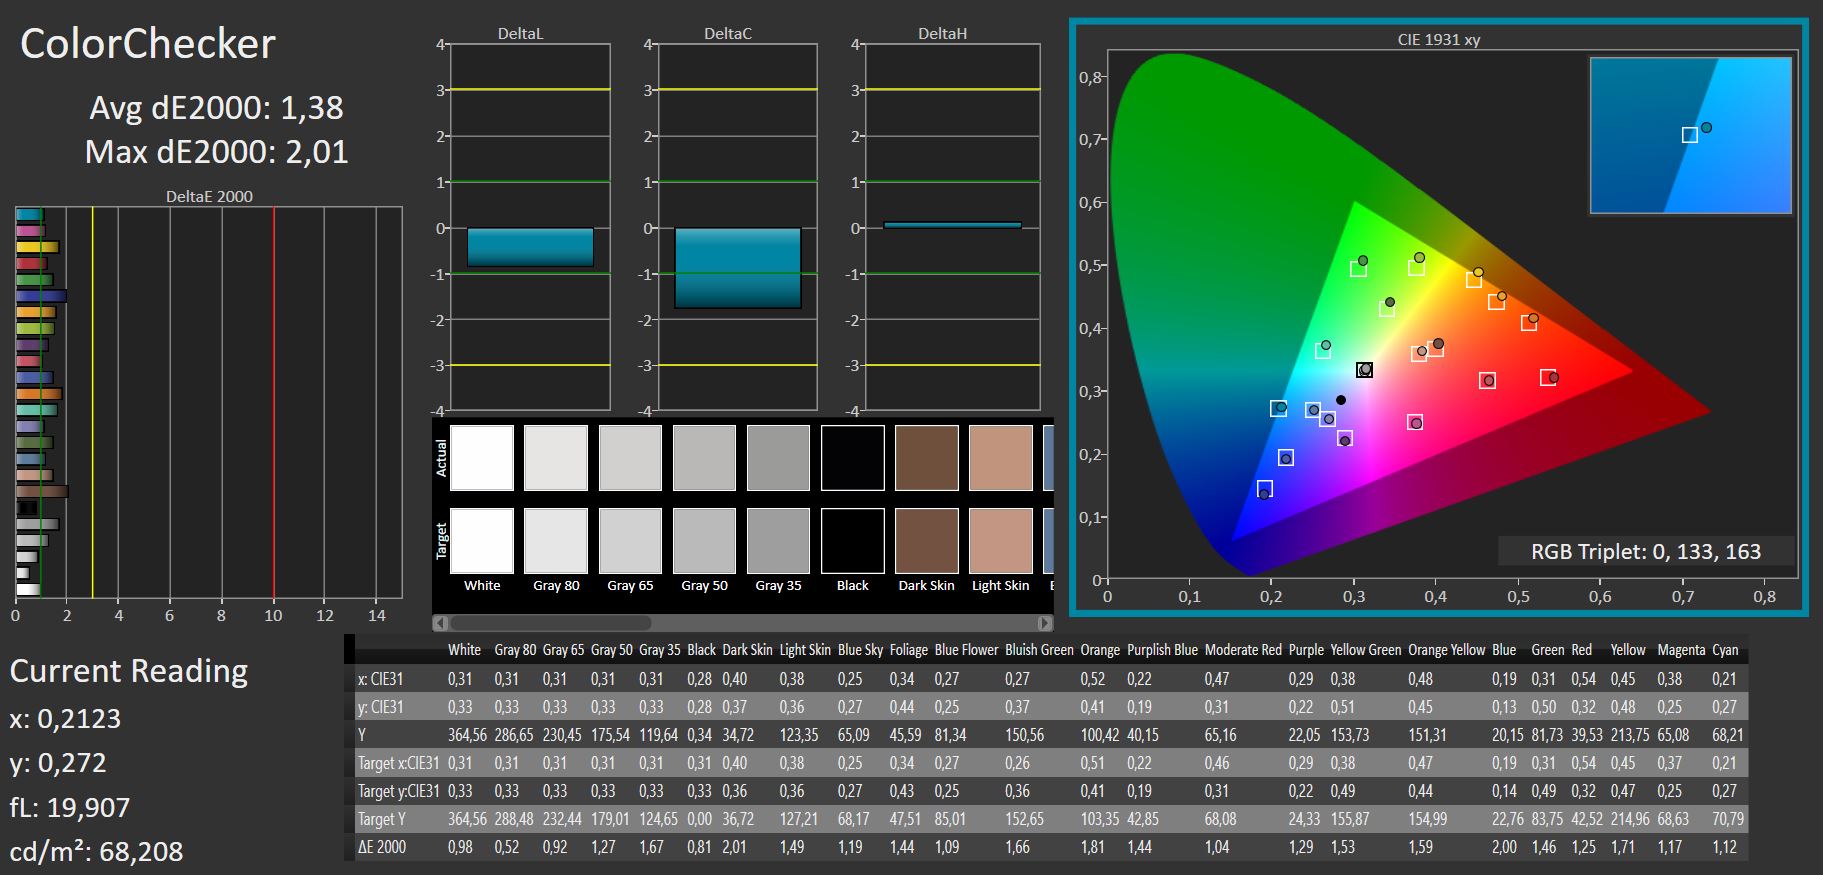
ΔE ColorChecker Calman: 1.38 | ∀{0.5-29.43 Ø4.71}
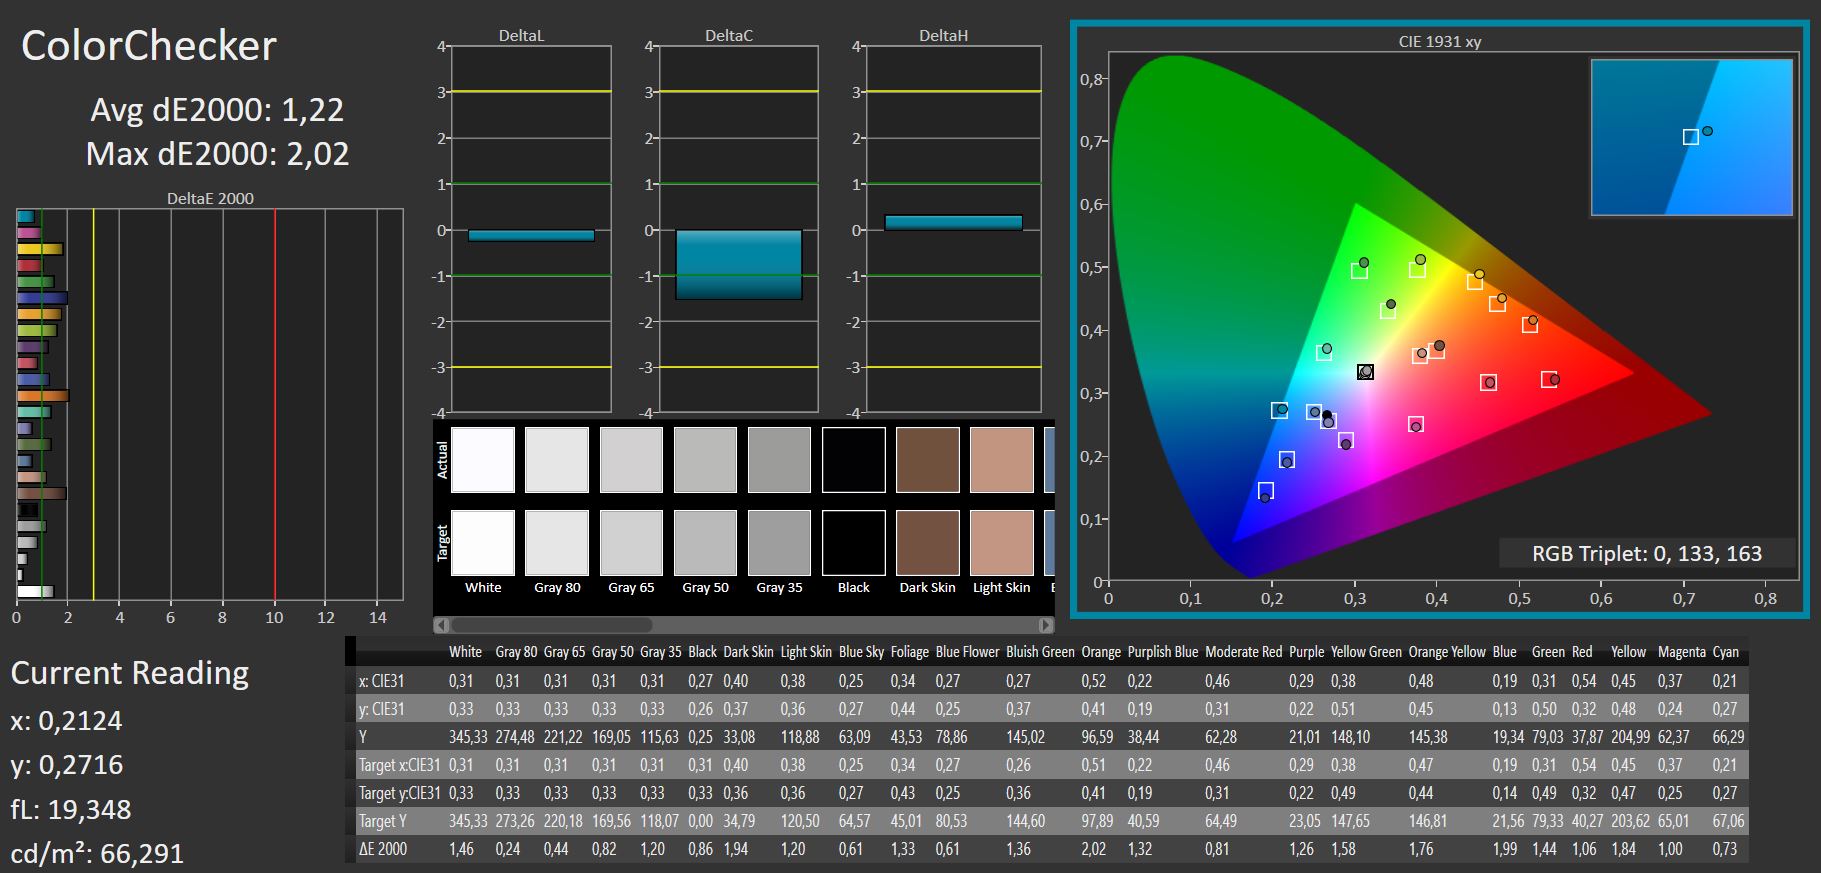
calibrated: 1.22
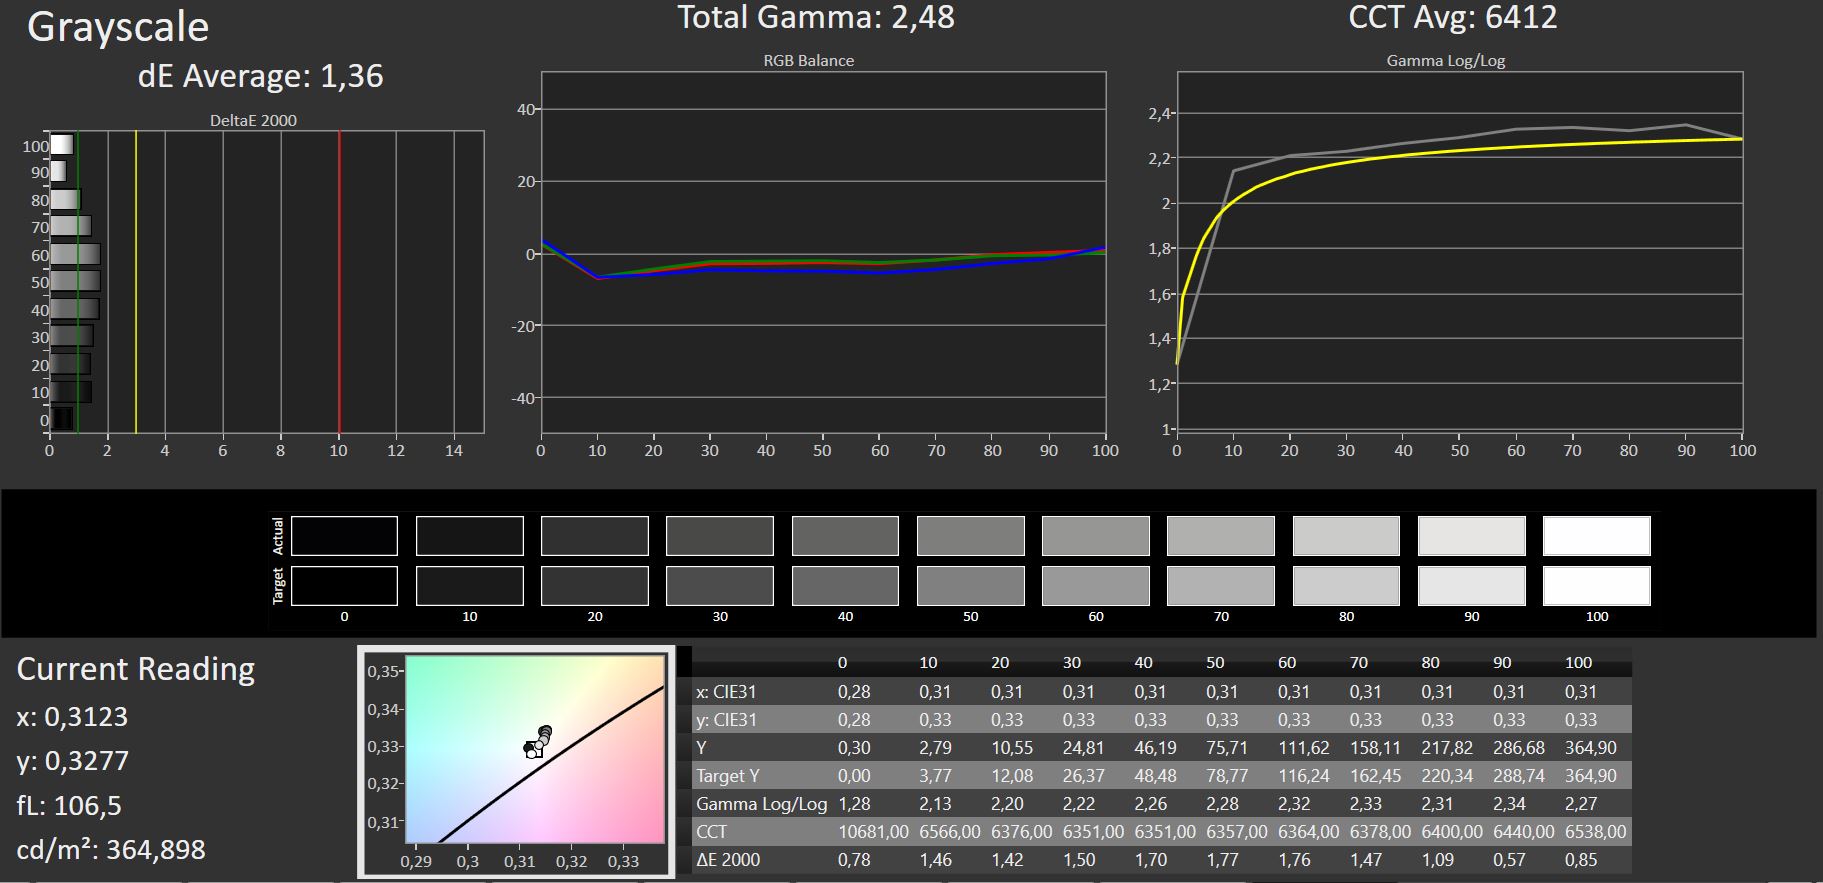
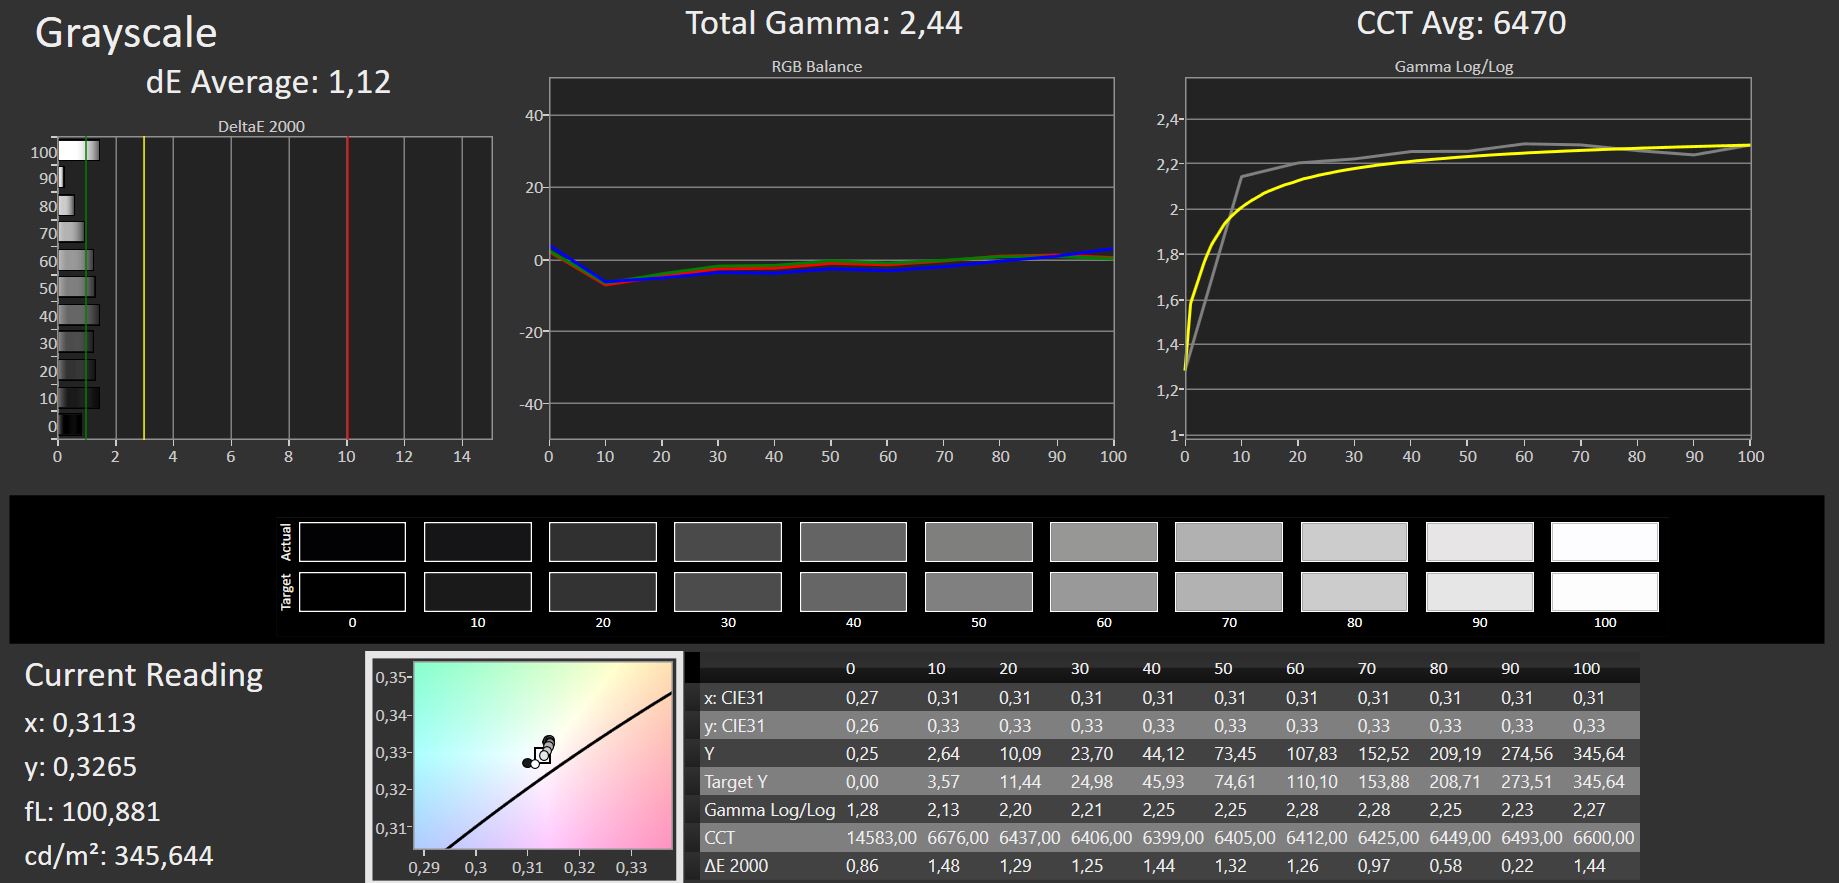
ΔE Greyscale Calman: 1.36 | ∀{0.09-98 Ø4.96}
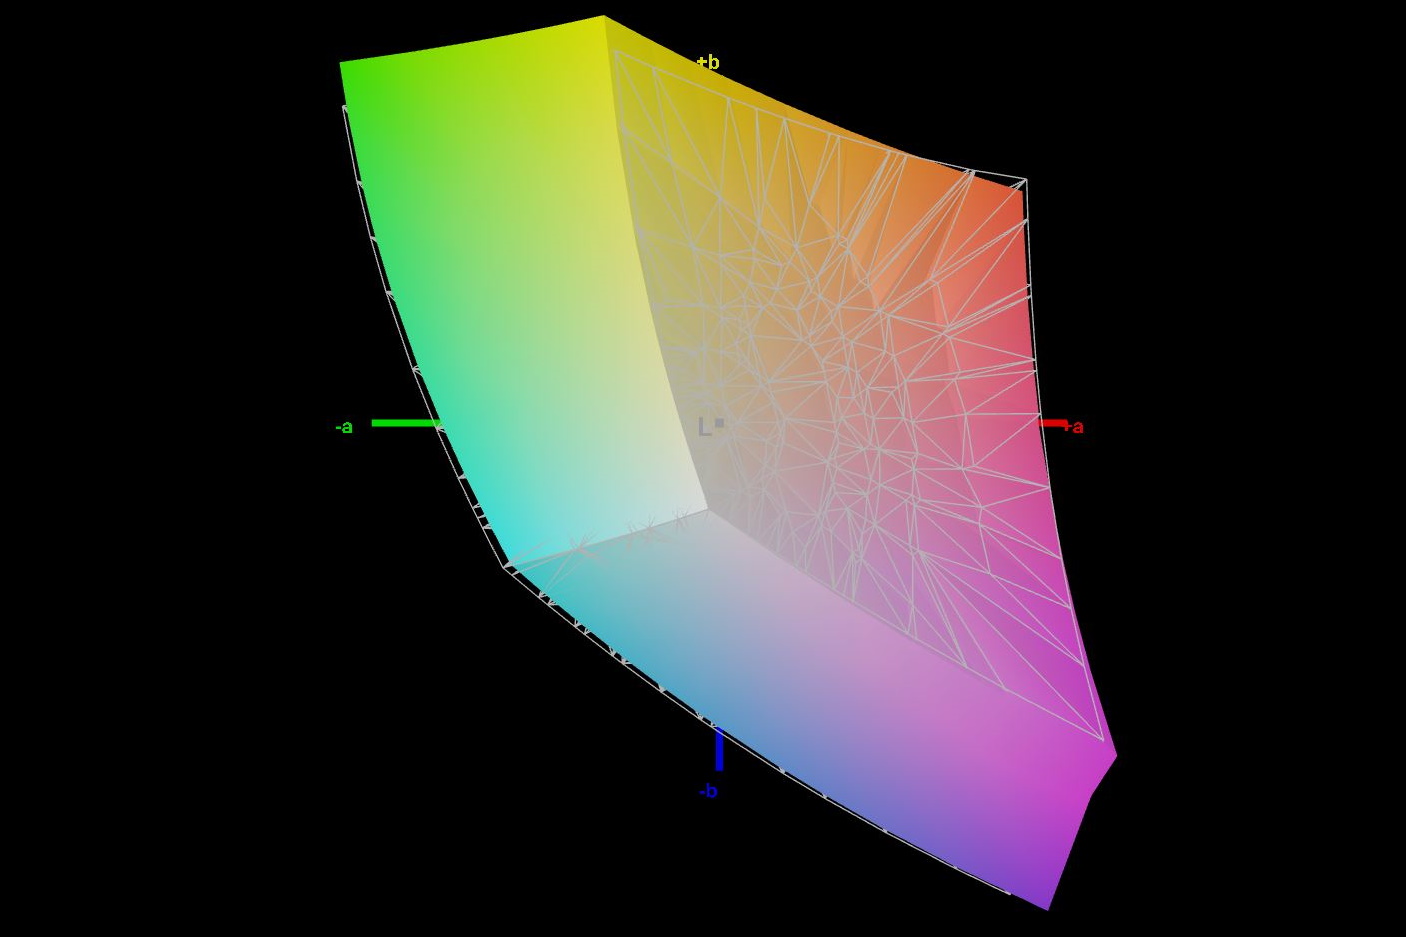
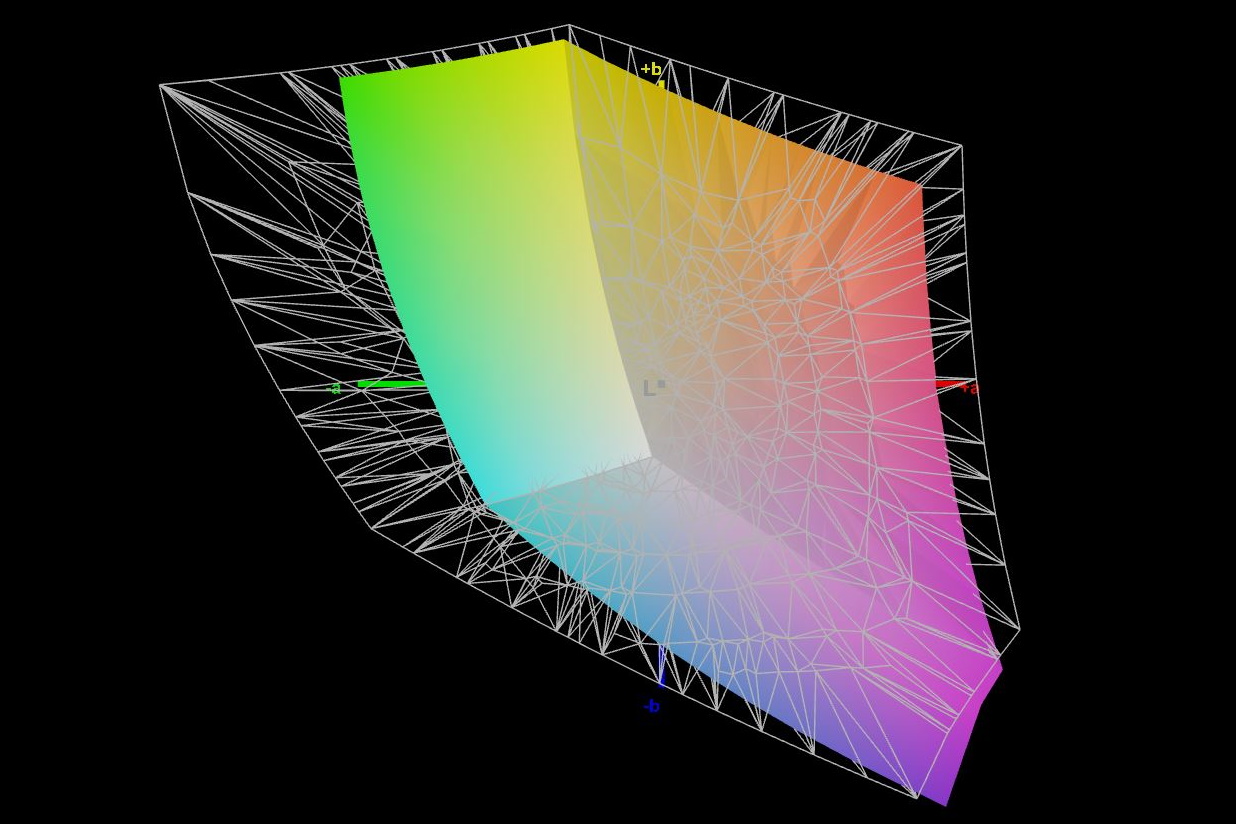
69.4% AdobeRGB 1998 (Argyll 3D)
97.2% sRGB (Argyll 3D)
68.2% Display P3 (Argyll 3D)
Gamma: 2.48
CCT: 6412 K
| Schenker XMG Neo 15 (i7-12700H, RTX 3080 Ti) BOE0A67, IPS, 2560x1440, 15.6" | Schenker XMG Neo 15 Tiger Lake BOE CQ NE156QHM-NY2, IPS, 2560x1440, 15.6" | Razer Blade 15 2022 Sharp LQ156T1JW03, IPS, 2560x1440, 15.6" | Asus ROG Zephyrus Duo 16 GX650RX BOE NE160QAM-NX1, IPS-Level, 3840x2400, 16" | Gigabyte Aero 16 YE5 Samsung SDC416B, AMOLED, 3840x2400, 16" | Alienware x17 R2 P48E AU Optronics B173HAN, IPS, 1920x1080, 17.3" | |
|---|---|---|---|---|---|---|
| Display | 1% | 24% | 24% | 11% | ||
| Display P3 Coverage (%) | 68.2 | 68.6 1% | 99.1 45% | 98 44% | 79.2 16% | |
| sRGB Coverage (%) | 97.2 | 98.6 1% | 99.9 3% | 99.9 3% | 99.8 3% | |
| AdobeRGB 1998 Coverage (%) | 69.4 | 69.3 0% | 86.8 25% | 86.3 24% | 79.6 15% | |
| Response Times | -33% | -24% | 9% | 79% | -3% | |
| Response Time Grey 50% / Grey 80% * (ms) | 12.4 ? | 16 ? -29% | 14.4 ? -16% | 14.6 ? -18% | 2.4 ? 81% | 12.4 ? -0% |
| Response Time Black / White * (ms) | 8.8 ? | 12 ? -36% | 11.6 ? -32% | 5.6 ? 36% | 2 ? 77% | 9.2 ? -5% |
| PWM Frequency (Hz) | 60 ? | |||||
| Screen | -94% | -39% | -72% | 388% | -69% | |
| Brightness middle (cd/m²) | 365 | 324 -11% | 286 -22% | 459 26% | 368 1% | 365.4 0% |
| Brightness (cd/m²) | 335 | 307 -8% | 271 -19% | 434 30% | 368 10% | 344 3% |
| Brightness Distribution (%) | 81 | 91 12% | 89 10% | 88 9% | 93 15% | 85 5% |
| Black Level * (cd/m²) | 0.32 | 0.27 16% | 0.25 22% | 0.44 -38% | 0.01 97% | 0.29 9% |
| Contrast (:1) | 1141 | 1200 5% | 1144 0% | 1043 -9% | 36800 3125% | 1260 10% |
| Colorchecker dE 2000 * | 1.38 | 3.36 -143% | 2.74 -99% | 2.97 -115% | 2.33 -69% | 3.17 -130% |
| Colorchecker dE 2000 max. * | 2.01 | 9.87 -391% | 5.21 -159% | 8.13 -304% | 4.34 -116% | 7.69 -283% |
| Colorchecker dE 2000 calibrated * | 1.22 | 1.23 -1% | 2.52 -107% | 1.03 16% | 0.51 58% | |
| Greyscale dE 2000 * | 1.36 | 5.8 -326% | 1.1 19% | 4.9 -260% | 0.8 41% | 5.3 -290% |
| Gamma | 2.48 89% | 2.311 95% | 2.2 100% | 2.235 98% | 2.119 104% | 2.18 101% |
| CCT | 6412 101% | 7087 92% | 6408 101% | 6775 96% | 6569 99% | 5879 111% |
| Color Space (Percent of AdobeRGB 1998) (%) | 69 | |||||
| Color Space (Percent of sRGB) (%) | 93 | |||||
| Media total (Programa/Opciones) | -42% /
-65% | -13% /
-24% | -13% /
-40% | 234% /
326% | -20% /
-42% |
* ... más pequeño es mejor
AdobeRGB y DisplayP3 están cubiertos cada uno en algo menos del 70 por ciento, mientras que sRGB está cubierto casi por completo en un 97 por ciento. El Razer Blade, por ejemplo, es claramente mejor aquí, ya que su panel también cubre DisplayP3 casi por completo.
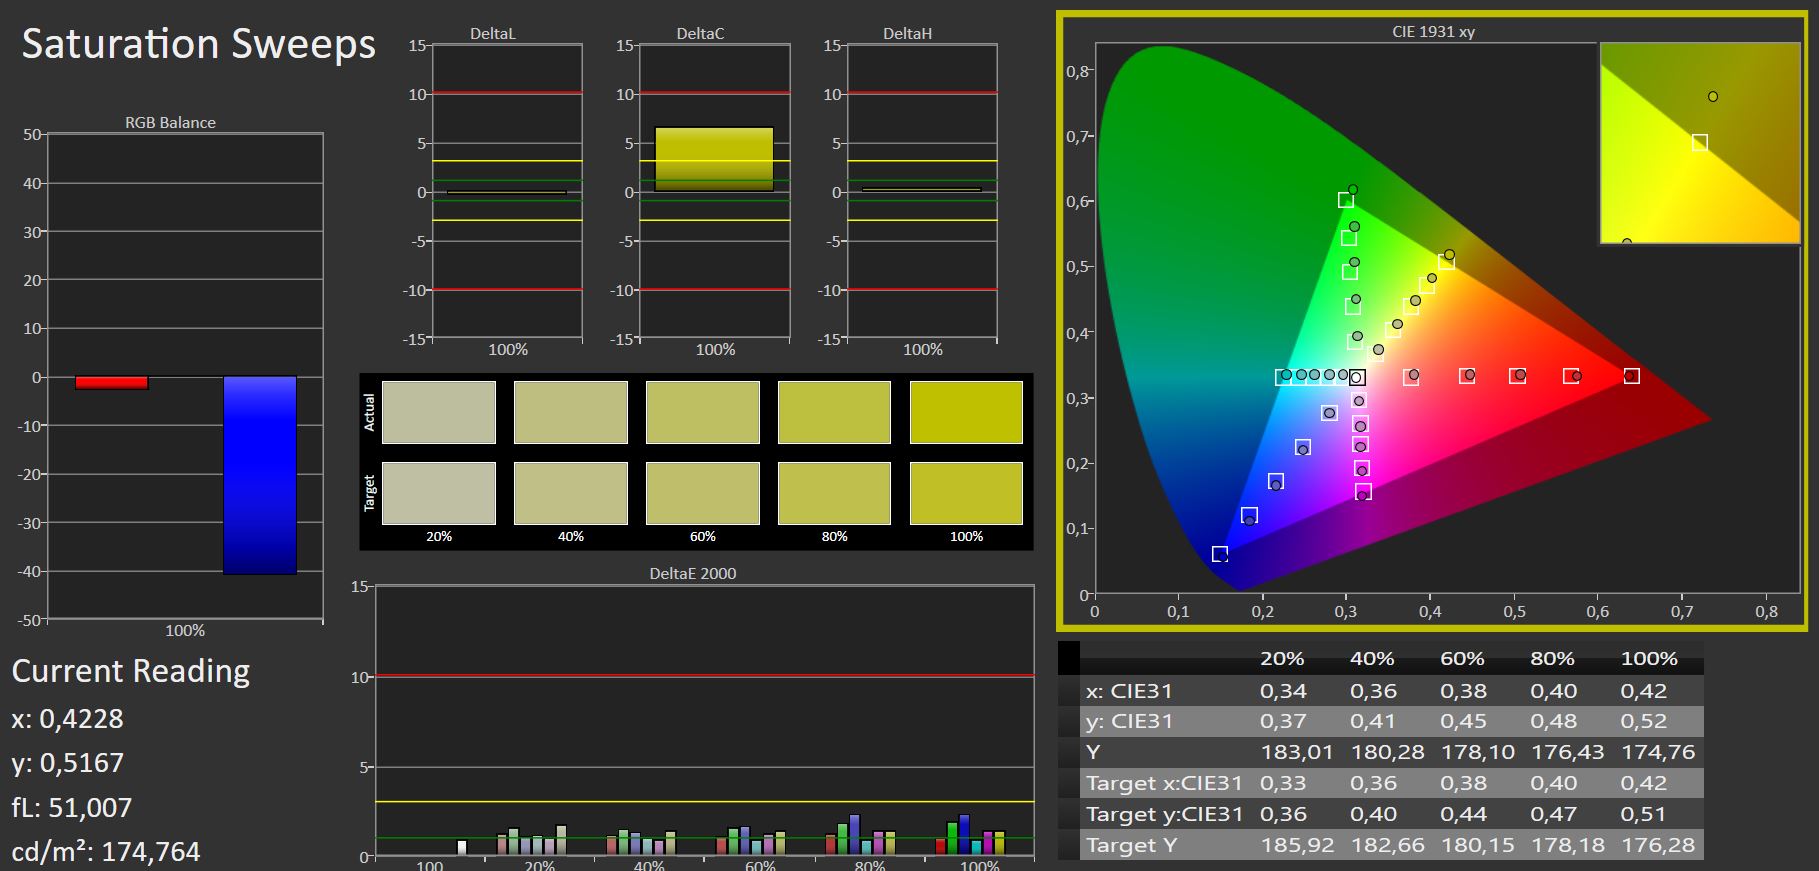
La pantalla ya está bastante bien calibrada de fábrica, y la calibración manual vuelve a rebajar un poco los ya bajos valores de DeltaE. Nuestro perfil ICC se puede descargar arriba

Tiempos de respuesta del display
| ↔ Tiempo de respuesta de Negro a Blanco | ||
|---|---|---|
| 8.8 ms ... subida ↗ y bajada ↘ combinada | ↗ 4.6 ms subida | 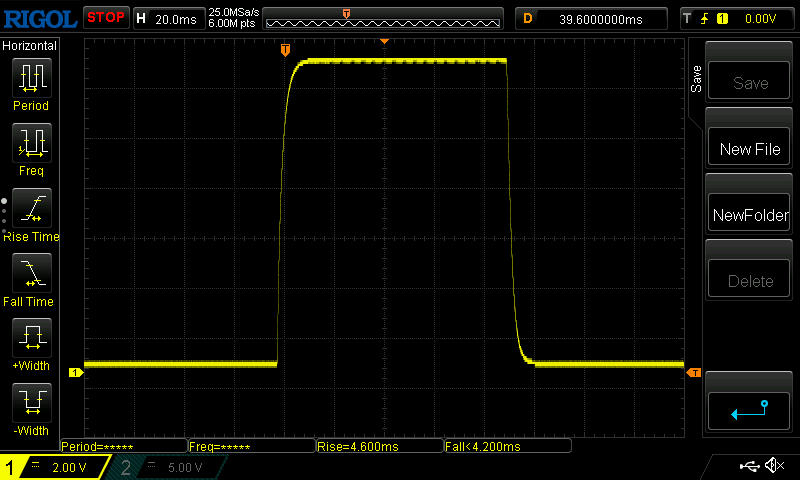 |
| ↘ 4.2 ms bajada | ||
| La pantalla mostró tiempos de respuesta rápidos en nuestros tests y debería ser adecuada para juegos. En comparación, todos los dispositivos de prueba van de ##min### (mínimo) a 240 (máximo) ms. » 25 % de todos los dispositivos son mejores. Esto quiere decir que el tiempo de respuesta medido es mejor que la media (19.8 ms) de todos los dispositivos testados. | ||
| ↔ Tiempo de respuesta 50% Gris a 80% Gris | ||
| 12.4 ms ... subida ↗ y bajada ↘ combinada | ↗ 5.8 ms subida | 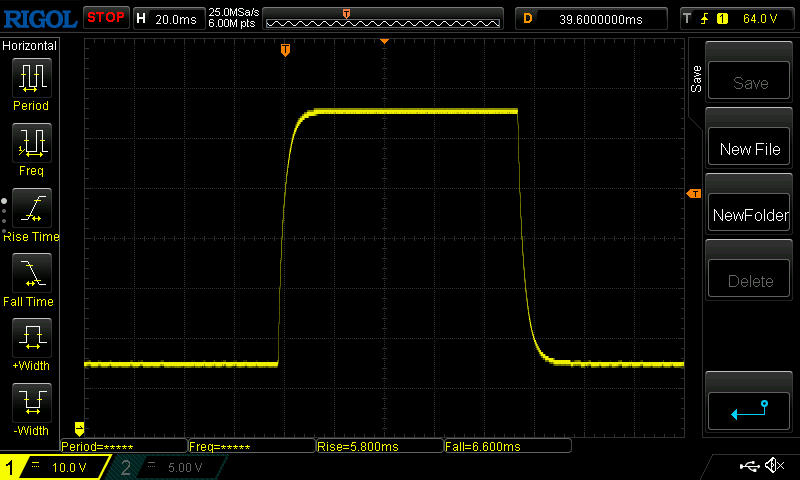 |
| ↘ 6.6 ms bajada | ||
| La pantalla mostró buenos tiempos de respuesta en nuestros tests pero podría ser demasiado lenta para los jugones competitivos. En comparación, todos los dispositivos de prueba van de ##min### (mínimo) a 636 (máximo) ms. » 26 % de todos los dispositivos son mejores. Esto quiere decir que el tiempo de respuesta medido es mejor que la media (31 ms) de todos los dispositivos testados. | ||
Parpadeo de Pantalla / PWM (Pulse-Width Modulation)
| Parpadeo de Pantalla / PWM no detectado | 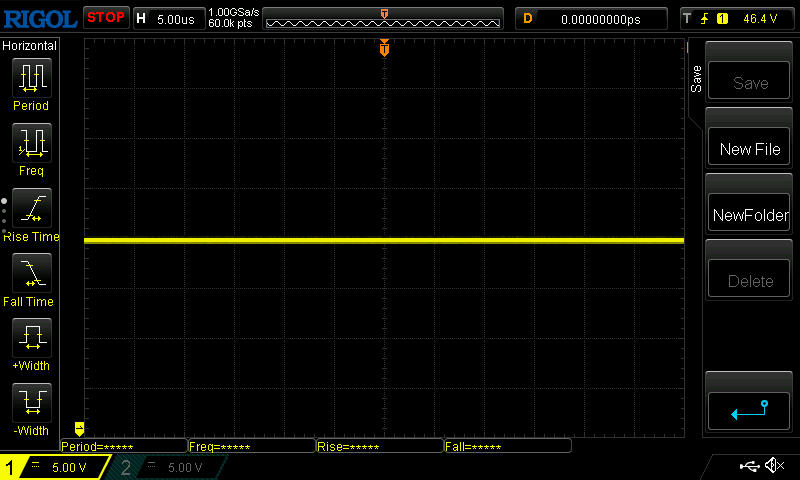 | ||
Comparación: 52 % de todos los dispositivos testados no usaron PWM para atenuar el display. Si se usó, medimos una media de 7757 (mínimo: 5 - máxmo: 343500) Hz. | |||
La superficie mate, el brillo decente y la sólida relación de contraste garantizan una buena visibilidad del contenido de la pantalla en exteriores, al menos en la sombra. La visibilidad es más bien escasa al sol
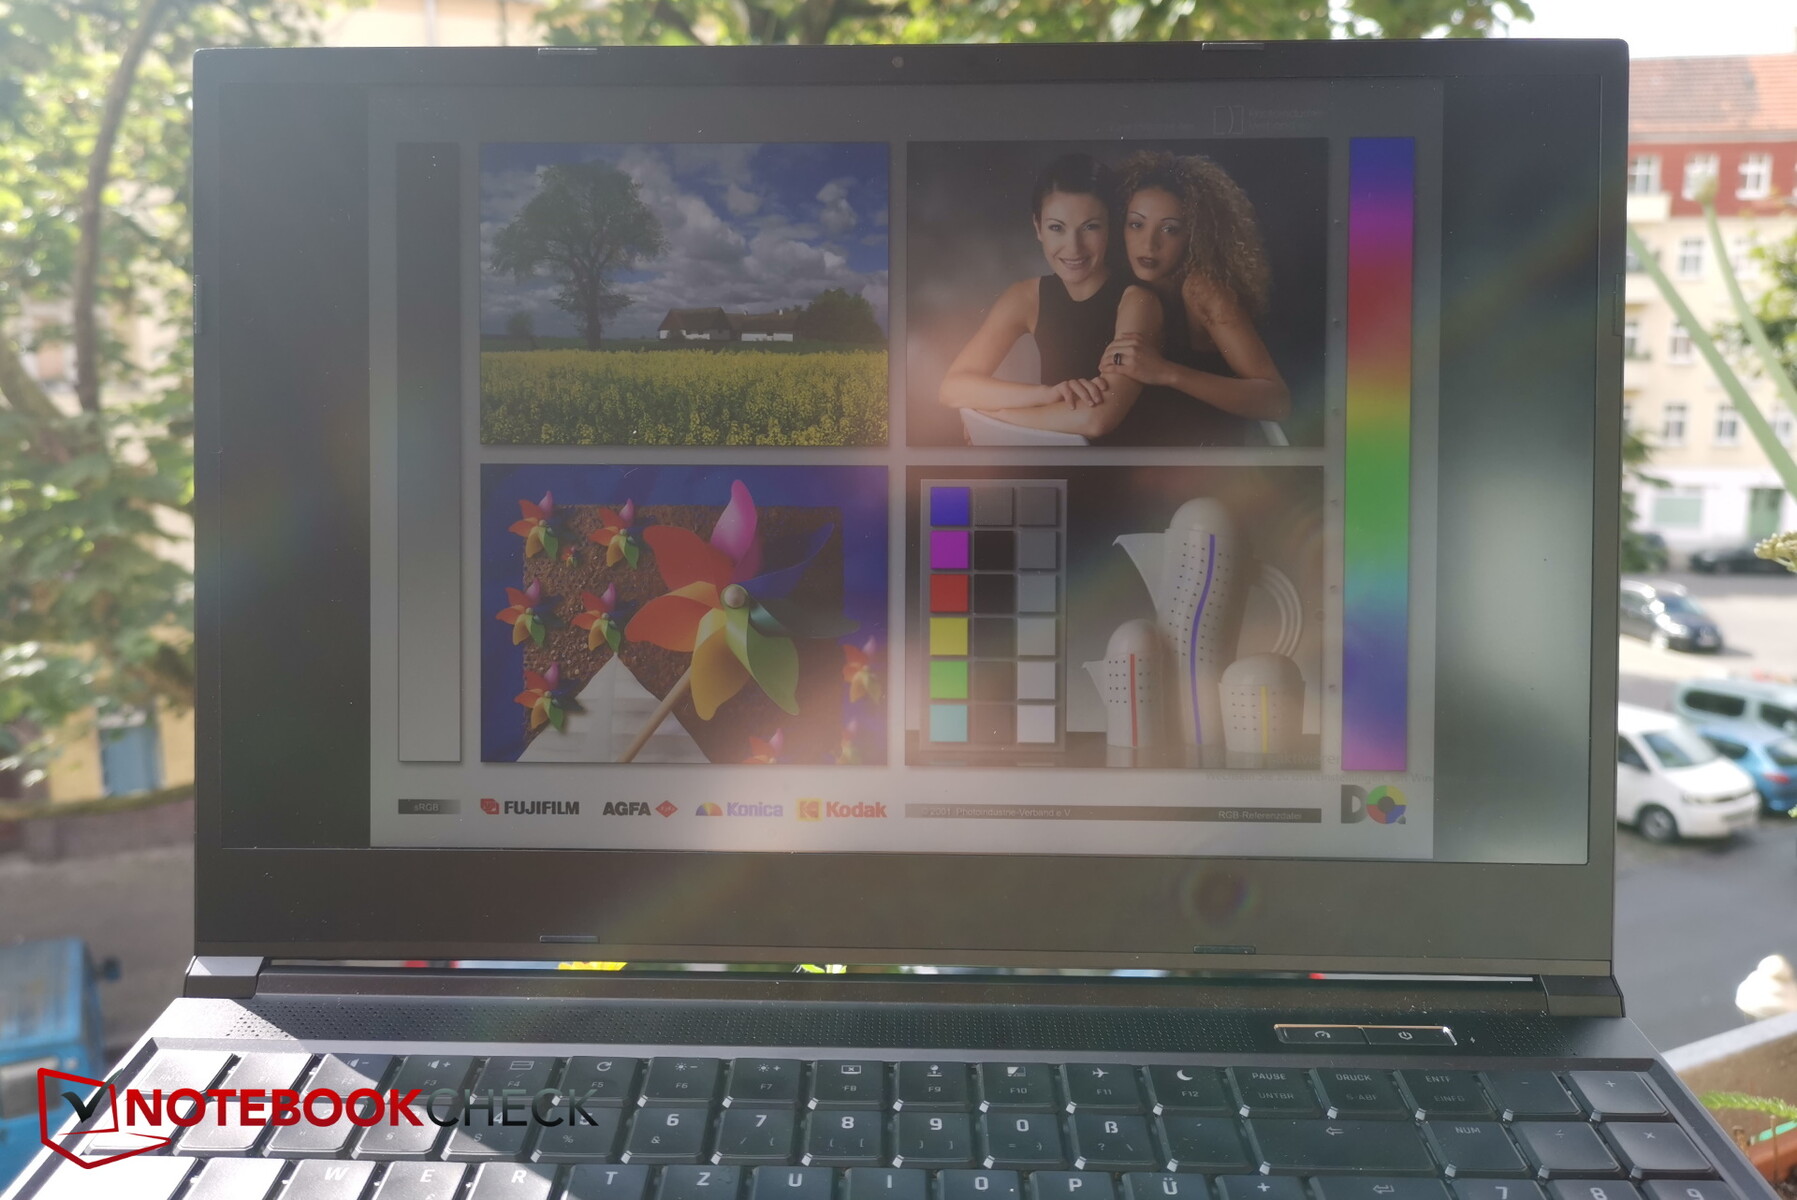
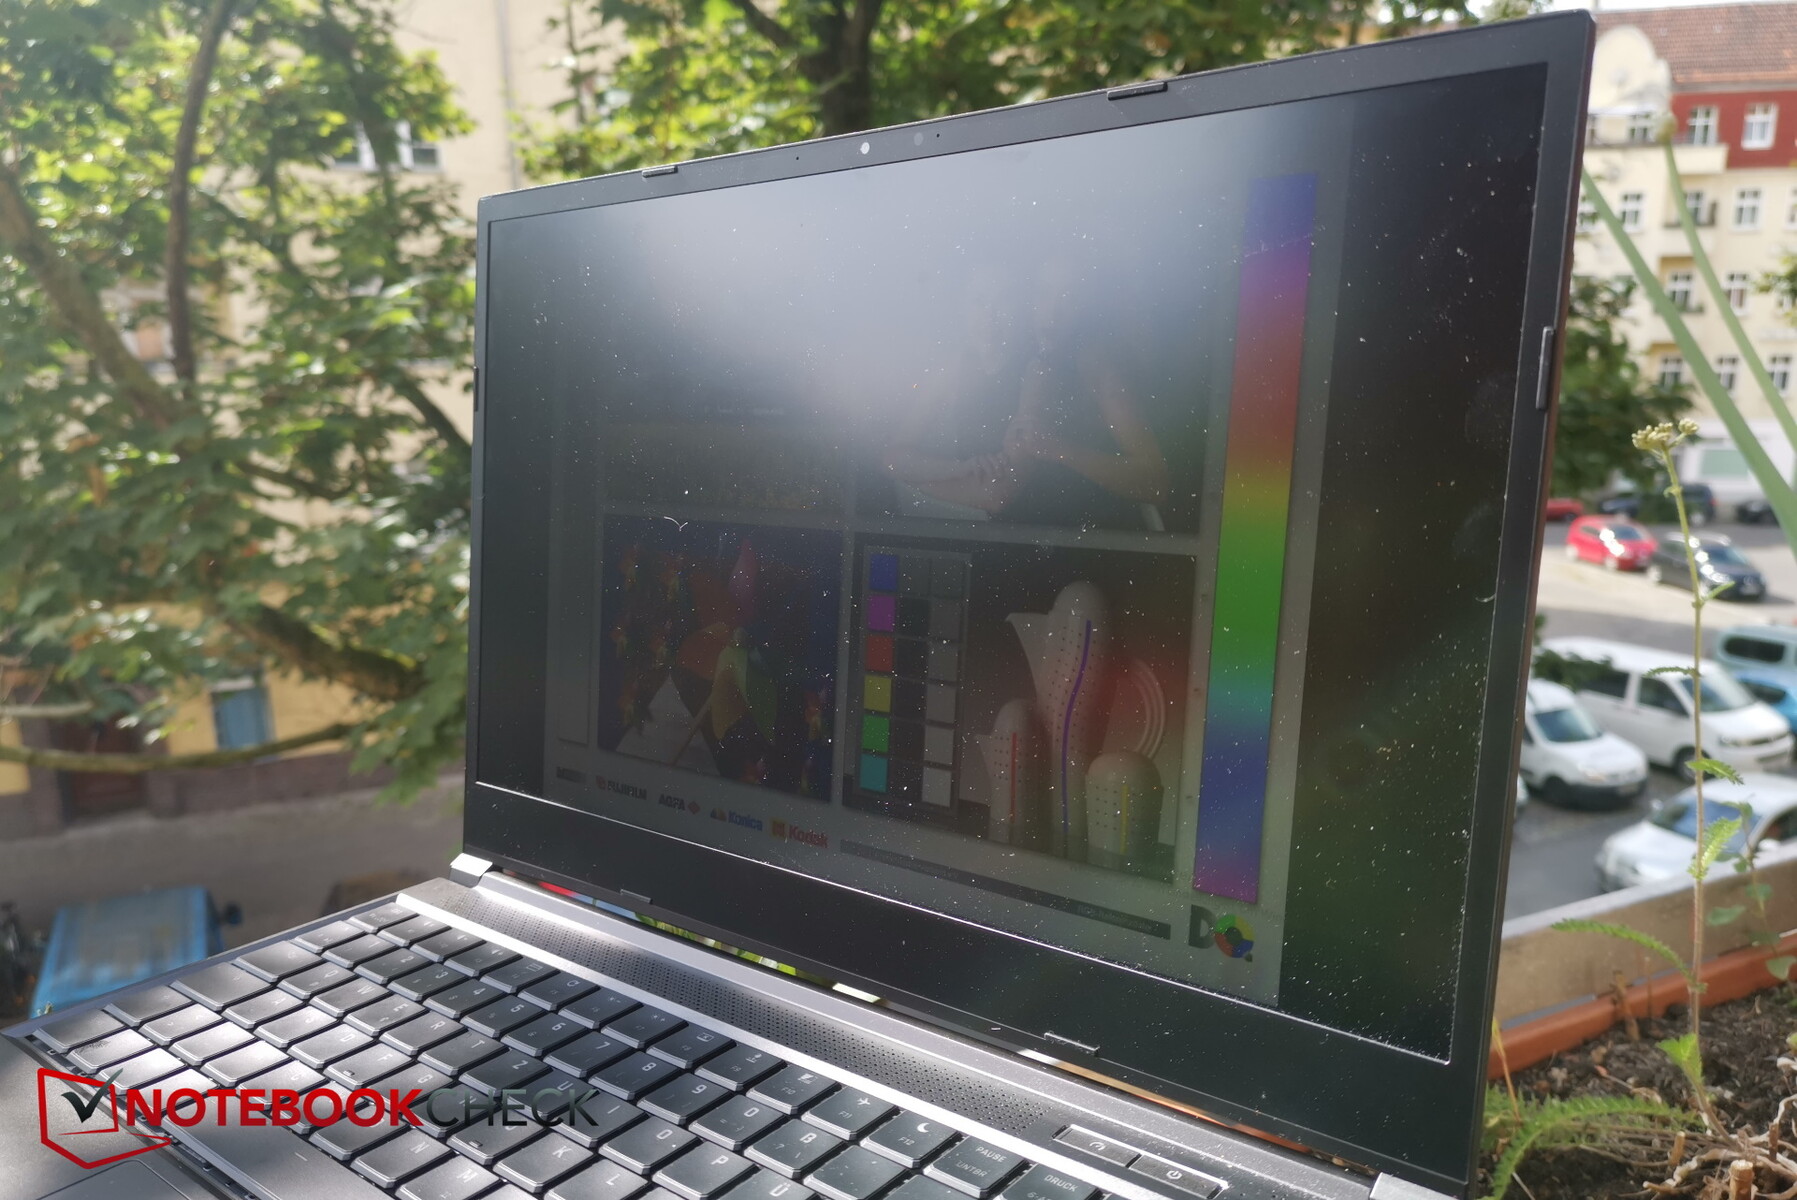
Todo el contenido sigue siendo muy visible incluso cuando no se ve directamente. El brillo sólo se resiente bajo ángulos de visión extremos

Rendimiento: RTX 3080 Ti e i7-12700H
El Neo 15 también está disponible con la CPU teóricamente más rápidai9-12900Hpero la combinación de i7-12700H y RTX 3080 Ti también es una combinación sólida para los gamers y debería poder ejecutar todos los juegos con fluidez. Si no fuera por la cobertura subóptima del espacio de color, el Neo sería una opción interesante para tareas exigentes de edición o creación de contenidos debido a su diseño elegante y la opción de refrigeración líquida silenciosa.
Además de la CPU, los usuarios también pueden elegir la GPU y optar por una RTX 3070 Ti como alternativa.
Condiciones de la prueba
Nuestras pruebas son más exhaustivas de lo habitual porque estamos revisando dos dispositivos al mismo tiempo, es decir, el Neo 15 por un lado y el Neo 15 con Oasis por el otro, lo que debería producir resultados diferentes (más claros) de benchmark y emisiones.
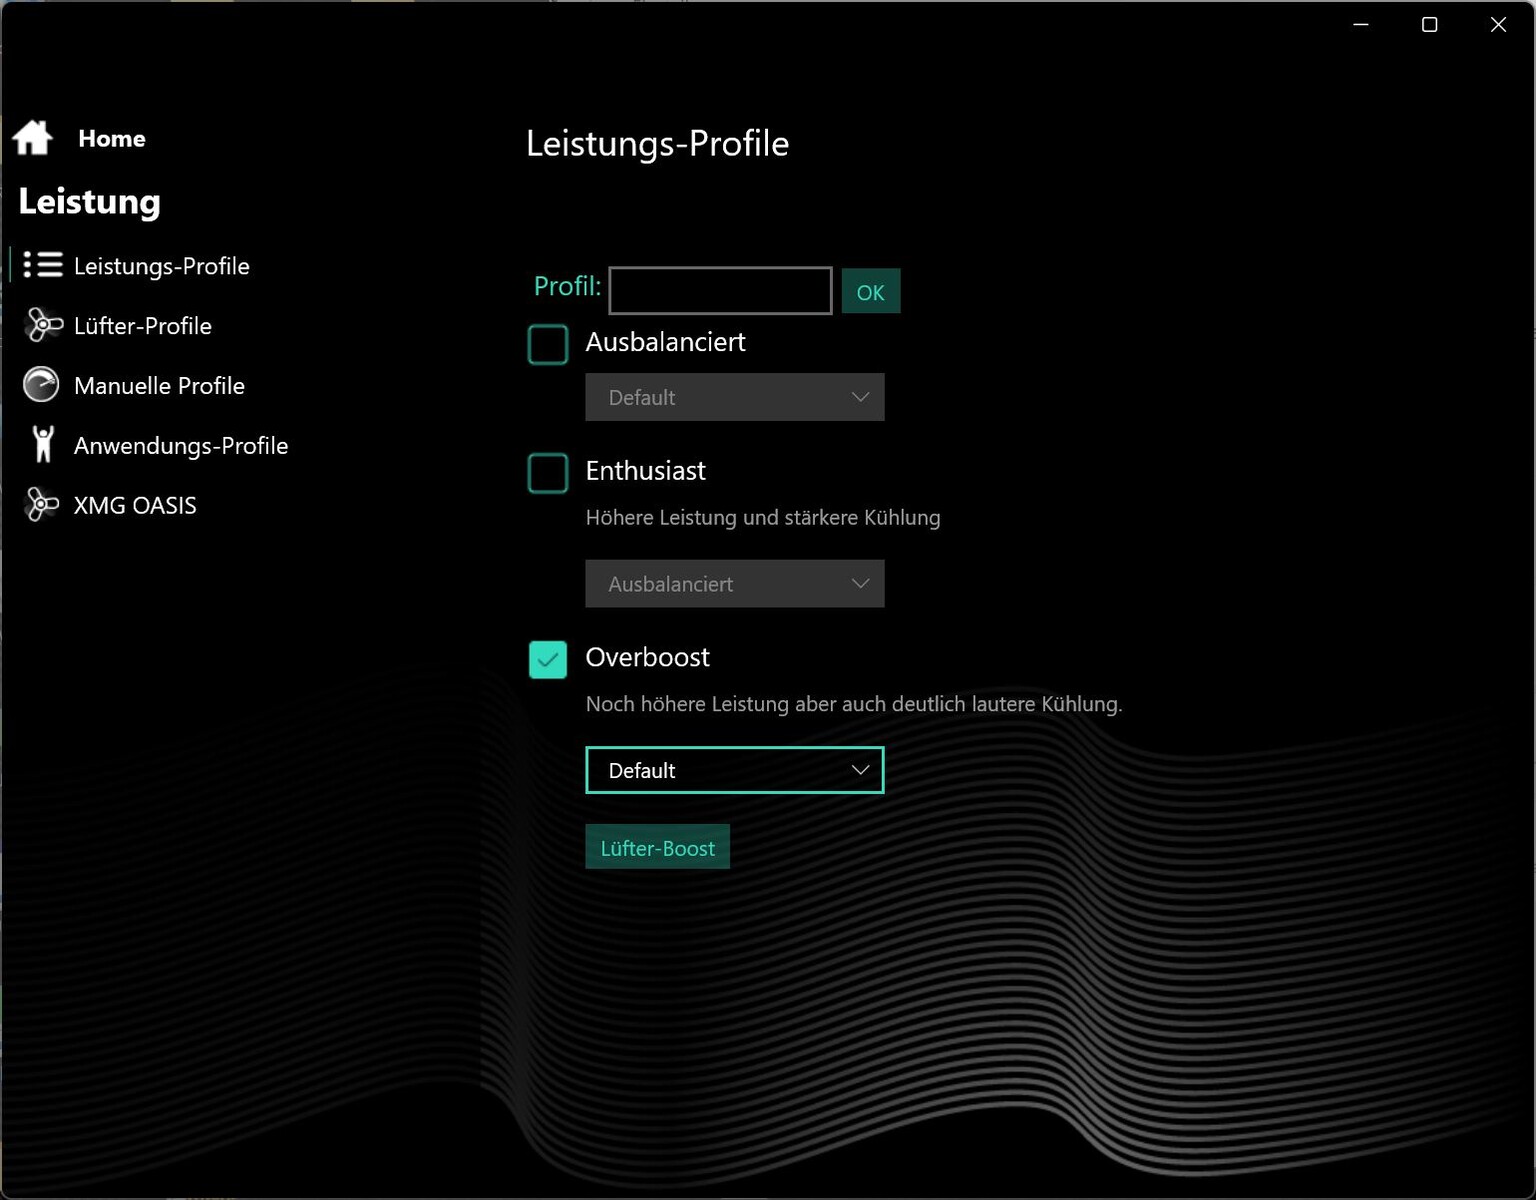
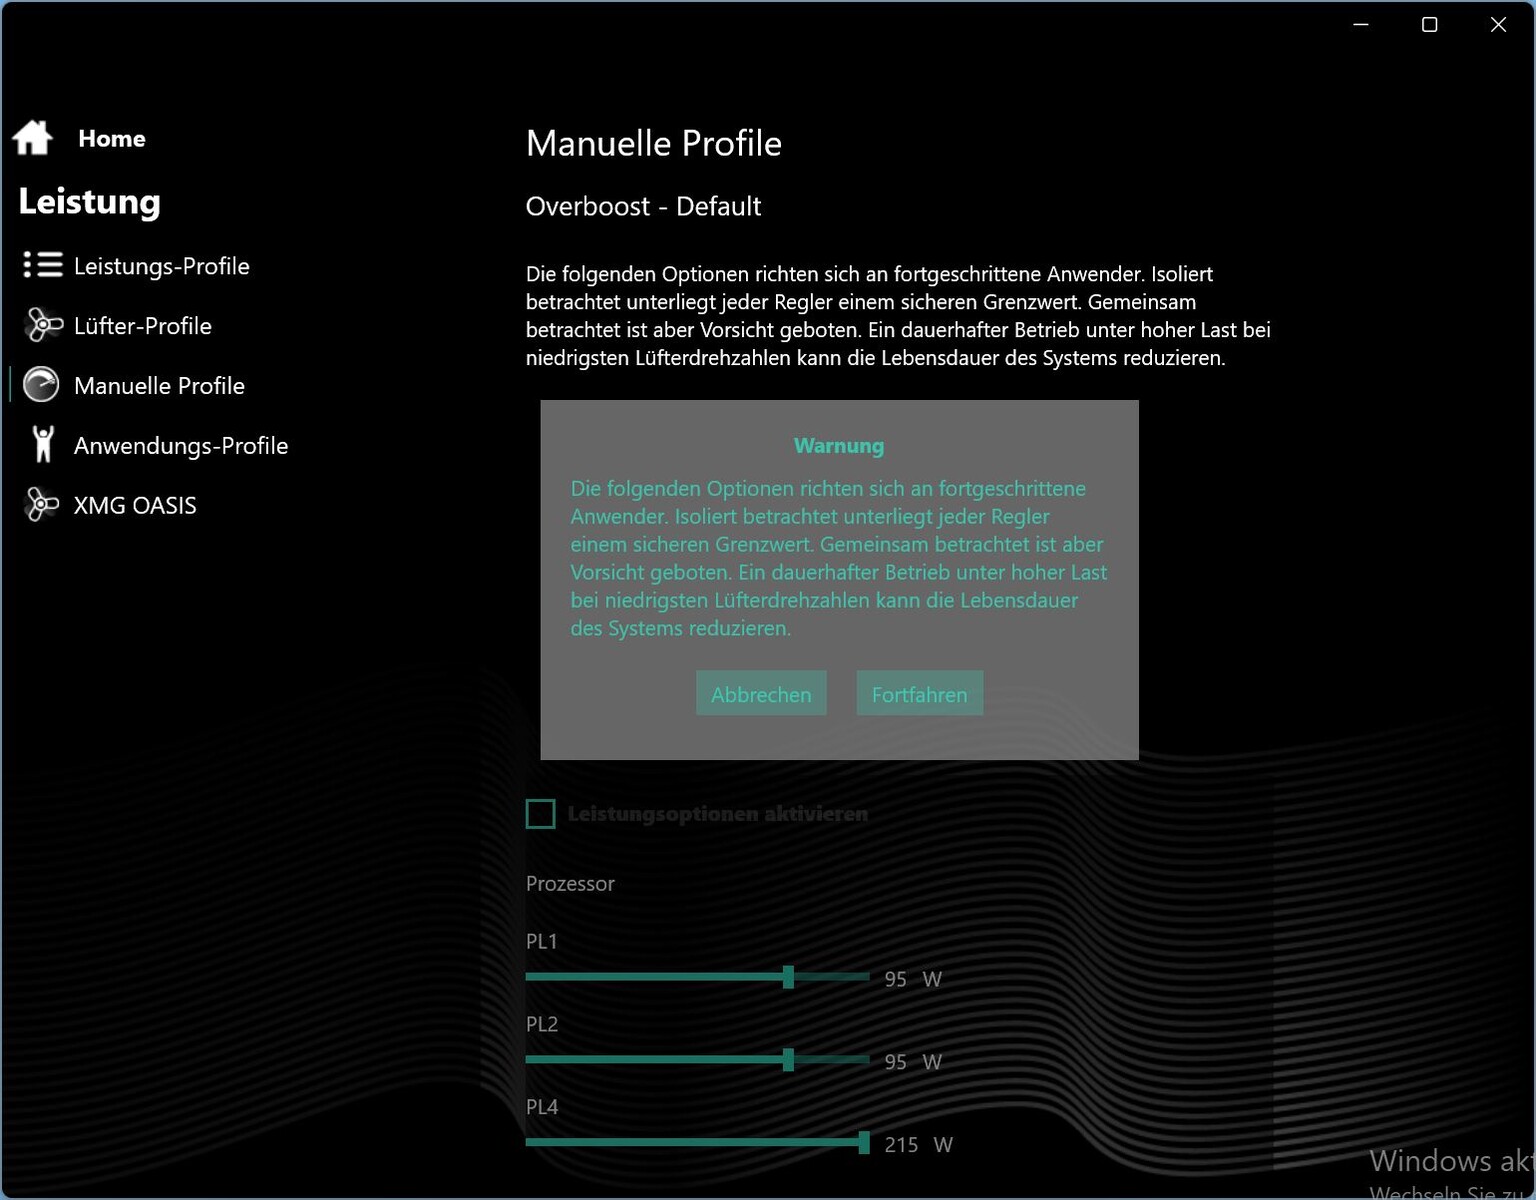
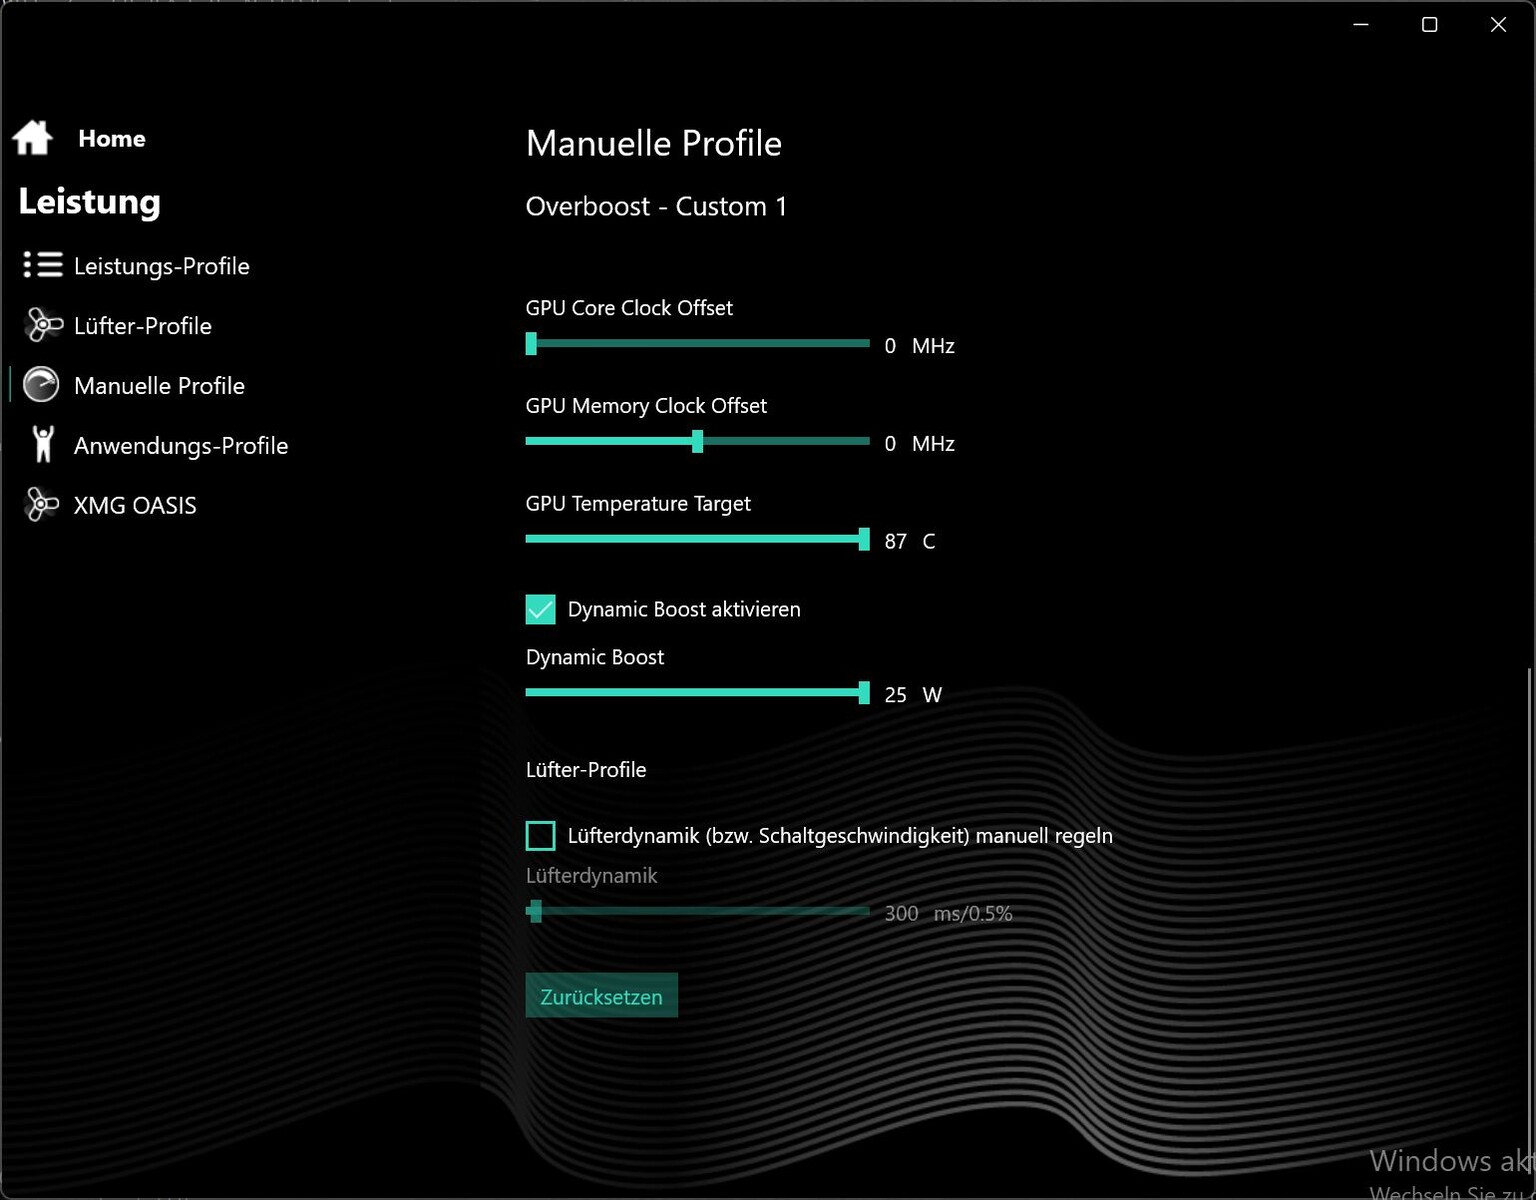
Ajustamos nuestra configuración en el Centro de Control de XMG. Aquí puedes elegir entre tres modos de rendimiento: Equilibrado, Enthusiast, Overboost. Para obtener las mejores puntuaciones, elegimos Overboost, pero lo dejamos en su configuración por defecto. Sin embargo, la RTX 3080 Ti "sólo" recibe 5 W en Dynamic Boost. Para obtener los 25 W de Dynamic Boost completos, puedes poner los valores al máximo en la configuración manual, algo que hacemos ocasionalmente (y que también indicamos para los lectores).
También dejamos el XMG Oasis en modo normal (equilibrado), pero también hay dos modos más silenciosos en los que es menos activo y menos probable que se dispare.
Procesador
El Core i7-12700Hes una de las CPUs estándar para portátiles de juegos. Con 14 núcleos y 20 hilos, debería ser capaz de manejar todas las tareas actuales, aunque hay una alternativa más rápida en la forma del i9-12900H.
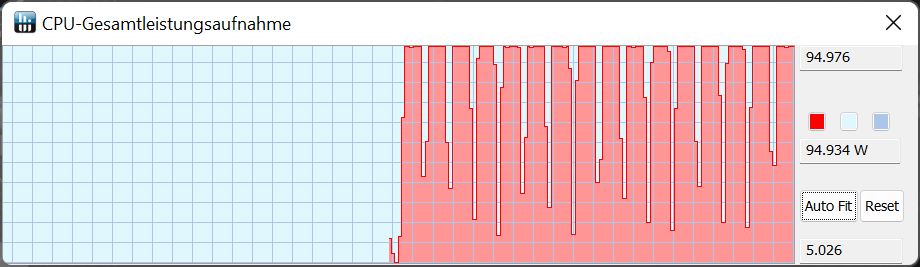
En el bucle Cinebench R15, el i7-12700H rinde constantemente a un nivel muy alto. También rinde a la par con el i9-12900H en el Aero 16 en la prueba multihilo, lo que lo hace entre un 5 y un 10 por ciento más rápido que la media de portátiles con esta CPU en nuestra base de datos. El TDP es bastante constante en 95 W en las pruebas.
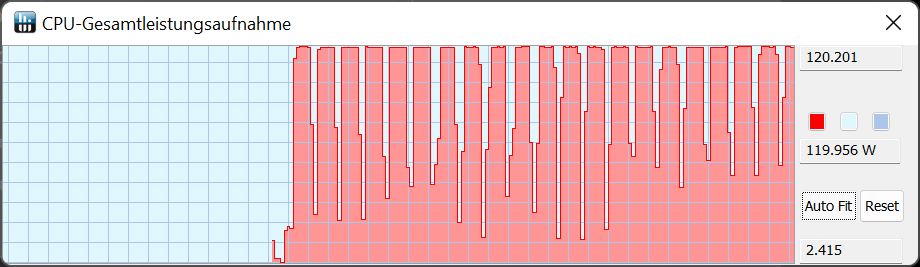
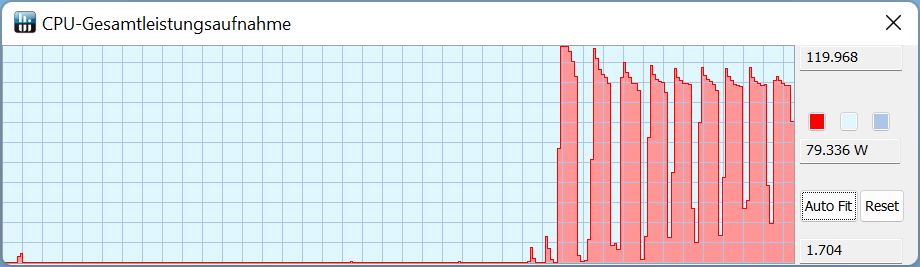
Si se maximizan manualmente los límites de la CPU en el Centro de Control, se alcanzan los 120 W en el bucle de Cinebench y la puntuación es aún mayor (máx. 2.815 en lugar de 2.711 puntos). Sin embargo, a pesar de la refrigeración líquida, los ventiladores del Neo se aceleran mucho más que en el pico de rendimiento de 95 W. Sin el Oasis, sin embargo, el Neo alcanza brevemente 119 W al principio, que luego baja a 103 W antes de suavizarse a 98 W en el curso de la prueba.
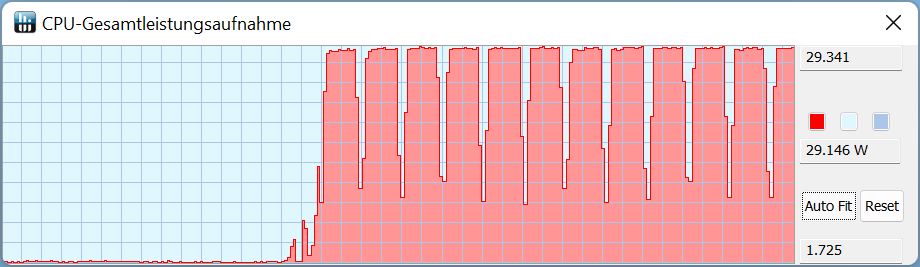
En modo batería, el rendimiento multihilo de Cinebench R15 disminuye. En lugar de 95 W, sólo se dispone de 29 W, y la puntuación cae en consecuencia de unos 2700 a sólo 1600 puntos.
Cinebench R15 Multi Sustained Load
Cinebench R23: Multi Core | Single Core
Cinebench R20: CPU (Multi Core) | CPU (Single Core)
Cinebench R15: CPU Multi 64Bit | CPU Single 64Bit
Blender: v2.79 BMW27 CPU
7-Zip 18.03: 7z b 4 | 7z b 4 -mmt1
Geekbench 5.5: Multi-Core | Single-Core
HWBOT x265 Benchmark v2.2: 4k Preset
LibreOffice : 20 Documents To PDF
R Benchmark 2.5: Overall mean
| CPU Performance rating | |
| Media de la clase Gaming | |
| Gigabyte Aero 16 YE5 | |
| Schenker XMG Neo 15 with XMG Oasis | |
| Schenker XMG Neo 15 (i7-12700H, RTX 3080 Ti) | |
| Medio Intel Core i7-12700H | |
| Razer Blade 15 2022 | |
| Asus ROG Zephyrus Duo 16 GX650RX | |
| Schenker XMG Neo 15 Tiger Lake | |
| Cinebench R23 / Multi Core | |
| Media de la clase Gaming (10488 - 42661, n=107, últimos 2 años) | |
| Gigabyte Aero 16 YE5 | |
| Schenker XMG Neo 15 with XMG Oasis | |
| Schenker XMG Neo 15 (i7-12700H, RTX 3080 Ti) | |
| Medio Intel Core i7-12700H (4032 - 19330, n=64) | |
| Razer Blade 15 2022 | |
| Schenker XMG Neo 15 Tiger Lake | |
| Asus ROG Zephyrus Duo 16 GX650RX | |
| Cinebench R23 / Single Core | |
| Media de la clase Gaming (1166 - 2415, n=107, últimos 2 años) | |
| Gigabyte Aero 16 YE5 | |
| Schenker XMG Neo 15 (i7-12700H, RTX 3080 Ti) | |
| Schenker XMG Neo 15 with XMG Oasis | |
| Razer Blade 15 2022 | |
| Medio Intel Core i7-12700H (778 - 1826, n=63) | |
| Asus ROG Zephyrus Duo 16 GX650RX | |
| Schenker XMG Neo 15 Tiger Lake | |
| Cinebench R20 / CPU (Multi Core) | |
| Media de la clase Gaming (4029 - 16433, n=106, últimos 2 años) | |
| Gigabyte Aero 16 YE5 | |
| Schenker XMG Neo 15 with XMG Oasis | |
| Schenker XMG Neo 15 (i7-12700H, RTX 3080 Ti) | |
| Medio Intel Core i7-12700H (1576 - 7407, n=64) | |
| Razer Blade 15 2022 | |
| Asus ROG Zephyrus Duo 16 GX650RX | |
| Schenker XMG Neo 15 Tiger Lake | |
| Cinebench R20 / CPU (Single Core) | |
| Media de la clase Gaming (442 - 913, n=106, últimos 2 años) | |
| Schenker XMG Neo 15 with XMG Oasis | |
| Razer Blade 15 2022 | |
| Schenker XMG Neo 15 (i7-12700H, RTX 3080 Ti) | |
| Gigabyte Aero 16 YE5 | |
| Medio Intel Core i7-12700H (300 - 704, n=64) | |
| Asus ROG Zephyrus Duo 16 GX650RX | |
| Schenker XMG Neo 15 Tiger Lake | |
| Cinebench R15 / CPU Multi 64Bit | |
| Media de la clase Gaming (1578 - 6330, n=105, últimos 2 años) | |
| Gigabyte Aero 16 YE5 | |
| Schenker XMG Neo 15 with XMG Oasis | |
| Schenker XMG Neo 15 (i7-12700H, RTX 3080 Ti) | |
| Medio Intel Core i7-12700H (1379 - 2916, n=70) | |
| Asus ROG Zephyrus Duo 16 GX650RX | |
| Razer Blade 15 2022 | |
| Schenker XMG Neo 15 Tiger Lake | |
| Cinebench R15 / CPU Single 64Bit | |
| Media de la clase Gaming (188.8 - 350, n=106, últimos 2 años) | |
| Gigabyte Aero 16 YE5 | |
| Schenker XMG Neo 15 (i7-12700H, RTX 3080 Ti) | |
| Schenker XMG Neo 15 with XMG Oasis | |
| Razer Blade 15 2022 | |
| Medio Intel Core i7-12700H (113 - 263, n=65) | |
| Asus ROG Zephyrus Duo 16 GX650RX | |
| Schenker XMG Neo 15 Tiger Lake | |
| Blender / v2.79 BMW27 CPU | |
| Razer Blade 15 2022 | |
| Medio Intel Core i7-12700H (168 - 732, n=63) | |
| Asus ROG Zephyrus Duo 16 GX650RX | |
| Schenker XMG Neo 15 Tiger Lake | |
| Gigabyte Aero 16 YE5 | |
| Schenker XMG Neo 15 (i7-12700H, RTX 3080 Ti) | |
| Schenker XMG Neo 15 with XMG Oasis | |
| Media de la clase Gaming (79 - 330, n=104, últimos 2 años) | |
| 7-Zip 18.03 / 7z b 4 | |
| Media de la clase Gaming (33491 - 148086, n=105, últimos 2 años) | |
| Schenker XMG Neo 15 with XMG Oasis | |
| Schenker XMG Neo 15 (i7-12700H, RTX 3080 Ti) | |
| Gigabyte Aero 16 YE5 | |
| Asus ROG Zephyrus Duo 16 GX650RX | |
| Razer Blade 15 2022 | |
| Medio Intel Core i7-12700H (22844 - 73067, n=63) | |
| Schenker XMG Neo 15 Tiger Lake | |
| 7-Zip 18.03 / 7z b 4 -mmt1 | |
| Media de la clase Gaming (4199 - 7436, n=105, últimos 2 años) | |
| Gigabyte Aero 16 YE5 | |
| Schenker XMG Neo 15 (i7-12700H, RTX 3080 Ti) | |
| Schenker XMG Neo 15 with XMG Oasis | |
| Asus ROG Zephyrus Duo 16 GX650RX | |
| Razer Blade 15 2022 | |
| Schenker XMG Neo 15 Tiger Lake | |
| Medio Intel Core i7-12700H (2743 - 5972, n=63) | |
| Geekbench 5.5 / Multi-Core | |
| Media de la clase Gaming (6460 - 28263, n=105, últimos 2 años) | |
| Gigabyte Aero 16 YE5 | |
| Schenker XMG Neo 15 with XMG Oasis | |
| Schenker XMG Neo 15 (i7-12700H, RTX 3080 Ti) | |
| Razer Blade 15 2022 | |
| Medio Intel Core i7-12700H (5144 - 13745, n=64) | |
| Asus ROG Zephyrus Duo 16 GX650RX | |
| Schenker XMG Neo 15 Tiger Lake | |
| Geekbench 5.5 / Single-Core | |
| Media de la clase Gaming (986 - 2474, n=105, últimos 2 años) | |
| Gigabyte Aero 16 YE5 | |
| Schenker XMG Neo 15 with XMG Oasis | |
| Razer Blade 15 2022 | |
| Schenker XMG Neo 15 (i7-12700H, RTX 3080 Ti) | |
| Medio Intel Core i7-12700H (803 - 1851, n=64) | |
| Schenker XMG Neo 15 Tiger Lake | |
| Asus ROG Zephyrus Duo 16 GX650RX | |
| HWBOT x265 Benchmark v2.2 / 4k Preset | |
| Media de la clase Gaming (11.5 - 44.4, n=105, últimos 2 años) | |
| Schenker XMG Neo 15 with XMG Oasis | |
| Schenker XMG Neo 15 (i7-12700H, RTX 3080 Ti) | |
| Gigabyte Aero 16 YE5 | |
| Asus ROG Zephyrus Duo 16 GX650RX | |
| Schenker XMG Neo 15 Tiger Lake | |
| Razer Blade 15 2022 | |
| Medio Intel Core i7-12700H (4.67 - 21.8, n=64) | |
| LibreOffice / 20 Documents To PDF | |
| Razer Blade 15 2022 | |
| Media de la clase Gaming (33.2 - 88.8, n=105, últimos 2 años) | |
| Schenker XMG Neo 15 (i7-12700H, RTX 3080 Ti) | |
| Schenker XMG Neo 15 Tiger Lake | |
| Medio Intel Core i7-12700H (34.2 - 95.3, n=63) | |
| Asus ROG Zephyrus Duo 16 GX650RX | |
| Schenker XMG Neo 15 with XMG Oasis | |
| Gigabyte Aero 16 YE5 | |
| R Benchmark 2.5 / Overall mean | |
| Schenker XMG Neo 15 Tiger Lake | |
| Asus ROG Zephyrus Duo 16 GX650RX | |
| Medio Intel Core i7-12700H (0.4441 - 1.052, n=63) | |
| Razer Blade 15 2022 | |
| Schenker XMG Neo 15 (i7-12700H, RTX 3080 Ti) | |
| Schenker XMG Neo 15 with XMG Oasis | |
| Media de la clase Gaming (0.3439 - 0.759, n=106, últimos 2 años) | |
| Gigabyte Aero 16 YE5 | |
* ... más pequeño es mejor
AIDA64: FP32 Ray-Trace | FPU Julia | CPU SHA3 | CPU Queen | FPU SinJulia | FPU Mandel | CPU AES | CPU ZLib | FP64 Ray-Trace | CPU PhotoWorxx
| Performance rating | |
| Media de la clase Gaming | |
| Asus ROG Zephyrus Duo 16 GX650RX | |
| Alienware x17 R2 P48E | |
| Schenker XMG Neo 15 with XMG Oasis | |
| Schenker XMG Neo 15 (i7-12700H, RTX 3080 Ti) | |
| Medio Intel Core i7-12700H | |
| Gigabyte Aero 16 YE5 | |
| Razer Blade 15 2022 | |
| Schenker XMG Neo 15 Tiger Lake -9! | |
| AIDA64 / FP32 Ray-Trace | |
| Media de la clase Gaming (10227 - 85542, n=105, últimos 2 años) | |
| Asus ROG Zephyrus Duo 16 GX650RX | |
| Medio Intel Core i7-12700H (2585 - 17957, n=64) | |
| Alienware x17 R2 P48E | |
| Schenker XMG Neo 15 with XMG Oasis | |
| Schenker XMG Neo 15 (i7-12700H, RTX 3080 Ti) | |
| Gigabyte Aero 16 YE5 | |
| Razer Blade 15 2022 | |
| AIDA64 / FPU Julia | |
| Media de la clase Gaming (51376 - 238426, n=105, últimos 2 años) | |
| Asus ROG Zephyrus Duo 16 GX650RX | |
| Medio Intel Core i7-12700H (12439 - 90760, n=64) | |
| Alienware x17 R2 P48E | |
| Schenker XMG Neo 15 (i7-12700H, RTX 3080 Ti) | |
| Schenker XMG Neo 15 with XMG Oasis | |
| Gigabyte Aero 16 YE5 | |
| Razer Blade 15 2022 | |
| AIDA64 / CPU SHA3 | |
| Media de la clase Gaming (2180 - 10115, n=105, últimos 2 años) | |
| Asus ROG Zephyrus Duo 16 GX650RX | |
| Alienware x17 R2 P48E | |
| Schenker XMG Neo 15 (i7-12700H, RTX 3080 Ti) | |
| Schenker XMG Neo 15 with XMG Oasis | |
| Medio Intel Core i7-12700H (833 - 4242, n=64) | |
| Gigabyte Aero 16 YE5 | |
| Razer Blade 15 2022 | |
| AIDA64 / CPU Queen | |
| Media de la clase Gaming (49785 - 173351, n=90, últimos 2 años) | |
| Alienware x17 R2 P48E | |
| Gigabyte Aero 16 YE5 | |
| Asus ROG Zephyrus Duo 16 GX650RX | |
| Schenker XMG Neo 15 with XMG Oasis | |
| Schenker XMG Neo 15 (i7-12700H, RTX 3080 Ti) | |
| Medio Intel Core i7-12700H (57923 - 103202, n=63) | |
| Razer Blade 15 2022 | |
| AIDA64 / FPU SinJulia | |
| Media de la clase Gaming (4424 - 33636, n=105, últimos 2 años) | |
| Asus ROG Zephyrus Duo 16 GX650RX | |
| Alienware x17 R2 P48E | |
| Schenker XMG Neo 15 with XMG Oasis | |
| Schenker XMG Neo 15 (i7-12700H, RTX 3080 Ti) | |
| Gigabyte Aero 16 YE5 | |
| Razer Blade 15 2022 | |
| Medio Intel Core i7-12700H (3249 - 9939, n=64) | |
| AIDA64 / FPU Mandel | |
| Media de la clase Gaming (25115 - 128721, n=105, últimos 2 años) | |
| Asus ROG Zephyrus Duo 16 GX650RX | |
| Medio Intel Core i7-12700H (7135 - 44760, n=64) | |
| Alienware x17 R2 P48E | |
| Schenker XMG Neo 15 with XMG Oasis | |
| Schenker XMG Neo 15 (i7-12700H, RTX 3080 Ti) | |
| Gigabyte Aero 16 YE5 | |
| Razer Blade 15 2022 | |
| AIDA64 / CPU AES | |
| Asus ROG Zephyrus Duo 16 GX650RX | |
| Media de la clase Gaming (39258 - 247074, n=105, últimos 2 años) | |
| Alienware x17 R2 P48E | |
| Gigabyte Aero 16 YE5 | |
| Medio Intel Core i7-12700H (31839 - 144360, n=64) | |
| Schenker XMG Neo 15 with XMG Oasis | |
| Schenker XMG Neo 15 (i7-12700H, RTX 3080 Ti) | |
| Razer Blade 15 2022 | |
| AIDA64 / CPU ZLib | |
| Media de la clase Gaming (574 - 2531, n=105, últimos 2 años) | |
| Alienware x17 R2 P48E | |
| Schenker XMG Neo 15 with XMG Oasis | |
| Schenker XMG Neo 15 (i7-12700H, RTX 3080 Ti) | |
| Gigabyte Aero 16 YE5 | |
| Medio Intel Core i7-12700H (305 - 1171, n=64) | |
| Razer Blade 15 2022 | |
| Asus ROG Zephyrus Duo 16 GX650RX | |
| Schenker XMG Neo 15 Tiger Lake | |
| AIDA64 / FP64 Ray-Trace | |
| Media de la clase Gaming (5509 - 45446, n=105, últimos 2 años) | |
| Asus ROG Zephyrus Duo 16 GX650RX | |
| Medio Intel Core i7-12700H (1437 - 9692, n=64) | |
| Alienware x17 R2 P48E | |
| Schenker XMG Neo 15 with XMG Oasis | |
| Schenker XMG Neo 15 (i7-12700H, RTX 3080 Ti) | |
| Gigabyte Aero 16 YE5 | |
| Razer Blade 15 2022 | |
| AIDA64 / CPU PhotoWorxx | |
| Media de la clase Gaming (12271 - 89891, n=105, últimos 2 años) | |
| Razer Blade 15 2022 | |
| Schenker XMG Neo 15 with XMG Oasis | |
| Schenker XMG Neo 15 (i7-12700H, RTX 3080 Ti) | |
| Gigabyte Aero 16 YE5 | |
| Alienware x17 R2 P48E | |
| Medio Intel Core i7-12700H (12863 - 52207, n=64) | |
| Asus ROG Zephyrus Duo 16 GX650RX | |
Rendimiento del sistema
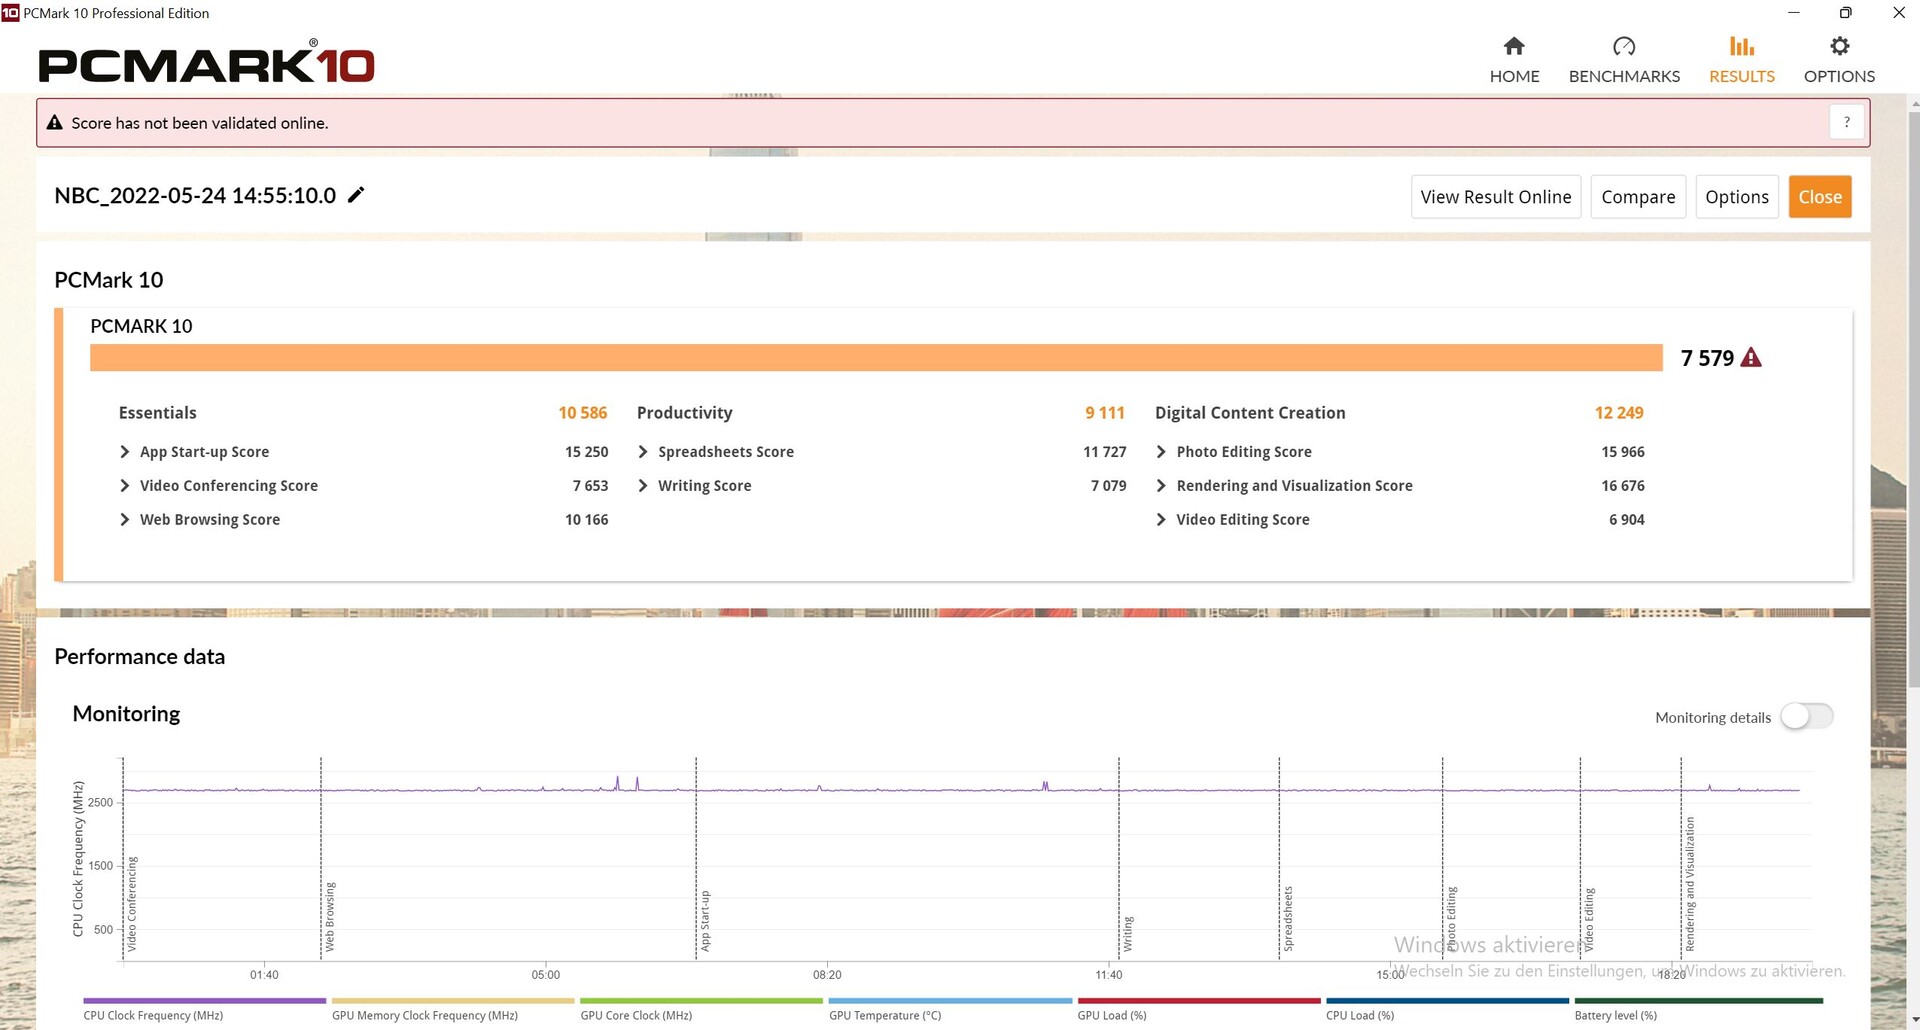
En PCMark 10, nuestro Neo 15 está a la par con el Razer Blade 15 y el Aero 16. Sólo el Alienware x17 está algo por delante. El XMG Oasis, por tanto, no confiere ninguna ventaja relacionada con el rendimiento
CrossMark: Overall | Productivity | Creativity | Responsiveness
| PCMark 10 / Score | |
| Media de la clase Gaming (5828 - 12414, n=93, últimos 2 años) | |
| Alienware x17 R2 P48E | |
| Gigabyte Aero 16 YE5 | |
| Razer Blade 15 2022 | |
| Schenker XMG Neo 15 (i7-12700H, RTX 3080 Ti) | |
| Medio Intel Core i7-12700H, NVIDIA GeForce RTX 3080 Ti Laptop GPU (6868 - 7638, n=7) | |
| Schenker XMG Neo 15 with XMG Oasis | |
| Schenker XMG Neo 15 Tiger Lake | |
| Asus ROG Zephyrus Duo 16 GX650RX | |
| PCMark 10 / Essentials | |
| Alienware x17 R2 P48E | |
| Gigabyte Aero 16 YE5 | |
| Razer Blade 15 2022 | |
| Media de la clase Gaming (8810 - 11935, n=97, últimos 2 años) | |
| Schenker XMG Neo 15 (i7-12700H, RTX 3080 Ti) | |
| Medio Intel Core i7-12700H, NVIDIA GeForce RTX 3080 Ti Laptop GPU (9987 - 11318, n=7) | |
| Schenker XMG Neo 15 Tiger Lake | |
| Schenker XMG Neo 15 with XMG Oasis | |
| Asus ROG Zephyrus Duo 16 GX650RX | |
| PCMark 10 / Productivity | |
| Media de la clase Gaming (6845 - 25323, n=95, últimos 2 años) | |
| Alienware x17 R2 P48E | |
| Gigabyte Aero 16 YE5 | |
| Razer Blade 15 2022 | |
| Medio Intel Core i7-12700H, NVIDIA GeForce RTX 3080 Ti Laptop GPU (8944 - 10726, n=7) | |
| Schenker XMG Neo 15 with XMG Oasis | |
| Schenker XMG Neo 15 (i7-12700H, RTX 3080 Ti) | |
| Schenker XMG Neo 15 Tiger Lake | |
| Asus ROG Zephyrus Duo 16 GX650RX | |
| PCMark 10 / Digital Content Creation | |
| Media de la clase Gaming (7602 - 19954, n=95, últimos 2 años) | |
| Alienware x17 R2 P48E | |
| Schenker XMG Neo 15 (i7-12700H, RTX 3080 Ti) | |
| Razer Blade 15 2022 | |
| Gigabyte Aero 16 YE5 | |
| Schenker XMG Neo 15 with XMG Oasis | |
| Medio Intel Core i7-12700H, NVIDIA GeForce RTX 3080 Ti Laptop GPU (8956 - 12249, n=7) | |
| Schenker XMG Neo 15 Tiger Lake | |
| Asus ROG Zephyrus Duo 16 GX650RX | |
| CrossMark / Overall | |
| Gigabyte Aero 16 YE5 | |
| Media de la clase Gaming (1366 - 2409, n=94, últimos 2 años) | |
| Alienware x17 R2 P48E | |
| Medio Intel Core i7-12700H, NVIDIA GeForce RTX 3080 Ti Laptop GPU (1761 - 1861, n=4) | |
| Schenker XMG Neo 15 (i7-12700H, RTX 3080 Ti) | |
| Schenker XMG Neo 15 with XMG Oasis | |
| Asus ROG Zephyrus Duo 16 GX650RX | |
| CrossMark / Productivity | |
| Gigabyte Aero 16 YE5 | |
| Media de la clase Gaming (1386 - 2254, n=94, últimos 2 años) | |
| Alienware x17 R2 P48E | |
| Medio Intel Core i7-12700H, NVIDIA GeForce RTX 3080 Ti Laptop GPU (1645 - 1800, n=4) | |
| Asus ROG Zephyrus Duo 16 GX650RX | |
| Schenker XMG Neo 15 (i7-12700H, RTX 3080 Ti) | |
| Schenker XMG Neo 15 with XMG Oasis | |
| CrossMark / Creativity | |
| Media de la clase Gaming (1343 - 2786, n=94, últimos 2 años) | |
| Gigabyte Aero 16 YE5 | |
| Alienware x17 R2 P48E | |
| Schenker XMG Neo 15 (i7-12700H, RTX 3080 Ti) | |
| Schenker XMG Neo 15 with XMG Oasis | |
| Medio Intel Core i7-12700H, NVIDIA GeForce RTX 3080 Ti Laptop GPU (1936 - 2041, n=4) | |
| Asus ROG Zephyrus Duo 16 GX650RX | |
| CrossMark / Responsiveness | |
| Gigabyte Aero 16 YE5 | |
| Asus ROG Zephyrus Duo 16 GX650RX | |
| Media de la clase Gaming (1226 - 2334, n=94, últimos 2 años) | |
| Alienware x17 R2 P48E | |
| Medio Intel Core i7-12700H, NVIDIA GeForce RTX 3080 Ti Laptop GPU (1461 - 1868, n=4) | |
| Schenker XMG Neo 15 (i7-12700H, RTX 3080 Ti) | |
| Schenker XMG Neo 15 with XMG Oasis | |
| PCMark 10 Score | 7579 puntos | |
ayuda | ||
| AIDA64 / Memory Copy | |
| Media de la clase Gaming (21750 - 129946, n=105, últimos 2 años) | |
| Schenker XMG Neo 15 (i7-12700H, RTX 3080 Ti) | |
| Schenker XMG Neo 15 with XMG Oasis | |
| Razer Blade 15 2022 | |
| Gigabyte Aero 16 YE5 | |
| Alienware x17 R2 P48E | |
| Medio Intel Core i7-12700H (25615 - 80511, n=64) | |
| Asus ROG Zephyrus Duo 16 GX650RX | |
| AIDA64 / Memory Read | |
| Media de la clase Gaming (22956 - 118858, n=105, últimos 2 años) | |
| Schenker XMG Neo 15 with XMG Oasis | |
| Schenker XMG Neo 15 (i7-12700H, RTX 3080 Ti) | |
| Razer Blade 15 2022 | |
| Gigabyte Aero 16 YE5 | |
| Alienware x17 R2 P48E | |
| Medio Intel Core i7-12700H (25586 - 79442, n=64) | |
| Asus ROG Zephyrus Duo 16 GX650RX | |
| AIDA64 / Memory Write | |
| Media de la clase Gaming (22297 - 135096, n=105, últimos 2 años) | |
| Razer Blade 15 2022 | |
| Schenker XMG Neo 15 with XMG Oasis | |
| Schenker XMG Neo 15 (i7-12700H, RTX 3080 Ti) | |
| Gigabyte Aero 16 YE5 | |
| Asus ROG Zephyrus Duo 16 GX650RX | |
| Medio Intel Core i7-12700H (23679 - 88660, n=64) | |
| Alienware x17 R2 P48E | |
| AIDA64 / Memory Latency | |
| Media de la clase Gaming (75.3 - 259, n=105, últimos 2 años) | |
| Alienware x17 R2 P48E | |
| Asus ROG Zephyrus Duo 16 GX650RX | |
| Gigabyte Aero 16 YE5 | |
| Medio Intel Core i7-12700H (76.2 - 133.9, n=62) | |
| Schenker XMG Neo 15 Tiger Lake | |
| Razer Blade 15 2022 | |
| Schenker XMG Neo 15 with XMG Oasis | |
* ... más pequeño es mejor
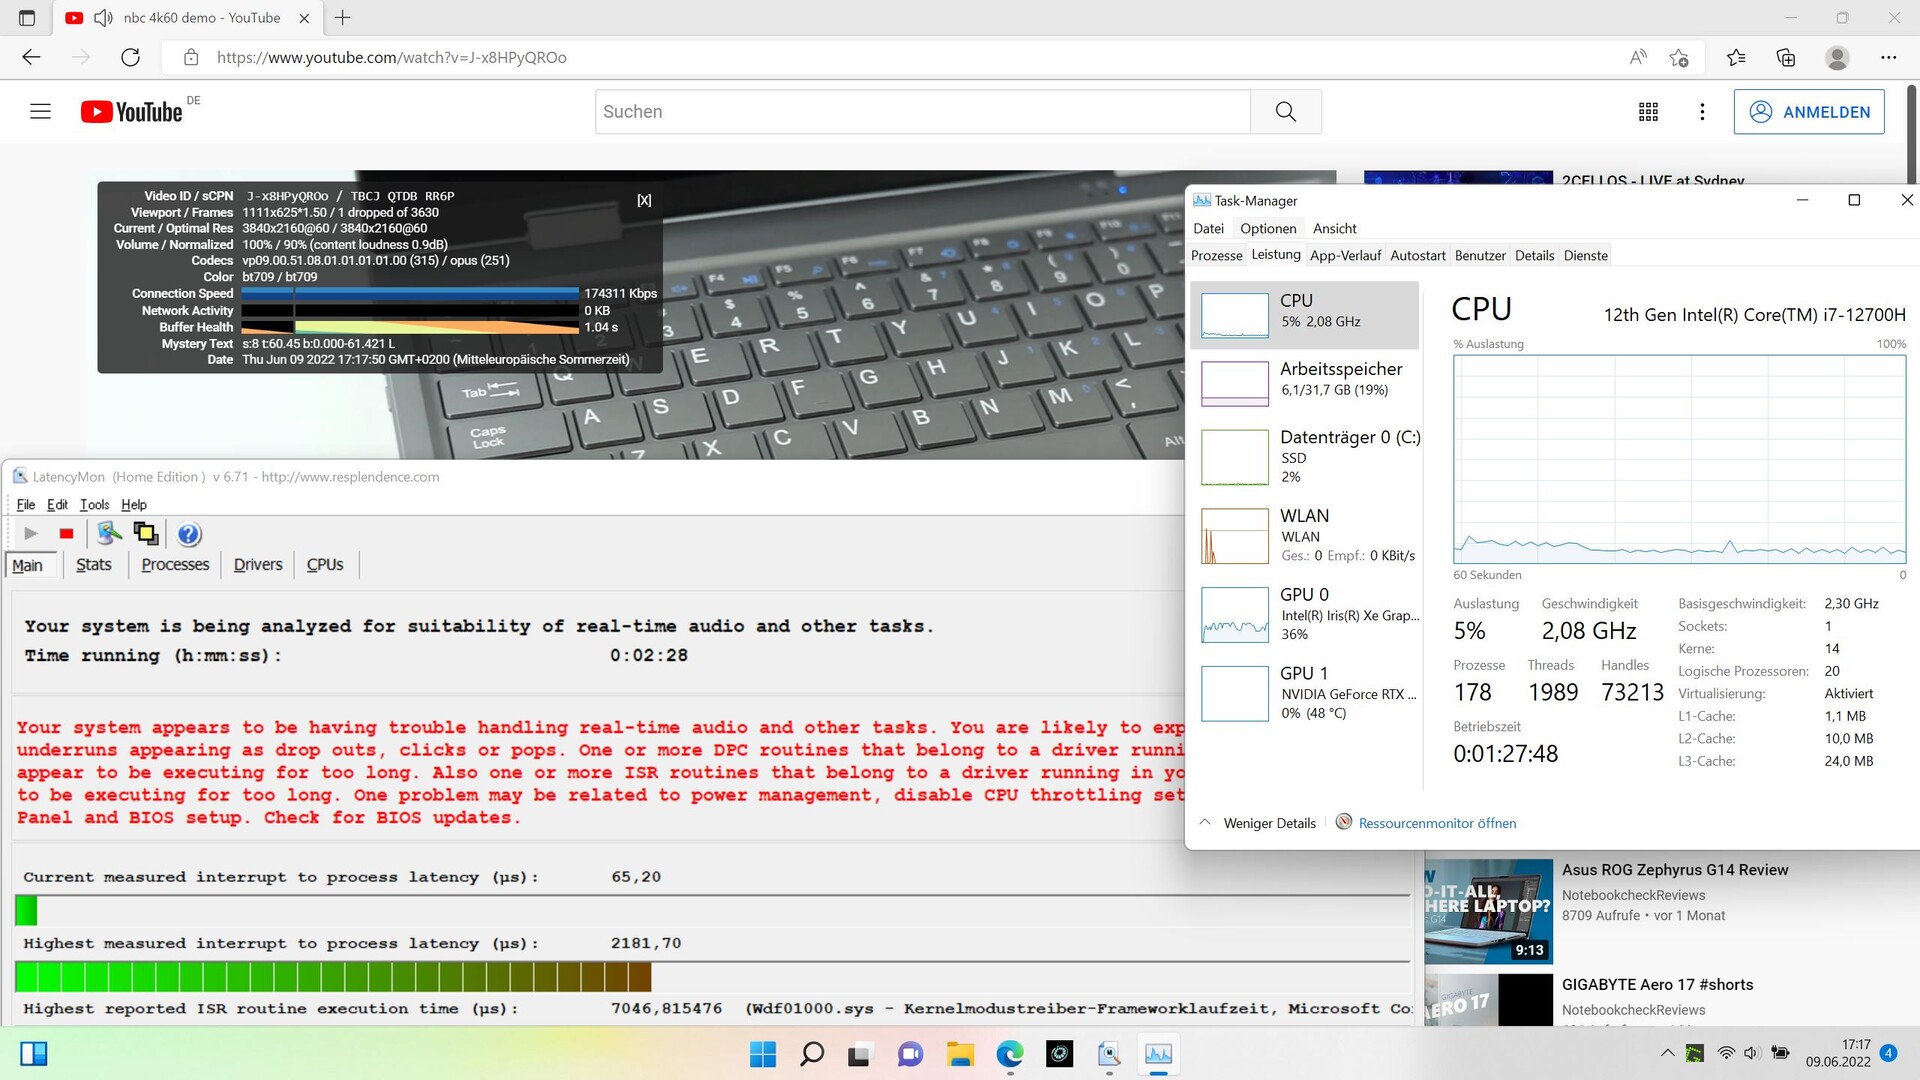
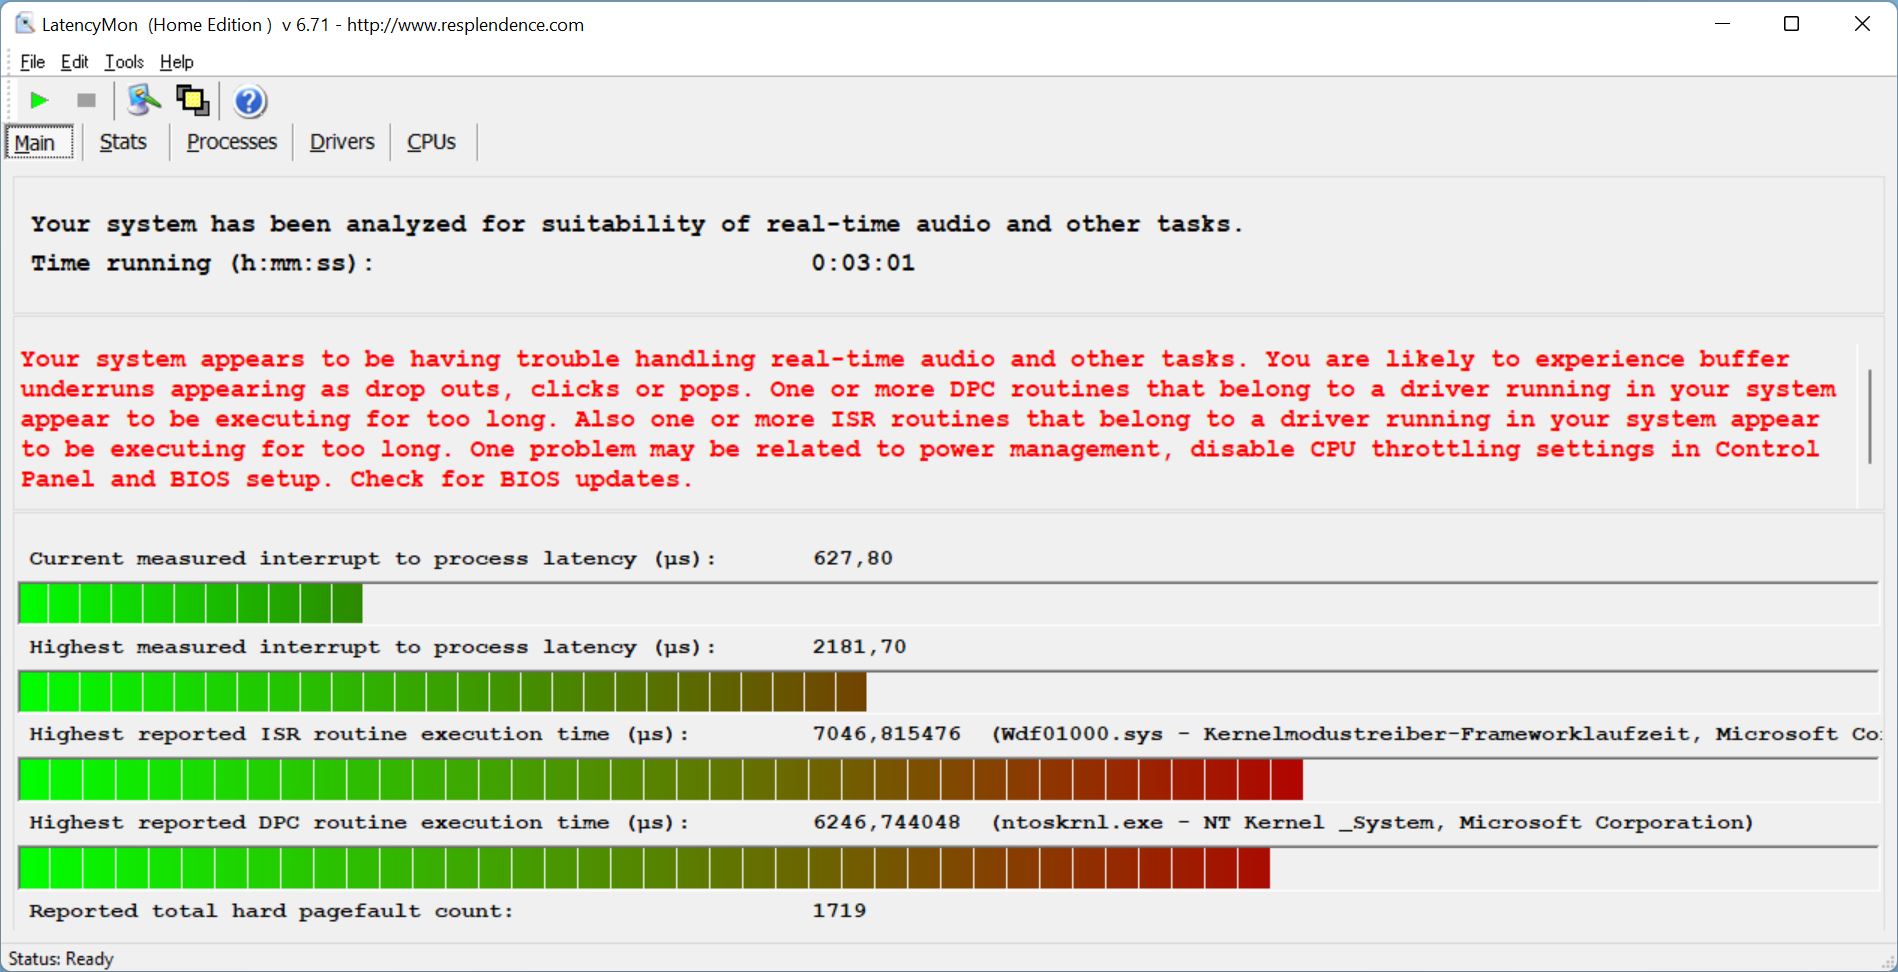
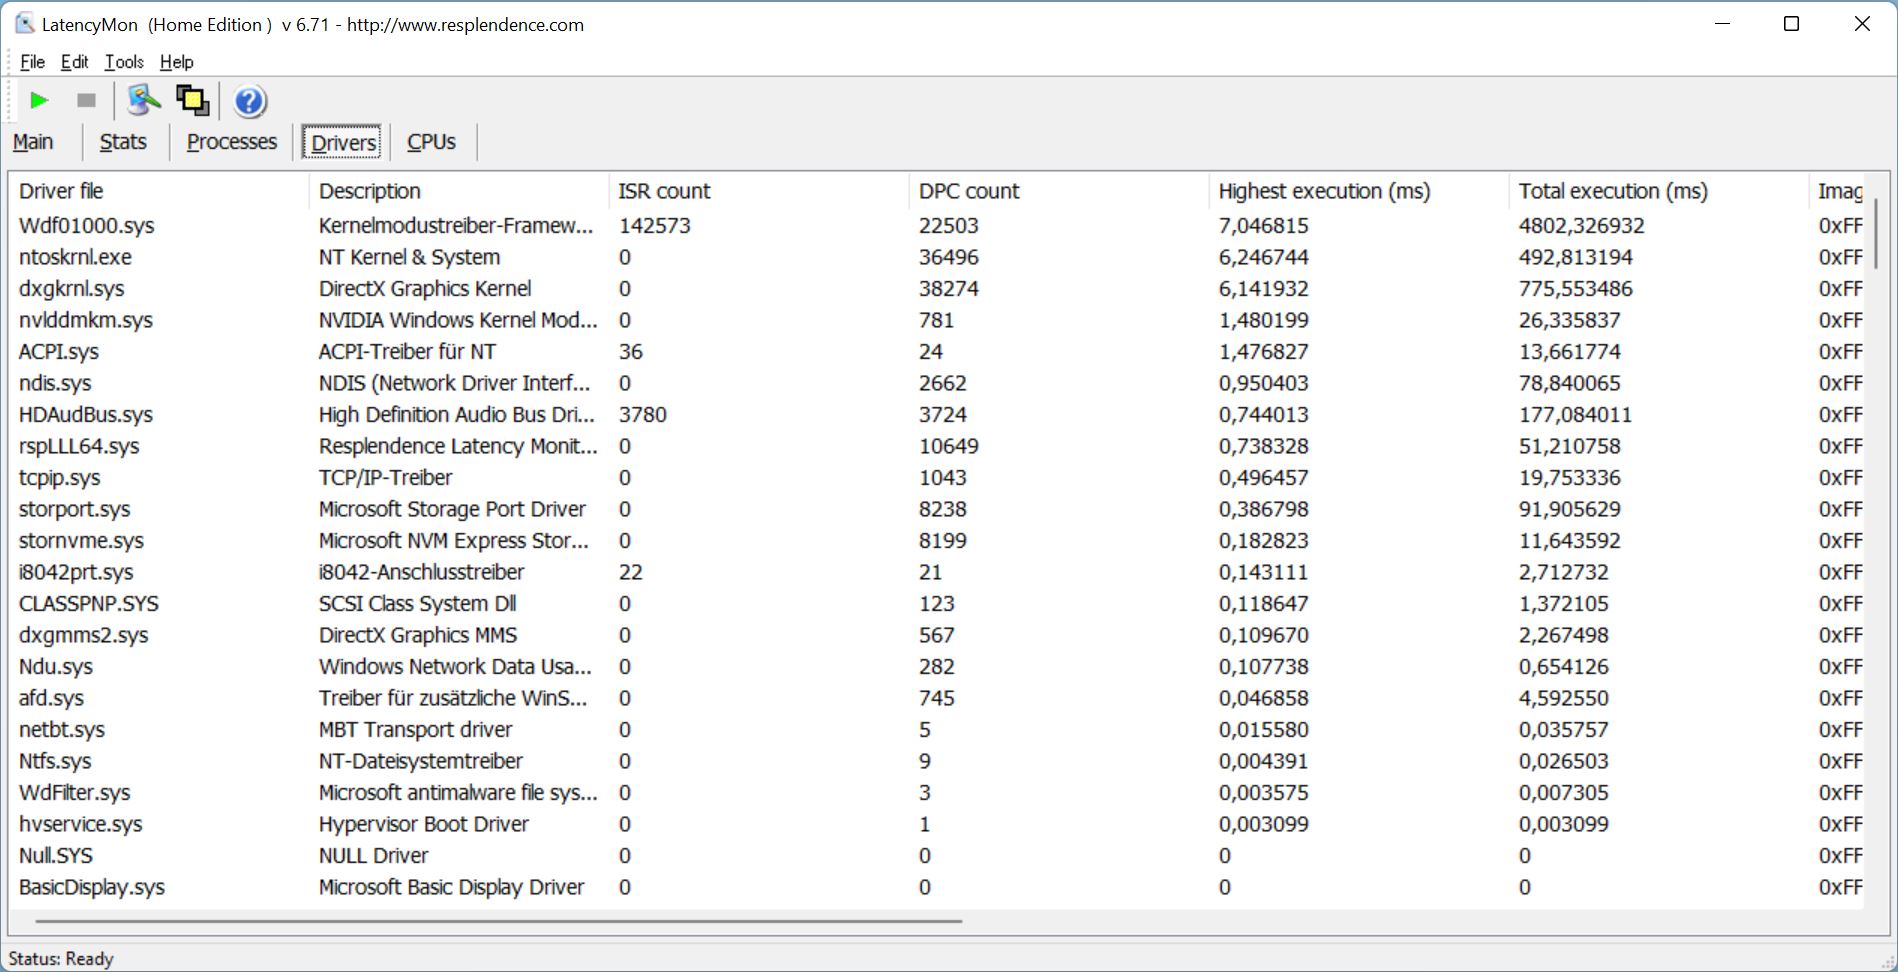
Latencia del CPD
LatencyMon muestra las latencias nada más abrirlo, que aumentan al abrir varias pestañas. La reproducción de nuestro vídeo 4K/60 fps de YouTube aumenta aún más el valor de latencia, pero sólo se pierde un fotograma. En general, la latencia es claramente demasiado alta, también en comparación con otros dispositivos
| DPC Latencies / LatencyMon - interrupt to process latency (max), Web, Youtube, Prime95 | |
| Schenker XMG Neo 15 (i7-12700H, RTX 3080 Ti) | |
| Razer Blade 15 2022 | |
| Alienware x17 R2 P48E | |
| Gigabyte Aero 16 YE5 | |
| Schenker XMG Neo 15 Tiger Lake | |
| Asus ROG Zephyrus Duo 16 GX650RX | |
* ... más pequeño es mejor
Dispositivos de almacenamiento
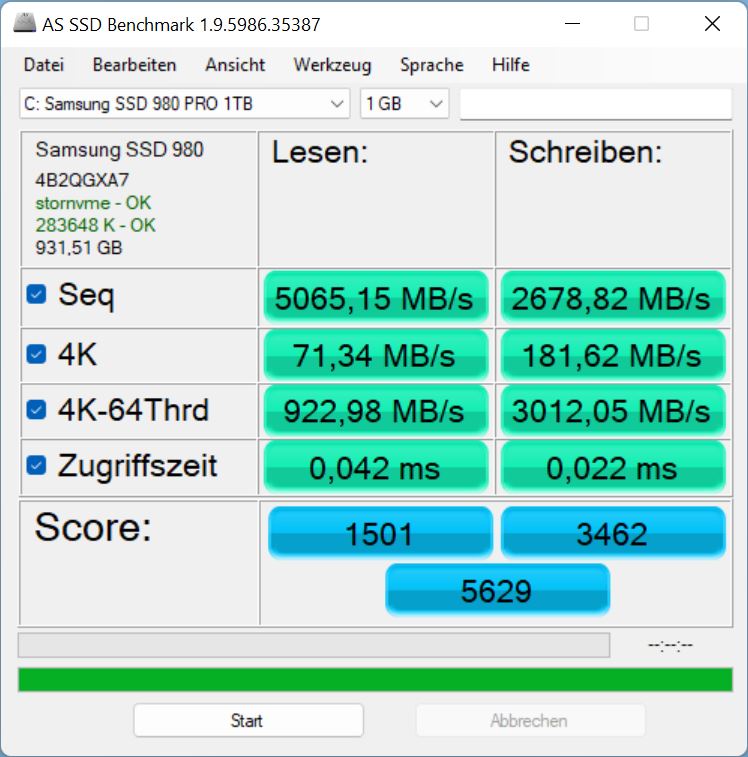
Schenker instala el conocido Samsung SSD 980 Pro de 1 TB, que ocupa el puesto 11 en nuestraRanking de SSD/HDDy es muy rápido.
En el Neo, su rendimiento es consistente a lo largo del tiempo, pero su rendimiento de lectura, en particular, queda por detrás del modelo medio de nuestra base de datos. También es más lento que el mismo modelo del predecesor

* ... más pequeño es mejor
Sustained Read Performance: DiskSpd Read Loop, Queue Depth 8
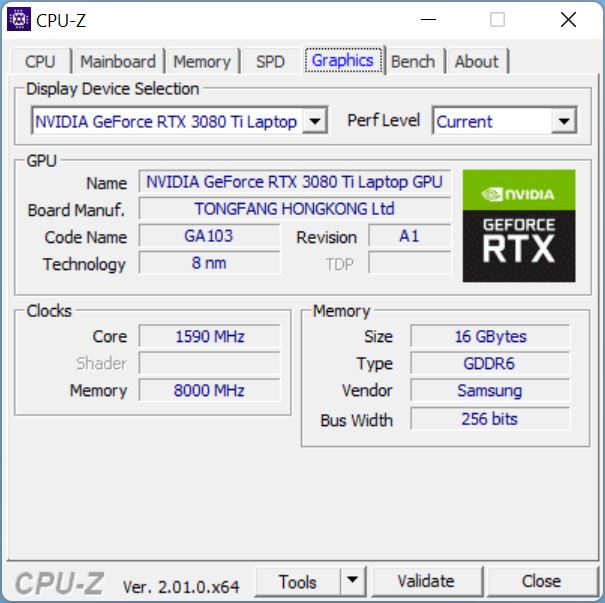
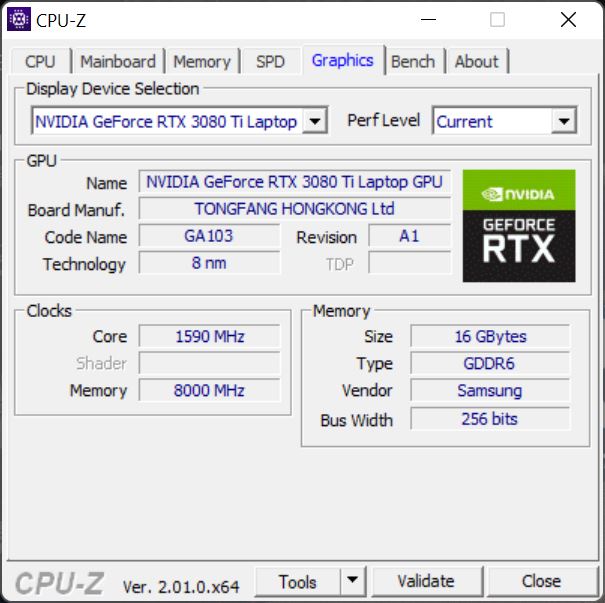
Tarjeta gráfica
Para aprovechar todo el potencial del XMG Oasis, Schenker utiliza laRTX 3080 Tiesta es actualmente la tarjeta gráfica más potente para portátiles, que se supone que asegura una tasa de fotogramas fluida en juegos a 4K y superiores.
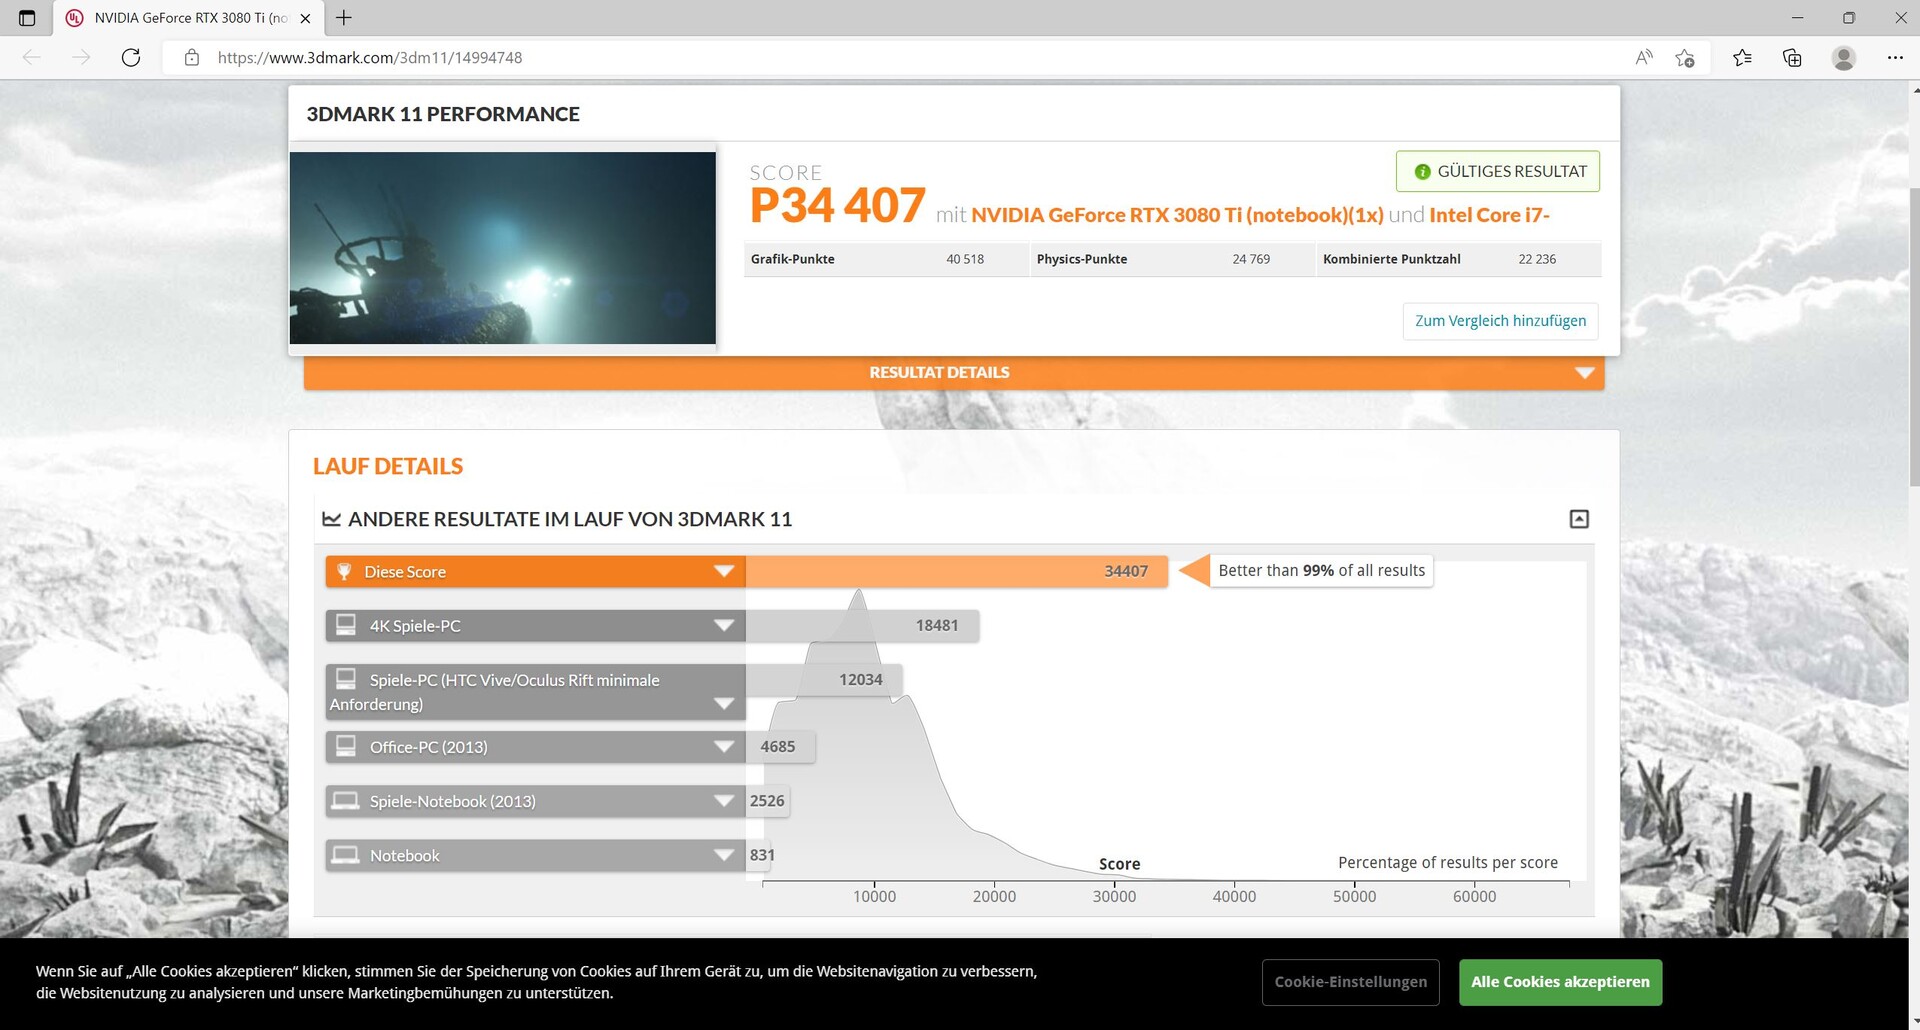
El Neo 15 con Oasis siempre está por delante del Neo 15 sin Oasis en 3DMarks, pero sólo por unos pocos puntos porcentuales en el rango de un solo dígito. Aunque el Neo con y sin Oasis siempre están por delante de los competidores seleccionados, el predecesor con su RTX 3080 apenas es peor.
el rendimiento del 3D disminuye drásticamente en el modo de batería. Un recorrido más de Fire Strike sólo produce 2.643 puntos en lugar de unos 31.000
| 3DMark Performance rating - Percent | |
| Media de la clase Gaming | |
| Schenker XMG Neo 15 with XMG Oasis | |
| Schenker XMG Neo 15 Tiger Lake | |
| Schenker XMG Neo 15 (i7-12700H, RTX 3080 Ti) | |
| Medio NVIDIA GeForce RTX 3080 Ti Laptop GPU | |
| Asus ROG Zephyrus Duo 16 GX650RX | |
| Razer Blade 15 2022 | |
| Gigabyte Aero 16 YE5 | |
| 3DMark 11 - 1280x720 Performance GPU | |
| Media de la clase Gaming (21841 - 80022, n=104, últimos 2 años) | |
| Schenker XMG Neo 15 with XMG Oasis | |
| Schenker XMG Neo 15 Tiger Lake | |
| Schenker XMG Neo 15 (i7-12700H, RTX 3080 Ti) | |
| Asus ROG Zephyrus Duo 16 GX650RX | |
| Medio NVIDIA GeForce RTX 3080 Ti Laptop GPU (13920 - 45841, n=45) | |
| Razer Blade 15 2022 | |
| Gigabyte Aero 16 YE5 | |
| 3DMark | |
| 1920x1080 Fire Strike Graphics | |
| Media de la clase Gaming (12242 - 62849, n=115, últimos 2 años) | |
| Schenker XMG Neo 15 with XMG Oasis | |
| Schenker XMG Neo 15 Tiger Lake | |
| Schenker XMG Neo 15 (i7-12700H, RTX 3080 Ti) | |
| Medio NVIDIA GeForce RTX 3080 Ti Laptop GPU (6928 - 34439, n=43) | |
| Razer Blade 15 2022 | |
| Asus ROG Zephyrus Duo 16 GX650RX | |
| Gigabyte Aero 16 YE5 | |
| 2560x1440 Time Spy Graphics | |
| Media de la clase Gaming (5012 - 26212, n=115, últimos 2 años) | |
| Schenker XMG Neo 15 with XMG Oasis | |
| Schenker XMG Neo 15 (i7-12700H, RTX 3080 Ti) | |
| Schenker XMG Neo 15 Tiger Lake | |
| Medio NVIDIA GeForce RTX 3080 Ti Laptop GPU (4921 - 13835, n=43) | |
| Asus ROG Zephyrus Duo 16 GX650RX | |
| Razer Blade 15 2022 | |
| Gigabyte Aero 16 YE5 | |
| 3DMark 11 Performance | 34407 puntos | |
| 3DMark Cloud Gate Standard Score | 65137 puntos | |
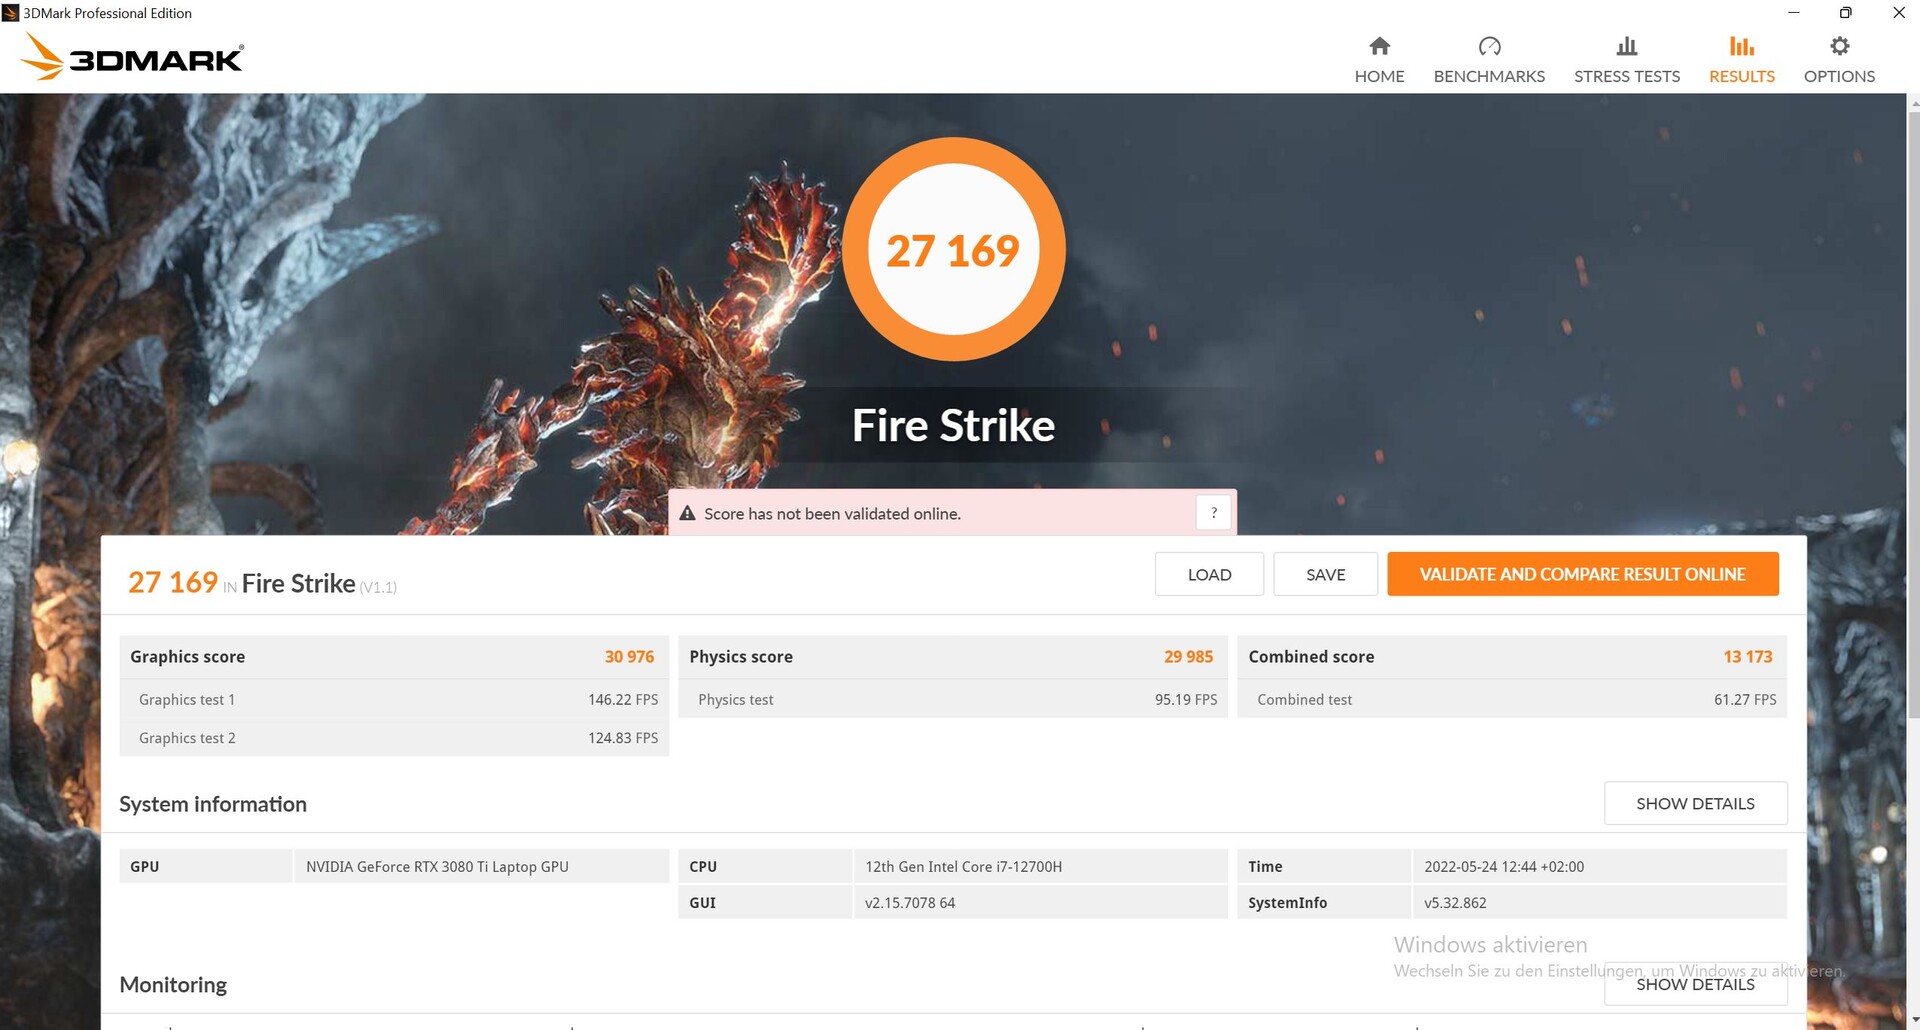
| 3DMark Fire Strike Score | 27169 puntos | |
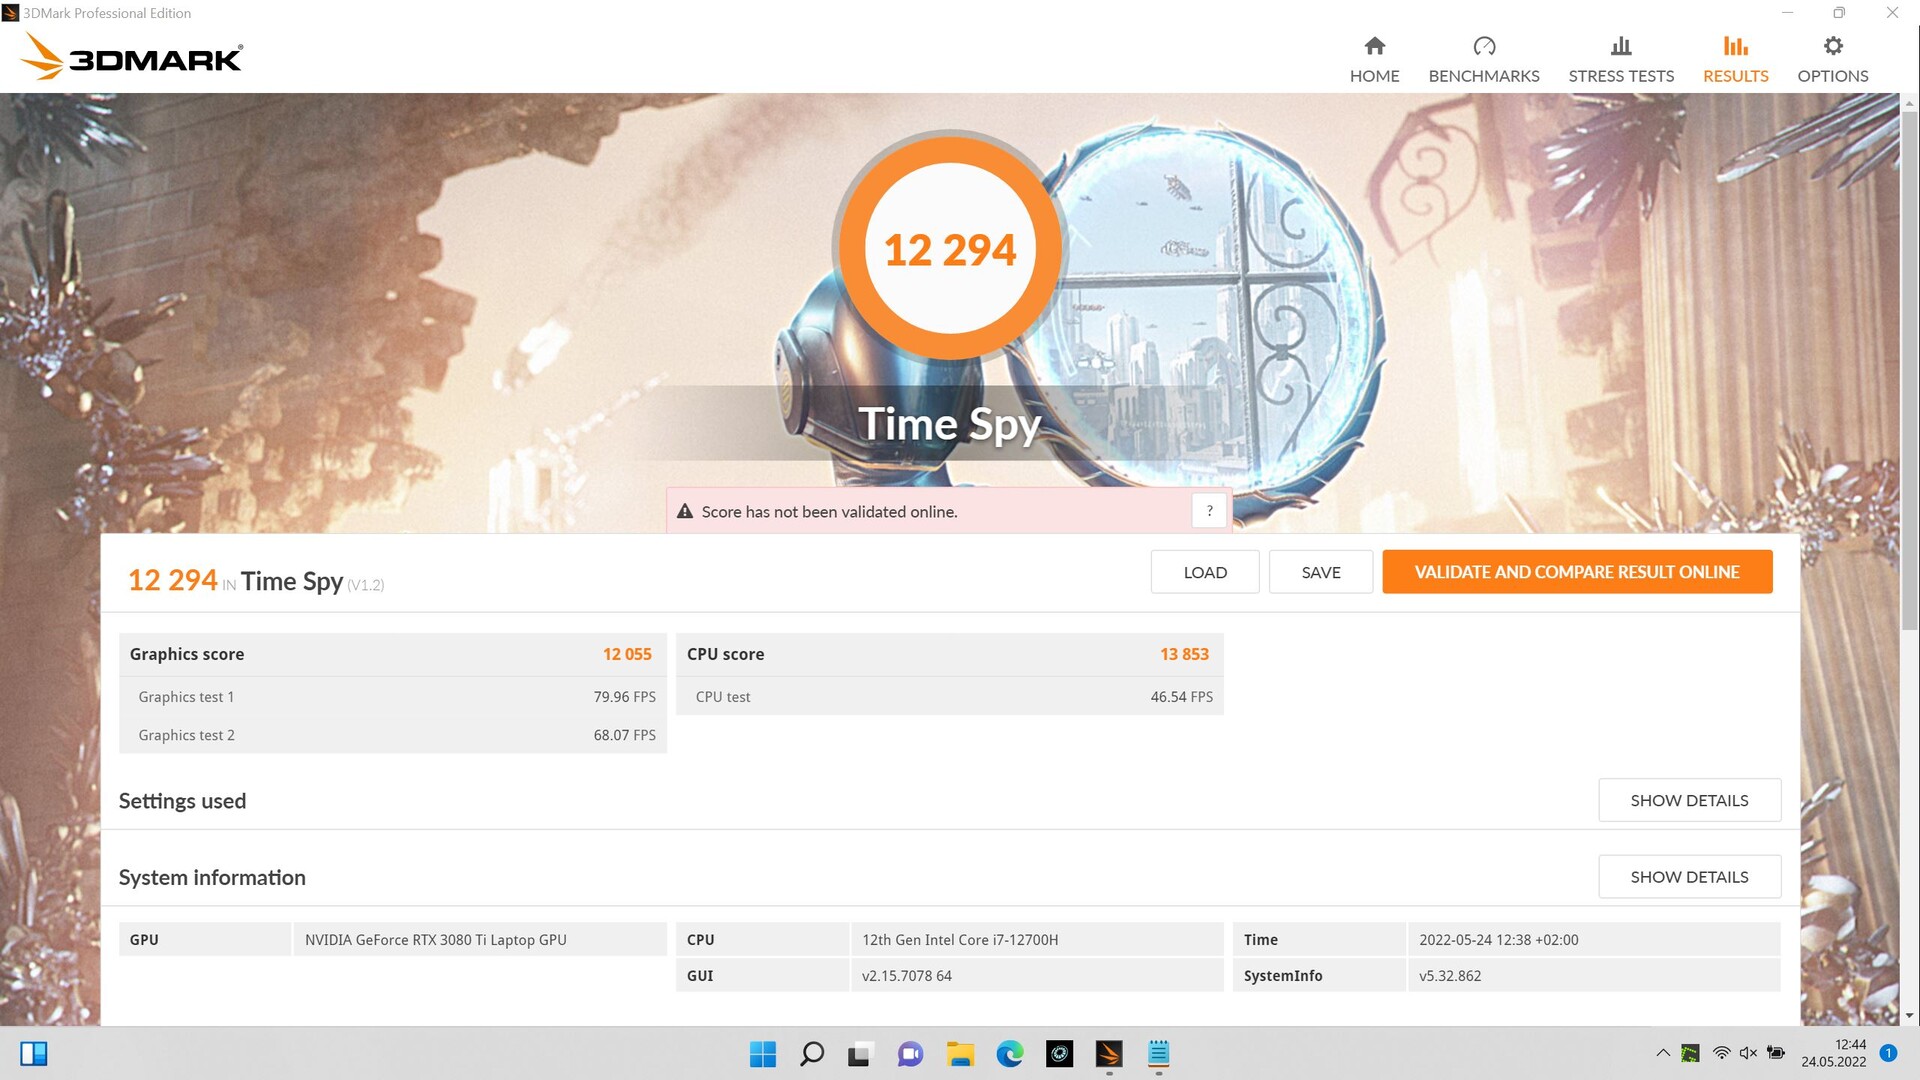
| 3DMark Time Spy Score | 12294 puntos | |
ayuda | ||
Rendimiento de los juegos
En los juegos, la ventaja de la refrigeración líquida depende del juego elegido. No hay ventaja medible en fps con Oasis (Overboost estándar) en Witcher 3 o Far Cry 5, pero sí en Cyberpoint, donde la ventaja es de al menos un 8 por ciento. Pero en general, las ventajas son insignificantes, ya que la RTX 3080 Ti del Neo 15 sigue teniendo suficiente potencia para los efectos de trazado de rayos (Cyberpunk) en FullHD sin Oasis.
Medimos Dying Light 2 con los valores de Overboost maximizados. Aquí el Neo es siempre alrededor de un 8% más rápido con Oasis que sin él, similar a Cyberpunk 2077. Sin embargo, ni siquiera la RTX 3080 Ti es lo bastante potente para los efectos de trazado de rayos altos en resolución nativa, logrando sólo una media de 25 fps.
| Cyberpunk 2077 1.6 | |
| 1920x1080 High Preset | |
| Alienware x17 R2 P48E | |
| Schenker XMG Neo 15 with XMG Oasis | |
| Medio NVIDIA GeForce RTX 3080 Ti Laptop GPU (64 - 145.6, n=14) | |
| Schenker XMG Neo 15 (i7-12700H, RTX 3080 Ti) | |
| Asus ROG Zephyrus Duo 16 GX650RX | |
| Gigabyte Aero 16 YE5 | |
| 1920x1080 Ultra Preset | |
| Alienware x17 R2 P48E | |
| Asus ROG Zephyrus Duo 16 GX650RX | |
| Medio NVIDIA GeForce RTX 3080 Ti Laptop GPU (54 - 144.1, n=16) | |
| Schenker XMG Neo 15 with XMG Oasis | |
| Schenker XMG Neo 15 (i7-12700H, RTX 3080 Ti) | |
| Gigabyte Aero 16 YE5 | |
| 2560x1440 Ultra Preset | |
| Schenker XMG Neo 15 with XMG Oasis | |
| Medio NVIDIA GeForce RTX 3080 Ti Laptop GPU (36 - 69.6, n=13) | |
| Asus ROG Zephyrus Duo 16 GX650RX | |
| Schenker XMG Neo 15 (i7-12700H, RTX 3080 Ti) | |
| Gigabyte Aero 16 YE5 | |
| 1920x1080 Ray Tracing Ultra Preset (DLSS off) | |
| Gigabyte Aero 16 YE5 | |
| Medio NVIDIA GeForce RTX 3080 Ti Laptop GPU (39.2 - 49.9, n=7) | |
| Schenker XMG Neo 15 with XMG Oasis | |
| Asus ROG Zephyrus Duo 16 GX650RX | |
| Schenker XMG Neo 15 (i7-12700H, RTX 3080 Ti) | |
| Far Cry 5 | |
| 1920x1080 High Preset AA:T | |
| Razer Blade 15 2022 | |
| Schenker XMG Neo 15 (i7-12700H, RTX 3080 Ti) | |
| Medio NVIDIA GeForce RTX 3080 Ti Laptop GPU (118 - 167, n=22) | |
| Schenker XMG Neo 15 with XMG Oasis | |
| Gigabyte Aero 16 YE5 | |
| Schenker XMG Neo 15 Tiger Lake | |
| Media de la clase Gaming (82 - 163, n=6, últimos 2 años) | |
| Asus ROG Zephyrus Duo 16 GX650RX | |
| 1920x1080 Ultra Preset AA:T | |
| Razer Blade 15 2022 | |
| Schenker XMG Neo 15 with XMG Oasis | |
| Medio NVIDIA GeForce RTX 3080 Ti Laptop GPU (111 - 162, n=24) | |
| Schenker XMG Neo 15 (i7-12700H, RTX 3080 Ti) | |
| Gigabyte Aero 16 YE5 | |
| Schenker XMG Neo 15 Tiger Lake | |
| Media de la clase Gaming (70 - 151, n=6, últimos 2 años) | |
| Asus ROG Zephyrus Duo 16 GX650RX | |
| 2560x1440 Ultra Preset AA:T | |
| Schenker XMG Neo 15 with XMG Oasis | |
| Media de la clase Gaming (93 - 149, n=5, últimos 2 años) | |
| Schenker XMG Neo 15 (i7-12700H, RTX 3080 Ti) | |
| Medio NVIDIA GeForce RTX 3080 Ti Laptop GPU (86 - 134, n=20) | |
| Schenker XMG Neo 15 Tiger Lake | |
| Razer Blade 15 2022 | |
| Asus ROG Zephyrus Duo 16 GX650RX | |
| Gigabyte Aero 16 YE5 | |
| Dota 2 Reborn | |
| 1920x1080 high (2/3) | |
| Gigabyte Aero 16 YE5 | |
| Alienware x17 R2 P48E | |
| Media de la clase Gaming (82.8 - 275, n=106, últimos 2 años) | |
| Razer Blade 15 2022 | |
| Schenker XMG Neo 15 (i7-12700H, RTX 3080 Ti) | |
| Schenker XMG Neo 15 with XMG Oasis | |
| Schenker XMG Neo 15 Tiger Lake | |
| Medio NVIDIA GeForce RTX 3080 Ti Laptop GPU (29.9 - 180.8, n=45) | |
| Asus ROG Zephyrus Duo 16 GX650RX | |
| 1920x1080 ultra (3/3) best looking | |
| Gigabyte Aero 16 YE5 | |
| Alienware x17 R2 P48E | |
| Razer Blade 15 2022 | |
| Media de la clase Gaming (84.8 - 248, n=107, últimos 2 años) | |
| Schenker XMG Neo 15 (i7-12700H, RTX 3080 Ti) | |
| Schenker XMG Neo 15 with XMG Oasis | |
| Schenker XMG Neo 15 Tiger Lake | |
| Medio NVIDIA GeForce RTX 3080 Ti Laptop GPU (29.9 - 170.5, n=45) | |
| Asus ROG Zephyrus Duo 16 GX650RX | |
| Dying Light 2 | |
| 1920x1080 Medium Quality | |
| Schenker XMG Neo 15 with XMG Oasis | |
| Schenker XMG Neo 15 (i7-12700H, RTX 3080 Ti) | |
| Medio NVIDIA GeForce RTX 3080 Ti Laptop GPU (79 - 103, n=5) | |
| Asus ROG Zephyrus Duo 16 GX650RX | |
| Gigabyte Aero 16 YE5 | |
| 1920x1080 High Quality | |
| Schenker XMG Neo 15 with XMG Oasis | |
| Schenker XMG Neo 15 (i7-12700H, RTX 3080 Ti) | |
| Medio NVIDIA GeForce RTX 3080 Ti Laptop GPU (69.2 - 88.4, n=5) | |
| Asus ROG Zephyrus Duo 16 GX650RX | |
| Gigabyte Aero 16 YE5 | |
| 2560x1440 High Quality | |
| Schenker XMG Neo 15 with XMG Oasis | |
| Schenker XMG Neo 15 (i7-12700H, RTX 3080 Ti) | |
| Medio NVIDIA GeForce RTX 3080 Ti Laptop GPU (49.6 - 64, n=5) | |
| Asus ROG Zephyrus Duo 16 GX650RX | |
| Gigabyte Aero 16 YE5 | |
| 1920x1080 High Quality Raytracing | |
| Schenker XMG Neo 15 with XMG Oasis | |
| Schenker XMG Neo 15 (i7-12700H, RTX 3080 Ti) | |
| Asus ROG Zephyrus Duo 16 GX650RX | |
| Medio NVIDIA GeForce RTX 3080 Ti Laptop GPU (33.4 - 42.3, n=5) | |
| Gigabyte Aero 16 YE5 | |
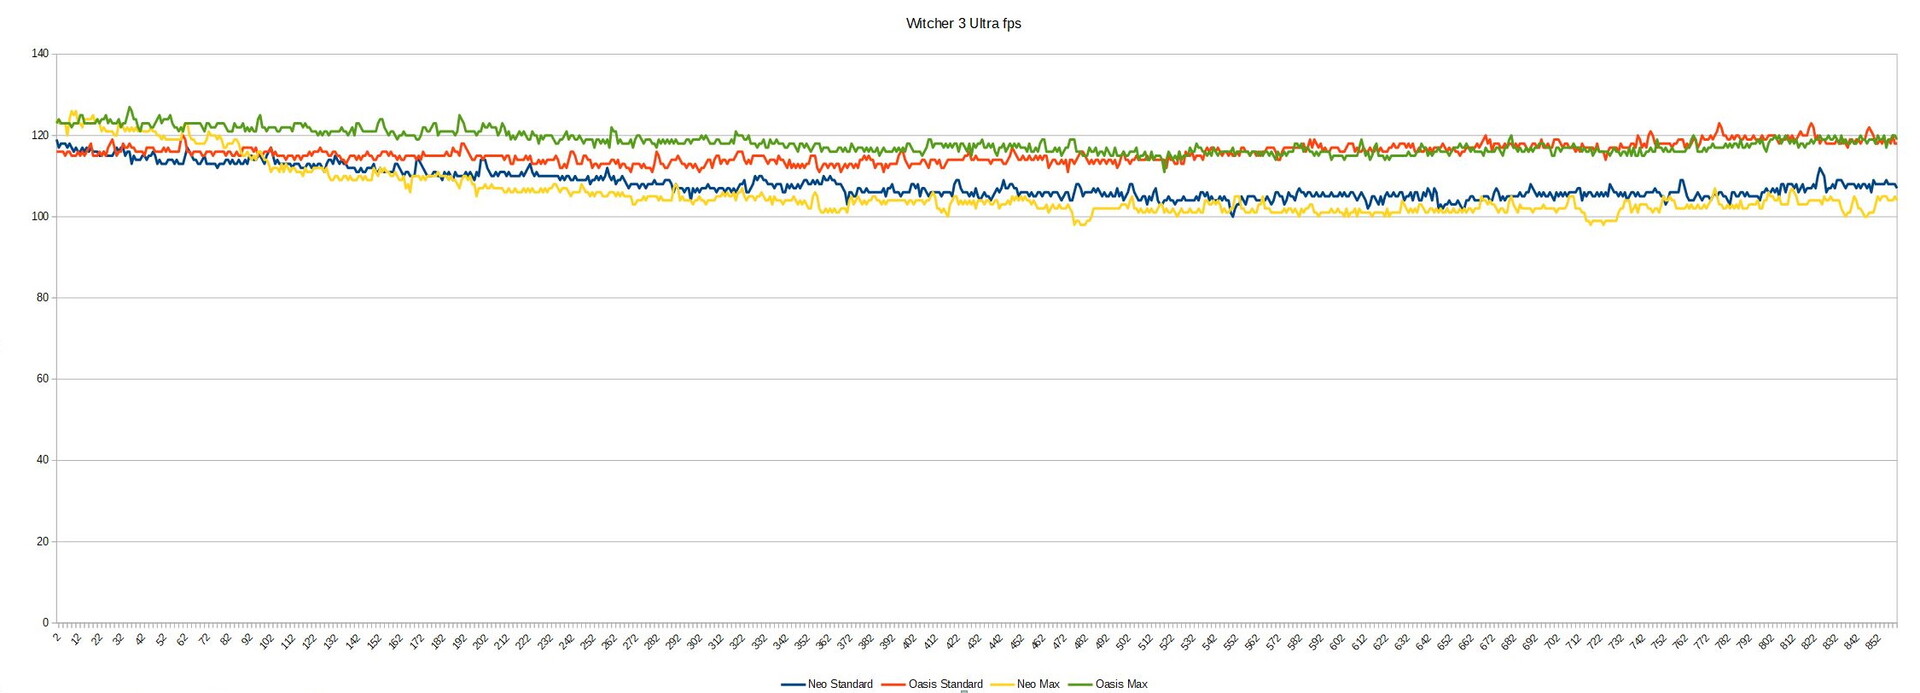
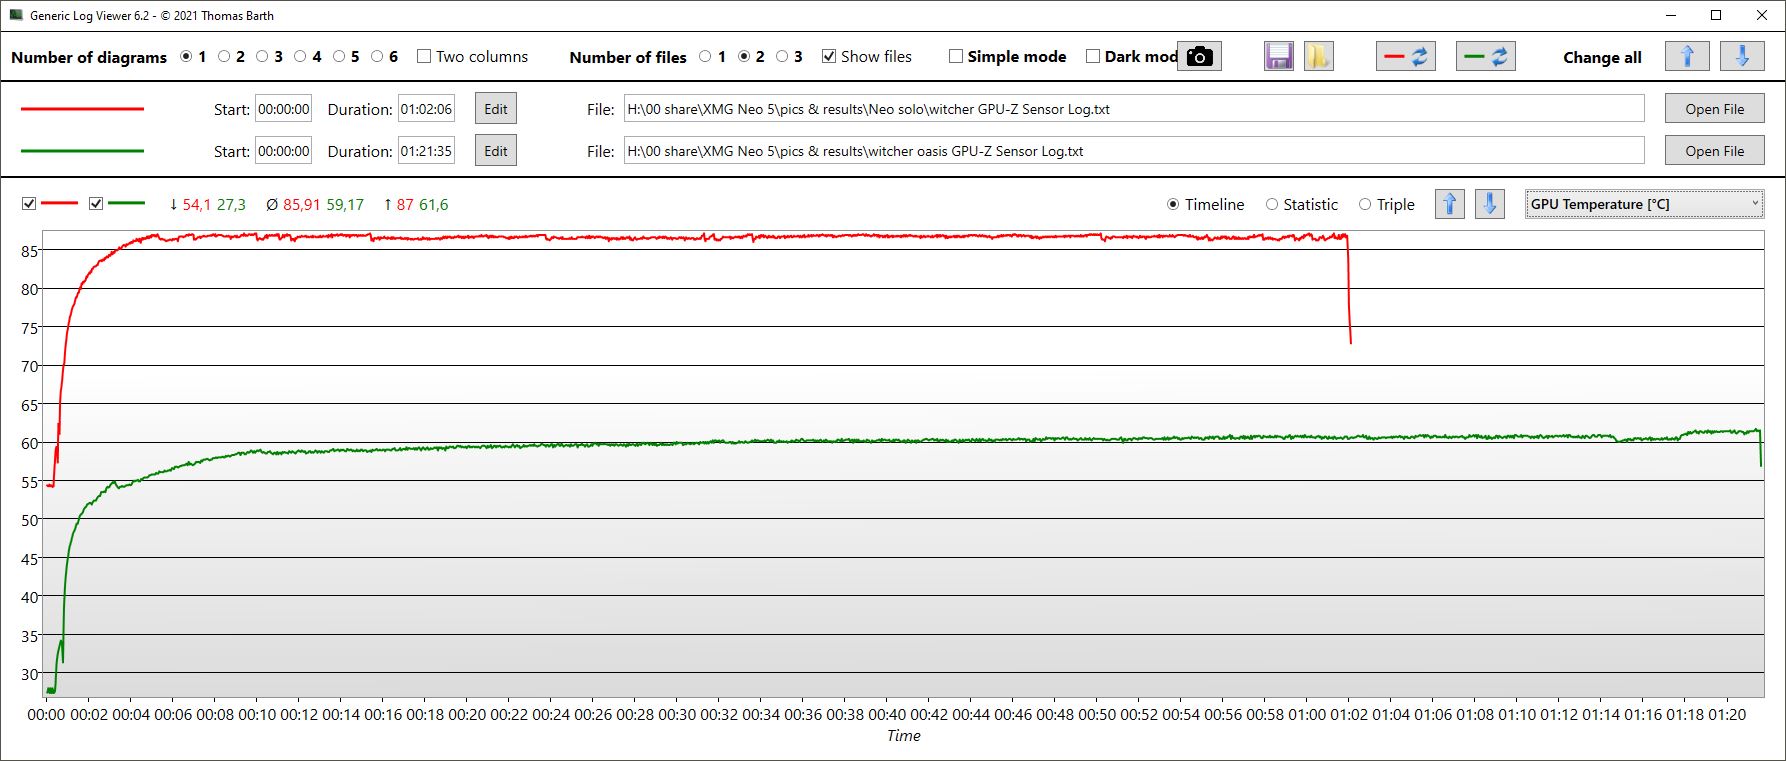
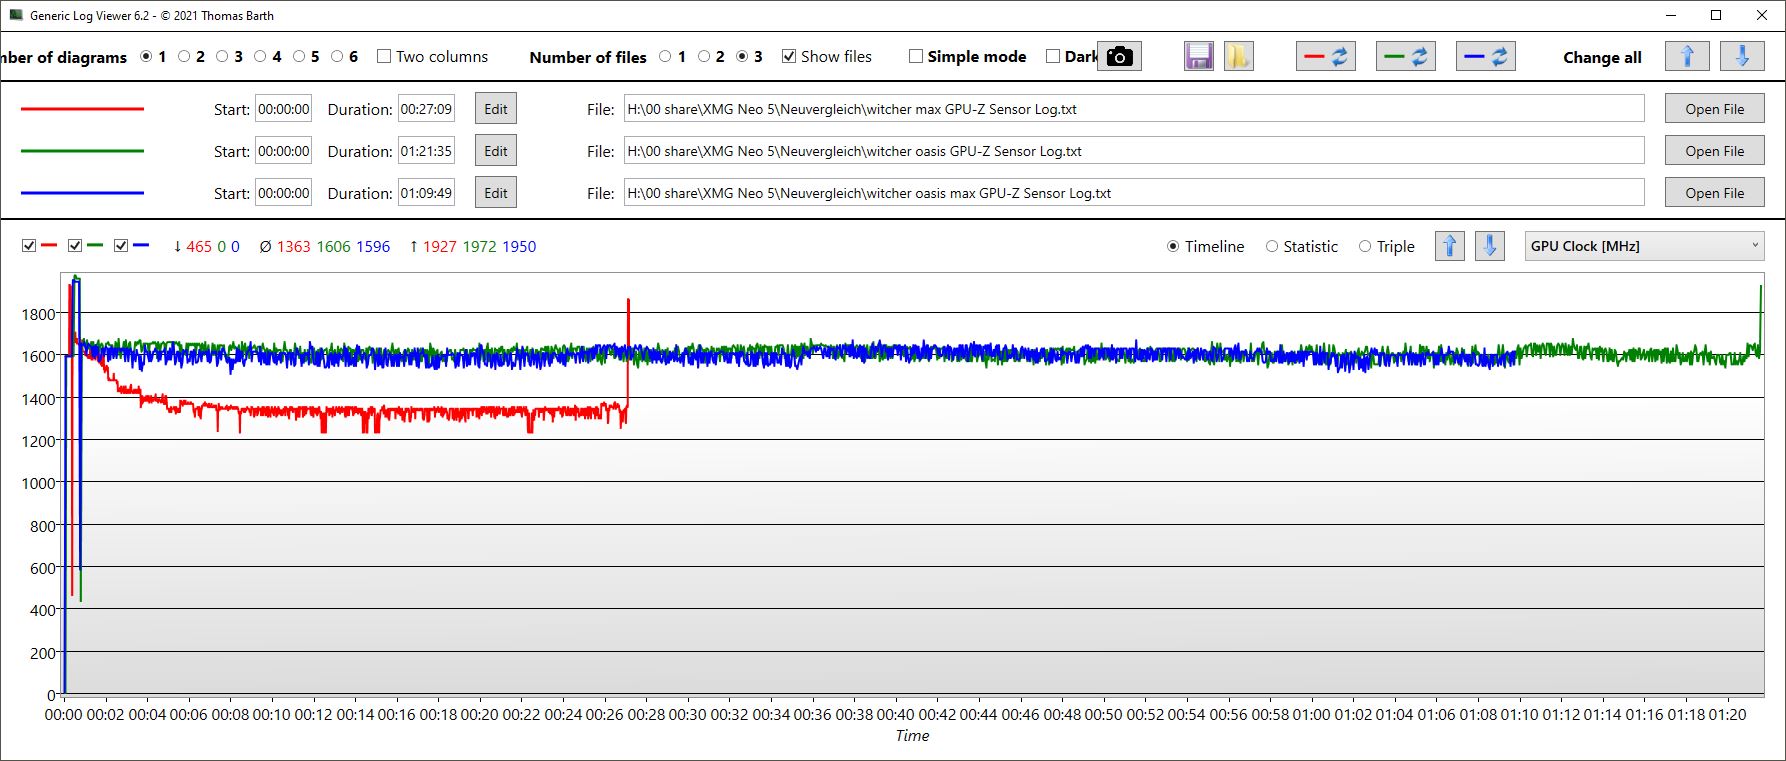
La tasa de fotogramas en Witcher 3 Ultra se mantiene muy constante durante una hora.
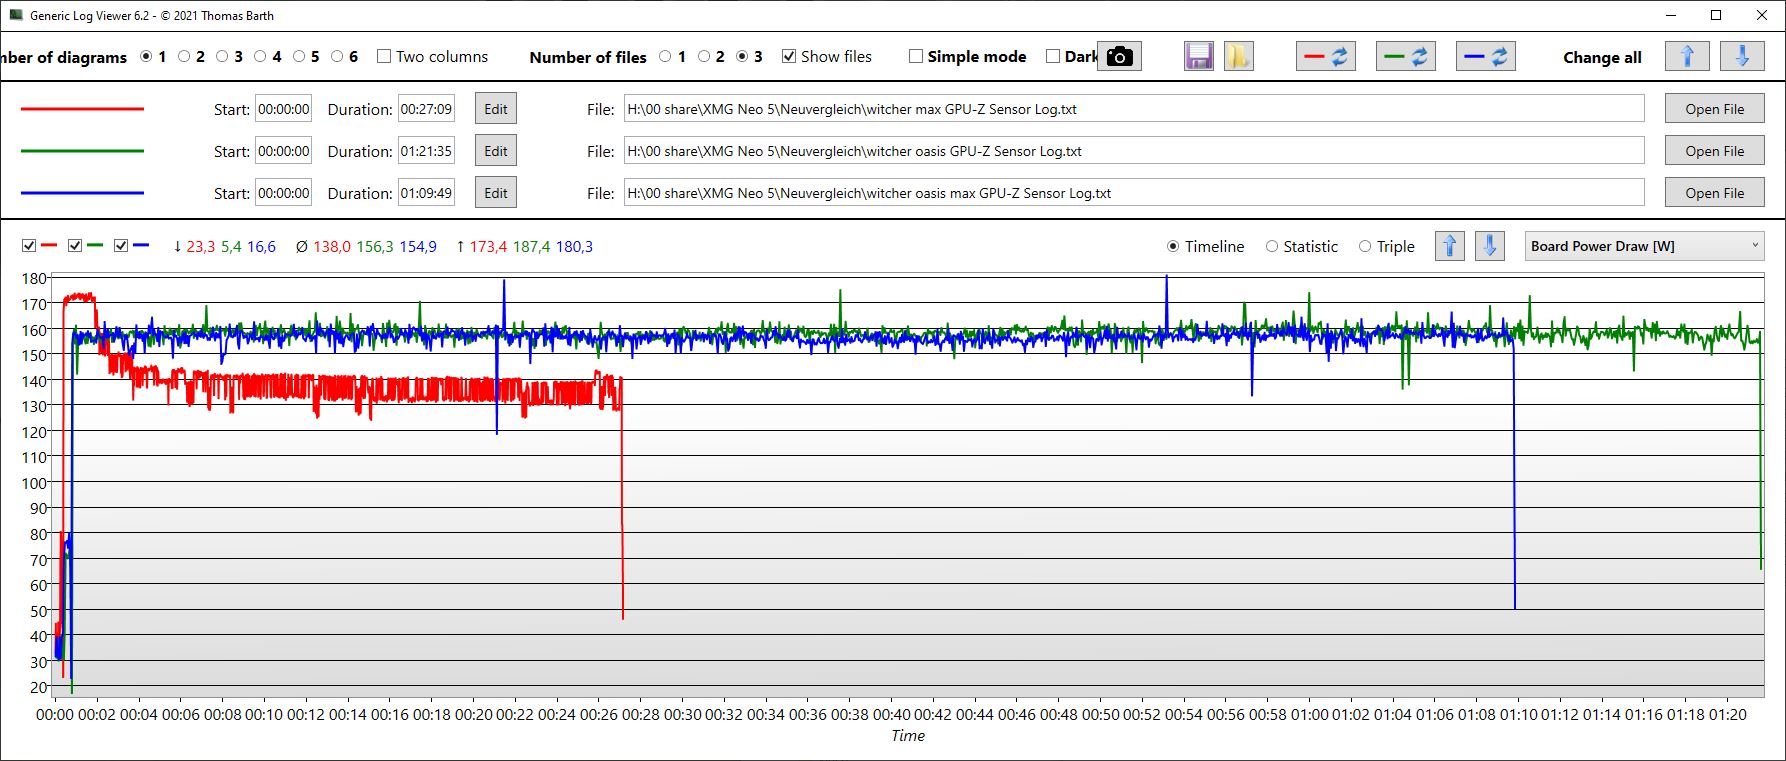
Las diferencias de fps con y sin Oasis son bastante pequeñas en todos los escenarios, pero hay un patrón. Por ejemplo, si se maximizan todos los valores en Neo (sin Oasis), el rendimiento también se maximiza. Sin embargo, éste disminuye rápidamente y a veces incluso cae por debajo de los fps de Neo en el Overboost estándar debido a las fuertes demandas térmicas.
Con Oasis, la situación es diferente: aquí el rendimiento del Overboost estándar está a la par con el Neo (sin Oasis), pero no cae con el tiempo, sino que aumenta. Por lo tanto, los fps son siempre un poco más altos con Oasis.
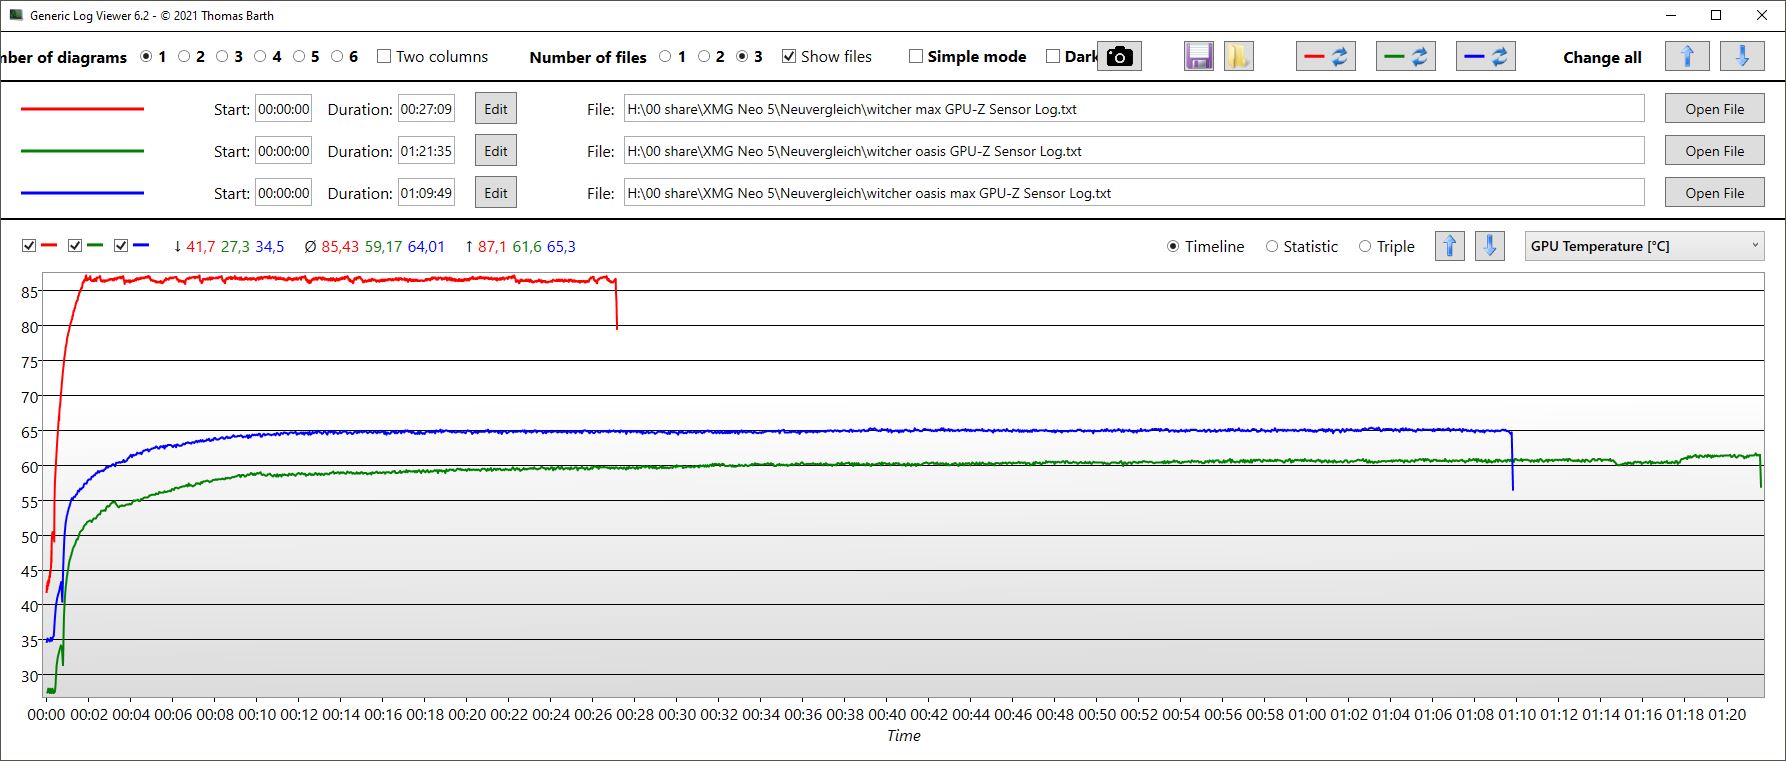
Aunque la tasa de fotogramas de Witcher sólo difiere ligeramente sin Oasis, el sistema de refrigeración líquida confiere muchas ventajas a nivel interno. La temperatura del núcleo de la CPU baja de una media de 86 °C a sólo 60 °C Sin embargo, esto no se traduce en una velocidad de reloj significativamente mayor, ya que el estrangulamiento térmico no entra en vigor todo el tiempo.
La GPU ofrece una historia similar: las temperaturas caen de 86 °C a sólo 59 °C, pero el reloj del núcleo de la GPU es sólo unos 200 MHz más alto. Incluso con los valores de offset maximizados, la imagen es la misma.
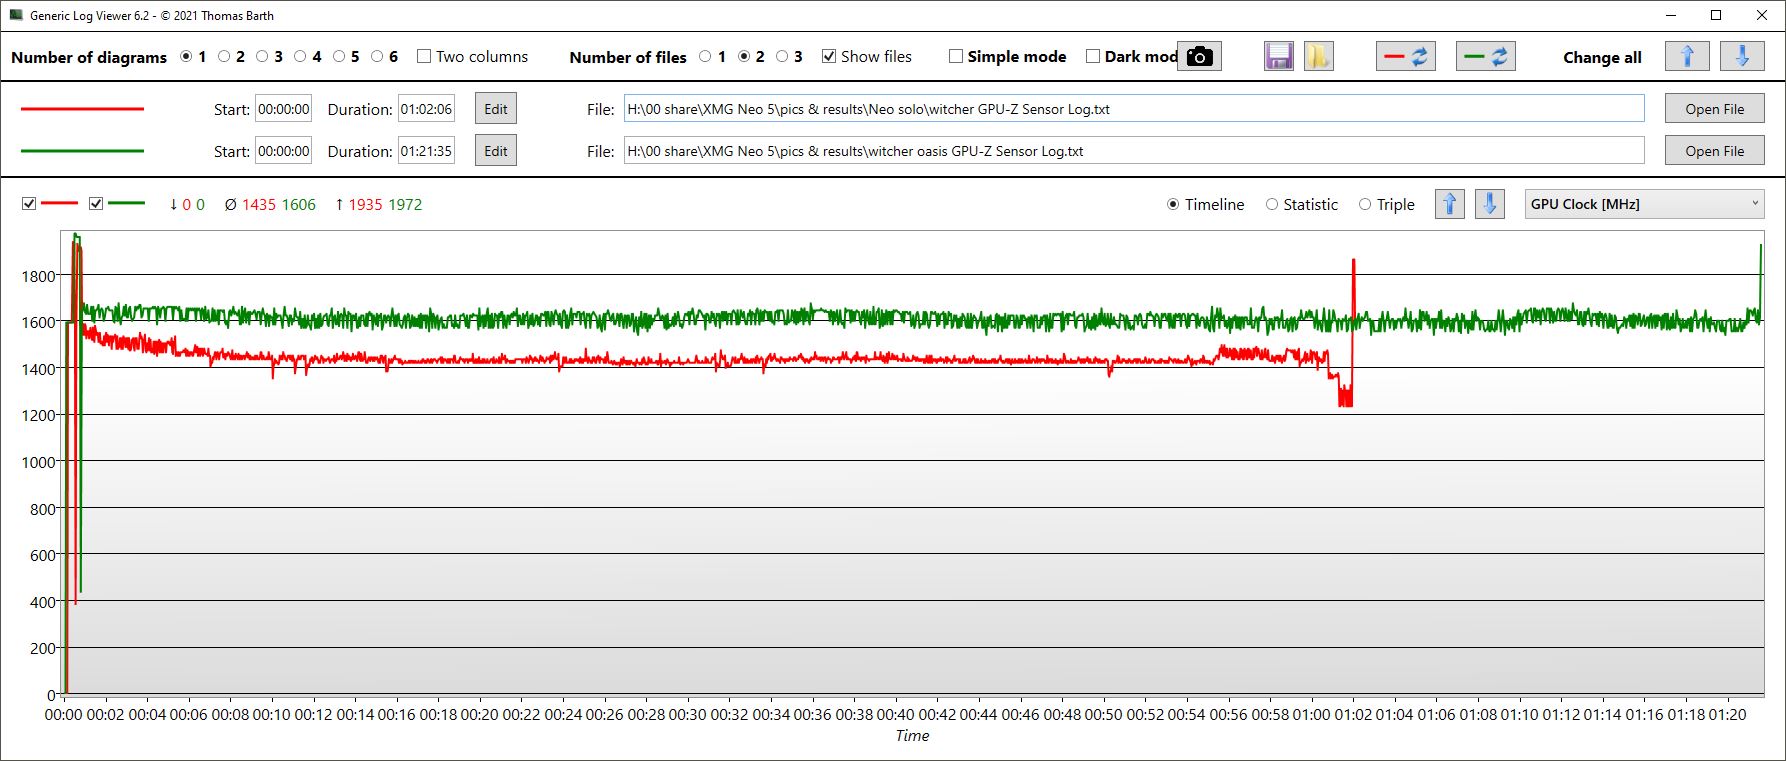
Curiosamente, al maximizar los valores de offset no se produce ninguna ganancia de fps, al menos en Witcher 3. La tarjeta se calienta un poco más, pero no consume más energía que en el Overboost estándar sin valores máximos de offset. La CPU muestra el mismo efecto. Es posible que los ajustes maximizados no estén correctamente implementados por el software de control - todavía hay un error confirmado en la versión actual que impide la activación simultánea de los valores de rendimiento y el Dynamic Boost (visualmente, al menos), pero la maximización debería seguir activa
| bajo | medio | alto | ultra | QHD | |
|---|---|---|---|---|---|
| GTA V (2015) | 186 | 182.4 | 177.7 | 123.1 | 110.8 |
| The Witcher 3 (2015) | 407 | 341 | 242.8 | 127.8 | |
| Dota 2 Reborn (2015) | 177.8 | 165 | 155.9 | 149.9 | |
| Final Fantasy XV Benchmark (2018) | 203 | 158.5 | 116.4 | 87.8 | |
| X-Plane 11.11 (2018) | 140.3 | 122.4 | 99.4 | ||
| Far Cry 5 (2018) | 152 | 142 | 132 | 116 | |
| Strange Brigade (2018) | 474 | 285 | 225 | 201 | 146 |
| Dying Light 2 (2022) | 139 | 96 | 83 | 60 | |
| Cyberpunk 2077 1.6 (2022) | 138.35 | 134.17 | 100.93 | 83.23 | 53.37 |
Emisiones: Fuerte y caliente sin Oasis
Ruido del sistema
En términos de ruido, el sistema ciertamente se beneficia de la refrigeración líquida. Mientras que los ventiladores del Neo 15 (sin Oasis) se aceleran bastante durante los juegos, permanecen a un nivel mucho más silencioso con el Oasis. Por supuesto, el Oasis en sí tampoco es silencioso, especialmente en el modo "Balanceado" cuando el gran ventilador del Oasis zumba constantemente a unos 44 dB (micrófono a una distancia de 15 cm). Por otro lado, esto es considerablemente más silencioso que los ventiladores del Neo sin Oasis.
En el modo "Muy silencioso", sin embargo, el Oasis emite un zumbido agudo y desagradable que no es audible en los otros dos modos. Esto hace que el modo "Silencioso" sea la opción más preferible en términos de reducción de ruido. El ventilador definitivamente necesita ser optimizado aquí para que "Very Quiet" haga honor a su nombre.
Las conexiones de la manguera del Oasis al Neo tienen una longitud de aproximadamente 57 cm. Esto le da una cierta pero limitada flexibilidad. Podrías desplazar el Oasis más hacia atrás, mientras que ponerlo debajo del escritorio plantea algunos problemas. Sin embargo, el volumen percibido del Oasis puede reducirse un poco cambiando la posición.
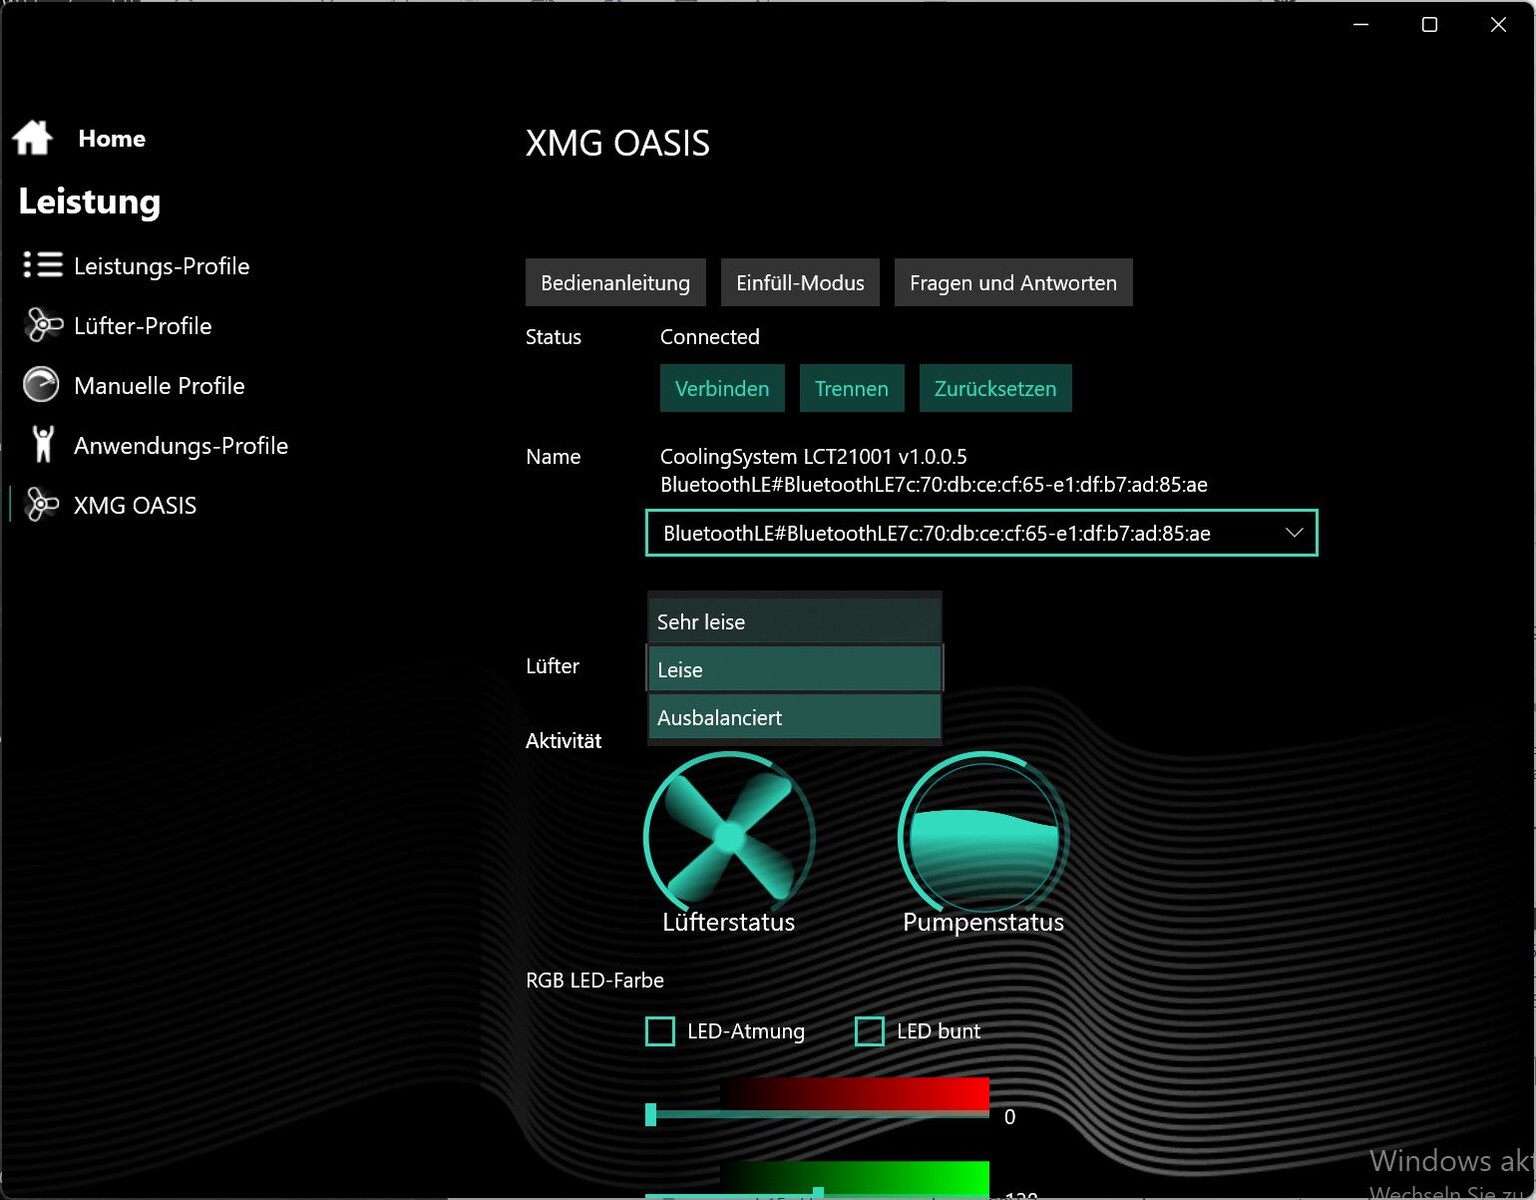
En este punto, surge una pequeña crítica a la política de etiquetado de Schenker para los modos del ventilador del Oasis: El modo equilibrado es el más alto posible, por lo que el ventilador integrado es el más ruidoso. Como se ha mencionado anteriormente, hay tres modos en total: Very Quiet, Quiet y Balanced. Habría sido más honesto nombrar los modos Silencioso, Equilibrado y Rendimiento, pues ¿qué se supone que equilibra el modo más alto posible con los niveles más altos de ruido? ¿Quizá pronto los modos de ventilador se llamen Quiet, Very Quiet y Extremely Quiet?
En cambio, el propio Neo también tiene tres modos de ventilador, que constituyen el otro extremo en cuanto a etiquetado: Equilibrado, Enthusiast y Overboost. Así que todo aquí está diseñado para el rendimiento. Incluso en el modo equilibrado, los ventiladores se ponen en marcha con frecuencia cuando el portátil está en reposo. Aunque giran de forma relativamente silenciosa, nos hubiera gustado un modo silencioso para el uso en la oficina. Por tanto, fue difícil medir los niveles de ruido del XMG Oasis ya que los ventiladores del Neo también estaban casi siempre activos, aunque fuera en silencio.
Cuando está en reposo y con poca carga, el Oasis es menos útil, a veces incluso inútil, debido al ruido electrónico en modo muy silencioso y a los bajos niveles de ruido del Neo 15. Por otro lado, la combinación conduce a una notable reducción del ruido durante los juegos y las cargas pesadas. Sin embargo, el Razer Blade, que no tiene refrigeración líquida, también sólo emite niveles moderados de ruido bajo carga. Sin Oasis, el Neo 15 es el dispositivo más ruidoso bajo carga pesada en comparación directa con los dispositivos de la competencia.
Ruido
| Ocioso |
| 23 / 26.39 / 26.39 dB(A) |
| Carga |
| 45.52 / 55.89 dB(A) |
 | ||
30 dB silencioso 40 dB(A) audible 50 dB(A) ruidosamente alto |
||
min: | ||
| Schenker XMG Neo 15 (i7-12700H, RTX 3080 Ti) GeForce RTX 3080 Ti Laptop GPU, i7-12700H, Samsung SSD 980 Pro 1TB MZ-V8P1T0BW | Schenker XMG Neo 15 with XMG Oasis GeForce RTX 3080 Ti Laptop GPU, i7-12700H, Samsung SSD 980 Pro 1TB MZ-V8P1T0BW | Schenker XMG Neo 15 Tiger Lake GeForce RTX 3080 Laptop GPU, i7-11800H, Samsung SSD 980 Pro 1TB MZ-V8P1T0BW | Razer Blade 15 2022 GeForce RTX 3080 Ti Laptop GPU, i7-12800H, SSSTC CA6-8D1024 | Asus ROG Zephyrus Duo 16 GX650RX GeForce RTX 3080 Ti Laptop GPU, R9 6900HX, 2x Samsung SSD 980 Pro 2TB MZ-V8P2T0 (RAID 0) | Gigabyte Aero 16 YE5 GeForce RTX 3080 Ti Laptop GPU, i9-12900HK, Phison ESR01TBMFCT | Alienware x17 R2 P48E GeForce RTX 3080 Ti Laptop GPU, i9-12900HK, 2x Samsung PM9A1 1TB (RAID 0) | |
|---|---|---|---|---|---|---|---|
| Noise | -25% | -8% | -0% | -0% | -9% | 10% | |
| apagado / medio ambiente * (dB) | 23 | 23 -0% | 25 -9% | 25.4 -10% | 26 -13% | 25 -9% | 22.7 1% |
| Idle Minimum * (dB) | 23 | 40.84 -78% | 27 -17% | 26.2 -14% | 26 -13% | 30 -30% | 23.1 -0% |
| Idle Average * (dB) | 26.39 | 41.4 -57% | 30 -14% | 26.2 1% | 27 -2% | 32 -21% | 23.1 12% |
| Idle Maximum * (dB) | 26.39 | 44.33 -68% | 32 -21% | 28.4 -8% | 29 -10% | 33 -25% | 23.1 12% |
| Load Average * (dB) | 45.52 | 44.33 3% | 46 -1% | 44.7 2% | 41 10% | 45 1% | 31.9 30% |
| Witcher 3 ultra * (dB) | 55.89 | 46.25 17% | 52 7% | 44.7 20% | 48 14% | 50 11% | 52.5 6% |
| Load Maximum * (dB) | 55.89 | 51.26 8% | 55 2% | 51.9 7% | 50 11% | 52 7% | 52.5 6% |
* ... más pequeño es mejor
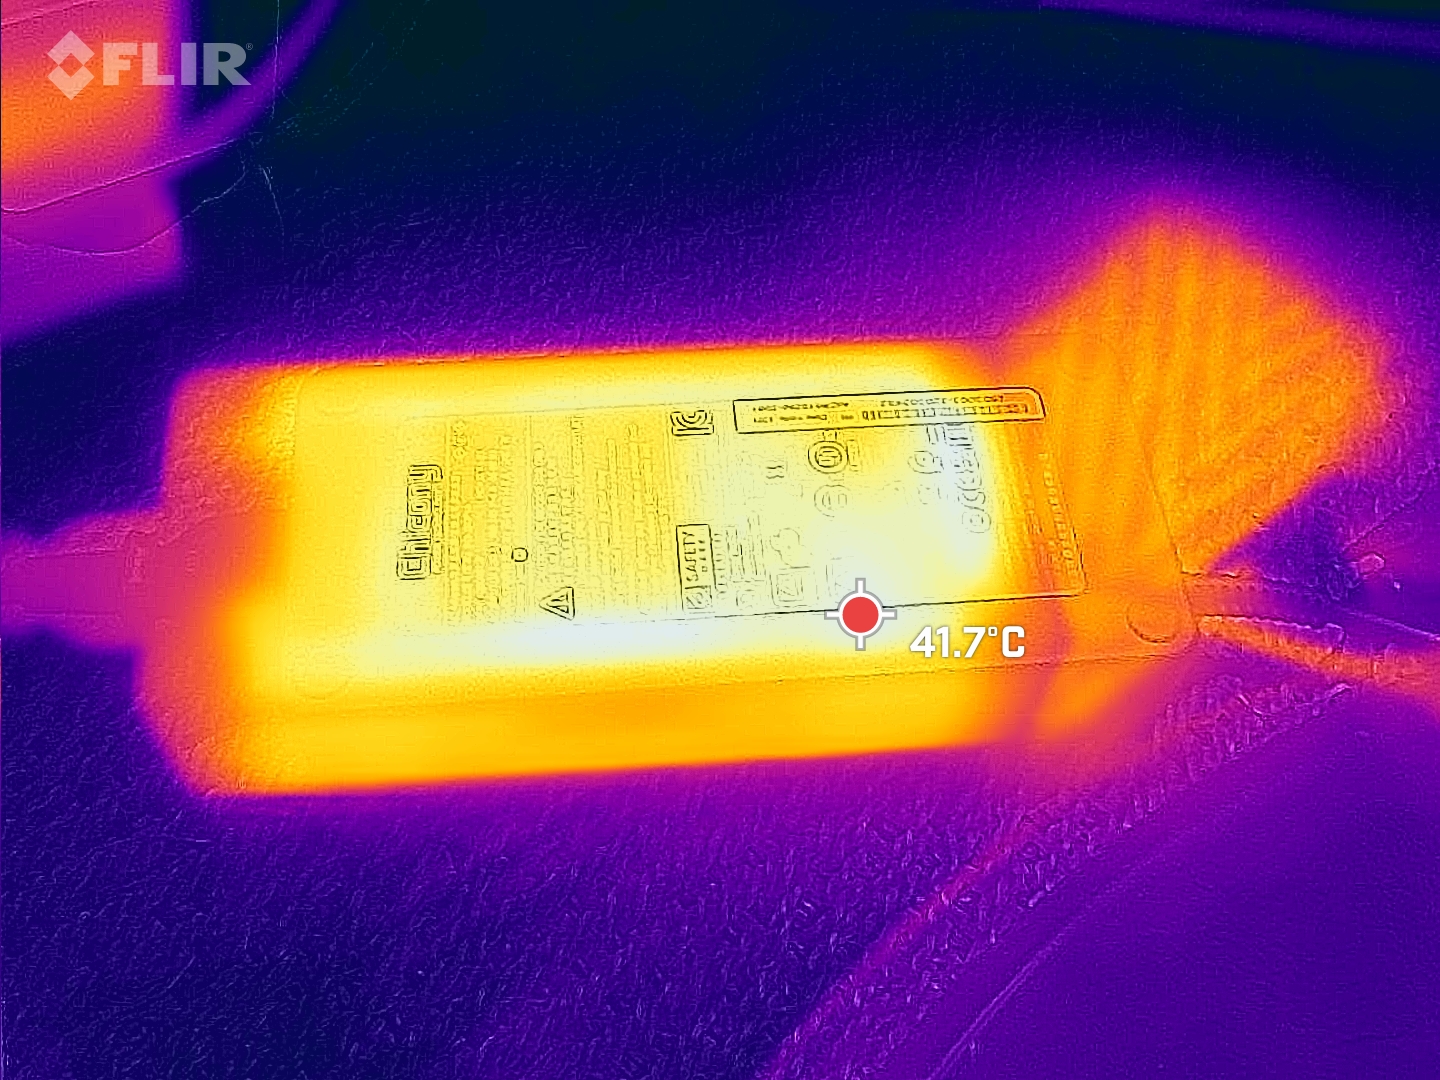
Temperatura
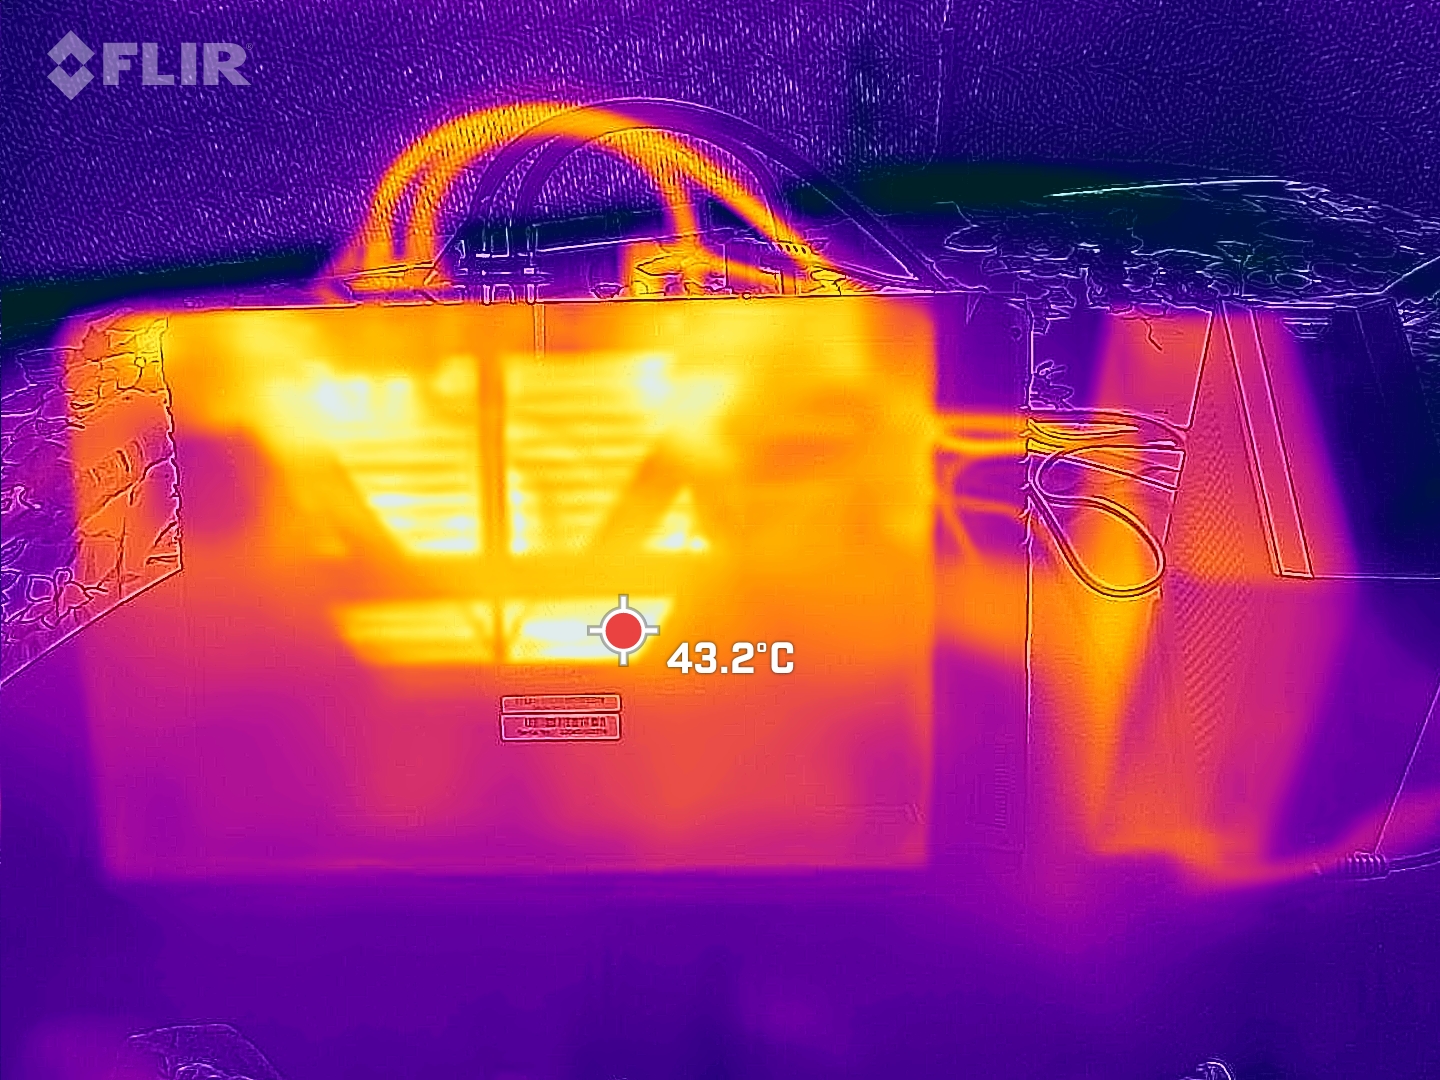
Bajo carga pesada, las temperaturas de la superficie también bajan gracias al Oasis, especialmente en la parte inferior, de un máximo de 56 a 49 °C.
También hay una reducción significativa de la temperatura al ralentí, pero esto se registró en el modo equilibrado, que es poco probable que se utilice para el ralentí debido a los altos niveles de ruido
El Oasis no tiene el mayor impacto en las temperaturas de la superficie, sino más bien en las temperaturas del núcleo y del hardware, como se puede ver en la siguiente sección bajo "Prueba de estrés".
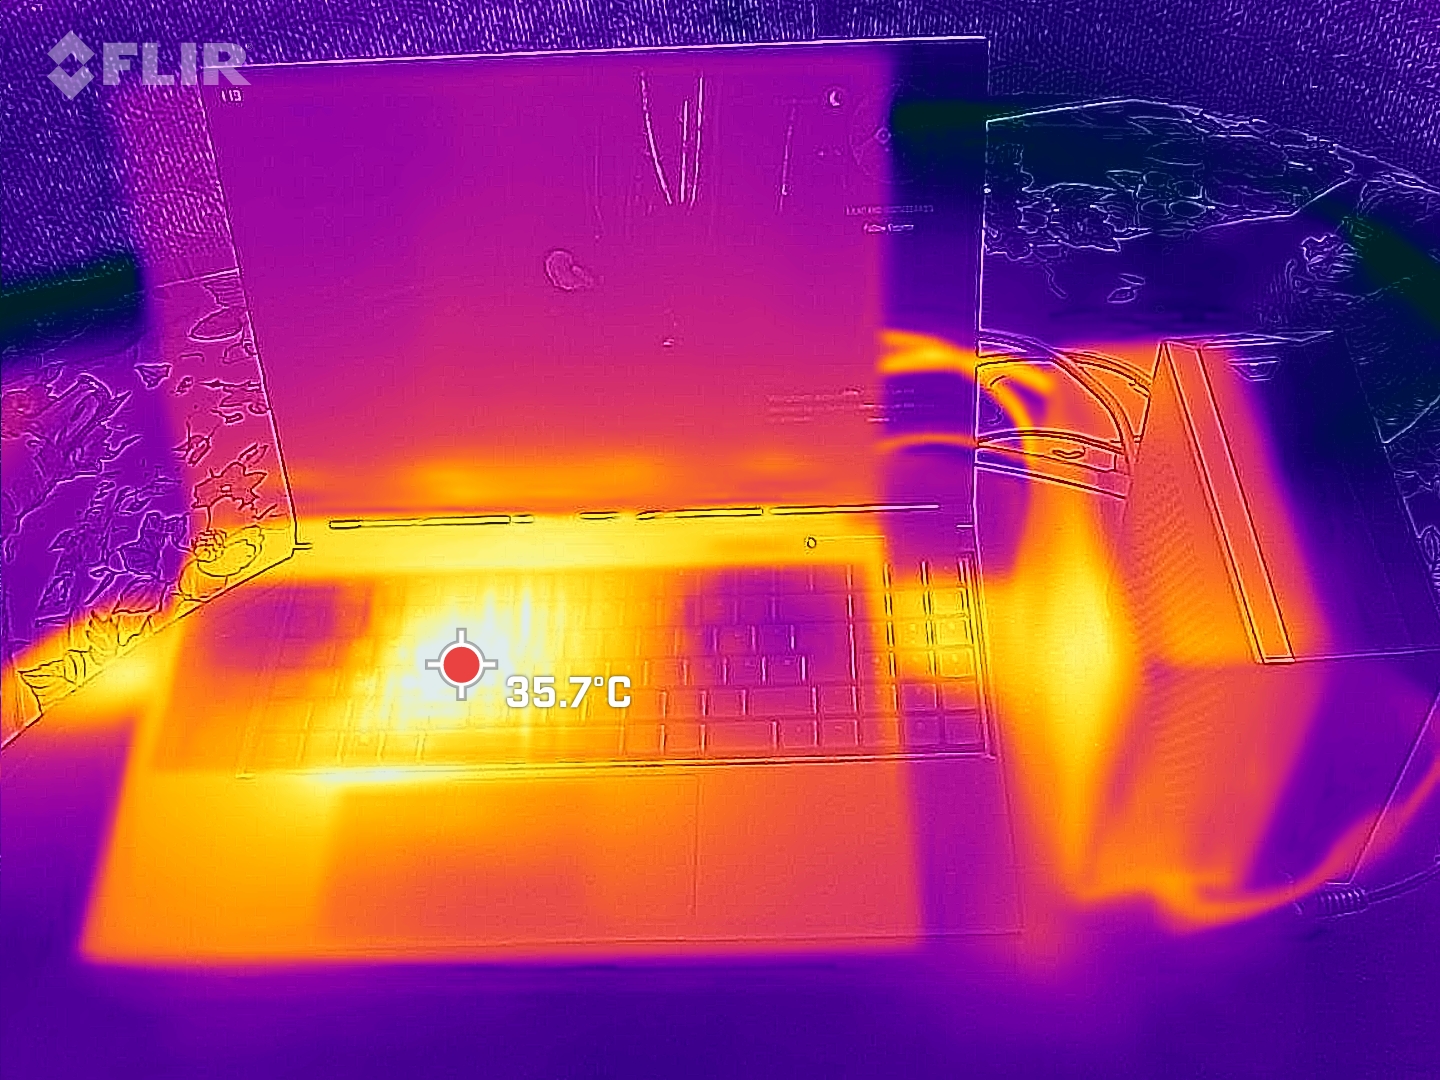
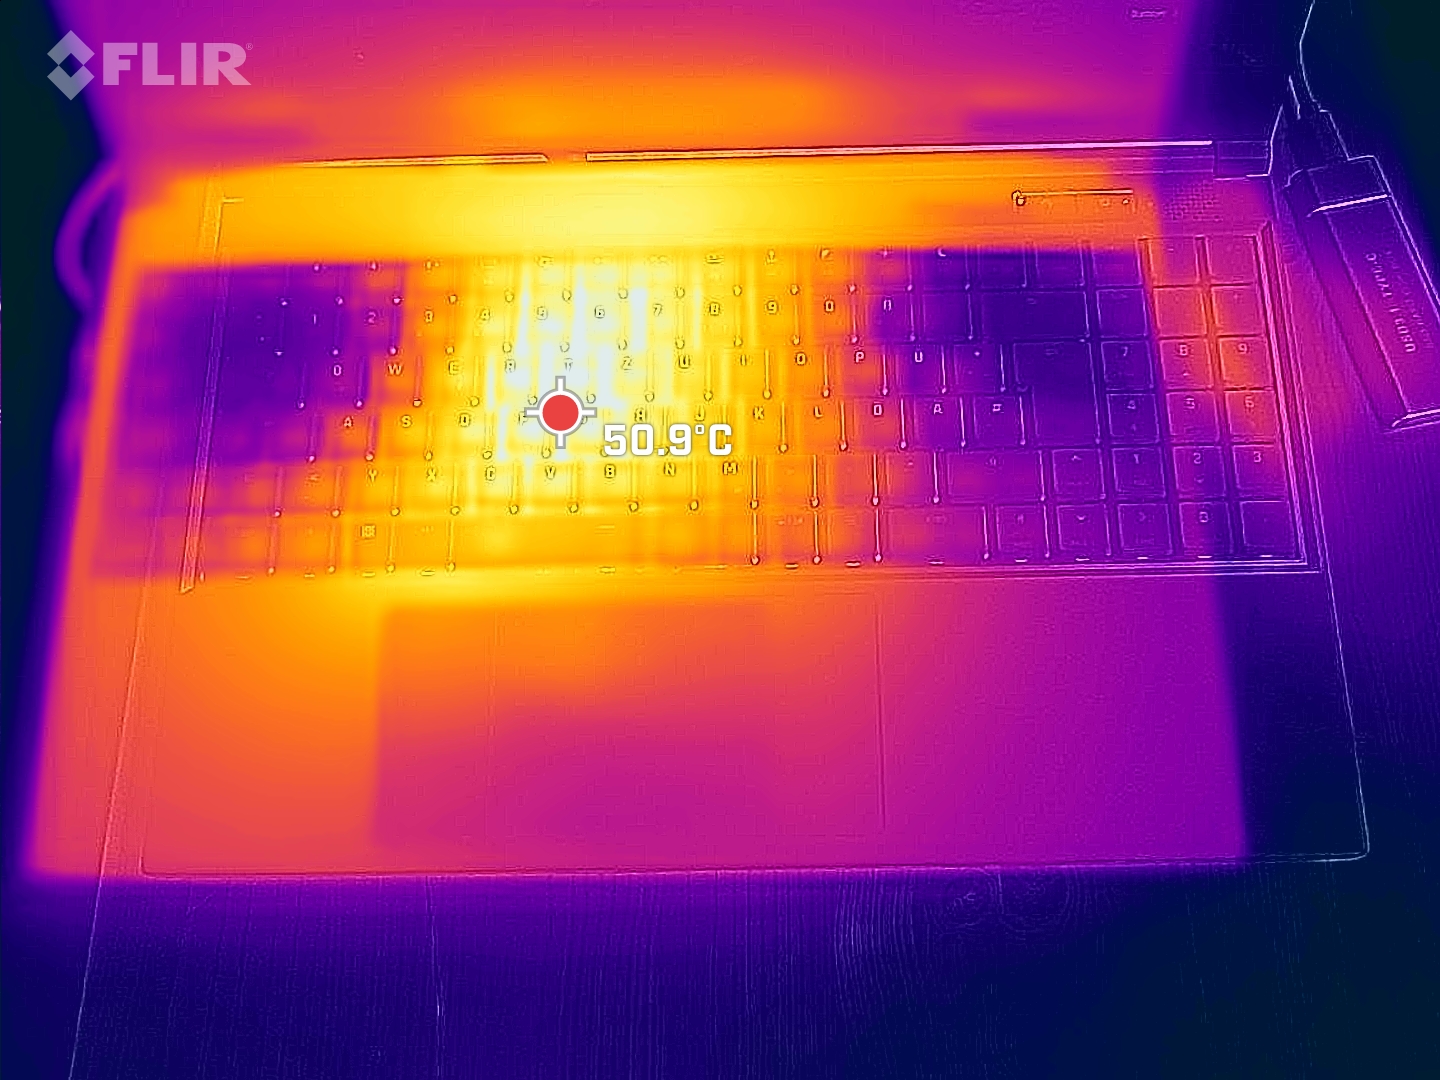
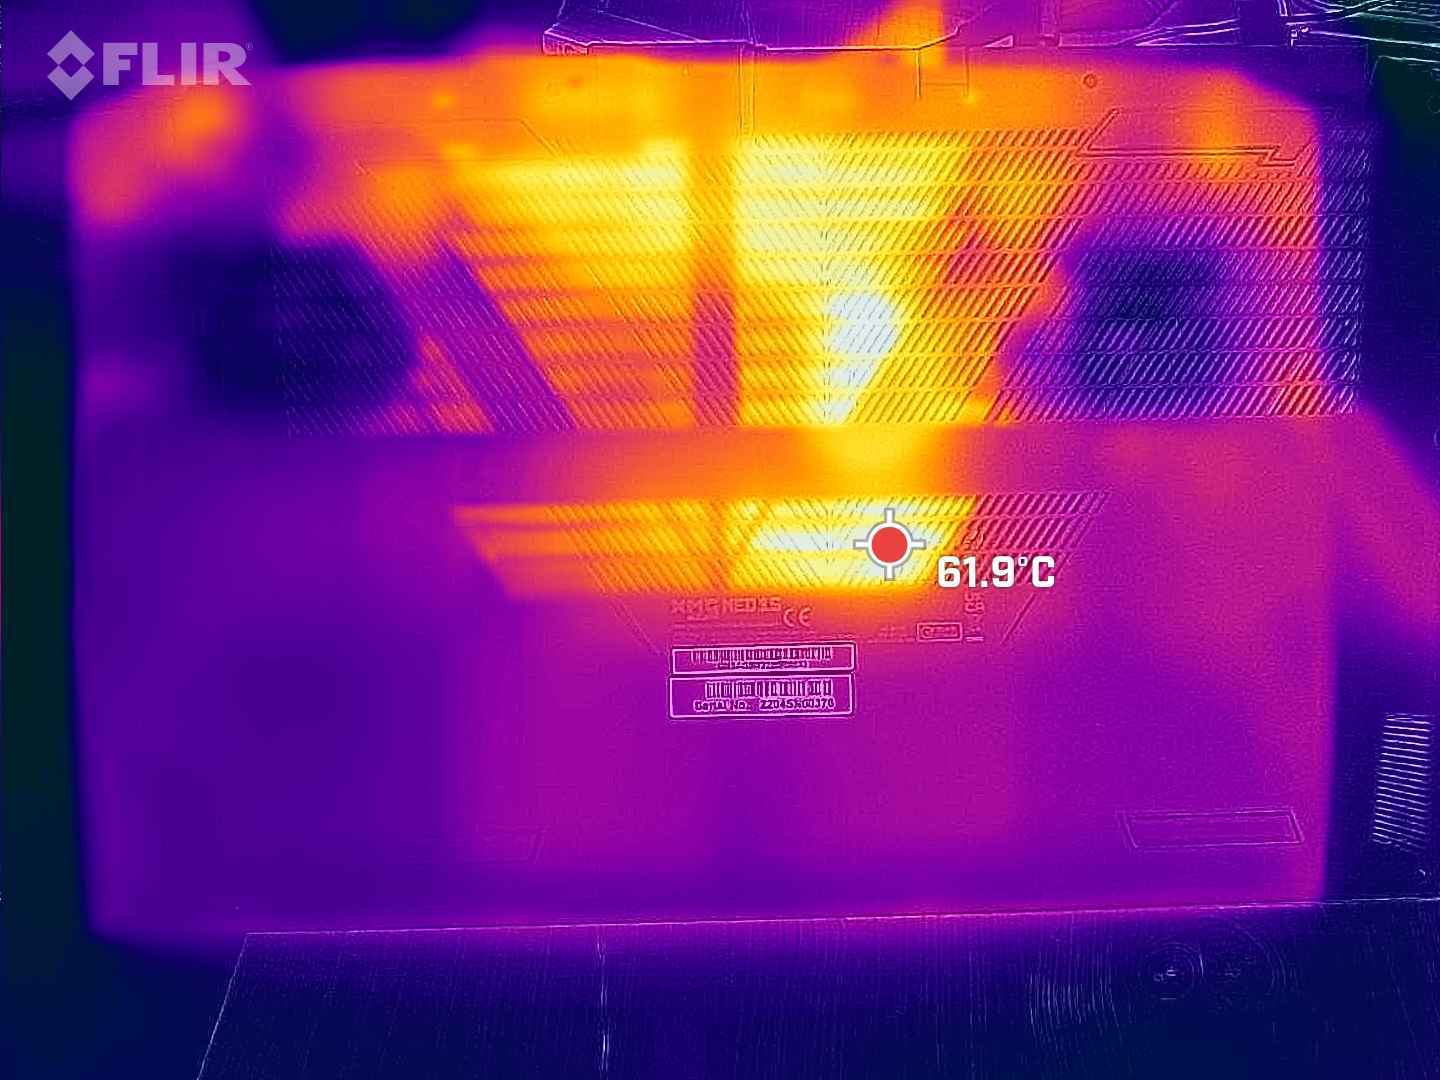
(±) La temperatura máxima en la parte superior es de 44 °C / 111 F, frente a la media de 40.4 °C / 105 F, que oscila entre 21.2 y 68.8 °C para la clase Gaming.
(-) El fondo se calienta hasta un máximo de 56 °C / 133 F, frente a la media de 43.2 °C / 110 F
(±) En reposo, la temperatura media de la parte superior es de 33.9 °C / 93# F, frente a la media del dispositivo de 33.9 °C / 93 F.
(-) Jugando a The Witcher 3, la temperatura media de la parte superior es de 39.8 °C / 104 F, frente a la media del dispositivo de 33.9 °C / 93 F.
(±) El reposamanos y el touchpad pueden calentarse mucho al tacto con un máximo de 37 °C / 98.6 F.
(-) La temperatura media de la zona del reposamanos de dispositivos similares fue de 28.8 °C / 83.8 F (-8.2 °C / -14.8 F).
| Schenker XMG Neo 15 (i7-12700H, RTX 3080 Ti) Intel Core i7-12700H, NVIDIA GeForce RTX 3080 Ti Laptop GPU | Schenker XMG Neo 15 with XMG Oasis Intel Core i7-12700H, NVIDIA GeForce RTX 3080 Ti Laptop GPU | Schenker XMG Neo 15 Tiger Lake Intel Core i7-11800H, NVIDIA GeForce RTX 3080 Laptop GPU | Razer Blade 15 2022 Intel Core i7-12800H, NVIDIA GeForce RTX 3080 Ti Laptop GPU | Asus ROG Zephyrus Duo 16 GX650RX AMD Ryzen 9 6900HX, NVIDIA GeForce RTX 3080 Ti Laptop GPU | Gigabyte Aero 16 YE5 Intel Core i9-12900HK, NVIDIA GeForce RTX 3080 Ti Laptop GPU | Alienware x17 R2 P48E Intel Core i9-12900HK, NVIDIA GeForce RTX 3080 Ti Laptop GPU | |
|---|---|---|---|---|---|---|---|
| Heat | 15% | 11% | 3% | 11% | 6% | 14% | |
| Maximum Upper Side * (°C) | 44 | 44 -0% | 39 11% | 50 -14% | 45 -2% | 49 -11% | 49.6 -13% |
| Maximum Bottom * (°C) | 56 | 49 12% | 50 11% | 47 16% | 50 11% | 55 2% | 42.4 24% |
| Idle Upper Side * (°C) | 38 | 30 21% | 34 11% | 37.4 2% | 33 13% | 33 13% | 29.2 23% |
| Idle Bottom * (°C) | 41 | 30 27% | 37 10% | 38.4 6% | 33 20% | 33 20% | 32 22% |
* ... más pequeño es mejor
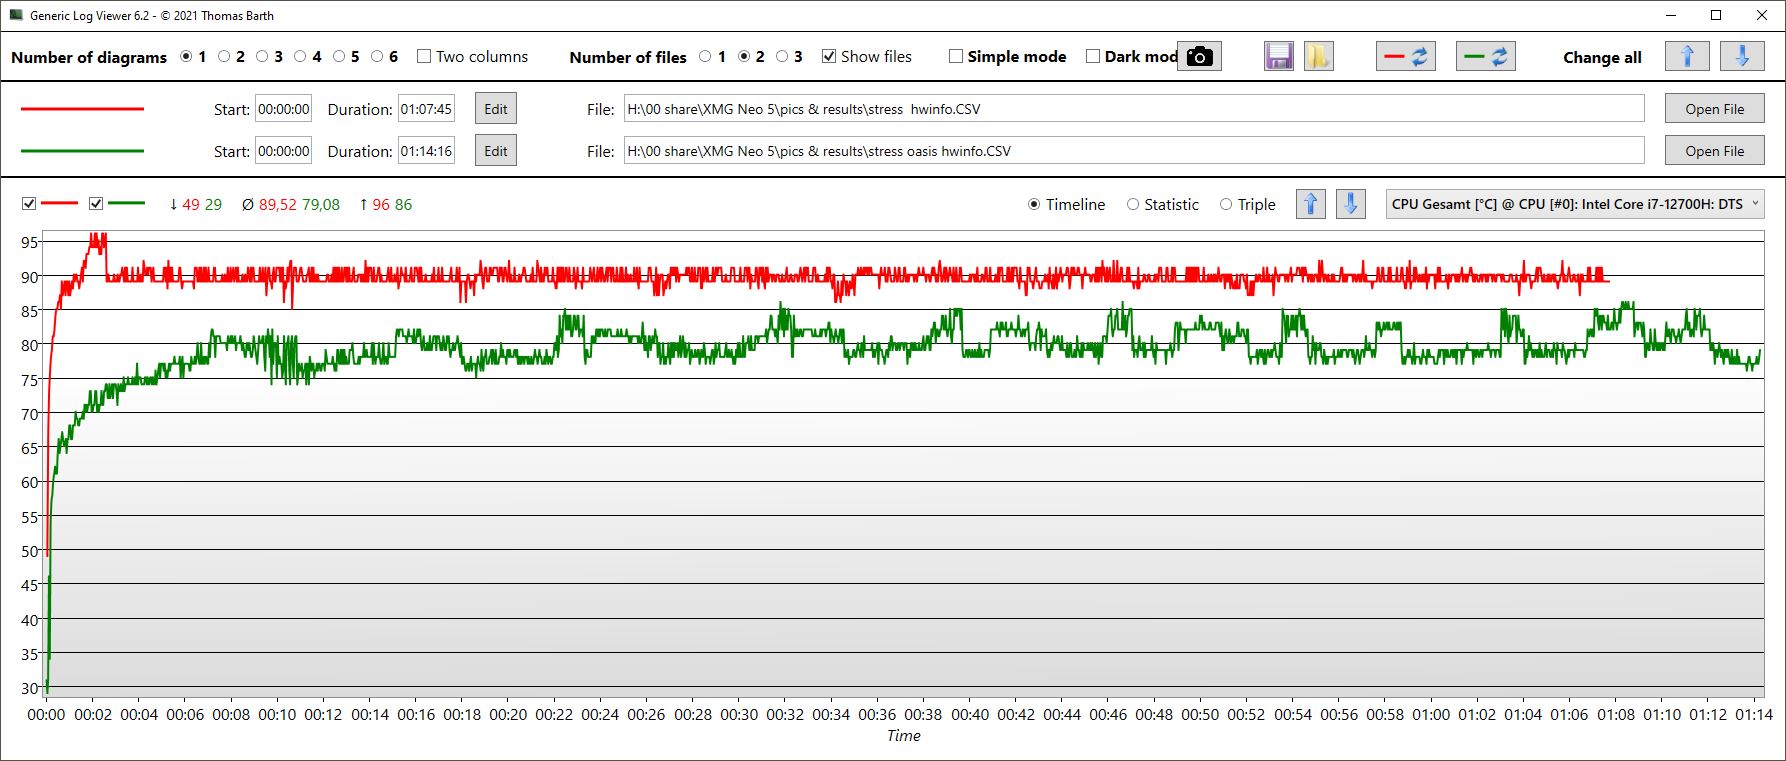
Prueba de esfuerzo
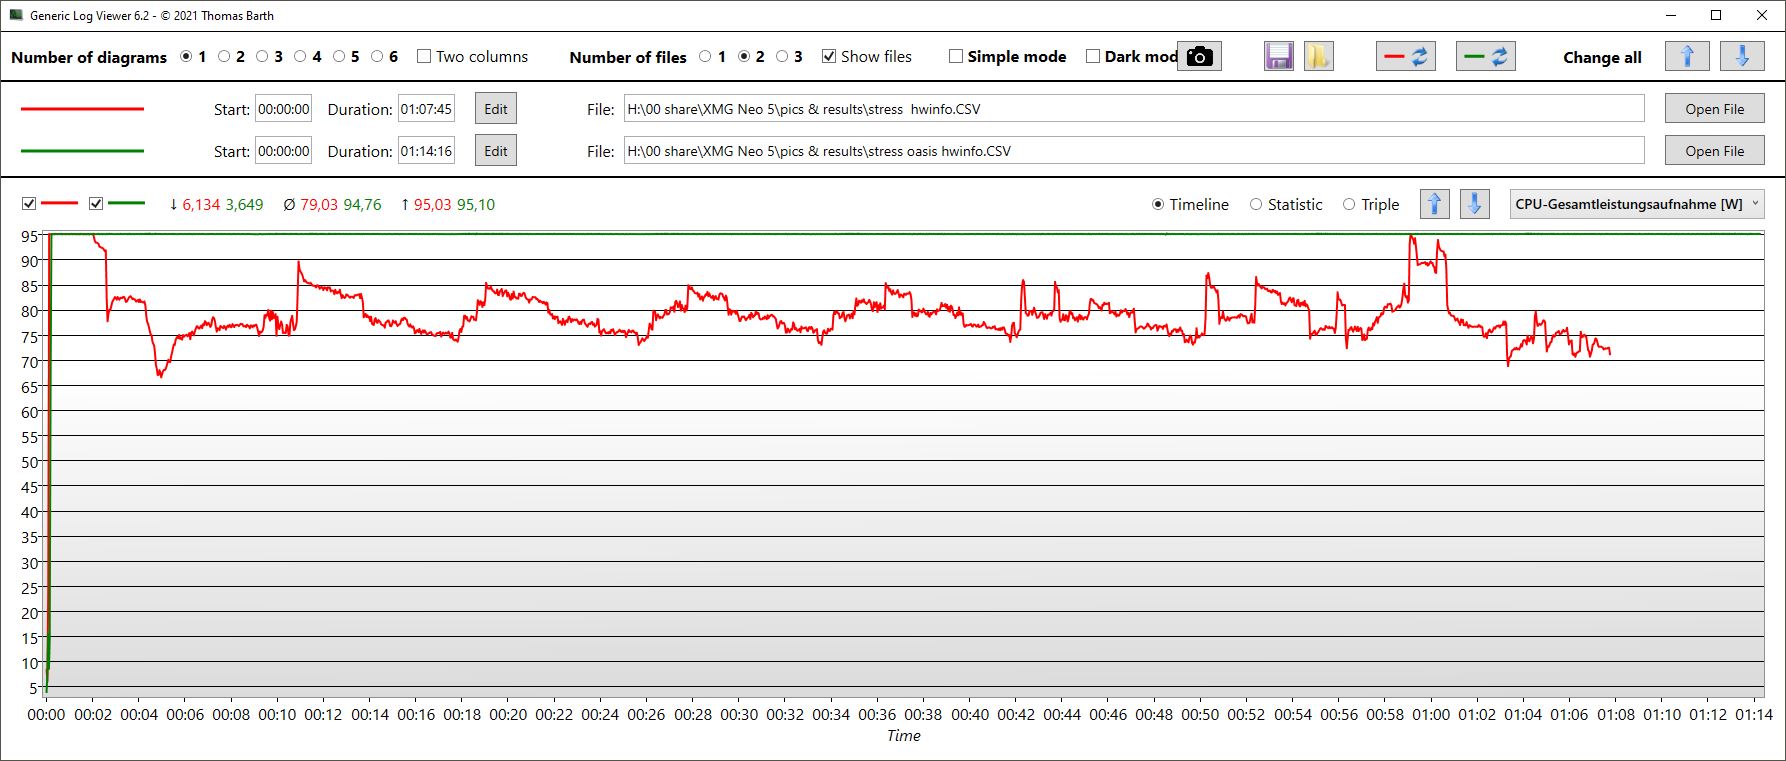
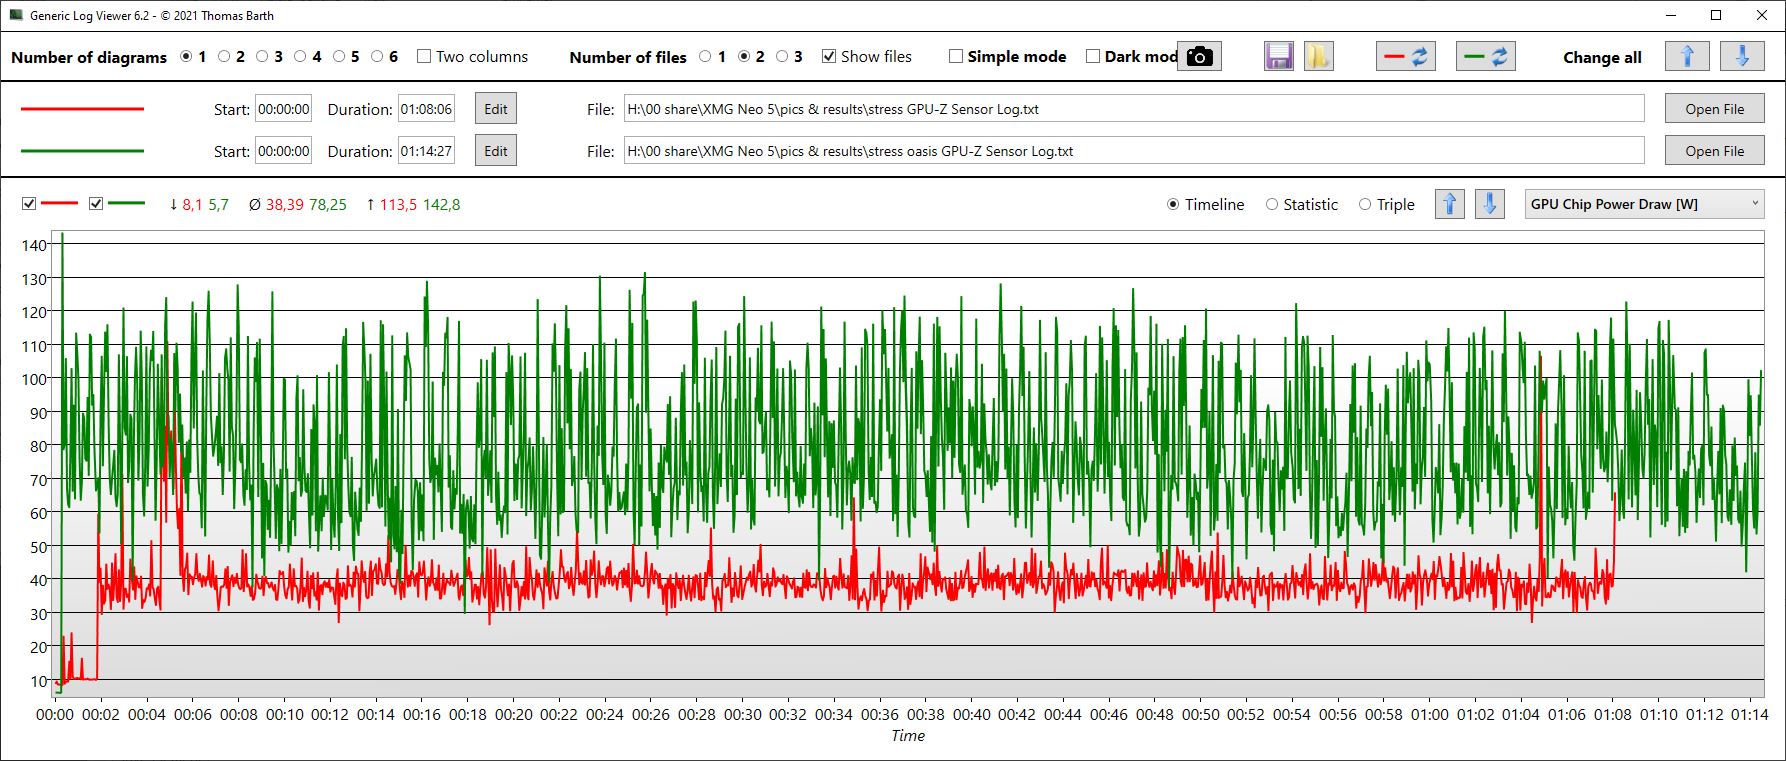
Y aquí es donde el XMG Oasis finalmente hace una contribución marcadamente positiva. Dado que la temperatura media del núcleo de la CPU del Neo 15 está justo por debajo de los 90 °C, Oasis reduce este valor en más de 10 °C a sólo 79 °C. Esto también se nota en el consumo de energía porque los límites térmicos están ausentes en presencia de Oasis. De este modo, el sistema puede utilizar siempre los 95 W completos (modo Overboost estándar) o más (Overboost
max), mientras que el Neo por sí solo no puede mantener los 95 W y por tanto cae a una media de 79 W debido a las limitaciones térmicas.
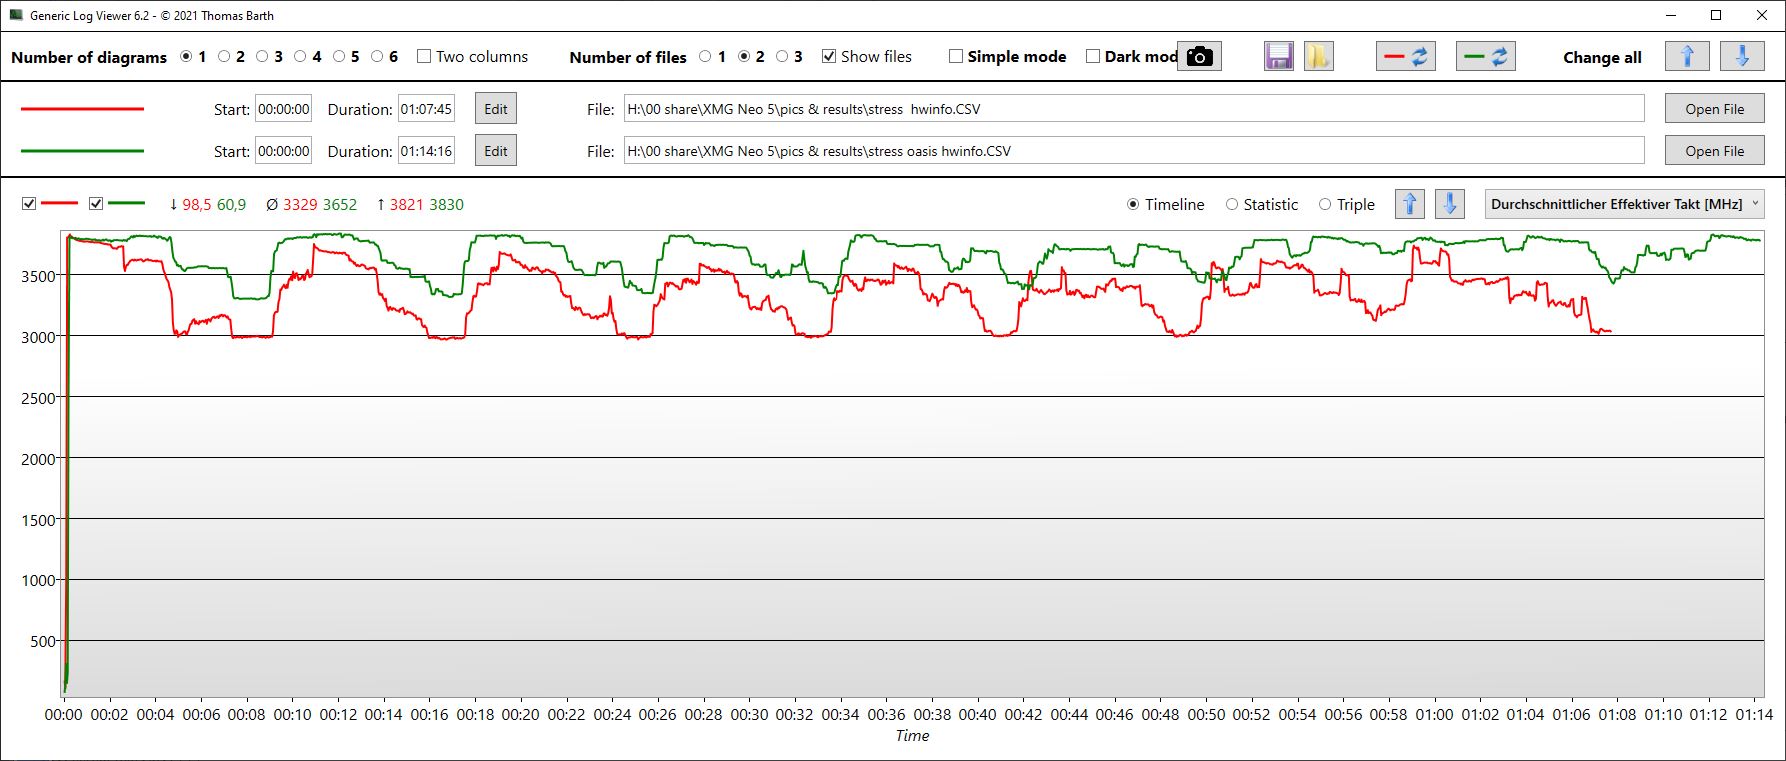
En consecuencia, las velocidades de reloj de la CPU son mayores, concretamente unos 300 MHz más con Oasis que sin él. Así que, gracias al Oasis, puedes experimentar con los valores de offset manual o incluso maximizarlos sin preocupaciones.
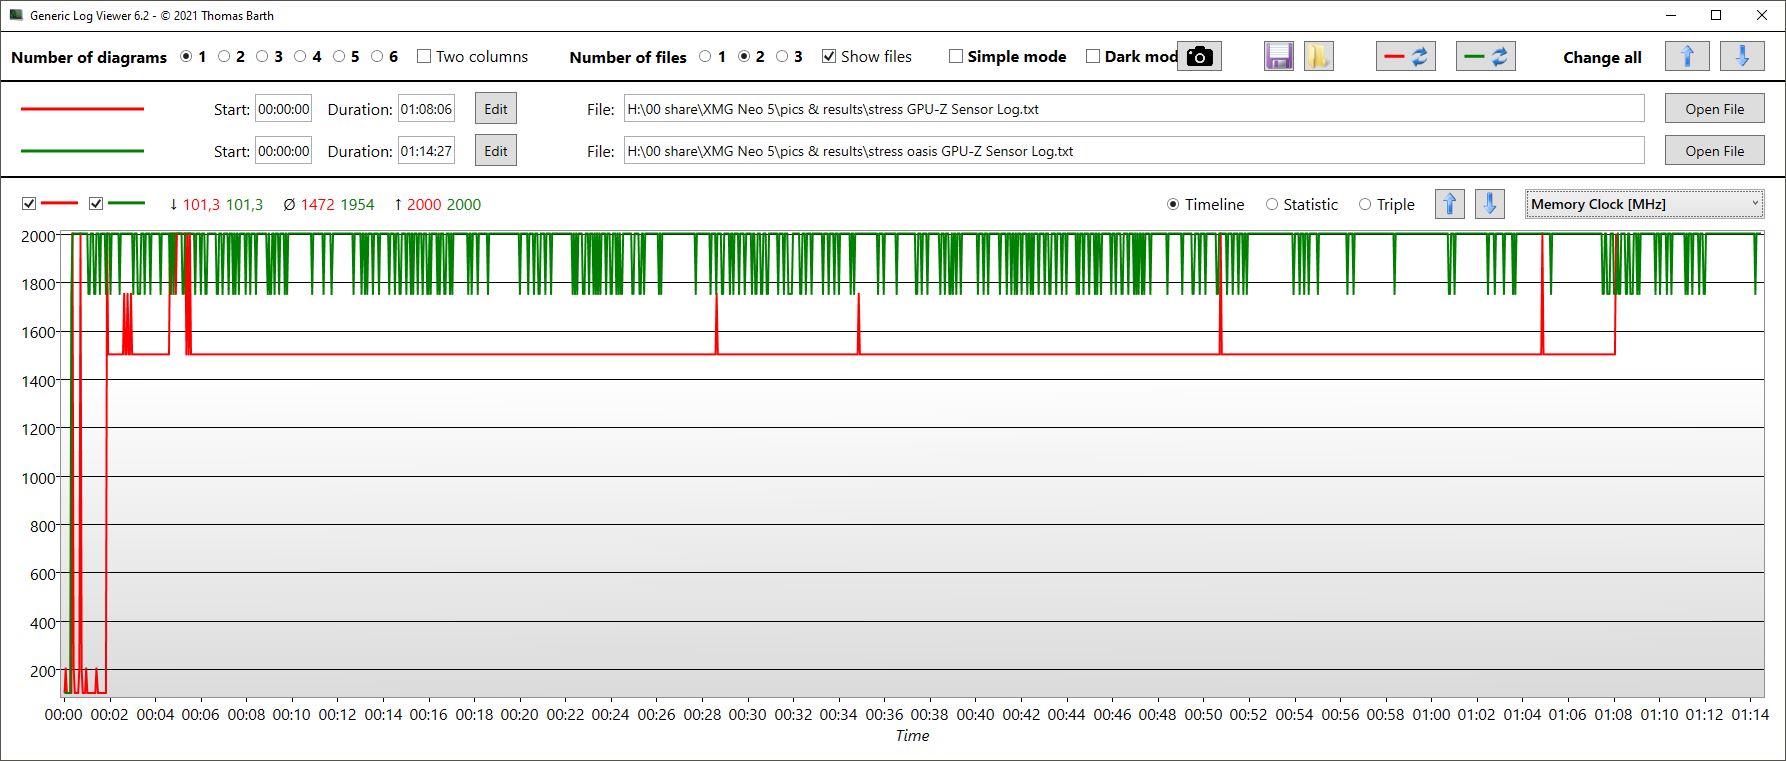
Los resultados de la tarjeta gráfica son análogos: en lugar de 67 °C, la GPU sólo se calienta hasta los 58 °C con Oasis, mientras que las velocidades de reloj casi se duplican de 800 a 1.600 MHz Incluso el reloj de la memoria es casi 500 MHz más alto y el chip es capaz de consumir más energía.
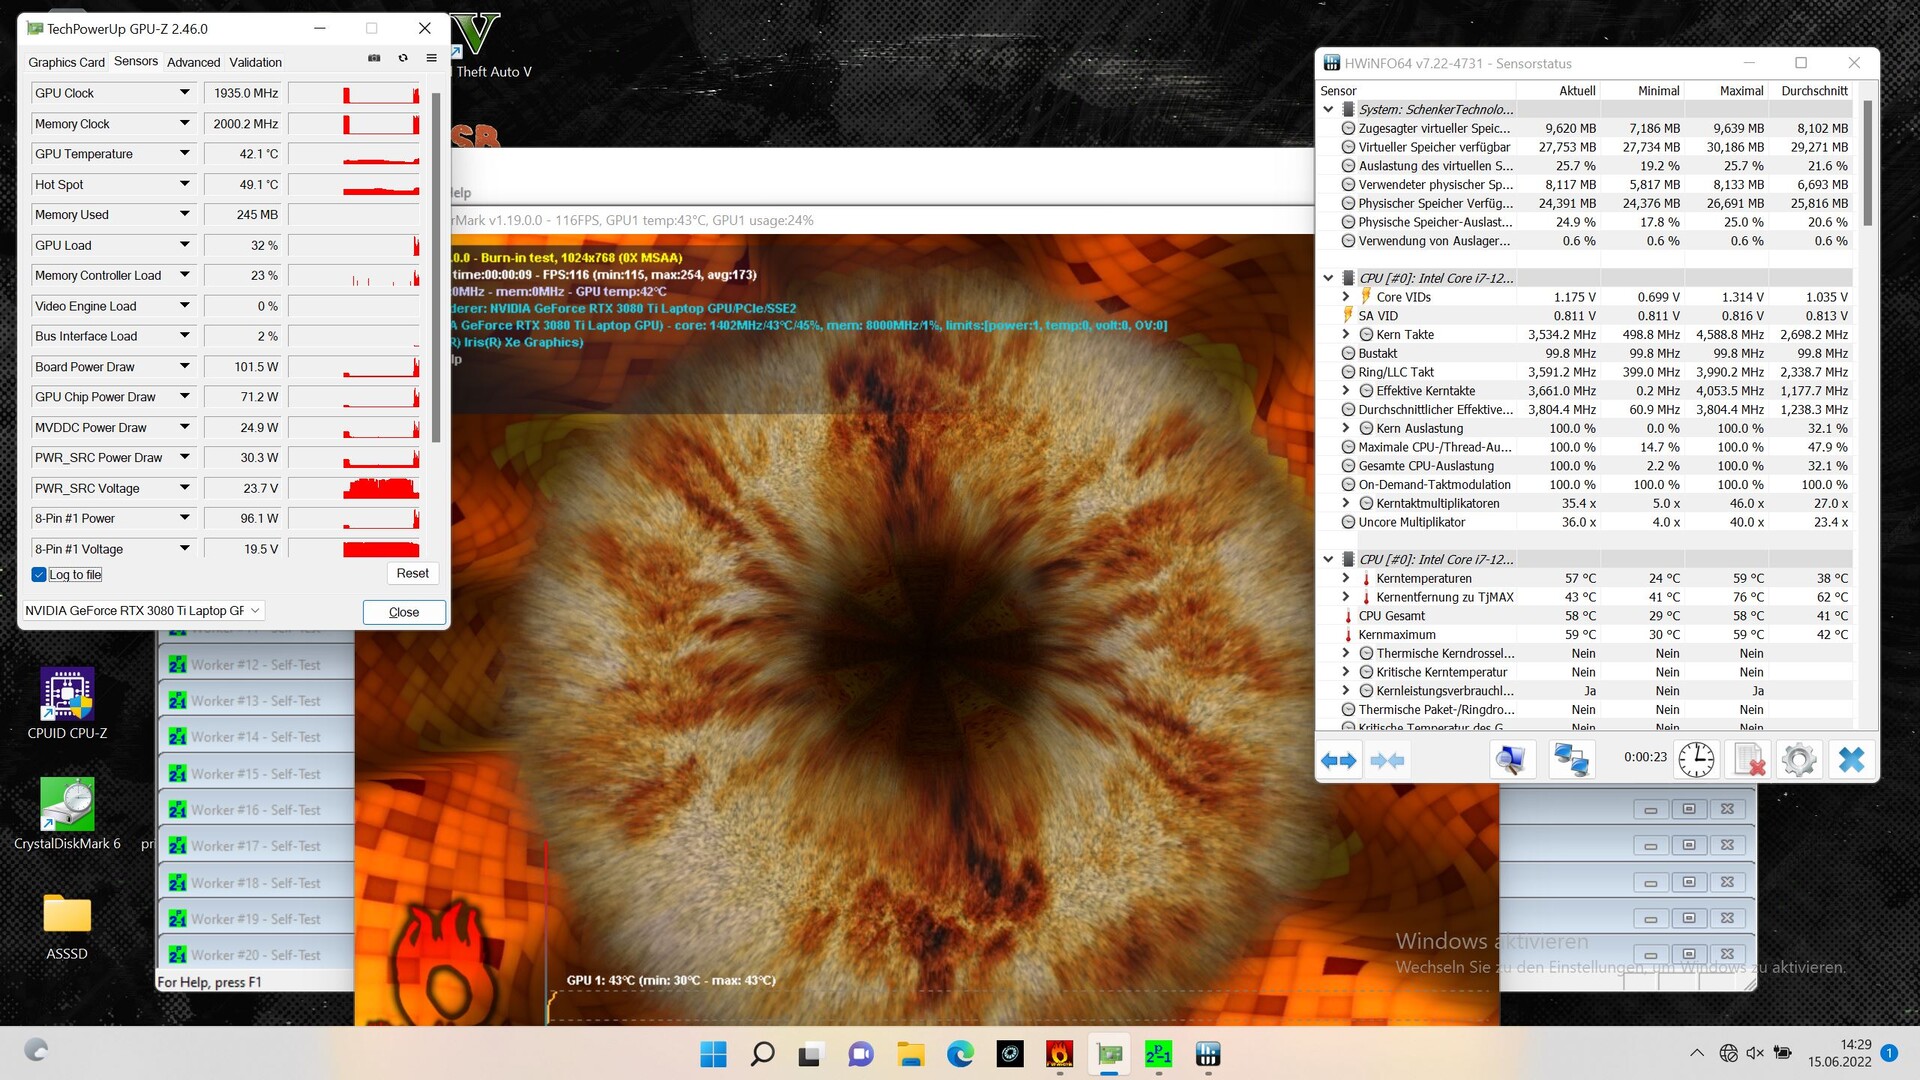
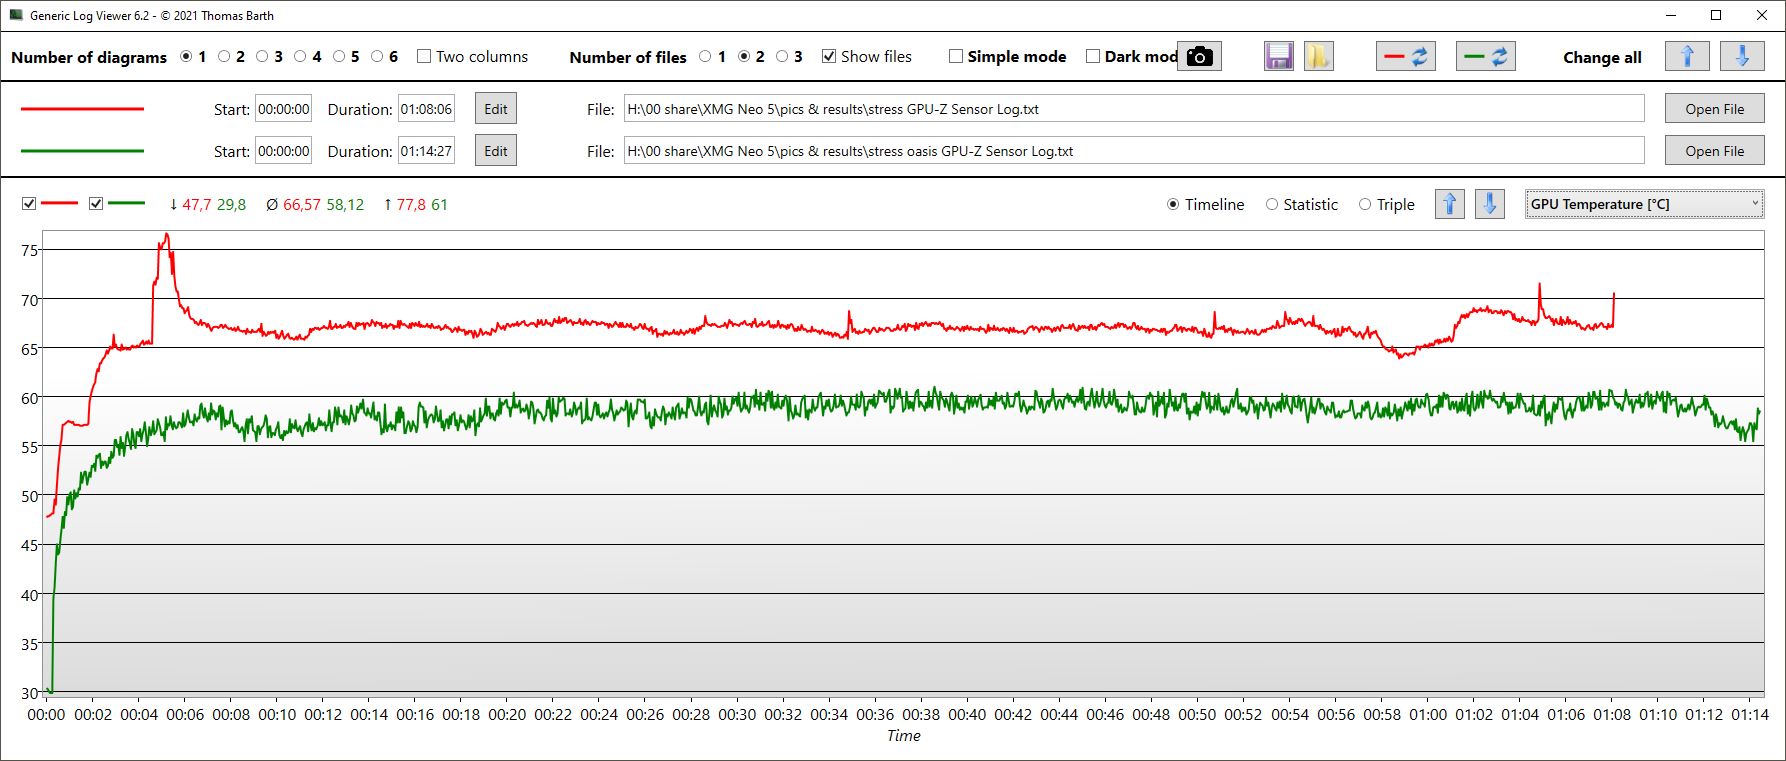
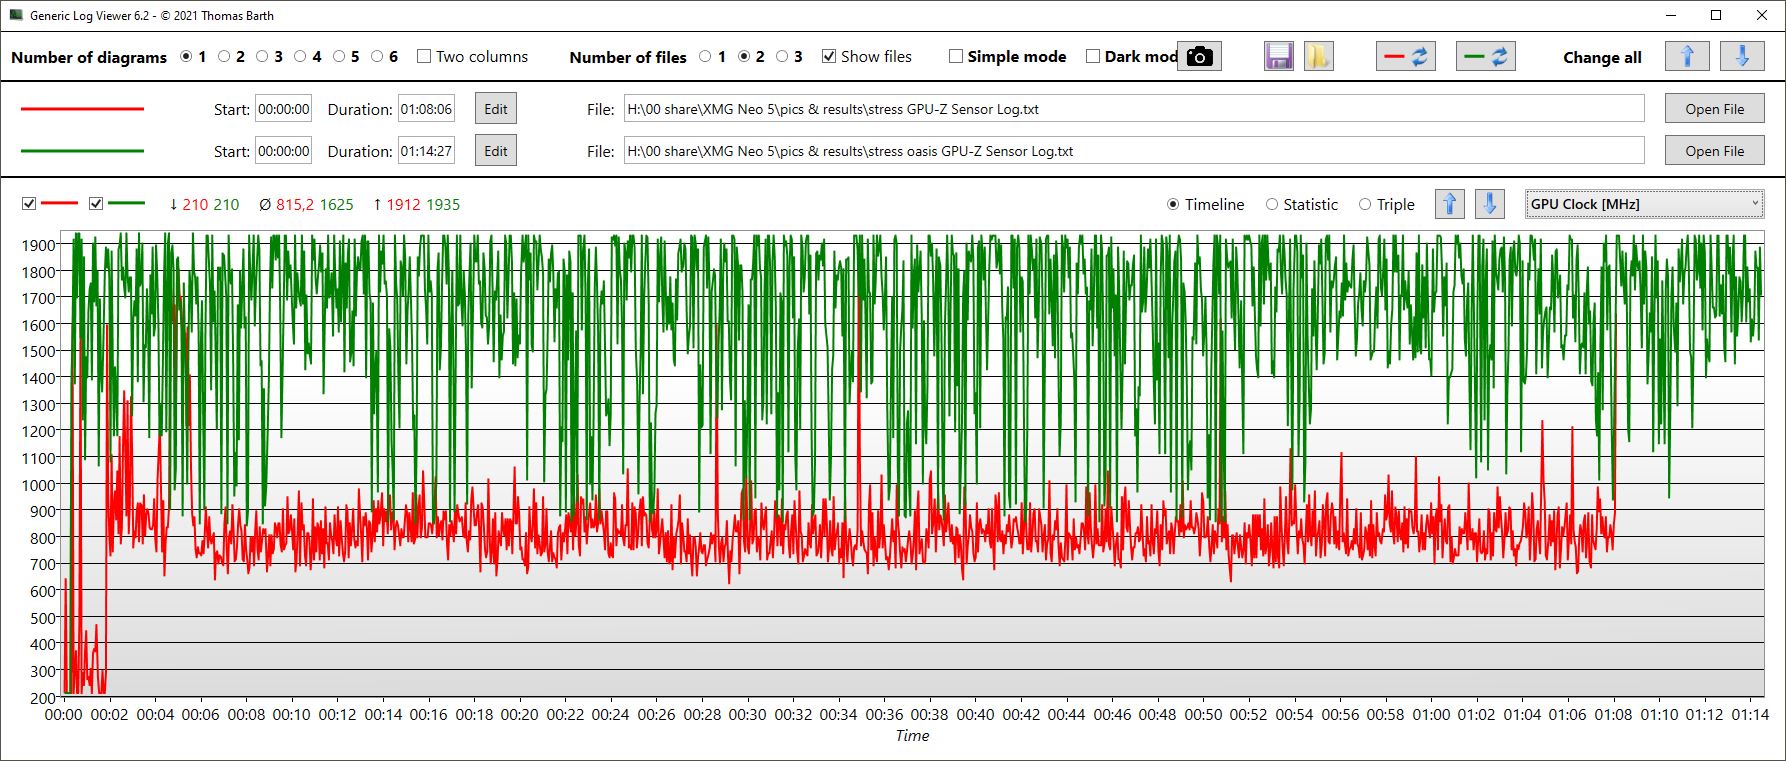
| con / sin Oasis | Relojdela CPU (GHz) | Reloj de la GPU (MHz) | Temperatura mediadela CPU (°C) | Temperatura media de la GPU (°C) |
| Prime95 + FurMark Stress | 3,3 / 3,6 | 815 / 1.625 | 90 / 79 | 67 / 58 |
| Witcher 3 Estrés | 3,2 | 1.435 / 1.602 | 86 / 60 | 86 / 59 |
Altavoces
A pesar de que los altavoces son ligeramente más grandes que los de su predecesor, el Neo reproduce a un volumen bastante mediocre y sigue ofreciendo muy pocos graves. Los medios también son demasiado altos. Sólo los agudos están bastante equilibrados.
El Neo ofrece dos puertos jack para conectar dispositivos de audio analógicos, concretamente unos separados para auriculares y micrófonos.
Schenker XMG Neo 15 (i7-12700H, RTX 3080 Ti) análisis de audio
(±) | la sonoridad del altavoz es media pero buena (78.58 dB)
Graves 100 - 315 Hz
(-) | casi sin bajos - de media 17.9% inferior a la mediana
(±) | la linealidad de los graves es media (8% delta a frecuencia anterior)
Medios 400 - 2000 Hz
(±) | medias más altas - de media 7% más altas que la mediana
(±) | la linealidad de los medios es media (9% delta respecto a la frecuencia anterior)
Altos 2 - 16 kHz
(+) | máximos equilibrados - a sólo 3.7% de la mediana
(±) | la linealidad de los máximos es media (8.5% delta a frecuencia anterior)
Total 100 - 16.000 Hz
(±) | la linealidad del sonido global es media (19.8% de diferencia con la mediana)
En comparación con la misma clase
» 70% de todos los dispositivos probados de esta clase eran mejores, 6% similares, 24% peores
» El mejor tuvo un delta de 6%, la media fue 18%, el peor fue ###max##%
En comparación con todos los dispositivos probados
» 51% de todos los dispositivos probados eran mejores, 7% similares, 42% peores
» El mejor tuvo un delta de 4%, la media fue 23%, el peor fue ###max##%
Razer Blade 15 2022 análisis de audio
(+) | los altavoces pueden reproducir a un volumen relativamente alto (#90.9 dB)
Graves 100 - 315 Hz
(-) | casi sin bajos - de media 21% inferior a la mediana
(±) | la linealidad de los graves es media (9.7% delta a frecuencia anterior)
Medios 400 - 2000 Hz
(+) | medios equilibrados - a sólo 3.9% de la mediana
(+) | los medios son lineales (3.9% delta a la frecuencia anterior)
Altos 2 - 16 kHz
(+) | máximos equilibrados - a sólo 4.2% de la mediana
(±) | la linealidad de los máximos es media (7.8% delta a frecuencia anterior)
Total 100 - 16.000 Hz
(±) | la linealidad del sonido global es media (15.7% de diferencia con la mediana)
En comparación con la misma clase
» 37% de todos los dispositivos probados de esta clase eran mejores, 7% similares, 57% peores
» El mejor tuvo un delta de 6%, la media fue 18%, el peor fue ###max##%
En comparación con todos los dispositivos probados
» 24% de todos los dispositivos probados eran mejores, 5% similares, 71% peores
» El mejor tuvo un delta de 4%, la media fue 23%, el peor fue ###max##%
Gestión de la energía: Un alto rendimiento equivale a un alto consumo
Consumo de energía
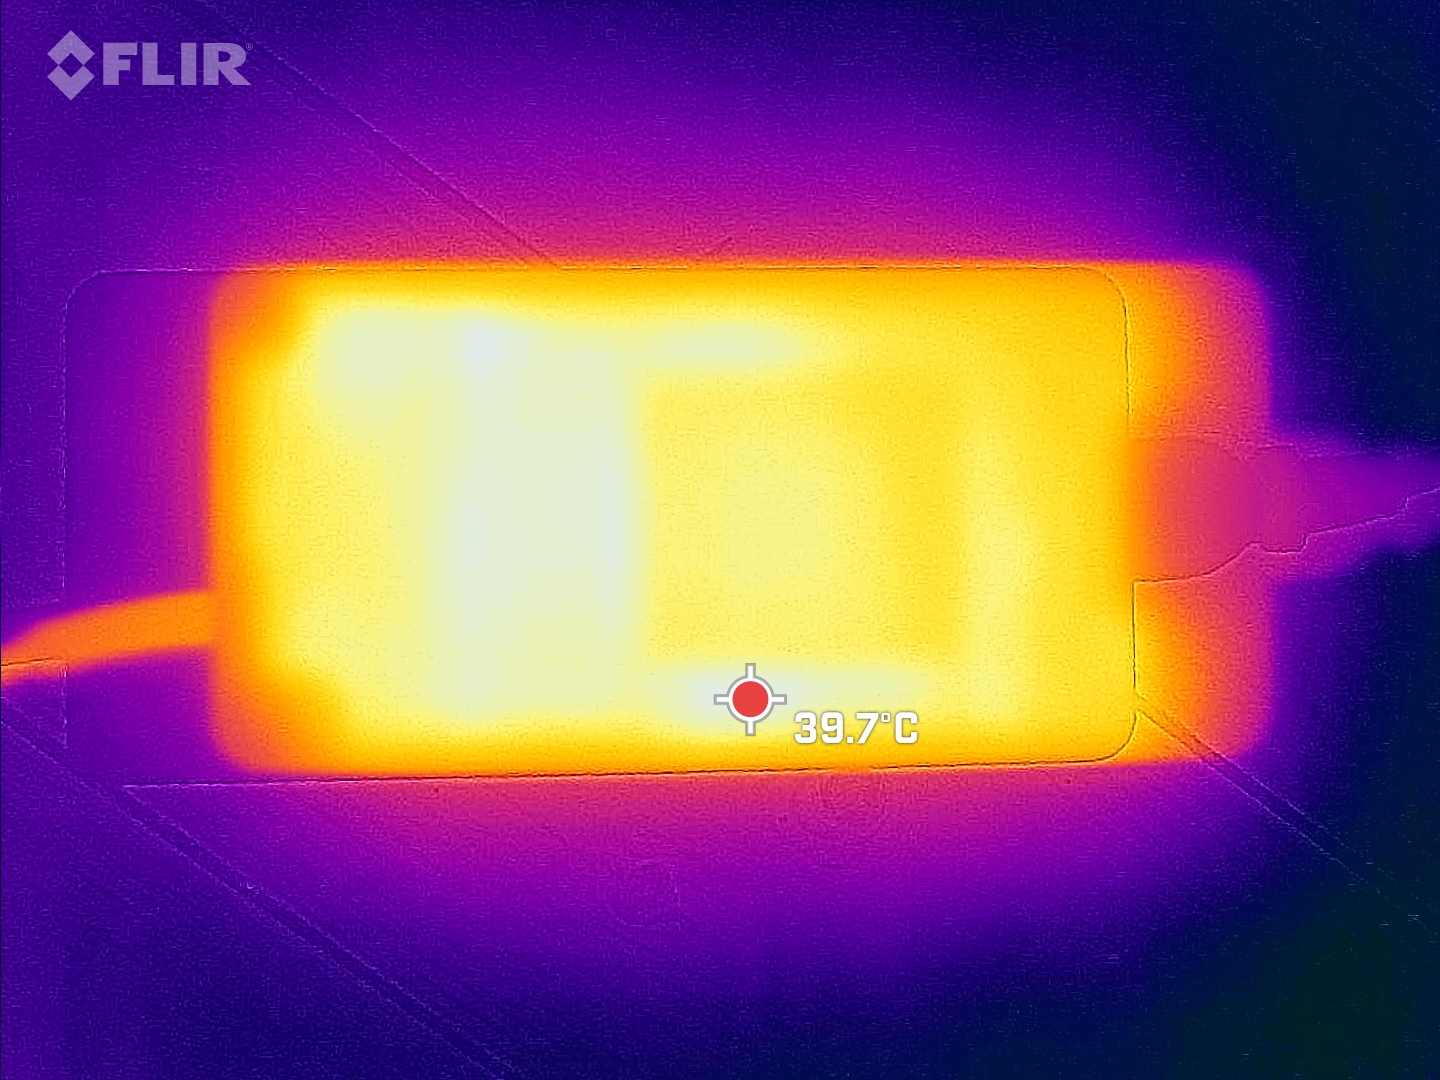
El consumo de energía del Neo es bastante bajo en reposo, pero mayor que el de muchos competidores bajo carga. Sólo el Alienware consume más. Medimos picos de carga a corto plazo de unos 300 W, pero los juegos consumieron 234 W de media. La enorme (aprox. 18 x 8,5 x 3,5 cm) fuente de alimentación de 280 W debería por tanto tener siempre suficientes reservas. También está prevista una fuente de alimentación de 330 W para usuarios extremos.
El consumo de energía del Oasis varía entre 4 y 9 vatios. Hemos medido una media de 6,6 W en modo equilibrado.
| Ocioso | |
| Carga |
|
Clave:
min: | |
| Schenker XMG Neo 15 (i7-12700H, RTX 3080 Ti) i7-12700H, GeForce RTX 3080 Ti Laptop GPU, Samsung SSD 980 Pro 1TB MZ-V8P1T0BW, IPS, 2560x1440, 15.6" | Schenker XMG Neo 15 Tiger Lake i7-11800H, GeForce RTX 3080 Laptop GPU, Samsung SSD 980 Pro 1TB MZ-V8P1T0BW, IPS, 2560x1440, 15.6" | Razer Blade 15 2022 i7-12800H, GeForce RTX 3080 Ti Laptop GPU, SSSTC CA6-8D1024, IPS, 2560x1440, 15.6" | Asus ROG Zephyrus Duo 16 GX650RX R9 6900HX, GeForce RTX 3080 Ti Laptop GPU, 2x Samsung SSD 980 Pro 2TB MZ-V8P2T0 (RAID 0), IPS-Level, 3840x2400, 16" | Gigabyte Aero 16 YE5 i9-12900HK, GeForce RTX 3080 Ti Laptop GPU, Phison ESR01TBMFCT, AMOLED, 3840x2400, 16" | Alienware x17 R2 P48E i9-12900HK, GeForce RTX 3080 Ti Laptop GPU, 2x Samsung PM9A1 1TB (RAID 0), IPS, 1920x1080, 17.3" | Medio NVIDIA GeForce RTX 3080 Ti Laptop GPU | Media de la clase Gaming | |
|---|---|---|---|---|---|---|---|---|
| Power Consumption | 7% | -46% | -14% | -34% | -62% | -21% | -1% | |
| Idle Minimum * (Watt) | 15 | 15 -0% | 33.2 -121% | 19 -27% | 26 -73% | 24.1 -61% | 17.2 ? -15% | 13 ? 13% |
| Idle Average * (Watt) | 18 | 17 6% | 36.4 -102% | 24 -33% | 30 -67% | 28.5 -58% | 23.3 ? -29% | 19 ? -6% |
| Idle Maximum * (Watt) | 18 | 22 -22% | 37.6 -109% | 31 -72% | 37 -106% | 60 -233% | 30.8 ? -71% | 24.6 ? -37% |
| Load Average * (Watt) | 123 | 101 18% | 116.7 5% | 104 15% | 127 -3% | 128.7 -5% | 121.2 ? 1% | 110.7 ? 10% |
| Witcher 3 ultra * (Watt) | 234 | 195 17% | 172 26% | 186.5 20% | 176 25% | 254 -9% | ||
| Load Maximum * (Watt) | 301 | 230 24% | 228.6 24% | 256 15% | 236 22% | 323 -7% | 276 ? 8% | 259 ? 14% |
* ... más pequeño es mejor
Power consumption Witcher 3 / Stress test
Power consumption with external monitor
Duración de la batería
La batería de 93 Wh es más o menos del mismo tamaño que ofrecen los dispositivos de la competencia. La reducción de la tasa de refresco de 240 Hz a 60 Hz es importante para una duración larga y razonable.
Una noche de cine puede planearse durante siete horas enteras a brillo reducido, o algo más de 3 horas a 240 Hz. La navegación web sencilla también dura entre 6 y 7 horas, dependiendo del brillo.
En el modo de batería, el Oasis no está activo porque se alimenta del enchufe de la red y no puede ser revertido por el Neo.
| Schenker XMG Neo 15 (i7-12700H, RTX 3080 Ti) i7-12700H, GeForce RTX 3080 Ti Laptop GPU, 93 Wh | Schenker XMG Neo 15 Tiger Lake i7-11800H, GeForce RTX 3080 Laptop GPU, 93 Wh | Razer Blade 15 2022 i7-12800H, GeForce RTX 3080 Ti Laptop GPU, 80 Wh | Asus ROG Zephyrus Duo 16 GX650RX R9 6900HX, GeForce RTX 3080 Ti Laptop GPU, 90 Wh | Gigabyte Aero 16 YE5 i9-12900HK, GeForce RTX 3080 Ti Laptop GPU, 99 Wh | Alienware x17 R2 P48E i9-12900HK, GeForce RTX 3080 Ti Laptop GPU, 87 Wh | Media de la clase Gaming | |
|---|---|---|---|---|---|---|---|
| Duración de Batería | 12% | -36% | -0% | -1% | -61% | 3% | |
| H.264 (h) | 7.1 | 5.9 -17% | 9.3 31% | 7.5 6% | 8.32 ? 17% | ||
| WiFi v1.3 (h) | 7.7 | 5.6 -27% | 4.9 -36% | 7.8 1% | 6.4 -17% | 2 -74% | 7.11 ? -8% |
| Load (h) | 1.5 | 2.7 80% | 1 -33% | 1.6 7% | 0.8 -47% | 1.502 ? 0% | |
| Reader / Idle (h) | 12.5 | 8.9 | 3.9 | 8.27 ? |
Pro
Contra
Veredicto: ¿Oasis es una bendición para los jugadores?

La puntuación de la reseña mostrada aquí se refiere al XMG Neo 15 sin refrigeración líquida, que debe adquirirse por separado como accesorio
Aparte del rendimiento bruto, también nos gustó el teclado, el diseño, la construcción y, salvo algunos inconvenientes, la pantalla. Por supuesto, el formato de 15 pulgadas tiene límites térmicos que restringen el rendimiento, pero las limitaciones son muy leves. A cambio, sin embargo, el Neo también se vuelve muy ruidoso y cálido
Utilizando el sistema de refrigeración líquida Oasis, las temperaturas y, por tanto, la carga térmica del hardware descienden drásticamente. Las ventajas de rendimiento son mínimas, ya que el Neo tiene pocas limitaciones por sí mismo. Los usuarios tienen que llevar al máximo todos los valores de rendimiento para alcanzar el límite térmico y beneficiarse del Oasis en términos de rendimiento
Dicho esto, el Oasis sí aporta ventajas en otras áreas: el volumen disminuye notablemente durante los juegos y las temperaturas bajan aún más. Esto sólo puede favorecer la longevidad de los componentes. Aunque el sistema de refrigeración líquida no está pensado para el uso móvil, aporta claras ventajas en el uso estacionario
En consecuencia, la valoración del Neo sería algo mayor con Oasis. Pero en cierto modo, Oasis simplemente oculta las debilidades del Neo 15, que es el dispositivo más ruidoso y caliente en su campo en ausencia de refrigeración líquida. Los valores de rendimiento, por su parte, no son criticables.
El XMG Neo 15 es un gamer extremadamente potente con muchas opciones manuales, pero también es muy ruidoso y caliente. Junto con el XMG Oasis, estos inconvenientes se mitigan, aunque todavía hay potencial de optimización.
El Razer Blade 15, por ejemplo, funciona de forma mucho más silenciosa que el Neo 15 incluso sin refrigeración por agua, pero no tiene el mismo nivel de rendimiento bruto.
Precio y disponibilidad
El Neo 15 (E22) se puede configurar y pedir a través de la propia página web de Schenker bestware.com. La versión de nuestra unidad de revisión costaba unos 3.400 euros, y una licencia de Windows 11 Home es opcional por unos 40 euros.
El XMG Oasis puede pedirse directamente en el configurador por 199 euros. Extrañamente, el Oasis puede pedirse en un paquete doble, lo que esperemos que no sea indicativo de una vida corta, porque por supuesto sólo se puede conectar un Oasis a un Neo a la vez.
Schenker XMG Neo 15 (i7-12700H, RTX 3080 Ti)
- 07/06/2022 v7 (old)
Christian Hintze
Price comparison

