Análisis del portátil para juegos Lenovo Legion Slim 7 16: Convence incluso con AMD Ryzen

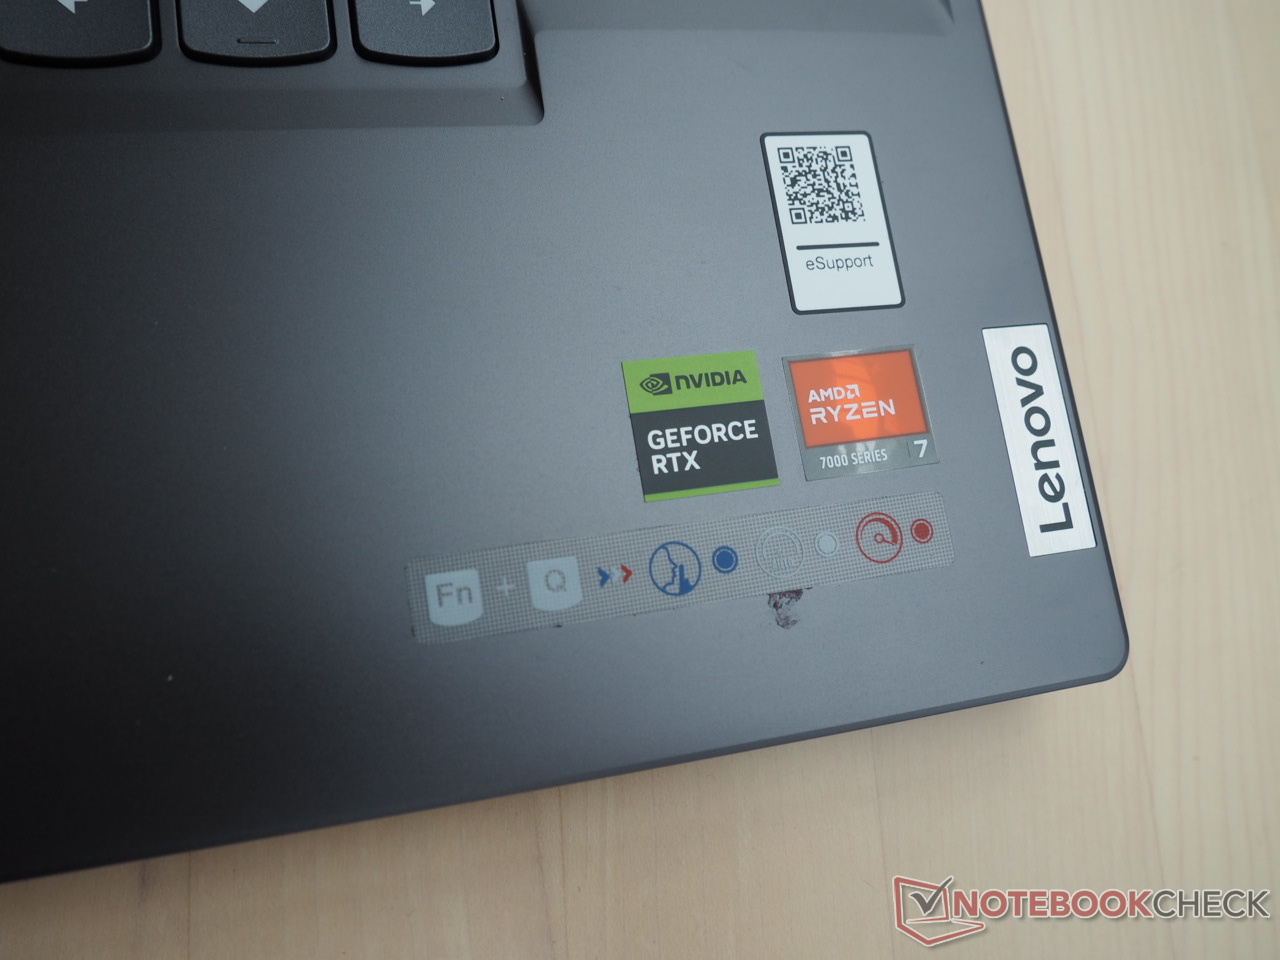
Además de los procesadores Intel, Lenovo ofrece CPU AMD para la serie Legion Slim 7. El modelo que probamos, 16APH8, cuenta con un procesador Ryzen 7 7840HS emparejado con un procesador GeForce RTX 4060 GPU, 32 GB DDR5-5600-RAM y una espaciosa SSD M.2 de 1 TB. El portátil cuenta con una vibrante pantalla WQXGA con una resolución de 2.560 x 1.600 píxeles, una alta frecuencia de actualización de 240 Hz, calibración de fábrica y compatibilidad con HDR, Windows 11 Home completa el producto. A pesar de sus impresionantes especificaciones, el 16APH8 tiene un precio de unos 1750 USD, lo que lo hace relativamente caro para un portátil equipado con una tarjeta gráfica RTX 4060.
El Slim 7 se enfrenta a la competencia de otros portátiles para juegos de 16 pulgadas que incorporan la RTX 4060, incluidos modelos como el Asus ROG Flow X16 GV601V, Alienware m16 R1, Acer Predator Helios 16 PH16-71-731Q, así como el propio de Lenovo Legion Pro 5 16IRX8 y Lenovo LOQ 16IRH8 de Lenovo.
Posibles contendientes en la comparación
Valoración | Fecha | Modelo | Peso | Altura | Tamaño | Resolución | Precio |
|---|---|---|---|---|---|---|---|
| 90.4 % v7 (old) | 11/2023 | Lenovo Legion Slim 7 16APH8 R7 7840HS, GeForce RTX 4060 Laptop GPU | 2.1 kg | 20 mm | 16.00" | 2560x1600 | |
| 89.7 % v7 (old) | 06/2023 | Asus ROG Flow X16 GV601V i9-13900H, GeForce RTX 4060 Laptop GPU | 2.1 kg | 19.4 mm | 16.00" | 2560x1600 | |
| 88.3 % v7 (old) | 09/2023 | Alienware m16 R1 Intel i7-13700HX, GeForce RTX 4060 Laptop GPU | 3 kg | 25.4 mm | 16.00" | 2560x1600 | |
| 89.5 % v7 (old) | 07/2023 | Acer Predator Helios 16 PH16-71-731Q i7-13700HX, GeForce RTX 4060 Laptop GPU | 2.6 kg | 26.9 mm | 16.00" | 2560x1600 | |
| 87.9 % v7 (old) | 05/2023 | Lenovo Legion Pro 5 16IRX8 i7-13700HX, GeForce RTX 4060 Laptop GPU | 2.5 kg | 26.8 mm | 16.00" | 2560x1600 | |
| 87.3 % v7 (old) | 09/2023 | Lenovo LOQ 16IRH8 i7-13620H, GeForce RTX 4060 Laptop GPU | 2.7 kg | 25.9 mm | 16.00" | 2560x1600 |
A excepción de algunas pequeñas diferencias, la carcasa es la misma que la de la Versión Intel con el Core i9-13900H y GeForce RTX 4070 que ya hemos examinado. Por tanto, en este artículo nos limitaremos a repasar brevemente la carcasa, las características y los dispositivos de entrada.
Caso
Una de las características más destacadas es su elegante cuerpo. El dispositivo de 16 pulgadas presenta un diseño elegante, materiales de primera calidad y una excelente estabilidad. Con un peso de sólo 4,6 libras, se sitúa en el extremo más ligero de la balanza en comparación con sus competidores.
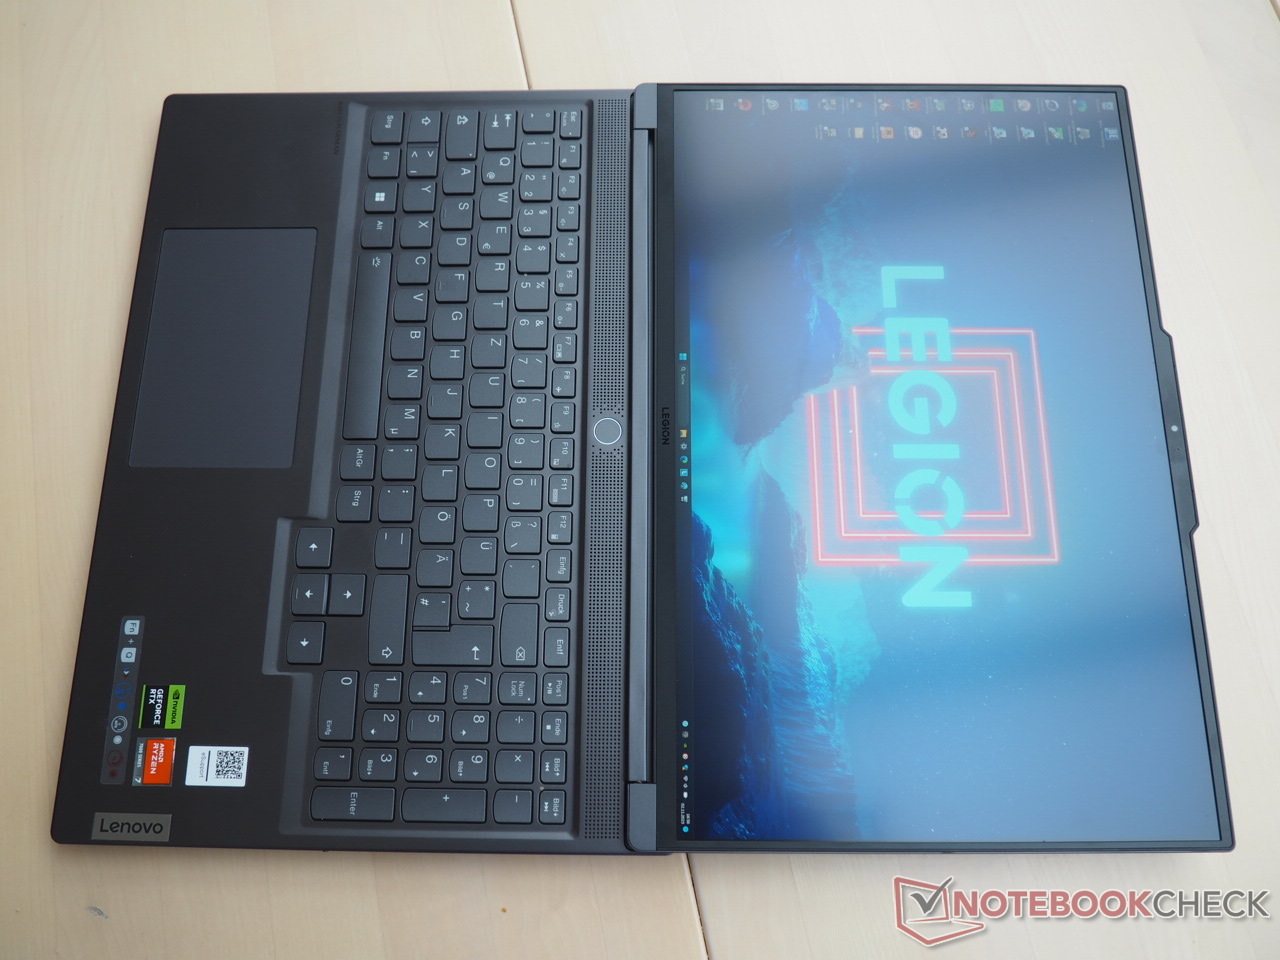
Conectividad
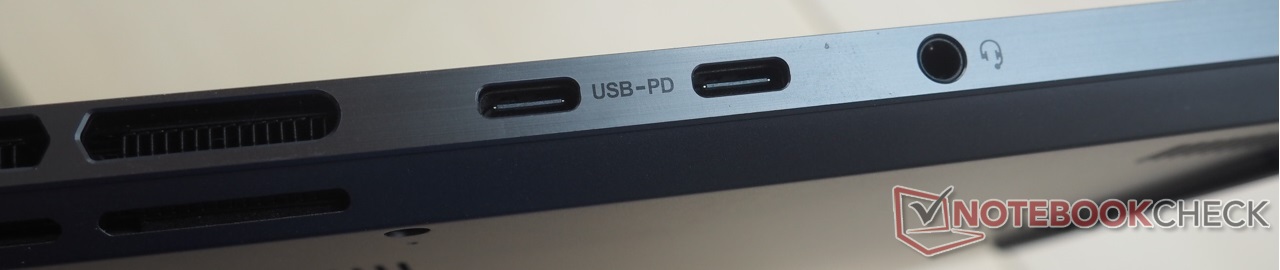
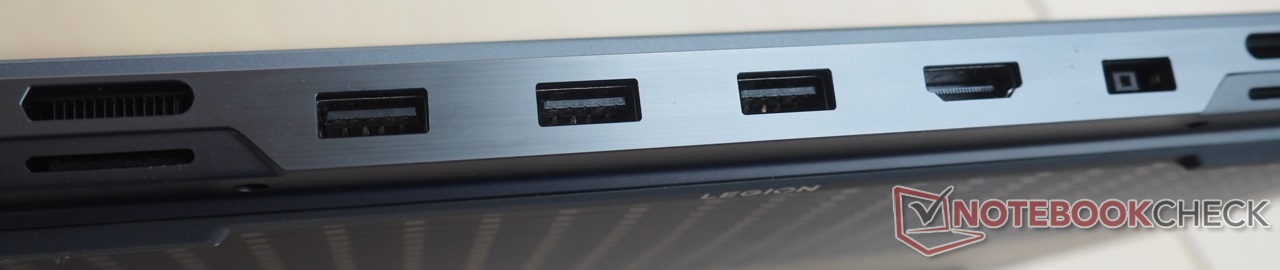
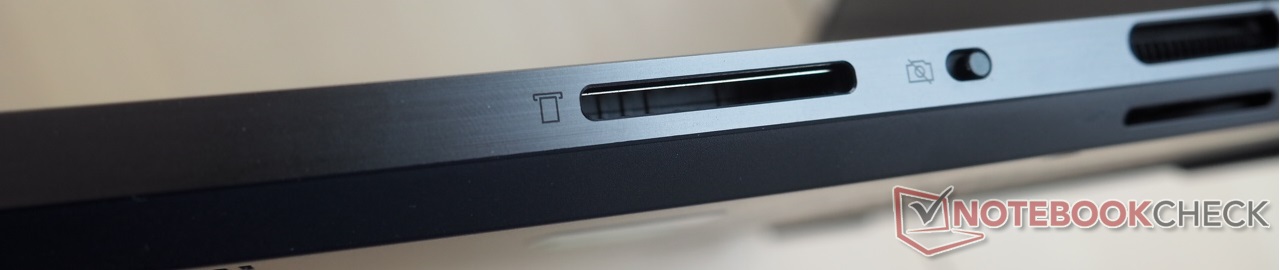
A pesar de la ausencia de un puerto RJ45, el Slim 7 ofrece una generosa gama de conexiones. En el lado derecho, encontrará un lector de tarjetas de velocidad media y un obturador de privacidad para una webcam decente. En el lado izquierdo hay una toma de audio y dos puertos USB (1x USB 4, 1x USB 3.2 Gen2), ambos compatibles con DisplayPort 1.4 y una entrega de potencia de 140 vatios. Además, hay un puerto HDMI 2.1, que permite la conexión de hasta tres monitores externos. En la parte trasera, hay tres puertos USB 3.2 Gen2 y la conexión para la fuente de alimentación de 230 vatios incluida.
Para la conectividad inalámbrica, el portátil utiliza un chip Wi-Fi 6E (MediaTek RZ616), que rinde ligeramente por debajo de la media durante la transmisión pero por encima de la media durante la recepción.
Lector de tarjetas SD
| SD Card Reader | |
| average JPG Copy Test (av. of 3 runs) | |
| Alienware m16 R1 Intel (AV PRO microSD 128 GB V60) | |
| Media de la clase Gaming (20.9 - 210, n=53, últimos 2 años) | |
| Asus ROG Flow X16 GV601V | |
| Lenovo Legion Slim 7 16APH8 (AV PRO microSD 128 GB V60) | |
| Acer Predator Helios 16 PH16-71-731Q | |
| maximum AS SSD Seq Read Test (1GB) | |
| Asus ROG Flow X16 GV601V | |
| Alienware m16 R1 Intel (AV PRO microSD 128 GB V60) | |
| Media de la clase Gaming (25.5 - 261, n=50, últimos 2 años) | |
| Acer Predator Helios 16 PH16-71-731Q | |
| Lenovo Legion Slim 7 16APH8 (AV PRO microSD 128 GB V60) | |
Comunicación
Cámara web


Dispositivos de entrada
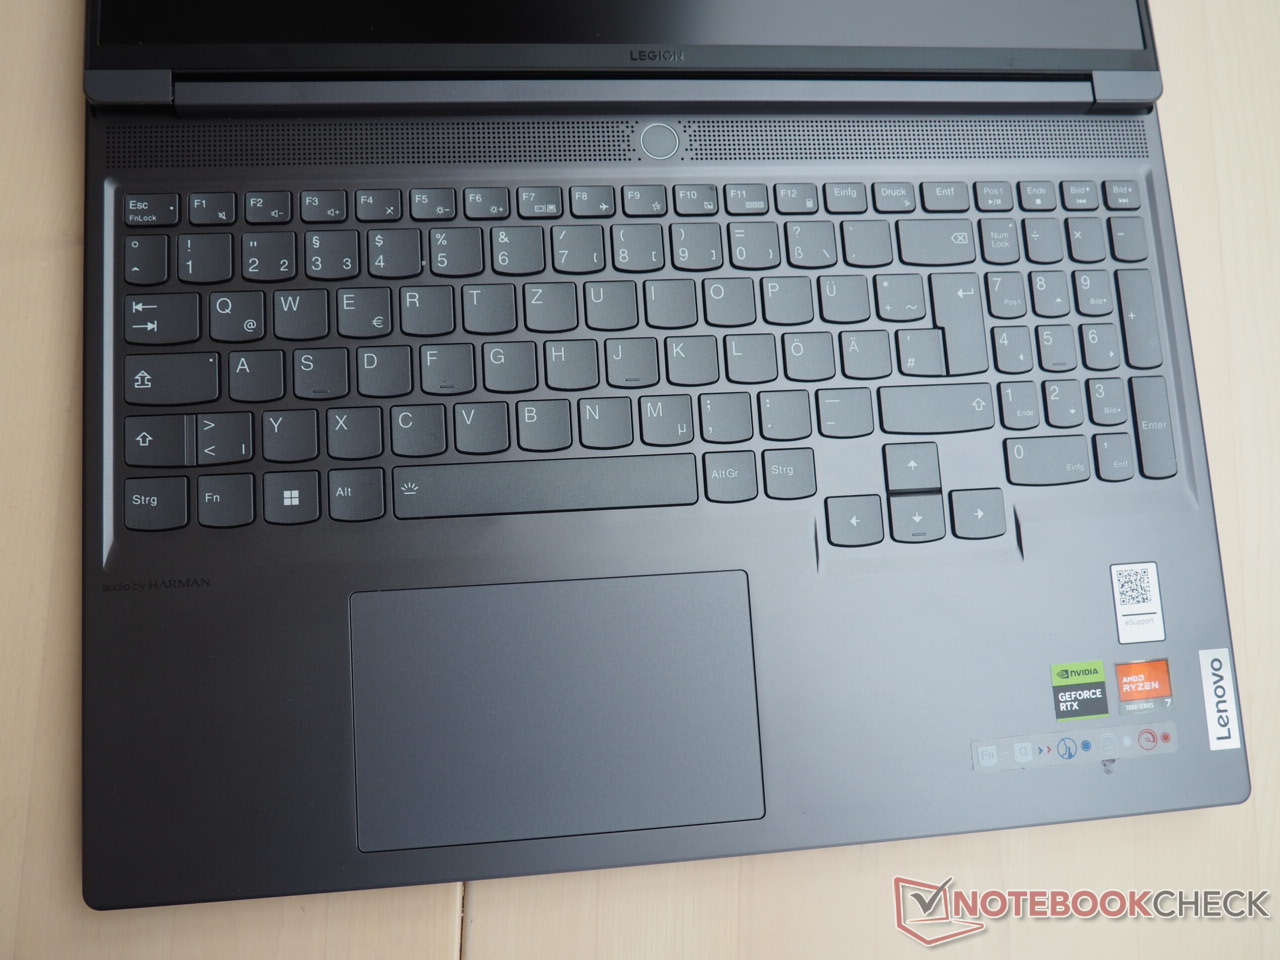
El teclado no sólo ofrece teclas de buen tamaño, sino también una buena distribución, una forma de tecla agradable y un teclado numérico dedicado. También tiene una sólida sensación de tecleo. Una almohadilla de clic que mide aproximadamente 4,72 x 2,95 pulgadas sustituye al ratón y también causa un buen impacto.
Mostrar
Aunque la pantalla del modelo de Intel y la de nuestro dispositivo de prueba comparten características fundamentales comparables, no son iguales. Nuestro modelo contaba con un panel BOE etiquetado como NE160QDM-NZ3.
| |||||||||||||||||||||||||
iluminación: 82 %
Brillo con batería: 545 cd/m²
Contraste: 1135:1 (Negro: 0.48 cd/m²)
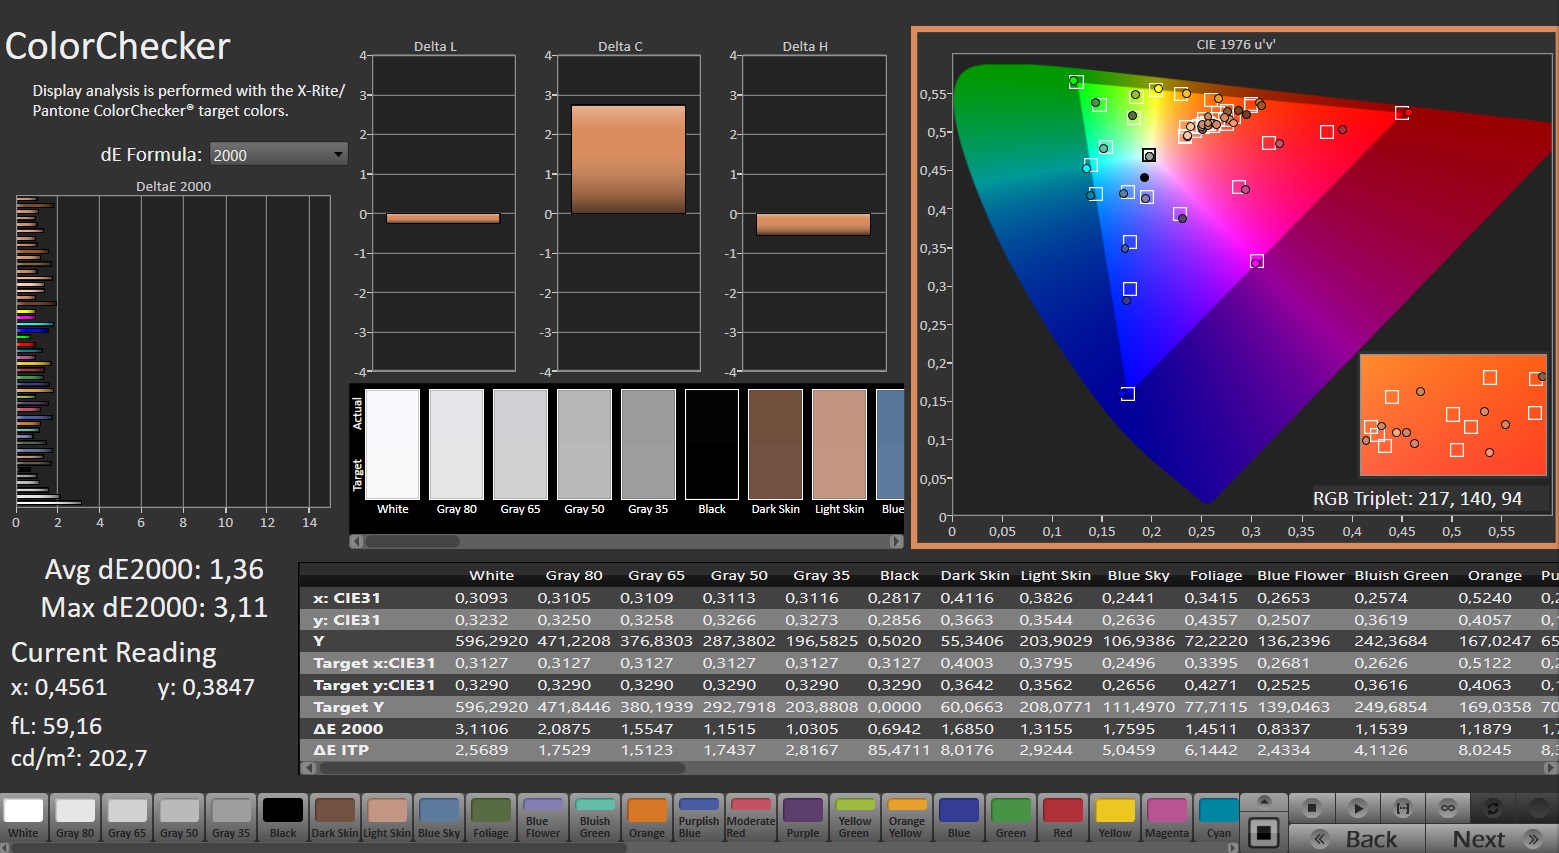
ΔE ColorChecker Calman: 1.36 | ∀{0.5-29.43 Ø4.72}
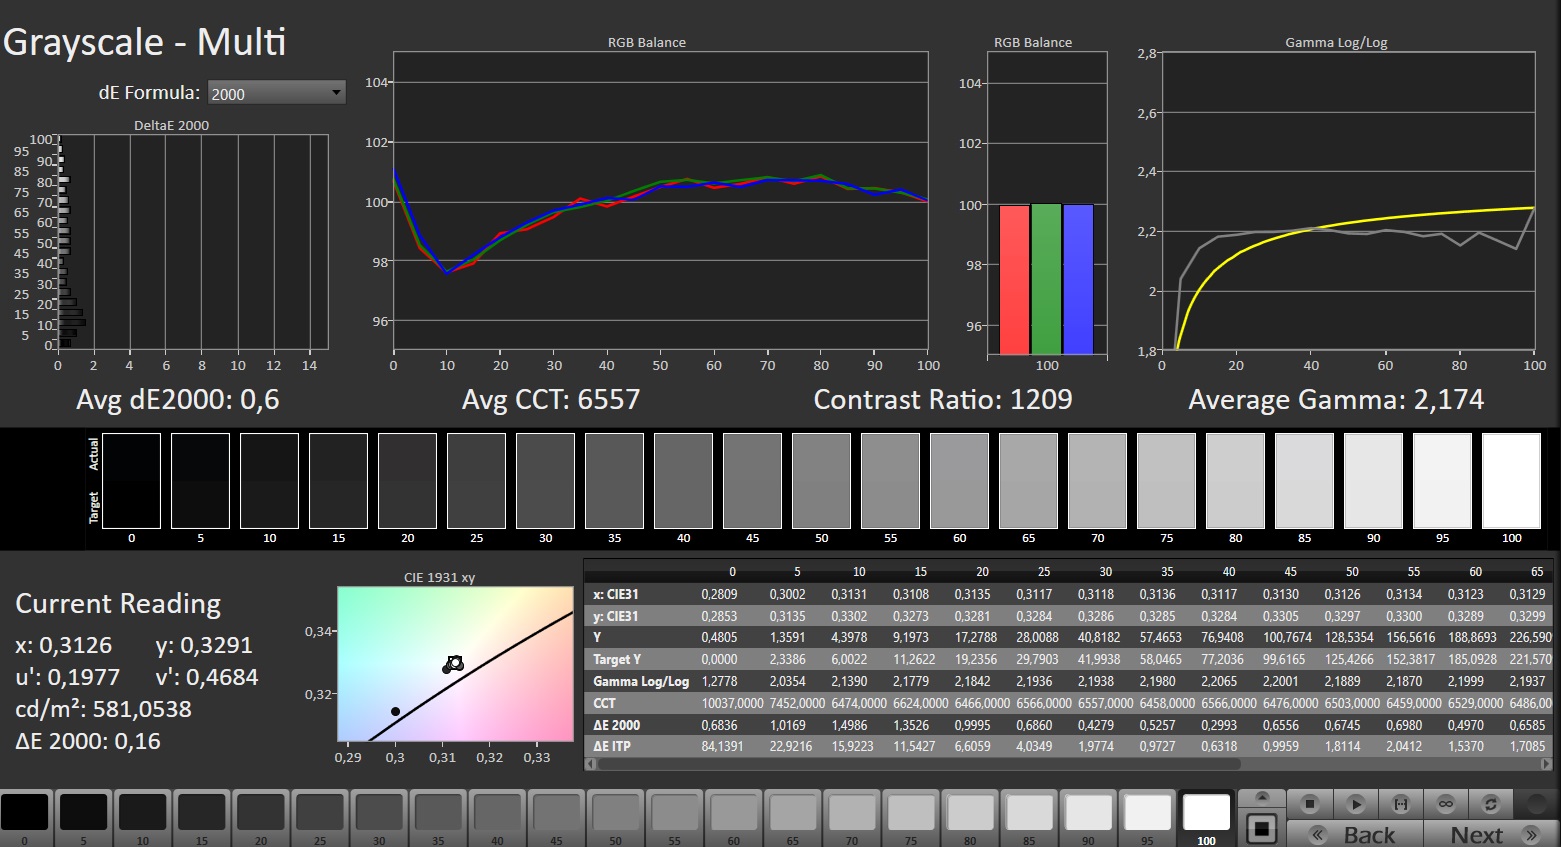
calibrated: 1.04
ΔE Greyscale Calman: 1.4 | ∀{0.09-98 Ø4.97}
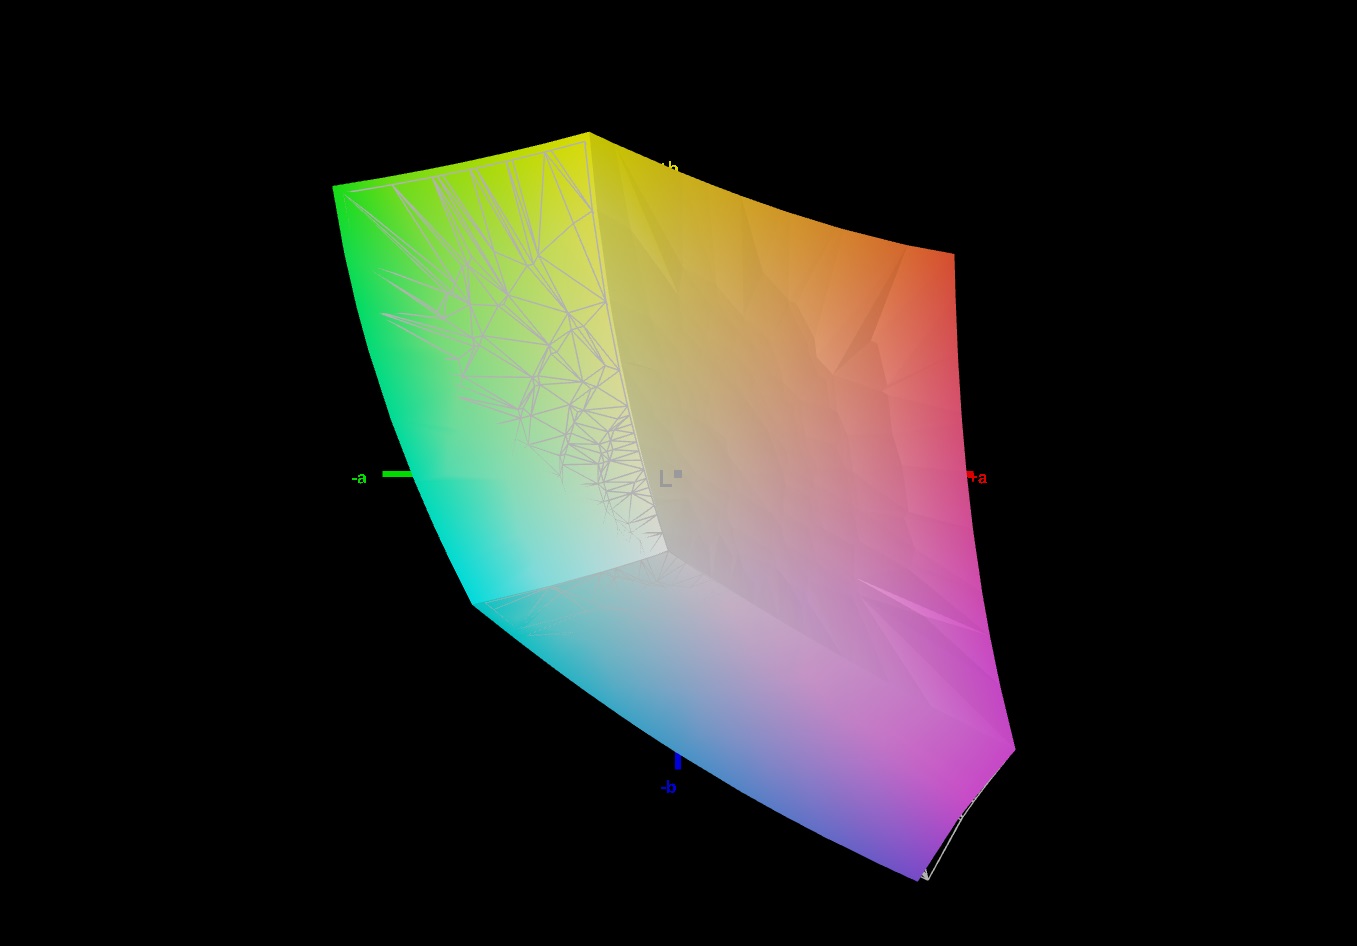
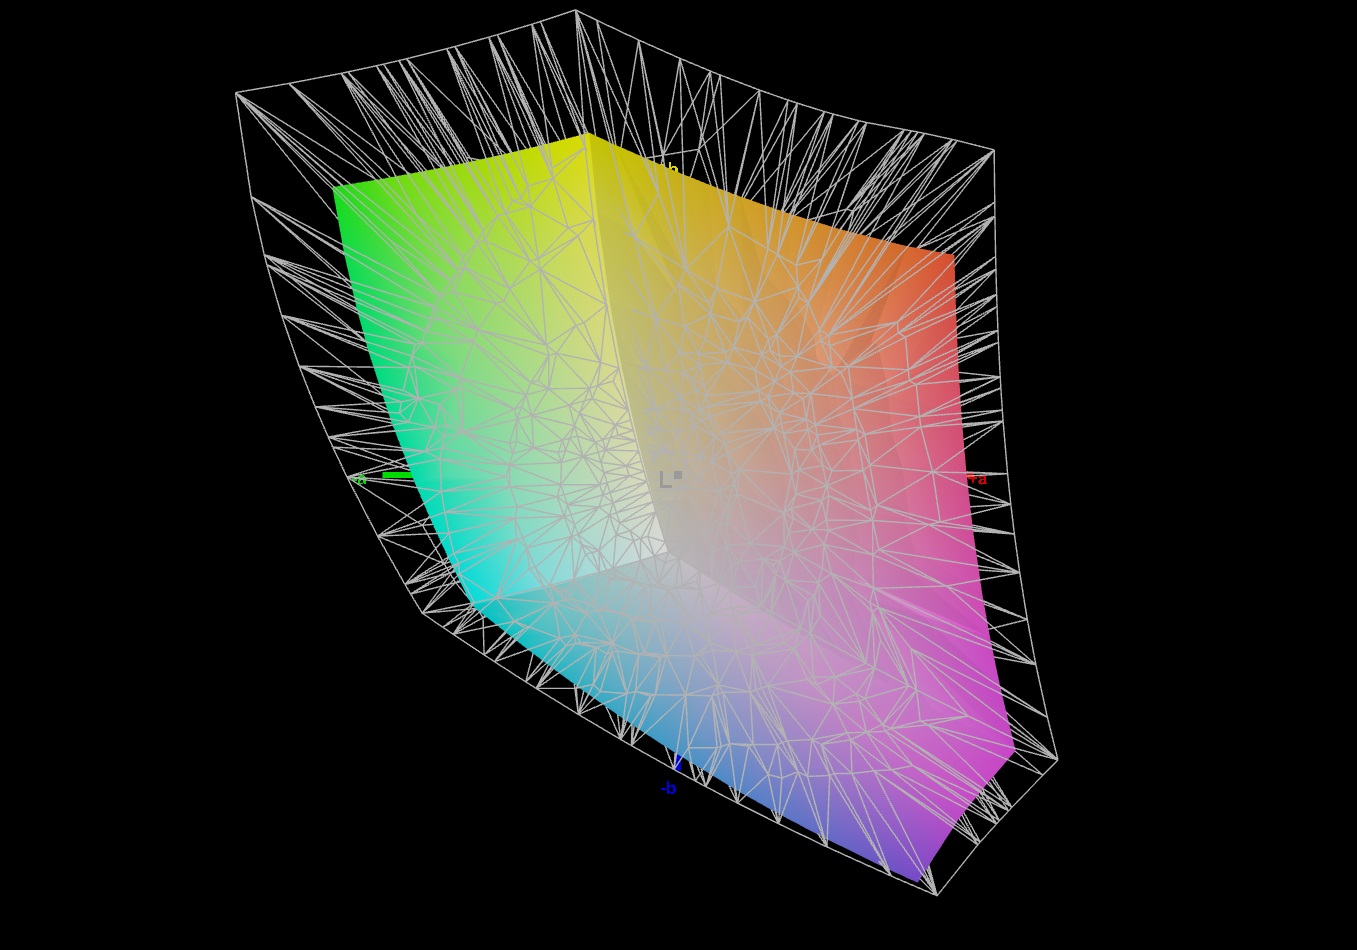
72.4% AdobeRGB 1998 (Argyll 3D)
99.6% sRGB (Argyll 3D)
70.3% Display P3 (Argyll 3D)
Gamma: 2.253
CCT: 6631 K
| Lenovo Legion Slim 7 16APH8 BOE NE160QDM-NZ3, IPS, 2560x1600, 16" | Asus ROG Flow X16 GV601V TMX1603 (TL160ADMP03-0), IPS, 2560x1600, 16" | Alienware m16 R1 Intel BOE NE16NYB, IPS, 2560x1600, 16" | Acer Predator Helios 16 PH16-71-731Q BOE NE160QDM-NZ2, IPS-LED, 2560x1600, 16" | Lenovo Legion Pro 5 16IRX8 AU Optronics B160QAN03.1, IPS, 2560x1600, 16" | Lenovo LOQ 16IRH8 AUOC1A5 (B160QAN03.L), IPS, 2560x1600, 16" | |
|---|---|---|---|---|---|---|
| Display | 18% | -3% | 18% | 0% | -0% | |
| Display P3 Coverage (%) | 70.3 | 96.61 37% | 67.7 -4% | 97.1 38% | 71.2 1% | 70.5 0% |
| sRGB Coverage (%) | 99.6 | 99.92 0% | 97.2 -2% | 100 0% | 98.8 -1% | 98.9 -1% |
| AdobeRGB 1998 Coverage (%) | 72.4 | 84.63 17% | 70 -3% | 84.7 17% | 73.3 1% | 72.6 0% |
| Response Times | 21% | 22% | -8% | -46% | 9% | |
| Response Time Grey 50% / Grey 80% * (ms) | 12.6 ? | 3.8 ? 70% | 4 ? 68% | 13.6 ? -8% | 14.5 ? -15% | 7.2 ? 43% |
| Response Time Black / White * (ms) | 5.9 ? | 7.6 ? -29% | 7.3 ? -24% | 6.4 ? -8% | 10.4 ? -76% | 7.4 ? -25% |
| PWM Frequency (Hz) | ||||||
| Screen | -25% | -32% | -17% | -3% | -7% | |
| Brightness middle (cd/m²) | 545 | 486 -11% | 306 -44% | 511 -6% | 405.7 -26% | 407 -25% |
| Brightness (cd/m²) | 502 | 469 -7% | 302 -40% | 498 -1% | 368 -27% | 369 -26% |
| Brightness Distribution (%) | 82 | 91 11% | 89 9% | 94 15% | 87 6% | 85 4% |
| Black Level * (cd/m²) | 0.48 | 0.39 19% | 0.3 37% | 0.36 25% | 0.38 21% | 0.45 6% |
| Contrast (:1) | 1135 | 1246 10% | 1020 -10% | 1419 25% | 1068 -6% | 904 -20% |
| Colorchecker dE 2000 * | 1.36 | 2.27 -67% | 2.57 -89% | 1.76 -29% | 1.65 -21% | 1.43 -5% |
| Colorchecker dE 2000 max. * | 3.11 | 5.73 -84% | 4.26 -37% | 3.7 -19% | 4.2 -35% | 3.58 -15% |
| Colorchecker dE 2000 calibrated * | 1.04 | 0.6 42% | 0.85 18% | 1.56 -50% | 0.53 49% | 1.07 -3% |
| Greyscale dE 2000 * | 1.4 | 3.36 -140% | 3.3 -136% | 3 -114% | 1.2 14% | 1.13 19% |
| Gamma | 2.253 98% | 2.46 89% | 1.997 110% | 2.33 94% | 2.3 96% | 2.5 88% |
| CCT | 6631 98% | 6625 98% | 6895 94% | 6341 103% | 6453 101% | 6526 100% |
| Media total (Programa/Opciones) | 5% /
-9% | -4% /
-18% | -2% /
-8% | -16% /
-8% | 1% /
-3% |
* ... más pequeño es mejor
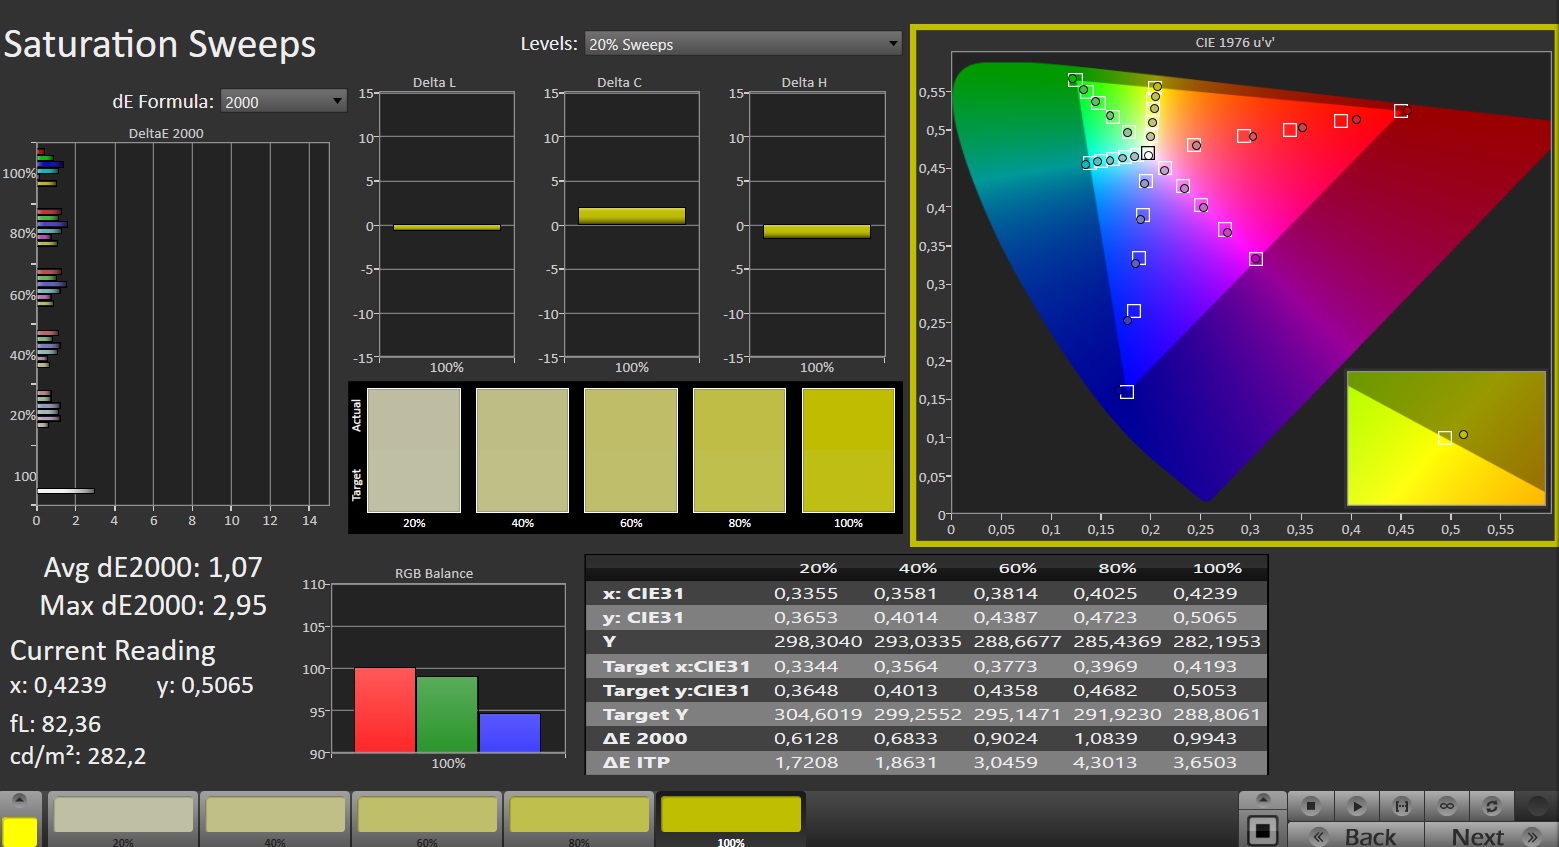
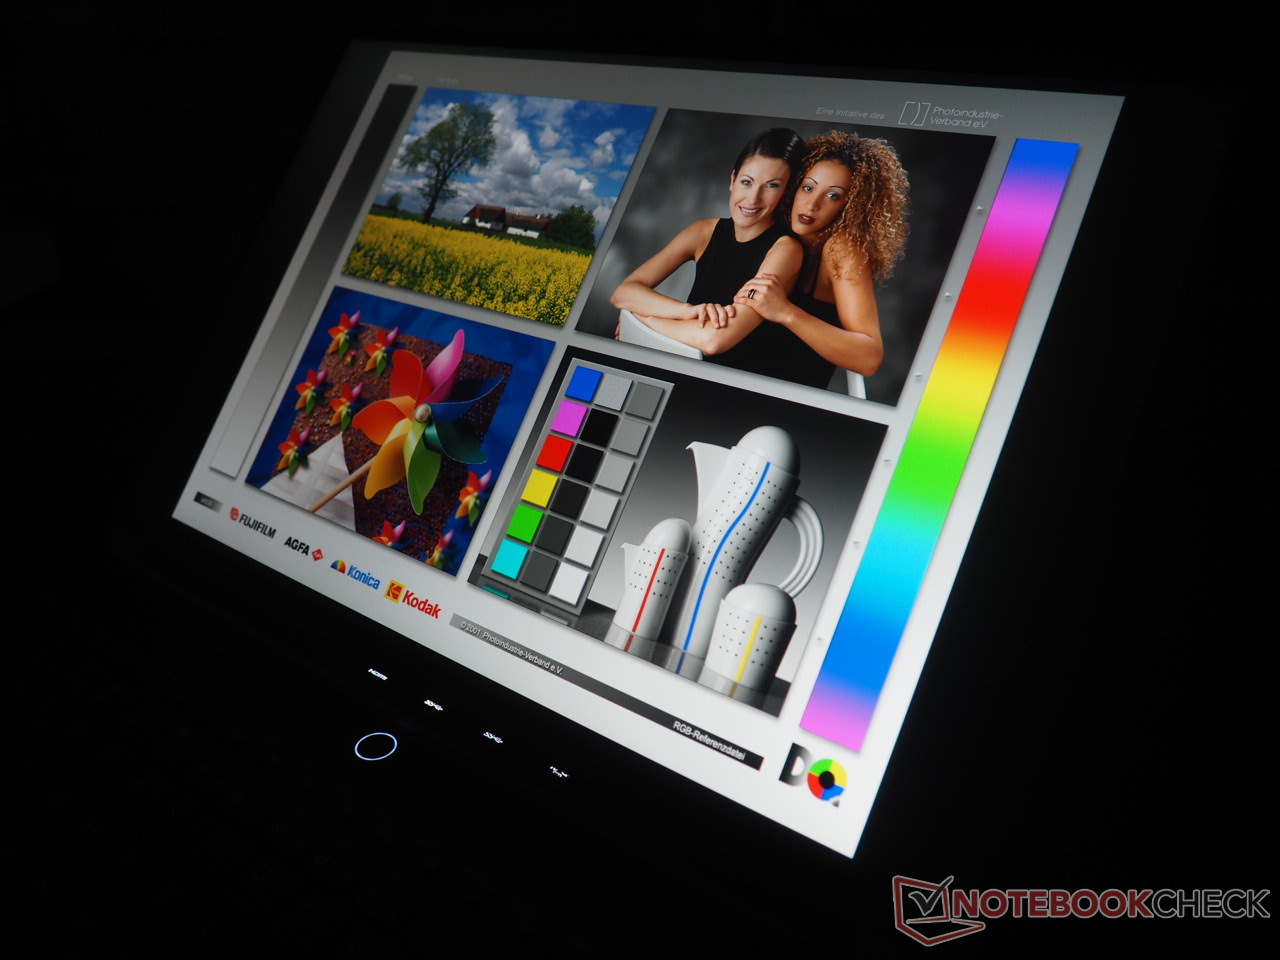
Aparte del espacio de color, que podría ser ligeramente superior teniendo en cuenta el 70% de cobertura DCI-P3 y el 72% de AdobeRGB (en comparación con el Alienware m16 y el Acer Predator Helios 16), la pantalla WQXGA funciona extraordinariamente bien en casi todos los aspectos. Gracias a la calibración de fábrica, la precisión del color es excepcional desde el primer momento. Además, los tiempos de respuesta del panel de 240 Hz son decentes, midiendo algo menos de 6 ms para las transiciones de negro a blanco y 12 ms para las transiciones de gris a gris.
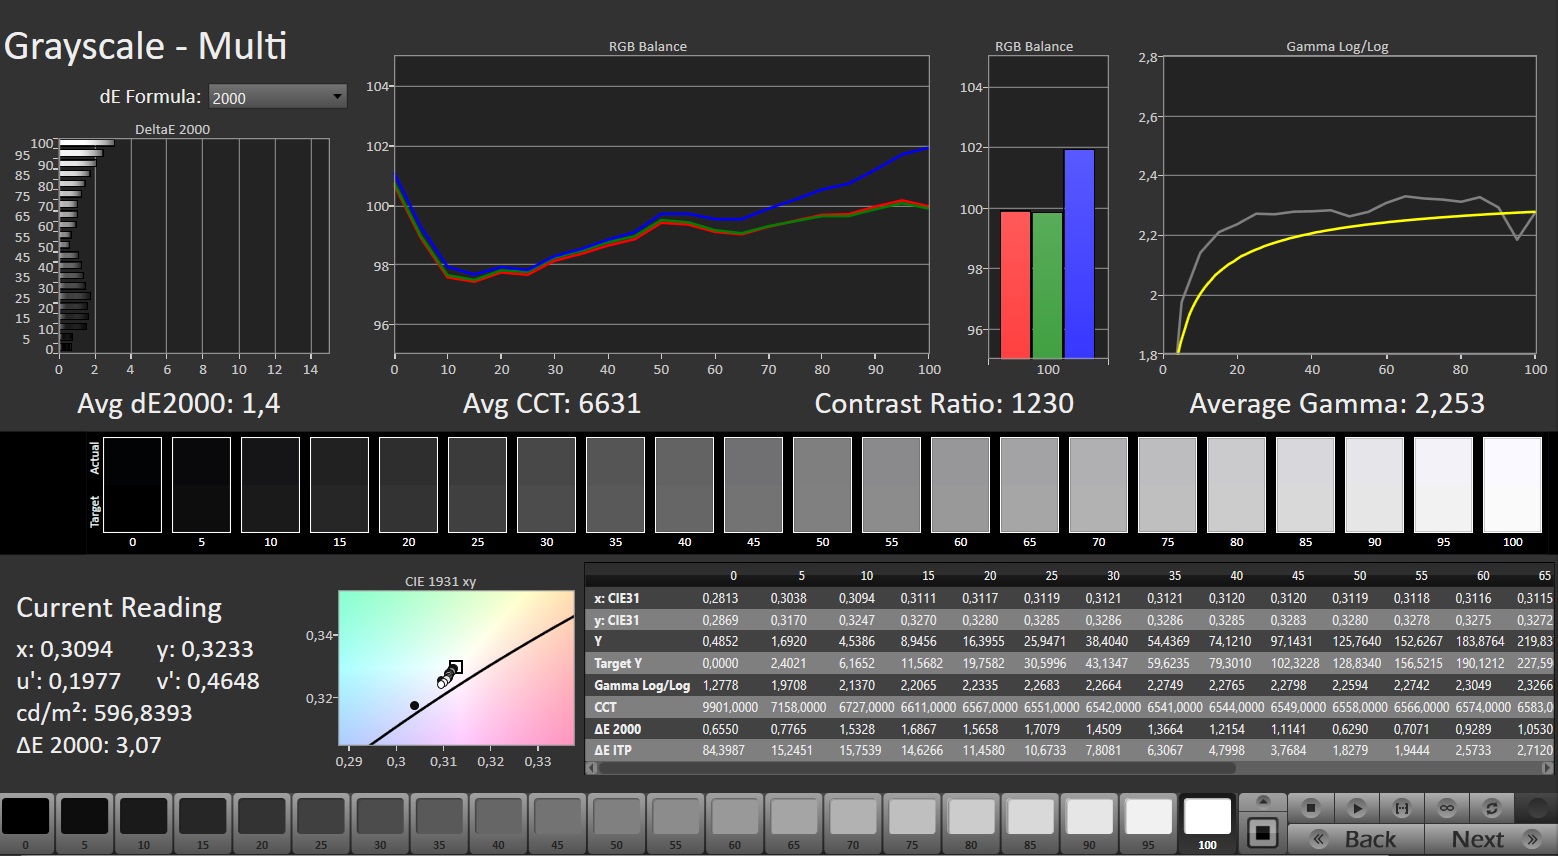

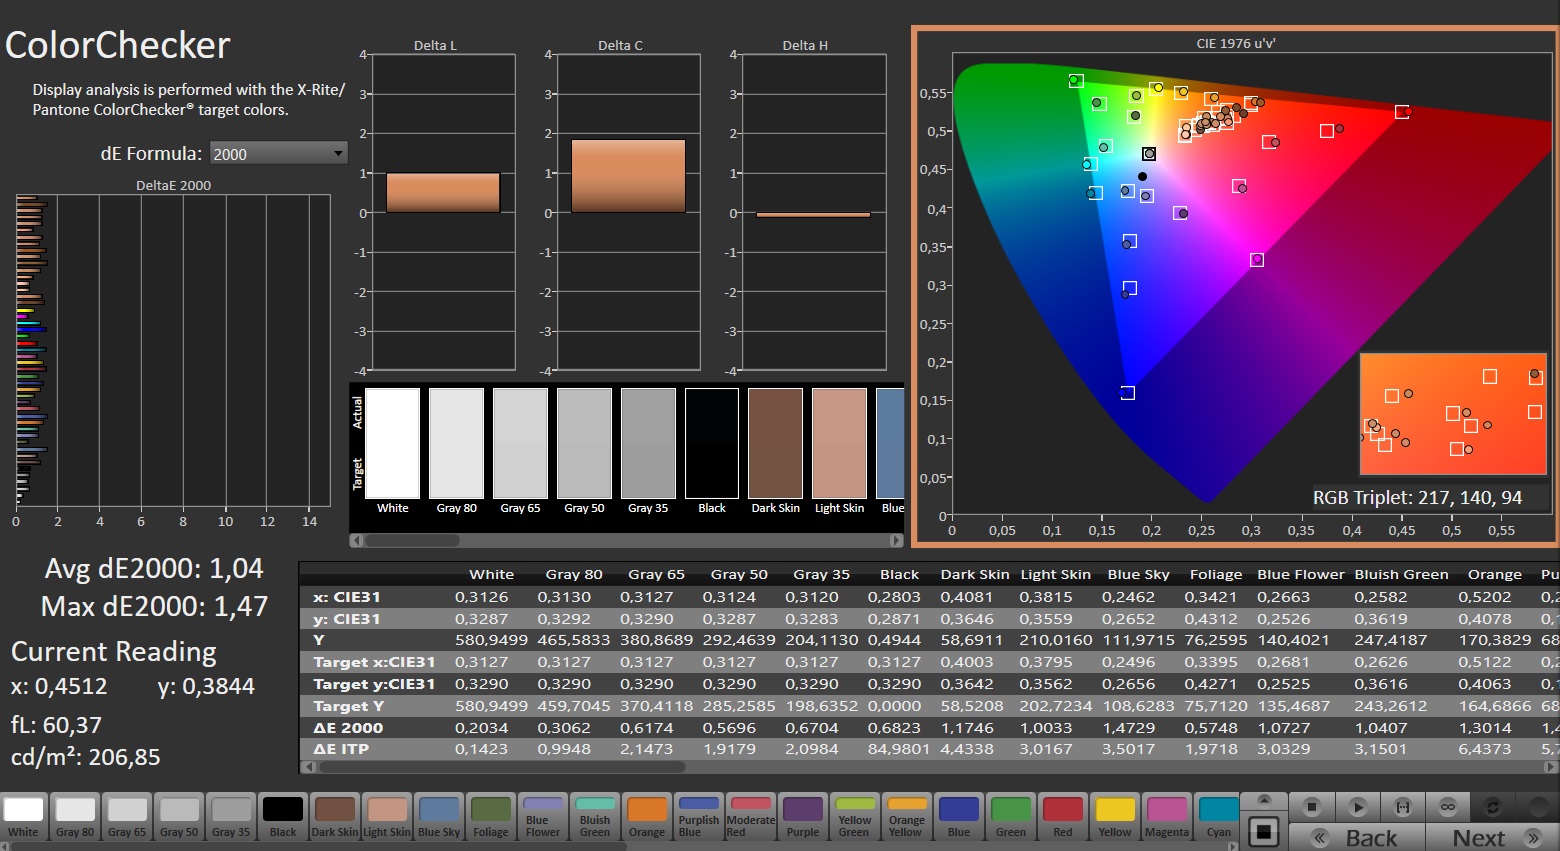
El brillo es especialmente digno de mención: un valor medio de 502 cd/m2 es bastante alto para una pantalla IPS e incluso supera los estándares de la compañía para el brillo en salas SDR (400 cd/m2). Los jugadores apreciarán la compatibilidad con FreeSync y GSync. A pesar de tener el brillo máximo en el campo de pruebas, el contraste no destaca entre los competidores. Esto se debe al insatisfactorio valor de negro de 0,48 cd/m².

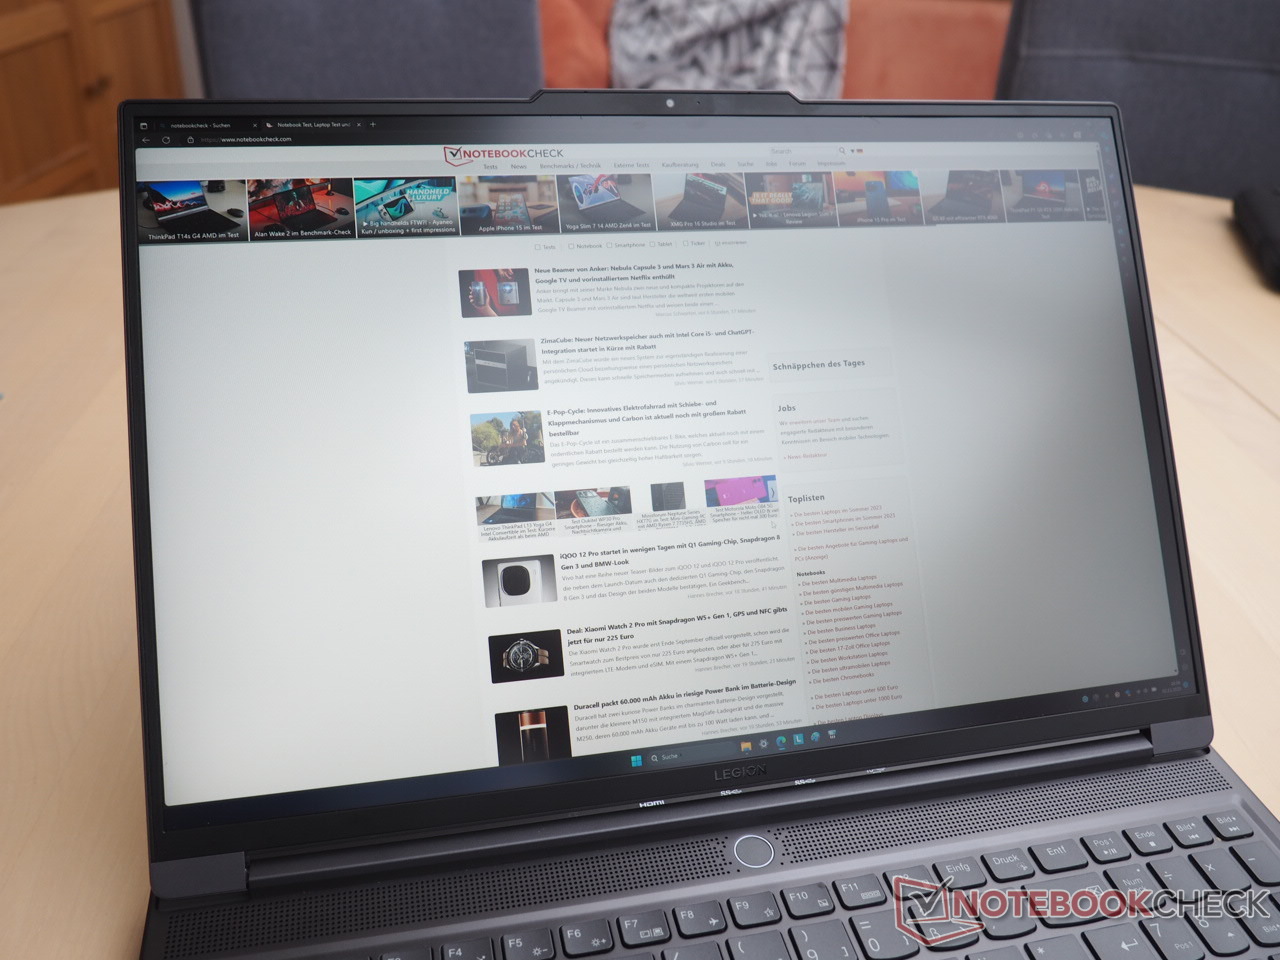
Los ángulos de visión se ajustan al típico estándar IPS, como se aprecia en nuestra foto. No hubo problemas perceptibles de parpadeo de la pantalla.
Tiempos de respuesta del display
| ↔ Tiempo de respuesta de Negro a Blanco | ||
|---|---|---|
| 5.9 ms ... subida ↗ y bajada ↘ combinada | ↗ 1.9 ms subida | 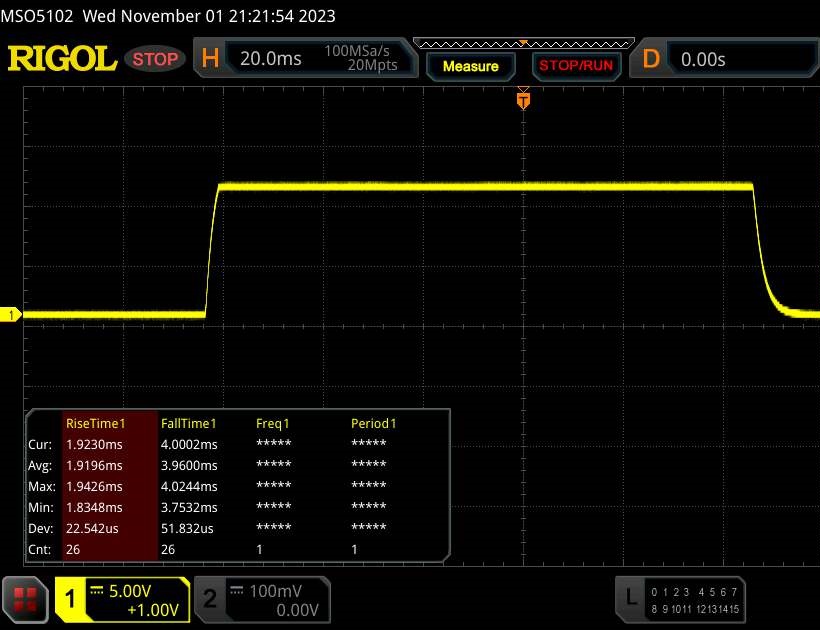 |
| ↘ 4 ms bajada | ||
| La pantalla mostró tiempos de respuesta muy rápidos en nuestros tests y debería ser adecuada para juegos frenéticos. En comparación, todos los dispositivos de prueba van de ##min### (mínimo) a 240 (máximo) ms. » 19 % de todos los dispositivos son mejores. Esto quiere decir que el tiempo de respuesta medido es mejor que la media (19.8 ms) de todos los dispositivos testados. | ||
| ↔ Tiempo de respuesta 50% Gris a 80% Gris | ||
| 12.6 ms ... subida ↗ y bajada ↘ combinada | ↗ 6.1 ms subida | 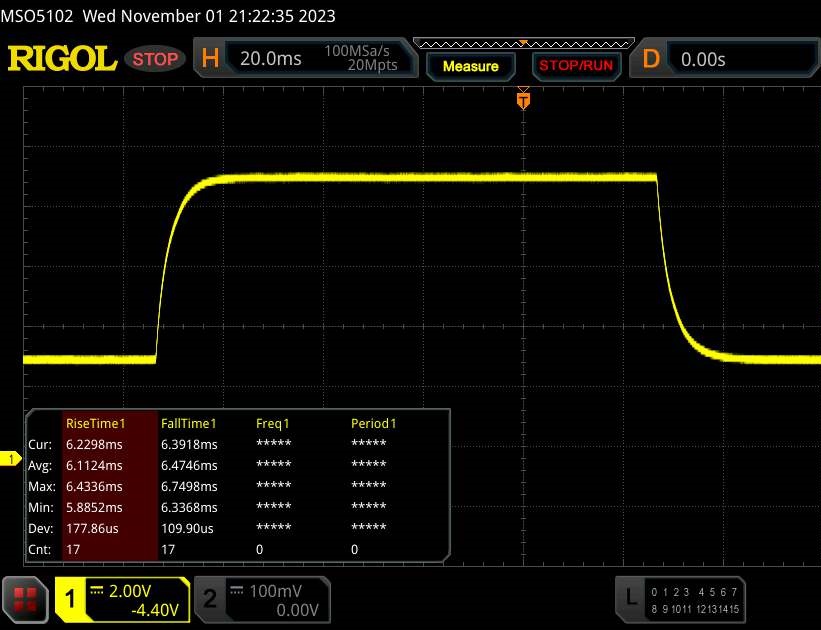 |
| ↘ 6.5 ms bajada | ||
| La pantalla mostró buenos tiempos de respuesta en nuestros tests pero podría ser demasiado lenta para los jugones competitivos. En comparación, todos los dispositivos de prueba van de ##min### (mínimo) a 636 (máximo) ms. » 26 % de todos los dispositivos son mejores. Esto quiere decir que el tiempo de respuesta medido es mejor que la media (31 ms) de todos los dispositivos testados. | ||
Parpadeo de Pantalla / PWM (Pulse-Width Modulation)
| Parpadeo de Pantalla / PWM no detectado | 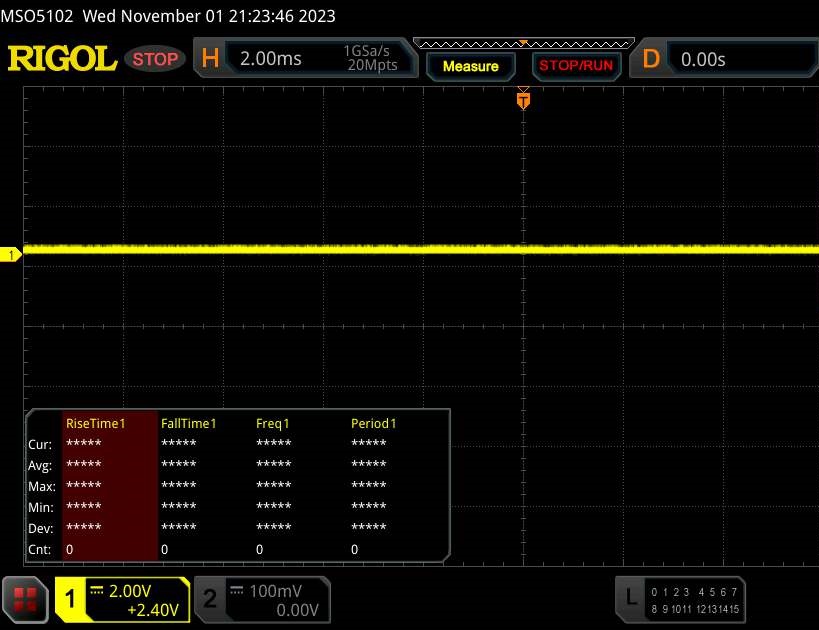 | ||
Comparación: 52 % de todos los dispositivos testados no usaron PWM para atenuar el display. Si se usó, medimos una media de 7753 (mínimo: 5 - máxmo: 343500) Hz. | |||
Rendimiento
El GeForce RTX 4060 posiciona al Legion en la categoría media de portátiles para juegos. Con 32 GB de RAM y una unidad SSD de 1 TB, debería ser suficiente para la mayoría de los compradores por el momento. Aquellos que busquen un mayor rendimiento pueden optar por la versión RTX 4070. Pero Lenovo no ofrece actualmente una versión RTX 4080 o RTX 4090 para la Slim 7.
Condiciones de prueba
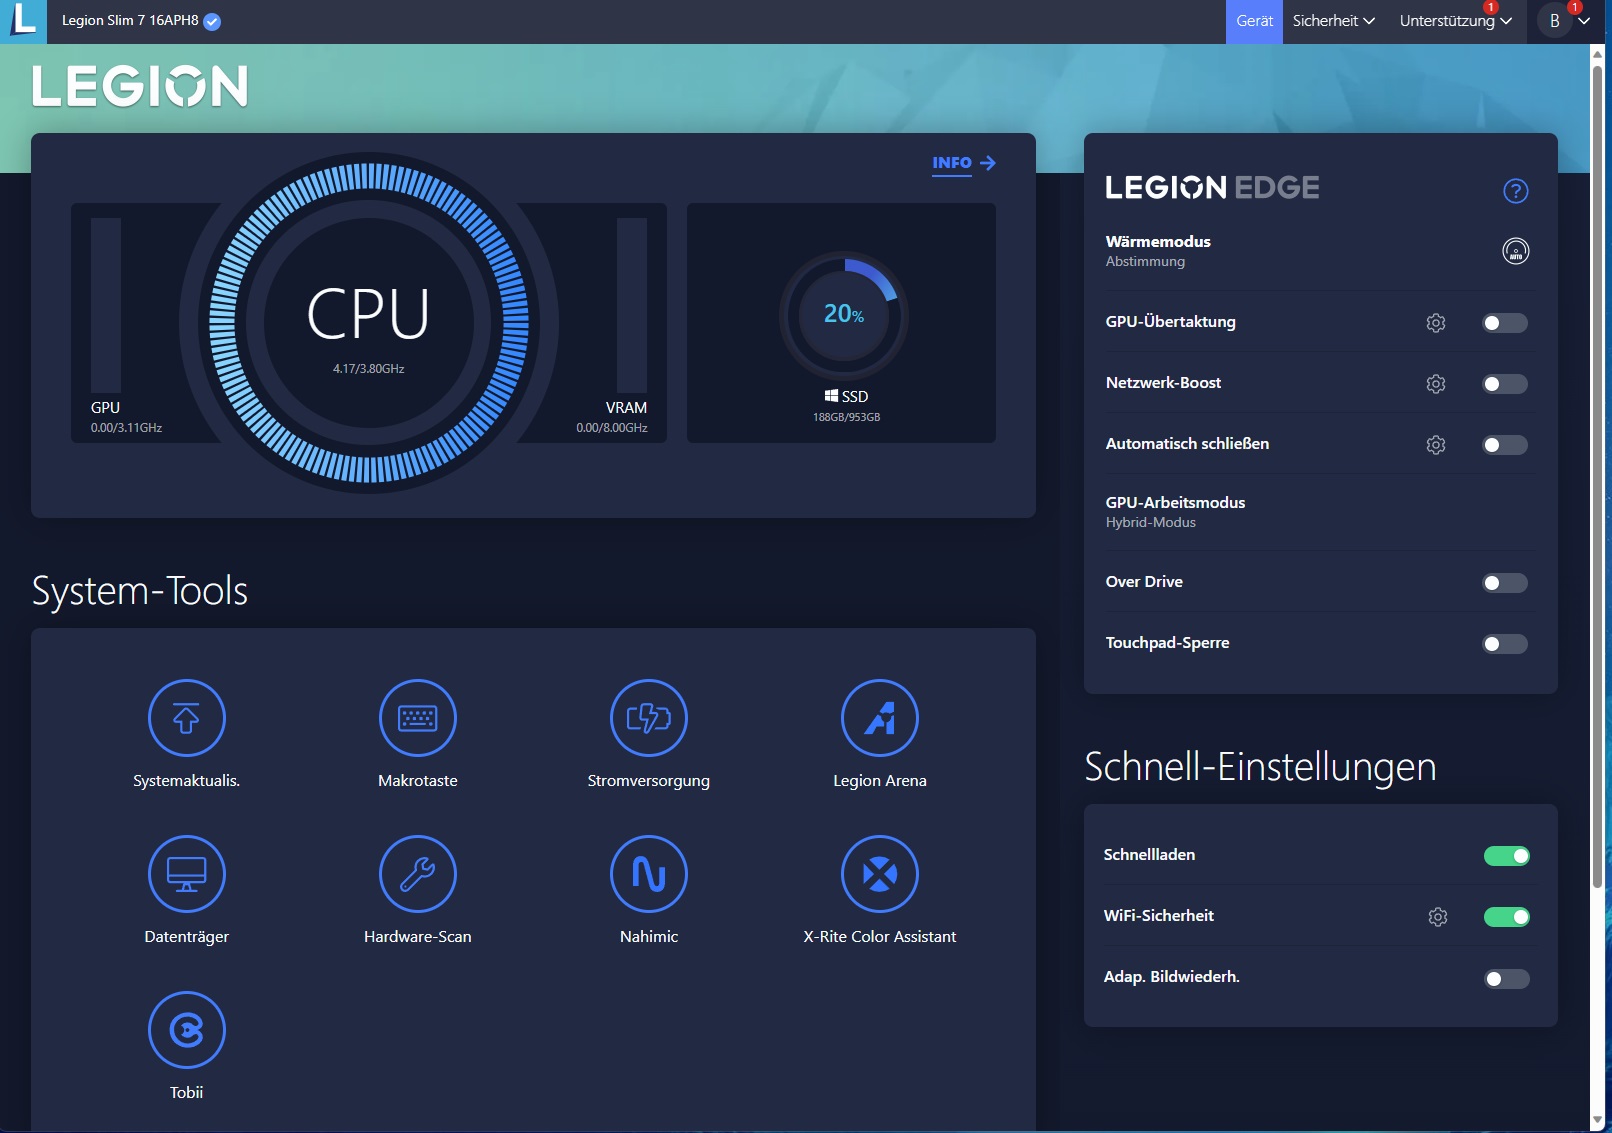
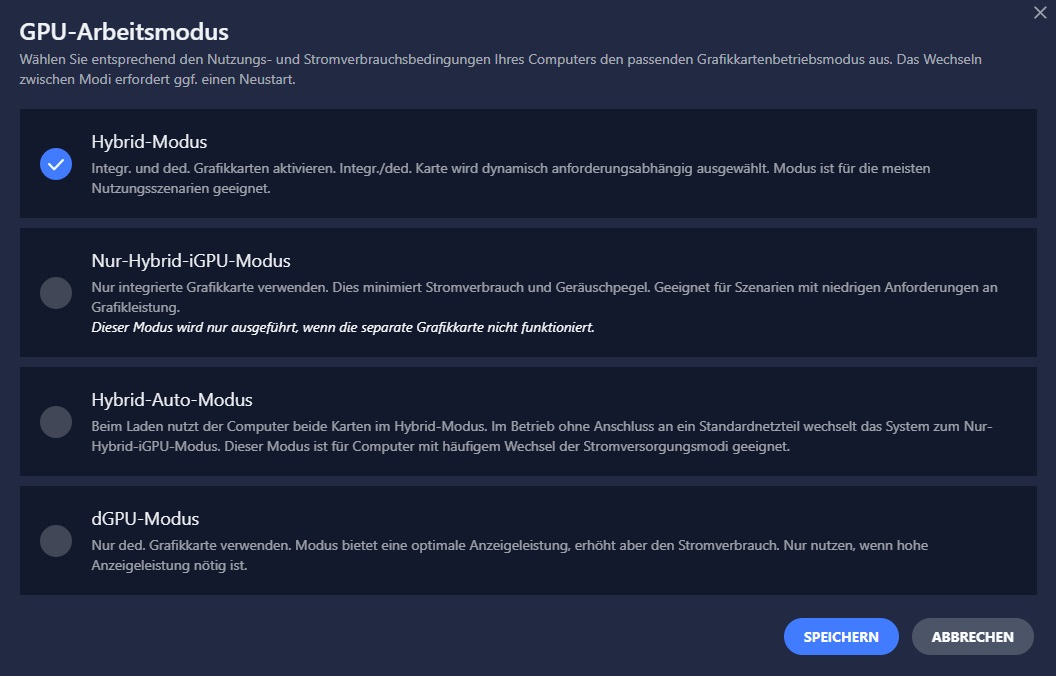
El software preinstalado Lenovo Vantage destaca por sus amplias posibilidades de personalización. Además del modo térmico, los usuarios también pueden elegir el modo de trabajo de la GPU. Como el aumento de FPS en el perfil Rendimiento no es proporcional al mayor volumen (como se muestra en la tabla), realizamos todas las mediciones en el perfil Equilibrado. La conmutación de gráficos por defecto (modo híbrido) estuvo siempre activada.
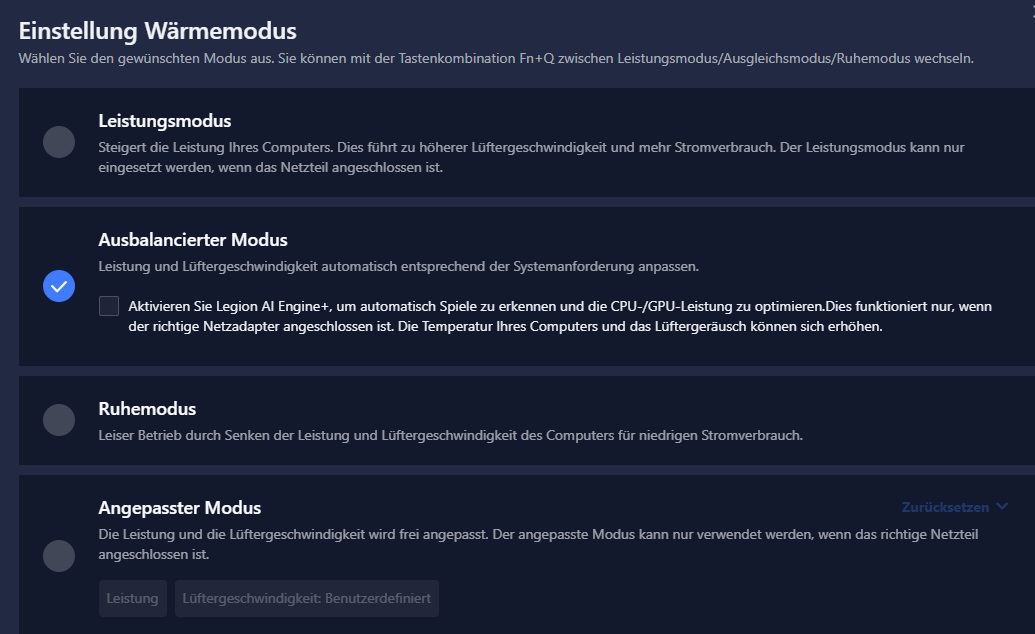
| Silenciosa | Equilibrada | Rendimiento | |
|---|---|---|---|
| Ruido (Witcher 3, FHD/Ultra) | 36 dB(A) | 47 dB(A) | 52 dB(A) |
| Rendimiento (Witcher 3, FHD/Ultra) | ~86 fps | ~98 fps | ~100 fps |
| Límite de potencia 1 (HWInfo) | 50 w | 54 w | 100 w |
| Límite de potencia 2 (HWInfo) | 60 w | 65 w | 125 w |
Procesador
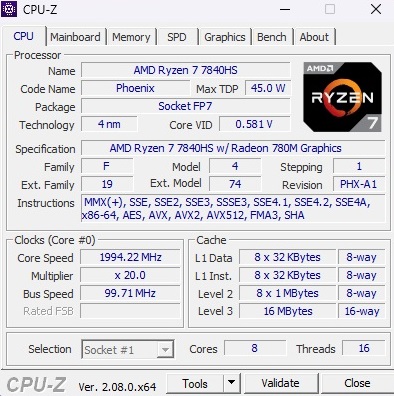
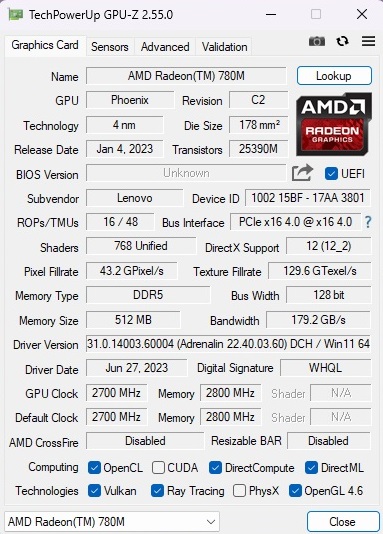
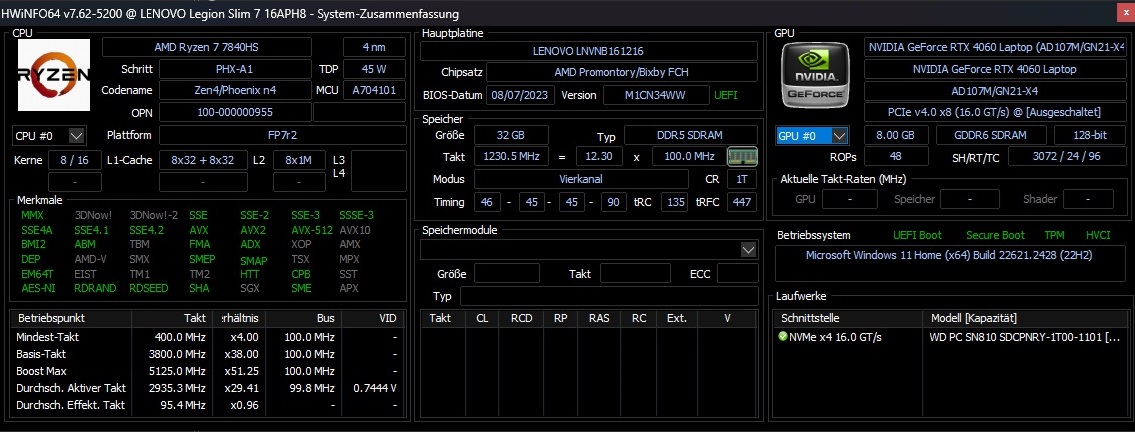
El Ryzen 7 7840HS es un procesador de ocho núcleos equipado con 16 MB de caché L3 y la capacidad de manejar hasta 16 hilos simultáneamente, gracias a SMT. Además, el chip de 4 nm cuenta con una GPU integrada relativamente rápida, la Radeon 780Mresponsable del cálculo y la visualización de imágenes, para tareas menos exigentes como el trabajo de oficina, la transmisión de vídeo y la navegación web. Durante las pruebas de referencia, el rendimiento de la CPU se sitúa entre el Core i7-13620H y el Core i7-13700HX. Una ventaja notable del procesador AMD radica en su mejora constante del rendimiento, un rasgo que no es totalmente aplicable o que sólo lo es parcialmente en el caso de muchos homólogos de Intel, como resulta evidente en pruebas de referencia como el bucle Cinebench.
Cinebench R15 Multi Loop
* ... más pequeño es mejor
AIDA64: FP32 Ray-Trace | FPU Julia | CPU SHA3 | CPU Queen | FPU SinJulia | FPU Mandel | CPU AES | CPU ZLib | FP64 Ray-Trace | CPU PhotoWorxx
| Performance rating | |
| Media de la clase Gaming | |
| Medio AMD Ryzen 7 7840HS | |
| Alienware m16 R1 Intel | |
| Lenovo Legion Slim 7 16APH8 | |
| Acer Predator Helios 16 PH16-71-731Q | |
| Lenovo Legion Pro 5 16IRX8 | |
| Asus ROG Flow X16 GV601V | |
| Lenovo LOQ 16IRH8 | |
| AIDA64 / FP32 Ray-Trace | |
| Media de la clase Gaming (10227 - 85542, n=104, últimos 2 años) | |
| Medio AMD Ryzen 7 7840HS (22845 - 28921, n=21) | |
| Lenovo Legion Slim 7 16APH8 | |
| Lenovo Legion Pro 5 16IRX8 | |
| Alienware m16 R1 Intel | |
| Acer Predator Helios 16 PH16-71-731Q | |
| Asus ROG Flow X16 GV601V | |
| Lenovo LOQ 16IRH8 | |
| AIDA64 / FPU Julia | |
| Media de la clase Gaming (51376 - 238426, n=104, últimos 2 años) | |
| Lenovo Legion Slim 7 16APH8 | |
| Medio AMD Ryzen 7 7840HS (97164 - 123167, n=21) | |
| Lenovo Legion Pro 5 16IRX8 | |
| Alienware m16 R1 Intel | |
| Acer Predator Helios 16 PH16-71-731Q | |
| Asus ROG Flow X16 GV601V | |
| Lenovo LOQ 16IRH8 | |
| AIDA64 / CPU SHA3 | |
| Media de la clase Gaming (2180 - 9817, n=104, últimos 2 años) | |
| Alienware m16 R1 Intel | |
| Medio AMD Ryzen 7 7840HS (4293 - 5155, n=21) | |
| Lenovo Legion Slim 7 16APH8 | |
| Lenovo Legion Pro 5 16IRX8 | |
| Acer Predator Helios 16 PH16-71-731Q | |
| Asus ROG Flow X16 GV601V | |
| Lenovo LOQ 16IRH8 | |
| AIDA64 / CPU Queen | |
| Media de la clase Gaming (49785 - 173351, n=91, últimos 2 años) | |
| Lenovo Legion Slim 7 16APH8 | |
| Medio AMD Ryzen 7 7840HS (102271 - 125820, n=21) | |
| Alienware m16 R1 Intel | |
| Acer Predator Helios 16 PH16-71-731Q | |
| Lenovo Legion Pro 5 16IRX8 | |
| Asus ROG Flow X16 GV601V | |
| Lenovo LOQ 16IRH8 | |
| AIDA64 / FPU SinJulia | |
| Lenovo Legion Slim 7 16APH8 | |
| Medio AMD Ryzen 7 7840HS (13767 - 15525, n=21) | |
| Media de la clase Gaming (4424 - 33636, n=104, últimos 2 años) | |
| Alienware m16 R1 Intel | |
| Lenovo Legion Pro 5 16IRX8 | |
| Acer Predator Helios 16 PH16-71-731Q | |
| Asus ROG Flow X16 GV601V | |
| Lenovo LOQ 16IRH8 | |
| AIDA64 / FPU Mandel | |
| Media de la clase Gaming (25115 - 128721, n=104, últimos 2 años) | |
| Lenovo Legion Slim 7 16APH8 | |
| Medio AMD Ryzen 7 7840HS (52084 - 65812, n=21) | |
| Lenovo Legion Pro 5 16IRX8 | |
| Alienware m16 R1 Intel | |
| Acer Predator Helios 16 PH16-71-731Q | |
| Asus ROG Flow X16 GV601V | |
| Lenovo LOQ 16IRH8 | |
| AIDA64 / CPU AES | |
| Alienware m16 R1 Intel | |
| Acer Predator Helios 16 PH16-71-731Q | |
| Medio AMD Ryzen 7 7840HS (67389 - 177158, n=21) | |
| Media de la clase Gaming (39258 - 247074, n=104, últimos 2 años) | |
| Lenovo Legion Pro 5 16IRX8 | |
| Asus ROG Flow X16 GV601V | |
| Lenovo Legion Slim 7 16APH8 | |
| Lenovo LOQ 16IRH8 | |
| AIDA64 / CPU ZLib | |
| Media de la clase Gaming (574 - 2531, n=104, últimos 2 años) | |
| Acer Predator Helios 16 PH16-71-731Q | |
| Alienware m16 R1 Intel | |
| Lenovo Legion Pro 5 16IRX8 | |
| Asus ROG Flow X16 GV601V | |
| Lenovo Legion Slim 7 16APH8 | |
| Medio AMD Ryzen 7 7840HS (944 - 1123, n=21) | |
| Lenovo LOQ 16IRH8 | |
| AIDA64 / FP64 Ray-Trace | |
| Media de la clase Gaming (5509 - 45446, n=104, últimos 2 años) | |
| Medio AMD Ryzen 7 7840HS (12248 - 15599, n=21) | |
| Lenovo Legion Slim 7 16APH8 | |
| Lenovo Legion Pro 5 16IRX8 | |
| Alienware m16 R1 Intel | |
| Acer Predator Helios 16 PH16-71-731Q | |
| Asus ROG Flow X16 GV601V | |
| Lenovo LOQ 16IRH8 | |
| AIDA64 / CPU PhotoWorxx | |
| Media de la clase Gaming (12271 - 89891, n=104, últimos 2 años) | |
| Lenovo Legion Slim 7 16APH8 | |
| Asus ROG Flow X16 GV601V | |
| Medio AMD Ryzen 7 7840HS (17615 - 41516, n=21) | |
| Lenovo Legion Pro 5 16IRX8 | |
| Alienware m16 R1 Intel | |
| Acer Predator Helios 16 PH16-71-731Q | |
| Lenovo LOQ 16IRH8 | |
Rendimiento del sistema
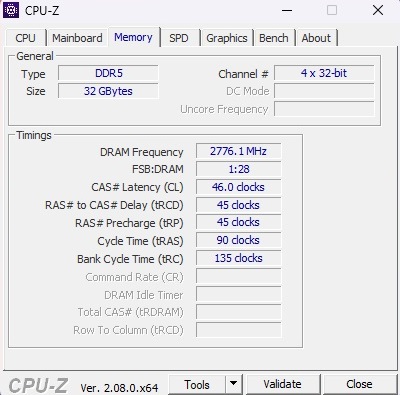
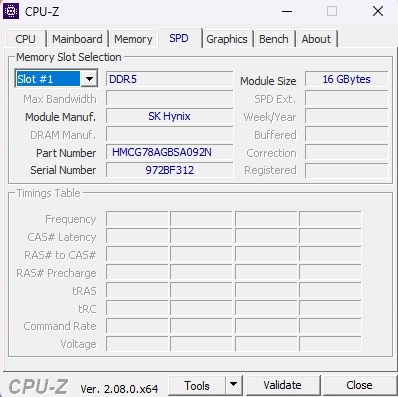
En términos de rendimiento del sistema, el Slim 7 compite fácilmente con sus rivales, obteniendo 7.502 puntos en PCMark 10. La memoria DDR5, conocida por su excepcional velocidad, supera la media. Además, el ordenador muestra una respuesta agradable y rápida en escenarios de uso prácticos.
CrossMark: Overall | Productivity | Creativity | Responsiveness
| PCMark 10 / Score | |
| Media de la clase Gaming (5828 - 11574, n=93, últimos 2 años) | |
| Asus ROG Flow X16 GV601V | |
| Medio AMD Ryzen 7 7840HS, NVIDIA GeForce RTX 4060 Laptop GPU (7502 - 7946, n=4) | |
| Acer Predator Helios 16 PH16-71-731Q | |
| Lenovo Legion Pro 5 16IRX8 | |
| Lenovo Legion Slim 7 16APH8 | |
| Alienware m16 R1 Intel | |
| Lenovo LOQ 16IRH8 | |
| PCMark 10 / Essentials | |
| Asus ROG Flow X16 GV601V | |
| Acer Predator Helios 16 PH16-71-731Q | |
| Lenovo Legion Pro 5 16IRX8 | |
| Medio AMD Ryzen 7 7840HS, NVIDIA GeForce RTX 4060 Laptop GPU (10441 - 11169, n=4) | |
| Alienware m16 R1 Intel | |
| Media de la clase Gaming (8810 - 11935, n=97, últimos 2 años) | |
| Lenovo Legion Slim 7 16APH8 | |
| Lenovo LOQ 16IRH8 | |
| PCMark 10 / Productivity | |
| Acer Predator Helios 16 PH16-71-731Q | |
| Media de la clase Gaming (6845 - 21327, n=95, últimos 2 años) | |
| Asus ROG Flow X16 GV601V | |
| Medio AMD Ryzen 7 7840HS, NVIDIA GeForce RTX 4060 Laptop GPU (9575 - 10273, n=4) | |
| Lenovo Legion Slim 7 16APH8 | |
| Alienware m16 R1 Intel | |
| Lenovo Legion Pro 5 16IRX8 | |
| Lenovo LOQ 16IRH8 | |
| PCMark 10 / Digital Content Creation | |
| Media de la clase Gaming (7602 - 19657, n=95, últimos 2 años) | |
| Lenovo Legion Pro 5 16IRX8 | |
| Medio AMD Ryzen 7 7840HS, NVIDIA GeForce RTX 4060 Laptop GPU (11464 - 12418, n=4) | |
| Lenovo Legion Slim 7 16APH8 | |
| Asus ROG Flow X16 GV601V | |
| Acer Predator Helios 16 PH16-71-731Q | |
| Alienware m16 R1 Intel | |
| Lenovo LOQ 16IRH8 | |
| CrossMark / Overall | |
| Acer Predator Helios 16 PH16-71-731Q | |
| Alienware m16 R1 Intel | |
| Media de la clase Gaming (1366 - 2409, n=93, últimos 2 años) | |
| Asus ROG Flow X16 GV601V | |
| Lenovo LOQ 16IRH8 | |
| Medio AMD Ryzen 7 7840HS, NVIDIA GeForce RTX 4060 Laptop GPU (1800 - 1866, n=3) | |
| Lenovo Legion Pro 5 16IRX8 | |
| CrossMark / Productivity | |
| Acer Predator Helios 16 PH16-71-731Q | |
| Alienware m16 R1 Intel | |
| Lenovo LOQ 16IRH8 | |
| Asus ROG Flow X16 GV601V | |
| Media de la clase Gaming (1386 - 2254, n=93, últimos 2 años) | |
| Medio AMD Ryzen 7 7840HS, NVIDIA GeForce RTX 4060 Laptop GPU (1743 - 1821, n=3) | |
| Lenovo Legion Pro 5 16IRX8 | |
| CrossMark / Creativity | |
| Acer Predator Helios 16 PH16-71-731Q | |
| Alienware m16 R1 Intel | |
| Media de la clase Gaming (1343 - 2729, n=93, últimos 2 años) | |
| Asus ROG Flow X16 GV601V | |
| Lenovo LOQ 16IRH8 | |
| Medio AMD Ryzen 7 7840HS, NVIDIA GeForce RTX 4060 Laptop GPU (1908 - 1966, n=3) | |
| Lenovo Legion Pro 5 16IRX8 | |
| CrossMark / Responsiveness | |
| Acer Predator Helios 16 PH16-71-731Q | |
| Alienware m16 R1 Intel | |
| Lenovo LOQ 16IRH8 | |
| Media de la clase Gaming (1226 - 2334, n=93, últimos 2 años) | |
| Asus ROG Flow X16 GV601V | |
| Lenovo Legion Pro 5 16IRX8 | |
| Medio AMD Ryzen 7 7840HS, NVIDIA GeForce RTX 4060 Laptop GPU (1522 - 1776, n=3) | |
| PCMark 10 Score | 7502 puntos | |
ayuda | ||
| AIDA64 / Memory Copy | |
| Lenovo Legion Slim 7 16APH8 | |
| Media de la clase Gaming (21750 - 129946, n=104, últimos 2 años) | |
| Medio AMD Ryzen 7 7840HS (30937 - 72158, n=21) | |
| Asus ROG Flow X16 GV601V | |
| Lenovo Legion Pro 5 16IRX8 | |
| Alienware m16 R1 Intel | |
| Acer Predator Helios 16 PH16-71-731Q | |
| Lenovo LOQ 16IRH8 | |
| AIDA64 / Memory Read | |
| Media de la clase Gaming (22956 - 118858, n=104, últimos 2 años) | |
| Asus ROG Flow X16 GV601V | |
| Lenovo Legion Pro 5 16IRX8 | |
| Alienware m16 R1 Intel | |
| Acer Predator Helios 16 PH16-71-731Q | |
| Lenovo LOQ 16IRH8 | |
| Lenovo Legion Slim 7 16APH8 | |
| Medio AMD Ryzen 7 7840HS (30497 - 62147, n=21) | |
| AIDA64 / Memory Write | |
| Lenovo Legion Slim 7 16APH8 | |
| Acer Predator Helios 16 PH16-71-731Q | |
| Medio AMD Ryzen 7 7840HS (34590 - 93323, n=21) | |
| Media de la clase Gaming (22297 - 135096, n=104, últimos 2 años) | |
| Lenovo Legion Pro 5 16IRX8 | |
| Asus ROG Flow X16 GV601V | |
| Alienware m16 R1 Intel | |
| Lenovo LOQ 16IRH8 | |
| AIDA64 / Memory Latency | |
| Lenovo LOQ 16IRH8 | |
| Media de la clase Gaming (75.3 - 259, n=104, últimos 2 años) | |
| Medio AMD Ryzen 7 7840HS (85.1 - 112, n=21) | |
| Asus ROG Flow X16 GV601V | |
| Lenovo Legion Slim 7 16APH8 | |
| Alienware m16 R1 Intel | |
| Acer Predator Helios 16 PH16-71-731Q | |
| Lenovo Legion Pro 5 16IRX8 | |
* ... más pequeño es mejor
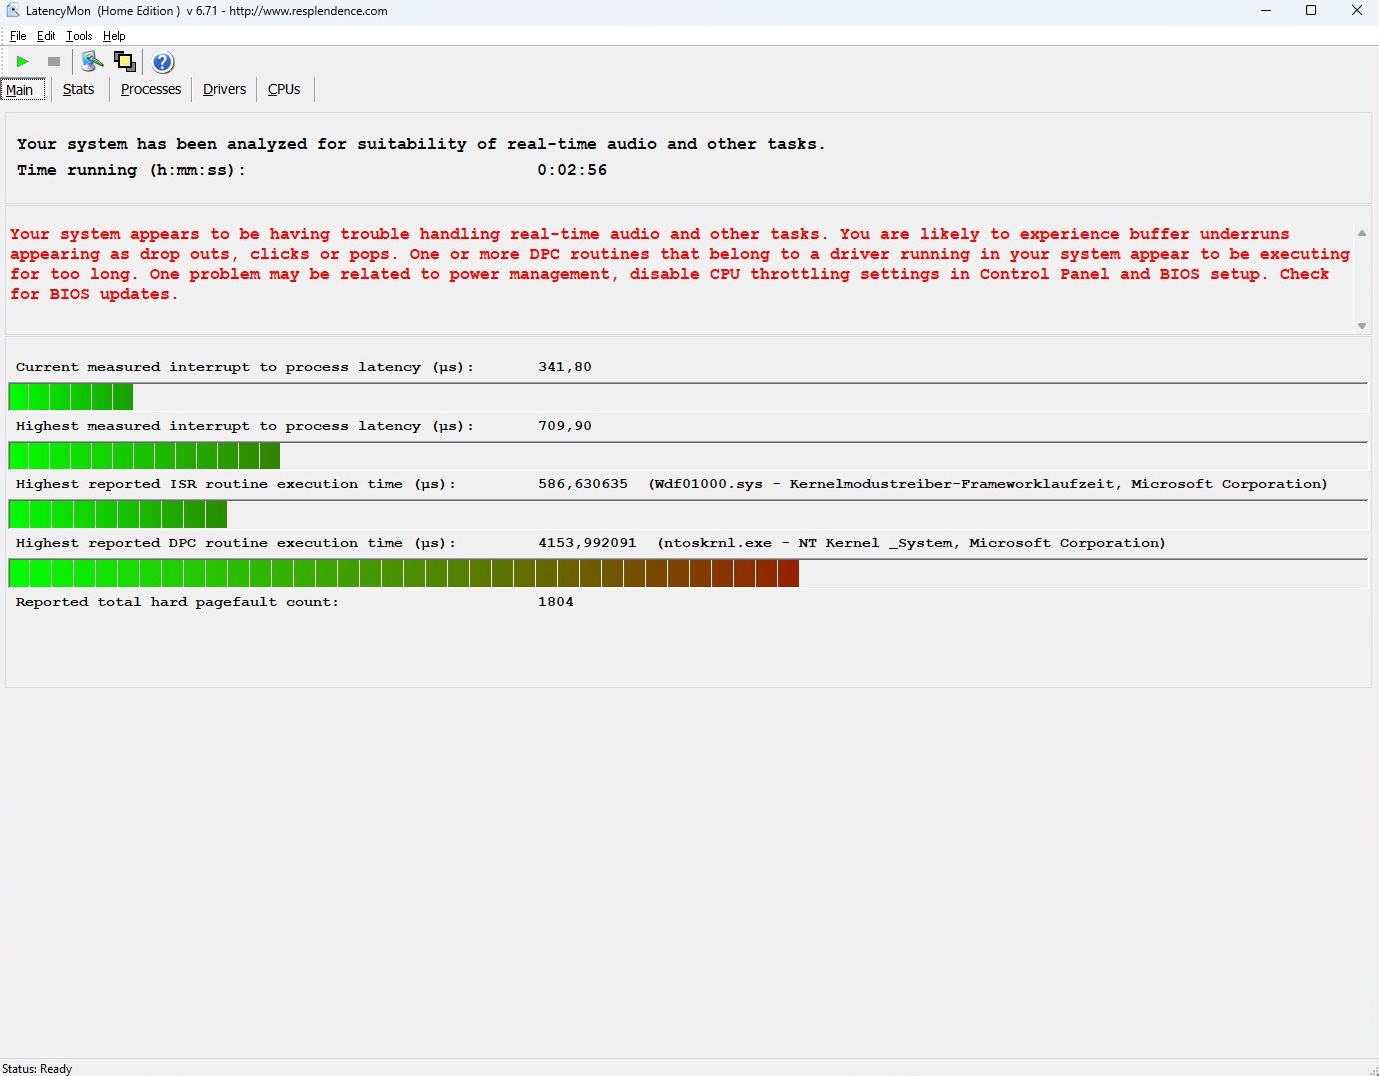
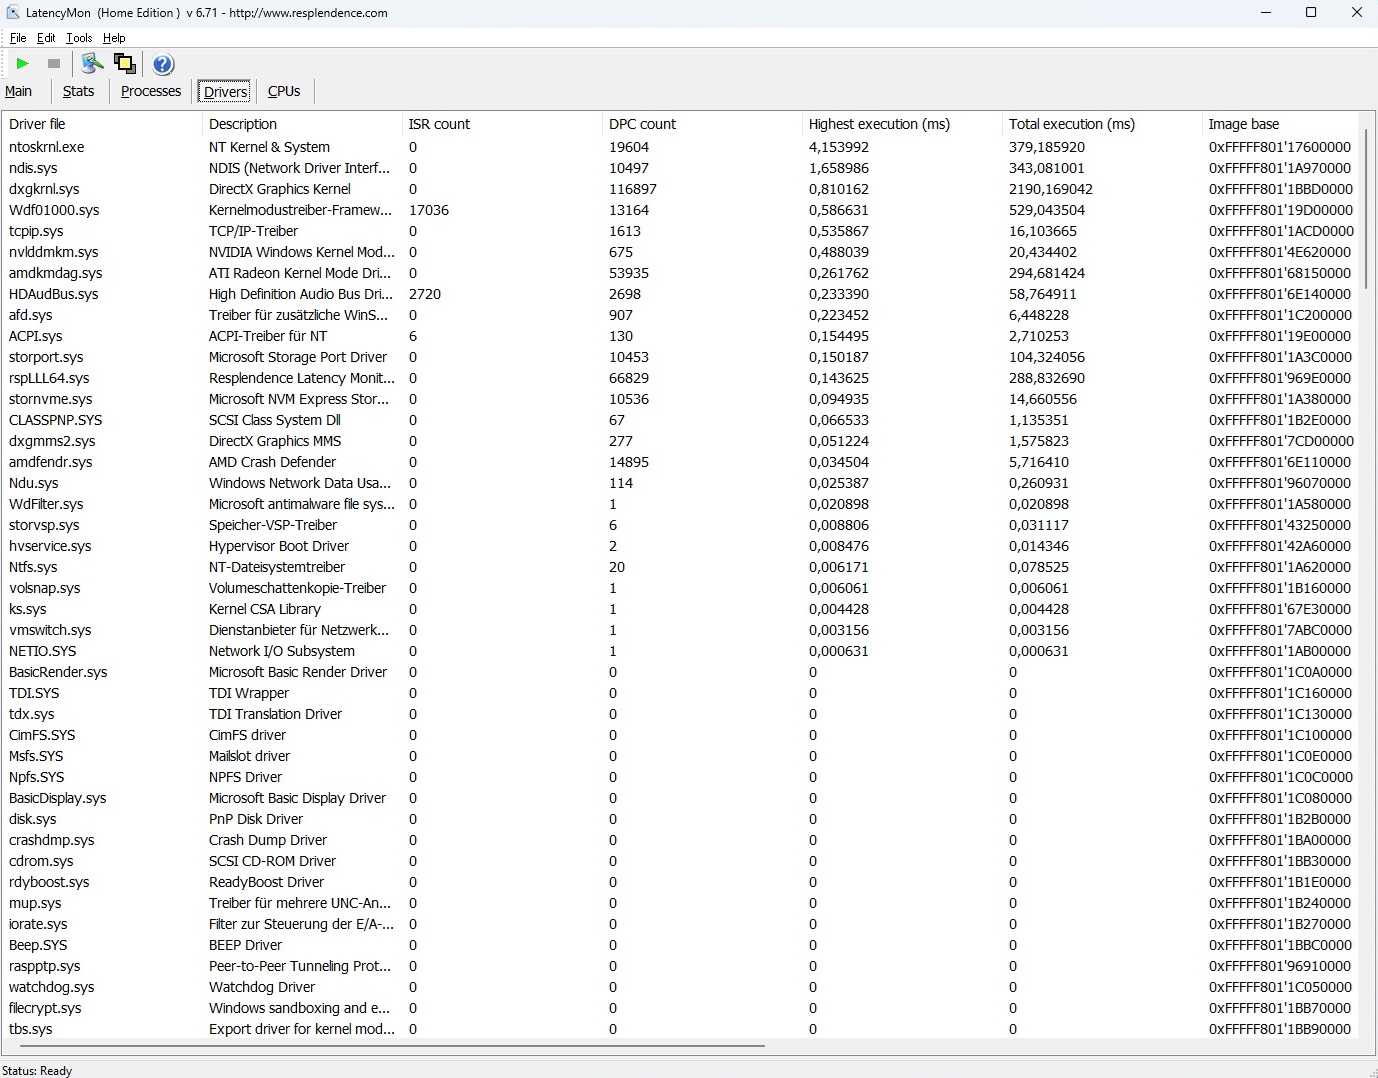
Latencia del CPD
Aunque tiene las latencias más bajas entre los dispositivos de 16 pulgadas de la prueba, la herramienta LatencyMon muestra posibles problemas con la edición de audio y vídeo en tiempo real.
| DPC Latencies / LatencyMon - interrupt to process latency (max), Web, Youtube, Prime95 | |
| Alienware m16 R1 Intel | |
| Acer Predator Helios 16 PH16-71-731Q | |
| Lenovo LOQ 16IRH8 | |
| Asus ROG Flow X16 GV601V | |
| Lenovo Legion Pro 5 16IRX8 | |
| Lenovo Legion Slim 7 16APH8 | |
* ... más pequeño es mejor
Dispositivos de almacenamiento
La unidad SSD integrada de 1 TB de WDC (modelo SN810) ofrece en general una velocidad excelente, pero ocasionalmente se enfrenta a problemas de ralentización bajo carga prolongada. Sin embargo, estos problemas no son tan graves como los observados en el Acer Predator Helios 16.

* ... más pequeño es mejor
Continuous power read: DiskSpd Read Loop, Queue Depth 8
Tarjeta gráfica
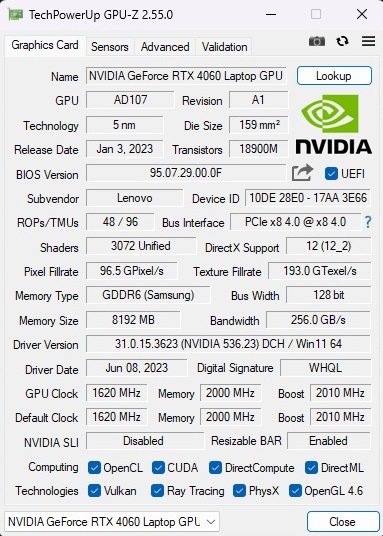
La GeForce RTX 4060 es una de las GPU para portátiles más populares y exitosas en estos momentos. Aunque este modelo de gama media no es adecuado para pantallas UHD y puede tener una resistencia limitada de cara al futuro debido a su escasa arquitectura de 8 GB de VRAM GDDR6, su rendimiento para resoluciones Full HD (FHD) o Quad HD (QHD) es, no obstante, notable.
En las pruebas comparativas de gráficos sintéticos, el rendimiento 3D en modo equilibrado es comparable al rendimiento medio de la RTX 4060 hasta el momento, aunque queda ligeramente por debajo del de los dispositivos de comparación. Cabe destacar que el Slim 7 ni siquiera se acerca a alcanzar el TGP máximo de 140 vatios, incluyendo Dynamic Boost.
| 3DMark 11 Performance | 30859 puntos | |
| 3DMark Ice Storm Standard Score | 123335 puntos | |
| 3DMark Cloud Gate Standard Score | 60481 puntos | |
| 3DMark Fire Strike Score | 23735 puntos | |
| 3DMark Time Spy Score | 10032 puntos | |
ayuda | ||
* ... más pequeño es mejor
Rendimiento en juegos
Los puntos de referencia de juegos muestran un patrón similar. Aparte de unos pocos juegos muy exigentes como Lords of the Fallen o Alan Wake 2la mayoría de ellos pueden jugarse a resolución nativa con ajustes de altos a máximos sin problemas, aunque alcanzar la marca de 60 FPS no siempre está garantizado.
| The Witcher 3 - 1920x1080 Ultra Graphics & Postprocessing (HBAO+) | |
| Media de la clase Gaming (104.7 - 240, n=6, últimos 2 años) | |
| Lenovo Legion Pro 5 16IRX8 | |
| Asus ROG Flow X16 GV601V | |
| Alienware m16 R1 Intel | |
| Lenovo LOQ 16IRH8 | |
| Acer Predator Helios 16 PH16-71-731Q | |
| Medio NVIDIA GeForce RTX 4060 Laptop GPU (77 - 159.7, n=42) | |
| Lenovo Legion Slim 7 16APH8 | |
| Alan Wake 2 | |
| 1920x1080 High Preset | |
| Media de la clase Gaming (61.7 - 133.2, n=30, últimos 2 años) | |
| Medio NVIDIA GeForce RTX 4060 Laptop GPU (53.8 - 64.3, n=3) | |
| XMG Pro 15 E23 | |
| Lenovo Legion Slim 7 16APH8 | |
| 2560x1440 High Preset | |
| Media de la clase Gaming (36.7 - 93.1, n=32, últimos 2 años) | |
| XMG Pro 15 E23 | |
| Medio NVIDIA GeForce RTX 4060 Laptop GPU (33 - 36.7, n=3) | |
| Lenovo Legion Slim 7 16APH8 | |
| Lords of the Fallen | |
| 1920x1080 High Preset | |
| XMG Pro 15 E23 | |
| Medio NVIDIA GeForce RTX 4060 Laptop GPU (46.7 - 53.9, n=3) | |
| Lenovo Legion Slim 7 16APH8 | |
| 1920x1080 Ultra Preset | |
| XMG Pro 15 E23 | |
| Medio NVIDIA GeForce RTX 4060 Laptop GPU (32.8 - 38.1, n=3) | |
| Lenovo Legion Slim 7 16APH8 | |
| 2560x1440 Ultra Preset | |
| XMG Pro 15 E23 | |
| Medio NVIDIA GeForce RTX 4060 Laptop GPU (24.2 - 25.7, n=2) | |
| Lenovo Legion Slim 7 16APH8 | |
| Total War Pharaoh | |
| 1920x1080 High Preset | |
| XMG Pro 15 E23 | |
| Medio NVIDIA GeForce RTX 4060 Laptop GPU (128 - 149, n=2) | |
| Lenovo Legion Slim 7 16APH8 | |
| Media de la clase Gaming (47.4 - 200, n=2, últimos 2 años) | |
| 1920x1080 Ultra Preset | |
| XMG Pro 15 E23 | |
| Medio NVIDIA GeForce RTX 4060 Laptop GPU (104 - 116, n=2) | |
| Lenovo Legion Slim 7 16APH8 | |
| Media de la clase Gaming (42.9 - 161.4, n=2, últimos 2 años) | |
| 2560x1440 Ultra Preset | |
| XMG Pro 15 E23 | |
| Medio NVIDIA GeForce RTX 4060 Laptop GPU (76 - 81.6, n=2) | |
| Lenovo Legion Slim 7 16APH8 | |
| Media de la clase Gaming (24.1 - 127.4, n=2, últimos 2 años) | |
| Assassin's Creed Mirage | |
| 1920x1080 High Preset (Adaptive Quality Off) | |
| XMG Pro 15 E23 | |
| Medio NVIDIA GeForce RTX 4060 Laptop GPU (76 - 118, n=4) | |
| Lenovo Legion Slim 7 16APH8 | |
| 1920x1080 Ultra High Preset (Adaptive Quality Off) | |
| XMG Pro 15 E23 | |
| Medio NVIDIA GeForce RTX 4060 Laptop GPU (65 - 93, n=6) | |
| Lenovo Legion Slim 7 16APH8 | |
| 2560x1440 Ultra High Preset (Adaptive Quality Off) | |
| XMG Pro 15 E23 | |
| Medio NVIDIA GeForce RTX 4060 Laptop GPU (64 - 72, n=5) | |
| Lenovo Legion Slim 7 16APH8 | |
| EA Sports FC 24 | |
| 1920x1080 High Preset | |
| Lenovo Legion Slim 7 16APH8 | |
| XMG Pro 15 E23 | |
| Medio NVIDIA GeForce RTX 4060 Laptop GPU (142.9 - 155.2, n=3) | |
| 1920x1080 Ultra Preset | |
| XMG Pro 15 E23 | |
| Medio NVIDIA GeForce RTX 4060 Laptop GPU (136.9 - 138, n=3) | |
| Lenovo Legion Slim 7 16APH8 | |
| Media de la clase Gaming (n=1últimos 2 años) | |
| 2560x1440 Ultra Preset | |
| XMG Pro 15 E23 | |
| Medio NVIDIA GeForce RTX 4060 Laptop GPU (117.5 - 121, n=2) | |
| Lenovo Legion Slim 7 16APH8 | |
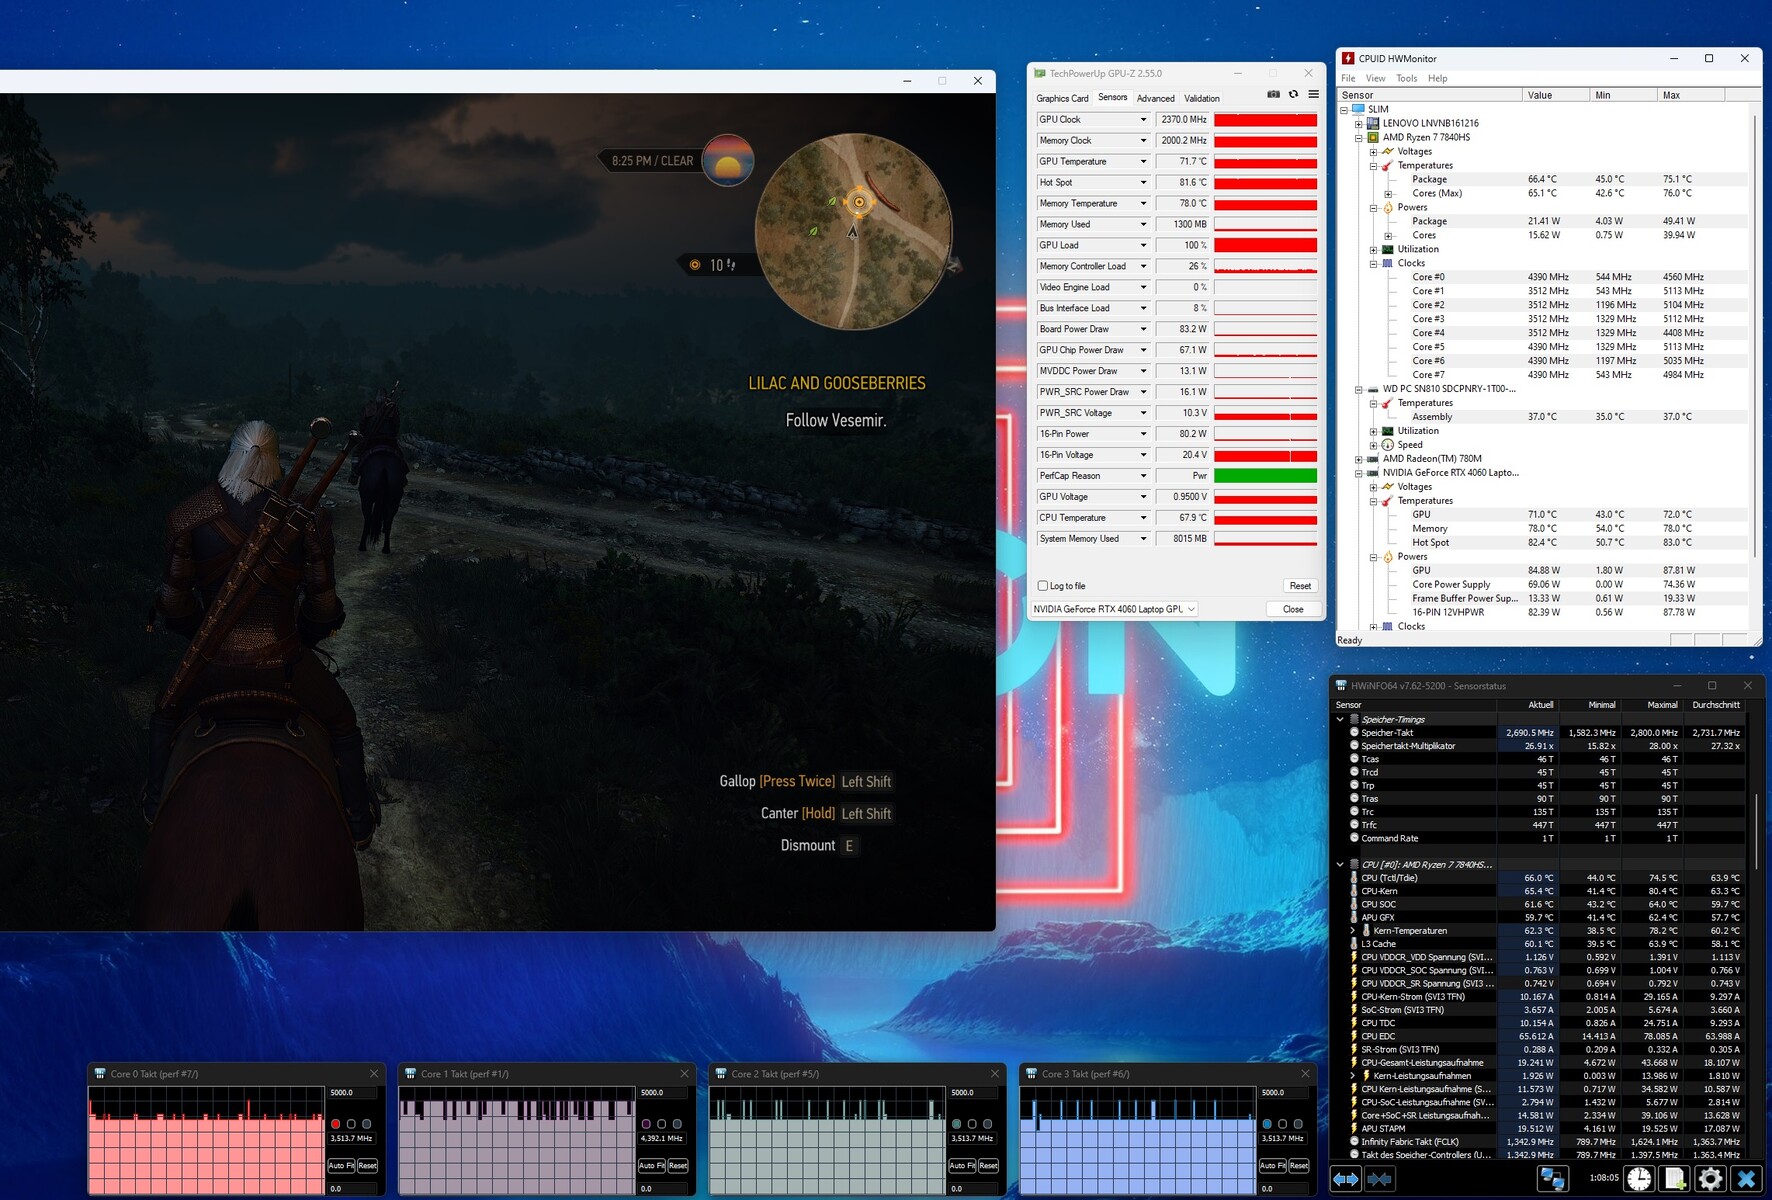
Durante la prueba de 60 minutos con La página Witcher 3no se observaron anomalías. La frecuencia de imagen se mantuvo relativamente estable durante toda la duración.
Witcher 3 FPS chart
| bajo | medio | alto | ultra | QHD | |
|---|---|---|---|---|---|
| GTA V (2015) | 172.9 | 166 | 103.2 | ||
| The Witcher 3 (2015) | 98 | ||||
| Dota 2 Reborn (2015) | 161.6 | 159.2 | 140.6 | 134.7 | |
| X-Plane 11.11 (2018) | 116 | 103.5 | 81.6 | ||
| Strange Brigade (2018) | 258 | 208 | 180.8 | ||
| Atomic Heart (2023) | 122.1 | 82.7 | 64.9 | 50.7 | |
| Company of Heroes 3 (2023) | 156 | 122 | 120 | 92 | |
| Sons of the Forest (2023) | 83.8 | 80.2 | 78.8 | 64.2 | |
| Resident Evil 4 Remake (2023) | 98.4 | 92.1 | 64.4 | 55.1 | |
| Armored Core 6 (2023) | 104.5 | 103.1 | 95.6 | 73.2 | |
| Baldur's Gate 3 (2023) | 98.7 | 84.8 | 82.6 | 55.8 | |
| EA Sports FC 24 (2023) | 187.9 | 155.2 | 136.9 | 117.5 | |
| Assassin's Creed Mirage (2023) | 80 | 76 | 65 | 64 | |
| Total War Pharaoh (2023) | 193 | 128 | 104 | 76 | |
| Lords of the Fallen (2023) | 66.4 | 48.2 | 33.2 | 24.2 | |
| Alan Wake 2 (2023) | 58.5 | 53.8 | 33.8 |
Emisiones
Ruido del sistema
Presenta los niveles de ruido más bajos del campo de pruebas, con niveles de ruido que oscilan entre los 33 y los 49 dB(A) en el modo 3D. Para los jugadores sensibles al ruido, recomendamos elegir el modo silencioso, que produce una pérdida mínima de rendimiento a la vez que reduce drásticamente el ruido de trabajo (consulte la tabla para conocer las condiciones de prueba específicas). En ocasiones, los ventiladores son totalmente silenciosos en reposo, e incluso cuando están activos, el ruido generado se mantiene al mínimo. Merece la pena mencionar que nuestra unidad de pruebas no mostró signos de quejidos en la bobina.
Ruido
| Ocioso |
| 25 / 28 / 31 dB(A) |
| Carga |
| 33 / 49 dB(A) |
 | ||
30 dB silencioso 40 dB(A) audible 50 dB(A) ruidosamente alto |
||
min: | ||
| Lenovo Legion Slim 7 16APH8 R7 7840HS, GeForce RTX 4060 Laptop GPU | Asus ROG Flow X16 GV601V i9-13900H, GeForce RTX 4060 Laptop GPU | Alienware m16 R1 Intel i7-13700HX, GeForce RTX 4060 Laptop GPU | Acer Predator Helios 16 PH16-71-731Q i7-13700HX, GeForce RTX 4060 Laptop GPU | Lenovo Legion Pro 5 16IRX8 i7-13700HX, GeForce RTX 4060 Laptop GPU | Lenovo LOQ 16IRH8 i7-13620H, GeForce RTX 4060 Laptop GPU | |
|---|---|---|---|---|---|---|
| Noise | 3% | -8% | -0% | 4% | -6% | |
| apagado / medio ambiente * (dB) | 24 | 24 -0% | 25 -4% | 24 -0% | 23 4% | 23 4% |
| Idle Minimum * (dB) | 25 | 24 4% | 25 -0% | 24 4% | 23.1 8% | 23 8% |
| Idle Average * (dB) | 28 | 24 14% | 26 7% | 24 14% | 23.1 17% | 23 18% |
| Idle Maximum * (dB) | 31 | 24 23% | 27 13% | 32.32 -4% | 26.6 14% | 27.66 11% |
| Load Average * (dB) | 33 | 36.71 -11% | 52 -58% | 36.66 -11% | 34.7 -5% | 53.62 -62% |
| Witcher 3 ultra * (dB) | 47 | 50.92 -8% | 51 -9% | 49.06 -4% | 47.6 -1% | 53.5 -14% |
| Load Maximum * (dB) | 49 | 50.92 -4% | 53 -8% | 49.49 -1% | 54.8 -12% | 53.5 -9% |
* ... más pequeño es mejor
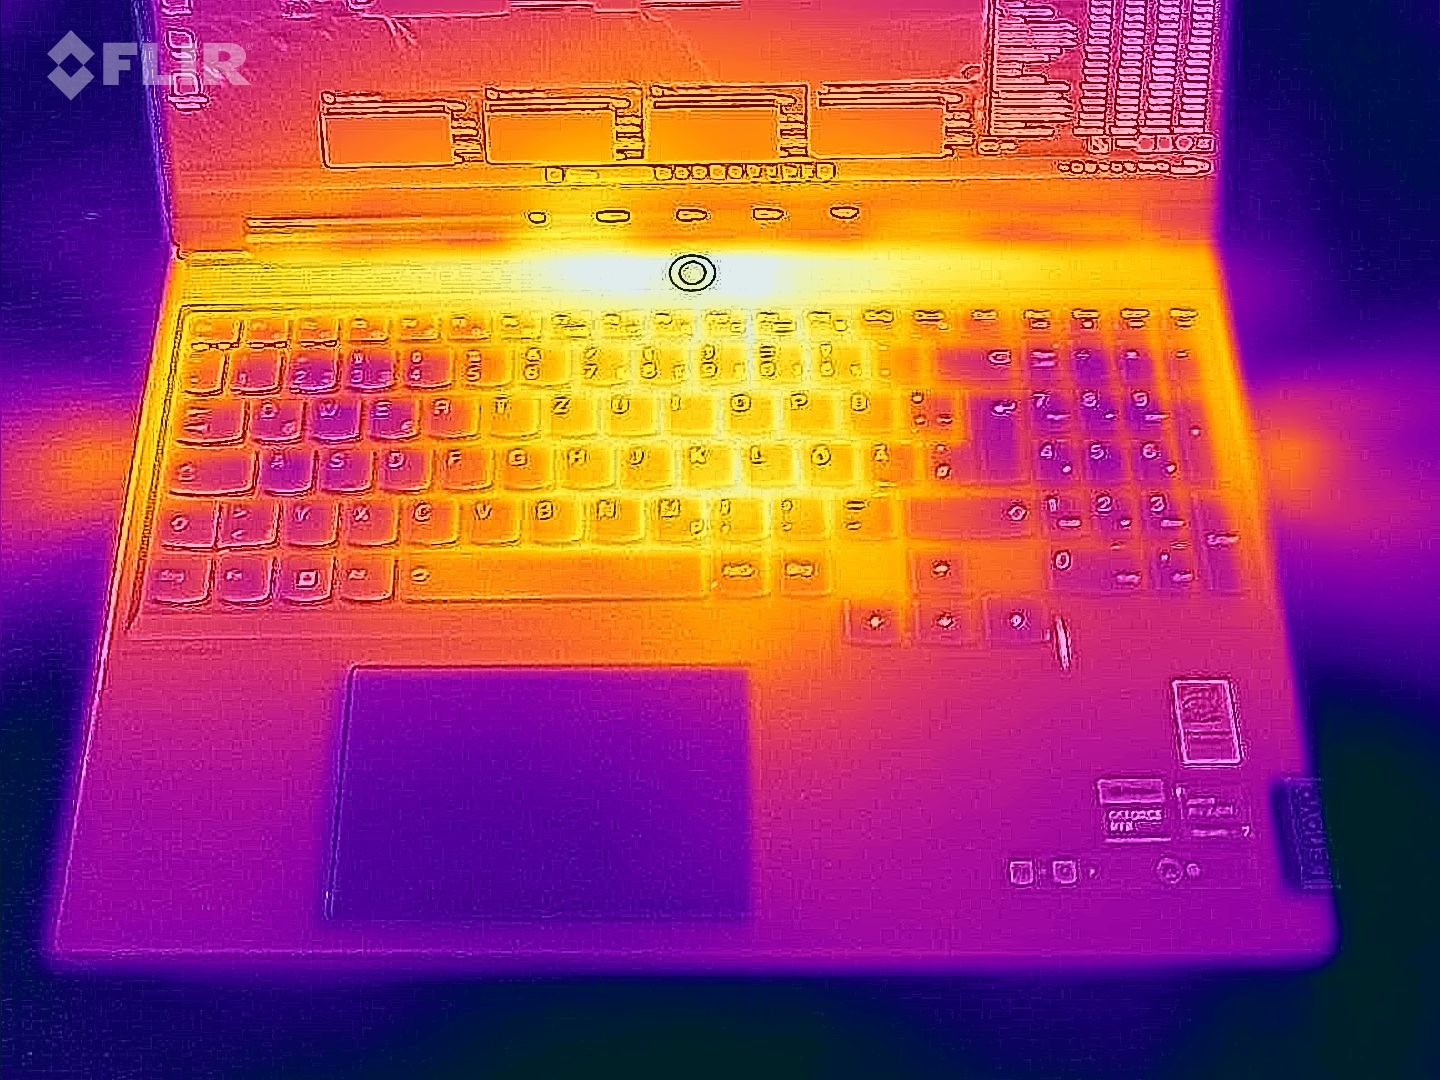
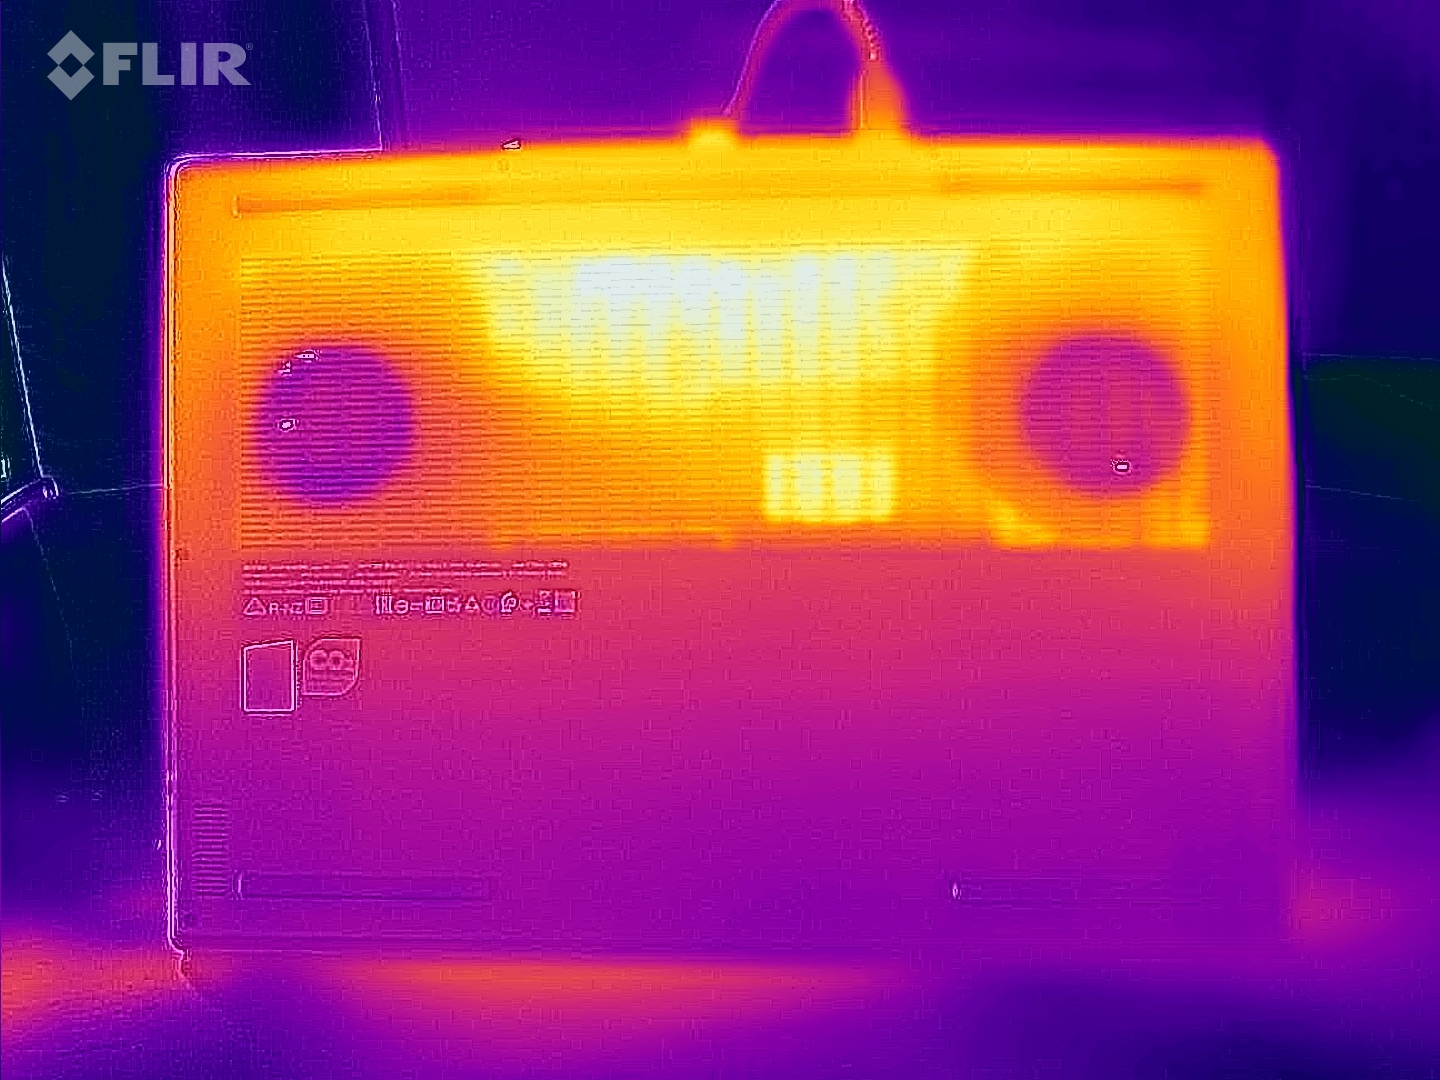
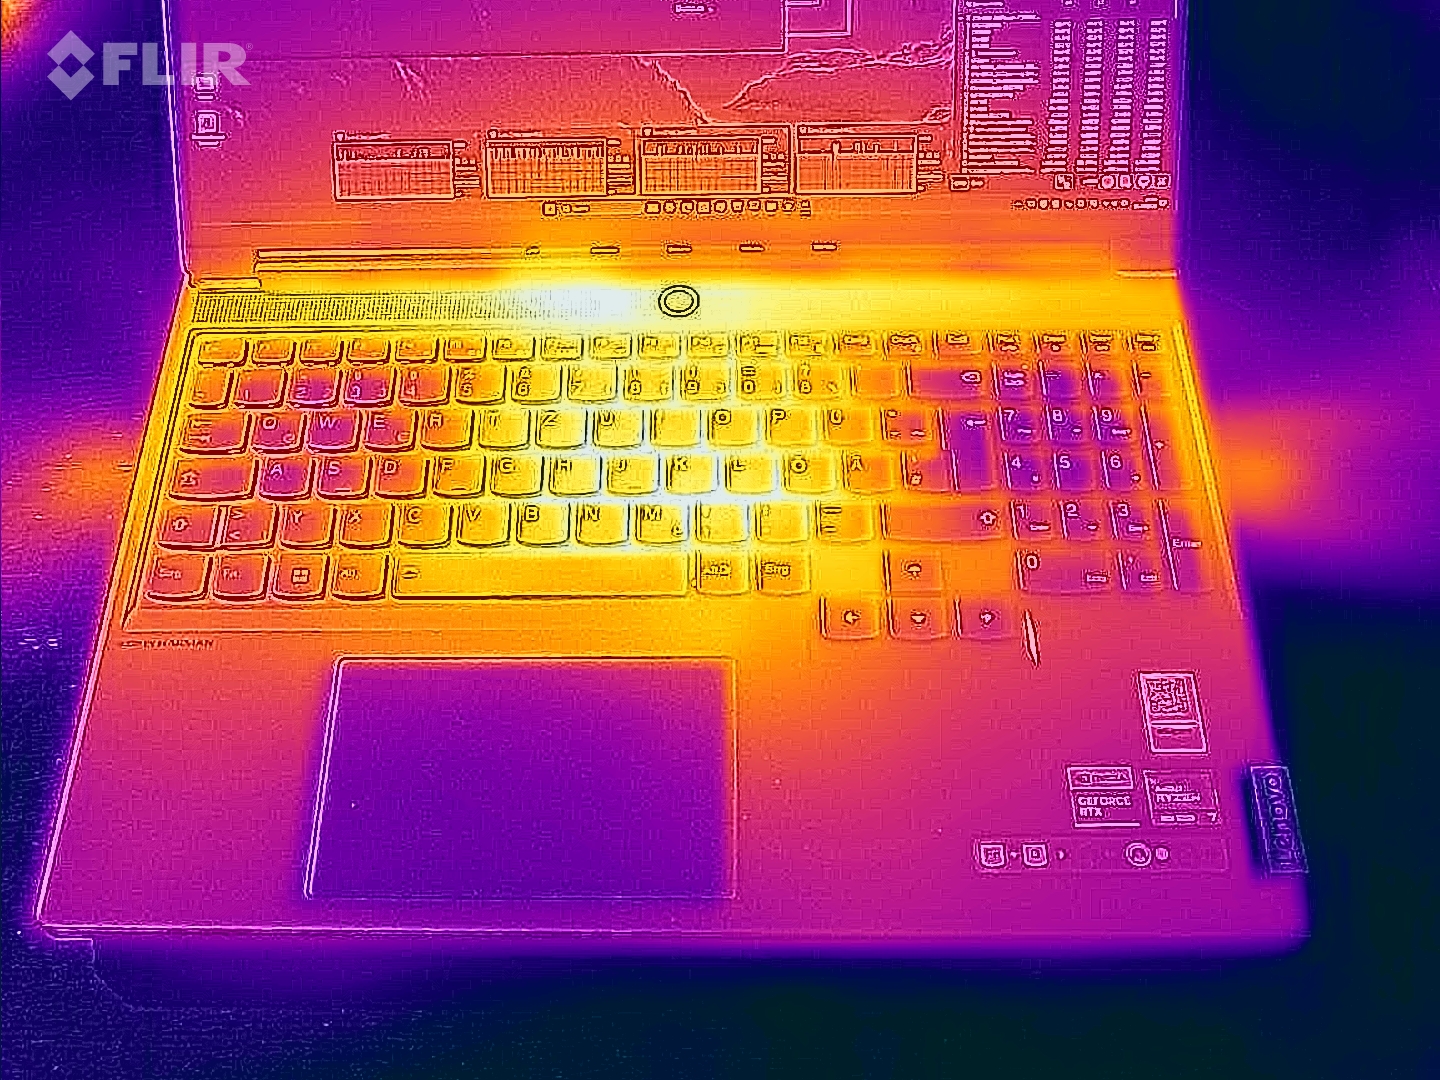
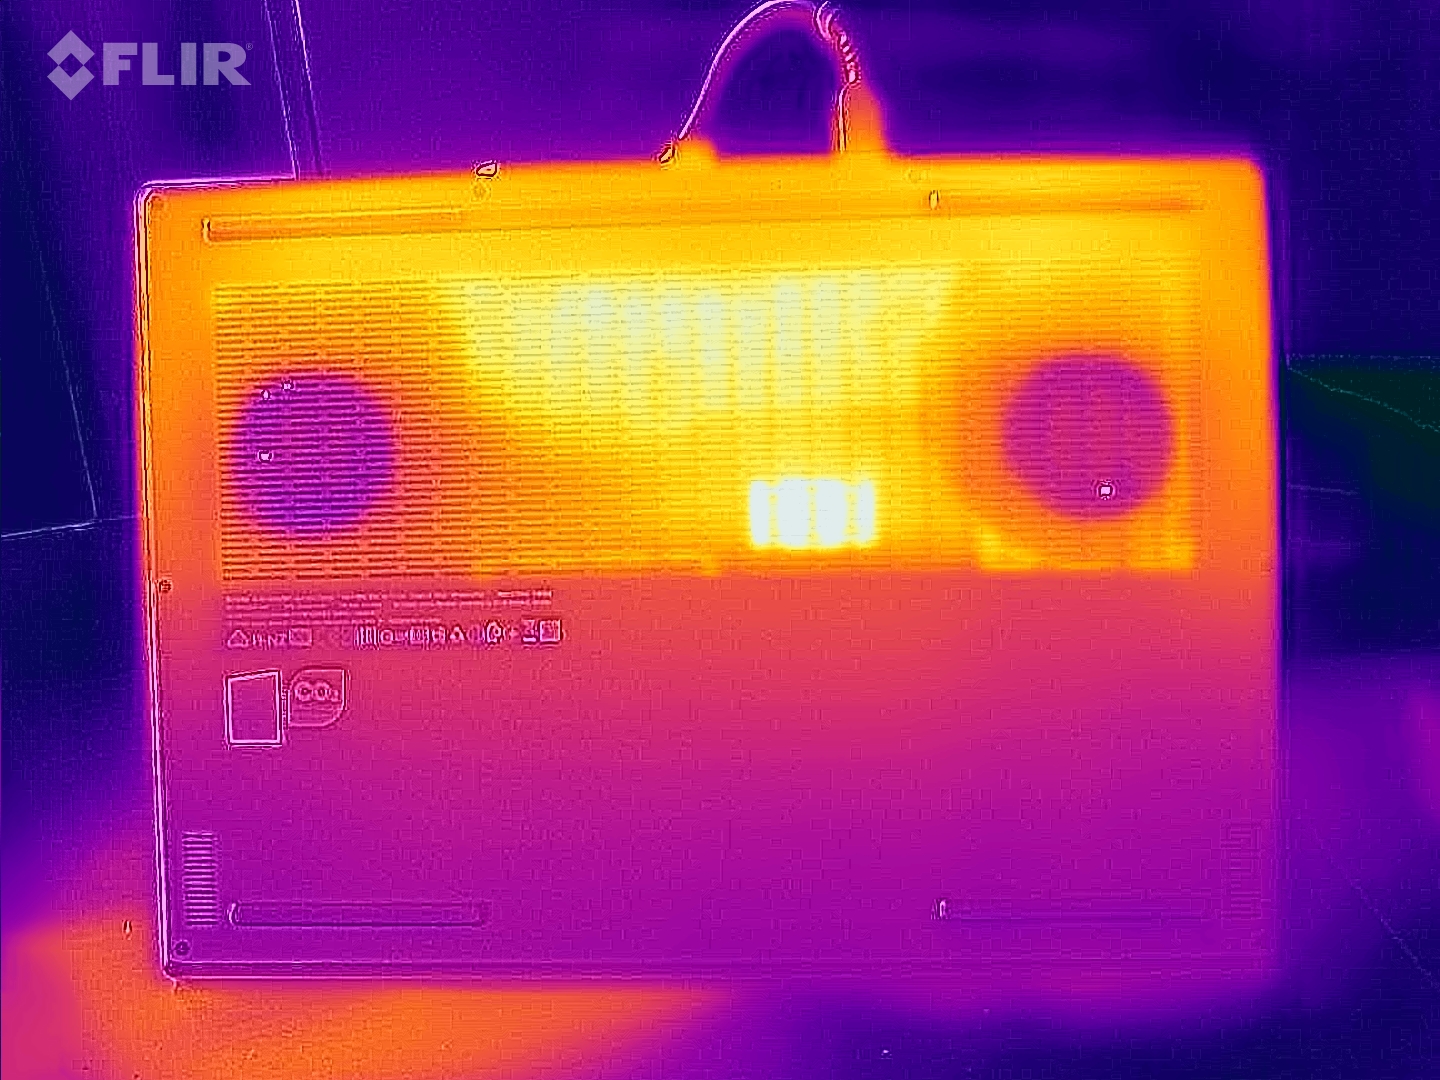
Temperatura
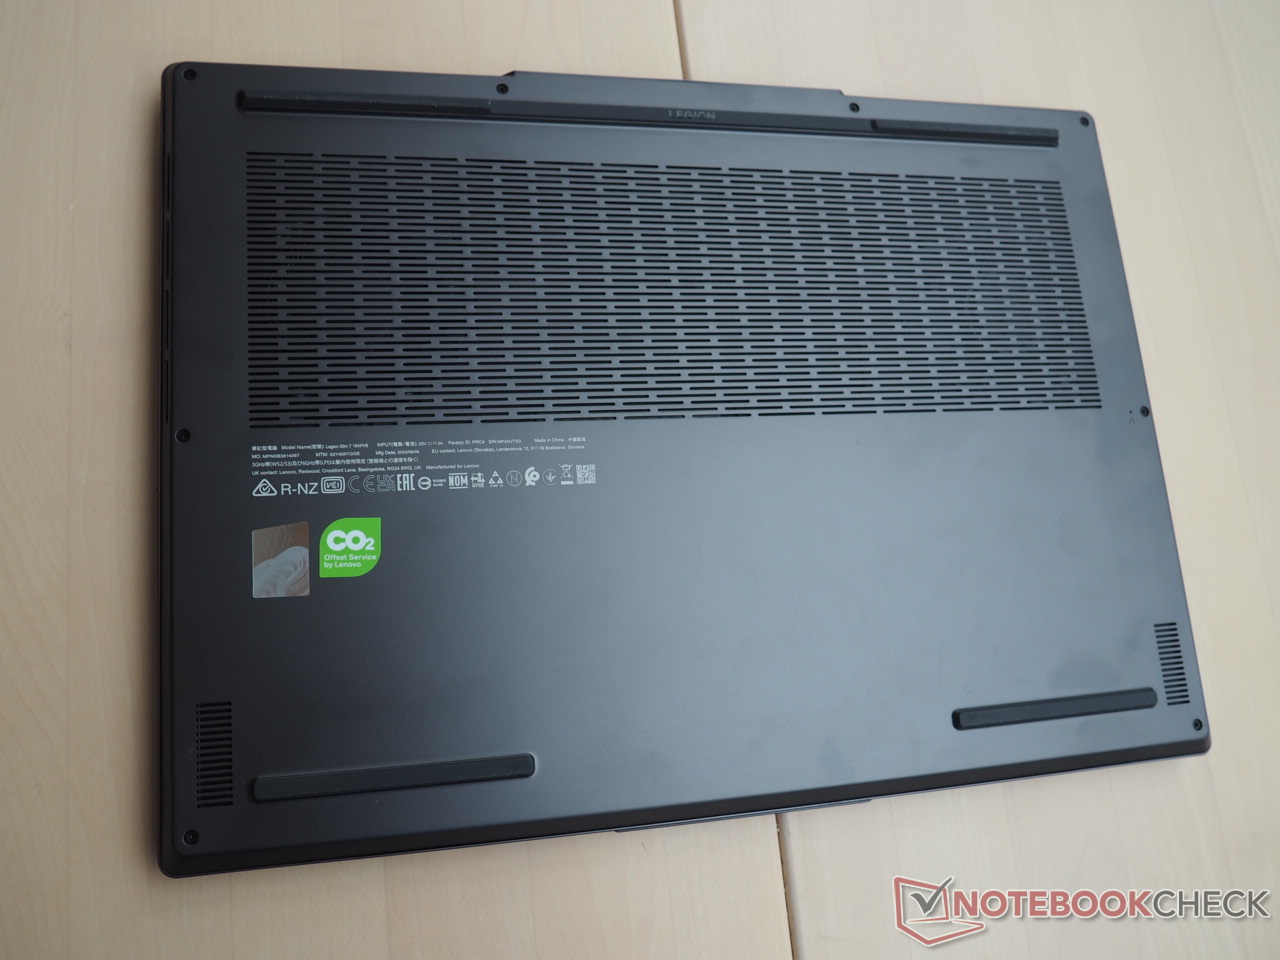
La temperatura en el interior de la carcasa está dentro del rango medio y no alcanza niveles excepcionalmente bajos o altos. Durante las pruebas de estrés con las herramientas Furmark y Prime95, la tarjeta gráfica se estranguló, lo que provocó que las temperaturas más altas se observaran en el modo de juego. Tras 60 minutos de funcionamiento de The Witcher 3, el chasis alcanzó un máximo de 49°C en la parte superior y 52°C en la inferior, valores típicos de un portátil para juegos. En modo inactivo, las temperaturas de la superficie rondan una media de 30°C, lo que indica un nivel de calor moderado.
(-) La temperatura máxima en la parte superior es de 46 °C / 115 F, frente a la media de 40.4 °C / 105 F, que oscila entre 21.2 y 68.8 °C para la clase Gaming.
(-) El fondo se calienta hasta un máximo de 46 °C / 115 F, frente a la media de 43.2 °C / 110 F
(+) En reposo, la temperatura media de la parte superior es de 30.3 °C / 87# F, frente a la media del dispositivo de 33.9 °C / 93 F.
(-) Jugando a The Witcher 3, la temperatura media de la parte superior es de 41.6 °C / 107 F, frente a la media del dispositivo de 33.9 °C / 93 F.
(+) Los reposamanos y el panel táctil alcanzan como máximo la temperatura de la piel (35 °C / 95 F) y, por tanto, no están calientes.
(-) La temperatura media de la zona del reposamanos de dispositivos similares fue de 28.8 °C / 83.8 F (-6.2 °C / -11.2 F).
| Lenovo Legion Slim 7 16APH8 R7 7840HS, GeForce RTX 4060 Laptop GPU | Asus ROG Flow X16 GV601V i9-13900H, GeForce RTX 4060 Laptop GPU | Alienware m16 R1 Intel i7-13700HX, GeForce RTX 4060 Laptop GPU | Acer Predator Helios 16 PH16-71-731Q i7-13700HX, GeForce RTX 4060 Laptop GPU | Lenovo Legion Pro 5 16IRX8 i7-13700HX, GeForce RTX 4060 Laptop GPU | Lenovo LOQ 16IRH8 i7-13620H, GeForce RTX 4060 Laptop GPU | |
|---|---|---|---|---|---|---|
| Heat | 1% | -12% | -13% | 2% | 0% | |
| Maximum Upper Side * (°C) | 46 | 46 -0% | 49 -7% | 41 11% | 42.8 7% | 48 -4% |
| Maximum Bottom * (°C) | 46 | 41 11% | 48 -4% | 66 -43% | 50 -9% | 59 -28% |
| Idle Upper Side * (°C) | 33 | 36 -9% | 40 -21% | 36 -9% | 29.6 10% | 28 15% |
| Idle Bottom * (°C) | 34 | 33 3% | 39 -15% | 37 -9% | 34 -0% | 28 18% |
* ... más pequeño es mejor
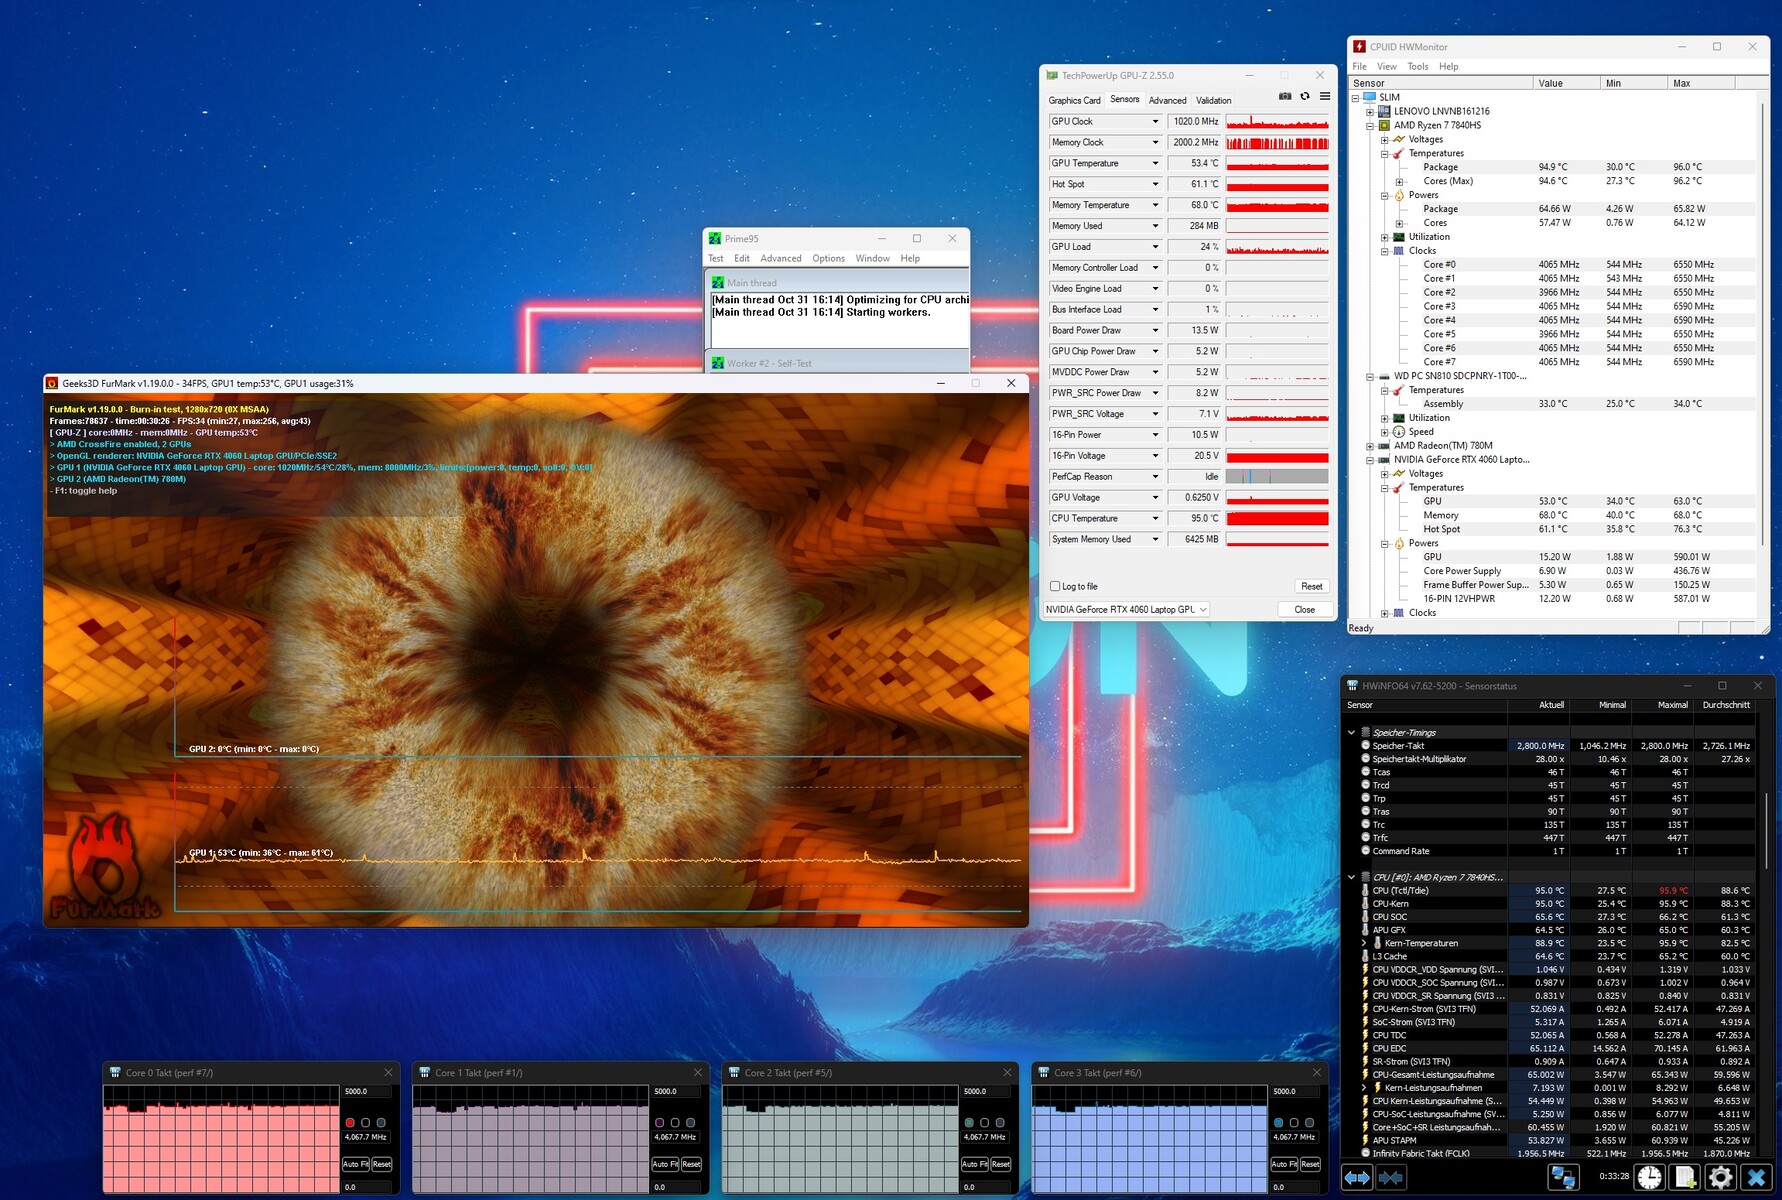
Prueba de estrés
La CPU se calentó bastante durante nuestra prueba de estrés de 60 minutos. Aunque el Ryzen 7 7840HS alcanzó los 95°C, mantuvo una frecuencia constante de 4,1 GHz. En el modo de juego, la situación es notablemente más relajada. Mientras jugábamos a The Witcher 3, la temperatura de la CPU rondó los 66°C, mientras que la temperatura de la tarjeta gráfica se mantuvo en el rango verde, justo por debajo de los 72°C.
Altavoces
La calidad del sonido supera a la de la mayoría de los competidores. El sistema 2.0 (Harman) produce un sonido robusto que puede ser agradablemente alto si es necesario. Sin embargo, al igual que la mayoría de los portátiles, los graves son algo escasos.
Lenovo Legion Slim 7 16APH8 análisis de audio
(+) | los altavoces pueden reproducir a un volumen relativamente alto (#87 dB)
Graves 100 - 315 Hz
(±) | lubina reducida - en promedio 13.8% inferior a la mediana
(±) | la linealidad de los graves es media (8.5% delta a frecuencia anterior)
Medios 400 - 2000 Hz
(+) | medios equilibrados - a sólo 1.1% de la mediana
(+) | los medios son lineales (2.5% delta a la frecuencia anterior)
Altos 2 - 16 kHz
(+) | máximos equilibrados - a sólo 4.1% de la mediana
(+) | los máximos son lineales (4.8% delta a la frecuencia anterior)
Total 100 - 16.000 Hz
(+) | el sonido global es lineal (9.9% de diferencia con la mediana)
En comparación con la misma clase
» 5% de todos los dispositivos probados de esta clase eran mejores, 2% similares, 94% peores
» El mejor tuvo un delta de 6%, la media fue 18%, el peor fue ###max##%
En comparación con todos los dispositivos probados
» 4% de todos los dispositivos probados eran mejores, 1% similares, 95% peores
» El mejor tuvo un delta de 4%, la media fue 23%, el peor fue ###max##%
Asus ROG Flow X16 GV601V análisis de audio
(±) | la sonoridad del altavoz es media pero buena (77.38 dB)
Graves 100 - 315 Hz
(±) | lubina reducida - en promedio 9.6% inferior a la mediana
(±) | la linealidad de los graves es media (9.2% delta a frecuencia anterior)
Medios 400 - 2000 Hz
(+) | medios equilibrados - a sólo 4.7% de la mediana
(±) | la linealidad de los medios es media (7.5% delta respecto a la frecuencia anterior)
Altos 2 - 16 kHz
(+) | máximos equilibrados - a sólo 2.2% de la mediana
(+) | los máximos son lineales (6.1% delta a la frecuencia anterior)
Total 100 - 16.000 Hz
(+) | el sonido global es lineal (12% de diferencia con la mediana)
En comparación con la misma clase
» 12% de todos los dispositivos probados de esta clase eran mejores, 4% similares, 84% peores
» El mejor tuvo un delta de 6%, la media fue 18%, el peor fue ###max##%
En comparación con todos los dispositivos probados
» 9% de todos los dispositivos probados eran mejores, 2% similares, 88% peores
» El mejor tuvo un delta de 4%, la media fue 23%, el peor fue ###max##%
Gestión de la energía
Consumo de energía
El consumo de energía a veces parece inconsistente. A pesar de la conmutación activa de gráficos, el consumo en reposo de 33 a 45 vatios es superior a la media. Sin embargo, el consumo de energía de 3DMark 06 de unos 59 vatios es muy bajo. Además, los resultados obtenidos durante The Witcher 3 (131 vatios) y la prueba de estrés (177 vatios como máximo) están por debajo de la competencia, lo que demuestra la eficiencia energética de la CPU Zen 4, al menos bajo carga.
| Off / Standby | |
| Ocioso | |
| Carga |
|
Clave:
min: | |
| Lenovo Legion Slim 7 16APH8 R7 7840HS, GeForce RTX 4060 Laptop GPU | Asus ROG Flow X16 GV601V i9-13900H, GeForce RTX 4060 Laptop GPU | Alienware m16 R1 Intel i7-13700HX, GeForce RTX 4060 Laptop GPU | Acer Predator Helios 16 PH16-71-731Q i7-13700HX, GeForce RTX 4060 Laptop GPU | Lenovo Legion Pro 5 16IRX8 i7-13700HX, GeForce RTX 4060 Laptop GPU | Lenovo LOQ 16IRH8 i7-13620H, GeForce RTX 4060 Laptop GPU | Media de la clase Gaming | |
|---|---|---|---|---|---|---|---|
| Power Consumption | 14% | -7% | -4% | -13% | 8% | 5% | |
| Idle Minimum * (Watt) | 33 | 9.6 71% | 10 70% | 15.9 52% | 24.5 26% | 17.2 48% | 13 ? 61% |
| Idle Average * (Watt) | 35 | 16 54% | 14 60% | 20.5 41% | 29.2 17% | 19.3 45% | 18.6 ? 47% |
| Idle Maximum * (Watt) | 45 | 16.9 62% | 21 53% | 20.9 54% | 34.3 24% | 21.2 53% | 24.2 ? 46% |
| Load Average * (Watt) | 59 | 104 -76% | 119 -102% | 106 -80% | 98.7 -67% | 90 -53% | 108.7 ? -84% |
| Witcher 3 ultra * (Watt) | 131 | 142 -8% | 186.7 -43% | 175 -34% | 178.6 -36% | 168 -28% | |
| Load Maximum * (Watt) | 177 | 214 -21% | 323 -82% | 276 -56% | 249.6 -41% | 211 -19% | 255 ? -44% |
* ... más pequeño es mejor
Power consumption Witcher 3 / stress test
Power consumption with external monitor
Duración de las pilas
Teniendo en cuenta la gran batería de 99,9 Wh, la autonomía no bate ningún récord. Unas 7 horas de navegación por Internet con el brillo reducido a 150 cd/m2 está bien, pero teniendo en cuenta el tamaño de la batería, podría ser bastante mejor. No obstante, se asegura el segundo puesto en la prueba, justo detrás del Asus ROG Flow X16.
| Lenovo Legion Slim 7 16APH8 R7 7840HS, GeForce RTX 4060 Laptop GPU, 99.9 Wh | Asus ROG Flow X16 GV601V i9-13900H, GeForce RTX 4060 Laptop GPU, 90 Wh | Alienware m16 R1 Intel i7-13700HX, GeForce RTX 4060 Laptop GPU, 86 Wh | Acer Predator Helios 16 PH16-71-731Q i7-13700HX, GeForce RTX 4060 Laptop GPU, 90 Wh | Lenovo Legion Pro 5 16IRX8 i7-13700HX, GeForce RTX 4060 Laptop GPU, 80 Wh | Lenovo LOQ 16IRH8 i7-13620H, GeForce RTX 4060 Laptop GPU, 80 Wh | Media de la clase Gaming | |
|---|---|---|---|---|---|---|---|
| Duración de Batería | 11% | -32% | -21% | -52% | -11% | 0% | |
| WiFi v1.3 (h) | 7.1 | 7.9 11% | 4.8 -32% | 5.6 -21% | 3.4 -52% | 6.3 -11% | 7.07 ? 0% |
| H.264 (h) | 8.9 | 5.6 | 4.8 | 6.4 | 8.64 ? | ||
| Load (h) | 1.5 | 1 | 1.5 | 0.7 | 1.5 | 1.502 ? | |
| Reader / Idle (h) | 6.4 | 6.7 | 8.71 ? | ||||
| Witcher 3 ultra (h) | 1.5 |
Pro
Contra
Veredicto

La versión AMD del portátil, al igual que su homólogo Intel, es muy recomendable.
La sinergia entre el Ryzen 7 7840HS y el GeForce RTX 4060 permite un rendimiento fluido, permitiendo ajustes de alto a máximo utilizando una resolución de 2.560 x 1.600 píxeles.
La pantalla de 240 Hz destaca no sólo por su alto brillo, sino también por su visibilidad en entornos exteriores. La carcasa del portátil sobresale en varios aspectos, como las conexiones, la estabilidad, el diseño y la calidad de los materiales. A pesar de su tamaño de 16 pulgadas, es bastante ligero (4,6 libras). También cuenta con dispositivos de entrada bien pensados y una excelente calidad de sonido.
Aunque hay pequeños defectos, como un consumo de energía ligeramente mayor en modo inactivo y una ralentización ocasional de la SSD con el tiempo, estas deficiencias no distraen significativamente de la excelente experiencia general. En consecuencia, el portátil recibe una valoración global muy buena.
Vale la pena mencionar que la competencia, como el Asus ROG Flow X16, también ofrece un rendimiento excelente, pero a un precio mayor, lo que hace que nuestra sugerencia sea aún más tentadora.
Precio y disponibilidad
El Lenovo Legion Slim 7 16APH8 probado está disponible por unos 1750 USD en Amazon.
Lenovo Legion Slim 7 16APH8
- 11/03/2023 v7 (old)
Florian Glaser
Transparencia
La selección de los dispositivos que se van a reseñar corre a cargo de nuestro equipo editorial. La muestra de prueba fue proporcionada al autor en calidad de préstamo por el fabricante o el minorista a los efectos de esta reseña. El prestamista no tuvo ninguna influencia en esta reseña, ni el fabricante recibió una copia de la misma antes de su publicación. No había ninguna obligación de publicar esta reseña. Como empresa de medios independiente, Notebookcheck no está sujeta a la autoridad de fabricantes, minoristas o editores.
Así es como prueba Notebookcheck
Cada año, Notebookcheck revisa de forma independiente cientos de portátiles y smartphones utilizando procedimientos estandarizados para asegurar que todos los resultados son comparables. Hemos desarrollado continuamente nuestros métodos de prueba durante unos 20 años y hemos establecido los estándares de la industria en el proceso. En nuestros laboratorios de pruebas, técnicos y editores experimentados utilizan equipos de medición de alta calidad. Estas pruebas implican un proceso de validación en varias fases. Nuestro complejo sistema de clasificación se basa en cientos de mediciones y puntos de referencia bien fundamentados, lo que mantiene la objetividad.Price comparison

