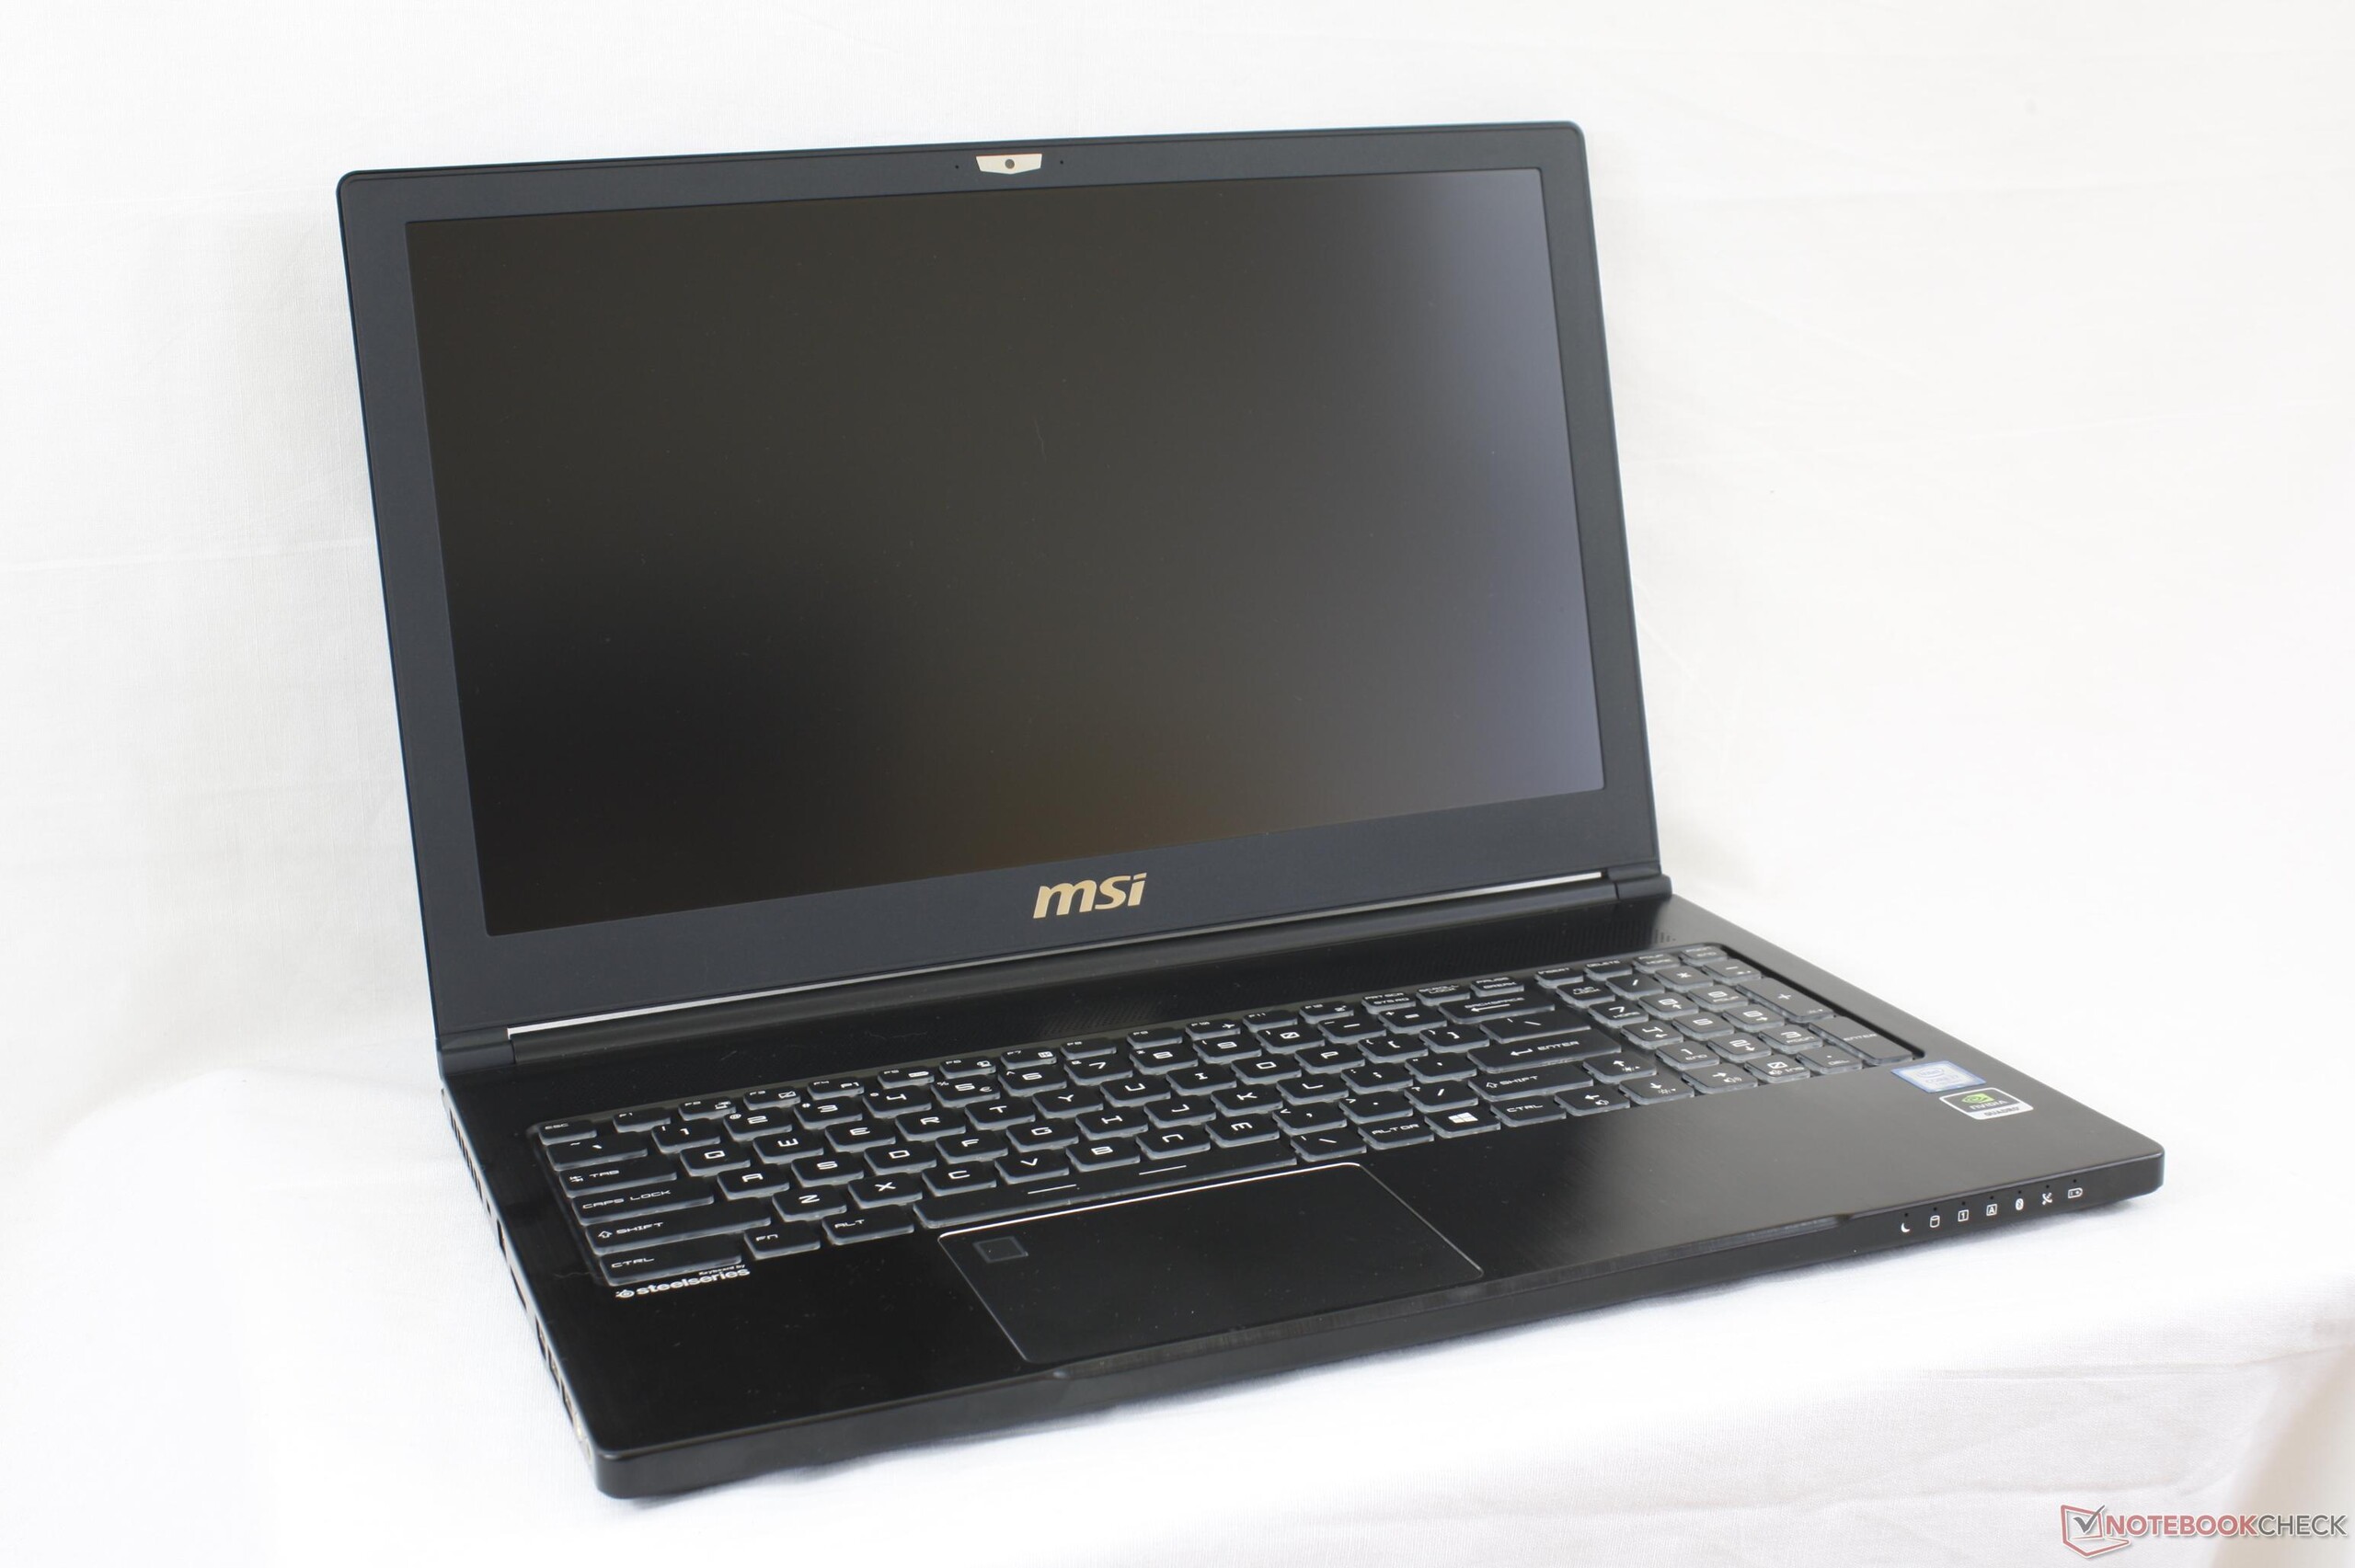
Breve análisis de la estación de trabajo MSI WS63 7RF (i7-7700HQ, FHD, P3000)

| SD Card Reader | |
| average JPG Copy Test (av. of 3 runs) | |
| Dell Precision 5520 UHD | |
| Lenovo ThinkPad P51 20HH0016GE | |
| MSI WT72-6QM | |
| MSI WS63 7RF-290US | |
| maximum AS SSD Seq Read Test (1GB) | |
| Dell Precision 5520 UHD | |
| Lenovo ThinkPad P51 20HH0016GE | |
| MSI WT72-6QM | |
| MSI WS63 7RF-290US | |
| Networking | |
| iperf3 transmit AX12 | |
| MSI GS63VR 7RF-228US | |
| MSI WS63 7RF-290US | |
| Lenovo ThinkPad P51 20HH0016GE | |
| Dell Precision 5520 UHD | |
| iperf3 receive AX12 | |
| MSI GS63VR 7RF-228US | |
| Lenovo ThinkPad P51 20HH0016GE | |
| MSI WS63 7RF-290US | |
| Dell Precision 5520 UHD | |
| |||||||||||||||||||||||||
iluminación: 92 %
Brillo con batería: 302.5 cd/m²
Contraste: 976:1 (Negro: 0.31 cd/m²)
ΔE ColorChecker Calman: 4.3 | ∀{0.5-29.43 Ø4.71}
ΔE Greyscale Calman: 3.1 | ∀{0.09-98 Ø4.96}
84.3% sRGB (Argyll 1.6.3 3D)
55% AdobeRGB 1998 (Argyll 1.6.3 3D)
61.5% AdobeRGB 1998 (Argyll 3D)
84.2% sRGB (Argyll 3D)
63.6% Display P3 (Argyll 3D)
Gamma: 2.16
CCT: 7071 K
| MSI WS63 7RF-290US ID: LGD046F, Name: LG Philips LP156W6, Dell P/N: 3874Y, IPS, 15.6", 1920x1080 | Lenovo ThinkPad P51 20HH0016GE LEN40BD, B156ZAN02.1, IPS, 15.6", 3840x2160 | Dell Precision 5520 UHD SHP1476, IPS, 15.6", 3840x2160 | Fujitsu Celsius H760 LGD046F LP156WF6-SPP1, IPS LED, 15.6", 1920x1080 | MSI WS60-6QJE316H11 SDC424B, IPS, 15.6", 3840x2160 | |
|---|---|---|---|---|---|
| Display | 38% | 12% | -1% | -7% | |
| Display P3 Coverage (%) | 63.6 | 86.3 36% | 67.4 6% | 63.9 0% | 55.1 -13% |
| sRGB Coverage (%) | 84.2 | 99.5 18% | 98.5 17% | 82.4 -2% | 83 -1% |
| AdobeRGB 1998 Coverage (%) | 61.5 | 99.3 61% | 68.9 12% | 60.3 -2% | 56.9 -7% |
| Response Times | 9% | -41% | 11% | 19% | |
| Response Time Grey 50% / Grey 80% * (ms) | 38 ? | 40.8 ? -7% | 59.2 ? -56% | 38 ? -0% | 34 ? 11% |
| Response Time Black / White * (ms) | 33 ? | 25.2 ? 24% | 41.6 ? -26% | 26 ? 21% | 24 ? 27% |
| PWM Frequency (Hz) | 21740 ? | 1316 ? | |||
| Screen | 15% | 6% | 3% | -10% | |
| Brightness middle (cd/m²) | 302.5 | 317 5% | 372.4 23% | 341 13% | 237 -22% |
| Brightness (cd/m²) | 295 | 309 5% | 368 25% | 310 5% | 208 -29% |
| Brightness Distribution (%) | 92 | 89 -3% | 90 -2% | 82 -11% | 77 -16% |
| Black Level * (cd/m²) | 0.31 | 0.36 -16% | 0.48 -55% | 0.34 -10% | 0.26 16% |
| Contrast (:1) | 976 | 881 -10% | 776 -20% | 1003 3% | 912 -7% |
| Colorchecker dE 2000 * | 4.3 | 2.7 37% | 2.6 40% | 3.8 12% | 4.42 -3% |
| Colorchecker dE 2000 max. * | 9.4 | 4.1 56% | 5.6 40% | 10.8 -15% | 8.54 9% |
| Greyscale dE 2000 * | 3.1 | 3 3% | 3.7 -19% | 2 35% | 4.43 -43% |
| Gamma | 2.16 102% | 2.27 97% | 2.14 103% | 2.17 101% | 2.23 99% |
| CCT | 7071 92% | 6077 107% | 7096 92% | 6581 99% | 6133 106% |
| Color Space (Percent of AdobeRGB 1998) (%) | 55 | 87.6 59% | 63 15% | 54 -2% | 52.5 -5% |
| Color Space (Percent of sRGB) (%) | 84.3 | 99.5 18% | 99 17% | 82.2 -2% | 82.9 -2% |
| Media total (Programa/Opciones) | 21% /
19% | -8% /
1% | 4% /
3% | 1% /
-6% |
* ... más pequeño es mejor
Tiempos de respuesta del display
| ↔ Tiempo de respuesta de Negro a Blanco | ||
|---|---|---|
| 33 ms ... subida ↗ y bajada ↘ combinada | ↗ 20 ms subida | 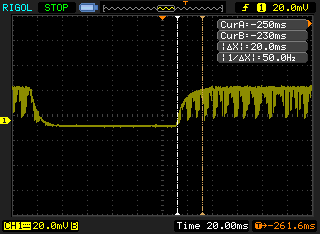 |
| ↘ 13 ms bajada | ||
| La pantalla mostró tiempos de respuesta lentos en nuestros tests y podría ser demasiado lenta para los jugones. En comparación, todos los dispositivos de prueba van de ##min### (mínimo) a 240 (máximo) ms. » 89 % de todos los dispositivos son mejores. Eso quiere decir que el tiempo de respuesta es peor que la media (19.8 ms) de todos los dispositivos testados. | ||
| ↔ Tiempo de respuesta 50% Gris a 80% Gris | ||
| 38 ms ... subida ↗ y bajada ↘ combinada | ↗ 20 ms subida | 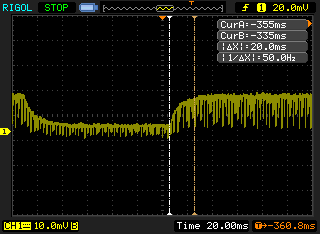 |
| ↘ 18 ms bajada | ||
| La pantalla mostró tiempos de respuesta lentos en nuestros tests y podría ser demasiado lenta para los jugones. En comparación, todos los dispositivos de prueba van de ##min### (mínimo) a 636 (máximo) ms. » 55 % de todos los dispositivos son mejores. Eso quiere decir que el tiempo de respuesta es peor que la media (30.9 ms) de todos los dispositivos testados. | ||
Parpadeo de Pantalla / PWM (Pulse-Width Modulation)
| Parpadeo de Pantalla / PWM detectado | 21740 Hz | ≤ 100 % de brillo | 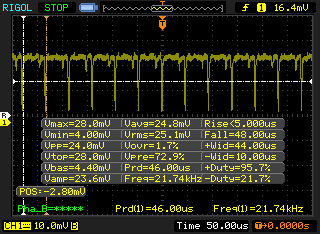 |
La retroiluminación del display parpadea a 21740 Hz (seguramente usa PWM - Pulse-Width Modulation) a un brillo del 100 % e inferior. Sobre este nivel de brillo no debería darse parpadeo / PWM. La frecuencia de 21740 Hz es bastante alta, por lo que la mayoría de gente sensible al parpadeo no debería ver parpadeo o tener fatiga visual. Comparación: 52 % de todos los dispositivos testados no usaron PWM para atenuar el display. Si se usó, medimos una media de 7748 (mínimo: 5 - máxmo: 343500) Hz. | |||
| Cinebench R15 | |
| CPU Single 64Bit | |
| Dell Precision 5520 UHD | |
| Lenovo ThinkPad P71-20HK0004GE | |
| MSI GS63VR 7RF-228US | |
| MSI WS63 7RF-290US | |
| MSI WS60 6QJ-535VPL | |
| MSI GE62 2QC-468XPL | |
| MSI GE72VR-6RF16H21 | |
| Nvidia Titan X (Pascal) | |
| CPU Multi 64Bit | |
| Nvidia Titan X (Pascal) | |
| Lenovo ThinkPad P71-20HK0004GE | |
| MSI WS63 7RF-290US | |
| MSI GS63VR 7RF-228US | |
| MSI GE62 2QC-468XPL | |
| MSI GE72VR-6RF16H21 | |
| MSI WS60 6QJ-535VPL | |
| Dell Precision 5520 UHD | |
| Cinebench R11.5 | |
| CPU Single 64Bit | |
| Dell Precision 5520 UHD | |
| Lenovo ThinkPad P71-20HK0004GE | |
| MSI WS63 7RF-290US | |
| MSI GS63VR 7RF-228US | |
| MSI GE62 2QC-468XPL | |
| MSI GE72VR-6RF16H21 | |
| Nvidia Titan X (Pascal) | |
| CPU Multi 64Bit | |
| Nvidia Titan X (Pascal) | |
| Lenovo ThinkPad P71-20HK0004GE | |
| MSI GS63VR 7RF-228US | |
| MSI WS63 7RF-290US | |
| MSI GE62 2QC-468XPL | |
| Dell Precision 5520 UHD | |
| MSI GE72VR-6RF16H21 | |
| Cinebench R10 | |
| Rendering Multiple CPUs 32Bit | |
| Nvidia Titan X (Pascal) | |
| Lenovo ThinkPad P71-20HK0004GE | |
| MSI WS63 7RF-290US | |
| MSI GS63VR 7RF-228US | |
| MSI GE62 2QC-468XPL | |
| MSI GE72VR-6RF16H21 | |
| Rendering Single 32Bit | |
| Lenovo ThinkPad P71-20HK0004GE | |
| MSI WS63 7RF-290US | |
| MSI GS63VR 7RF-228US | |
| MSI GE62 2QC-468XPL | |
| MSI GE72VR-6RF16H21 | |
| Nvidia Titan X (Pascal) | |
| wPrime 2.10 - 1024m | |
| MSI WS60 6QJ-535VPL | |
| Dell Precision 5520 UHD | |
| MSI GS63VR 7RF-228US | |
| MSI WS63 7RF-290US | |
| MSI GE62 2QC-468XPL | |
* ... más pequeño es mejor
| PCMark 8 | |
| Home Score Accelerated v2 | |
| EVGA SC15 | |
| MSI WS63 7RF-290US | |
| Lenovo ThinkPad P51 20HH0016GE | |
| MSI WS60-6QJE316H11 | |
| Work Score Accelerated v2 | |
| EVGA SC15 | |
| MSI WS63 7RF-290US | |
| Lenovo ThinkPad P51 20HH0016GE | |
| MSI WS60-6QJE316H11 | |
| Creative Score Accelerated v2 | |
| EVGA SC15 | |
| Lenovo ThinkPad P51 20HH0016GE | |
| MSI WS63 7RF-290US | |
| PCMark 8 Home Score Accelerated v2 | 4284 puntos | |
| PCMark 8 Creative Score Accelerated v2 | 5348 puntos | |
| PCMark 8 Work Score Accelerated v2 | 5331 puntos | |
ayuda | ||
| MSI WS63 7RF-290US Samsung SM961 MZVKW512HMJP m.2 PCI-e | MSI WS60 6QJ-535VPL 2x Plextor PX512M6GV-2280 (RAID 0) | Lenovo ThinkPad P51 20HH0016GE Samsung PM961 NVMe MZVLW512HMJP | Dell Precision 5520 UHD Samsung SM961 MZVKW512HMJP m.2 PCI-e | Fujitsu Celsius H760 Samsung SM951 MZVPV512 m.2 PCI-e | |
|---|---|---|---|---|---|
| AS SSD | -55% | -4% | -1% | -17% | |
| Copy Game MB/s (MB/s) | 1121 | 1140 2% | 921 -18% | 978 -13% | |
| Copy Program MB/s (MB/s) | 447.3 | 425.6 -5% | 372.8 -17% | 571 28% | |
| Copy ISO MB/s (MB/s) | 1760 | 1607 -9% | 1659 -6% | 1325 -25% | |
| Score Total (Points) | 3759 | 1392 -63% | 3424 -9% | 3681 -2% | 2201 -41% |
| Score Write (Points) | 1440 | 543 -62% | 917 -36% | 1379 -4% | 623 -57% |
| Score Read (Points) | 1568 | 557 -64% | 1690 8% | 1554 -1% | 1048 -33% |
| Access Time Write * (ms) | 0.028 | 0.041 -46% | 0.025 11% | 0.023 18% | 0.018 36% |
| Access Time Read * (ms) | 0.036 | 0.054 -50% | 0.032 11% | 0.038 -6% | 0.036 -0% |
| 4K-64 Write (MB/s) | 1151 | 375.8 -67% | 623 -46% | 1055 -8% | 285 -75% |
| 4K-64 Read (MB/s) | 1244 | 437.1 -65% | 1372 10% | 1223 -2% | 801 -36% |
| 4K Write (MB/s) | 128.5 | 85 -34% | 143.1 11% | 155.3 21% | 188 46% |
| 4K Read (MB/s) | 49.02 | 32.19 -34% | 55.6 13% | 51.5 5% | 34 -31% |
| Seq Write (MB/s) | 1603 | 821 -49% | 1506 -6% | 1694 6% | 1492 -7% |
| Seq Read (MB/s) | 2750 | 880 -68% | 2624 -5% | 2799 2% | 1916 -30% |
* ... más pequeño es mejor

| Rise of the Tomb Raider - 1920x1080 Very High Preset AA:FX AF:16x | |
| EVGA SC15 | |
| Asus Strix GL502VY-DS71 | |
| MSI WS63 7RF-290US | |
| Lenovo ThinkPad P70-20ER000XUS | |
| Asus GL753VE-DS74 | |
| HP ZBook 17 G3 TZV66eA | |
| HP Pavilion 15 Power 1GK62AV | |
| bajo | medio | alto | ultra | |
|---|---|---|---|---|
| BioShock Infinite (2013) | 92.1 | |||
| Metro: Last Light (2013) | 67.5 | |||
| Thief (2014) | 65 | |||
| The Witcher 3 (2015) | 66 | 33 | ||
| Batman: Arkham Knight (2015) | 73 | 49 | ||
| Metal Gear Solid V (2015) | 60 | |||
| Fallout 4 (2015) | 51.9 | |||
| Rise of the Tomb Raider (2016) | 53.6 | |||
| Ashes of the Singularity (2016) | 52.5 | 47.8 | ||
| Doom (2016) | 73 | |||
| Overwatch (2016) | 89.9 | |||
| Mafia 3 (2016) | 36.5 | |||
| Prey (2017) | 89.3 |
Ruido
| Ocioso |
| 28.1 / 28.1 / 32 dB(A) |
| Carga |
| 38 / 47.2 dB(A) |
 | ||
30 dB silencioso 40 dB(A) audible 50 dB(A) ruidosamente alto |
||
min: | ||
| MSI WS63 7RF-290US Quadro P3000, i7-7700HQ, Samsung SM961 MZVKW512HMJP m.2 PCI-e | Lenovo ThinkPad P51 20HH0016GE Quadro M2200, E3-1505M v6, Samsung PM961 NVMe MZVLW512HMJP | Dell Precision 5520 UHD Quadro M1200, E3-1505M v6, Samsung SM961 MZVKW512HMJP m.2 PCI-e | MSI WS60-6QJE316H11 Quadro M2000M, E3-1505M v5, Toshiba NVMe THNSN5128GP | HP ZBook 15 G3 Quadro M2000M, E3-1505M v5, Samsung SM951 MZVPV512HDGL m.2 PCI-e | Fujitsu Celsius H760 Quadro M2000M, E3-1505M v5, Samsung SM951 MZVPV512 m.2 PCI-e | |
|---|---|---|---|---|---|---|
| Noise | 5% | -7% | -20% | -7% | -3% | |
| apagado / medio ambiente * (dB) | 28.1 | 29.6 -5% | 28.7 -2% | 30 -7% | 29 -3% | |
| Idle Minimum * (dB) | 28.1 | 29.6 -5% | 28.7 -2% | 37.2 -32% | 30 -7% | 29 -3% |
| Idle Average * (dB) | 28.1 | 29.6 -5% | 32.1 -14% | 37.2 -32% | 30 -7% | 29 -3% |
| Idle Maximum * (dB) | 32 | 29.6 7% | 32.1 -0% | 37.2 -16% | 30 6% | 29 9% |
| Load Average * (dB) | 38 | 32.2 15% | 41.3 -9% | 42.1 -11% | 45.3 -19% | 43.1 -13% |
| Witcher 3 ultra * (dB) | 35.8 | 45.5 -27% | ||||
| Load Maximum * (dB) | 47.2 | 36.6 22% | 45.5 4% | 50.7 -7% | 49.7 -5% | 49.2 -4% |
* ... más pequeño es mejor
(-) La temperatura máxima en la parte superior es de 46.4 °C / 116 F, frente a la media de 38.2 °C / 101 F, que oscila entre 22.2 y 69.8 °C para la clase Workstation.
(-) El fondo se calienta hasta un máximo de 62 °C / 144 F, frente a la media de 41.1 °C / 106 F
(+) En reposo, la temperatura media de la parte superior es de 27.2 °C / 81# F, frente a la media del dispositivo de 32 °C / 90 F.
(±) Jugando a The Witcher 3, la temperatura media de la parte superior es de 36.2 °C / 97 F, frente a la media del dispositivo de 32 °C / 90 F.
(±) El reposamanos y el touchpad pueden calentarse mucho al tacto con un máximo de 36.4 °C / 97.5 F.
(-) La temperatura media de la zona del reposamanos de dispositivos similares fue de 27.8 °C / 82 F (-8.6 °C / -15.5 F).
MSI WS63 7RF-290US análisis de audio
(-) | altavoces no muy altos (#66.6 dB)
Graves 100 - 315 Hz
(-) | casi sin bajos - de media 17.1% inferior a la mediana
(±) | la linealidad de los graves es media (11.9% delta a frecuencia anterior)
Medios 400 - 2000 Hz
(±) | medias más altas - de media 6.4% más altas que la mediana
(-) | los medios no son lineales (15.4% delta respecto a la frecuencia anterior)
Altos 2 - 16 kHz
(+) | máximos equilibrados - a sólo 4.8% de la mediana
(±) | la linealidad de los máximos es media (10.8% delta a frecuencia anterior)
Total 100 - 16.000 Hz
(-) | el sonido global no es lineal (35.1% de diferencia con la mediana)
En comparación con la misma clase
» 99% de todos los dispositivos probados de esta clase eran mejores, 1% similares, 0% peores
» El mejor tuvo un delta de 7%, la media fue 17%, el peor fue ###max##%
En comparación con todos los dispositivos probados
» 93% de todos los dispositivos probados eran mejores, 1% similares, 6% peores
» El mejor tuvo un delta de 4%, la media fue 23%, el peor fue ###max##%
Apple MacBook 12 (Early 2016) 1.1 GHz análisis de audio
(+) | los altavoces pueden reproducir a un volumen relativamente alto (#83.6 dB)
Graves 100 - 315 Hz
(±) | lubina reducida - en promedio 11.3% inferior a la mediana
(±) | la linealidad de los graves es media (14.2% delta a frecuencia anterior)
Medios 400 - 2000 Hz
(+) | medios equilibrados - a sólo 2.4% de la mediana
(+) | los medios son lineales (5.5% delta a la frecuencia anterior)
Altos 2 - 16 kHz
(+) | máximos equilibrados - a sólo 2% de la mediana
(+) | los máximos son lineales (4.5% delta a la frecuencia anterior)
Total 100 - 16.000 Hz
(+) | el sonido global es lineal (10.2% de diferencia con la mediana)
En comparación con la misma clase
» 7% de todos los dispositivos probados de esta clase eran mejores, 2% similares, 90% peores
» El mejor tuvo un delta de 5%, la media fue 18%, el peor fue ###max##%
En comparación con todos los dispositivos probados
» 5% de todos los dispositivos probados eran mejores, 1% similares, 94% peores
» El mejor tuvo un delta de 4%, la media fue 23%, el peor fue ###max##%
| Off / Standby | |
| Ocioso | |
| Carga |
|
Clave:
min: | |
| MSI WS63 7RF-290US i7-7700HQ, Quadro P3000, Samsung SM961 MZVKW512HMJP m.2 PCI-e, IPS, 1920x1080, 15.6" | MSI WS60-6QJE316H11 E3-1505M v5, Quadro M2000M, Toshiba NVMe THNSN5128GP, IPS, 3840x2160, 15.6" | EVGA SC15 i7-7700HQ, GeForce GTX 1060 Mobile, Toshiba NVMe THNSN5256GPU7, , 1920x1080, 15.6" | HP ZBook 17 G3 TZV66eA E3-1535M v5, Quadro M3000M, Samsung SM951 MZVPV256HDGL m.2 PCI-e, IPS, 1920x1080, 17.3" | MSI WT72-6QM E3-1505M v5, Quadro M5000M, Toshiba NVMe THNSN5256GPU7, IPS, 1920x1080, 17.3" | |
|---|---|---|---|---|---|
| Power Consumption | -59% | -57% | -0% | -79% | |
| Idle Minimum * (Watt) | 11 | 18.8 -71% | 25.8 -135% | 6.7 39% | 24.8 -125% |
| Idle Average * (Watt) | 14.2 | 29.6 -108% | 26.6 -87% | 12.5 12% | 29.7 -109% |
| Idle Maximum * (Watt) | 14.6 | 30.3 -108% | 26.7 -83% | 13.2 10% | 30.1 -106% |
| Load Average * (Watt) | 77.7 | 90.4 -16% | 80.3 -3% | 128.2 -65% | 105.2 -35% |
| Witcher 3 ultra * (Watt) | 89.1 | 121.2 -36% | |||
| Load Maximum * (Watt) | 161.7 | 150.2 7% | 159.3 1% | 158.9 2% | 192.2 -19% |
* ... más pequeño es mejor
| MSI WS63 7RF-290US i7-7700HQ, Quadro P3000, 65 Wh | MSI WS60-6QJE316H11 E3-1505M v5, Quadro M2000M, 47 Wh | Lenovo ThinkPad P51 20HH0016GE E3-1505M v6, Quadro M2200, 90 Wh | Dell Precision 5520 UHD E3-1505M v6, Quadro M1200, 97 Wh | MSI WT72-6QM E3-1505M v5, Quadro M5000M, Wh | HP ZBook 15 G3 E3-1505M v5, Quadro M2000M, 90 Wh | |
|---|---|---|---|---|---|---|
| Duración de Batería | -50% | 70% | 14% | -3% | 60% | |
| Reader / Idle (h) | 7.1 | 2.7 -62% | 16.4 131% | 12.1 70% | 6.9 -3% | 13.7 93% |
| WiFi v1.3 (h) | 4.7 | 1.8 -62% | 6.9 47% | 4.2 -11% | 4.1 -13% | 6.4 36% |
| Load (h) | 1.2 | 0.9 -25% | 1.6 33% | 1 -17% | 1.3 8% | 1.8 50% |
Pro
Contra
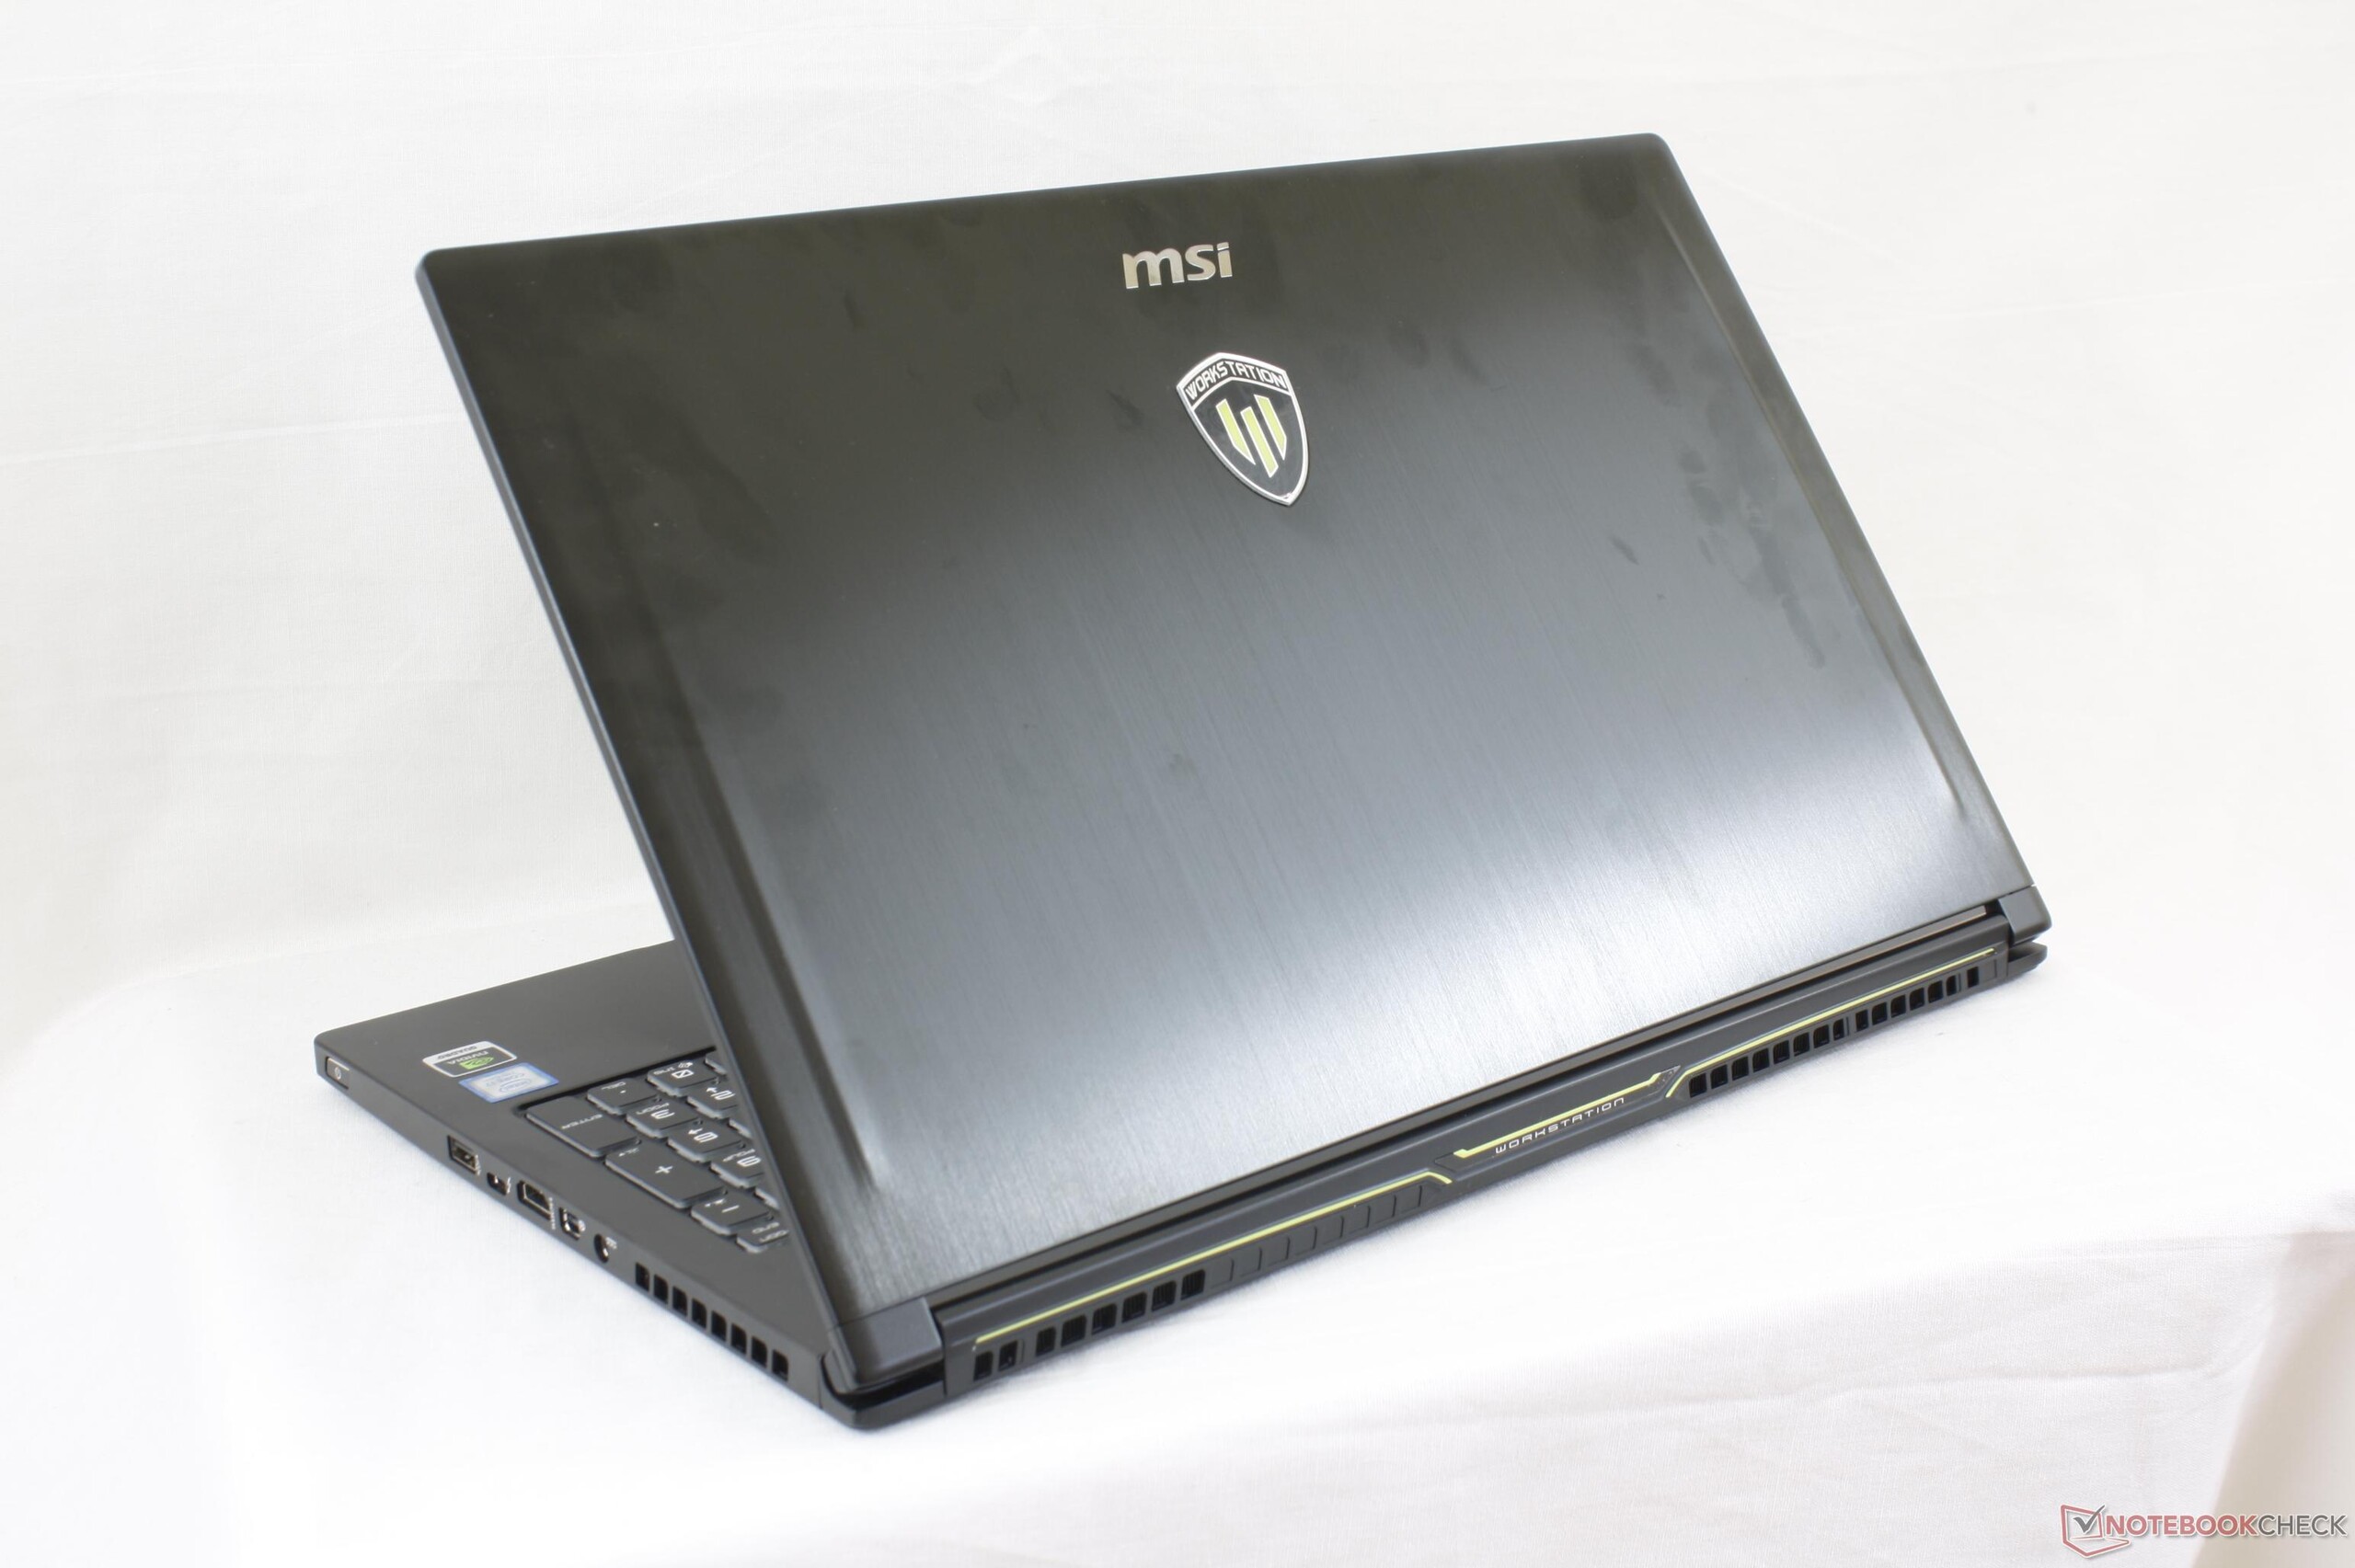
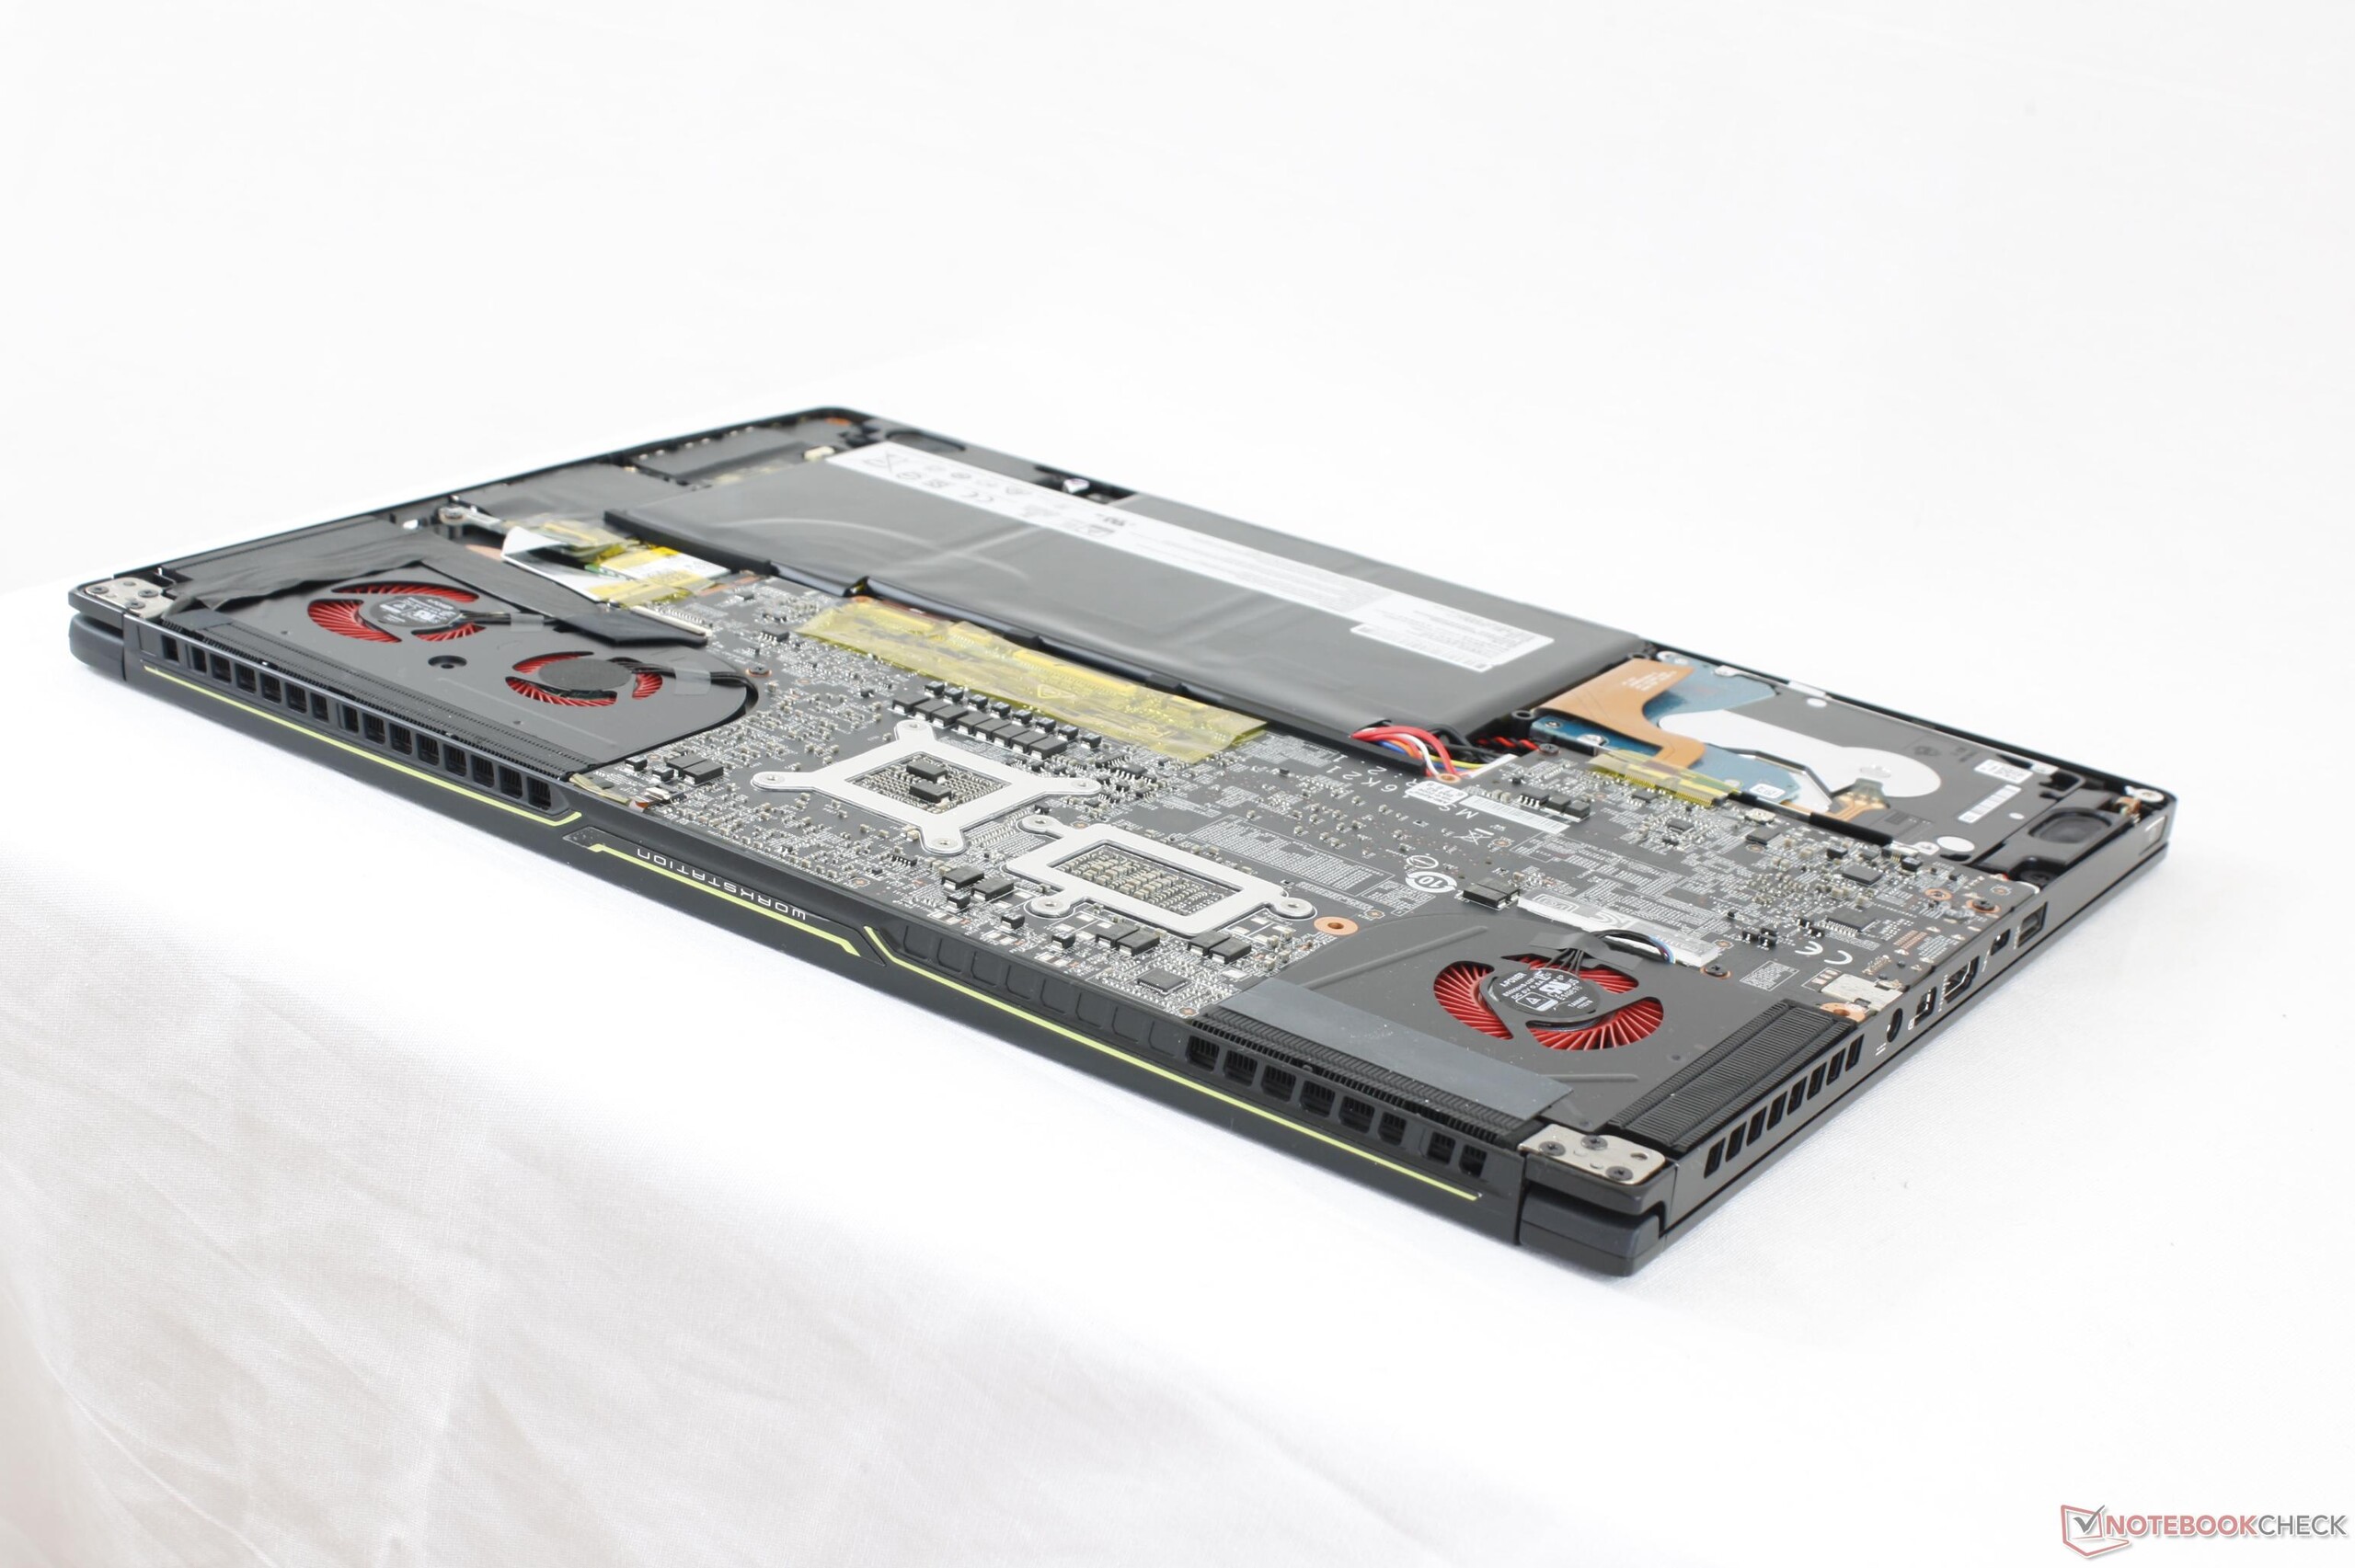
Las estaciones de trabajo tradicionales representadas por Dell Precision, Lenovo ThinkPad P y HP ZBook son pesadas y tienen diseños poco atractivos. La gama MSI WS se atreve a mirar en otra dirección ofreciendo algo más ligero y delgado sin sacrificar el rendimiento. La nueva Quadro P3000 de Nvidia convierte al WS63 en una compra atractiva gracias a su consumo energético, que es menor que el de la Quadro M5000M a pesar de mantener un rendimiento del nivel del GTX 980M. Es casi increíble ver como el WS63 rinde más que el ZBook 15 G3 del año pasado que puede costar miles de euros más. Los profesionales que busquen un buen rendimiento de GPU y portabilidad sobre todo no tienen que buscar más.
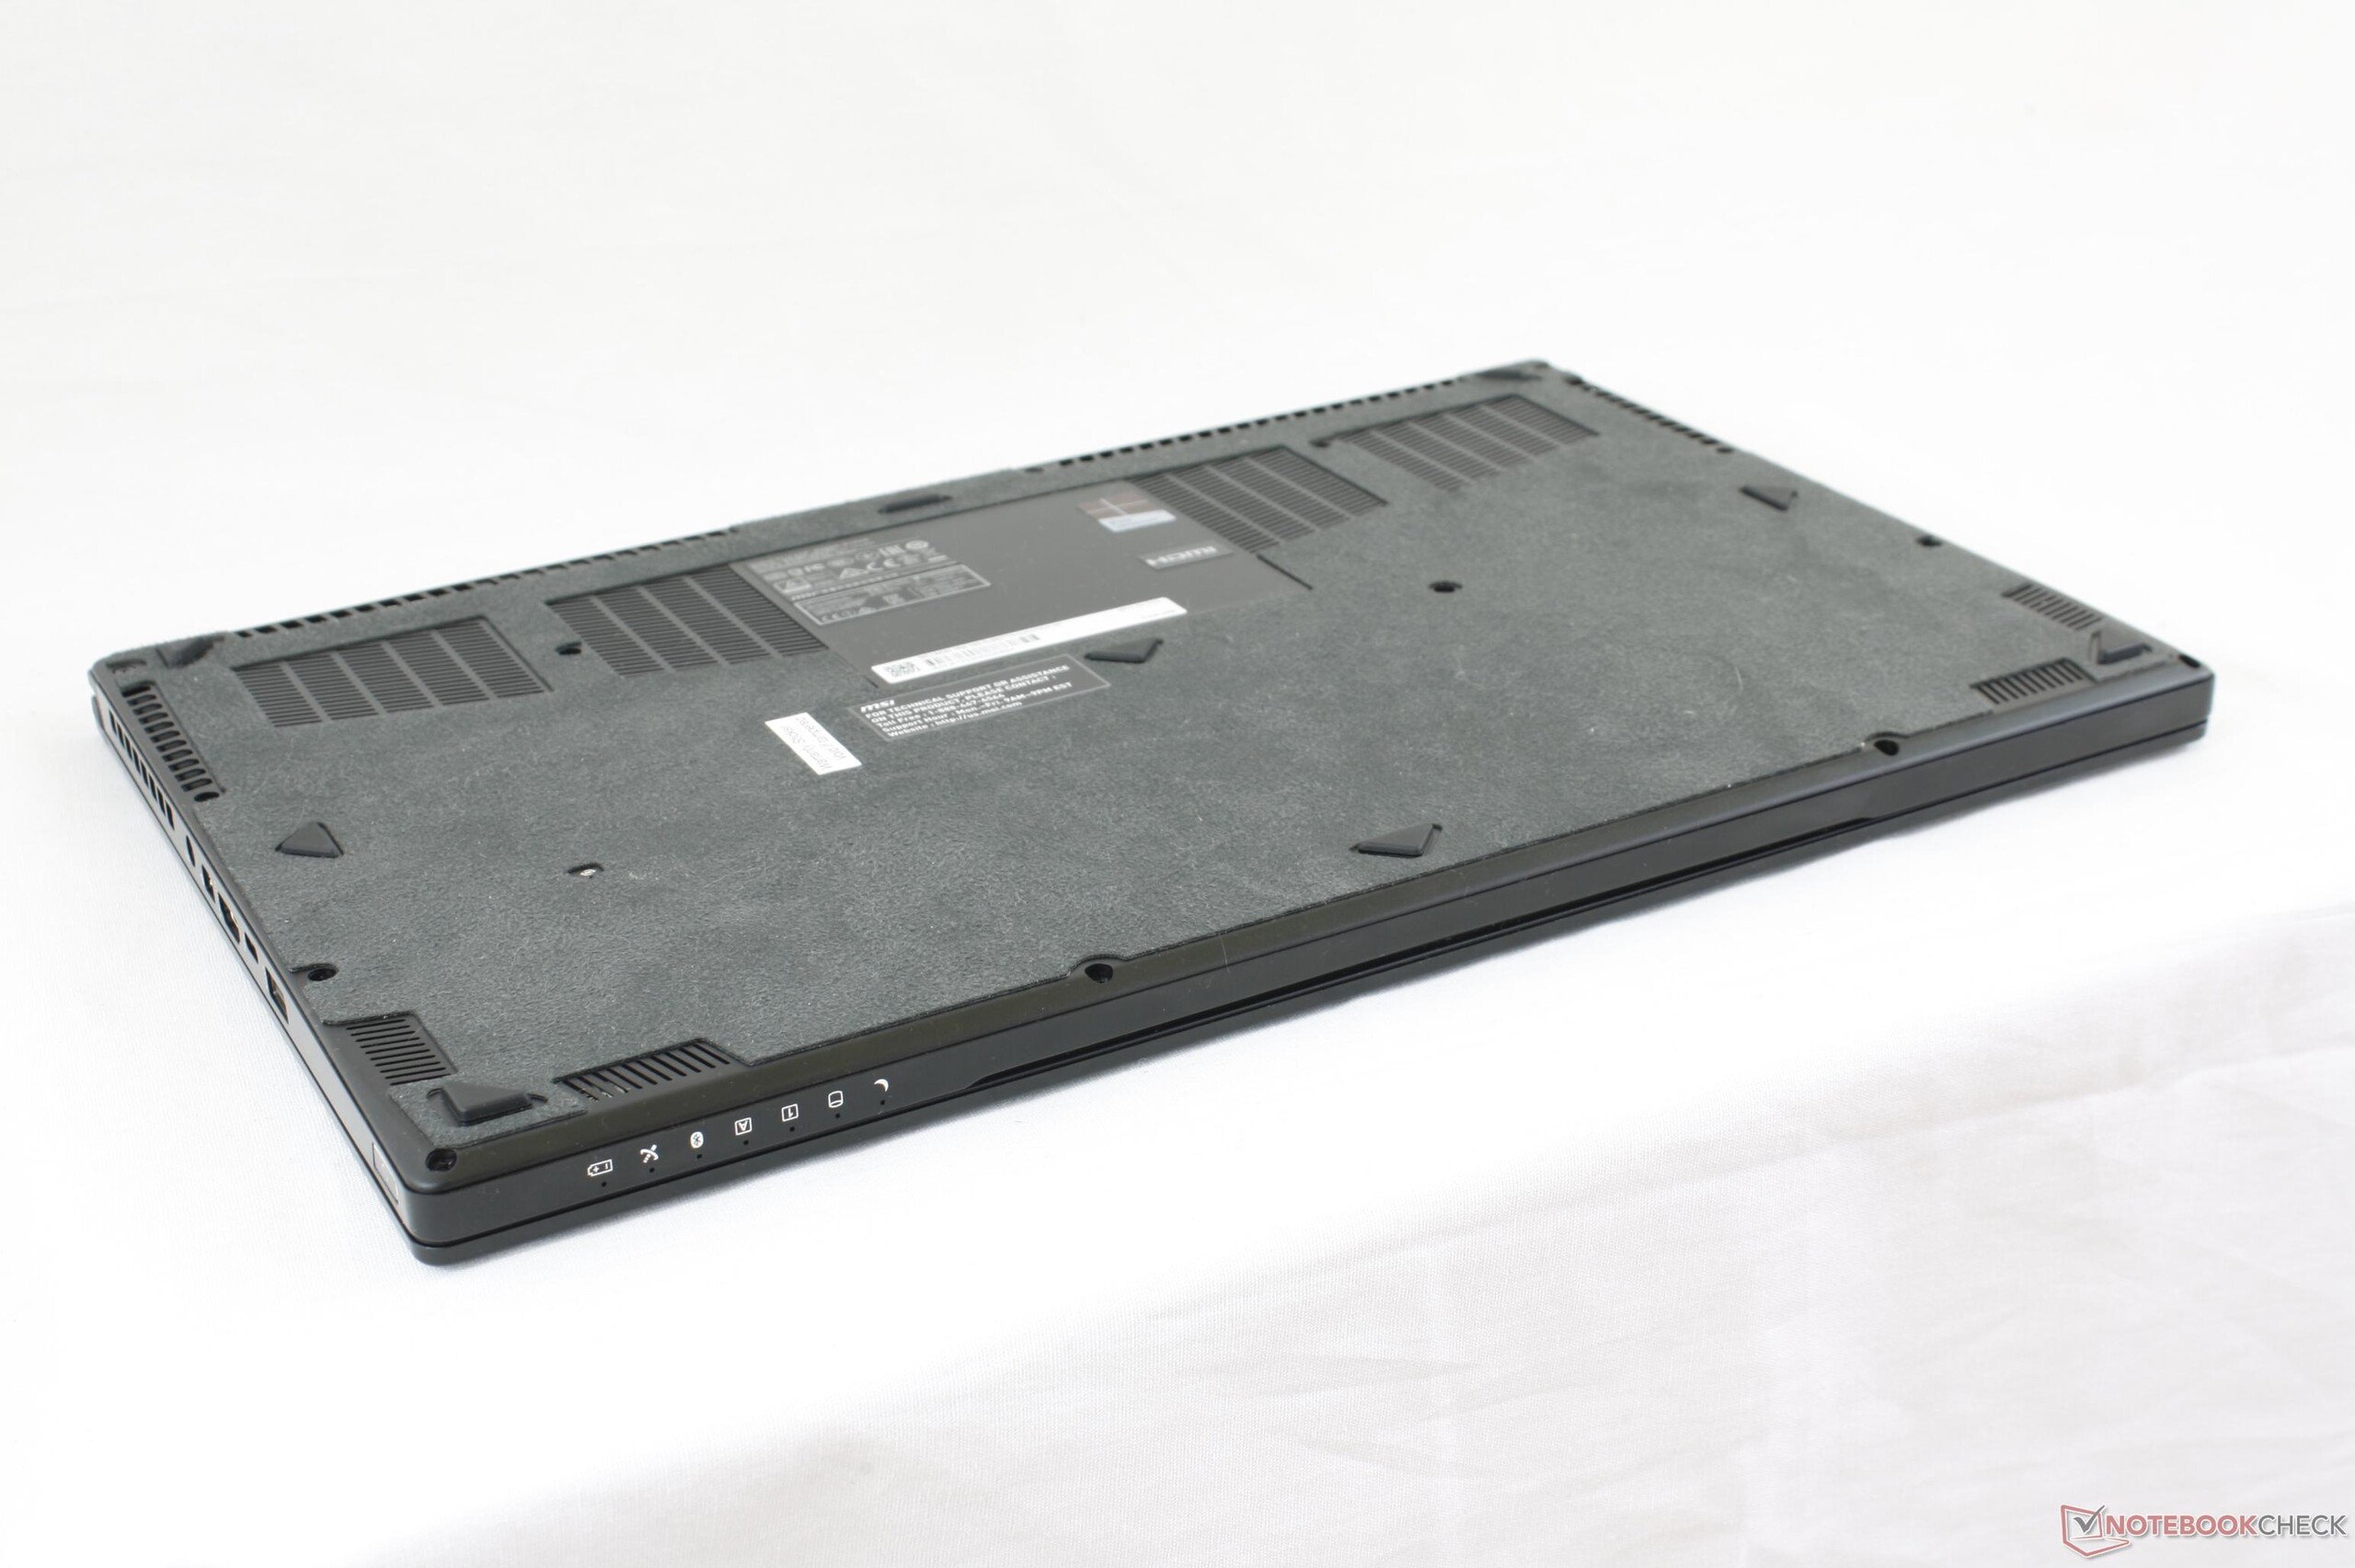
Los mayores inconvenientes son predecibles ya que se deben el diseño fino y a la ligera carcasa. El chasis es más flexible, el ruido de ventilador es muy agudo y el mantenimiento resulta más difícil de lo deseado debido al menor tamaño. Las temperaturas de la CPU son más elevadas bajo cargas intensas de trabajo y eso tiene como consecuencia que la velocidad Turbo Boost fluctúa. No tiene una pantalla mucho más brillante que otras estaciones de trabajo, y parece una oportunidad perdida de haber hecho al portátil aún más portable y más adecuado para viajes. Esperamos que en futuras versiones se añadan opciones para soporte full sRGB o AdobeRGB o CPU Xeon y RAM ECC para llevar a la gama WS más arriba en la categoría de estaciones de trabajo.
El WS63 supone un gran salto en rendimiento y diseño frente al WS60. Aún carece de ciertas características y continúa pareciendo más una mezcla entre estación de trabajo y portátil para juegos que una estación de trabajo completa.
Ésta es una versión acortada del análisis original. Puedes leer el análisis completo en inglés aquí.
MSI WS63 7RF-290US
- 07/09/2017 v6 (old)
Allen Ngo
Price comparison
