Review del portátil Eurocom Sky X4C Core i9-9900KS: Procesador de escritorio desbloqueado en un factor de forma móvil
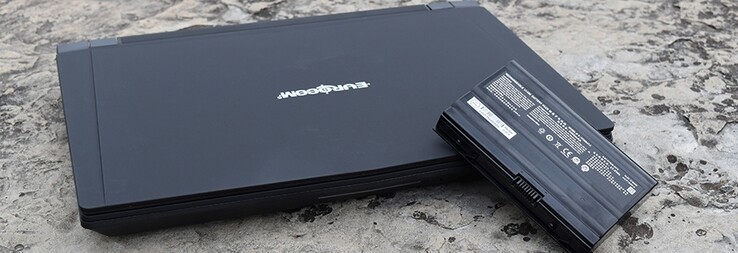
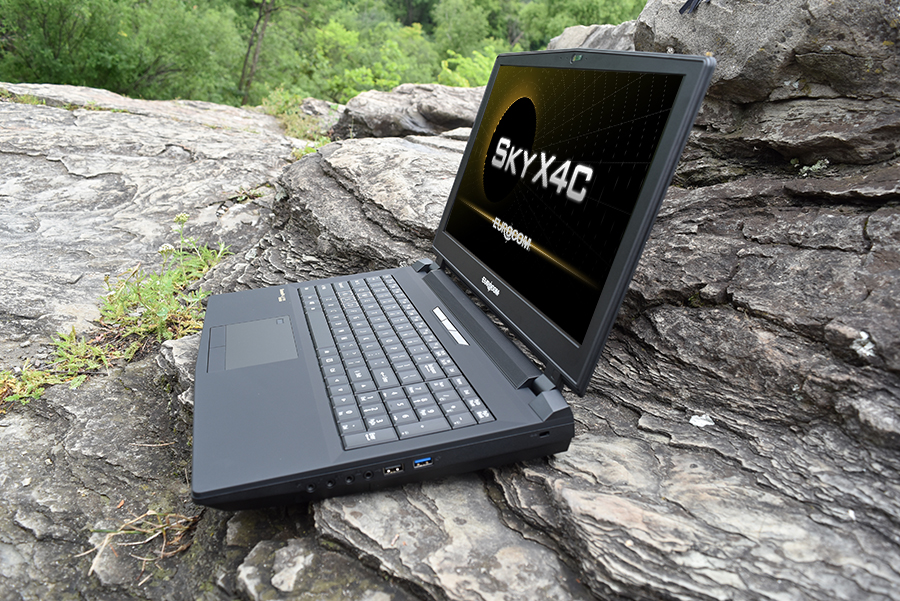
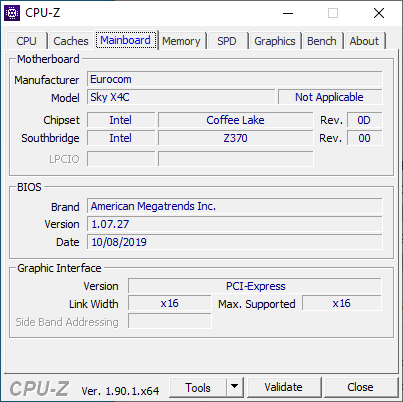
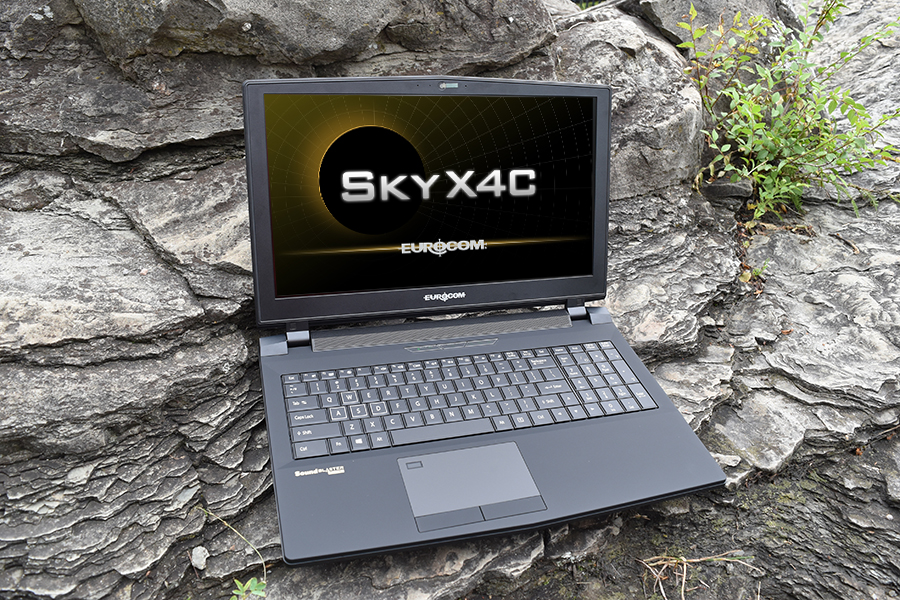
El Eurocom Sky X4C es un portátil de alto rendimiento y fácil mantenimiento dirigido a los entusiastas. A diferencia de la mayoría de los demás portátiles, dispone de CPUs de sobremesa LGA 1151 y GPUs MXM para una mayor versatilidad.
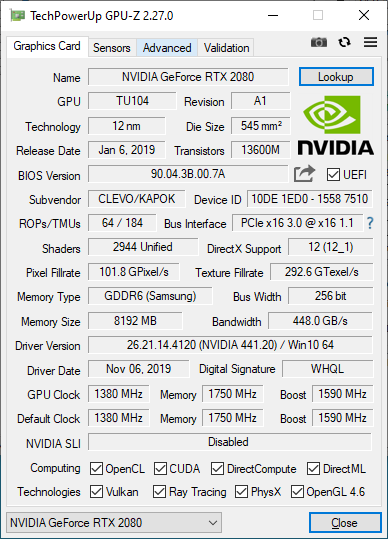
Hace casi dos años habíamos comprobado el Sky X4C con la CPU Coffee Lake Core i7-8700K y la GPU Pascal GeForce GTX 1080. Nuestra unidad viene equipada con el nuevo y más rápido Coffee Lake Core i9-9900KS y Turing GeForce RTX 2080. Recomendamos revisar nuestra revisión actual sobre el Sky X4C, ya que todos nuestros comentarios sobre el chasis y sus características siguen siendo válidos.
Más reseñas de Eurocom:
Valoración | Fecha | Modelo | Peso | Altura | Tamaño | Resolución | Precio |
|---|---|---|---|---|---|---|---|
| 84.6 % v7 (old) | 11/2019 | Eurocom Sky X4C i9-9900KS i9-9900KS, GeForce RTX 2080 Mobile | 3.6 kg | 38 mm | 15.60" | 1920x1080 | |
| 87.3 % v6 (old) | 07/2018 | MSI GT63 Titan 8RG-046 i7-8750H, GeForce GTX 1080 Mobile | 2.9 kg | 40 mm | 15.60" | 1920x1080 | |
| 86.1 % v7 (old) | 05/2019 | MSI GE75 9SG i9-9880H, GeForce RTX 2080 Mobile | 2.7 kg | 27.5 mm | 17.30" | 1920x1080 | |
| 88.3 % v6 (old) | 03/2019 | Eurocom Sky X7C i9-9900K i9-9900K, GeForce RTX 2080 Mobile | 4.3 kg | 41 mm | 17.30" | 1920x1080 | |
| 85.8 % v7 (old) | 03/2019 | Alienware Area-51m i9-9900K RTX 2080 i9-9900K, GeForce RTX 2080 Mobile | 3.9 kg | 42 mm | 17.30" | 1920x1080 |
Carcasa
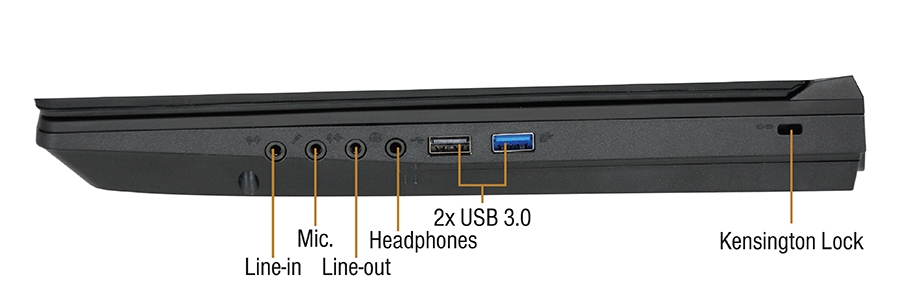
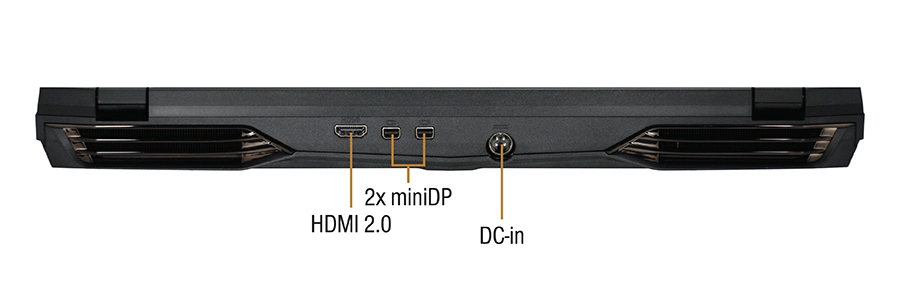
Conectividad
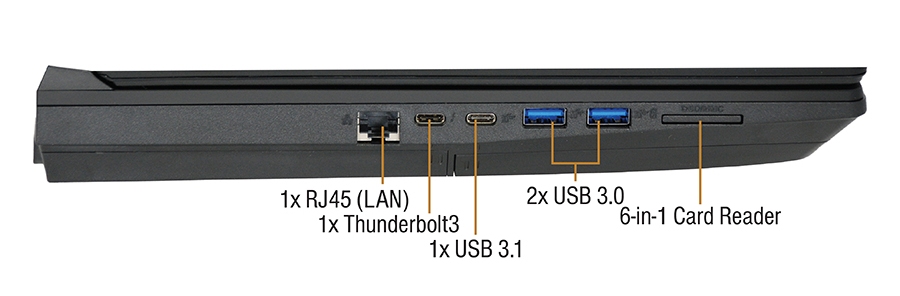
Lector de tarjetas SD
| SD Card Reader | |
| average JPG Copy Test (av. of 3 runs) | |
| Eurocom Sky X4C i9-9900KS (Toshiba Exceria Pro SDXC 64 GB UHS-II) | |
| Razer Blade Pro 17 4K UHD 120 Hz (Toshiba Exceria Pro SDXC 64 GB UHS-II) | |
| MSI GE63VR 7RF Raider (Toshiba Exceria Pro SDXC 64 GB UHS-II) | |
| MSI Prestige 15 A10SC (Toshiba Exceria Pro M501 UHS-II) | |
| MSI GT63 Titan 8RG-046 (Toshiba Exceria Pro SDXC 64 GB UHS-II) | |
| maximum AS SSD Seq Read Test (1GB) | |
| Eurocom Sky X4C i9-9900KS (Toshiba Exceria Pro SDXC 64 GB UHS-II) | |
| MSI GE63VR 7RF Raider (Toshiba Exceria Pro SDXC 64 GB UHS-II) | |
| Razer Blade Pro 17 4K UHD 120 Hz (Toshiba Exceria Pro SDXC 64 GB UHS-II) | |
| MSI Prestige 15 A10SC (Toshiba Exceria Pro M501 UHS-II) | |
| MSI GT63 Titan 8RG-046 (Toshiba Exceria Pro SDXC 64 GB UHS-II) | |
Comunicación
El módulo Killer Wi-Fi 6 AX1650x es esencialmente una nueva marca de Intel AX200/201, por lo que el rendimiento es similar entre ellos. En cambio, la AX1650x se beneficia de funciones y controles específicos de Killer.
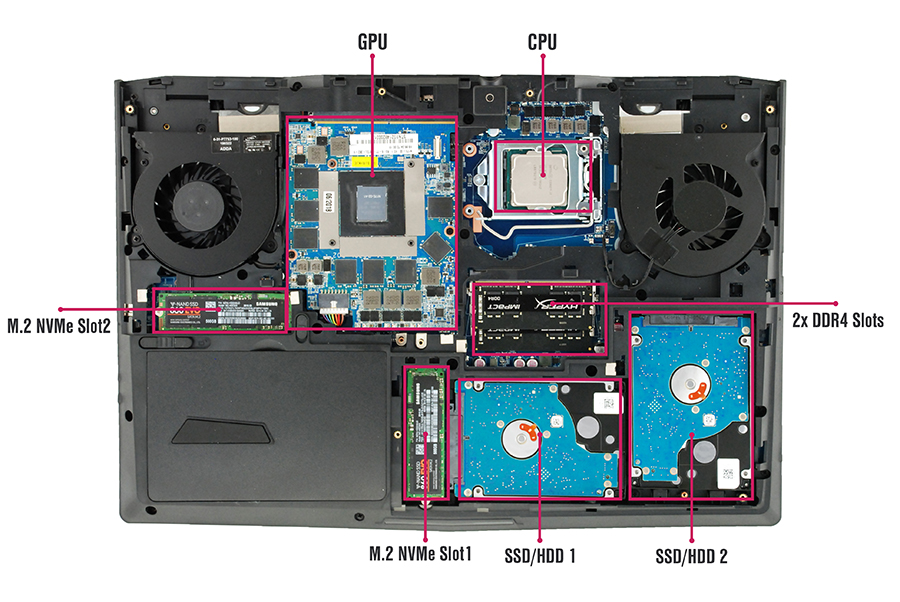
Mantenimiento
Accesorios y Garantía
Los manuales habituales, los tornillos HDD/SSD y el CD de controladores se incluyen con los adaptadores, bases e inversores opcionales. Se aplica una garantía limitada de un año con extensiones de hasta tres años.
Display
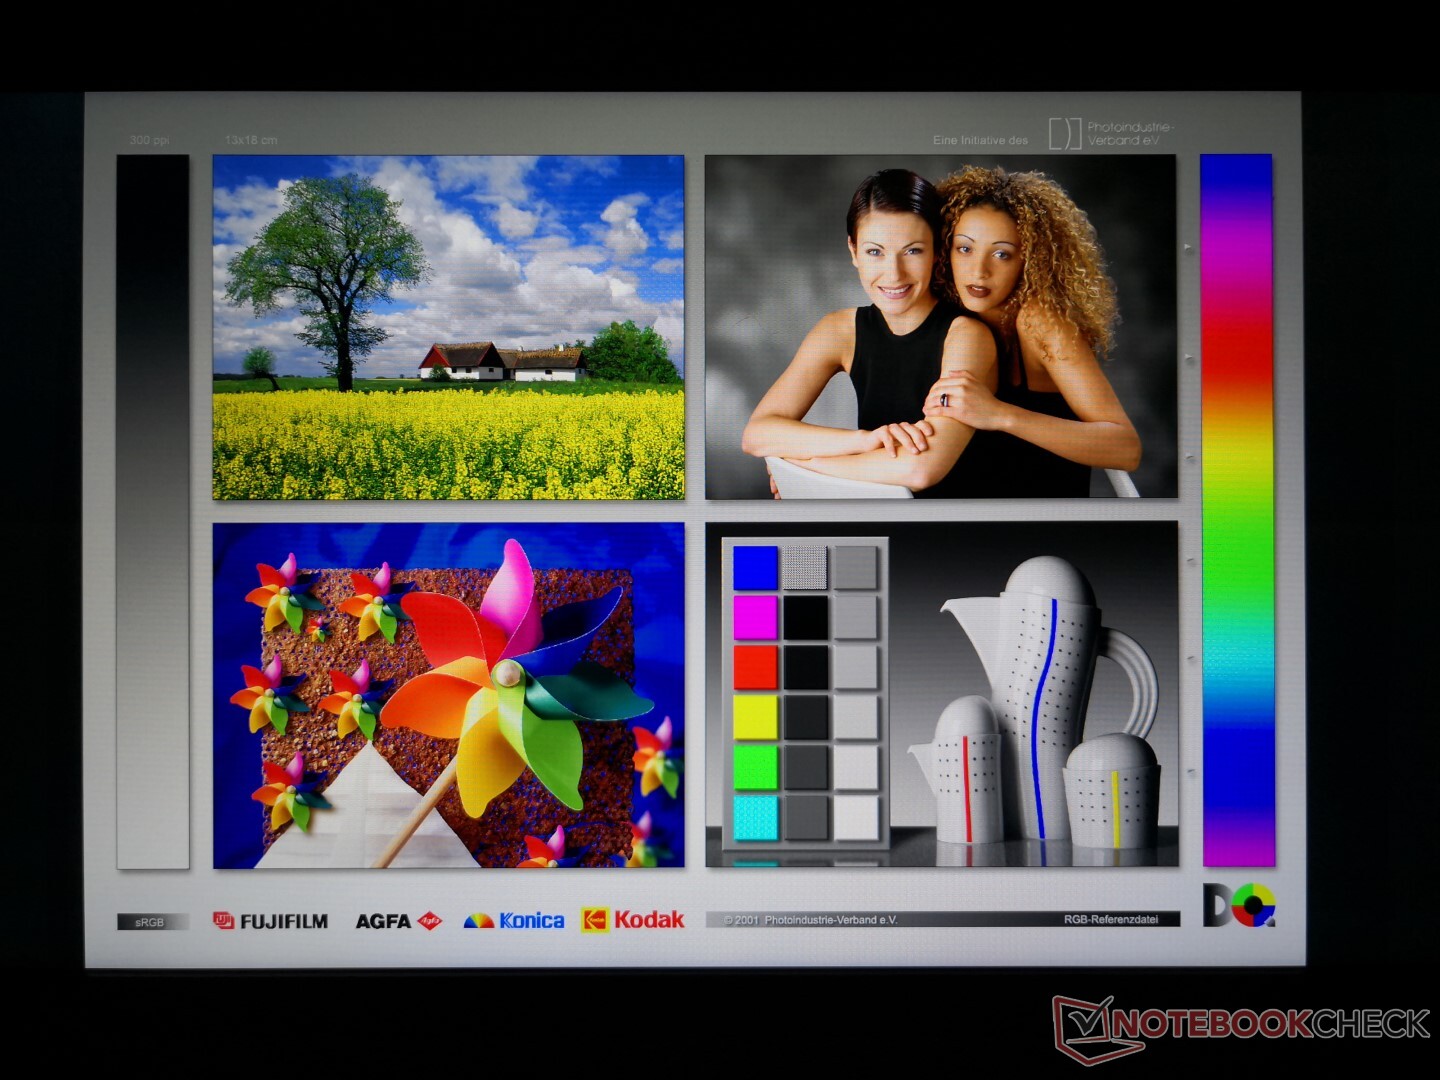
A diferencia del panel brillante 4K UHD 60 Hz de nuestro 2018 SKy X4C, nuestra última unidad viene con un panel mate FHD 144 Hz. El panel AU Optronics B156HAN07.0 también se puede encontrar aquí tanto en el Schenker XMG Ultra 15 como en el Gigabyte Aorus X5 v8, lo que significa que estos tres portátiles comparten cualidades de pantalla similares, incluidos los tiempos de respuesta rápidos, una buena relación de contraste y una cobertura de color decente. En comparación con la opción 4K UHD, la opción FHD muestra menos fantasmas.
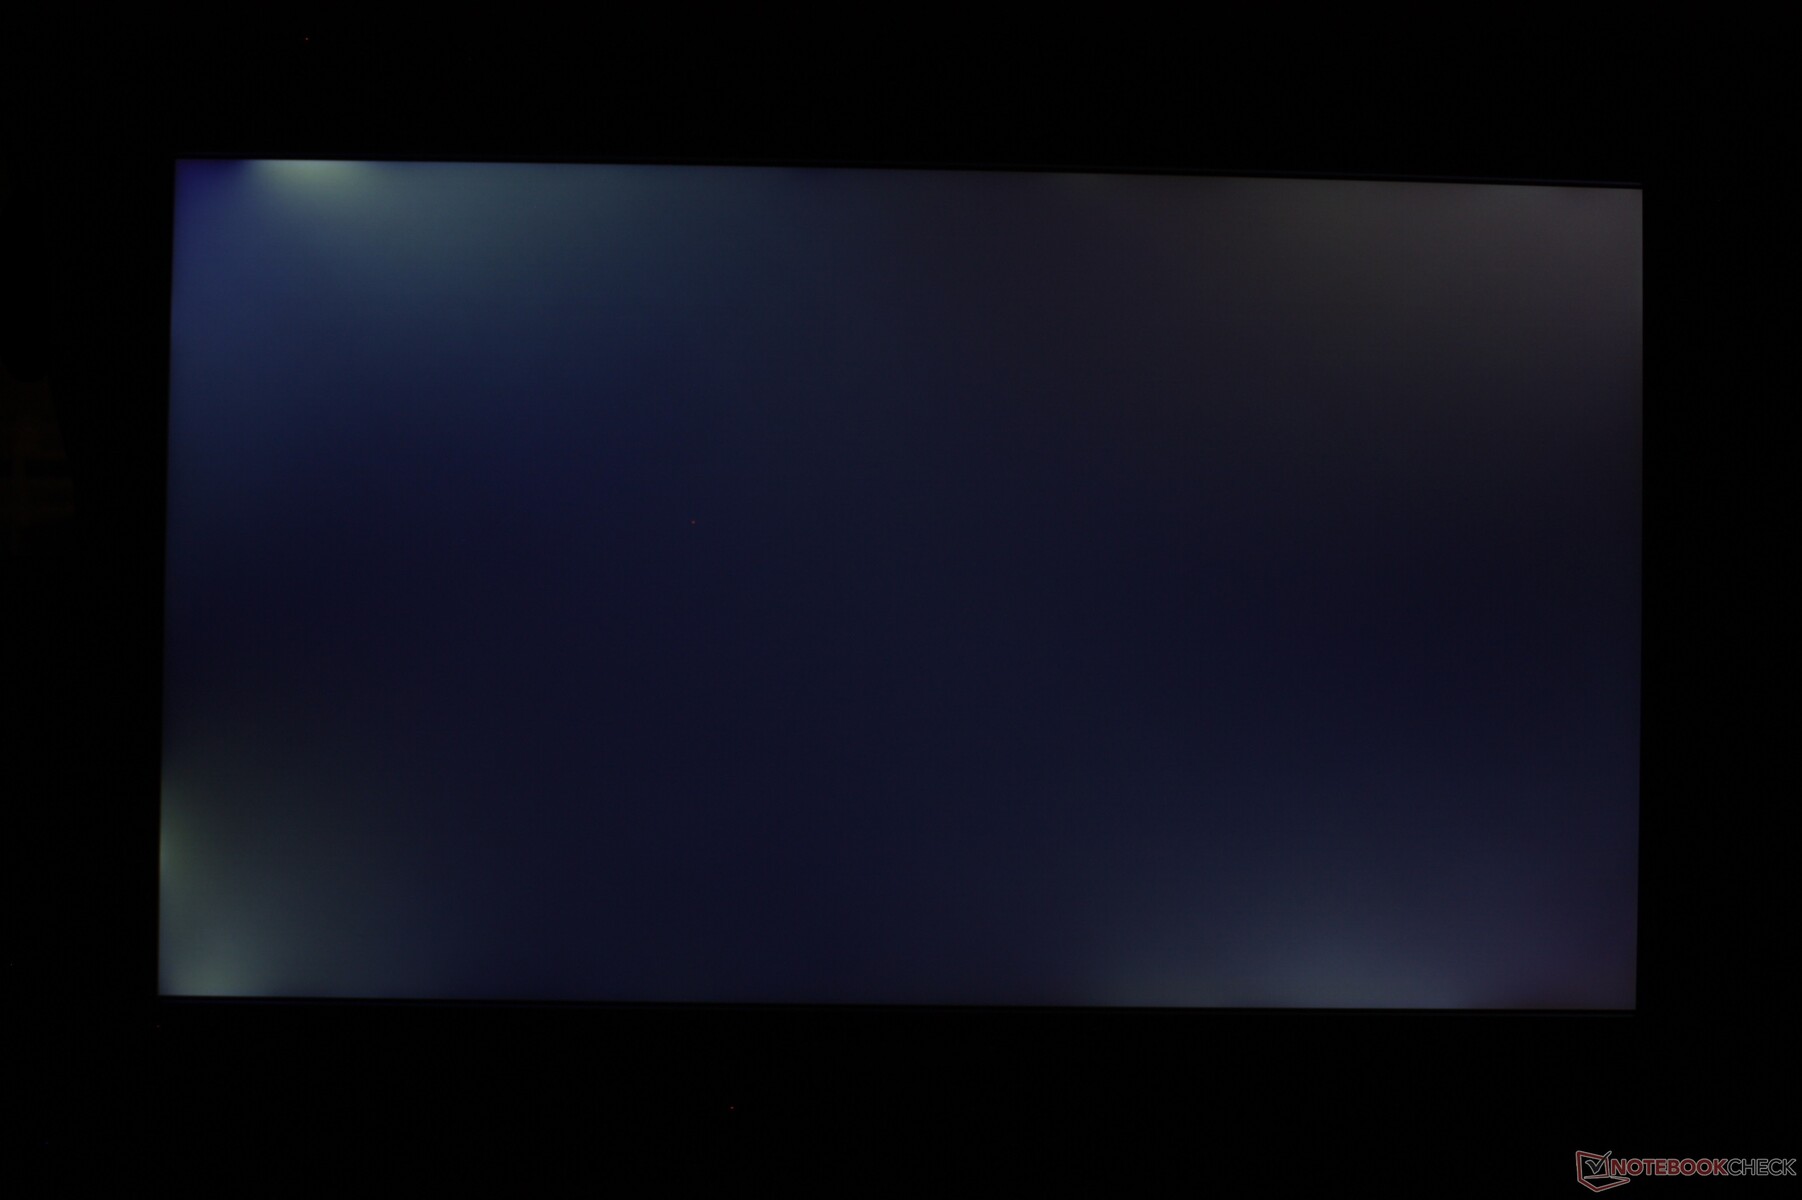
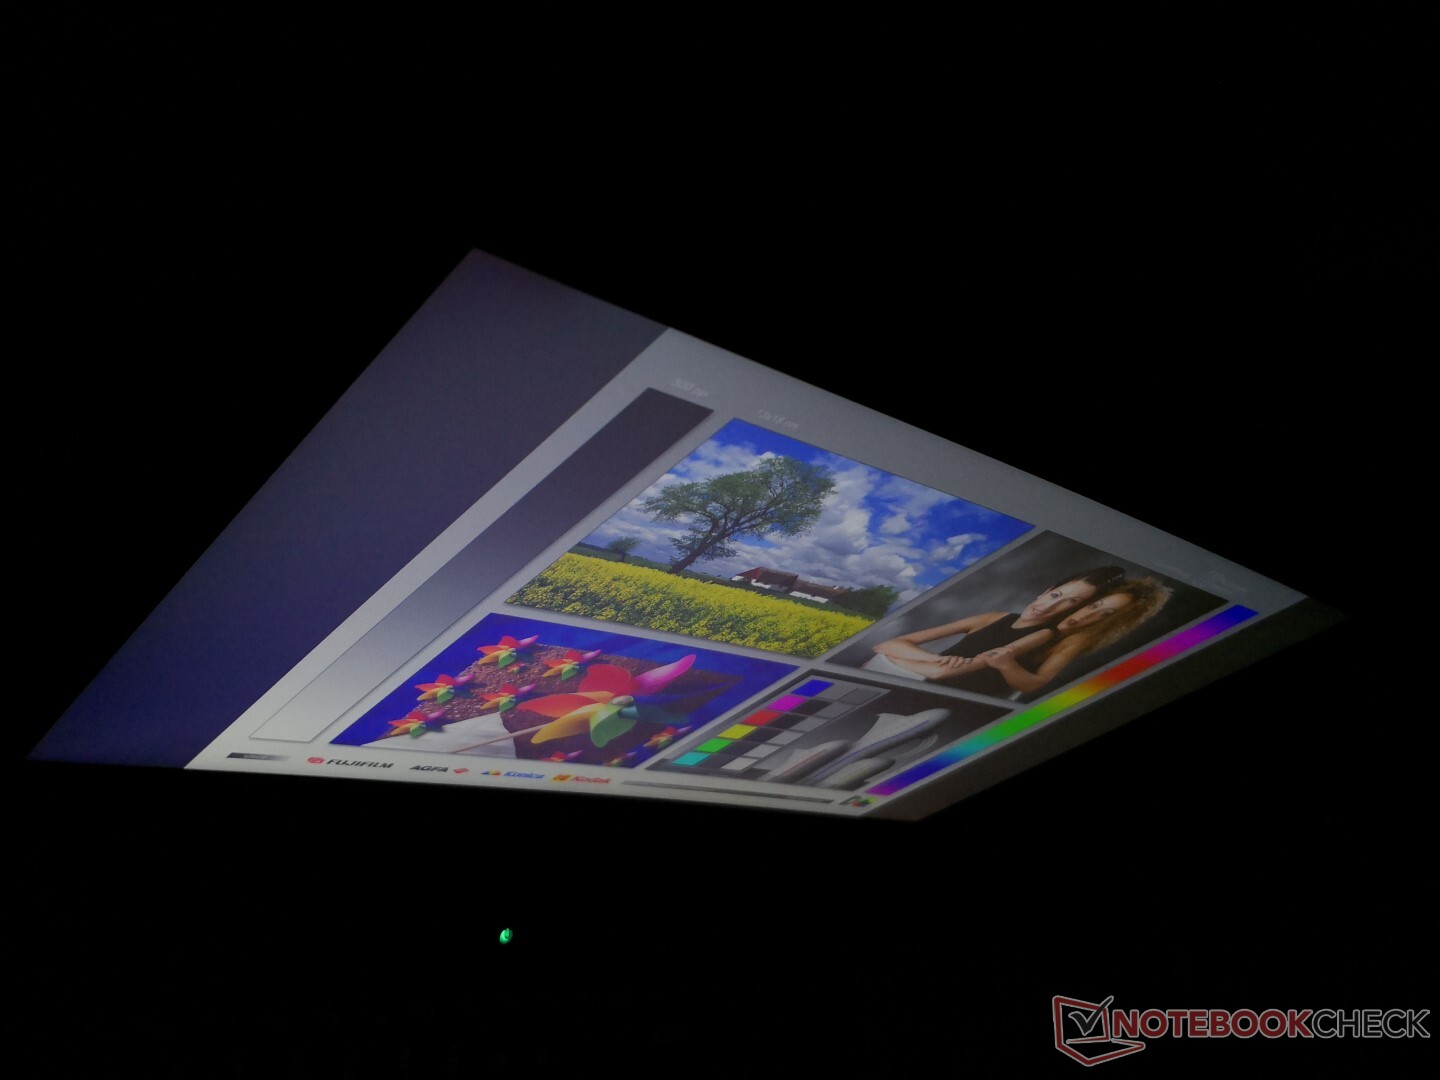
En nuestra unidad de prueba hay un fuerte sangrado desigual de la retroiluminación, como se muestra en la imagen de abajo. Recomendamos comprobar esto inmediatamente, ya que el sangrado de la luz puede distraer durante la reproducción de vídeo u otras aplicaciones oscurecidas.
| |||||||||||||||||||||||||
iluminación: 82 %
Brillo con batería: 258.8 cd/m²
Contraste: 924:1 (Negro: 0.28 cd/m²)
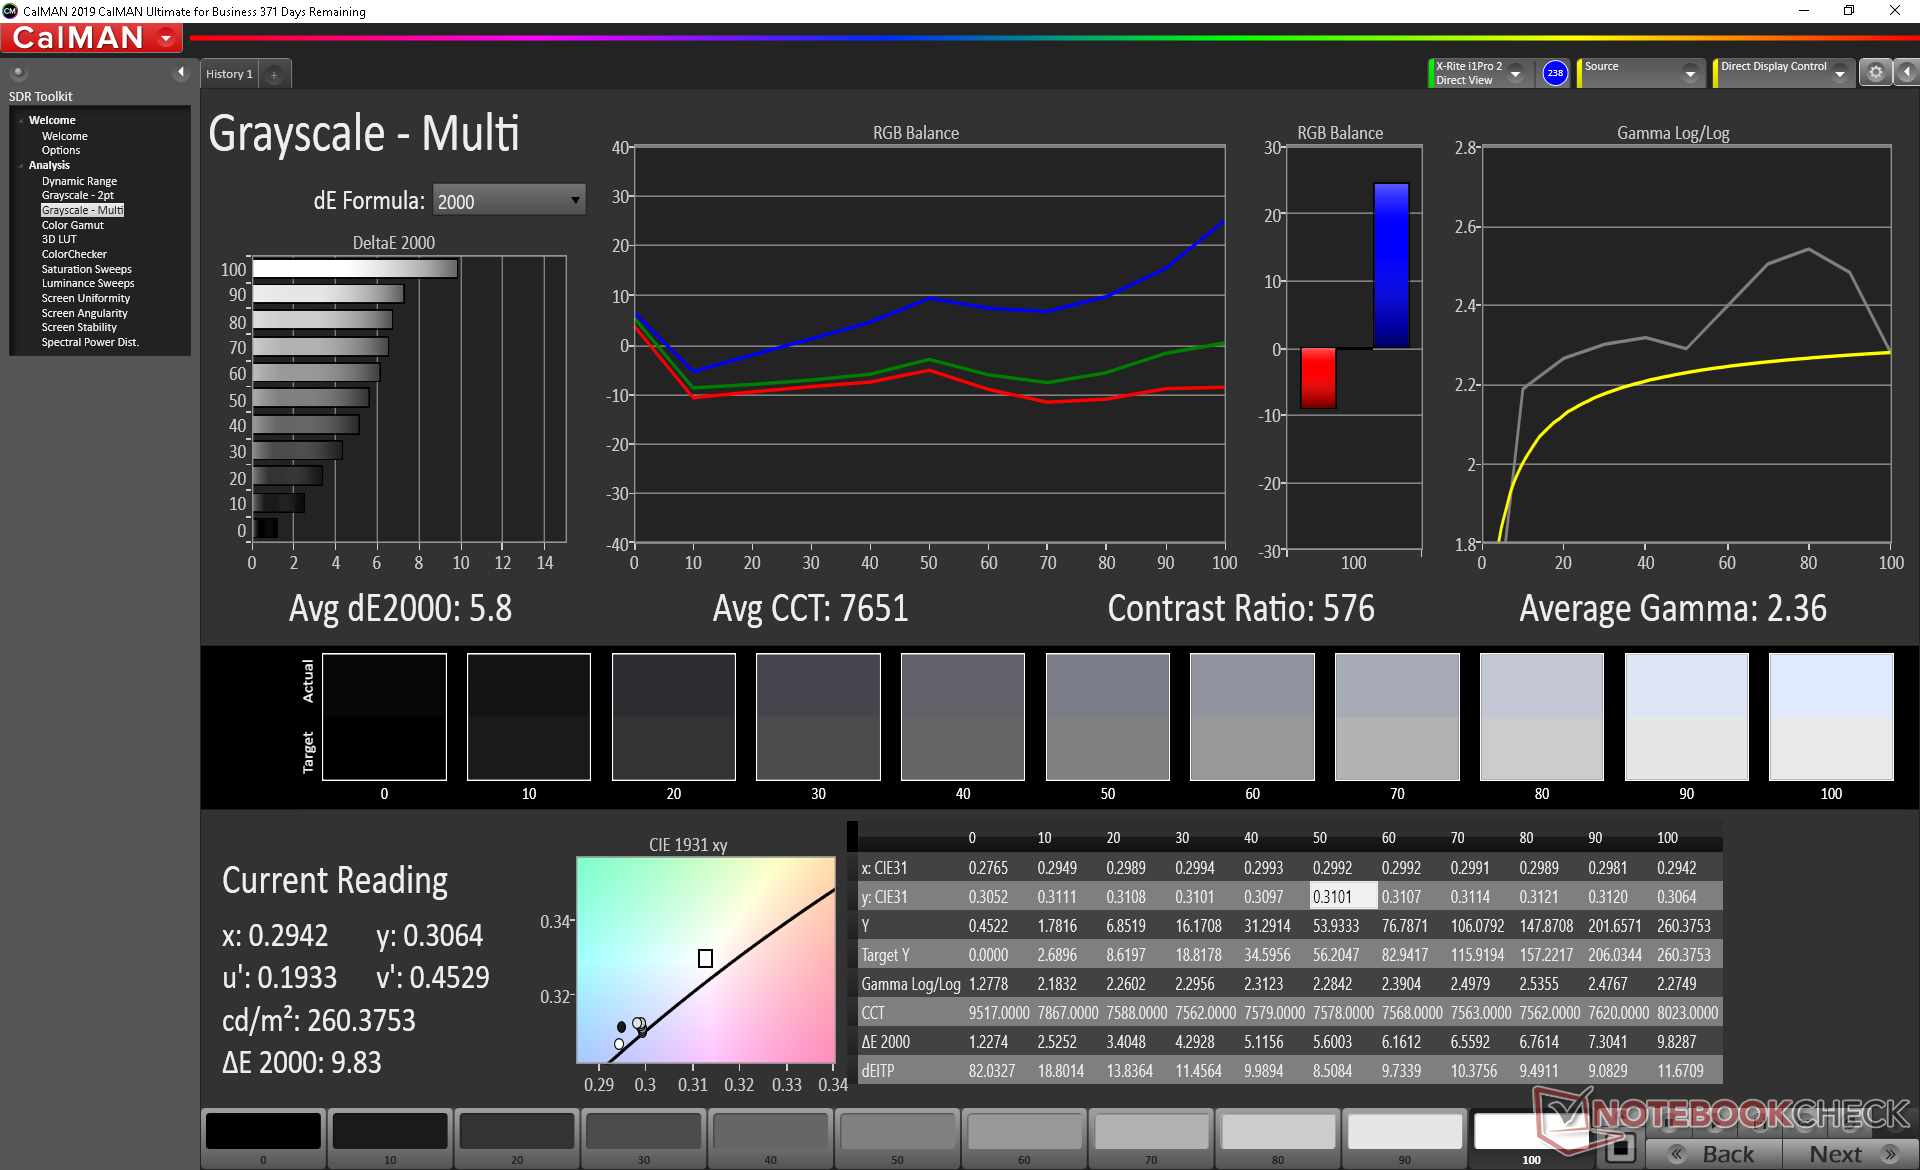
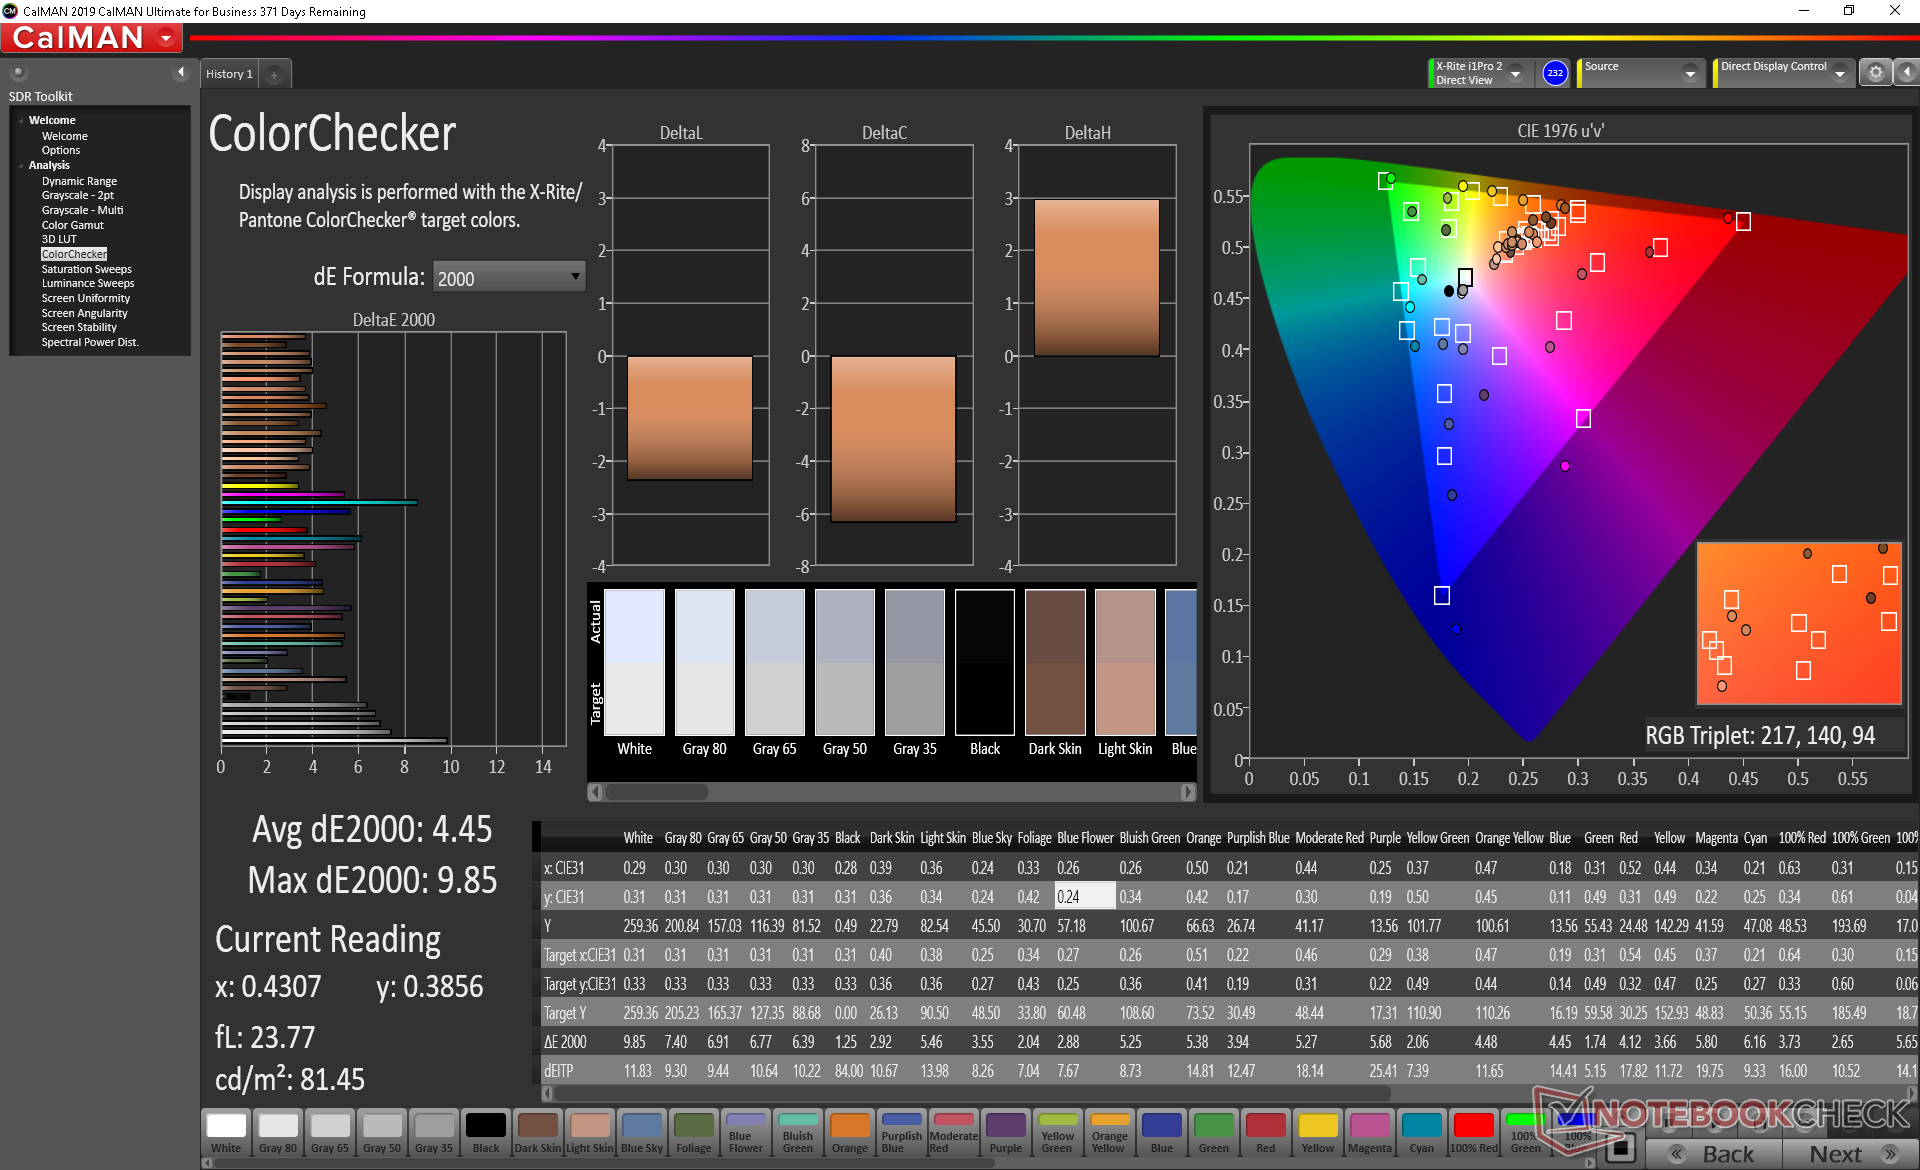
ΔE ColorChecker Calman: 4.45 | ∀{0.5-29.43 Ø4.72}
calibrated: 3
ΔE Greyscale Calman: 5.8 | ∀{0.09-98 Ø4.97}
90.5% sRGB (Argyll 1.6.3 3D)
58.8% AdobeRGB 1998 (Argyll 1.6.3 3D)
64.7% AdobeRGB 1998 (Argyll 3D)
90.9% sRGB (Argyll 3D)
63.6% Display P3 (Argyll 3D)
Gamma: 2.36
CCT: 7651 K
| Eurocom Sky X4C i9-9900KS AU Optronics B156HAN07.0, IPS, 15.6", 1920x1080 | MSI GE63VR 7RF Raider Chi Mei N156HHE-GA1 (CMN15F4), TN LED, 15.6", 1920x1080 | Asus Strix Scar III G531GW-AZ062T Sharp LQ156M1JW09 (SHP14D3), IPS, 15.6", 1920x1080 | Lenovo Legion Y740-15ICHg BOE NV156FHM-N4J, IPS, 15.6", 1920x1080 | MSI GT63 Titan 8RG-046 N156HHE-GA1, TN, 15.6", 1920x1080 | Eurocom Sky X4C ID: SHP142A, Name: LQ156D1JX01B, IPS, 15.6", 3840x2160 | |
|---|---|---|---|---|---|---|
| Display | 29% | 5% | 4% | 29% | 4% | |
| Display P3 Coverage (%) | 63.6 | 91.3 44% | 66.2 4% | 67.7 6% | 91.3 44% | 65.1 2% |
| sRGB Coverage (%) | 90.9 | 100 10% | 97.1 7% | 91.6 1% | 99.9 10% | 96.5 6% |
| AdobeRGB 1998 Coverage (%) | 64.7 | 86.7 34% | 67.6 4% | 67.1 4% | 85.7 32% | 67.2 4% |
| Response Times | 38% | 14% | -3% | 48% | -154% | |
| Response Time Grey 50% / Grey 80% * (ms) | 16.8 ? | 9.6 ? 43% | 15 ? 11% | 19 ? -13% | 8.4 ? 50% | 33.6 ? -100% |
| Response Time Black / White * (ms) | 10.8 ? | 7.2 ? 33% | 9 ? 17% | 10 ? 7% | 5.8 ? 46% | 33.2 ? -207% |
| PWM Frequency (Hz) | 26000 ? | 250 ? | 25510 ? | 1000 ? | ||
| Screen | 22% | 7% | 44% | 18% | 11% | |
| Brightness middle (cd/m²) | 258.8 | 285 10% | 309 19% | 477 84% | 307.1 19% | 324.7 25% |
| Brightness (cd/m²) | 258 | 273 6% | 284 10% | 431 67% | 276 7% | 318 23% |
| Brightness Distribution (%) | 82 | 84 2% | 88 7% | 84 2% | 80 -2% | 81 -1% |
| Black Level * (cd/m²) | 0.28 | 0.23 18% | 0.42 -50% | 0.175 38% | 0.37 -32% | 0.26 7% |
| Contrast (:1) | 924 | 1239 34% | 736 -20% | 2726 195% | 830 -10% | 1249 35% |
| Colorchecker dE 2000 * | 4.45 | 3.52 21% | 3.99 10% | 4.17 6% | 2.53 43% | 4.67 -5% |
| Colorchecker dE 2000 max. * | 9.85 | 5.18 47% | 8.3 16% | 6.97 29% | 4.66 53% | 8.16 17% |
| Colorchecker dE 2000 calibrated * | 3 | 1.12 63% | 2.51 16% | 2.82 6% | ||
| Greyscale dE 2000 * | 5.8 | 3.41 41% | 5.43 6% | 3.49 40% | 1.7 71% | 5.9 -2% |
| Gamma | 2.36 93% | 2.05 107% | 2.57 86% | 2.5 88% | 2.194 100% | 2.14 103% |
| CCT | 7651 85% | 7077 92% | 7767 84% | 7076 92% | 6893 94% | 7176 91% |
| Color Space (Percent of AdobeRGB 1998) (%) | 58.8 | 77 31% | 63 7% | 60 2% | 76 29% | 61.1 4% |
| Color Space (Percent of sRGB) (%) | 90.5 | 100 10% | 97 7% | 91 1% | 100 10% | 96.1 6% |
| Media total (Programa/Opciones) | 30% /
26% | 9% /
7% | 15% /
30% | 32% /
24% | -46% /
-12% |
* ... más pequeño es mejor
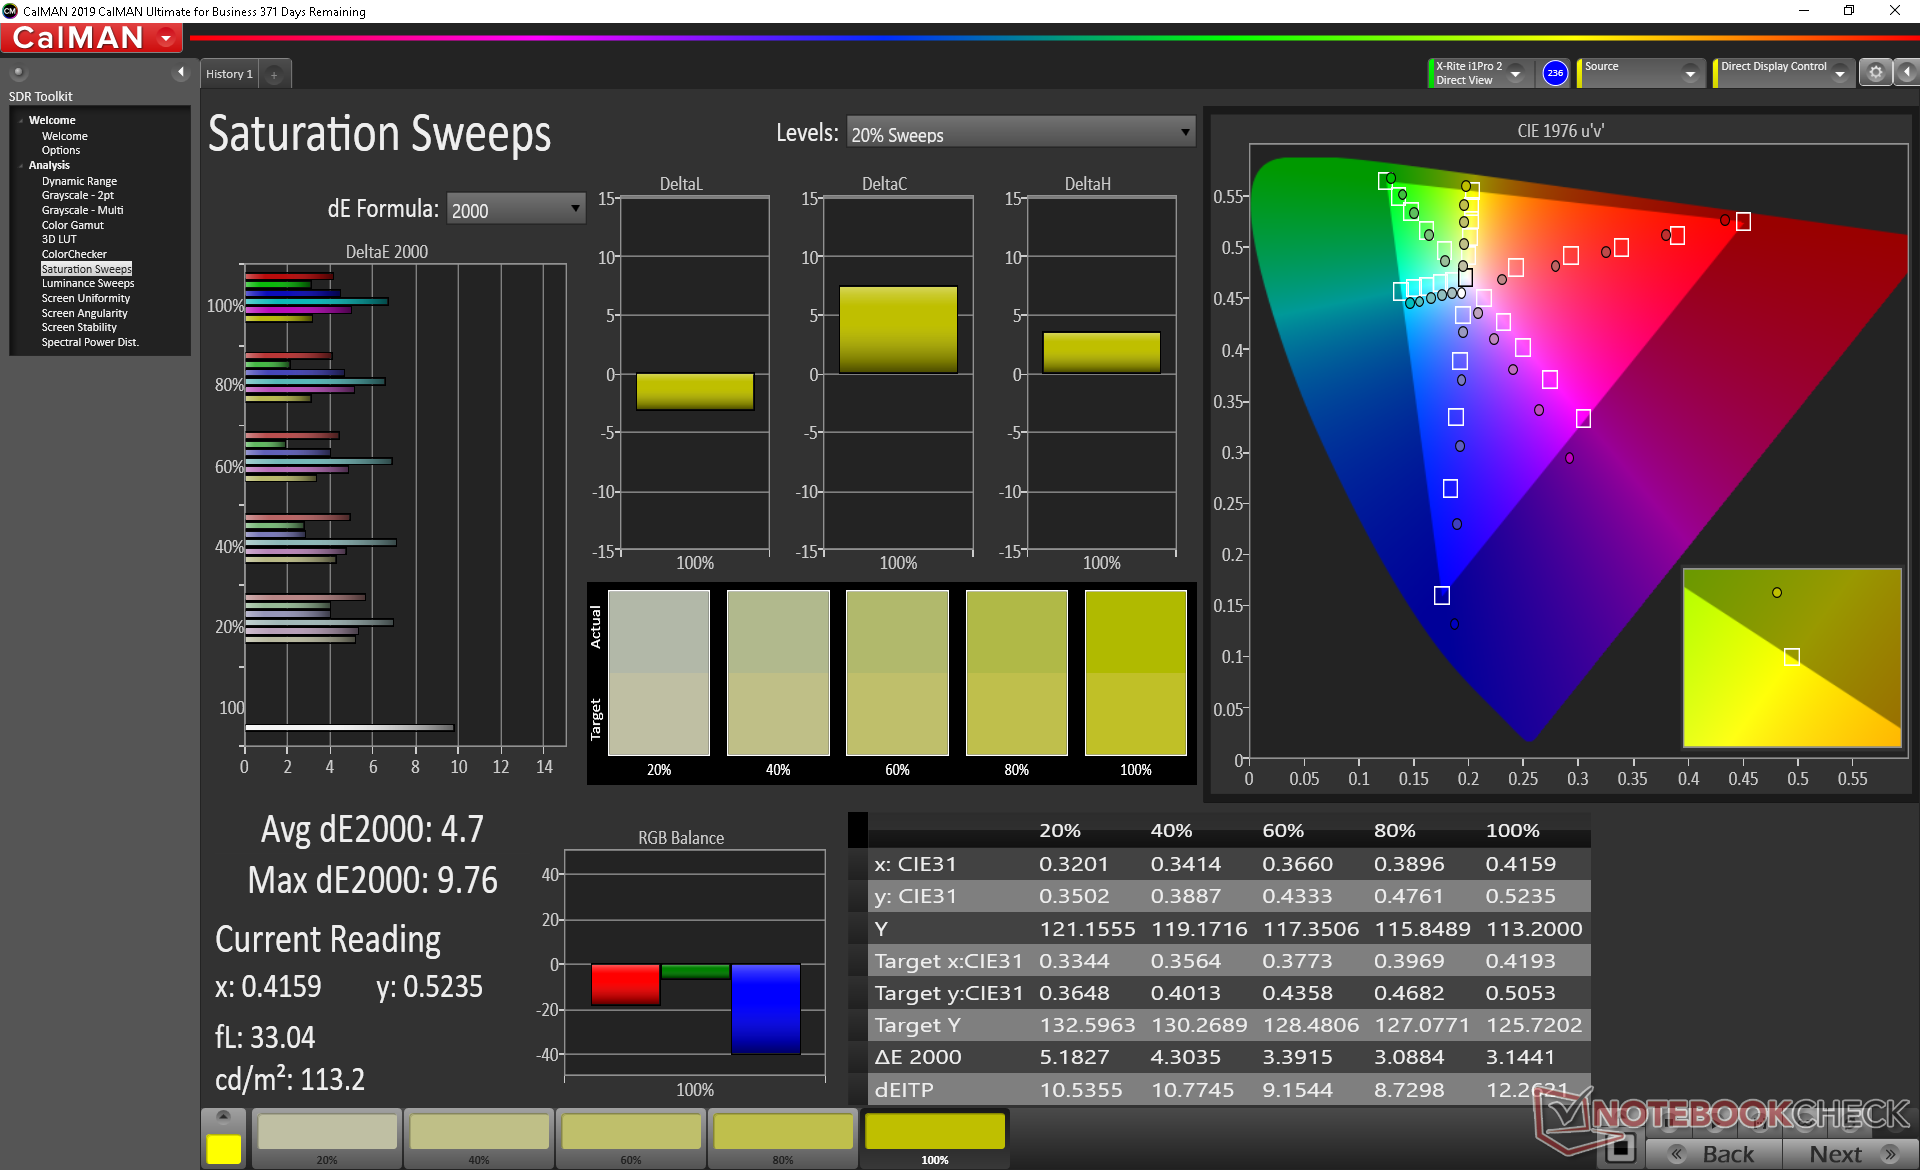
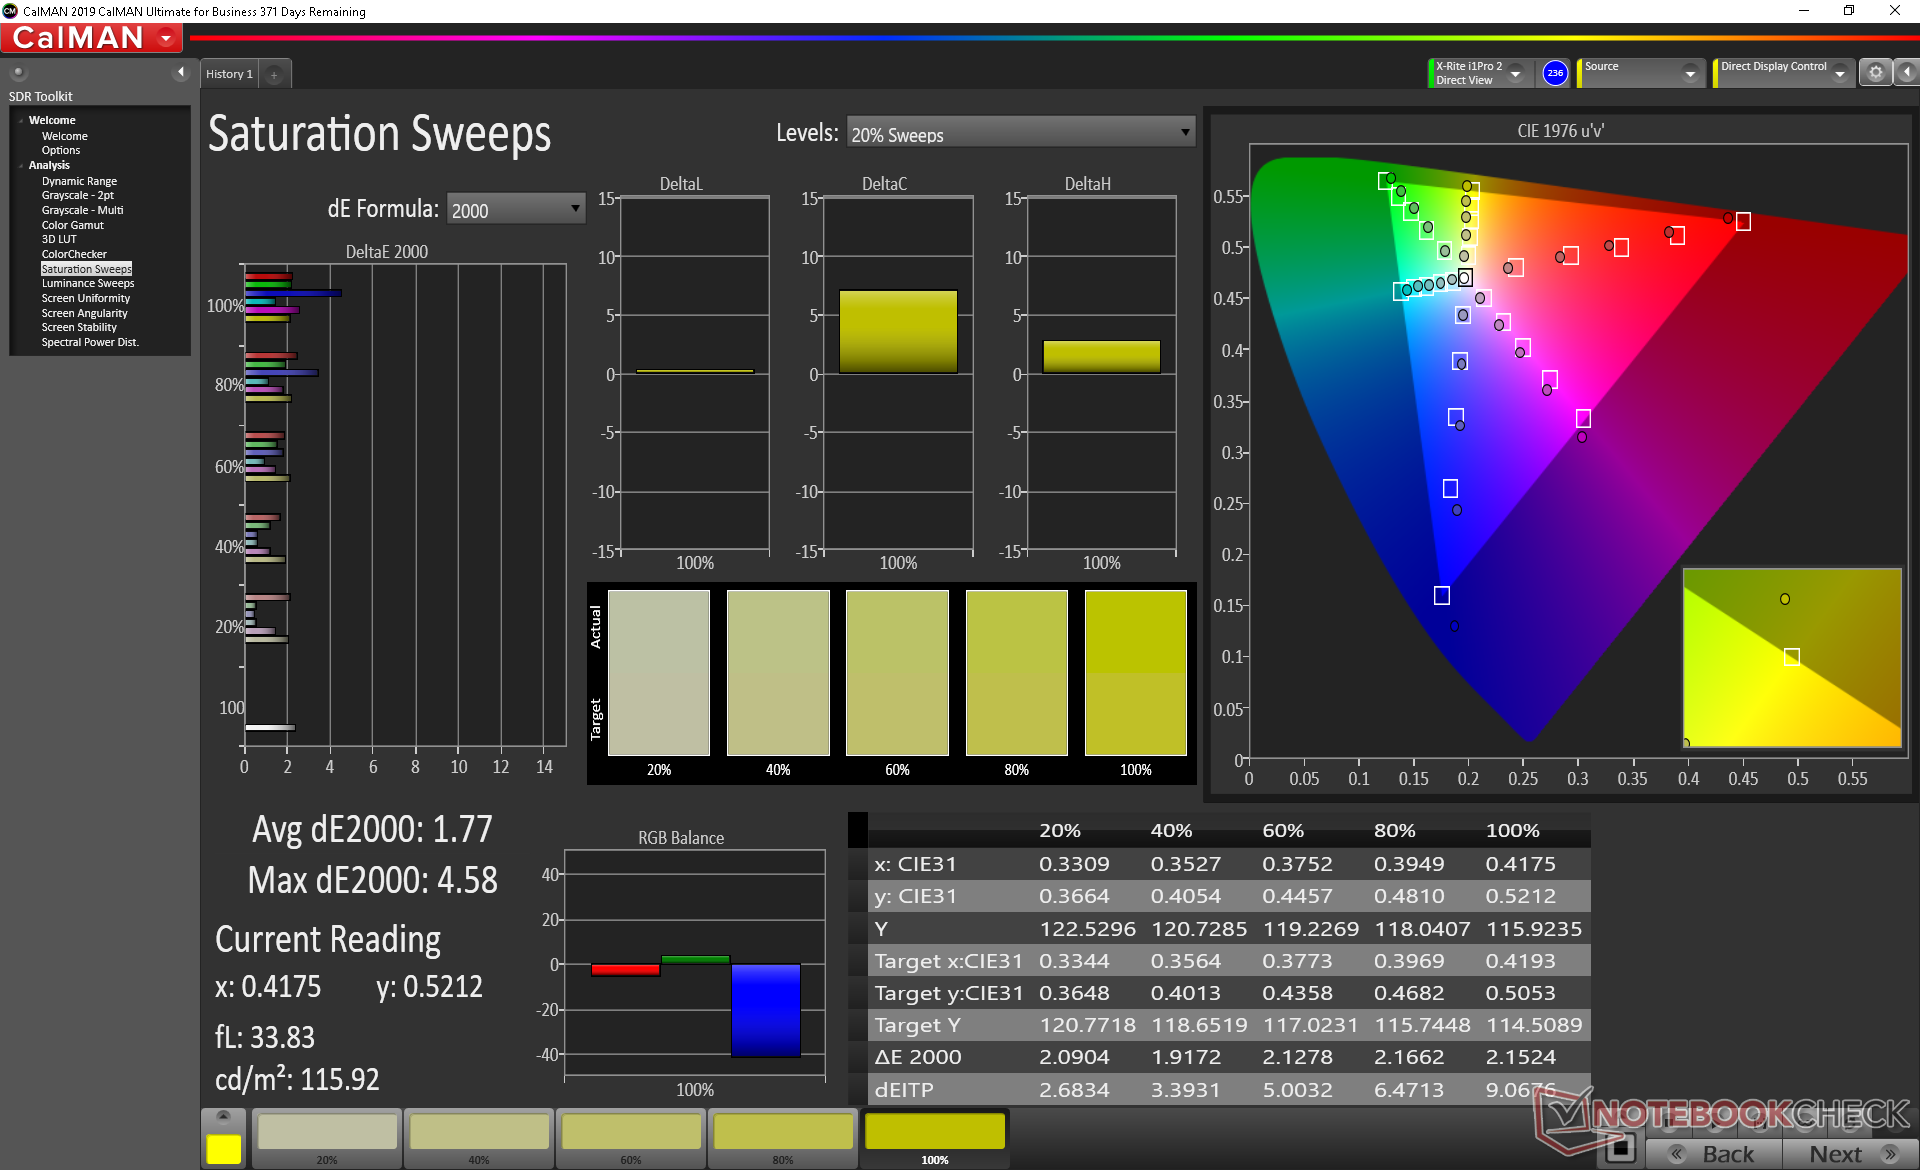
El espacio de color cubre aproximadamente el 59 por ciento y el 91 por ciento de los estándares AdobeRGB y sRGB, respectivamente, y es similar a todos los demás paneles de 144 Hz de 15,6 pulgadas que existen actualmente en el mercado. El único otro panel de alta frecuencia de actualización que puede ofrecer una gama significativamente más amplia en este momento es el panel de 120 Hz del último Razer Blade Pro 17.
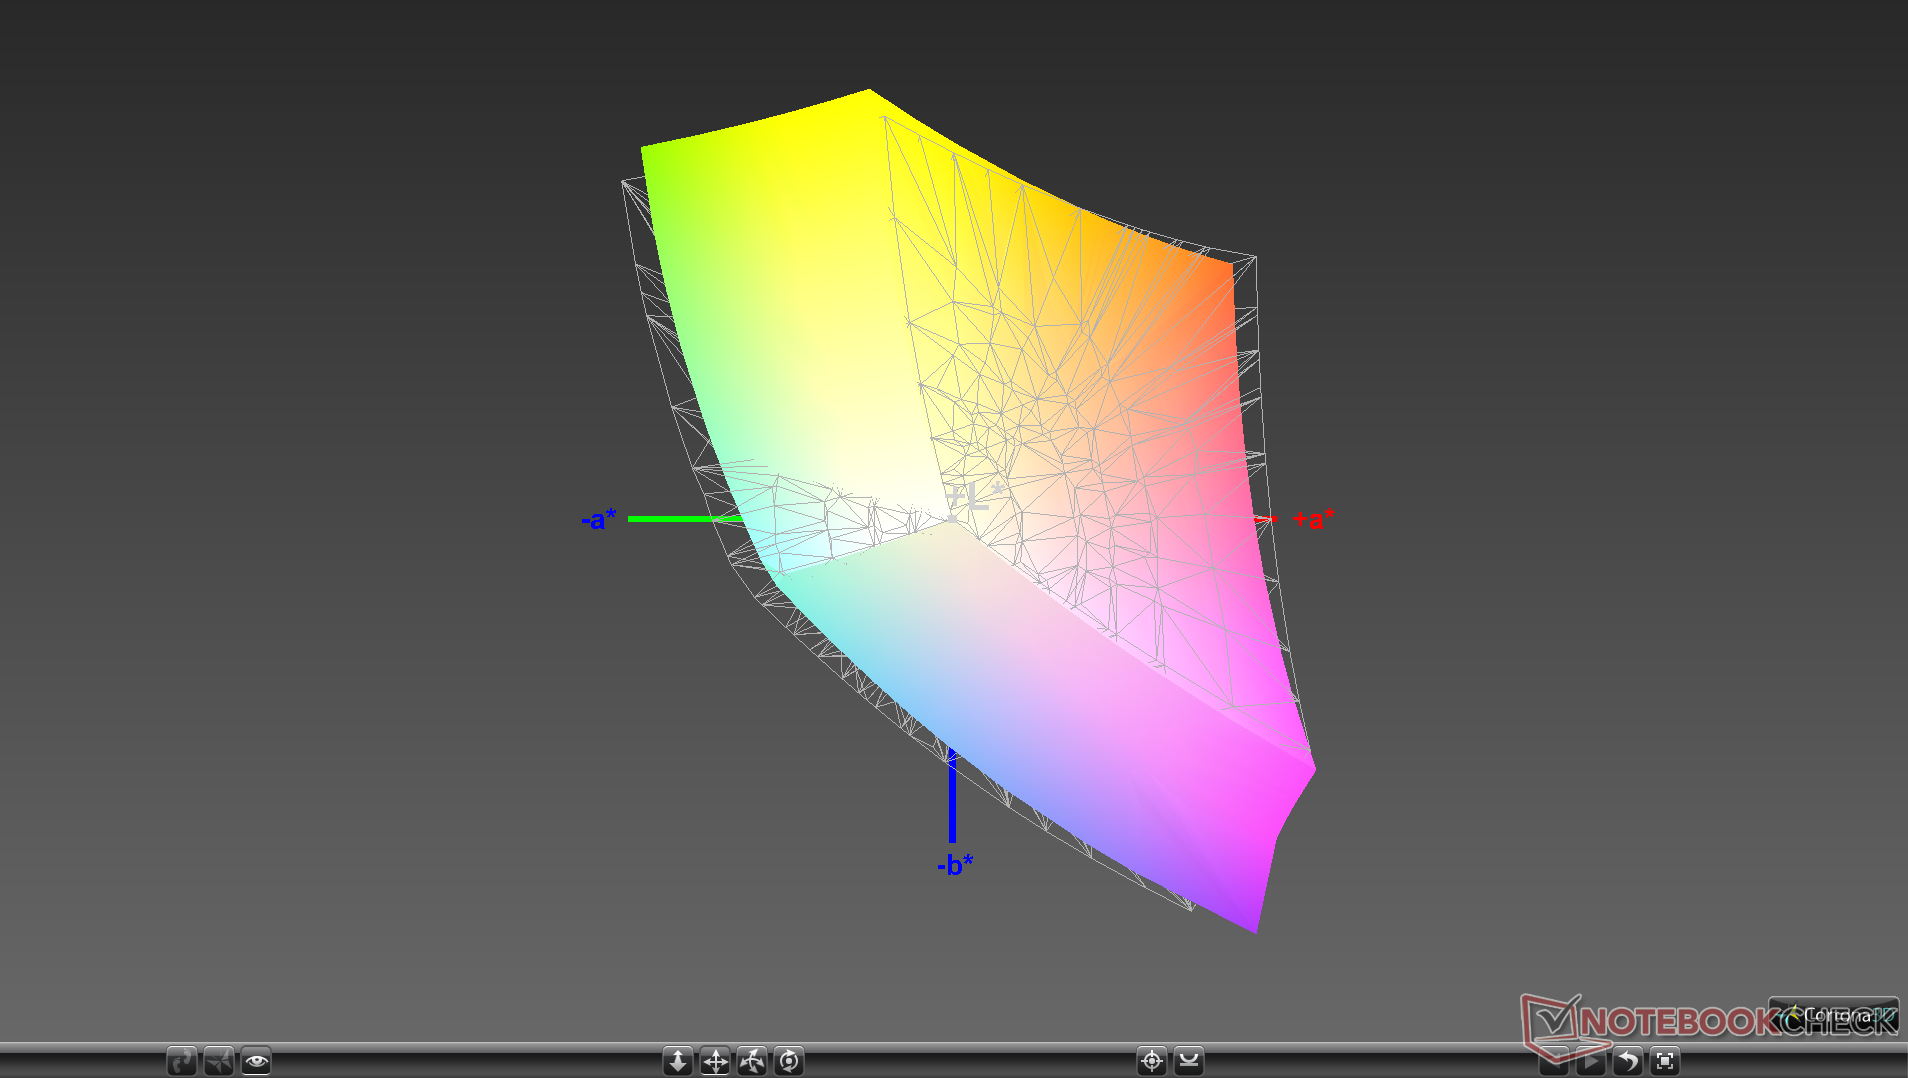
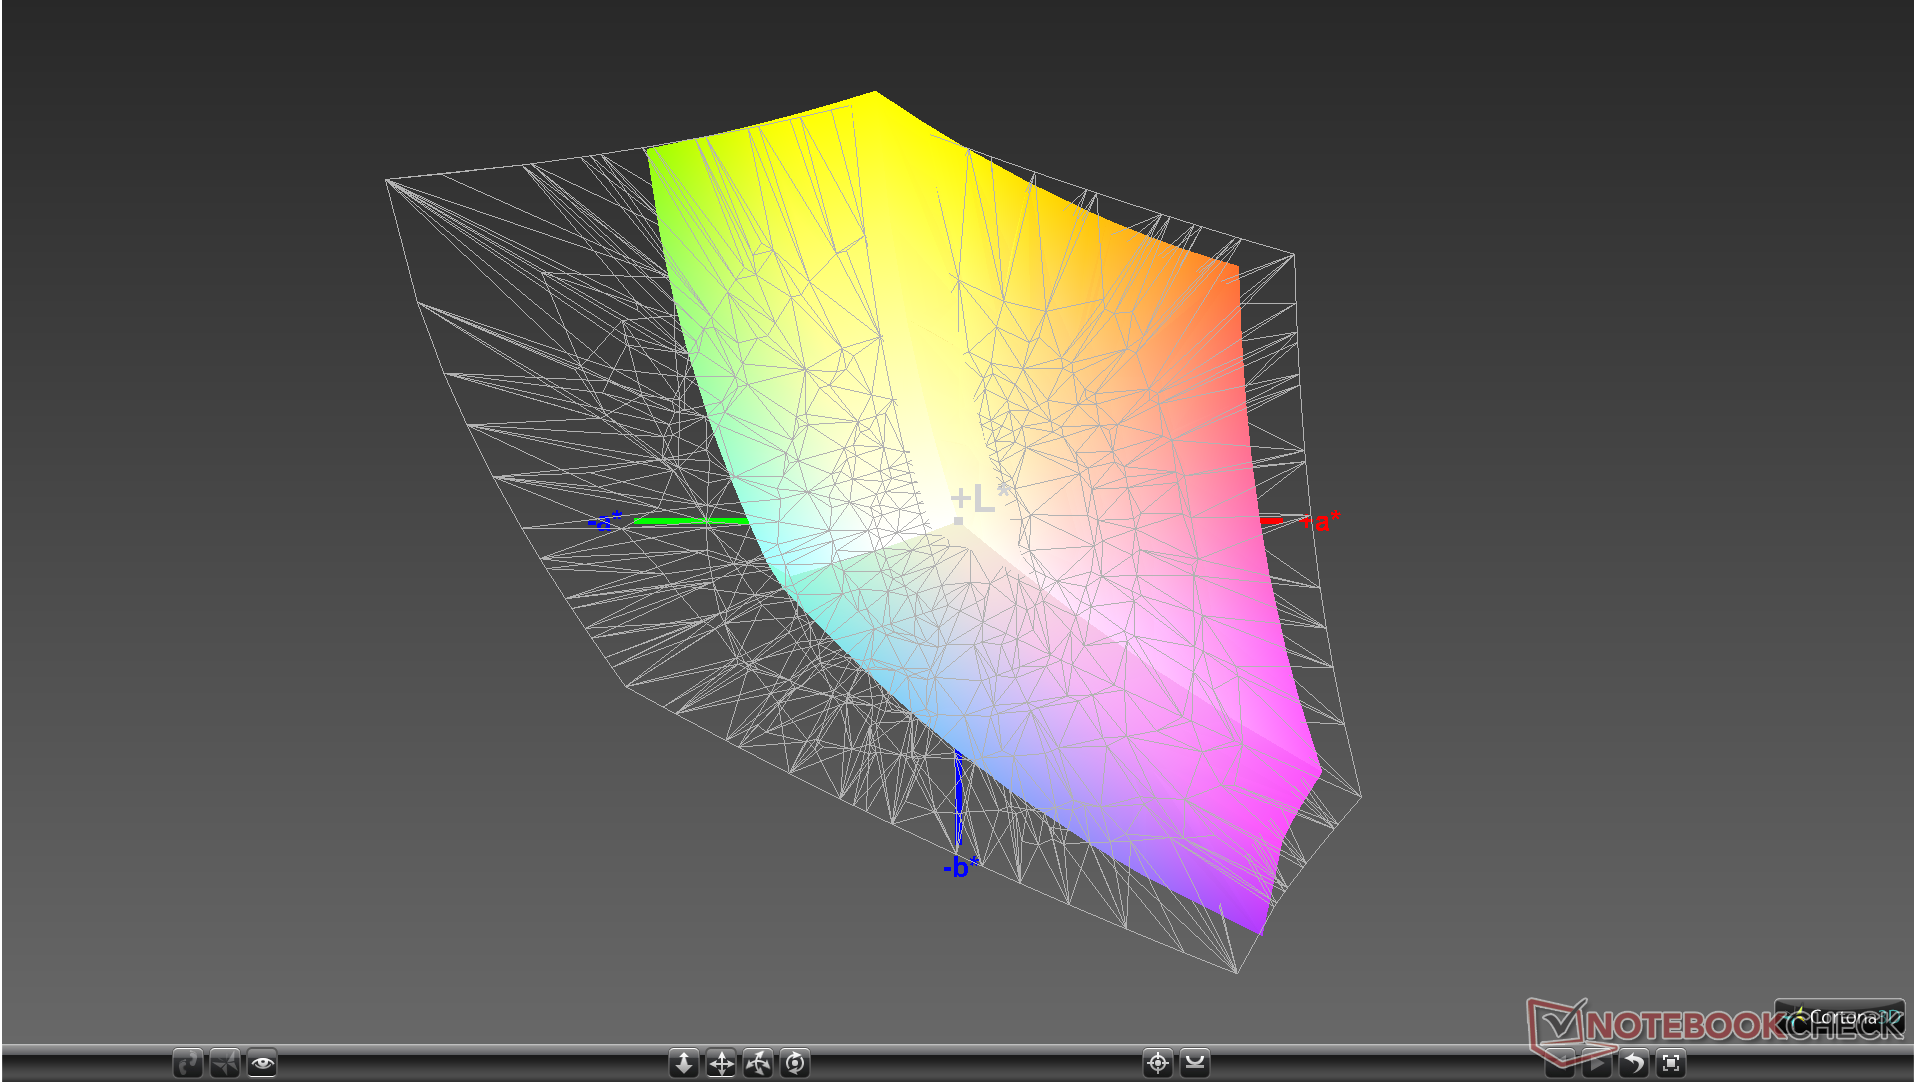
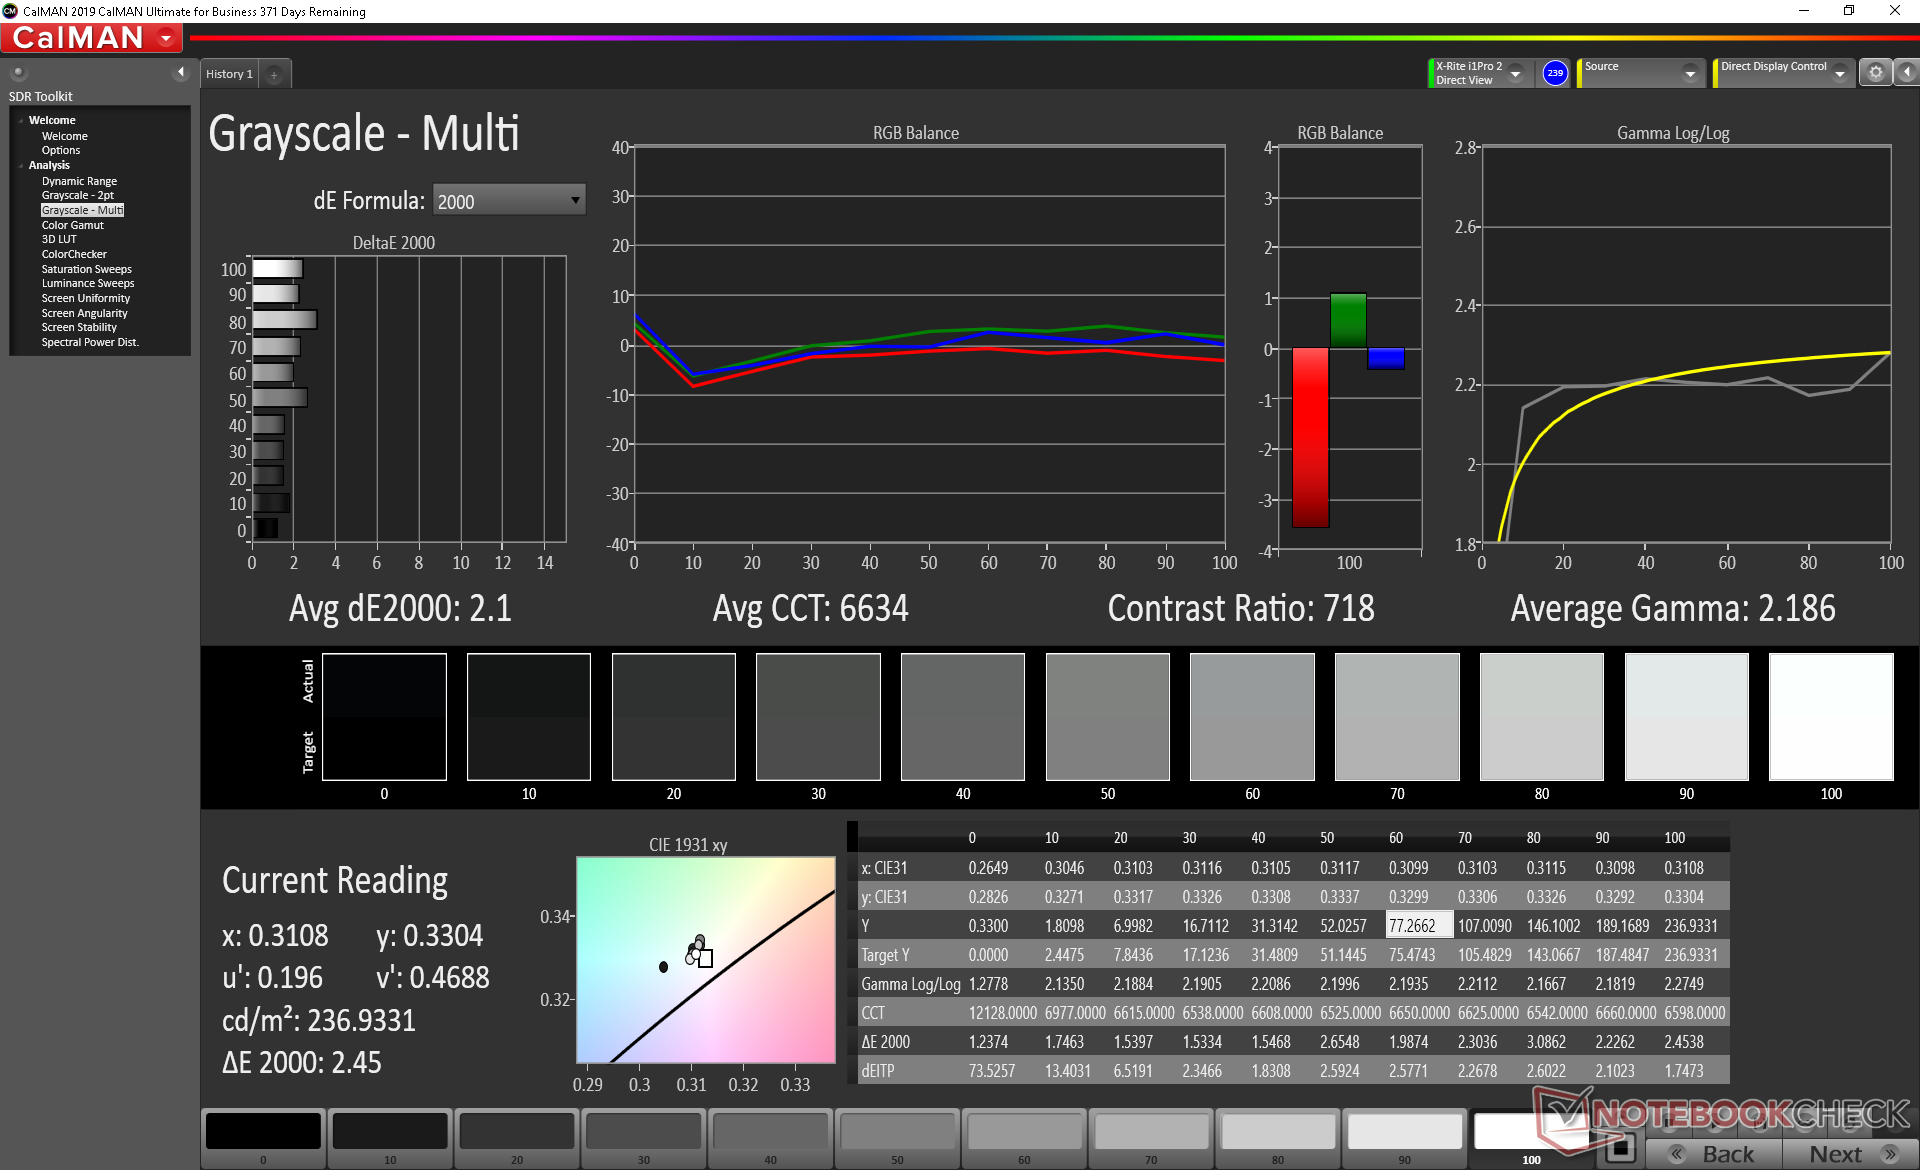
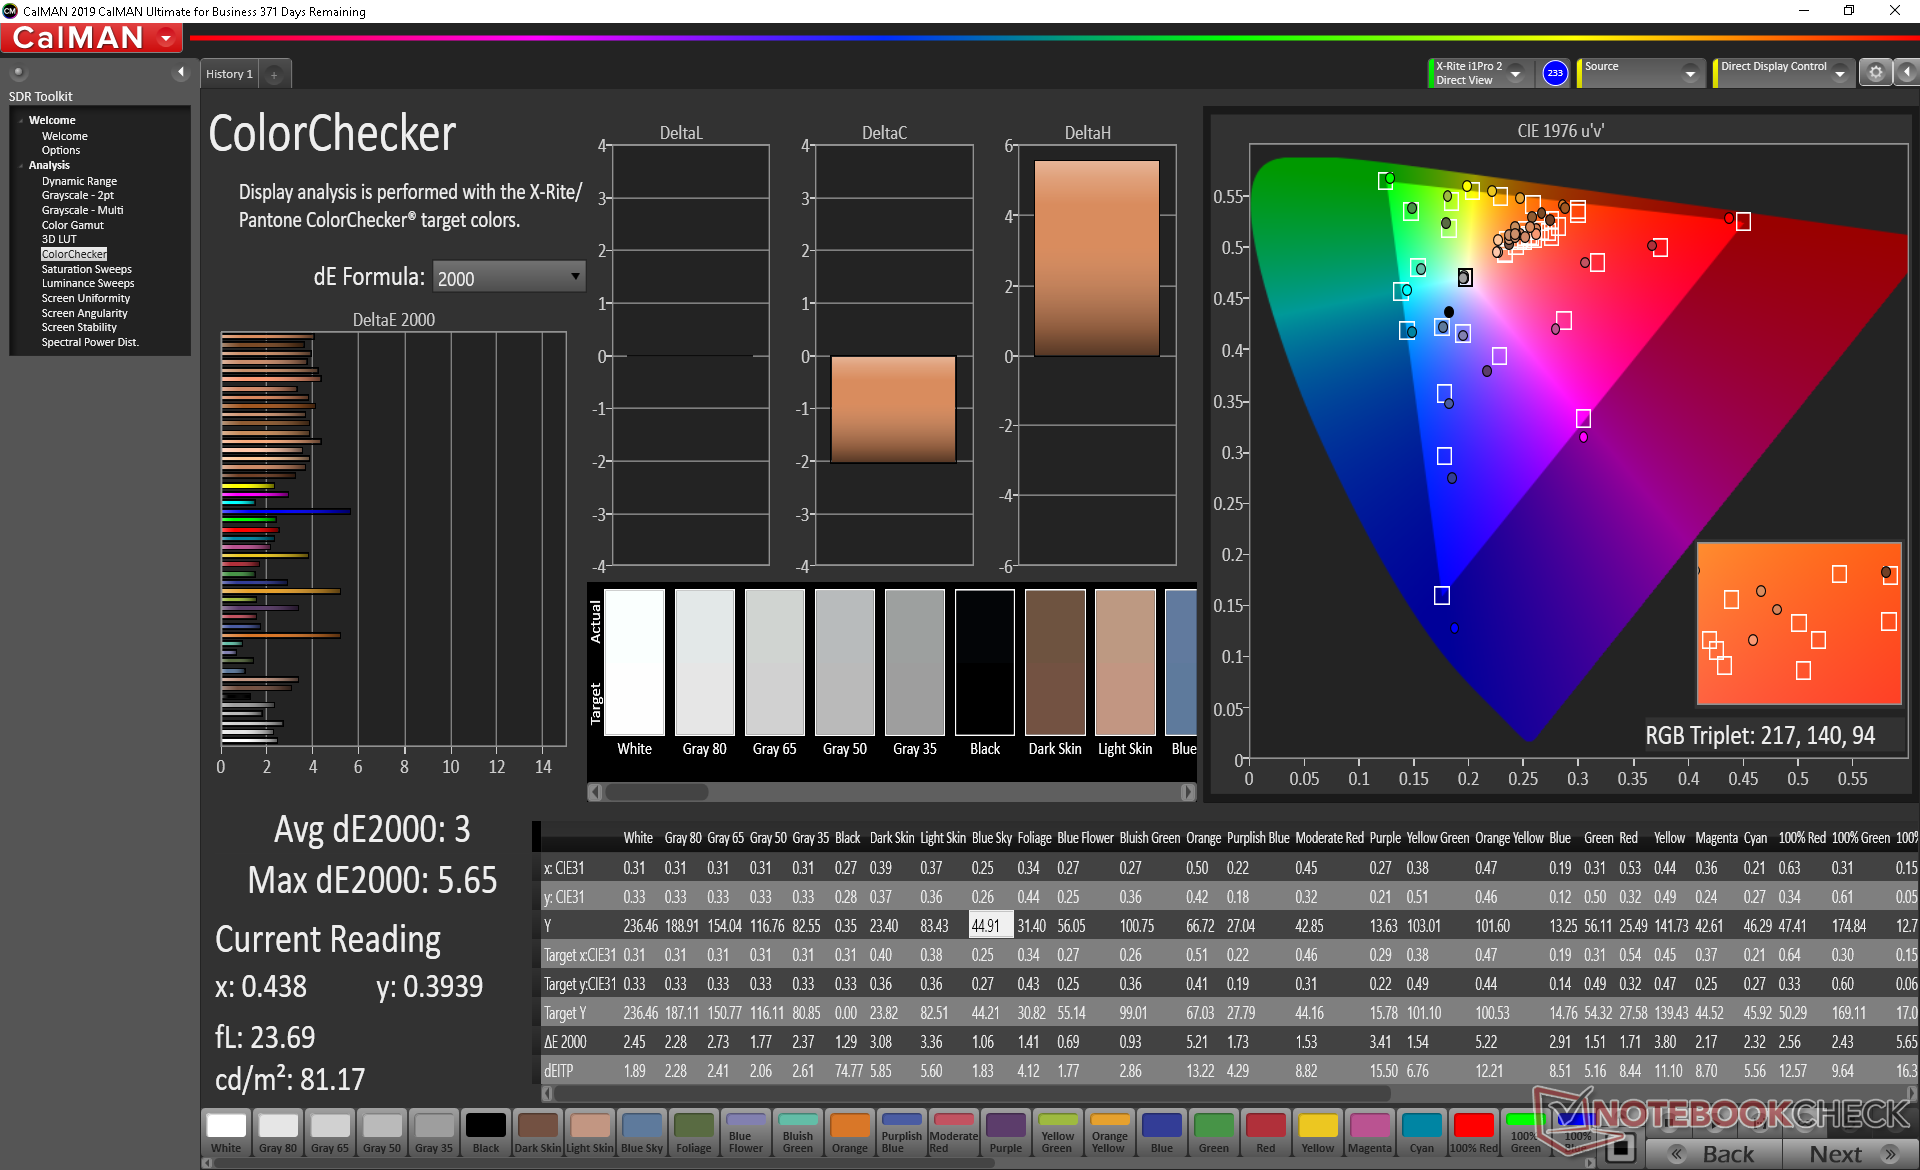
El panel no está bien calibrado fuera de la caja y la temperatura de color es demasiado fría. Los valores medios de escala de grises y deltaE de color se sitúan en 5,8 y 4,7 en comparación con 2,1 y 1,77, respectivamente, después de calibrar el panel nosotros mismos. Eurocom precalibrará el portátil antes de enviarlo con un coste adicional.
Tiempos de respuesta del display
| ↔ Tiempo de respuesta de Negro a Blanco | ||
|---|---|---|
| 10.8 ms ... subida ↗ y bajada ↘ combinada | ↗ 5.2 ms subida | 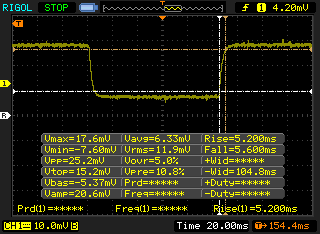 |
| ↘ 5.6 ms bajada | ||
| La pantalla mostró buenos tiempos de respuesta en nuestros tests pero podría ser demasiado lenta para los jugones competitivos. En comparación, todos los dispositivos de prueba van de ##min### (mínimo) a 240 (máximo) ms. » 29 % de todos los dispositivos son mejores. Esto quiere decir que el tiempo de respuesta medido es mejor que la media (19.8 ms) de todos los dispositivos testados. | ||
| ↔ Tiempo de respuesta 50% Gris a 80% Gris | ||
| 16.8 ms ... subida ↗ y bajada ↘ combinada | ↗ 9.2 ms subida | 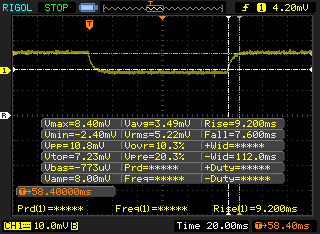 |
| ↘ 7.6 ms bajada | ||
| La pantalla mostró buenos tiempos de respuesta en nuestros tests pero podría ser demasiado lenta para los jugones competitivos. En comparación, todos los dispositivos de prueba van de ##min### (mínimo) a 636 (máximo) ms. » 31 % de todos los dispositivos son mejores. Esto quiere decir que el tiempo de respuesta medido es mejor que la media (31 ms) de todos los dispositivos testados. | ||
Parpadeo de Pantalla / PWM (Pulse-Width Modulation)
| Parpadeo de Pantalla / PWM no detectado | 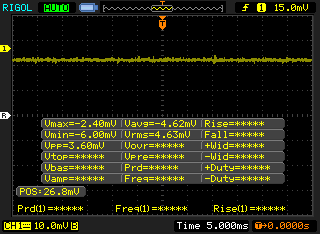 | ||
Comparación: 52 % de todos los dispositivos testados no usaron PWM para atenuar el display. Si se usó, medimos una media de 7781 (mínimo: 5 - máxmo: 343500) Hz. | |||
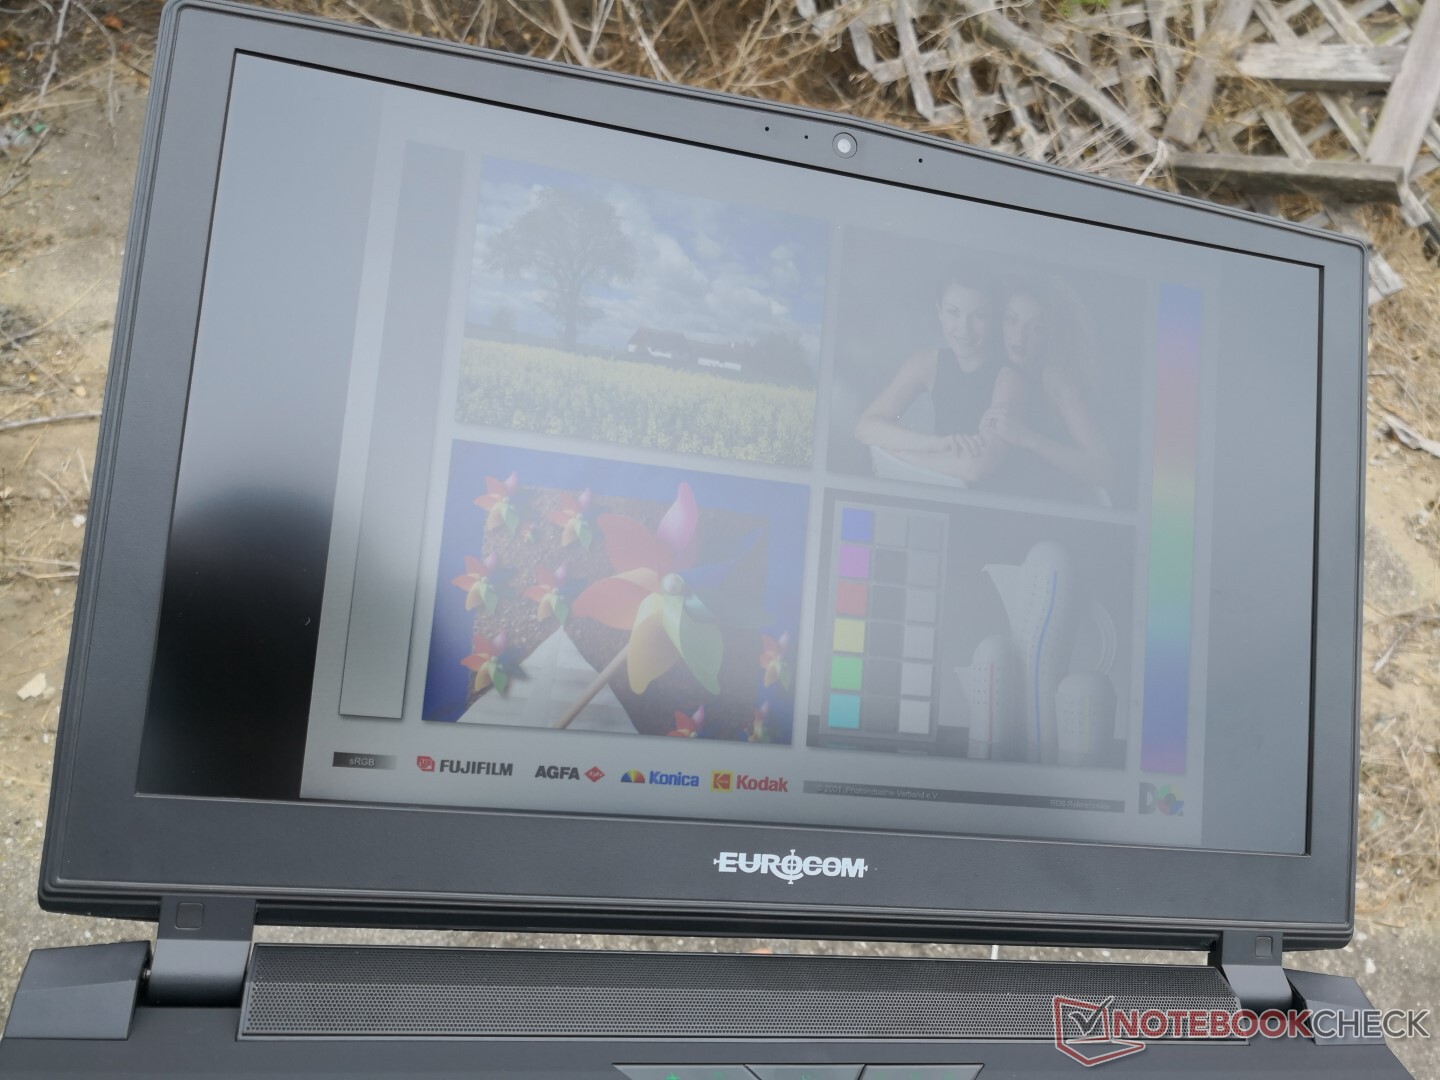
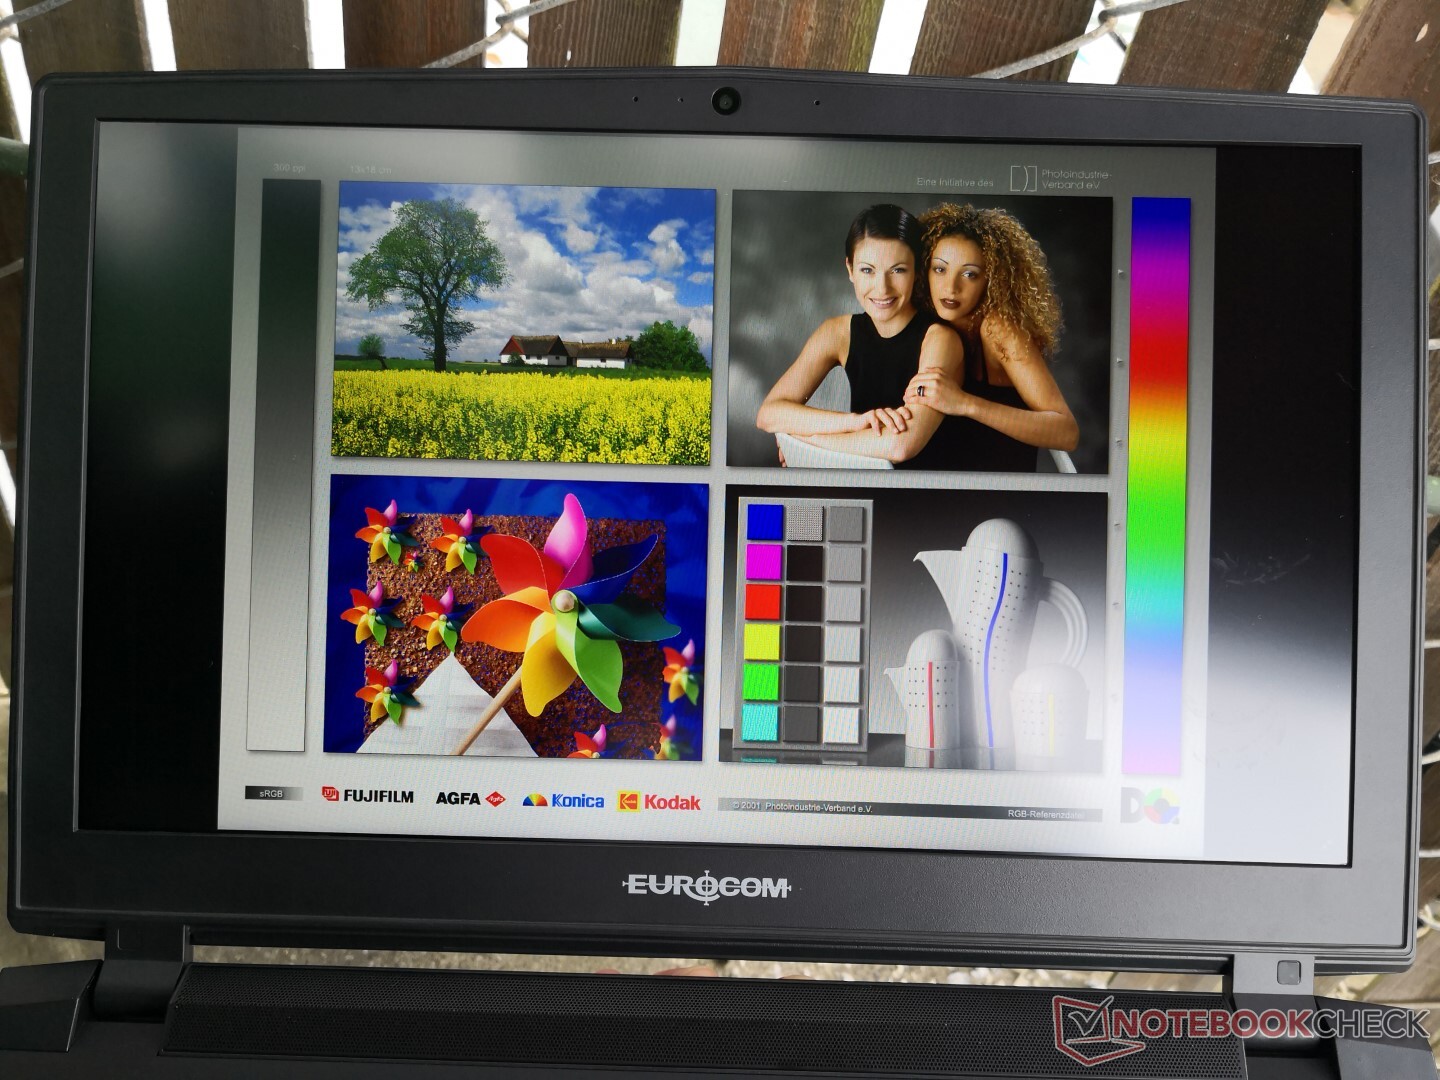
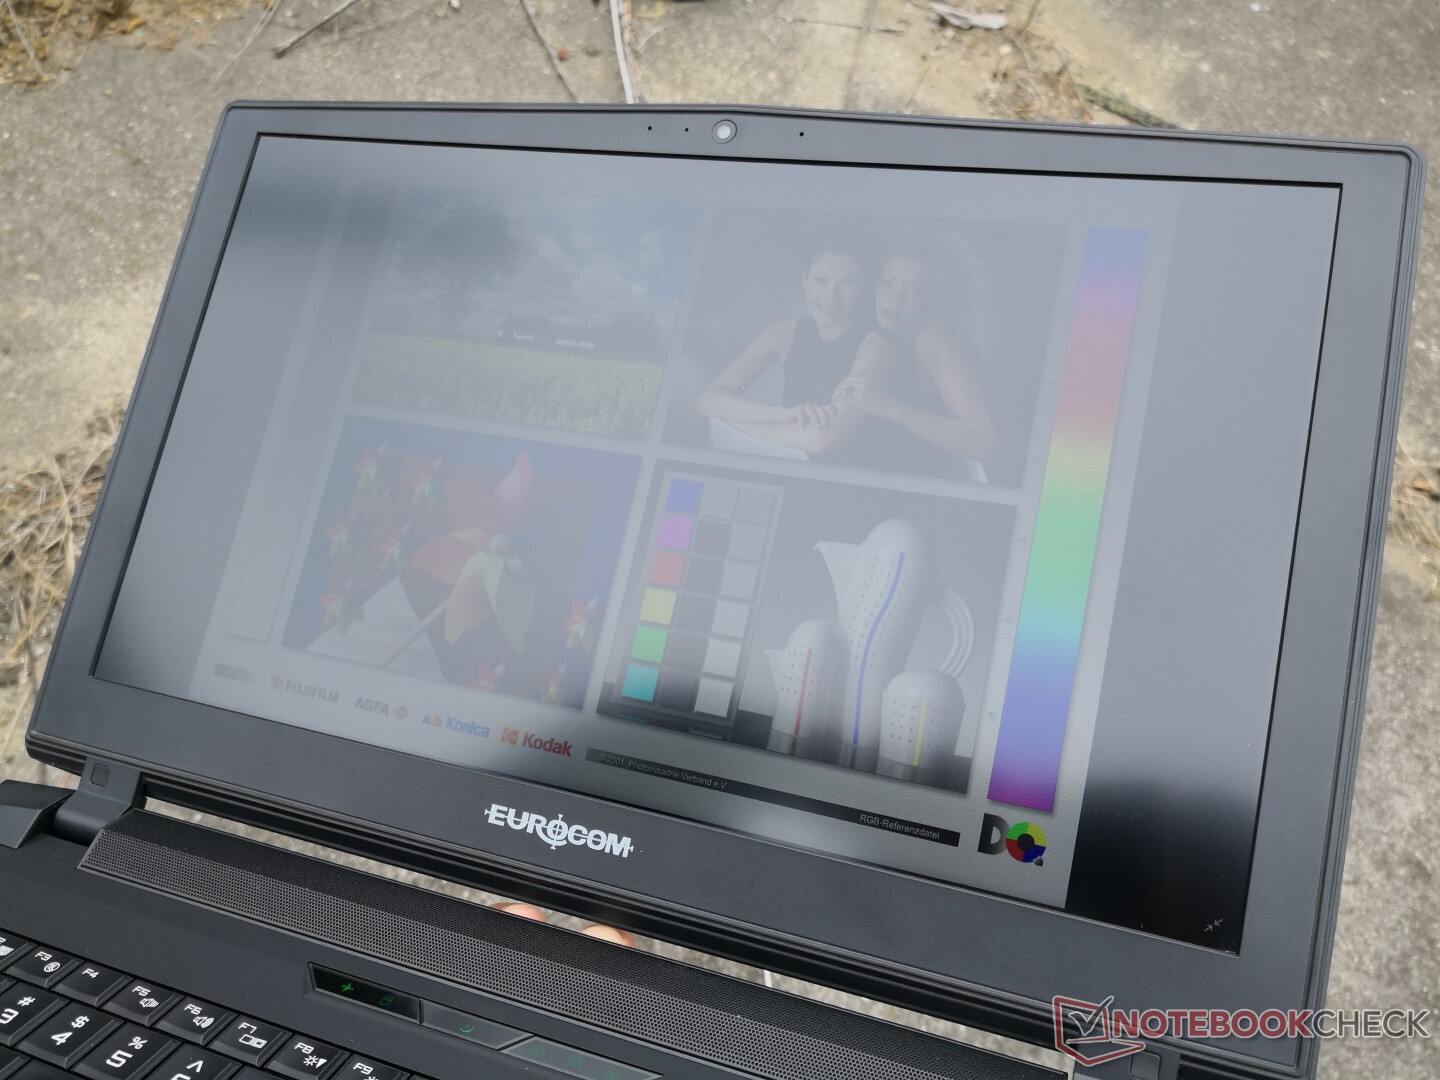
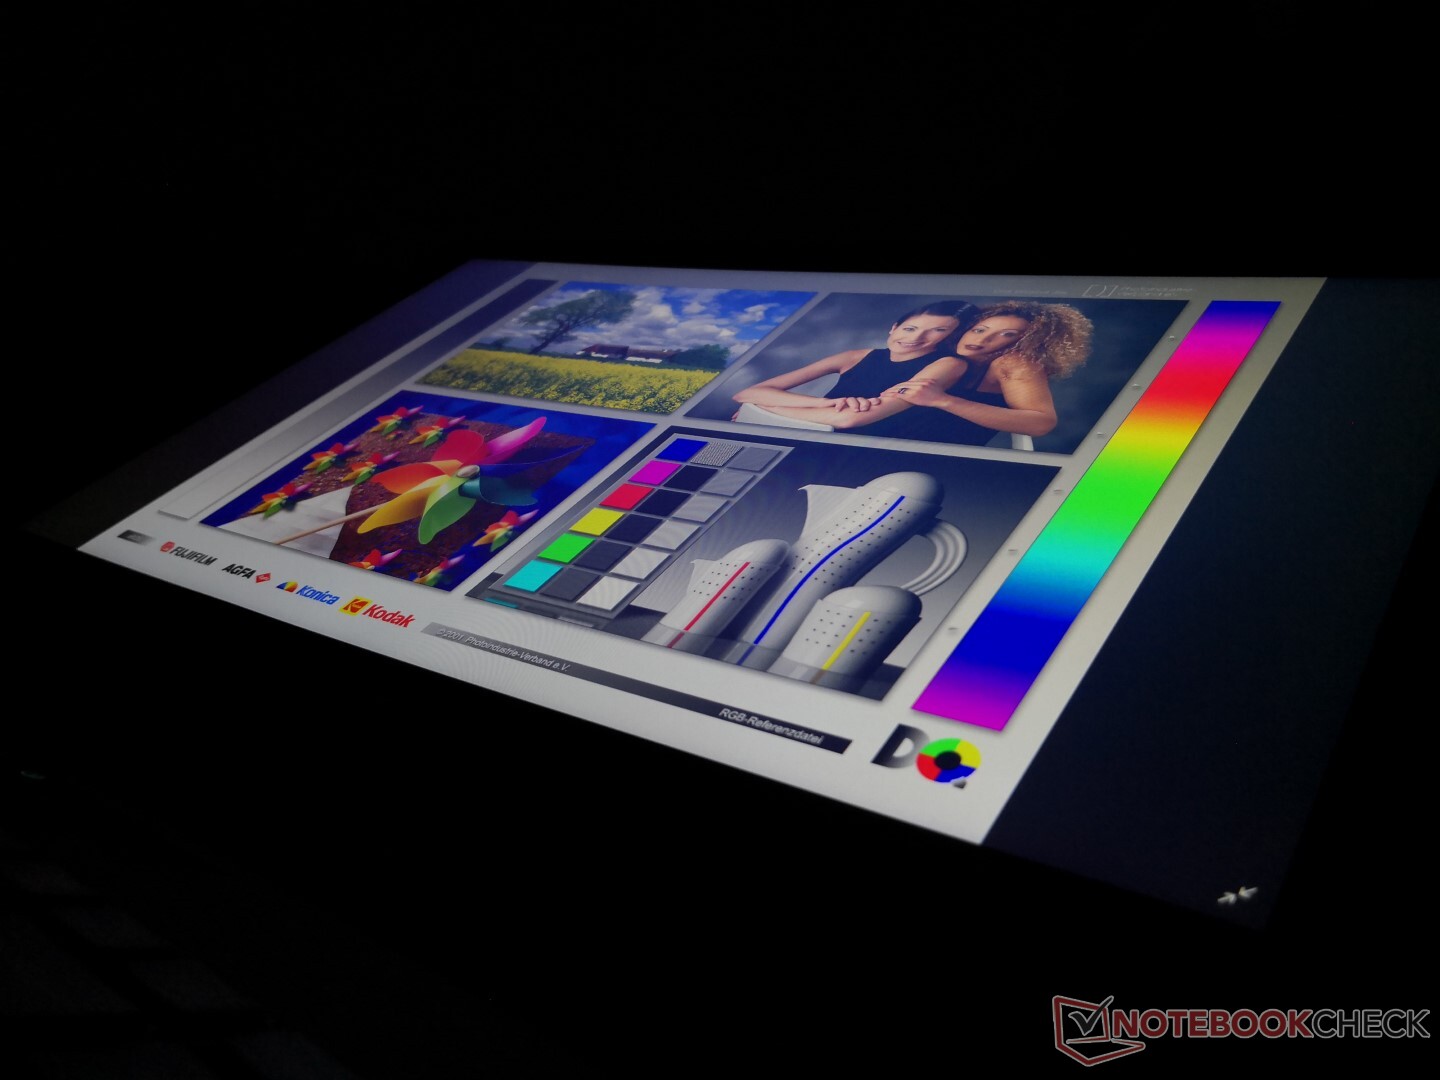
La visibilidad al aire libre es peor que la opción 4K UHD ya que este panel FHD es más tenue. Los ángulos de visión siguen siendo excelentes, excepto si se observa desde ángulos anormalmente amplios, donde el contraste y los colores comienzan a degradarse.
Rendimiento
El Core i9-9900KS (S de Special Edition) es esencialmente idéntico al Core i9-9900K con un par de diferencias como se describe en sus respectivas páginas de producto aquí. Desde un punto de vista de rendimiento puro, el modelo de edición especial tiene una frecuencia de reloj base más alta de 4 GHz en comparación con los 3,6 GHz de i9-9900K. En la práctica, sin embargo, las dos CPUs funcionan de forma casi idéntica en portátiles debido a que tienen un potencial de velocidad de reloj Turbo Boost similar.
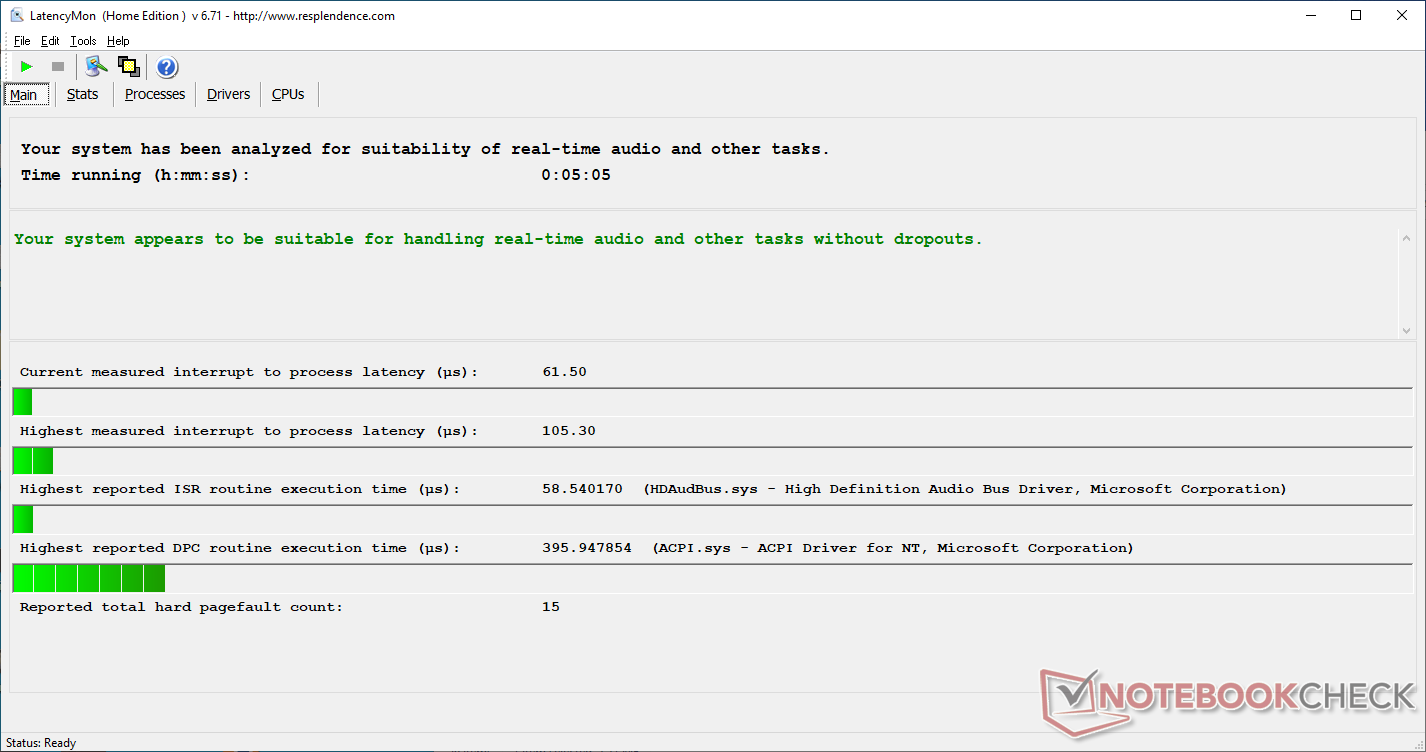
LatencyMon no muestra ningún problema de latencia del DPC cuando la conexión inalámbrica está activada o desactivada. G-Sync es compatible ya que no existe Optimus.
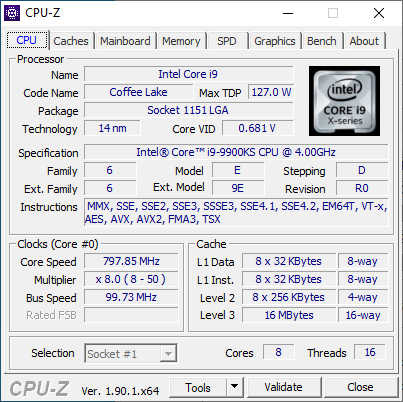
Procesador
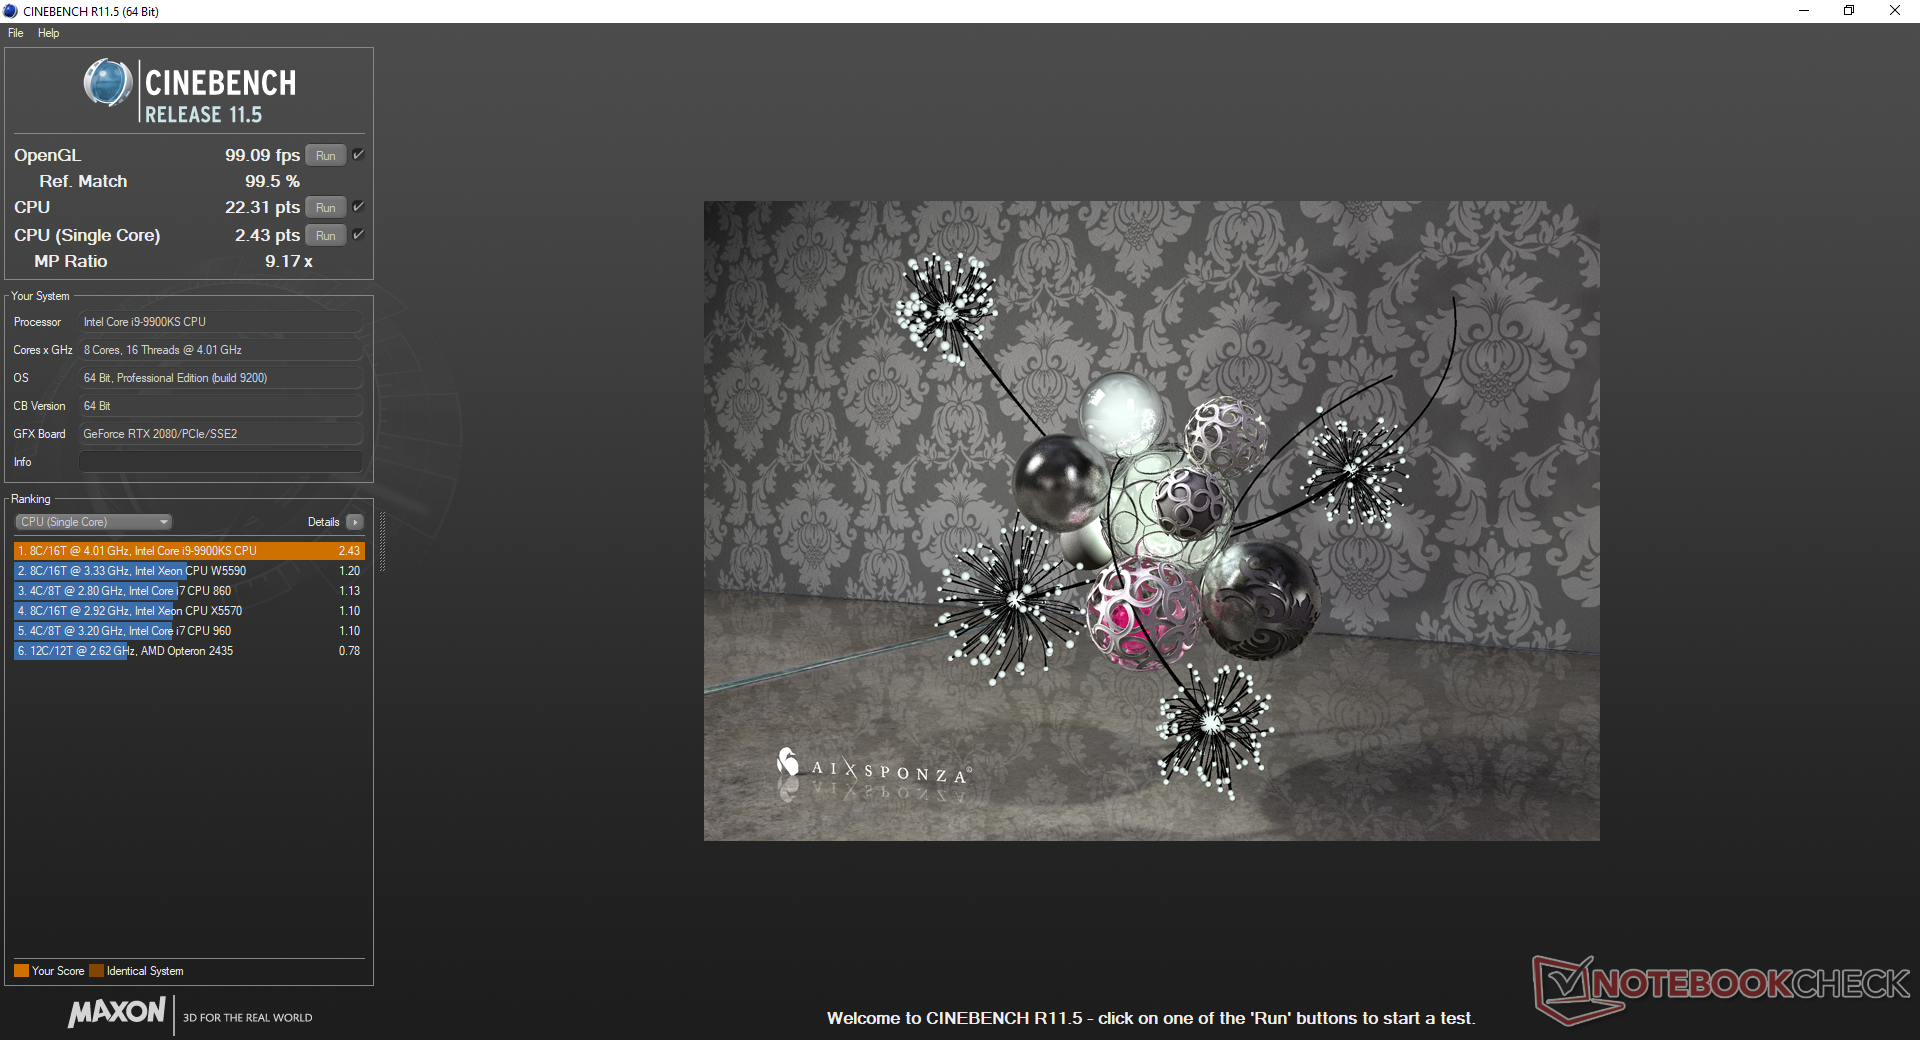
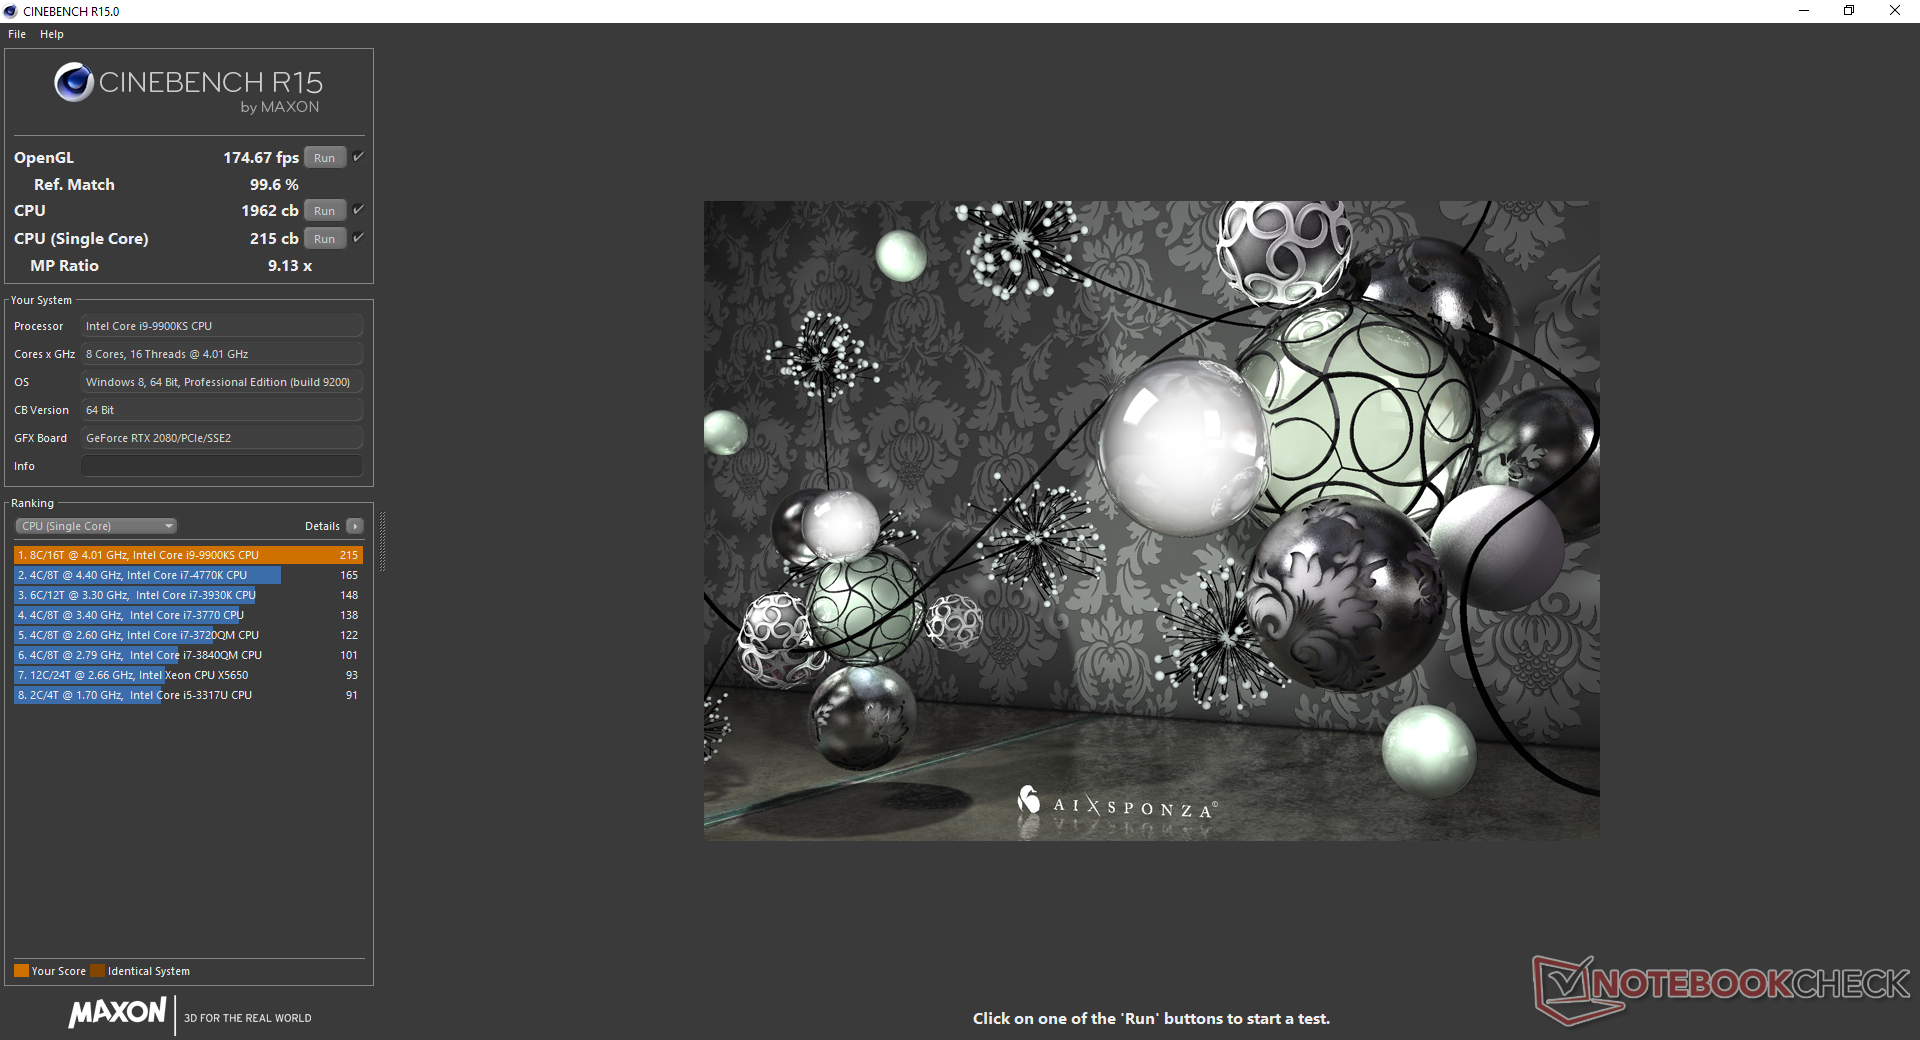
El núcleo octagonal i9-9900KS ofrece un rendimiento multihilo aproximadamente un 45 por ciento más rápido que el hexa-core Core i7-8700K de nuestro antiguo Sky X4C y el Core i9-9980HK del último MacBook Pro 15 de Apple. Sin embargo, el rendimiento en bruto se encuentra entre el 1 y el 2 por ciento del Core i9-9900K. La sostenibilidad del rendimiento es buena, pero creemos que podría ser un poco mejor; si se ejecuta CineBench R15 Multi-Thread en bucle, el rendimiento disminuye un 8% con el paso del tiempo. El MSI GT76 más masivo es capaz de mantener frecuencias de reloj más rápidas durante más tiempo con el Core i9-9900K "más lento", tal y como se muestra en el gráfico siguiente.
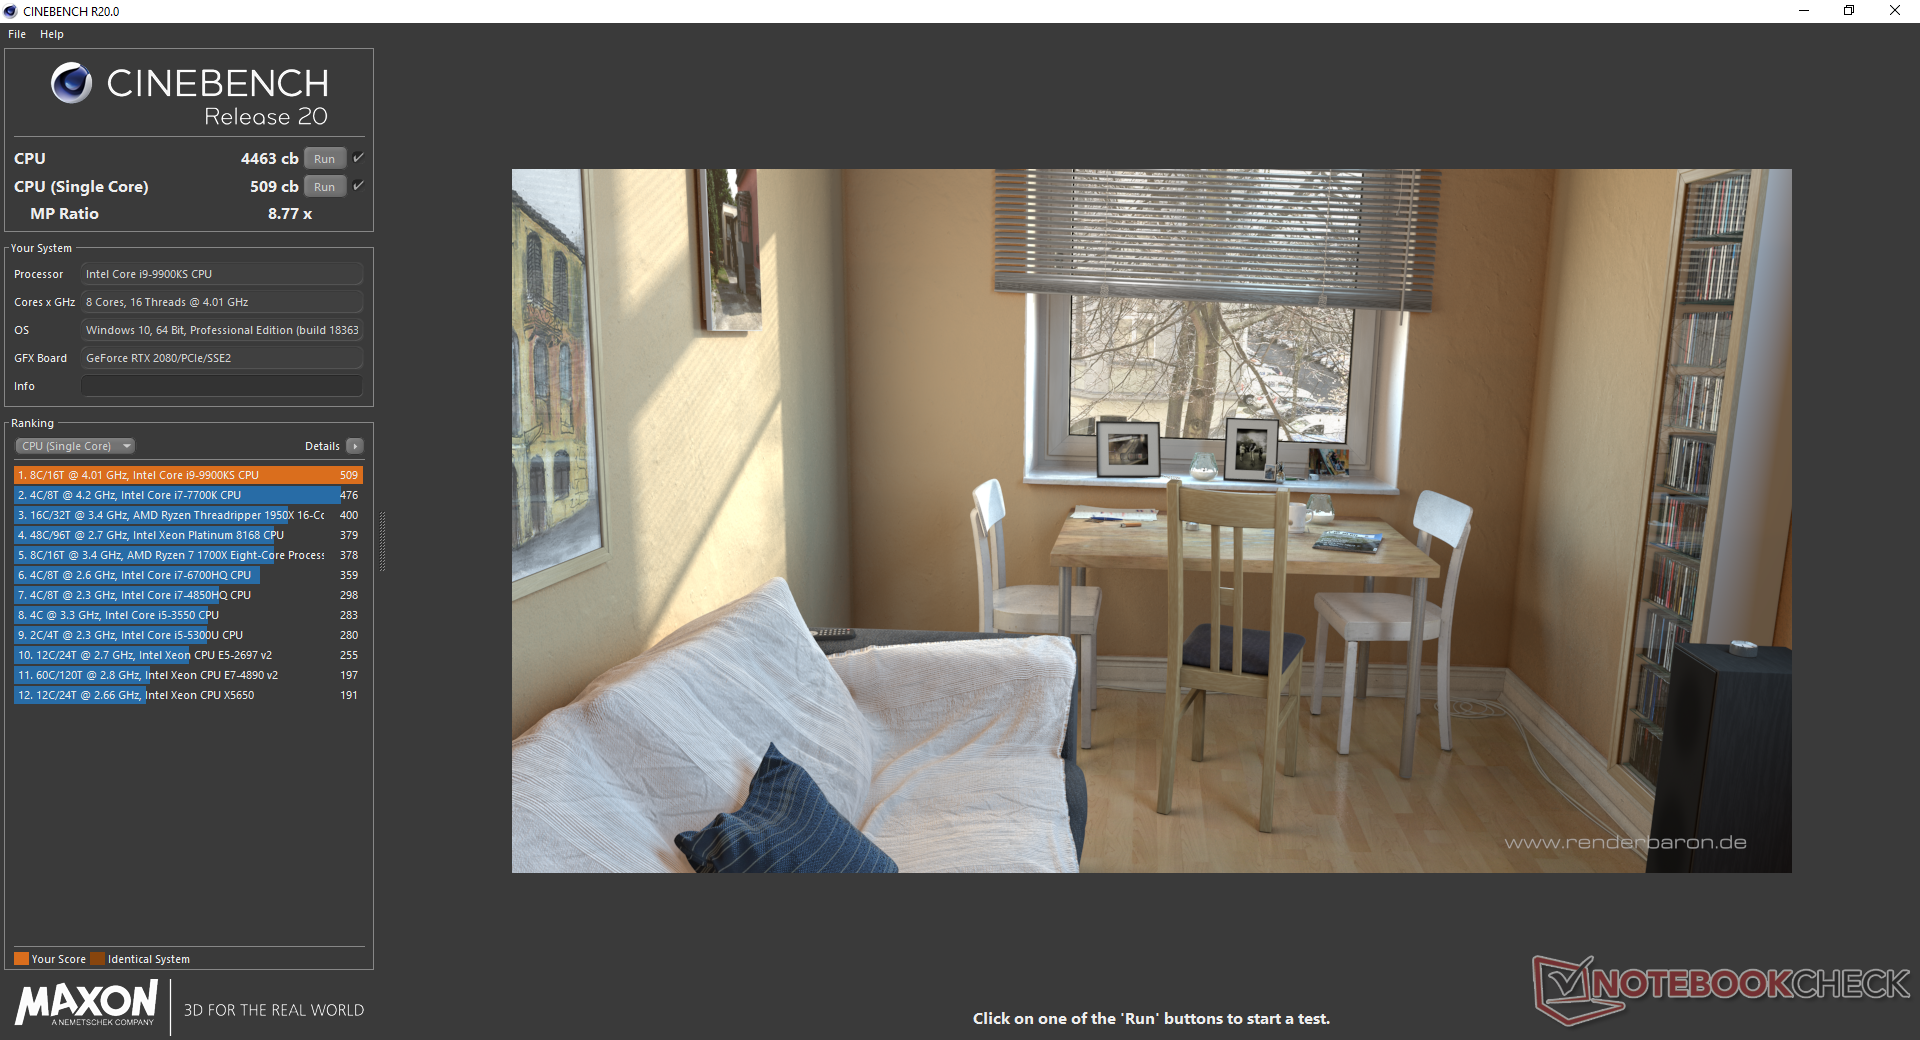
| Cinebench R20 | |
| CPU (Single Core) | |
| AMD Radeon RX Vega 64 | |
| Eurocom Sky X4C i9-9900KS | |
| Medion Erazer X15805 | |
| Apple MacBook Pro 15 2019 i9 Vega 20 | |
| MSI Prestige 15 A10SC | |
| MSI GE75 9SG | |
| Schenker Key 16 | |
| Eurocom Nightsky Ti15 | |
| AMD Ryzen 1800X - Asus Crosshair VI Hero | |
| Razer Blade Stealth i7-1065G7 Iris Plus | |
| MSI GL62M 7RD-077 | |
| CPU (Multi Core) | |
| AMD Radeon RX Vega 64 | |
| Eurocom Sky X4C i9-9900KS | |
| MSI GE75 9SG | |
| AMD Ryzen 1800X - Asus Crosshair VI Hero | |
| Apple MacBook Pro 15 2019 i9 Vega 20 | |
| Medion Erazer X15805 | |
| Eurocom Nightsky Ti15 | |
| MSI Prestige 15 A10SC | |
| Schenker Key 16 | |
| MSI GL62M 7RD-077 | |
| Razer Blade Stealth i7-1065G7 Iris Plus | |
| Cinebench R11.5 | |
| CPU Single 64Bit | |
| Eurocom Sky X4C i9-9900KS | |
| AMD Radeon RX Vega 64 | |
| Eurocom Sky X4C | |
| MSI GE75 9SG | |
| Eurocom Nightsky Ti15 | |
| AMD Ryzen 1800X - Asus Crosshair VI Hero | |
| MSI GL62M 7RD-077 | |
| Asus GL702ZC-GC104T | |
| CPU Multi 64Bit | |
| AMD Radeon RX Vega 64 | |
| Eurocom Sky X4C i9-9900KS | |
| MSI GE75 9SG | |
| AMD Ryzen 1800X - Asus Crosshair VI Hero | |
| Asus GL702ZC-GC104T | |
| Eurocom Sky X4C | |
| Eurocom Nightsky Ti15 | |
| MSI GL62M 7RD-077 | |
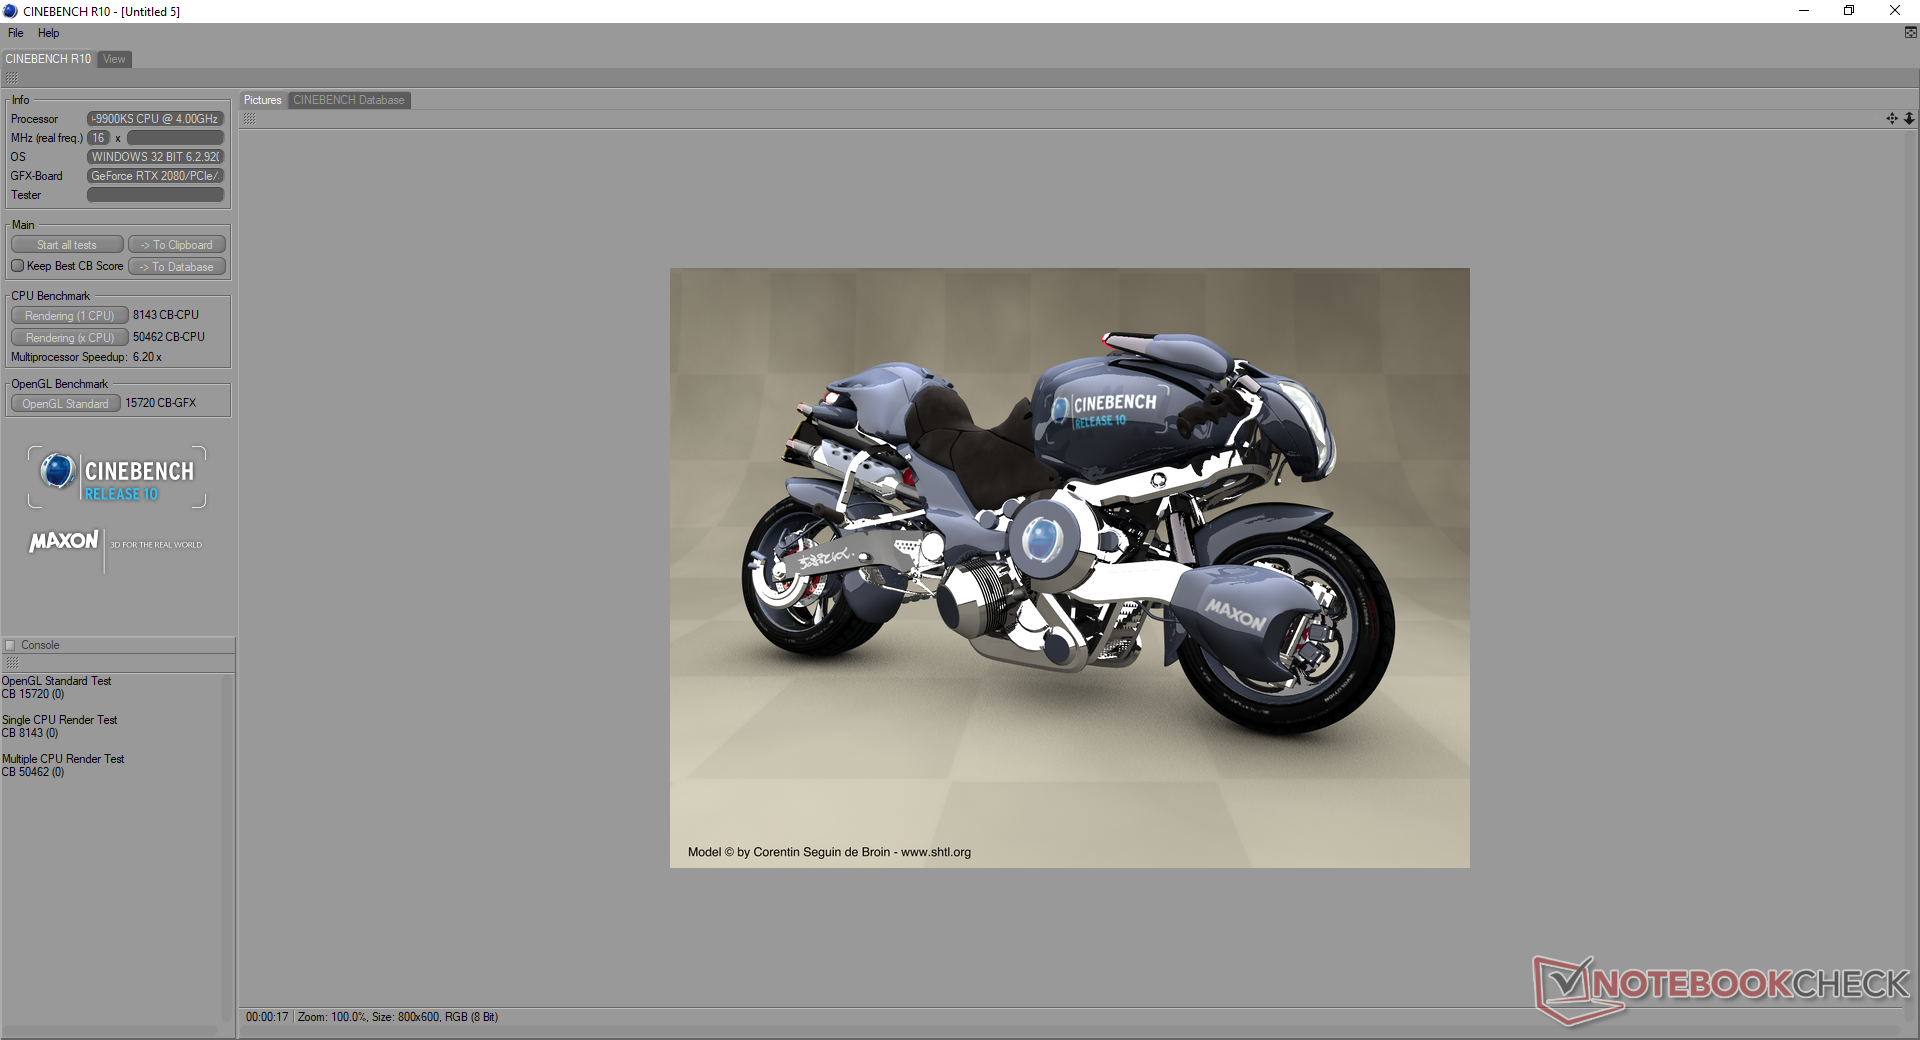
| Cinebench R10 | |
| Rendering Multiple CPUs 32Bit | |
| Eurocom Sky X4C i9-9900KS | |
| AMD Radeon RX Vega 64 | |
| MSI GE75 9SG | |
| Eurocom Sky X4C | |
| Medion Erazer X15805 | |
| Schenker Key 16 | |
| AMD Ryzen 1800X - Asus Crosshair VI Hero | |
| Asus GL702ZC-GC104T | |
| MSI GL62M 7RD-077 | |
| Rendering Single 32Bit | |
| Eurocom Sky X4C i9-9900KS | |
| Medion Erazer X15805 | |
| Eurocom Sky X4C | |
| MSI GE75 9SG | |
| Schenker Key 16 | |
| AMD Radeon RX Vega 64 | |
| MSI GL62M 7RD-077 | |
| AMD Ryzen 1800X - Asus Crosshair VI Hero | |
| Asus GL702ZC-GC104T | |
| wPrime 2.10 - 1024m | |
| Eurocom Sky X4C | |
| MSI GE75 9SG | |
| AMD Ryzen 1800X - Asus Crosshair VI Hero | |
| Eurocom Sky X4C i9-9900KS | |
| AMD Radeon RX Vega 64 | |
| X264 HD Benchmark 4.0 | |
| Pass 2 | |
| AMD Radeon RX Vega 64 | |
| Eurocom Sky X4C i9-9900KS | |
| MSI GE75 9SG | |
| Asus GL702ZC-GC104T | |
| AMD Ryzen 1800X - Asus Crosshair VI Hero | |
| Pass 1 | |
| Eurocom Sky X4C i9-9900KS | |
| AMD Radeon RX Vega 64 | |
| MSI GE75 9SG | |
| AMD Ryzen 1800X - Asus Crosshair VI Hero | |
| Asus GL702ZC-GC104T | |
| WinRAR - Result | |
| Eurocom Sky X4C i9-9900KS | |
| AMD Radeon RX Vega 64 | |
| MSI GE75 9SG | |
| AMD Ryzen 1800X - Asus Crosshair VI Hero | |
| Asus GL702ZC-GC104T | |
| TrueCrypt | |
| Serpent Mean 100MB | |
| AMD Radeon RX Vega 64 | |
| Eurocom Sky X4C i9-9900KS | |
| Asus GL702ZC-GC104T | |
| Eurocom Sky X4C | |
| MSI GE75 9SG | |
| Twofish Mean 100MB | |
| AMD Radeon RX Vega 64 | |
| Eurocom Sky X4C i9-9900KS | |
| AMD Ryzen 1800X - Asus Crosshair VI Hero | |
| Asus GL702ZC-GC104T | |
| Eurocom Sky X4C | |
| MSI GE75 9SG | |
| AES Mean 100MB | |
| Eurocom Sky X4C i9-9900KS | |
| AMD Radeon RX Vega 64 | |
| AMD Ryzen 1800X - Asus Crosshair VI Hero | |
| MSI GE75 9SG | |
| Eurocom Sky X4C | |
| Asus GL702ZC-GC104T | |
| Geekbench 4.0 | |
| Compute OpenCL Score | |
| Eurocom Sky X4C i9-9900KS | |
| MSI GL62M 7RD-077 | |
| 64 Bit Multi-Core Score | |
| Eurocom Sky X4C i9-9900KS | |
| AMD Ryzen 1800X - Asus Crosshair VI Hero | |
| MSI GL62M 7RD-077 | |
| 64 Bit Single-Core Score | |
| Eurocom Sky X4C i9-9900KS | |
| AMD Ryzen 1800X - Asus Crosshair VI Hero | |
| MSI GL62M 7RD-077 | |
| Blender - v2.79 BMW27 CPU | |
| MSI GE75 9SG | |
| AMD Ryzen 1800X - Asus Crosshair VI Hero | |
| Eurocom Sky X4C i9-9900KS | |
| AMD Radeon RX Vega 64 | |
| 7-Zip 18.03 | |
| 7z b 4 | |
| AMD Radeon RX Vega 64 | |
| Eurocom Sky X4C i9-9900KS | |
| MSI GE75 9SG | |
| 7z b 4 -mmt1 | |
| Eurocom Sky X4C i9-9900KS | |
| AMD Radeon RX Vega 64 | |
| MSI GE75 9SG | |
| HWBOT x265 Benchmark v2.2 - 4k Preset | |
| AMD Radeon RX Vega 64 | |
| Eurocom Sky X4C i9-9900KS | |
| MSI GE75 9SG | |
| MSI GL62M 7RD-077 | |
* ... más pequeño es mejor
Rendimiento del sistema
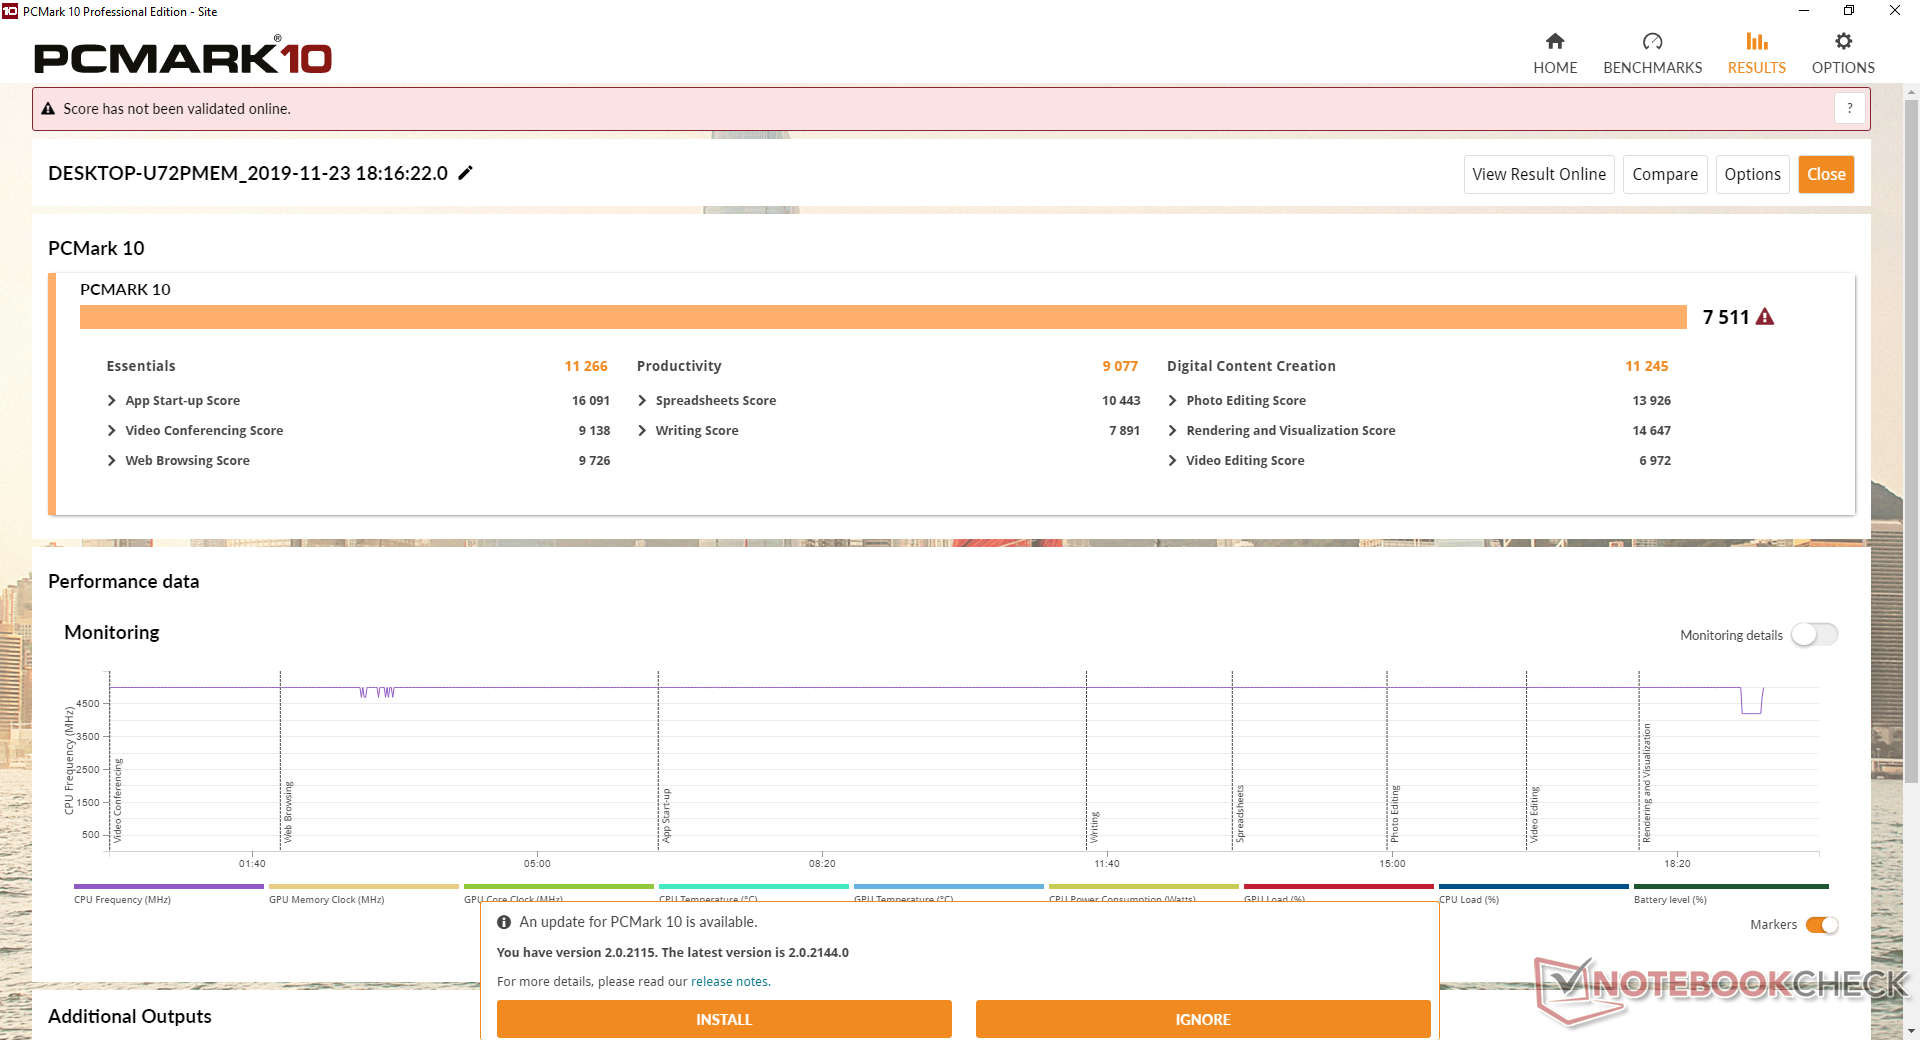
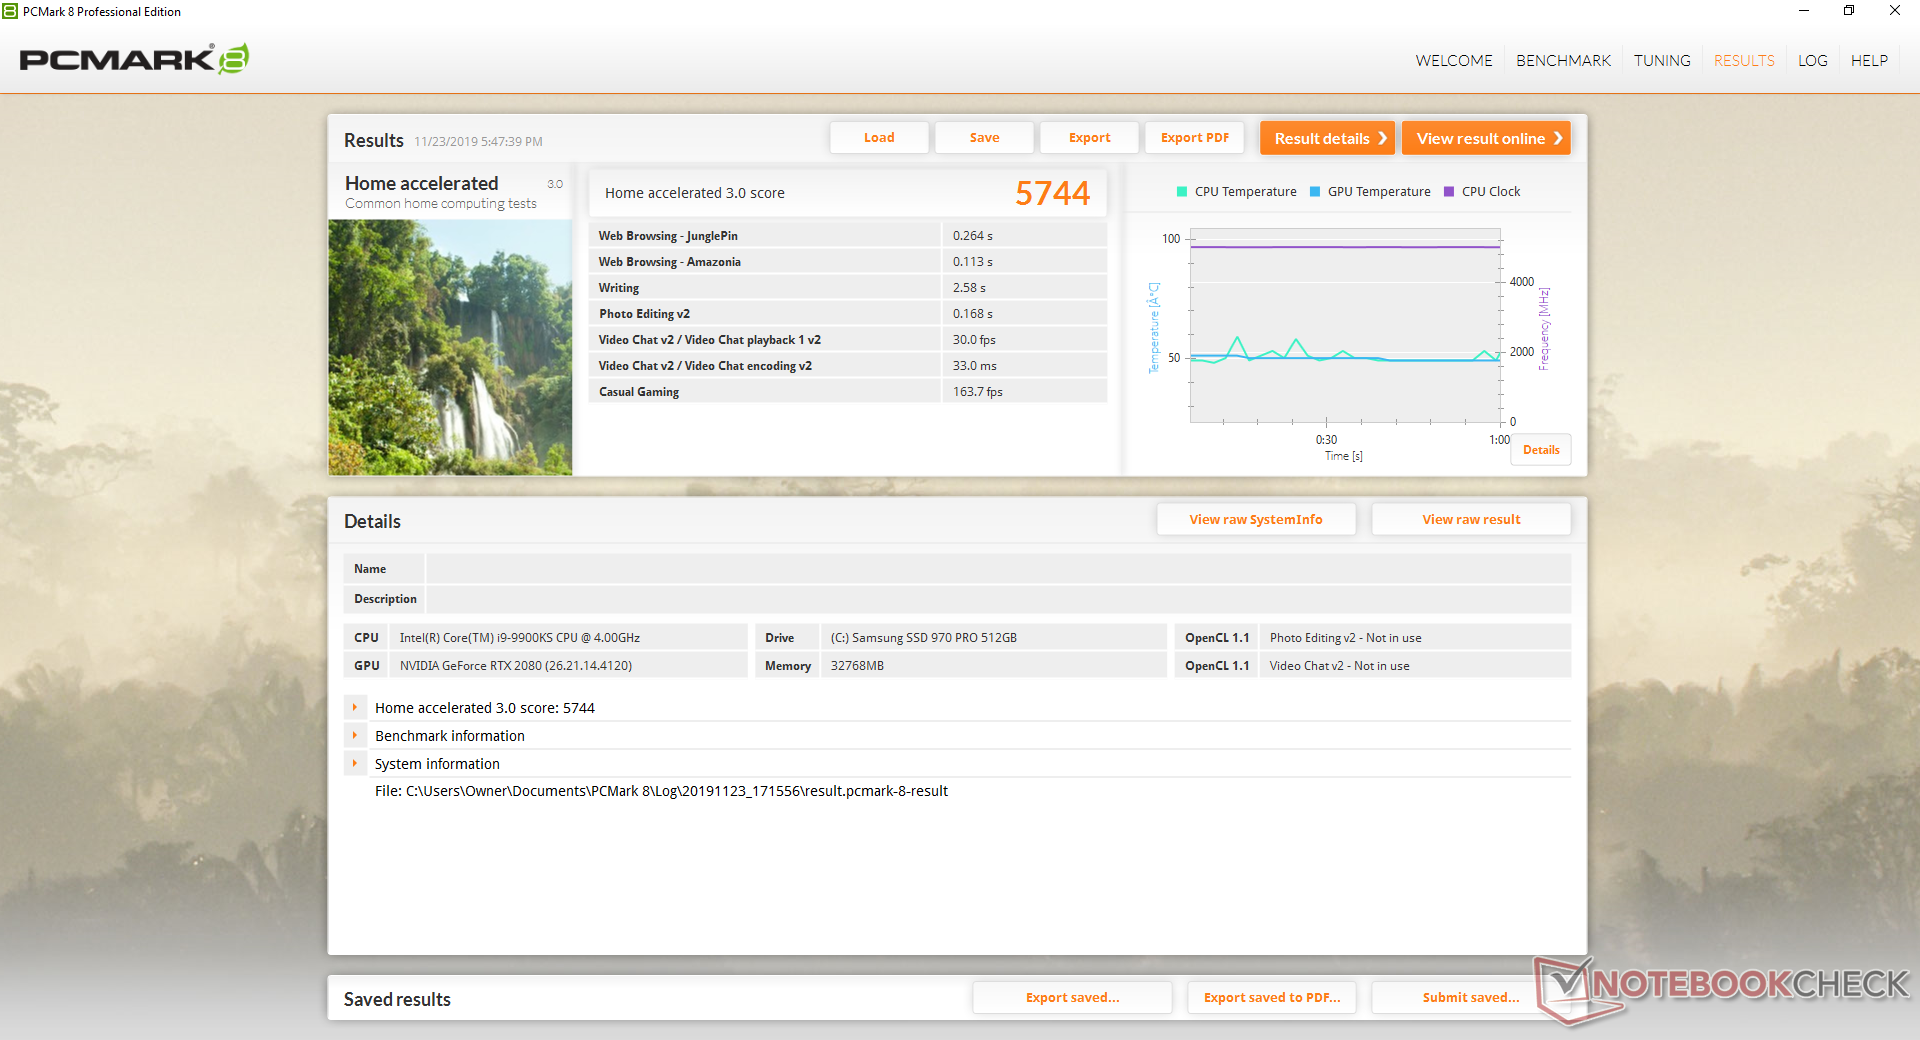
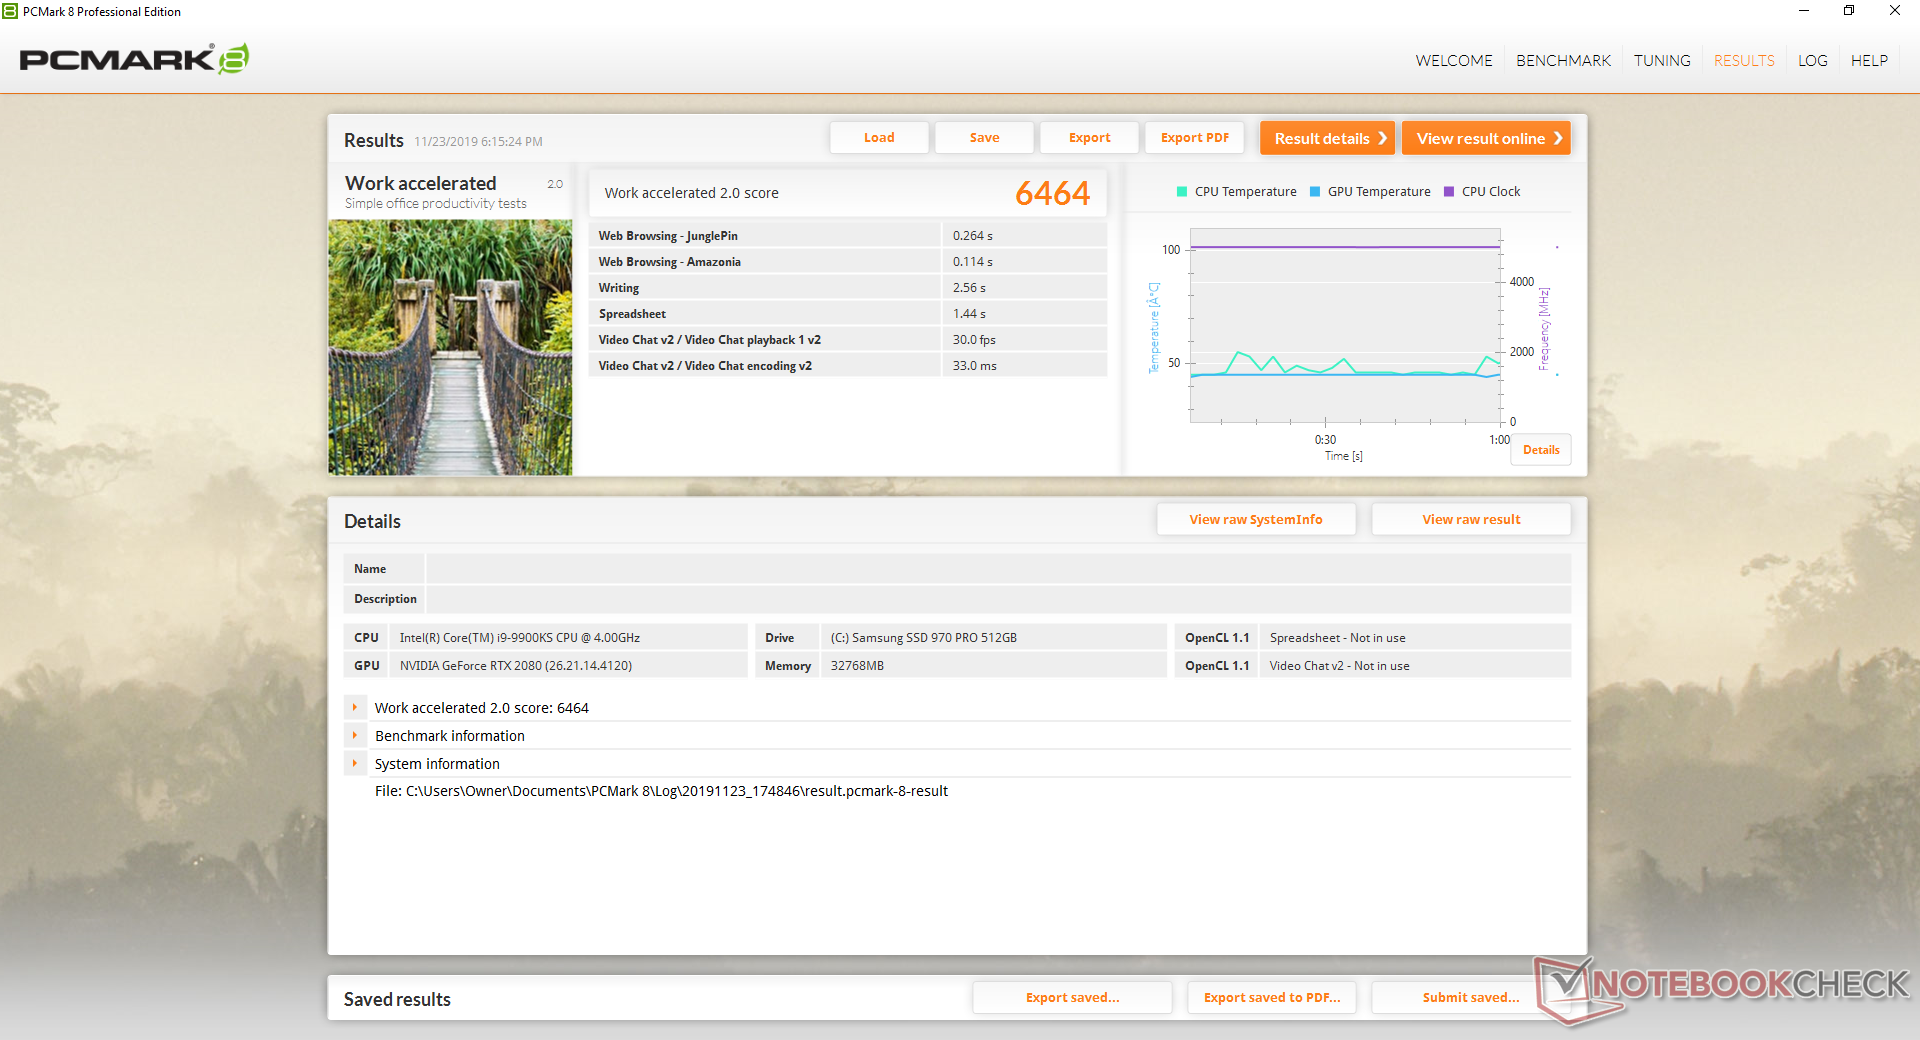
Los portátiles Eurocom tienen una de las puntuaciones más altas de PCMark en nuestra base de datos y el X4C no es diferente. De hecho, actualmente tiene la puntuación más alta de PCMark 10 con 7511 puntos en comparación con los 7151 puntos del Sky X7C. No hemos experimentado ningún problema de software o hardware durante nuestro tiempo con la unidad de prueba.
| PCMark 8 | |
| Home Score Accelerated v2 | |
| Eurocom Sky X4C i9-9900KS | |
| Eurocom Sky X7C i9-9900K | |
| Alienware Area-51m i9-9900K RTX 2080 | |
| Asus GL702ZC-GC104T | |
| Work Score Accelerated v2 | |
| Eurocom Sky X4C i9-9900KS | |
| Eurocom Sky X7C i9-9900K | |
| Alienware Area-51m i9-9900K RTX 2080 | |
| Asus GL702ZC-GC104T | |
| PCMark 8 Home Score Accelerated v2 | 5744 puntos | |
| PCMark 8 Work Score Accelerated v2 | 6464 puntos | |
| PCMark 10 Score | 7511 puntos | |
ayuda | ||
Dispositivos de almacenamiento
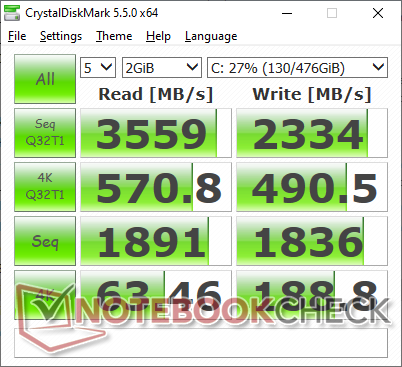
Un total de cuatro bahías de almacenamiento internas (2x M.2 2280 + 2x 2,5 pulgadas SATA III) están disponibles. Nuestra unidad de prueba viene con el NVMe Samsung SSD 970 Pro comparado con el NVMe Samsung SSD 960 Pro en nuestro 2018 Sky X4C para una lectura más rápida.
Consulte nuestra tabla de HDDs y SSDs para obtener más comparaciones de referencia.
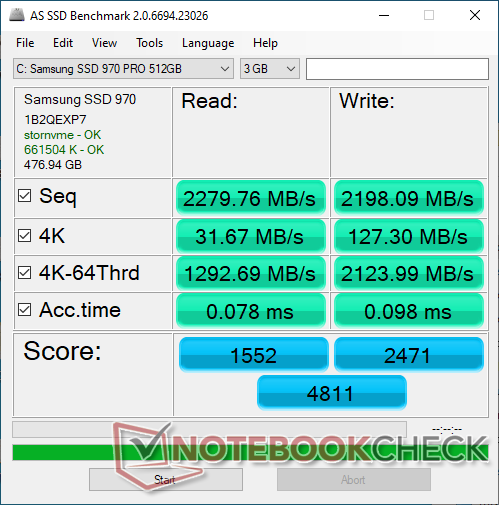
| Eurocom Sky X4C i9-9900KS Samsung SSD 970 Pro 512GB | MSI GE63VR 7RF Raider Toshiba HG6 THNSNJ256G8NY | Asus Strix Scar III G531GW-AZ062T Intel SSD 660p SSDPEKNW512G8 | Lenovo Legion Y740-15ICHg WDC PC SN520 SDAPMUW-128G | MSI GT63 Titan 8RG-046 CUK Cyclone 500GB M.2 NVMe | Eurocom Sky X4C Samsung SSD 960 Pro 1TB m.2 NVMe | |
|---|---|---|---|---|---|---|
| AS SSD | -64% | -54% | -50% | -8% | 3% | |
| Seq Read (MB/s) | 2280 | 506 -78% | 1163 -49% | 1372 -40% | 2399 5% | 2541 11% |
| Seq Write (MB/s) | 2198 | 447 -80% | 919 -58% | 746 -66% | 1665 -24% | 1989 -10% |
| 4K Read (MB/s) | 31.67 | 19.55 -38% | 48.88 54% | 35.42 12% | 49.17 55% | 44.83 42% |
| 4K Write (MB/s) | 127.3 | 77.3 -39% | 90.1 -29% | 99.9 -22% | 87.7 -31% | 129.6 2% |
| 4K-64 Read (MB/s) | 1293 | 350.3 -73% | 323.8 -75% | 302.1 -77% | 1144 -12% | 1646 27% |
| 4K-64 Write (MB/s) | 2124 | 170.6 -92% | 403.8 -81% | 191.4 -91% | 648 -69% | 1375 -35% |
| Access Time Read * (ms) | 0.078 | 0.168 -115% | 0.24 -208% | 0.132 -69% | 0.05 36% | 0.032 59% |
| Access Time Write * (ms) | 0.098 | 0.045 54% | 0.046 53% | 0.037 62% | 0.042 57% | 0.03 69% |
| Score Read (Points) | 1552 | 420 -73% | 489 -68% | 475 -69% | 1433 -8% | 1945 25% |
| Score Write (Points) | 2471 | 293 -88% | 586 -76% | 366 -85% | 902 -63% | 1703 -31% |
| Score Total (Points) | 4811 | 930 -81% | 1332 -72% | 1065 -78% | 3040 -37% | 4615 -4% |
| Copy ISO MB/s (MB/s) | 3007 | 1269 -58% | 1062 -65% | 1908 -37% | ||
| Copy Program MB/s (MB/s) | 731 | 452.8 -38% | 426 -42% | 467.2 -36% | ||
| Copy Game MB/s (MB/s) | 1756 | 755 -57% | 650 -63% | 1055 -40% |
* ... más pequeño es mejor

Rendimiento de la GPU
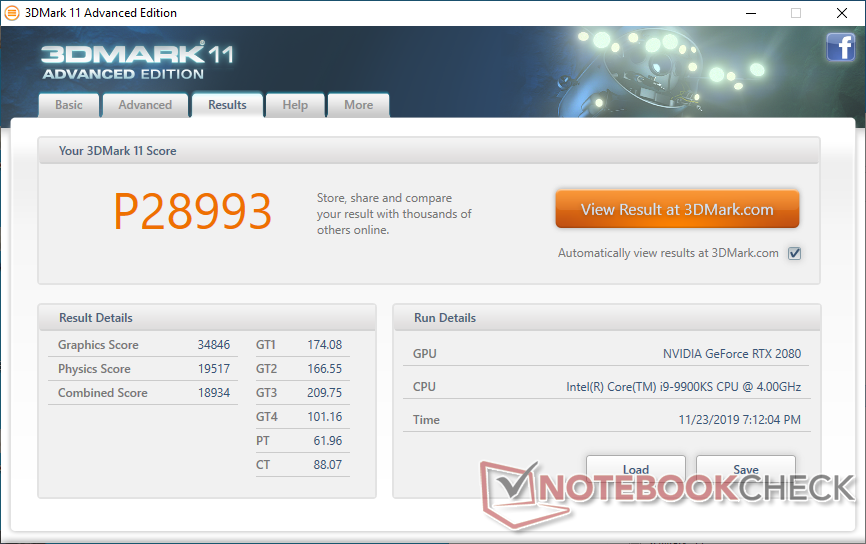
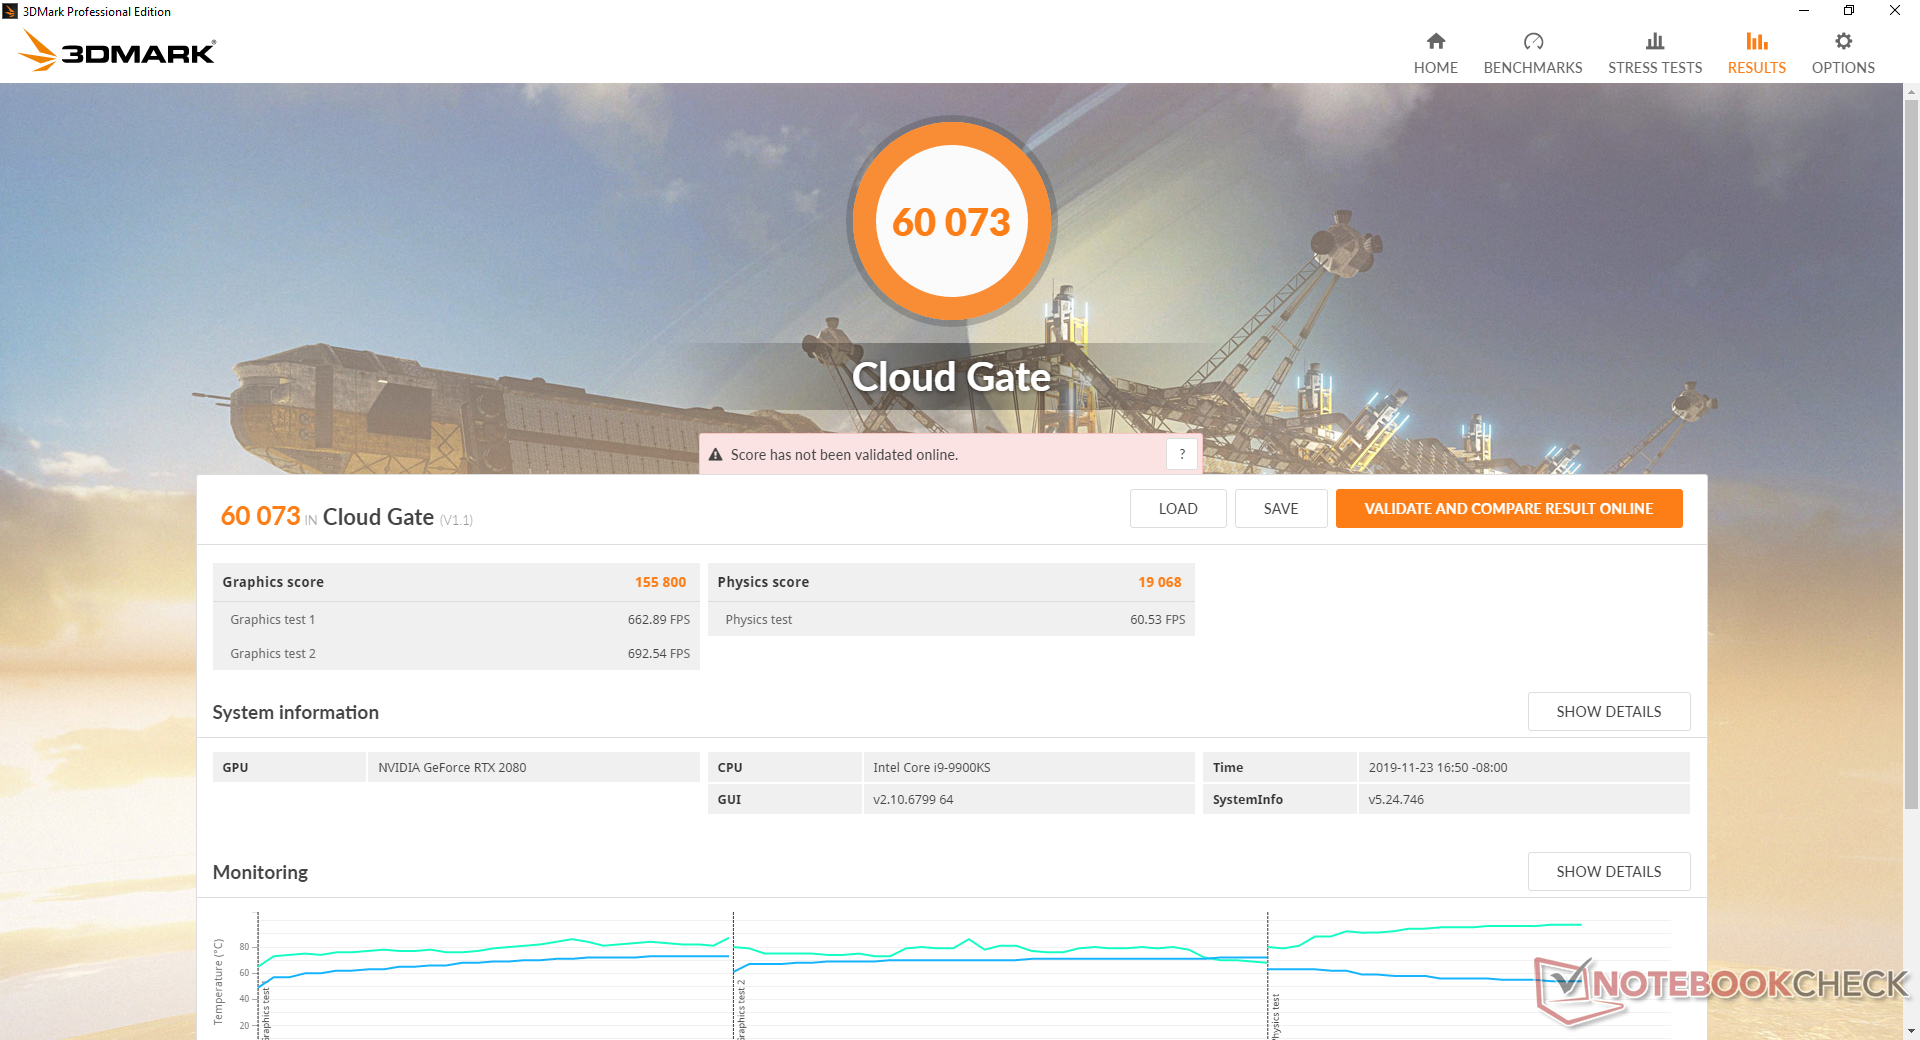
En stock, la GeForce RTX 2080 en nuestro Eurocom es entre un 6 y un 8 por ciento más lenta que la misma GPU en el Dell Alienware Area-51m. Un RTX 2080 de sobremesa "adecuado" puede ofrecer entre un 8 y un 15 por ciento más de rendimiento que nuestra GPU Eurocom.
Consulte nuestra página dedicada a la GeForce RTX 2080 para obtener más información técnica y comparaciones de referencia. Se espera que Nvidia lance opciones móviles Super para portátiles en 2020.
| 3DMark 06 Standard Score | 47829 puntos | |
| 3DMark 11 Performance | 28993 puntos | |
| 3DMark Cloud Gate Standard Score | 60073 puntos | |
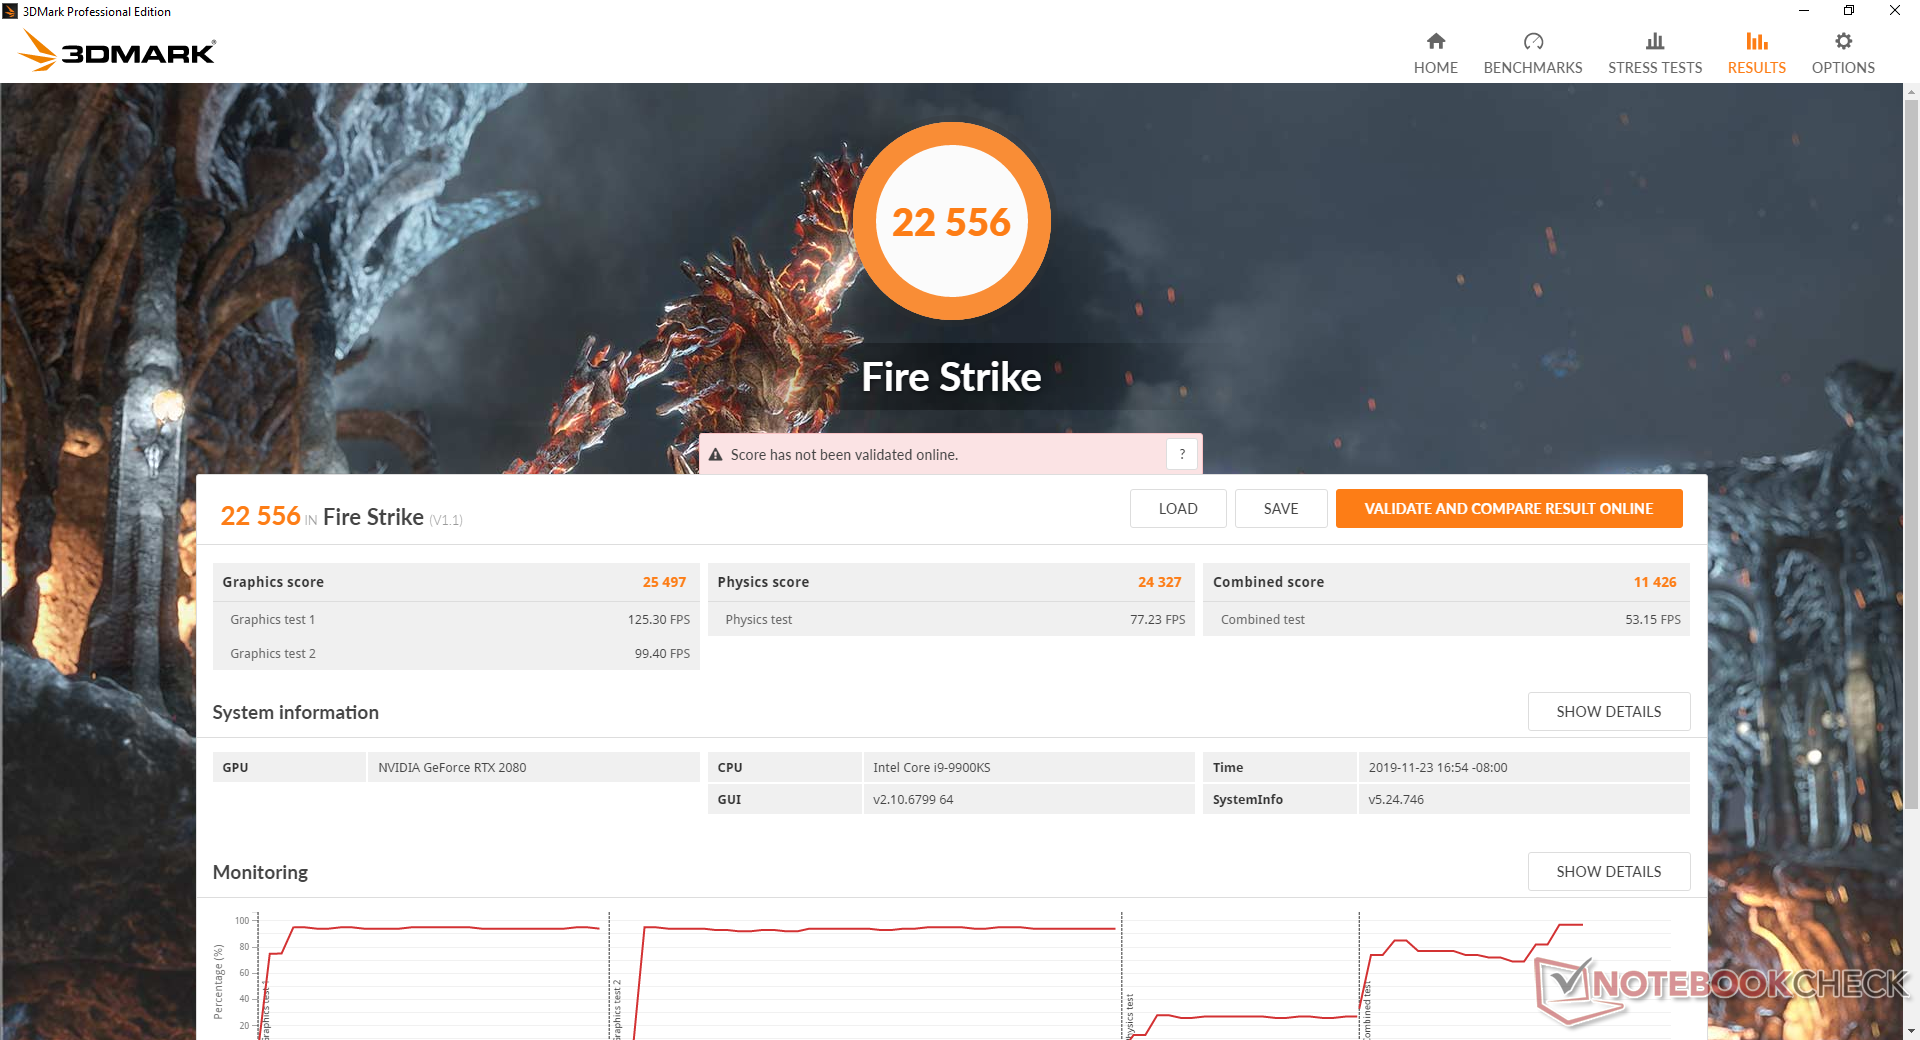
| 3DMark Fire Strike Score | 22556 puntos | |
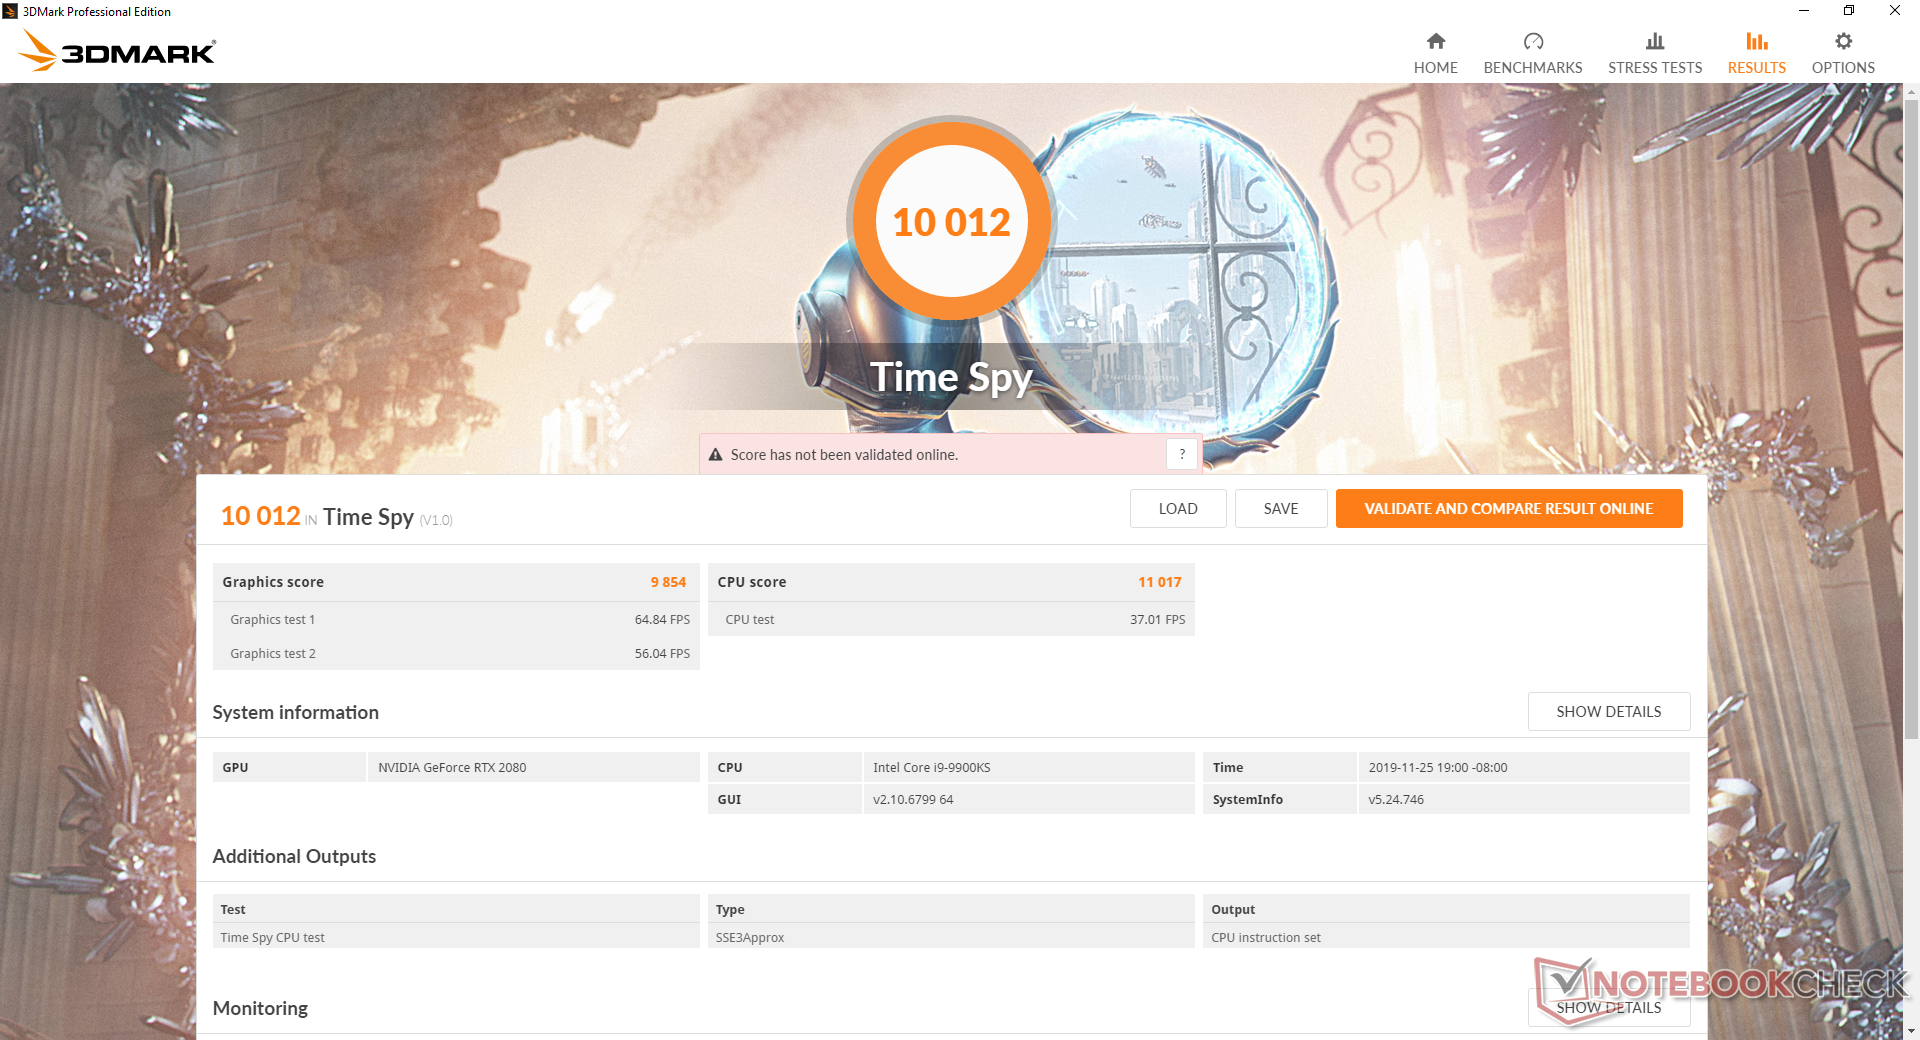
| 3DMark Time Spy Score | 10012 puntos | |
ayuda | ||
| bajo | medio | alto | ultra | |
|---|---|---|---|---|
| BioShock Infinite (2013) | 528 | 443.5 | 408.6 | 208.2 |
| The Witcher 3 (2015) | 414.3 | 284.2 | 175.9 | 95.5 |
| Shadow of the Tomb Raider (2018) | 178 | 141 | 134 | 124 |
Emisiones
Ruido del sistema
No sería realista esperar ventiladores silenciosos considerando el factor de forma de 15,6 pulgadas y los componentes de alta calidad que hay dentro. Cuando se ejecutan cargas exigentes como juegos, el ruido del ventilador puede llegar a ser de 55 a 59 dB(A) para ser más fuerte que la mayoría de los portátiles para juegos y estar a la par con el MSI GT76 Titan. Incluso el Alienware Area-51m con el i9-9900K y el RTX 2080 con overclocking funciona más silenciosamente (51 dB(A)) en condiciones similares.
La buena noticia, sin embargo, es que el Eurocom es silencioso cuando se espera que sea silencioso y sólo es ruidoso cuando se espera que sea ruidoso. Por ejemplo, el ruido del ventilador durante cargas bajas, como la navegación web o la transmisión de vídeo, se dispara a sólo 31,7 dB(A). Los ventiladores pueden tener pulso ocasionalmente, pero son de corta duración y no molestos. Sólo cuando se ejecutan cargas muy exigentes, los ventiladores comienzan a aumentar exponencialmente con ruido.
No podemos notar ningún quejido de la bobina o ruido electrónico en nuestra unidad de prueba.
| Eurocom Sky X4C i9-9900KS GeForce RTX 2080 Mobile, i9-9900KS, Samsung SSD 970 Pro 512GB | Eurocom Sky X7C i9-9900K GeForce RTX 2080 Mobile, i9-9900K, 2x Samsung SSD 970 Pro 512GB (RAID 0) | MSI GT76 Titan DT 9SG GeForce RTX 2080 Mobile, i9-9900K, 2x Samsung PM961 MZVLW256HEHP (RAID 0) | Alienware Area-51m i9-9900K RTX 2080 GeForce RTX 2080 Mobile, i9-9900K, 2x SK Hynix PC400 512GB (RAID 0) | Asus GL702ZC-GC104T Radeon RX 580 (Laptop), R7 1700, SanDisk SD8SN8U256G1002 | Asus Strix Scar III G531GW-AZ062T GeForce RTX 2070 Mobile, i7-9750H, Intel SSD 660p SSDPEKNW512G8 | |
|---|---|---|---|---|---|---|
| Noise | -2% | -19% | -16% | -17% | -6% | |
| apagado / medio ambiente * (dB) | 28.1 | 28.9 -3% | 30 -7% | 28.1 -0% | 31 -10% | 30 -7% |
| Idle Minimum * (dB) | 28.5 | 29.7 -4% | 33 -16% | 28.1 1% | 32 -12% | 30.6 -7% |
| Idle Average * (dB) | 28.7 | 29.7 -3% | 34 -18% | 28.6 -0% | 38 -32% | 30.6 -7% |
| Idle Maximum * (dB) | 29.5 | 30 -2% | 44 -49% | 51 -73% | 40 -36% | 37.7 -28% |
| Load Average * (dB) | 31.2 | 36.5 -17% | 47 -51% | 51 -63% | 42 -35% | 36.5 -17% |
| Witcher 3 ultra * (dB) | 55.1 | 49 11% | 53 4% | 51 7% | 54 2% | 52.1 5% |
| Load Maximum * (dB) | 59.3 | 57 4% | 59 1% | 51 14% | 57 4% | 48.1 19% |
* ... más pequeño es mejor
Ruido
| Ocioso |
| 28.5 / 28.7 / 29.5 dB(A) |
| Carga |
| 31.2 / 59.3 dB(A) |
 | ||
30 dB silencioso 40 dB(A) audible 50 dB(A) ruidosamente alto |
||
min: | ||
Temperatura
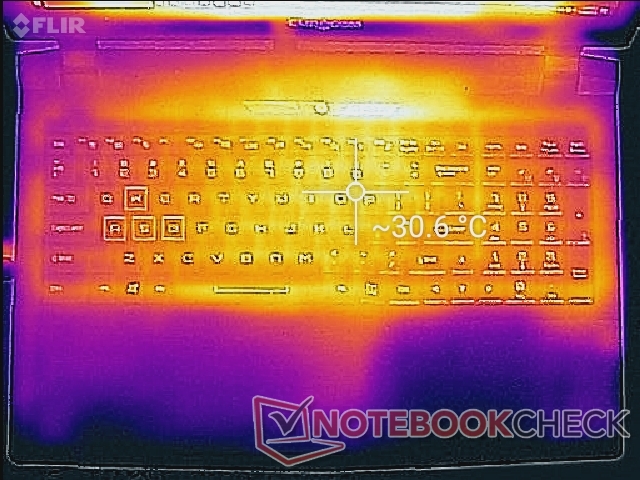
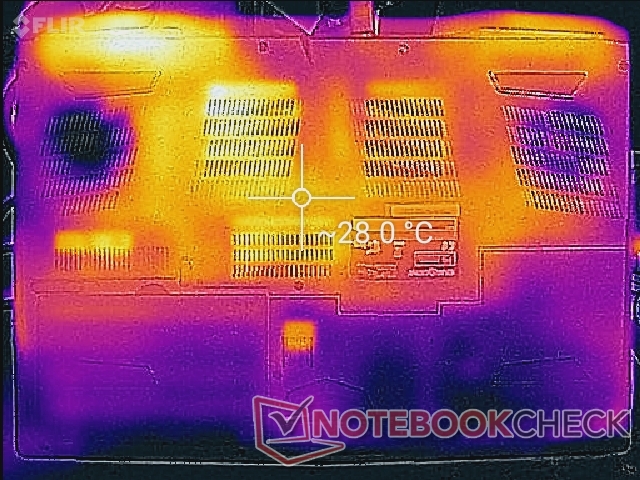
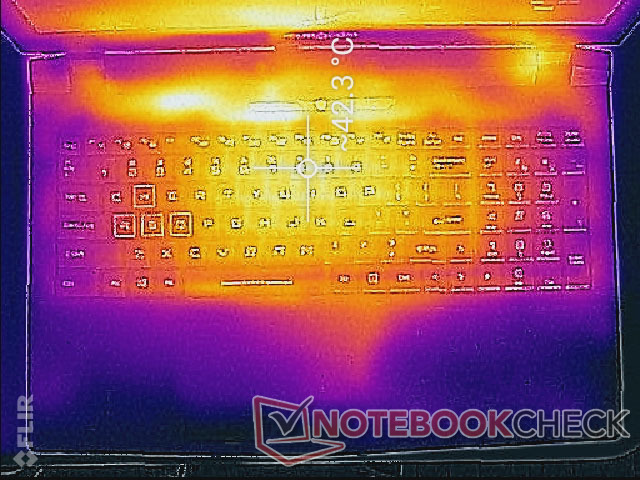
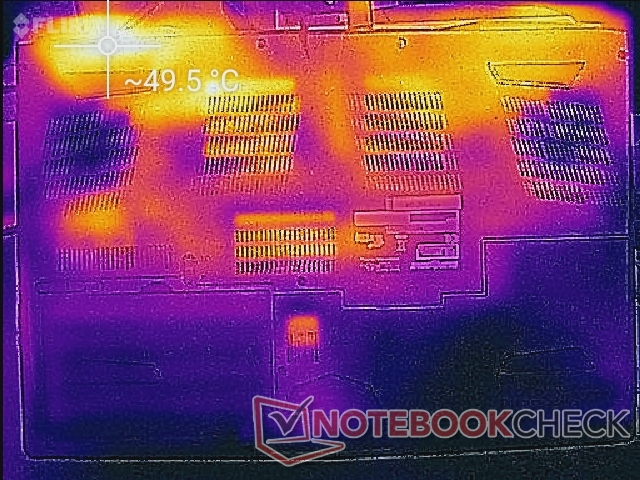
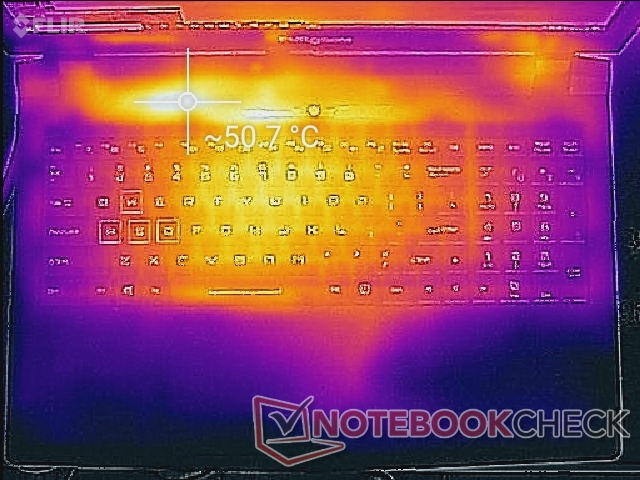
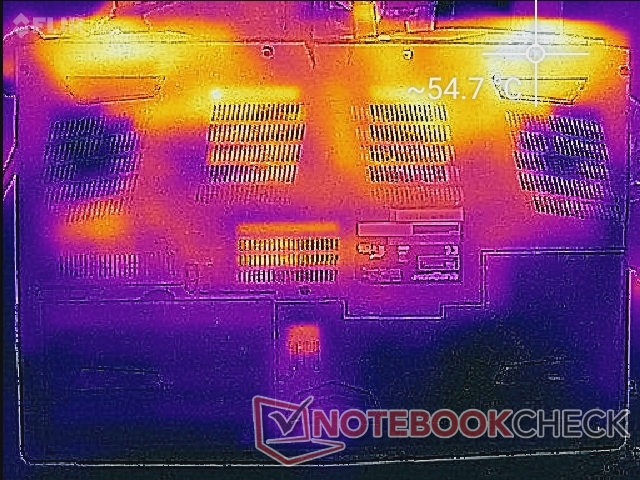
Las temperaturas de la superficie nunca son incómodas a pesar de la rapidez de los componentes en su interior. En el peor de los casos, los puntos calientes pueden llegar a ser tan calientes como 51 C cuando están sometidos a un alto estrés de procesamiento. Afortunadamente, estos puntos se encuentran por encima de la primera fila de teclas del teclado, donde es poco probable que los usuarios los toquen. El centro del teclado puede calentarse hasta 42 C mientras que los reposamanos, las teclas WASD, el NumPad y el touchpad permanecen relativamente fríos.
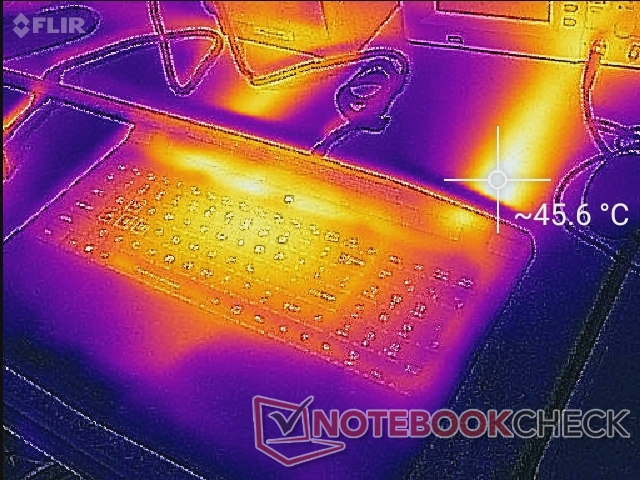
(-) La temperatura máxima en la parte superior es de 51.6 °C / 125 F, frente a la media de 40.4 °C / 105 F, que oscila entre 21.2 y 68.8 °C para la clase Gaming.
(-) El fondo se calienta hasta un máximo de 54.6 °C / 130 F, frente a la media de 43.2 °C / 110 F
(+) En reposo, la temperatura media de la parte superior es de 27.7 °C / 82# F, frente a la media del dispositivo de 33.9 °C / 93 F.
(±) Jugando a The Witcher 3, la temperatura media de la parte superior es de 33.1 °C / 92 F, frente a la media del dispositivo de 33.9 °C / 93 F.
(+) El reposamanos y el panel táctil están a una temperatura inferior a la de la piel, con un máximo de 28.8 °C / 83.8 F y, por tanto, son fríos al tacto.
(±) La temperatura media de la zona del reposamanos de dispositivos similares fue de 28.8 °C / 83.8 F (0 °C / 0 F).
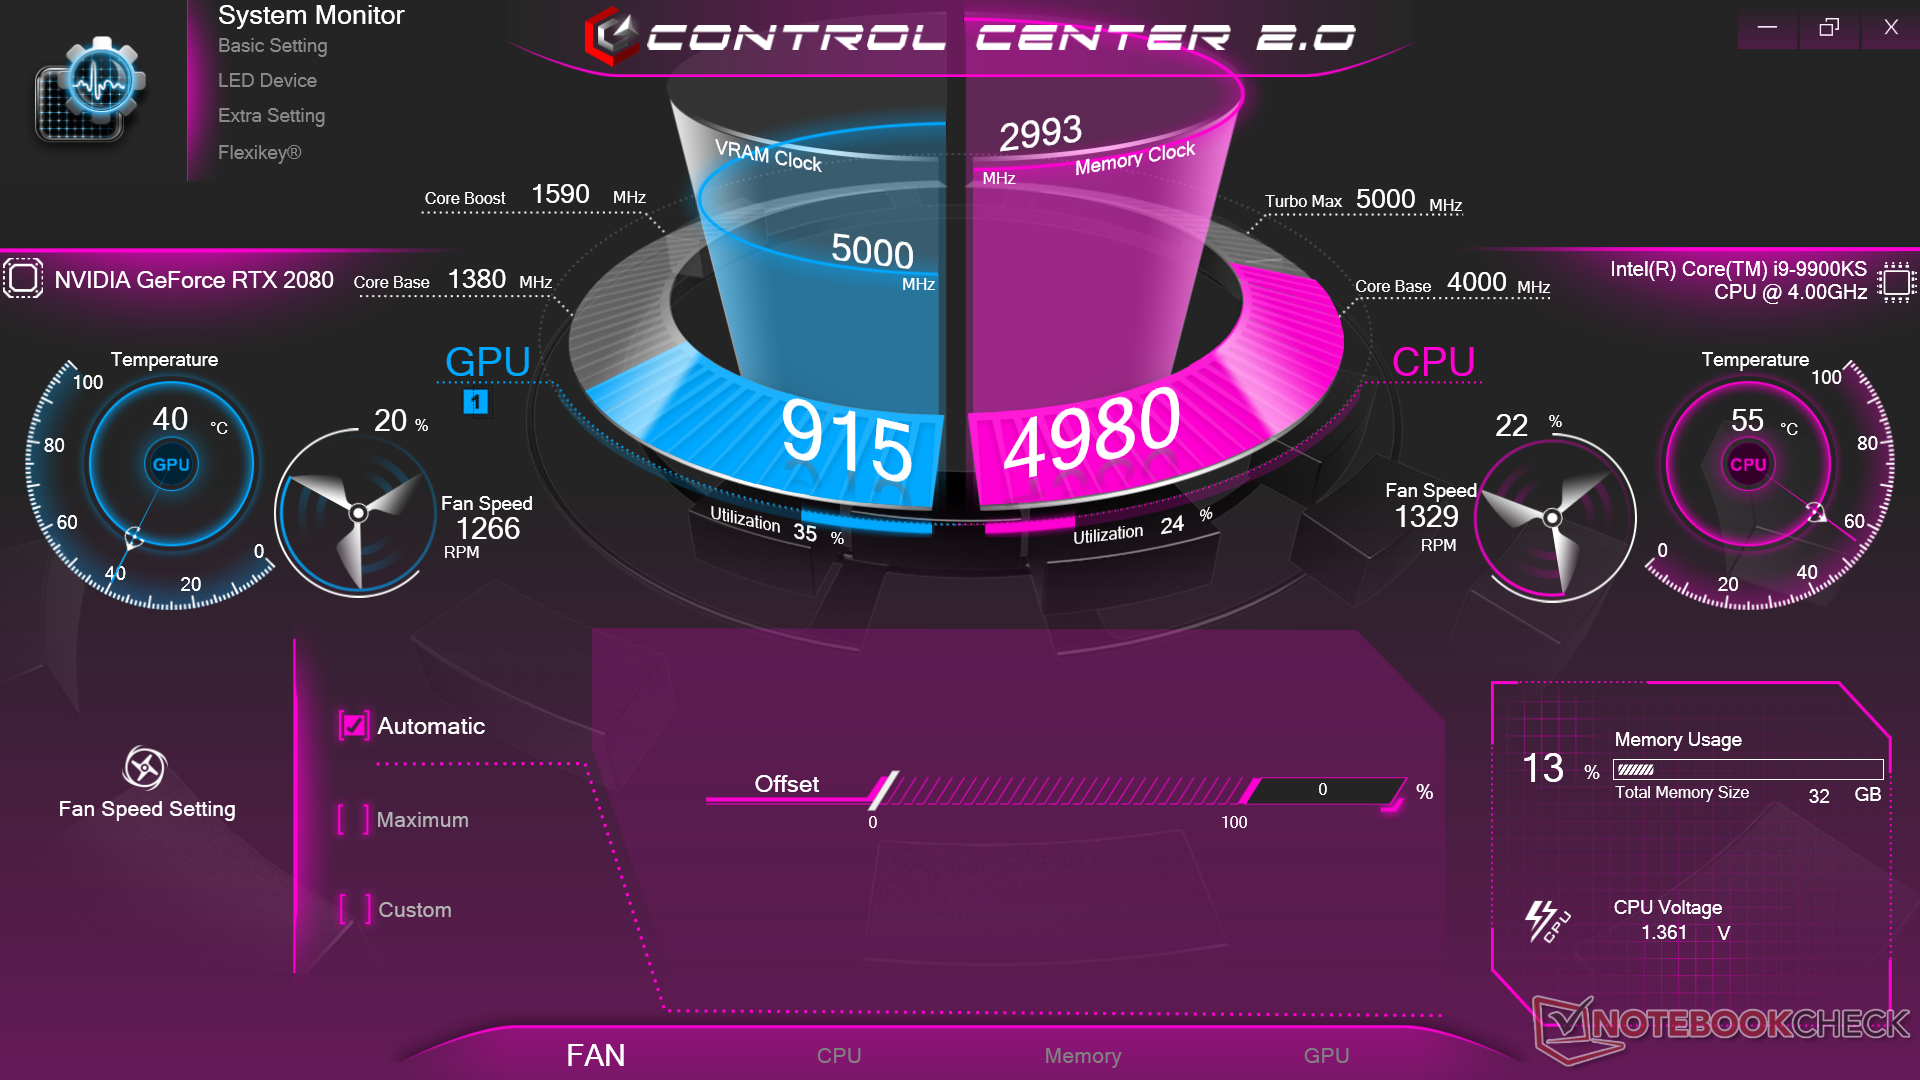
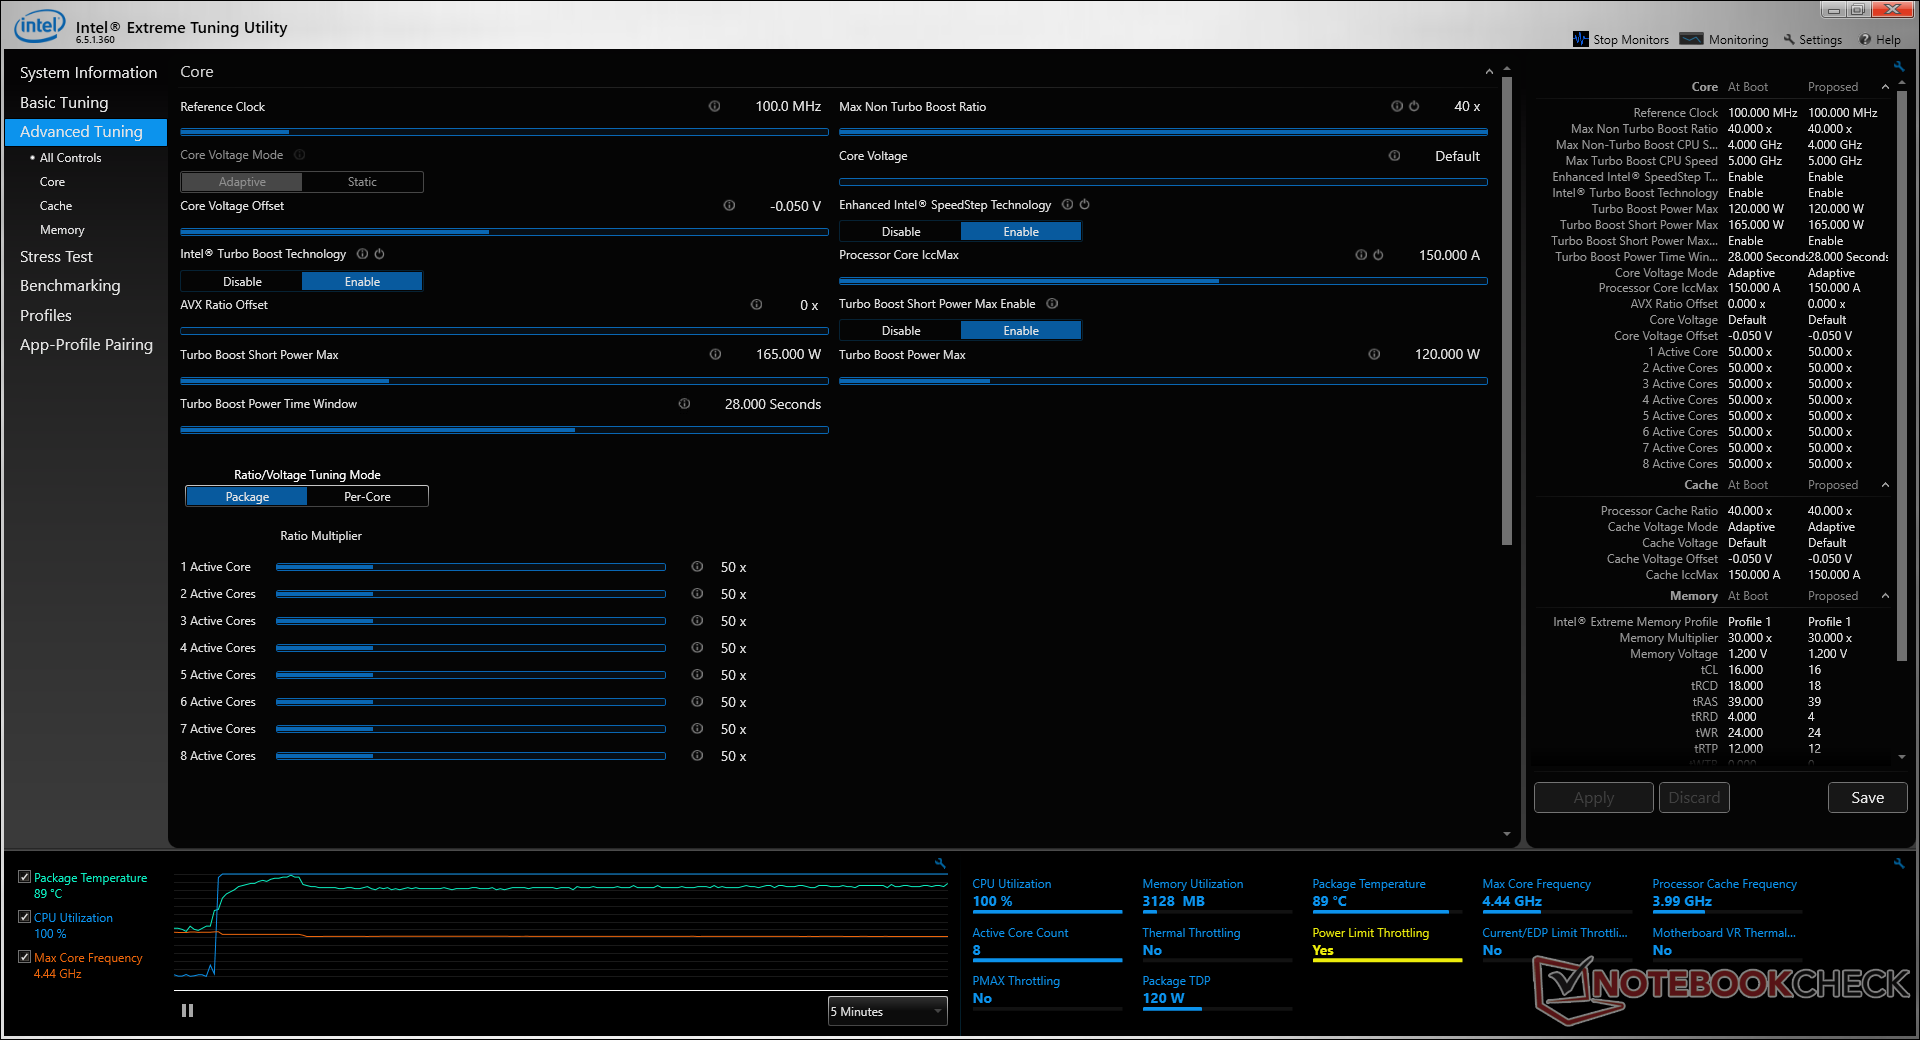
Prueba de esfuerzo
Hacemos hincapié en el portátil con cargas sintéticas para identificar cualquier problema potencial de estrangulamiento o estabilidad. Cuando se ejecuta Prime95, la CPU se dispara hasta 4,7 GHz y a una temperatura central de 98 C durante unos 30 segundos. Después, la frecuencia de los relojes baja a unos 4,4 GHz para mantener una temperatura central ligeramente más fría de 88 C. Aunque hay sobrecarga térmica para el overclocking, la diferencia es tan pequeña que no podrás sacar mucho más del Core i9-9900KS en la práctica.
Tenga en cuenta que la CPU y la GPU no comparten los tubos de calor, a diferencia de la mayoría de los demás portátiles para juegos. La temperatura de la GPU se ralentiza a sólo 41ºC, mientras que la CPU puede superar los 90ºC para permitir un overclocking independiente. En este caso, la GPU tendrá un mejor potencial de overclocking que la CPU, ya que tiene un promedio de 80 C cuando está sometida a cargas extremas. En general, los usuarios pueden esperar >80 C cuando juegan en este Sky X4C SKU en particular.
El funcionamiento con batería limitará el rendimiento. Una Huelga de Fuego ejecutada con baterías devuelve puntuaciones de Física y Gráficos de 13000 y 13973 puntos, respectivamente, en comparación con 24327 y 25497 puntos cuando se está en la red.
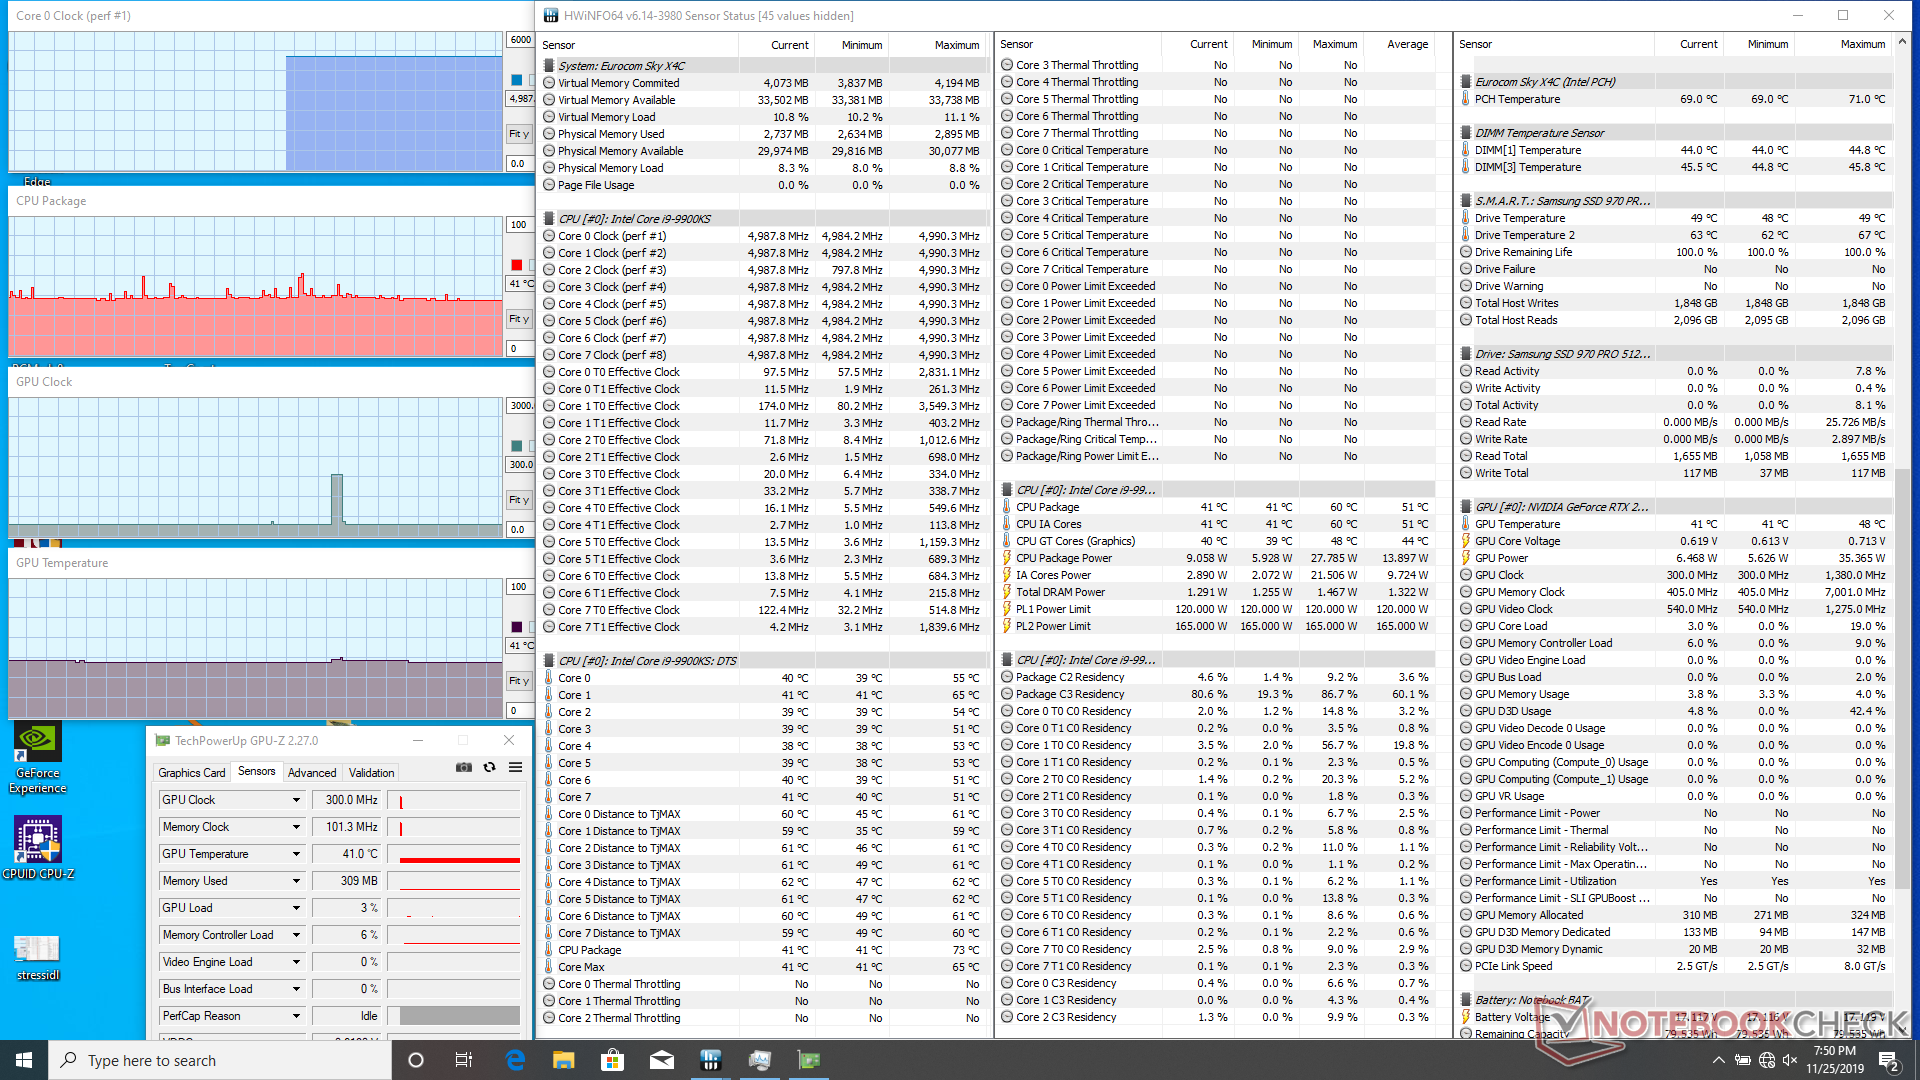
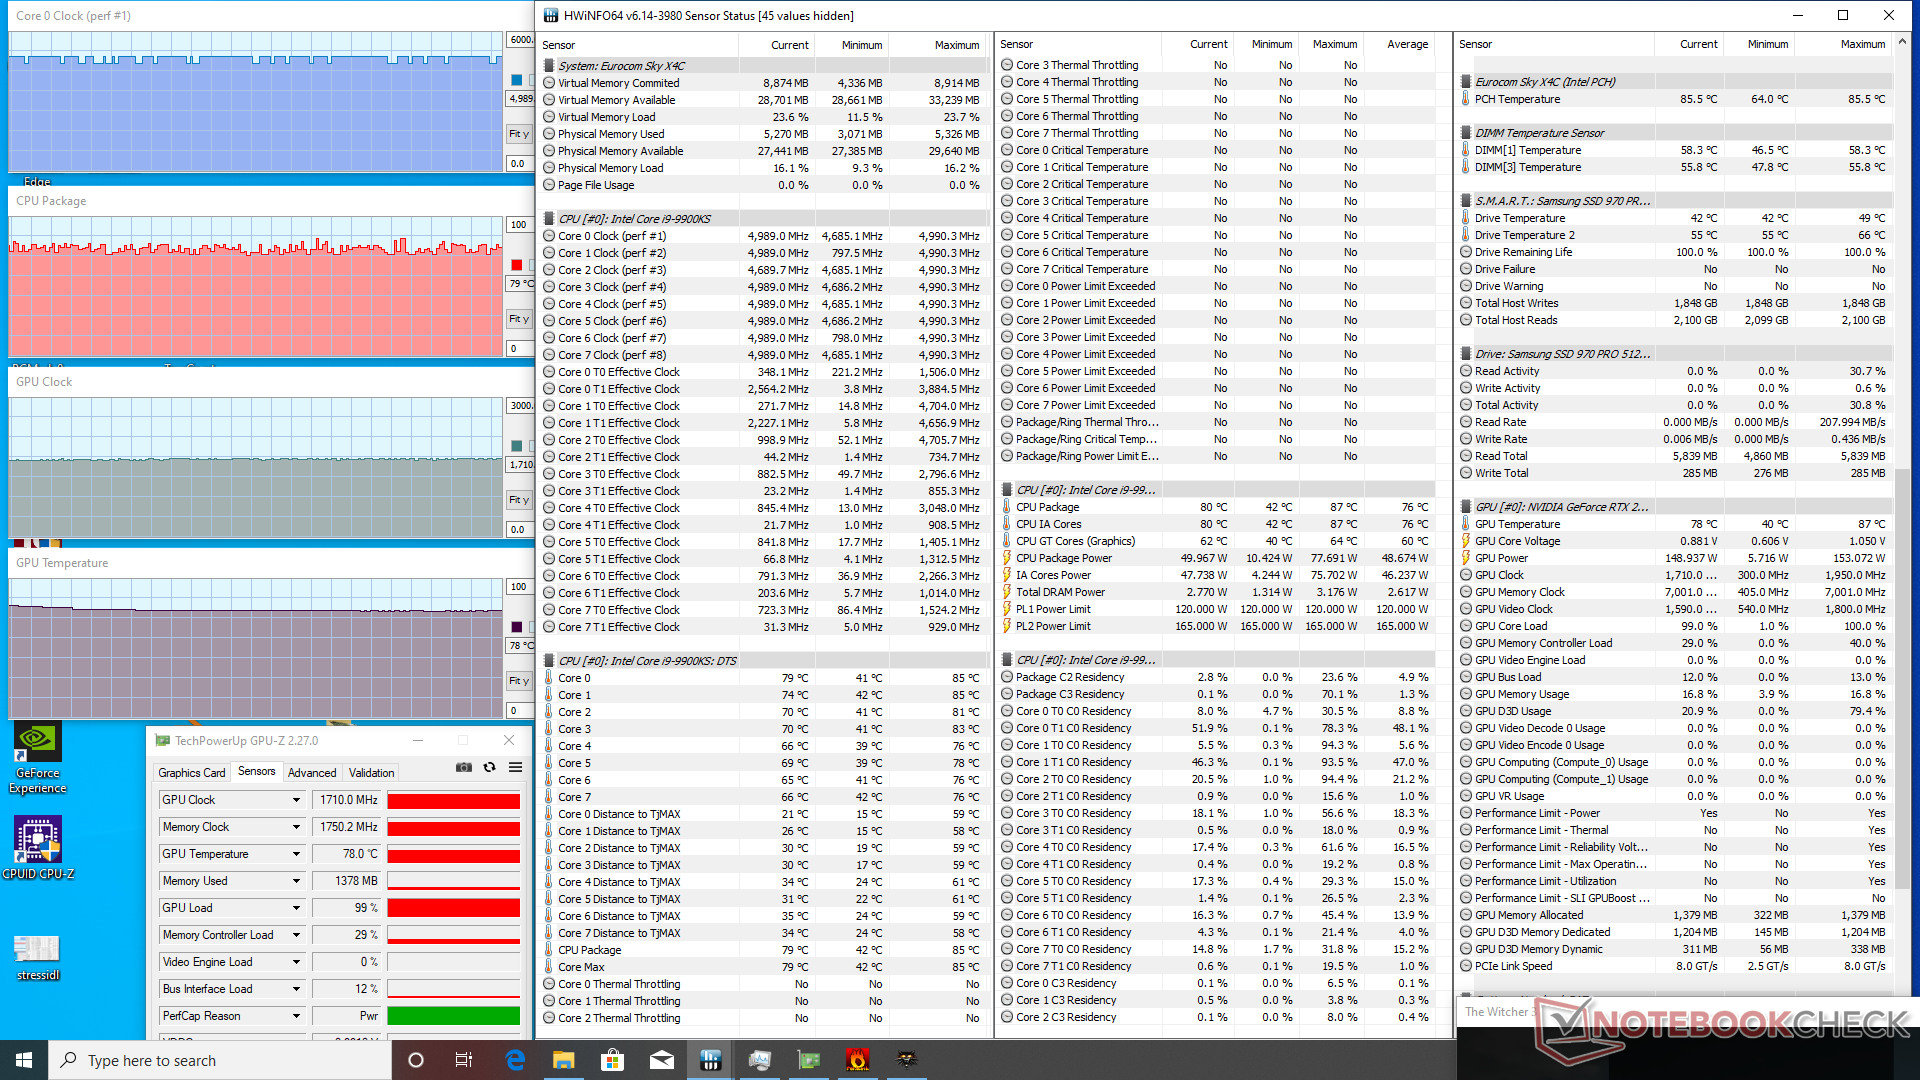
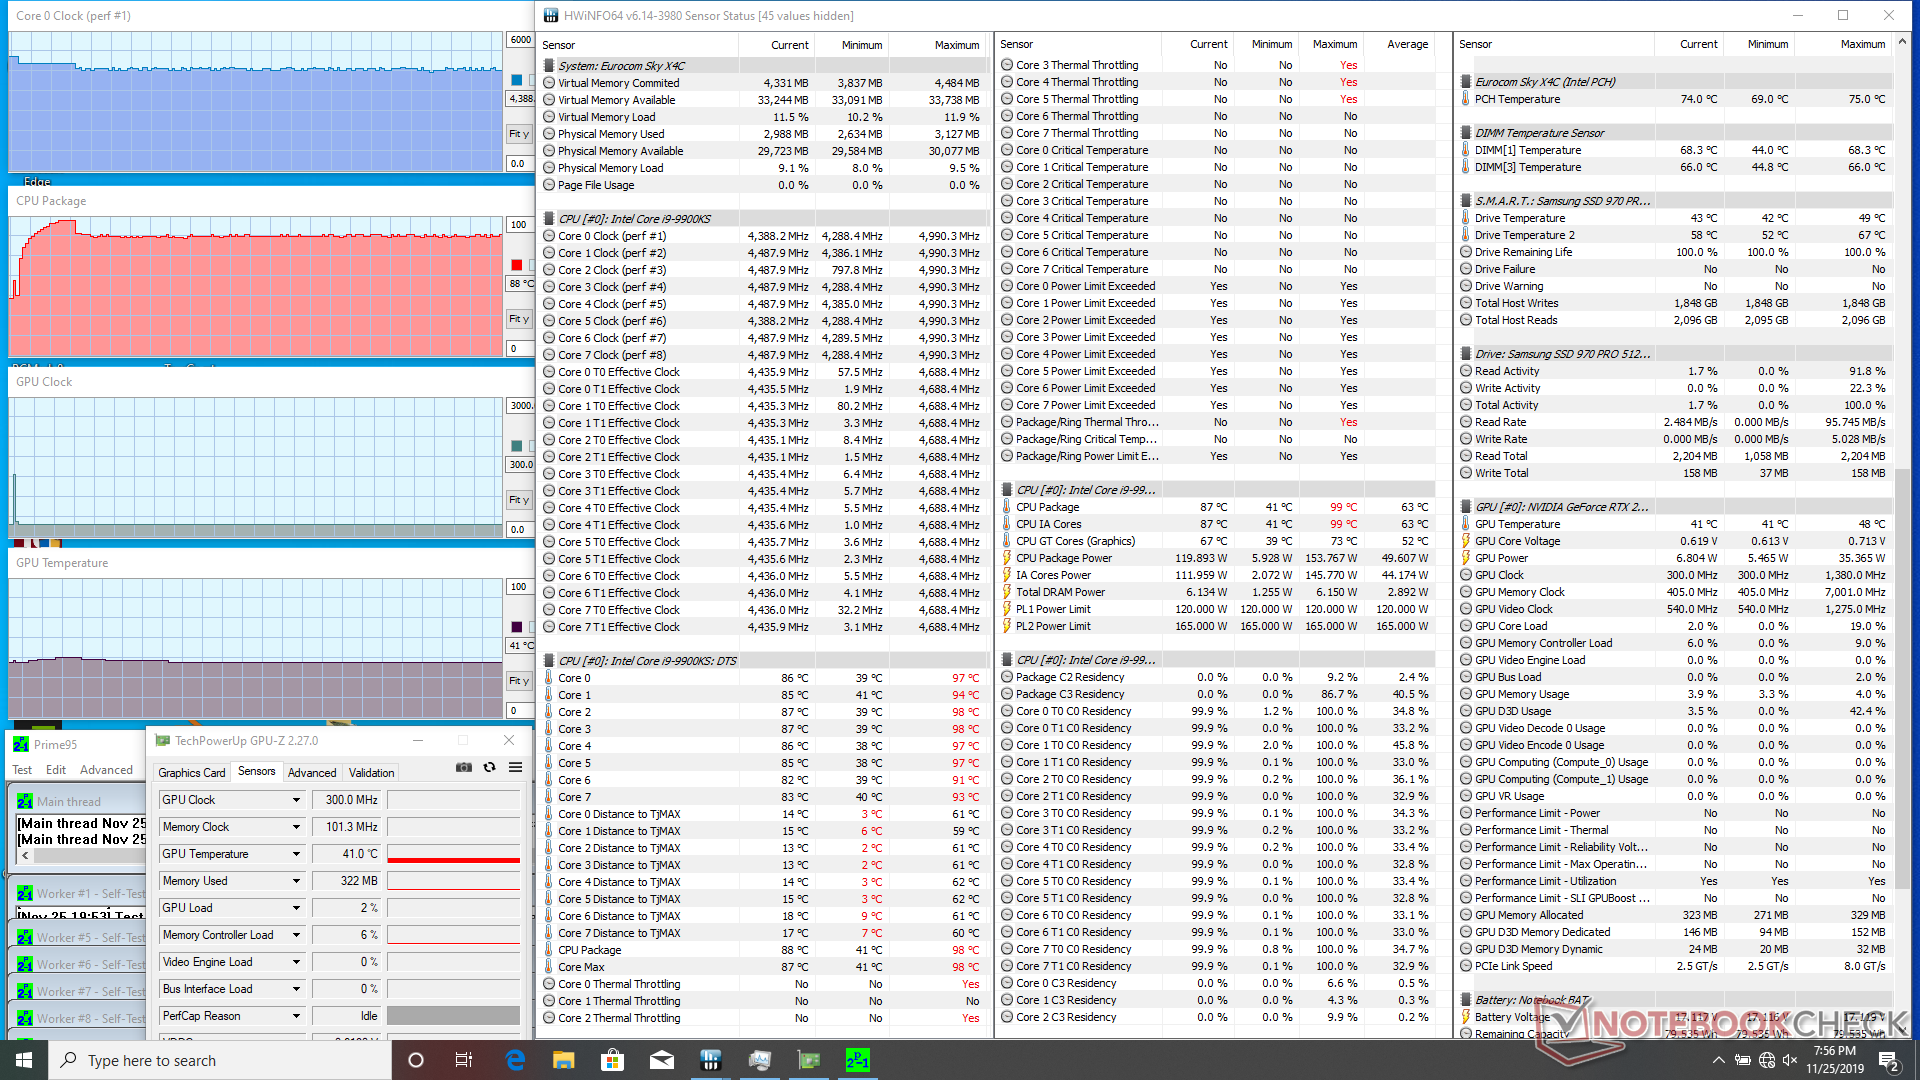
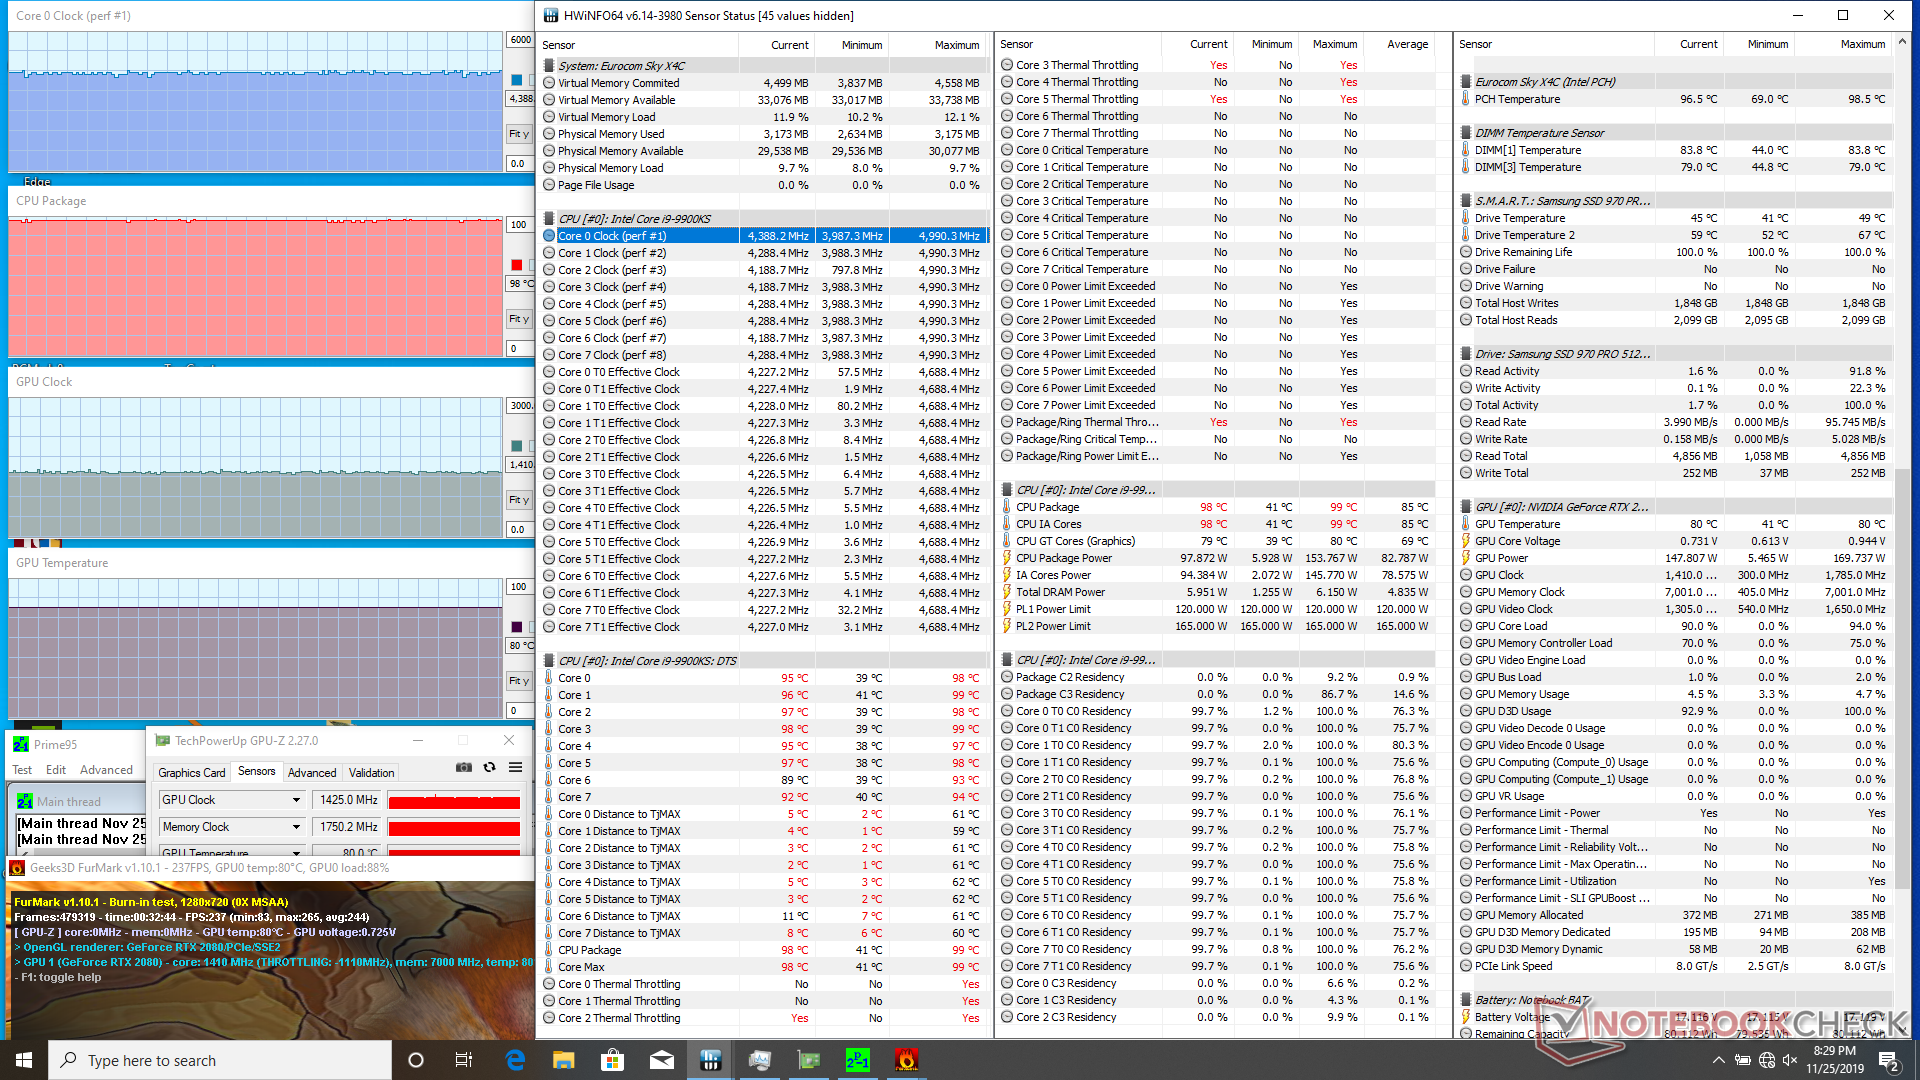

| CPU Clock (GHz) | GPU Clock (MHz) | Average CPU Temperature (°C) | Average GPU Temperature (°C) | |
| System Idle | -- | -- | 41 | 41 |
| Prime95 Stress | 4.4 | 88 | -- | 41 |
| Prime95 + FurMark Stress | 4.4 | 1425 | 98 | 80 |
| Witcher 3 Stress | 4.8 - 5.0 | 1710 | ~79 | 78 |
Altavoces

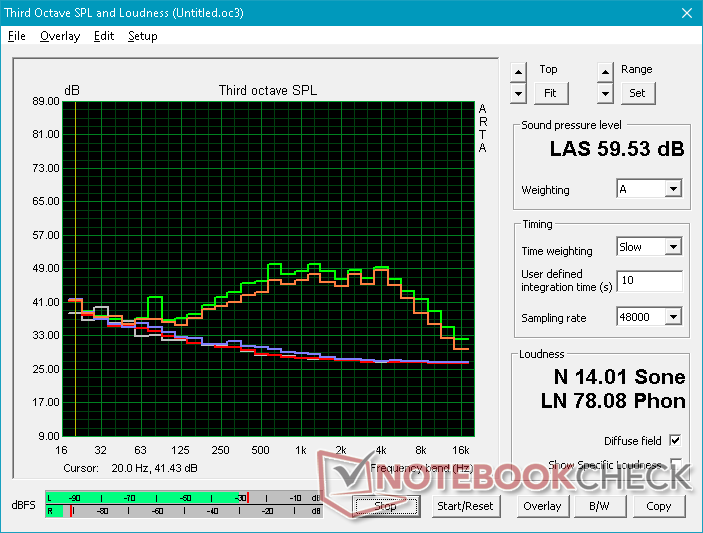
Eurocom Sky X4C i9-9900KS análisis de audio
(±) | la sonoridad del altavoz es media pero buena (77.6 dB)
Graves 100 - 315 Hz
(-) | casi sin bajos - de media 15.7% inferior a la mediana
(±) | la linealidad de los graves es media (10.3% delta a frecuencia anterior)
Medios 400 - 2000 Hz
(±) | medias más altas - de media 7.1% más altas que la mediana
(±) | la linealidad de los medios es media (11.6% delta respecto a la frecuencia anterior)
Altos 2 - 16 kHz
(+) | máximos equilibrados - a sólo 3.9% de la mediana
(±) | la linealidad de los máximos es media (10.6% delta a frecuencia anterior)
Total 100 - 16.000 Hz
(-) | el sonido global no es lineal (30.7% de diferencia con la mediana)
En comparación con la misma clase
» 96% de todos los dispositivos probados de esta clase eran mejores, 2% similares, 2% peores
» El mejor tuvo un delta de 6%, la media fue 18%, el peor fue ###max##%
En comparación con todos los dispositivos probados
» 89% de todos los dispositivos probados eran mejores, 3% similares, 8% peores
» El mejor tuvo un delta de 4%, la media fue 24%, el peor fue ###max##%
Apple MacBook 12 (Early 2016) 1.1 GHz análisis de audio
(+) | los altavoces pueden reproducir a un volumen relativamente alto (#83.6 dB)
Graves 100 - 315 Hz
(±) | lubina reducida - en promedio 11.3% inferior a la mediana
(±) | la linealidad de los graves es media (14.2% delta a frecuencia anterior)
Medios 400 - 2000 Hz
(+) | medios equilibrados - a sólo 2.4% de la mediana
(+) | los medios son lineales (5.5% delta a la frecuencia anterior)
Altos 2 - 16 kHz
(+) | máximos equilibrados - a sólo 2% de la mediana
(+) | los máximos son lineales (4.5% delta a la frecuencia anterior)
Total 100 - 16.000 Hz
(+) | el sonido global es lineal (10.2% de diferencia con la mediana)
En comparación con la misma clase
» 7% de todos los dispositivos probados de esta clase eran mejores, 2% similares, 91% peores
» El mejor tuvo un delta de 5%, la media fue 18%, el peor fue ###max##%
En comparación con todos los dispositivos probados
» 5% de todos los dispositivos probados eran mejores, 1% similares, 94% peores
» El mejor tuvo un delta de 4%, la media fue 24%, el peor fue ###max##%
Gestión de la energía
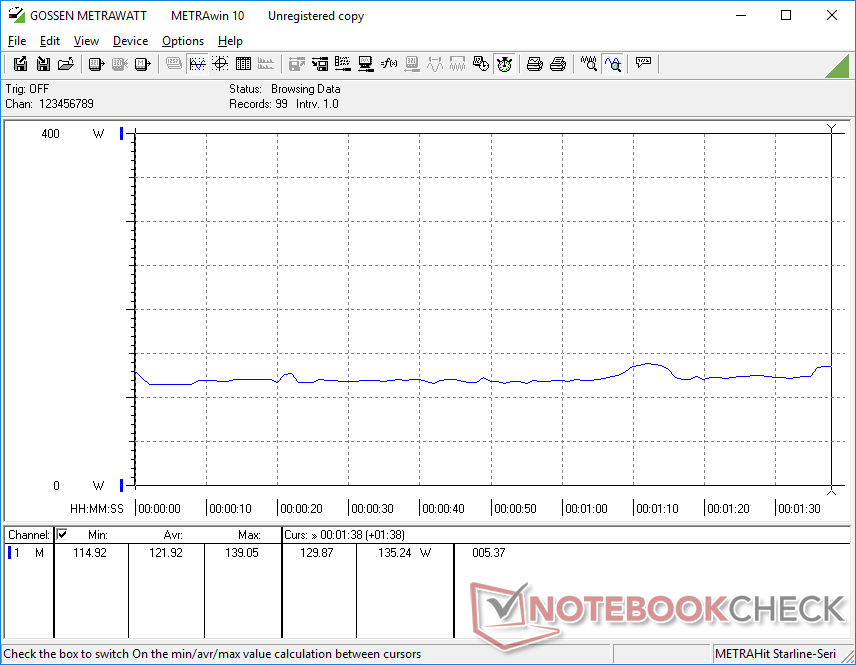
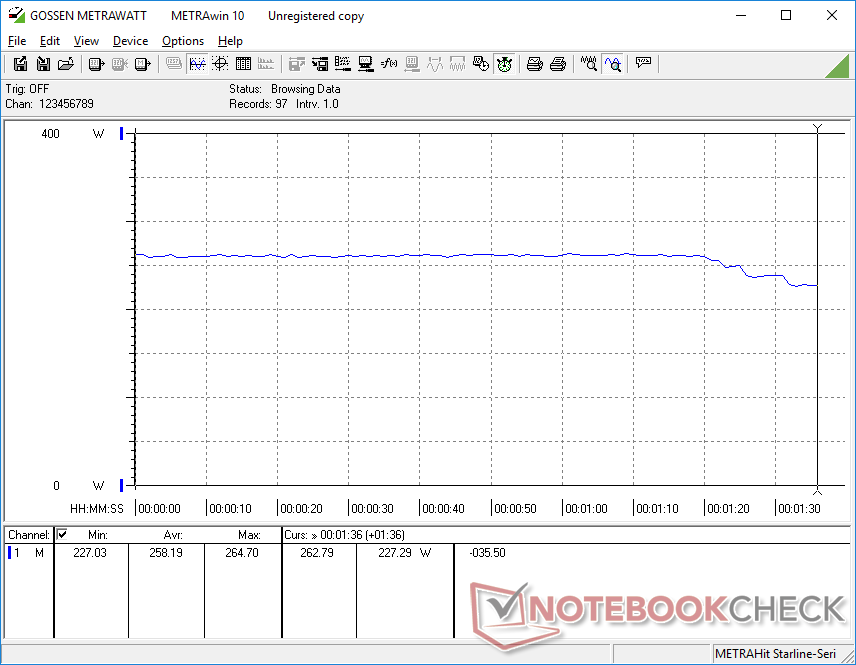
Consumo de energía
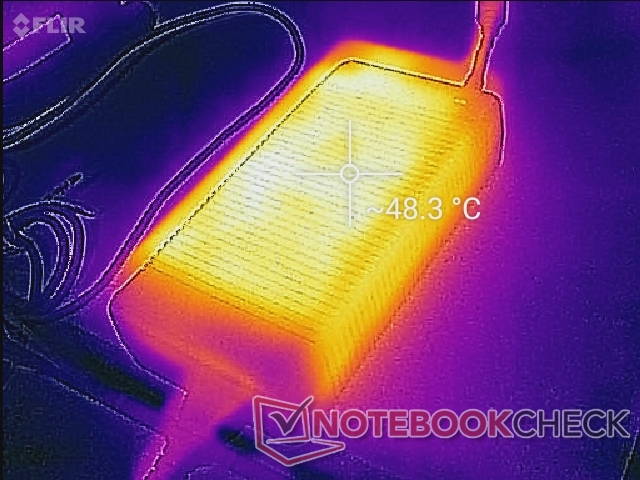
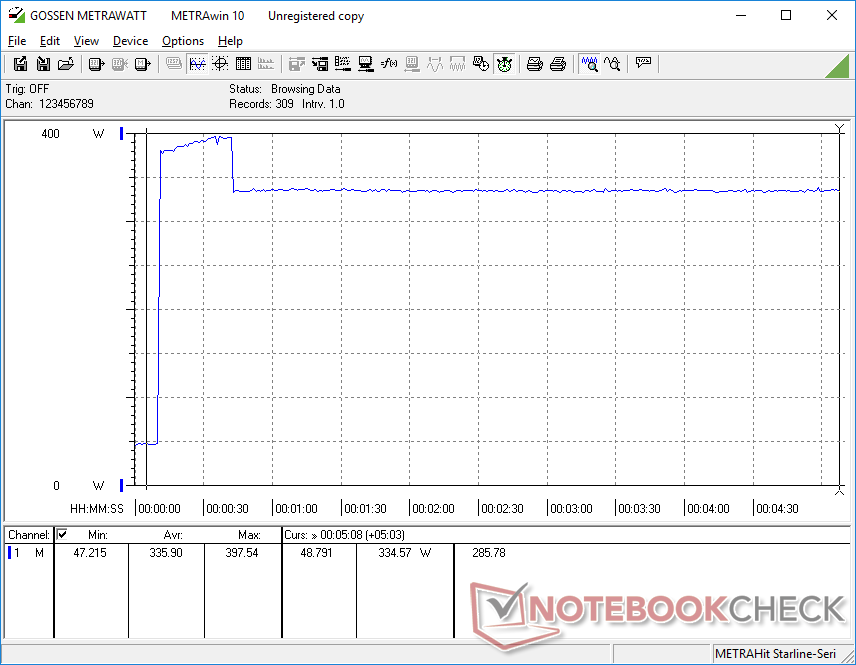
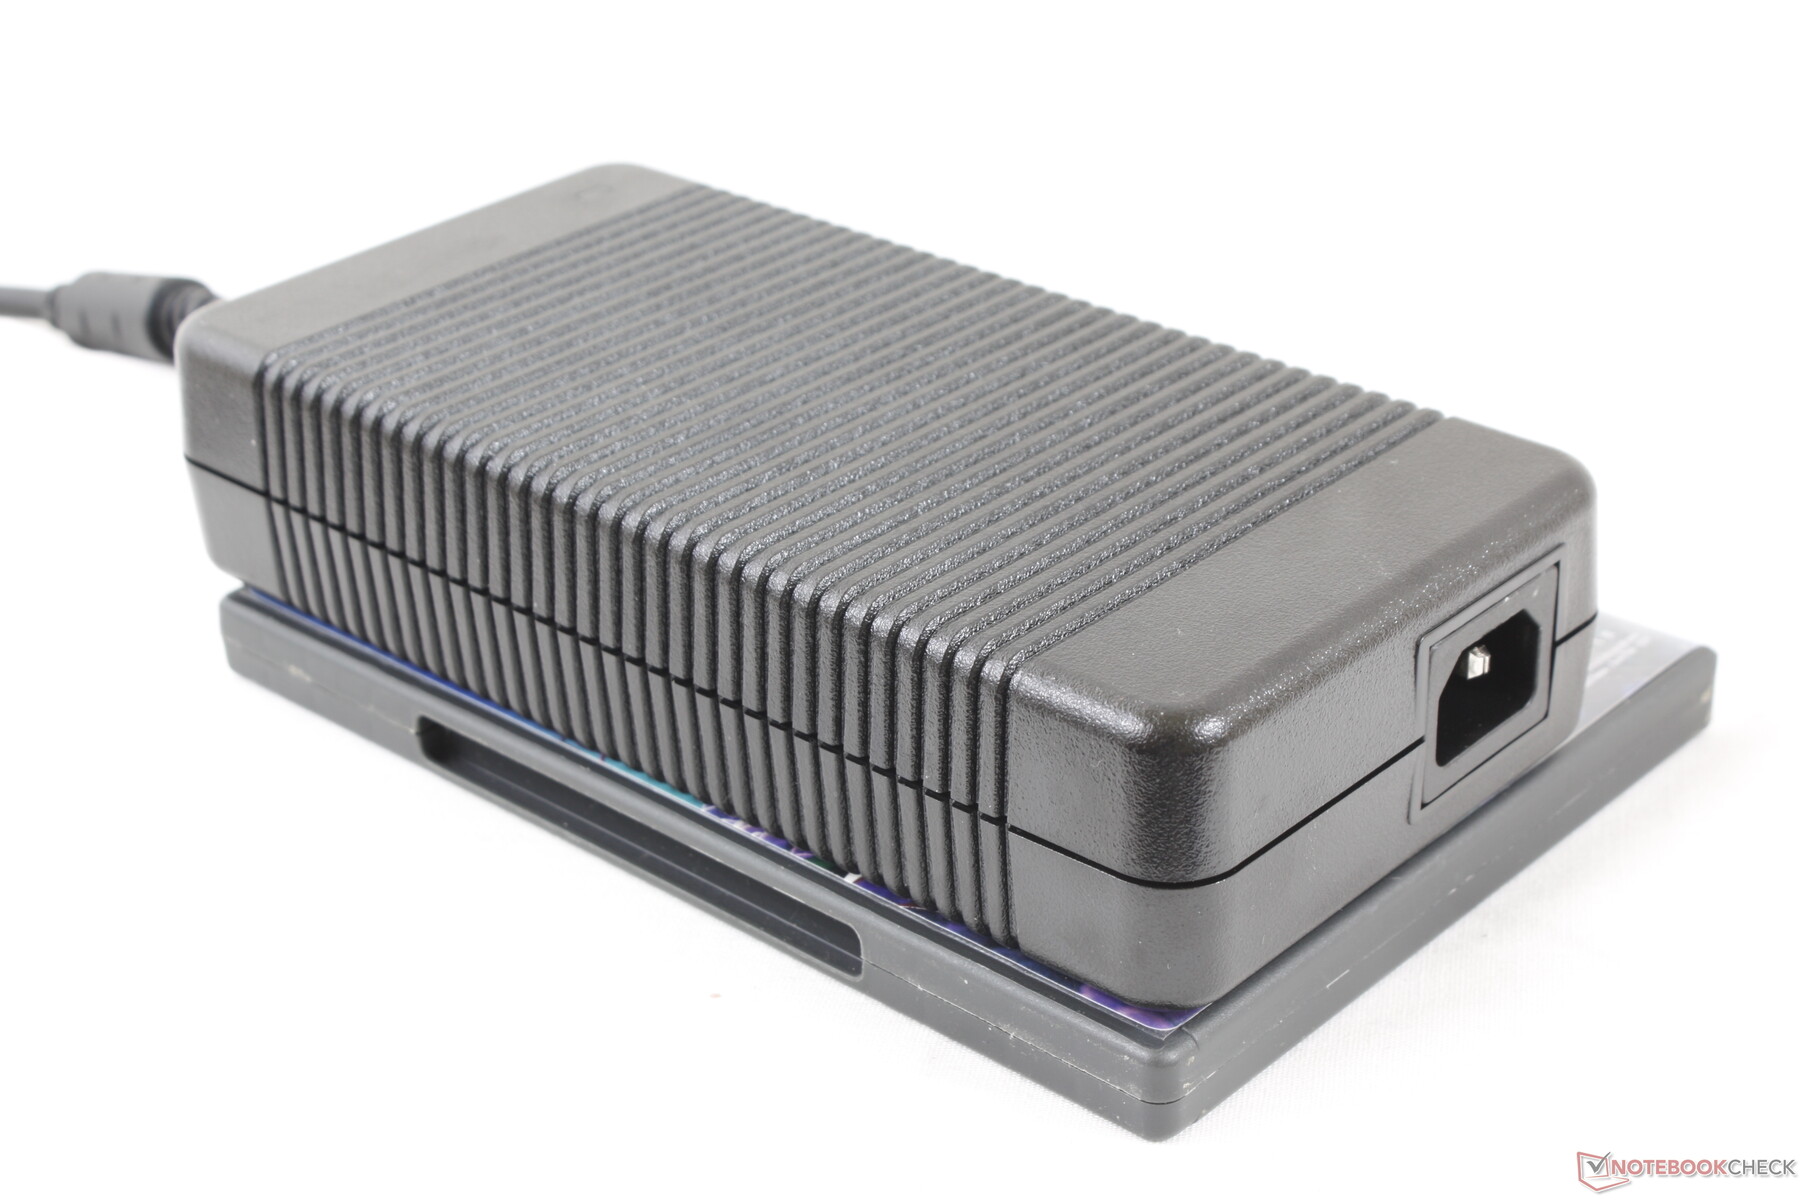
Los i9-9900KS y RTX 2080, más potentes, tienen un coste. En comparación con el Sky X4C del año pasado con el i7-8700K y el GTX 1080, nuestro nuevo Sky X4C consume un 50 por ciento más de energía (172 W frente a 258 W) en los juegos. Podemos medir un consumo máximo temporal de 398 W de los 330 W grandes (~20 x 10 x 4,3 cm) cuando se ejecuta tanto Prime95 como FurMark simultáneamente. Esto eventualmente cae y se estabiliza en 335 W, lo que significa que no será capaz de recargar el sistema y ejecutar cargas extremas al mismo tiempo.
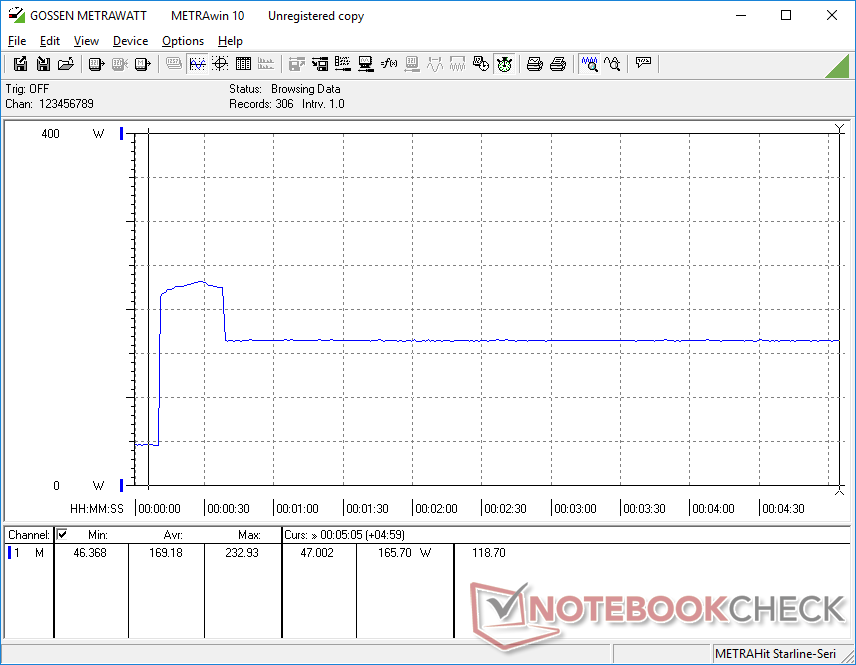
Cuando se ejecuta sólo Prime95, el consumo aumentará a 233 W durante unos 30 segundos antes de caer y estabilizarse en 166 W a partir de entonces. Este comportamiento refleja nuestras observaciones de la prueba de esfuerzo Prime95 arriba, donde las frecuencias de reloj sólo serían más rápidas durante los primeros 30 segundos antes de caer.
| Off / Standby | |
| Ocioso | |
| Carga |
|
Clave:
min: | |
| Eurocom Sky X4C i9-9900KS i9-9900KS, GeForce RTX 2080 Mobile, Samsung SSD 970 Pro 512GB, IPS, 1920x1080, 15.6" | Alienware Area-51m i9-9900K RTX 2080 i9-9900K, GeForce RTX 2080 Mobile, 2x SK Hynix PC400 512GB (RAID 0), IPS, 1920x1080, 17.3" | MSI GT63 Titan 8RG-046 i7-8750H, GeForce GTX 1080 Mobile, CUK Cyclone 500GB M.2 NVMe, TN, 1920x1080, 15.6" | Asus GL702ZC-GC104T R7 1700, Radeon RX 580 (Laptop), SanDisk SD8SN8U256G1002, IPS, 1920x1080, 17.3" | MSI GE63VR 7RF Raider i7-7700HQ, GeForce GTX 1070 Mobile, Toshiba HG6 THNSNJ256G8NY, TN LED, 1920x1080, 15.6" | Eurocom Sky X4C i7-8700K, GeForce GTX 1080 Mobile, Samsung SSD 960 Pro 1TB m.2 NVMe, IPS, 3840x2160, 15.6" | |
|---|---|---|---|---|---|---|
| Power Consumption | 2% | 25% | -3% | 46% | 18% | |
| Idle Minimum * (Watt) | 33.4 | 23.3 30% | 26.4 21% | 43 -29% | 11 67% | 30.2 10% |
| Idle Average * (Watt) | 40.5 | 33.5 17% | 30 26% | 50 -23% | 16 60% | 34.7 14% |
| Idle Maximum * (Watt) | 44 | 38.4 13% | 30.6 30% | 57 -30% | 21 52% | 37.8 14% |
| Load Average * (Watt) | 121.9 | 114.1 6% | 90.4 26% | 125 -3% | 92 25% | 130.3 -7% |
| Witcher 3 ultra * (Watt) | 258.2 | 339.5 -31% | 255.6 1% | 180 30% | 185 28% | 172.2 33% |
| Load Maximum * (Watt) | 397.6 | 485.1 -22% | 224.4 44% | 240 40% | 224 44% | 217.7 45% |
* ... más pequeño es mejor
Duración de la batería
La autonomía de la batería extraíble de 82 Wh es prácticamente la misma que la de nuestro Sky X4C 2018. Los usuarios pueden esperar algo más de 2,5 horas de uso real de WLAN antes del apagado automático. La carga de vacío a lleno tarda unas 2 horas.
El sistema no se puede recargar a través de USB tipo C.
| Eurocom Sky X4C i9-9900KS i9-9900KS, GeForce RTX 2080 Mobile, 82 Wh | Lenovo Legion Y740-15ICHg i7-9750H, GeForce RTX 2070 Max-Q, 57 Wh | Alienware Area-51m i9-9900K RTX 2080 i9-9900K, GeForce RTX 2080 Mobile, 90 Wh | MSI GT76 Titan DT 9SG i9-9900K, GeForce RTX 2080 Mobile, 90 Wh | Asus Strix Scar III G531GW-AZ062T i7-9750H, GeForce RTX 2070 Mobile, 66 Wh | Eurocom Sky X4C i7-8700K, GeForce GTX 1080 Mobile, 82 Wh | |
|---|---|---|---|---|---|---|
| Duración de Batería | 7% | -25% | 79% | 100% | -7% | |
| WiFi v1.3 (h) | 2.8 | 3 7% | 2.1 -25% | 5 79% | 5.6 100% | 2.6 -7% |
| Reader / Idle (h) | 2.6 | 6.8 | 3 | |||
| Load (h) | 1.1 | 0.9 | 1.4 |
Pro
Contra
Veredicto
El Core i9-9900K original no tenía mucho headroom de overclocking y por lo tanto no es sorprendente que el Core i9-9900KS no sea diferente. En stock, el Core i9-9900KS del Sky X4C se estabilizará a 4,4 GHz y 88 C, o sea, sólo 400 MHz por encima de la frecuencia de reloj base del procesador. Los portátiles más grandes como el Alienware Area-51m y el MSI GT76 con el i9-9900K pueden igualar o superar al i9-9900KS en nuestro Eurocom. Por muy versátil que pueda ser este chasis Clevo de tres años de antigüedad, la serie Core i9 lo está llevando a sus límites con poco espacio de sobra. Ya es hora de que Clevo actualice este sistema para aprovechar mejor el alto potencial Turbo Boost de las CPUs Intel Core i9.
Desde una perspectiva gen-gen, el i9-9900K y el 9900KS son entre un 35 y un 45 por ciento más rápidos que el i7-8700K y el i7-9700K. Todavía puede beneficiarse de la actualización a un Core i9 en este sentido, pero no espere mucho potencial de overclocking de la CPU en el portátil Sky X4C.
Súper rápido, pero también súper cálido. Configurar un portátil con el Core i9-9900KS se trata más bien de alardear de sus derechos, especialmente cuando el Core i9-9900K original funciona de forma muy similar. El Eurocom Sky X4C es capaz de ejecutar el i9-9900KS de forma estable a una velocidad de reloj un 10 por ciento superior a la velocidad del reloj base, a pesar de que la CPU es capaz de más en un escritorio adecuado.
Eurocom Sky X4C i9-9900KS
- 11/28/2019 v7 (old)
Allen Ngo
Price comparison
