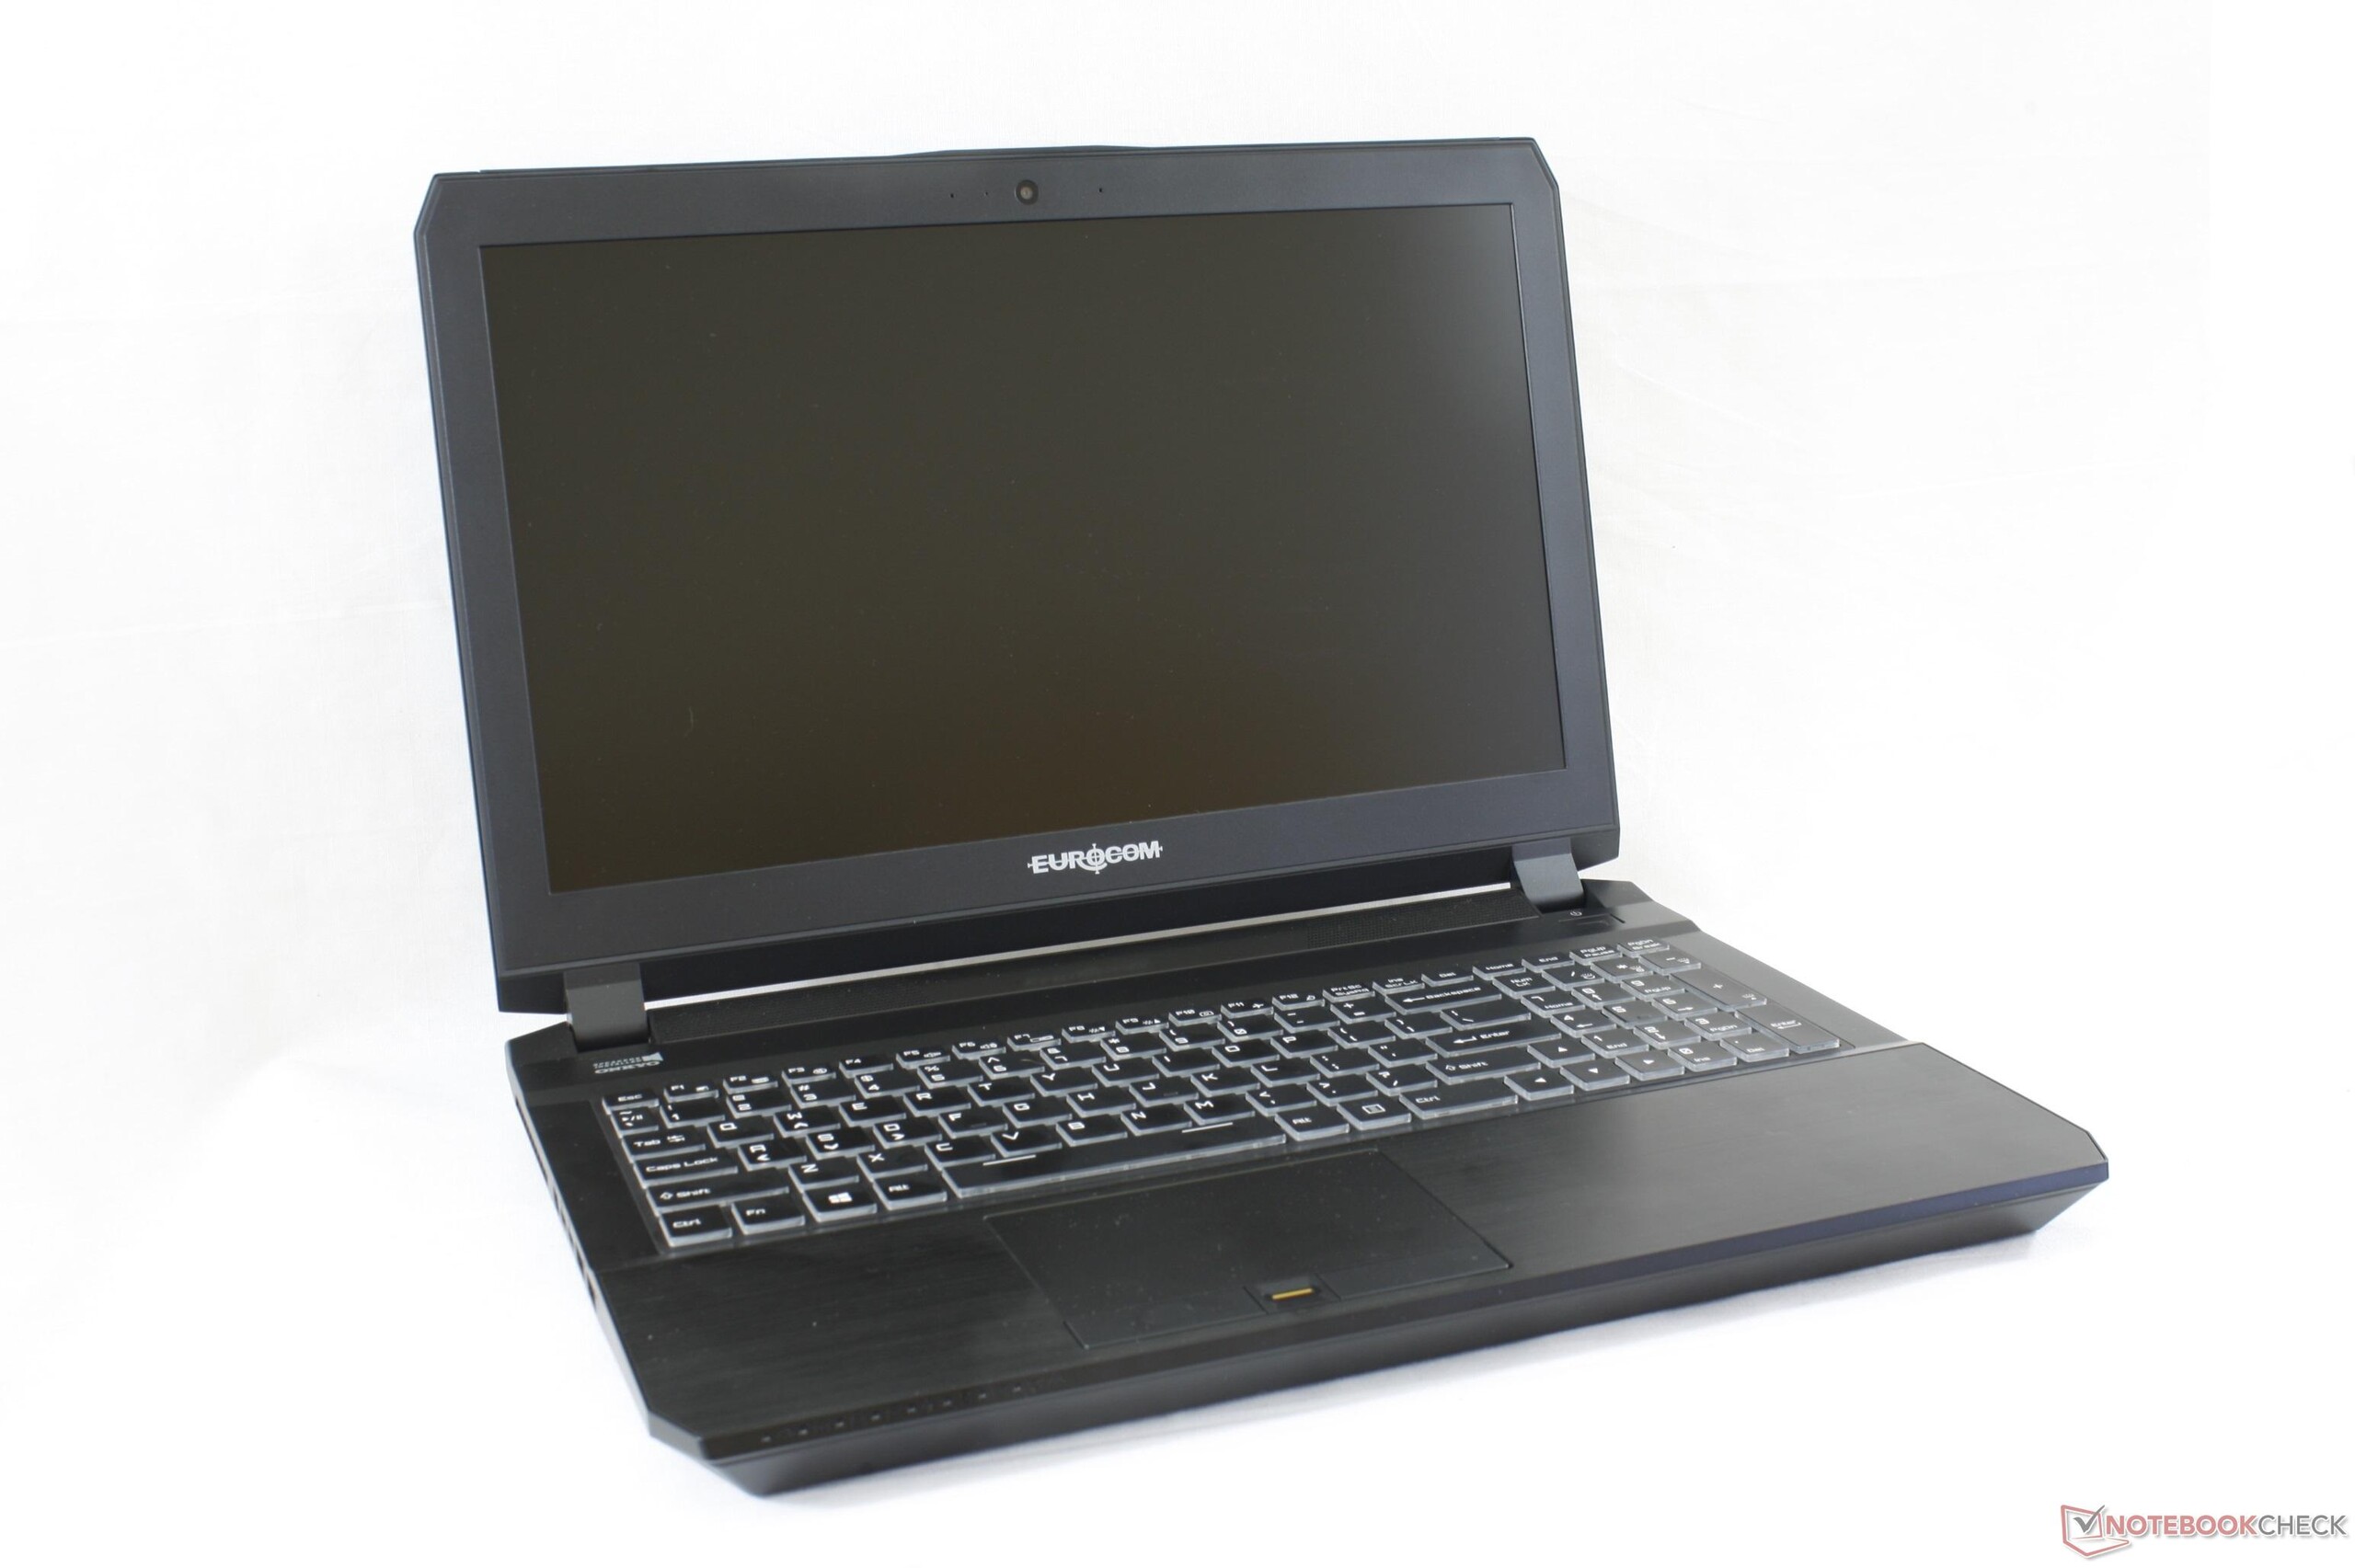
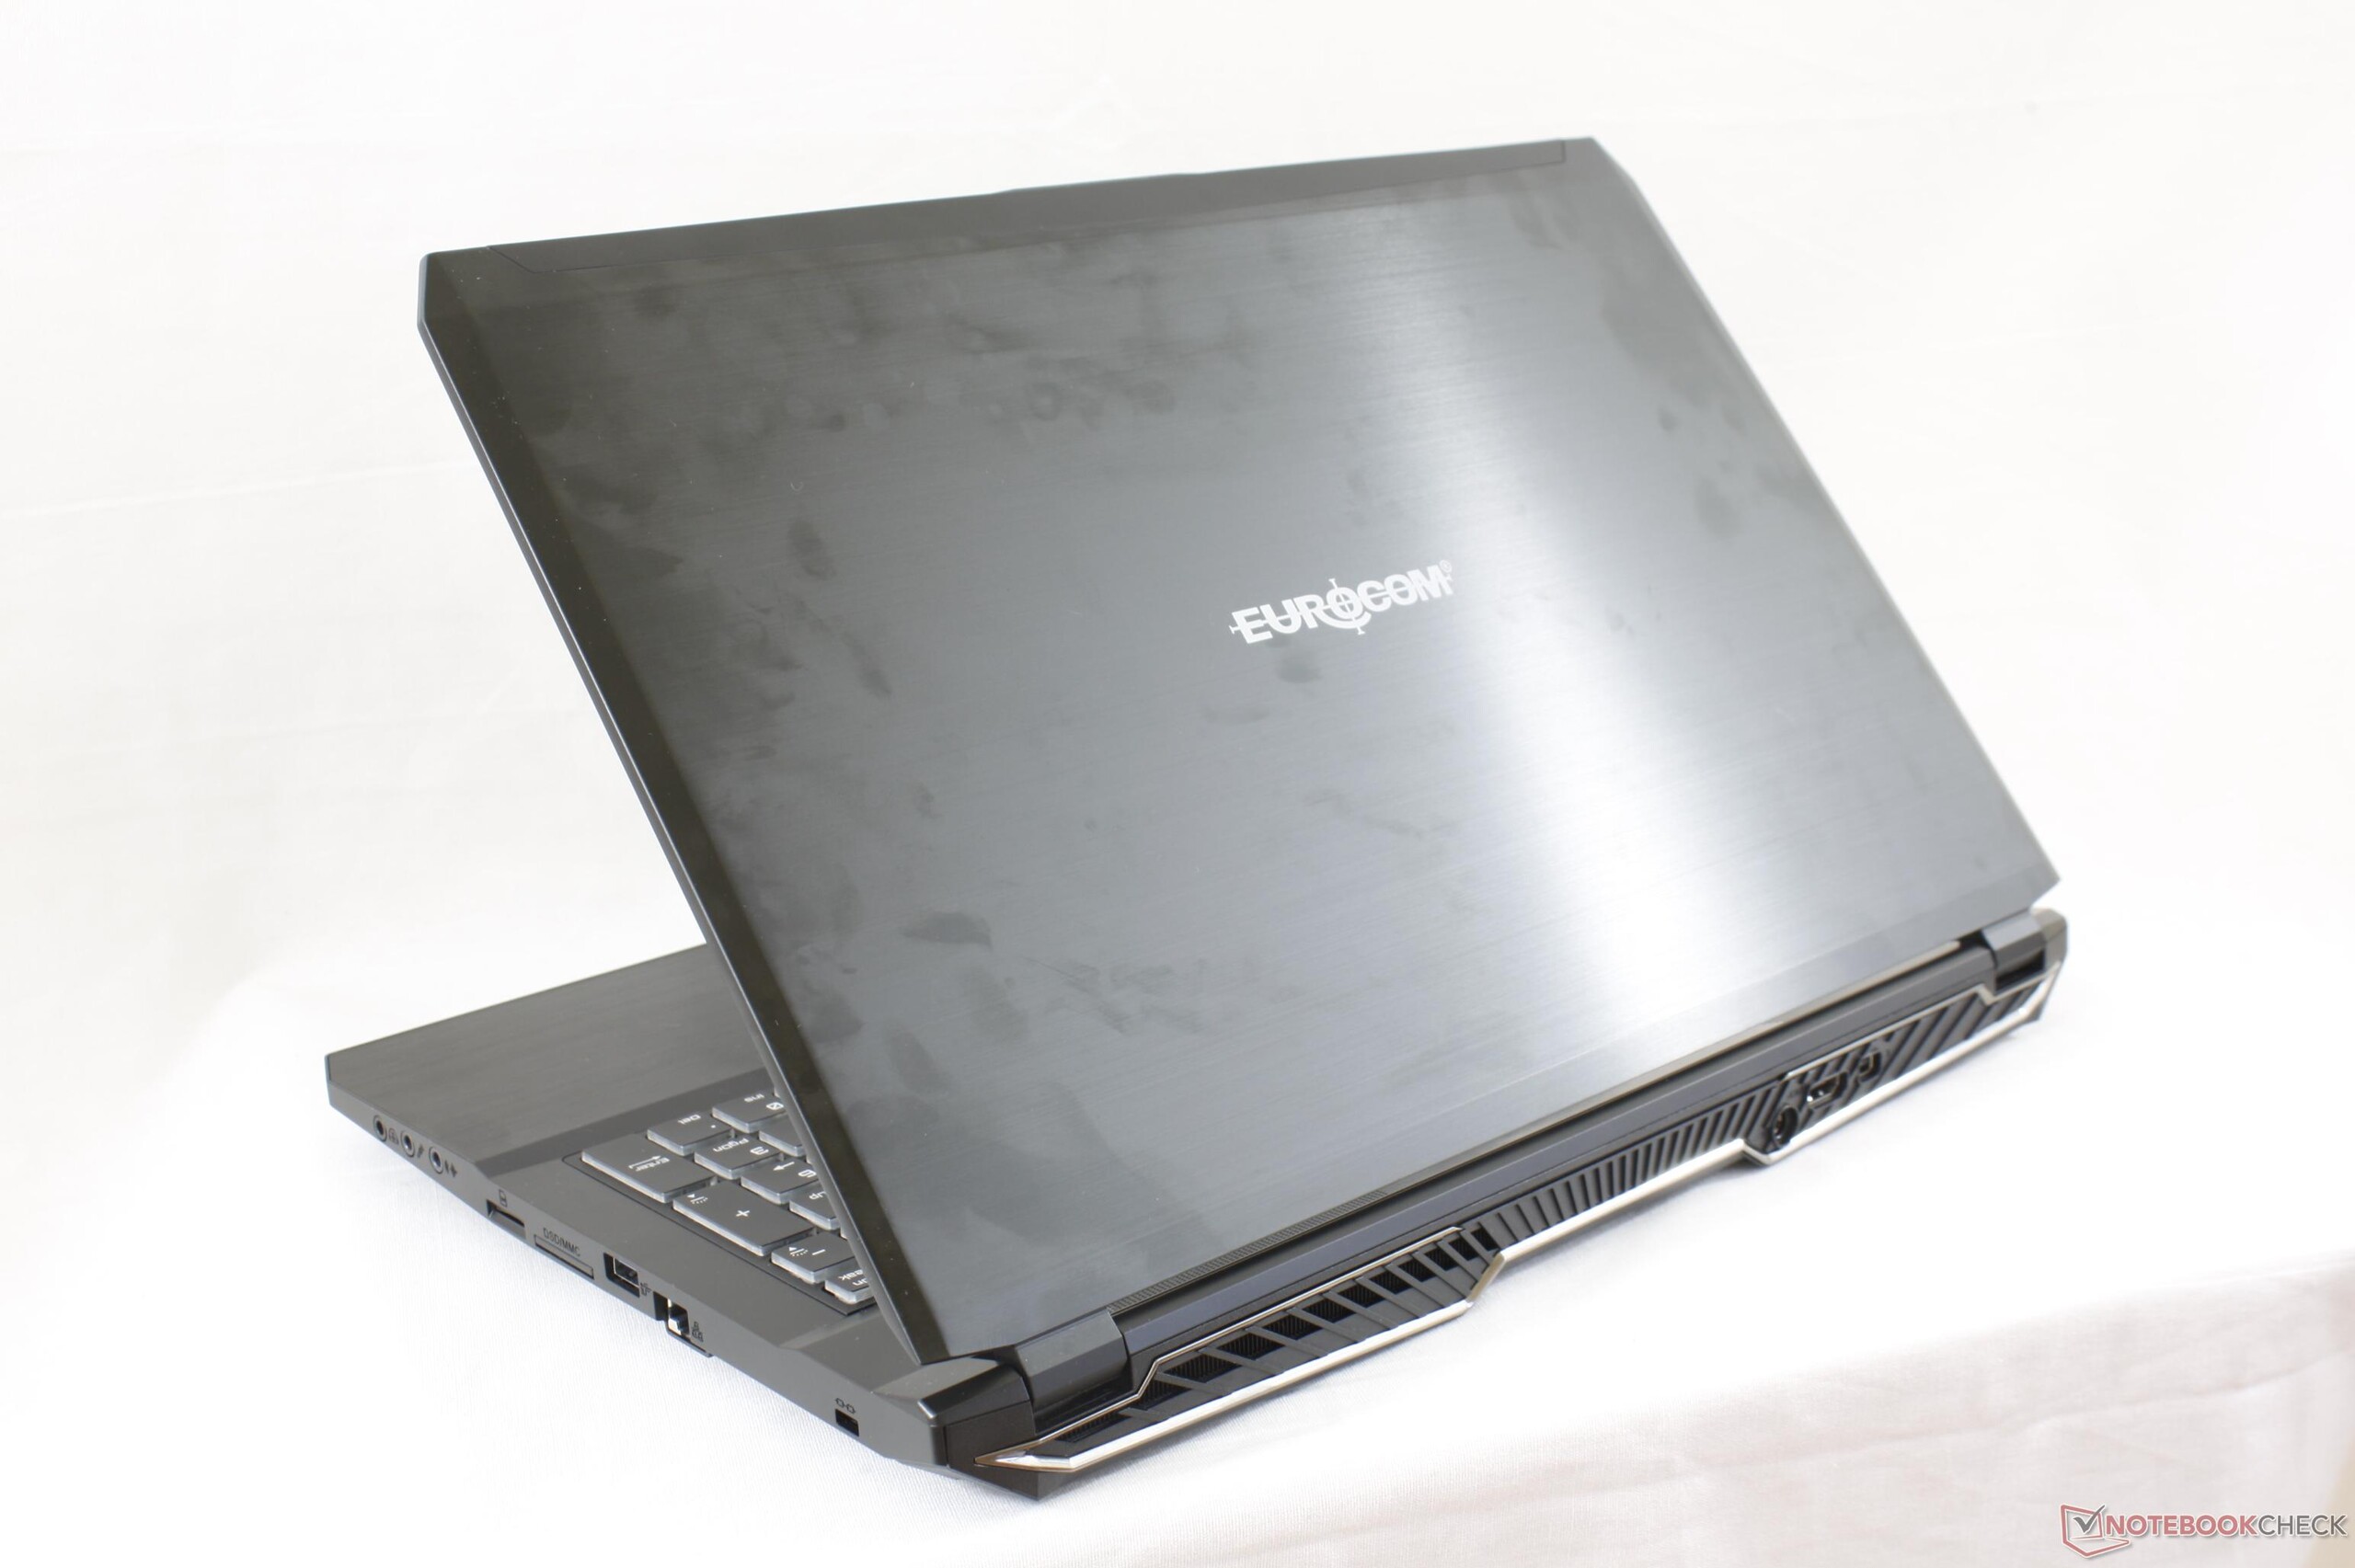
Breve análisis del portátil Eurocom Sky MX5 R3 (i7-7820HK, FHD, Clevo P650HS-G)

| SD Card Reader | |
| average JPG Copy Test (av. of 3 runs) | |
| Eurocom Sky X7E2 | |
| MSI GT62VR 7RE-223 | |
| Eurocom Sky MX5 R3 | |
| Gigabyte Aero 15 | |
| maximum AS SSD Seq Read Test (1GB) | |
| Eurocom Sky X7E2 | |
| MSI GT62VR 7RE-223 | |
| Eurocom Sky MX5 R3 | |
| Gigabyte Aero 15 | |
| Networking | |
| iperf3 transmit AX12 | |
| Eurocom Sky MX5 R3 | |
| Gigabyte Aero 15 | |
| Lenovo Legion Y520-15IKBN-80WK001KUS | |
| iperf3 receive AX12 | |
| Gigabyte Aero 15 | |
| Eurocom Sky MX5 R3 | |
| Lenovo Legion Y520-15IKBN-80WK001KUS | |
| |||||||||||||||||||||||||
iluminación: 94 %
Brillo con batería: 416.2 cd/m²
Contraste: 484:1 (Negro: 0.86 cd/m²)
ΔE ColorChecker Calman: 8.4 | ∀{0.5-29.43 Ø4.71}
ΔE Greyscale Calman: 11.2 | ∀{0.09-98 Ø4.96}
87.3% sRGB (Argyll 1.6.3 3D)
57.2% AdobeRGB 1998 (Argyll 1.6.3 3D)
64.2% AdobeRGB 1998 (Argyll 3D)
87.8% sRGB (Argyll 3D)
65.9% Display P3 (Argyll 3D)
Gamma: 2.23
CCT: 10036 K
| Eurocom Sky MX5 R3 ID: AUO52ED, Name: AU Optronics B156HTN05.2, , 15.6", 1920x1080 | Acer Predator 15 G9-593-751X LG Philips LP156WF6-SPP1 (LGD04D5), IPS, 15.6", 1920x1080 | Lenovo Legion Y520-15IKBN-80WK001KUS LP156WF6-SPK3, IPS, 15.6", 1920x1080 | Gigabyte Aero 15 N156HCA-EA1 (CMN15D7), IPS, 15.6", 1920x1080 | Alienware 15 R3 HPJGK_B156HTN (AUO51ED), TN, 15.6", 1920x1080 | MSI GT62VR 7RE-223 LG Philips LP156WF6 (LGD046F), IPS, 15.6", 1920x1080 | |
|---|---|---|---|---|---|---|
| Display | -2% | 3% | 2% | -4% | ||
| Display P3 Coverage (%) | 65.9 | 65.4 -1% | 65.2 -1% | 66 0% | 63.9 -3% | |
| sRGB Coverage (%) | 87.8 | 85.5 -3% | 92.5 5% | 90.5 3% | 83.1 -5% | |
| AdobeRGB 1998 Coverage (%) | 64.2 | 62.5 -3% | 66.5 4% | 66.2 3% | 60.8 -5% | |
| Response Times | -137% | -246% | -185% | -28% | -131% | |
| Response Time Grey 50% / Grey 80% * (ms) | 20.8 ? | 36 ? -73% | 58.8 ? -183% | 42.8 ? -106% | 25 ? -20% | 37 ? -78% |
| Response Time Black / White * (ms) | 8.8 ? | 26.4 ? -200% | 36 ? -309% | 32 ? -264% | 12 ? -36% | 25 ? -184% |
| PWM Frequency (Hz) | 20830 ? | 21550 ? | 26000 ? | |||
| Screen | 22% | -6% | 23% | 13% | 25% | |
| Brightness middle (cd/m²) | 416.2 | 295 -29% | 239 -43% | 320 -23% | 386 -7% | 310 -26% |
| Brightness (cd/m²) | 409 | 274 -33% | 244 -40% | 316 -23% | 382 -7% | 311 -24% |
| Brightness Distribution (%) | 94 | 88 -6% | 88 -6% | 90 -4% | 93 -1% | 85 -10% |
| Black Level * (cd/m²) | 0.86 | 0.32 63% | 0.35 59% | 0.36 58% | 0.39 55% | 0.3 65% |
| Contrast (:1) | 484 | 922 90% | 683 41% | 889 84% | 990 105% | 1033 113% |
| Colorchecker dE 2000 * | 8.4 | 4.59 45% | 7.3 13% | 4.62 45% | 10.2 -21% | 4.82 43% |
| Colorchecker dE 2000 max. * | 15.4 | 11 29% | 24.7 -60% | 9.75 37% | 15.81 -3% | 10.14 34% |
| Greyscale dE 2000 * | 11.2 | 4.03 64% | 4.9 56% | 6 46% | 11.28 -1% | 3.94 65% |
| Gamma | 2.23 99% | 2.3 96% | 2.19 100% | 2.46 89% | 2.23 99% | 2.45 90% |
| CCT | 10036 65% | 7229 90% | 7332 89% | 6761 96% | 11383 57% | 6877 95% |
| Color Space (Percent of AdobeRGB 1998) (%) | 57.2 | 56 -2% | 35 -39% | 60 5% | 59 3% | 54 -6% |
| Color Space (Percent of sRGB) (%) | 87.3 | 85 -3% | 55 -37% | 92 5% | 90 3% | 83 -5% |
| Media total (Programa/Opciones) | -39% /
-4% | -126% /
-46% | -53% /
-9% | -4% /
5% | -37% /
-2% |
* ... más pequeño es mejor
Tiempos de respuesta del display
| ↔ Tiempo de respuesta de Negro a Blanco | ||
|---|---|---|
| 8.8 ms ... subida ↗ y bajada ↘ combinada | ↗ 6.8 ms subida | 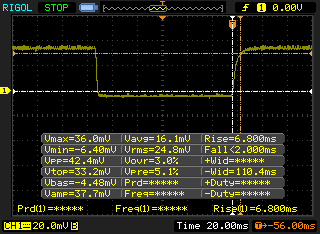 |
| ↘ 2 ms bajada | ||
| La pantalla mostró tiempos de respuesta rápidos en nuestros tests y debería ser adecuada para juegos. En comparación, todos los dispositivos de prueba van de ##min### (mínimo) a 240 (máximo) ms. » 25 % de todos los dispositivos son mejores. Esto quiere decir que el tiempo de respuesta medido es mejor que la media (19.8 ms) de todos los dispositivos testados. | ||
| ↔ Tiempo de respuesta 50% Gris a 80% Gris | ||
| 20.8 ms ... subida ↗ y bajada ↘ combinada | ↗ 11.6 ms subida | 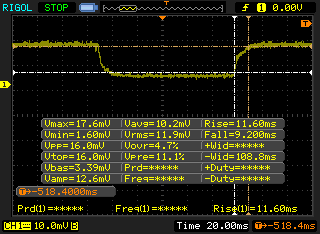 |
| ↘ 9.2 ms bajada | ||
| La pantalla mostró buenos tiempos de respuesta en nuestros tests pero podría ser demasiado lenta para los jugones competitivos. En comparación, todos los dispositivos de prueba van de ##min### (mínimo) a 636 (máximo) ms. » 33 % de todos los dispositivos son mejores. Esto quiere decir que el tiempo de respuesta medido es mejor que la media (31 ms) de todos los dispositivos testados. | ||
Parpadeo de Pantalla / PWM (Pulse-Width Modulation)
| Parpadeo de Pantalla / PWM no detectado | 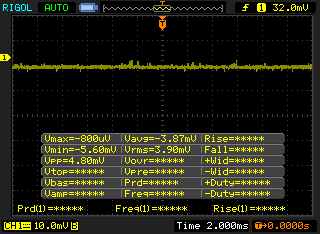 | ||
Comparación: 52 % de todos los dispositivos testados no usaron PWM para atenuar el display. Si se usó, medimos una media de 7757 (mínimo: 5 - máxmo: 343500) Hz. | |||
| Cinebench R11.5 | |
| CPU Single 64Bit | |
| Schenker XMG U507 2017 | |
| MSI GT83VR-6RE32SR451 | |
| Eurocom Sky MX5 R3 | |
| Eurocom Sky X7E2 | |
| Alienware 17 R4 | |
| MSI GE62 2QC-468XPL | |
| Lenovo IdeaPad Y50 | |
| CPU Multi 64Bit | |
| Schenker XMG U507 2017 | |
| Alienware 17 R4 | |
| MSI GT83VR-6RE32SR451 | |
| Eurocom Sky X7E2 | |
| Eurocom Sky MX5 R3 | |
| MSI GE62 2QC-468XPL | |
| Lenovo IdeaPad Y50 | |
| Cinebench R10 | |
| Rendering Multiple CPUs 32Bit | |
| Alienware 17 R4 | |
| Eurocom Sky X7E2 | |
| Eurocom Sky MX5 R3 | |
| MSI GE62 2QC-468XPL | |
| Lenovo IdeaPad Y50 | |
| Rendering Single 32Bit | |
| Alienware 17 R4 | |
| Eurocom Sky X7E2 | |
| Eurocom Sky MX5 R3 | |
| MSI GE62 2QC-468XPL | |
| Lenovo IdeaPad Y50 | |
| wPrime 2.10 - 1024m | |
| Lenovo IdeaPad Y50 | |
| Apple MacBook Pro 15 2017 (2.8 GHz, 555) | |
| Eurocom Sky MX5 R3 | |
| MSI GE62 2QC-468XPL | |
| Eurocom Sky X7E2 | |
| Alienware 17 R4 | |
* ... más pequeño es mejor
| PCMark 8 | |
| Home Score Accelerated v2 | |
| Acer Predator 15 G9-593-751X | |
| Eurocom Sky MX5 R3 | |
| Gigabyte Aero 15 | |
| Work Score Accelerated v2 | |
| Acer Predator 15 G9-593-751X | |
| Gigabyte Aero 15 | |
| Eurocom Sky MX5 R3 | |
| Creative Score Accelerated v2 | |
| Eurocom Sky MX5 R3 | |
| Acer Predator 15 G9-593-751X | |
| PCMark 8 Home Score Accelerated v2 | 5065 puntos | |
| PCMark 8 Creative Score Accelerated v2 | 8233 puntos | |
| PCMark 8 Work Score Accelerated v2 | 5192 puntos | |
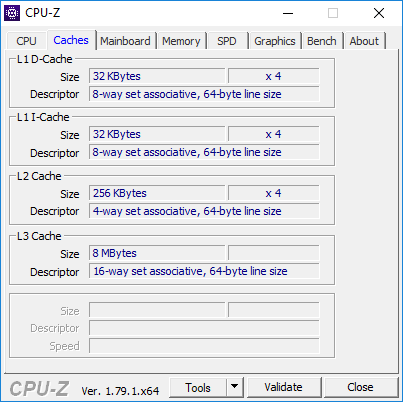
ayuda | ||
| Eurocom Sky MX5 R3 Samsung SSD 960 Evo 500GB m.2 NVMe | Acer Predator 15 G9-593-751X Samsung SM951 MZVPV256HDGL m.2 PCI-e | Lenovo Legion Y520-15IKBN-80WK001KUS Samsung PM961 MZVLW256HEHP | MSI GT62VR 7RE-223 Samsung SSD PM871a MZNLN256HMHQ | Aorus X5 v6 Samsung SM951 MZVPV256 m.2 | |
|---|---|---|---|---|---|
| AS SSD | -22% | -14% | -69% | -94% | |
| Copy Game MB/s (MB/s) | 1191 | 1091 -8% | 1115 -6% | 377.8 -68% | 1073 -10% |
| Copy Program MB/s (MB/s) | 441.8 | 488.6 11% | 502 14% | 199 -55% | 351.5 -20% |
| Copy ISO MB/s (MB/s) | 1375 | 1575 15% | 1912 39% | 354.7 -74% | 351.1 -74% |
| Score Total (Points) | 3987 | 2574 -35% | 2617 -34% | 1019 -74% | 1630 -59% |
| Score Write (Points) | 1670 | 570 -66% | 807 -52% | 304 -82% | 514 -69% |
| Score Read (Points) | 1550 | 1350 -13% | 1232 -21% | 472 -70% | 756 -51% |
| Access Time Write * (ms) | 0.029 | 0.032 -10% | 0.027 7% | 0.037 -28% | 0.025 14% |
| Access Time Read * (ms) | 0.038 | 0.059 -55% | 0.065 -71% | 0.1 -163% | 0.367 -866% |
| 4K-64 Write (MB/s) | 1375 | 346 -75% | 529 -62% | 171.6 -88% | 272.5 -80% |
| 4K-64 Read (MB/s) | 1280 | 1109 -13% | 919 -28% | 383.4 -70% | 521 -59% |
| 4K Write (MB/s) | 129.1 | 117.3 -9% | 139.4 8% | 104 -19% | 131.3 2% |
| 4K Read (MB/s) | 44.54 | 46.35 4% | 48.57 9% | 37.2 -16% | 44.6 0% |
| Seq Write (MB/s) | 1660 | 1067 -36% | 1392 -16% | 288.2 -83% | 1099 -34% |
| Seq Read (MB/s) | 2257 | 1941 -14% | 2649 17% | 510 -77% | 1904 -16% |
* ... más pequeño es mejor

| 3DMark | |
| 1920x1080 Fire Strike Graphics | |
| Nvidia GeForce GTX 1080 Ti Founders Edition | |
| Alienware 17 R4 | |
| Eurocom Sky MX5 R3 | |
| Asus G752VS-BA338T | |
| Nvidia GeForce GTX 1070 Founders Edition | |
| Asus G701VO-CS74K | |
| Aorus x3 Plus v7 | |
| Fire Strike Extreme Graphics | |
| Alienware 17 R4 | |
| Asus G752VS-BA338T | |
| Eurocom Sky MX5 R3 | |
| Asus G701VO-CS74K | |
| Aorus x3 Plus v7 | |
| 3840x2160 Fire Strike Ultra Graphics | |
| Nvidia GeForce GTX 1080 Ti Founders Edition | |
| Alienware 17 R4 | |
| Asus G752VS-BA338T | |
| Eurocom Sky MX5 R3 | |
| Nvidia GeForce GTX 1070 Founders Edition | |
| Asus G701VO-CS74K | |
| 3DMark 11 | |
| 1280x720 Performance GPU | |
| Nvidia GeForce GTX 1080 Ti Founders Edition | |
| Alienware 17 R4 | |
| Asus G752VS-BA338T | |
| Nvidia GeForce GTX 1070 Founders Edition | |
| Eurocom Sky MX5 R3 | |
| Asus G701VO-CS74K | |
| 1280x720 Performance Combined | |
| Nvidia GeForce GTX 1080 Ti Founders Edition | |
| Nvidia GeForce GTX 1070 Founders Edition | |
| Alienware 17 R4 | |
| Eurocom Sky MX5 R3 | |
| Asus G701VO-CS74K | |
| Asus G752VS-BA338T | |
| 3DMark 11 Performance | 17505 puntos | |
| 3DMark Ice Storm Standard Score | 156072 puntos | |
| 3DMark Cloud Gate Standard Score | 28943 puntos | |
| 3DMark Fire Strike Score | 14447 puntos | |
| 3DMark Fire Strike Extreme Score | 7854 puntos | |
ayuda | ||
| Rise of the Tomb Raider - 1920x1080 Very High Preset AA:FX AF:16x | |
| Nvidia GeForce GTX 1080 Ti Founders Edition | |
| Alienware 17 R4 | |
| Eurocom Sky MX5 R3 | |
| Eurocom Tornado F5 | |
| Nvidia GeForce GTX 1070 Founders Edition | |
| Zotac ZBOX Magnus EN980-U | |
| Aorus x3 Plus v7 | |
| BioShock Infinite - 1920x1080 Ultra Preset, DX11 (DDOF) | |
| Nvidia GeForce GTX 1080 Ti Founders Edition | |
| Alienware 17 R4 | |
| Nvidia GeForce GTX 1070 Founders Edition | |
| Eurocom Tornado F5 | |
| Eurocom Sky MX5 R3 | |
| Zotac ZBOX Magnus EN980-U | |
| Aorus x3 Plus v7 | |
| Metro: Last Light - 1920x1080 Very High (DX11) AF:16x | |
| Nvidia GeForce GTX 1080 Ti Founders Edition | |
| Alienware 17 R4 | |
| Nvidia GeForce GTX 1070 Founders Edition | |
| Eurocom Tornado F5 | |
| Eurocom Sky MX5 R3 | |
| Zotac ZBOX Magnus EN980-U | |
| Aorus x3 Plus v7 | |
| Batman: Arkham Knight - 1920x1080 High / On AA:SM AF:16x | |
| Alienware 17 R4 | |
| Eurocom Tornado F5 | |
| Eurocom Sky MX5 R3 | |
| Zotac ZBOX Magnus EN980-U | |
| Fallout 4 - 1920x1080 Ultra Preset AA:T AF:16x | |
| Nvidia GeForce GTX 1080 Ti Founders Edition | |
| Alienware 17 R4 | |
| Nvidia GeForce GTX 1070 Founders Edition | |
| Eurocom Tornado F5 | |
| Eurocom Sky MX5 R3 | |
| Zotac ZBOX Magnus EN980-U | |
| Aorus x3 Plus v7 | |
| Ashes of the Singularity - 1920x1080 high | |
| Nvidia GeForce GTX 1080 Ti Founders Edition | |
| Eurocom Tornado F5 | |
| Nvidia GeForce GTX 1070 Founders Edition | |
| Eurocom Sky MX5 R3 | |
| Alienware 17 R4 | |
| Aorus x3 Plus v7 | |
| Doom - 1920x1080 Ultra Preset AA:SM | |
| Nvidia GeForce GTX 1080 Ti Founders Edition | |
| Nvidia GeForce GTX 1080 Ti Founders Edition | |
| Alienware 17 R4 | |
| Eurocom Tornado F5 | |
| Nvidia GeForce GTX 1070 Founders Edition | |
| Eurocom Sky MX5 R3 | |
| Aorus x3 Plus v7 | |
| Overwatch - 1920x1080 Epic (Render Scale 100 %) AA:SM AF:16x | |
| Nvidia GeForce GTX 1080 Ti Founders Edition | |
| Alienware 17 R4 | |
| Nvidia GeForce GTX 1070 Founders Edition | |
| Eurocom Sky MX5 R3 | |
| Eurocom Tornado F5 | |
| Zotac ZBOX Magnus EN980-U | |
| Mafia 3 - 1920x1080 High Preset | |
| Nvidia GeForce GTX 1080 Ti Founders Edition | |
| Alienware 17 R4 | |
| Eurocom Tornado F5 | |
| Eurocom Sky MX5 R3 | |
| Aorus x3 Plus v7 | |
| Prey - 1920x1080 Very High Preset AA:2TX SM AF:16x | |
| Nvidia GeForce GTX 1080 Ti Founders Edition | |
| Eurocom Sky MX5 R3 | |
| bajo | medio | alto | ultra | |
|---|---|---|---|---|
| BioShock Infinite (2013) | 141 | |||
| Metro: Last Light (2013) | 115 | |||
| The Witcher 3 (2015) | 66.3 | |||
| Batman: Arkham Knight (2015) | 85 | |||
| Metal Gear Solid V (2015) | 60 | |||
| Fallout 4 (2015) | 103.3 | |||
| Rise of the Tomb Raider (2016) | 100.5 | |||
| Ashes of the Singularity (2016) | 76.4 | |||
| Doom (2016) | 126.7 | |||
| Overwatch (2016) | 160.6 | |||
| Mafia 3 (2016) | 65.7 | |||
| Prey (2017) | 138.5 |
| The Witcher 3 | |||
| Resolución | Configuraciones | Valor | |
| 1920x1080 | Ultra Graphics & Postprocessing (HBAO+) | 66.3 fps | |
Ruido
| Ocioso |
| 28.5 / 29.2 / 35.5 dB(A) |
| Carga |
| 47 / 51 dB(A) |
 | ||
30 dB silencioso 40 dB(A) audible 50 dB(A) ruidosamente alto |
||
min: | ||
| Eurocom Sky MX5 R3 GeForce GTX 1070 Mobile, i7-7820HK, Samsung SSD 960 Evo 500GB m.2 NVMe | Acer Predator 15 G9-593-751X GeForce GTX 1070 Mobile, i7-7700HQ, Samsung SM951 MZVPV256HDGL m.2 PCI-e | Lenovo Legion Y520-15IKBN-80WK001KUS GeForce GTX 1050 Ti Mobile, i7-7700HQ, Samsung PM961 MZVLW256HEHP | Gigabyte Aero 15 GeForce GTX 1060 Mobile, i7-7700HQ, Lite-On CX2-8B512-Q11 | Alienware 15 R3 GeForce GTX 1070 Mobile, i7-7700HQ | MSI GT62VR 7RE-223 GeForce GTX 1070 Mobile, i7-7700HQ, Samsung SSD PM871a MZNLN256HMHQ | |
|---|---|---|---|---|---|---|
| Noise | -8% | 6% | -2% | -8% | -4% | |
| apagado / medio ambiente * (dB) | 28 | 32 -14% | 27.7 1% | 31 -11% | 30 -7% | 30 -7% |
| Idle Minimum * (dB) | 28.5 | 34 -19% | 30.5 -7% | 32 -12% | 31 -9% | 34 -19% |
| Idle Average * (dB) | 29.2 | 36 -23% | 30.5 -4% | 33 -13% | 32 -10% | 35 -20% |
| Idle Maximum * (dB) | 35.5 | 38 -7% | 30.6 14% | 34 4% | 42 -18% | 36 -1% |
| Load Average * (dB) | 47 | 41 13% | 40 15% | 39 17% | 49 -4% | 40 15% |
| Load Maximum * (dB) | 51 | 50 2% | 42.6 16% | 50 2% | 50 2% | 46 10% |
| Witcher 3 ultra * (dB) | 42 | 40 | 43 |
* ... más pequeño es mejor
(-) La temperatura máxima en la parte superior es de 50 °C / 122 F, frente a la media de 40.4 °C / 105 F, que oscila entre 21.2 y 68.8 °C para la clase Gaming.
(-) El fondo se calienta hasta un máximo de 52.2 °C / 126 F, frente a la media de 43.2 °C / 110 F
(+) En reposo, la temperatura media de la parte superior es de 30 °C / 86# F, frente a la media del dispositivo de 33.9 °C / 93 F.
(±) Jugando a The Witcher 3, la temperatura media de la parte superior es de 36.7 °C / 98 F, frente a la media del dispositivo de 33.9 °C / 93 F.
(+) El reposamanos y el panel táctil están a una temperatura inferior a la de la piel, con un máximo de 28.2 °C / 82.8 F y, por tanto, son fríos al tacto.
(±) La temperatura media de la zona del reposamanos de dispositivos similares fue de 28.8 °C / 83.8 F (+0.6 °C / 1 F).
Eurocom Sky MX5 R3 análisis de audio
(-) | altavoces no muy altos (#55.7 dB)
Graves 100 - 315 Hz
(±) | lubina reducida - en promedio 11.4% inferior a la mediana
(±) | la linealidad de los graves es media (11.8% delta a frecuencia anterior)
Medios 400 - 2000 Hz
(+) | medios equilibrados - a sólo 3.7% de la mediana
(±) | la linealidad de los medios es media (10.8% delta respecto a la frecuencia anterior)
Altos 2 - 16 kHz
(+) | máximos equilibrados - a sólo 2% de la mediana
(±) | la linealidad de los máximos es media (7% delta a frecuencia anterior)
Total 100 - 16.000 Hz
(±) | la linealidad del sonido global es media (28.3% de diferencia con la mediana)
En comparación con la misma clase
» 94% de todos los dispositivos probados de esta clase eran mejores, 1% similares, 4% peores
» El mejor tuvo un delta de 6%, la media fue 18%, el peor fue ###max##%
En comparación con todos los dispositivos probados
» 86% de todos los dispositivos probados eran mejores, 3% similares, 12% peores
» El mejor tuvo un delta de 4%, la media fue 23%, el peor fue ###max##%
Apple MacBook 12 (Early 2016) 1.1 GHz análisis de audio
(+) | los altavoces pueden reproducir a un volumen relativamente alto (#83.6 dB)
Graves 100 - 315 Hz
(±) | lubina reducida - en promedio 11.3% inferior a la mediana
(±) | la linealidad de los graves es media (14.2% delta a frecuencia anterior)
Medios 400 - 2000 Hz
(+) | medios equilibrados - a sólo 2.4% de la mediana
(+) | los medios son lineales (5.5% delta a la frecuencia anterior)
Altos 2 - 16 kHz
(+) | máximos equilibrados - a sólo 2% de la mediana
(+) | los máximos son lineales (4.5% delta a la frecuencia anterior)
Total 100 - 16.000 Hz
(+) | el sonido global es lineal (10.2% de diferencia con la mediana)
En comparación con la misma clase
» 7% de todos los dispositivos probados de esta clase eran mejores, 2% similares, 90% peores
» El mejor tuvo un delta de 5%, la media fue 18%, el peor fue ###max##%
En comparación con todos los dispositivos probados
» 5% de todos los dispositivos probados eran mejores, 1% similares, 94% peores
» El mejor tuvo un delta de 4%, la media fue 23%, el peor fue ###max##%
| Off / Standby | |
| Ocioso | |
| Carga |
|
Clave:
min: | |
| Eurocom Sky MX5 R3 i7-7820HK, GeForce GTX 1070 Mobile, Samsung SSD 960 Evo 500GB m.2 NVMe, , 1920x1080, 15.6" | Acer Predator 15 G9-593-751X i7-7700HQ, GeForce GTX 1070 Mobile, Samsung SM951 MZVPV256HDGL m.2 PCI-e, IPS, 1920x1080, 15.6" | Lenovo Legion Y520-15IKBN-80WK001KUS i7-7700HQ, GeForce GTX 1050 Ti Mobile, Samsung PM961 MZVLW256HEHP, IPS, 1920x1080, 15.6" | Gigabyte Aero 15 i7-7700HQ, GeForce GTX 1060 Mobile, Lite-On CX2-8B512-Q11, IPS, 1920x1080, 15.6" | Alienware 15 R3 i7-7700HQ, GeForce GTX 1070 Mobile, , TN, 1920x1080, 15.6" | MSI GT62VR 7RE-223 i7-7700HQ, GeForce GTX 1070 Mobile, Samsung SSD PM871a MZNLN256HMHQ, IPS, 1920x1080, 15.6" | |
|---|---|---|---|---|---|---|
| Power Consumption | 3% | 49% | 31% | 6% | 4% | |
| Idle Minimum * (Watt) | 22 | 18 18% | 8.5 61% | 12 45% | 19 14% | 20 9% |
| Idle Average * (Watt) | 24.5 | 23 6% | 9.1 63% | 15 39% | 23 6% | 24 2% |
| Idle Maximum * (Watt) | 25.2 | 30 -19% | 9.7 62% | 20 21% | 29 -15% | 29 -15% |
| Load Average * (Watt) | 97.2 | 89 8% | 79.9 18% | 82 16% | 85 13% | 82 16% |
| Witcher 3 ultra * (Watt) | 177.5 | 168 5% | 97.7 45% | 111 37% | ||
| Load Maximum * (Watt) | 213.8 | 213 -0% | 121.5 43% | 161 25% | 192 10% | 193 10% |
* ... más pequeño es mejor
| Eurocom Sky MX5 R3 i7-7820HK, GeForce GTX 1070 Mobile, Wh | Acer Predator 15 G9-593-751X i7-7700HQ, GeForce GTX 1070 Mobile, 90 Wh | Lenovo Legion Y520-15IKBN-80WK001KUS i7-7700HQ, GeForce GTX 1050 Ti Mobile, 45 Wh | Gigabyte Aero 15 i7-7700HQ, GeForce GTX 1060 Mobile, 94.24 Wh | Alienware 15 R3 i7-7700HQ, GeForce GTX 1070 Mobile, 99 Wh | MSI GT62VR 7RE-223 i7-7700HQ, GeForce GTX 1070 Mobile, 75 Wh | |
|---|---|---|---|---|---|---|
| Duración de Batería | 83% | 44% | 120% | 45% | 38% | |
| Reader / Idle (h) | 3.4 | 8.4 147% | 8.5 150% | 10.6 212% | 6.4 88% | 6.3 85% |
| WiFi v1.3 (h) | 2.9 | 5.5 90% | 4 38% | 7 141% | 4.4 52% | 4.1 41% |
| Load (h) | 1.8 | 2 11% | 0.8 -56% | 1.9 6% | 1.7 -6% | 1.6 -11% |
Pro
Contra
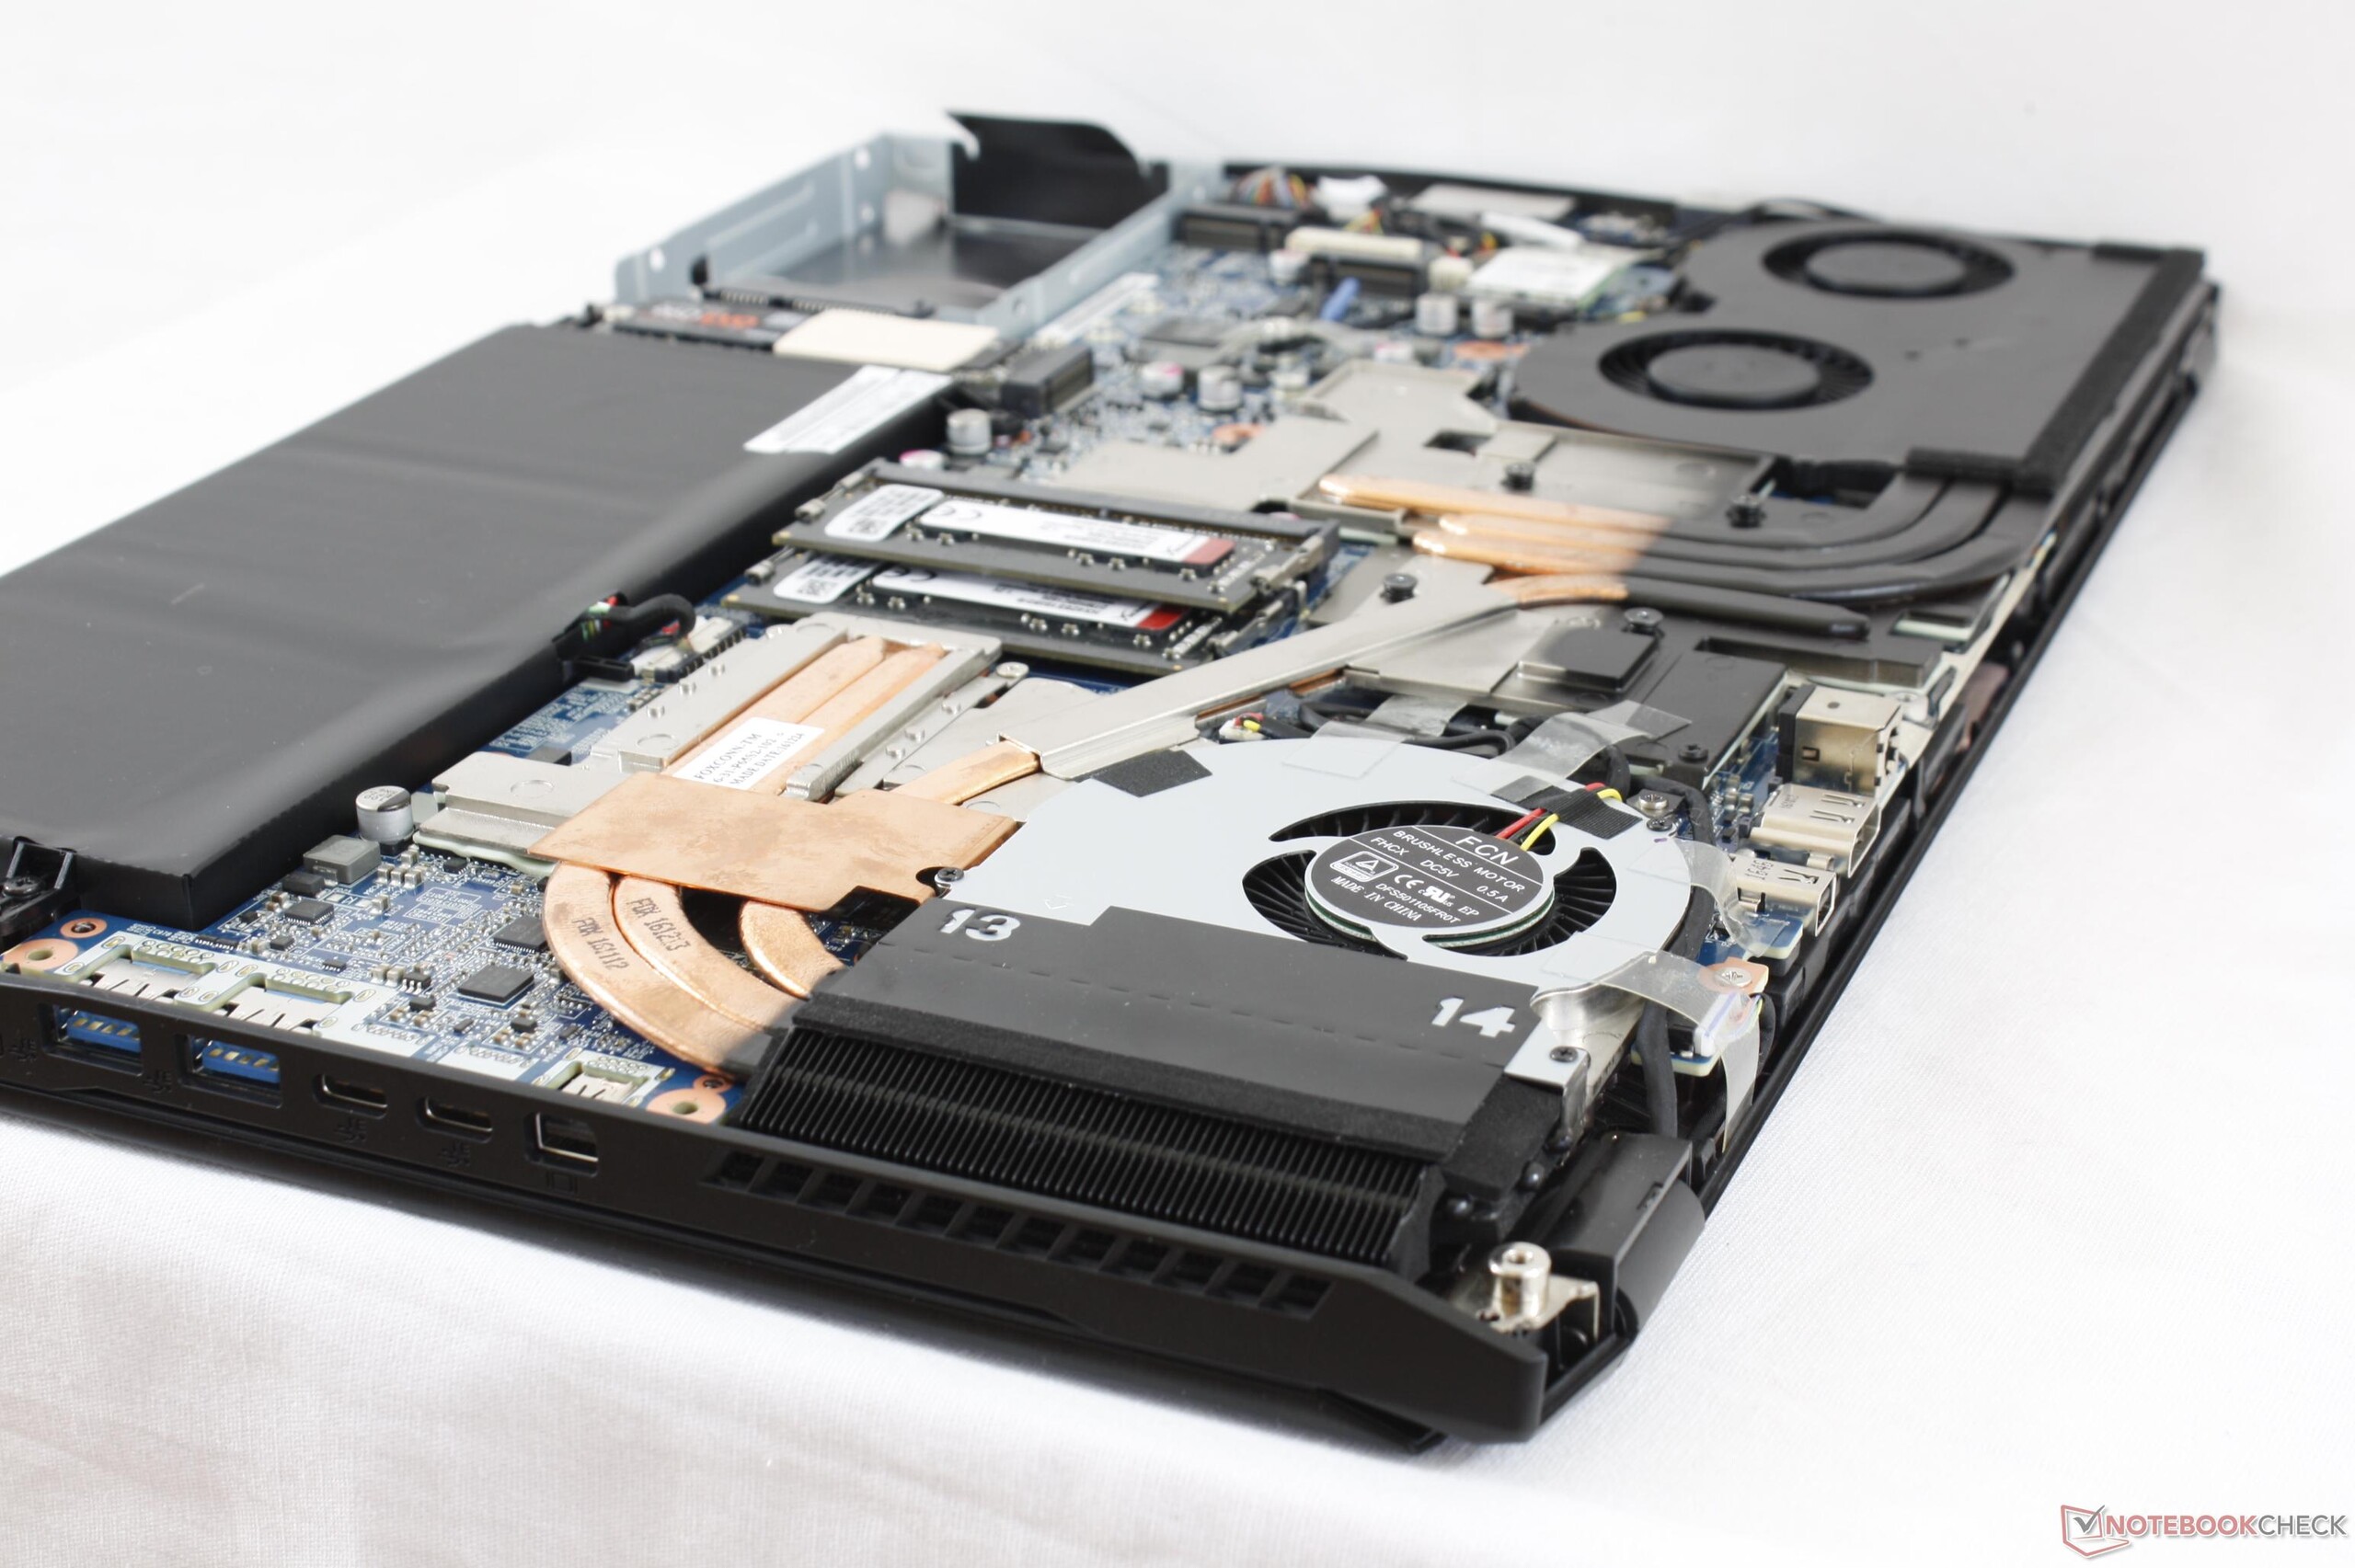
El Sky MX5 R3 tiene casi todo lo que un portátil para juegos necesita, incluyendo un mantenimiento sencillo, un buen número de opciones de pantallas y puertos, y un excelente equilibrio entre sus componentes que se complementan muy bien. La GTX 1070 encaja perfectamente con la pantalla 1080p a 120Hz y con la 4K UHD a 60 Hz y la CPU i7-7820HK o la i7-7700HQ son más que suficientes para la mayoría de los títulos. Los usuarios encontrarán especialmente adecuado el dispositivo si van a hacer uso de la conexión a través de 4G/WWAN y si no se plantean actualizar la GPU.
Los mayores inconvenientes incluyen la ausencia de puerto Thunderbolt 3, un contraste medio y un elevado ruido del ventilador incluso para un portátil de juegos. El rendimiento medio del i7-7820HK con velocidades de reloj por defecto es medio y las elevadas temperaturas que alcanza la CPU a velocidades Turbo Boost máximas son los problemas más evidentes en un sistema muy versátil. Es en este aspecto, vital por otra parte, donde el MSI GT62VR supone una mejor opción debido a su ventilador más silencioso. Aún así el Eurocom bate al MSI en otros aspectos como la retroiluminación más brillante, menores temperaturas generadas, construcción más delgada y mayor selección de puertos.
La calidad de construcción es mayor que la del Asus GL702VS y posee más opciones de configuración que el MSI GT62VR. El ruido del ventilador resulta decepcionante y recomendamos su configuración con el i7-7700HQ ya que las ventajas que se consiguen con el i7-7820HK son imperceptibles.
Ésta es una versión acortada del análisis original. Puedes leer el análisis completo en inglés aquí.
Eurocom Sky MX5 R3
- 06/23/2017 v6 (old)
Allen Ngo
Price comparison
