Breve análisis del HP Pavilion 15-aw004ng

| SD Card Reader | |
| average JPG Copy Test (av. of 3 runs) | |
| Toshiba Satellite L50-C-275 | |
| HP Pavilion 15-aw004ng W8Y60EA | |
| Lenovo Ideapad 500-15ACZ | |
| Lenovo Ideapad 310-15ISK | |
| Asus F555UB-XO043T | |
| Acer Aspire E5-552G-F62G | |
| maximum AS SSD Seq Read Test (1GB) | |
| Toshiba Satellite L50-C-275 | |
| HP Pavilion 15-aw004ng W8Y60EA | |
| Lenovo Ideapad 500-15ACZ | |
| Lenovo Ideapad 310-15ISK | |
| Asus F555UB-XO043T | |
| Acer Aspire E5-552G-F62G | |
| Networking | |
| iperf Server (receive) TCP 1 m | |
| Lenovo Ideapad 310-15ISK | |
| HP Pavilion 15-aw004ng W8Y60EA | |
| iperf Client (transmit) TCP 1 m | |
| Lenovo Ideapad 310-15ISK | |
| HP Pavilion 15-aw004ng W8Y60EA | |
| |||||||||||||||||||||||||
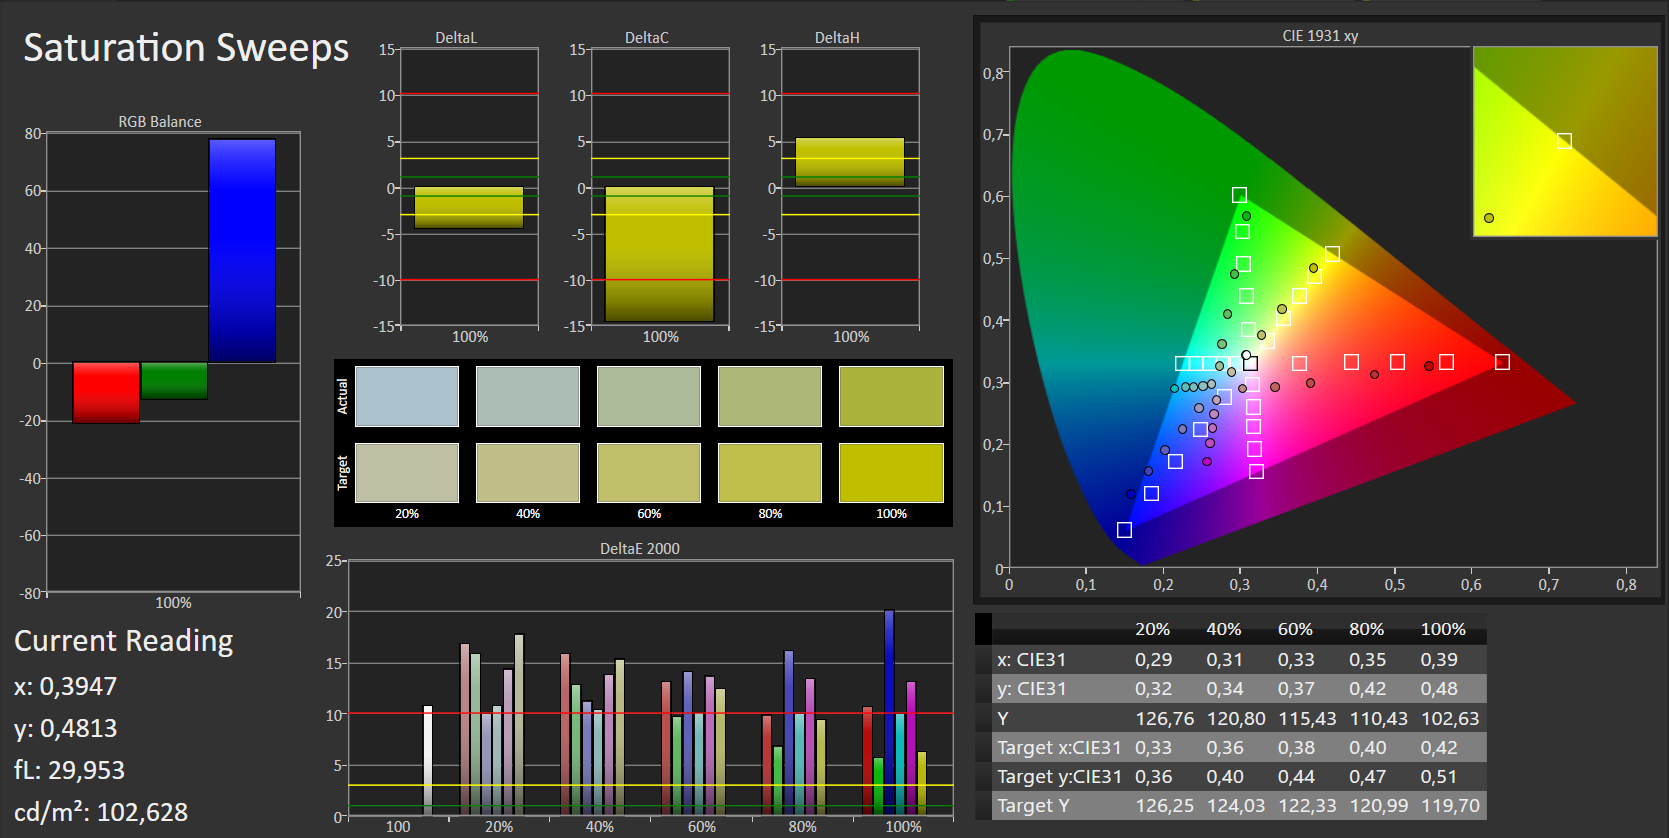
iluminación: 89 %
Brillo con batería: 139 cd/m²
Contraste: 490:1 (Negro: 0.49 cd/m²)
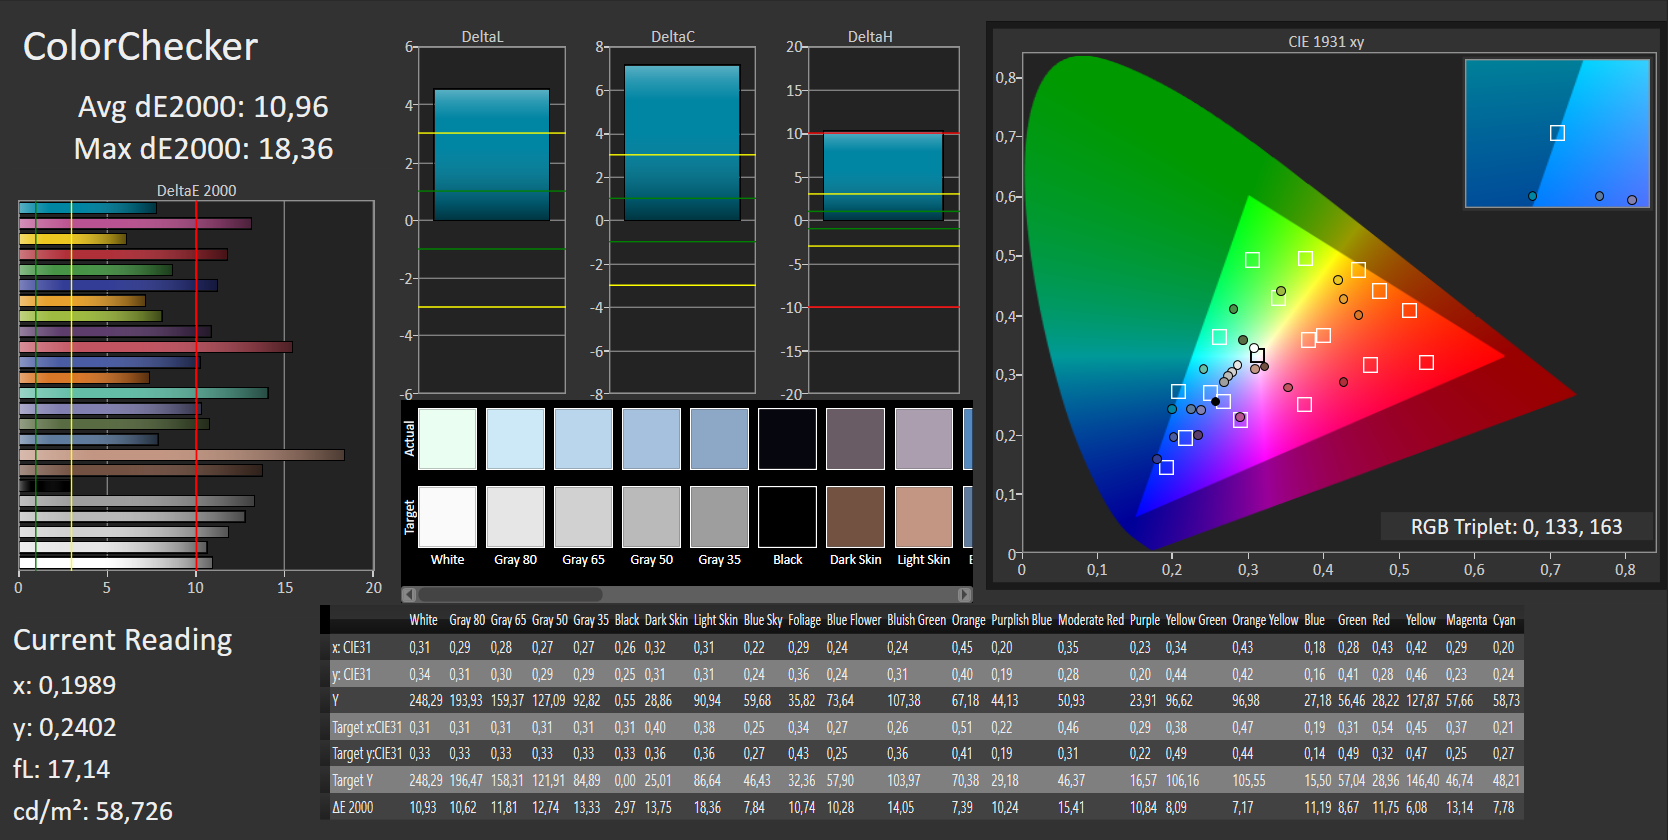
ΔE ColorChecker Calman: 10.96 | ∀{0.5-29.43 Ø4.71}
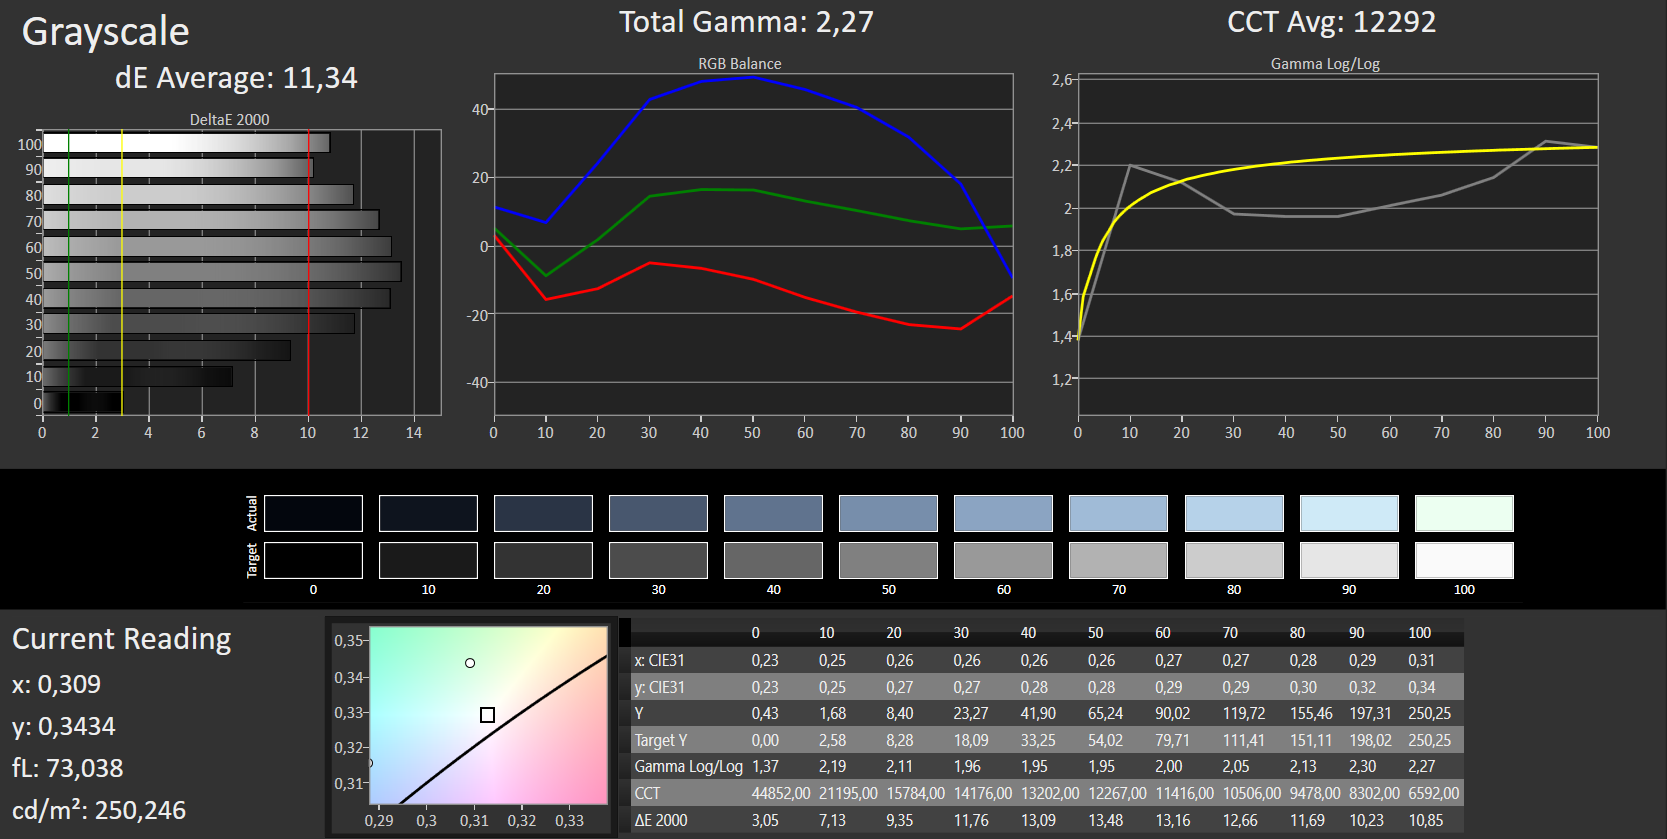
ΔE Greyscale Calman: 11.34 | ∀{0.09-98 Ø4.96}
60% sRGB (Argyll 1.6.3 3D)
39% AdobeRGB 1998 (Argyll 1.6.3 3D)
41.71% AdobeRGB 1998 (Argyll 3D)
60.3% sRGB (Argyll 3D)
40.35% Display P3 (Argyll 3D)
Gamma: 2.27
CCT: 12292 K
| HP Pavilion 15-aw004ng W8Y60EA TN LED, 1920x1080 | Acer Aspire E5-552G-F62G TN LED, 1920x1080 | Lenovo Ideapad 500-15ACZ TN LED, 1920x1080 | Toshiba Satellite L50-C-275 IPS, 1920x1080 | Asus F555UB-XO043T TN LED, 1366x768 | Lenovo Ideapad 310-15ISK TN LED, 1366x768 | |
|---|---|---|---|---|---|---|
| Display | -8% | -1% | 47% | -5% | -8% | |
| Display P3 Coverage (%) | 40.35 | 37.13 -8% | 39.82 -1% | 64.1 59% | 38.22 -5% | 37.06 -8% |
| sRGB Coverage (%) | 60.3 | 55.9 -7% | 59.7 -1% | 82.9 37% | 57.5 -5% | 55.8 -7% |
| AdobeRGB 1998 Coverage (%) | 41.71 | 38.36 -8% | 41.16 -1% | 60.6 45% | 39.49 -5% | 38.29 -8% |
| Response Times | -3% | -5% | 25% | -15% | 19% | |
| Response Time Grey 50% / Grey 80% * (ms) | 41 ? | 45 ? -10% | 43 ? -5% | 24 ? 41% | 46 ? -12% | 27 ? 34% |
| Response Time Black / White * (ms) | 23 ? | 22 ? 4% | 24 ? -4% | 21 ? 9% | 27 ? -17% | 22 ? 4% |
| PWM Frequency (Hz) | 50 ? | 50 ? | 50 ? | |||
| Screen | -3% | -3% | 46% | 9% | 5% | |
| Brightness middle (cd/m²) | 240 | 200 -17% | 238 -1% | 294 23% | 214 -11% | 200 -17% |
| Brightness (cd/m²) | 228 | 196 -14% | 221 -3% | 285 25% | 205 -10% | 198 -13% |
| Brightness Distribution (%) | 89 | 76 -15% | 84 -6% | 83 -7% | 82 -8% | 83 -7% |
| Black Level * (cd/m²) | 0.49 | 0.34 31% | 0.49 -0% | 0.26 47% | 0.46 6% | 0.28 43% |
| Contrast (:1) | 490 | 588 20% | 486 -1% | 1131 131% | 465 -5% | 714 46% |
| Colorchecker dE 2000 * | 10.96 | 11.54 -5% | 11.19 -2% | 5.07 54% | 6.52 41% | 10.63 3% |
| Colorchecker dE 2000 max. * | 18.36 | 19.36 -5% | 19.6 -7% | 9.33 49% | 9.1 50% | 15.69 15% |
| Greyscale dE 2000 * | 11.34 | 12.98 -14% | 11.53 -2% | 4.25 63% | 7.05 38% | 11.19 1% |
| Gamma | 2.27 97% | 2.58 85% | 2.41 91% | 2.49 88% | 2.41 91% | 1.78 124% |
| CCT | 12292 53% | 14060 46% | 13057 50% | 6597 99% | 8623 75% | 11258 58% |
| Color Space (Percent of AdobeRGB 1998) (%) | 39 | 36 -8% | 38 -3% | 54 38% | 36.6 -6% | 35 -10% |
| Color Space (Percent of sRGB) (%) | 60 | 56 -7% | 60 0% | 83 38% | 57.8 -4% | 56 -7% |
| Media total (Programa/Opciones) | -5% /
-4% | -3% /
-2% | 39% /
43% | -4% /
3% | 5% /
5% |
* ... más pequeño es mejor
Parpadeo de Pantalla / PWM (Pulse-Width Modulation)
| Parpadeo de Pantalla / PWM no detectado | ||
Comparación: 52 % de todos los dispositivos testados no usaron PWM para atenuar el display. Si se usó, medimos una media de 7754 (mínimo: 5 - máxmo: 343500) Hz. | ||
Tiempos de respuesta del display
| ↔ Tiempo de respuesta de Negro a Blanco | ||
|---|---|---|
| 23 ms ... subida ↗ y bajada ↘ combinada | ↗ 10 ms subida | 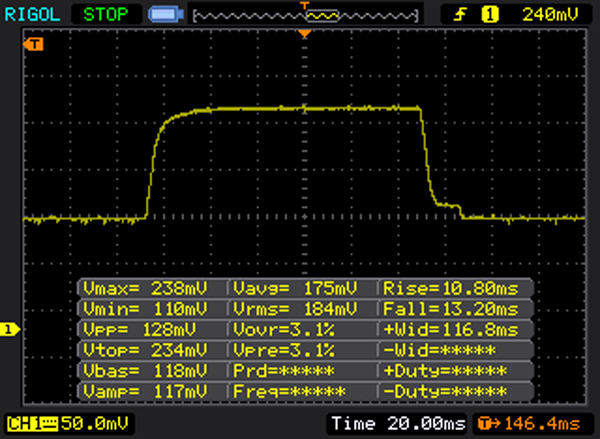 |
| ↘ 13 ms bajada | ||
| La pantalla mostró buenos tiempos de respuesta en nuestros tests pero podría ser demasiado lenta para los jugones competitivos. En comparación, todos los dispositivos de prueba van de ##min### (mínimo) a 240 (máximo) ms. » 52 % de todos los dispositivos son mejores. Eso quiere decir que el tiempo de respuesta es peor que la media (19.8 ms) de todos los dispositivos testados. | ||
| ↔ Tiempo de respuesta 50% Gris a 80% Gris | ||
| 41 ms ... subida ↗ y bajada ↘ combinada | ↗ 19 ms subida | 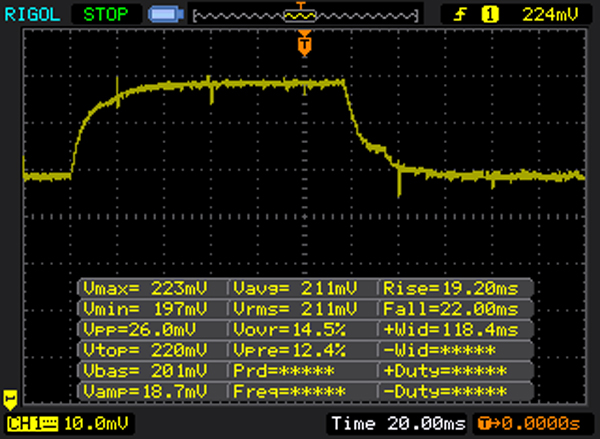 |
| ↘ 22 ms bajada | ||
| La pantalla mostró tiempos de respuesta lentos en nuestros tests y podría ser demasiado lenta para los jugones. En comparación, todos los dispositivos de prueba van de ##min### (mínimo) a 636 (máximo) ms. » 65 % de todos los dispositivos son mejores. Eso quiere decir que el tiempo de respuesta es peor que la media (31 ms) de todos los dispositivos testados. | ||
| Geekbench 3 | |
| 32 Bit Single-Core Score | |
| Asus F555UB-XO043T | |
| Toshiba Satellite L50-C-275 | |
| Asus F555LJ-XX110H | |
| HP Pavilion 15-aw004ng W8Y60EA | |
| Lenovo Ideapad 500-15ACZ | |
| 32 Bit Multi-Core Score | |
| Asus F555UB-XO043T | |
| Toshiba Satellite L50-C-275 | |
| HP Pavilion 15-aw004ng W8Y60EA | |
| Lenovo Ideapad 500-15ACZ | |
| Asus F555LJ-XX110H | |
| JetStream 1.1 - 1.1 Total | |
| Lenovo Ideapad 310-15ISK | |
| Asus F555UB-XO043T | |
| Toshiba Satellite L50-C-275 | |
| HP Pavilion 15-aw004ng W8Y60EA | |
| Lenovo Ideapad 500-15ACZ | |
| Mozilla Kraken 1.1 - Total | |
| Asus F555LJ-XX110H | |
| Lenovo Ideapad 500-15ACZ | |
| HP Pavilion 15-aw004ng W8Y60EA | |
| Asus F555UB-XO043T | |
| Toshiba Satellite L50-C-275 | |
| Octane V2 - Total Score | |
| Toshiba Satellite L50-C-275 | |
| Asus F555UB-XO043T | |
| HP Pavilion 15-aw004ng W8Y60EA | |
| Lenovo Ideapad 500-15ACZ | |
| Asus F555LJ-XX110H | |
* ... más pequeño es mejor
| PCMark 7 Score | 4340 puntos | |
| PCMark 8 Home Score Accelerated v2 | 2904 puntos | |
| PCMark 8 Creative Score Accelerated v2 | 3569 puntos | |
| PCMark 8 Work Score Accelerated v2 | 3883 puntos | |
ayuda | ||

| HP Pavilion 15-aw004ng W8Y60EA | Acer Aspire E5-552G-F62G Western Digital Scorpio Blue WD5000LPVX | Lenovo Ideapad 500-15ACZ Seagate Momentus SpinPoint M8 ST1000LM024 | Toshiba Satellite L50-C-275 Samsung SSD PM871 MZNLN256HCHP | Asus F555UB-XO043T Seagate Momentus SpinPoint M8 ST1000LM024 | |
|---|---|---|---|---|---|
| CrystalDiskMark 3.0 | -88% | -89% | 67% | -89% | |
| Read Seq (MB/s) | 503 | 110.7 -78% | 96.3 -81% | 490.6 -2% | 108.5 -78% |
| Write Seq (MB/s) | 316.6 | 108.9 -66% | 95.9 -70% | 304.1 -4% | 106.2 -66% |
| Read 512 (MB/s) | 261.9 | 36.71 -86% | 36.46 -86% | 414.6 58% | 34.52 -87% |
| Write 512 (MB/s) | 281.2 | 53.7 -81% | 42.75 -85% | 299.6 7% | 42.45 -85% |
| Read 4k (MB/s) | 17.04 | 0.415 -98% | 0.451 -97% | 36.82 116% | 0.391 -98% |
| Write 4k (MB/s) | 46.55 | 1.261 -97% | 0.895 -98% | 99.5 114% | 0.855 -98% |
| Read 4k QD32 (MB/s) | 125 | 1.126 -99% | 0.847 -99% | 333.4 167% | 0.774 -99% |
| Write 4k QD32 (MB/s) | 131.4 | 1.312 -99% | 0.892 -99% | 236.8 80% | 0.852 -99% |
| 3DMark 06 Standard Score | 8878 puntos | |
| 3DMark Vantage P Result | 6853 puntos | |
| 3DMark 11 Performance | 2979 puntos | |
| 3DMark Ice Storm Standard Score | 44367 puntos | |
| 3DMark Cloud Gate Standard Score | 5225 puntos | |
| 3DMark Fire Strike Score | 1678 puntos | |
| 3DMark Fire Strike Extreme Score | 686 puntos | |
| 3DMark Time Spy Score | 315 puntos | |
ayuda | ||
| 3DMark 11 - 1280x720 Performance GPU | |
| Acer Aspire E5-552G-F62G | |
| HP Pavilion 15-aw004ng W8Y60EA | |
| Lenovo Ideapad 500-15ACZ | |
| Asus F555UB-XO043T | |
| HP Pavilion 15-aw004ng | |
| Toshiba Satellite L50-C-275 | |
| Lenovo Ideapad 310-15ISK | |
| 3DMark | |
| 1280x720 Cloud Gate Standard Graphics | |
| HP Pavilion 15-aw004ng W8Y60EA | |
| Acer Aspire E5-552G-F62G | |
| Lenovo Ideapad 500-15ACZ | |
| Asus F555UB-XO043T | |
| Toshiba Satellite L50-C-275 | |
| HP Pavilion 15-aw004ng | |
| 1920x1080 Fire Strike Graphics | |
| HP Pavilion 15-aw004ng W8Y60EA | |
| Asus F555UB-XO043T | |
| Toshiba Satellite L50-C-275 | |
| Lenovo Ideapad 500-15ACZ | |
| HP Pavilion 15-aw004ng | |
| bajo | medio | alto | ultra | |
|---|---|---|---|---|
| Counter-Strike: GO (2012) | 82 | 77.8 | 71.7 | 50.3 |
| Tomb Raider (2013) | 83.6 | 55.7 | 46.3 | 21.8 |
| BioShock Infinite (2013) | 72.7 | 42.9 | 33.7 | 11.7 |
| Battlefield 4 (2013) | 50.1 | 37.2 | 23.4 | 7.7 |
| Middle-earth: Shadow of Mordor (2014) | 33.3 | 21.3 | 12.2 | |
| Alien: Isolation (2014) | 51.6 | 42.7 | 28 | |
| F1 2014 (2014) | 59 | 42 | 39 | 24 |
| Dragon Age: Inquisition (2014) | 40.8 | 27.8 | 9.6 | |
| Battlefield Hardline (2015) | 37.7 | 29.3 | 14 | 8.3 |
| GTA V (2015) | 54.6 | 52.4 | 11.7 | |
| Batman: Arkham Knight (2015) | 19 | 17 | 7 | |
| Metal Gear Solid V (2015) | 60 | 37.5 | 13.3 | |
| FIFA 16 (2015) | 77.5 | 53.8 | 25 | |
| Anno 2205 (2015) | 36 | 17.8 | 7.4 | |
| Call of Duty: Black Ops 3 (2015) | 38.1 | 26.2 | 11.7 | |
| Assassin's Creed Syndicate (2015) | 15.9 | 13.1 | 6.6 | |
| Rainbow Six Siege (2015) | 53.5 | 33.7 | 13.3 | |
| Rise of the Tomb Raider (2016) | 24.4 | 13.9 | 7.7 | |
| XCOM 2 (2016) | 22 | 8 | 5.2 | |
| Far Cry Primal (2016) | 23 | 10 | 9 | |
| The Division (2016) | 23.3 | 15.1 | 7.1 | |
| Hitman 2016 (2016) | 18.6 | 17.7 | 10.5 | |
| Need for Speed 2016 (2016) | 25.6 | 22.6 | 11.7 | 9.5 |
| Ashes of the Singularity (2016) | 14.2 | 7 | 6.2 | |
| Doom (2016) | 22.4 | 12.8 | 8.3 | |
| Mirror's Edge Catalyst (2016) | 26.4 | 12.8 | 5.8 | |
| No Man's Sky (2016) | 21.8 | 18 | 10 | |
| Deus Ex Mankind Divided (2016) | 15.1 | 10.9 | 5.4 |
| BioShock Infinite - 1366x768 Medium Preset | |
| Asus F555UB-XO043T | |
| Toshiba Satellite L50-C-275 | |
| HP Pavilion 15-aw004ng W8Y60EA | |
| HP Pavilion 15-aw004ng | |
| Lenovo Ideapad 310-15ISK | |
| Lenovo Ideapad 500-15ACZ | |
| Tomb Raider - 1366x768 Normal Preset AA:FX AF:4x | |
| Toshiba Satellite L50-C-275 | |
| HP Pavilion 15-aw004ng W8Y60EA | |
| Lenovo Ideapad 500-15ACZ | |
| Battlefield 4 - 1024x768 Low Preset | |
| HP Pavilion 15-aw004ng | |
| HP Pavilion 15-aw004ng W8Y60EA | |
| Lenovo Ideapad 500-15ACZ | |
| Acer Aspire E5-552G-F62G | |
| FIFA 16 - 1366x768 High Preset AA:2x MS | |
| HP Pavilion 15-aw004ng W8Y60EA | |
| Lenovo Ideapad 500-15ACZ | |
| Acer Aspire E5-552G-F62G | |
| GTA V - 1024x768 Lowest Settings possible | |
| Lenovo Ideapad 310-15ISK | |
| HP Pavilion 15-aw004ng W8Y60EA | |
| F1 2014 - 1920x1080 High Preset | |
| Lenovo Ideapad 310-15ISK | |
| HP Pavilion 15-aw004ng W8Y60EA | |
| Lenovo Ideapad 500-15ACZ | |
| Counter-Strike: GO - 1366x768 High AA:2x MS AF:4x | |
| HP Pavilion 15-aw004ng W8Y60EA | |
Ruido
| Ocioso |
| 31.7 / 31.9 / 31.9 dB(A) |
| HDD |
| 32.2 dB(A) |
| DVD |
| 36.6 / dB(A) |
| Carga |
| 41 / 42.7 dB(A) |
 | ||
30 dB silencioso 40 dB(A) audible 50 dB(A) ruidosamente alto |
||
min: | ||
| HP Pavilion 15-aw004ng W8Y60EA A10-9600P, Radeon R8 M445DX | Acer Aspire E5-552G-F62G FX-8800P, Radeon R8 M365DX | Lenovo Ideapad 500-15ACZ A10-8700P, Radeon R6 M340DX | Toshiba Satellite L50-C-275 6200U, GeForce 930M | Asus F555UB-XO043T 6200U, GeForce 940M | Lenovo Ideapad 310-15ISK 6500U, GeForce 920MX | |
|---|---|---|---|---|---|---|
| Noise | 3% | 0% | 9% | -4% | -1% | |
| apagado / medio ambiente * (dB) | 31.2 | 31.3 -0% | 31.3 -0% | 22 29% | 31.2 -0% | |
| Idle Minimum * (dB) | 31.7 | 32.4 -2% | 33.1 -4% | 31.3 1% | 34 -7% | 32.6 -3% |
| Idle Average * (dB) | 31.9 | 33.2 -4% | 33.3 -4% | 31.3 2% | 34 -7% | 32.6 -2% |
| Idle Maximum * (dB) | 31.9 | 33.2 -4% | 33.5 -5% | 32.2 -1% | 34.2 -7% | 33.8 -6% |
| Load Average * (dB) | 41 | 36.5 11% | 38.9 5% | 36.4 11% | 38.9 5% | 40.2 2% |
| Load Maximum * (dB) | 42.7 | 34.4 19% | 38.9 9% | 36.6 14% | 43.6 -2% | 40.4 5% |
* ... más pequeño es mejor
(+) La temperatura máxima en la parte superior es de 33.4 °C / 92 F, frente a la media de 36.8 °C / 98 F, que oscila entre 21 y 71 °C para la clase Multimedia.
(+) El fondo se calienta hasta un máximo de 32.9 °C / 91 F, frente a la media de 39.1 °C / 102 F
(+) En reposo, la temperatura media de la parte superior es de 26 °C / 79# F, frente a la media del dispositivo de 31.3 °C / 88 F.
(+) El reposamanos y el panel táctil están a una temperatura inferior a la de la piel, con un máximo de 27 °C / 80.6 F y, por tanto, son fríos al tacto.
(±) La temperatura media de la zona del reposamanos de dispositivos similares fue de 28.7 °C / 83.7 F (+1.7 °C / 3.1 F).
| HP Pavilion 15-aw004ng W8Y60EA A10-9600P, Radeon R8 M445DX | Acer Aspire E5-552G-F62G FX-8800P, Radeon R8 M365DX | Lenovo Ideapad 500-15ACZ A10-8700P, Radeon R6 M340DX | Toshiba Satellite L50-C-275 6200U, GeForce 930M | Asus F555UB-XO043T 6200U, GeForce 940M | Lenovo Ideapad 310-15ISK 6500U, GeForce 920MX | |
|---|---|---|---|---|---|---|
| Heat | -5% | -4% | -13% | -8% | -10% | |
| Maximum Upper Side * (°C) | 33.4 | 34 -2% | 36 -8% | 42.5 -27% | 33.2 1% | 38.6 -16% |
| Maximum Bottom * (°C) | 32.9 | 39.6 -20% | 39.2 -19% | 46.9 -43% | 44 -34% | 42 -28% |
| Idle Upper Side * (°C) | 27.7 | 27.7 -0% | 27.1 2% | 25.8 7% | 28.2 -2% | 28.1 -1% |
| Idle Bottom * (°C) | 29.4 | 29 1% | 26.6 10% | 26 12% | 28.1 4% | 28.1 4% |
* ... más pequeño es mejor
HP Pavilion 15-aw004ng W8Y60EA análisis de audio
(-) | altavoces no muy altos (#68 dB)
Graves 100 - 315 Hz
(-) | casi sin bajos - de media 22.8% inferior a la mediana
(+) | el bajo es lineal (5.9% delta a la frecuencia anterior)
Medios 400 - 2000 Hz
(±) | medias más altas - de media 5.5% más altas que la mediana
(±) | la linealidad de los medios es media (12.2% delta respecto a la frecuencia anterior)
Altos 2 - 16 kHz
(+) | máximos equilibrados - a sólo 4.7% de la mediana
(+) | los máximos son lineales (4.7% delta a la frecuencia anterior)
Total 100 - 16.000 Hz
(±) | la linealidad del sonido global es media (29.1% de diferencia con la mediana)
En comparación con la misma clase
» 95% de todos los dispositivos probados de esta clase eran mejores, 2% similares, 4% peores
» El mejor tuvo un delta de 5%, la media fue 17%, el peor fue ###max##%
En comparación con todos los dispositivos probados
» 87% de todos los dispositivos probados eran mejores, 2% similares, 11% peores
» El mejor tuvo un delta de 4%, la media fue 23%, el peor fue ###max##%
Apple MacBook 12 (Early 2016) 1.1 GHz análisis de audio
(+) | los altavoces pueden reproducir a un volumen relativamente alto (#83.6 dB)
Graves 100 - 315 Hz
(±) | lubina reducida - en promedio 11.3% inferior a la mediana
(±) | la linealidad de los graves es media (14.2% delta a frecuencia anterior)
Medios 400 - 2000 Hz
(+) | medios equilibrados - a sólo 2.4% de la mediana
(+) | los medios son lineales (5.5% delta a la frecuencia anterior)
Altos 2 - 16 kHz
(+) | máximos equilibrados - a sólo 2% de la mediana
(+) | los máximos son lineales (4.5% delta a la frecuencia anterior)
Total 100 - 16.000 Hz
(+) | el sonido global es lineal (10.2% de diferencia con la mediana)
En comparación con la misma clase
» 7% de todos los dispositivos probados de esta clase eran mejores, 2% similares, 90% peores
» El mejor tuvo un delta de 5%, la media fue 18%, el peor fue ###max##%
En comparación con todos los dispositivos probados
» 5% de todos los dispositivos probados eran mejores, 1% similares, 94% peores
» El mejor tuvo un delta de 4%, la media fue 23%, el peor fue ###max##%
| Off / Standby | |
| Ocioso | |
| Carga |
|
Clave:
min: | |
| HP Pavilion 15-aw004ng W8Y60EA A10-9600P, Radeon R8 M445DX | Acer Aspire E5-552G-F62G FX-8800P, Radeon R8 M365DX | Lenovo Ideapad 500-15ACZ A10-8700P, Radeon R6 M340DX | Toshiba Satellite L50-C-275 6200U, GeForce 930M | Asus F555UB-XO043T 6200U, GeForce 940M | Lenovo Ideapad 310-15ISK 6500U, GeForce 920MX | |
|---|---|---|---|---|---|---|
| Power Consumption | -2% | -10% | 4% | 13% | 2% | |
| Idle Minimum * (Watt) | 5.5 | 6.7 -22% | 6.8 -24% | 4.7 15% | 4.7 15% | 7 -27% |
| Idle Average * (Watt) | 8.2 | 9.8 -20% | 10.5 -28% | 9.9 -21% | 6.5 21% | 8 2% |
| Idle Maximum * (Watt) | 9.5 | 10.6 -12% | 11 -16% | 10.1 -6% | 6.8 28% | 8.4 12% |
| Load Average * (Watt) | 44.5 | 46 -3% | 41.6 7% | 36 19% | 42.7 4% | 38.8 13% |
| Load Maximum * (Watt) | 58 | 32 45% | 51 12% | 51 12% | 59 -2% | 52.8 9% |
* ... más pequeño es mejor
| HP Pavilion 15-aw004ng W8Y60EA 41 Wh | Acer Aspire E5-552G-F62G 37 Wh | Lenovo Ideapad 500-15ACZ 32 Wh | Toshiba Satellite L50-C-275 45 Wh | Asus F555UB-XO043T 37 Wh | |
|---|---|---|---|---|---|
| Duración de Batería | -32% | -31% | 35% | 37% | |
| Reader / Idle (h) | 9.3 | 6.7 -28% | 6.1 -34% | ||
| H.264 (h) | 3.2 | 2.8 -13% | |||
| WiFi v1.3 (h) | 4.3 | 2.8 -35% | 3.1 -28% | 5.8 35% | 5.9 37% |
| Load (h) | 1.6 | 0.8 -50% |
Pro
Contra
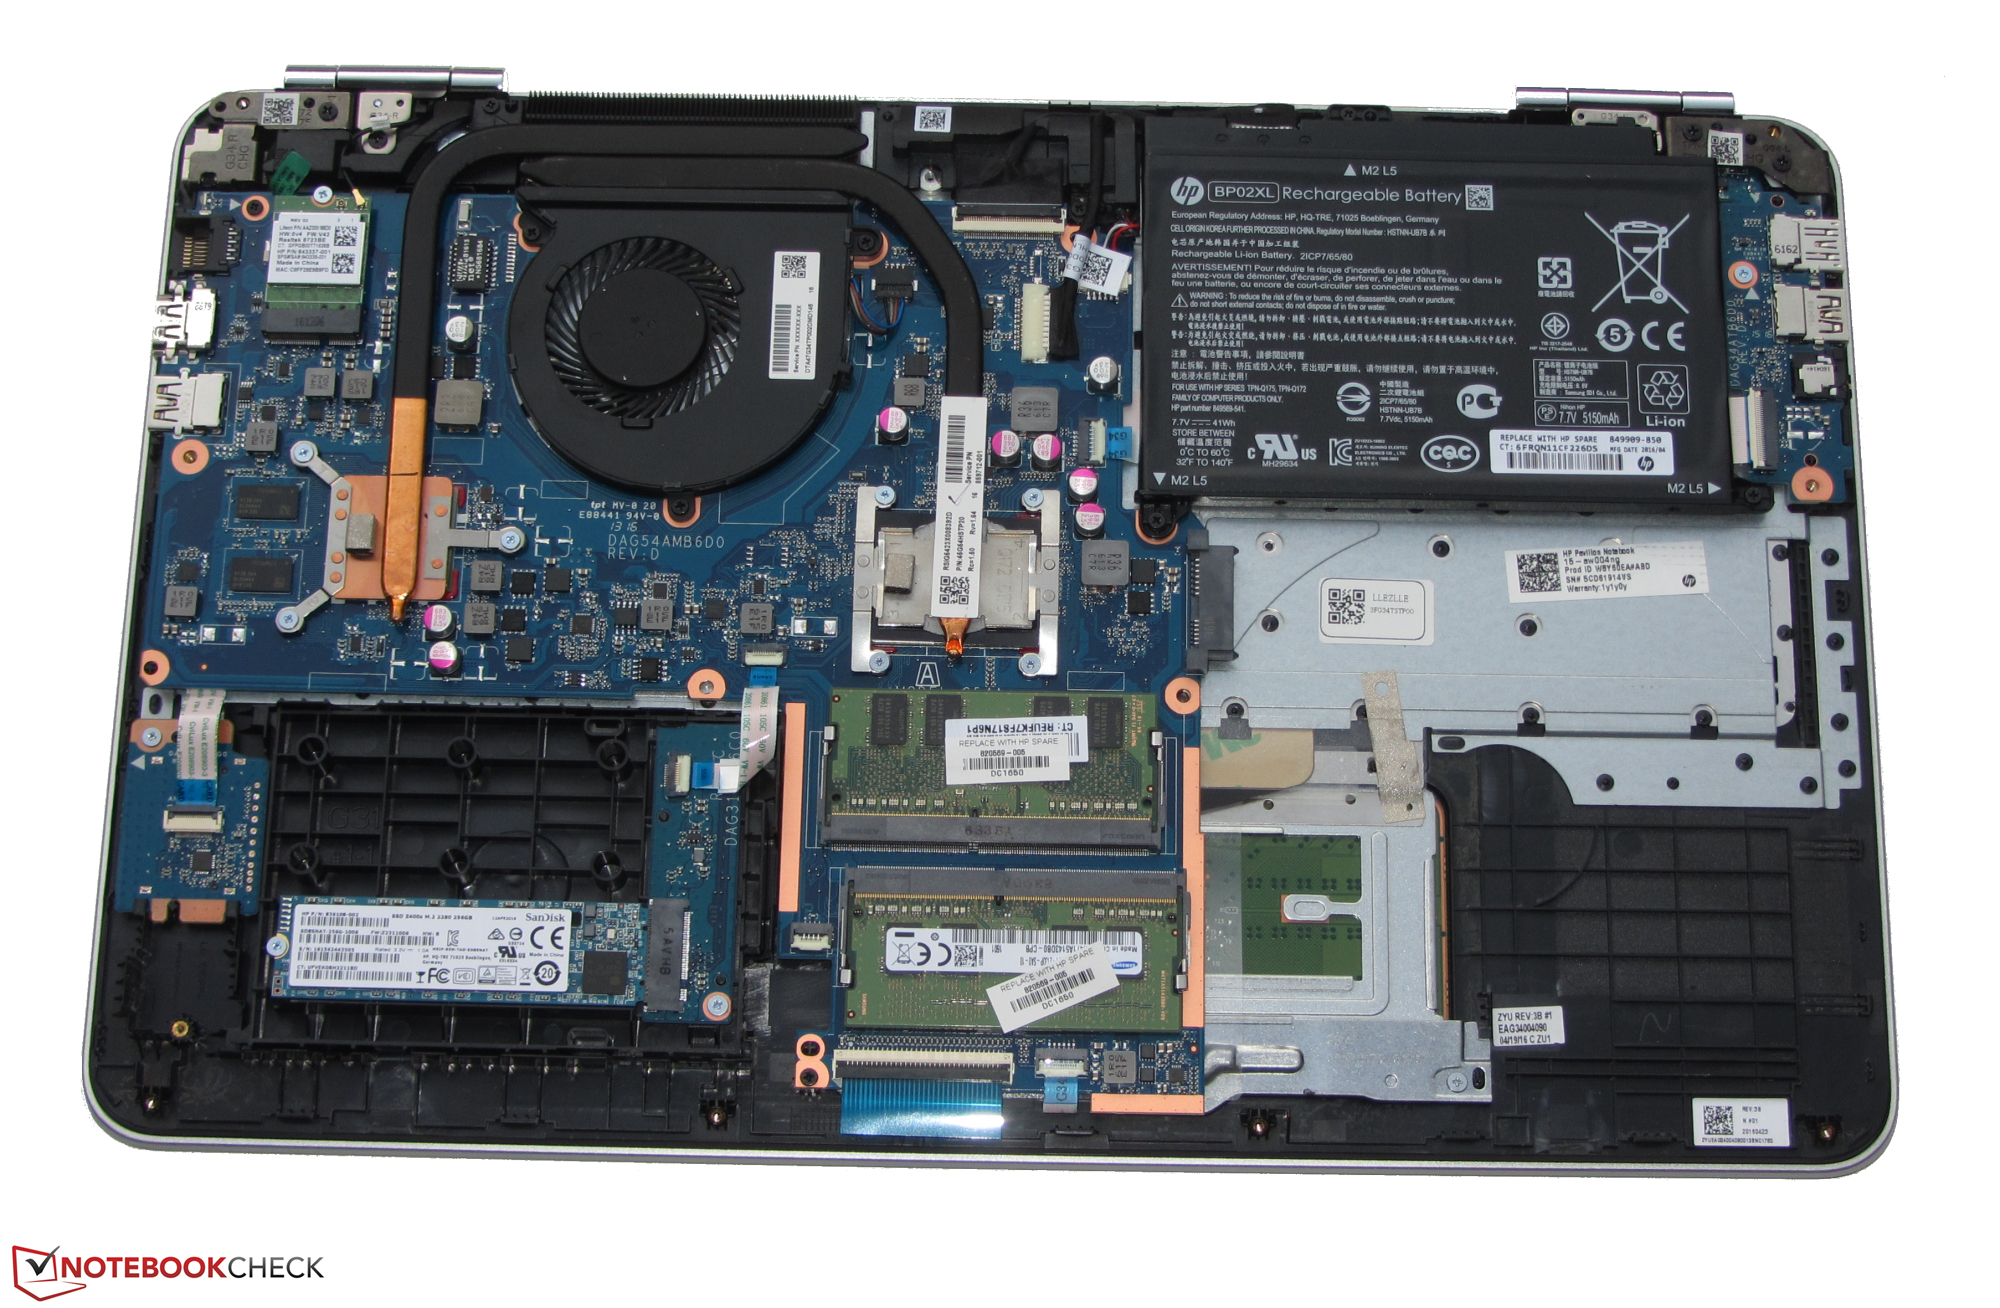
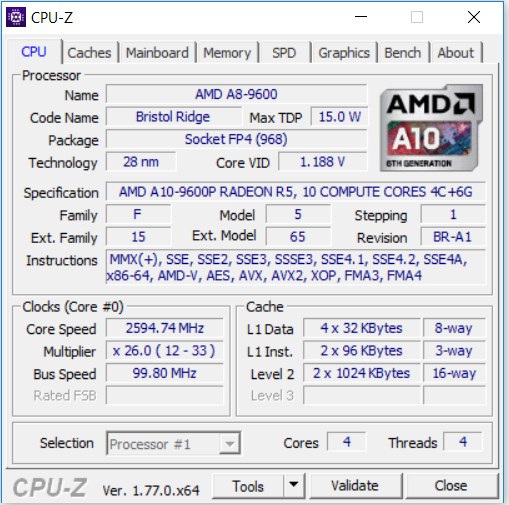
El procesador AMD del modelo de pruebas ofrece suficiente rendimiento para el uso diario. Lo que es más, el portátil es quedo la mayor parte del tiempo y apenas se calienta. Un veloz SSD asegura que el sistema vaya fluido. Por desgracia, el portátil no tiene escotilla de mantenimiento. Para cambiar el SSD hay que abrir la carcasa. El teclado basta para el uso doméstico y el aguante de batería no tiene nada de especial. El Pavilion podría haber sido mejor en estas áreas.
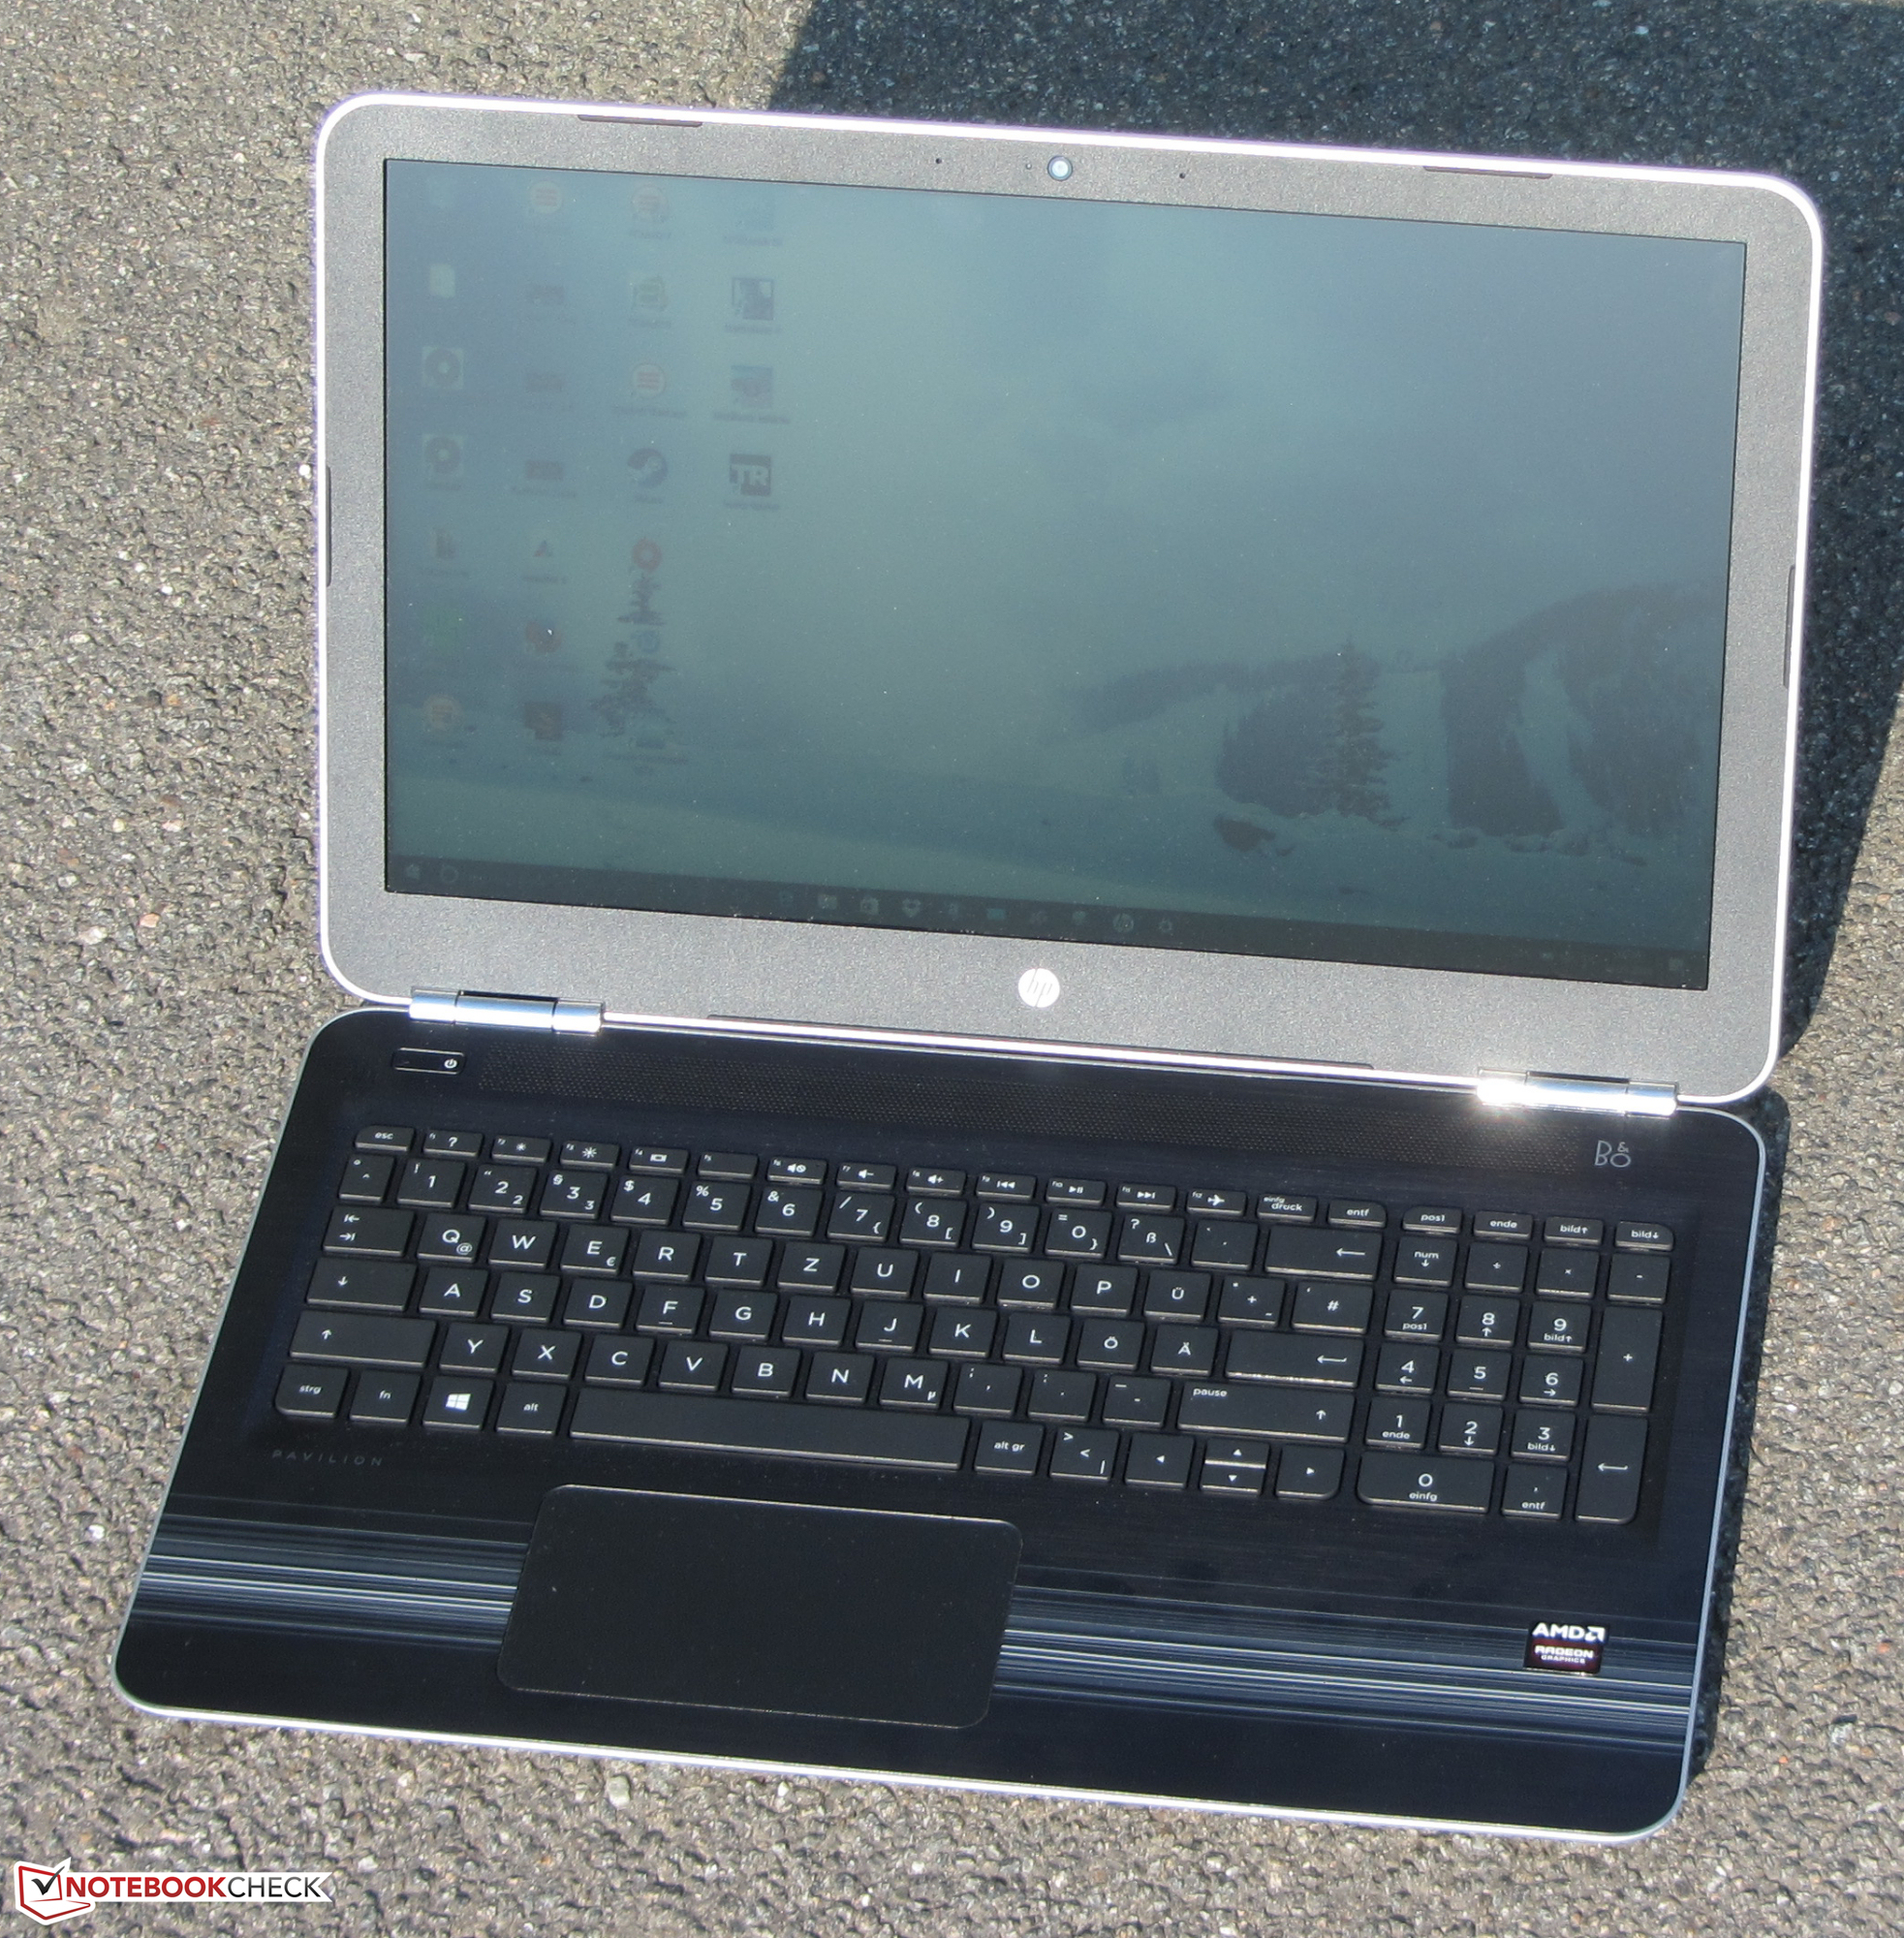
Por unos 550 Euros, el Pavilion 15-aw004ng es un buen todoterreno para los usuarios con necesidades básicas.
Por un precio relativamente bajo, HP incluye un display FHD y un sistema de doble gráfica. Por otro lado, el panel no es muy brillante y tiene poco ángulo de visión y contraste. El sistema en sí está cubierto por una garantía de 1 año. Con todo, HP ofrece un portátil de 15.6" de bajo precio con claros defectos, que puede resultar útil para algunos usuarios.
Ésta es una versión acortada del análisis original. Puedes leer el análisis completo en inglés aquí.
HP Pavilion 15-aw004ng W8Y60EA
- 09/22/2016 v5.1 (old)
Sascha Mölck