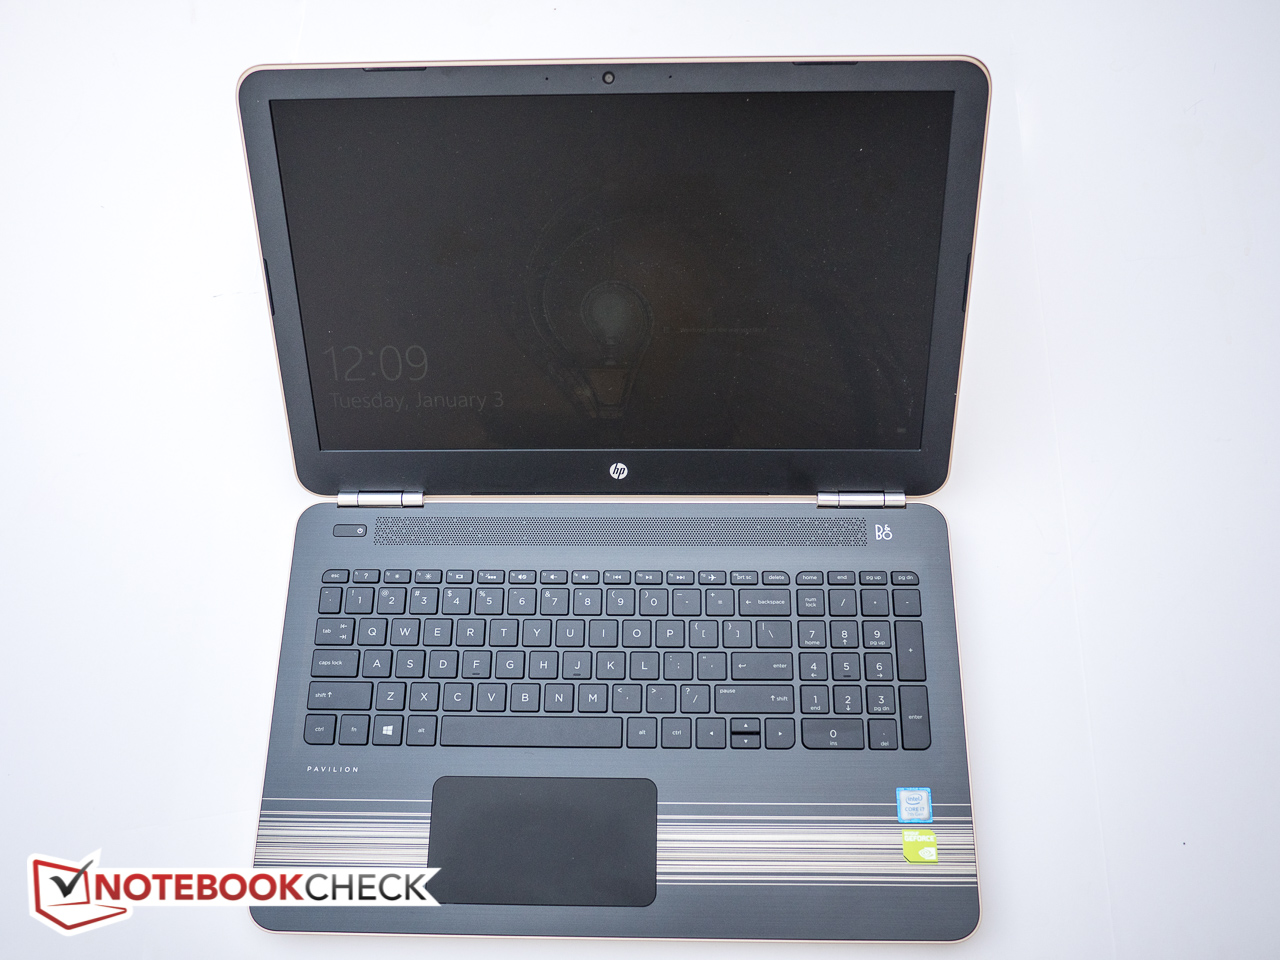
Breve análisis del HP Pavilion 15t-au100 (W0P31AV)
| SD Card Reader | |
| average JPG Copy Test (av. of 3 runs) | |
| Dell XPS 15-9550 i7 | |
| HP Pavilion 15t-au100 CTO (W0P31AV) | |
| Lenovo IdeaPad 510-15IKB 80SV0087GE | |
| Acer Aspire E5-575G-549D | |
| Asus Zenbook UX510UW-CN044T | |
| maximum AS SSD Seq Read Test (1GB) | |
| Dell XPS 15-9550 i7 | |
| HP Pavilion 15t-au100 CTO (W0P31AV) | |
| Acer Aspire E5-575G-549D | |
| Asus Zenbook UX510UW-CN044T | |
| Lenovo IdeaPad 510-15IKB 80SV0087GE | |
| Networking | |
| Wi-Fi Client 1m 512KB | |
| Wi-Fi Server 1m 512KB |
| |||||||||||||||||||||||||
iluminación: 69 %
Brillo con batería: 186.5 cd/m²
Contraste: 1036:1 (Negro: 0.18 cd/m²)
ΔE ColorChecker Calman: 5.7 | ∀{0.5-29.43 Ø4.71}
ΔE Greyscale Calman: 4.4 | ∀{0.09-98 Ø4.96}
64.95% sRGB (Argyll 1.6.3 3D)
44.71% AdobeRGB 1998 (Argyll 1.6.3 3D)
44.71% AdobeRGB 1998 (Argyll 3D)
64.9% sRGB (Argyll 3D)
43.27% Display P3 (Argyll 3D)
Gamma: 2.35
CCT: 6963 K
| HP Pavilion 15t-au100 CTO (W0P31AV) BOE0693, IPS, 15.6", 1920x1080 | Asus Zenbook UX510UW-CN044T LG Philips LP156WF6-SPB6, IPS, 15.6", 1920x1080 | Lenovo IdeaPad 510-15IKB 80SV0087GE BOE HF NV156FHM-N42, IPS, 15.6", 1920x1080 | Acer Aspire E5-575G-549D Chi Mei CMN15C4, TN, 15.6", 1920x1080 | HP Pavilion 15 UHD T9Y85AV SDC5958, IPS, 15.6", 3840x2160 | |
|---|---|---|---|---|---|
| Display | 33% | -1% | -11% | 36% | |
| Display P3 Coverage (%) | 43.27 | 61.5 42% | 42.66 -1% | 38.57 -11% | 60 39% |
| sRGB Coverage (%) | 64.9 | 80.4 24% | 64.1 -1% | 57.4 -12% | 85.8 32% |
| AdobeRGB 1998 Coverage (%) | 44.71 | 58.8 32% | 44.08 -1% | 39.89 -11% | 61.8 38% |
| Response Times | 14% | -17% | 18% | 13% | |
| Response Time Grey 50% / Grey 80% * (ms) | 42 ? | 40 ? 5% | 51 ? -21% | 39 ? 7% | 39.6 ? 6% |
| Response Time Black / White * (ms) | 33.6 ? | 26 ? 23% | 38 ? -13% | 24 ? 29% | 27.2 ? 19% |
| PWM Frequency (Hz) | 198.4 | 50 ? | 1282 ? | ||
| Screen | 16% | 21% | -35% | 10% | |
| Brightness middle (cd/m²) | 186.5 | 326 75% | 291 56% | 176 -6% | 336.2 80% |
| Brightness (cd/m²) | 174 | 316 82% | 265 52% | 169 -3% | 323 86% |
| Brightness Distribution (%) | 69 | 80 16% | 86 25% | 91 32% | 87 26% |
| Black Level * (cd/m²) | 0.18 | 0.35 -94% | 0.23 -28% | 0.47 -161% | 0.629 -249% |
| Contrast (:1) | 1036 | 931 -10% | 1265 22% | 374 -64% | 534 -48% |
| Colorchecker dE 2000 * | 5.7 | 5.49 4% | 4.78 16% | 8.83 -55% | 3.32 42% |
| Colorchecker dE 2000 max. * | 22.5 | 11.36 50% | 9.51 58% | 14.01 38% | 7.4 67% |
| Greyscale dE 2000 * | 4.4 | 4.84 -10% | 3.49 21% | 8.97 -104% | 2.88 35% |
| Gamma | 2.35 94% | 2.23 99% | 2.58 85% | 2.43 91% | 2.34 94% |
| CCT | 6963 93% | 5971 109% | 6013 108% | 10234 64% | 6279 104% |
| Color Space (Percent of AdobeRGB 1998) (%) | 44.71 | 53 19% | 40 -11% | 36.8 -18% | 55.3 24% |
| Color Space (Percent of sRGB) (%) | 64.95 | 80 23% | 64 -1% | 57.3 -12% | 85.5 32% |
| Media total (Programa/Opciones) | 21% /
19% | 1% /
12% | -9% /
-23% | 20% /
15% |
* ... más pequeño es mejor
Tiempos de respuesta del display
| ↔ Tiempo de respuesta de Negro a Blanco | ||
|---|---|---|
| 33.6 ms ... subida ↗ y bajada ↘ combinada | ↗ 7.6 ms subida | 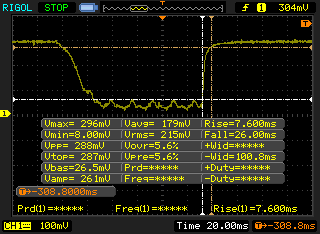 |
| ↘ 26 ms bajada | ||
| La pantalla mostró tiempos de respuesta lentos en nuestros tests y podría ser demasiado lenta para los jugones. En comparación, todos los dispositivos de prueba van de ##min### (mínimo) a 240 (máximo) ms. » 90 % de todos los dispositivos son mejores. Eso quiere decir que el tiempo de respuesta es peor que la media (19.8 ms) de todos los dispositivos testados. | ||
| ↔ Tiempo de respuesta 50% Gris a 80% Gris | ||
| 42 ms ... subida ↗ y bajada ↘ combinada | ↗ 13.2 ms subida | 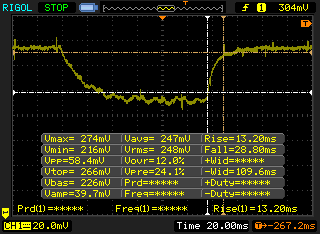 |
| ↘ 28.8 ms bajada | ||
| La pantalla mostró tiempos de respuesta lentos en nuestros tests y podría ser demasiado lenta para los jugones. En comparación, todos los dispositivos de prueba van de ##min### (mínimo) a 636 (máximo) ms. » 67 % de todos los dispositivos son mejores. Eso quiere decir que el tiempo de respuesta es peor que la media (30.9 ms) de todos los dispositivos testados. | ||
Parpadeo de Pantalla / PWM (Pulse-Width Modulation)
| Parpadeo de Pantalla / PWM detectado | 198.4 Hz | 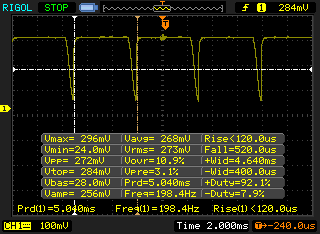 | |
La retroiluminación del display parpadea a 198.4 Hz (seguramente usa PWM - Pulse-Width Modulation) . La frecuencia de 198.4 Hz es relativamente baja, por lo que la gente sensible debería ver parpadeos y padecer fatiga visual por la pantalla (usado al brillo indicado a continuación). Comparación: 52 % de todos los dispositivos testados no usaron PWM para atenuar el display. Si se usó, medimos una media de 7744 (mínimo: 5 - máxmo: 343500) Hz. | |||
| wPrime 2.10 - 1024m | |
| HP Pavilion 15t-au100 CTO (W0P31AV) | |
| Acer Aspire E5-575G-549D | |
| Dell XPS 15 9550 i7 FHD | |
| HP Pavilion 15 UHD T9Y85AV | |
| Super Pi Mod 1.5 XS 32M - 32M | |
| Acer Aspire E5-575G-549D | |
| HP Pavilion 15t-au100 CTO (W0P31AV) | |
| Dell XPS 15 9550 i7 FHD | |
| HP Pavilion 15 UHD T9Y85AV | |
* ... más pequeño es mejor
| PCMark 8 Home Score Accelerated v2 | 3424 puntos | |
| PCMark 8 Creative Score Accelerated v2 | 4089 puntos | |
| PCMark 8 Work Score Accelerated v2 | 4340 puntos | |
ayuda | ||
| HP Pavilion 15t-au100 CTO (W0P31AV) Toshiba MQ01ABD100 | Acer Aspire E5-575G-549D Toshiba MQ01ABD100 | Lenovo IdeaPad 510-15IKB 80SV0087GE Liteonit CV3-DE256 | Asus Zenbook UX510UW-CN044T SanDisk SD8SNAT256G1002 | Dell XPS 15 9550 i7 FHD Samsung PM951 NVMe 512 GB | HP Pavilion 15 UHD T9Y85AV SanDisk Z400s SD8SNAT-128G | |
|---|---|---|---|---|---|---|
| CrystalDiskMark 3.0 | -20% | 10956% | 7338% | 16558% | 6457% | |
| Read Seq (MB/s) | 109.5 | 95.3 -13% | 469.2 328% | 459.3 319% | 1291 1079% | 484.6 343% |
| Write Seq (MB/s) | 105.2 | 85.6 -19% | 431.5 310% | 325.5 209% | 590 461% | 185.2 76% |
| Read 512 (MB/s) | 34.08 | 29.32 -14% | 338.3 893% | 279.2 719% | 632 1754% | 307.6 803% |
| Write 512 (MB/s) | 40.02 | 25.93 -35% | 297.9 644% | 280.1 600% | 588 1369% | 180 350% |
| Read 4k (MB/s) | 0.429 | 0.366 -15% | 28.68 6585% | 22.43 5128% | 41.4 9550% | 22.08 5047% |
| Write 4k (MB/s) | 1.008 | 0.726 -28% | 66.8 6527% | 74.9 7331% | 132.4 13035% | 77.7 7608% |
| Read 4k QD32 (MB/s) | 0.81 | 0.647 -20% | 364.7 44925% | 149 18295% | 542 66814% | 143.7 17641% |
| Write 4k QD32 (MB/s) | 0.893 | 0.722 -19% | 245.9 27436% | 234 26104% | 343.8 38399% | 177.6 19788% |

| 3DMark | |
| 1280x720 Cloud Gate Standard Graphics | |
| Dell XPS 15 9550 i7 FHD | |
| HP Pavilion 15 UHD T9Y85AV | |
| Asus Zenbook UX510UW-CN044T | |
| Acer Aspire E5-575G-549D | |
| HP Pavilion 15t-au100 CTO (W0P31AV) | |
| 1920x1080 Fire Strike Graphics | |
| HP Pavilion 15 UHD T9Y85AV | |
| Dell XPS 15 9550 i7 FHD | |
| Asus Zenbook UX510UW-CN044T | |
| Acer Aspire E5-575G-549D | |
| HP Pavilion 15t-au100 CTO (W0P31AV) | |
| 1920x1080 Ice Storm Extreme Graphics | |
| Dell XPS 15 9550 i7 FHD | |
| Asus Zenbook UX510UW-CN044T | |
| HP Pavilion 15 UHD T9Y85AV | |
| 3DMark 11 Performance | 2622 puntos | |
| 3DMark Cloud Gate Standard Score | 7017 puntos | |
| 3DMark Fire Strike Score | 1538 puntos | |
| 3DMark Fire Strike Extreme Score | 777 puntos | |
ayuda | ||
| Rise of the Tomb Raider | |
| 1024x768 Lowest Preset (ordenar por valor) | |
| HP Pavilion 15t-au100 CTO (W0P31AV) | |
| Acer Aspire E5-575G-549D | |
| 1366x768 Medium Preset AF:2x (ordenar por valor) | |
| HP Pavilion 15t-au100 CTO (W0P31AV) | |
| Acer Aspire E5-575G-549D | |
| 1920x1080 High Preset AA:FX AF:4x (ordenar por valor) | |
| HP Pavilion 15t-au100 CTO (W0P31AV) | |
| Acer Aspire E5-575G-549D | |
| Dell XPS 15 9550 i7 FHD | |
| HP Pavilion 15 UHD T9Y85AV | |
| 1920x1080 Very High Preset AA:FX AF:16x (ordenar por valor) | |
| HP Pavilion 15t-au100 CTO (W0P31AV) | |
| Acer Aspire E5-575G-549D | |
| Dell XPS 15 9550 i7 FHD | |
| HP Pavilion 15 UHD T9Y85AV | |
| GRID 2 | |
| 1024x768 Ultra Low Preset (ordenar por valor) | |
| HP Pavilion 15t-au100 CTO (W0P31AV) | |
| 1366x768 Medium Preset (ordenar por valor) | |
| HP Pavilion 15t-au100 CTO (W0P31AV) | |
| 1366x768 High Preset AA:2xMS (ordenar por valor) | |
| HP Pavilion 15t-au100 CTO (W0P31AV) | |
| 1920x1080 Ultra Preset AA:4xMS (ordenar por valor) | |
| HP Pavilion 15t-au100 CTO (W0P31AV) | |
| Metro: Last Light | |
| 1024x768 Low (DX10) AF:4x (ordenar por valor) | |
| HP Pavilion 15t-au100 CTO (W0P31AV) | |
| 1366x768 Medium (DX10) AF:4x (ordenar por valor) | |
| HP Pavilion 15t-au100 CTO (W0P31AV) | |
| 1366x768 High (DX11) AF:16x (ordenar por valor) | |
| HP Pavilion 15t-au100 CTO (W0P31AV) | |
| Dell XPS 15 9550 i7 FHD | |
| HP Pavilion 15 UHD T9Y85AV | |
| 1920x1080 Very High (DX11) AF:16x (ordenar por valor) | |
| HP Pavilion 15t-au100 CTO (W0P31AV) | |
| Dell XPS 15 9550 i7 FHD | |
| HP Pavilion 15 UHD T9Y85AV | |
| Tomb Raider | |
| 1024x768 Low Preset (ordenar por valor) | |
| HP Pavilion 15t-au100 CTO (W0P31AV) | |
| Asus Zenbook UX510UW-CN044T | |
| 1366x768 Normal Preset AA:FX AF:4x (ordenar por valor) | |
| HP Pavilion 15t-au100 CTO (W0P31AV) | |
| Asus Zenbook UX510UW-CN044T | |
| 1366x768 High Preset AA:FX AF:8x (ordenar por valor) | |
| HP Pavilion 15t-au100 CTO (W0P31AV) | |
| Asus Zenbook UX510UW-CN044T | |
| Dell XPS 15 9550 i7 FHD | |
| 1920x1080 Ultra Preset AA:FX AF:16x (ordenar por valor) | |
| HP Pavilion 15t-au100 CTO (W0P31AV) | |
| Asus Zenbook UX510UW-CN044T | |
| Dell XPS 15 9550 i7 FHD | |
| Company of Heroes 2 | |
| 1024x768 Minimum / Low / Off AA:Off (ordenar por valor) | |
| HP Pavilion 15t-au100 CTO (W0P31AV) | |
| 1366x768 Medium AA:Off (ordenar por valor) | |
| HP Pavilion 15t-au100 CTO (W0P31AV) | |
| 1366x768 High AA:Medium (ordenar por valor) | |
| HP Pavilion 15t-au100 CTO (W0P31AV) | |
| 1920x1080 Maximum / Higher / High AA:High (ordenar por valor) | |
| HP Pavilion 15t-au100 CTO (W0P31AV) | |
| Sleeping Dogs | |
| 1024x768 Low Preset AA:Normal (ordenar por valor) | |
| HP Pavilion 15t-au100 CTO (W0P31AV) | |
| 1366x768 Medium Preset AA:Normal (ordenar por valor) | |
| HP Pavilion 15t-au100 CTO (W0P31AV) | |
| 1366x768 High Preset AA:High (ordenar por valor) | |
| HP Pavilion 15t-au100 CTO (W0P31AV) | |
| Dell XPS 15 9550 i7 FHD | |
| HP Pavilion 15 UHD T9Y85AV | |
| 1920x1080 Extreme Preset AA:Extreme (ordenar por valor) | |
| HP Pavilion 15t-au100 CTO (W0P31AV) | |
| Dell XPS 15 9550 i7 FHD | |
| HP Pavilion 15 UHD T9Y85AV | |
| bajo | medio | alto | ultra | |
|---|---|---|---|---|
| Dirt 3 (2011) | 67.8 | 48.7 | 41.6 | 28.9 |
| Anno 2070 (2011) | 130.4 | 66.8 | 42.5 | 21 |
| Sleeping Dogs (2012) | 92.9 | 69.9 | 34 | 9 |
| Hitman: Absolution (2012) | 61.3 | 38.3 | 17.8 | 6.6 |
| Tomb Raider (2013) | 137 | 66.4 | 37.4 | 18.3 |
| BioShock Infinite (2013) | 90.3 | 62.4 | 42.7 | 14.6 |
| Metro: Last Light (2013) | 49.3 | 38.4 | 23.5 | 11.6 |
| GRID 2 (2013) | 125.4 | 89.8 | 60.3 | 21.2 |
| Company of Heroes 2 (2013) | 36.1 | 29.5 | 21 | 7.2 |
| F1 2013 (2013) | 120 | 81 | 41 | 31 |
| Rise of the Tomb Raider (2016) | 34.7 | 22.1 | 13.2 | 10.1 |
Ruido
| Ocioso |
| 32.2 / 32.2 / 33.7 dB(A) |
| Carga |
| 39.4 / 42.2 dB(A) |
 | ||
30 dB silencioso 40 dB(A) audible 50 dB(A) ruidosamente alto |
||
min: | ||
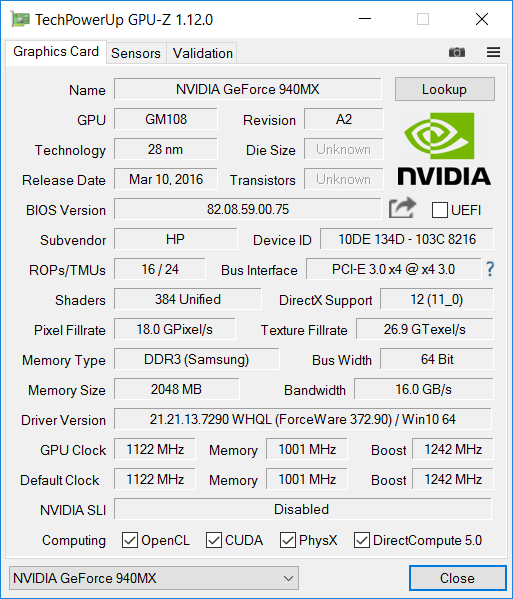
| HP Pavilion 15t-au100 CTO (W0P31AV) GeForce 940MX, i7-7500U, Toshiba MQ01ABD100 | Asus Zenbook UX510UW-CN044T GeForce GTX 960M, 6500U, SanDisk SD8SNAT256G1002 | Lenovo IdeaPad 510-15IKB 80SV0087GE GeForce 940MX, i7-7500U, Liteonit CV3-DE256 | Acer Aspire E5-575G-549D GeForce GTX 950M, i5-7200U, Toshiba MQ01ABD100 | Dell XPS 15 9550 i7 FHD GeForce GTX 960M, 6700HQ, Samsung PM951 NVMe 512 GB | HP Pavilion 15 UHD T9Y85AV GeForce GTX 960M, 6700HQ, SanDisk Z400s SD8SNAT-128G | |
|---|---|---|---|---|---|---|
| Noise | -1% | 5% | 7% | 5% | -4% | |
| Idle Minimum * (dB) | 32.2 | 31.6 2% | 32.6 -1% | 30.8 4% | 29.2 9% | 32.3 -0% |
| Idle Average * (dB) | 32.2 | 31.6 2% | 32.6 -1% | 30.8 4% | 29.3 9% | 32.4 -1% |
| Idle Maximum * (dB) | 33.7 | 33.4 1% | 32.6 3% | 30.8 9% | 29.5 12% | 32.4 4% |
| Load Average * (dB) | 39.4 | 41.7 -6% | 35.3 10% | 33.4 15% | 36.5 7% | 40.5 -3% |
| Load Maximum * (dB) | 42.2 | 44.8 -6% | 37.1 12% | 40.1 5% | 47.7 -13% | 50.3 -19% |
| apagado / medio ambiente * (dB) | 31.6 | 31.6 | 28.9 | 29.5 |
* ... más pequeño es mejor
(±) La temperatura máxima en la parte superior es de 40 °C / 104 F, frente a la media de 36.8 °C / 98 F, que oscila entre 21 y 71 °C para la clase Multimedia.
(+) El fondo se calienta hasta un máximo de 34.8 °C / 95 F, frente a la media de 39.1 °C / 102 F
(+) En reposo, la temperatura media de la parte superior es de 24.4 °C / 76# F, frente a la media del dispositivo de 31.3 °C / 88 F.
(+) El reposamanos y el panel táctil están a una temperatura inferior a la de la piel, con un máximo de 27.2 °C / 81 F y, por tanto, son fríos al tacto.
(±) La temperatura media de la zona del reposamanos de dispositivos similares fue de 28.7 °C / 83.7 F (+1.5 °C / 2.7 F).
HP Pavilion 15t-au100 CTO (W0P31AV) análisis de audio
(-) | altavoces no muy altos (#58 dB)
Graves 100 - 315 Hz
(±) | lubina reducida - en promedio 14.1% inferior a la mediana
(±) | la linealidad de los graves es media (12.4% delta a frecuencia anterior)
Medios 400 - 2000 Hz
(±) | medias más altas - de media 5.6% más altas que la mediana
(±) | la linealidad de los medios es media (7.2% delta respecto a la frecuencia anterior)
Altos 2 - 16 kHz
(+) | máximos equilibrados - a sólo 3.1% de la mediana
(+) | los máximos son lineales (6.6% delta a la frecuencia anterior)
Total 100 - 16.000 Hz
(-) | el sonido global no es lineal (32.9% de diferencia con la mediana)
En comparación con la misma clase
» 97% de todos los dispositivos probados de esta clase eran mejores, 1% similares, 2% peores
» El mejor tuvo un delta de 5%, la media fue 17%, el peor fue ###max##%
En comparación con todos los dispositivos probados
» 92% de todos los dispositivos probados eran mejores, 1% similares, 7% peores
» El mejor tuvo un delta de 4%, la media fue 23%, el peor fue ###max##%
Apple MacBook 12 (Early 2016) 1.1 GHz análisis de audio
(+) | los altavoces pueden reproducir a un volumen relativamente alto (#83.6 dB)
Graves 100 - 315 Hz
(±) | lubina reducida - en promedio 11.3% inferior a la mediana
(±) | la linealidad de los graves es media (14.2% delta a frecuencia anterior)
Medios 400 - 2000 Hz
(+) | medios equilibrados - a sólo 2.4% de la mediana
(+) | los medios son lineales (5.5% delta a la frecuencia anterior)
Altos 2 - 16 kHz
(+) | máximos equilibrados - a sólo 2% de la mediana
(+) | los máximos son lineales (4.5% delta a la frecuencia anterior)
Total 100 - 16.000 Hz
(+) | el sonido global es lineal (10.2% de diferencia con la mediana)
En comparación con la misma clase
» 7% de todos los dispositivos probados de esta clase eran mejores, 2% similares, 90% peores
» El mejor tuvo un delta de 5%, la media fue 18%, el peor fue ###max##%
En comparación con todos los dispositivos probados
» 5% de todos los dispositivos probados eran mejores, 1% similares, 94% peores
» El mejor tuvo un delta de 4%, la media fue 23%, el peor fue ###max##%
| Off / Standby | |
| Ocioso | |
| Carga |
|
Clave:
min: | |
| HP Pavilion 15t-au100 CTO (W0P31AV) i7-7500U, GeForce 940MX, Toshiba MQ01ABD100, IPS, 1920x1080, 15.6" | Asus Zenbook UX510UW-CN044T 6500U, GeForce GTX 960M, SanDisk SD8SNAT256G1002, IPS, 1920x1080, 15.6" | Lenovo IdeaPad 510-15IKB 80SV0087GE i7-7500U, GeForce 940MX, Liteonit CV3-DE256, IPS, 1920x1080, 15.6" | Acer Aspire E5-575G-549D i5-7200U, GeForce GTX 950M, Toshiba MQ01ABD100, TN, 1920x1080, 15.6" | HP Pavilion 15 UHD T9Y85AV 6700HQ, GeForce GTX 960M, SanDisk Z400s SD8SNAT-128G, IPS, 3840x2160, 15.6" | |
|---|---|---|---|---|---|
| Power Consumption | -18% | 15% | -10% | -69% | |
| Idle Minimum * (Watt) | 6.16 | 5 19% | 3.9 37% | 6 3% | 8.3 -35% |
| Idle Average * (Watt) | 8.48 | 8.9 -5% | 7.4 13% | 8.1 4% | 14.8 -75% |
| Idle Maximum * (Watt) | 9.62 | 11.8 -23% | 9.5 1% | 9.8 -2% | 16.8 -75% |
| Load Average * (Watt) | 41.63 | 55 -32% | 41 2% | 52.5 -26% | 71 -71% |
| Load Maximum * (Watt) | 63.22 | 93 -47% | 48 24% | 81.6 -29% | 119.2 -89% |
* ... más pequeño es mejor
| HP Pavilion 15t-au100 CTO (W0P31AV) i7-7500U, GeForce 940MX, 41 Wh | Asus Zenbook UX510UW-CN044T 6500U, GeForce GTX 960M, 48 Wh | Lenovo IdeaPad 510-15IKB 80SV0087GE i7-7500U, GeForce 940MX, 30 Wh | Acer Aspire E5-575G-549D i5-7200U, GeForce GTX 950M, 62 Wh | Dell XPS 15 9550 i7 FHD 6700HQ, GeForce GTX 960M, 84 Wh | HP Pavilion 15 UHD T9Y85AV 6700HQ, GeForce GTX 960M, 61.5 Wh | |
|---|---|---|---|---|---|---|
| Duración de Batería | 57% | 24% | 50% | 90% | 8% | |
| Reader / Idle (h) | 7.3 | 13.6 86% | 12.8 75% | 16.3 123% | 8.5 16% | |
| WiFi v1.3 (h) | 3.7 | 7.2 95% | 4.6 24% | 7.5 103% | 9.1 146% | 4.4 19% |
| Load (h) | 1.8 | 1.6 -11% | 1.3 -28% | 1.8 0% | 1.6 -11% |
Pro
Contra


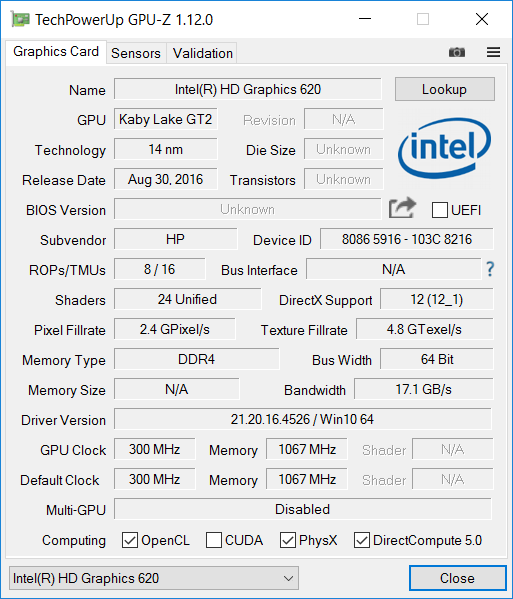
El HP Pavilion 15t-au100 es un portátil de 15.6" bastante atractivo con montones de rendimiento para las tareas diarias. Equipado con una CPU i7 dual-core actual, 8 GB de RAM, y una gráfica dedicada de gama media GeForce 940MX, ni siquiera un juego ligero a moderado está descartado. Mientras que el rendimiento general es muy decente, el cuello de botella del sistema es sin duda el HDD, que gira a unos pedestres 5400 RPM. El portátil sencillamente no parece tan rápido cuando compite con sistemas con SSDs. Por suerte, algunos modelos de la serie tienen SSDs M.2 PCIe NVMe y hasta se pueden equipar con un SSD ademásd e con unidades SATA convencionales para un aumento de rendimiento sin que el almacenamiento se vuelva caro.
Otra crítica merece el display, que por desgracia es muy tenue y además reflectante. Esta combinación dificultan trabajar fuera o en ambientes más brillantes. Por último, el aguante de batería también es mediocre, algunos competidores augantan hasta el doble.
El HP Pavilion 15t ofrece un aguante decente, pero lo lastran su HDD, su decepcionante display, y su escaso aguante de batería. A menos que HP aumente el brillo del modelo Full-HD, optaríamos por el modelo UHD con SSD y gráfica más potente.
Ésta es una versión acortada del análisis original. Puedes leer el análisis completo en inglés aquí.
HP Pavilion 15t-au100 CTO (W0P31AV)
- 01/07/2017 v6 (old)
Bernhard Pechlaner
Price comparison
