Breve análisis del HP Pavilion 15z-bw000 (A10-9620P, HD)
| SD Card Reader | |
| average JPG Copy Test (av. of 3 runs) | |
| Lenovo ThinkPad E570-20H6S00000 | |
| Acer Aspire E15 E5-553G-109A | |
| HP 15-ba077ng | |
| HP Pavilion 15z-bw000 | |
| Asus X555DA-BB11 | |
| Dell Inspiron 15 5000 5567-1753 | |
| maximum AS SSD Seq Read Test (1GB) | |
| Acer Aspire E15 E5-553G-109A | |
| Lenovo ThinkPad E570-20H6S00000 | |
| HP 15-ba077ng | |
| HP Pavilion 15z-bw000 | |
| Dell Inspiron 15 5000 5567-1753 | |
| Asus X555DA-BB11 | |
| |||||||||||||||||||||||||
iluminación: 83 %
Brillo con batería: 251.3 cd/m²
Contraste: 524:1 (Negro: 0.48 cd/m²)
ΔE ColorChecker Calman: 9.9 | ∀{0.5-29.43 Ø4.71}
ΔE Greyscale Calman: 11.7 | ∀{0.09-98 Ø4.96}
56.8% sRGB (Argyll 1.6.3 3D)
39.17% AdobeRGB 1998 (Argyll 1.6.3 3D)
39.17% AdobeRGB 1998 (Argyll 3D)
56.8% sRGB (Argyll 3D)
37.92% Display P3 (Argyll 3D)
Gamma: 2.05
CCT: 11713 K
| HP Pavilion 15z-bw000 BOE06A4, TN LED, 15.6", 1366x768 | Asus X555DA-BB11 TN LED, 15.6", 1920x1080 | Dell Inspiron 15 5000 5567-1753 BOE NT15N41, TN LED, 15.6", 1920x1080 | Acer Aspire E15 E5-553G-109A Chi Mei CMN15C4 / N156HGE-EAB, TN LED, 15.6", 1920x1080 | Lenovo ThinkPad E570-20H6S00000 AUO B156HAN04.4, IPS LED, 15.6", 1920x1080 | Lenovo Ideapad 110-15ACL 15.6", 1366x768 | |
|---|---|---|---|---|---|---|
| Display | -7% | -4% | 5% | 2% | -1% | |
| Display P3 Coverage (%) | 37.92 | 35.12 -7% | 36.24 -4% | 39.72 5% | 38.65 2% | 37.39 -1% |
| sRGB Coverage (%) | 56.8 | 52.7 -7% | 54.6 -4% | 59.2 4% | 58 2% | 56.2 -1% |
| AdobeRGB 1998 Coverage (%) | 39.17 | 36.29 -7% | 37.44 -4% | 41.07 5% | 39.94 2% | 38.63 -1% |
| Response Times | -2% | 17% | 16% | -12% | -22% | |
| Response Time Grey 50% / Grey 80% * (ms) | 41.6 ? | 42 ? -1% | 43 ? -3% | 42.4 ? -2% | 44.8 ? -8% | 58 ? -39% |
| Response Time Black / White * (ms) | 22 ? | 22.4 ? -2% | 14 ? 36% | 14.6 ? 34% | 25.6 ? -16% | 23 ? -5% |
| PWM Frequency (Hz) | 198.4 ? | 28740 | 200 ? | |||
| Screen | 10% | -11% | -2% | 31% | 6% | |
| Brightness middle (cd/m²) | 251.3 | 242.7 -3% | 145 -42% | 224 -11% | 242 -4% | 253 1% |
| Brightness (cd/m²) | 243 | 232 -5% | 144 -41% | 201 -17% | 243 0% | 246 1% |
| Brightness Distribution (%) | 83 | 88 6% | 90 8% | 75 -10% | 75 -10% | 86 4% |
| Black Level * (cd/m²) | 0.48 | 0.52 -8% | 0.49 -2% | 0.46 4% | 0.24 50% | 0.43 10% |
| Contrast (:1) | 524 | 467 -11% | 296 -44% | 487 -7% | 1008 92% | 588 12% |
| Colorchecker dE 2000 * | 9.9 | 4.9 51% | 9.27 6% | 10.5 -6% | 4.65 53% | |
| Colorchecker dE 2000 max. * | 22.9 | 20.3 11% | 16.9 26% | 16.8 27% | 9.64 58% | |
| Greyscale dE 2000 * | 11.7 | 2.7 77% | 12.28 -5% | 11.23 4% | 3.39 71% | |
| Gamma | 2.05 107% | 2.34 94% | 2.03 108% | 2.12 104% | 2.7 81% | |
| CCT | 11713 55% | 6876 95% | 10732 61% | 11096 59% | 6246 104% | |
| Color Space (Percent of AdobeRGB 1998) (%) | 39.17 | 33.5 -14% | 35 -11% | 38 -3% | 36.69 -6% | |
| Color Space (Percent of sRGB) (%) | 56.8 | 52.5 -8% | 55 -3% | 59 4% | 57.66 2% | |
| Media total (Programa/Opciones) | 0% /
5% | 1% /
-6% | 6% /
2% | 7% /
19% | -6% /
-2% |
* ... más pequeño es mejor
Tiempos de respuesta del display
| ↔ Tiempo de respuesta de Negro a Blanco | ||
|---|---|---|
| 22 ms ... subida ↗ y bajada ↘ combinada | ↗ 16 ms subida | 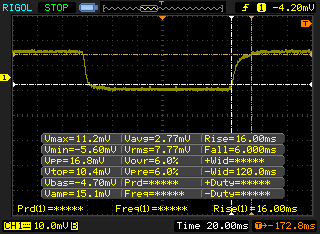 |
| ↘ 6 ms bajada | ||
| La pantalla mostró buenos tiempos de respuesta en nuestros tests pero podría ser demasiado lenta para los jugones competitivos. En comparación, todos los dispositivos de prueba van de ##min### (mínimo) a 240 (máximo) ms. » 49 % de todos los dispositivos son mejores. Eso quiere decir que el tiempo de respuesta es peor que la media (19.8 ms) de todos los dispositivos testados. | ||
| ↔ Tiempo de respuesta 50% Gris a 80% Gris | ||
| 41.6 ms ... subida ↗ y bajada ↘ combinada | ↗ 14.8 ms subida | 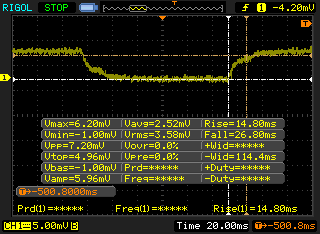 |
| ↘ 26.8 ms bajada | ||
| La pantalla mostró tiempos de respuesta lentos en nuestros tests y podría ser demasiado lenta para los jugones. En comparación, todos los dispositivos de prueba van de ##min### (mínimo) a 636 (máximo) ms. » 67 % de todos los dispositivos son mejores. Eso quiere decir que el tiempo de respuesta es peor que la media (31 ms) de todos los dispositivos testados. | ||
Parpadeo de Pantalla / PWM (Pulse-Width Modulation)
| Parpadeo de Pantalla / PWM detectado | 198.4 Hz | ≤ 99 % de brillo | 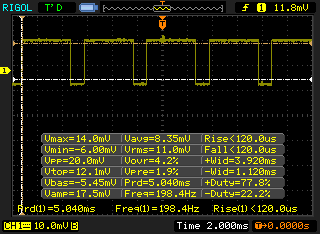 |
La retroiluminación del display parpadea a 198.4 Hz (seguramente usa PWM - Pulse-Width Modulation) a un brillo del 99 % e inferior. Sobre este nivel de brillo no debería darse parpadeo / PWM. La frecuencia de 198.4 Hz es relativamente baja, por lo que la gente sensible debería ver parpadeos y padecer fatiga visual por la pantalla (usado al brillo indicado a continuación). Comparación: 52 % de todos los dispositivos testados no usaron PWM para atenuar el display. Si se usó, medimos una media de 7757 (mínimo: 5 - máxmo: 343500) Hz. | |||
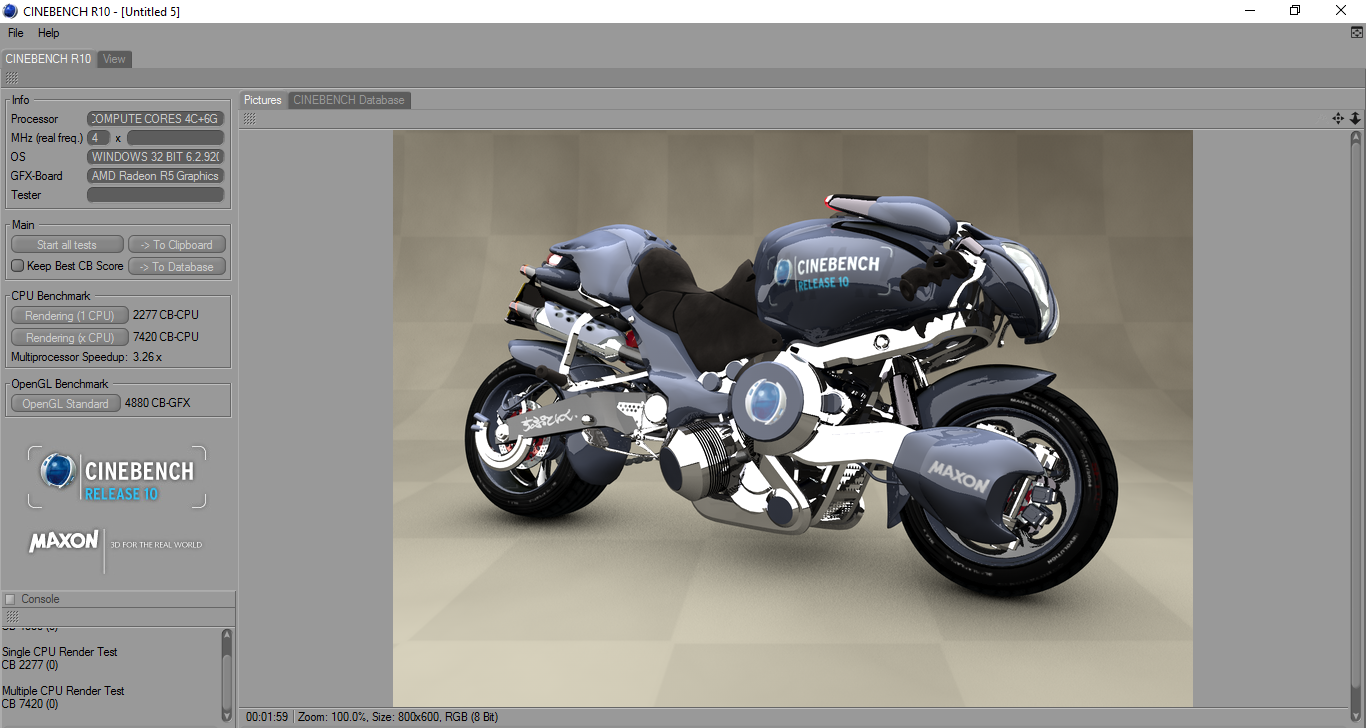
| Cinebench R10 | |
| Rendering Multiple CPUs 32Bit | |
| Dell Inspiron 15 5000 5567-1753 | |
| HP Pavilion 15z-bw000 | |
| HP 15-ba077ng | |
| Acer Aspire E15 E5-553G-109A | |
| Asus X555DA-BB11 | |
| Rendering Single 32Bit | |
| Dell Inspiron 15 5000 5567-1753 | |
| HP 15-ba077ng | |
| HP Pavilion 15z-bw000 | |
| Acer Aspire E15 E5-553G-109A | |
| Asus X555DA-BB11 | |
| wPrime 2.10 - 1024m | |
| Asus X555DA-BB11 | |
| HP Pavilion 15z-bw000 | |
* ... más pequeño es mejor
| PCMark 8 Home Score Accelerated v2 | 2624 puntos | |
| PCMark 8 Creative Score Accelerated v2 | 3075 puntos | |
| PCMark 8 Work Score Accelerated v2 | 3669 puntos | |
| PCMark 10 Score | 2080 puntos | |
ayuda | ||
| HP Pavilion 15z-bw000 Avolusion MD1TBLSSHD | Asus X555DA-BB11 Seagate Momentus SpinPoint M8 ST1000LM024 HN-M101MBB | Dell Inspiron 15 5000 5567-1753 SanDisk X400 SED 256GB, SATA (SD8TB8U-256G) | HP 15-ba077ng SanDisk Z400s SD8SNAT-256G | Acer Aspire E15 E5-553G-109A Liteonit CV3-8D128 | Lenovo ThinkPad E570-20H6S00000 Toshiba THNSF5256GPUK | |
|---|---|---|---|---|---|---|
| CrystalDiskMark 3.0 | -26% | 6943% | 4243% | 4443% | 11273% | |
| Read Seq (MB/s) | 109.6 | 106.9 -2% | 502 358% | 447.4 308% | 348.6 218% | 1140 940% |
| Write Seq (MB/s) | 104.6 | 97.5 -7% | 458.1 338% | 243.3 133% | 311.8 198% | 468.1 348% |
| Read 512 (MB/s) | 36.88 | 32.28 -12% | 382.8 938% | 333.4 804% | 295.9 702% | 759 1958% |
| Write 512 (MB/s) | 56.3 | 35.39 -37% | 385.7 585% | 283.1 403% | 185.8 230% | 414 635% |
| Read 4k (MB/s) | 0.436 | 0.373 -14% | 29.25 6609% | 20.99 4714% | 23.76 5350% | 34.3 7767% |
| Write 4k (MB/s) | 1.212 | 0.636 -48% | 55.9 4512% | 62.7 5073% | 44.94 3608% | 123.4 10082% |
| Read 4k QD32 (MB/s) | 1.234 | 0.694 -44% | 285.2 23012% | 143.1 11496% | 171.6 13806% | 530 42850% |
| Write 4k QD32 (MB/s) | 1.242 | 0.682 -45% | 239.6 19191% | 138 11011% | 143.2 11430% | 319.2 25600% |

| 3DMark | |
| 1280x720 Cloud Gate Standard Graphics | |
| Lenovo ThinkPad E570-20H6S00000 | |
| Acer Aspire E15 E5-553G-109A | |
| Dell Inspiron 15 5000 5567-1753 | |
| HP Pavilion 15z-bw000 | |
| Asus X555DA-BB11 | |
| 1920x1080 Fire Strike Graphics | |
| Lenovo ThinkPad E570-20H6S00000 | |
| Acer Aspire E15 E5-553G-109A | |
| Dell Inspiron 15 5000 5567-1753 | |
| HP Pavilion 15z-bw000 | |
| Asus X555DA-BB11 | |
| 1920x1080 Ice Storm Extreme Graphics | |
| Dell Inspiron 15 5000 5567-1753 | |
| HP Pavilion 15z-bw000 | |
| Asus X555DA-BB11 | |
| 3DMark 11 Performance | 1686 puntos | |
| 3DMark Ice Storm Standard Score | 37793 puntos | |
| 3DMark Cloud Gate Standard Score | 4365 puntos | |
| 3DMark Fire Strike Score | 898 puntos | |
| 3DMark Fire Strike Extreme Score | 464 puntos | |
ayuda | ||
| bajo | medio | alto | ultra | |
|---|---|---|---|---|
| Tomb Raider (2013) | 51.8 | 29.1 | 21.3 | |
| BioShock Infinite (2013) | 45.9 | 28.7 | 21.8 | |
| Rise of the Tomb Raider (2016) | 19 | 12.2 |
Ruido
| Ocioso |
| 31 / 31.2 / 31.3 dB(A) |
| Carga |
| 34.4 / 38.9 dB(A) |
 | ||
30 dB silencioso 40 dB(A) audible 50 dB(A) ruidosamente alto |
||
min: | ||
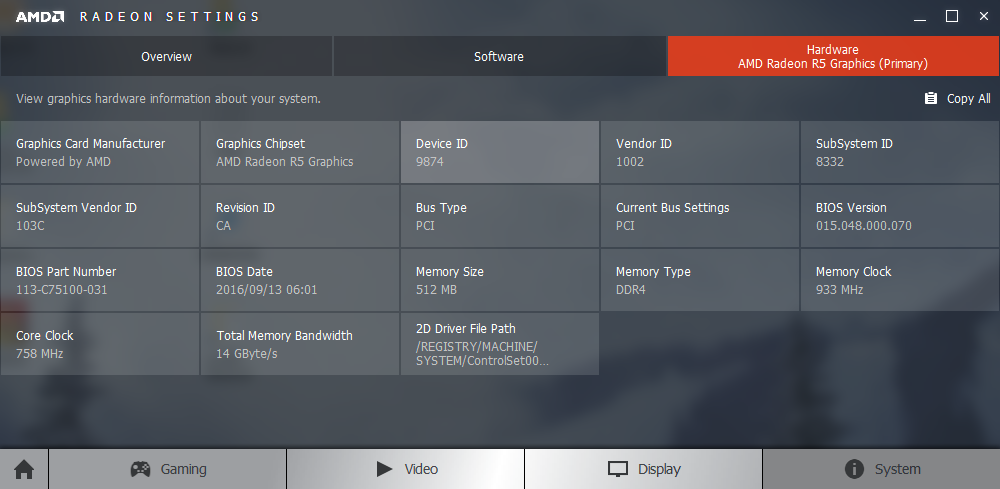
| HP Pavilion 15z-bw000 Radeon R5 (Carrizo), A10-9620P, Avolusion MD1TBLSSHD | Asus X555DA-BB11 Radeon R6 (Carrizo), A10-8700P, Seagate Momentus SpinPoint M8 ST1000LM024 HN-M101MBB | Dell Inspiron 15 5000 5567-1753 Radeon R7 M445, i7-7500U, SanDisk X400 SED 256GB, SATA (SD8TB8U-256G) | HP 15-ba077ng Radeon R7 (Bristol Ridge), A12-9700P, SanDisk Z400s SD8SNAT-256G | Acer Aspire E15 E5-553G-109A Radeon R8 M445DX, A12-9700P, Liteonit CV3-8D128 | Lenovo ThinkPad E570-20H6S00000 GeForce GTX 950M, i5-7200U, Toshiba THNSF5256GPUK | Lenovo Ideapad 110-15ACL Radeon R5 (Beema/Carrizo-L), A8-7410 | Acer Aspire E5-774-54HJ HD Graphics 620, i5-7200U, Western Digital Scorpio Blue WD5000LPCX-24C6HT0 | Apple MacBook 12 (Early 2016) 1.1 GHz HD Graphics 515, 6Y30, Apple SSD AP0256 | |
|---|---|---|---|---|---|---|---|---|---|
| Noise | 0% | -5% | 2% | 1% | 3% | 4% | 3% | ||
| apagado / medio ambiente * (dB) | 28.3 | 28.9 -2% | 30.6 -8% | 30.6 -8% | 30.5 -8% | 29 -2% | 30.4 -7% | 30.5 -8% | |
| Idle Minimum * (dB) | 31 | 31.6 -2% | 30.6 1% | 31.5 -2% | 31.4 -1% | 29 6% | 30.9 -0% | 30.8 1% | |
| Idle Average * (dB) | 31.2 | 32 -3% | 30.6 2% | 31.8 -2% | 31.4 -1% | 29 7% | 30.9 1% | 30.8 1% | |
| Idle Maximum * (dB) | 31.3 | 32.4 -4% | 30.6 2% | 31.8 -2% | 31.9 -2% | 29 7% | 31 1% | 30.8 2% | |
| Load Average * (dB) | 34.4 | 33.3 3% | 41.9 -22% | 31.4 9% | 33.7 2% | 34.3 -0% | 31.8 8% | 32.1 7% | |
| Load Maximum * (dB) | 38.9 | 35.5 9% | 41.8 -7% | 33.4 14% | 33.8 13% | 40.1 -3% | 31.9 18% | 33.8 13% | |
| Witcher 3 ultra * (dB) | 40.6 |
* ... más pequeño es mejor
(+) La temperatura máxima en la parte superior es de 38 °C / 100 F, frente a la media de 36.8 °C / 98 F, que oscila entre 21 y 71 °C para la clase Multimedia.
(±) El fondo se calienta hasta un máximo de 40.8 °C / 105 F, frente a la media de 39.1 °C / 102 F
(+) En reposo, la temperatura media de la parte superior es de 26.2 °C / 79# F, frente a la media del dispositivo de 31.3 °C / 88 F.
(±) El reposamanos y el touchpad pueden calentarse mucho al tacto con un máximo de 36 °C / 96.8 F.
(-) La temperatura media de la zona del reposamanos de dispositivos similares fue de 28.7 °C / 83.7 F (-7.3 °C / -13.1 F).
HP Pavilion 15z-bw000 análisis de audio
(±) | la sonoridad del altavoz es media pero buena (75 dB)
Graves 100 - 315 Hz
(-) | casi sin bajos - de media 17.5% inferior a la mediana
(-) | los graves no son lineales (16.2% delta a la frecuencia anterior)
Medios 400 - 2000 Hz
(+) | medios equilibrados - a sólo 2.6% de la mediana
(±) | la linealidad de los medios es media (10.4% delta respecto a la frecuencia anterior)
Altos 2 - 16 kHz
(+) | máximos equilibrados - a sólo 1.9% de la mediana
(±) | la linealidad de los máximos es media (9.1% delta a frecuencia anterior)
Total 100 - 16.000 Hz
(±) | la linealidad del sonido global es media (18.8% de diferencia con la mediana)
En comparación con la misma clase
» 58% de todos los dispositivos probados de esta clase eran mejores, 8% similares, 34% peores
» El mejor tuvo un delta de 5%, la media fue 17%, el peor fue ###max##%
En comparación con todos los dispositivos probados
» 43% de todos los dispositivos probados eran mejores, 8% similares, 49% peores
» El mejor tuvo un delta de 4%, la media fue 23%, el peor fue ###max##%
Apple MacBook 12 (Early 2016) 1.1 GHz análisis de audio
(+) | los altavoces pueden reproducir a un volumen relativamente alto (#83.6 dB)
Graves 100 - 315 Hz
(±) | lubina reducida - en promedio 11.3% inferior a la mediana
(±) | la linealidad de los graves es media (14.2% delta a frecuencia anterior)
Medios 400 - 2000 Hz
(+) | medios equilibrados - a sólo 2.4% de la mediana
(+) | los medios son lineales (5.5% delta a la frecuencia anterior)
Altos 2 - 16 kHz
(+) | máximos equilibrados - a sólo 2% de la mediana
(+) | los máximos son lineales (4.5% delta a la frecuencia anterior)
Total 100 - 16.000 Hz
(+) | el sonido global es lineal (10.2% de diferencia con la mediana)
En comparación con la misma clase
» 7% de todos los dispositivos probados de esta clase eran mejores, 2% similares, 90% peores
» El mejor tuvo un delta de 5%, la media fue 18%, el peor fue ###max##%
En comparación con todos los dispositivos probados
» 5% de todos los dispositivos probados eran mejores, 1% similares, 94% peores
» El mejor tuvo un delta de 4%, la media fue 23%, el peor fue ###max##%
| Off / Standby | |
| Ocioso | |
| Carga |
|
Clave:
min: | |
| HP Pavilion 15z-bw000 A10-9620P, Radeon R5 (Carrizo), Avolusion MD1TBLSSHD, TN LED, 1366x768, 15.6" | Asus X555DA-BB11 A10-8700P, Radeon R6 (Carrizo), Seagate Momentus SpinPoint M8 ST1000LM024 HN-M101MBB, TN LED, 1920x1080, 15.6" | Dell Inspiron 15 5000 5567-1753 i7-7500U, Radeon R7 M445, SanDisk X400 SED 256GB, SATA (SD8TB8U-256G), TN LED, 1920x1080, 15.6" | HP 15-ba077ng A12-9700P, Radeon R7 (Bristol Ridge), SanDisk Z400s SD8SNAT-256G, TN LED, 1920x1080, 15.6" | Acer Aspire E15 E5-553G-109A A12-9700P, Radeon R8 M445DX, Liteonit CV3-8D128, TN LED, 1920x1080, 15.6" | Lenovo ThinkPad E570-20H6S00000 i5-7200U, GeForce GTX 950M, Toshiba THNSF5256GPUK, IPS LED, 1920x1080, 15.6" | Acer Aspire E5-774-54HJ i5-7200U, HD Graphics 620, Western Digital Scorpio Blue WD5000LPCX-24C6HT0, TN LED, 1920x1080, 17.3" | |
|---|---|---|---|---|---|---|---|
| Power Consumption | -21% | -4% | 14% | -37% | -4% | -6% | |
| Idle Minimum * (Watt) | 5.38 | 8.3 -54% | 4 26% | 4.4 18% | 7.2 -34% | 2.8 48% | 5.3 1% |
| Idle Average * (Watt) | 7.9 | 8.6 -9% | 5.4 32% | 6.8 14% | 10.3 -30% | 6.3 20% | 10.1 -28% |
| Idle Maximum * (Watt) | 8.98 | 13.1 -46% | 8.3 8% | 8.9 1% | 11.9 -33% | 6.9 23% | 10.5 -17% |
| Load Average * (Watt) | 34.74 | 31.2 10% | 54 -55% | 30.9 11% | 48.2 -39% | 51.6 -49% | 34.3 1% |
| Load Maximum * (Watt) | 42.41 | 43.9 -4% | 55.4 -31% | 31 27% | 63 -49% | 69.7 -64% | 37 13% |
| Witcher 3 ultra * (Watt) | 51.8 |
* ... más pequeño es mejor
| HP Pavilion 15z-bw000 A10-9620P, Radeon R5 (Carrizo), 31 Wh | Asus X555DA-BB11 A10-8700P, Radeon R6 (Carrizo), 37 Wh | Dell Inspiron 15 5000 5567-1753 i7-7500U, Radeon R7 M445, 42 Wh | Acer Aspire E15 E5-553G-109A A12-9700P, Radeon R8 M445DX, 40 Wh | Lenovo ThinkPad E570-20H6S00000 i5-7200U, GeForce GTX 950M, 41 Wh | Acer Aspire E5-774-54HJ i5-7200U, HD Graphics 620, 41 Wh | |
|---|---|---|---|---|---|---|
| Duración de Batería | 0% | 52% | -3% | 113% | 43% | |
| Reader / Idle (h) | 6.4 | 7.3 14% | 7.8 22% | 6 -6% | 14.7 130% | |
| WiFi v1.3 (h) | 3.7 | 2.9 -22% | 7 89% | 4.3 16% | 7.7 108% | 5.3 43% |
| Load (h) | 1.1 | 1.2 9% | 1.6 45% | 0.9 -18% | 2.2 100% |
Pro
Contra


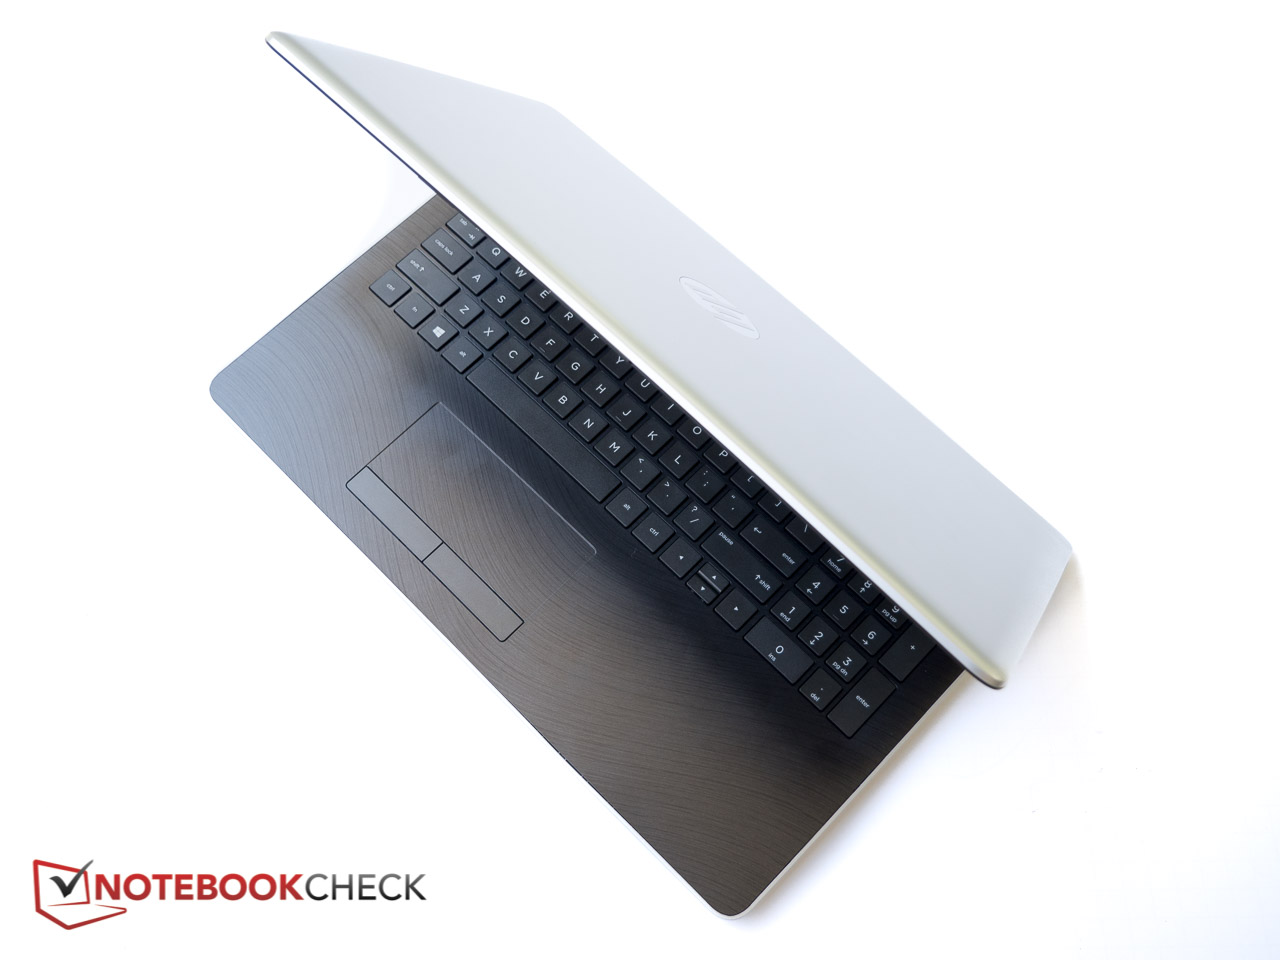
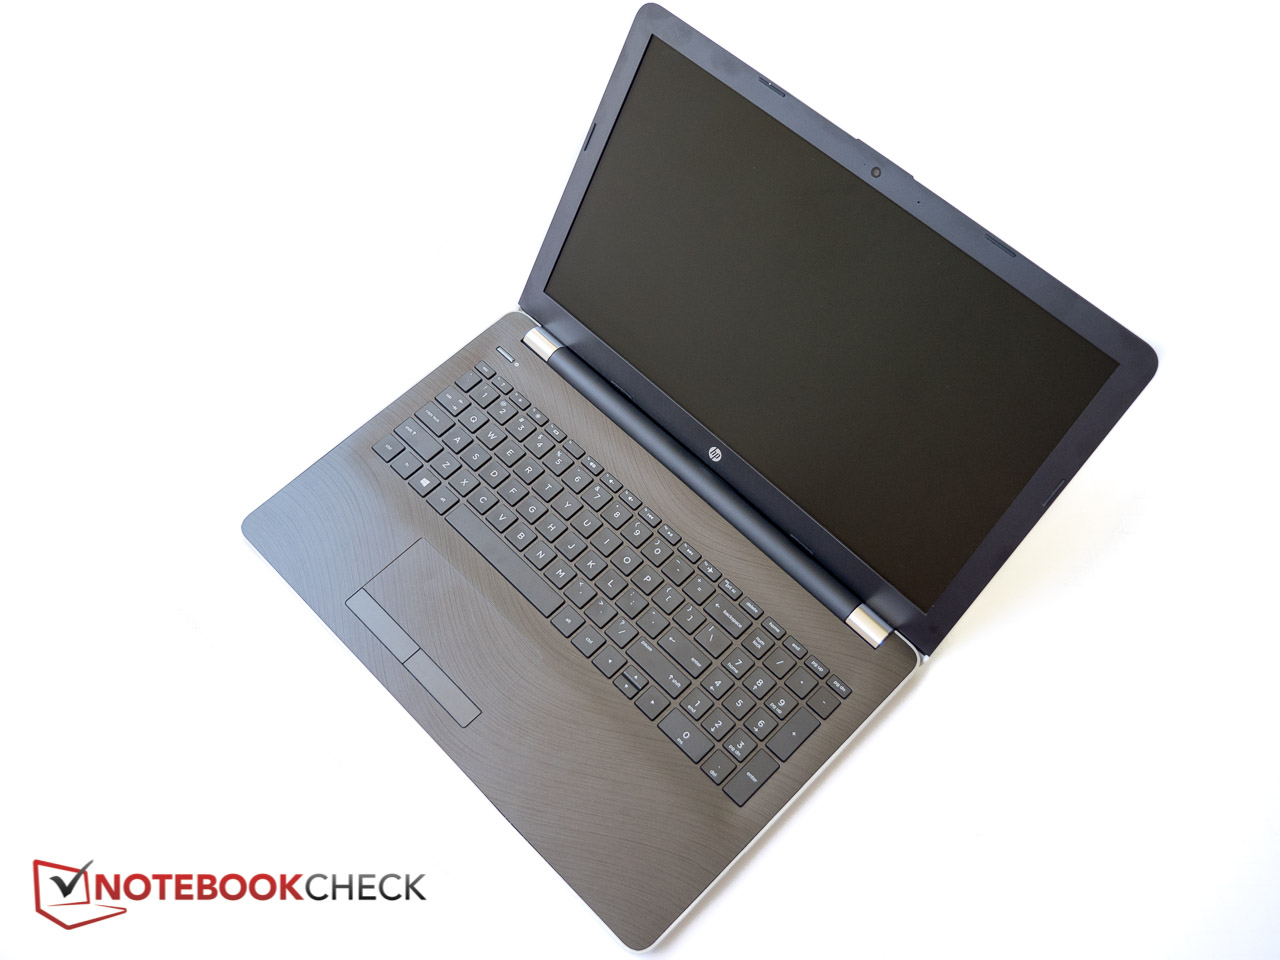
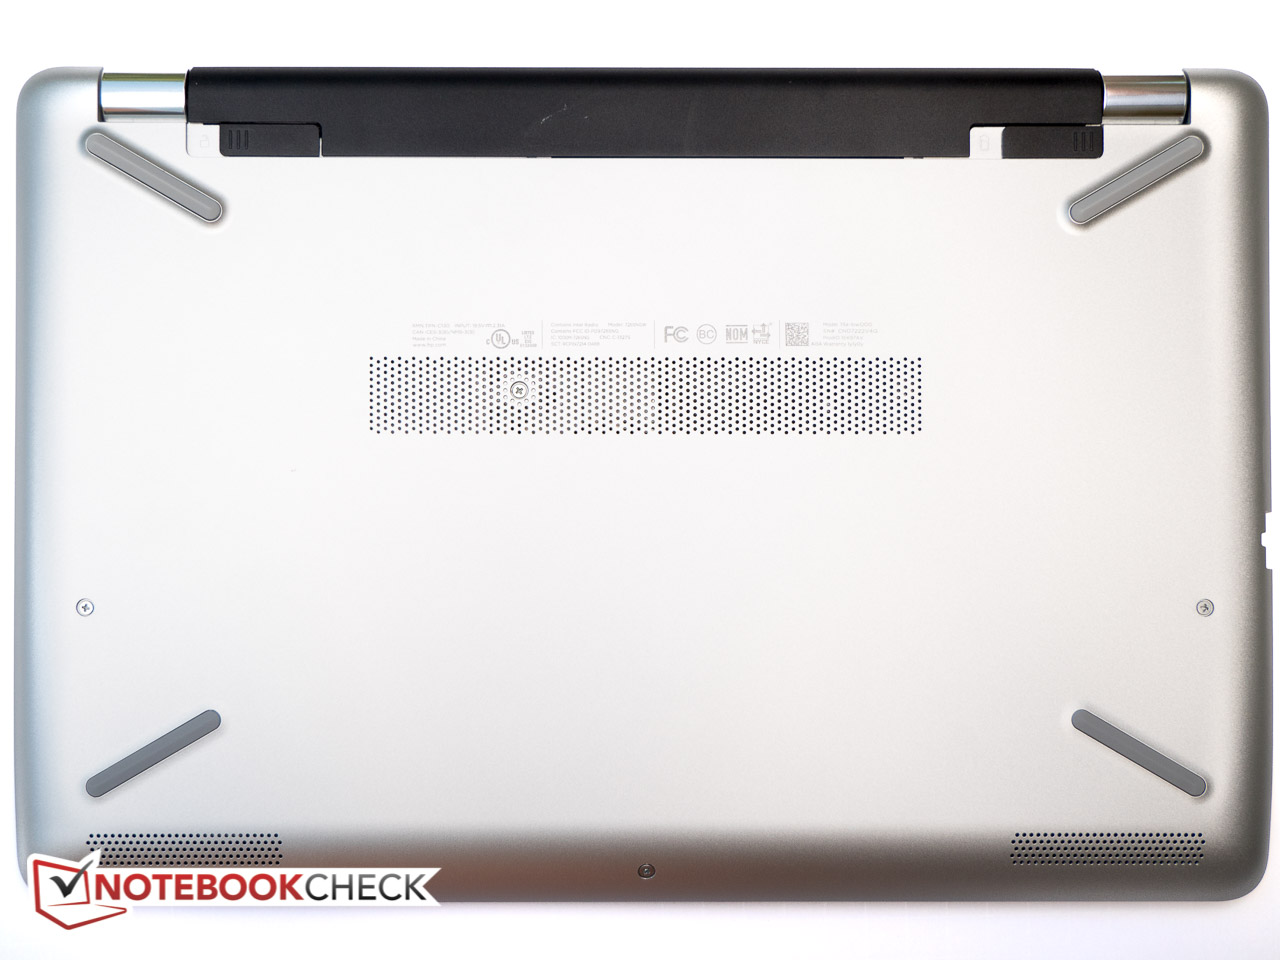
El Pavilion 15z es un portátil básico de 15.6" razonablemente ligero, discreto, pero también soso. El procesador de la APU AMD no termina de alcanzar el nivel de la actual generación de CPUs ULV Intel, aunque la Radeon R5 iGP ofrece bastante rendimiento para manejar al menos algunos juegos más antiguos con resolución y ajustes bajos.-
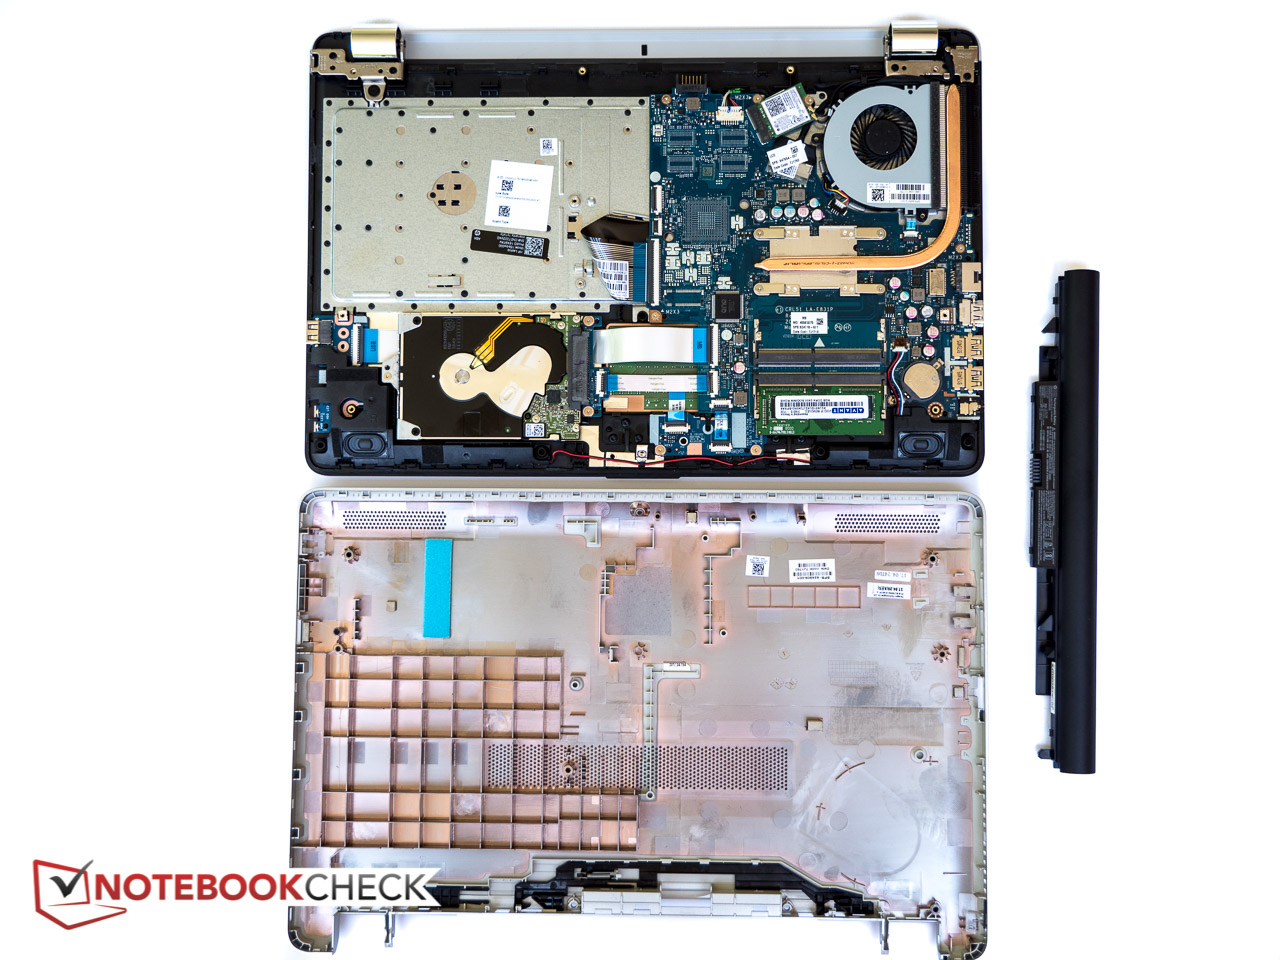
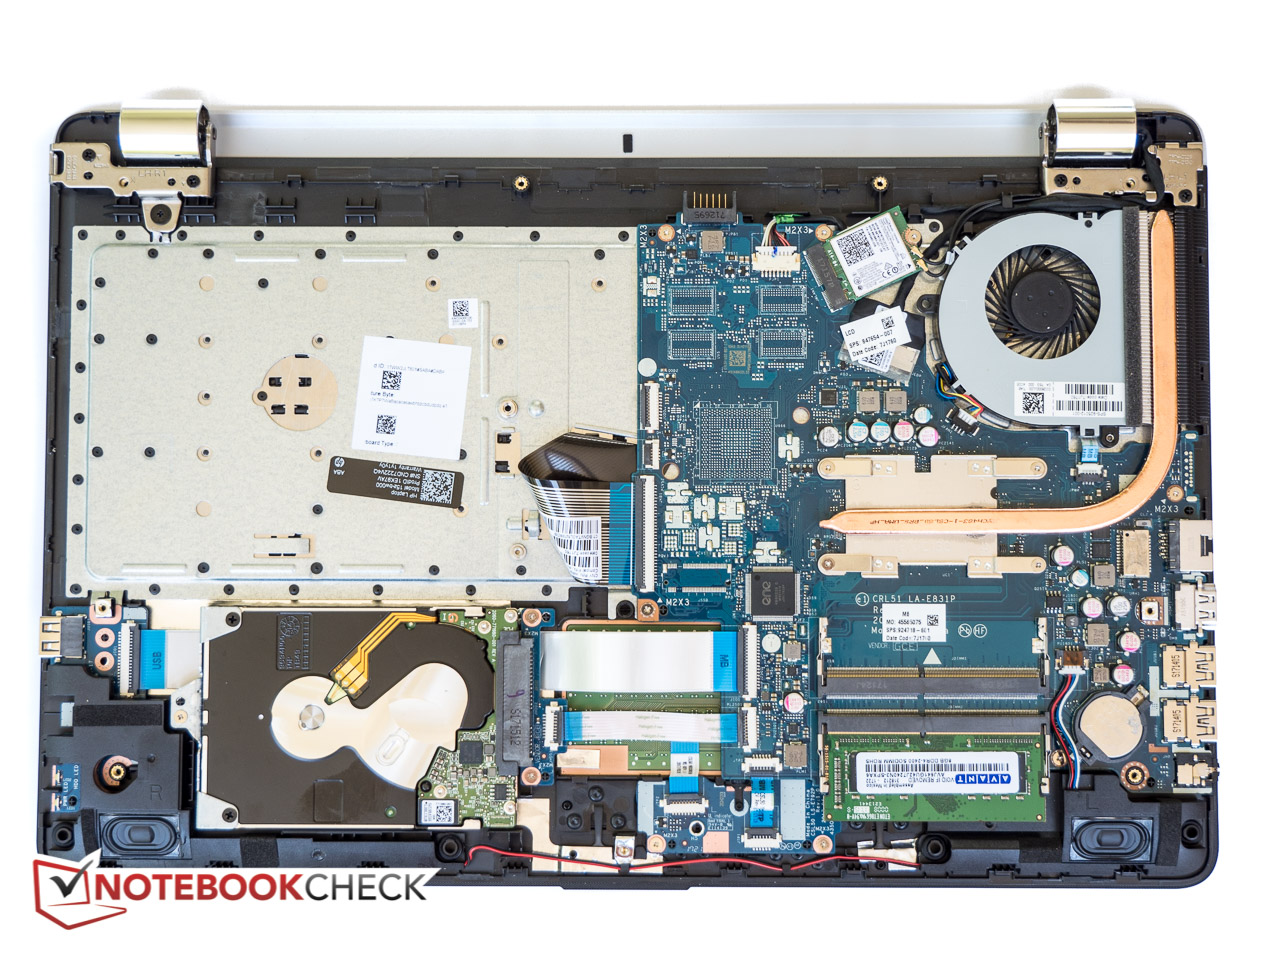
El sistema queda lastrado por su lento HDD, un display HD TN con poca estabilidad de ángulo de visión, y su deprimente aguante de batería.
Con tantas ofertas básicas en el mercado, cuesta encontrar argumentos para el HP Pavilion 15z - sencillamente no destaca bastante.
Ésta es una versión acortada del análisis original. Puedes leer el análisis completo en inglés aquí.
HP Pavilion 15z-bw000
- 07/15/2017 v6 (old)
Bernie Pechlaner
Price comparison
