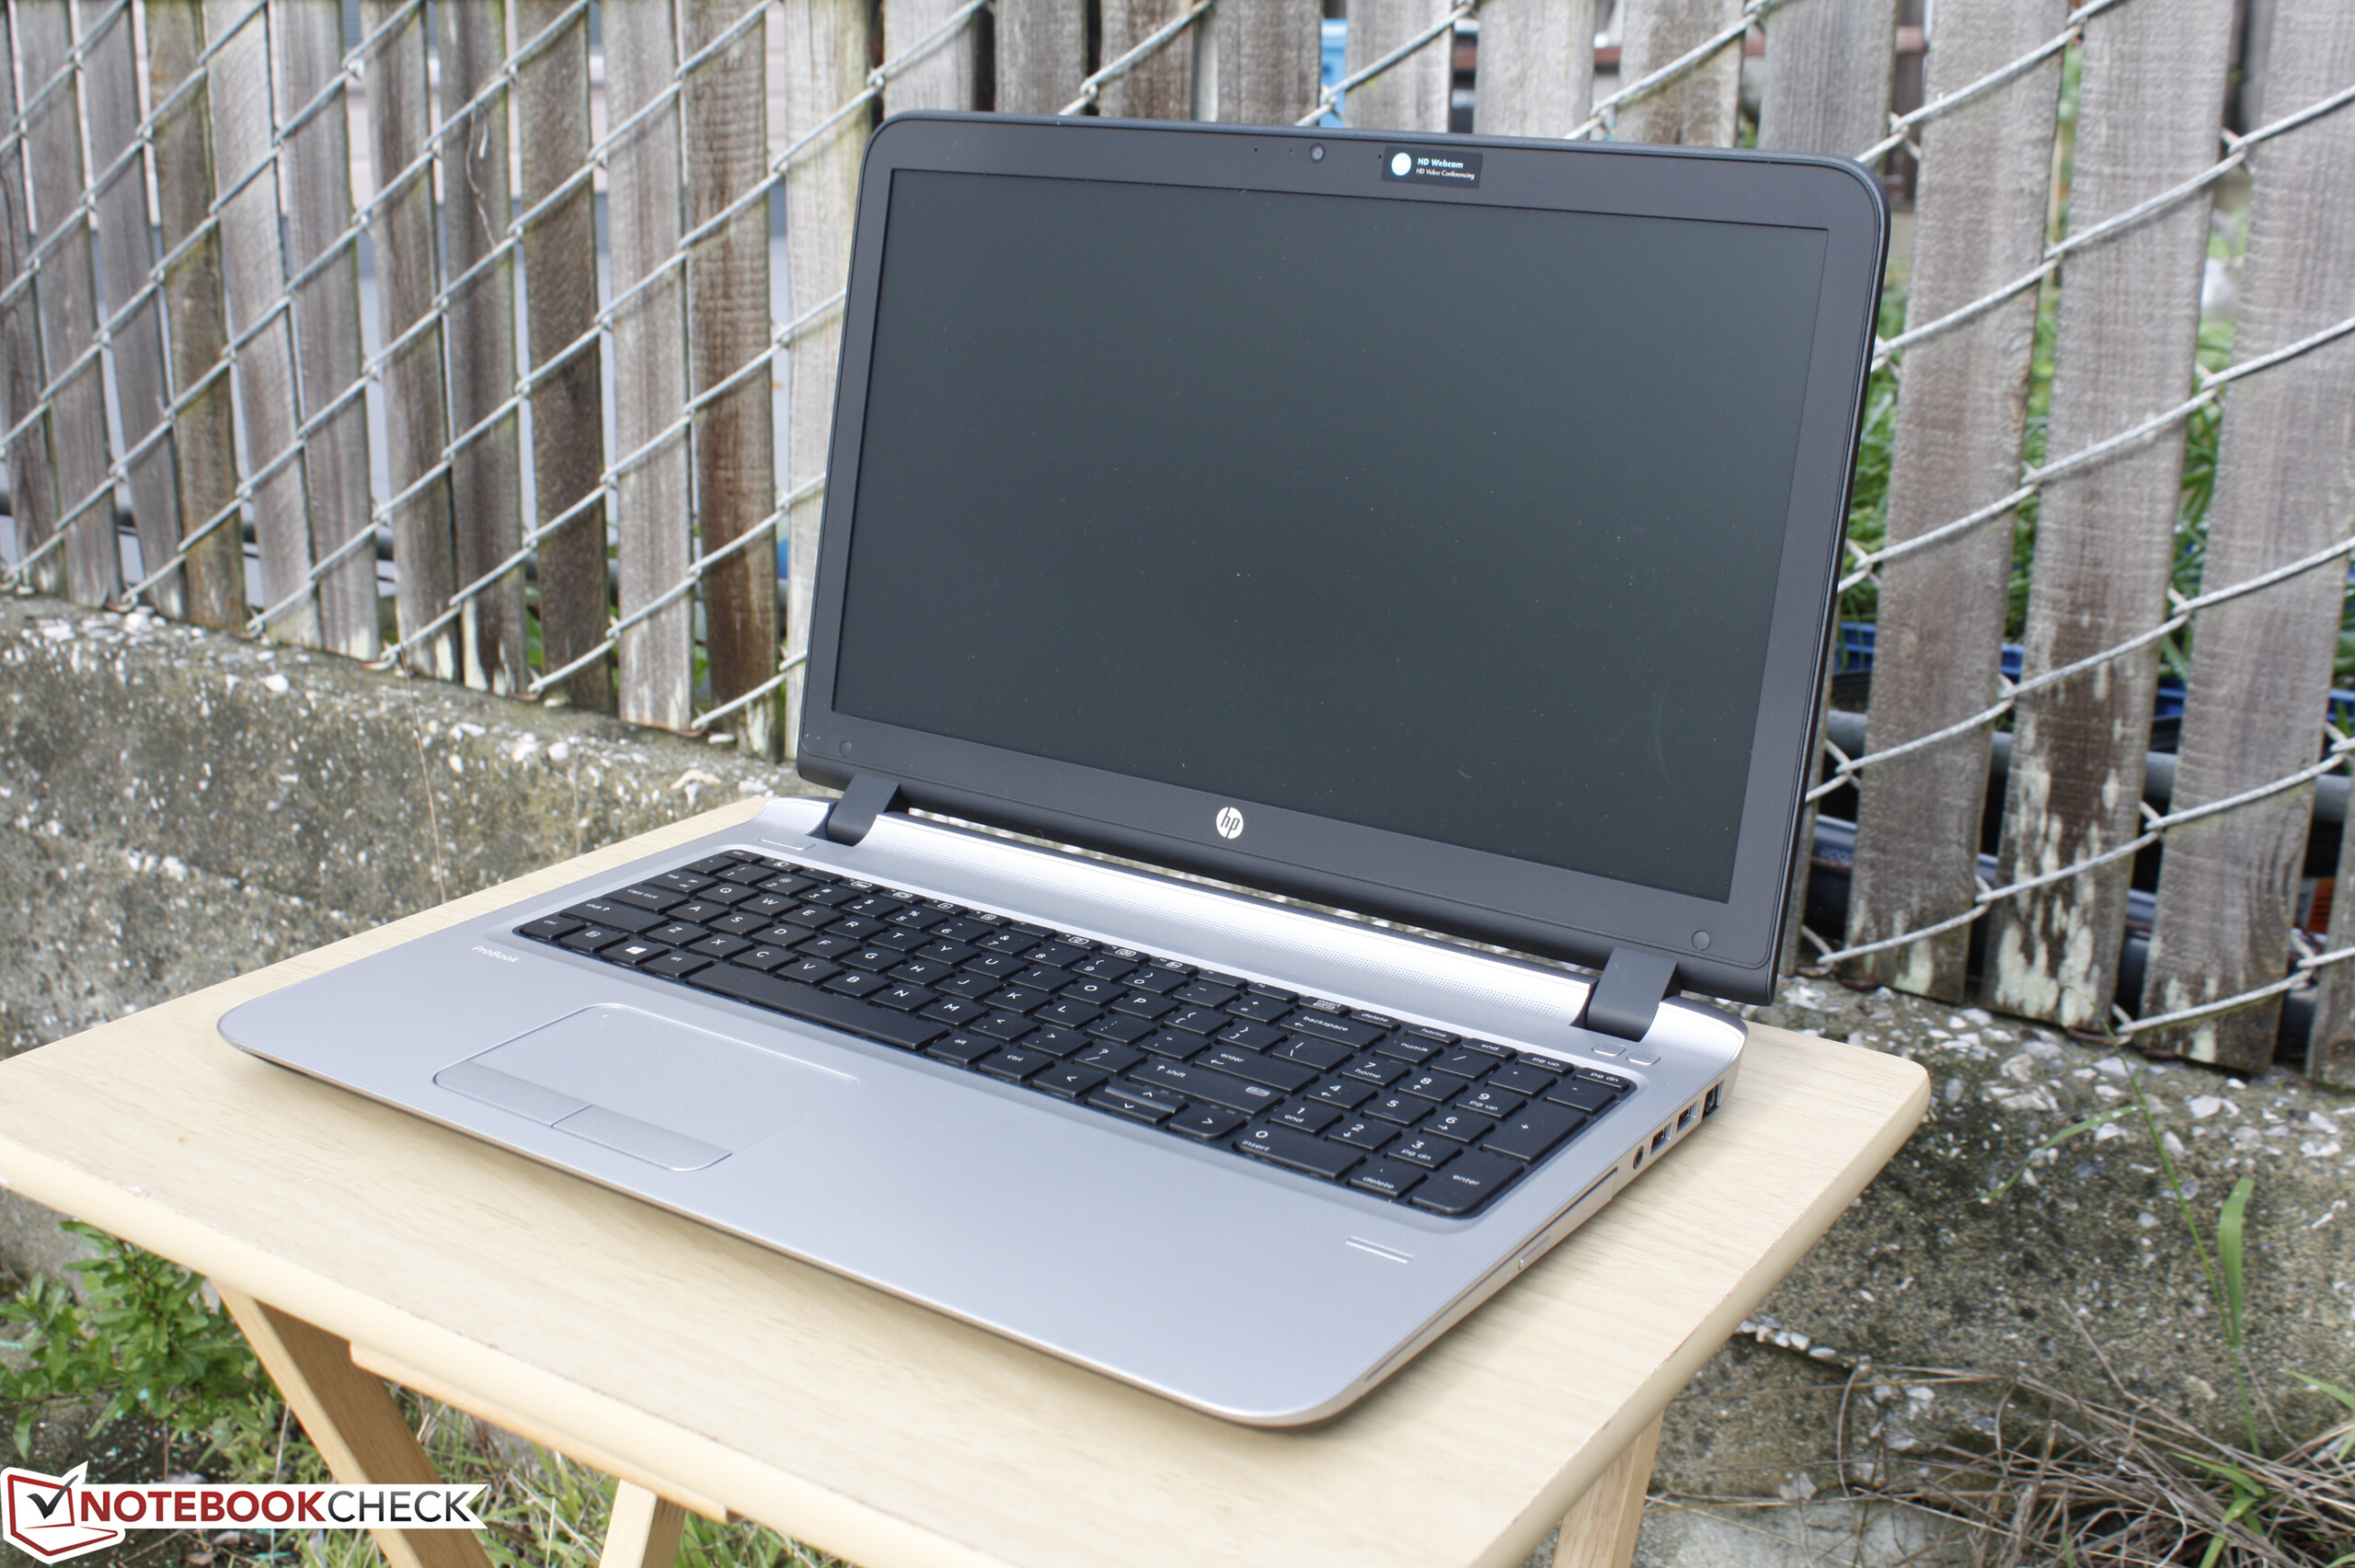
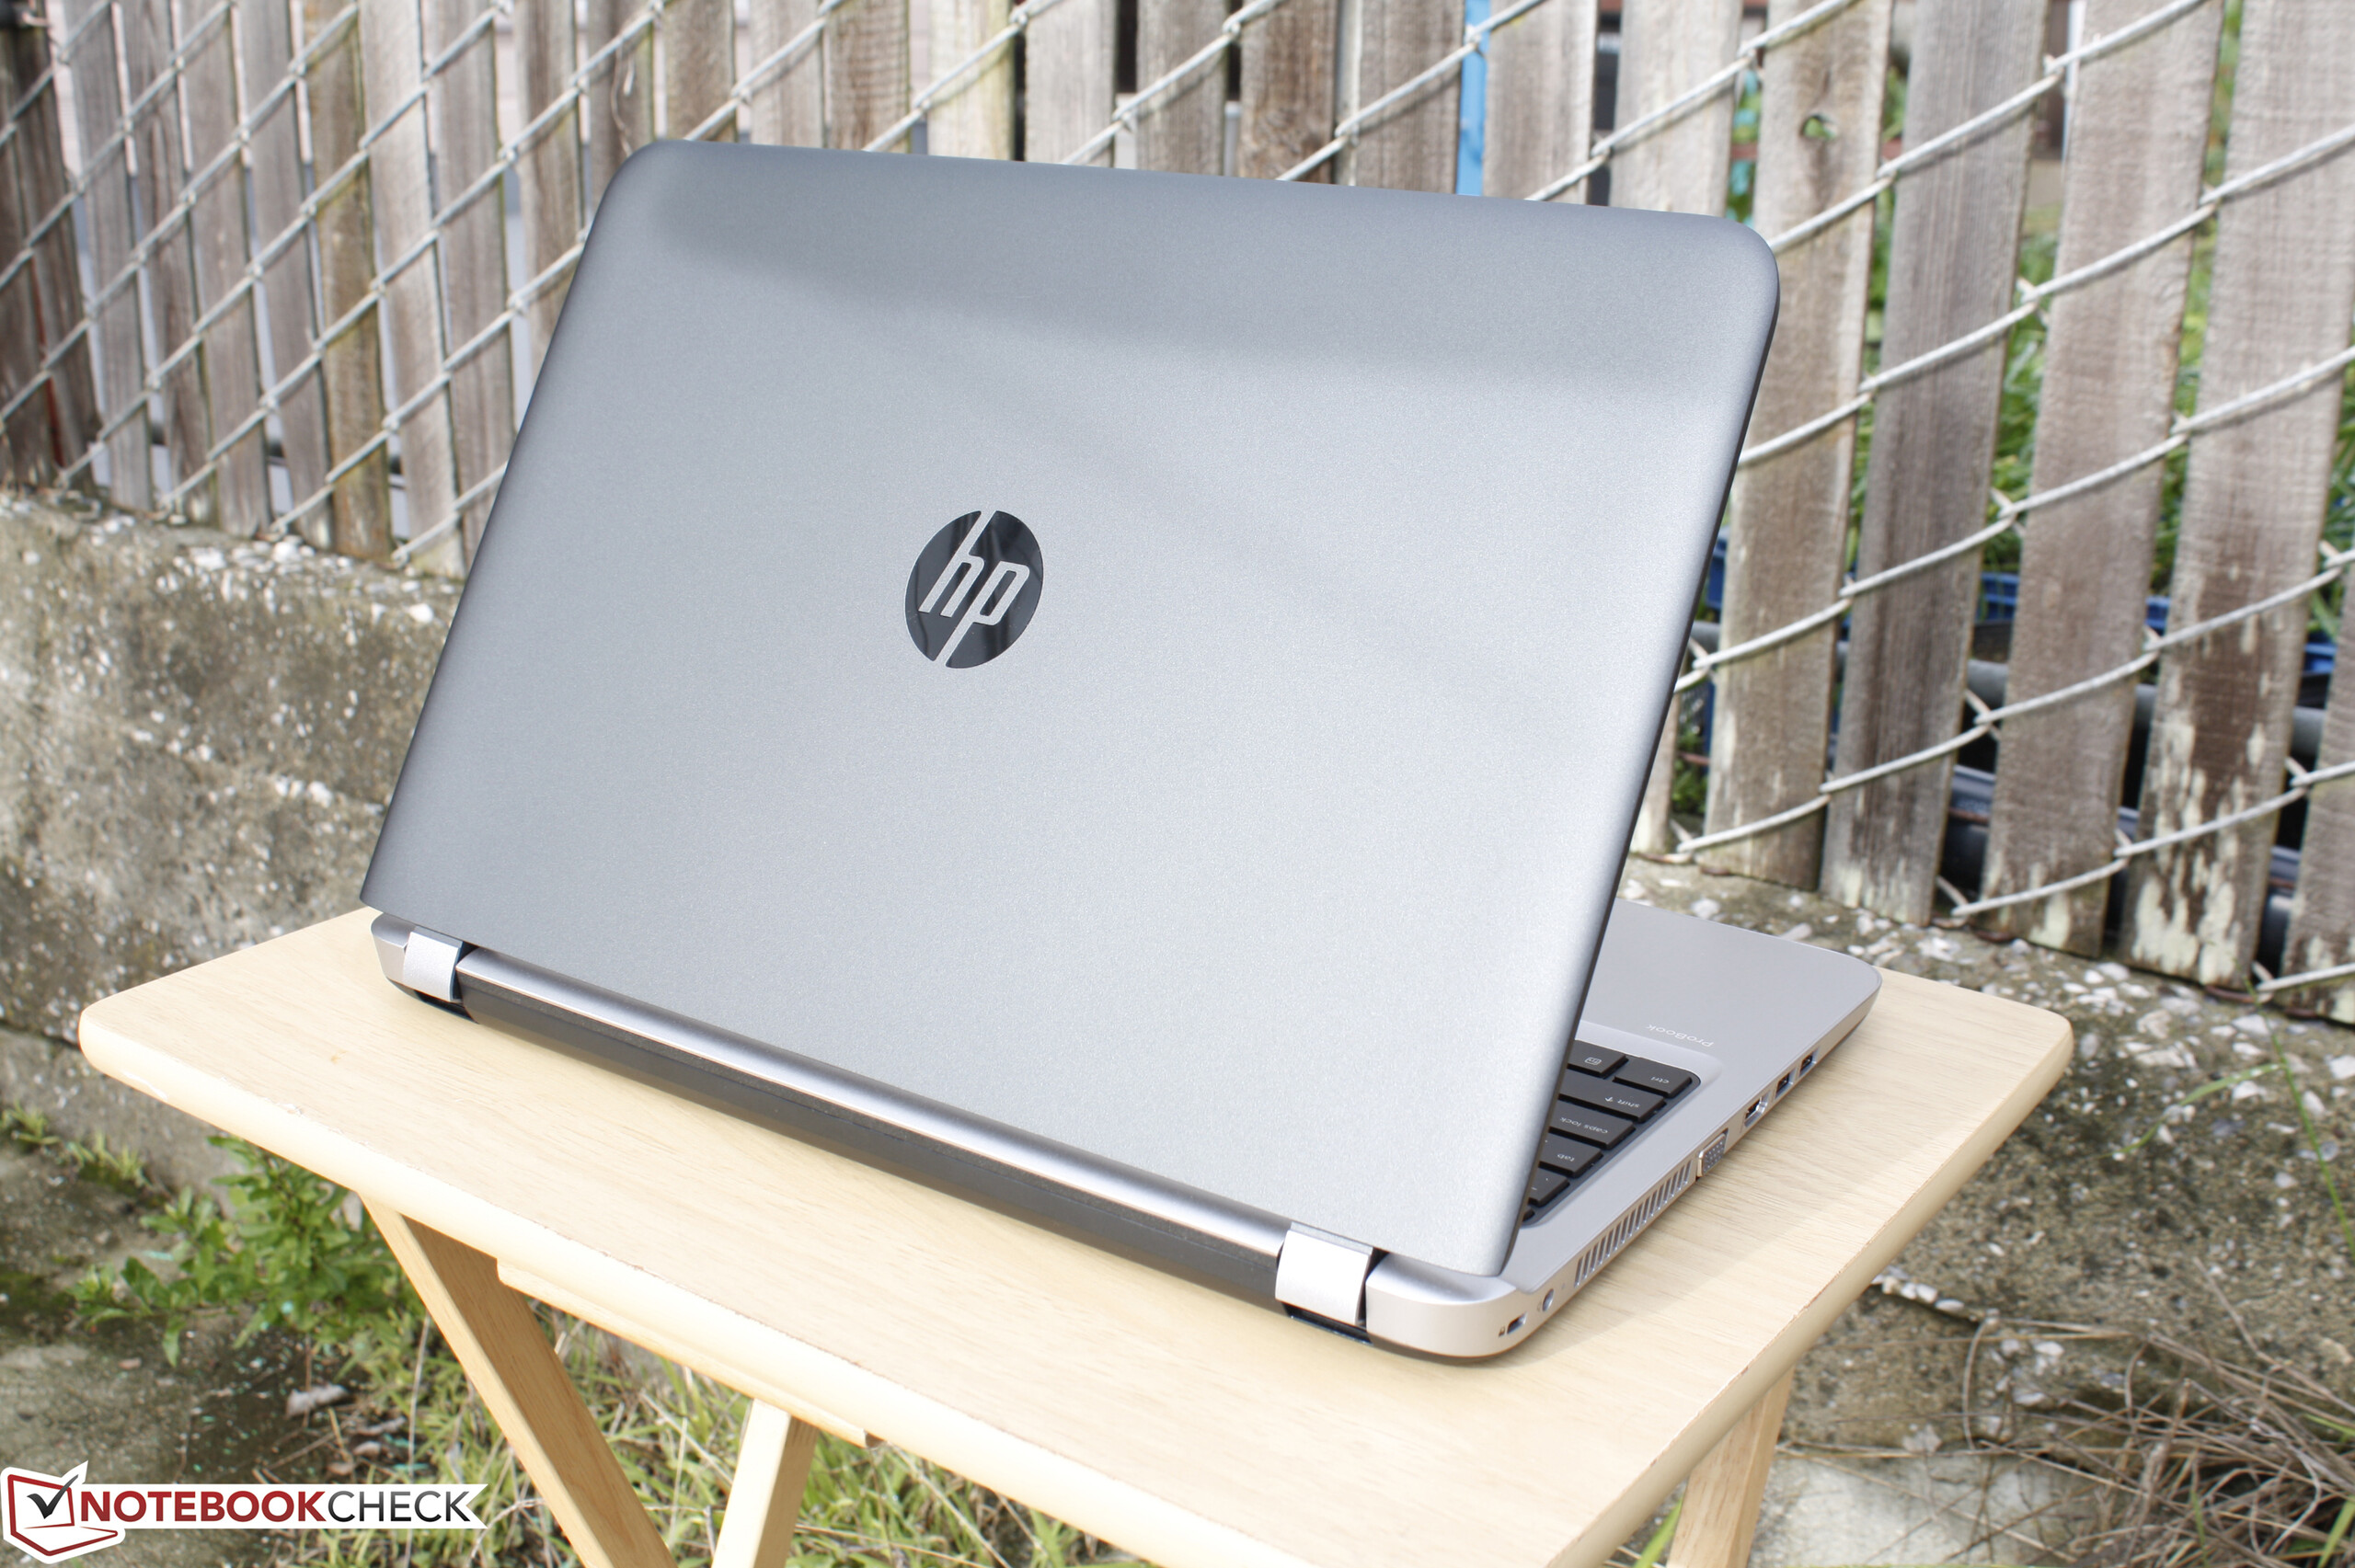
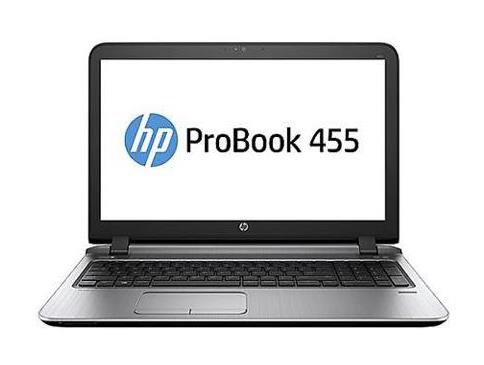
Breve análisis del HP ProBook 455 G3 T1B79UT


| SD Card Reader | |
| average JPG Copy Test (av. of 3 runs) | |
| MSI GT73VR 6RF | |
| Dell XPS 13 9360 FHD i5 | |
| HP ProBook 455 T1B79UT | |
| maximum AS SSD Seq Read Test (1GB) | |
| Dell XPS 13 9360 FHD i5 | |
| MSI GT73VR 6RF | |
| HP ProBook 455 T1B79UT | |
| Networking | |
| iperf3 receive AX12 | |
| Dell XPS 13 9360 FHD i5 | |
| HP Pavilion x360 15t X3W72AV | |
| HP ProBook 455 T1B79UT | |
| iperf3 transmit AX12 | |
| Dell XPS 13 9360 FHD i5 | |
| HP Pavilion x360 15t X3W72AV | |
| HP ProBook 455 T1B79UT | |
| |||||||||||||||||||||||||
iluminación: 72 %
Brillo con batería: 245.3 cd/m²
Contraste: 598:1 (Negro: 0.41 cd/m²)
ΔE ColorChecker Calman: 9.4 | ∀{0.5-29.43 Ø4.71}
ΔE Greyscale Calman: 11.1 | ∀{0.09-98 Ø4.96}
66.1% sRGB (Argyll 1.6.3 3D)
42.3% AdobeRGB 1998 (Argyll 1.6.3 3D)
45.98% AdobeRGB 1998 (Argyll 3D)
66.4% sRGB (Argyll 3D)
44.46% Display P3 (Argyll 3D)
Gamma: 2.27
CCT: 12802 K
| HP ProBook 455 T1B79UT TN, 15.6", 1366x768 | HP 15z-ba000 BOE06A4, TN, 15.6", 1366x768 | Dell Latitude 15-3570 LG Philips LGD04AF / 156WHU, TN LED, 15.6", 1366x768 | Lenovo ThinkPad E560 20EV000MGE Lenovo N156B6-L07, TN LED, 15.6", 1366x768 | Asus F555UB-XO043T AU Optronics B156XTN04.6, TN LED, 15.6", 1366x768 | |
|---|---|---|---|---|---|
| Display | -13% | -9% | -15% | -14% | |
| Display P3 Coverage (%) | 44.46 | 38.58 -13% | 40.61 -9% | 37.63 -15% | 38.22 -14% |
| sRGB Coverage (%) | 66.4 | 57.7 -13% | 61.1 -8% | 56.7 -15% | 57.5 -13% |
| AdobeRGB 1998 Coverage (%) | 45.98 | 39.86 -13% | 41.96 -9% | 38.88 -15% | 39.49 -14% |
| Response Times | 0% | -1% | 7% | 5% | |
| Response Time Grey 50% / Grey 80% * (ms) | 45.2 ? | 41.2 ? 9% | 37 ? 18% | 50 ? -11% | 46 ? -2% |
| Response Time Black / White * (ms) | 30.8 ? | 33.6 ? -9% | 37 ? -20% | 23 ? 25% | 27 ? 12% |
| PWM Frequency (Hz) | 198.4 ? | 595 ? | 50 ? | ||
| Screen | 4% | -17% | -10% | 5% | |
| Brightness middle (cd/m²) | 245.3 | 244.5 0% | 202 -18% | 241 -2% | 214 -13% |
| Brightness (cd/m²) | 231 | 232 0% | 211 -9% | 226 -2% | 205 -11% |
| Brightness Distribution (%) | 72 | 80 11% | 88 22% | 89 24% | 82 14% |
| Black Level * (cd/m²) | 0.41 | 0.385 6% | 0.62 -51% | 0.48 -17% | 0.46 -12% |
| Contrast (:1) | 598 | 635 6% | 326 -45% | 502 -16% | 465 -22% |
| Colorchecker dE 2000 * | 9.4 | 8.62 8% | 12.35 -31% | 12.43 -32% | 6.52 31% |
| Colorchecker dE 2000 max. * | 20 | 17.38 13% | 19.9 1% | 21.03 -5% | 9.1 55% |
| Greyscale dE 2000 * | 11.1 | 9.8 12% | 13.46 -21% | 13.24 -19% | 7.05 36% |
| Gamma | 2.27 97% | 2.09 105% | 2.44 90% | 2.61 84% | 2.41 91% |
| CCT | 12802 51% | 11391 57% | 15217 43% | 15733 41% | 8623 75% |
| Color Space (Percent of AdobeRGB 1998) (%) | 42.3 | 39.86 -6% | 39 -8% | 36 -15% | 36.6 -13% |
| Color Space (Percent of sRGB) (%) | 66.1 | 57.71 -13% | 61 -8% | 57 -14% | 57.8 -13% |
| Media total (Programa/Opciones) | -3% /
-0% | -9% /
-13% | -6% /
-9% | -1% /
1% |
* ... más pequeño es mejor
Tiempos de respuesta del display
| ↔ Tiempo de respuesta de Negro a Blanco | ||
|---|---|---|
| 30.8 ms ... subida ↗ y bajada ↘ combinada | ↗ 11.2 ms subida | 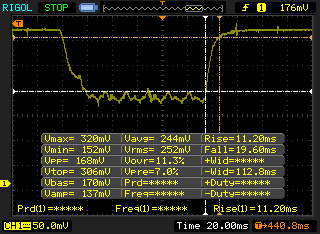 |
| ↘ 19.6 ms bajada | ||
| La pantalla mostró tiempos de respuesta lentos en nuestros tests y podría ser demasiado lenta para los jugones. En comparación, todos los dispositivos de prueba van de ##min### (mínimo) a 240 (máximo) ms. » 83 % de todos los dispositivos son mejores. Eso quiere decir que el tiempo de respuesta es peor que la media (19.8 ms) de todos los dispositivos testados. | ||
| ↔ Tiempo de respuesta 50% Gris a 80% Gris | ||
| 45.2 ms ... subida ↗ y bajada ↘ combinada | ↗ 23.2 ms subida | 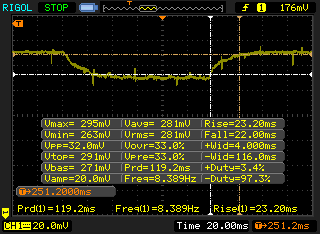 |
| ↘ 22 ms bajada | ||
| La pantalla mostró tiempos de respuesta lentos en nuestros tests y podría ser demasiado lenta para los jugones. En comparación, todos los dispositivos de prueba van de ##min### (mínimo) a 636 (máximo) ms. » 78 % de todos los dispositivos son mejores. Eso quiere decir que el tiempo de respuesta es peor que la media (31 ms) de todos los dispositivos testados. | ||
Parpadeo de Pantalla / PWM (Pulse-Width Modulation)
| Parpadeo de Pantalla / PWM detectado | 198.4 Hz | ≤ 99 % de brillo | 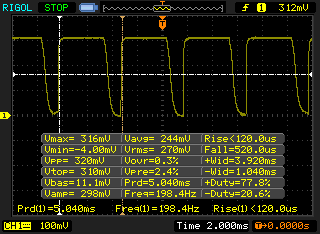 |
La retroiluminación del display parpadea a 198.4 Hz (seguramente usa PWM - Pulse-Width Modulation) a un brillo del 99 % e inferior. Sobre este nivel de brillo no debería darse parpadeo / PWM. La frecuencia de 198.4 Hz es relativamente baja, por lo que la gente sensible debería ver parpadeos y padecer fatiga visual por la pantalla (usado al brillo indicado a continuación). Comparación: 52 % de todos los dispositivos testados no usaron PWM para atenuar el display. Si se usó, medimos una media de 7754 (mínimo: 5 - máxmo: 343500) Hz. | |||
| wPrime 2.10 - 1024m | |
| HP 250 G5 Y1V08UT | |
| Lenovo IdeaPad Z40-59422614 | |
| HP ProBook 455 T1B79UT | |
| Super Pi Mod 1.5 XS 32M - 32M | |
| HP 250 G5 Y1V08UT | |
| HP ProBook 455 T1B79UT | |
| Lenovo IdeaPad Z40-59422614 | |
| Dell XPS 13 9360 FHD i5 | |
* ... más pequeño es mejor
| PCMark 8 Home Score Accelerated v2 | 2577 puntos | |
| PCMark 8 Creative Score Accelerated v2 | 3086 puntos | |
| PCMark 8 Work Score Accelerated v2 | 3511 puntos | |
ayuda | ||
| HP ProBook 455 T1B79UT Toshiba MQ01ACF050 | HP 15z-ba000 Adata IM2S3138E-128GM-B | Dell Latitude 15-3570 Samsung CM871 MZNLF128HCHP | Lenovo ThinkPad E560 20EV000MGE Western Digital WD Black Mobile 500GB (WD5000LPLX) | Lenovo Yoga 510-15IKB 80VC000XGE Samsung MZYTY256HDHP | |
|---|---|---|---|---|---|
| CrystalDiskMark 3.0 | 4322% | 1964% | -7% | 8581% | |
| Read Seq (MB/s) | 124.3 | 397.9 220% | 453.2 265% | 120.4 -3% | 529 326% |
| Write Seq (MB/s) | 121.8 | 171.4 41% | 137.7 13% | 123.1 1% | 508 317% |
| Read 512 (MB/s) | 43.07 | 367.5 753% | 308.5 616% | 34.31 -20% | 409.8 851% |
| Write 512 (MB/s) | 62 | 172.3 178% | 134.1 116% | 66.8 8% | 316.5 410% |
| Read 4k (MB/s) | 0.53 | 26.11 4826% | 19.06 3496% | 0.373 -30% | 36.01 6694% |
| Write 4k (MB/s) | 1.304 | 52.3 3911% | 21.31 1534% | 1.29 -1% | 106.7 8083% |
| Read 4k QD32 (MB/s) | 1.174 | 164.3 13895% | 93.5 7864% | 0.976 -17% | 384.8 32677% |
| Write 4k QD32 (MB/s) | 1.224 | 132.8 10750% | 23.3 1804% | 1.285 5% | 237.3 19287% |

| 3DMark | |
| 1280x720 Cloud Gate Standard Graphics | |
| Dell XPS 13 9360 FHD i5 | |
| Acer TravelMate P249-M-5452 | |
| Lenovo IdeaPad Z40-59422614 | |
| HP 250 G4 T6P08ES | |
| HP ProBook 455 T1B79UT | |
| HP 250 G5 Y1V08UT | |
| 1920x1080 Fire Strike Graphics | |
| HP 250 G4 T6P08ES | |
| Dell XPS 13 9360 FHD i5 | |
| Lenovo IdeaPad Z40-59422614 | |
| HP ProBook 455 T1B79UT | |
| Acer TravelMate P249-M-5452 | |
| 1920x1080 Ice Storm Extreme Graphics | |
| Dell XPS 13 9360 FHD i5 | |
| Acer TravelMate P249-M-5452 | |
| HP ProBook 455 T1B79UT | |
| HP 250 G5 Y1V08UT | |
| 3DMark 11 Performance | 1457 puntos | |
| 3DMark Ice Storm Standard Score | 36716 puntos | |
| 3DMark Cloud Gate Standard Score | 3463 puntos | |
| 3DMark Fire Strike Score | 736 puntos | |
| 3DMark Fire Strike Extreme Score | 373 puntos | |
ayuda | ||
| BioShock Infinite | |
| 1280x720 Very Low Preset | |
| Acer TravelMate P249-M-5452 | |
| HP 250 G4 T6P08ES | |
| Acer TravelMate P257-M-56AX | |
| HP ProBook 455 T1B79UT | |
| Asus UX32LA-R3025H | |
| Acer Aspire E5-774-54HJ | |
| 1366x768 Medium Preset | |
| HP 250 G4 T6P08ES | |
| Acer TravelMate P249-M-5452 | |
| HP ProBook 455 T1B79UT | |
| Acer TravelMate P257-M-56AX | |
| Acer Aspire E5-774-54HJ | |
| Asus UX32LA-R3025H | |
| 1366x768 High Preset | |
| HP 250 G4 T6P08ES | |
| Acer TravelMate P249-M-5452 | |
| HP ProBook 455 T1B79UT | |
| Acer Aspire E5-774-54HJ | |
| Asus UX32LA-R3025H | |
| bajo | medio | alto | ultra | |
|---|---|---|---|---|
| BioShock Infinite (2013) | 40.9 | 24.4 | 19.2 | |
| Metro: Last Light (2013) | 15.4 | |||
| Rise of the Tomb Raider (2016) | 16.8 | |||
| Overwatch (2016) | 26.1 |
Ruido
| Ocioso |
| 32.4 / 32.4 / 32.5 dB(A) |
| Carga |
| 35.5 / 36.6 dB(A) |
 | ||
30 dB silencioso 40 dB(A) audible 50 dB(A) ruidosamente alto |
||
min: | ||
| HP ProBook 455 T1B79UT Radeon R6 (Carrizo), A10-8700P, Toshiba MQ01ACF050 | HP 15z-ba000 Radeon R4 (Beema), A6-7310, Adata IM2S3138E-128GM-B | Dell Latitude 15-3570 HD Graphics 520, 6200U, Samsung CM871 MZNLF128HCHP | Lenovo ThinkPad E560 20EV000MGE HD Graphics 520, 6100U, Western Digital WD Black Mobile 500GB (WD5000LPLX) | Lenovo Yoga 510-15IKB 80VC000XGE Radeon R7 M460, i5-7200U, Samsung MZYTY256HDHP | |
|---|---|---|---|---|---|
| Noise | -0% | 3% | -3% | 0% | |
| apagado / medio ambiente * (dB) | 28.8 | 28.6 1% | 31 -8% | 31.2 -8% | 30.15 -5% |
| Idle Minimum * (dB) | 32.4 | 31.6 2% | 31 4% | 32.3 -0% | 30.2 7% |
| Idle Average * (dB) | 32.4 | 31.6 2% | 31 4% | 32.3 -0% | 30.2 7% |
| Idle Maximum * (dB) | 32.5 | 31.6 3% | 31 5% | 32.5 -0% | 31 5% |
| Load Average * (dB) | 35.5 | 37.2 -5% | 34.2 4% | 36 -1% | 38 -7% |
| Load Maximum * (dB) | 36.6 | 38.2 -4% | 34.3 6% | 38.8 -6% | 38.6 -5% |
* ... más pequeño es mejor
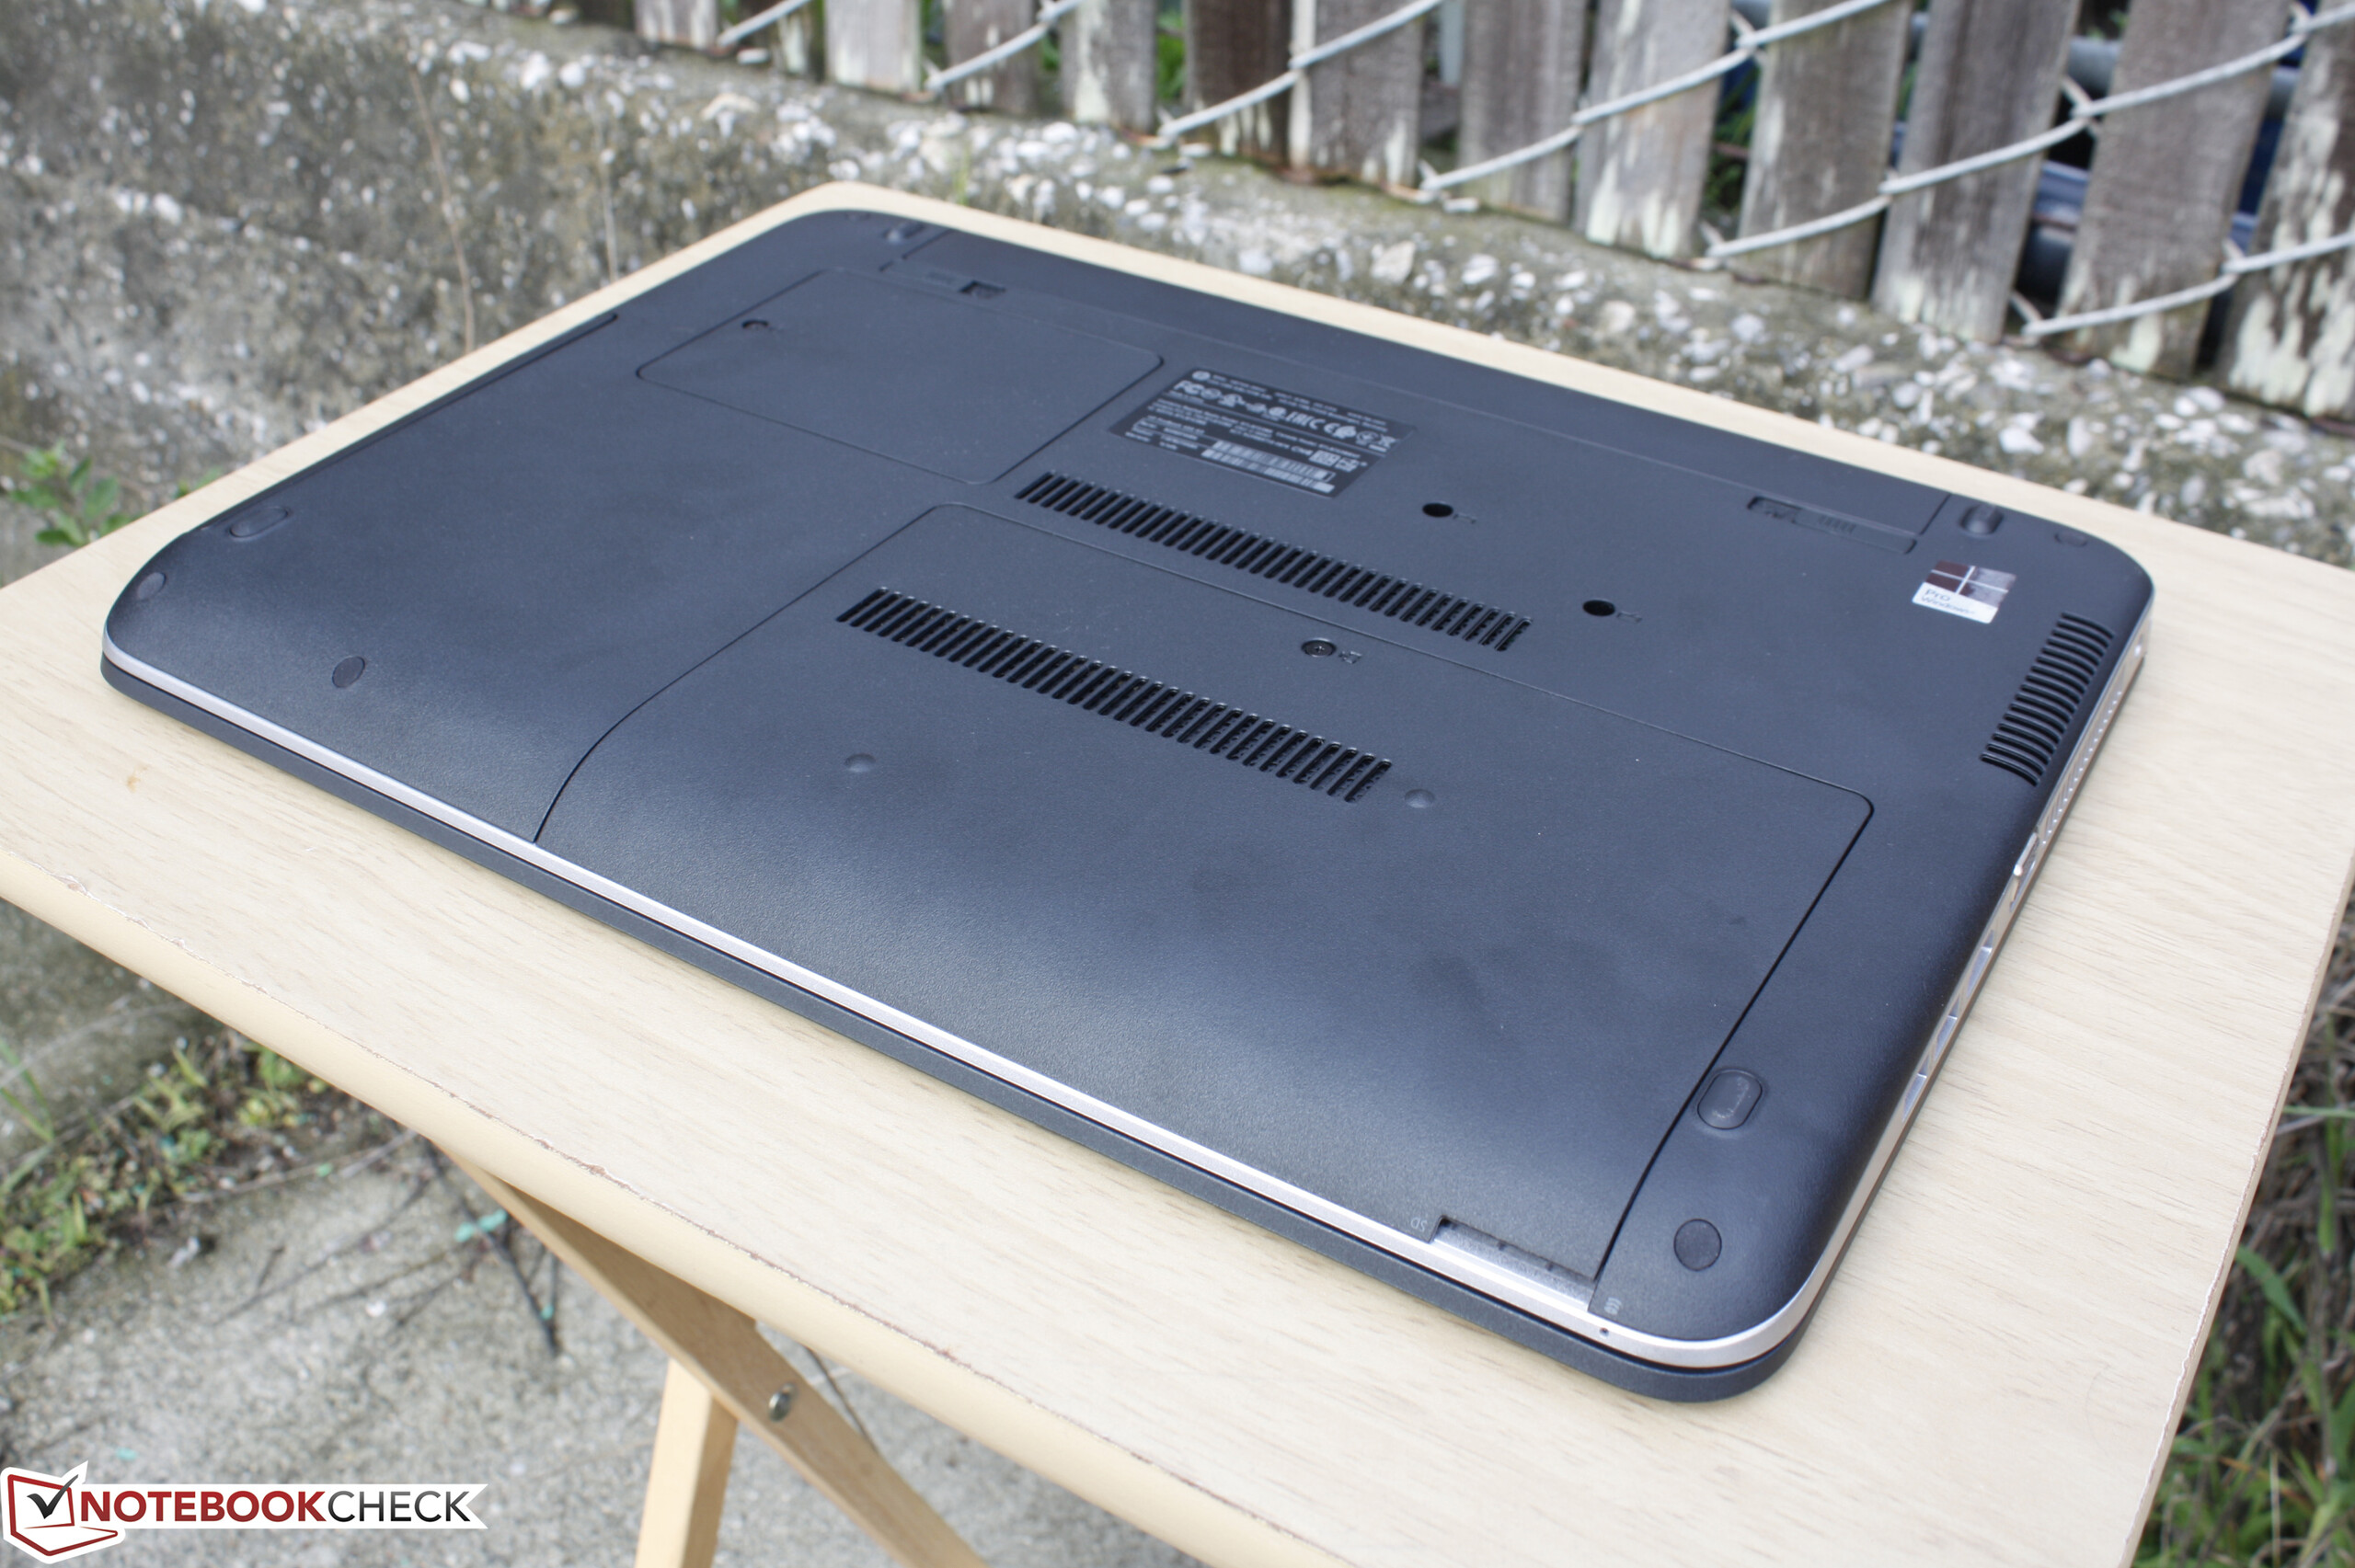
(±) La temperatura máxima en la parte superior es de 44 °C / 111 F, frente a la media de 34.3 °C / 94 F, que oscila entre 21.2 y 62.5 °C para la clase Office.
(±) El fondo se calienta hasta un máximo de 42 °C / 108 F, frente a la media de 36.8 °C / 98 F
(+) En reposo, la temperatura media de la parte superior es de 24.8 °C / 77# F, frente a la media del dispositivo de 29.5 °C / 85 F.
(+) El reposamanos y el panel táctil están a una temperatura inferior a la de la piel, con un máximo de 25.8 °C / 78.4 F y, por tanto, son fríos al tacto.
(±) La temperatura media de la zona del reposamanos de dispositivos similares fue de 27.5 °C / 81.5 F (+1.7 °C / 3.1 F).
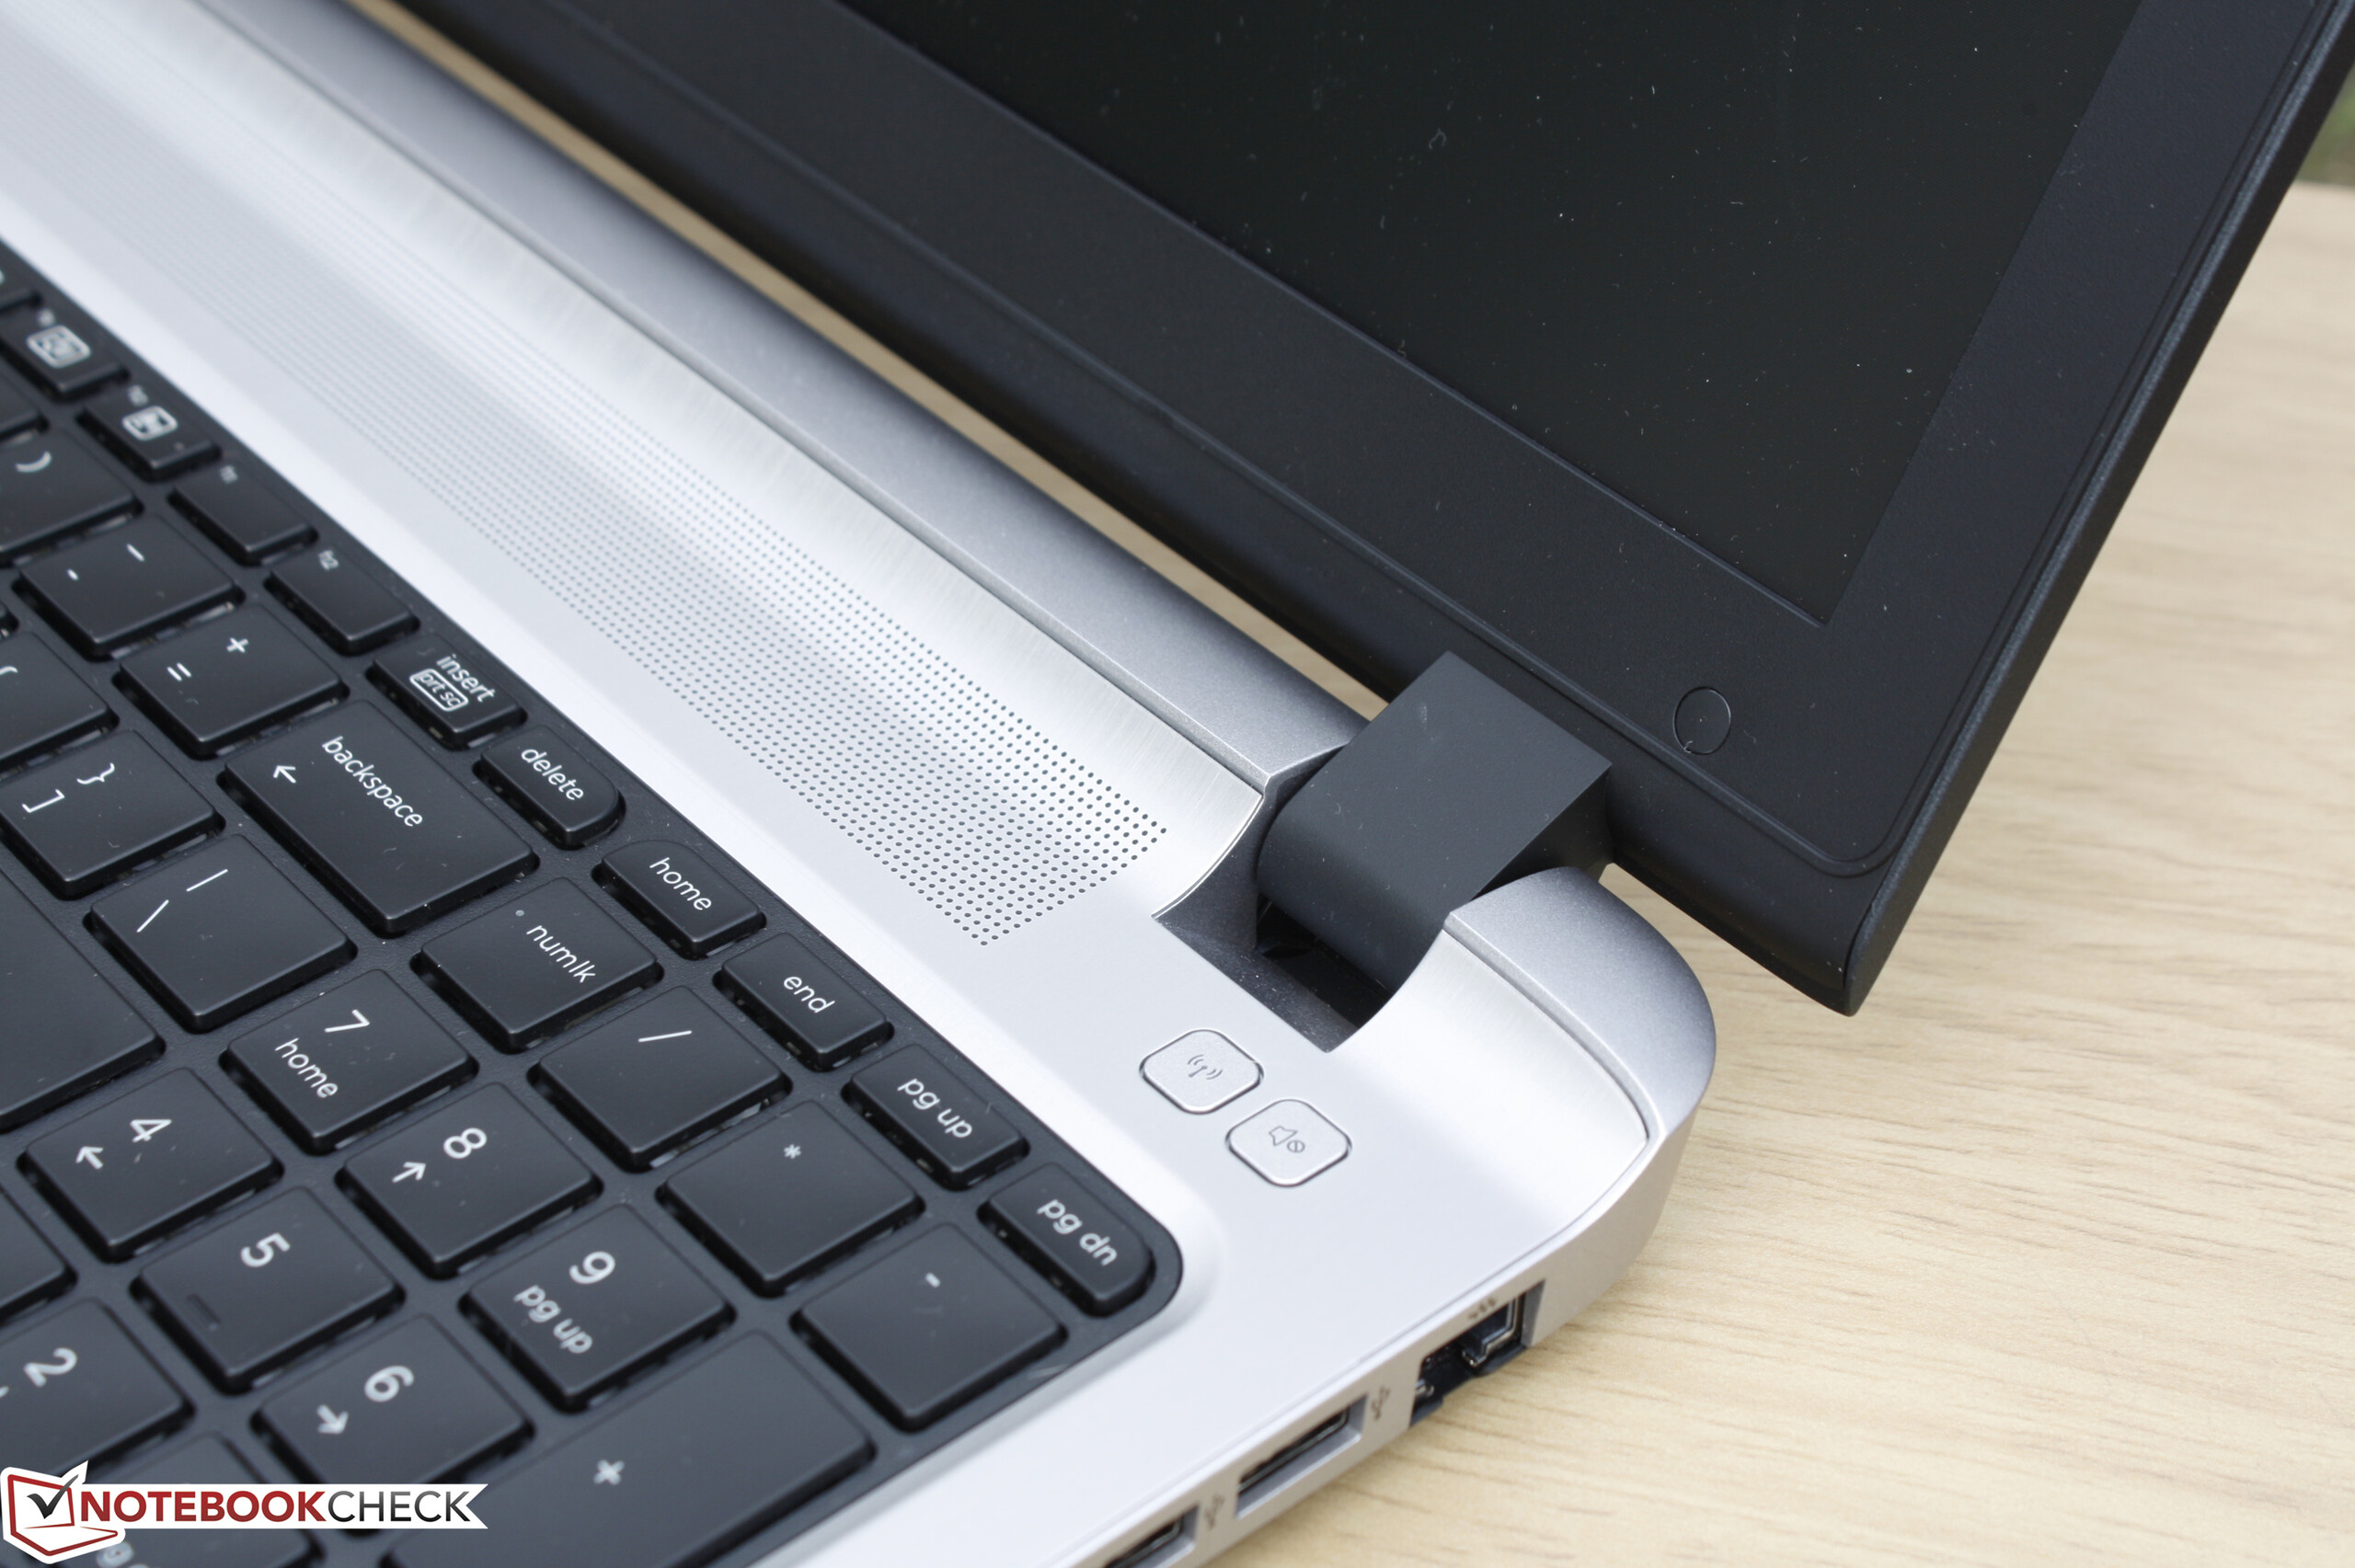
HP ProBook 455 T1B79UT análisis de audio
(±) | la sonoridad del altavoz es media pero buena (77.6 dB)
Graves 100 - 315 Hz
(-) | casi sin bajos - de media 26.8% inferior a la mediana
(±) | la linealidad de los graves es media (11.8% delta a frecuencia anterior)
Medios 400 - 2000 Hz
(+) | medios equilibrados - a sólo 3.6% de la mediana
(±) | la linealidad de los medios es media (9.7% delta respecto a la frecuencia anterior)
Altos 2 - 16 kHz
(+) | máximos equilibrados - a sólo 2.8% de la mediana
(+) | los máximos son lineales (6.2% delta a la frecuencia anterior)
Total 100 - 16.000 Hz
(±) | la linealidad del sonido global es media (28.1% de diferencia con la mediana)
En comparación con la misma clase
» 88% de todos los dispositivos probados de esta clase eran mejores, 3% similares, 9% peores
» El mejor tuvo un delta de 7%, la media fue 21%, el peor fue ###max##%
En comparación con todos los dispositivos probados
» 85% de todos los dispositivos probados eran mejores, 3% similares, 12% peores
» El mejor tuvo un delta de 4%, la media fue 23%, el peor fue ###max##%
Apple MacBook 12 (Early 2016) 1.1 GHz análisis de audio
(+) | los altavoces pueden reproducir a un volumen relativamente alto (#83.6 dB)
Graves 100 - 315 Hz
(±) | lubina reducida - en promedio 11.3% inferior a la mediana
(±) | la linealidad de los graves es media (14.2% delta a frecuencia anterior)
Medios 400 - 2000 Hz
(+) | medios equilibrados - a sólo 2.4% de la mediana
(+) | los medios son lineales (5.5% delta a la frecuencia anterior)
Altos 2 - 16 kHz
(+) | máximos equilibrados - a sólo 2% de la mediana
(+) | los máximos son lineales (4.5% delta a la frecuencia anterior)
Total 100 - 16.000 Hz
(+) | el sonido global es lineal (10.2% de diferencia con la mediana)
En comparación con la misma clase
» 7% de todos los dispositivos probados de esta clase eran mejores, 2% similares, 90% peores
» El mejor tuvo un delta de 5%, la media fue 18%, el peor fue ###max##%
En comparación con todos los dispositivos probados
» 5% de todos los dispositivos probados eran mejores, 1% similares, 94% peores
» El mejor tuvo un delta de 4%, la media fue 23%, el peor fue ###max##%
| Off / Standby | |
| Ocioso | |
| Carga |
|
Clave:
min: | |
| HP ProBook 455 T1B79UT A10-8700P, Radeon R6 (Carrizo), Toshiba MQ01ACF050, TN, 1366x768, 15.6" | HP 15z-ba000 A6-7310, Radeon R4 (Beema), Adata IM2S3138E-128GM-B, TN, 1366x768, 15.6" | Dell Latitude 15-3570 6200U, HD Graphics 520, Samsung CM871 MZNLF128HCHP, TN LED, 1366x768, 15.6" | Lenovo ThinkPad E560 20EV000MGE 6100U, HD Graphics 520, Western Digital WD Black Mobile 500GB (WD5000LPLX), TN LED, 1366x768, 15.6" | Lenovo Yoga 510-15IKB 80VC000XGE i5-7200U, Radeon R7 M460, Samsung MZYTY256HDHP, IPS, 1920x1080, 15.6" | |
|---|---|---|---|---|---|
| Power Consumption | 29% | 23% | 23% | 9% | |
| Idle Minimum * (Watt) | 5.9 | 5.22 12% | 4.9 17% | 5.2 12% | 3.9 34% |
| Idle Average * (Watt) | 8.2 | 5.67 31% | 7.2 12% | 7.25 12% | 7.8 5% |
| Idle Maximum * (Watt) | 9.9 | 7.82 21% | 7.5 24% | 7.9 20% | 8.4 15% |
| Load Average * (Watt) | 37.5 | 19.67 48% | 25.4 32% | 25.1 33% | 37 1% |
| Load Maximum * (Watt) | 41 | 26.72 35% | 28 32% | 25.1 39% | 46 -12% |
* ... más pequeño es mejor
| HP ProBook 455 T1B79UT A10-8700P, Radeon R6 (Carrizo), 44 Wh | HP 15z-ba000 A6-7310, Radeon R4 (Beema), 31 Wh | Dell Latitude 15-3570 6200U, HD Graphics 520, 65 Wh | Lenovo ThinkPad E560 20EV000MGE 6100U, HD Graphics 520, 48 Wh | Lenovo Yoga 510-15IKB 80VC000XGE i5-7200U, Radeon R7 M460, 35 Wh | |
|---|---|---|---|---|---|
| Duración de Batería | 21% | 114% | 109% | 33% | |
| Reader / Idle (h) | 9.5 | 8.5 -11% | 17.1 80% | 14.8 56% | |
| WiFi v1.3 (h) | 4 | 4.1 2% | 9 125% | 9.4 135% | 5.3 33% |
| Load (h) | 1.1 | 1.9 73% | 2.6 136% | 2.6 136% |
Pro
Contra
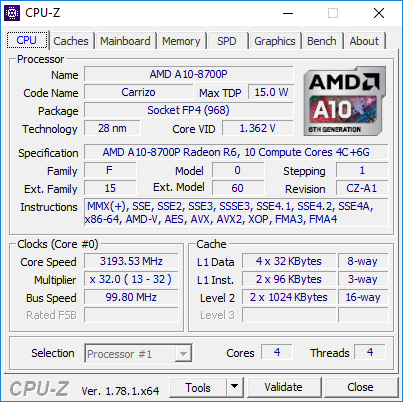
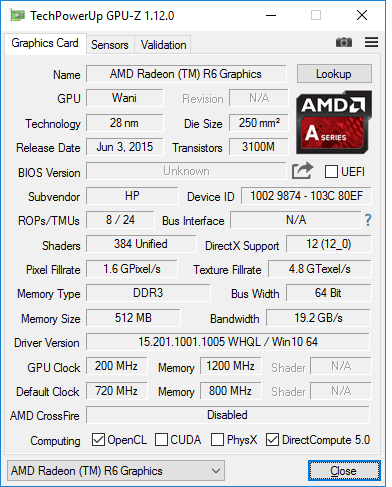
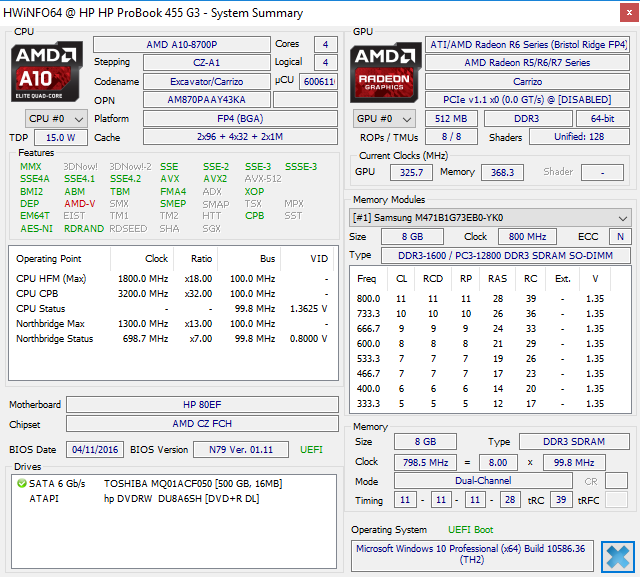
La plataforma AMD Carrizo para portátiles debería ser muy versátil con su TDP configurable. Su rendimiento aquí, empero, es considerablemente más lento que incluso la Core i5-4200U de hace tres generaciones. La GPU integrada Radeon R6 pinta parecido cuando se la compara con HD Graphics 520 o HD Graphics 5500 que se encuentran en hardware Intel antiguo.
Las desventajas de rendimiento de AMD habrían sido aceptables si el ProBook 455 hubiera ido bastante más silencioso y aguantado más como resultado, pero por desgracia no es el caso. Las temperatura superficiales no son más frescas y el aguante de batería es hasta más corto de lo esperado.
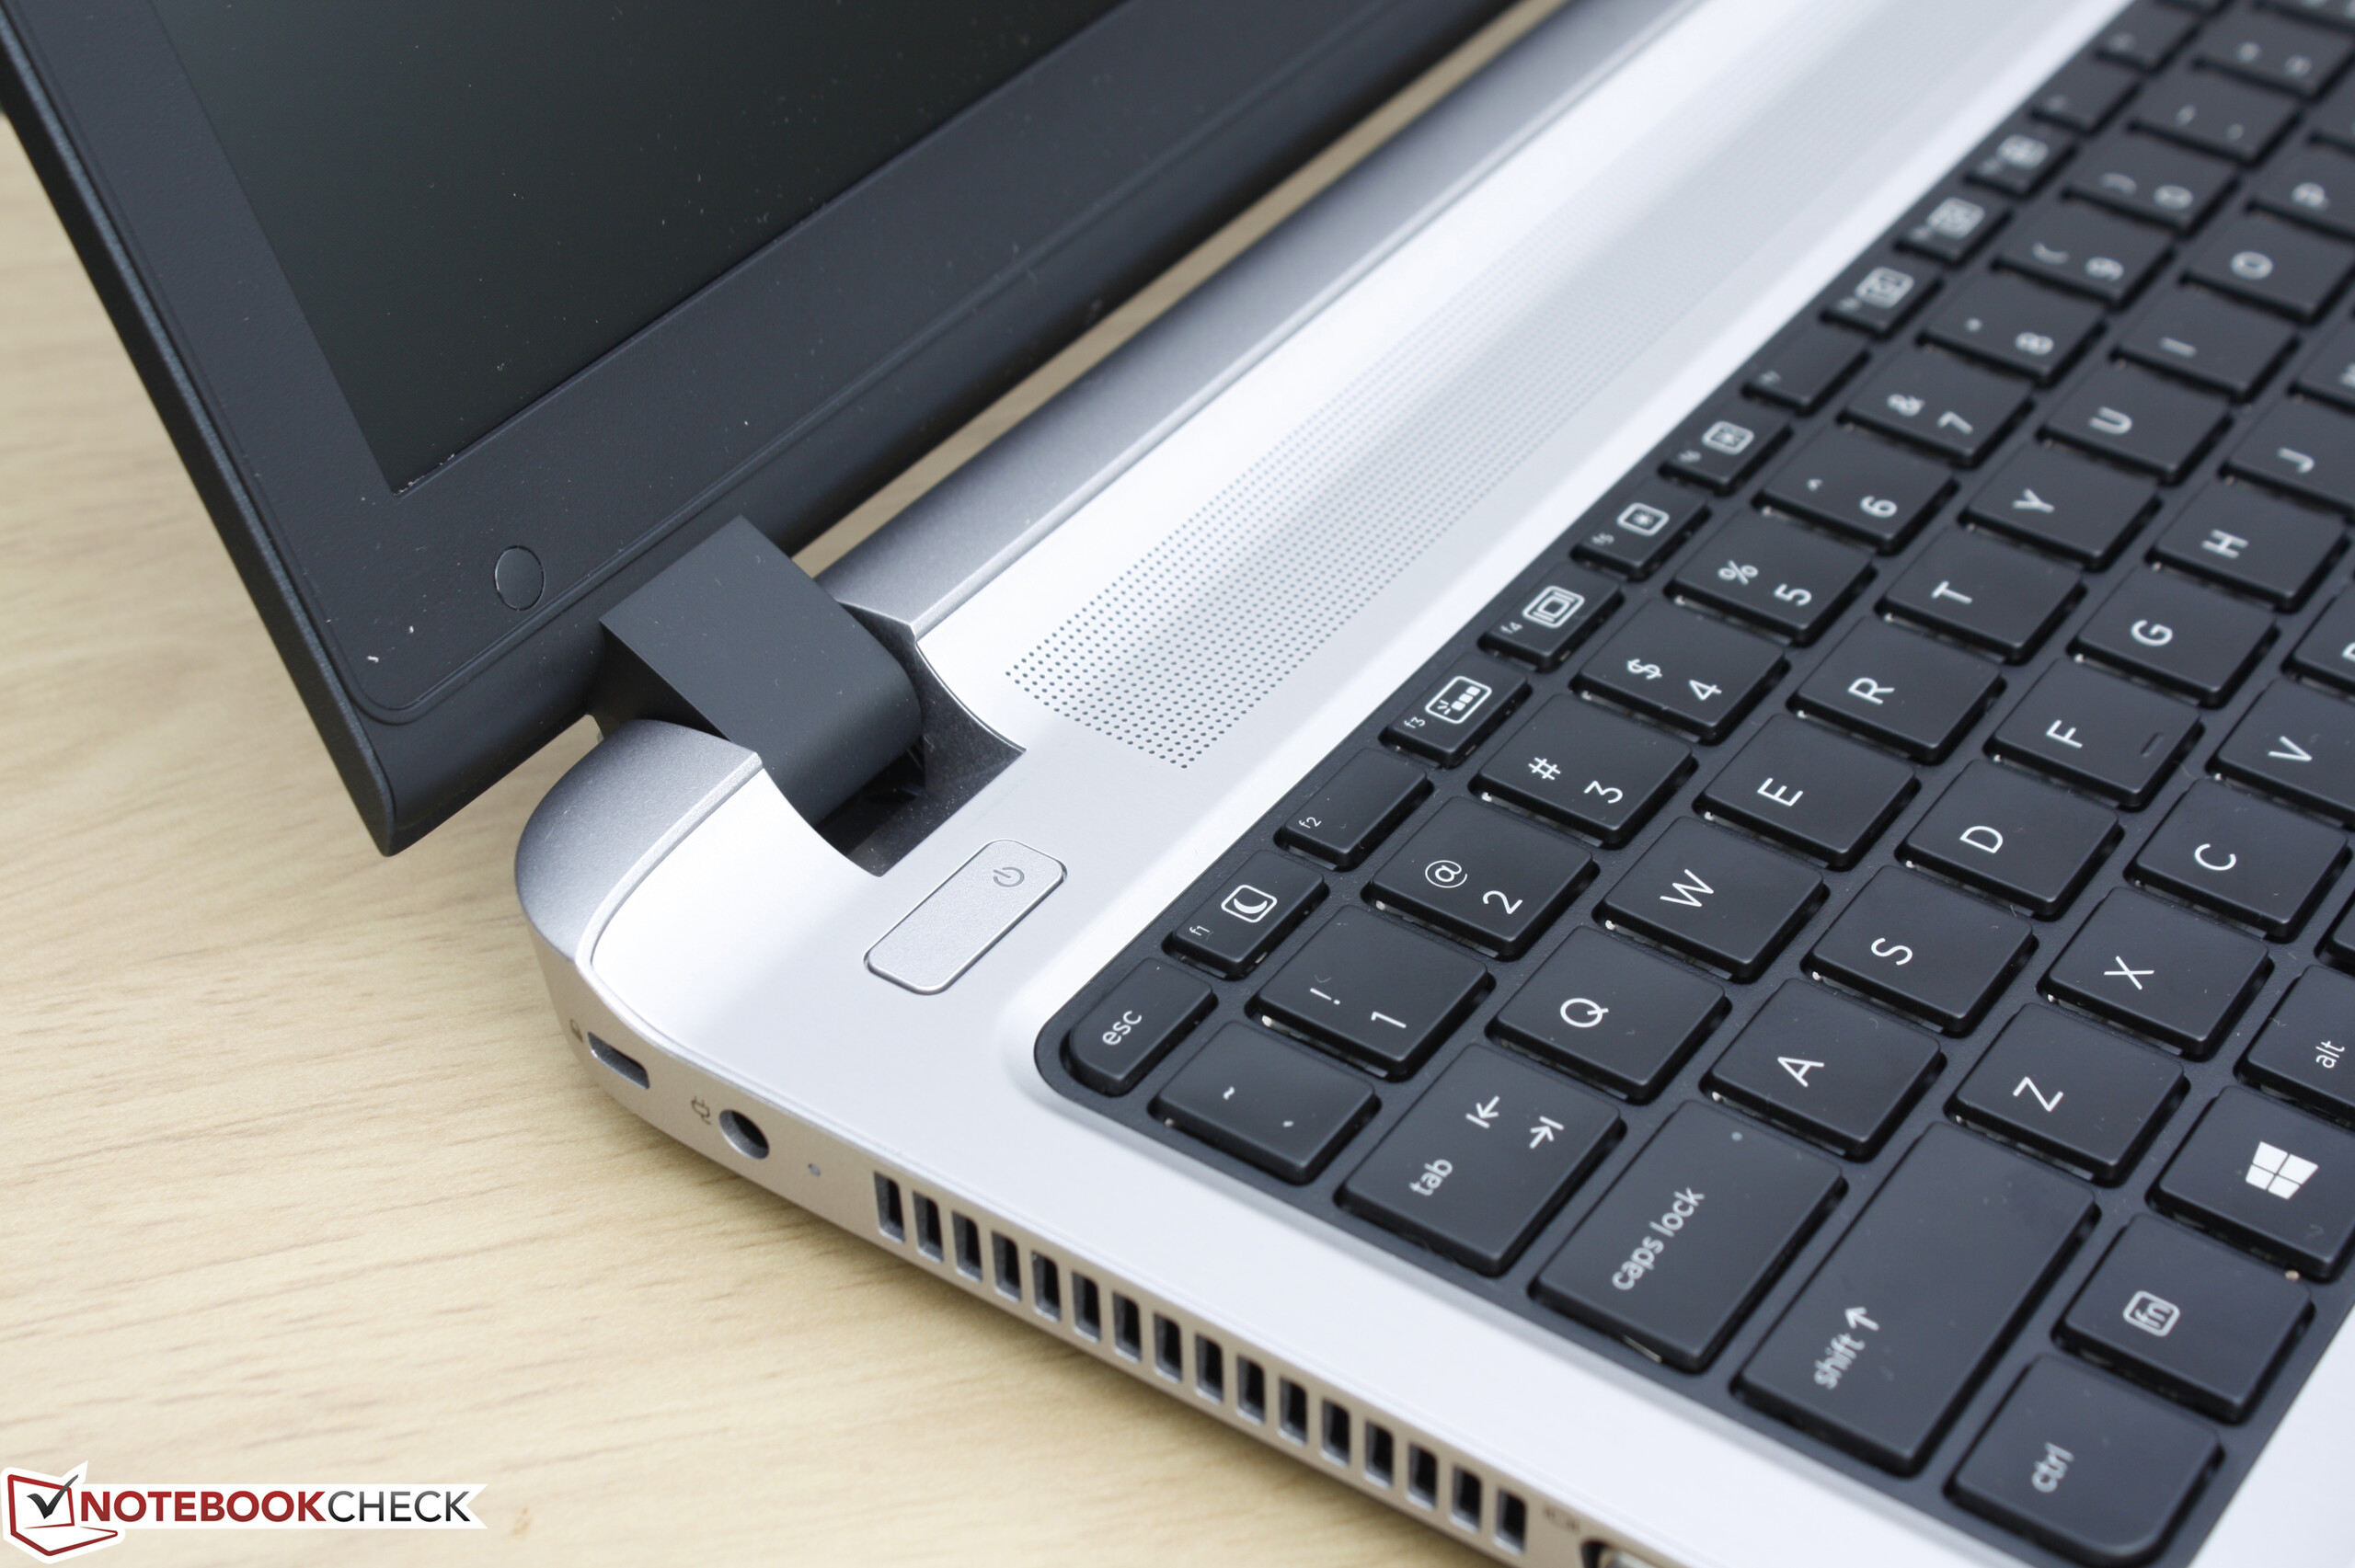
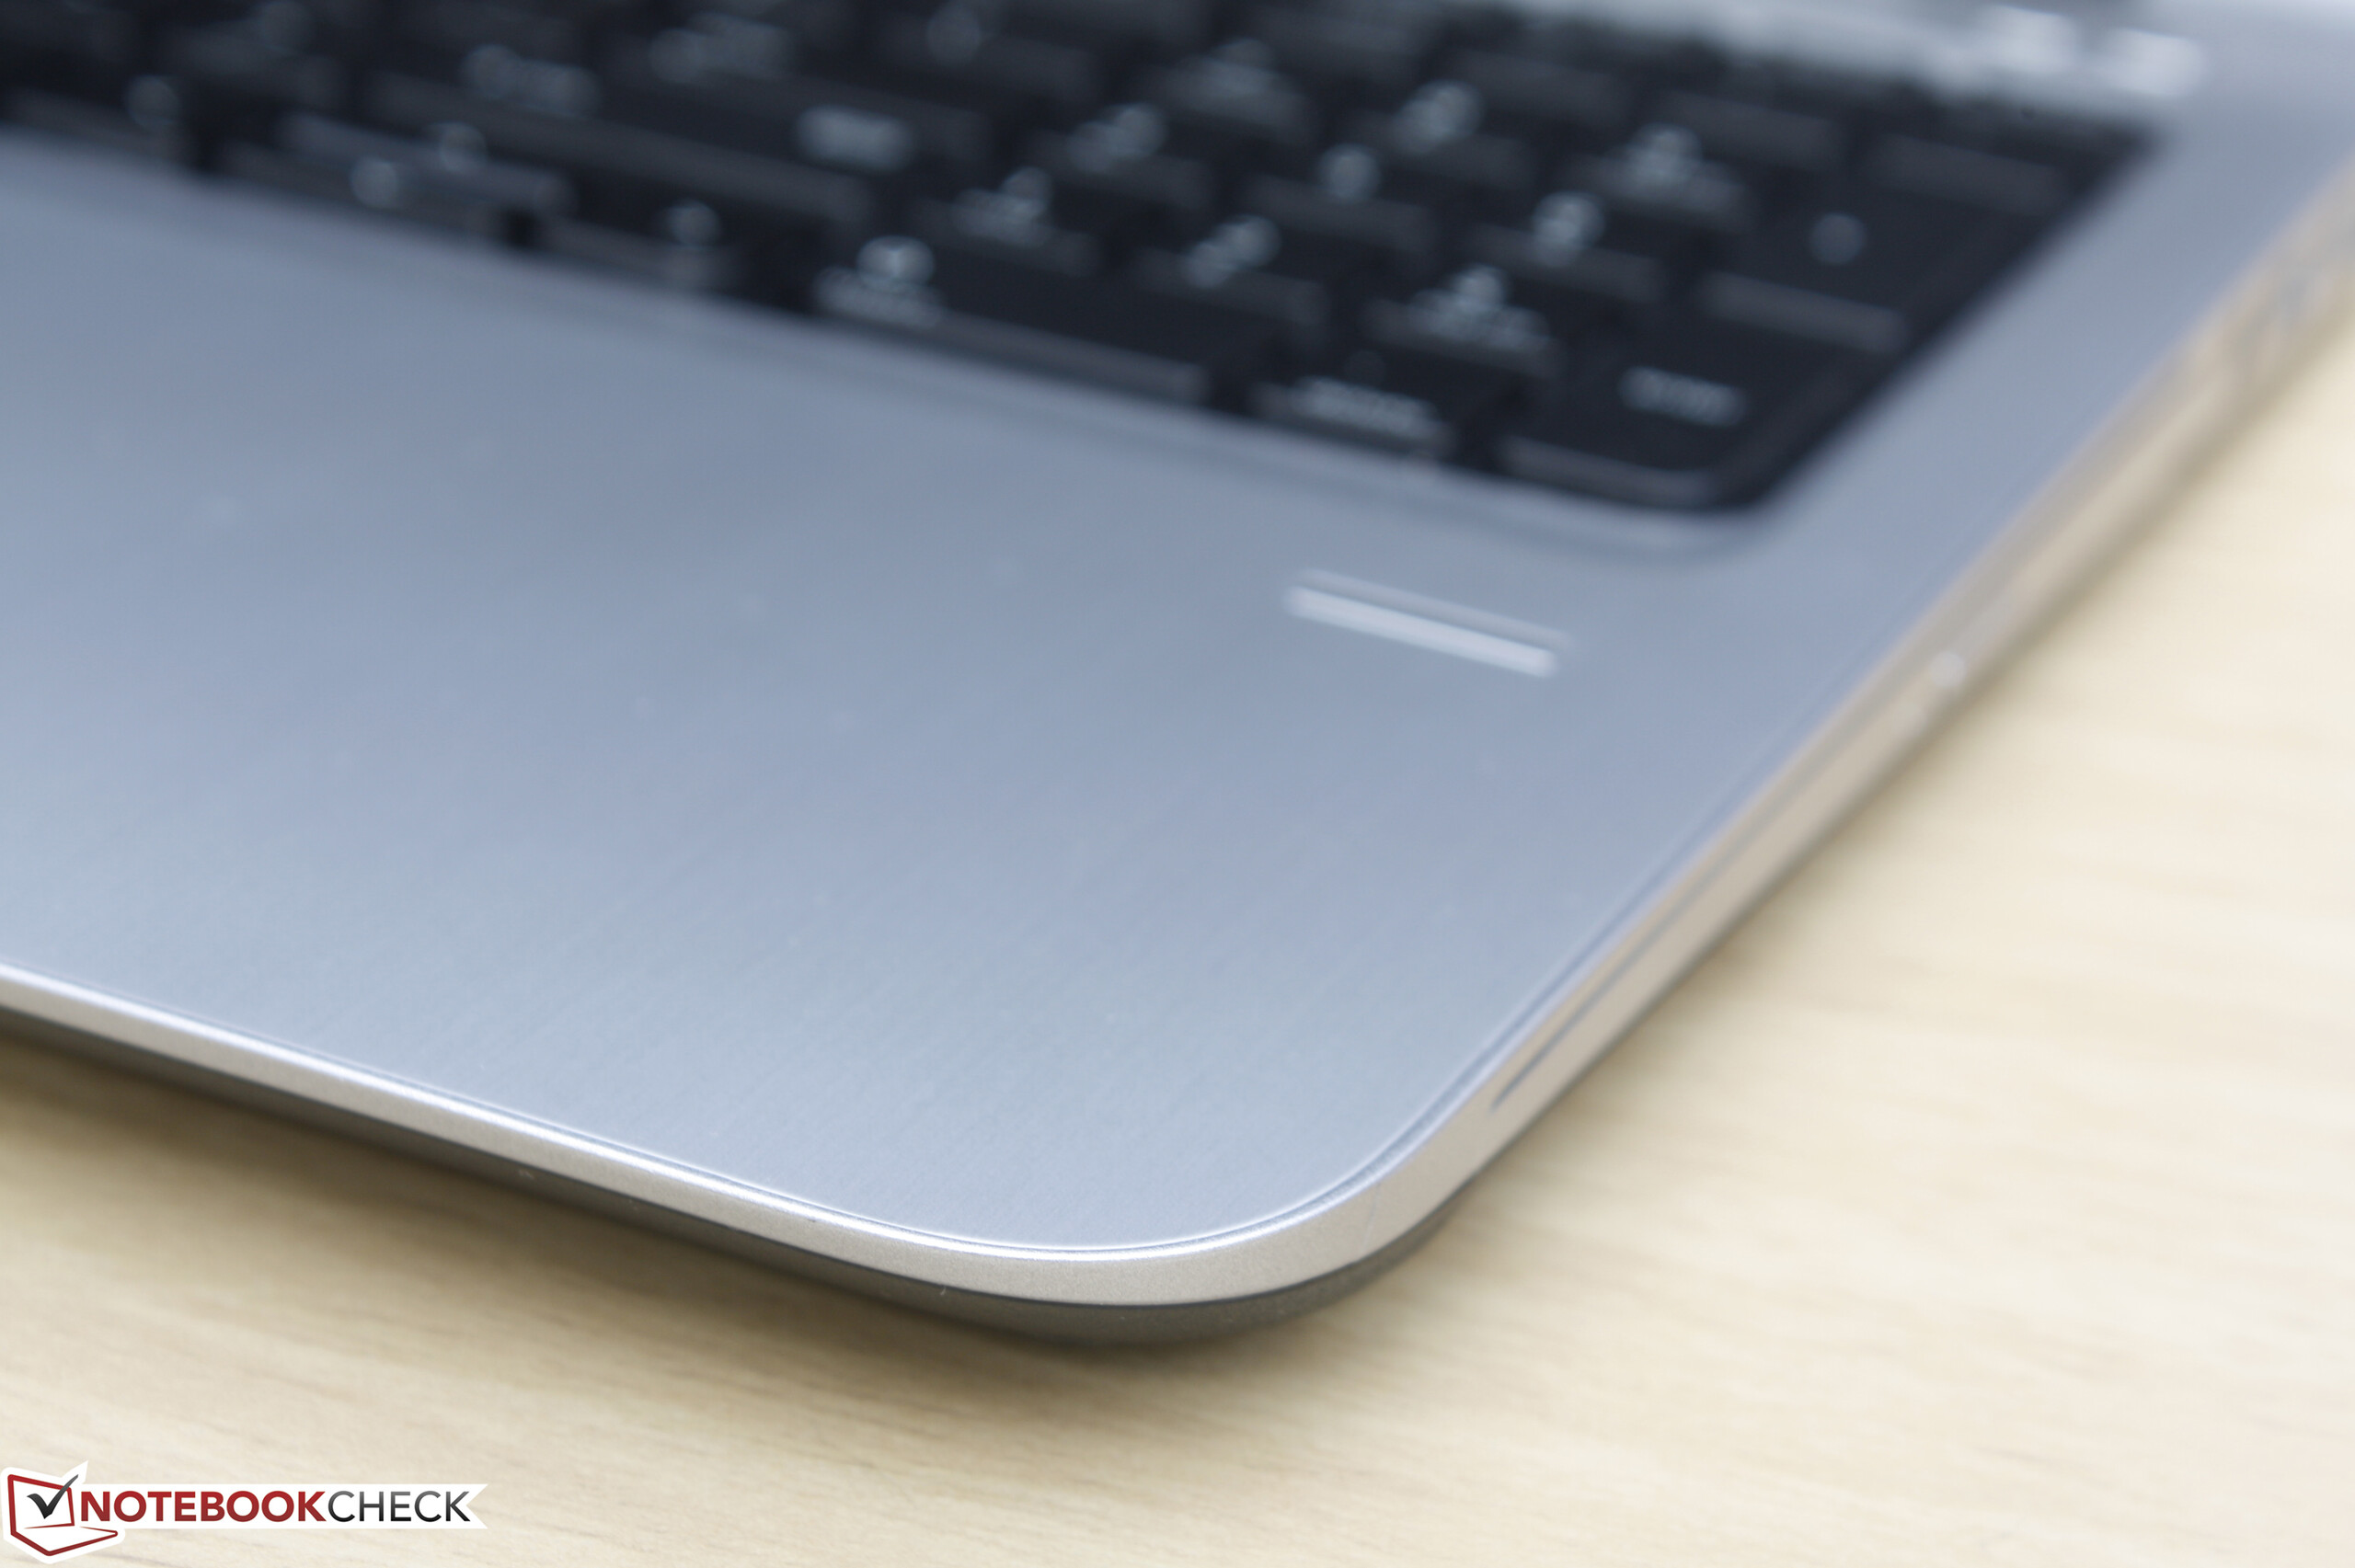
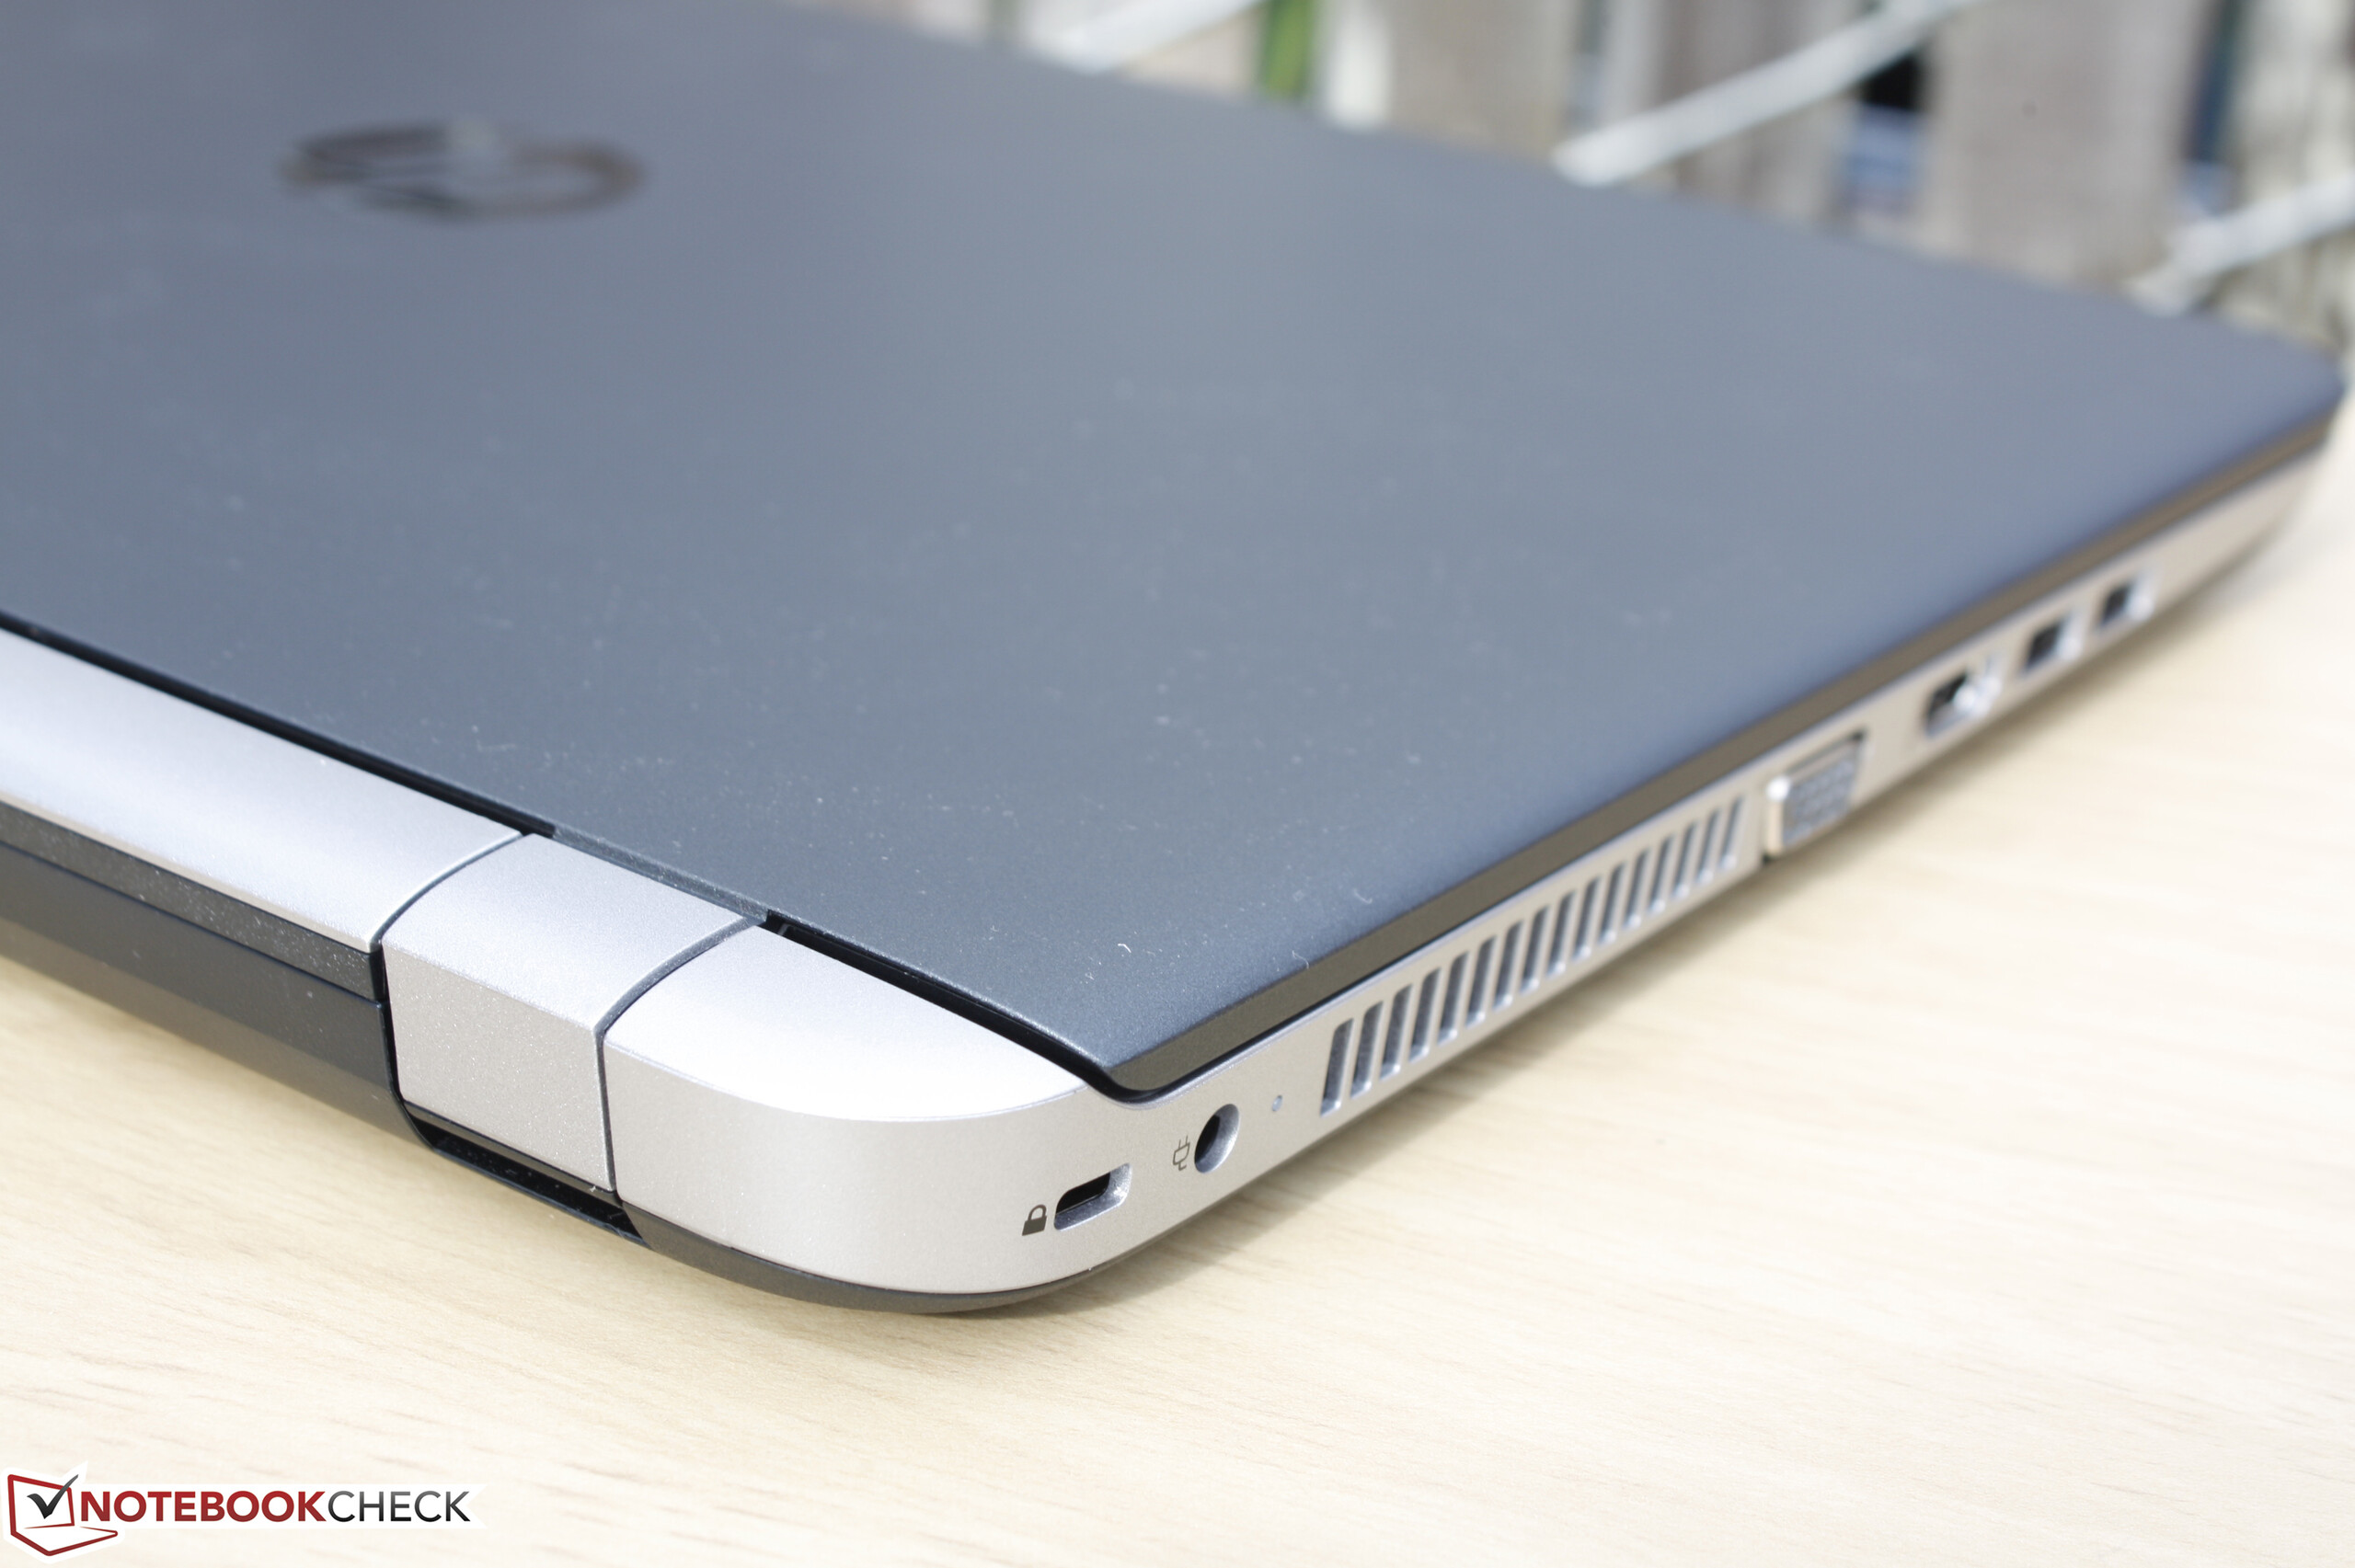
Aparte del procesador, el ProBook 455 funciona bien como un barebones pensado para cargas de trabajo poco exigentes. Ni concepto ni diseño llaman la atención y esperamos que en futuras revisiones añadan al menos alguna funcionalidad al hardware incluyendo opciones USB Type-C y TrackPoint.
Es difícil recomendar el Carrizo SKU cuando las viejas opciones Intel Core ix pueden dejar atrás en rendimiento y aguante lo que AMD tiene que ofrecer a su generación actual.
Ésta es una versión acortada del análisis original. Puedes leer el análisis completo en inglés aquí.
HP ProBook 455 T1B79UT
- 12/15/2016 v6 (old)
Allen Ngo
Price comparison
