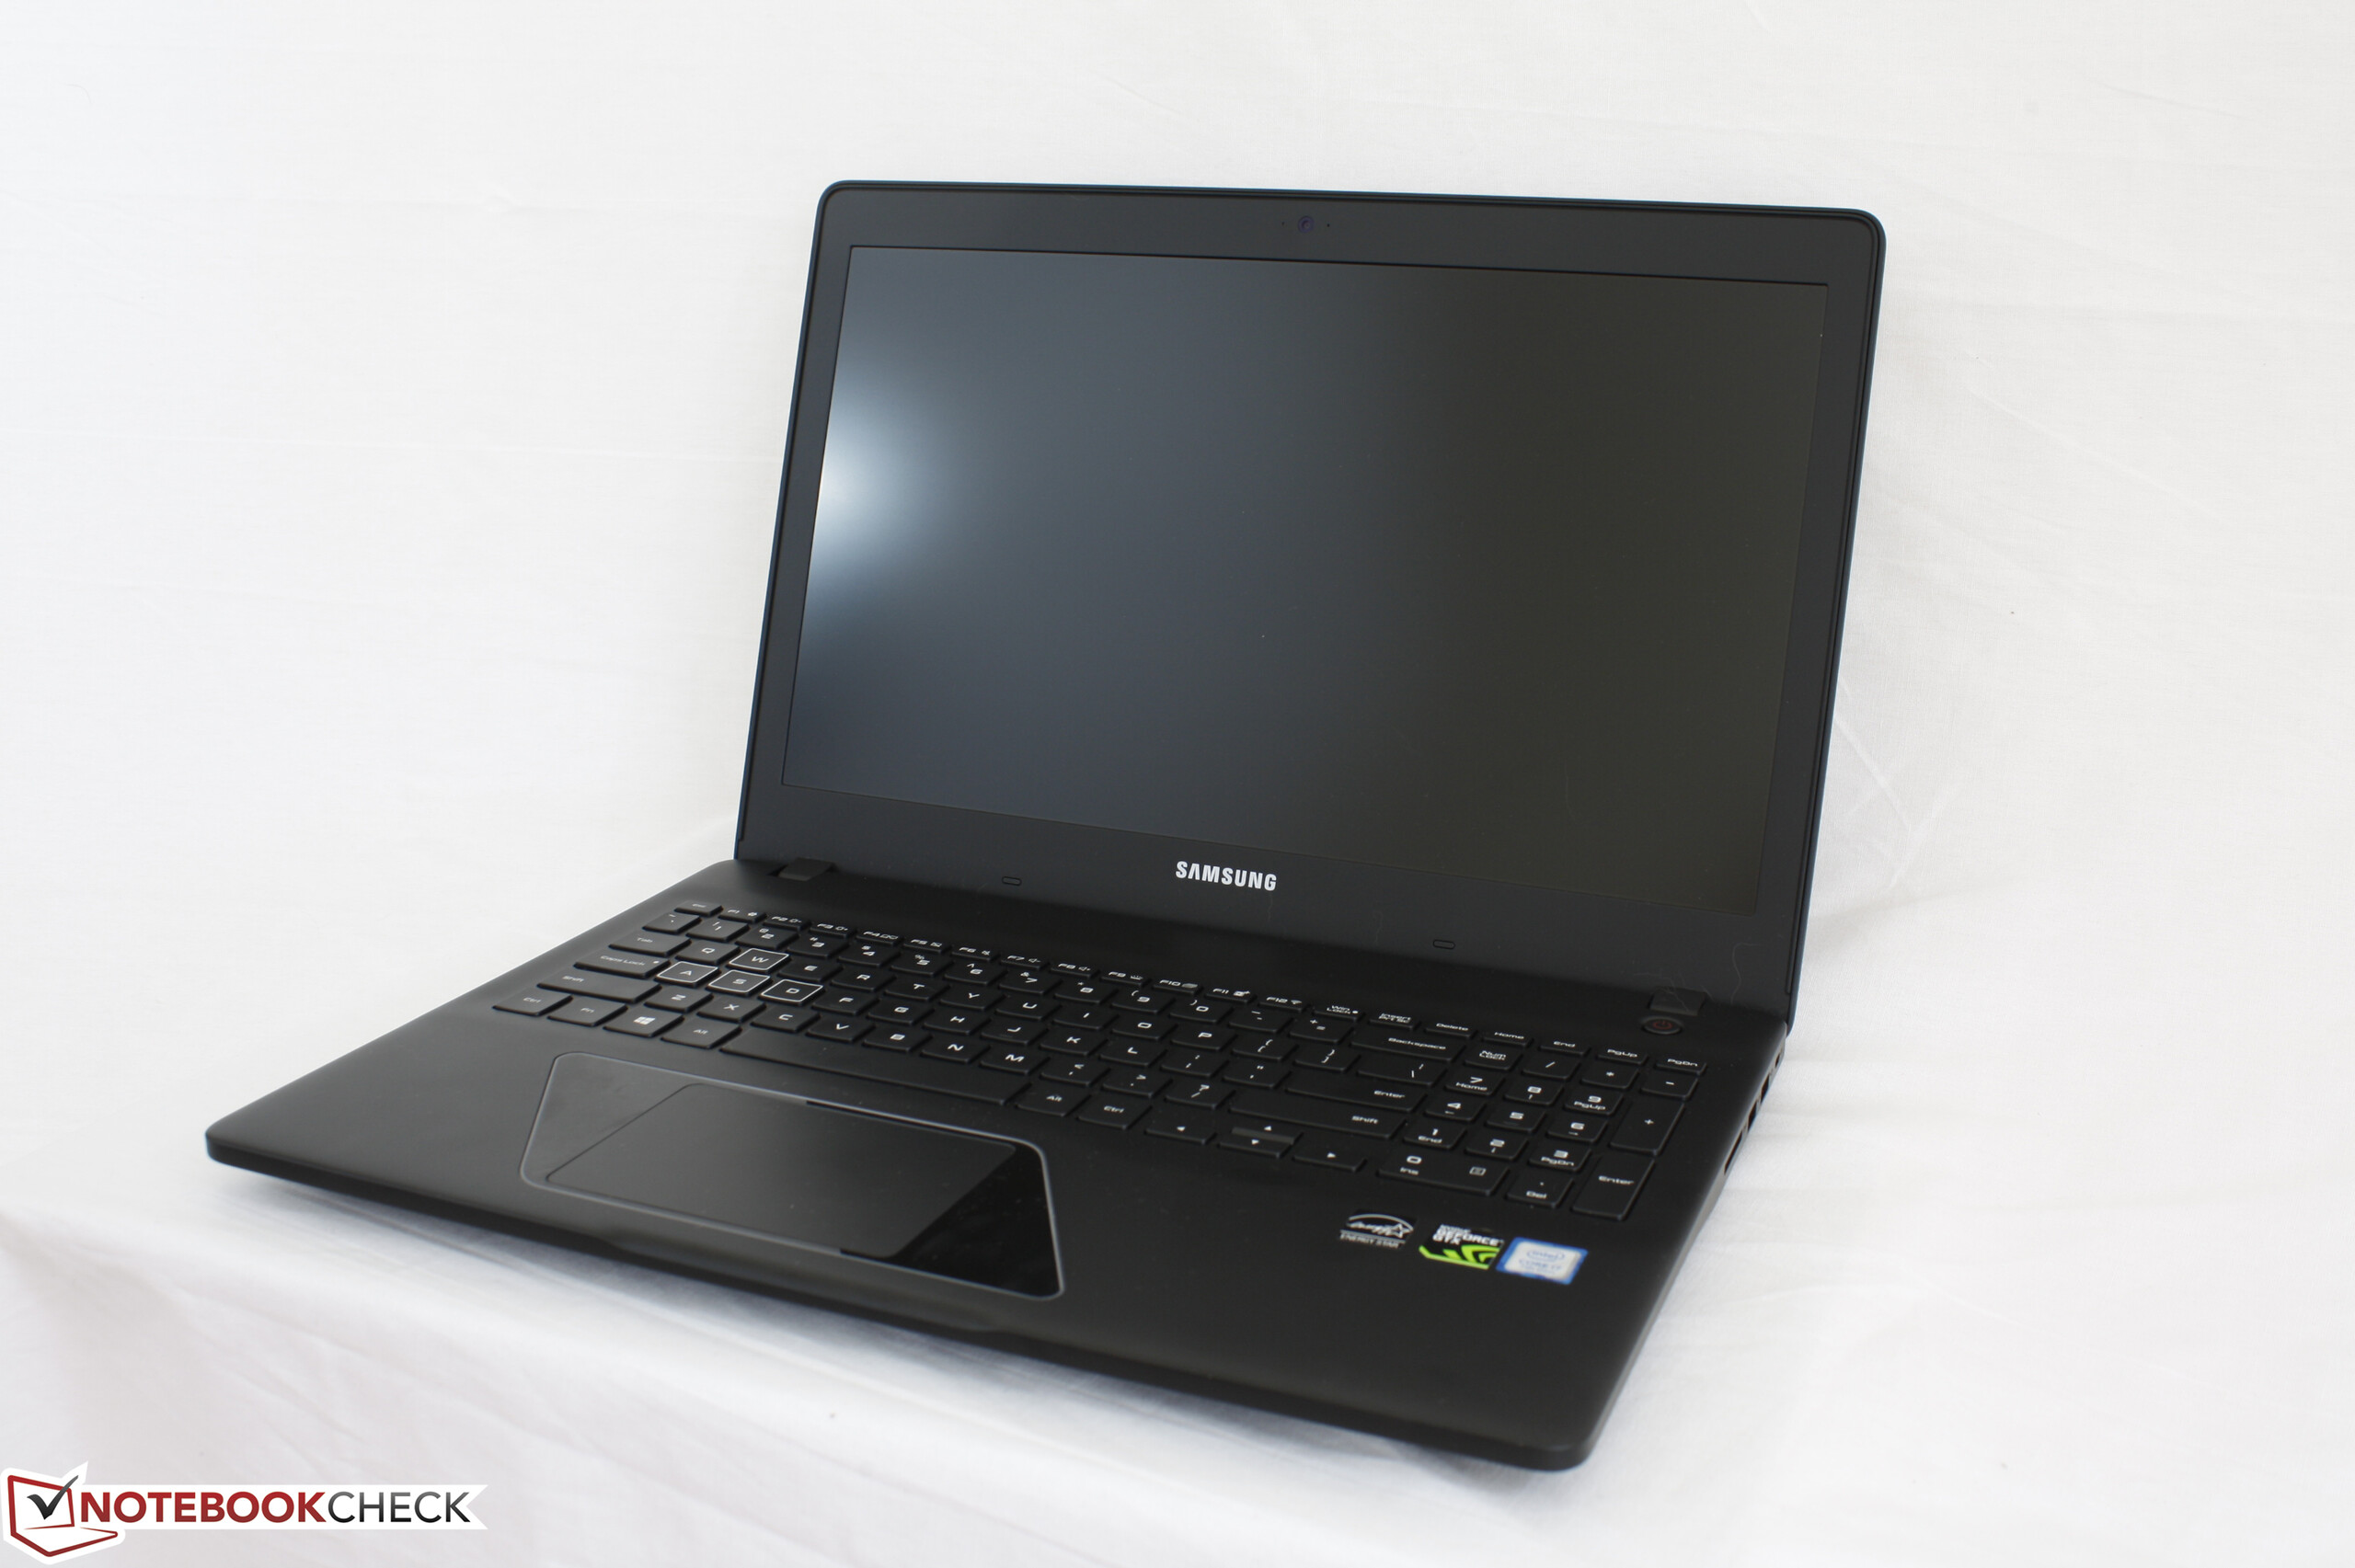
Breve análisis del Samsung Odyssey NP800G5M (7700HQ, FHD, GTX 1050)
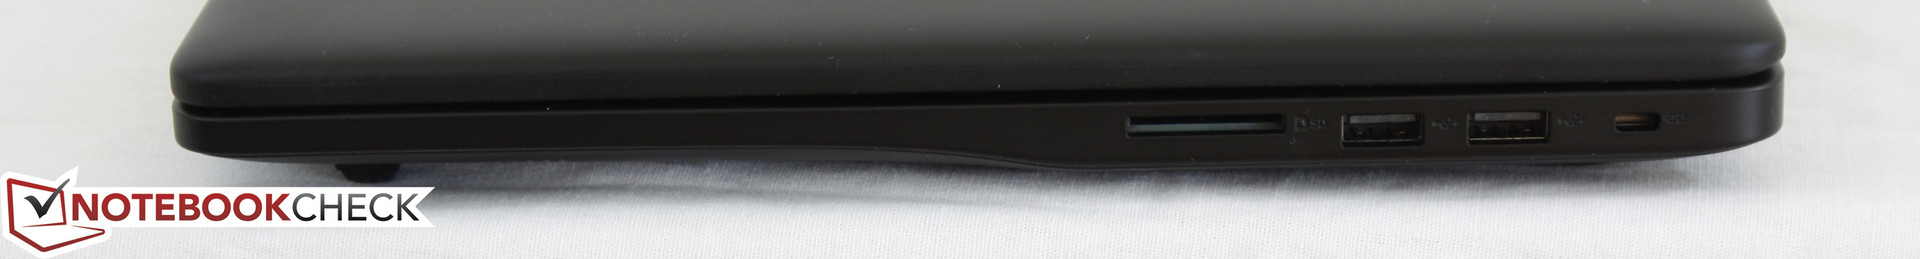


| SD Card Reader | |
| average JPG Copy Test (av. of 3 runs) | |
| Dell XPS 15 9560 (i7-7700HQ, UHD) | |
| Asus FX502VM-AS73 | |
| Samsung Odyssey NP800G5M-X01US | |
| maximum AS SSD Seq Read Test (1GB) | |
| Dell XPS 15 9560 (i7-7700HQ, UHD) | |
| Asus FX502VM-AS73 | |
| Samsung Odyssey NP800G5M-X01US | |
| Networking | |
| iperf3 transmit AX12 | |
| HP Pavilion 15t-bc200 X7P44AV | |
| Asus FX502VM-AS73 | |
| Samsung Odyssey NP800G5M-X01US | |
| iperf3 receive AX12 | |
| HP Pavilion 15t-bc200 X7P44AV | |
| Asus FX502VM-AS73 | |
| Samsung Odyssey NP800G5M-X01US | |
| |||||||||||||||||||||||||
iluminación: 90 %
Brillo con batería: 255.9 cd/m²
Contraste: 533:1 (Negro: 0.48 cd/m²)
ΔE ColorChecker Calman: 5.9 | ∀{0.5-29.43 Ø4.71}
ΔE Greyscale Calman: 5.6 | ∀{0.09-98 Ø4.96}
70.1% sRGB (Argyll 1.6.3 3D)
44.8% AdobeRGB 1998 (Argyll 1.6.3 3D)
48.71% AdobeRGB 1998 (Argyll 3D)
70.4% sRGB (Argyll 3D)
47.11% Display P3 (Argyll 3D)
Gamma: 2.21
CCT: 7250 K
| Samsung Odyssey NP800G5M-X01US IPS, 15.6", 1920x1080 | Asus FX502VM-AS73 TN LED, 15.6", 1920x1080 | HP Pavilion 15t-bc200 X7P44AV LGD04D4, , 15.6", 3840x2160 | Dell XPS 15 2017 9560 (7300HQ, Full-HD) Sharp SHP1453 LQ156M1, LED IGZO IPS InfinityEdge, 15.6", 1920x1080 | Gigabyte P55W v7 LG Philips LP156WF6 (LGD046F), IPS, 15.6", 1920x1080 | Apple MacBook Pro 15 2016 (2.9 GHz, 460) Apple APPA030, IPS, 15.4", 2880x1800 | |
|---|---|---|---|---|---|---|
| Display | -19% | 34% | 44% | 25% | 77% | |
| Display P3 Coverage (%) | 47.11 | 38.28 -19% | 63 34% | 68.9 46% | 63.5 35% | 99 110% |
| sRGB Coverage (%) | 70.4 | 56.9 -19% | 94.4 34% | 98.9 40% | 82 16% | 100 42% |
| AdobeRGB 1998 Coverage (%) | 48.71 | 39.47 -19% | 64.8 33% | 70.9 46% | 59.9 23% | 87.3 79% |
| Response Times | 30% | 24% | -48% | 16% | -43% | |
| Response Time Grey 50% / Grey 80% * (ms) | 38.8 ? | 28.4 ? 27% | 30.4 ? 22% | 54 ? -39% | 37 ? 5% | 46 ? -19% |
| Response Time Black / White * (ms) | 33.6 ? | 22.4 ? 33% | 24.8 ? 26% | 52.4 ? -56% | 25 ? 26% | 56 ? -67% |
| PWM Frequency (Hz) | 19230 ? | 119000 ? | ||||
| Screen | -8% | 15% | 46% | 28% | 61% | |
| Brightness middle (cd/m²) | 255.9 | 209.5 -18% | 259 1% | 400 56% | 287 12% | 420 64% |
| Brightness (cd/m²) | 249 | 205 -18% | 255 2% | 392 57% | 289 16% | 401 61% |
| Brightness Distribution (%) | 90 | 92 2% | 87 -3% | 89 -1% | 87 -3% | 90 0% |
| Black Level * (cd/m²) | 0.48 | 0.69 -44% | 0.51 -6% | 0.26 46% | 0.29 40% | 0.3 37% |
| Contrast (:1) | 533 | 304 -43% | 508 -5% | 1538 189% | 990 86% | 1400 163% |
| Colorchecker dE 2000 * | 5.9 | 4.7 20% | 3.9 34% | 4.9 17% | 4.92 17% | 3.33 44% |
| Colorchecker dE 2000 max. * | 18.9 | 19.7 -4% | 6.9 63% | 11 42% | 11 42% | 5.11 73% |
| Greyscale dE 2000 * | 5.6 | 1.8 68% | 4.5 20% | 7.2 -29% | 3.66 35% | 2.73 51% |
| Gamma | 2.21 100% | 2.23 99% | 2.43 91% | 2.11 104% | 2.32 95% | 2.48 89% |
| CCT | 7250 90% | 6975 93% | 7257 90% | 6911 94% | 6482 100% | 6457 101% |
| Color Space (Percent of AdobeRGB 1998) (%) | 44.8 | 36.2 -19% | 59.5 33% | 64.2 43% | 54 21% | 78.09 74% |
| Color Space (Percent of sRGB) (%) | 70.1 | 56.6 -19% | 98.9 41% | 82 17% | 99.97 43% | |
| Media total (Programa/Opciones) | 1% /
-5% | 24% /
21% | 14% /
33% | 23% /
26% | 32% /
50% |
* ... más pequeño es mejor
Tiempos de respuesta del display
| ↔ Tiempo de respuesta de Negro a Blanco | ||
|---|---|---|
| 33.6 ms ... subida ↗ y bajada ↘ combinada | ↗ 18.8 ms subida | 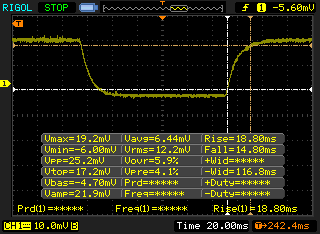 |
| ↘ 14.8 ms bajada | ||
| La pantalla mostró tiempos de respuesta lentos en nuestros tests y podría ser demasiado lenta para los jugones. En comparación, todos los dispositivos de prueba van de ##min### (mínimo) a 240 (máximo) ms. » 90 % de todos los dispositivos son mejores. Eso quiere decir que el tiempo de respuesta es peor que la media (19.8 ms) de todos los dispositivos testados. | ||
| ↔ Tiempo de respuesta 50% Gris a 80% Gris | ||
| 38.8 ms ... subida ↗ y bajada ↘ combinada | ↗ 20.8 ms subida | 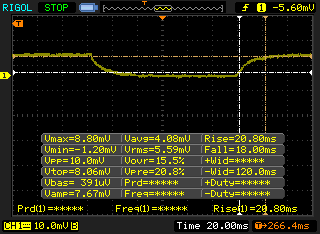 |
| ↘ 18 ms bajada | ||
| La pantalla mostró tiempos de respuesta lentos en nuestros tests y podría ser demasiado lenta para los jugones. En comparación, todos los dispositivos de prueba van de ##min### (mínimo) a 636 (máximo) ms. » 58 % de todos los dispositivos son mejores. Eso quiere decir que el tiempo de respuesta es peor que la media (30.9 ms) de todos los dispositivos testados. | ||
Parpadeo de Pantalla / PWM (Pulse-Width Modulation)
| Parpadeo de Pantalla / PWM detectado | 19230 Hz | ≤ 99 % de brillo | 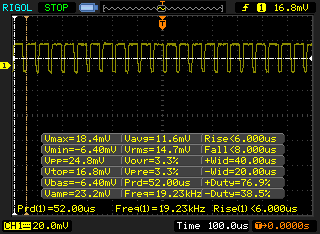 |
La retroiluminación del display parpadea a 19230 Hz (seguramente usa PWM - Pulse-Width Modulation) a un brillo del 99 % e inferior. Sobre este nivel de brillo no debería darse parpadeo / PWM. La frecuencia de 19230 Hz es bastante alta, por lo que la mayoría de gente sensible al parpadeo no debería ver parpadeo o tener fatiga visual. Comparación: 52 % de todos los dispositivos testados no usaron PWM para atenuar el display. Si se usó, medimos una media de 7748 (mínimo: 5 - máxmo: 343500) Hz. | |||
| Cinebench R10 | |
| Rendering Multiple CPUs 32Bit | |
| Eurocom Tornado F5 | |
| Samsung Odyssey NP800G5M-X01US | |
| MSI GS63VR 7RF-228US | |
| MSI GT80 Titan SLI | |
| Asus GL702VM-GC102D | |
| Rendering Single 32Bit | |
| Eurocom Tornado F5 | |
| Samsung Odyssey NP800G5M-X01US | |
| MSI GS63VR 7RF-228US | |
| MSI GT80 Titan SLI | |
| Asus GL702VM-GC102D | |
| wPrime 2.10 - 1024m | |
| MSI GS63VR 7RF-228US | |
| Samsung Odyssey NP800G5M-X01US | |
| Eurocom Tornado F5 | |
* ... más pequeño es mejor
| PCMark 8 | |
| Home Score Accelerated v2 | |
| Asus FX502VM-AS73 | |
| Gigabyte P55W v7 | |
| Samsung Odyssey NP800G5M-X01US | |
| Asus ROG Strix GL553VD-DS71 | |
| Dell XPS 15 2017 9560 (7300HQ, Full-HD) | |
| Work Score Accelerated v2 | |
| Gigabyte P55W v7 | |
| Samsung Odyssey NP800G5M-X01US | |
| Dell XPS 15 2017 9560 (7300HQ, Full-HD) | |
| Asus ROG Strix GL553VD-DS71 | |
| Asus FX502VM-AS73 | |
| Creative Score Accelerated v2 | |
| Asus FX502VM-AS73 | |
| Samsung Odyssey NP800G5M-X01US | |
| Asus ROG Strix GL553VD-DS71 | |
| PCMark 8 Home Score Accelerated v2 | 4001 puntos | |
| PCMark 8 Creative Score Accelerated v2 | 5362 puntos | |
| PCMark 8 Work Score Accelerated v2 | 5305 puntos | |
ayuda | ||
| Samsung Odyssey NP800G5M-X01US Samsung PM961 NVMe MZVLW128HEGR | Asus FX502VM-AS73 SK Hynix HFS256G39TND-N210A | HP Pavilion 15t-bc200 X7P44AV Intel SSD 600p SSDPEKKW256G7 | Asus ROG Strix GL553VD-DS71 HGST Travelstar 7K1000 HTS721010A9E630 | Dell XPS 15 9560 (i7-7700HQ, UHD) Lite-On CX2-8B512-Q11 | |
|---|---|---|---|---|---|
| CrystalDiskMark 3.0 | -46% | 19% | -93% | 94% | |
| Read Seq (MB/s) | 1518 | 503 -67% | 1115 -27% | 93.5 -94% | 1684 11% |
| Write Seq (MB/s) | 798 | 138.2 -83% | 311 -61% | 89.6 -89% | 1106 39% |
| Read 512 (MB/s) | 460.5 | 343.5 -25% | 706 53% | 39.06 -92% | 977 112% |
| Write 512 (MB/s) | 195.8 | 137.8 -30% | 472.3 141% | 51.1 -74% | 1119 472% |
| Read 4k (MB/s) | 47.16 | 29.36 -38% | 31.97 -32% | 0.57 -99% | 45.14 -4% |
| Write 4k (MB/s) | 143.1 | 70.9 -50% | 135.1 -6% | 1.05 -99% | 134.1 -6% |
| Read 4k QD32 (MB/s) | 521 | 369.9 -29% | 288.3 -45% | 1.06 -100% | 509 -2% |
| Write 4k QD32 (MB/s) | 176.4 | 99.7 -43% | 405.5 130% | 1.04 -99% | 398.1 126% |

| 3DMark 11 Performance | 7872 puntos | |
| 3DMark Ice Storm Standard Score | 84774 puntos | |
| 3DMark Cloud Gate Standard Score | 20291 puntos | |
| 3DMark Fire Strike Score | 5455 puntos | |
| 3DMark Fire Strike Extreme Score | 2678 puntos | |
ayuda | ||
| bajo | medio | alto | ultra | |
|---|---|---|---|---|
| BioShock Infinite (2013) | 63.6 | |||
| Metro: Last Light (2013) | 78 | 43.8 | ||
| Thief (2014) | 73 | 40.4 | ||
| The Witcher 3 (2015) | 43 | 20.8 | ||
| Batman: Arkham Knight (2015) | 91 | 79 | 47 | 25 |
| Dota 2 Reborn (2015) | 115 | |||
| Fallout 4 (2015) | 41.5 | 34.2 | ||
| Rise of the Tomb Raider (2016) | 70.1 | 38.7 | 33.4 | |
| Ashes of the Singularity (2016) | 54.7 | 34.1 | 29.6 | |
| Doom (2016) | 47.5 | 43.5 | ||
| Overwatch (2016) | 95.3 | 54.2 |
Ruido
| Ocioso |
| 28.1 / 29.1 / 29.1 dB(A) |
| HDD |
| 29.1 dB(A) |
| Carga |
| 49.2 / 49.2 dB(A) |
 | ||
30 dB silencioso 40 dB(A) audible 50 dB(A) ruidosamente alto |
||
min: | ||
| Samsung Odyssey NP800G5M-X01US GeForce GTX 1050 Mobile, i7-7700HQ, Samsung PM961 NVMe MZVLW128HEGR | Asus FX502VM-AS73 GeForce GTX 1060 Mobile, i7-7700HQ, SK Hynix HFS256G39TND-N210A | HP Pavilion 15t-bc200 X7P44AV GeForce GTX 1050 Mobile, i7-7700HQ, Intel SSD 600p SSDPEKKW256G7 | Dell XPS 15 9560 (i7-7700HQ, UHD) GeForce GTX 1050 Mobile, i7-7700HQ, Lite-On CX2-8B512-Q11 | Gigabyte P55W v7 GeForce GTX 1060 Mobile, i7-7700HQ, Liteonit CV3-8D256 | Apple MacBook Pro 15 2016 (2.9 GHz, 460) Radeon Pro 460, 6920HQ, Apple SSD SM1024L | |
|---|---|---|---|---|---|---|
| Noise | -4% | -3% | -1% | -7% | 3% | |
| apagado / medio ambiente * (dB) | 28.1 | 28.7 -2% | 28.9 -3% | 28.4 -1% | 30 -7% | 29 -3% |
| Idle Minimum * (dB) | 28.1 | 30.6 -9% | 32.3 -15% | 29 -3% | 33 -17% | 30.3 -8% |
| Idle Average * (dB) | 29.1 | 30.6 -5% | 32.3 -11% | 29 -0% | 34 -17% | 30.3 -4% |
| Idle Maximum * (dB) | 29.1 | 31 -7% | 32.3 -11% | 32.2 -11% | 35 -20% | 30.3 -4% |
| Load Average * (dB) | 49.2 | 46.2 6% | 43.2 12% | 47.1 4% | 39 21% | 35.1 29% |
| Load Maximum * (dB) | 49.2 | 52.3 -6% | 45.2 8% | 47.1 4% | 50 -2% | 46 7% |
| Witcher 3 ultra * (dB) | 52 |
* ... más pequeño es mejor
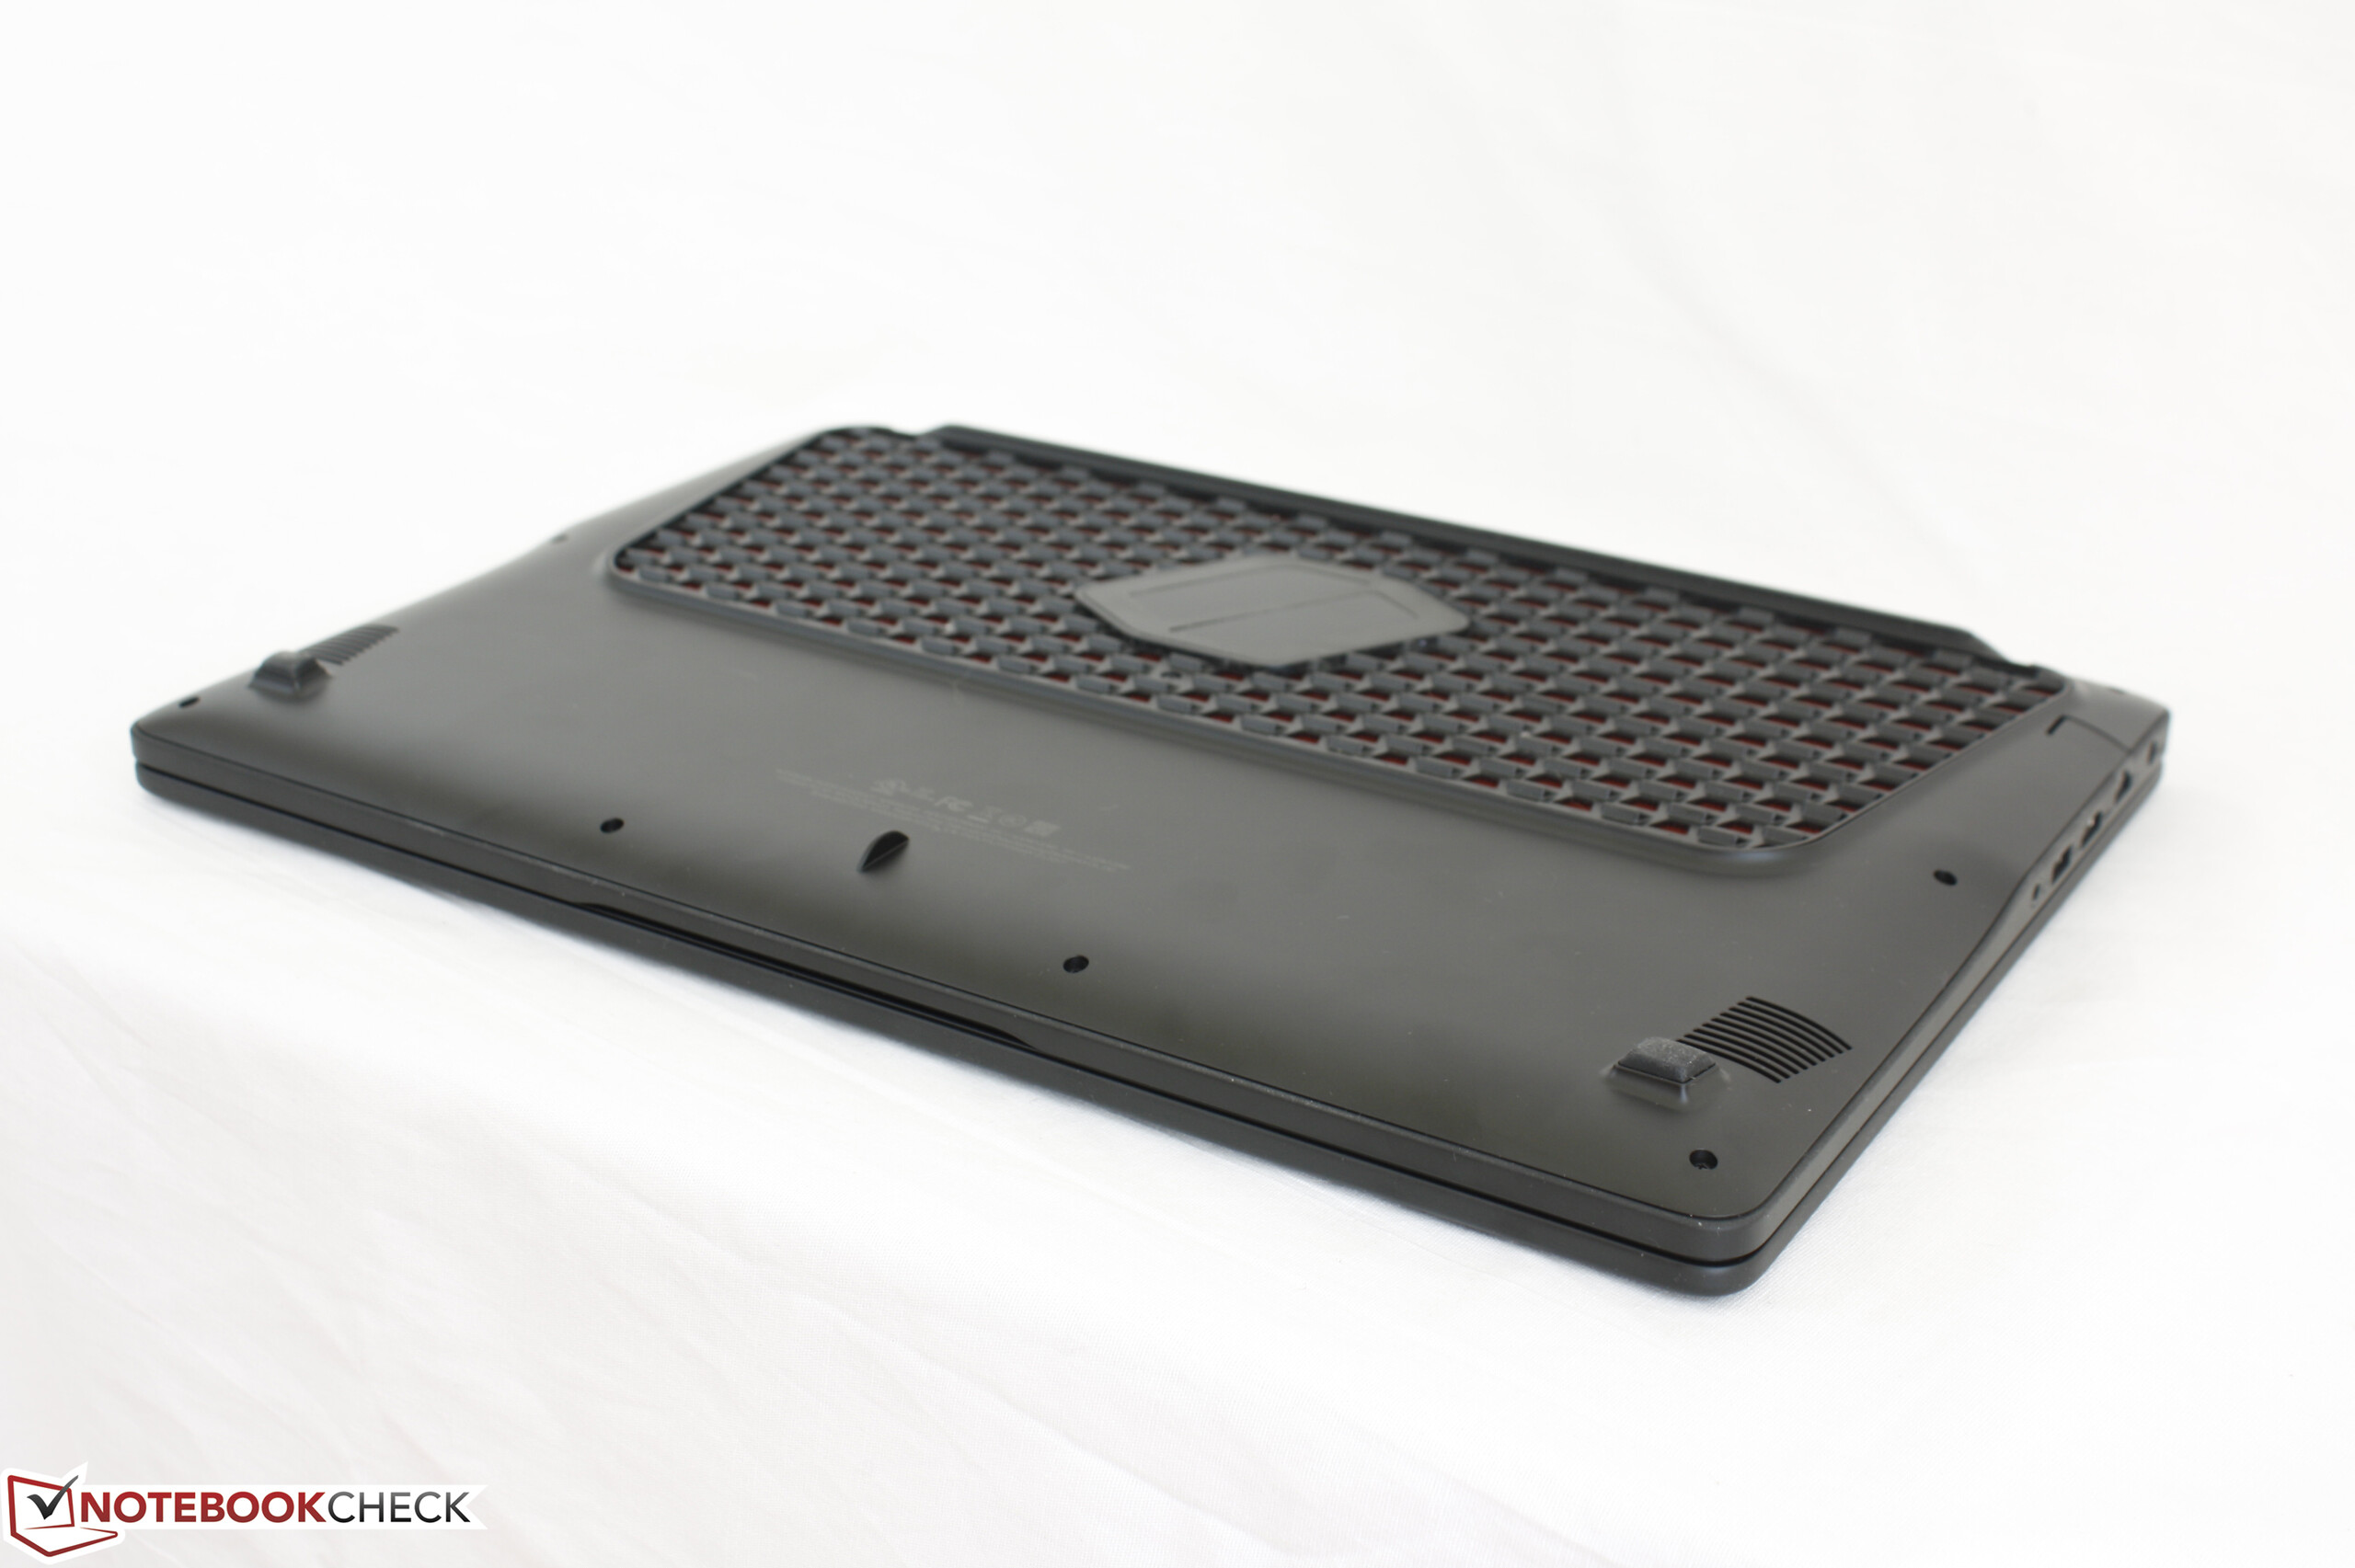
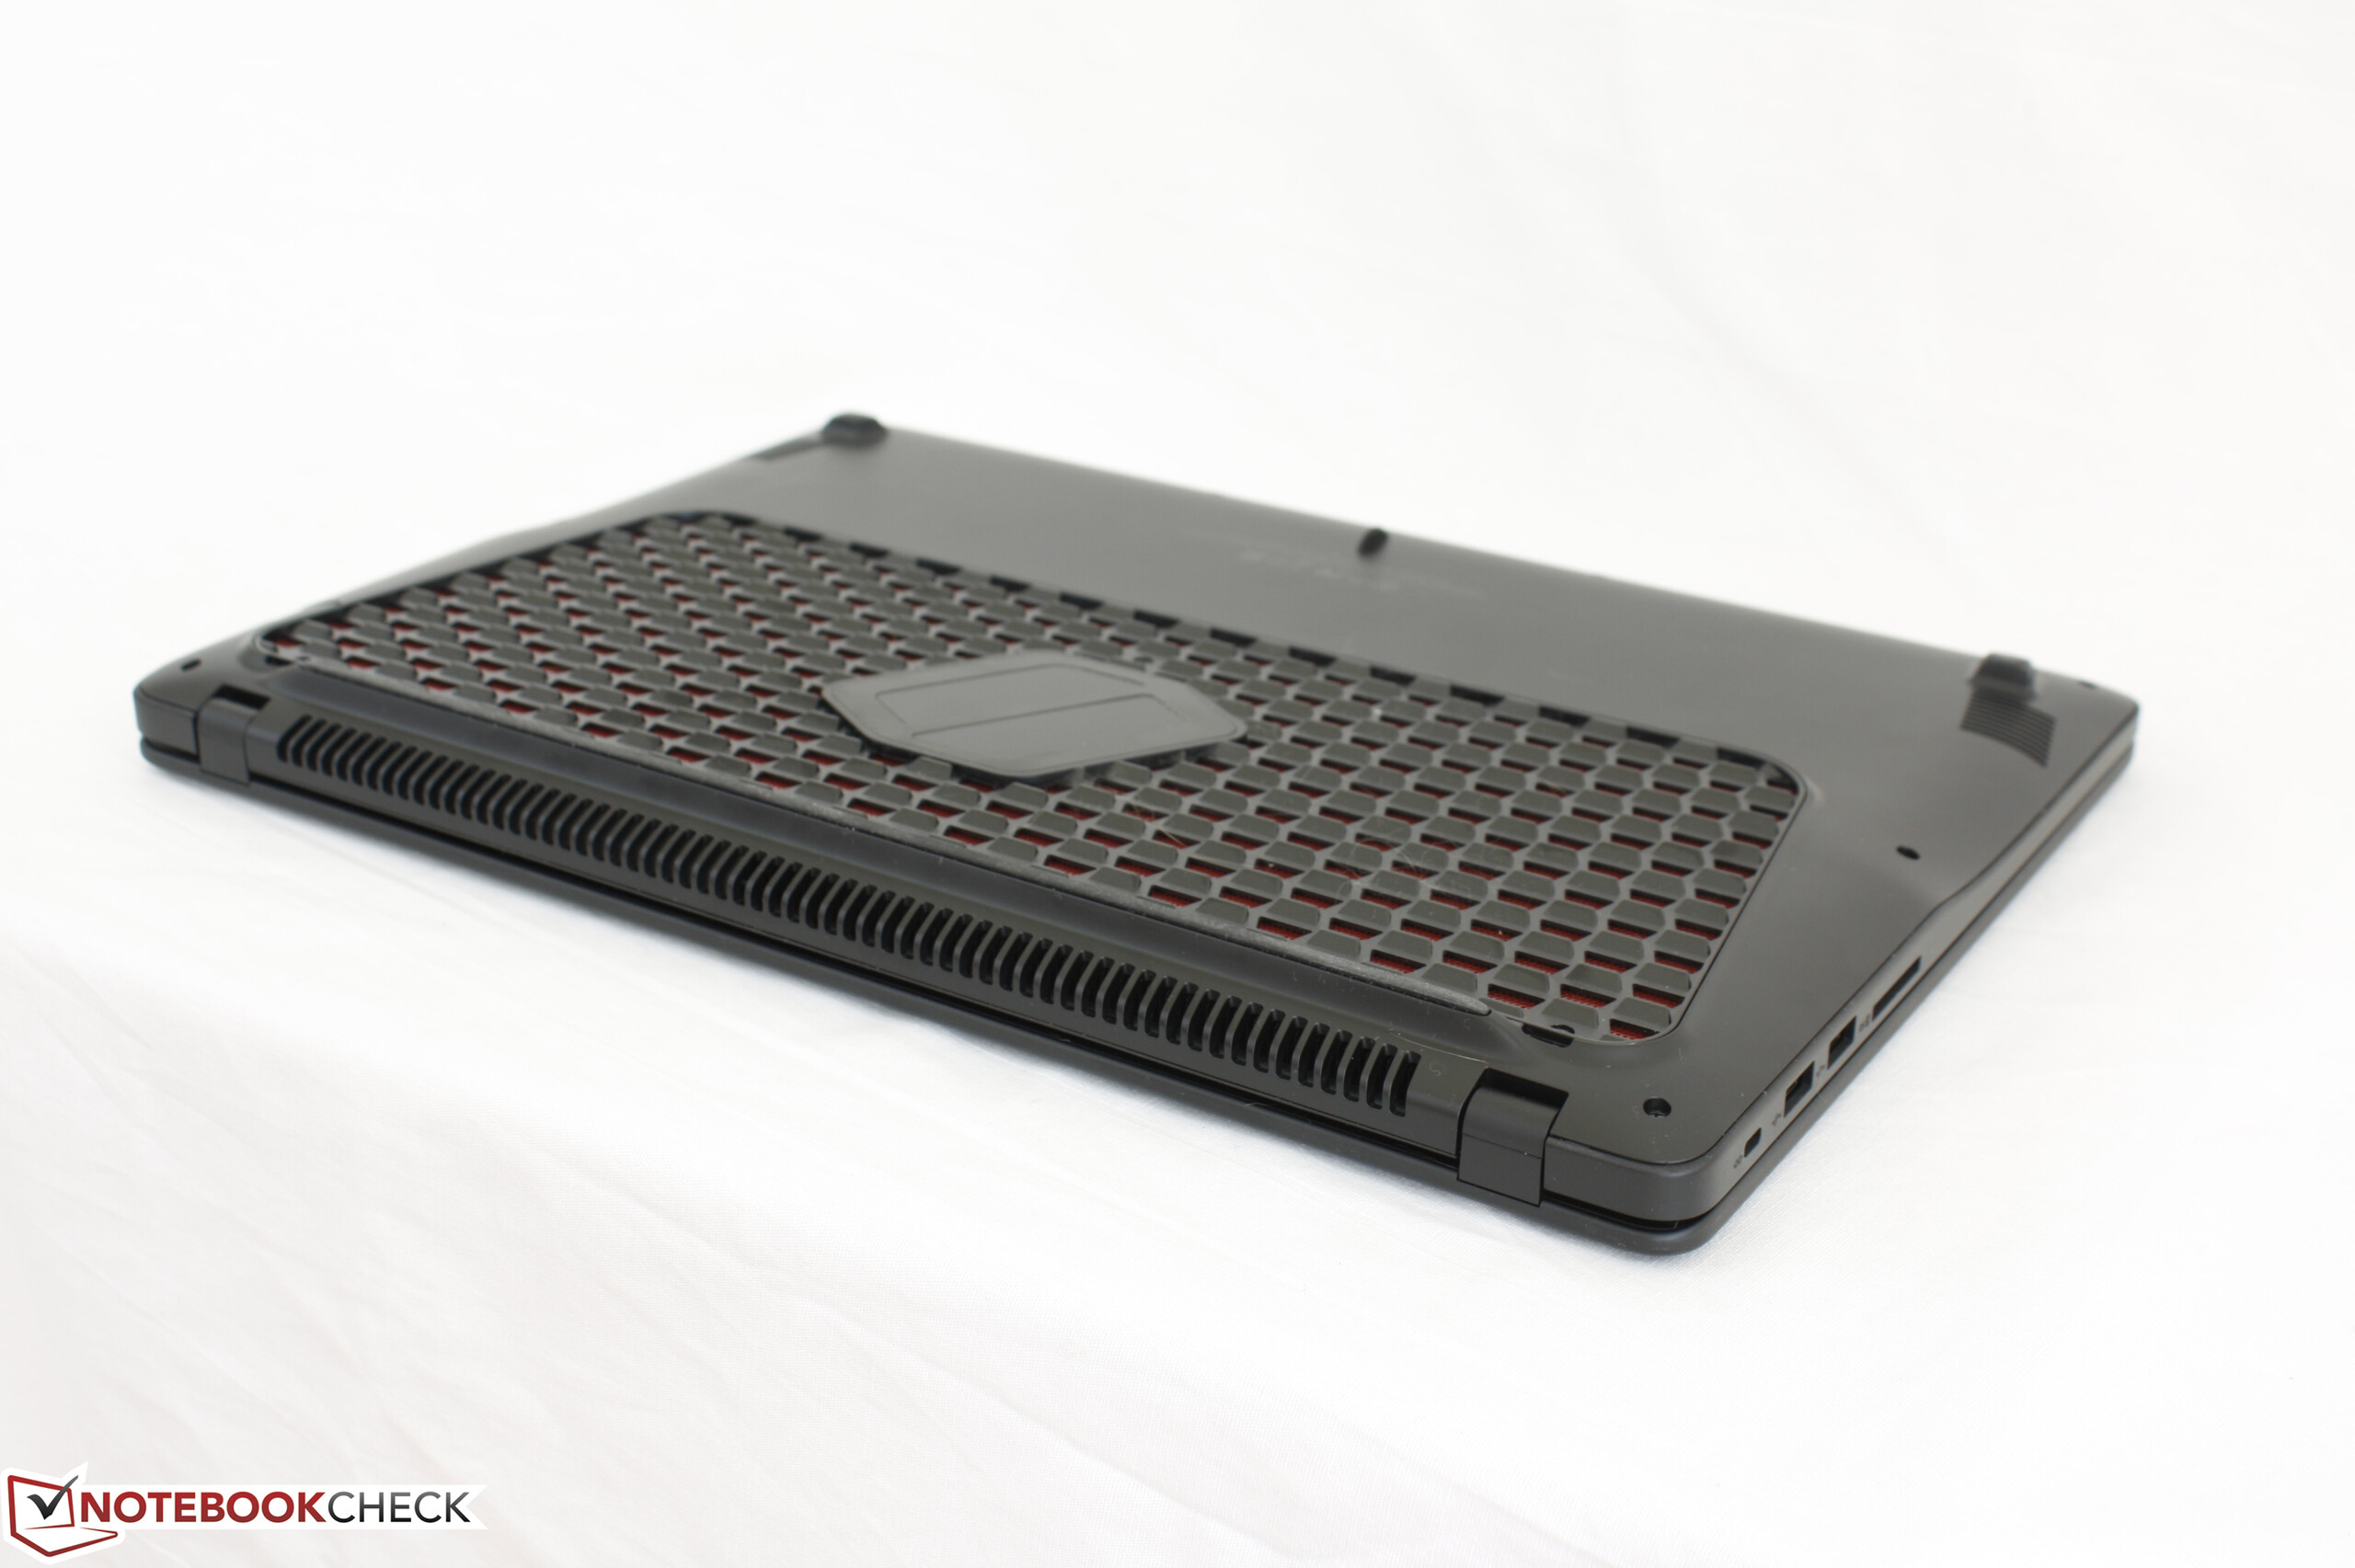
(-) La temperatura máxima en la parte superior es de 58.4 °C / 137 F, frente a la media de 40.4 °C / 105 F, que oscila entre 21.2 y 68.8 °C para la clase Gaming.
(-) El fondo se calienta hasta un máximo de 54.2 °C / 130 F, frente a la media de 43.2 °C / 110 F
(+) En reposo, la temperatura media de la parte superior es de 25.4 °C / 78# F, frente a la media del dispositivo de 33.9 °C / 93 F.
(±) Jugando a The Witcher 3, la temperatura media de la parte superior es de 33.8 °C / 93 F, frente a la media del dispositivo de 33.9 °C / 93 F.
(+) El reposamanos y el panel táctil están a una temperatura inferior a la de la piel, con un máximo de 27 °C / 80.6 F y, por tanto, son fríos al tacto.
(±) La temperatura media de la zona del reposamanos de dispositivos similares fue de 28.8 °C / 83.8 F (+1.8 °C / 3.2 F).
Samsung Odyssey NP800G5M-X01US análisis de audio
(-) | altavoces no muy altos (#63.1 dB)
Graves 100 - 315 Hz
(-) | casi sin bajos - de media 15.2% inferior a la mediana
(±) | la linealidad de los graves es media (13.7% delta a frecuencia anterior)
Medios 400 - 2000 Hz
(+) | medios equilibrados - a sólo 2% de la mediana
(±) | la linealidad de los medios es media (10.1% delta respecto a la frecuencia anterior)
Altos 2 - 16 kHz
(±) | máximos más altos - de media 8.4% más altos que la mediana
(±) | la linealidad de los máximos es media (11.5% delta a frecuencia anterior)
Total 100 - 16.000 Hz
(-) | el sonido global no es lineal (37.2% de diferencia con la mediana)
En comparación con la misma clase
» 99% de todos los dispositivos probados de esta clase eran mejores, 0% similares, 1% peores
» El mejor tuvo un delta de 6%, la media fue 18%, el peor fue ###max##%
En comparación con todos los dispositivos probados
» 94% de todos los dispositivos probados eran mejores, 1% similares, 5% peores
» El mejor tuvo un delta de 4%, la media fue 23%, el peor fue ###max##%
Apple MacBook 12 (Early 2016) 1.1 GHz análisis de audio
(+) | los altavoces pueden reproducir a un volumen relativamente alto (#83.6 dB)
Graves 100 - 315 Hz
(±) | lubina reducida - en promedio 11.3% inferior a la mediana
(±) | la linealidad de los graves es media (14.2% delta a frecuencia anterior)
Medios 400 - 2000 Hz
(+) | medios equilibrados - a sólo 2.4% de la mediana
(+) | los medios son lineales (5.5% delta a la frecuencia anterior)
Altos 2 - 16 kHz
(+) | máximos equilibrados - a sólo 2% de la mediana
(+) | los máximos son lineales (4.5% delta a la frecuencia anterior)
Total 100 - 16.000 Hz
(+) | el sonido global es lineal (10.2% de diferencia con la mediana)
En comparación con la misma clase
» 7% de todos los dispositivos probados de esta clase eran mejores, 2% similares, 90% peores
» El mejor tuvo un delta de 5%, la media fue 18%, el peor fue ###max##%
En comparación con todos los dispositivos probados
» 5% de todos los dispositivos probados eran mejores, 1% similares, 94% peores
» El mejor tuvo un delta de 4%, la media fue 23%, el peor fue ###max##%
| Off / Standby | |
| Ocioso | |
| Carga |
|
Clave:
min: | |
| Samsung Odyssey NP800G5M-X01US | Asus FX502VM-AS73 | Dell XPS 15 2017 9560 (7300HQ, Full-HD) | Asus ROG Strix GL553VD-DS71 | Gigabyte P55W v7 | Apple MacBook Pro 15 2016 (2.9 GHz, 460) | |
|---|---|---|---|---|---|---|
| Power Consumption | -57% | 0% | -12% | -28% | 14% | |
| Idle Minimum * (Watt) | 6.7 | 14.9 -122% | 6.6 1% | 7.7 -15% | 8 -19% | 3 55% |
| Idle Average * (Watt) | 8.9 | 15.1 -70% | 9 -1% | 11.7 -31% | 13 -46% | 9.9 -11% |
| Idle Maximum * (Watt) | 10.8 | 15.2 -41% | 10.7 1% | 12 -11% | 18 -67% | 12.5 -16% |
| Load Average * (Watt) | 81.8 | 105.8 -29% | 77.5 5% | 80.5 2% | 76 7% | 70.6 14% |
| Witcher 3 ultra * (Watt) | 92.2 | |||||
| Load Maximum * (Watt) | 122.7 | 148.8 -21% | 130 -6% | 128.4 -5% | 143 -17% | 90.8 26% |
* ... más pequeño es mejor
| Samsung Odyssey NP800G5M-X01US i7-7700HQ, GeForce GTX 1050 Mobile, 43 Wh | Asus FX502VM-AS73 i7-7700HQ, GeForce GTX 1060 Mobile, 64 Wh | Dell XPS 15 2017 9560 (7300HQ, Full-HD) i5-7300HQ, GeForce GTX 1050 Mobile, 56 Wh | Asus ROG Strix GL553VD-DS71 i7-7700HQ, GeForce GTX 1050 Mobile, 48 Wh | Gigabyte P55W v7 i7-7700HQ, GeForce GTX 1060 Mobile, 63 Wh | Apple MacBook Pro 15 2016 (2.9 GHz, 460) 6920HQ, Radeon Pro 460, 76 Wh | |
|---|---|---|---|---|---|---|
| Duración de Batería | -17% | 9% | -20% | 28% | 52% | |
| Reader / Idle (h) | 10.2 | 6.1 -40% | 9.4 -8% | 7.3 -28% | 13.2 29% | |
| WiFi v1.3 (h) | 4.4 | 4.6 5% | 5.6 27% | 4.6 5% | 5.8 32% | 10.3 134% |
| Load (h) | 1.3 | 1.1 -15% | 1.4 8% | 0.8 -38% | 1.6 23% | 0.9 -31% |
Pro
Contra
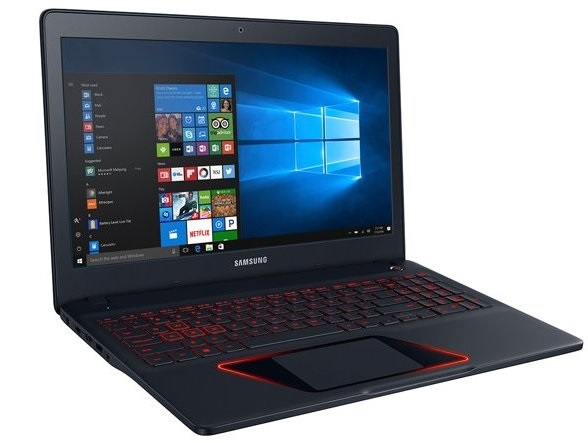
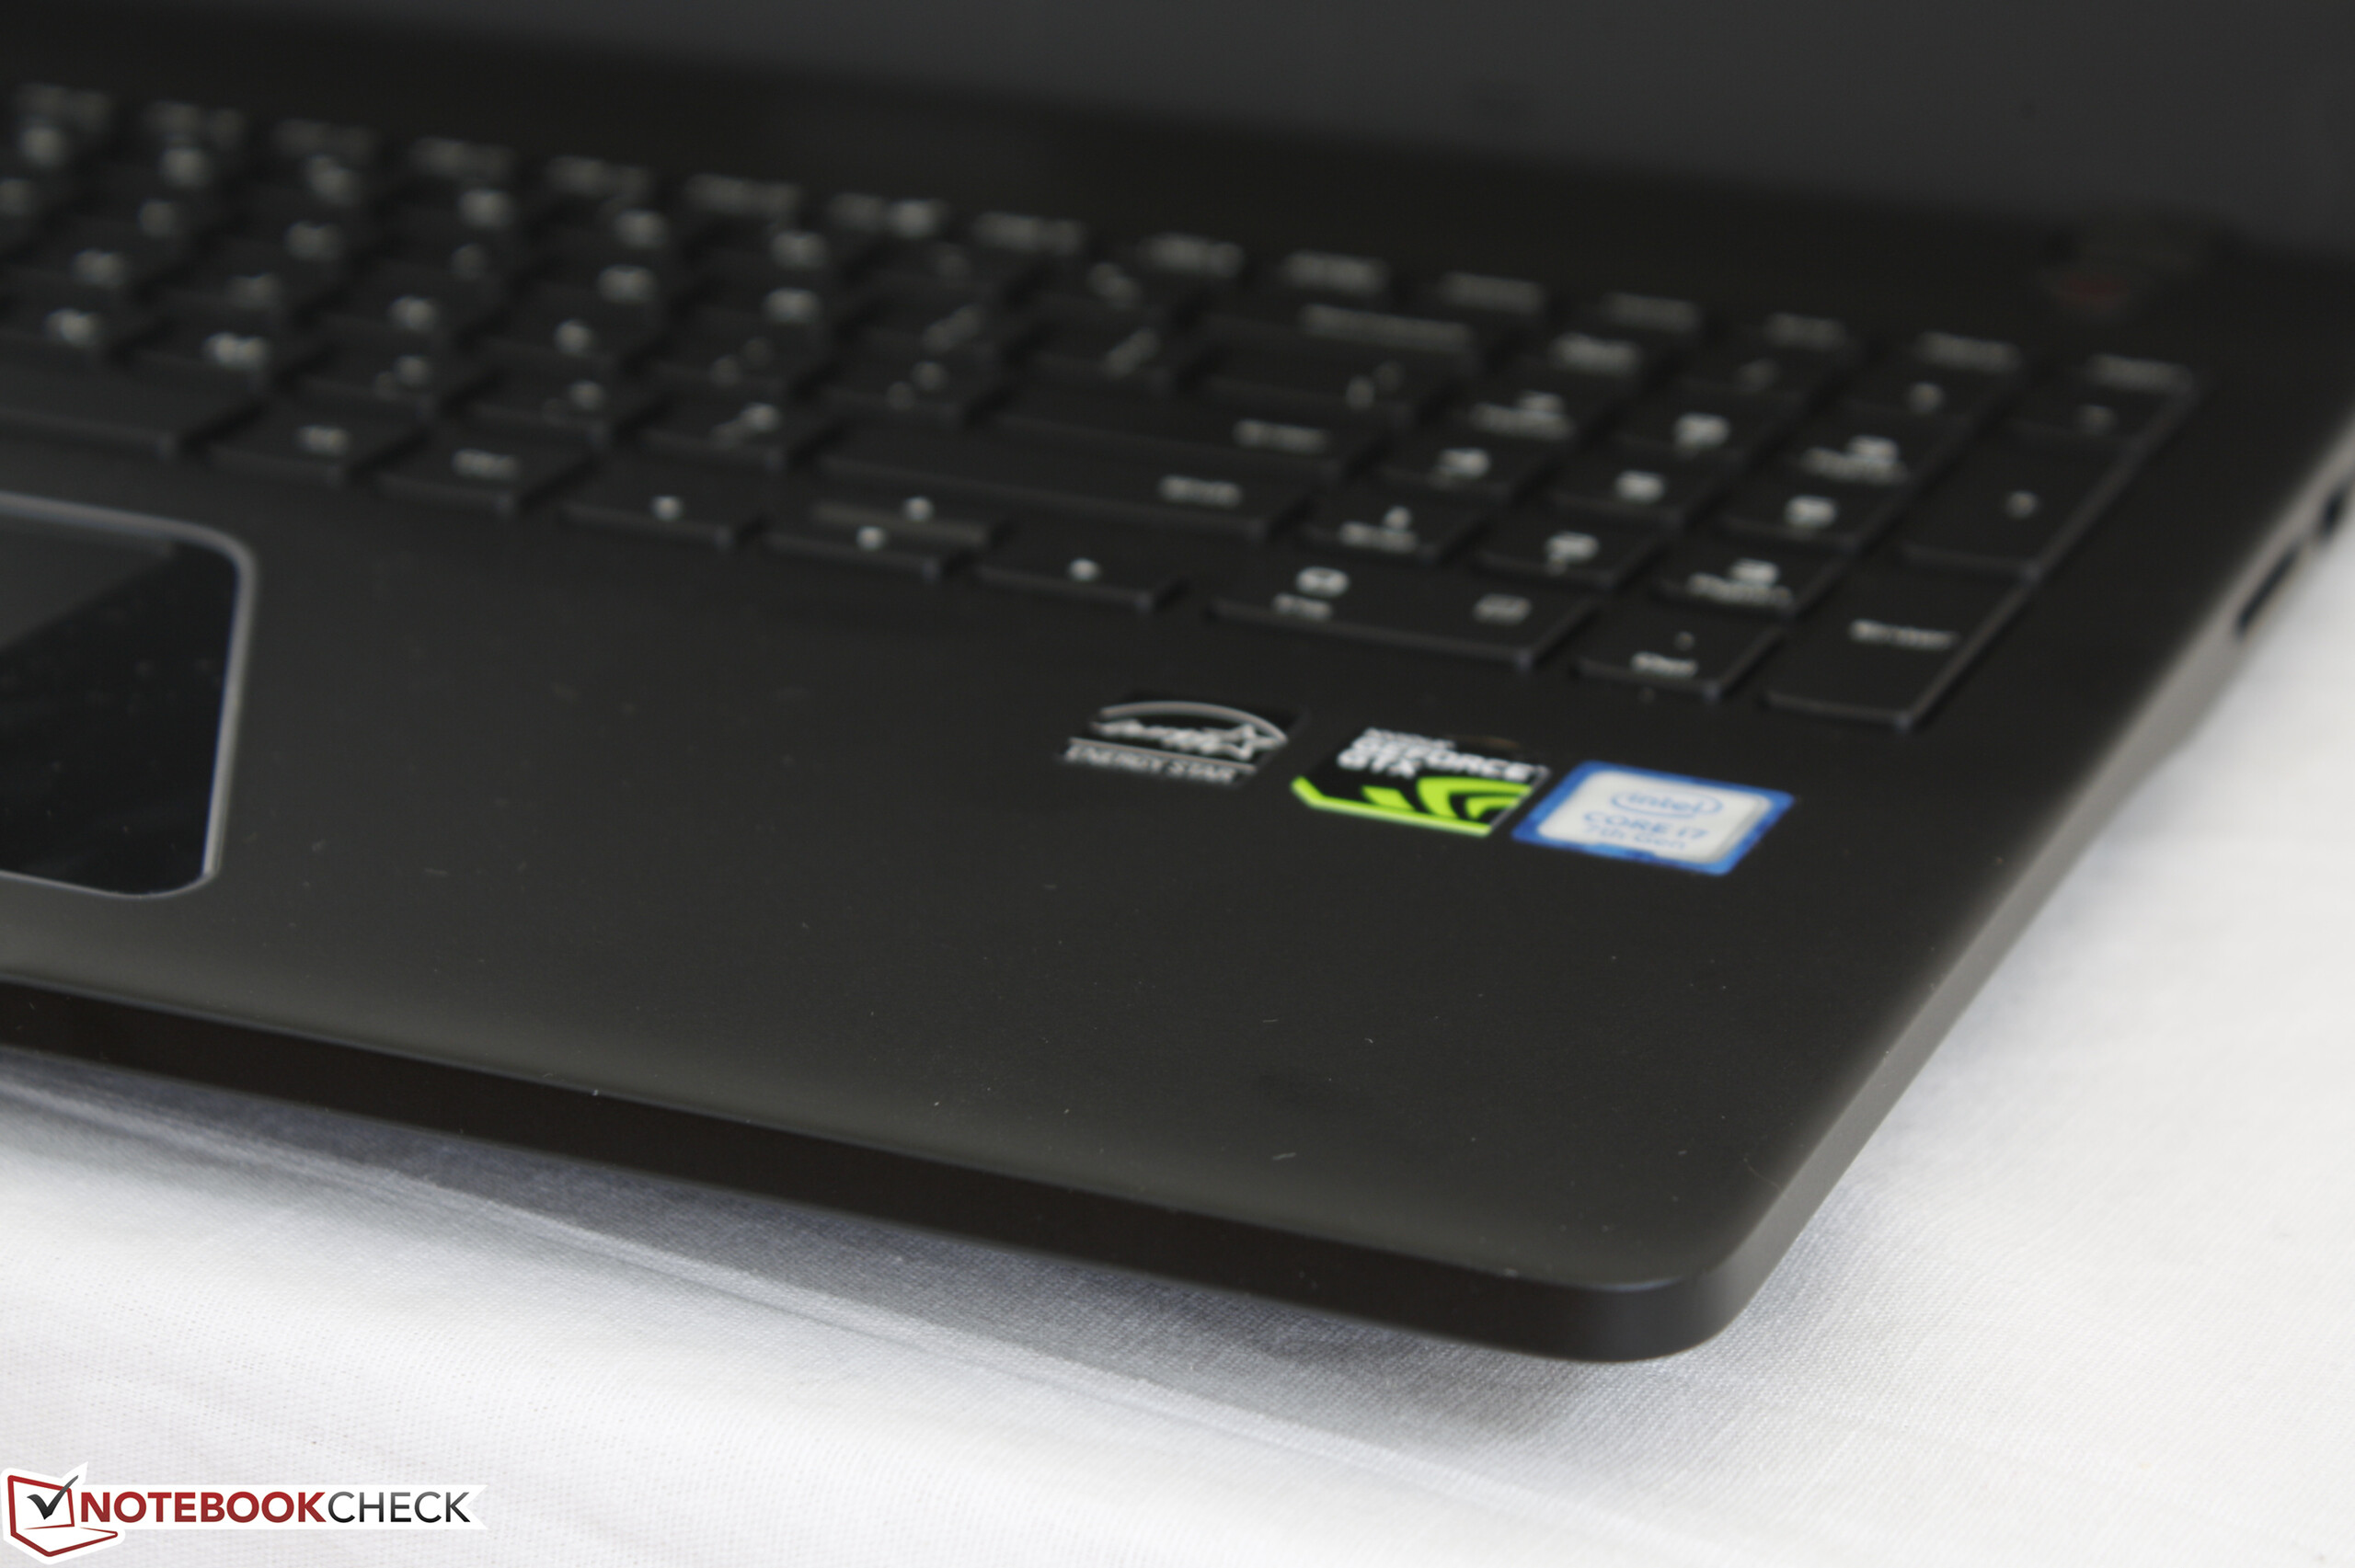
El primer portátil Odyssey nos provoca sentimientos encontrados. Por un lado, el sistema rinde admirablemente sin ralentizaciones CPU o GPU y funciona con temperaturas aceptablemente bajas para un portátil gaming. Su capacidad de mantener altos valores Turbo Boost es algo con lo que los portátiles gaming superdelgados tienden a tener problemas, por lo que el Odyssey al menos tiene el rendimiento al dedillo.
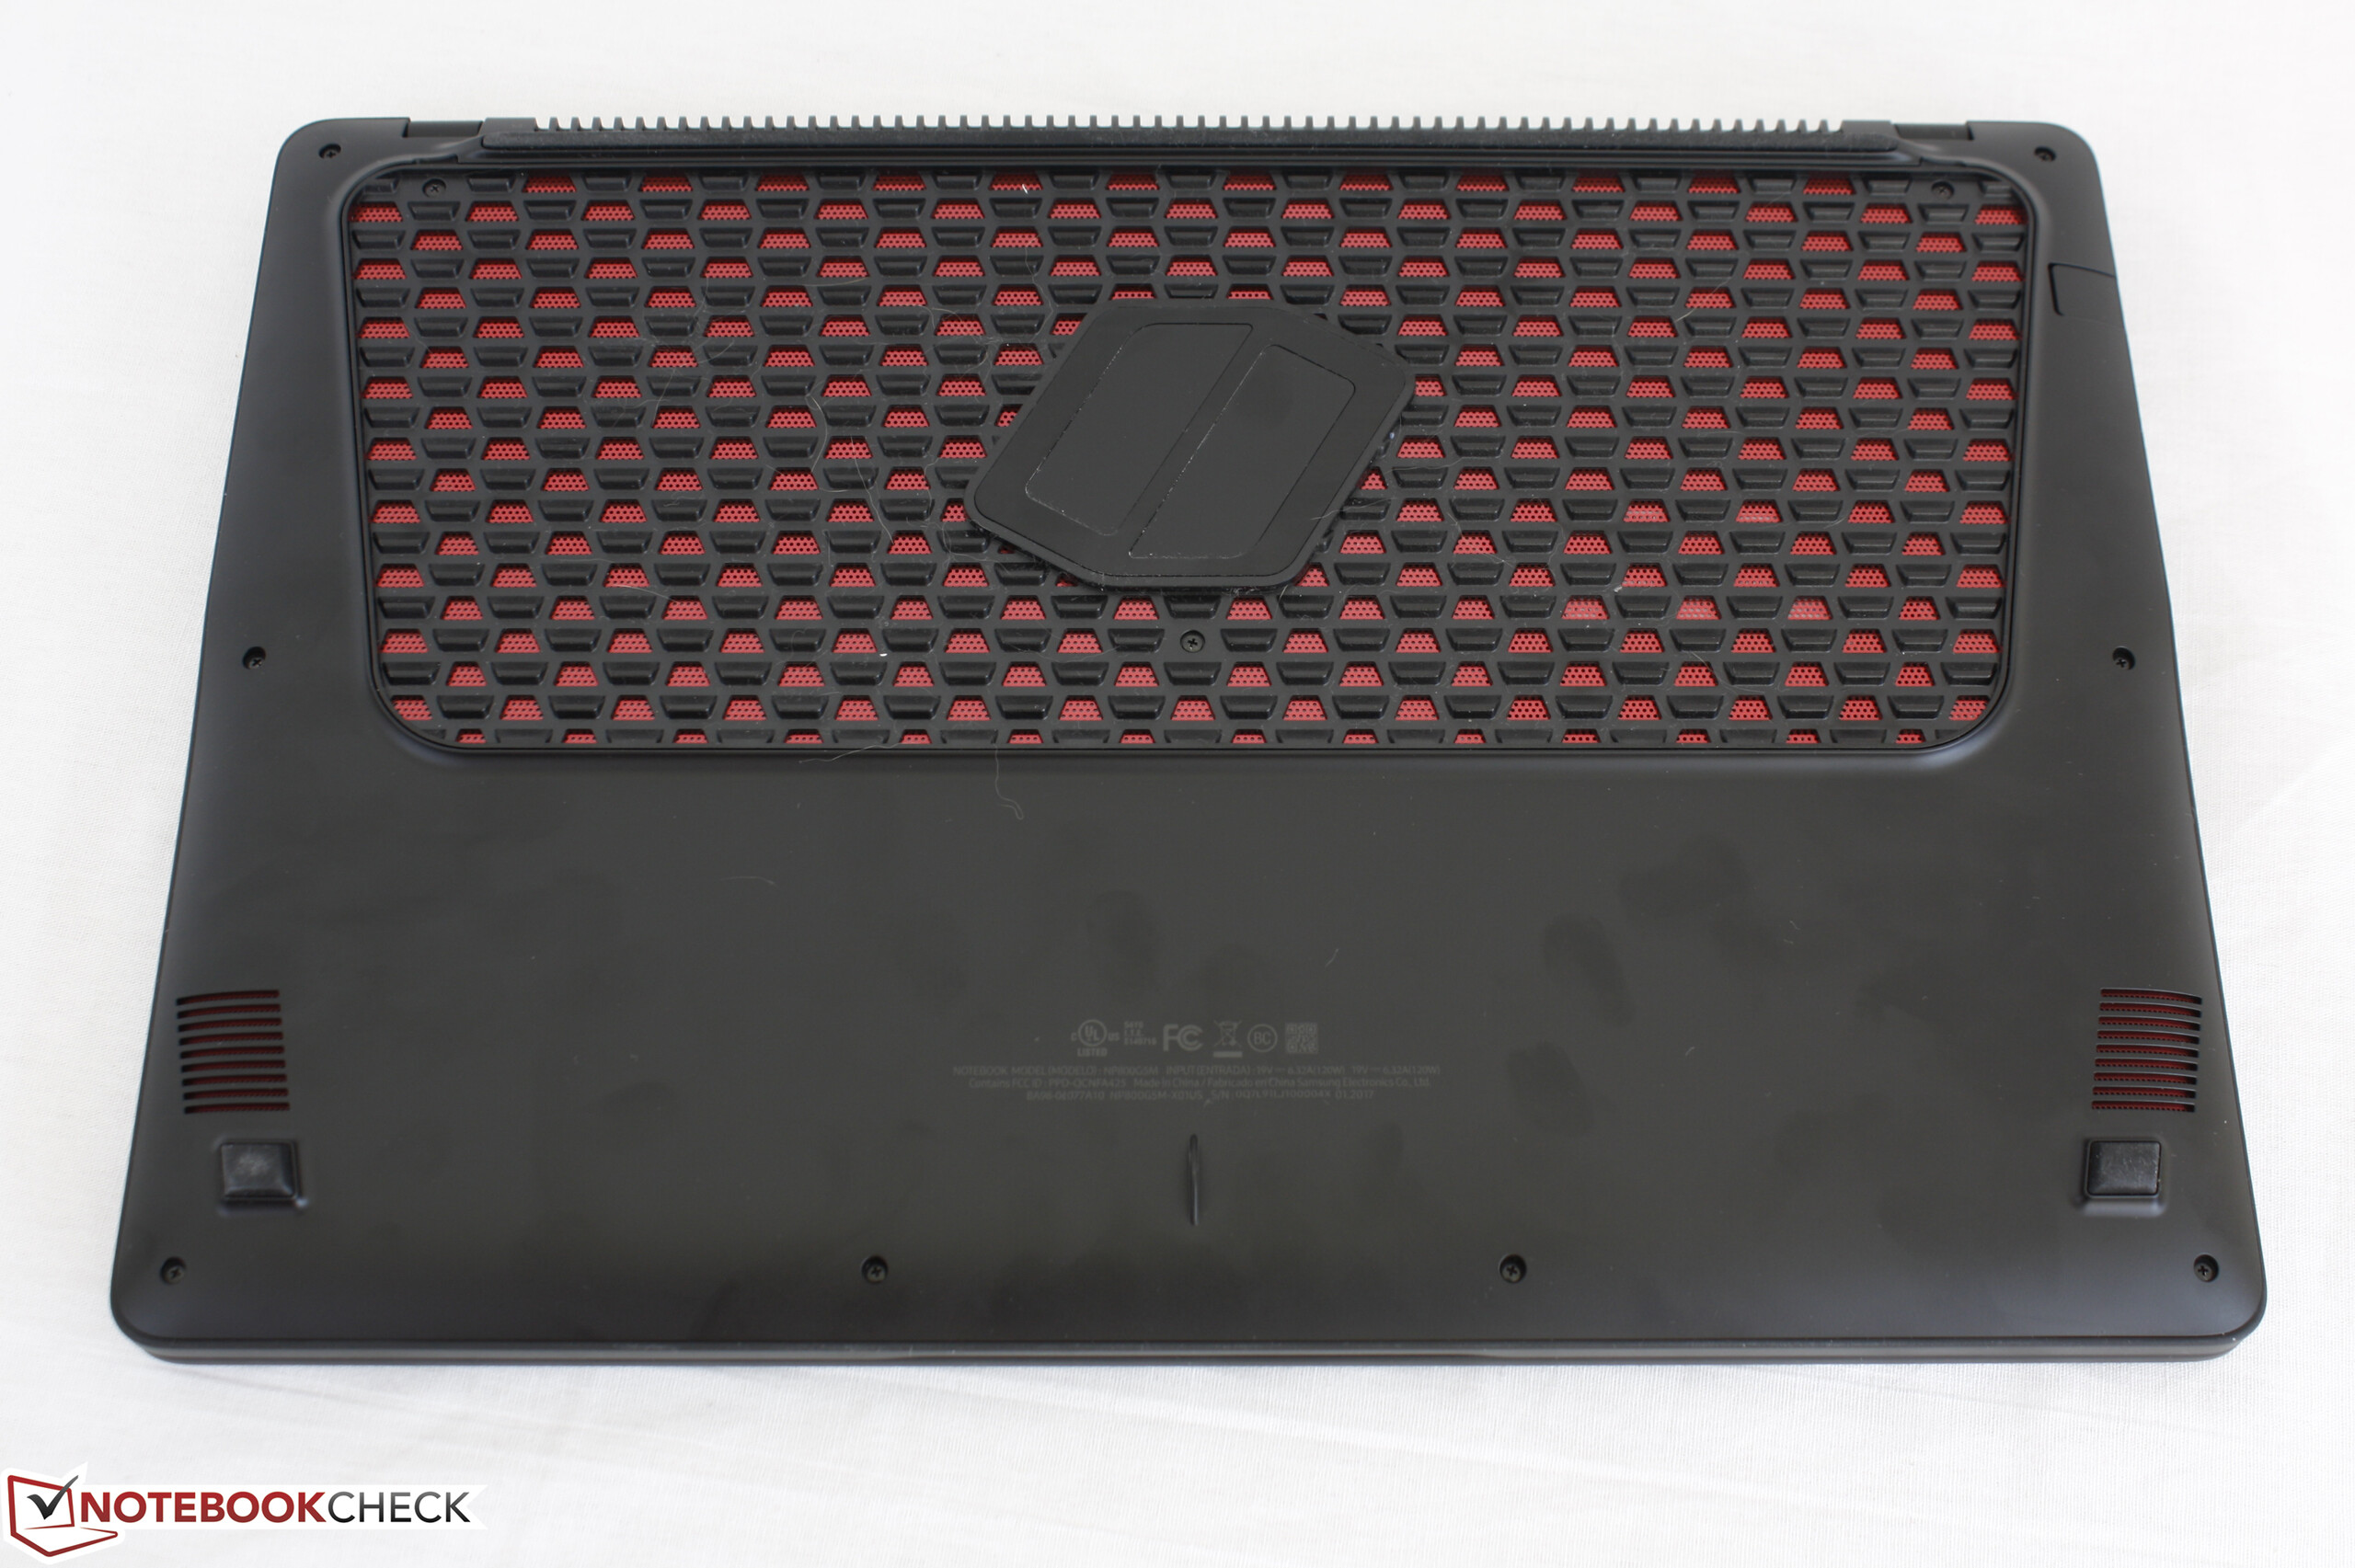
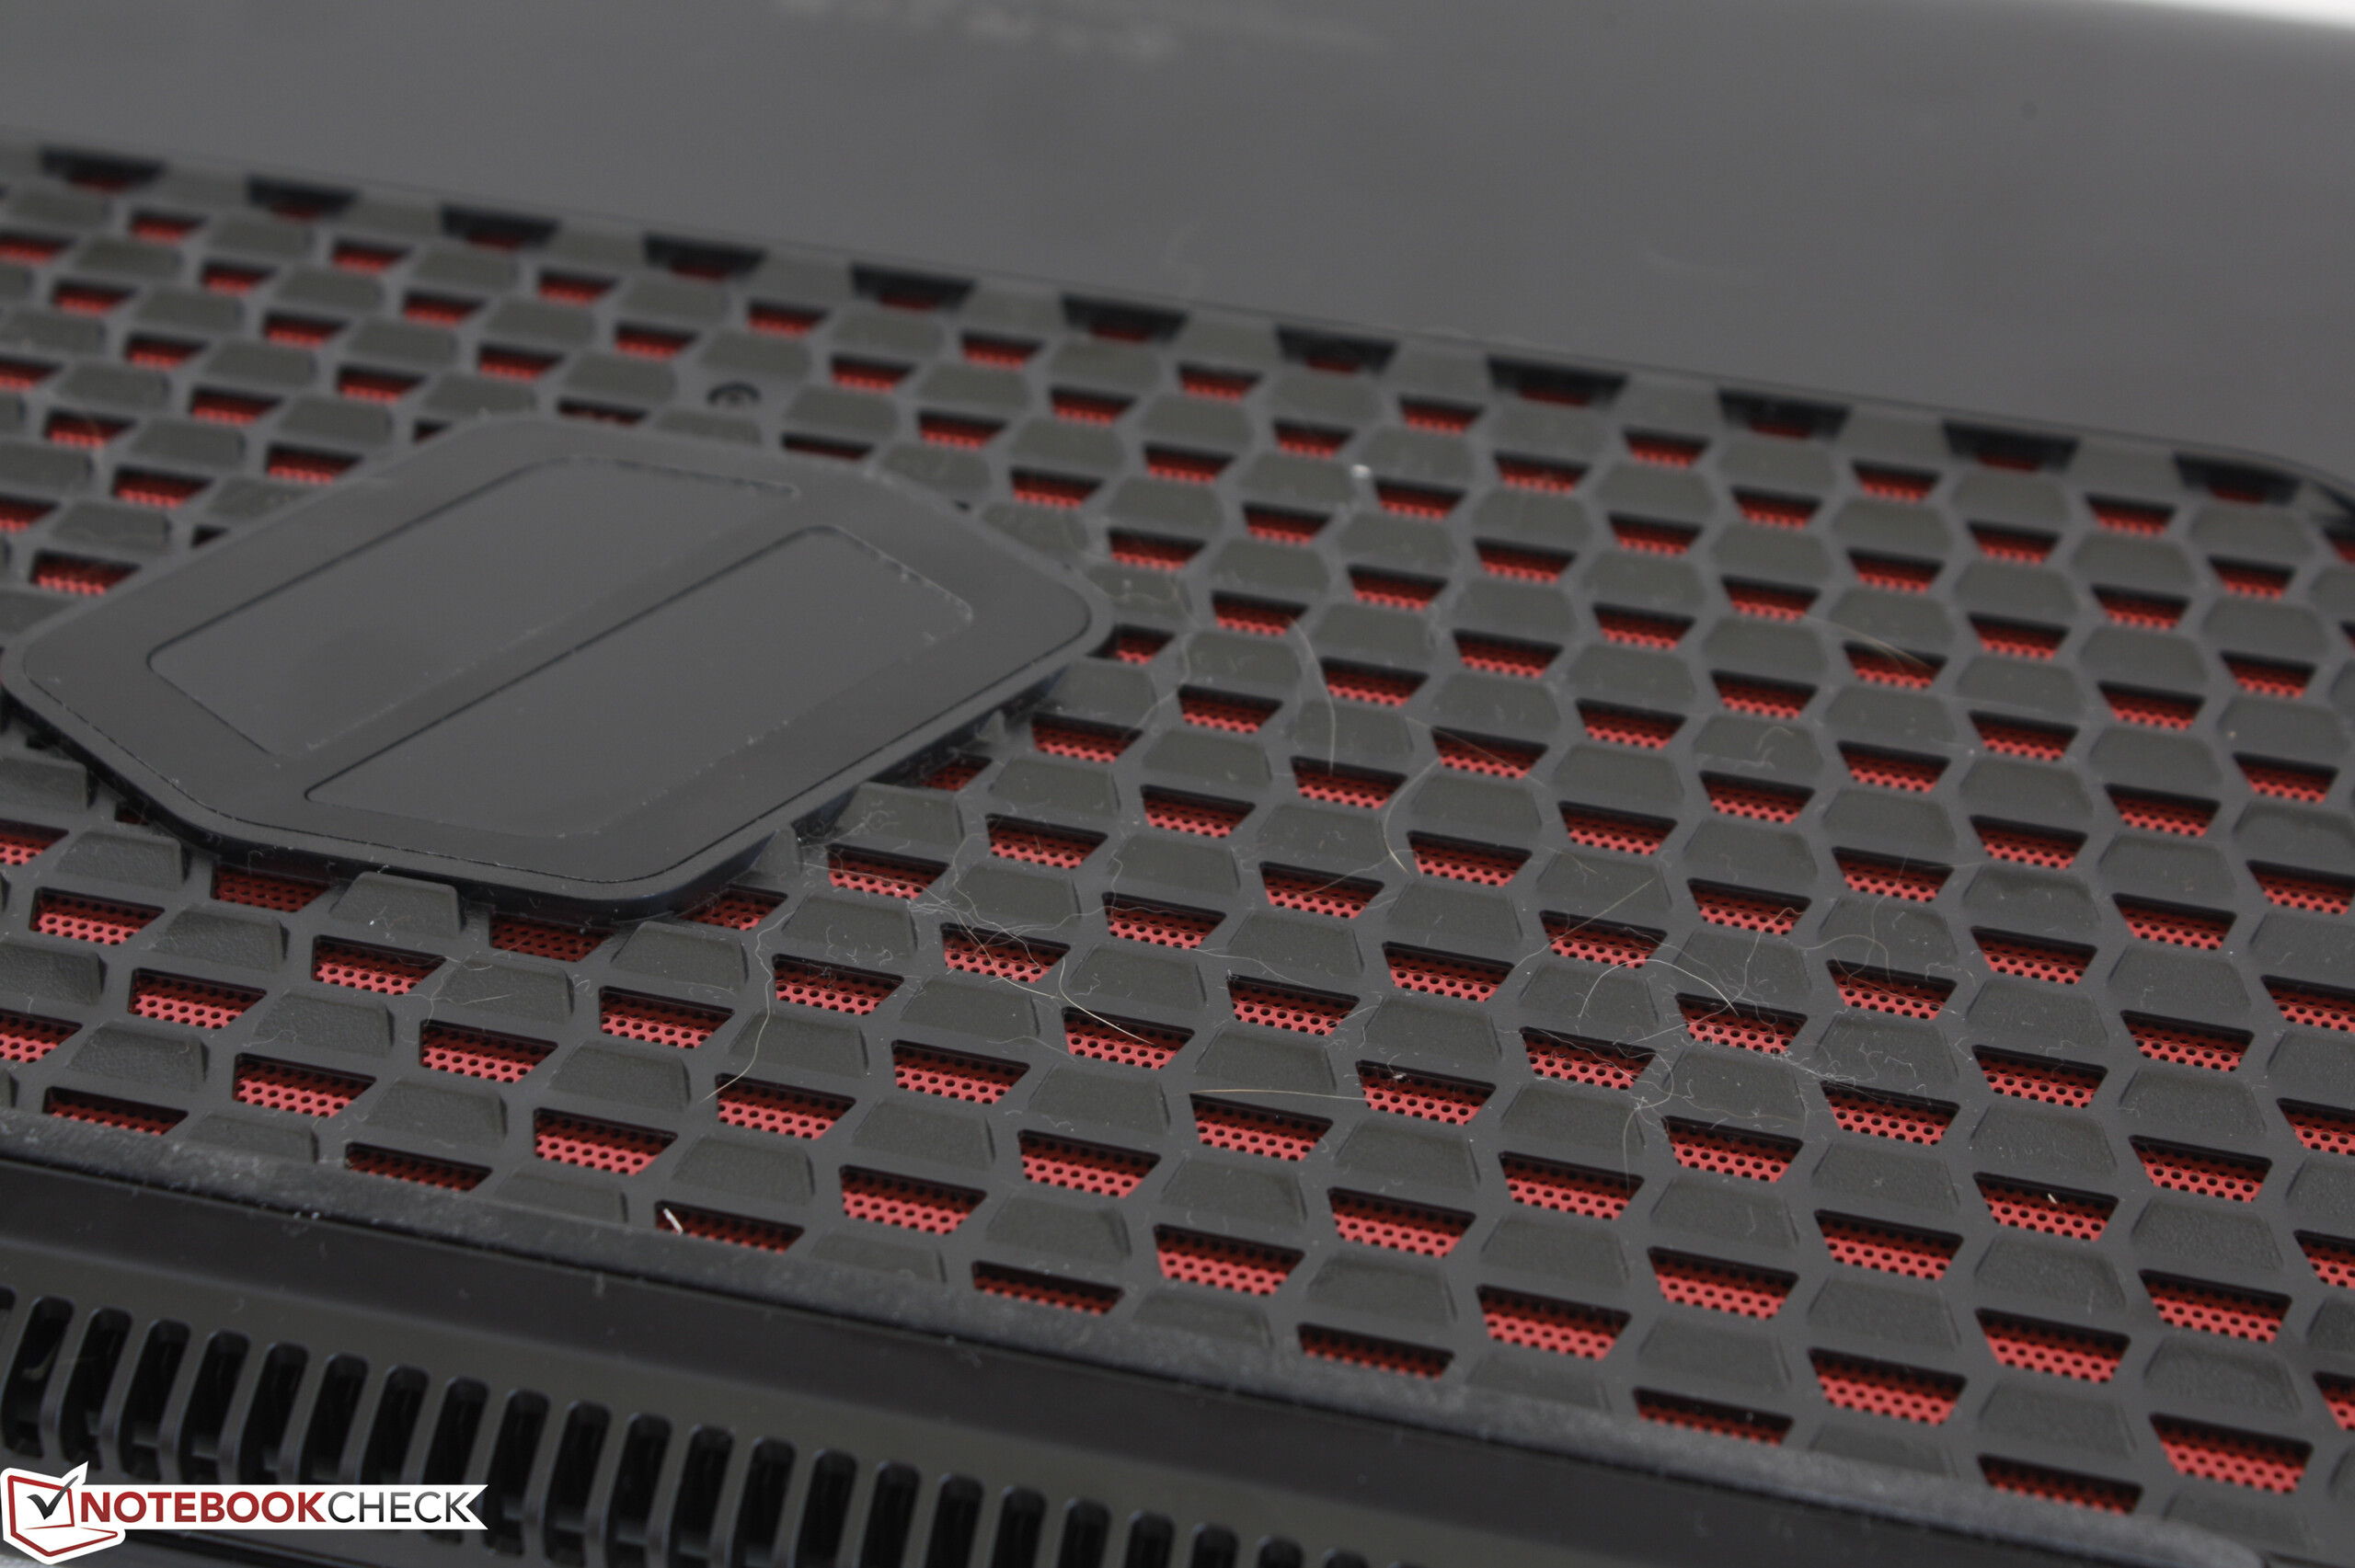
Fuera de su fiable rendimiento, el Odyssey tiene problemas con otros factores. Notablemente, el ruido del ventilador es muy alto durante el juego, incluso para un portátil gaming. Con casi 50 dB(A), este nivel se espera de GPUs más potentes como GTX 1070 o GTX 1080 - no la GTX 1050. Los controles manuales de ventilador habrían ganado mucho si permitieran que el usuario equilibrara ruido y temperaturas internas para experiencias de juego más disfrutables.
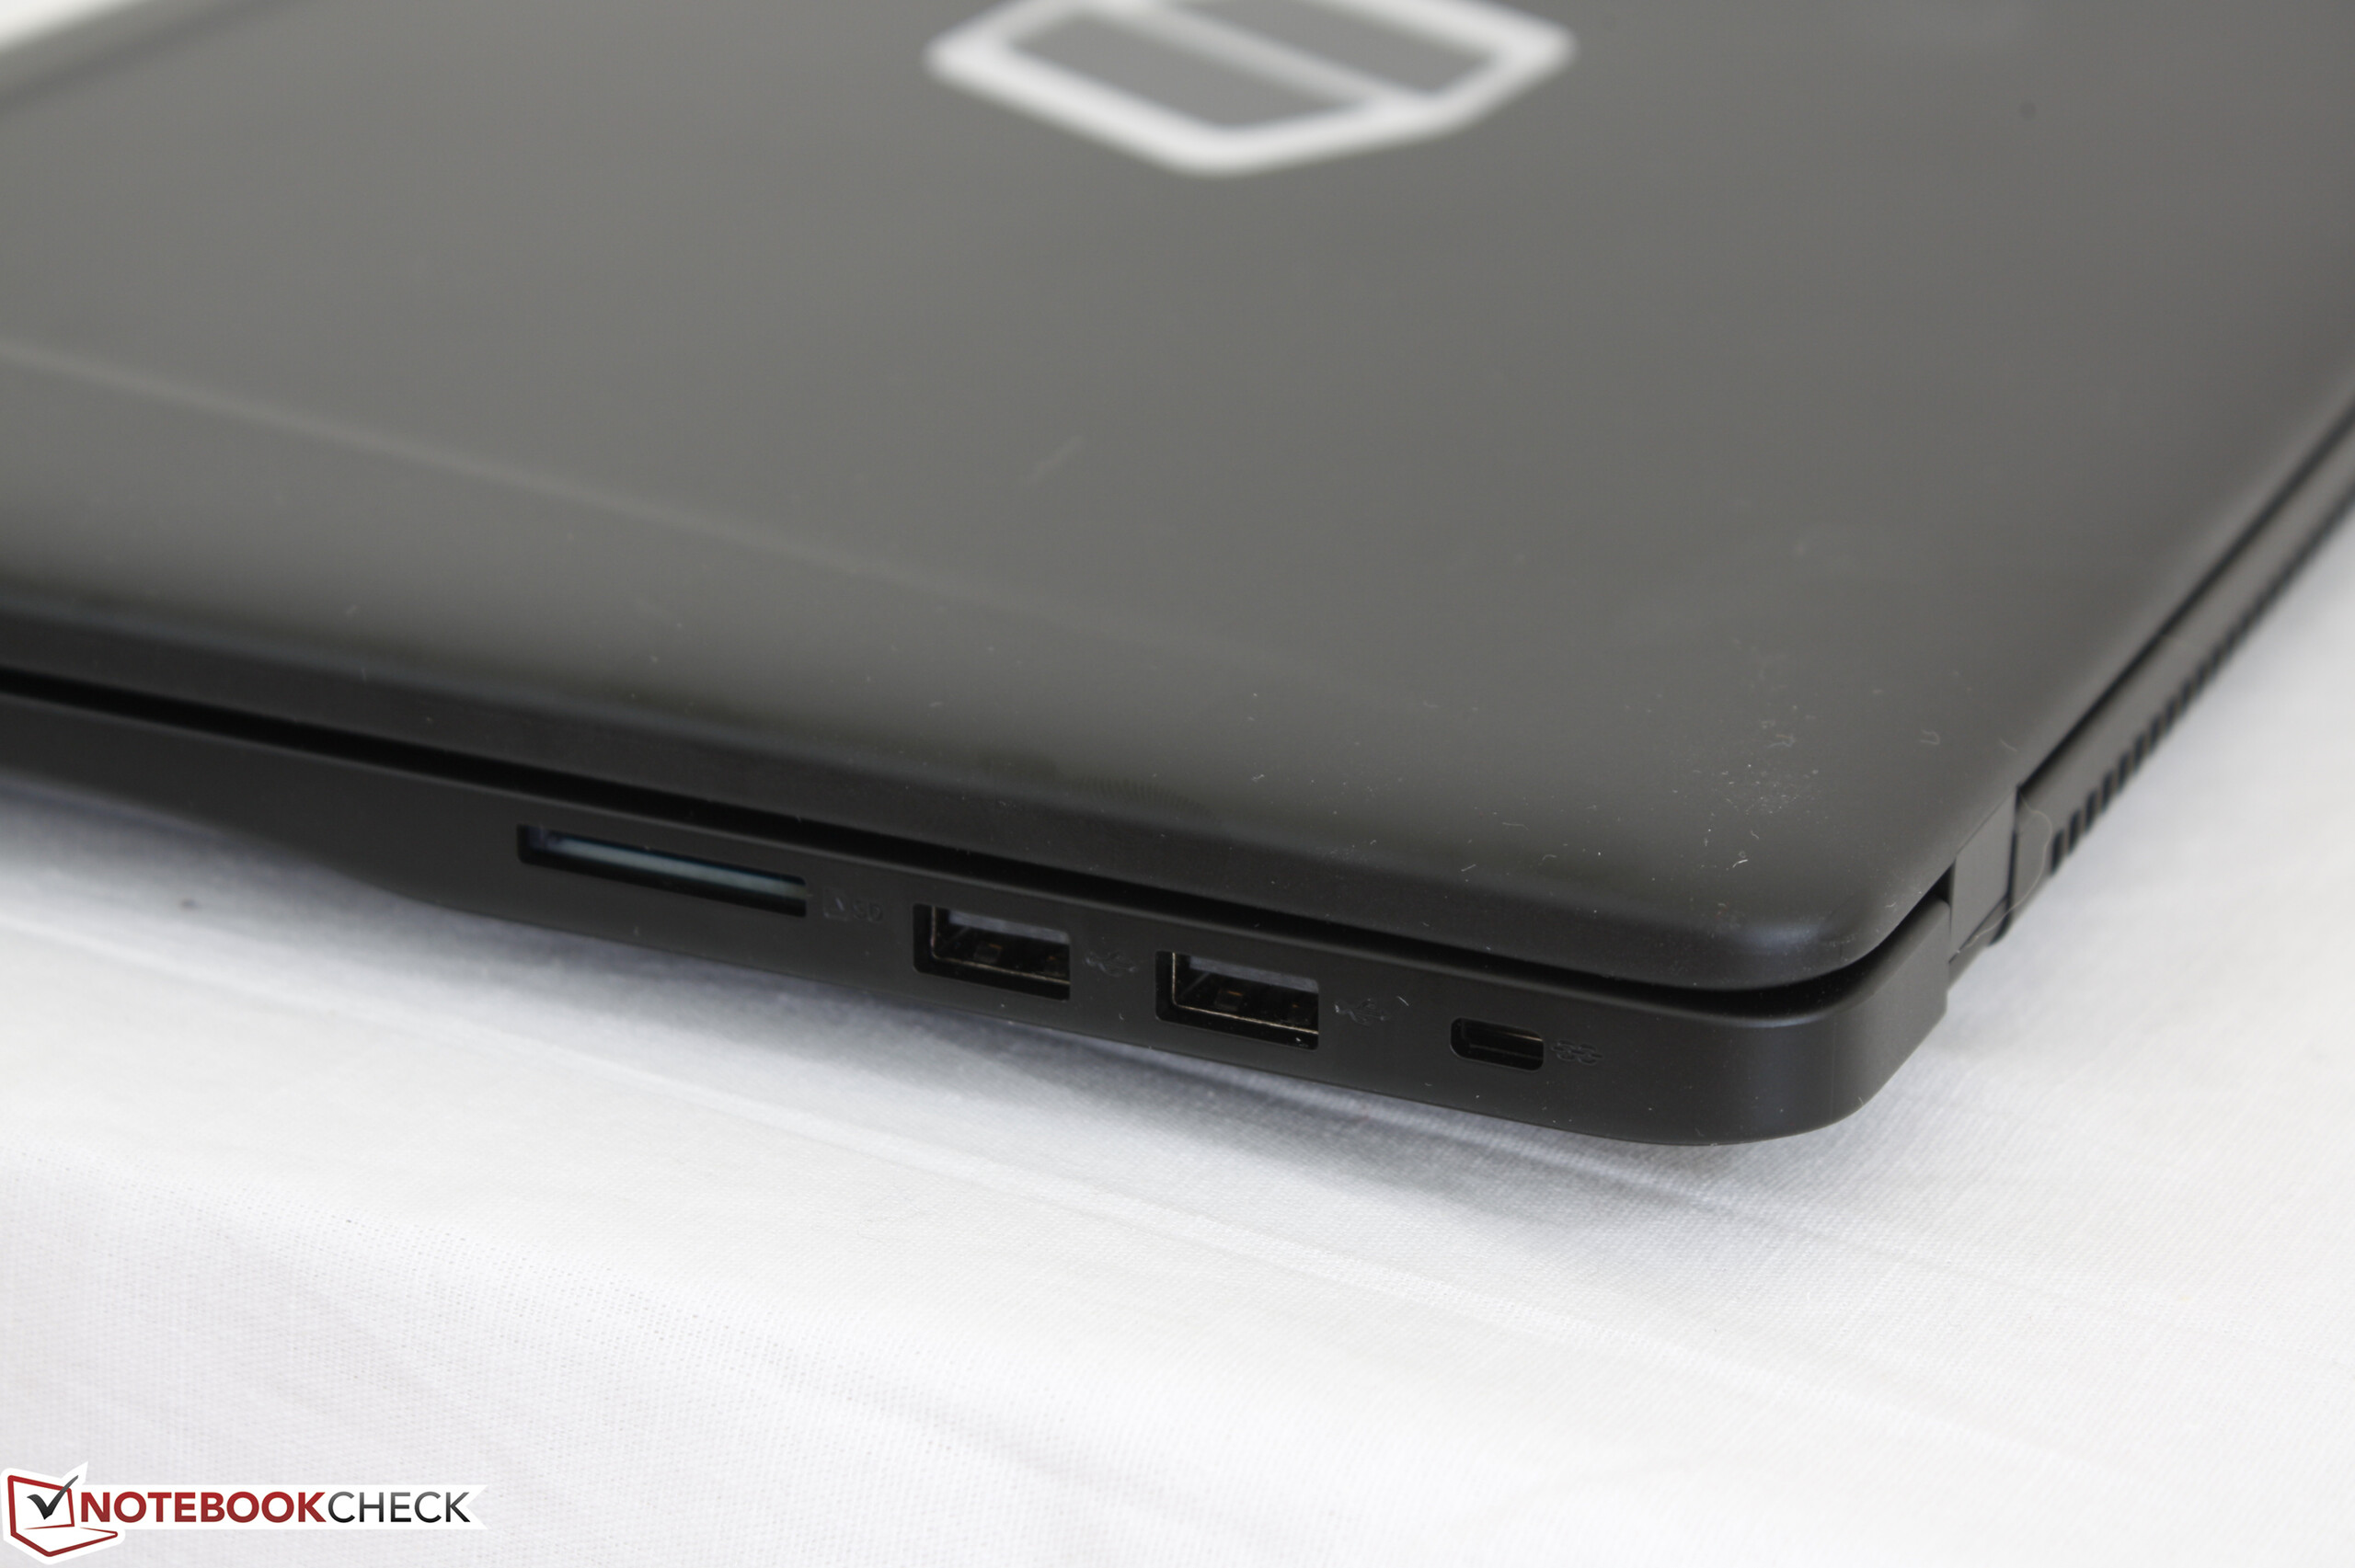
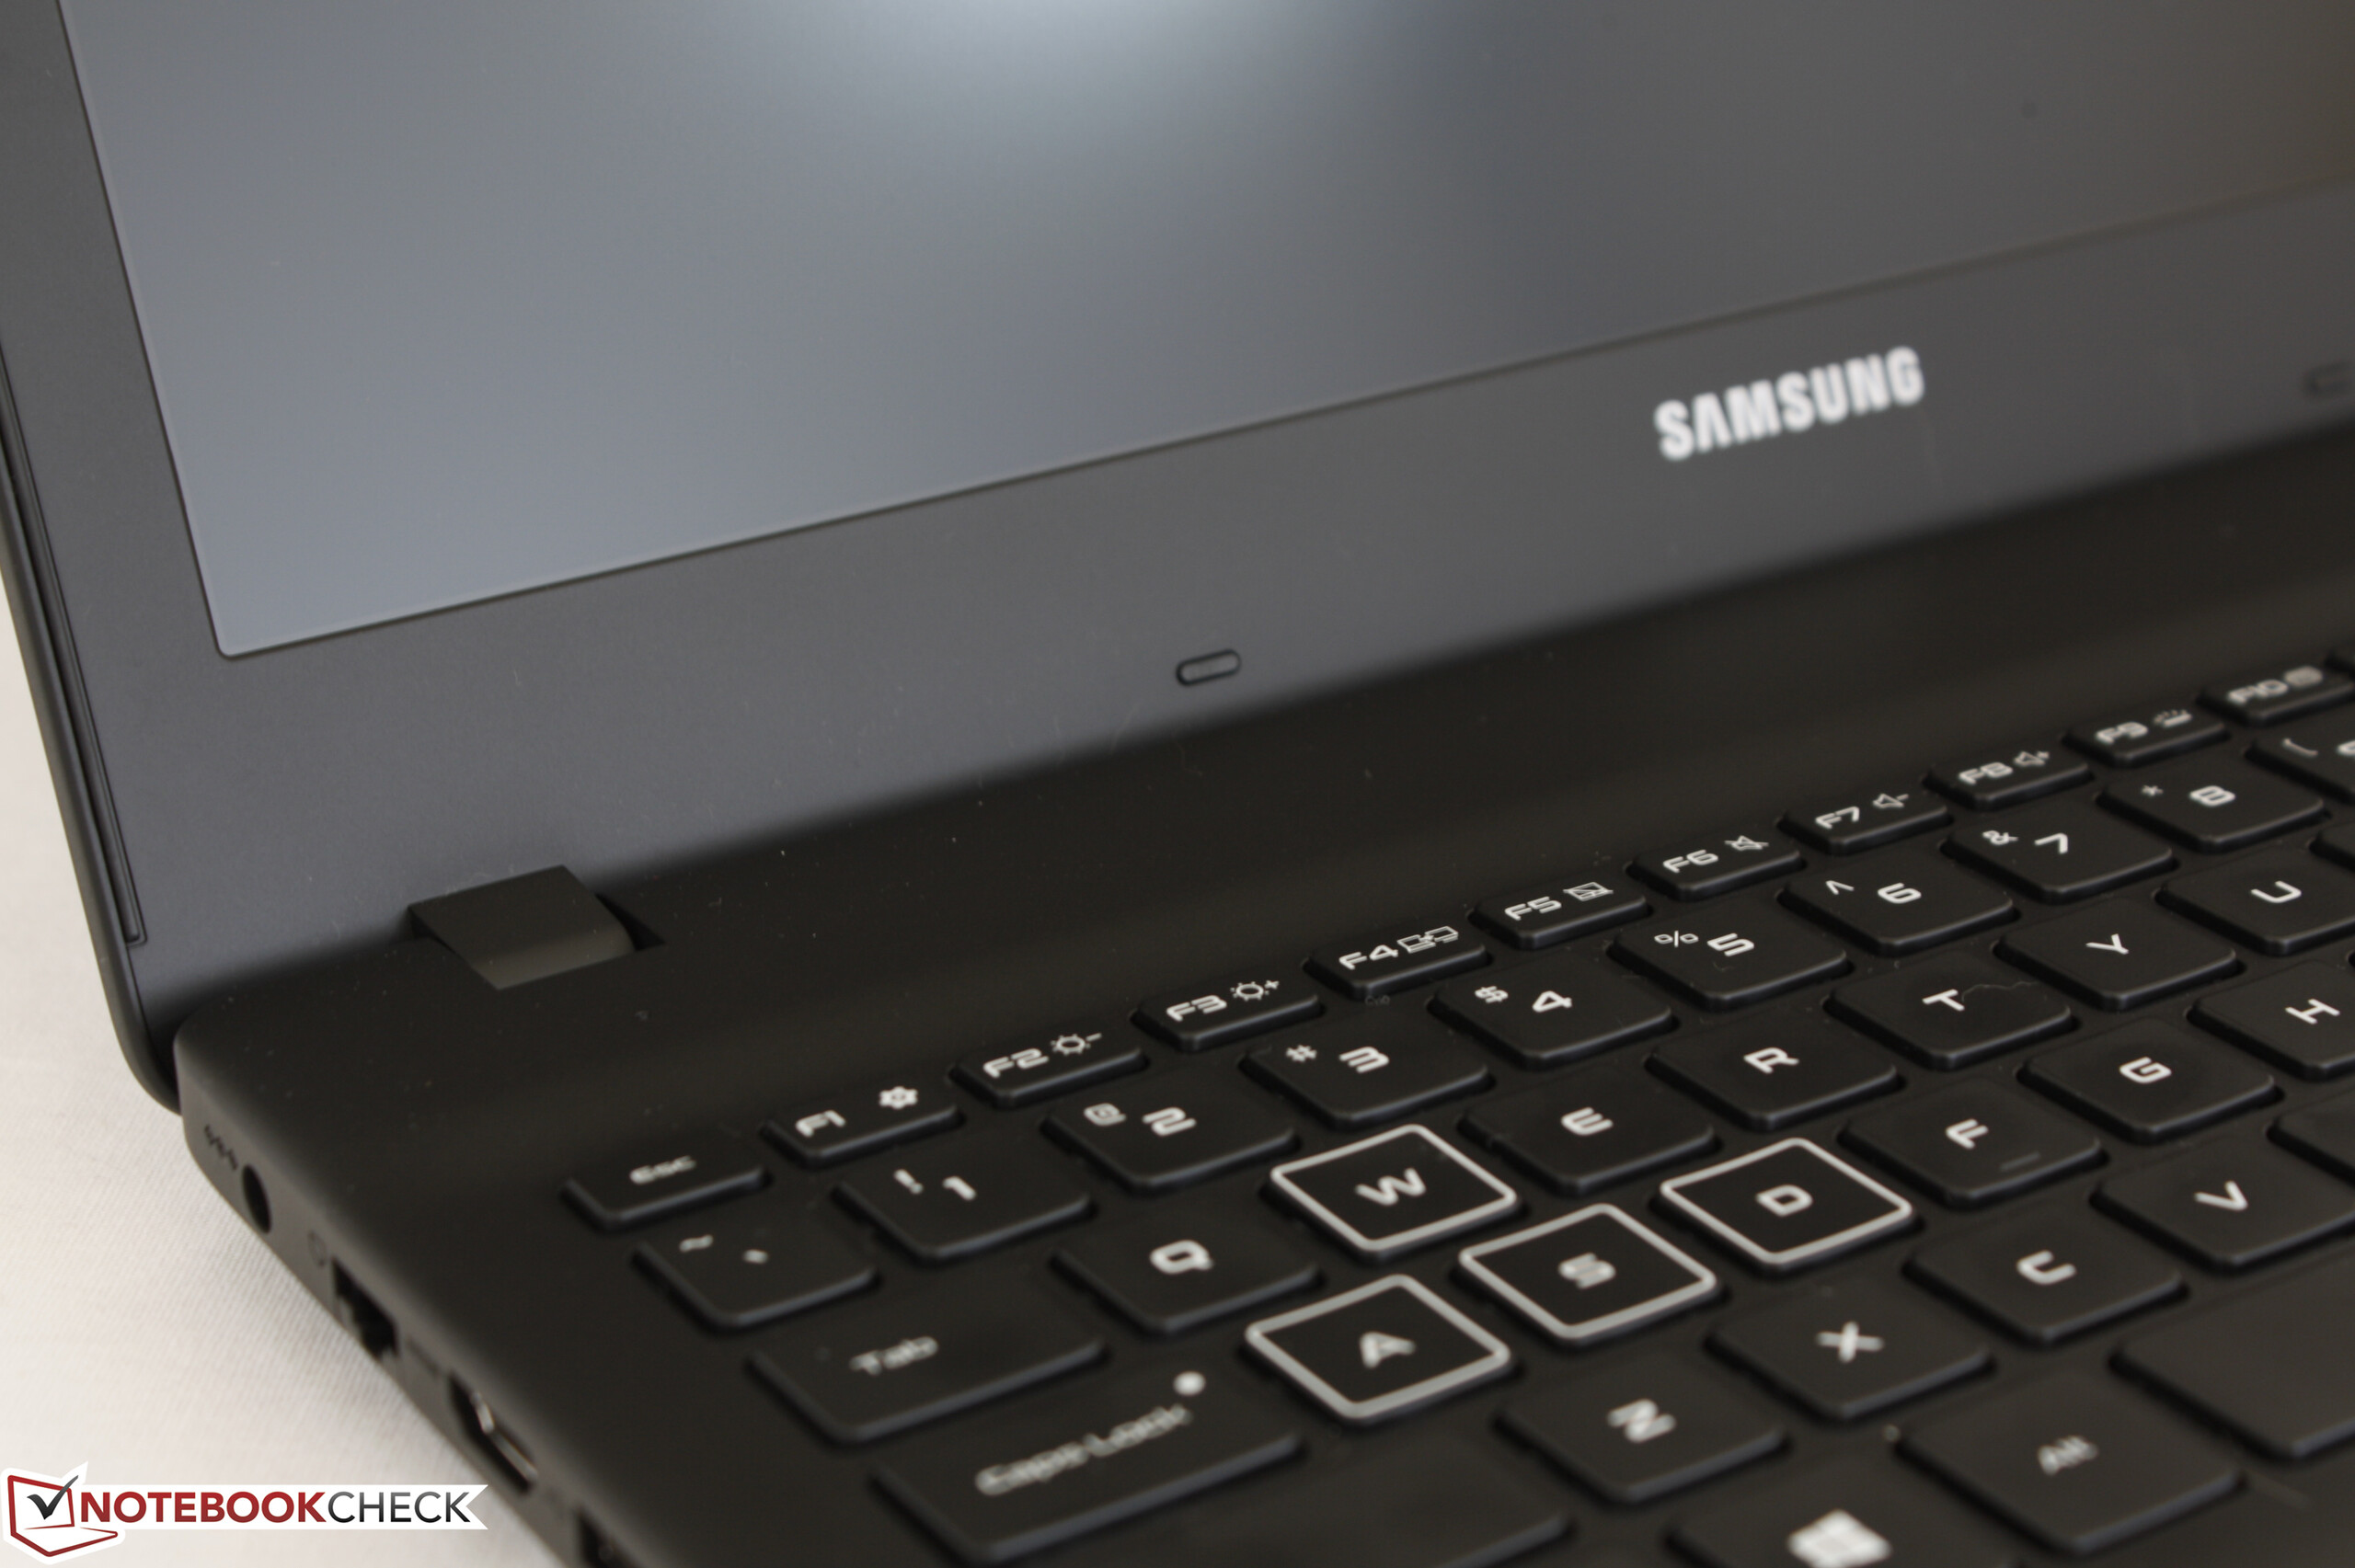
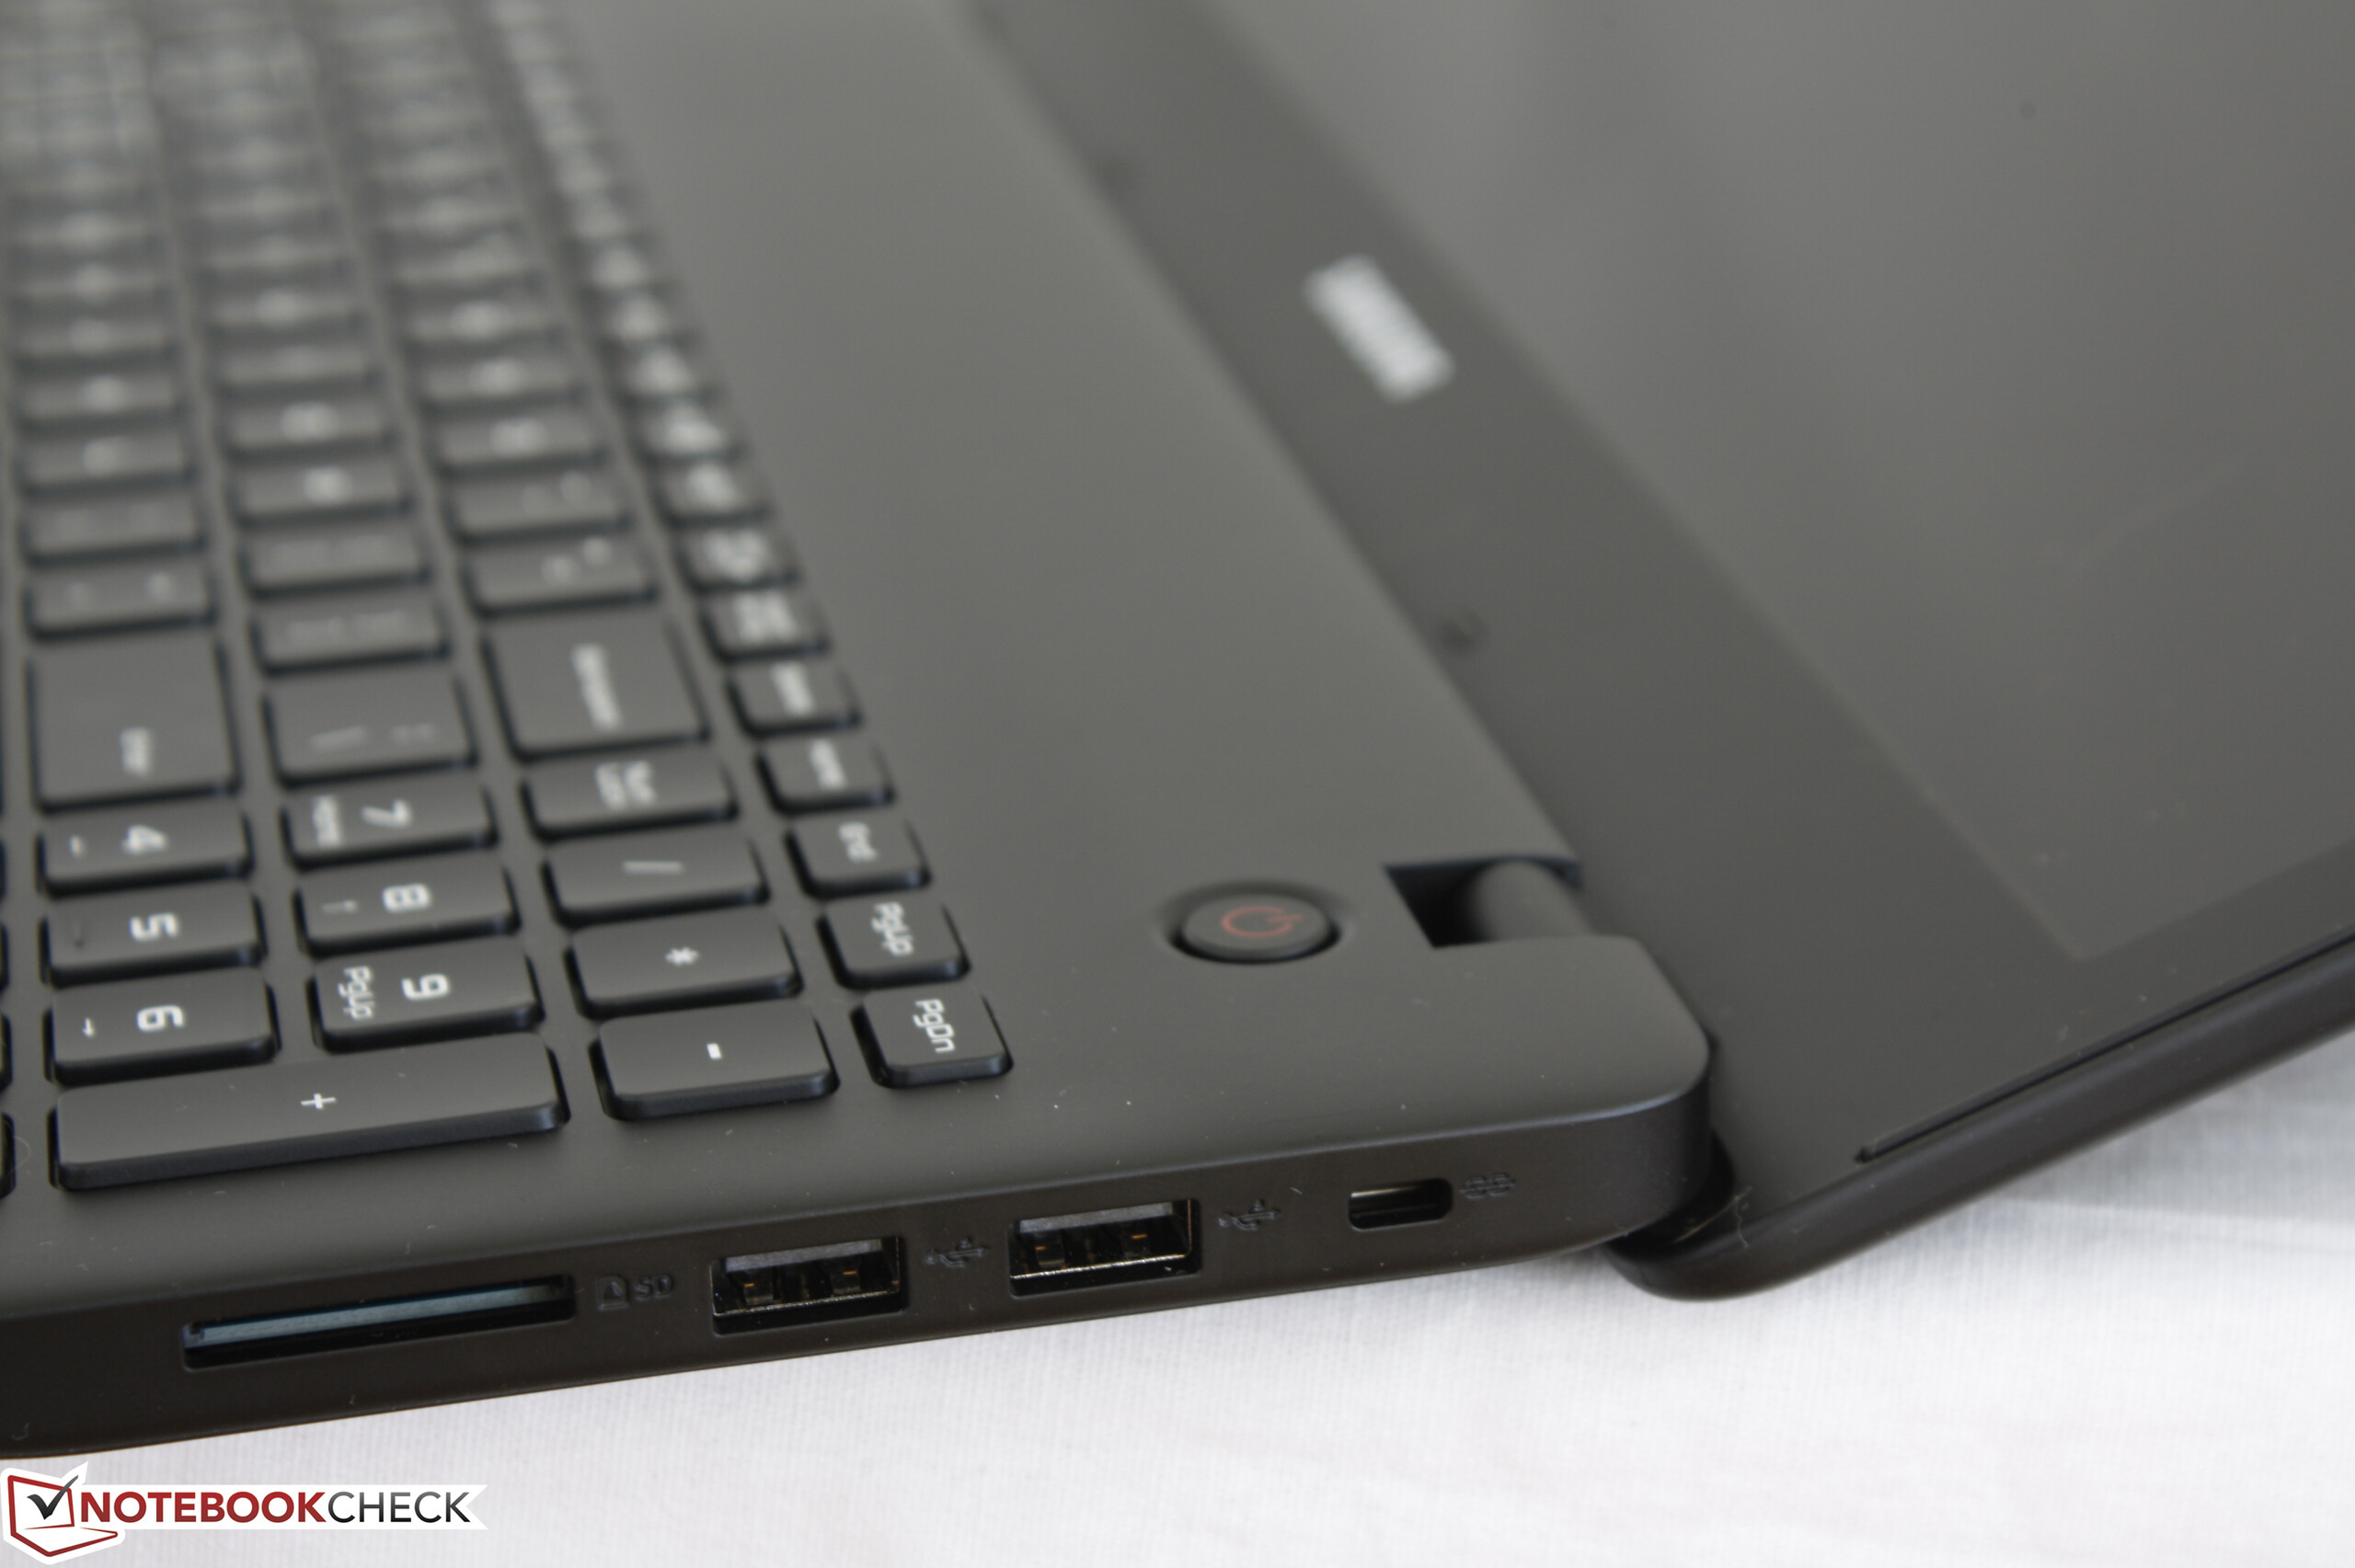
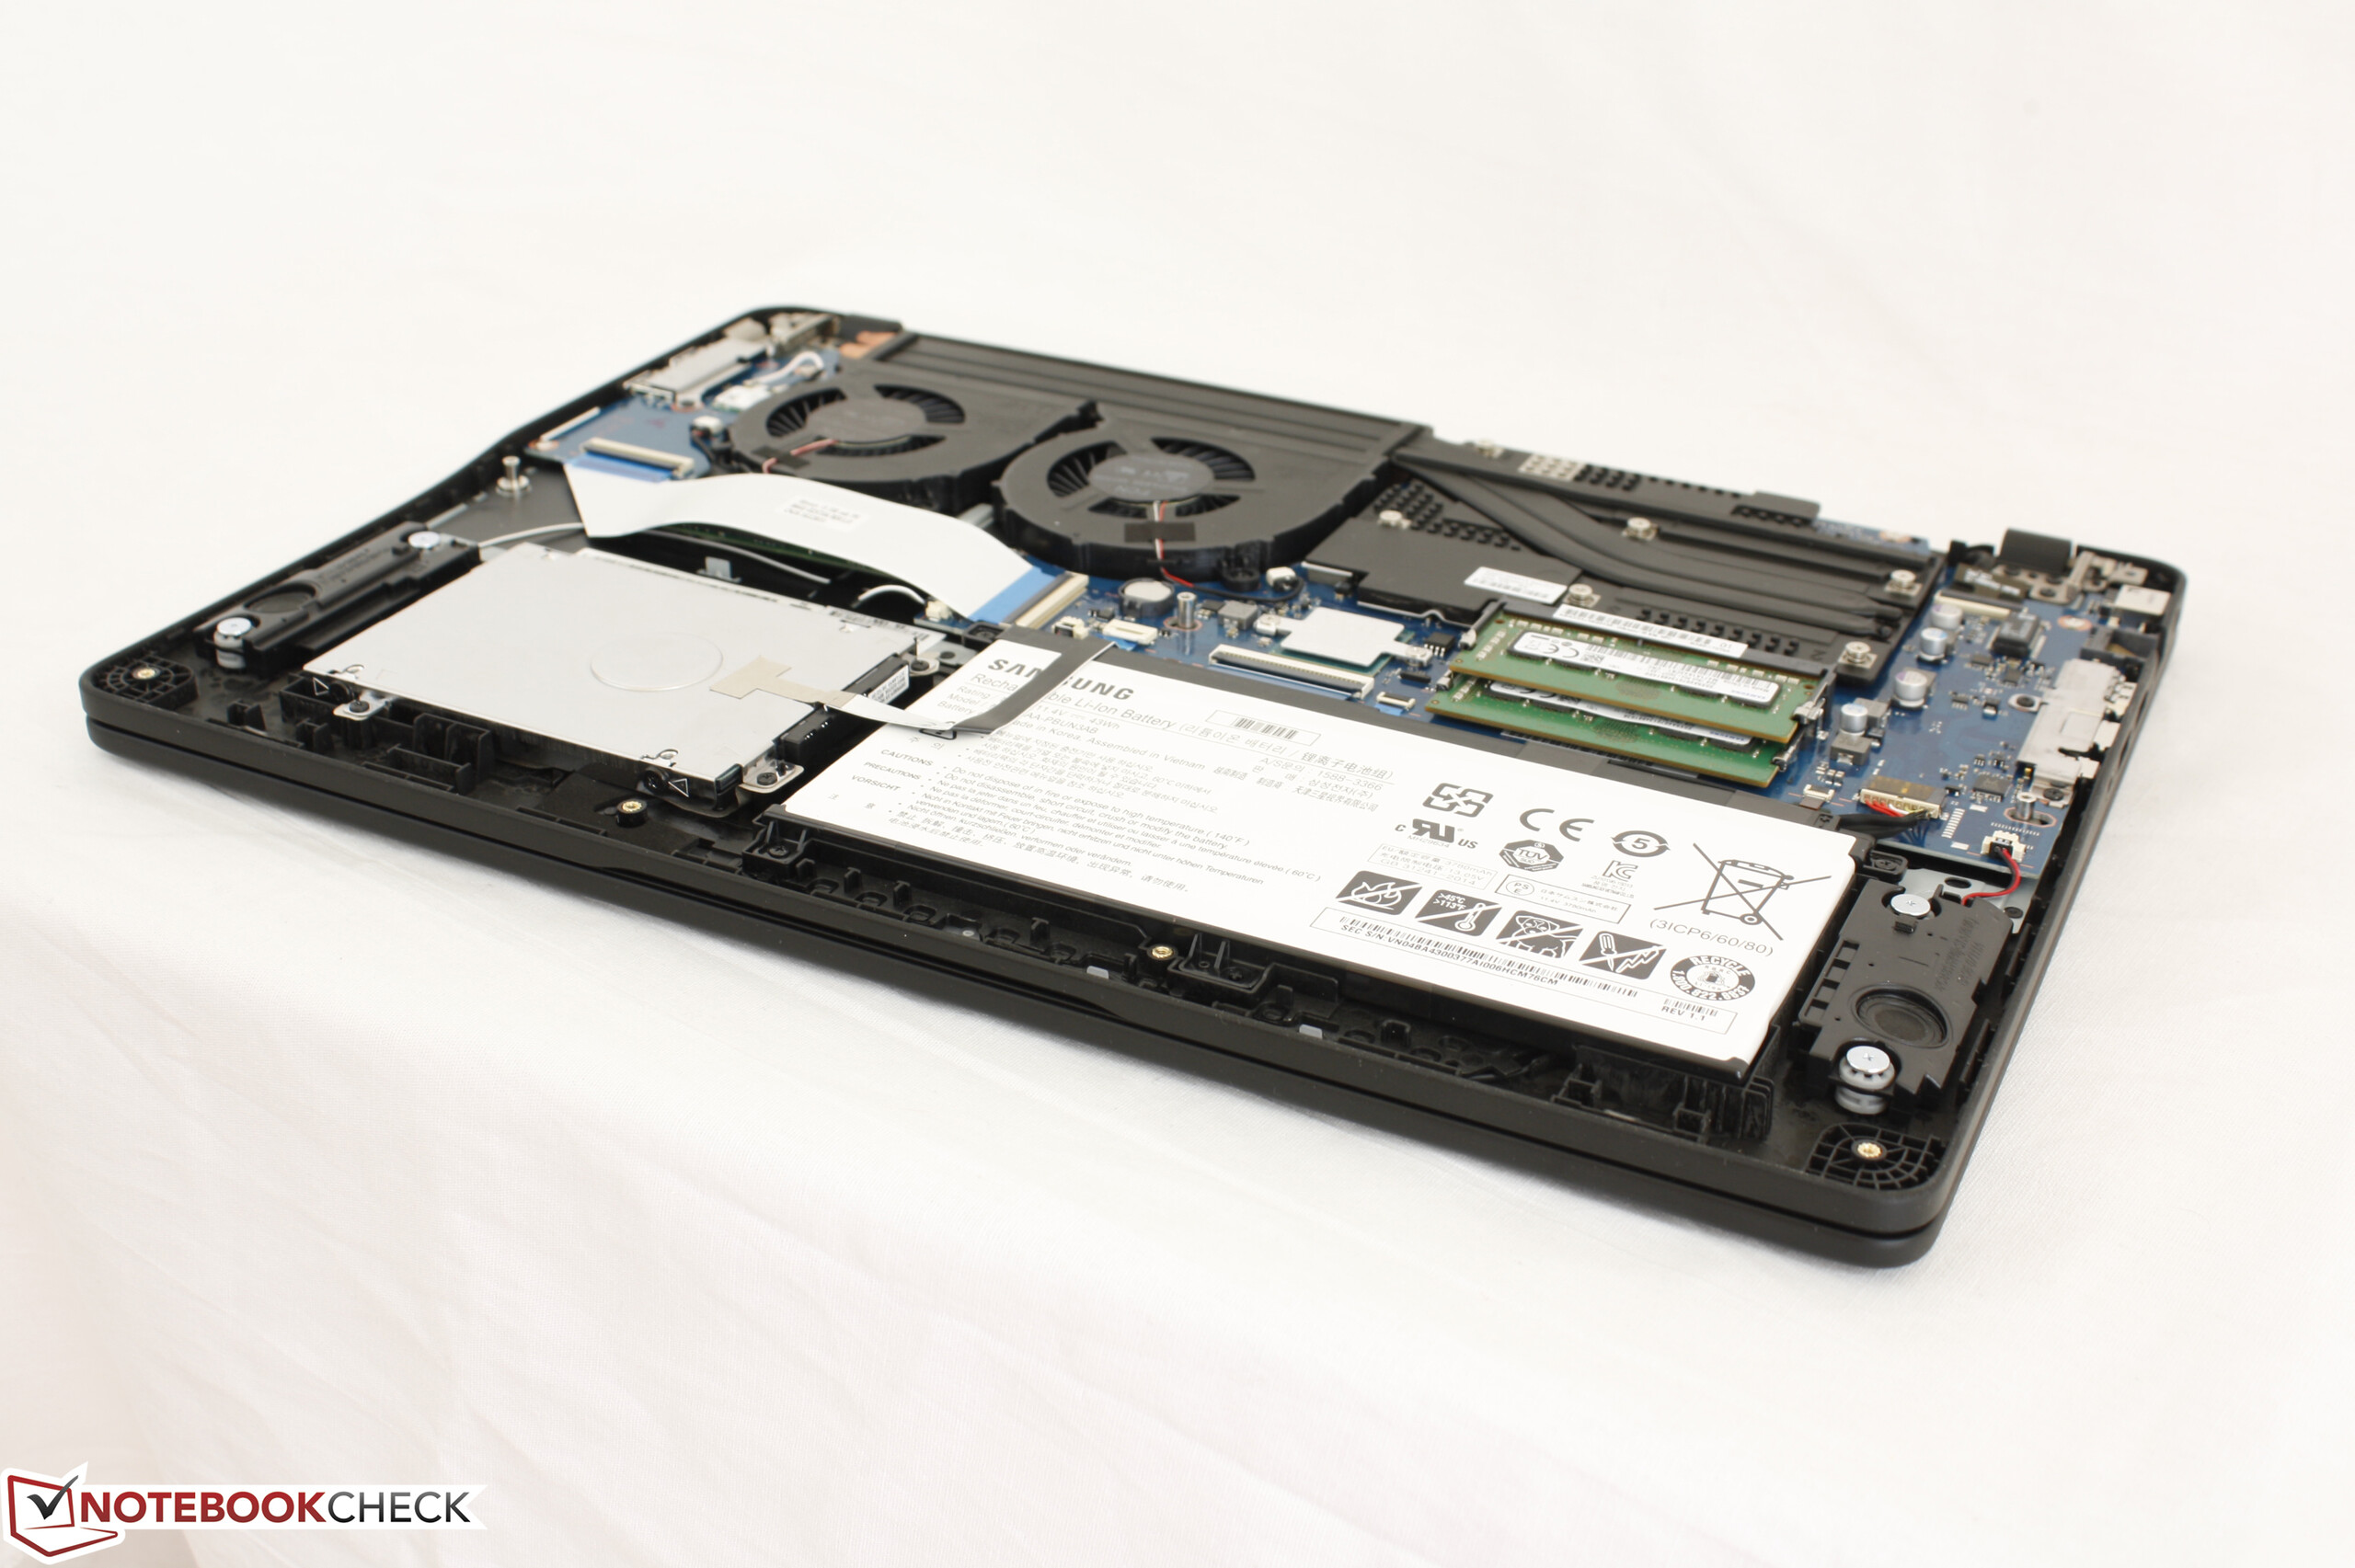
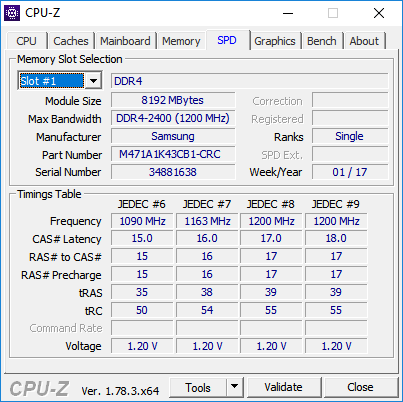
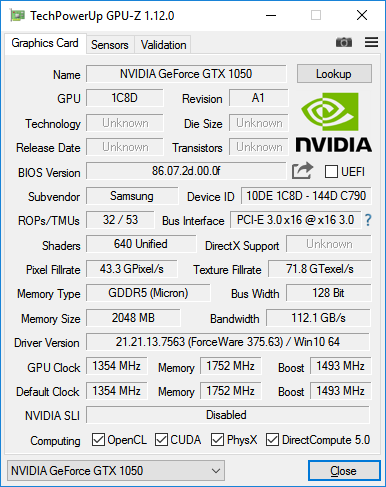
Los recortes también se vuelven más obvios cuanto más tiempos pasamos con el portátil. El lector SD es lento, la conectividad está en los huesos, ya VRAM de la GPU está a la mitad, la capacidad de batería es escasa, y tanto el contraste como el color no son tan profundos como en alternativas más costosas. Las teclas WASD extra cálidas también son una extraña decisión de diseño; un fabricante de coches nunca diseñaría un volante incómodamente cálido por el mismo motivo por el que un portátil gaming nunca debería tener teclas WASD incómodamente cálidas.
El HP Pavilion 15t con las mismas CPU y GPU tambié está en el segmento de $1100 a $1200 USD como nuestra configuración del Odyssey. Si bien el Samsung brilla con su rendimiento, en el resto de aspecots es del montón y no ofrece bastante para que supere otros portátiles GTX 1050.
El primer portátil gaming Samsung Odyssey ha llegado por fin y.. es soso y nada especial. Los rendimientos CPU y GPU son geniales sin ralentización alguna, pero el ruido de ventilador es severo.
Ésta es una versión acortada del análisis original. Puedes leer el análisis completo en inglés aquí.
Samsung Odyssey NP800G5M-X01US
- 04/24/2017 v6 (old)
Allen Ngo
Price comparison
