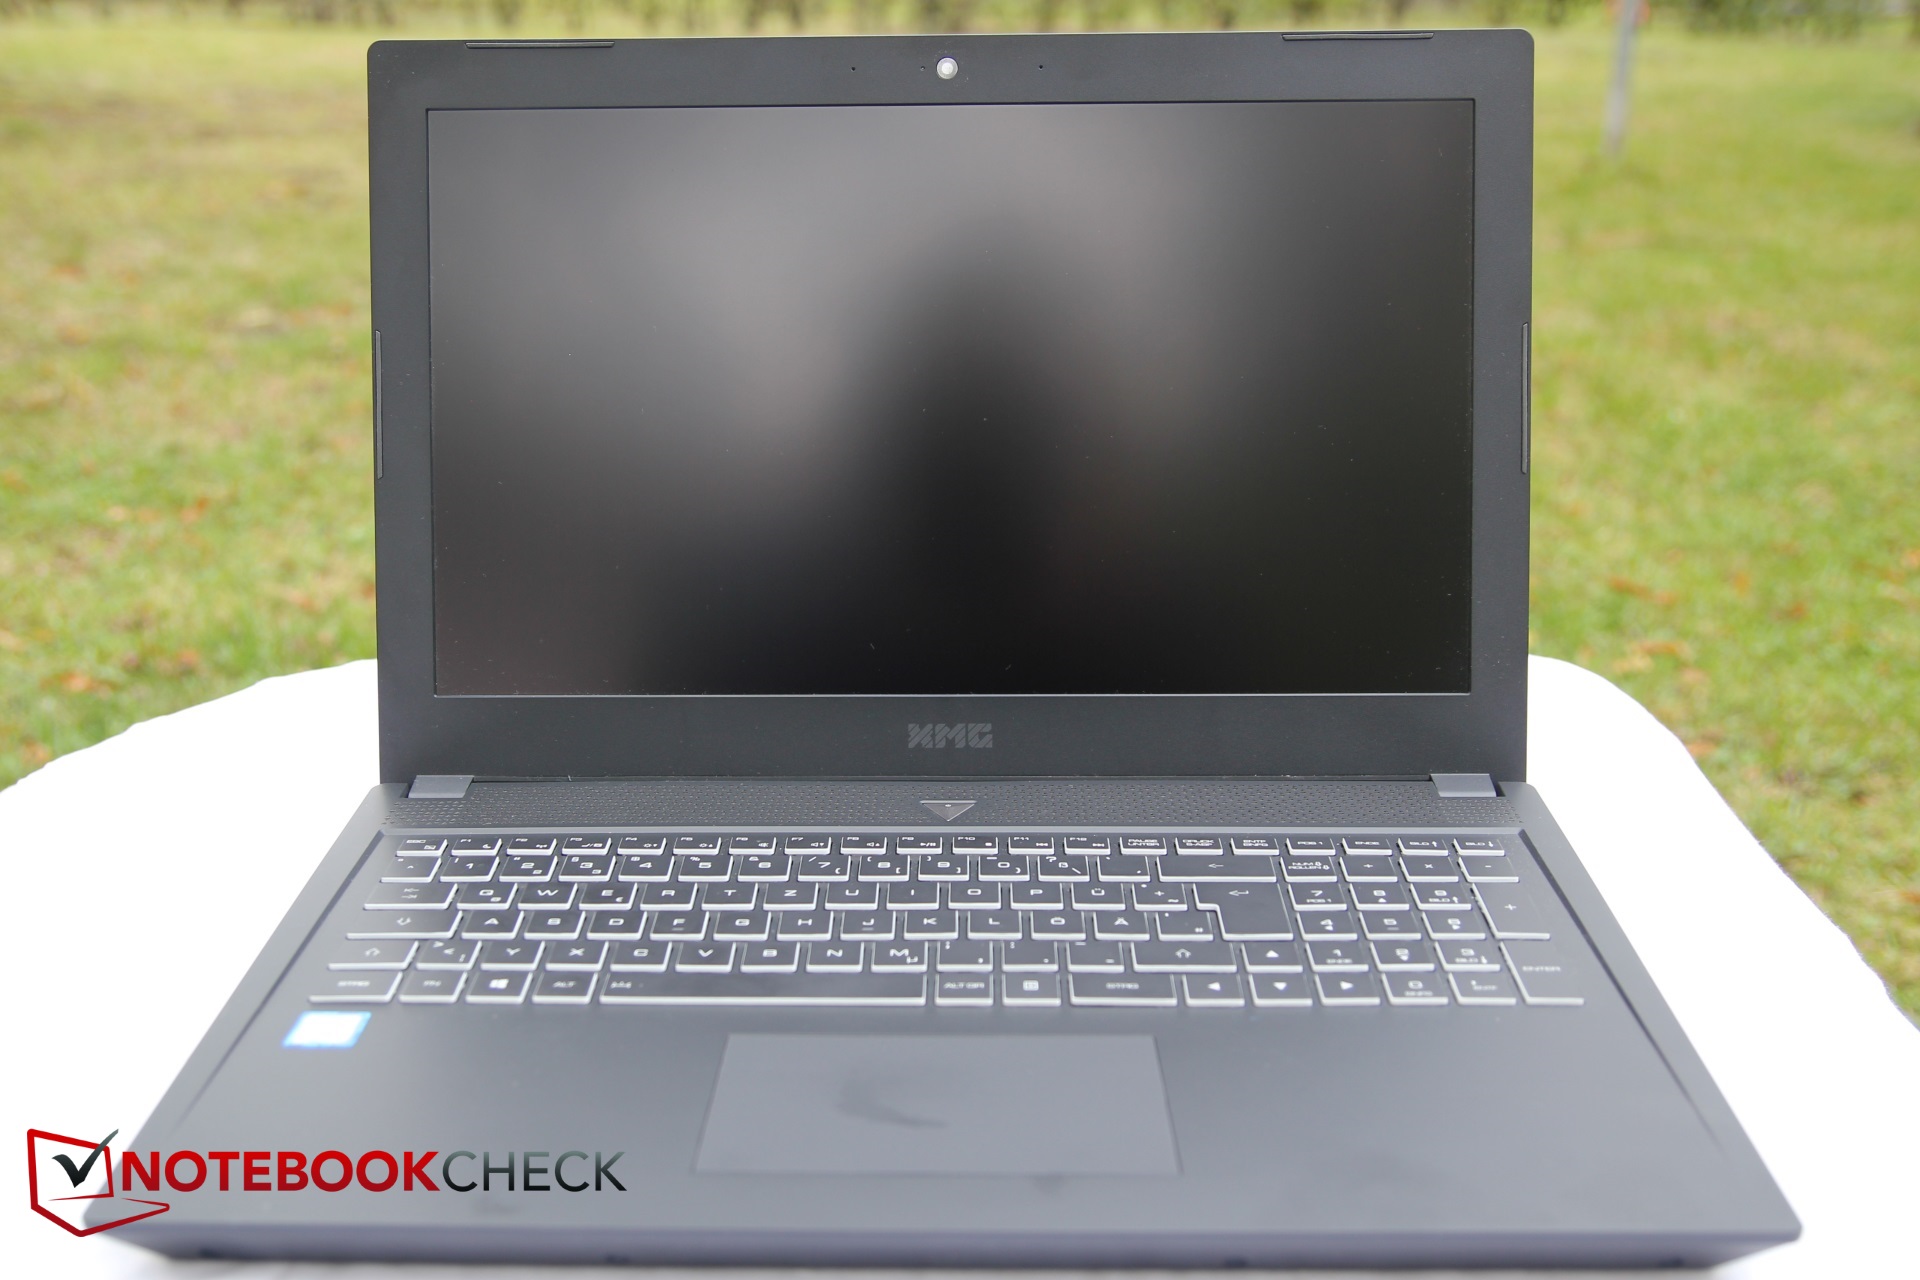
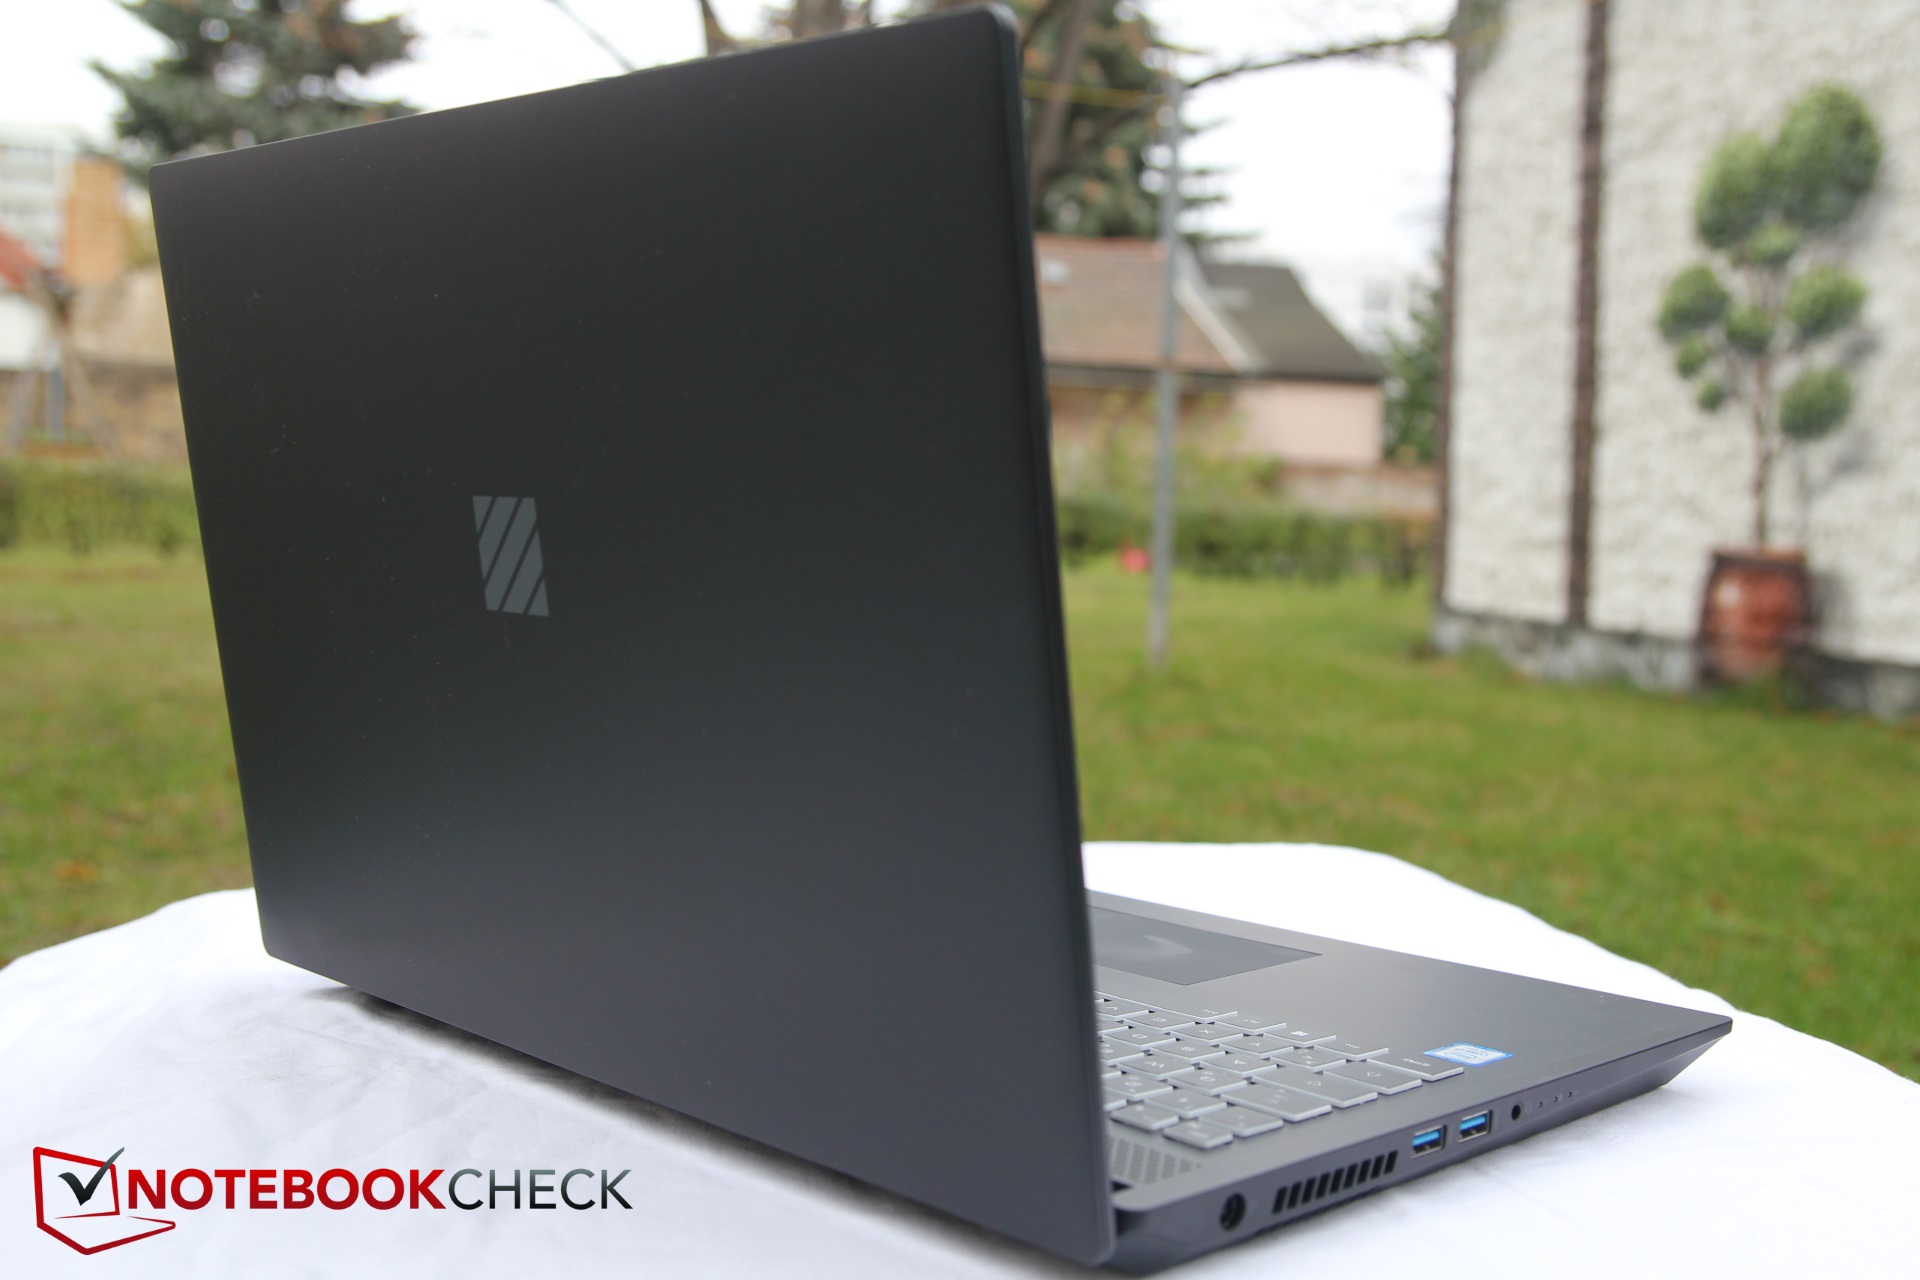
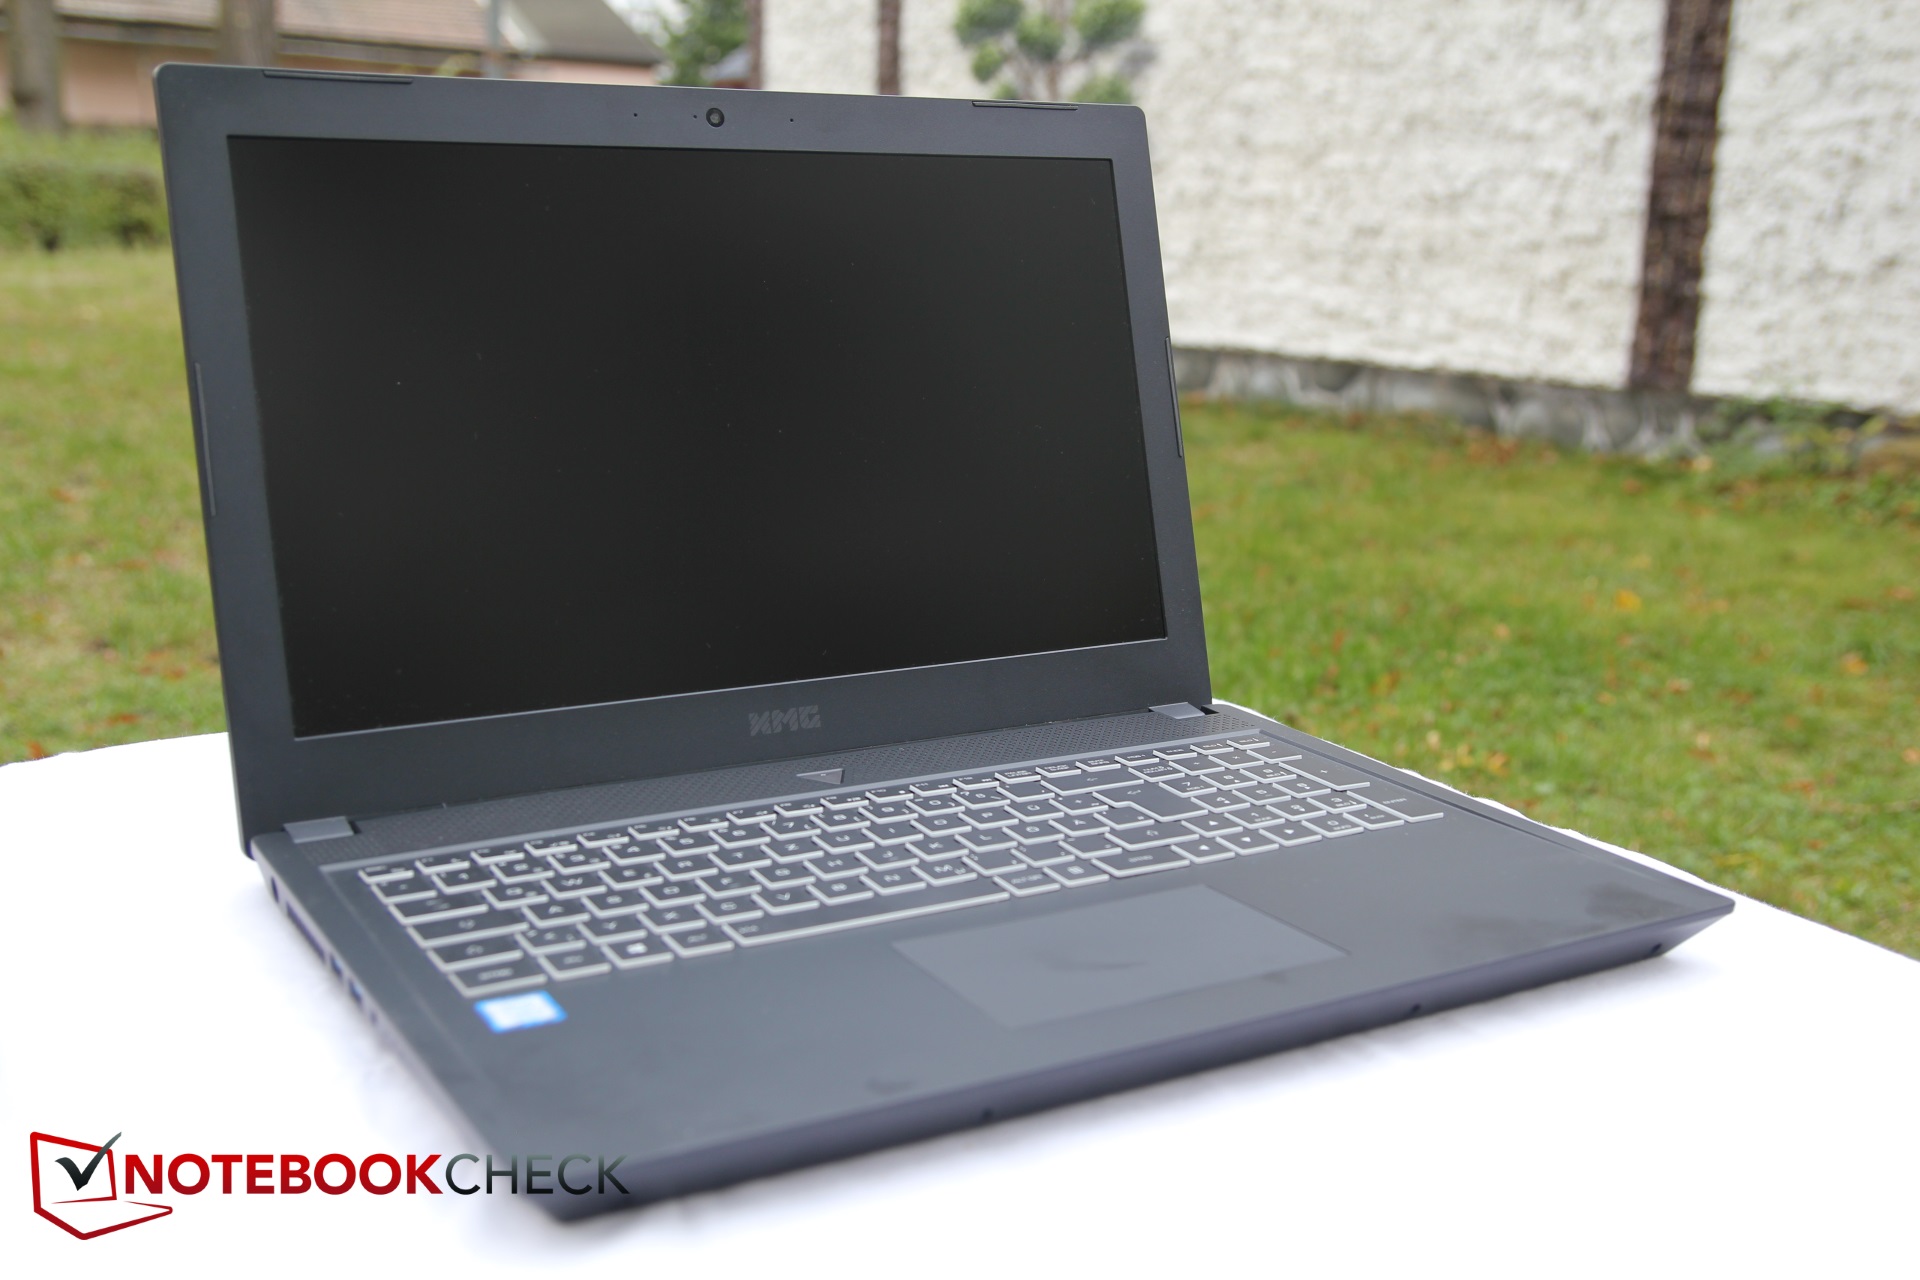
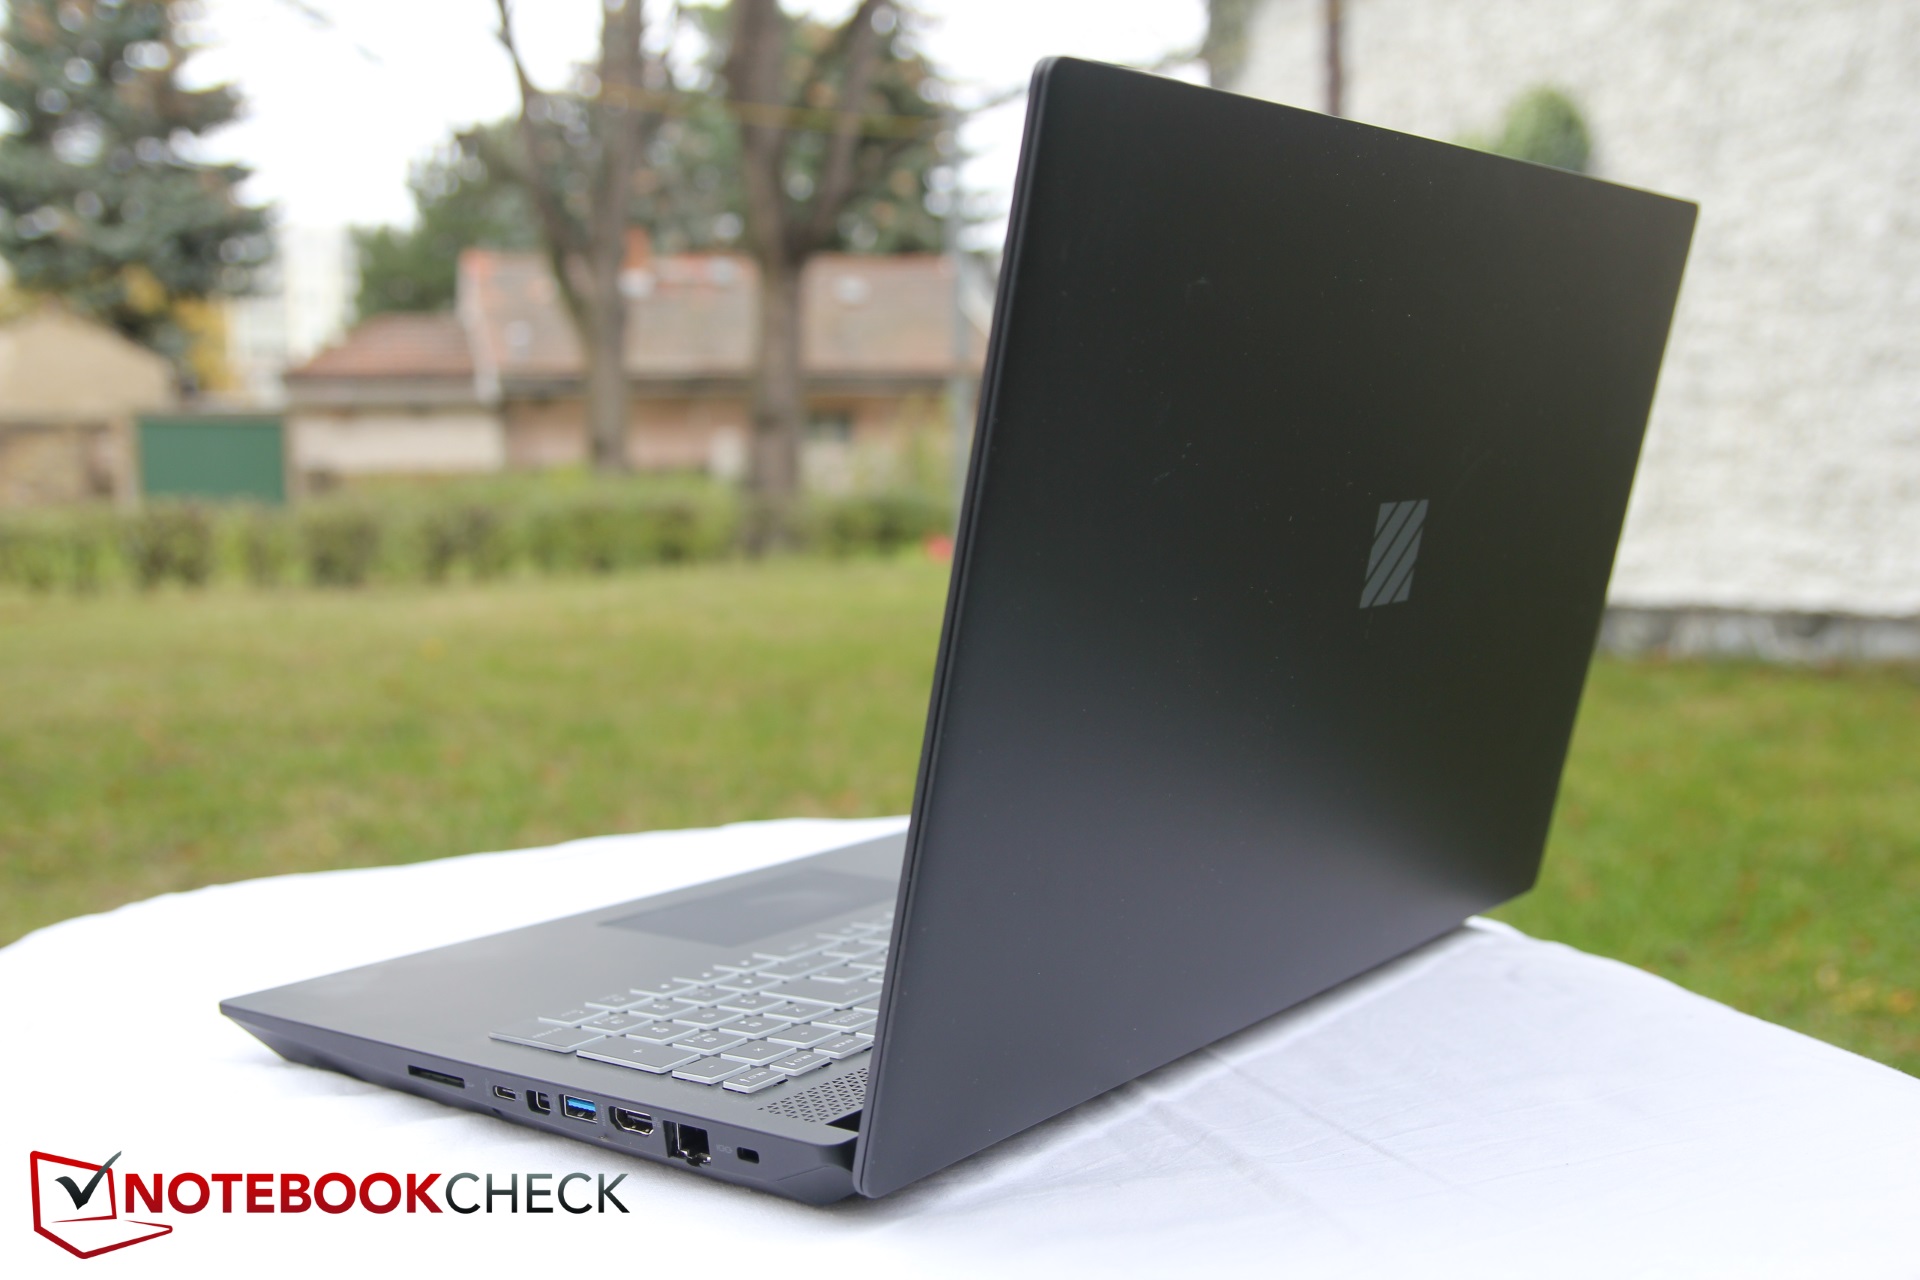
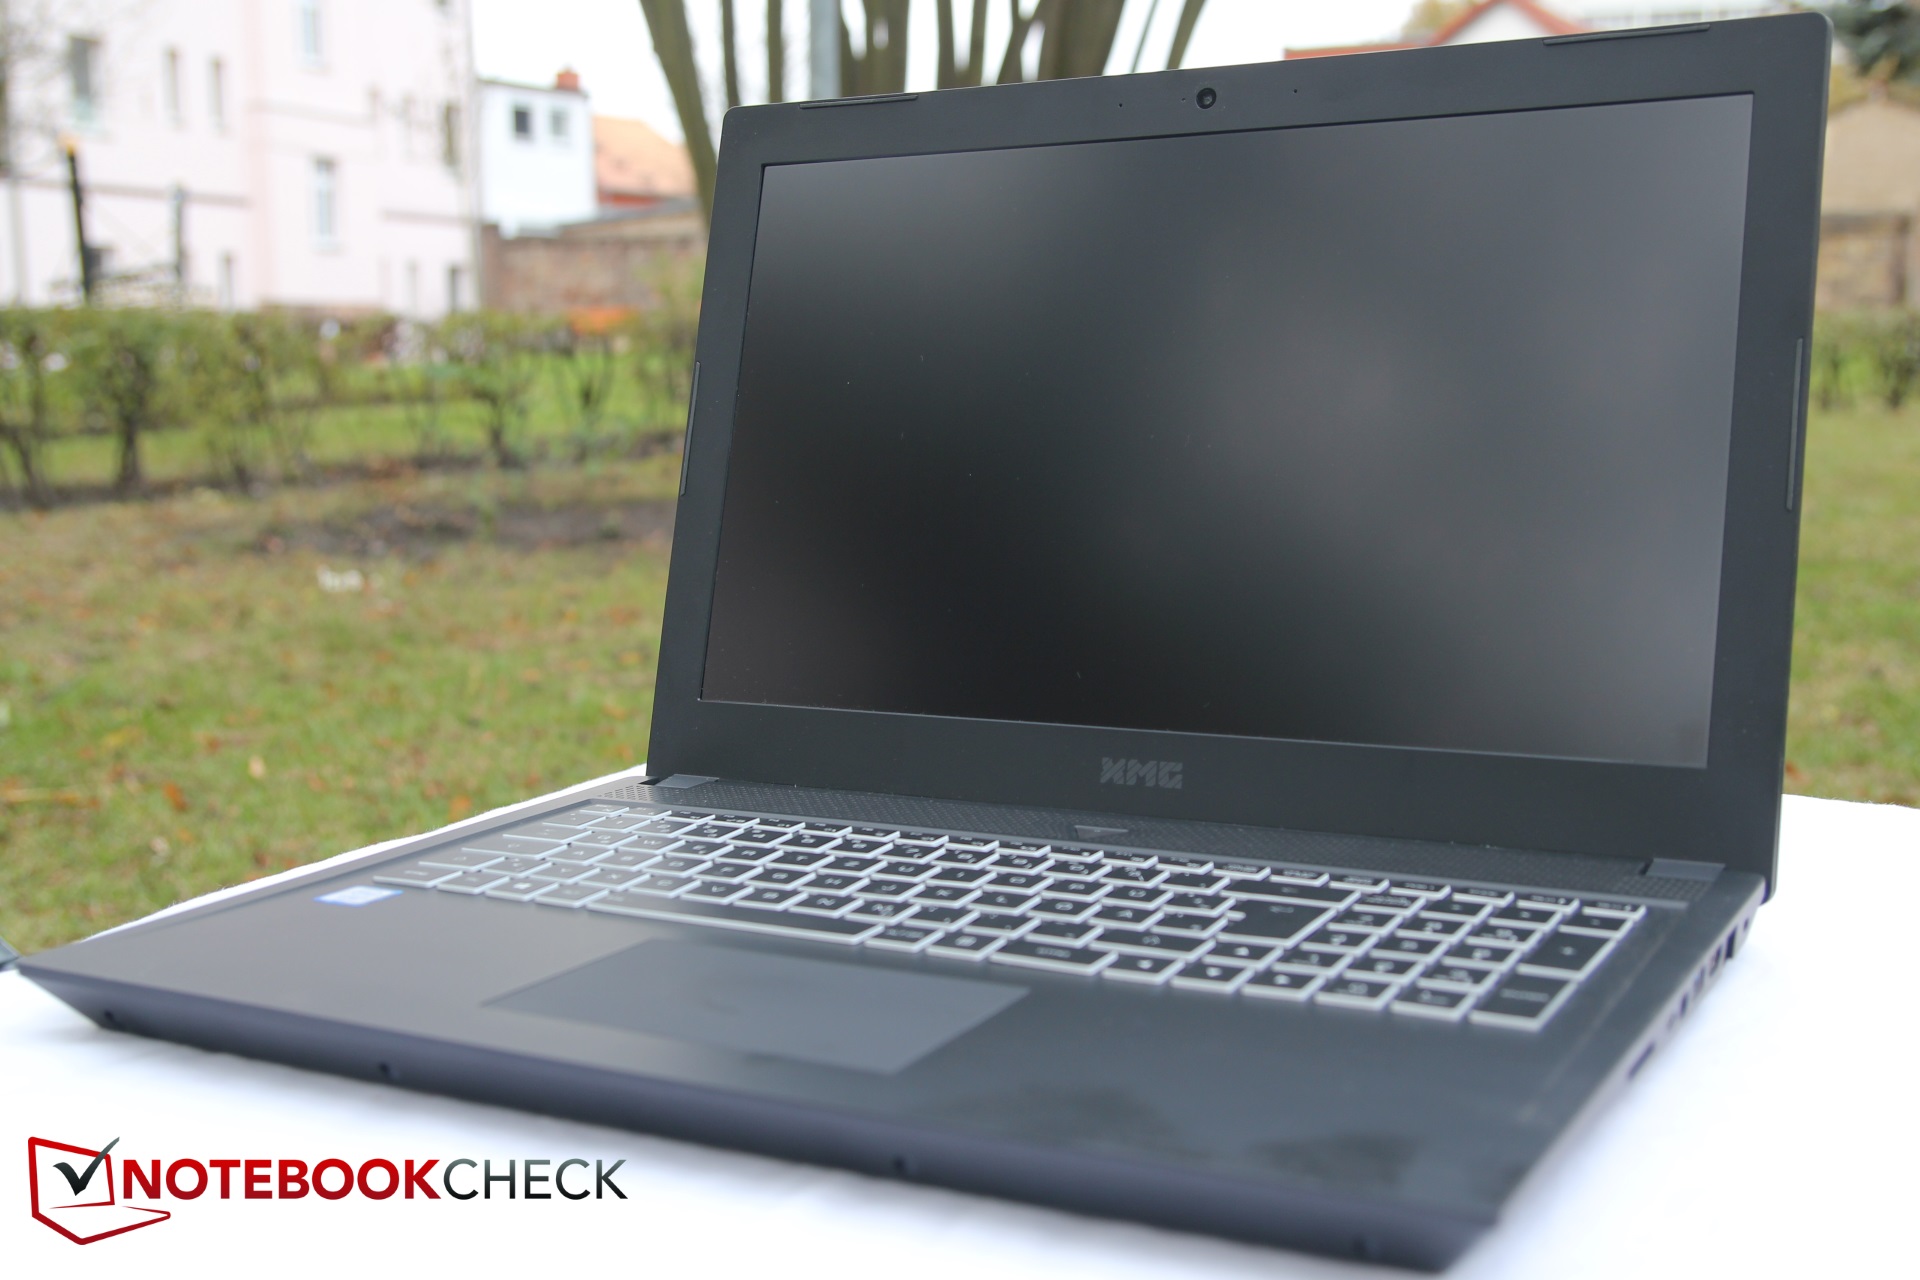
Breve análisis del Schenker Technologies XMG Core 15 (i7-7700HQ, GTX 1060, Full HD)
| SD Card Reader | |
| average JPG Copy Test (av. of 3 runs) | |
| Schenker XMG Core 15 (Toshiba Exceria Pro SDXC 64 GB UHS-II) | |
| Asus FX502VM-AS73 (Toshiba Exceria Pro SDXC 64 GB UHS-II) | |
| Schenker XMG A517 (Toshiba Exceria Pro SDXC 64 GB UHS-II) | |
| Gigabyte P55W v7 (Toshiba Exceria Pro SDXC 64 GB UHS-II) | |
| Acer Aspire VN7-593G-73HP V15 Nitro BE | |
| maximum AS SSD Seq Read Test (1GB) | |
| Gigabyte P55W v7 (Toshiba Exceria Pro SDXC 64 GB UHS-II) | |
| Schenker XMG A517 (Toshiba Exceria Pro SDXC 64 GB UHS-II) | |
| Schenker XMG Core 15 (Toshiba Exceria Pro SDXC 64 GB UHS-II) | |
| Asus FX502VM-AS73 (Toshiba Exceria Pro SDXC 64 GB UHS-II) | |
| Acer Aspire VN7-593G-73HP V15 Nitro BE | |
| |||||||||||||||||||||||||
iluminación: 87 %
Brillo con batería: 297 cd/m²
Contraste: 990:1 (Negro: 0.3 cd/m²)
ΔE ColorChecker Calman: 5.25 | ∀{0.5-29.43 Ø4.73}
ΔE Greyscale Calman: 4.64 | ∀{0.09-98 Ø4.97}
83% sRGB (Argyll 1.6.3 3D)
54% AdobeRGB 1998 (Argyll 1.6.3 3D)
60.6% AdobeRGB 1998 (Argyll 3D)
83% sRGB (Argyll 3D)
64.3% Display P3 (Argyll 3D)
Gamma: 2.39
CCT: 6600 K
| Schenker XMG Core 15 LG Philips LP156WF6 (LGD046F), 1920x1080, 15.6" | Schenker XMG A517 LG Philips LP156WF6 (LGD046F), 1920x1080, 15.6" | Asus FX502VM-AS73 1920x1080, 15.6" | Lenovo Legion Y720 80VR002XGE LG Philips LGD0533 LP156WF6-SPK3, 1920x1080, 15.6" | Gigabyte P55W v7 LG Philips LP156WF6 (LGD046F), 1920x1080, 15.6" | Acer Aspire VN7-593G-73HP V15 Nitro BE LG Display LP156WF6-SPP1, 1920x1080, 15.6" | |
|---|---|---|---|---|---|---|
| Display | 2% | -35% | -35% | -1% | 3% | |
| Display P3 Coverage (%) | 64.3 | 65 1% | 38.28 -40% | 38.43 -40% | 63.5 -1% | 65.8 2% |
| sRGB Coverage (%) | 83 | 85.1 3% | 56.9 -31% | 57.5 -31% | 82 -1% | 85.1 3% |
| AdobeRGB 1998 Coverage (%) | 60.6 | 62.2 3% | 39.47 -35% | 39.75 -34% | 59.9 -1% | 62.2 3% |
| Response Times | 17% | 28% | 8% | 14% | -6% | |
| Response Time Grey 50% / Grey 80% * (ms) | 40.8 ? | 36 ? 12% | 28.4 ? 30% | 43 ? -5% | 37 ? 9% | 41 ? -0% |
| Response Time Black / White * (ms) | 30.4 ? | 24 ? 21% | 22.4 ? 26% | 24 ? 21% | 25 ? 18% | 34 ? -12% |
| PWM Frequency (Hz) | 20490 ? | 21000 ? | 21000 ? | |||
| Screen | 1% | -33% | -10% | 2% | 5% | |
| Brightness middle (cd/m²) | 297 | 320 8% | 209.5 -29% | 288 -3% | 287 -3% | 322 8% |
| Brightness (cd/m²) | 276 | 311 13% | 205 -26% | 275 0% | 289 5% | 297 8% |
| Brightness Distribution (%) | 87 | 90 3% | 92 6% | 86 -1% | 87 0% | 86 -1% |
| Black Level * (cd/m²) | 0.3 | 0.36 -20% | 0.69 -130% | 0.36 -20% | 0.29 3% | 0.31 -3% |
| Contrast (:1) | 990 | 889 -10% | 304 -69% | 800 -19% | 990 0% | 1039 5% |
| Colorchecker dE 2000 * | 5.25 | 5.08 3% | 4.7 10% | 5.29 -1% | 4.92 6% | 4.73 10% |
| Colorchecker dE 2000 max. * | 10.3 | 10.73 -4% | 19.7 -91% | 9.97 3% | 11 -7% | 12.37 -20% |
| Greyscale dE 2000 * | 4.64 | 4.04 13% | 1.8 61% | 4.5 3% | 3.66 21% | 2.99 36% |
| Gamma | 2.39 92% | 2.34 94% | 2.23 99% | 2.39 92% | 2.32 95% | 2.32 95% |
| CCT | 6600 98% | 7029 92% | 6975 93% | 6839 95% | 6482 100% | 6905 94% |
| Color Space (Percent of AdobeRGB 1998) (%) | 54 | 56 4% | 36.2 -33% | 37 -31% | 54 0% | 56 4% |
| Color Space (Percent of sRGB) (%) | 83 | 85 2% | 56.6 -32% | 57 -31% | 82 -1% | 85 2% |
| Media total (Programa/Opciones) | 7% /
3% | -13% /
-26% | -12% /
-13% | 5% /
3% | 1% /
3% |
* ... más pequeño es mejor
Tiempos de respuesta del display
| ↔ Tiempo de respuesta de Negro a Blanco | ||
|---|---|---|
| 30.4 ms ... subida ↗ y bajada ↘ combinada | ↗ 16.4 ms subida | 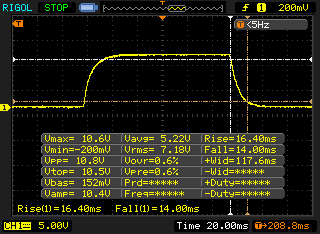 |
| ↘ 14 ms bajada | ||
| La pantalla mostró tiempos de respuesta lentos en nuestros tests y podría ser demasiado lenta para los jugones. En comparación, todos los dispositivos de prueba van de ##min### (mínimo) a 240 (máximo) ms. » 82 % de todos los dispositivos son mejores. Eso quiere decir que el tiempo de respuesta es peor que la media (19.9 ms) de todos los dispositivos testados. | ||
| ↔ Tiempo de respuesta 50% Gris a 80% Gris | ||
| 40.8 ms ... subida ↗ y bajada ↘ combinada | ↗ 20.4 ms subida | 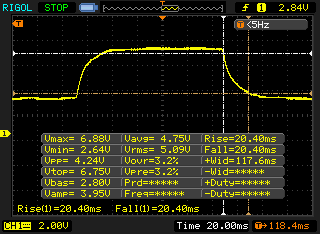 |
| ↘ 20.4 ms bajada | ||
| La pantalla mostró tiempos de respuesta lentos en nuestros tests y podría ser demasiado lenta para los jugones. En comparación, todos los dispositivos de prueba van de ##min### (mínimo) a 636 (máximo) ms. » 64 % de todos los dispositivos son mejores. Eso quiere decir que el tiempo de respuesta es peor que la media (31.1 ms) de todos los dispositivos testados. | ||
Parpadeo de Pantalla / PWM (Pulse-Width Modulation)
| Parpadeo de Pantalla / PWM detectado | 20490 Hz | ≤ 95 % de brillo | 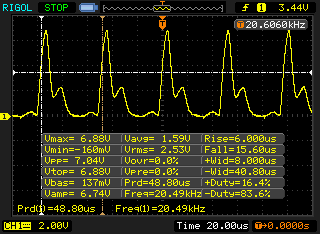 |
La retroiluminación del display parpadea a 20490 Hz (seguramente usa PWM - Pulse-Width Modulation) a un brillo del 95 % e inferior. Sobre este nivel de brillo no debería darse parpadeo / PWM. La frecuencia de 20490 Hz es bastante alta, por lo que la mayoría de gente sensible al parpadeo no debería ver parpadeo o tener fatiga visual. Comparación: 52 % de todos los dispositivos testados no usaron PWM para atenuar el display. Si se usó, medimos una media de 7797 (mínimo: 5 - máxmo: 343500) Hz. | |||
| Cinebench R11.5 | |
| CPU Single 64Bit | |
| Schenker XMG Core 15 | |
| Schenker XMG A517 | |
| Asus FX502VM-AS73 | |
| CPU Multi 64Bit | |
| Schenker XMG Core 15 | |
| Asus FX502VM-AS73 | |
| Schenker XMG A517 | |
| Cinebench R10 | |
| Rendering Single CPUs 64Bit | |
| Schenker XMG Core 15 | |
| Rendering Multiple CPUs 64Bit | |
| Schenker XMG Core 15 | |
| PCMark 8 | |
| Home Score Accelerated v2 | |
| Asus FX502VM-AS73 | |
| Schenker XMG Core 15 | |
| Schenker XMG A517 | |
| Lenovo Legion Y720 80VR002XGE | |
| Gigabyte P55W v7 | |
| Work Score Accelerated v2 | |
| Schenker XMG Core 15 | |
| Gigabyte P55W v7 | |
| Schenker XMG A517 | |
| Lenovo Legion Y720 80VR002XGE | |
| Asus FX502VM-AS73 | |
| PCMark 8 Home Score Accelerated v2 | 4626 puntos | |
| PCMark 8 Work Score Accelerated v2 | 5332 puntos | |
| PCMark 10 Score | 5134 puntos | |
ayuda | ||
| Schenker XMG Core 15 Samsung SSD 960 Evo 250GB m.2 NVMe | Asus FX502VM-AS73 SK Hynix HFS256G39TND-N210A | Lenovo Legion Y720 80VR002XGE Samsung PM961 MZVLW256HEHP | Gigabyte P55W v7 Liteonit CV3-8D256 | Acer Aspire VN7-593G-73HP V15 Nitro BE Seagate Mobile HDD 1TB ST1000LM035 | |
|---|---|---|---|---|---|
| CrystalDiskMark 3.0 | -63% | 3% | -61% | -96% | |
| Read Seq (MB/s) | 1338 | 503 -62% | 2196 64% | 466.2 -65% | 120.9 -91% |
| Write Seq (MB/s) | 1188 | 138.2 -88% | 1144 -4% | 261.9 -78% | 101.8 -91% |
| Read 512 (MB/s) | 780 | 343.5 -56% | 747 -4% | 252.5 -68% | 37.83 -95% |
| Write 512 (MB/s) | 1006 | 137.8 -86% | 810 -19% | 254.8 -75% | 84.4 -92% |
| Read 4k (MB/s) | 58.3 | 29.36 -50% | 60.1 3% | 25.4 -56% | 0.473 -99% |
| Write 4k (MB/s) | 134 | 70.9 -47% | 153.5 15% | 55 -59% | 0.313 -100% |
| Read 4k QD32 (MB/s) | 577 | 369.9 -36% | 485.4 -16% | 358.5 -38% | 1.133 -100% |
| Write 4k QD32 (MB/s) | 481.9 | 99.7 -79% | 396.3 -18% | 240.1 -50% | 0.274 -100% |

| 3DMark - 1920x1080 Fire Strike Graphics | |
| Asus FX502VM-AS73 | |
| Acer Aspire VN7-593G-73HP V15 Nitro BE | |
| Schenker XMG A517 | |
| Gigabyte P55W v7 | |
| Schenker XMG Core 15 | |
| Lenovo Legion Y720 80VR002XGE | |
| 3DMark 11 - 1280x720 Performance GPU | |
| Acer Aspire VN7-593G-73HP V15 Nitro BE | |
| Asus FX502VM-AS73 | |
| Gigabyte P55W v7 | |
| Schenker XMG Core 15 | |
| Schenker XMG A517 | |
| Lenovo Legion Y720 80VR002XGE | |
| 3DMark 11 Performance | 12840 puntos | |
| 3DMark Cloud Gate Standard Score | 26226 puntos | |
| 3DMark Fire Strike Score | 9660 puntos | |
ayuda | ||
| bajo | medio | alto | ultra | |
|---|---|---|---|---|
| The Witcher 3 (2015) | 207.2 | 132 | 69.6 | 38.2 |
| Rise of the Tomb Raider (2016) | 181.1 | 136.1 | 71.1 | 59.4 |
| Doom (2016) | 155.3 | 146.4 | 102.2 | 97.4 |
| The Witcher 3 | |
| 1920x1080 Ultra Graphics & Postprocessing (HBAO+) | |
| Schenker XMG A517 | |
| Gigabyte P55W v7 | |
| Acer Aspire VN7-593G-73HP V15 Nitro BE | |
| Schenker XMG Core 15 | |
| Lenovo Legion Y720 80VR002XGE | |
| 1920x1080 High Graphics & Postprocessing (Nvidia HairWorks Off) | |
| Schenker XMG A517 | |
| Gigabyte P55W v7 | |
| Schenker XMG Core 15 | |
| Acer Aspire VN7-593G-73HP V15 Nitro BE | |
| Lenovo Legion Y720 80VR002XGE | |
| Rise of the Tomb Raider | |
| 1920x1080 Very High Preset AA:FX AF:16x | |
| Gigabyte P55W v7 | |
| Asus FX502VM-AS73 | |
| Acer Aspire VN7-593G-73HP V15 Nitro BE | |
| Schenker XMG Core 15 | |
| 1920x1080 High Preset AA:FX AF:4x | |
| Acer Aspire VN7-593G-73HP V15 Nitro BE | |
| Gigabyte P55W v7 | |
| Schenker XMG Core 15 | |
| Doom | |
| 1920x1080 Ultra Preset AA:SM | |
| Schenker XMG Core 15 | |
| Asus FX502VM-AS73 | |
| Lenovo Legion Y720 80VR002XGE | |
| 1920x1080 High Preset AA:FX | |
| Schenker XMG Core 15 | |
| Lenovo Legion Y720 80VR002XGE | |
Ruido
| Ocioso |
| 31 / 32 / 34 dB(A) |
| Carga |
| 41 / 47 dB(A) |
 | ||
30 dB silencioso 40 dB(A) audible 50 dB(A) ruidosamente alto |
||
min: | ||
| Schenker XMG Core 15 GeForce GTX 1060 Mobile, i7-7700HQ | Schenker XMG A517 GeForce GTX 1060 Mobile, i7-7700HQ | Asus FX502VM-AS73 GeForce GTX 1060 Mobile, i7-7700HQ | Lenovo Legion Y720 80VR002XGE GeForce GTX 1060 Mobile, i7-7700HQ | Gigabyte P55W v7 GeForce GTX 1060 Mobile, i7-7700HQ | Acer Aspire VN7-593G-73HP V15 Nitro BE GeForce GTX 1060 Mobile, i7-7700HQ | |
|---|---|---|---|---|---|---|
| Noise | -7% | -2% | 2% | -3% | -1% | |
| apagado / medio ambiente * (dB) | 29 | 30 -3% | 28.7 1% | 30.3 -4% | 30 -3% | 30.4 -5% |
| Idle Minimum * (dB) | 31 | 30 3% | 30.6 1% | 31 -0% | 33 -6% | 30.9 -0% |
| Idle Average * (dB) | 32 | 35 -9% | 30.6 4% | 30.9 3% | 34 -6% | 30.9 3% |
| Idle Maximum * (dB) | 34 | 40 -18% | 31 9% | 31.5 7% | 35 -3% | 31.5 7% |
| Load Average * (dB) | 41 | 43 -5% | 46.2 -13% | 38.7 6% | 39 5% | 40.7 1% |
| Witcher 3 ultra * (dB) | 39 | 43 -10% | 42 -8% | 45.5 -17% | ||
| Load Maximum * (dB) | 47 | 49 -4% | 52.3 -11% | 41.9 11% | 50 -6% | 43.9 7% |
* ... más pequeño es mejor
(-) La temperatura máxima en la parte superior es de 53 °C / 127 F, frente a la media de 40.4 °C / 105 F, que oscila entre 21.2 y 68.8 °C para la clase Gaming.
(-) El fondo se calienta hasta un máximo de 61 °C / 142 F, frente a la media de 43.2 °C / 110 F
(+) En reposo, la temperatura media de la parte superior es de 31.8 °C / 89# F, frente a la media del dispositivo de 33.9 °C / 93 F.
(-) Jugando a The Witcher 3, la temperatura media de la parte superior es de 42.7 °C / 109 F, frente a la media del dispositivo de 33.9 °C / 93 F.
(+) Los reposamanos y el panel táctil alcanzan como máximo la temperatura de la piel (35 °C / 95 F) y, por tanto, no están calientes.
(-) La temperatura media de la zona del reposamanos de dispositivos similares fue de 28.8 °C / 83.8 F (-6.2 °C / -11.2 F).
| Schenker XMG Core 15 GeForce GTX 1060 Mobile, i7-7700HQ | Schenker XMG A517 GeForce GTX 1060 Mobile, i7-7700HQ | Asus FX502VM-AS73 GeForce GTX 1060 Mobile, i7-7700HQ | Lenovo Legion Y720 80VR002XGE GeForce GTX 1060 Mobile, i7-7700HQ | Gigabyte P55W v7 GeForce GTX 1060 Mobile, i7-7700HQ | Acer Aspire VN7-593G-73HP V15 Nitro BE GeForce GTX 1060 Mobile, i7-7700HQ | |
|---|---|---|---|---|---|---|
| Heat | 12% | 11% | 32% | 25% | 14% | |
| Maximum Upper Side * (°C) | 53 | 53 -0% | 53.2 -0% | 41.6 22% | 49.6 6% | 51.9 2% |
| Maximum Bottom * (°C) | 61 | 49 20% | 56.8 7% | 37 39% | 47.7 22% | 54.6 10% |
| Idle Upper Side * (°C) | 35 | 33 6% | 28.8 18% | 24.9 29% | 23.6 33% | 29.1 17% |
| Idle Bottom * (°C) | 39 | 30 23% | 31.4 19% | 24.3 38% | 24.6 37% | 29.3 25% |
* ... más pequeño es mejor
Schenker XMG Core 15 análisis de audio
(±) | la sonoridad del altavoz es media pero buena (75 dB)
Graves 100 - 315 Hz
(±) | lubina reducida - en promedio 8% inferior a la mediana
(±) | la linealidad de los graves es media (11.7% delta a frecuencia anterior)
Medios 400 - 2000 Hz
(±) | medias más altas - de media 10.1% más altas que la mediana
(±) | la linealidad de los medios es media (13.2% delta respecto a la frecuencia anterior)
Altos 2 - 16 kHz
(+) | máximos equilibrados - a sólo 1.9% de la mediana
(±) | la linealidad de los máximos es media (7.5% delta a frecuencia anterior)
Total 100 - 16.000 Hz
(±) | la linealidad del sonido global es media (23.6% de diferencia con la mediana)
En comparación con la misma clase
» 86% de todos los dispositivos probados de esta clase eran mejores, 4% similares, 10% peores
» El mejor tuvo un delta de 6%, la media fue 18%, el peor fue ###max##%
En comparación con todos los dispositivos probados
» 71% de todos los dispositivos probados eran mejores, 6% similares, 23% peores
» El mejor tuvo un delta de 4%, la media fue 24%, el peor fue ###max##%
HP Omen 15-ce002ng análisis de audio
(±) | la sonoridad del altavoz es media pero buena (80 dB)
Graves 100 - 315 Hz
(±) | lubina reducida - en promedio 12.9% inferior a la mediana
(±) | la linealidad de los graves es media (14.8% delta a frecuencia anterior)
Medios 400 - 2000 Hz
(+) | medios equilibrados - a sólo 3.5% de la mediana
(+) | los medios son lineales (3.3% delta a la frecuencia anterior)
Altos 2 - 16 kHz
(+) | máximos equilibrados - a sólo 2.9% de la mediana
(+) | los máximos son lineales (5% delta a la frecuencia anterior)
Total 100 - 16.000 Hz
(+) | el sonido global es lineal (13.6% de diferencia con la mediana)
En comparación con la misma clase
» 20% de todos los dispositivos probados de esta clase eran mejores, 7% similares, 73% peores
» El mejor tuvo un delta de 6%, la media fue 18%, el peor fue ###max##%
En comparación con todos los dispositivos probados
» 15% de todos los dispositivos probados eran mejores, 4% similares, 82% peores
» El mejor tuvo un delta de 4%, la media fue 24%, el peor fue ###max##%
| Off / Standby | |
| Ocioso | |
| Carga |
|
Clave:
min: | |
| Schenker XMG Core 15 GeForce GTX 1060 Mobile, i7-7700HQ | Schenker XMG A517 GeForce GTX 1060 Mobile, i7-7700HQ | Asus FX502VM-AS73 GeForce GTX 1060 Mobile, i7-7700HQ | Lenovo Legion Y720 80VR002XGE GeForce GTX 1060 Mobile, i7-7700HQ | Gigabyte P55W v7 GeForce GTX 1060 Mobile, i7-7700HQ | Acer Aspire VN7-593G-73HP V15 Nitro BE GeForce GTX 1060 Mobile, i7-7700HQ | |
|---|---|---|---|---|---|---|
| Power Consumption | 20% | 18% | 36% | 33% | 28% | |
| Idle Minimum * (Watt) | 18 | 8 56% | 14.9 17% | 8 56% | 8 56% | 7.2 60% |
| Idle Average * (Watt) | 22 | 12 45% | 15.1 31% | 10.9 50% | 13 41% | 10.5 52% |
| Idle Maximum * (Watt) | 26 | 25 4% | 15.2 42% | 11.8 55% | 18 31% | 16 38% |
| Load Average * (Watt) | 93 | 85 9% | 105.8 -14% | 70 25% | 76 18% | 82 12% |
| Witcher 3 ultra * (Watt) | 119 | 110 8% | 102 14% | 124 -4% | ||
| Load Maximum * (Watt) | 175 | 180 -3% | 148.8 15% | 148 15% | 143 18% | 155 11% |
* ... más pequeño es mejor
| Schenker XMG Core 15 GeForce GTX 1060 Mobile, i7-7700HQ, 82 Wh | Schenker XMG A517 GeForce GTX 1060 Mobile, i7-7700HQ, 62 Wh | Asus FX502VM-AS73 GeForce GTX 1060 Mobile, i7-7700HQ, 64 Wh | Lenovo Legion Y720 80VR002XGE GeForce GTX 1060 Mobile, i7-7700HQ, 60 Wh | Gigabyte P55W v7 GeForce GTX 1060 Mobile, i7-7700HQ, 63 Wh | Acer Aspire VN7-593G-73HP V15 Nitro BE GeForce GTX 1060 Mobile, i7-7700HQ, 69 Wh | |
|---|---|---|---|---|---|---|
| Duración de Batería | 30% | 2% | 49% | 70% | 60% | |
| Reader / Idle (h) | 5 | 7.5 50% | 6.1 22% | 11.8 136% | 13.2 164% | 8.4 68% |
| H.264 (h) | 3.9 | 5.2 33% | 5.2 33% | |||
| WiFi v1.3 (h) | 4.7 | 5 6% | 4.6 -2% | 6.3 34% | 5.8 23% | 6 28% |
| Load (h) | 1.3 | 1.7 31% | 1.1 -15% | 1.2 -8% | 1.6 23% | 2.4 85% |
Pro
Contra
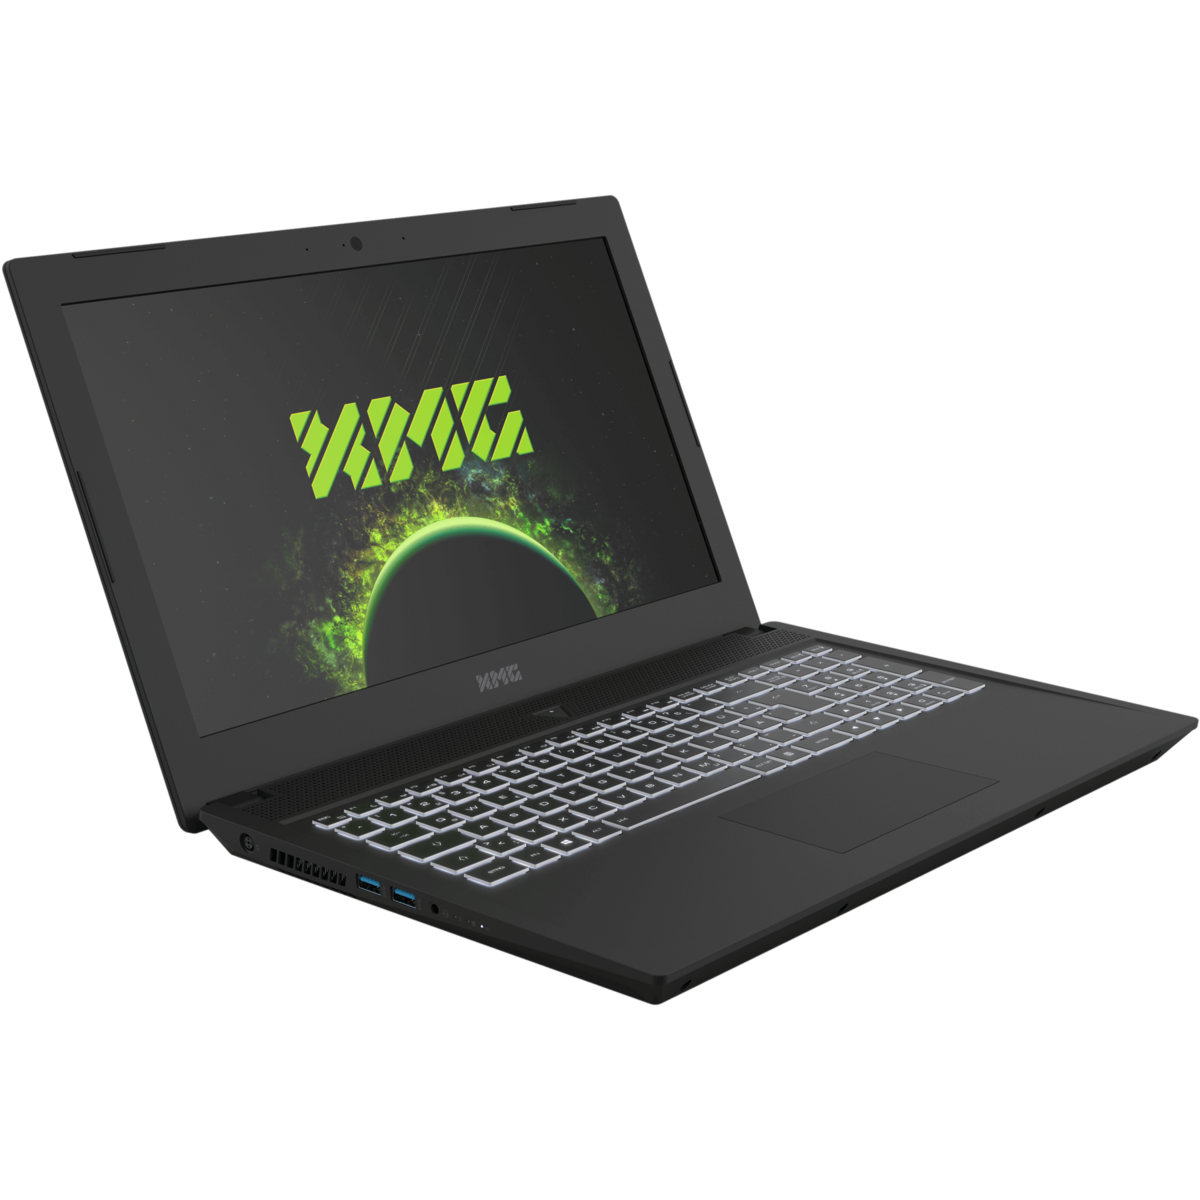
El portátil gaming realmente bueno Schenker XMG Core 15 se estaba quedando sin gas al final de nuestras pruebas.
El Core 15 puntúa con un display bastante decente, componentes de fácil acceso, buena configurabilidad, y sobre todo, un rendimiento buenísimo.
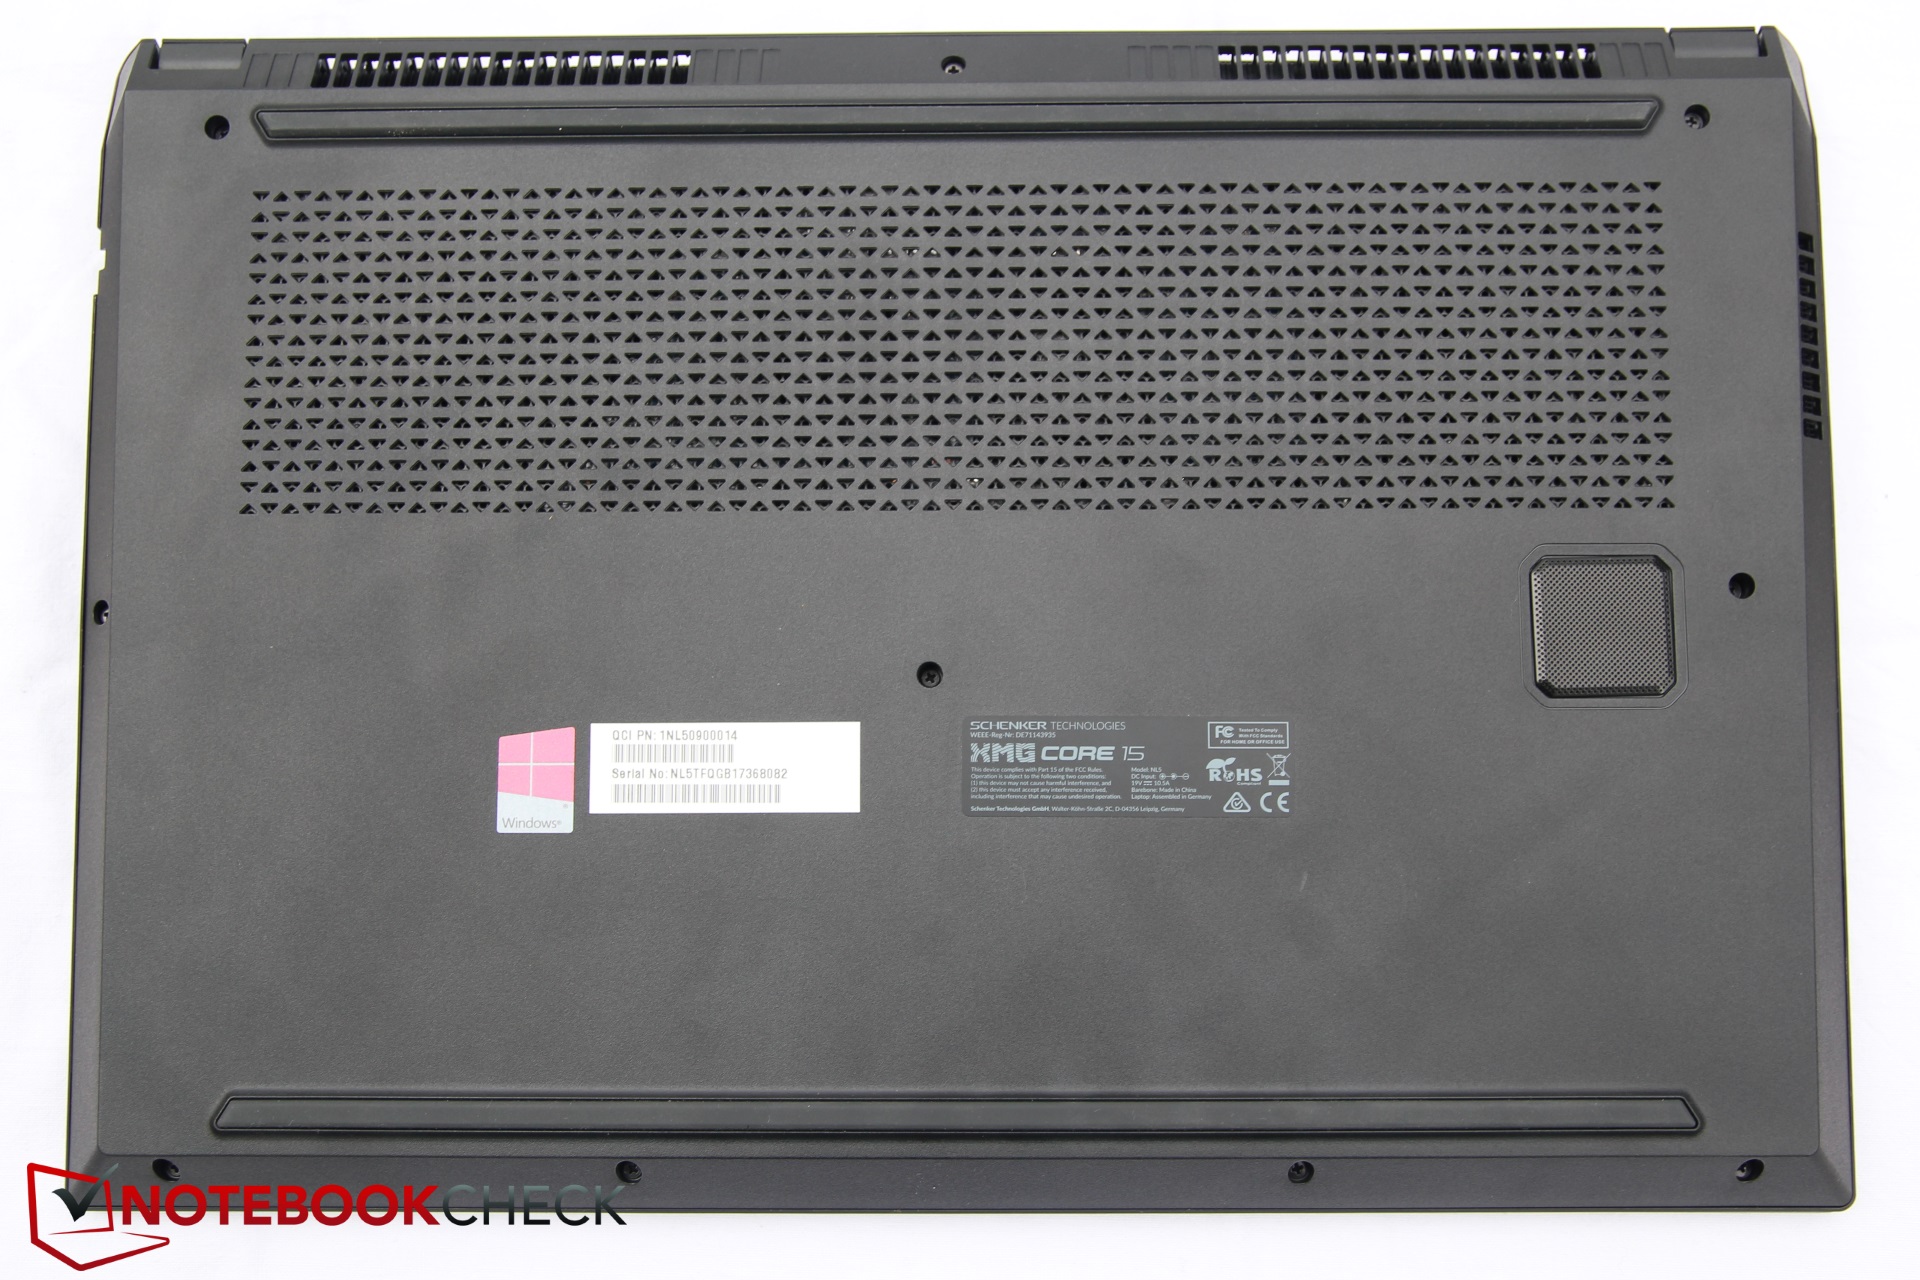
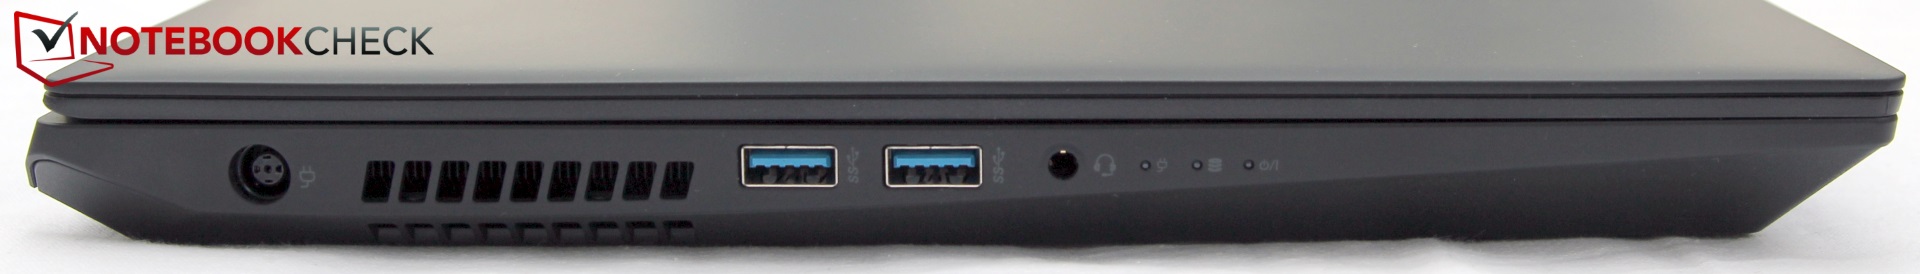
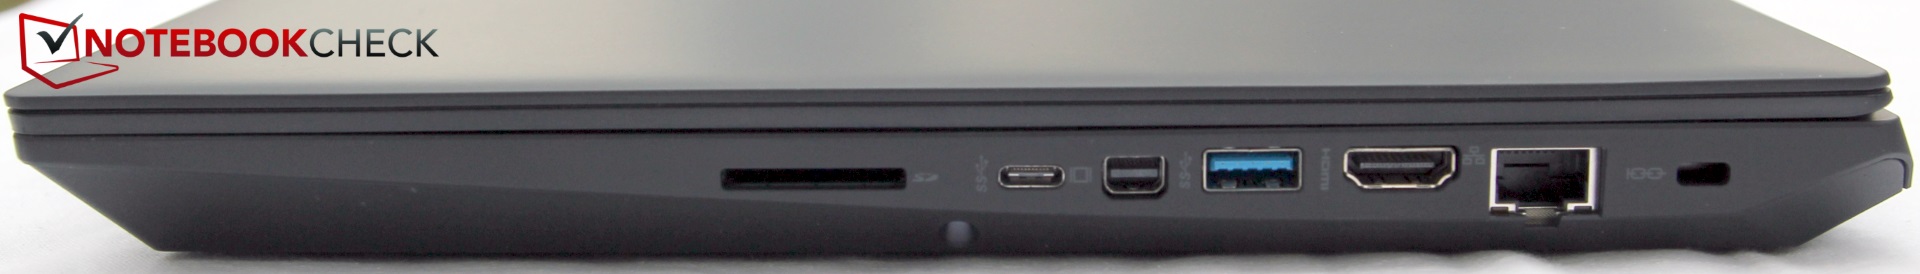
Por otro lado, el dispositivo sufre mala disipación de calor, alto consumo de energía, un aguante de batería algo bajo, y le falta optimización de drivers (palabra clave: latencia). El nuevo chasis parece más un descenso que un ascenso en disipación de calor, aunque por lo demás es bastante agradable y sobre todo más quedo que el XMG A517. La falta de Thunderbolt 3 y puertos USB 3.1 de segunda generación también es algo molesta.
Ésta es una versión acortada del análisis original. Puedes leer el análisis completo en inglés aquí.
Schenker XMG Core 15
- 11/07/2017 v6 (old)
Christian Hintze