Breve análisis del Teclast Tbook 16 Power (x7-Z8750, 8 GB)
| SD Card Reader - average JPG Copy Test (av. of 3 runs) | |
| Apple MacBook Pro Retina 13 inch 2013-10 | |
| Acer Aspire S 13 S5-371-71QZ | |
| Teclast Tbook 16 Power | |
| Microsoft Surface Pro 4, Core i5, 256GB | |
| Lenovo ThinkPad Yoga 370-20JJS00100 | |
| Dell Latitude 12 5285 2-in-1 | |
| Asus Zenbook UX3410UA | |
| Chuwi Vi8 Plus (CWI519) | |
| Networking | |
| iperf3 transmit AX12 | |
| Microsoft Surface Pro 4, Core i5, 128GB (Klaus I211) | |
| Microsoft Surface Book with Performance Base | |
| Cube i7 Book CDK09 (Klaus I211) | |
| Teclast Tbook 16 Power | |
| Chuwi Hi10 Pro | |
| iperf3 receive AX12 | |
| Microsoft Surface Book with Performance Base | |
| Microsoft Surface Pro 4, Core i5, 128GB (Klaus I211) | |
| Cube i7 Book CDK09 (Klaus I211) | |
| Teclast Tbook 16 Power | |
| Chuwi Hi10 Pro | |
| |||||||||||||||||||||||||
iluminación: 79 %
Brillo con batería: 244 cd/m²
Contraste: 642:1 (Negro: 0.38 cd/m²)
ΔE ColorChecker Calman: 6.7 | ∀{0.5-29.43 Ø4.73}
ΔE Greyscale Calman: 7.4 | ∀{0.09-98 Ø4.97}
93% sRGB (Argyll 1.6.3 3D)
60.6% AdobeRGB 1998 (Argyll 1.6.3 3D)
67.4% AdobeRGB 1998 (Argyll 3D)
93.2% sRGB (Argyll 3D)
66.1% Display P3 (Argyll 3D)
Gamma: 2.15
CCT: 8867 K
| Teclast Tbook 16 Power 1920x1080, 11.6" | Microsoft Surface Pro 4 Core i7 Samsung 123YL01-001 ID: SDC3853, , 2736x1824, 12.3" | Cube i9 KDC0000, , 1920x1200, 12.2" | Chuwi Hi12 SEC3542, , 2160x1440, 12" | |
|---|---|---|---|---|
| Display | 3% | -3% | 1% | |
| Display P3 Coverage (%) | 66.1 | 66.9 1% | 65.7 -1% | 66 0% |
| sRGB Coverage (%) | 93.2 | 97.5 5% | 88.7 -5% | 95.3 2% |
| AdobeRGB 1998 Coverage (%) | 67.4 | 68.6 2% | 65.1 -3% | 68.1 1% |
| Response Times | -20% | 14% | 39% | |
| Response Time Grey 50% / Grey 80% * (ms) | 40 ? | 48.4 ? -21% | 37.2 ? 7% | 28 ? 30% |
| Response Time Black / White * (ms) | 30.2 ? | 35.6 ? -18% | 24 ? 21% | 16 ? 47% |
| PWM Frequency (Hz) | 12000 ? | 10420 | 200 ? | |
| Screen | 53% | 16% | 17% | |
| Brightness middle (cd/m²) | 244 | 436.7 79% | 263 8% | 293 20% |
| Brightness (cd/m²) | 215 | 433 101% | 263 22% | 277 29% |
| Brightness Distribution (%) | 79 | 87 10% | 77 -3% | 89 13% |
| Black Level * (cd/m²) | 0.38 | 0.326 14% | 0.28 26% | 0.256 33% |
| Contrast (:1) | 642 | 1340 109% | 939 46% | 1145 78% |
| Colorchecker dE 2000 * | 6.7 | 1.82 73% | 4.1 39% | 5.2 22% |
| Colorchecker dE 2000 max. * | 11.7 | 12.1 -3% | 11.4 3% | |
| Greyscale dE 2000 * | 7.4 | 1.44 81% | 3.8 49% | 8.5 -15% |
| Gamma | 2.15 102% | 2.1 105% | 2.25 98% | 2.21 100% |
| CCT | 8867 73% | 6560 99% | 6433 101% | 7048 92% |
| Color Space (Percent of AdobeRGB 1998) (%) | 60.6 | 62.3 3% | 57.7 -5% | 62 2% |
| Color Space (Percent of sRGB) (%) | 93 | 97.5 5% | 76.2 -18% | 82.5 -11% |
| Media total (Programa/Opciones) | 12% /
32% | 9% /
12% | 19% /
17% |
* ... más pequeño es mejor
Tiempos de respuesta del display
| ↔ Tiempo de respuesta de Negro a Blanco | ||
|---|---|---|
| 30.2 ms ... subida ↗ y bajada ↘ combinada | ↗ 16.8 ms subida | |
| ↘ 13.4 ms bajada | ||
| La pantalla mostró tiempos de respuesta lentos en nuestros tests y podría ser demasiado lenta para los jugones. En comparación, todos los dispositivos de prueba van de ##min### (mínimo) a 240 (máximo) ms. » 82 % de todos los dispositivos son mejores. Eso quiere decir que el tiempo de respuesta es peor que la media (19.9 ms) de todos los dispositivos testados. | ||
| ↔ Tiempo de respuesta 50% Gris a 80% Gris | ||
| 40 ms ... subida ↗ y bajada ↘ combinada | ↗ 20 ms subida | |
| ↘ 20 ms bajada | ||
| La pantalla mostró tiempos de respuesta lentos en nuestros tests y podría ser demasiado lenta para los jugones. En comparación, todos los dispositivos de prueba van de ##min### (mínimo) a 636 (máximo) ms. » 61 % de todos los dispositivos son mejores. Eso quiere decir que el tiempo de respuesta es peor que la media (31.1 ms) de todos los dispositivos testados. | ||
Parpadeo de Pantalla / PWM (Pulse-Width Modulation)
| Parpadeo de Pantalla / PWM detectado | 12000 Hz | ≤ 26 % de brillo |
| ≤ 60 cd/m² brillo | ||
La retroiluminación del display parpadea a 12000 Hz (seguramente usa PWM - Pulse-Width Modulation) a un brillo del 26 % (60 cd/m²) e inferior. Sobre este nivel de brillo no debería darse parpadeo / PWM. La frecuencia de 12000 Hz es bastante alta, por lo que la mayoría de gente sensible al parpadeo no debería ver parpadeo o tener fatiga visual. Como el parpadeo sólo se da a bajo brillo, en el nivel habitual no a problemas. Sólo la lectura puede resultar fatigosa. Comparación: 52 % de todos los dispositivos testados no usaron PWM para atenuar el display. Si se usó, medimos una media de 7784 (mínimo: 5 - máxmo: 343500) Hz. | ||
| Cinebench R15 | |
| CPU Single 64Bit | |
| Cube i7 Book CDK09 | |
| Microsoft Surface Pro 4, Core m3 | |
| Cube i9 | |
| Acer TravelMate B117-M-P16Q | |
| Chiligreen Mobilitas SF2600 | |
| Acer Swift 1 SF114-31-P6F6 | |
| HP Pavilion x360 11t T5M27AV | |
| Teclast Tbook 16 Power | |
| Microsoft Surface 3 | |
| Chuwi Hi12 | |
| VOYO VBook V3 | |
| Medion Akoya P2211T MD98602 | |
| CPU Multi 64Bit | |
| Cube i7 Book CDK09 | |
| Microsoft Surface Pro 4, Core m3 | |
| Cube i9 | |
| Acer Swift 1 SF114-31-P6F6 | |
| Acer TravelMate B117-M-P16Q | |
| Chiligreen Mobilitas SF2600 | |
| Microsoft Surface 3 | |
| Teclast Tbook 16 Power | |
| HP Pavilion x360 11t T5M27AV | |
| Teclast Tbook 10s | |
| Chuwi Hi12 | |
| Medion Akoya P2211T MD98602 | |
| VOYO VBook V3 | |
| Chuwi Hi10 Pro | |
| PCMark 8 - Home Score Accelerated v2 | |
| Cube i7 Book CDK09 | |
| Cube i9 | |
| Microsoft Surface Pro 4, Core m3 | |
| Acer Swift 1 SF114-31-P6F6 | |
| Acer TravelMate B117-M-P16Q | |
| Chiligreen Mobilitas SF2600 | |
| Microsoft Surface 3 | |
| HP Pavilion x360 11t T5M27AV | |
| Teclast Tbook 16 Power | |
| VOYO VBook V3 | |
| Acer Switch One 10 SW1-011-14UQ | |
| Medion Akoya E2215T | |
| Teclast Tbook 10s | |
| PCMark 8 Home Score Accelerated v2 | 1499 puntos | |
| PCMark 8 Creative Score Accelerated v2 | 1732 puntos | |
| PCMark 10 Score | 1006 puntos | |
ayuda | ||
| Performance rating - Percent | |
| Microsoft Surface Pro 4, Core m3 | |
| Cube i9 | |
| Cube i7 Book CDK09 | |
| Microsoft Surface 3 | |
| Teclast Tbook 16 Power | |
| Medion Akoya P2211T MD98602 | |

| 3DMark 11 - 1280x720 Performance GPU | |
| Acer Aspire ES1-731G-P5UR | |
| Cube i9 | |
| Acer Swift 1 SF114-31-P6F6 | |
| Chiligreen Mobilitas SF2600 | |
| Acer TravelMate B117-M-P16Q | |
| HP Pavilion x360 11t T5M27AV | |
| Lenovo Yoga Book 2016 Windows 64GB LTE | |
| Teclast Tbook 16 Power | |
| HP 250 G5 Y1V08UT | |
| Acer Switch One 10 SW1-011-14UQ | |
| 3DMark | |
| 1280x720 Cloud Gate Standard Graphics | |
| Acer Aspire ES1-731G-P5UR | |
| Cube i9 | |
| Acer TravelMate B117-M-P16Q | |
| Lenovo Yoga Book 2016 Windows 64GB LTE | |
| Chiligreen Mobilitas SF2600 | |
| HP 250 G5 Y1V08UT | |
| HP Pavilion x360 11t T5M27AV | |
| Teclast Tbook 16 Power | |
| 1920x1080 Fire Strike Graphics | |
| Acer Aspire ES1-731G-P5UR | |
| Acer TravelMate B117-M-P16Q | |
| HP Pavilion x360 11t T5M27AV | |
| 3DMark 06 Standard Score | 2274 puntos | |
| 3DMark 11 Performance | 451 puntos | |
| 3DMark Cloud Gate Standard Score | 1743 puntos | |
ayuda | ||
| Dota 2 Reborn - 1280x720 min (0/3) fastest | |
| Cube i9 | |
| Acer Swift 1 SF114-31-P6F6 | |
| Teclast Tbook 16 Power | |
| Chuwi Hi12 | |
| World of Warships - 1366x768 Low Preset AF:Trilinear | |
| Cube i9 | |
| Acer TravelMate B117-M-P16Q | |
| Teclast Tbook 16 Power | |
| Chuwi Hi12 | |
| Farming Simulator 17 - 1280x720 Low Preset | |
| Cube i9 | |
| Acer Swift 1 SF114-31-P6F6 | |
| Chuwi Hi12 | |
| Teclast Tbook 16 Power | |
| bajo | medio | alto | ultra | |
|---|---|---|---|---|
| Dota 2 Reborn (2015) | 22.1 | 13.7 | ||
| World of Warships (2015) | 15 | |||
| Farming Simulator 17 (2016) | 17.6 | |||
| Rocket League (2017) | 18.7 | |||
| Team Fortress 2 (2017) | 19.6 | |||
| Battle Bay (2018) | 37 | |||
| World of Tanks Blitz (2018) | 37 | 24 | ||
| Arena of Valor (2018) | 25 | |||
| Shadow Fight 3 (2018) | 30 | |||
| PUBG Mobile (2018) | 0 el juego no arranca (Hangs after a few minutes) | |||
| League of Legends (2019) | 23.6 | 18 | 13.9 | |
| Hearthstone (2020) | 17.8 | 18 | 9.91 |
(±) La temperatura máxima en la parte superior es de 43 °C / 109 F, frente a la media de 35.4 °C / 96 F, que oscila entre 19.6 y 60 °C para la clase Convertible.
(±) El fondo se calienta hasta un máximo de 40 °C / 104 F, frente a la media de 36.9 °C / 98 F
(+) En reposo, la temperatura media de la parte superior es de 27.9 °C / 82# F, frente a la media del dispositivo de 30.3 °C / 87 F.
(-) El reposamanos y el touchpad pueden calentarse mucho al tacto con un máximo de 41 °C / 105.8 F.
(-) La temperatura media de la zona del reposamanos de dispositivos similares fue de 28 °C / 82.4 F (-13 °C / -23.4 F).
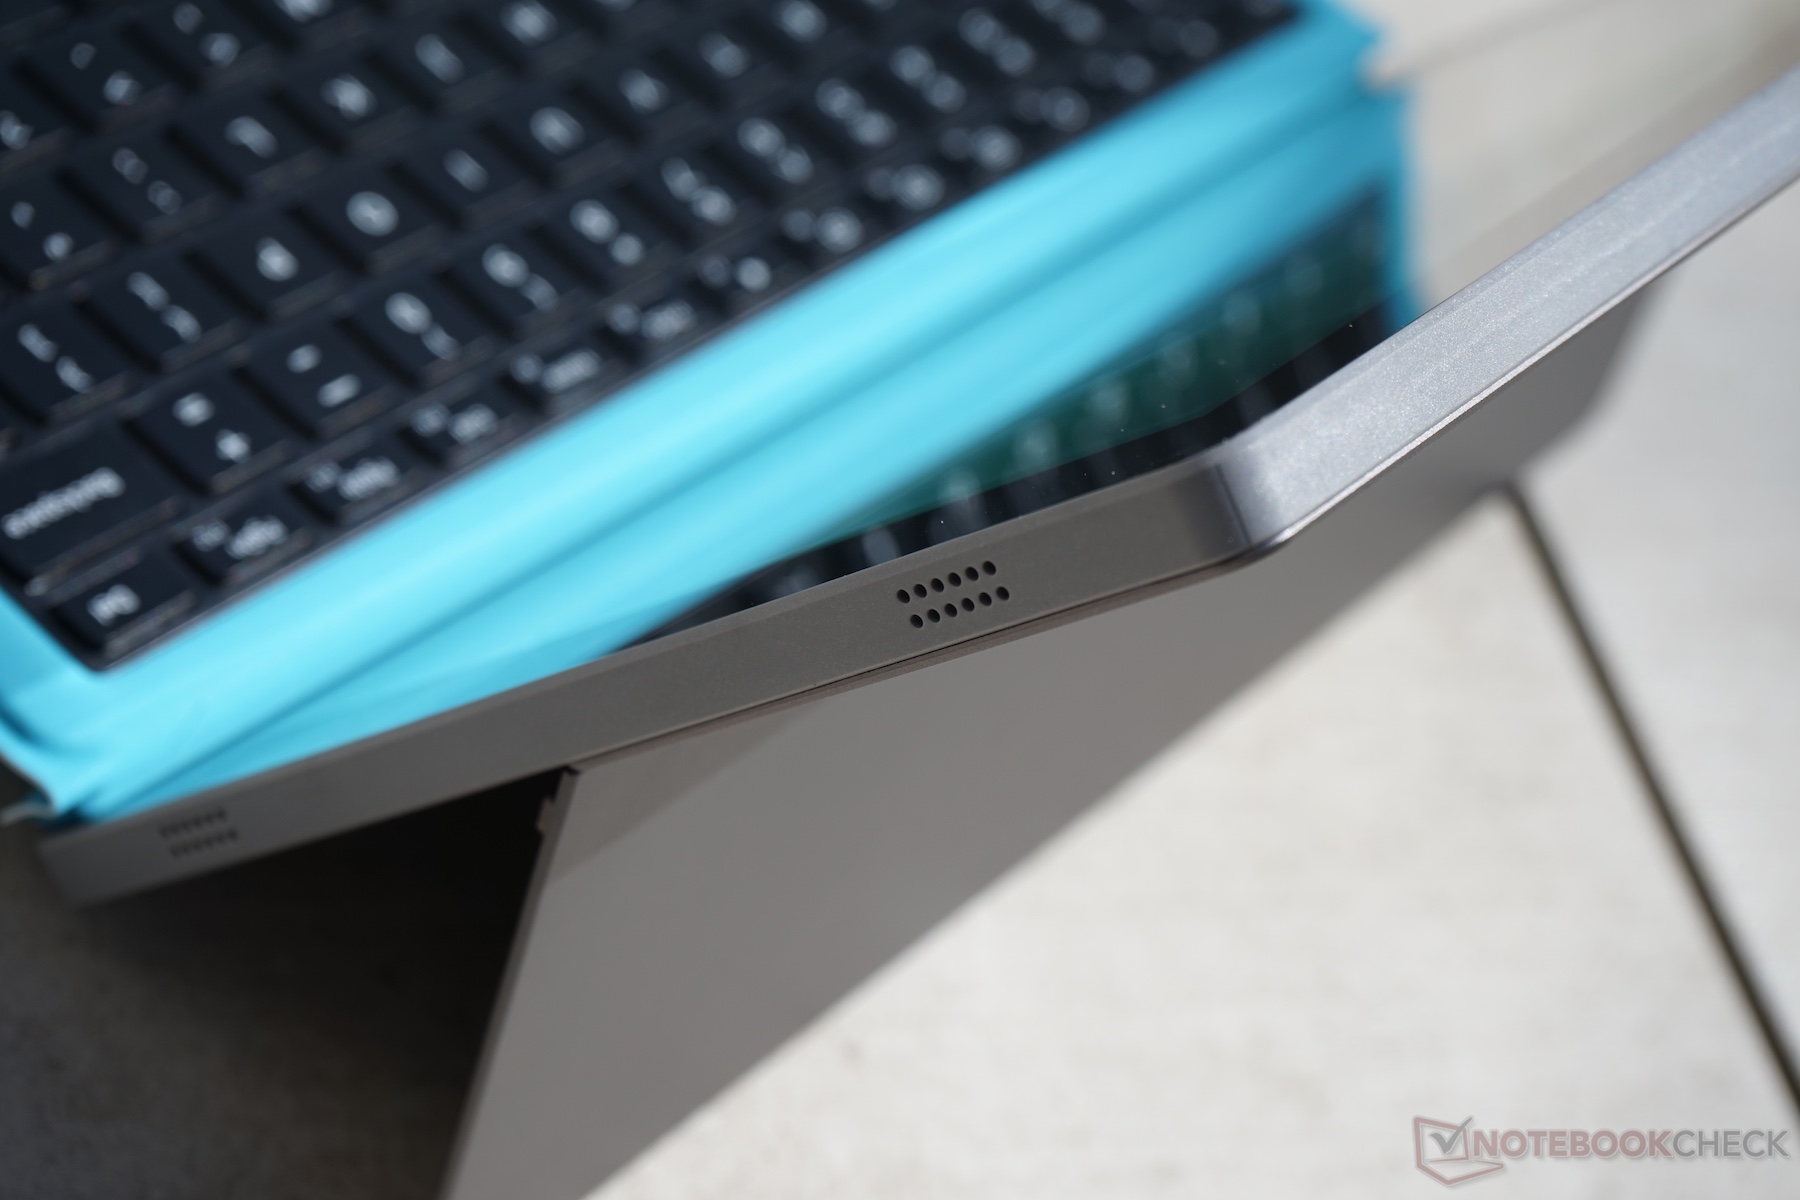
Teclast Tbook 16 Power análisis de audio
(-) | altavoces no muy altos (#70.6 dB)
Graves 100 - 315 Hz
(±) | lubina reducida - en promedio 14.3% inferior a la mediana
(±) | la linealidad de los graves es media (8.4% delta a frecuencia anterior)
Medios 400 - 2000 Hz
(±) | medias más altas - de media 13.2% más altas que la mediana
(-) | los medios no son lineales (26.2% delta respecto a la frecuencia anterior)
Altos 2 - 16 kHz
(±) | máximos más altos - de media 12.2% más altos que la mediana
(-) | los máximos no son lineales (22.3% delta a la frecuencia anterior)
Total 100 - 16.000 Hz
(-) | el sonido global no es lineal (56.8% de diferencia con la mediana)
En comparación con la misma clase
» 100% de todos los dispositivos probados de esta clase eran mejores, 0% similares, 0% peores
» El mejor tuvo un delta de 6%, la media fue 20%, el peor fue ###max##%
En comparación con todos los dispositivos probados
» 96% de todos los dispositivos probados eran mejores, 0% similares, 4% peores
» El mejor tuvo un delta de 4%, la media fue 24%, el peor fue ###max##%
Apple MacBook 12 (Early 2016) 1.1 GHz análisis de audio
(+) | los altavoces pueden reproducir a un volumen relativamente alto (#83.6 dB)
Graves 100 - 315 Hz
(±) | lubina reducida - en promedio 11.3% inferior a la mediana
(±) | la linealidad de los graves es media (14.2% delta a frecuencia anterior)
Medios 400 - 2000 Hz
(+) | medios equilibrados - a sólo 2.4% de la mediana
(+) | los medios son lineales (5.5% delta a la frecuencia anterior)
Altos 2 - 16 kHz
(+) | máximos equilibrados - a sólo 2% de la mediana
(+) | los máximos son lineales (4.5% delta a la frecuencia anterior)
Total 100 - 16.000 Hz
(+) | el sonido global es lineal (10.2% de diferencia con la mediana)
En comparación con la misma clase
» 7% de todos los dispositivos probados de esta clase eran mejores, 2% similares, 91% peores
» El mejor tuvo un delta de 5%, la media fue 18%, el peor fue ###max##%
En comparación con todos los dispositivos probados
» 5% de todos los dispositivos probados eran mejores, 1% similares, 94% peores
» El mejor tuvo un delta de 4%, la media fue 24%, el peor fue ###max##%
| Off / Standby | |
| Ocioso | |
| Carga |
|
Clave:
min: | |
| Teclast Tbook 16 Power Z8750, HD Graphics 405 (Braswell), 64 GB eMMC Flash, IPS, 1920x1080, 11.6" | Chuwi Hi12 Z8300, HD Graphics (Cherry Trail), Hynix HCG8E 64 GB, IPS, 2160x1440, 12" | Cube i7 Book CDK09 6Y30, HD Graphics 515, FORESEE 64GB O1229B, IPS, 1920x1080, 10.6" | Cube i9 6Y30, HD Graphics 515, FORESEE 128GB O1229B, IPS, 1920x1200, 12.2" | Microsoft Surface 3 Z8700, HD Graphics (Cherry Trail), 128 GB eMMC Flash, IPS, 1920x1280, 10.8" | Acer Swift 1 SF114-31-P6F6 N3710, HD Graphics 405 (Braswell), 128 GB eMMC Flash, TN LED, 1366x768, 14" | |
|---|---|---|---|---|---|---|
| Power Consumption | 21% | -180% | -132% | -70% | -100% | |
| Idle Minimum * (Watt) | 2.6 | 1.7 35% | 6.6 -154% | 4.6 -77% | 2.5 4% | 4.1 -58% |
| Idle Average * (Watt) | 2.7 | 1.7 37% | 10 -270% | 9.6 -256% | 7 -159% | 8.3 -207% |
| Idle Maximum * (Watt) | 2.7 | 3.3 -22% | 12 -344% | 9.6 -256% | 8.4 -211% | 8.6 -219% |
| Load Average * (Watt) | 12.7 | 7.9 38% | 21.1 -66% | 18.6 -46% | 11.2 12% | 13.5 -6% |
| Load Maximum * (Watt) | 13.1 | 10.8 18% | 22 -68% | 16.3 -24% | 12.4 5% | 14.5 -11% |
* ... más pequeño es mejor
| Battery Runtime - WiFi Websurfing | |
| Acer Swift 1 SF114-31-P6F6 | |
| Acer Switch One 10 SW1-011-14UQ | |
| Microsoft Surface Pro 4, Core m3 | |
| Chuwi Vi10 Ultimate 64GB | |
| Chuwi Hi12 | |
| Teclast Tbook 16 Power | |
| Chuwi Hi10 Pro | |
| Cube i7 Book CDK09 | |
| Cube i9 | |
| Teclast Tbook 10s | |
Pro
Contra
El mayor gancho comercial del Teclast Tbook 16 Power es el rápido procesador Atom x7. Además de batir a los dispositivos de la competencia que incluyen Atom x5, resultó mucho más lento que los competidores con Core M3 y Pentium N3710. La Intel HD Graphics 405 ha resultado una gran decepción, especialmente con juegos.
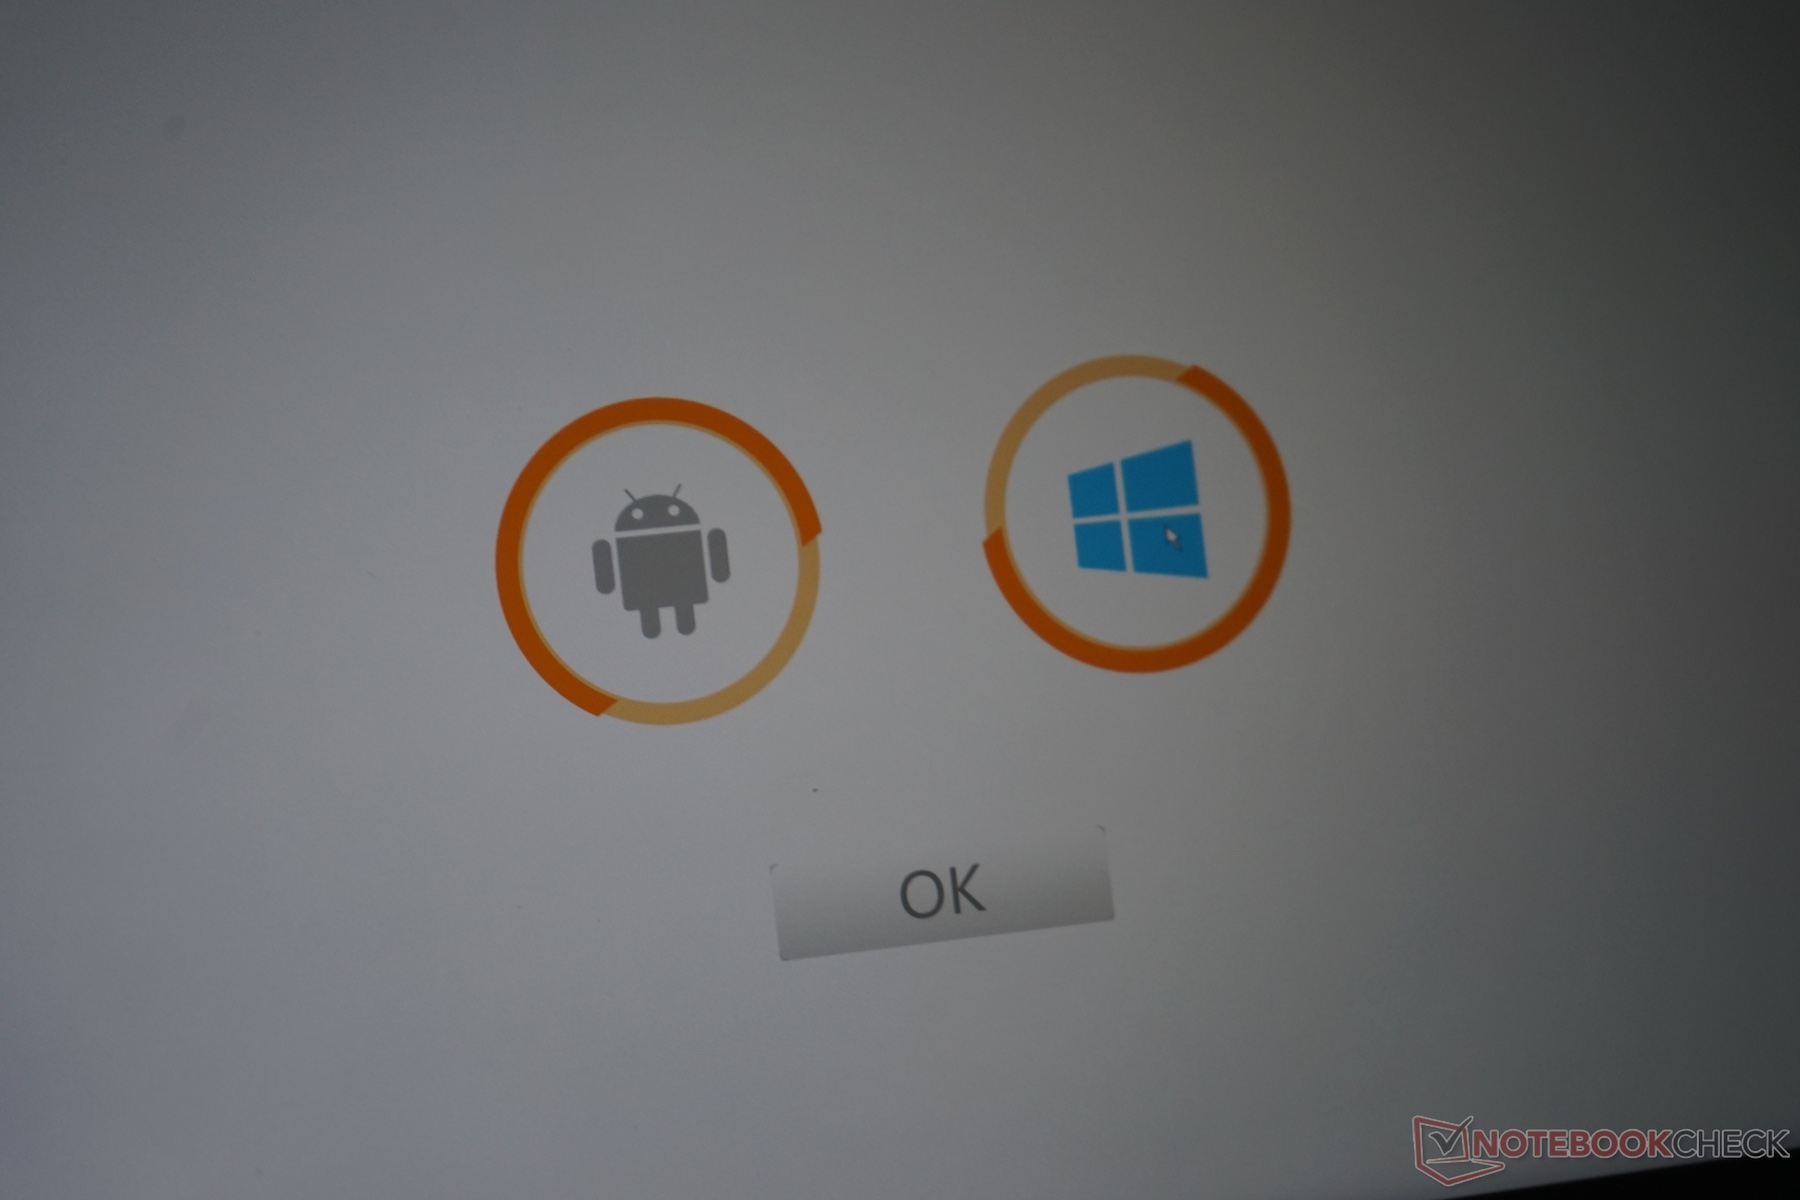
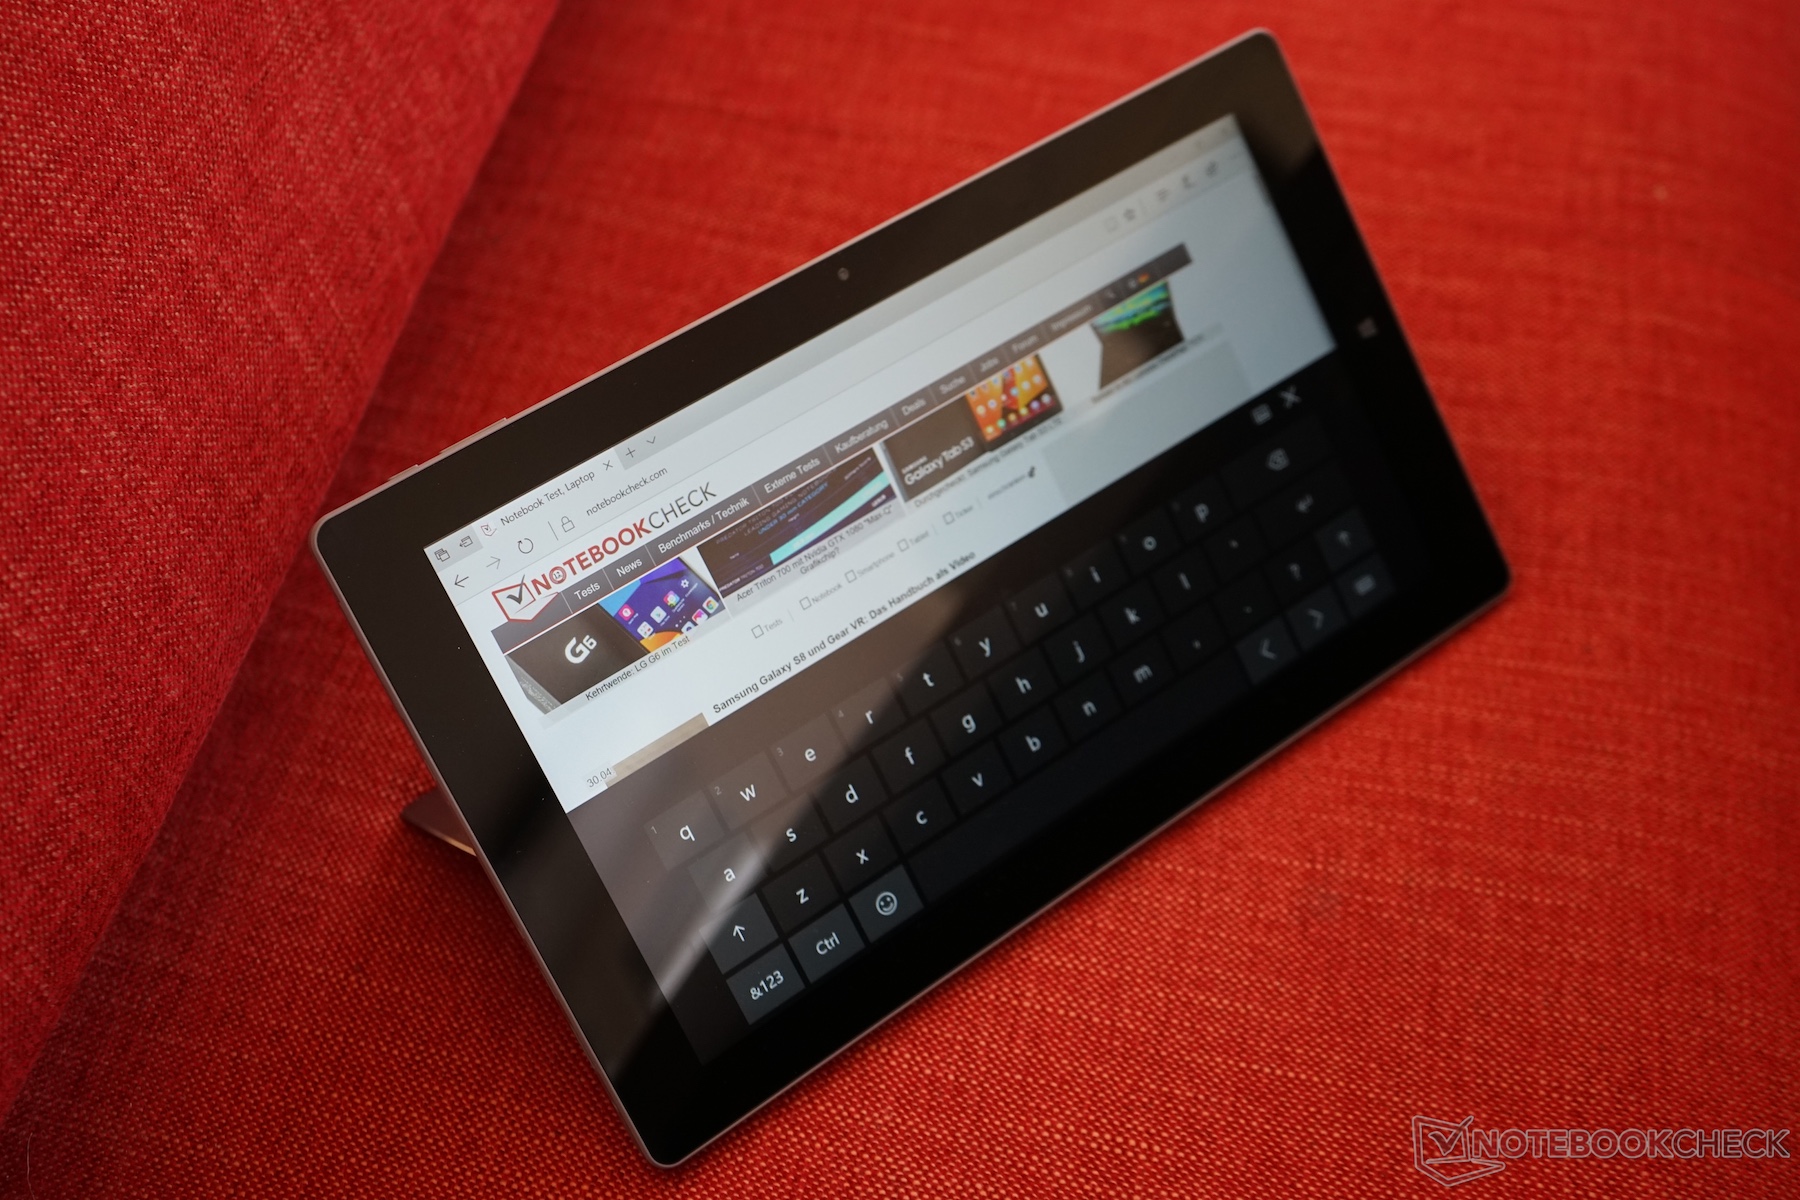
Otro gancho es la preinstalación de Android 6. Durante el tiempo que lo usamos rindió muy bien y fue ligero y ágil. Desafortunadamente la opción de arranque dual desapareció después de instalar las actualizaciones de Windows, así que fuimos incapaces de probarlo con más detalle.
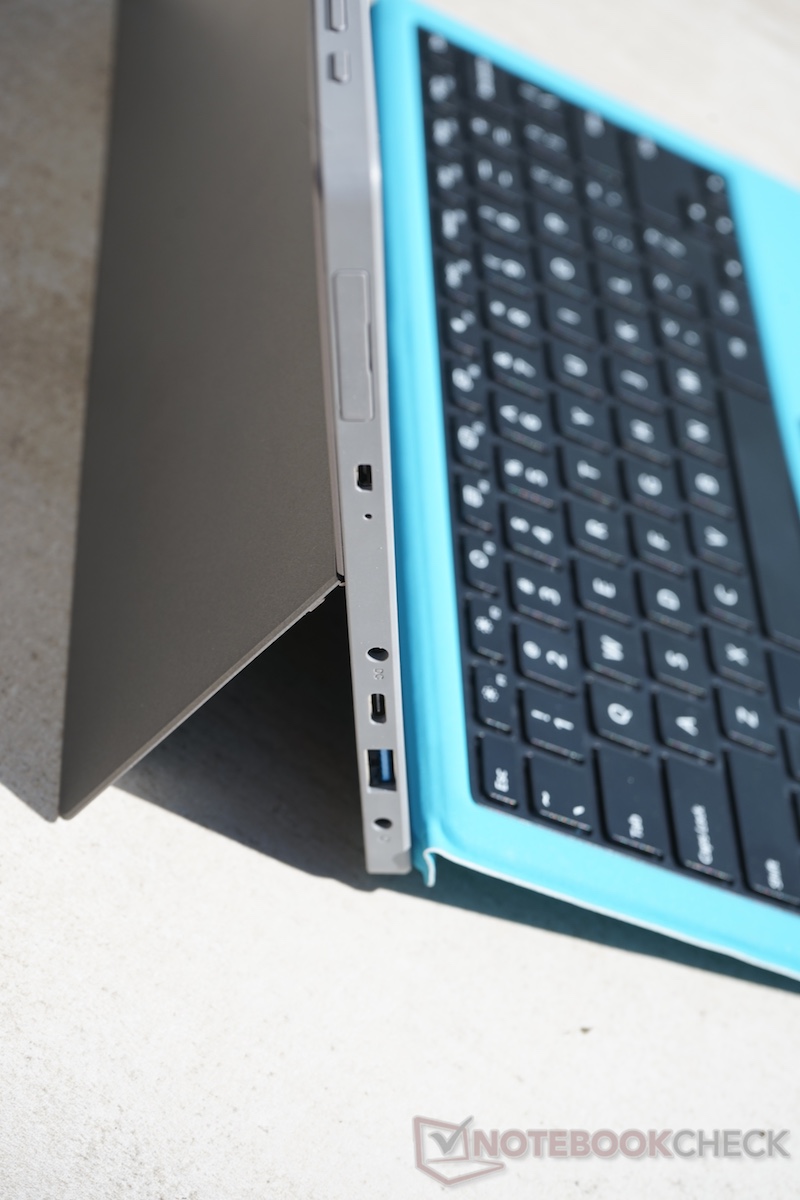
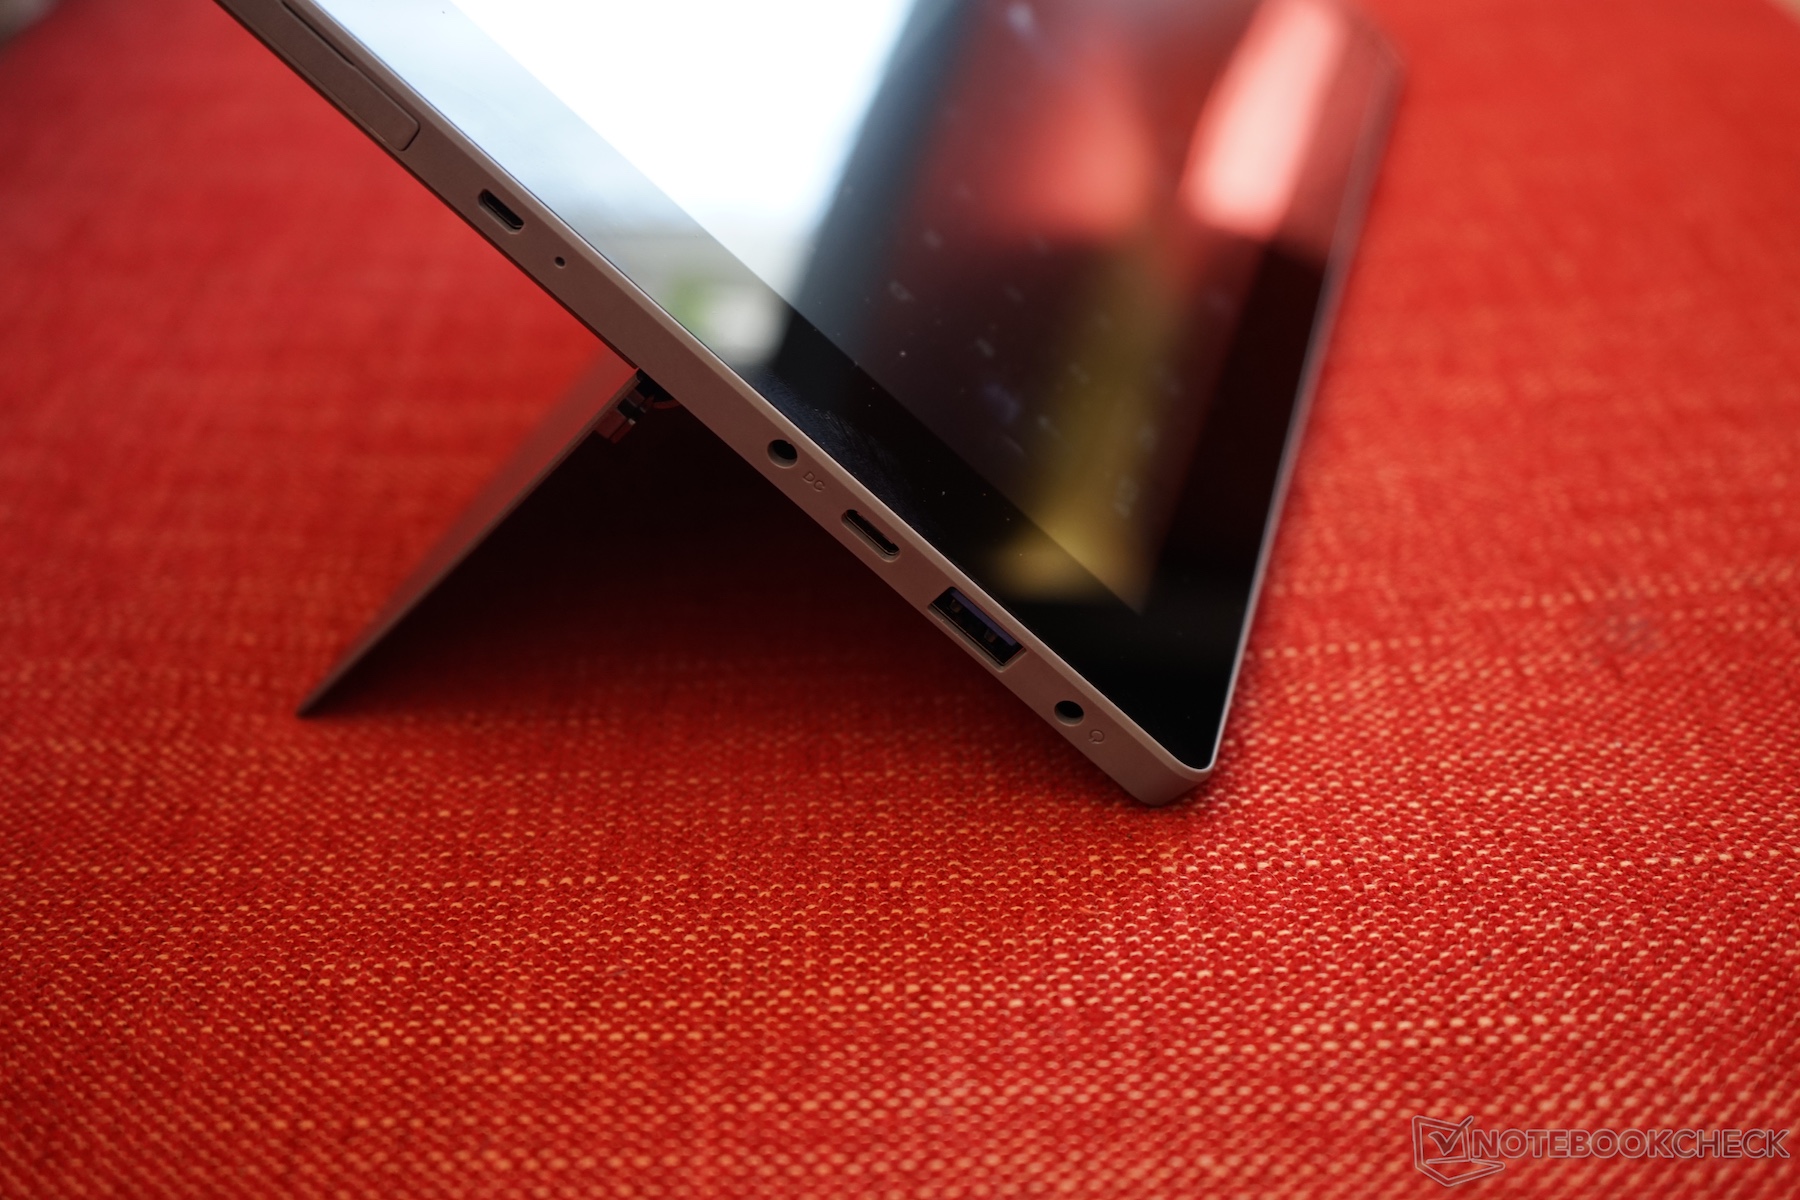
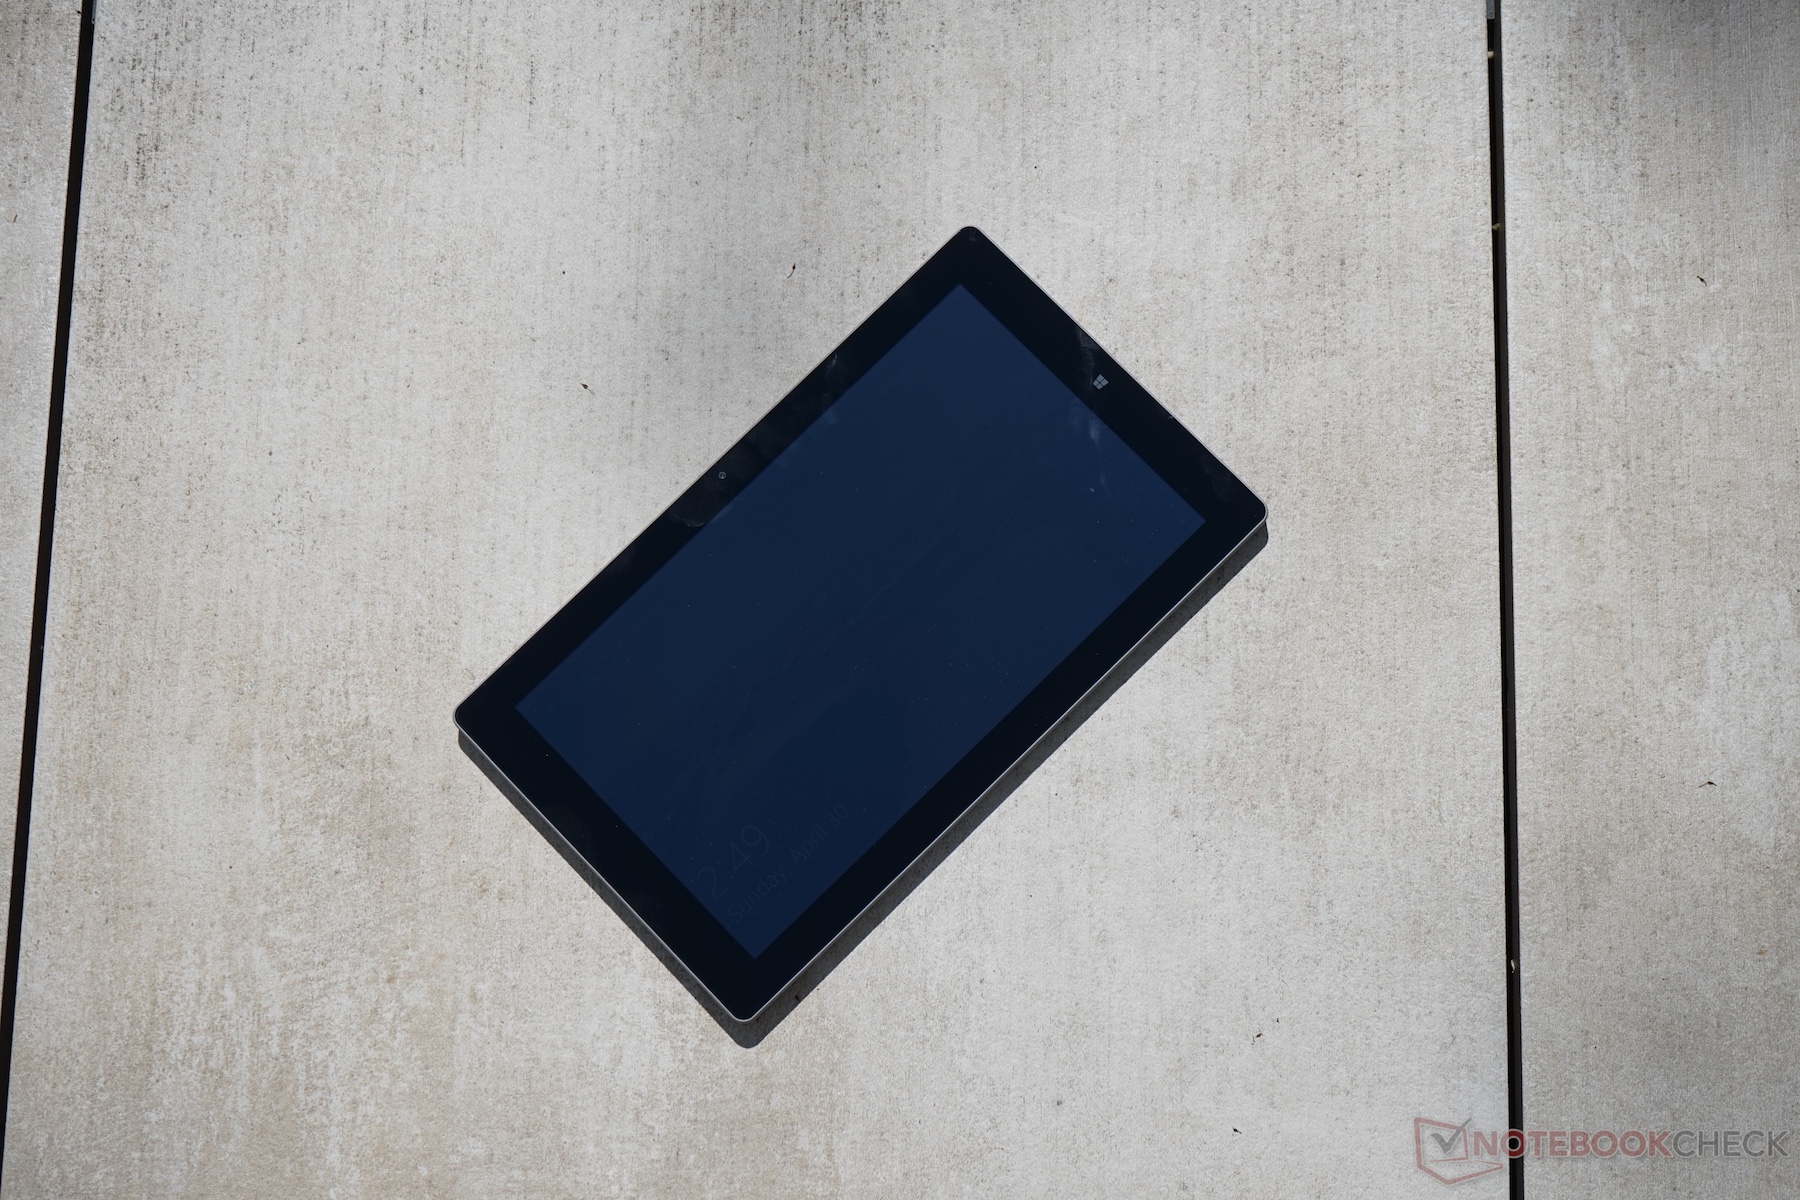
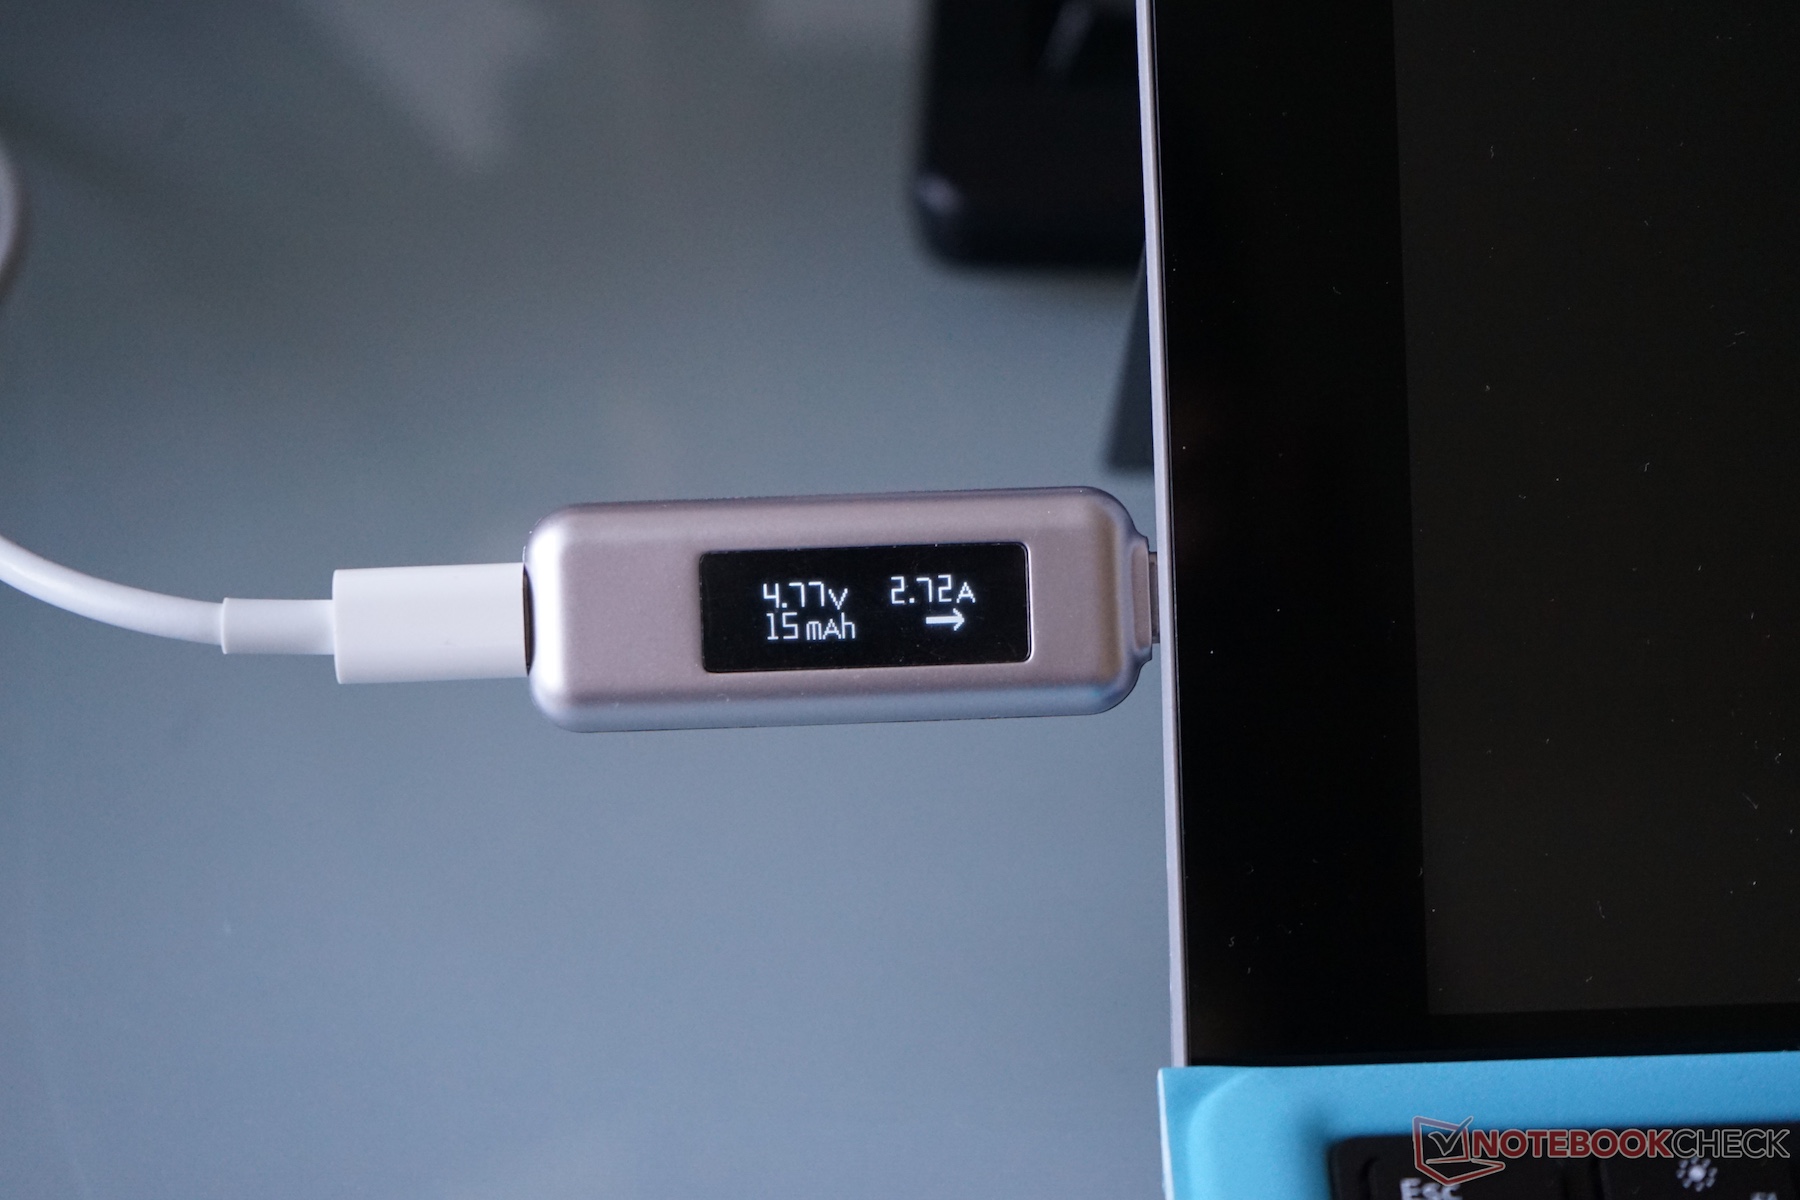
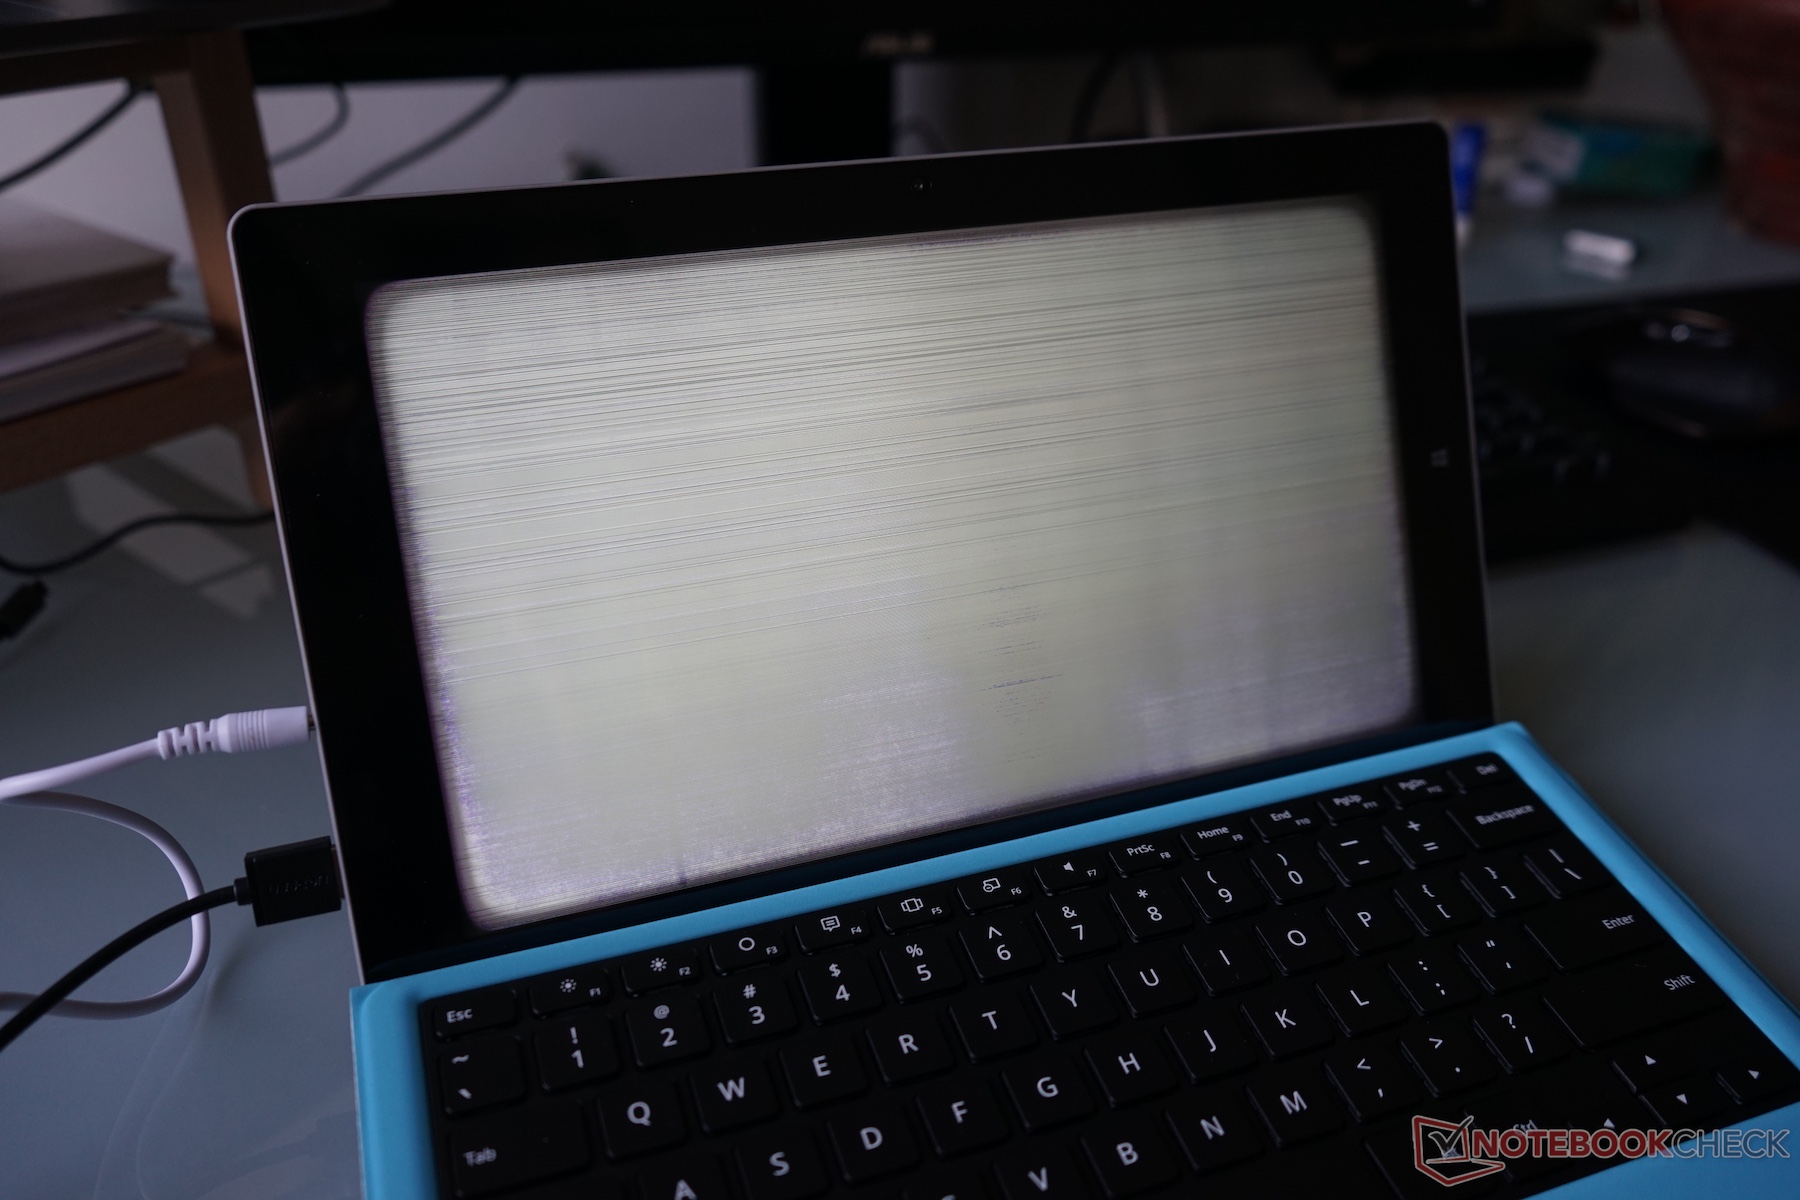
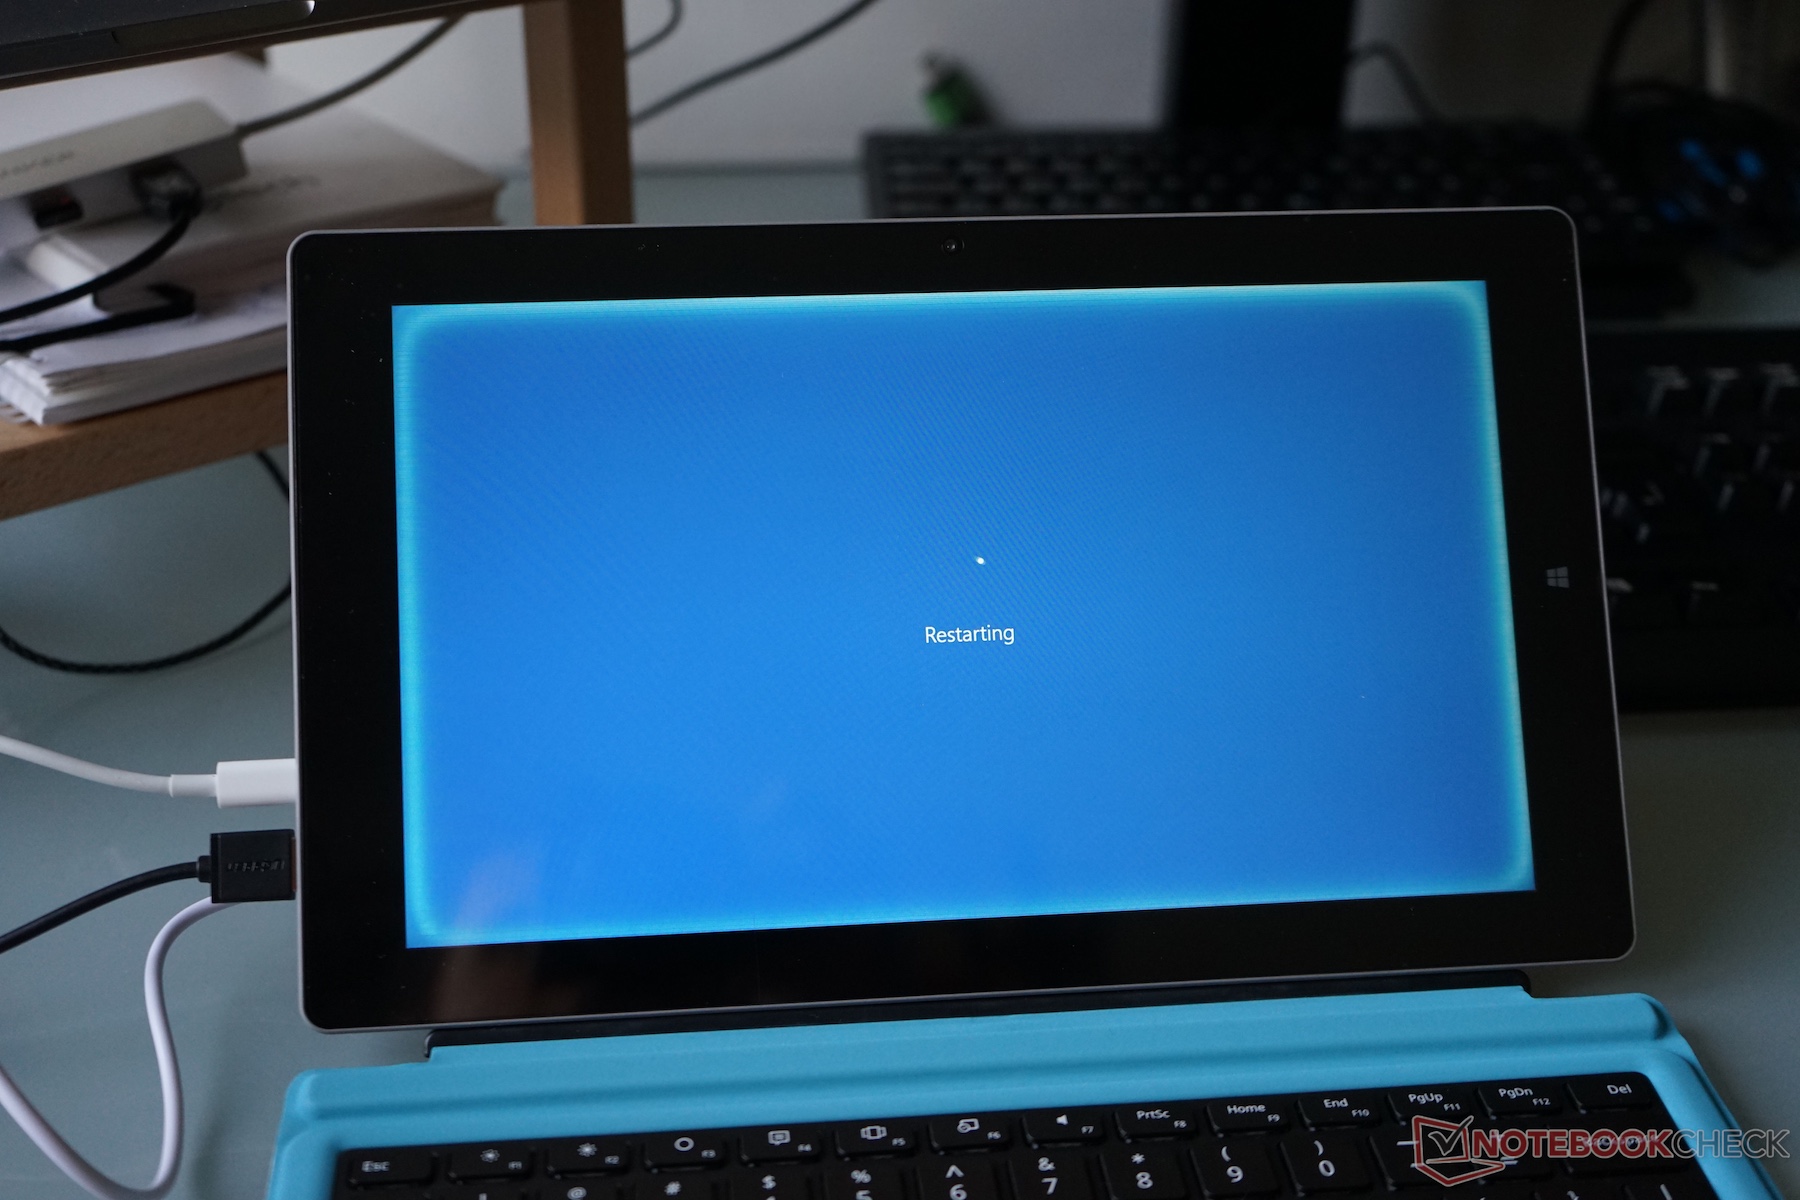
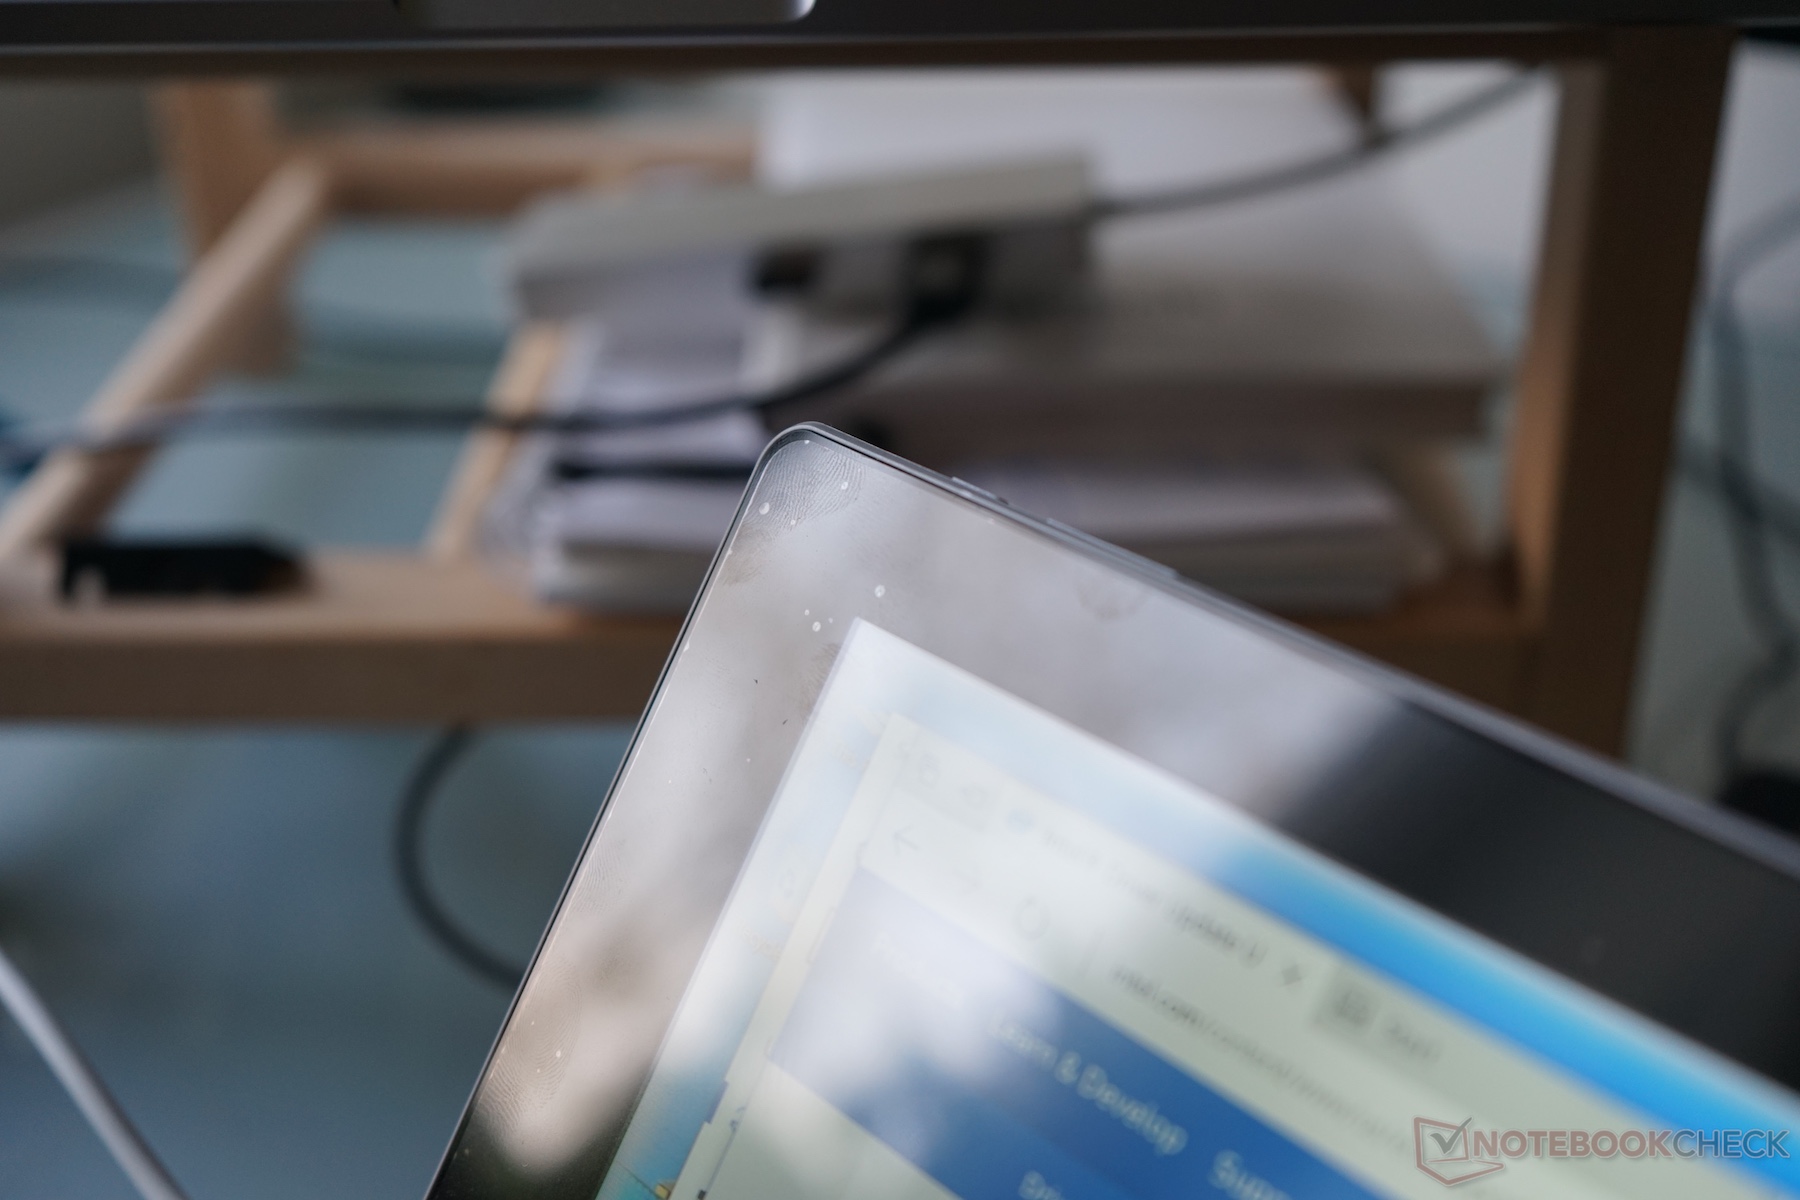
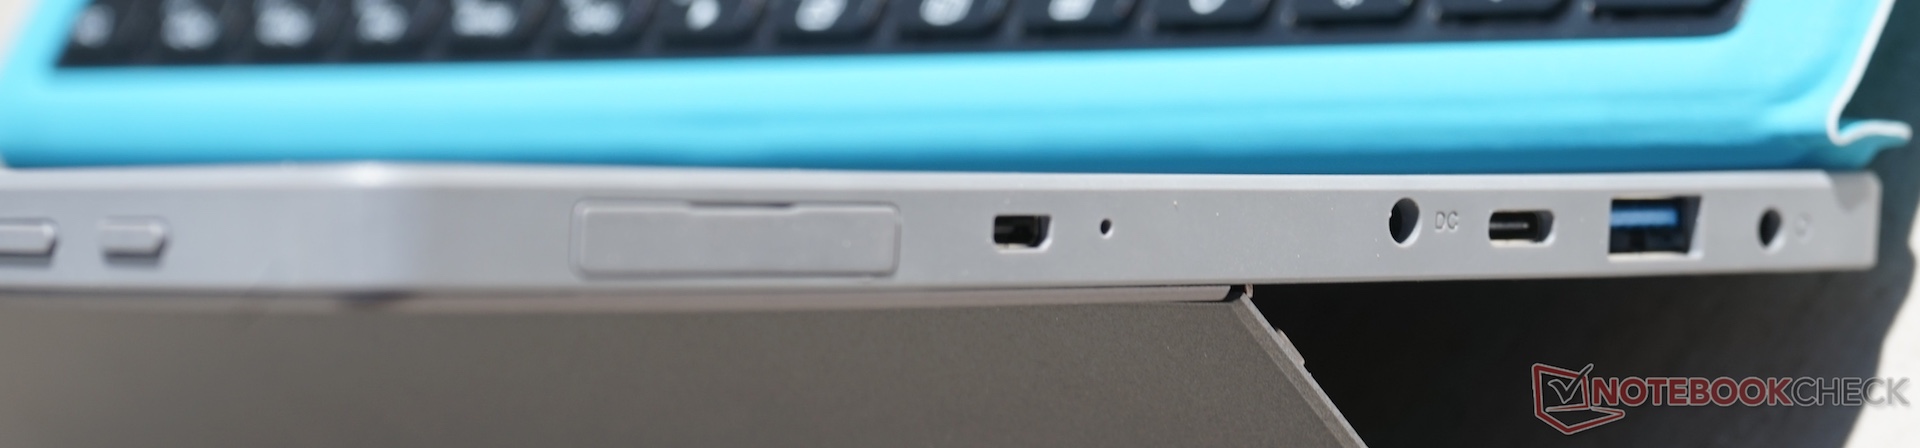
En general, tuvimos unos cuantos problemas mayores o menores con el dispositivo analizado. Una mañana la pantalla decidió no mostrar nada más que ruido blanco y tuvimos que reiniciar el dispositivo. Por alguna razón las esquinas se mantuvieron más brillantes que el resto de la pantalla durante un par de horas después. La ausencia de cargador también nos provocó algún dolor de cabeza - el dispositivo no funcionó correcta y consistentemente con cargadores USB-C de Inateck ni de Apple ni de Anger. En ocasiones no cargaba, en otras ocasiones cargaba y paraba de cargar intermitentemente, en ocasiones se desconectaba cuando la batería estaba totalmente cargada.
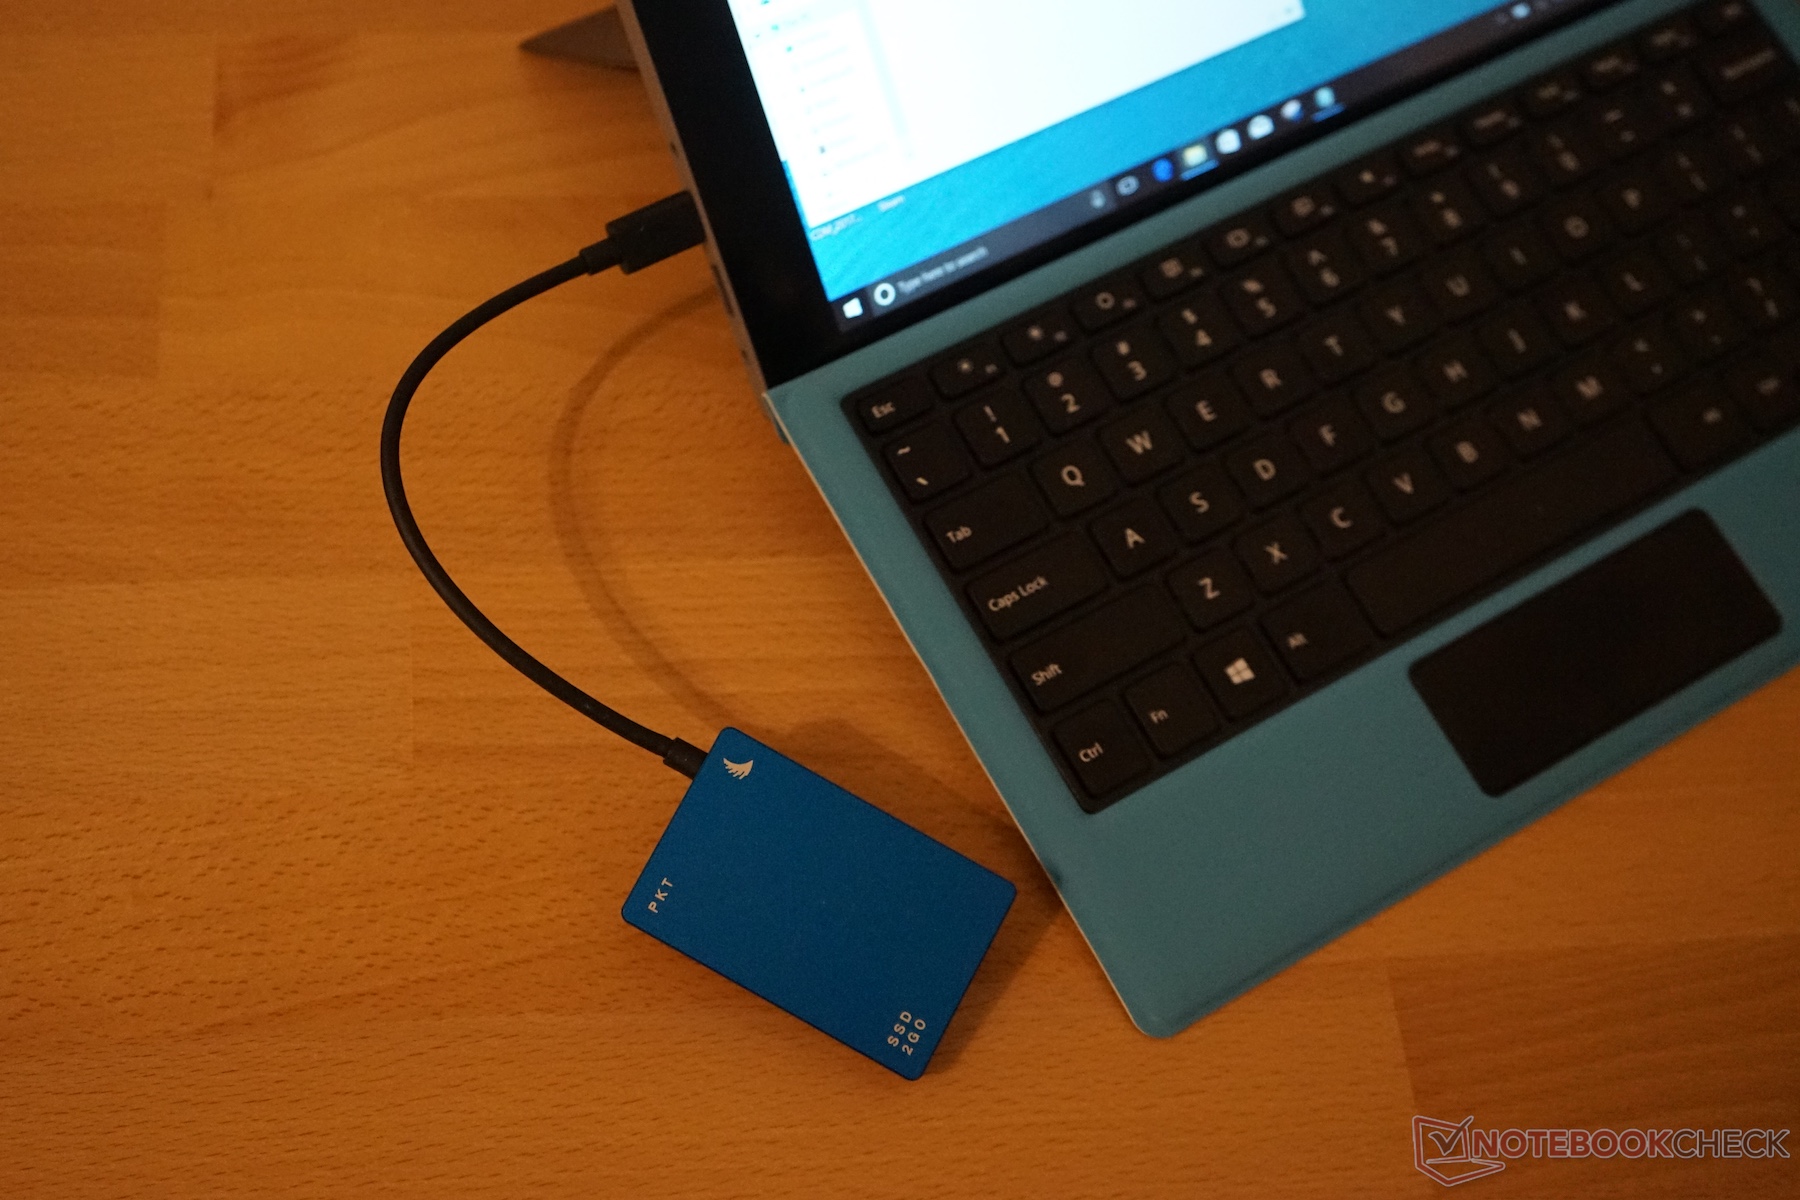
Los puertos USB integrados no funcionaron de la forma esperada y fuimos incapaces de usar un SSD externo como el G-Drive, el Angelbird, o los de OCZ. Otros dispositivos como un disco duro externo o el SanDisk Extreme 900 funcionaron perfectamente. Nuestra apuesta es que los puertos USB o proporcionan suficiente potencia. El modo reposo fue otro problema del dispositivo. Además de un gran consumo de batería, el tablet en ocasiones simplemente se mantuvo con la pantalla apagada y algún proceso en segundo plano causando una elevada carga de CPU y vaciando la batería totalmente en poco tiempo. No fuimos capaces de averiguar cual era el problema; nuestra apuesta es que se trataba de algún controlador defectuoso.
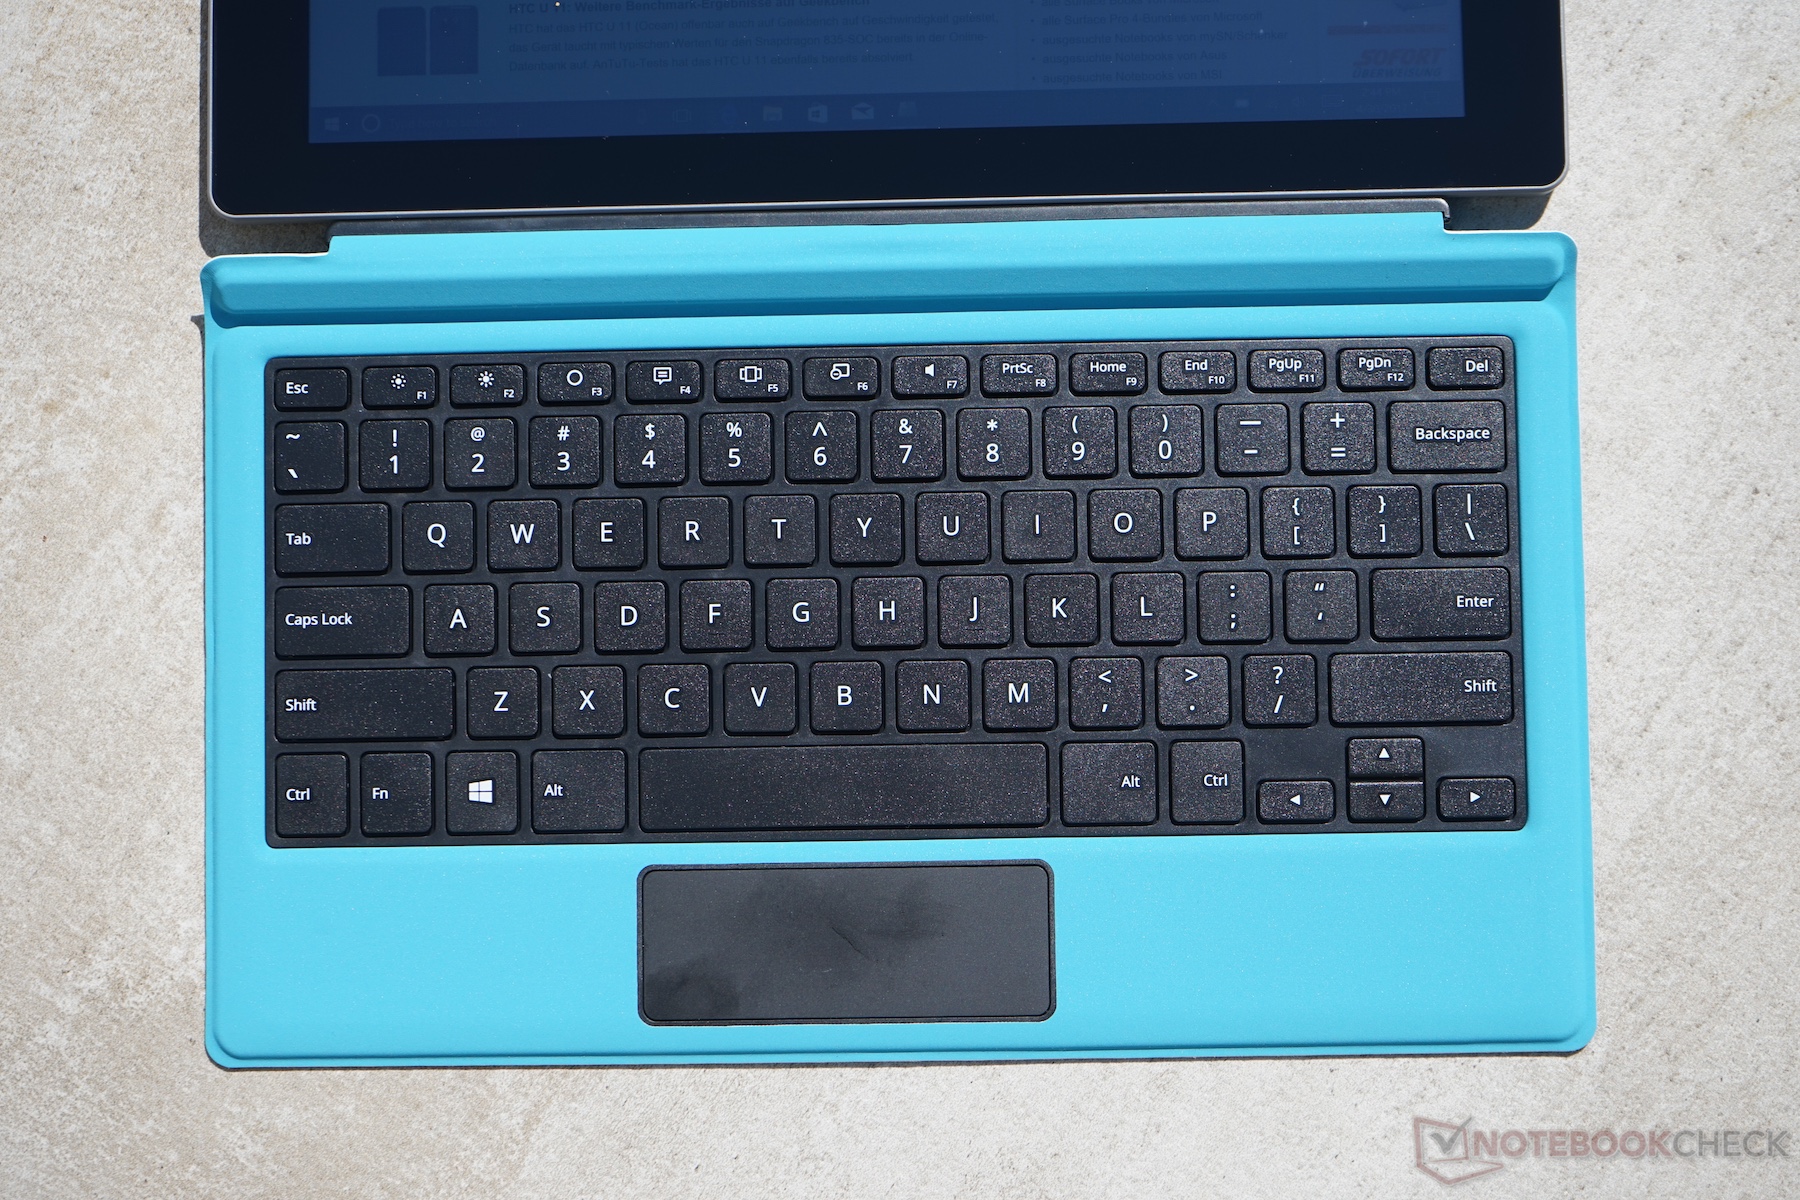
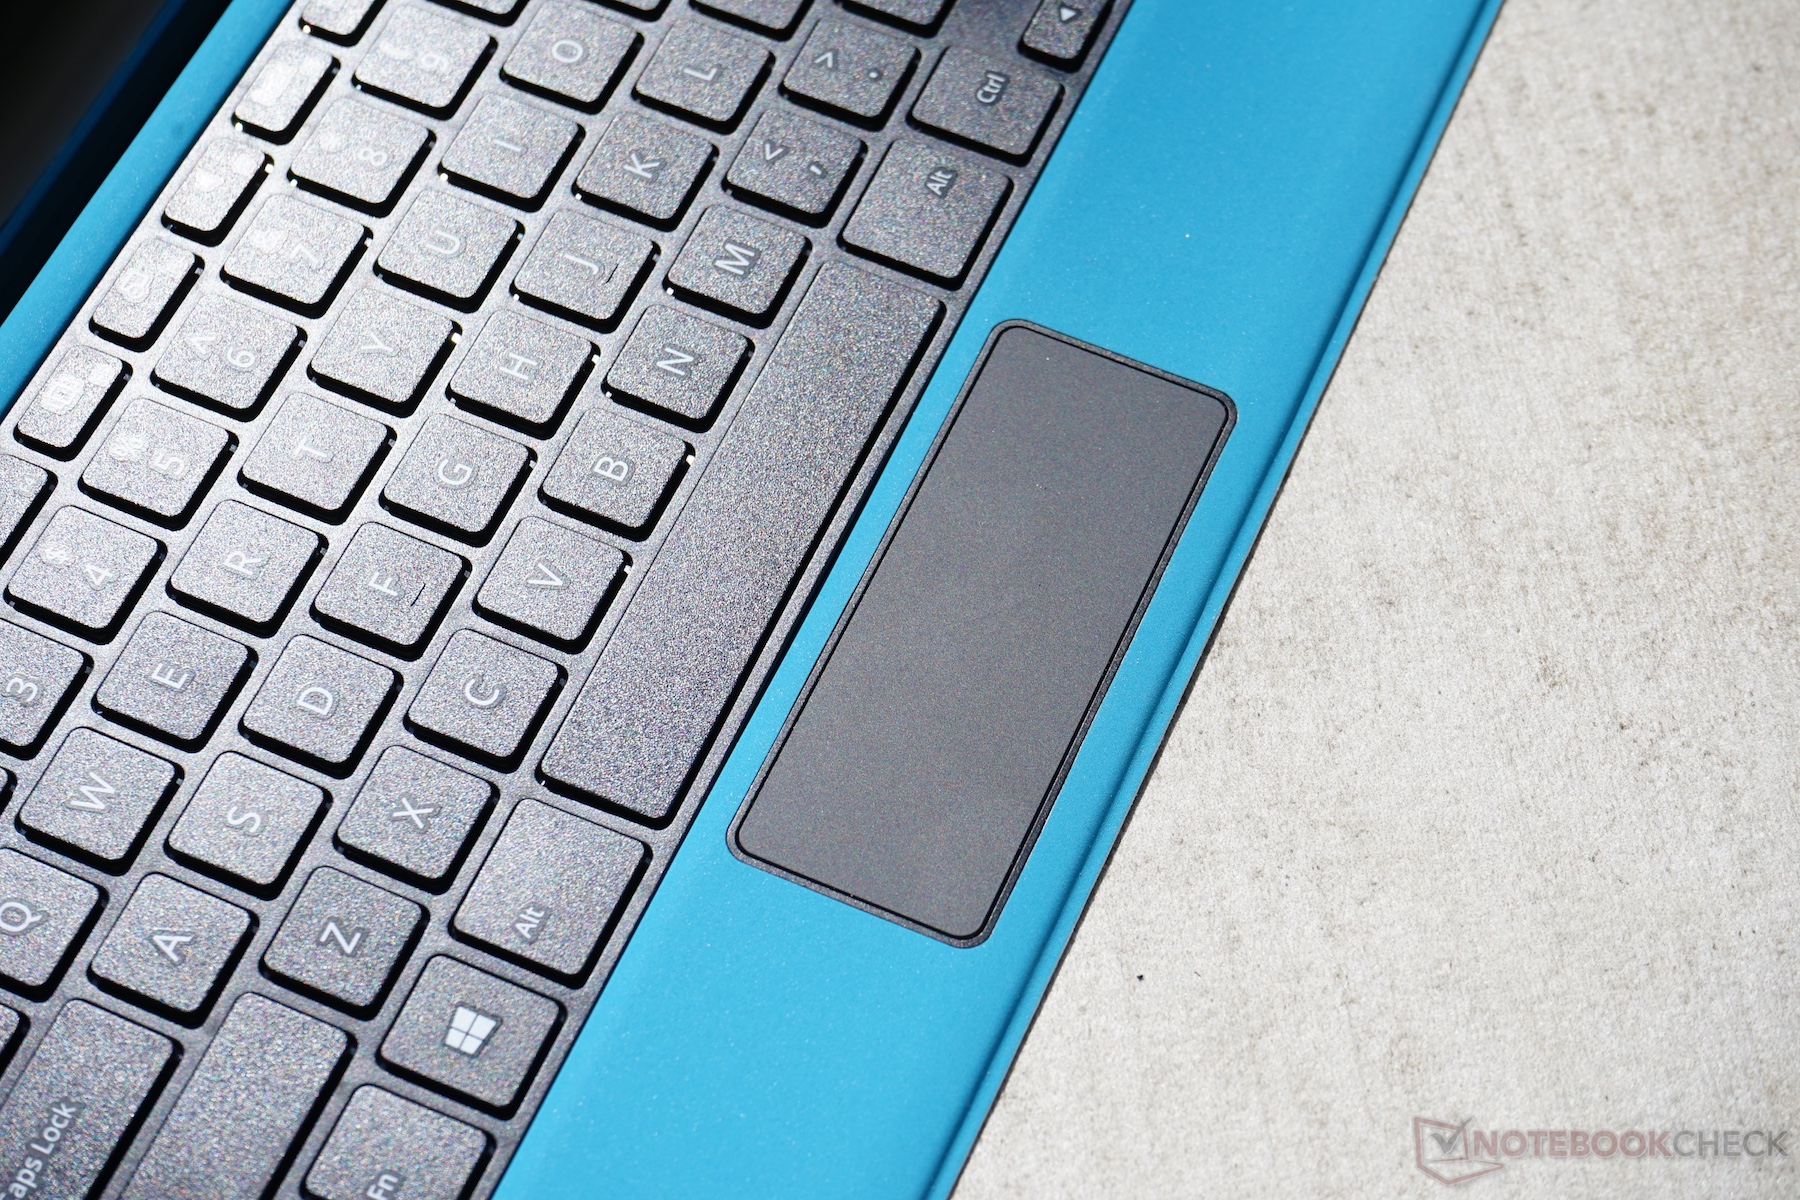
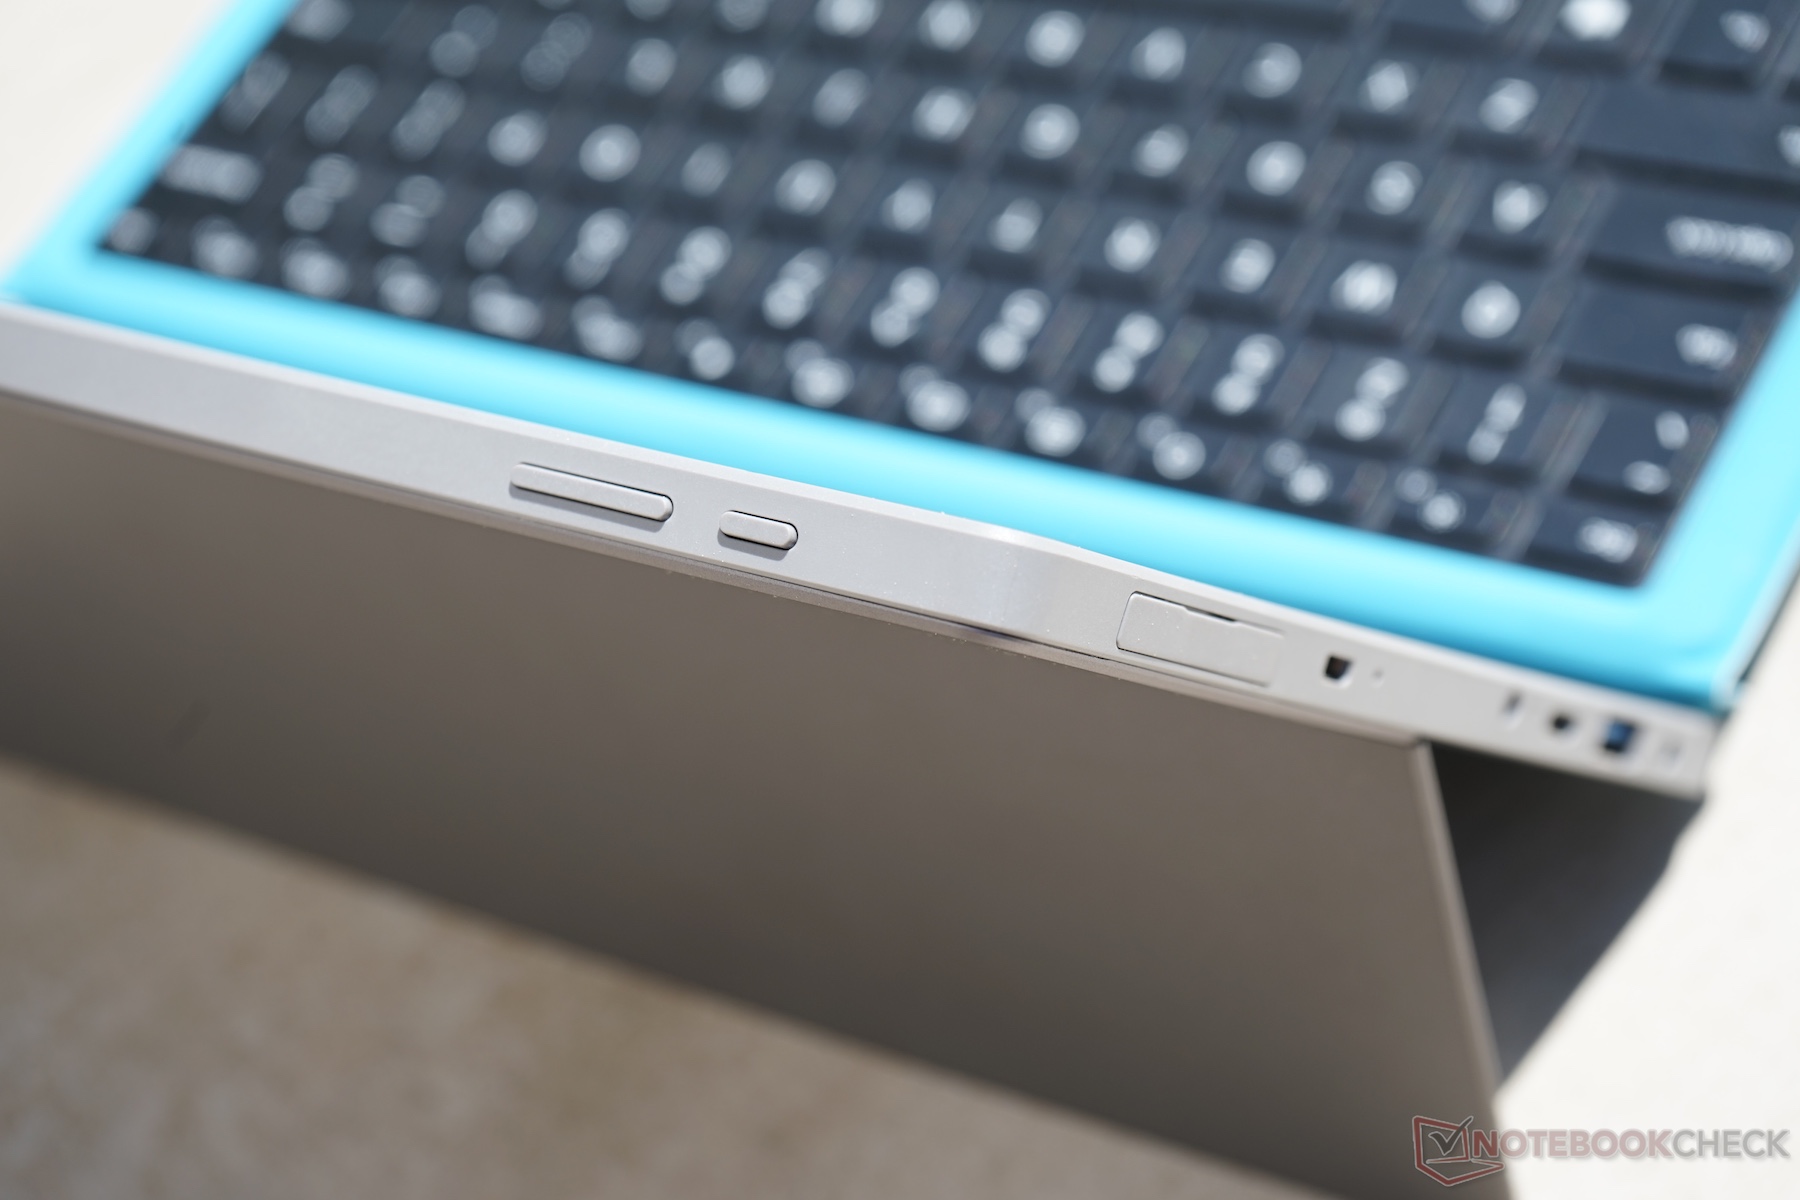
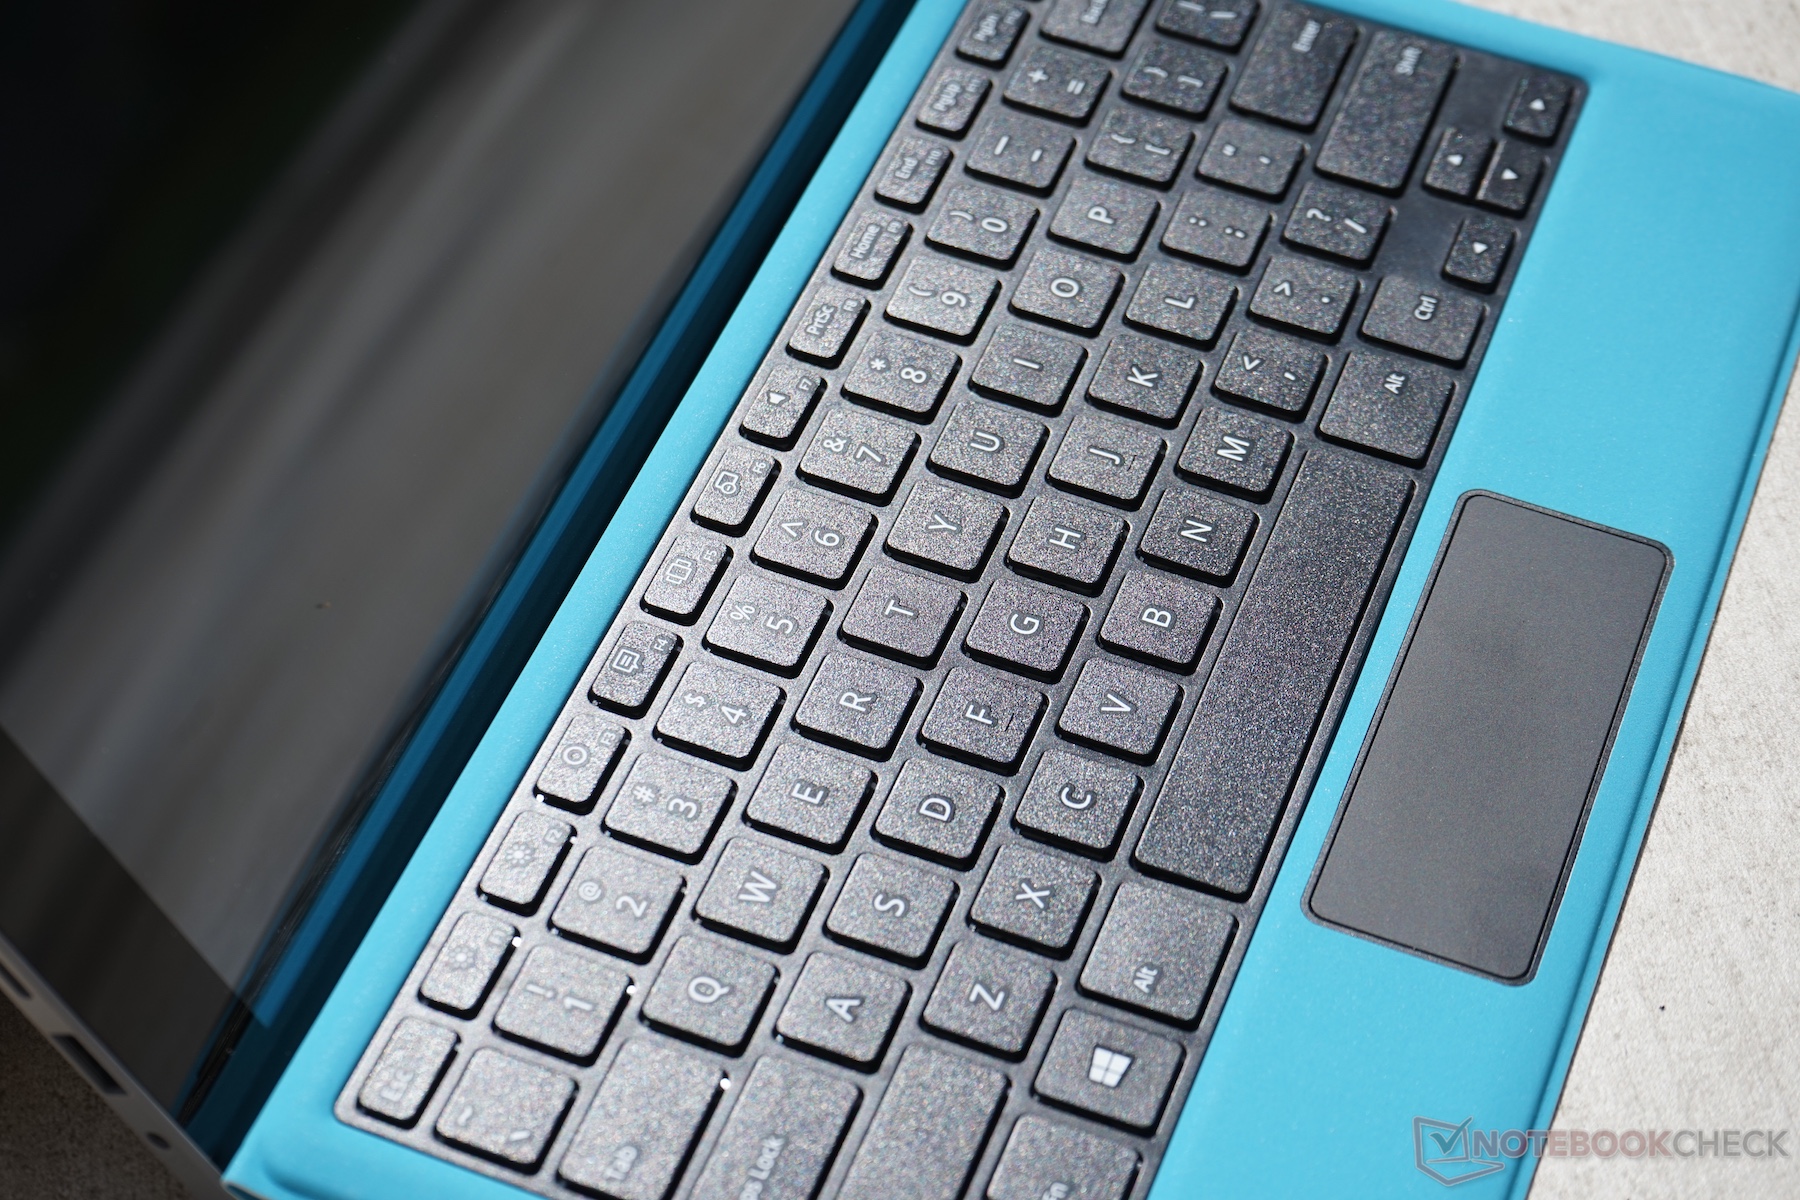
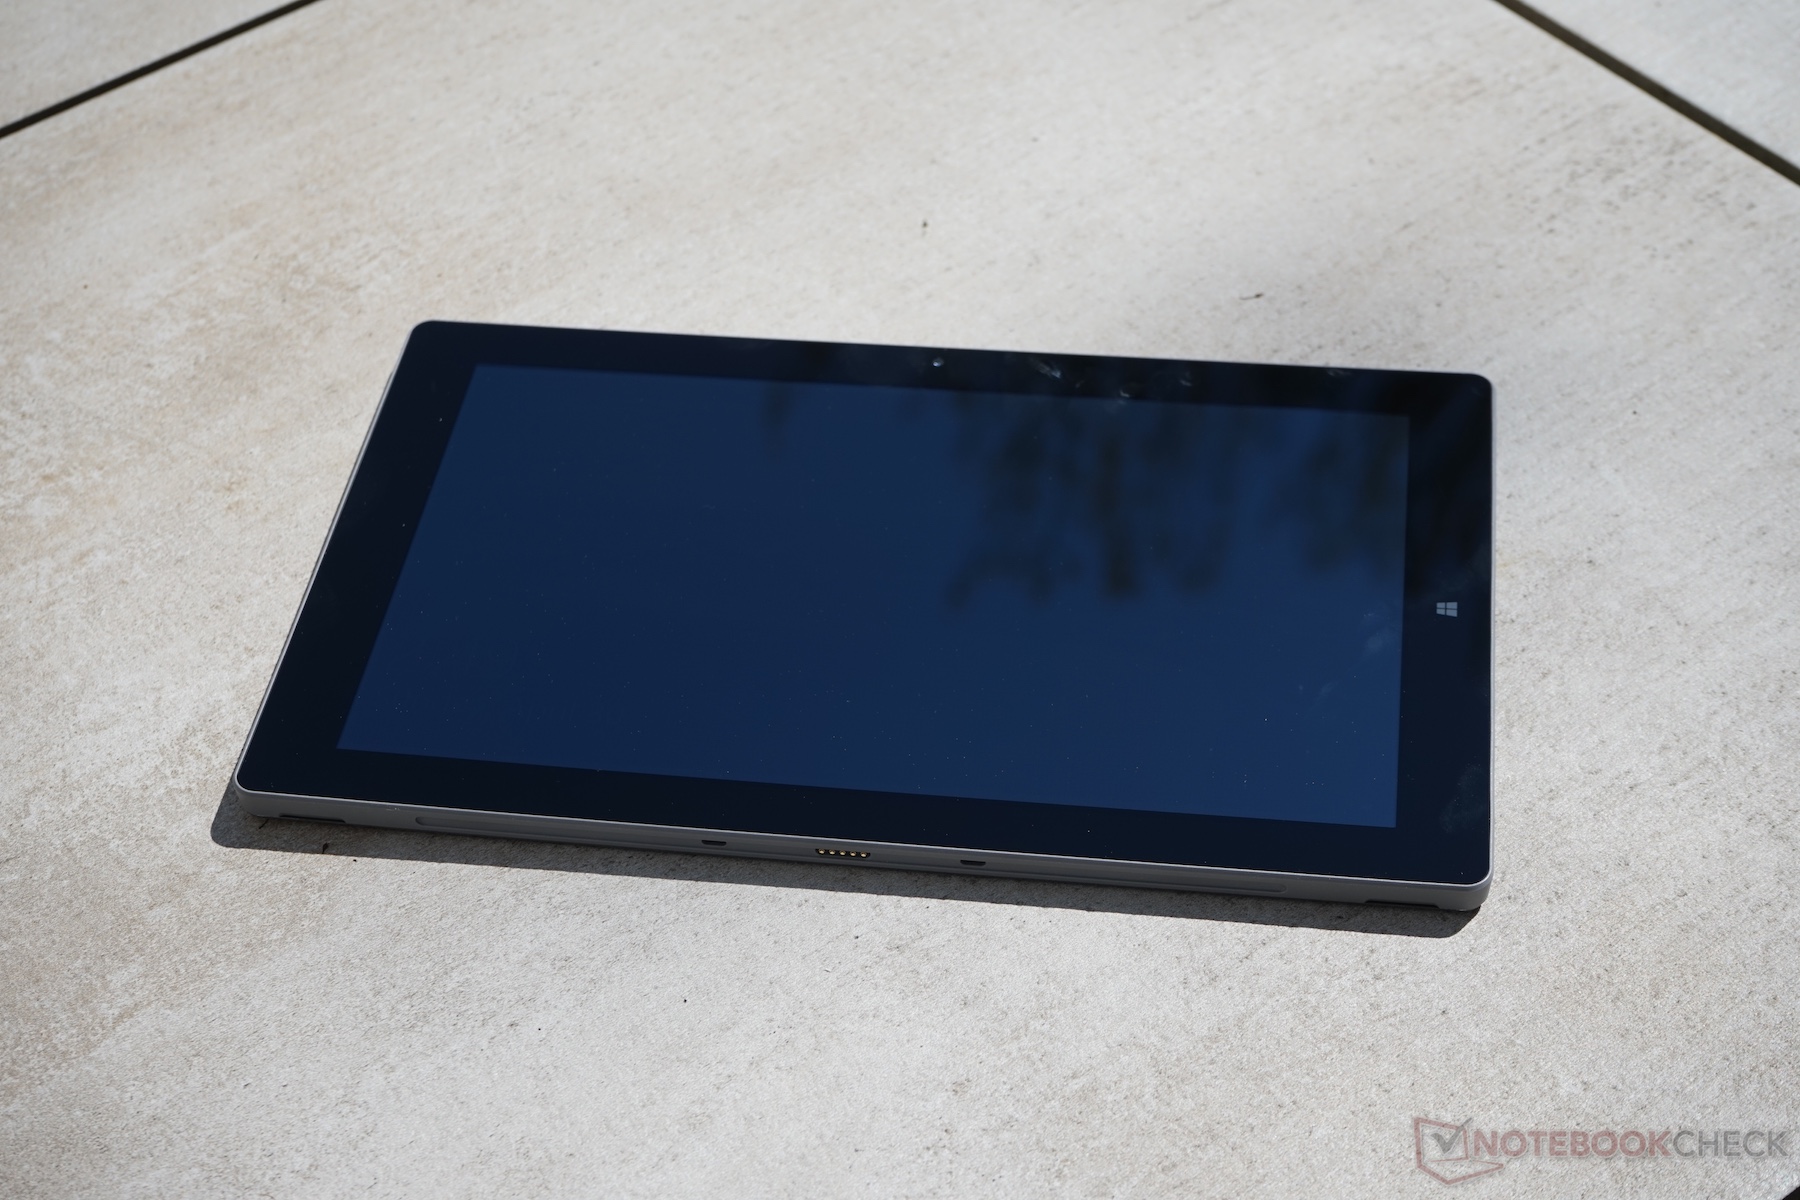
Aparte de estos problemas, el tablet también tiene un par de inconvenientes notables en su diseño: las cámaras, altavoces y el touchpad. Además el dispositivo no está a la venta en Europa debido a la ausencia de certificación CE y solo puede ser importado desde China. La garantía y el soporte por tanto dependen del vendedor, además de tener que pagar los costes de aduanas y envío.
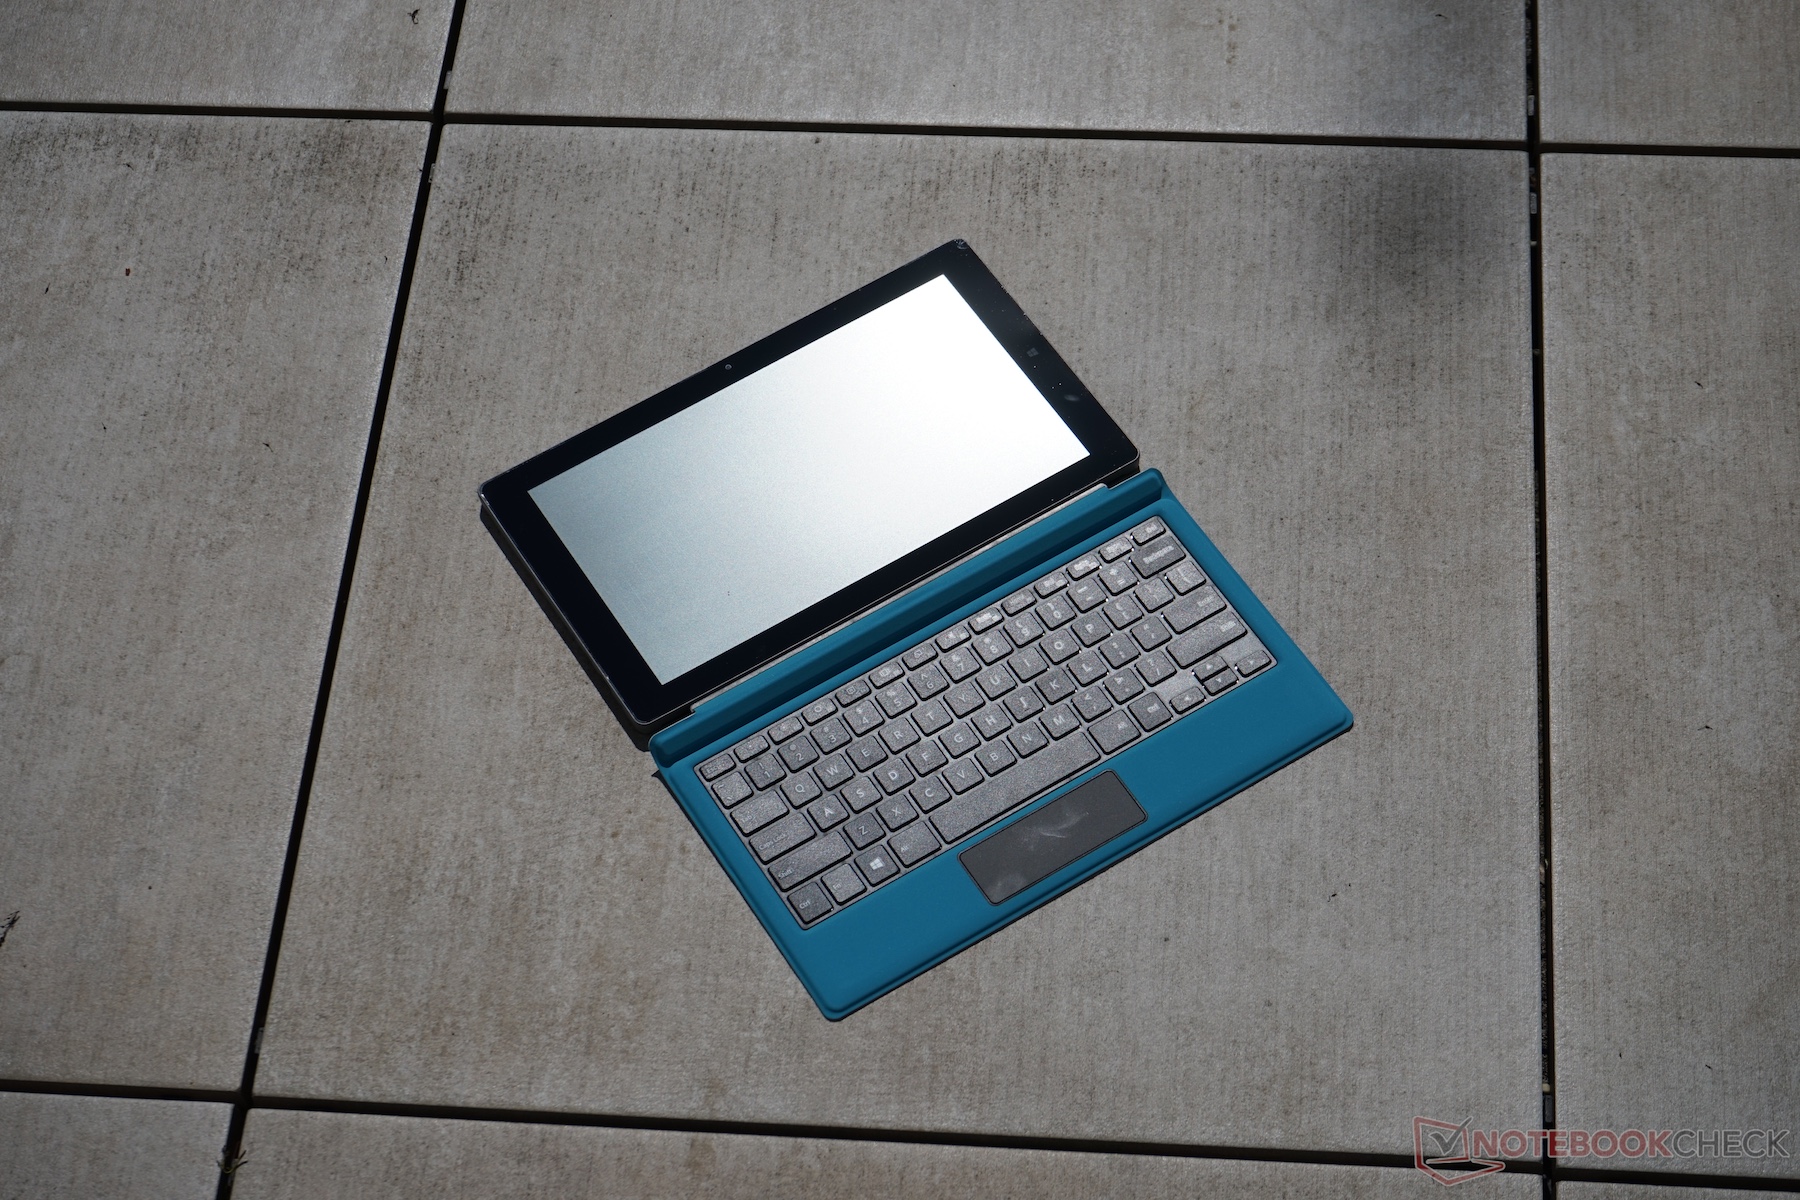
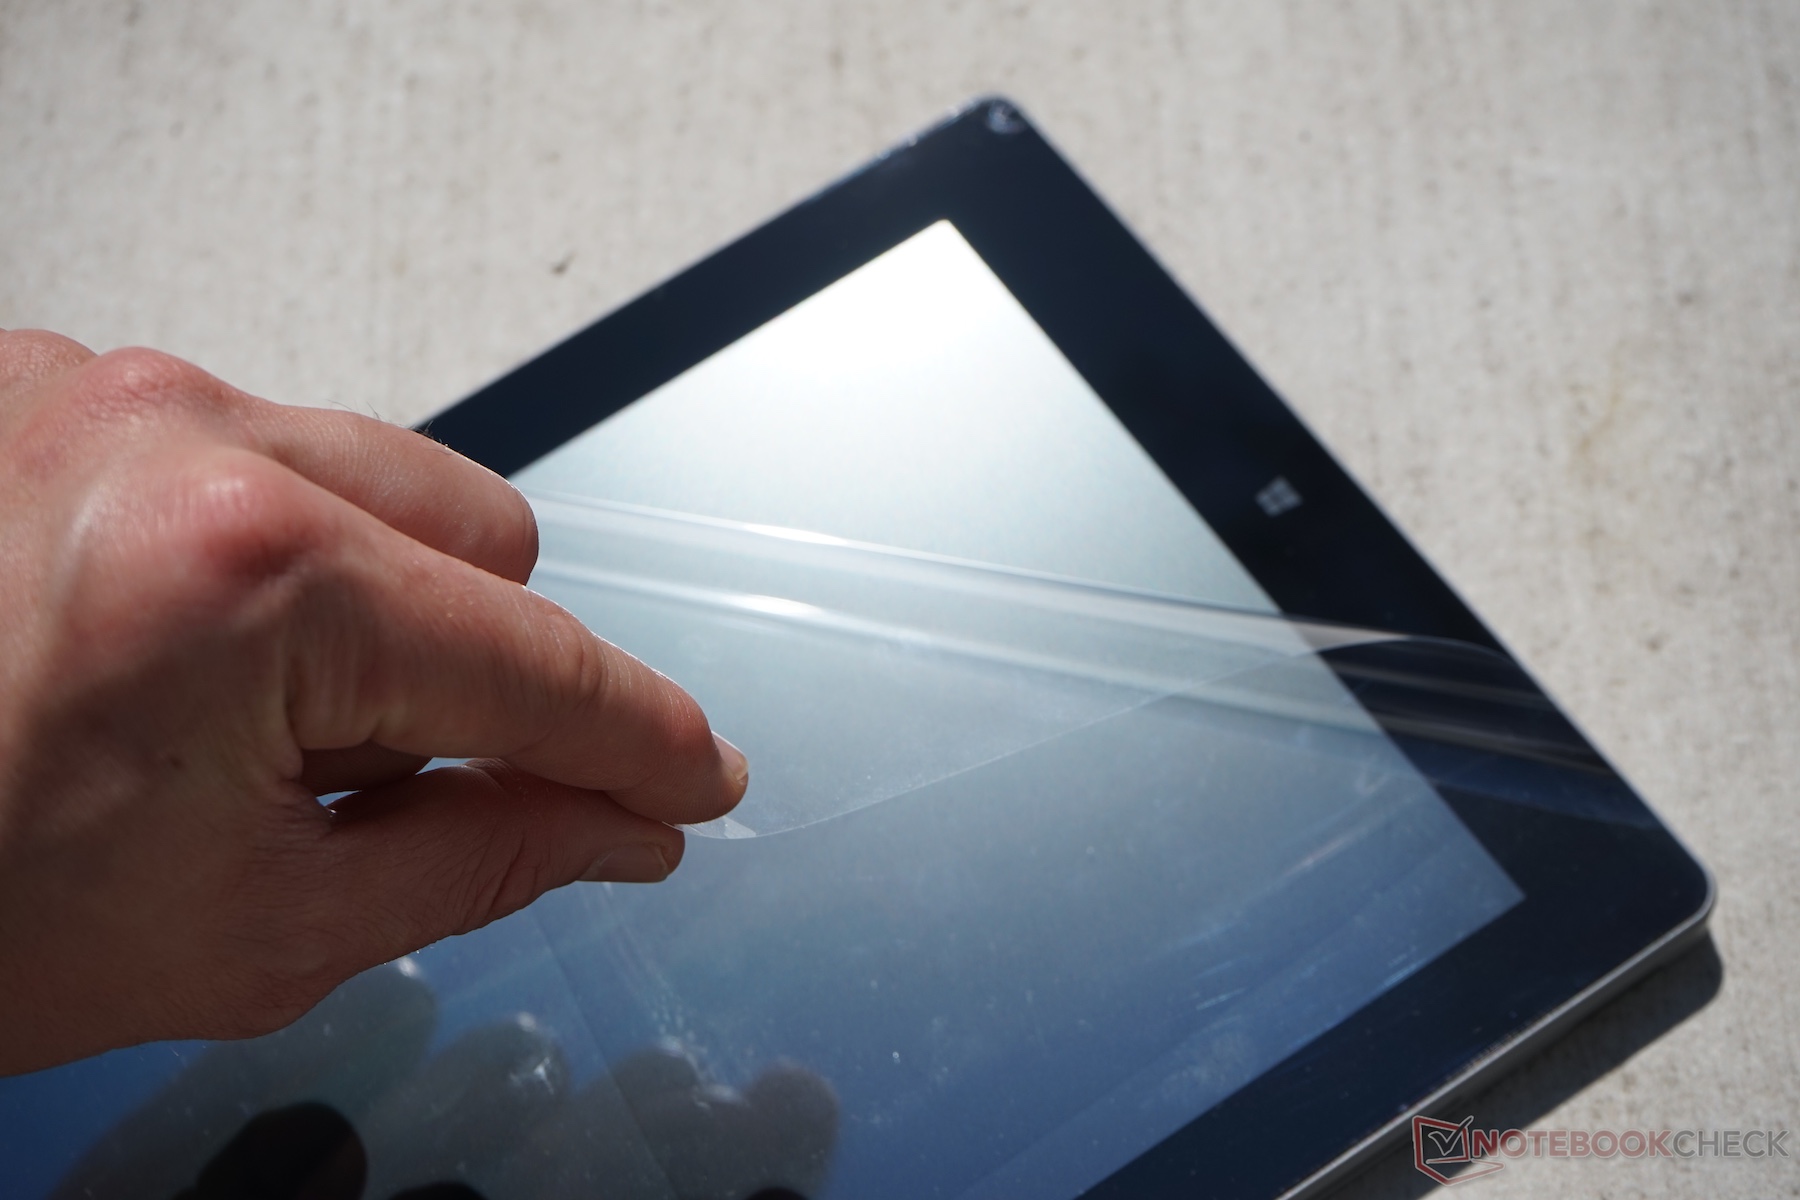
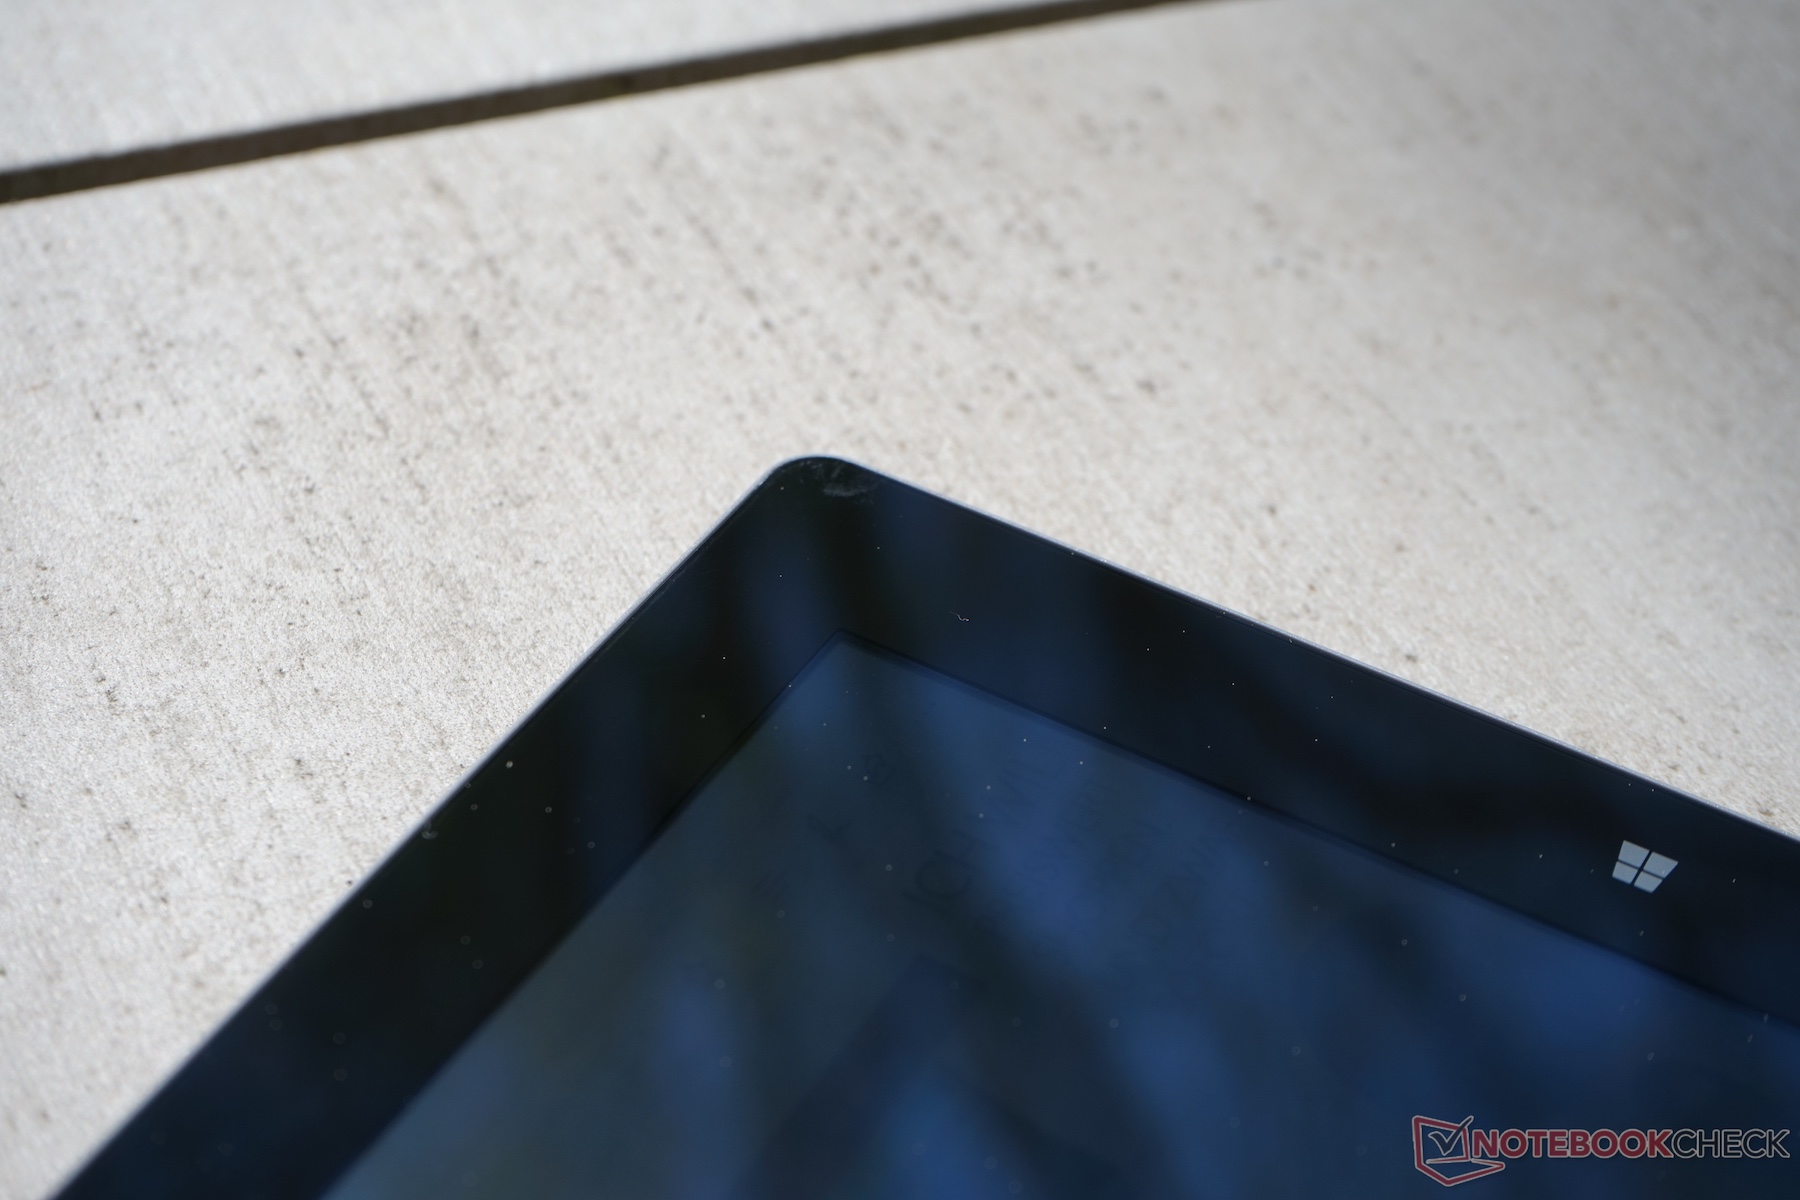
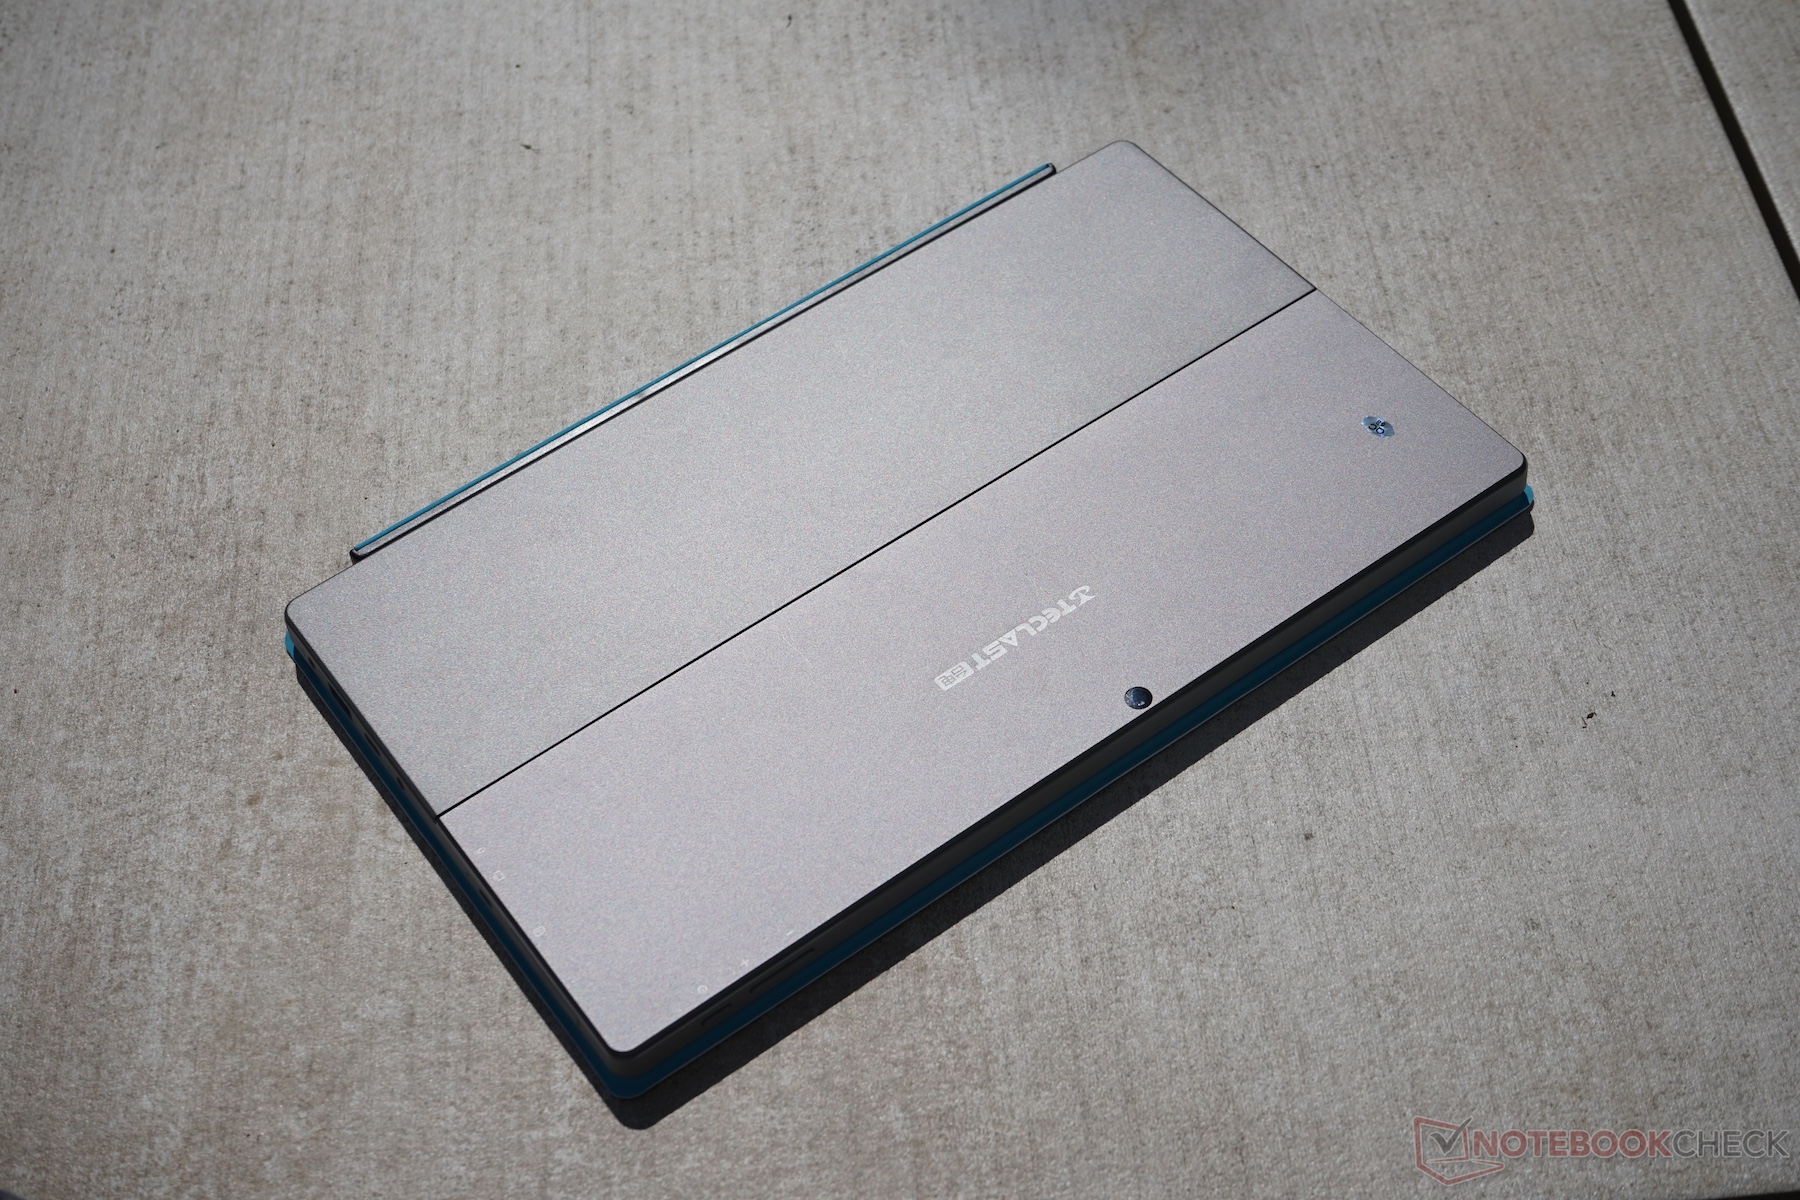
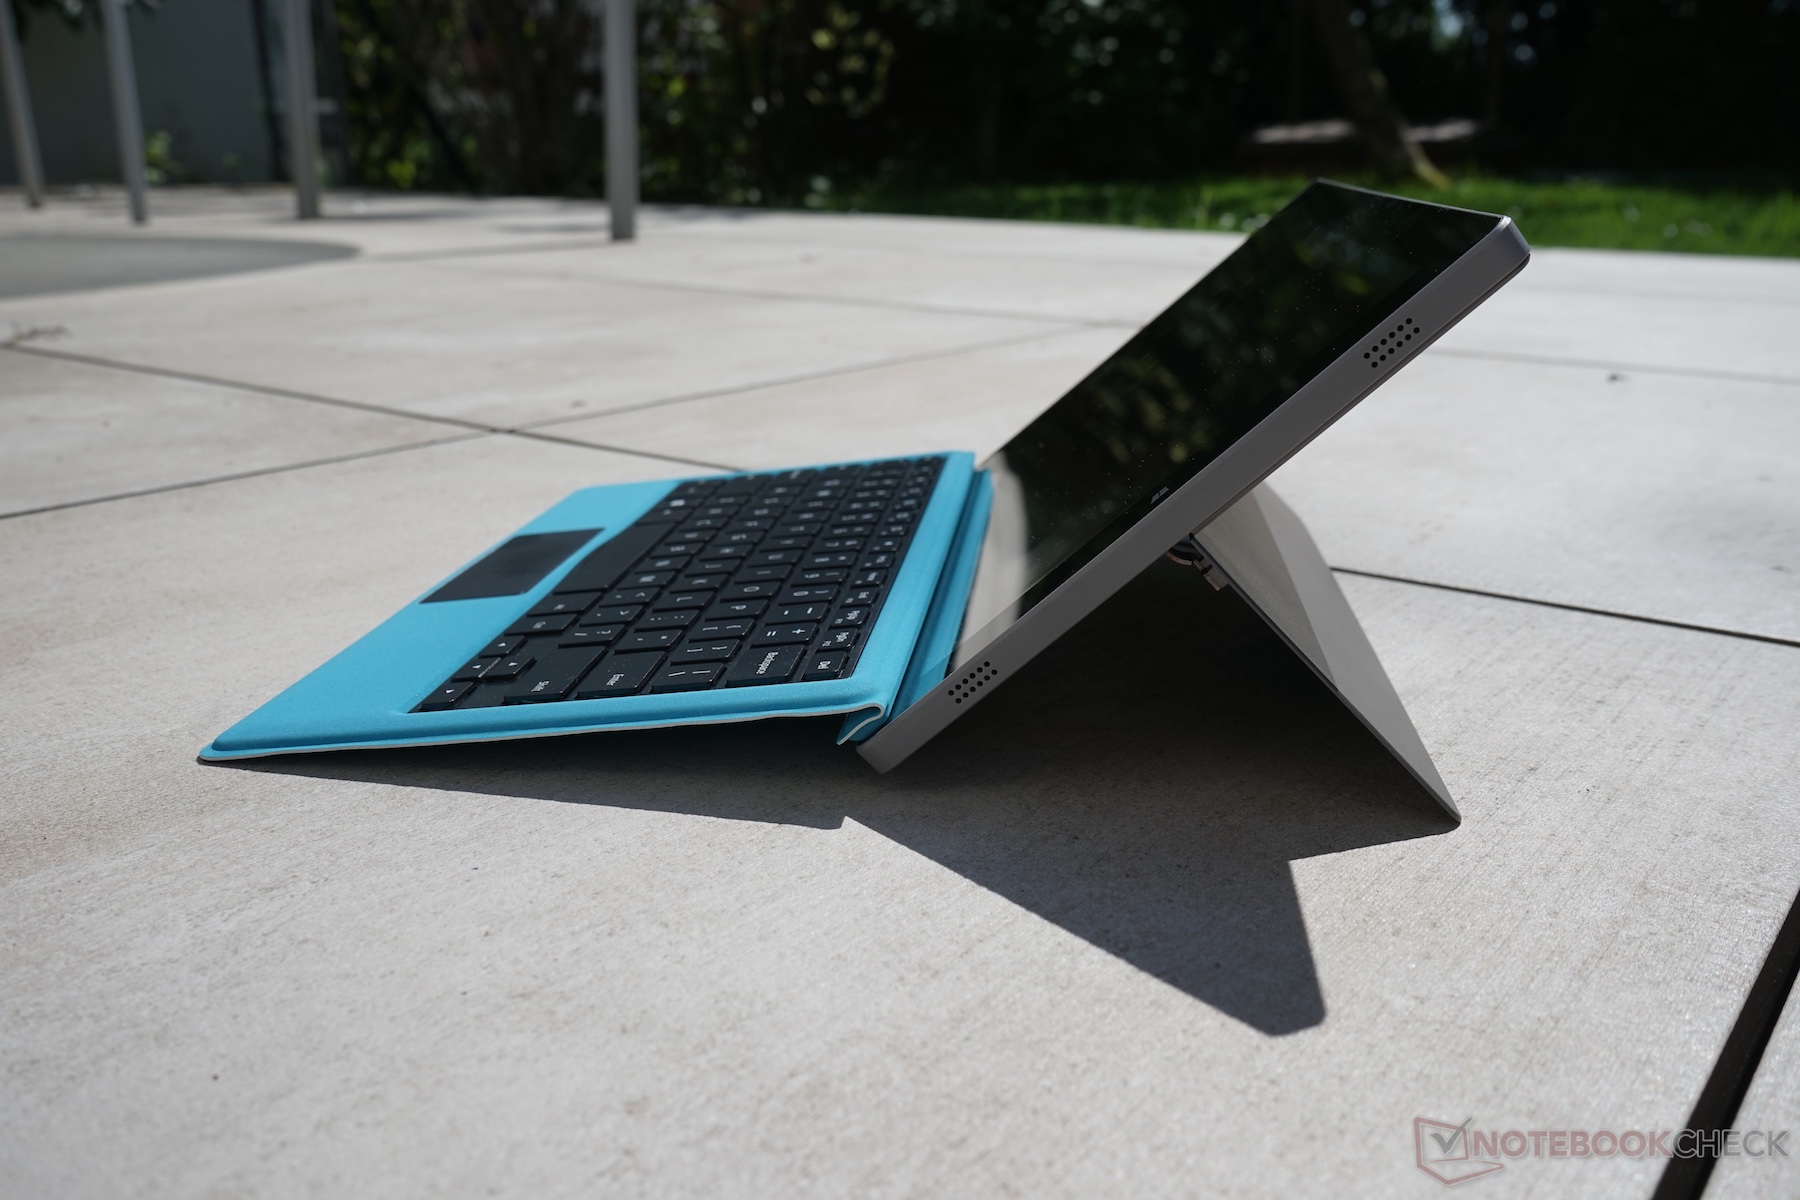
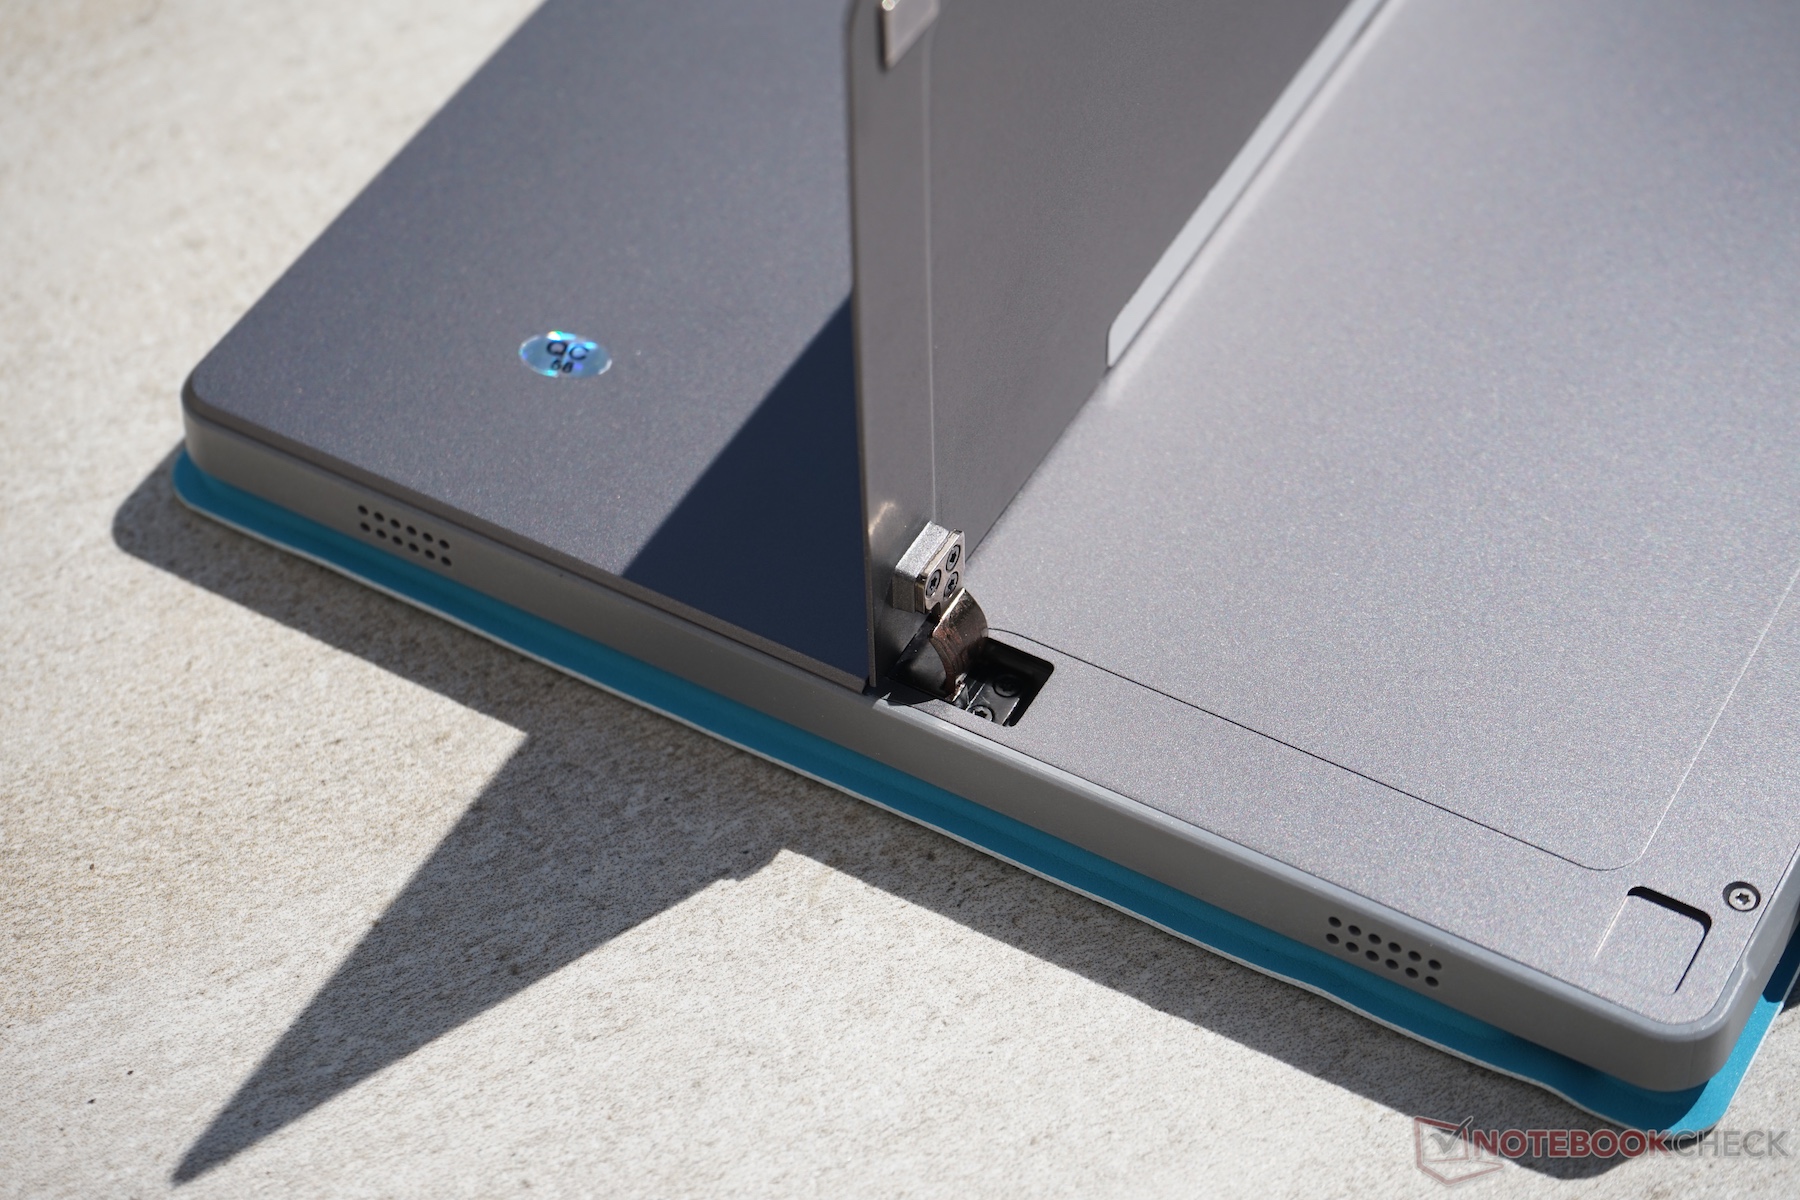
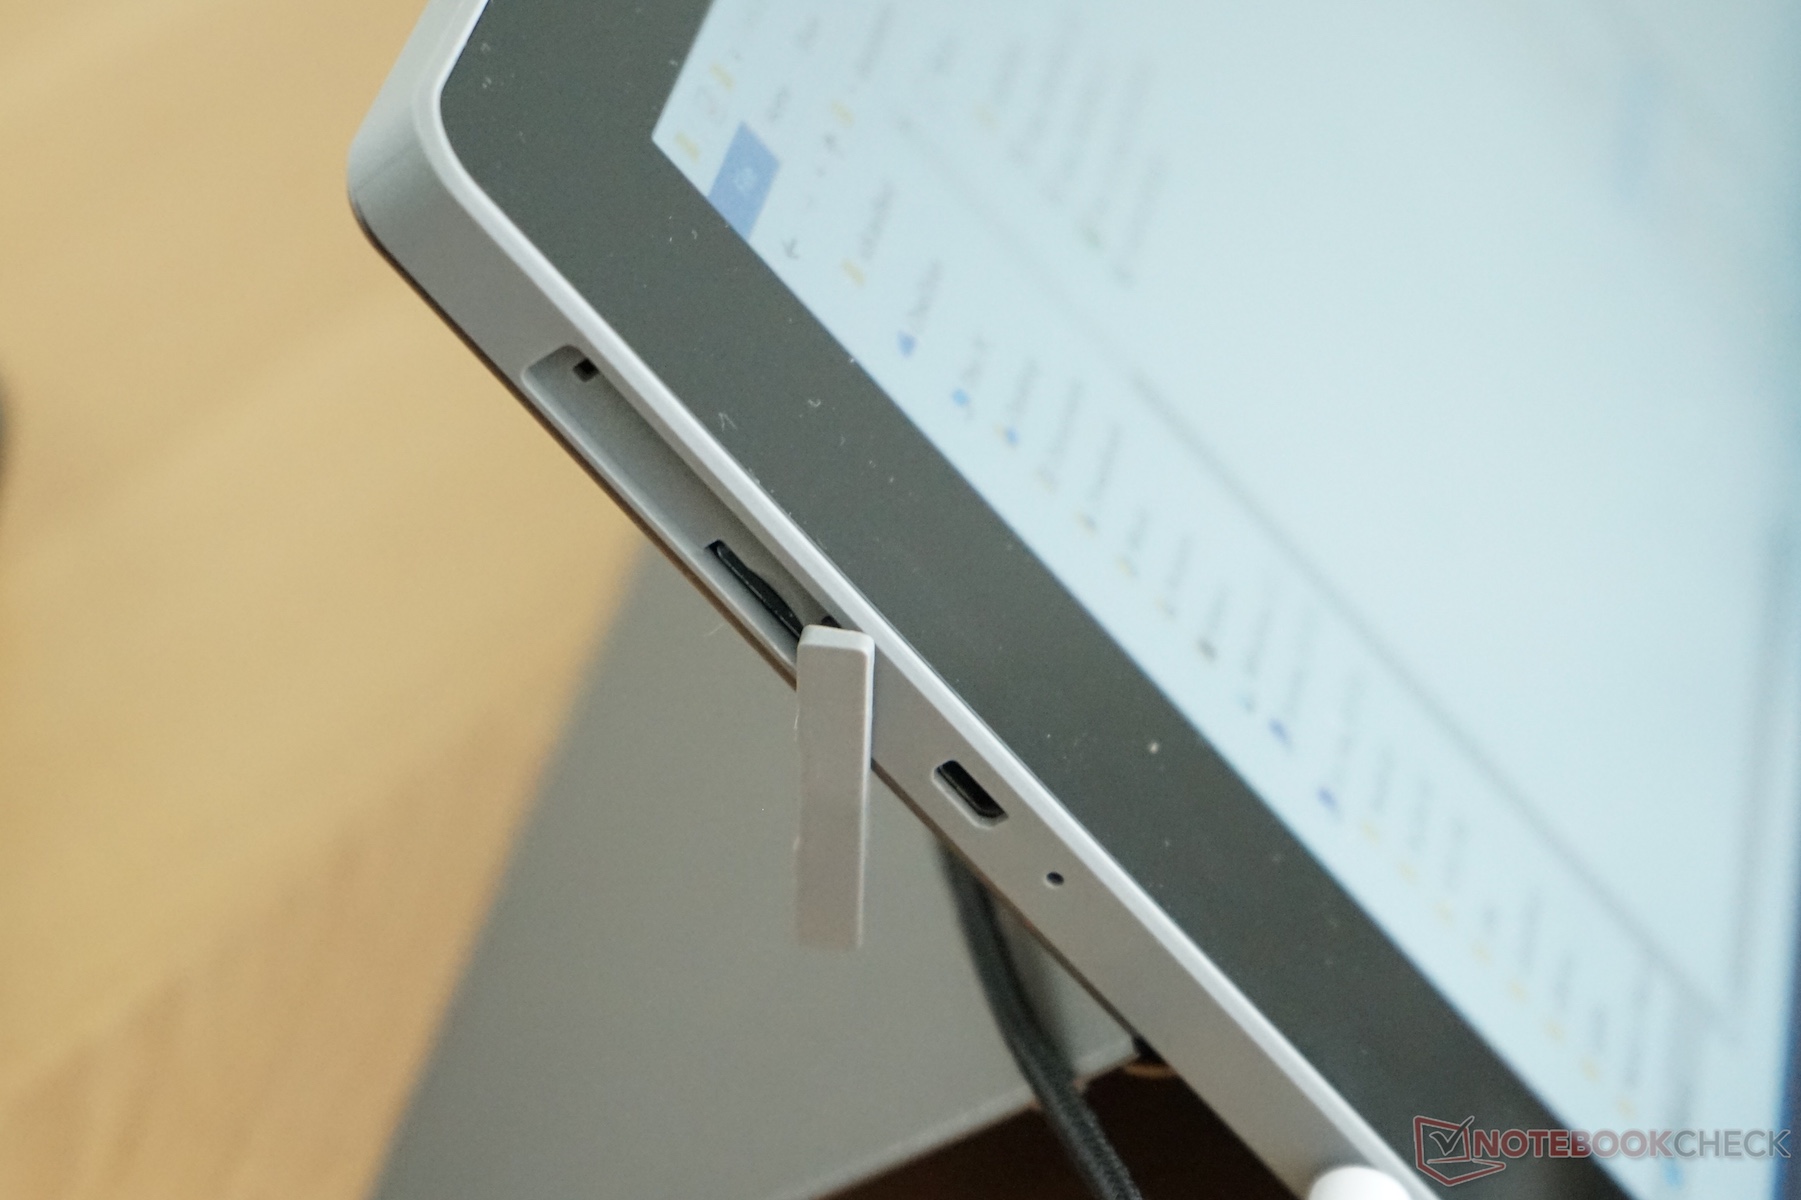
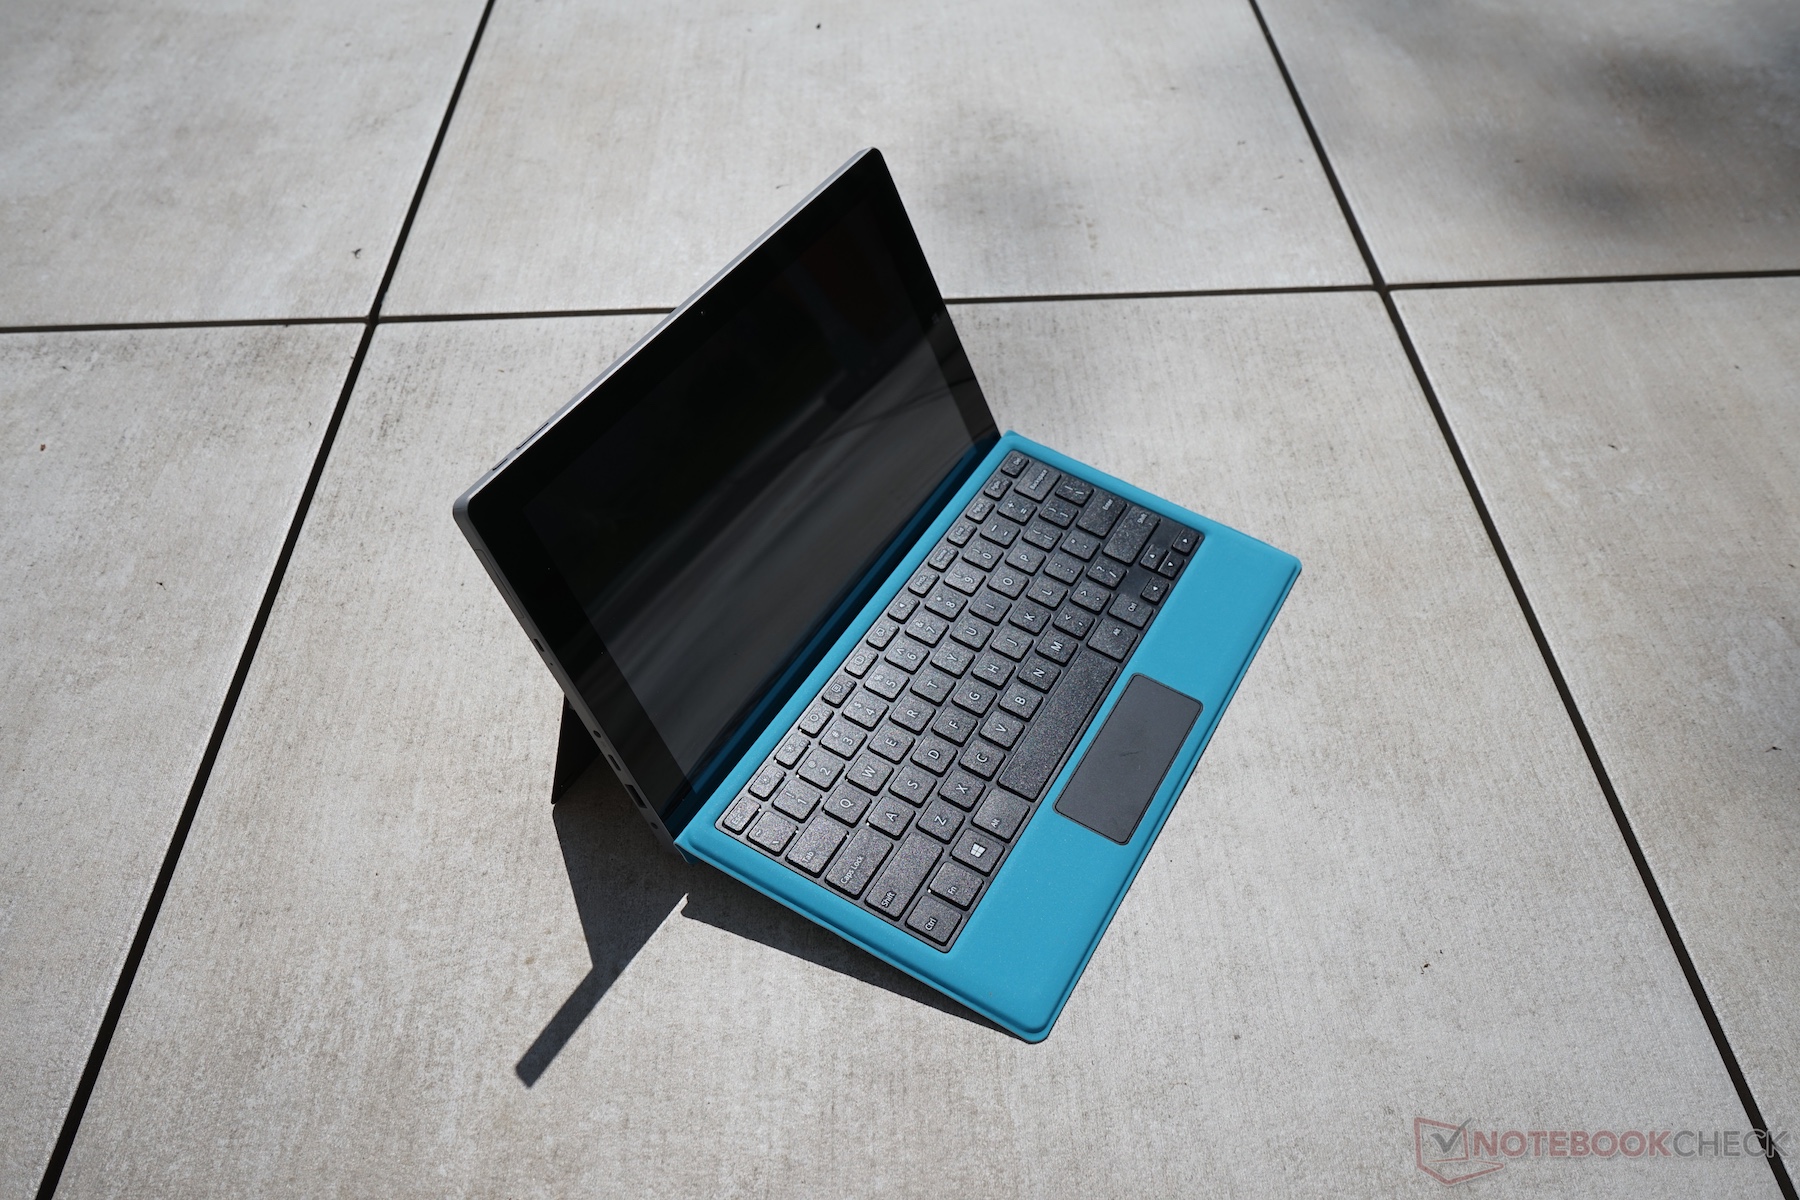
Sin embargo también tiene un par de aspectos positivos. A pesar de no ser adecuado para su uso en exteriores, la pantalla no estaba mal de todo. La rigidez de la carcasa es excelente y tiene un tacto y un aspecto muy agradable. Nos gustó lo silencioso que resulta (no tiene ventiladores) y el lector de tarjeta MicroSD resultó ser muy rápido.
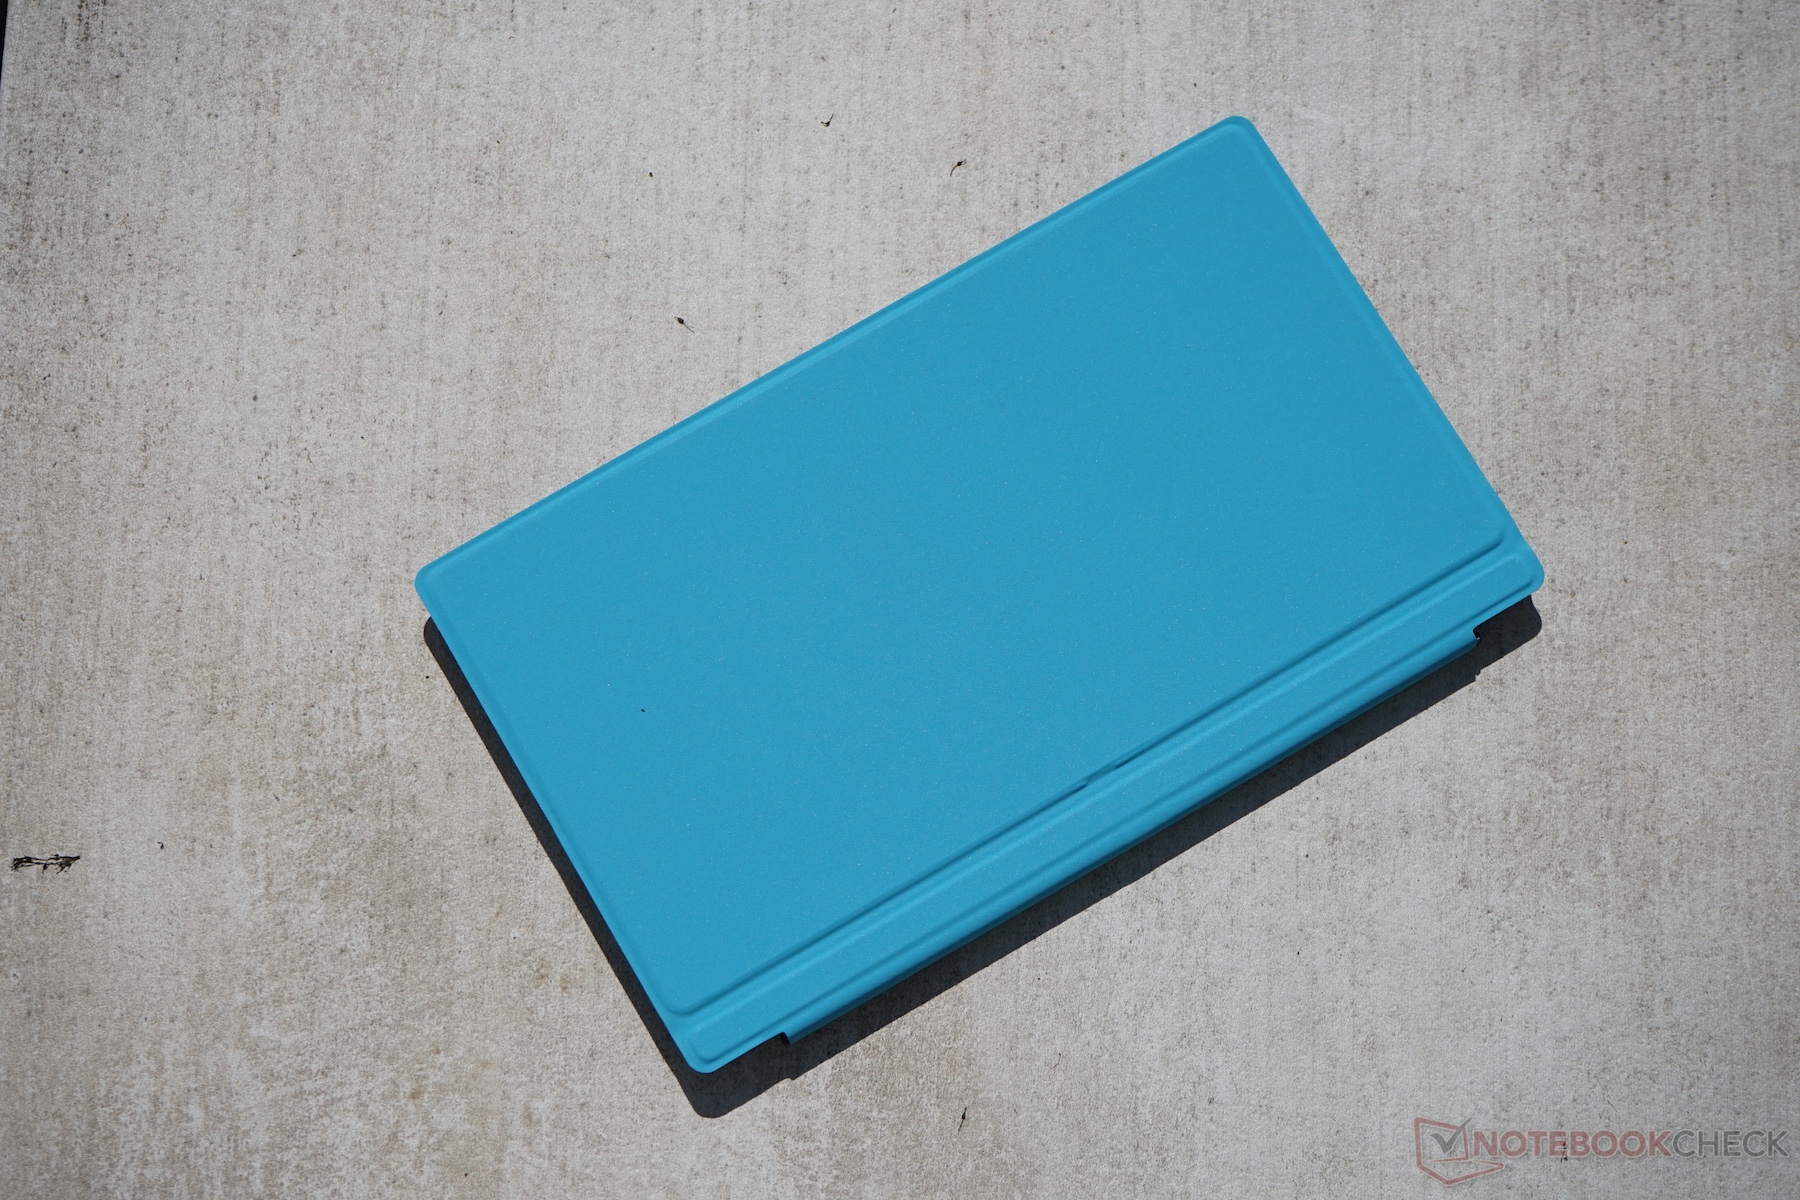
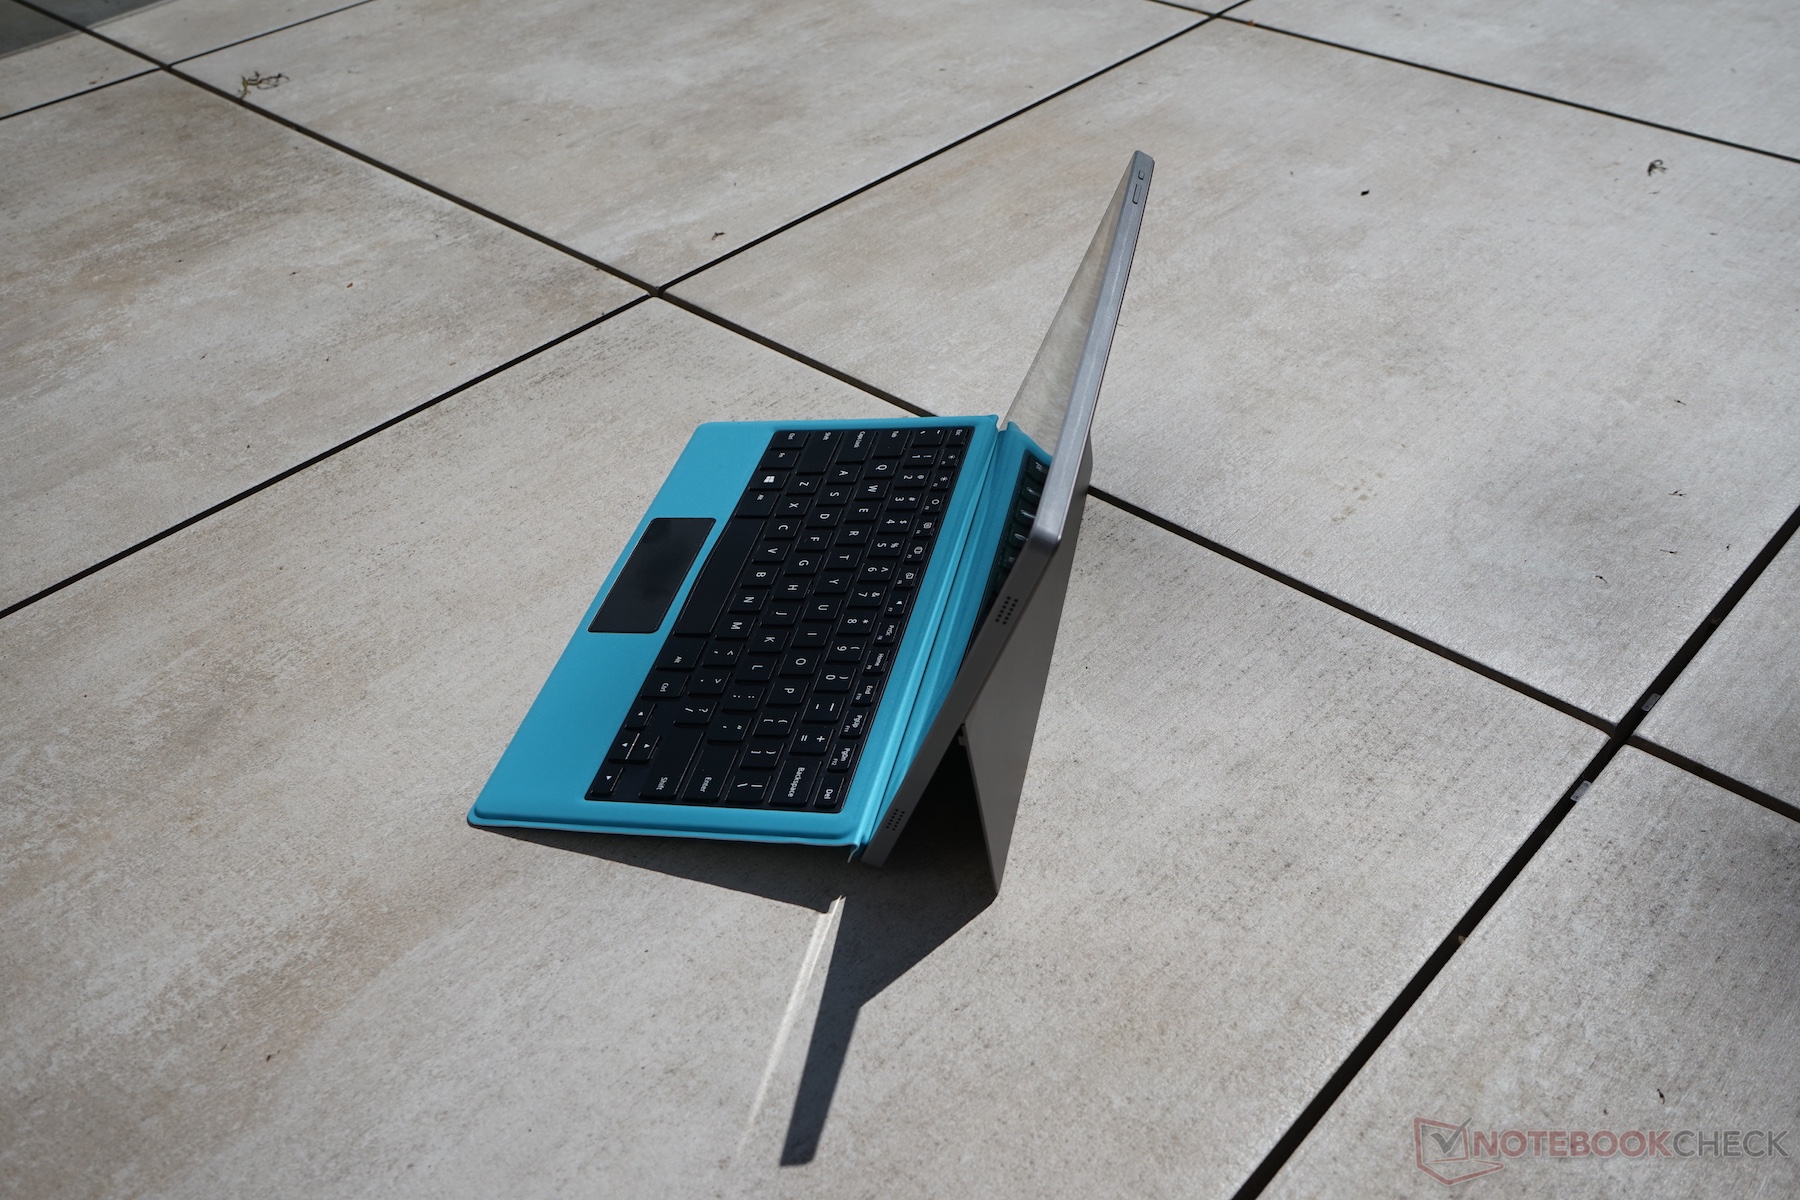
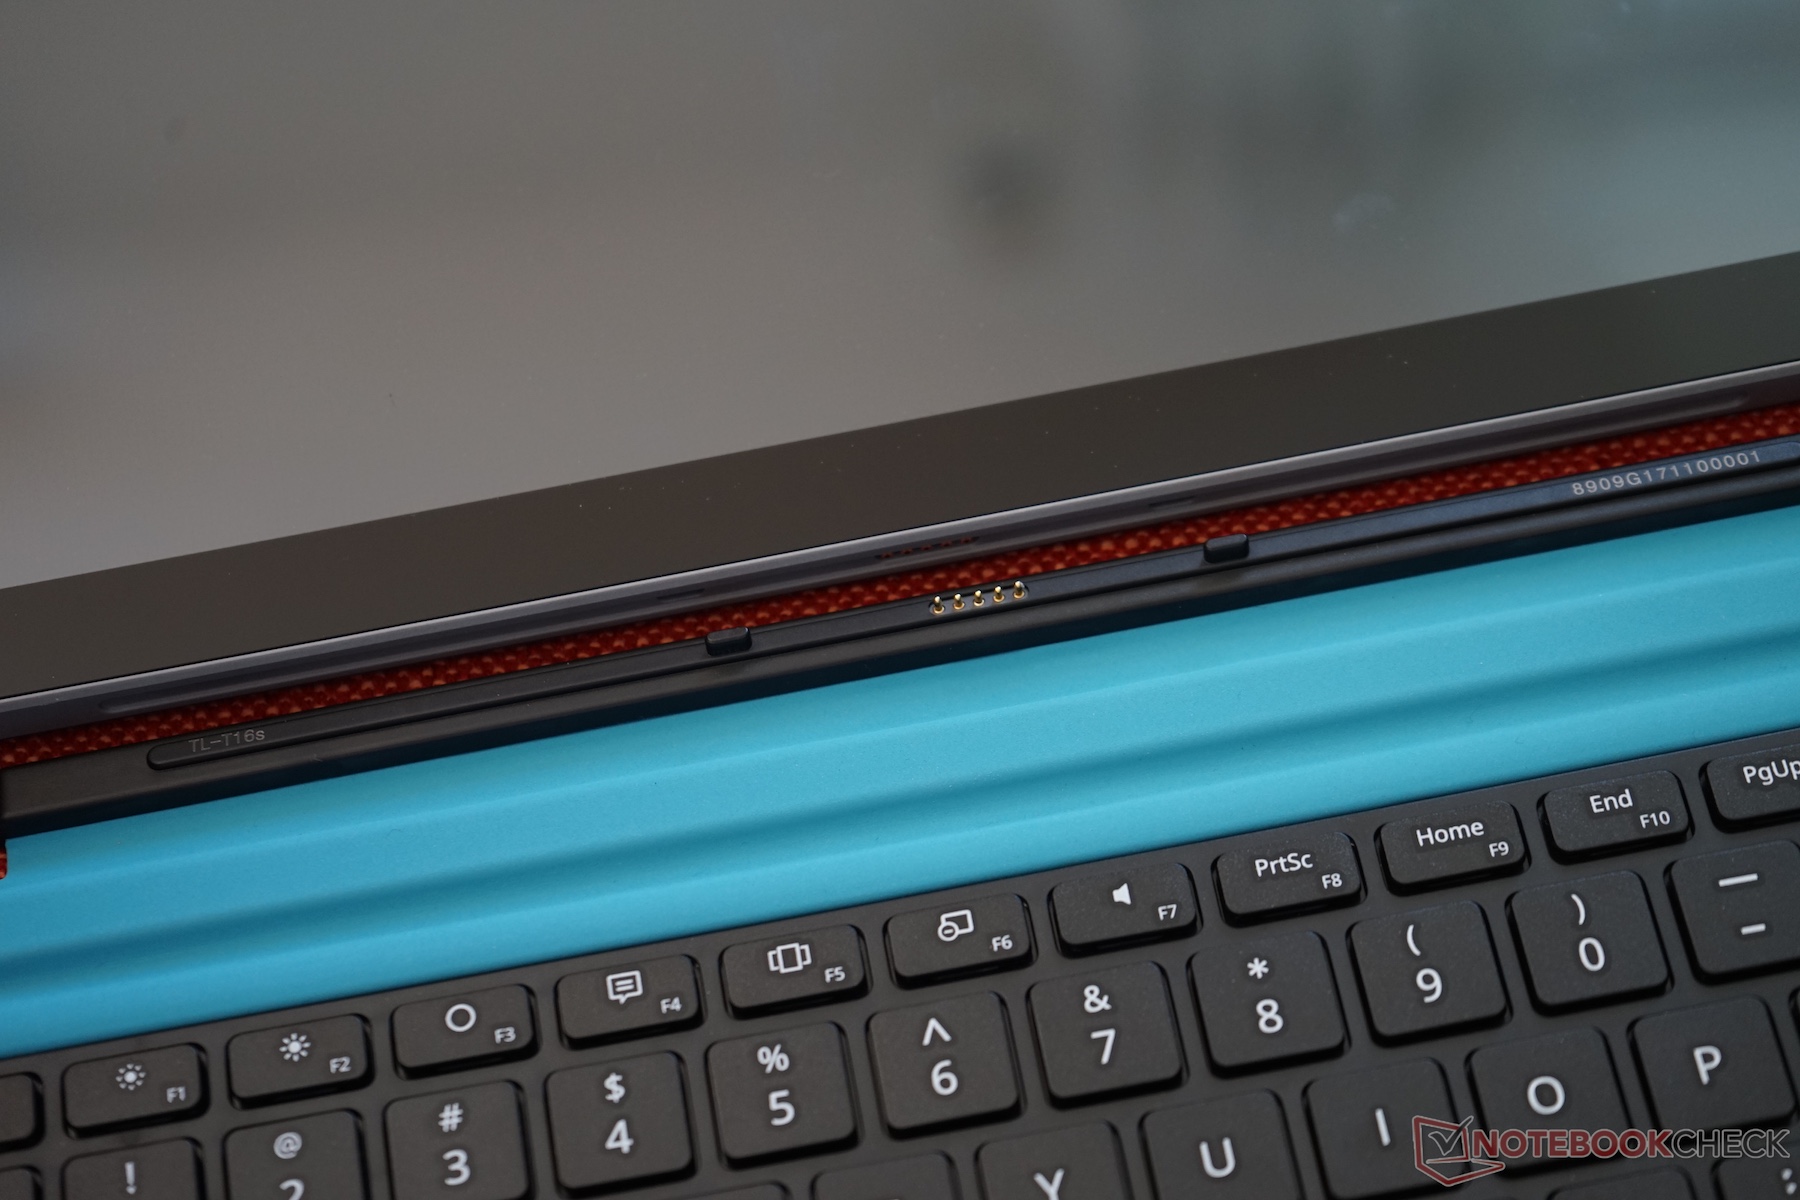
Recibimos nuestro dispositivo de prueba de Gearbest directamente desde China, donde se vendé actualmente por unos 310$. La base de expansión con teclado cuesta otros $35 y es, a pesar de sus inconvenientes, muy recomendable.
Ésta es una versión acortada del análisis original. Puedes leer el análisis completo en inglés aquí.
Teclast Tbook 16 Power
- 05/15/2017 v6 (old)
Klaus Hinum
Price comparison
