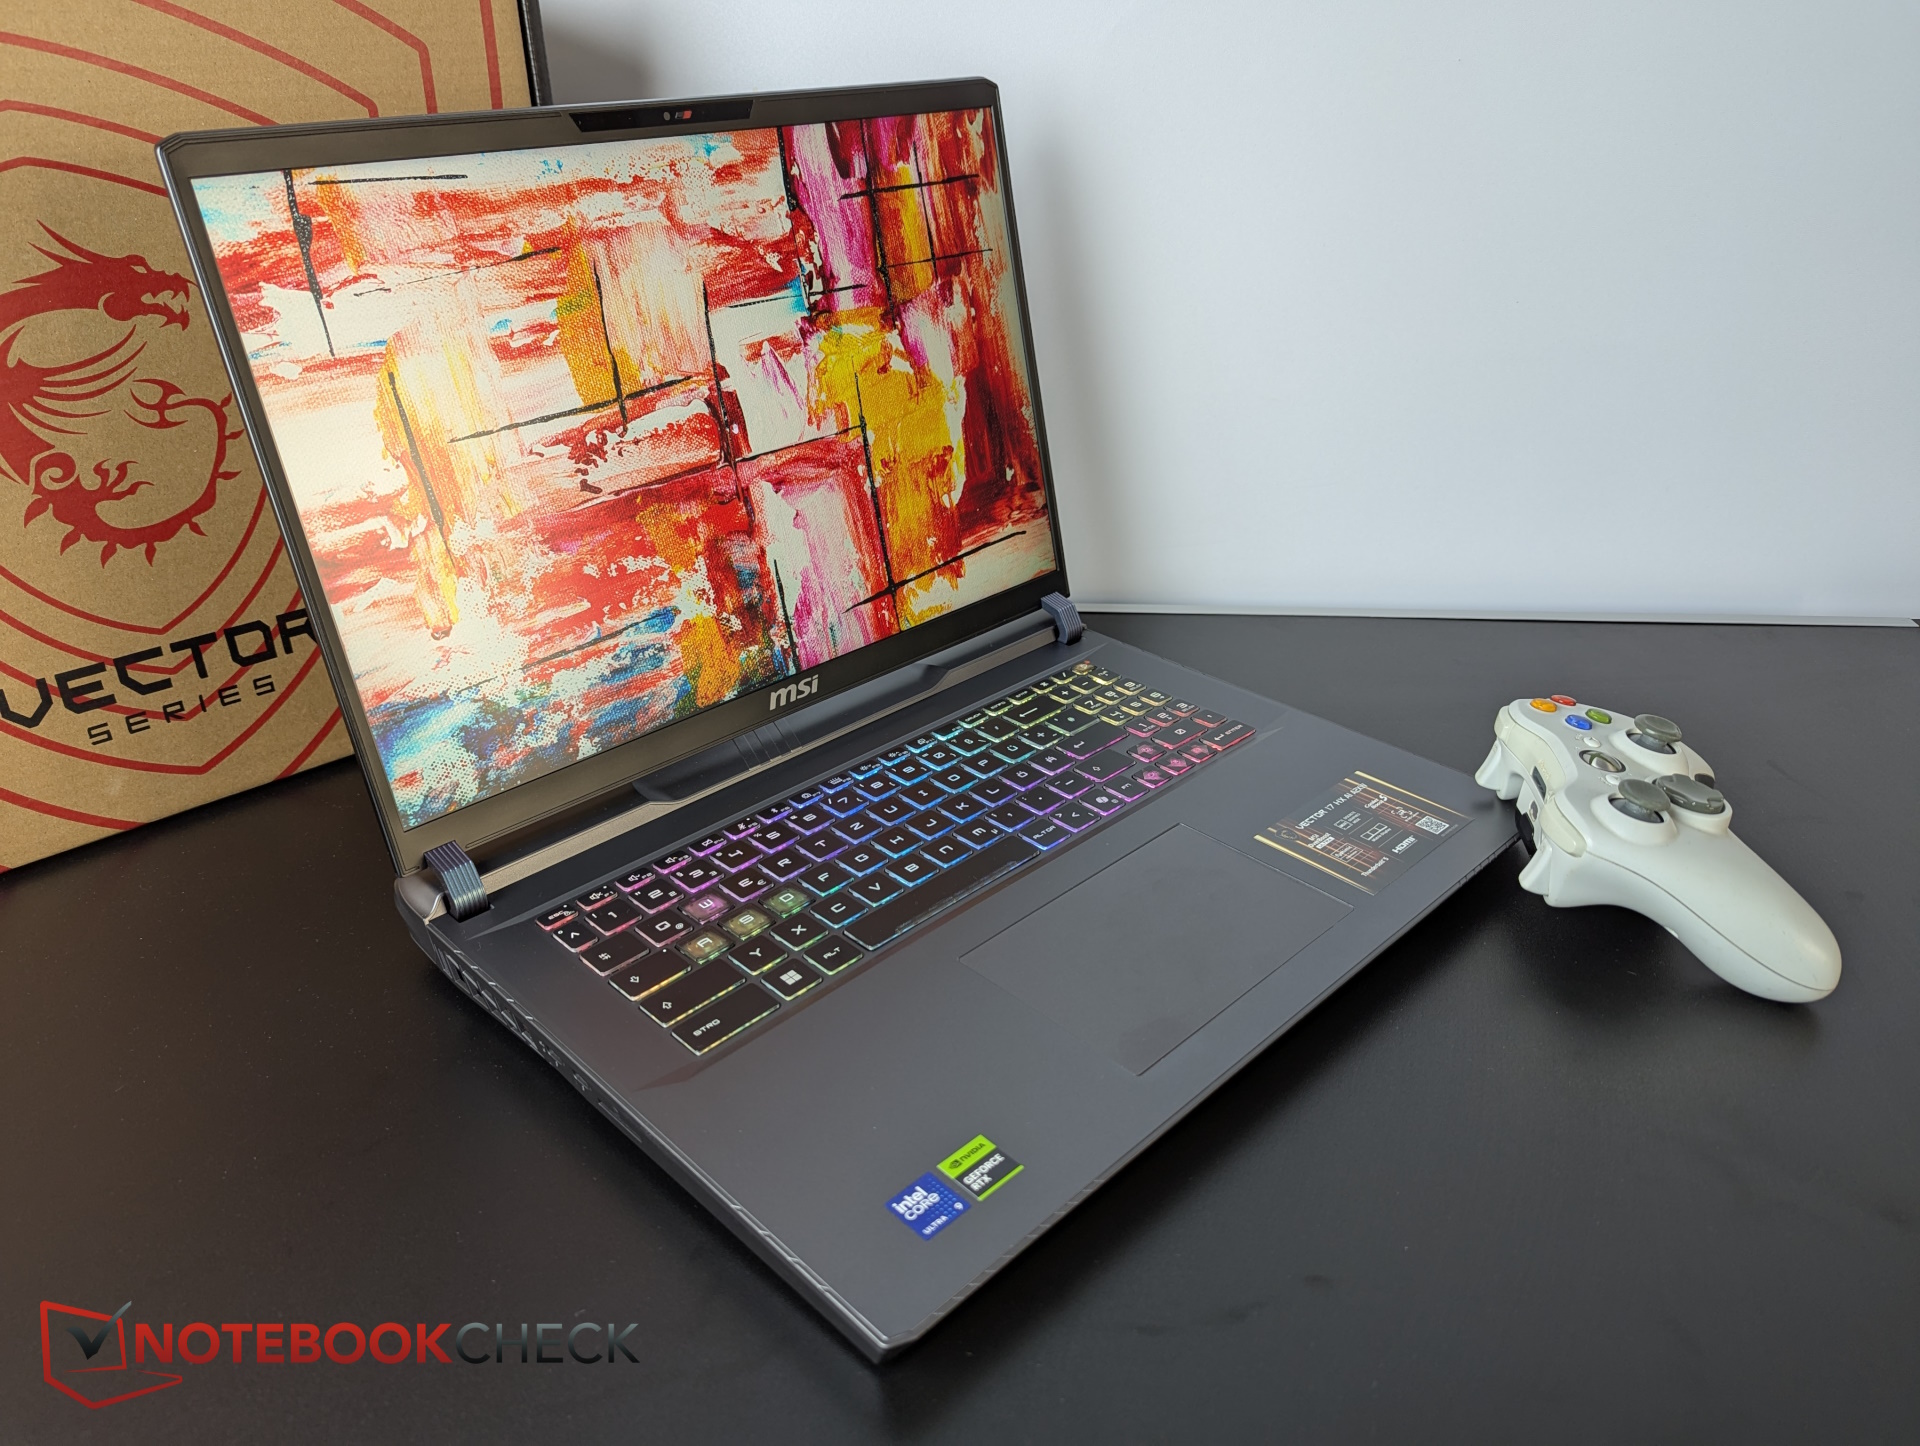
Veredicto - Rendimiento débil de la CPU, rendimiento poco destacable en juegos
Resulta molesto que el rendimiento de la CPU del Vector 17 caiga bruscamente en la prueba de resistencia, sobre todo porque el Vector 16 rinde consistentemente con una CPU más débil. El rendimiento puro en juegos es mediocre en el mejor de los casos, pero bastante consistente. Por desgracia, el Vector 17 es bastante ruidoso.
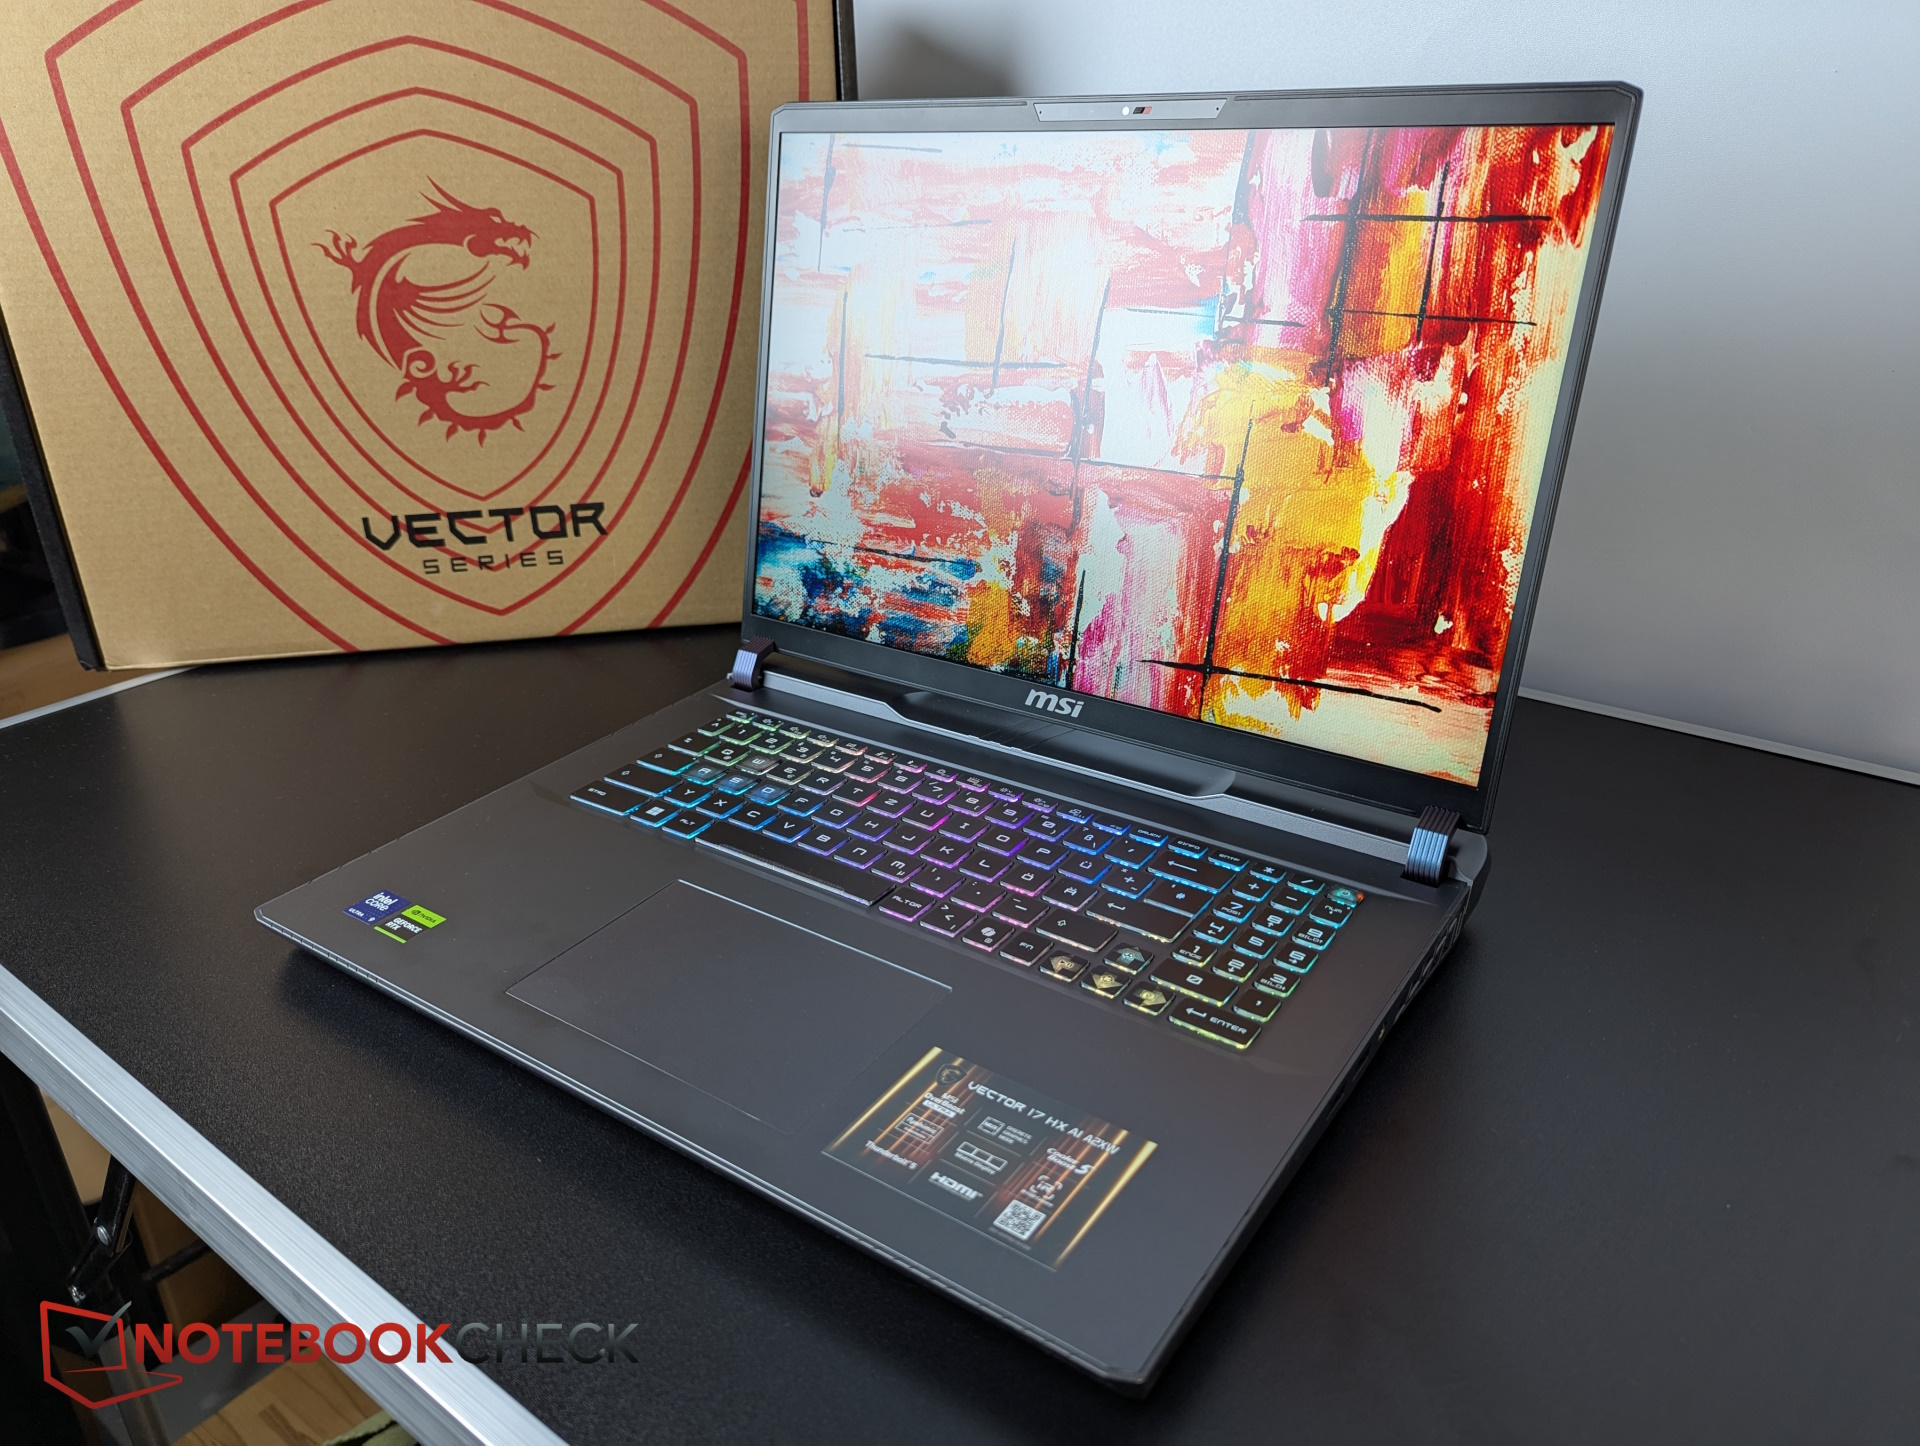
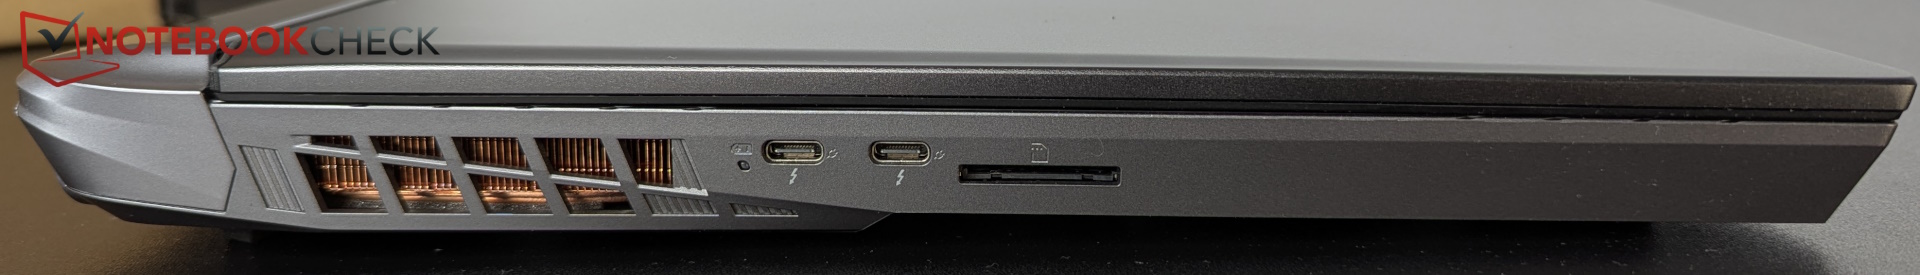
La pantalla deja una impresión ambivalente: Puntúa con una luminosidad decente y el espacio de color P3, pero pierde algo de simpatía debido al valor de negro demasiado alto. Por otro lado, el equipo con doble Thunderbolt 5, lector SD completo y Wi-Fi 7 deja una impresión positiva.
Sigue siendo un portátil para juegos entre medio y bueno que, aparte de sus características, no destaca entre la multitud. Por aproximadamente el mismo precio, también puede conseguir el Legion Pro 7i Gen 10 con la misma GPU, que nos impresionó mucho más en la prueba.
Pro
Contra
Precio y disponibilidad
El Vector 17 con RTX 5080 cuesta normalmente 3.499 Euros (~$4066). Acaba de rebajarse a 3.099 euros (~3602 dólares) en Amazon.
- $1,899.99msi Vector 16 HX AI A2XWHG-285US WQXGA 240Hz Gaming Laptop, Intel Core Ultra 7 255HX 2.4GHz, 32GB RAM, 1TB SSD, NVIDIA GeForce RTX 5070 Ti 12GB, Window 11 Home, Cosmo Gray
- $99.99400W 20V 20A AC Adapter for MSI Raider Titan 18 HX AI A2XWJG A2XWIG Vector A18 HX A9WIG A9WHG Laptop Charger A23-400P1A A400A001P ADP-400CB B Power Supply
- $2,709.00msi Vector 16 HX AI 400 Gaming Laptop, Intel Ultra 9-275HX, 32 GB DDR5 RAM, 1 TB PCIe SSD, 16" WQXGA (2560x1600) 240Hz Display, Nvidia G-Force RTX 5080, RGB Backlit Keyboard, W11 Pro, Cosmo Gray
Índice
- Veredicto - Rendimiento débil de la CPU, rendimiento poco destacable en juegos
- Especificaciones
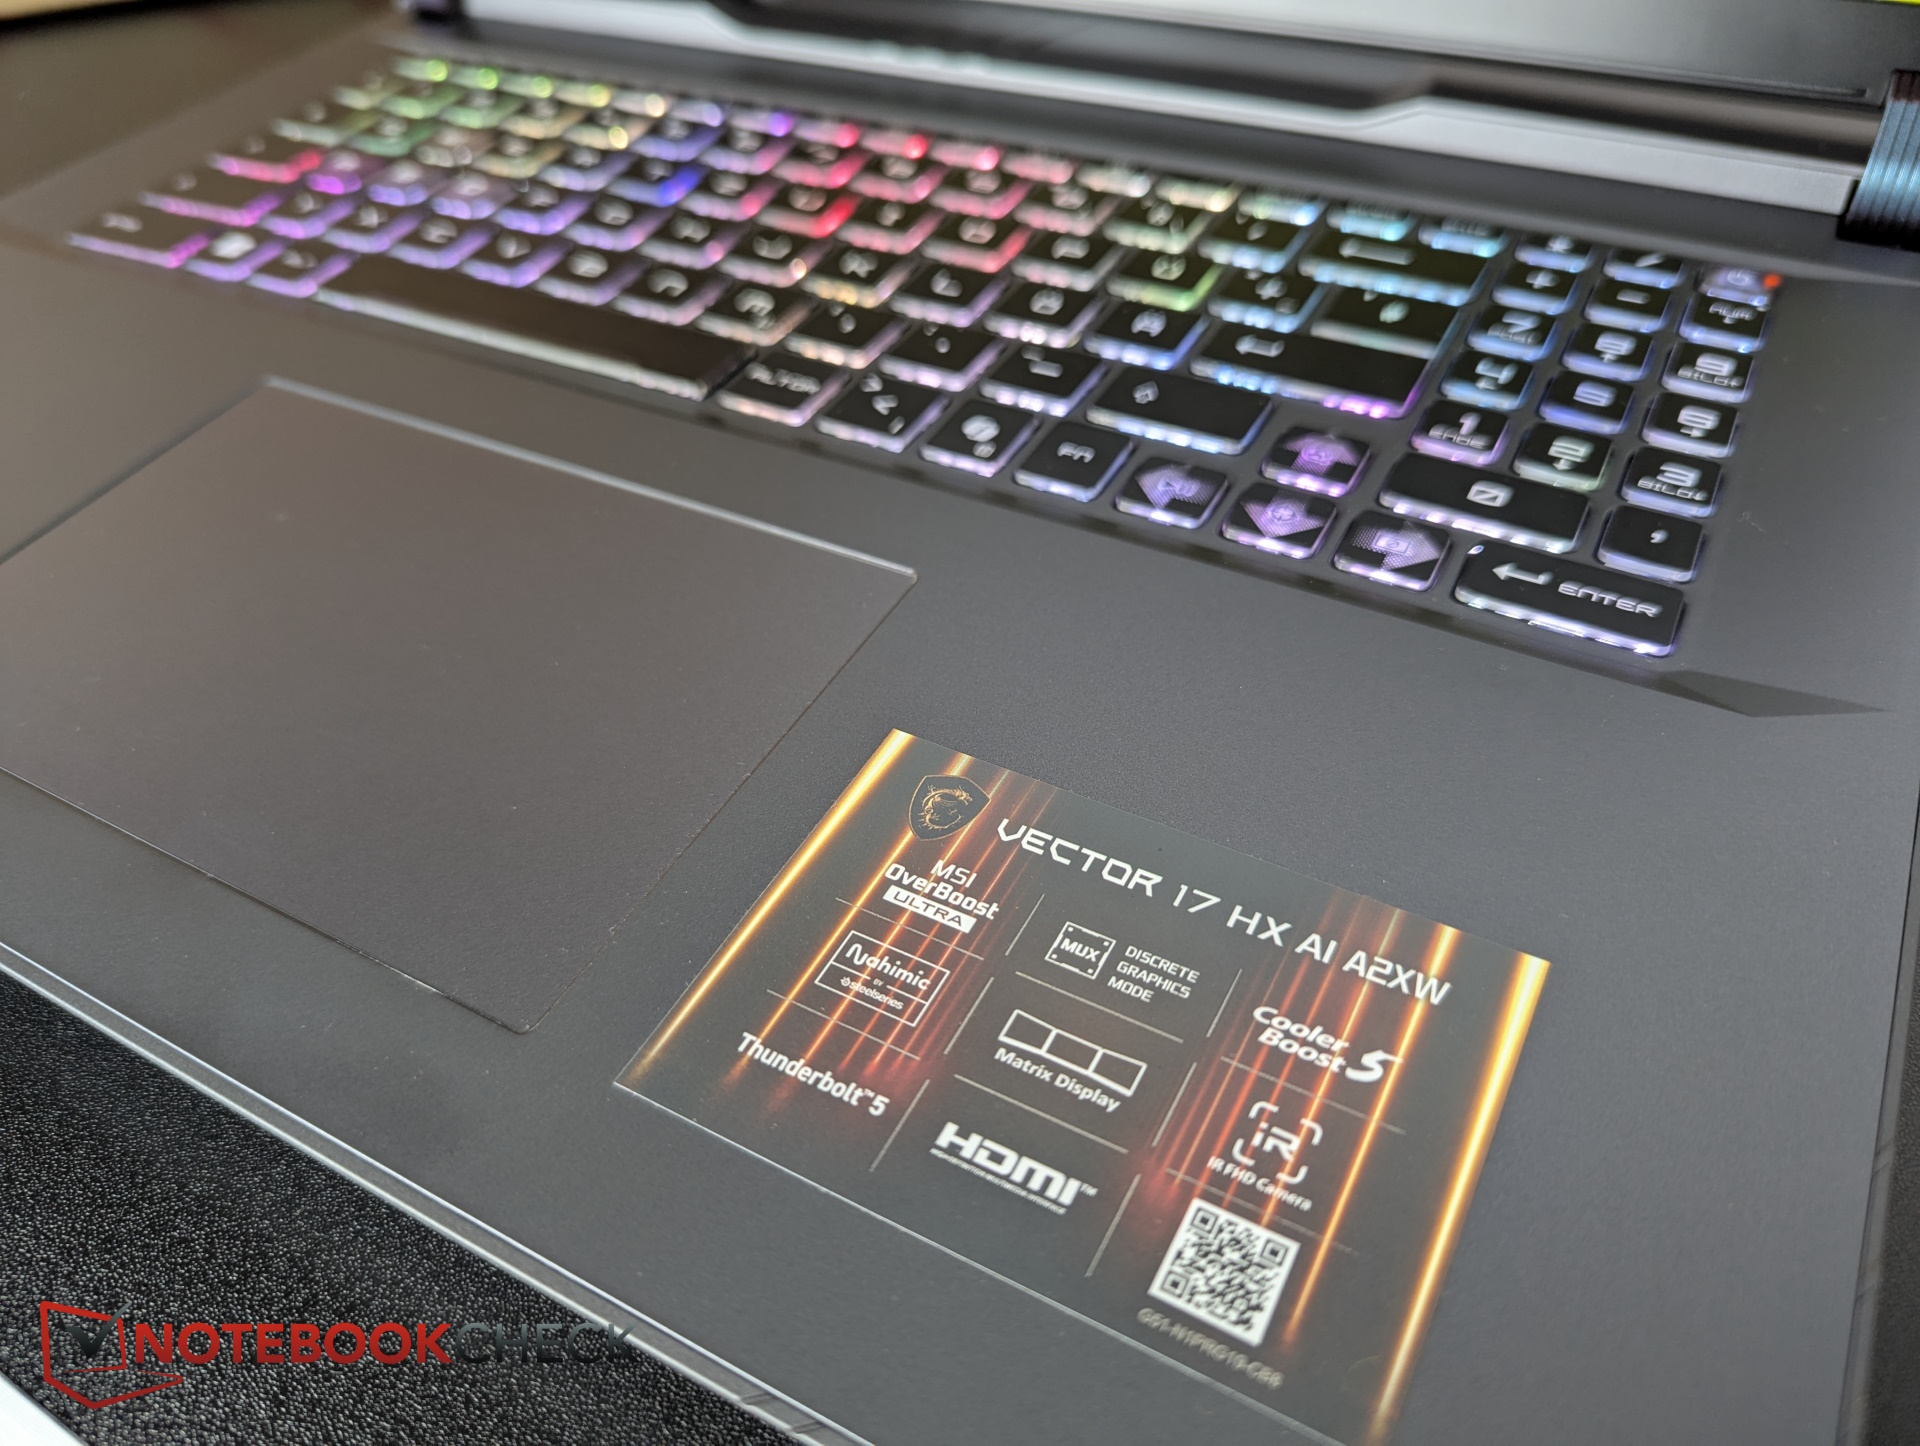
- Caja y características - Tan masiva como una Alienware
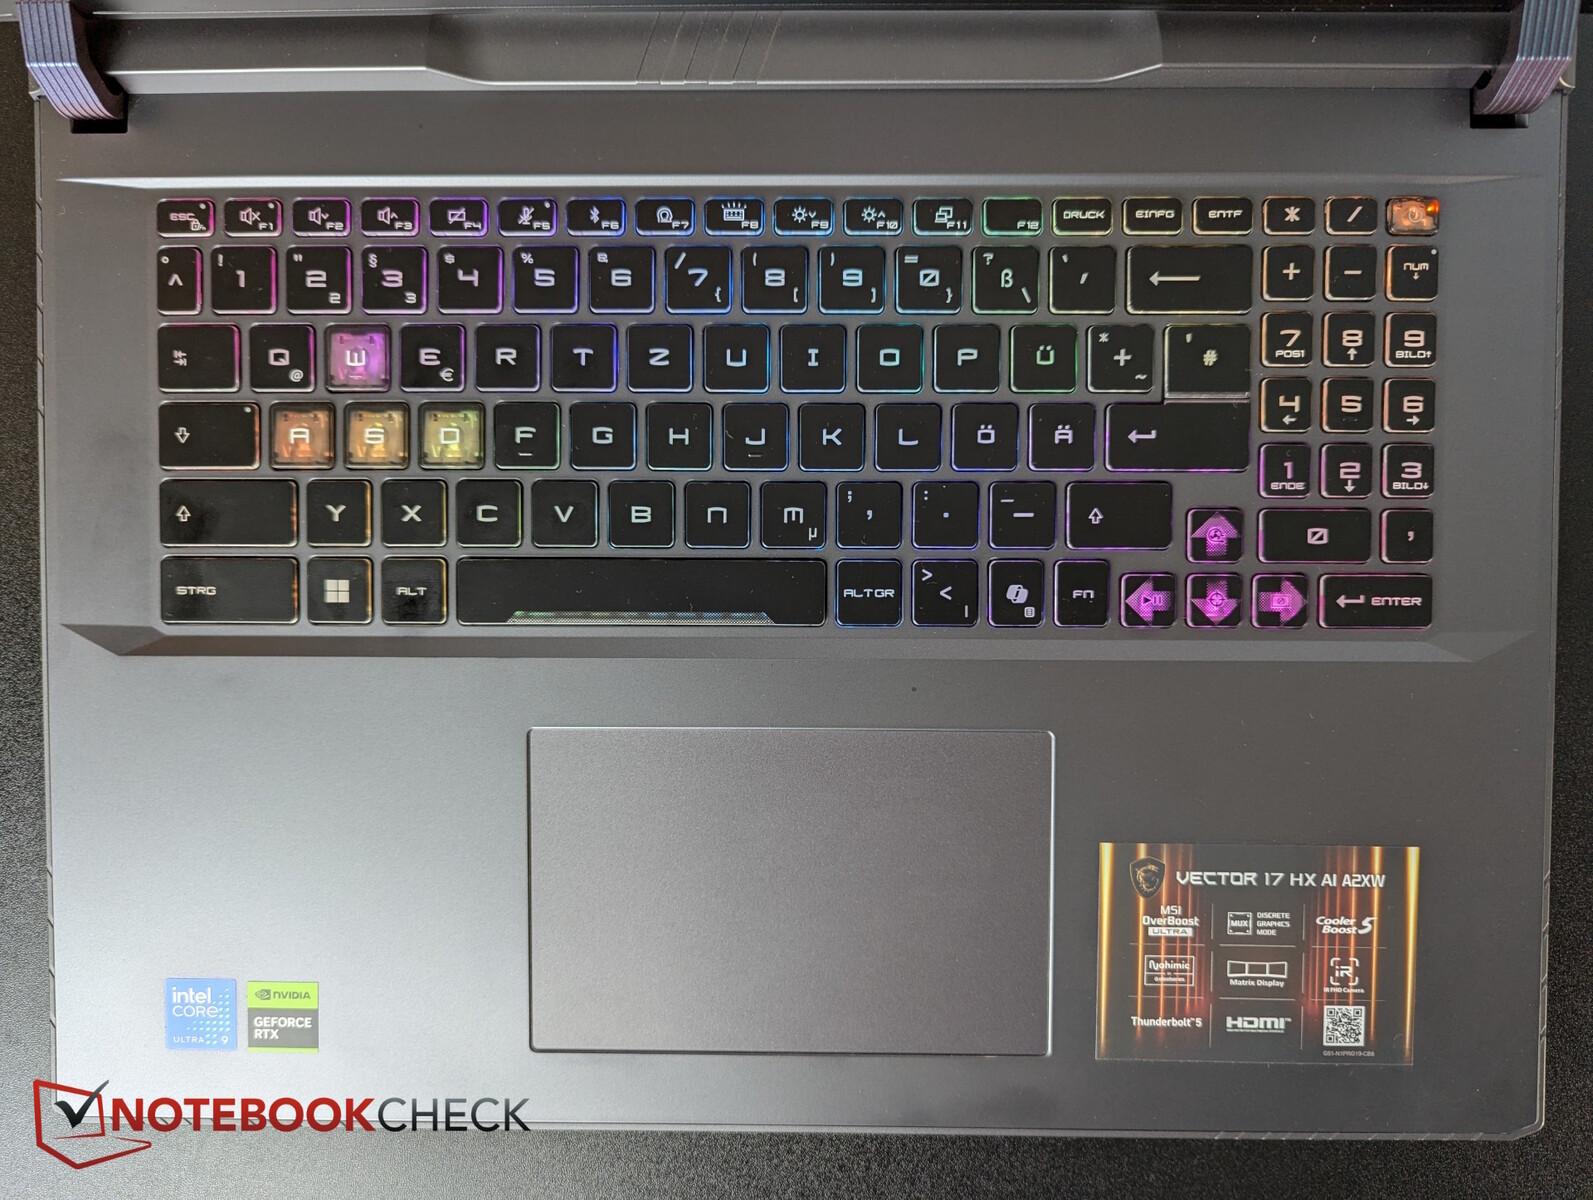
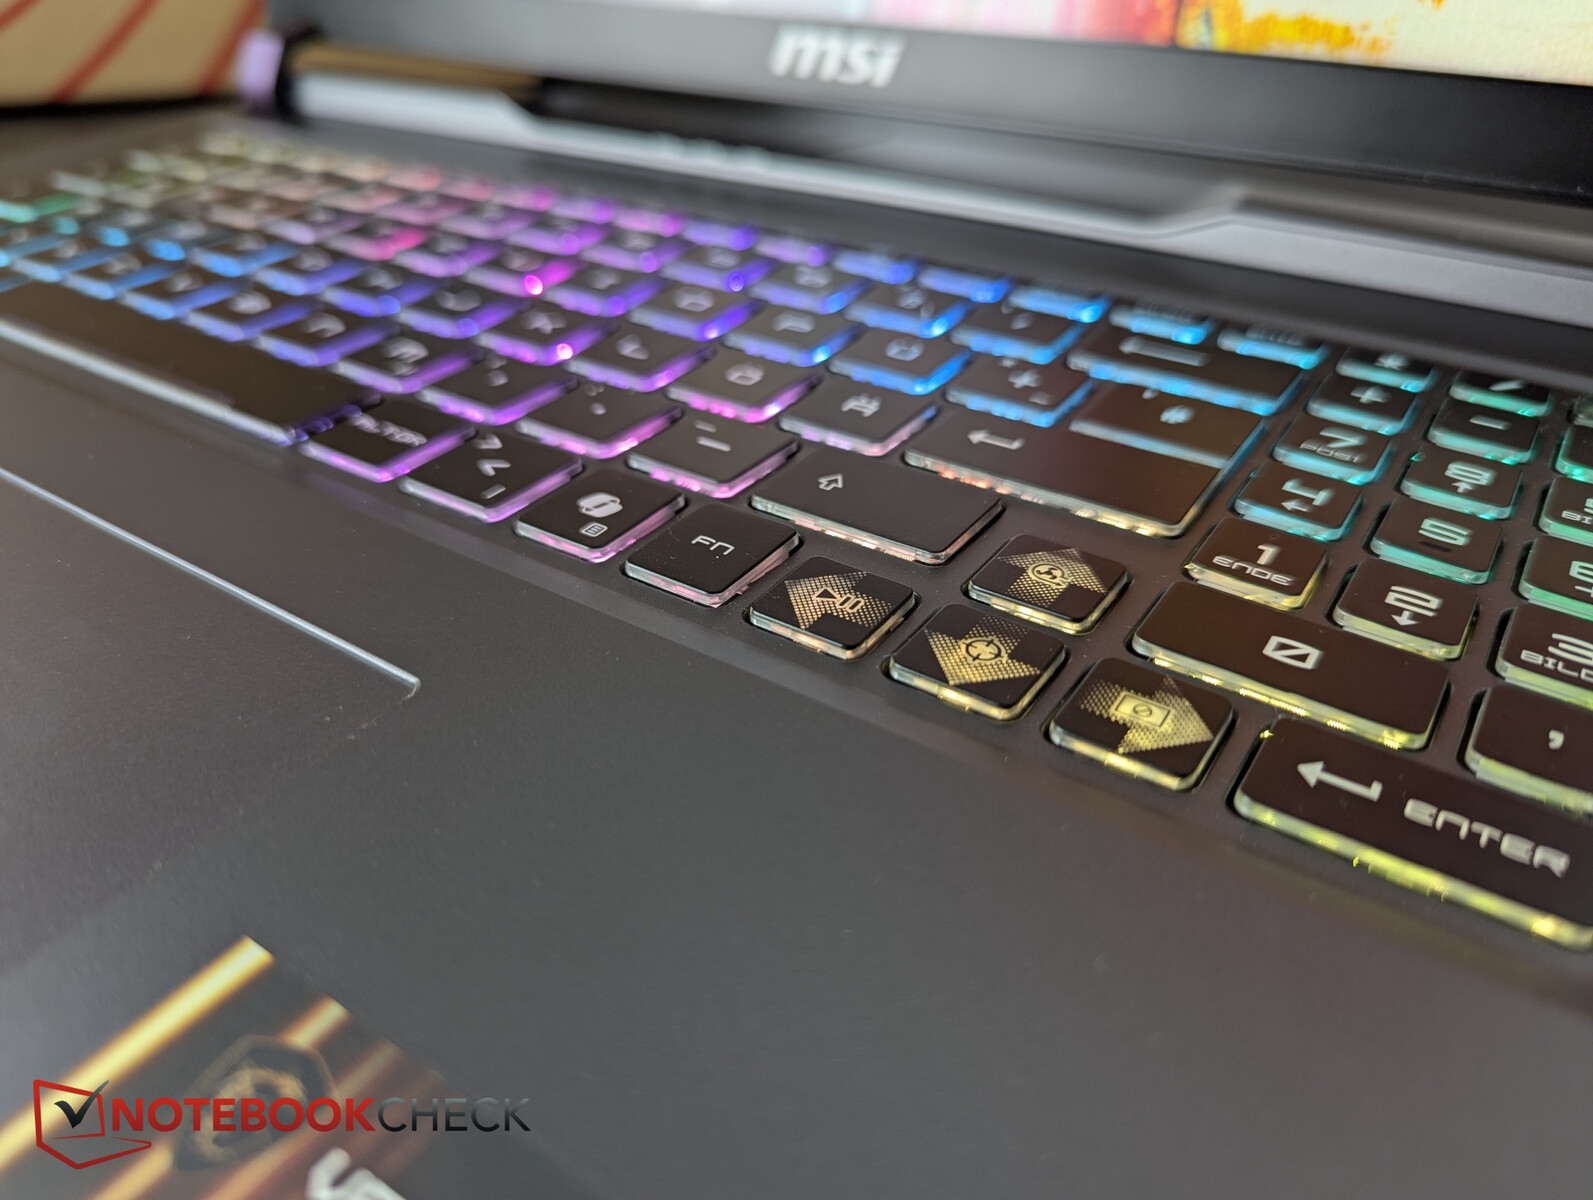
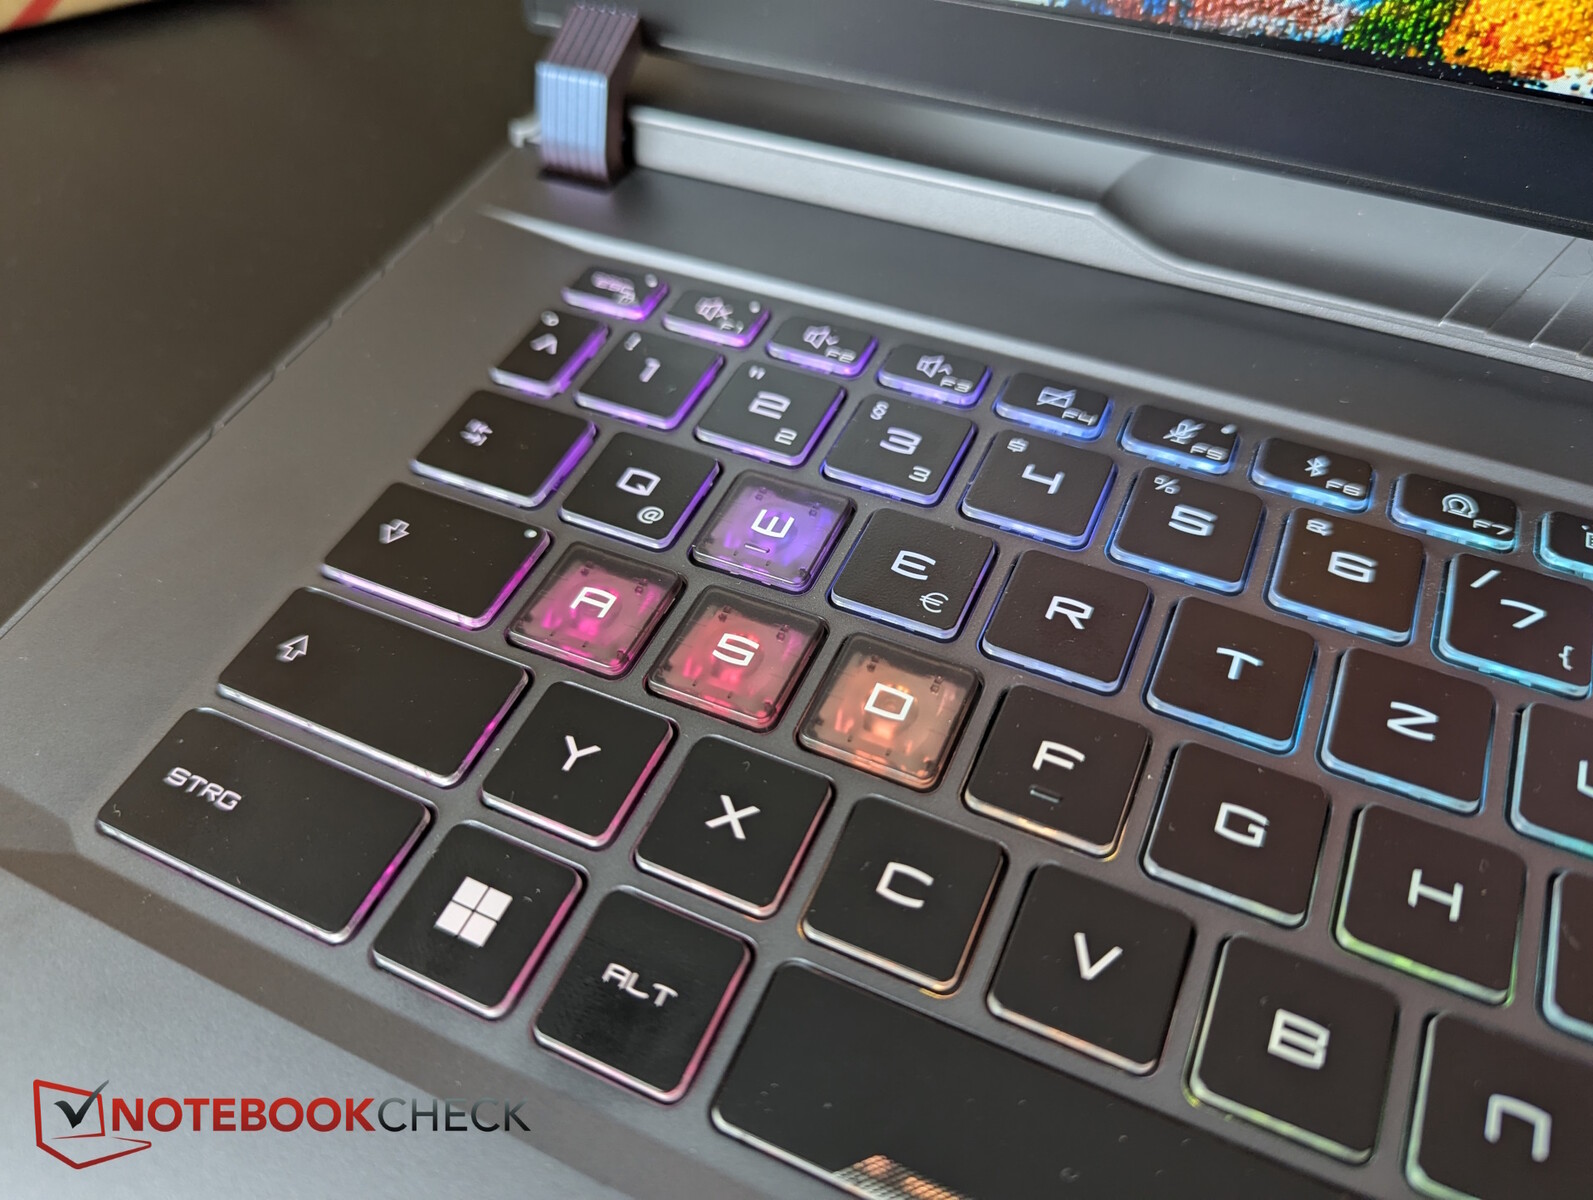
- Dispositivos de entrada - ¡Esta disposición MSI!
- Pantalla - QHD+ IPS con 470 nits
- Rendimiento - Colapso de la CPU bajo carga continua
- Emisiones y energía - Hasta 60 dB(A) es bastante ruidoso en comparación
- Valoración general de Notebookcheck
- Comparación de posibles alternativas
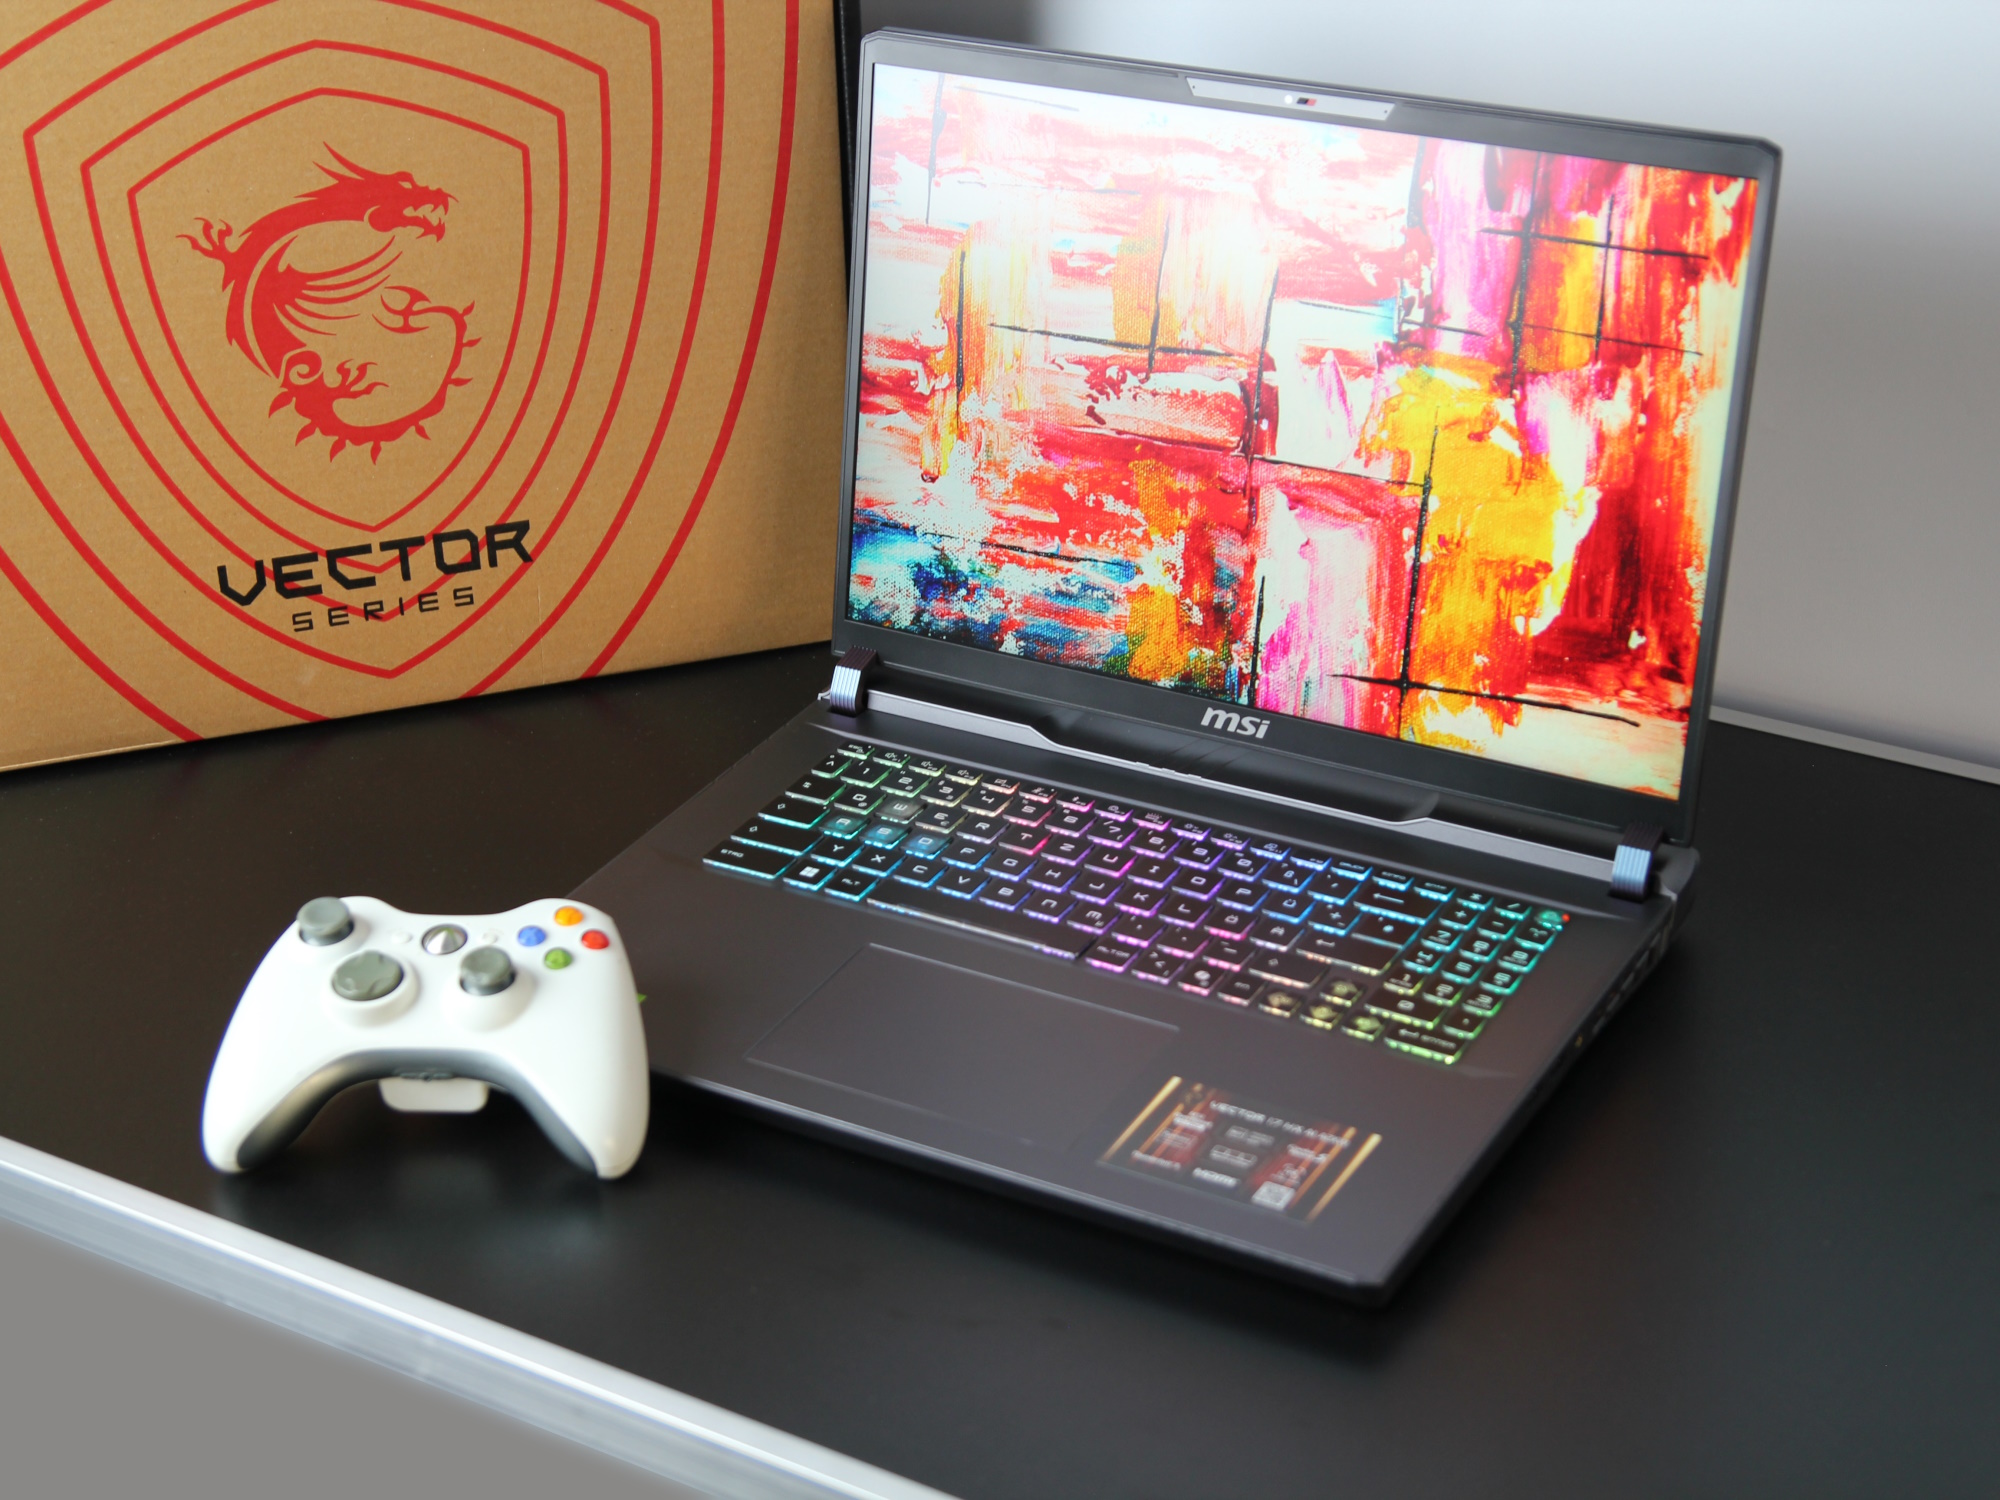
los modelos de 17 pulgadas con gráficos Blackwell son extremadamente raros, por lo que el jugador se sitúa justo entre los numerosos dispositivos de 16 y 18 pulgadas. Nuestro Vector 17 HX AI está disponible con RTX 5090, 5080 o 5070 Ti, nosotros estamos probando la configuración intermedia.
Especificaciones
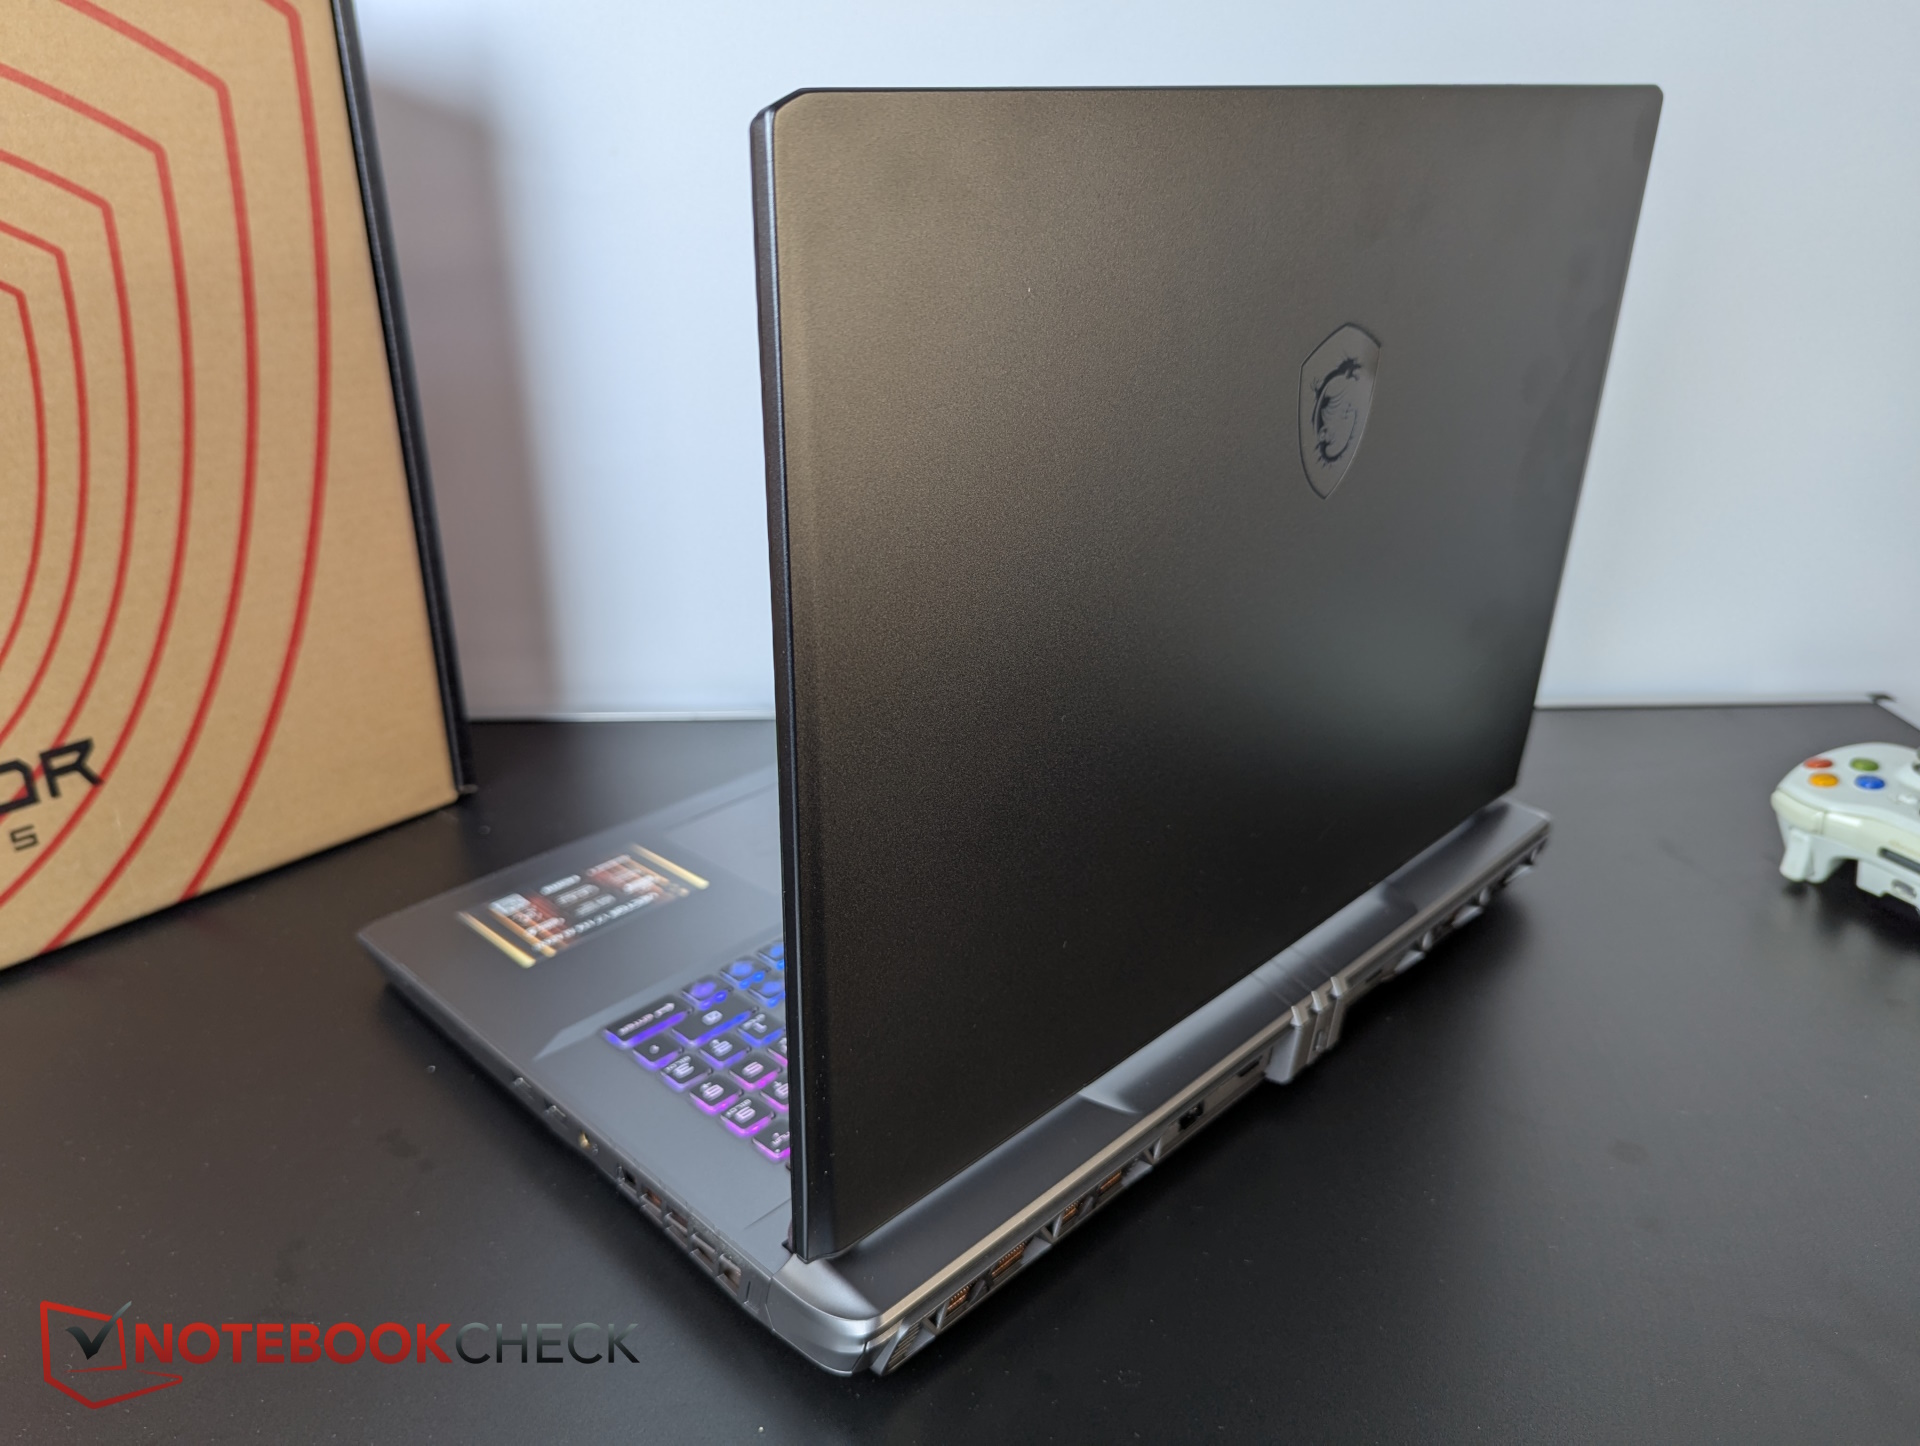
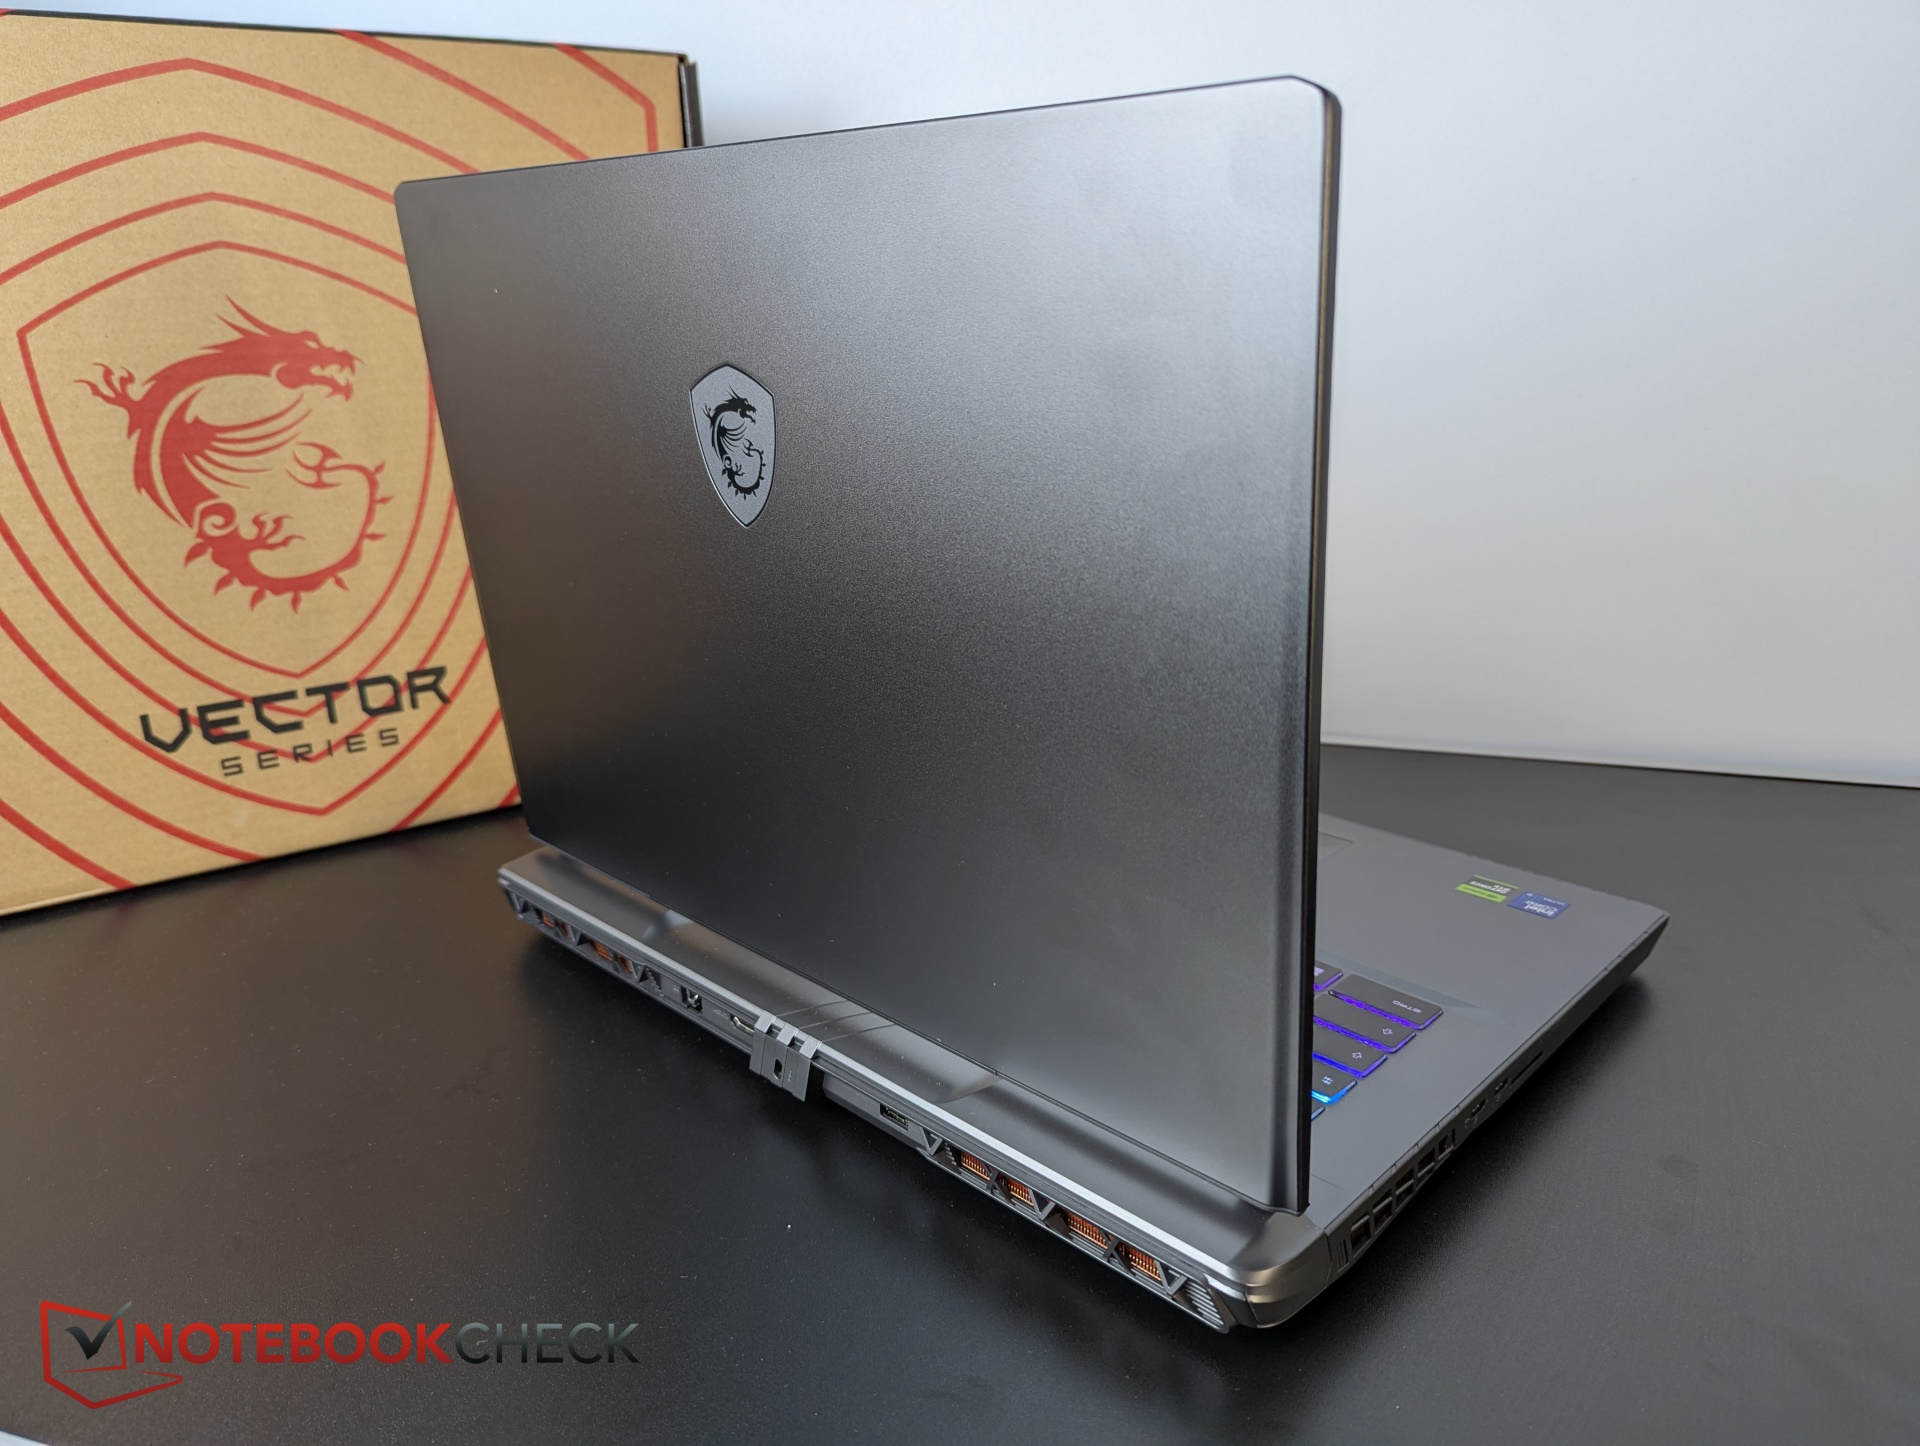
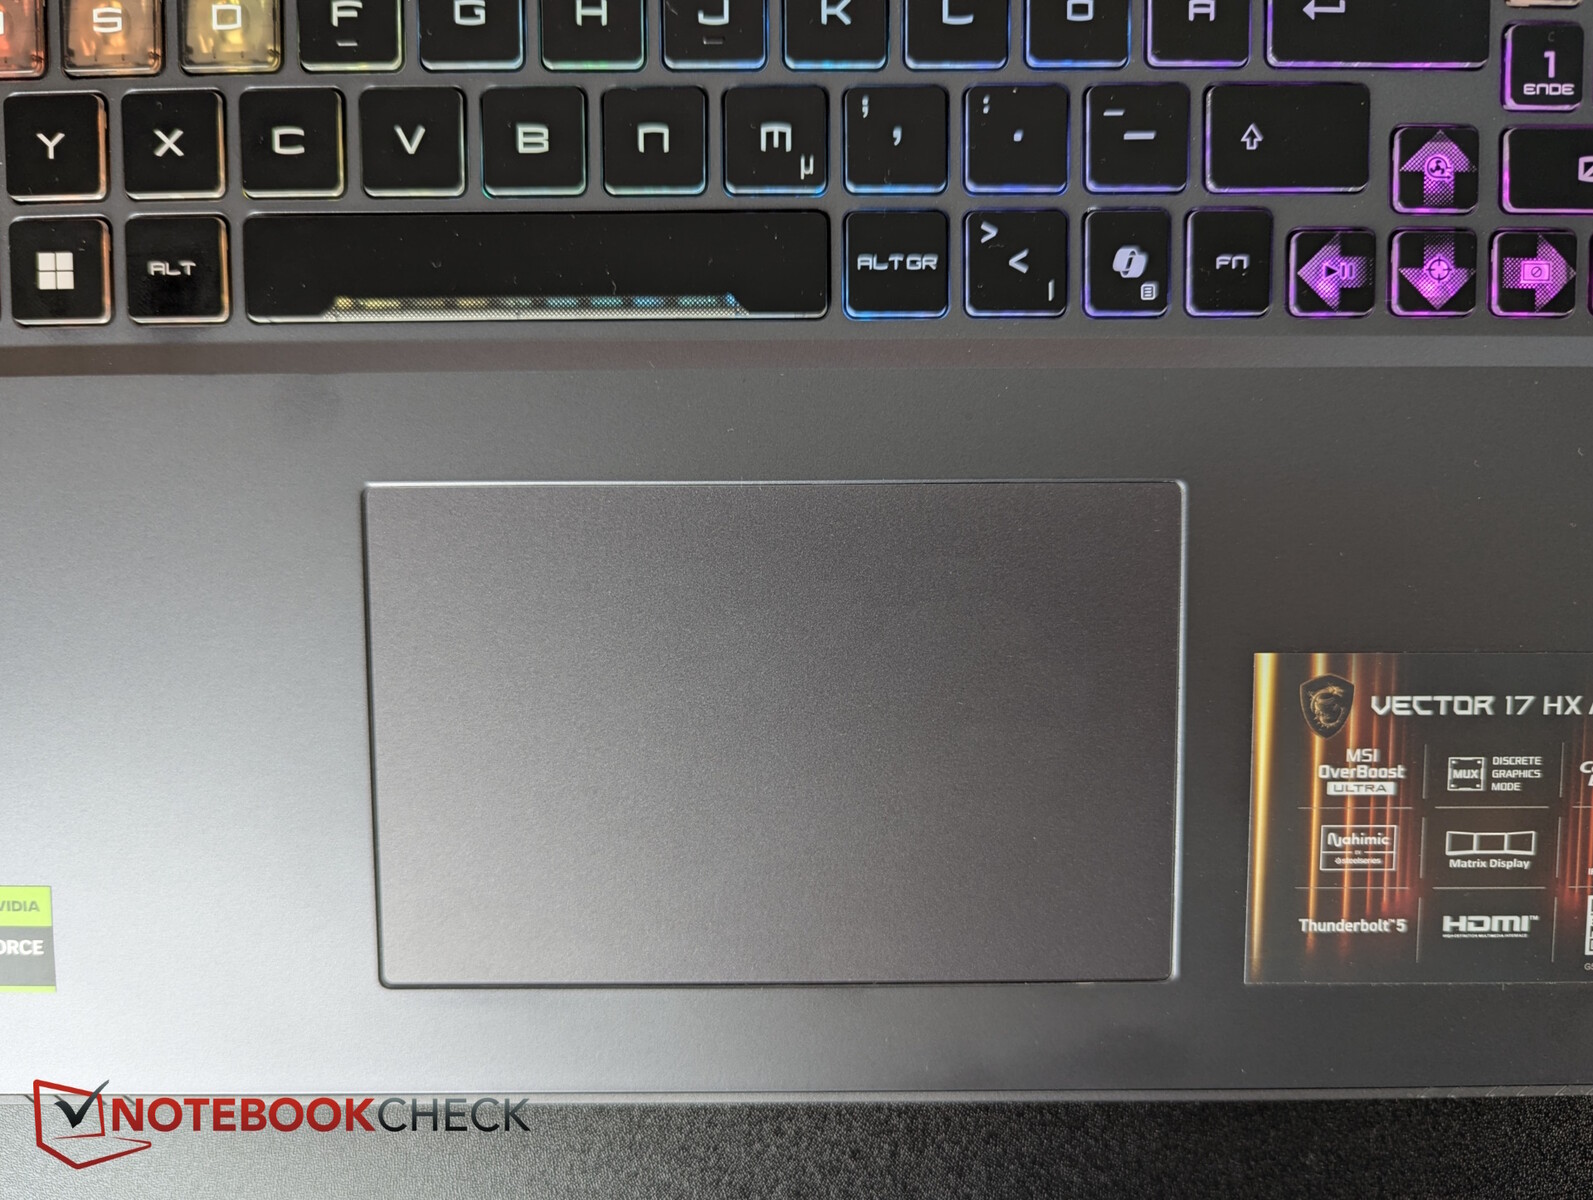
Caja y características - Tan masiva como una Alienware
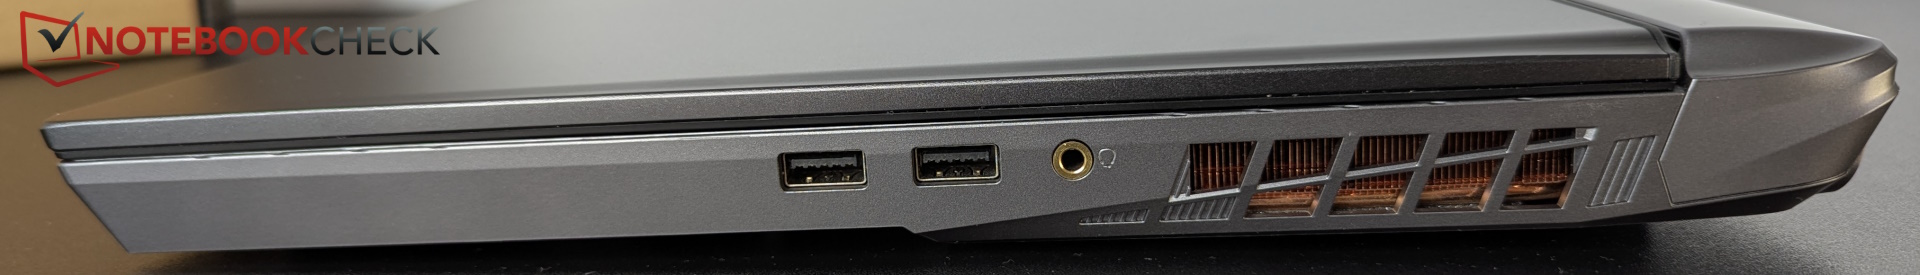
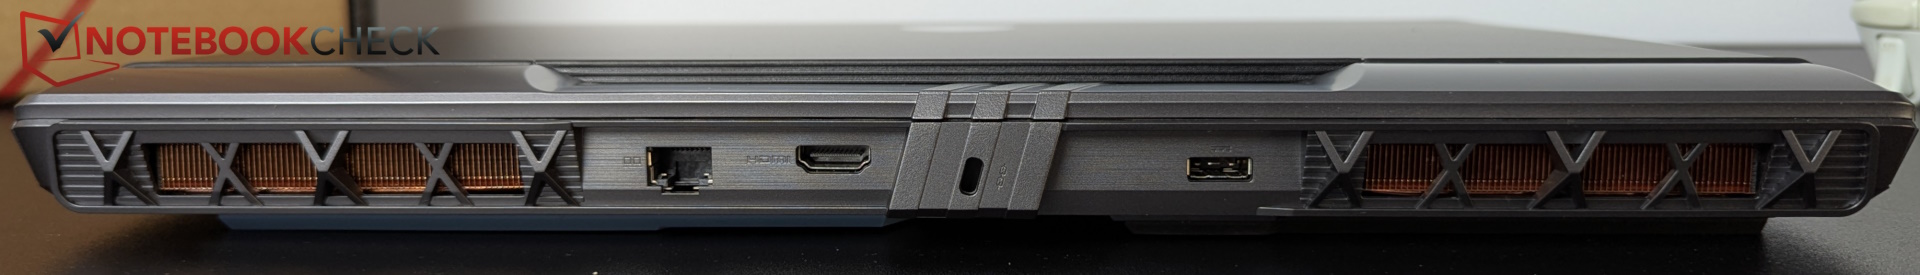
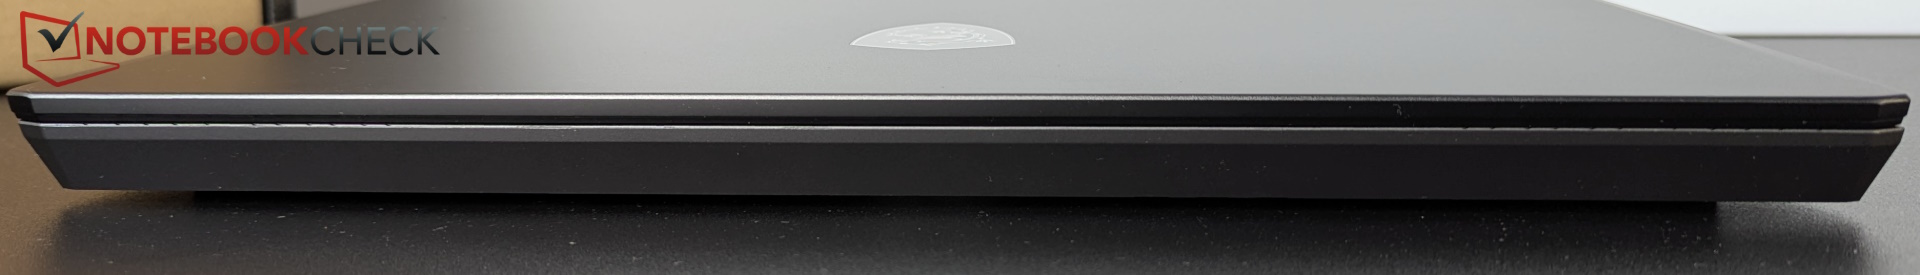
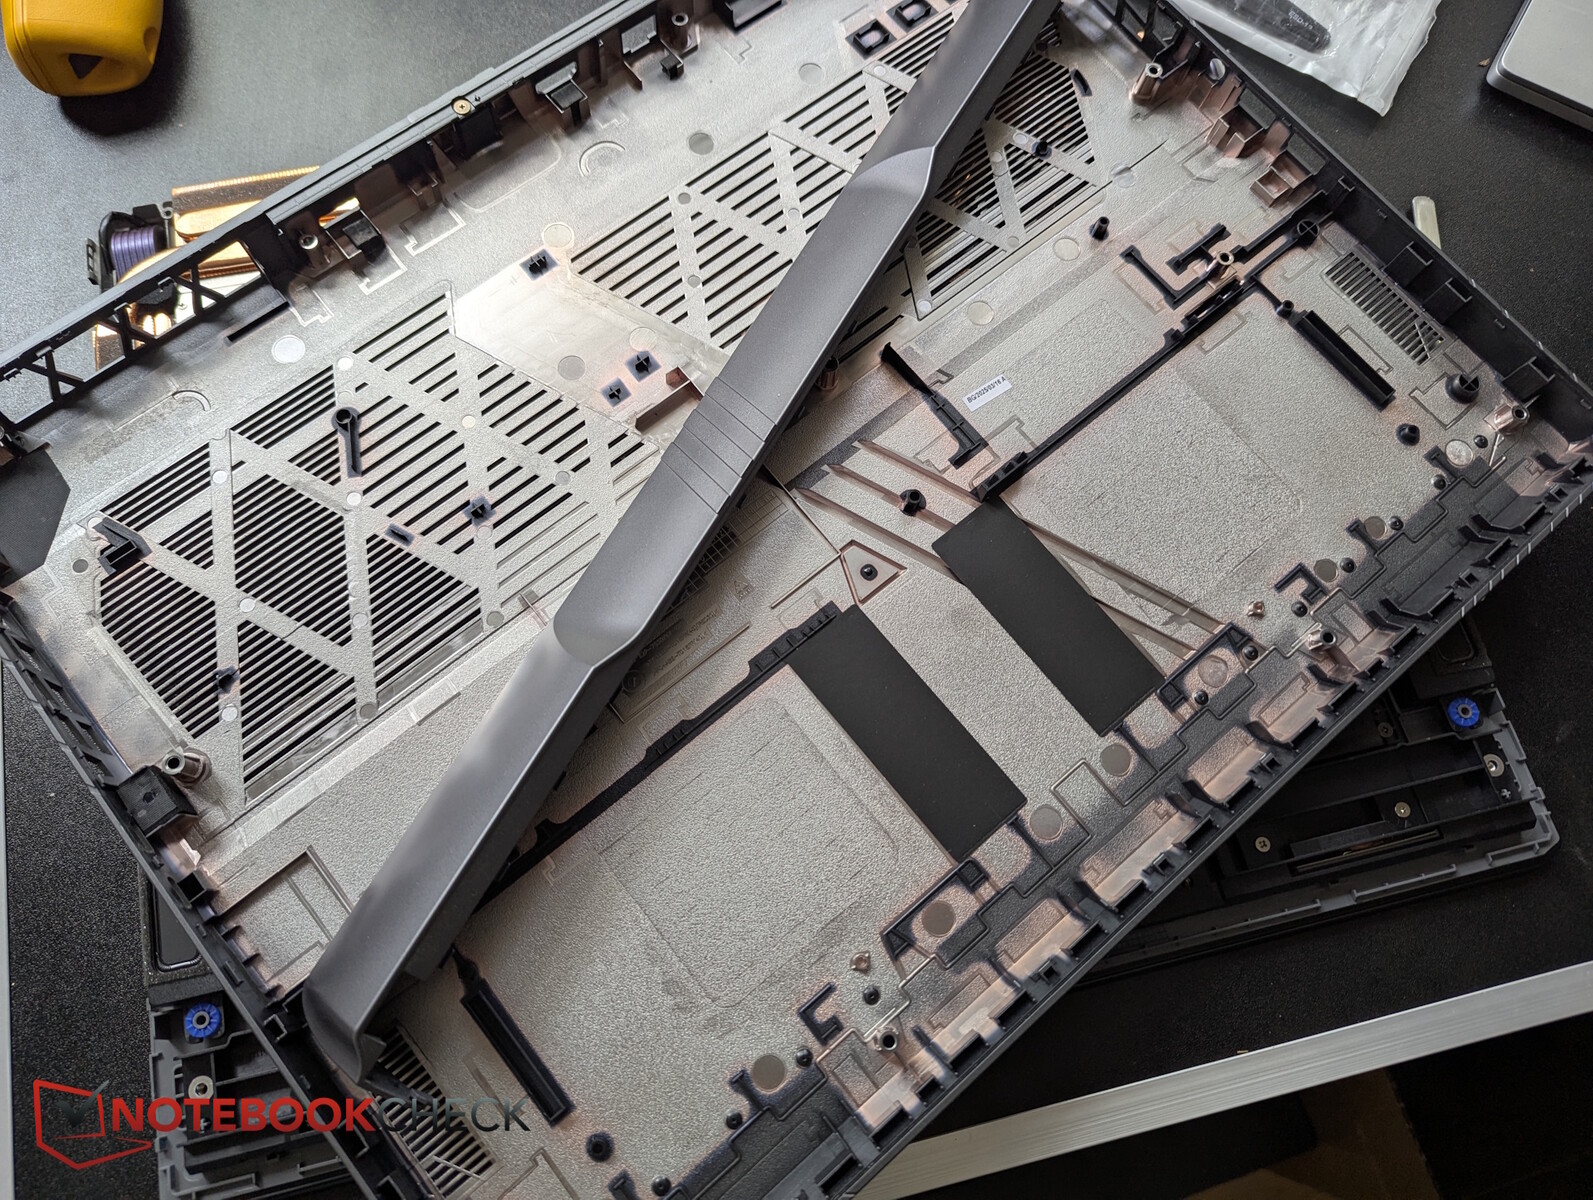
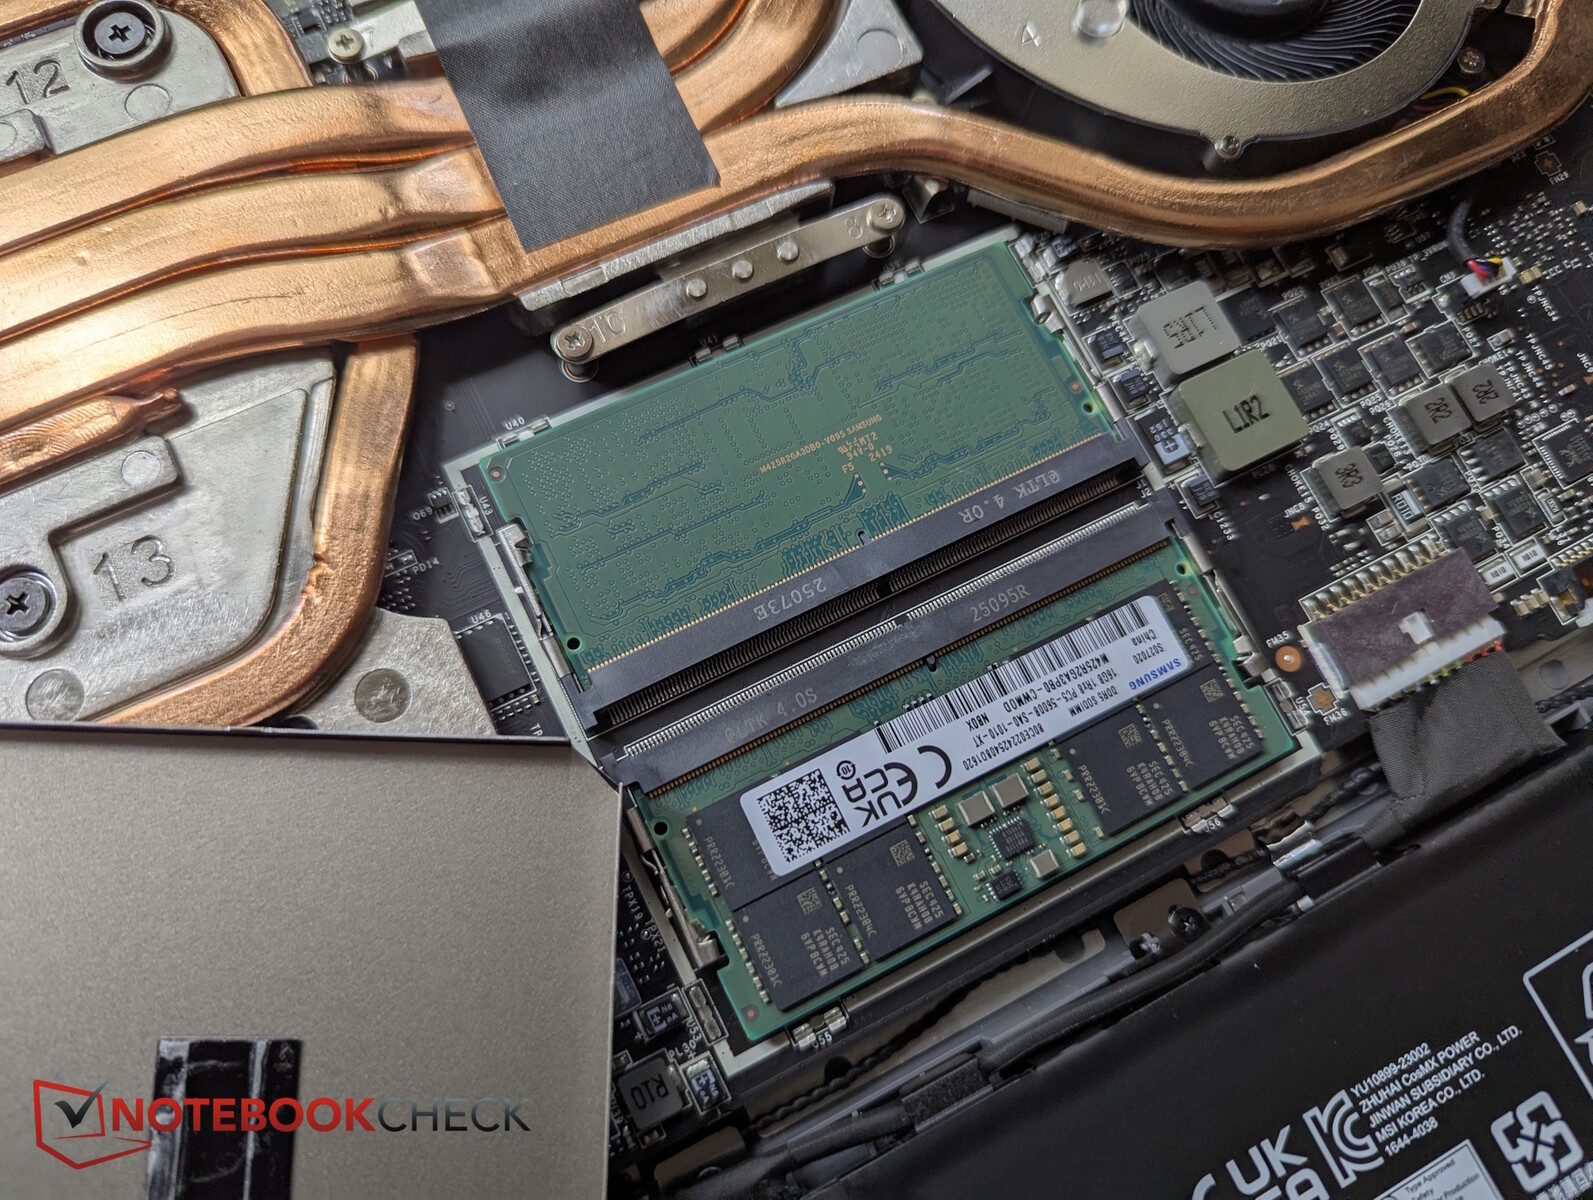
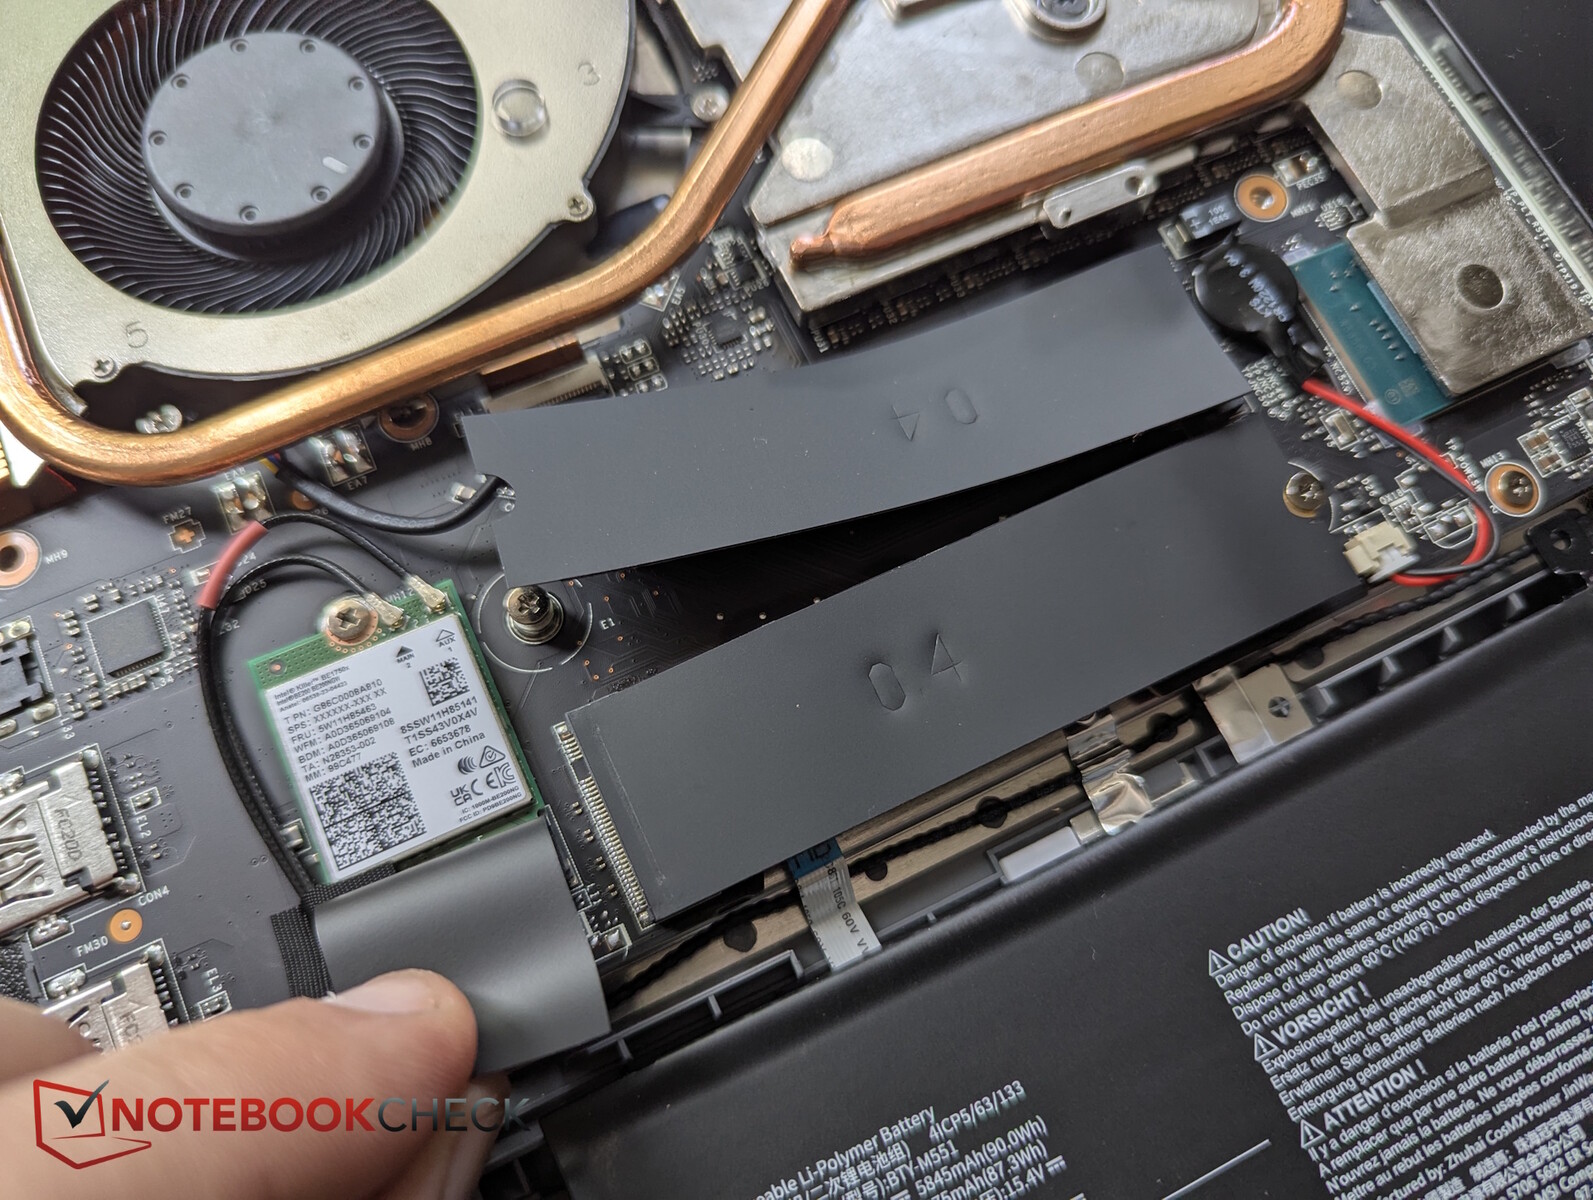
Puesto que ya tenemos el MSI Vector 16 HX AI con casi la misma carcasa, nos referimos en este punto a su Prueba y nos saltamos las secciones sobre la carcasa, el mantenimiento y los dispositivos de entrada.
| SD Card Reader | |
| average JPG Copy Test (av. of 3 runs) | |
| Alienware 16 Area-51 (Toshiba Exceria Pro SDXC 64 GB UHS-II) | |
| Media de la clase Gaming (20.9 - 210, n=54, últimos 2 años) | |
| Schenker XMG Neo 16 A25 5090 (Angelbird AV Pro V60) | |
| Aorus MASTER 16 AM6H | |
| MSI Vector 17 HX AI A2XWIG | |
| MSI Titan 18 HX AI A2XWJG (AV PRO microSD 128 GB V60) | |
| MSI Raider A18 HX A9WIG-080 | |
| maximum AS SSD Seq Read Test (1GB) | |
| Schenker XMG Neo 16 A25 5090 (Angelbird AV Pro V60) | |
| Alienware 16 Area-51 (Toshiba Exceria Pro SDXC 64 GB UHS-II) | |
| MSI Vector 17 HX AI A2XWIG | |
| Aorus MASTER 16 AM6H | |
| MSI Raider A18 HX A9WIG-080 | |
| Media de la clase Gaming (25.5 - 261, n=51, últimos 2 años) | |
| MSI Titan 18 HX AI A2XWJG (AV PRO microSD 128 GB V60) | |
Cámara web
Lleva instalada una cámara web Full HD con obturador manual, buena fidelidad de color y nitidez media.


Dispositivos de entrada - ¡Esta disposición MSI!
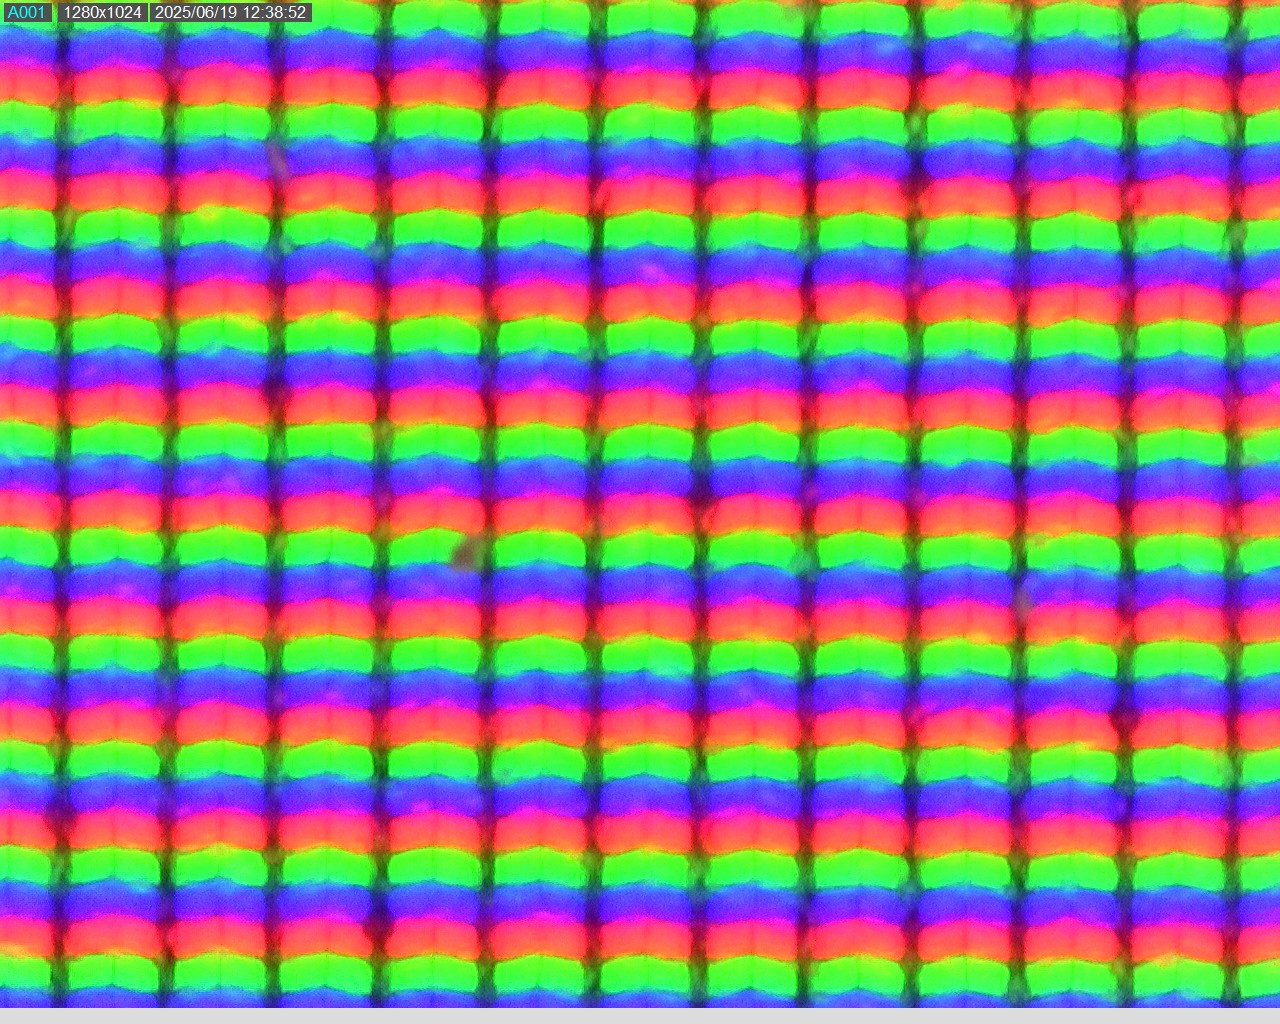
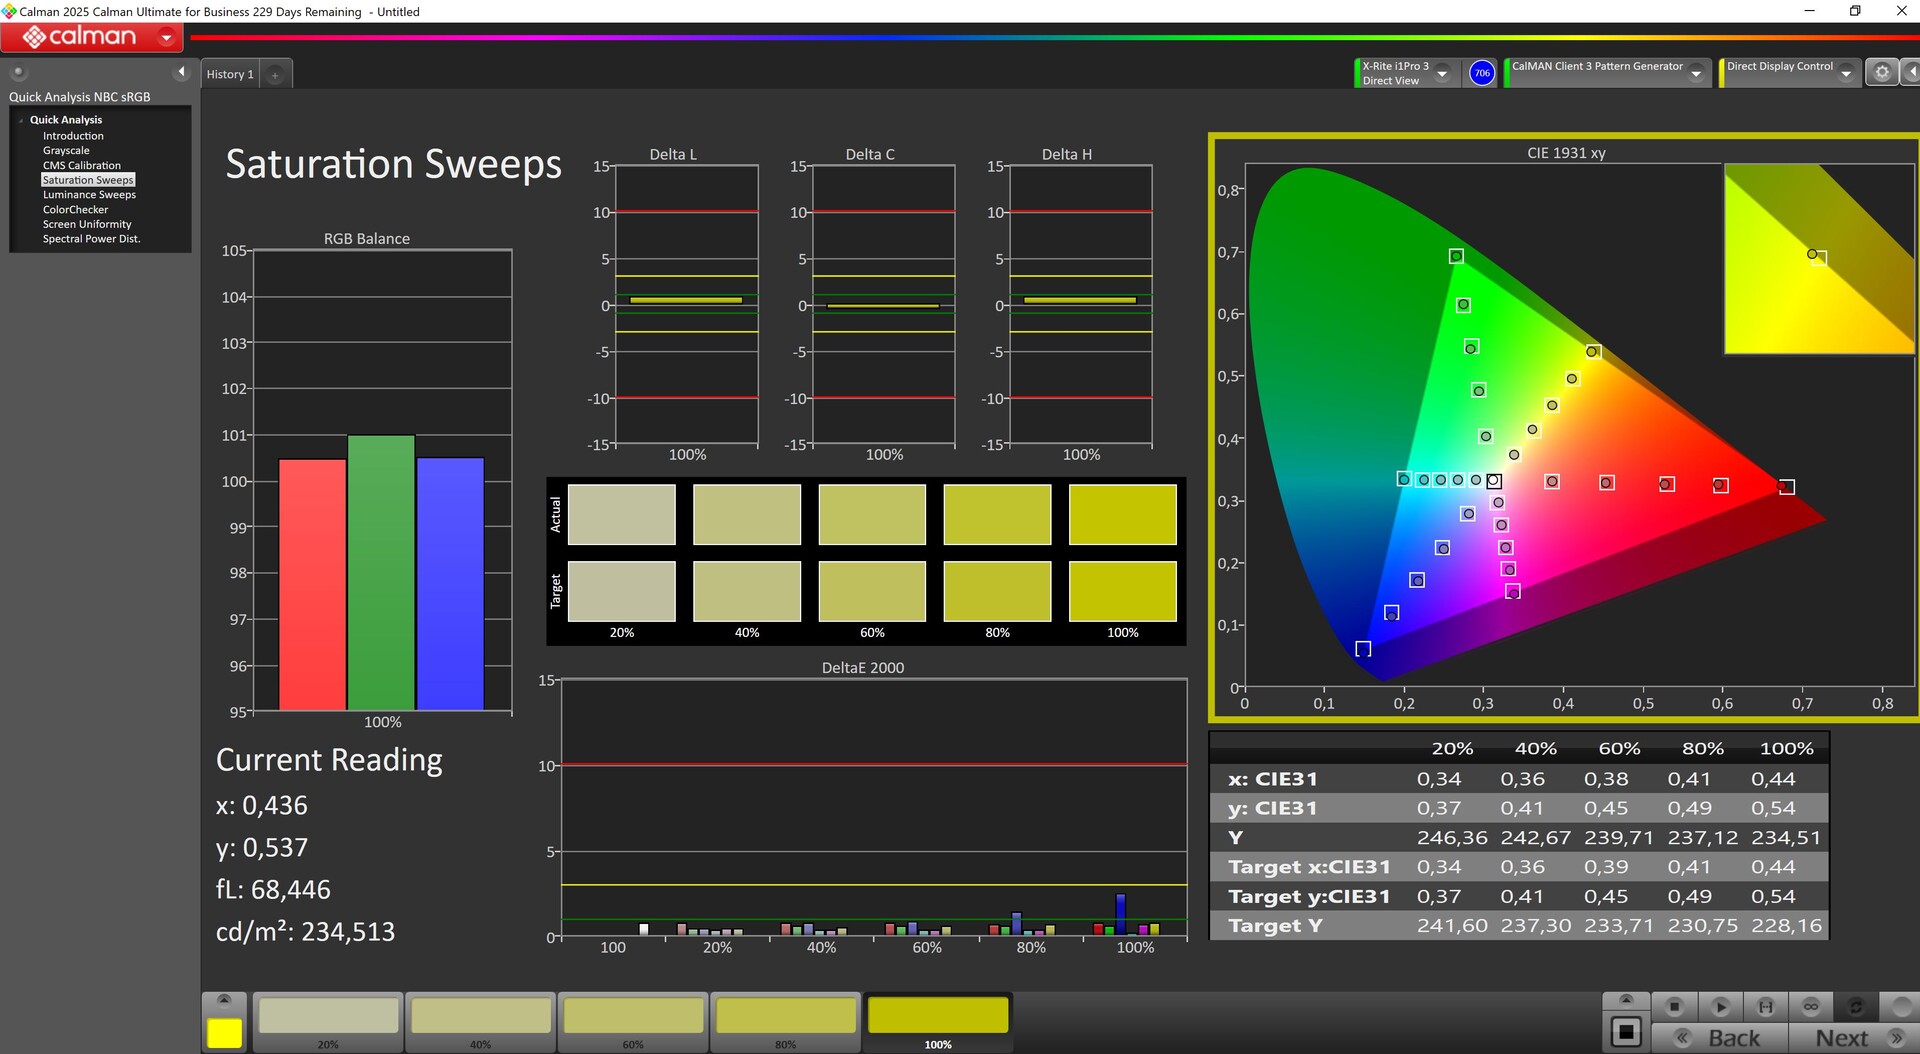
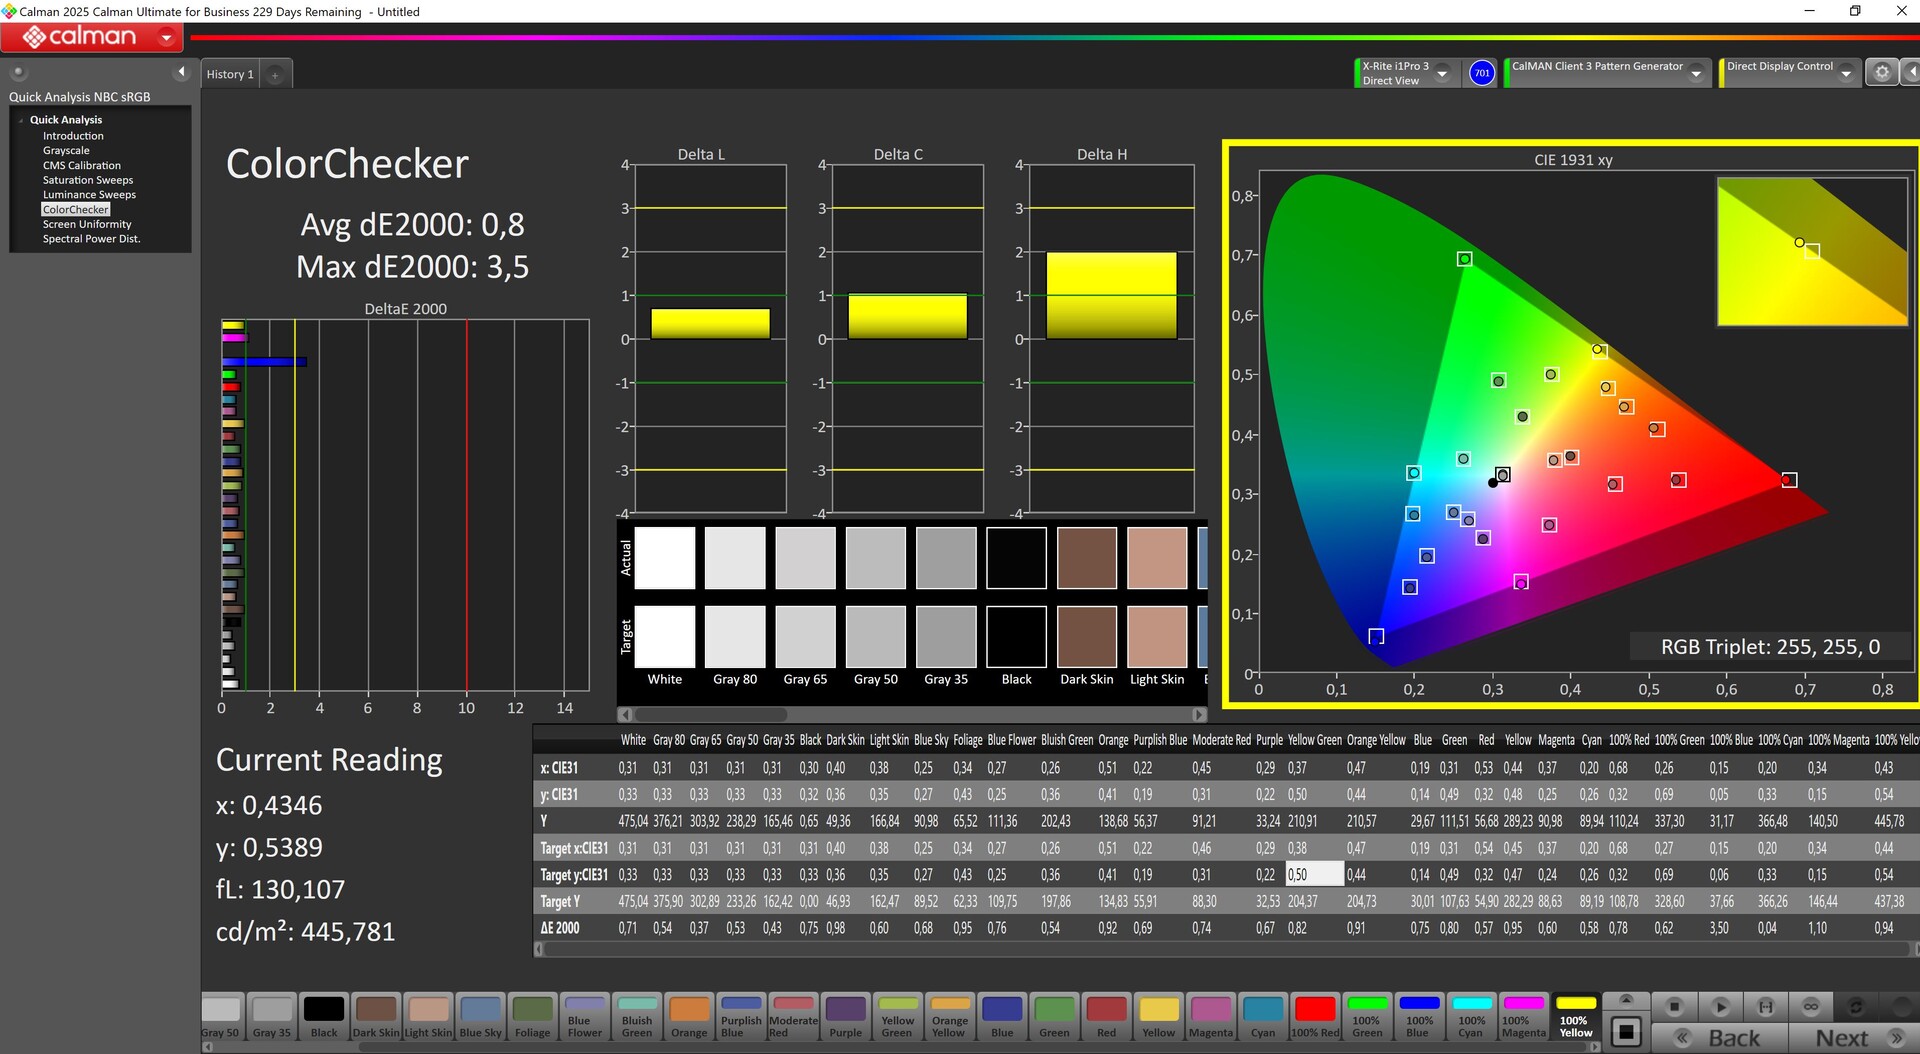
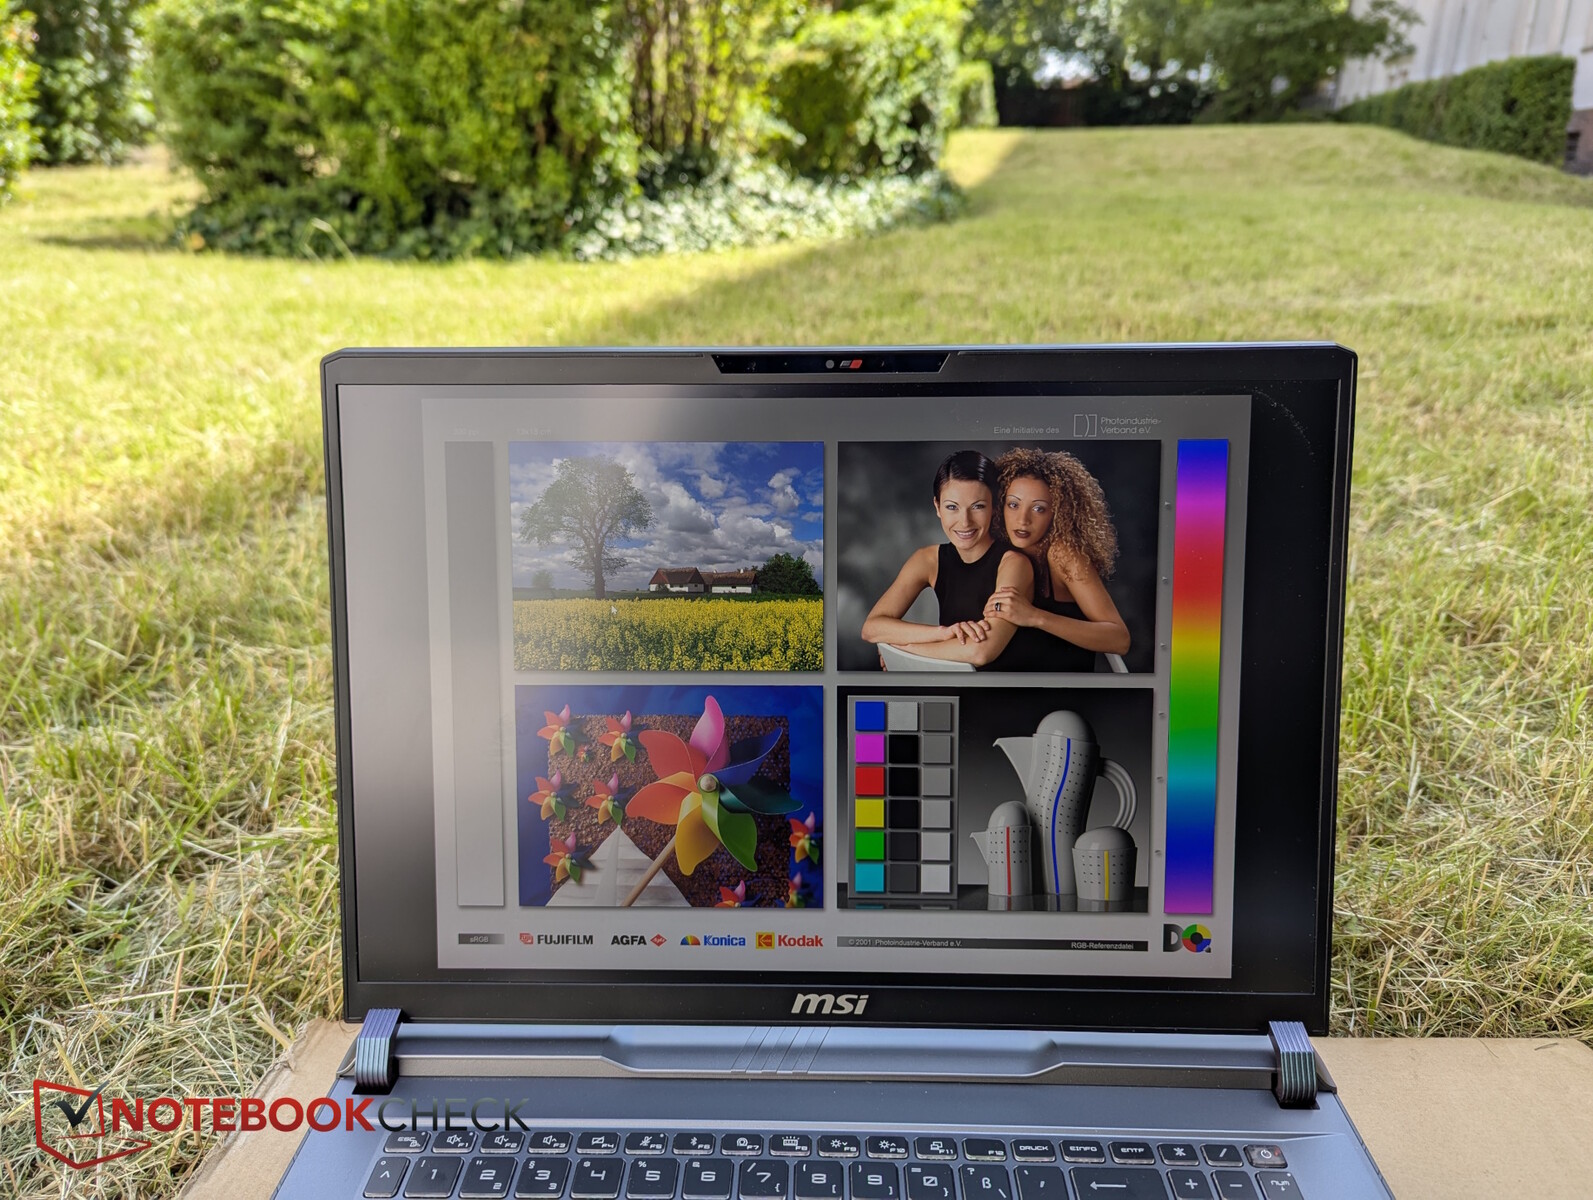
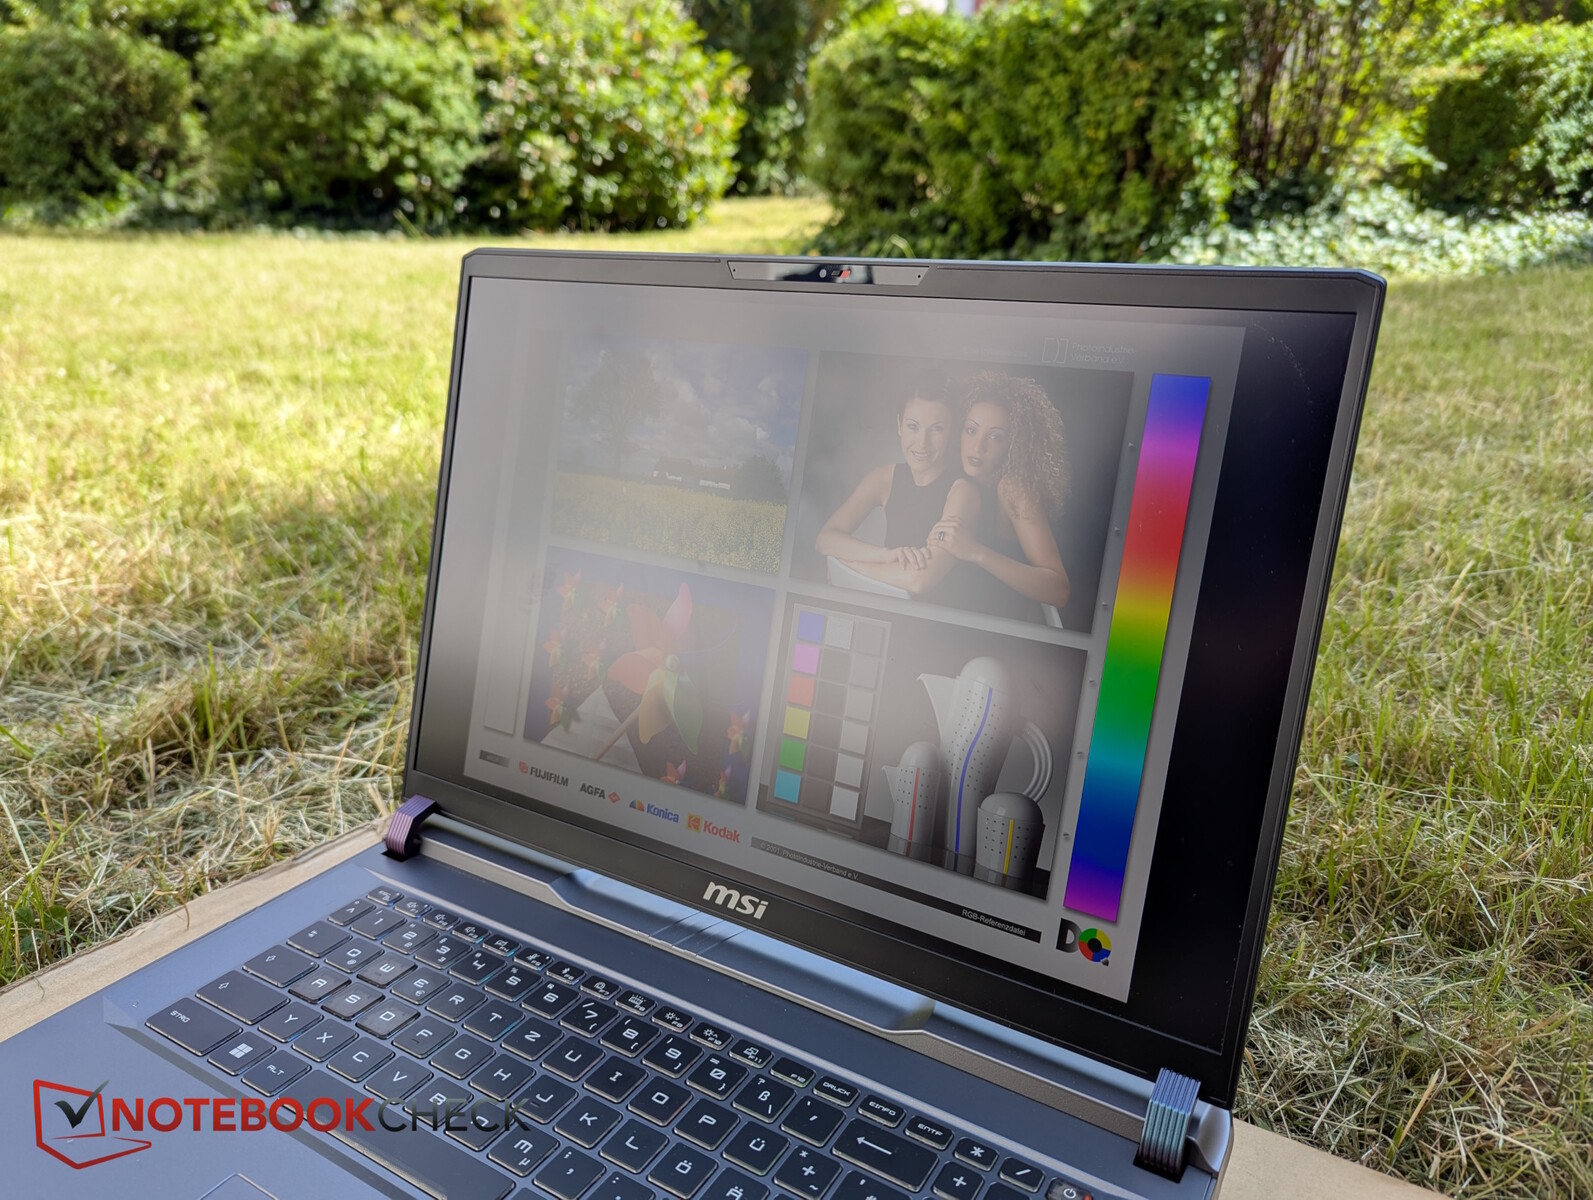
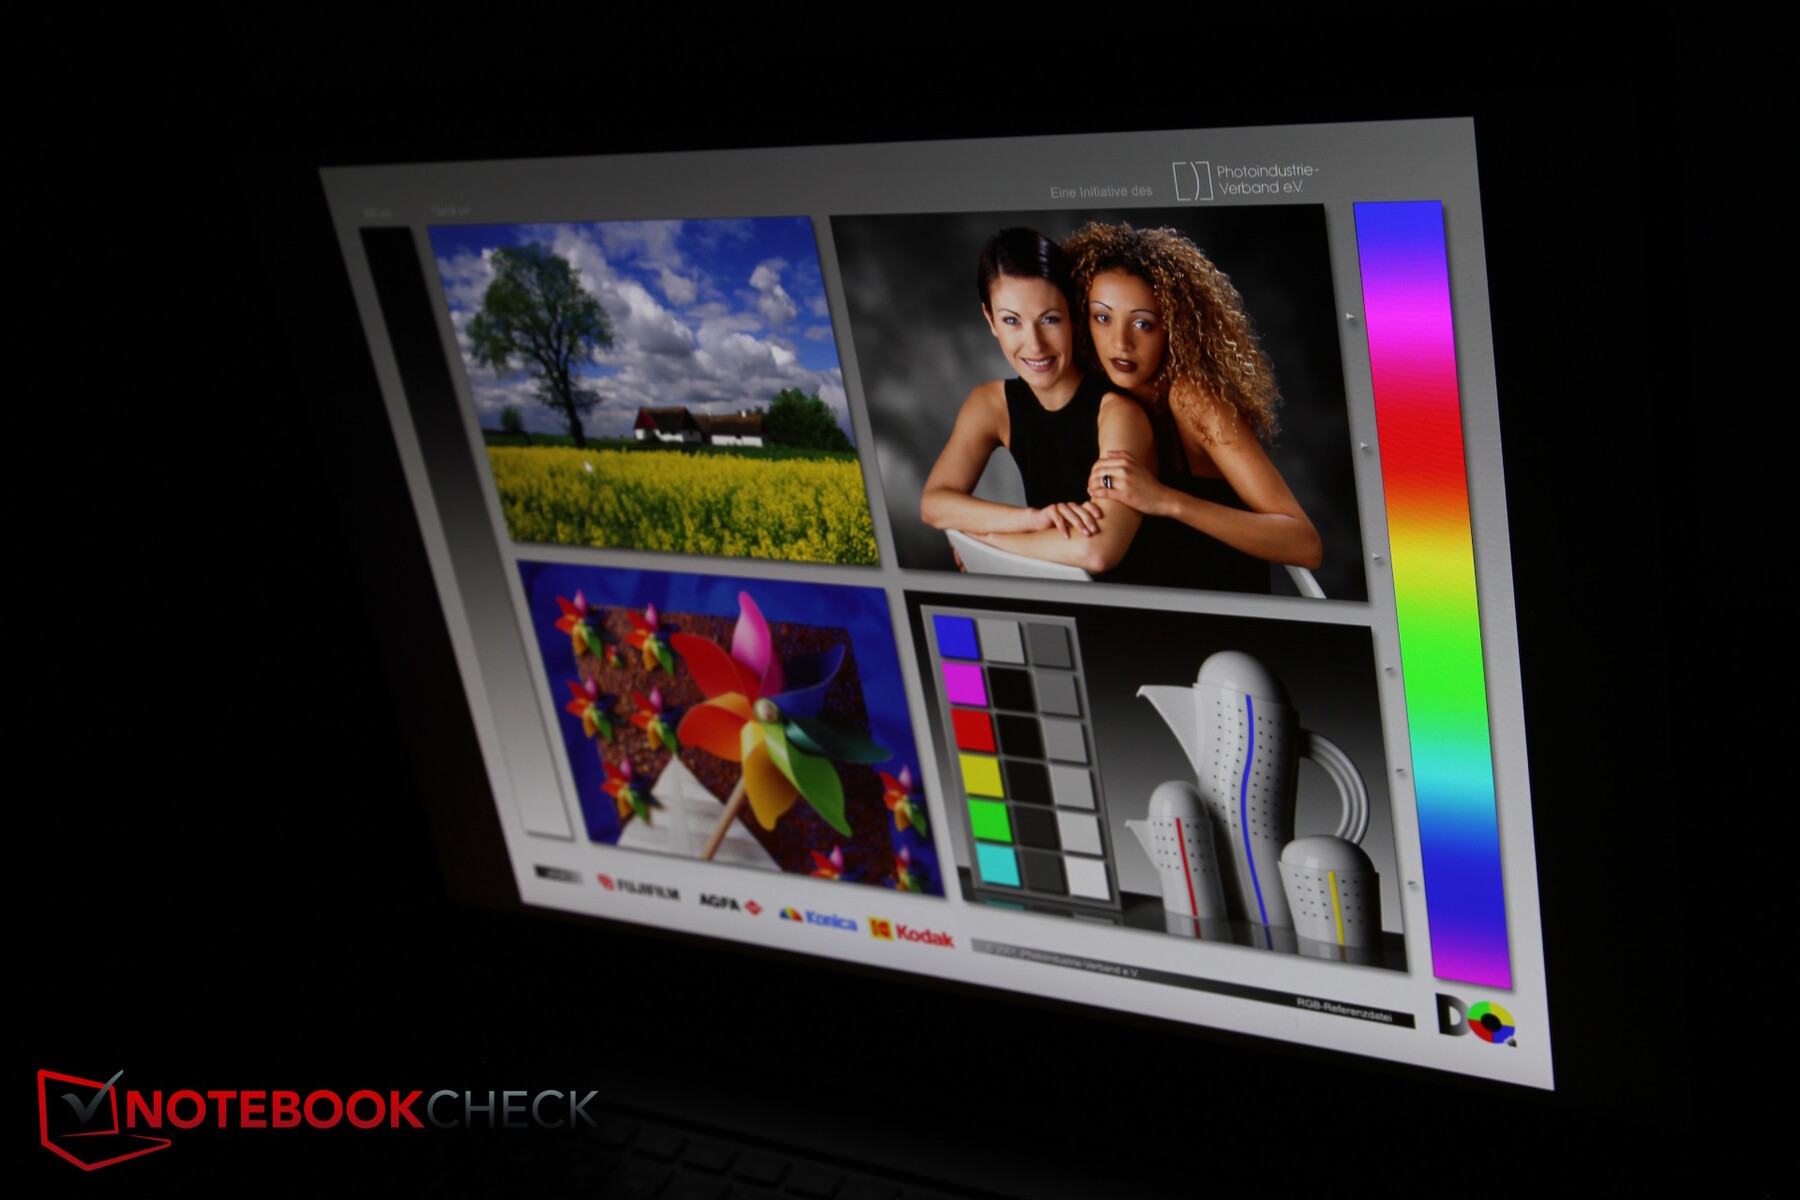
Pantalla - QHD+ IPS con 470 nits
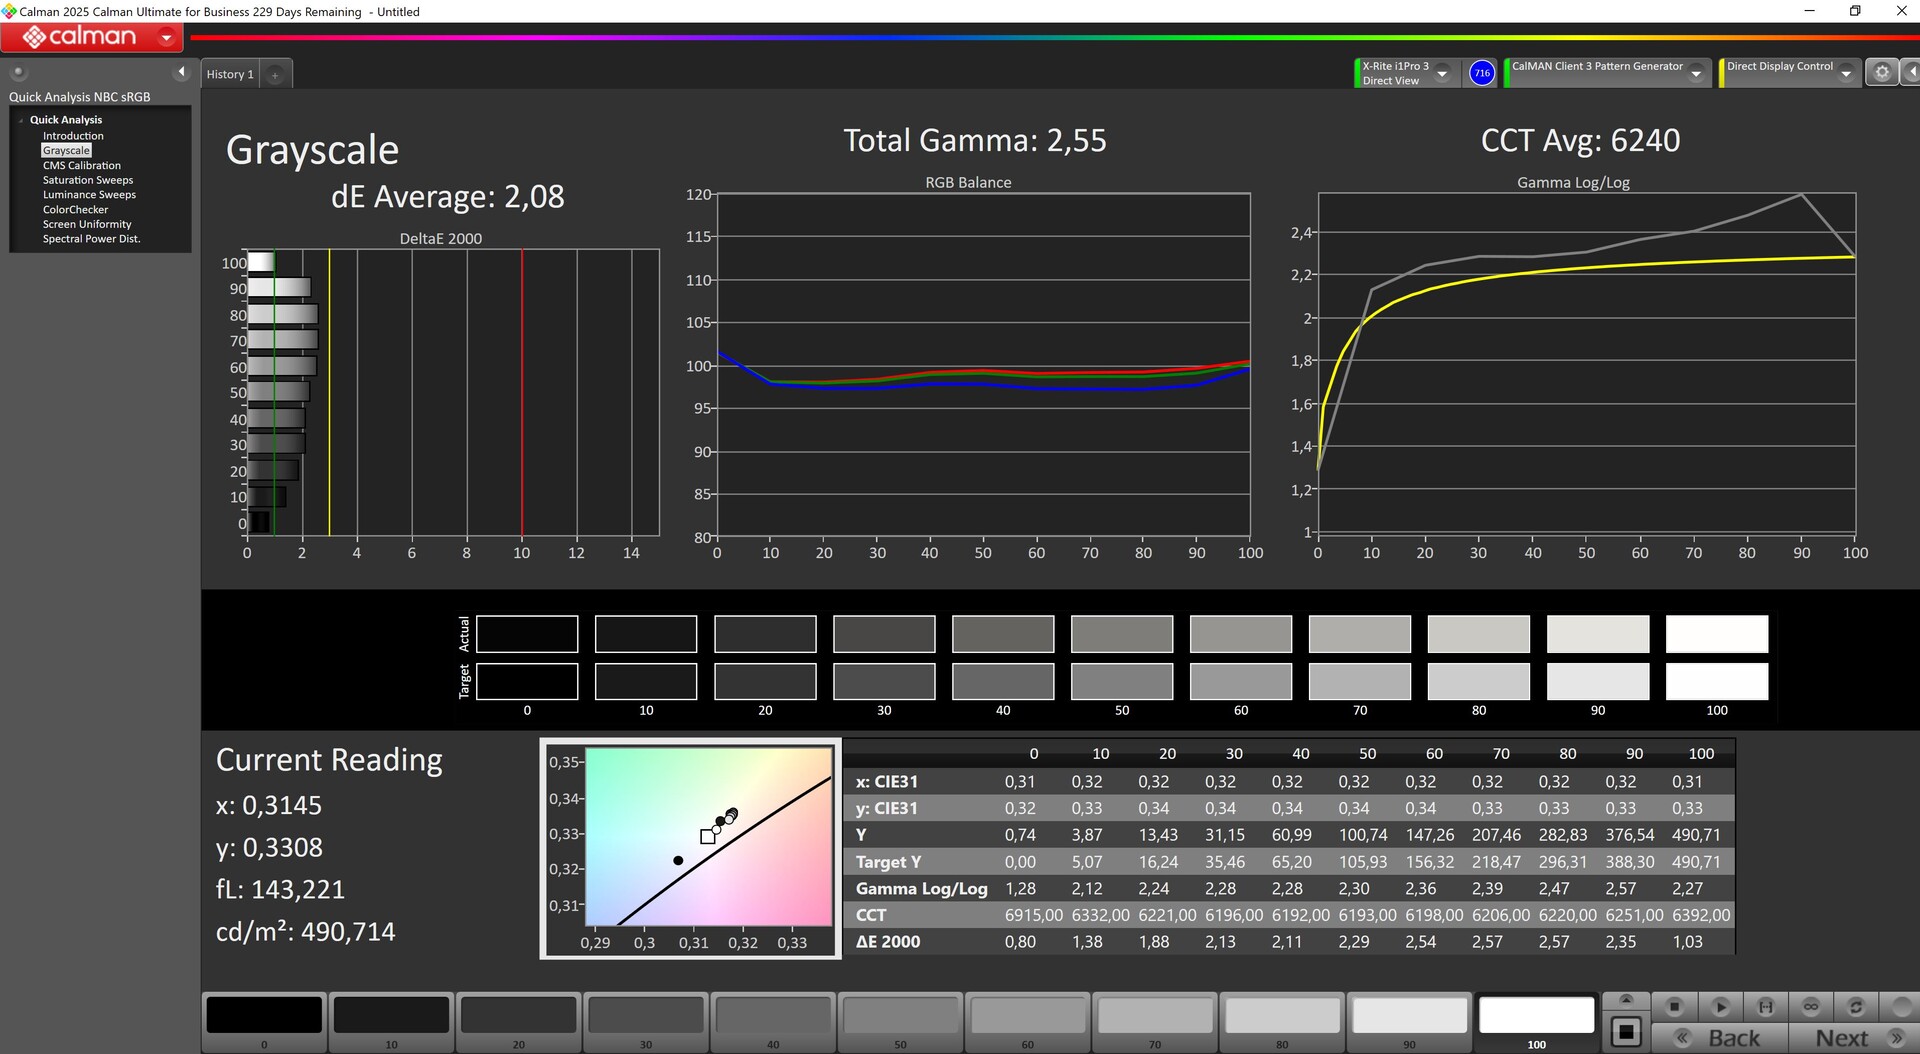
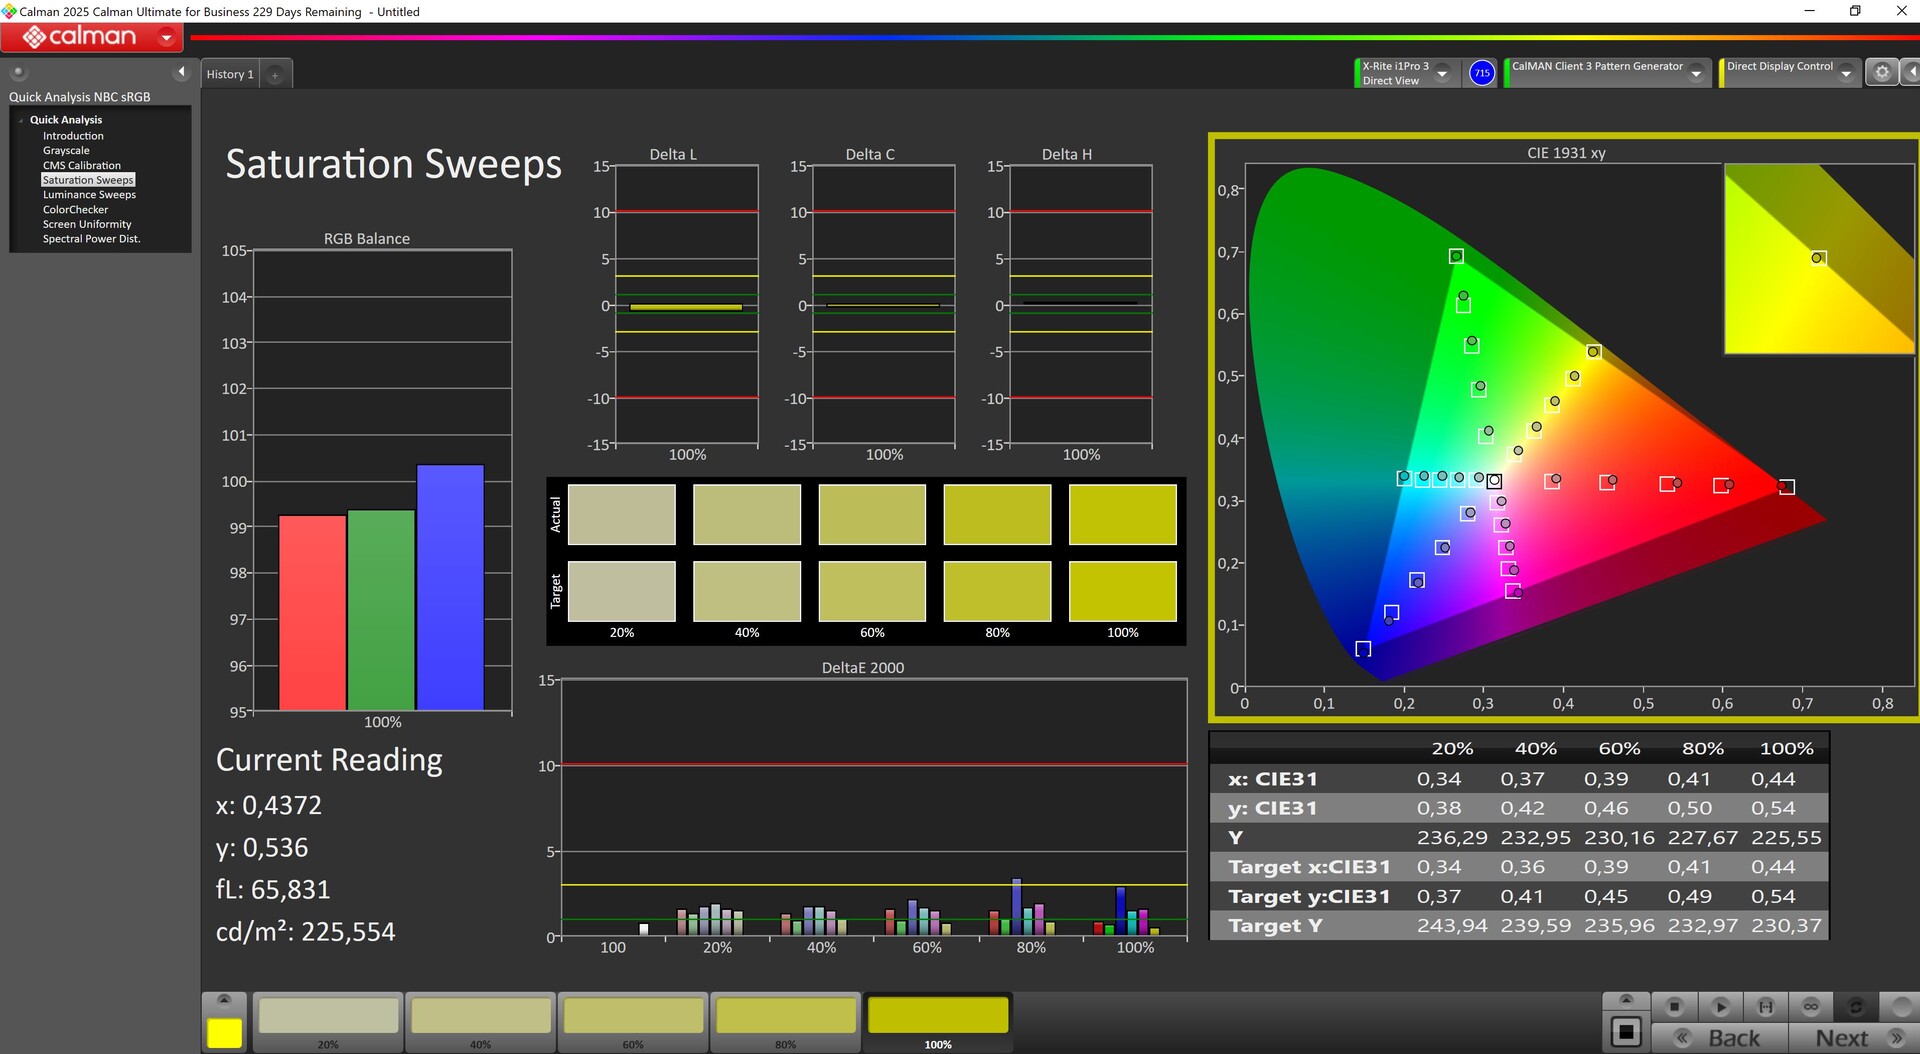
Utiliza una pantalla IPS QHD+ mate y rápida (aprox. 4 ms) (2.560 x 1.600 píxeles) con 240 Hz. El brillo medio ronda los 470 nits y la iluminación es bastante uniforme. Sin embargo, el valor de negro es claramente demasiado alto, lo que encarece el contraste.
Nota: MSI también ofrece como alternativa una pantalla IPS Full HD con 165 Hz.

| |||||||||||||||||||||||||
iluminación: 91 %
Brillo con batería: 486 cd/m²
Contraste: 659:1 (Negro: 0.74 cd/m²)
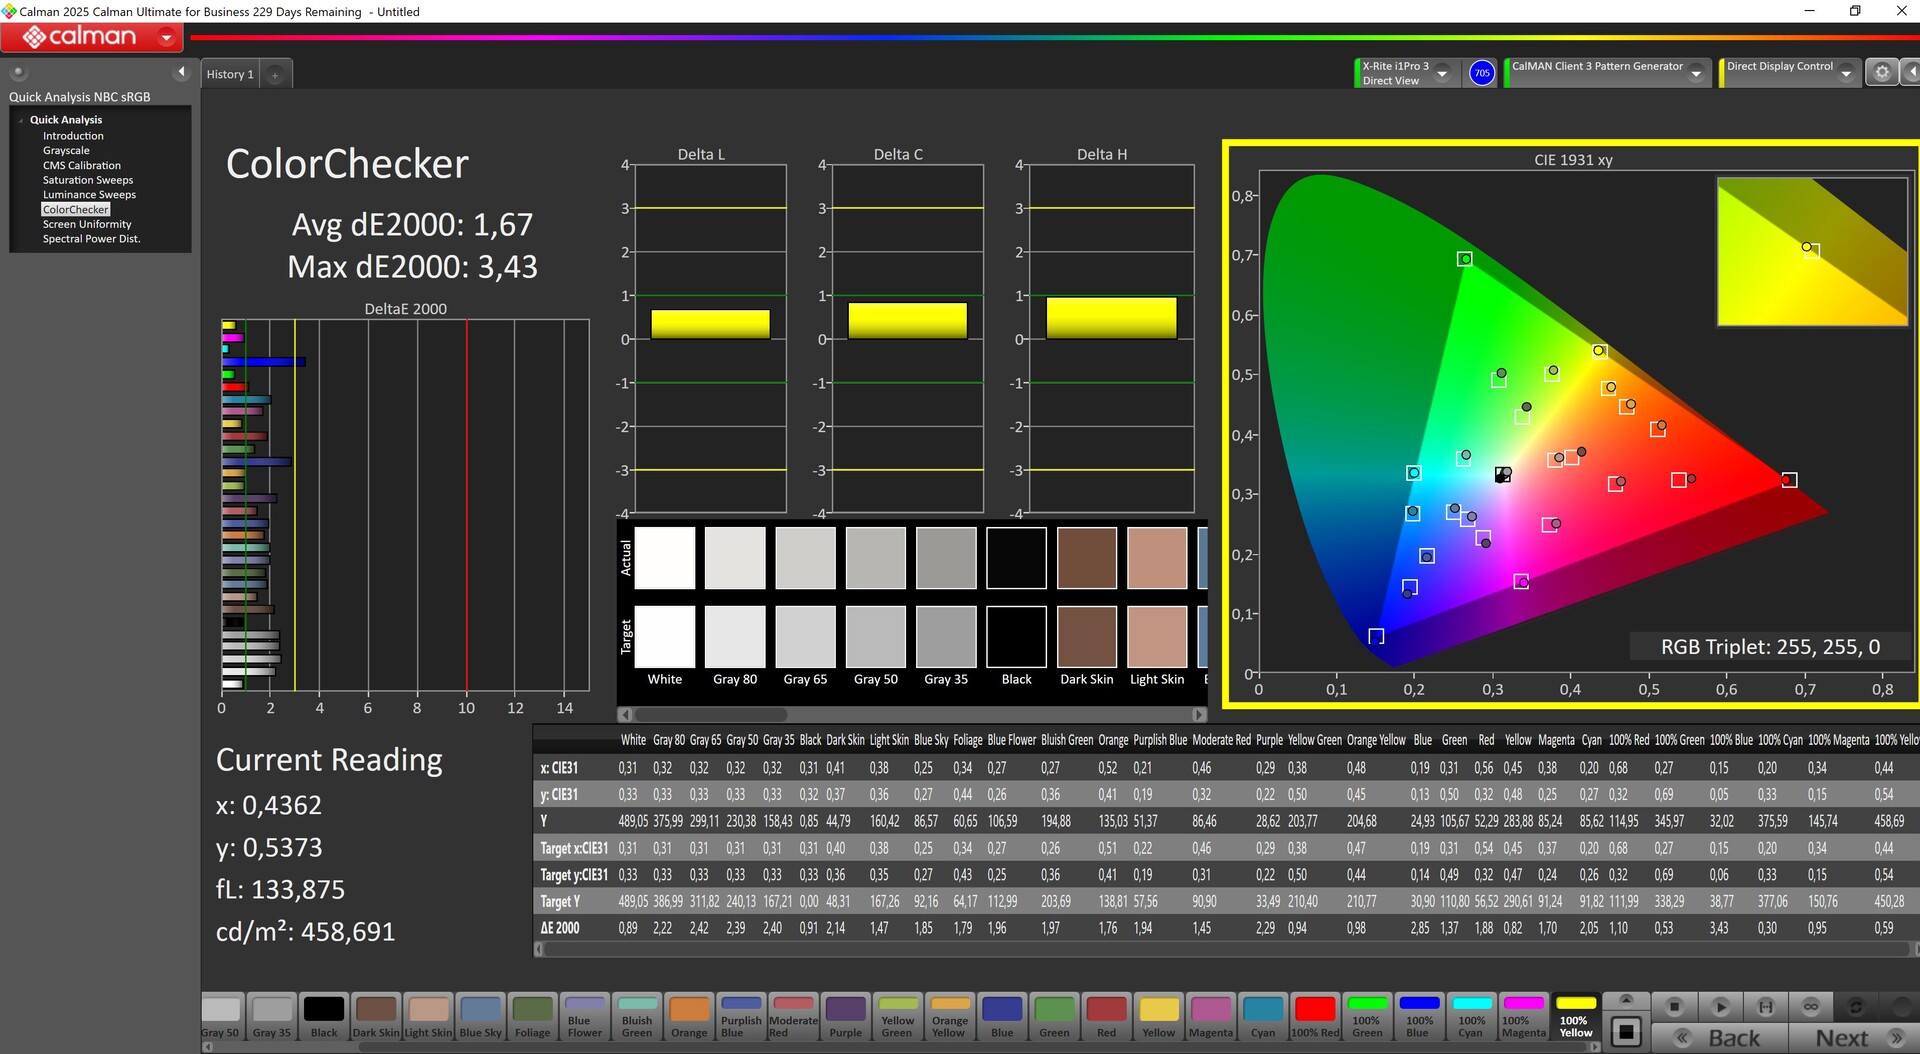
ΔE ColorChecker Calman: 1.67 | ∀{0.5-29.43 Ø4.72}
calibrated: 0.8
ΔE Greyscale Calman: 2.08 | ∀{0.09-98 Ø4.97}
87.4% AdobeRGB 1998 (Argyll 3D)
100% sRGB (Argyll 3D)
99.6% Display P3 (Argyll 3D)
Gamma: 2.55
CCT: 6240 K
| MSI Vector 17 HX AI A2XWIG B170QAN01.2 (AUO84A6), IPS, 2560x1600, 17", 240 Hz | Alienware 16 Area-51 AU Optronics B160QAN, IPS, 2560x1600, 16", 240 Hz | MSI Raider A18 HX A9WIG-080 B180ZAN01.0, MiniLED IPS, 3840x2400, 18", 120 Hz | Aorus MASTER 16 AM6H ATNA60DL03-0 (SDC41AB), OLED, 2560x1600, 16", 240 Hz | MSI Titan 18 HX AI A2XWJG AU Optronics B180ZAN01.0, Mini-LED, 3840x2160, 18", 120 Hz | Schenker XMG Neo 16 A25 5090 NE160QDM-NM9, Mini-LED, 2560x1600, 16", 300 Hz | |
|---|---|---|---|---|---|---|
| Display | -1% | 2% | 1% | 1% | 0% | |
| HDR Peak Brightness (cd/m²) | 1153 | |||||
| Display P3 Coverage (%) | 99.6 | 96 -4% | 99.9 0% | 95.3 -4% | 99.7 0% | 99.9 0% |
| sRGB Coverage (%) | 100 | 100 0% | 100 0% | 98.8 -1% | 99.9 0% | 100 0% |
| AdobeRGB 1998 Coverage (%) | 87.4 | 89.2 2% | 93.9 7% | 94.1 8% | 90.4 3% | 88.5 1% |
| Response Times | -42% | -377% | 92% | -179% | -277% | |
| Response Time Grey 50% / Grey 80% * (ms) | 3.6 ? | 4.8 ? -33% | 23 ? -539% | 0.24 ? 93% | 8.8 ? -144% | 17.4 ? -383% |
| Response Time Black / White * (ms) | 4.8 ? | 7.2 ? -50% | 15.1 ? -215% | 0.43 ? 91% | 15 ? -213% | 13 ? -171% |
| PWM Frequency (Hz) | 15203 | 960 | 15430 ? | 20253 | ||
| PWM Amplitude * (%) | 100 | 47 | 50 | 75 | ||
| Screen | -23% | 759% | 57% | -71% | -23% | |
| Brightness middle (cd/m²) | 488 | 554 14% | 510 5% | 435 -11% | 704 44% | 888 82% |
| Brightness (cd/m²) | 473 | 532 12% | 470 -1% | 437 -8% | 680 44% | 859 82% |
| Brightness Distribution (%) | 91 | 88 -3% | 85 -7% | 96 5% | 88 -3% | 94 3% |
| Black Level * (cd/m²) | 0.74 | 0.52 30% | 0.01 99% | 0.08 89% | ||
| Contrast (:1) | 659 | 1065 62% | 51000 7639% | 5438 725% | ||
| Colorchecker dE 2000 * | 1.67 | 2.81 -68% | 4.5 -169% | 2.42 -45% | 4.11 -146% | 3.3 -98% |
| Colorchecker dE 2000 max. * | 3.43 | 8.32 -143% | 7.3 -113% | 4.81 -40% | 6.43 -87% | 5.5 -60% |
| Colorchecker dE 2000 calibrated * | 0.8 | 0.65 19% | 5.7 -613% | 2.03 -154% | 2.5 -213% | 1.5 -88% |
| Greyscale dE 2000 * | 2.08 | 4.7 -126% | 2.3 -11% | 3.11 -50% | 4.9 -136% | 3.8 -83% |
| Gamma | 2.55 86% | 2.3 96% | 2.08 106% | 2.48 89% | 2.03 108% | 2.46 89% |
| CCT | 6240 104% | 6476 100% | 6648 98% | 6270 104% | 6331 103% | 6267 104% |
| Media total (Programa/Opciones) | -22% /
-21% | 128% /
434% | 50% /
50% | -83% /
-71% | -100% /
-60% |
* ... más pequeño es mejor
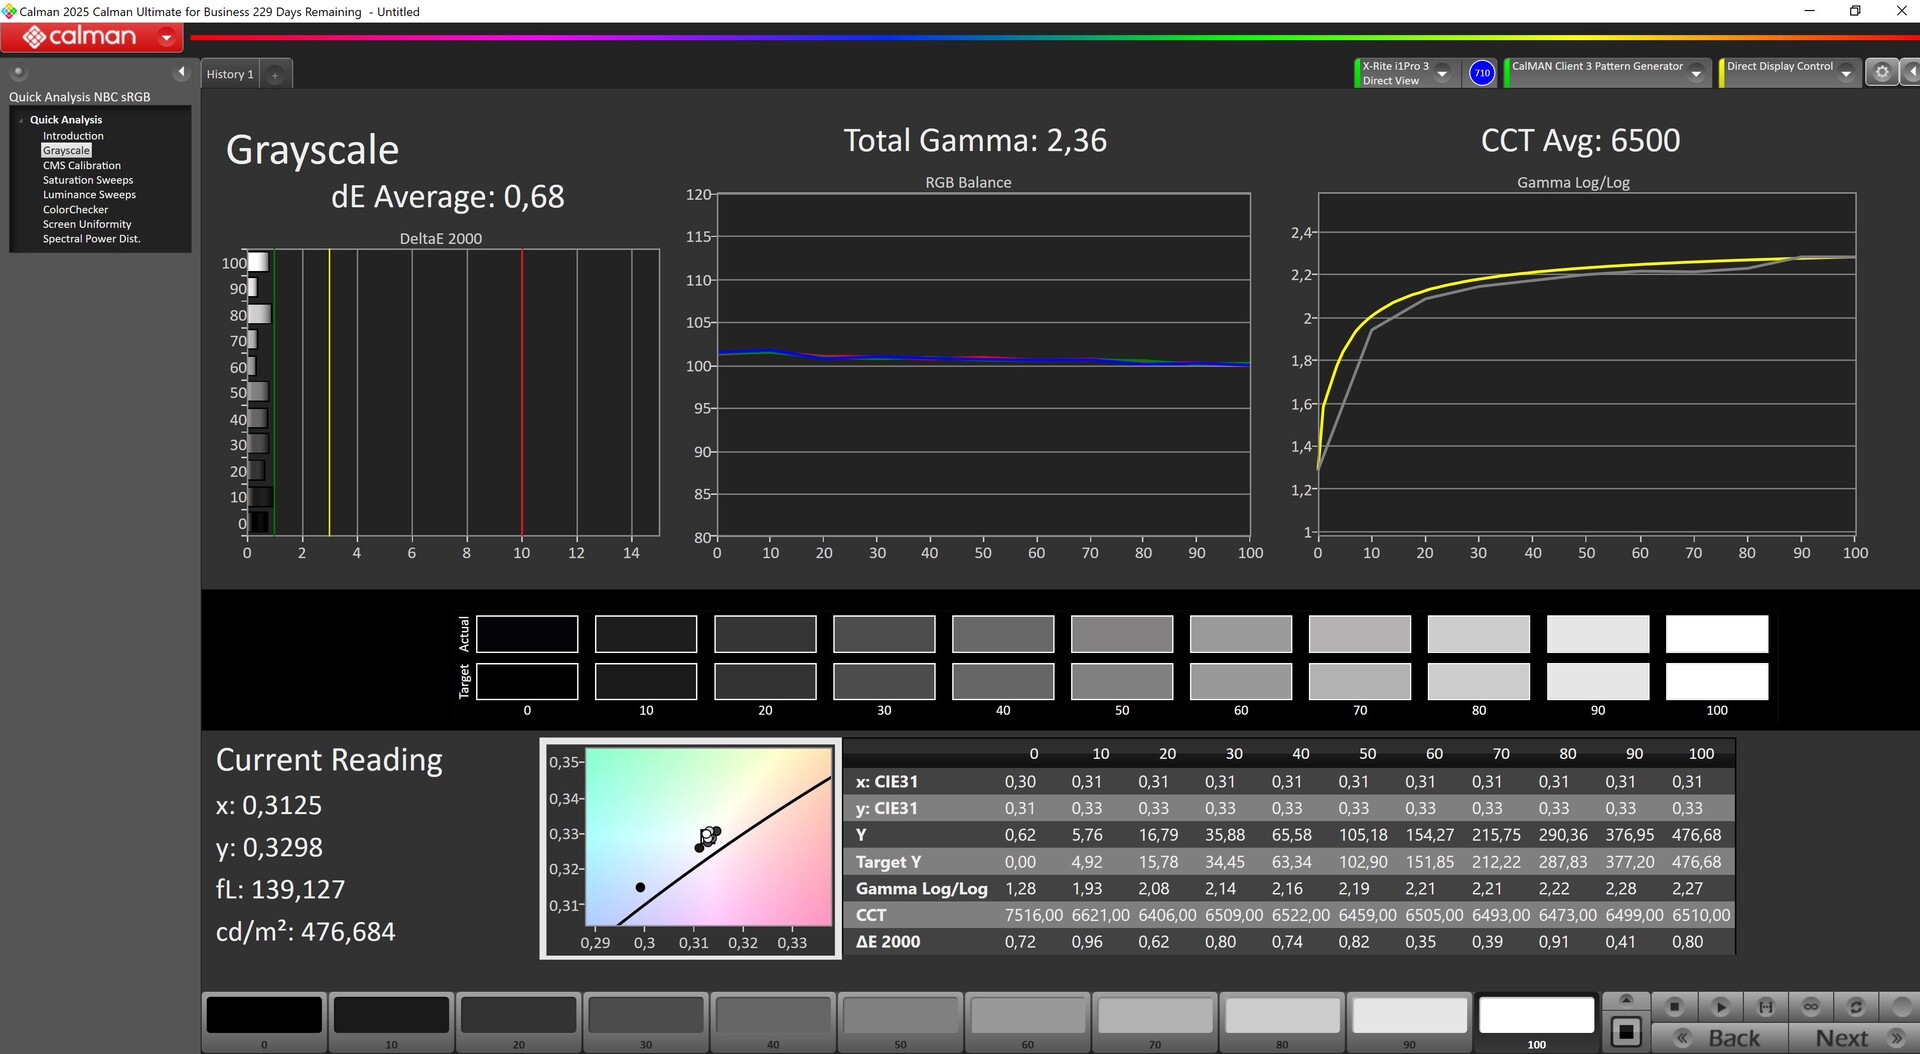
Ya medimos de fábrica valores bien calibrados. Tras nuestra propia calibración, incluso reducimos las desviaciones por debajo de 1.
Tiempos de respuesta del display
| ↔ Tiempo de respuesta de Negro a Blanco | ||
|---|---|---|
| 4.8 ms ... subida ↗ y bajada ↘ combinada | ↗ 1.8 ms subida | 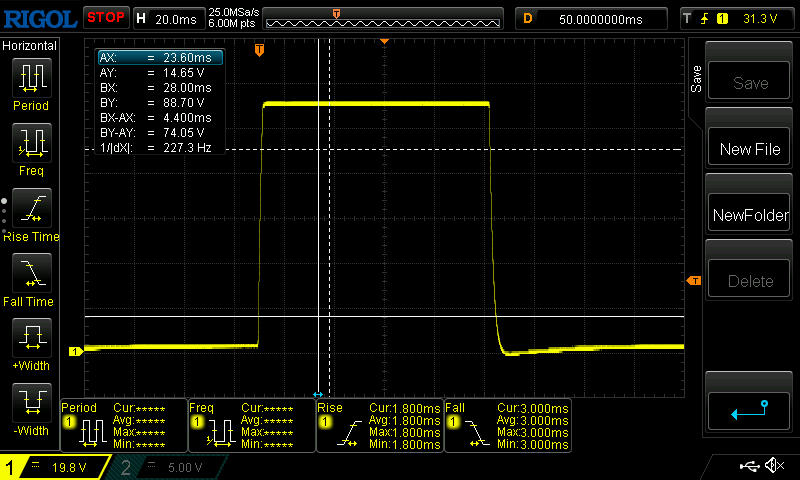 |
| ↘ 3 ms bajada | ||
| La pantalla mostró tiempos de respuesta muy rápidos en nuestros tests y debería ser adecuada para juegos frenéticos. En comparación, todos los dispositivos de prueba van de ##min### (mínimo) a 240 (máximo) ms. » 17 % de todos los dispositivos son mejores. Esto quiere decir que el tiempo de respuesta medido es mejor que la media (19.8 ms) de todos los dispositivos testados. | ||
| ↔ Tiempo de respuesta 50% Gris a 80% Gris | ||
| 3.6 ms ... subida ↗ y bajada ↘ combinada | ↗ 1.8 ms subida | 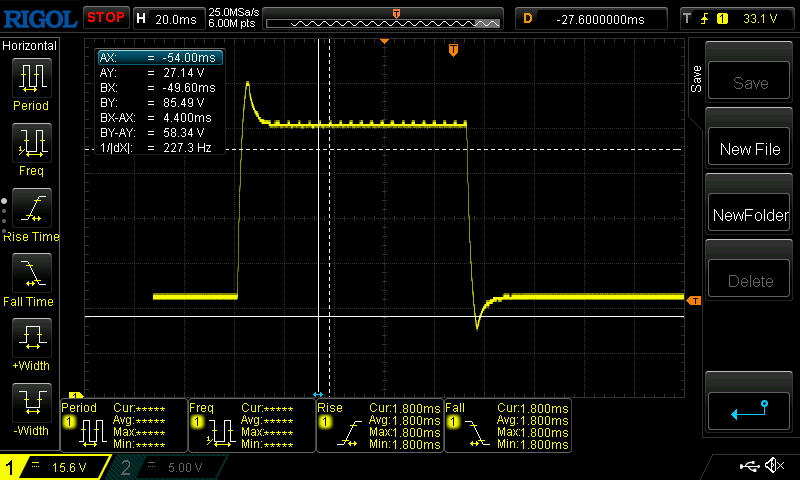 |
| ↘ 1.8 ms bajada | ||
| La pantalla mostró tiempos de respuesta muy rápidos en nuestros tests y debería ser adecuada para juegos frenéticos. En comparación, todos los dispositivos de prueba van de ##min### (mínimo) a 636 (máximo) ms. » 14 % de todos los dispositivos son mejores. Esto quiere decir que el tiempo de respuesta medido es mejor que la media (31 ms) de todos los dispositivos testados. | ||
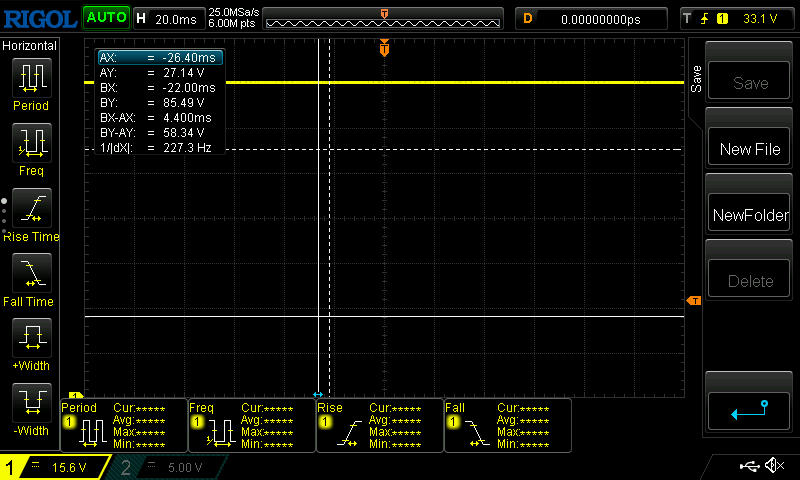
Parpadeo de Pantalla / PWM (Pulse-Width Modulation)
| Parpadeo de Pantalla / PWM no detectado |  | ||
Comparación: 52 % de todos los dispositivos testados no usaron PWM para atenuar el display. Si se usó, medimos una media de 7747 (mínimo: 5 - máxmo: 343500) Hz. | |||


Rendimiento - Colapso de la CPU bajo carga continua
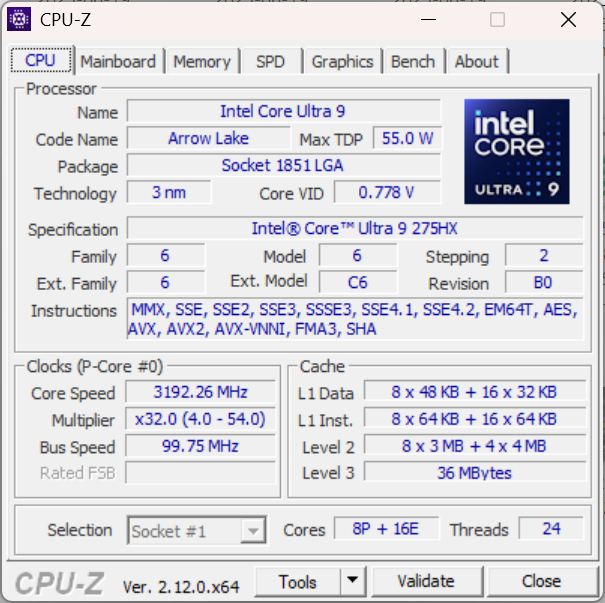
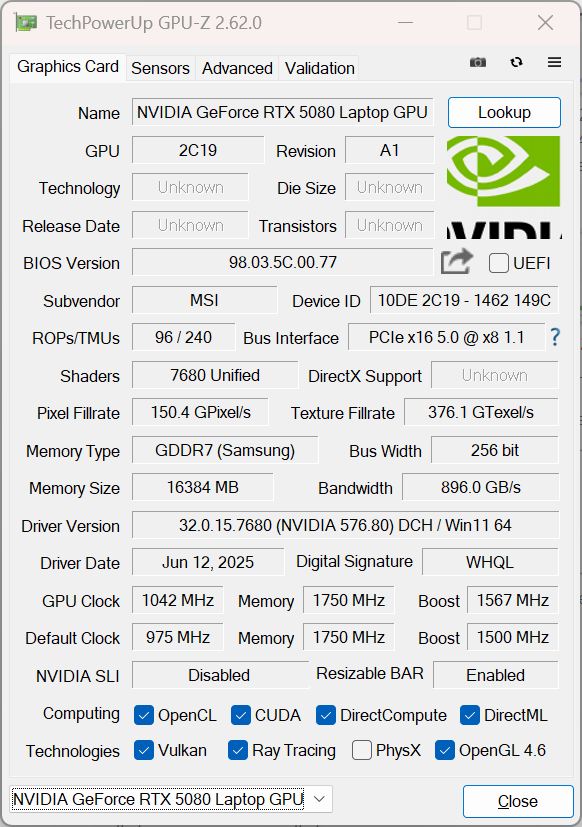
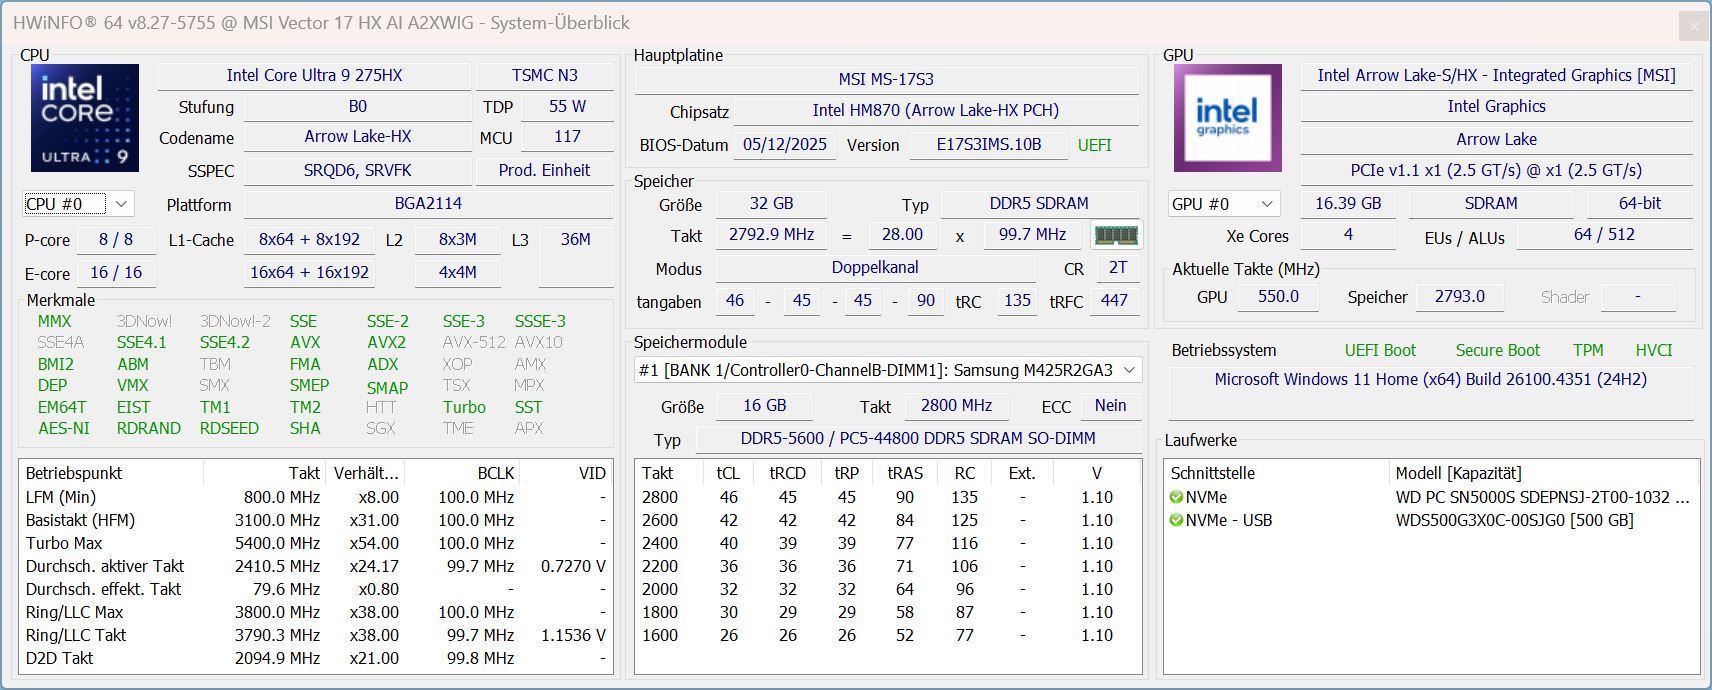
Con Intel Core Ultra 9 275HX, Portátil RTX 5080, 2 TB SSD y 32 GB RAM, el Vector 17 HX es un gamer de gama alta y debería estar equipado para todos los títulos actuales.
Condiciones de la prueba
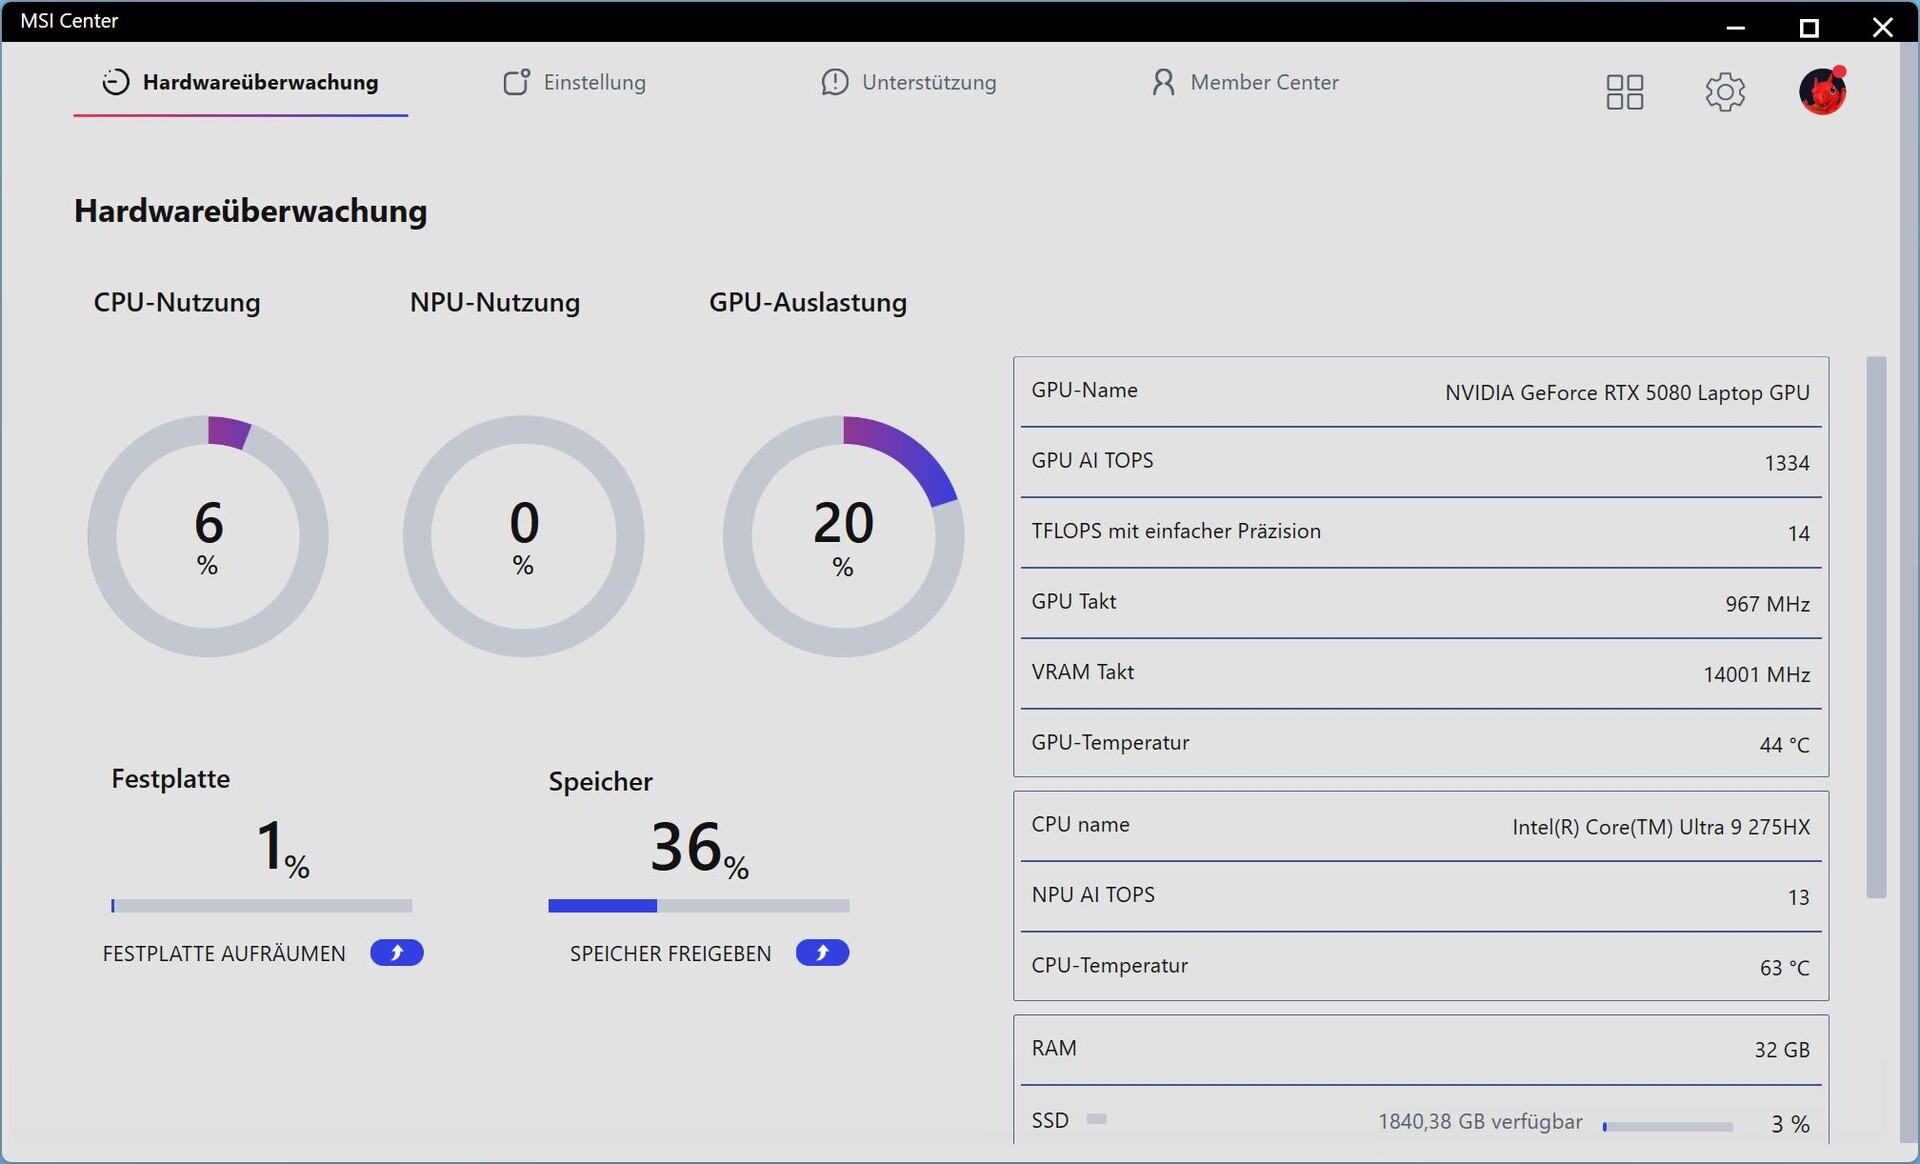
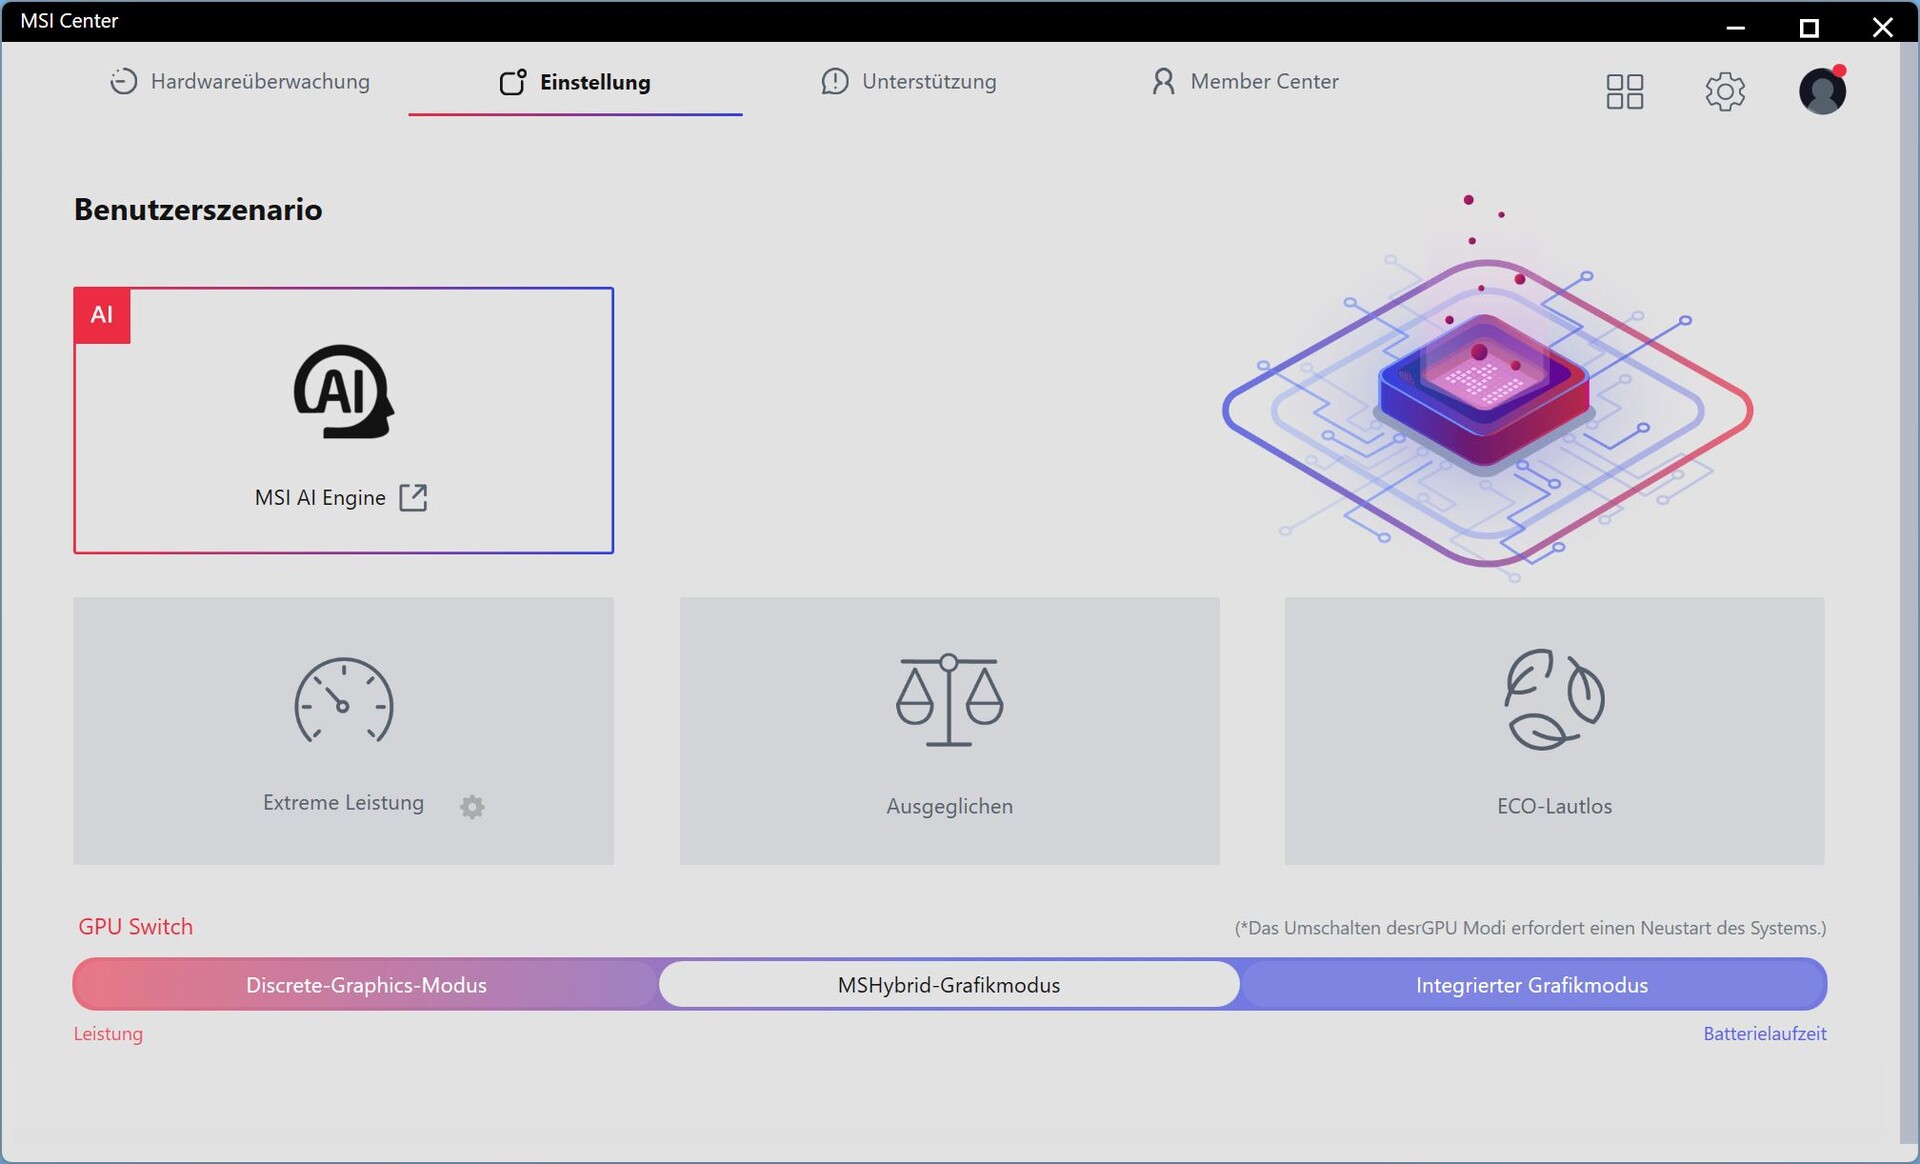
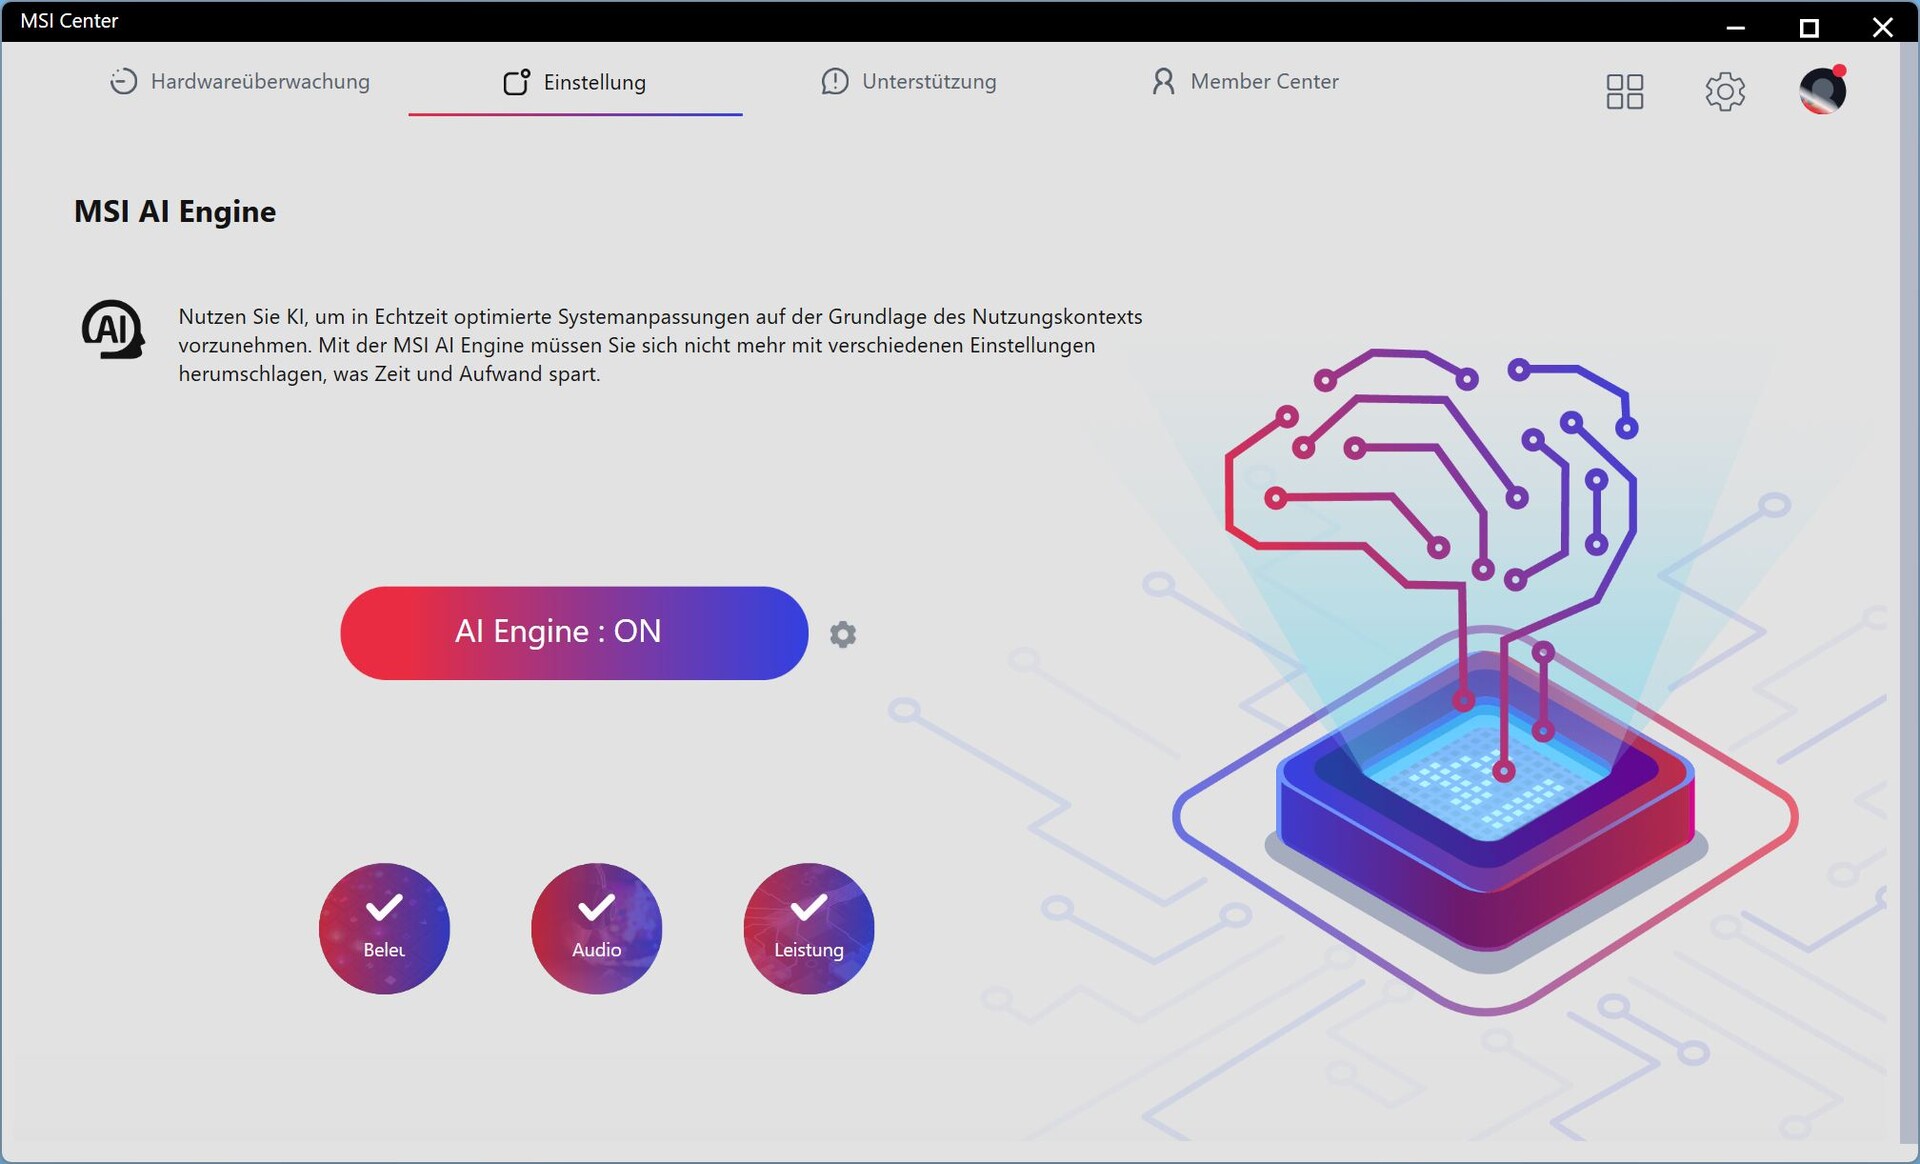
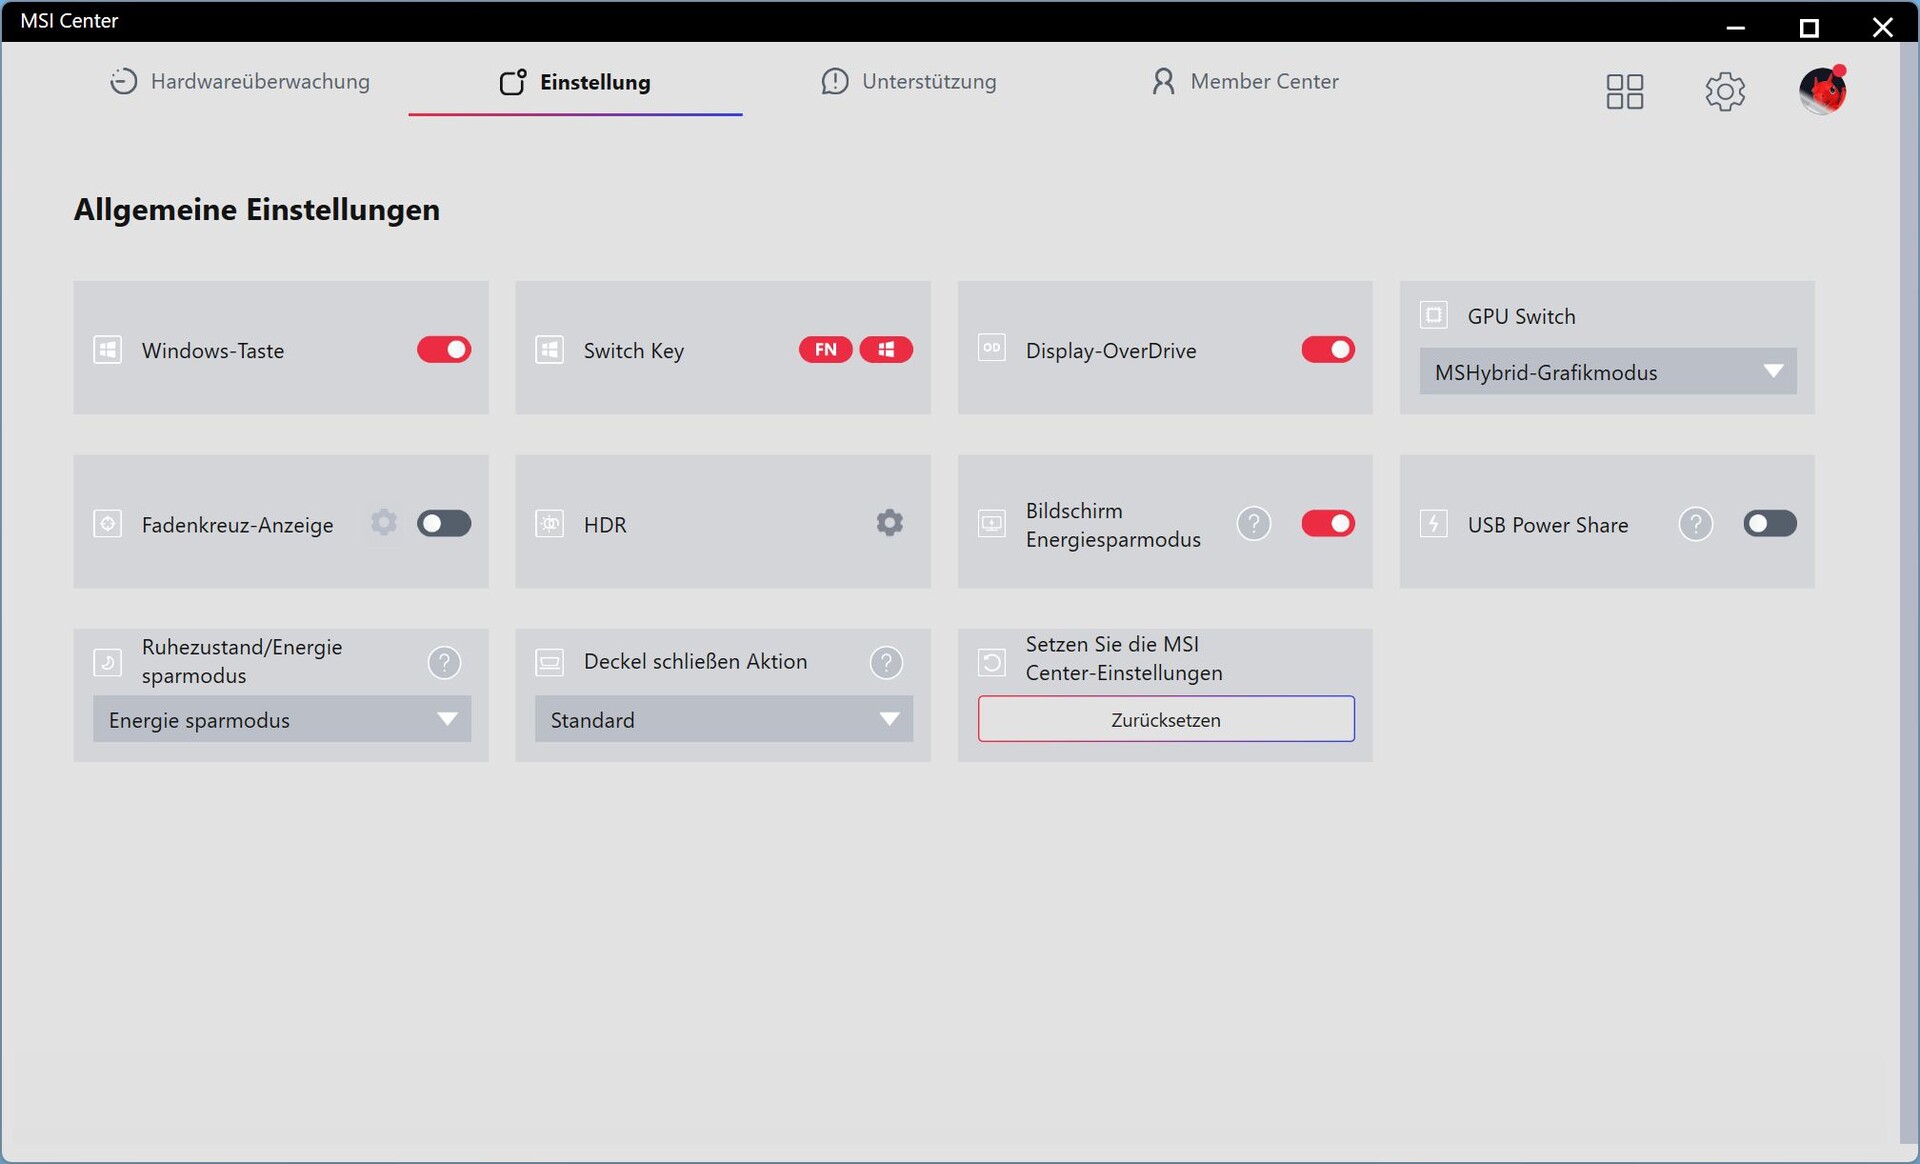
De los cuatro perfiles de rendimiento, seleccionamos el motor AI; también se integra un MUX en el Centro MSI.
Al principio tuvimos que lidiar con un consumo en ralentí muy elevado de hasta 60 W y niveles de ruido excesivos en la prueba. Una actualización de la BIOS y del Centro MSI no aportó inicialmente ninguna mejora. El problema sólo se solucionó tras la reinstalación adicional de Windows. Tuvimos que volver a realizar varias mediciones.
| MSI Modo central | MSIAI Engine | Rendimientoextremo | Equilibrado | ECO Silencioso |
| Cyberpunk 2077 Ruido en dB(A) | 60,35 | 60,35 | 47,4 | 36,21 |
| Consumo de energía Cyberpunk | 313 W | 313 W | 253 W | 134 W |
| Consumo de energía de la GPU | 160 W | 160 W | 130 W | 80 W |
| Rendimiento de Cyberpunk 2077 (FHD/Ultra) | 134,6 fps | 134,5 fps | 123 fps | 78,4 fps |
| Cinebench R15 Puntuación múltiple | 5112 Puntos | 5430 Puntos | 4813 Puntos | 2019 Puntos |
| CPU PL1 | 110 vatios | 150 vatios | 65 vatios | 20 vatios |
| CPU PL2 | 150 vatios | 150 vatios | 110 vatios | 25 vatios |
Procesador
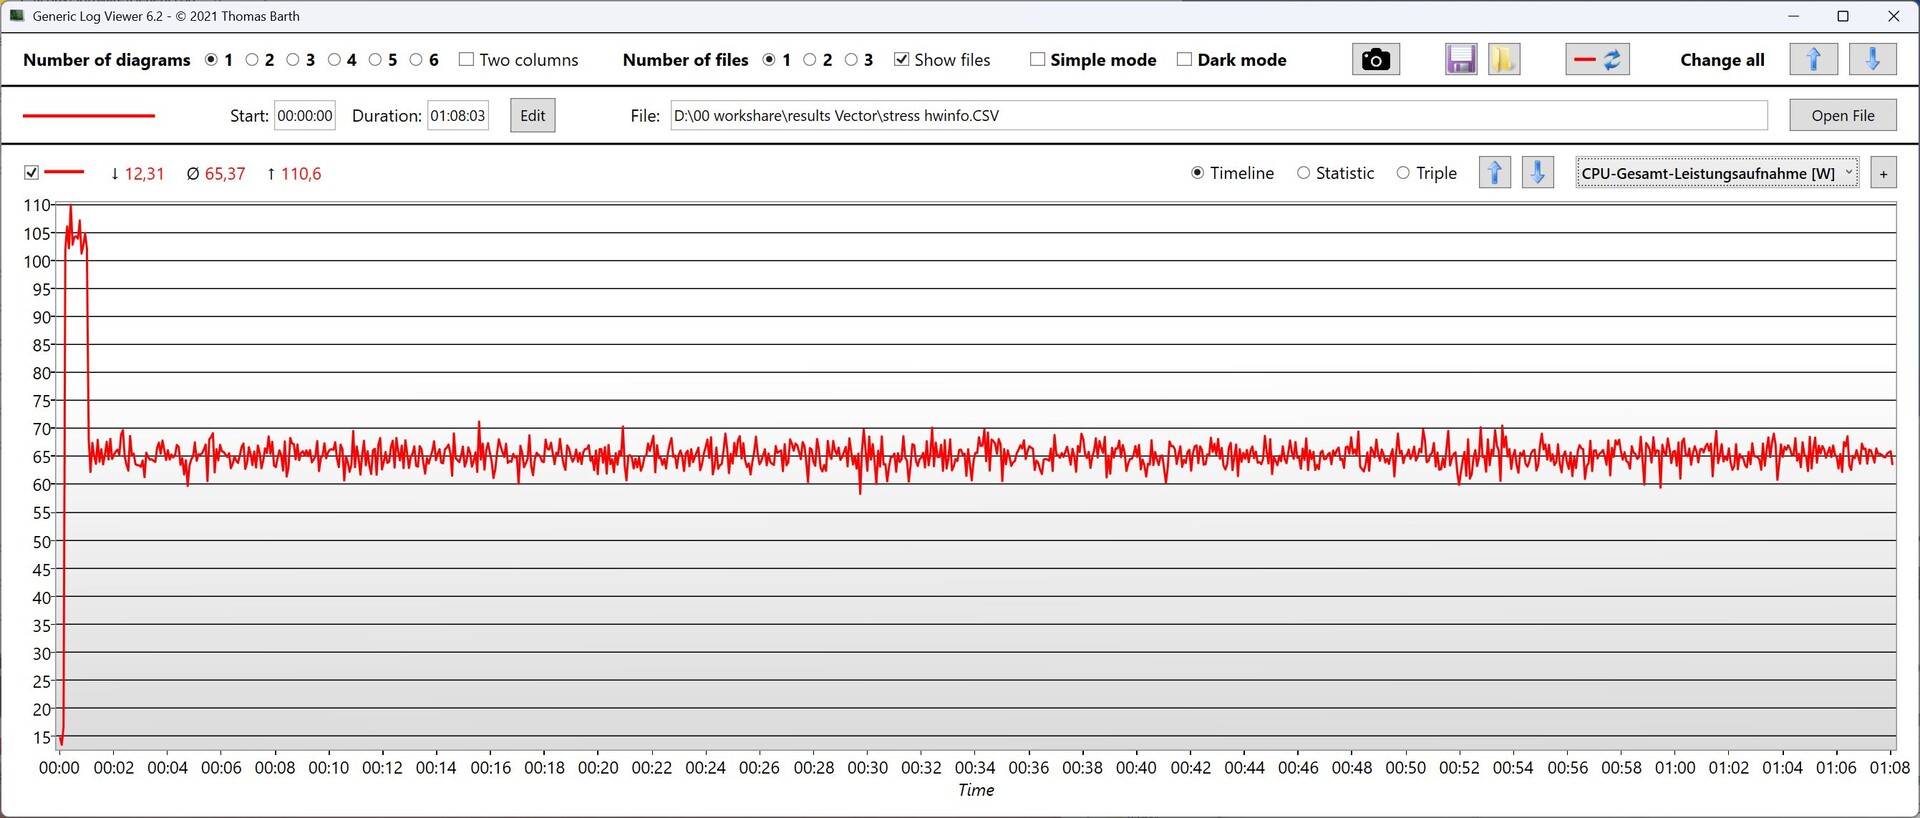
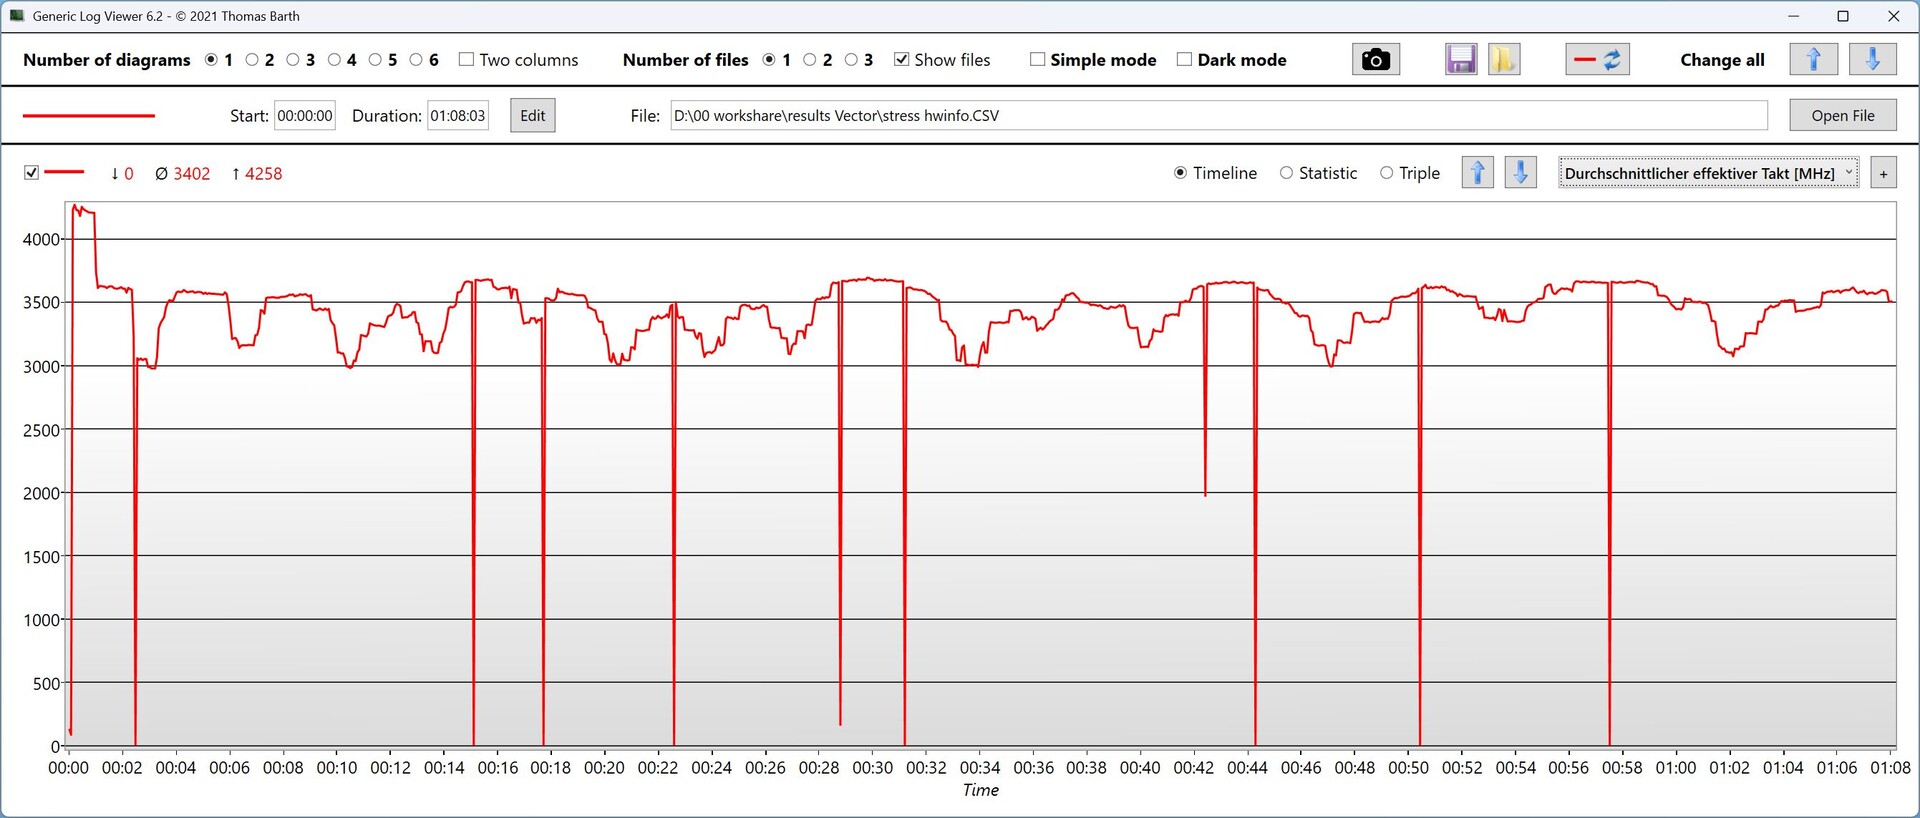
El Core Ultra 9 275HX con 24 núcleos (8 núcleos P y 16 núcleos E, hasta 5,4 GHz) se estrangula bajo carga continua: mantiene un rendimiento medio durante 2 ciclos, tras los cuales cae más de 1.000 puntos. El rendimiento a largo plazo es, por tanto, más débil que el de un Core Ultra 7 255HX. En el modo de rendimiento extremo, sin embargo, el rendimiento es estable.
En todas las pruebas de CPU, el Vector 17 HX está en torno a un 6 por ciento por detrás de la media con la misma CPU. En el modo de batería se pierde alrededor de un 59 por ciento de rendimiento de la CPU.
Cinebench R15 Multi Endurance test
Cinebench R23: Multi Core | Single Core
Cinebench R20: CPU (Multi Core) | CPU (Single Core)
Cinebench R15: CPU Multi 64Bit | CPU Single 64Bit
Blender: v2.79 BMW27 CPU
7-Zip 18.03: 7z b 4 | 7z b 4 -mmt1
Geekbench 6.7: Multi-Core | Single-Core
Geekbench 5.5: Multi-Core | Single-Core
HWBOT x265 Benchmark v2.2: 4k Preset
LibreOffice : 20 Documents To PDF
R Benchmark 2.5: Overall mean
| CPU Performance rating | |
| Schenker XMG Neo 16 A25 5090 | |
| MSI Raider A18 HX A9WIG-080 | |
| MSI Titan 18 HX AI A2XWJG | |
| Aorus MASTER 16 AM6H | |
| Medio Intel Core Ultra 9 275HX | |
| MSI Vector 17 HX AI A2XWIG | |
| Alienware 16 Area-51 | |
| Media de la clase Gaming | |
| Cinebench R23 / Multi Core | |
| MSI Titan 18 HX AI A2XWJG | |
| Schenker XMG Neo 16 A25 5090 | |
| MSI Raider A18 HX A9WIG-080 | |
| Aorus MASTER 16 AM6H | |
| Medio Intel Core Ultra 9 275HX (30712 - 40970, n=31) | |
| MSI Vector 17 HX AI A2XWIG | |
| Alienware 16 Area-51 | |
| Media de la clase Gaming (10488 - 40970, n=106, últimos 2 años) | |
| Cinebench R23 / Single Core | |
| Aorus MASTER 16 AM6H | |
| Medio Intel Core Ultra 9 275HX (2009 - 2267, n=31) | |
| MSI Titan 18 HX AI A2XWJG | |
| MSI Vector 17 HX AI A2XWIG | |
| Schenker XMG Neo 16 A25 5090 | |
| MSI Raider A18 HX A9WIG-080 | |
| Media de la clase Gaming (1166 - 2387, n=106, últimos 2 años) | |
| Alienware 16 Area-51 | |
| Cinebench R20 / CPU (Multi Core) | |
| MSI Titan 18 HX AI A2XWJG | |
| Schenker XMG Neo 16 A25 5090 | |
| MSI Raider A18 HX A9WIG-080 | |
| Aorus MASTER 16 AM6H | |
| Medio Intel Core Ultra 9 275HX (12026 - 16108, n=30) | |
| Alienware 16 Area-51 | |
| MSI Vector 17 HX AI A2XWIG | |
| Media de la clase Gaming (4029 - 16108, n=105, últimos 2 años) | |
| Cinebench R20 / CPU (Single Core) | |
| Aorus MASTER 16 AM6H | |
| MSI Raider A18 HX A9WIG-080 | |
| Schenker XMG Neo 16 A25 5090 | |
| Medio Intel Core Ultra 9 275HX (774 - 870, n=30) | |
| MSI Titan 18 HX AI A2XWJG | |
| MSI Vector 17 HX AI A2XWIG | |
| Media de la clase Gaming (442 - 904, n=105, últimos 2 años) | |
| Alienware 16 Area-51 | |
| Cinebench R15 / CPU Multi 64Bit | |
| MSI Titan 18 HX AI A2XWJG | |
| Schenker XMG Neo 16 A25 5090 | |
| MSI Raider A18 HX A9WIG-080 | |
| Aorus MASTER 16 AM6H | |
| Medio Intel Core Ultra 9 275HX (4737 - 6271, n=30) | |
| MSI Vector 17 HX AI A2XWIG | |
| Alienware 16 Area-51 | |
| Media de la clase Gaming (1578 - 6271, n=104, últimos 2 años) | |
| Cinebench R15 / CPU Single 64Bit | |
| MSI Vector 17 HX AI A2XWIG | |
| MSI Vector 17 HX AI A2XWIG | |
| Schenker XMG Neo 16 A25 5090 | |
| Aorus MASTER 16 AM6H | |
| Medio Intel Core Ultra 9 275HX (306 - 343, n=31) | |
| MSI Titan 18 HX AI A2XWJG | |
| MSI Raider A18 HX A9WIG-080 | |
| Alienware 16 Area-51 | |
| Media de la clase Gaming (188.8 - 344, n=105, últimos 2 años) | |
| Blender / v2.79 BMW27 CPU | |
| Media de la clase Gaming (80 - 330, n=103, últimos 2 años) | |
| MSI Vector 17 HX AI A2XWIG | |
| Alienware 16 Area-51 | |
| Medio Intel Core Ultra 9 275HX (82 - 116, n=29) | |
| Aorus MASTER 16 AM6H | |
| MSI Titan 18 HX AI A2XWJG | |
| MSI Raider A18 HX A9WIG-080 | |
| Schenker XMG Neo 16 A25 5090 | |
| 7-Zip 18.03 / 7z b 4 | |
| Schenker XMG Neo 16 A25 5090 | |
| MSI Raider A18 HX A9WIG-080 | |
| MSI Titan 18 HX AI A2XWJG | |
| Medio Intel Core Ultra 9 275HX (98236 - 124155, n=30) | |
| Aorus MASTER 16 AM6H | |
| Alienware 16 Area-51 | |
| MSI Vector 17 HX AI A2XWIG | |
| Media de la clase Gaming (33491 - 148086, n=104, últimos 2 años) | |
| 7-Zip 18.03 / 7z b 4 -mmt1 | |
| Schenker XMG Neo 16 A25 5090 | |
| MSI Raider A18 HX A9WIG-080 | |
| MSI Titan 18 HX AI A2XWJG | |
| Medio Intel Core Ultra 9 275HX (6026 - 7149, n=30) | |
| Aorus MASTER 16 AM6H | |
| MSI Vector 17 HX AI A2XWIG | |
| Media de la clase Gaming (4199 - 7436, n=104, últimos 2 años) | |
| Alienware 16 Area-51 | |
| Geekbench 6.7 / Multi-Core | |
| MSI Titan 18 HX AI A2XWJG | |
| Schenker XMG Neo 16 A25 5090 | |
| MSI Raider A18 HX A9WIG-080 | |
| Medio Intel Core Ultra 9 275HX (16033 - 21668, n=33) | |
| Aorus MASTER 16 AM6H | |
| MSI Vector 17 HX AI A2XWIG | |
| Alienware 16 Area-51 | |
| Media de la clase Gaming (6625 - 22104, n=105, últimos 2 años) | |
| Geekbench 6.7 / Single-Core | |
| Schenker XMG Neo 16 A25 5090 | |
| MSI Raider A18 HX A9WIG-080 | |
| MSI Vector 17 HX AI A2XWIG | |
| MSI Titan 18 HX AI A2XWJG | |
| Aorus MASTER 16 AM6H | |
| Medio Intel Core Ultra 9 275HX (2843 - 3160, n=33) | |
| Alienware 16 Area-51 | |
| Media de la clase Gaming (1490 - 3259, n=105, últimos 2 años) | |
| Geekbench 5.5 / Multi-Core | |
| MSI Titan 18 HX AI A2XWJG | |
| Schenker XMG Neo 16 A25 5090 | |
| MSI Raider A18 HX A9WIG-080 | |
| Medio Intel Core Ultra 9 275HX (19105 - 25855, n=31) | |
| Aorus MASTER 16 AM6H | |
| Alienware 16 Area-51 | |
| MSI Vector 17 HX AI A2XWIG | |
| Media de la clase Gaming (6460 - 27010, n=104, últimos 2 años) | |
| Geekbench 5.5 / Single-Core | |
| MSI Raider A18 HX A9WIG-080 | |
| Schenker XMG Neo 16 A25 5090 | |
| MSI Titan 18 HX AI A2XWJG | |
| MSI Vector 17 HX AI A2XWIG | |
| Aorus MASTER 16 AM6H | |
| Medio Intel Core Ultra 9 275HX (2033 - 2292, n=31) | |
| Alienware 16 Area-51 | |
| Media de la clase Gaming (986 - 2474, n=104, últimos 2 años) | |
| HWBOT x265 Benchmark v2.2 / 4k Preset | |
| MSI Titan 18 HX AI A2XWJG | |
| MSI Raider A18 HX A9WIG-080 | |
| Schenker XMG Neo 16 A25 5090 | |
| Medio Intel Core Ultra 9 275HX (30.7 - 43.8, n=30) | |
| Aorus MASTER 16 AM6H | |
| MSI Vector 17 HX AI A2XWIG | |
| Alienware 16 Area-51 | |
| Media de la clase Gaming (11.5 - 44.3, n=104, últimos 2 años) | |
| LibreOffice / 20 Documents To PDF | |
| Media de la clase Gaming (33.2 - 88.8, n=104, últimos 2 años) | |
| MSI Titan 18 HX AI A2XWJG | |
| Schenker XMG Neo 16 A25 5090 | |
| MSI Raider A18 HX A9WIG-080 | |
| Medio Intel Core Ultra 9 275HX (33.2 - 62.1, n=30) | |
| Aorus MASTER 16 AM6H | |
| MSI Vector 17 HX AI A2XWIG | |
| Alienware 16 Area-51 | |
| R Benchmark 2.5 / Overall mean | |
| Aorus MASTER 16 AM6H | |
| Alienware 16 Area-51 | |
| Media de la clase Gaming (0.3439 - 0.759, n=105, últimos 2 años) | |
| Medio Intel Core Ultra 9 275HX (0.3943 - 0.4568, n=30) | |
| MSI Vector 17 HX AI A2XWIG | |
| MSI Titan 18 HX AI A2XWJG | |
| MSI Raider A18 HX A9WIG-080 | |
| Schenker XMG Neo 16 A25 5090 | |
* ... más pequeño es mejor
AIDA64: FP32 Ray-Trace | FPU Julia | CPU SHA3 | CPU Queen | FPU SinJulia | FPU Mandel | CPU AES | CPU ZLib | FP64 Ray-Trace | CPU PhotoWorxx
| Performance rating | |
| Schenker XMG Neo 16 E25 RTX 5090 Laptop | |
| Medion Erazer Beast 16 X1 Ultimate | |
| Aorus MASTER 16 AM6H | |
| Lenovo Legion 5 Pro 16IAX10H | |
| Medio Intel Core Ultra 9 275HX | |
| Alienware 16 Area-51 | |
| Media de la clase Gaming | |
| MSI Vector 17 HX AI A2XWIG | |
| MSI Vector 16 HX AI A2XWHG | |
| AIDA64 / FP32 Ray-Trace | |
| Schenker XMG Neo 16 E25 RTX 5090 Laptop | |
| Medion Erazer Beast 16 X1 Ultimate | |
| Aorus MASTER 16 AM6H | |
| Medio Intel Core Ultra 9 275HX (28039 - 39895, n=30) | |
| Lenovo Legion 5 Pro 16IAX10H | |
| Alienware 16 Area-51 | |
| Media de la clase Gaming (10227 - 85542, n=103, últimos 2 años) | |
| MSI Vector 17 HX AI A2XWIG | |
| MSI Vector 16 HX AI A2XWHG | |
| AIDA64 / FPU Julia | |
| Schenker XMG Neo 16 E25 RTX 5090 Laptop | |
| Medion Erazer Beast 16 X1 Ultimate | |
| Aorus MASTER 16 AM6H | |
| Lenovo Legion 5 Pro 16IAX10H | |
| Medio Intel Core Ultra 9 275HX (140254 - 200744, n=30) | |
| Alienware 16 Area-51 | |
| MSI Vector 17 HX AI A2XWIG | |
| MSI Vector 16 HX AI A2XWHG | |
| Media de la clase Gaming (51376 - 238426, n=103, últimos 2 años) | |
| AIDA64 / CPU SHA3 | |
| Schenker XMG Neo 16 E25 RTX 5090 Laptop | |
| Medion Erazer Beast 16 X1 Ultimate | |
| Aorus MASTER 16 AM6H | |
| Medio Intel Core Ultra 9 275HX (6710 - 9817, n=30) | |
| Lenovo Legion 5 Pro 16IAX10H | |
| Alienware 16 Area-51 | |
| MSI Vector 17 HX AI A2XWIG | |
| MSI Vector 16 HX AI A2XWHG | |
| Media de la clase Gaming (2180 - 9817, n=103, últimos 2 años) | |
| AIDA64 / CPU Queen | |
| Schenker XMG Neo 16 E25 RTX 5090 Laptop | |
| Medion Erazer Beast 16 X1 Ultimate | |
| Lenovo Legion 5 Pro 16IAX10H | |
| Aorus MASTER 16 AM6H | |
| Medio Intel Core Ultra 9 275HX (113887 - 140937, n=30) | |
| Alienware 16 Area-51 | |
| MSI Vector 17 HX AI A2XWIG | |
| Media de la clase Gaming (49785 - 173351, n=89, últimos 2 años) | |
| MSI Vector 16 HX AI A2XWHG | |
| AIDA64 / FPU SinJulia | |
| Media de la clase Gaming (4424 - 33636, n=103, últimos 2 años) | |
| Medion Erazer Beast 16 X1 Ultimate | |
| Schenker XMG Neo 16 E25 RTX 5090 Laptop | |
| Lenovo Legion 5 Pro 16IAX10H | |
| Alienware 16 Area-51 | |
| Aorus MASTER 16 AM6H | |
| Medio Intel Core Ultra 9 275HX (11172 - 14425, n=30) | |
| MSI Vector 17 HX AI A2XWIG | |
| MSI Vector 16 HX AI A2XWHG | |
| AIDA64 / FPU Mandel | |
| Schenker XMG Neo 16 E25 RTX 5090 Laptop | |
| Aorus MASTER 16 AM6H | |
| Medion Erazer Beast 16 X1 Ultimate | |
| Medio Intel Core Ultra 9 275HX (72596 - 104508, n=30) | |
| Lenovo Legion 5 Pro 16IAX10H | |
| Alienware 16 Area-51 | |
| MSI Vector 17 HX AI A2XWIG | |
| MSI Vector 16 HX AI A2XWHG | |
| Media de la clase Gaming (25115 - 128721, n=103, últimos 2 años) | |
| AIDA64 / CPU AES | |
| Schenker XMG Neo 16 E25 RTX 5090 Laptop | |
| Medion Erazer Beast 16 X1 Ultimate | |
| Lenovo Legion 5 Pro 16IAX10H | |
| Medio Intel Core Ultra 9 275HX (105608 - 247074, n=30) | |
| Alienware 16 Area-51 | |
| Aorus MASTER 16 AM6H | |
| Media de la clase Gaming (39258 - 247074, n=103, últimos 2 años) | |
| MSI Vector 17 HX AI A2XWIG | |
| MSI Vector 16 HX AI A2XWHG | |
| AIDA64 / CPU ZLib | |
| Schenker XMG Neo 16 E25 RTX 5090 Laptop | |
| Medion Erazer Beast 16 X1 Ultimate | |
| Lenovo Legion 5 Pro 16IAX10H | |
| Aorus MASTER 16 AM6H | |
| Medio Intel Core Ultra 9 275HX (1582 - 2263, n=30) | |
| Alienware 16 Area-51 | |
| MSI Vector 17 HX AI A2XWIG | |
| Media de la clase Gaming (574 - 2531, n=103, últimos 2 años) | |
| MSI Vector 16 HX AI A2XWHG | |
| AIDA64 / FP64 Ray-Trace | |
| Schenker XMG Neo 16 E25 RTX 5090 Laptop | |
| Medion Erazer Beast 16 X1 Ultimate | |
| Aorus MASTER 16 AM6H | |
| Medio Intel Core Ultra 9 275HX (14847 - 21854, n=30) | |
| Lenovo Legion 5 Pro 16IAX10H | |
| Alienware 16 Area-51 | |
| Media de la clase Gaming (5509 - 45446, n=103, últimos 2 años) | |
| MSI Vector 16 HX AI A2XWHG | |
| MSI Vector 17 HX AI A2XWIG | |
| AIDA64 / CPU PhotoWorxx | |
| Schenker XMG Neo 16 E25 RTX 5090 Laptop | |
| Alienware 16 Area-51 | |
| Medio Intel Core Ultra 9 275HX (37482 - 62916, n=30) | |
| Lenovo Legion 5 Pro 16IAX10H | |
| Medion Erazer Beast 16 X1 Ultimate | |
| MSI Vector 17 HX AI A2XWIG | |
| Aorus MASTER 16 AM6H | |
| Media de la clase Gaming (12271 - 89891, n=103, últimos 2 años) | |
| MSI Vector 16 HX AI A2XWHG | |
Rendimiento del sistema
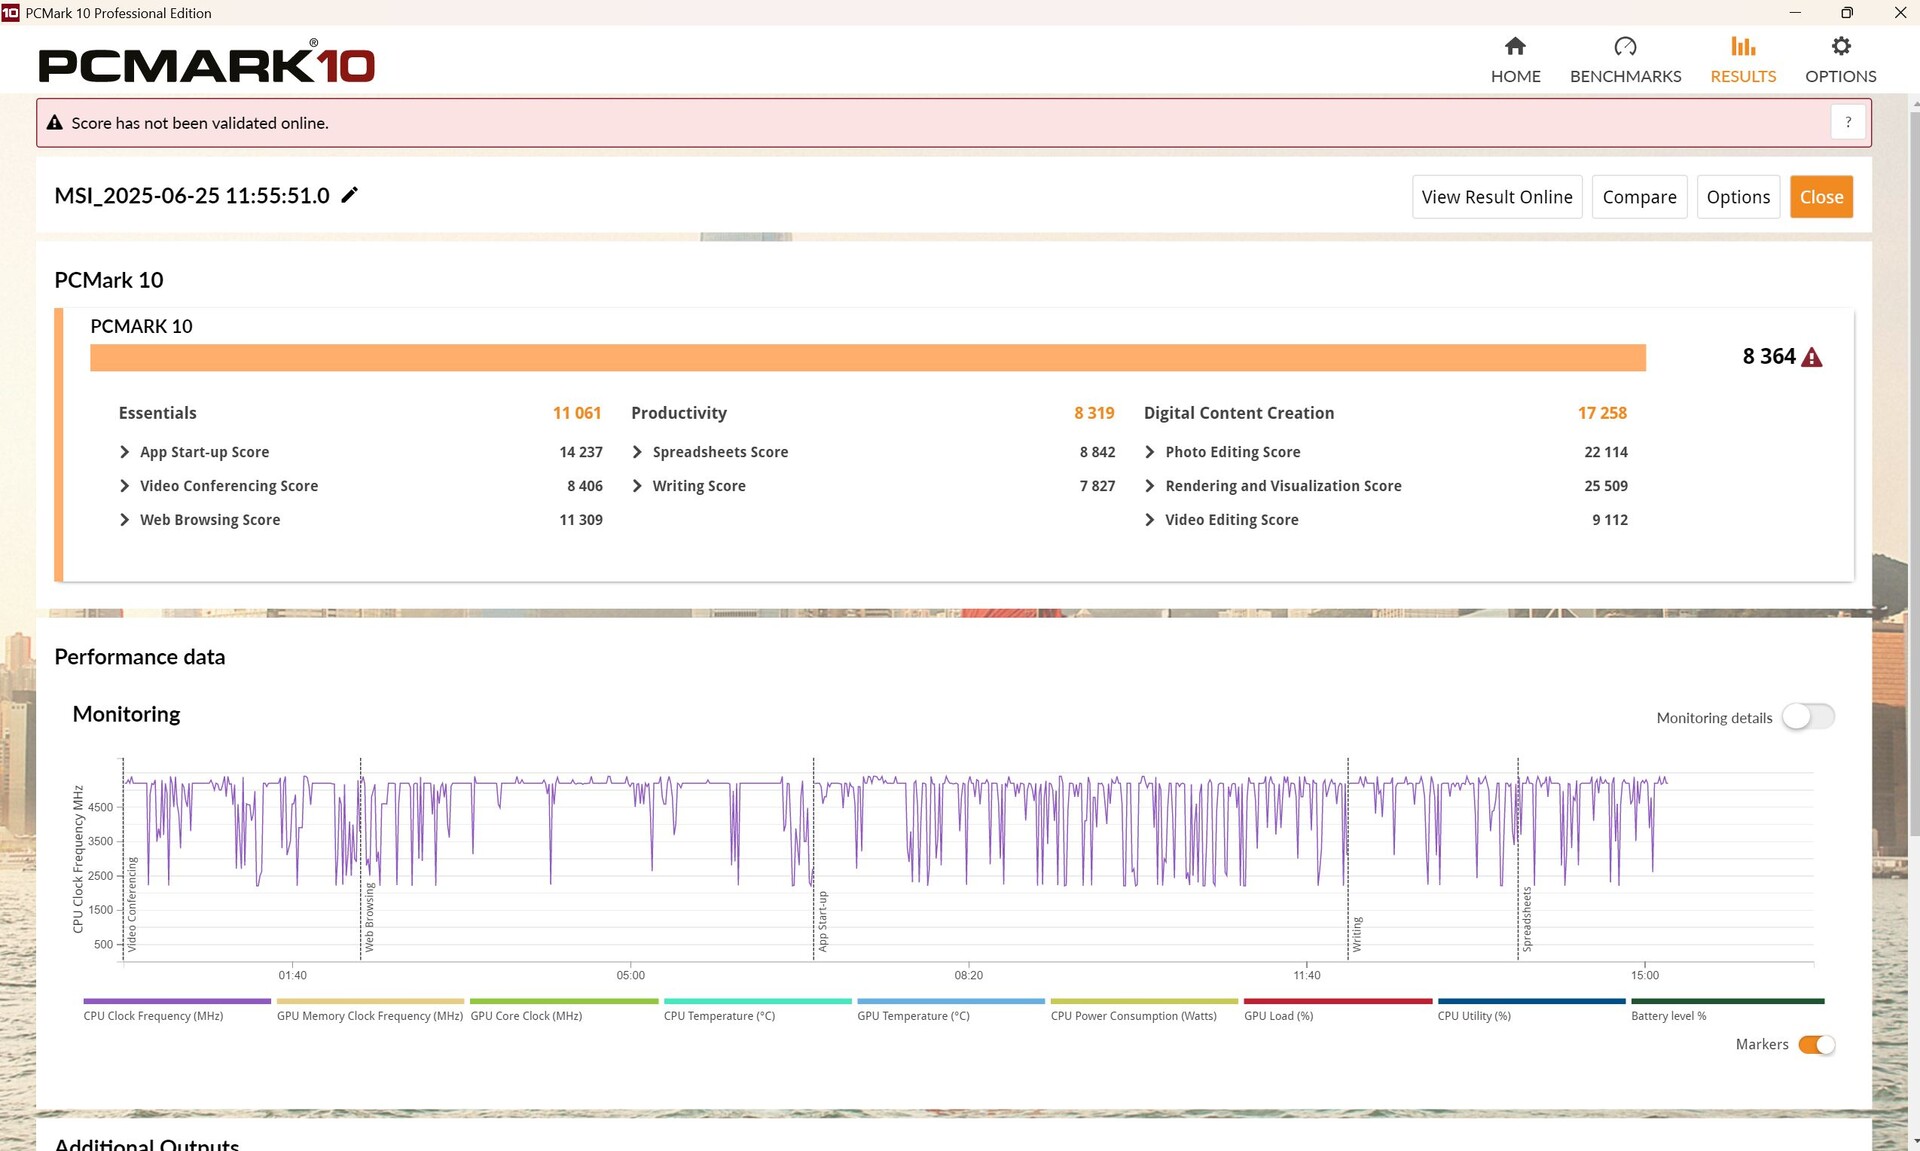
El Vector 17 rinde ligeramente por debajo de la media en PCMark 10, pero ligeramente por encima de la media en CrossMark, por lo que vemos un rendimiento general al nivel esperado.
PCMark 10: Score | Essentials | Productivity | Digital Content Creation
CrossMark: Overall | Productivity | Creativity | Responsiveness
WebXPRT 3: Overall
WebXPRT 4: Overall
Mozilla Kraken 1.1: Total
| Performance rating | |
| MSI Raider A18 HX A9WIG-080 | |
| Lenovo Legion 5 Pro 16IAX10H | |
| Alienware 16 Area-51 | |
| Medio Intel Core Ultra 9 275HX, NVIDIA GeForce RTX 5080 Laptop | |
| Lenovo Legion Pro 7i 16 Gen 10 | |
| MSI Vector 17 HX AI A2XWIG | |
| Media de la clase Gaming | |
| Medion Erazer Beast 18 X1 MD62731 | |
| MSI Vector 16 HX AI A2XWHG | |
| PCMark 10 / Score | |
| Lenovo Legion Pro 7i 16 Gen 10 | |
| MSI Raider A18 HX A9WIG-080 | |
| Alienware 16 Area-51 | |
| Medio Intel Core Ultra 9 275HX, NVIDIA GeForce RTX 5080 Laptop (7805 - 10409, n=9) | |
| Media de la clase Gaming (5828 - 11730, n=92, últimos 2 años) | |
| Medion Erazer Beast 18 X1 MD62731 | |
| MSI Vector 17 HX AI A2XWIG | |
| Lenovo Legion 5 Pro 16IAX10H | |
| MSI Vector 16 HX AI A2XWHG | |
| PCMark 10 / Essentials | |
| MSI Raider A18 HX A9WIG-080 | |
| Lenovo Legion Pro 7i 16 Gen 10 | |
| Alienware 16 Area-51 | |
| MSI Vector 17 HX AI A2XWIG | |
| Medio Intel Core Ultra 9 275HX, NVIDIA GeForce RTX 5080 Laptop (10206 - 11472, n=9) | |
| Lenovo Legion 5 Pro 16IAX10H | |
| MSI Vector 16 HX AI A2XWHG | |
| Media de la clase Gaming (8810 - 11935, n=96, últimos 2 años) | |
| Medion Erazer Beast 18 X1 MD62731 | |
| PCMark 10 / Productivity | |
| Media de la clase Gaming (6845 - 21327, n=94, últimos 2 años) | |
| MSI Raider A18 HX A9WIG-080 | |
| Medio Intel Core Ultra 9 275HX, NVIDIA GeForce RTX 5080 Laptop (8319 - 20616, n=9) | |
| Medion Erazer Beast 18 X1 MD62731 | |
| Lenovo Legion 5 Pro 16IAX10H | |
| Lenovo Legion Pro 7i 16 Gen 10 | |
| MSI Vector 16 HX AI A2XWHG | |
| Alienware 16 Area-51 | |
| MSI Vector 17 HX AI A2XWIG | |
| PCMark 10 / Digital Content Creation | |
| Lenovo Legion Pro 7i 16 Gen 10 | |
| Alienware 16 Area-51 | |
| MSI Vector 17 HX AI A2XWIG | |
| Medio Intel Core Ultra 9 275HX, NVIDIA GeForce RTX 5080 Laptop (10505 - 19351, n=9) | |
| Medion Erazer Beast 18 X1 MD62731 | |
| Lenovo Legion 5 Pro 16IAX10H | |
| MSI Raider A18 HX A9WIG-080 | |
| Media de la clase Gaming (7602 - 19954, n=94, últimos 2 años) | |
| MSI Vector 16 HX AI A2XWHG | |
| CrossMark / Overall | |
| MSI Raider A18 HX A9WIG-080 | |
| MSI Vector 17 HX AI A2XWIG | |
| Lenovo Legion 5 Pro 16IAX10H | |
| Alienware 16 Area-51 | |
| Medio Intel Core Ultra 9 275HX, NVIDIA GeForce RTX 5080 Laptop (1857 - 2244, n=9) | |
| Lenovo Legion Pro 7i 16 Gen 10 | |
| Media de la clase Gaming (1366 - 2409, n=93, últimos 2 años) | |
| MSI Vector 16 HX AI A2XWHG | |
| Medion Erazer Beast 18 X1 MD62731 | |
| CrossMark / Productivity | |
| MSI Vector 17 HX AI A2XWIG | |
| Lenovo Legion 5 Pro 16IAX10H | |
| Alienware 16 Area-51 | |
| MSI Raider A18 HX A9WIG-080 | |
| Medio Intel Core Ultra 9 275HX, NVIDIA GeForce RTX 5080 Laptop (1764 - 2122, n=9) | |
| Lenovo Legion Pro 7i 16 Gen 10 | |
| Media de la clase Gaming (1386 - 2254, n=93, últimos 2 años) | |
| MSI Vector 16 HX AI A2XWHG | |
| Medion Erazer Beast 18 X1 MD62731 | |
| CrossMark / Creativity | |
| MSI Raider A18 HX A9WIG-080 | |
| Lenovo Legion 5 Pro 16IAX10H | |
| MSI Vector 17 HX AI A2XWIG | |
| Alienware 16 Area-51 | |
| Medio Intel Core Ultra 9 275HX, NVIDIA GeForce RTX 5080 Laptop (2115 - 2498, n=9) | |
| Lenovo Legion Pro 7i 16 Gen 10 | |
| MSI Vector 16 HX AI A2XWHG | |
| Media de la clase Gaming (1343 - 2729, n=93, últimos 2 años) | |
| Medion Erazer Beast 18 X1 MD62731 | |
| CrossMark / Responsiveness | |
| Alienware 16 Area-51 | |
| MSI Vector 17 HX AI A2XWIG | |
| Lenovo Legion 5 Pro 16IAX10H | |
| Medio Intel Core Ultra 9 275HX, NVIDIA GeForce RTX 5080 Laptop (1466 - 2096, n=9) | |
| MSI Raider A18 HX A9WIG-080 | |
| Media de la clase Gaming (1226 - 2334, n=93, últimos 2 años) | |
| Lenovo Legion Pro 7i 16 Gen 10 | |
| MSI Vector 16 HX AI A2XWHG | |
| Medion Erazer Beast 18 X1 MD62731 | |
| WebXPRT 3 / Overall | |
| Lenovo Legion 5 Pro 16IAX10H | |
| MSI Raider A18 HX A9WIG-080 | |
| Lenovo Legion Pro 7i 16 Gen 10 | |
| Alienware 16 Area-51 | |
| Medio Intel Core Ultra 9 275HX, NVIDIA GeForce RTX 5080 Laptop (306 - 378, n=9) | |
| Medion Erazer Beast 18 X1 MD62731 | |
| MSI Vector 17 HX AI A2XWIG | |
| MSI Vector 16 HX AI A2XWHG | |
| Media de la clase Gaming (220 - 532, n=97, últimos 2 años) | |
| WebXPRT 4 / Overall | |
| MSI Vector 17 HX AI A2XWIG | |
| Lenovo Legion Pro 7i 16 Gen 10 | |
| MSI Raider A18 HX A9WIG-080 | |
| Alienware 16 Area-51 | |
| Lenovo Legion 5 Pro 16IAX10H | |
| Medion Erazer Beast 18 X1 MD62731 | |
| Medio Intel Core Ultra 9 275HX, NVIDIA GeForce RTX 5080 Laptop (285 - 336, n=9) | |
| MSI Vector 16 HX AI A2XWHG | |
| Media de la clase Gaming (165 - 354, n=97, últimos 2 años) | |
| Mozilla Kraken 1.1 / Total | |
| Media de la clase Gaming (391 - 590, n=99, últimos 2 años) | |
| MSI Vector 16 HX AI A2XWHG | |
| MSI Vector 17 HX AI A2XWIG | |
| Medion Erazer Beast 18 X1 MD62731 | |
| Medio Intel Core Ultra 9 275HX, NVIDIA GeForce RTX 5080 Laptop (405 - 432, n=9) | |
| Lenovo Legion 5 Pro 16IAX10H | |
| Alienware 16 Area-51 | |
| Lenovo Legion Pro 7i 16 Gen 10 | |
| MSI Raider A18 HX A9WIG-080 | |
* ... más pequeño es mejor
| PCMark 10 Score | 8364 puntos | |
ayuda | ||
| AIDA64 / Memory Copy | |
| Alienware 16 Area-51 | |
| Lenovo Legion Pro 7i 16 Gen 10 | |
| Medio Intel Core Ultra 9 275HX (56003 - 94460, n=30) | |
| Lenovo Legion 5 Pro 16IAX10H | |
| MSI Vector 17 HX AI A2XWIG | |
| Medion Erazer Beast 18 X1 MD62731 | |
| Media de la clase Gaming (21750 - 129946, n=103, últimos 2 años) | |
| MSI Vector 16 HX AI A2XWHG | |
| MSI Raider A18 HX A9WIG-080 | |
| AIDA64 / Memory Read | |
| Lenovo Legion Pro 7i 16 Gen 10 | |
| Alienware 16 Area-51 | |
| Lenovo Legion 5 Pro 16IAX10H | |
| Medion Erazer Beast 18 X1 MD62731 | |
| MSI Vector 17 HX AI A2XWIG | |
| Medio Intel Core Ultra 9 275HX (55795 - 97151, n=30) | |
| MSI Vector 16 HX AI A2XWHG | |
| Media de la clase Gaming (22956 - 118858, n=103, últimos 2 años) | |
| MSI Raider A18 HX A9WIG-080 | |
| AIDA64 / Memory Write | |
| Lenovo Legion Pro 7i 16 Gen 10 | |
| Alienware 16 Area-51 | |
| Medio Intel Core Ultra 9 275HX (55663 - 116129, n=30) | |
| Lenovo Legion 5 Pro 16IAX10H | |
| Medion Erazer Beast 18 X1 MD62731 | |
| MSI Vector 17 HX AI A2XWIG | |
| Media de la clase Gaming (22297 - 135096, n=103, últimos 2 años) | |
| MSI Vector 16 HX AI A2XWHG | |
| MSI Raider A18 HX A9WIG-080 | |
| AIDA64 / Memory Latency | |
| Alienware 16 Area-51 | |
| Medio Intel Core Ultra 9 275HX (105.8 - 161.6, n=30) | |
| MSI Vector 17 HX AI A2XWIG | |
| Lenovo Legion 5 Pro 16IAX10H | |
| Medion Erazer Beast 18 X1 MD62731 | |
| Lenovo Legion Pro 7i 16 Gen 10 | |
| Media de la clase Gaming (75.3 - 259, n=103, últimos 2 años) | |
| MSI Vector 16 HX AI A2XWHG | |
| MSI Raider A18 HX A9WIG-080 | |
* ... más pequeño es mejor
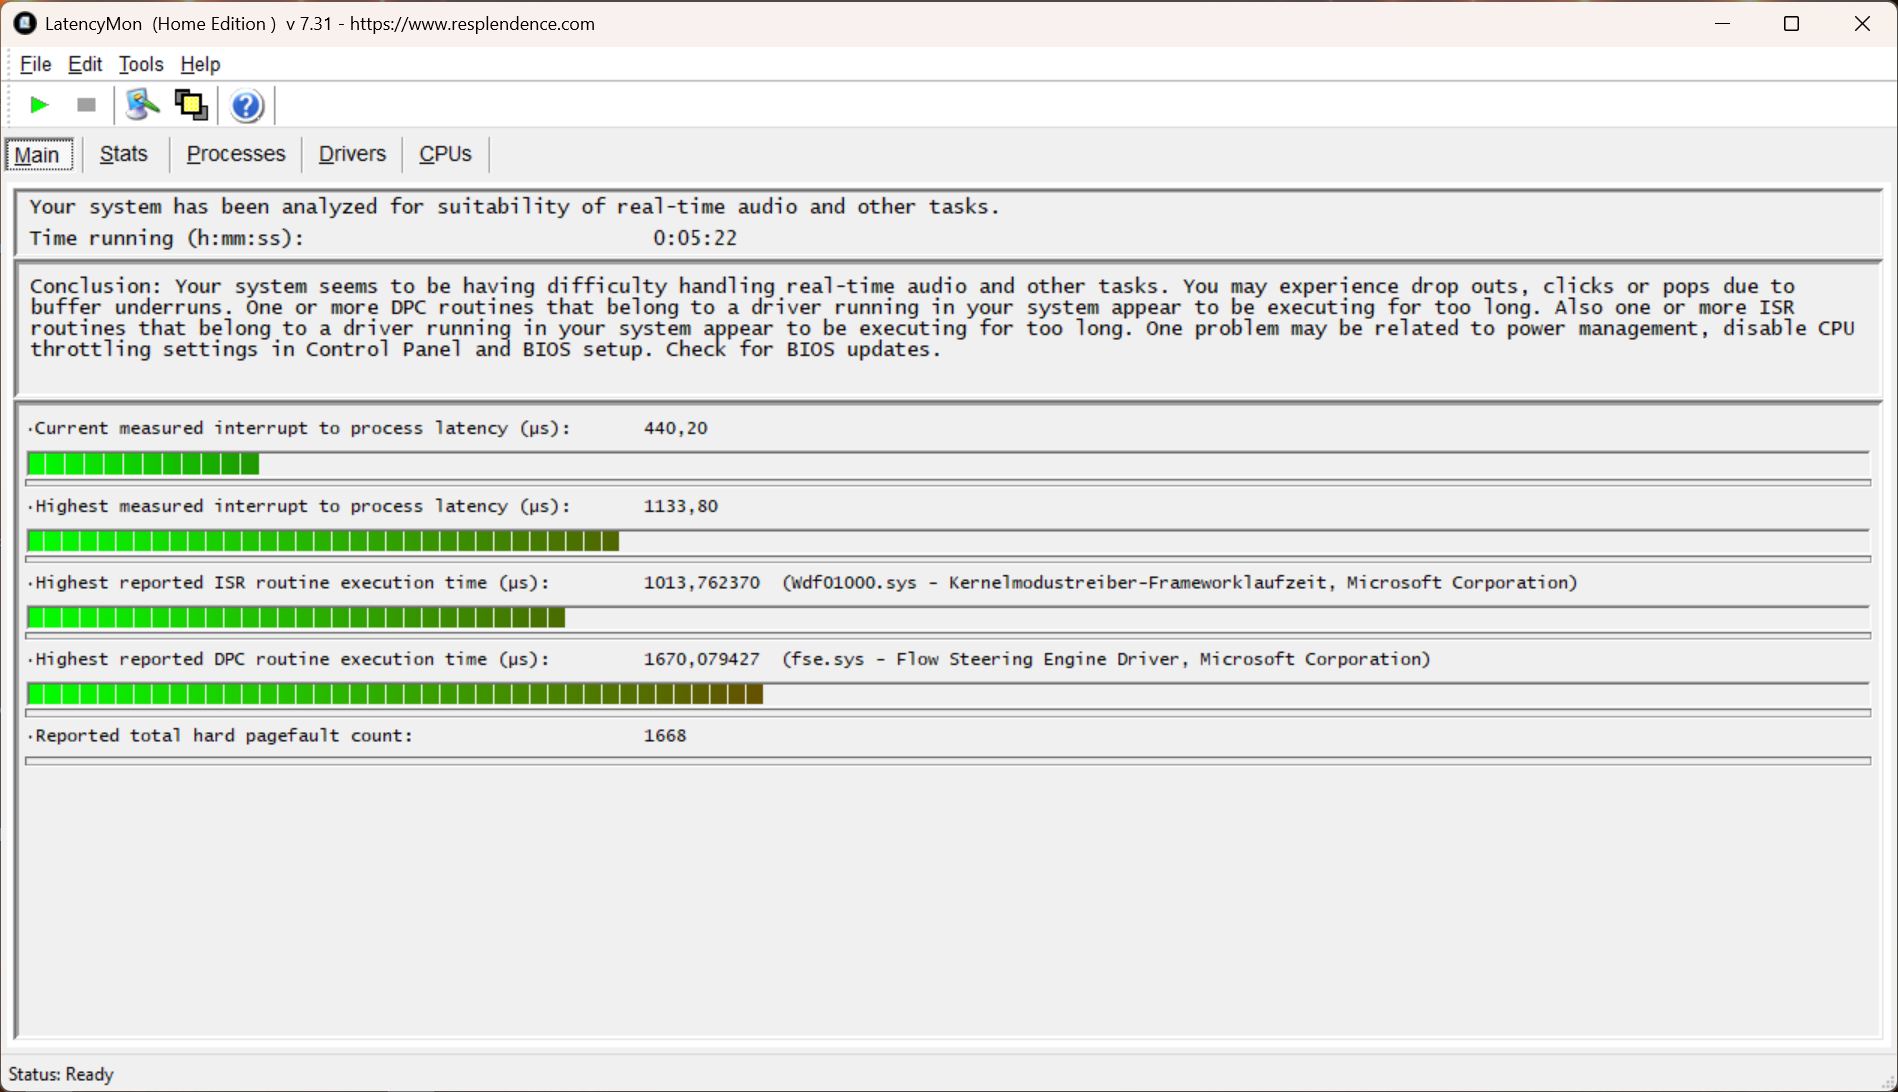
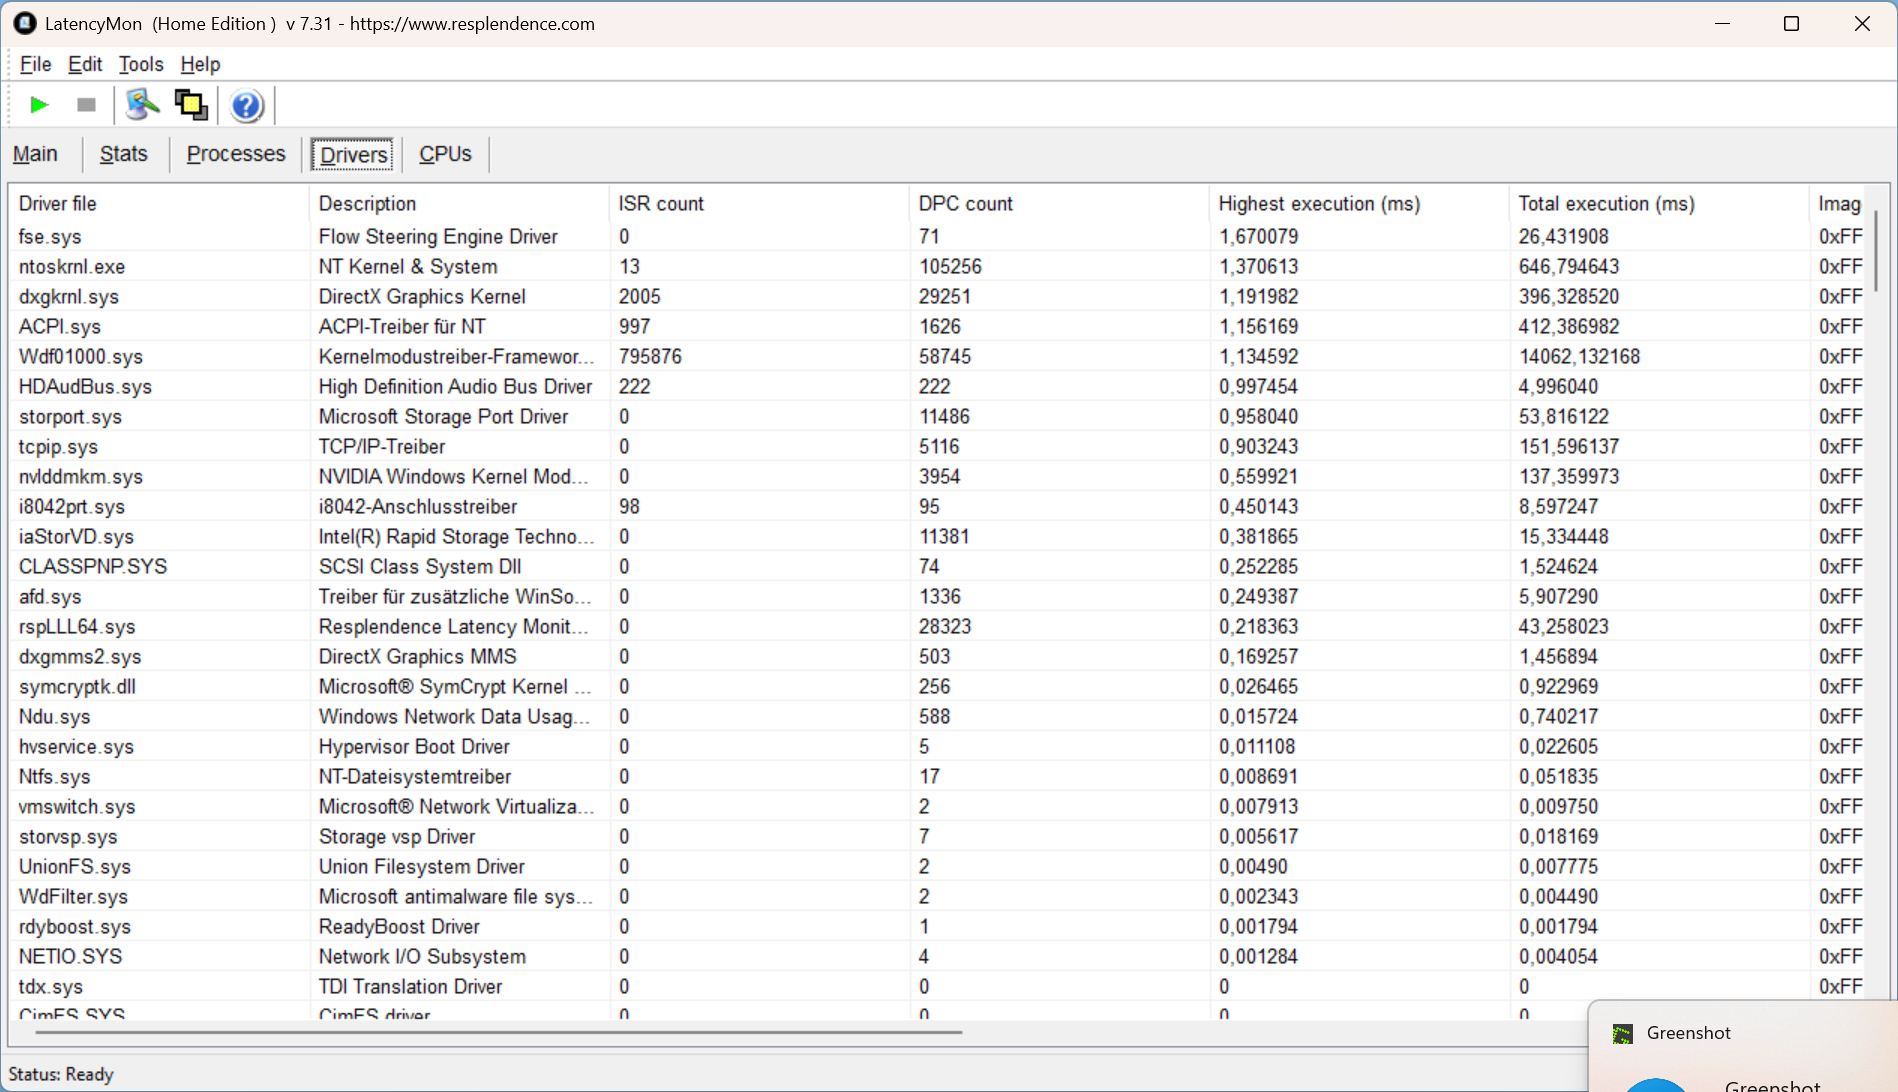
Latencias del CPD
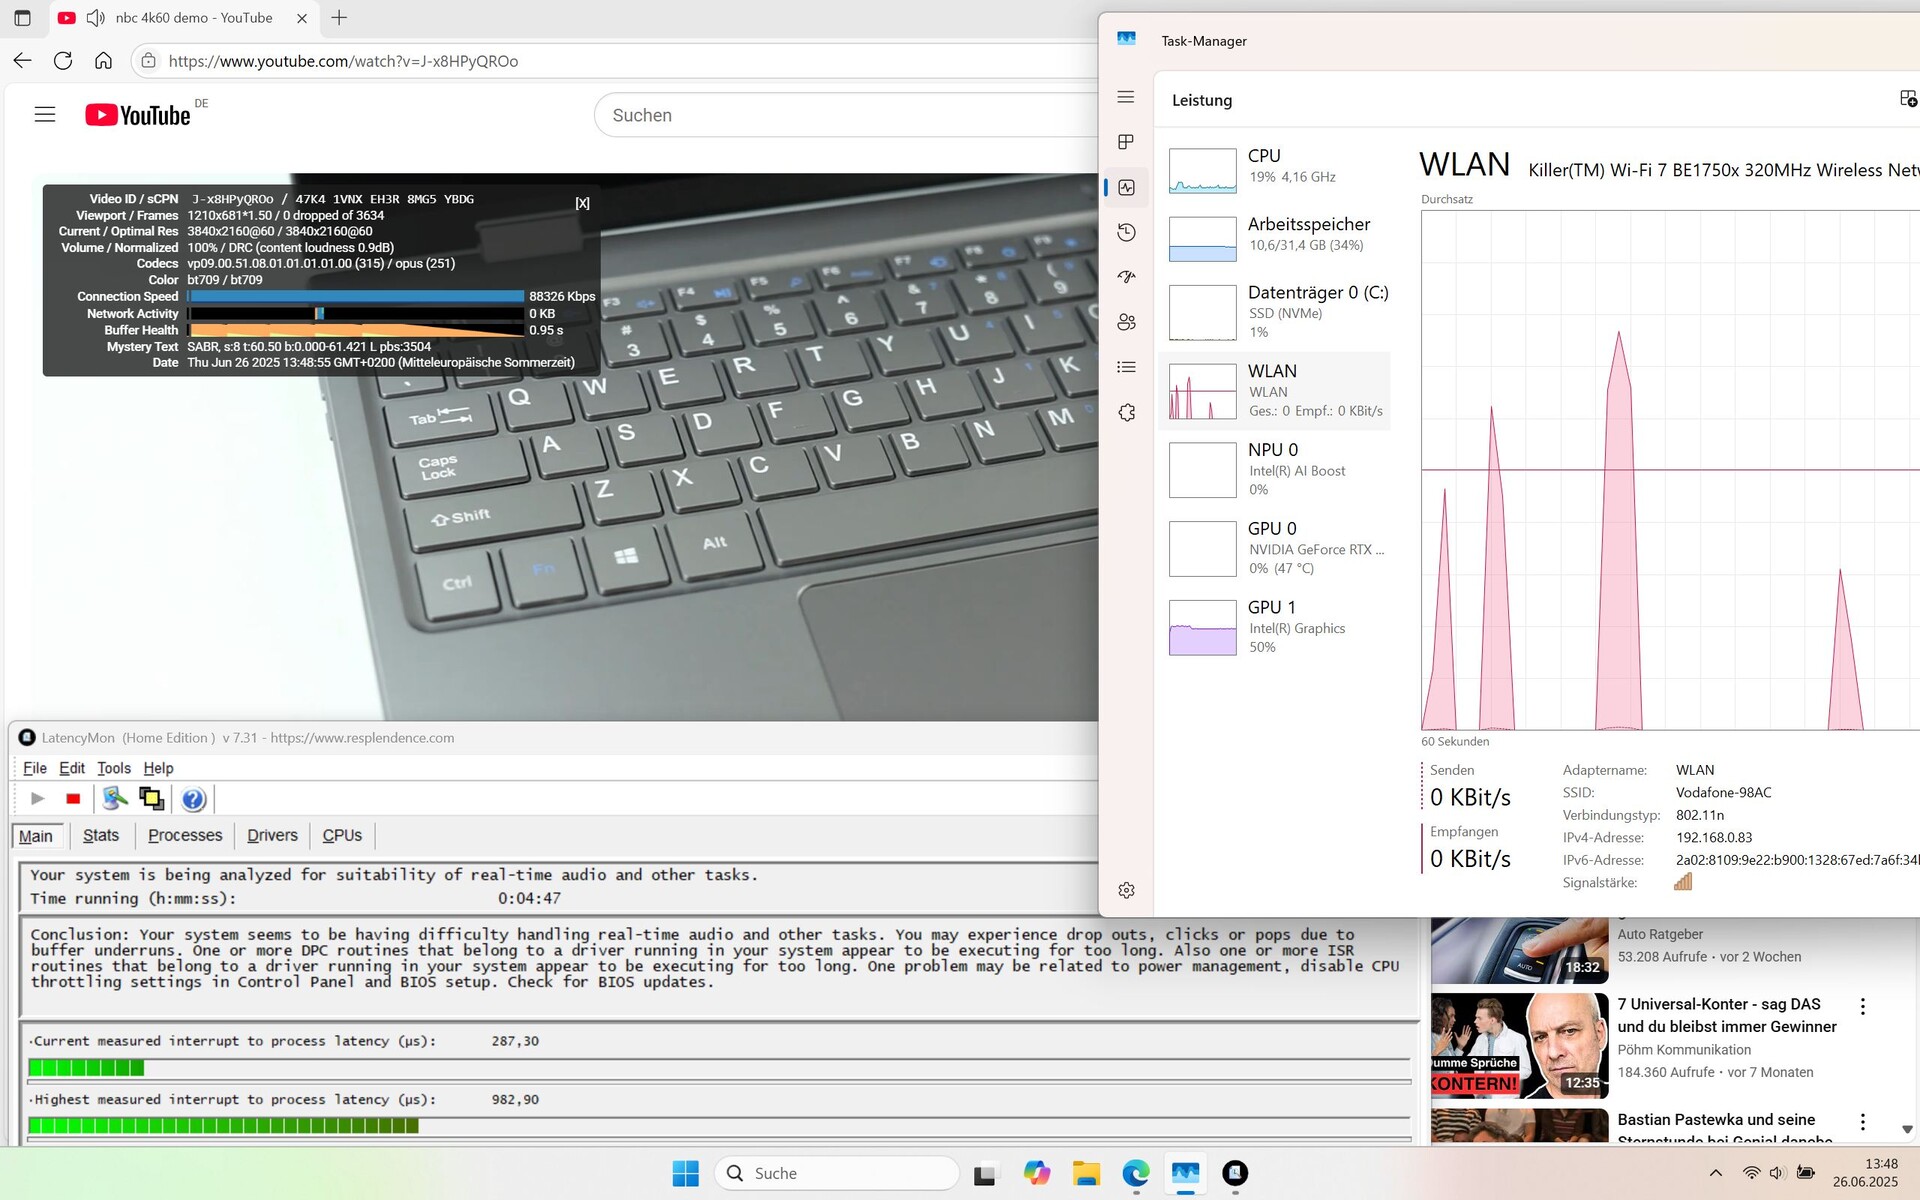
Las latencias sólo se producen al abrir varias pestañas del navegador y es relativamente baja incluso después. Nuestro vídeo 4K/60 fps se reproduce sin caídas de fotogramas.
| DPC Latencies / LatencyMon - interrupt to process latency (max), Web, Youtube, Prime95 | |
| Medion Erazer Beast 18 X1 MD62731 | |
| MSI Vector 16 HX AI A2XWHG | |
| Alienware 16 Area-51 | |
| MSI Vector 17 HX AI A2XWIG | |
| Lenovo Legion 5 Pro 16IAX10H | |
| MSI Raider A18 HX A9WIG-080 | |
| Lenovo Legion Pro 7i 16 Gen 10 | |
* ... más pequeño es mejor
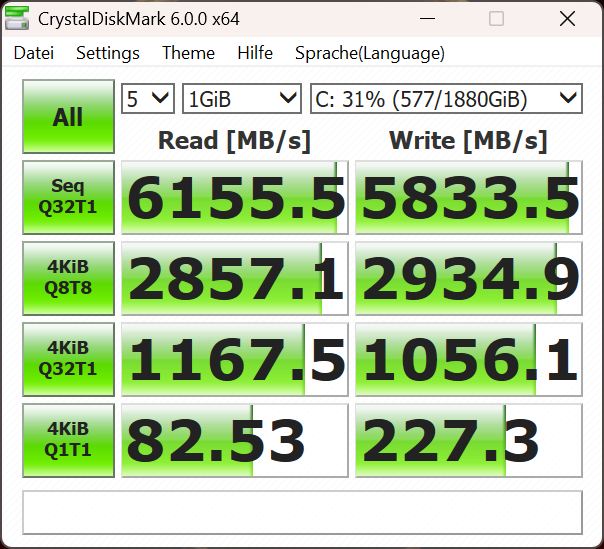
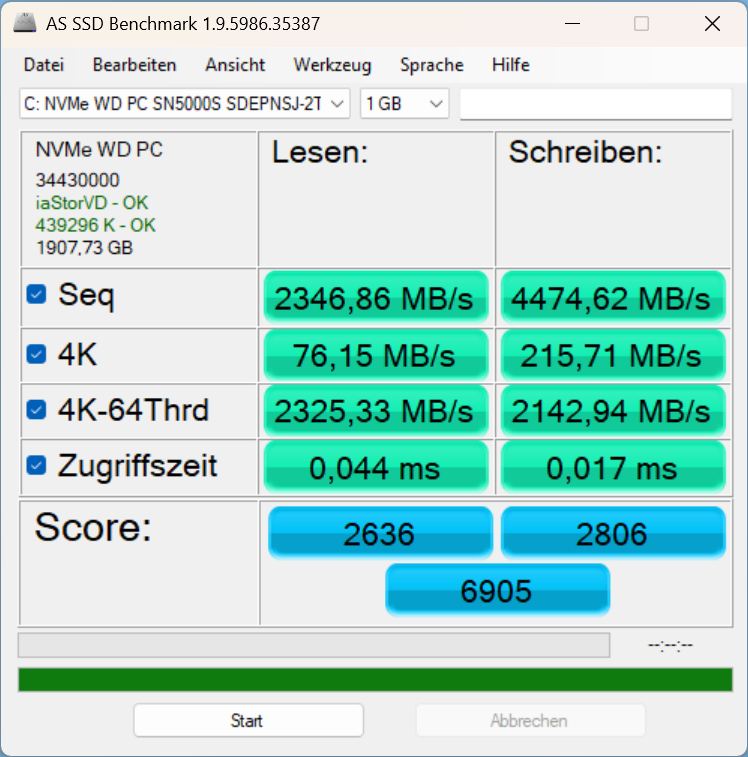
Almacenamiento masivo
La unidad SSD Western Digital de 2 TB alcanza valores entre medios y buenos y no se ralentiza ni siquiera bajo carga prolongada.
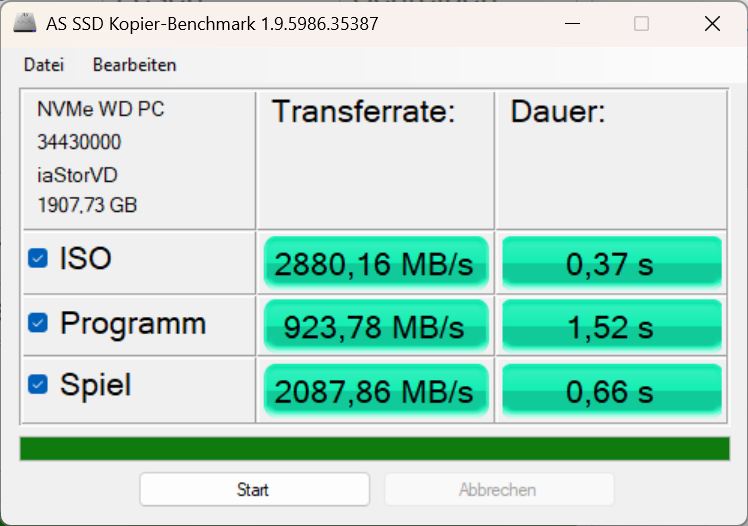

* ... más pequeño es mejor
Continuous Reading: DiskSpd Read Loop, Queue Depth 8
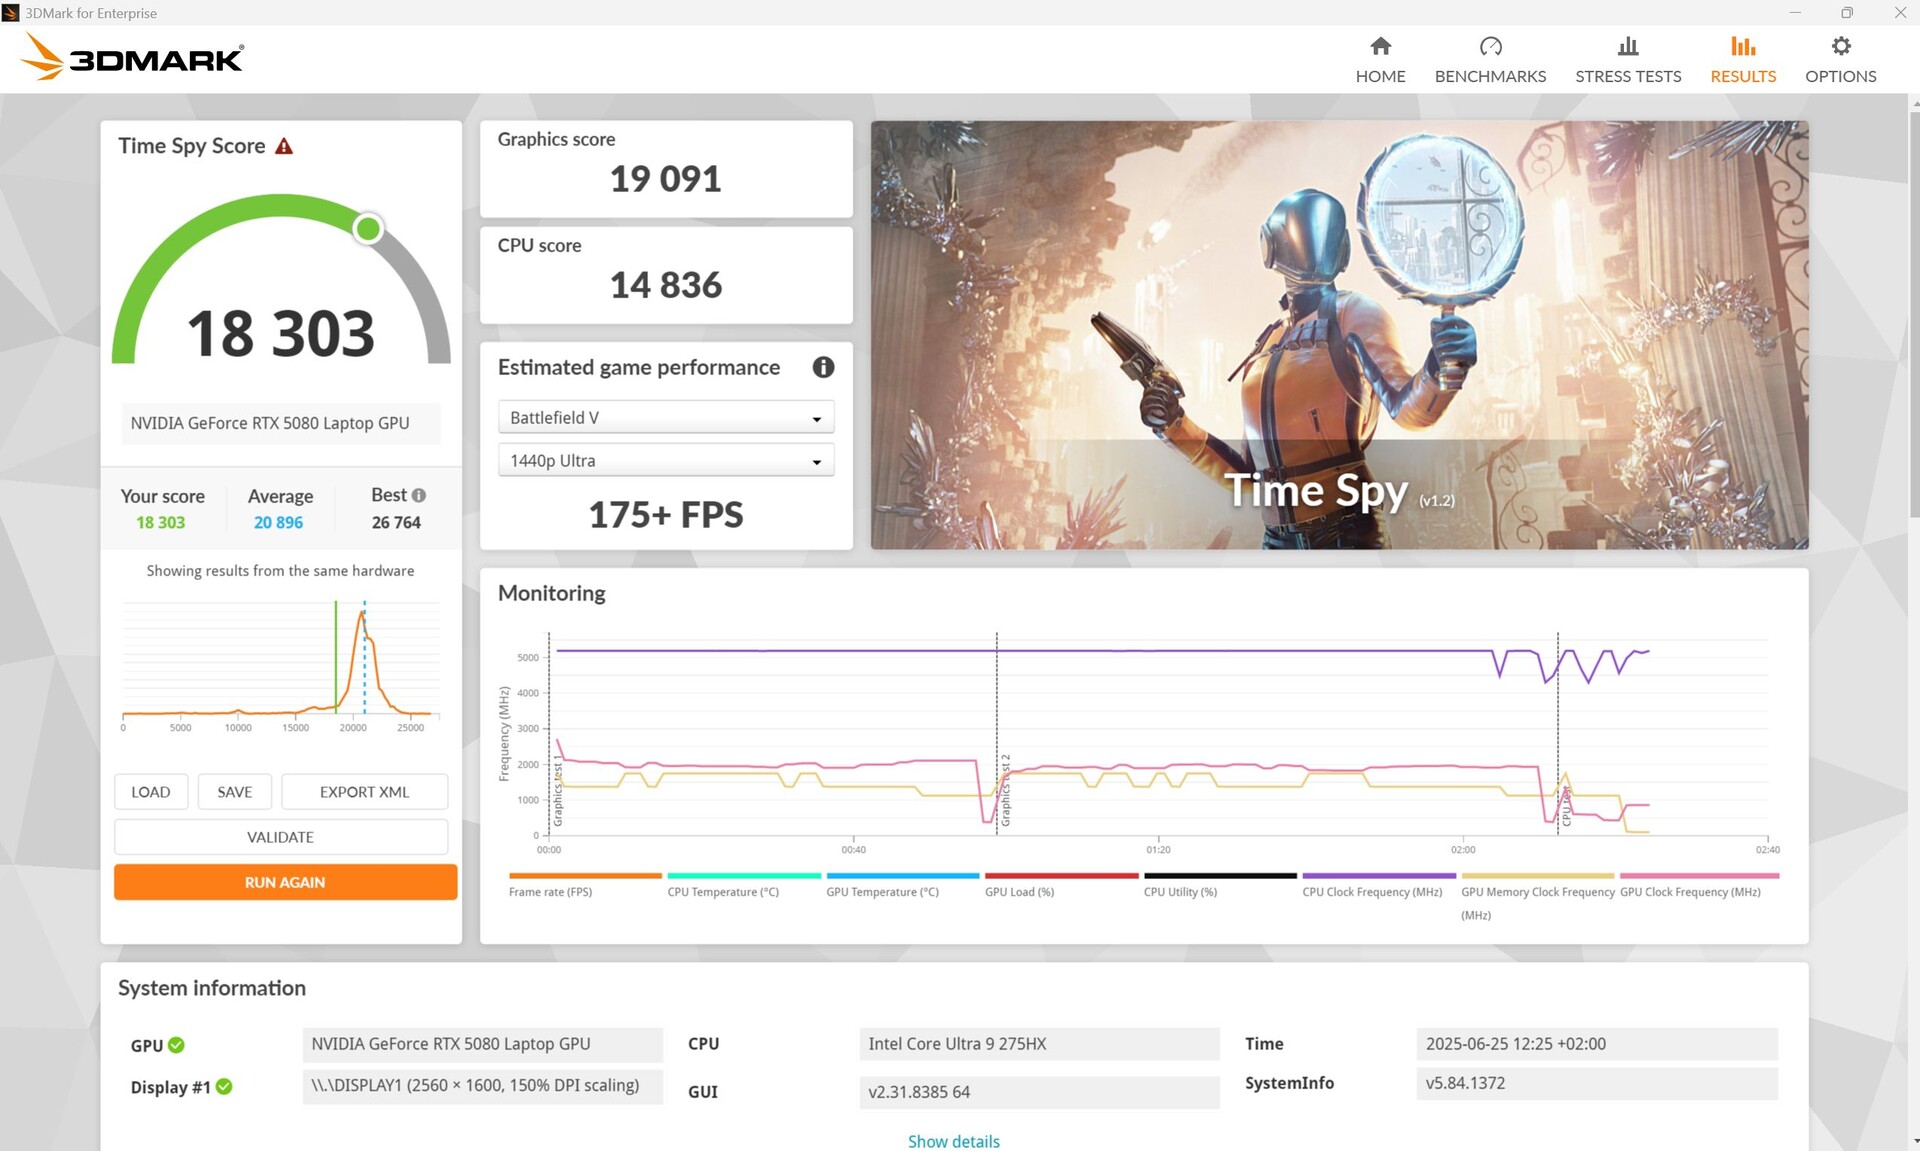
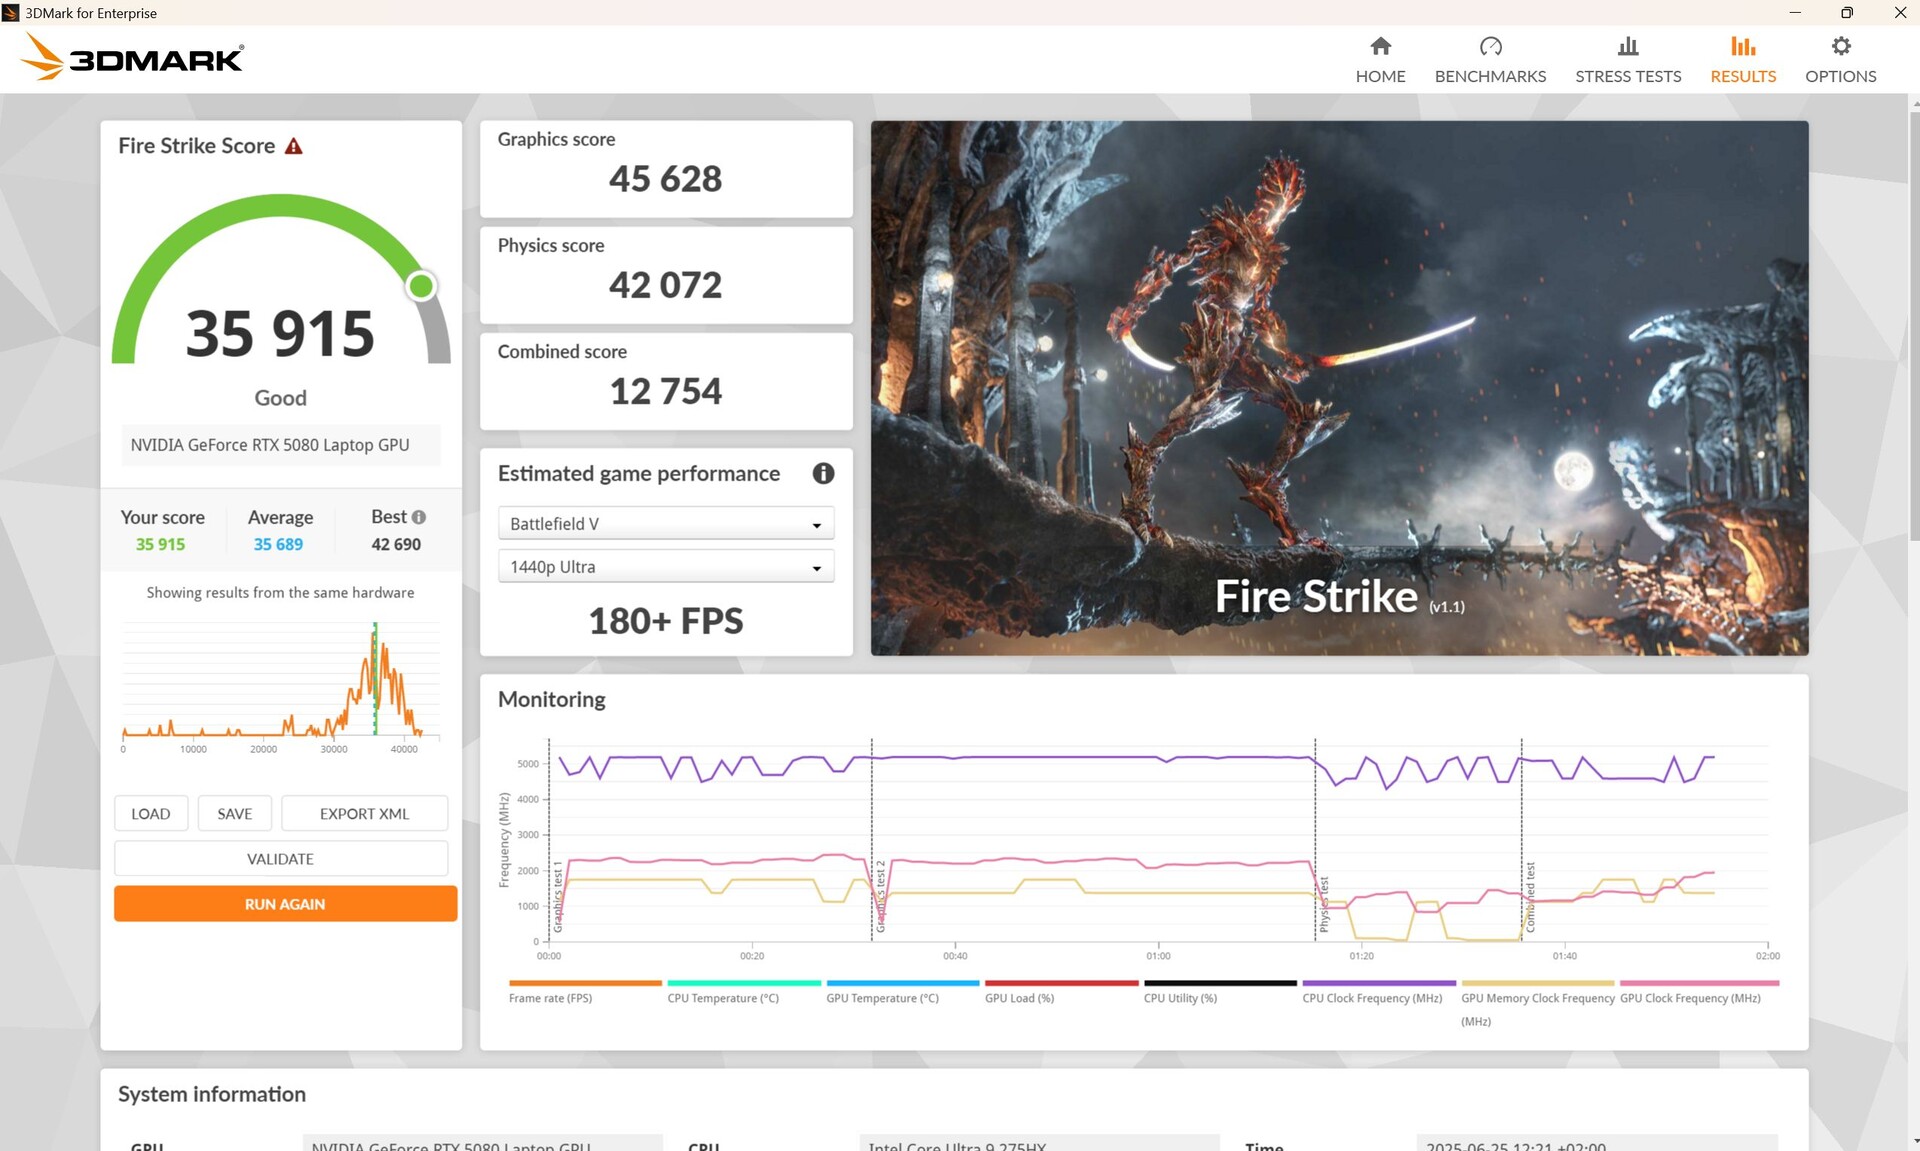
Rendimiento de la GPU
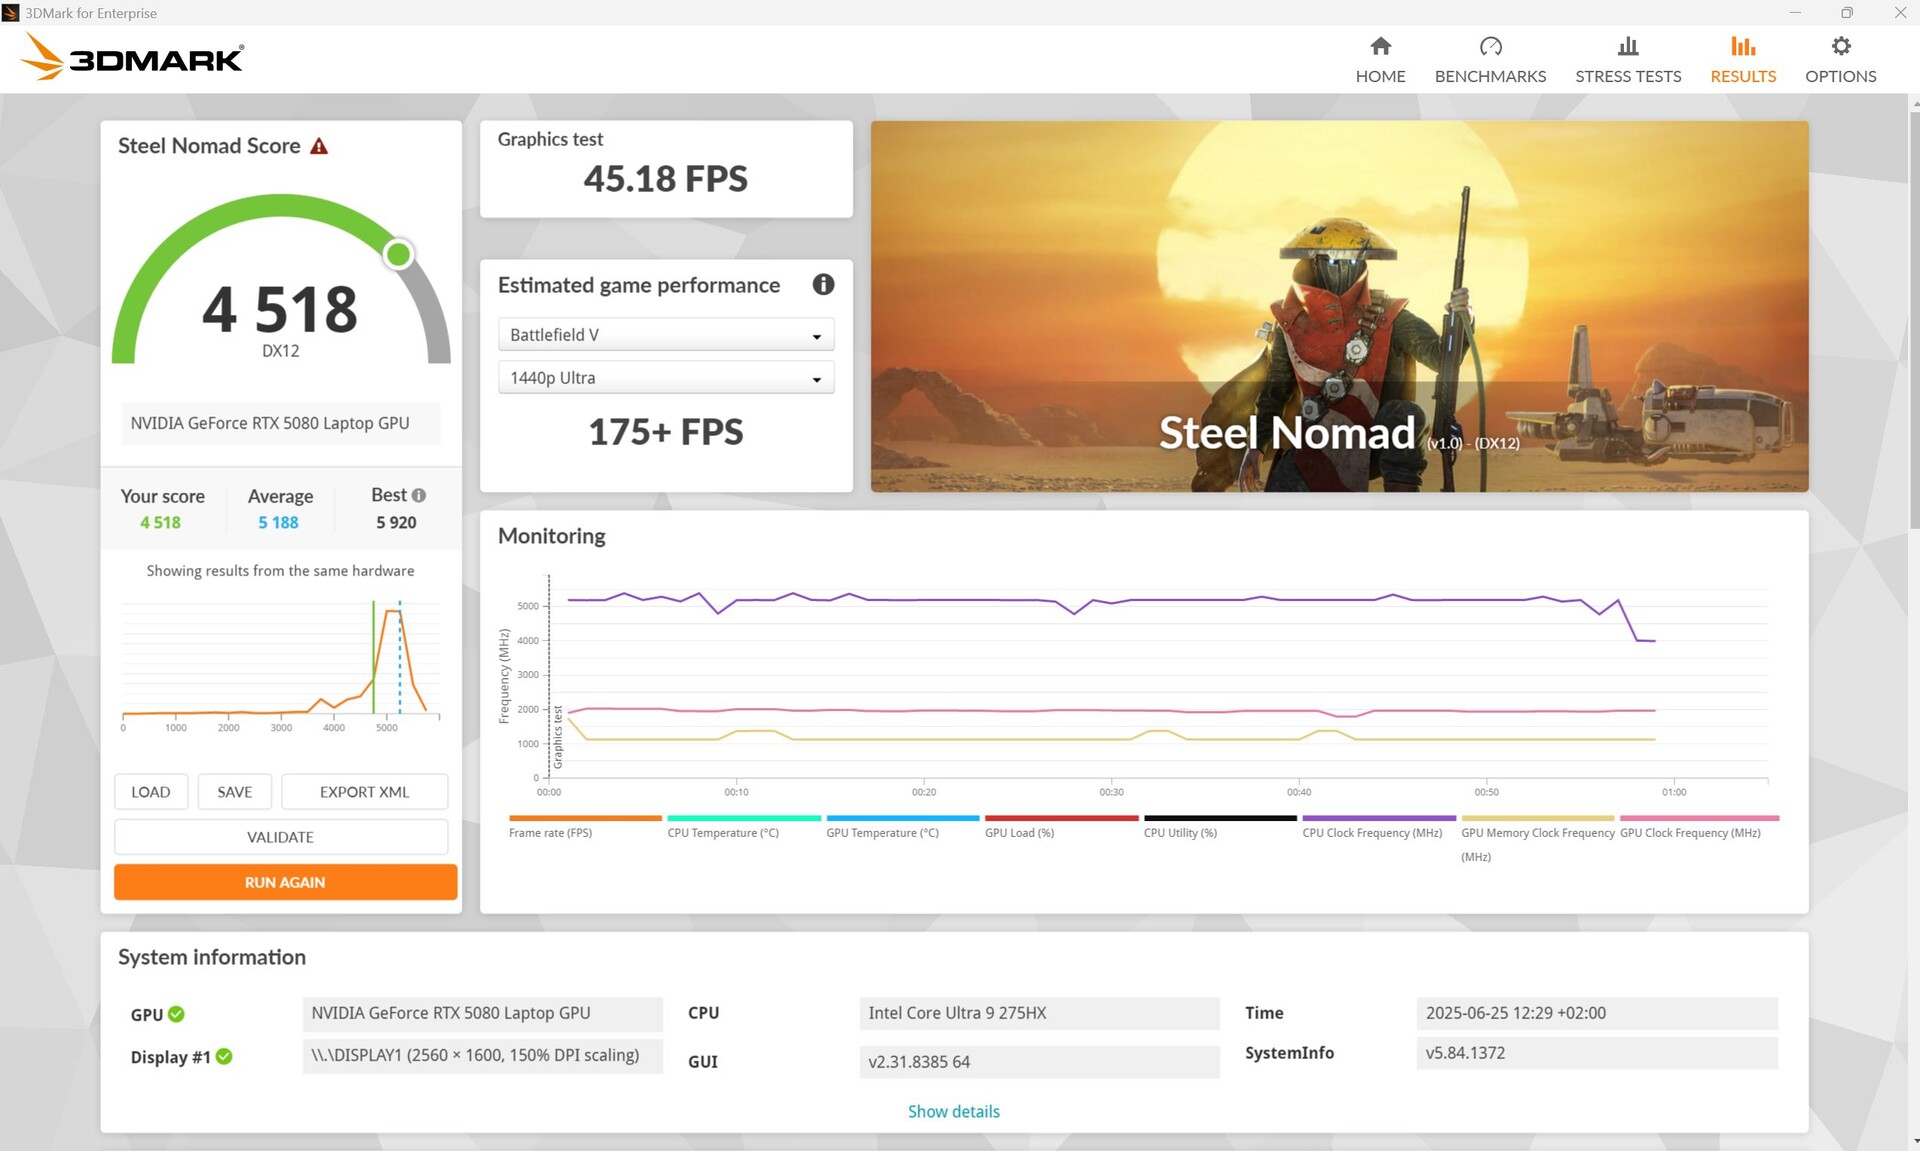
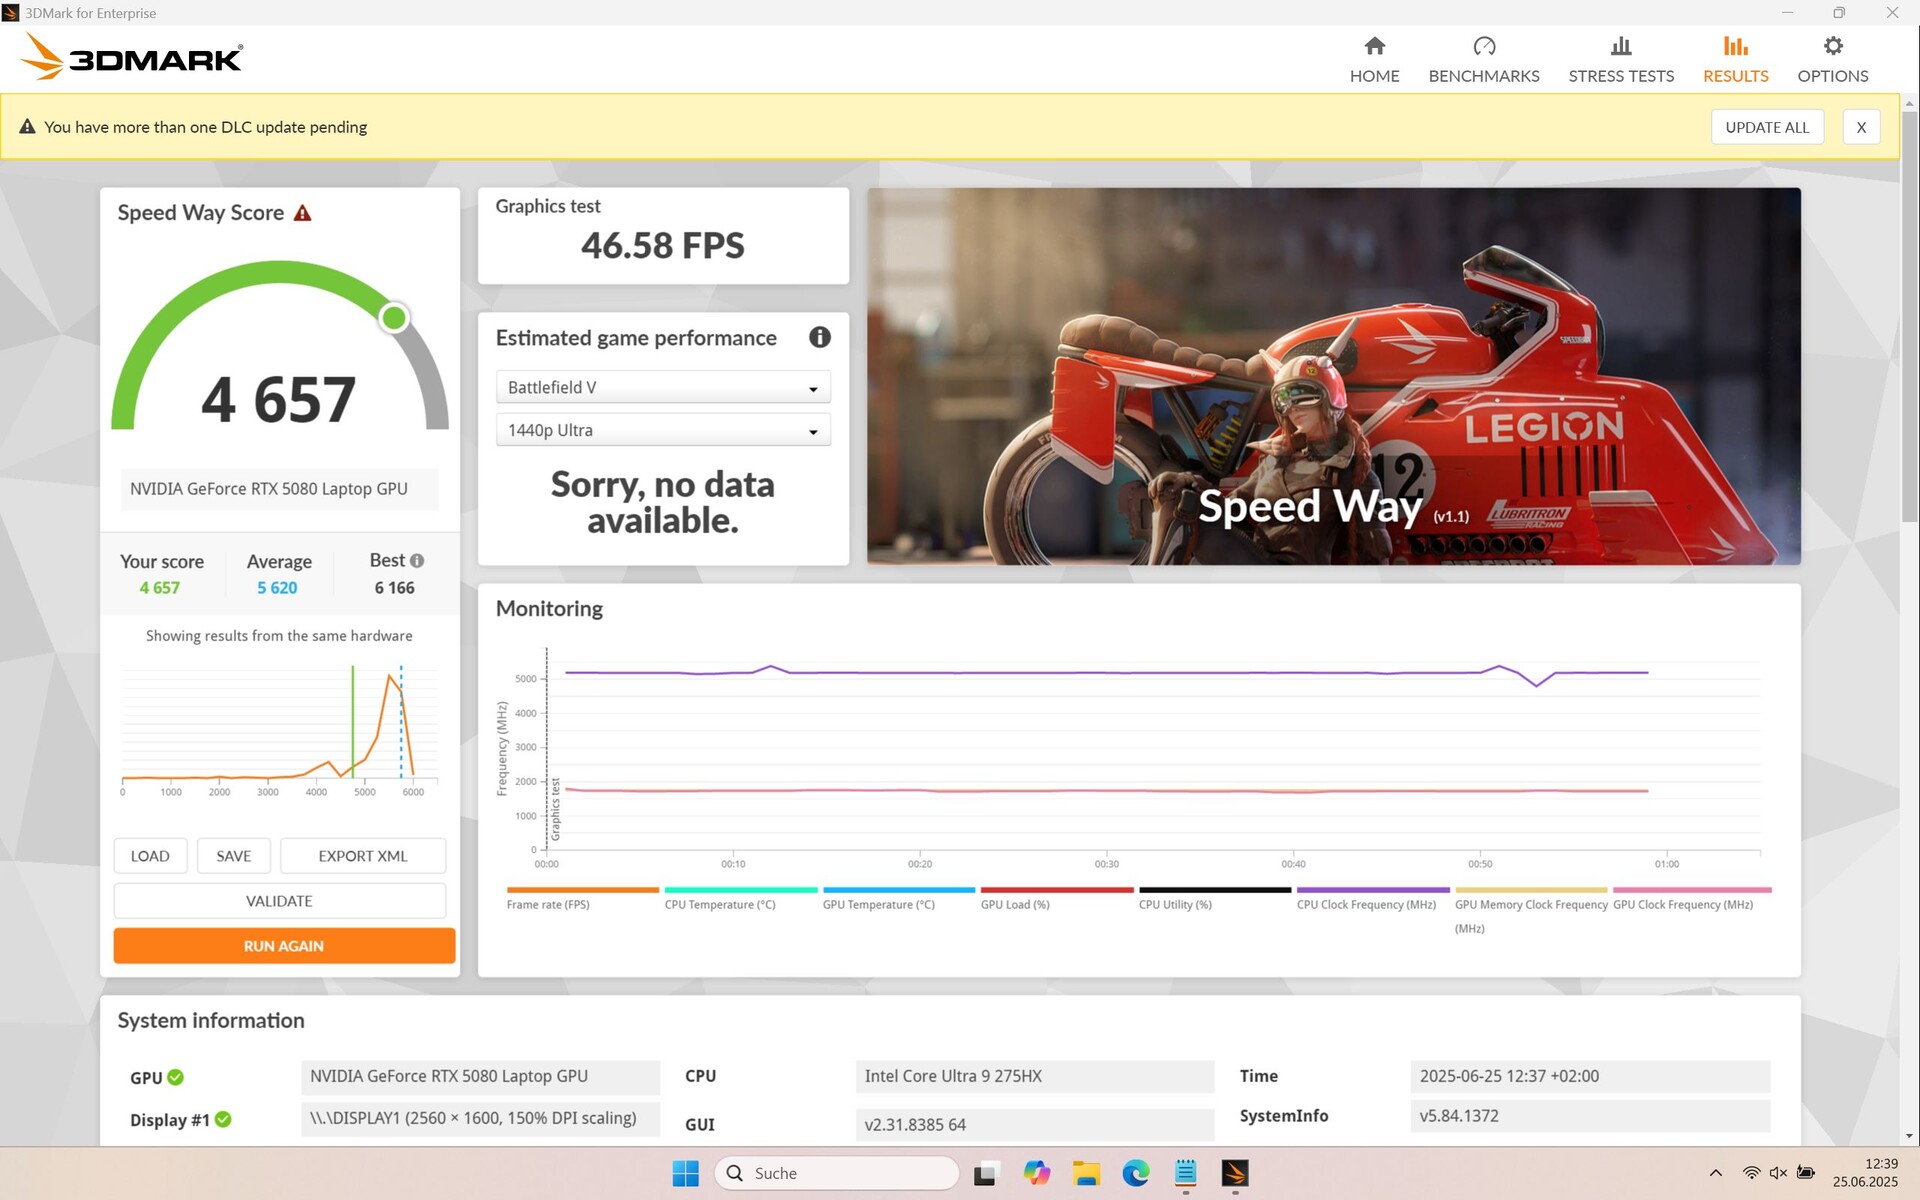
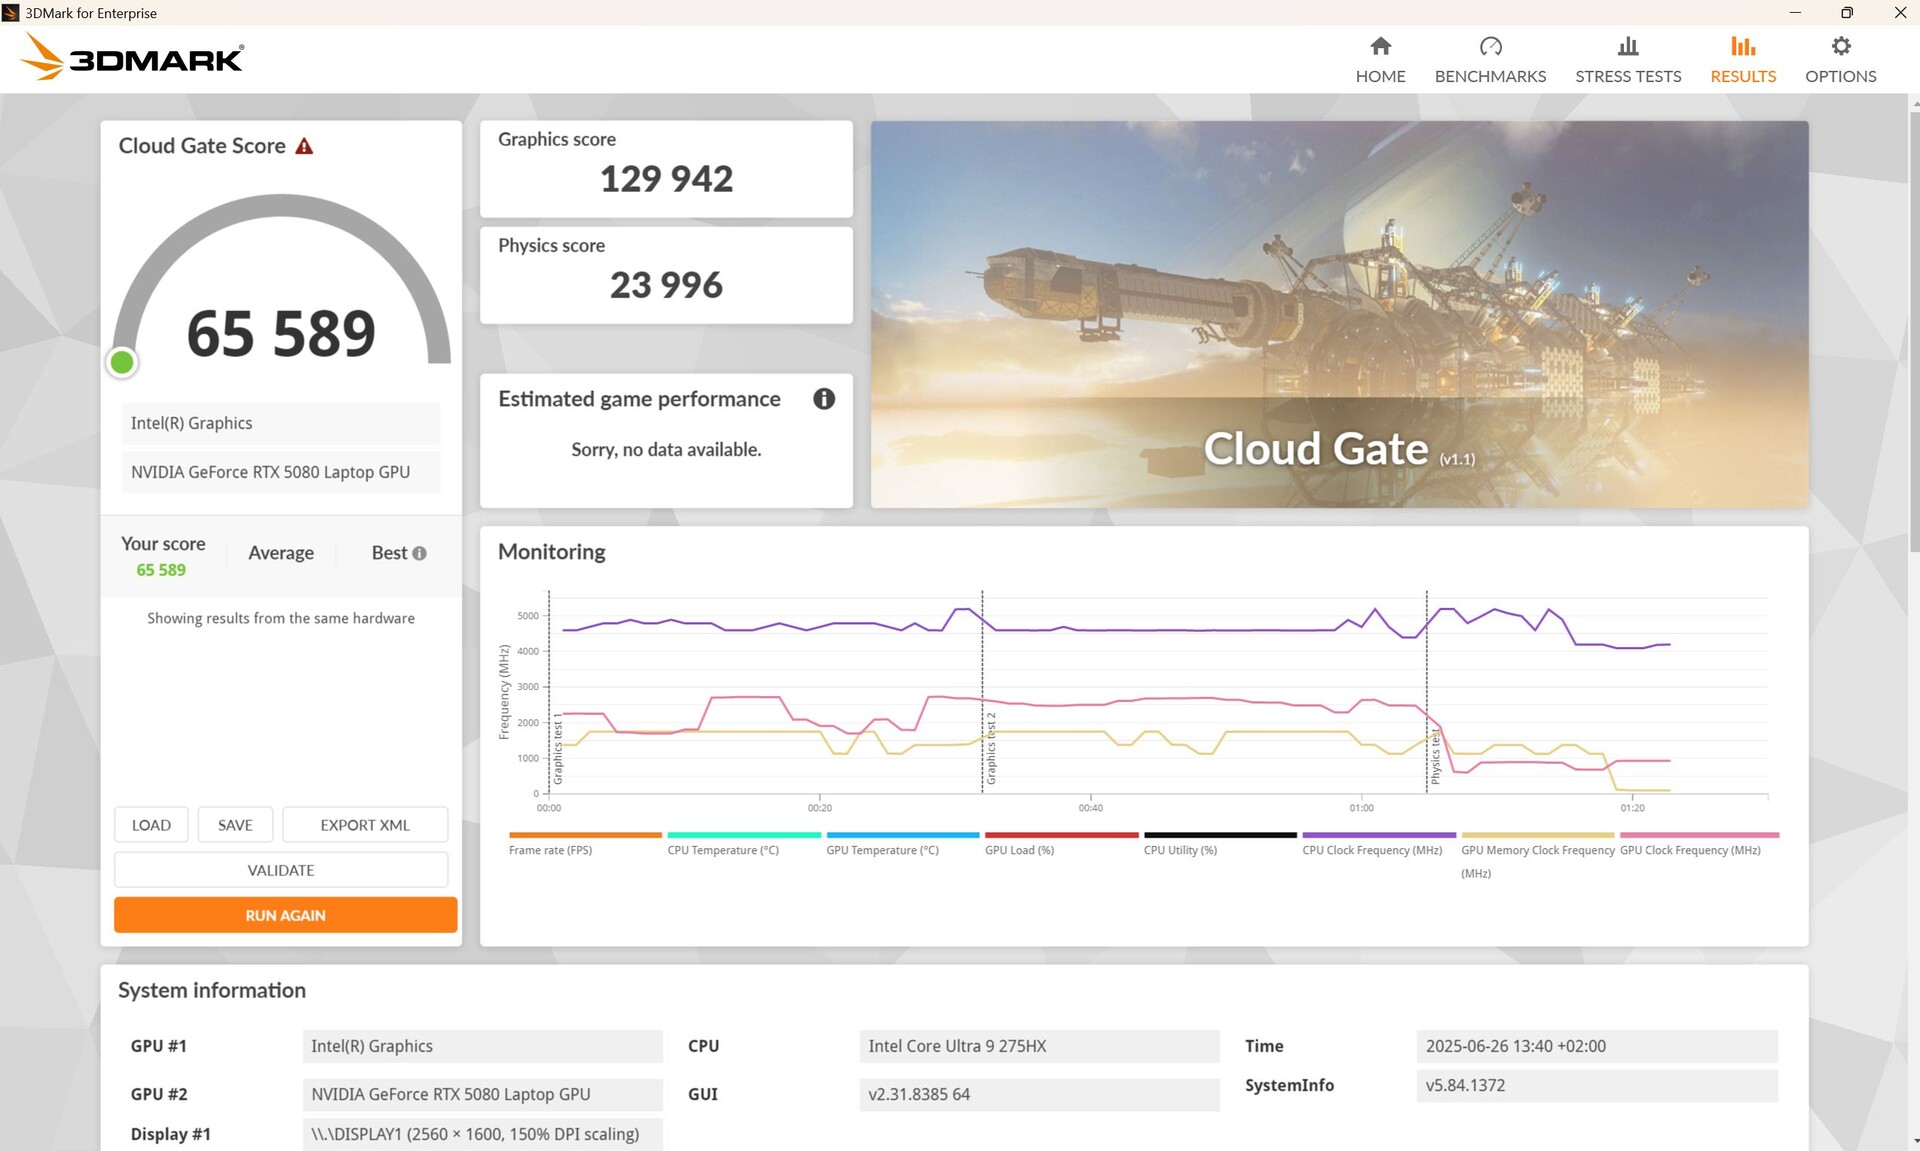
El Portátil RTX 5080 rinde un 4 por ciento por debajo de la media en el 3DMarks. Una prueba de Fire Strike en modo batería revela una pérdida de rendimiento 3D del 50 por ciento.
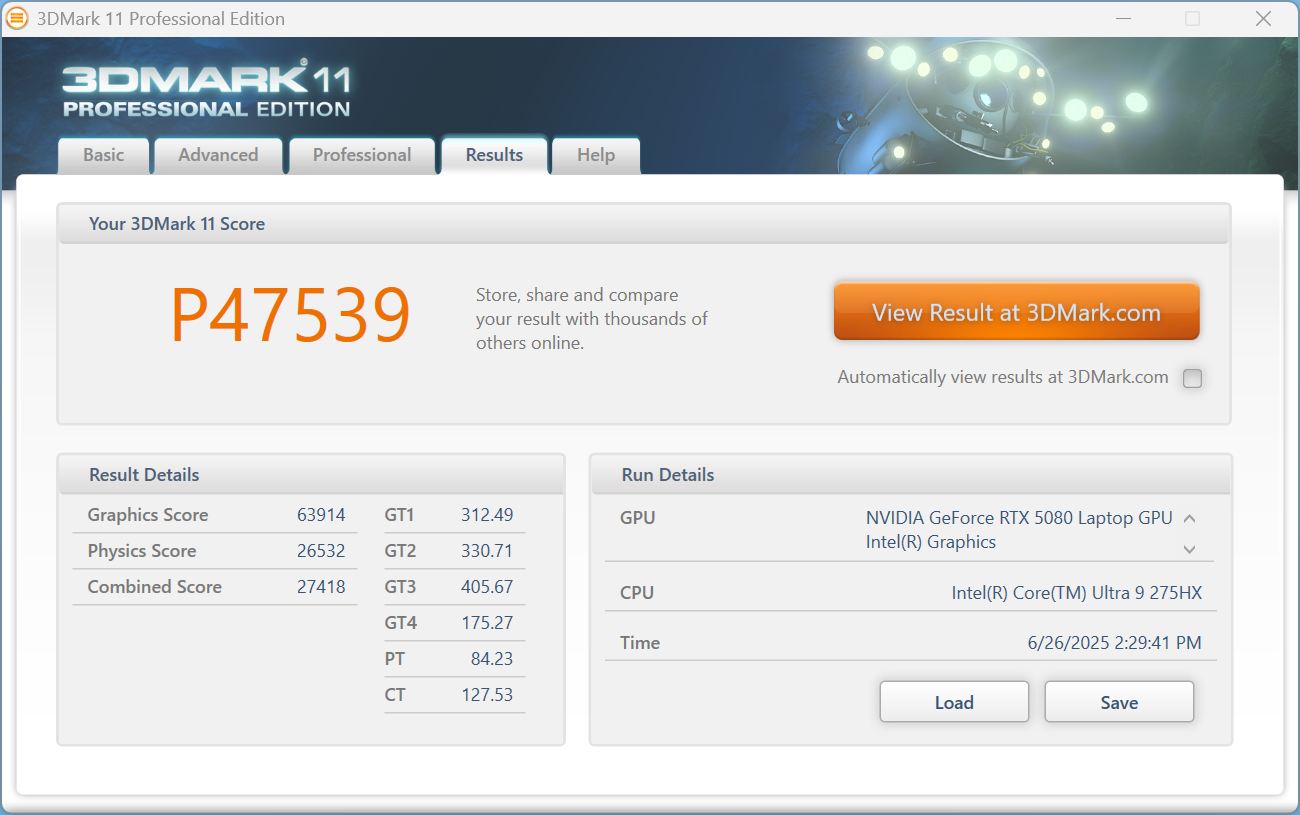
| 3DMark 11 Performance | 47539 puntos | |
| 3DMark Cloud Gate Standard Score | 65589 puntos | |
| 3DMark Fire Strike Score | 35915 puntos | |
| 3DMark Time Spy Score | 18303 puntos | |
| 3DMark Steel Nomad Score | 4518 puntos | |
ayuda | ||
* ... más pequeño es mejor
Rendimiento de juego
En nuestros juegos, el Vector 17 en Full HD está a la par con un Medion Erazer Beast 18 X1 y, por tanto, ligeramente por debajo de la media de los juegos con RTX 5080. El rendimiento continuo en Cyberpunk es muy consistente.
Se siente más a gusto en QHD, principalmente gracias al DLSS. Por ejemplo, Doom: The Dark Ages puede jugarse en QHD con DLSS a aproximadamente la misma velocidad de fotogramas que en Full HD (85 - 88 fps). Combinado con la generación de fotogramas 4x, nuestro Vector 17 consigue incluso 214 fps, lo que se acerca a la frecuencia de actualización nativa de la pantalla. No notamos ningún aumento de latencia, pero la experiencia subjetiva puede variar aquí.
| GTA V - 1920x1080 Highest AA:4xMSAA + FX AF:16x | |
| MSI Raider A18 HX A9WIG-080 | |
| MSI Vector 17 HX AI A2XWIG | |
| Lenovo Legion 5 Pro 16IAX10H | |
| MSI Vector 16 HX AI A2XWHG | |
| Medion Erazer Beast 18 X1 MD62731 | |
| Media de la clase Gaming (48.3 - 186.9, n=93, últimos 2 años) | |
| Strange Brigade - 1920x1080 ultra AA:ultra AF:16 | |
| Lenovo Legion Pro 7i 16 Gen 10 | |
| Alienware 16 Area-51 | |
| Medion Erazer Beast 18 X1 MD62731 | |
| MSI Vector 17 HX AI A2XWIG | |
| Lenovo Legion 5 Pro 16IAX10H | |
| Media de la clase Gaming (76.3 - 456, n=86, últimos 2 años) | |
Cyberpunk 2077 ultra FPS-Diagram
Datos de la GPU de Cyberpunk 2077

| bajo | medio | alto | ultra | QHD DLSS | QHD | 4K DLSS | 4K | |
|---|---|---|---|---|---|---|---|---|
| GTA V (2015) | 186.5 | 184.1 | 181.5 | 158.7 | 151.7 | |||
| Dota 2 Reborn (2015) | 220 | 193.1 | 185.9 | 171.7 | 167.9 | |||
| Final Fantasy XV Benchmark (2018) | 231 | 207 | 183.7 | 111.2 | 68.6 | |||
| X-Plane 11.11 (2018) | 163.7 | 139.5 | 108.8 | 98.7 | ||||
| Strange Brigade (2018) | 549 | 429 | 393 | 356 | 265 | 144 | ||
| Baldur's Gate 3 (2023) | 203 | 160 | 141 | 166.3 | 167.3 | 118.3 | 83.2 | 55.7 |
| Cyberpunk 2077 (2023) | 171.8 | 136.6 | 103.9 | 90 | 39.1 | |||
| Doom: The Dark Ages (2025) | 88 | 85 | 64 |
Emisiones y energía - Hasta 60 dB(A) es bastante ruidoso en comparación
Emisiones sonoras
Los ventiladores suelen estar apagados en ralentí, pero no se apagan por completo durante mucho tiempo después de una carga, ni siquiera en modo Eco. Al jugar, tienden a funcionar más ruidosamente que los de la competencia a pesar de un rendimiento 3D medio.
Ruido
| Ocioso |
| 24 / 30.82 / 31.31 dB(A) |
| Carga |
| 31.12 / 59.24 dB(A) |
 | ||
30 dB silencioso 40 dB(A) audible 50 dB(A) ruidosamente alto |
||
min: | ||
| MSI Vector 17 HX AI A2XWIG GeForce RTX 5080 Laptop, Ultra 9 275HX, Western Digital PC SN5000S SDEPNSJ-2T00-1032 | Alienware 16 Area-51 GeForce RTX 5080 Laptop, Ultra 9 275HX, Samsung PM9C1a MZ9L81T0HDLB | MSI Vector 16 HX AI A2XWHG GeForce RTX 5070 Ti Laptop, Ultra 7 255HX, Micron 2400 MTFDKBA512QFM | Lenovo Legion Pro 7i 16 Gen 10 GeForce RTX 5080 Laptop, Ultra 9 275HX, SK Hynix HFS001TEJ9X115N | Lenovo Legion 5 Pro 16IAX10H GeForce RTX 5070 Ti Laptop, Ultra 9 275HX, Western Digital PC SN8000S SDEPNRK-1T00 | MSI Raider A18 HX A9WIG-080 GeForce RTX 5080 Laptop, R9 9955HX3D, Samsung PM9E1 MZVLC2T0HBLD | Medion Erazer Beast 18 X1 MD62731 GeForce RTX 5080 Laptop, Ultra 9 275HX, Phison E31 2 TB | |
|---|---|---|---|---|---|---|---|
| Noise | 6% | -12% | 12% | -7% | -4% | -17% | |
| apagado / medio ambiente * (dB) | 24 | 23.6 2% | 25 -4% | 22.9 5% | 24 -0% | 25.1 -5% | 25 -4% |
| Idle Minimum * (dB) | 24 | 25.4 -6% | 33 -38% | 22.9 5% | 24 -0% | 28.6 -19% | 25 -4% |
| Idle Average * (dB) | 30.82 | 27.8 10% | 34 -10% | 22.9 26% | 24 22% | 28.9 6% | 39 -27% |
| Idle Maximum * (dB) | 31.31 | 28.1 10% | 38 -21% | 26.3 16% | 30.9 1% | 29.2 7% | 42 -34% |
| Load Average * (dB) | 31.12 | 28.8 7% | 46 -48% | 27.8 11% | 55.9 -80% | 45.6 -47% | 52 -67% |
| Cyberpunk 2077 ultra * (dB) | 59.24 | 50.4 15% | 47 21% | 54.2 9% | 56.72 4% | 55.6 6% | 53 11% |
| Load Maximum * (dB) | 59.24 | 56.4 5% | 49 17% | 53.9 9% | 56.72 4% | 45.8 23% | 55 7% |
* ... más pequeño es mejor
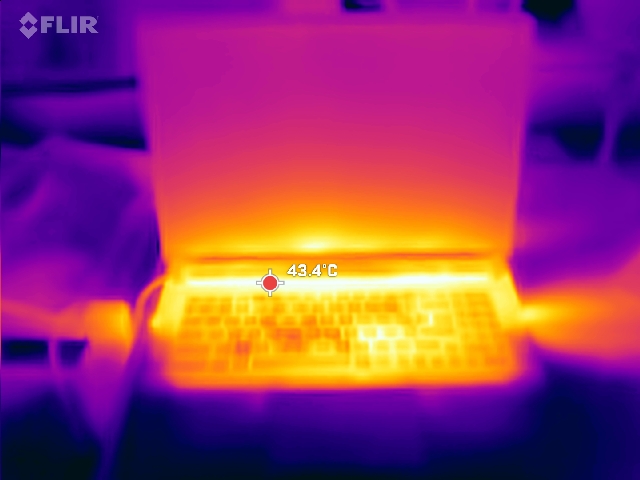
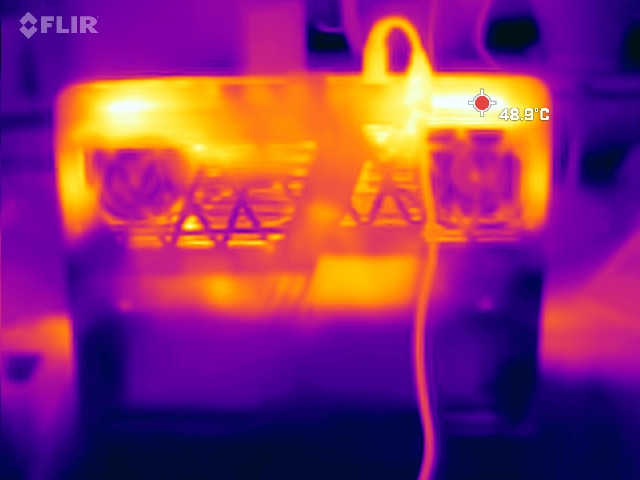
Temperatura
Bajo tensión, las temperaturas de la superficie alcanzan hasta 53 °C (127,4 °F), mientras que las del juego son más moderadas, 47 °C (116,6 °F), con la zona clave WASD a 38 °C (100,4 °F).
(-) La temperatura máxima en la parte superior es de 53 °C / 127 F, frente a la media de 40.4 °C / 105 F, que oscila entre 21.2 y 68.8 °C para la clase Gaming.
(-) El fondo se calienta hasta un máximo de 54 °C / 129 F, frente a la media de 43.2 °C / 110 F
(+) En reposo, la temperatura media de la parte superior es de 31.4 °C / 89# F, frente a la media del dispositivo de 33.9 °C / 93 F.
(±) 3: The average temperature for the upper side is 36.4 °C / 98 F, compared to the average of 33.9 °C / 93 F for the class Gaming.
(+) El reposamanos y el panel táctil están a una temperatura inferior a la de la piel, con un máximo de 29 °C / 84.2 F y, por tanto, son fríos al tacto.
(±) La temperatura media de la zona del reposamanos de dispositivos similares fue de 28.8 °C / 83.8 F (-0.2 °C / -0.4 F).
| MSI Vector 17 HX AI A2XWIG Intel Core Ultra 9 275HX, NVIDIA GeForce RTX 5080 Laptop | Alienware 16 Area-51 Intel Core Ultra 9 275HX, NVIDIA GeForce RTX 5080 Laptop | MSI Vector 16 HX AI A2XWHG Intel Core Ultra 7 255HX, NVIDIA GeForce RTX 5070 Ti Laptop | Lenovo Legion Pro 7i 16 Gen 10 Intel Core Ultra 9 275HX, NVIDIA GeForce RTX 5080 Laptop | Lenovo Legion 5 Pro 16IAX10H Intel Core Ultra 9 275HX, NVIDIA GeForce RTX 5070 Ti Laptop | MSI Raider A18 HX A9WIG-080 AMD Ryzen 9 9955HX3D, NVIDIA GeForce RTX 5080 Laptop | Medion Erazer Beast 18 X1 MD62731 Intel Core Ultra 9 275HX, NVIDIA GeForce RTX 5080 Laptop | |
|---|---|---|---|---|---|---|---|
| Heat | 12% | 9% | 16% | -1% | 6% | 13% | |
| Maximum Upper Side * (°C) | 53 | 43.8 17% | 53 -0% | 42.6 20% | 48 9% | 49.3 7% | 47 11% |
| Maximum Bottom * (°C) | 54 | 40 26% | 52 4% | 41.2 24% | 50 7% | 50.9 6% | 48 11% |
| Idle Upper Side * (°C) | 39 | 35.8 8% | 33 15% | 32.6 16% | 38 3% | 35.2 10% | 29 26% |
| Idle Bottom * (°C) | 34 | 35.2 -4% | 29 15% | 32.4 5% | 42 -24% | 33.5 1% | 33 3% |
* ... más pequeño es mejor
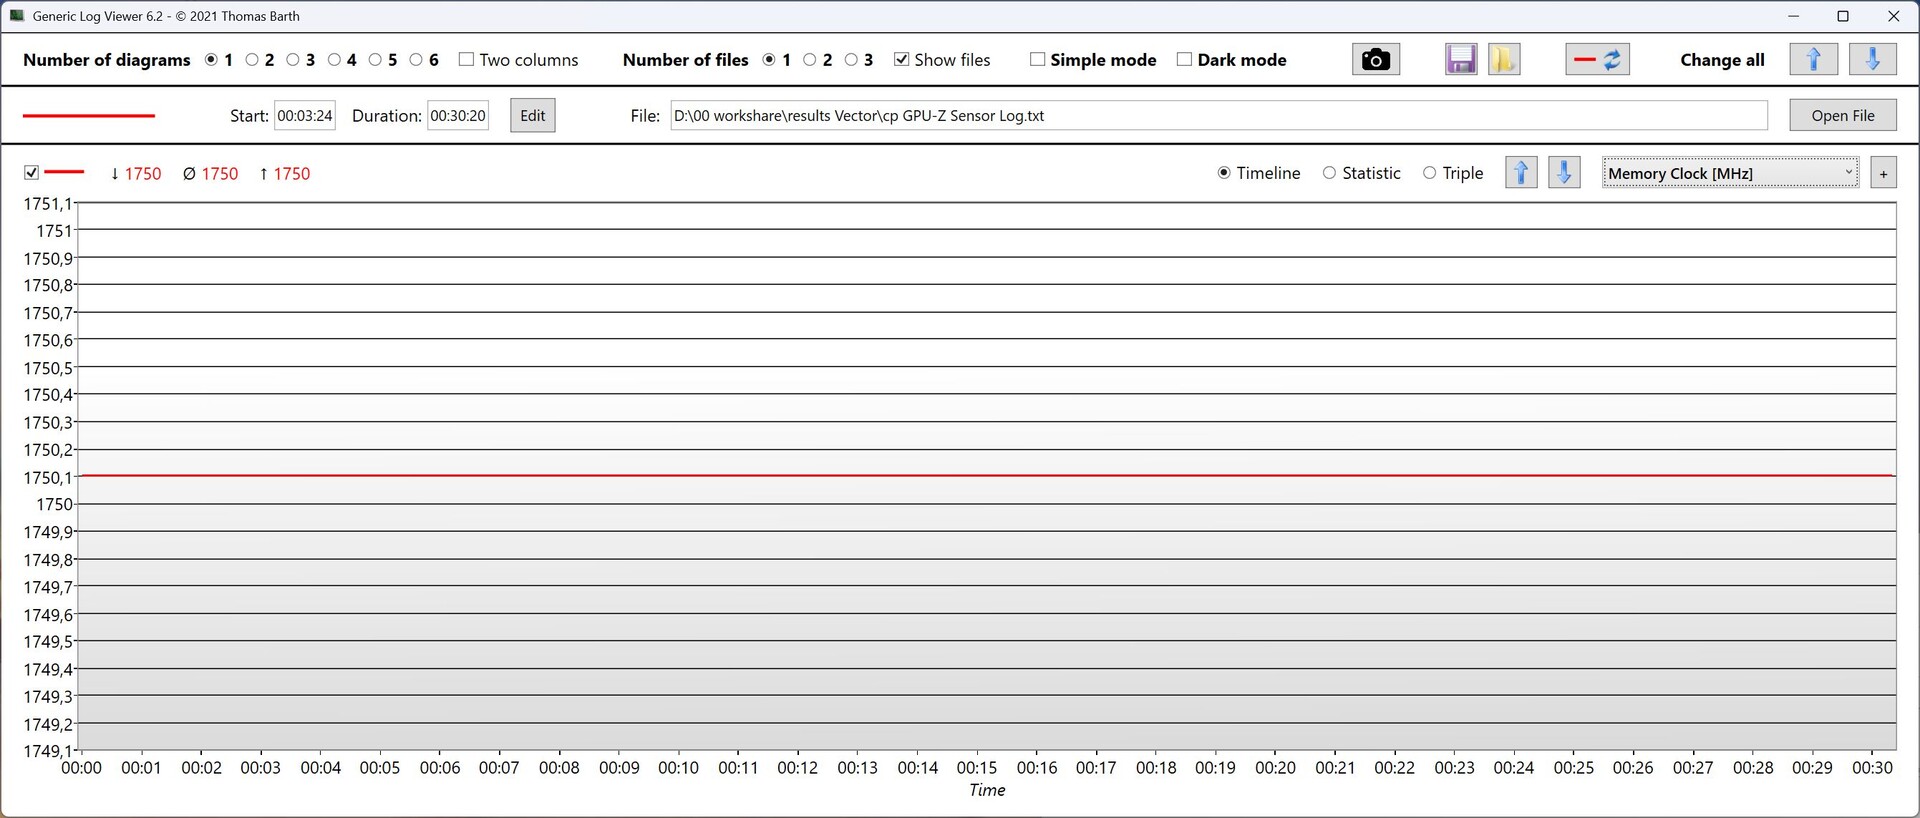
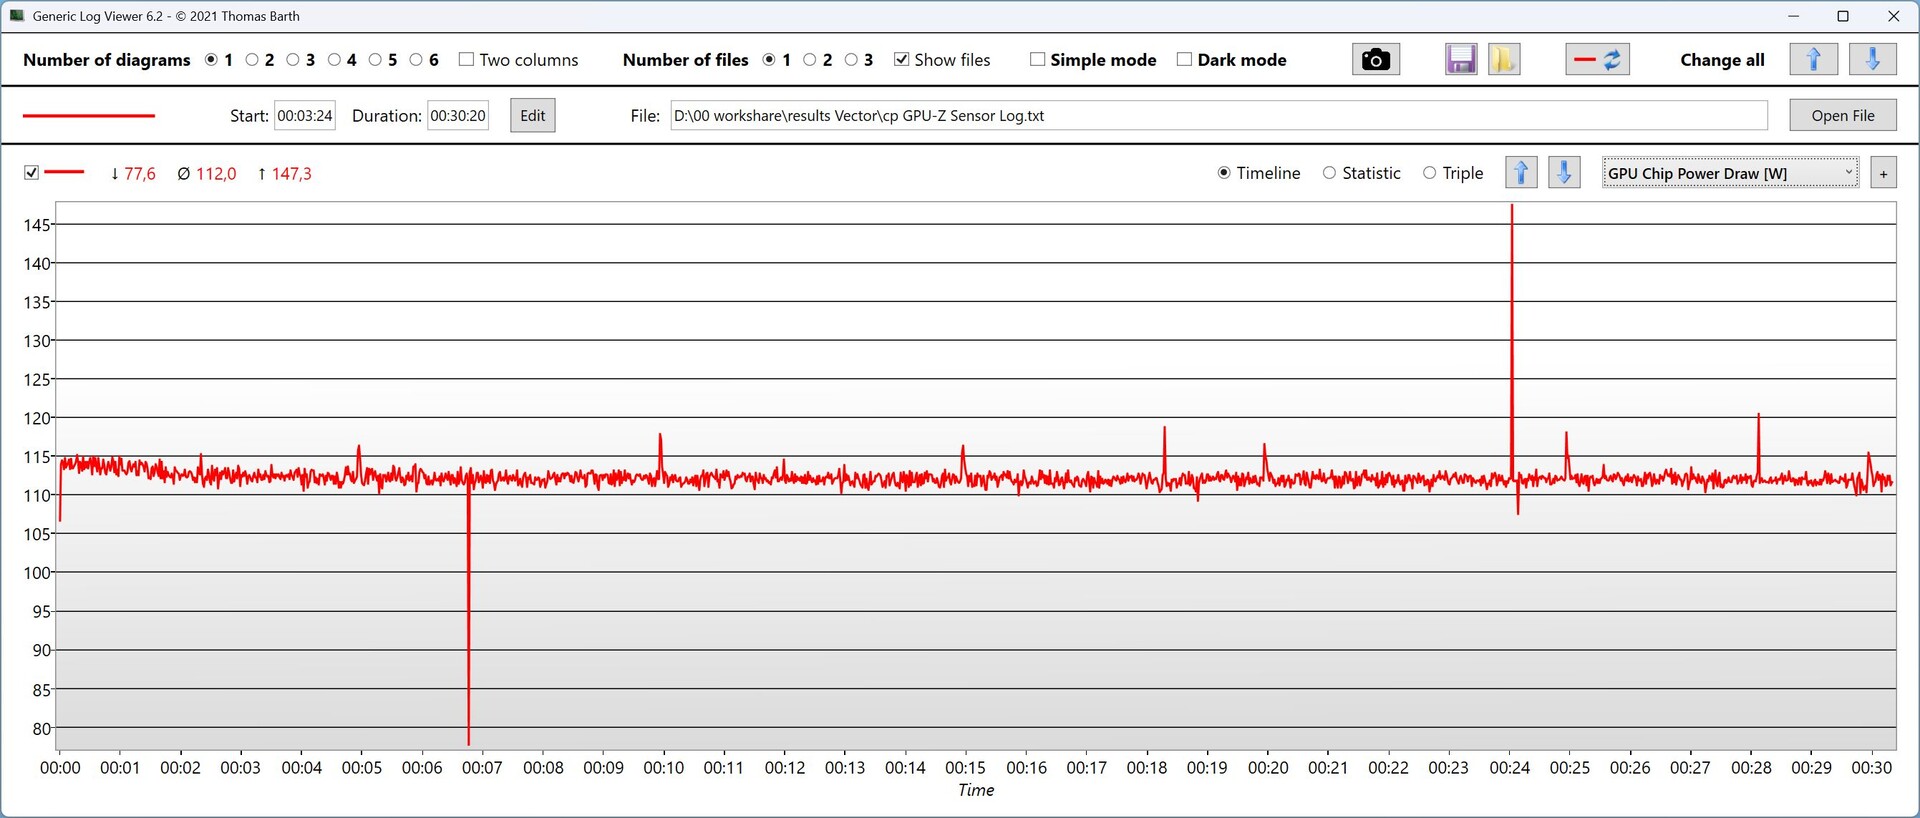
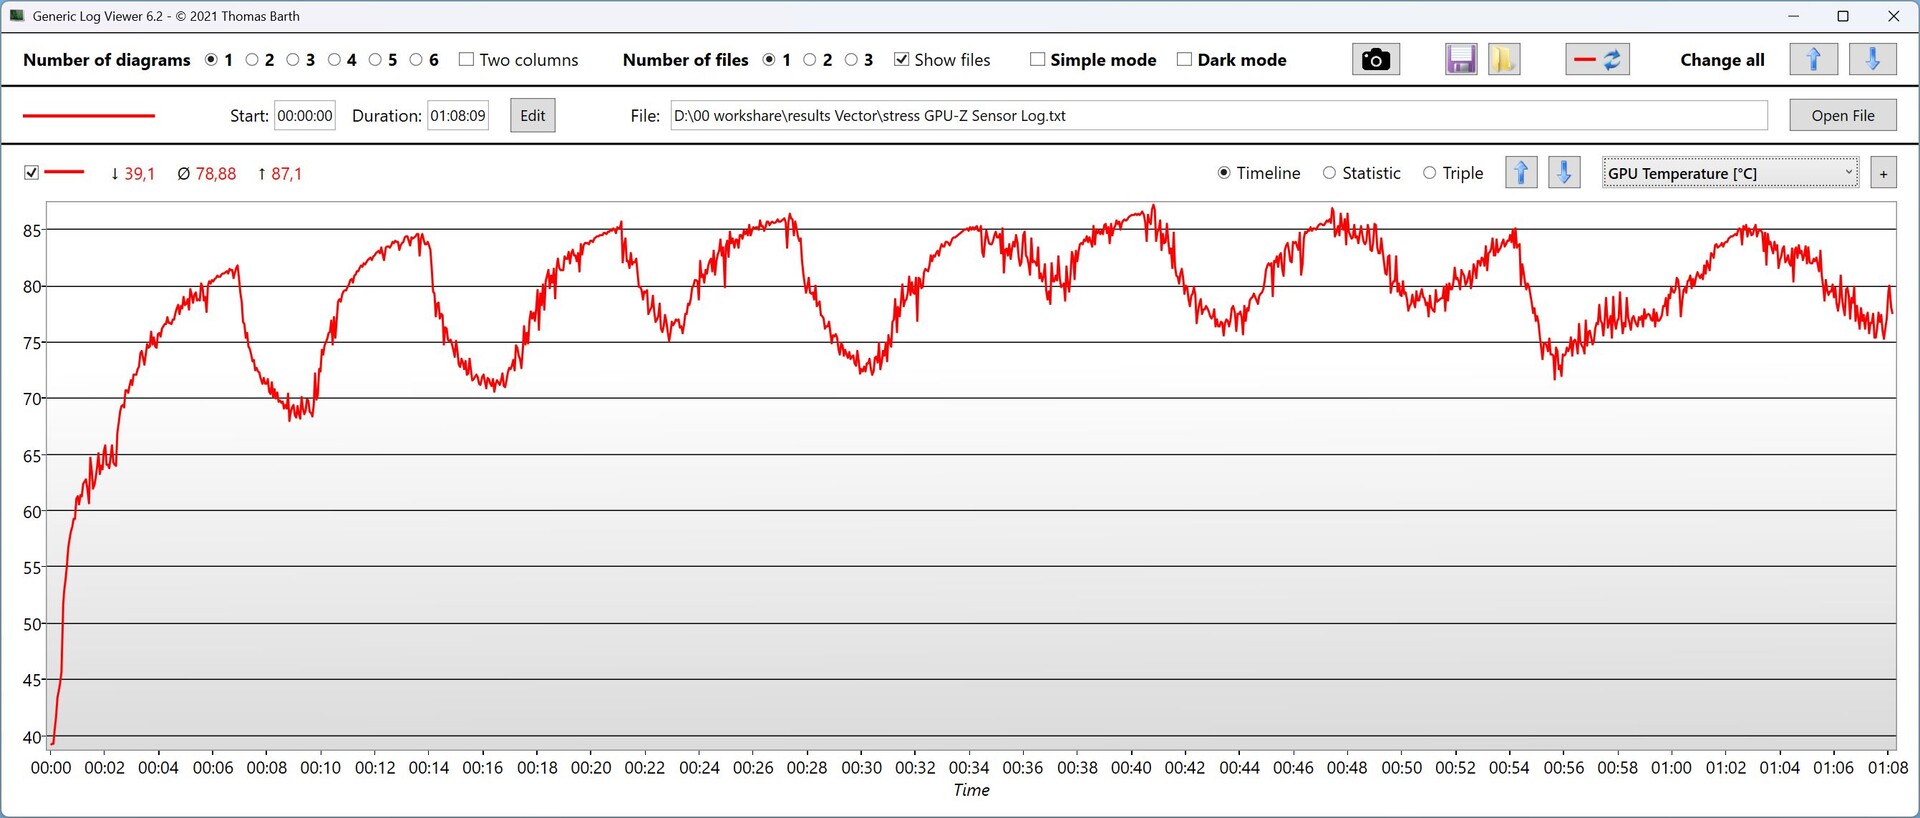
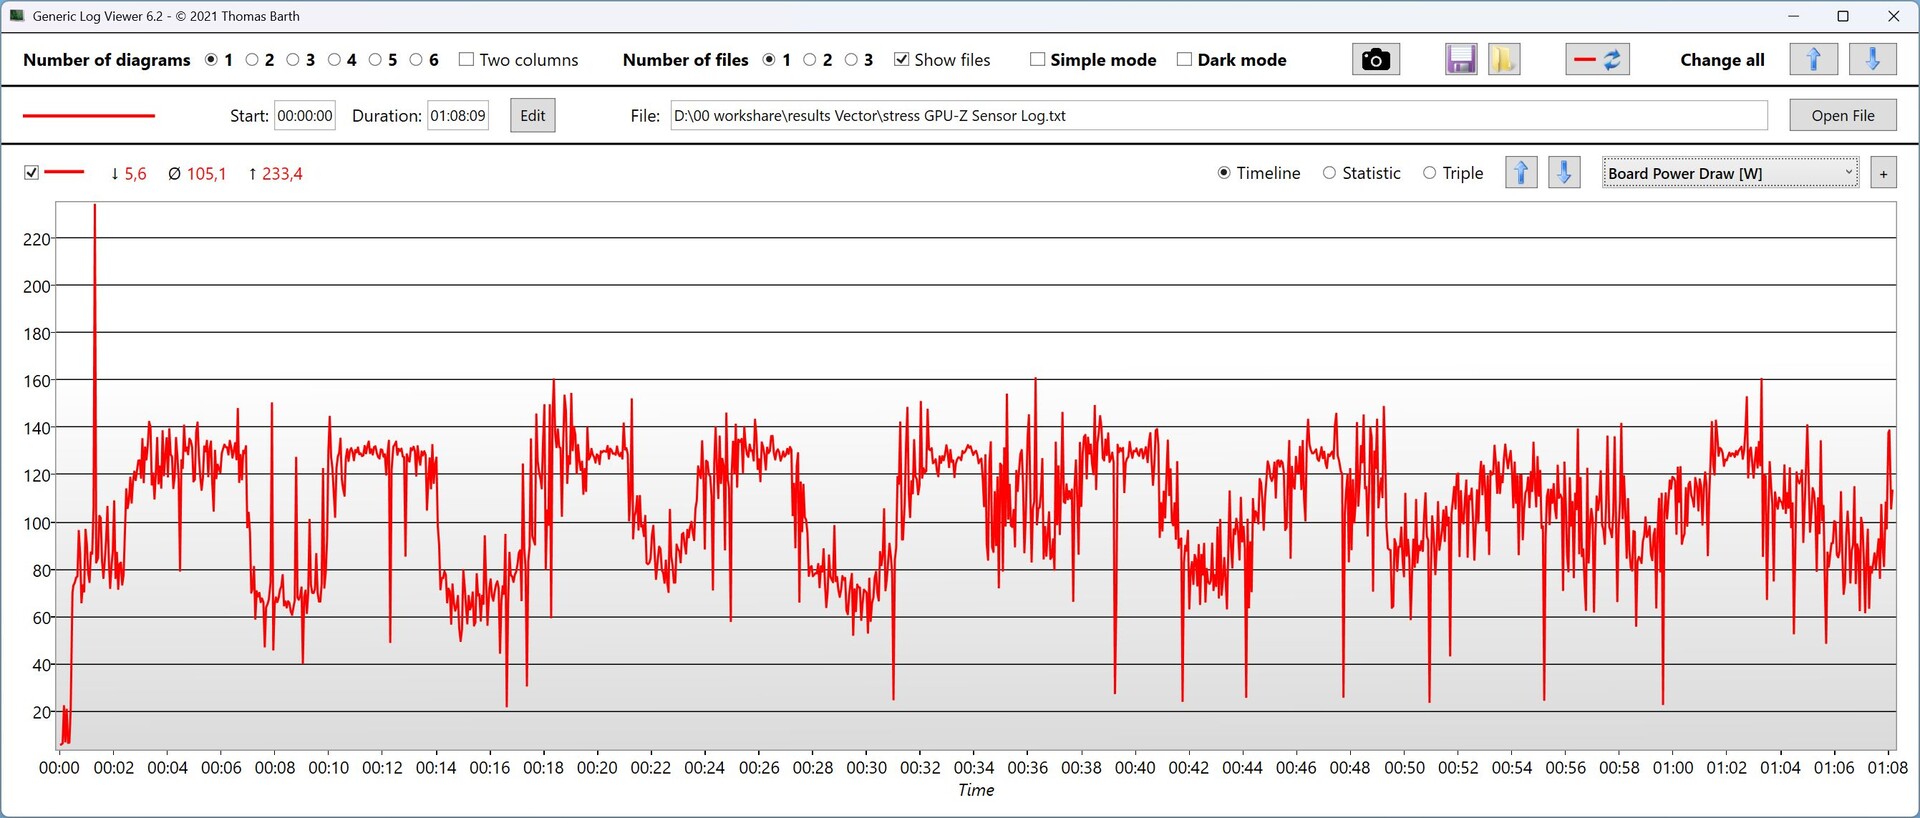
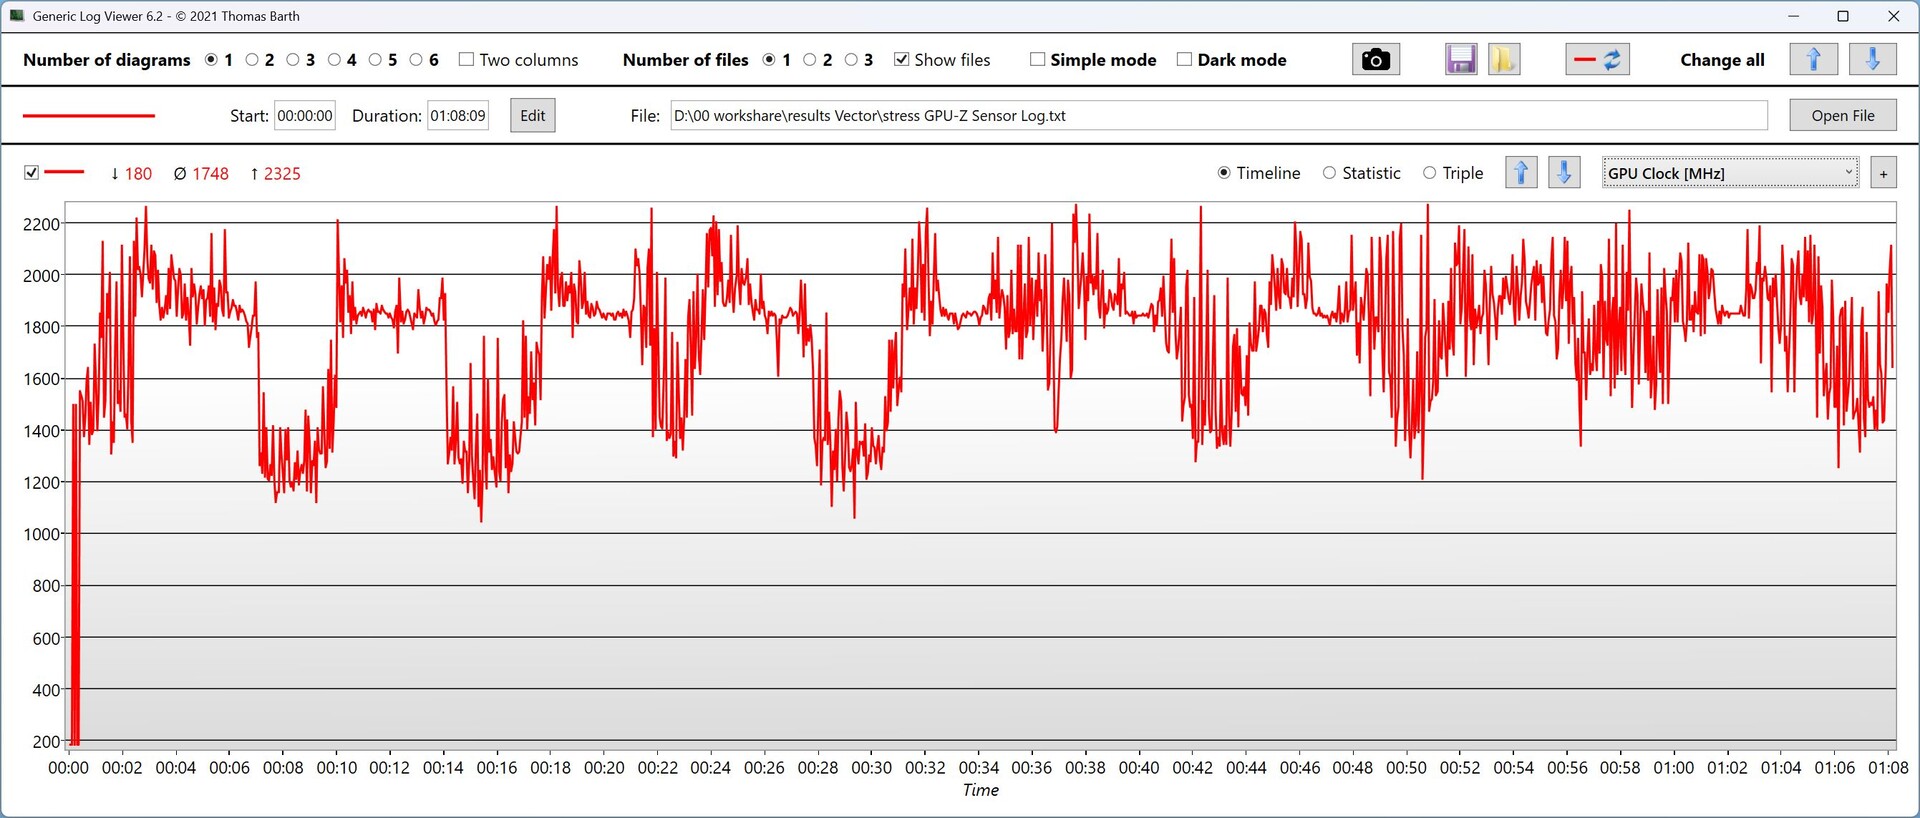
| Reloj de la CPU (GHz) | Reloj de la GPU (MHz) | Temperatura media dela CPU (°C) | Temperatura media de la GPU (°C) | |
| Prime95 Stress | 4,25 | 750 | 80 | 45 |
| Prime95 + FurMark Stress | 3,4 | 1.750 | 74 - 81 | 70 - 87 |
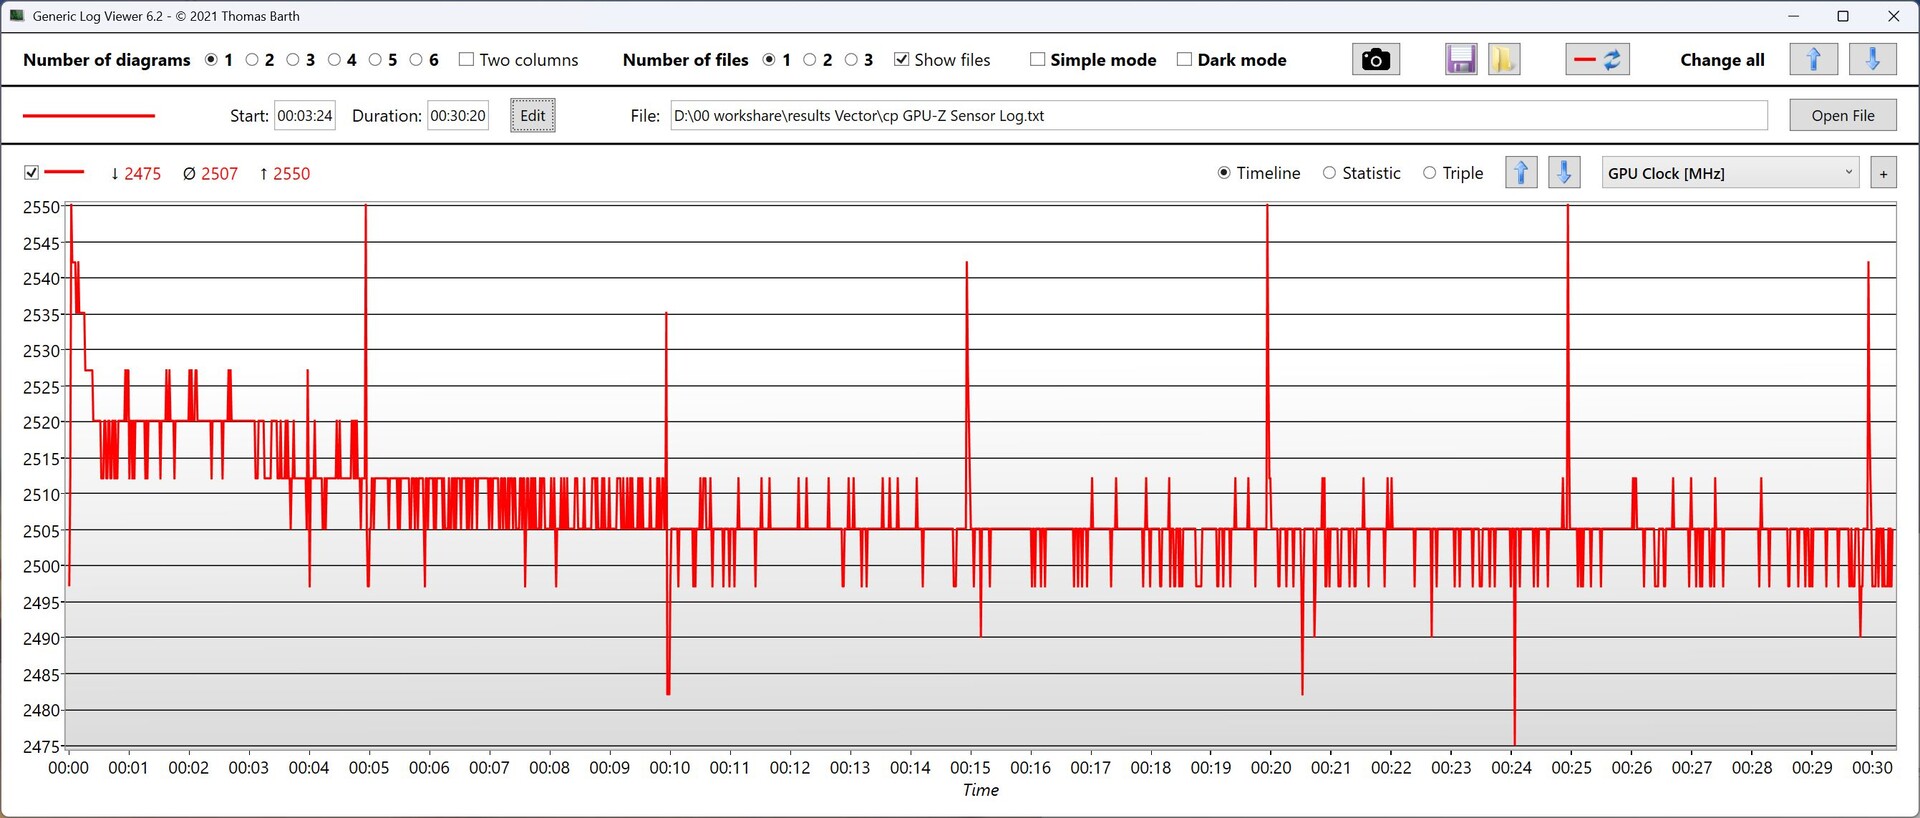
| Cyberpunk 2077 Estrés | 1,9 | 2.500 | 81 - 89 | hasta 80 |
Prueba de esfuerzo

Altavoz
Los altavoces hacen un trabajo medio. Dispone de un puerto jack de 3,5 mm para auriculares y similares.
MSI Vector 17 HX AI A2XWIG análisis de audio
(±) | la sonoridad del altavoz es media pero buena (80.39 dB)
Graves 100 - 315 Hz
(±) | lubina reducida - en promedio 10.4% inferior a la mediana
(±) | la linealidad de los graves es media (7.4% delta a frecuencia anterior)
Medios 400 - 2000 Hz
(±) | medias más altas - de media 6.2% más altas que la mediana
(+) | los medios son lineales (4.7% delta a la frecuencia anterior)
Altos 2 - 16 kHz
(+) | máximos equilibrados - a sólo 4.3% de la mediana
(±) | la linealidad de los máximos es media (8.7% delta a frecuencia anterior)
Total 100 - 16.000 Hz
(±) | la linealidad del sonido global es media (15.6% de diferencia con la mediana)
En comparación con la misma clase
» 36% de todos los dispositivos probados de esta clase eran mejores, 6% similares, 58% peores
» El mejor tuvo un delta de 6%, la media fue 18%, el peor fue ###max##%
En comparación con todos los dispositivos probados
» 23% de todos los dispositivos probados eran mejores, 5% similares, 72% peores
» El mejor tuvo un delta de 4%, la media fue 23%, el peor fue ###max##%
Lenovo Legion 5 Pro 16IAX10H análisis de audio
(±) | la sonoridad del altavoz es media pero buena (78.2 dB)
Graves 100 - 315 Hz
(-) | casi sin bajos - de media 21.1% inferior a la mediana
(±) | la linealidad de los graves es media (8% delta a frecuencia anterior)
Medios 400 - 2000 Hz
(±) | medias más altas - de media 6.3% más altas que la mediana
(+) | los medios son lineales (6.5% delta a la frecuencia anterior)
Altos 2 - 16 kHz
(+) | máximos equilibrados - a sólo 1.6% de la mediana
(+) | los máximos son lineales (4.9% delta a la frecuencia anterior)
Total 100 - 16.000 Hz
(±) | la linealidad del sonido global es media (18.3% de diferencia con la mediana)
En comparación con la misma clase
» 58% de todos los dispositivos probados de esta clase eran mejores, 9% similares, 33% peores
» El mejor tuvo un delta de 6%, la media fue 18%, el peor fue ###max##%
En comparación con todos los dispositivos probados
» 40% de todos los dispositivos probados eran mejores, 8% similares, 52% peores
» El mejor tuvo un delta de 4%, la media fue 23%, el peor fue ###max##%
Consumo de energía
Tras las actualizaciones, el consumo en reposo es ahora correcto. En juegos, sigue siendo demasiado alto en vista del rendimiento ofrecido. Si se conecta un monitor externo a través de HDMI, la dGPU está activa y se consume más energía en modo inactivo.
| Off / Standby | |
| Ocioso | |
| Carga |
|
Clave:
min: | |
| MSI Vector 17 HX AI A2XWIG Ultra 9 275HX, GeForce RTX 5080 Laptop, Western Digital PC SN5000S SDEPNSJ-2T00-1032, IPS, 2560x1600, 17" | Alienware 16 Area-51 Ultra 9 275HX, GeForce RTX 5080 Laptop, Samsung PM9C1a MZ9L81T0HDLB, IPS, 2560x1600, 16" | MSI Vector 16 HX AI A2XWHG Ultra 7 255HX, GeForce RTX 5070 Ti Laptop, Micron 2400 MTFDKBA512QFM, IPS, 2560x1600, 16" | Lenovo Legion Pro 7i 16 Gen 10 Ultra 9 275HX, GeForce RTX 5080 Laptop, SK Hynix HFS001TEJ9X115N, OLED, 2560x1600, 16" | Lenovo Legion 5 Pro 16IAX10H Ultra 9 275HX, GeForce RTX 5070 Ti Laptop, Western Digital PC SN8000S SDEPNRK-1T00, OLED, 2560x1600, 16" | MSI Raider A18 HX A9WIG-080 R9 9955HX3D, GeForce RTX 5080 Laptop, Samsung PM9E1 MZVLC2T0HBLD, MiniLED IPS, 3840x2400, 18" | Medion Erazer Beast 18 X1 MD62731 Ultra 9 275HX, GeForce RTX 5080 Laptop, Phison E31 2 TB, IPS, 2560x1600, 18" | Medio NVIDIA GeForce RTX 5080 Laptop | Media de la clase Gaming | |
|---|---|---|---|---|---|---|---|---|---|
| Power Consumption | -61% | -3% | -80% | -14% | -119% | 6% | -52% | -17% | |
| Idle Minimum * (Watt) | 10 | 27 -170% | 7.1 29% | 28.5 -185% | 14 -40% | 41.5 -315% | 7.9 21% | 19.1 ? -91% | 13 ? -30% |
| Idle Average * (Watt) | 15.4 | 33.5 -118% | 15.9 -3% | 38.8 -152% | 14.3 7% | 53.5 -247% | 11.5 25% | 25.3 ? -64% | 18.7 ? -21% |
| Idle Maximum * (Watt) | 18.7 | 41.4 -121% | 29.5 -58% | 45.6 -144% | 20.1 -7% | 53.8 -188% | 16.6 11% | 30.4 ? -63% | 24.3 ? -30% |
| Load Average * (Watt) | 89.7 | 124.7 -39% | 124 -38% | 132.2 -47% | 177 -97% | 168.5 -88% | 130 -45% | 128.5 ? -43% | 110.2 ? -23% |
| Cyberpunk 2077 ultra * (Watt) | 308 | 256 17% | 222 28% | 318 -3% | 255 17% | 298 3% | 253 18% | ||
| Cyberpunk 2077 ultra external monitor * (Watt) | 300 | 249 17% | 217 28% | 319 -6% | 255 15% | 295 2% | 245 18% | ||
| Load Maximum * (Watt) | 321 | 367.2 -14% | 336 -5% | 384 -20% | 294 8% | 323.7 -1% | 330 -3% | 314 ? 2% | 258 ? 20% |
* ... más pequeño es mejor
Energy consumption Cyberpunk / Stress test
Energy consumption with external Monitor
Duración de las pilas
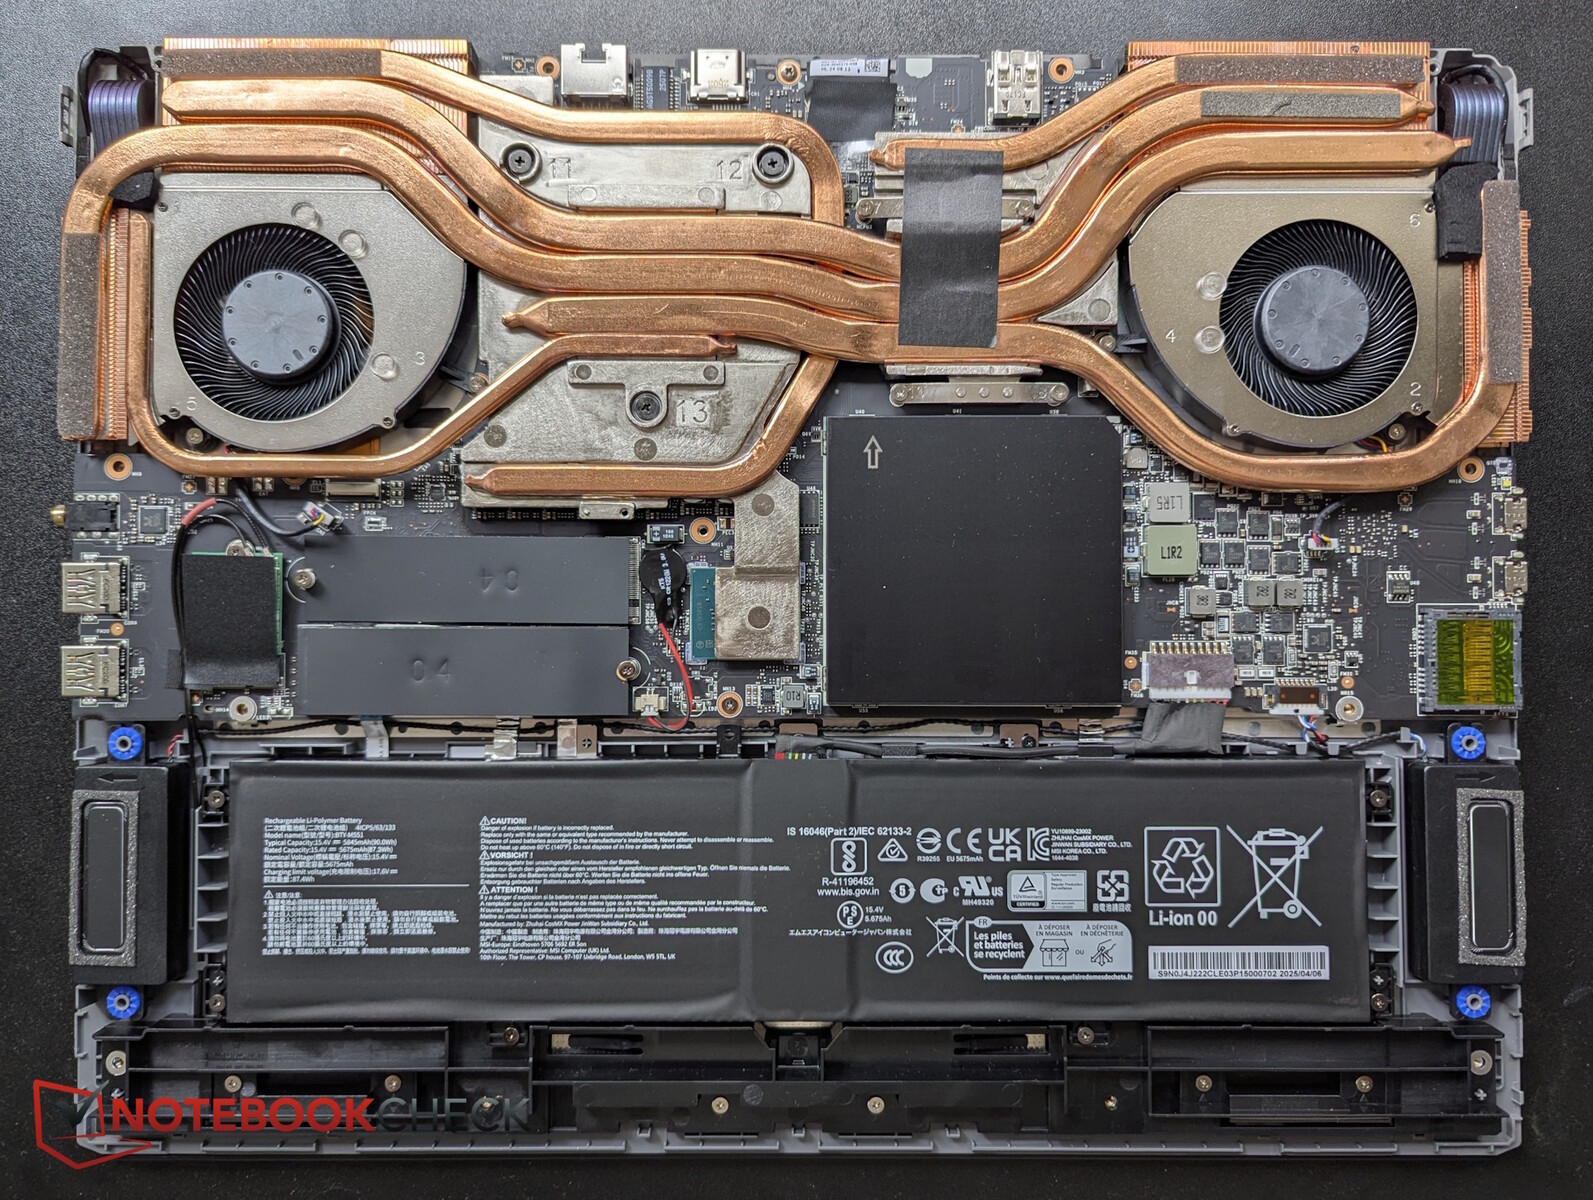
Con la batería de 90 Wh, el Vector 17 alcanza unas 6,75 horas en nuestra prueba Wi-Fi con el brillo bajado (modo Eco). Se trata de un buen valor en comparación.
| MSI Vector 17 HX AI A2XWIG Ultra 9 275HX, GeForce RTX 5080 Laptop, 90 Wh | Alienware 16 Area-51 Ultra 9 275HX, GeForce RTX 5080 Laptop, 96 Wh | MSI Vector 16 HX AI A2XWHG Ultra 7 255HX, GeForce RTX 5070 Ti Laptop, 90 Wh | Lenovo Legion Pro 7i 16 Gen 10 Ultra 9 275HX, GeForce RTX 5080 Laptop, 99 Wh | Lenovo Legion 5 Pro 16IAX10H Ultra 9 275HX, GeForce RTX 5070 Ti Laptop, 80 Wh | MSI Raider A18 HX A9WIG-080 R9 9955HX3D, GeForce RTX 5080 Laptop, 99 Wh | Medion Erazer Beast 18 X1 MD62731 Ultra 9 275HX, GeForce RTX 5080 Laptop, 99 Wh | Media de la clase Gaming | |
|---|---|---|---|---|---|---|---|---|
| Duración de Batería | -58% | 4% | -39% | -19% | -56% | 18% | -7% | |
| WiFi v1.3 (h) | 6.7 | 2.8 -58% | 7 4% | 5.4 -19% | 4.9 -27% | 2.1 -69% | 7.9 18% | 7.15 ? 7% |
| Load (h) | 1.9 | 0.8 -58% | 1.7 -11% | 1.1 -42% | 1.502 ? -21% | |||
| Reader / Idle (h) | 3.1 | 8.71 ? | ||||||
| H.264 (h) | 4.8 | 8.64 ? |
Valoración general de Notebookcheck
El MSI Vector 17 HX AI es un portátil gaming medio que se anota unos puntos extra gracias a su doble Thunderbolt 5 y Wi-Fi 7.
MSI Vector 17 HX AI A2XWIG
- 07/16/2025 v8
Christian Hintze
 Total Sustainability Score:
 Comparación de posibles alternativas
Transparencia
La selección de los dispositivos que se van a reseñar corre a cargo de nuestro equipo editorial. La muestra de prueba fue proporcionada al autor en calidad de préstamo por el fabricante o el minorista a los efectos de esta reseña. El prestamista no tuvo ninguna influencia en esta reseña, ni el fabricante recibió una copia de la misma antes de su publicación. No había ninguna obligación de publicar esta reseña. Como empresa de medios independiente, Notebookcheck no está sujeta a la autoridad de fabricantes, minoristas o editores.
Así es como prueba Notebookcheck
Cada año, Notebookcheck revisa de forma independiente cientos de portátiles y smartphones utilizando procedimientos estandarizados para asegurar que todos los resultados son comparables. Hemos desarrollado continuamente nuestros métodos de prueba durante unos 20 años y hemos establecido los estándares de la industria en el proceso. En nuestros laboratorios de pruebas, técnicos y editores experimentados utilizan equipos de medición de alta calidad. Estas pruebas implican un proceso de validación en varias fases. Nuestro complejo sistema de clasificación se basa en cientos de mediciones y puntos de referencia bien fundamentados, lo que mantiene la objetividad.