Reseña del mini PC GMK NucBox K6: Tan potente como los últimos portátiles Intel Core Ultra

El GMK NucBox K6 es uno de los mini PC más recientes de la compañía, diseñado para multimedia doméstico y streaming. Compite directamente con los mini PC Intel NUC y Beelink en el rango de precios de 500 dólares.
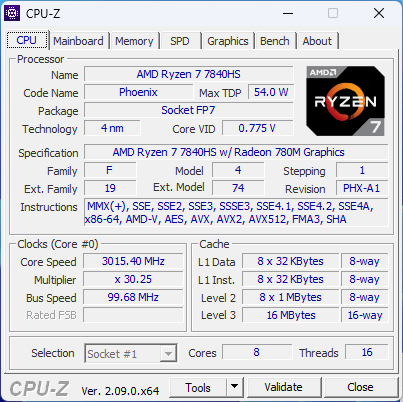
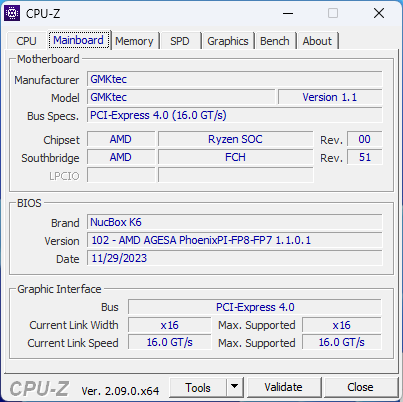
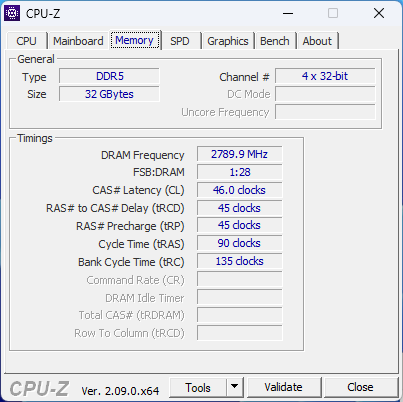
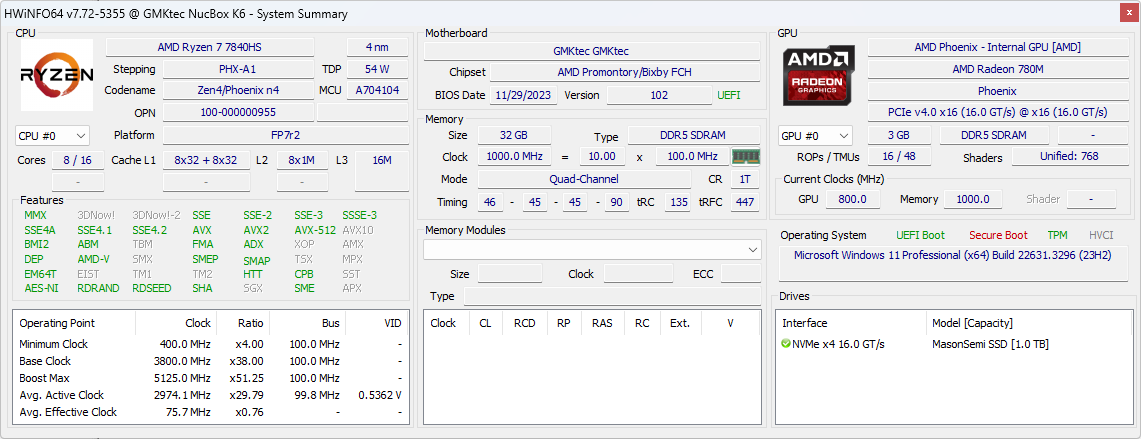
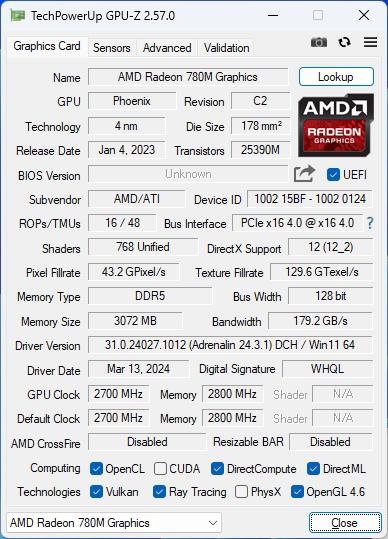
Todas las configuraciones actuales vienen con el AMD Ryzen 7 7840HS CPU Zen 4 con gráficos Radeon 780M integrados. Los SKU barebone están disponibles desde 400 $ hasta 730 $ si se configuran con 32 GB de RAM, 1 TB de almacenamiento y Windows 11 Pro preinstalado. Las alternativas al NucBox K6 incluyen el Intel NUC 13 Pro, Beelink SER5o el Geekom A7.
Más reseñas de GMKtec:
Posibles contendientes en la comparación
Valoración | Fecha | Modelo | Peso | Altura | Tamaño | Resolución | Precio |
|---|---|---|---|---|---|---|---|
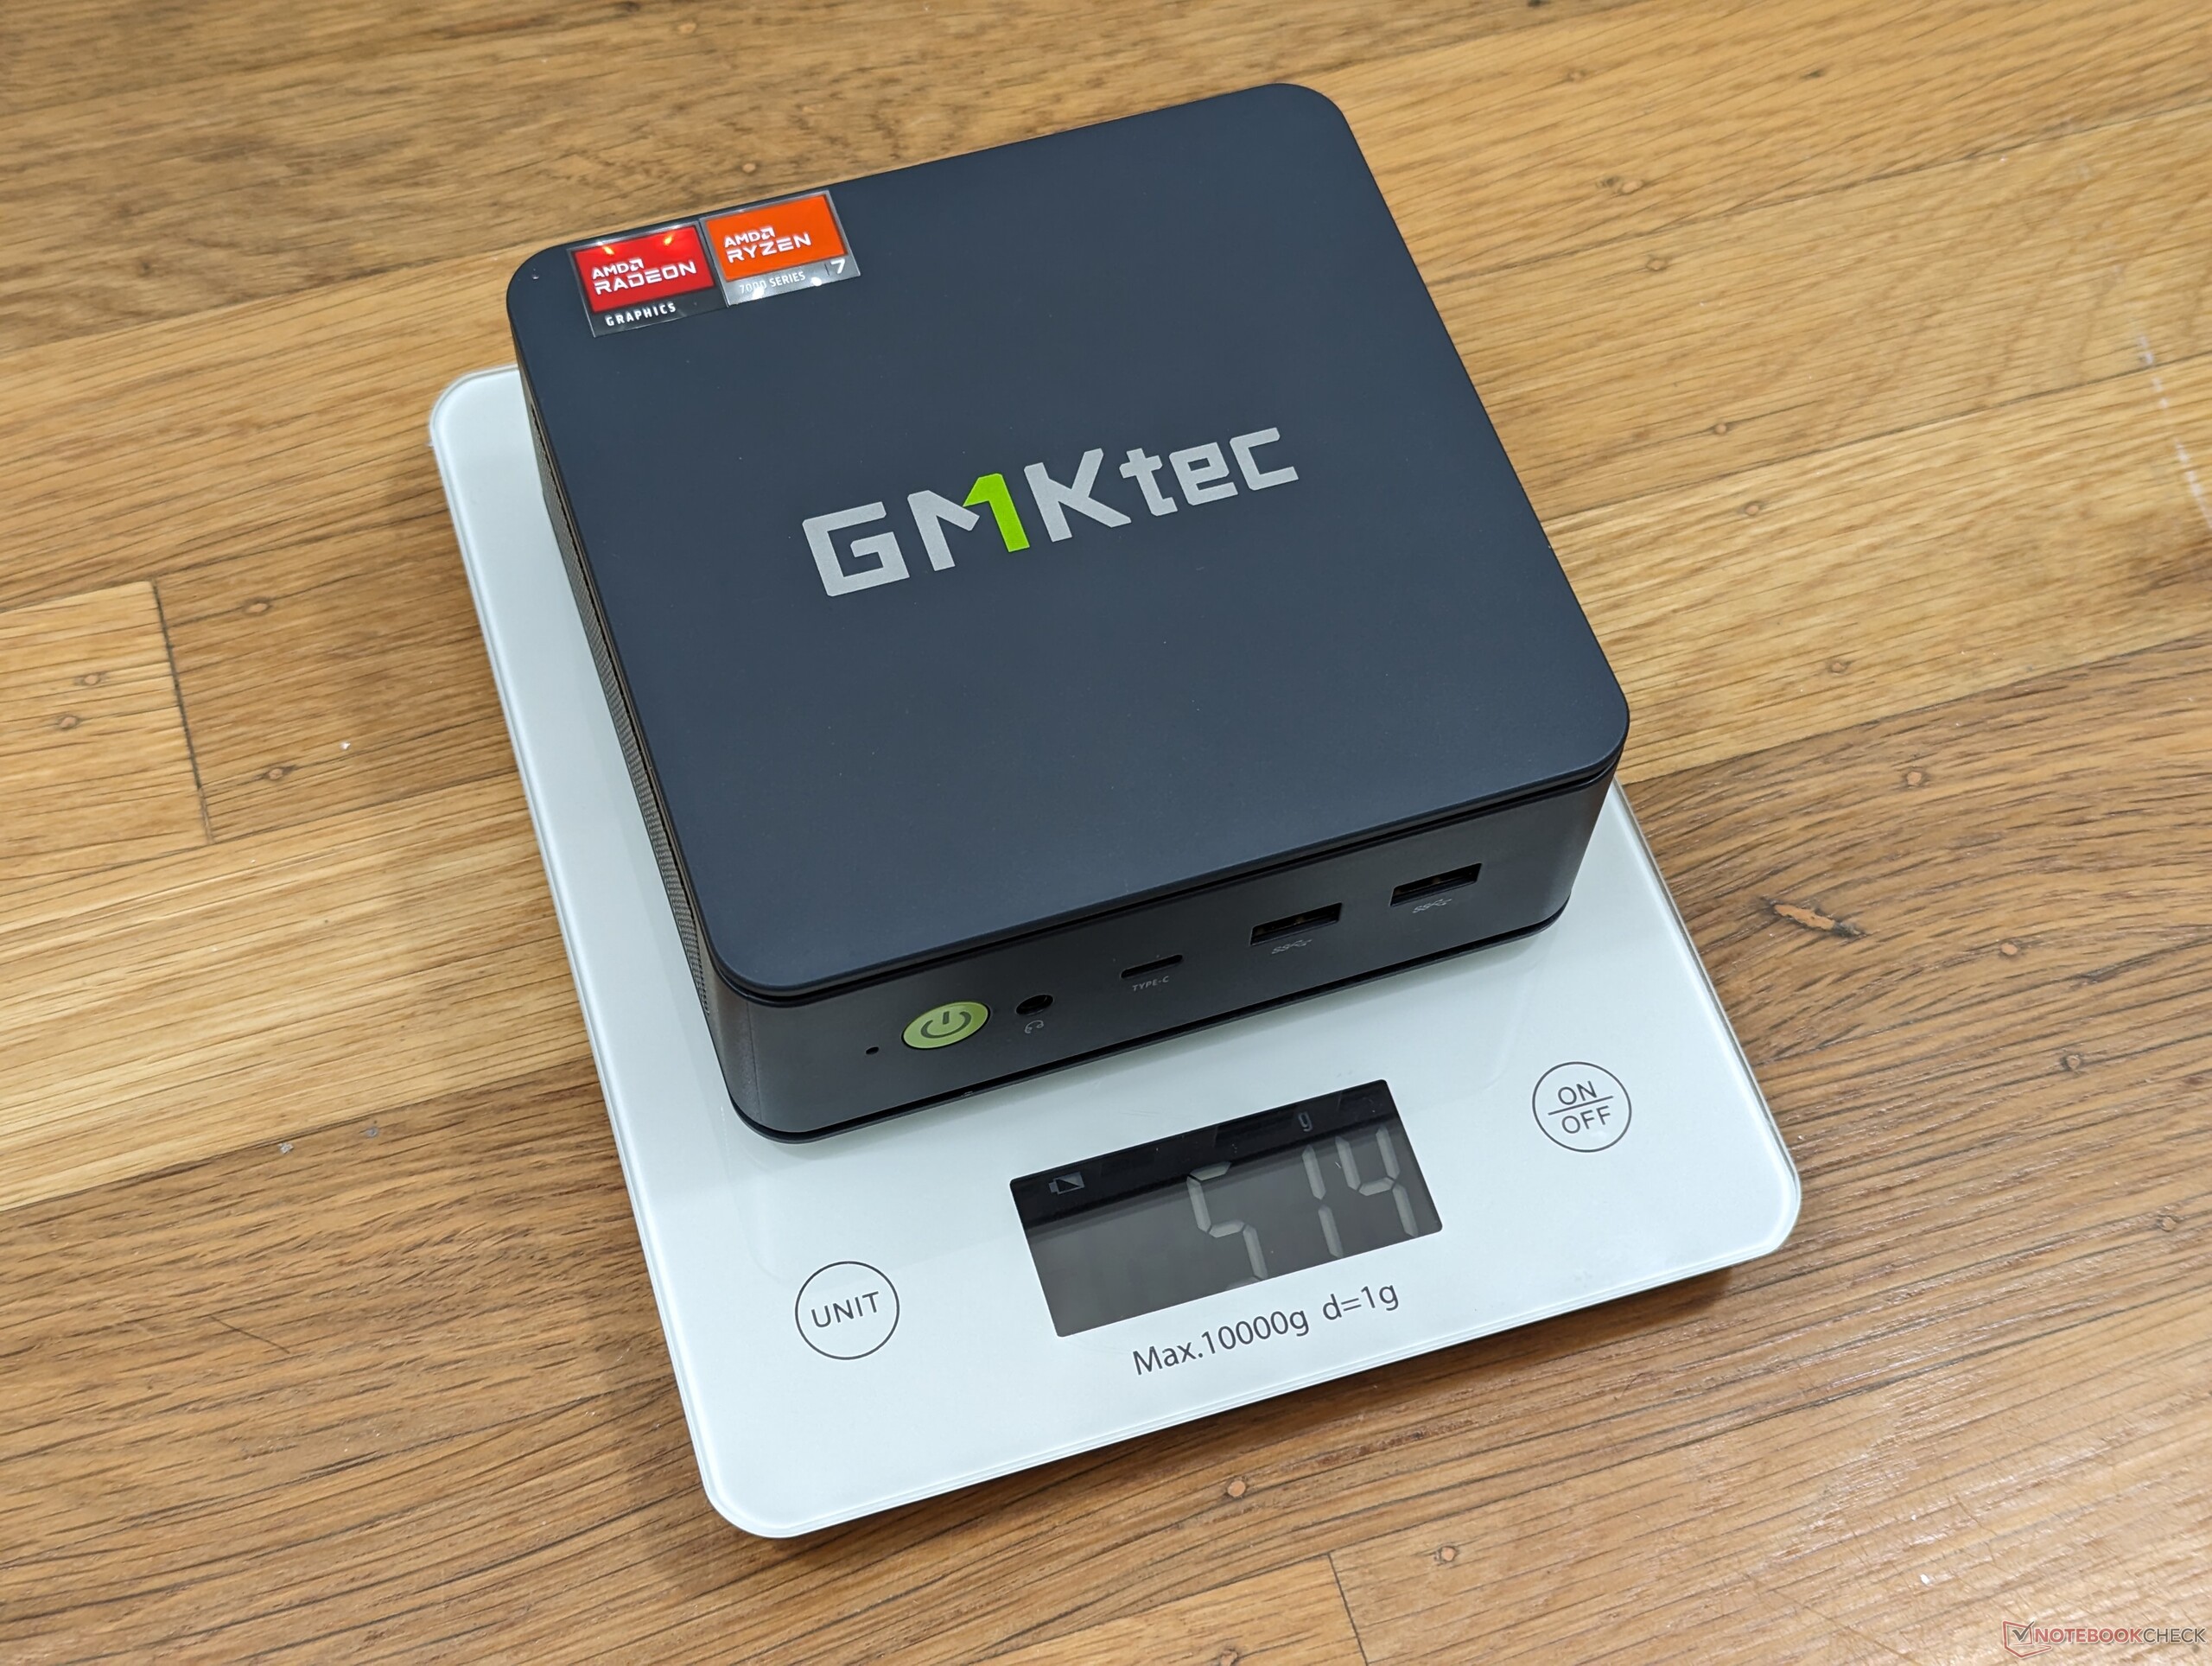
| 83.6 % v7 (old) | 04/2024 | GMK NucBox K6 R7 7840HS, Radeon 780M | 514 g | 47 mm | x | ||
| 82.8 % v7 (old) | GMK NucBox K3 Pro i7-12650H, UHD Graphics 64EUs | 396 g | 43.2 mm | x | |||
| 83.1 % v7 (old) | 08/2023 | Intel NUC 13 Pro Desk Edition Kit i7-1360P, Iris Xe G7 96EUs | 558 g | 37 mm | x | ||
| 82.1 % v7 (old) | 11/2023 | Beelink SER5 R5 5560U, Vega 6 | 439 g | 42 mm | x | ||
| 85.2 % v7 (old) | 04/2024 | AcePC Wizbox AI Ultra 7 155H, Arc 8-Core | 840 g | 55.55 mm | x | ||
| 82.6 % v7 (old) | 03/2024 | Geekom A7 R9 7940HS, Radeon 780M | 417 g | 38 mm | x |
Caso
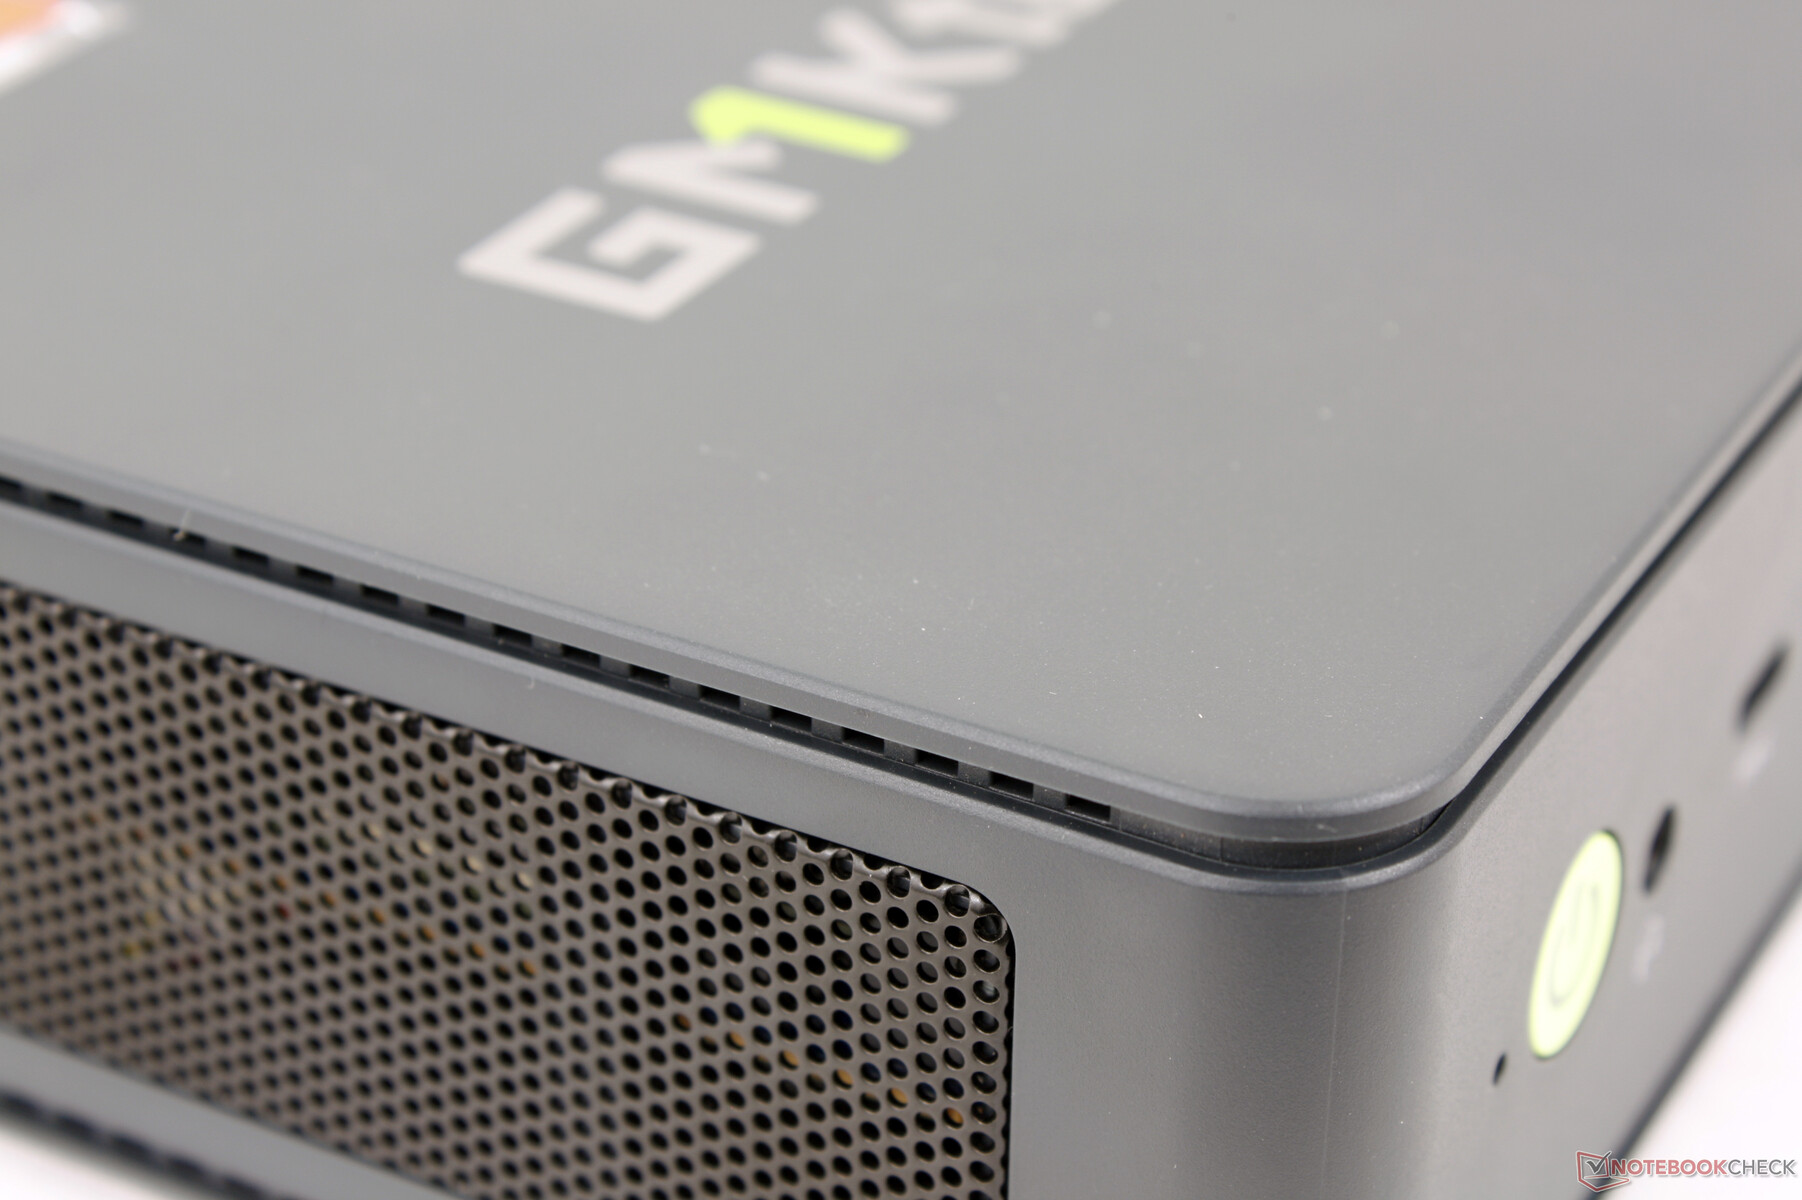
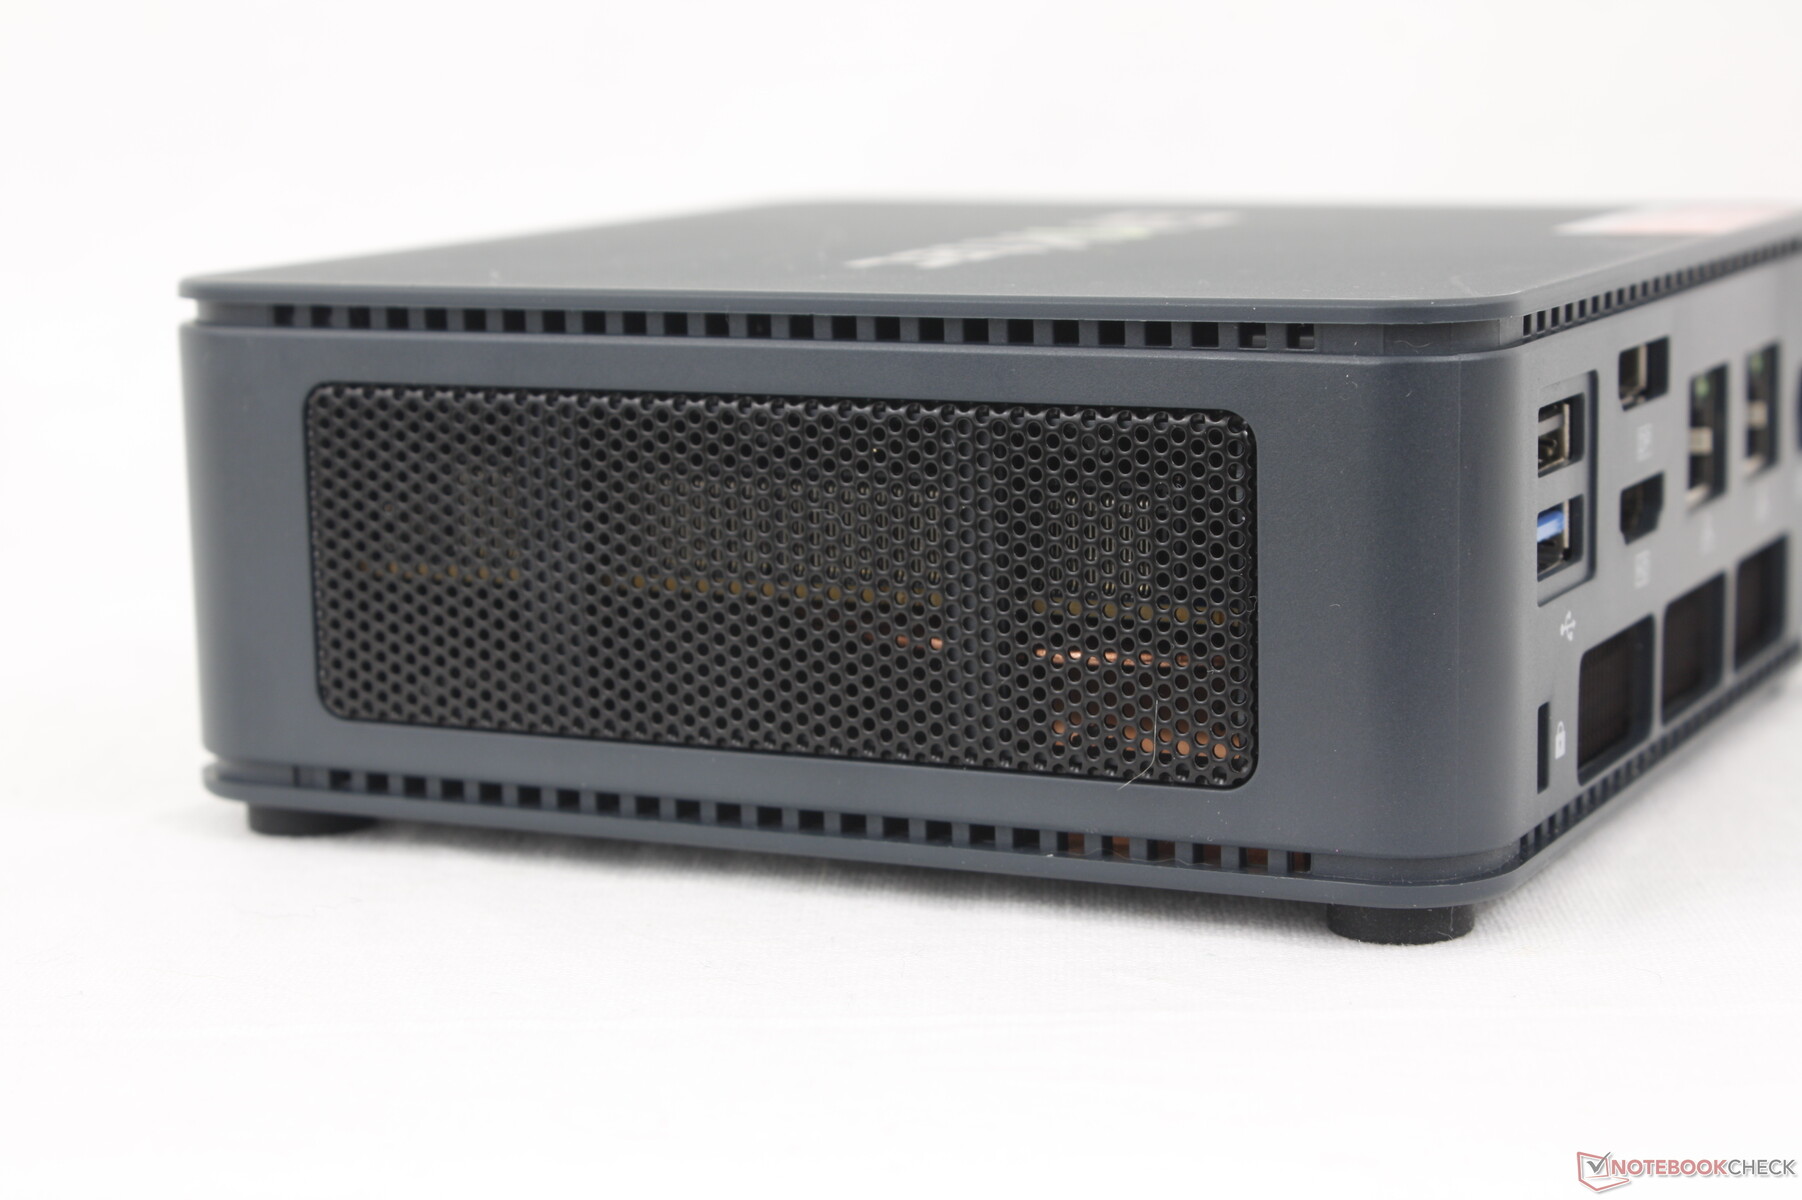
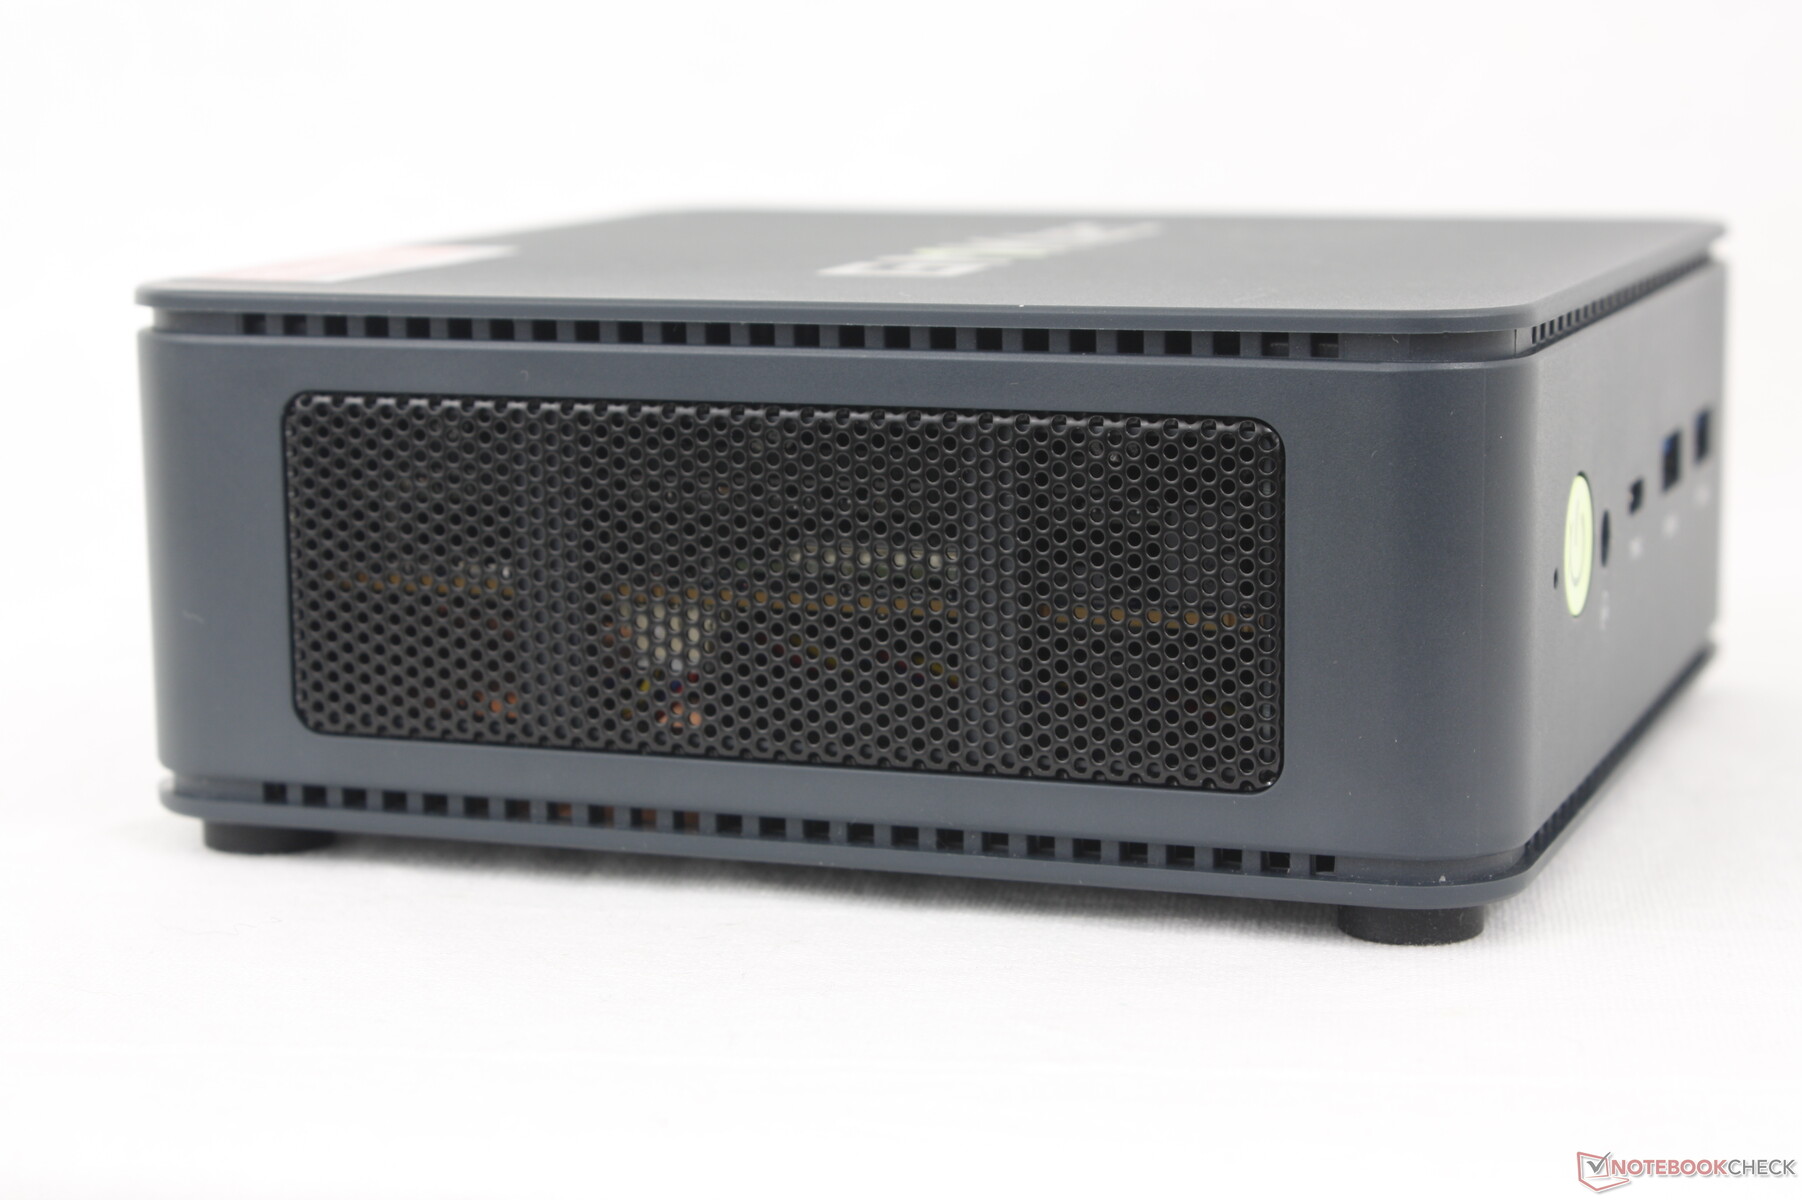
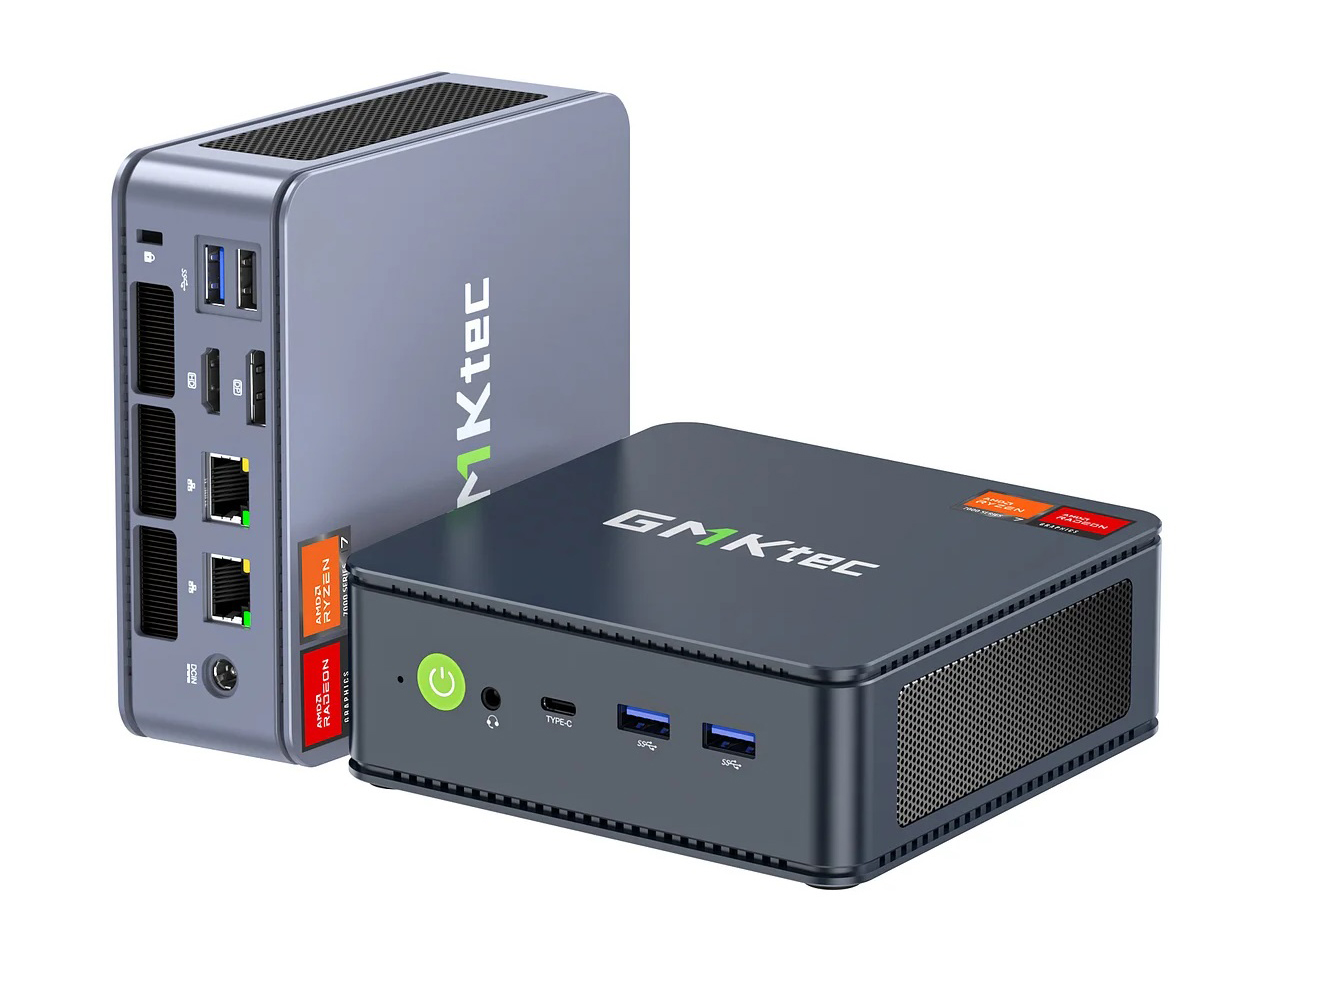
El chasis consiste en plástico para la parte superior e inferior con metal para los laterales o caras, como en los modelos de la generación anterior. Sin embargo, la novedad de este año son las ranuras de ventilación a lo largo de los laterales, como muestra la imagen inferior. Este enfoque permite que la parte superior no tenga agujeros y sea más atractiva a la vista sin reducir el flujo de aire ni la refrigeración.
El tamaño y el peso totales son ligeramente mayores y más ligeros, respectivamente, que los del Intel NUC 13 Pro. El chasis más delgado utiliza menos metal que un Intel NUC, lo que hace que el NucBox K6 sea ligeramente más susceptible a los daños. Sin embargo, esto no es realmente un problema, ya que no vemos a muchos compradores maltratando el mini PC como si fuera un portátil de viaje.
Conectividad
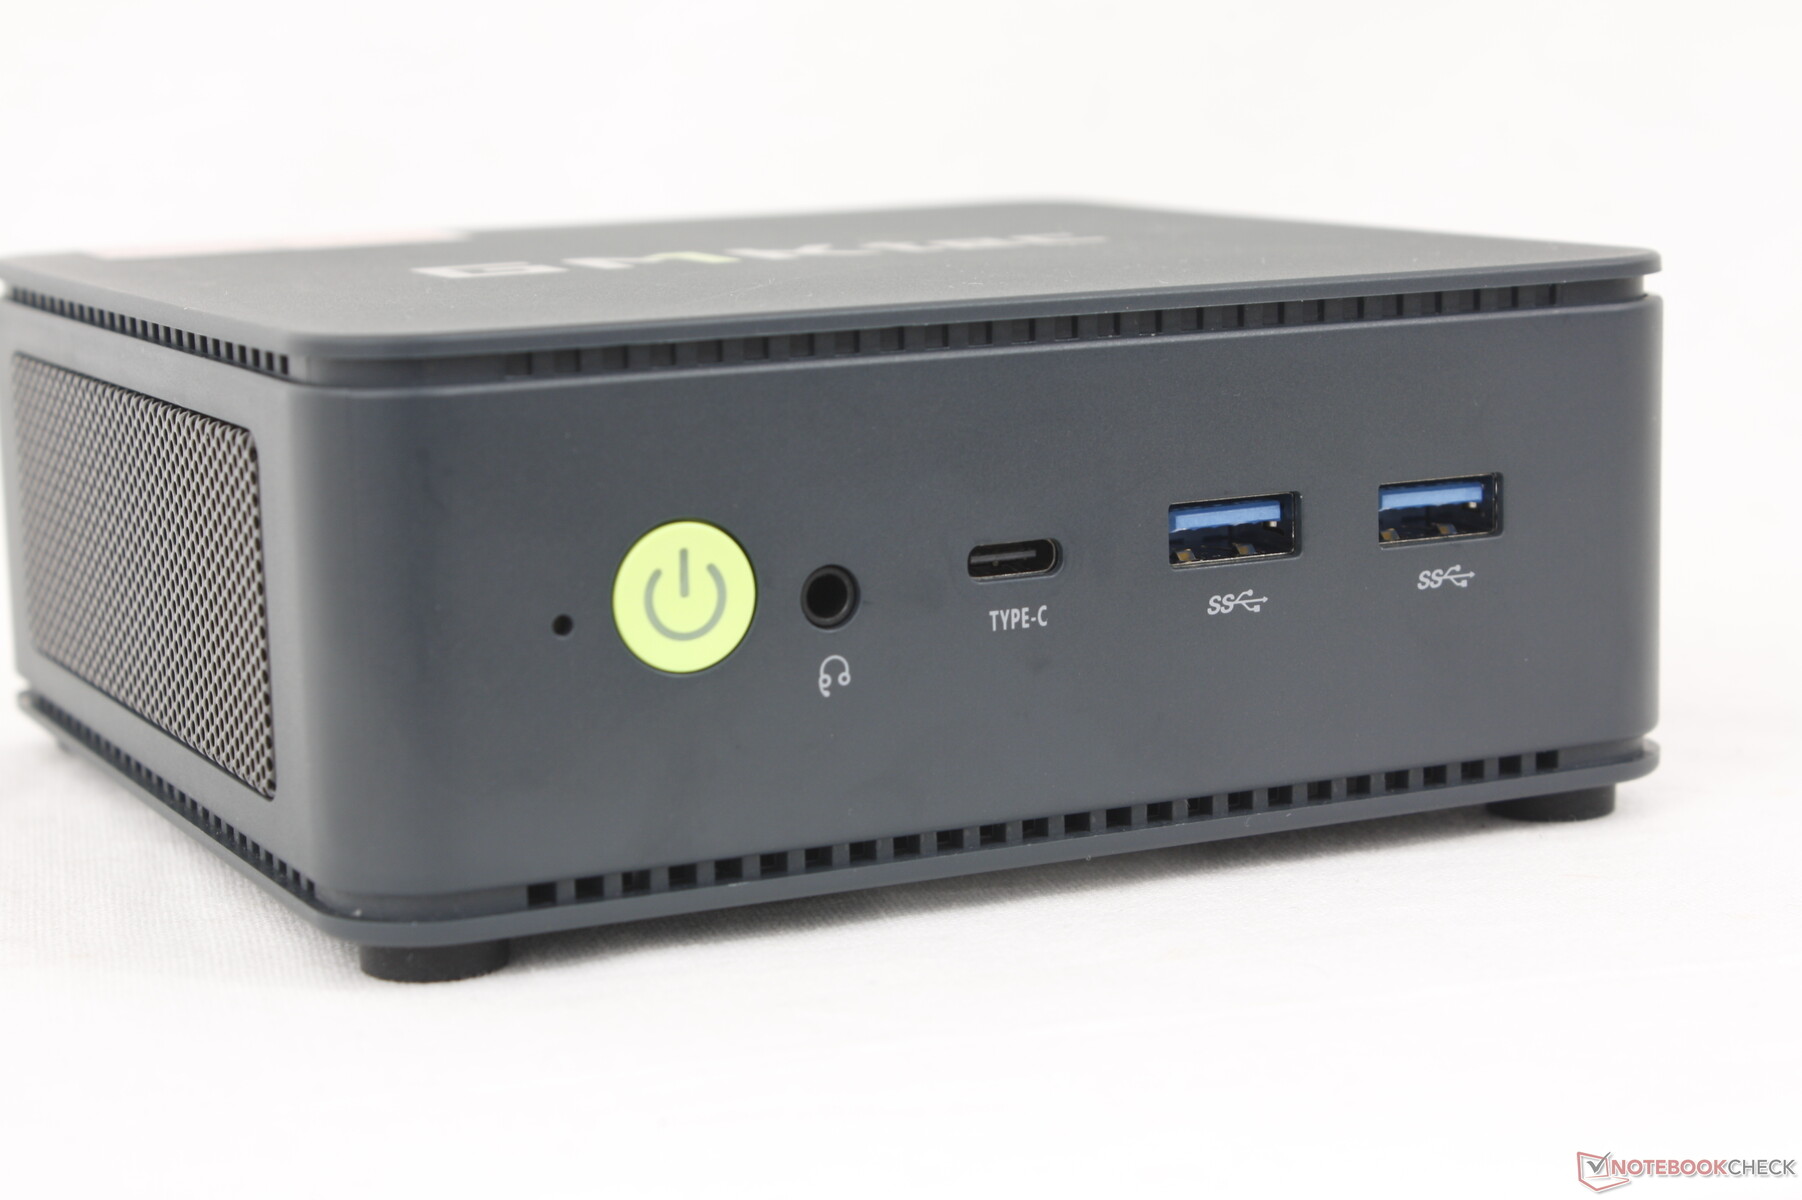
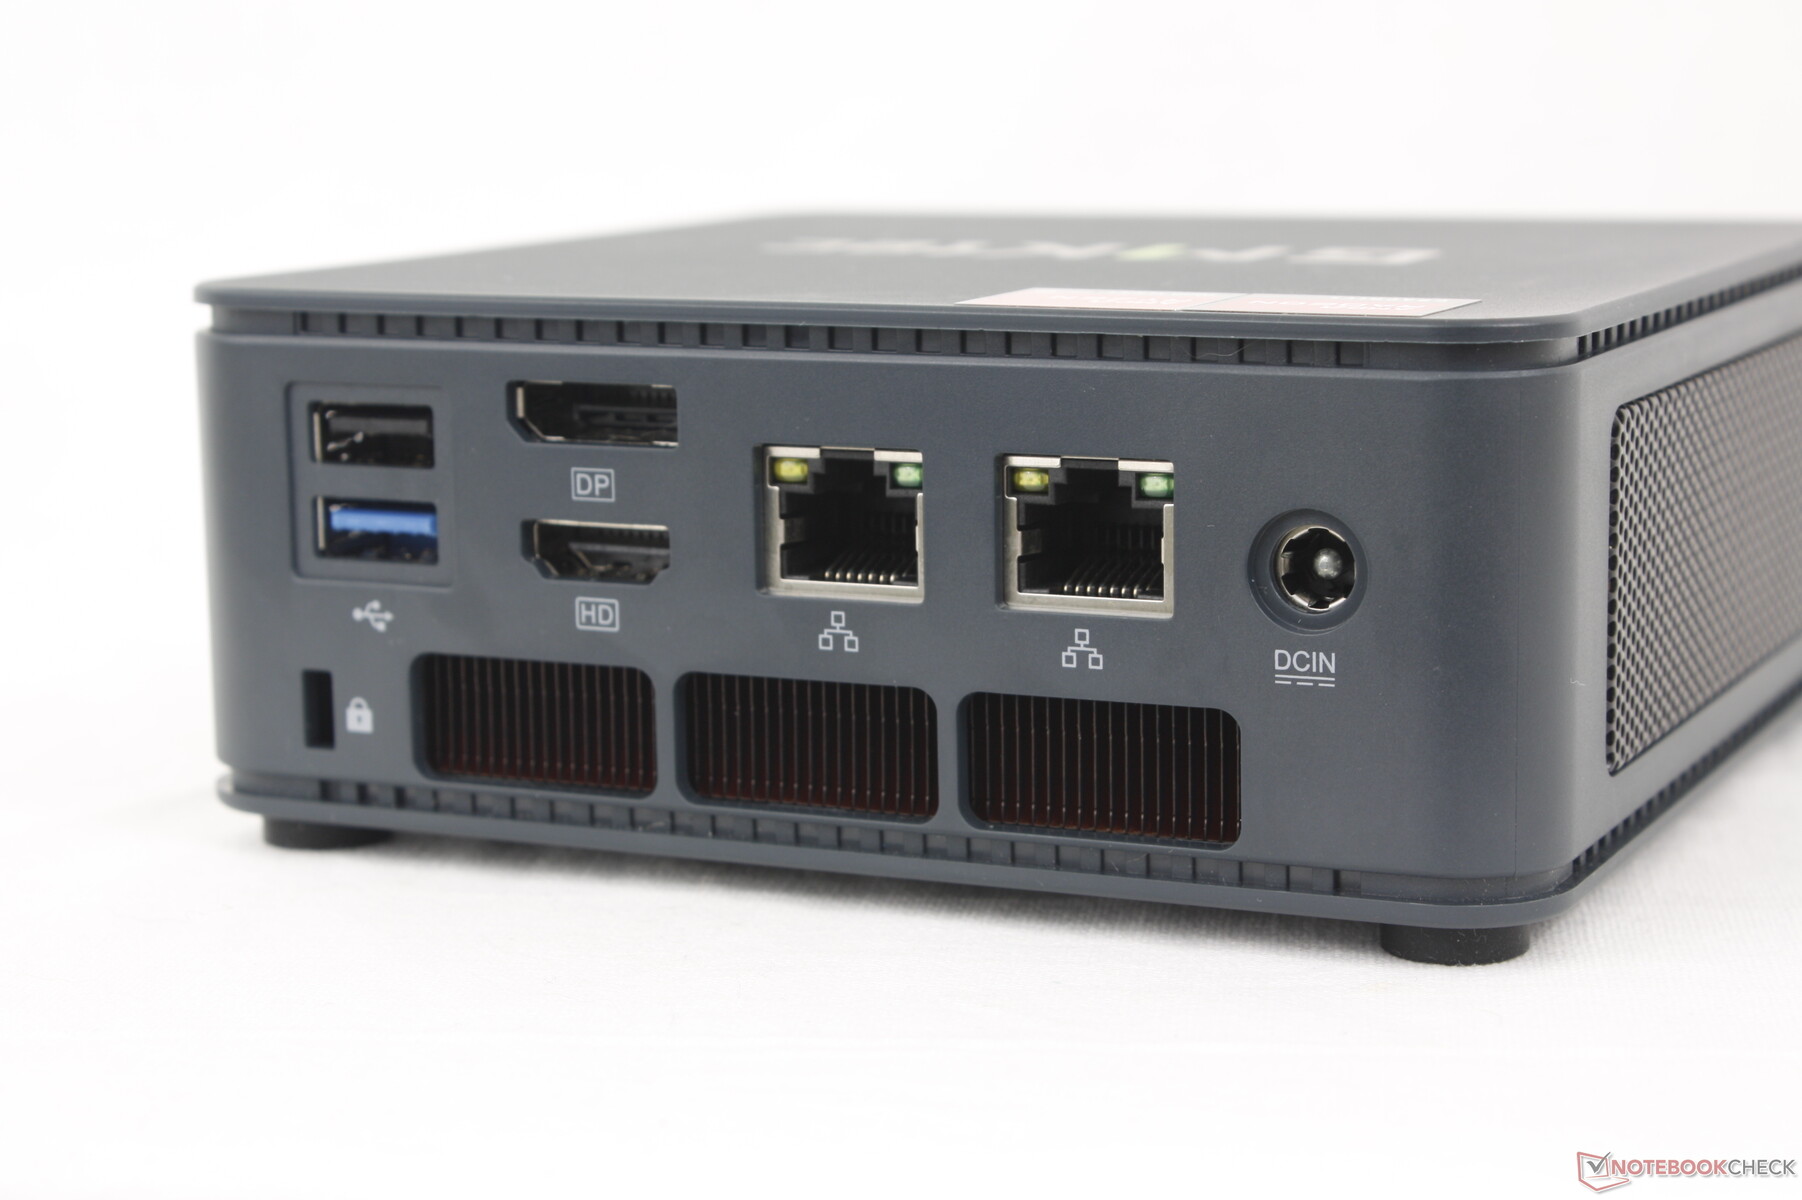
Las opciones de puerto son acertadas o no dependiendo de las preferencias. En comparación con el Intel NUC 13 Pro, por ejemplo, el GMK incluye más puertos RJ-45 y un DisplayPort de tamaño completo. Por otro lado, cuenta con un único puerto USB-C mientras que el modelo de Intel integra dos.
Los dispositivos Thunderbolt son compatibles a través del puerto USB-C 4. También es posible alimentar el mini PC con adaptadores de CA USB-C de terceros en lugar de depender del adaptador de barril propietario; nuestro adaptador de CA USB-C de 135 W de Lenovo funcionaría sin problemas.
Comunicación
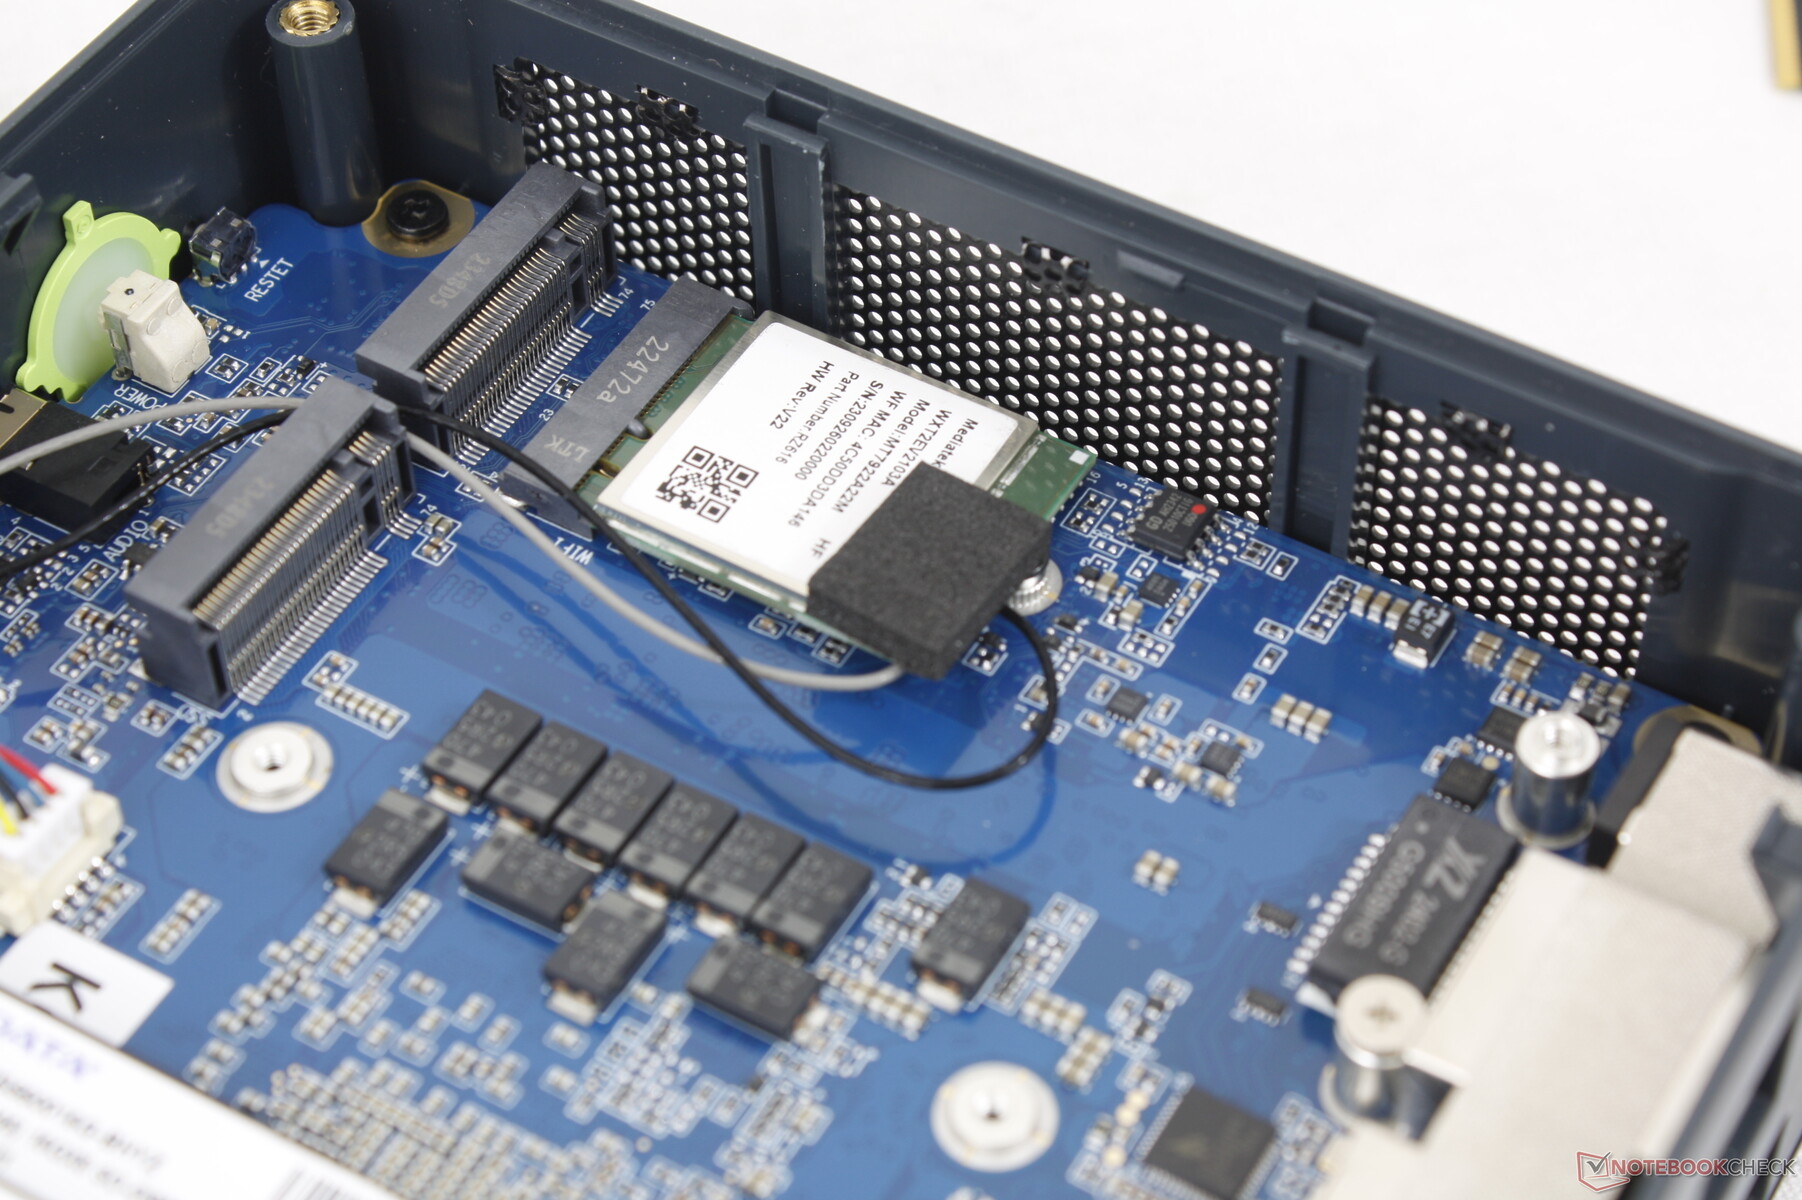
La máquina, exclusiva de AMD, incorpora el MediaTek RZ616 en lugar de la habitual solución Intel AX para la conectividad Wi-Fi 6E y Bluetooth 5.3. El rendimiento es constante y fiable aunque con velocidades de transmisión más lentas.
| Networking | |
| iperf3 transmit AXE11000 | |
| Intel NUC 13 Pro Desk Edition Kit | |
| Beelink SER5 | |
| GMK NucBox K3 Pro | |
| AcePC Wizbox AI | |
| Geekom A7 | |
| GMK NucBox K6 | |
| iperf3 receive AXE11000 | |
| Beelink SER5 | |
| GMK NucBox K3 Pro | |
| GMK NucBox K6 | |
| Intel NUC 13 Pro Desk Edition Kit | |
| AcePC Wizbox AI | |
| Geekom A7 | |
| iperf3 transmit AXE11000 6GHz | |
| AcePC Wizbox AI | |
| Intel NUC 13 Pro Desk Edition Kit | |
| Geekom A7 | |
| GMK NucBox K6 | |
| iperf3 receive AXE11000 6GHz | |
| AcePC Wizbox AI | |
| Intel NUC 13 Pro Desk Edition Kit | |
| Geekom A7 | |
| GMK NucBox K6 | |
Mantenimiento
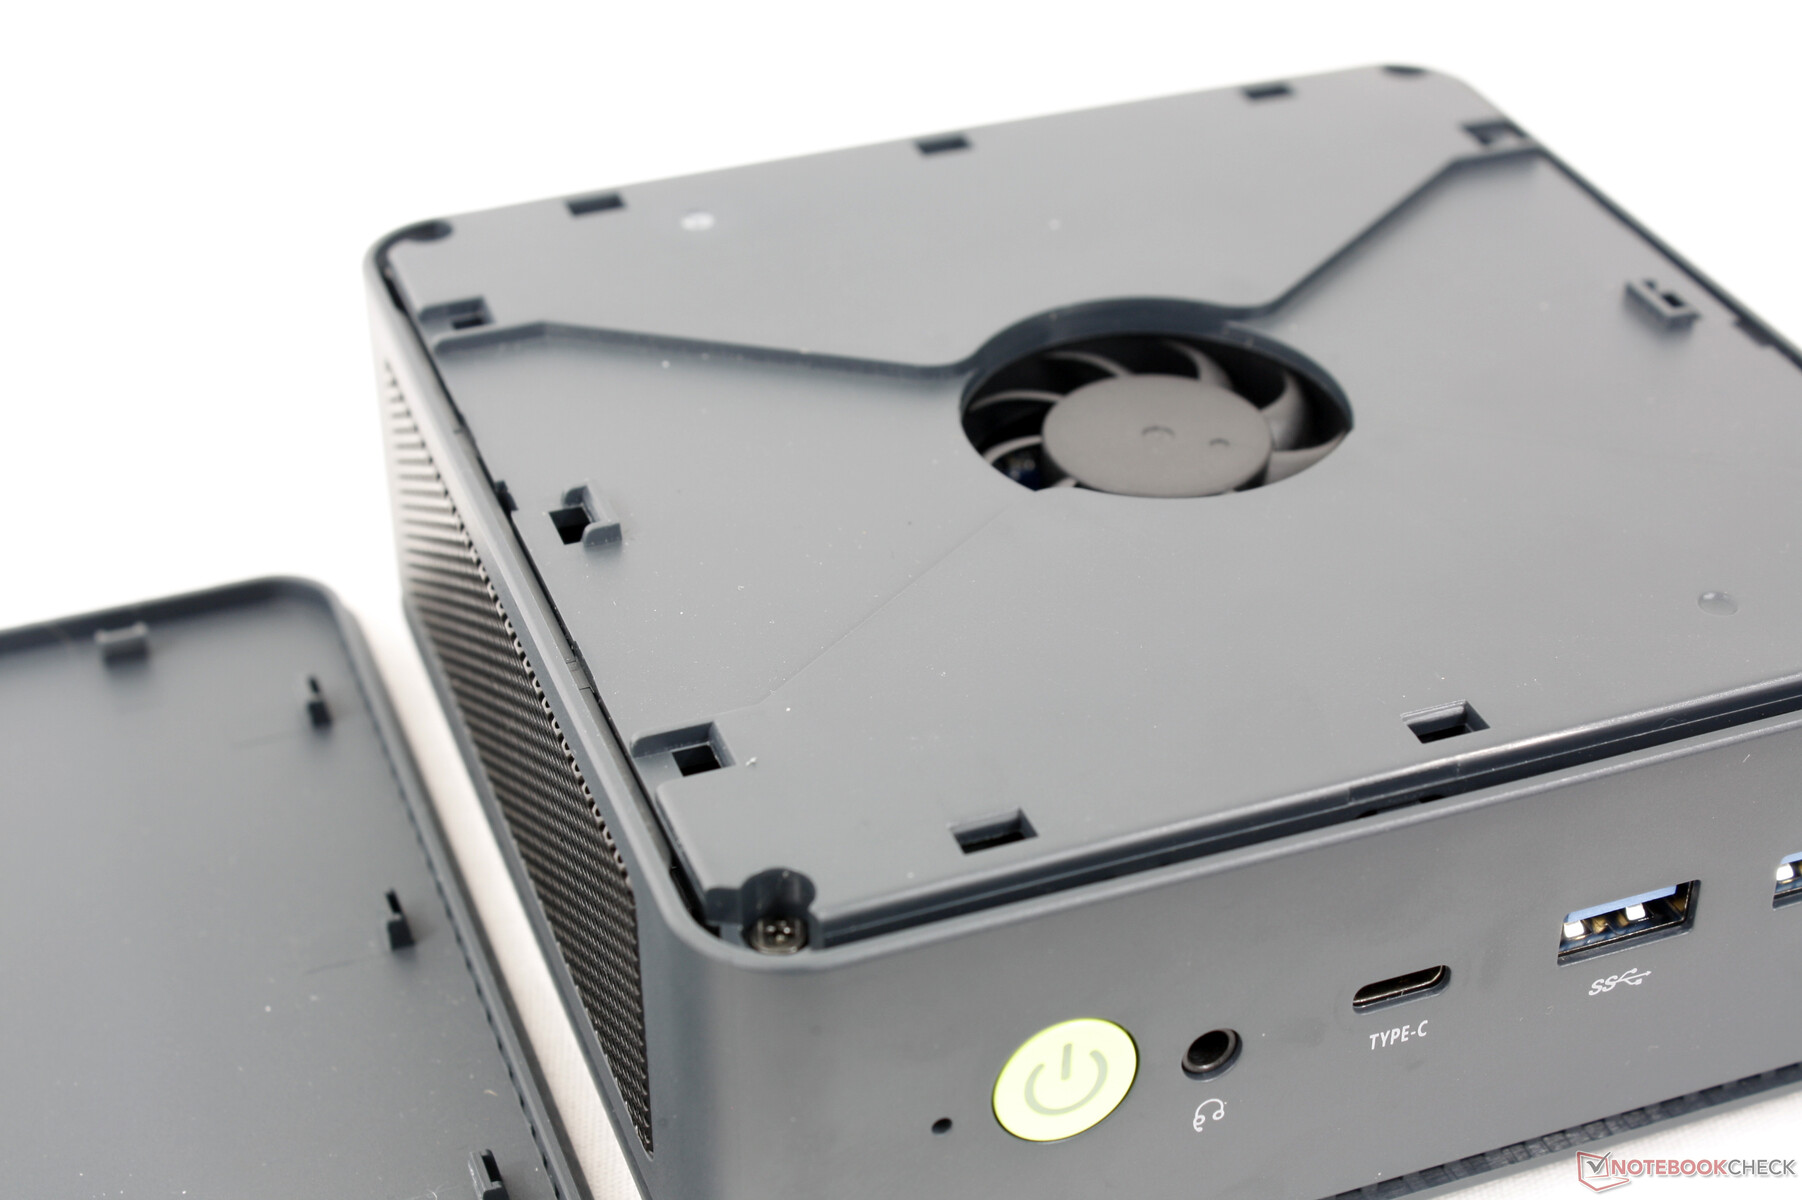
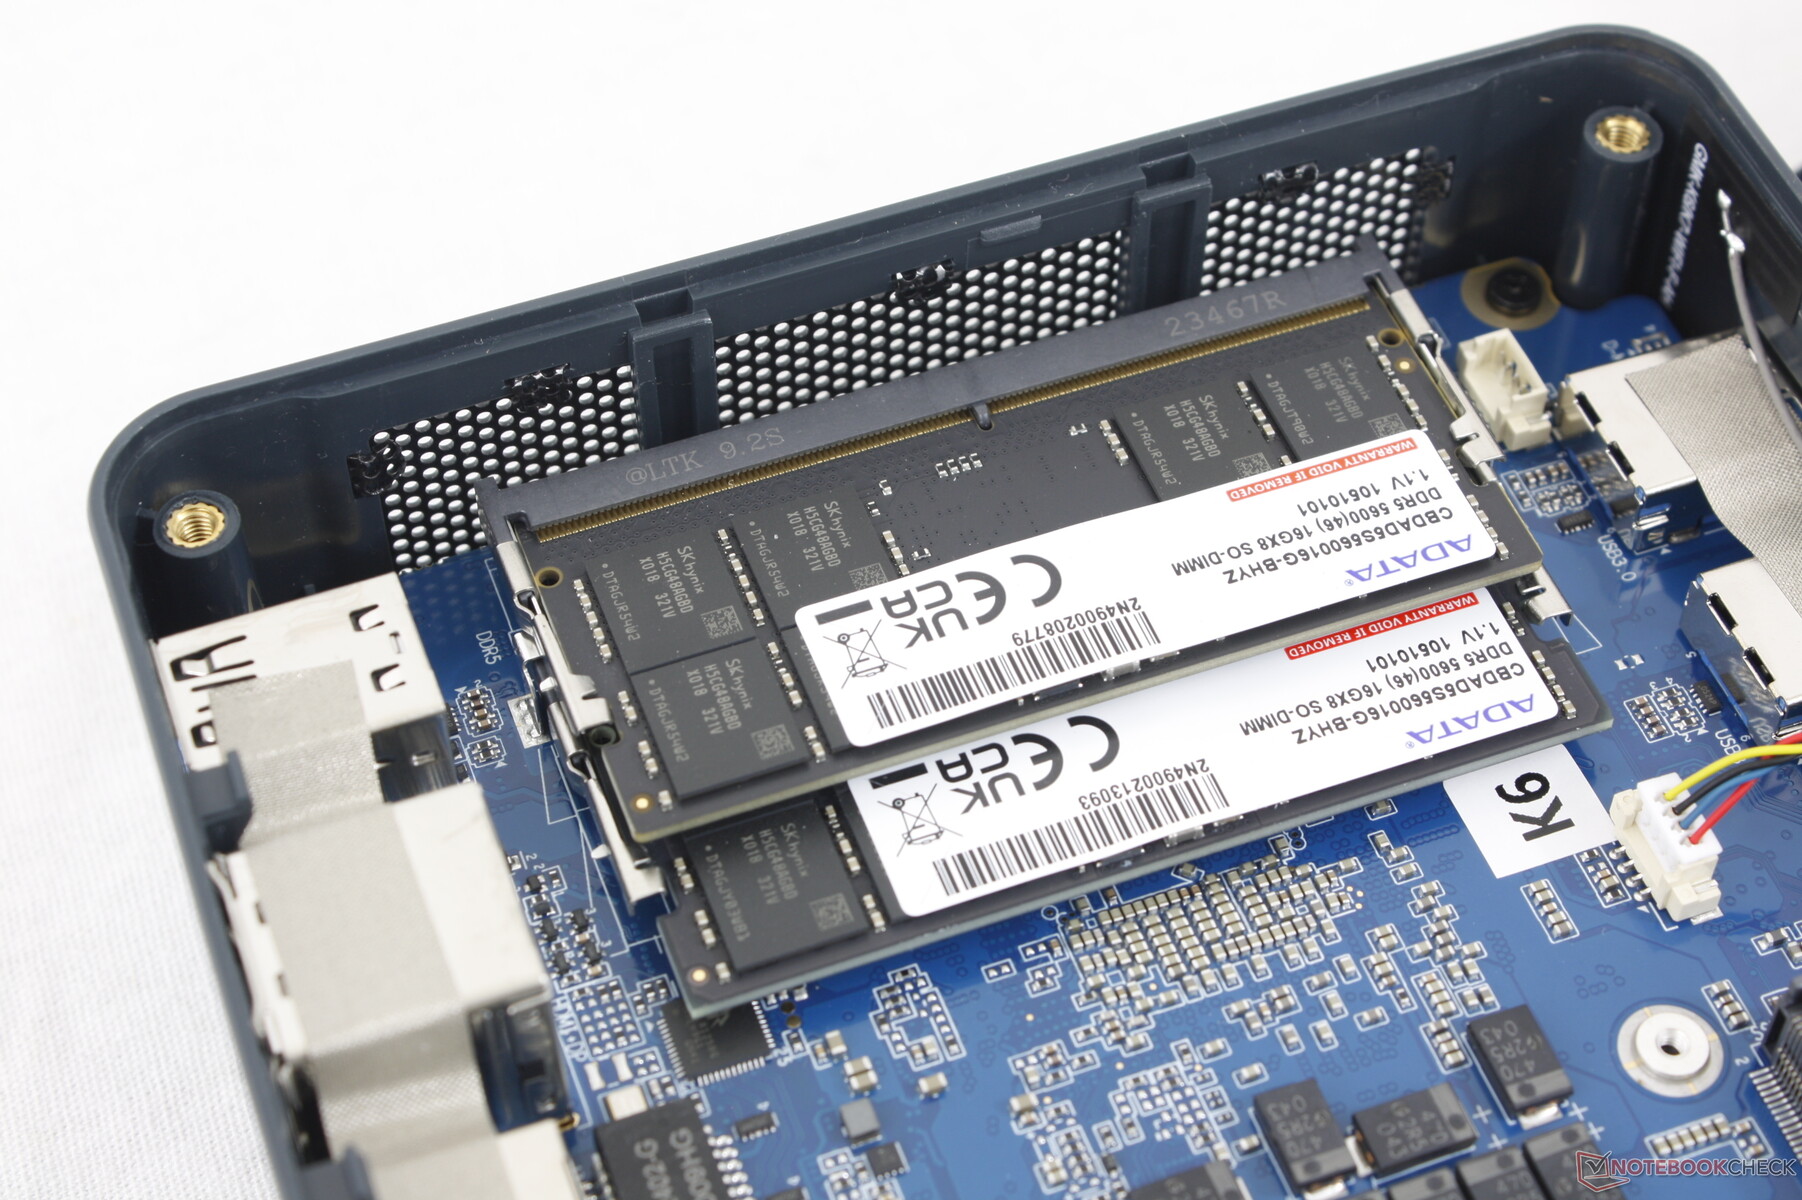
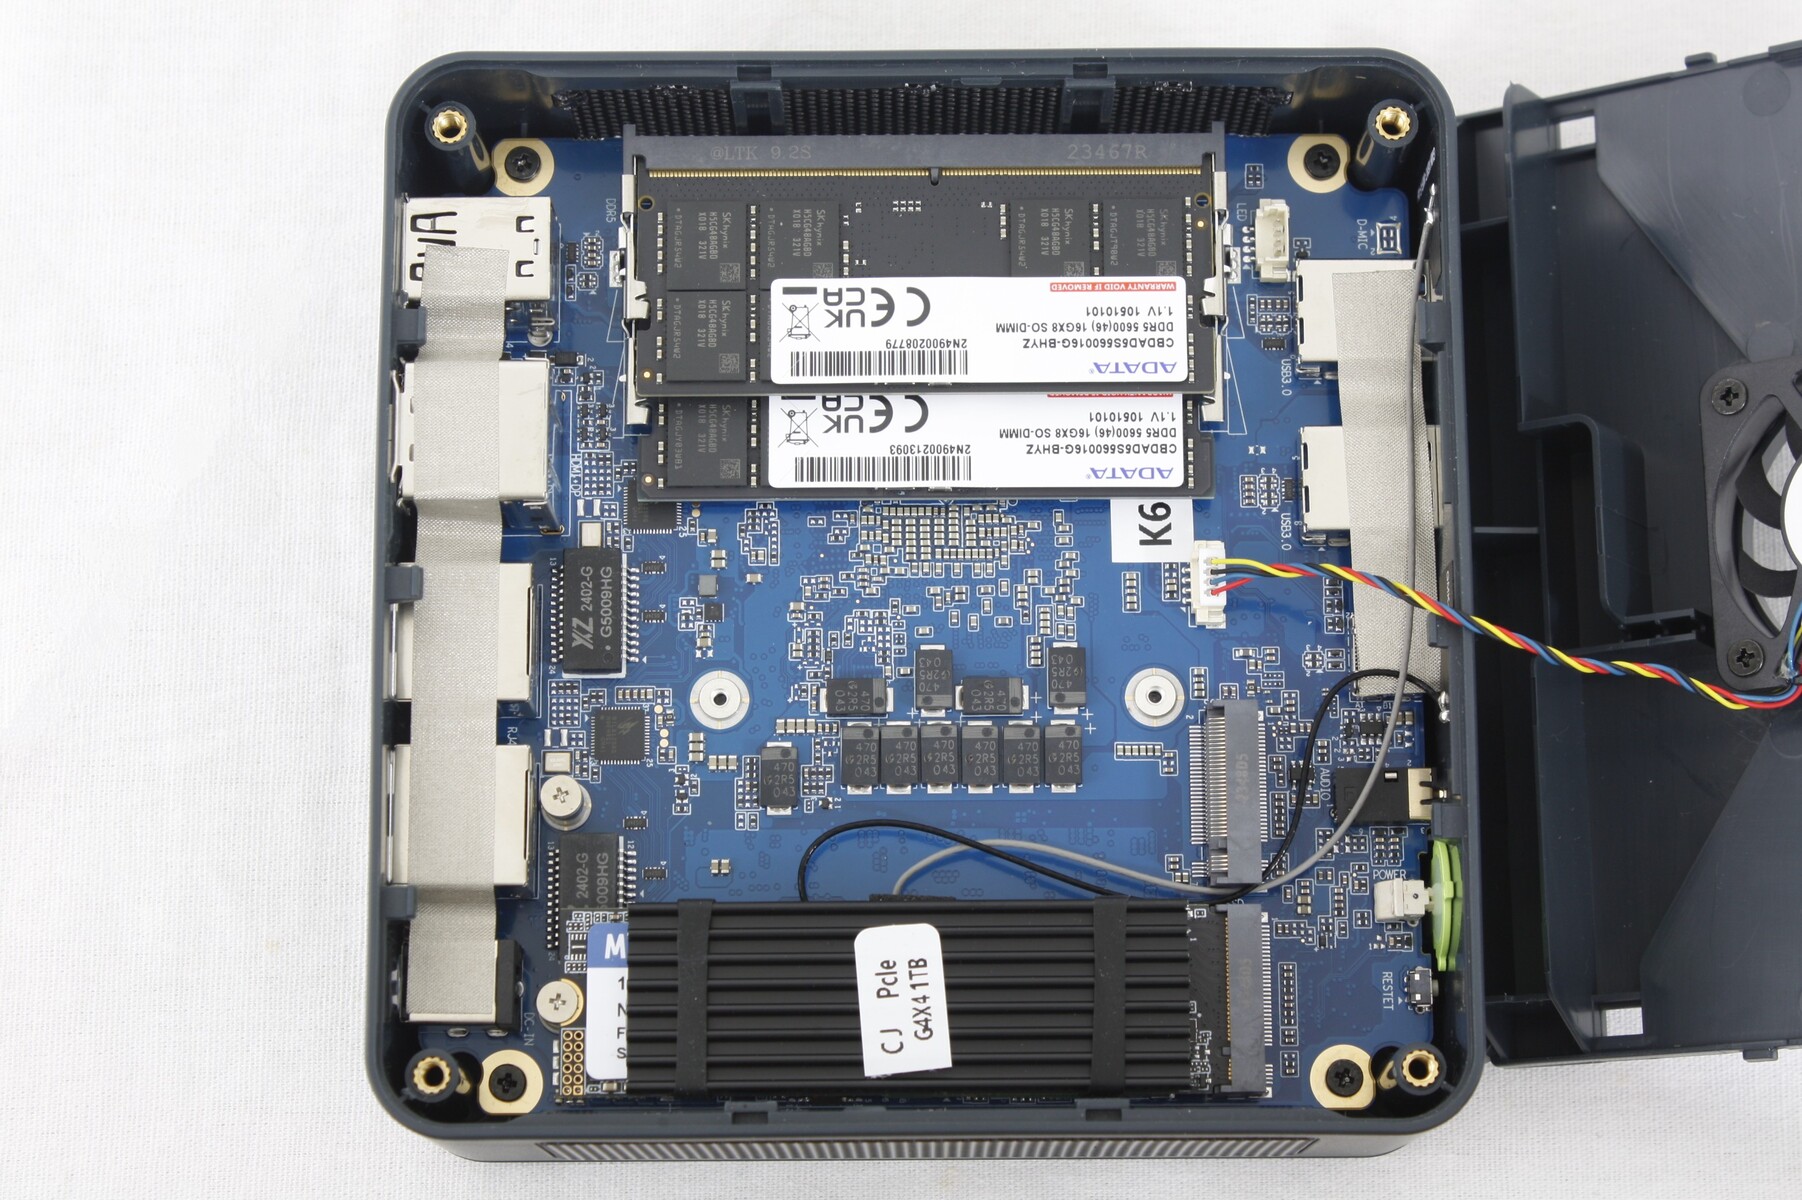
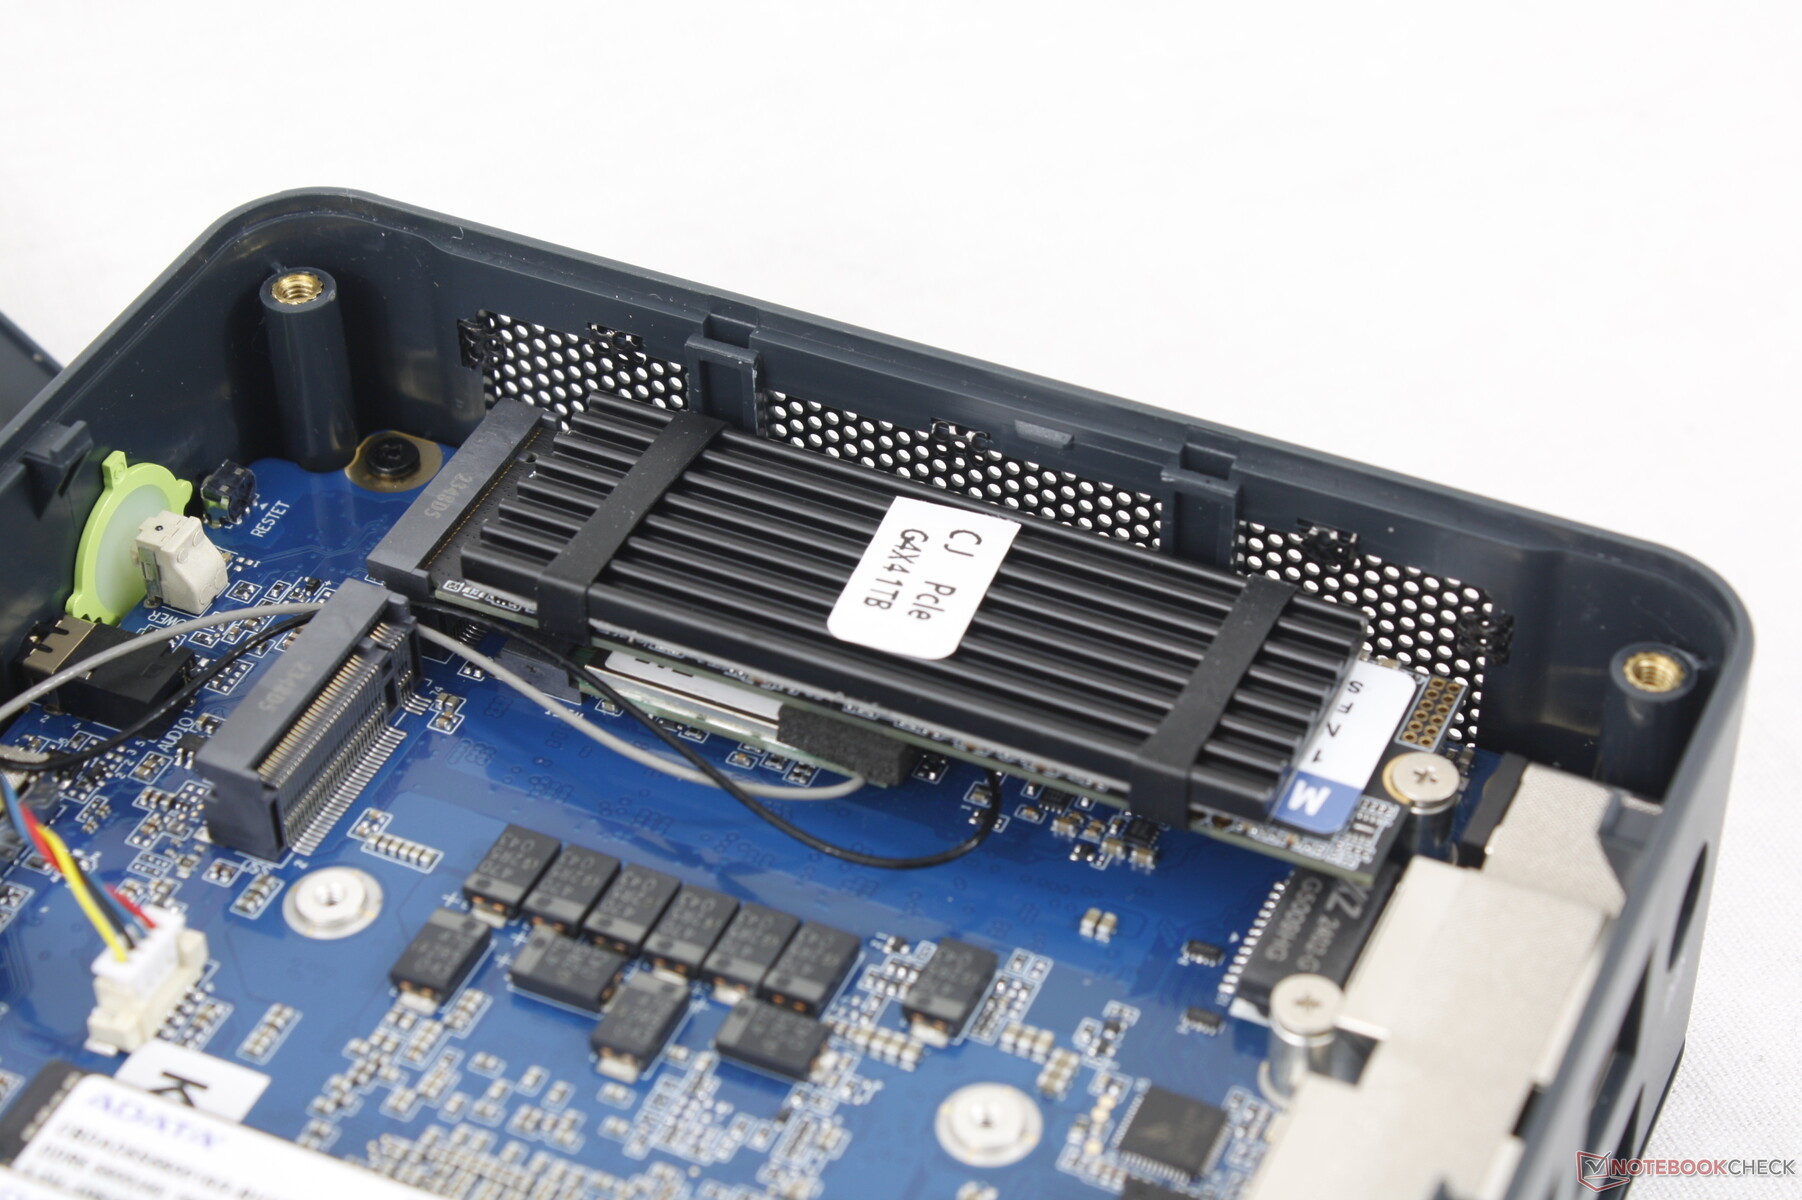
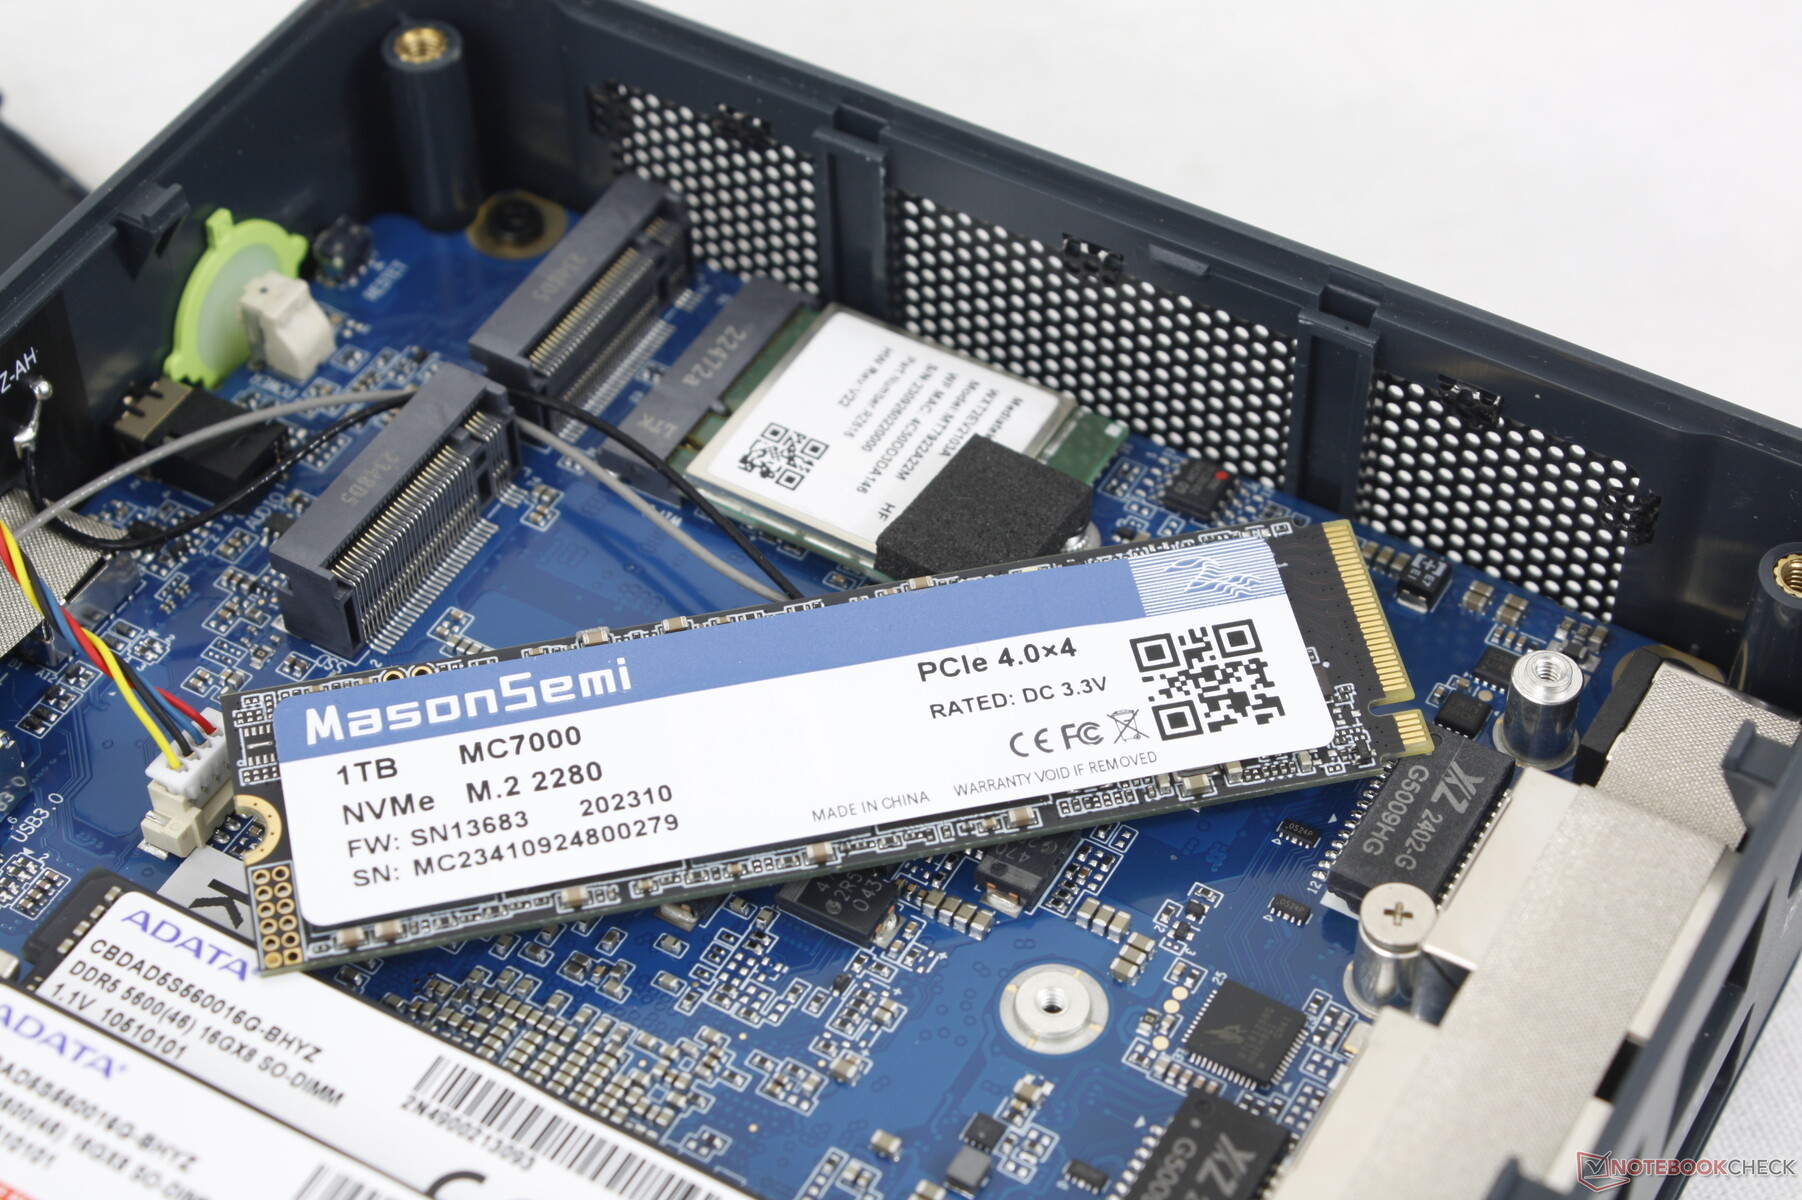
Los componentes actualizables son accesibles desde la parte superior pero no desde la inferior, a diferencia de lo que ocurre en la mayoría de los demás mini PC. Mientras que la tapa exterior es desmontable sin necesidad de herramientas, la cubierta del ventilador situada debajo sigue necesitando un destornillador.
Los usuarios tienen acceso directo a dos ranuras de RAM SODIMM, al módulo WLAN y a dos ranuras para SSD M.2 PCIe4 x4 2280, como muestra la imagen inferior. No hay soporte SATA III de 2,5 pulgadas. Para acceder a la solución de refrigeración, al procesador y al ventilador secundario es necesario dar la vuelta a la placa base.
Accesorios y garantía
La caja de venta incluye un cable HDMI y un soporte VESA desmontable con tornillos. Se aplica la garantía limitada estándar del fabricante de un año si se adquiere en EE.UU.
Rendimiento - AMD Zen 4 sigue siendo muy potente
Condiciones de prueba
Pusimos Windows en modo Rendimiento antes de ejecutar los puntos de referencia que se muestran a continuación. No hay aplicaciones preinstaladas para una experiencia de usuario limpia de Windows.
Procesador
El Ryzen 7 7840HS funciona bien sin mayores problemas de ralentización incluso en las pruebas de estrés. Sigue siendo una de las CPU más rápidas para mini PC de tamaño NUC. El rendimiento general es comparable al del más caro Ryzen 9 7940HS y el competidor Core i7-13700H en el Lenovo IdeaCentre Mini.
Cinebench R15 Multi Loop
Cinebench R20: CPU (Multi Core) | CPU (Single Core)
Cinebench R15: CPU Multi 64Bit | CPU Single 64Bit
Blender: v2.79 BMW27 CPU
7-Zip 18.03: 7z b 4 | 7z b 4 -mmt1
Geekbench 6.7: Multi-Core | Single-Core
Geekbench 5.5: Multi-Core | Single-Core
HWBOT x265 Benchmark v2.2: 4k Preset
LibreOffice : 20 Documents To PDF
R Benchmark 2.5: Overall mean
| Cinebench R23 / Multi Core | |
| AcePC Wizbox AI | |
| Medio AMD Ryzen 7 7840HS (14784 - 17214, n=19) | |
| GMK NucBox K6 | |
| Geekom A7 | |
| Lenovo IdeaCentre Mini 01IRH8 | |
| Geekom Mini IT13 | |
| Geekom Mini IT13 | |
| Geekom Mini IT13 | |
| Aoostar GOD77 | |
| Intel NUC 13 Pro Desk Edition Kit | |
| Beelink GTR6 | |
| Beelink SER6 Pro | |
| GMK NucBox M4 | |
| GMK NucBox K3 Pro | |
| Beelink SER5 | |
| GMK NucBox M3 | |
| Acemagic Tank03 | |
| Cinebench R23 / Single Core | |
| Lenovo IdeaCentre Mini 01IRH8 | |
| Intel NUC 13 Pro Desk Edition Kit | |
| AcePC Wizbox AI | |
| GMK NucBox K3 Pro | |
| GMK NucBox K6 | |
| Medio AMD Ryzen 7 7840HS (1718 - 1812, n=19) | |
| Geekom A7 | |
| Geekom Mini IT13 | |
| GMK NucBox M3 | |
| Acemagic Tank03 | |
| Beelink GTR6 | |
| GMK NucBox M4 | |
| Aoostar GOD77 | |
| Beelink SER6 Pro | |
| Beelink SER5 | |
| Cinebench R20 / CPU (Multi Core) | |
| Medio AMD Ryzen 7 7840HS (5761 - 6744, n=19) | |
| Geekom A7 | |
| GMK NucBox K6 | |
| AcePC Wizbox AI | |
| Lenovo IdeaCentre Mini 01IRH8 | |
| Geekom Mini IT13 | |
| Aoostar GOD77 | |
| Intel NUC 13 Pro Desk Edition Kit | |
| Beelink GTR6 | |
| Beelink SER6 Pro | |
| GMK NucBox M4 | |
| GMK NucBox K3 Pro | |
| Beelink SER5 | |
| GMK NucBox M3 | |
| Acemagic Tank03 | |
| Cinebench R20 / CPU (Single Core) | |
| Intel NUC 13 Pro Desk Edition Kit | |
| Lenovo IdeaCentre Mini 01IRH8 | |
| Geekom A7 | |
| GMK NucBox K3 Pro | |
| GMK NucBox K6 | |
| Medio AMD Ryzen 7 7840HS (661 - 705, n=19) | |
| AcePC Wizbox AI | |
| Geekom Mini IT13 | |
| GMK NucBox M3 | |
| Beelink GTR6 | |
| Acemagic Tank03 | |
| GMK NucBox M4 | |
| Aoostar GOD77 | |
| Beelink SER6 Pro | |
| Beelink SER5 | |
| Cinebench R15 / CPU Multi 64Bit | |
| AcePC Wizbox AI | |
| Medio AMD Ryzen 7 7840HS (2300 - 2729, n=19) | |
| GMK NucBox K6 | |
| Geekom Mini IT13 | |
| Geekom Mini IT13 | |
| Geekom A7 | |
| Lenovo IdeaCentre Mini 01IRH8 | |
| Aoostar GOD77 | |
| Intel NUC 13 Pro Desk Edition Kit | |
| Beelink GTR6 | |
| Beelink SER6 Pro | |
| GMK NucBox M4 | |
| GMK NucBox K3 Pro | |
| Acemagic Tank03 | |
| Beelink SER5 | |
| GMK NucBox M3 | |
| Cinebench R15 / CPU Single 64Bit | |
| GMK NucBox K6 | |
| Geekom A7 | |
| Medio AMD Ryzen 7 7840HS (270 - 286, n=19) | |
| Intel NUC 13 Pro Desk Edition Kit | |
| Beelink GTR6 | |
| Lenovo IdeaCentre Mini 01IRH8 | |
| GMK NucBox K3 Pro | |
| AcePC Wizbox AI | |
| Geekom Mini IT13 | |
| Geekom Mini IT13 | |
| Aoostar GOD77 | |
| GMK NucBox M4 | |
| Beelink SER6 Pro | |
| GMK NucBox M3 | |
| Acemagic Tank03 | |
| Beelink SER5 | |
| Blender / v2.79 BMW27 CPU | |
| Acemagic Tank03 | |
| GMK NucBox M3 | |
| Beelink SER5 | |
| GMK NucBox K3 Pro | |
| GMK NucBox M4 | |
| Beelink SER6 Pro | |
| Intel NUC 13 Pro Desk Edition Kit | |
| Geekom Mini IT13 | |
| Beelink GTR6 | |
| Aoostar GOD77 | |
| Lenovo IdeaCentre Mini 01IRH8 | |
| AcePC Wizbox AI | |
| Geekom A7 | |
| Medio AMD Ryzen 7 7840HS (185 - 231, n=20) | |
| GMK NucBox K6 | |
| 7-Zip 18.03 / 7z b 4 | |
| GMK NucBox K6 | |
| Geekom A7 | |
| Medio AMD Ryzen 7 7840HS (59538 - 73035, n=20) | |
| AcePC Wizbox AI | |
| Aoostar GOD77 | |
| Beelink GTR6 | |
| Beelink SER6 Pro | |
| Lenovo IdeaCentre Mini 01IRH8 | |
| Intel NUC 13 Pro Desk Edition Kit | |
| GMK NucBox M4 | |
| Geekom Mini IT13 | |
| GMK NucBox K3 Pro | |
| Beelink SER5 | |
| Acemagic Tank03 | |
| GMK NucBox M3 | |
| 7-Zip 18.03 / 7z b 4 -mmt1 | |
| Geekom A7 | |
| GMK NucBox K6 | |
| Medio AMD Ryzen 7 7840HS (6049 - 6754, n=20) | |
| GMK NucBox M4 | |
| Lenovo IdeaCentre Mini 01IRH8 | |
| Beelink GTR6 | |
| Aoostar GOD77 | |
| Intel NUC 13 Pro Desk Edition Kit | |
| GMK NucBox K3 Pro | |
| Beelink SER6 Pro | |
| Acemagic Tank03 | |
| GMK NucBox M3 | |
| Geekom Mini IT13 | |
| AcePC Wizbox AI | |
| Beelink SER5 | |
| Geekbench 6.7 / Multi-Core | |
| Geekom A7 | |
| GMK NucBox K6 | |
| Medio AMD Ryzen 7 7840HS (11804 - 13538, n=21) | |
| AcePC Wizbox AI | |
| GMK NucBox K3 Pro | |
| Intel NUC 13 Pro Desk Edition Kit | |
| Lenovo IdeaCentre Mini 01IRH8 | |
| Aoostar GOD77 | |
| GMK NucBox M4 | |
| Acemagic Tank03 | |
| GMK NucBox M3 | |
| Beelink SER5 | |
| Geekbench 6.7 / Single-Core | |
| Geekom A7 | |
| GMK NucBox K6 | |
| Medio AMD Ryzen 7 7840HS (2585 - 2721, n=21) | |
| Lenovo IdeaCentre Mini 01IRH8 | |
| Intel NUC 13 Pro Desk Edition Kit | |
| GMK NucBox K3 Pro | |
| AcePC Wizbox AI | |
| GMK NucBox M4 | |
| GMK NucBox M3 | |
| Acemagic Tank03 | |
| Aoostar GOD77 | |
| Beelink SER5 | |
| Geekbench 5.5 / Multi-Core | |
| Geekom A7 | |
| AcePC Wizbox AI | |
| GMK NucBox K6 | |
| Medio AMD Ryzen 7 7840HS (8446 - 12339, n=23) | |
| Lenovo IdeaCentre Mini 01IRH8 | |
| Intel NUC 13 Pro Desk Edition Kit | |
| GMK NucBox K3 Pro | |
| Aoostar GOD77 | |
| Beelink GTR6 | |
| Beelink SER6 Pro | |
| Geekom Mini IT13 | |
| GMK NucBox M4 | |
| Acemagic Tank03 | |
| GMK NucBox M3 | |
| Beelink SER5 | |
| Geekbench 5.5 / Single-Core | |
| Geekom A7 | |
| GMK NucBox K6 | |
| Medio AMD Ryzen 7 7840HS (1837 - 2017, n=23) | |
| Geekom Mini IT13 | |
| Lenovo IdeaCentre Mini 01IRH8 | |
| Intel NUC 13 Pro Desk Edition Kit | |
| GMK NucBox K3 Pro | |
| AcePC Wizbox AI | |
| GMK NucBox M4 | |
| Acemagic Tank03 | |
| Beelink GTR6 | |
| GMK NucBox M3 | |
| Aoostar GOD77 | |
| Beelink SER6 Pro | |
| Beelink SER5 | |
| HWBOT x265 Benchmark v2.2 / 4k Preset | |
| Geekom A7 | |
| GMK NucBox K6 | |
| Medio AMD Ryzen 7 7840HS (11.7 - 21.8, n=20) | |
| AcePC Wizbox AI | |
| Lenovo IdeaCentre Mini 01IRH8 | |
| Aoostar GOD77 | |
| Beelink GTR6 | |
| Beelink SER6 Pro | |
| Geekom Mini IT13 | |
| Intel NUC 13 Pro Desk Edition Kit | |
| GMK NucBox M4 | |
| GMK NucBox K3 Pro | |
| Beelink SER5 | |
| GMK NucBox M3 | |
| Acemagic Tank03 | |
| LibreOffice / 20 Documents To PDF | |
| Beelink SER5 | |
| Geekom A7 | |
| AcePC Wizbox AI | |
| Aoostar GOD77 | |
| Beelink SER6 Pro | |
| Medio AMD Ryzen 7 7840HS (38.3 - 68.3, n=20) | |
| Intel NUC 13 Pro Desk Edition Kit | |
| Beelink GTR6 | |
| GMK NucBox K6 | |
| GMK NucBox M4 | |
| GMK NucBox M3 | |
| GMK NucBox K3 Pro | |
| Acemagic Tank03 | |
| Lenovo IdeaCentre Mini 01IRH8 | |
| Geekom Mini IT13 | |
| R Benchmark 2.5 / Overall mean | |
| Beelink SER5 | |
| GMK NucBox M4 | |
| Aoostar GOD77 | |
| Beelink SER6 Pro | |
| GMK NucBox M3 | |
| Acemagic Tank03 | |
| AcePC Wizbox AI | |
| Geekom Mini IT13 | |
| GMK NucBox K3 Pro | |
| Beelink GTR6 | |
| Lenovo IdeaCentre Mini 01IRH8 | |
| Intel NUC 13 Pro Desk Edition Kit | |
| Medio AMD Ryzen 7 7840HS (0.4184 - 0.4739, n=20) | |
| Geekom A7 | |
| GMK NucBox K6 | |
Cinebench R20: CPU (Multi Core) | CPU (Single Core)
Cinebench R15: CPU Multi 64Bit | CPU Single 64Bit
Blender: v2.79 BMW27 CPU
7-Zip 18.03: 7z b 4 | 7z b 4 -mmt1
Geekbench 6.7: Multi-Core | Single-Core
Geekbench 5.5: Multi-Core | Single-Core
HWBOT x265 Benchmark v2.2: 4k Preset
LibreOffice : 20 Documents To PDF
R Benchmark 2.5: Overall mean
* ... más pequeño es mejor
AIDA64: FP32 Ray-Trace | FPU Julia | CPU SHA3 | CPU Queen | FPU SinJulia | FPU Mandel | CPU AES | CPU ZLib | FP64 Ray-Trace | CPU PhotoWorxx
| Performance rating | |
| Geekom A7 | |
| GMK NucBox K6 | |
| Medio AMD Ryzen 7 7840HS | |
| AcePC Wizbox AI | |
| Intel NUC 13 Pro Desk Edition Kit | |
| GMK NucBox K3 Pro | |
| Beelink SER5 | |
| AIDA64 / FP32 Ray-Trace | |
| Medio AMD Ryzen 7 7840HS (22845 - 28921, n=21) | |
| GMK NucBox K6 | |
| Geekom A7 | |
| AcePC Wizbox AI | |
| Intel NUC 13 Pro Desk Edition Kit | |
| GMK NucBox K3 Pro | |
| Beelink SER5 | |
| AIDA64 / FPU Julia | |
| Medio AMD Ryzen 7 7840HS (97164 - 123167, n=21) | |
| GMK NucBox K6 | |
| Geekom A7 | |
| AcePC Wizbox AI | |
| Intel NUC 13 Pro Desk Edition Kit | |
| Beelink SER5 | |
| GMK NucBox K3 Pro | |
| AIDA64 / CPU SHA3 | |
| Medio AMD Ryzen 7 7840HS (4293 - 5155, n=21) | |
| GMK NucBox K6 | |
| Geekom A7 | |
| AcePC Wizbox AI | |
| Intel NUC 13 Pro Desk Edition Kit | |
| GMK NucBox K3 Pro | |
| Beelink SER5 | |
| AIDA64 / CPU Queen | |
| Geekom A7 | |
| Medio AMD Ryzen 7 7840HS (102271 - 125820, n=21) | |
| GMK NucBox K6 | |
| AcePC Wizbox AI | |
| Intel NUC 13 Pro Desk Edition Kit | |
| GMK NucBox K3 Pro | |
| Beelink SER5 | |
| AIDA64 / FPU SinJulia | |
| Medio AMD Ryzen 7 7840HS (13767 - 15525, n=21) | |
| GMK NucBox K6 | |
| Geekom A7 | |
| AcePC Wizbox AI | |
| Beelink SER5 | |
| Intel NUC 13 Pro Desk Edition Kit | |
| GMK NucBox K3 Pro | |
| AIDA64 / FPU Mandel | |
| Medio AMD Ryzen 7 7840HS (52084 - 65812, n=21) | |
| GMK NucBox K6 | |
| Geekom A7 | |
| AcePC Wizbox AI | |
| Beelink SER5 | |
| Intel NUC 13 Pro Desk Edition Kit | |
| GMK NucBox K3 Pro | |
| AIDA64 / CPU AES | |
| Geekom A7 | |
| GMK NucBox K6 | |
| AcePC Wizbox AI | |
| Medio AMD Ryzen 7 7840HS (67389 - 177158, n=21) | |
| GMK NucBox K3 Pro | |
| Beelink SER5 | |
| Intel NUC 13 Pro Desk Edition Kit | |
| AIDA64 / CPU ZLib | |
| AcePC Wizbox AI | |
| Medio AMD Ryzen 7 7840HS (944 - 1123, n=21) | |
| GMK NucBox K6 | |
| Geekom A7 | |
| Intel NUC 13 Pro Desk Edition Kit | |
| GMK NucBox K3 Pro | |
| Beelink SER5 | |
| AIDA64 / FP64 Ray-Trace | |
| Medio AMD Ryzen 7 7840HS (12248 - 15599, n=21) | |
| GMK NucBox K6 | |
| Geekom A7 | |
| AcePC Wizbox AI | |
| Intel NUC 13 Pro Desk Edition Kit | |
| GMK NucBox K3 Pro | |
| Beelink SER5 | |
| AIDA64 / CPU PhotoWorxx | |
| GMK NucBox K3 Pro | |
| GMK NucBox K6 | |
| Geekom A7 | |
| Medio AMD Ryzen 7 7840HS (17615 - 41516, n=21) | |
| AcePC Wizbox AI | |
| Intel NUC 13 Pro Desk Edition Kit | |
| Beelink SER5 | |
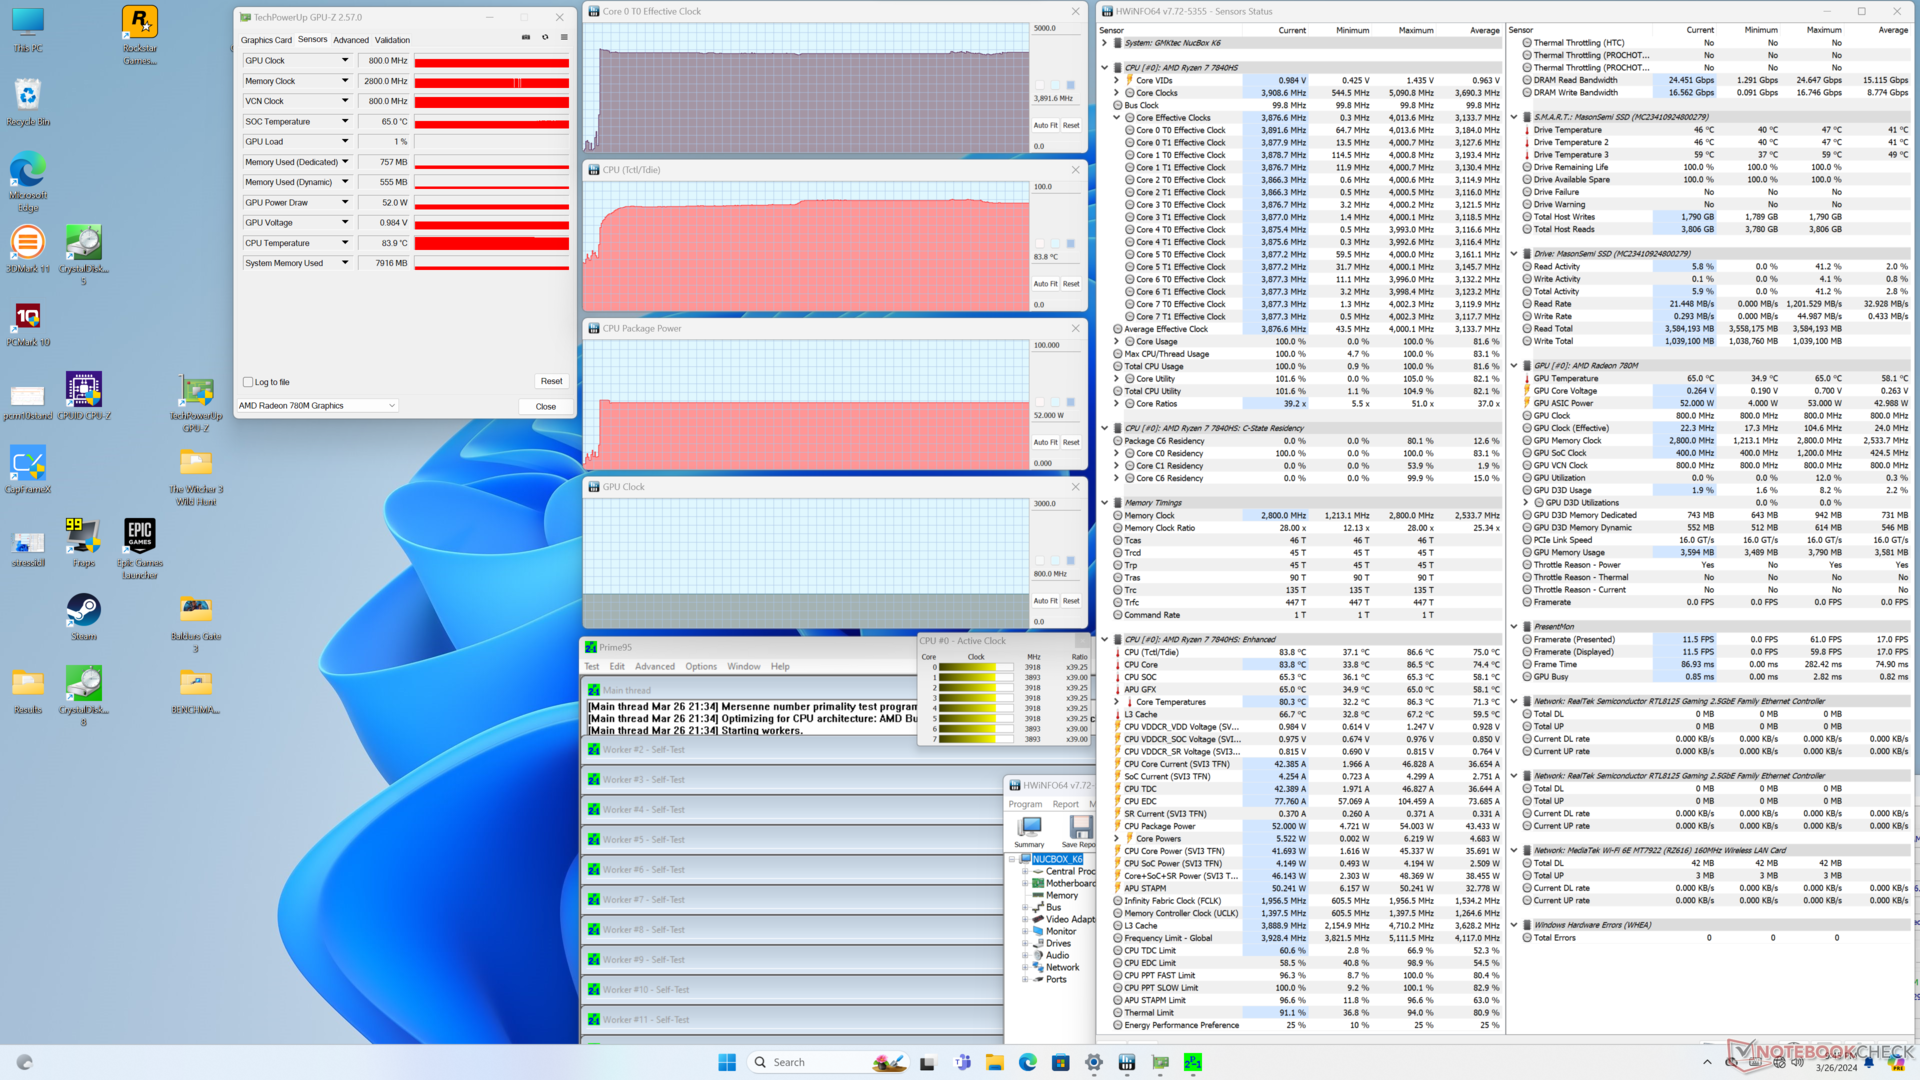
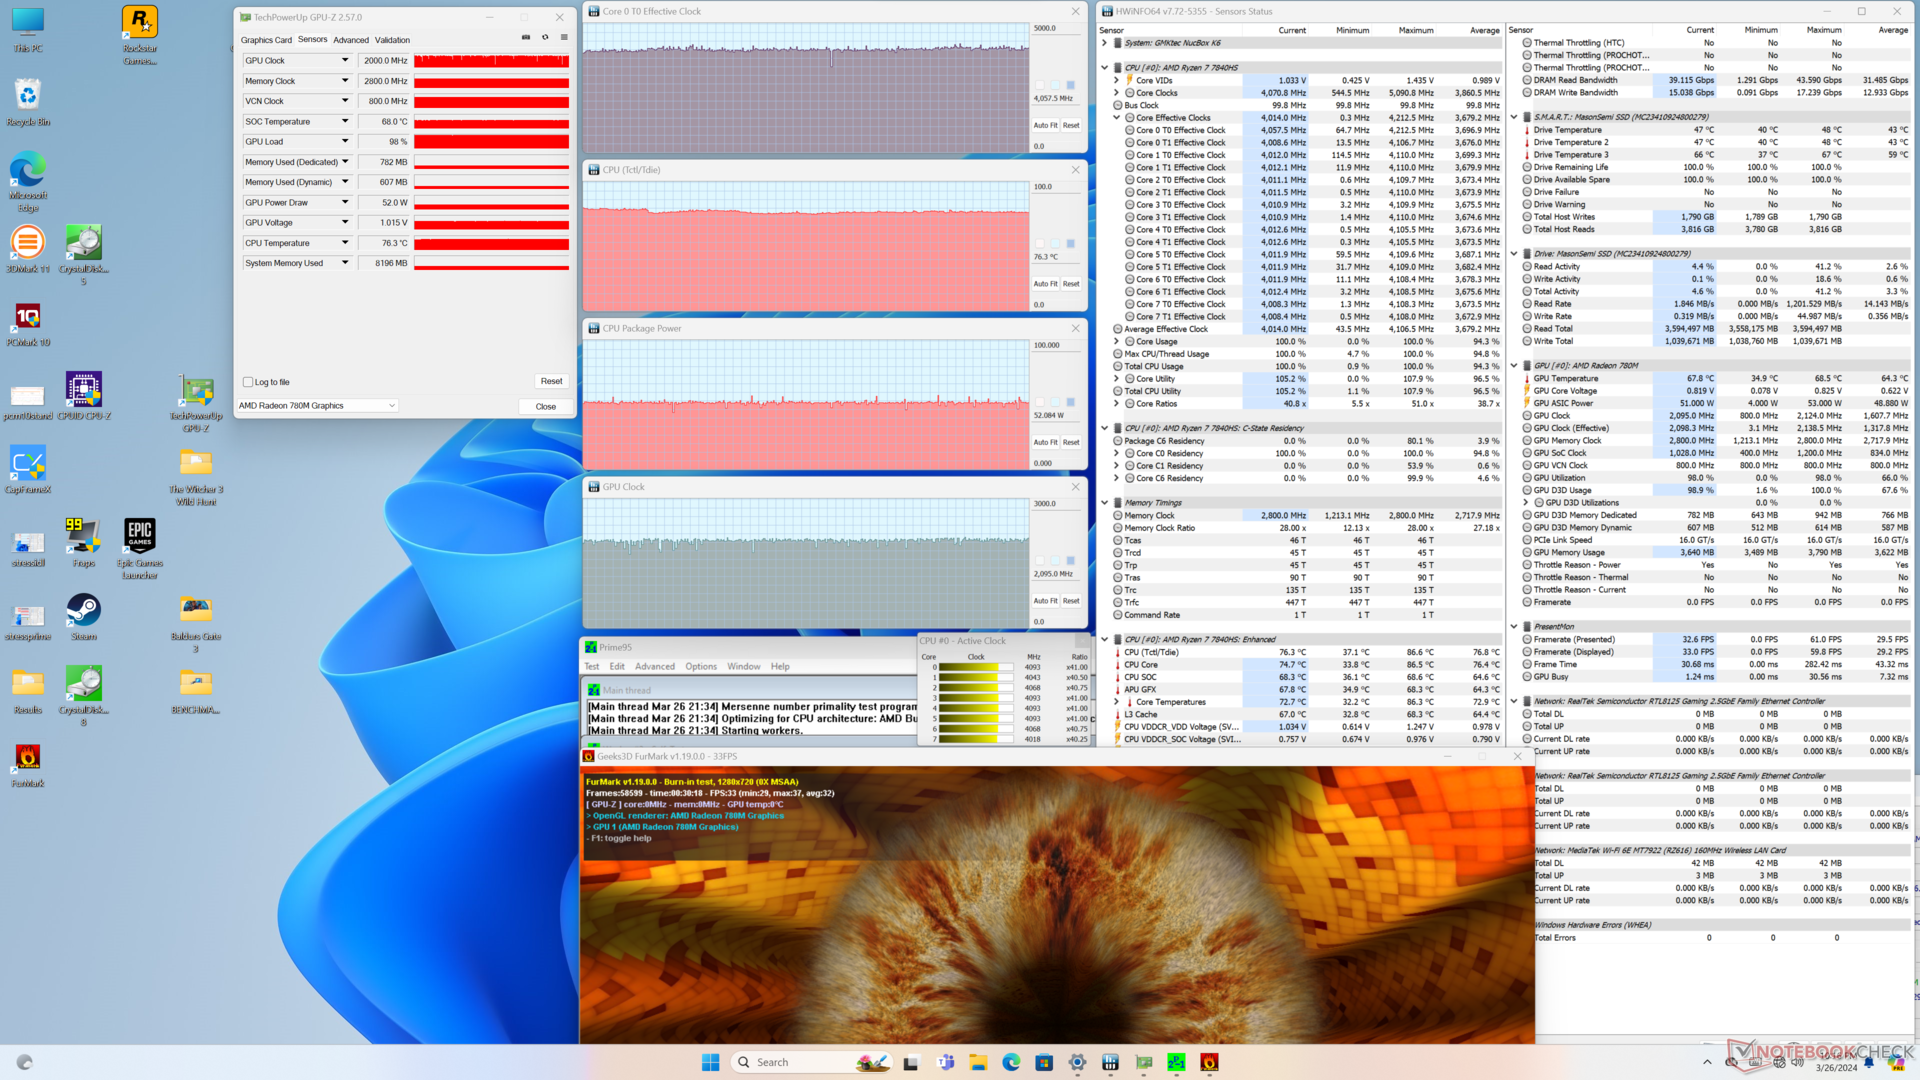
Prueba de estrés
Cuando se ejecutaba Prime95 bajo estrés, la CPU aumentaba a 4 GHz y 54 W durante sólo un par de segundos antes de caer ligeramente a 3,8 GHz y 52 W. La temperatura del núcleo cuando se ejecutaban cargas exigentes como juegos se estabilizaba en el rango medio de 70 C en comparación con los 65 C del más antiguo pero más débil Beelink SER5.
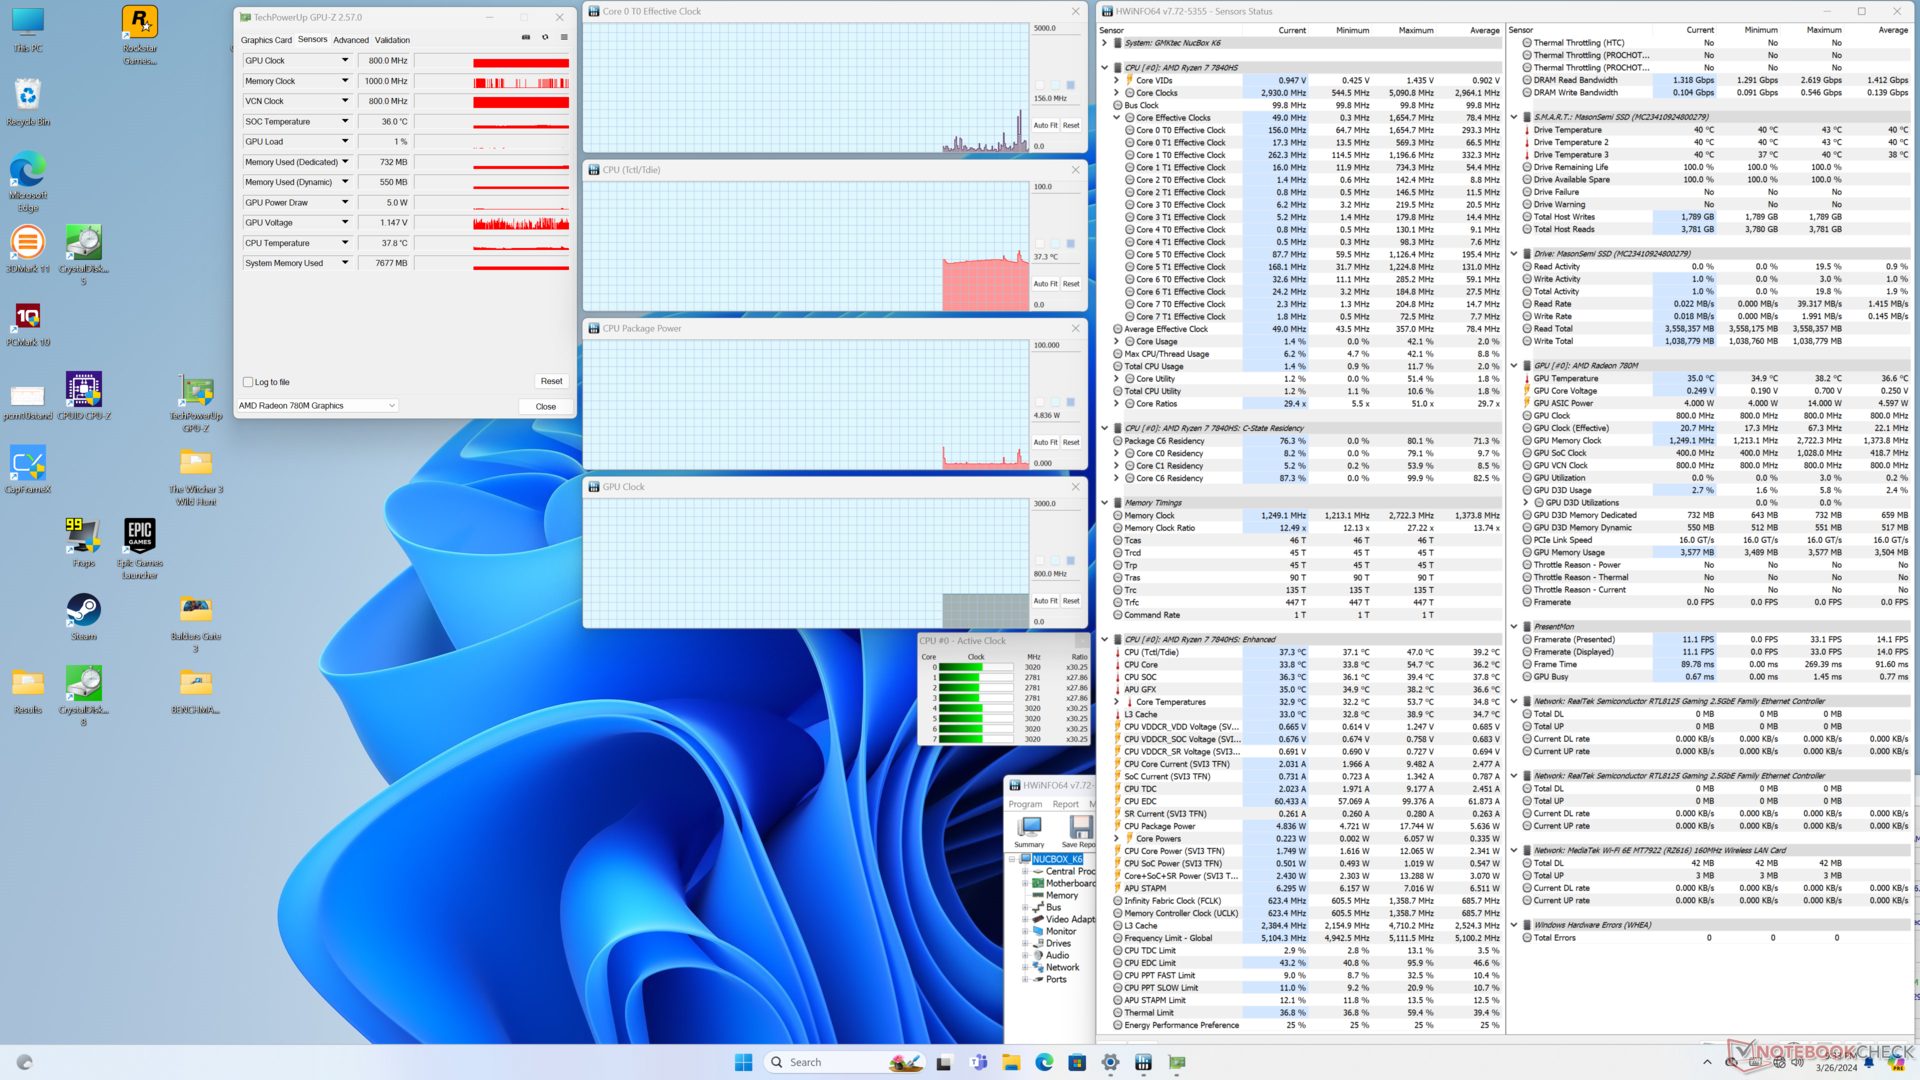
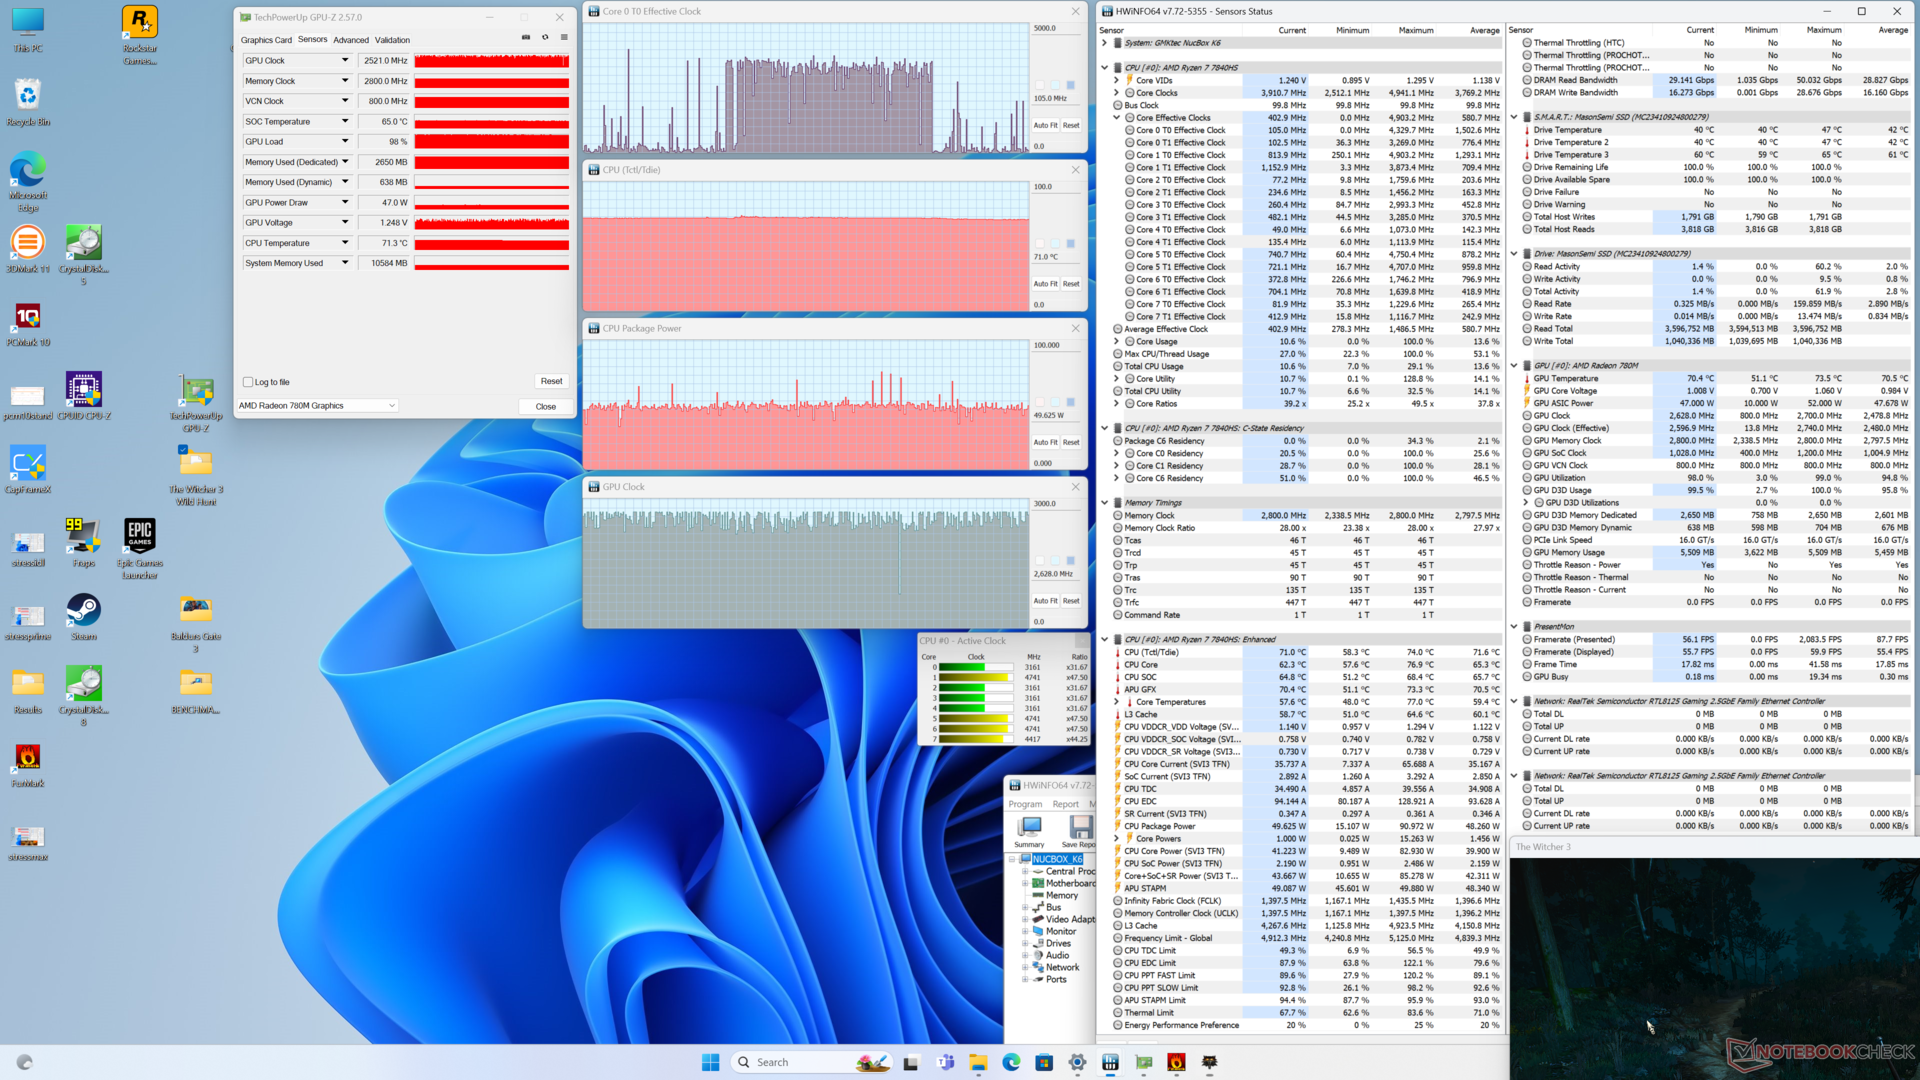
| Reloj dela CPU (GHz) | Reloj de la GPU (MHz) | Temperatura media de la CPU (°C) | |
| Sistema en reposo | -- | -- | 37 |
| Prime95 Stress | 3.9 | 800 | 84 |
| Estrés Prime95+ FurMark | 4,1 | 2000 | 76 |
| Witcher 3 Estrés | ~0,4 | 2200 - 2700 | 71 |
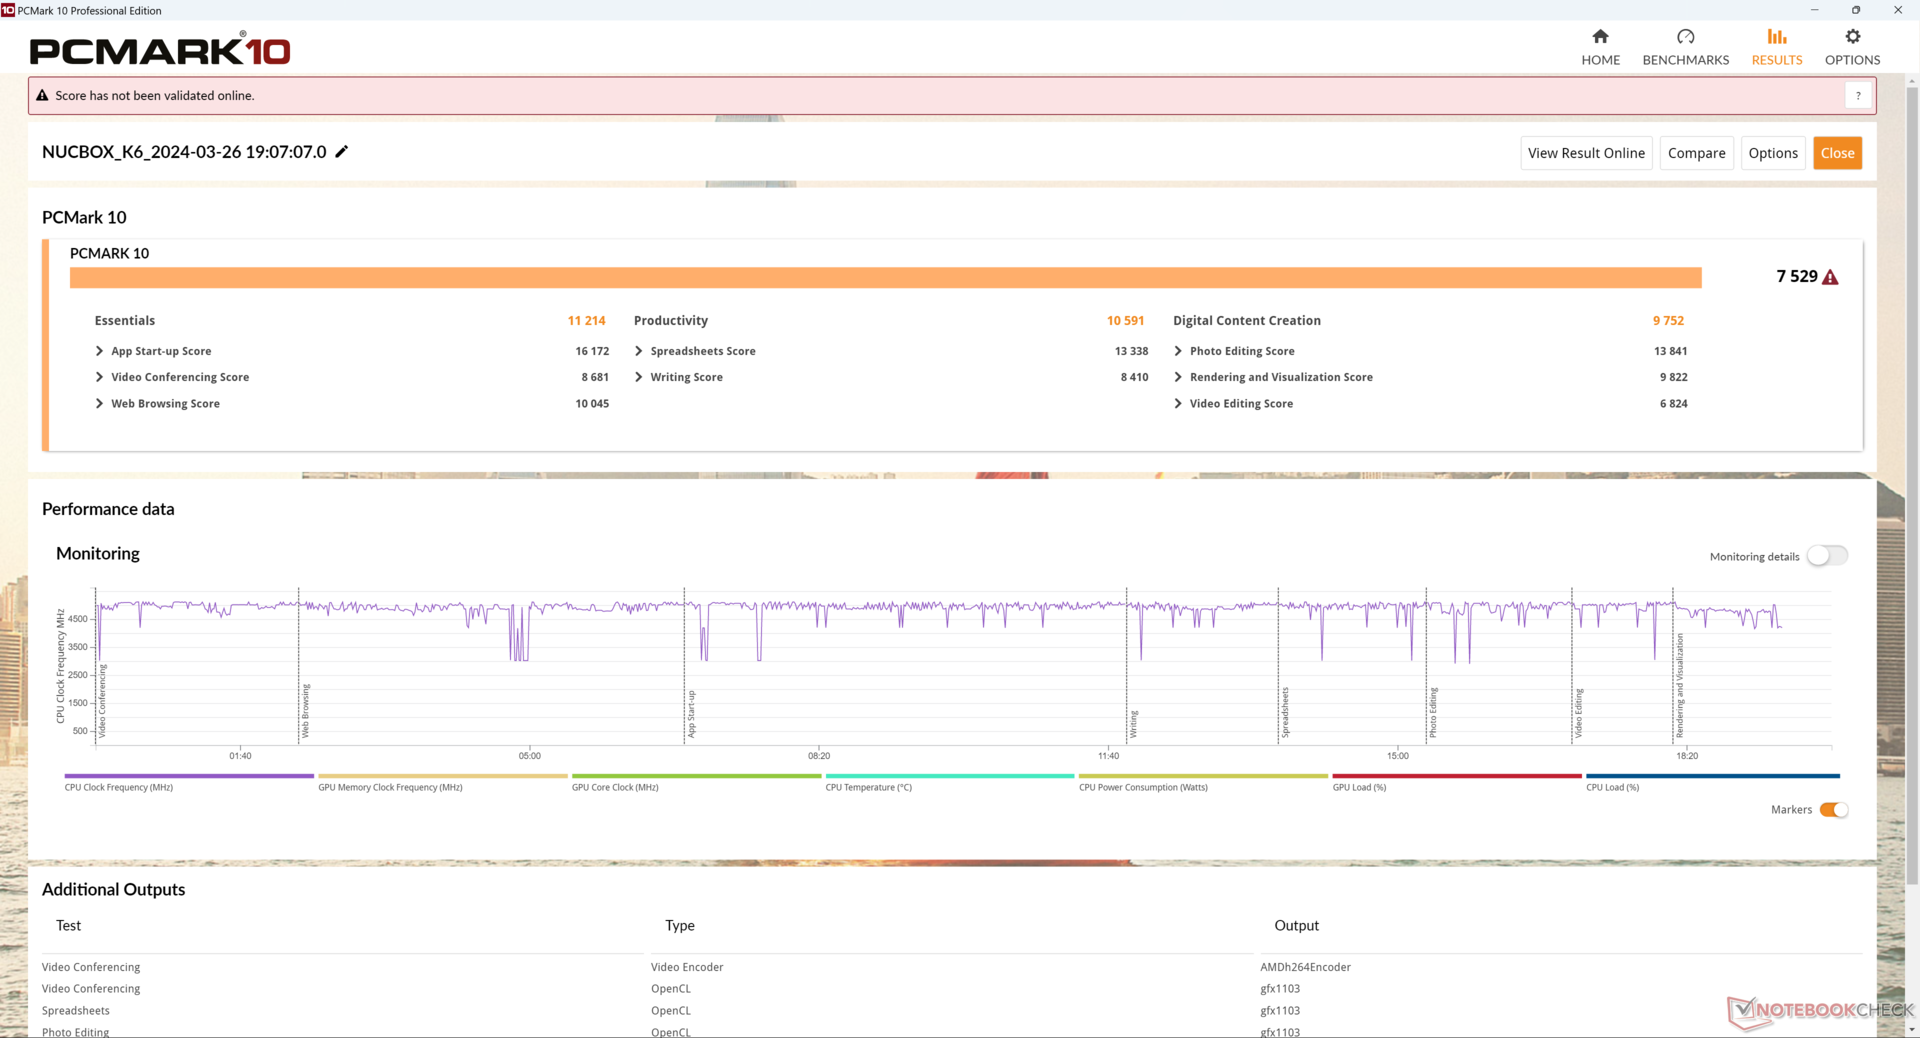
Rendimiento del sistema
Los resultados de PCMark son comparables a los del Geekom A7 a pesar de que el Geekom viene con el Ryzen 9 7940HS más caro. En cuanto a Intel, los mini PC equipados con CPU Meteor Lake-H como el AcePC son los equivalentes más cercanos a nuestro GMK.
CrossMark: Overall | Productivity | Creativity | Responsiveness
WebXPRT 3: Overall
WebXPRT 4: Overall
Mozilla Kraken 1.1: Total
| PCMark 10 / Score | |
| GMK NucBox K6 | |
| Geekom A7 | |
| Medio AMD Ryzen 7 7840HS, AMD Radeon 780M (6914 - 7651, n=10) | |
| AcePC Wizbox AI | |
| Intel NUC 13 Pro Desk Edition Kit | |
| GMK NucBox K3 Pro | |
| Beelink SER5 | |
| PCMark 10 / Essentials | |
| GMK NucBox K6 | |
| Geekom A7 | |
| Intel NUC 13 Pro Desk Edition Kit | |
| Medio AMD Ryzen 7 7840HS, AMD Radeon 780M (10519 - 11214, n=10) | |
| AcePC Wizbox AI | |
| GMK NucBox K3 Pro | |
| Beelink SER5 | |
| PCMark 10 / Productivity | |
| GMK NucBox K6 | |
| Geekom A7 | |
| Medio AMD Ryzen 7 7840HS, AMD Radeon 780M (9075 - 10970, n=10) | |
| AcePC Wizbox AI | |
| Beelink SER5 | |
| GMK NucBox K3 Pro | |
| Intel NUC 13 Pro Desk Edition Kit | |
| PCMark 10 / Digital Content Creation | |
| AcePC Wizbox AI | |
| Geekom A7 | |
| GMK NucBox K6 | |
| Medio AMD Ryzen 7 7840HS, AMD Radeon 780M (9052 - 9987, n=10) | |
| Intel NUC 13 Pro Desk Edition Kit | |
| GMK NucBox K3 Pro | |
| Beelink SER5 | |
| CrossMark / Overall | |
| GMK NucBox K6 | |
| Geekom A7 | |
| Medio AMD Ryzen 7 7840HS, AMD Radeon 780M (1566 - 1891, n=10) | |
| AcePC Wizbox AI | |
| Intel NUC 13 Pro Desk Edition Kit | |
| GMK NucBox K3 Pro | |
| Beelink SER5 | |
| CrossMark / Productivity | |
| GMK NucBox K6 | |
| Geekom A7 | |
| Medio AMD Ryzen 7 7840HS, AMD Radeon 780M (1535 - 1823, n=10) | |
| AcePC Wizbox AI | |
| Intel NUC 13 Pro Desk Edition Kit | |
| GMK NucBox K3 Pro | |
| Beelink SER5 | |
| CrossMark / Creativity | |
| Geekom A7 | |
| GMK NucBox K6 | |
| Medio AMD Ryzen 7 7840HS, AMD Radeon 780M (1556 - 2040, n=10) | |
| AcePC Wizbox AI | |
| Intel NUC 13 Pro Desk Edition Kit | |
| GMK NucBox K3 Pro | |
| Beelink SER5 | |
| CrossMark / Responsiveness | |
| GMK NucBox K6 | |
| Medio AMD Ryzen 7 7840HS, AMD Radeon 780M (1293 - 1749, n=10) | |
| Geekom A7 | |
| AcePC Wizbox AI | |
| Intel NUC 13 Pro Desk Edition Kit | |
| GMK NucBox K3 Pro | |
| Beelink SER5 | |
| WebXPRT 3 / Overall | |
| Geekom A7 | |
| GMK NucBox K6 | |
| Medio AMD Ryzen 7 7840HS, AMD Radeon 780M (297 - 339, n=10) | |
| Intel NUC 13 Pro Desk Edition Kit | |
| GMK NucBox K3 Pro | |
| AcePC Wizbox AI | |
| Beelink SER5 | |
| WebXPRT 4 / Overall | |
| Geekom A7 | |
| GMK NucBox K6 | |
| Intel NUC 13 Pro Desk Edition Kit | |
| Medio AMD Ryzen 7 7840HS, AMD Radeon 780M (245 - 319, n=9) | |
| Beelink SER5 | |
| Mozilla Kraken 1.1 / Total | |
| Beelink SER5 | |
| AcePC Wizbox AI | |
| GMK NucBox K6 | |
| GMK NucBox K3 Pro | |
| Medio AMD Ryzen 7 7840HS, AMD Radeon 780M (485 - 544, n=10) | |
| Geekom A7 | |
| Intel NUC 13 Pro Desk Edition Kit | |
* ... más pequeño es mejor
| PCMark 10 Score | 7529 puntos | |
ayuda | ||
| AIDA64 / Memory Copy | |
| GMK NucBox K3 Pro | |
| GMK NucBox K6 | |
| Geekom A7 | |
| Medio AMD Ryzen 7 7840HS (30937 - 72158, n=21) | |
| AcePC Wizbox AI | |
| Intel NUC 13 Pro Desk Edition Kit | |
| Beelink SER5 | |
| AIDA64 / Memory Read | |
| GMK NucBox K3 Pro | |
| GMK NucBox K6 | |
| Geekom A7 | |
| AcePC Wizbox AI | |
| Medio AMD Ryzen 7 7840HS (30497 - 62147, n=21) | |
| Intel NUC 13 Pro Desk Edition Kit | |
| Beelink SER5 | |
| AIDA64 / Memory Write | |
| Geekom A7 | |
| GMK NucBox K6 | |
| Medio AMD Ryzen 7 7840HS (34590 - 93323, n=21) | |
| AcePC Wizbox AI | |
| GMK NucBox K3 Pro | |
| Intel NUC 13 Pro Desk Edition Kit | |
| Beelink SER5 | |
| AIDA64 / Memory Latency | |
| AcePC Wizbox AI | |
| GMK NucBox K3 Pro | |
| Intel NUC 13 Pro Desk Edition Kit | |
| Beelink SER5 | |
| Medio AMD Ryzen 7 7840HS (85.1 - 112, n=21) | |
| Geekom A7 | |
| GMK NucBox K6 | |
* ... más pequeño es mejor
Latencia del CPD
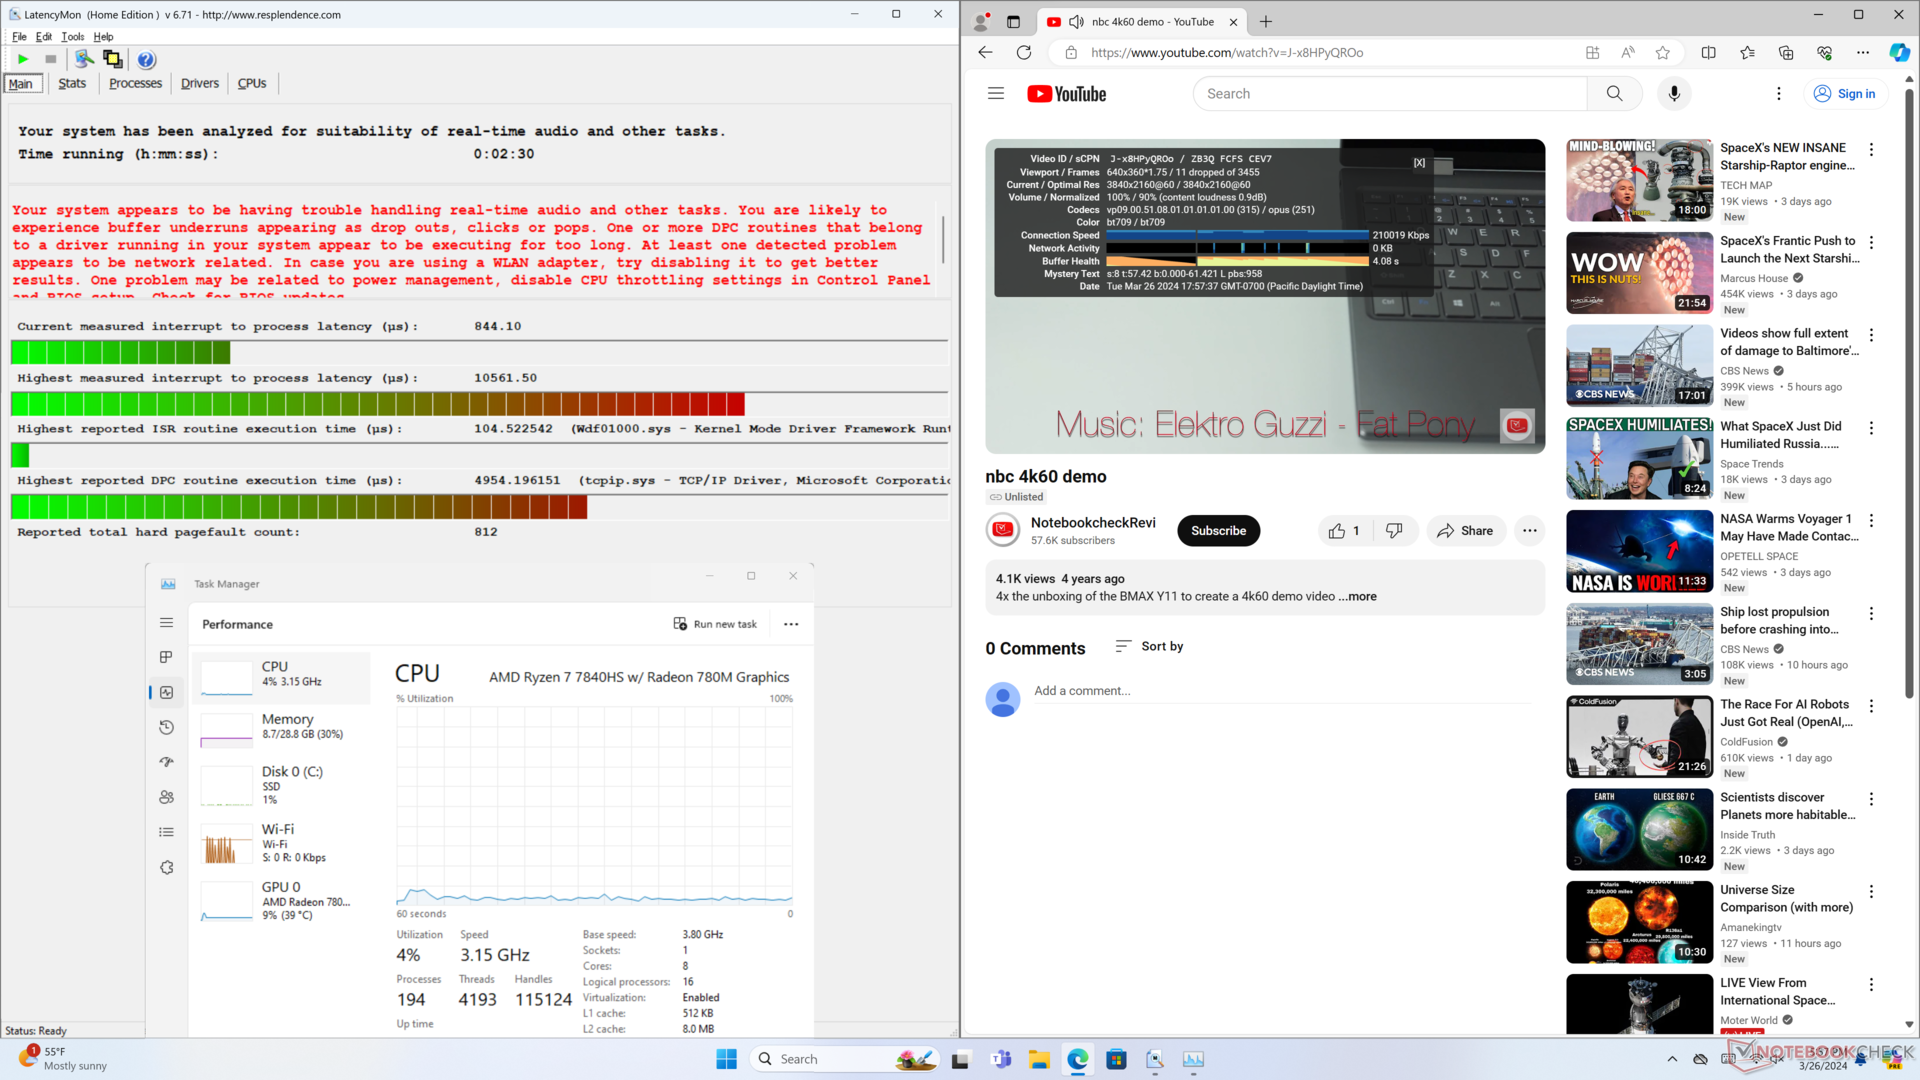
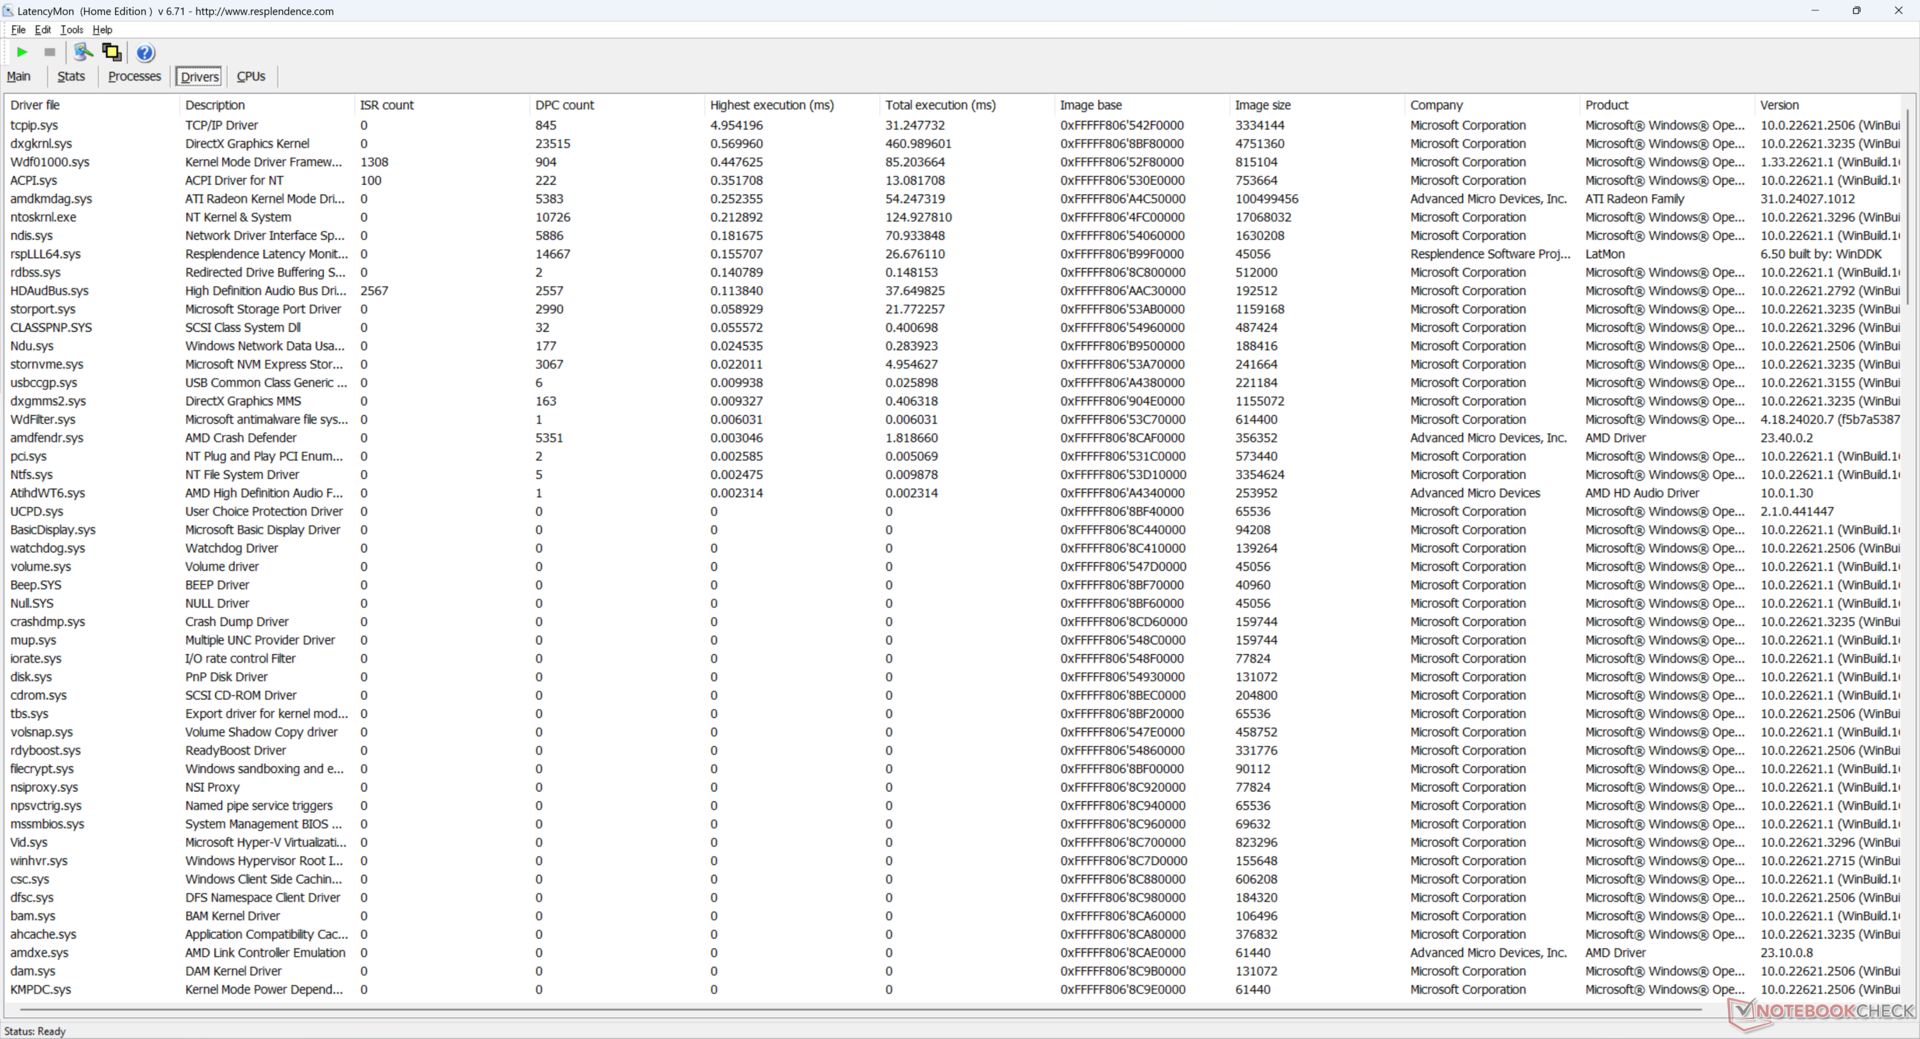
Por desgracia, el sistema sufre problemas de latencia DPC que afectan a la reproducción de vídeo. Nuestro vídeo 4K60 de un minuto de duración devolvía 11 fotogramas perdidos cuando debería ser cero. Como resultado, puede esperar un poco de tartamudeo al transmitir vídeo.
| DPC Latencies / LatencyMon - interrupt to process latency (max), Web, Youtube, Prime95 | |
| GMK NucBox K6 | |
| Geekom A7 | |
| GMK NucBox K3 Pro | |
| Intel NUC 13 Pro Desk Edition Kit | |
| AcePC Wizbox AI | |
| Beelink SER5 | |
* ... más pequeño es mejor
Dispositivos de almacenamiento
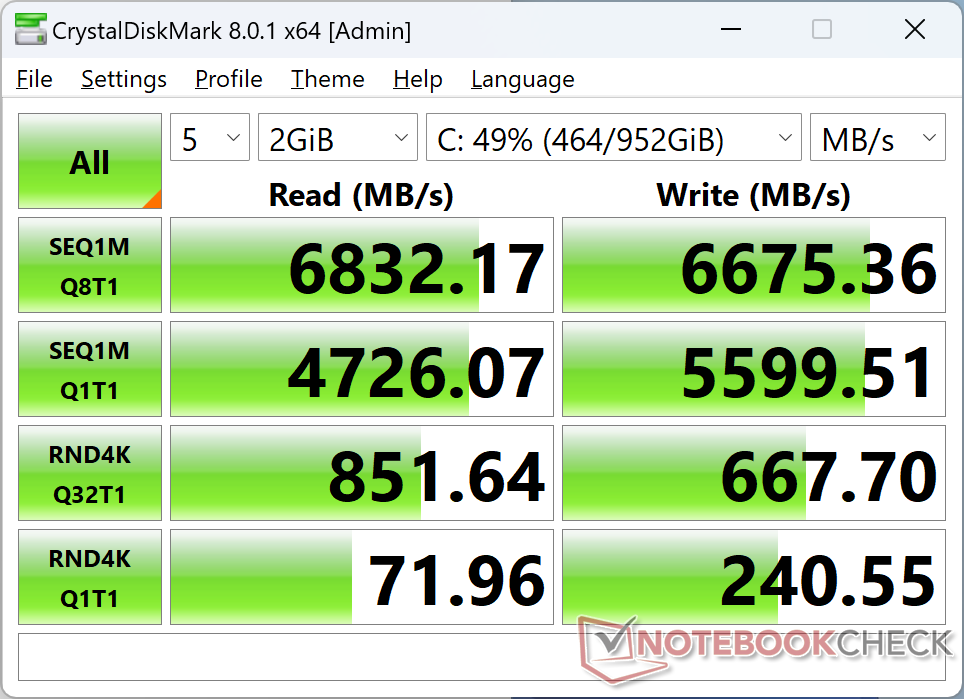
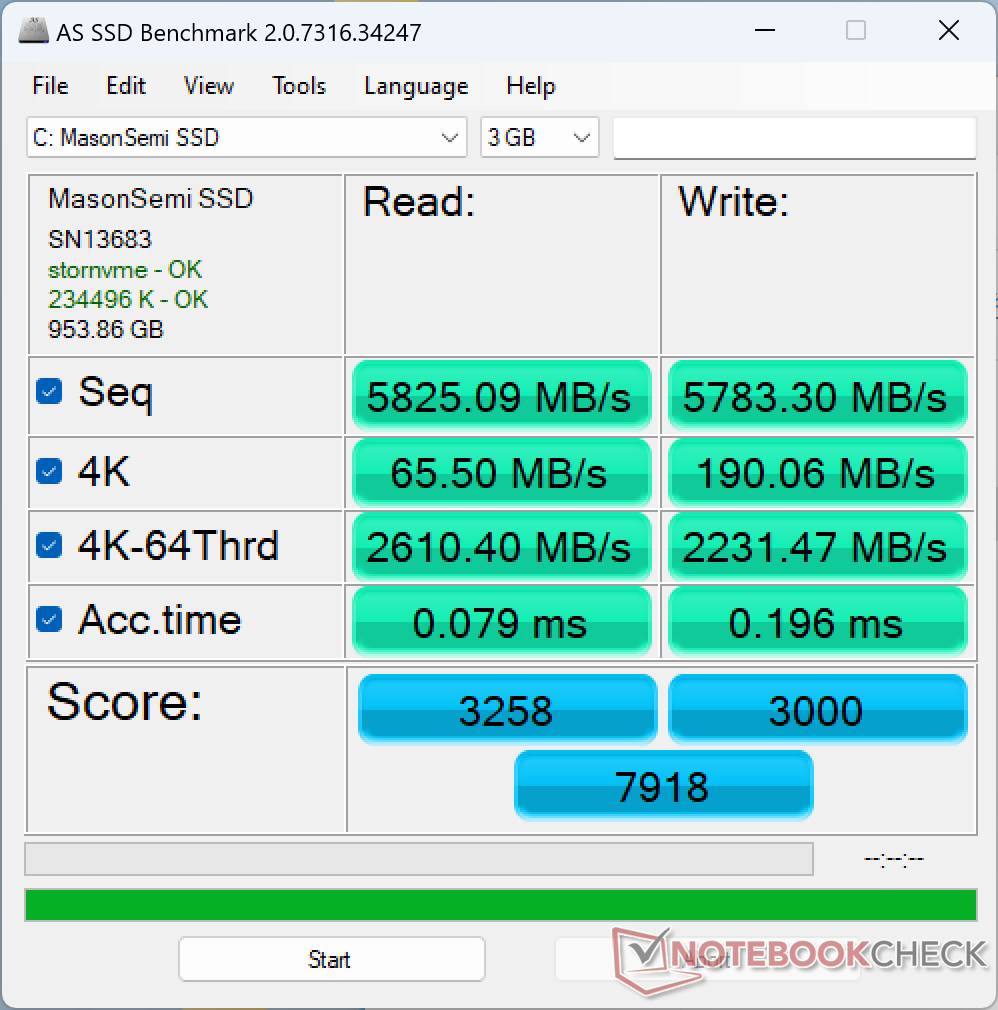
Los mini PC de GMK suelen enviarse con marcas de SSD menos conocidas, probablemente para mantener los costes bajos. El MasonSemi MC7000 puede que no sea un nombre muy conocido, pero el rendimiento es sin embargo excelente con resultados comparables a la popular serie Samsung PM9A1. Las velocidades de lectura son sostenibles a ~7000 MB/s, lo que está cerca del límite superior para las unidades PCIe4 x4.
Tenga en cuenta que sólo se incluye un disipador de calor a pesar de que el sistema puede soportar hasta dos unidades.

| Drive Performance rating - Percent | |
| GMK NucBox K6 | |
| Intel NUC 13 Pro Desk Edition Kit | |
| Geekom A7 | |
| Beelink SER5 | |
| AcePC Wizbox AI | |
| GMK NucBox K3 Pro | |
| DiskSpd | |
| seq read | |
| Geekom A7 | |
| GMK NucBox K6 | |
| Intel NUC 13 Pro Desk Edition Kit | |
| Beelink SER5 | |
| AcePC Wizbox AI | |
| GMK NucBox K3 Pro | |
| seq write | |
| GMK NucBox K6 | |
| Geekom A7 | |
| Intel NUC 13 Pro Desk Edition Kit | |
| Beelink SER5 | |
| AcePC Wizbox AI | |
| GMK NucBox K3 Pro | |
| seq q8 t1 read | |
| GMK NucBox K6 | |
| Intel NUC 13 Pro Desk Edition Kit | |
| Geekom A7 | |
| AcePC Wizbox AI | |
| Beelink SER5 | |
| GMK NucBox K3 Pro | |
| seq q8 t1 write | |
| GMK NucBox K6 | |
| Intel NUC 13 Pro Desk Edition Kit | |
| Geekom A7 | |
| Beelink SER5 | |
| AcePC Wizbox AI | |
| GMK NucBox K3 Pro | |
| 4k q1 t1 read | |
| Intel NUC 13 Pro Desk Edition Kit | |
| GMK NucBox K6 | |
| AcePC Wizbox AI | |
| Beelink SER5 | |
| Geekom A7 | |
| GMK NucBox K3 Pro | |
| 4k q1 t1 write | |
| GMK NucBox K6 | |
| Beelink SER5 | |
| Geekom A7 | |
| GMK NucBox K3 Pro | |
| AcePC Wizbox AI | |
| Intel NUC 13 Pro Desk Edition Kit | |
| 4k q32 t16 read | |
| Beelink SER5 | |
| GMK NucBox K6 | |
| Geekom A7 | |
| GMK NucBox K3 Pro | |
| AcePC Wizbox AI | |
| Intel NUC 13 Pro Desk Edition Kit | |
| 4k q32 t16 write | |
| GMK NucBox K6 | |
| Beelink SER5 | |
| AcePC Wizbox AI | |
| Geekom A7 | |
| GMK NucBox K3 Pro | |
| Intel NUC 13 Pro Desk Edition Kit | |
* ... más pequeño es mejor
Disk Throttling: DiskSpd Read Loop, Queue Depth 8
Rendimiento de la GPU - Suficientemente potente para la mayoría de los juegos
La Radeon 780M ha demostrado ser una potente GPU integrada y puede funcionar incluso más rápido en los mini PC que en los portátiles, ya que el mayor grosor de su factor de forma permite, por lo general, mayores envolventes de potencia. En este caso, la iGPU de nuestro NucBox K6 funciona aproximadamente un 10 por ciento más rápido que el portátil medio de nuestra base de datos equipado con la misma opción gráfica. La ventaja de rendimiento puede ser incluso mayor en juegos como Tiny Tina's Wonderlands o F1 22, donde podemos observar un delta de hasta el 20 por ciento. Los usuarios que actualicen desde UHD Graphics o Iris Xe deberían ver un aumento significativo.
| 3DMark Performance rating - Percent | |
| Geekom A7 | |
| GMK NucBox K6 | |
| Medio AMD Radeon 780M | |
| Beelink SER6 Pro | |
| Beelink GTR6 | |
| Aoostar GOD77 | |
| Intel NUC 13 Pro Desk Edition Kit | |
| Geekom Mini IT13 | |
| Lenovo IdeaCentre Mini 01IRH8 | |
| GMK NucBox K3 Pro | |
| Beelink SER5 | |
| GMK NucBox M3 | |
| 3DMark 11 - 1280x720 Performance GPU | |
| Geekom A7 | |
| GMK NucBox K6 | |
| Medio AMD Radeon 780M (7868 - 14312, n=77) | |
| Beelink SER6 Pro | |
| Beelink GTR6 | |
| Aoostar GOD77 | |
| Intel NUC 13 Pro Desk Edition Kit | |
| Geekom Mini IT13 | |
| Lenovo IdeaCentre Mini 01IRH8 | |
| GMK NucBox K3 Pro | |
| Beelink SER5 | |
| GMK NucBox M3 | |
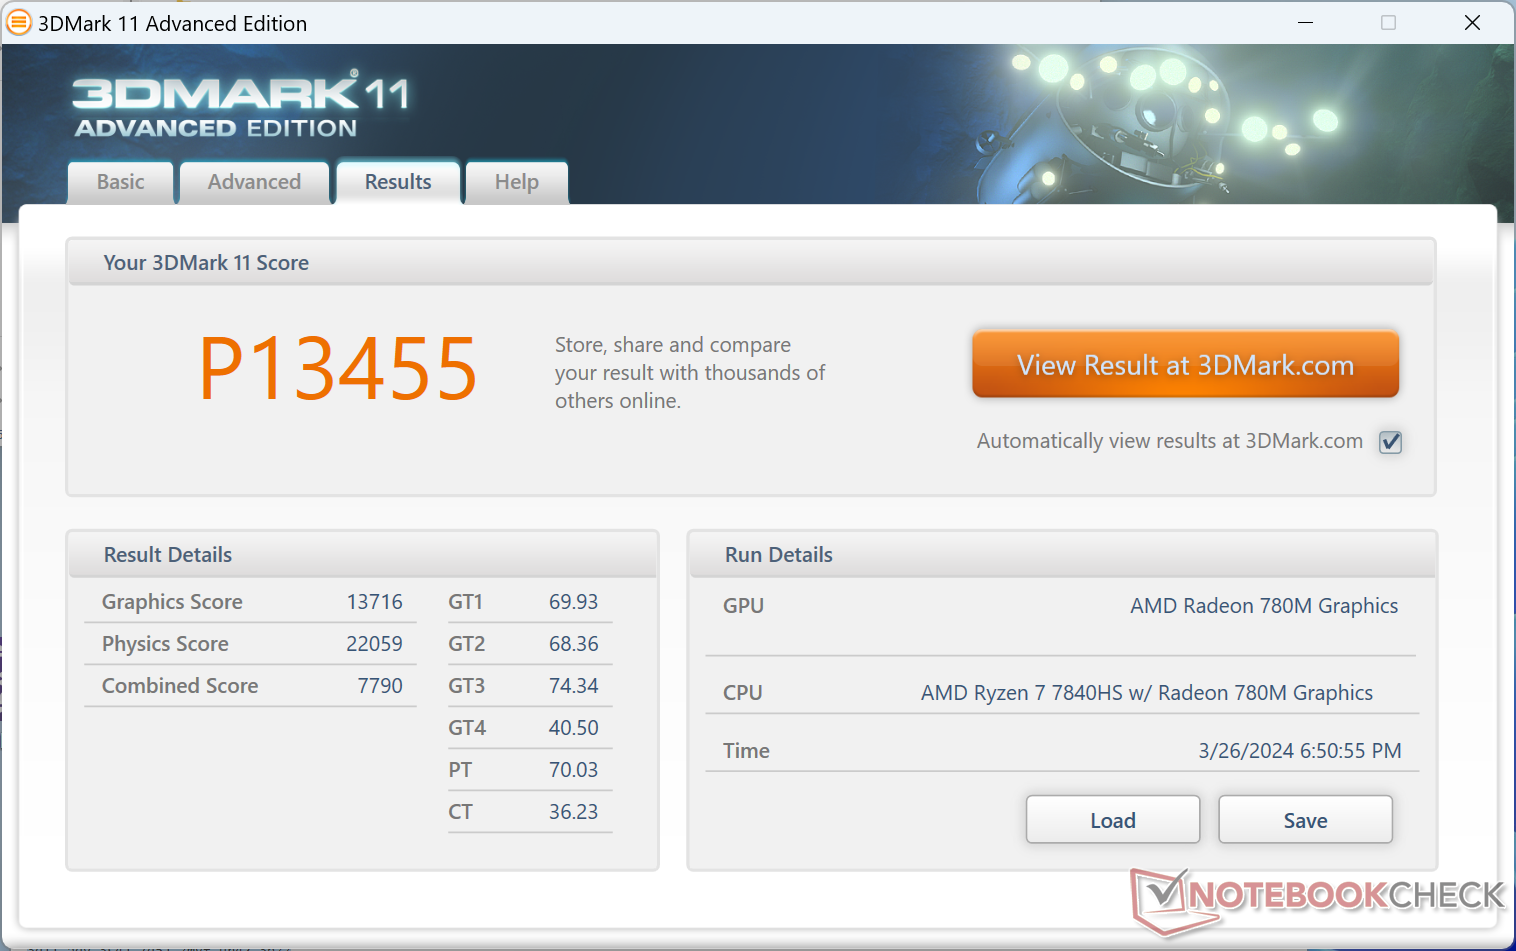
| 3DMark 11 Performance | 13455 puntos | |
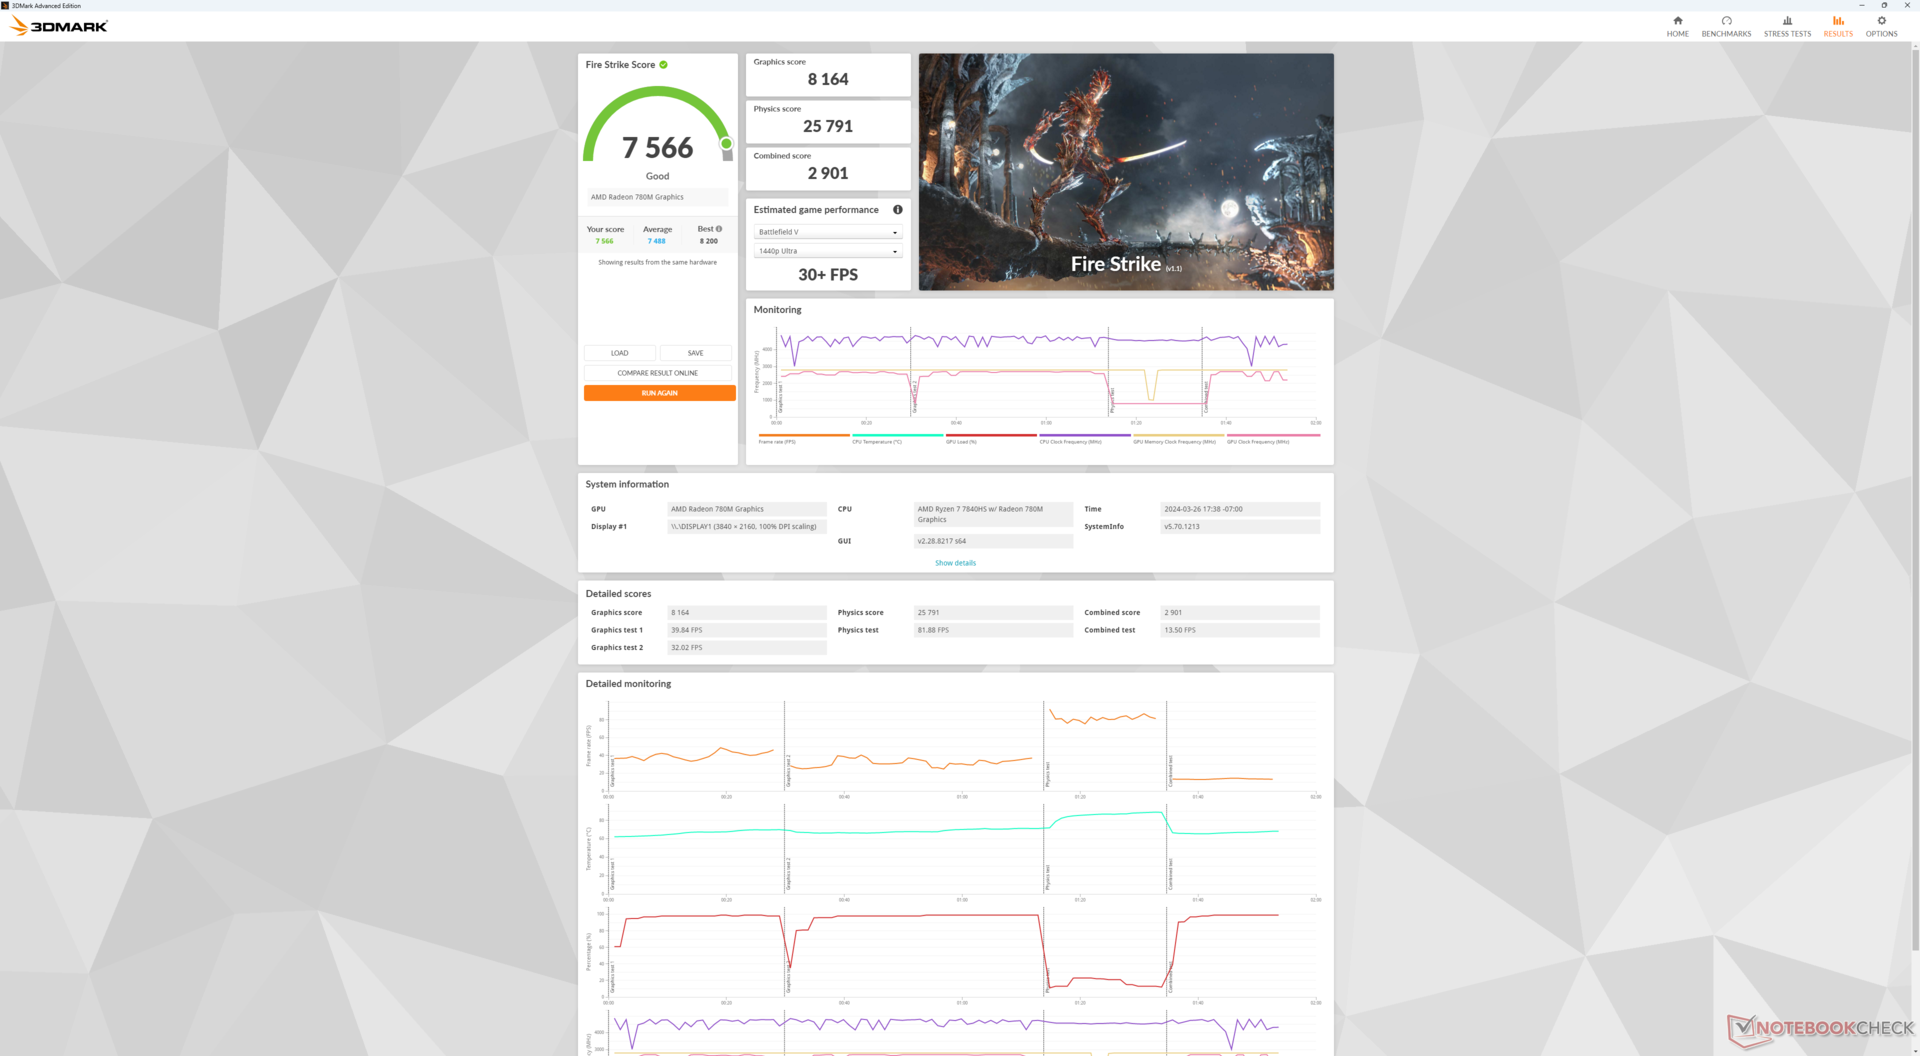
| 3DMark Fire Strike Score | 7566 puntos | |
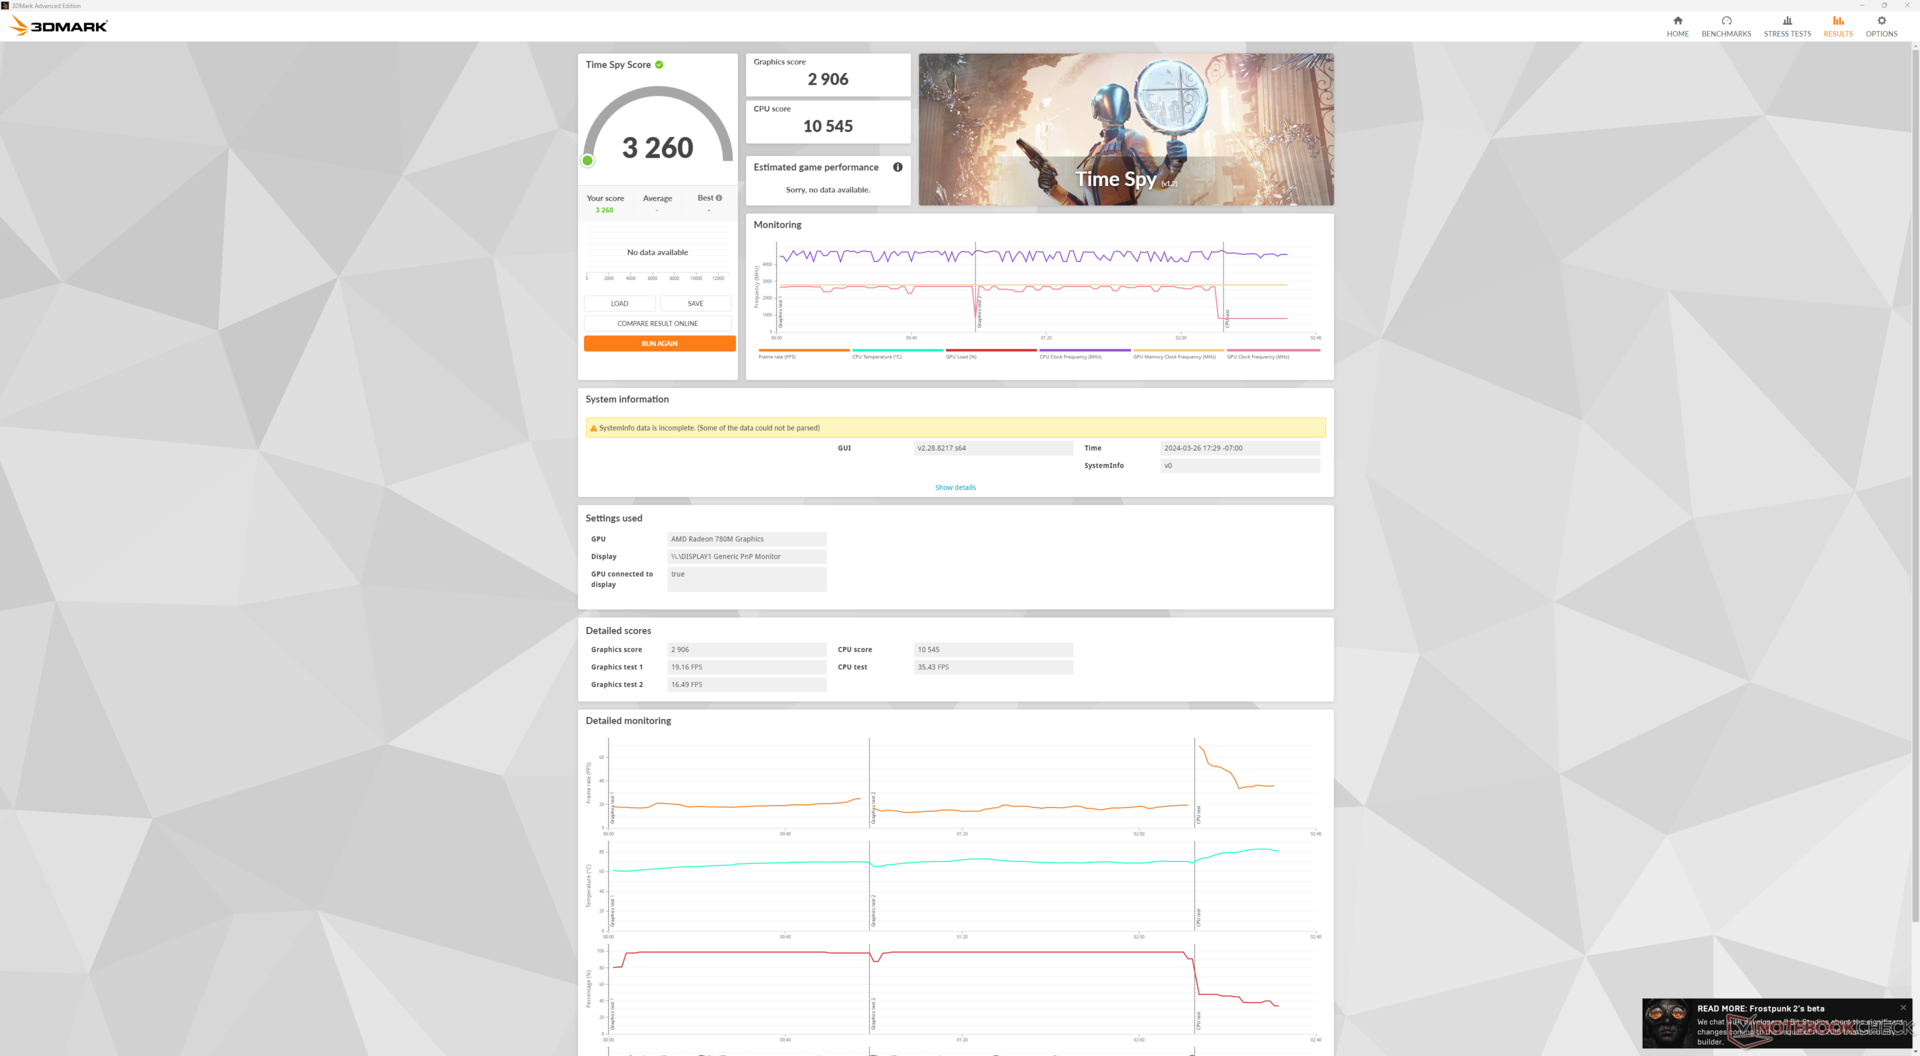
| 3DMark Time Spy Score | 3260 puntos | |
ayuda | ||
| Blender | |
| v3.3 Classroom HIP/AMD | |
| Beelink SER5 | |
| Beelink GTR6 | |
| Aoostar GOD77 | |
| Beelink SER6 Pro | |
| v3.3 Classroom CPU | |
| GMK NucBox M3 | |
| Beelink SER5 | |
| GMK NucBox K3 Pro | |
| GMK NucBox M4 | |
| Intel NUC 13 Pro Desk Edition Kit | |
| Beelink SER6 Pro | |
| Lenovo IdeaCentre Mini 01IRH8 | |
| Beelink GTR6 | |
| Aoostar GOD77 | |
| Medio AMD Radeon 780M (300 - 664, n=76) | |
| AcePC Wizbox AI | |
| Geekom A7 | |
| GMK NucBox K6 | |
| v3.3 Classroom oneAPI/Intel | |
| AcePC Wizbox AI | |
* ... más pequeño es mejor
| Performance rating - Percent | |
| GMK NucBox K6 | |
| AcePC Wizbox AI | |
| Intel NUC 13 Pro Desk Edition Kit | |
| Beelink SER5 | |
| The Witcher 3 - 1920x1080 Ultra Graphics & Postprocessing (HBAO+) | |
| GMK NucBox K6 | |
| AcePC Wizbox AI | |
| Intel NUC 13 Pro Desk Edition Kit | |
| Beelink SER5 | |
| GTA V - 1920x1080 Highest AA:4xMSAA + FX AF:16x | |
| GMK NucBox K6 | |
| AcePC Wizbox AI | |
| Beelink SER5 | |
| Intel NUC 13 Pro Desk Edition Kit | |
| Final Fantasy XV Benchmark - 1920x1080 High Quality | |
| GMK NucBox K6 | |
| AcePC Wizbox AI | |
| Intel NUC 13 Pro Desk Edition Kit | |
| Beelink SER5 | |
| Strange Brigade - 1920x1080 ultra AA:ultra AF:16 | |
| GMK NucBox K6 | |
| AcePC Wizbox AI | |
| Intel NUC 13 Pro Desk Edition Kit | |
| Beelink SER5 | |
| Dota 2 Reborn - 1920x1080 ultra (3/3) best looking | |
| GMK NucBox K6 | |
| AcePC Wizbox AI | |
| Intel NUC 13 Pro Desk Edition Kit | |
| Beelink SER5 | |
| X-Plane 11.11 - 1920x1080 high (fps_test=3) | |
| GMK NucBox K6 | |
| AcePC Wizbox AI | |
| Intel NUC 13 Pro Desk Edition Kit | |
| Beelink SER5 | |
| F1 22 | |
| 1280x720 Ultra Low Preset AA:T AF:16x | |
| Geekom A7 | |
| GMK NucBox K6 | |
| Medio AMD Radeon 780M (85.4 - 186.7, n=29) | |
| Aoostar GOD77 | |
| Intel NUC 13 Pro Desk Edition Kit | |
| Lenovo IdeaCentre Mini 01IRH8 | |
| Beelink SER5 | |
| GMK NucBox M3 | |
| 1920x1080 Low Preset AA:T AF:16x | |
| GMK NucBox K6 | |
| Geekom A7 | |
| Medio AMD Radeon 780M (47 - 109.9, n=35) | |
| Aoostar GOD77 | |
| Intel NUC 13 Pro Desk Edition Kit | |
| Lenovo IdeaCentre Mini 01IRH8 | |
| Beelink SER5 | |
| GMK NucBox M3 | |
| 1920x1080 Medium Preset AA:T AF:16x | |
| Geekom A7 | |
| GMK NucBox K6 | |
| Medio AMD Radeon 780M (41.5 - 95, n=35) | |
| Aoostar GOD77 | |
| Intel NUC 13 Pro Desk Edition Kit | |
| Lenovo IdeaCentre Mini 01IRH8 | |
| Beelink SER5 | |
| GMK NucBox M3 | |
| 1920x1080 High Preset AA:T AF:16x | |
| GMK NucBox K6 | |
| Geekom A7 | |
| Medio AMD Radeon 780M (31.7 - 70.6, n=35) | |
| Aoostar GOD77 | |
| Intel NUC 13 Pro Desk Edition Kit | |
| Lenovo IdeaCentre Mini 01IRH8 | |
| Beelink SER5 | |
| GMK NucBox M3 | |
| 1920x1080 Ultra High Preset AA:T AF:16x | |
| Intel NUC 13 Pro Desk Edition Kit | |
| Lenovo IdeaCentre Mini 01IRH8 | |
| Geekom A7 | |
| GMK NucBox K6 | |
| Medio AMD Radeon 780M (9.92 - 19.3, n=27) | |
| Beelink SER5 | |
| GMK NucBox M3 | |
| Baldur's Gate 3 | |
| 1920x1080 Low Preset AA:SM | |
| GMK NucBox K6 | |
| Medio AMD Radeon 780M (20.2 - 44.1, n=47) | |
| 1920x1080 Medium Preset AA:T | |
| GMK NucBox K6 | |
| Medio AMD Radeon 780M (15.7 - 36.8, n=50) | |
| 1920x1080 High Preset AA:T | |
| GMK NucBox K6 | |
| Medio AMD Radeon 780M (13.3 - 30.6, n=50) | |
| 1920x1080 Ultra Preset AA:T | |
| GMK NucBox K6 | |
| Medio AMD Radeon 780M (12.8 - 29.6, n=49) | |
| Cyberpunk 2077 | |
| 1280x720 Low Preset (FSR off) | |
| GMK NucBox K6 | |
| Medio AMD Radeon 780M (41.8 - 80.6, n=38) | |
| 1920x1080 Low Preset (FSR off) | |
| GMK NucBox K6 | |
| Medio AMD Radeon 780M (23.9 - 52.1, n=63) | |
| 1920x1080 Medium Preset (FSR off) | |
| GMK NucBox K6 | |
| Medio AMD Radeon 780M (16.3 - 37.5, n=59) | |
| AcePC Wizbox AI | |
| 1920x1080 High Preset (FSR off) | |
| GMK NucBox K6 | |
| Medio AMD Radeon 780M (13.8 - 29.6, n=59) | |
| AcePC Wizbox AI | |
| 1920x1080 Ultra Preset (FSR off) | |
| GMK NucBox K6 | |
| Medio AMD Radeon 780M (11.5 - 26.3, n=54) | |
Witcher 3 FPS Chart
| bajo | medio | alto | ultra | |
|---|---|---|---|---|
| GTA V (2015) | 163.4 | 153.8 | 65.7 | 26 |
| The Witcher 3 (2015) | 155.1 | 99 | 50.9 | 30.8 |
| Dota 2 Reborn (2015) | 161.2 | 124.8 | 96.8 | 87.4 |
| Final Fantasy XV Benchmark (2018) | 80.8 | 39.3 | 29.3 | |
| X-Plane 11.11 (2018) | 65.9 | 47.3 | 39.7 | |
| Far Cry 5 (2018) | 86 | 49 | 45 | 43 |
| Strange Brigade (2018) | 167.7 | 67.9 | 57.9 | 48.8 |
| Tiny Tina's Wonderlands (2022) | 74.6 | 52.2 | 36.6 | 29.5 |
| F1 22 (2022) | 99.8 | 85.9 | 66.7 | 18.4 |
| Baldur's Gate 3 (2023) | 40.5 | 33.7 | 28.1 | 27 |
| Cyberpunk 2077 (2023) | 46.3 | 35.2 | 27.7 | 24.5 |
Emisiones - Sin miedo a hacer ruido
Ruido del sistema
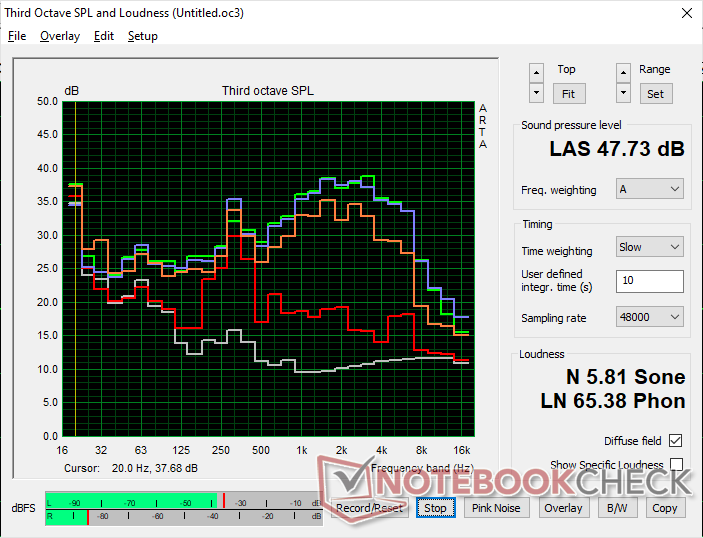
El ruido del ventilador siempre está presente en una base de 31,3 dB(A) frente a un fondo silencioso de 23,2 dB(A), lo que automáticamente hace que el NucBox K6 sea más ruidoso que la mayoría de los portátiles que funcionan con CPU de la serie U. Sin embargo, tenga en cuenta que los usuarios normalmente se sientan más lejos de los mini PC en comparación con los portátiles, por lo que los niveles de ruido pueden ser menos perceptibles en general. El sistema se vuelve ligeramente más ruidoso con 33,4 dB(A) si se realiza streaming de vídeo o se navega por la web, pero cualquier cambio en las RPM es afortunadamente constante y sin picos repentinos.
Ejecutar cargas más exigentes como juegos induciría un ruido del ventilador de entre 44 y 48 dB(A) más perceptible y casi tan alto como el de algunos portátiles para juegos como el MSI Stealth GS66. Curiosamente, el rango de ruido del ventilador y su comportamiento casi coincide con lo que observamos en el Geekom A7.
Ruido
| Ocioso |
| 31.3 / 31.3 / 33.4 dB(A) |
| Carga |
| 47.5 / 47.7 dB(A) |
 | ||
30 dB silencioso 40 dB(A) audible 50 dB(A) ruidosamente alto |
||
min: | ||
| GMK NucBox K6 Radeon 780M, R7 7840HS, MasonSemi 1TB MC7000 | GMK NucBox K3 Pro UHD Graphics 64EUs, i7-12650H, Lexar NM610 Pro NM610P001T-HNNNG | Intel NUC 13 Pro Desk Edition Kit Iris Xe G7 96EUs, i7-1360P, Samsung PM9A1 MZVL2512HCJQ | Beelink SER5 Vega 6, R5 5560U, Crucial P3 Plus CT1000P3PSSD8 | AcePC Wizbox AI Arc 8-Core, Ultra 7 155H, Rayson RS512GSSD710 512 GB PCIe 4.0 NVMe | Geekom A7 Radeon 780M, R9 7940HS, Acer N5000 | |
|---|---|---|---|---|---|---|
| Noise | 15% | 8% | 26% | 19% | -1% | |
| apagado / medio ambiente * (dB) | 23.2 | 23.1 -0% | 25.2 -9% | 23.7 -2% | 23.54 -1% | 25.4 -9% |
| Idle Minimum * (dB) | 31.3 | 25 20% | 28.1 10% | 23.9 24% | 23.54 25% | 33.3 -6% |
| Idle Average * (dB) | 31.3 | 25.5 19% | 28.2 10% | 23.9 24% | 24.9 20% | 33.6 -7% |
| Idle Maximum * (dB) | 33.4 | 25.5 24% | 28.3 15% | 23.9 28% | 24.9 25% | 33.7 -1% |
| Load Average * (dB) | 47.5 | 39.9 16% | 42 12% | 28 41% | 35.78 25% | 43.3 9% |
| Witcher 3 ultra * (dB) | 43.6 | 39.9 8% | 27.6 37% | 43.2 1% | ||
| Load Maximum * (dB) | 47.7 | 39.9 16% | 42.1 12% | 32.8 31% | 37.57 21% | 43.3 9% |
* ... más pequeño es mejor
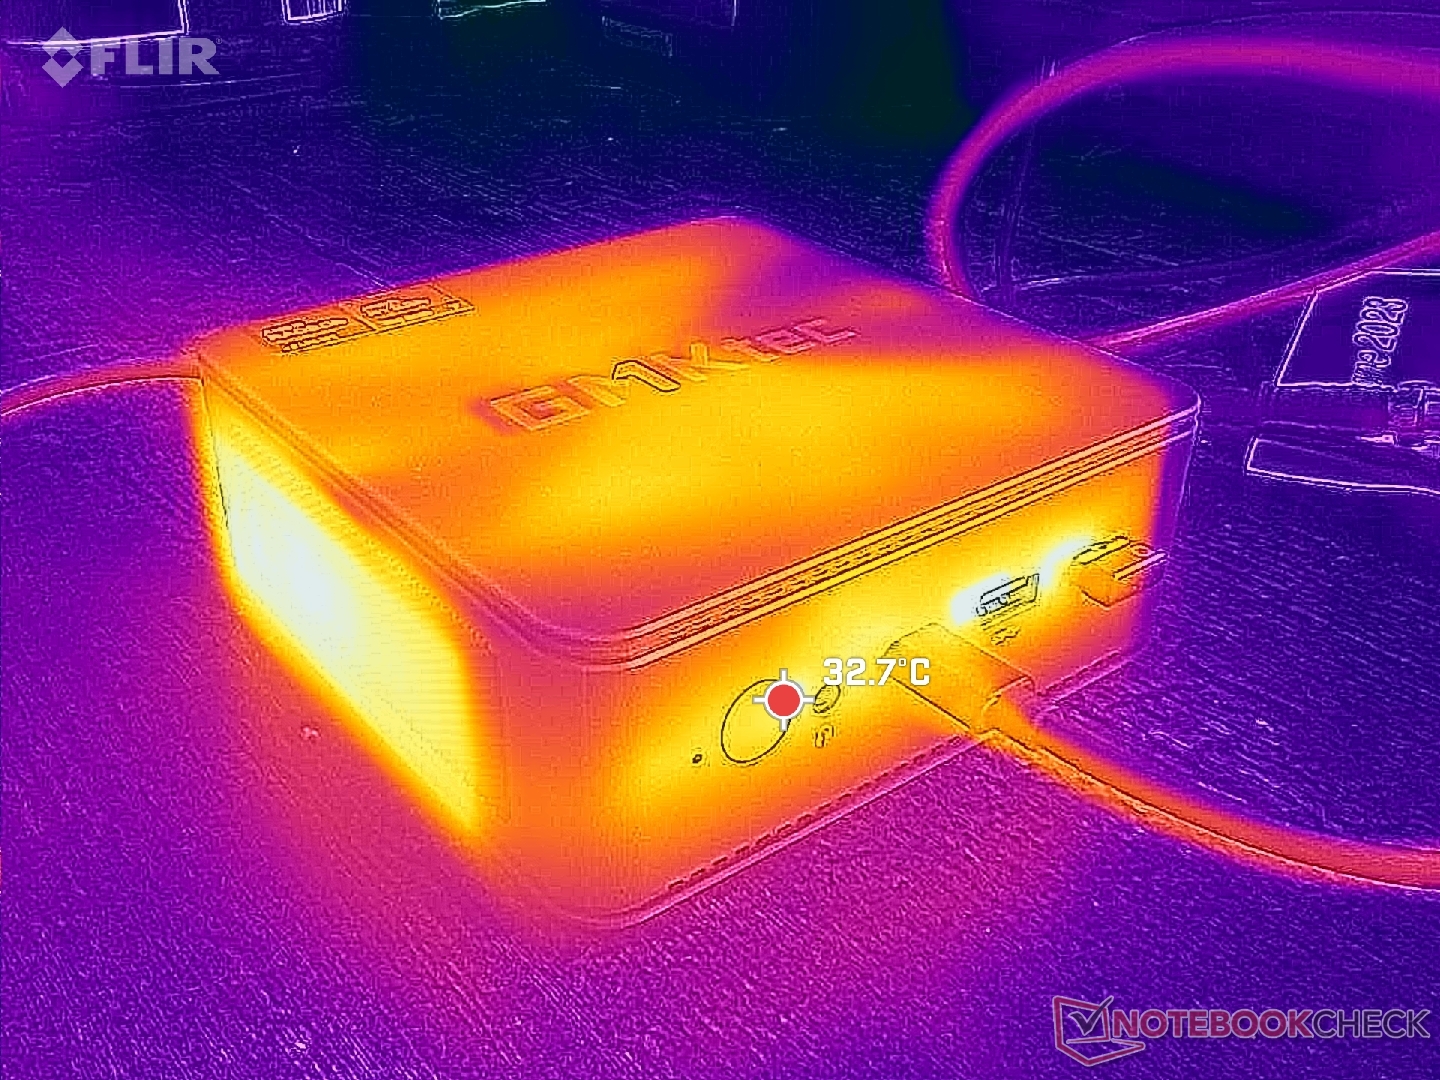
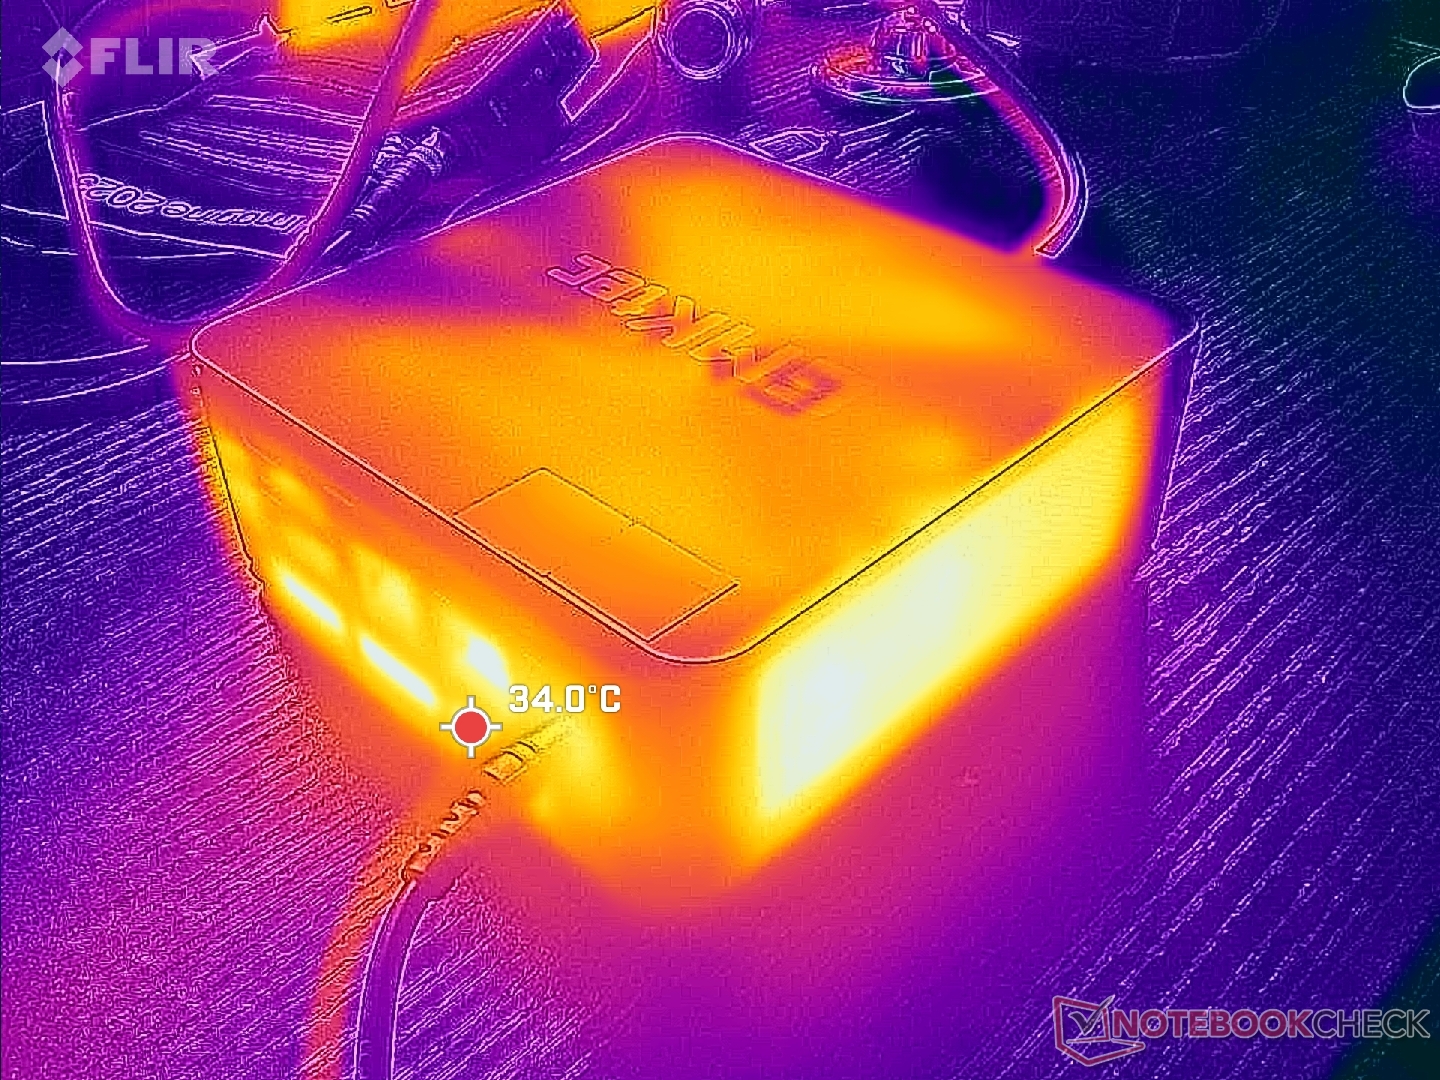
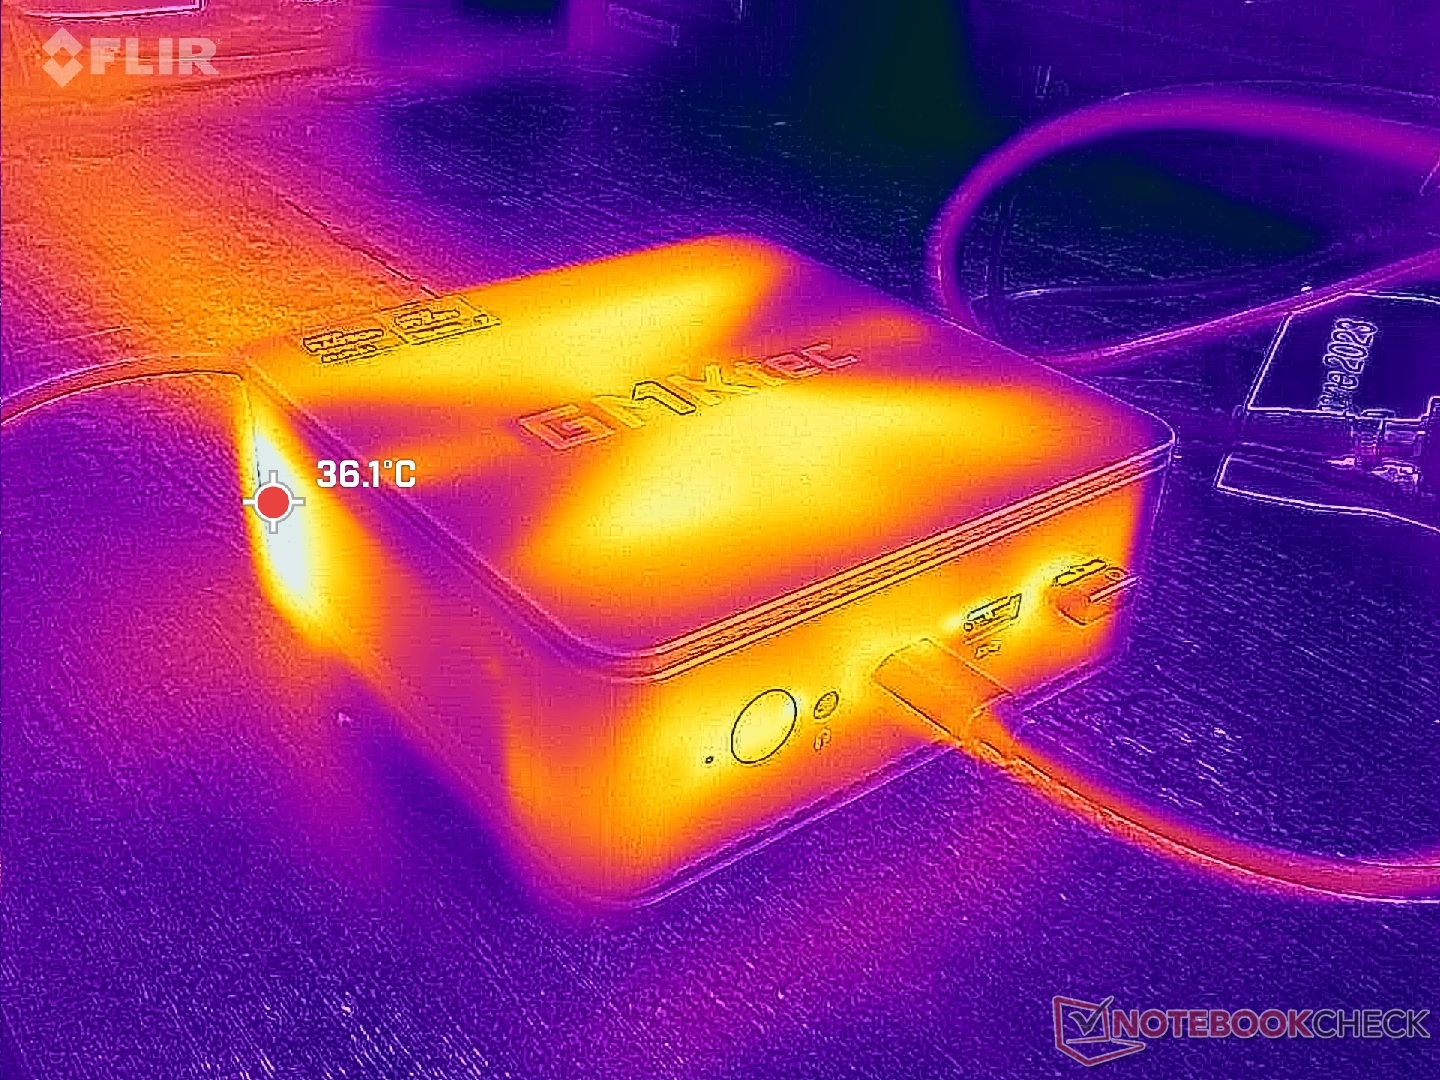
Temperatura
El aire fresco entra por la parte inferior y a lo largo del perímetro del borde superior, mientras que el escape sale por la parte trasera. Este diseño hace que la unidad sea más amigable para posiciones horizontales o verticales sin impedir el flujo de aire.
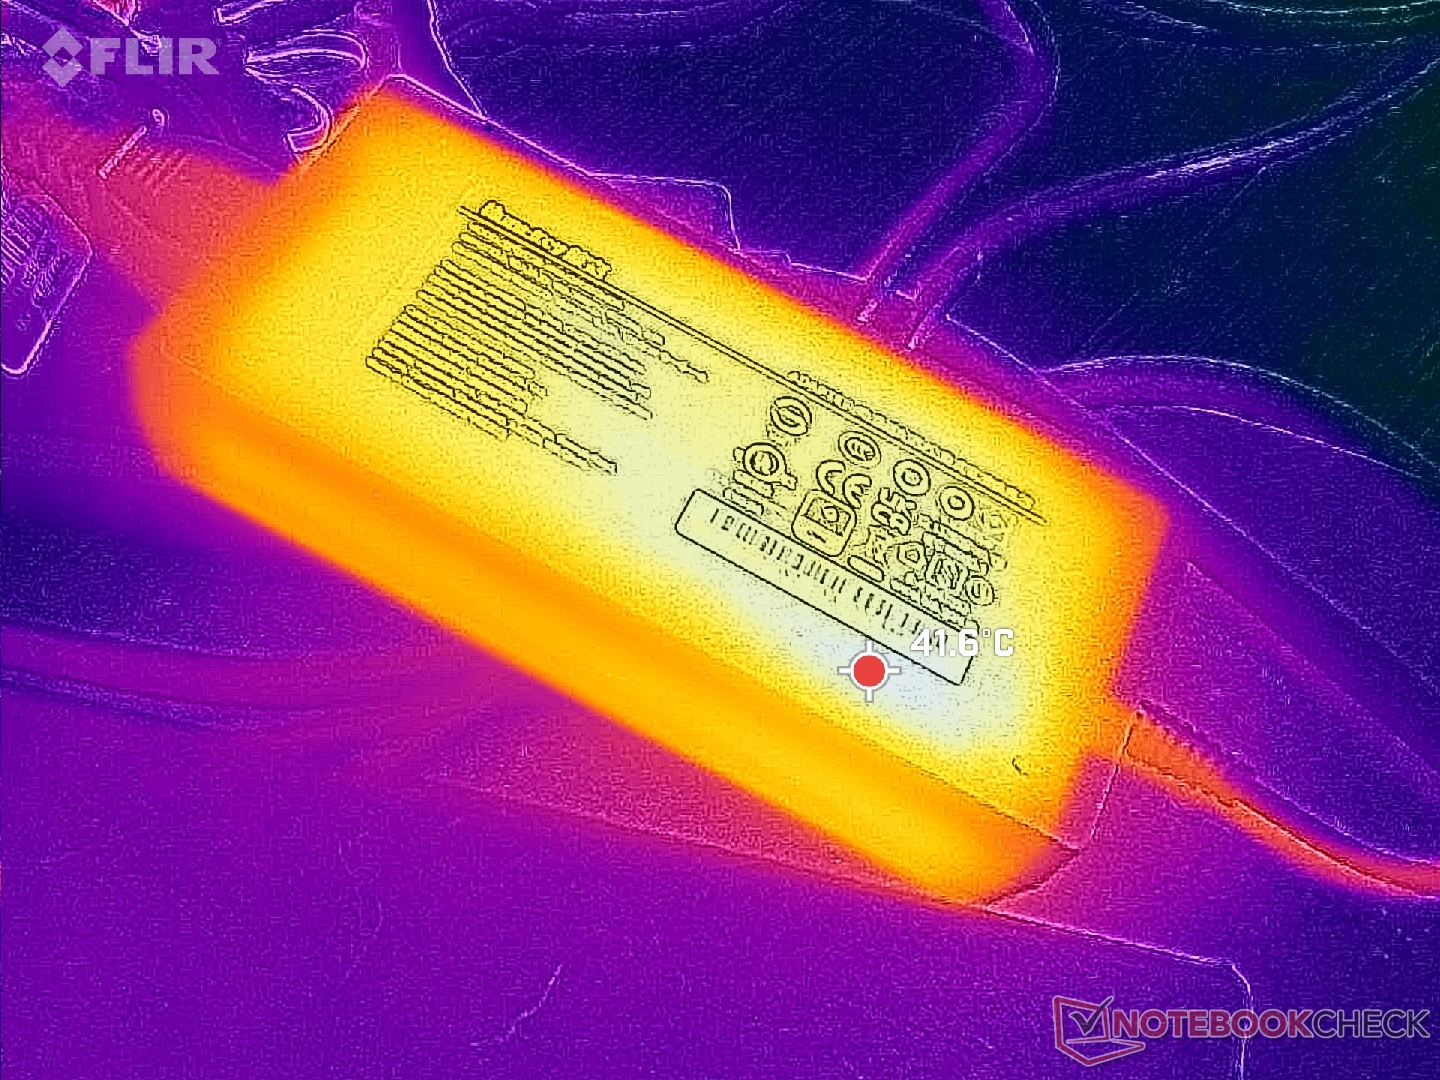
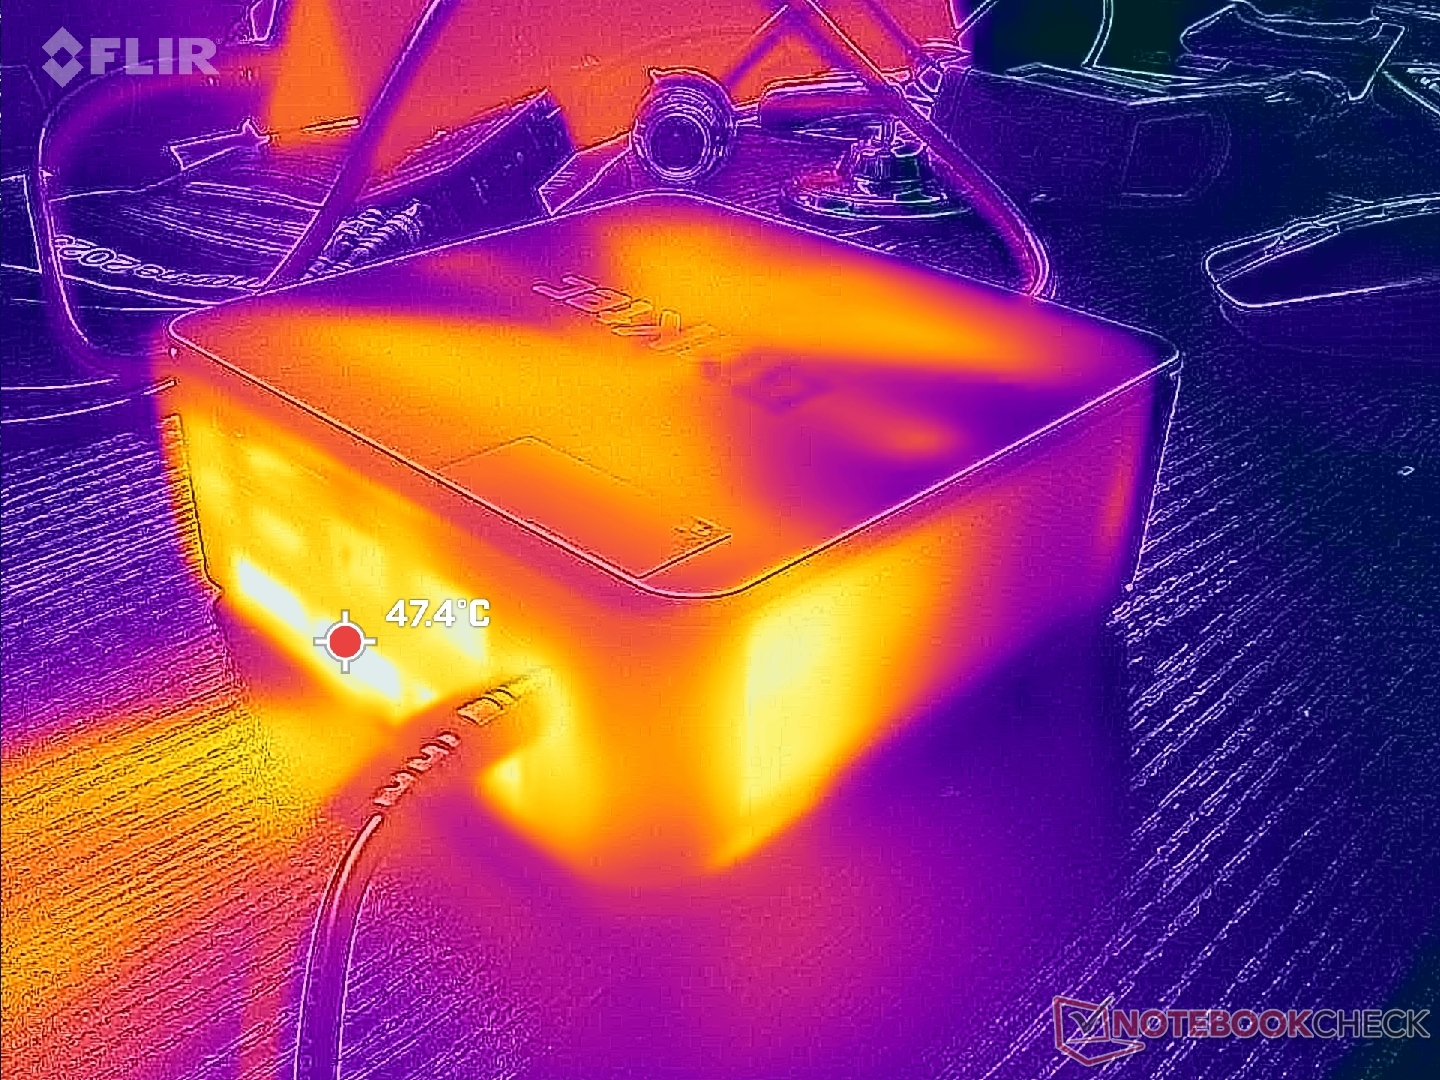
El adaptador de CA puede alcanzar más de 42 C cuando se utilizan cargas exigentes durante periodos prolongados.
Gestión de la energía
Consumo de energía
El sistema consume unos 73 W cuando juega, lo que es relativamente alto para un mini PC con sólo gráficos integrados. El NUC 13 Pro, más lento, por ejemplo, demandaría sólo 45 W en condiciones similares. El elevado consumo está en consonancia con nuestras conclusiones anteriores relacionadas con la mayor envolvente de potencia del NucBox K6.
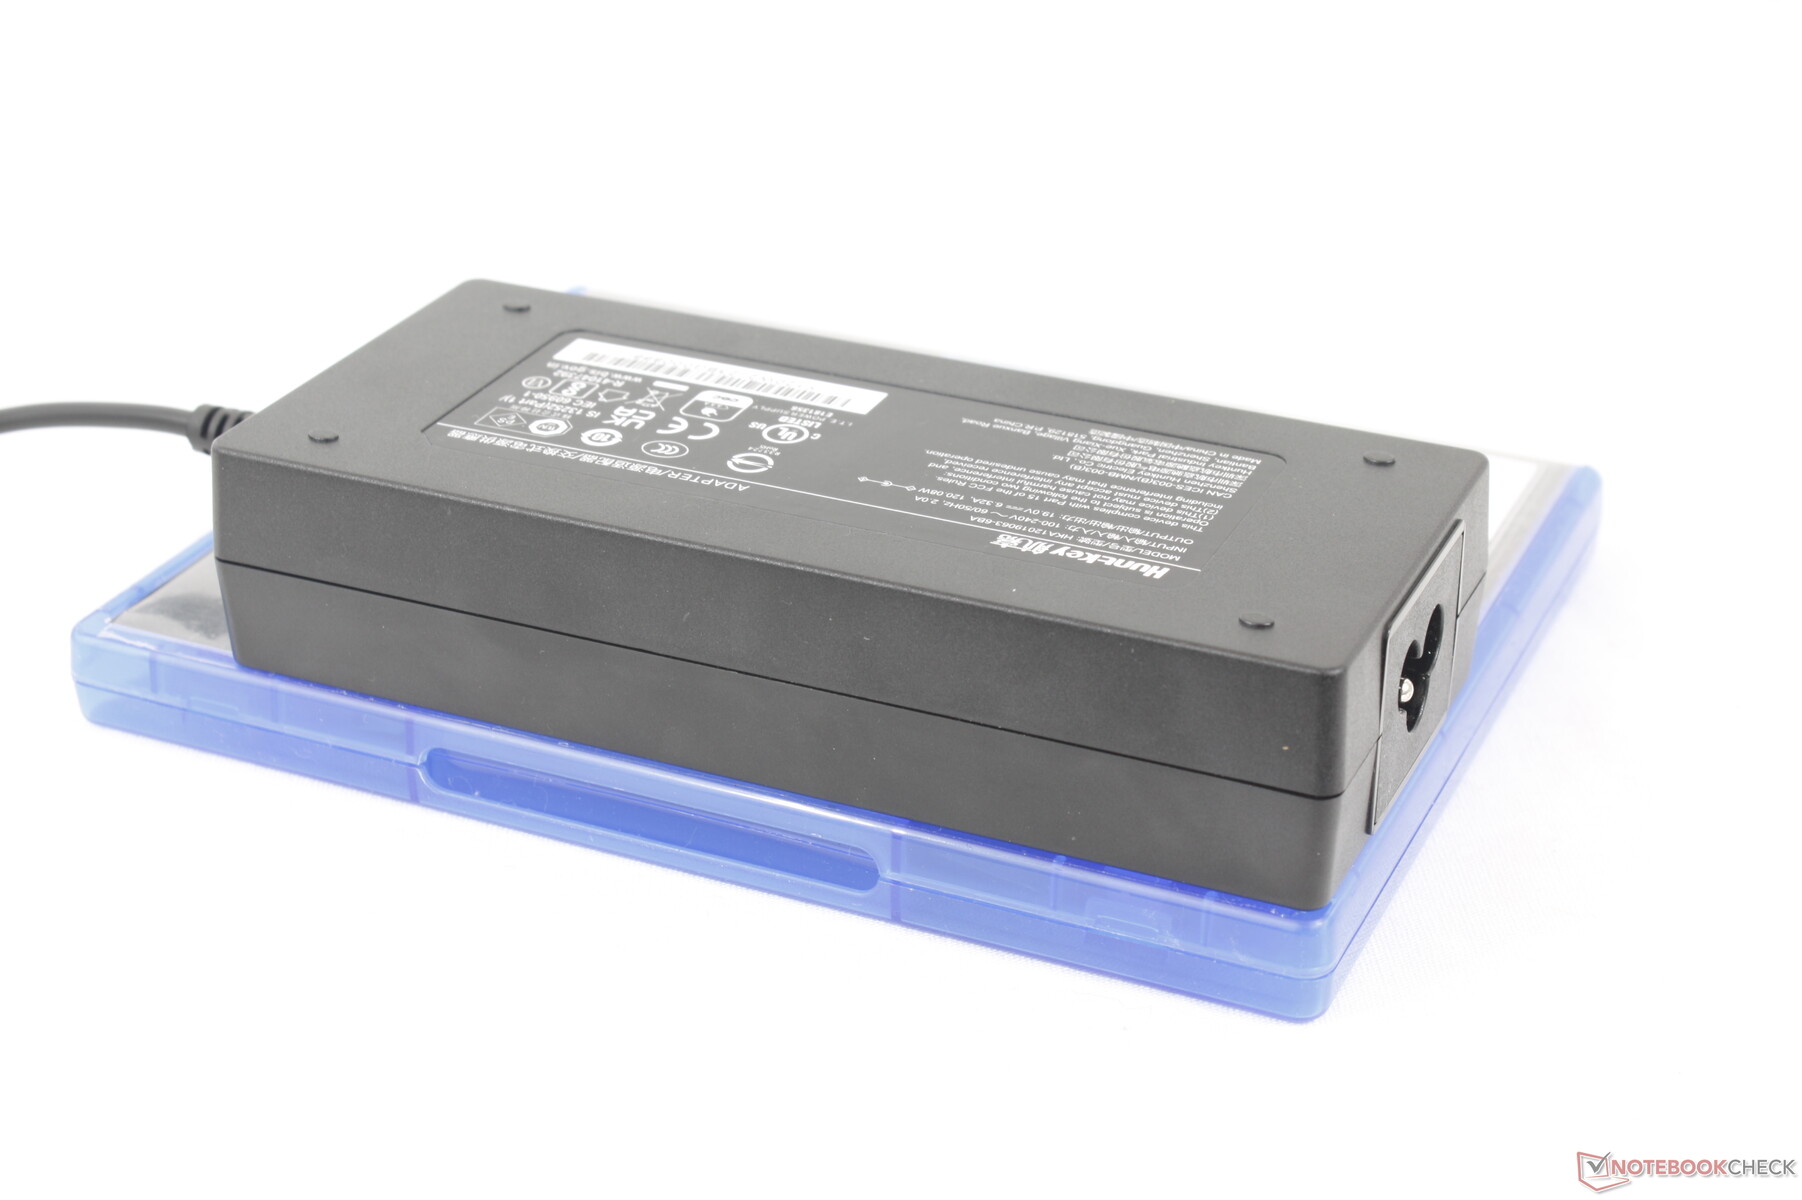
Somos capaces de registrar un consumo máximo de alrededor de 88 W desde el adaptador de CA de 130 W de tamaño medio (~ 14,9 x 6,3 x 3 cm) cuando la CPU está al 100 por ciento de utilización. La sobrecarga de energía se puede utilizar para dispositivos USB-C externos como los SSD.
(Nota del editor: Esta sección se actualizará cuando finalicen las reparaciones de nuestro multímetro Metrahit Energy. Rogamos disculpen las molestias)
| Off / Standby | |
| Ocioso | |
| Carga |
|
Clave:
min: | |
| GMK NucBox K6 R7 7840HS, Radeon 780M, MasonSemi 1TB MC7000, , x, | GMK NucBox K3 Pro i7-12650H, UHD Graphics 64EUs, Lexar NM610 Pro NM610P001T-HNNNG, , x, | Intel NUC 13 Pro Desk Edition Kit i7-1360P, Iris Xe G7 96EUs, Samsung PM9A1 MZVL2512HCJQ, , x, | Beelink SER5 R5 5560U, Vega 6, Crucial P3 Plus CT1000P3PSSD8, , x, | AcePC Wizbox AI Ultra 7 155H, Arc 8-Core, Rayson RS512GSSD710 512 GB PCIe 4.0 NVMe, , x, | Geekom A7 R9 7940HS, Radeon 780M, Acer N5000, , x, | |
|---|---|---|---|---|---|---|
| Power Consumption | -15% | -13% | 45% | -115% | 16% | |
| Idle Minimum * (Watt) | 6.7 | 7.1 -6% | 7 -4% | 4.4 34% | 7.23 -8% | 3.8 43% |
| Idle Average * (Watt) | 7 | 10.1 -44% | 9.2 -31% | 5 29% | 10 -43% | 4.8 31% |
| Idle Maximum * (Watt) | 7.6 | 18.6 -145% | 11.8 -55% | 5.3 30% | 49 -545% | 6.5 14% |
| Load Average * (Watt) | 74.3 | 45.3 39% | 45 39% | 29.8 60% | 53 29% | 71.9 3% |
| Witcher 3 ultra * (Watt) | 75 | 55.2 26% | 28.8 62% | |||
| Load Maximum * (Watt) | 85.7 | 52.9 38% | 97.2 -13% | 40.4 53% | 91 -6% | 94.7 -11% |
* ... más pequeño es mejor
Power Consumption Witcher 3 / Stresstest
Power Consumption external Monitor
Pro
Contra
Veredicto - Potente y relativamente barato
El NucBox K6 es uno de los mini PC más convincentes que hemos probado hasta ahora de GMK. Cumple varios requisitos clave, como un precio asequible de 500 dólares, un gran rendimiento de la CPU y la iGPU, memoria RAM y almacenamiento ampliables y un pequeño formato del tamaño de un NUC. Su rendimiento en particular es especialmente impresionante para la categoría ya que alternativas como el Intel NUC 13 Pro o Geekom A7 son más lentas, más caras o incluso ambas cosas.
El fuerte rendimiento y el atractivo precio eclipsan la corta lista de inconvenientes para hacer del GMK NucBox K6 una recomendación fácil para HTPC y para fines casuales de juego a 1080p.
Sólo hay algunos inconvenientes menores. El único puerto USB-C, por ejemplo, puede parecer limitante si tiene muchos accesorios o monitores que conectar. También nos gustaría ver un servicio sin herramientas similar al del Lenovo IdeaCentre Mini o ciertos NUC de Intel. También deberían solucionarse los problemas de latencia del CPD para una experiencia de reproducción de vídeo más fluida. Y, por último, un cambio a adaptadores de CA USB-C haría que el mini PC fuera más fácil de transportar y aumentaría la compatibilidad con los adaptadores USB-C existentes.
Precio y disponibilidad
GMKtec ya tiene a la venta el NucBox K6 a partir de 400 dólares el kit barebone o 500 dólares con 16 GB de RAM, 1 TB de SSD y Windows 11 Pro. Los códigos de cupón 'K6-0-NBC' y 'K6-2T-NBC' pueden aplicarse en la caja para los SKUs barebone y de 32 GB, respectivamente.
Alternativamente, Amazon también está enviando el NucBox K6.
GMK NucBox K6
- 04/03/2024 v7 (old)
Allen Ngo
Transparencia
La selección de los dispositivos que se van a reseñar corre a cargo de nuestro equipo editorial. La muestra de prueba fue proporcionada al autor en calidad de préstamo por el fabricante o el minorista a los efectos de esta reseña. El prestamista no tuvo ninguna influencia en esta reseña, ni el fabricante recibió una copia de la misma antes de su publicación. No había ninguna obligación de publicar esta reseña. Como empresa de medios independiente, Notebookcheck no está sujeta a la autoridad de fabricantes, minoristas o editores.
Así es como prueba Notebookcheck
Cada año, Notebookcheck revisa de forma independiente cientos de portátiles y smartphones utilizando procedimientos estandarizados para asegurar que todos los resultados son comparables. Hemos desarrollado continuamente nuestros métodos de prueba durante unos 20 años y hemos establecido los estándares de la industria en el proceso. En nuestros laboratorios de pruebas, técnicos y editores experimentados utilizan equipos de medición de alta calidad. Estas pruebas implican un proceso de validación en varias fases. Nuestro complejo sistema de clasificación se basa en cientos de mediciones y puntos de referencia bien fundamentados, lo que mantiene la objetividad.Price comparison

