Review de Schenker Key 15 (Clevo PC50DN2): Mucho rendimiento en una carcasa delgada y compacta

Con el Key 15, Schenker tiene en su gama un compacto y ligero portátil para juegos de 15,6 pulgadas equipado con un potente hardware. El dispositivo de prueba que se nos ha proporcionado está alimentado por un procesador Core i7-10875H octa-core y una GPU GeForce RTX 2080 Super Max-Q. El ordenador está basado en el PC50DN2 barebone de Clevo. Entre sus competidores se encuentran dispositivos como el MSI GS66 10SGS, el Aorus 15G XB, el Razer Blade 15 Advanced Model (2020), el Gigabyte Aero 15 XB y el Acer Predator Triton 500.
Valoración | Fecha | Modelo | Peso | Altura | Tamaño | Resolución | Precio |
|---|---|---|---|---|---|---|---|
| 84.5 % v7 (old) | 09/2020 | Schenker Key 15 Comet Lake i7-10875H, GeForce RTX 2080 Super Max-Q | 2 kg | 19.8 mm | 15.60" | 1920x1080 | |
| 84 % v7 (old) | 05/2020 | MSI GS66 10SGS i7-10750H, GeForce RTX 2080 Super Max-Q | 2.2 kg | 20 mm | 15.60" | 1920x1080 | |
| 86.5 % v7 (old) | 08/2020 | Aorus 15G XB i7-10875H, GeForce RTX 2070 Super Max-Q | 2.3 kg | 25 mm | 15.60" | 1920x1080 | |
| 85.9 % v7 (old) | 08/2020 | Razer Blade 15 RTX 2080 Super Max-Q i7-10875H, GeForce RTX 2080 Super Max-Q | 2.2 kg | 17.8 mm | 15.60" | 1920x1080 | |
| 85.8 % v7 (old) | 05/2020 | Gigabyte Aero 15 OLED XB-8DE51B0SP i7-10875H, GeForce RTX 2070 Super Max-Q | 2.2 kg | 20 mm | 15.60" | 3840x2160 | |
v (old) | 04/2020 | Acer Predator Triton 500 PT515-52-70N3 i7-10750H, GeForce RTX 2080 Super Max-Q | 2.1 kg | 18 mm | 15.60" | 1920x1080 |
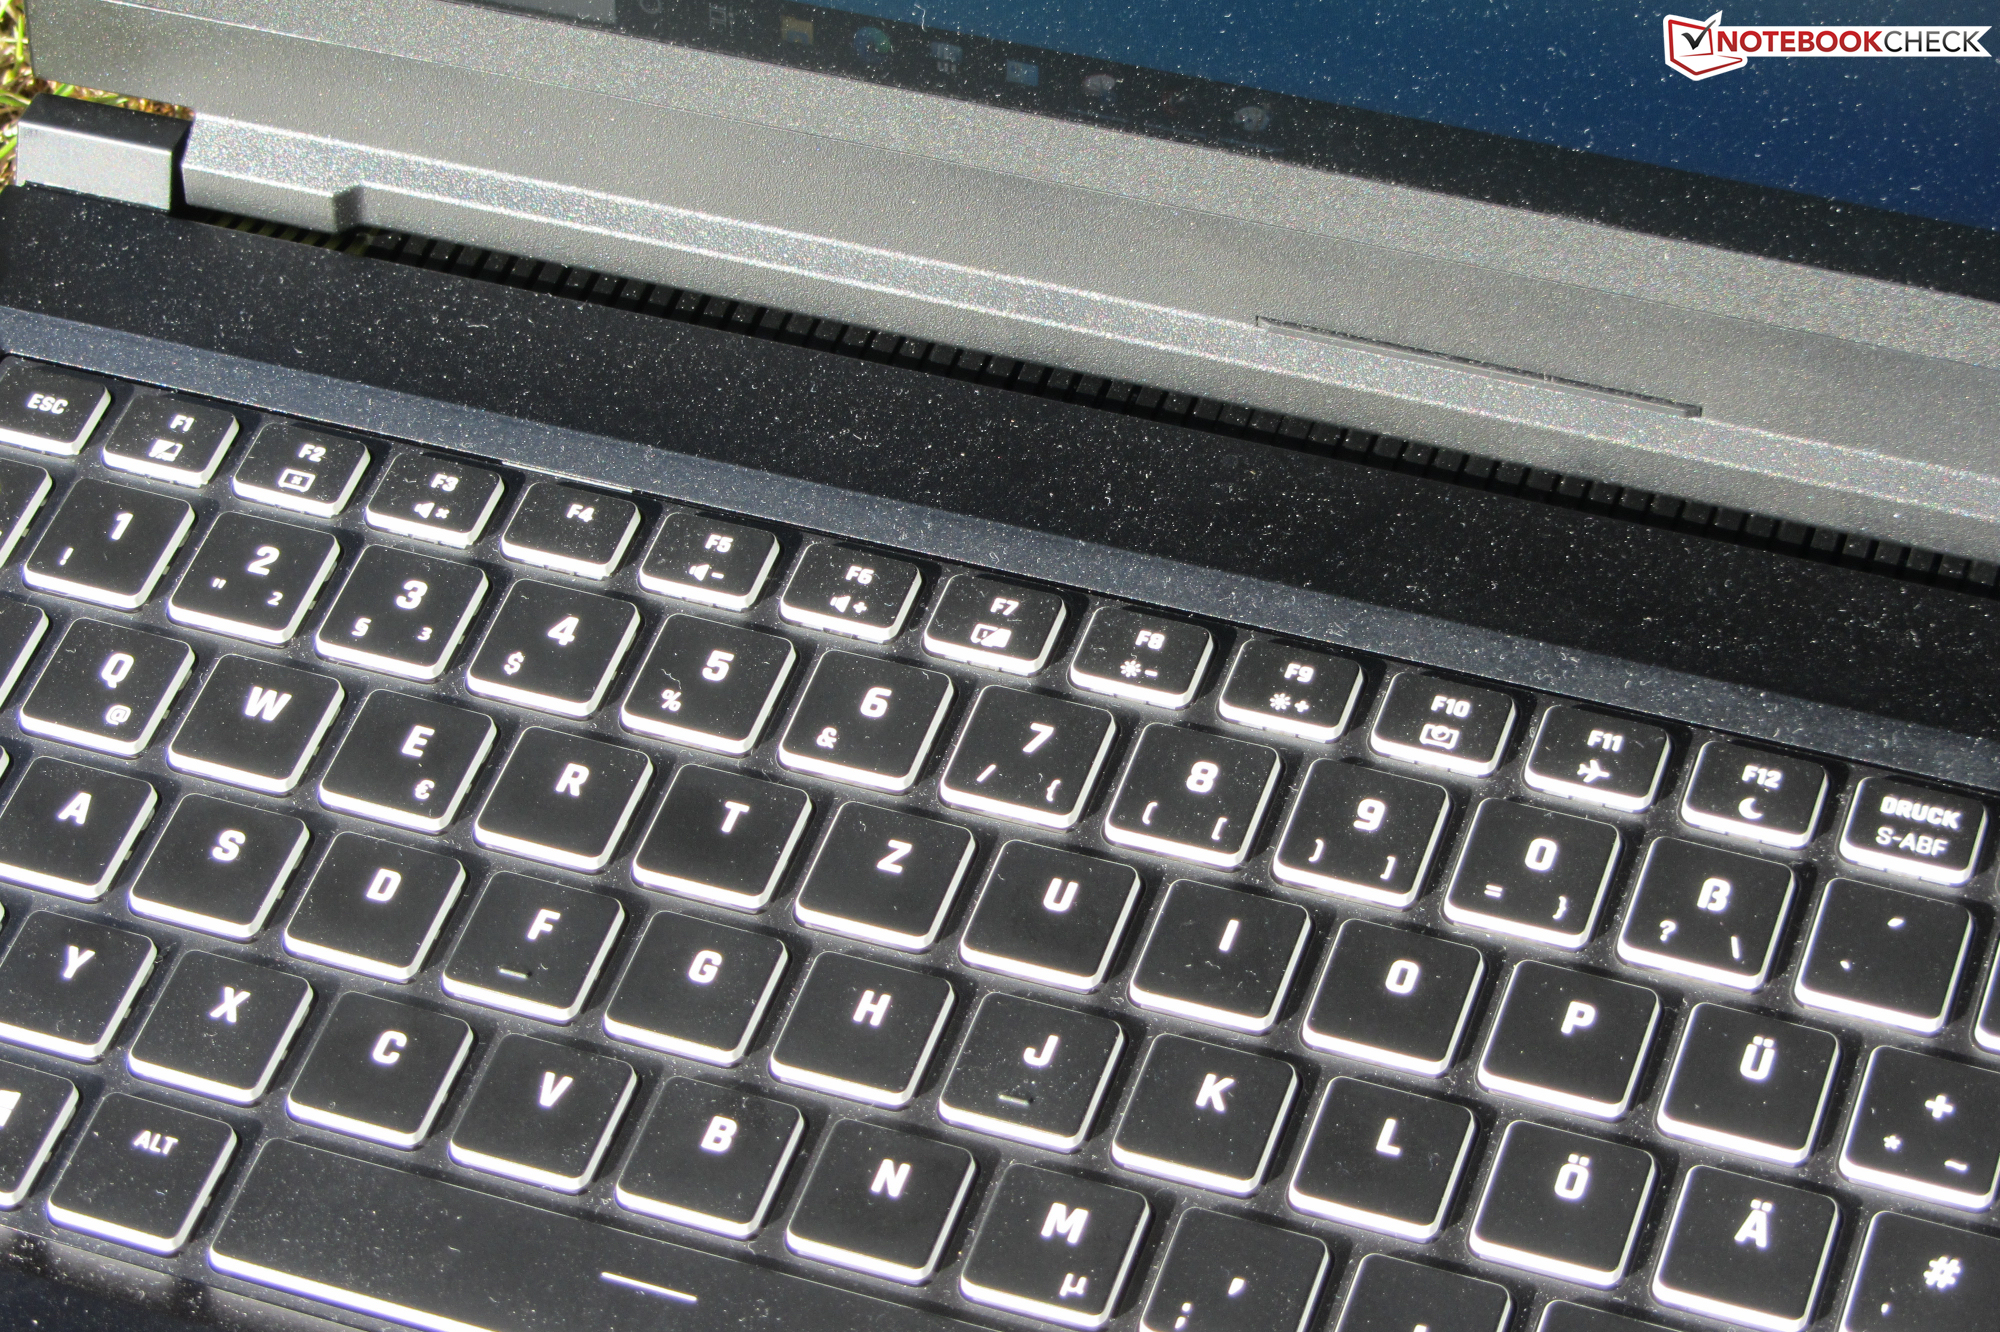
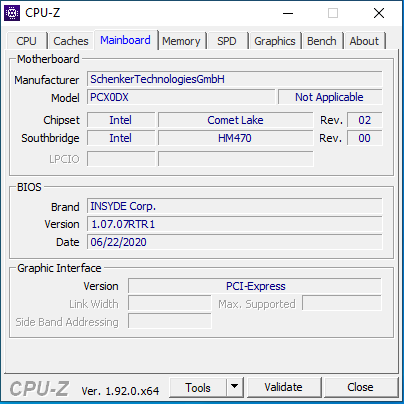
Carcasa - El Key 15 tiene un chasis de metal
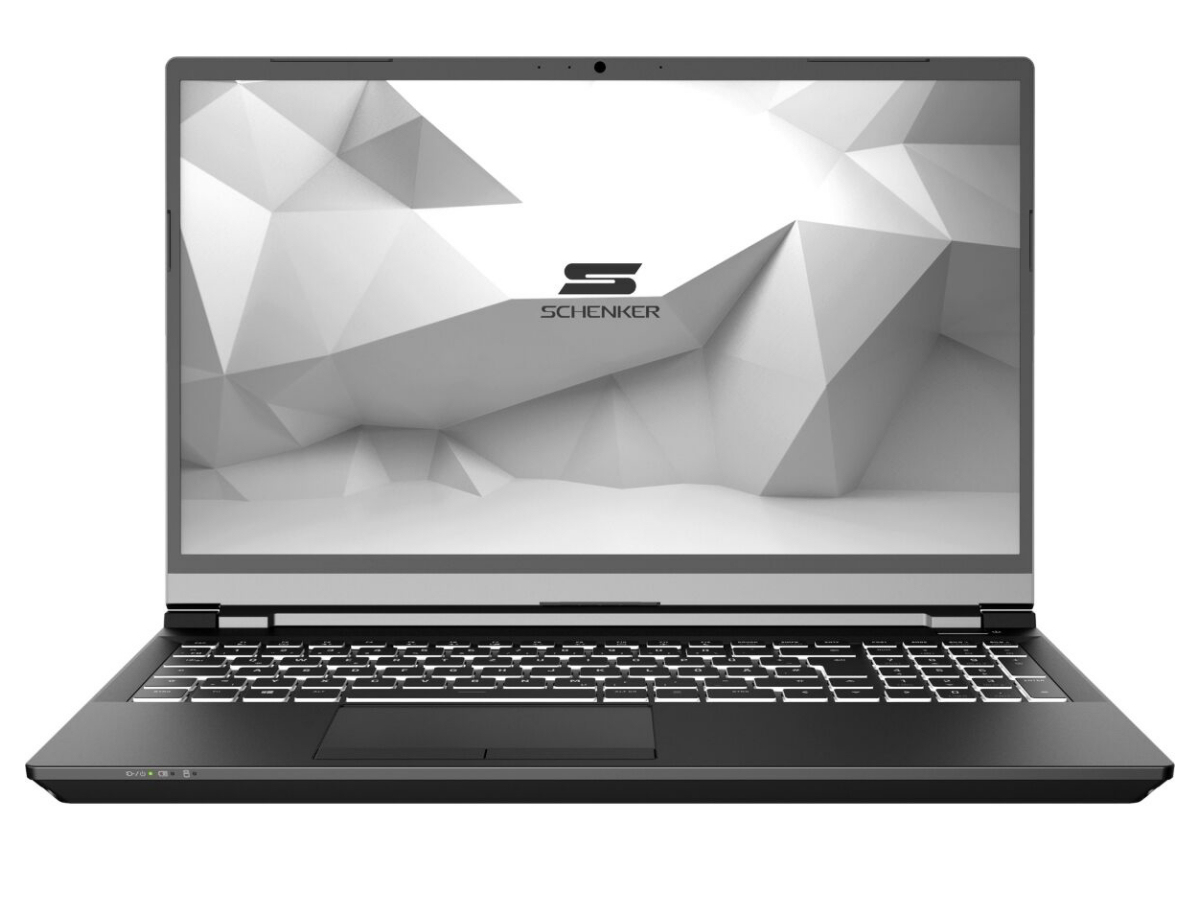
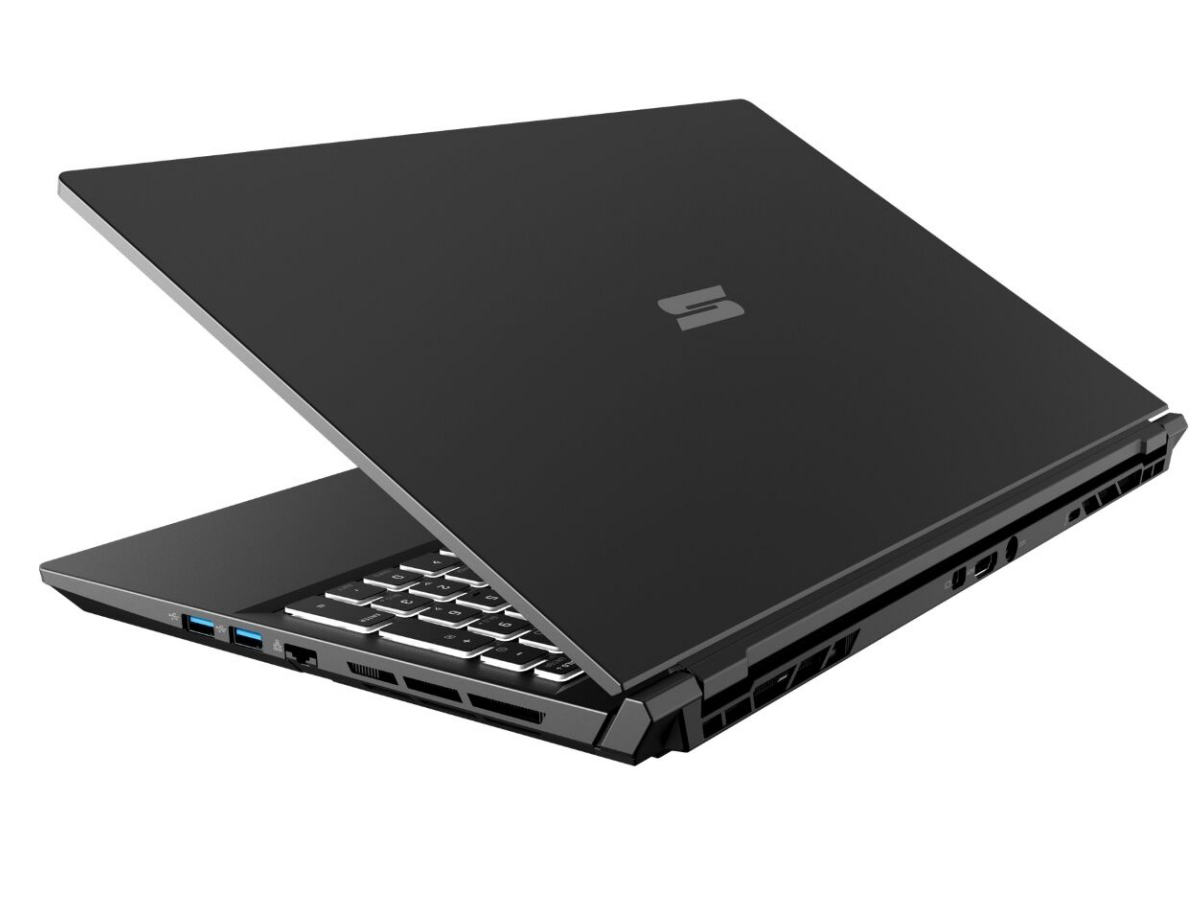
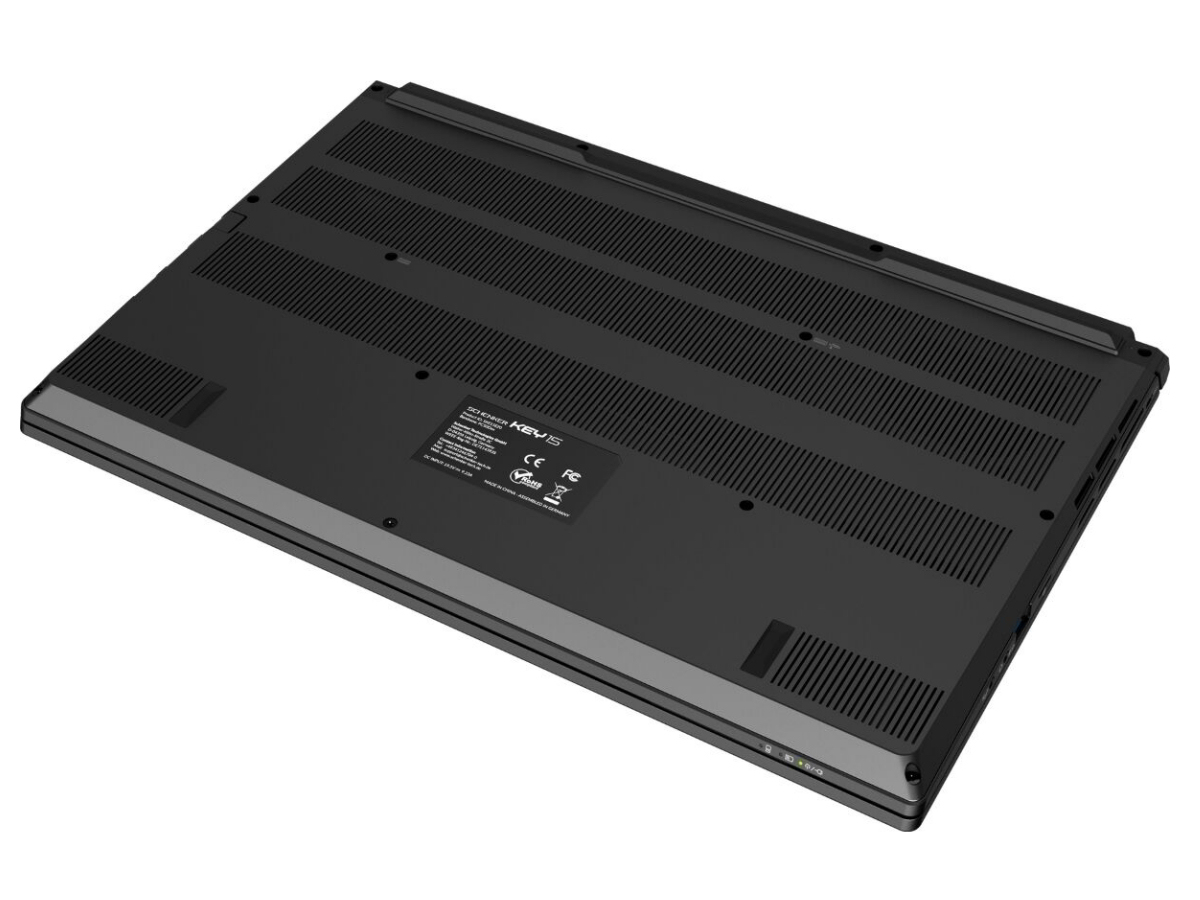
El término "discreto" describe el Key 15 bastante bien. Schenker ha elegido un aspecto sobrio y sin adornos. La apariencia del dispositivo no corresponde al típico esquema de un portátil de juego, sino a un elegante portátil de negocios. No llamaría la atención en ninguna oficina del mundo. Además, el chasis negro mate está hecho de metal. Sólo el bisel de la pantalla es de plástico. Además, la batería está firmemente instalada, y no hay escotilla de mantenimiento.
La carcasa muestra una buena mano de obra. Las dimensiones del hueco están en orden, y los bordes afilados no se notan. La unidad de base y la tapa en particular pueden ser retorcidas un poco demasiado. Un mayor grado de rigidez sería apropiado aquí. Además, ejercer presión en la parte trasera de la tapa no conduce a cambios en la imagen. Las bisagras mantienen la tapa firmemente en su posición, pero dejan que se tambalee un poco. El ángulo máximo de apertura es de unos 130°, y es posible abrir la tapa con una mano.
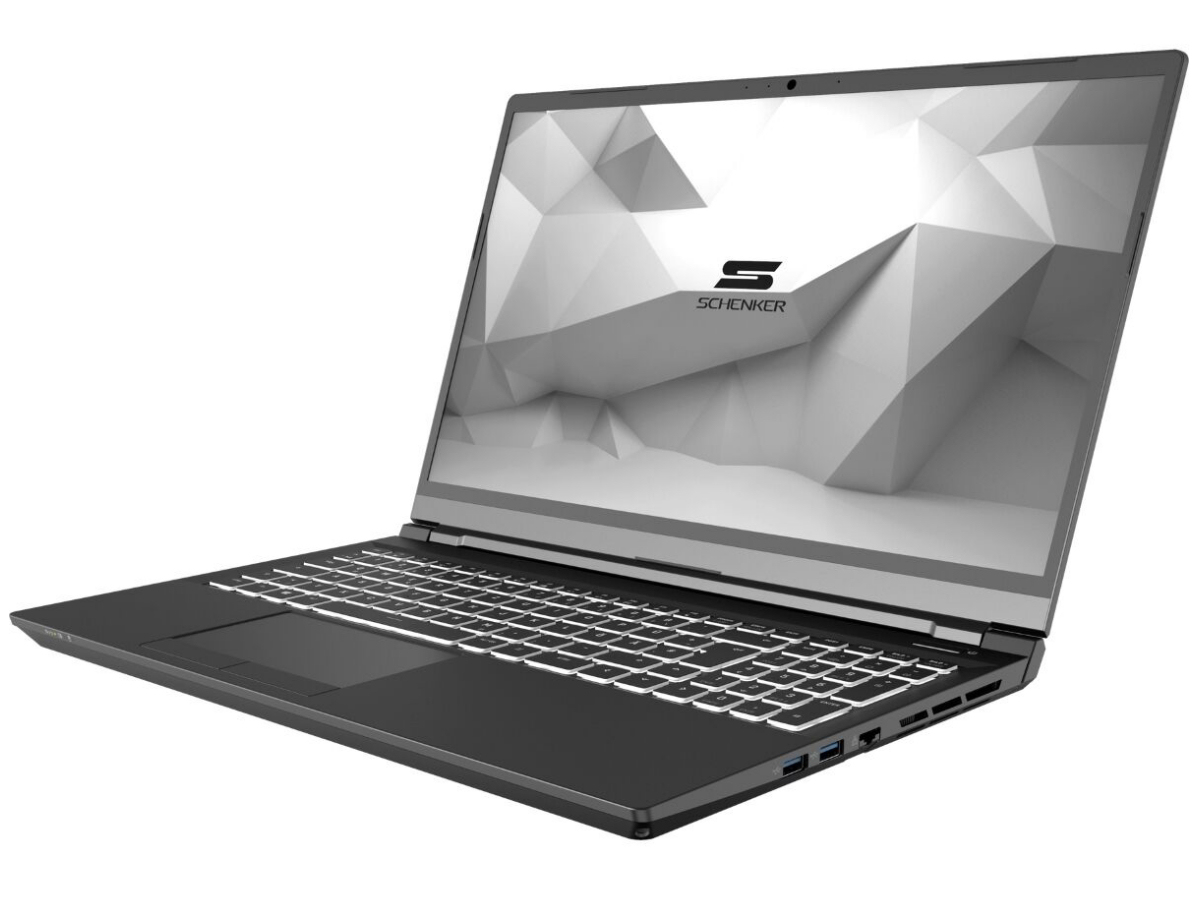

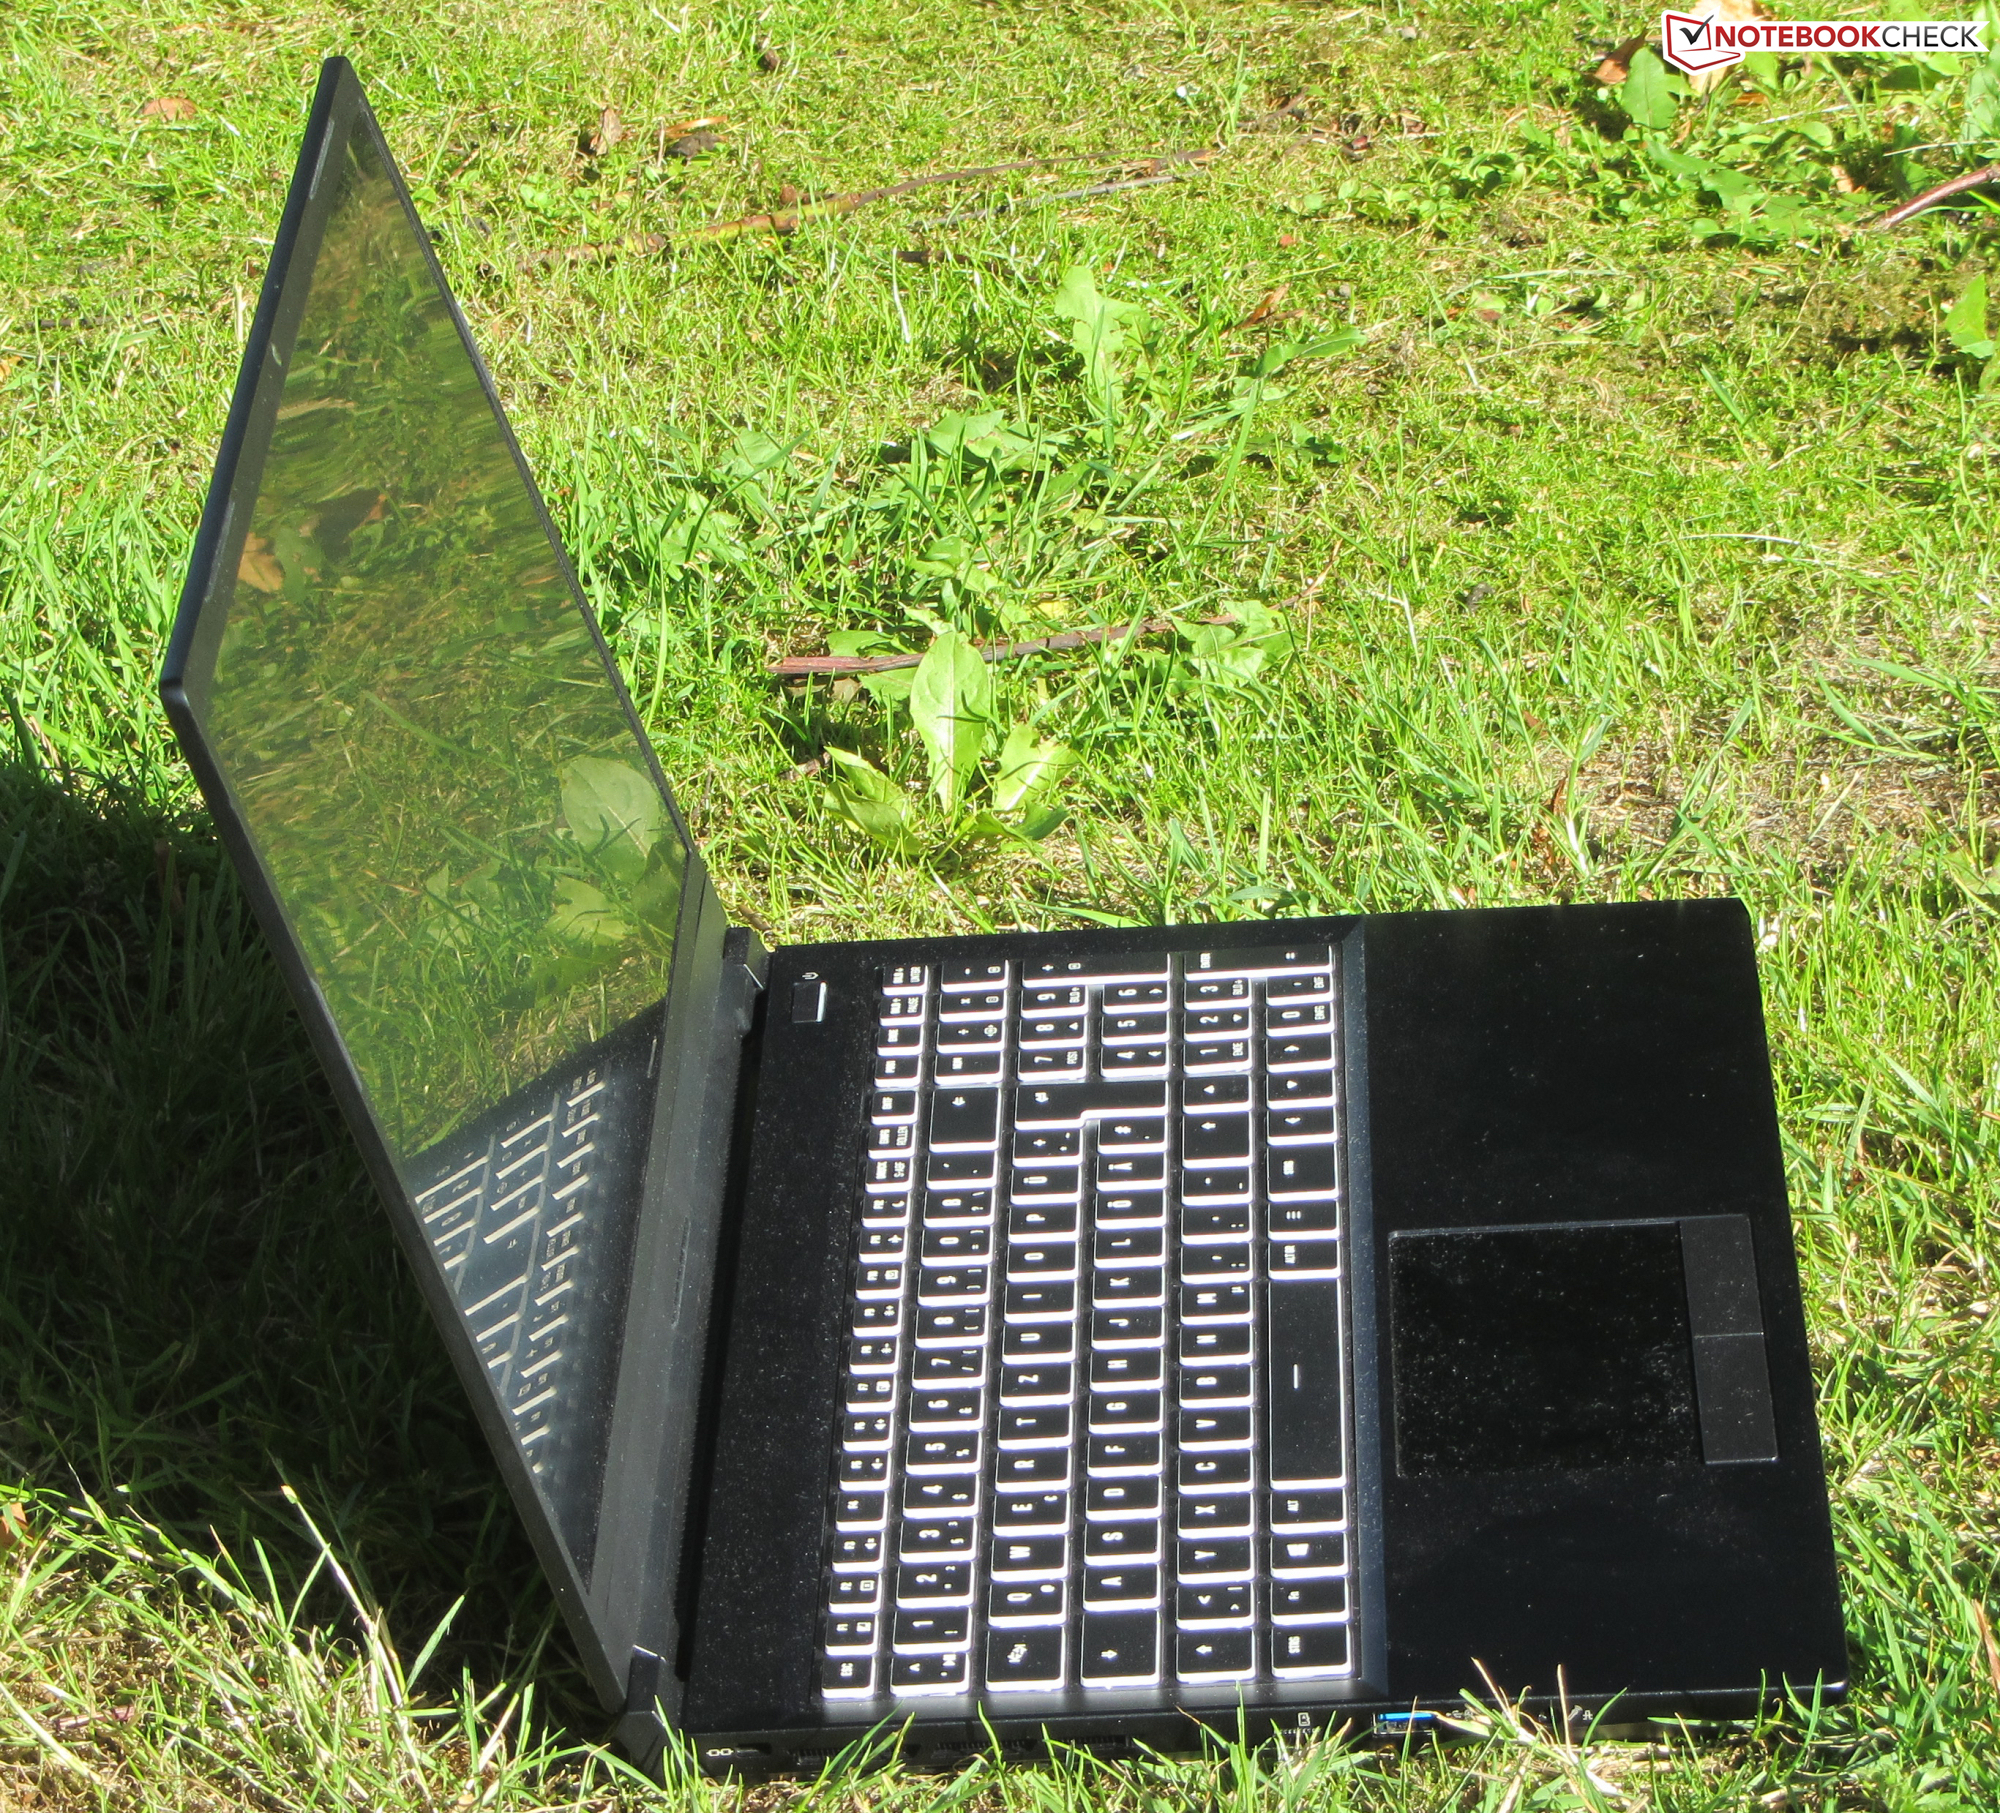
Dentro de nuestro campo de comparación, el Key es uno de los dispositivos más compactos. Sólo la Razer Blade 15 es un poco más pequeña. Con un peso de unos 2 kg, es el portátil más ligero.
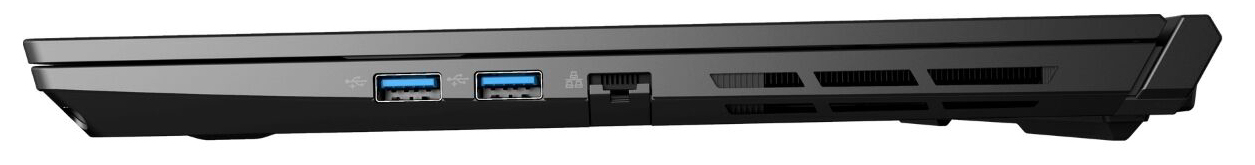
Conectividad - Thunderbolt 3 a bordo
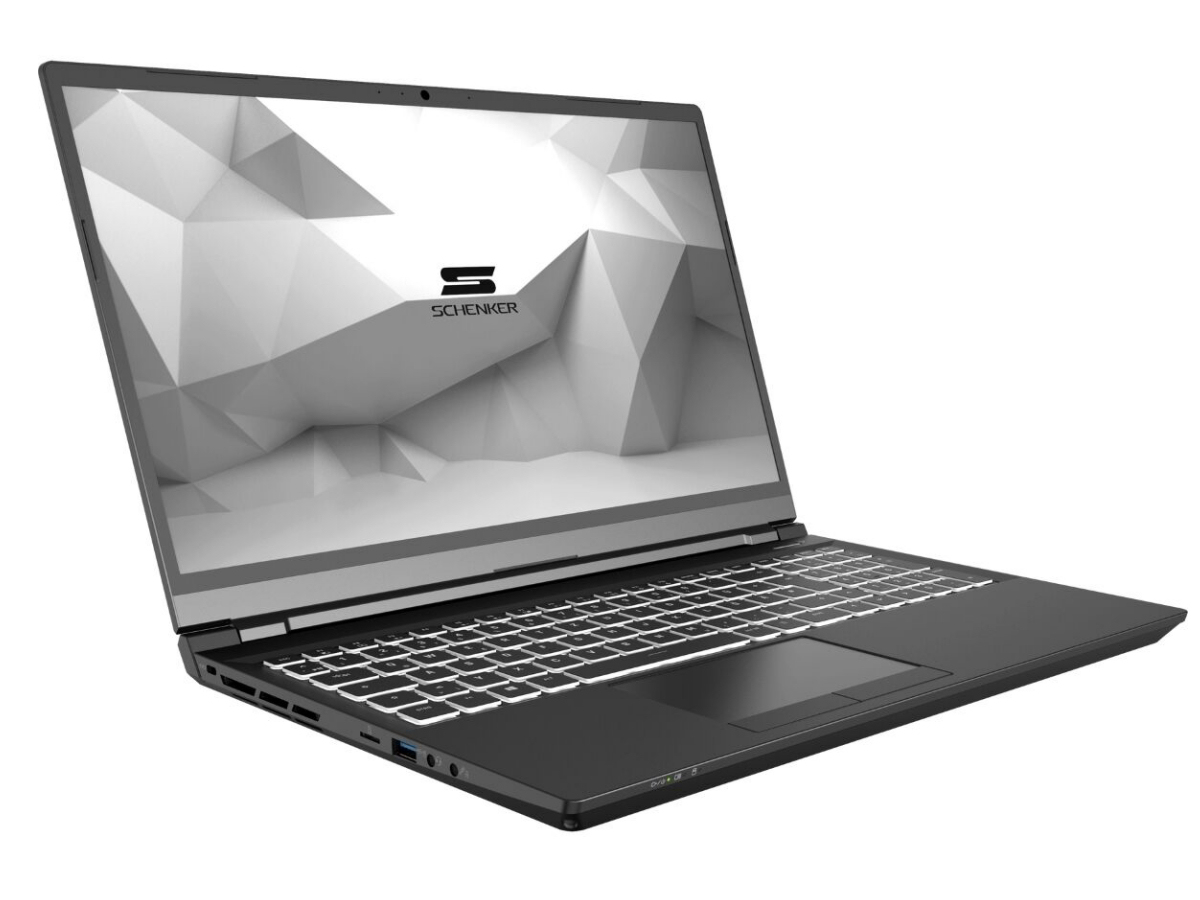
El Key 15 viene con un total de tres puertos USB tipo A (USB 3.2 Gen 1). Además, hay un puerto Thunderbolt 3 que soporta DisplayPort a través de USB-C. Junto con el puerto HDMI (versión 2.0) y el Mini DisplayPort (versión 1.4), el portátil tiene tres salidas de vídeo. Ambos DisplayPort son compatibles con G-Sync. Alternativamente, el puerto Thunderbolt 3 ofrece la posibilidad de conectar una solución de acoplamiento o una GPU externa. La configuración del puerto se completa con una conexión Gigabit Ethernet y dos puertos de audio.

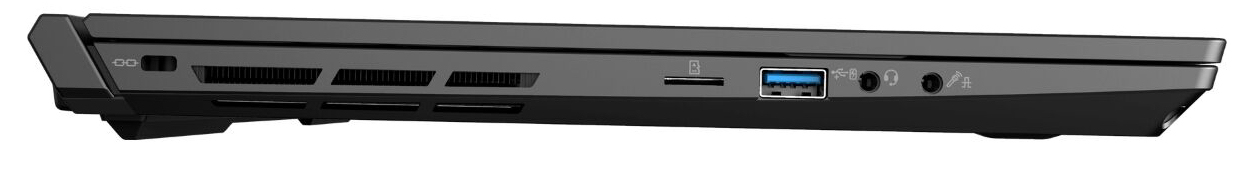
Lector de tarjetas SD
El Key no ofrece un lector de tarjetas de memoria SD completo. Se utiliza un modelo MicroSD.
Comunicación
El módulo WLAN utiliza un chip Intel (Wi-Fi 6 AX200) que soporta los estándares WLAN 802.11a/b/g/h/n/ac/ax. Las velocidades de transmisión determinadas en condiciones óptimas (ningún otro dispositivo WLAN cercano, corta distancia entre el portátil y el PC servidor) van de buenas a muy buenas. Las conexiones de red alámbrica se manejan con un chip Gigabit Ethernet de la conocida familia RTL8168/8111 de Realtek.
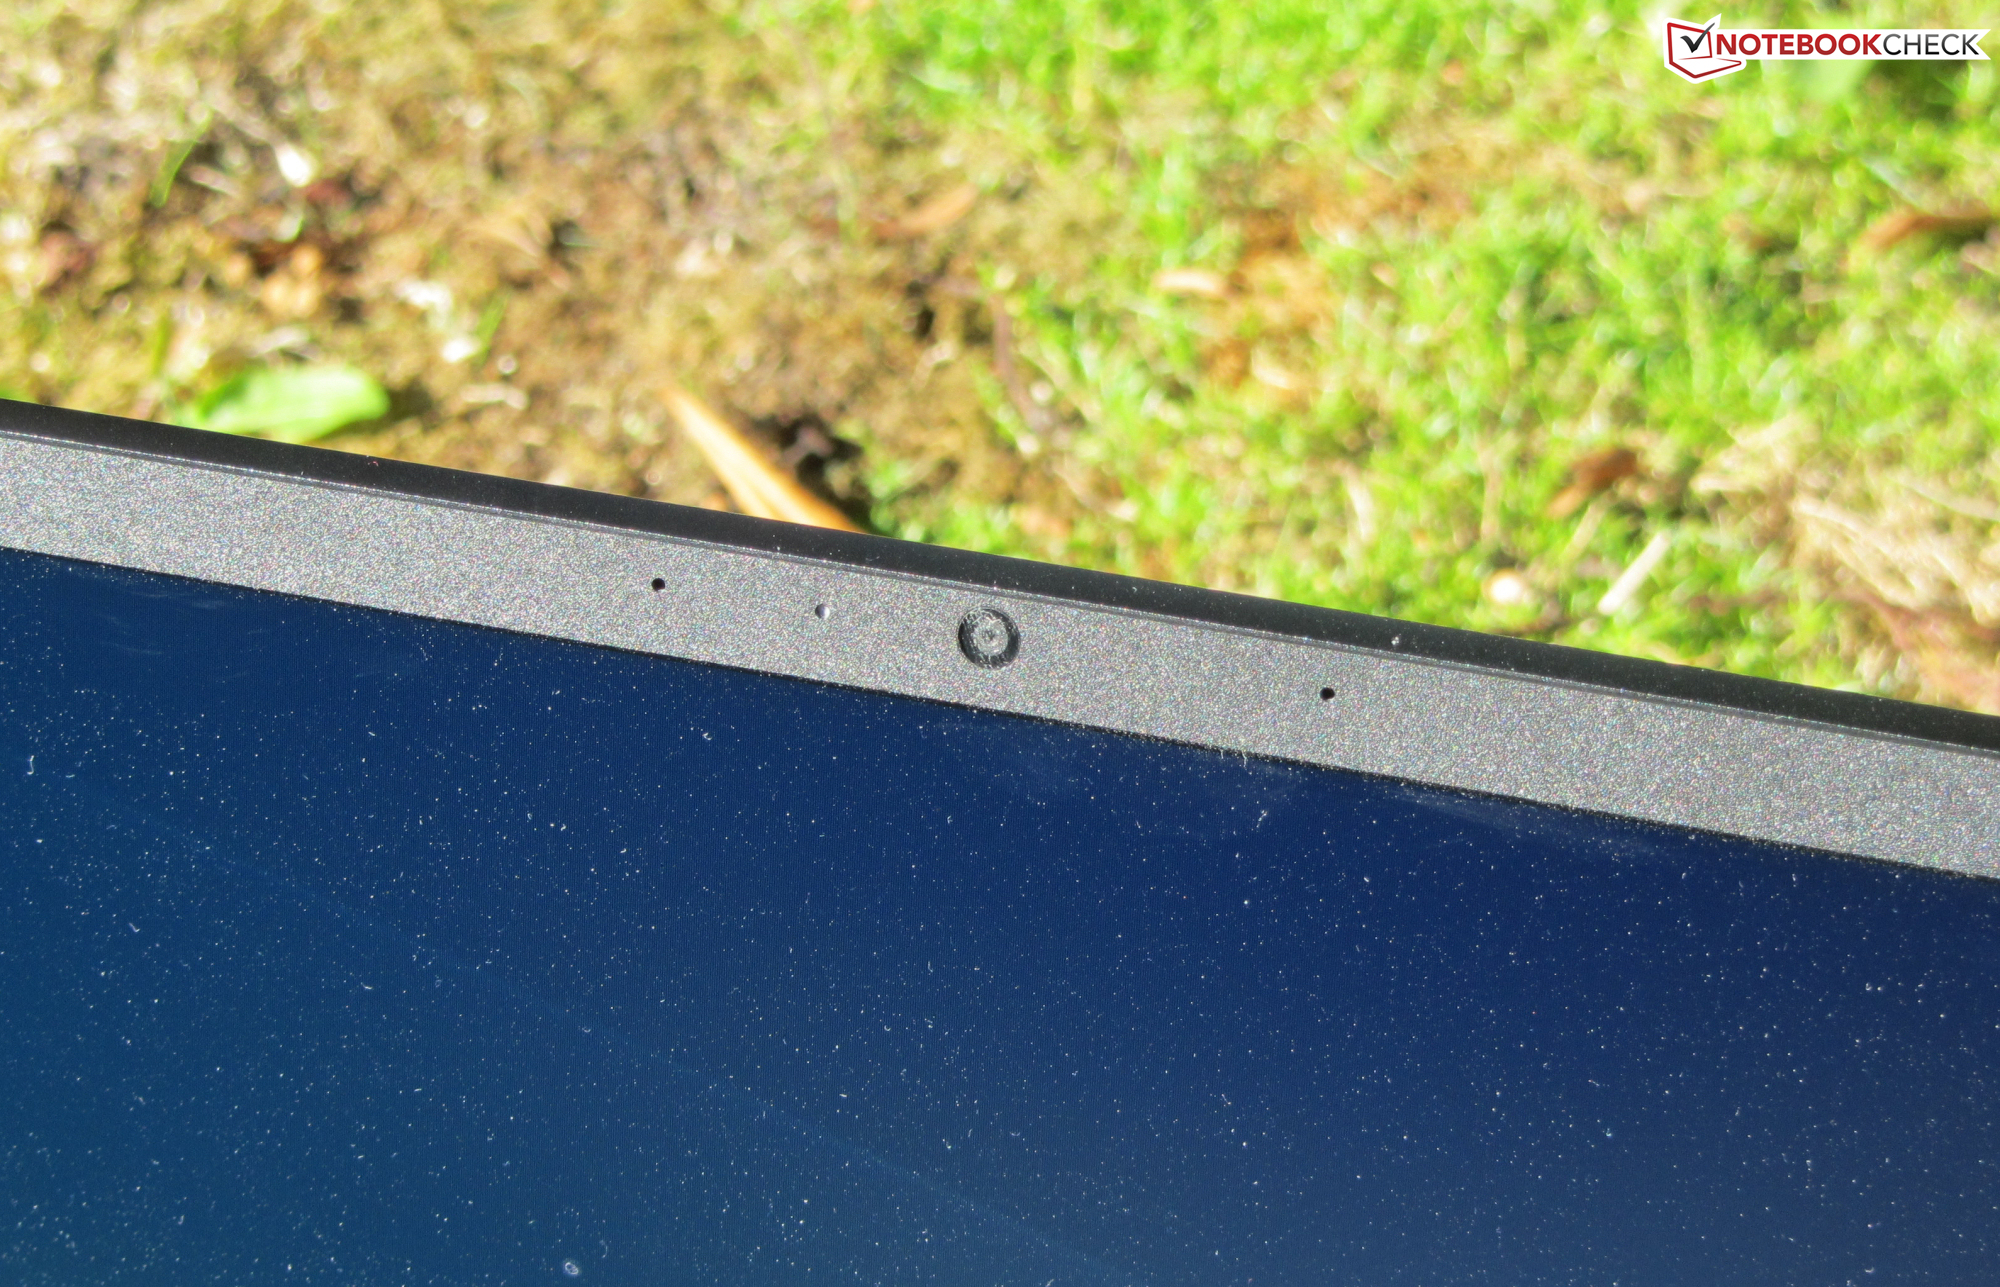
Webcam
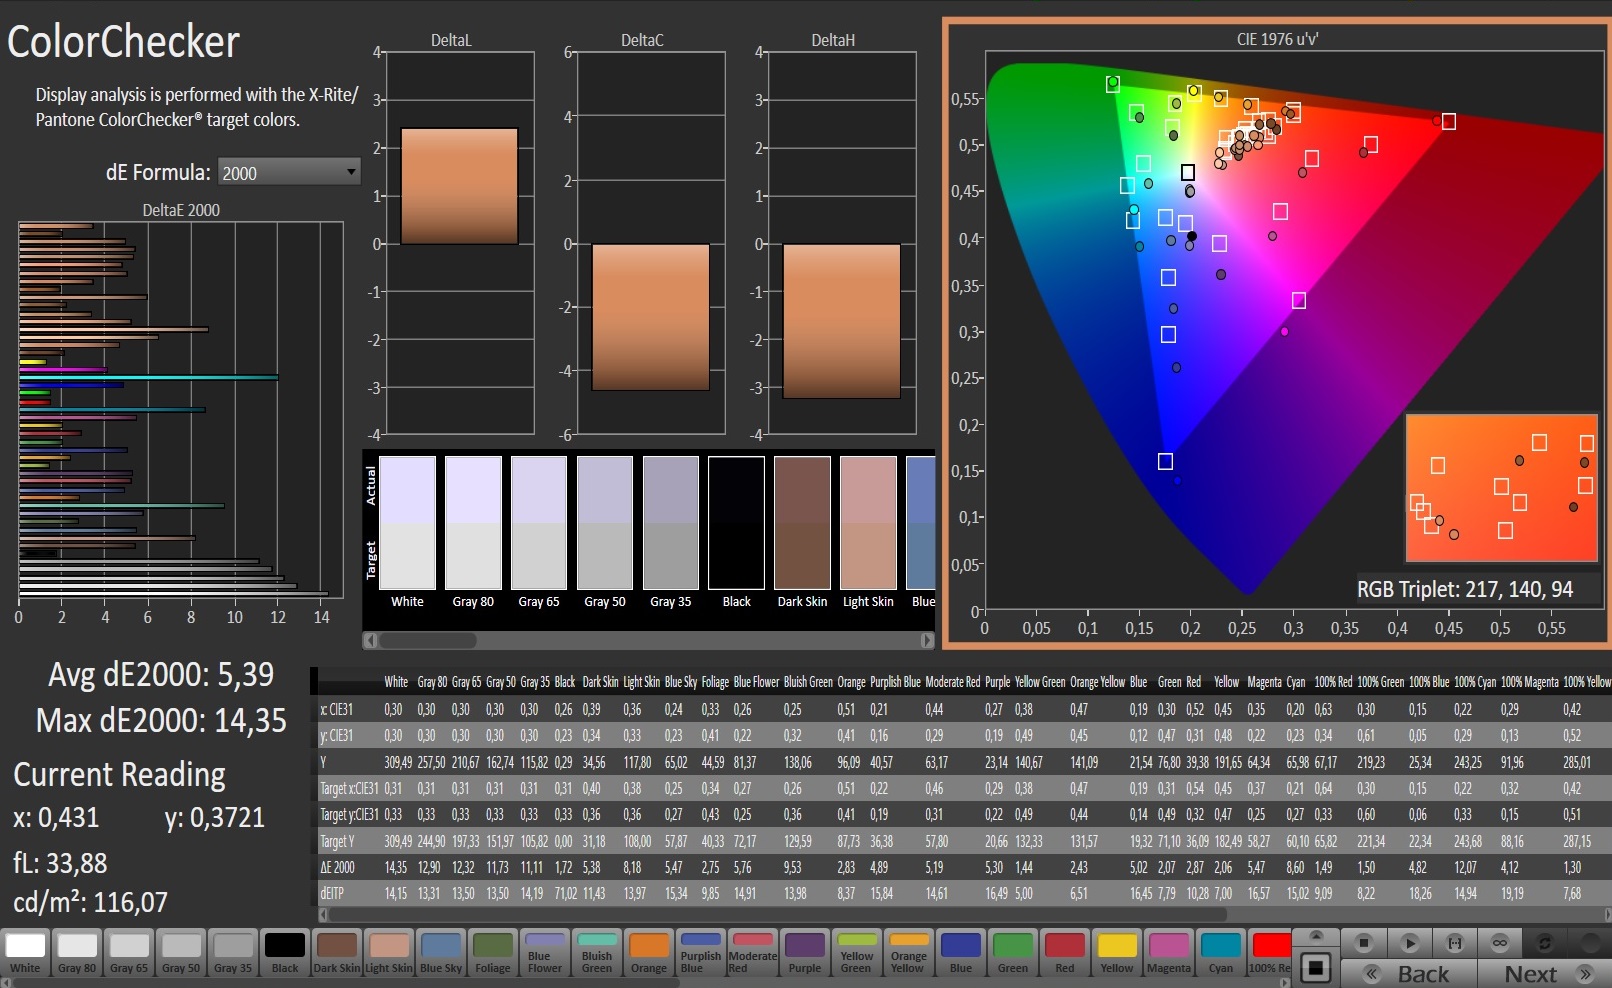
La cámara web incorporada (0,9 MP) produce imágenes con una resolución máxima de 1280x720 píxeles. Además, hay problemas con la precisión del color. Con una desviación de color Delta E 2000 de casi 15, el objetivo (Delta E menos de 3) se pierde claramente.


")
")


Accesorios
Además de los documentos habituales (guía de inicio rápido, información sobre la garantía) el portátil viene con un DVD de controladores, un juego de tornillos, un tornillo de retención para un segundo SSD, una almohadilla térmica y un paño de microfibra.
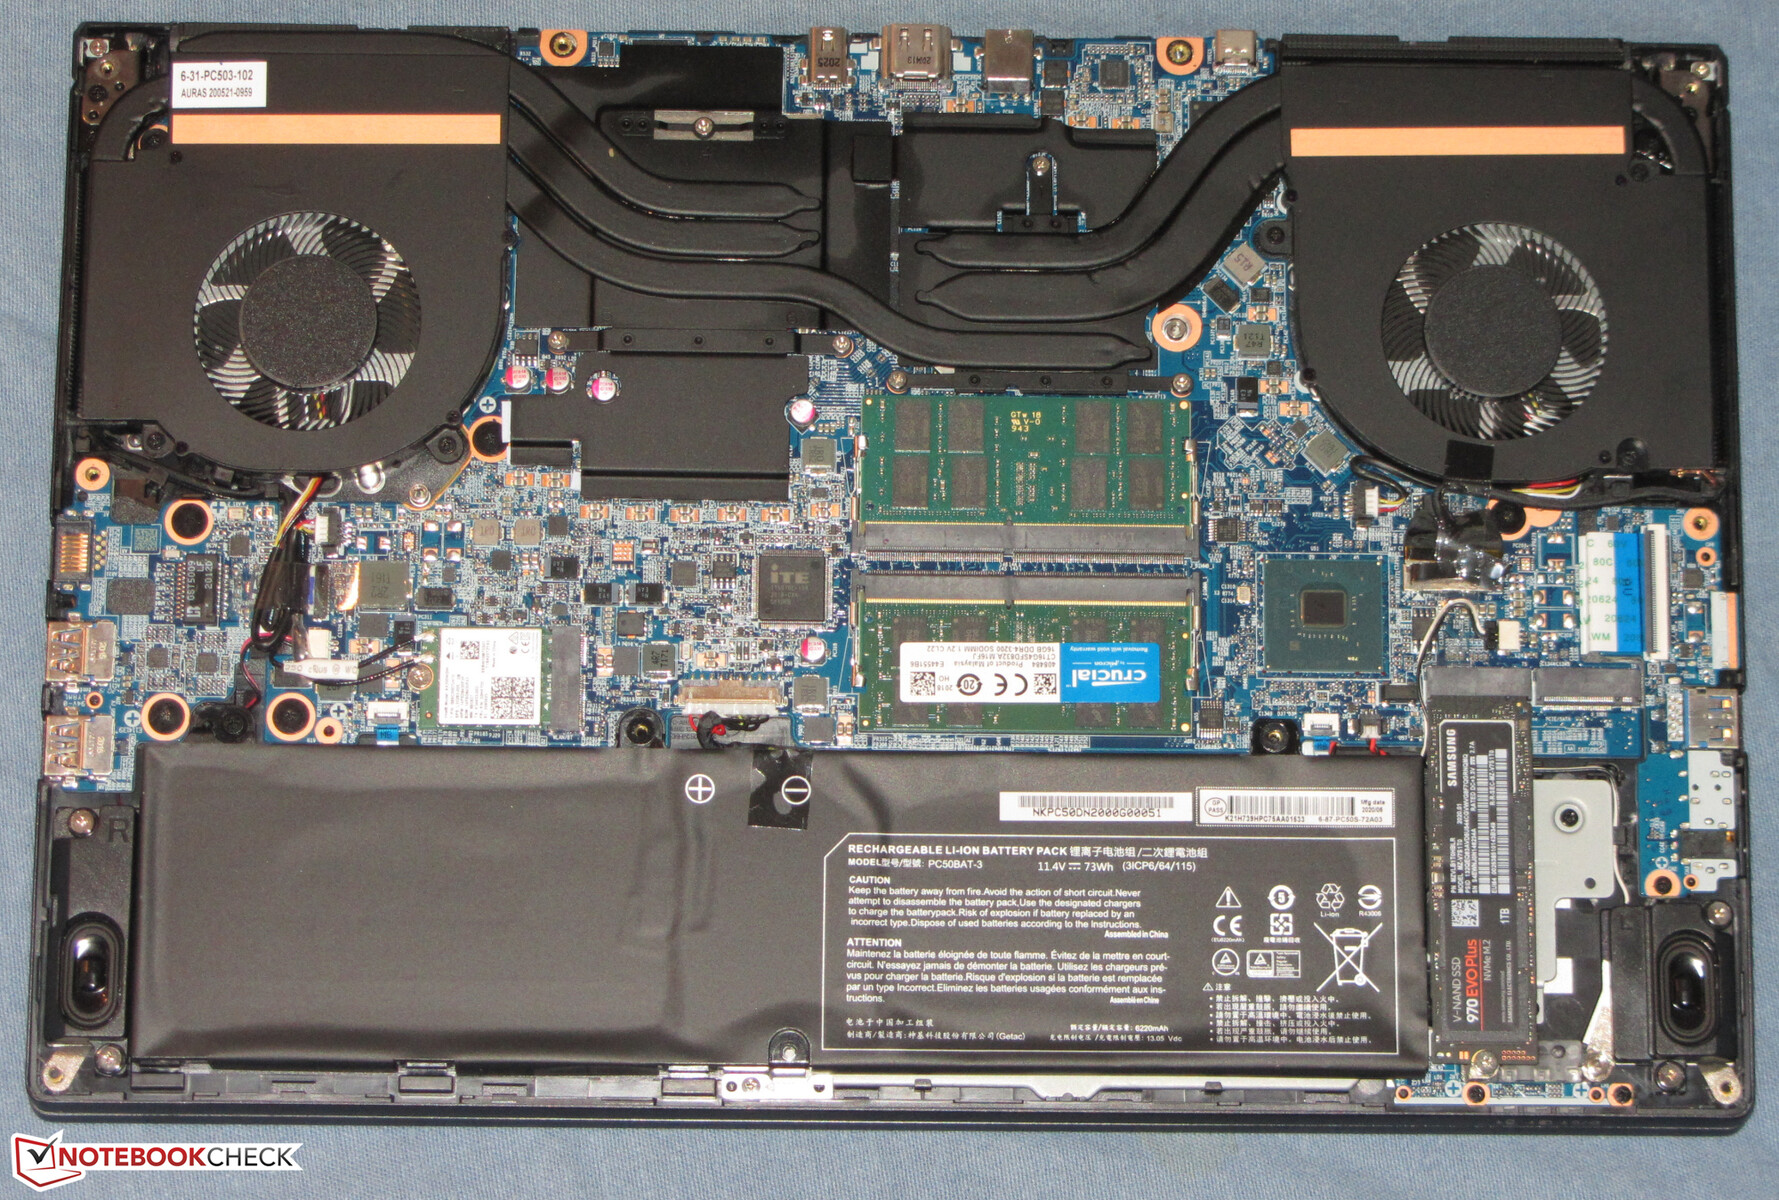
Mantenimiento
El portátil de Schenker no tiene una escotilla de mantenimiento. Para llegar al interior, la cubierta inferior tiene que ser desmontada. Para ello, hay que quitar todos los tornillos de la parte inferior del dispositivo. La cubierta inferior puede entonces ser levantada. No está excesivamente apretada en su lugar.
Dispositivos de entrada - Adecuados para el uso diario
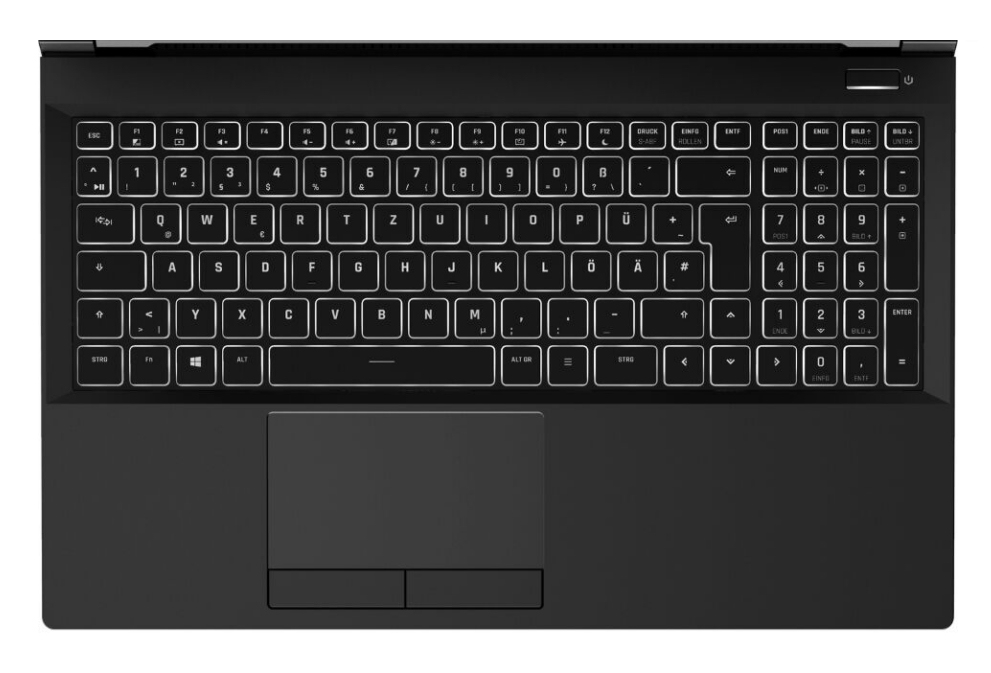
Teclado
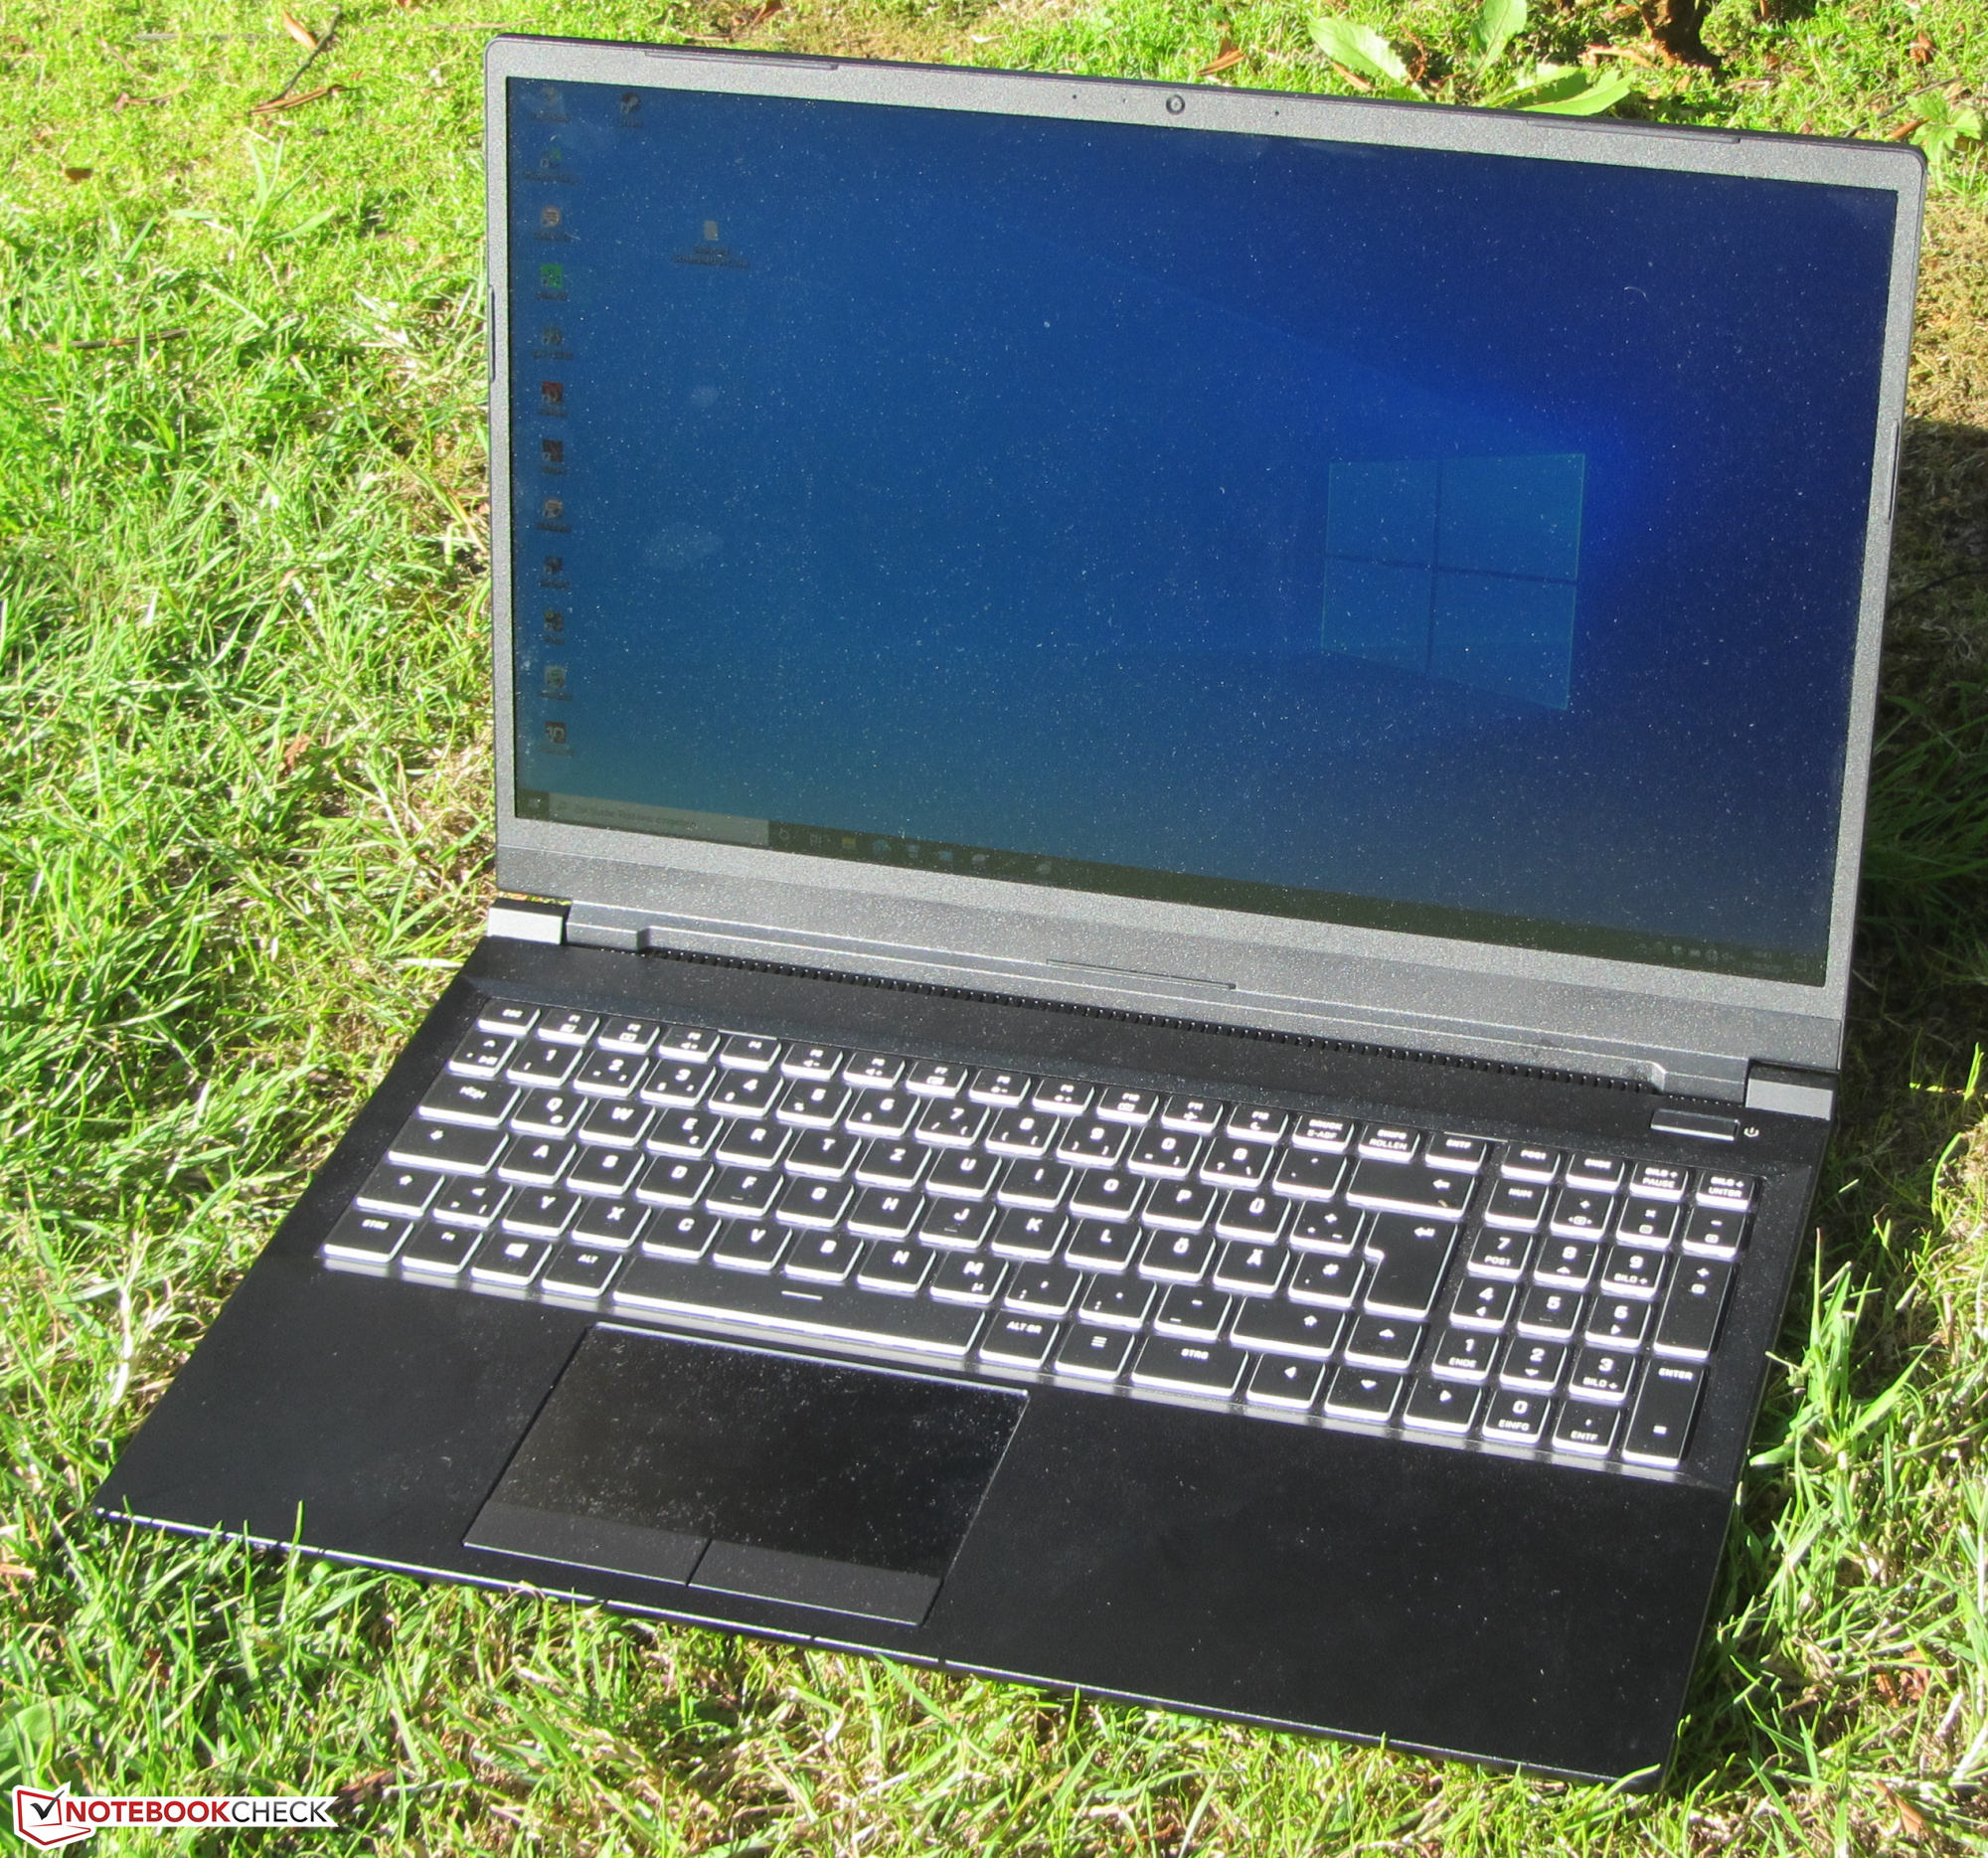
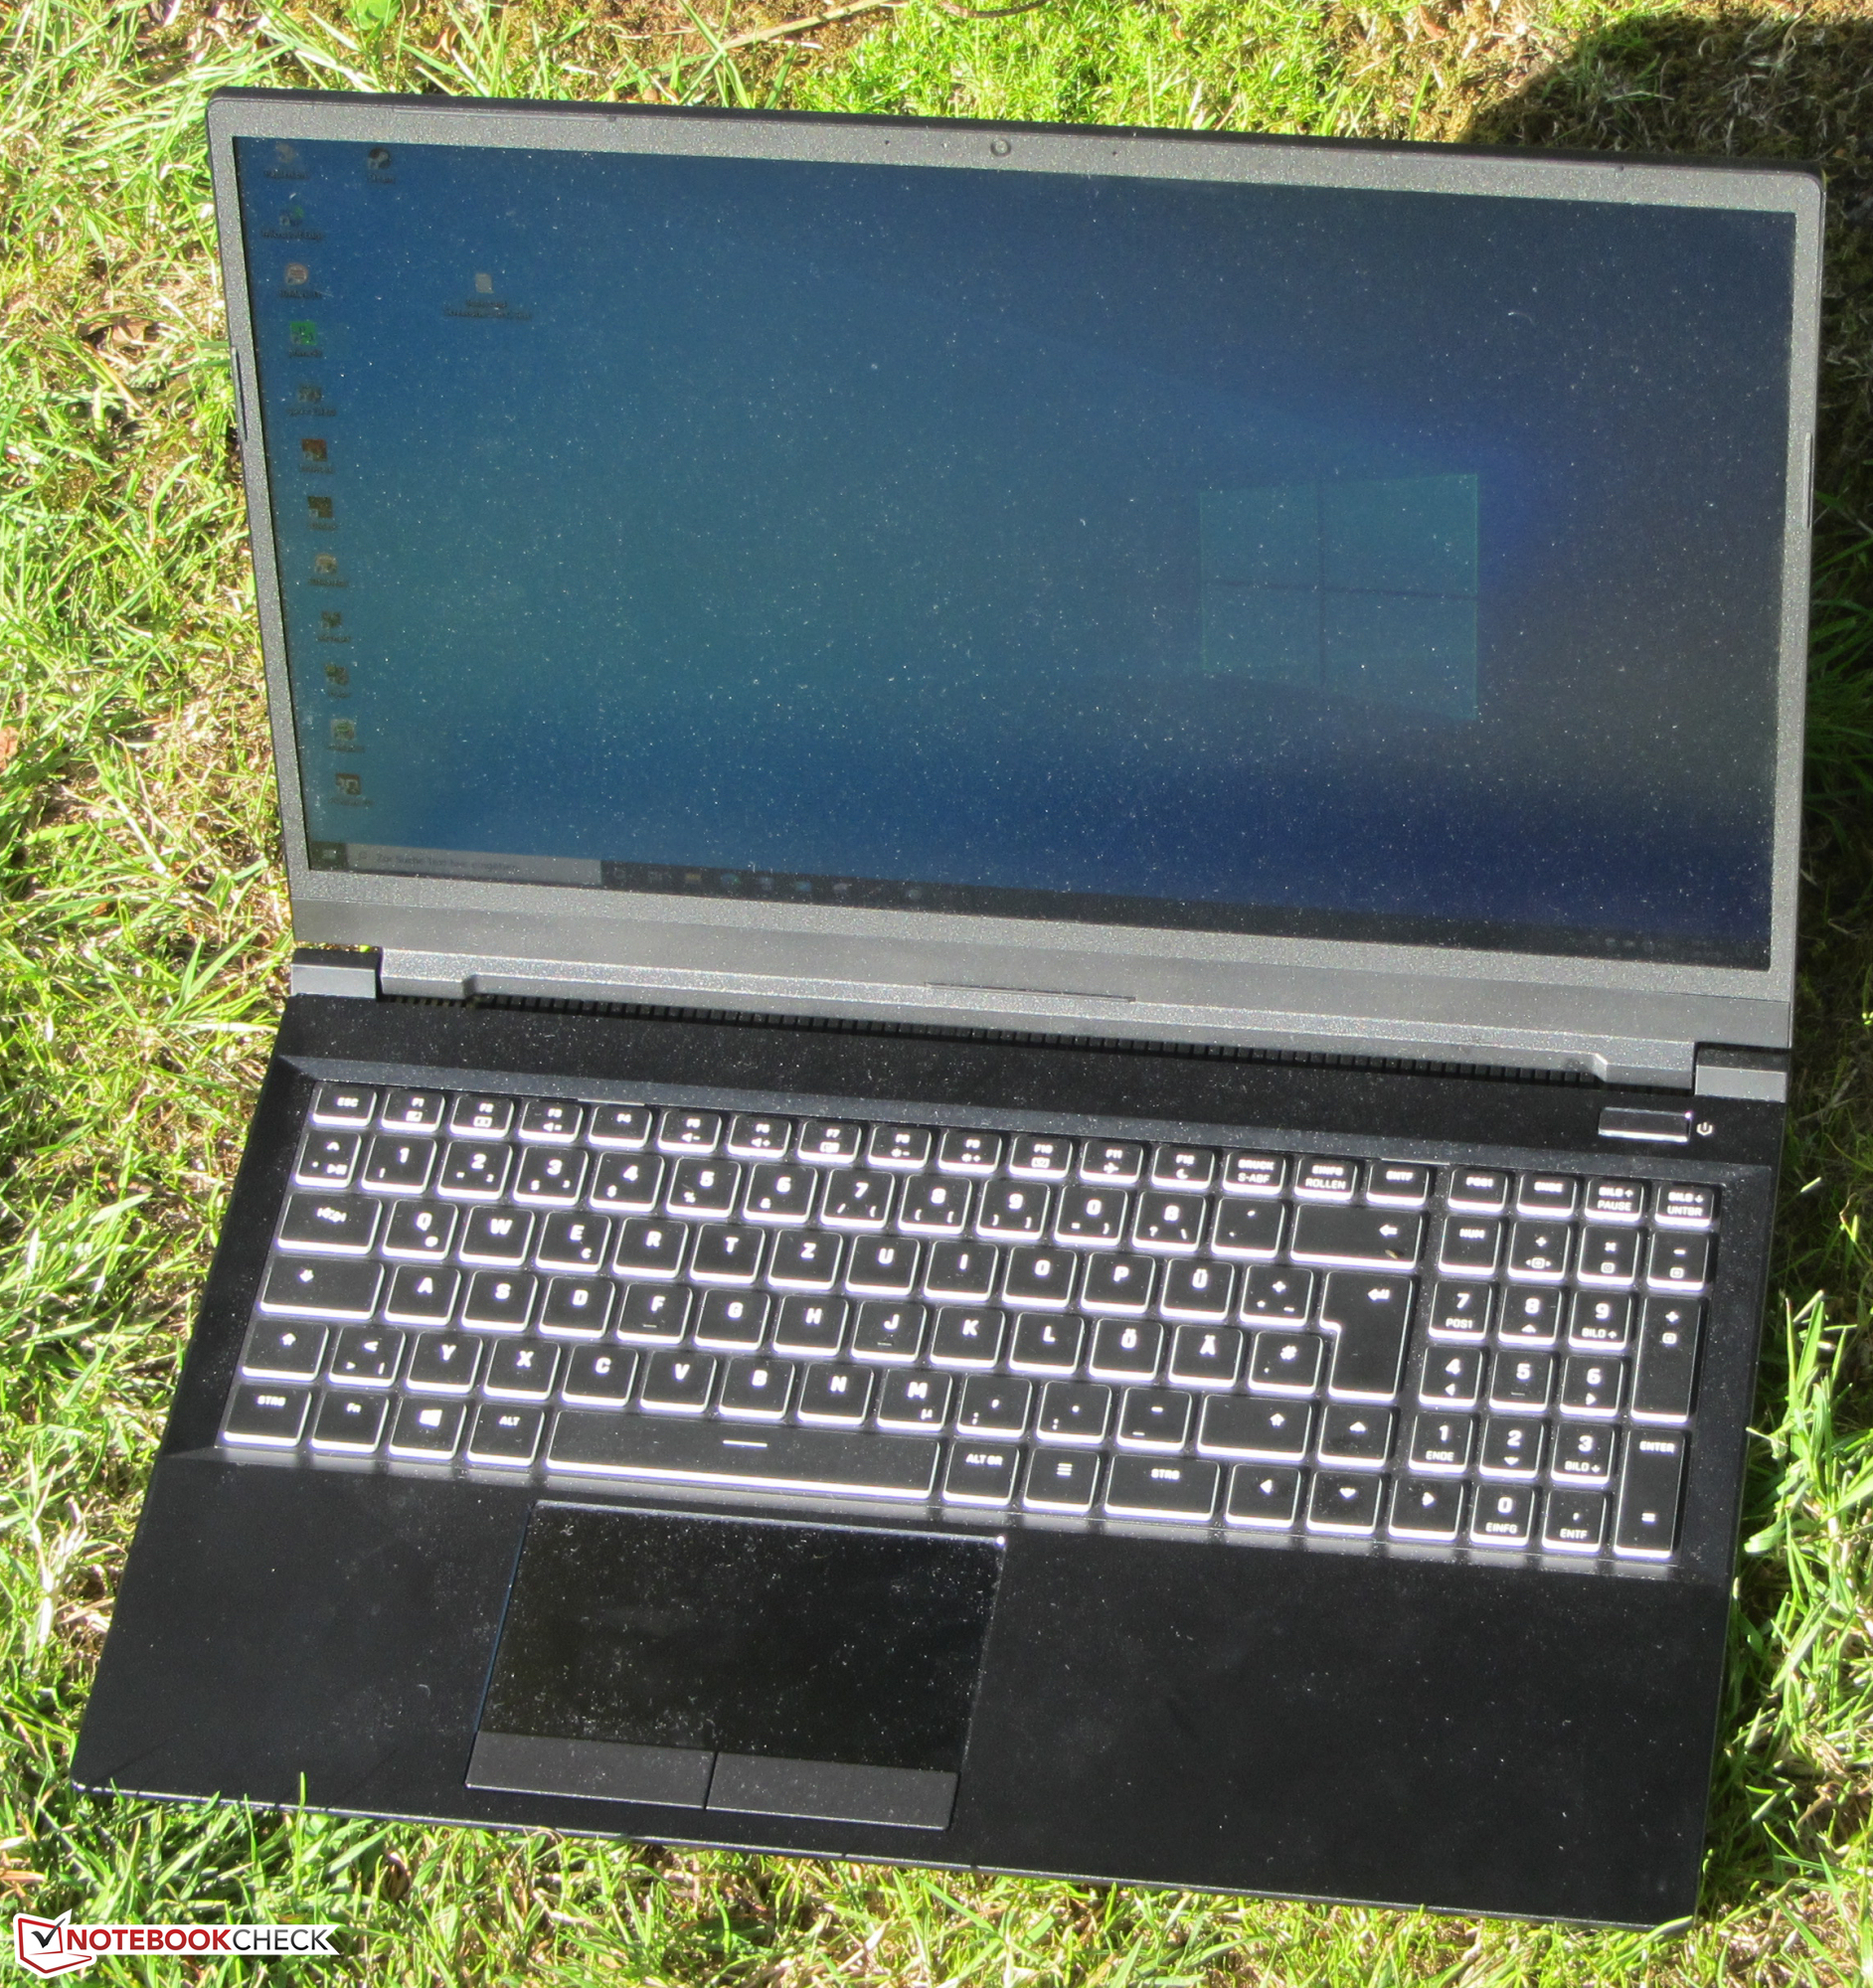
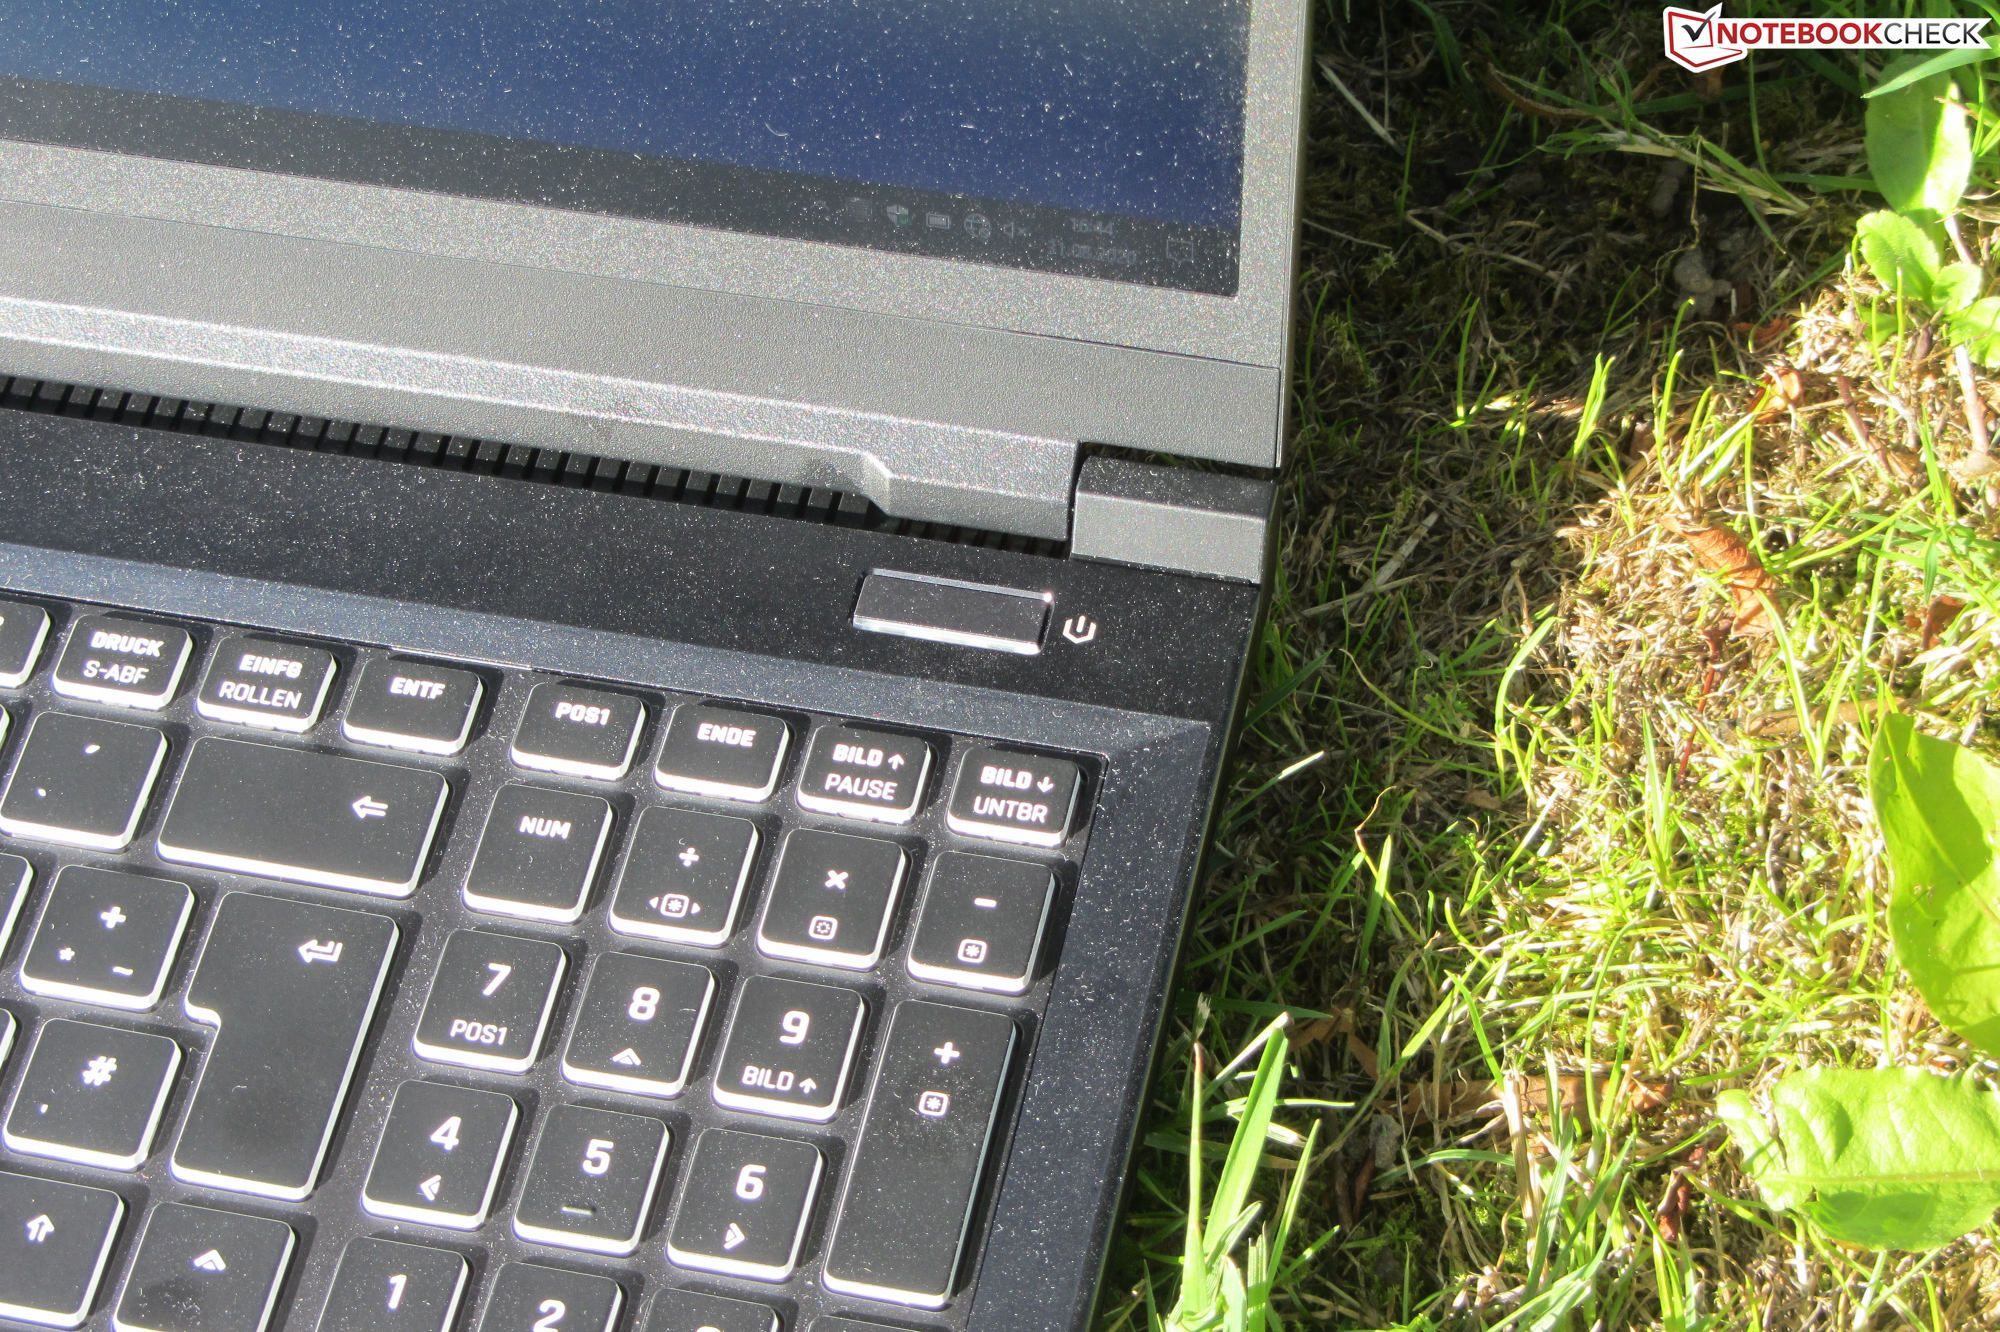
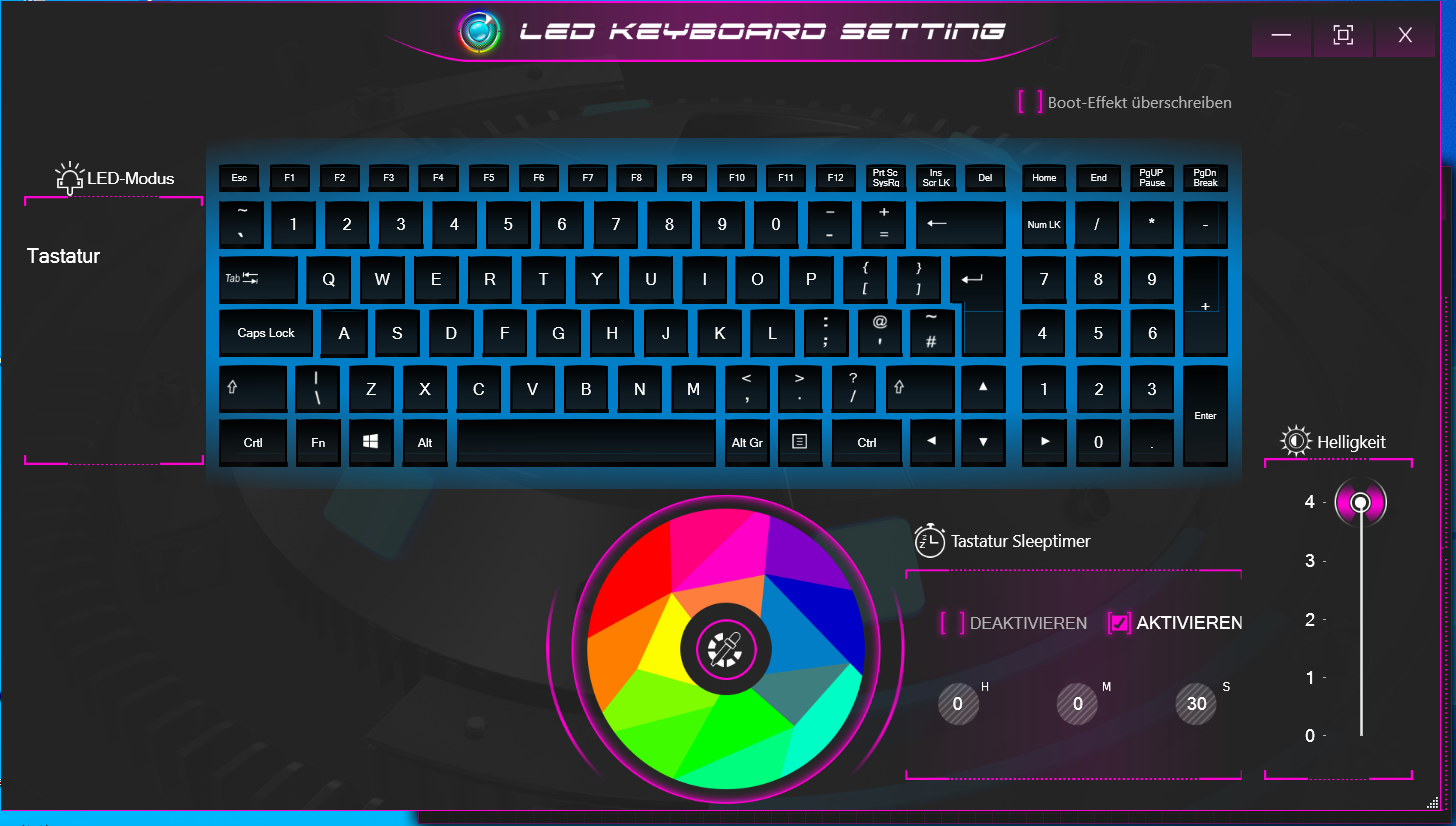
El portátil de Schenker tiene un teclado chiclet retroiluminado (iluminación RGB) que también viene con un teclado numérico a bordo. Las teclas planas y suaves tienen un recorrido medio y un punto de presión claro. Al escribir, el teclado cede ligeramente en el medio, pero esto no resultó ser excesivamente molesto. Con todo, aquí encontrará un teclado adecuado para el uso diario.
Touchpad
El panel táctil con capacidad multitáctil ocupa un área de aproximadamente 10,8 x 6,1 cm. Esto proporciona mucho espacio para usar los controles de gestos. Además, la superficie lisa de la almohadilla facilita el deslizamiento de los dedos sobre ella. La almohadilla también reacciona a la entrada en las esquinas, y los dos botones separados del ratón ofrecen un recorrido corto y un punto de presión claro.
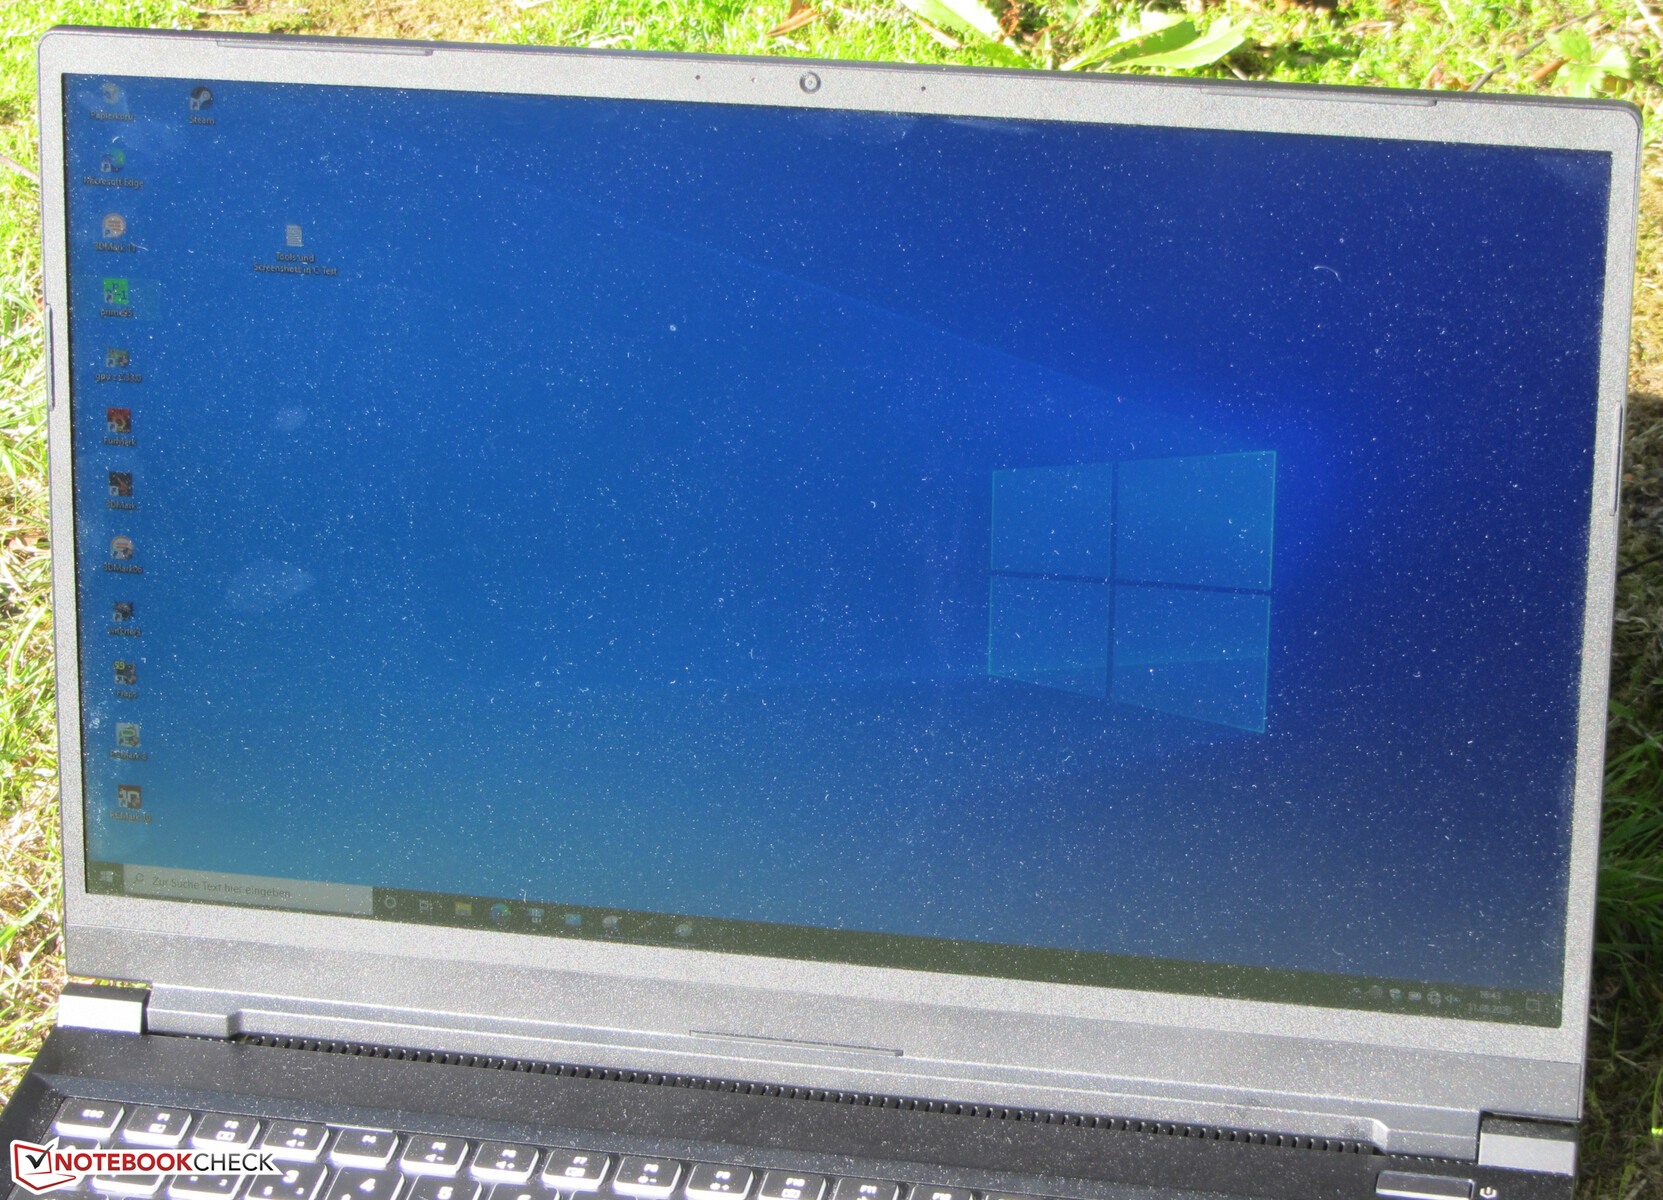
Display - 144 Hz IPS
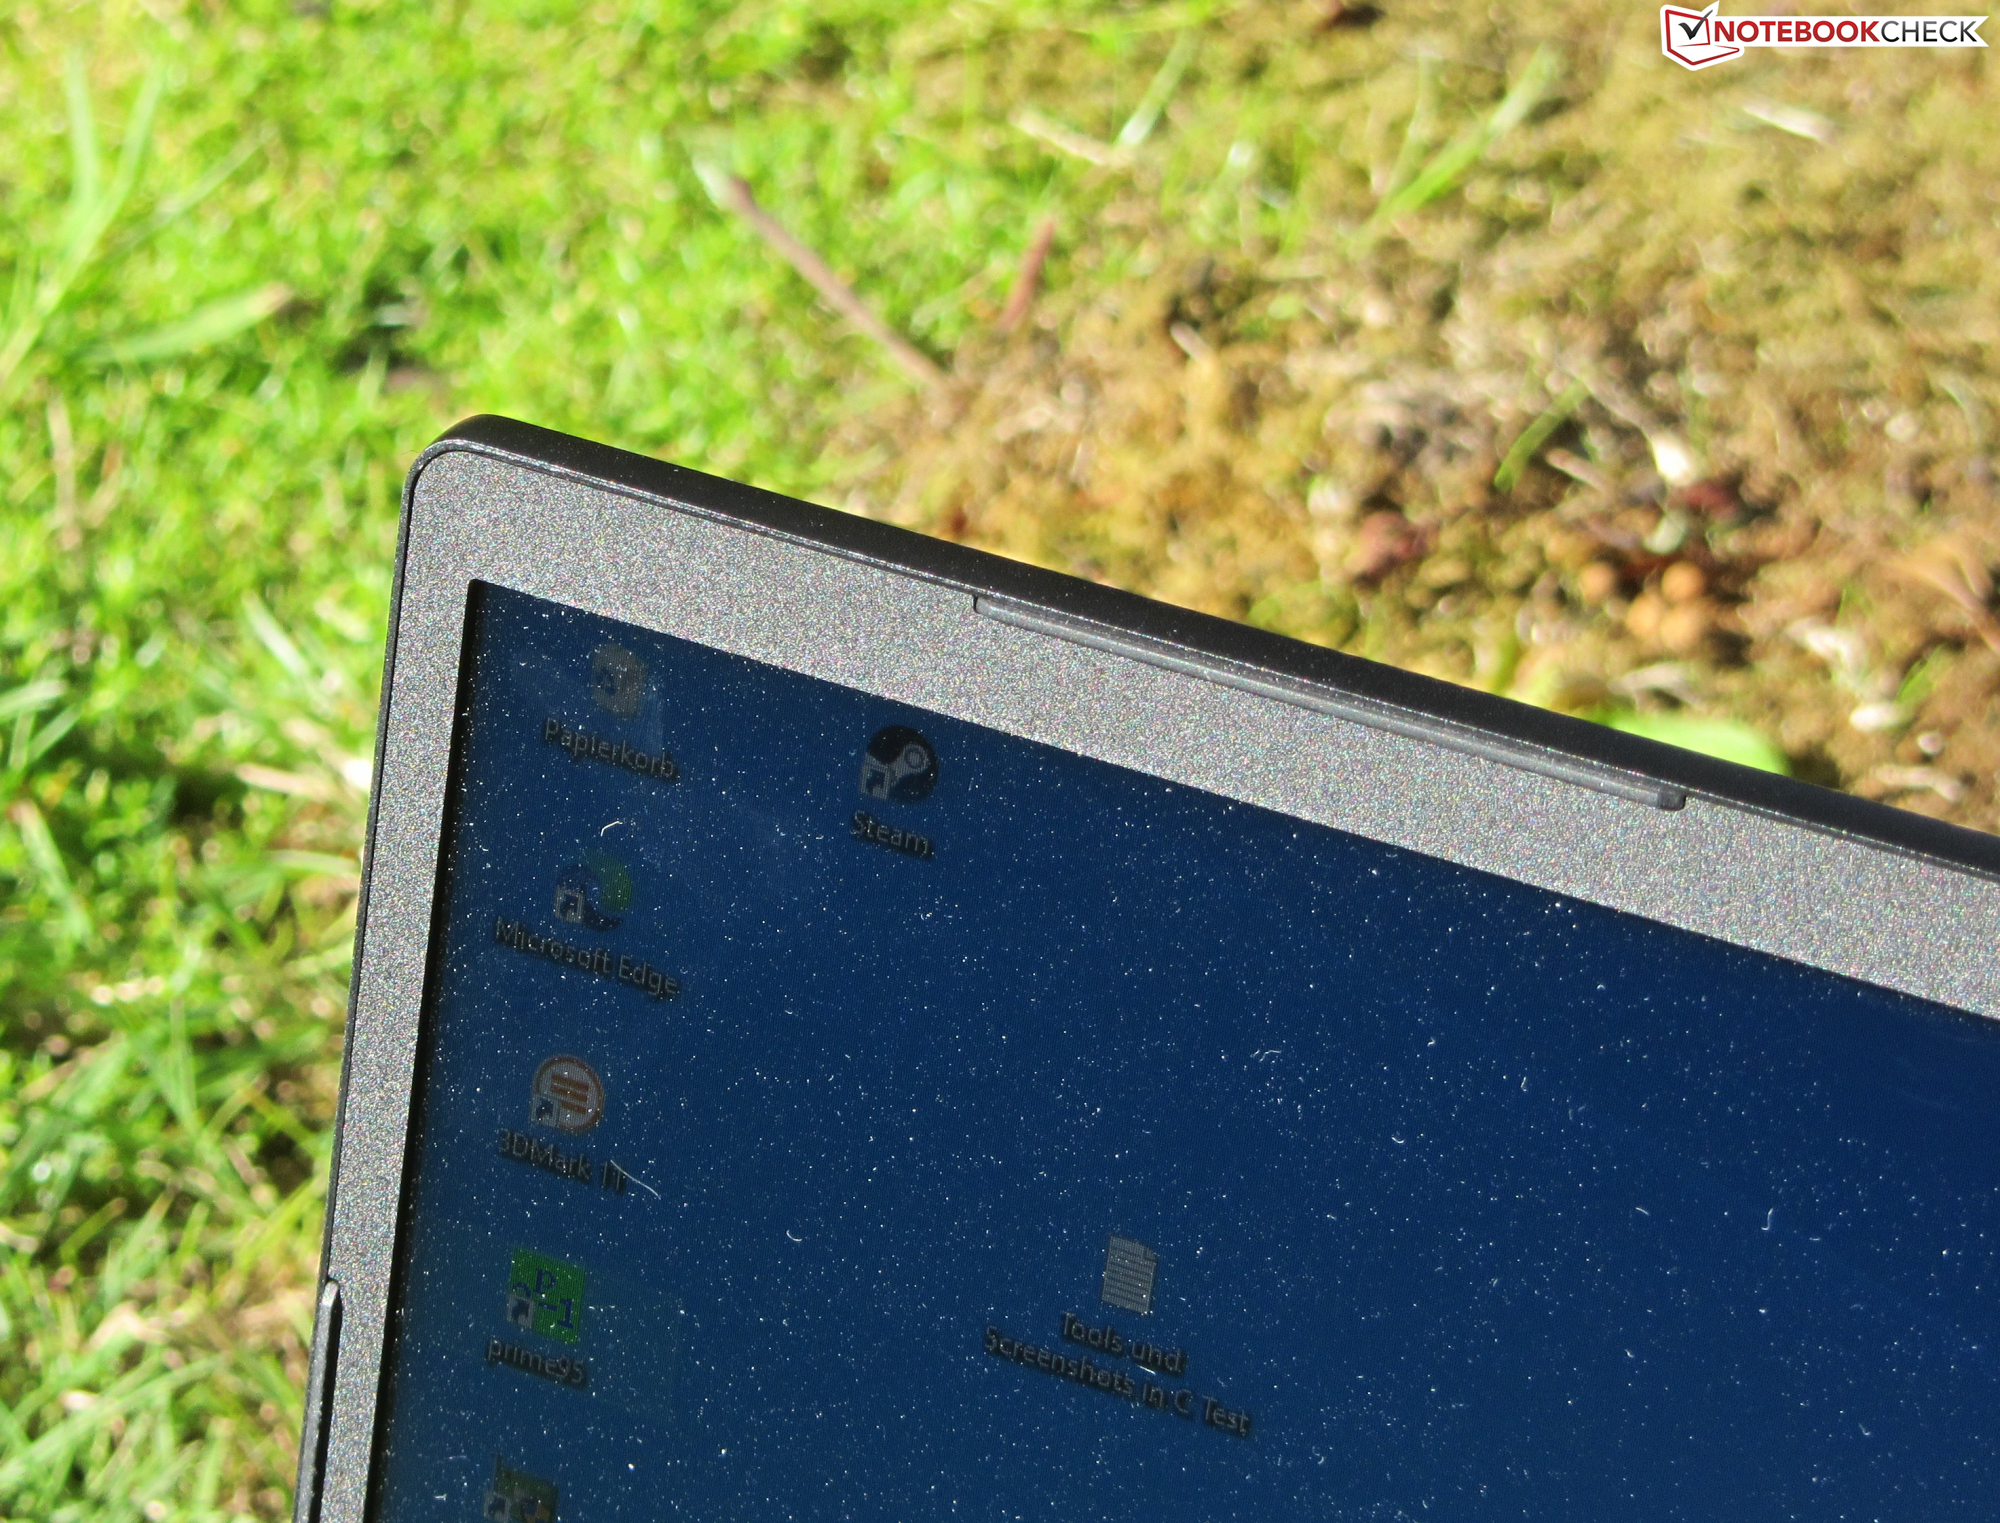
La pantalla de 15,6 pulgadas del Key tiene una resolución nativa de 1920x1080 píxeles. Aunque el contraste (1.034:1) es agradable, todavía se puede mejorar en términos de brillo (281 cd/m²). Consideramos que los valores por encima de 300 cd/m² son buenos. Además, el panel de 144 Hz proporciona tiempos de respuesta rápidos. Positivo: La pantalla no muestra ningún parpadeo de PWM. Como alternativa, la tecla 15 puede equiparse con una pantalla OLED de 4K.
| |||||||||||||||||||||||||
iluminación: 80 %
Brillo con batería: 300 cd/m²
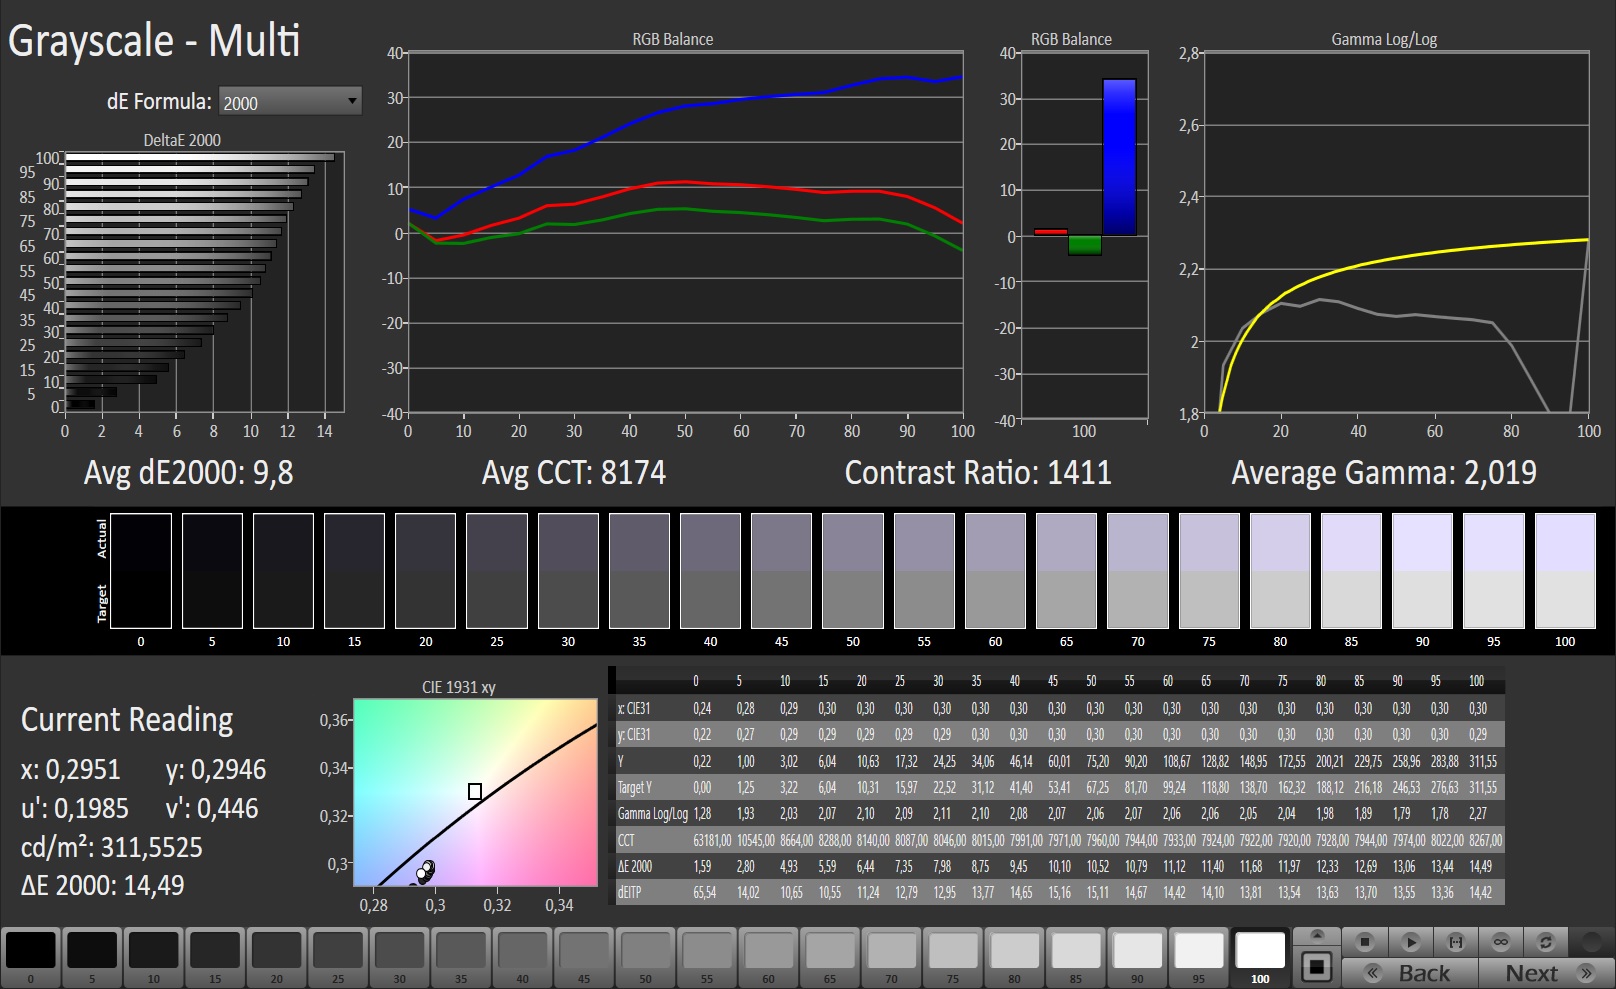
Contraste: 1034:1 (Negro: 0.29 cd/m²)
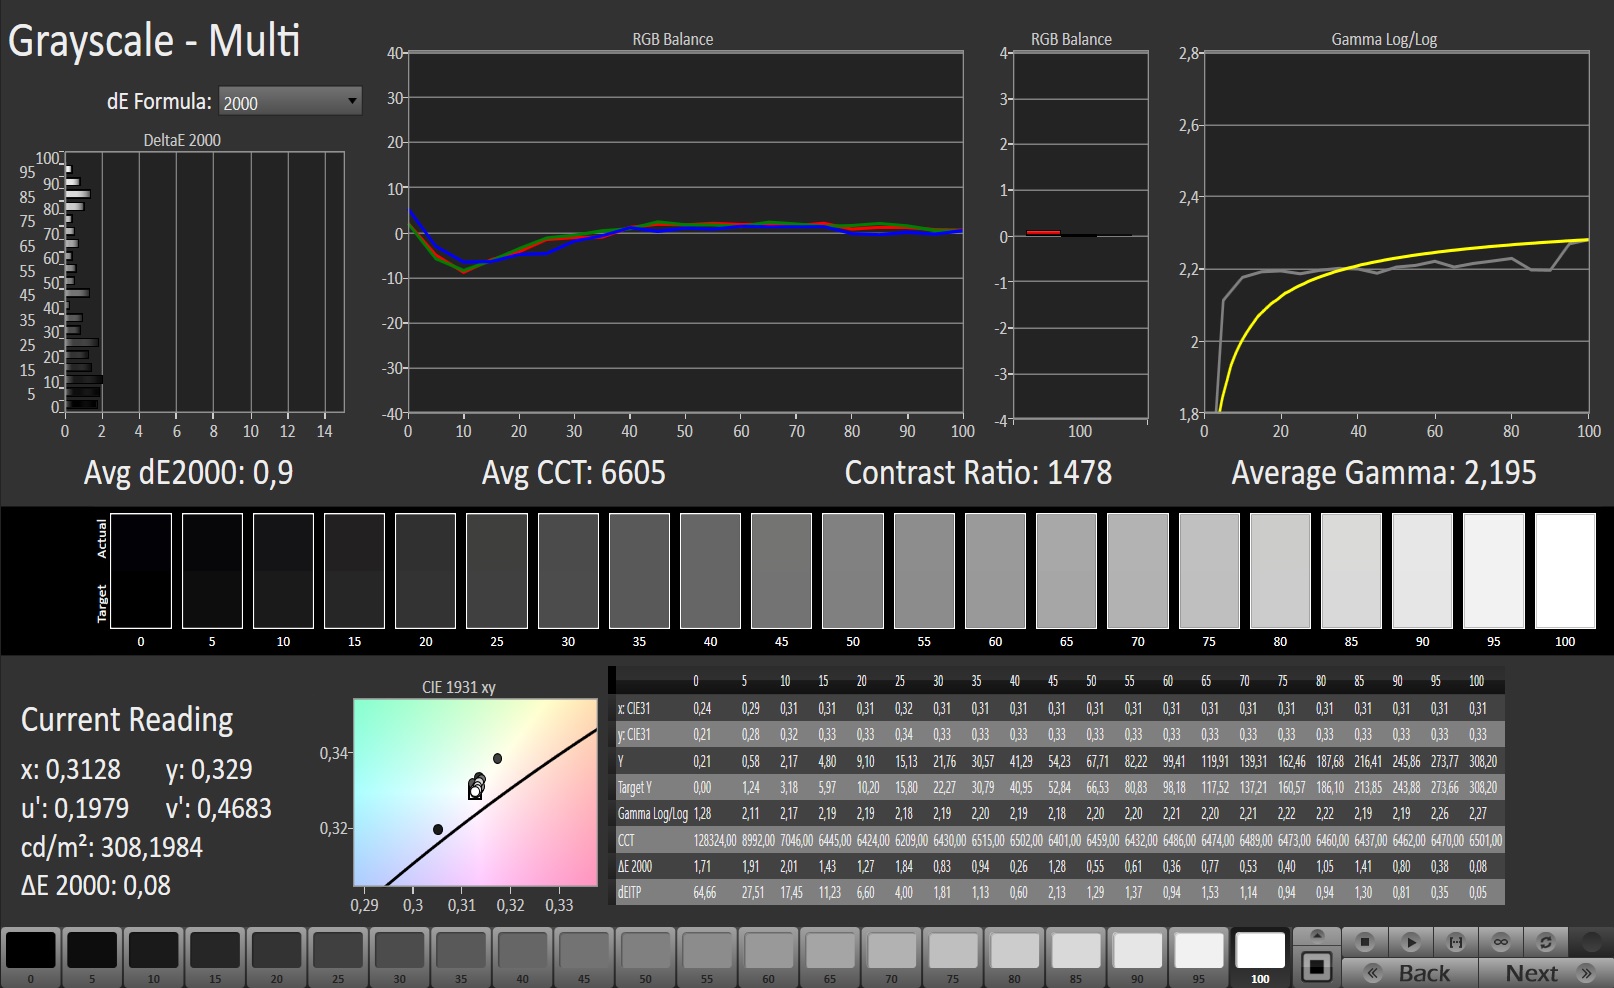
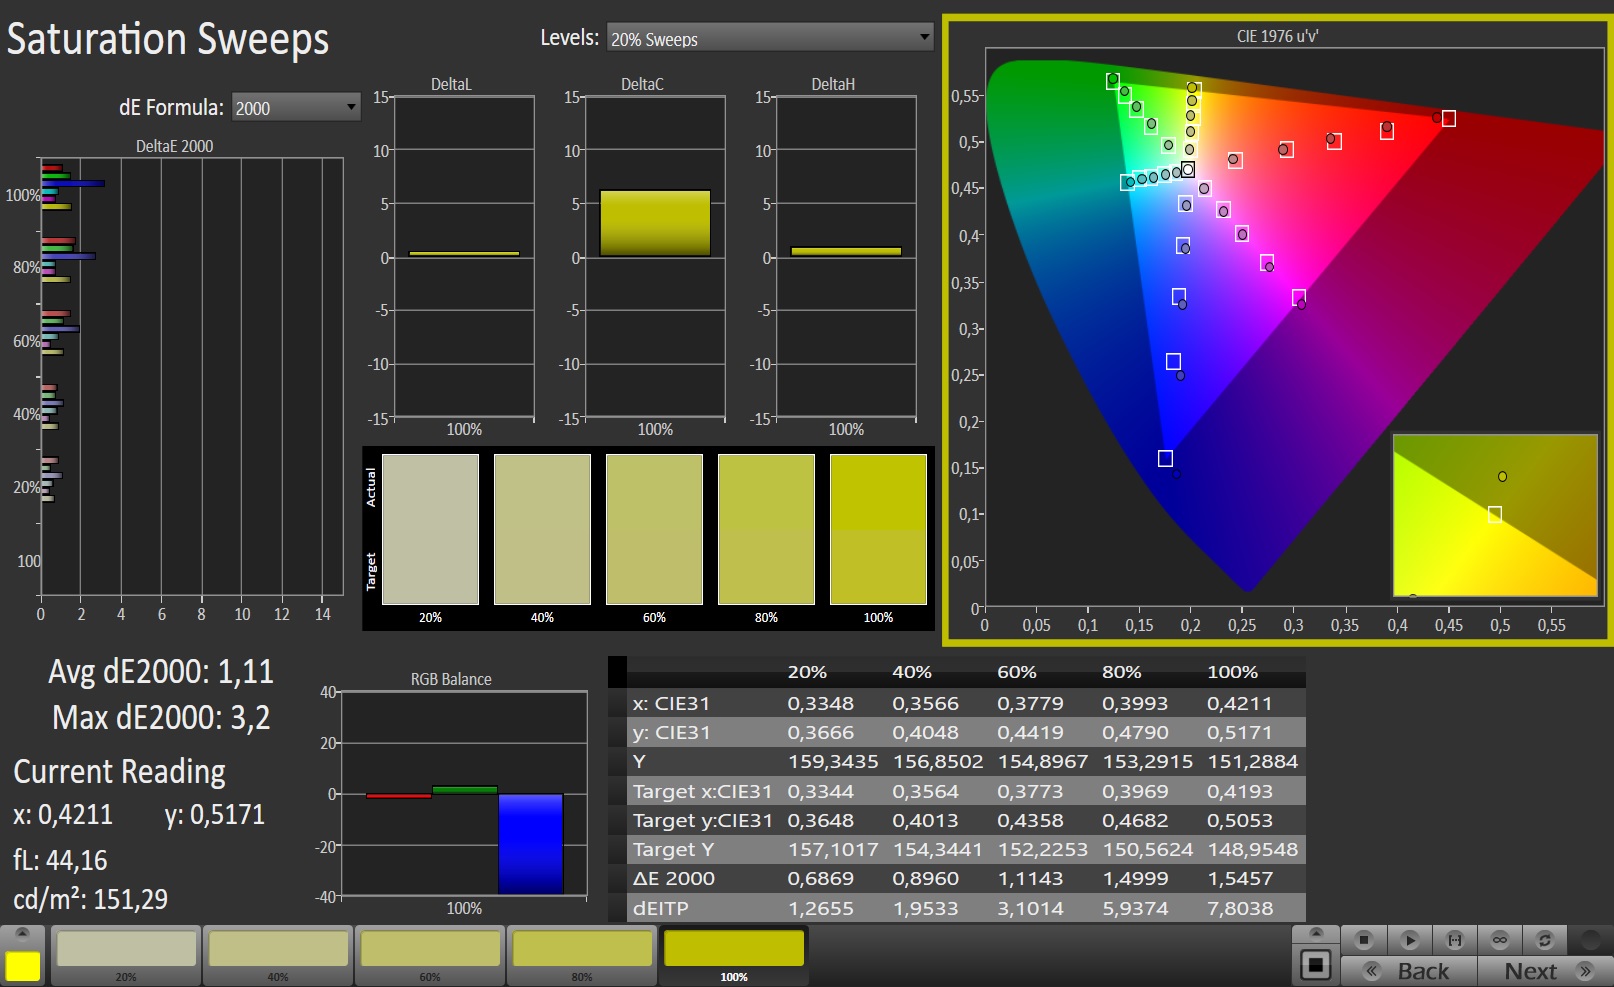
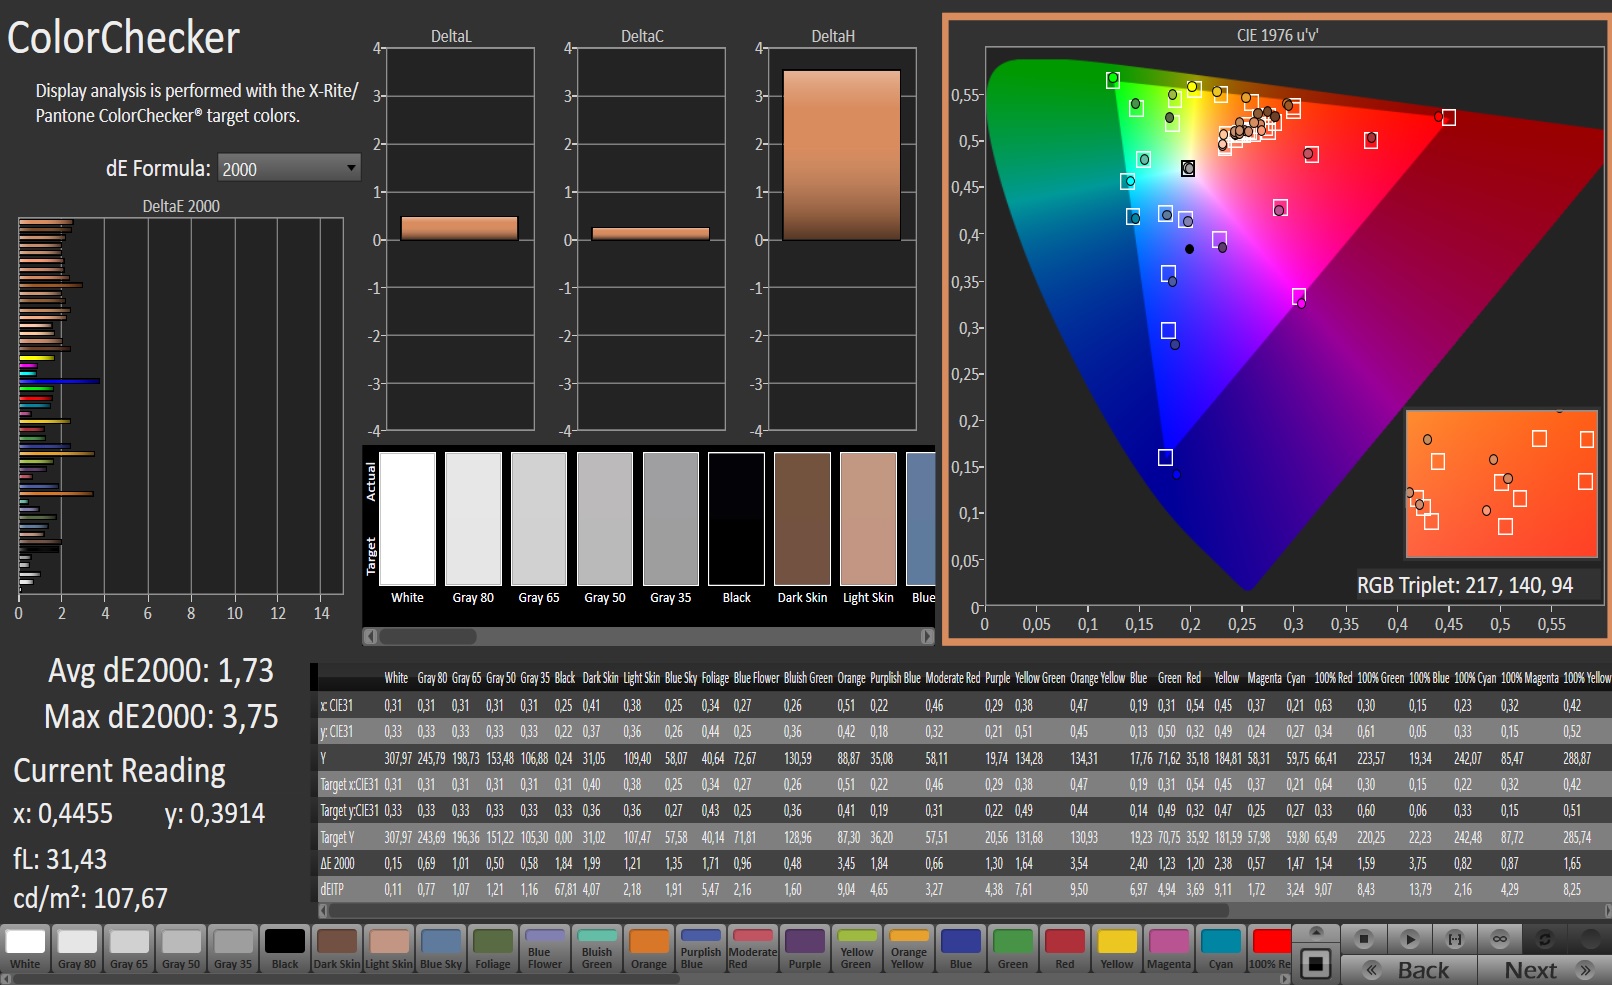
ΔE ColorChecker Calman: 5.39 | ∀{0.5-29.43 Ø4.72}
calibrated: 1.73
ΔE Greyscale Calman: 9.8 | ∀{0.09-98 Ø4.97}
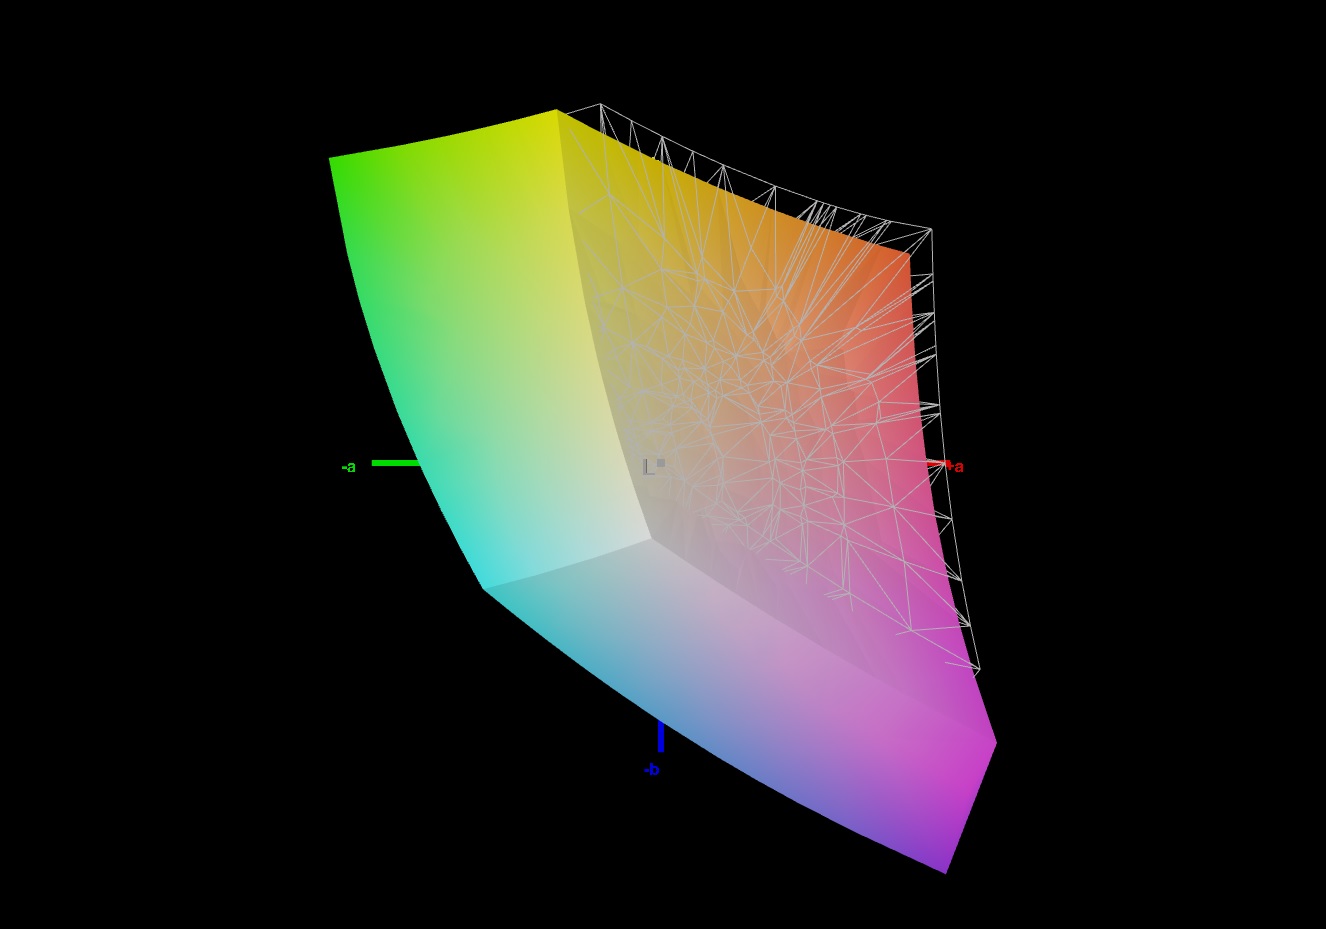
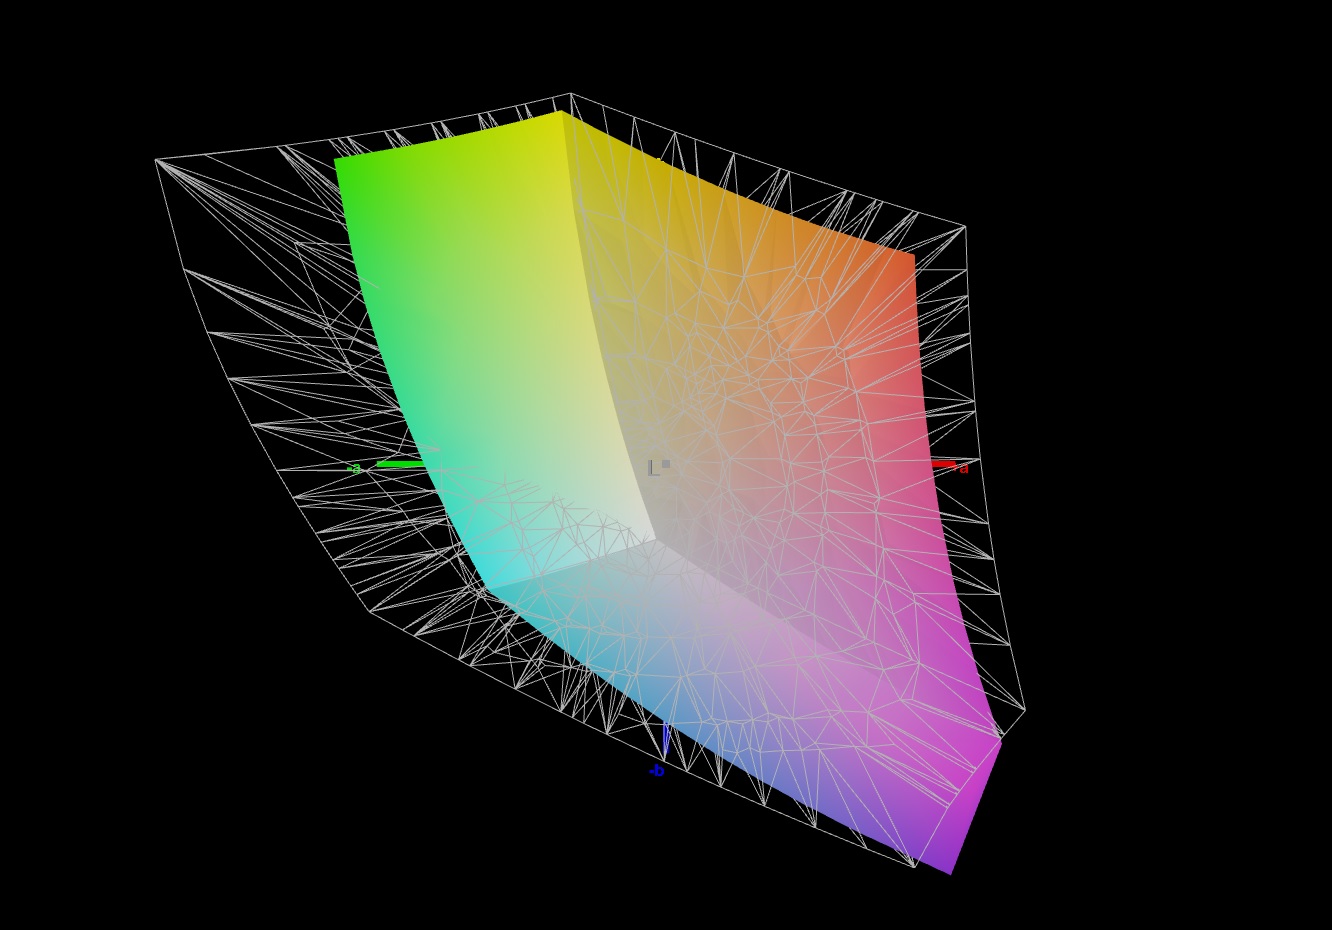
92% sRGB (Argyll 1.6.3 3D)
69% AdobeRGB 1998 (Argyll 1.6.3 3D)
68.7% AdobeRGB 1998 (Argyll 3D)
96.2% sRGB (Argyll 3D)
67.2% Display P3 (Argyll 3D)
Gamma: 2.019
CCT: 8174 K
| Schenker Key 15 Comet Lake Panda LM156LF-1F02, IPS, 1920x1080, 15.6" | MSI GS66 10SGS AU Optronics B156HAN12.0, IPS, 1920x1080, 15.6" | Aorus 15G XB Sharp LQ156M1JW03, IGZO, 1920x1080, 15.6" | Razer Blade 15 RTX 2080 Super Max-Q AU Optronics B156HAN12.0, IPS, 1920x1080, 15.6" | Gigabyte Aero 15 OLED XB-8DE51B0SP Samsung SDCA029, OLED, 3840x2160, 15.6" | Acer Predator Triton 500 PT515-52-70N3 AUO B156HAN12.0 (AUO7A8C), IPS, 1920x1080, 15.6" | |
|---|---|---|---|---|---|---|
| Display | 3% | 0% | 4% | 32% | 4% | |
| Display P3 Coverage (%) | 67.2 | 69.9 4% | 67.2 0% | 70.2 4% | 99.9 49% | 70.3 5% |
| sRGB Coverage (%) | 96.2 | 99.1 3% | 97.8 2% | 99 3% | 100 4% | 99.5 3% |
| AdobeRGB 1998 Coverage (%) | 68.7 | 71.1 3% | 68 -1% | 71.4 4% | 98.2 43% | 72.2 5% |
| Response Times | -11% | -41% | 21% | 79% | -29% | |
| Response Time Grey 50% / Grey 80% * (ms) | 10 ? | 11.2 ? -12% | 16 ? -60% | 6 ? 40% | 2.2 ? 78% | 14.4 ? -44% |
| Response Time Black / White * (ms) | 9.2 ? | 10 ? -9% | 11.2 ? -22% | 9 ? 2% | 1.8 ? 80% | 10.4 ? -13% |
| PWM Frequency (Hz) | 23580 ? | 60 ? | ||||
| Screen | 31% | 23% | 27% | 33% | 21% | |
| Brightness middle (cd/m²) | 300 | 339.4 13% | 264 -12% | 347 16% | 385 28% | 320 7% |
| Brightness (cd/m²) | 281 | 331 18% | 248 -12% | 328 17% | 390 39% | 318 13% |
| Brightness Distribution (%) | 80 | 92 15% | 89 11% | 89 11% | 93 16% | 88 10% |
| Black Level * (cd/m²) | 0.29 | 0.24 17% | 0.3 -3% | 0.285 2% | 0.24 17% | |
| Contrast (:1) | 1034 | 1414 37% | 880 -15% | 1218 18% | 1333 29% | |
| Colorchecker dE 2000 * | 5.39 | 1.58 71% | 1.21 78% | 2.35 56% | 2.46 54% | 4.03 25% |
| Colorchecker dE 2000 max. * | 14.35 | 3.8 74% | 3.07 79% | 4.15 71% | 4.01 72% | 8.43 41% |
| Colorchecker dE 2000 calibrated * | 1.73 | 1.47 15% | 0.92 47% | 1.16 33% | 2.6 -50% | 0.98 43% |
| Greyscale dE 2000 * | 9.8 | 2.3 77% | 1.6 84% | 3.04 69% | 1.39 86% | 5.94 39% |
| Gamma | 2.019 109% | 2.24 98% | 2.192 100% | 2.35 94% | 2.31 95% | 2.42 91% |
| CCT | 8174 80% | 6952 93% | 6340 103% | 6658 98% | 6395 102% | 6751 96% |
| Color Space (Percent of AdobeRGB 1998) (%) | 69 | 64.8 -6% | 68 -1% | 65 -6% | 98 42% | 66 -4% |
| Color Space (Percent of sRGB) (%) | 92 | 99.4 8% | 90 -2% | 99 8% | 100 9% | 99 8% |
| Media total (Programa/Opciones) | 8% /
21% | -6% /
11% | 17% /
22% | 48% /
39% | -1% /
12% |
* ... más pequeño es mejor
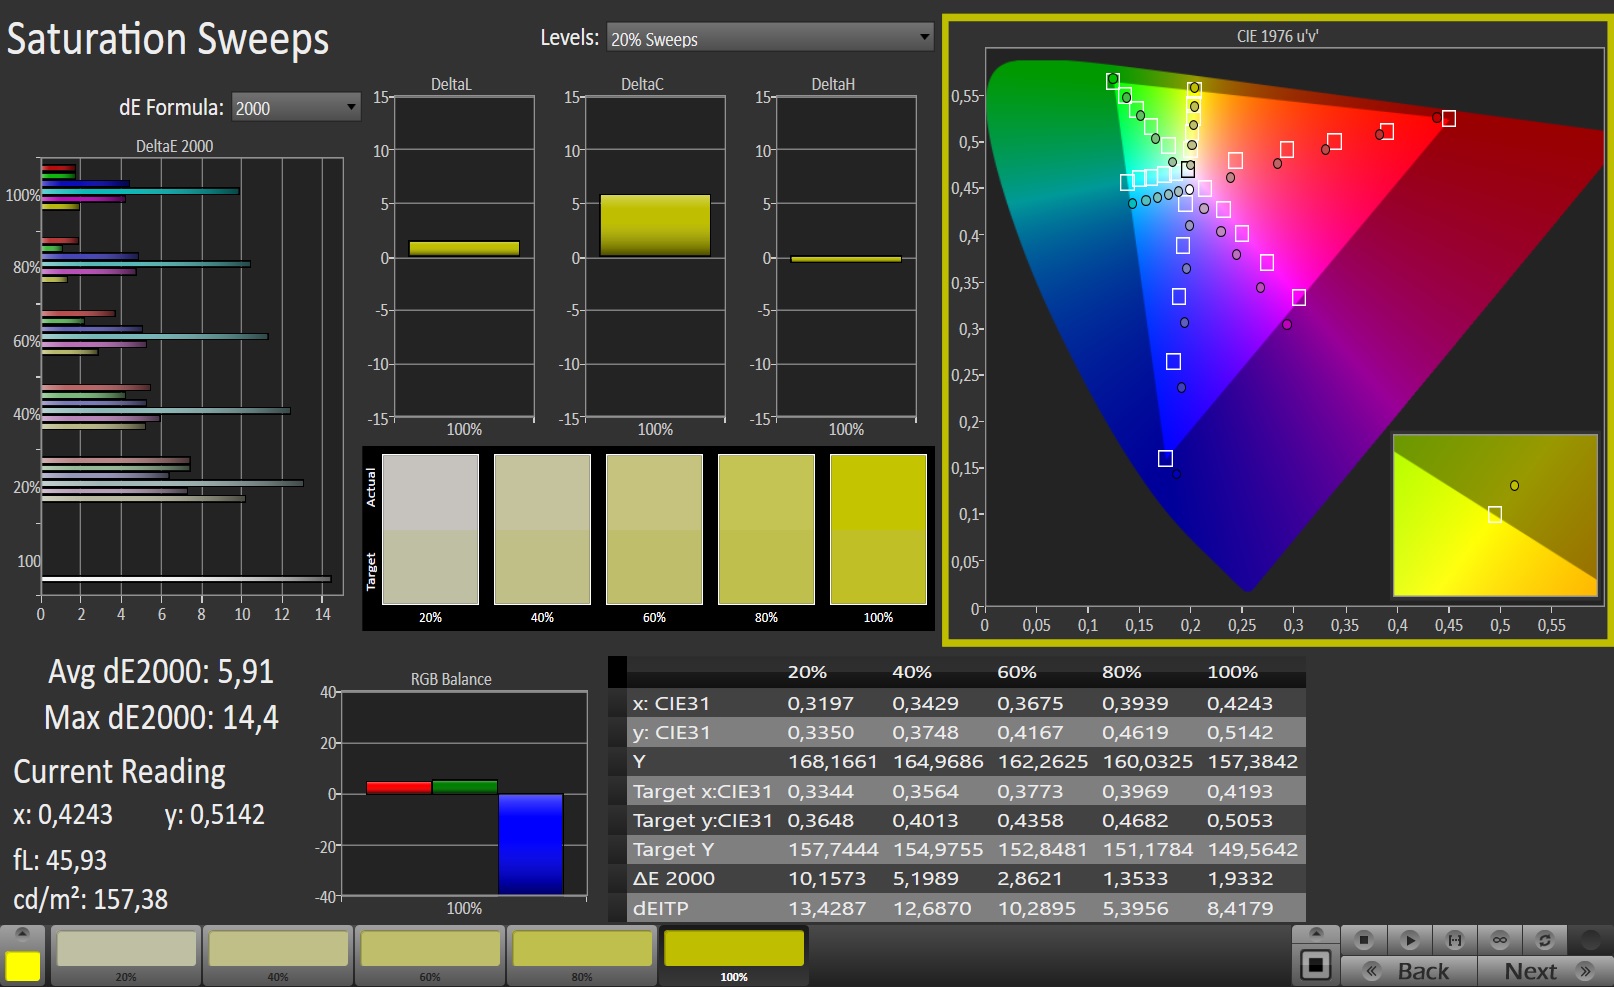
Fuera de la caja, la pantalla muestra una reproducción de color mediocre. Con una desviación de color Delta E 2000 de 5,39, el objetivo (Delta E menos de 3) se pierde. Además, la pantalla sufre de un tinte azul. La calibración proporciona mejoras significativas. De esta manera, la desviación de color se reduce a 1,73, el tinte azul desaparece, y las escalas de grises se muestran de una manera más equilibrada. Los espacios de color AdobeRGB (69%) y sRGB (92%) no se reproducen completamente.
Tiempos de respuesta del display
| ↔ Tiempo de respuesta de Negro a Blanco | ||
|---|---|---|
| 9.2 ms ... subida ↗ y bajada ↘ combinada | ↗ 4.4 ms subida | 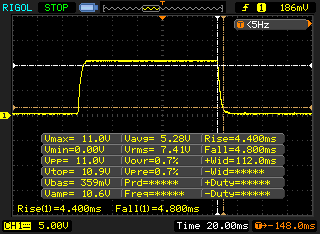 |
| ↘ 4.8 ms bajada | ||
| La pantalla mostró tiempos de respuesta rápidos en nuestros tests y debería ser adecuada para juegos. En comparación, todos los dispositivos de prueba van de ##min### (mínimo) a 240 (máximo) ms. » 26 % de todos los dispositivos son mejores. Esto quiere decir que el tiempo de respuesta medido es mejor que la media (19.8 ms) de todos los dispositivos testados. | ||
| ↔ Tiempo de respuesta 50% Gris a 80% Gris | ||
| 10 ms ... subida ↗ y bajada ↘ combinada | ↗ 5.2 ms subida | 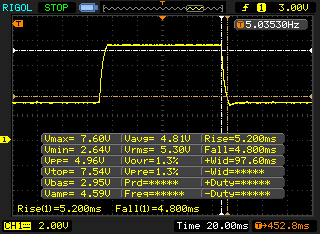 |
| ↘ 4.8 ms bajada | ||
| La pantalla mostró buenos tiempos de respuesta en nuestros tests pero podría ser demasiado lenta para los jugones competitivos. En comparación, todos los dispositivos de prueba van de ##min### (mínimo) a 636 (máximo) ms. » 23 % de todos los dispositivos son mejores. Esto quiere decir que el tiempo de respuesta medido es mejor que la media (31 ms) de todos los dispositivos testados. | ||
Parpadeo de Pantalla / PWM (Pulse-Width Modulation)
| Parpadeo de Pantalla / PWM no detectado | 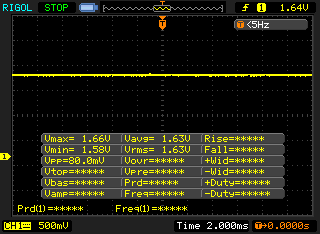 | ||
Comparación: 52 % de todos los dispositivos testados no usaron PWM para atenuar el display. Si se usó, medimos una media de 7769 (mínimo: 5 - máxmo: 343500) Hz. | |||
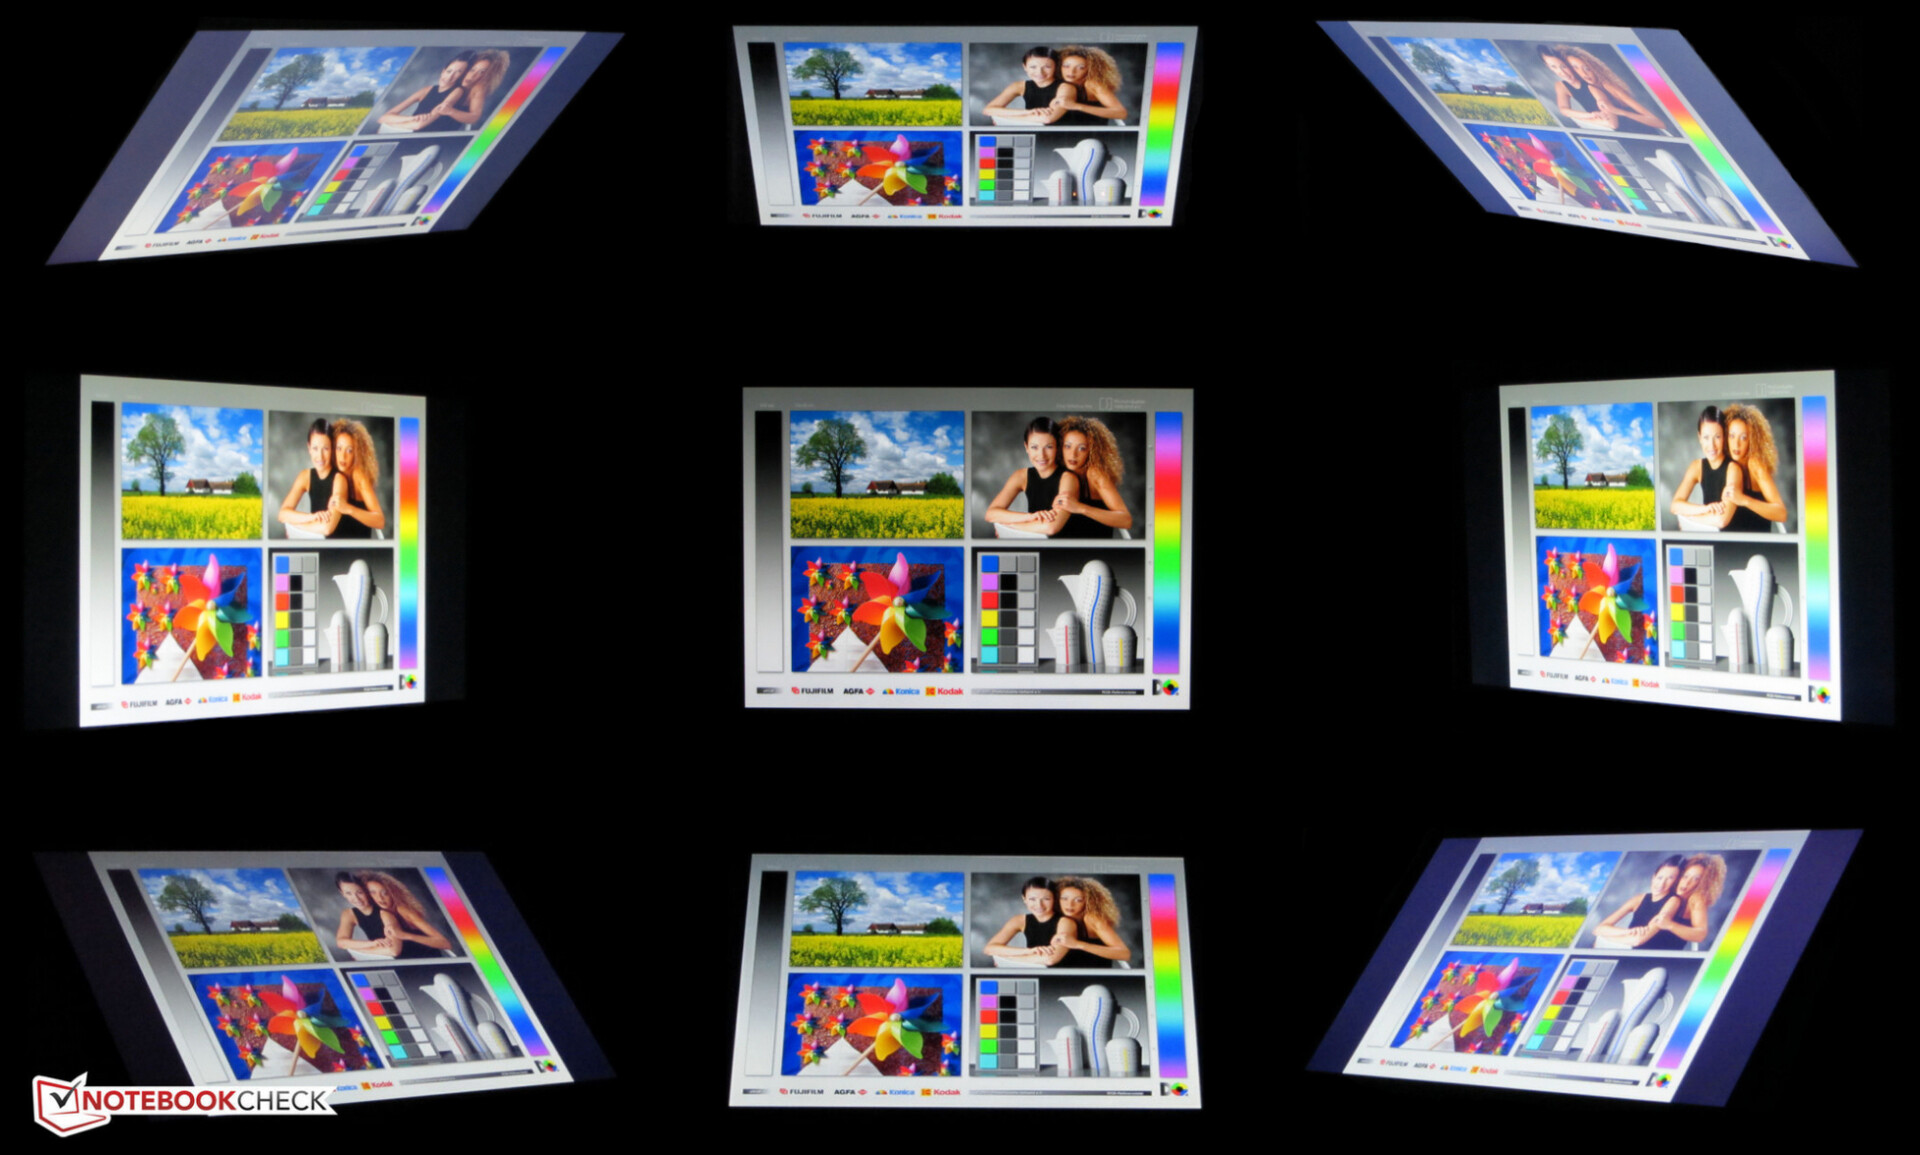
Schenker ha equipado el portátil con un panel IPS de ángulo de visión estable. De este modo, la pantalla puede ser leída desde cualquier posición. En el exterior, la pantalla sólo puede ser leída cuando el sol no es demasiado brillante.
Rendimiento - El portátil de Schenker ofrece un hardware de alta gama
Con el Key 15, Schenker tiene un portátil para juegos de 15,6 pulgadas en su gama que lleva todos los juegos modernos a la pantalla sin problemas y que también se destaca en todas las demás áreas de aplicación. Nuestro dispositivo de prueba cuesta un poco menos de 3.000 euros (~$3.548). Además, el dispositivo puede ser personalizado individualmente en la tienda online de Schenker.
Condiciones de la prueba
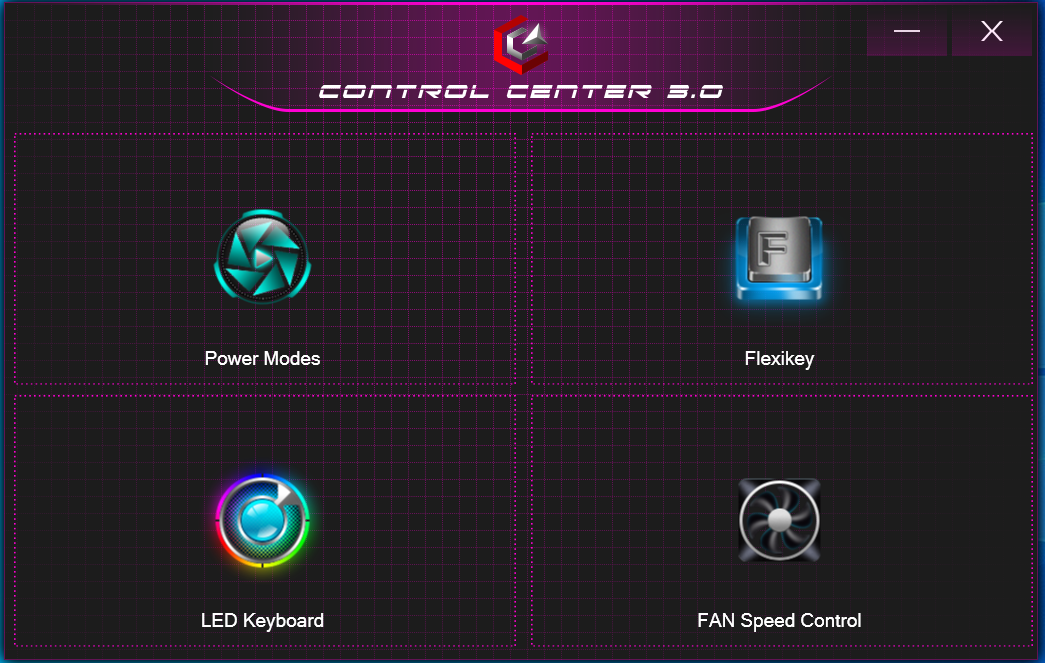
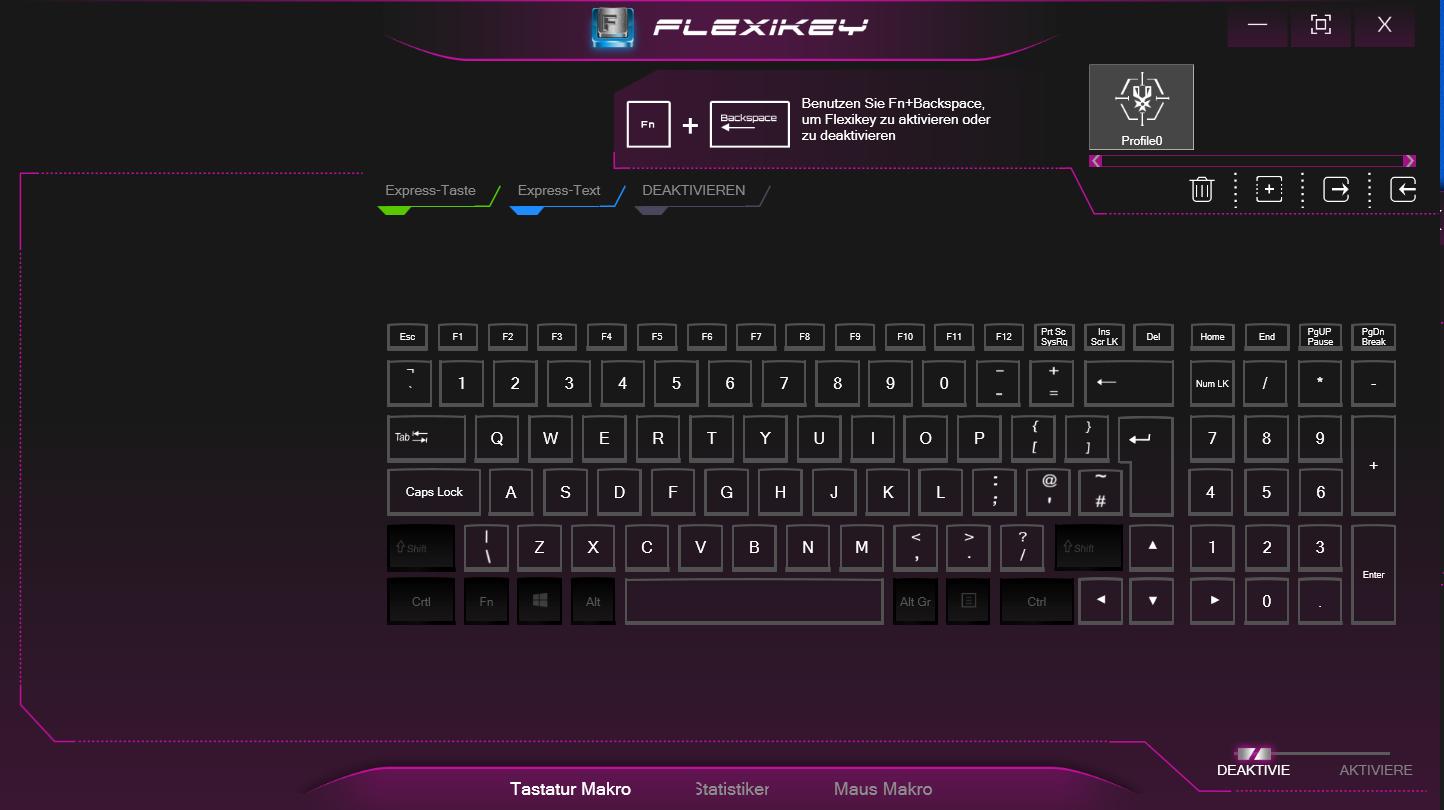
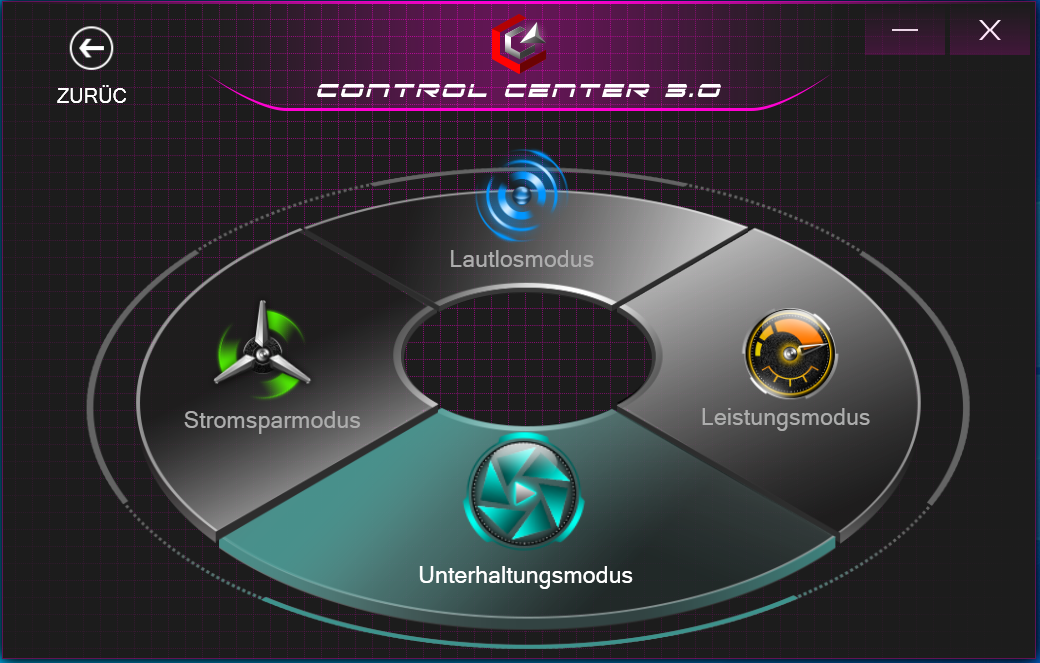
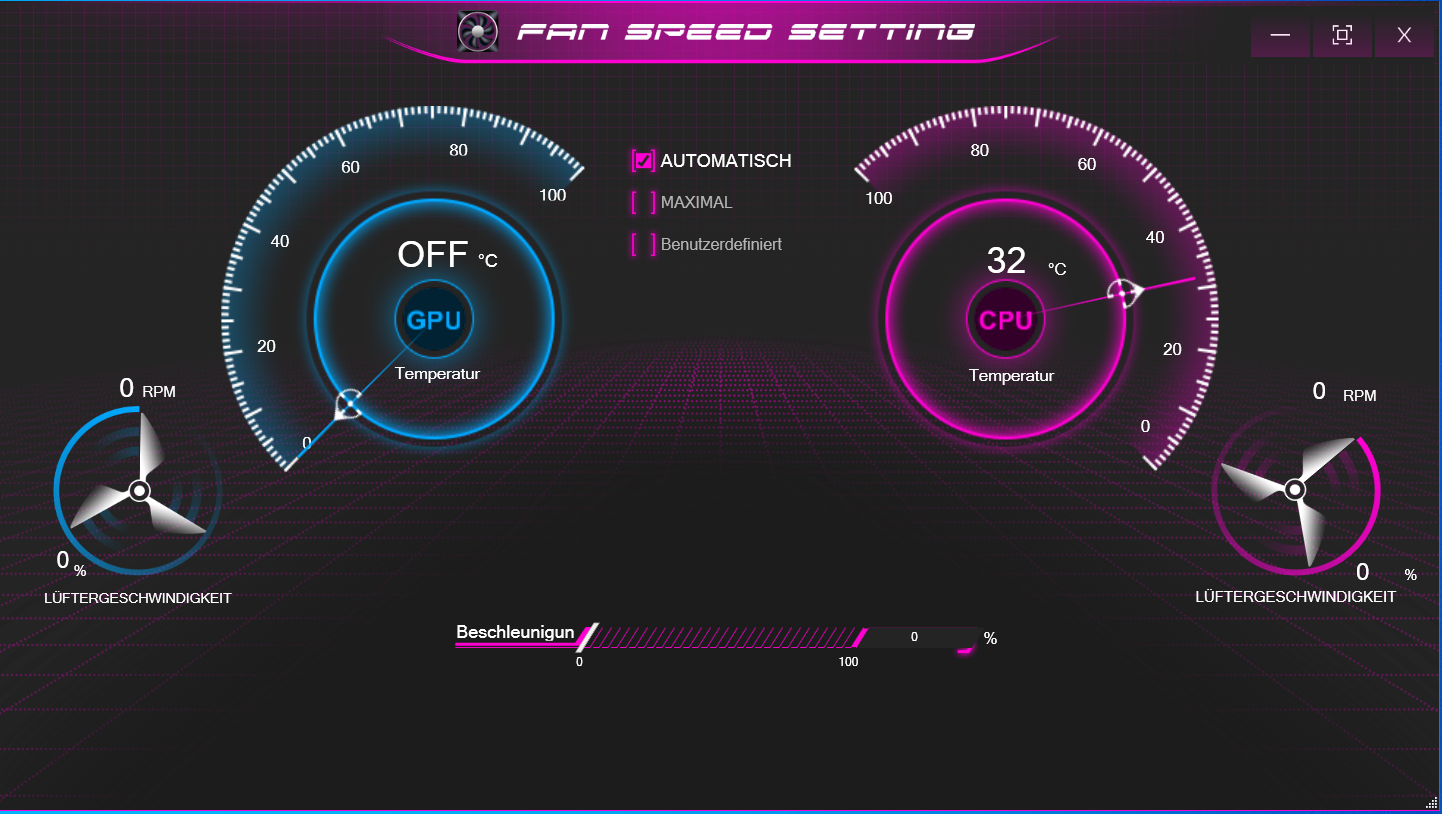
El software preinstalado del Control Center permite, entre otras cosas, ajustar el control del ventilador y seleccionar un perfil de energía. Realizamos todas las pruebas con el control automático del ventilador y el perfil de energía del "Modo de Entretenimiento". También realizamos algunas pruebas con el perfil de energía del "Modo de Entretenimiento" activo.
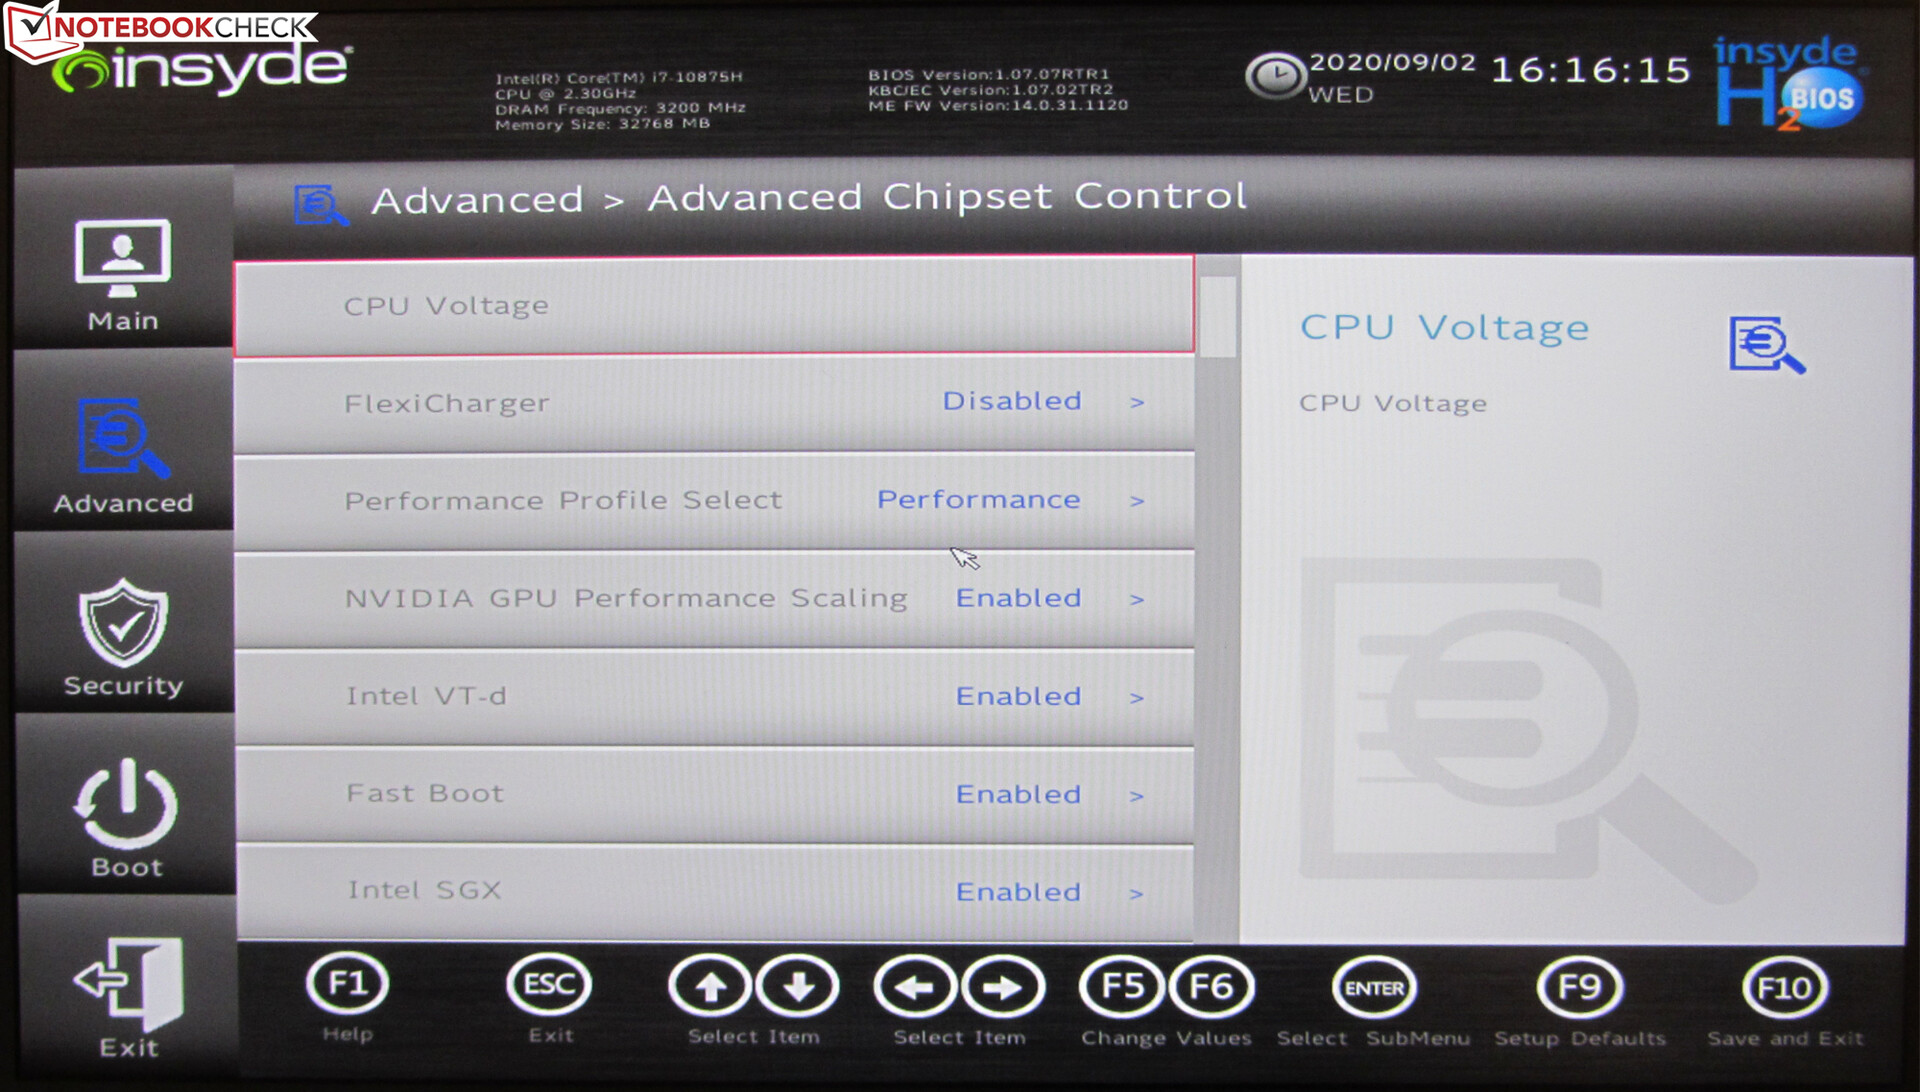
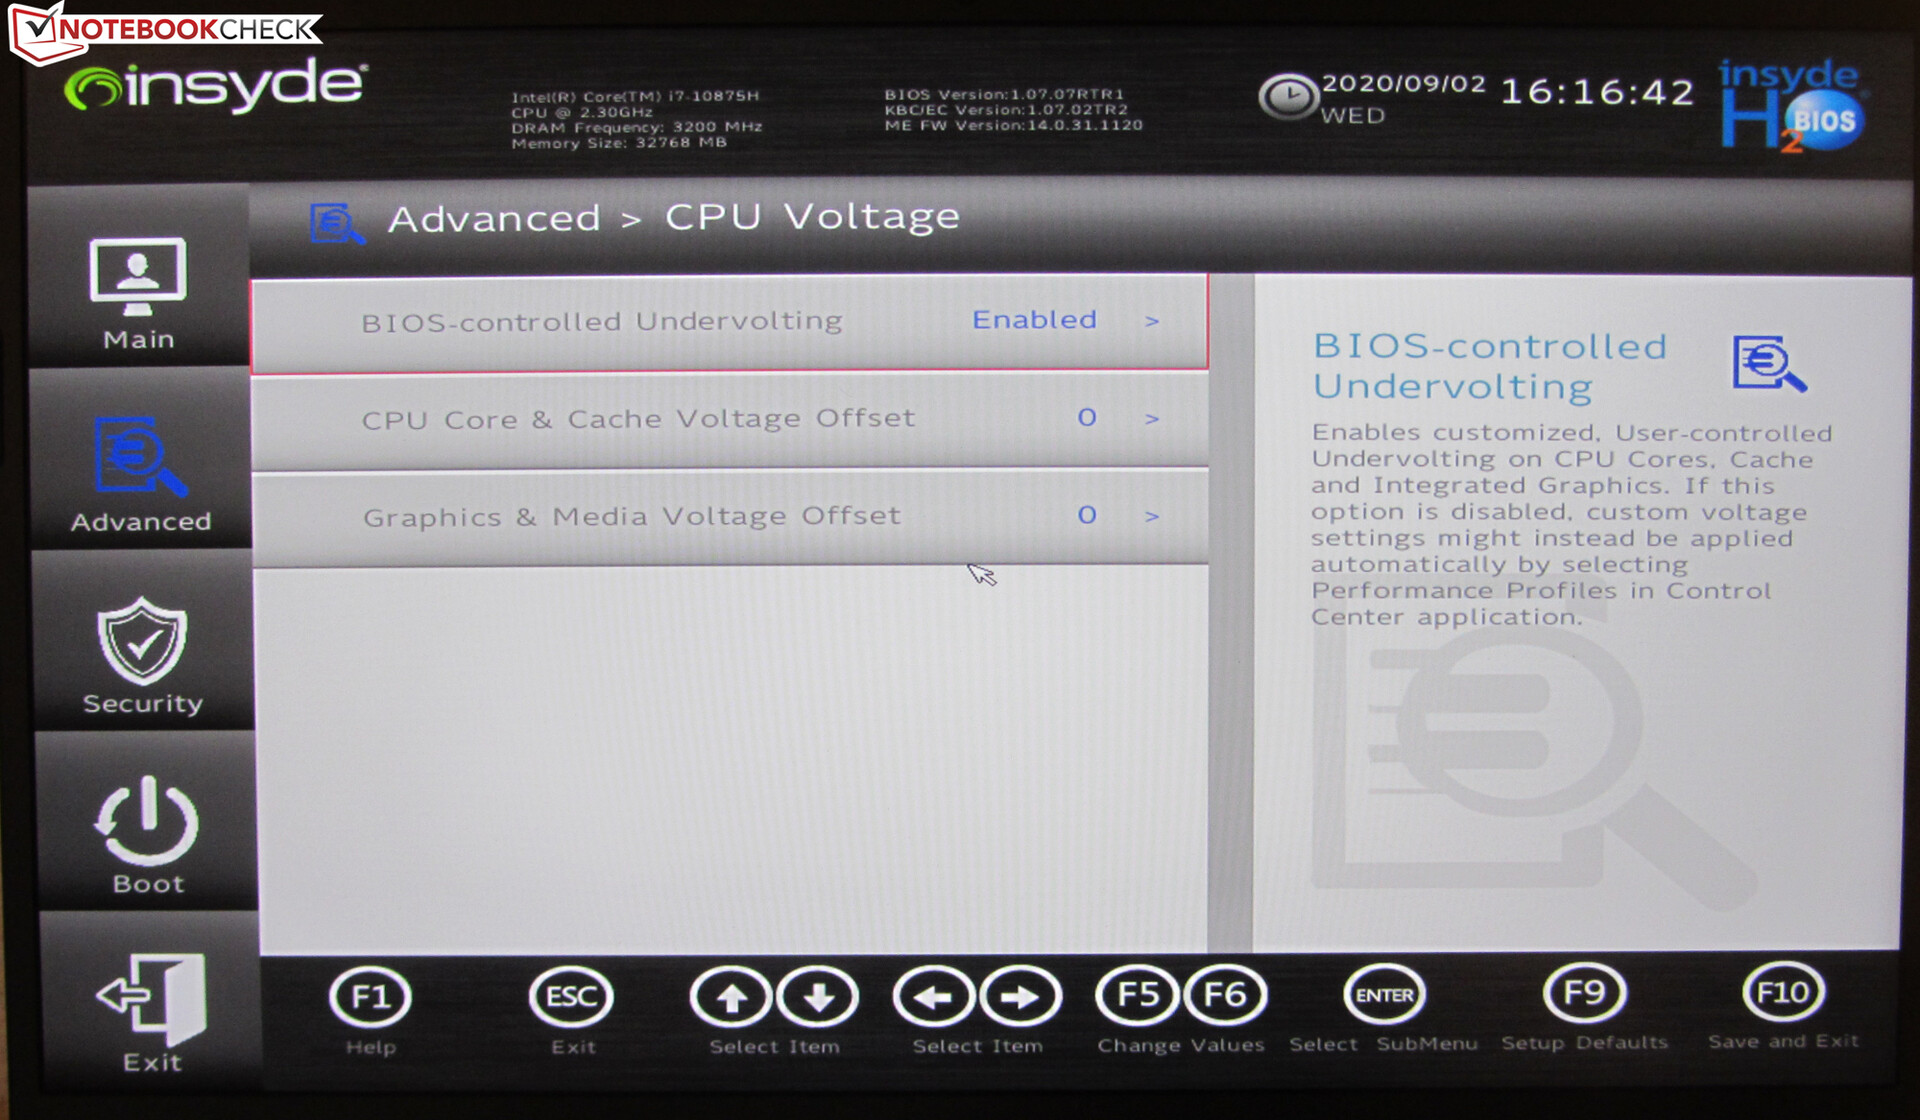
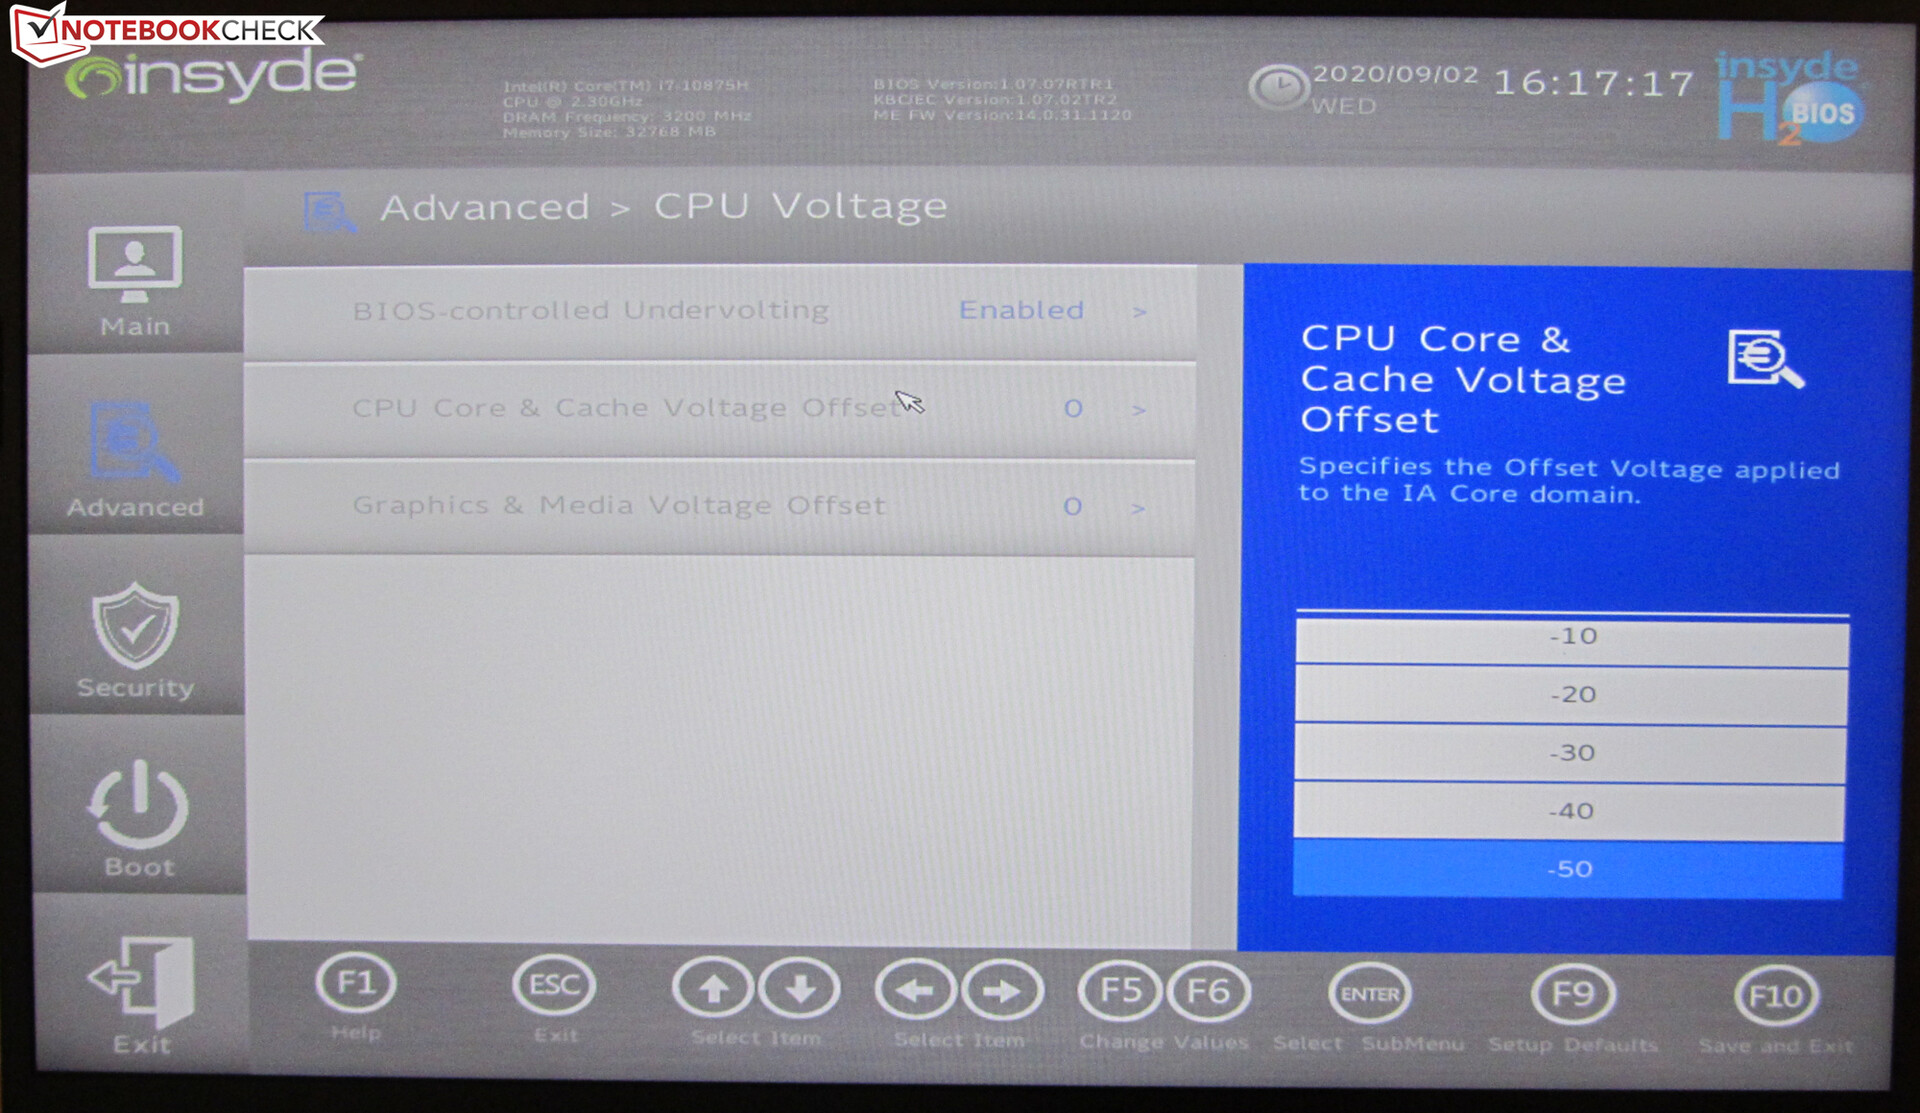
Undervolting por BIOS
El procesador y la GPU integrada pueden funcionar con voltajes más bajos que los proporcionados por el fabricante (subvoltaje). Como resultado, el consumo de energía y el desarrollo de calor son menores. Pero reducir demasiado el voltaje puede llevar a un sistema inestable o defectuoso. Por lo tanto, Schenker ha limitado la disminución de voltaje a un máximo de 50 mV usando pasos de 10 mV. Si se producen errores o inestabilidades, es necesario volver al paso de voltaje anterior. Por favor, tenga en cuenta: La subtensión siempre se hace bajo el propio riesgo del usuario.
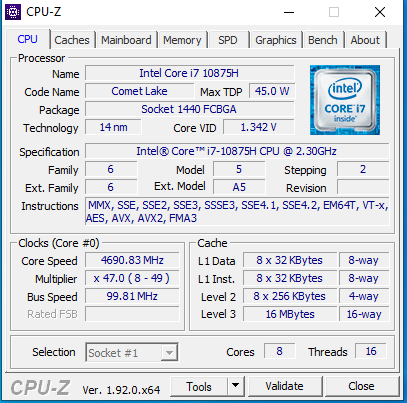
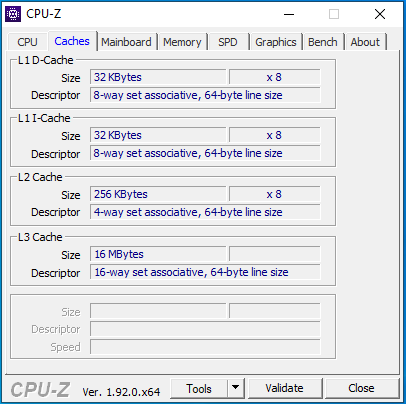
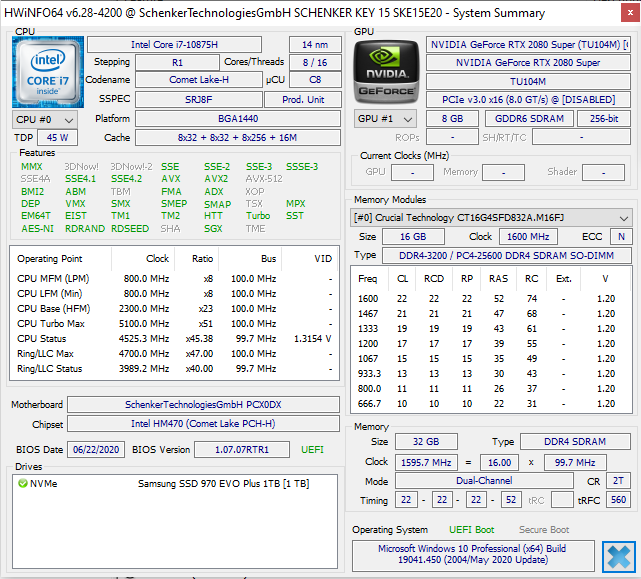
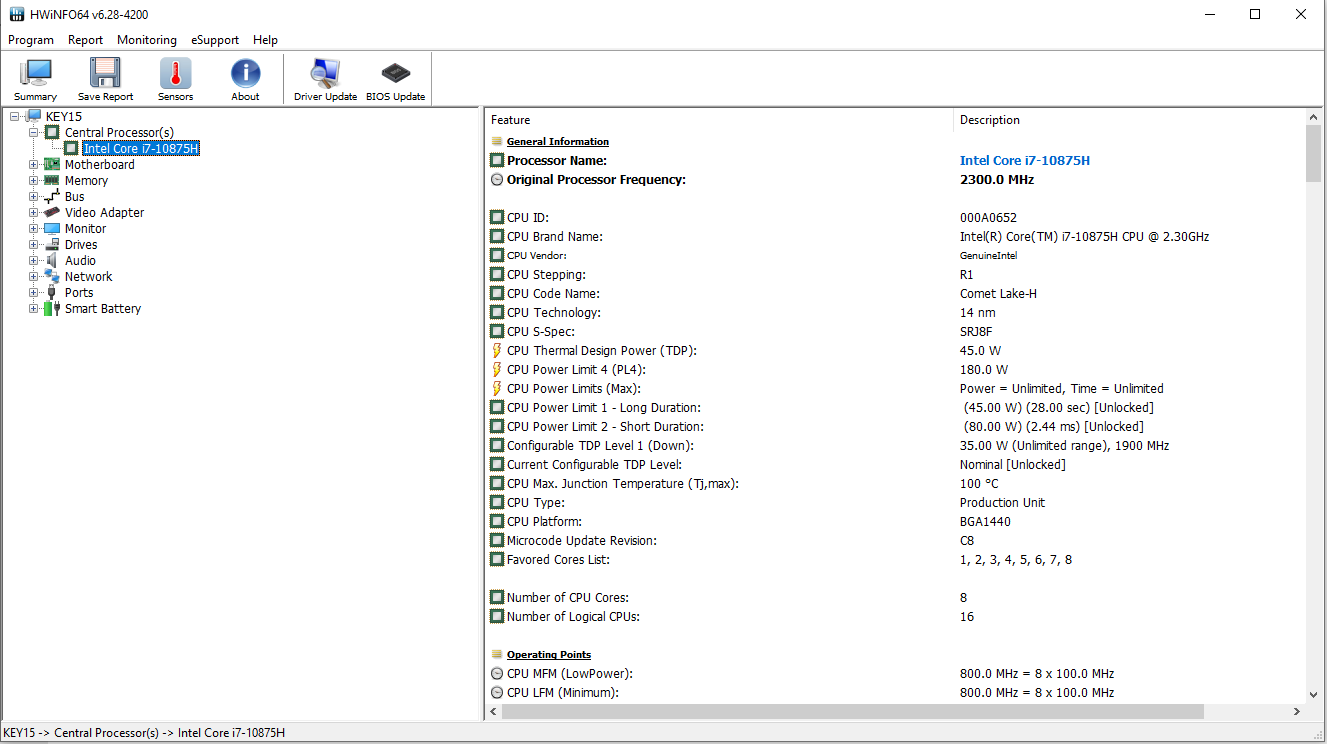
Procesador
El Key 15 está alimentado por un procesador octa-core Core i7-10875H (Comet Lake). El CPU opera a una velocidad base de 2,3 GHz. La velocidad puede aumentarse a 4,3 GHz (ocho núcleos) o 5,1 GHz (un núcleo) mediante Turbo. Se admite Hyper-Threading (dos hilos por núcleo).
El procesador funciona brevemente a través de la prueba de multihilo de la referencia Cinebench R15 a 2,3 a 4,3 GHz. La prueba de un solo hilo se realiza a 4,3 a 5,1 GHz. Con la energía de las baterías, las velocidades son de 1,9 a 2,6 GHz (multihilo) y 2 a 4,9 GHz (un solo hilo), respectivamente.
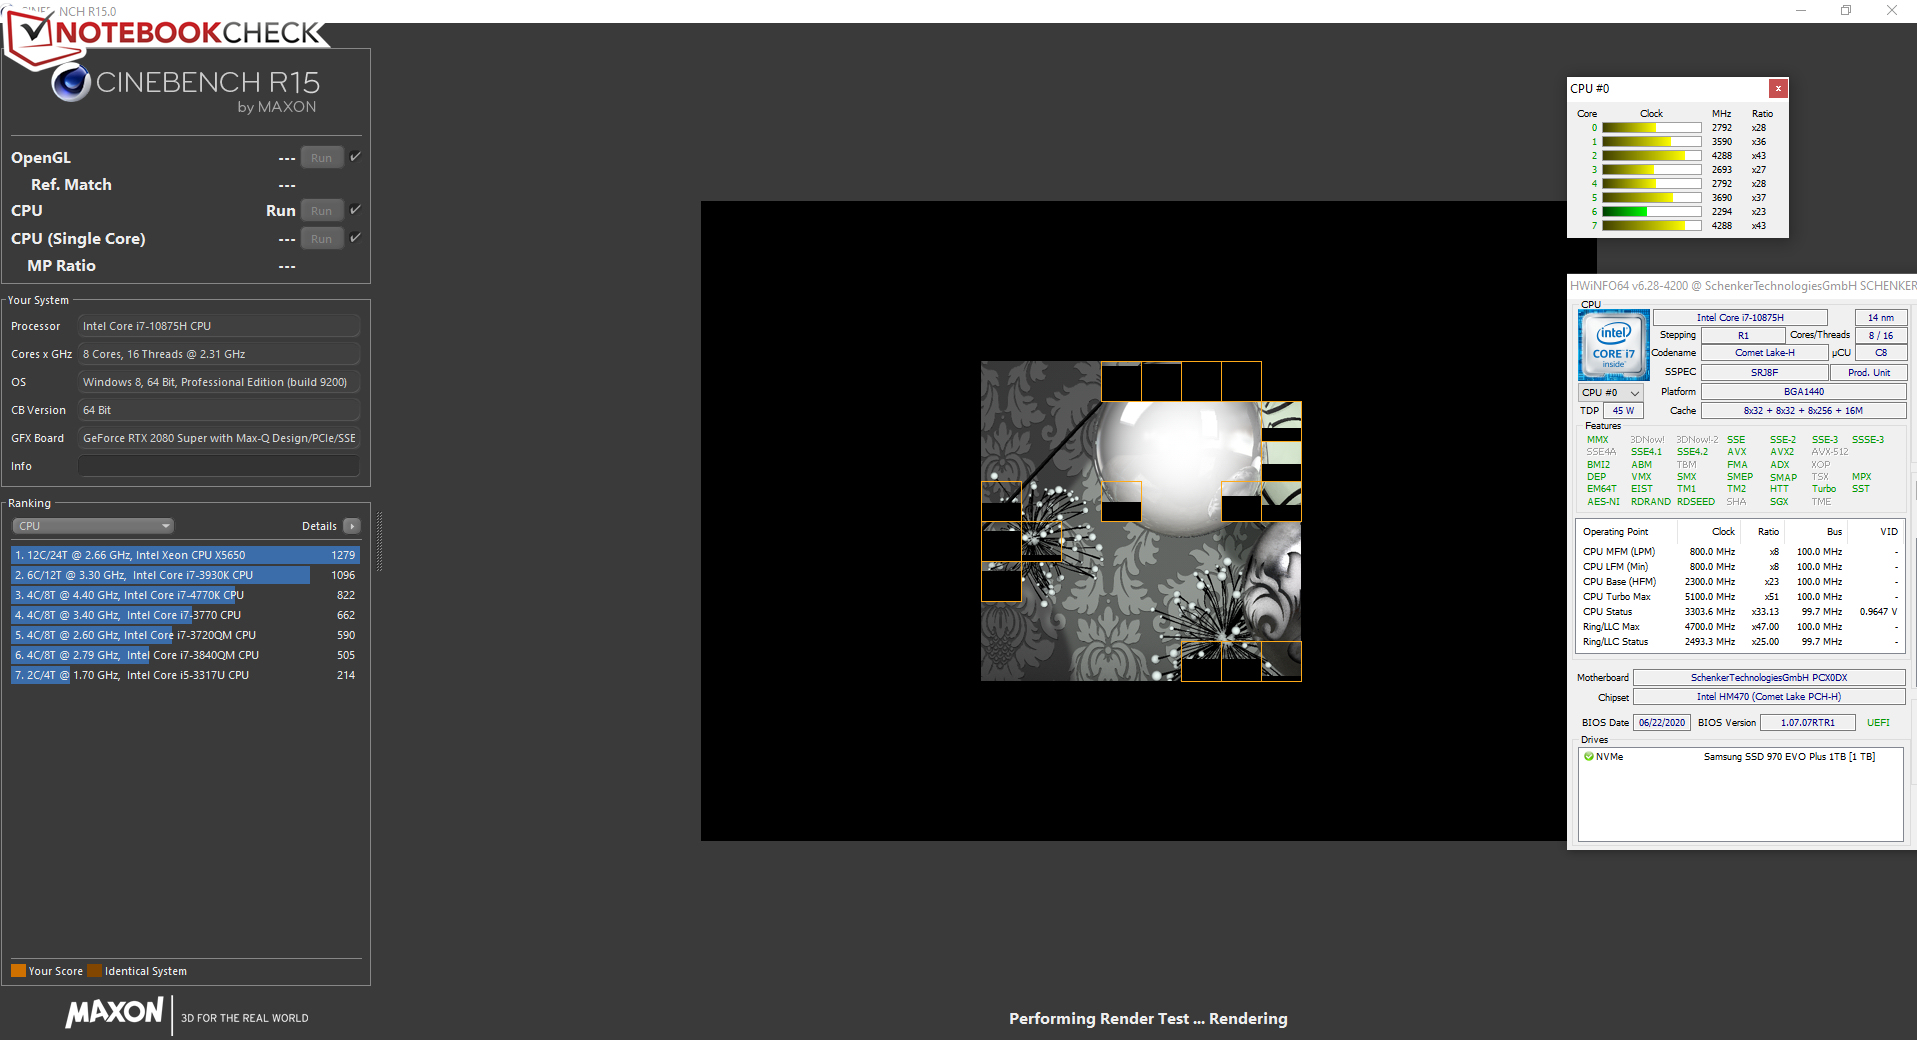
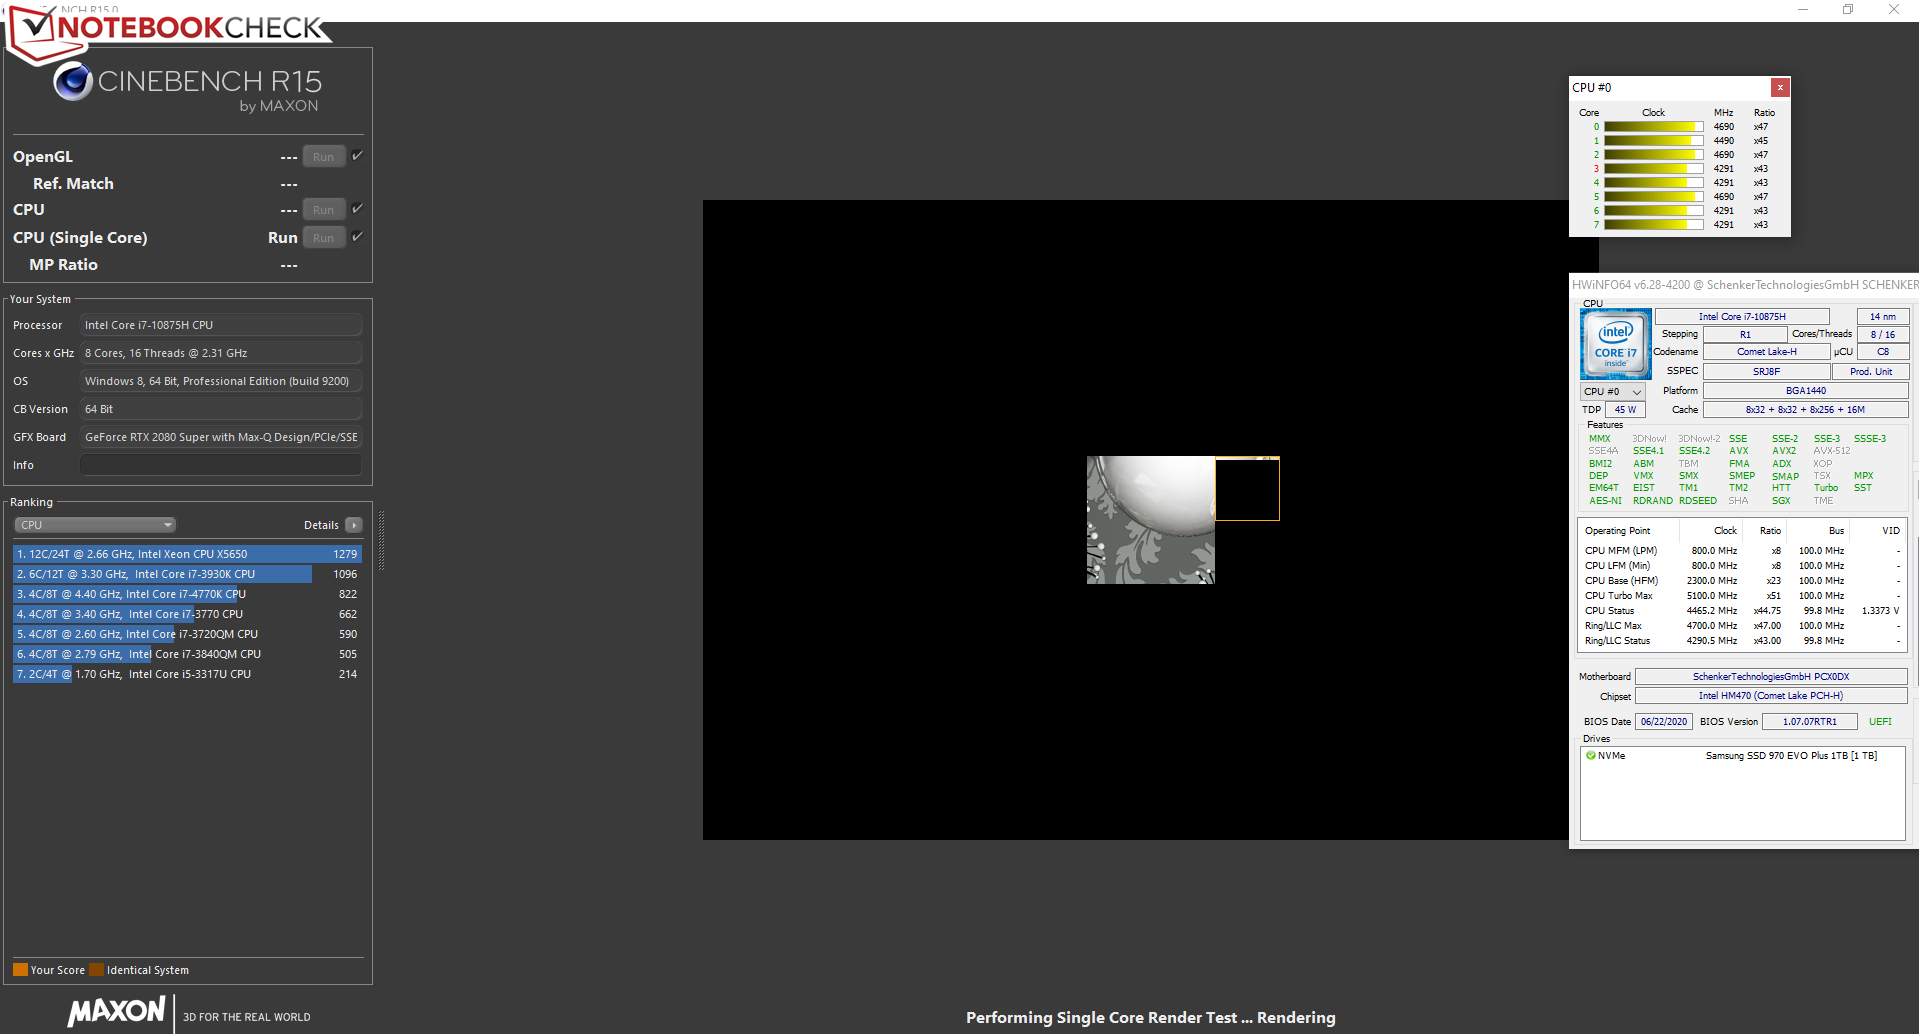
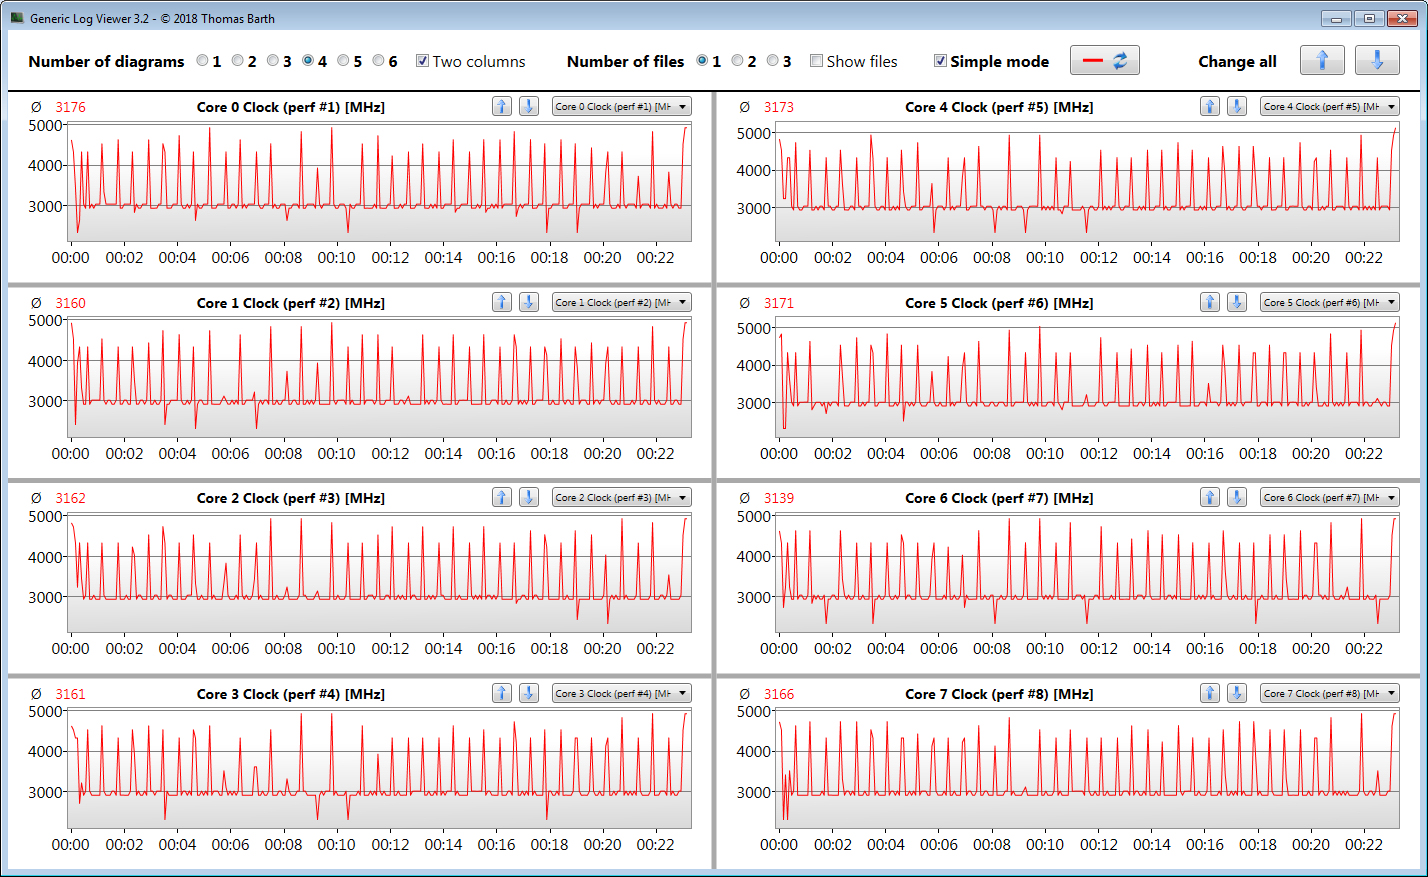
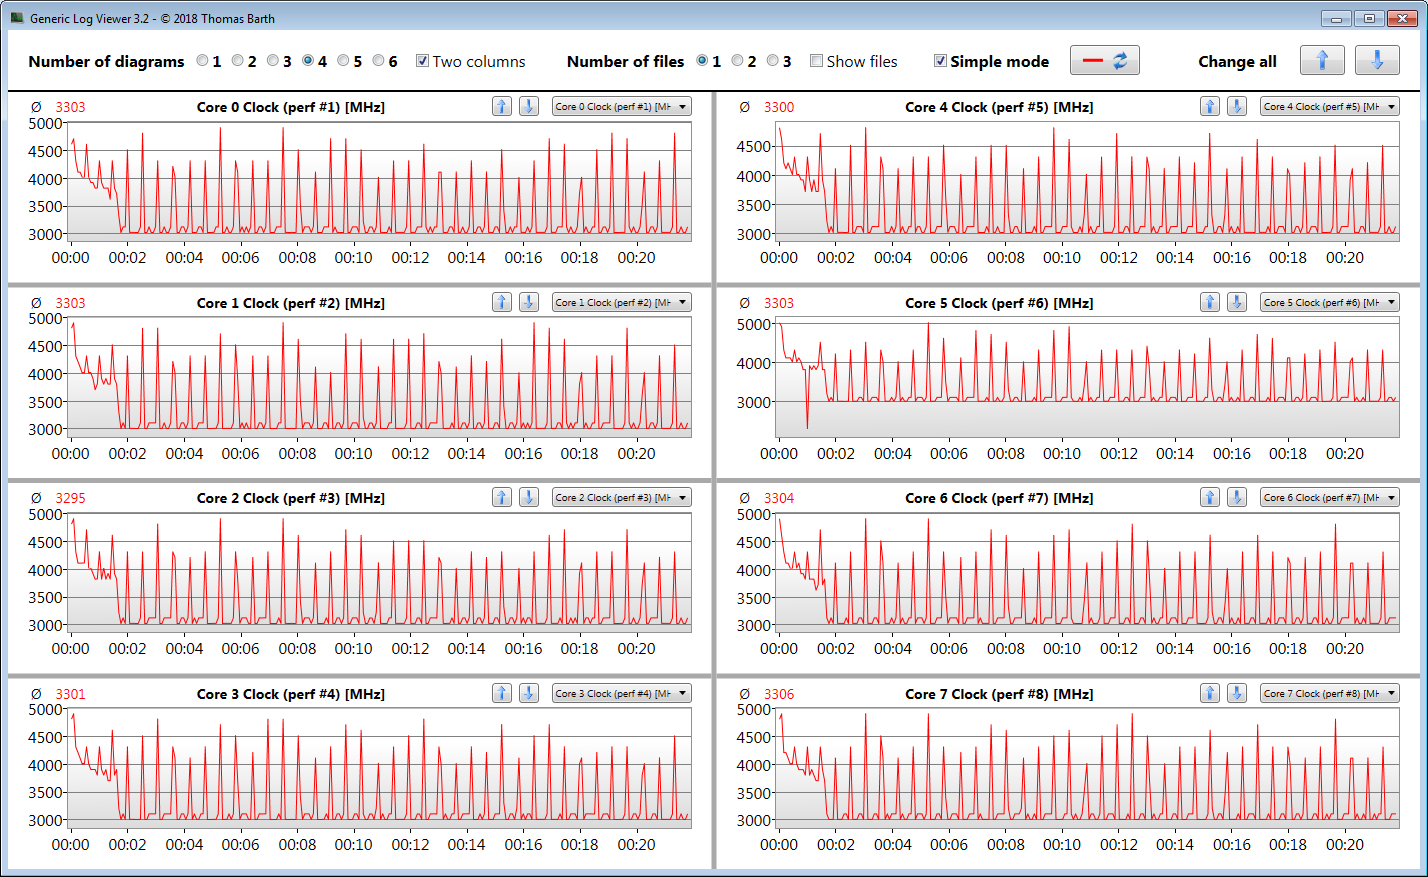
Verificamos si el Turbo de la CPU también se usa consistentemente cuando se conecta ejecutando la prueba multihilo del Cinebench R15 en un bucle continuo durante al menos 30 minutos. Los resultados caen de la primera a la segunda corrida y luego permanecen en un nivel constante. Se utiliza el turbo. Si se activa el modo de rendimiento en el Control, las velocidades del Turbo aumentan y por consiguiente los resultados también.
| Cinebench R15 | |
| CPU Single 64Bit | |
| Media de la clase Gaming (188.8 - 343, n=109, últimos 2 años) | |
| Gigabyte Aero 15 OLED XB-8DE51B0SP | |
| Schenker Key 15 Comet Lake (Leistungsmodus) | |
| Schenker Key 15 Comet Lake | |
| Medio Intel Core i7-10875H (190 - 220, n=37) | |
| Aorus 15G XB | |
| Razer Blade 15 RTX 2080 Super Max-Q | |
| Acer Predator Triton 500 PT515-52-70N3 | |
| MSI GS66 10SGS | |
| CPU Multi 64Bit | |
| Media de la clase Gaming (1578 - 6271, n=108, últimos 2 años) | |
| Aorus 15G XB | |
| Gigabyte Aero 15 OLED XB-8DE51B0SP | |
| Schenker Key 15 Comet Lake (Leistungsmodus) | |
| Medio Intel Core i7-10875H (1003 - 1833, n=38) | |
| Schenker Key 15 Comet Lake | |
| Acer Predator Triton 500 PT515-52-70N3 | |
| MSI GS66 10SGS | |
| Razer Blade 15 RTX 2080 Super Max-Q | |
| Blender - v2.79 BMW27 CPU | |
| Razer Blade 15 RTX 2080 Super Max-Q | |
| MSI GS66 10SGS | |
| Acer Predator Triton 500 PT515-52-70N3 | |
| Schenker Key 15 Comet Lake | |
| Medio Intel Core i7-10875H (259 - 535, n=30) | |
| Schenker Key 15 Comet Lake (Leistungsmodus) | |
| Gigabyte Aero 15 OLED XB-8DE51B0SP | |
| Aorus 15G XB | |
| Media de la clase Gaming (80 - 330, n=107, últimos 2 años) | |
| Cinebench R20 | |
| CPU (Single Core) | |
| Media de la clase Gaming (442 - 895, n=109, últimos 2 años) | |
| Gigabyte Aero 15 OLED XB-8DE51B0SP | |
| Schenker Key 15 Comet Lake (Leistungsmodus) | |
| Schenker Key 15 Comet Lake | |
| Medio Intel Core i7-10875H (430 - 524, n=32) | |
| Aorus 15G XB | |
| Razer Blade 15 RTX 2080 Super Max-Q | |
| Acer Predator Triton 500 PT515-52-70N3 | |
| MSI GS66 10SGS | |
| CPU (Multi Core) | |
| Media de la clase Gaming (4029 - 16108, n=109, últimos 2 años) | |
| Schenker Key 15 Comet Lake (Leistungsmodus) | |
| Gigabyte Aero 15 OLED XB-8DE51B0SP | |
| Aorus 15G XB | |
| Medio Intel Core i7-10875H (1986 - 4176, n=32) | |
| Schenker Key 15 Comet Lake | |
| Acer Predator Triton 500 PT515-52-70N3 | |
| MSI GS66 10SGS | |
| Razer Blade 15 RTX 2080 Super Max-Q | |
| Geekbench 5.5 | |
| Single-Core | |
| Media de la clase Gaming (986 - 2474, n=108, últimos 2 años) | |
| Schenker Key 15 Comet Lake (Leistungsmodus) | |
| Gigabyte Aero 15 OLED XB-8DE51B0SP | |
| Schenker Key 15 Comet Lake | |
| Medio Intel Core i7-10875H (1233 - 1371, n=29) | |
| Razer Blade 15 RTX 2080 Super Max-Q | |
| Aorus 15G XB | |
| Acer Predator Triton 500 PT515-52-70N3 | |
| MSI GS66 10SGS | |
| Multi-Core | |
| Media de la clase Gaming (6460 - 27010, n=108, últimos 2 años) | |
| Schenker Key 15 Comet Lake (Leistungsmodus) | |
| Aorus 15G XB | |
| Gigabyte Aero 15 OLED XB-8DE51B0SP | |
| Medio Intel Core i7-10875H (5715 - 8620, n=29) | |
| Schenker Key 15 Comet Lake | |
| Razer Blade 15 RTX 2080 Super Max-Q | |
| MSI GS66 10SGS | |
| Acer Predator Triton 500 PT515-52-70N3 | |
| HWBOT x265 Benchmark v2.2 - 4k Preset | |
| Media de la clase Gaming (11.5 - 44.3, n=108, últimos 2 años) | |
| Gigabyte Aero 15 OLED XB-8DE51B0SP | |
| Aorus 15G XB | |
| Schenker Key 15 Comet Lake (Leistungsmodus) | |
| Medio Intel Core i7-10875H (7.27 - 14.1, n=27) | |
| Schenker Key 15 Comet Lake | |
| Razer Blade 15 RTX 2080 Super Max-Q | |
| Acer Predator Triton 500 PT515-52-70N3 | |
| MSI GS66 10SGS | |
| LibreOffice - 20 Documents To PDF | |
| MSI GS66 10SGS | |
| Aorus 15G XB | |
| Gigabyte Aero 15 OLED XB-8DE51B0SP | |
| Acer Predator Triton 500 PT515-52-70N3 | |
| Schenker Key 15 Comet Lake | |
| Medio Intel Core i7-10875H (30.2 - 84.3, n=30) | |
| Media de la clase Gaming (19 - 88.8, n=108, últimos 2 años) | |
| Razer Blade 15 RTX 2080 Super Max-Q | |
| Schenker Key 15 Comet Lake (Leistungsmodus) | |
| R Benchmark 2.5 - Overall mean | |
| MSI GS66 10SGS | |
| Acer Predator Triton 500 PT515-52-70N3 | |
| Aorus 15G XB | |
| Medio Intel Core i7-10875H (0.546 - 0.662, n=29) | |
| Razer Blade 15 RTX 2080 Super Max-Q | |
| Schenker Key 15 Comet Lake | |
| Schenker Key 15 Comet Lake (Leistungsmodus) | |
| Gigabyte Aero 15 OLED XB-8DE51B0SP | |
| Media de la clase Gaming (0.3439 - 0.759, n=109, últimos 2 años) | |
* ... más pequeño es mejor
Rendimiento del sistema
El sistema funciona bien y sin problemas, y no encontramos ningún problema. El hardware incorporado ofrece suficiente potencia de cálculo para todas las áreas de aplicación comunes. Esto se confirma especialmente por los buenos resultados de PCMark.
| PCMark 8 Home Score Accelerated v2 | 4375 puntos | |
| PCMark 8 Creative Score Accelerated v2 | 5721 puntos | |
| PCMark 8 Work Score Accelerated v2 | 5682 puntos | |
| PCMark 10 Score | 5909 puntos | |
ayuda | ||
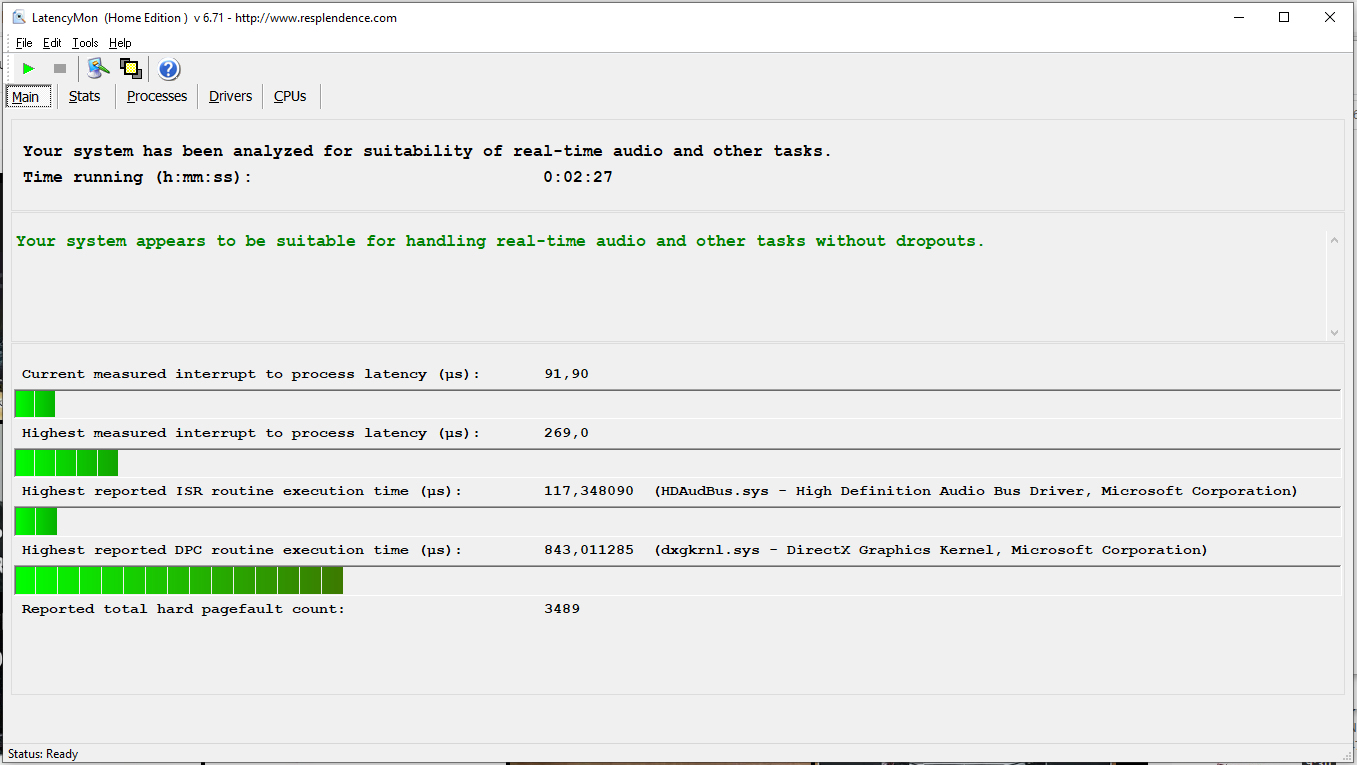
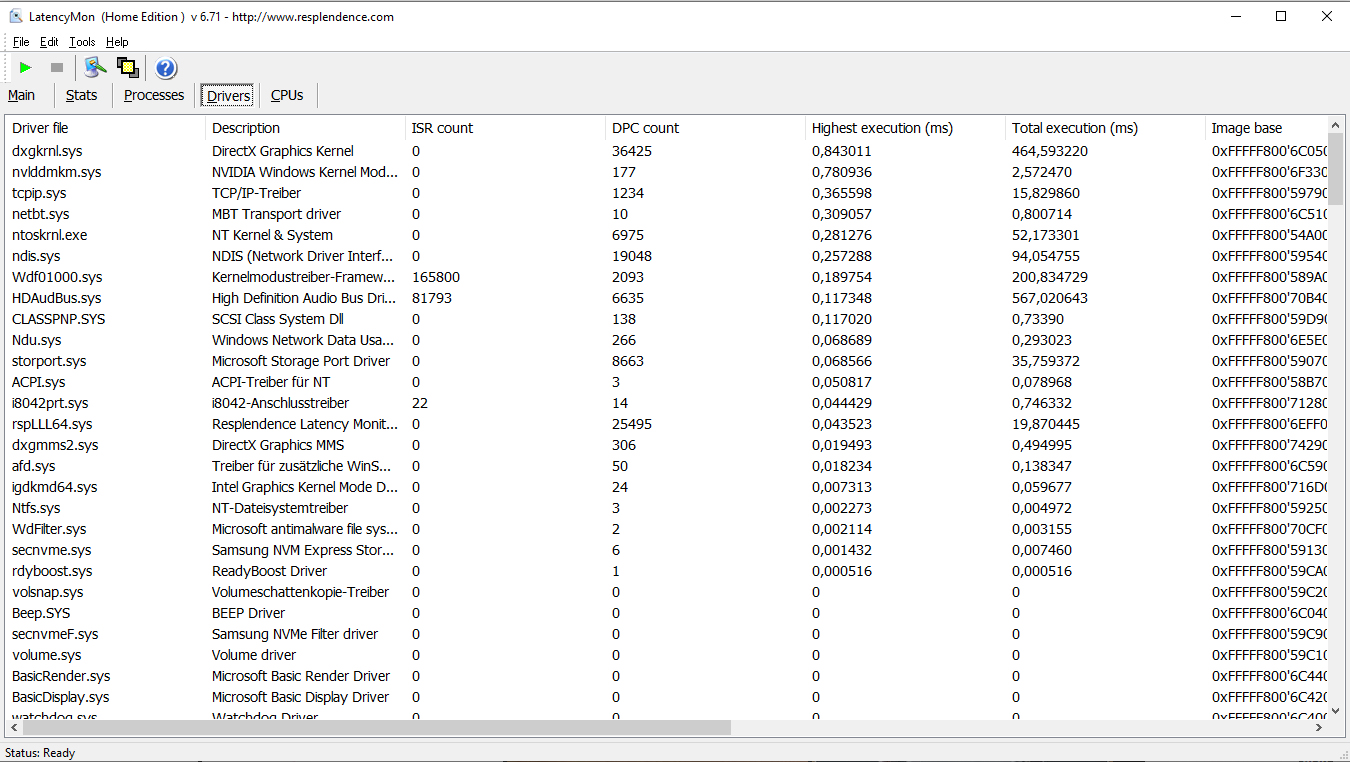
Latencias DPC
En nuestra prueba de monitor de latencia estandarizada (navegación por la web, reproducción de vídeo 4K, Prime95 de alta carga), no observamos ningún problema con las latencias DPC. El sistema parece ser adecuado para la edición de vídeo y audio en tiempo real.
| DPC Latencies / LatencyMon - interrupt to process latency (max), Web, Youtube, Prime95 | |
| Acer Predator Triton 500 PT515-52-70N3 | |
| Aorus 15G XB | |
| Gigabyte Aero 15 OLED XB-8DE51B0SP | |
| MSI GS66 10SGS | |
| Razer Blade 15 RTX 2080 Super Max-Q | |
| Schenker Key 15 Comet Lake | |
* ... más pequeño es mejor
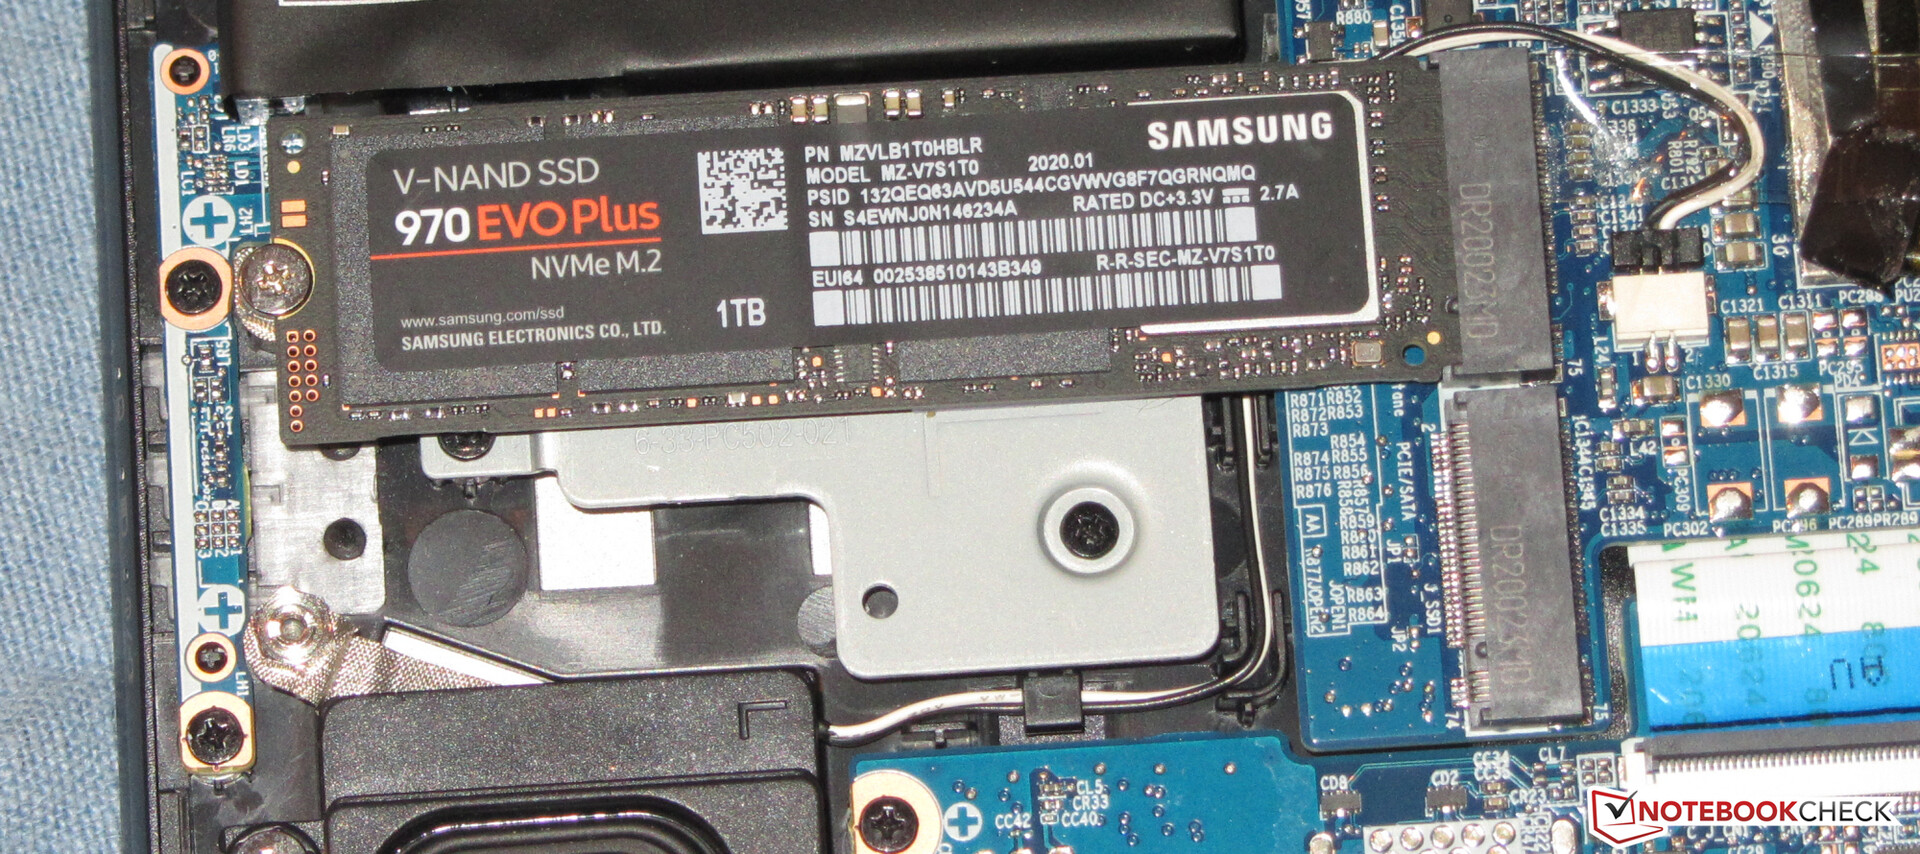
Almacenamiento
La unidad del sistema es un SSD NVMe (M.2 2280) de Samsung que proporciona 1 TB de espacio de almacenamiento. Las tasas de transferencia del SSD son excelentes. El portátil tiene una segunda ranura M.2 2280 que puede ser ocupada por un NVMe o un SSD SATA. Si ambas ranuras están equipadas con SSDs NVMe, éstas podrían formar un arreglo RAID 0 o RAID 1 si fuera necesario.

| Schenker Key 15 Comet Lake Samsung SSD 970 EVO Plus 1TB | MSI GS66 10SGS Samsung SSD PM981 MZVLB512HAJQ | Aorus 15G XB Samsung SSD PM981a MZVLB512HBJQ | Razer Blade 15 RTX 2080 Super Max-Q Samsung PM981a MZVLB1T0HBLR | Gigabyte Aero 15 OLED XB-8DE51B0SP Intel Optane Memory H10 with Solid State Storage 32GB + 512GB HBRPEKNX0202A(L/H) | Acer Predator Triton 500 PT515-52-70N3 Samsung SSD PM981a MZVLB512HBJQ | |
|---|---|---|---|---|---|---|
| CrystalDiskMark 5.2 / 6 | -25% | -19% | -16% | -15% | -15% | |
| Write 4K (MB/s) | 193 | 132.5 -31% | 121.6 -37% | 135.7 -30% | 127.4 -34% | 131.7 -32% |
| Read 4K (MB/s) | 54.3 | 45.03 -17% | 44.37 -18% | 46.98 -13% | 147.5 172% | 47.34 -13% |
| Write Seq (MB/s) | 2988 | 1987 -34% | 2617 -12% | 2180 -27% | 485.9 -84% | 2884 -3% |
| Read Seq (MB/s) | 2633 | 1434 -46% | 1297 -51% | 1949 -26% | 1352 -49% | 2303 -13% |
| Write 4K Q32T1 (MB/s) | 540 | 467.5 -13% | 499 -8% | 510 -6% | 476.5 -12% | 423.9 -22% |
| Read 4K Q32T1 (MB/s) | 620 | 536 -14% | 557 -10% | 569 -8% | 531 -14% | 487.7 -21% |
| Write Seq Q32T1 (MB/s) | 3284 | 2003 -39% | 2978 -9% | 2984 -9% | 1061 -68% | 2822 -14% |
| Read Seq Q32T1 (MB/s) | 3564 | 3306 -7% | 3360 -6% | 3238 -9% | 2552 -28% | 3478 -2% |
| AS SSD | -43% | -27% | -26% | -48% | -17% | |
| Seq Read (MB/s) | 2928 | 1086 -63% | 1795 -39% | 1950 -33% | 1200 -59% | 2767 -5% |
| Seq Write (MB/s) | 2733 | 1901 -30% | 2724 0% | 2322 -15% | 836 -69% | 2613 -4% |
| 4K Read (MB/s) | 51.6 | 51 -1% | 49.67 -4% | 45.48 -12% | 65.8 28% | 47.55 -8% |
| 4K Write (MB/s) | 129.8 | 117.3 -10% | 109.3 -16% | 95.4 -27% | 103.8 -20% | 98.9 -24% |
| 4K-64 Read (MB/s) | 1838 | 1503 -18% | 1284 -30% | 1484 -19% | 789 -57% | 1205 -34% |
| 4K-64 Write (MB/s) | 2291 | 1721 -25% | 1962 -14% | 1887 -18% | 929 -59% | 2007 -12% |
| Access Time Read * (ms) | 0.062 | 0.059 5% | 0.063 -2% | 0.051 18% | 0.103 -66% | 0.065 -5% |
| Access Time Write * (ms) | 0.029 | 0.1 -245% | 0.034 -17% | 0.038 -31% | 0.045 -55% | 0.038 -31% |
| Score Read (Points) | 2183 | 1662 -24% | 1513 -31% | 1725 -21% | 975 -55% | 1529 -30% |
| Score Write (Points) | 2694 | 2029 -25% | 2344 -13% | 2215 -18% | 1117 -59% | 2367 -12% |
| Score Total (Points) | 5984 | 4588 -23% | 4685 -22% | 4843 -19% | 2594 -57% | 4677 -22% |
| Copy ISO MB/s (MB/s) | 2183 | 2155 -1% | 1533 -30% | 1903 -13% | ||
| Copy Program MB/s (MB/s) | 2694 | 715 -73% | 528 -80% | 505 -81% | ||
| Copy Game MB/s (MB/s) | 5984 | 1506 -75% | 1042 -83% | 1113 -81% | ||
| Media total (Programa/Opciones) | -34% /
-37% | -23% /
-24% | -21% /
-23% | -32% /
-34% | -16% /
-16% |
* ... más pequeño es mejor
Continuous load read: DiskSpd Read Loop, Queue Depth 8
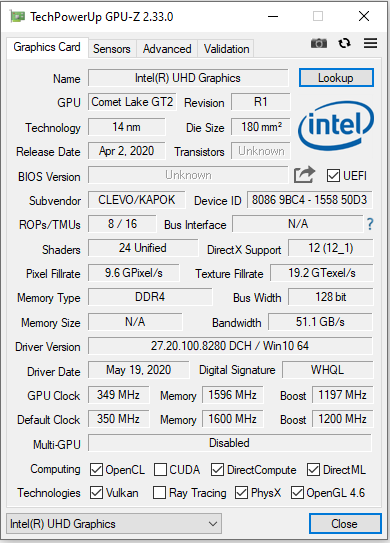
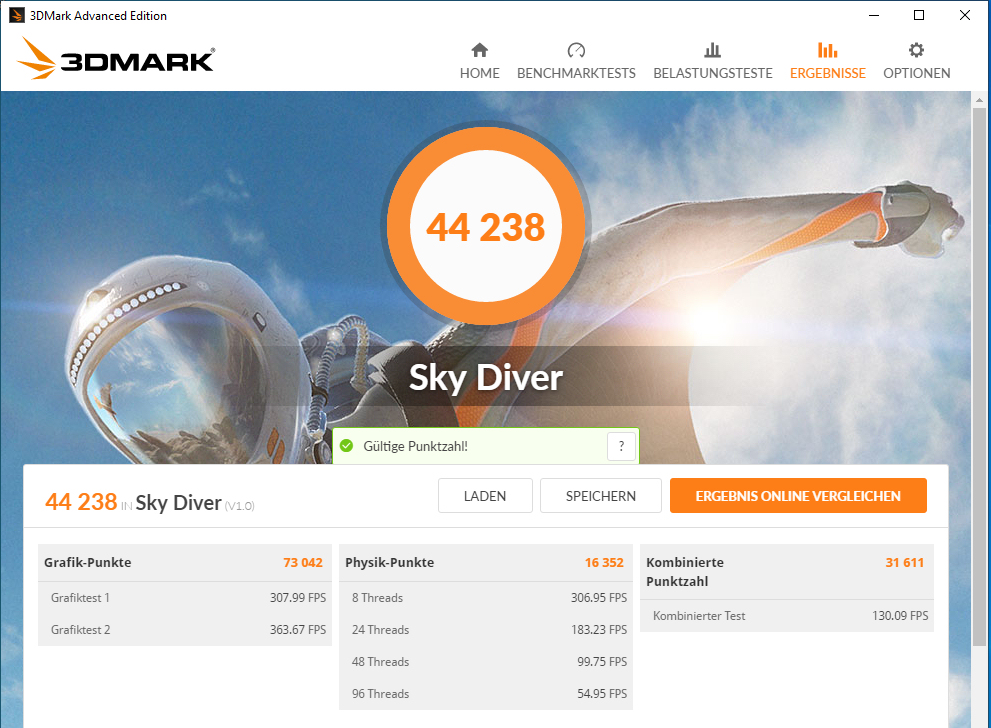
Tarjeta gráfica
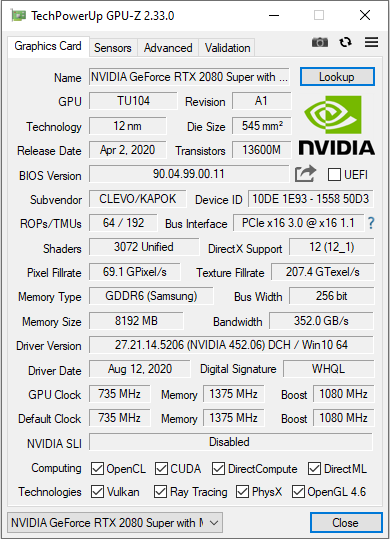
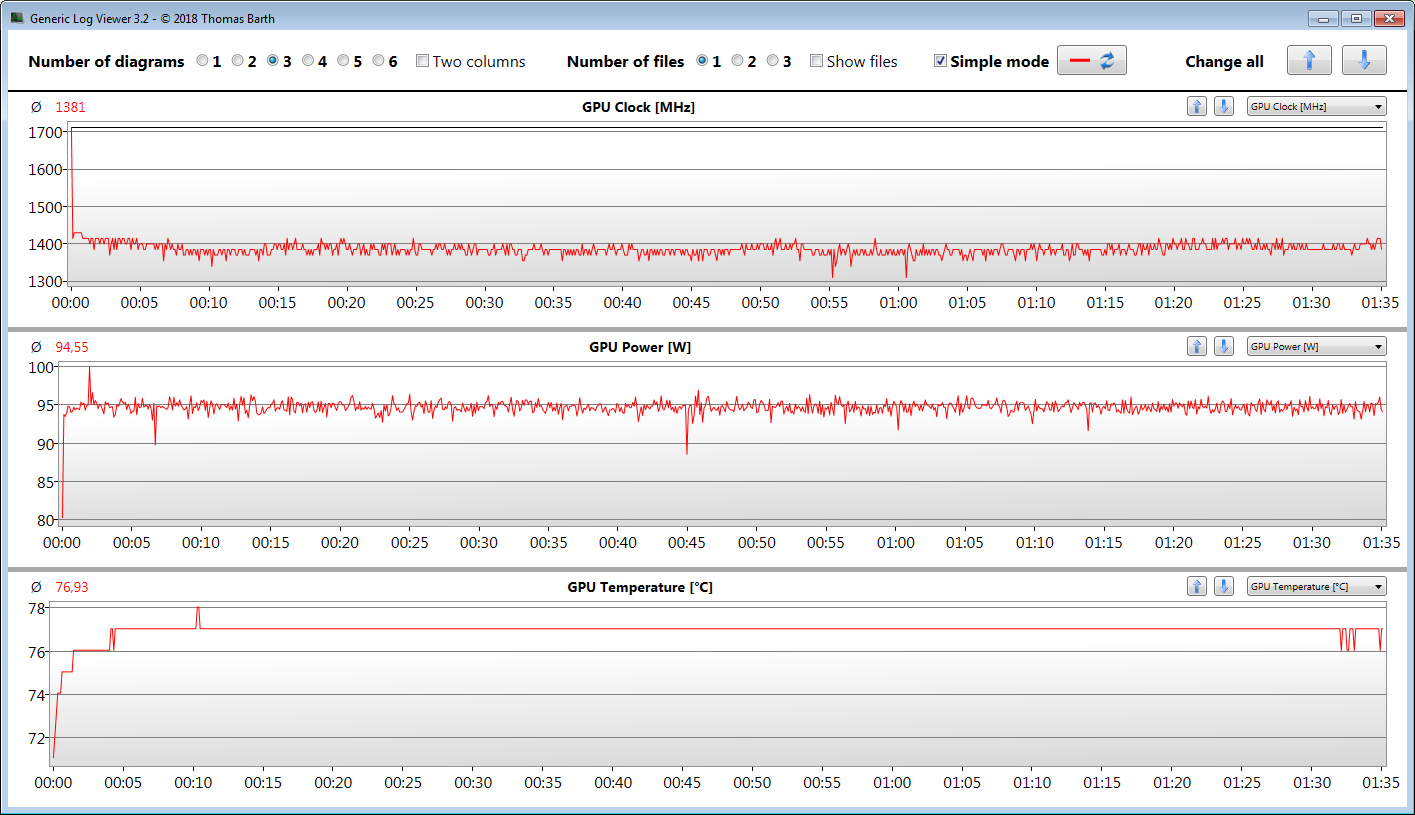
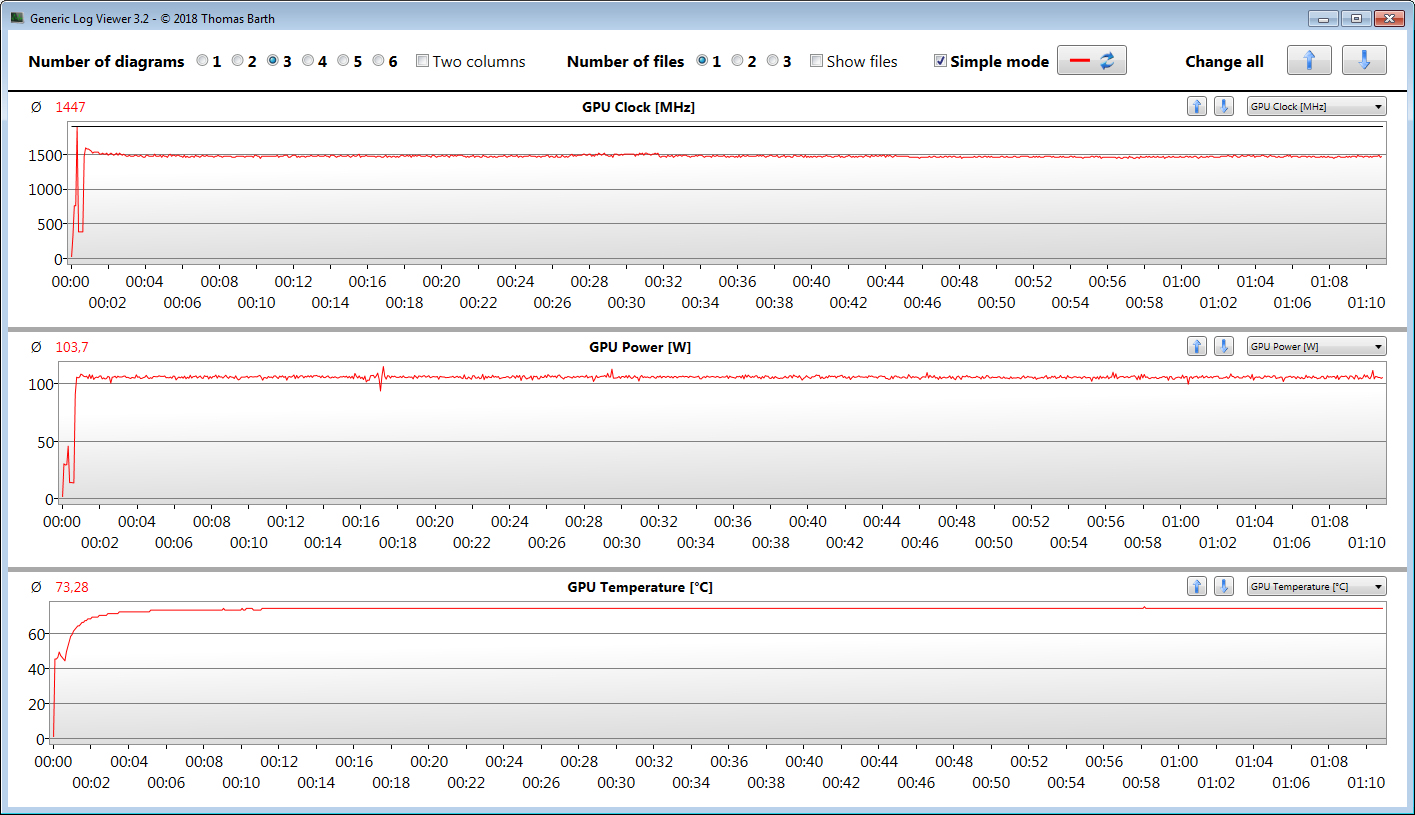
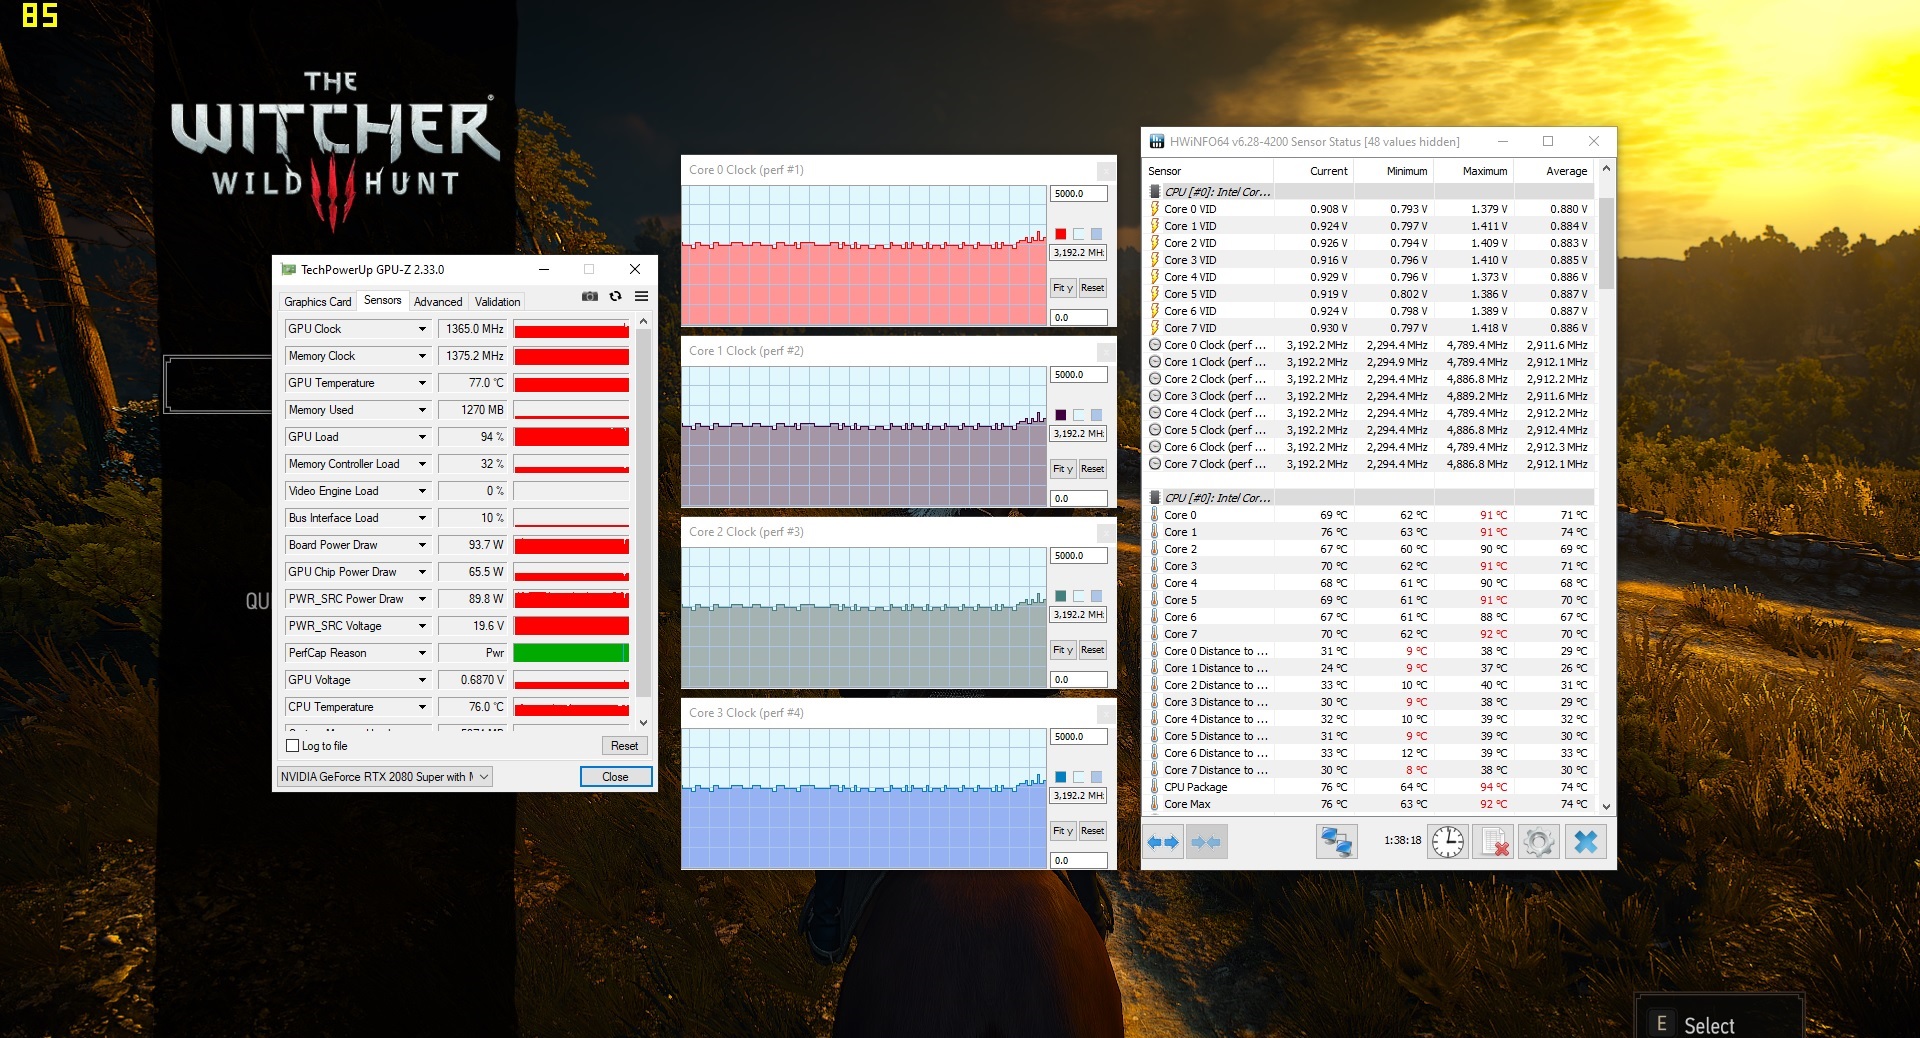
El núcleo gráfico de la GeForce 2080 Super Max-Q (Turing) funciona a una velocidad base de 735 MHz. Cuando se impulsa, es posible un aumento hasta 1.080 MHz. Se pueden alcanzar velocidades más altas si la GPU no alcanza un umbral de temperatura y/o energía especificado. La velocidad máxima que medimos es de 1.880 MHz. Además, la GPU ejecuta nuestra prueba de The Witcher 3 a velocidades medias de 1.381 MHz y 1.447 MHz (modo de rendimiento), respectivamente. La GPU es compatible con la rápida memoria GDDR6 (8.192 MB).
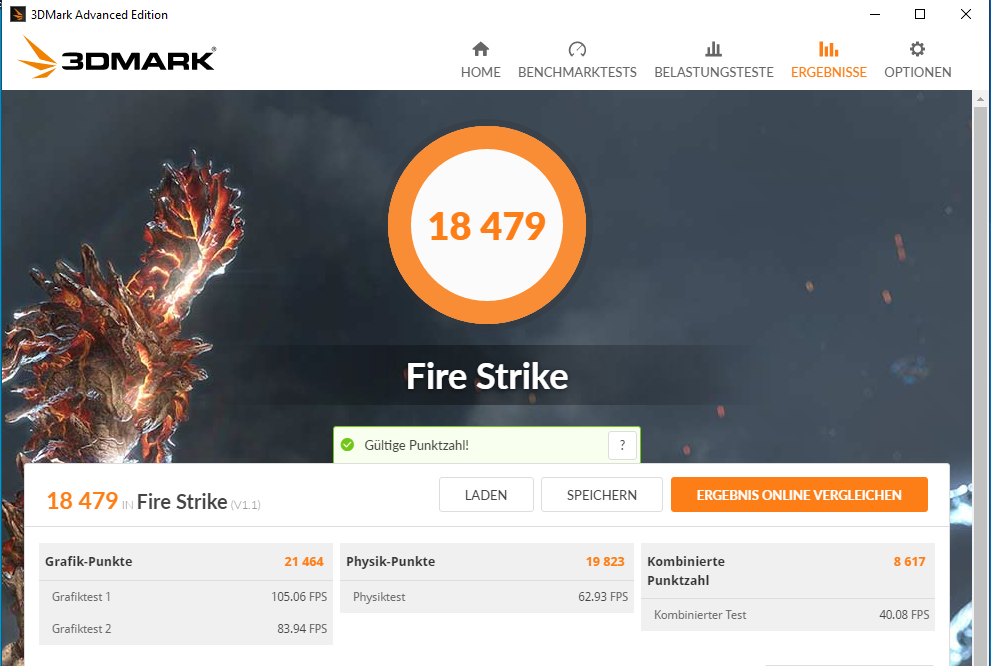
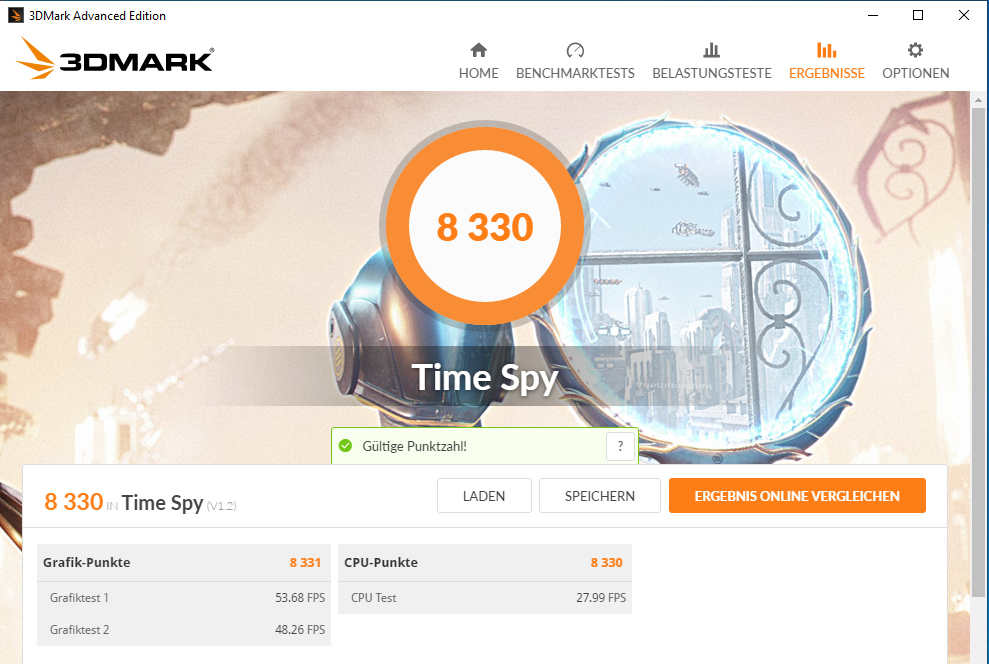
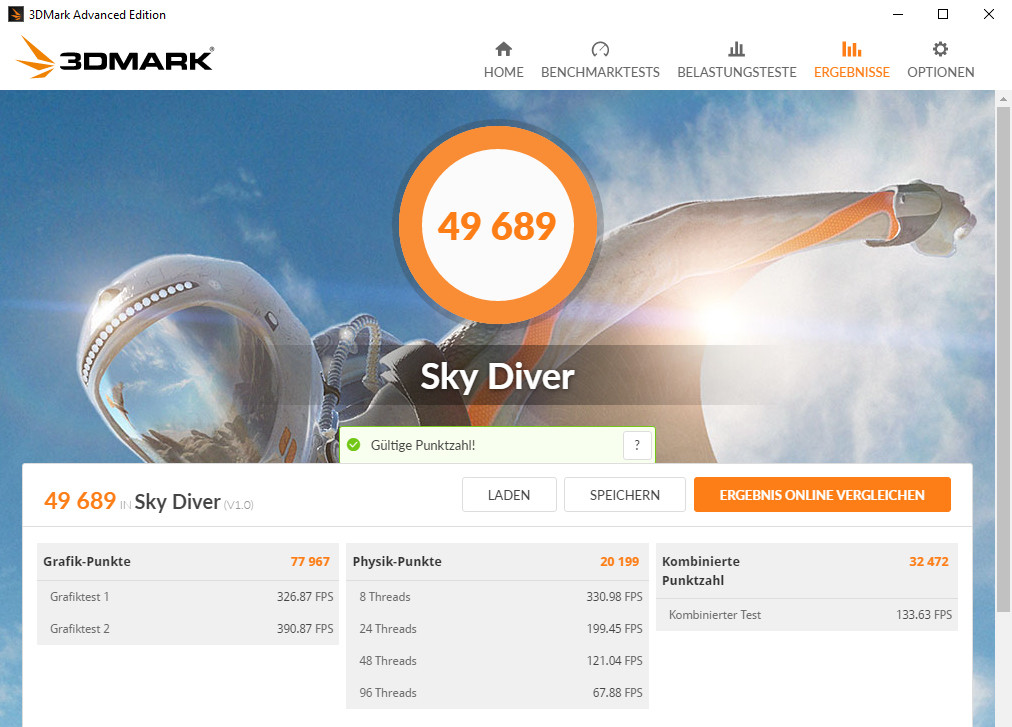
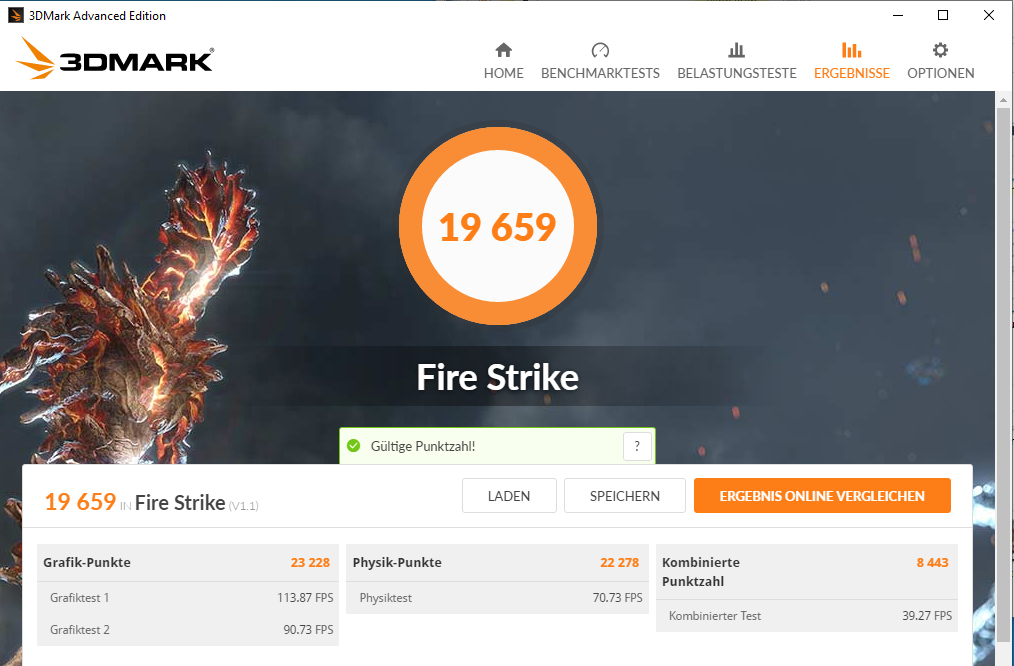
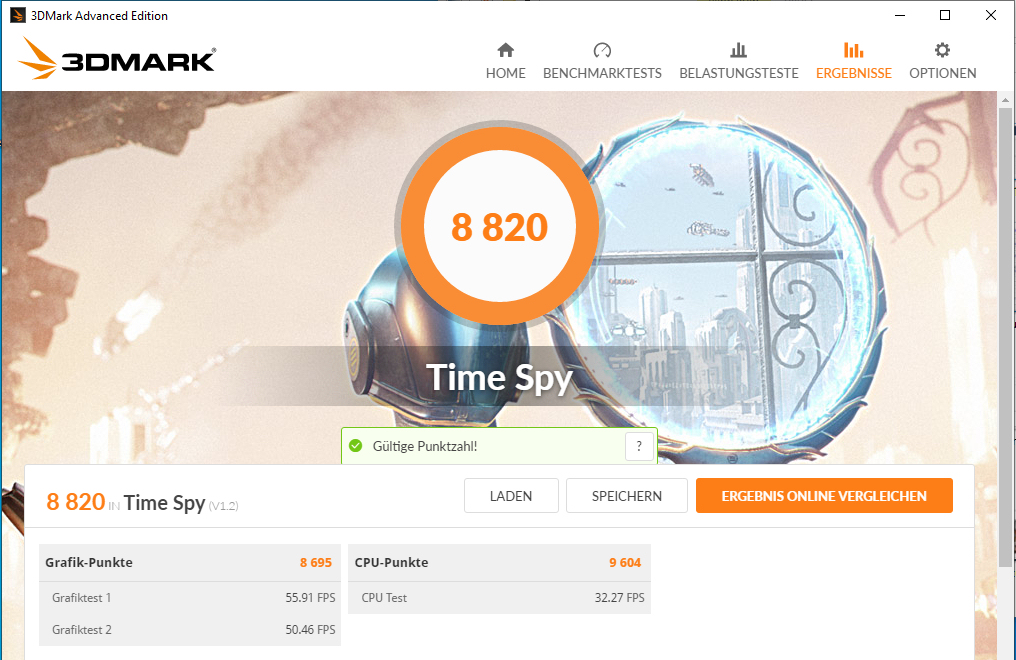
Los resultados de 3DMark están a un nivel normal para la GPU instalada aquí. La GPU UHD Graphics 630 integrada en el procesador está activa, y el portátil funciona con la solución de conmutación de gráficos Optimus de Nvidia. Además, al activar el modo de rendimiento en el centro de control, se incrementa el rendimiento de los gráficos.


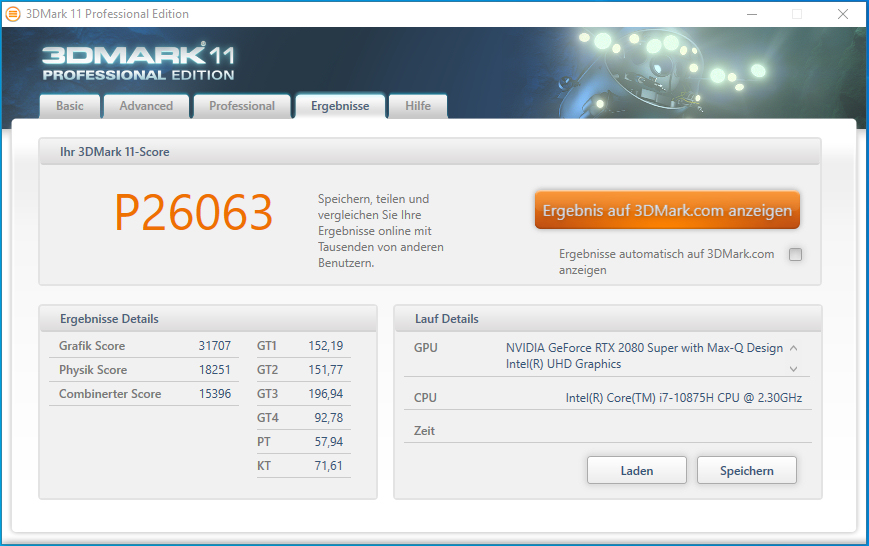
| 3DMark 11 Performance | 24712 puntos | |
| 3DMark Cloud Gate Standard Score | 44991 puntos | |
| 3DMark Fire Strike Score | 18479 puntos | |
| 3DMark Time Spy Score | 8330 puntos | |
ayuda | ||
| 3DMark 11 - 1280x720 Performance GPU | |
| Media de la clase Gaming (21841 - 80022, n=106, últimos 2 años) | |
| Schenker Key 15 Comet Lake (Leistungsmodus) | |
| Acer Predator Triton 500 PT515-52-70N3 | |
| Medio NVIDIA GeForce RTX 2080 Super Max-Q (26292 - 32995, n=10) | |
| Gigabyte Aero 15 OLED XB-8DE51B0SP | |
| Schenker Key 15 Comet Lake | |
| Razer Blade 15 RTX 2080 Super Max-Q | |
| Aorus 15G XB | |
| MSI GS66 10SGS | |
El rendimiento de los juegos
El portátil de Schenker lleva todos los últimos juegos sin problemas a la pantalla. La resolución Full HD y los ajustes de máxima calidad se pueden seleccionar aquí. La GPU también maneja resoluciones más allá de Full HD (para ello es necesario conectar un monitor apropiado). Sin embargo, el nivel de calidad debe ser ajustado de forma más conservadora, especialmente en el nivel de 4K.
Una mirada a la siguiente tabla muestra que la activación del Modo de Rendimiento resulta en un aumento de la tasa de fotogramas. Sin embargo, en la mayoría de los casos, el aumento es bastante pequeño. Un atípico en la parte superior se observa con el juego F1 2020.
| The Witcher 3 - 1920x1080 Ultra Graphics & Postprocessing (HBAO+) | |
| Media de la clase Gaming (95 - 240, n=8, últimos 2 años) | |
| Schenker Key 15 Comet Lake (Leistungsmodus) | |
| Schenker Key 15 Comet Lake | |
| Razer Blade 15 RTX 2080 Super Max-Q | |
| Medio NVIDIA GeForce RTX 2080 Super Max-Q (74.3 - 96, n=11) | |
| Acer Predator Triton 500 PT515-52-70N3 | |
| Gigabyte Aero 15 OLED XB-8DE51B0SP | |
| Aorus 15G XB | |
| MSI GS66 10SGS | |
| BioShock Infinite - 1920x1080 Ultra Preset, DX11 (DDOF) | |
| Medio NVIDIA GeForce RTX 2080 Super Max-Q (170.2 - 181.1, n=4) | |
| Razer Blade 15 RTX 2080 Super Max-Q | |
| Schenker Key 15 Comet Lake | |
| Aorus 15G XB | |
| F1 2020 - 1920x1080 Ultra High Preset AA:T AF:16x | |
| Schenker Key 15 Comet Lake (Leistungsmodus) | |
| Medio NVIDIA GeForce RTX 2080 Super Max-Q (102 - 126, n=5) | |
| Razer Blade 15 RTX 2080 Super Max-Q | |
| Aorus 15G XB | |
| Schenker Key 15 Comet Lake | |
| Horizon Zero Dawn - 1920x1080 Ultimate Quality | |
| Schenker Key 15 Comet Lake (Leistungsmodus) | |
| Medio NVIDIA GeForce RTX 2080 Super Max-Q (74 - 76, n=2) | |
| Schenker Key 15 Comet Lake | |
| Doom Eternal - 1920x1080 Ultra Preset | |
| Schenker Key 15 Comet Lake (Leistungsmodus) | |
| Medio NVIDIA GeForce RTX 2080 Super Max-Q (140 - 177.7, n=8) | |
| Schenker Key 15 Comet Lake | |
| Acer Predator Triton 500 PT515-52-70N3 | |
| Razer Blade 15 RTX 2080 Super Max-Q | |
| MSI GS66 10SGS | |
| Aorus 15G XB | |
| Star Wars Jedi Fallen Order - 1920x1080 Epic Preset | |
| Schenker Key 15 Comet Lake | |
| Medio NVIDIA GeForce RTX 2080 Super Max-Q (88.7 - 97.5, n=4) | |
| Aorus 15G XB | |
| Acer Predator Triton 500 PT515-52-70N3 | |
| Razer Blade 15 RTX 2080 Super Max-Q | |
| Gears Tactics - 1920x1080 Ultra Preset | |
| Schenker Key 15 Comet Lake (Leistungsmodus) | |
| Medio NVIDIA GeForce RTX 2080 Super Max-Q (78.4 - 92.7, n=5) | |
| Schenker Key 15 Comet Lake | |
| Razer Blade 15 RTX 2080 Super Max-Q | |
| Aorus 15G XB | |
| Shadow of the Tomb Raider - 1920x1080 Highest Preset AA:T | |
| Media de la clase Gaming (96 - 116, n=2, últimos 2 años) | |
| Schenker Key 15 Comet Lake (Leistungsmodus) | |
| Gigabyte Aero 15 OLED XB-8DE51B0SP | |
| Schenker Key 15 Comet Lake | |
| Acer Predator Triton 500 PT515-52-70N3 | |
| MSI GS66 10SGS | |
| Aorus 15G XB | |
| Medio NVIDIA GeForce RTX 2080 Super Max-Q (89 - 106, n=10) | |
| Razer Blade 15 RTX 2080 Super Max-Q | |
Para verificar si las frecuencias de cuadro se mantienen en gran medida constantes incluso durante un período de tiempo prolongado, dejamos que el juego The Witcher 3 se ejecute durante unos 60 minutos con una resolución Full HD y una configuración de máxima calidad. El personaje encarnado por el jugador no se mueve durante todo este período. No se encontró una caída en la velocidad de fotogramas.
| bajo | medio | alto | ultra | |
|---|---|---|---|---|
| BioShock Infinite (2013) | 426.3 | 364.5 | 323.7 | 170.2 |
| The Witcher 3 (2015) | 348.2 | 251.3 | 159.8 | 90.2 |
| Shadow of the Tomb Raider (2018) | 139 | 116 | 110 | 99 |
| Total War: Three Kingdoms (2019) | 273.1 | 142.4 | 95.4 | 69 |
| Star Wars Jedi Fallen Order (2019) | 113.7 | 103.7 | 97.5 | |
| Red Dead Redemption 2 (2019) | 138.4 | 101.5 | 69 | 45 |
| Doom Eternal (2020) | 249 | 176.6 | 156.7 | 155.1 |
| Gears Tactics (2020) | 267.4 | 184.5 | 126.2 | 84.3 |
| F1 2020 (2020) | 268 | 184 | 161 | 102 |
| Death Stranding (2020) | 166.1 | 123.5 | 114.5 | 112.8 |
| Horizon Zero Dawn (2020) | 148 | 109 | 90 | 74 |
Emisiones - El Key de Schenker produce mucho ruido bajo carga
Emisiones de ruido
En el uso en reposo, los dos ventiladores funcionan principalmente a bajas velocidades de rotación. Sin embargo, suben con fuerza de vez en cuando - medimos niveles de presión sonora de hasta 44 dB(A). Bajo carga, los ventiladores producen aún más ruido. Durante la prueba de esfuerzo y nuestra prueba de The Witcher 3, los valores son 53 dB(A) y 51 dB(A), respectivamente. Sin unos auriculares, los juegos no son divertidos aquí.
Para un menor nivel de ruido en general, es necesario cambiar al modo silencioso en el centro de control. Sin embargo, esto es a expensas del rendimiento.
Ruido
| Ocioso |
| 26 / 27 / 44 dB(A) |
| Carga |
| 53 / 53 dB(A) |
 | ||
30 dB silencioso 40 dB(A) audible 50 dB(A) ruidosamente alto |
||
min: | ||
| Schenker Key 15 Comet Lake i7-10875H, GeForce RTX 2080 Super Max-Q | MSI GS66 10SGS i7-10750H, GeForce RTX 2080 Super Max-Q | Aorus 15G XB i7-10875H, GeForce RTX 2070 Super Max-Q | Razer Blade 15 RTX 2080 Super Max-Q i7-10875H, GeForce RTX 2080 Super Max-Q | Gigabyte Aero 15 OLED XB-8DE51B0SP i7-10875H, GeForce RTX 2070 Super Max-Q | Acer Predator Triton 500 PT515-52-70N3 i7-10750H, GeForce RTX 2080 Super Max-Q | |
|---|---|---|---|---|---|---|
| Noise | 1% | -4% | 2% | -9% | -3% | |
| apagado / medio ambiente * (dB) | 25 | 28.5 -14% | 25 -0% | 30.1 -20% | 30 -20% | 30 -20% |
| Idle Minimum * (dB) | 26 | 30 -15% | 32 -23% | 30.1 -16% | 34 -31% | 30 -15% |
| Idle Average * (dB) | 27 | 30 -11% | 34 -26% | 30.1 -11% | 36 -33% | 33 -22% |
| Idle Maximum * (dB) | 44 | 30.9 30% | 38 14% | 30.1 32% | 41 7% | 36 18% |
| Load Average * (dB) | 53 | 39.5 25% | 48 9% | 46.8 12% | 48 9% | 50 6% |
| Witcher 3 ultra * (dB) | 51 | 48 6% | 50 2% | 48.4 5% | 48 6% | 48 6% |
| Load Maximum * (dB) | 53 | 59.4 -12% | 54 -2% | 46 13% | 54 -2% | 50 6% |
* ... más pequeño es mejor
Temperatura
Nuestra prueba de estrés (Prime95 y FurMark funcionan durante al menos una hora) se realiza con el procesador y el núcleo de gráficos a 2,3 a 2,4 GHz y 1.260 MHz, respectivamente. Con la energía de la batería, las velocidades son de 1,3 a 1,7 GHz (CPU) y 300 MHz (GPU), respectivamente. La prueba de estrés representa un escenario extremo que no ocurre en la vida cotidiana. Con esta prueba comprobamos si el sistema se mantiene estable incluso a plena carga.
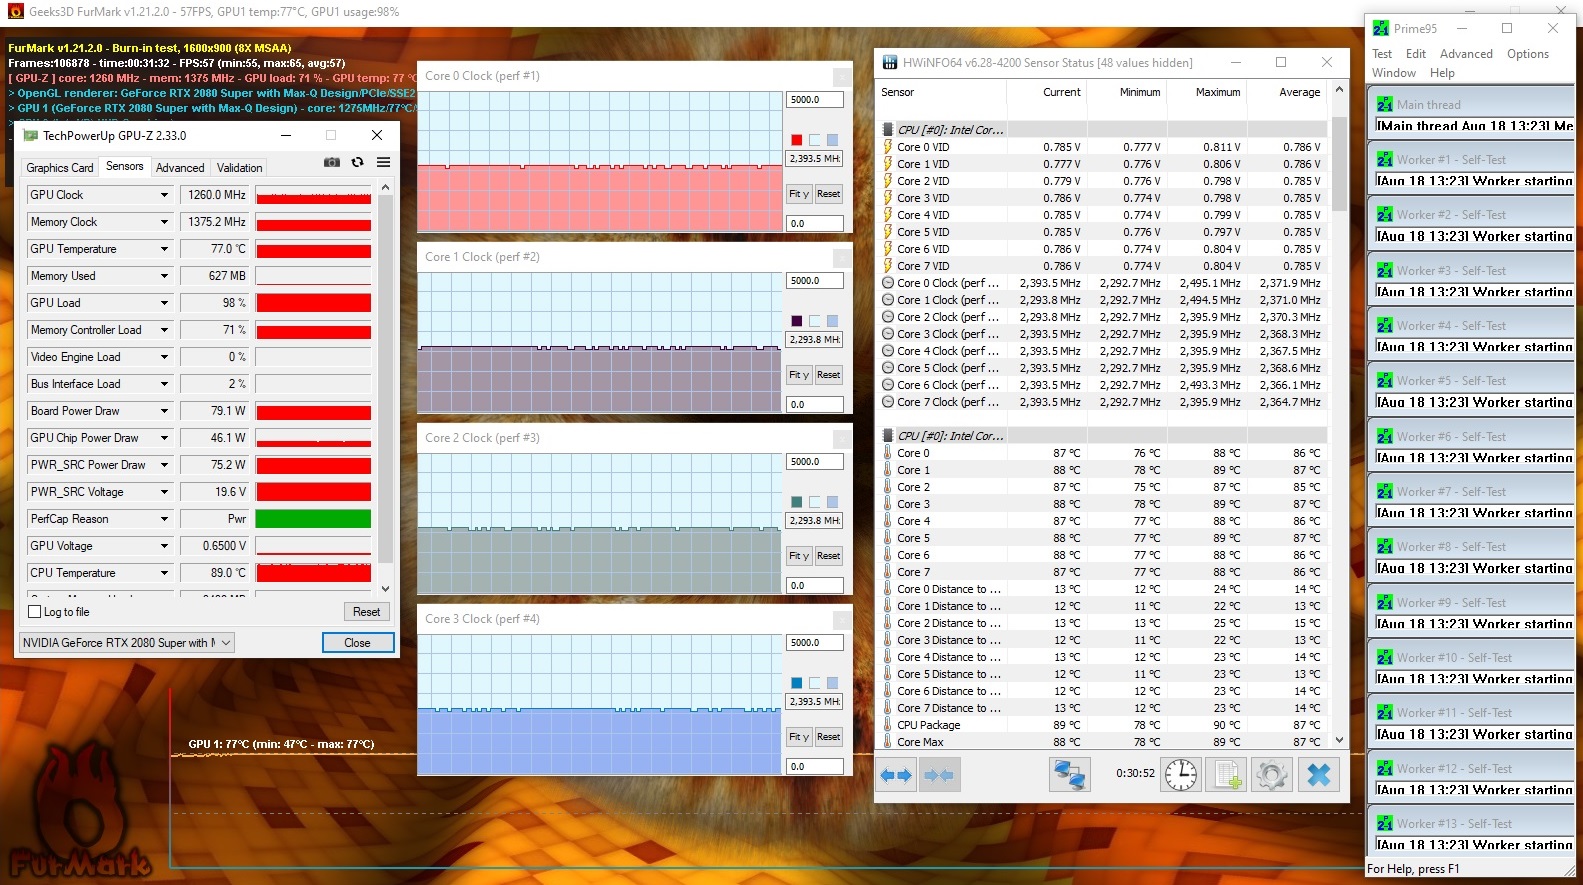
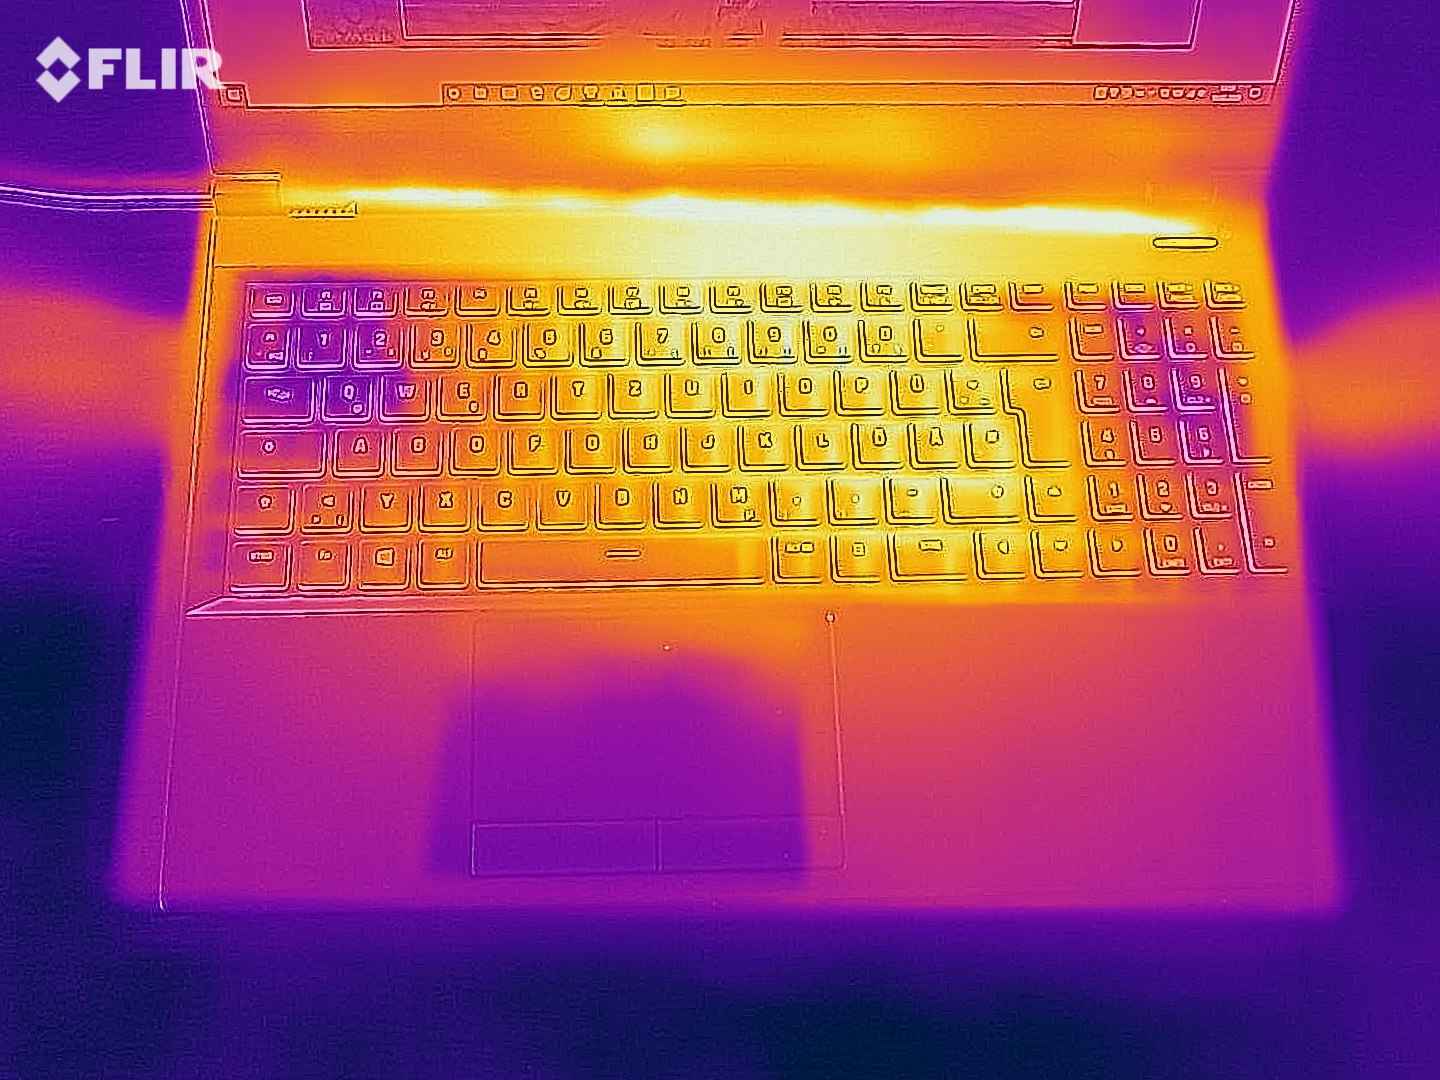
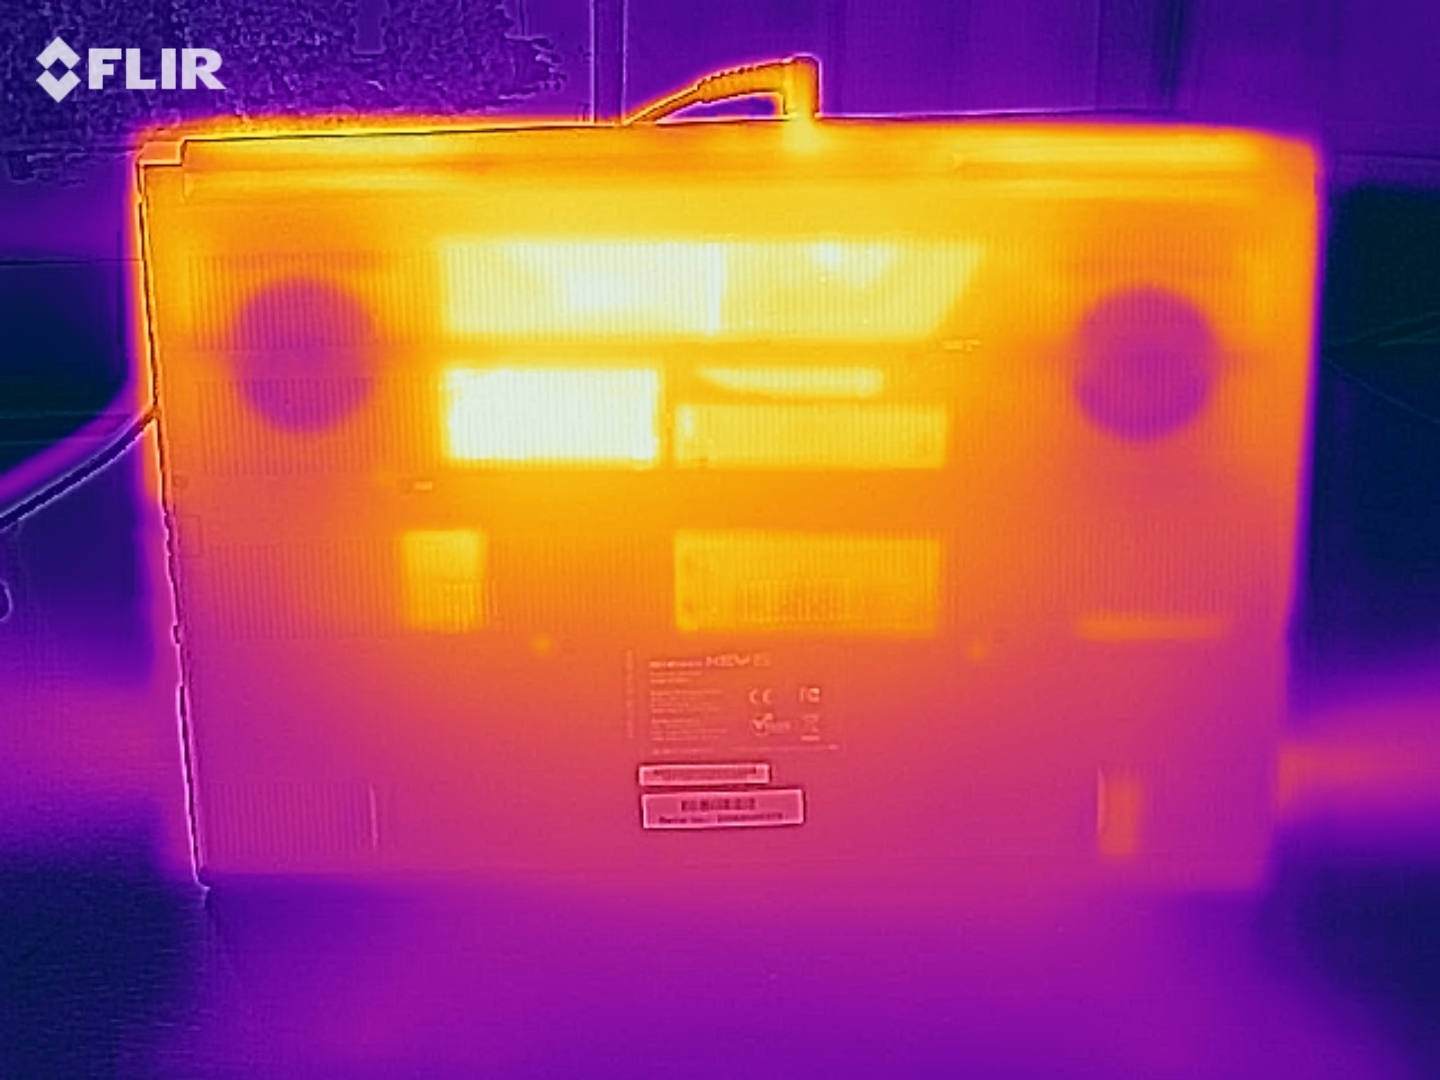
The laptop warms up noticeably. During the stress test, we register temperatures just above 60 °C (~140 °F) at two measuring points. Moreover, heat development is even more pronounced when performing our The Witcher 3 test. Consequently, the device shouldn't be placed on the lap. In everyday use, however, the temperatures are in the green range.
(-) La temperatura máxima en la parte superior es de 52 °C / 126 F, frente a la media de 40.4 °C / 105 F, que oscila entre 21.2 y 68.8 °C para la clase Gaming.
(-) El fondo se calienta hasta un máximo de 62 °C / 144 F, frente a la media de 43.2 °C / 110 F
(+) En reposo, la temperatura media de la parte superior es de 30.1 °C / 86# F, frente a la media del dispositivo de 33.9 °C / 93 F.
(-) Jugando a The Witcher 3, la temperatura media de la parte superior es de 44.4 °C / 112 F, frente a la media del dispositivo de 33.9 °C / 93 F.
(±) El reposamanos y el touchpad pueden calentarse mucho al tacto con un máximo de 37 °C / 98.6 F.
(-) La temperatura media de la zona del reposamanos de dispositivos similares fue de 28.8 °C / 83.8 F (-8.2 °C / -14.8 F).
| Schenker Key 15 Comet Lake i7-10875H, GeForce RTX 2080 Super Max-Q | MSI GS66 10SGS i7-10750H, GeForce RTX 2080 Super Max-Q | Aorus 15G XB i7-10875H, GeForce RTX 2070 Super Max-Q | Razer Blade 15 RTX 2080 Super Max-Q i7-10875H, GeForce RTX 2080 Super Max-Q | Gigabyte Aero 15 OLED XB-8DE51B0SP i7-10875H, GeForce RTX 2070 Super Max-Q | Acer Predator Triton 500 PT515-52-70N3 i7-10750H, GeForce RTX 2080 Super Max-Q | |
|---|---|---|---|---|---|---|
| Heat | 9% | 10% | 7% | 8% | 12% | |
| Maximum Upper Side * (°C) | 52 | 47.8 8% | 44 15% | 52 -0% | 49 6% | 44 15% |
| Maximum Bottom * (°C) | 62 | 54.4 12% | 63 -2% | 53 15% | 61 2% | 50 19% |
| Idle Upper Side * (°C) | 31 | 27.4 12% | 27 13% | 29.3 5% | 27 13% | 29 6% |
| Idle Bottom * (°C) | 33 | 32 3% | 29 12% | 30.2 8% | 29 12% | 31 6% |
* ... más pequeño es mejor
Altavoces
Los altavoces estéreo están situados en la zona frontal de la parte inferior del dispositivo. Producen un sonido muy decente que carece de bajos, sin embargo. Para una mejor experiencia de sonido, se deben usar auriculares o altavoces externos.
Schenker Key 15 Comet Lake análisis de audio
(+) | los altavoces pueden reproducir a un volumen relativamente alto (#82 dB)
Graves 100 - 315 Hz
(-) | casi sin bajos - de media 15.7% inferior a la mediana
(+) | el bajo es lineal (2.9% delta a la frecuencia anterior)
Medios 400 - 2000 Hz
(+) | medios equilibrados - a sólo 3.2% de la mediana
(+) | los medios son lineales (6% delta a la frecuencia anterior)
Altos 2 - 16 kHz
(+) | máximos equilibrados - a sólo 2.3% de la mediana
(+) | los máximos son lineales (5.7% delta a la frecuencia anterior)
Total 100 - 16.000 Hz
(+) | el sonido global es lineal (11.8% de diferencia con la mediana)
En comparación con la misma clase
» 11% de todos los dispositivos probados de esta clase eran mejores, 4% similares, 85% peores
» El mejor tuvo un delta de 6%, la media fue 18%, el peor fue ###max##%
En comparación con todos los dispositivos probados
» 8% de todos los dispositivos probados eran mejores, 3% similares, 89% peores
» El mejor tuvo un delta de 4%, la media fue 24%, el peor fue ###max##%
Gestión de la energía - Duración aceptable de la batería
Consumo de energía
En el uso inactivo, registramos un consumo máximo de 18 vatios. Durante nuestra prueba de esfuerzo, el valor se eleva hasta 210 vatios. No encontramos ninguna inestabilidad aquí. Además, el adaptador de energía de 180 vatios parece tener suficiente capacidad (el factor de eficiencia falta en nuestras mediciones). En el modo de juego (nuestra prueba de The Witcher 3), la demanda de energía es menor con un promedio de 142 vatios.
| Off / Standby | |
| Ocioso | |
| Carga |
|
Clave:
min: | |
| Schenker Key 15 Comet Lake i7-10875H, GeForce RTX 2080 Super Max-Q | MSI GS66 10SGS i7-10750H, GeForce RTX 2080 Super Max-Q | Aorus 15G XB i7-10875H, GeForce RTX 2070 Super Max-Q | Razer Blade 15 RTX 2080 Super Max-Q i7-10875H, GeForce RTX 2080 Super Max-Q | Gigabyte Aero 15 OLED XB-8DE51B0SP i7-10875H, GeForce RTX 2070 Super Max-Q | Acer Predator Triton 500 PT515-52-70N3 i7-10750H, GeForce RTX 2080 Super Max-Q | |
|---|---|---|---|---|---|---|
| Power Consumption | -22% | -33% | 1% | -46% | -8% | |
| Idle Minimum * (Watt) | 10 | 14.9 -49% | 16 -60% | 10.6 -6% | 18 -80% | 11 -10% |
| Idle Average * (Watt) | 14 | 17.5 -25% | 20 -43% | 13.1 6% | 21 -50% | 15 -7% |
| Idle Maximum * (Watt) | 18 | 29.5 -64% | 30 -67% | 15.8 12% | 38 -111% | 25 -39% |
| Load Average * (Watt) | 106 | 94.8 11% | 102 4% | 131 -24% | 113 -7% | 95 10% |
| Witcher 3 ultra * (Watt) | 142 | 146.1 -3% | 156 -10% | 146 -3% | 149 -5% | 140 1% |
| Load Maximum * (Watt) | 210 | 210.9 -0% | 256 -22% | 169 20% | 256 -22% | 211 -0% |
* ... más pequeño es mejor
Duración de la batería
La duración de la batería está bien para un portátil para juegos, pero no le quitará los calcetines a nadie. Nuestra prueba de WLAN (acceso a sitios web usando un guión) y prueba de video (cortometraje Big Buck Bunny [codificación H.264, Full HD] corriendo en un bucle) son completadas por el de 15,6 pulgadas después de 4:49 horas y 5:44 horas, respectivamente.
| Schenker Key 15 Comet Lake i7-10875H, GeForce RTX 2080 Super Max-Q, 73 Wh | MSI GS66 10SGS i7-10750H, GeForce RTX 2080 Super Max-Q, 99.99 Wh | Aorus 15G XB i7-10875H, GeForce RTX 2070 Super Max-Q, 94 Wh | Razer Blade 15 RTX 2080 Super Max-Q i7-10875H, GeForce RTX 2080 Super Max-Q, 80 Wh | Gigabyte Aero 15 OLED XB-8DE51B0SP i7-10875H, GeForce RTX 2070 Super Max-Q, 94.2 Wh | Acer Predator Triton 500 PT515-52-70N3 i7-10750H, GeForce RTX 2080 Super Max-Q, 84 Wh | |
|---|---|---|---|---|---|---|
| Duración de Batería | 38% | 53% | 31% | 55% | 17% | |
| Reader / Idle (h) | 7 | 10.2 46% | 9.7 39% | 8.7 24% | 8.6 23% | 8.3 19% |
| H.264 (h) | 5.7 | 7.7 35% | 7.3 28% | |||
| WiFi v1.3 (h) | 4.8 | 6.9 44% | 7 46% | 6.1 27% | 6.1 27% | 6.3 31% |
| Load (h) | 1.3 | 1.6 23% | 2.5 92% | 1.9 46% | 2.8 115% | 1.3 0% |
Pro
Contra
Veredicto
El Schenker Key 15 entra en la categoría de portátiles para juegos delgados y compactos. Pero no te dejes engañar por su apariencia. Con el procesador octa-core Core i7-10875H y el núcleo gráfico GeForce RTX 2080 Super Max-Q, el dispositivo está equipado con componentes modernos y potentes que llevan todos los últimos juegos de ordenador sin problemas a la pantalla mate Full HD. Los ajustes de máxima calidad siempre se pueden seleccionar aquí
Con el Key 15, Schenker ofrece un portátil de juego ligero, potente pero también ruidoso que puede personalizarse muy individualmente según sus propias necesidades.
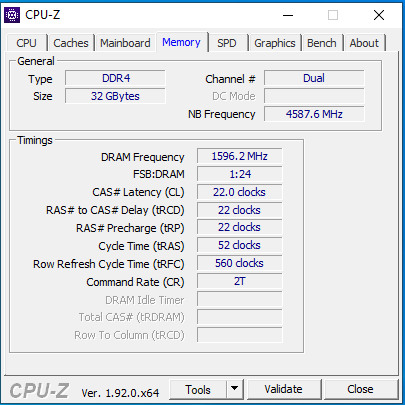
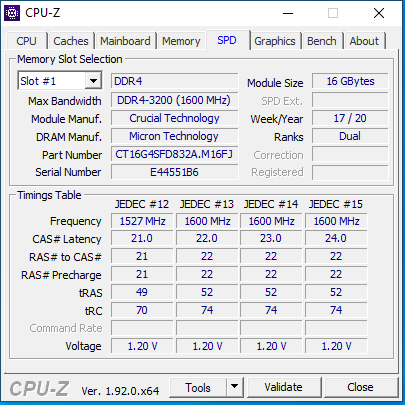
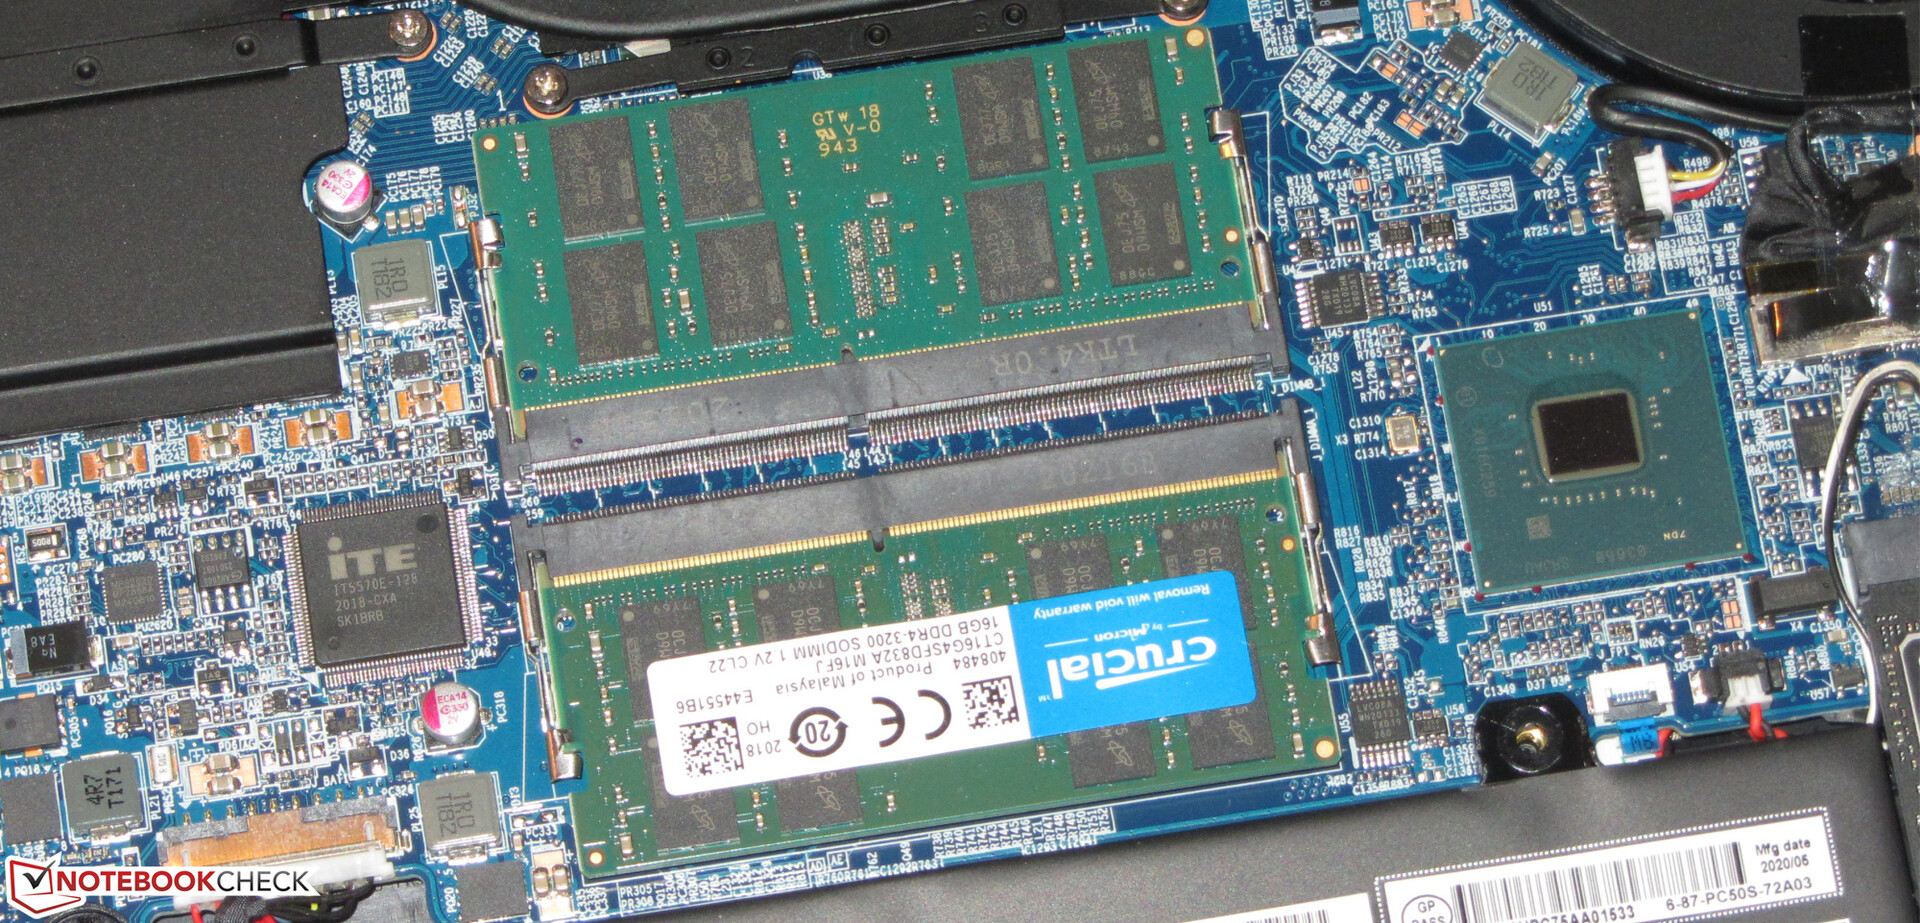
El hardware está equipado con 16 GB de RAM (modo de doble canal), y sería posible una actualización hasta 64 GB. El portátil ofrece espacio para dos M.2 2280 SSD (1x NVMe, 1x NVMe/SATA; RAID 0/1). En caso de que el espacio de almacenamiento de la SSD de 1 TB incorporada se agotara, podría ampliarse fácilmente. Los procedimientos de mantenimiento y actualización requieren la retirada de la tapa inferior de la carcasa, lo que no es una tarea compleja.
Schenker empaqueta un montón de rendimiento en una carcasa compacta. Las consecuencias: El portátil se calienta considerablemente bajo carga, y los ventiladores producen mucho ruido - también esporádicamente en el uso en reposo, por desgracia. Si estás dispuesto a reducir el rendimiento, el modo silencioso puede ser utilizado para proporcionar un poco más de paz y tranquilidad.
El portátil está equipado con un puerto Thunderbolt 3 que permite la conexión de una solución de acoplamiento o una GPU externa. DisplayPort a través de USB-C es compatible, pero la entrega de energía no lo es. Esto último no es sorprendente: No sería posible un suministro de energía completo del portátil a través de esta conexión, ya que se puede transferir un máximo de 100 vatios de potencia. Sin embargo, competidores comparables como el Blade 15 Advanced ofrecen la posibilidad de cargar la batería a través del puerto Thunderbolt 3. Esta función no está soportada por el Key.
La pantalla Full HD (IPS, 144 Hz) ofrece ángulos de visión estables, una superficie mate, un buen contraste, tiempos de respuesta rápidos, una reproducción decente del color y una cobertura aceptable del espacio de color. Sin embargo, el brillo máximo es un poco demasiado bajo. El teclado incorporado (iluminación RGB) ha demostrado ser adecuado para el uso diario. Además, la duración de la batería también es decente.
Schenker Key 15 Comet Lake
- 09/07/2020 v7 (old)
Sascha Mölck
Price comparison
