Notebookcheck Logo

AMD Ryzen 7 7700 65 W Análisis de Ryzen 7000: Capaz de competir con Core i9-12900K y Core i5-13600K por 70 dólares menos que Ryzen 7 7700X

Raphael sin el factor X. La línea AMD Ryzen 7000 non-X de 65 W busca hacer que Zen 4 esté disponible a precios más asequibles. Hoy probamos el AMD Ryzen 7 7700 y vemos cómo rinde frente a sus primos de mayor TDP y también frente a la competencia de Intel Raptor Lake. Aunque el Ryzen 7 7700 puede ofrecerte un rendimiento cercano al Core i9-12900K por 70 dólares menos que el MSRP del Ryzen 7 7700X, factores externos como los elevados precios de la DDR5 pueden ser un obstáculo.

Después de haber presentado la línea Ryzen 7000 a finales del año pasado, AMD ha introducido algunas adiciones a la familia Raphael Zen 4 en CES 2023. El lanzamiento original incluía cuatro procesadores encabezados por el 16C/32T Ryzen 9 7950X.

La gama Ryzen 7x0X tiene un TDP de 105 W, mientras que el 12C/24T Ryzen 9 7900X y el Ryzen 9 7950X de 16C/32T llegan hasta los 170 W. Los usuarios pueden utilizar estas CPU con un TDP inferior de 105 W y 65 W, según el caso, lo que se traduce en un ahorro sustancial de energía con una pérdida de rendimiento insignificante.

Hoy, AMD pone a disposición de los usuarios las nuevas CPU Ryzen 7000 de 65 W presentadas en el CES. Estas CPU no X se basan en la nueva plataforma AM5 y están orientadas a precios asequibles. Aunque no son procesadores X, están totalmente desbloqueados, admiten overclocking e incluso vienen con un refrigerador Wraith en la caja.

Visión general de los procesadores de sobremesa AMD 'Raphael' Zen 4 Ryzen 7000

AMD Ryzen 7000 SKU Núcleos / Hilos Reloj Base Turbo Clock Caché L2 Caché L3 TDP PPT Precio de Lanzamiento
AMD Ryzen 9 7950X 16 / 32 4,5 GHz 5,7 GHz 16x 1 MB 64 MB 170 W 230 W US$699
AMD Ryzen 9 7900X 12 / 24 4,7 GHz 5,6 GHz 12x 1 MB 64 MB 170 W 230 W 549 US$
AMD Ryzen 9 7900 12 / 24 3,7 GHz 5,4 GHz 12x 1 MB 64 MB 65 W 88 W 429 US$
AMD Ryzen 7 7700X 8 / 16 4,5 GHz 5,4 GHz 8x 1 MB 32 MB 105 W 142 W US$399
AMD Ryzen 77700 8 / 16 3,8 GHz 5,3 GHz 8x 1 MB 32 MB 65 W 88 W 329US$
AMD Ryzen 5 7600X 6 / 12 4,7 GHz 5,3 GHz 6x 1 MB 32 MB 105 W 142 W US$299
AMD Ryzen 5 7600 6 / 12 3,8 GHz 5,1 GHz 6x 1 MB 32 MB 65 W 88 W US$229

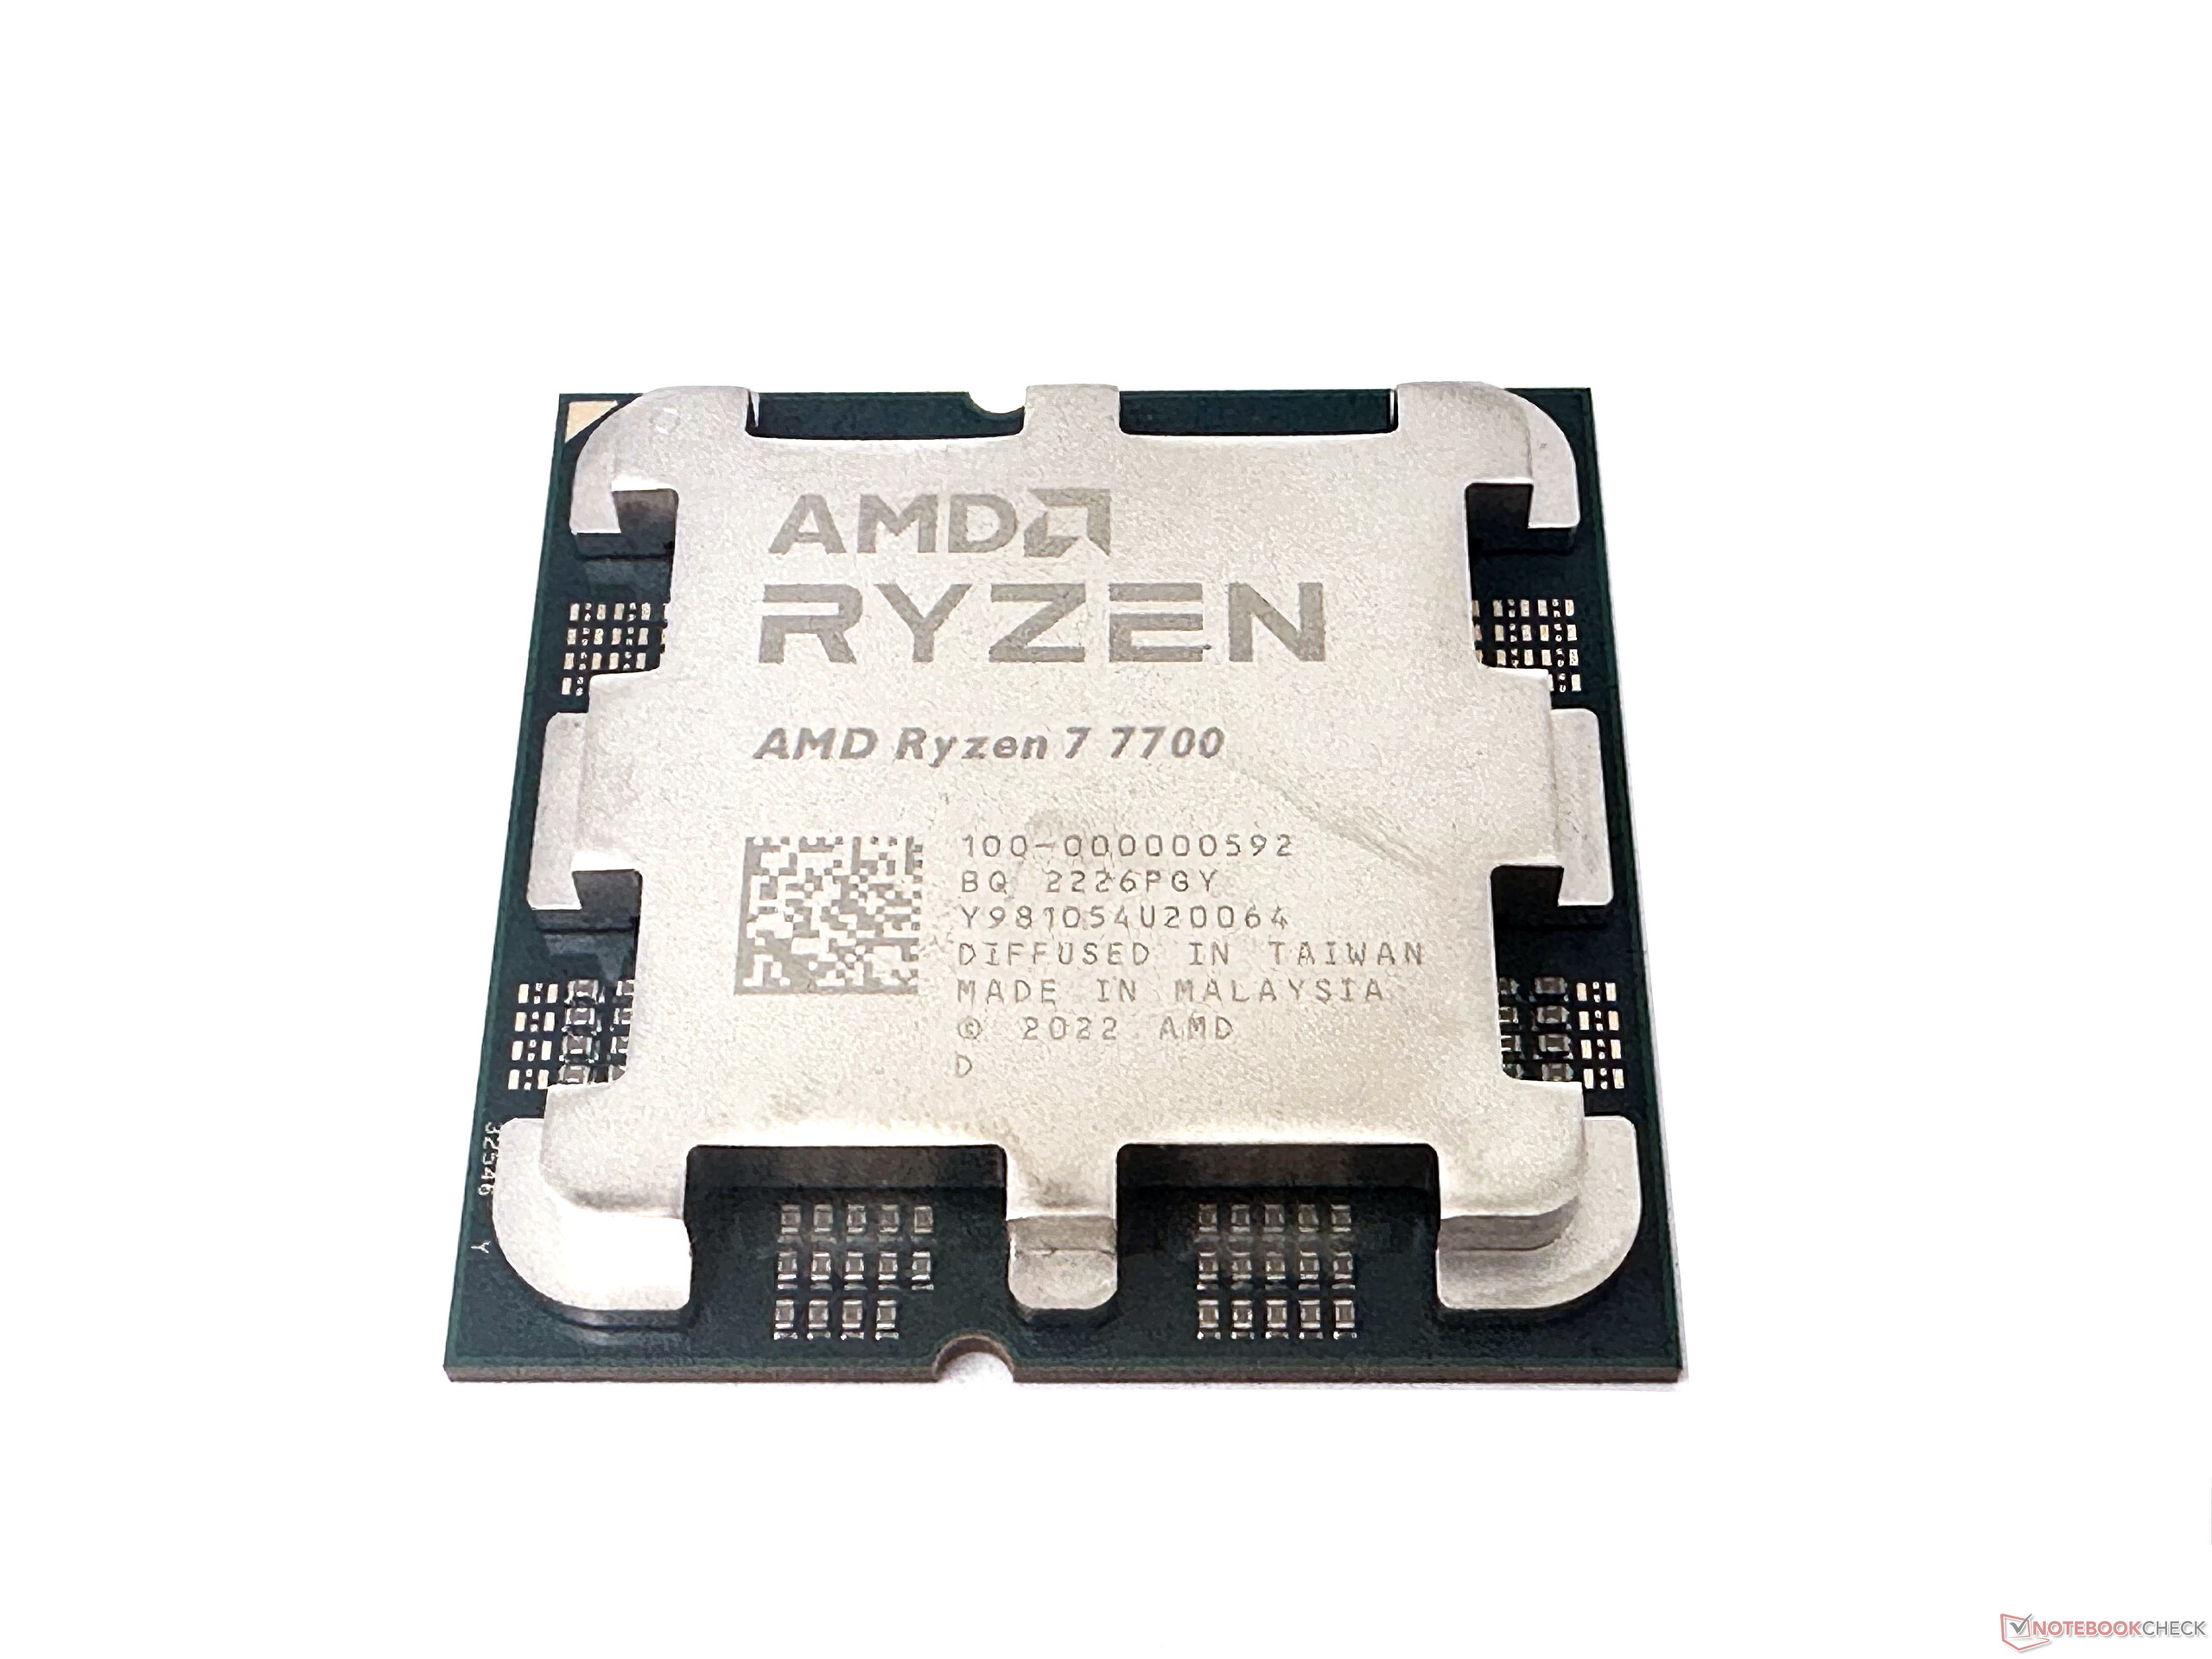
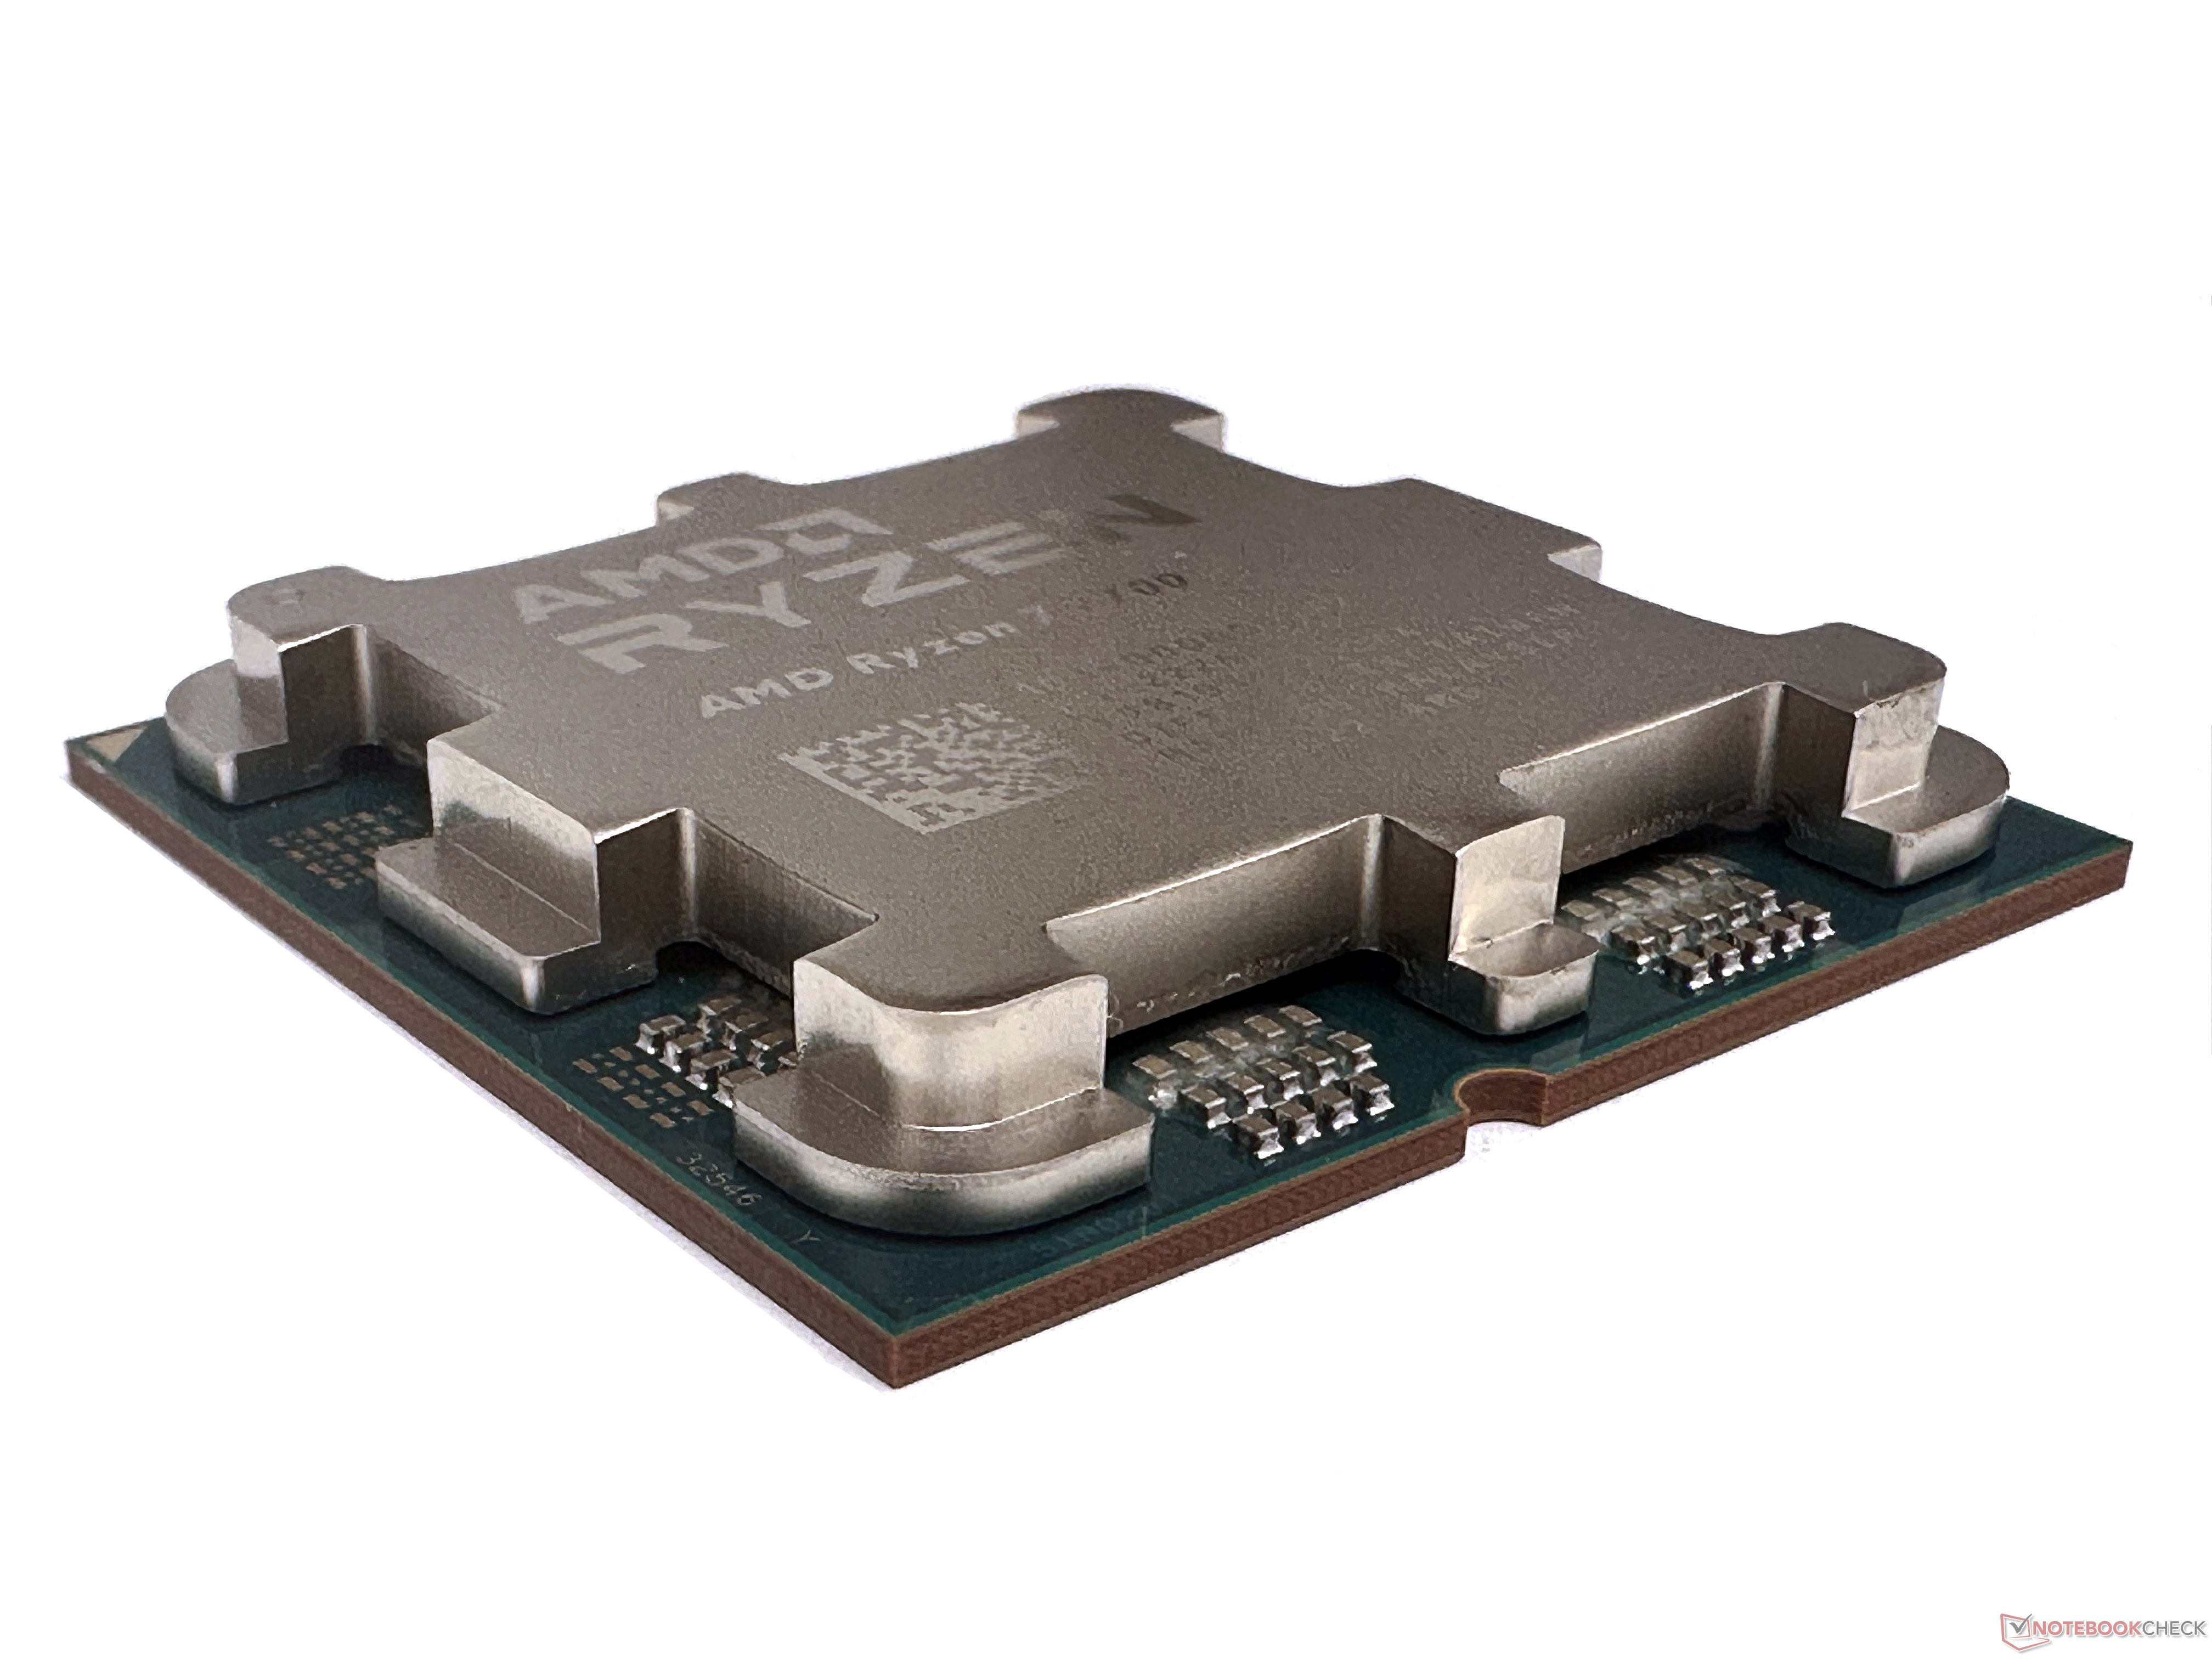
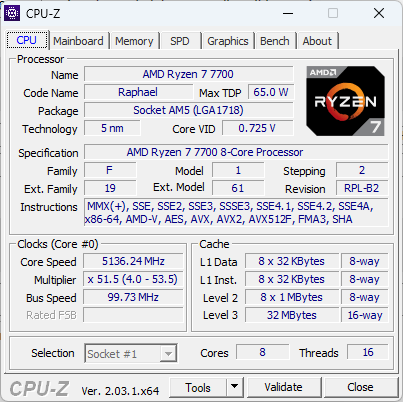
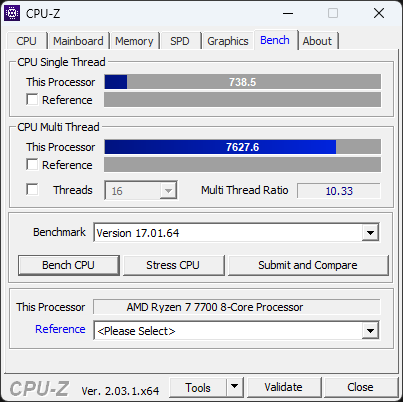
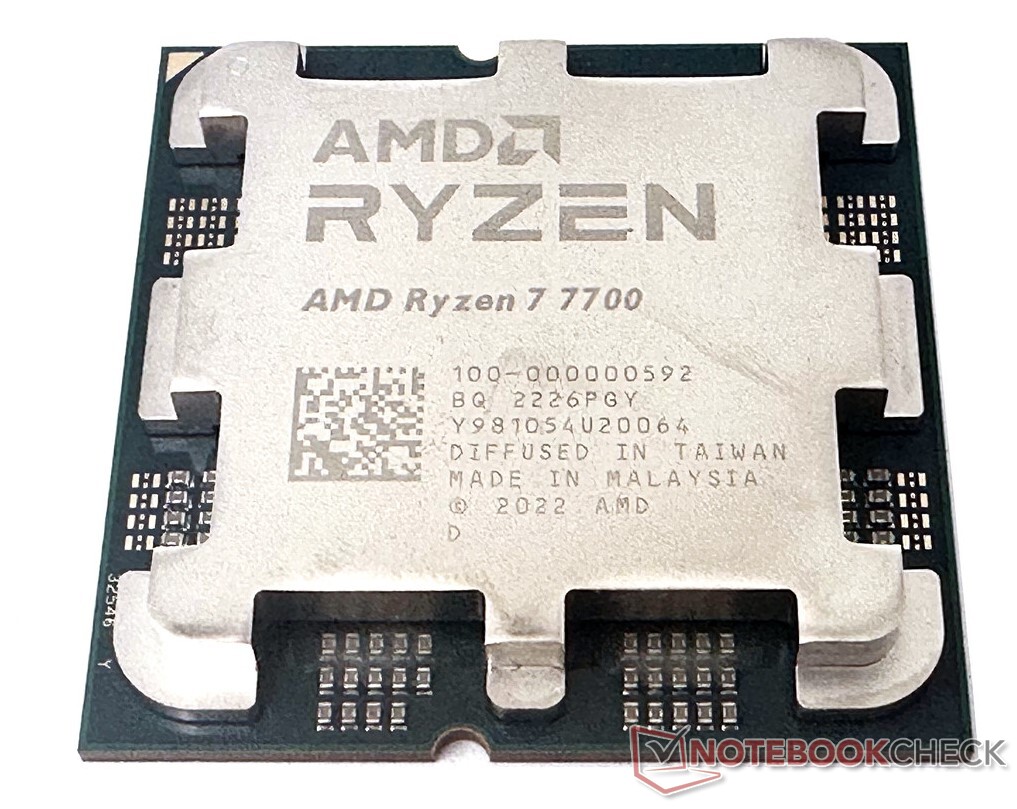
Tenemos con nosotros el AMD Ryzen 7 7700. El Ryzen 7 7700 es en muchos aspectos similar alRyzen 7 7700Xpero funciona a frecuencias base y boost más bajas por defecto, lo que requiere un TDP menor. El procesador también es unos 70 dólares más barato que su primo X.

En este análisis, echamos un vistazo al AMD Ryzen 7 7700 y vemos en qué medida su precio de 329 dólares se corresponde en términos de rendimiento con el de sus primos más caros.

AMD Ryzen 7 7700
AMD Ryzen 7 7700
AMD Ryzen 7 7700 con ASRock B650E Steel Legend Wi-Fi

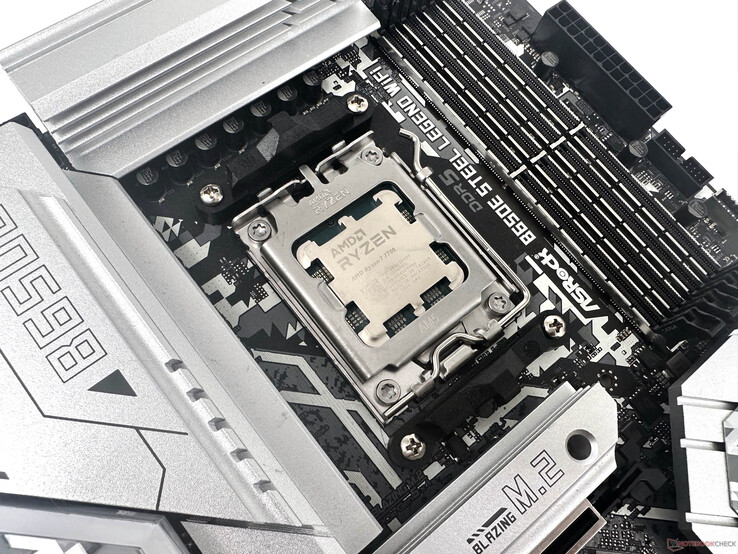
El banco de pruebas: Ryzen 7 7700 se empareja con la RTX 3090

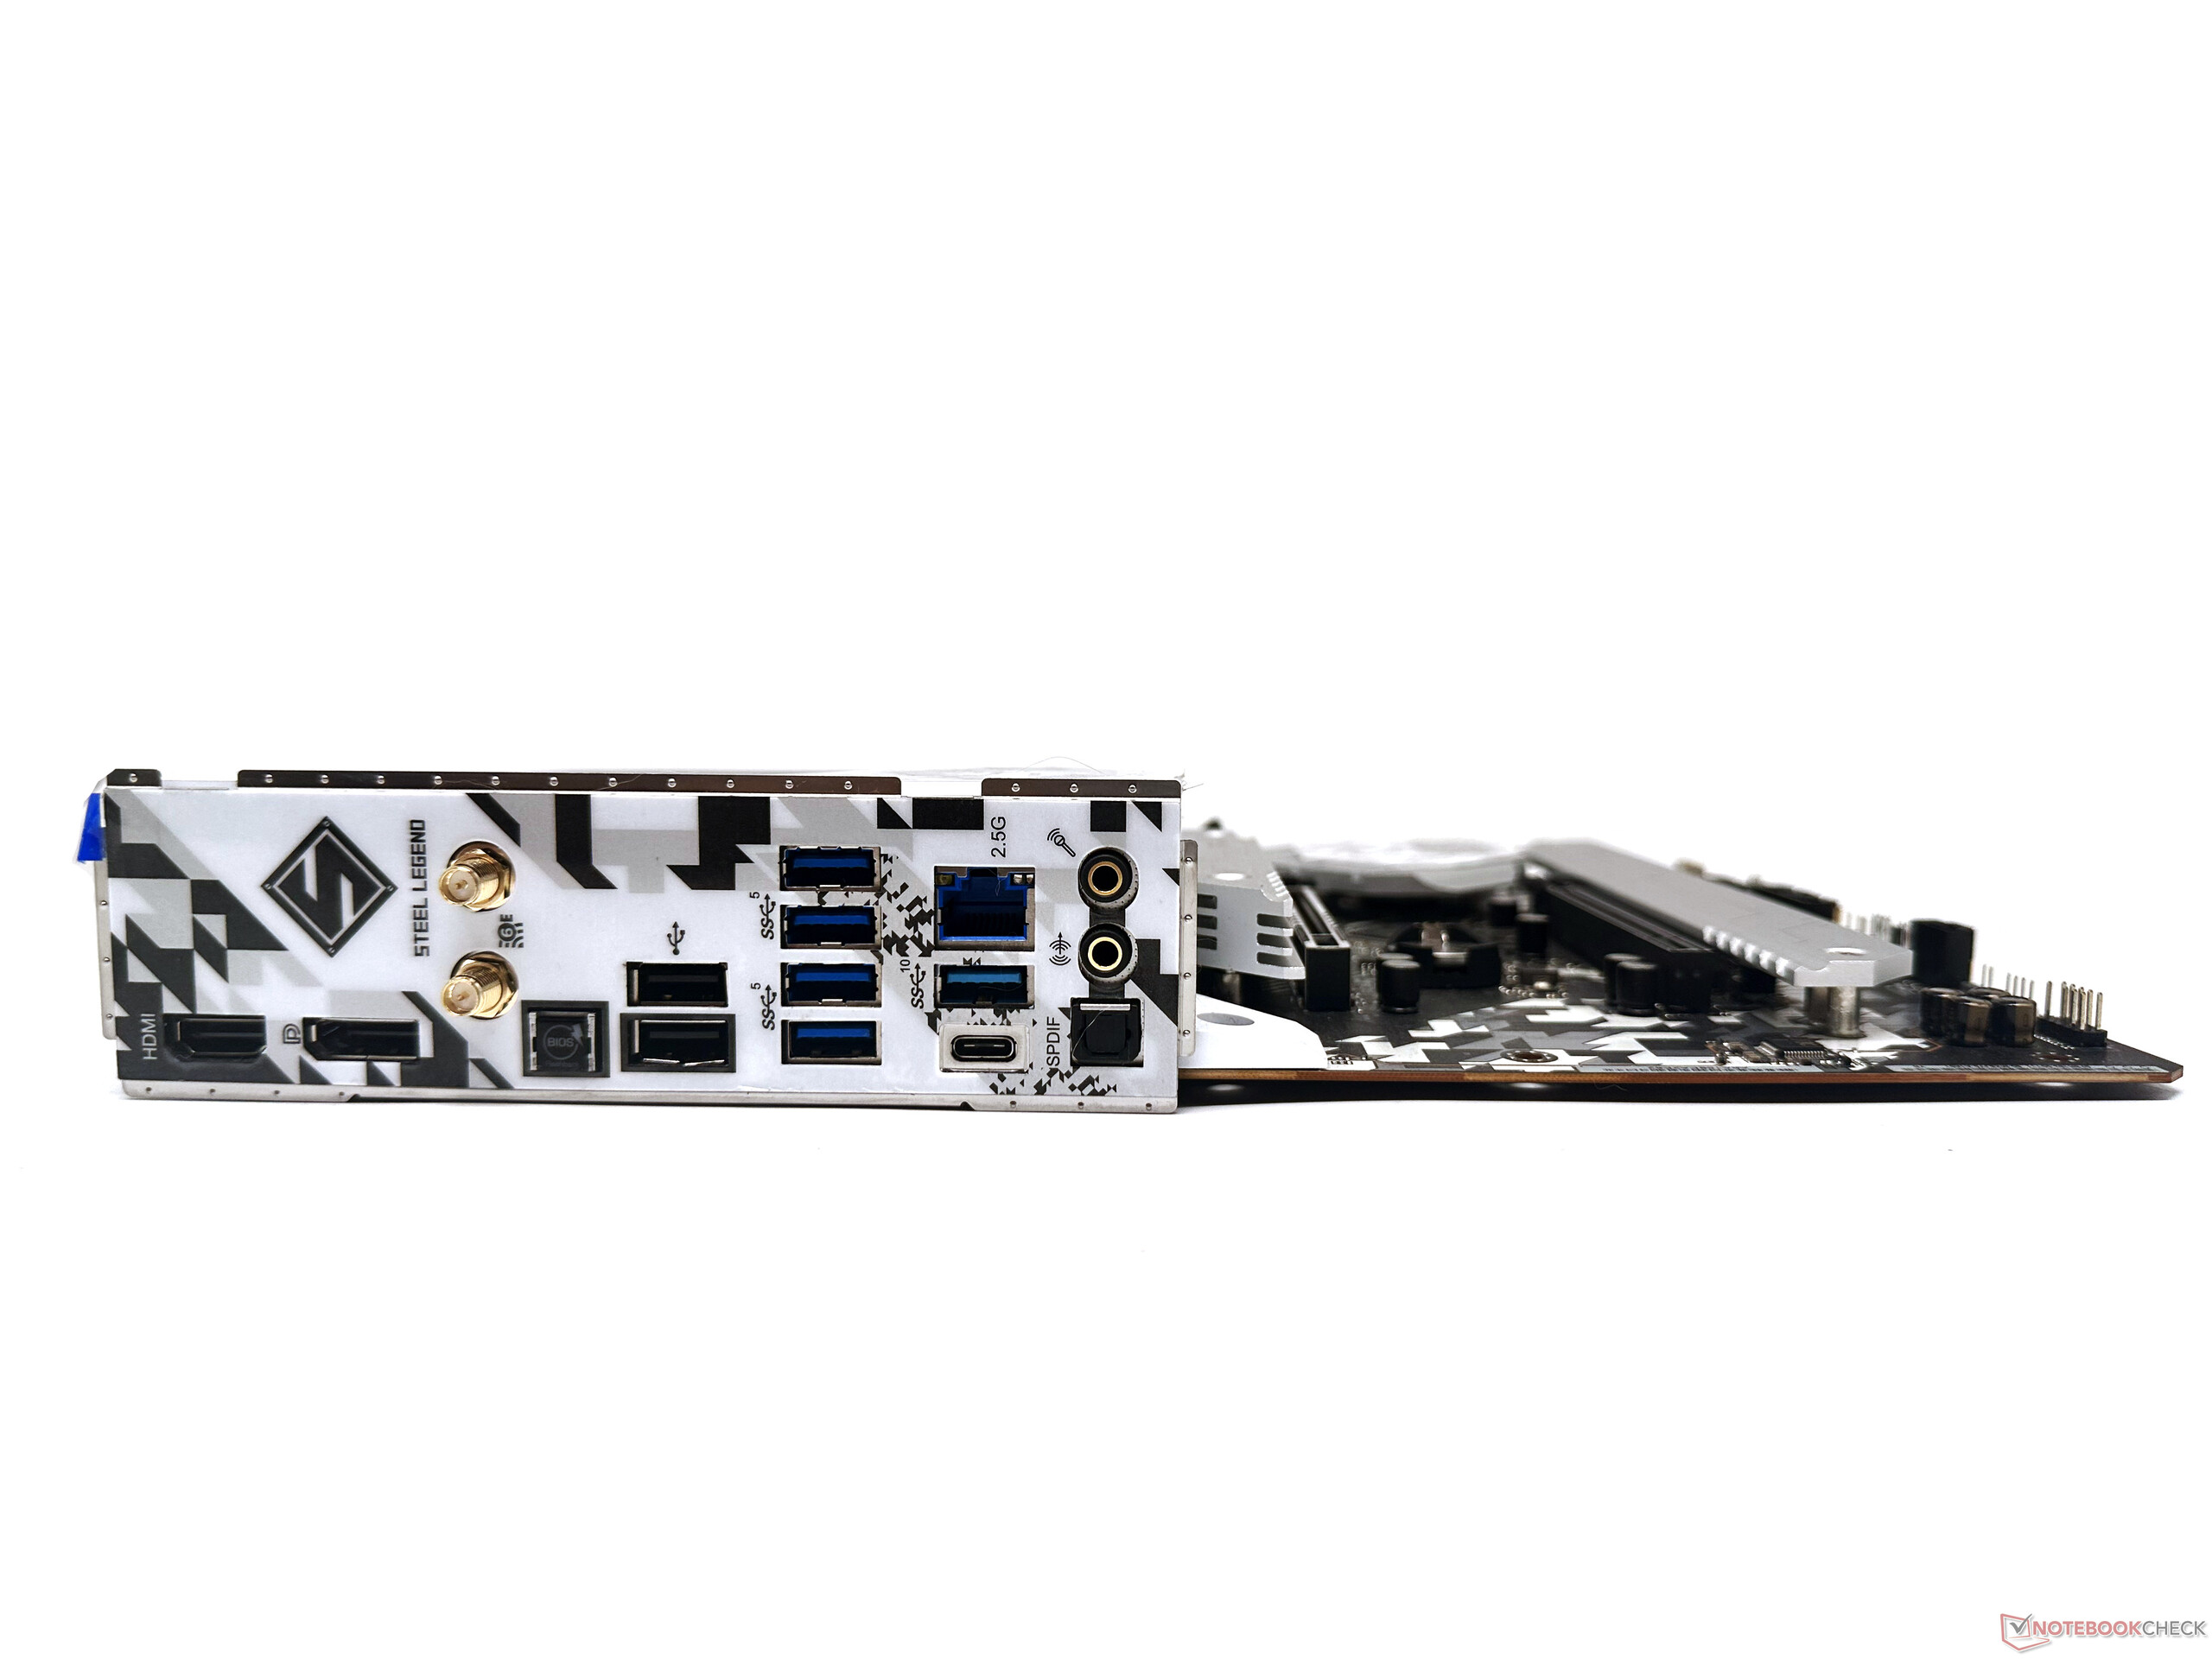
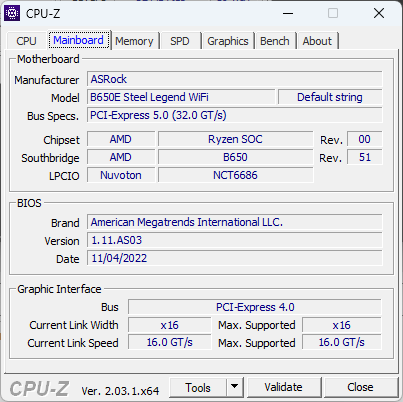
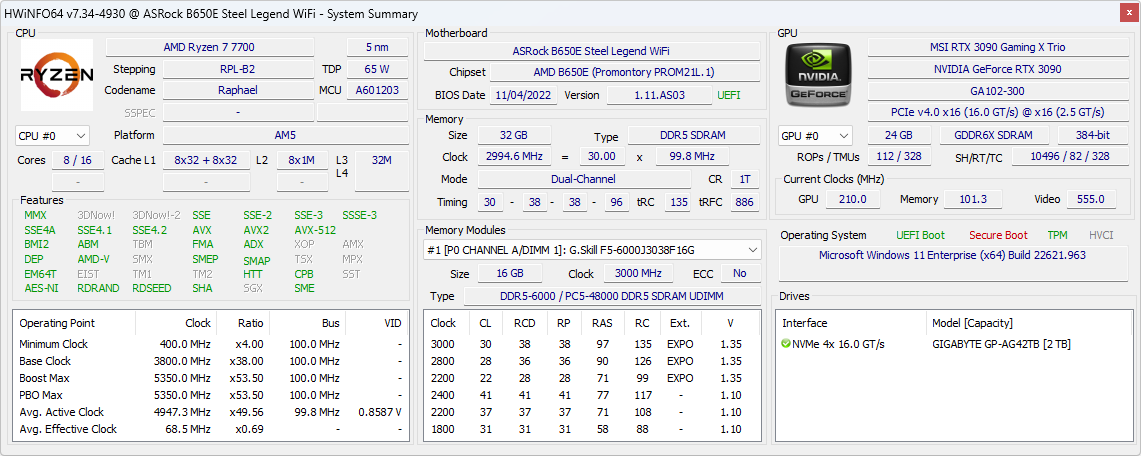
Nuestro banco de pruebas para el AMD Ryzen 7 7700 se basa en el nuevo chipset B650E. Incluye los siguientes componentes:

  • Banco de pruebas Cooler Master MasterFrame 700
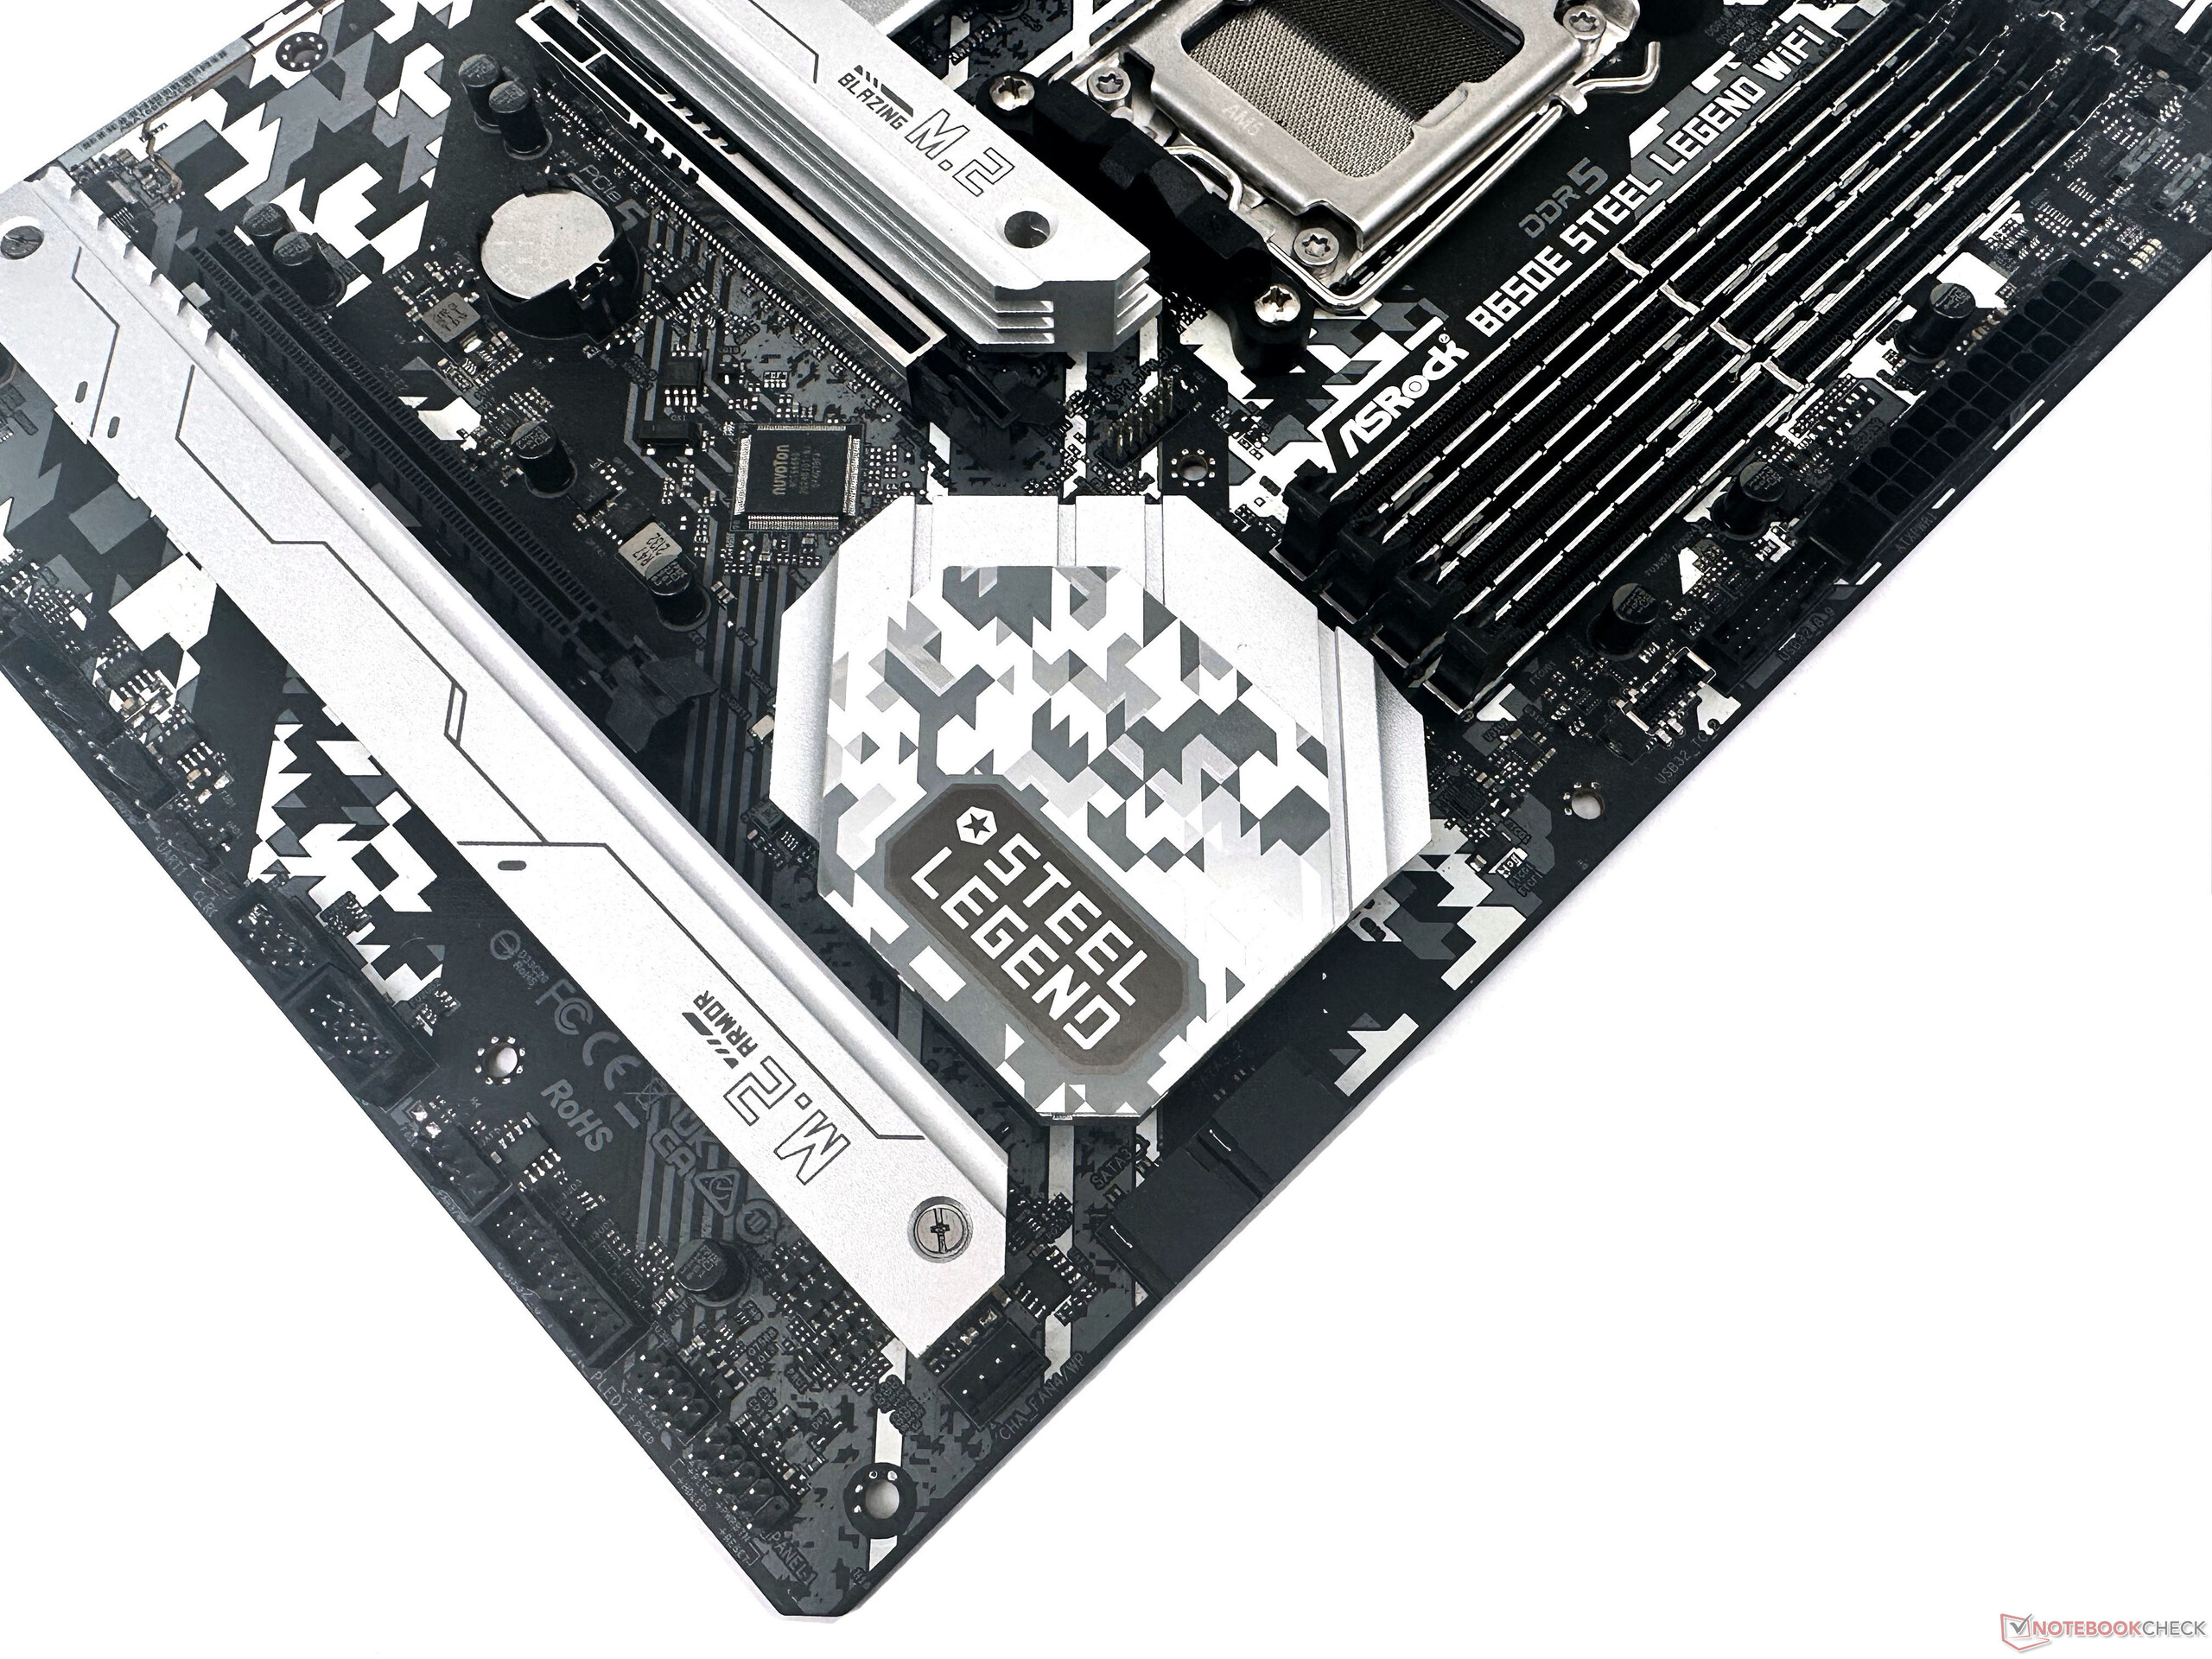
  • ASRock B650E Steel Legend Wi-Fi con BIOS 1.11.AS03
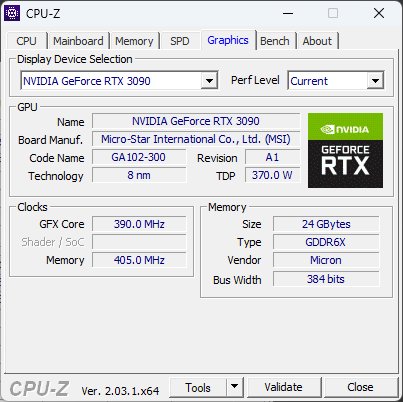
  • GPU MSI Gaming X Trio GeForce RTX 3090
  • SSD Gigabyte Aorus Gen 4 de 2 TB NVMe para pruebas y juegos
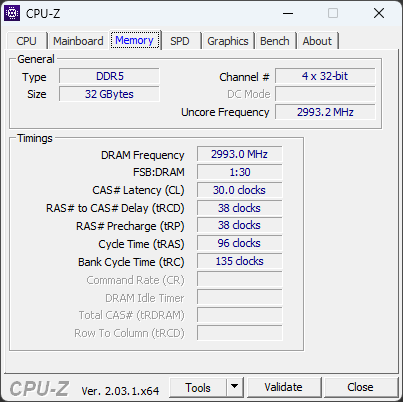
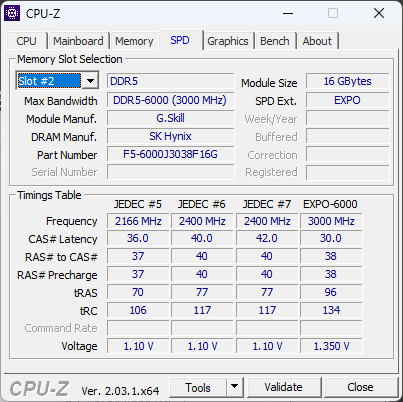
  • 2x 16 GB de RAM G.SKILL Trident Z5 Neo DDR5-6000 con tiempos de 30-38-38-96 a 1,35 V
  • Monitor Gigabyte M28U 4K 144 Hz
  • Refrigerador Cooler Master MasterLiquid ML360L V2 ARGB AIO
  • Fuente de alimentación Thermaltake ToughPower Grand RGB 850 W

Nos gustaría dar las gracias a AMD por suministrar la CPU Ryzen 7 7700, la placa base ASRock B650E y el kit de memoria G.SKILL DDR5. También nos gustaría dar las gracias a MSI por la GPU Gaming X Trio RTX 3090, a Gigabyte por el monitor M28U y el SSD Aorus NVMe y, por último, a Cooler Master por el banco de pruebas y el refrigerador AIO.

Benchmarks de CPU: Pisando los talones al Core i9-12900K en single-core

Los benchmarks acumulativos de CPU muestran al Ryzen 7 7700 royendo los infiernos de los Intel Alder Lake Core i9-12900K mientras que está a sólo un 4% por detrás del Ryzen 7 7700X. Si bien esto es un gran espectáculo, los benchmarks individuales ayudan a pintar una imagen más clara.

En Cinebench R23, R20 y R15, el Ryzen 7 7700 muestra un muy buen rendimiento de un solo núcleo que está a la par con el resto de la pila Ryzen 7000. La última CPU Zen 4 queda por detrás del Intel Raptor Lake Core i9-13900K hasta en un 15% en estas pruebas. En las pruebas multinúcleo de Cinebench, el Ryzen 7 7700 no está a la altura del Core i9-12900K ni del Core i5-13600K debido al menor número de hilos.

El menor boost clocks en comparación con el Ryzen 7 7700X sitúa a la versión no-X en una ligera desventaja del 5% en las pruebas multinúcleo de Cinebench.

También se observan tendencias similares en Geekbench, pero la diferencia entre el Core i9-13900K y el Ryzen 7 7700 es mucho menor en las pruebas mononúcleo que en Cinebench.

El Ryzen 7 7700 intenta cerrar la brecha con el Core i9-12900K en pruebas como wPrime, R Benchmark, y LibreOffice. No puede superar al buque insignia de Intel de última generación, pero se acerca bastante.

Esencialmente, el rendimiento del Ryzen 7 7700 es exactamente el mismo que el de un Ryzen 7 7700X con TDP limitado a 65 W, con la ventaja de que los usuarios que ejecuten cargas de trabajo de un solo subproceso obtendrán un rendimiento similar al del Ryzen 9 7950X y ahorrarán mucho dinero.

Performance Rating - Percent
AMD Ryzen 9 7950X
88.9 pt
Intel Core i9-13900K
88.9 pt
AMD Ryzen 9 7950X ECO 105 W -12!
84.1 pt
AMD Ryzen 9 7900X
77.8 pt
AMD Ryzen 9 7950X ECO 65 W -14!
75.7 pt
AMD Ryzen 9 5950X
69.1 pt
AMD Ryzen 7 7700X
66.7 pt
Intel Core i5-13600K
65.3 pt
Intel Core i9-12900K
65.3 pt
AMD Ryzen 7 7700
64.2 pt
AMD Ryzen 7 7700X ECO 65 W -12!
63.7 pt
AMD Ryzen 9 5900X -2!
61.7 pt
AMD Ryzen 5 7600X
60.3 pt
AMD Ryzen 7 5800X
54.4 pt
Intel Core i5-12600K
50.4 pt
AMD Ryzen 7 5800X3D
49.5 pt
AMD Ryzen 5 5600X
45.5 pt
Cinebench R23
Single Core
Intel Core i9-13900K
2267 Points +17%
AMD Ryzen 9 7900X
2039 Points +6%
AMD Ryzen 9 7950X
2017 Points +5%
Intel Core i5-13600K
2010 Points +4%
AMD Ryzen 9 7950X ECO 65 W
2001 Points +4%
AMD Ryzen 9 7950X ECO 105 W
1999 Points +4%
Intel Core i9-12900K
1998 Points +4%
AMD Ryzen 7 7700X ECO 65 W
1988 Points +3%
AMD Ryzen 7 7700X
1986 Points +3%
AMD Ryzen 5 7600X
1967 Points +2%
AMD Ryzen 7 7700
1930 Points
Intel Core i5-12600K
1907 Points -1%
AMD Ryzen 9 5950X
1649 Points -15%
AMD Ryzen 9 5900X
1568 Points -19%
AMD Ryzen 7 5800X
1554 Points -19%
AMD Ryzen 5 5600X
1541 Points -20%
AMD Ryzen 7 5800X3D
1452 Points -25%
Multi Core
Intel Core i9-13900K
40103 Points +114%
AMD Ryzen 9 7950X
38248 Points +104%
AMD Ryzen 9 7950X ECO 105 W
35693 Points +90%
AMD Ryzen 9 7950X ECO 65 W
29882 Points +59%
AMD Ryzen 9 7900X
29480 Points +57%
AMD Ryzen 9 5950X
27062 Points +44%
Intel Core i9-12900K
27005 Points +44%
Intel Core i5-13600K
24268 Points +29%
AMD Ryzen 9 5900X
20634 Points +10%
AMD Ryzen 7 7700X
19509 Points +4%
AMD Ryzen 7 7700
18760 Points
AMD Ryzen 7 7700X ECO 65 W
18667 Points 0%
Intel Core i5-12600K
17491 Points -7%
AMD Ryzen 5 7600X
15322 Points -18%
AMD Ryzen 7 5800X
15241 Points -19%
AMD Ryzen 7 5800X3D
14317 Points -24%
AMD Ryzen 5 5600X
11838 Points -37%
Cinebench R20
CPU (Single Core)
Intel Core i9-13900K
828 Points +10%
AMD Ryzen 9 7900X
786 Points +5%
AMD Ryzen 9 7950X
783 Points +4%
AMD Ryzen 9 7950X ECO 65 W
778 Points +4%
AMD Ryzen 9 7950X ECO 105 W
776 Points +3%
Intel Core i5-13600K
775 Points +3%
AMD Ryzen 7 7700X ECO 65 W
773 Points +3%
AMD Ryzen 7 7700X
772 Points +3%
Intel Core i9-12900K
766 Points +2%
AMD Ryzen 5 7600X
761 Points +1%
AMD Ryzen 7 7700
750 Points
Intel Core i5-12600K
734 Points -2%
AMD Ryzen 9 5950X
641 Points -15%
AMD Ryzen 9 5900X
639 Points -15%
AMD Ryzen 7 5800X
625 Points -17%
AMD Ryzen 5 5600X
601 Points -20%
AMD Ryzen 7 5800X3D
566 Points -25%
CPU (Multi Core)
Intel Core i9-13900K
15181 Points +109%
AMD Ryzen 9 7950X
14891 Points +105%
AMD Ryzen 9 7950X ECO 105 W
13945 Points +92%
AMD Ryzen 9 7950X ECO 65 W
11727 Points +62%
AMD Ryzen 9 7900X
11563 Points +59%
AMD Ryzen 9 5950X
10482 Points +44%
Intel Core i9-12900K
10240 Points +41%
Intel Core i5-13600K
9265 Points +28%
AMD Ryzen 9 5900X
8629 Points +19%
AMD Ryzen 7 7700X
7617 Points +5%
AMD Ryzen 7 7700X ECO 65 W
7308 Points +1%
AMD Ryzen 7 7700
7259 Points
Intel Core i5-12600K
6692 Points -8%
AMD Ryzen 7 5800X
6068 Points -16%
AMD Ryzen 5 7600X
5985 Points -18%
AMD Ryzen 7 5800X3D
5479 Points -25%
AMD Ryzen 5 5600X
4567 Points -37%
Cinebench R15
CPU Single 64Bit
Intel Core i9-13900K
327 Points +6%
AMD Ryzen 9 7900X
324 Points +5%
AMD Ryzen 9 7950X
317 Points +3%
AMD Ryzen 9 7950X ECO 105 W
316 Points +3%
AMD Ryzen 7 7700X ECO 65 W
316 Points +3%
AMD Ryzen 5 7600X
315 Points +2%
AMD Ryzen 9 7950X ECO 65 W
315 Points +2%
AMD Ryzen 7 7700X
314 Points +2%
AMD Ryzen 7 7700
308 Points
Intel Core i5-13600K
289 Points -6%
Intel Core i9-12900K
286 Points -7%
Intel Core i5-12600K
275 Points -11%
AMD Ryzen 9 5950X
272 Points -12%
AMD Ryzen 9 5900X
271 Points -12%
AMD Ryzen 7 5800X
266 Points -14%
AMD Ryzen 5 5600X
254 Points -18%
AMD Ryzen 7 5800X3D
241 Points -22%
CPU Multi 64Bit
AMD Ryzen 9 7950X
6236 (6091.06min - 6236.36max) Points +105%
Intel Core i9-13900K
6191 Points +103%
AMD Ryzen 9 7950X ECO 105 W
5800 (5721.64min - 5799.62max) Points +90%
AMD Ryzen 9 7900X
4856 Points +59%
AMD Ryzen 9 7950X ECO 65 W
4836 (4772.13min - 4835.59max) Points +59%
AMD Ryzen 9 5950X
4492 Points +47%
Intel Core i9-12900K
4057 Points +33%
AMD Ryzen 9 5900X
3717 Points +22%
Intel Core i5-13600K
3643 Points +20%
AMD Ryzen 7 7700X
3191 (3116.72min - 3191.32max) Points +5%
AMD Ryzen 7 7700
3047 (2985.74min - 3046.92max) Points
AMD Ryzen 7 7700X ECO 65 W
3036 (2977.74min - 3035.82max) Points 0%
AMD Ryzen 7 5800X
2616 Points -14%
Intel Core i5-12600K
2555 Points -16%
AMD Ryzen 5 7600X
2507 Points -18%
AMD Ryzen 7 5800X3D
2413 (2388.2min - 2413.42max) Points -21%
AMD Ryzen 5 5600X
1968 Points -35%
Blender - v2.79 BMW27 CPU
AMD Ryzen 5 5600X
260.2 Seconds * -57%
AMD Ryzen 7 5800X3D
212.6 Seconds * -28%
AMD Ryzen 5 7600X
203 Seconds * -22%
AMD Ryzen 7 5800X
196.8 Seconds * -19%
Intel Core i5-12600K
189.5 Seconds * -14%
AMD Ryzen 7 7700X ECO 65 W
166 Seconds * -0%
AMD Ryzen 7 7700
166 Seconds *
AMD Ryzen 7 7700X
160 Seconds * +4%
AMD Ryzen 9 5900X
141 Seconds * +15%
Intel Core i5-13600K
135 Seconds * +19%
Intel Core i9-12900K
121.1 Seconds * +27%
AMD Ryzen 9 5950X
112.8 Seconds * +32%
AMD Ryzen 9 7900X
106 Seconds * +36%
AMD Ryzen 9 7950X ECO 65 W
103 Seconds * +38%
AMD Ryzen 9 7950X ECO 105 W
87 Seconds * +48%
AMD Ryzen 9 7950X
82 Seconds * +51%
Intel Core i9-13900K
80 Seconds * +52%
wPrime 2.10
32m
Intel Core i9-12900K
4.924 s * -81%
Intel Core i5-12600K
4.725 s * -74%
AMD Ryzen 5 5600X
3.891 s * -43%
AMD Ryzen 7 5800X3D
3.648 s * -34%
AMD Ryzen 7 5800X
3.037 s * -12%
AMD Ryzen 5 7600X
2.78 s * -2%
AMD Ryzen 7 7700
2.72 s *
AMD Ryzen 9 5950X
2.538 s * +7%
Intel Core i5-13600K
2.527 s * +7%
AMD Ryzen 7 7700X
2.154 s * +21%
Intel Core i9-13900K
1.818 s * +33%
AMD Ryzen 9 7900X
1.781 s * +35%
AMD Ryzen 9 7950X
1.557 s * +43%
1024m
Intel Core i5-12600K
202.7 s * -224%
Intel Core i9-12900K
190.6 s * -204%
Intel Core i5-13600K
177.592 s * -184%
AMD Ryzen 5 5600X
113.9 s * -82%
AMD Ryzen 7 5800X3D
92.572 s * -48%
AMD Ryzen 7 5800X
86.1 s * -37%
Intel Core i9-13900K
79.738 s * -27%
AMD Ryzen 5 7600X
74.491 s * -19%
AMD Ryzen 9 5950X
64.9 s * -4%
AMD Ryzen 7 7700
62.625 s *
AMD Ryzen 7 7700X
61.148 s * +2%
AMD Ryzen 9 7900X
39.954 s * +36%
AMD Ryzen 9 7950X
30.427 s * +51%
X264 HD Benchmark 4.0
Pass 1
Intel Core i9-13900K
412 (410min - 417max) fps +12%
Intel Core i5-13600K
388 (386min - 388max) fps +5%
AMD Ryzen 9 7950X
383 (381min - 386max) fps +4%
AMD Ryzen 9 7900X
376 (369min - 378max) fps +2%
AMD Ryzen 7 7700X
373.5 (363min - 381max) fps +1%
Intel Core i9-12900K
368.5 (366min - 369max) fps 0%
AMD Ryzen 7 7700
368 (359min - 370max) fps
AMD Ryzen 5 7600X
367 (363min - 371max) fps 0%
AMD Ryzen 7 5800X
339 (338min - 341max) fps -8%
AMD Ryzen 9 5950X
338.5 (337min - 340max) fps -8%
AMD Ryzen 9 5900X
335 (325min - 337max) fps -9%
Intel Core i5-12600K
333.5 (332min - 336max) fps -9%
AMD Ryzen 5 5600X
320 (319min - 321max) fps -13%
AMD Ryzen 7 5800X3D
292 (290min - 295max) fps -21%
Pass 2
AMD Ryzen 9 7950X
274 (272min - 274max) fps +57%
Intel Core i9-13900K
267 (266min - 271max) fps +53%
AMD Ryzen 9 7900X
241 (240min - 242max) fps +38%
AMD Ryzen 9 5950X
221 (220min - 221max) fps +26%
Intel Core i9-12900K
206 (206min - 206max) fps +18%
Intel Core i5-13600K
199 (198.5min - 199.4max) fps +14%
AMD Ryzen 9 5900X
191 (190min - 192max) fps +9%
AMD Ryzen 7 7700X
181.2 (181min - 181.4max) fps +4%
AMD Ryzen 7 7700
174.95 (174.4min - 175.5max) fps
AMD Ryzen 7 5800X
152 (151min - 152max) fps -13%
Intel Core i5-12600K
148 (147min - 148max) fps -15%
AMD Ryzen 5 7600X
147.8 (147.7min - 147.9max) fps -16%
AMD Ryzen 7 5800X3D
138.25 (137.7min - 138.6max) fps -21%
AMD Ryzen 5 5600X
117 (117min - 117max) fps -33%
WinRAR - Result
AMD Ryzen 9 7900X
17225 KB/s +16%
AMD Ryzen 5 7600X
16178 KB/s +9%
AMD Ryzen 7 5800X
15604 KB/s +5%
AMD Ryzen 9 7950X
15449 KB/s +4%
AMD Ryzen 7 7700X
14879 KB/s 0%
AMD Ryzen 7 7700
14860 KB/s
Intel Core i9-13900K
14836 KB/s 0%
AMD Ryzen 7 5800X3D
14431 KB/s -3%
AMD Ryzen 9 5900X
13361 KB/s -10%
AMD Ryzen 5 5600X
13282 KB/s -11%
AMD Ryzen 9 5950X
12503 KB/s -16%
Intel Core i5-13600K
10937 KB/s -26%
Intel Core i9-12900K
10792 KB/s -27%
Intel Core i5-12600K
6239 KB/s -58%
TrueCrypt
AES Mean 100MB
AMD Ryzen 9 7950X
32.5 GB/s +104%
Intel Core i9-13900K
27 GB/s +70%
AMD Ryzen 9 5950X
26.9 GB/s +69%
AMD Ryzen 9 5900X
21.2 GB/s +33%
Intel Core i5-13600K
18.8 GB/s +18%
Intel Core i9-12900K
18.5 GB/s +16%
AMD Ryzen 7 7700X
17.5 GB/s +10%
AMD Ryzen 7 7700
15.9 GB/s
AMD Ryzen 7 5800X
15 GB/s -6%
AMD Ryzen 9 7900X
14.8 GB/s -7%
AMD Ryzen 7 5800X3D
13.8 GB/s -13%
AMD Ryzen 5 7600X
13.2 GB/s -17%
Intel Core i5-12600K
12.8 GB/s -19%
AMD Ryzen 5 5600X
10.7 GB/s -33%
Twofish Mean 100MB
Intel Core i9-13900K
5.4 GB/s +135%
AMD Ryzen 9 7950X
4.6 GB/s +100%
AMD Ryzen 9 5950X
3.7 GB/s +61%
Intel Core i9-12900K
3.7 GB/s +61%
Intel Core i5-13600K
3.1 GB/s +35%
AMD Ryzen 9 5900X
2.9 GB/s +26%
AMD Ryzen 9 7900X
2.8 GB/s +22%
AMD Ryzen 7 7700X
2.3 GB/s 0%
AMD Ryzen 7 7700
2.3 GB/s
Intel Core i5-12600K
2.2 GB/s -4%
AMD Ryzen 7 5800X
2 GB/s -13%
AMD Ryzen 7 5800X3D
1.9 GB/s -17%
AMD Ryzen 5 7600X
1.8 GB/s -22%
AMD Ryzen 5 5600X
1.5 GB/s -35%
Serpent Mean 100MB
Intel Core i9-13900K
3 GB/s +100%
AMD Ryzen 9 7950X
2.9 GB/s +93%
AMD Ryzen 9 5950X
2.4 GB/s +60%
Intel Core i9-12900K
1.9 GB/s +27%
AMD Ryzen 9 5900X
1.8 GB/s +20%
Intel Core i5-13600K
1.7 GB/s +13%
AMD Ryzen 9 7900X
1.5 GB/s 0%
AMD Ryzen 7 7700
1.5 GB/s
AMD Ryzen 7 7700X
1.4 GB/s -7%
AMD Ryzen 7 5800X
1.3 GB/s -13%
Intel Core i5-12600K
1.3 GB/s -13%
AMD Ryzen 7 5800X3D
1.2 GB/s -20%
AMD Ryzen 5 7600X
1.1 GB/s -27%
AMD Ryzen 5 5600X
0.938 GB/s -37%
Geekbench 5.5
Single-Core
Intel Core i9-13900K
2290 Points +6%
AMD Ryzen 9 7900X
2274 Points +5%
AMD Ryzen 9 7950X ECO 65 W
2252 Points +4%
AMD Ryzen 9 7950X ECO 105 W
2250 Points +4%
AMD Ryzen 9 7950X
2241 Points +4%
AMD Ryzen 7 7700X
2218 Points +3%
AMD Ryzen 7 7700X ECO 65 W
2218 Points +3%
AMD Ryzen 5 7600X
2205 Points +2%
AMD Ryzen 7 7700
2161 Points
Intel Core i9-12900K
2042 Points -6%
Intel Core i5-13600K
1967 Points -9%
Intel Core i5-12600K
1904 Points -12%
AMD Ryzen 9 5950X
1682 Points -22%
AMD Ryzen 9 5900X
1669 Points -23%
AMD Ryzen 7 5800X
1665 Points -23%
AMD Ryzen 5 5600X
1657 Points -23%
AMD Ryzen 7 5800X3D
1622 Points -25%
Multi-Core
Intel Core i9-13900K
24157 Points +73%
AMD Ryzen 9 7950X
23948 Points +72%
AMD Ryzen 9 7950X ECO 105 W
22921 Points +65%
AMD Ryzen 9 7950X ECO 65 W
20496 Points +47%
AMD Ryzen 9 7900X
19987 Points +43%
Intel Core i9-12900K
17854 Points +28%
AMD Ryzen 9 5950X
16891 Points +21%
Intel Core i5-13600K
16651 Points +20%
AMD Ryzen 7 7700X
14373 Points +3%
AMD Ryzen 7 7700
13929 Points
AMD Ryzen 7 7700X ECO 65 W
13889 Points 0%
AMD Ryzen 9 5900X
12990 Points -7%
Intel Core i5-12600K
12797 Points -8%
AMD Ryzen 5 7600X
11917 Points -14%
AMD Ryzen 7 5800X
11354 Points -18%
AMD Ryzen 7 5800X3D
10856 Points -22%
AMD Ryzen 5 5600X
8980 Points -36%
Geekbench 5.0
5.0 Single-Core
Intel Core i9-13900K
2214 Points +7%
AMD Ryzen 9 7900X
2194 Points +6%
AMD Ryzen 9 7950X
2156 Points +4%
AMD Ryzen 5 7600X
2126 Points +2%
AMD Ryzen 7 7700X
2123 Points +2%
AMD Ryzen 7 7700
2078 Points
Intel Core i9-12900K
1968 Points -5%
Intel Core i5-13600K
1931 Points -7%
Intel Core i5-12600K
1821 Points -12%
AMD Ryzen 9 5950X
1683 Points -19%
AMD Ryzen 7 5800X
1673 Points -19%
AMD Ryzen 9 5900X
1667 Points -20%
AMD Ryzen 5 5600X
1587 Points -24%
AMD Ryzen 7 5800X3D
1526 Points -27%
5.0 Multi-Core
Intel Core i9-13900K
24021 Points +73%
AMD Ryzen 9 7950X
22891 Points +65%
AMD Ryzen 9 7900X
19975 Points +44%
Intel Core i9-12900K
17959 Points +29%
Intel Core i5-13600K
16635 Points +20%
AMD Ryzen 9 5950X
16570 Points +19%
AMD Ryzen 7 7700X
14215 Points +2%
AMD Ryzen 7 7700
13869 Points
AMD Ryzen 9 5900X
12974 Points -6%
Intel Core i5-12600K
12746 Points -8%
AMD Ryzen 5 7600X
11880 Points -14%
AMD Ryzen 7 5800X
11246 Points -19%
AMD Ryzen 7 5800X3D
10836 Points -22%
AMD Ryzen 5 5600X
8926 Points -36%
Geekbench 4.4
64 Bit Single-Core Score
Intel Core i9-13900K
9598 Points +10%
AMD Ryzen 9 7900X
9193 Points +5%
AMD Ryzen 9 7950X
9023 Points +3%
AMD Ryzen 7 7700X
8991 Points +3%
AMD Ryzen 5 7600X
8926 Points +2%
AMD Ryzen 7 7700
8753 Points
Intel Core i9-12900K
8665 Points -1%
Intel Core i5-13600K
8618 Points -2%
Intel Core i5-12600K
8223 Points -6%
AMD Ryzen 7 5800X
7333 Points -16%
AMD Ryzen 9 5900X
7297 Points -17%
AMD Ryzen 9 5950X
7216 Points -18%
AMD Ryzen 7 5800X3D
7187 Points -18%
AMD Ryzen 5 5600X
6953 Points -21%
64 Bit Multi-Core Score
Intel Core i9-13900K
86695 Points +56%
AMD Ryzen 9 7950X
85554 Points +54%
AMD Ryzen 9 7900X
74731 Points +35%
Intel Core i9-12900K
63583 Points +14%
AMD Ryzen 9 5950X
63233 Points +14%
Intel Core i5-13600K
60407 Points +9%
AMD Ryzen 7 7700X
56909 Points +2%
AMD Ryzen 7 7700
55542 Points
AMD Ryzen 9 5900X
51794 Points -7%
AMD Ryzen 5 7600X
47407 Points -15%
Intel Core i5-12600K
46557 Points -16%
AMD Ryzen 7 5800X
44131 Points -21%
AMD Ryzen 7 5800X3D
43687 Points -21%
AMD Ryzen 5 5600X
35617 Points -36%
7-Zip 18.03
7z b 4
AMD Ryzen 9 7950X
158242 MIPS +86%
AMD Ryzen 9 7950X ECO 105 W
151967 MIPS +78%
Intel Core i9-13900K
147068 MIPS +72%
AMD Ryzen 9 5950X
127792 MIPS +50%
AMD Ryzen 9 7900X
124975 MIPS +47%
Intel Core i9-12900K
97671 MIPS +15%
AMD Ryzen 9 5900X
95123 MIPS +12%
Intel Core i5-13600K
89647 MIPS +5%
AMD Ryzen 7 7700X
85789 MIPS +1%
AMD Ryzen 7 7700X ECO 65 W
85624 MIPS 0%
AMD Ryzen 7 7700
85260 MIPS
AMD Ryzen 7 5800X
74306 MIPS -13%
AMD Ryzen 7 5800X3D
69518 MIPS -18%
AMD Ryzen 5 7600X
69291 MIPS -19%
Intel Core i5-12600K
64260 MIPS -25%
AMD Ryzen 5 5600X
56607 MIPS -34%
7z b 4 -mmt1
AMD Ryzen 9 7900X
8282 MIPS +5%
AMD Ryzen 9 7950X
8211 MIPS +4%
AMD Ryzen 9 7950X ECO 105 W
8176 MIPS +4%
AMD Ryzen 7 7700X
8096 MIPS +3%
AMD Ryzen 5 7600X
8063 MIPS +2%
AMD Ryzen 7 7700X ECO 65 W
8052 MIPS +2%
AMD Ryzen 7 7700
7880 MIPS
Intel Core i9-13900K
7272 MIPS -8%
AMD Ryzen 9 5950X
6974 MIPS -11%
AMD Ryzen 7 5800X
6970 MIPS -12%
AMD Ryzen 7 5800X3D
6799 MIPS -14%
AMD Ryzen 9 5900X
6785 MIPS -14%
AMD Ryzen 5 5600X
6594 MIPS -16%
Intel Core i9-12900K
6571 MIPS -17%
Intel Core i5-13600K
6502 MIPS -17%
Intel Core i5-12600K
5944 MIPS -25%
HWBOT x265 Benchmark v2.2 - 4k Preset
AMD Ryzen 9 7950X
44 fps +76%
Intel Core i9-13900K
42.6 fps +70%
AMD Ryzen 9 7950X ECO 105 W
41.7 fps +67%
AMD Ryzen 9 7900X
36.2 fps +45%
AMD Ryzen 9 7950X ECO 65 W
36.2 fps +45%
AMD Ryzen 9 5950X
31.8 fps +27%
Intel Core i5-12600K
30.1 fps +20%
Intel Core i9-12900K
30 fps +20%
Intel Core i5-13600K
27.6 fps +10%
AMD Ryzen 7 7700X
26.1 fps +4%
AMD Ryzen 9 5900X
25.5 fps +2%
AMD Ryzen 7 7700
25 fps
AMD Ryzen 7 7700X ECO 65 W
24.8 fps -1%
AMD Ryzen 5 7600X
21.1 fps -16%
AMD Ryzen 7 5800X
20.8 fps -17%
AMD Ryzen 7 5800X3D
19.1 fps -24%
AMD Ryzen 5 5600X
15.7 fps -37%
R Benchmark 2.5 - Overall mean
AMD Ryzen 7 5800X3D
0.4784 sec * -19%
AMD Ryzen 5 5600X
0.4778 sec * -19%
AMD Ryzen 9 5950X
0.4556 sec * -13%
AMD Ryzen 9 5900X
0.4513 sec * -12%
AMD Ryzen 7 5800X
0.4509 sec * -12%
Intel Core i5-12600K
0.4456 sec * -11%
Intel Core i9-12900K
0.4216 sec * -5%
Intel Core i5-13600K
0.405 sec * -1%
AMD Ryzen 7 7700
0.4022 sec *
AMD Ryzen 7 7700X ECO 65 W
0.383 sec * +5%
AMD Ryzen 9 7950X
0.3776 sec * +6%
AMD Ryzen 9 7950X ECO 65 W
0.3773 sec * +6%
AMD Ryzen 9 7950X ECO 105 W
0.3769 sec * +6%
AMD Ryzen 7 7700X
0.3758 sec * +7%
AMD Ryzen 5 7600X
0.3749 sec * +7%
AMD Ryzen 9 7900X
0.3736 sec * +7%
Intel Core i9-13900K
0.3539 sec * +12%
LibreOffice - 20 Documents To PDF
Intel Core i5-12600K
71.8 s * -82%
AMD Ryzen 7 5800X3D
55 s * -39%
AMD Ryzen 9 5900X
47.65 s * -21%
AMD Ryzen 9 5950X
45.97 s * -16%
AMD Ryzen 5 5600X
45.14 s * -14%
AMD Ryzen 7 5800X
43.31 s * -10%
Intel Core i9-12900K
40.6 s * -3%
AMD Ryzen 7 7700
39.5 s *
AMD Ryzen 5 7600X
36.8 s * +7%
Intel Core i9-13900K
36.6 s * +7%
AMD Ryzen 9 7950X
36.6 s * +7%
Intel Core i5-13600K
35 s * +11%
AMD Ryzen 9 7900X
34.9 s * +12%
AMD Ryzen 7 7700X ECO 65 W
34.1 s * +14%
AMD Ryzen 7 7700X
33.6 s * +15%
AMD Ryzen 9 7950X ECO 65 W
33.1 s * +16%
AMD Ryzen 9 7950X ECO 105 W
33 s * +16%

* ... más pequeño es mejor

Bucle múltiple Cinebench R15

A diferencia de la serie Ryzen 7000X, AMD suministra un refrigerador en la caja para los procesadores de 65 W que no son X. El Ryzen 9 7900 y el Ryzen 7 7700 vienen con un disipador Wraith Prism (¡ah, nostalgia del Zen 2!) mientras que el Ryzen 5 7600 viene con un disipador de bajo perfil Wraith Stealth.

Los disipadores Wraith no son los mejores del mercado, pero pueden resultar muy útiles y cumplir con su cometido en tareas informáticas no intensivas. El Ryzen 7 7700 ofrece un rendimiento bien sostenido en nuestra prueba de bucle multinúcleo Cinebench R15 sin signos de ralentización cuando se combina con nuestro Cooler MasterLiquid ML360L V2 ARGB AIO.

Recomendamos optar por una solución AIO capaz si planeas llevar el Ryzen 7 7700 al límite.

01553104656207759301085124013951550170518602015217023252480263527902945Tooltip
AMD Ryzen 7 7700: Ø3021 (2985.74-3046.92)

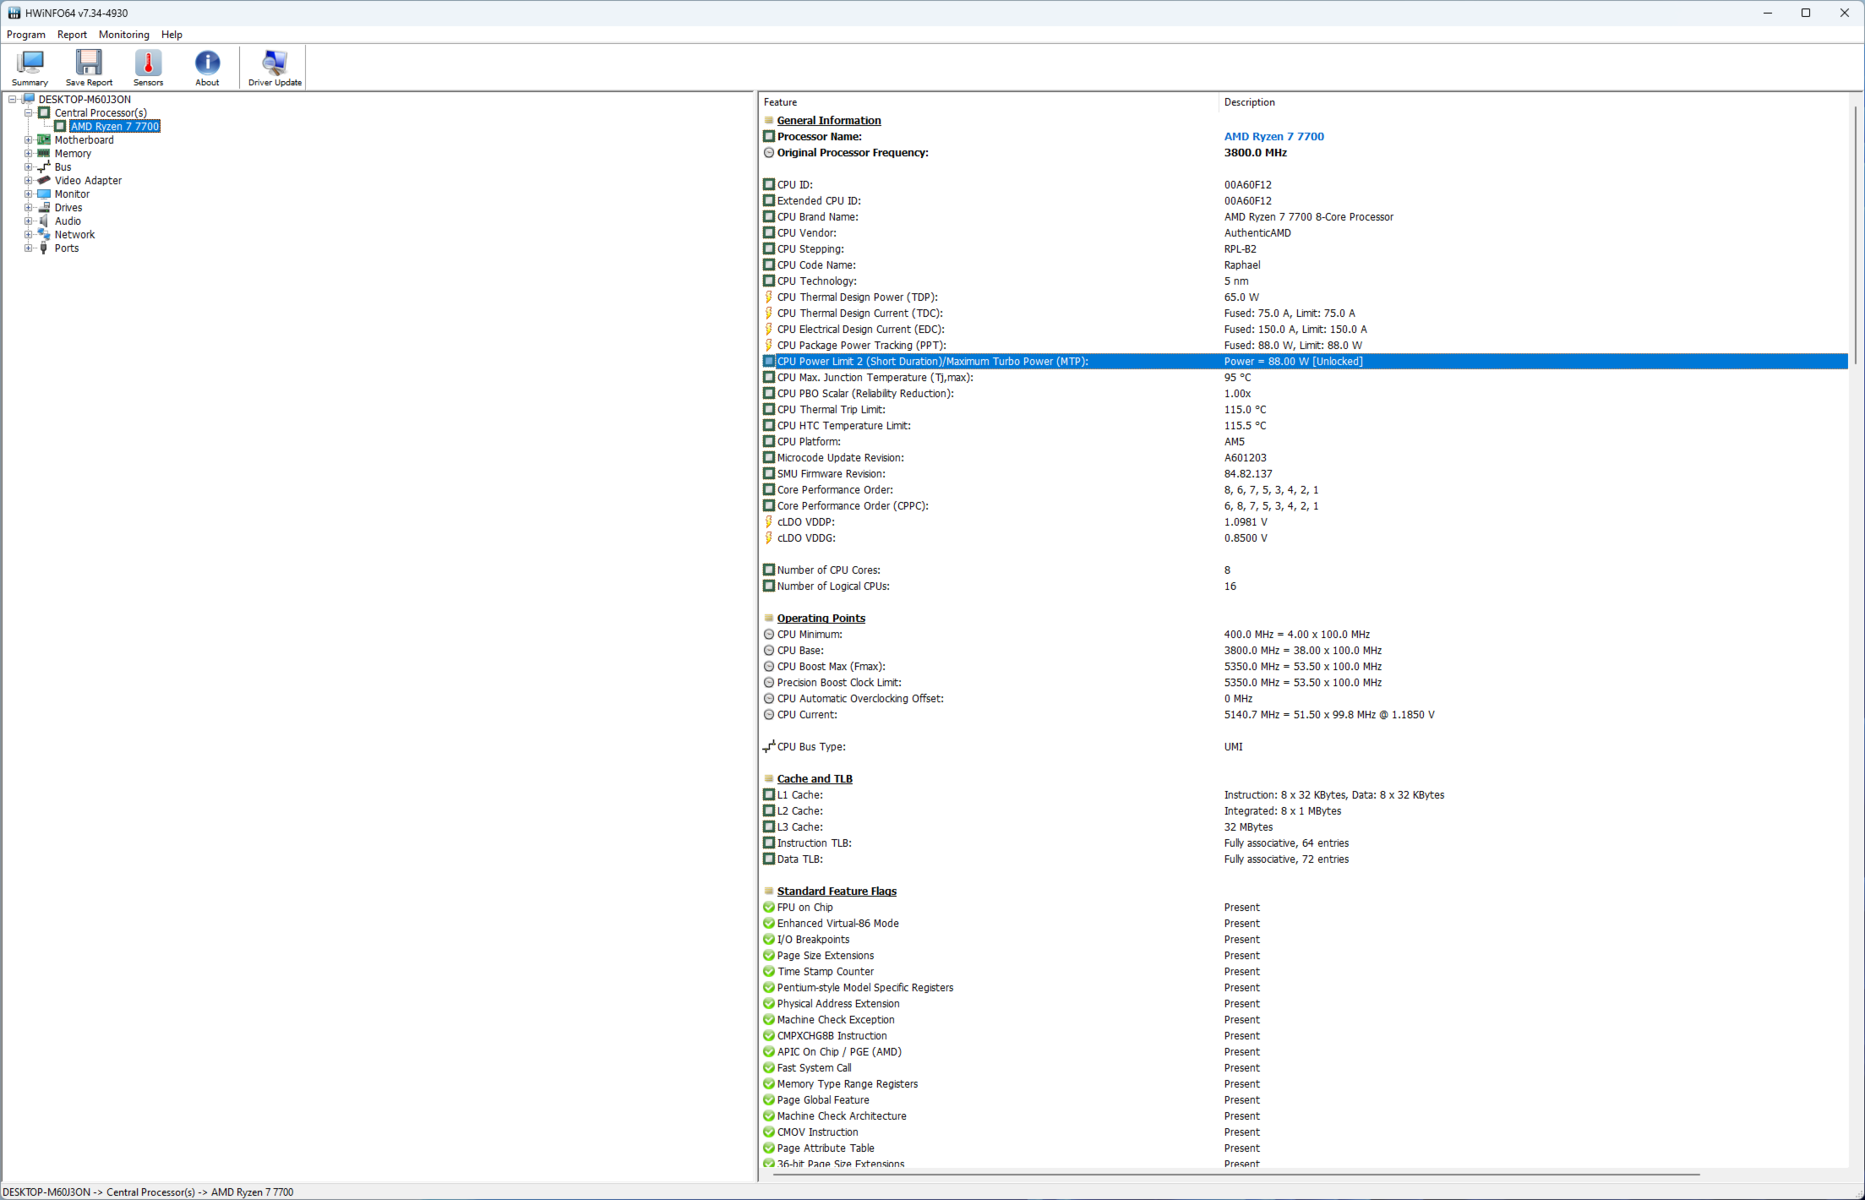
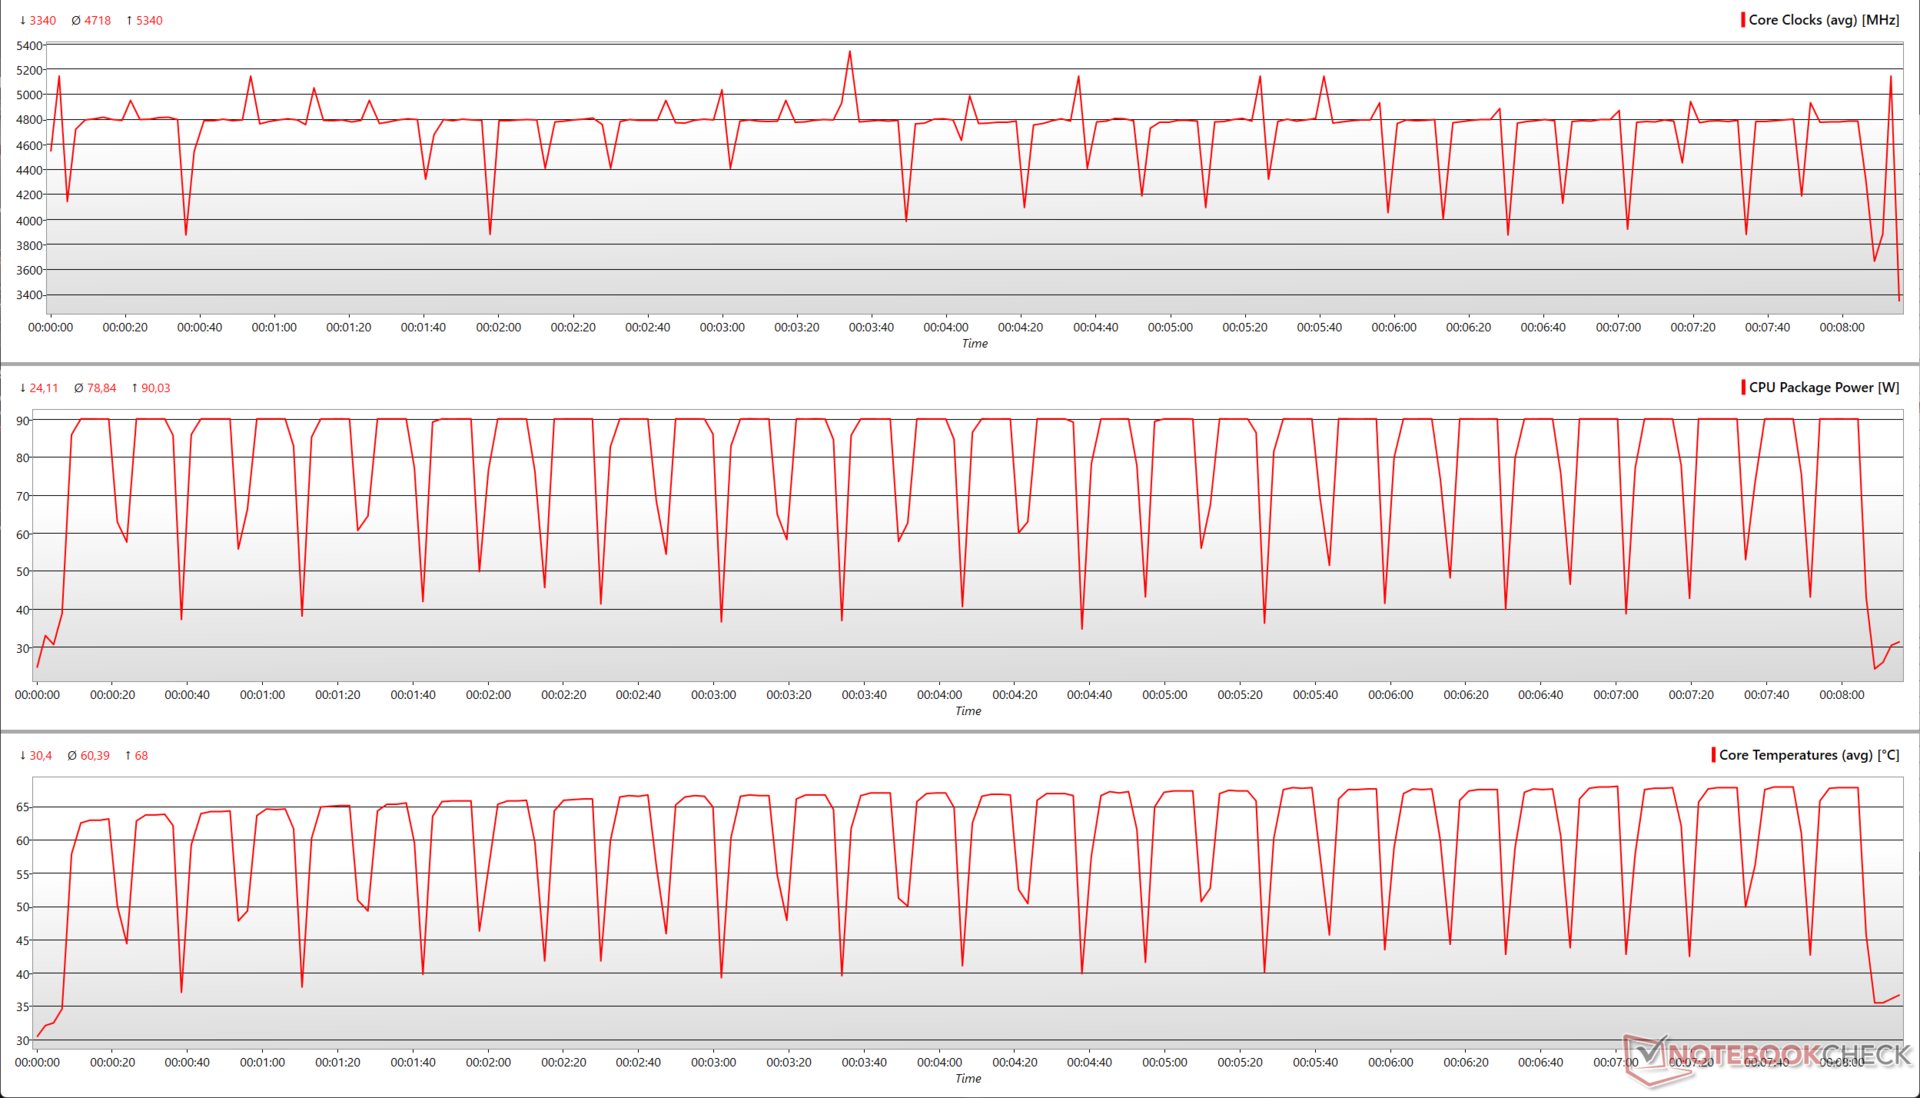
Durante el bucle, vemos que el Ryzen 7 7700 es capaz de alcanzar la marca de 5,3 GHz, aunque sólo una vez - el procesador parece cómodo en torno a la marca de 5,1 GHz en esta prueba. La potencia del paquete se mantiene estable en 90 W durante cada bucle - es superior al TDP de 65 W, pero las temperaturas del núcleo sólo alcanzan un máximo de 68 °C.

Al igual que los chips de la serie X, AMD menciona que los homólogos que no son X también tienen un TjMax de 95 °C, pero este límite no suele alcanzarse durante el estrés debido al menor TDP. Aun así, el límite TjMax más alto permite a Precision Boost 2 extraer el máximo rendimiento de este chip.

AMD Ryzen 7 7700 - Parámetros de la CPU durante el bucle multinúcleo de Cinebench R15
Cinebench R10 Rendering Multiple CPUs 32Bit
53881
Cinebench R10 Shading 32Bit
16110
Cinebench R10 Rendering Single 32Bit
8345
Cinebench R11.5 CPU Multi 64Bit
34.29 Points
Cinebench R11.5 OpenGL 64Bit
199.31 fps
Cinebench R11.5 CPU Single 64Bit
3.64 Points
Cinebench R15 CPU Single 64Bit
308 Points
Cinebench R15 Ref. Match 64Bit
99.6 %
Cinebench R15 OpenGL 64Bit
359 fps
Cinebench R15 CPU Multi 64Bit
3047 Points
ayuda

Rendimiento del sistema: A una distancia sorprendente de un Ryzen 9 7900X

No hay contratiempos en el rendimiento normal del sistema con el Ryzen 7 7700. CrossMark pone al Ryzen 7 7700 a la par con el Core i5-13600K y el Ryzen 5 7600X mientras que los componentes de Productividad y Creatividad de la prueba lo ven compitiendo por el lugar del Ryzen 9 7900X.

En varias pruebas de AIDA64, el Ryzen 7 7700 supera con creces al Core i9-12900K. Los procesadores Intel, por otro lado, parecen tener una ventaja significativa en 3DMark Time Spy CPU.

3DMark 11 - 1280x720 Performance Physics
AMD Ryzen 9 7950X
34239 Points +11%
Intel Core i9-13900K
32273 Points +4%
AMD Ryzen 7 7700
30945 Points
Intel Core i5-13600K
30480 Points -2%
AMD Ryzen 9 7900X
28618 Points -8%
Intel Core i9-12900K
28211 Points -9%
AMD Ryzen 7 5800X3D
27236 Points -12%
AMD Ryzen 5 7600X
25396 Points -18%
AMD Ryzen 9 5950X
25367 Points -18%
Intel Core i5-12600K
25017 Points -19%
AMD Ryzen 9 5900X
23423 Points -24%
AMD Ryzen 7 5800X
23381 Points -24%
AMD Ryzen 5 5600X
19649 Points -37%
3DMark - 2560x1440 Time Spy CPU
Intel Core i9-13900K
19392 Points +39%
Intel Core i9-12900K
18431 Points +32%
Intel Core i5-13600K
17124 Points +23%
AMD Ryzen 9 7900X
16616 Points +19%
AMD Ryzen 9 7950X
15856 Points +14%
AMD Ryzen 7 7700
13918 Points
Intel Core i5-12600K
13869 Points 0%
AMD Ryzen 9 5950X
13650 Points -2%
AMD Ryzen 9 5900X
12633 Points -9%
AMD Ryzen 7 5800X3D
11809 Points -15%
AMD Ryzen 7 5800X
11599 Points -17%
AMD Ryzen 5 7600X
10458 Points -25%
AMD Ryzen 5 5600X
8911 Points -36%
CrossMark
Overall
Intel Core i9-13900K
2589 Points +16%
AMD Ryzen 9 7950X
2495 Points +11%
AMD Ryzen 9 7900X
2405 Points +7%
Intel Core i5-13600K
2271 Points +1%
AMD Ryzen 7 7700
2238 Points
AMD Ryzen 5 7600X
2236 Points 0%
AMD Ryzen 7 5800X3D
1770 Points -21%
AMD Ryzen 9 5950X
1495 Points -33%
AMD Ryzen 5 5600X
1489 Points -33%
Productivity
Intel Core i9-13900K
2388 Points +13%
AMD Ryzen 9 7950X
2292 Points +8%
AMD Ryzen 9 7900X
2211 Points +4%
AMD Ryzen 7 7700
2119 Points
Intel Core i5-13600K
2115 Points 0%
AMD Ryzen 5 7600X
2101 Points -1%
AMD Ryzen 7 5800X3D
1706 Points -19%
AMD Ryzen 9 5950X
1359 Points -36%
Creativity
AMD Ryzen 9 7950X
2793 Points +15%
Intel Core i9-13900K
2784 Points +14%
AMD Ryzen 9 7900X
2673 Points +10%
AMD Ryzen 7 7700
2439 Points
AMD Ryzen 5 7600X
2414 Points -1%
Intel Core i5-13600K
2412 Points -1%
AMD Ryzen 7 5800X3D
1910 Points -22%
AMD Ryzen 9 5950X
1710 Points -30%
Responsiveness
Intel Core i9-13900K
2653 Points +30%
Intel Core i5-13600K
2350 Points +15%
AMD Ryzen 9 7950X
2297 Points +13%
AMD Ryzen 9 7900X
2251 Points +11%
AMD Ryzen 5 7600X
2145 Points +5%
AMD Ryzen 7 7700
2036 Points
AMD Ryzen 7 5800X3D
1574 Points -23%
AMD Ryzen 9 5950X
1332 Points -35%
AIDA64
FP32 Ray-Trace
AMD Ryzen 9 7950X
62786 KRay/s +110%
Intel Core i9-13900K
36939 KRay/s +24%
AMD Ryzen 9 7900X
33676 KRay/s +13%
AMD Ryzen 7 7700
29867 KRay/s
AMD Ryzen 9 5950X
28150 KRay/s -6%
Intel Core i5-13600K
23446 KRay/s -21%
AMD Ryzen 9 5900X
23391 KRay/s -22%
AMD Ryzen 5 7600X
17633 KRay/s -41%
AMD Ryzen 7 5800X
17545 KRay/s -41%
AMD Ryzen 7 5800X3D
17125 KRay/s -43%
Intel Core i9-12900K
13266 KRay/s -56%
AMD Ryzen 5 5600X
12482 KRay/s -58%
Intel Core i5-12600K
8243 KRay/s -72%
FPU Julia
AMD Ryzen 9 7950X
264044 Points +106%
AMD Ryzen 9 7900X
201995 Points +58%
Intel Core i9-13900K
183390 Points +43%
AMD Ryzen 9 5950X
144072 Points +12%
AMD Ryzen 7 7700
128212 Points
AMD Ryzen 9 5900X
114330 Points -11%
Intel Core i5-13600K
111374 Points -13%
AMD Ryzen 5 7600X
103526 Points -19%
AMD Ryzen 7 5800X3D
103015 Points -20%
AMD Ryzen 7 5800X
82429 Points -36%
AMD Ryzen 5 5600X
61688 Points -52%
Intel Core i9-12900K
59419 Points -54%
Intel Core i5-12600K
37321 Points -71%
CPU SHA3
AMD Ryzen 9 7950X
10362 MB/s +109%
Intel Core i9-13900K
9180 MB/s +85%
AMD Ryzen 9 7900X
7018 MB/s +42%
Intel Core i5-13600K
5253 MB/s +6%
AMD Ryzen 7 7700
4956 MB/s
Intel Core i9-12900K
4952 MB/s 0%
AMD Ryzen 9 5950X
4569 MB/s -8%
AMD Ryzen 5 7600X
3601 MB/s -27%
AMD Ryzen 9 5900X
3591 MB/s -28%
AMD Ryzen 7 5800X3D
3587 MB/s -28%
Intel Core i5-12600K
3250 MB/s -34%
AMD Ryzen 7 5800X
2542 MB/s -49%
AMD Ryzen 5 5600X
1920 MB/s -61%
CPU Queen
AMD Ryzen 9 7950X
205588 Points +59%
AMD Ryzen 9 7900X
172637 Points +33%
AMD Ryzen 9 5950X
164437 Points +27%
Intel Core i9-13900K
159676 Points +23%
AMD Ryzen 9 5900X
138724 Points +7%
AMD Ryzen 7 7700
129569 Points
Intel Core i5-13600K
120485 Points -7%
AMD Ryzen 7 5800X
113297 Points -13%
Intel Core i9-12900K
112694 Points -13%
AMD Ryzen 5 7600X
107954 Points -17%
AMD Ryzen 7 5800X3D
104367 Points -19%
Intel Core i5-12600K
88337 Points -32%
AMD Ryzen 5 5600X
85863 Points -34%
FPU SinJulia
AMD Ryzen 9 7950X
32855 Points +105%
AMD Ryzen 9 5950X
26364 Points +64%
AMD Ryzen 9 7900X
24881 Points +55%
Intel Core i9-13900K
19920 Points +24%
AMD Ryzen 9 5900X
19353 Points +21%
AMD Ryzen 7 7700
16050 Points
Intel Core i9-12900K
14664 Points -9%
AMD Ryzen 7 5800X
13527 Points -16%
AMD Ryzen 7 5800X3D
12794 Points -20%
AMD Ryzen 5 7600X
12774 Points -20%
Intel Core i5-13600K
12201 Points -24%
AMD Ryzen 5 5600X
10088 Points -37%
Intel Core i5-12600K
9510 Points -41%
FPU Mandel
AMD Ryzen 9 7950X
138291 Points +109%
AMD Ryzen 9 7900X
106620 Points +61%
Intel Core i9-13900K
91721 Points +38%
AMD Ryzen 9 5950X
78269 Points +18%
AMD Ryzen 7 7700
66267 Points
AMD Ryzen 9 5900X
62547 Points -6%
Intel Core i5-13600K
57797 Points -13%
AMD Ryzen 7 5800X3D
56568 Points -15%
AMD Ryzen 5 7600X
54555 Points -18%
AMD Ryzen 7 5800X
45369 Points -32%
Intel Core i9-12900K
38042 Points -43%
AMD Ryzen 5 5600X
33927 Points -49%
Intel Core i5-12600K
24230 Points -63%
CPU AES
AMD Ryzen 9 7950X
379659 MB/s +105%
Intel Core i9-13900K
297727 MB/s +61%
AMD Ryzen 9 7900X
279956 MB/s +51%
AMD Ryzen 7 7700
185246 MB/s
Intel Core i5-13600K
175556 MB/s -5%
AMD Ryzen 9 5950X
153484 MB/s -17%
AMD Ryzen 5 7600X
144365 MB/s -22%
AMD Ryzen 9 5900X
118228 MB/s -36%
Intel Core i9-12900K
94062 MB/s -49%
AMD Ryzen 7 5800X
82897 MB/s -55%
AMD Ryzen 7 5800X3D
66065 MB/s -64%
AMD Ryzen 5 5600X
62563 MB/s -66%
Intel Core i5-12600K
58635 MB/s -68%
CPU ZLib
Intel Core i9-13900K
2490 MB/s +111%
AMD Ryzen 9 7950X
2441 MB/s +107%
AMD Ryzen 9 7900X
1848 MB/s +56%
AMD Ryzen 9 5950X
1727 MB/s +46%
Intel Core i9-12900K
1560 MB/s +32%
Intel Core i5-13600K
1426 MB/s +21%
AMD Ryzen 9 5900X
1345 MB/s +14%
AMD Ryzen 7 7700
1181 MB/s
Intel Core i5-12600K
988 MB/s -16%
AMD Ryzen 5 7600X
945 MB/s -20%
AMD Ryzen 7 5800X
942 MB/s -20%
AMD Ryzen 7 5800X3D
890 MB/s -25%
AMD Ryzen 5 5600X
719 MB/s -39%
FP64 Ray-Trace
AMD Ryzen 9 7950X
33821 KRay/s +111%
Intel Core i9-13900K
20298 KRay/s +27%
AMD Ryzen 9 7900X
18490 KRay/s +15%
AMD Ryzen 7 7700
16020 KRay/s
AMD Ryzen 9 5950X
15213 KRay/s -5%
Intel Core i5-13600K
12806 KRay/s -20%
AMD Ryzen 9 5900X
12613 KRay/s -21%
AMD Ryzen 5 7600X
9488 KRay/s -41%
AMD Ryzen 7 5800X
9469 KRay/s -41%
AMD Ryzen 7 5800X3D
9090 KRay/s -43%
Intel Core i9-12900K
8078 KRay/s -50%
AMD Ryzen 5 5600X
6894 KRay/s -57%
Intel Core i5-12600K
5149 KRay/s -68%
CPU PhotoWorxx
Intel Core i9-13900K
48674 MPixel/s +51%
Intel Core i5-12600K
48577 MPixel/s +51%
Intel Core i5-13600K
48434 MPixel/s +50%
Intel Core i9-12900K
48307 MPixel/s +50%
AMD Ryzen 9 7900X
40893 MPixel/s +27%
AMD Ryzen 9 7950X
40261 MPixel/s +25%
AMD Ryzen 5 7600X
32202 MPixel/s 0%
AMD Ryzen 7 7700
32185 MPixel/s
AMD Ryzen 9 5950X
27530 MPixel/s -14%
AMD Ryzen 7 5800X
25309 MPixel/s -21%
AMD Ryzen 7 5800X3D
25224 MPixel/s -22%
AMD Ryzen 5 5600X
24352 MPixel/s -24%
AMD Ryzen 9 5900X
21433 MPixel/s -33%
Performance Rating - Percent
Intel Core i9-12900K -1!
95 pt
Intel Core i5-12600K -1!
92.3 pt
AMD Ryzen 9 7900X
74.7 pt
Intel Core i9-13900K
74.2 pt
AMD Ryzen 9 7950X
73.8 pt
Intel Core i5-13600K
69.1 pt
AMD Ryzen 5 7600X
67.9 pt
AMD Ryzen 7 7700
67.6 pt
AMD Ryzen 9 5900X
67.2 pt
AMD Ryzen 9 5950X
57.6 pt
AMD Ryzen 7 5800X
53.6 pt
AMD Ryzen 5 5600X
49.8 pt
AMD Ryzen 7 5800X3D
44.2 pt
AIDA64
Memory Copy
Intel Core i9-13900K
74937 MB/s +25%
Intel Core i9-12900K
73146 MB/s +22%
Intel Core i5-13600K
71725 MB/s +20%
Intel Core i5-12600K
70749 MB/s +18%
AMD Ryzen 9 7900X
69140 MB/s +16%
AMD Ryzen 9 7950X
68526 MB/s +15%
AMD Ryzen 9 5900X
66130 MB/s +11%
AMD Ryzen 5 7600X
59949 MB/s 0%
AMD Ryzen 7 7700
59838 MB/s
AMD Ryzen 9 5950X
59171 MB/s -1%
AMD Ryzen 7 5800X
57120 MB/s -5%
AMD Ryzen 5 5600X
53947 MB/s -10%
AMD Ryzen 7 5800X3D
49404 MB/s -17%
Memory Latency
Intel Core i5-13600K
81.1 ns * -26%
Intel Core i9-13900K
76.5 ns * -19%
AMD Ryzen 7 5800X3D
69.3 ns * -8%
AMD Ryzen 9 5950X
67.7 ns * -5%
AMD Ryzen 9 7950X
65.3 ns * -2%
AMD Ryzen 7 7700
64.3 ns *
AMD Ryzen 5 5600X
63.9 ns * +1%
AMD Ryzen 5 7600X
63.8 ns * +1%
AMD Ryzen 9 7900X
63.3 ns * +2%
AMD Ryzen 7 5800X
60.9 ns * +5%
AMD Ryzen 9 5900X
58.4 ns * +9%
Memory Read
Intel Core i9-13900K
83883 MB/s +42%
Intel Core i9-12900K
81059 MB/s +37%
Intel Core i5-12600K
76864 MB/s +30%
Intel Core i5-13600K
75757 MB/s +28%
AMD Ryzen 9 7950X
75590 MB/s +28%
AMD Ryzen 9 7900X
75338 MB/s +28%
AMD Ryzen 9 5900X
70692 MB/s +20%
AMD Ryzen 7 5800X
63645 MB/s +8%
AMD Ryzen 9 5950X
62991 MB/s +7%
AMD Ryzen 5 5600X
59238 MB/s 0%
AMD Ryzen 5 7600X
59007 MB/s 0%
AMD Ryzen 7 7700
58988 MB/s
AMD Ryzen 7 5800X3D
50995 MB/s -14%
Memory Write
AMD Ryzen 5 7600X
81320 MB/s 0%
AMD Ryzen 7 7700
80948 MB/s
AMD Ryzen 9 7900X
76967 MB/s -5%
AMD Ryzen 9 7950X
76515 MB/s -5%
Intel Core i9-13900K
74140 MB/s -8%
Intel Core i5-12600K
73824 MB/s -9%
Intel Core i9-12900K
73707 MB/s -9%
Intel Core i5-13600K
73484 MB/s -9%
AMD Ryzen 9 5900X
55525 MB/s -31%
AMD Ryzen 9 5950X
48748 MB/s -40%
AMD Ryzen 7 5800X
30399 MB/s -62%
AMD Ryzen 5 5600X
28798 MB/s -64%
AMD Ryzen 7 5800X3D
28787 MB/s -64%

* ... más pequeño es mejor

rendimiento 3D y en juegos: A la par con el Ryzen 9 7900X y el Core i9-13900K

El Ryzen 7 7700 se presenta como una CPU de juego muy capaz que está a la altura de lo mejor que Intel y AMD tienen que ofrecer en esta generación.

El Ryzen 7 7700 empata con el Core i9-13900K, el Ryzen 9 7900X y el Ryzen 5 7600X en rendimiento general para juegos. Sin embargo, los resultados pueden variar en función del juego.

Por ejemplo, F1 22 parece favorecer mucho más a las CPU AMD que a las Intel, mientras que lo contrario ocurre en el caso de Far Cry 5. La última CPU de 8 núcleos y 65 W de AMD también consigue superar ligeramente al Ryzen 9 7900X en The Witcher 3 a 1080p Ultra, mientras que prácticamente empata con el Core i9-13900K a una resolución muy baja de 1024 x 768 con los ajustes gráficos más bajos posibles.

En cualquier caso, el Ryzen 7 7700 es una excelente CPU para juegos, especialmente si lo que buscas es alcanzar los máximos fotogramas posibles a 1080p o QHD.

Performance Rating - Percent
AMD Ryzen 7 7700
100 pt
AMD Ryzen 5 7600X
94.9 pt
AMD Ryzen 9 7900X
94.5 pt
Intel Core i5-13600K
92.8 pt
Intel Core i9-13900K
91.8 pt
AMD Ryzen 9 7950X
90.3 pt
3DMark - 2560x1440 Time Spy Graphics
AMD Ryzen 7 7700
20433 Points
AMD Ryzen 9 7900X
19467 Points -5%
AMD Ryzen 5 7600X
19403 Points -5%
Intel Core i9-13900K
19198 Points -6%
Intel Core i5-13600K
19164 Points -6%
AMD Ryzen 9 7950X
18786 Points -8%
3DMark 11 - 1280x720 Performance GPU
AMD Ryzen 7 7700
66934 Points
AMD Ryzen 5 7600X
63479 Points -5%
AMD Ryzen 9 7900X
62735 Points -6%
Intel Core i5-13600K
61518 Points -8%
Intel Core i9-13900K
59972 Points -10%
AMD Ryzen 9 7950X
59280 Points -11%
3DMark 11 Performance
50542 puntos
3DMark Time Spy Score
19092 puntos
ayuda
Performance Rating - Percent
AMD Ryzen 7 7700
AMD Ryzen 7 7700, NVIDIA GeForce RTX 3090
94.6 pt
Intel Core i9-13900K
Intel Core i9-13900K, NVIDIA GeForce RTX 3090
94.5 pt
AMD Ryzen 9 7900X
AMD Ryzen 9 7900X, NVIDIA GeForce RTX 3090
94.2 pt
AMD Ryzen 5 7600X
AMD Ryzen 5 7600X, NVIDIA GeForce RTX 3090
93.8 pt
AMD Ryzen 9 7950X
AMD Ryzen 9 7950X, NVIDIA GeForce RTX 3090
91.6 pt
Intel Core i5-13600K
Intel Core i5-13600K, NVIDIA GeForce RTX 3090
87.8 pt
Average of class Desktop
 
72 pt
F1 22
1920x1080 Ultra High Preset AA:T AF:16x
Average of class Desktop
  (61.9 - 199.2, n=18, last 2 years)
145.2 fps +6%
AMD Ryzen 7 7700
AMD Ryzen 7 7700, NVIDIA GeForce RTX 3090
136.9 (117min, 106P1) fps
Intel Core i5-13600K
Intel Core i5-13600K, NVIDIA GeForce RTX 3090
128.1 (110min, 102P1) fps -6%
AMD Ryzen 9 7950X
AMD Ryzen 9 7950X, NVIDIA GeForce RTX 3090
127.9 (109min, 101P1) fps -7%
AMD Ryzen 5 7600X
AMD Ryzen 5 7600X, NVIDIA GeForce RTX 3090
126.4 (109min, 100P1) fps -8%
AMD Ryzen 9 7900X
AMD Ryzen 9 7900X, NVIDIA GeForce RTX 3090
125.1 (108min, 100P1) fps -9%
Intel Core i9-13900K
Intel Core i9-13900K, NVIDIA GeForce RTX 3090
122.6 (104min, 98P1) fps -10%
1920x1080 Low Preset AA:T AF:16x
AMD Ryzen 9 7950X
AMD Ryzen 9 7950X, NVIDIA GeForce RTX 3090
412 (288min, 229P1) fps +3%
AMD Ryzen 7 7700
AMD Ryzen 7 7700, NVIDIA GeForce RTX 3090
399 (277min, 230P1) fps
Average of class Desktop
  (239 - 427, n=17, last 2 years)
371 fps -7%
AMD Ryzen 9 7900X
AMD Ryzen 9 7900X, NVIDIA GeForce RTX 3090
344 (260min, 201P1) fps -14%
AMD Ryzen 5 7600X
AMD Ryzen 5 7600X, NVIDIA GeForce RTX 3090
333 (255min, 199P1) fps -17%
Intel Core i5-13600K
Intel Core i5-13600K, NVIDIA GeForce RTX 3090
322 (252min, 186P1) fps -19%
Intel Core i9-13900K
Intel Core i9-13900K, NVIDIA GeForce RTX 3090
320 (269min, 180P1) fps -20%
The Witcher 3
1920x1080 Ultra Graphics & Postprocessing (HBAO+)
AMD Ryzen 7 7700
AMD Ryzen 7 7700, NVIDIA GeForce RTX 3090
192 (167min, 167.47P1) fps
AMD Ryzen 9 7900X
AMD Ryzen 9 7900X, NVIDIA GeForce RTX 3090
188.1 (93.6min, 119.6P0.1, 157P1) fps -2%
AMD Ryzen 5 7600X
AMD Ryzen 5 7600X, NVIDIA GeForce RTX 3090
186.4 (85.2min, 119.4P0.1, 152.4P1) fps -3%
Intel Core i5-13600K
Intel Core i5-13600K, NVIDIA GeForce RTX 3090
183.2 (34.9min, 116.1P0.1, 149.9P1) fps -5%
Intel Core i9-13900K
Intel Core i9-13900K, NVIDIA GeForce RTX 3090
179.8 (98.3min, 120.2P0.1, 148.7P1) fps -6%
AMD Ryzen 9 7950X
AMD Ryzen 9 7950X, NVIDIA GeForce RTX 3090
175.2 (158min, 158.56P1) fps -9%
Average of class Desktop
  (3.9 - 314, n=30, last 2 years)
165.5 fps -14%
1024x768 Low Graphics & Postprocessing
AMD Ryzen 9 7900X
AMD Ryzen 9 7900X, NVIDIA GeForce RTX 3090
773 (81.6min, 345P0.1, 543P1) fps +2%
AMD Ryzen 7 7700
AMD Ryzen 7 7700, NVIDIA GeForce RTX 3090
756 (630min, 637.5P1) fps
Intel Core i9-13900K
Intel Core i9-13900K, NVIDIA GeForce RTX 3090
752 (33.9min, 316P0.1, 533P1) fps -1%
AMD Ryzen 5 7600X
AMD Ryzen 5 7600X, NVIDIA GeForce RTX 3090
710 (99.8min, 384P0.1, 495P1) fps -6%
AMD Ryzen 9 7950X
AMD Ryzen 9 7950X, NVIDIA GeForce RTX 3090
703 (623min, 625.28P1) fps -7%
Intel Core i5-13600K
Intel Core i5-13600K, NVIDIA GeForce RTX 3090
611 (87.5min, 340P0.1, 454P1) fps -19%
Average of class Desktop
  (11.3 - 790, n=21, last 2 years)
430 fps -43%
Far Cry 5
1920x1080 Ultra Preset AA:T
Intel Core i9-13900K
Intel Core i9-13900K, NVIDIA GeForce RTX 3090
205 (155min) fps +16%
Intel Core i5-13600K
Intel Core i5-13600K, NVIDIA GeForce RTX 3090
188 (143min) fps +6%
AMD Ryzen 9 7900X
AMD Ryzen 9 7900X, NVIDIA GeForce RTX 3090
186 (133min) fps +5%
AMD Ryzen 5 7600X
AMD Ryzen 5 7600X, NVIDIA GeForce RTX 3090
183 (136min) fps +3%
AMD Ryzen 7 7700
AMD Ryzen 7 7700, NVIDIA GeForce RTX 3090
177 (133min) fps
AMD Ryzen 9 7950X
AMD Ryzen 9 7950X, NVIDIA GeForce RTX 3090
176 (132min) fps -1%
Average of class Desktop
  (8 - 219, n=23, last 2 years)
135.5 fps -23%
1280x720 Low Preset AA:T
Intel Core i9-13900K
Intel Core i9-13900K, NVIDIA GeForce RTX 3090
263 (199min) fps +16%
AMD Ryzen 9 7900X
AMD Ryzen 9 7900X, NVIDIA GeForce RTX 3090
244 (164min) fps +8%
Intel Core i5-13600K
Intel Core i5-13600K, NVIDIA GeForce RTX 3090
240 (175min) fps +6%
AMD Ryzen 5 7600X
AMD Ryzen 5 7600X, NVIDIA GeForce RTX 3090
238 (152min) fps +5%
AMD Ryzen 7 7700
AMD Ryzen 7 7700, NVIDIA GeForce RTX 3090
226 (170min) fps
AMD Ryzen 9 7950X
AMD Ryzen 9 7950X, NVIDIA GeForce RTX 3090
216 (160min) fps -4%
Average of class Desktop
  (8 - 259, n=20, last 2 years)
155.3 fps -31%
GTA V
1920x1080 Highest Settings possible AA:4xMSAA + FX AF:16x
Intel Core i9-13900K
Intel Core i9-13900K, NVIDIA GeForce RTX 3090
165.6 (9.1min, 125P1) fps +6%
AMD Ryzen 9 7900X
AMD Ryzen 9 7900X, NVIDIA GeForce RTX 3090
161.4 (8.93min, 125P1) fps +4%
AMD Ryzen 7 7700
AMD Ryzen 7 7700, NVIDIA GeForce RTX 3090
155.7 (8.09min, 111.1P1) fps
AMD Ryzen 9 7950X
AMD Ryzen 9 7950X, NVIDIA GeForce RTX 3090
155.4 (7.73min, 111.1P1) fps 0%
AMD Ryzen 5 7600X
AMD Ryzen 5 7600X, NVIDIA GeForce RTX 3090
155.2 (5.9min, 111.1P1) fps 0%
Intel Core i5-13600K
Intel Core i5-13600K, NVIDIA GeForce RTX 3090
154.9 (8.8min, 125P1) fps -1%
Average of class Desktop
  (3.38 - 172.4, n=27, last 2 years)
123.1 fps -21%
1920x1080 Lowest Settings possible
AMD Ryzen 9 7950X
AMD Ryzen 9 7950X, NVIDIA GeForce RTX 3090
187.9 (8.2min, 200P1) fps 0%
Intel Core i9-13900K
Intel Core i9-13900K, NVIDIA GeForce RTX 3090
187.8 (3.95min, 200P1) fps 0%
AMD Ryzen 7 7700
AMD Ryzen 7 7700, NVIDIA GeForce RTX 3090
187.7 (4.18min, 200P1) fps
Intel Core i5-13600K
Intel Core i5-13600K, NVIDIA GeForce RTX 3090
187.6 (1.325min, 200P1) fps 0%
AMD Ryzen 9 7900X
AMD Ryzen 9 7900X, NVIDIA GeForce RTX 3090
187.4 (6.53min, 200P1) fps 0%
AMD Ryzen 5 7600X
AMD Ryzen 5 7600X, NVIDIA GeForce RTX 3090
187.4 (9.49min, 200P1) fps 0%
Average of class Desktop
  (19 - 188.1, n=25, last 2 years)
159.7 fps -15%
X-Plane 11.11
1920x1080 high (fps_test=3)
AMD Ryzen 9 7900X
AMD Ryzen 9 7900X, NVIDIA GeForce RTX 3090
160.9 fps +9%
AMD Ryzen 5 7600X
AMD Ryzen 5 7600X, NVIDIA GeForce RTX 3090
151.8 fps +3%
Intel Core i9-13900K
Intel Core i9-13900K, NVIDIA GeForce RTX 3090
148.4 fps +1%
AMD Ryzen 7 7700
AMD Ryzen 7 7700, NVIDIA GeForce RTX 3090
147.5 fps
AMD Ryzen 9 7950X
AMD Ryzen 9 7950X, NVIDIA GeForce RTX 3090
141 fps -4%
Intel Core i5-13600K
Intel Core i5-13600K, NVIDIA GeForce RTX 3090
131.4 fps -11%
Average of class Desktop
  (4.64 - 166.3, n=31, last 2 years)
103.8 fps -30%
1280x720 low (fps_test=1)
Intel Core i9-13900K
Intel Core i9-13900K, NVIDIA GeForce RTX 3090
234 fps +7%
AMD Ryzen 5 7600X
AMD Ryzen 5 7600X, NVIDIA GeForce RTX 3090
227 fps +4%
AMD Ryzen 9 7900X
AMD Ryzen 9 7900X, NVIDIA GeForce RTX 3090
225 fps +3%
AMD Ryzen 7 7700
AMD Ryzen 7 7700, NVIDIA GeForce RTX 3090
218 fps
AMD Ryzen 9 7950X
AMD Ryzen 9 7950X, NVIDIA GeForce RTX 3090
216 fps -1%
Intel Core i5-13600K
Intel Core i5-13600K, NVIDIA GeForce RTX 3090
200 fps -8%
Average of class Desktop
  (7.76 - 251, n=31, last 2 years)
153.7 fps -29%
Dota 2 Reborn
1920x1080 ultra (3/3) best looking
AMD Ryzen 9 7900X
AMD Ryzen 9 7900X, NVIDIA GeForce RTX 3090
231.65 (196.5min) fps +5%
Intel Core i9-13900K
Intel Core i9-13900K, NVIDIA GeForce RTX 3090
229.2 (192.7min) fps +4%
AMD Ryzen 5 7600X
AMD Ryzen 5 7600X, NVIDIA GeForce RTX 3090
228.5 (193.7min) fps +4%
AMD Ryzen 9 7950X
AMD Ryzen 9 7950X, NVIDIA GeForce RTX 3090
222.3 (190.1min) fps +1%
AMD Ryzen 7 7700
AMD Ryzen 7 7700, NVIDIA GeForce RTX 3090
219.9 (187.6min) fps
Intel Core i5-13600K
Intel Core i5-13600K, NVIDIA GeForce RTX 3090
205.4 (178.9min) fps -7%
Average of class Desktop
  (5.2 - 246, n=33, last 2 years)
148.5 fps -32%
1280x720 min (0/3) fastest
AMD Ryzen 5 7600X
AMD Ryzen 5 7600X, NVIDIA GeForce RTX 3090
301.3 (255.5min) fps +3%
AMD Ryzen 9 7950X
AMD Ryzen 9 7950X, NVIDIA GeForce RTX 3090
293.2 (253.6min) fps 0%
AMD Ryzen 9 7900X
AMD Ryzen 9 7900X, NVIDIA GeForce RTX 3090
293.1 (253min) fps 0%
AMD Ryzen 7 7700
AMD Ryzen 7 7700, NVIDIA GeForce RTX 3090
292.6 (240.9min) fps
Intel Core i9-13900K
Intel Core i9-13900K, NVIDIA GeForce RTX 3090
285.3 (242.4min) fps -2%
Intel Core i5-13600K
Intel Core i5-13600K, NVIDIA GeForce RTX 3090
246.2 (214min) fps -16%
Average of class Desktop
  (24.3 - 303, n=33, last 2 years)
199.3 fps -32%
Strange Brigade
1920x1080 ultra AA:ultra AF:16
AMD Ryzen 7 7700
AMD Ryzen 7 7700, NVIDIA GeForce RTX 3090
378 (125.8min, 276P1) fps
AMD Ryzen 5 7600X
AMD Ryzen 5 7600X, NVIDIA GeForce RTX 3090
354 (60min, 259P1) fps -6%
AMD Ryzen 9 7950X
AMD Ryzen 9 7950X, NVIDIA GeForce RTX 3090
351 (100.5min, 254P1) fps -7%
Intel Core i9-13900K
Intel Core i9-13900K, NVIDIA GeForce RTX 3090
350 (57.6min, 258P1) fps -7%
Intel Core i5-13600K
Intel Core i5-13600K, NVIDIA GeForce RTX 3090
348 (59.9min, 256P1) fps -8%
AMD Ryzen 9 7900X
AMD Ryzen 9 7900X, NVIDIA GeForce RTX 3090
329 (127.3min, 237P1) fps -13%
Average of class Desktop
  (13.6 - 569, n=21, last 2 years)
295 fps -22%
1280x720 lowest AF:1
AMD Ryzen 5 7600X
AMD Ryzen 5 7600X, NVIDIA GeForce RTX 3090
819 (60.2min, 627P1) fps +8%
AMD Ryzen 7 7700
AMD Ryzen 7 7700, NVIDIA GeForce RTX 3090
756 (144min, 586P1) fps
Intel Core i9-13900K
Intel Core i9-13900K, NVIDIA GeForce RTX 3090
749 (60.3min, 591P1) fps -1%
AMD Ryzen 9 7900X
AMD Ryzen 9 7900X, NVIDIA GeForce RTX 3090
741 (352min, 583P1) fps -2%
AMD Ryzen 9 7950X
AMD Ryzen 9 7950X, NVIDIA GeForce RTX 3090
694 (143.1min, 555P1) fps -8%
Intel Core i5-13600K
Intel Core i5-13600K, NVIDIA GeForce RTX 3090
679 (62min, 496P1) fps -10%
Average of class Desktop
  (9.2 - 797, n=24, last 2 years)
436 fps -42%

AMD Ryzen 7 7700 with Nvidia GeForce RTX 3090

bajo medio alto ultraQHD4K
GTA V (2015) 187 187.6 187.2 155.7 150.5 184.2
The Witcher 3 (2015) 756 591 379 192 160.2
Dota 2 Reborn (2015) 292.6 242.3 233.2 219.9 211.3
Final Fantasy XV Benchmark (2018) 235 196.1 153 92.4
X-Plane 11.11 (2018) 218 196.3 147.5 120.5
Far Cry 5 (2018) 226 202 194 177 171 115
Strange Brigade (2018) 756 542 433 378 282 169
F1 2021 (2021) 658 565 463 244 186.2 110
F1 22 (2022) 399 427 361 136.9 89.9 45.7

Gestión de la energía: Más eficiente que un Ryzen 7 7700X de 65 W

El AMD Ryzen 7 7700 tiene un consumo energético muy reducido en comparación con la competencia. En Cinebench R15 multi, el Ryzen 7 7700 consume un 24% menos de energía que un Ryzen 7 7700X de 65 W con TDP limitado, lo que hace que el nuevo chip de 65 W de AMD sea hasta un 32% más eficiente en términos de rendimiento.

En Witcher 3 a 1080p Ultra, el consumo total de energía del sistema Ryzen 7 7700 está más o menos en línea con los sistemas Core i9-13900K y Ryzen 9 7950X, incluso cuando estos últimos tienen un TDP limitado.

Dicho esto, el Ryzen 7 7700 es capaz de ofrecer fotogramas adicionales en comparación con sus rivales, lo que hace que el procesador ascienda en la clasificación de eficiencia energética para este juego.

Power Consumption: External Monitor

0306090120150180210240270300330360390420450480510Tooltip
AMD Ryzen 7 7700; Prime95 V2810 Stress (external Monitor): Ø163.2 (156.6-174.5)
AMD Ryzen 7 7700; Cinebench R15 Multi (external Monitor): Ø149.4 (148.6-150.3)
AMD Ryzen 7 7700; Cinebench R20 Multi (external Monitor): Ø148.6 (147.6-150.2)
AMD Ryzen 7 7700; Cinebench R20 Single (external Monitor): Ø97.2 (95.1-127)
AMD Ryzen 7 7700; Cinebench R23 Single (external Monitor): Ø98.1 (95.6-135.1)
AMD Ryzen 7 7700; Cinebench R23 Multi (external Monitor): Ø164.6 (163-166.5)
AMD Ryzen 7 7700; 1920x1080 The Witcher 3 ultra (external Monitor): Ø519 (511-532)
AMD Ryzen 7 7700; Idle 1min (external Monitor): Ø73.4 (71.8-81.7)
Power Consumption / Cinebench R15 Multi Efficiency (external Monitor)
AMD Ryzen 9 7950X ECO 65 W, NVIDIA GeForce RTX 3090
25.2 Points per Watt +24%
AMD Ryzen 9 7950X ECO 105 W, NVIDIA GeForce RTX 3090
22.1 Points per Watt +8%
AMD Ryzen 7 7700, NVIDIA GeForce RTX 3090
20.4 Points per Watt
AMD Ryzen 9 5950X, NVIDIA Titan RTX
19.9 Points per Watt -2%
AMD Ryzen 9 7950X, NVIDIA GeForce RTX 3090
17.1 Points per Watt -16%
Average NVIDIA GeForce RTX 3090 (11.7 - 25.2, n=13)
16.7 Points per Watt -18%
Average of class Desktop (10.1 - 26.5, n=20, last 2 years)
16.7 Points per Watt -18%
AMD Ryzen 9 5900X, NVIDIA Titan RTX
15.8 Points per Watt -23%
AMD Ryzen 9 7900X, NVIDIA GeForce RTX 3090
15.5 Points per Watt -24%
AMD Ryzen 7 7700X ECO 65 W, NVIDIA GeForce RTX 3090
15.5 Points per Watt -24%
AMD Ryzen 7 7700X, NVIDIA GeForce RTX 3090
13.3 Points per Watt -35%
Intel Core i9-13900K, NVIDIA GeForce RTX 3090
12.9 Points per Watt -37%
Intel Core i5-13600K, NVIDIA GeForce RTX 3090
12.7 Points per Watt -38%
Intel Core i9-12900K, NVIDIA Titan RTX
12.5 Points per Watt -39%
Intel Core i5-12600K, NVIDIA Titan RTX
12.4 Points per Watt -39%
AMD Ryzen 7 5800X, NVIDIA Titan RTX
11.9 Points per Watt -42%
AMD Ryzen 5 7600X, NVIDIA GeForce RTX 3090
11.7 Points per Watt -43%
AMD Ryzen 5 5600X, NVIDIA Titan RTX
11.6 Points per Watt -43%
AMD Ryzen 7 5800X3D, NVIDIA GeForce RTX 3090 Ti
11.5 Points per Watt -44%
Power Consumption / Witcher 3 ultra Efficiency (external Monitor)
Average of class Desktop (0.1429 - 0.652, n=26, last 2 years)
0.437 fps per Watt +18%
AMD Ryzen 7 7700, NVIDIA GeForce RTX 3090
0.3699 fps per Watt
Intel Core i5-13600K, NVIDIA GeForce RTX 3090
0.3664 fps per Watt -1%
AMD Ryzen 5 7600X, NVIDIA GeForce RTX 3090
0.3592 fps per Watt -3%
Intel Core i5-12600K, NVIDIA Titan RTX
0.3522 fps per Watt -5%
AMD Ryzen 7 5800X3D, NVIDIA GeForce RTX 3090 Ti
0.3447 fps per Watt -7%
Average NVIDIA GeForce RTX 3090 (0.268 - 0.3954, n=14)
0.3429 fps per Watt -7%
AMD Ryzen 5 5600X, NVIDIA Titan RTX
0.3397 fps per Watt -8%
AMD Ryzen 9 7900X, NVIDIA GeForce RTX 3090
0.3389 fps per Watt -8%
Intel Core i9-13900K, NVIDIA GeForce RTX 3090
0.3373 fps per Watt -9%
AMD Ryzen 7 7700X, NVIDIA GeForce RTX 3090
0.3341 fps per Watt -10%
AMD Ryzen 7 5800X, NVIDIA Titan RTX
0.332 fps per Watt -10%
AMD Ryzen 9 7950X ECO 105 W, NVIDIA GeForce RTX 3090
0.3286 fps per Watt -11%
AMD Ryzen 9 7950X ECO 65 W, NVIDIA GeForce RTX 3090
0.3284 fps per Watt -11%
AMD Ryzen 9 7950X, NVIDIA GeForce RTX 3090
0.325 fps per Watt -12%
AMD Ryzen 7 7700X ECO 65 W, NVIDIA GeForce RTX 3090
0.3218 fps per Watt -13%
AMD Ryzen 9 5900X, NVIDIA Titan RTX
0.3207 fps per Watt -13%
AMD Ryzen 9 5950X, NVIDIA Titan RTX
0.3201 fps per Watt -13%
Intel Core i9-12900K, NVIDIA Titan RTX
0.3002 fps per Watt -19%
Power Consumption / Cinebench R15 Multi (external Monitor)
Intel Core i9-13900K, NVIDIA GeForce RTX 3090
480 (263min, 277P1 - 553max) Watt * -221%
AMD Ryzen 9 7950X, NVIDIA GeForce RTX 3090 (Idle: 95.2 W)
364 (357min, 357P1 - 373max) Watt * -144%
Intel Core i9-12900K, NVIDIA Titan RTX (Idle: 70.5 W)
324.4 Watt * -117%
AMD Ryzen 9 7900X, NVIDIA GeForce RTX 3090
313 (214min, 221P1 - 406max) Watt * -110%
Intel Core i5-13600K, NVIDIA GeForce RTX 3090
286 (232min, 235P1 - 343max) Watt * -91%
Average NVIDIA GeForce RTX 3090 (Idle: 149.4 - 480, n=14 W)
272 Watt * -82%
AMD Ryzen 9 7950X ECO 105 W, NVIDIA GeForce RTX 3090 (Idle: 93.4 W)
263 (262min, 262P1 - 265max) Watt * -76%
AMD Ryzen 7 7700X, NVIDIA GeForce RTX 3090 (Idle: 89.8 W)
240 (236min, 236P1 - 252max) Watt * -61%
AMD Ryzen 9 5900X, NVIDIA Titan RTX (Idle: 78.1 W)
235.8 (204min - 238max) Watt * -58%
AMD Ryzen 9 5950X, NVIDIA Titan RTX (Idle: 78 W)
226.1 (160min - 249max) Watt * -51%
AMD Ryzen 7 5800X, NVIDIA Titan RTX (Idle: 77.5 W)
220.7 (219min - 222max) Watt * -48%
AMD Ryzen 5 7600X, NVIDIA GeForce RTX 3090
215 (134.8min, 135.6P1 - 259max) Watt * -44%
AMD Ryzen 7 5800X3D, NVIDIA GeForce RTX 3090 Ti (Idle: 102 W)
209 (208min, 208P1 - 212max) Watt * -40%
Intel Core i5-12600K, NVIDIA Titan RTX (Idle: 70.45 W)
205.9 (145min - 213max) Watt * -38%
AMD Ryzen 7 7700X ECO 65 W, NVIDIA GeForce RTX 3090
196.1 (195.3min, 195.3P1 - 196.7max) Watt * -31%
AMD Ryzen 9 7950X ECO 65 W, NVIDIA GeForce RTX 3090 (Idle: 93.1 W)
191.9 (191.1min, 191.1P1 - 192.5max) Watt * -28%
AMD Ryzen 5 5600X, NVIDIA Titan RTX (Idle: 79.23 W)
170.1 (165min - 210max) Watt * -14%
Average of class Desktop (Idle: 10.4 - 428, n=21, last 2 years W)
161.9 Watt * -8%
AMD Ryzen 7 7700, NVIDIA GeForce RTX 3090 (Idle: 73.4 W)
149.4 (148.6min, 148.6P1 - 150.3max) Watt *
Power Consumption / Prime95 V2810 Stress (external Monitor)
Intel Core i9-13900K, NVIDIA GeForce RTX 3090
471 (414min, 427P1 - 561max) Watt * -189%
Intel Core i5-13600K, NVIDIA GeForce RTX 3090
348 (283min, 288P1 - 496max) Watt * -113%
AMD Ryzen 9 7950X, NVIDIA GeForce RTX 3090 (Idle: 95.2 W)
335 (311min, 312P1 - 364max) Watt * -105%
AMD Ryzen 9 7900X, NVIDIA GeForce RTX 3090
319 (310min, 311P1 - 357max) Watt * -95%
Intel Core i9-12900K, NVIDIA Titan RTX (Idle: 70.5 W)
279.6 (261min - 357max) Watt * -71%
Average NVIDIA GeForce RTX 3090 (Idle: 163.2 - 471, n=14 W)
278 Watt * -70%
Intel Core i5-12600K, NVIDIA Titan RTX (Idle: 70.45 W)
256.5 (238min - 275max) Watt * -57%
AMD Ryzen 9 7950X ECO 105 W, NVIDIA GeForce RTX 3090 (Idle: 93.4 W)
254 (247min, 247P1 - 268max) Watt * -56%
AMD Ryzen 9 5950X, NVIDIA Titan RTX (Idle: 78 W)
252.3 (227min - 259max) Watt * -55%
AMD Ryzen 7 5800X, NVIDIA Titan RTX (Idle: 77.5 W)
242.3 (222min - 254max) Watt * -48%
AMD Ryzen 9 5900X, NVIDIA Titan RTX (Idle: 78.1 W)
235.6 (211min - 284max) Watt * -44%
AMD Ryzen 7 7700X, NVIDIA GeForce RTX 3090 (Idle: 89.8 W)
230 (216min, 217P1 - 265max) Watt * -41%
AMD Ryzen 5 7600X, NVIDIA GeForce RTX 3090
227 (218min, 219P1 - 245max) Watt * -39%
AMD Ryzen 7 5800X3D, NVIDIA GeForce RTX 3090 Ti (Idle: 102 W)
226 (221min, 222P1 - 234max) Watt * -38%
AMD Ryzen 7 7700X ECO 65 W, NVIDIA GeForce RTX 3090
189.8 (184.1min, 184.2P1 - 204max) Watt * -16%
AMD Ryzen 9 7950X ECO 65 W, NVIDIA GeForce RTX 3090 (Idle: 93.1 W)
186.8 (180.7min, 180.9P1 - 201max) Watt * -14%
AMD Ryzen 5 5600X, NVIDIA Titan RTX (Idle: 79.23 W)
175.8 (170min - 179max) Watt * -8%
AMD Ryzen 7 7700, NVIDIA GeForce RTX 3090 (Idle: 73.4 W)
163.2 (156.6min, 156.8P1 - 174.5max) Watt *
Average of class Desktop (Idle: 11.1 - 400, n=21, last 2 years W)
150.8 Watt * +8%
Power Consumption / The Witcher 3 ultra (external Monitor)
AMD Ryzen 7 5800X3D, NVIDIA GeForce RTX 3090 Ti (Idle: 102 W)
561 (533min, 542P1 - 582max) Watt * -8%
AMD Ryzen 9 7900X, NVIDIA GeForce RTX 3090
555 (547min, 549P1 - 607max) Watt * -7%
AMD Ryzen 9 7950X, NVIDIA GeForce RTX 3090 (Idle: 95.2 W)
539 (534min, 535P1 - 547max) Watt * -4%
AMD Ryzen 9 7950X ECO 105 W, NVIDIA GeForce RTX 3090 (Idle: 93.4 W)
539 (252min, 535P1 - 573max) Watt * -4%
AMD Ryzen 9 7950X ECO 65 W, NVIDIA GeForce RTX 3090 (Idle: 93.1 W)
539 (534min, 534P1 - 547max) Watt * -4%
Intel Core i9-13900K, NVIDIA GeForce RTX 3090
533 (520min, 525P1 - 568max) Watt * -3%
AMD Ryzen 7 7700X ECO 65 W, NVIDIA GeForce RTX 3090
524 (515min, 517P1 - 533max) Watt * -1%
Average NVIDIA GeForce RTX 3090 (Idle: 464 - 597, n=17 W)
524 Watt * -1%
AMD Ryzen 5 7600X, NVIDIA GeForce RTX 3090
519 (510min, 513P1 - 564max) Watt * -0%
AMD Ryzen 7 7700, NVIDIA GeForce RTX 3090 (Idle: 73.4 W)
519 (511min, 512P1 - 532max) Watt *
AMD Ryzen 7 7700X, NVIDIA GeForce RTX 3090 (Idle: 89.8 W)
516 (512min, 512P1 - 529max) Watt * +1%
Intel Core i5-13600K, NVIDIA GeForce RTX 3090
500 (491min, 493P1 - 528max) Watt * +4%
Intel Core i9-12900K, NVIDIA Titan RTX (Idle: 70.5 W)
463 (439min - 490max) Watt * +11%
AMD Ryzen 9 5950X, NVIDIA Titan RTX (Idle: 78 W)
440.5 (420min - 466max) Watt * +15%
AMD Ryzen 9 5900X, NVIDIA Titan RTX (Idle: 78.1 W)
439.6 (419min - 497max) Watt * +15%
AMD Ryzen 7 5800X, NVIDIA Titan RTX (Idle: 77.5 W)
418.7 (403min - 452max) Watt * +19%
AMD Ryzen 5 5600X, NVIDIA Titan RTX (Idle: 79.23 W)
409.2 (381min - 434max) Watt * +21%
Intel Core i5-12600K, NVIDIA Titan RTX (Idle: 70.45 W)
408.9 (401min - 460max) Watt * +21%
Average of class Desktop (Idle: 19.1 - 569, n=37, last 2 years W)
354 Watt * +32%

* ... más pequeño es mejor

Pro

+ Compite bien con el Core i9-12900K en rendimiento de un solo núcleo
+ Mucho más eficiente energéticamente que un Ryzen 7 7700X con TDP limitado
+ Soporte de overclocking manual y PBO
+ IGPU RDNA 2 integrada en la matriz de E/S
+ Refrigerador Wraith Prism incluido

Contra

- Los precios de DDR5 siguen siendo altos
- Pierde frente al Core i5-13600K en compatibilidad con versiones anteriores y DDR4
- Los precios pueden ser más bajos

Veredicto: Zen 4 para las masas, pero con advertencias

AMD Ryzen 7 7700. Unidad de prueba cortesía de AMD India.

No te culparíamos si no estuvieras al tanto de los nuevos procesadores Ryzen 7000 de 65 W que llegan hoy a las estanterías, dado que la mayor parte del protagonismo lo acaparó el Ryzen 7000X3D y Dragon Range-HX durante la keynote de AMD en CES 2023. La nueva gama Zen 4 de 65 W puede parecer superflua a primera vista, ya que ofrecen los mismos niveles de rendimiento que sus homólogos no X con contrapartidas insignificantes. Sin embargo, estos nuevos procesadores Raphael llenan un vacío importante en la gama.

Los procesadores Ryzen 7000 de 65 W rebajan significativamente el listón de entrada para Zen 4. El Ryzen 7 7700 en cuestión se vende por 329 dólares, 70 menos que el PVPR del Ryzen 7 7700X. En nuestras pruebas, el AMD Ryzen 7 7700 ofrece un excelente rendimiento de un solo núcleo que es comparable al resto de la gama Zen 4, superando incluso al 241 W Core i9-12900K en muchas pruebas.

De hecho, todos los chips Zen 4, desde el básico Ryzen 5 7600X hasta el buque insignia Ryzen 9 7950X parecen competir entre sí por las ganancias de un solo núcleo. Dicho esto, Intel Raptor Lake tiene la sartén por el mango en multi-core y el Core i9-13900K puede ponerle las cosas difíciles al Ryzen 9 7950X.

El principal competidor del Ryzen 7 7700 es el Core i5-13600K. Aunque el Ryzen 7 7700 puede superar al Core i5-13600K en rendimiento mononúcleo y en juegos, este último es intrínsecamente un buen augurio para multi-núcleo, mononúcleo y juegos juntos. Además, el Core i5-13600K es unos 10 dólares más barato que el Ryzen 7 7700 en estos momentos, por lo que es una buena opción si ya tienes una plataforma Intel compatible.

Con una barra de entrada significativamente más baja, junto con placas base con chipset B650E asequibles y potencial para overclocking, Zen 4 65 W, en particular el AMD Ryzen 7 7700, es una gran opción para los entusiastas del rendimiento frugales que buscan probar las aguas AM5."

El Ryzen 7 7700 rinde exactamente igual que un Ryzen 7 7700X de 65 W con TDP limitado AMD Raphael (Zen 4, Ryzen 7000) R7 7700X Notebook Processor . El corolario es que puedes aprovechar Precision Boost Overdrive y la compatibilidad con los perfiles de memoria EXPO para reducir la diferencia de rendimiento con un Ryzen 7 7700X y seguir ahorrando 70 dólares. Sin embargo, no todo es de color de rosa.

La plataforma AM5 de AMD aún es bastante nueva y los precios de la memoria DDR5 siguen siendo elevados, lo que compensa cualquier ventaja de ahorro con los nuevos Ryzen de 65 W. Uno de los inconvenientes de innovar en una nueva plataforma es ceder terreno a la competencia.

Por el momento, Intel tiene las de ganar en lo que respecta a la retrocompatibilidad: puedes instalar una CPU Raptor Lake en una placa base de última generación con memoria DDR4 y seguir obteniendo niveles de rendimiento comparables por mucho menos dinero.

Dicho esto, cabe esperar que AMD ofrezca soporte para AM5 al menos hasta 2025. Por lo tanto, cualquier inversión que hagas ahora puede durar bastante tiempo.

Hemos visto una excelente eficiencia energética con el Ryzen 7 7700X y el Ryzen 9 7950X con TDP limitado, y el nuevo Ryzen 7 7700 continúa la tendencia con cifras aún mejores. Tendremos una mejor perspectiva una vez que lleguemos a probar las nuevas piezas Rocket Lake de 65 W de Intel que se anunciaron en CES 2023, pero por ahora los Ryzen de 65 W parecen estar haciendo un gran trabajo.

El AMD Ryzen 7 7700, con la inclusión de un refrigerador Wraith Prism en la caja, sin duda aumenta la propuesta de valor de Zen 4, pero recomendamos vigilar los precios de la placa base y la RAM DDR5 antes de gastar el dinero.

Precio y disponibilidad

El AMD Ryzen 7 7700 y el resto de la gama Ryzen 65 W estarán disponibles a partir de hoy, pero aún no se han agotado en línea. Actualizaremos esta sección con los enlaces de compra en cuanto haya existencias.

Pricecompare

Please share our article, every link counts!
> Análisis y pruebas de ordenadores portátiles y móviles teléfonos > Análisis > AMD Ryzen 7 7700 65 W Análisis de Ryzen 7000: Capaz de competir con Core i9-12900K y Core i5-13600K por 70 dólares menos que Ryzen 7 7700X
Vaidyanathan Subramaniam, 2023-01-10 (Update: 2023-01-10)