Análisis del AMD Ryzen 7 5800X3D: Mejor CPU para juegos que el Core i9-12900K por 120 dólares menos
AMD ha pasado finalmente a una nueva plataforma de socket y chipset con el Ryzen 7000 pero la compañía sigue buscando sacar el máximo provecho del socket AM4. AMD anunció por primera vez su diseño de caché 3D en V basado en la tecnología de empaquetado 3DFabric de TSMC en Computex 2021, mostrando enormes mejoras en el rendimiento de los juegos a 1080p
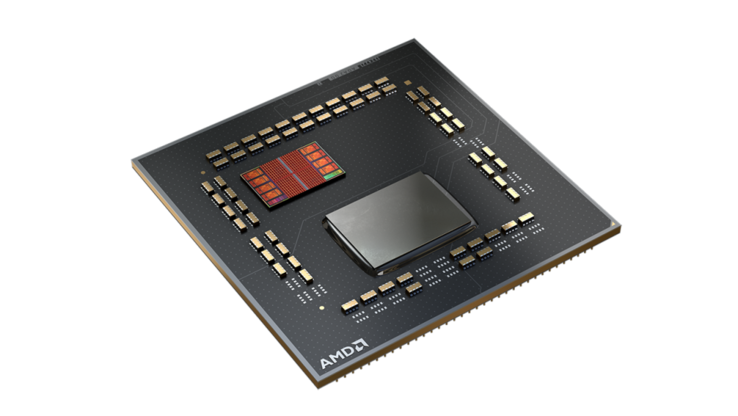
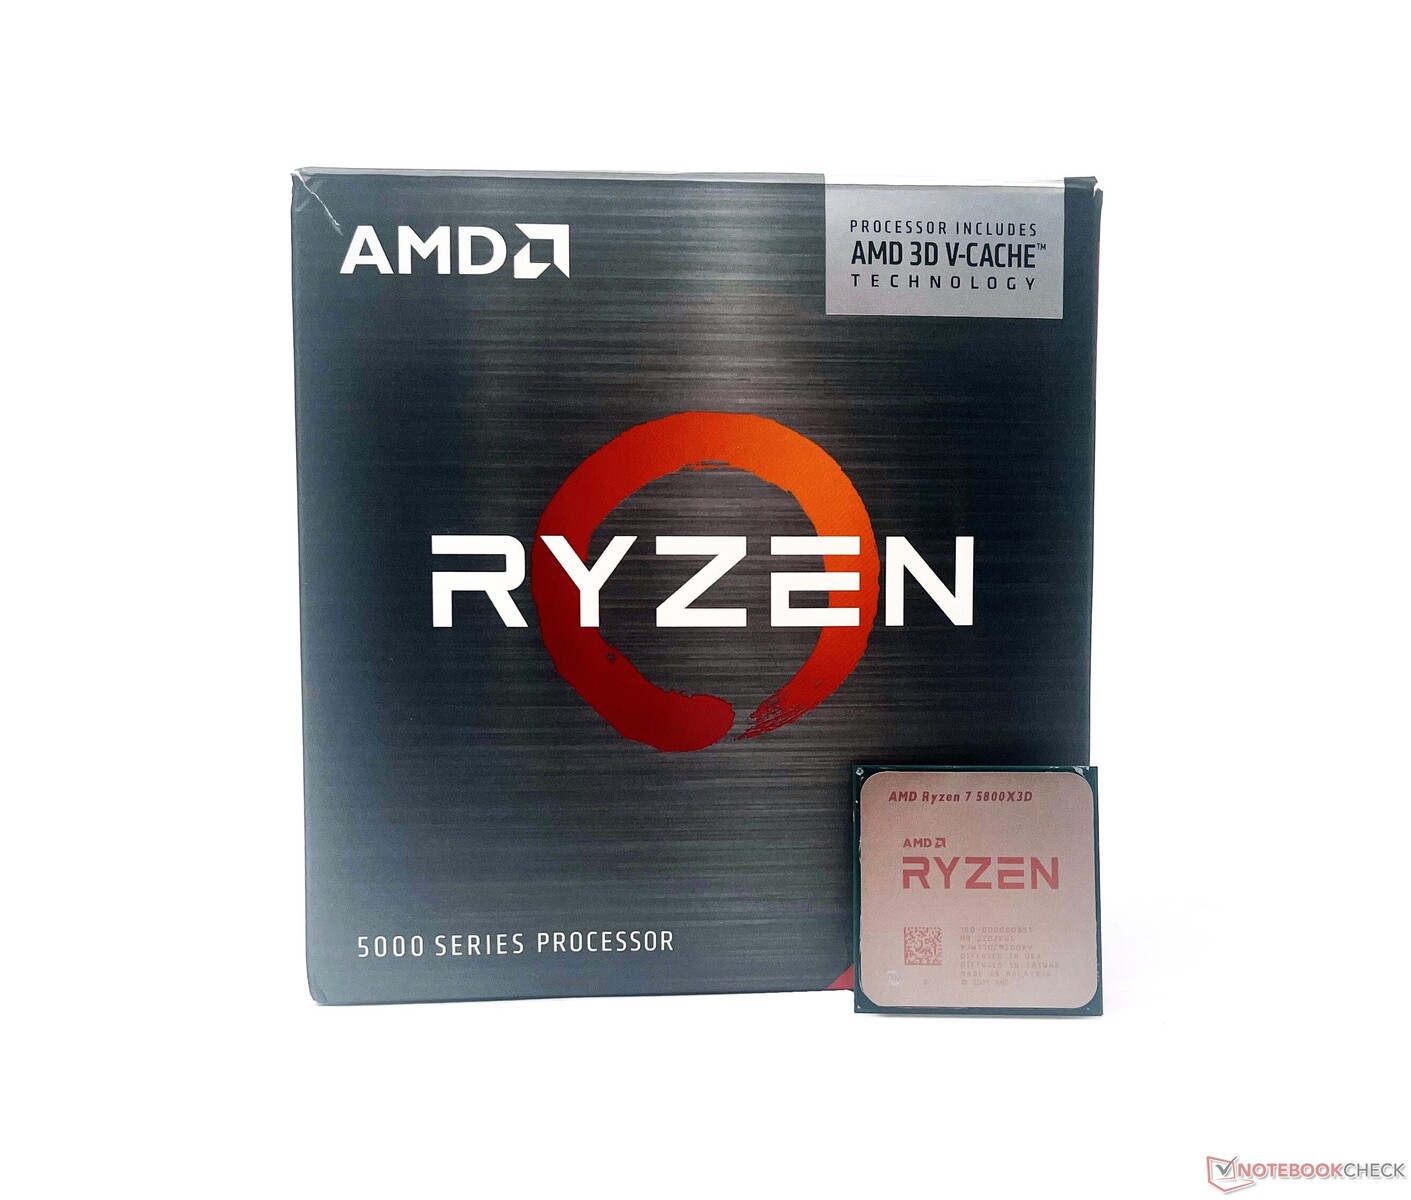
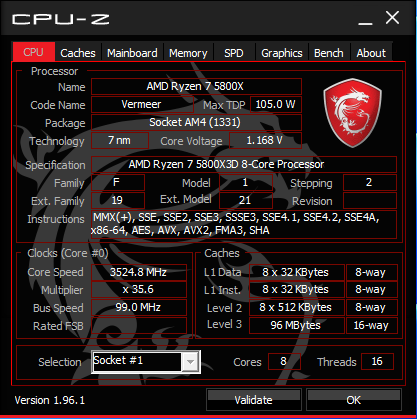
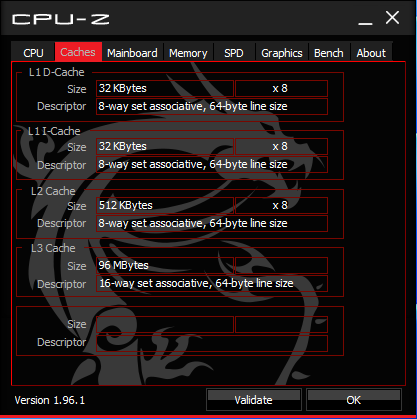
Si avanzamos hasta el CES 2022, AMD desveló el Ryzen 7 5800X3D, un procesador de 8 núcleos, 16 hilos y 105 W con 64 MB de caché V 3D adicionales a los 32 MB de caché 2D existentes.
Mientras que AMD ha tenido una carrera en casa con la línea Zen 3 Vermeer en su mayor parte, Intel rápidamente dio un salto con la Arquitectura Core híbrida Alder Lake liderada por el Core i9-12900K y, posteriormente, el Core i9-12900KS.
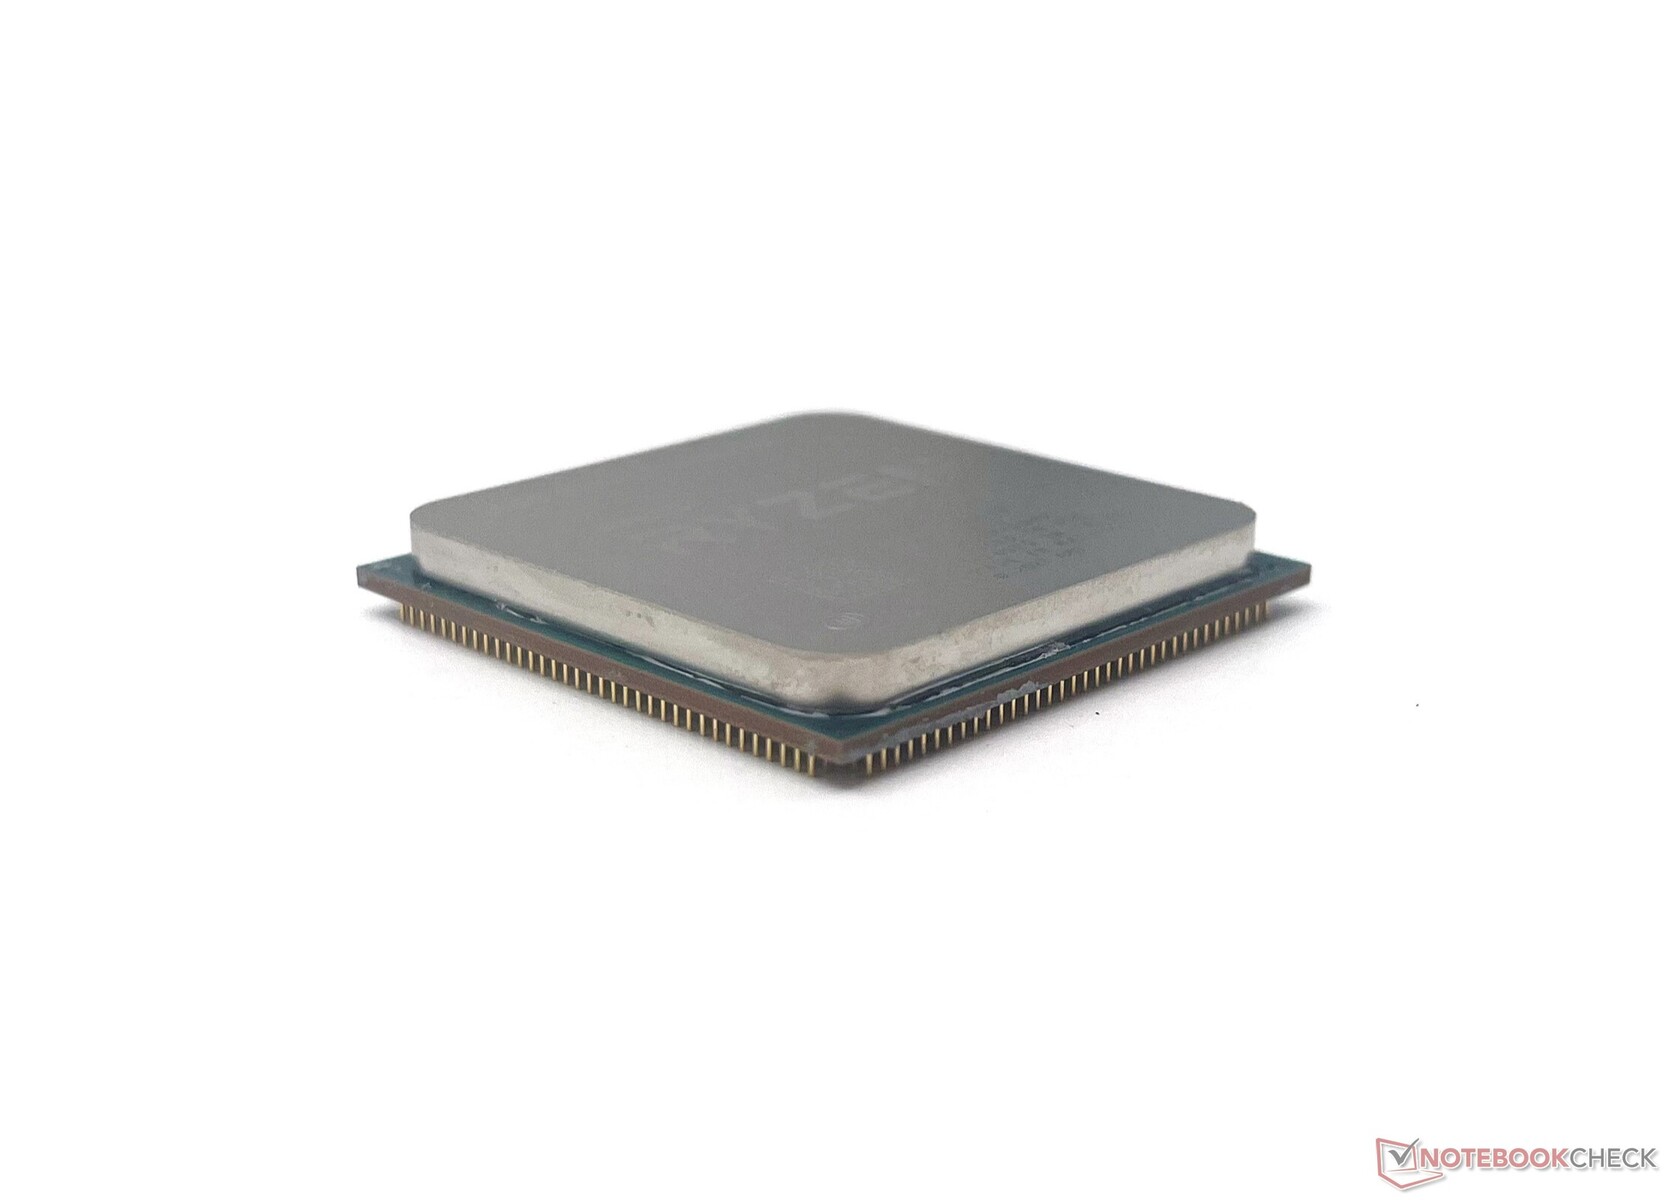
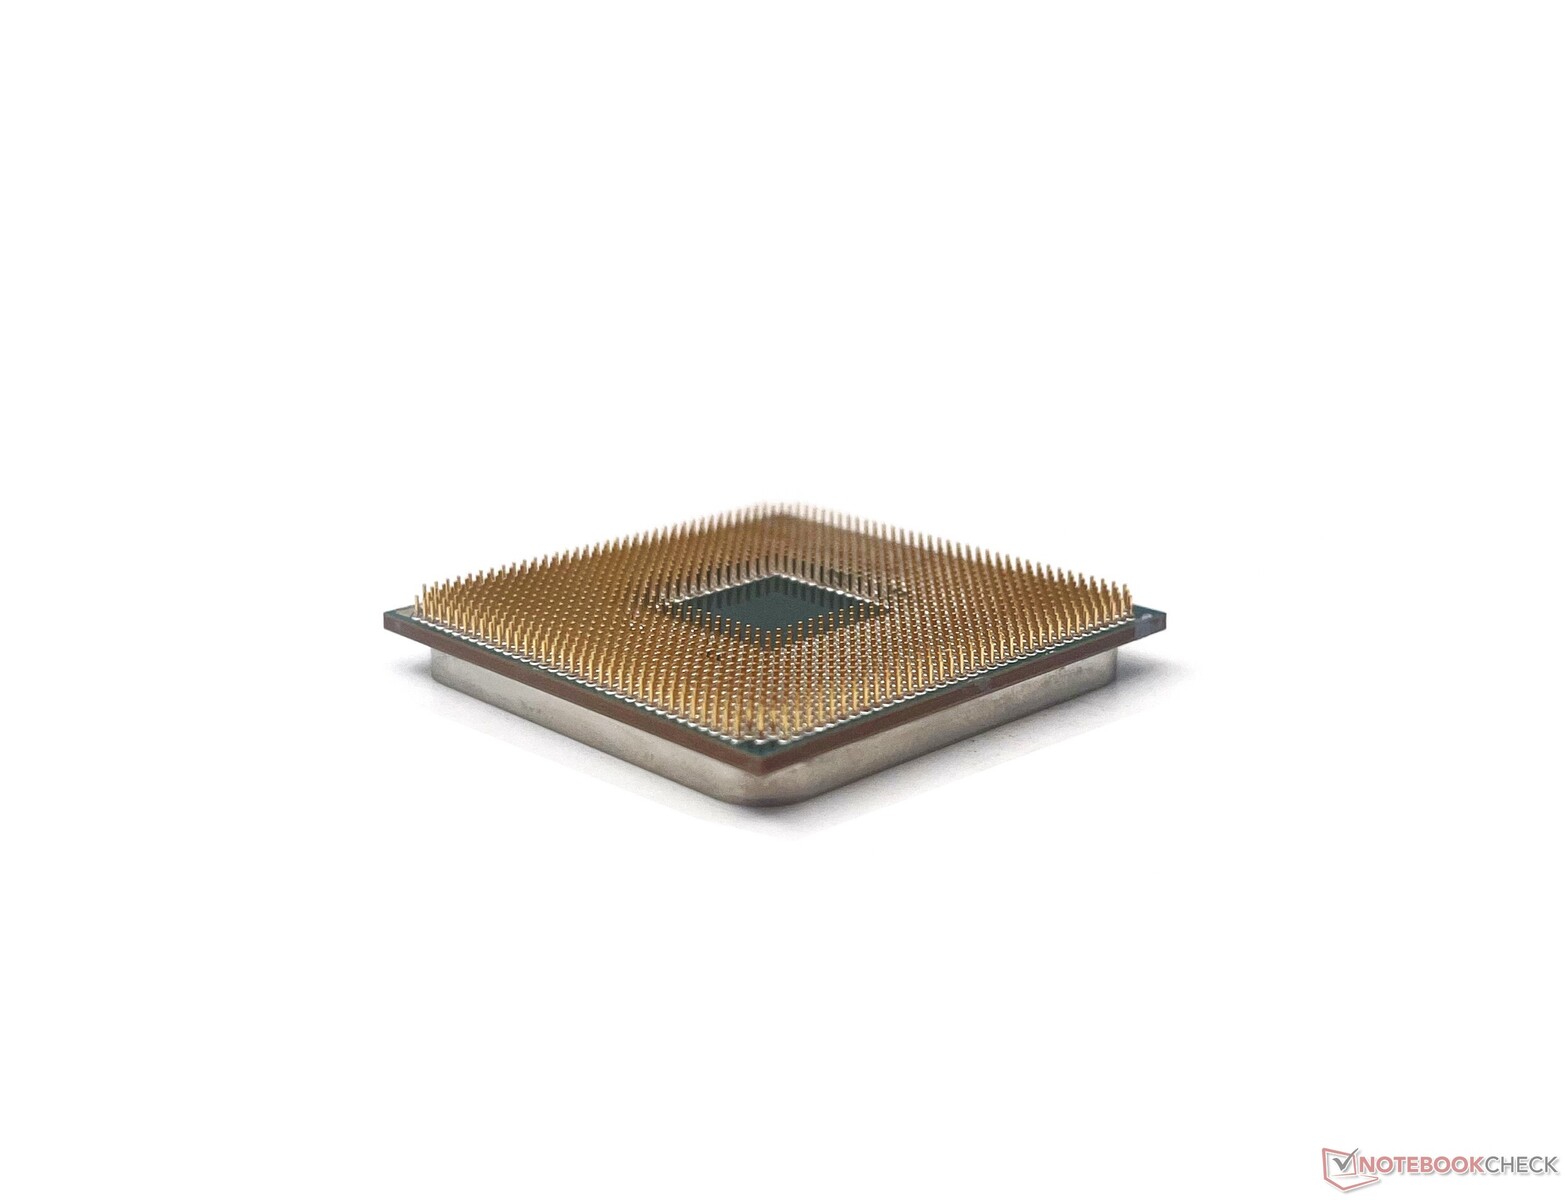
A pesar de contar con una nueva tecnología de caché, el Ryzen 7 5800X3D tiene un aspecto exactamente idéntico al de otros procesadores Zen 3, incluso con la misma altura Z. Por lo tanto, los refrigeradores de socket AM4 existentes funcionan bien con esta CPU.
En este análisis, echamos un vistazo al AMD Ryzen 7 5800X3D, para ver cómo se compara con la competencia actual de Alder Lake de Intel, y si es una inversión que deberías contemplar en 2022.
La línea de CPUs de escritorio AMD Ryzen Zen 3 Vermeer
| SKU | Núcleos/Hilos | Reloj base (GHz) | Reloj turbo (GHz) | L3-Cache (MB) | TDP (W) | MSRP al lanzamiento (US$) |
|---|---|---|---|---|---|---|
| Ryzen 9 5950X | 16/32 | 3,4 | 4,9 | 64 | 105 | 799 |
| Ryzen 9 5900X | 12/24 | 3,7 | 4,8 | 64 | 105 | 549 |
| Ryzen 75800X3D | 8/16 | 3.4 | 4.5 | 32+64 | 105 | 449 |
| Ryzen 7 5800X | 8/16 | 3,8 | 4,7 | 32 | 105 | 449 |
| Ryzen 7 5700X | 8/16 | 3,4 | 4,6 | 32 | 65 | 299 |
| Ryzen 5 5600X | 6/12 | 3,7 | 4,6 | 32 | 65 | 299 |
| Ryzen 5 5600 | 6/12 | 3.5 | 4.4 | 32 | 65 | 199 |
El banco de pruebas: El Ryzen 7 5800X3D se enfrenta a la RTX 3090 Ti
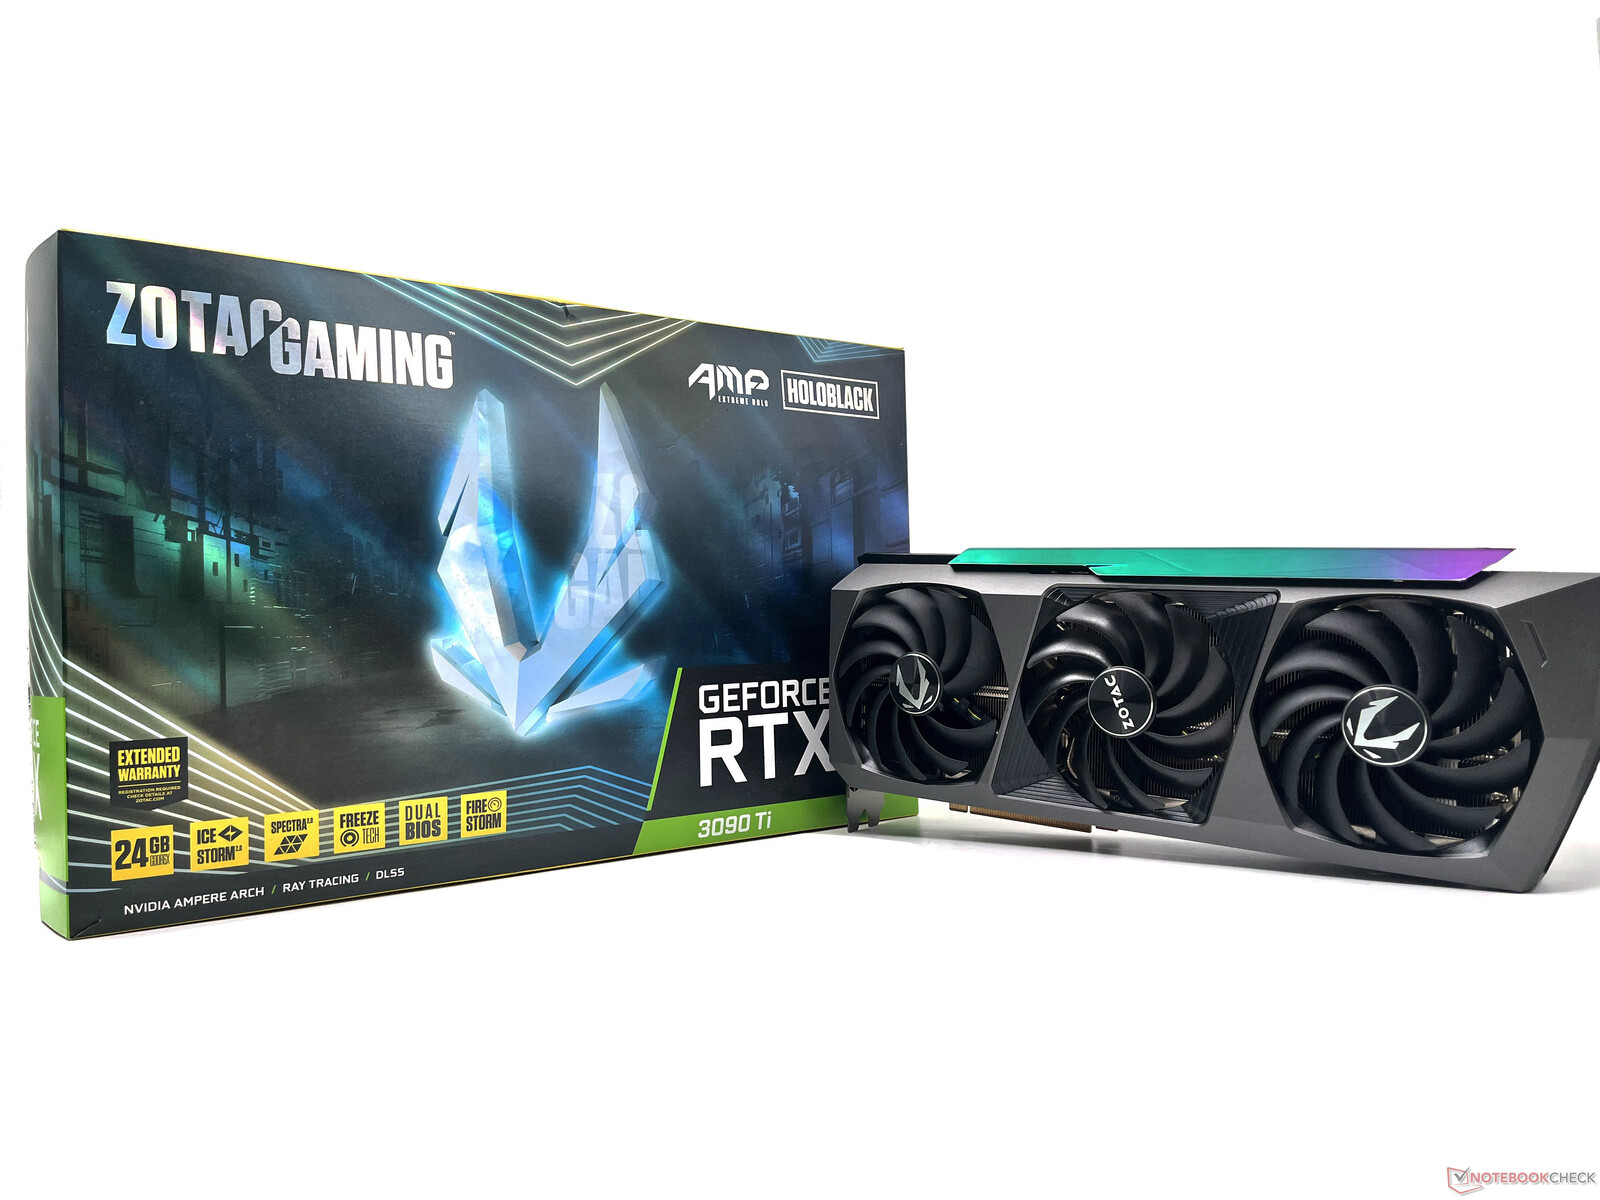
Nuestro banco de pruebas está basado en el que habíamos utilizado anteriormente para la GPU Zotac Gaming GeForce RTX 3090 Ti AMP Extreme Holo de Zotac Gaming. Esto incluye lo siguiente:
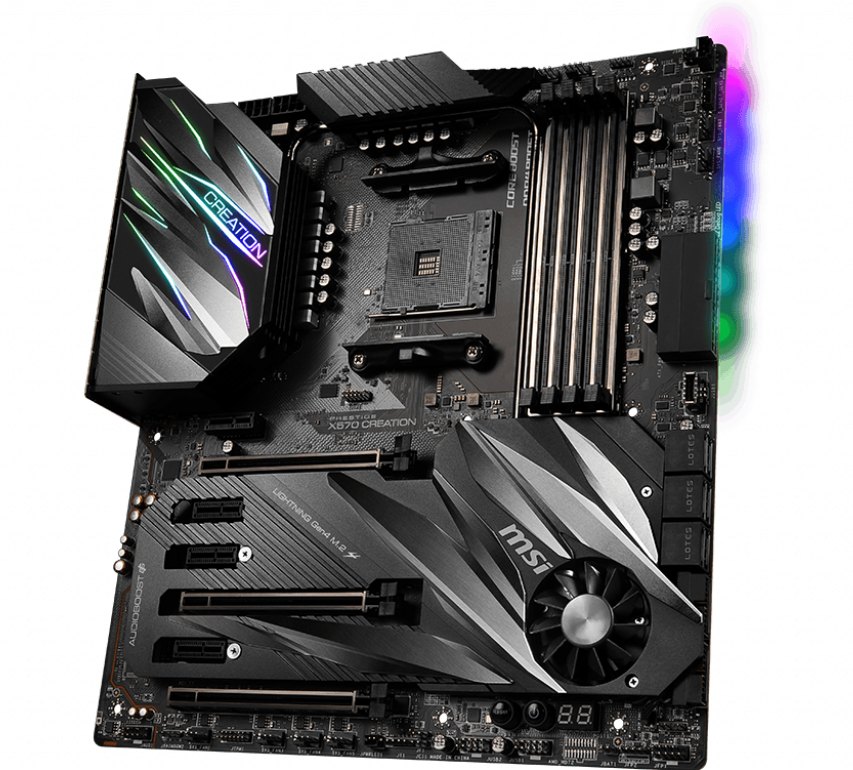
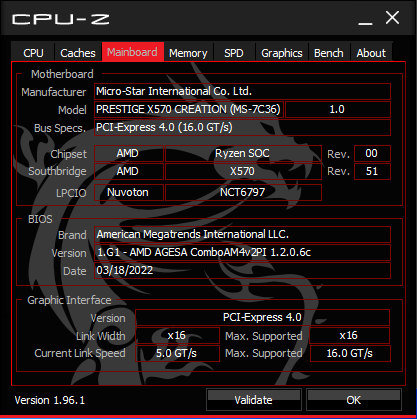
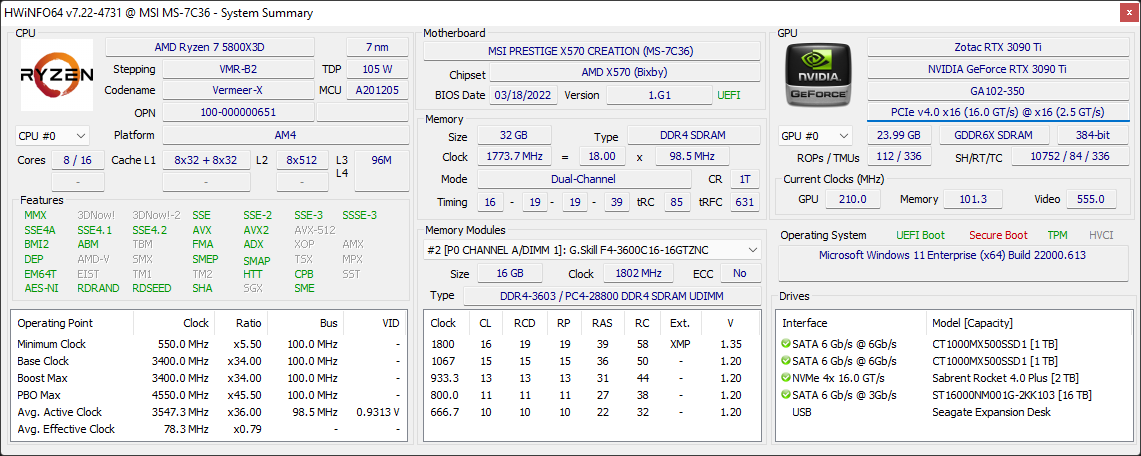
- Placa base MSI Prestige X570 Creation con AGESA 1.2.0.6c
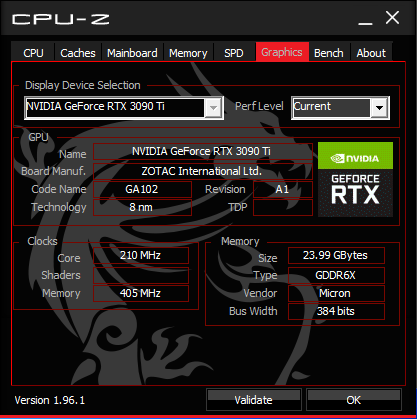
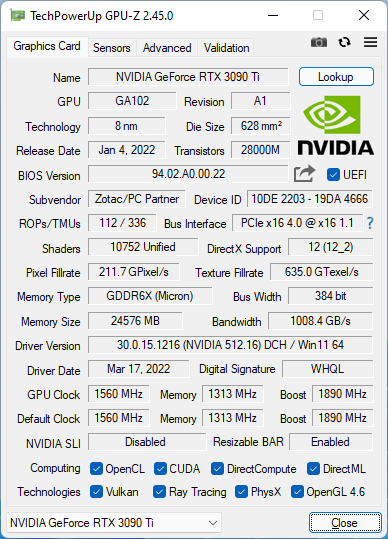
- GPU Zotac Gaming GeForce RTX 3090 Ti AMP Extreme Holo
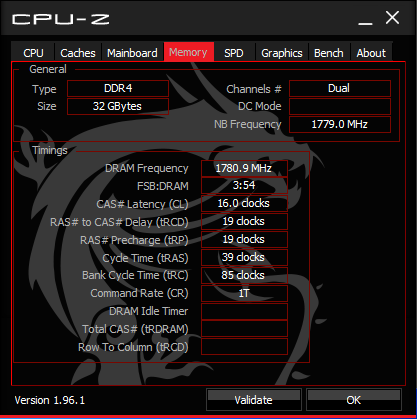
- 2x 16 GB de memoria RAM G.SKILL Trident Z Neo DDR4-3600 con timings 16-19-19-39
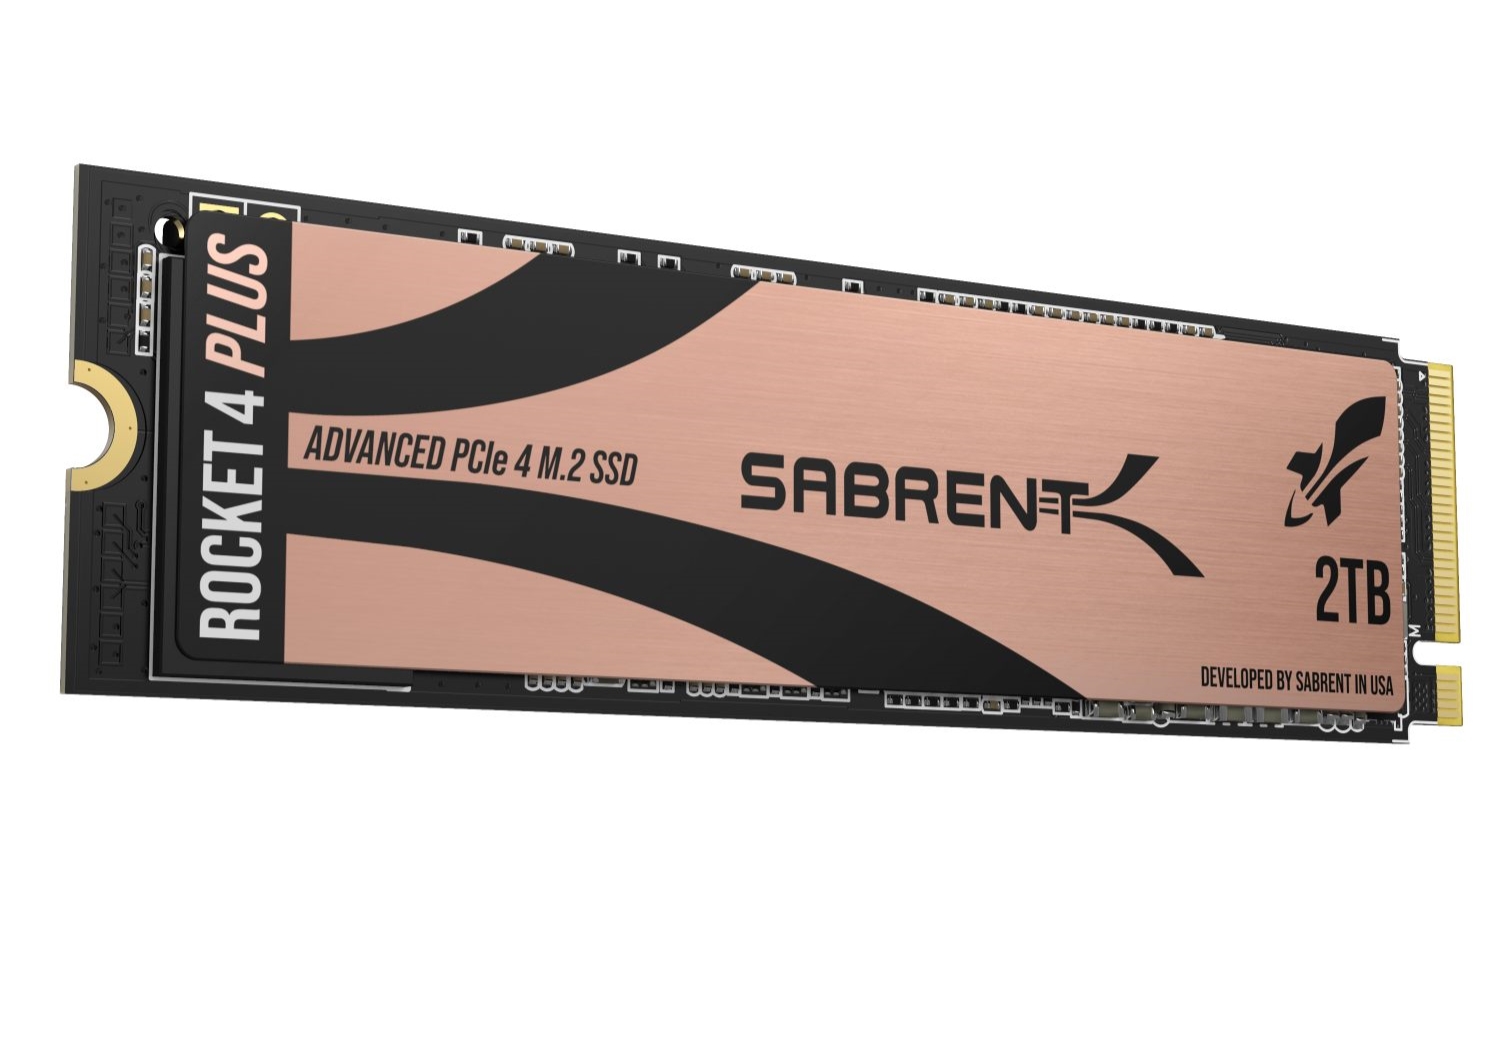
- 2 TB de SSD Sabrent Rocket 4 Plus Gen4 NVMe
- 2x 1 TB Crucial MX500 SATA SSDs
- Fuente de alimentación Thermaltake Toughpower 850 W Plus Gold
- Refrigerador Corsair iCUE H115i Elite Capellix AIO
- Caja Corsair iCUE 4000X RGB
- Monitor Gigabyte M28U 4K 144 Hz AMD FreeSync Premium Pro
Nos gustaría dar las gracias a AMD por proporcionar la muestra de revisión Ryzen 7 5800X3D, a Nvidia por la GPU Zotac RTX 3090 Ti, a Sabrent por el SSD Rocket 4 Plus Gen4, a Corsair por el refrigerador iCUE H115i Elite Capellix y la caja 4000X, y a Gigabyte por el monitor para juegos M28U.
Benchmarks sintéticos: El Ryzen 7 5800X3D queda en segundo plano
El rendimiento bruto de la CPU no es el fuerte del Ryzen 7 5800X3D. Esto se debe principalmente a un par de razones:
- El Ryzen 7 5800X3D tiene una velocidad de reloj más baja - 400 MHz menos de base y 200 MHz menos de impulso - que el Ryzen 7 5800X
- Aunque el 5800X3D soporta overclock de memoria y Infinity Fabric, la V-Cache 3D añadida impide cualquier forma de overclocking de núcleo, incluyendo Precision Boost Overdrive
Por lo tanto, el rendimiento multinúcleo en Cinebench R15, R20 y R23 es alrededor de un 6-10% más lento en comparación con un Ryzen 7 5800X. En mononúcleo, incluso el Ryzen 5 5600X es más rápido en un 6% comparado con el 5800X3D.
Una tendencia similar se refleja en otras pruebas sintéticas de CPU, en las que el Ryzen 7 5800X obtiene una cómoda ventaja sobre el Ryzen 7 5800X3D, salvo en las pruebas de CPU wPrime, 3DMark 11 Physics y 3DMark Time Spy.
El Intel Core i9-12900K, gracias a su configuración de 16 núcleos y 24 hilos y a un reloj de refuerzo de 5,1 GHz, mantiene una cómoda ventaja en nuestras pruebas sin sudar.
| Blender - v2.79 BMW27 CPU | |
| AMD Ryzen 5 5600X | |
| AMD Ryzen 7 5800X3D | |
| AMD Ryzen 7 5800X | |
| Intel Core i5-12600K | |
| AMD Ryzen 9 5900X | |
| Intel Core i9-12900K | |
| AMD Ryzen 9 5950X | |
| WinRAR - Result | |
| AMD Ryzen 7 5800X | |
| AMD Ryzen 7 5800X3D | |
| AMD Ryzen 9 5900X | |
| AMD Ryzen 5 5600X | |
| AMD Ryzen 9 5950X | |
| Intel Core i9-12900K | |
| Intel Core i5-12600K | |
| HWBOT x265 Benchmark v2.2 - 4k Preset | |
| AMD Ryzen 9 5950X | |
| Intel Core i5-12600K | |
| Intel Core i9-12900K | |
| AMD Ryzen 9 5900X | |
| AMD Ryzen 7 5800X | |
| AMD Ryzen 7 5800X3D | |
| AMD Ryzen 5 5600X | |
| R Benchmark 2.5 - Overall mean | |
| AMD Ryzen 7 5800X3D | |
| AMD Ryzen 5 5600X | |
| AMD Ryzen 9 5950X | |
| AMD Ryzen 9 5900X | |
| AMD Ryzen 7 5800X | |
| Intel Core i5-12600K | |
| Intel Core i9-12900K | |
| LibreOffice - 20 Documents To PDF | |
| Intel Core i5-12600K | |
| AMD Ryzen 7 5800X3D | |
| AMD Ryzen 9 5900X | |
| AMD Ryzen 9 5950X | |
| AMD Ryzen 5 5600X | |
| AMD Ryzen 7 5800X | |
| Intel Core i9-12900K | |
| 3DMark 11 - 1280x720 Performance Physics | |
| Intel Core i9-12900K | |
| AMD Ryzen 7 5800X3D | |
| AMD Ryzen 9 5950X | |
| Intel Core i5-12600K | |
| AMD Ryzen 9 5900X | |
| AMD Ryzen 7 5800X | |
| AMD Ryzen 5 5600X | |
* ... más pequeño es mejor
El refrigerador Corsair H115i Elite Capellix AIO combinado con el radiador de 280 mm es capaz de hacer un buen trabajo para mantener el Ryzen 7 5800X3D fresco. No notamos ninguna ralentización en nuestro test de bucle multinúcleo Cinebench R15 sostenido.
Rendimiento de las aplicaciones: Sin grandes reparos en la productividad diaria y en determinados flujos de trabajo creativos
El Ryzen 7 5800X3D es capaz de manejar hábilmente las tareas de productividad diarias, como demuestran los resultados de PCMark 10. Su clasificación en la parte inferior de la tabla puede atribuirse a los relojes más bajos, pero solo vemos un déficit de rendimiento del 8% en comparación con el Ryzen 7 5800X.
Como no teníamos una Titan RTX para esta comparación, tuvimos que conformarnos con la RTX 3090 Ti como GPU elegida. Aunque es una tarjeta de clase Titan sobre el papel, la RTX 3090 Ti utiliza los controladores convencionales de GeForce, lo que conlleva penalizaciones artificiales de rendimiento en algunas aplicaciones profesionales.
No obstante, la combinación de Ryzen 7 5800X3D y RTX 3090 Ti se presta a algunas buenas puntuaciones en ciertos subconjuntos de las pruebas SPECviewperf como 3ds Max, Maya, Showcase y Medical.
| PCMark 10 Score | 7607 puntos | |
ayuda | ||
rendimiento en 3D y en juegos: El Ryzen 7 5800X3D supera al Core i9-12900K a 1080p
AMD comercializa el Ryzen 7 5800X3D principalmente como un procesador para juegos. Mientras que el 5800X3D lucha claramente en el rendimiento bruto de la CPU, las tablas cambian cuando se trata de aplicaciones de juegos. Lo vemos sobre todo en las resoluciones más bajas, como los 1080p.
El combo Ryzen 7 5800X3D+RTX 3090 Ti lidera claramente el paquete e incluso consigue vencer de forma convincente a la configuración Core i9-12900K+Titan RTX en una buena mayoría de pruebas 3DMark y Unigine por un margen significativo. Hay que tener en cuenta que el Ryzen 7 5800X3D sigue perdiendo frente a las ofertas de Intel Alder Lake y la mayoría de sus primos Zen 3 en los aspectos de sólo CPU de estos benchmarks, como se ha mostrado anteriormente. La RTX 3090 Ti parece haber aportado su músculo en estas pruebas, ya que es claramente una tarjeta mucho más potente que la Titan RTX que habíamos utilizado en anteriores análisis.
Para un análisis más detallado de los resultados de los benchmarks 3D sintéticos, nos remitimos a nuestro análisis de la GPU Zotac GeForce RTX 3090 Ti AMP Extreme Holo.
| 3DMark 11 Performance | 49471 puntos | |
| 3DMark Ice Storm Standard Score | 233264 puntos | |
| 3DMark Cloud Gate Standard Score | 75753 puntos | |
| 3DMark Fire Strike Score | 36563 puntos | |
| 3DMark Fire Strike Extreme Score | 24198 puntos | |
| 3DMark Time Spy Score | 19241 puntos | |
ayuda | ||
El Ryzen 7 5800X3D es el claro ganador si buscas una de las CPUs de juego más rápidas disponibles actualmente. Por desgracia, no hemos podido conseguir todavía una muestra del Core i9-12900KS, por lo que la siguiente comparación se limita al Core i9-12900K y al Core i5-12600K del establo de Team Blue.
Las resoluciones a 1080p son las que más se benefician del aumento de caché, ya que estas configuraciones están más limitadas por la CPU que las de 2K y superiores. En consecuencia, el Ryzen 7 5800X3D parece ser un complemento ideal para la RTX 3090 Ti para empujar tantos cuadros como sea posible en esta resolución. La mejora del Core i9-12900K puede ser de hasta un 40% (Borderlands 3, 1080p Badass Quality) dependiendo del juego y de los ajustes de calidad elegidos.
| F1 2021 | |
| 1920x1080 Medium Preset AA:T AF:16x | |
| AMD Ryzen 7 5800X3D, NVIDIA GeForce RTX 3090 Ti | |
| AMD Ryzen 9 5900X, NVIDIA Titan RTX | |
| Intel Core i9-12900K, NVIDIA Titan RTX | |
| Intel Core i5-12600K, NVIDIA Titan RTX | |
| 1920x1080 High Preset AA:T AF:16x | |
| AMD Ryzen 7 5800X3D, NVIDIA GeForce RTX 3090 Ti | |
| AMD Ryzen 9 5900X, NVIDIA Titan RTX | |
| Intel Core i9-12900K, NVIDIA Titan RTX | |
| Intel Core i5-12600K, NVIDIA Titan RTX | |
| 1920x1080 Ultra High Preset + Raytracing AA:T AF:16x | |
| AMD Ryzen 7 5800X3D, NVIDIA GeForce RTX 3090 Ti | |
| AMD Ryzen 9 5900X, NVIDIA Titan RTX | |
| Intel Core i9-12900K, NVIDIA Titan RTX | |
| Intel Core i5-12600K, NVIDIA Titan RTX | |
| bajo | medio | alto | ultra | QHD | 4K | |
|---|---|---|---|---|---|---|
| GTA V (2015) | 185.59 | 160.67 | 155.26 | 182.63 | ||
| The Witcher 3 (2015) | 394 | 193.4 | 172.9 | |||
| Dota 2 Reborn (2015) | 257.7 | 231.2 | 217.1 | 195.8 | 184.2 | |
| Final Fantasy XV Benchmark (2018) | 222 | 226 | 186.1 | 151.6 | 96.3 | |
| X-Plane 11.11 (2018) | 169.1 | 158.1 | 135.9 | 115.7 | ||
| Shadow of the Tomb Raider (2018) | 265 | 257 | 244 | 184 | 106 | |
| Metro Exodus (2019) | 213 | 175.2 | 145.9 | 125.3 | 84.3 | |
| Total War: Three Kingdoms (2019) | 342.6 | 248.9 | 176.6 | 117.9 | 59.9 | |
| Control (2019) | 240 | 209 | 142.5 | 73.9 | ||
| Borderlands 3 (2019) | 204 | 187.6 | 173.3 | 143.1 | 83.8 | |
| Mafia Definitive Edition (2020) | 240 | 231 | 173.9 | 99.2 | ||
| Watch Dogs Legion (2020) | 171.4 | 154.2 | 130.2 | 107.8 | 70.1 | |
| Assassin´s Creed Valhalla (2020) | 160 | 138 | 123 | 108 | 73 | |
| F1 2021 (2021) | 537 | 470 | 242 | 189.3 | 114.9 | |
| Far Cry 6 (2021) | 179 | 161.6 | 142 | 132.9 | 89.9 | |
| Call of Duty Vanguard (2021) | 195.5 | 207 | 191.2 | 149.9 | 93.7 | |
| Forza Horizon 5 (2021) | 231 | 200 | 188 | 127 | 114 | 89 |
| Rainbow Six Extraction (2022) | 411 | 347 | 315 | 290 | 208 | 116 |
| Dying Light 2 (2022) | 202 | 171.4 | 153 | 113.2 | 64.3 | |
| GRID Legends (2022) | 228 | 202 | 173.4 | 156.6 | 153.2 | 120.5 |
| Elden Ring (2022) | 60 | 60 | 60 | 60 | 60 | 60 |
| Cyberpunk 2077 1.6 (2022) | 219 | 201 | 172.8 | 151.8 | 103.9 | 53.3 |
| Ghostwire Tokyo (2022) | 263 | 260 | 261 | 261 | 210 | 113.2 |
| Tiny Tina's Wonderlands (2022) | 324 | 277 | 231 | 190.2 | 142.6 | 81.1 |
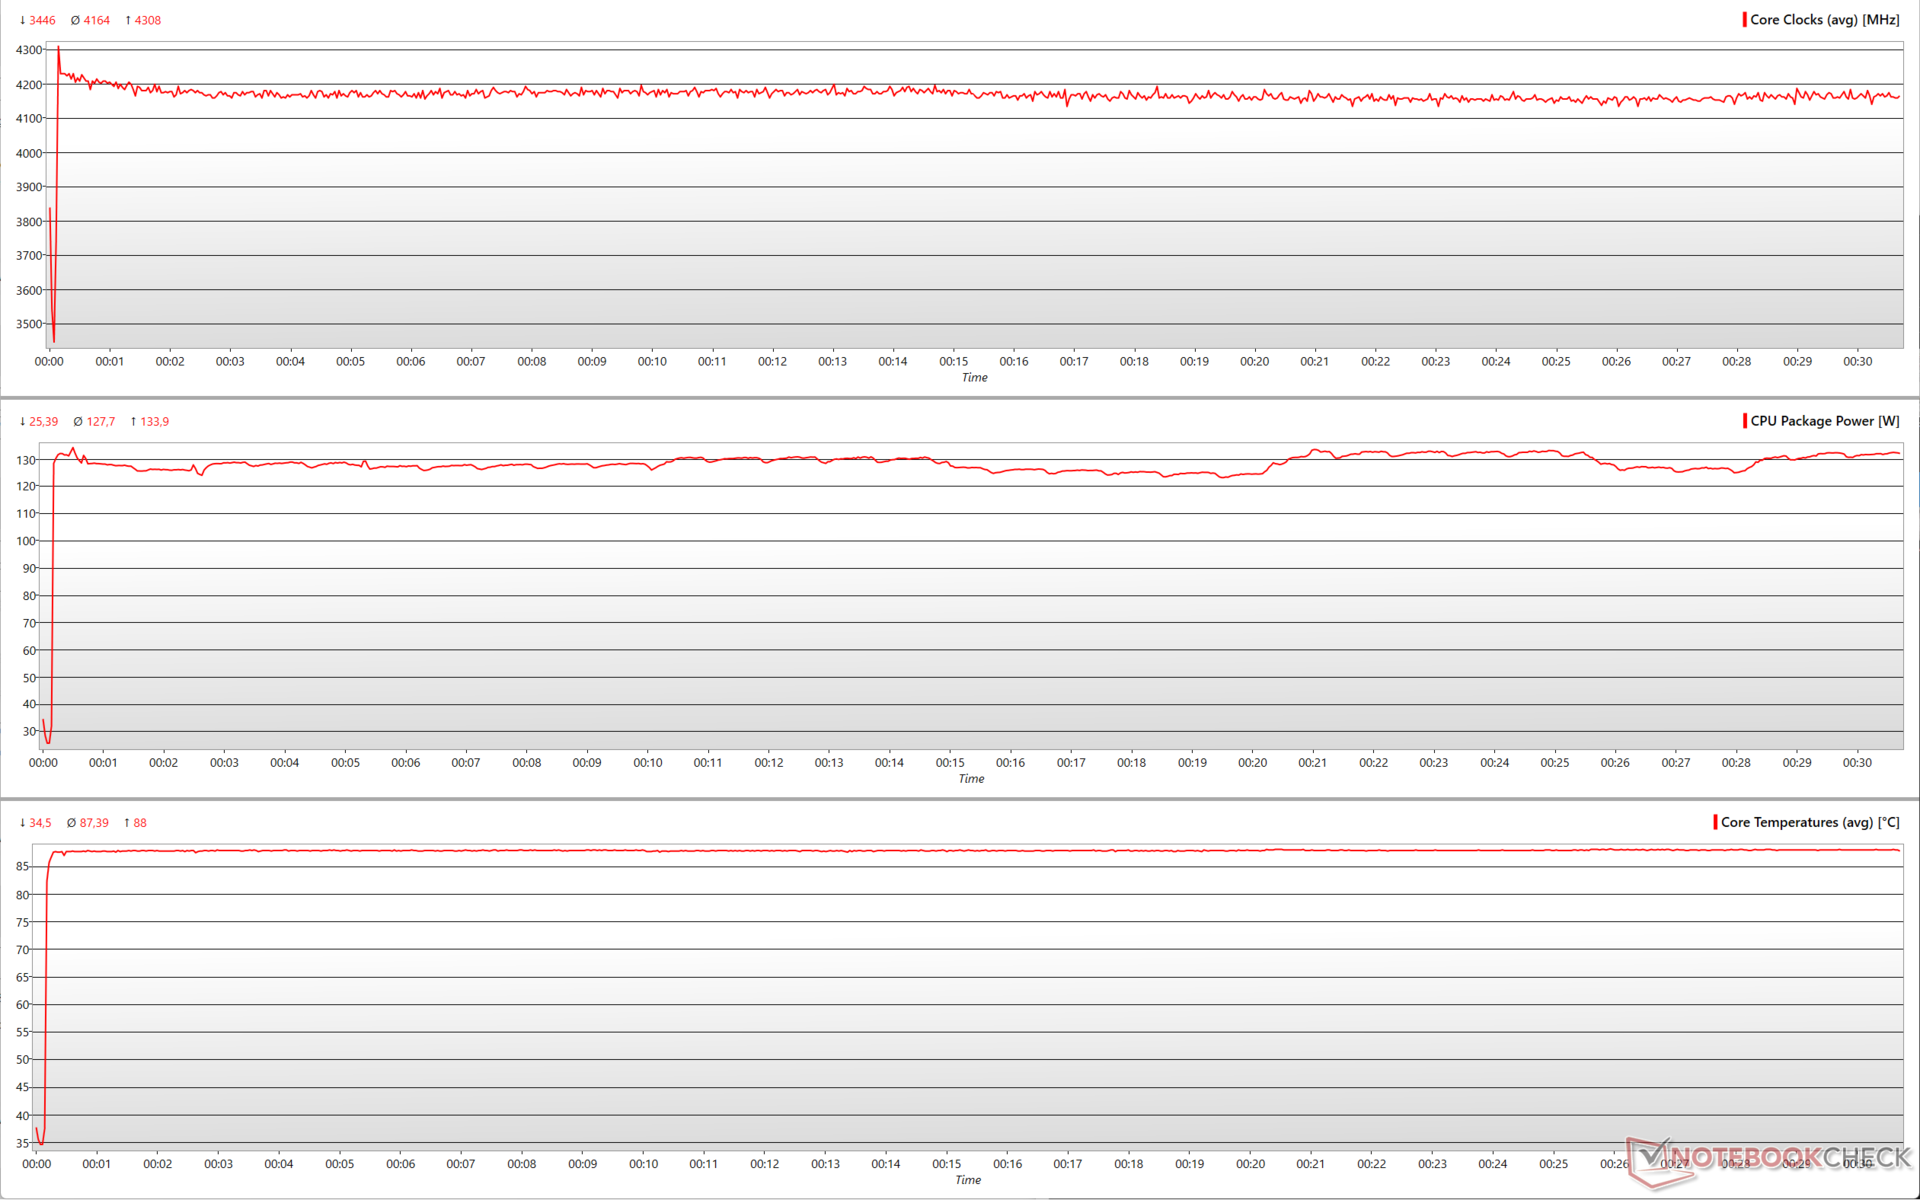
Prueba de estrés y temperaturas: No hay problemas de ralentización
Al estresar el Ryzen 7 5800X3D con Prime95, la potencia del paquete de la CPU se mantiene justo por encima de la marca de 130 W y las velocidades de reloj son bastante consistentes cerca de los 4,2 GHz. Las temperaturas de la CPU rondan los 90 °C sin ralentización.
Esta consistencia en el rendimiento también se vio anteriormente en la prueba de bucle multinúcleo de Cinebench R15. Esto se puede atribuir en parte al Ryzen 7 5800X3D y también en parte al excelente rendimiento de refrigeración del refrigerador Corsair H115i Elite Capellix AIO.
Consumo de energía: Menos económico que el Core i5-12600K a pesar de su menor rendimiento
Nuestro sistema de prueba consume unos 102 W en reposo con un total de cinco ventiladores de carcasa (tres ventiladores de carcasa Corsair SP de 120 mm y dos ventiladores de radiador Corsair ML de 120 mm) y el refrigerador Elite Capellix funcionando en el perfil equilibrado. Toda la iluminación RGB estaba apagada.
El consumo de energía es más o menos similar al del Ryzen 9 5900X y un 29% mayor que el Ryzen 5 5600X en el estrés FFT de Prime95. En Cinebench R15 multinúcleo, el Ryzen 7 5800X3D es ligeramente menos económico que el Core i5-12600K aunque el chip de AMD muestra un déficit de rendimiento del 6%. Un perfil similar se ve con Cinebench R20 multi también, esta vez con una brecha de rendimiento aún mayor del 18% en comparación con el Core i5-12600K.
El Ryzen 7 5800X3D queda por detrás del Core i9-12900K en un 26% en Cinebench R20 single-core pero parece consumir ligeramente más energía. En general, sin embargo, el consumo total del sistema con el Ryzen 7 5800X3D sigue limitado a unos 230 W, mientras que el PC con el Core i9-12900K puede consumir casi un 57% más de energía en las pruebas de CPU multinúcleo.
Power Consumption: External Monitor
* ... más pequeño es mejor
Pro
Contra
Veredicto: Sólo para jugadores y usuarios de OG Zen
AMD se ha aferrado al socket AM4 durante mucho tiempo. Incluso con el lanzamiento de la serie Ryzen 7000 en el socket AM5, la compañía espera que el socket más antiguo tenga un buen rendimiento en su mayor parte. El Ryzen 7 5800X3D es más bien un banco de pruebas para AMD, cuyas enseñanzas se incorporarán en futuras iteraciones. Dicho esto, el Ryzen 7 5800X3D parece claramente una gran opción si tu caso de uso principal es el de los juegos, especialmente a bajas resoluciones.
El uso de una caché 3D apilada da a los juegos un margen de maniobra importante. Sin embargo, conlleva varios inconvenientes, como la imposibilidad de overclockear los propios núcleos y la reducción de los relojes base/de refuerzo para garantizar que el TDP no supere los 105 W
la caché 3D es una forma ingeniosa de mejorar el rendimiento de los juegos sin aumentar el TDP. Los jugadores encontrarán útil el 3D V-cache para conseguir más frames que el Core i9-12900K por unos 120 dólares menos. Para todas las demás tareas, los relojes más bajos y la falta de overclocking resultan ser limitaciones importantes.
El Ryzen 7 5800X3D sufre cuando se trata de rendimiento bruto de la CPU en comparación con sus hermanos de la familia Zen 3, y definitivamente pierde ante el Alder Lake Core i5-12600K y Core i9-12900K y Core i9-12900K. La otra cara de la moneda es que este déficit de rendimiento no va acompañado de un menor consumo de energía
Aunque vemos que el Ryzen 7 5800X3D va a la zaga en lo que respecta al componente físico de las pruebas 3D sintéticas, el procesador empieza a mostrar su valía en los componentes gráficos de estas pruebas. Los juegos a 1080p o QHD son el mejor caso de uso para este procesador. Junto con la GPU correcta, el Ryzen 7 5800X3D puede impulsar los fotogramas mucho más de lo que es posible con el Core i9-12900K.
Esto nos lleva a preguntarnos. ¿Merece la pena actualizar esta CPU?
El socket AM4 es ahora una plataforma muy estable. Todavía es pronto para el socket AM5 y los usuarios querrán esperar a ver cómo se comportan las nuevas CPUs Ryzen 7000 en las pruebas del mundo real y también averiguar las mejores combinaciones posibles de memoria DDR5 antes de dar el paso.
Los jugadores que todavía utilizan procesadores Zen de la generación anterior, como un Ryzen 7 2700Xpor ejemplo, encontrarán que el Ryzen 7 5800X3D es una actualización que merece la pena y se embolsarán con gusto el ahorro de 120 dólares en comparación con el Core i9-12900K, además de ahorrarse la actualización de la placa base (suponiendo que su placa actual siga ofreciendo un suministro de energía decente). Sin embargo, los creadores de contenidos y quienes necesiten un rendimiento más completo quizá quieran buscar otras opciones como el Ryzen 7 5800X por el mismo precio de 449 dólares.
El Core i5-12600K es una ganga aún mejor por sólo 289 dólares, siempre y cuando la inversión adicional en el ecosistema de Intel no sea una limitación.
Precio y disponibilidad
Price comparison

