Análisis del Acer Nitro 5 AN517: Un portátil para juegos con una silenciosa RTX 4050
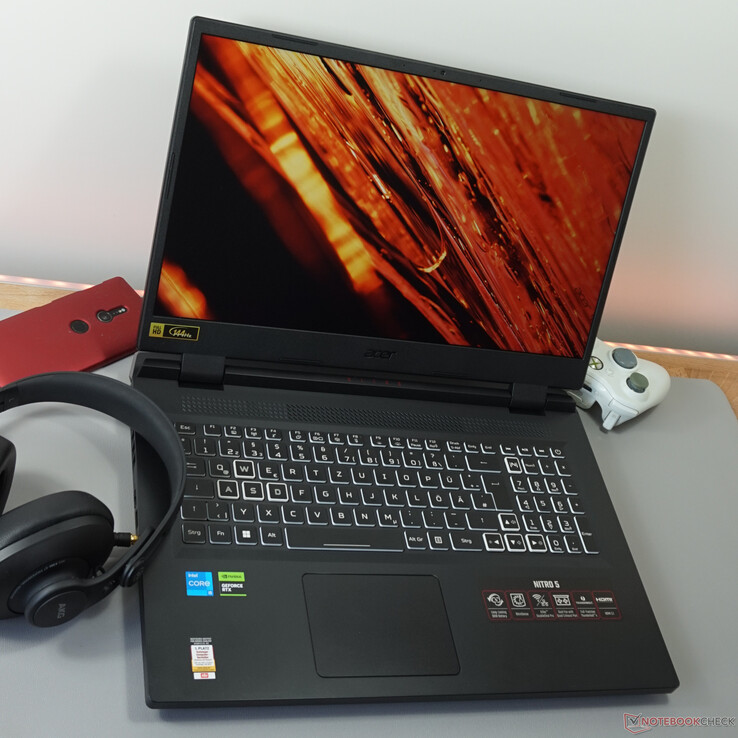
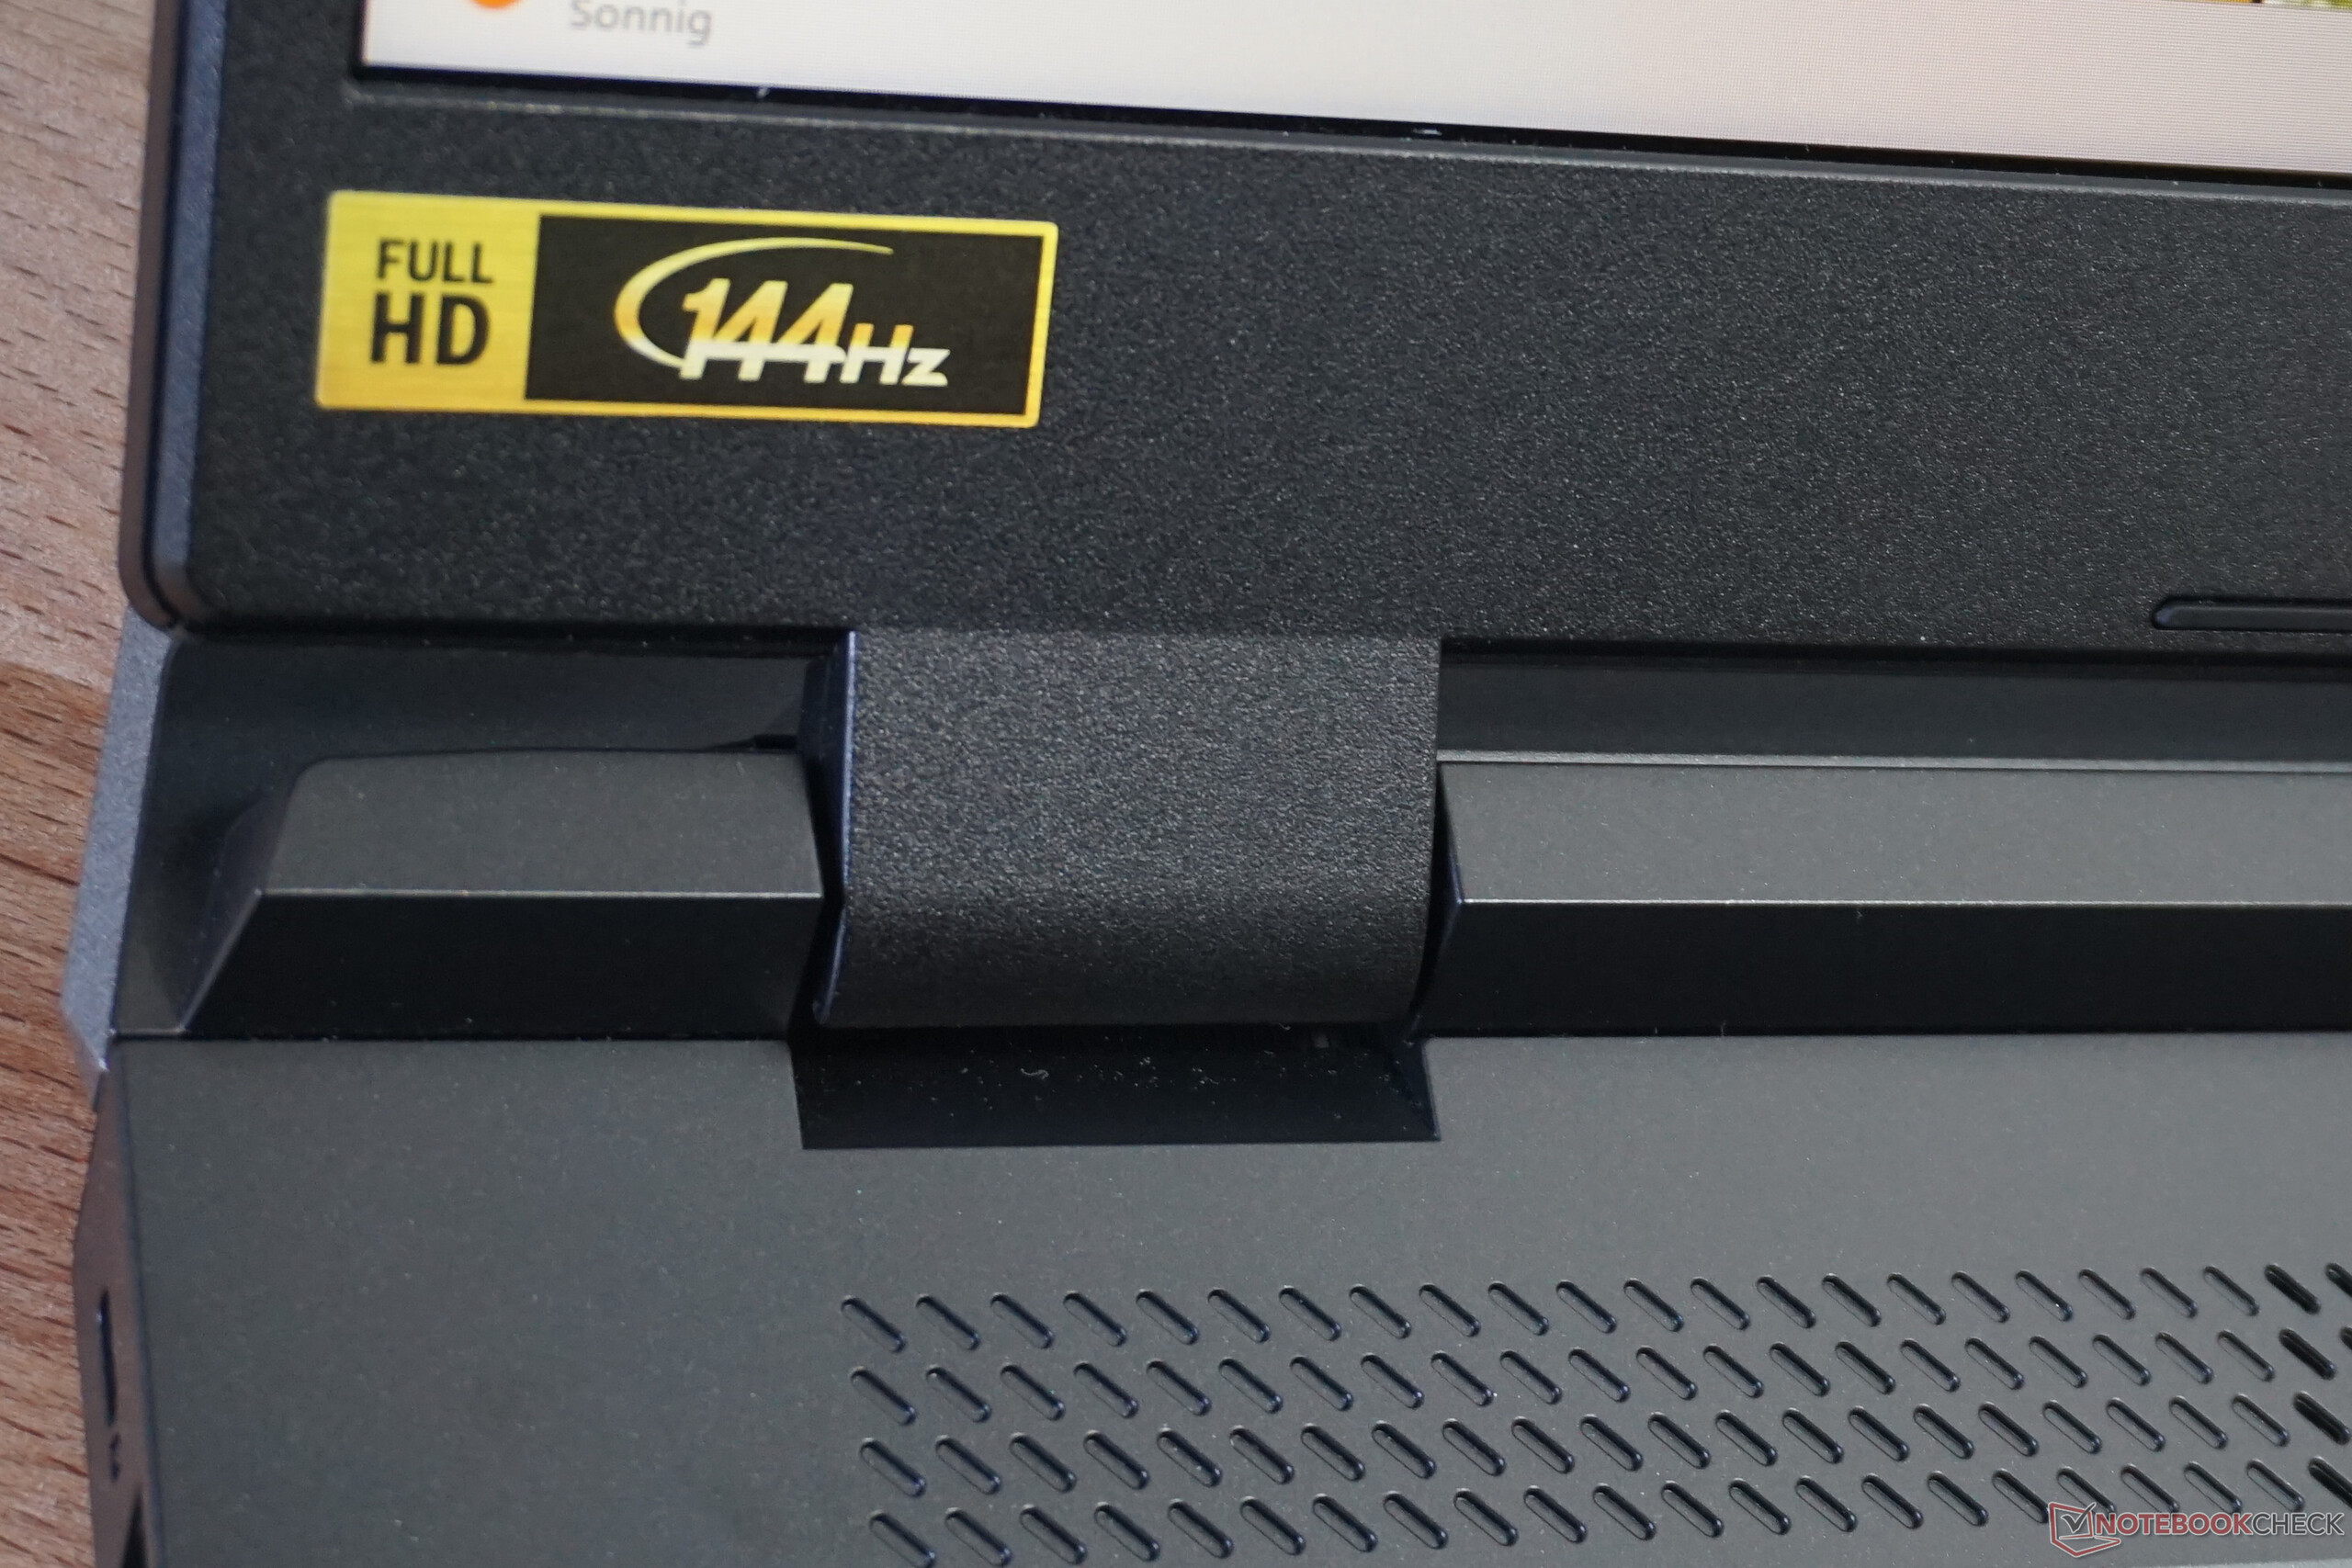
El relativamente grande Acer Nitro 5 AN517 alberga un procesador Alder Lake - que ya no es el chico más nuevo del barrio - y se combina con una tarjeta gráfica Nvidia GeForce RTX serie 4000. El resultado es un sólido portátil para juegos de gama básica que cuenta con especificaciones decentes, iluminación RGB, un panel de 144 Hz y un puerto Thunderbolt 4.
El año pasado analizamos un predecesor muy similar, elAcer Nitro 5 AN517-55-738Rcon una tarjetaRTX 3060; entre otras cosas, llamó la atención por los excesivos niveles de ruido. Es precisamente en esta área donde Acer ha hecho mejoras y al mismo tiempo consigue beneficiarse de la RTX 4050como en nuestro modelo de pruebas. Nuestro análisis revela qué nivel de juego silencioso puedes esperar.
Competidores con tecnología comparable son el Medion Erazer Scout E20que está equipado con un procesador más nuevo y más grande o el Asus TUF Gaming A16que ha optado por componentes AMD.
Posibles contendientes en la comparación
Valoración | Fecha | Modelo | Peso | Altura | Tamaño | Resolución | Precio |
|---|---|---|---|---|---|---|---|
| 85.5 % v7 (old) | 06/2023 | Acer Nitro 5 AN517-55-5552 i5-12500H, GeForce RTX 4050 Laptop GPU | 3 kg | 28.9 mm | 17.30" | 1920x1080 | |
| 86.9 % v7 (old) | 06/2023 | Asus TUF Gaming A16 FA617XS R9 7940HS, Radeon RX 7600S | 2.2 kg | 22.1 mm | 16.00" | 1920x1200 | |
| 83.9 % v7 (old) | 08/2022 | Acer Nitro 5 AN517-55-738R i7-12700H, GeForce RTX 3060 Laptop GPU | 3.1 kg | 28.6 mm | 17.30" | 1920x1080 | |
| 83 % v7 (old) | 05/2023 | Medion Erazer Scout E20 i7-13700H, GeForce RTX 4050 Laptop GPU | 2.8 kg | 29 mm | 17.30" | 1920x1080 | |
| 82.9 % v7 (old) | 03/2023 | MSI Katana 15 B12VEK i7-12650H, GeForce RTX 4050 Laptop GPU | 2.3 kg | 24.9 mm | 15.60" | 1920x1080 | |
| 82.4 % v7 (old) | 04/2023 | MSI Cyborg 15 A12VF i7-12650H, GeForce RTX 4060 Laptop GPU | 2 kg | 22.9 mm | 15.60" | 1920x1080 |
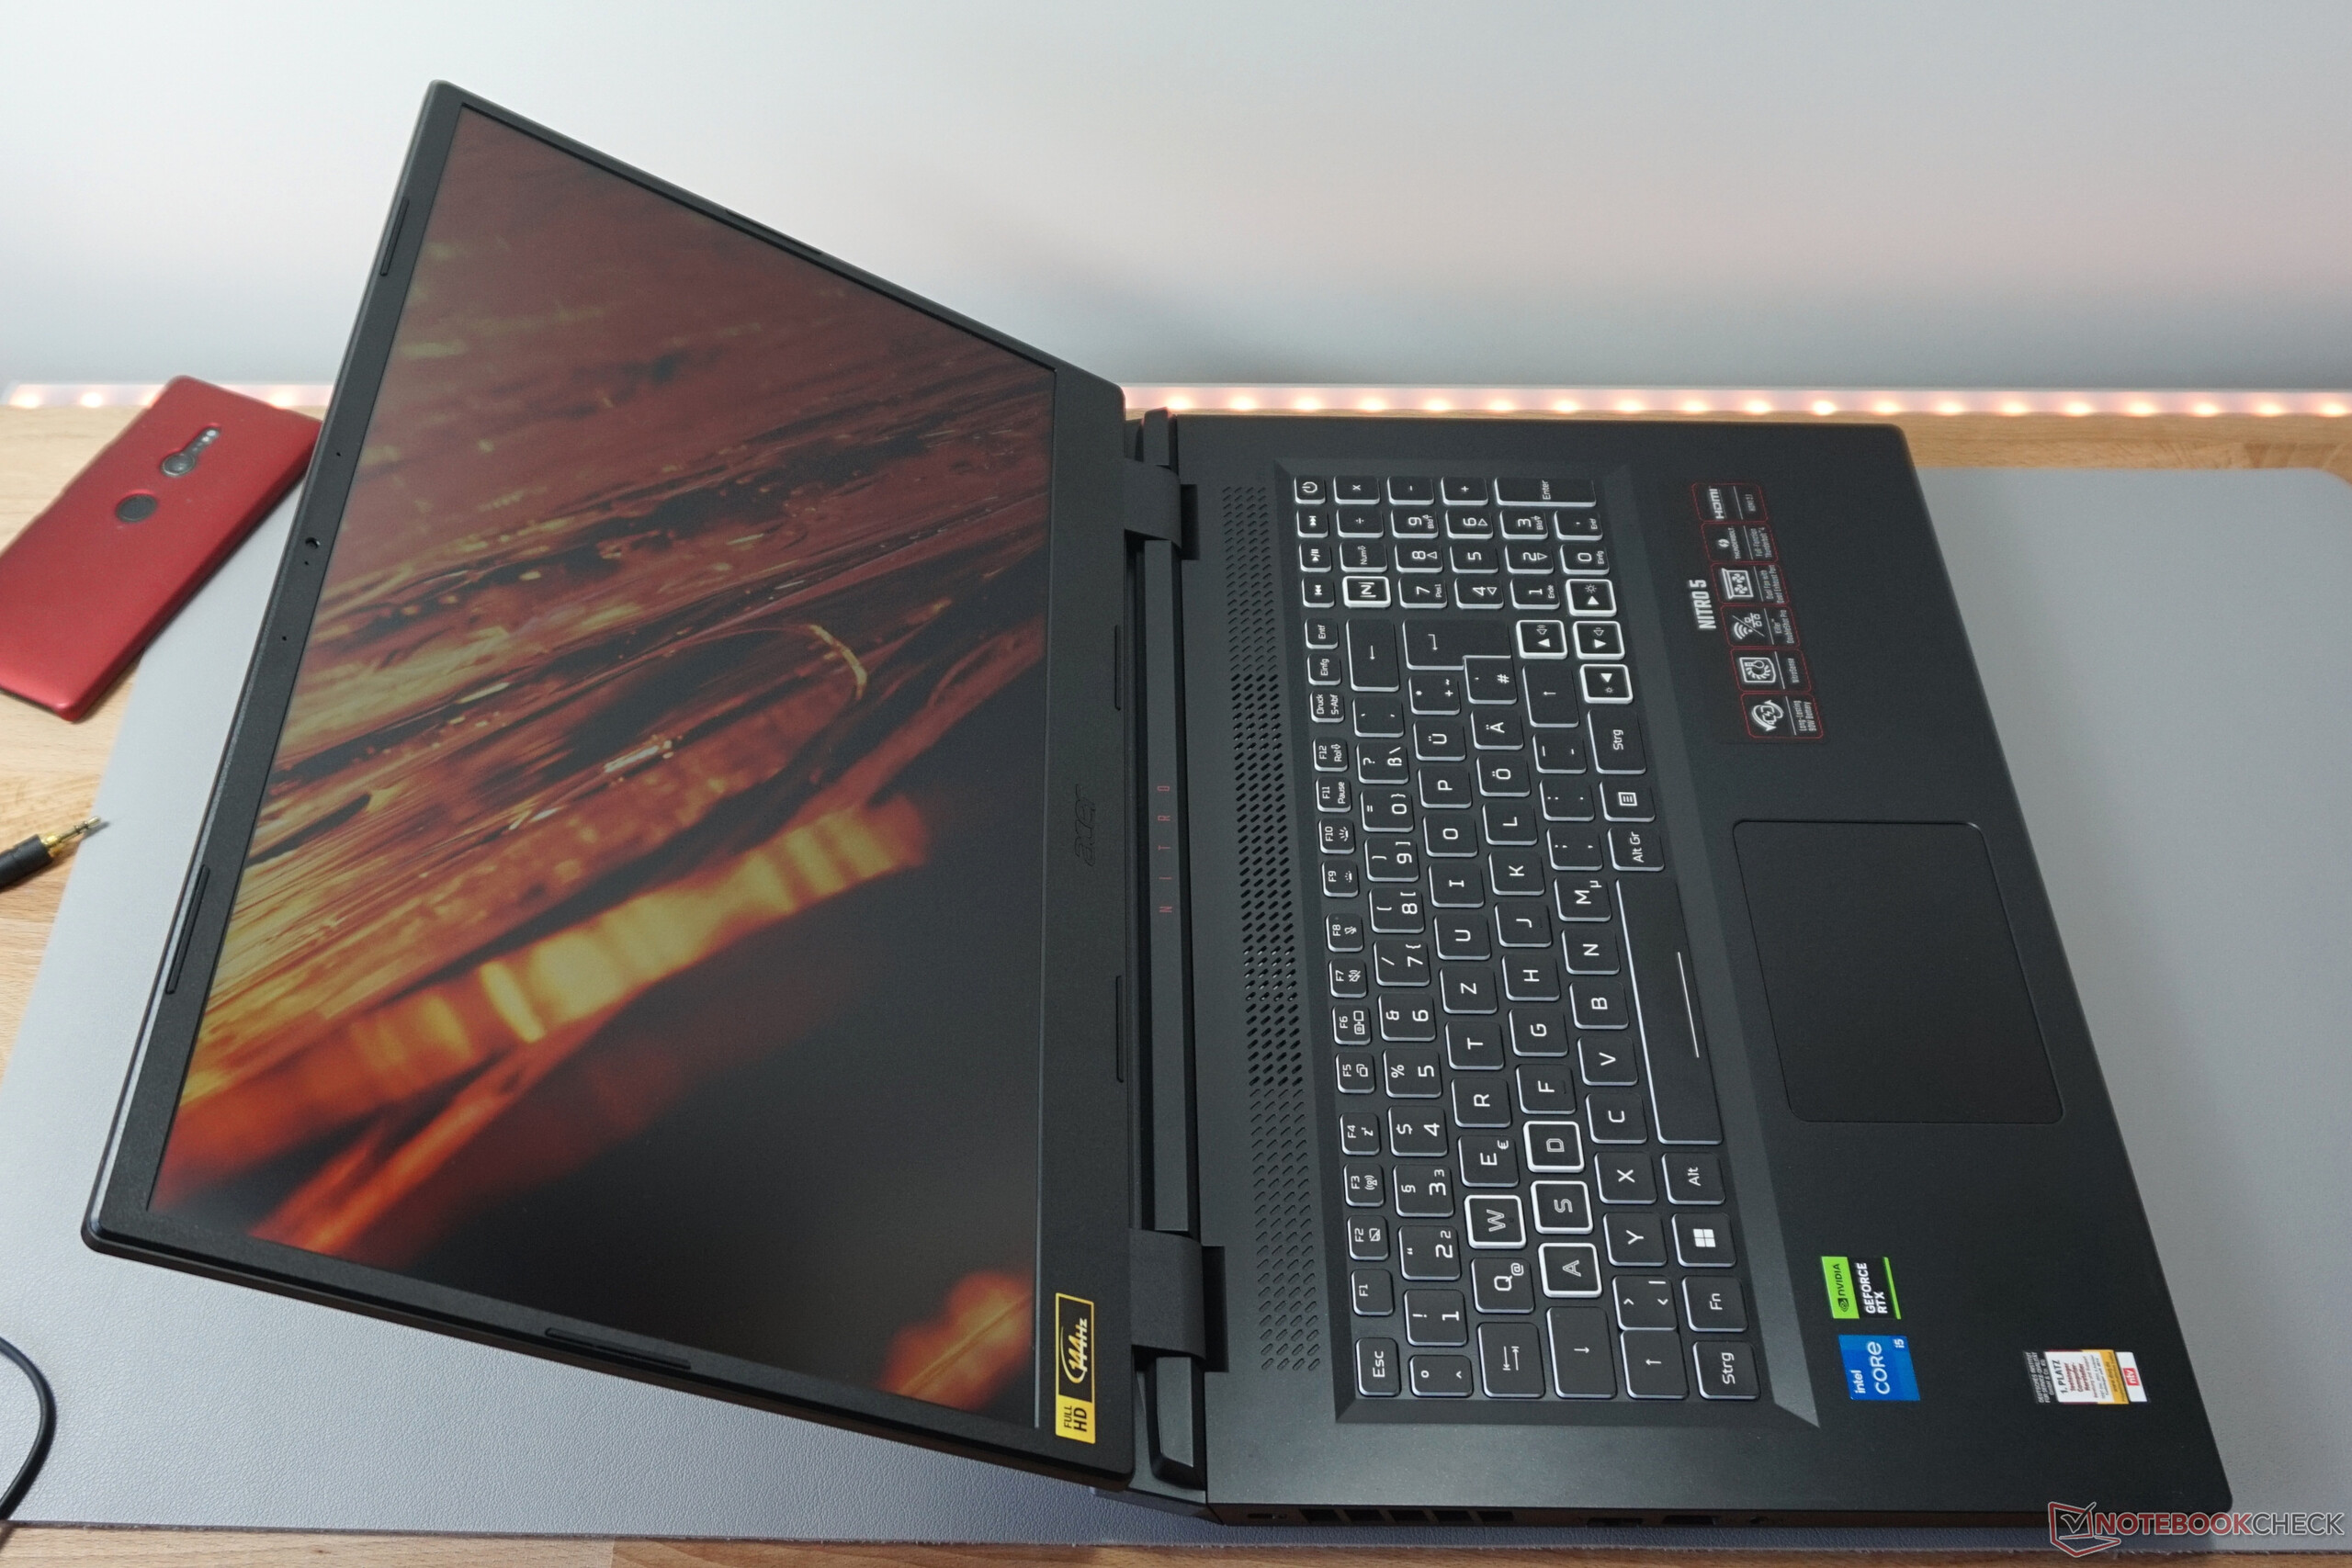
Maletín - El gran Nitro 5 necesita espacio
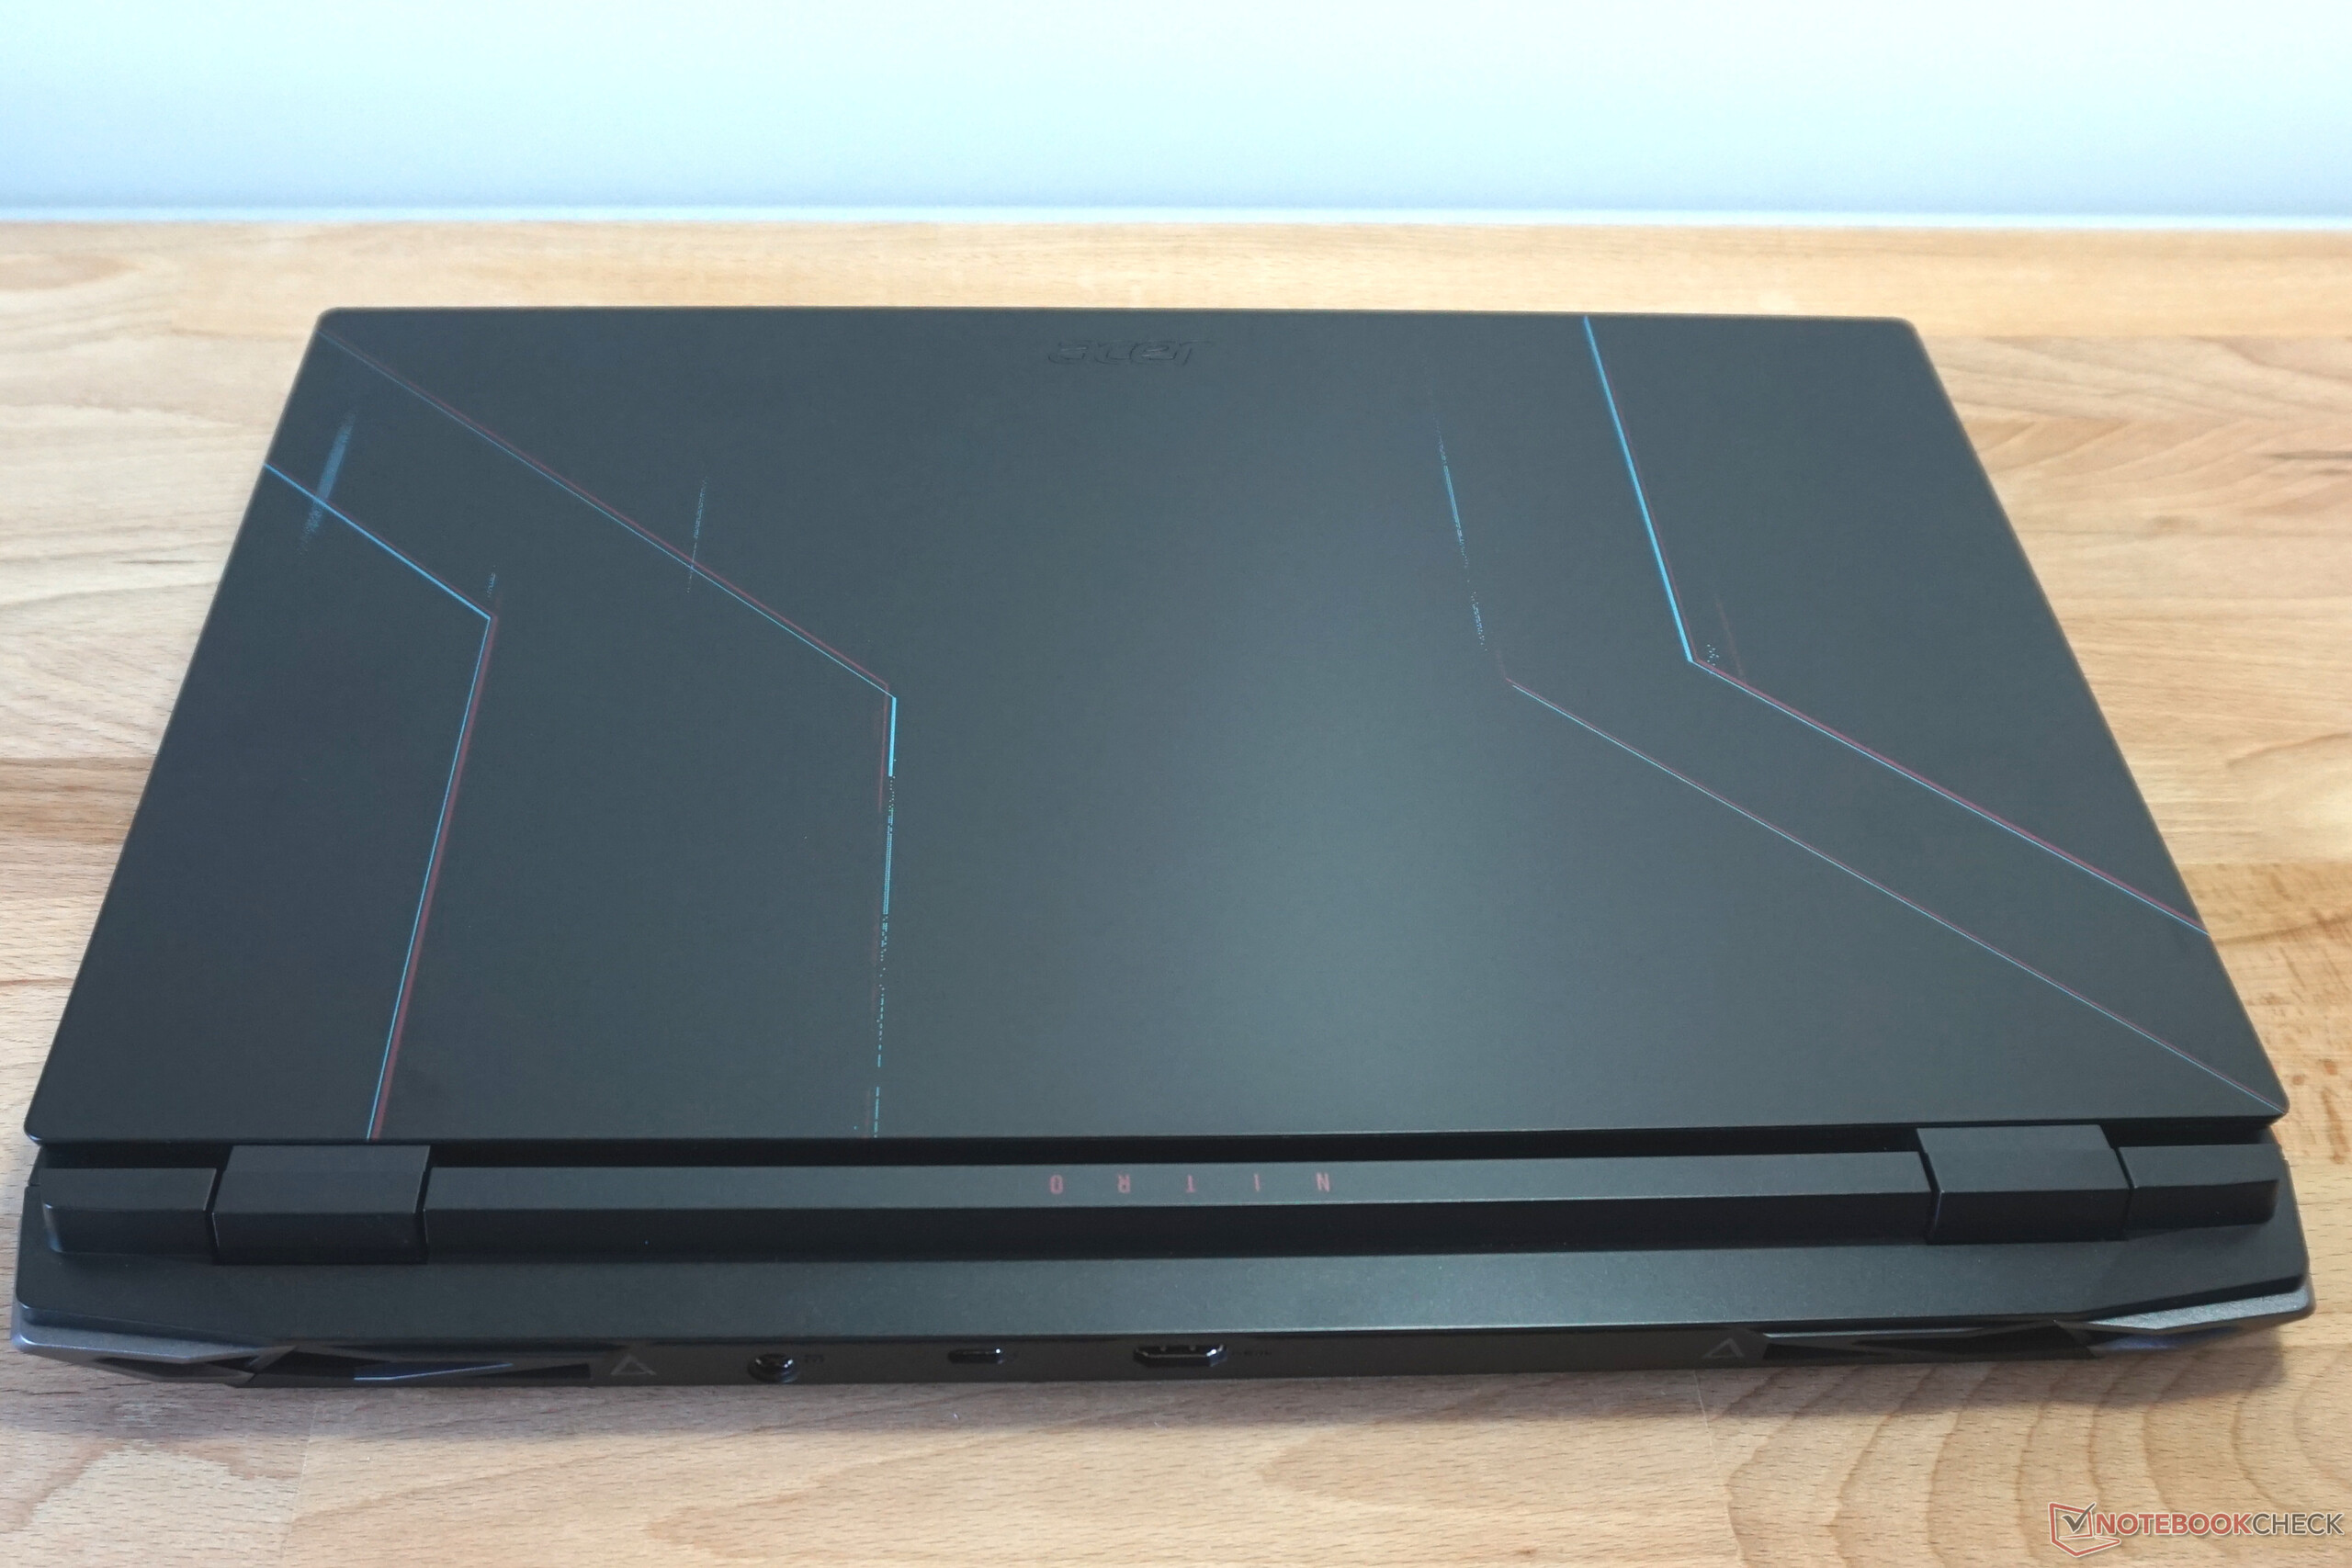
La profundidad bastante superior a la media del Acer Nitro 5 es considerable, incluso para un dispositivo de 17,3 pulgadas. Así que no sorprende que el dispositivo sea algo más pesado que otros competidores equipados de forma similar. A cambio, el portátil tiene una construcción muy sólida.
Las bisagras son firmes, se pueden abrir hasta un ángulo de 145 °, y evitan que la gran pantalla se tambalee. Toda la carcasa es de plástico, lo que no afecta negativamente a la rigidez torsional de la unidad. El marco de la pantalla puede torcerse ligeramente. Por el contrario, la base permanece absolutamente sólida en todo momento, y silenciosa.
Por supuesto, puede haber división de opiniones en cuanto al diseño. Sin embargo, las esquinas plateadas ligeramente desplazadas y las finas franjas de color parecen algo menos que aventureras. Es cuestionable si la diferencia con una carcasa completamente negra sería siquiera perceptible.

Características - Un portátil para juegos con los extras necesarios
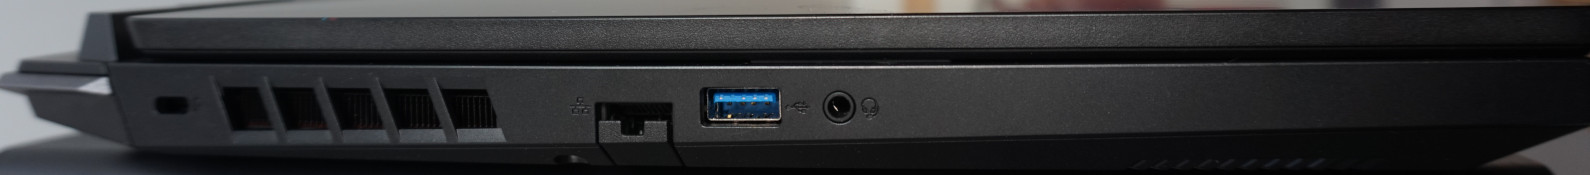
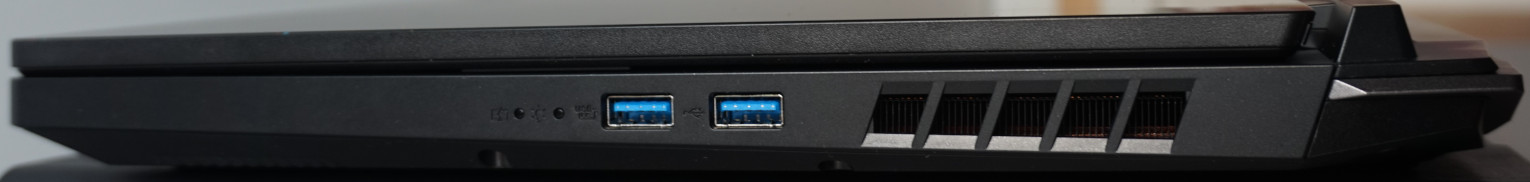
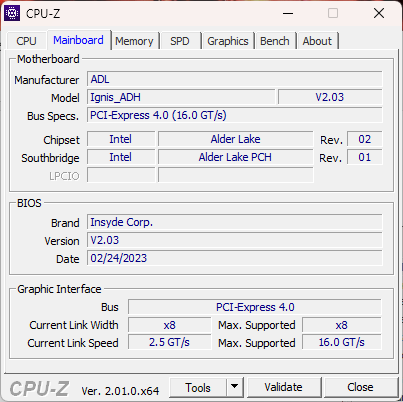
La selección de puertos es limitada pero, por suerte, los más importantes están a mano. A izquierda y derecha están los puertos USB-A, con dos en el lado derecho. Tienen una velocidad máxima de transferencia de 10 Gbit/s (USB 3.2 Gen2). En la parte trasera del portátil hay un puerto HDMI y Thunderbolt 4, así como dos salidas de vídeo. Además, el TB4 tiene una interfaz adecuada para poder usar un SSD externo a su máxima velocidad.
Se echa en falta una ranura para tarjetas y una tercera salida de vídeo -que a veces se usa como Mini DP pero normalmente como un puerto USB-C adicional con soporte DP-. Además, el puerto LAN sólo tiene una velocidad de transferencia de datos de 1 Gbit/s.

Comunicación
El módulo Wi-Fi Killer Wi-Fi 6 AX1650i funciona como se esperaba. Si la distancia al router es corta, es posible alcanzar velocidades de más de 1,5 Gbit/s.
Wi-Fi 6E no es compatible, lo que significa que cabe esperar una notable reducción de las velocidades de transferencia de datos teóricamente posibles, especialmente en zonas con múltiples redes inalámbricas.
Cámara web
La webcam rinde mal con resolución HD, un máximo de 30fps y una calidad de imagen apenas aceptable. Pero, al menos hay un brillo decente en condiciones de poca luz, sin producir demasiado ruido de imagen.
El micrófono de doble array se comporta mucho mejor. Hace un buen trabajo grabando la voz del usuario desde múltiples direcciones y distancias a un volumen relativamente estable y hay una ausencia de distorsiones, ruido o subtonos metálicos. Esto hace que el portátil esté bien equipado para manejar videollamadas o chats de juegos.


Servicio
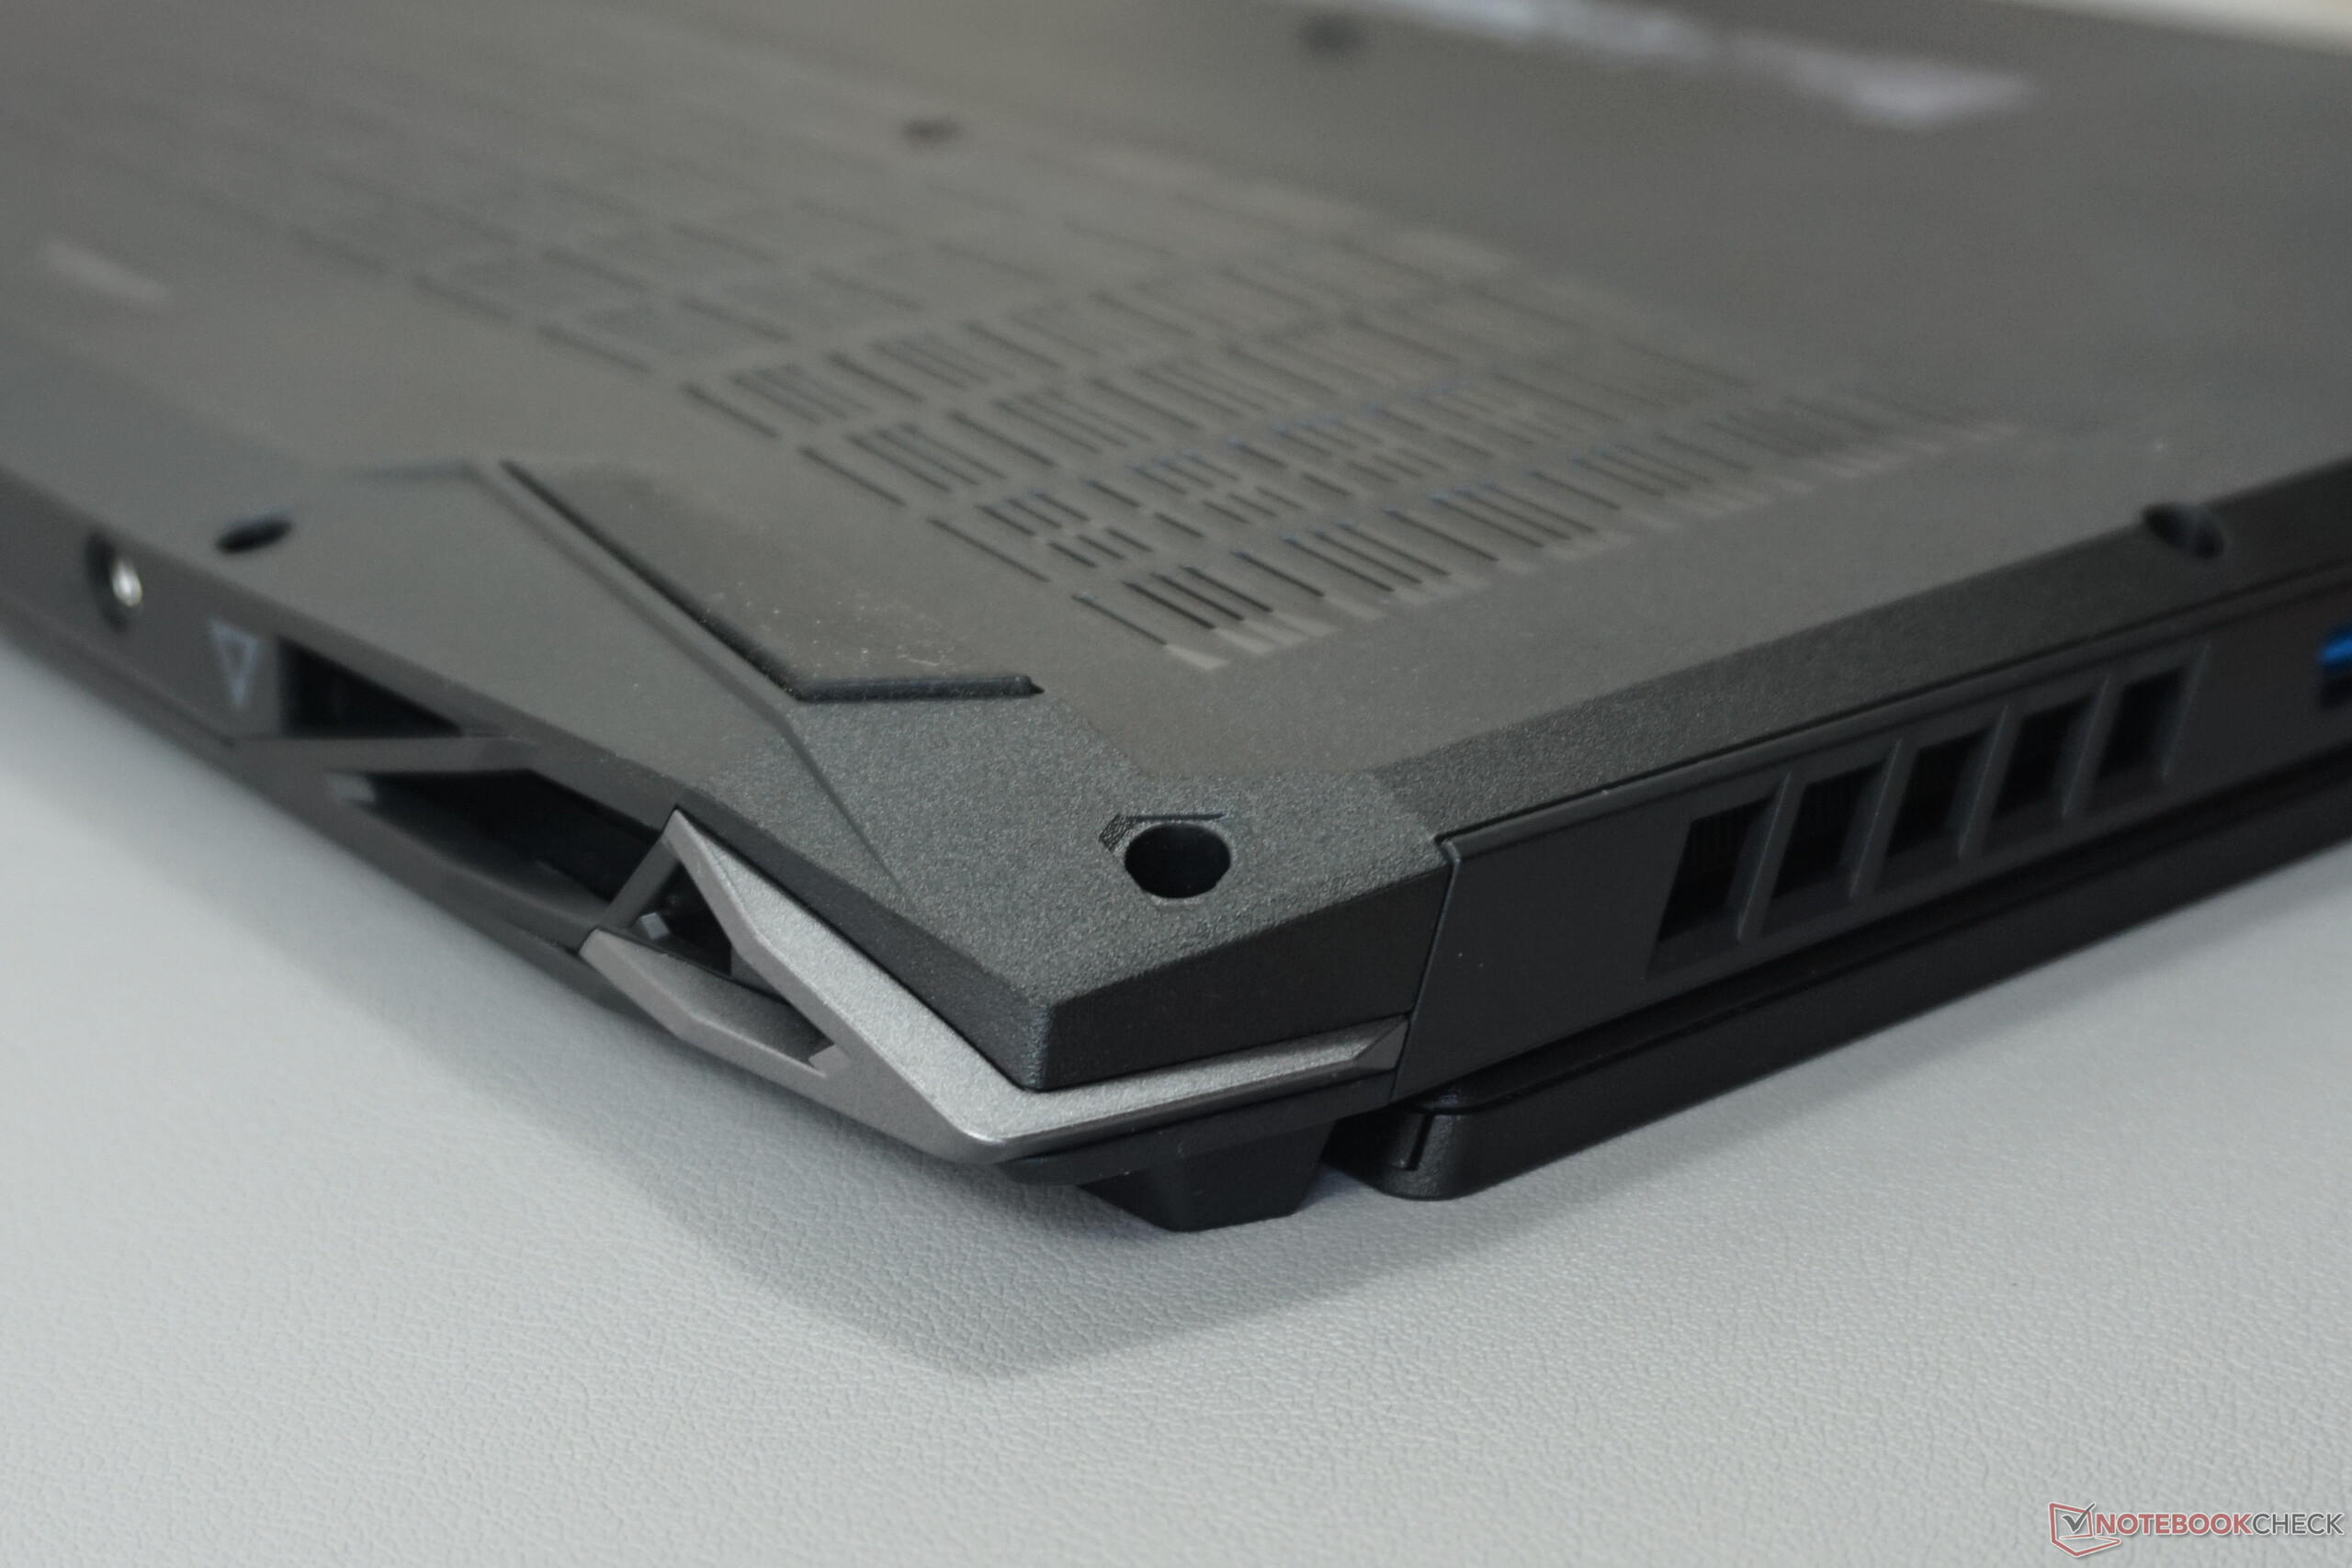
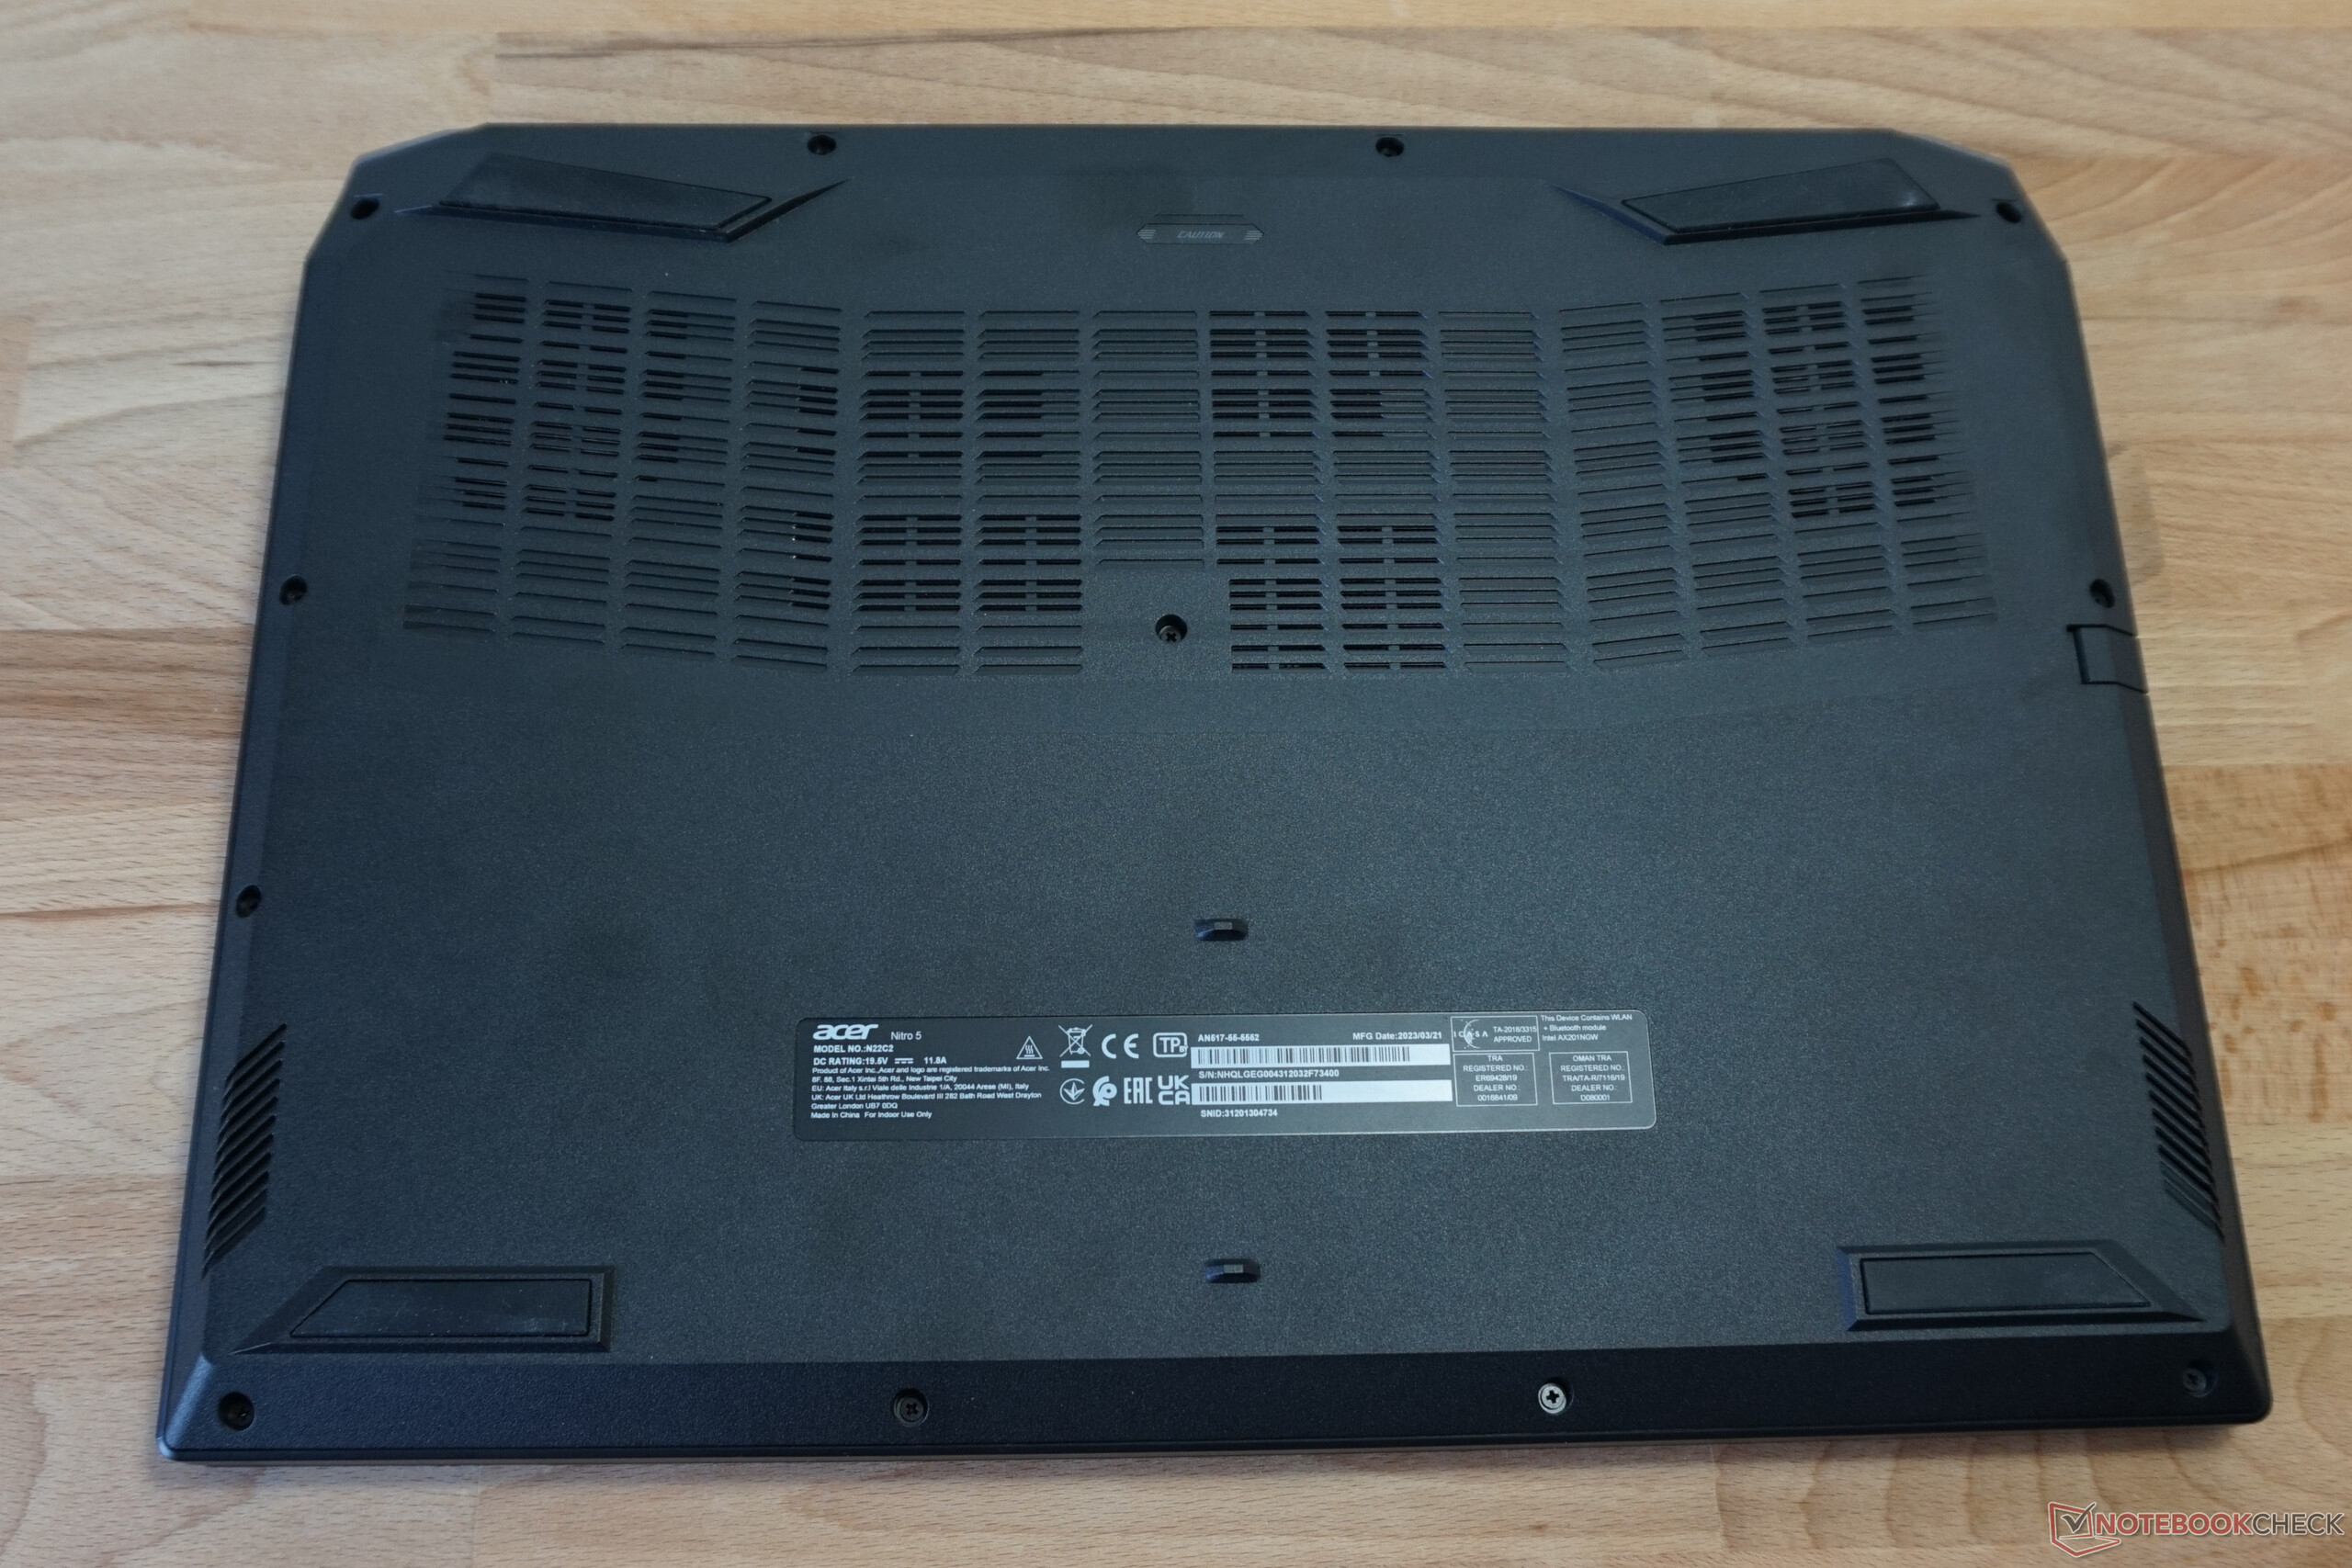
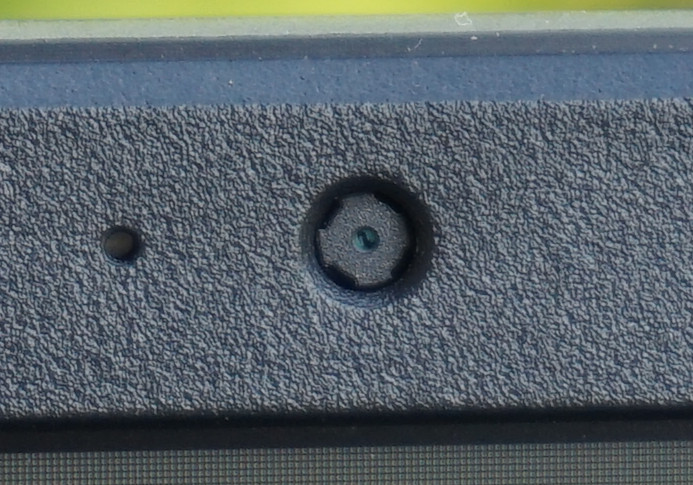
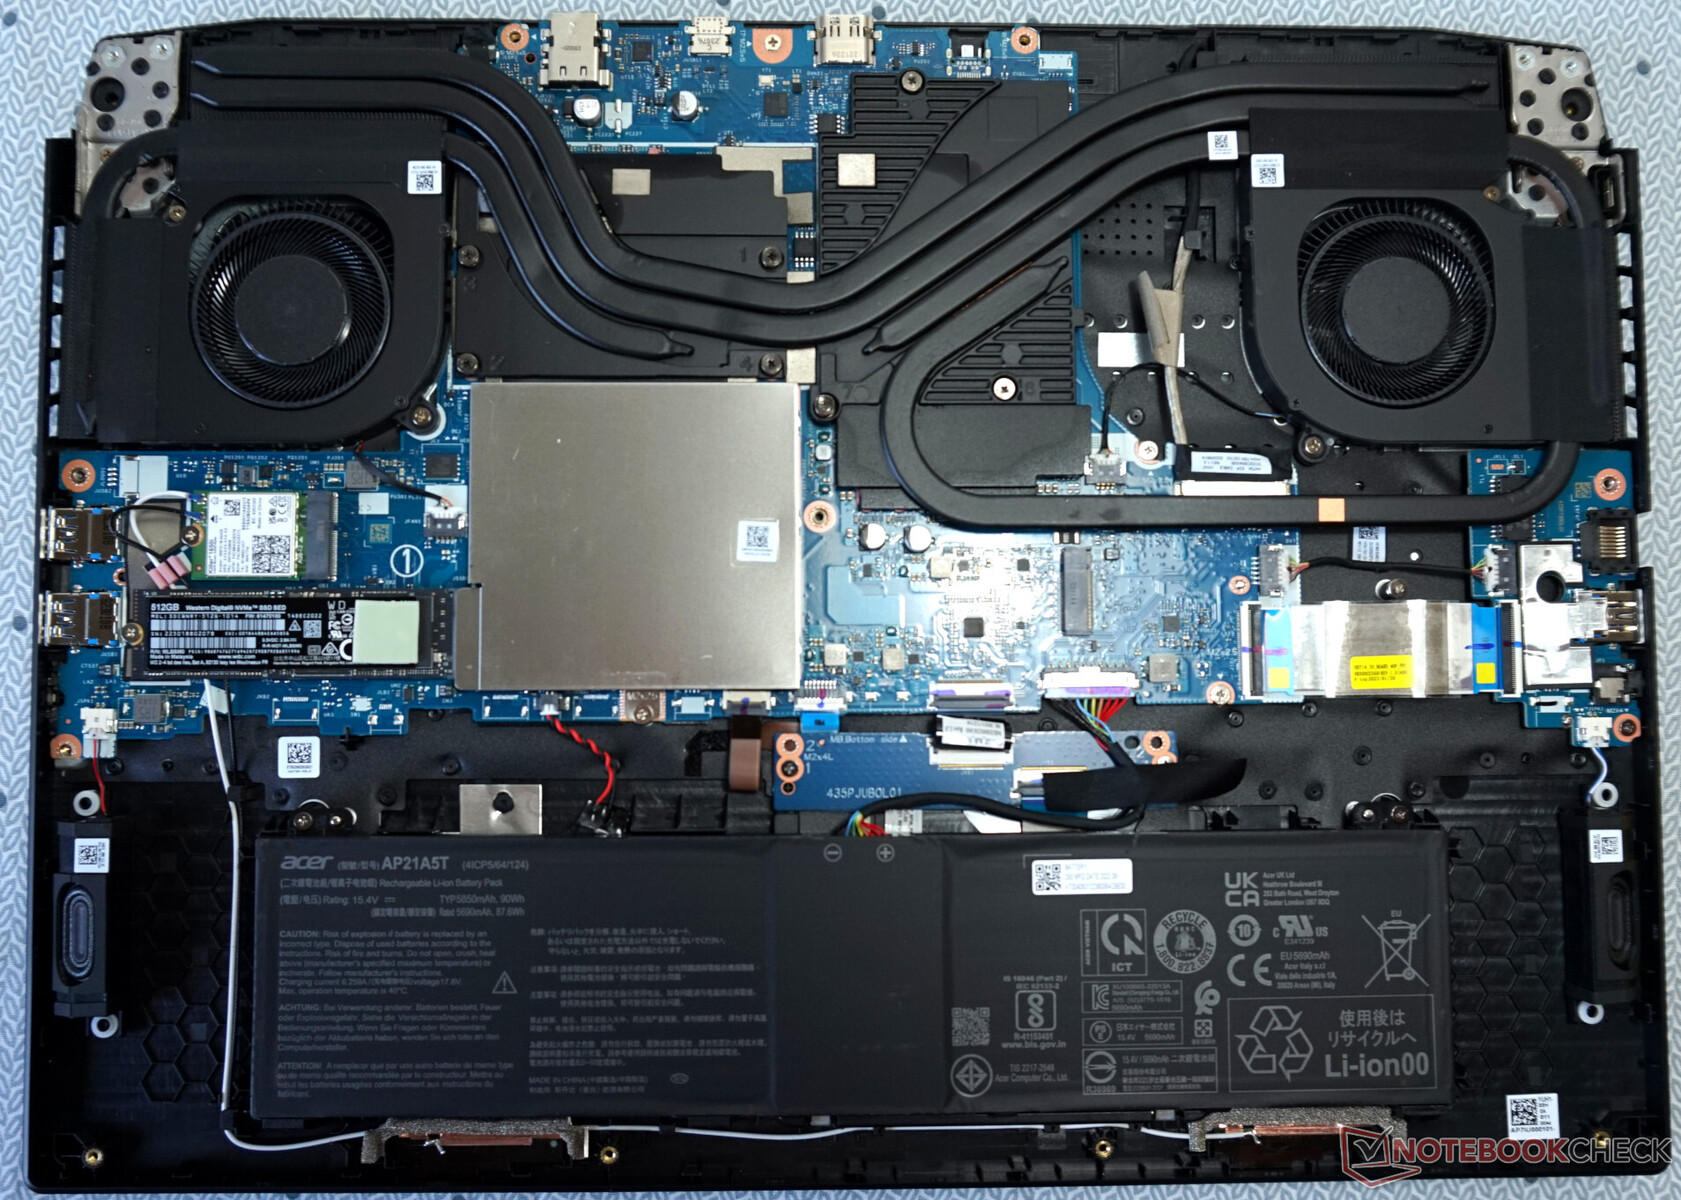
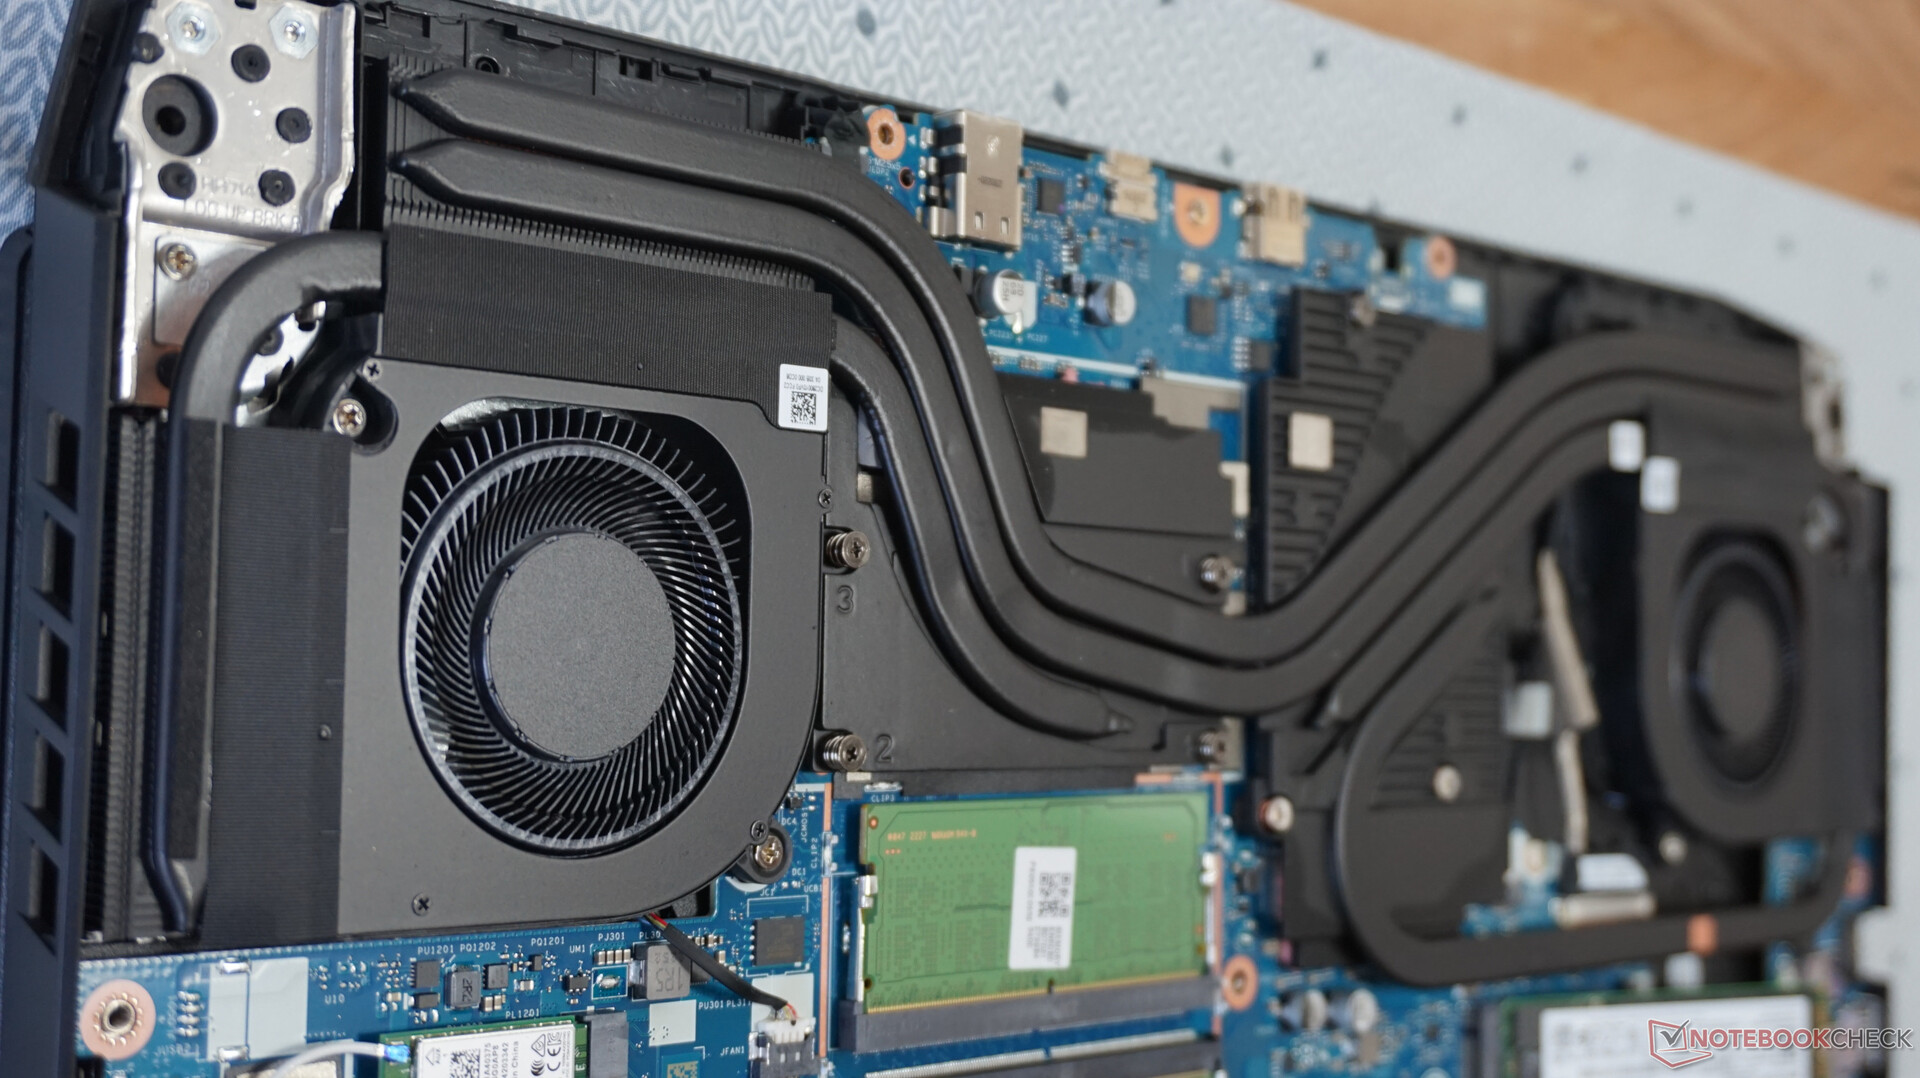
Abrir el Acer Nitro 5 no es particularmente problemático: En primer lugar, es necesario retirar doce tornillos de estrella de idéntico tamaño. Una vez hecho esto, es posible quitar la base extrayéndola de las esquinas traseras, y todo ello con un esfuerzo mínimo.
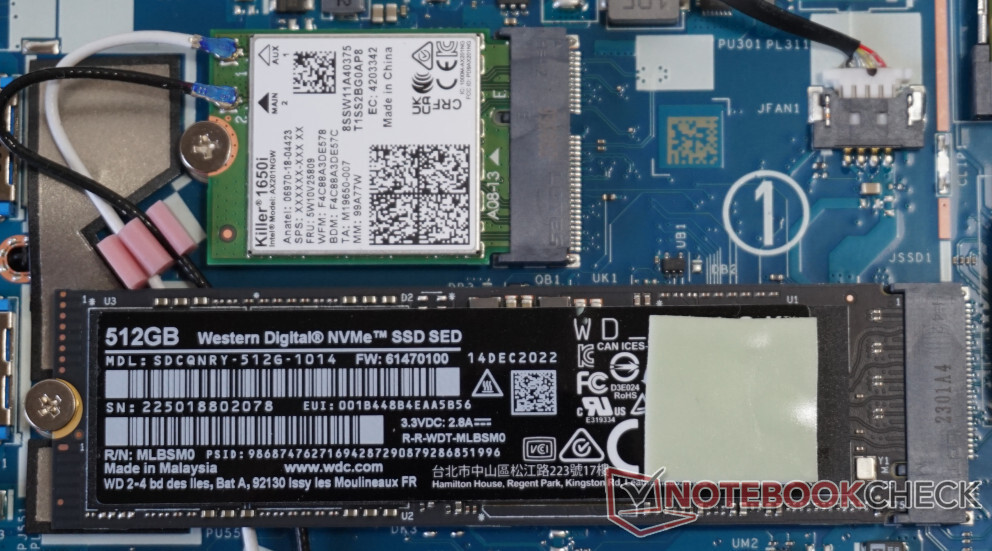
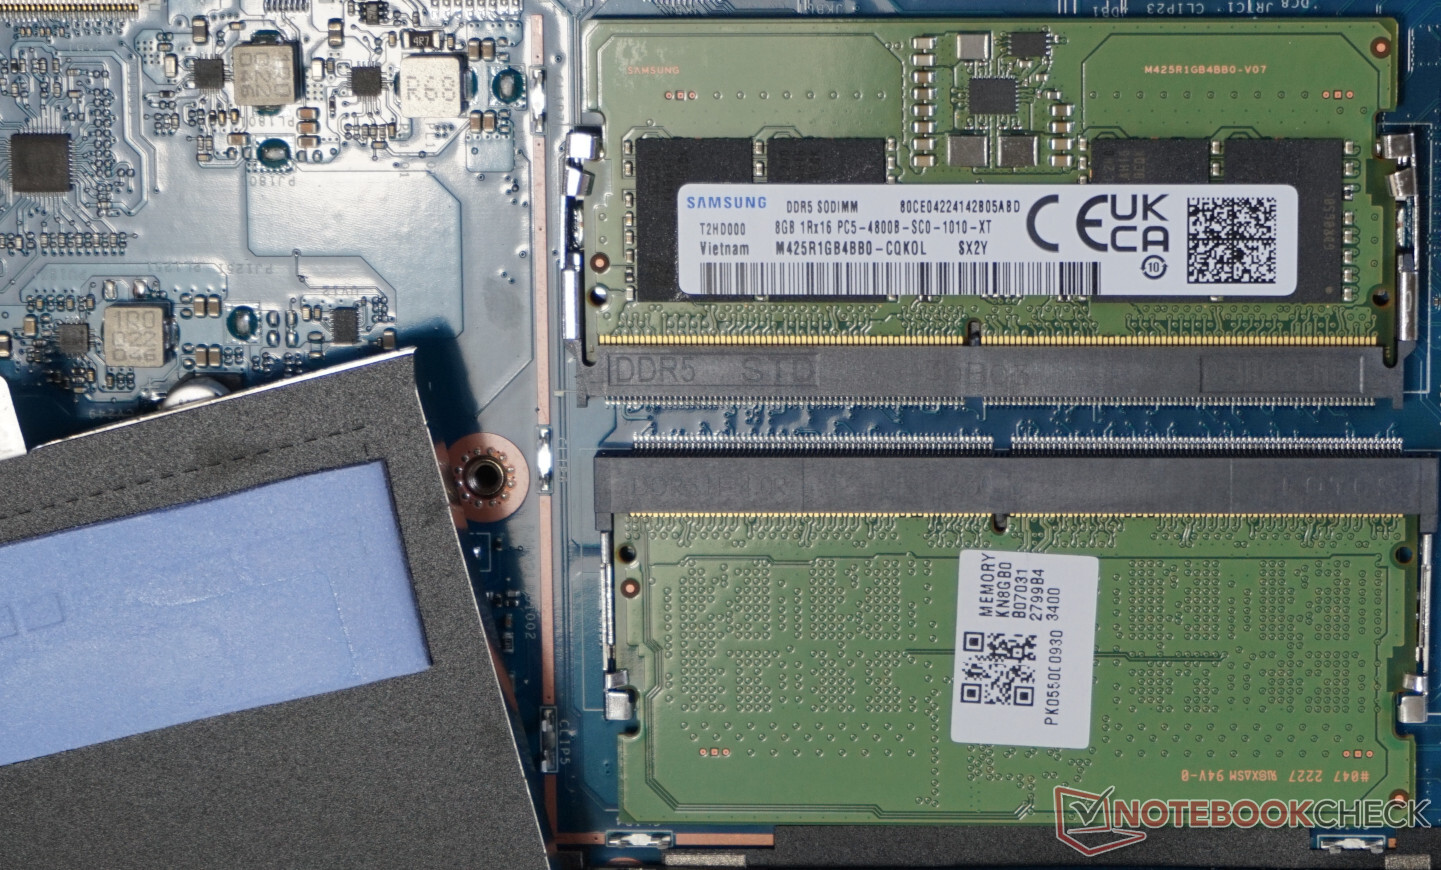
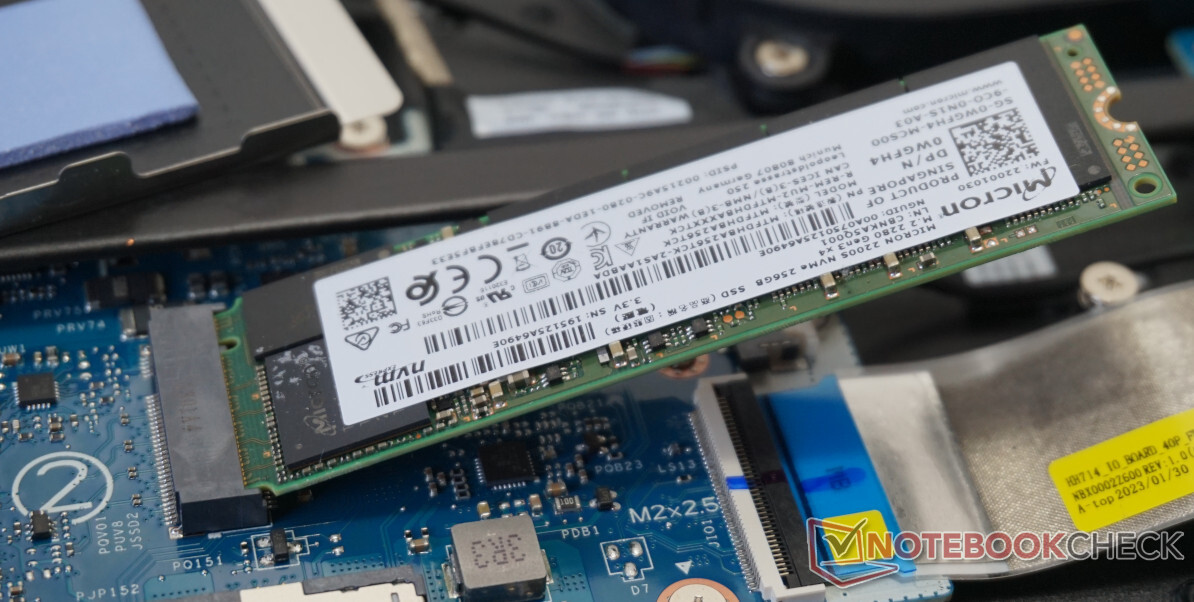
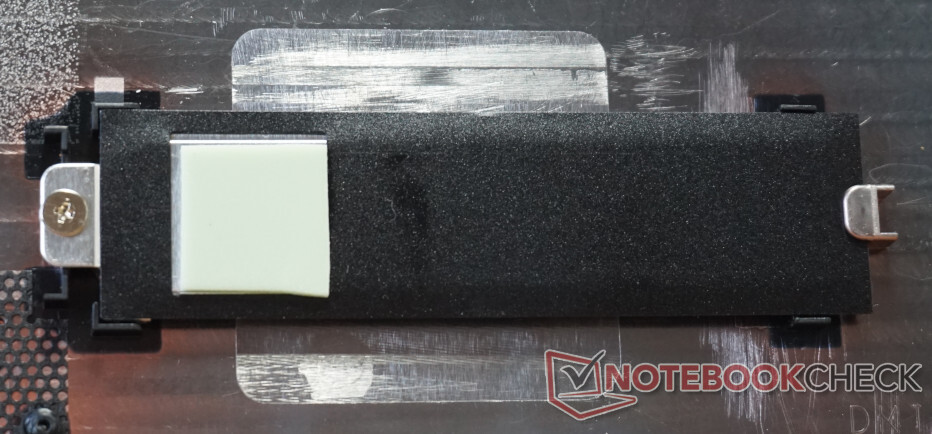
Un rápido vistazo al interior revela una gran superficie espaciosa. Sin embargo, el espacio libre disponible se podría haber aprovechado un poco mejor, especialmente en la zona alrededor de la batería, para algo así como SSDs M.2. También se puede acceder fácilmente a ambas ranuras. La segunda ranura puede ponerse en funcionamiento más adelante y está claramente marcada con el número "2". El módulo Wi-Fi, los chips de memoria y la batería pueden sustituirse fácilmente.
Llaman la atención numerosos elementos de refrigeración pasiva. La memoria RAM bajo la cubierta está equipada con grandes almohadillas térmicas. Además, también hay una almohadilla de este tipo en el controlador del SSD y entra en contacto con un elemento de refrigeración en la placa base cuando la tapa está cerrada. Dicho elemento y una almohadilla térmica también están preinstalados para la segunda ranura M.2.
Dispositivos de entrada
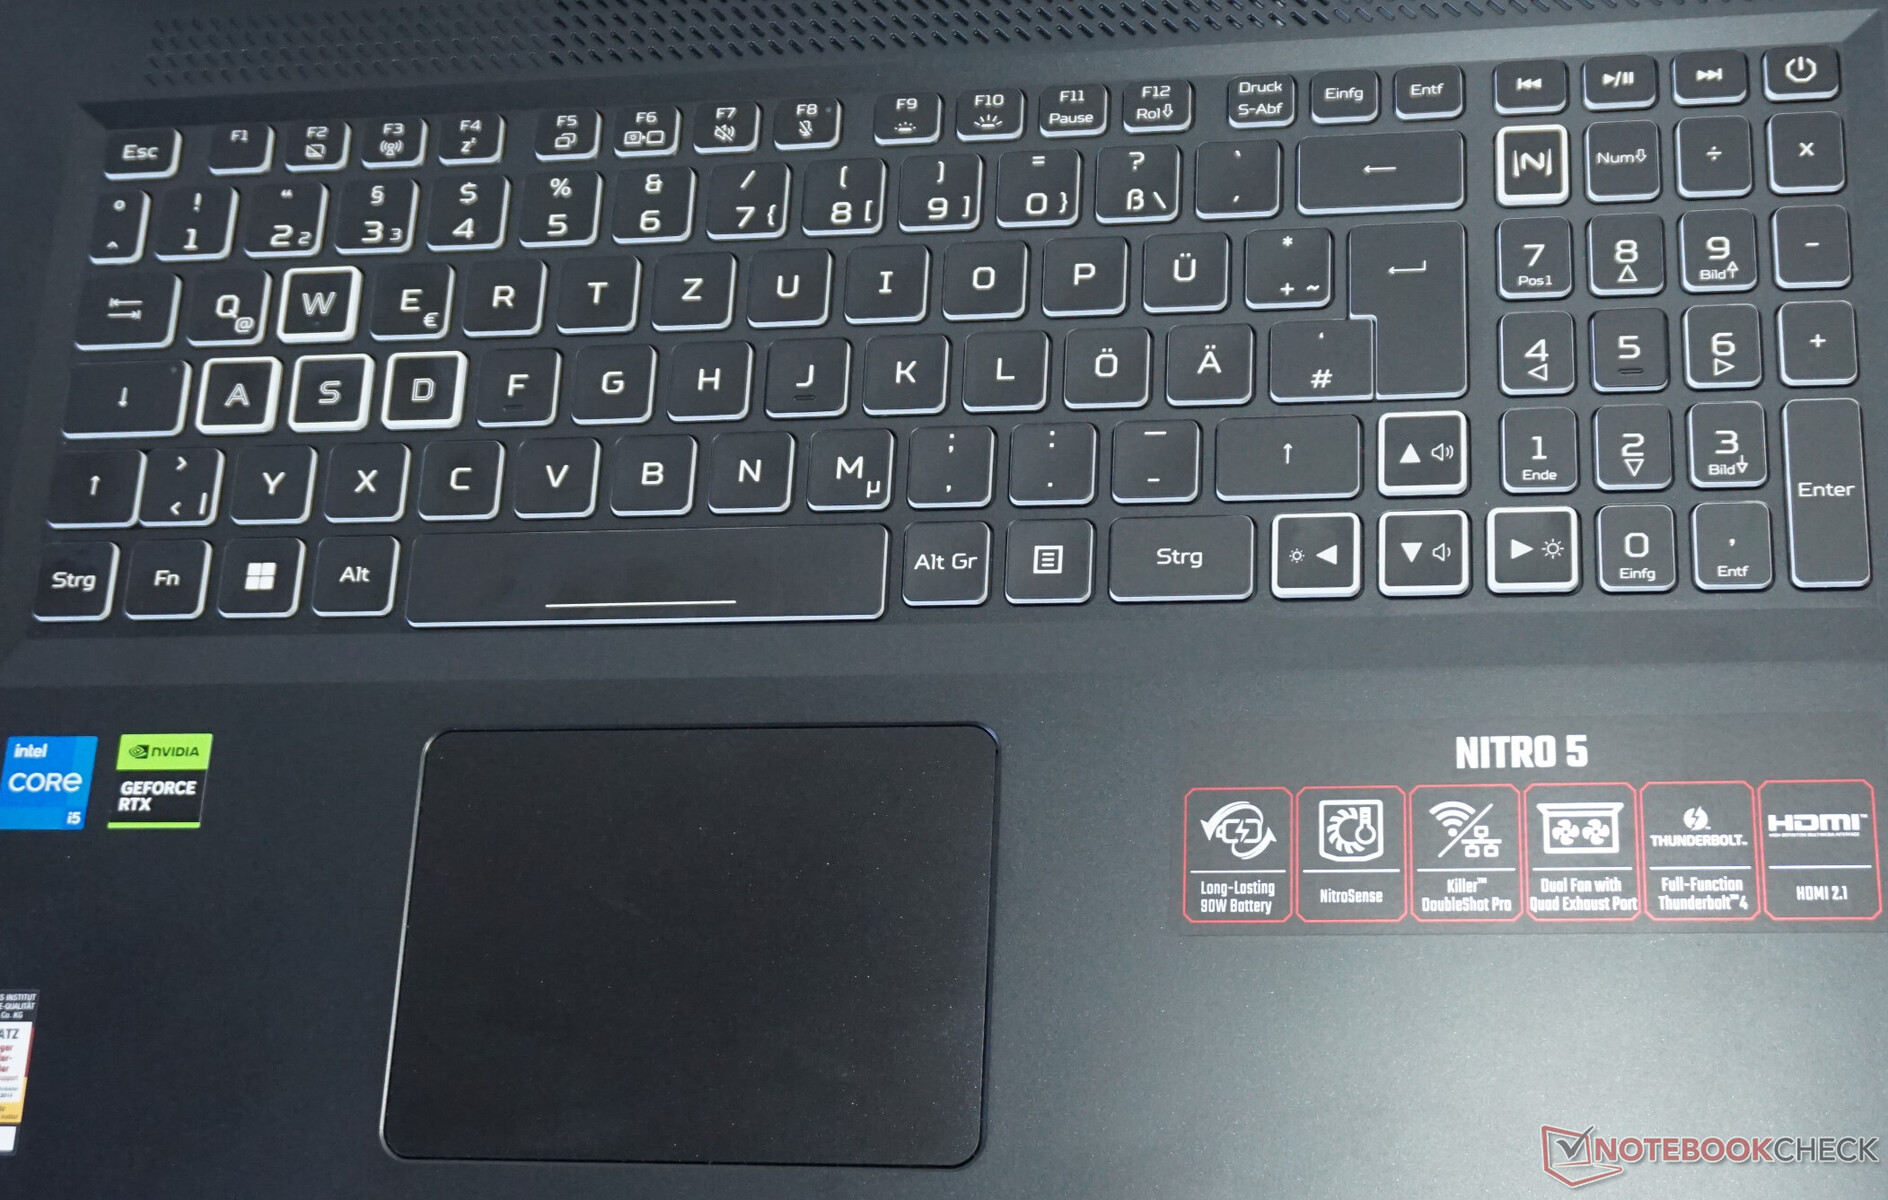
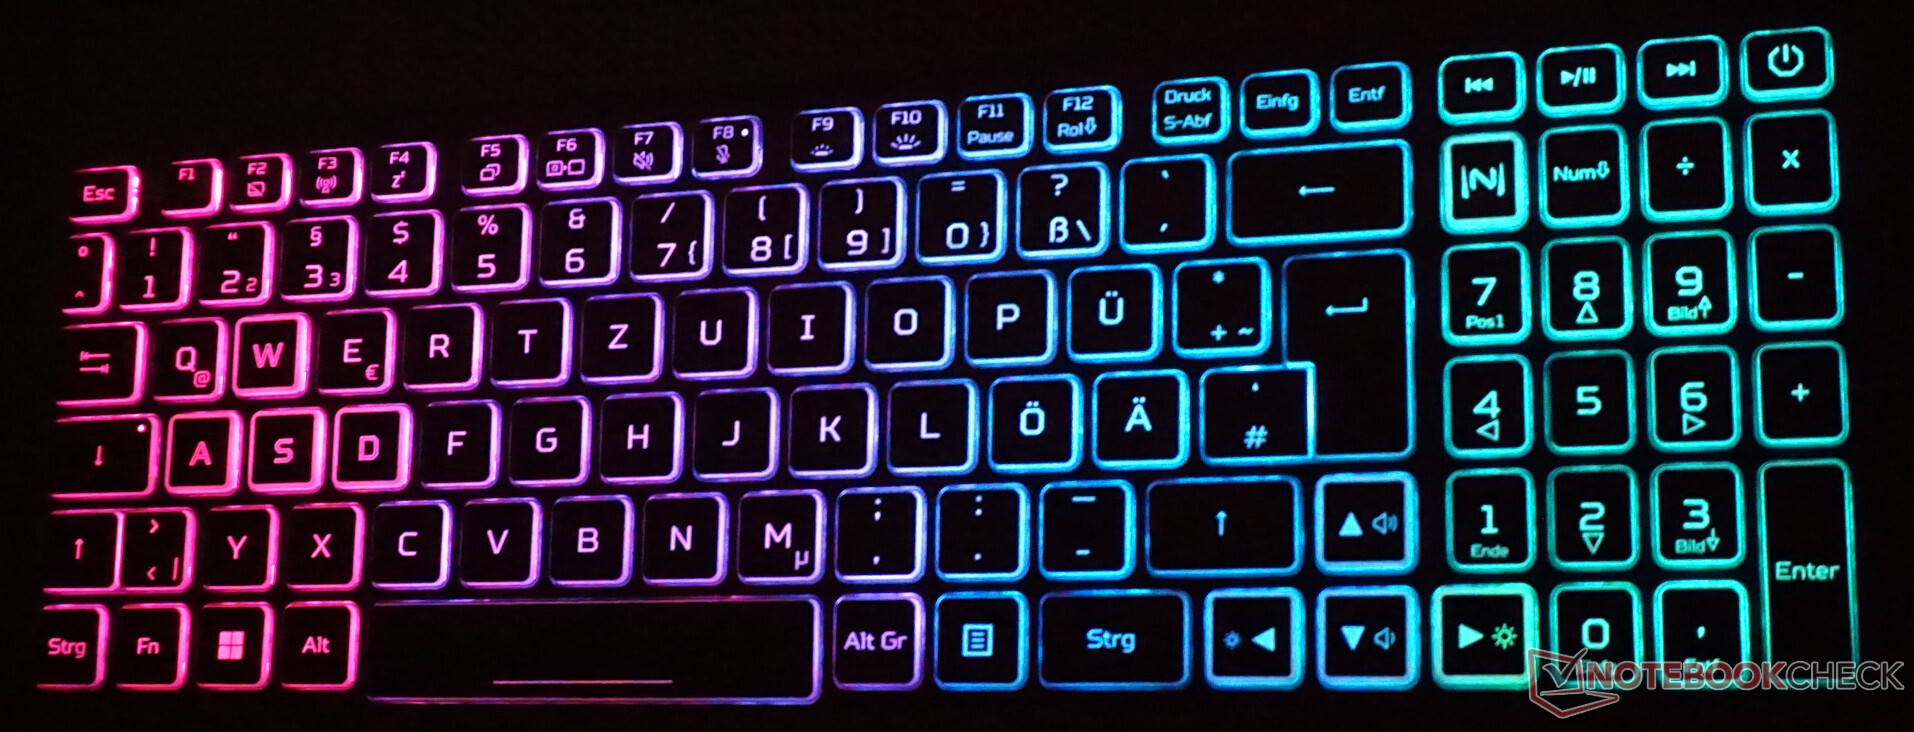
La experiencia de tecleo es agradable. No como un teclado mecánico, por supuesto, pero aún así presume de un recorrido de tecla de 1,5 mm (nuestra medición), con una resistencia uniforme y tranquilizadora, así como un marco de teclado estable.
Además, el diseño visual también está bien logrado: Gracias a los bordes blancos, las teclas destacan entre sí. Las teclas de flecha, "WASD" y una tecla especial para el software "NitroSense" de Acer tienen una marca adicional que hace que encontrarlas sea notablemente más fácil, especialmente con el rabillo del ojo.
La colorida iluminación de las teclas sólo utiliza cuatro áreas personalizables. Al mismo tiempo, se dispone de un espectro de colores amplio y finamente graduado que hace que el efecto arco iris, entre otras cosas, sea realmente efectivo.
El touchpad es mucho menos impresionante y, con 10 x 8 cm, no es particularmente grande. Las teclas ocultas no siempre responden inmediatamente. Esto se notó repetidamente con representaciones imprecisas de los movimientos de los dedos. Sin embargo, como en la mayoría de los portátiles para juegos, esto no debería ocurrir cuando se juega.
Pantalla - Demasiado oscura y sosa para un portátil de juegos
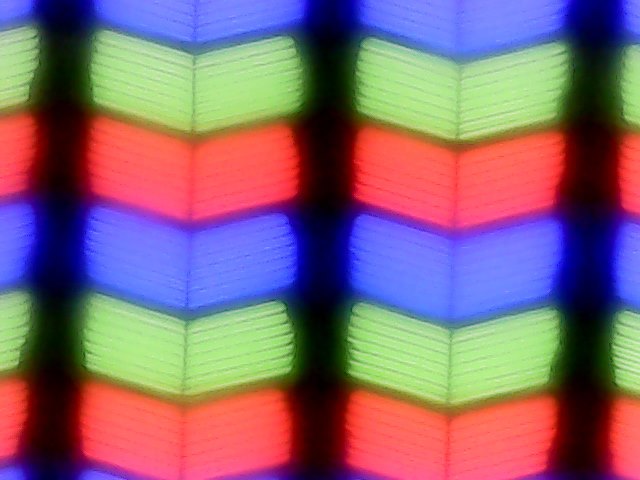

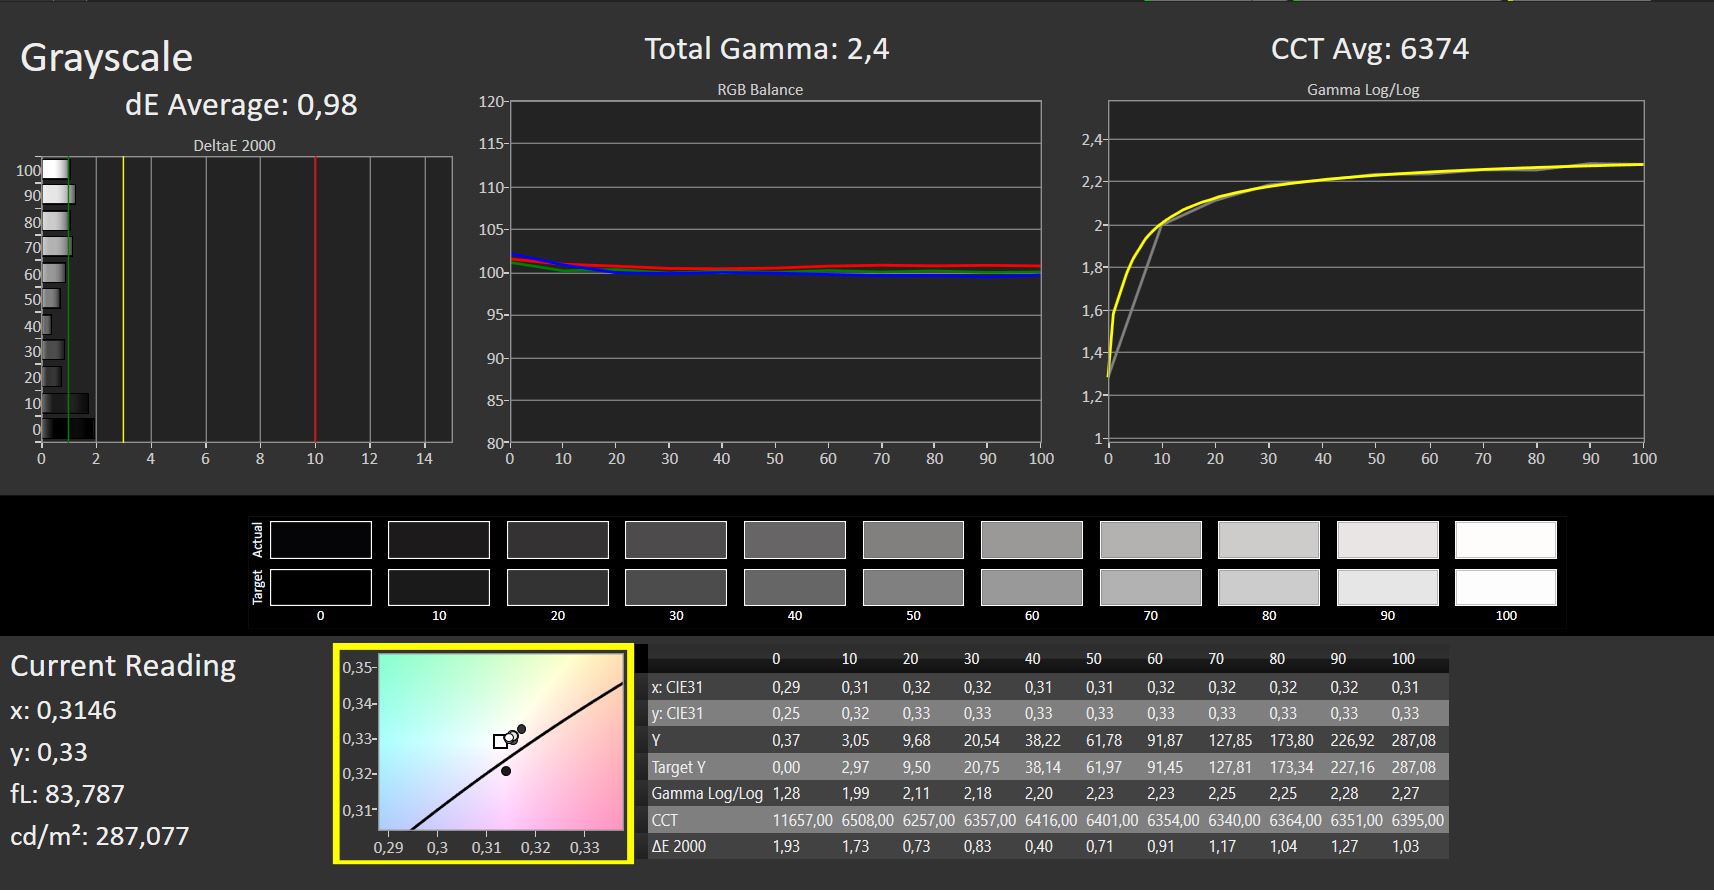
El muy básico panel IPS del Acer Nitro 5 casi nos recuerda a un monitor de oficina si no fuera por la tasa de refresco de 144 Hz. Y esto está en armonía con la resolución Full HD así como con el limitado rendimiento gráfico. Además, los tiempos de respuesta medidos también son decentes.
Por desgracia, todos los demás aspectos están por debajo de la media. Un brillo medio de casi 250 cd/m² y unos niveles de negro relativamente malos resultan en un contraste pobre. Al ver una imagen oscura en una habitación oscura, se puede ver un sangrado de pantalla significativo alrededor de la pantalla.
La variedad de colores, la precisión de reproducción del color y la iluminación también son consistentemente pobres. Esto no afecta negativamente a los juegos, pero hace que algunos efectos no sean muy llamativos.
Además, limita la versatilidad del portátil. La pantalla no es una opción seria, ni siquiera para fotógrafos aficionados modestamente ambiciosos.
| |||||||||||||||||||||||||
iluminación: 81 %
Brillo con batería: 285 cd/m²
Contraste: 491:1 (Negro: 0.58 cd/m²)
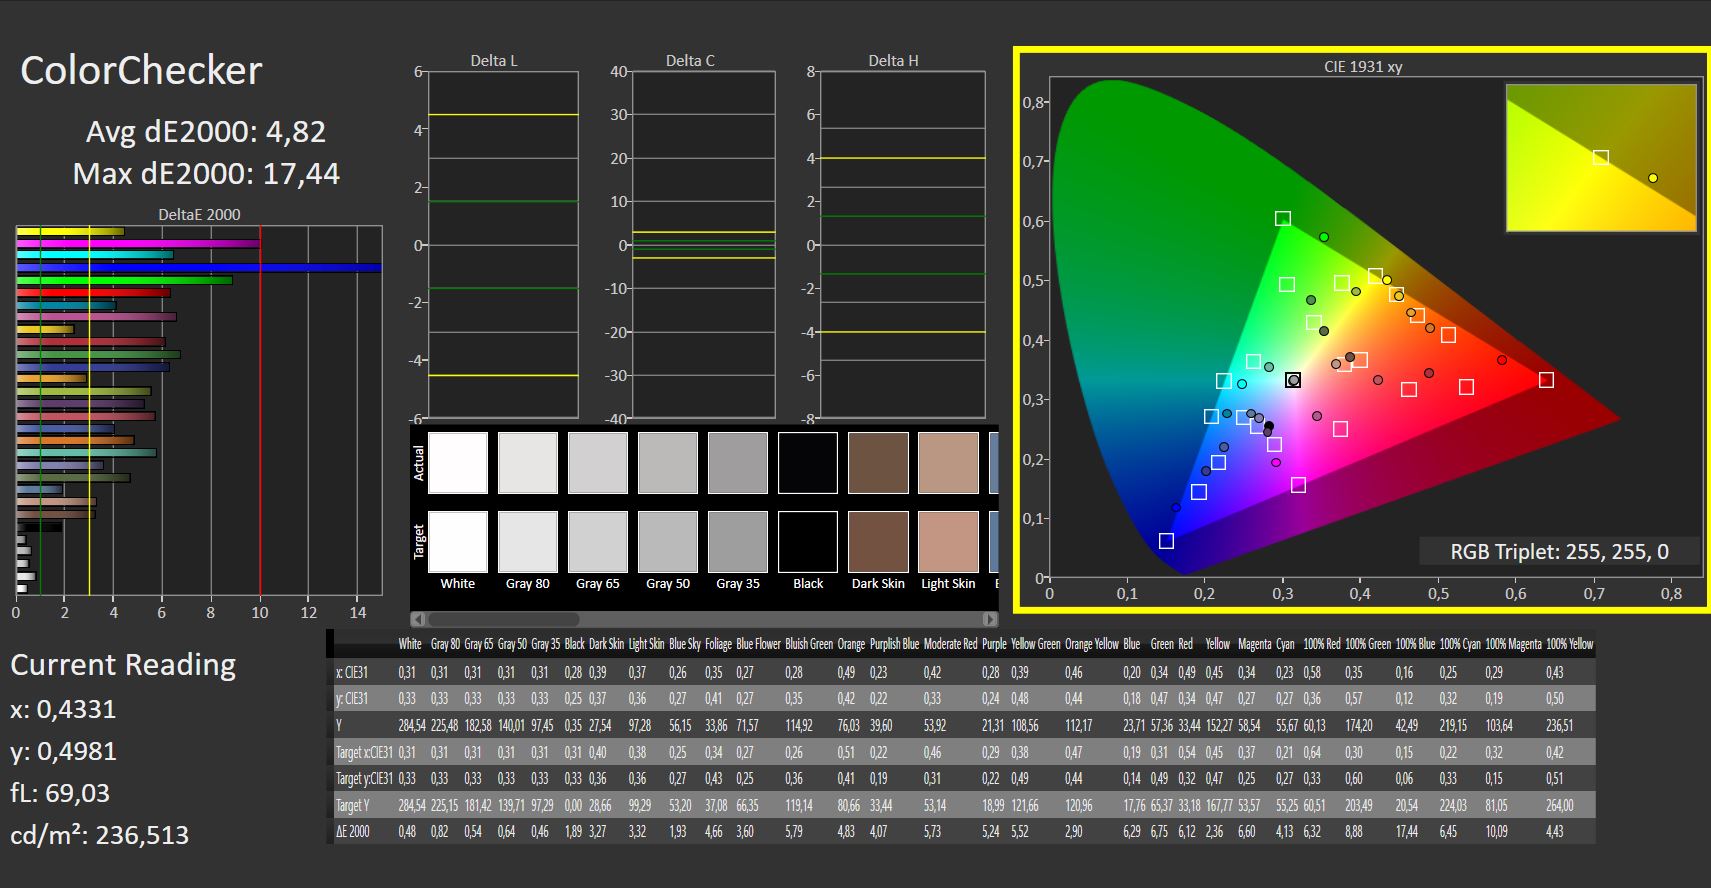
ΔE ColorChecker Calman: 4.59 | ∀{0.5-29.43 Ø4.73}
calibrated: 4.82
ΔE Greyscale Calman: 2.89 | ∀{0.09-98 Ø4.97}
38.9% AdobeRGB 1998 (Argyll 3D)
56.4% sRGB (Argyll 3D)
37.6% Display P3 (Argyll 3D)
Gamma: 2.38
CCT: 7000 K
| Acer Nitro 5 AN517-55-5552 BOE0A6F NV173FHM-NX4, IPS, 1920x1080, 17.3" | Asus TUF Gaming A16 FA617XS BOE NE160WUM-NX2, IPS, 1920x1200, 16" | Acer Nitro 5 AN517-55-738R B173HAN04.0, IPS, 1920x1080, 17.3" | Medion Erazer Scout E20 LG Philips LGD0611, IPS, 1920x1080, 17.3" | MSI Katana 15 B12VEK AUOAF90 (B156HAN08.4), IPS, 1920x1080, 15.6" | MSI Cyborg 15 A12VF AU Optronics B156HAN15.1, IPS, 1920x1080, 15.6" | |
|---|---|---|---|---|---|---|
| Display | 80% | 55% | 72% | 1% | 12% | |
| Display P3 Coverage (%) | 37.6 | 69.3 84% | 58.9 57% | 65.1 73% | 38.1 1% | 42.3 12% |
| sRGB Coverage (%) | 56.4 | 97.3 73% | 86.4 53% | 96.7 71% | 56.8 1% | 62.6 11% |
| AdobeRGB 1998 Coverage (%) | 38.9 | 70.7 82% | 60.5 56% | 66.5 71% | 39.3 1% | 43.7 12% |
| Response Times | 21% | 55% | 22% | -104% | -11% | |
| Response Time Grey 50% / Grey 80% * (ms) | 18 ? | 15.6 ? 13% | 6 ? 67% | 14.8 ? 18% | 38.8 ? -116% | 22 ? -22% |
| Response Time Black / White * (ms) | 14 ? | 10 ? 29% | 8 ? 43% | 10.4 ? 26% | 26.8 ? -91% | 14 ? -0% |
| PWM Frequency (Hz) | ||||||
| Screen | 55% | 24% | 41% | 3% | 24% | |
| Brightness middle (cd/m²) | 285 | 301 6% | 286 0% | 312 9% | 261 -8% | 247 -13% |
| Brightness (cd/m²) | 257 | 294 14% | 278 8% | 303 18% | 258 0% | 234 -9% |
| Brightness Distribution (%) | 81 | 94 16% | 89 10% | 91 12% | 92 14% | 89 10% |
| Black Level * (cd/m²) | 0.58 | 0.21 64% | 0.32 45% | 0.25 57% | 0.19 67% | 0.25 57% |
| Contrast (:1) | 491 | 1433 192% | 894 82% | 1248 154% | 1374 180% | 988 101% |
| Colorchecker dE 2000 * | 4.59 | 1.79 61% | 3.05 34% | 2.65 42% | 5.57 -21% | 3.78 18% |
| Colorchecker dE 2000 max. * | 6.98 | 3.48 50% | 5.83 16% | 6.44 8% | 20.6 -195% | 6.42 8% |
| Colorchecker dE 2000 calibrated * | 4.82 | 1.2 75% | 3.13 35% | 0.96 80% | 4.63 4% | 3.94 18% |
| Greyscale dE 2000 * | 2.89 | 2.5 13% | 3.17 -10% | 3.2 -11% | 3.19 -10% | 2.16 25% |
| Gamma | 2.38 92% | 2.265 97% | 2.29 96% | 2.246 98% | 2.45 90% | 2.33 94% |
| CCT | 7000 93% | 6157 106% | 6916 94% | 7258 90% | 6146 106% | 6906 94% |
| Media total (Programa/Opciones) | 52% /
55% | 45% /
35% | 45% /
45% | -33% /
-12% | 8% /
16% |
* ... más pequeño es mejor
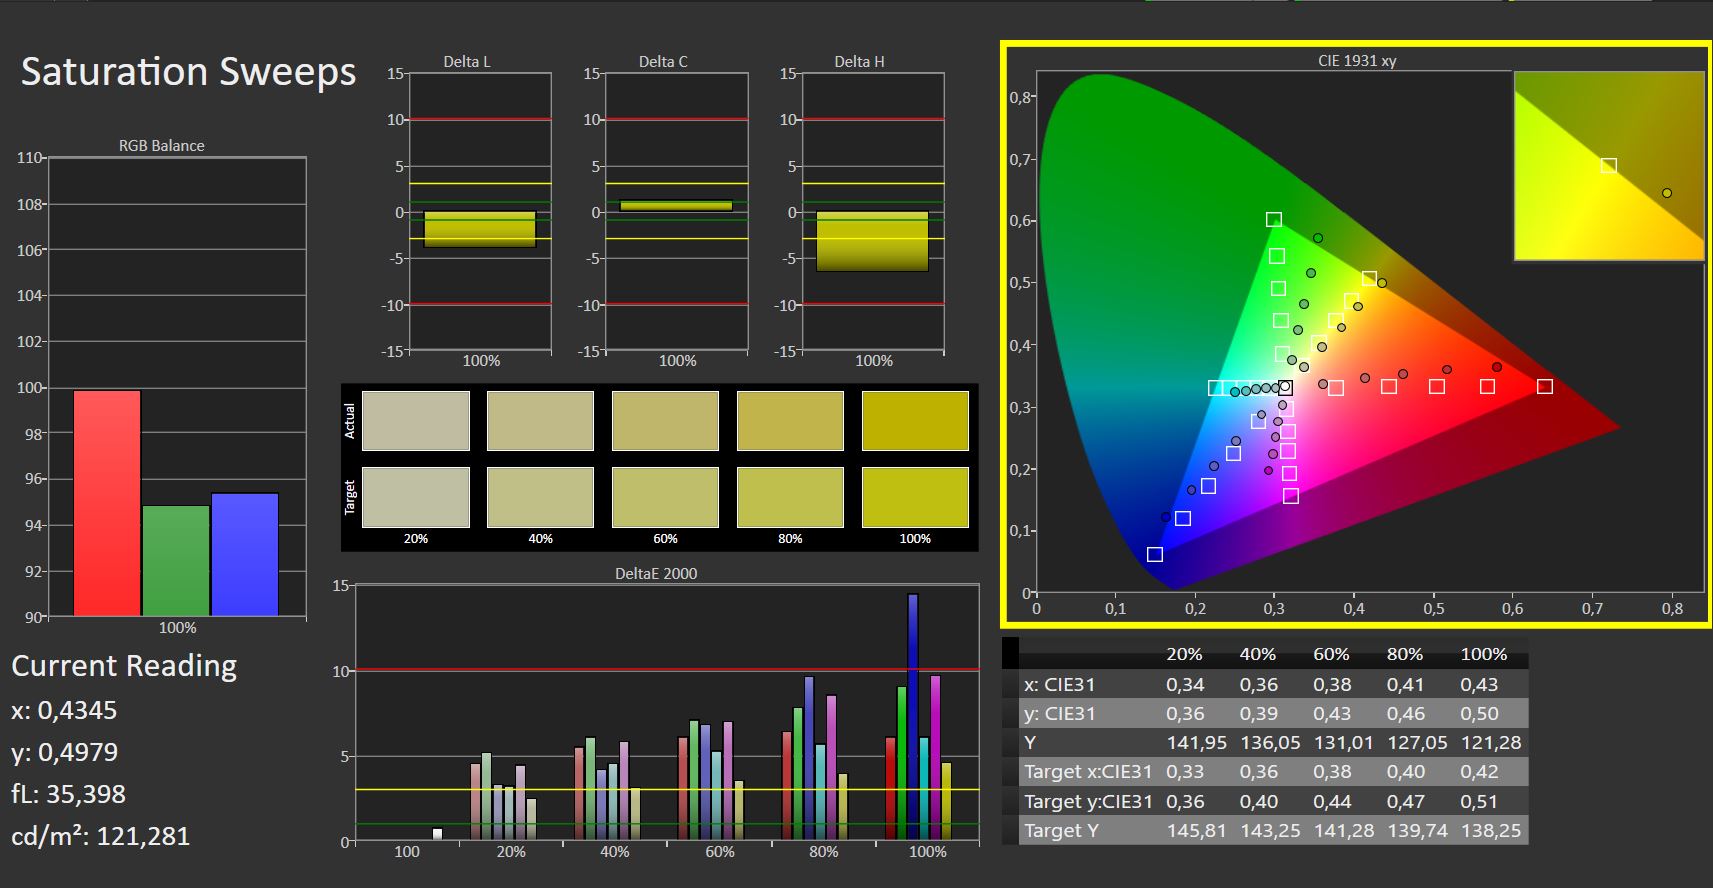
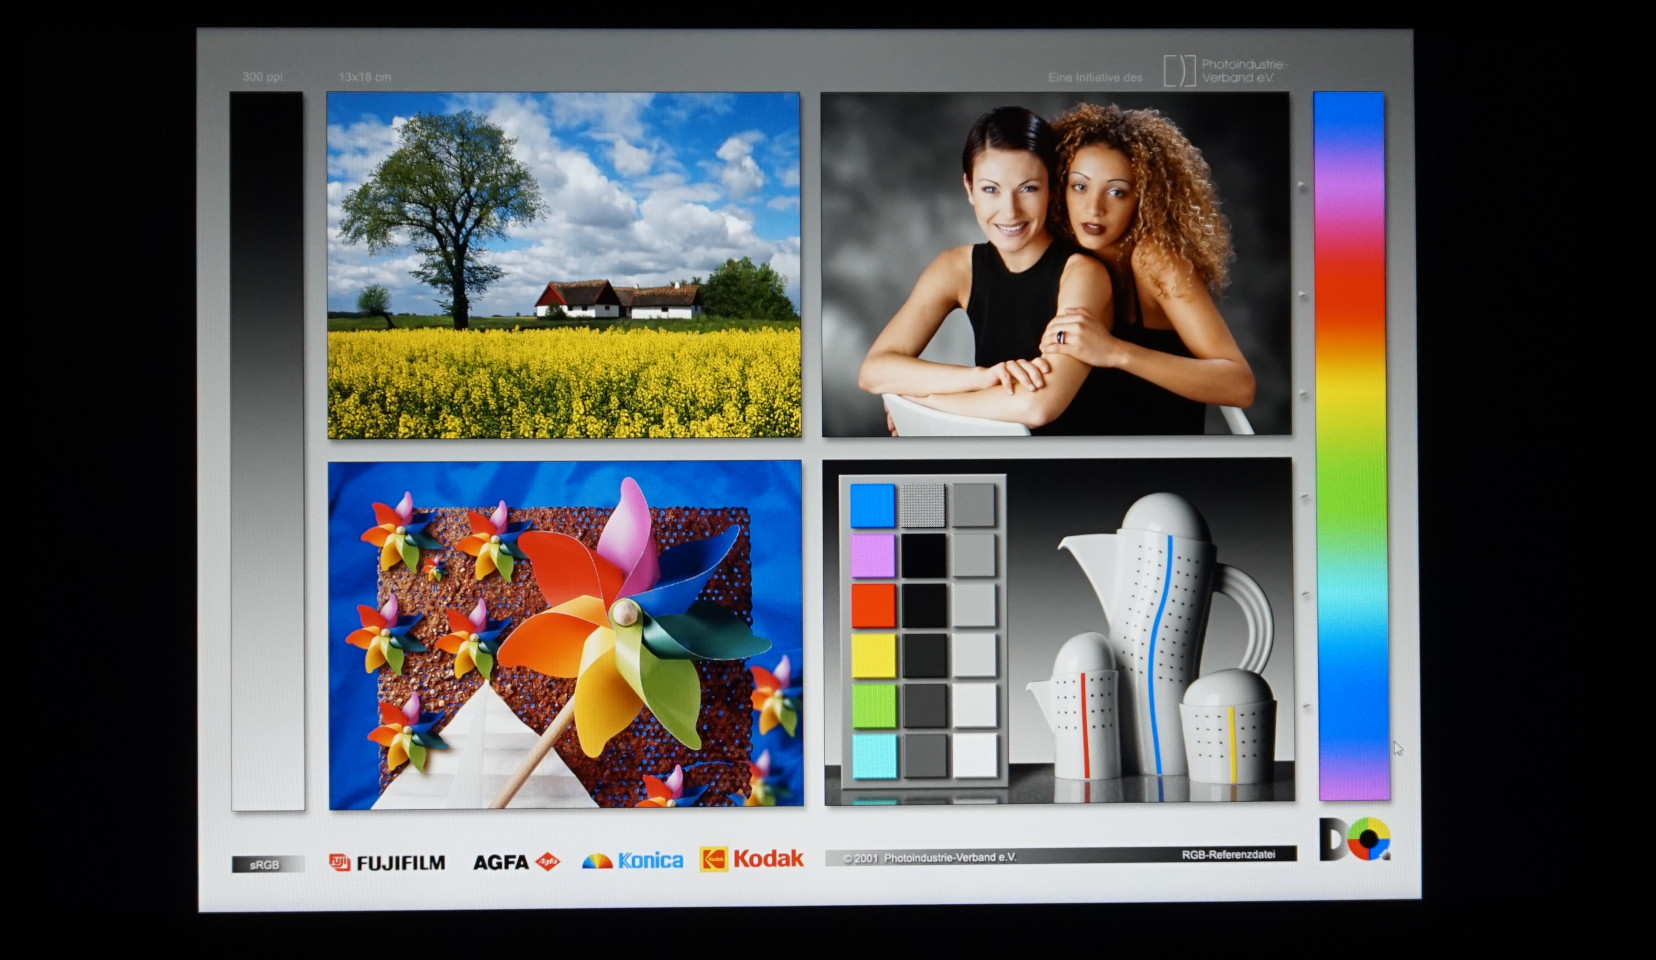
La pantalla puede mostrar aproximadamente más de la mitad de sRGB, el espacio de color que se suele utilizar en los juegos. Como resultado, la gradación fina del color, como una representación del cielo, puede acabar pareciendo un bloque. Lo correcto sería esperar una cobertura sRGB al menos cercana a la completa, como se vio en el predecesor, elNitro 5 AN517-55-738R. Pero, por desgracia, no es el caso. Es suficiente para los juegos, pero decepcionante.
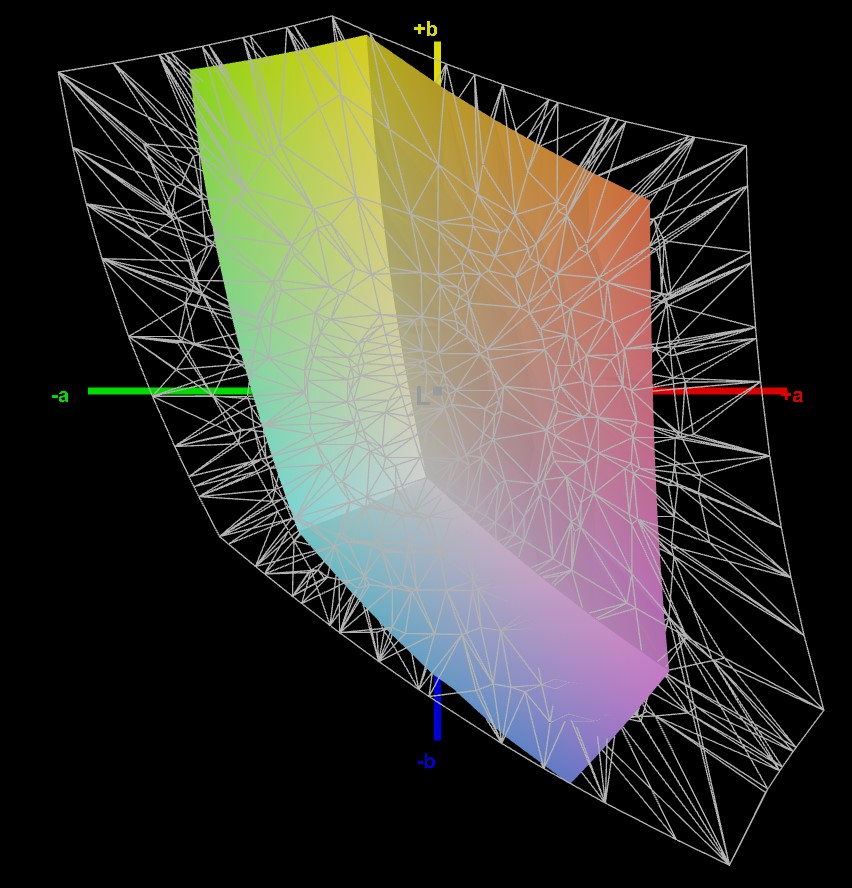
Medimos una desviación en la reproducción del color, especialmente en lo que se refiere a los tonos azules, y esto también era visible para los ojos menos experimentados. Sin embargo, no se podía esperar un resultado mejor en vista de la mala reproducción general del color. Un DeltaE medio de poco menos de 5, que no puede mejorarse con calibrado, es bastante decente, si el objetivo es básicamente jugar.
Tiempos de respuesta del display
| ↔ Tiempo de respuesta de Negro a Blanco | ||
|---|---|---|
| 14 ms ... subida ↗ y bajada ↘ combinada | ↗ 7 ms subida |  |
| ↘ 7 ms bajada | ||
| La pantalla mostró buenos tiempos de respuesta en nuestros tests pero podría ser demasiado lenta para los jugones competitivos. En comparación, todos los dispositivos de prueba van de ##min### (mínimo) a 240 (máximo) ms. » 34 % de todos los dispositivos son mejores. Esto quiere decir que el tiempo de respuesta medido es mejor que la media (19.9 ms) de todos los dispositivos testados. | ||
| ↔ Tiempo de respuesta 50% Gris a 80% Gris | ||
| 18 ms ... subida ↗ y bajada ↘ combinada | ↗ 8 ms subida |  |
| ↘ 10 ms bajada | ||
| La pantalla mostró buenos tiempos de respuesta en nuestros tests pero podría ser demasiado lenta para los jugones competitivos. En comparación, todos los dispositivos de prueba van de ##min### (mínimo) a 636 (máximo) ms. » 32 % de todos los dispositivos son mejores. Esto quiere decir que el tiempo de respuesta medido es mejor que la media (31.1 ms) de todos los dispositivos testados. | ||
Parpadeo de Pantalla / PWM (Pulse-Width Modulation)
| Parpadeo de Pantalla / PWM no detectado |  | ||
Comparación: 52 % de todos los dispositivos testados no usaron PWM para atenuar el display. Si se usó, medimos una media de 7798 (mínimo: 5 - máxmo: 343500) Hz. | |||
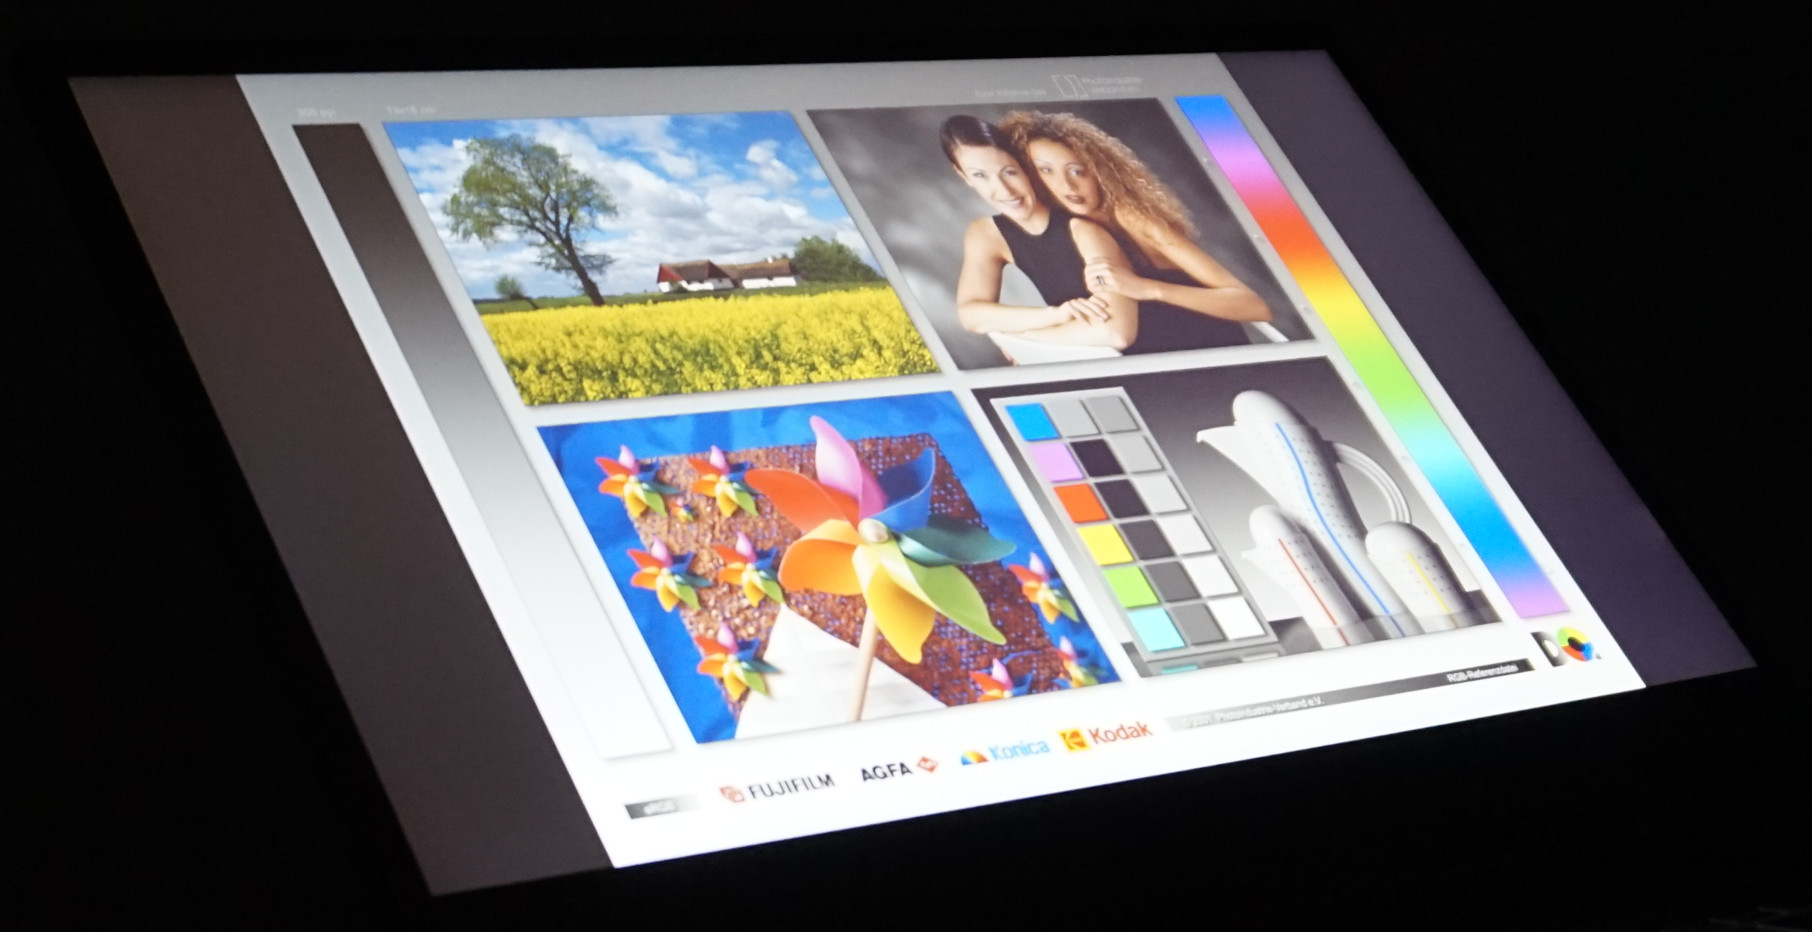
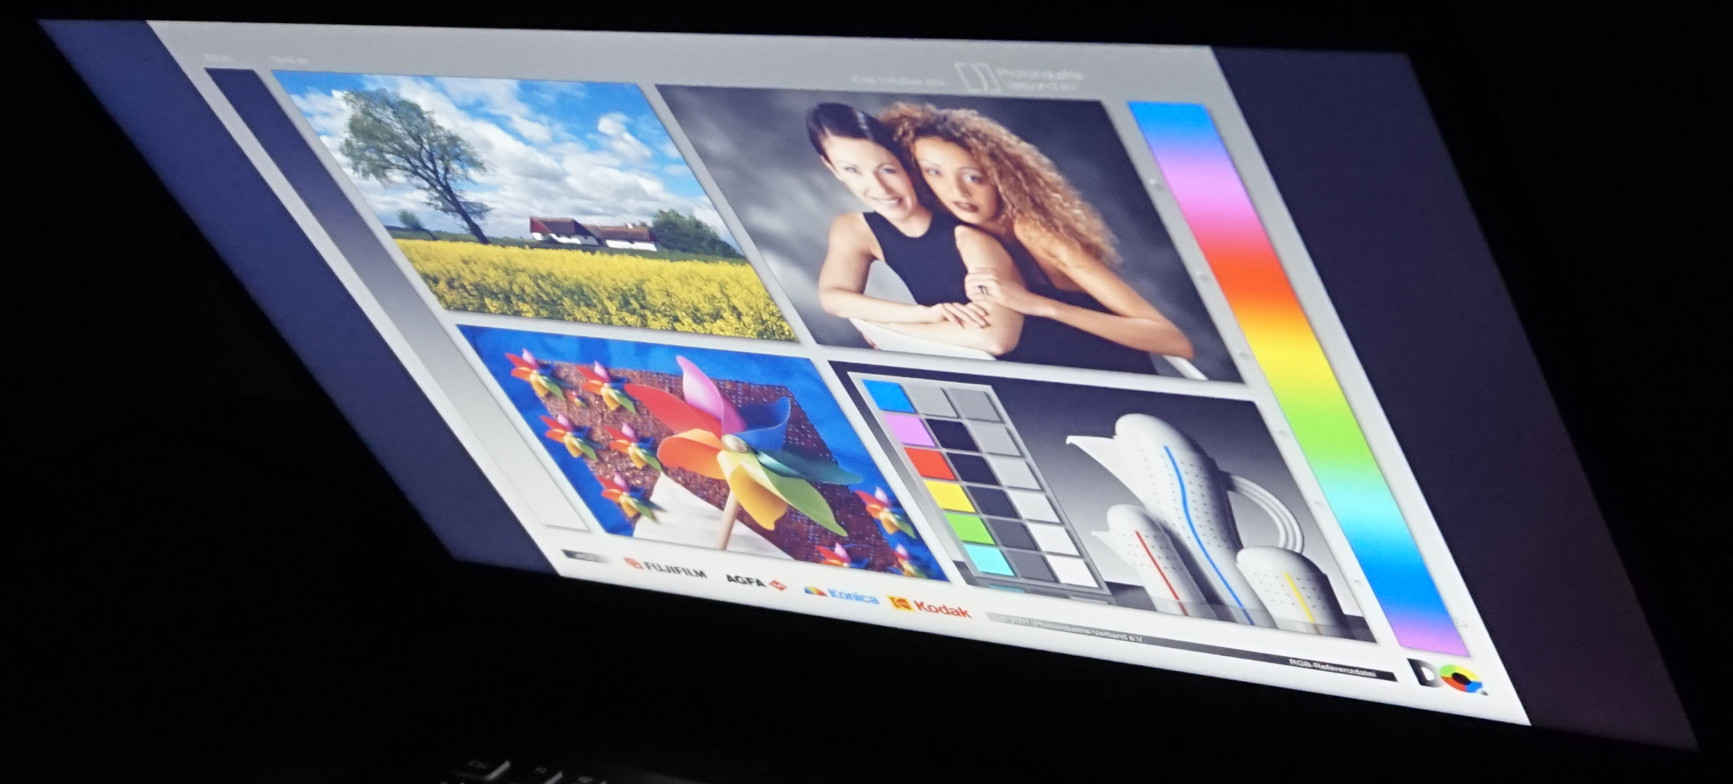
A la sombra, las fotos y el texto son claramente legibles, aunque un poco grisáceos. En cuanto la luz del sol incide sobre la pantalla o el cielo se refleja por detrás, incluso el texto sólo puede ser difícil de descifrar.

La decepción de la pantalla no disminuyó cuando pasamos a los ángulos de visión: En un ángulo de unos 45 °, se aprecian distorsiones de color significativas, desplazándose hacia el amarillo o el azul. Para un panel IPS, es un rendimiento inusualmente pobre.
Rendimiento - El Acer Nitro 517 es impresionante pero sólo gracias a la RTX 4050
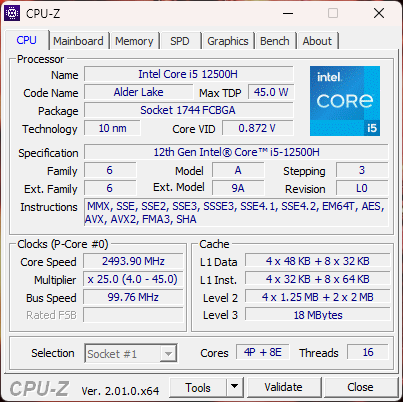
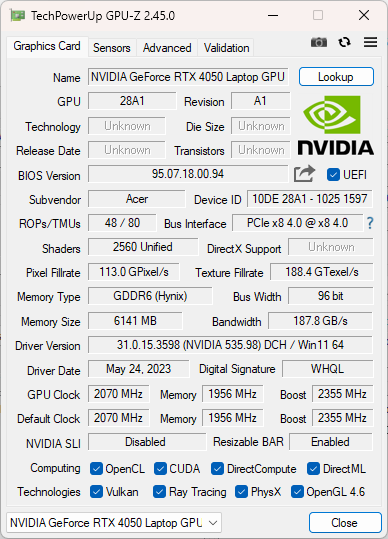
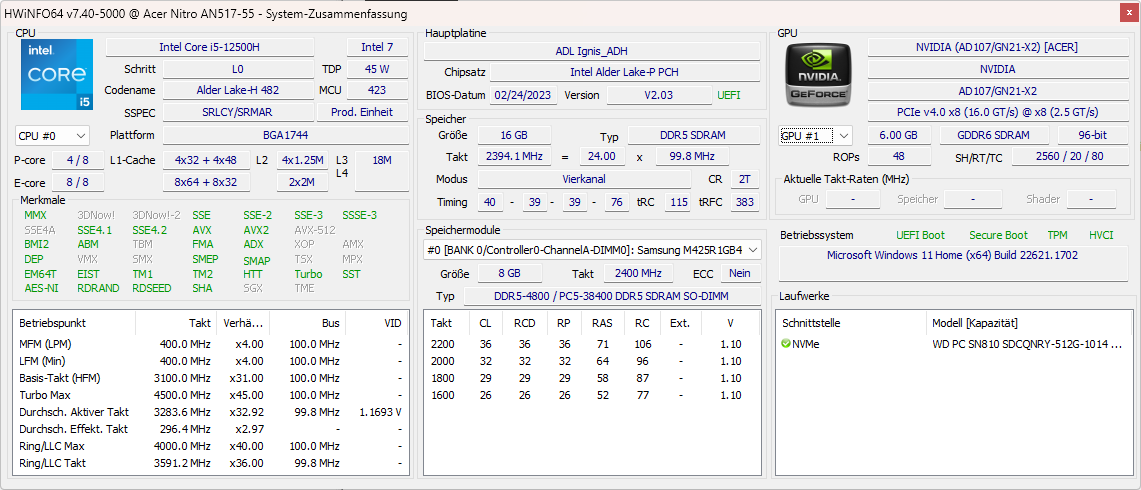
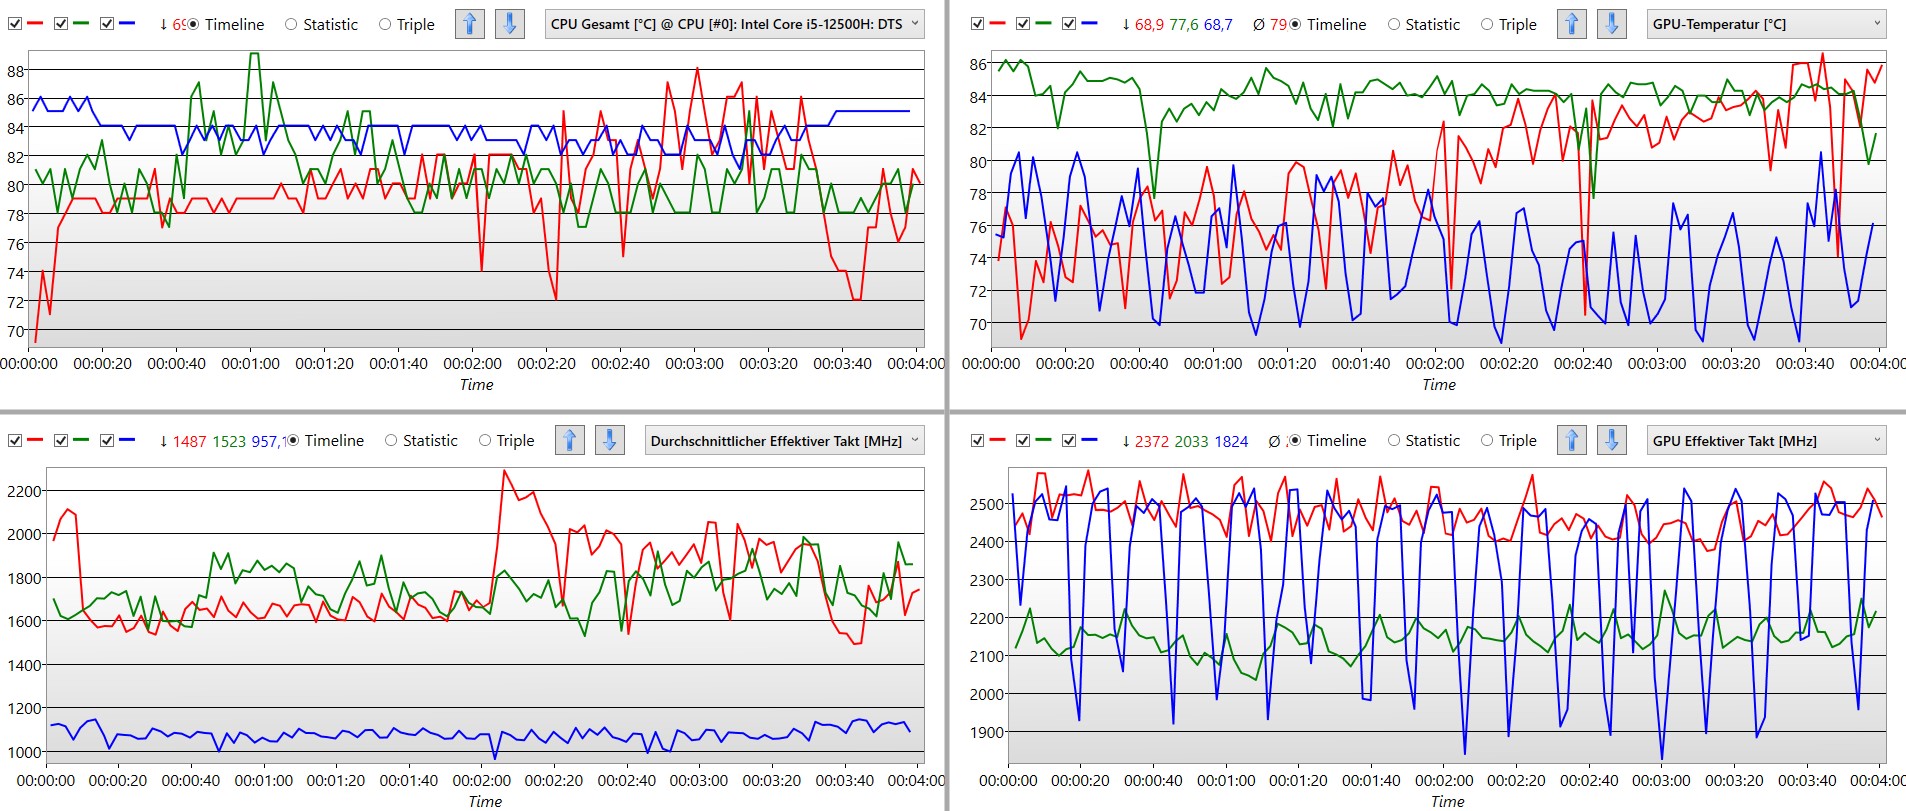
Con la GPU más pequeña de la serie RTX 4000, la RTX 4050el Nitro pertenece a la clase de entrada de los portátiles para juegos. A ella se une un chip ya lanzado a principios de 2022, el Intel Core i5-12500H. No era un modelo de gama alta, incluso cuando se introdujo, pero sigue ofreciendo suficiente potencia de cálculo para el uso previsto. Además, ambos componentes pueden suministrarse con mucha potencia, al menos sobre el papel. La CPU consume hasta 115 vatios y la GPU incluso 140 vatios con boost dinámico.
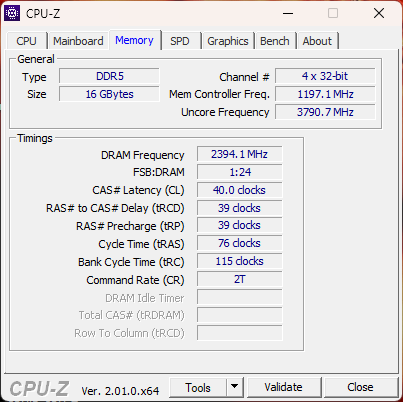
Además, tenemos 16 GB de RAM DDR5 4800 de Samsung, que es lo suficientemente rápida para altas velocidades de fotogramas en juegos menos exigentes. Para los juegos Full HD, lo básico parece relativamente coherente siempre que puedas vivir sin uno o dos detalles aquí o allá.
Condiciones de la prueba
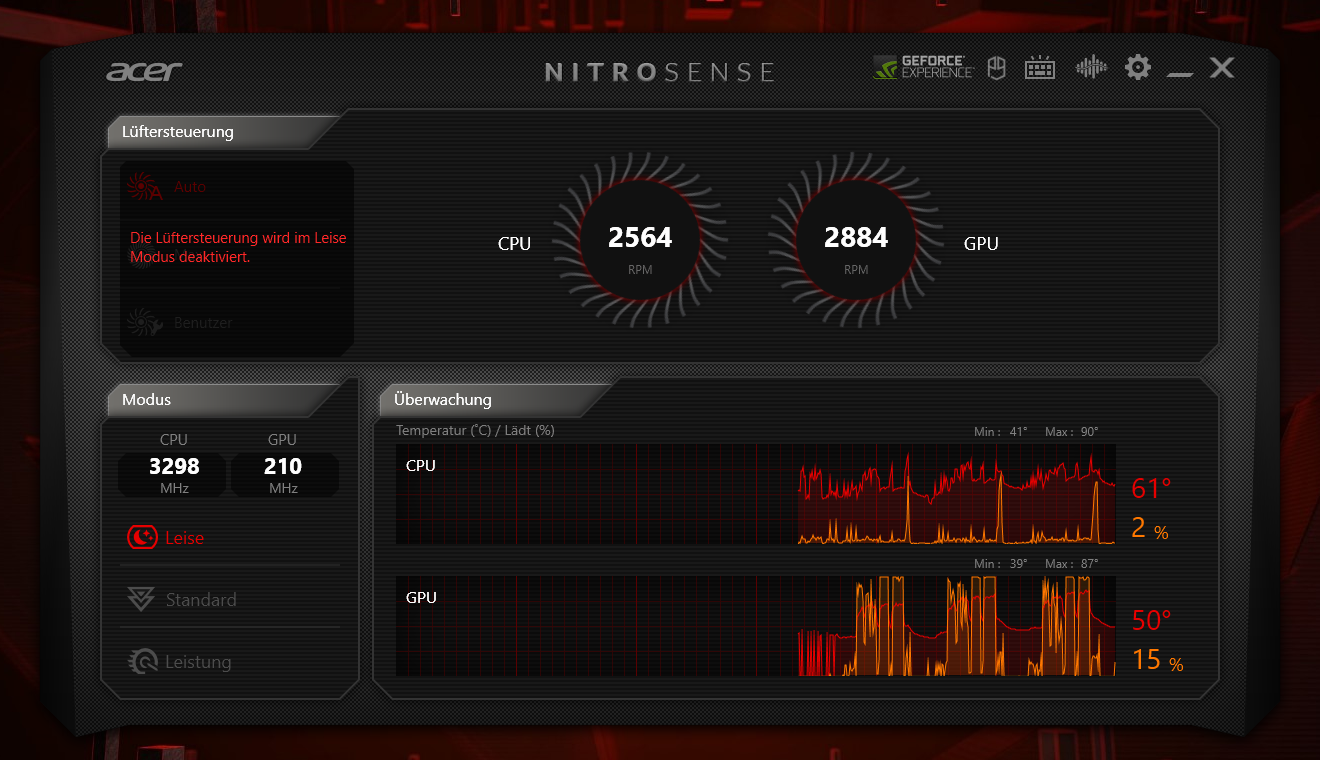
El software de control "NitroSense" suministrado por Acer es accesible a través de un botón designado y permite acceder a los diversos ajustes del modo de rendimiento, así como a la gestión del ventilador. Además, se puede ajustar la iluminación de las teclas, seleccionar los perfiles de sonido de los altavoces y realizar algunos ajustes básicos.
Para nuestras pruebas de juegos y benchmarks, seleccionamos el perfil "Rendimiento" y mantuvimos el ventilador automático. Usando el perfil "Estándar" los niveles de ruido se reducen sustancialmente y en el modo "Silencio" el volumen del sonido de refrigeración baja aún más pero sigue siendo continuamente audible.
| Rendimiento | Estándar | Silencioso | Modo batería | |
| PL1 | 95 vatios | 80 vatios | 80 vatios | 70 vatios |
| PL2 | 115 vatios | 115 vatios | 115 vatios | 115 vatios |
Procesador
El Intel Core i5-12500Hes un procesador pequeño -al menos para un portátil de juegos- y ofrece doce núcleos, de los cuales cuatro son de rendimiento y ocho de eficiencia, con un total de 16 hilos. Eso es suficiente para la multitarea de alto nivel. El portátil sigue siendo fácil de usar, incluso con programas exigentes. La velocidad de reloj máxima es de sólo 4,5 GHz y la caché L3 de 18 MB no es especialmente grande.
A pesar de estas especificaciones más bien modestas, el bucle Cinebench R15 funcionó muy bien. Por ejemplo, elMedion Erazer Defender P40consigue un 30% más al principio con su considerablemente más rápido i7-13700HX. Hacia el final del bucle, no llega ni al 10% de ventaja. Aquí es donde la generosa refrigeración pasa a primer plano y puede verse en la serie de mediciones casi planas. El procesador puede consumir 95 vatios durante un periodo largo y 115 vatios durante periodos cortos sin que se produzca un aumento drástico de las temperaturas.
También en modo "Silencioso" (la línea verde en el bucle Cinebench) - durante el cual apenas se oyen ruidos molestos - se obtuvieron resultados sólidos que, de media, estaban a la par con elMSI Cyborg 15 A12VF. El Nitro consume menos energía a pesar de que el MSI tiene una CPU mayor. El hecho de que el Nitro 5 siga rindiendo bien aquí se debe a una reducción a 70 vatios mientras que el breve máximo de 115 vatios permanece inalterado. En los modos "Estándar" y batería, el límite de potencia es de 80 vatios.
Puedes encontrar más pruebas e información aquí, en nuestraLista de pruebas de CPU.
Cinebench R15 Multi continuous test
Cinebench R23: Multi Core | Single Core
Cinebench R20: CPU (Multi Core) | CPU (Single Core)
Cinebench R15: CPU Multi 64Bit | CPU Single 64Bit
Blender: v2.79 BMW27 CPU
7-Zip 18.03: 7z b 4 | 7z b 4 -mmt1
Geekbench 5.5: Multi-Core | Single-Core
HWBOT x265 Benchmark v2.2: 4k Preset
LibreOffice : 20 Documents To PDF
R Benchmark 2.5: Overall mean
| CPU Performance rating | |
| Media de la clase Gaming | |
| Asus TUF Gaming A16 FA617XS | |
| Medion Erazer Scout E20 | |
| MSI Cyborg 15 A12VF | |
| MSI Katana 15 B12VEK | |
| Acer Nitro 5 AN517-55-738R | |
| Acer Nitro 5 AN517-55-5552 | |
| Medio Intel Core i5-12500H | |
| Cinebench R23 / Multi Core | |
| Media de la clase Gaming (10488 - 40970, n=113, últimos 2 años) | |
| Asus TUF Gaming A16 FA617XS | |
| Medion Erazer Scout E20 | |
| MSI Katana 15 B12VEK | |
| MSI Cyborg 15 A12VF | |
| Acer Nitro 5 AN517-55-5552 | |
| Acer Nitro 5 AN517-55-738R | |
| Medio Intel Core i5-12500H (11330 - 14686, n=9) | |
| Cinebench R23 / Single Core | |
| Media de la clase Gaming (1166 - 2356, n=113, últimos 2 años) | |
| Medion Erazer Scout E20 | |
| Acer Nitro 5 AN517-55-738R | |
| Asus TUF Gaming A16 FA617XS | |
| MSI Cyborg 15 A12VF | |
| MSI Katana 15 B12VEK | |
| Medio Intel Core i5-12500H (1558 - 1701, n=9) | |
| Acer Nitro 5 AN517-55-5552 | |
| Cinebench R20 / CPU (Multi Core) | |
| Media de la clase Gaming (4029 - 16108, n=112, últimos 2 años) | |
| Asus TUF Gaming A16 FA617XS | |
| Medion Erazer Scout E20 | |
| Acer Nitro 5 AN517-55-738R | |
| MSI Katana 15 B12VEK | |
| MSI Cyborg 15 A12VF | |
| Acer Nitro 5 AN517-55-5552 | |
| Medio Intel Core i5-12500H (4687 - 5640, n=9) | |
| Cinebench R20 / CPU (Single Core) | |
| Media de la clase Gaming (442 - 895, n=112, últimos 2 años) | |
| Medion Erazer Scout E20 | |
| Asus TUF Gaming A16 FA617XS | |
| Acer Nitro 5 AN517-55-738R | |
| MSI Cyborg 15 A12VF | |
| MSI Katana 15 B12VEK | |
| Medio Intel Core i5-12500H (602 - 656, n=9) | |
| Acer Nitro 5 AN517-55-5552 | |
| Cinebench R15 / CPU Multi 64Bit | |
| Media de la clase Gaming (1578 - 6271, n=113, últimos 2 años) | |
| Medion Erazer Scout E20 | |
| Asus TUF Gaming A16 FA617XS | |
| Acer Nitro 5 AN517-55-738R | |
| MSI Katana 15 B12VEK | |
| Acer Nitro 5 AN517-55-5552 | |
| MSI Cyborg 15 A12VF | |
| Medio Intel Core i5-12500H (1970 - 2283, n=10) | |
| Cinebench R15 / CPU Single 64Bit | |
| Media de la clase Gaming (188.8 - 343, n=112, últimos 2 años) | |
| Asus TUF Gaming A16 FA617XS | |
| Medion Erazer Scout E20 | |
| Acer Nitro 5 AN517-55-738R | |
| MSI Katana 15 B12VEK | |
| MSI Cyborg 15 A12VF | |
| Medio Intel Core i5-12500H (220 - 250, n=9) | |
| Acer Nitro 5 AN517-55-5552 | |
| Blender / v2.79 BMW27 CPU | |
| MSI Cyborg 15 A12VF | |
| Medio Intel Core i5-12500H (223 - 288, n=9) | |
| MSI Katana 15 B12VEK | |
| Acer Nitro 5 AN517-55-5552 | |
| Acer Nitro 5 AN517-55-738R | |
| Medion Erazer Scout E20 | |
| Asus TUF Gaming A16 FA617XS | |
| Media de la clase Gaming (80 - 330, n=110, últimos 2 años) | |
| 7-Zip 18.03 / 7z b 4 | |
| Media de la clase Gaming (33491 - 148086, n=111, últimos 2 años) | |
| Asus TUF Gaming A16 FA617XS | |
| Medion Erazer Scout E20 | |
| MSI Katana 15 B12VEK | |
| MSI Cyborg 15 A12VF | |
| Acer Nitro 5 AN517-55-738R | |
| Acer Nitro 5 AN517-55-5552 | |
| Medio Intel Core i5-12500H (44105 - 54380, n=9) | |
| 7-Zip 18.03 / 7z b 4 -mmt1 | |
| Asus TUF Gaming A16 FA617XS | |
| Media de la clase Gaming (4199 - 7436, n=111, últimos 2 años) | |
| Medion Erazer Scout E20 | |
| MSI Cyborg 15 A12VF | |
| Acer Nitro 5 AN517-55-738R | |
| MSI Katana 15 B12VEK | |
| Medio Intel Core i5-12500H (5151 - 5563, n=9) | |
| Acer Nitro 5 AN517-55-5552 | |
| Geekbench 5.5 / Multi-Core | |
| Media de la clase Gaming (6460 - 27010, n=111, últimos 2 años) | |
| Acer Nitro 5 AN517-55-738R | |
| Medion Erazer Scout E20 | |
| Asus TUF Gaming A16 FA617XS | |
| MSI Katana 15 B12VEK | |
| MSI Cyborg 15 A12VF | |
| Acer Nitro 5 AN517-55-5552 | |
| Medio Intel Core i5-12500H (7962 - 10828, n=9) | |
| Geekbench 5.5 / Single-Core | |
| Media de la clase Gaming (986 - 2474, n=111, últimos 2 años) | |
| Asus TUF Gaming A16 FA617XS | |
| Medion Erazer Scout E20 | |
| MSI Cyborg 15 A12VF | |
| Acer Nitro 5 AN517-55-738R | |
| MSI Katana 15 B12VEK | |
| Medio Intel Core i5-12500H (1471 - 1693, n=9) | |
| Acer Nitro 5 AN517-55-5552 | |
| HWBOT x265 Benchmark v2.2 / 4k Preset | |
| Media de la clase Gaming (11.5 - 44.3, n=111, últimos 2 años) | |
| Asus TUF Gaming A16 FA617XS | |
| MSI Katana 15 B12VEK | |
| Medion Erazer Scout E20 | |
| Acer Nitro 5 AN517-55-5552 | |
| MSI Cyborg 15 A12VF | |
| MSI Cyborg 15 A12VF | |
| Medio Intel Core i5-12500H (12 - 16.6, n=9) | |
| Acer Nitro 5 AN517-55-738R | |
| LibreOffice / 20 Documents To PDF | |
| Acer Nitro 5 AN517-55-5552 | |
| Acer Nitro 5 AN517-55-738R | |
| Media de la clase Gaming (19 - 88.8, n=111, últimos 2 años) | |
| Medio Intel Core i5-12500H (40.1 - 58.5, n=9) | |
| MSI Katana 15 B12VEK | |
| Medion Erazer Scout E20 | |
| Asus TUF Gaming A16 FA617XS | |
| MSI Cyborg 15 A12VF | |
| R Benchmark 2.5 / Overall mean | |
| Acer Nitro 5 AN517-55-5552 | |
| Medio Intel Core i5-12500H (0.4748 - 0.535, n=9) | |
| MSI Katana 15 B12VEK | |
| MSI Cyborg 15 A12VF | |
| Acer Nitro 5 AN517-55-738R | |
| Medion Erazer Scout E20 | |
| Media de la clase Gaming (0.3439 - 0.759, n=112, últimos 2 años) | |
| Asus TUF Gaming A16 FA617XS | |
* ... más pequeño es mejor
AIDA64: FP32 Ray-Trace | FPU Julia | CPU SHA3 | CPU Queen | FPU SinJulia | FPU Mandel | CPU AES | CPU ZLib | FP64 Ray-Trace | CPU PhotoWorxx
| Performance rating | |
| Media de la clase Gaming | |
| Asus TUF Gaming A16 FA617XS | |
| Medion Erazer Scout E20 | |
| MSI Katana 15 B12VEK | |
| MSI Cyborg 15 A12VF | |
| Acer Nitro 5 AN517-55-5552 | |
| Medio Intel Core i5-12500H | |
| Acer Nitro 5 AN517-55-738R | |
| AIDA64 / FP32 Ray-Trace | |
| Media de la clase Gaming (10227 - 85542, n=110, últimos 2 años) | |
| Asus TUF Gaming A16 FA617XS (v6.75.6100) | |
| MSI Katana 15 B12VEK (v6.85.6300) | |
| Medion Erazer Scout E20 (v6.75.6100) | |
| Acer Nitro 5 AN517-55-5552 (v6.75.6100) | |
| MSI Cyborg 15 A12VF (v6.75.6100) | |
| Medio Intel Core i5-12500H (6851 - 13947, n=9) | |
| Acer Nitro 5 AN517-55-738R (v6.50.5800) | |
| AIDA64 / FPU Julia | |
| Media de la clase Gaming (51376 - 238426, n=110, últimos 2 años) | |
| Asus TUF Gaming A16 FA617XS (v6.75.6100) | |
| MSI Katana 15 B12VEK (v6.85.6300) | |
| Medion Erazer Scout E20 | |
| MSI Cyborg 15 A12VF (v6.75.6100) | |
| Acer Nitro 5 AN517-55-5552 (v6.75.6100) | |
| Medio Intel Core i5-12500H (29874 - 68178, n=9) | |
| Acer Nitro 5 AN517-55-738R (v6.50.5800) | |
| AIDA64 / CPU SHA3 | |
| Media de la clase Gaming (2180 - 9817, n=110, últimos 2 años) | |
| Asus TUF Gaming A16 FA617XS (v6.75.6100) | |
| MSI Katana 15 B12VEK (v6.85.6300) | |
| Medion Erazer Scout E20 (v6.75.6100) | |
| Acer Nitro 5 AN517-55-5552 (v6.75.6100) | |
| MSI Cyborg 15 A12VF (v6.75.6100) | |
| Medio Intel Core i5-12500H (2287 - 3337, n=9) | |
| Acer Nitro 5 AN517-55-738R (v6.50.5800) | |
| AIDA64 / CPU Queen | |
| Asus TUF Gaming A16 FA617XS (v6.75.6100) | |
| Media de la clase Gaming (49785 - 173351, n=101, últimos 2 años) | |
| Medion Erazer Scout E20 (v6.75.6100) | |
| Acer Nitro 5 AN517-55-738R (v6.50.5800) | |
| MSI Katana 15 B12VEK (v6.85.6300) | |
| MSI Cyborg 15 A12VF (v6.75.6100) | |
| Medio Intel Core i5-12500H (77935 - 80703, n=9) | |
| Acer Nitro 5 AN517-55-5552 (v6.75.6100) | |
| AIDA64 / FPU SinJulia | |
| Asus TUF Gaming A16 FA617XS (v6.75.6100) | |
| Media de la clase Gaming (4424 - 33636, n=110, últimos 2 años) | |
| Medion Erazer Scout E20 (v6.75.6100) | |
| Acer Nitro 5 AN517-55-738R (v6.50.5800) | |
| MSI Katana 15 B12VEK (v6.85.6300) | |
| MSI Cyborg 15 A12VF (v6.75.6100) | |
| Acer Nitro 5 AN517-55-5552 (v6.75.6100) | |
| Medio Intel Core i5-12500H (6590 - 7431, n=9) | |
| AIDA64 / FPU Mandel | |
| Media de la clase Gaming (25115 - 128721, n=110, últimos 2 años) | |
| Asus TUF Gaming A16 FA617XS (v6.75.6100) | |
| MSI Katana 15 B12VEK (v6.85.6300) | |
| Medion Erazer Scout E20 (v6.75.6100) | |
| Acer Nitro 5 AN517-55-5552 (v6.75.6100) | |
| MSI Cyborg 15 A12VF (v6.75.6100) | |
| Medio Intel Core i5-12500H (18252 - 34041, n=9) | |
| Acer Nitro 5 AN517-55-738R (v6.50.5800) | |
| AIDA64 / CPU AES | |
| Media de la clase Gaming (39258 - 247074, n=110, últimos 2 años) | |
| Medio Intel Core i5-12500H (50298 - 111567, n=9) | |
| Asus TUF Gaming A16 FA617XS (v6.75.6100) | |
| Medion Erazer Scout E20 (v6.75.6100) | |
| MSI Katana 15 B12VEK (v6.85.6300) | |
| MSI Cyborg 15 A12VF (v6.75.6100) | |
| Acer Nitro 5 AN517-55-5552 (v6.75.6100) | |
| Acer Nitro 5 AN517-55-738R (v6.50.5800) | |
| AIDA64 / CPU ZLib | |
| Media de la clase Gaming (574 - 2531, n=110, últimos 2 años) | |
| Asus TUF Gaming A16 FA617XS (v6.75.6100) | |
| Medion Erazer Scout E20 (v6.75.6100) | |
| Acer Nitro 5 AN517-55-738R (v6.50.5800) | |
| Acer Nitro 5 AN517-55-5552 (v6.75.6100) | |
| MSI Cyborg 15 A12VF (v6.75.6100) | |
| MSI Katana 15 B12VEK (v6.85.6300) | |
| Medio Intel Core i5-12500H (746 - 924, n=9) | |
| AIDA64 / FP64 Ray-Trace | |
| Media de la clase Gaming (5509 - 45446, n=110, últimos 2 años) | |
| Asus TUF Gaming A16 FA617XS (v6.75.6100) | |
| MSI Katana 15 B12VEK (v6.85.6300) | |
| Medion Erazer Scout E20 (v6.75.6100) | |
| Acer Nitro 5 AN517-55-5552 (v6.75.6100) | |
| MSI Cyborg 15 A12VF (v6.75.6100) | |
| Medio Intel Core i5-12500H (3848 - 7405, n=9) | |
| Acer Nitro 5 AN517-55-738R (v6.50.5800) | |
| AIDA64 / CPU PhotoWorxx | |
| Media de la clase Gaming (12271 - 89891, n=110, últimos 2 años) | |
| Medion Erazer Scout E20 (v6.75.6100) | |
| MSI Katana 15 B12VEK (v6.85.6300) | |
| MSI Cyborg 15 A12VF (v6.75.6100) | |
| Acer Nitro 5 AN517-55-5552 (v6.75.6100) | |
| Medio Intel Core i5-12500H (13686 - 43813, n=9) | |
| Asus TUF Gaming A16 FA617XS (v6.75.6100) | |
| Acer Nitro 5 AN517-55-738R (v6.50.5800) | |
Rendimiento del sistema
Con la CPU no muy potente, los resultados de CrossMark y PCMark tampoco son precisamente emocionantes. Portátiles de juego comparables pueden lograr unos pocos puntos porcentuales extra.
No obstante, estamos ante un potente procesador de 16 hilos que no tiene dificultades para manejar la multitarea, el lanzamiento de programas y los procesos de instalación y desinstalación. Abrir el navegador, reproducir vídeos y otras tareas cotidianas se pueden hacer sin lag alguno.
CrossMark: Overall | Productivity | Creativity | Responsiveness
| PCMark 10 / Score | |
| Media de la clase Gaming (5828 - 11574, n=96, últimos 2 años) | |
| Asus TUF Gaming A16 FA617XS | |
| Medion Erazer Scout E20 | |
| MSI Cyborg 15 A12VF | |
| MSI Katana 15 B12VEK | |
| Acer Nitro 5 AN517-55-5552 | |
| Medio Intel Core i5-12500H, NVIDIA GeForce RTX 4050 Laptop GPU (6220 - 6719, n=2) | |
| Gigabyte G7 KE | |
| PCMark 10 / Essentials | |
| Medion Erazer Scout E20 | |
| Asus TUF Gaming A16 FA617XS | |
| MSI Cyborg 15 A12VF | |
| Media de la clase Gaming (8810 - 12600, n=100, últimos 2 años) | |
| Gigabyte G7 KE | |
| MSI Katana 15 B12VEK | |
| Acer Nitro 5 AN517-55-5552 | |
| Medio Intel Core i5-12500H, NVIDIA GeForce RTX 4050 Laptop GPU (9418 - 9985, n=2) | |
| PCMark 10 / Productivity | |
| Media de la clase Gaming (6845 - 18766, n=98, últimos 2 años) | |
| Asus TUF Gaming A16 FA617XS | |
| MSI Cyborg 15 A12VF | |
| Medion Erazer Scout E20 | |
| MSI Katana 15 B12VEK | |
| Gigabyte G7 KE | |
| Acer Nitro 5 AN517-55-5552 | |
| Medio Intel Core i5-12500H, NVIDIA GeForce RTX 4050 Laptop GPU (8822 - 8980, n=2) | |
| PCMark 10 / Digital Content Creation | |
| Media de la clase Gaming (7602 - 19657, n=98, últimos 2 años) | |
| Asus TUF Gaming A16 FA617XS | |
| Medion Erazer Scout E20 | |
| Acer Nitro 5 AN517-55-5552 | |
| MSI Cyborg 15 A12VF | |
| MSI Katana 15 B12VEK | |
| Medio Intel Core i5-12500H, NVIDIA GeForce RTX 4050 Laptop GPU (7862 - 9180, n=2) | |
| Gigabyte G7 KE | |
| CrossMark / Overall | |
| Media de la clase Gaming (1366 - 2409, n=98, últimos 2 años) | |
| Medion Erazer Scout E20 | |
| Gigabyte G7 KE | |
| MSI Cyborg 15 A12VF | |
| Asus TUF Gaming A16 FA617XS | |
| Acer Nitro 5 AN517-55-5552 | |
| MSI Katana 15 B12VEK | |
| Medio Intel Core i5-12500H, NVIDIA GeForce RTX 4050 Laptop GPU (1702 - 1726, n=2) | |
| CrossMark / Productivity | |
| Medion Erazer Scout E20 | |
| Media de la clase Gaming (1386 - 2254, n=98, últimos 2 años) | |
| Gigabyte G7 KE | |
| MSI Cyborg 15 A12VF | |
| Asus TUF Gaming A16 FA617XS | |
| Acer Nitro 5 AN517-55-5552 | |
| Medio Intel Core i5-12500H, NVIDIA GeForce RTX 4050 Laptop GPU (1648 - 1675, n=2) | |
| MSI Katana 15 B12VEK | |
| CrossMark / Creativity | |
| Media de la clase Gaming (1343 - 2729, n=98, últimos 2 años) | |
| Medion Erazer Scout E20 | |
| Asus TUF Gaming A16 FA617XS | |
| MSI Cyborg 15 A12VF | |
| MSI Katana 15 B12VEK | |
| Gigabyte G7 KE | |
| Acer Nitro 5 AN517-55-5552 | |
| Medio Intel Core i5-12500H, NVIDIA GeForce RTX 4050 Laptop GPU (1752 - 1775, n=2) | |
| CrossMark / Responsiveness | |
| Gigabyte G7 KE | |
| Medion Erazer Scout E20 | |
| Acer Nitro 5 AN517-55-5552 | |
| Medio Intel Core i5-12500H, NVIDIA GeForce RTX 4050 Laptop GPU (1718 - 1736, n=2) | |
| Media de la clase Gaming (1226 - 2334, n=98, últimos 2 años) | |
| MSI Cyborg 15 A12VF | |
| MSI Katana 15 B12VEK | |
| Asus TUF Gaming A16 FA617XS | |
| PCMark 10 Score | 6719 puntos | |
ayuda | ||
| AIDA64 / Memory Copy | |
| Media de la clase Gaming (21750 - 129946, n=110, últimos 2 años) | |
| Asus TUF Gaming A16 FA617XS | |
| Medion Erazer Scout E20 | |
| MSI Cyborg 15 A12VF | |
| MSI Katana 15 B12VEK | |
| Acer Nitro 5 AN517-55-5552 | |
| Medio Intel Core i5-12500H (23850 - 66598, n=9) | |
| Acer Nitro 5 AN517-55-738R | |
| AIDA64 / Memory Read | |
| Media de la clase Gaming (22956 - 118858, n=110, últimos 2 años) | |
| Medion Erazer Scout E20 | |
| MSI Katana 15 B12VEK | |
| MSI Cyborg 15 A12VF | |
| Asus TUF Gaming A16 FA617XS | |
| Acer Nitro 5 AN517-55-5552 | |
| Medio Intel Core i5-12500H (24879 - 68013, n=9) | |
| Acer Nitro 5 AN517-55-738R | |
| AIDA64 / Memory Write | |
| Media de la clase Gaming (22297 - 135096, n=110, últimos 2 años) | |
| Asus TUF Gaming A16 FA617XS | |
| Medion Erazer Scout E20 | |
| MSI Katana 15 B12VEK | |
| MSI Cyborg 15 A12VF | |
| Acer Nitro 5 AN517-55-5552 | |
| Acer Nitro 5 AN517-55-738R | |
| Medio Intel Core i5-12500H (23543 - 58797, n=9) | |
| AIDA64 / Memory Latency | |
| Media de la clase Gaming (75.3 - 259, n=110, últimos 2 años) | |
| Acer Nitro 5 AN517-55-5552 | |
| Medio Intel Core i5-12500H (83.8 - 114.7, n=9) | |
| Medion Erazer Scout E20 | |
| MSI Katana 15 B12VEK | |
| MSI Cyborg 15 A12VF | |
| Asus TUF Gaming A16 FA617XS | |
| Acer Nitro 5 AN517-55-738R | |
* ... más pequeño es mejor
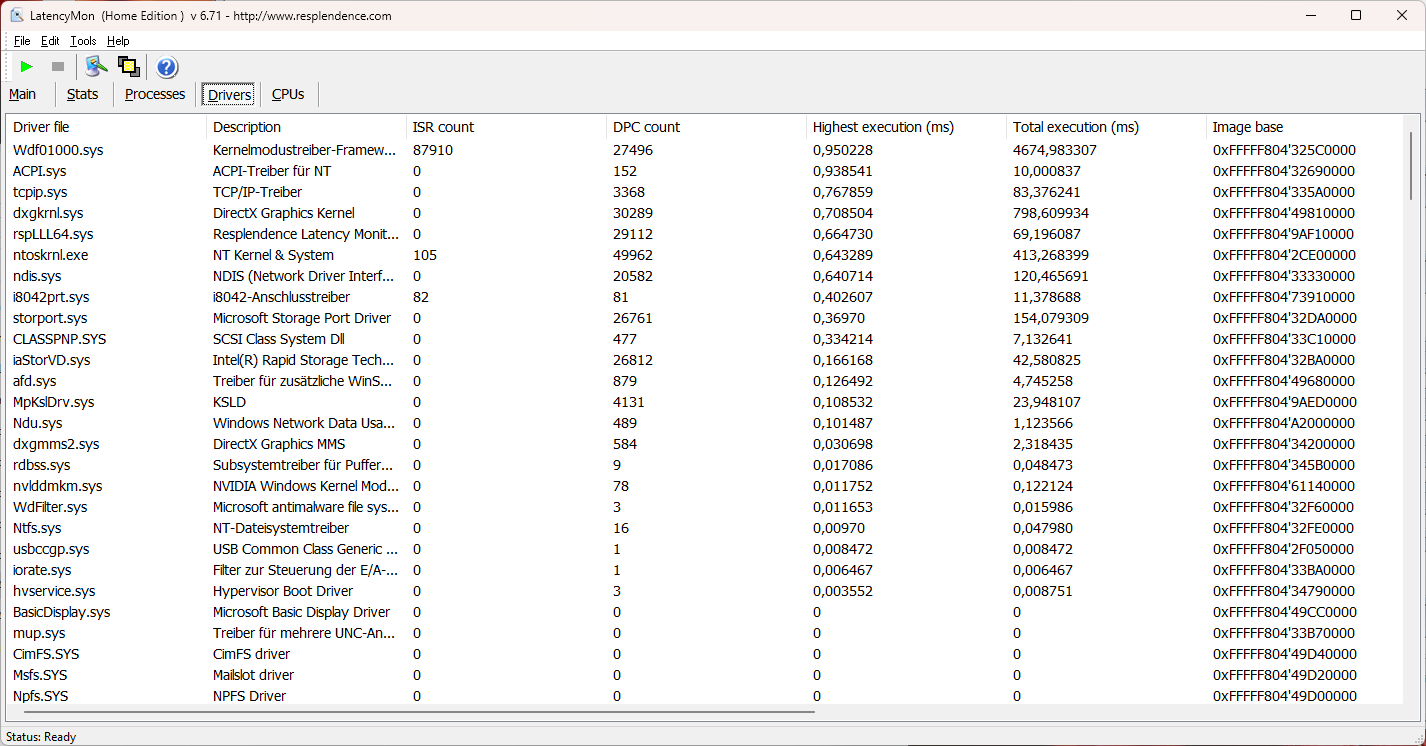
Latencias del CPD
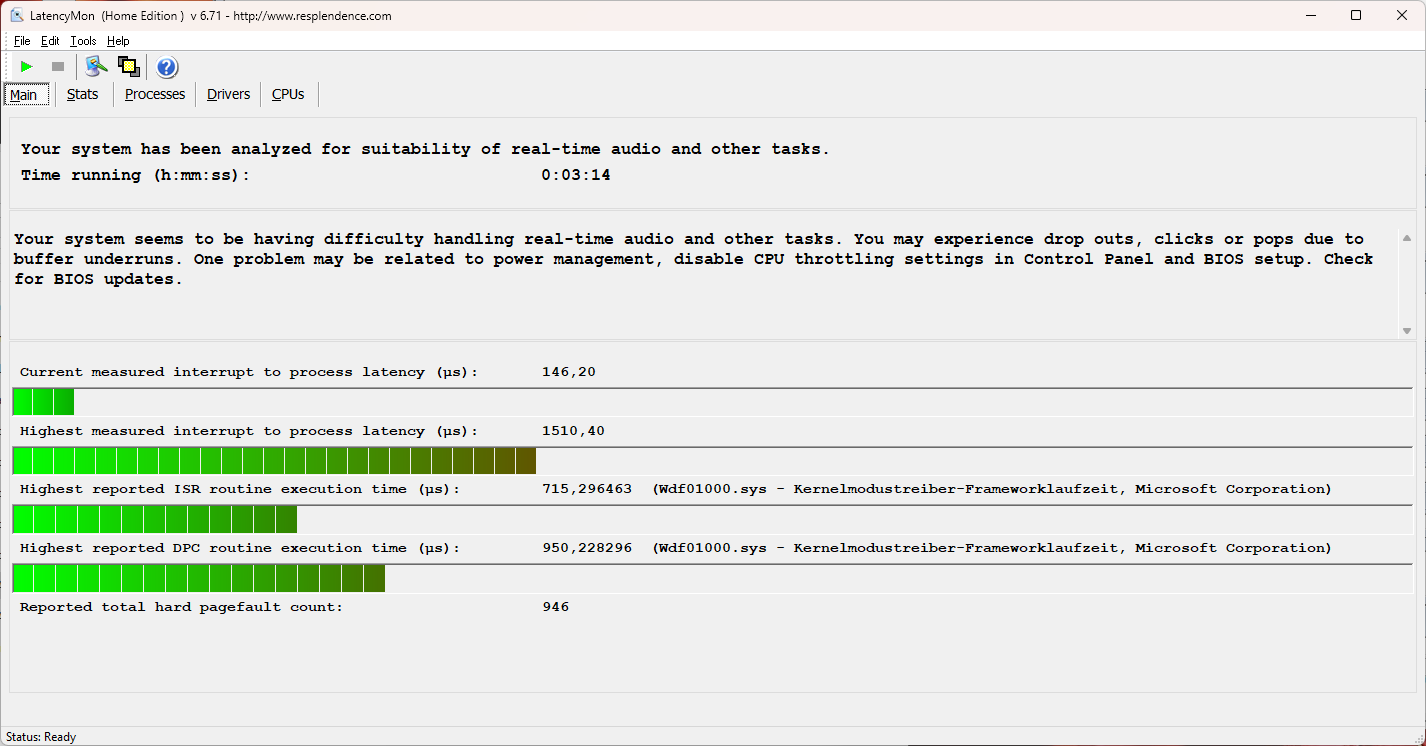
Nuestra prueba LatencyMon fue muy sólida. Para pruebas especiales como la edición de audio en tiempo real, el Acer Nitro 5 ofrece sólo una idoneidad limitada, pero aún así es capaz de manejarlo con muy pocos fallos.
Actualmente, el driver Nvidia contribuye a las caídas de rendimiento medidas. Las actualizaciones y los drivers generalmente cambiados o eliminados podrían mejorar o empeorar significativamente los resultados.
la reproducción de vídeo 4K se ejecutó en paralelo sin problemas. No se detectaron fotogramas omitidos. La iGPU está sobrecargada a casi el 40% y la culpa de ello puede achacarse a la mayoría de procesadores Alder Lake.
| DPC Latencies / LatencyMon - interrupt to process latency (max), Web, Youtube, Prime95 | |
| MSI Katana 15 B12VEK | |
| Medion Erazer Scout E20 | |
| Acer Nitro 5 AN517-55-5552 | |
| MSI Cyborg 15 A12VF | |
| Asus TUF Gaming A16 FA617XS | |
| Acer Nitro 5 AN517-55-738R | |
* ... más pequeño es mejor
Almacenamiento masivo
El SSD M.2 NVMe de Western Digital logró un resultado excelente que es mejor que la media del almacenamiento masivo de nuestro portátil de juego analizado.
A pesar de un controlador refrigerado pasivamente, no pudo mantener una tasa de acceso muy alta en el test continuo, pero aún así logró una media de más de 6 GB/s.

* ... más pequeño es mejor
Continuous Performance Read: DiskSpd Read Loop, Queue Depth 8
Tarjeta gráfica
ElNvidia GeForce RTX 4050 es el modelo básico de la serie RTX 4000 con un nivel de rendimiento comparable al de una RTX 3060. A diferencia de la generación anterior, el TDP de la GPU es de 140 vatios, incluidos 25 vatios de aumento dinámico. Con laRTX 3050(pero también de 140 vatios con laRTX 3060).
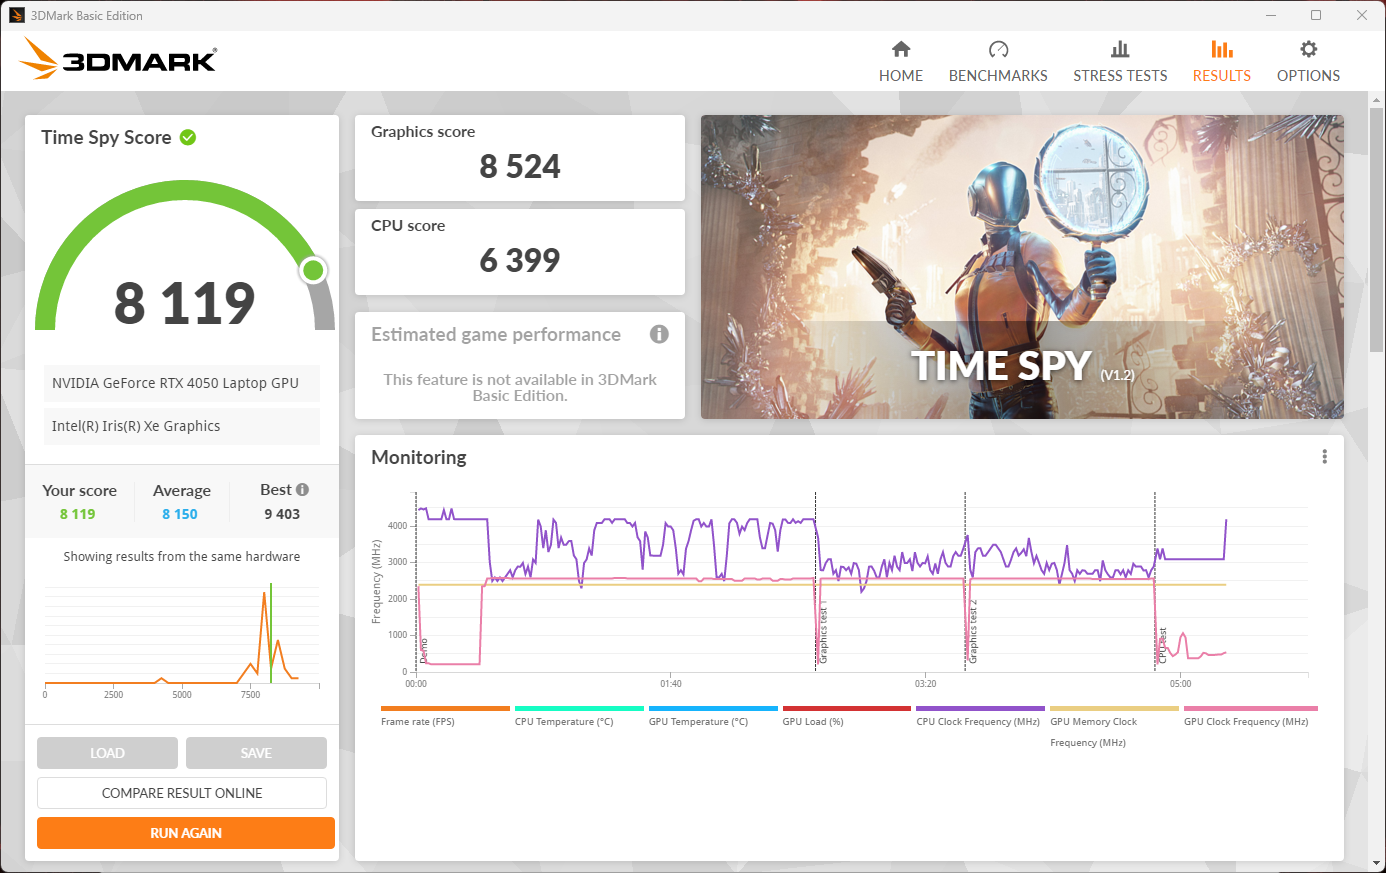
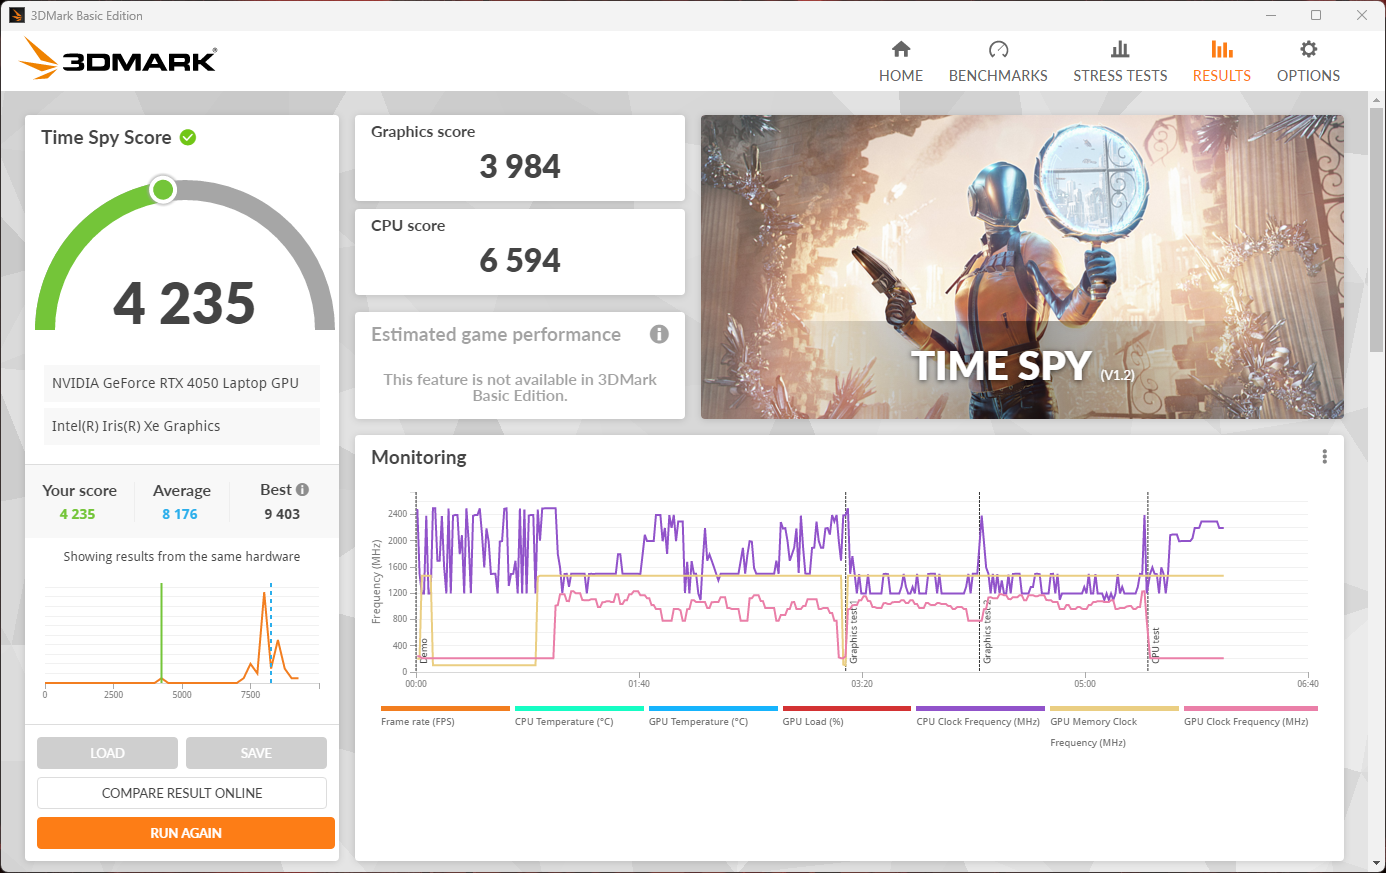
La Acer Nitro 5 RTX 4050sólo alcanza este valor en situaciones extremas. En la prueba de estrés de la tarjeta gráfica, medimos brevemente el máximo posible de 140 vatios, pero, por lo demás, el consumo de energía al máximo rendimiento y máxima velocidad del ventilador se situó en torno a los 100 vatios porque alcanzar la temperatura crítica de la GPU es responsable de una caída de la velocidad de reloj. Durante un periodo de tiempo más largo, por ejemplo, en la prueba continua de Witcher 3, sólo se dispone de 80 vatios de forma constante y en modo silencioso, es de sólo 50 vatios.
Al mismo tiempo, nuestras mediciones de Witcher 3 y los benchmarks sintéticos no mostraron caídas de rendimiento de las que hablar, si los ventiladores están configurados en "Silencio". En situaciones reales de juego, la velocidad media de fotogramas cayó menos de un 10% y sólo un 15% en 3DMark Time Spy. En las pruebas comparativas de Blender, los valores se diferencian en sólo 1 segundo.
El rendimiento gráfico se mantuvo alto en el modo silencioso y las aplicaciones gráficamente exigentes se ejecutaron sin problemas, aunque el consumo de energía se redujo considerablemente. A cambio, esto reduce significativamente las necesidades de refrigeración.
| 3DMark Performance rating - Percent | |
| Media de la clase Gaming | |
| Medion Erazer Defender P40 | |
| Asus TUF Gaming A16 FA617XS | |
| Acer Nitro 5 AN517-55-5552 | |
| MSI Katana 15 B12VEK | |
| Medion Erazer Scout E20 | |
| Acer Nitro 5 AN517-55-5552 | |
| MSI Cyborg 15 A12VF | |
| Medio NVIDIA GeForce RTX 4050 Laptop GPU | |
| Acer Nitro 5 AN517-55-738R | |
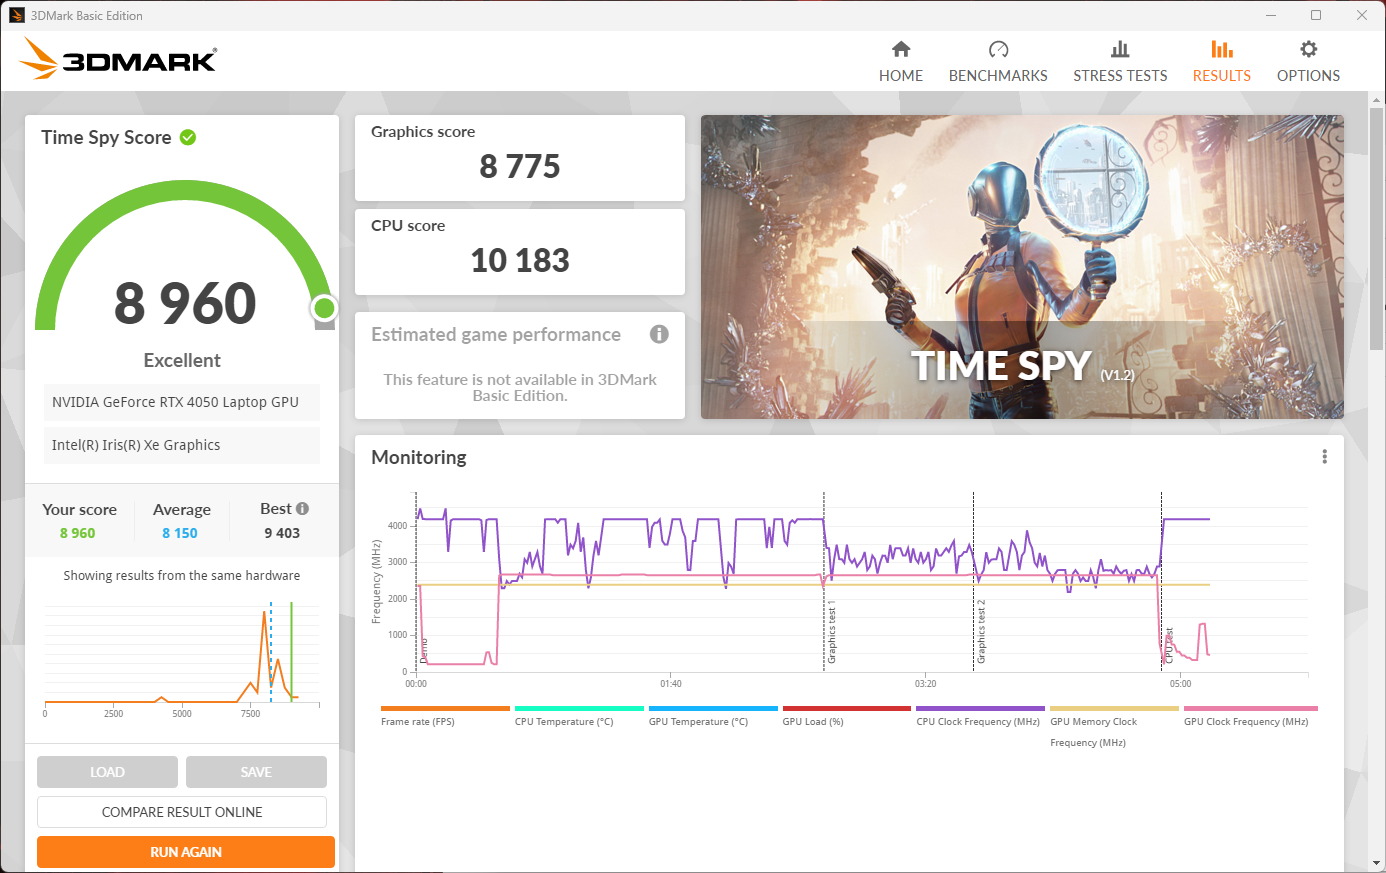
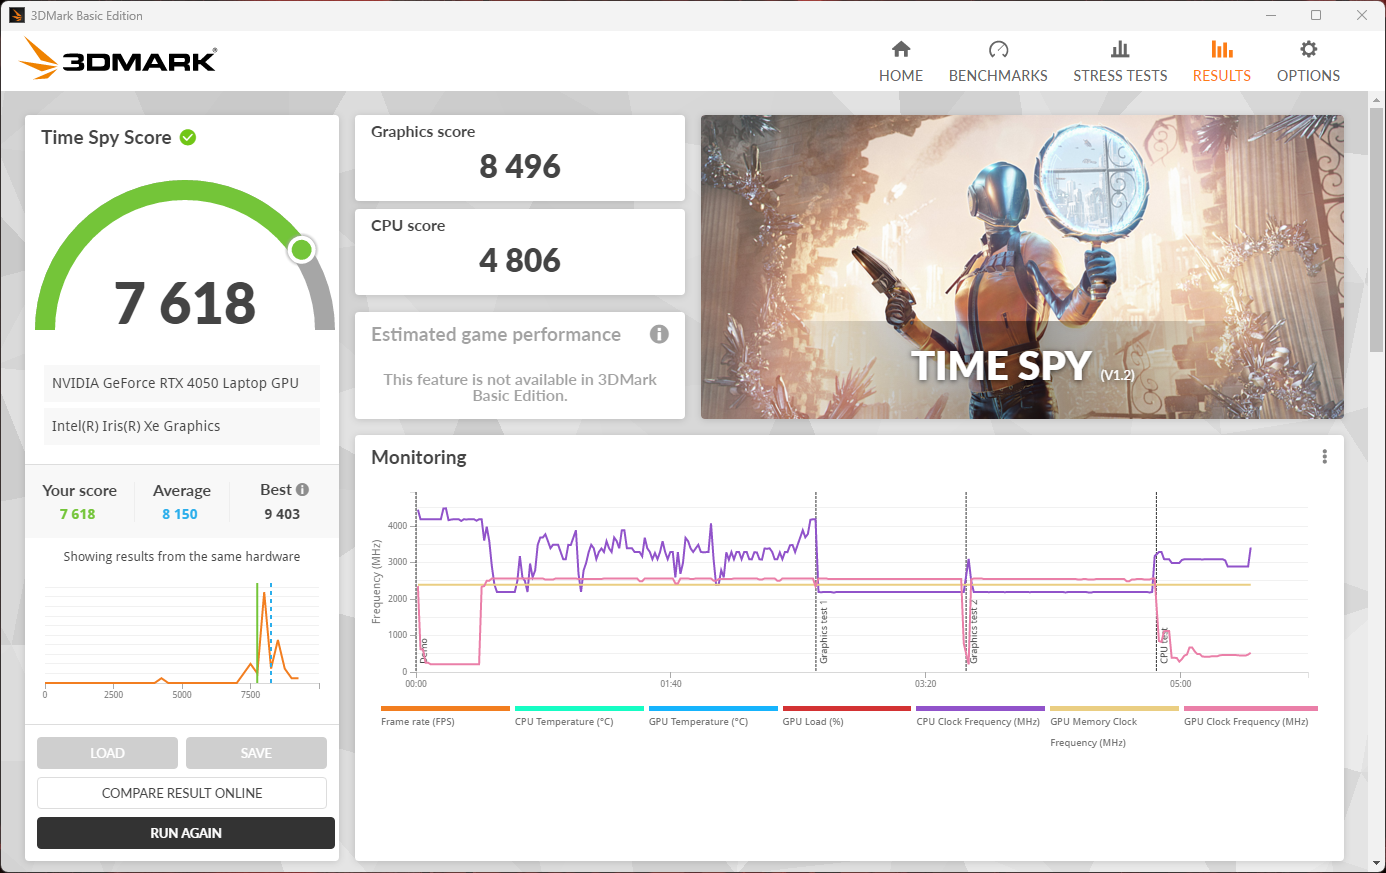
| 3DMark 11 Performance | 27855 puntos | |
| 3DMark Cloud Gate Standard Score | 56305 puntos | |
| 3DMark Fire Strike Score | 19904 puntos | |
| 3DMark Time Spy Score | 8960 puntos | |
ayuda | ||
* ... más pequeño es mejor
Rendimiento de juego
En cuanto al rendimiento en juegos, el Nitro 5 AN517 alcanza velocidades de fotogramas decentes, incluso en los juegos actuales. Si puedes prescindir de algunos detalles aquí y allá, los juegos exigentes pueden funcionar a más de 60 fps. Esto se corresponde con los resultados que obtuvimos con portátiles para juegos equipados de forma similar. La generación anterior Nitro 5con una RTX 3060está casi al mismo nivel. De forma similar, eso también se aplica al AMD Asus TUF Gaming A16. El rendimiento del sistema es coherente con la resolución de pantalla Full HD del dispositivo.
Los benchmarks del Nitro son especialmente interesantes cuando se trata de enfriamiento silencioso con algunos de los resultados que permanecen casi idénticos. A veces están mínimamente por debajo de las mediciones de rendimiento máximo. Sólo en GTA V notamos una caída de la tasa de fotogramas de alrededor del 22%. Esto significa que hubo una diferencia de sólo el 6% en seis juegos. Quitando GTA V, la diferencia fue de apenas un 3%, aunque los niveles de ruido del ventilador cayeron alrededor de un tercio.
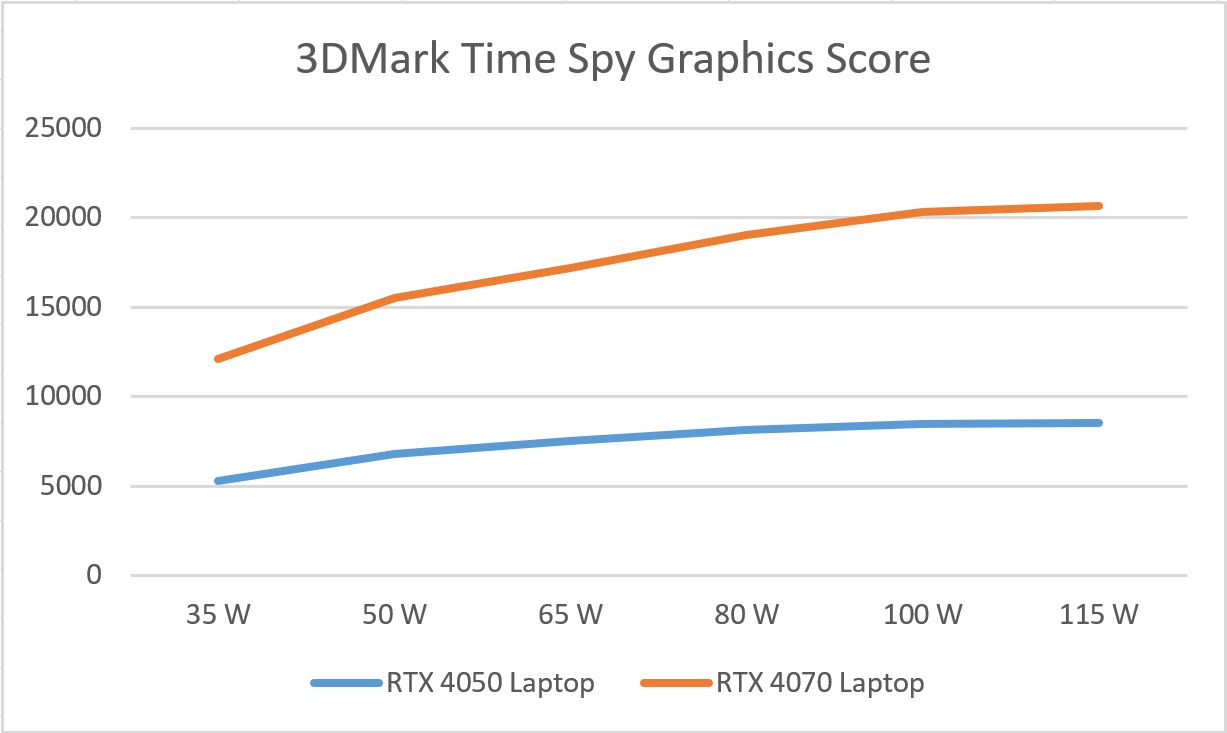
Esto significa que, con un consumo adicional de entre 40 y 50 vatios y una producción de ruido considerablemente mayor, sólo cabe esperar un aumento ínfimo del rendimiento. La RTX 4050 parece ser muy eficiente, pero sin apenas beneficios cuando funciona a sus máximos requisitos de potencia posibles. Nuestro análisis de Valores de rendimiento de la GPU bajo distintas cargas. El gráfico del artículo se muestra a la derecha.
| Performance rating - Percent | |
| Media de la clase Gaming | |
| Medion Erazer Defender P40 | |
| Medion Erazer Scout E20 | |
| MSI Katana 15 B12VEK | |
| MSI Cyborg 15 A12VF | |
| Acer Nitro 5 AN517-55-738R | |
| Acer Nitro 5 AN517-55-5552 | |
| Asus TUF Gaming A16 FA617XS | |
| Acer Nitro 5 AN517-55-5552 | |
| The Witcher 3 - 1920x1080 Ultra Graphics & Postprocessing (HBAO+) | |
| Media de la clase Gaming (95 - 240, n=8, últimos 2 años) | |
| Medion Erazer Defender P40 | |
| Asus TUF Gaming A16 FA617XS (neu) | |
| Acer Nitro 5 AN517-55-5552 | |
| Acer Nitro 5 AN517-55-5552 (Leiser Modus) | |
| Medion Erazer Scout E20 | |
| Acer Nitro 5 AN517-55-738R | |
| MSI Katana 15 B12VEK | |
| MSI Cyborg 15 A12VF | |
| GTA V - 1920x1080 Highest AA:4xMSAA + FX AF:16x | |
| Media de la clase Gaming (48.3 - 186.9, n=103, últimos 2 años) | |
| Medion Erazer Defender P40 | |
| Medion Erazer Scout E20 | |
| Asus TUF Gaming A16 FA617XS | |
| MSI Katana 15 B12VEK | |
| MSI Cyborg 15 A12VF | |
| Acer Nitro 5 AN517-55-5552 | |
| Acer Nitro 5 AN517-55-738R | |
| Acer Nitro 5 AN517-55-5552 (Leiser Modus) | |
| Final Fantasy XV Benchmark - 1920x1080 High Quality | |
| Media de la clase Gaming (41 - 215, n=104, últimos 2 años) | |
| Medion Erazer Defender P40 (1.3) | |
| Asus TUF Gaming A16 FA617XS (1.3) | |
| Acer Nitro 5 AN517-55-5552 (1.3) | |
| MSI Katana 15 B12VEK (1.3) | |
| Medion Erazer Scout E20 (1.3) | |
| MSI Cyborg 15 A12VF (1.3) | |
| Acer Nitro 5 AN517-55-5552 (Leiser Modus) | |
| Acer Nitro 5 AN517-55-738R (1.3) | |
| Strange Brigade - 1920x1080 ultra AA:ultra AF:16 | |
| Media de la clase Gaming (76.3 - 456, n=94, últimos 2 años) | |
| Medion Erazer Defender P40 (1.47.22.14 D3D12) | |
| Asus TUF Gaming A16 FA617XS (1.47.22.14 D3D12) | |
| Acer Nitro 5 AN517-55-5552 (1.47.22.14 D3D12) | |
| MSI Katana 15 B12VEK (1.47.22.14 D3D12) | |
| Acer Nitro 5 AN517-55-5552 (Leiser Modus) | |
| Medion Erazer Scout E20 (1.47.22.14 D3D12) | |
| Acer Nitro 5 AN517-55-738R (1.47.22.14 D3D12) | |
| MSI Cyborg 15 A12VF (1.47.22.14 D3D12) | |
| Dota 2 Reborn - 1920x1080 ultra (3/3) best looking | |
| Acer Nitro 5 AN517-55-738R | |
| Media de la clase Gaming (84.8 - 248, n=113, últimos 2 años) | |
| Medion Erazer Defender P40 | |
| MSI Katana 15 B12VEK | |
| Medion Erazer Scout E20 | |
| MSI Cyborg 15 A12VF | |
| Acer Nitro 5 AN517-55-5552 | |
| Acer Nitro 5 AN517-55-5552 (Leiser Modus) | |
| Asus TUF Gaming A16 FA617XS | |
| X-Plane 11.11 - 1920x1080 high (fps_test=3) | |
| Medion Erazer Defender P40 | |
| Medion Erazer Scout E20 | |
| Media de la clase Gaming (52.1 - 143.5, n=116, últimos 2 años) | |
| MSI Katana 15 B12VEK | |
| MSI Cyborg 15 A12VF | |
| Acer Nitro 5 AN517-55-738R | |
| Acer Nitro 5 AN517-55-5552 (Leiser Modus) | |
| Acer Nitro 5 AN517-55-5552 | |
| Asus TUF Gaming A16 FA617XS | |
| The Witcher 3 | |
| 1920x1080 High Graphics & Postprocessing (Nvidia HairWorks Off) | |
| Media de la clase Gaming (181 - 341, n=3, últimos 2 años) | |
| Asus TUF Gaming A16 FA617XS | |
| Acer Nitro 5 AN517-55-5552 | |
| MSI Katana 15 B12VEK | |
| Acer Nitro 5 AN517-55-738R | |
| Medion Erazer Scout E20 | |
| Medio NVIDIA GeForce RTX 4050 Laptop GPU (87 - 177, n=28) | |
| MSI Cyborg 15 A12VF | |
| 1920x1080 Ultra Graphics & Postprocessing (HBAO+) | |
| Media de la clase Gaming (95 - 240, n=8, últimos 2 años) | |
| Asus TUF Gaming A16 FA617XS | |
| Acer Nitro 5 AN517-55-5552 | |
| Medion Erazer Scout E20 | |
| Acer Nitro 5 AN517-55-738R | |
| MSI Katana 15 B12VEK | |
| MSI Cyborg 15 A12VF | |
| Medio NVIDIA GeForce RTX 4050 Laptop GPU (18.5 - 94.7, n=40) | |
| Hogwarts Legacy | |
| 1920x1080 High Preset AA:High T | |
| Media de la clase Gaming (n=1últimos 2 años) | |
| MSI Cyborg 15 A12VF | |
| Asus TUF Gaming A16 FA617XS | |
| Acer Nitro 5 AN517-55-5552 | |
| Medio NVIDIA GeForce RTX 4050 Laptop GPU (44.8 - 93.6, n=8) | |
| 1920x1080 Ultra Preset AA:High T | |
| Media de la clase Gaming (76 - 108.3, n=2, últimos 2 años) | |
| MSI Cyborg 15 A12VF | |
| Asus TUF Gaming A16 FA617XS | |
| Medio NVIDIA GeForce RTX 4050 Laptop GPU (39 - 77.3, n=8) | |
| Acer Nitro 5 AN517-55-5552 | |
| Sons of the Forest | |
| 1920x1080 Ultra Preset AA:T | |
| Asus TUF Gaming A16 FA617XS | |
| Acer Nitro 5 AN517-55-5552 | |
| Medio NVIDIA GeForce RTX 4050 Laptop GPU (61.9 - 76, n=4) | |
| MSI Cyborg 15 A12VF | |
| 1920x1080 High Preset AA:T | |
| Asus TUF Gaming A16 FA617XS | |
| Acer Nitro 5 AN517-55-5552 | |
| Medio NVIDIA GeForce RTX 4050 Laptop GPU (63.5 - 76, n=4) | |
| MSI Cyborg 15 A12VF | |
| Star Wars Jedi Survivor | |
| 1920x1080 High Preset | |
| Medion Erazer Scout E20 | |
| Medio NVIDIA GeForce RTX 4050 Laptop GPU (51.6 - 65.9, n=7) | |
| Acer Nitro 5 AN517-55-5552 | |
| Media de la clase Gaming (n=1últimos 2 años) | |
| 1920x1080 Epic Preset | |
| Acer Nitro 5 AN517-55-5552 | |
| Medio NVIDIA GeForce RTX 4050 Laptop GPU (48.4 - 56, n=7) | |
| Medion Erazer Scout E20 | |
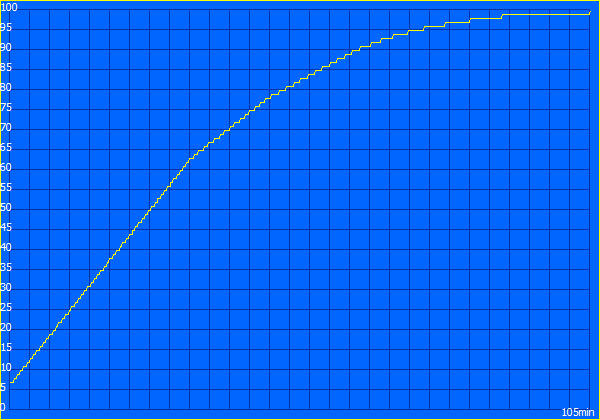
En la prueba de resistencia Witcher 3, el Acer Nitro 5 AN517 no mostró debilidades con velocidades de fotogramas que se mantuvieron estables de forma constante. Las ligeras fluctuaciones corresponden al ritmo de los ciclos diurno y nocturno del juego.
Por el contrario, utilizando el modo "Silencio", observamos una ligera caída. Al principio, la línea verde (Silencio) se mantuvo casi congruente con la línea roja (Rendimiento). Con la velocidad de reloj y la fuente de alimentación más bajas, hubo un 7% menos de fps medidos después de una hora.
Además, hubo pequeñas caídas. Ya que los ventiladores no pueden ser simplemente encendidos en "Silencio", la velocidad del reloj tuvo que ser reducida por un corto tiempo una vez más. Sin embargo, este valor se mantuvo en un nivel alto y sólo estuvo por debajo de 60fps una vez. ElMedion Erazer Scout E20con la misma tarjeta gráfica, sólo alcanzó valores de fps comparables en modo rendimiento.
Witcher 3 FPS diagram
| bajo | medio | alto | ultra | |
|---|---|---|---|---|
| GTA V (2015) | 162.4 | 88.8 | ||
| The Witcher 3 (2015) | 164 | 88 | ||
| Dota 2 Reborn (2015) | 129 | 123.1 | ||
| Final Fantasy XV Benchmark (2018) | 83.6 | |||
| X-Plane 11.11 (2018) | 79.7 | |||
| Far Cry 5 (2018) | 123 | 116 | ||
| Strange Brigade (2018) | 174.8 | 152 | ||
| Cyberpunk 2077 1.6 (2022) | 91.3 | 79.4 | ||
| F1 22 (2022) | 149 | 55 | ||
| Hogwarts Legacy (2023) | 67 | 53 | ||
| Sons of the Forest (2023) | 75 | 73 | ||
| Star Wars Jedi Survivor (2023) | 56 | 53 |
Emisiones - El silencioso y cálido Nitro 5
Emisiones sonoras
Incluso cuando el sistema está poco cargado, los ventiladores se encienden. El resultado es un ruido de fondo que no perturba ni las sesiones de juego ni tus propios pensamientos.
Por el contrario, el portátil para juegos se vuelve muy ruidoso con el ajuste "Rendimiento". Es posible distinguir cuando alguien está jugando, incluso desde detrás de una puerta cerrada. Eso cambia considerablemente en "Silencio". Wie midió sólo un tercio del nivel de ruido original.
Los sonidos producidos se sitúan por encima de los niveles de ruido que se encuentran, por ejemplo, en un portátil de negocios con sus ventiladores. Sin embargo, nunca se siente la necesidad de coger un par de auriculares. Algunos PC de sobremesa y la mayoría de portátiles para juegos son mucho más ruidosos.
Ruido
| Ocioso |
| 25.7 / 31.5 / 31.2 dB(A) |
| Carga |
| 62.9 / 67.5 dB(A) |
 | ||
30 dB silencioso 40 dB(A) audible 50 dB(A) ruidosamente alto |
||
min: | ||
| Acer Nitro 5 AN517-55-5552 GeForce RTX 4050 Laptop GPU, i5-12500H, WDC PC SN810 512GB | Asus TUF Gaming A16 FA617XS Radeon RX 7600S, R9 7940HS, Micron 2400 MTFDKBA512QFM | Acer Nitro 5 AN517-55-738R GeForce RTX 3060 Laptop GPU, i7-12700H, Samsung PM9A1 MZVL2512HCJQ | Medion Erazer Scout E20 GeForce RTX 4050 Laptop GPU, i7-13700H, Phison PS5021-E21 1TB | MSI Katana 15 B12VEK GeForce RTX 4050 Laptop GPU, i7-12650H, Micron 2400 MTFDKBA1T0QFM | MSI Cyborg 15 A12VF GeForce RTX 4060 Laptop GPU, i7-12650H, Samsung PM9B1 1024GB MZVL41T0HBLB | |
|---|---|---|---|---|---|---|
| Noise | 14% | 8% | 6% | 20% | -4% | |
| apagado / medio ambiente * (dB) | 25.7 | 25 3% | 25.5 1% | 25 3% | 24 7% | 27 -5% |
| Idle Minimum * (dB) | 25.7 | 25 3% | 25.5 1% | 26 -1% | 24 7% | 27 -5% |
| Idle Average * (dB) | 31.5 | 26 17% | 25.5 19% | 27 14% | 24 24% | 37.5 -19% |
| Idle Maximum * (dB) | 31.2 | 28 10% | 27 13% | 32 -3% | 24 23% | 38 -22% |
| Load Average * (dB) | 62.9 | 43 32% | 52.6 16% | 57 9% | 37.71 40% | 56.3 10% |
| Load Maximum * (dB) | 67.5 | 53 21% | 68.2 -1% | 57 16% | 54.55 19% | 56.3 17% |
| Witcher 3 ultra * (dB) | 51 | 50 | 45.75 |
* ... más pequeño es mejor
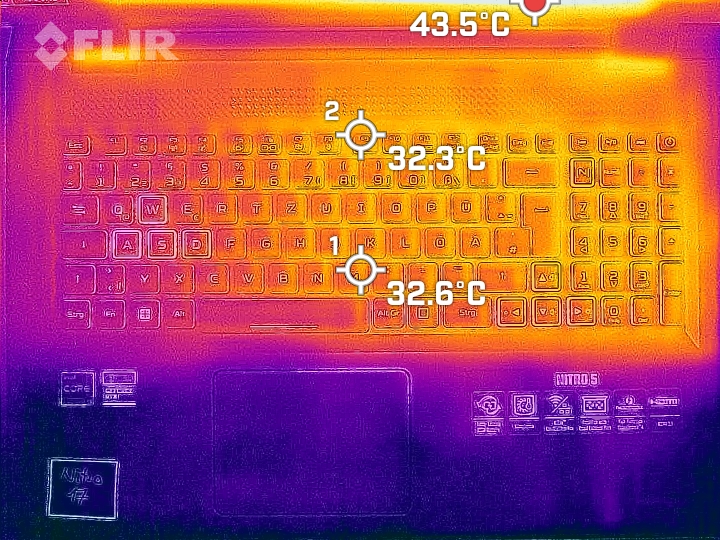
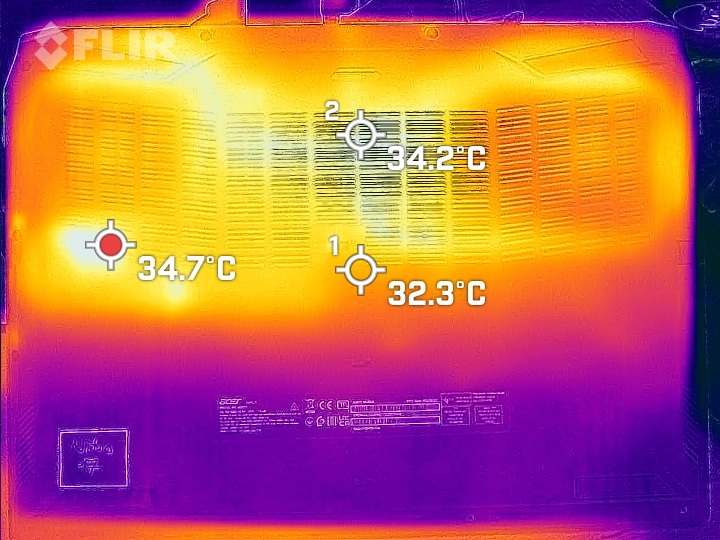
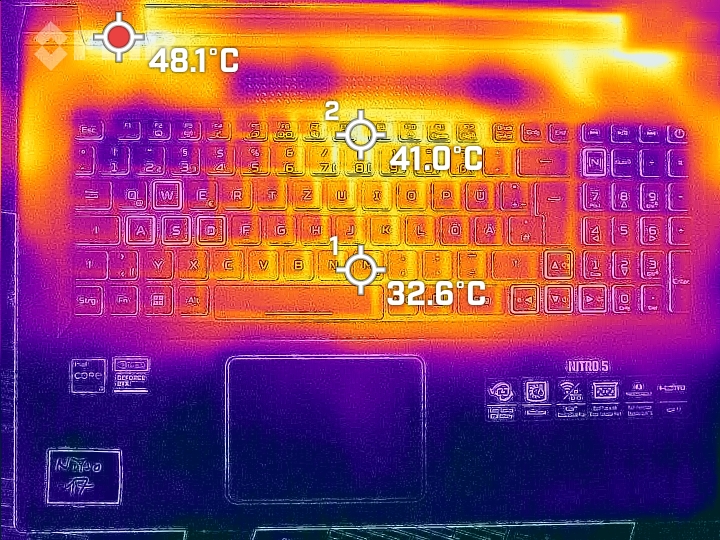
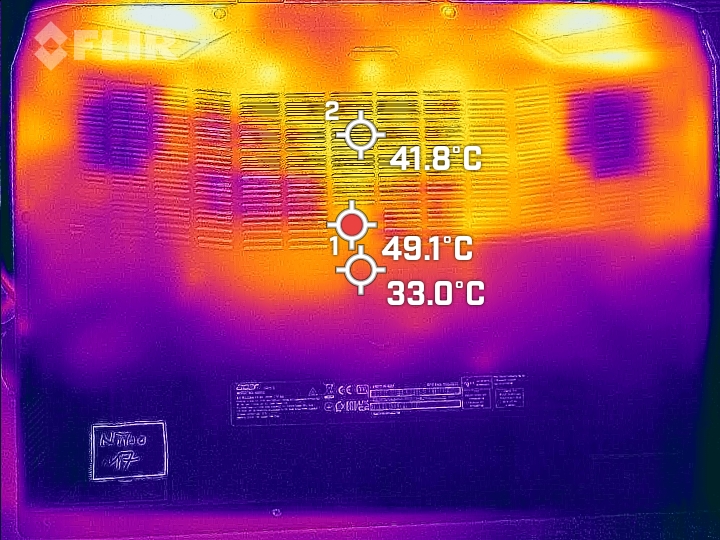
Temperatura
Como ya se puede adivinar por la imagen vista en la sección "Mantenimiento", el reposamanos se mantiene frío, incluso funcionando bajo el escenario más bien teórico de carga máxima. Sólo medimos algo más de 30 °C en el centro. Por el contrario, en Witcher 3 no se produjeron aumentos de temperatura significativos.
Esto significa que al menos la zona del teclado se mantiene por debajo de los 40 °C. Algo que no es ideal pero aún así manejable. En la zona trasera, donde están los ventiladores, la temperatura sube pero se mantiene por debajo de los 50 °C, algo que el predecesor fue incapaz de lograr.
En los otros modos de rendimiento, la disipación de calor sigue siendo comparable. Esto significa que puedes esperar un teclado caliente.
(±) La temperatura máxima en la parte superior es de 42.4 °C / 108 F, frente a la media de 40.4 °C / 105 F, que oscila entre 21.2 y 68.8 °C para la clase Gaming.
(-) El fondo se calienta hasta un máximo de 48.2 °C / 119 F, frente a la media de 43.2 °C / 110 F
(+) En reposo, la temperatura media de la parte superior es de 29.2 °C / 85# F, frente a la media del dispositivo de 33.9 °C / 93 F.
(±) Jugando a The Witcher 3, la temperatura media de la parte superior es de 32.2 °C / 90 F, frente a la media del dispositivo de 33.9 °C / 93 F.
(+) El reposamanos y el panel táctil están a una temperatura inferior a la de la piel, con un máximo de 27.4 °C / 81.3 F y, por tanto, son fríos al tacto.
(±) La temperatura media de la zona del reposamanos de dispositivos similares fue de 28.8 °C / 83.8 F (+1.4 °C / 2.5 F).
| Acer Nitro 5 AN517-55-5552 Intel Core i5-12500H, NVIDIA GeForce RTX 4050 Laptop GPU | Asus TUF Gaming A16 FA617XS AMD Ryzen 9 7940HS, AMD Radeon RX 7600S | Acer Nitro 5 AN517-55-738R Intel Core i7-12700H, NVIDIA GeForce RTX 3060 Laptop GPU | Medion Erazer Scout E20 Intel Core i7-13700H, NVIDIA GeForce RTX 4050 Laptop GPU | MSI Katana 15 B12VEK Intel Core i7-12650H, NVIDIA GeForce RTX 4050 Laptop GPU | MSI Cyborg 15 A12VF Intel Core i7-12650H, NVIDIA GeForce RTX 4060 Laptop GPU | |
|---|---|---|---|---|---|---|
| Heat | -3% | -10% | 9% | -9% | 9% | |
| Maximum Upper Side * (°C) | 42.4 | 53 -25% | 48.3 -14% | 41 3% | 47 -11% | 47.5 -12% |
| Maximum Bottom * (°C) | 48.2 | 48 -0% | 52 -8% | 39 19% | 48 -0% | 35.5 26% |
| Idle Upper Side * (°C) | 31.6 | 30 5% | 34.5 -9% | 31 2% | 35 -11% | 27.7 12% |
| Idle Bottom * (°C) | 33.1 | 30 9% | 35.8 -8% | 29 12% | 38 -15% | 29.5 11% |
* ... más pequeño es mejor
Prueba de esfuerzo
Incluso bajo carga máxima, el procesador no alcanza el consumo máximo posible de 115 vatios. Durante unos instantes, medimos casi 100 vatios mientras la temperatura subía a 100 °C, lo que, a su vez, reducía el consumo de energía.
Por el contrario, la CPU puede consumir brevemente 140 vatios y consigue mantenerse permanentemente por debajo de los 90 °C con más de 100 vatios. Así es exactamente como se fabrica un portátil para juegos.
La comparación de los modos de rendimiento es interesante, especialmente cuando se ajusta a "Silencioso" (línea azul): El rendimiento del procesador está claramente restringido, mientras que el chip gráfico aún logra alcanzar el nivel que normalmente sólo se permite cuando se usa el modo "Rendimiento". Aunque parezca errático en nuestro diagrama, la velocidad de reloj de la GPU sólo fluctúa entre 1.800 y más de 2.500 MHz. Al mismo tiempo, la temperatura se mantiene significativamente por encima de los 80 °C.
El modo "Silencioso" permite un alto rendimiento gráfico sin excesiva producción de calor, ya que la potencia del procesador está muy limitada.
Altavoces
Los pequeños altavoces estéreo cumplen los requisitos mínimos. En particular, la reproducción de voz está bien hecha. Desde la palabra hablada hasta las voces sofisticadas suenan bien.
Los graves brillan por su ausencia y los medios están poco definidos. Los altavoces del Nitro 5 no son realmente adecuados para la música, pero son bastante suficientes para el streaming de vídeo o los juegos.
Acer Nitro 5 AN517-55-5552 análisis de audio
(±) | la sonoridad del altavoz es media pero buena (80.4 dB)
Graves 100 - 315 Hz
(-) | casi sin bajos - de media 23.4% inferior a la mediana
(±) | la linealidad de los graves es media (14.9% delta a frecuencia anterior)
Medios 400 - 2000 Hz
(+) | medios equilibrados - a sólo 2.2% de la mediana
(+) | los medios son lineales (5.8% delta a la frecuencia anterior)
Altos 2 - 16 kHz
(+) | máximos equilibrados - a sólo 4.6% de la mediana
(+) | los máximos son lineales (4.8% delta a la frecuencia anterior)
Total 100 - 16.000 Hz
(±) | la linealidad del sonido global es media (17.1% de diferencia con la mediana)
En comparación con la misma clase
» 46% de todos los dispositivos probados de esta clase eran mejores, 12% similares, 43% peores
» El mejor tuvo un delta de 6%, la media fue 18%, el peor fue ###max##%
En comparación con todos los dispositivos probados
» 31% de todos los dispositivos probados eran mejores, 8% similares, 61% peores
» El mejor tuvo un delta de 4%, la media fue 24%, el peor fue ###max##%
Apple MacBook Pro 16 2021 M1 Pro análisis de audio
(+) | los altavoces pueden reproducir a un volumen relativamente alto (#84.7 dB)
Graves 100 - 315 Hz
(+) | buen bajo - sólo 3.8% lejos de la mediana
(+) | el bajo es lineal (5.2% delta a la frecuencia anterior)
Medios 400 - 2000 Hz
(+) | medios equilibrados - a sólo 1.3% de la mediana
(+) | los medios son lineales (2.1% delta a la frecuencia anterior)
Altos 2 - 16 kHz
(+) | máximos equilibrados - a sólo 1.9% de la mediana
(+) | los máximos son lineales (2.7% delta a la frecuencia anterior)
Total 100 - 16.000 Hz
(+) | el sonido global es lineal (4.6% de diferencia con la mediana)
En comparación con la misma clase
» 0% de todos los dispositivos probados de esta clase eran mejores, 0% similares, 100% peores
» El mejor tuvo un delta de 5%, la media fue 17%, el peor fue ###max##%
En comparación con todos los dispositivos probados
» 0% de todos los dispositivos probados eran mejores, 0% similares, 100% peores
» El mejor tuvo un delta de 4%, la media fue 24%, el peor fue ###max##%
Gestión de la energía
Consumo de energía
El hecho de que el procesador no esté actualizado se nota en términos de consumo. Con algo más de 7 vatios, el consumo mínimo es bueno pero podría ser algo menor, como el del Medion Erazer Scoutcon sui7-13700H. Incluso con un uso típico, 150 vatios es un valor bastante pobre. La media de laRTX 4050se sitúa por debajo de los 100 vatios. Sin embargo, en modo silencioso, el consumo total de energía también ronda los 100 vatios.
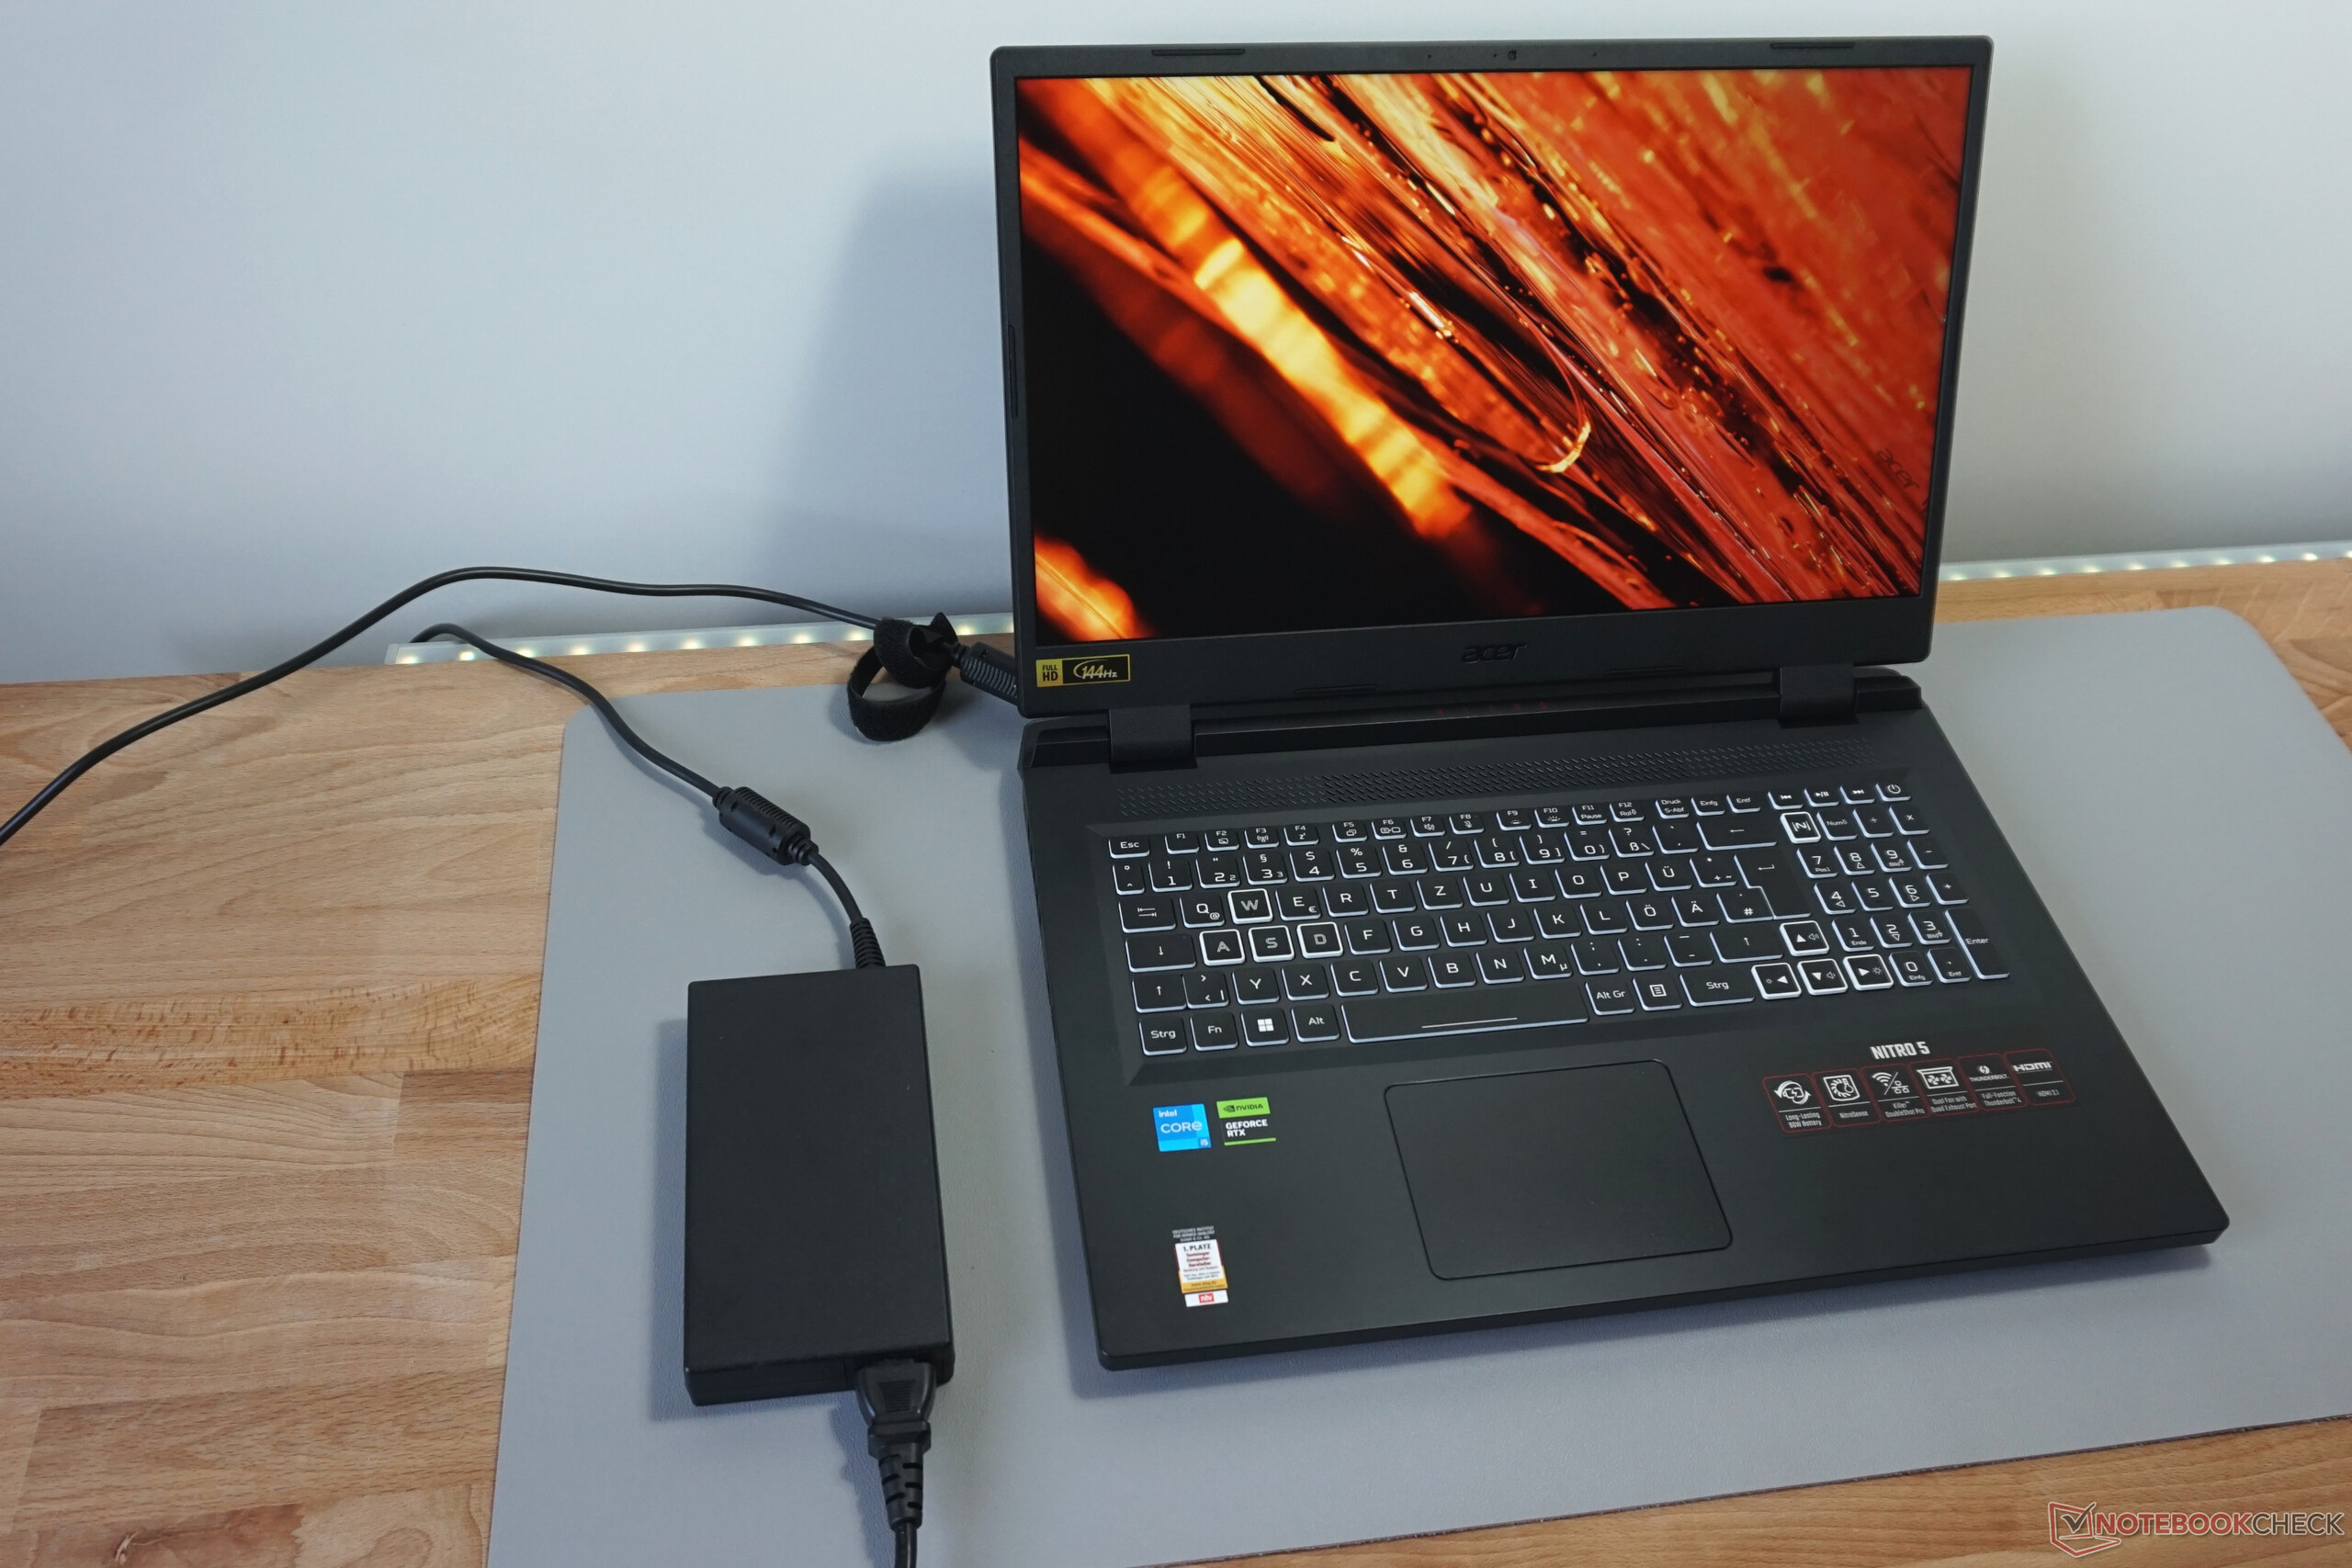
El consumo máximo de 244 vatios sólo se registró en una única medición de pico. La fuente de alimentación de 230 vatios debería, por tanto, ser suficiente y tener reservas suficientes para cargar la batería.
| Off / Standby | |
| Ocioso | |
| Carga |
|
Clave:
min: | |
| Acer Nitro 5 AN517-55-5552 i5-12500H, GeForce RTX 4050 Laptop GPU, WDC PC SN810 512GB, IPS, 1920x1080, 17.3" | Asus TUF Gaming A16 FA617XS R9 7940HS, Radeon RX 7600S, Micron 2400 MTFDKBA512QFM, IPS, 1920x1200, 16" | Acer Nitro 5 AN517-55-738R i7-12700H, GeForce RTX 3060 Laptop GPU, Samsung PM9A1 MZVL2512HCJQ, IPS, 1920x1080, 17.3" | Medion Erazer Scout E20 i7-13700H, GeForce RTX 4050 Laptop GPU, Phison PS5021-E21 1TB, IPS, 1920x1080, 17.3" | MSI Katana 15 B12VEK i7-12650H, GeForce RTX 4050 Laptop GPU, Micron 2400 MTFDKBA1T0QFM, IPS, 1920x1080, 15.6" | MSI Cyborg 15 A12VF i7-12650H, GeForce RTX 4060 Laptop GPU, Samsung PM9B1 1024GB MZVL41T0HBLB, IPS, 1920x1080, 15.6" | Medio NVIDIA GeForce RTX 4050 Laptop GPU | Media de la clase Gaming | |
|---|---|---|---|---|---|---|---|---|
| Power Consumption | 13% | -14% | 7% | 17% | 33% | -6% | -36% | |
| Idle Minimum * (Watt) | 7.6 | 7 8% | 9.7 -28% | 5 34% | 8.5 -12% | 6 21% | 9.95 ? -31% | 13.3 ? -75% |
| Idle Average * (Watt) | 11.3 | 10 12% | 14.6 -29% | 11 3% | 10.2 10% | 8.8 22% | 15.8 ? -40% | 19 ? -68% |
| Idle Maximum * (Watt) | 15.4 | 15 3% | 16.7 -8% | 22 -43% | 11.3 27% | 11.9 23% | 20.1 ? -31% | 24.5 ? -59% |
| Load Average * (Watt) | 151 | 86 43% | 166 -10% | 96 36% | 84 44% | 89 41% | 88 ? 42% | 108.1 ? 28% |
| Witcher 3 ultra * (Watt) | 137.8 | 160.6 -17% | 145.2 -5% | 128 7% | 90.3 34% | |||
| Load Maximum * (Watt) | 244 | 172 30% | 235 4% | 201 18% | 189 23% | 99 59% | 176.3 ? 28% | 254 ? -4% |
* ... más pequeño es mejor
Power consumption Witcher 3 / stress test
Power consumption with an external monitor
Duración de la batería
La duración de la batería del Acer Nitro 5 es muy práctica: Incluso con el brillo de pantalla al máximo, el portátil logró bastante más de 8 horas en nuestra prueba Wi-Fi mientras cambiaba de sitio web. Con brillo limitado, puedes esperar una hora extra. Sin embargo, con 90 Wh, la capacidad de la batería también es muy alta.
ElAsus TUF Gaming 16- que puede conseguir 12 horas y más con una batería del mismo tamaño - demuestra que un portátil de juego puede funcionar de forma mucho más eficiente.
| Acer Nitro 5 AN517-55-5552 i5-12500H, GeForce RTX 4050 Laptop GPU, 90 Wh | Asus TUF Gaming A16 FA617XS R9 7940HS, Radeon RX 7600S, 90 Wh | Acer Nitro 5 AN517-55-738R i7-12700H, GeForce RTX 3060 Laptop GPU, 90.61 Wh | Medion Erazer Scout E20 i7-13700H, GeForce RTX 4050 Laptop GPU, 53.35 Wh | MSI Katana 15 B12VEK i7-12650H, GeForce RTX 4050 Laptop GPU, 53.5 Wh | MSI Cyborg 15 A12VF i7-12650H, GeForce RTX 4060 Laptop GPU, 53.5 Wh | Media de la clase Gaming | |
|---|---|---|---|---|---|---|---|
| Duración de Batería | 50% | -30% | -44% | -48% | -6% | -7% | |
| H.264 (h) | 7.4 | 12.4 68% | 5.3 -28% | 4.6 -38% | 4.4 -41% | 8 8% | 8.26 ? 12% |
| WiFi v1.3 (h) | 9.4 | 12.4 32% | 6.5 -31% | 4.7 -50% | 4.3 -54% | 7.5 -20% | 7.01 ? -25% |
Pro
Contra
Veredicto - La eficiente GPU del Nitro 5 está bien implementada
Con el sencillo i5-12500H y la tarjeta gráfica RTX 4050 de nivel básico, el Acer Nitro 5 no ofrece un mal rendimiento, sino, en el mejor de los casos, un rendimiento medio. Entonces se activa el modo "Silencioso":
Con ruidos de ventilador audibles, pero nunca molestos, el rendimiento de juego baja mínimamente, especialmente en juegos, donde sólo determinamos una diferencia de unos pocos puntos porcentuales. El Nitro reproduce los juegos actuales sin problemas en resolución Full HD, con ajustes de detalles altos y nunca supera los niveles de ruido de sus compañeros.
Los ventiladores silenciosos y los juegos Full HD no son mutuamente excluyentes en el Acer Nitro 5.
Esto es posible gracias al eficiente chip gráfico de Nvidia, que no se beneficia de un mayor consumo de energía. Sin embargo, esto también es posible gracias a la carcasa muy grande y un sistema de refrigeración igualmente grande que posee ajustes inteligentes. Además de eso, hay un teclado RGB, Thunderbolt 4 y dos puertos USB de 10 Gbit/s.
Lo que es realmente decepcionante es la pantalla: Si bien la resolución y el tamaño encajan perfectamente con el tamaño del portátil Acer, la reproducción del color, el contraste y el brillo máximo están claramente por debajo de la media, incluso para los estándares de gama de entrada que vienen bien en términos de precio.
Si sólo se trata de rendimiento en juegos, hay portátiles más rápidos. Por ejemplo, elMedion Erazer Scout E20 también está equipado con unaRTX 4050 y también tiene una pantalla significativamente mejor. Sin embargo, no es tan silencioso como el Nitro y es mínimamente más caro.
Precio y disponibilidad
El Acer Nitro 5 (RTX 4050, 16 GB de RAM DDR5) está disponible en Amazon por unos 1225 dólares.
Acer Nitro 5 AN517-55-5552
- 06/13/2023 v7 (old)
Mario Petzold
Transparencia
La selección de los dispositivos que se van a reseñar corre a cargo de nuestro equipo editorial. La muestra de prueba fue proporcionada al autor en calidad de préstamo por el fabricante o el minorista a los efectos de esta reseña. El prestamista no tuvo ninguna influencia en esta reseña, ni el fabricante recibió una copia de la misma antes de su publicación. No había ninguna obligación de publicar esta reseña. Como empresa de medios independiente, Notebookcheck no está sujeta a la autoridad de fabricantes, minoristas o editores.
Así es como prueba Notebookcheck
Cada año, Notebookcheck revisa de forma independiente cientos de portátiles y smartphones utilizando procedimientos estandarizados para asegurar que todos los resultados son comparables. Hemos desarrollado continuamente nuestros métodos de prueba durante unos 20 años y hemos establecido los estándares de la industria en el proceso. En nuestros laboratorios de pruebas, técnicos y editores experimentados utilizan equipos de medición de alta calidad. Estas pruebas implican un proceso de validación en varias fases. Nuestro complejo sistema de clasificación se basa en cientos de mediciones y puntos de referencia bien fundamentados, lo que mantiene la objetividad.Price comparison

