Análisis del Asus ROG Flow X13 GV302XV (2023): Convertible gaming esbelto que pega fuerte con AMD Zen 4 Ryzen 9 7940HS y Nvidia RTX 4060 de 60 W

Los convertibles para juegos, especialmente los de 13 pulgadas, son una especie rara. Asus prácticamente domina este espacio con la gama ROG Flow. Ya hemos analizado el ROG Flow Z13 y el ROG Flow Z13 ACRNMambos con procesador Intel Raptor Lake-H y GPU Nvidia RTX serie 40.
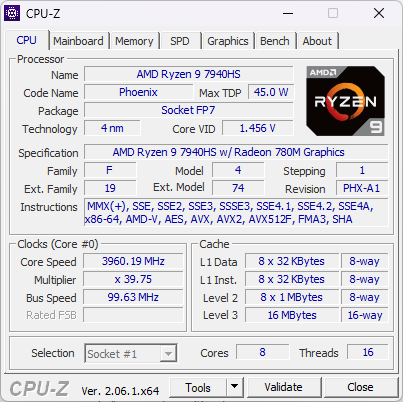
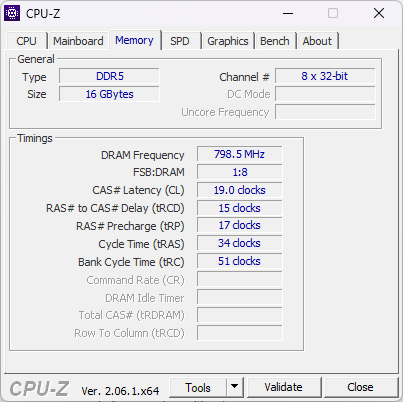
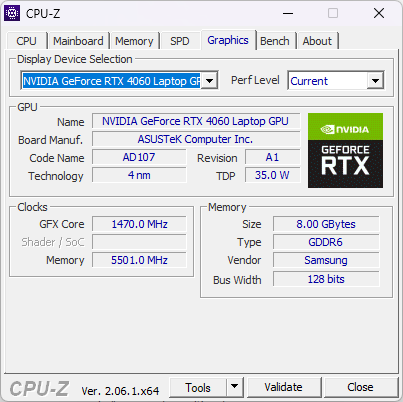
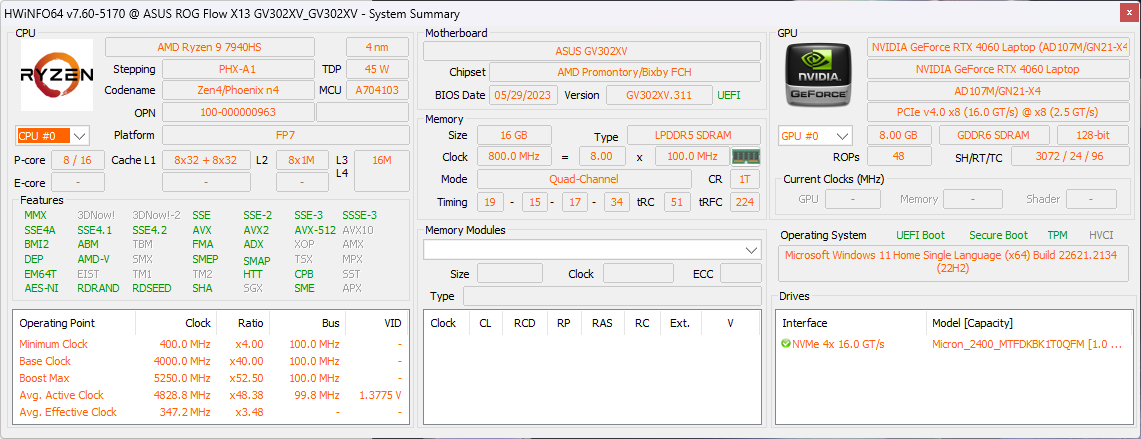
Ahora, echamos un vistazo al ROG Flow X13 con sabor a AMD. Nuestro ROG Flow X13 de muestra cuenta con un AMD Ryzen 9 7940HS Y una GPU Nvidia GPU Nvidia GeForce RTX 4060 para portátiles junto con 16 GB de RAM LPDDR5-6400 y un SSD NVMe PCIe Gen4 de 1 TB. Esta configuración te costará ₹1,84,990 o US$2,500.
El ROG Flow X13 adopta un enfoque de diseño diferente al del Z13 desmontable. El Flow X13 carece de Thunderbolt y utiliza USB4 en su lugar. MediaTek Wi-Fi 6E sustituye a la conectividad Intel. No hay cámara secundaria, pero el Flow X13 lleva una batería más grande de 75 WHr en comparación con la célula de 56 WHr del Z13.
Tanto el ROG Flow Z13 como el X13 tienen un precio similar, lo que plantea un enigma de compra. En este análisis, analizamos a fondo el ROG Flow X13 y vemos si este convertible basado en AMD es mejor dispositivo en general que sus homólogos basados en Intel.
Posibles contendientes en la comparación
Valoración | Fecha | Modelo | Peso | Altura | Tamaño | Resolución | Precio |
|---|---|---|---|---|---|---|---|
| 88.2 % v7 (old) | 10/2023 | Asus ROG Flow X13 GV302XV R9 7940HS, GeForce RTX 4060 Laptop GPU | 1.3 kg | 18.7 mm | 13.40" | 2560x1600 | |
| 89.4 % v7 (old) | 04/2023 | Asus ROG Flow Z13 ACRNM i9-13900H, GeForce RTX 4070 Laptop GPU | 1.7 kg | 20 mm | 13.40" | 2560x1600 | |
| 89.1 % v7 (old) | 04/2023 | Asus ROG Flow Z13 GZ301V i9-13900H, GeForce RTX 4060 Laptop GPU | 1.6 kg | 14.2 mm | 13.40" | 2560x1600 | |
| 88.7 % v7 (old) | 06/2023 | Razer Blade 14 RTX 4070 R9 7940HS, GeForce RTX 4070 Laptop GPU | 1.8 kg | 17.99 mm | 14.00" | 2560x1600 | |
| 86.9 % v7 (old) | 06/2023 | Asus TUF Gaming A16 FA617XS R9 7940HS, Radeon RX 7600S | 2.2 kg | 22.1 mm | 16.00" | 1920x1200 | |
| 87.7 % v7 (old) | 08/2023 | Lenovo Legion Slim 5 16APH8 R7 7840HS, GeForce RTX 4060 Laptop GPU | 2.4 kg | 25.2 mm | 16.00" | 2560x1600 | |
| 87.3 % v7 (old) | 07/2023 | Acer Predator Triton 14 PT14-51 i7-13700H, GeForce RTX 4050 Laptop GPU | 1.7 kg | 19.81 mm | 14.00" | 2560x1600 |
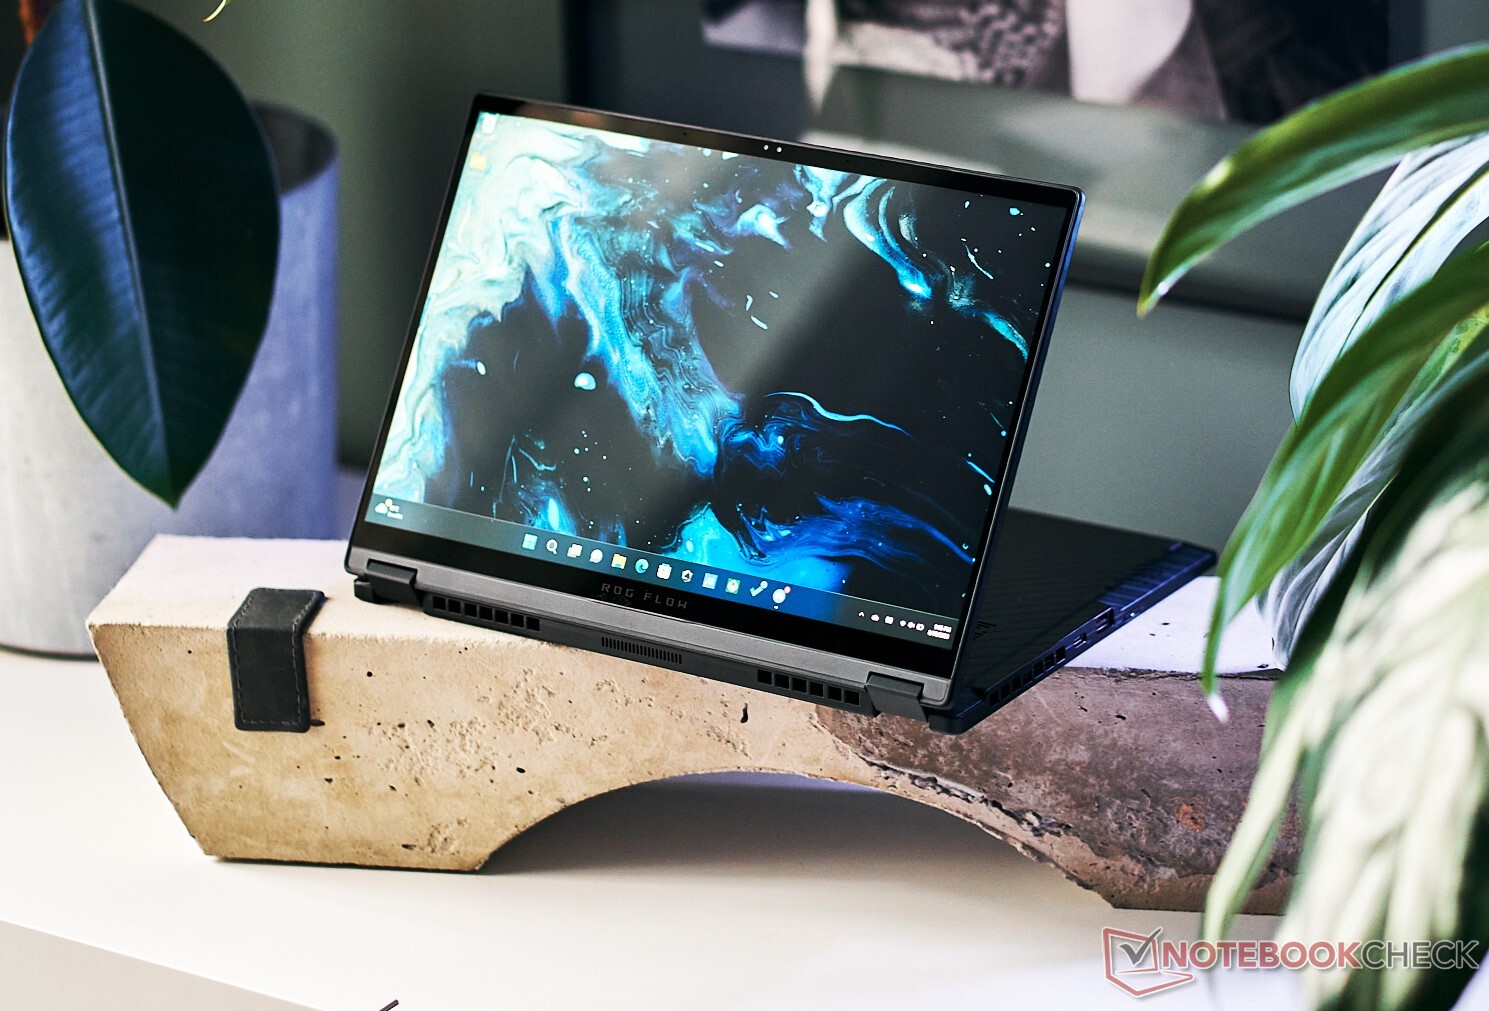
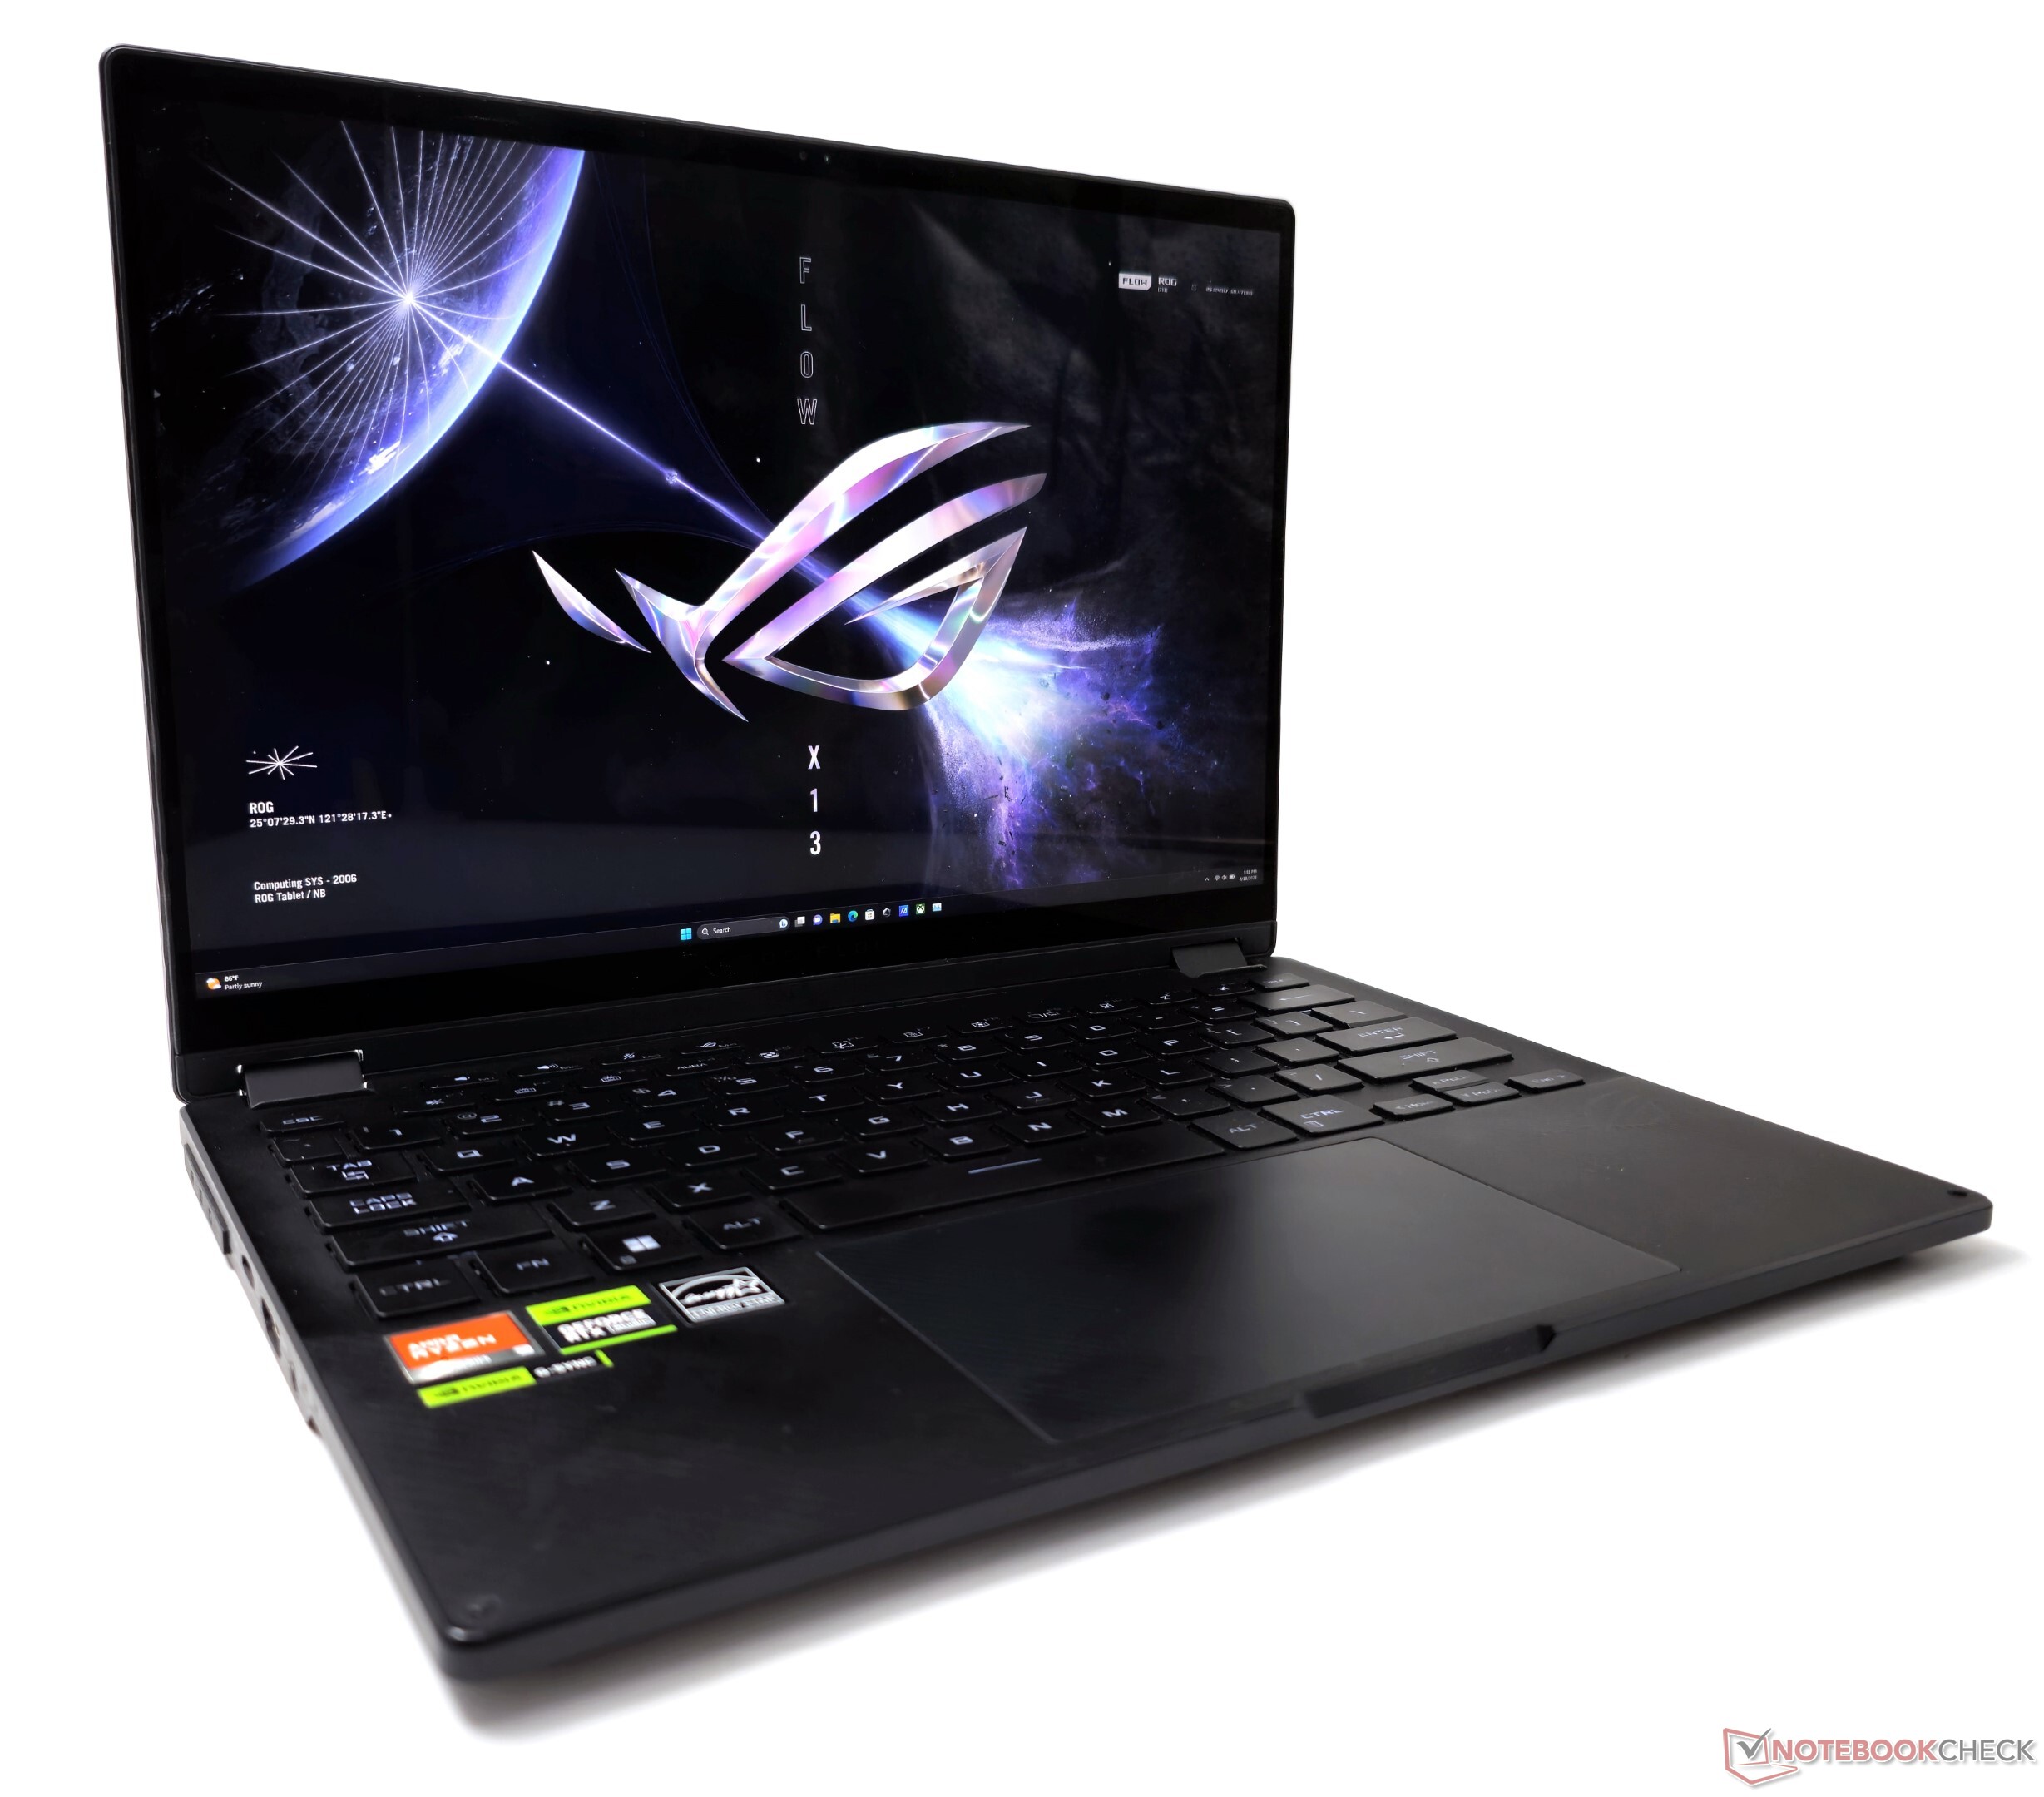
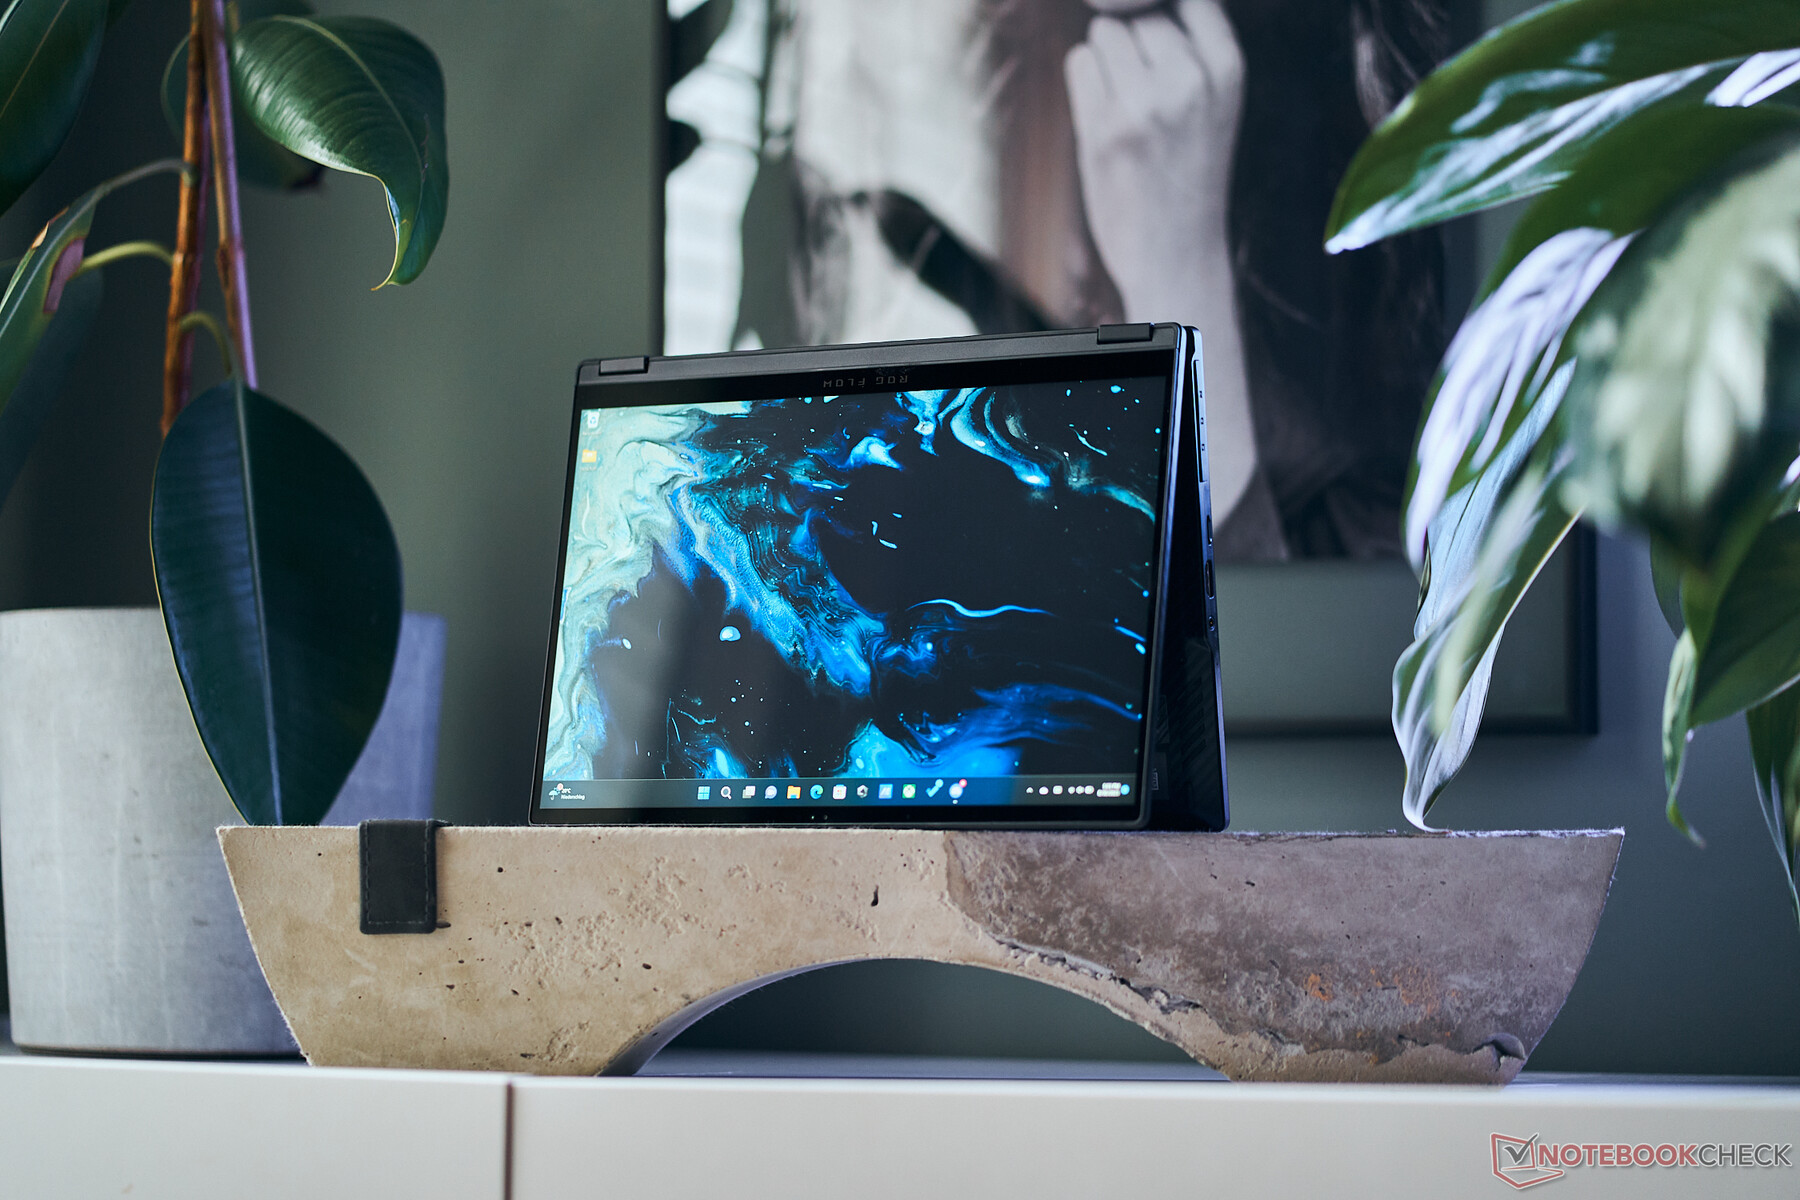
Chasis: Premium, elegancia discreta
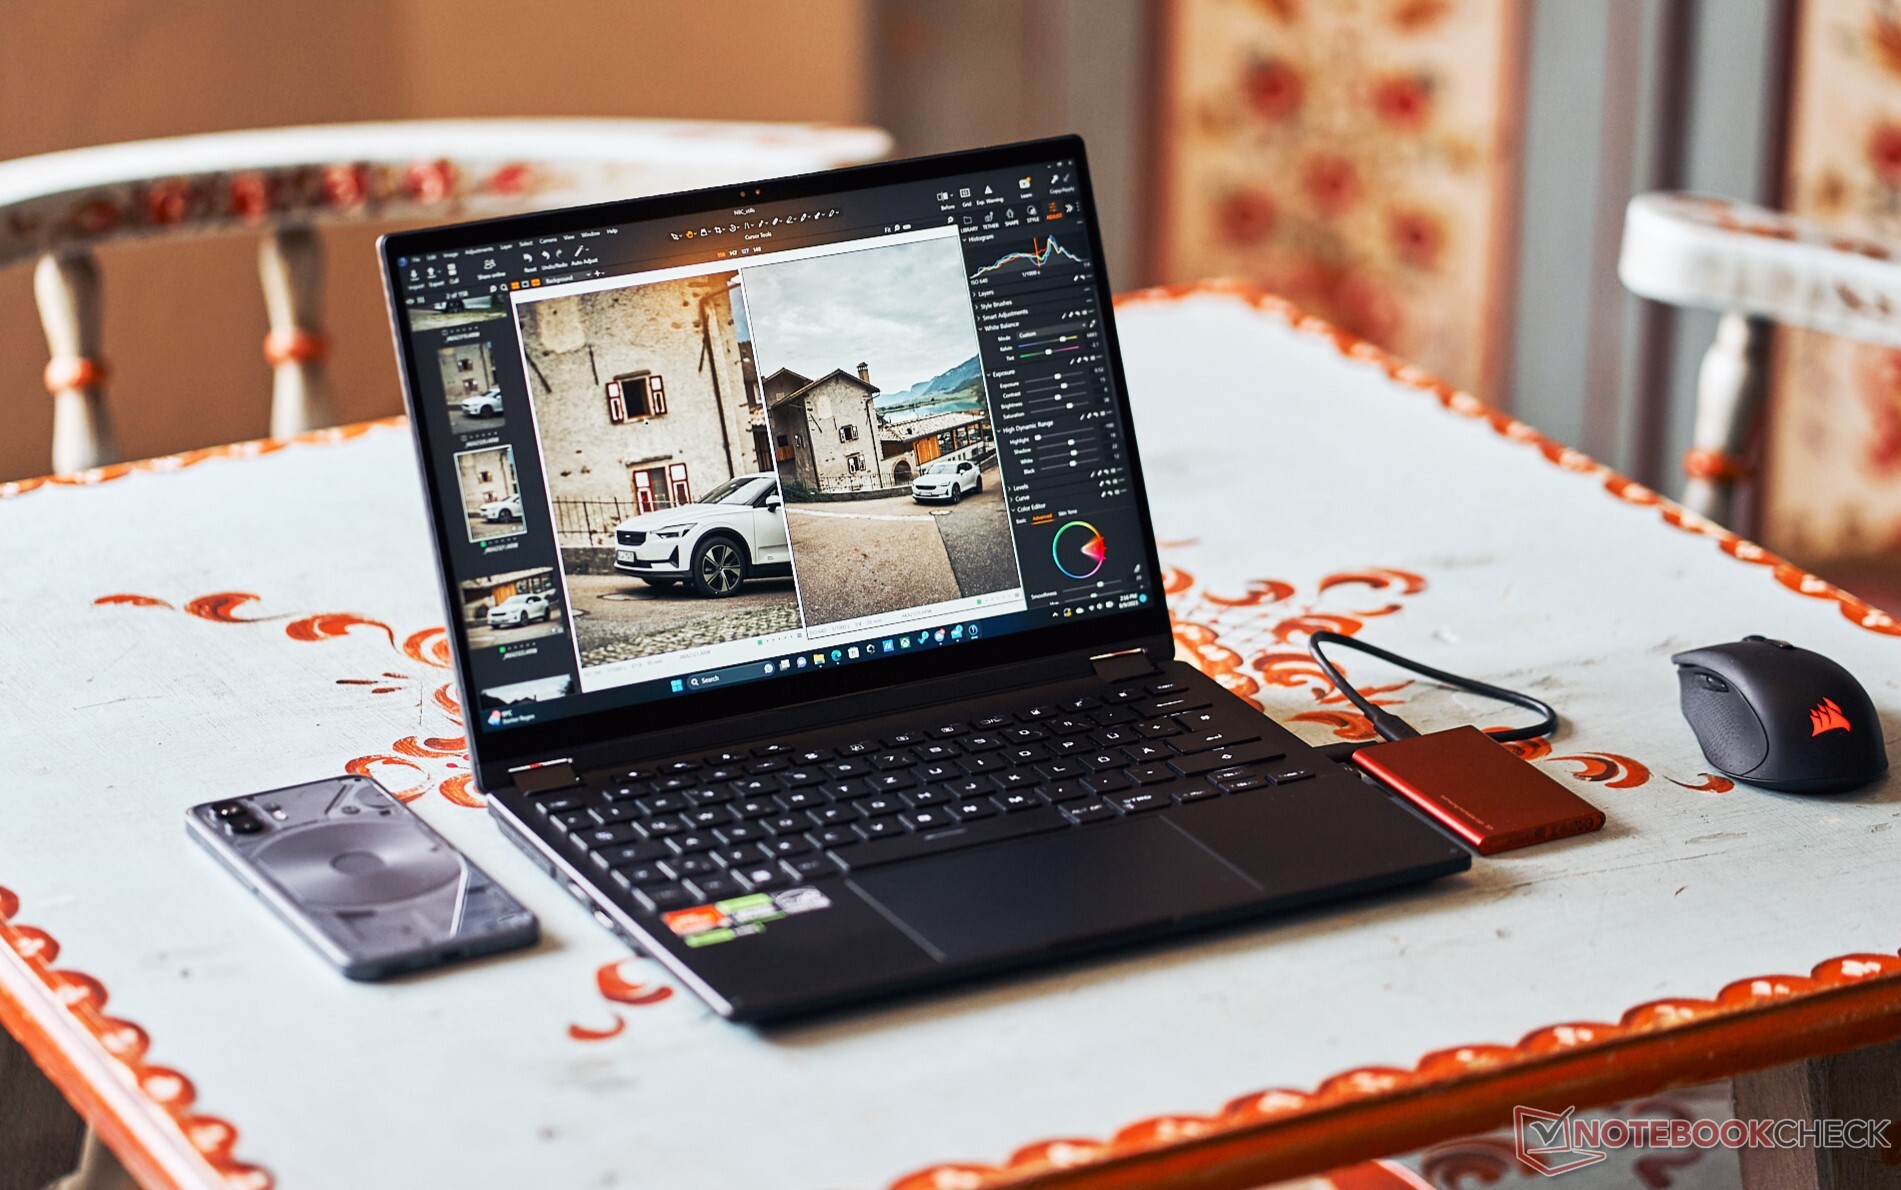
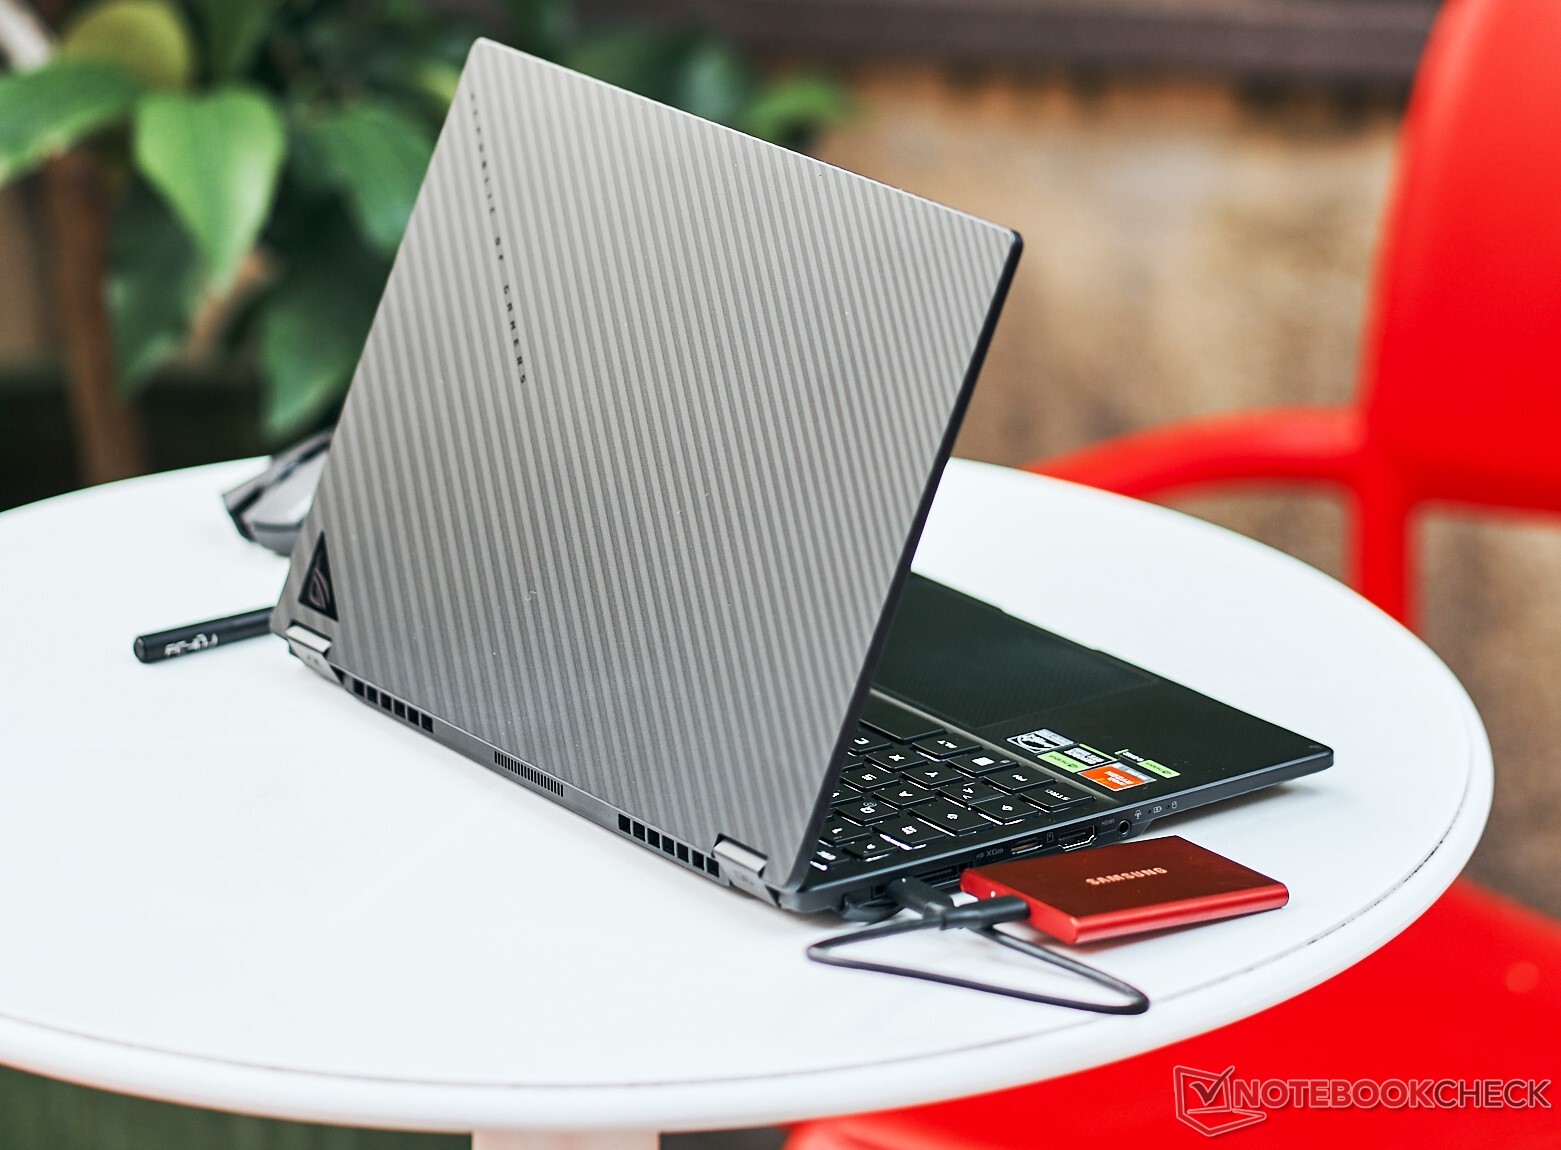
Revestido de aluminio minimalista, el ROG Flow X13 evita la ostentosa estética "gamer" en favor de una sutil sofisticación. No hay "ventana de visualización" interna como hemos visto en el ROG Flow Z13.
El chasis de 13,4 pulgadas del Flow X13 logra un equilibrio ideal entre portabilidad y productividad, con un peso de sólo 1,3 kg que permite transportarlo fácilmente con una sola mano. La distintiva tapa texturizada añade un toque de estilo a la vez que proporciona un agarre acanalado, abriéndose suavemente con un solo dedo.
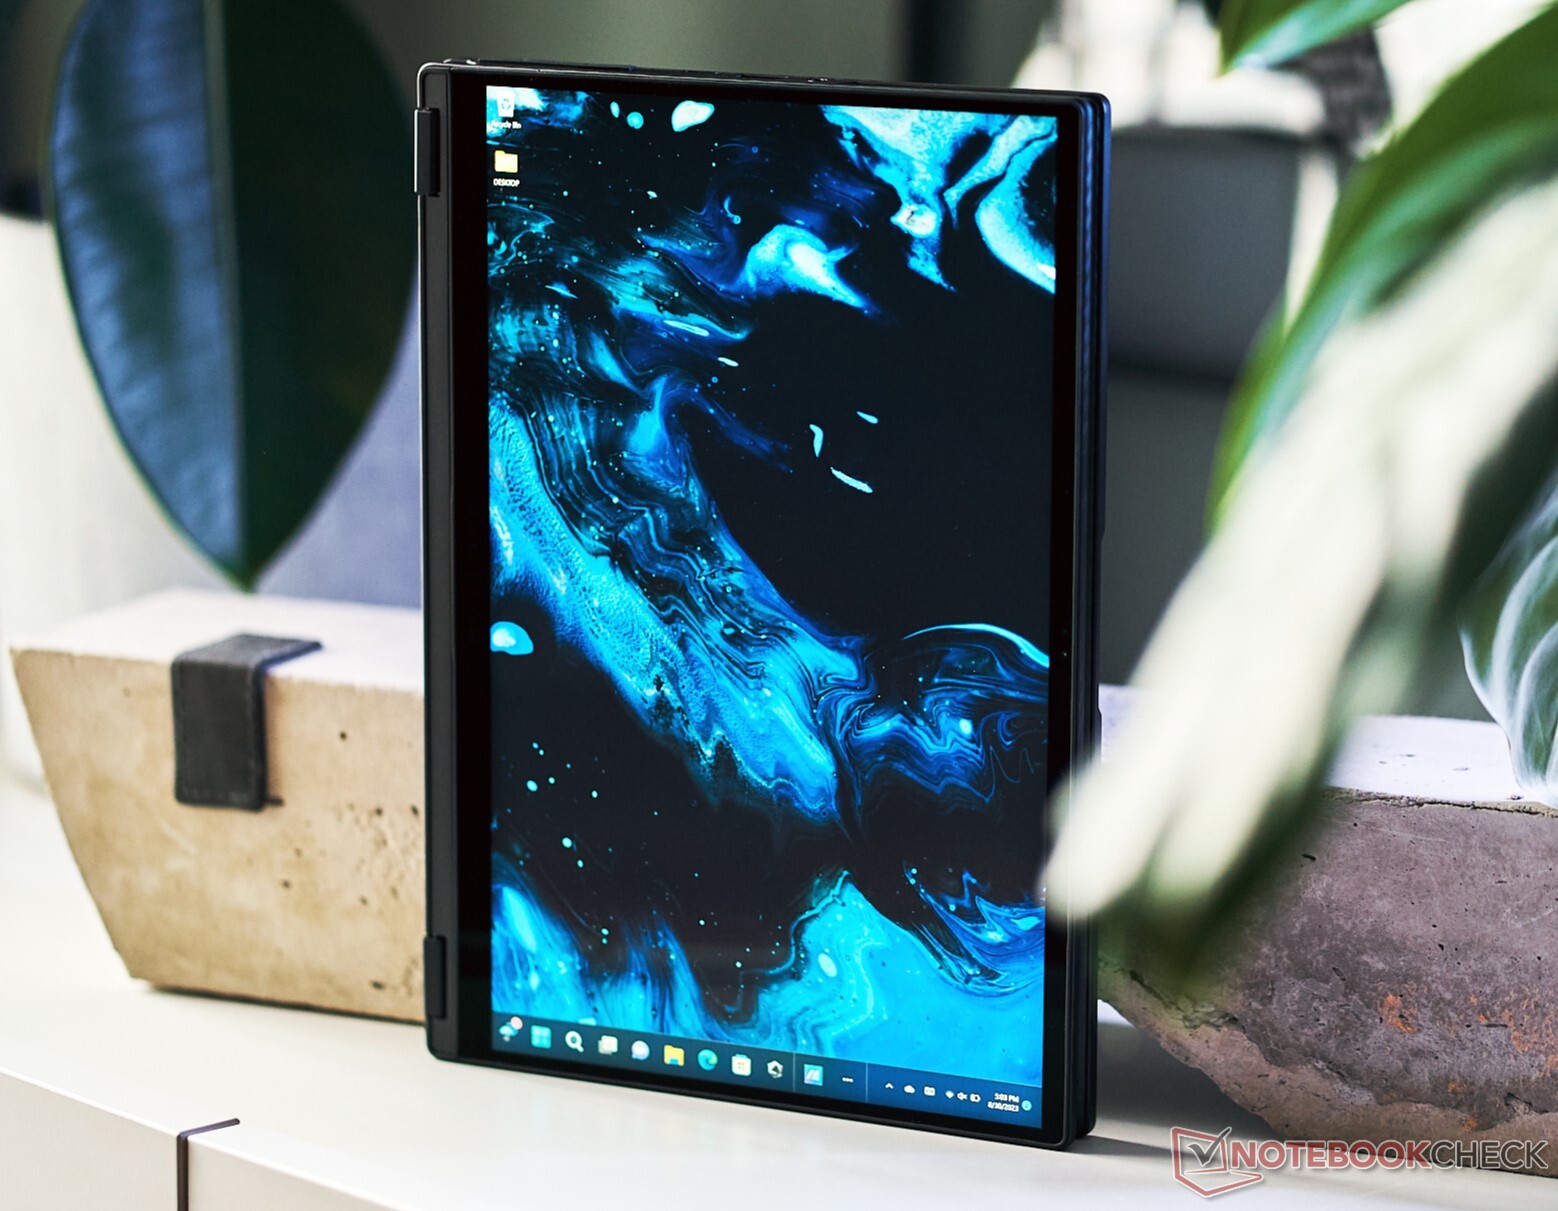
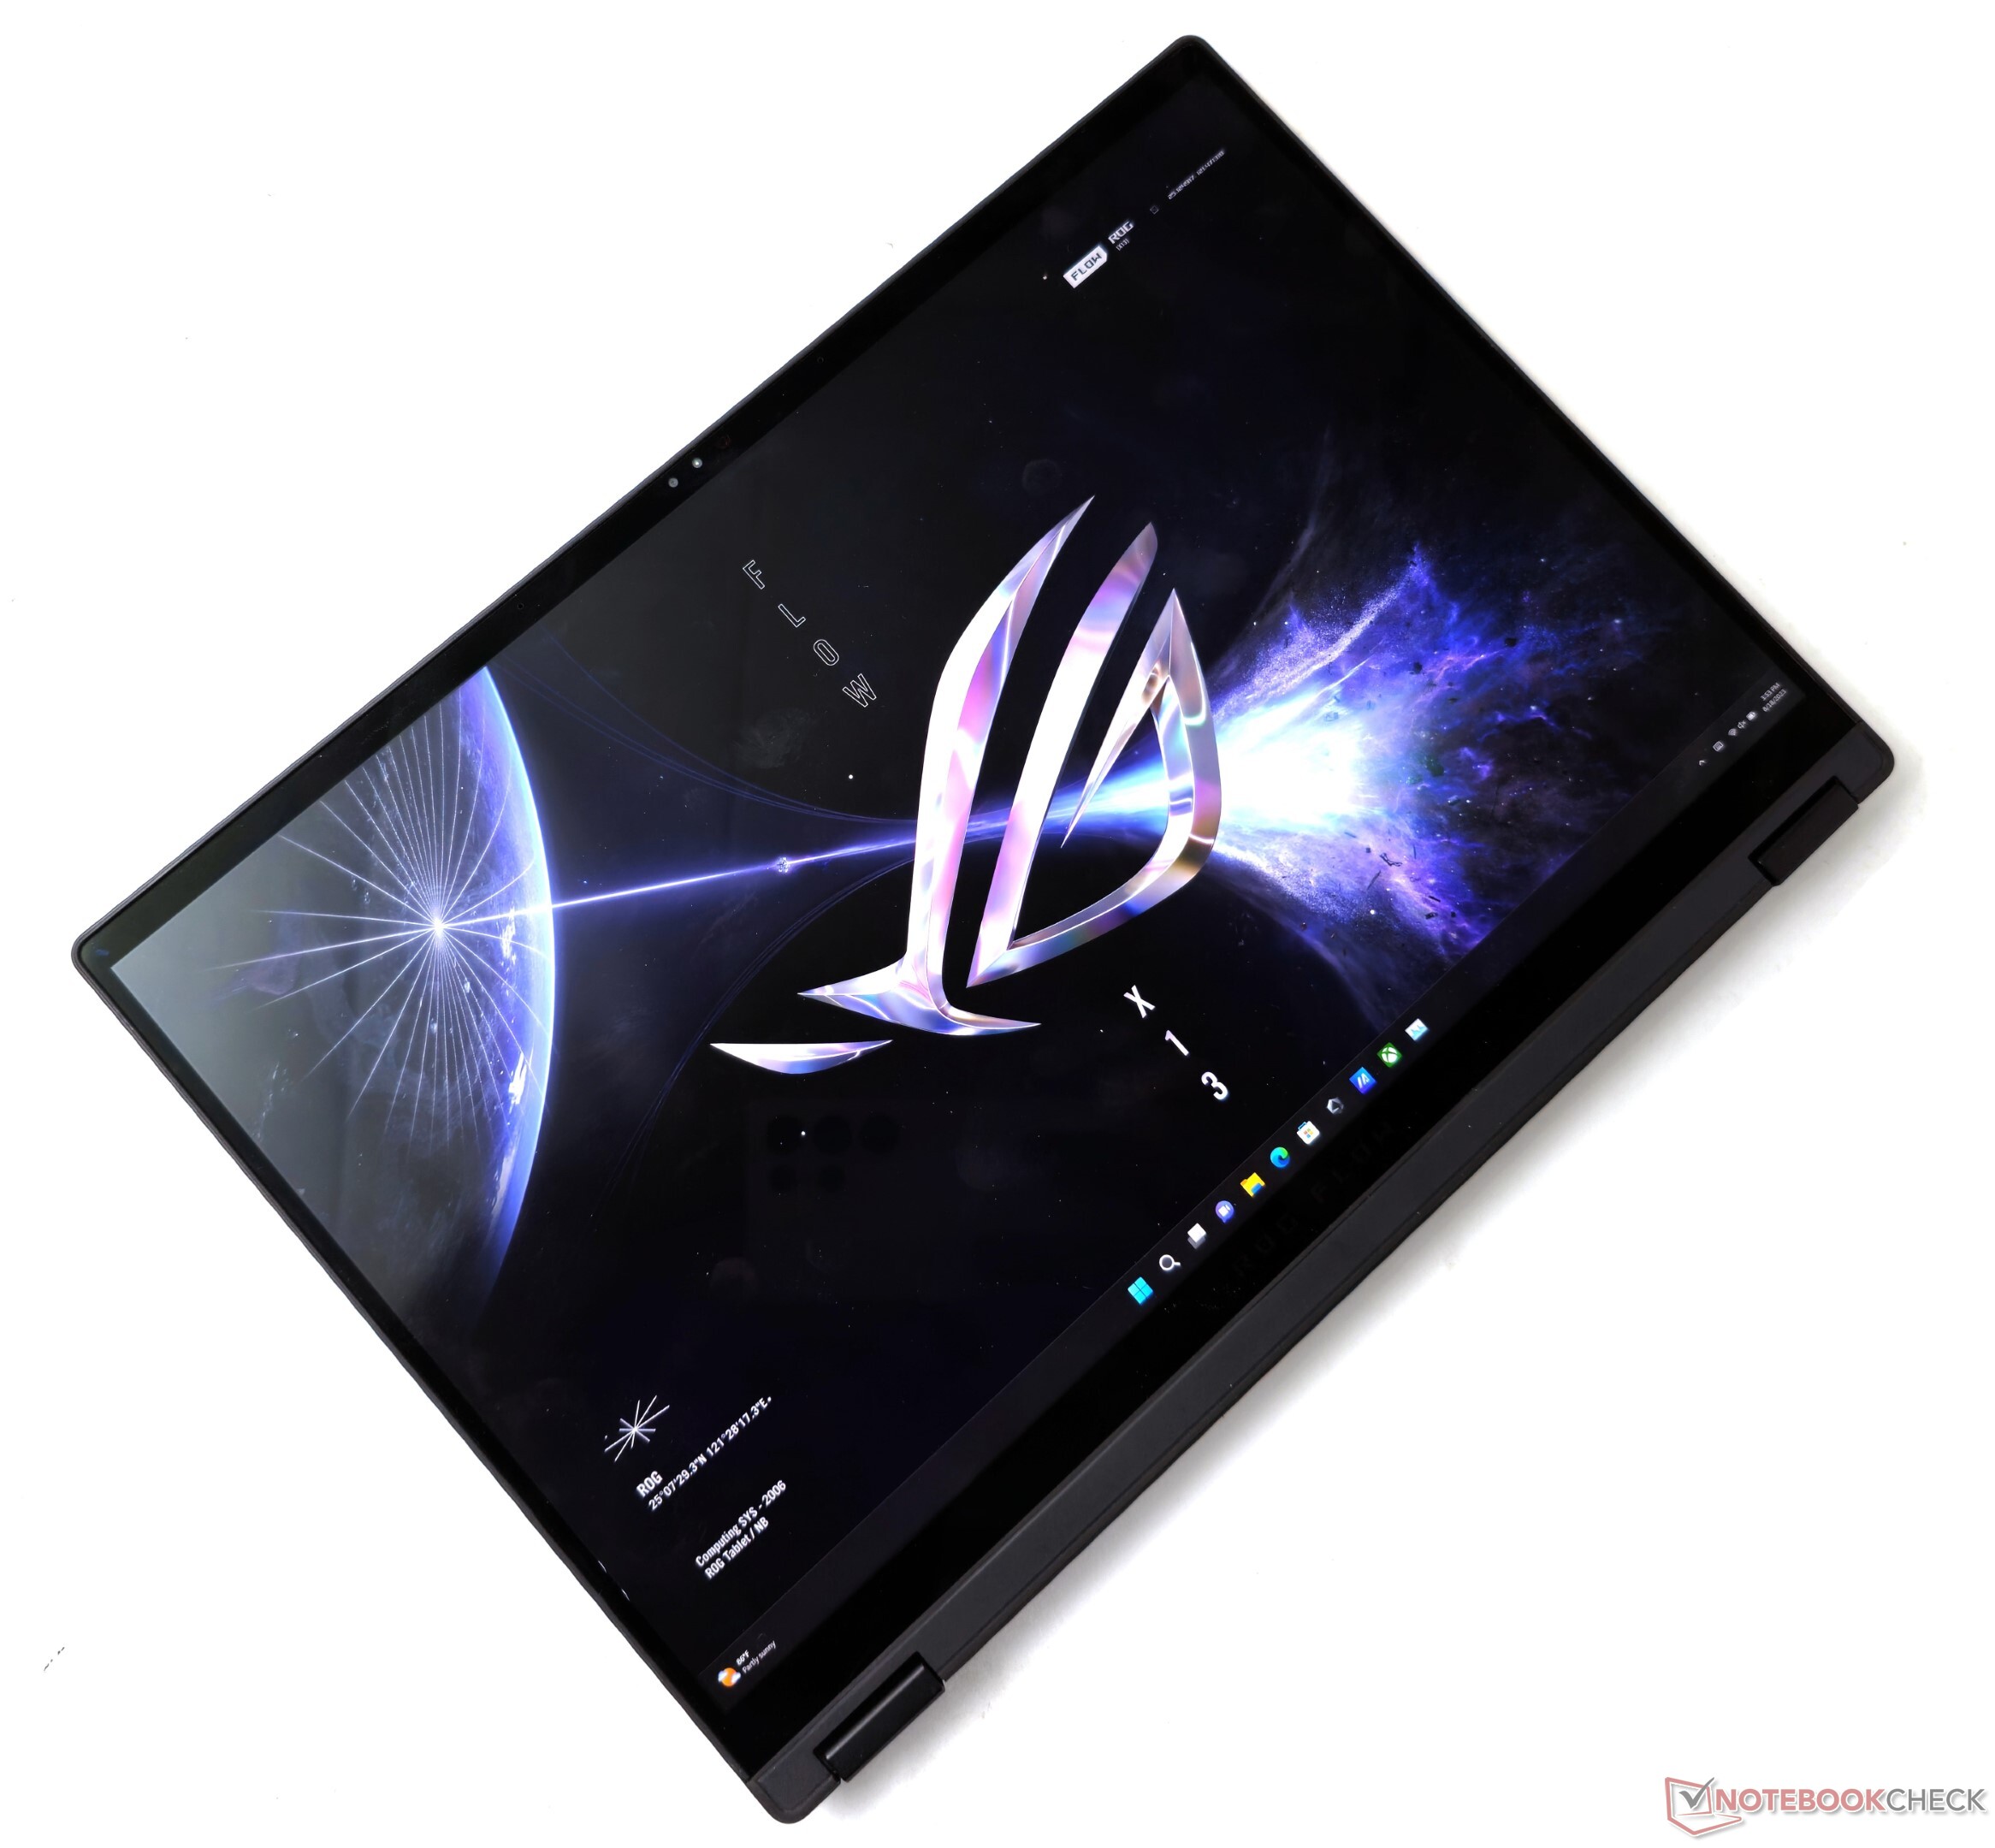
Como convertible, el Flow X13 puede cambiar sin problemas entre los modos portátil, tableta, tienda de campaña o soporte con unas bisagras resistentes y sin tambaleos. A pesar de sus 18,7 mm de grosor, el chasis no muestra flexión ni debilidades estructurales en ningún modo.
En general, Asus ha conseguido un convertible de primera calidad en un formato compacto de 13,4 pulgadas sin que se note ningún compromiso en la fabricación.
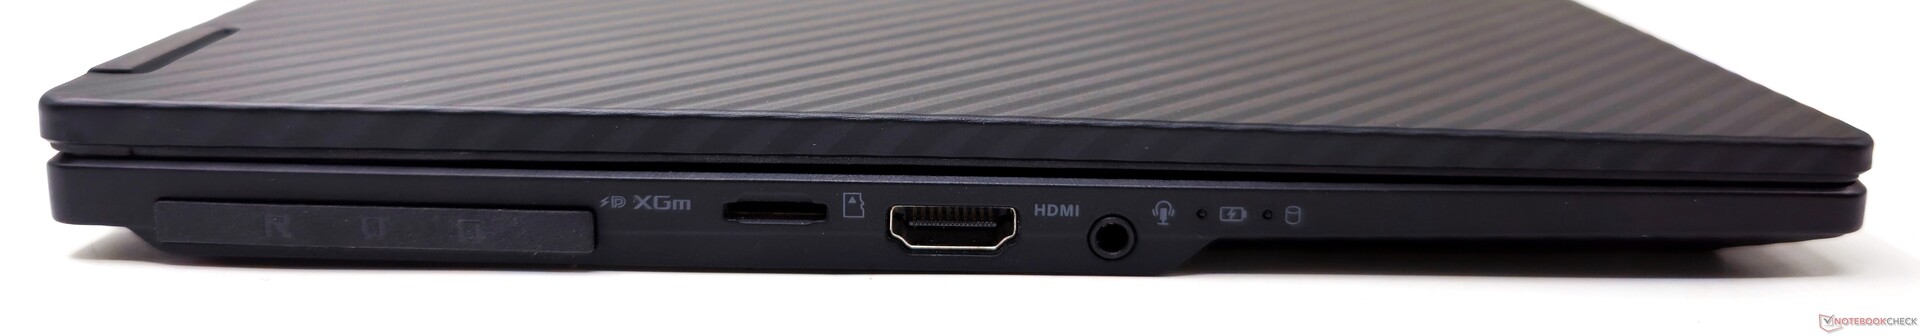
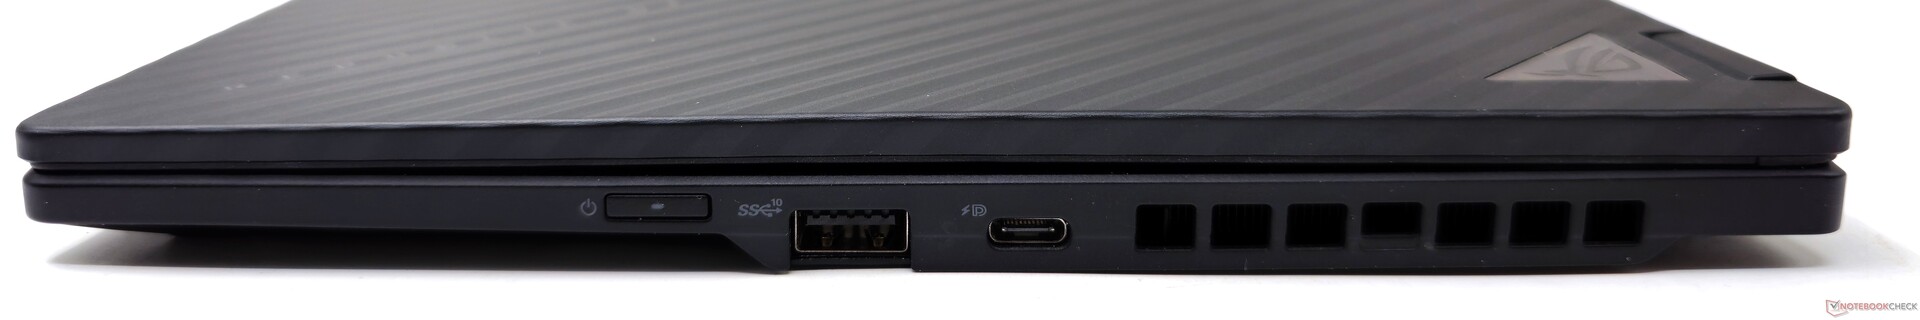
Conectividad: USB4 e interfaz ROG XG Mobile
A pesar de sus dimensiones compactas, el Flow X13 impresiona por su versátil conectividad. Una interfaz exclusiva ROG XG Mobile permite vincular la base de GPU externa de Asus para añadir potencia gráfica hasta una GPU RTX 4090 para portátiles junto con E/S ampliadas.
El ROG Flow X13 está entre el puñado de portátiles AMD en 2023 con un puerto USB4. No encontramos ninguna obstrucción al conectar varios periféricos a la vez.
Lector de tarjetas SD
El lector de tarjetas microSD del Flow X13 tiene un rendimiento admirable, con velocidades secuenciales de hasta 256 MB/s. Las velocidades de copia de JPG variados son comparables a las observadas con los modelos Flow Z13.
| SD Card Reader | |
| average JPG Copy Test (av. of 3 runs) | |
| Asus ROG Flow Z13 GZ301V | |
| Asus ROG Flow Z13 ACRNM (Angelbird AV Pro V60) | |
| Asus ROG Flow X13 GV302XV (Angelbird AV Pro V60) | |
| Media de la clase Convertible (29.4 - 141, n=20, últimos 2 años) | |
| Lenovo Legion Slim 5 16APH8 (PNY EliteX-Pro60 V60 256 GB) | |
| Acer Predator Triton 14 PT14-51 (AV PRO microSD 128 GB V60) | |
| maximum AS SSD Seq Read Test (1GB) | |
| Asus ROG Flow X13 GV302XV (Angelbird AV Pro V60) | |
| Asus ROG Flow Z13 ACRNM (Angelbird AV Pro V60) | |
| Asus ROG Flow Z13 GZ301V | |
| Media de la clase Convertible (67.5 - 254, n=19, últimos 2 años) | |
| Lenovo Legion Slim 5 16APH8 (PNY EliteX-Pro60 V60 256 GB) | |
| Acer Predator Triton 14 PT14-51 (AV PRO microSD 128 GB V60) | |
Comunicación
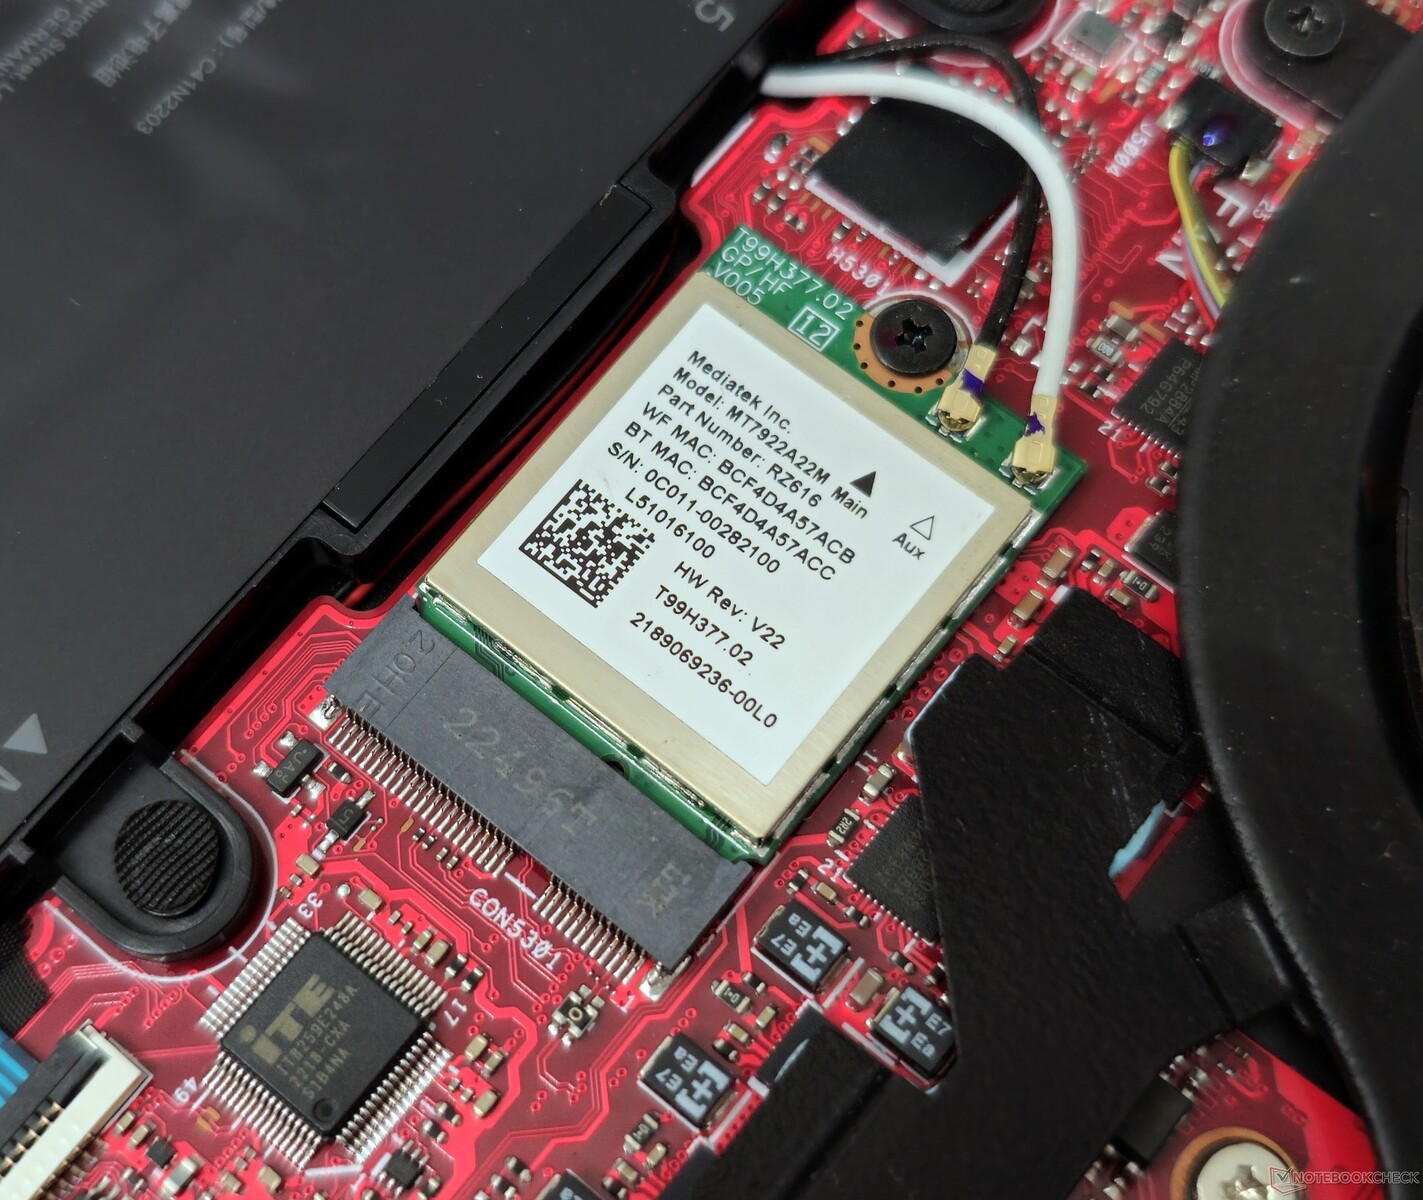
Al tratarse de un dispositivo AMD, el Flow X13 incorpora una tarjeta Wi-Fi 6E de MediaTek en lugar de la solución Intel del Flow Z13. El Flow X13 obtiene un beneficio real mínimo al pasar de la banda de 5 GHz a la de 6 GHz, pero esta última es menos propensa a las interferencias.
Cuando se probó con el router ROG Rapture GT-AXE11000 de Asus, las velocidades de recepción 6E resultaron ser prácticamente idénticas entre los dos modelos. Sin embargo, el Flow X13 mostró una ligera ventaja en las pruebas de transmisión 6E.
El convertible tuvo problemas para mantener un rendimiento estable al principio de la prueba, pero el rendimiento se suavizó con el tiempo.
| Networking / iperf3 transmit AXE11000 | |
| Asus ROG Flow X13 GV302XV | |
| Asus ROG Flow Z13 ACRNM | |
| Lenovo Legion Slim 5 16APH8 | |
| Acer Predator Triton 14 PT14-51 | |
| Razer Blade 14 RTX 4070 | |
| Medio MediaTek Wi-Fi 6E MT7922 160MHz Wireless LAN Card (358 - 1785, n=86) | |
| Media de la clase Convertible (131.3 - 1845, n=43, últimos 2 años) | |
| Asus TUF Gaming A16 FA617XS | |
| Networking / iperf3 receive AXE11000 | |
| Asus ROG Flow X13 GV302XV | |
| Acer Predator Triton 14 PT14-51 | |
| Asus ROG Flow Z13 ACRNM | |
| Razer Blade 14 RTX 4070 | |
| Lenovo Legion Slim 5 16APH8 | |
| Medio MediaTek Wi-Fi 6E MT7922 160MHz Wireless LAN Card (644 - 1775, n=87) | |
| Media de la clase Convertible (492 - 1755, n=44, últimos 2 años) | |
| Asus TUF Gaming A16 FA617XS | |
| Networking / iperf3 transmit AXE11000 6GHz | |
| Asus ROG Flow X13 GV302XV | |
| Lenovo Legion Slim 5 16APH8 | |
| Asus ROG Flow Z13 GZ301V | |
| Razer Blade 14 RTX 4070 | |
| Medio MediaTek Wi-Fi 6E MT7922 160MHz Wireless LAN Card (394 - 1890, n=61) | |
| Media de la clase Convertible (848 - 1825, n=25, últimos 2 años) | |
| Networking / iperf3 receive AXE11000 6GHz | |
| Asus ROG Flow Z13 GZ301V | |
| Asus ROG Flow X13 GV302XV | |
| Razer Blade 14 RTX 4070 | |
| Media de la clase Convertible (928 - 1775, n=27, últimos 2 años) | |
| Medio MediaTek Wi-Fi 6E MT7922 160MHz Wireless LAN Card (684 - 1779, n=63) | |
| Lenovo Legion Slim 5 16APH8 | |
Cámara web
La webcam 1080p del Flow X13 hace el trabajo con una claridad básica. La webcam captura imágenes útiles con una reproducción del color decente. Los detalles parecen adecuados para una cámara de portátil, aunque la nitidez es mejorable.


Seguridad
La cámara IR integrada permite una autenticación biométrica rápida y precisa basada en Windows Hello. Además, cuenta con un módulo TPM 2.0 para cifrado.
Accesorios y garantía
Asus incluye una práctica funda ROG Sleeve en la caja para transportar fácilmente el Flow X13. Las unidades de venta también incluyen el lápiz óptico Asus Pen SA203 en algunas regiones. Los compradores pueden conectar accesorios opcionales como la eGPU ROG XG Mobile.
En la India, el ROG Flow X13 viene con una garantía estándar de un año. Los compradores tienen la opción de optar por una variedad de planes de extensión de garantía y protección contra daños accidentales que van desde ₹999 para una extensión de un año hasta ₹4.999 que incluye una extensión de dos años y tres años de protección contra daños.
Puede encontrar más información y precios individuales en aquí.
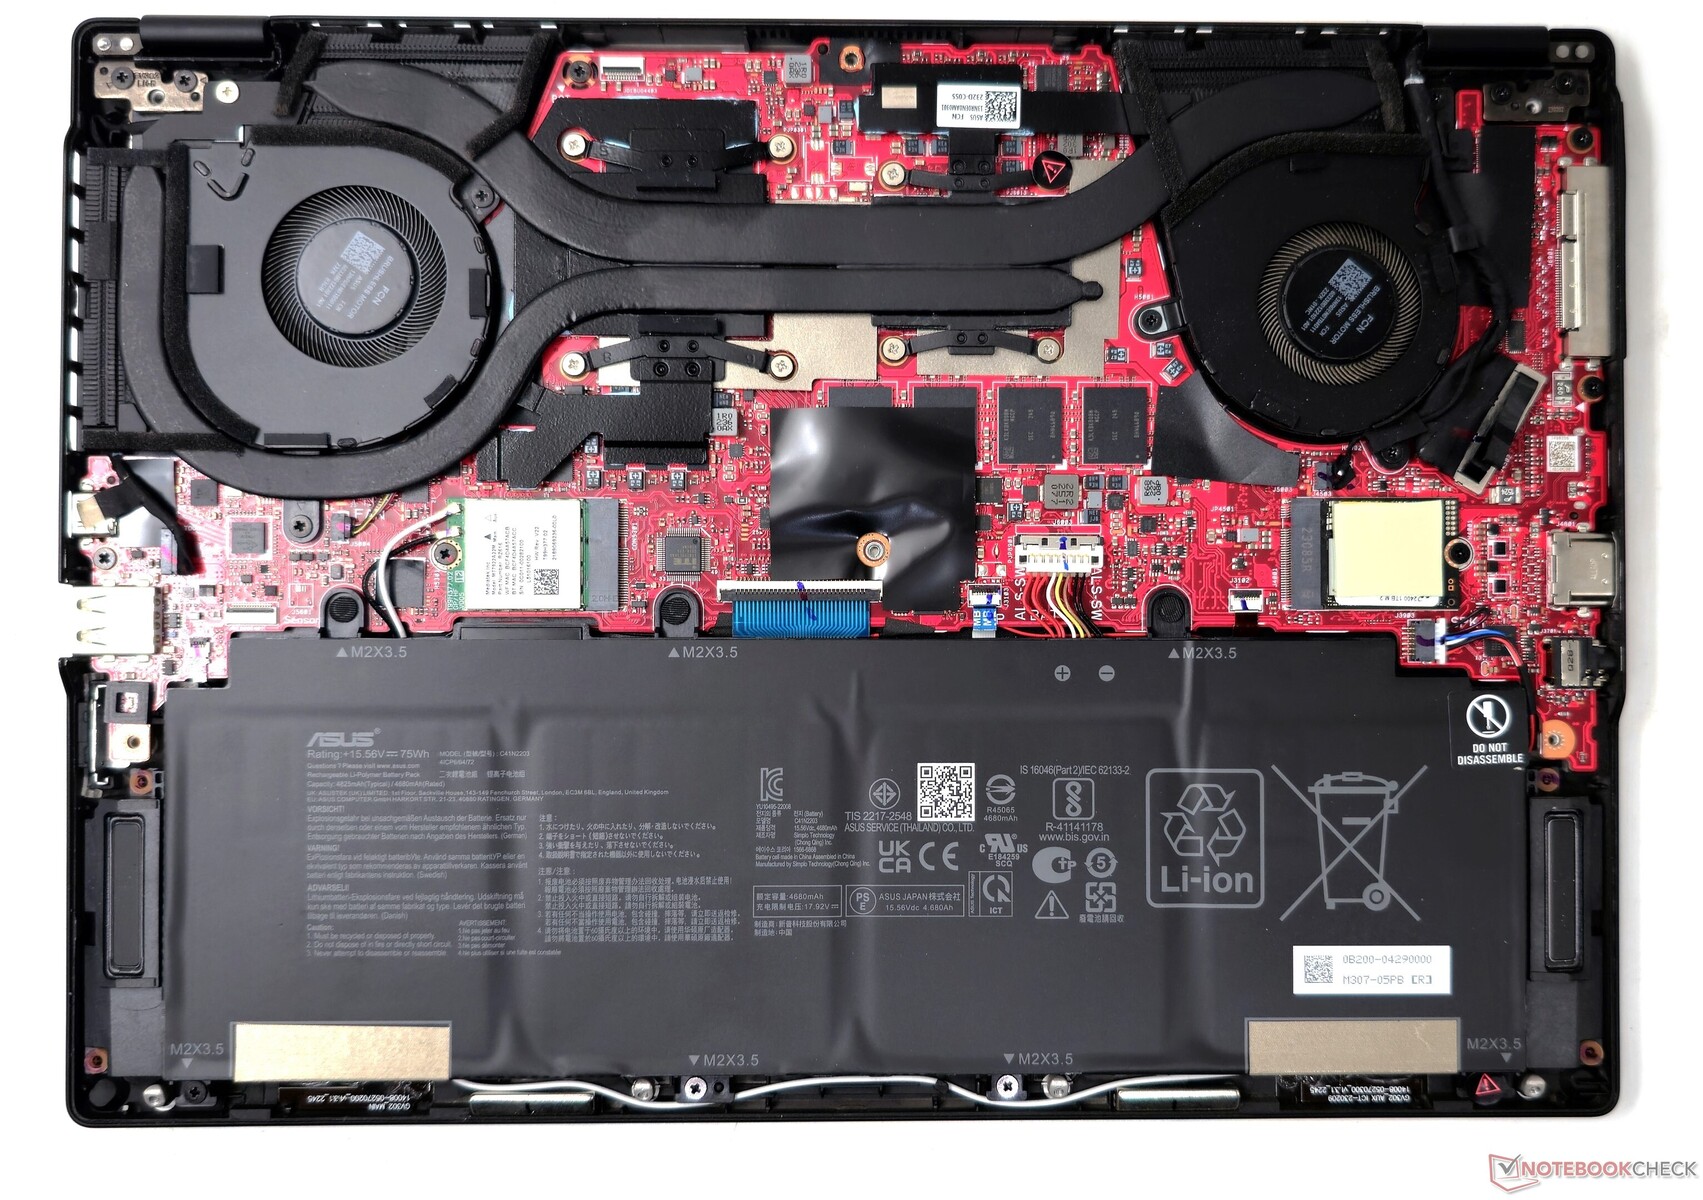
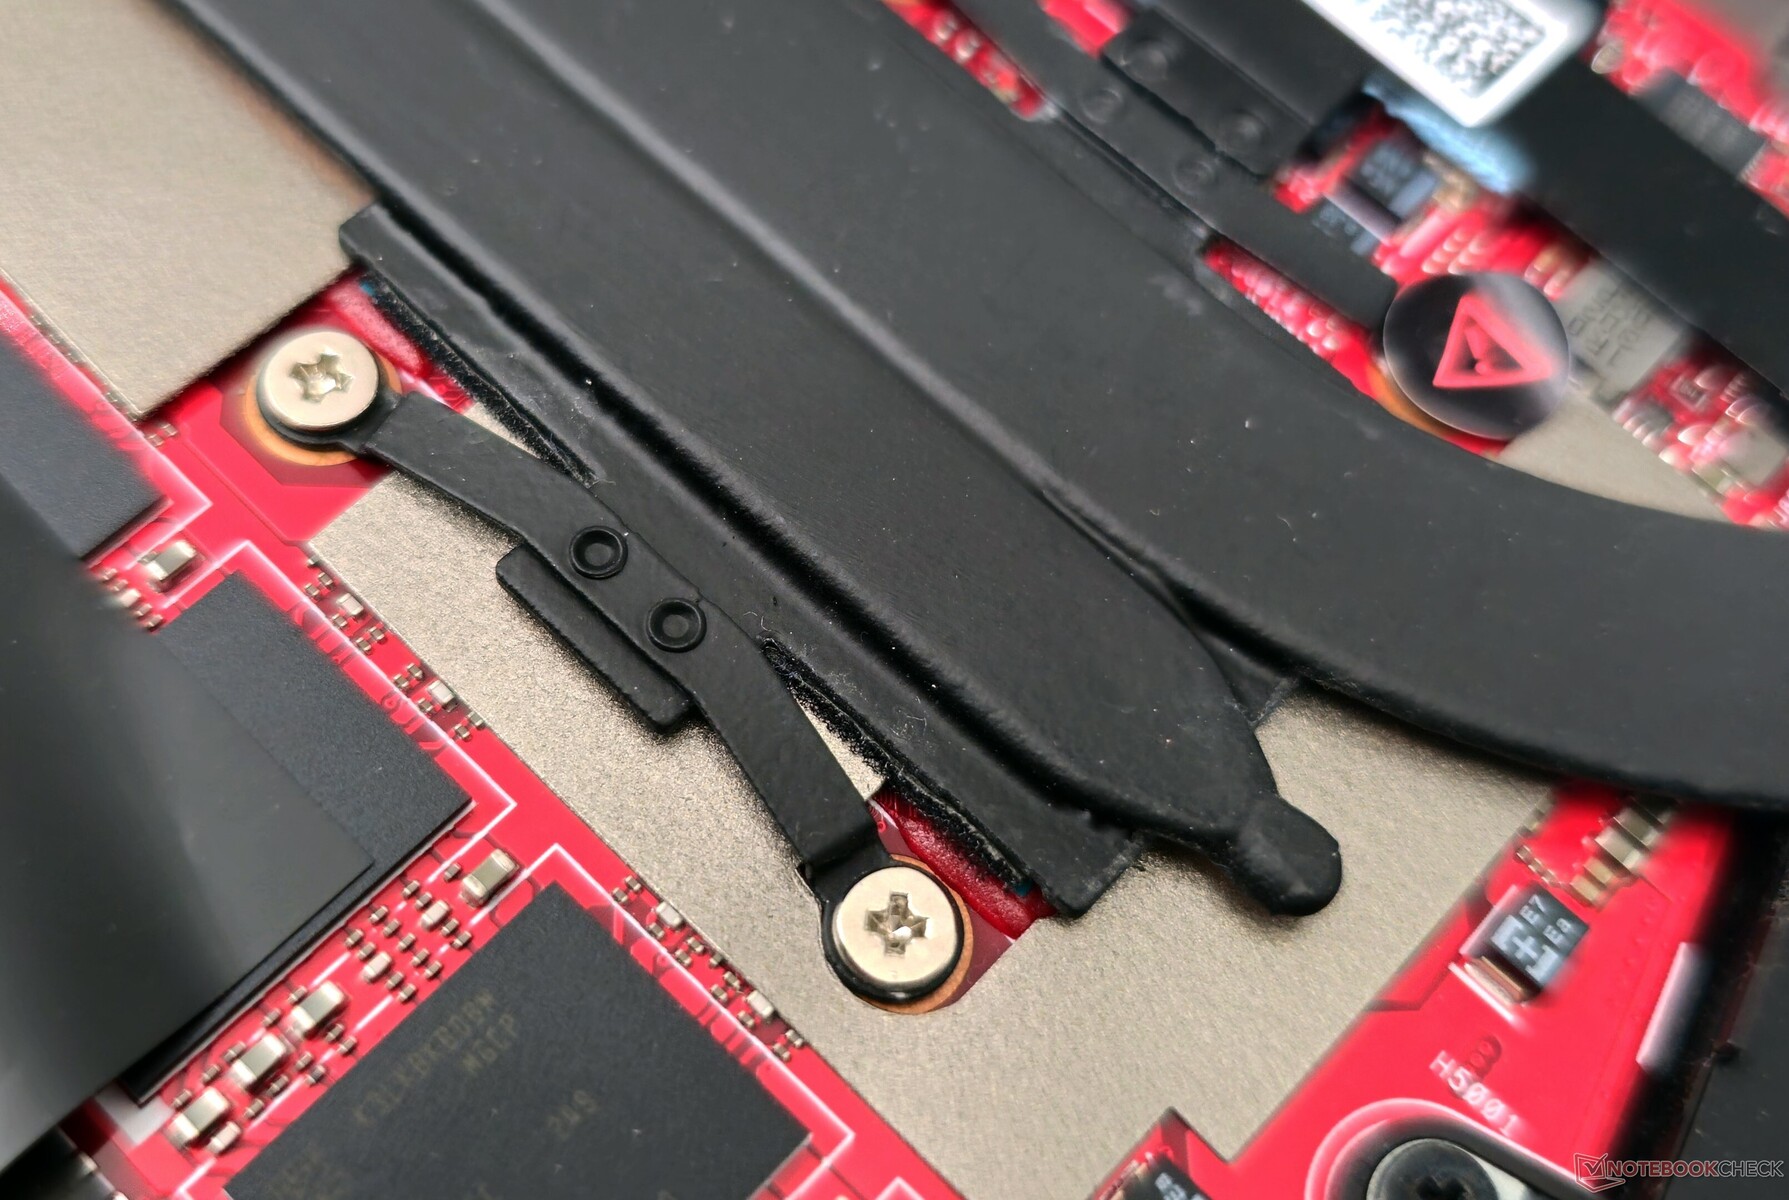
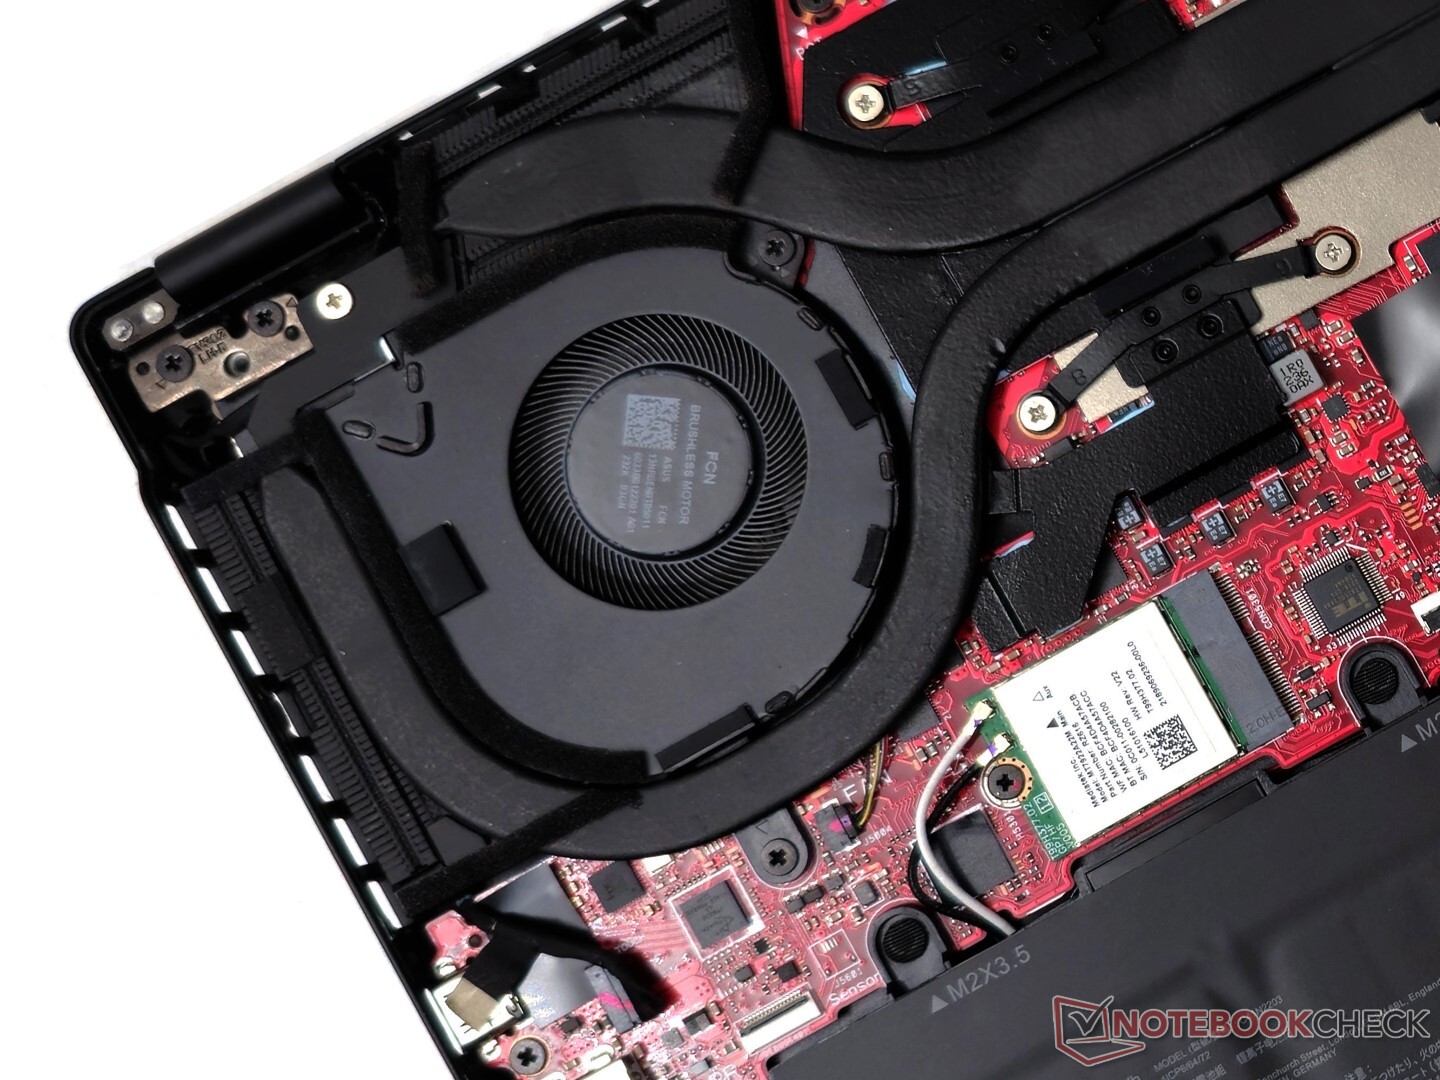
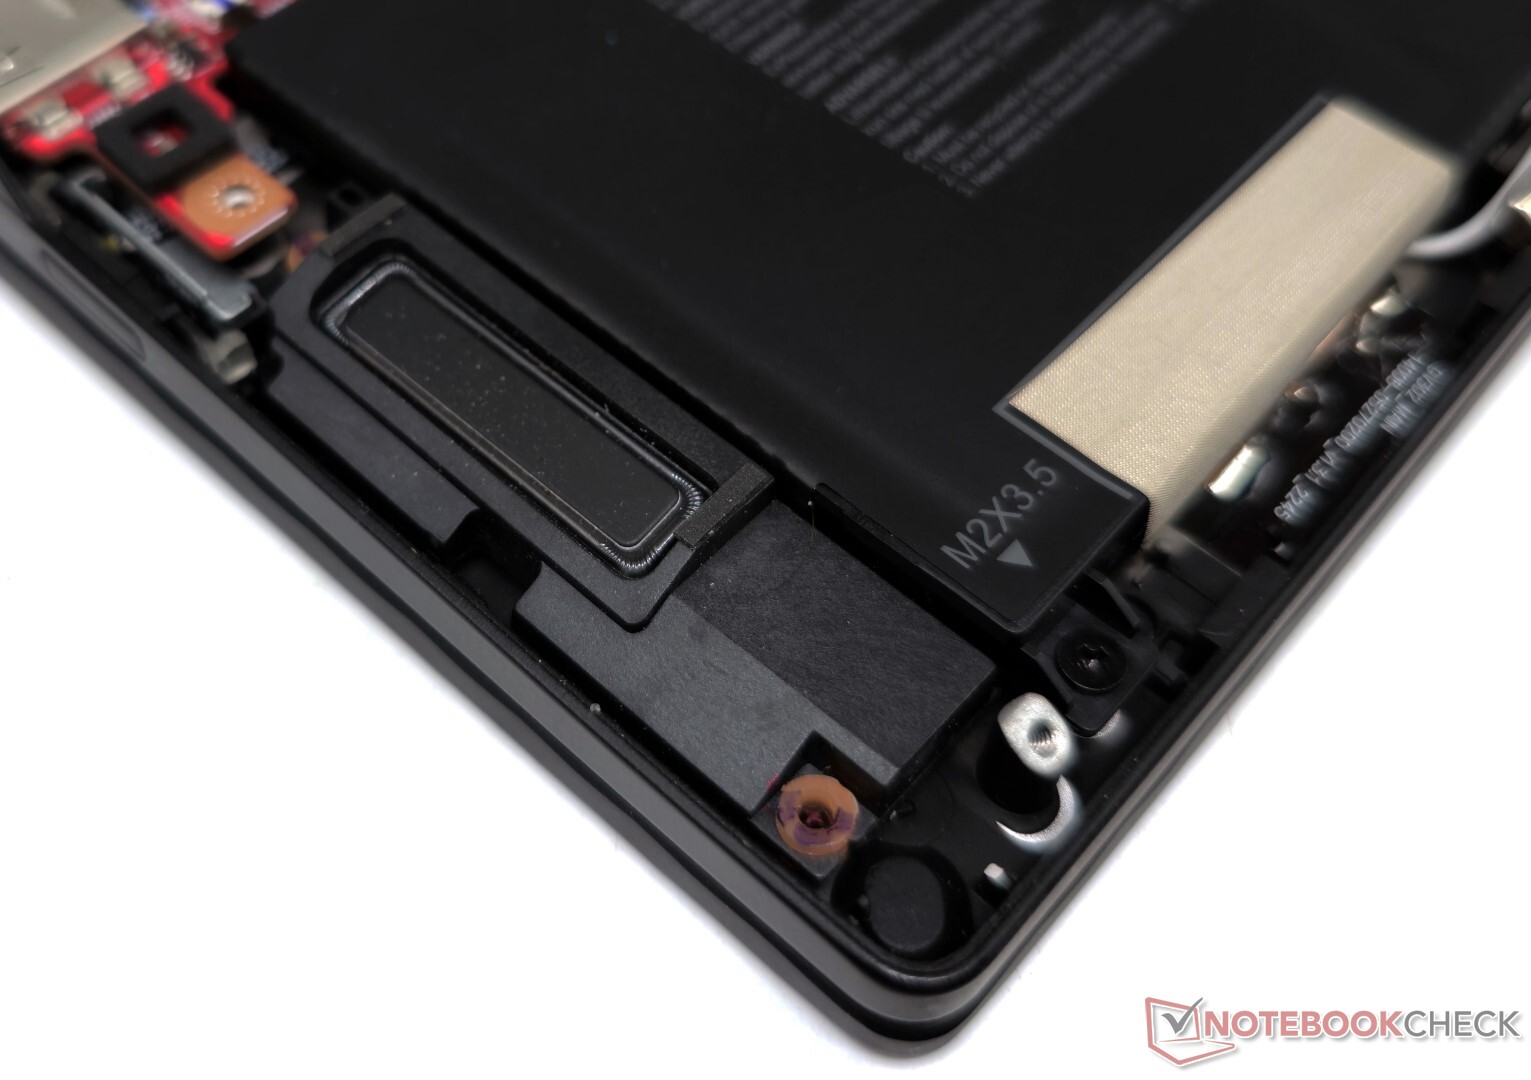
Mantenimiento
Al retirar los 10 tornillos PH00 de la parte inferior se accede fácilmente a los componentes internos del Flow X13. La RAM viene soldada, pero la tarjeta WLAN y el SSD M.2 2230 se pueden intercambiar si es necesario. Es posible desenroscar y extraer la batería.
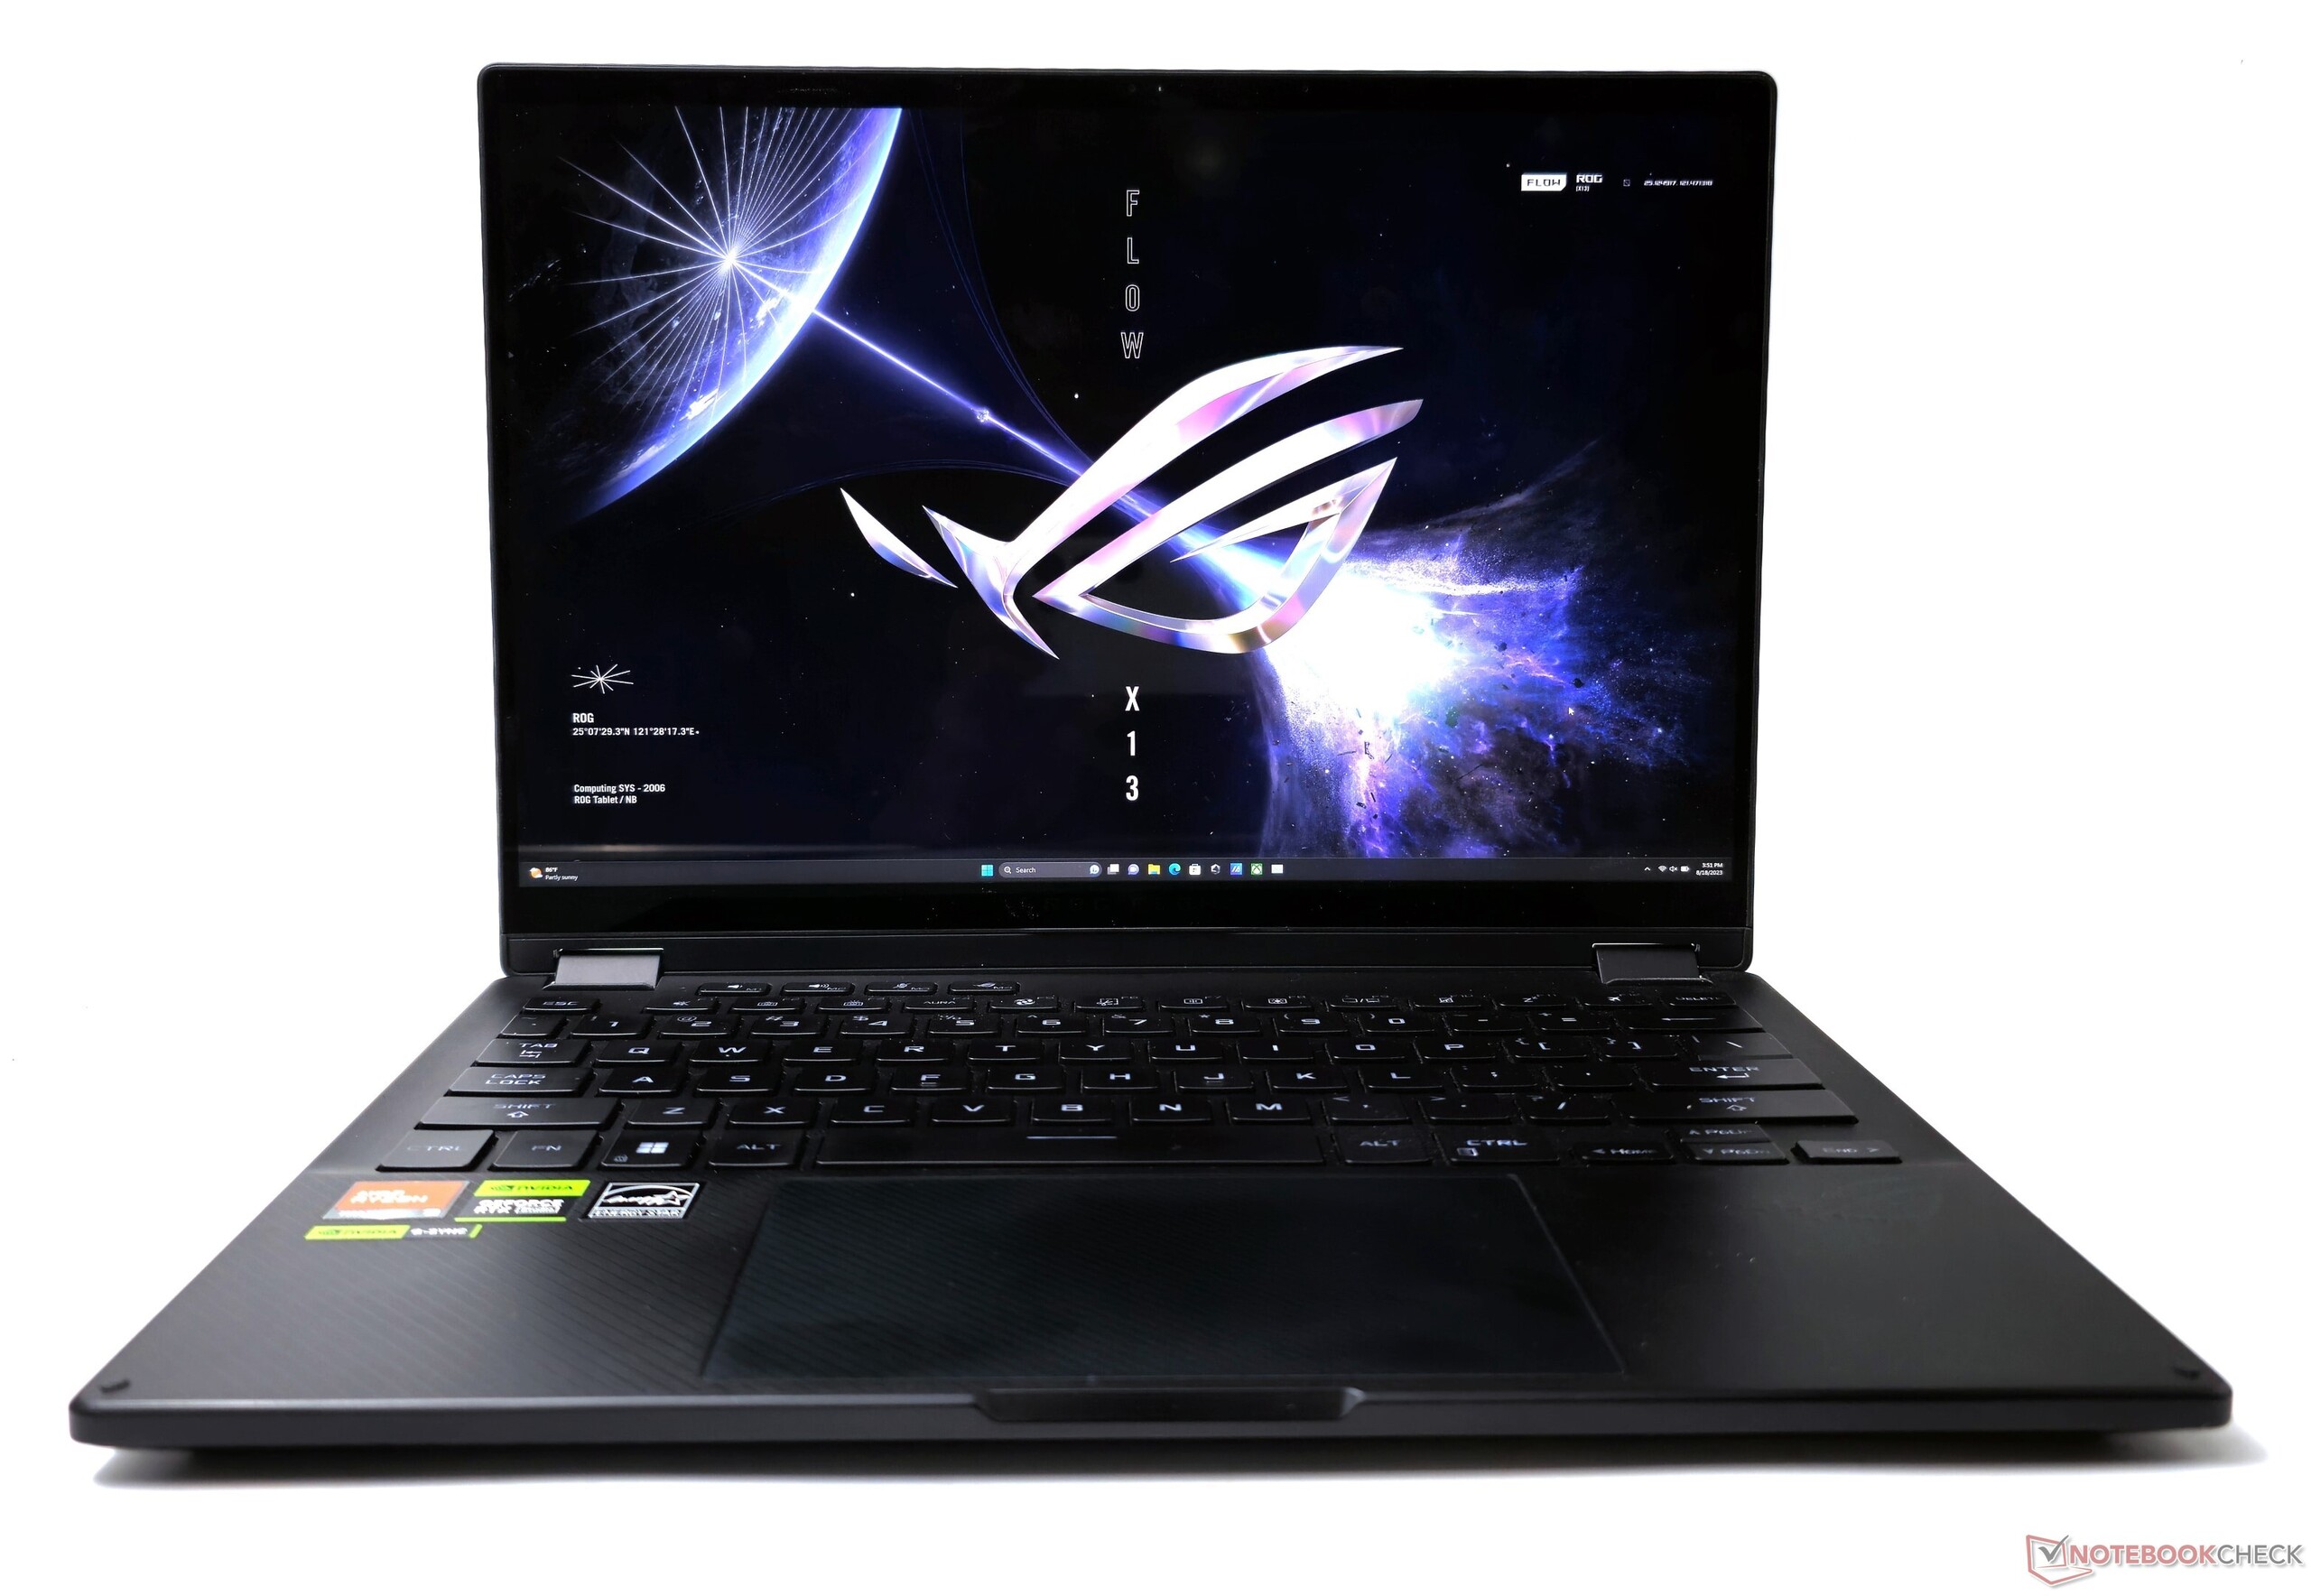
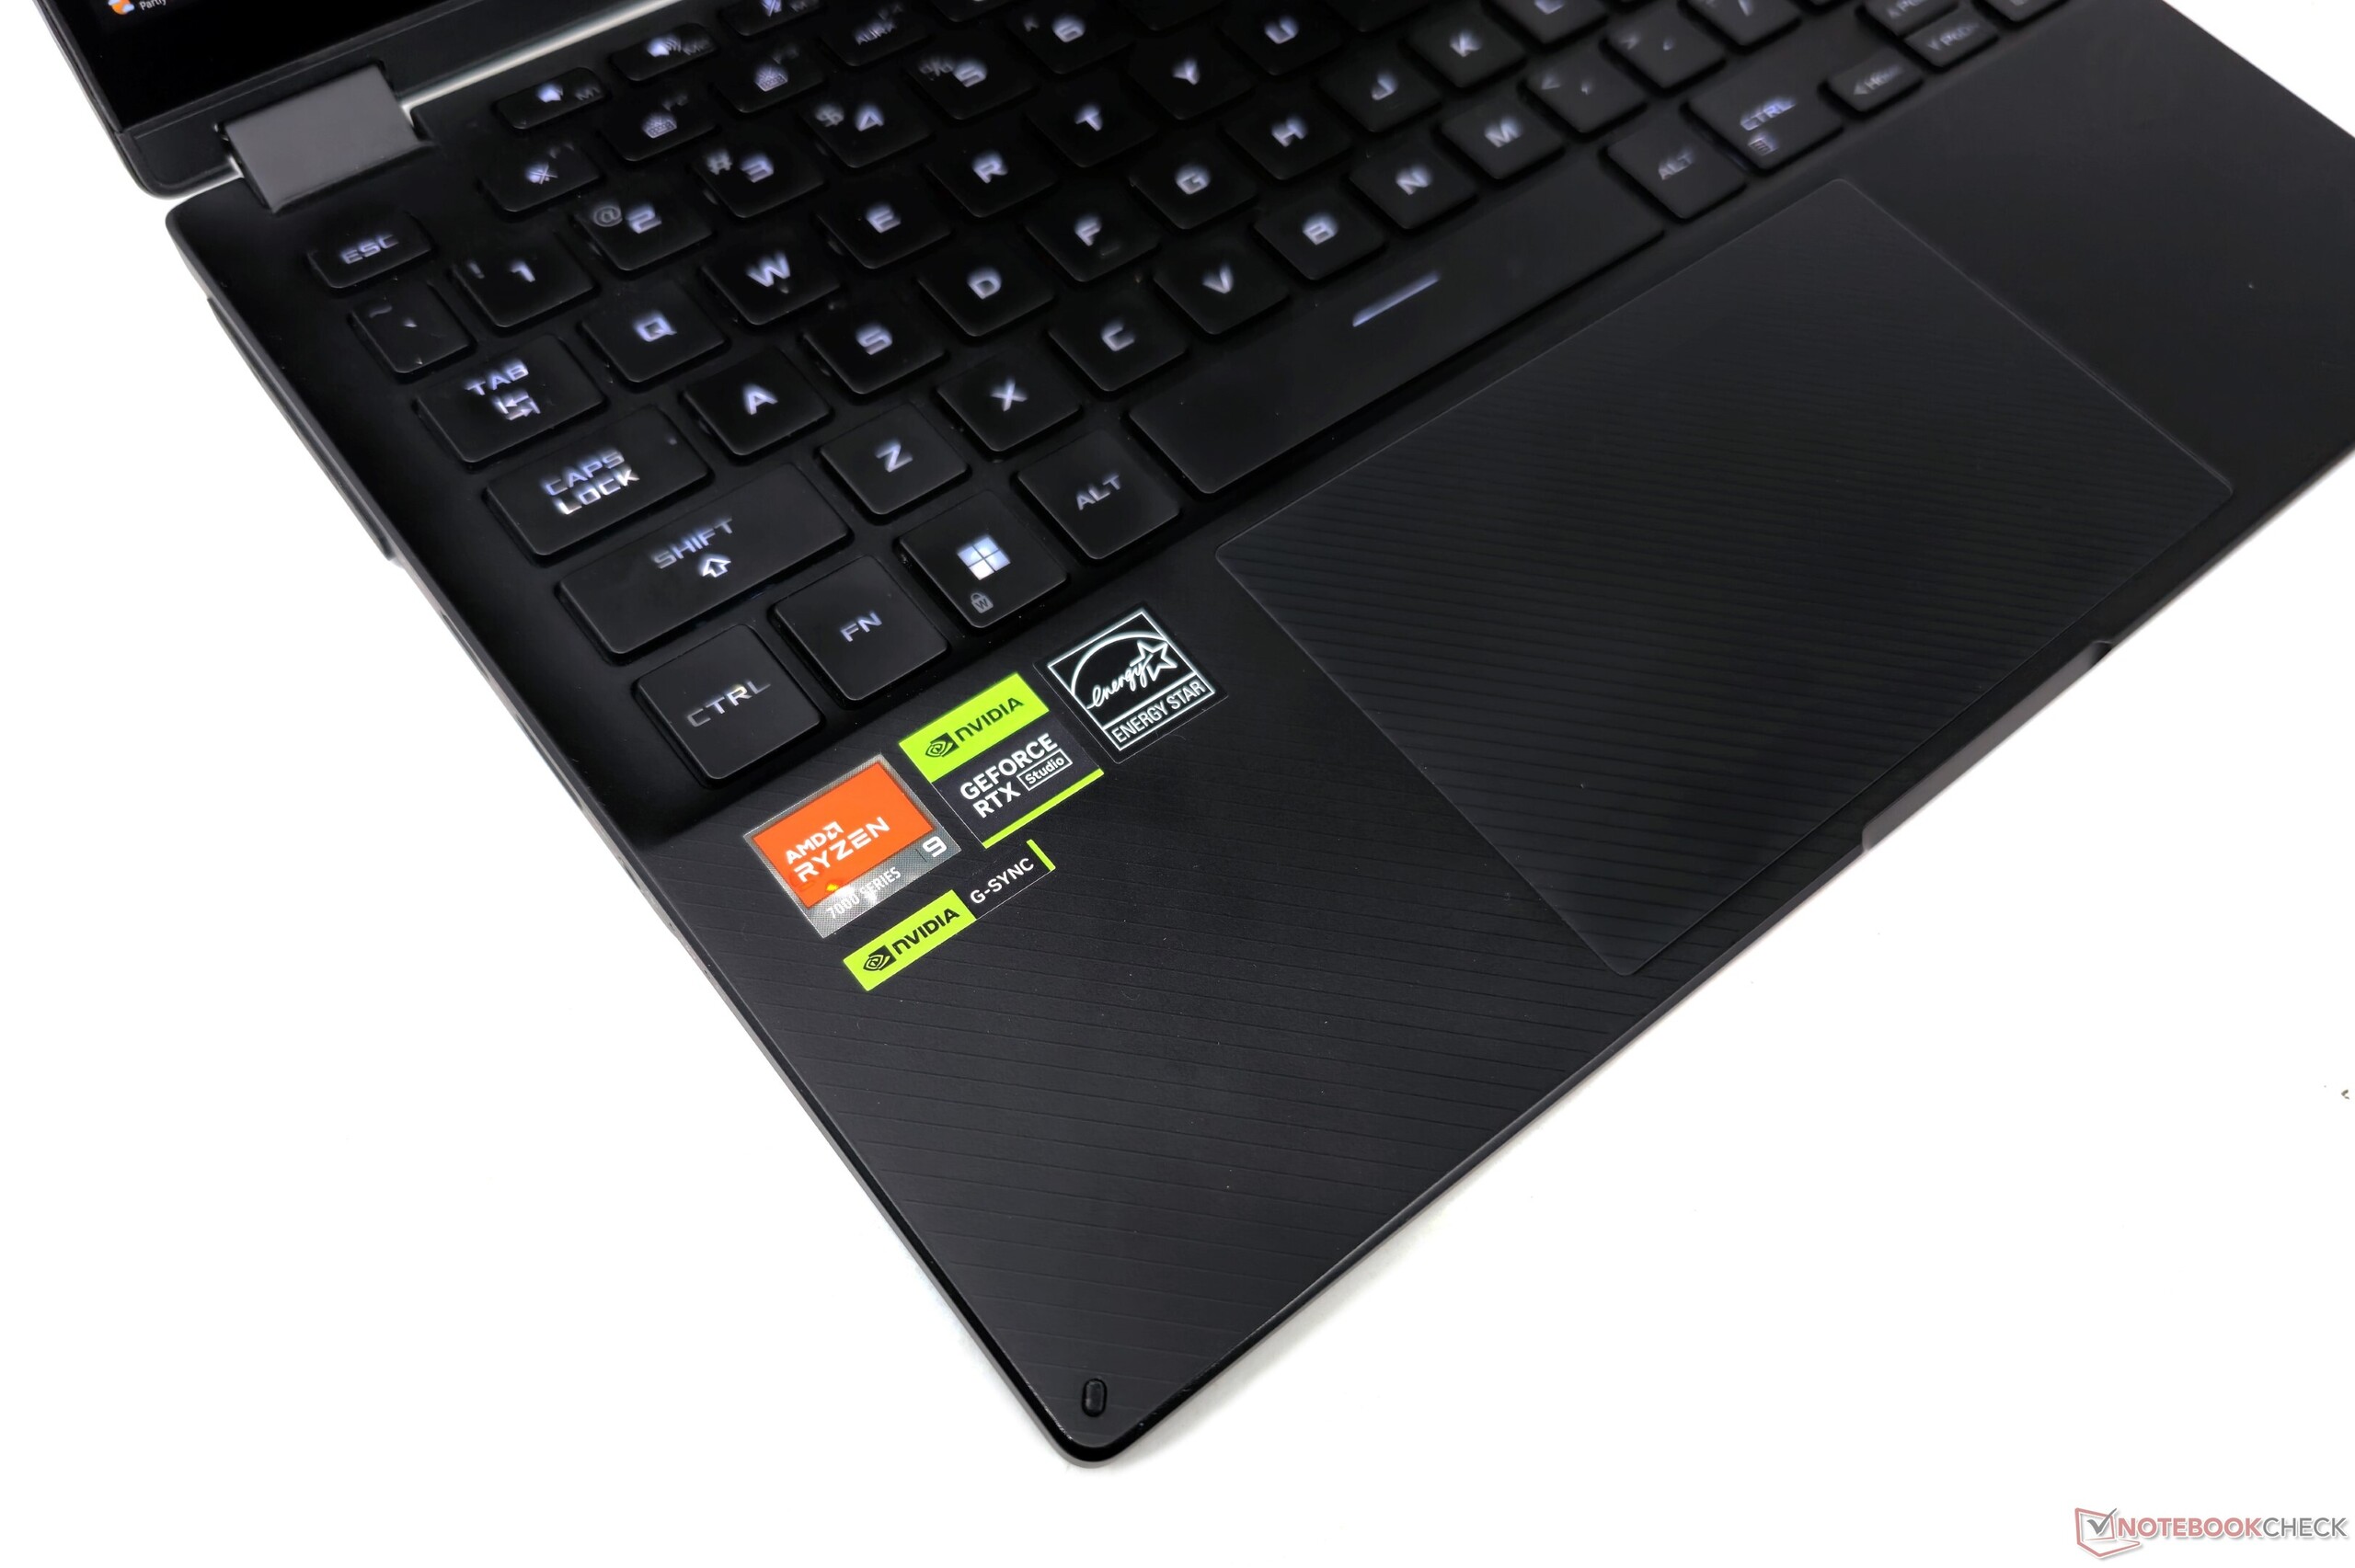
Dispositivos de entrada: Navegación táctil sin esfuerzo
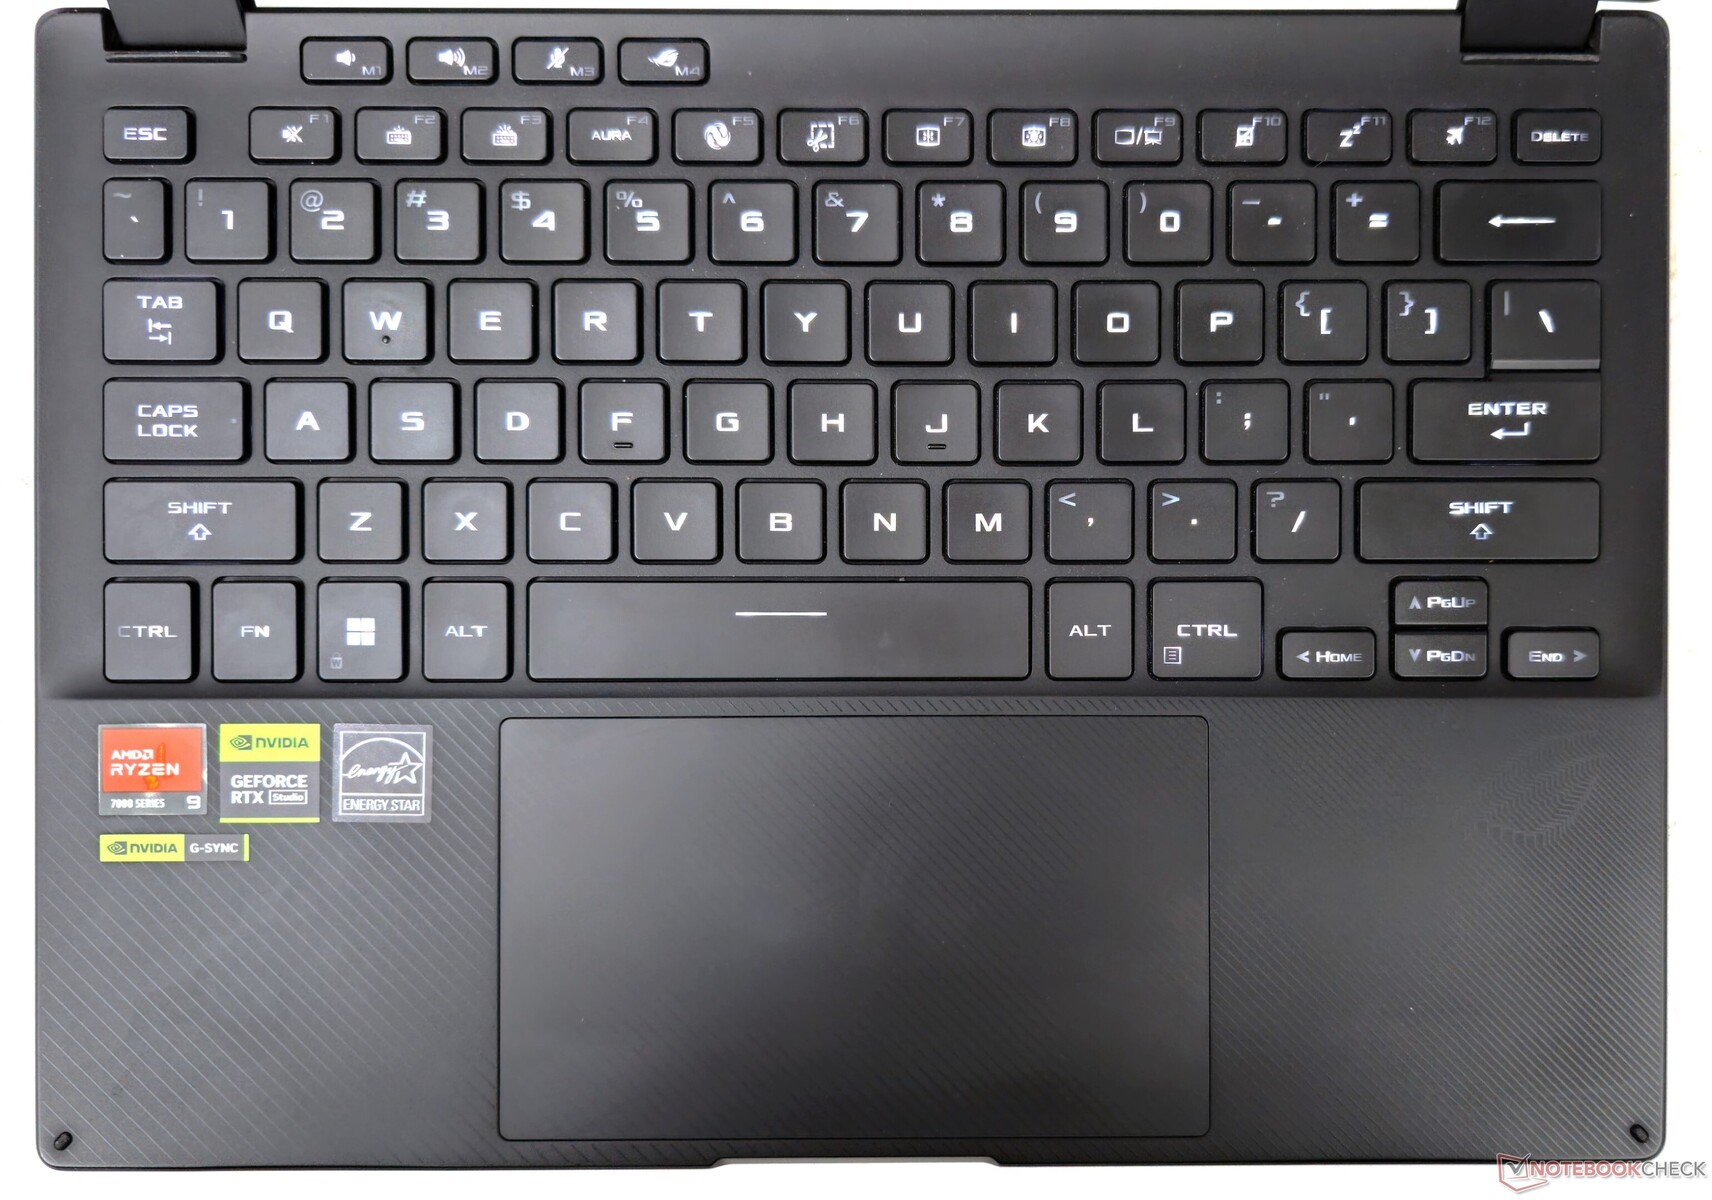
Teclado
Escribir en el Flow X13 es una experiencia agradable gracias a unas teclas bien espaciadas y táctiles con un recorrido decente. La fila superior ofrece prácticos accesos directos para el volumen, el micrófono y Armory Crate, que se pueden personalizar según las necesidades.
Funciones adicionales como la iluminación Aura Sync y los perfiles de ventilador también están a una pulsación de botón. Las teclas de flecha a media altura sirven para la navegación básica, pero pueden resultar tediosas para jugar.
En lugar de RGB llamativo, el teclado emplea retroiluminación blanca relajante ajustable en tres niveles de brillo. La nítida iluminación blanca sigue siendo claramente visible a través de las teclas para escribir cómodamente en la oscuridad.
Touchpad y pantalla táctil
El amplio touchpad de 7,5 cm x 13 cm ofrece una superficie de deslizamiento perfecta para un control sin esfuerzo y es totalmente compatible con los gestos de Windows Precision.
Los clics se emiten suavemente, sin resistencia ni ruido. Las entradas se registran con precisión incluso en las esquinas. Toda la superficie actúa como botón izquierdo del ratón, aunque los clics parecen localizarse cerca de la parte inferior del touchpad.
El Flow X13 ofrece una pantalla táctil capacitiva multitáctil, que según Asus ha recibido el tratamiento Gorilla Glass DXC. No tuvimos problemas con la pantalla táctil, incluso hacia las esquinas, en todos los modos soportados.
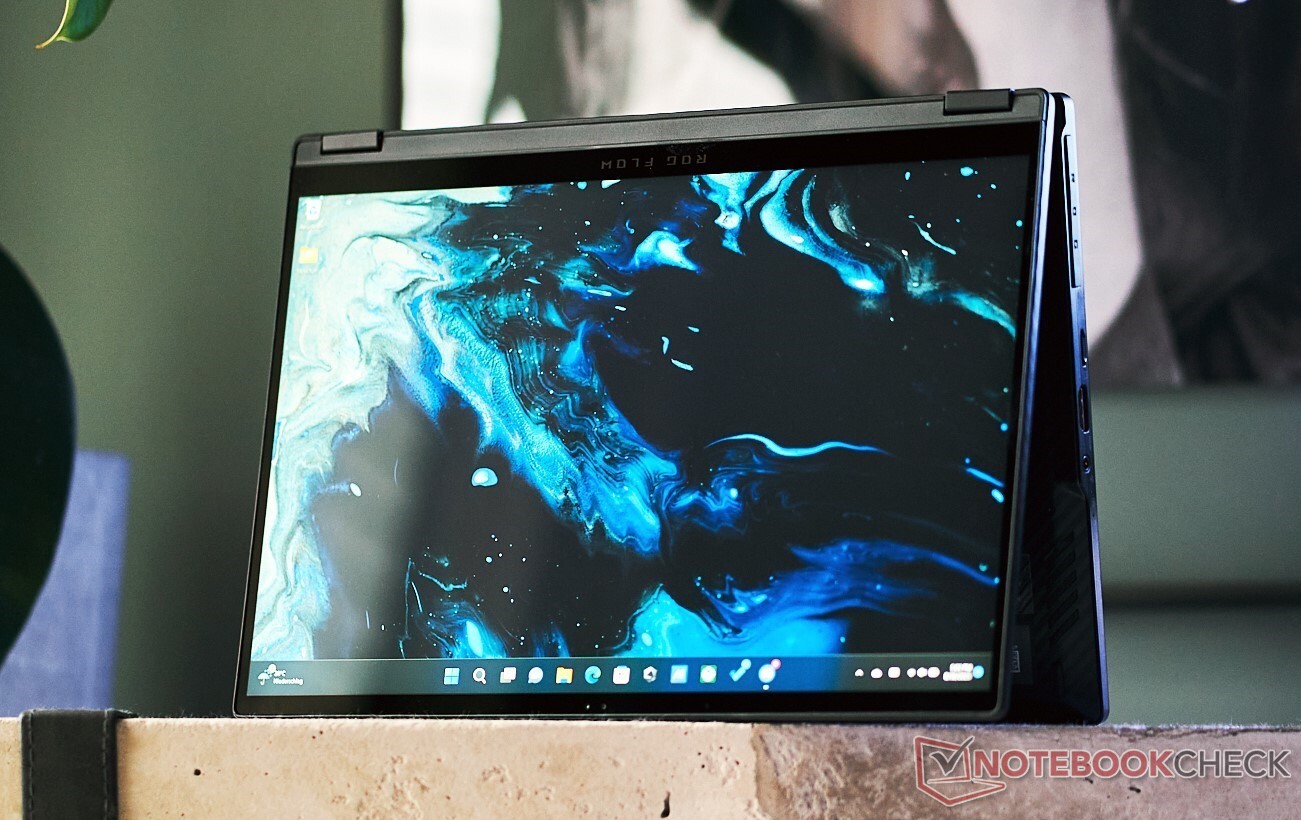
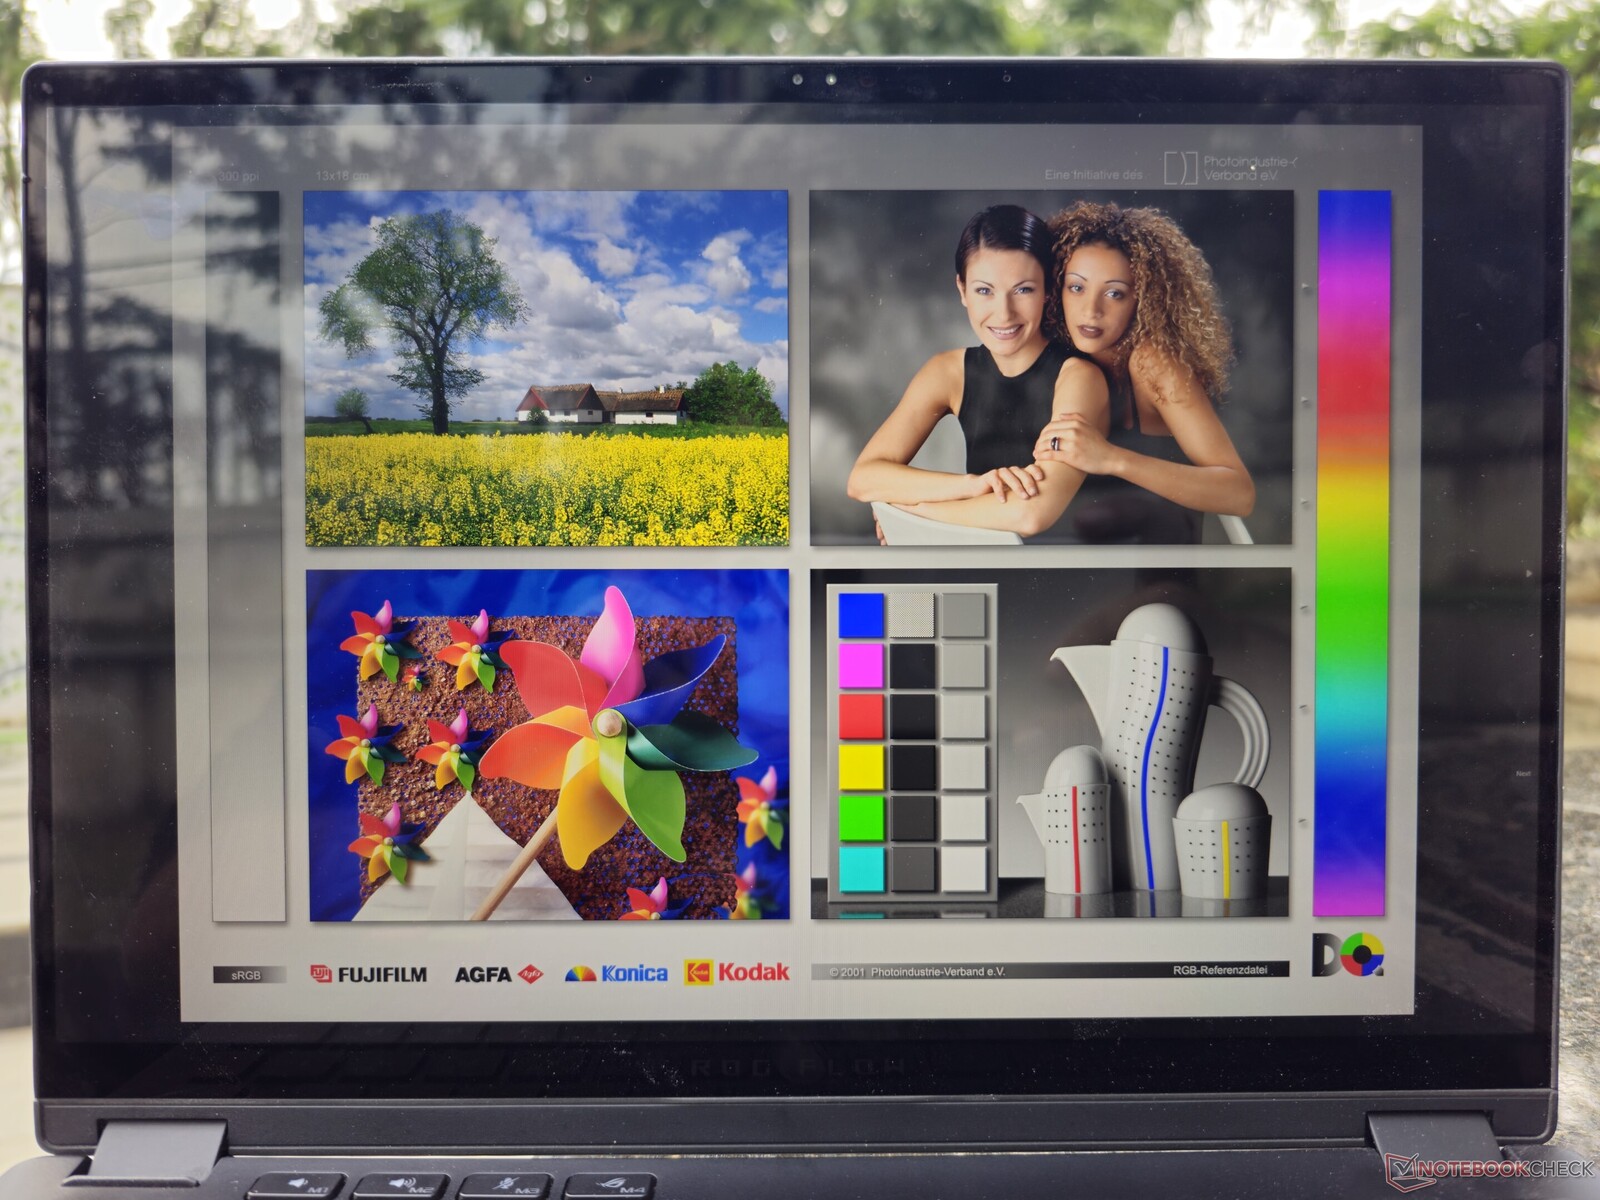
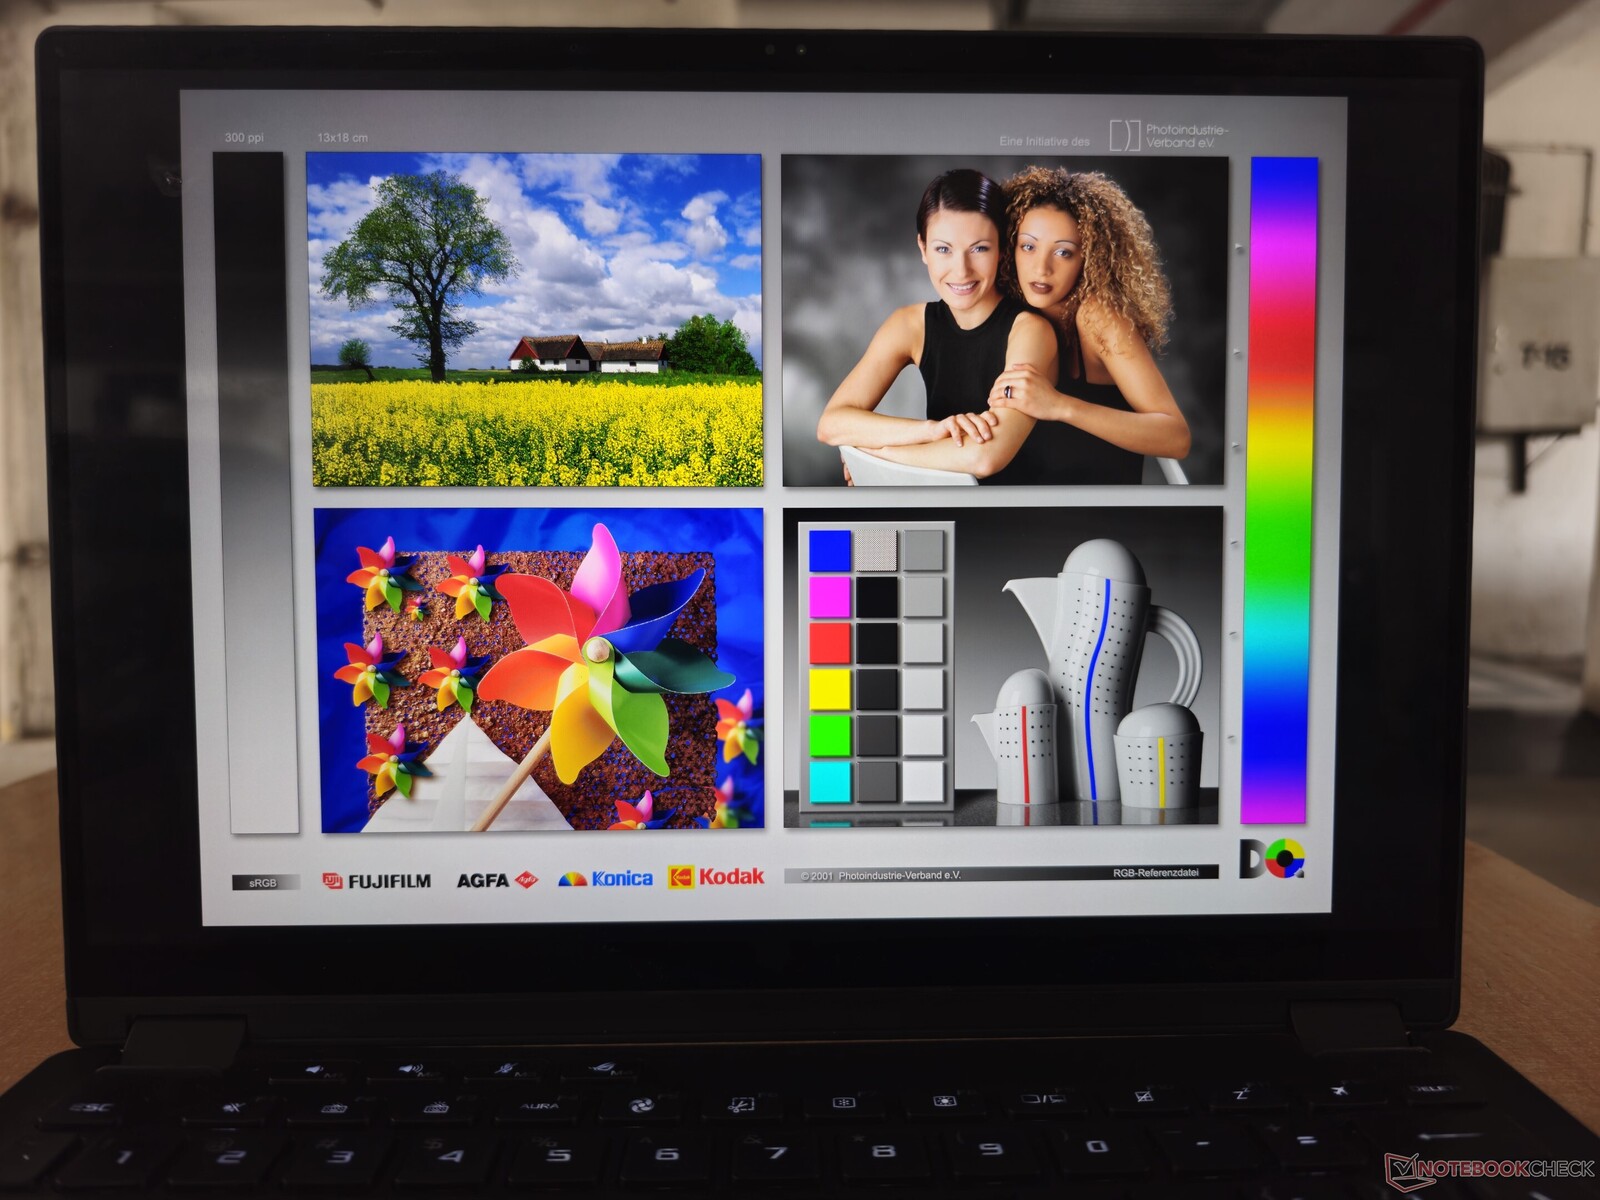
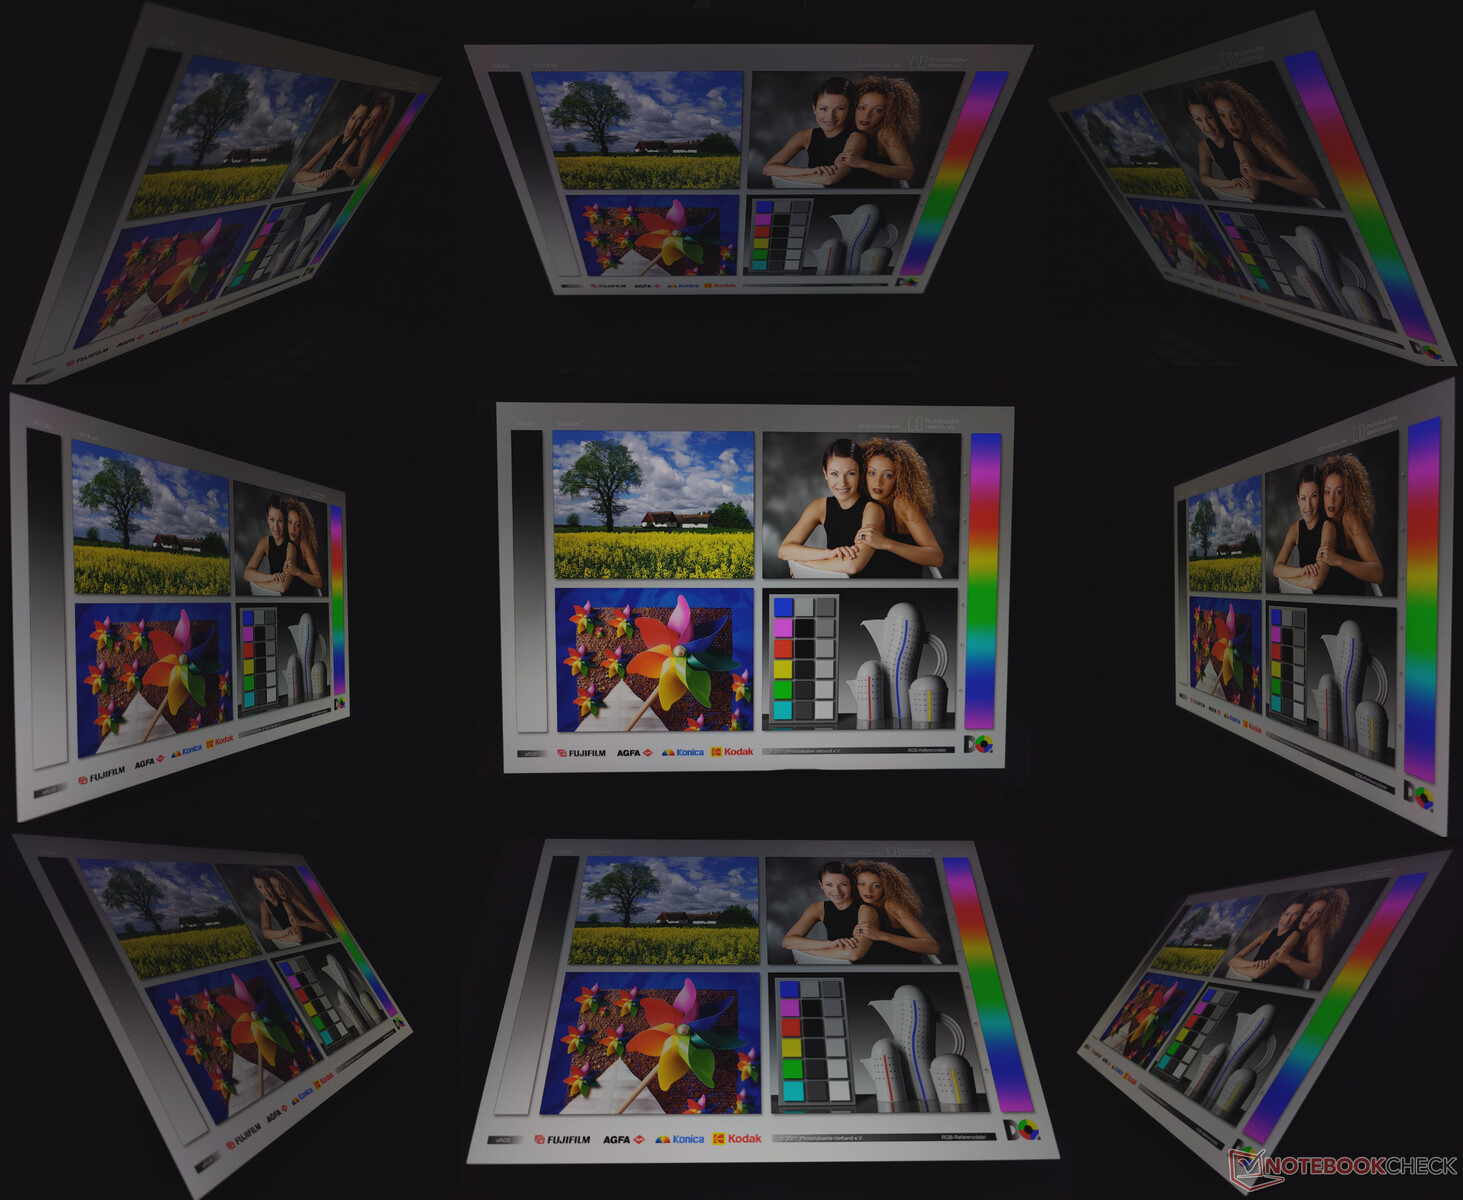
Pantalla: pantalla táctil QHD+ G-Sync de 165 Hz con Dolby Vision y sin PWM
El panel IPS táctil de 13,4 pulgadas 2560 x 1600 16:10 del ROG Flow X13 ofrece una tasa de refresco de 165 Hz con soporte Nvidia G-Sync y una densa densidad de píxeles de 225 PPI. El panel soporta Dolby Vision pero no HDR10.
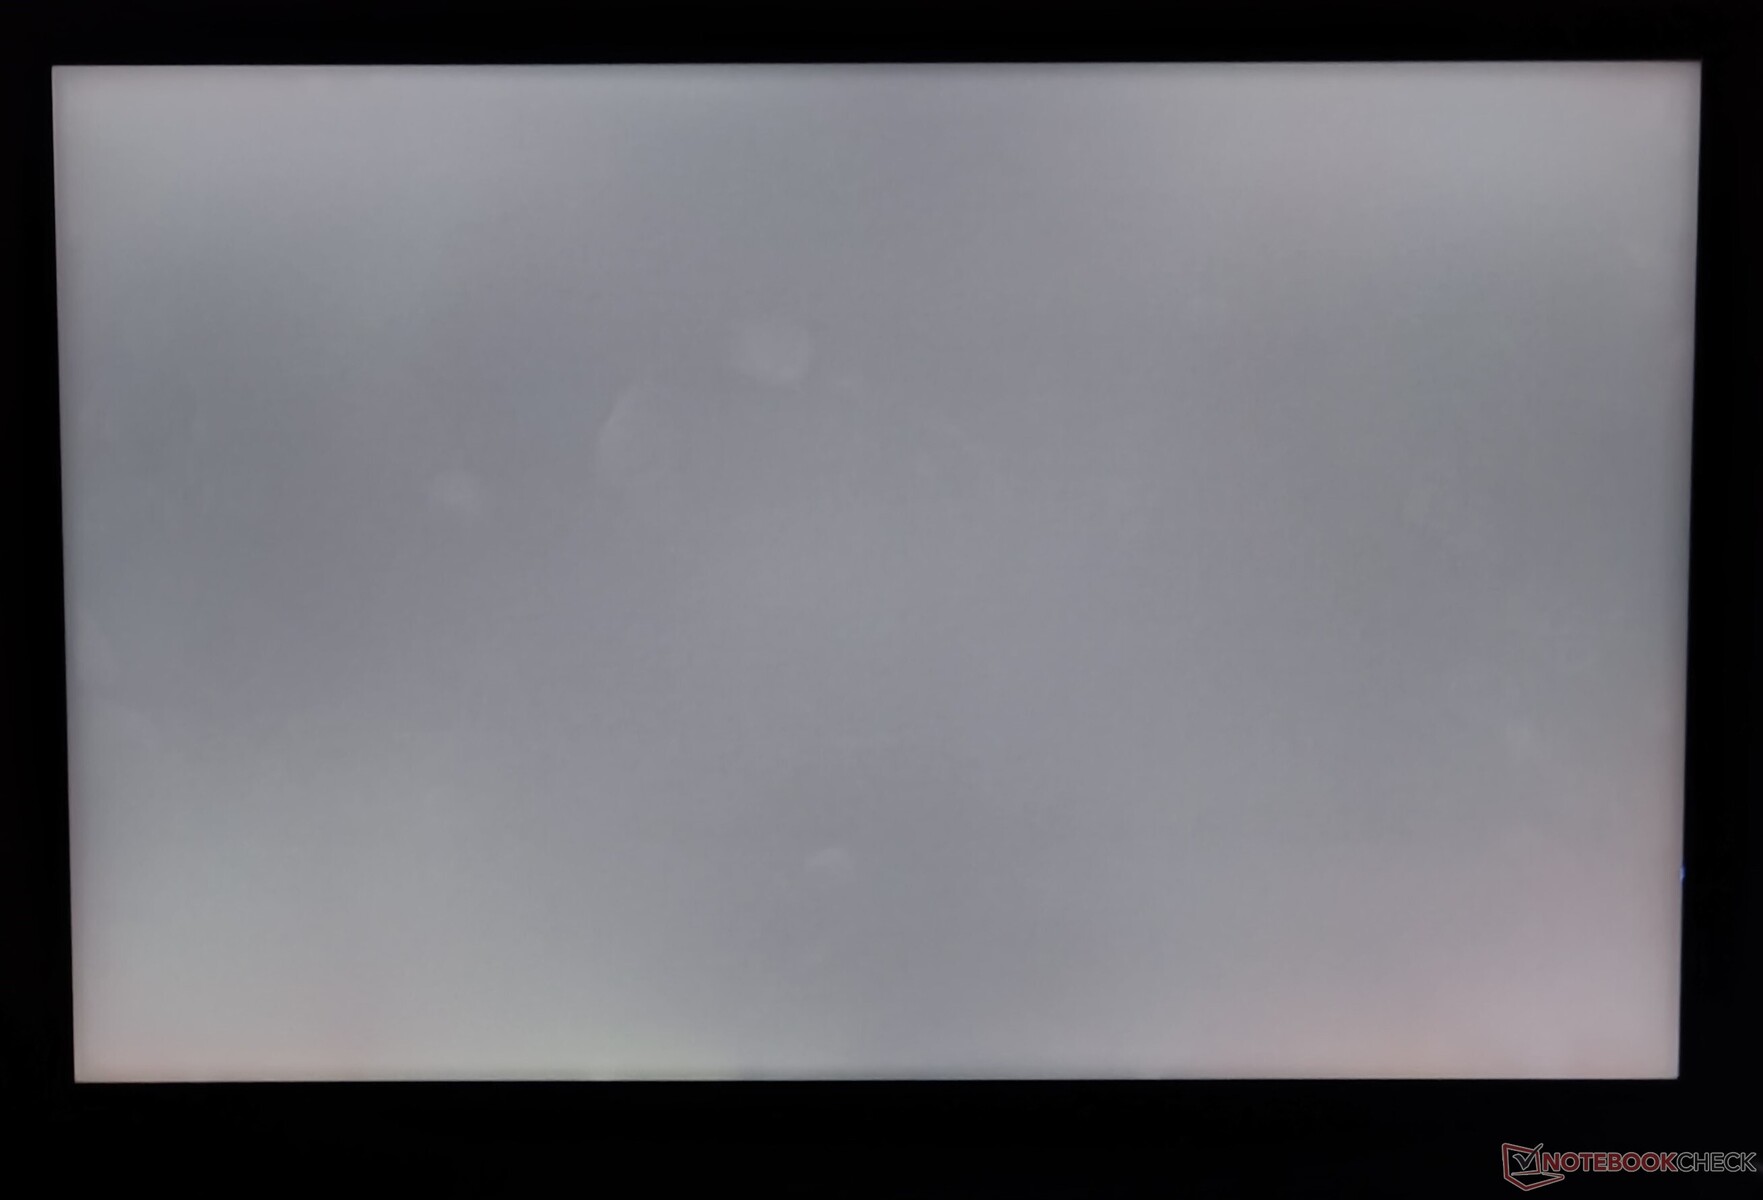
Medimos un brillo máximo de 473 nits con una buena distribución del 89% y un mínimo traspaso de luz. El ratio de contraste medido de 1.231:1 se presta a una experiencia visual subjetivamente buena.

| |||||||||||||||||||||||||
iluminación: 89 %
Brillo con batería: 305 cd/m²
Contraste: 1213:1 (Negro: 0.39 cd/m²)
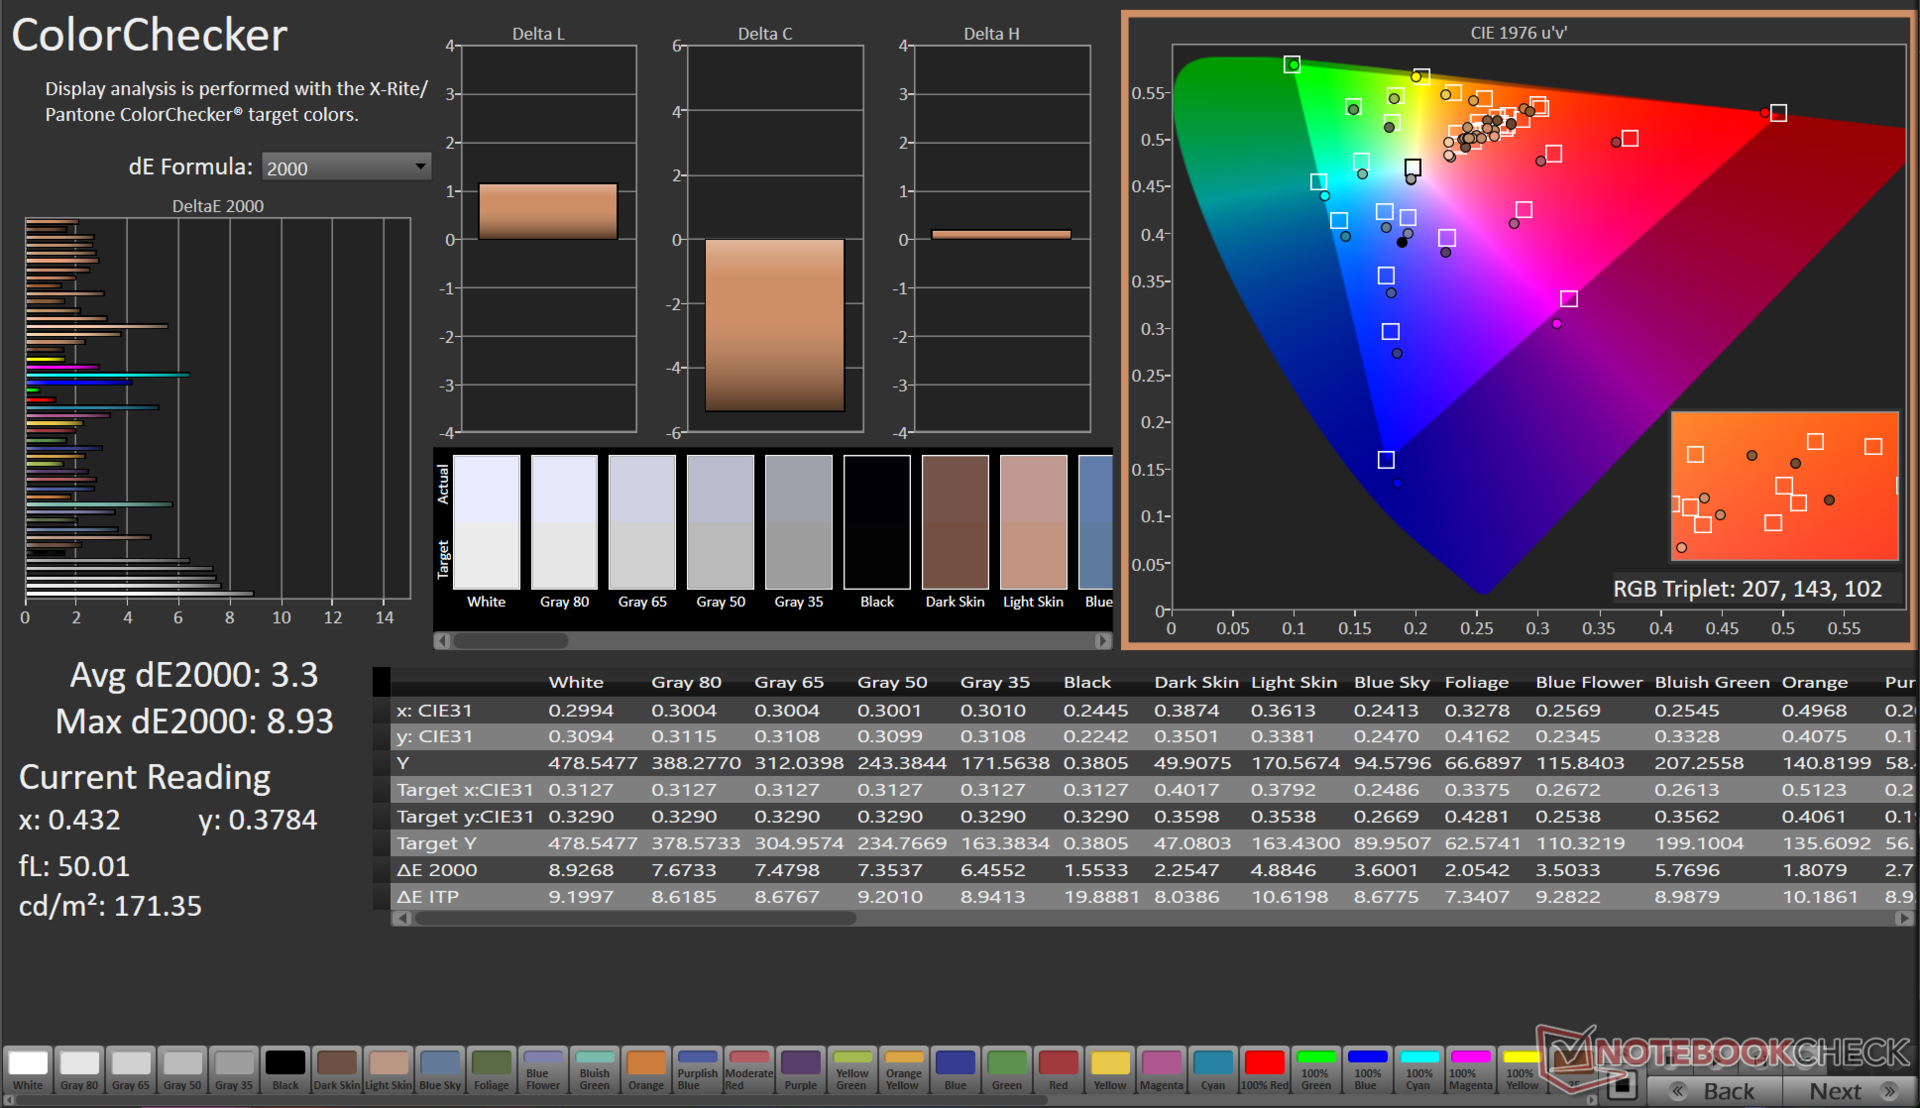
ΔE ColorChecker Calman: 3.3 | ∀{0.5-29.43 Ø4.71}
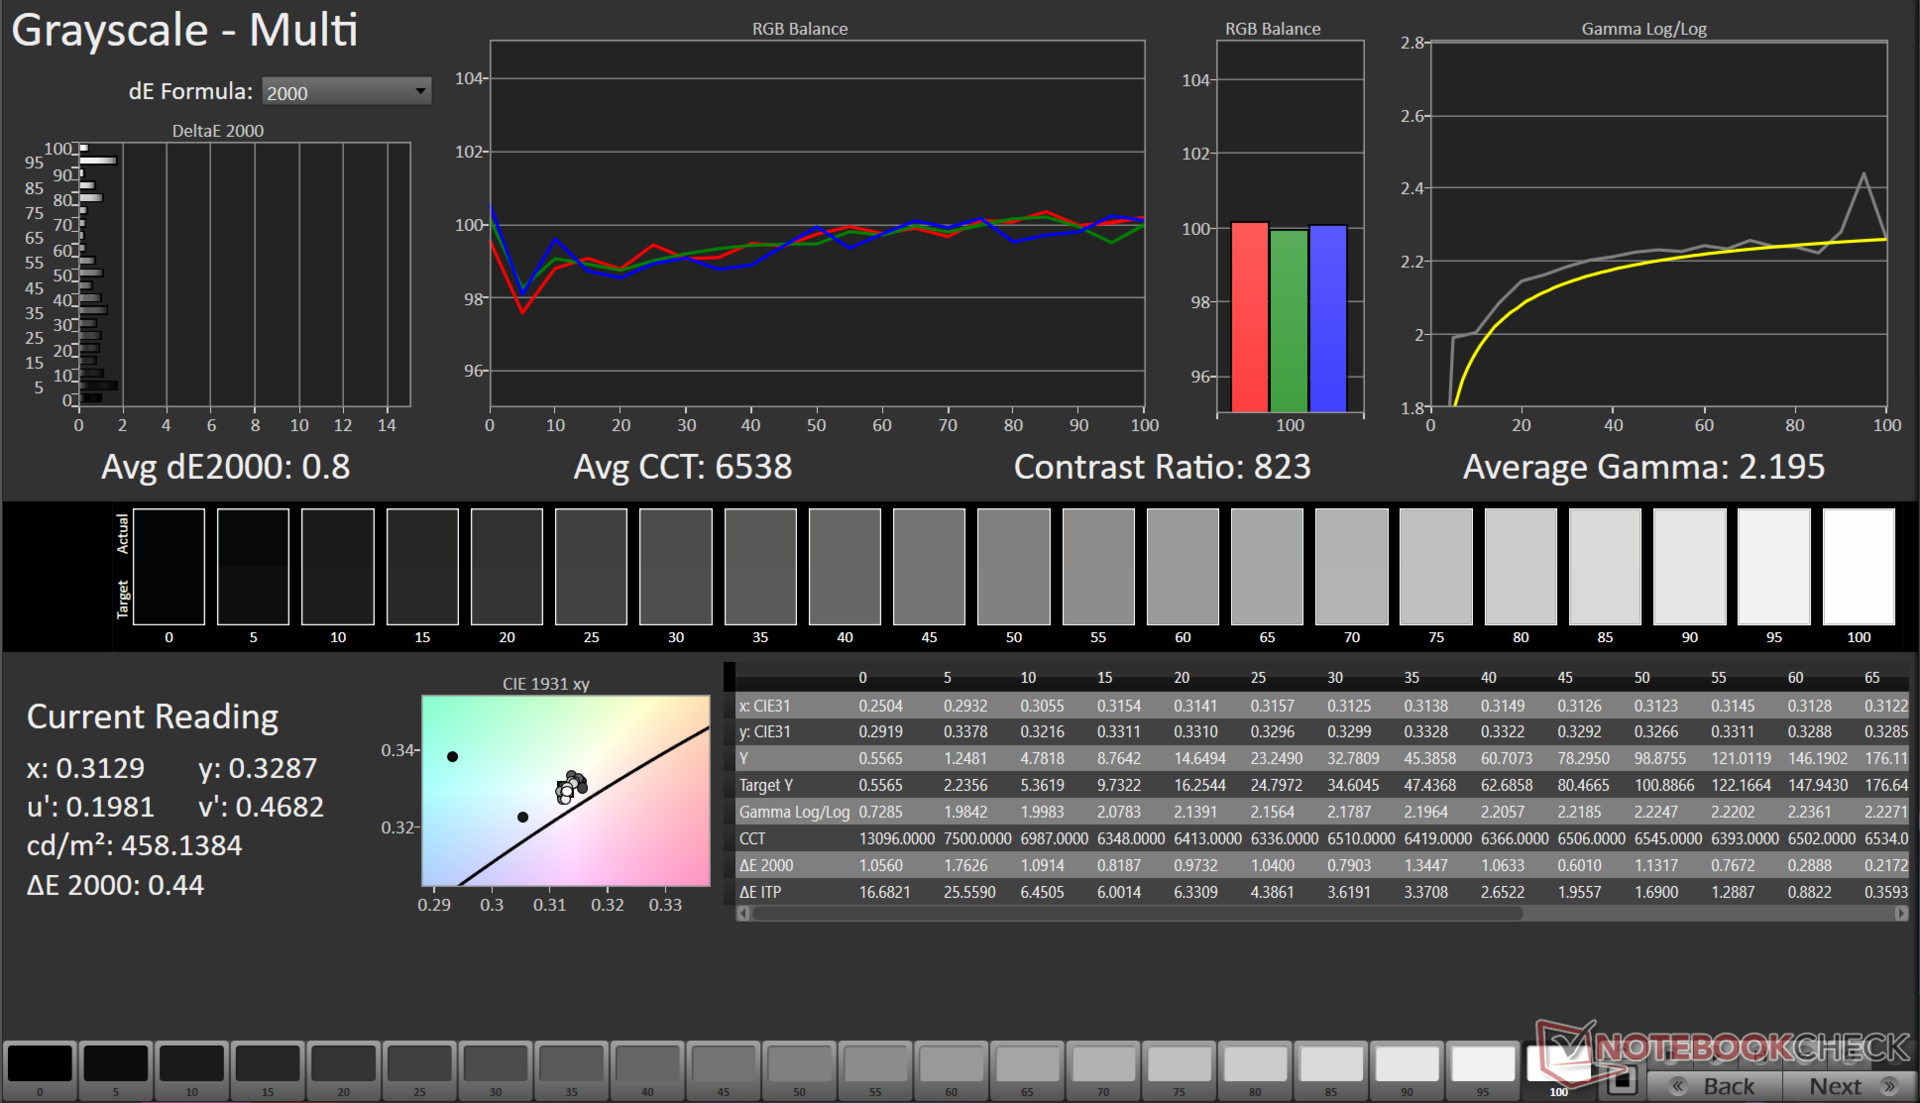
calibrated: 1.09
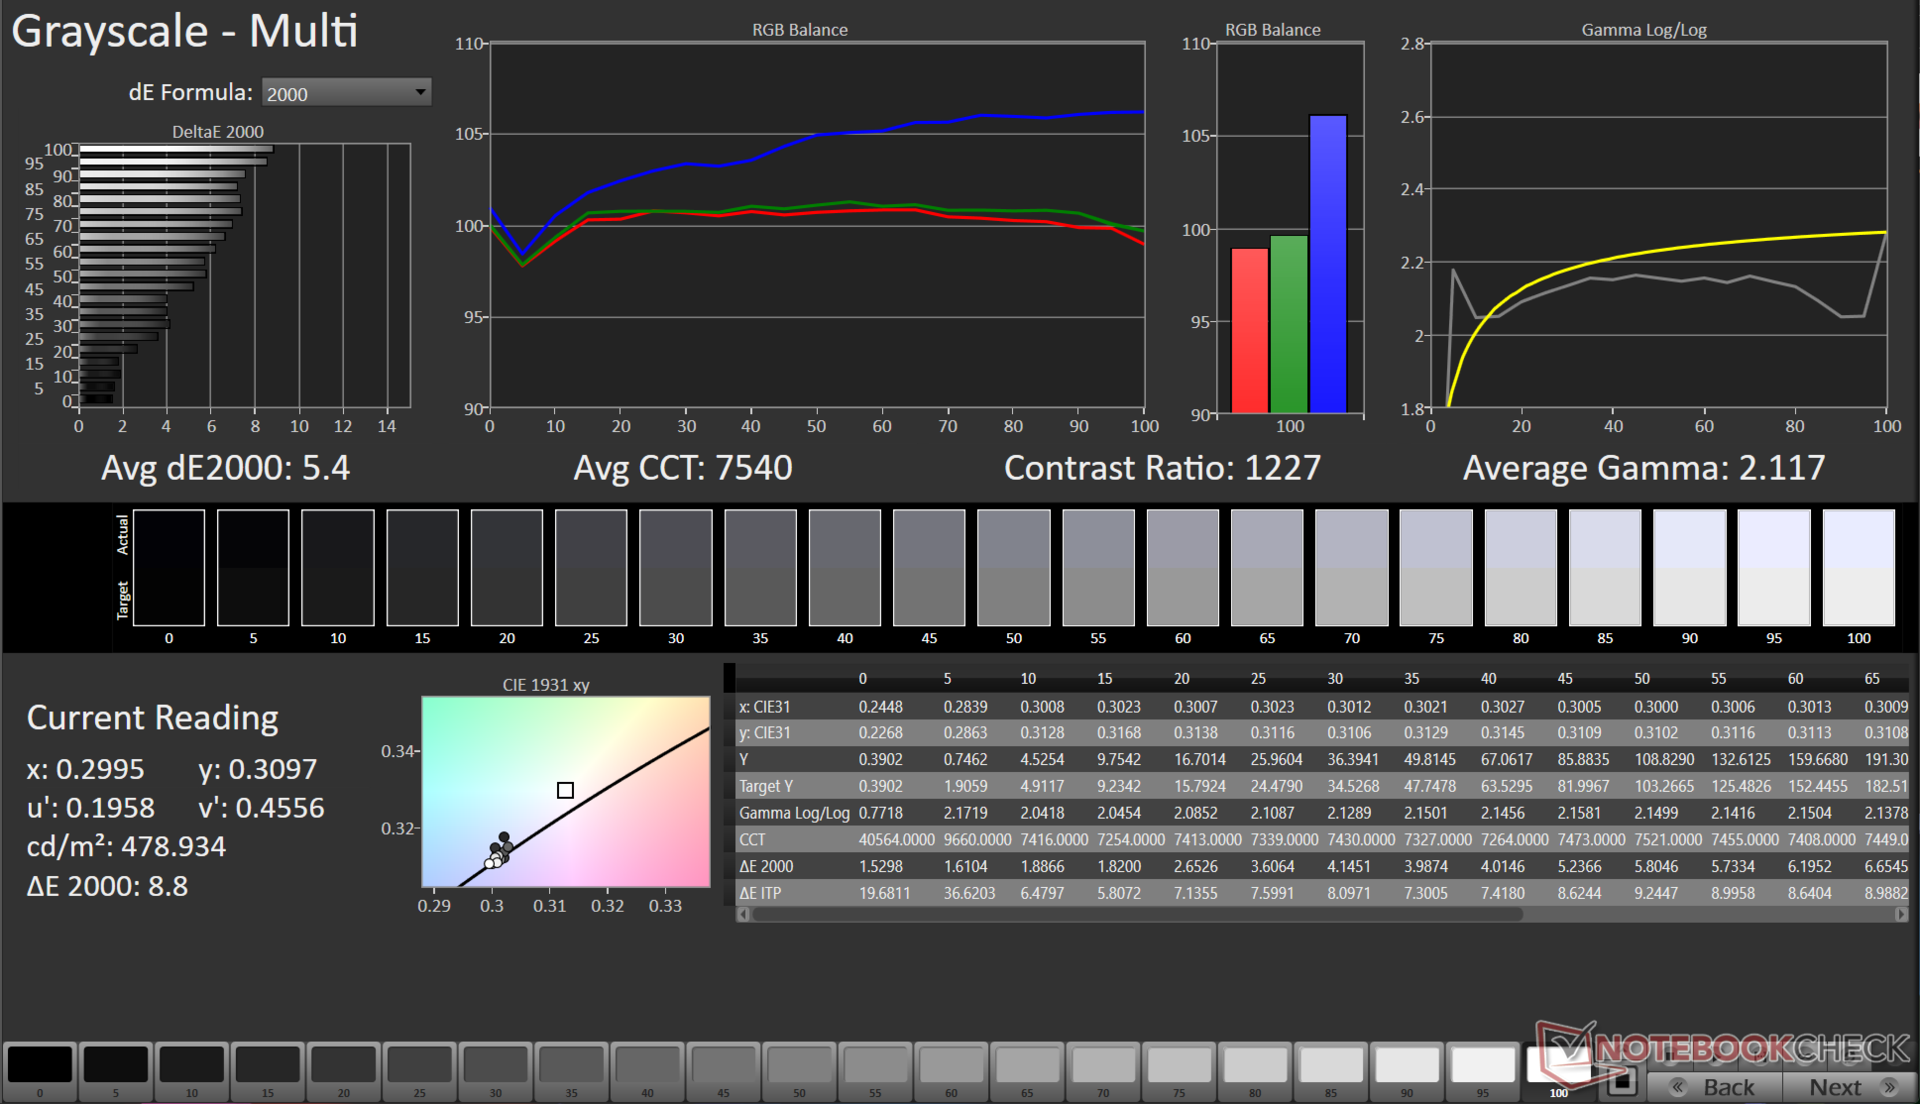
ΔE Greyscale Calman: 5.4 | ∀{0.09-98 Ø4.96}
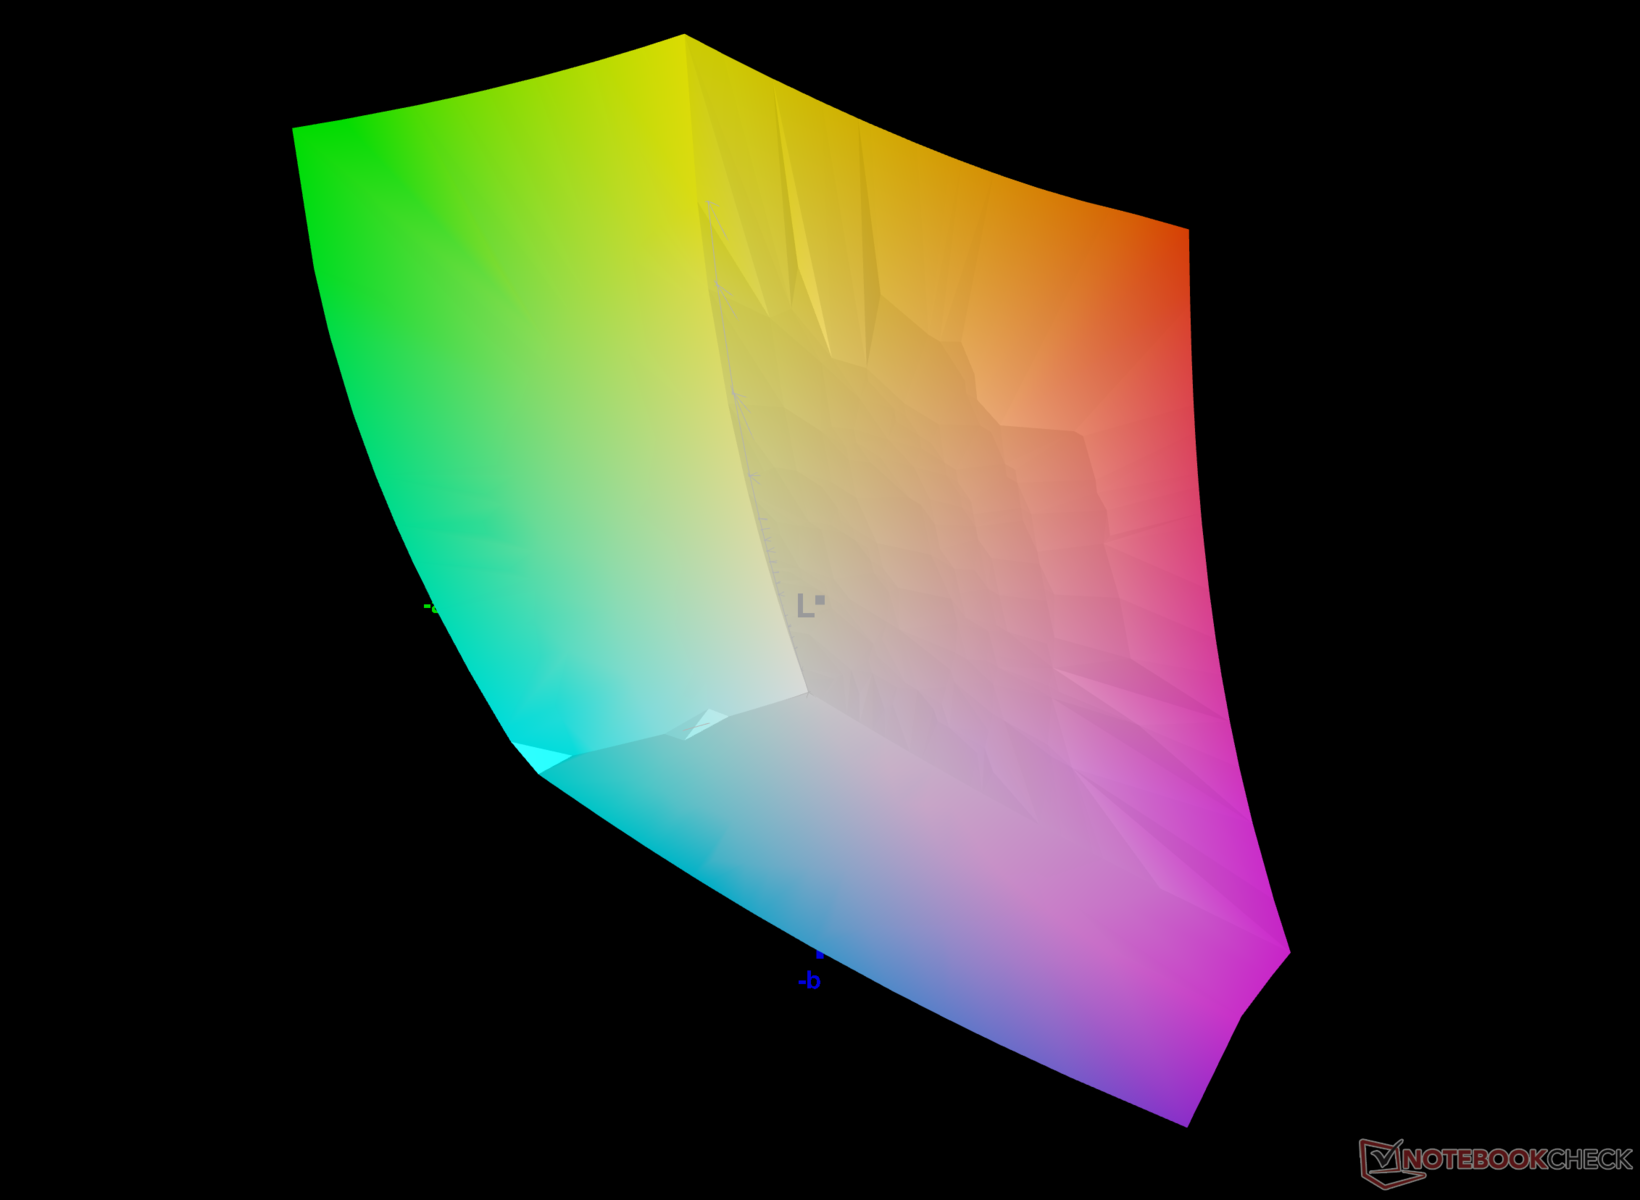
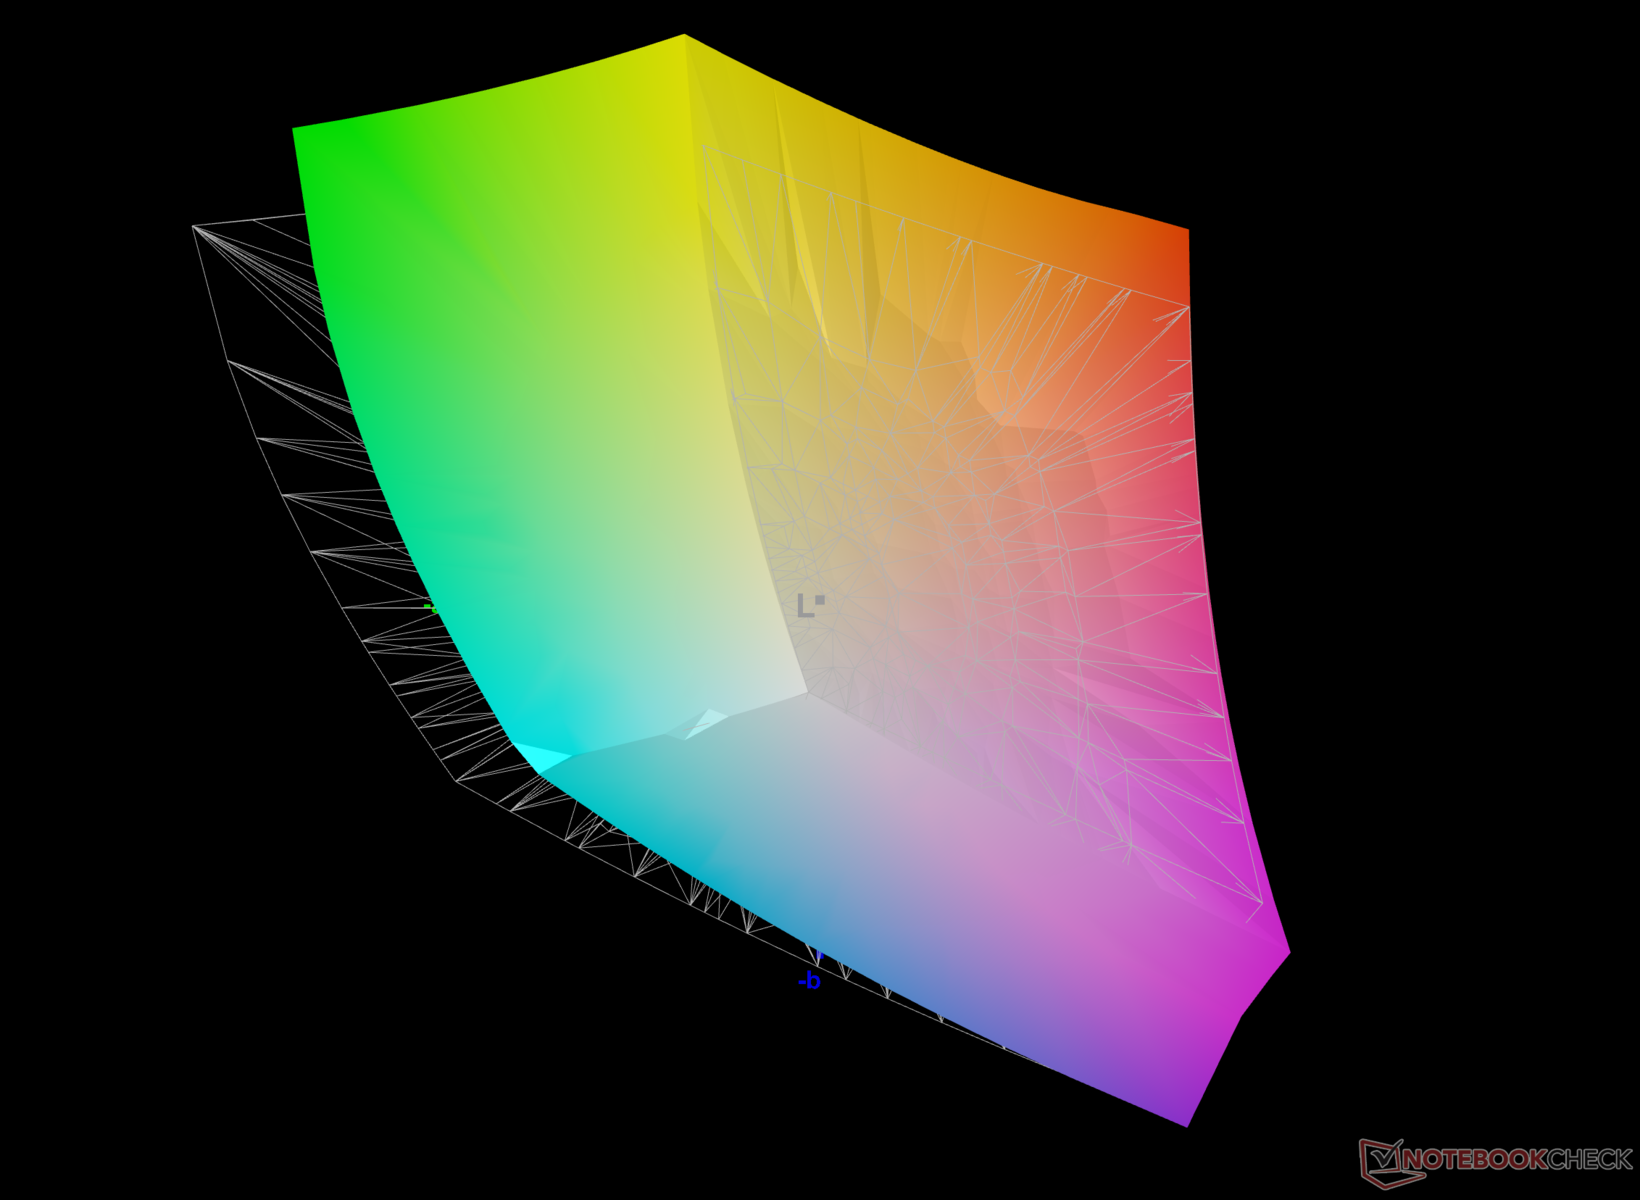
84.4% AdobeRGB 1998 (Argyll 3D)
99.7% sRGB (Argyll 3D)
95.1% Display P3 (Argyll 3D)
Gamma: 2.11
CCT: 7540 K
| Asus ROG Flow X13 GV302XV TL134ADXP01-0, IPS, 2560x1600, 13.4" | Asus ROG Flow Z13 ACRNM TL134ADXP01-0, IPS, 2560x1600, 13.4" | Asus ROG Flow Z13 GZ301V TL134ADXP01-0, IPS, 2560x1600, 13.4" | Razer Blade 14 RTX 4070 AU Optronics B140QAN06.U, IPS, 2560x1600, 14" | Asus TUF Gaming A16 FA617XS BOE NE160WUM-NX2, IPS, 1920x1200, 16" | Lenovo Legion Slim 5 16APH8 BOE NJ NE160QDM-NYC, IPS, 2560x1600, 16" | Acer Predator Triton 14 PT14-51 BOE NE140QDM-NY1, IPS, 2560x1600, 14" | |
|---|---|---|---|---|---|---|---|
| Display | 1% | 1% | 1% | -15% | -15% | 1% | |
| Display P3 Coverage (%) | 95.1 | 96.94 2% | 97 2% | 97.3 2% | 69.3 -27% | 69.3 -27% | 96.9 2% |
| sRGB Coverage (%) | 99.7 | 99.92 0% | 99.9 0% | 99.8 0% | 97.3 -2% | 100 0% | 99.9 0% |
| AdobeRGB 1998 Coverage (%) | 84.4 | 85.17 1% | 85.3 1% | 85.3 1% | 70.7 -16% | 70 -17% | 85.5 1% |
| Response Times | 55% | -19% | -87% | -141% | -72% | -103% | |
| Response Time Grey 50% / Grey 80% * (ms) | 4.79 ? | 2.1 ? 56% | 6.5 ? -36% | 11.9 ? -148% | 15.6 ? -226% | 10.7 ? -123% | 15.1 ? -215% |
| Response Time Black / White * (ms) | 6.42 ? | 3 ? 53% | 6.5 ? -1% | 8 ? -25% | 10 ? -56% | 7.8 ? -21% | 5.8 ? 10% |
| PWM Frequency (Hz) | |||||||
| Screen | 14% | 21% | 4% | 17% | 20% | -1% | |
| Brightness middle (cd/m²) | 473 | 464 -2% | 537 14% | 559.3 18% | 301 -36% | 371.6 -21% | 547 16% |
| Brightness (cd/m²) | 445 | 455 2% | 511 15% | 560 26% | 294 -34% | 343 -23% | 516 16% |
| Brightness Distribution (%) | 89 | 89 0% | 88 -1% | 88 -1% | 94 6% | 84 -6% | 88 -1% |
| Black Level * (cd/m²) | 0.39 | 0.4 -3% | 0.45 -15% | 0.44 -13% | 0.21 46% | 0.44 -13% | 0.56 -44% |
| Contrast (:1) | 1213 | 1160 -4% | 1193 -2% | 1271 5% | 1433 18% | 845 -30% | 977 -19% |
| Colorchecker dE 2000 * | 3.3 | 2 39% | 1.49 55% | 4.44 -35% | 1.79 46% | 1.52 54% | 3.28 1% |
| Colorchecker dE 2000 max. * | 8.93 | 4.2 53% | 3.68 59% | 9.3 -4% | 3.48 61% | 2.68 70% | 8.57 4% |
| Colorchecker dE 2000 calibrated * | 1.09 | 1.2 -10% | 1.12 -3% | 0.39 64% | 1.2 -10% | 0.33 70% | 1.09 -0% |
| Greyscale dE 2000 * | 5.4 | 2.7 50% | 1.66 69% | 6.8 -26% | 2.5 54% | 1.2 78% | 4.4 19% |
| Gamma | 2.11 104% | 2.24 98% | 2.43 91% | 2.3 96% | 2.265 97% | 2.1 105% | 2.168 101% |
| CCT | 7540 86% | 6832 95% | 6772 96% | 6242 104% | 6157 106% | 6503 100% | 7767 84% |
| Media total (Programa/Opciones) | 23% /
17% | 1% /
11% | -27% /
-10% | -46% /
-13% | -22% /
-1% | -34% /
-15% |
* ... más pequeño es mejor
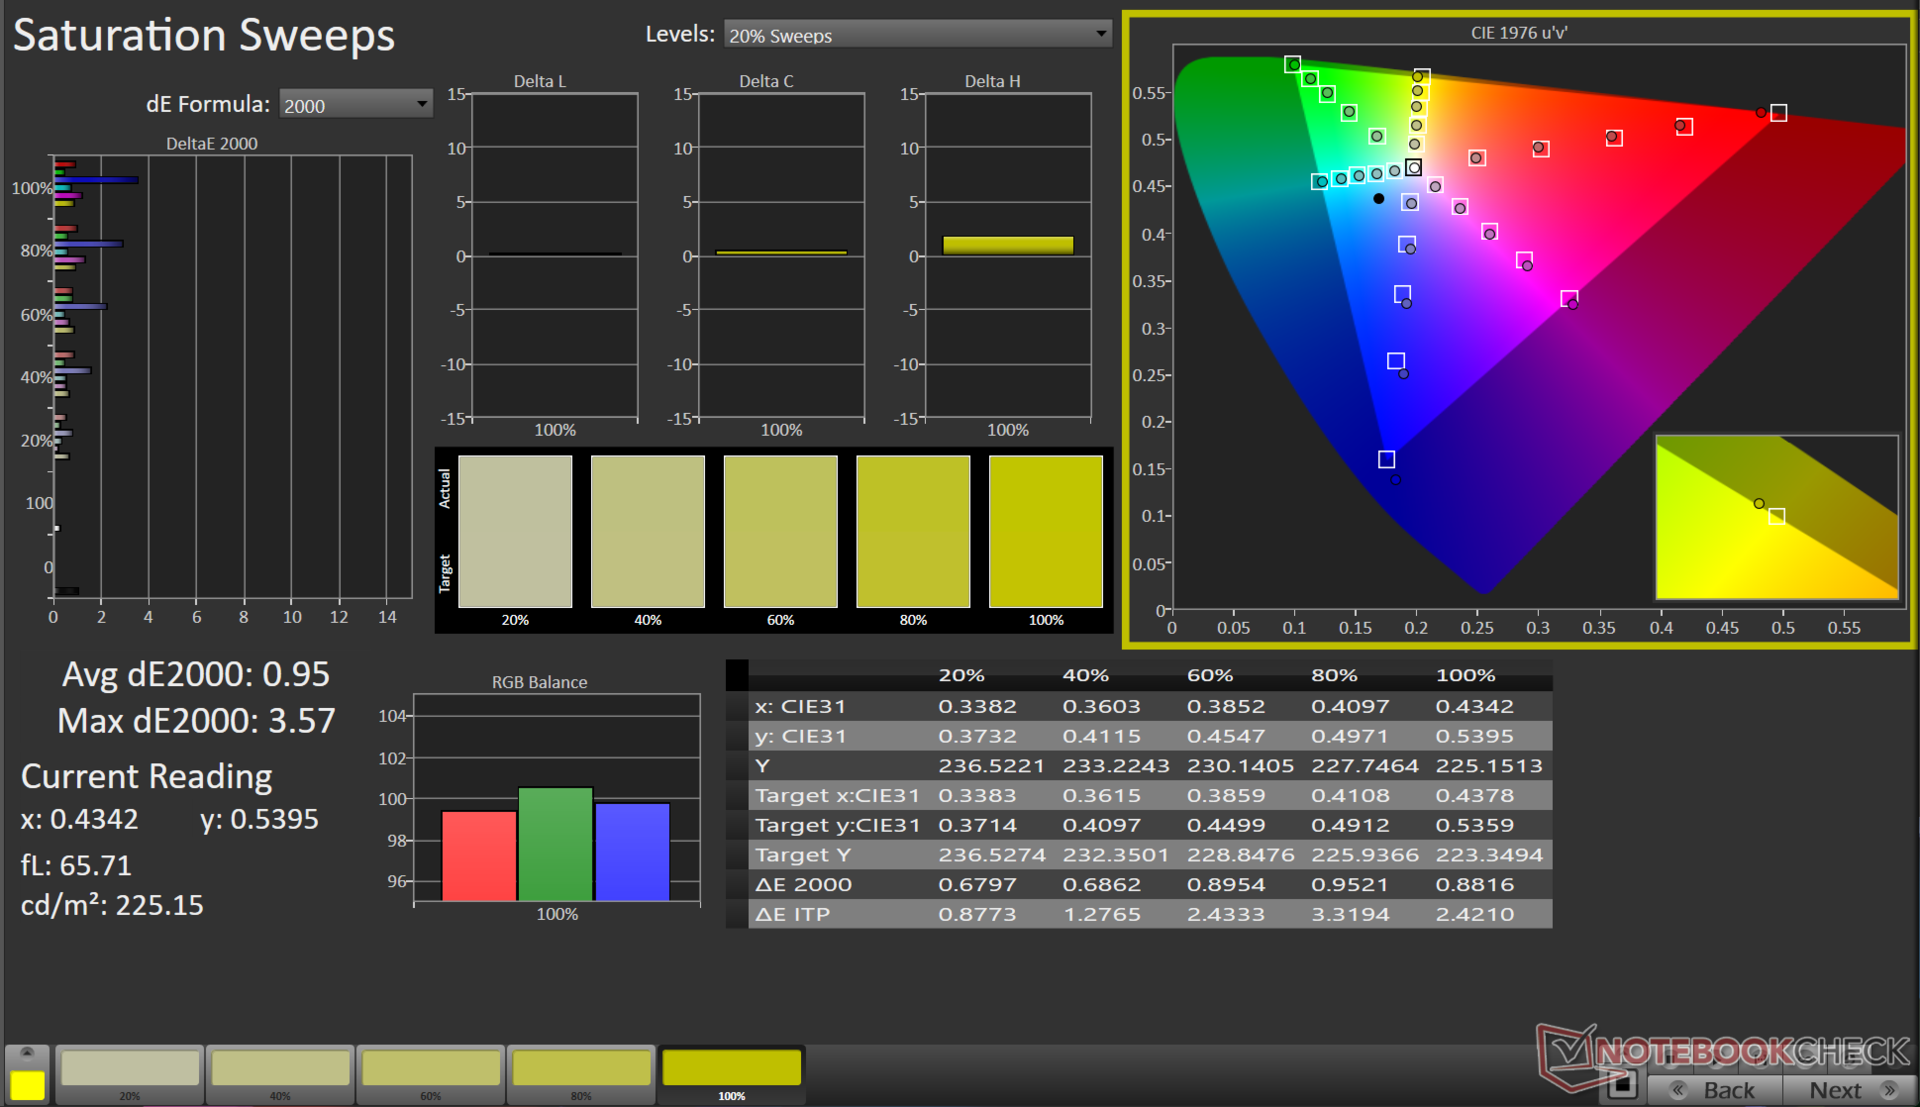
Aunque no está al mismo nivel que los VivoBooks basados en OLEDla pantalla IPS del Flow X13 ofrece una amplia paleta de colores con una excelente cobertura de las gamas de color sRGB, Adobe RGB y Display P3.

Aunque el perfil de color predeterminado es útil, muestra grandes desviaciones en blancos, cian y tonos de piel. Nuestra rutina de calibración con el espectrofotómetro X-Rite i1Basic Pro 3 y el software Calman Ultimate de Portrait Displays lo soluciona en gran medida.
Pudimos conseguir mejoras significativas en los valores de escala de grises (Delta E medio 0,8) y ColorChecker (Delta E medio 1,09) tras la calibración. Sin embargo, el panel sigue teniendo problemas para reproducir con precisión la parte 100% azul del espectro.

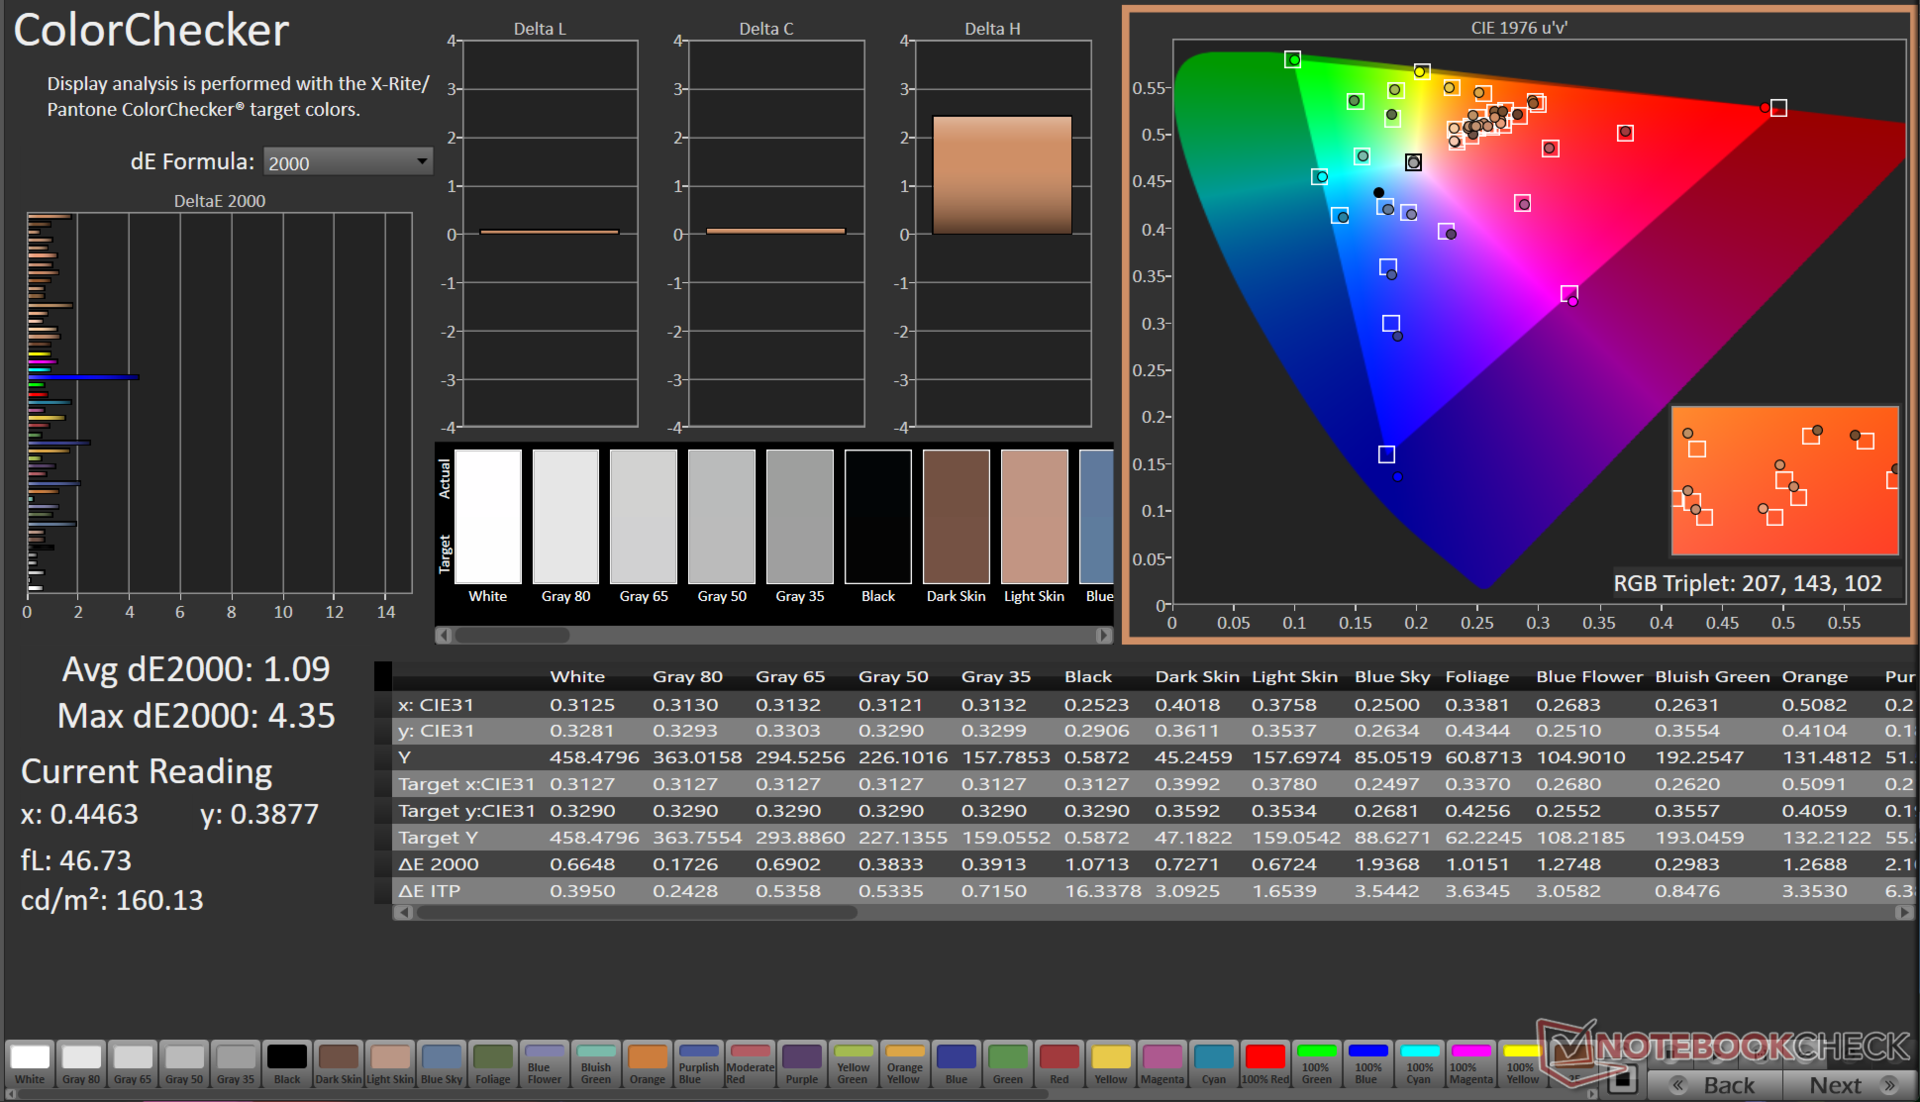
Nuestro archivo ICC calibrado puede descargarse desde el enlace anterior.
Tiempos de respuesta del display
| ↔ Tiempo de respuesta de Negro a Blanco | ||
|---|---|---|
| 6.42 ms ... subida ↗ y bajada ↘ combinada | ↗ 3.29 ms subida | 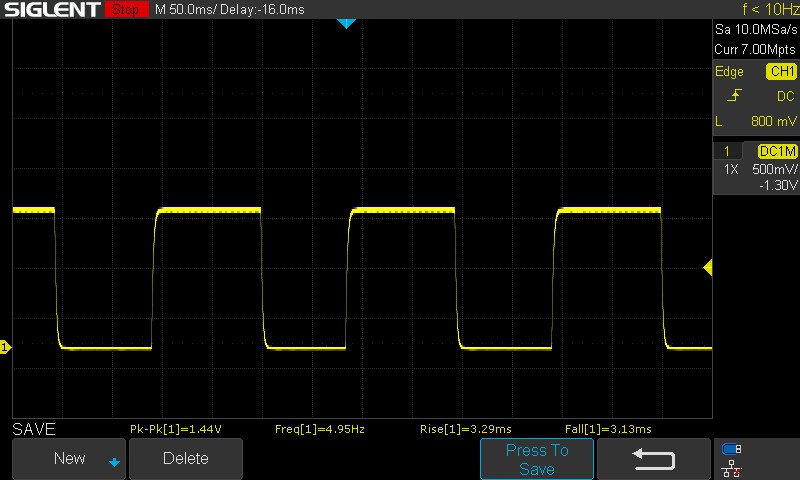 |
| ↘ 3.13 ms bajada | ||
| La pantalla mostró tiempos de respuesta muy rápidos en nuestros tests y debería ser adecuada para juegos frenéticos. En comparación, todos los dispositivos de prueba van de ##min### (mínimo) a 240 (máximo) ms. » 21 % de todos los dispositivos son mejores. Esto quiere decir que el tiempo de respuesta medido es mejor que la media (19.8 ms) de todos los dispositivos testados. | ||
| ↔ Tiempo de respuesta 50% Gris a 80% Gris | ||
| 4.79 ms ... subida ↗ y bajada ↘ combinada | ↗ 2.26 ms subida | 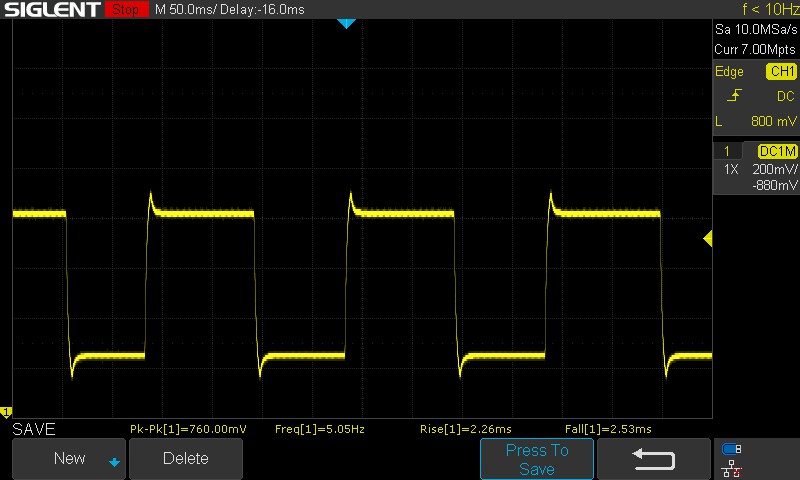 |
| ↘ 2.53 ms bajada | ||
| La pantalla mostró tiempos de respuesta muy rápidos en nuestros tests y debería ser adecuada para juegos frenéticos. En comparación, todos los dispositivos de prueba van de ##min### (mínimo) a 636 (máximo) ms. » 17 % de todos los dispositivos son mejores. Esto quiere decir que el tiempo de respuesta medido es mejor que la media (31 ms) de todos los dispositivos testados. | ||
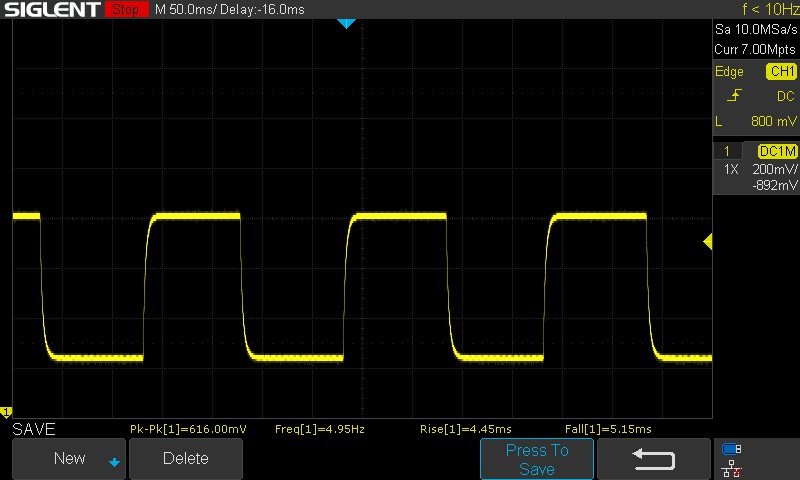
La pantalla del Flow X13 muestra transiciones 100% negro a 100% blanco bastante rápidas. El panel utiliza overdrive por defecto, lo que permite un rápido tiempo de respuesta de 4,79 ms del 50% de gris al 80% de gris.
Si se desactiva la sobremarcha del panel a través de Armory Crate, la transición combinada del 50 % de gris al 80 % de gris aumenta a 9,6 ms.
No observamos PWM en ninguno de los niveles de brillo probados. Nuestro artículo "Por qué el PWM es un dolor de cabeza"explica por qué esto es bueno.
Parpadeo de Pantalla / PWM (Pulse-Width Modulation)
| Parpadeo de Pantalla / PWM no detectado | ≤ 100 % de brillo | 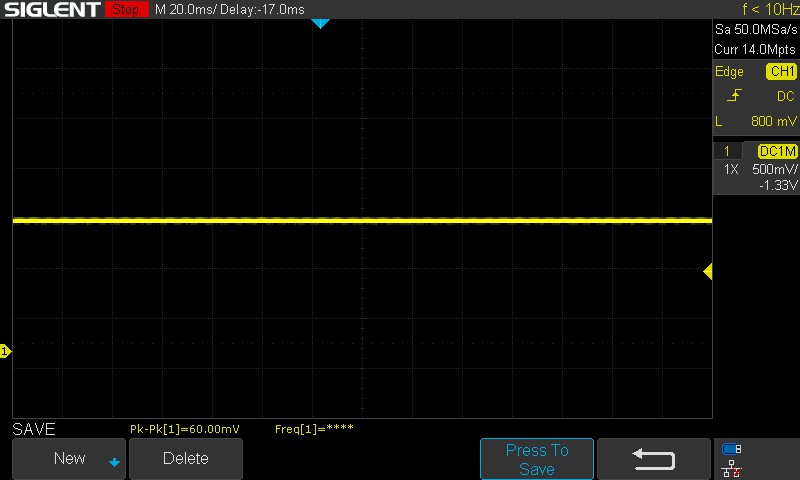 | |
Comparación: 52 % de todos los dispositivos testados no usaron PWM para atenuar el display. Si se usó, medimos una media de 7757 (mínimo: 5 - máxmo: 343500) Hz. | |||
Según Asus, el recubrimiento Gorilla Glass DXC debería ayudar a mejorar la visibilidad en exteriores. Aunque la visibilidad en exteriores parece mejor que la de los VivoBooks OLED, la pantalla brillante puede seguir siendo bastante reflectante en un día luminoso de verano.
Los ángulos de visión son relativamente estables, salvo cierta pérdida de brillo y color en los extremos.
Rendimiento: Formidable combo Ryzen 9 7940HS de 65 W y RTX 4060 de 60 W
En India, Asus ofrece dos configuraciones del ROG Flow X13 GV302, ambas con el AMD Ryzen 9 7940HS Y pantallas QHD+. Los compradores pueden elegir entre 60 W GPU RTX 4050 para portátiles o 60 W GPU RTX 4060 para portátiles opciones.
Los mercados estadounidense y europeo tienen acceso a una variante con una GPU RTX 4070 de 60 W para portátiles y 32 GB de RAM LPDDR5. También hay una variante que se reduce a una pantalla Full HD+ y depende únicamente de los gráficos Radeon 780M integrados en el Ryzen 9 7940HS.
Condiciones de ensayo
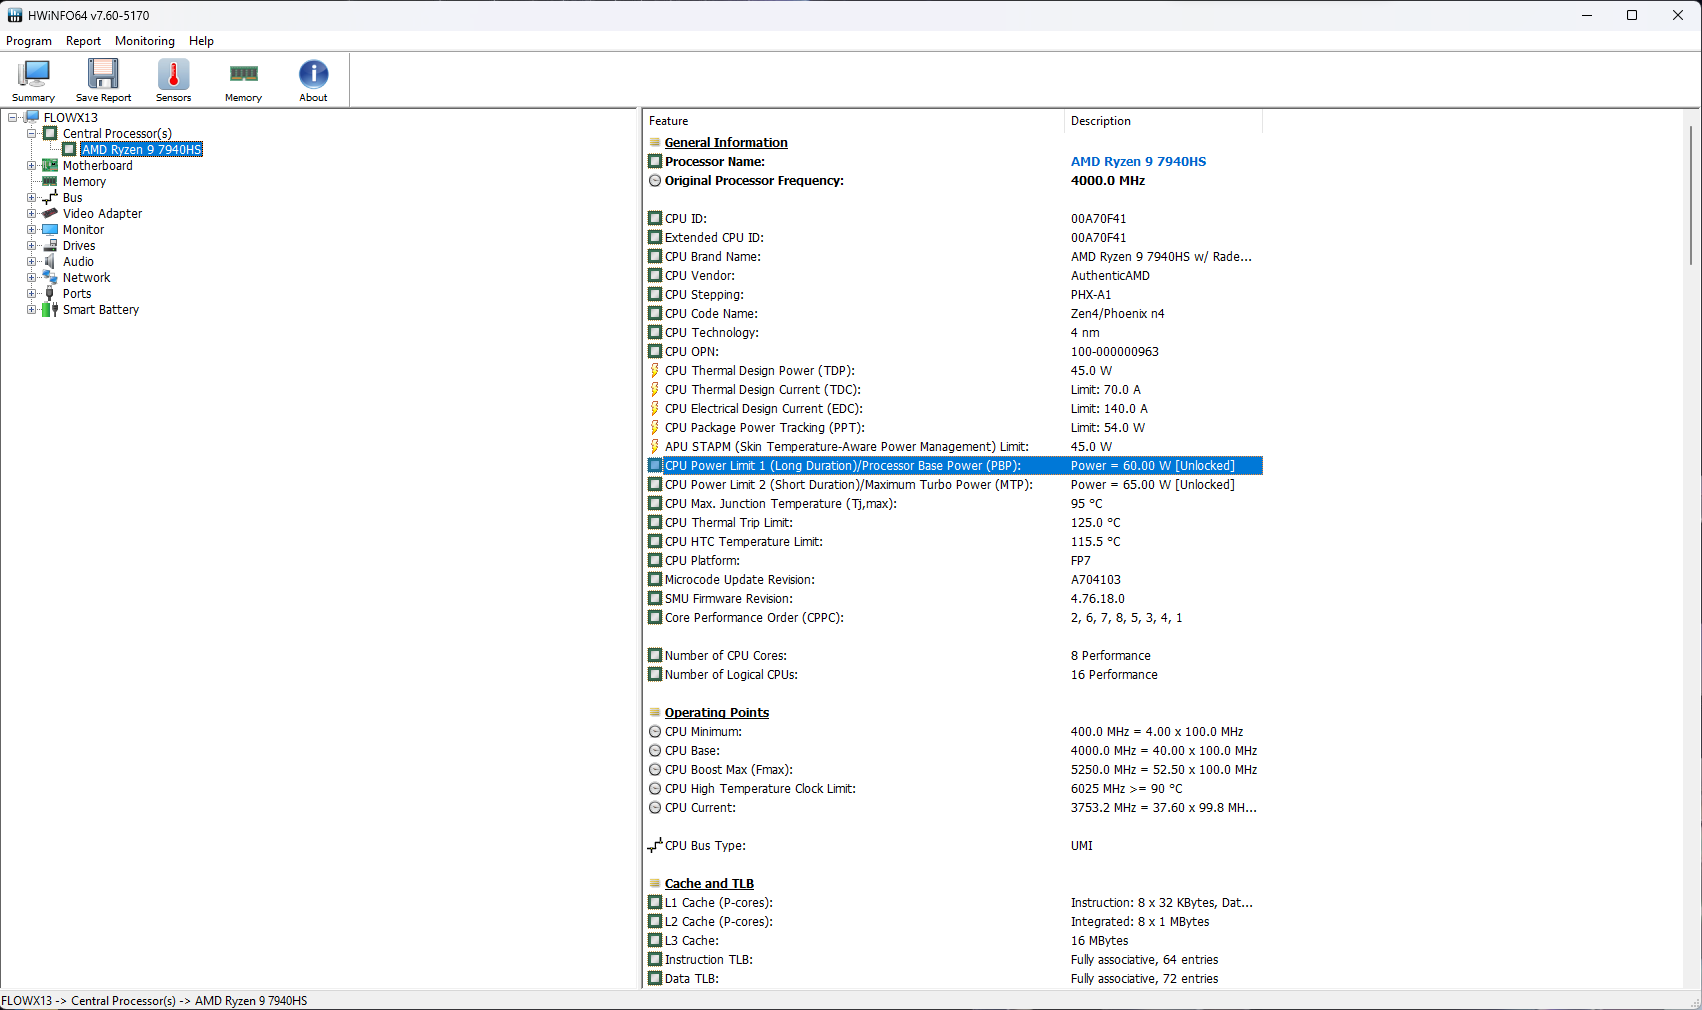
El chasis compacto del Flow X13 limita naturalmente el techo de potencia del Ryzen 9 7940HS. Puede alcanzar hasta 65 W en modo Turbo frente a los 114 W del Asus TUF Gaming A16.
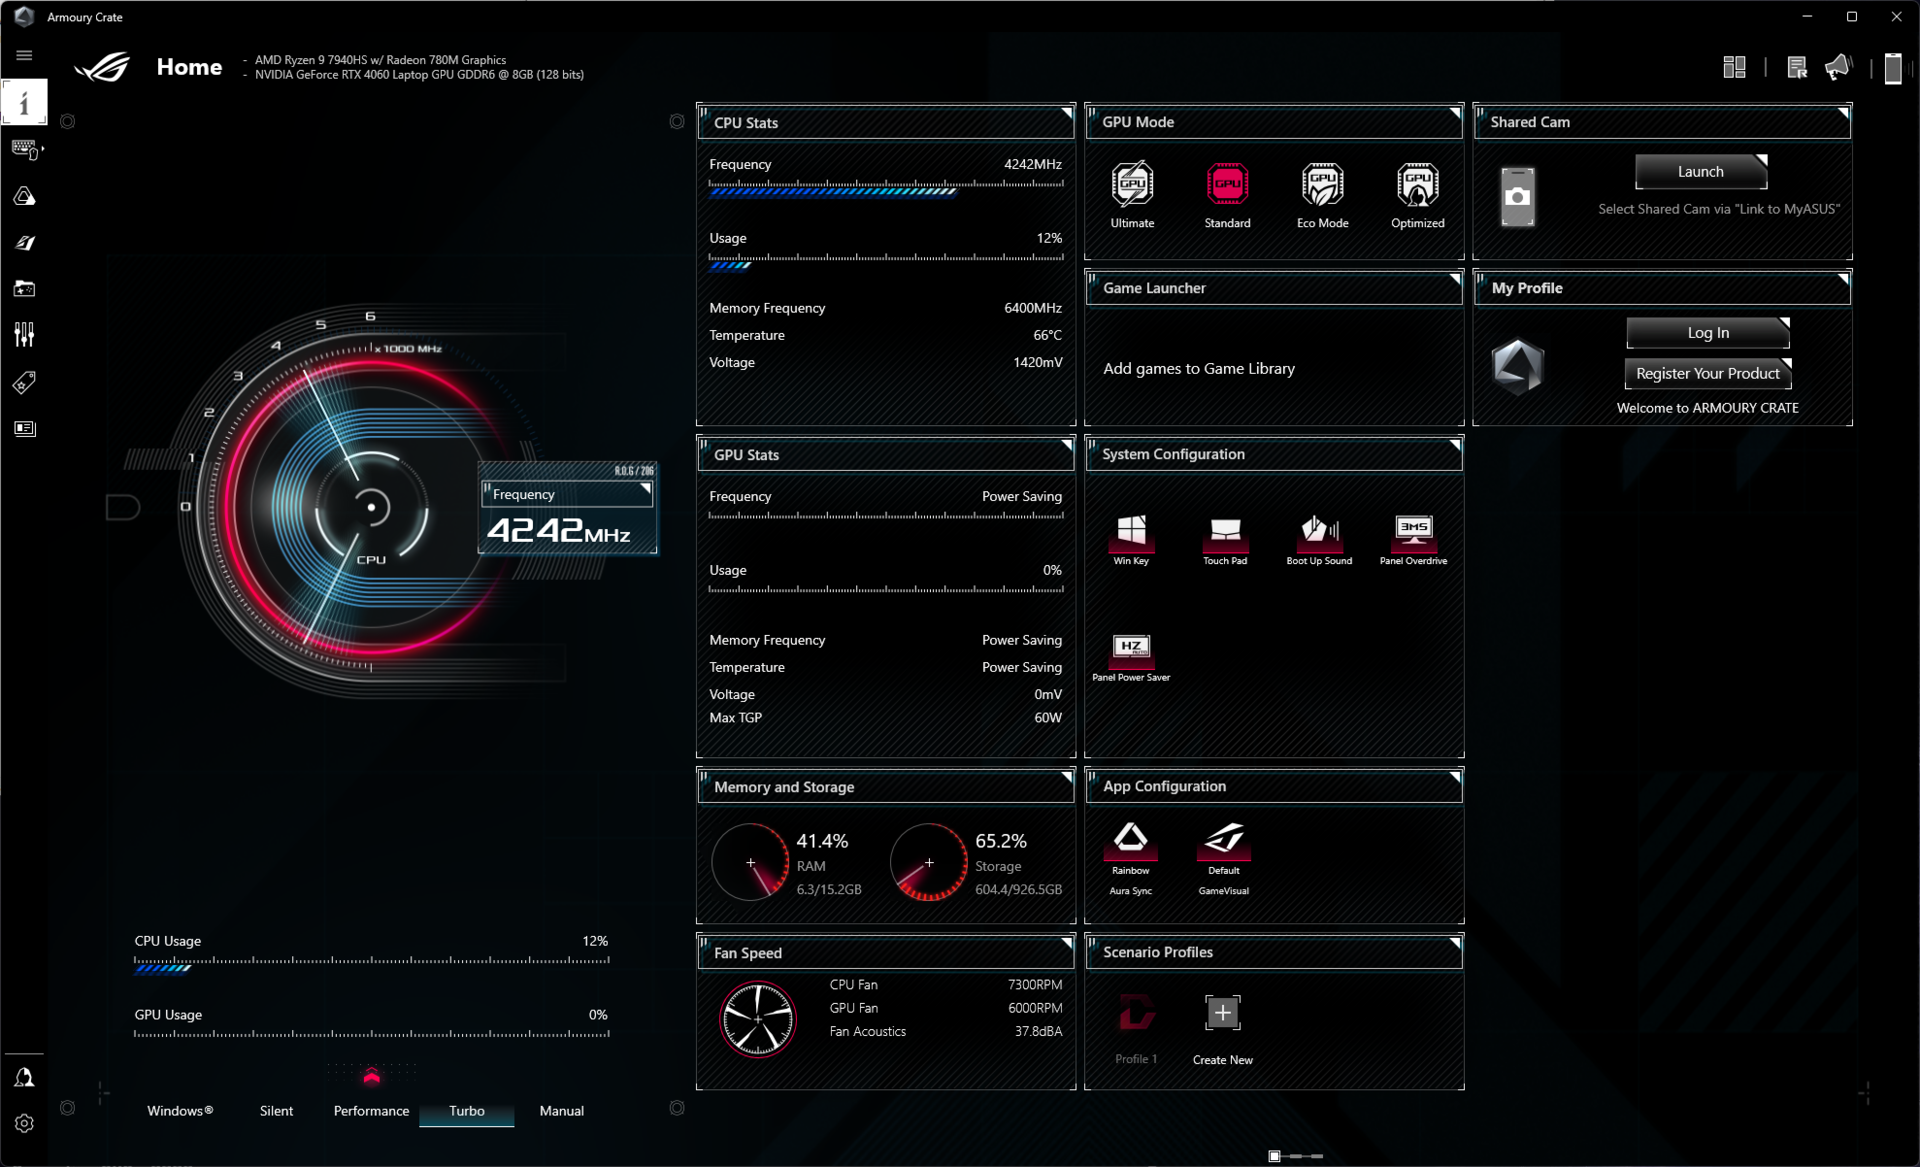
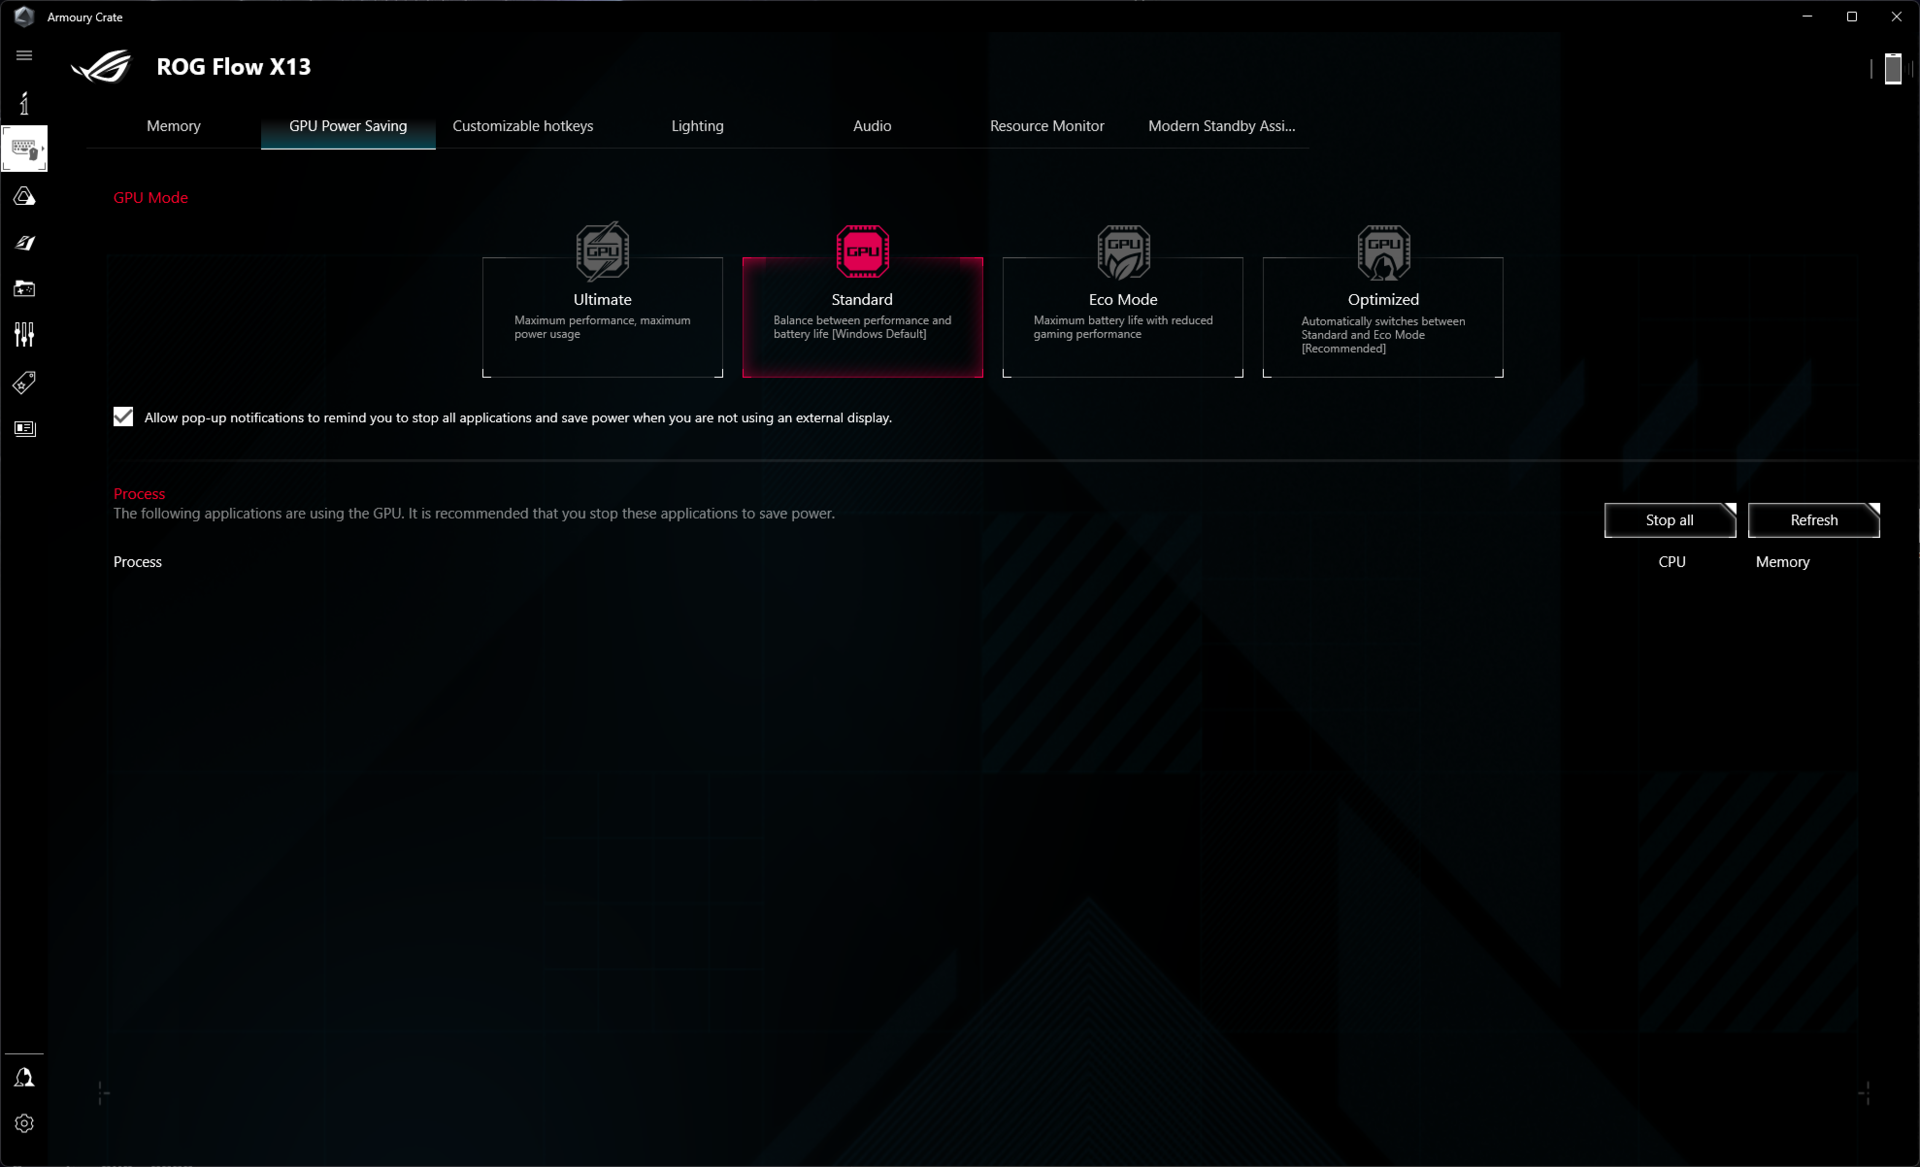
El software Asus Armory Crate permite ajustar varios aspectos de rendimiento del Flow X13. Nuestras pruebas usan el perfil Turbo con la GPU en Ultimate, activando el modo exclusivo dGPU. Las pruebas de batería emplean el perfil Windows y el modo GPU Estándar.
| Modo de rendimiento | STAPM | PL1 | PL2 | Cinebench R15 Puntuación múltiple | Cinebench R15 Puntuación múltiple (30 bucles) |
|---|---|---|---|---|---|
| Silencioso | 45 W | 45 W | 65 W | 2476 (-6,12%) | 2094 (-12,05%) |
| Rendimiento | 45 W | 54 W | 65 W | 2582 (-2,1%) | 2097 (-11,92%) |
| Turbo | 45 W | 60 W | 65 W | 2637,5 (100%) | 2381 (100%) |
Procesador
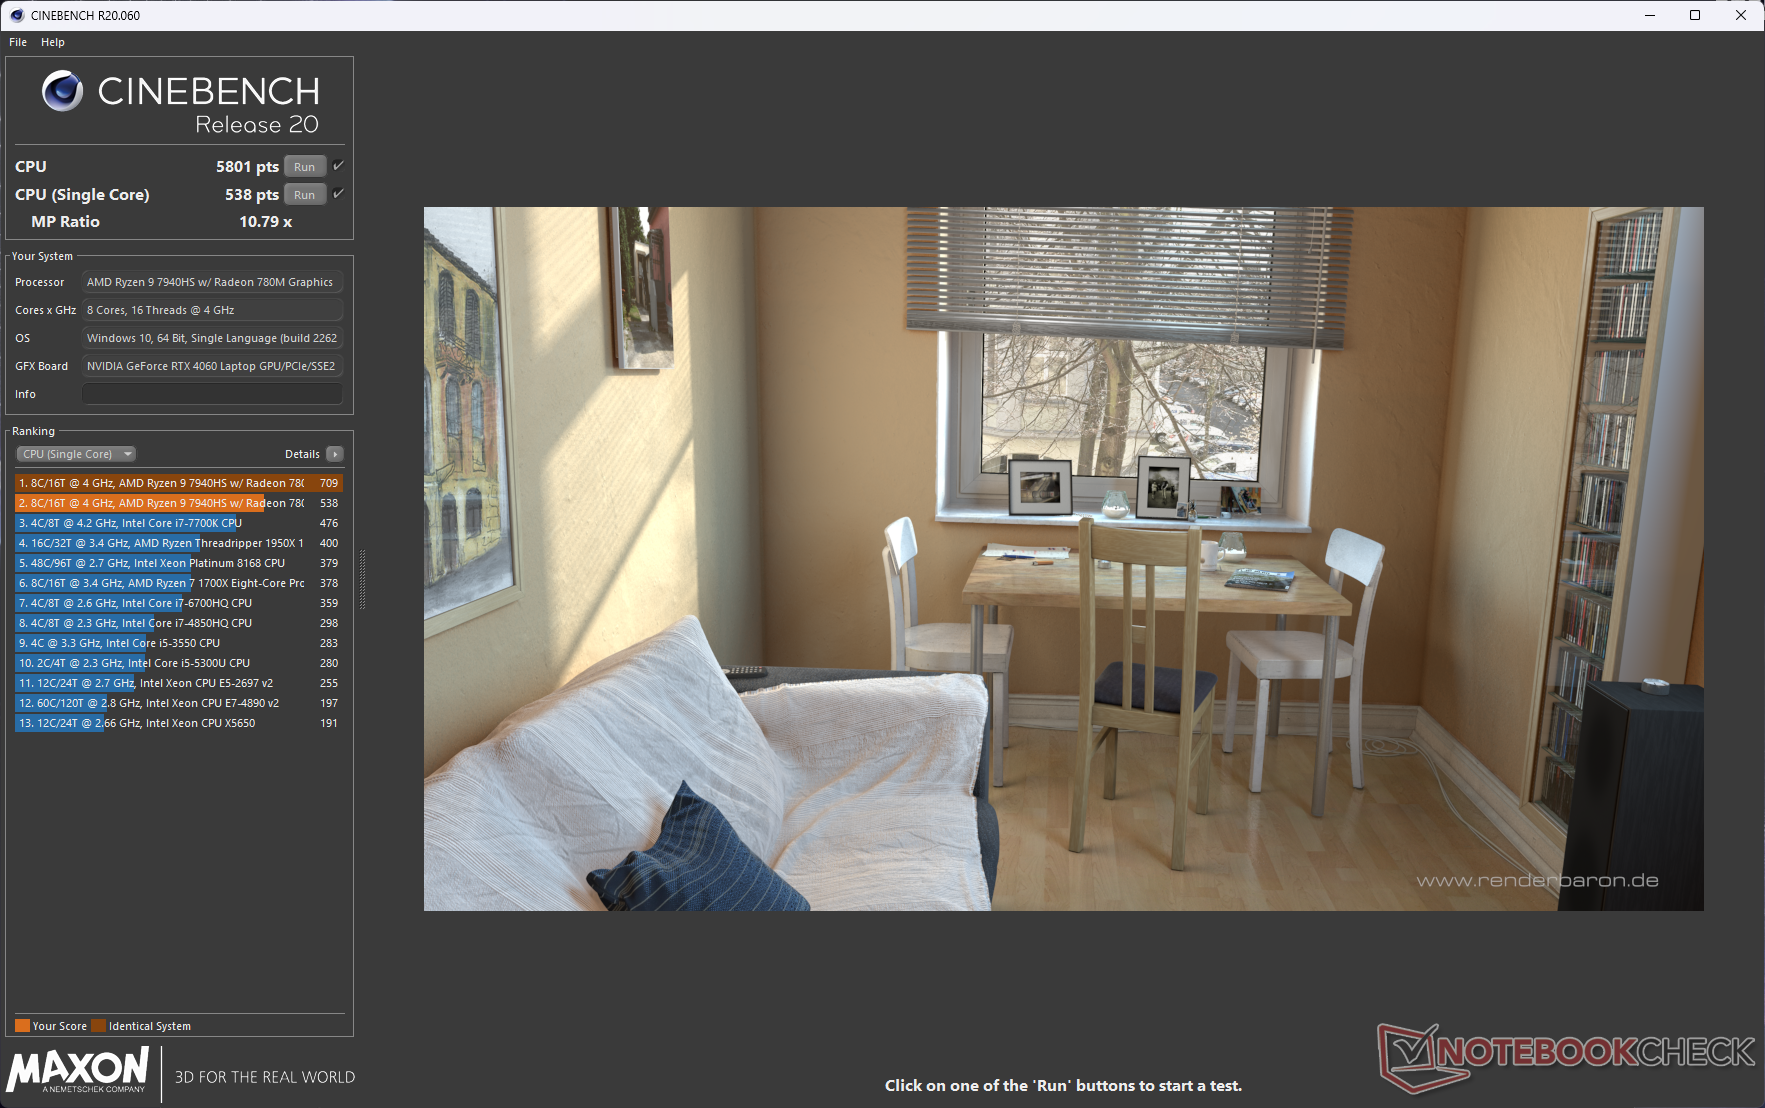
El Ryzen 9 7940HS del ROG Flow X13 queda por detrás de la competencia debido a su menor margen operativo, pero no por mucho. El portátil muestra un rendimiento bien sostenido en el test Cinebench R15 multi-core loop. Los deltas de rendimiento en pruebas multinúcleo individuales son algo superiores a las ejecuciones mononúcleo en general.
Sólo hay un 4% de déficit de rendimiento general comparado con el PL2 de 100 W Core i9-13900H-powered ROG Flow Z13 ACRNM, el PL2 Ryzen 9 7940HS de 88 W en el Razer Blade 14, y la configuración de 114 W en el TUF A16, lo que indica considerables ganancias de eficiencia a pesar de un factor de forma más pequeño.
Cinebench R15 Multi Loop
Cinebench R23: Multi Core | Single Core
Cinebench R20: CPU (Multi Core) | CPU (Single Core)
Cinebench R15: CPU Multi 64Bit | CPU Single 64Bit
Blender: v2.79 BMW27 CPU
7-Zip 18.03: 7z b 4 | 7z b 4 -mmt1
Geekbench 5.5: Multi-Core | Single-Core
HWBOT x265 Benchmark v2.2: 4k Preset
LibreOffice : 20 Documents To PDF
R Benchmark 2.5: Overall mean
| CPU Performance rating | |
| Asus ROG Flow Z13 GZ301V | |
| Asus ROG Flow Z13 ACRNM | |
| Razer Blade 14 RTX 4070 | |
| Lenovo Legion Slim 5 16APH8 | |
| Asus TUF Gaming A16 FA617XS | |
| Medio AMD Ryzen 9 7940HS | |
| Acer Predator Triton 14 PT14-51 | |
| Asus ROG Flow X13 GV302XV | |
| Media de la clase Convertible | |
| Cinebench R23 / Multi Core | |
| Acer Predator Triton 14 PT14-51 | |
| Asus ROG Flow Z13 ACRNM | |
| Asus ROG Flow Z13 GZ301V | |
| Razer Blade 14 RTX 4070 | |
| Lenovo Legion Slim 5 16APH8 | |
| Asus TUF Gaming A16 FA617XS | |
| Medio AMD Ryzen 9 7940HS (15556 - 18131, n=12) | |
| Asus ROG Flow X13 GV302XV | |
| Media de la clase Convertible (1317 - 30959, n=48, últimos 2 años) | |
| Cinebench R23 / Single Core | |
| Asus ROG Flow Z13 GZ301V | |
| Asus ROG Flow Z13 ACRNM | |
| Razer Blade 14 RTX 4070 | |
| Lenovo Legion Slim 5 16APH8 | |
| Asus TUF Gaming A16 FA617XS | |
| Medio AMD Ryzen 9 7940HS (1733 - 1832, n=12) | |
| Asus ROG Flow X13 GV302XV | |
| Media de la clase Convertible (740 - 2188, n=48, últimos 2 años) | |
| Acer Predator Triton 14 PT14-51 | |
| Cinebench R20 / CPU (Multi Core) | |
| Acer Predator Triton 14 PT14-51 | |
| Asus ROG Flow Z13 ACRNM | |
| Asus ROG Flow Z13 GZ301V | |
| Razer Blade 14 RTX 4070 | |
| Lenovo Legion Slim 5 16APH8 | |
| Asus TUF Gaming A16 FA617XS | |
| Medio AMD Ryzen 9 7940HS (6277 - 7111, n=12) | |
| Asus ROG Flow X13 GV302XV | |
| Media de la clase Convertible (595 - 12102, n=48, últimos 2 años) | |
| Cinebench R20 / CPU (Single Core) | |
| Asus ROG Flow Z13 GZ301V | |
| Asus ROG Flow Z13 ACRNM | |
| Asus ROG Flow X13 GV302XV | |
| Asus TUF Gaming A16 FA617XS | |
| Razer Blade 14 RTX 4070 | |
| Lenovo Legion Slim 5 16APH8 | |
| Medio AMD Ryzen 9 7940HS (679 - 714, n=12) | |
| Media de la clase Convertible (273 - 834, n=48, últimos 2 años) | |
| Acer Predator Triton 14 PT14-51 | |
| Cinebench R15 / CPU Multi 64Bit | |
| Acer Predator Triton 14 PT14-51 | |
| Asus ROG Flow Z13 GZ301V | |
| Asus ROG Flow Z13 ACRNM | |
| Razer Blade 14 RTX 4070 | |
| Lenovo Legion Slim 5 16APH8 | |
| Asus TUF Gaming A16 FA617XS | |
| Medio AMD Ryzen 9 7940HS (2470 - 2848, n=12) | |
| Asus ROG Flow X13 GV302XV | |
| Media de la clase Convertible (478 - 4940, n=47, últimos 2 años) | |
| Cinebench R15 / CPU Single 64Bit | |
| Asus ROG Flow Z13 GZ301V | |
| Asus ROG Flow Z13 ACRNM | |
| Asus ROG Flow X13 GV302XV | |
| Razer Blade 14 RTX 4070 | |
| Asus TUF Gaming A16 FA617XS | |
| Medio AMD Ryzen 9 7940HS (258 - 288, n=12) | |
| Lenovo Legion Slim 5 16APH8 | |
| Media de la clase Convertible (149.8 - 317, n=47, últimos 2 años) | |
| Acer Predator Triton 14 PT14-51 | |
| Blender / v2.79 BMW27 CPU | |
| Media de la clase Convertible (105 - 1051, n=47, últimos 2 años) | |
| Asus ROG Flow X13 GV302XV | |
| Asus ROG Flow Z13 GZ301V | |
| Medio AMD Ryzen 9 7940HS (182 - 202, n=11) | |
| Asus TUF Gaming A16 FA617XS | |
| Acer Predator Triton 14 PT14-51 | |
| Razer Blade 14 RTX 4070 | |
| Lenovo Legion Slim 5 16APH8 | |
| Asus ROG Flow Z13 ACRNM | |
| 7-Zip 18.03 / 7z b 4 | |
| Acer Predator Triton 14 PT14-51 | |
| Asus ROG Flow Z13 GZ301V | |
| Asus ROG Flow Z13 ACRNM | |
| Medio AMD Ryzen 9 7940HS (63459 - 73434, n=12) | |
| Asus TUF Gaming A16 FA617XS | |
| Razer Blade 14 RTX 4070 | |
| Lenovo Legion Slim 5 16APH8 | |
| Asus ROG Flow X13 GV302XV | |
| Media de la clase Convertible (12977 - 121368, n=47, últimos 2 años) | |
| 7-Zip 18.03 / 7z b 4 -mmt1 | |
| Asus TUF Gaming A16 FA617XS | |
| Medio AMD Ryzen 9 7940HS (6310 - 6776, n=12) | |
| Asus ROG Flow Z13 GZ301V | |
| Razer Blade 14 RTX 4070 | |
| Lenovo Legion Slim 5 16APH8 | |
| Asus ROG Flow X13 GV302XV | |
| Asus ROG Flow Z13 ACRNM | |
| Acer Predator Triton 14 PT14-51 | |
| Media de la clase Convertible (3672 - 6655, n=47, últimos 2 años) | |
| Geekbench 5.5 / Multi-Core | |
| Acer Predator Triton 14 PT14-51 | |
| Asus ROG Flow Z13 GZ301V | |
| Asus ROG Flow Z13 ACRNM | |
| Asus TUF Gaming A16 FA617XS | |
| Medio AMD Ryzen 9 7940HS (10089 - 12500, n=13) | |
| Lenovo Legion Slim 5 16APH8 | |
| Razer Blade 14 RTX 4070 | |
| Asus ROG Flow X13 GV302XV | |
| Media de la clase Convertible (1608 - 22023, n=48, últimos 2 años) | |
| Geekbench 5.5 / Single-Core | |
| Asus TUF Gaming A16 FA617XS | |
| Asus ROG Flow Z13 GZ301V | |
| Lenovo Legion Slim 5 16APH8 | |
| Asus ROG Flow X13 GV302XV | |
| Medio AMD Ryzen 9 7940HS (1823 - 2032, n=13) | |
| Asus ROG Flow Z13 ACRNM | |
| Razer Blade 14 RTX 4070 | |
| Media de la clase Convertible (806 - 2275, n=48, últimos 2 años) | |
| Acer Predator Triton 14 PT14-51 | |
| HWBOT x265 Benchmark v2.2 / 4k Preset | |
| Lenovo Legion Slim 5 16APH8 | |
| Razer Blade 14 RTX 4070 | |
| Medio AMD Ryzen 9 7940HS (18.5 - 22.6, n=11) | |
| Asus TUF Gaming A16 FA617XS | |
| Asus ROG Flow Z13 ACRNM | |
| Acer Predator Triton 14 PT14-51 | |
| Asus ROG Flow X13 GV302XV | |
| Asus ROG Flow Z13 GZ301V | |
| Media de la clase Convertible (3.43 - 36.2, n=47, últimos 2 años) | |
| LibreOffice / 20 Documents To PDF | |
| Asus ROG Flow Z13 ACRNM | |
| Media de la clase Convertible (42.5 - 84.3, n=47, últimos 2 años) | |
| Asus ROG Flow X13 GV302XV | |
| Acer Predator Triton 14 PT14-51 | |
| Medio AMD Ryzen 9 7940HS (36.9 - 54.8, n=12) | |
| Asus TUF Gaming A16 FA617XS | |
| Asus ROG Flow Z13 GZ301V | |
| Razer Blade 14 RTX 4070 | |
| Lenovo Legion Slim 5 16APH8 | |
| R Benchmark 2.5 / Overall mean | |
| Media de la clase Convertible (0.3915 - 0.84, n=47, últimos 2 años) | |
| Acer Predator Triton 14 PT14-51 | |
| Razer Blade 14 RTX 4070 | |
| Asus ROG Flow X13 GV302XV | |
| Lenovo Legion Slim 5 16APH8 | |
| Medio AMD Ryzen 9 7940HS (0.4159 - 0.4467, n=12) | |
| Asus ROG Flow Z13 ACRNM | |
| Asus TUF Gaming A16 FA617XS | |
| Asus ROG Flow Z13 GZ301V | |
* ... más pequeño es mejor
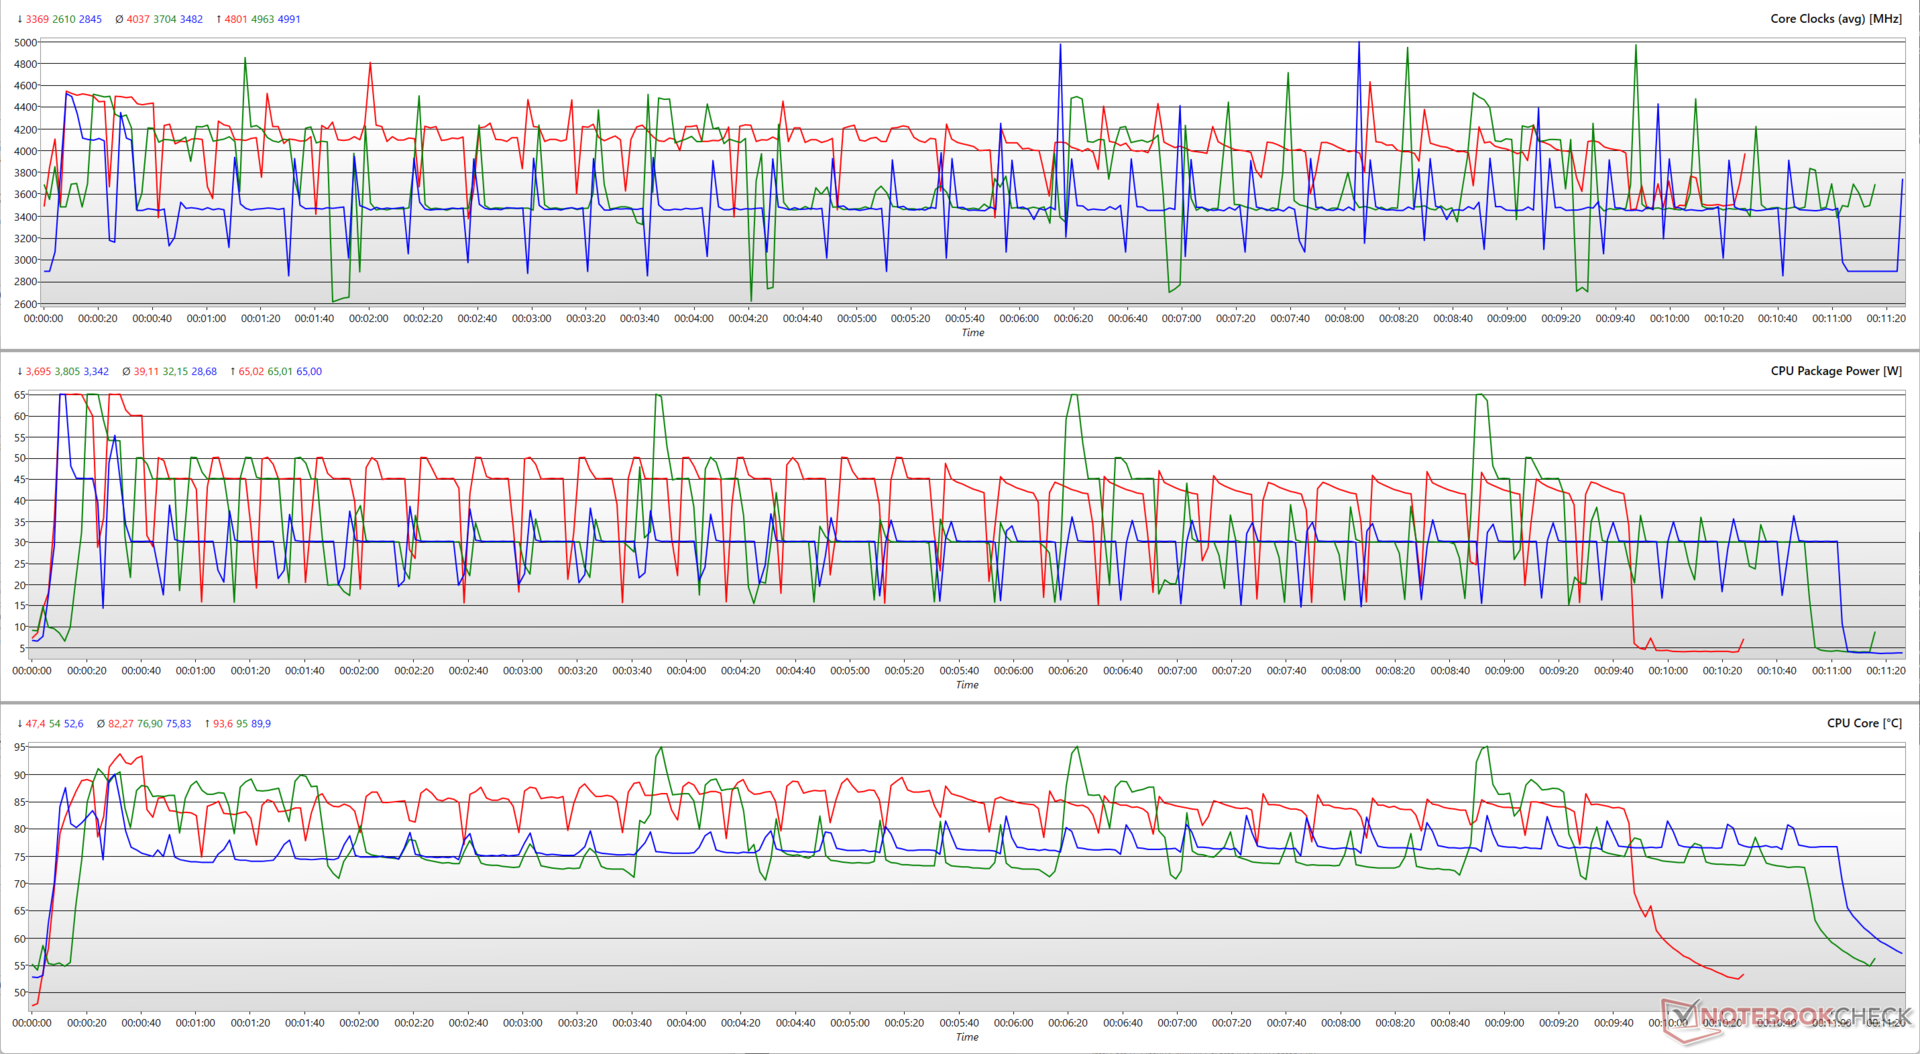
El Ryzen 9 7940HS es capaz de alcanzar potencias cercanas a los 5 GHz con una potencia máxima de 65 W en todos los modos de rendimiento probados. No vemos mucha diferencia entre los perfiles Turbo y Rendimiento en el primer bucle de la ejecución multi-core de Cinebench R15.
Sin embargo, estresar la CPU durante 30 bucles resulta en una media de frecuencias de 4 GHz (39 W) en Turbo, 3,7 GHz (32,15 W) en Rendimiento y 3,48 GHz (28,7 W) en modo Silencioso. Vemos hasta un 12% de caída de rendimiento al pasar de Turbo a Silencioso.
La regresión de rendimiento en batería parece bastante significativa, con caídas del 23.5% y 9.6% en las puntuaciones Cinebench R20 mononúcleo y multinúcleo, respectivamente.
AIDA64: FP32 Ray-Trace | FPU Julia | CPU SHA3 | CPU Queen | FPU SinJulia | FPU Mandel | CPU AES | CPU ZLib | FP64 Ray-Trace | CPU PhotoWorxx
| Performance rating | |
| Razer Blade 14 RTX 4070 | |
| Medio AMD Ryzen 9 7940HS | |
| Asus ROG Flow X13 GV302XV | |
| Lenovo Legion Slim 5 16APH8 | |
| Asus TUF Gaming A16 FA617XS | |
| Acer Predator Triton 14 PT14-51 | |
| Asus ROG Flow Z13 ACRNM | |
| Asus ROG Flow Z13 GZ301V | |
| Media de la clase Convertible | |
| AIDA64 / FP32 Ray-Trace | |
| Razer Blade 14 RTX 4070 | |
| Lenovo Legion Slim 5 16APH8 | |
| Asus TUF Gaming A16 FA617XS | |
| Medio AMD Ryzen 9 7940HS (25226 - 29109, n=10) | |
| Asus ROG Flow X13 GV302XV | |
| Asus ROG Flow Z13 ACRNM | |
| Acer Predator Triton 14 PT14-51 | |
| Asus ROG Flow Z13 GZ301V | |
| Media de la clase Convertible (1480 - 64158, n=47, últimos 2 años) | |
| AIDA64 / FPU Julia | |
| Razer Blade 14 RTX 4070 | |
| Asus TUF Gaming A16 FA617XS | |
| Lenovo Legion Slim 5 16APH8 | |
| Medio AMD Ryzen 9 7940HS (106512 - 123214, n=10) | |
| Asus ROG Flow X13 GV302XV | |
| Acer Predator Triton 14 PT14-51 | |
| Asus ROG Flow Z13 ACRNM | |
| Asus ROG Flow Z13 GZ301V | |
| Media de la clase Convertible (11392 - 184800, n=47, últimos 2 años) | |
| AIDA64 / CPU SHA3 | |
| Razer Blade 14 RTX 4070 | |
| Lenovo Legion Slim 5 16APH8 | |
| Medio AMD Ryzen 9 7940HS (4566 - 5119, n=10) | |
| Asus ROG Flow X13 GV302XV | |
| Asus TUF Gaming A16 FA617XS | |
| Acer Predator Triton 14 PT14-51 | |
| Asus ROG Flow Z13 ACRNM | |
| Asus ROG Flow Z13 GZ301V | |
| Media de la clase Convertible (797 - 8291, n=47, últimos 2 años) | |
| AIDA64 / CPU Queen | |
| Razer Blade 14 RTX 4070 | |
| Asus TUF Gaming A16 FA617XS | |
| Lenovo Legion Slim 5 16APH8 | |
| Medio AMD Ryzen 9 7940HS (118174 - 124783, n=10) | |
| Asus ROG Flow X13 GV302XV | |
| Asus ROG Flow Z13 GZ301V | |
| Asus ROG Flow Z13 ACRNM | |
| Acer Predator Triton 14 PT14-51 | |
| Media de la clase Convertible (14686 - 148874, n=38, últimos 2 años) | |
| AIDA64 / FPU SinJulia | |
| Razer Blade 14 RTX 4070 | |
| Asus TUF Gaming A16 FA617XS | |
| Medio AMD Ryzen 9 7940HS (14663 - 15551, n=10) | |
| Lenovo Legion Slim 5 16APH8 | |
| Asus ROG Flow X13 GV302XV | |
| Asus ROG Flow Z13 ACRNM | |
| Asus ROG Flow Z13 GZ301V | |
| Acer Predator Triton 14 PT14-51 | |
| Media de la clase Convertible (1120 - 29155, n=47, últimos 2 años) | |
| AIDA64 / FPU Mandel | |
| Razer Blade 14 RTX 4070 | |
| Lenovo Legion Slim 5 16APH8 | |
| Asus TUF Gaming A16 FA617XS | |
| Medio AMD Ryzen 9 7940HS (56839 - 66238, n=10) | |
| Asus ROG Flow X13 GV302XV | |
| Asus ROG Flow Z13 ACRNM | |
| Acer Predator Triton 14 PT14-51 | |
| Asus ROG Flow Z13 GZ301V | |
| Media de la clase Convertible (4929 - 97193, n=47, últimos 2 años) | |
| AIDA64 / CPU AES | |
| Asus ROG Flow X13 GV302XV | |
| Acer Predator Triton 14 PT14-51 | |
| Medio AMD Ryzen 9 7940HS (86309 - 171350, n=10) | |
| Razer Blade 14 RTX 4070 | |
| Asus TUF Gaming A16 FA617XS | |
| Asus ROG Flow Z13 ACRNM | |
| Asus ROG Flow Z13 GZ301V | |
| Lenovo Legion Slim 5 16APH8 | |
| Media de la clase Convertible (5271 - 190280, n=47, últimos 2 años) | |
| AIDA64 / CPU ZLib | |
| Asus ROG Flow Z13 ACRNM | |
| Acer Predator Triton 14 PT14-51 | |
| Razer Blade 14 RTX 4070 | |
| Lenovo Legion Slim 5 16APH8 | |
| Asus TUF Gaming A16 FA617XS | |
| Asus ROG Flow X13 GV302XV | |
| Medio AMD Ryzen 9 7940HS (866 - 1152, n=10) | |
| Asus ROG Flow Z13 GZ301V | |
| Media de la clase Convertible (218 - 2017, n=47, últimos 2 años) | |
| AIDA64 / FP64 Ray-Trace | |
| Razer Blade 14 RTX 4070 | |
| Lenovo Legion Slim 5 16APH8 | |
| Asus TUF Gaming A16 FA617XS | |
| Medio AMD Ryzen 9 7940HS (13175 - 15675, n=10) | |
| Asus ROG Flow X13 GV302XV | |
| Asus ROG Flow Z13 ACRNM | |
| Acer Predator Triton 14 PT14-51 | |
| Asus ROG Flow Z13 GZ301V | |
| Media de la clase Convertible (1169 - 34297, n=47, últimos 2 años) | |
| AIDA64 / CPU PhotoWorxx | |
| Acer Predator Triton 14 PT14-51 | |
| Media de la clase Convertible (14193 - 85327, n=47, últimos 2 años) | |
| Asus ROG Flow Z13 ACRNM | |
| Asus ROG Flow Z13 GZ301V | |
| Medio AMD Ryzen 9 7940HS (22477 - 41567, n=10) | |
| Lenovo Legion Slim 5 16APH8 | |
| Asus ROG Flow X13 GV302XV | |
| Razer Blade 14 RTX 4070 | |
| Asus TUF Gaming A16 FA617XS | |
Encontrará más información y pruebas comparativas en nuestra sección dedicada al AMD Ryzen 9 7940HS dedicada.
Rendimiento del sistema
El ROG Flow X13 logra una buena puntuación global en PCMark 10, sólo al lado del Asus ROG Zephyrus G14 con una GPU RTX 4090 para portátiles. El dispositivo queda por detrás de la competencia en CrossMark, pero no notamos áreas especialmente preocupantes o lentitud en el uso diario.
CrossMark: Overall | Productivity | Creativity | Responsiveness
AIDA64: Memory Copy | Memory Read | Memory Write | Memory Latency
| PCMark 10 / Score | |
| Asus ROG Zephyrus G14 GA402XY | |
| Asus ROG Flow X13 GV302XV | |
| Medio AMD Ryzen 9 7940HS, NVIDIA GeForce RTX 4060 Laptop GPU (n=1) | |
| Asus ROG Flow Z13 GZ301V | |
| Acer Predator Triton 14 PT14-51 | |
| Lenovo Yoga Pro 9-14IRP G8 | |
| Lenovo Yoga Pro 7 14IRH G8 | |
| Gigabyte Aero 14 OLED BMF | |
| MSI Stealth 14 Studio A13V | |
| Media de la clase Convertible (3229 - 10123, n=45, últimos 2 años) | |
| PCMark 10 / Essentials | |
| Gigabyte Aero 14 OLED BMF | |
| Asus ROG Flow Z13 GZ301V | |
| Lenovo Yoga Pro 9-14IRP G8 | |
| Asus ROG Flow X13 GV302XV | |
| Medio AMD Ryzen 9 7940HS, NVIDIA GeForce RTX 4060 Laptop GPU (n=1) | |
| Lenovo Yoga Pro 7 14IRH G8 | |
| Asus ROG Zephyrus G14 GA402XY | |
| Media de la clase Convertible (7233 - 12222, n=45, últimos 2 años) | |
| Acer Predator Triton 14 PT14-51 | |
| MSI Stealth 14 Studio A13V | |
| PCMark 10 / Productivity | |
| Asus ROG Zephyrus G14 GA402XY | |
| Asus ROG Flow Z13 GZ301V | |
| Media de la clase Convertible (5062 - 17914, n=45, últimos 2 años) | |
| Acer Predator Triton 14 PT14-51 | |
| Asus ROG Flow X13 GV302XV | |
| Medio AMD Ryzen 9 7940HS, NVIDIA GeForce RTX 4060 Laptop GPU (n=1) | |
| Gigabyte Aero 14 OLED BMF | |
| Lenovo Yoga Pro 7 14IRH G8 | |
| Lenovo Yoga Pro 9-14IRP G8 | |
| MSI Stealth 14 Studio A13V | |
| PCMark 10 / Digital Content Creation | |
| Asus ROG Zephyrus G14 GA402XY | |
| Asus ROG Flow X13 GV302XV | |
| Medio AMD Ryzen 9 7940HS, NVIDIA GeForce RTX 4060 Laptop GPU (n=1) | |
| Lenovo Yoga Pro 9-14IRP G8 | |
| Acer Predator Triton 14 PT14-51 | |
| MSI Stealth 14 Studio A13V | |
| Lenovo Yoga Pro 7 14IRH G8 | |
| Asus ROG Flow Z13 GZ301V | |
| Gigabyte Aero 14 OLED BMF | |
| Media de la clase Convertible (2496 - 16551, n=45, últimos 2 años) | |
| CrossMark / Overall | |
| Asus ROG Flow Z13 GZ301V | |
| Lenovo Yoga Pro 9-14IRP G8 | |
| Acer Predator Triton 14 PT14-51 | |
| Gigabyte Aero 14 OLED BMF | |
| Asus ROG Zephyrus G14 GA402XY | |
| Lenovo Yoga Pro 7 14IRH G8 | |
| Asus ROG Flow X13 GV302XV | |
| Medio AMD Ryzen 9 7940HS, NVIDIA GeForce RTX 4060 Laptop GPU (n=1) | |
| MSI Stealth 14 Studio A13V | |
| Media de la clase Convertible (524 - 2274, n=48, últimos 2 años) | |
| CrossMark / Productivity | |
| Asus ROG Flow Z13 GZ301V | |
| Gigabyte Aero 14 OLED BMF | |
| Asus ROG Zephyrus G14 GA402XY | |
| Acer Predator Triton 14 PT14-51 | |
| Asus ROG Flow X13 GV302XV | |
| Medio AMD Ryzen 9 7940HS, NVIDIA GeForce RTX 4060 Laptop GPU (n=1) | |
| Lenovo Yoga Pro 9-14IRP G8 | |
| Lenovo Yoga Pro 7 14IRH G8 | |
| MSI Stealth 14 Studio A13V | |
| Media de la clase Convertible (554 - 1942, n=48, últimos 2 años) | |
| CrossMark / Creativity | |
| Asus ROG Flow Z13 GZ301V | |
| Lenovo Yoga Pro 9-14IRP G8 | |
| Asus ROG Zephyrus G14 GA402XY | |
| Lenovo Yoga Pro 7 14IRH G8 | |
| Acer Predator Triton 14 PT14-51 | |
| Asus ROG Flow X13 GV302XV | |
| Medio AMD Ryzen 9 7940HS, NVIDIA GeForce RTX 4060 Laptop GPU (n=1) | |
| Gigabyte Aero 14 OLED BMF | |
| MSI Stealth 14 Studio A13V | |
| Media de la clase Convertible (550 - 2949, n=48, últimos 2 años) | |
| CrossMark / Responsiveness | |
| Acer Predator Triton 14 PT14-51 | |
| Gigabyte Aero 14 OLED BMF | |
| Asus ROG Flow Z13 GZ301V | |
| MSI Stealth 14 Studio A13V | |
| Lenovo Yoga Pro 9-14IRP G8 | |
| Asus ROG Flow X13 GV302XV | |
| Medio AMD Ryzen 9 7940HS, NVIDIA GeForce RTX 4060 Laptop GPU (n=1) | |
| Asus ROG Zephyrus G14 GA402XY | |
| Lenovo Yoga Pro 7 14IRH G8 | |
| Media de la clase Convertible (381 - 1719, n=48, últimos 2 años) | |
| AIDA64 / Memory Copy | |
| Media de la clase Convertible (23880 - 161475, n=47, últimos 2 años) | |
| Lenovo Yoga Pro 9-14IRP G8 | |
| Gigabyte Aero 14 OLED BMF | |
| Acer Predator Triton 14 PT14-51 | |
| Asus ROG Flow X13 GV302XV | |
| Medio AMD Ryzen 9 7940HS, NVIDIA GeForce RTX 4060 Laptop GPU (n=1) | |
| Asus ROG Flow Z13 GZ301V | |
| Lenovo Yoga Pro 7 14IRH G8 | |
| MSI Stealth 14 Studio A13V | |
| AIDA64 / Memory Read | |
| Gigabyte Aero 14 OLED BMF | |
| Media de la clase Convertible (19931 - 131960, n=47, últimos 2 años) | |
| Lenovo Yoga Pro 9-14IRP G8 | |
| MSI Stealth 14 Studio A13V | |
| Lenovo Yoga Pro 7 14IRH G8 | |
| Acer Predator Triton 14 PT14-51 | |
| Asus ROG Flow Z13 GZ301V | |
| Asus ROG Flow X13 GV302XV | |
| Medio AMD Ryzen 9 7940HS, NVIDIA GeForce RTX 4060 Laptop GPU (n=1) | |
| AIDA64 / Memory Write | |
| Gigabyte Aero 14 OLED BMF | |
| Asus ROG Flow X13 GV302XV | |
| Medio AMD Ryzen 9 7940HS, NVIDIA GeForce RTX 4060 Laptop GPU (n=1) | |
| Lenovo Yoga Pro 9-14IRP G8 | |
| Media de la clase Convertible (17473 - 216896, n=47, últimos 2 años) | |
| Acer Predator Triton 14 PT14-51 | |
| Asus ROG Flow Z13 GZ301V | |
| Lenovo Yoga Pro 7 14IRH G8 | |
| MSI Stealth 14 Studio A13V | |
| AIDA64 / Memory Latency | |
| Media de la clase Convertible (6.9 - 536, n=47, últimos 2 años) | |
| Asus ROG Flow X13 GV302XV | |
| Medio AMD Ryzen 9 7940HS, NVIDIA GeForce RTX 4060 Laptop GPU (n=1) | |
| Lenovo Yoga Pro 7 14IRH G8 | |
| Acer Predator Triton 14 PT14-51 | |
| Lenovo Yoga Pro 9-14IRP G8 | |
| Gigabyte Aero 14 OLED BMF | |
| MSI Stealth 14 Studio A13V | |
| Asus ROG Flow Z13 GZ301V | |
* ... más pequeño es mejor
| PCMark 8 Home Score Accelerated v2 | 5830 puntos | |
| PCMark 8 Work Score Accelerated v2 | 6089 puntos | |
| PCMark 10 Score | 7676 puntos | |
ayuda | ||
Latencia del CPD
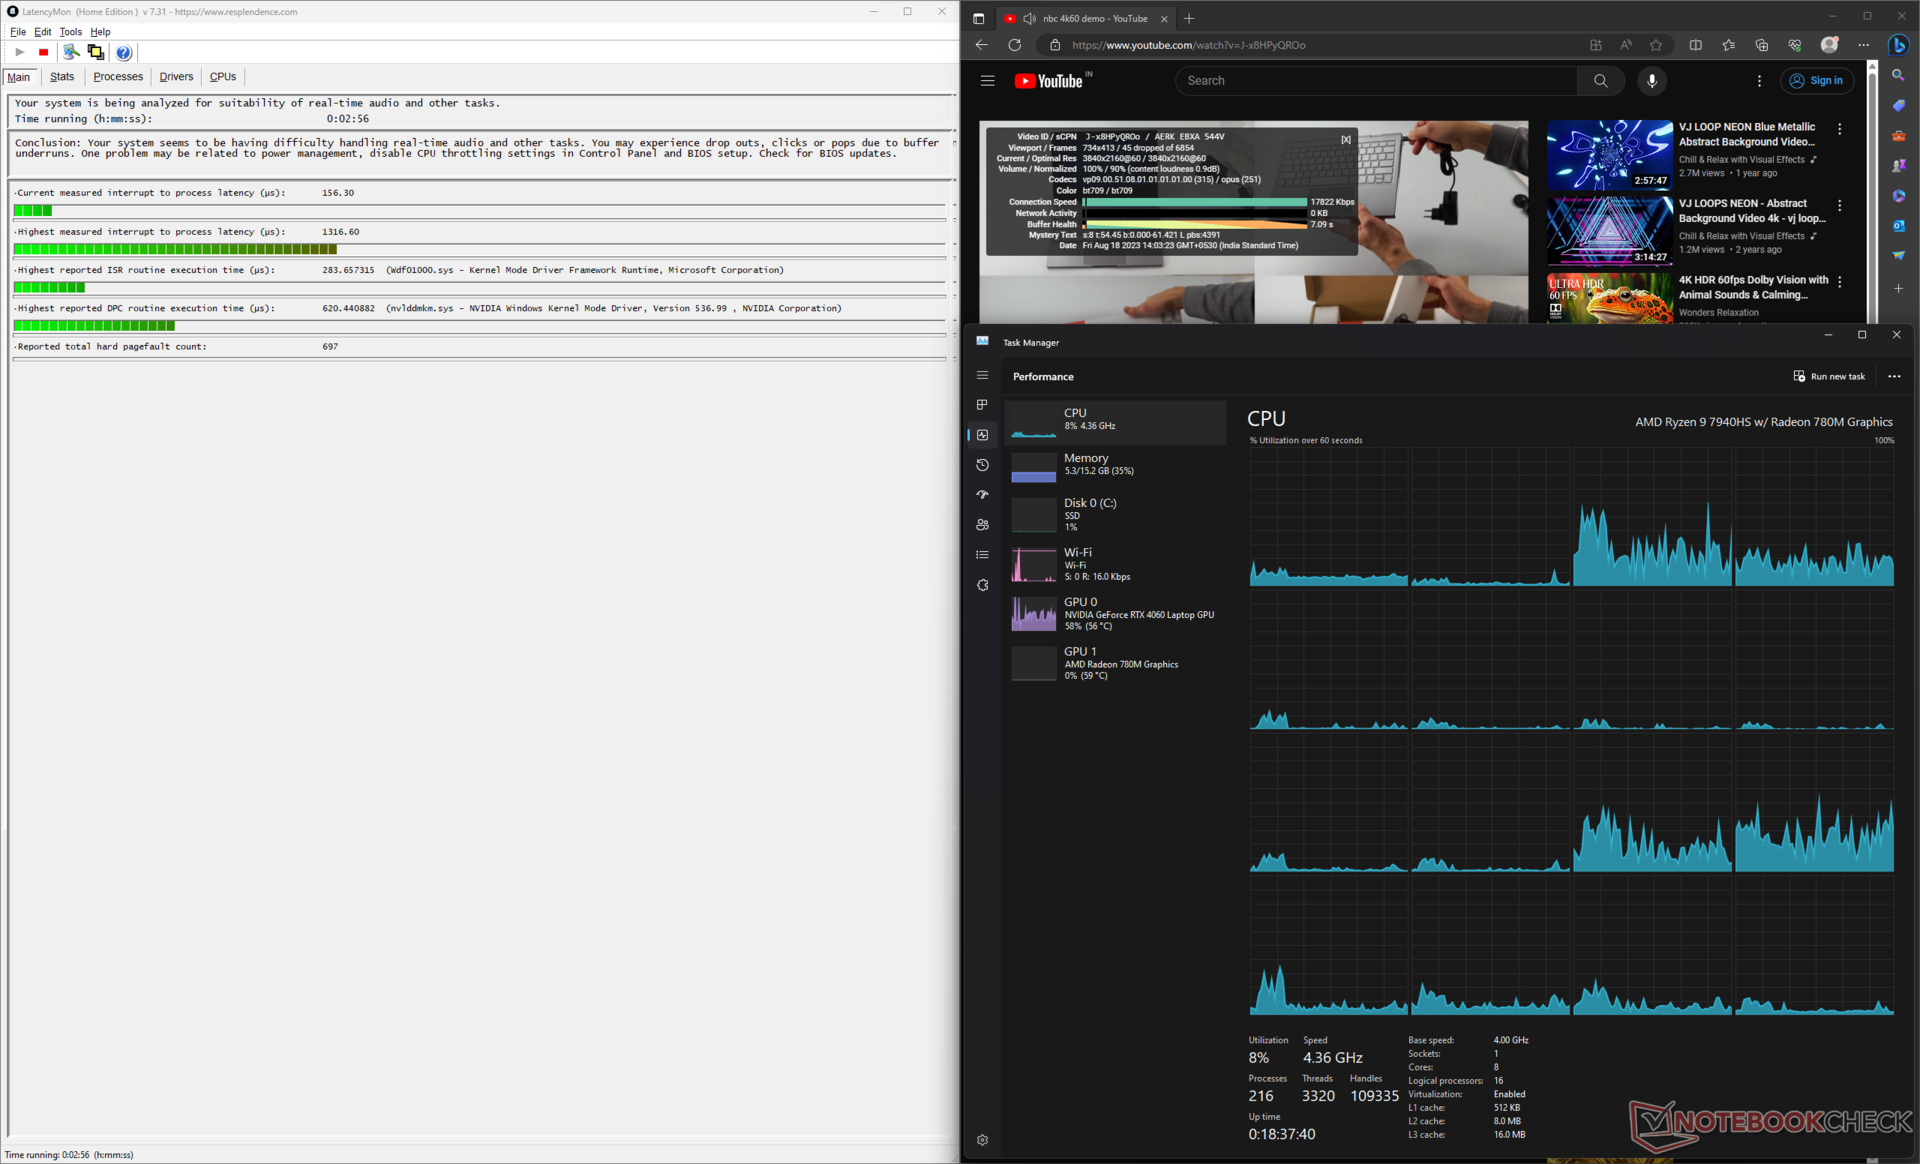
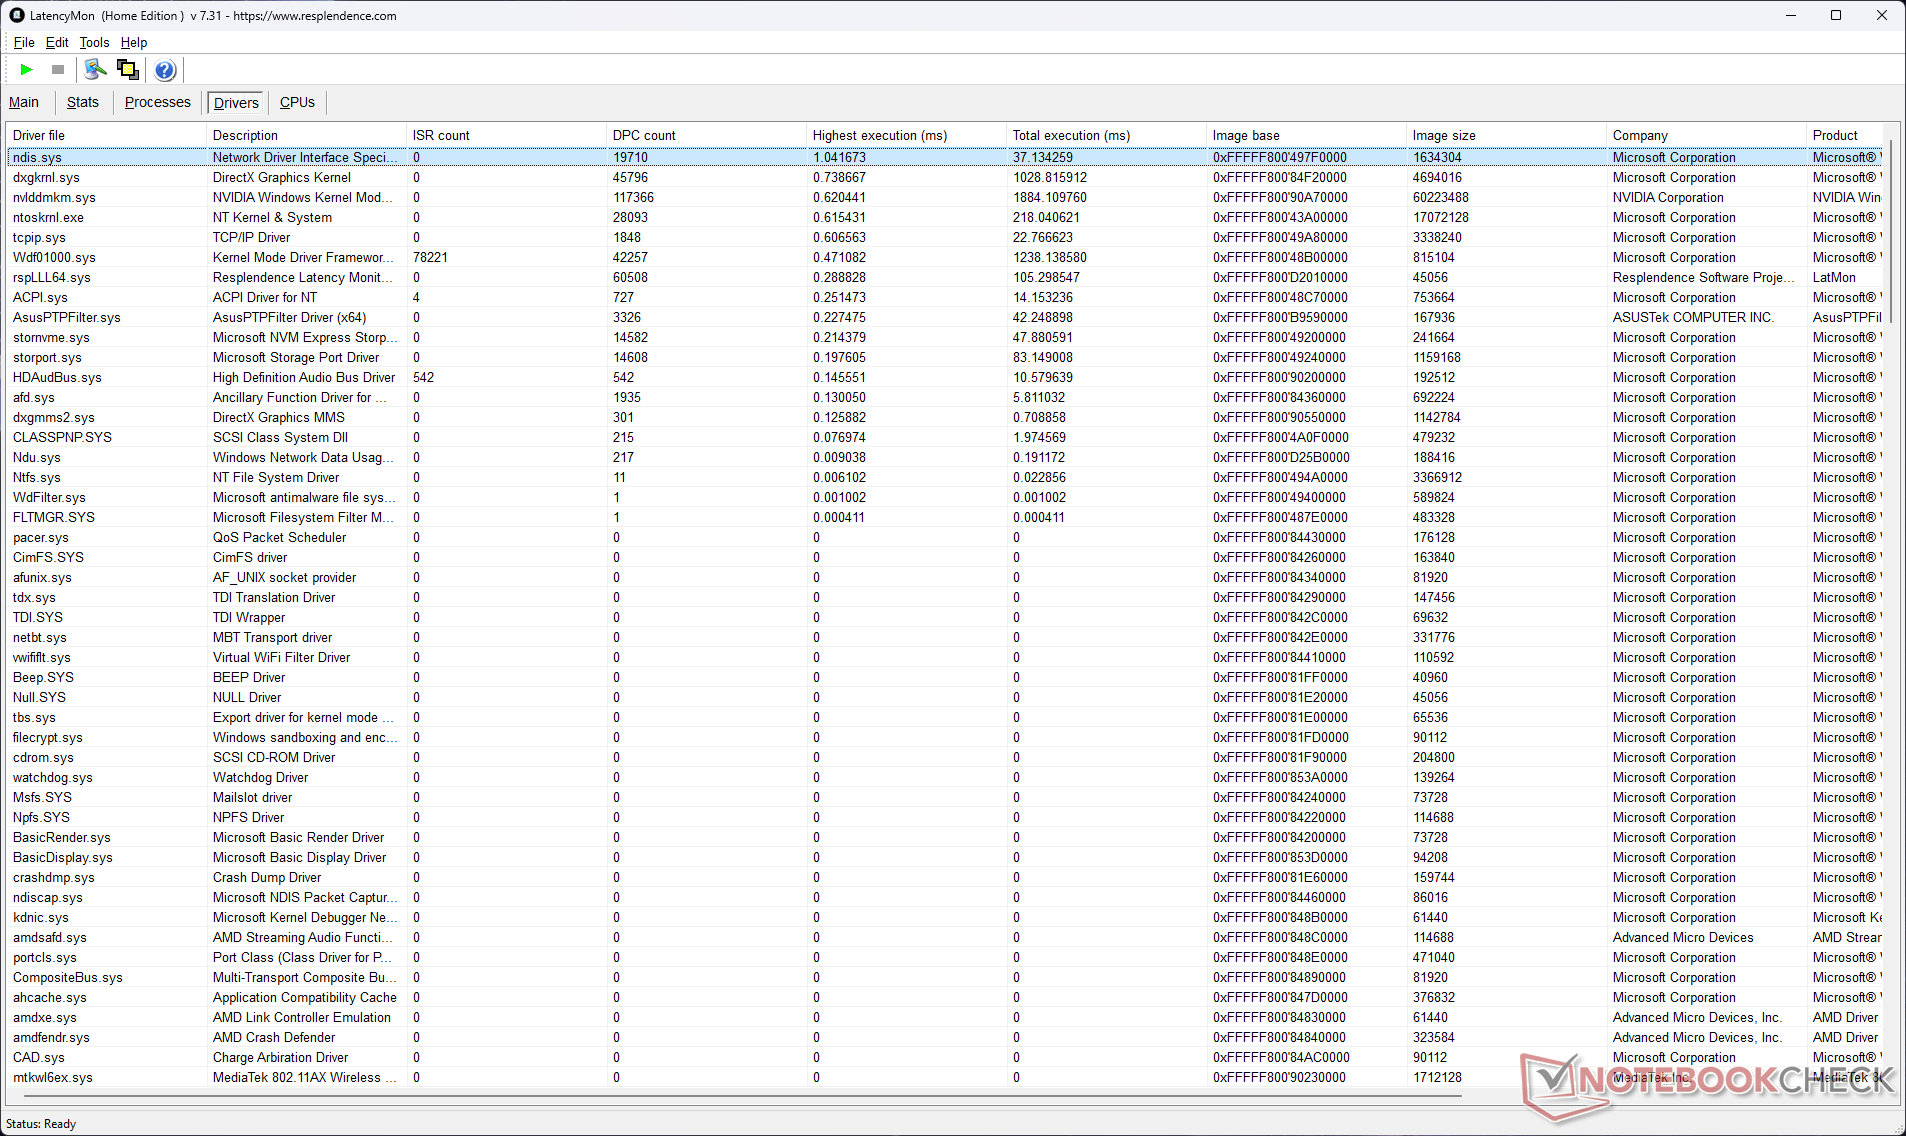
La latencia DPC es mayor debido a los tiempos de ejecución más largos del controlador NDIS (Network Driver Interface Specification). Esto puede causar pequeños problemas con los flujos de trabajo de audio y vídeo en tiempo real.
| DPC Latencies / LatencyMon - interrupt to process latency (max), Web, Youtube, Prime95 | |
| Asus ROG Flow Z13 GZ301V | |
| Asus ROG Flow Z13 ACRNM | |
| Acer Predator Triton 14 PT14-51 | |
| Asus ROG Flow X13 GV302XV | |
| Asus TUF Gaming A16 FA617XS | |
| Lenovo Legion Slim 5 16APH8 | |
| Razer Blade 14 RTX 4070 | |
* ... más pequeño es mejor
Consulte nuestra Clasificación de latencia del CPD para comparar la latencia medida en los dispositivos analizados.
Dispositivos de almacenamiento
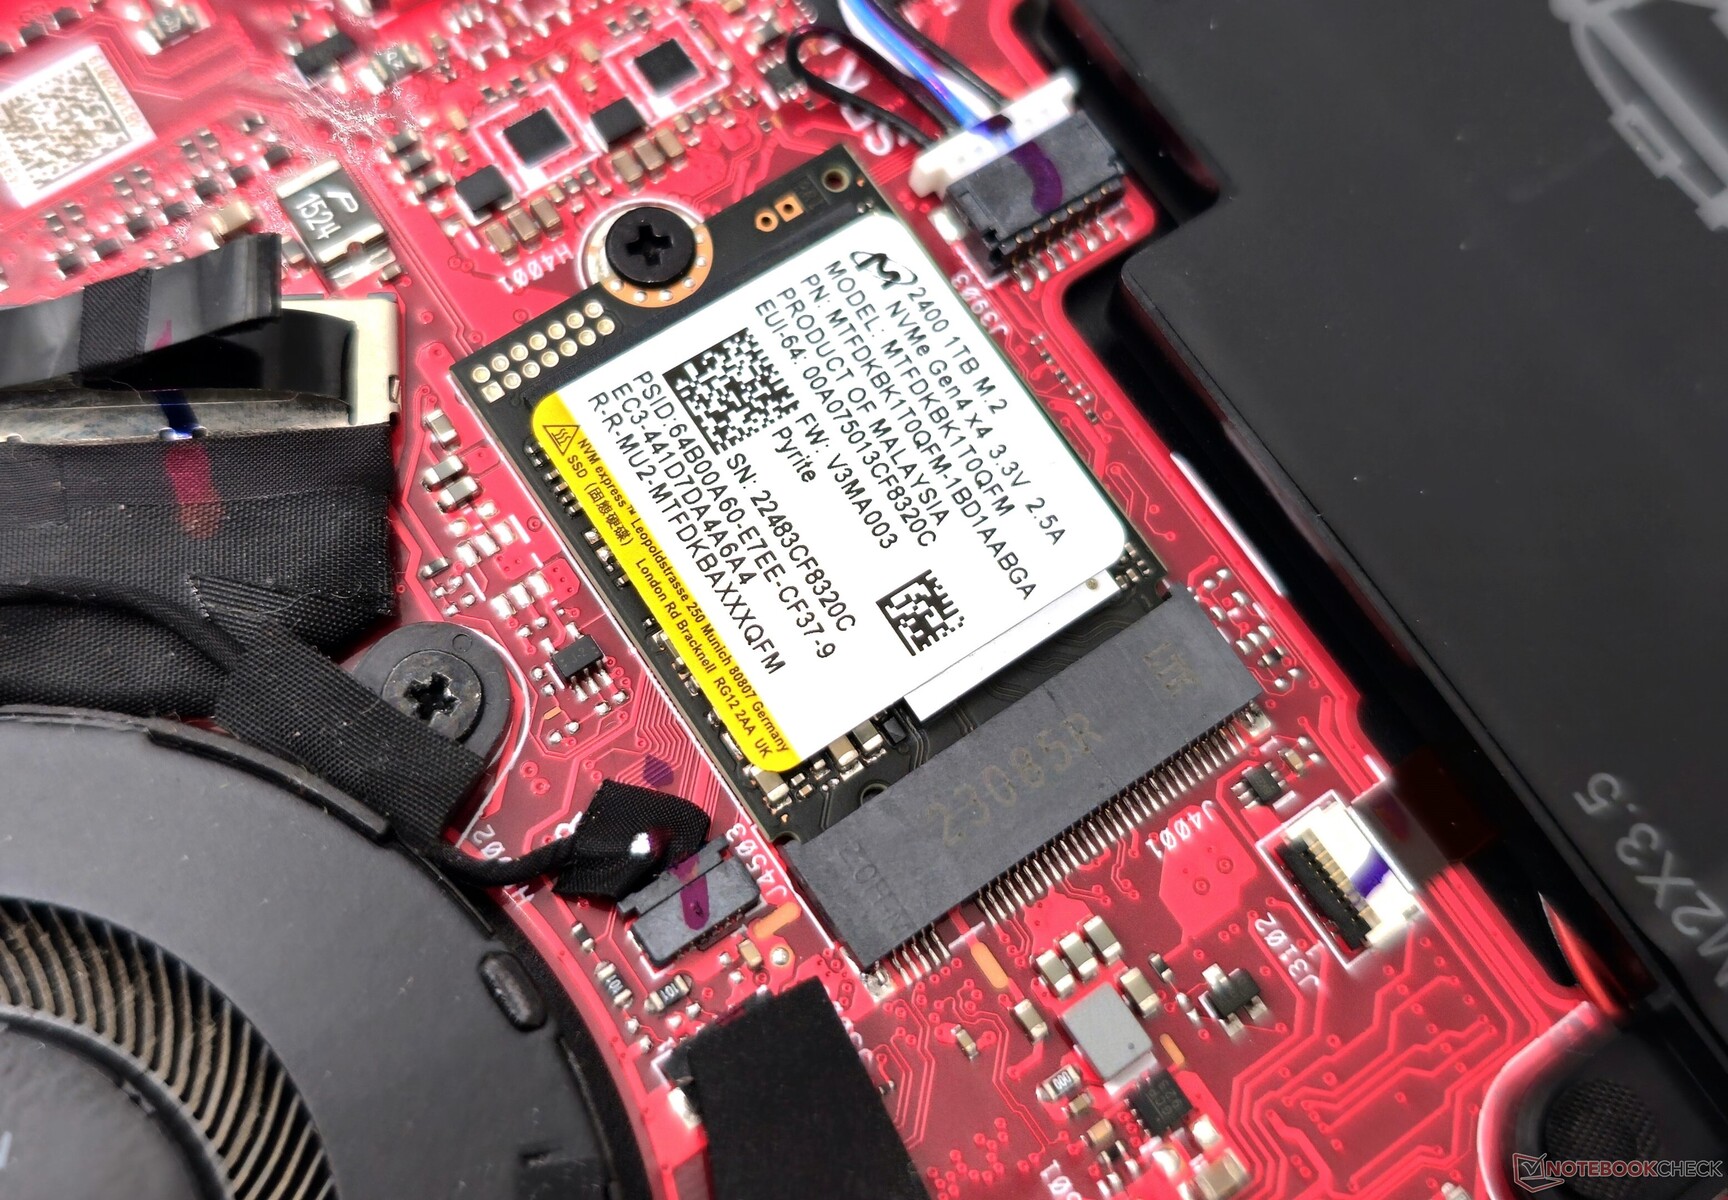
Nuestra unidad Flow X13 incluye una unidad SSD M.2 2230 Micron 2400 PCIe Gen4.0 de 1 TB. Están apareciendo modelos M.2 2230 de 2 TB con más capacidad, pero siguen siendo relativamente caros en comparación con los SSD M.2 2280 de mayor tamaño.
El rendimiento general de la unidad queda por detrás del WD PC SN740 M.2 2230 en los modelos Flow Z13, pero debería ser apto para la mayoría de juegos y flujos de trabajo creativos. No observamos ralentización durante la prueba de bucle de lectura DiskSpd a una profundidad de cola de 8.

* ... más pequeño es mejor
Disk Throttling: DiskSpd Read Loop, Queue Depth 8
Nuestro Comparativas de HDD y SSD ofrece más comparaciones de rendimiento de almacenamiento.
Rendimiento de la GPU
Los 60 W del Flow X13 GPU Nvidia GeForce RTX 4060 para portátiles tiene una ligera ventaja sobre la versión de 65 W que se encuentra en el ROG Flow Z13 GZ301V, mientras que por detrás de los 65 W RTX 4070 para portátiles del Flow Z13 ACRNM en un 10% en rendimiento 3DMark acumulado.
Curiosamente, la GPU de 95 W GPU RTX 4050 para portátiles del Acer Predator Triton 14 intercambia golpes en 3DMark con la RTX 4060 de 60 W del Flow X13. ElLenovo Legion Slim 5rTX 4060 de 100 W tiene una ventaja del 9%, aunque descubrimos que funciona principalmente a 60 W como el Flow X13.
| 3DMark 11 Performance | 26182 puntos | |
| 3DMark Ice Storm Standard Score | 269199 puntos | |
| 3DMark Cloud Gate Standard Score | 59032 puntos | |
| 3DMark Fire Strike Score | 19903 puntos | |
| 3DMark Fire Strike Extreme Score | 9654 puntos | |
| 3DMark Time Spy Score | 8496 puntos | |
ayuda | ||
| Blender / v3.3 Classroom OPTIX/RTX | |
| Asus ROG Flow Z13 GZ301V | |
| Acer Predator Triton 14 PT14-51 | |
| Asus ROG Flow Z13 ACRNM | |
| Asus ROG Flow X13 GV302XV | |
| Medio NVIDIA GeForce RTX 4060 Laptop GPU (19 - 28, n=53) | |
| Razer Blade 14 RTX 4070 | |
| Lenovo Legion Slim 5 16APH8 | |
| Blender / v3.3 Classroom CUDA | |
| Asus ROG Flow Z13 GZ301V | |
| Asus ROG Flow X13 GV302XV | |
| Acer Predator Triton 14 PT14-51 | |
| Lenovo Legion Slim 5 16APH8 | |
| Medio NVIDIA GeForce RTX 4060 Laptop GPU (39 - 53, n=53) | |
| Asus ROG Flow Z13 ACRNM | |
| Razer Blade 14 RTX 4070 | |
| Blender / v3.3 Classroom CPU | |
| Media de la clase Convertible (159 - 2067, n=48, últimos 2 años) | |
| Asus ROG Flow Z13 GZ301V | |
| Asus ROG Flow X13 GV302XV | |
| Acer Predator Triton 14 PT14-51 | |
| Asus ROG Flow Z13 ACRNM | |
| Medio NVIDIA GeForce RTX 4060 Laptop GPU (189 - 452, n=53) | |
| Asus TUF Gaming A16 FA617XS | |
| Lenovo Legion Slim 5 16APH8 | |
| Razer Blade 14 RTX 4070 | |
* ... más pequeño es mejor
Rendimiento en juegos
El ROG Flow X13, con su pantalla G-Sync de 165 Hz y la RTX 4060, se presenta como un convertible gaming muy capaz. A 1080p Ultra, queda por detrás del 65W 4070 del Flow Z13 ACRNM por un 10% y del 140W 4070 del Blade 14 por un 17%.
4K Ultra resulta demasiado exigente, pero QHD Ultra ofrece una experiencia de juego decente en títulos algo más antiguos. En cualquier caso, los jugadores tendrán que usar algoritmos de escalado como DLSS, FSR o XeSS en los títulos compatibles para jugar con fluidez.
| The Witcher 3 - 1920x1080 Ultra Graphics & Postprocessing (HBAO+) | |
| Razer Blade 14 RTX 4070 | |
| Asus TUF Gaming A16 FA617XS | |
| Lenovo Legion Slim 5 16APH8 | |
| Asus ROG Flow X13 GV302XV | |
| Asus ROG Flow Z13 ACRNM | |
| Acer Predator Triton 14 PT14-51 | |
| Asus ROG Flow Z13 GZ301V | |
| Media de la clase Convertible (13.4 - 101, n=3, últimos 2 años) | |
| The Witcher 3 | |
| 1920x1080 Ultra Graphics & Postprocessing (HBAO+) | |
| Razer Blade 14 RTX 4070 | |
| Medio NVIDIA GeForce RTX 4060 Laptop GPU (77 - 159.7, n=42) | |
| Asus TUF Gaming A16 FA617XS | |
| Lenovo Legion Slim 5 16APH8 | |
| Asus ROG Flow X13 GV302XV | |
| Asus ROG Flow Z13 ACRNM | |
| Acer Predator Triton 14 PT14-51 | |
| Asus ROG Flow Z13 GZ301V | |
| Media de la clase Convertible (13.4 - 101, n=3, últimos 2 años) | |
| 2560x1440 Ultra Graphics & Postprocessing (HBAO+) | |
| Medio NVIDIA GeForce RTX 4060 Laptop GPU (42.4 - 83.4, n=14) | |
| Asus ROG Flow X13 GV302XV | |
| Shadow of the Tomb Raider | |
| 1920x1080 Highest Preset AA:T | |
| Razer Blade 14 RTX 4070 | |
| Medio NVIDIA GeForce RTX 4060 Laptop GPU (104 - 155.6, n=7) | |
| Asus ROG Flow Z13 ACRNM | |
| Asus ROG Flow X13 GV302XV | |
| Media de la clase Convertible (n=1últimos 2 años) | |
| 2560x1440 Highest Preset AA:T | |
| Razer Blade 14 RTX 4070 | |
| Medio NVIDIA GeForce RTX 4060 Laptop GPU (71 - 120.7, n=6) | |
| Asus ROG Flow Z13 ACRNM | |
| Asus ROG Flow X13 GV302XV | |
| Media de la clase Convertible (n=1últimos 2 años) | |
| Far Cry 6 | |
| 1920x1080 Ultra Graphics Quality + HD Textures AA:T | |
| Razer Blade 14 RTX 4070 | |
| Asus TUF Gaming A16 FA617XS | |
| Medio NVIDIA GeForce RTX 4060 Laptop GPU (76 - 117, n=5) | |
| Asus ROG Flow Z13 ACRNM | |
| Asus ROG Flow X13 GV302XV | |
| 2560x1440 Ultra Graphics Quality + HD Textures AA:T | |
| Razer Blade 14 RTX 4070 | |
| Asus ROG Flow Z13 ACRNM | |
| Medio NVIDIA GeForce RTX 4060 Laptop GPU (32.6 - 83, n=5) | |
| Asus ROG Flow X13 GV302XV | |
| Cyberpunk 2077 1.6 | |
| 1920x1080 Ultra Preset | |
| Razer Blade 14 RTX 4070 | |
| Medio NVIDIA GeForce RTX 4060 Laptop GPU (57.9 - 93.2, n=18) | |
| Asus ROG Flow Z13 ACRNM | |
| Lenovo Legion Slim 5 16APH8 | |
| Asus ROG Flow X13 GV302XV | |
| 2560x1440 Ultra Preset | |
| Razer Blade 14 RTX 4070 | |
| Asus ROG Flow Z13 ACRNM | |
| Medio NVIDIA GeForce RTX 4060 Laptop GPU (39 - 58.6, n=13) | |
| Lenovo Legion Slim 5 16APH8 | |
| Asus ROG Flow X13 GV302XV | |
| 1920x1080 Ray Tracing Ultra Preset (DLSS off) | |
| Asus ROG Flow Z13 ACRNM | |
| Medio NVIDIA GeForce RTX 4060 Laptop GPU (25.6 - 60, n=6) | |
| Asus ROG Flow X13 GV302XV | |
| Star Wars Jedi Survivor | |
| 1920x1080 Epic Preset | |
| Medio NVIDIA GeForce RTX 4060 Laptop GPU (45.5 - 66.7, n=10) | |
| Acer Predator Triton 14 PT14-51 | |
| Asus ROG Flow X13 GV302XV | |
| 2560x1440 Epic Preset | |
| Medio NVIDIA GeForce RTX 4060 Laptop GPU (30.3 - 41.7, n=10) | |
| Acer Predator Triton 14 PT14-51 | |
| Asus ROG Flow X13 GV302XV | |
| 1920x1080 Epic Preset + Ray Tracing | |
| Medio NVIDIA GeForce RTX 4060 Laptop GPU (47 - 52.8, n=4) | |
| Acer Predator Triton 14 PT14-51 | |
| Call of Duty Modern Warfare 2 2022 | |
| 1920x1080 Extreme Quality Preset AA:T2X Filmic SM | |
| Razer Blade 14 RTX 4070 | |
| Medio NVIDIA GeForce RTX 4060 Laptop GPU (68 - 94, n=9) | |
| Asus ROG Flow Z13 ACRNM | |
| Asus ROG Flow X13 GV302XV | |
| 2560x1440 Extreme Quality Preset AA:T2X Filmic SM | |
| Razer Blade 14 RTX 4070 | |
| Medio NVIDIA GeForce RTX 4060 Laptop GPU (49 - 66, n=7) | |
| Asus ROG Flow Z13 ACRNM | |
| Asus ROG Flow X13 GV302XV | |
| Immortals of Aveum | |
| 1920x1080 Ultra AF:16x | |
| Medio NVIDIA GeForce RTX 4060 Laptop GPU (33 - 48.9, n=4) | |
| Asus ROG Flow X13 GV302XV | |
| 2560x1440 Ultra AF:16x | |
| Medio NVIDIA GeForce RTX 4060 Laptop GPU (20.5 - 32.8, n=4) | |
| Asus ROG Flow X13 GV302XV | |
Witcher 3 Tabla de FPS
La RTX 4060 del Flow X13 parece refrigerarse bien, dado que vemos un rendimiento relativamente estable sin caídas importantes de fotogramas al estresarlo con The Witcher 3 a 1080p Ultra.
Witcher 3 FPS Chart
| bajo | medio | alto | ultra | QHD | 4K | |
|---|---|---|---|---|---|---|
| GTA V (2015) | 179.3 | 175.4 | 160 | 89.5 | 71.3 | 71.5 |
| The Witcher 3 (2015) | 354 | 257 | 155.3 | 87.4 | 62.7 | 52 |
| Dota 2 Reborn (2015) | 150.5 | 134.4 | 128.5 | 123.2 | 103.4 | |
| Final Fantasy XV Benchmark (2018) | 182.7 | 112.5 | 82.9 | 60.1 | 34.2 | |
| X-Plane 11.11 (2018) | 123.3 | 105.6 | 82.3 | 70.8 | ||
| Far Cry 5 (2018) | 135 | 115 | 109 | 103 | 77 | 40 |
| Strange Brigade (2018) | 407 | 230 | 182 | 157.9 | 105.8 | 56.8 |
| Shadow of the Tomb Raider (2018) | 104 | 71 | ||||
| Far Cry 6 (2021) | 76 | 60 | ||||
| Cyberpunk 2077 1.6 (2022) | 104.2 | 81.6 | 70.4 | 63.1 | 39 | 17.4 |
| F1 22 (2022) | 203 | 184.8 | 146.8 | 52.9 | 33.3 | 15.7 |
| Call of Duty Modern Warfare 2 2022 (2022) | 69 | 49 | ||||
| Star Wars Jedi Survivor (2023) | 45.5 | 30.3 | ||||
| Immortals of Aveum (2023) | 33 | 20.5 |
Emisiones: Mayor ruido y temperaturas superficiales en modo Turbo
Ruido del sistema
El ruido del ventilador bajo carga es mayor en el Flow X13 que en el Flow Z13 GZ301V. Asus parece haber limitado los niveles de ruido en cada modo de rendimiento. Silencioso tiene un máximo de 35 dB(A) mientras que los modos Rendimiento y Turbo pueden llegar a 40 dB(A) y ~50 db(A), respectivamente.
Estos modos pueden impactar en el rendimiento como se muestra en las pruebas multi-core Cinebench R15 arriba, y también en The Witcher 3 1080p Ultra fps indicado en la tabla de abajo.
Ruido
| Ocioso |
| 29.07 / 29.07 / 29.07 dB(A) |
| Carga |
| 44.54 / 47.08 dB(A) |
 | ||
30 dB silencioso 40 dB(A) audible 50 dB(A) ruidosamente alto |
||
min: | ||
| Modo de rendimiento | En ralentí dB(A) | Carga media dB(A) | Carga máxima dB(A) | El Witcher 3 1080p Ultra dB(A) |
|---|---|---|---|---|
| Silencioso | 21,85 | 35,49 | 35,33 | 35,33 / 60 fps |
| Rendimiento | 23,31 | 40,02 | 40,80 | 40,03 / 73 fps |
| Turbo | 29,07 | 44,54 | 47,08 | 45,05 / 84 fps |
| Asus ROG Flow X13 GV302XV R9 7940HS, GeForce RTX 4060 Laptop GPU | Asus ROG Flow Z13 ACRNM i9-13900H, GeForce RTX 4070 Laptop GPU | Asus ROG Flow Z13 GZ301V i9-13900H, GeForce RTX 4060 Laptop GPU | Razer Blade 14 RTX 4070 R9 7940HS, GeForce RTX 4070 Laptop GPU | Asus TUF Gaming A16 FA617XS R9 7940HS, Radeon RX 7600S | Lenovo Legion Slim 5 16APH8 R7 7840HS, GeForce RTX 4060 Laptop GPU | Acer Predator Triton 14 PT14-51 i7-13700H, GeForce RTX 4050 Laptop GPU | |
|---|---|---|---|---|---|---|---|
| Noise | 1% | 10% | 7% | -2% | 4% | -0% | |
| apagado / medio ambiente * (dB) | 21.42 | 24 -12% | 24 -12% | 22.7 -6% | 25 -17% | 22.9 -7% | 25 -17% |
| Idle Minimum * (dB) | 29.07 | 24 17% | 24 17% | 23.4 20% | 25 14% | 23.1 21% | 27 7% |
| Idle Average * (dB) | 29.07 | 24 17% | 24 17% | 23.4 20% | 26 11% | 23.1 21% | 29 -0% |
| Idle Maximum * (dB) | 29.07 | 36.5 -26% | 24 17% | 23.4 20% | 28 4% | 27.7 5% | 31 -7% |
| Load Average * (dB) | 44.54 | 41.3 7% | 38.61 13% | 33 26% | 43 3% | 33.3 25% | 42 6% |
| Witcher 3 ultra * (dB) | 45.1 | 44.7 1% | 41.24 9% | 51.8 -15% | 51 -13% | 54 -20% | 43 5% |
| Load Maximum * (dB) | 47.08 | 46.9 -0% | 43.59 7% | 55.6 -18% | 53 -13% | 54 -15% | 45 4% |
* ... más pequeño es mejor
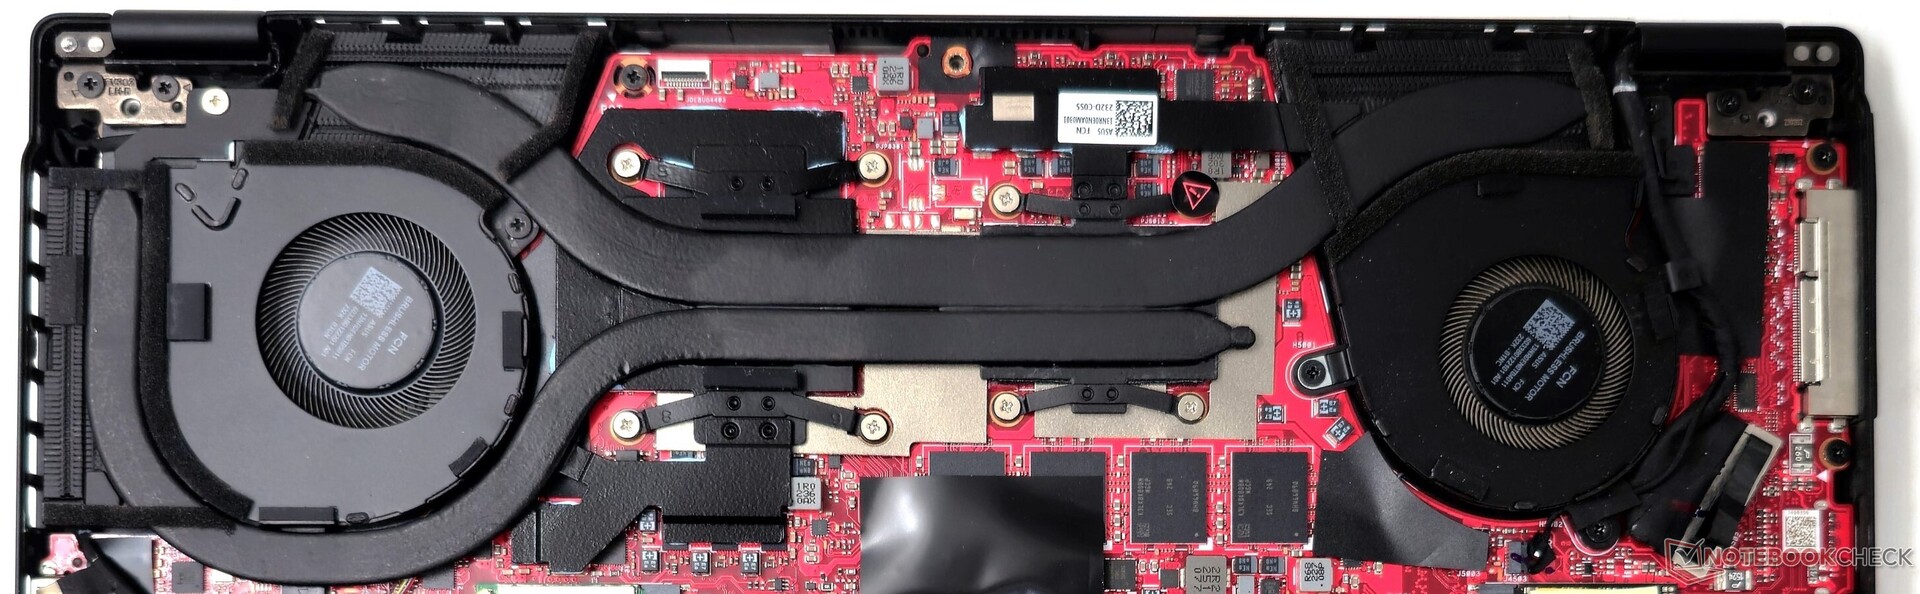
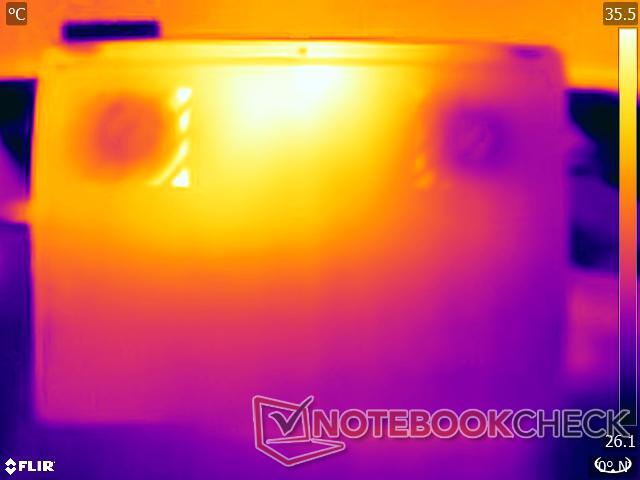
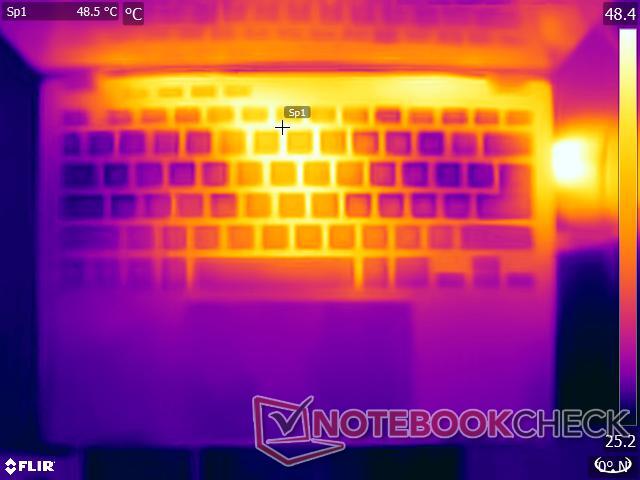
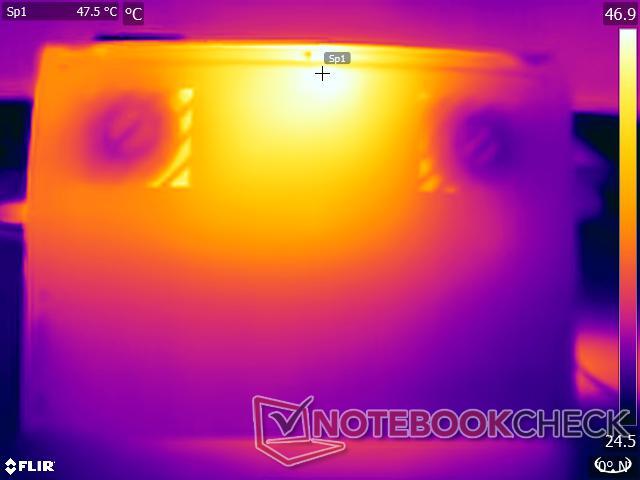
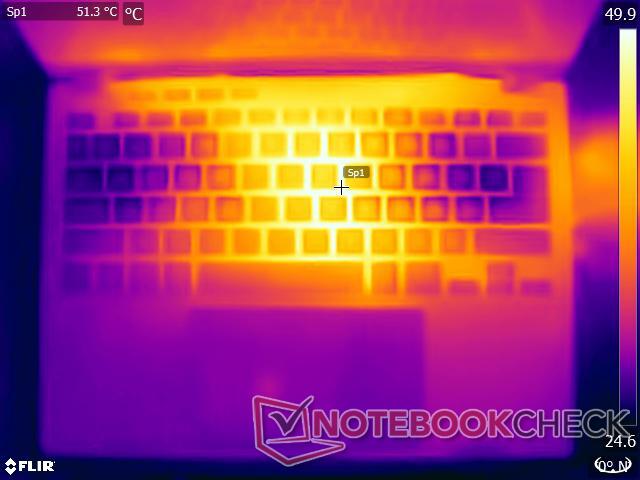
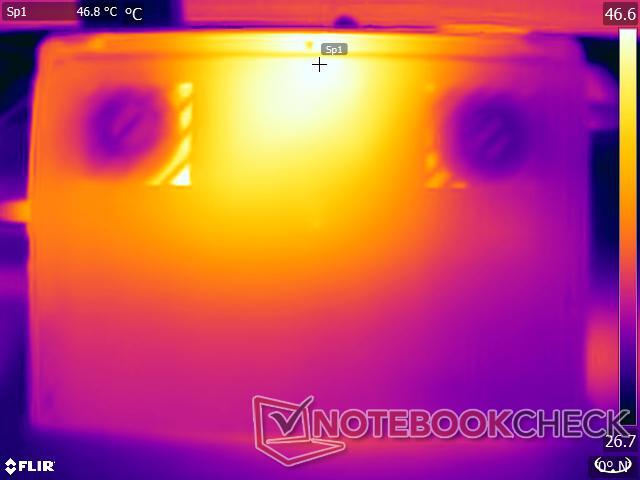
Temperatura
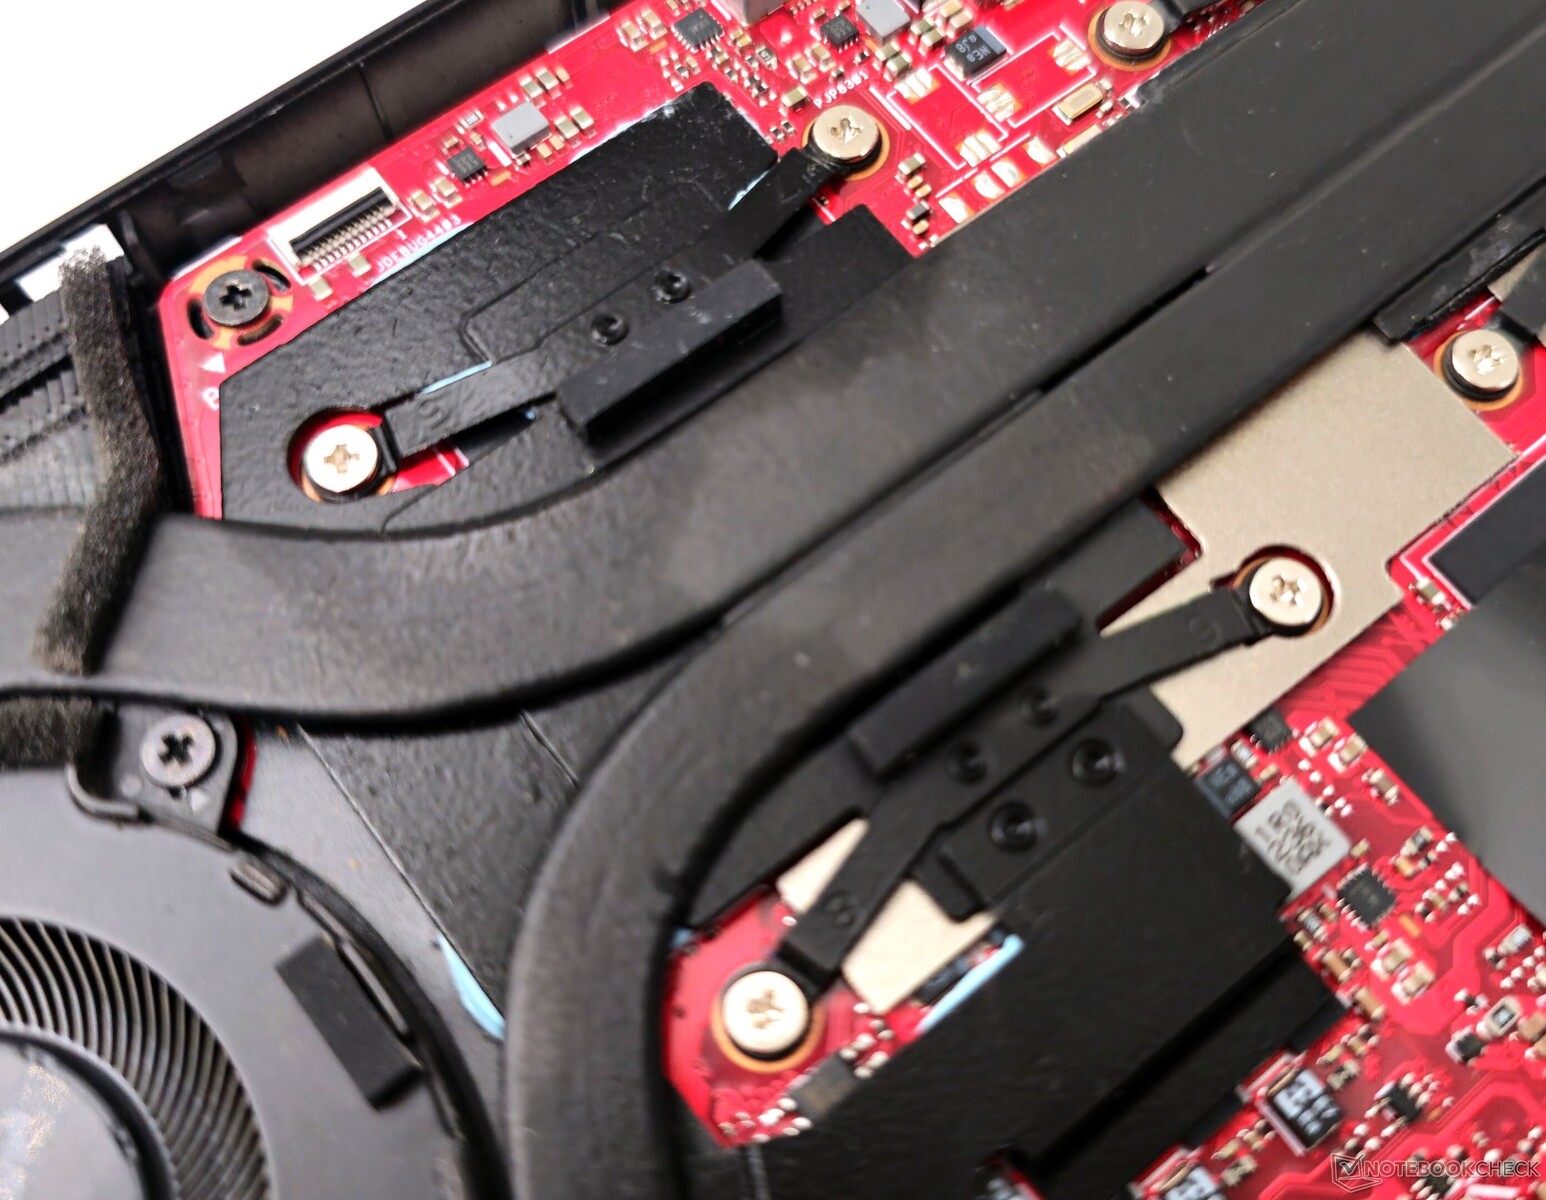
Asus emplea metal líquido en la CPU y heatpipes más finos para refrigerar el Flow X13 en el chasis delgado. Este sistema es capaz de mantener el rendimiento diario sin ralentización perceptible. Pero las pruebas de estrés siguen elevando las temperaturas superficiales como se muestra a continuación.
Nuestras pruebas de estrés representan escenarios extremos y son poco probables en el uso diario. Usar el Flow X13 como tablet o sobre el regazo para productividad o multimedia no debería plantear problemas, especialmente en los perfiles Silencio o Rendimiento.
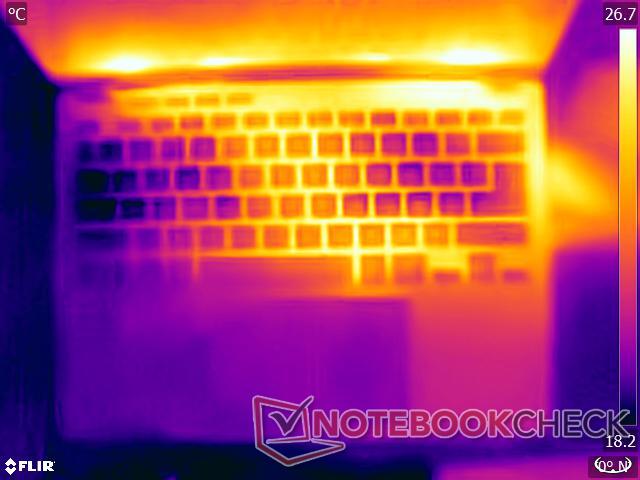
(-) La temperatura máxima en la parte superior es de 45.6 °C / 114 F, frente a la media de 35.4 °C / 96 F, que oscila entre 19.6 y 60 °C para la clase Convertible.
(±) El fondo se calienta hasta un máximo de 44.2 °C / 112 F, frente a la media de 36.9 °C / 98 F
(+) En reposo, la temperatura media de la parte superior es de 31.2 °C / 88# F, frente a la media del dispositivo de 30.3 °C / 87 F.
(-) Jugando a The Witcher 3, la temperatura media de la parte superior es de 43.2 °C / 110 F, frente a la media del dispositivo de 30.3 °C / 87 F.
(+) Los reposamanos y el panel táctil alcanzan como máximo la temperatura de la piel (33.8 °C / 92.8 F) y, por tanto, no están calientes.
(-) La temperatura media de la zona del reposamanos de dispositivos similares fue de 28 °C / 82.4 F (-5.8 °C / -10.4 F).
| Asus ROG Flow X13 GV302XV AMD Ryzen 9 7940HS, NVIDIA GeForce RTX 4060 Laptop GPU | Asus ROG Flow Z13 ACRNM Intel Core i9-13900H, NVIDIA GeForce RTX 4070 Laptop GPU | Asus ROG Flow Z13 GZ301V Intel Core i9-13900H, NVIDIA GeForce RTX 4060 Laptop GPU | Razer Blade 14 RTX 4070 AMD Ryzen 9 7940HS, NVIDIA GeForce RTX 4070 Laptop GPU | Asus TUF Gaming A16 FA617XS AMD Ryzen 9 7940HS, AMD Radeon RX 7600S | Lenovo Legion Slim 5 16APH8 AMD Ryzen 7 7840HS, NVIDIA GeForce RTX 4060 Laptop GPU | Acer Predator Triton 14 PT14-51 Intel Core i7-13700H, NVIDIA GeForce RTX 4050 Laptop GPU | |
|---|---|---|---|---|---|---|---|
| Heat | 14% | 8% | 8% | -1% | 13% | -8% | |
| Maximum Upper Side * (°C) | 45.6 | 42.5 7% | 42 8% | 37.4 18% | 53 -16% | 40.6 11% | 54 -18% |
| Maximum Bottom * (°C) | 44.2 | 42.6 4% | 47 -6% | 35.2 20% | 48 -9% | 42 5% | 56 -27% |
| Idle Upper Side * (°C) | 33.8 | 26.2 22% | 27 20% | 33.2 2% | 30 11% | 27.8 18% | 31 8% |
| Idle Bottom * (°C) | 32.8 | 26 21% | 30 9% | 36.2 -10% | 30 9% | 26.6 19% | 31 5% |
* ... más pequeño es mejor
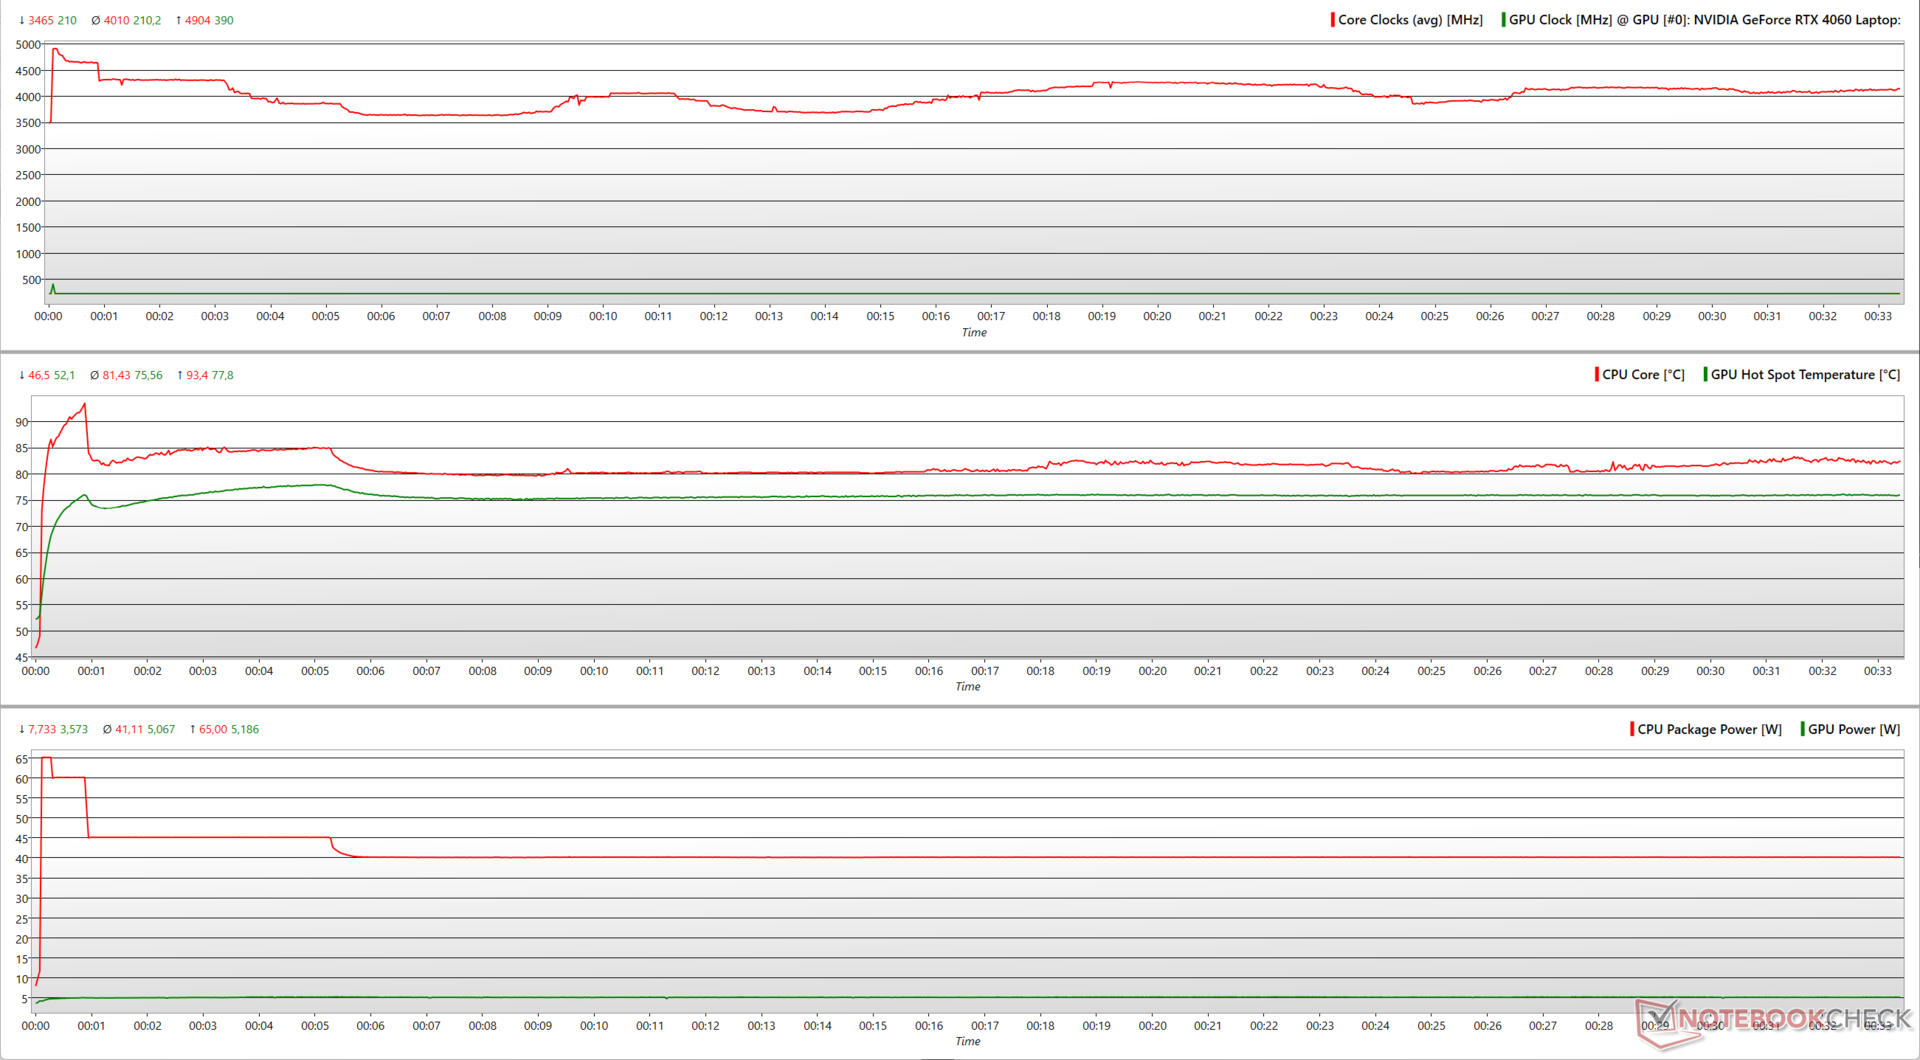
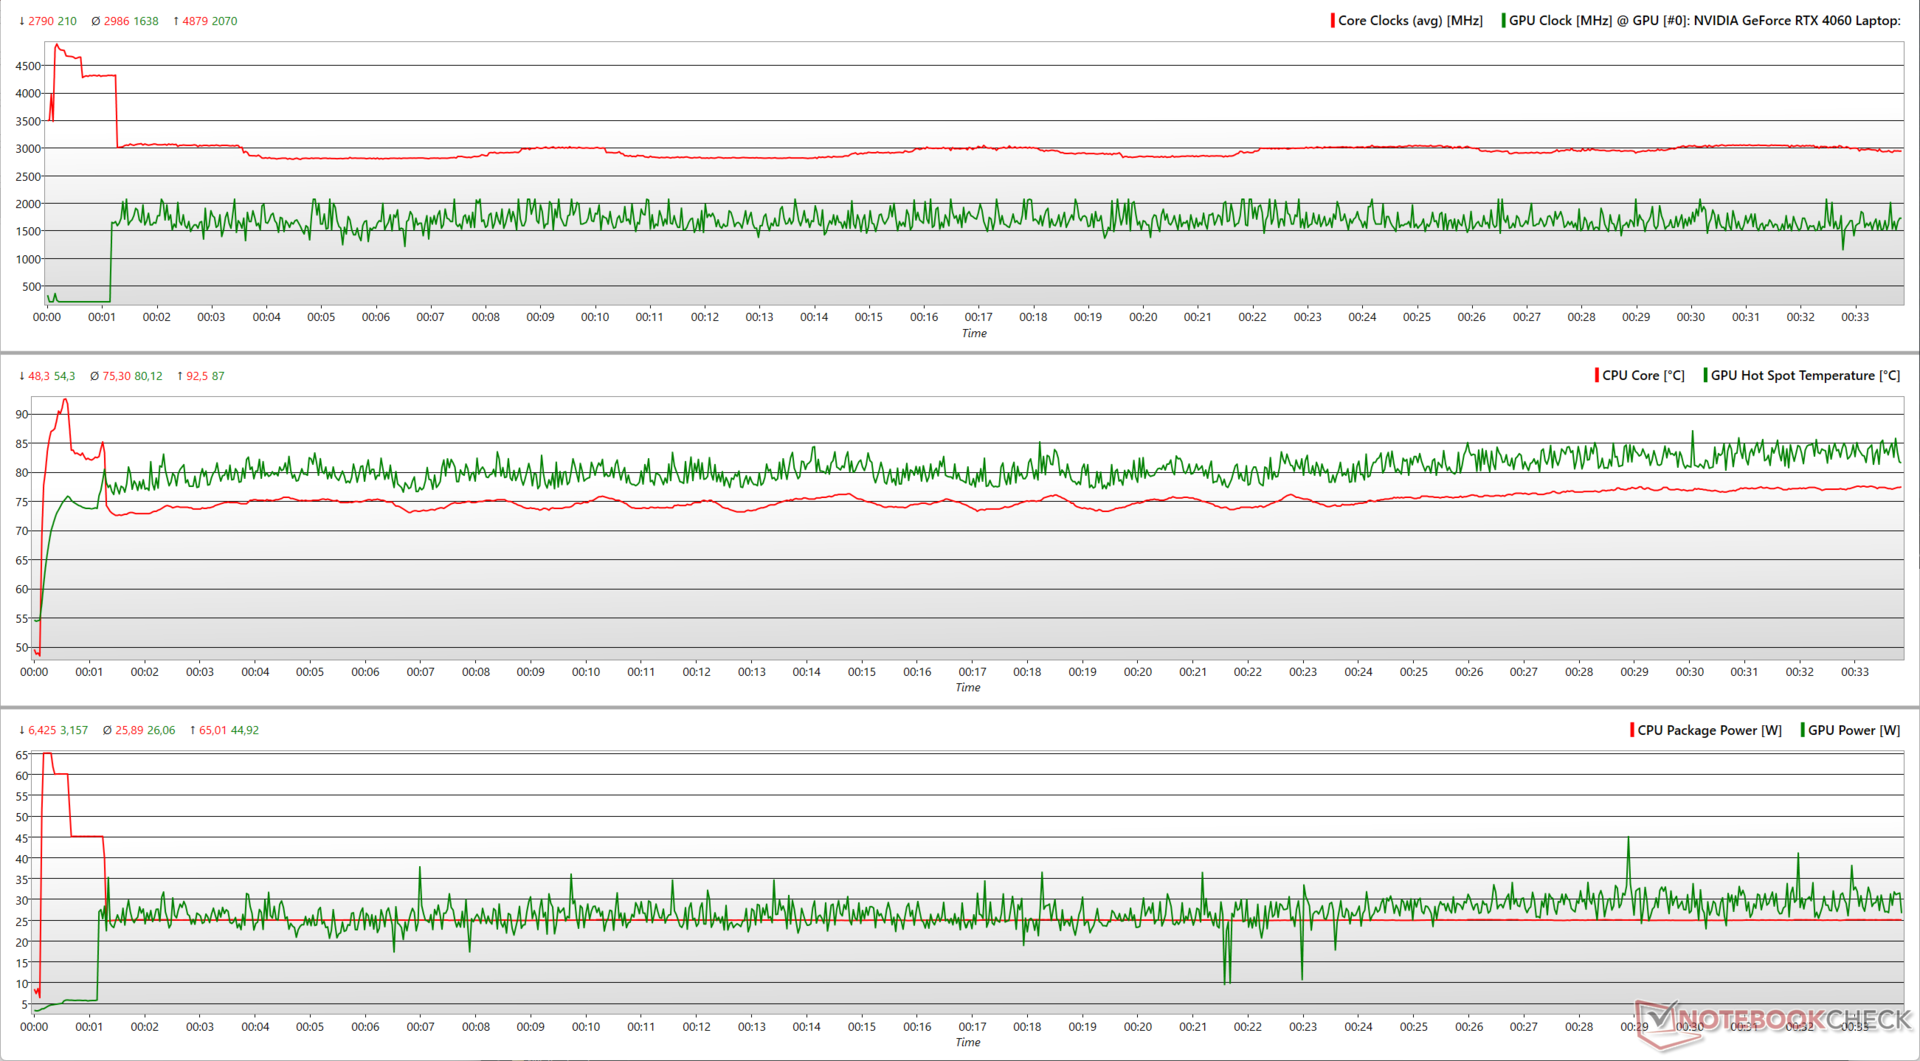
Prueba de resistencia
Al estresar el ROG Flow X13 con Prime95 in-place FFTs, el Ryzen 9 7940HS alcanza frecuencias medias de 4,1 GHz y consume unos 41 W. Al añadir FurMark, las frecuencias de la CPU caen a unos 3 GHz y la potencia del paquete a unos 26 W. El margen restante se comparte con la RTX 4060, que consume unos 26 W y frecuencias medias de 1.638 MHz.
| Prueba de estrés | Relojdela CPU (GHz) | Reloj de la GPU (MHz) | Temperatura media dela CPU (°C) | Temperatura media de la GPU (°C) |
| Sistema en reposo | 3,7 | 210 | 41,6 | 41,4 |
| Prime95 | 4,1 | 210 | 80,7 | 65,4 |
| Prime95+ FurMark | 3 | 1.935 | 75,3 | 73 |
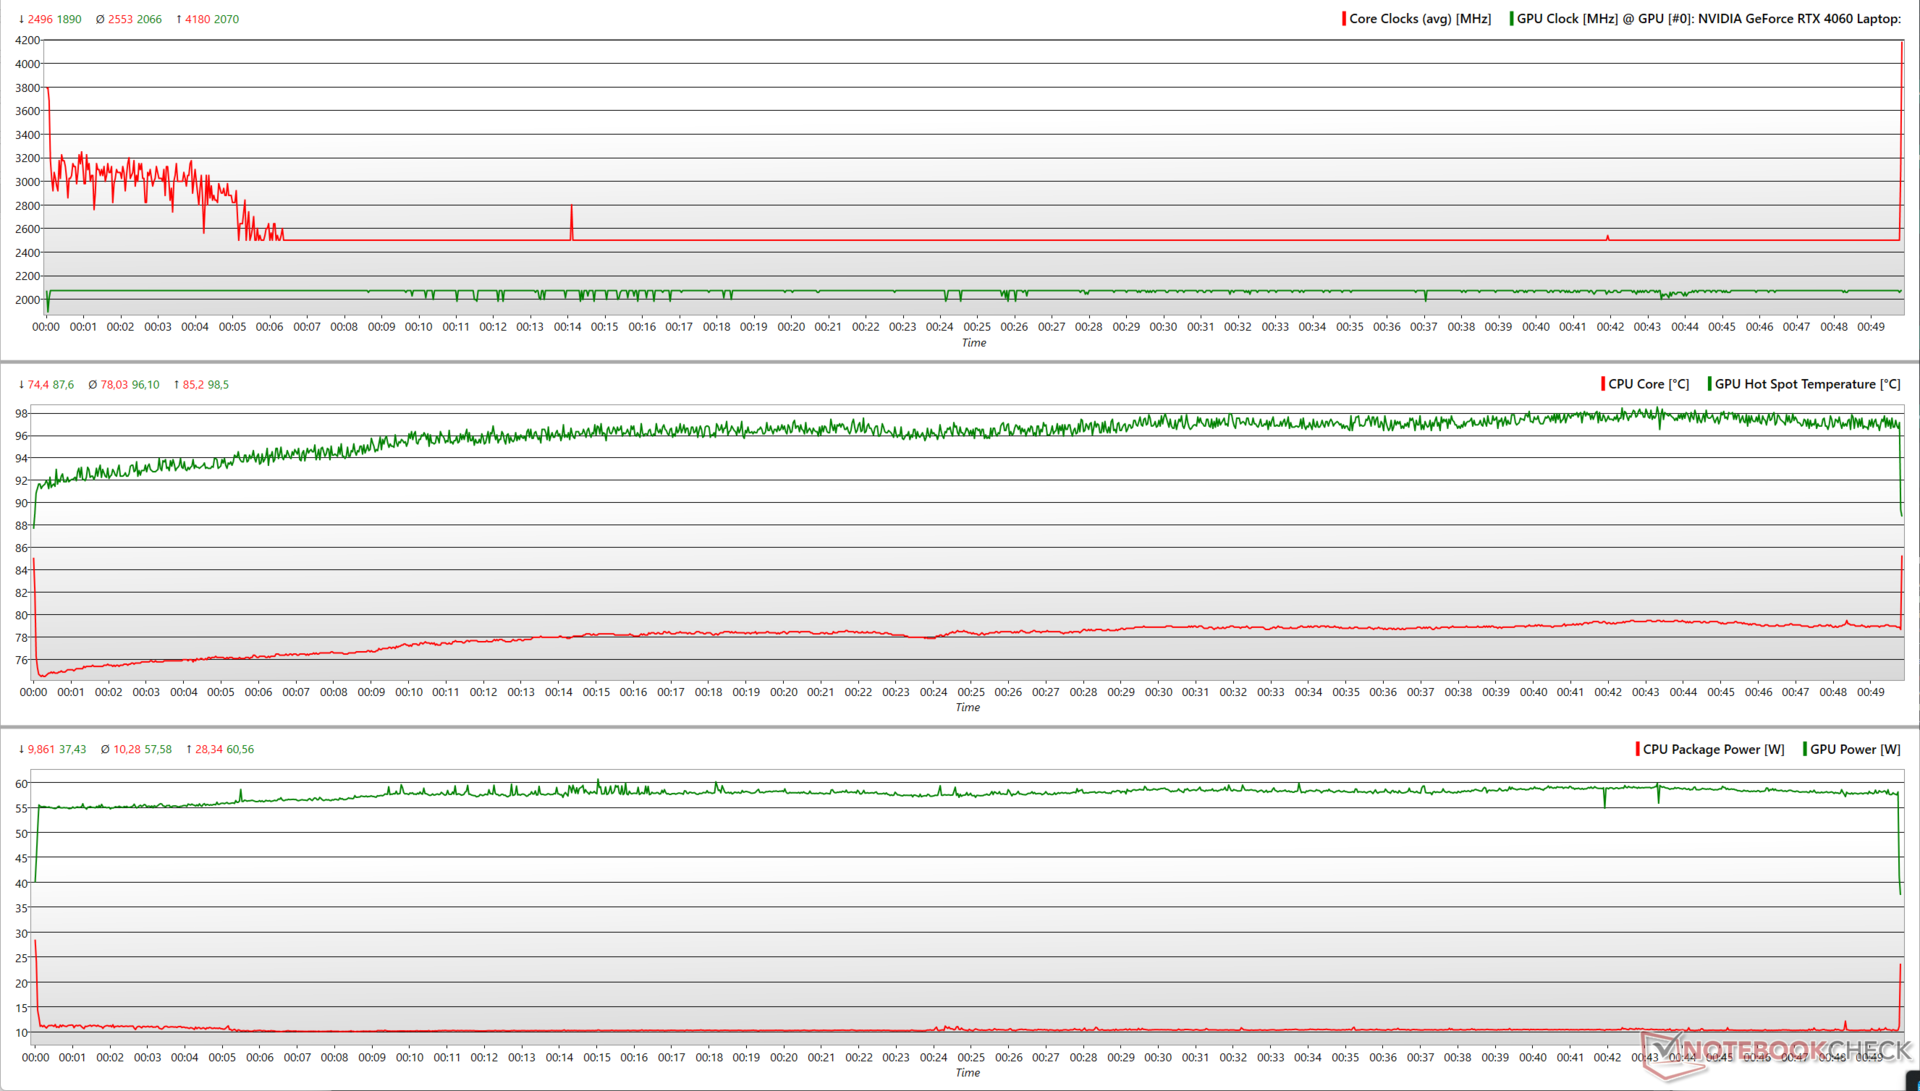
| El Witcher 3 1080p Ultra | 3,99 | 2.070 | 92,5 | 83,5 |
Con un estrés real como The Witcher 3 a 1080p Ultra, vemos que la RTX 4060 alcanza su reloj máximo a 2.070 MHz mientras consume una potencia máxima de 60,5 W. El Ryzen 9 7940HS se queda relativamente inutilizado aquí con un promedio de reloj de sólo 2,5 GHz a 10 W.
Esencialmente, el Flow X13 no puede mantener frecuencias máximas bajo estrés durante periodos prolongados. La CPU y la GPU juntas pueden consumir hasta un máximo de 110 W bajo carga en el perfil de potencia Turbo.
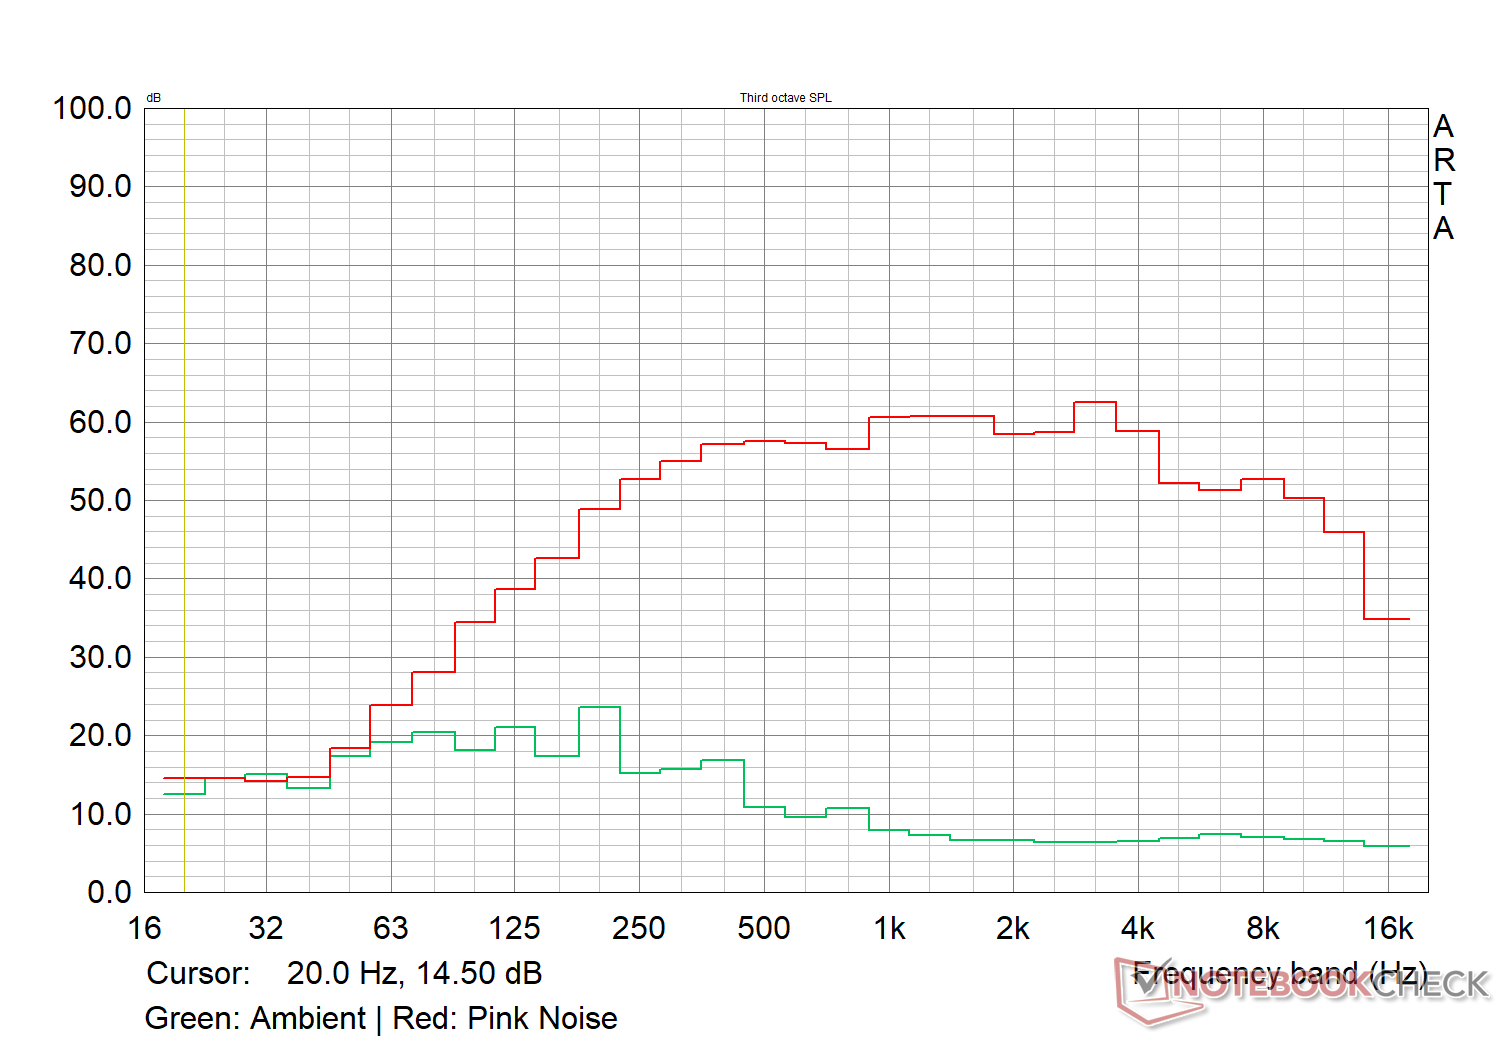
Altavoces
El Flow X13 no es el portátil más ruidoso, pero el audio de los altavoces integrados debería ser claro al máximo volumen en un entorno silencioso. Los graves son perceptibles pero no muy profundos. Los medios y agudos suenan equilibrados y se reproducen bien.
Los usuarios pueden obtener una mejor experiencia de audio con audio externo por cable o por Bluetooth 5.3.
Asus ROG Flow X13 GV302XV análisis de audio
(-) | altavoces no muy altos (#70.6 dB)
Graves 100 - 315 Hz
(±) | lubina reducida - en promedio 9.6% inferior a la mediana
(±) | la linealidad de los graves es media (9.4% delta a frecuencia anterior)
Medios 400 - 2000 Hz
(+) | medios equilibrados - a sólo 3.6% de la mediana
(+) | los medios son lineales (2.7% delta a la frecuencia anterior)
Altos 2 - 16 kHz
(+) | máximos equilibrados - a sólo 4.1% de la mediana
(+) | los máximos son lineales (5.7% delta a la frecuencia anterior)
Total 100 - 16.000 Hz
(±) | la linealidad del sonido global es media (15.8% de diferencia con la mediana)
En comparación con la misma clase
» 28% de todos los dispositivos probados de esta clase eran mejores, 3% similares, 69% peores
» El mejor tuvo un delta de 6%, la media fue 20%, el peor fue ###max##%
En comparación con todos los dispositivos probados
» 24% de todos los dispositivos probados eran mejores, 5% similares, 70% peores
» El mejor tuvo un delta de 4%, la media fue 23%, el peor fue ###max##%
Apple MacBook Pro 16 2021 M1 Pro análisis de audio
(+) | los altavoces pueden reproducir a un volumen relativamente alto (#84.7 dB)
Graves 100 - 315 Hz
(+) | buen bajo - sólo 3.8% lejos de la mediana
(+) | el bajo es lineal (5.2% delta a la frecuencia anterior)
Medios 400 - 2000 Hz
(+) | medios equilibrados - a sólo 1.3% de la mediana
(+) | los medios son lineales (2.1% delta a la frecuencia anterior)
Altos 2 - 16 kHz
(+) | máximos equilibrados - a sólo 1.9% de la mediana
(+) | los máximos son lineales (2.7% delta a la frecuencia anterior)
Total 100 - 16.000 Hz
(+) | el sonido global es lineal (4.6% de diferencia con la mediana)
En comparación con la misma clase
» 0% de todos los dispositivos probados de esta clase eran mejores, 0% similares, 100% peores
» El mejor tuvo un delta de 5%, la media fue 17%, el peor fue ###max##%
En comparación con todos los dispositivos probados
» 0% de todos los dispositivos probados eran mejores, 0% similares, 100% peores
» El mejor tuvo un delta de 4%, la media fue 23%, el peor fue ###max##%
Gestión de la energía: Consumo prudente de energía bajo carga
Consumo de energía
El consumo en reposo del Flow X13 es más elevado, pero el convertible es bastante económico bajo carga. Observamos fluctuaciones en el consumo en inactivo independientemente del perfil de potencia elegido.
El combo Ryzen 7 7840HS/RTX 4060 del Lenovo Legion Slim 5 muestra un consumo de energía un 73% superior en Witcher 3 a 1080p Ultra. El adaptador de corriente de 130 W suministrado puede mantener al Flow X13 adecuadamente alimentado incluso bajo estrés.
| Off / Standby | |
| Ocioso | |
| Carga |
|
Clave:
min: | |
| Asus ROG Flow X13 GV302XV R9 7940HS, GeForce RTX 4060 Laptop GPU, IPS, 2560x1600, 13.4" | Asus ROG Flow Z13 ACRNM i9-13900H, GeForce RTX 4070 Laptop GPU, IPS, 2560x1600, 13.4" | Asus ROG Flow Z13 GZ301V i9-13900H, GeForce RTX 4060 Laptop GPU, IPS, 2560x1600, 13.4" | Razer Blade 14 RTX 4070 R9 7940HS, GeForce RTX 4070 Laptop GPU, IPS, 2560x1600, 14" | Asus TUF Gaming A16 FA617XS R9 7940HS, Radeon RX 7600S, IPS, 1920x1200, 16" | Lenovo Legion Slim 5 16APH8 R7 7840HS, GeForce RTX 4060 Laptop GPU, IPS, 2560x1600, 16" | Acer Predator Triton 14 PT14-51 i7-13700H, GeForce RTX 4050 Laptop GPU, IPS, 2560x1600, 14" | Medio NVIDIA GeForce RTX 4060 Laptop GPU | Media de la clase Convertible | |
|---|---|---|---|---|---|---|---|---|---|
| Power Consumption | 15% | 18% | -33% | 4% | -3% | -9% | -4% | 59% | |
| Idle Minimum * (Watt) | 16.63 | 8.9 46% | 8.5 49% | 19.5 -17% | 7 58% | 9.4 43% | 12 28% | 11.5 ? 31% | 4.2 ? 75% |
| Idle Average * (Watt) | 20.68 | 12.6 39% | 12.4 40% | 24.7 -19% | 10 52% | 15.5 25% | 14 32% | 16 ? 23% | 6.89 ? 67% |
| Idle Maximum * (Watt) | 29.88 | 13 56% | 13.3 55% | 27 10% | 15 50% | 24.4 18% | 26 13% | 20.3 ? 32% | 8.63 ? 71% |
| Load Average * (Watt) | 75.5 | 92.5 -23% | 93 -23% | 83.2 -10% | 86 -14% | 74.1 2% | 88 -17% | 92.9 ? -23% | 44.1 ? 42% |
| Witcher 3 ultra * (Watt) | 92.6 | 104.4 -13% | 87.8 5% | 165.8 -79% | 160.6 -73% | 112.9 -22% | 114.9 -24% | ||
| Load Maximum * (Watt) | 113.3 | 133.6 -18% | 135 -19% | 204.5 -80% | 172 -52% | 206.5 -82% | 213 -88% | 210 ? -85% | 66.5 ? 41% |
* ... más pequeño es mejor
Power Consumption: The Witcher 3 / Stress test
Power Consumption: External monitor
Duración de la batería
La célula de 75 WHr proporciona tiempos de ejecución largos que deberían ayudarle fácilmente a pasar un día de trabajo típico, especialmente a niveles de brillo más bajos. Si bien esto es cierto para la navegación web típica y la reproducción de vídeo, la batería dura sólo unos 90 minutos mientras se juega.
| Asus ROG Flow X13 GV302XV R9 7940HS, GeForce RTX 4060 Laptop GPU, 75 Wh | Asus ROG Flow Z13 ACRNM i9-13900H, GeForce RTX 4070 Laptop GPU, 56 Wh | Asus ROG Flow Z13 GZ301V i9-13900H, GeForce RTX 4060 Laptop GPU, 56 Wh | Razer Blade 14 RTX 4070 R9 7940HS, GeForce RTX 4070 Laptop GPU, 68 Wh | Asus TUF Gaming A16 FA617XS R9 7940HS, Radeon RX 7600S, 90 Wh | Lenovo Legion Slim 5 16APH8 R7 7840HS, GeForce RTX 4060 Laptop GPU, 80 Wh | Acer Predator Triton 14 PT14-51 i7-13700H, GeForce RTX 4050 Laptop GPU, 76.3 Wh | Media de la clase Convertible | |
|---|---|---|---|---|---|---|---|---|
| Duración de Batería | -50% | -55% | -48% | 7% | -40% | -40% | 17% | |
| H.264 (h) | 11.4 | 5.2 -54% | 4.7 -59% | 12.4 9% | 9 -21% | 15 ? 32% | ||
| WiFi v1.3 (h) | 11.9 | 6.6 -45% | 5 -58% | 6.2 -48% | 12.4 4% | 7.1 -40% | 5 -58% | 12 ? 1% |
| Witcher 3 ultra (h) | 1.5 | 0.8 -47% | ||||||
| Load (h) | 0.9 | 1 | 1 | 0.9 | 1.2 | 1.8 | 1.713 ? | |
| Reader / Idle (h) | 8.6 | 20.3 | 11.7 | 11.2 | 26.7 ? |
Pro
Contra
Veredicto: Lo bueno viene en frasco pequeño
El Asus ROG Flow X13 2023 tiene una gran calidad de construcción, y su elegante formato convertible de 13,4 pulgadas facilita la adaptación dependiendo de si quieres crear o consumir contenido.
Este año, Asus ha refinado la experiencia general del convertible, incluyendo el uso de una pantalla táctil QHD+ 165 Hz G-Sync más práctica en lugar del panel UHD+ 60 Hz del año pasado, un touchpad más grande y un teclado cómodamente espaciado, USB4 y una webcam FHD.
El Flow X13 saca partido de las entrañas AMD Ryzen 9 7940HS y RTX 4060. Aunque la potencia es limitada en comparación con máquinas más grandes, los componentes impresionan al alcanzar una potencia combinada de 110 W en condiciones de estrés. El consumo de energía en ralentí necesita algunos ajustes, pero la batería de 75 WHr, frente a los 62 WHr anteriores, permite una verdadera productividad durante todo el día.
Con su esbelto chasis que alberga un hardware AMD y Nvidia capaz, junto con una gran autonomía de batería y una amplia conectividad, el Asus ROG Flow X13 se encuentra entre el puñado de convertibles para juegos que logra un ingenioso equilibrio entre rendimiento y equilibrio"
Entonces, ¿es el ROG Flow X13 basado en AMD una mejor opción que el ROG Flow Z13 basado en Intel con un precio idéntico? En muchos sentidos, sí
El ROG Flow Z13 ACRNM y el ROG Flow Z13 GZ301V son más portátiles con sus pantallas desmontables. El Core i9-13900H del Flow Z13 y la RTX 4070 del ACRNM ofrecen ventajas perceptibles en cuanto a rendimiento, pero el Flow X13 logra un mejor equilibrio para su uso sobre la marcha y ofrece una batería más grande con una autonomía mucho mayor. Los jugadores pueden mejorar aún más las capacidades gráficas del Flow X13 gastándose otros dos de los grandes en el ROG XG Mobile con una GPU RTX 4090 para portátil si lo desean.
El Flow X13 intercambia golpes con el Acer Predator Triton 14pero el Core i7-13700H de este último tiene evidentes ventajas multinúcleo gracias a su mayor número de hilos. El convertible de Asus también está a tiro del Razer Blade 14 en términos de rendimiento CPU general, pero la RTX 4070 del Blade 14 le da bastante ventaja en las puntuaciones GPU.
Al final, el Asus ROG Flow X13 es un convertible que tiene pocos iguales. Tendrás que desembolsar una buena suma por lo que en última instancia es un portátil Zen 4 con RTX 4060 de potencia limitada, pero la experiencia general de uso hace que merezca la pena si te gusta este formato.
Precio y disponibilidad
La configuración probada del Asus ROG Flow X13 GV302 (2023) se puede conseguir directamente en la tienda online Asus India por 1.84.990 ₹. Amazon India ofrece actualmente la variante RTX 4050 por 1.77.999 ₹.
En Estados Unidos, el ROG Flow X13 con la RTX 4070 se vende actualmente por 2.499,99 dólares en la tienda online de Asus https://shop.asus.com/us/rog/90nr0g41-m000k0-rog-flow-x13-2023.html?utm_source=Landing+Page&utm_medium=Gaming+Microsite y Best Buy. La versión básica con pantalla FHD+ y Radeon 780M iGPU también está disponible en Best Buy por 1.249,99 dólares.
Asus ROG Flow X13 GV302XV
- 10/06/2023 v7 (old)
Vaidyanathan Subramaniam
Transparencia
La selección de los dispositivos que se van a reseñar corre a cargo de nuestro equipo editorial. La muestra de prueba fue proporcionada al autor en calidad de préstamo por el fabricante o el minorista a los efectos de esta reseña. El prestamista no tuvo ninguna influencia en esta reseña, ni el fabricante recibió una copia de la misma antes de su publicación. No había ninguna obligación de publicar esta reseña. Como empresa de medios independiente, Notebookcheck no está sujeta a la autoridad de fabricantes, minoristas o editores.
Así es como prueba Notebookcheck
Cada año, Notebookcheck revisa de forma independiente cientos de portátiles y smartphones utilizando procedimientos estandarizados para asegurar que todos los resultados son comparables. Hemos desarrollado continuamente nuestros métodos de prueba durante unos 20 años y hemos establecido los estándares de la industria en el proceso. En nuestros laboratorios de pruebas, técnicos y editores experimentados utilizan equipos de medición de alta calidad. Estas pruebas implican un proceso de validación en varias fases. Nuestro complejo sistema de clasificación se basa en cientos de mediciones y puntos de referencia bien fundamentados, lo que mantiene la objetividad.Price comparison

