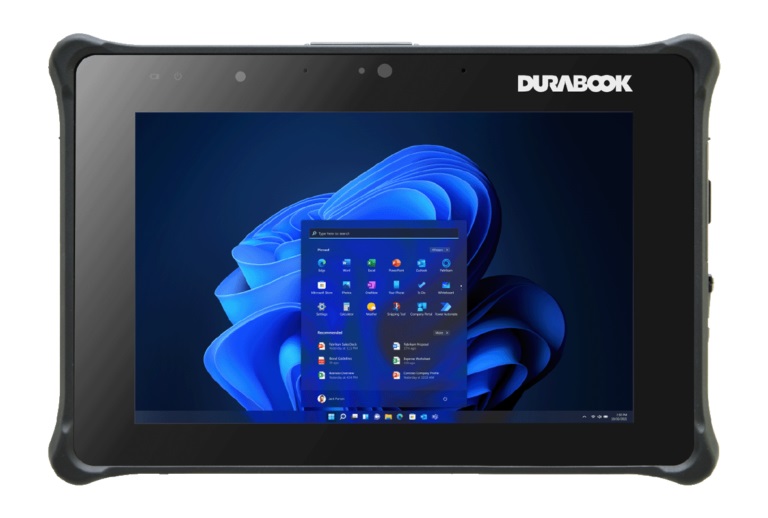
Análisis del Durabook R8: La primera tableta robusta sin ventilador del mundo con Intel 12ª generación

Durabook se especializa en ordenadores portátiles y tabletas robustos diseñados para entornos exigentes como la fabricación, las fuerzas de seguridad, la investigación de campo, las agencias gubernamentales y otras industrias fuera del espacio de oficina tradicional. El último modelo es el Durabook R8, totalmente robusto, que es uno de los primeros de su categoría en incorporar CPU Alder Lake-U de 12ª generación en un diseño sin ventilador.
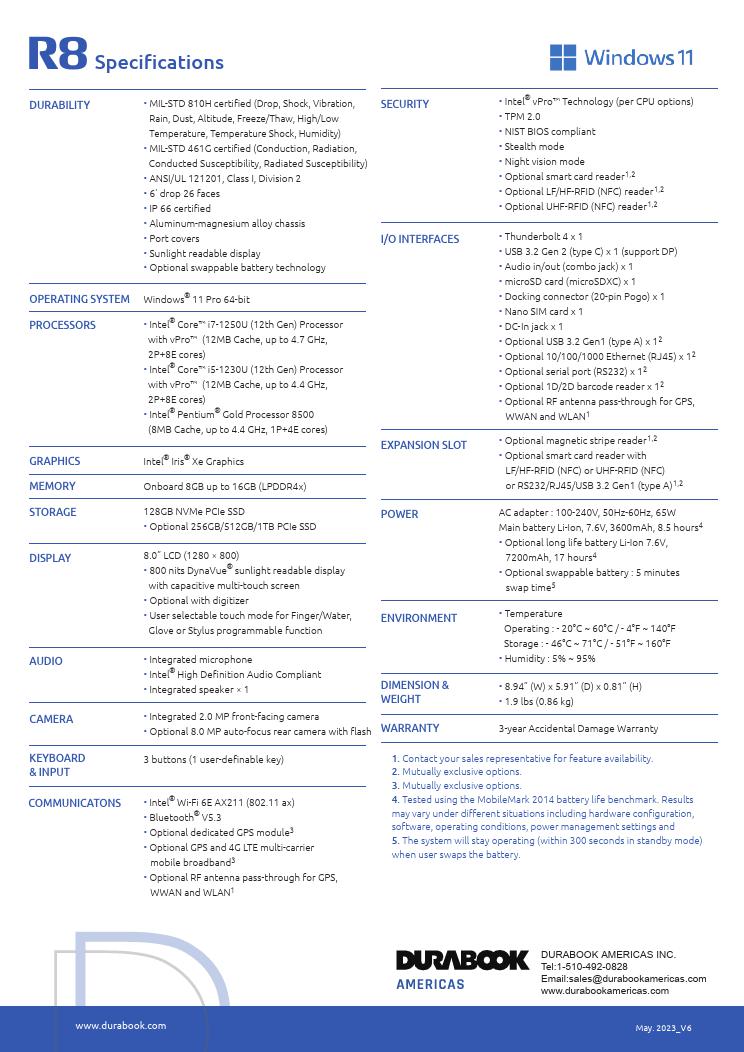
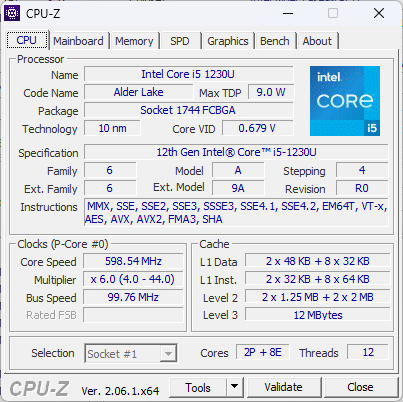
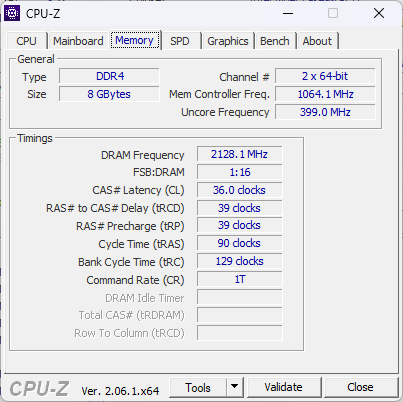
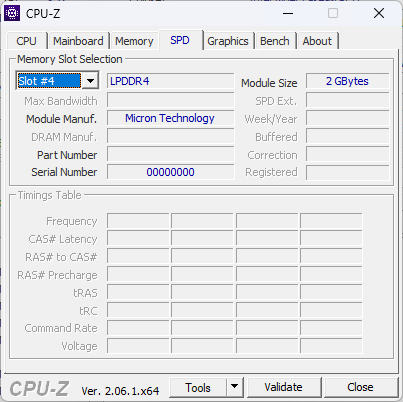
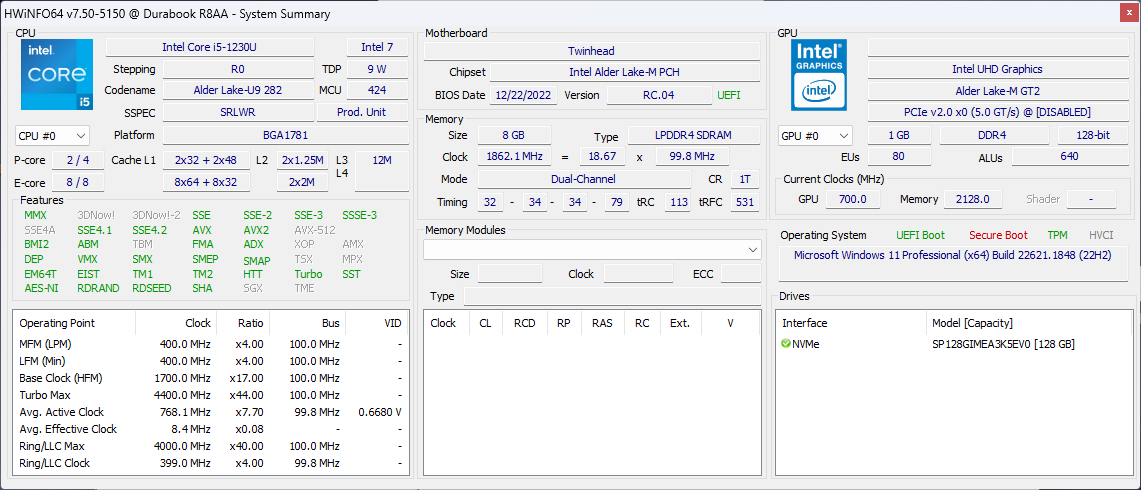
Nuestra unidad de prueba lleva un Core i5-1230U, 8 GB de RAM LPDDR4x-2133 soldada y un SSD de 128 GB. Hay otros modelos disponibles con Pentium 8500, Core i7-1250U, 16 GB de RAM o 1 TB de SSD, pero todas las opciones incluyen la misma pantalla táctil de 8 pulgadas y resolución 1280 x 800 píxeles.
Entre las alternativas a la Durabook R8 se encuentran otras tabletas robustas como laAcer Enduro T1,Dell Latitude 7230 Rugged Extremeo elPanasonic Toughbook FZ-G2.
Más opiniones sobre Durabook:
Posibles contendientes en la comparación
Valoración | Fecha | Modelo | Peso | Altura | Tamaño | Resolución | Precio |
|---|---|---|---|---|---|---|---|
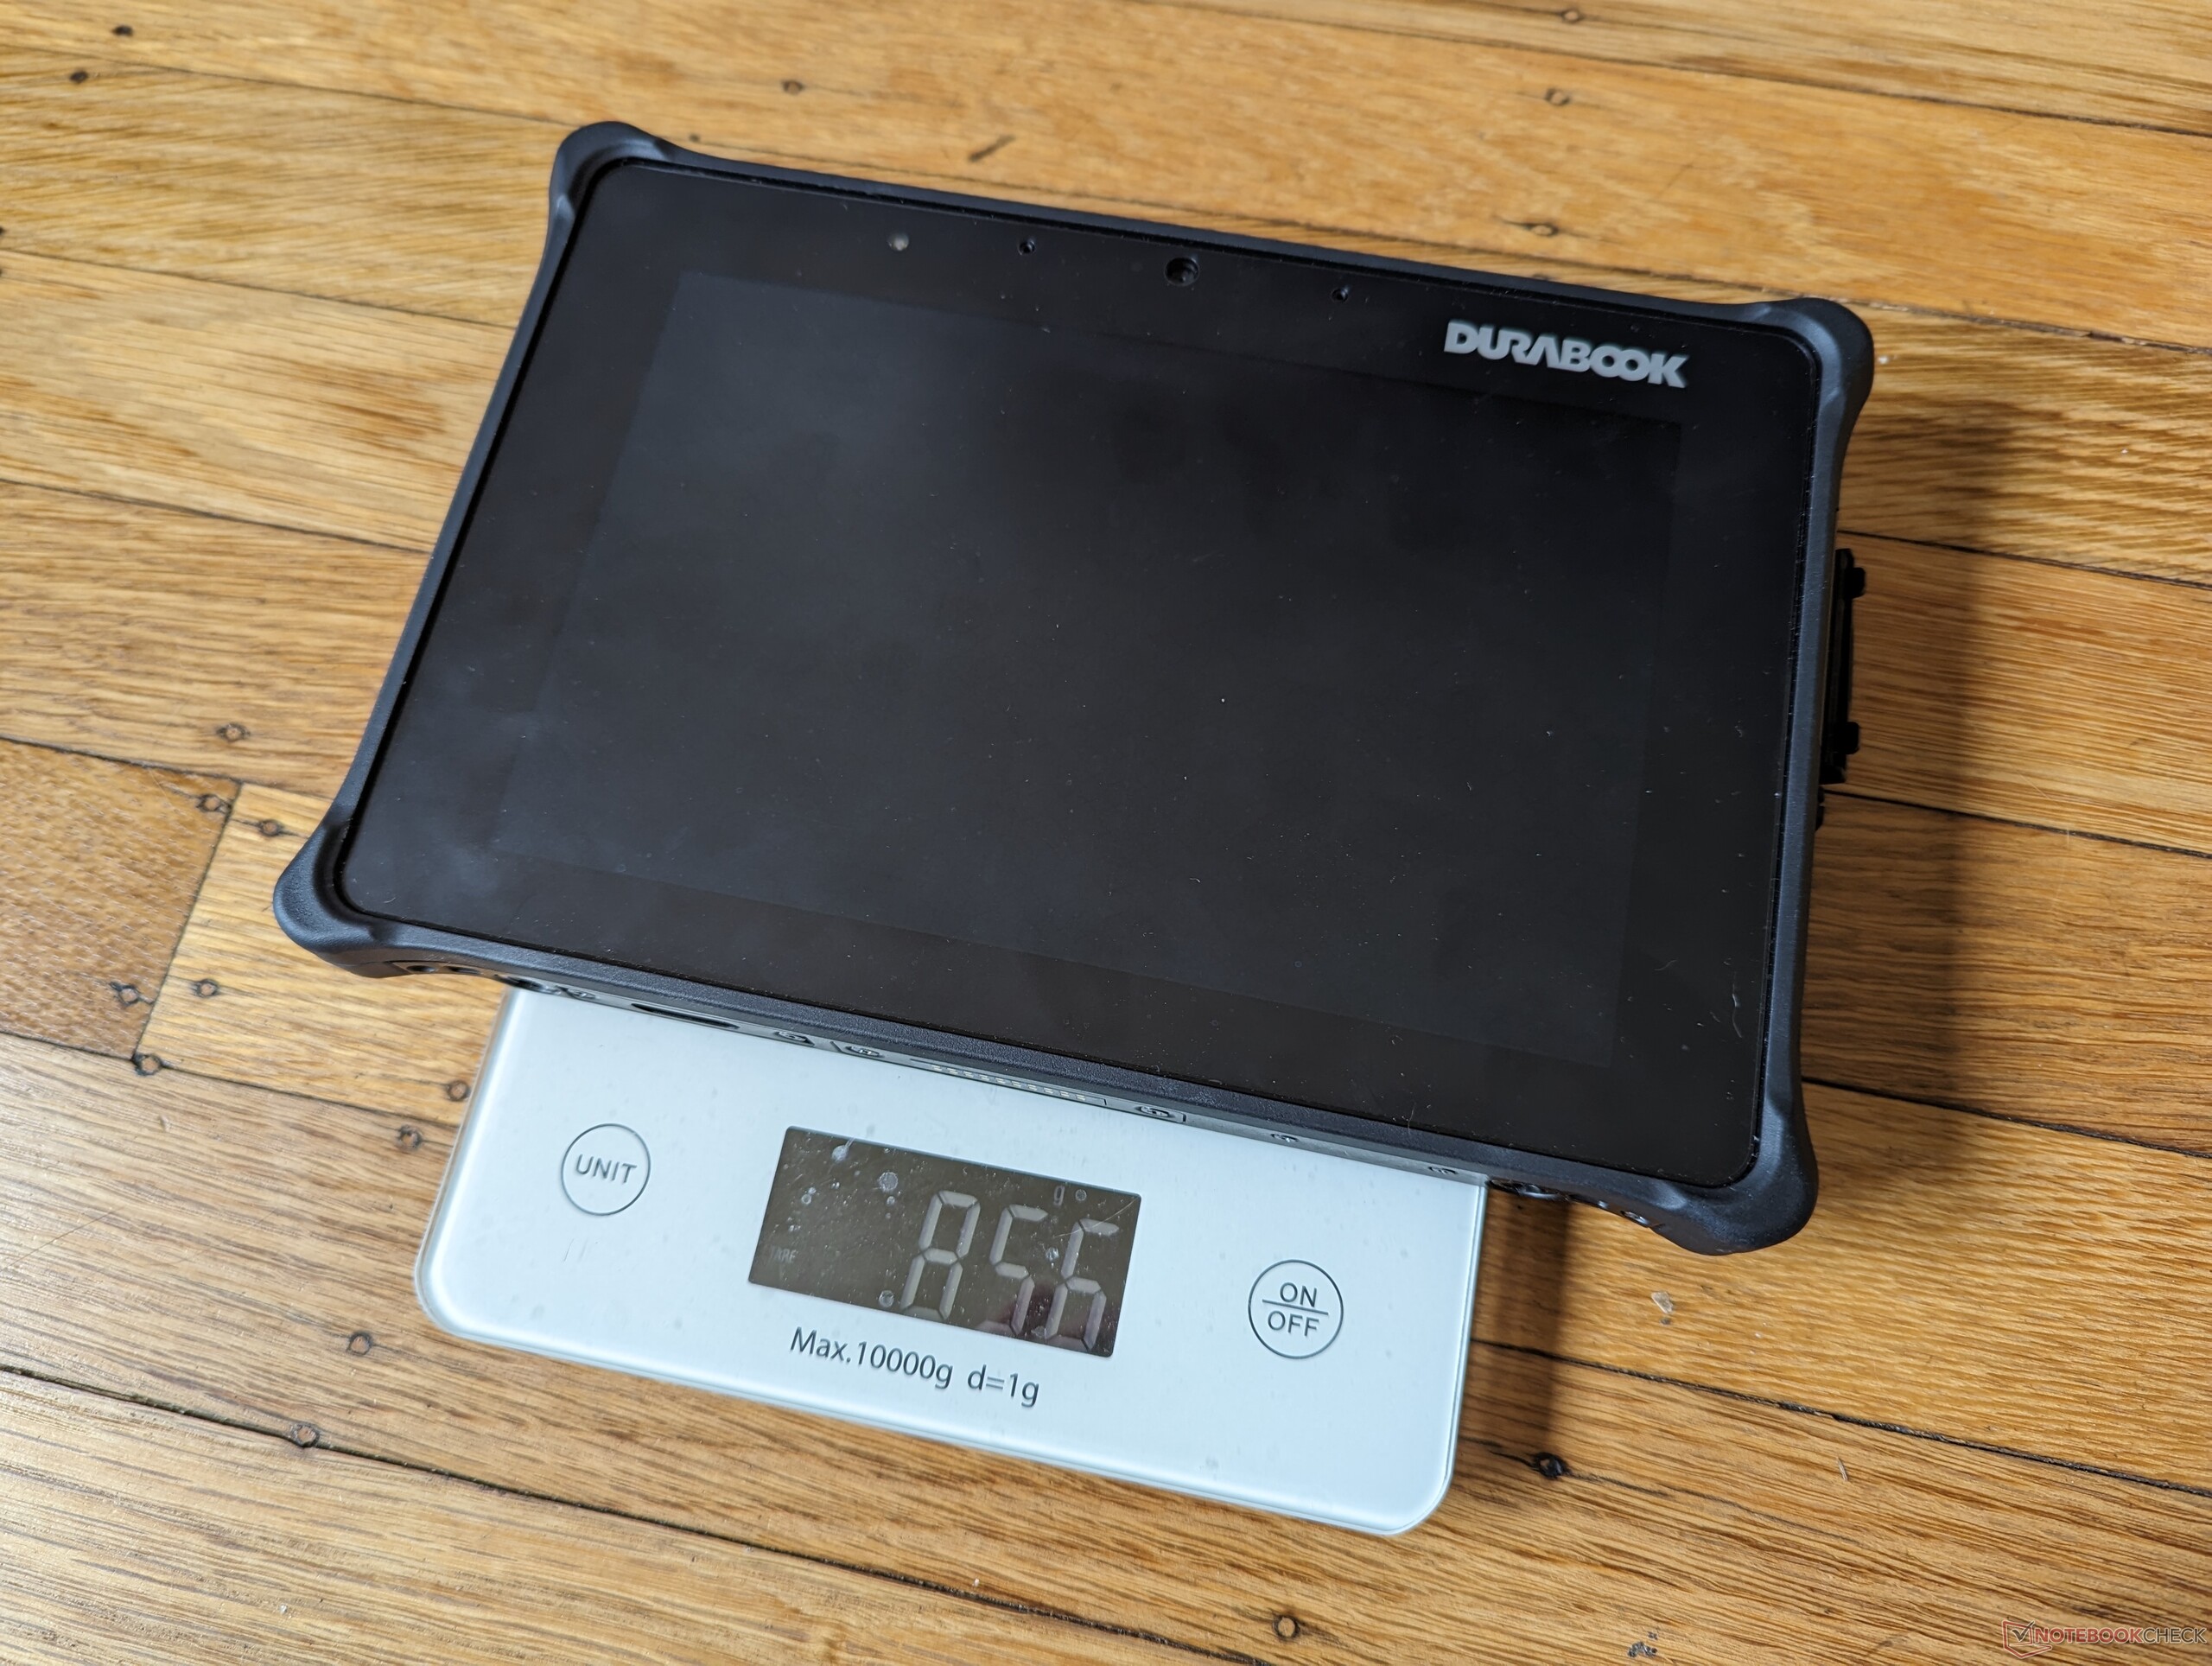
| 79.6 % v7 (old) | 07/2023 | Durabook R8 Tablet i5-1230U, Iris Xe G7 80EUs | 856 g | 20.6 mm | 8.00" | 1280x800 | |
v (old) | 09/2020 | Acer Enduro T1 ET108-11A A9001 | 499 g | 10.9 mm | 8.00" | 1280x800 | |
| 79.5 % v7 (old) | 05/2023 | Lenovo Tab M8 (Gen 4) Helio A22 MT6761, PowerVR GE8300 | 320 g | 9 mm | 8.00" | 1280x800 | |
| 83.9 % v7 (old) | 04/2023 | Dell Latitude 7230 Rugged Extreme i5-1240U, Iris Xe G7 80EUs | 1.6 kg | 23.9 mm | 12.00" | 1920x1200 | |
v (old) | 08/2021 | Panasonic Toughbook FZ-G2 i5-10310U, UHD Graphics 620 | 1.5 kg | 28 mm | 10.10" | 1920x1200 |
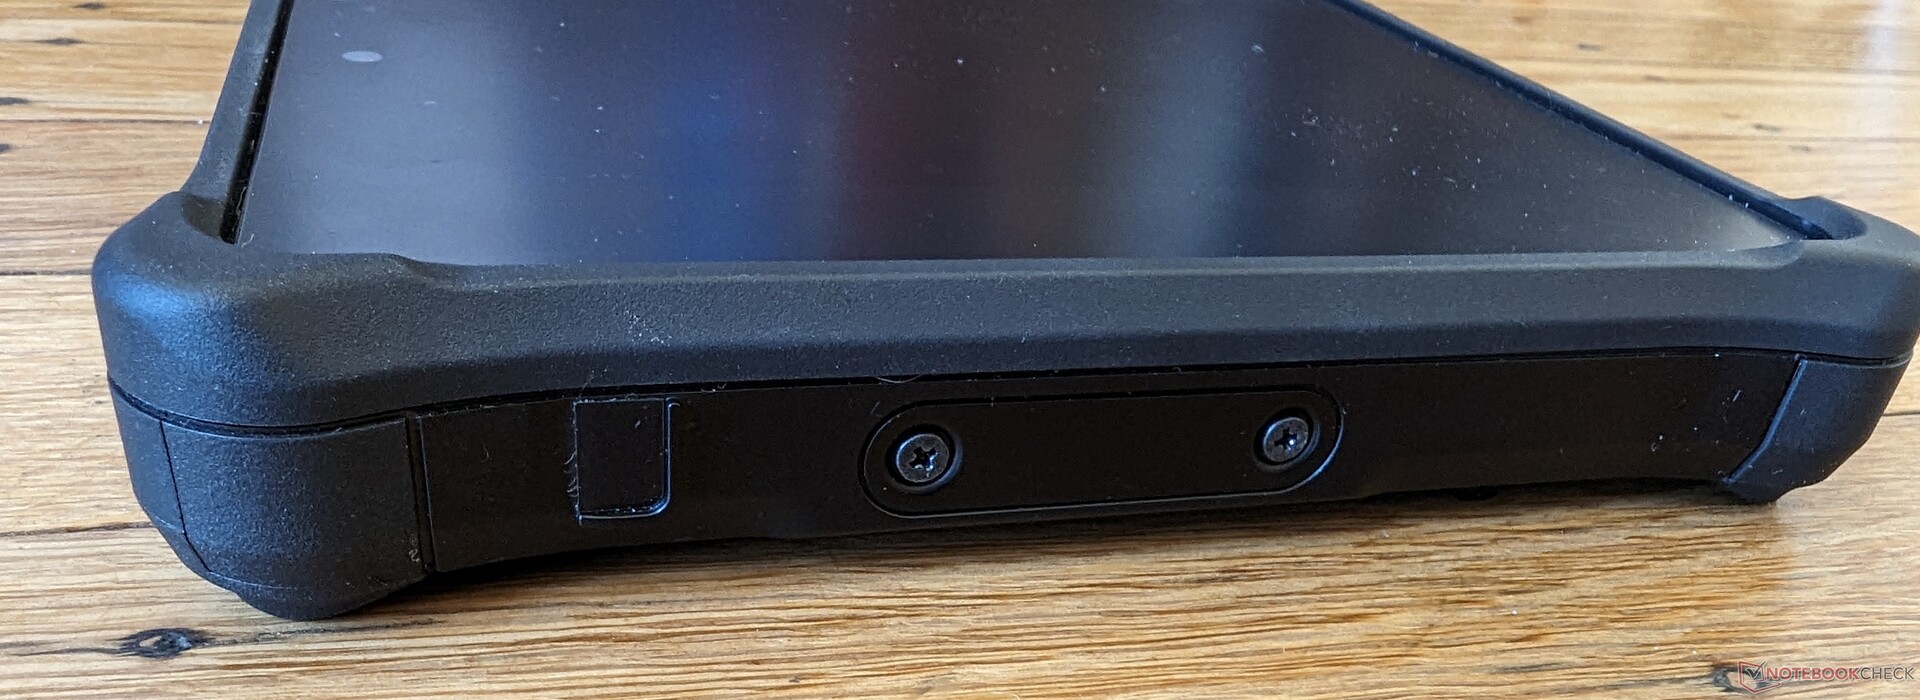
Funda - Durable Durabook
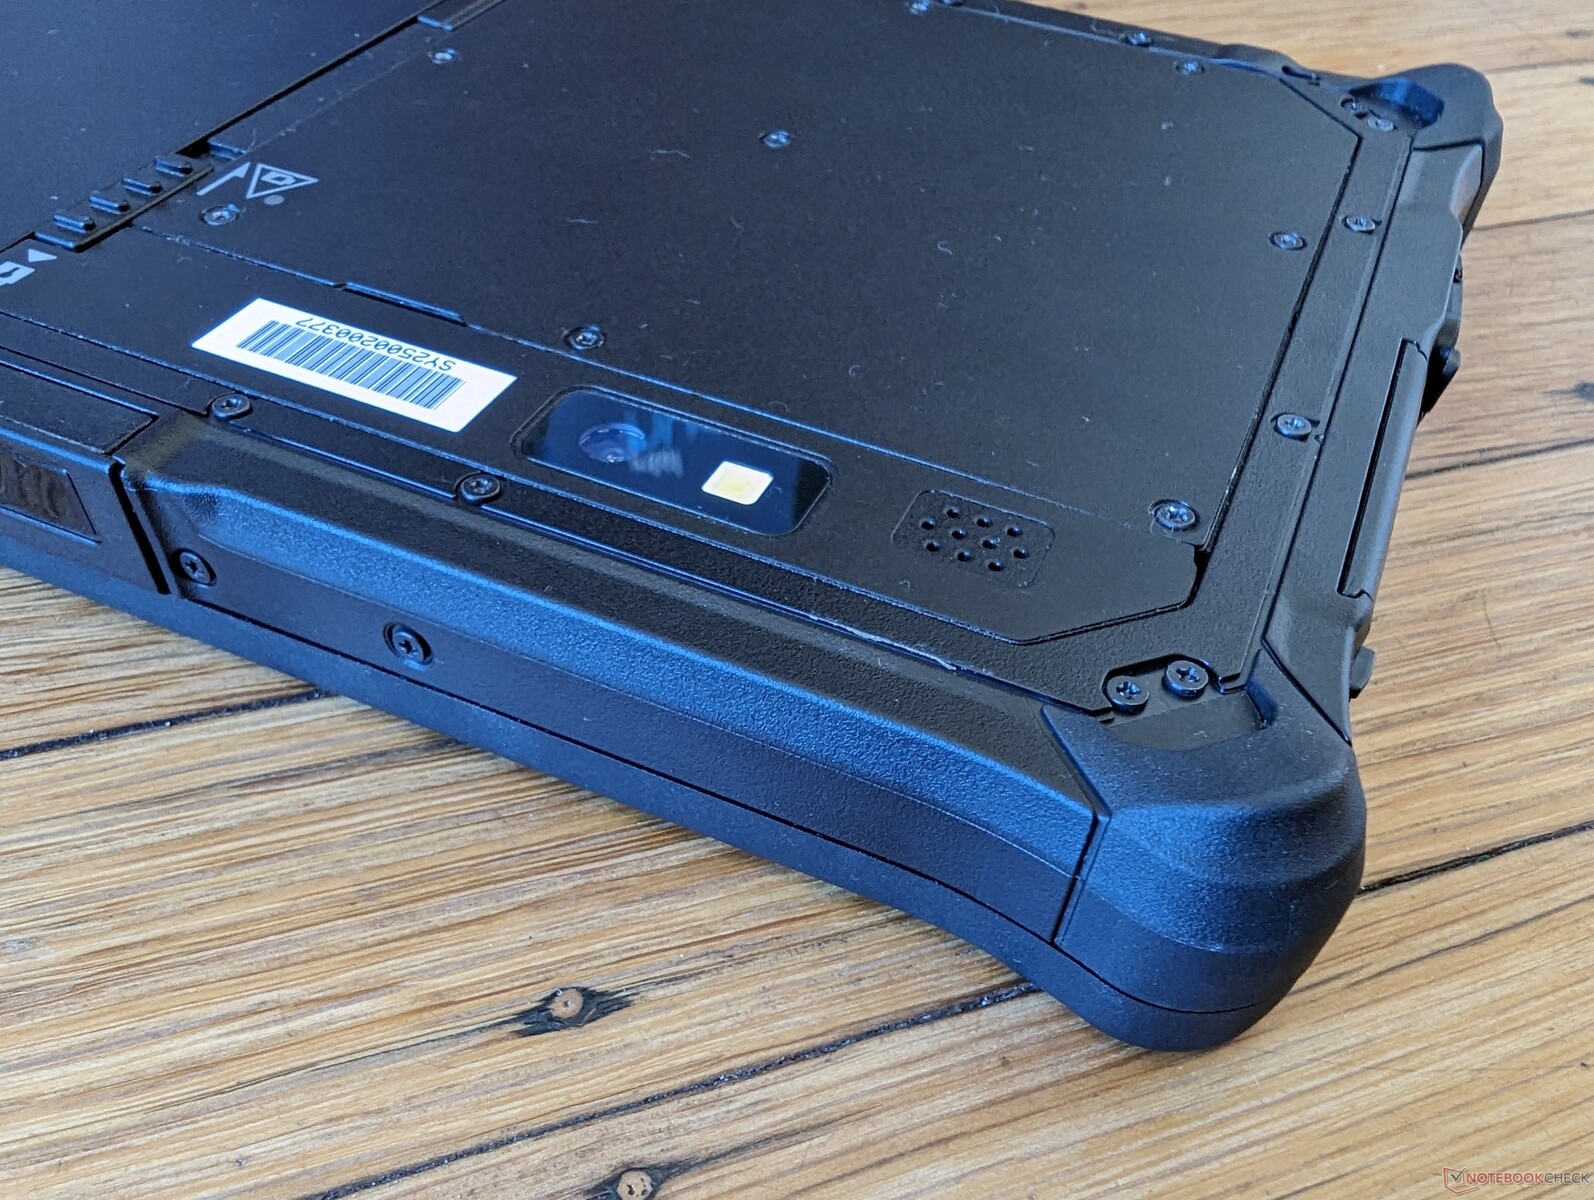
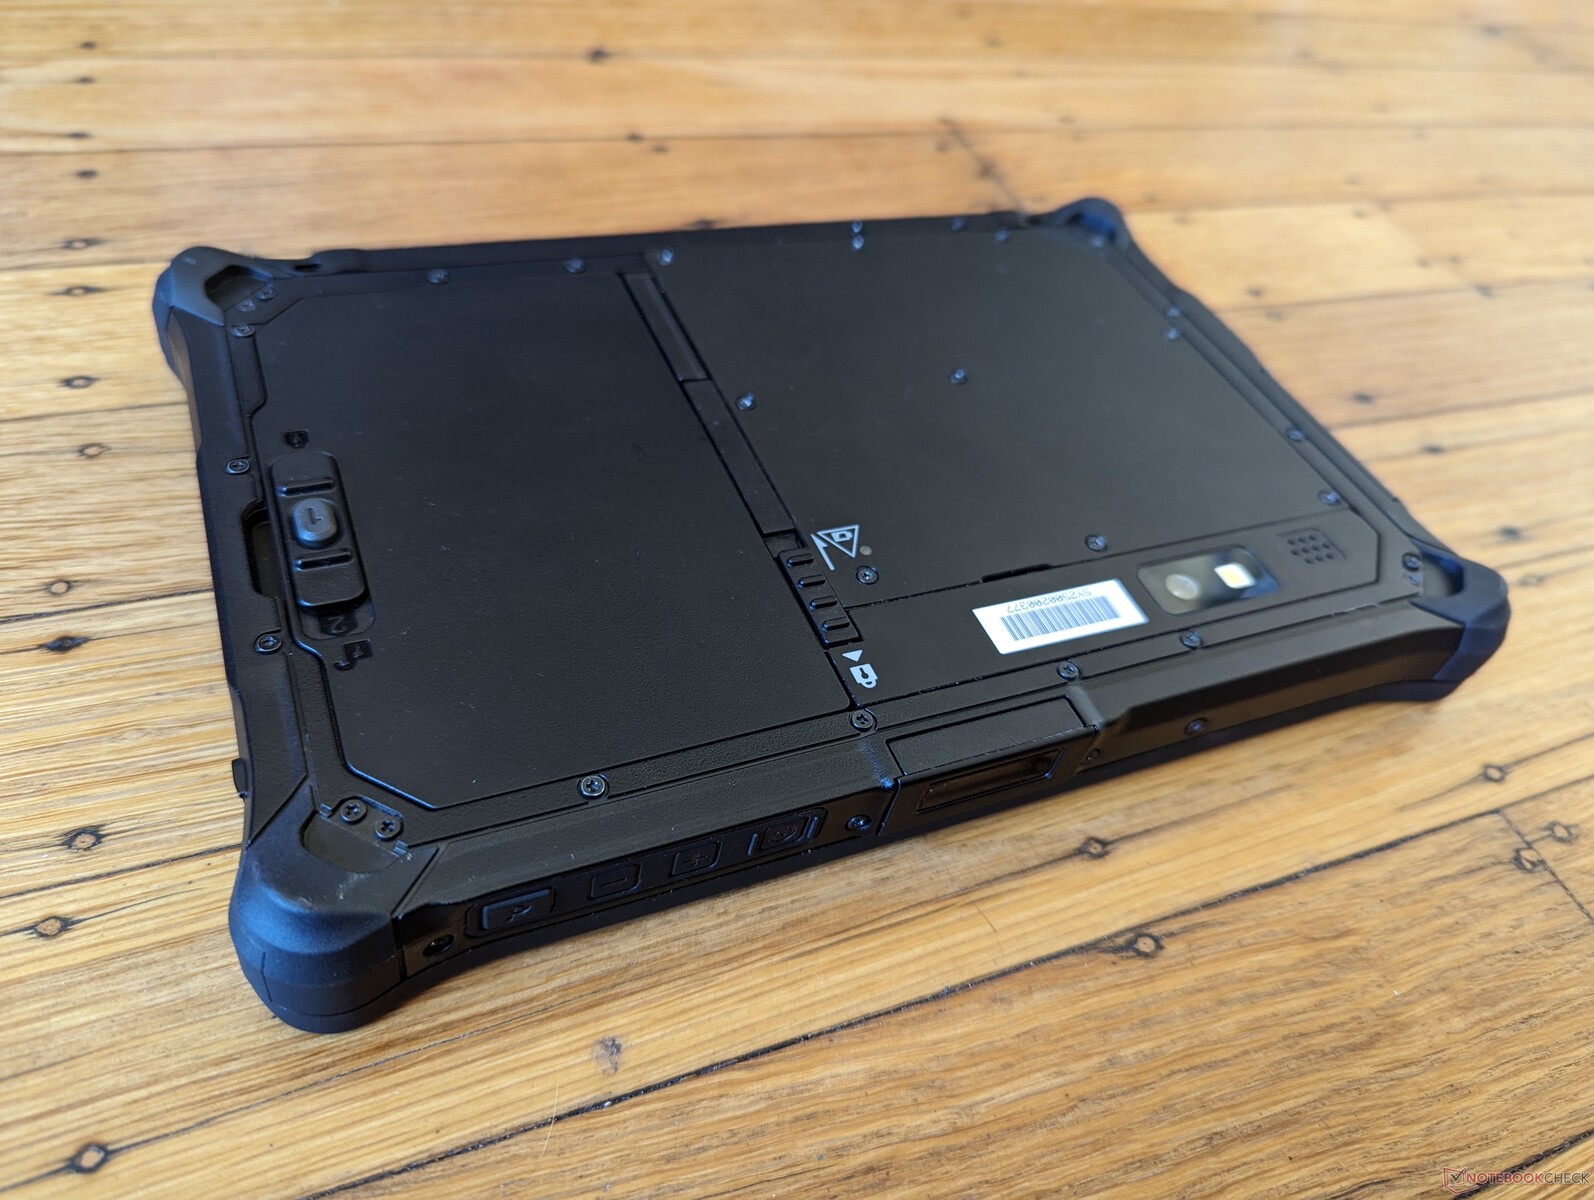
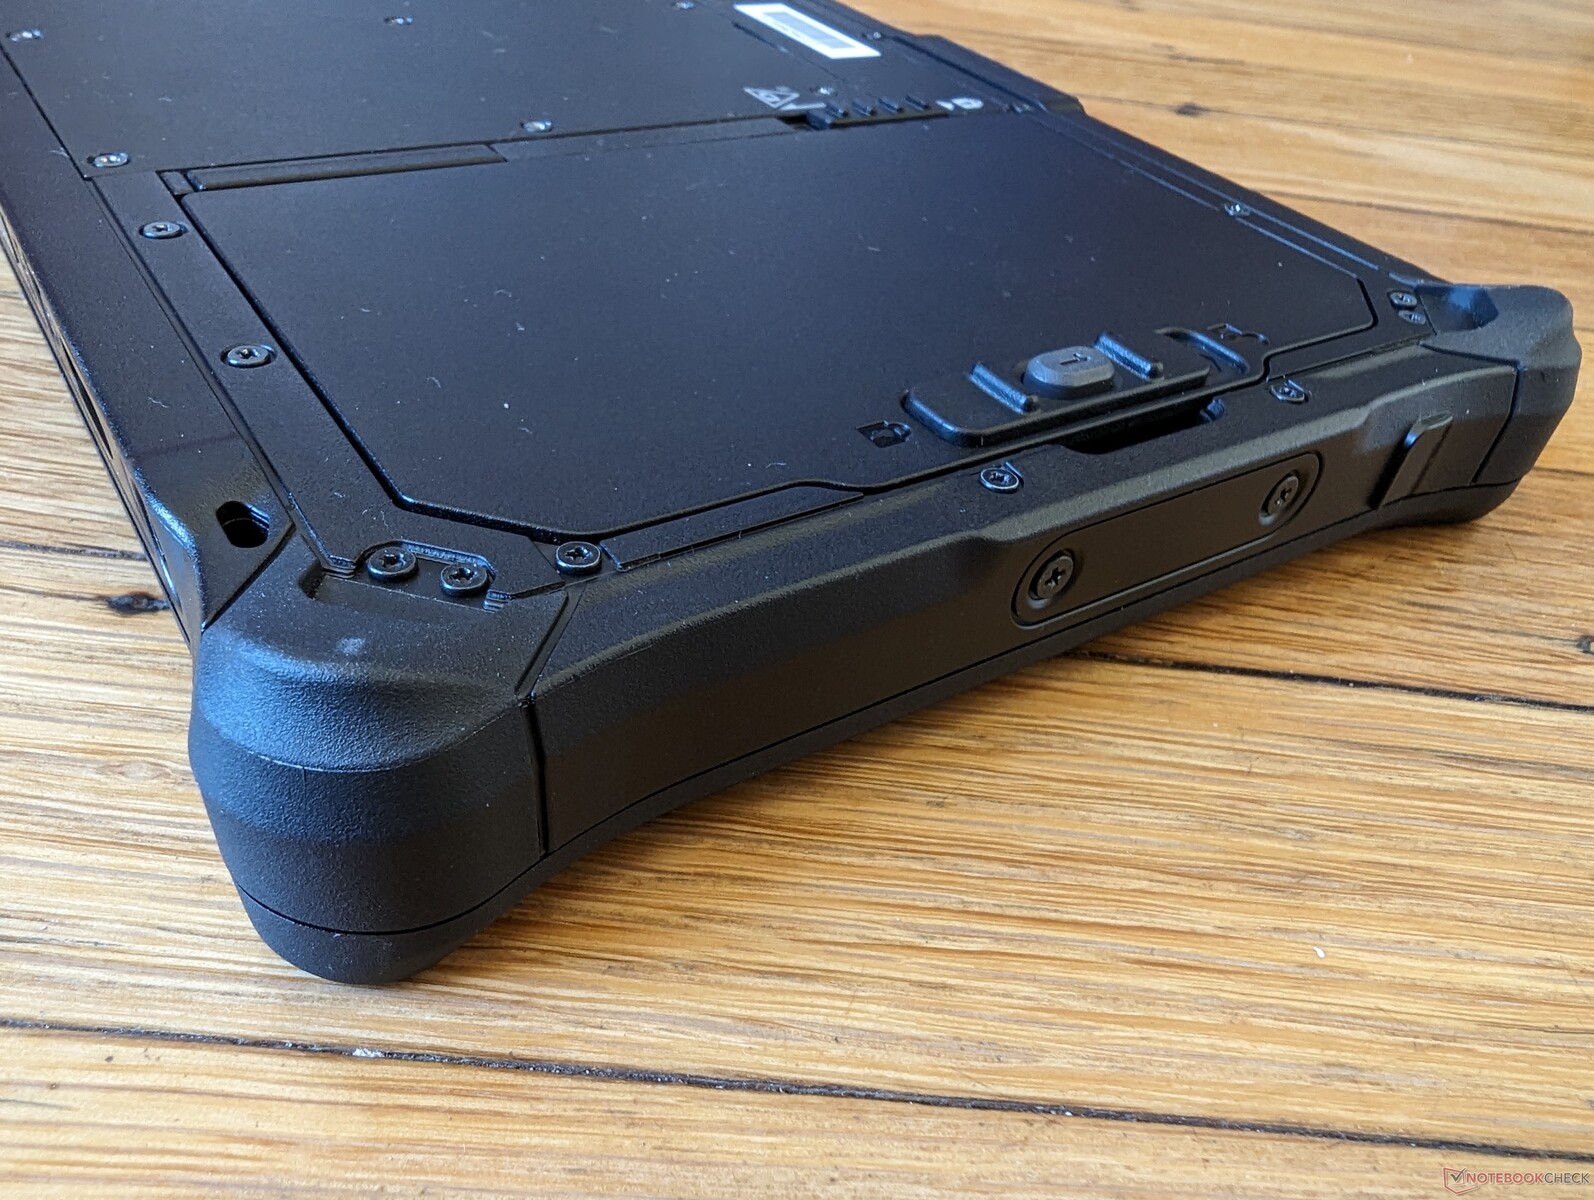
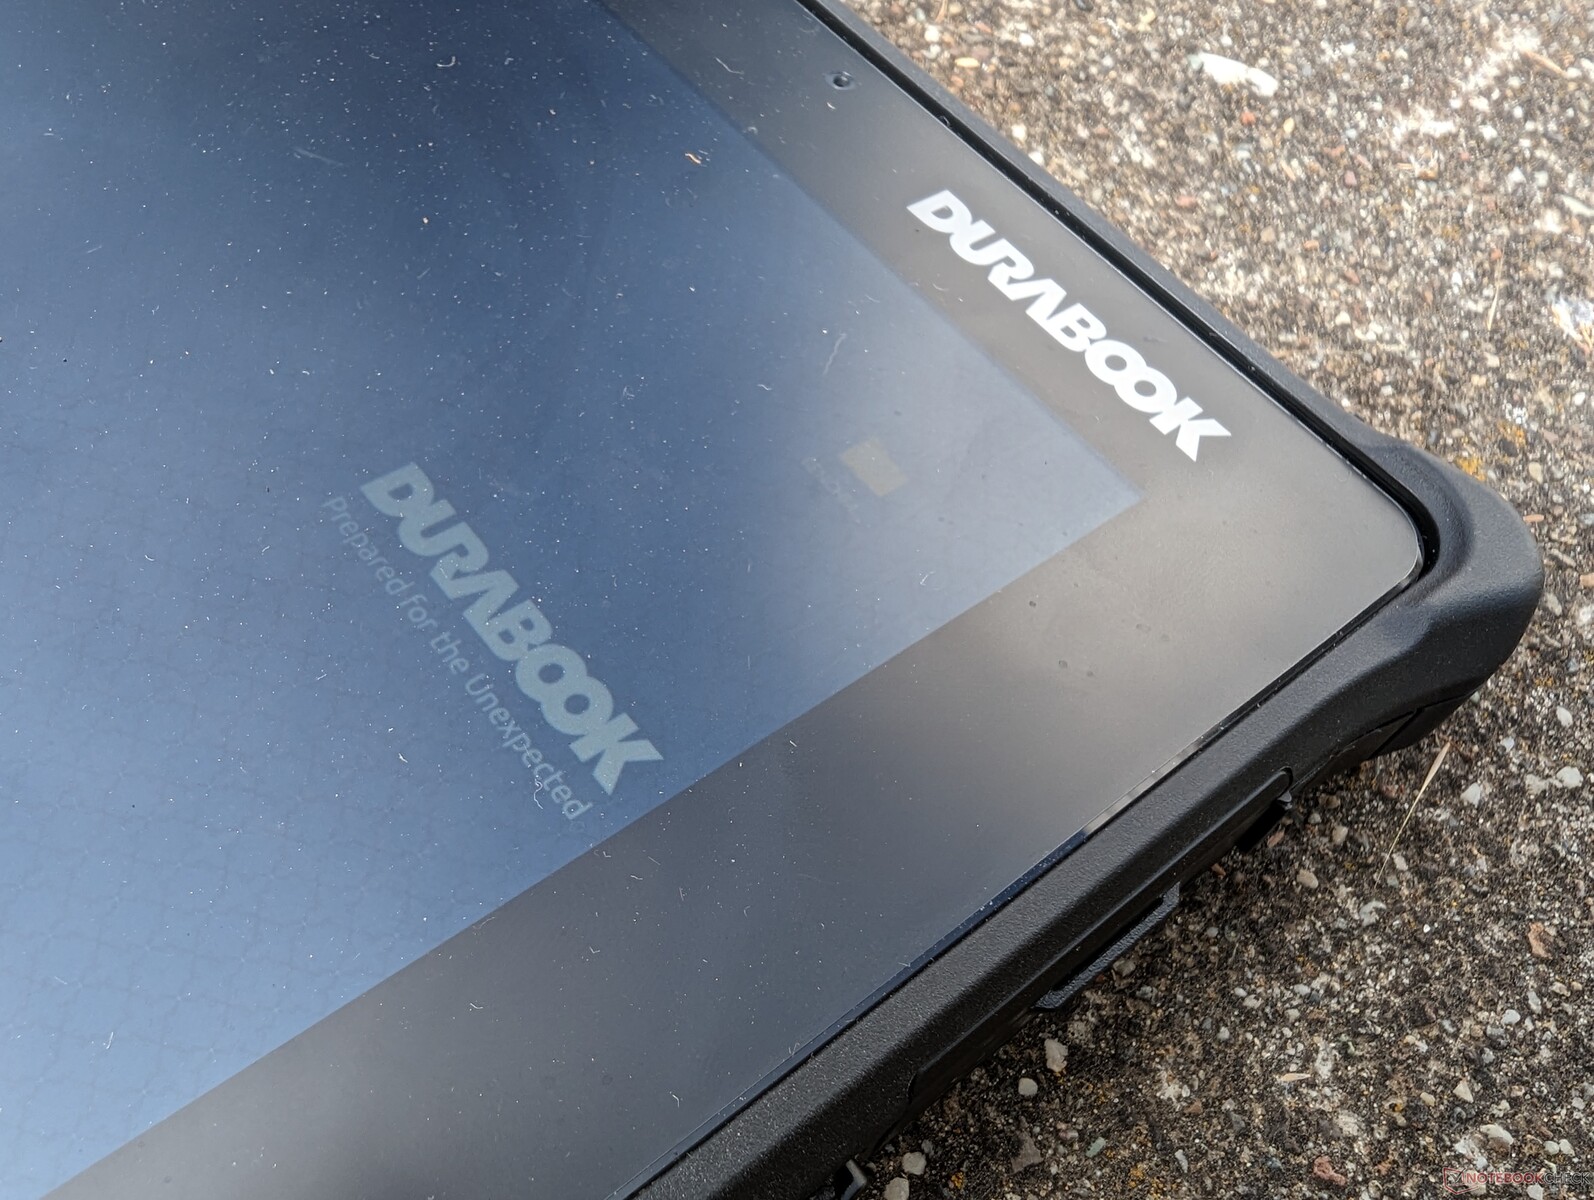
El chasis cuenta con las certificaciones MIL-STD 810H, MIL-STD 461G e IP66 contra una amplia gama de elementos ambientales. Si se intenta girar la tableta desde las esquinas o presionar el centro de la pantalla, no se producen crujidos ni deformaciones perceptibles, lo que da como resultado una primera impresión sólida.
La especificación totalmente robusta añade indudablemente peso y grosor al diseño. Si lo comparamos con el Acer Enduro T1 de la competencia, por ejemplo, nuestro Durabook es casi el doble de grueso y pesado a pesar de que ambos tienen pantallas táctiles de 8 pulgadas.
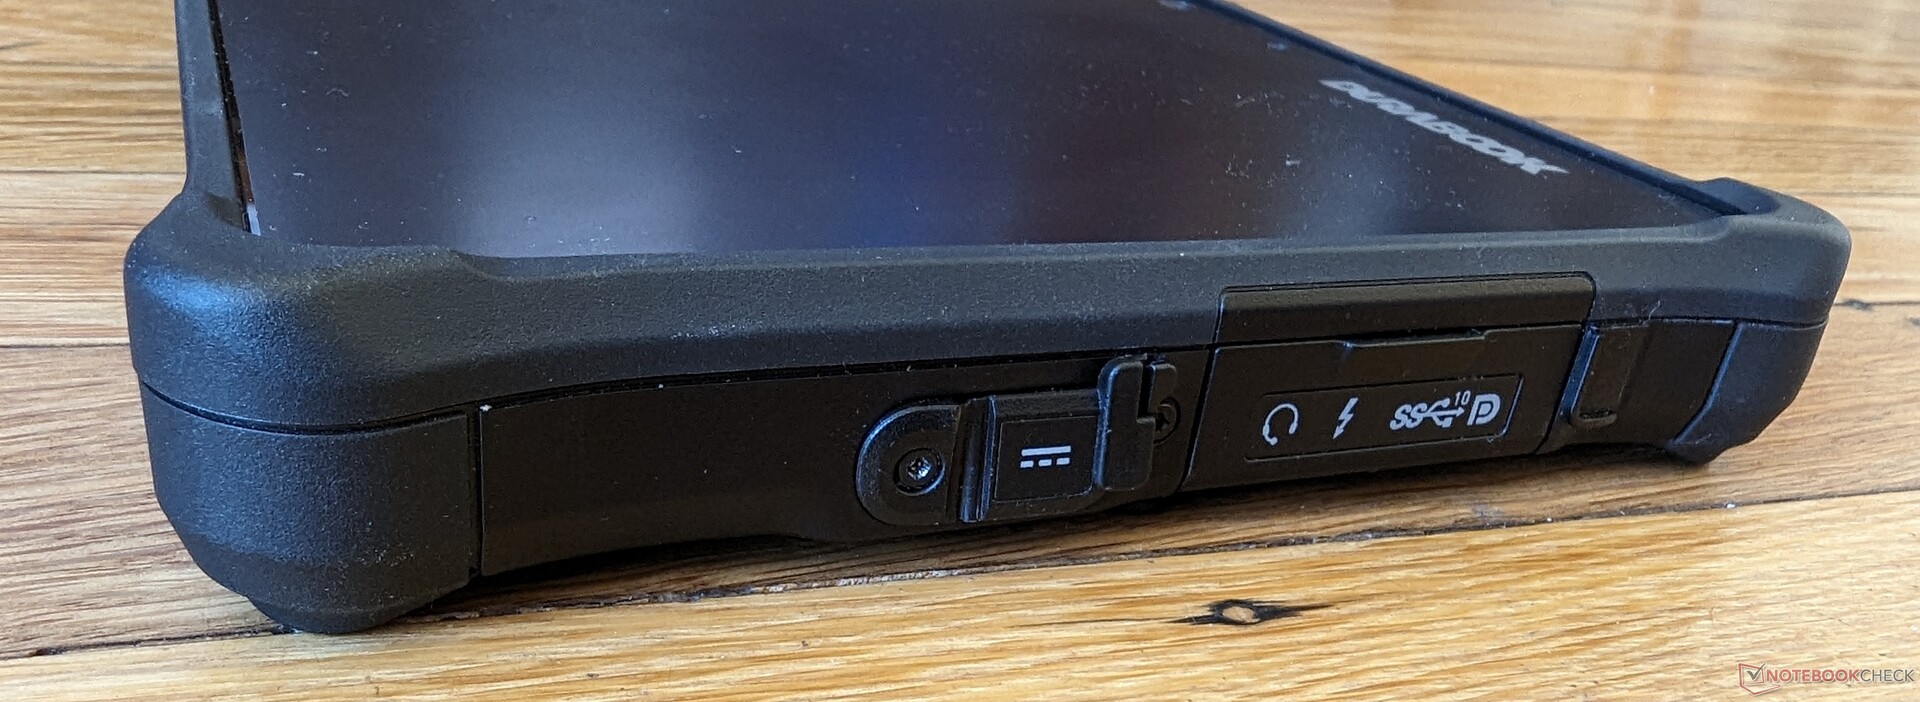
Conectividad: compatibilidad con Thunderbolt 4
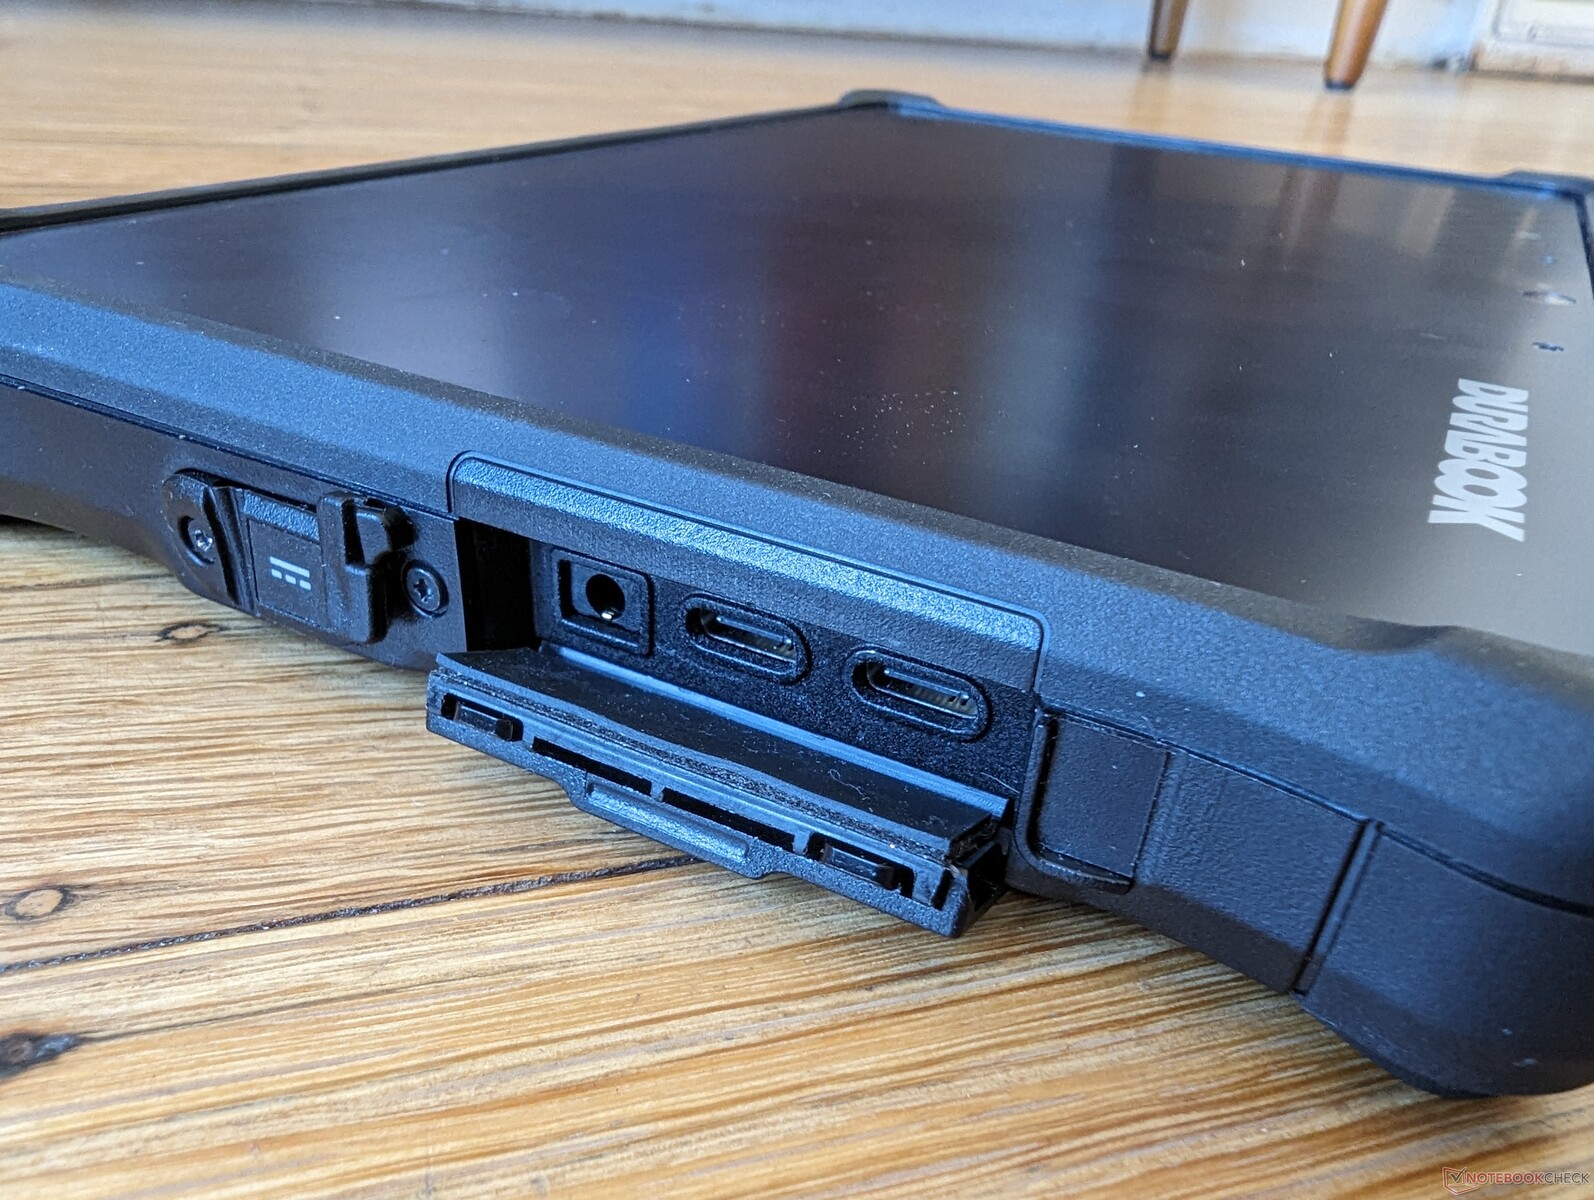
Algunos puertos son estándar en todas las SKU, mientras que otros se pueden añadir por un coste adicional, como USB-A, Gigabit RJ-45, RS232 o un lector de códigos de barras.
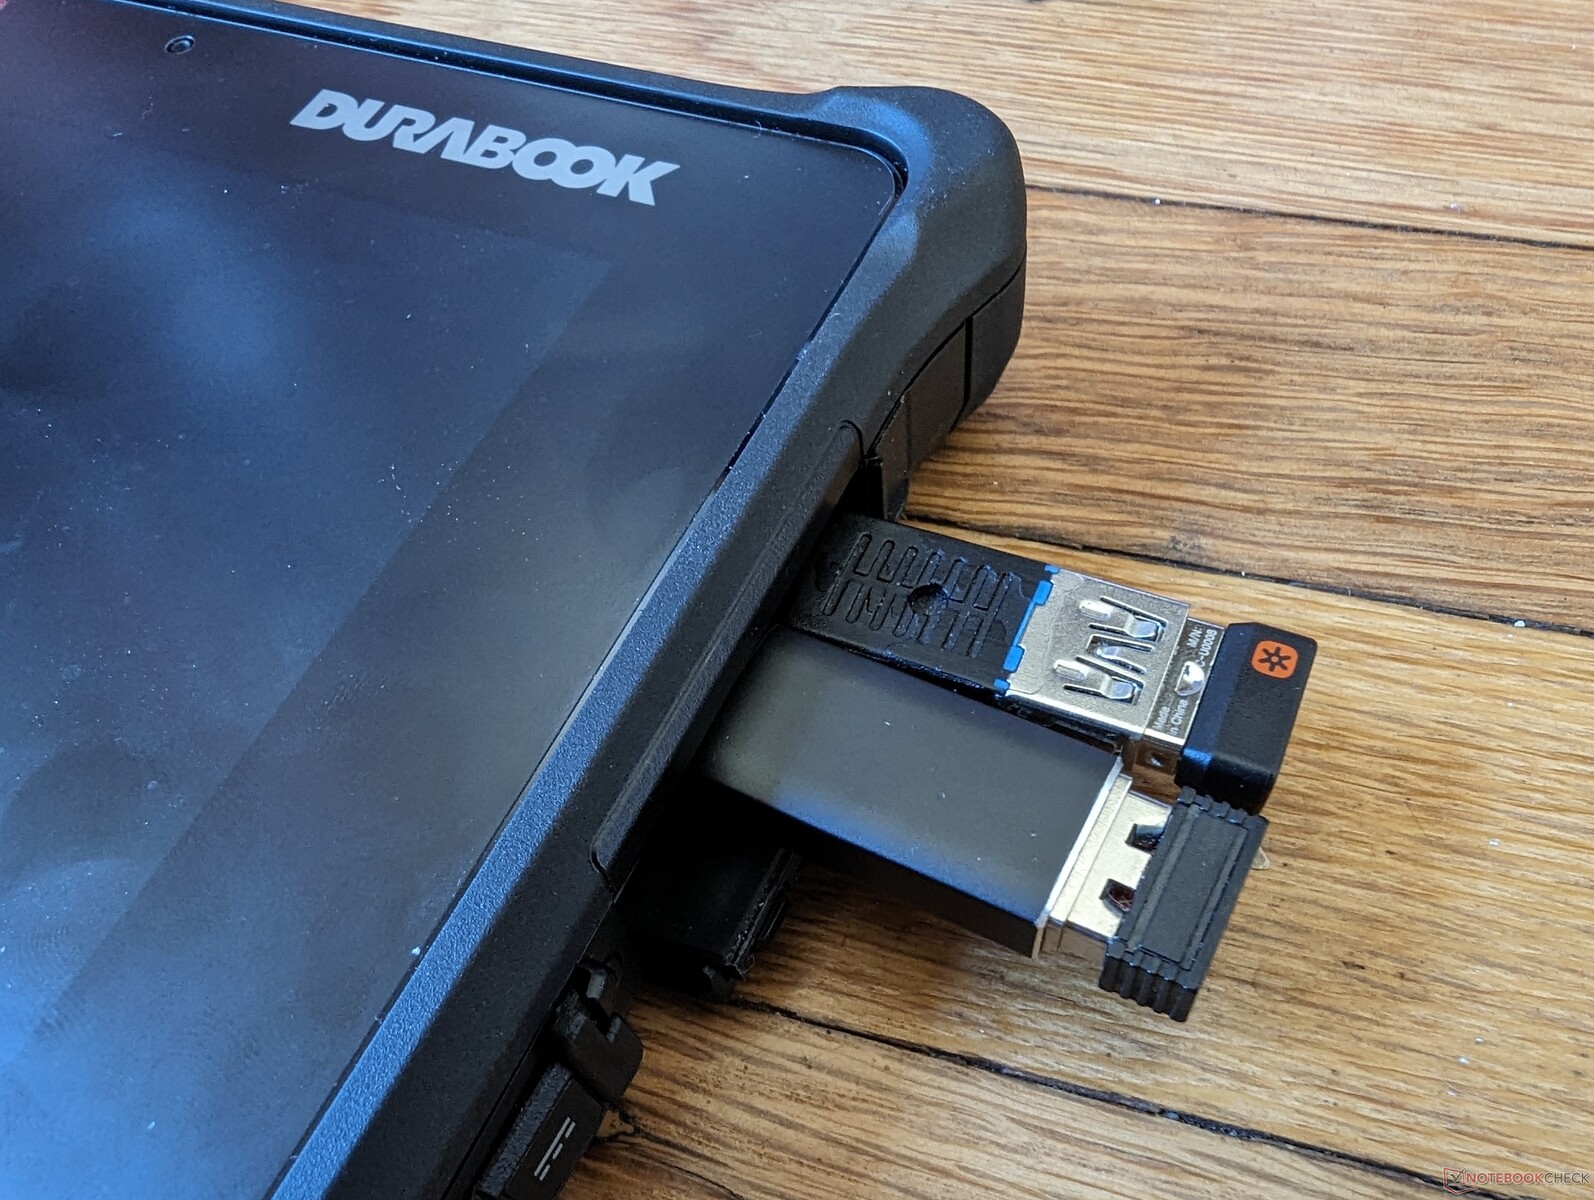
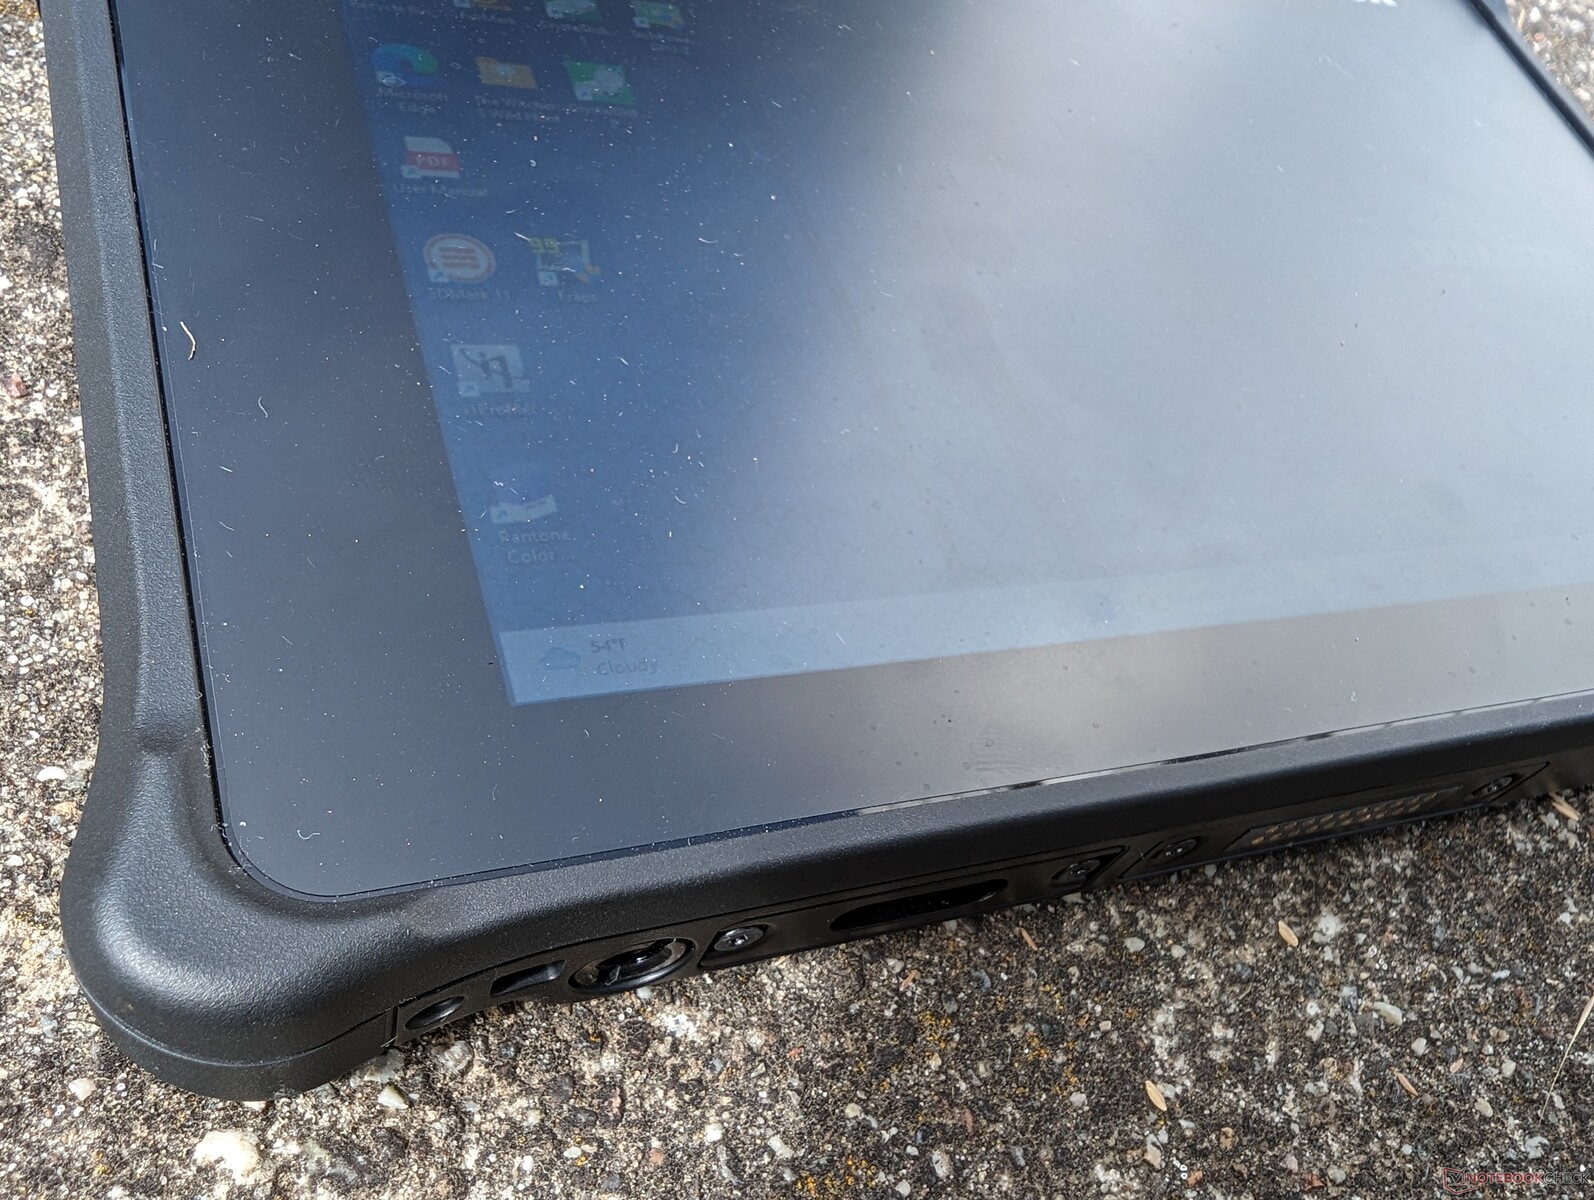
Uno de los dos puertos USB-C admite Thunderbolt 4 para una amplia gama de dispositivos externos compatibles. Sin embargo, sólo uno de los puertos soporta Power Delivery. Los puertos están demasiado apretados, por lo que algunos cables o adaptadores USB-C más gruesos pueden bloquear parcialmente el acceso a los otros puertos, como muestra la imagen de la derecha.
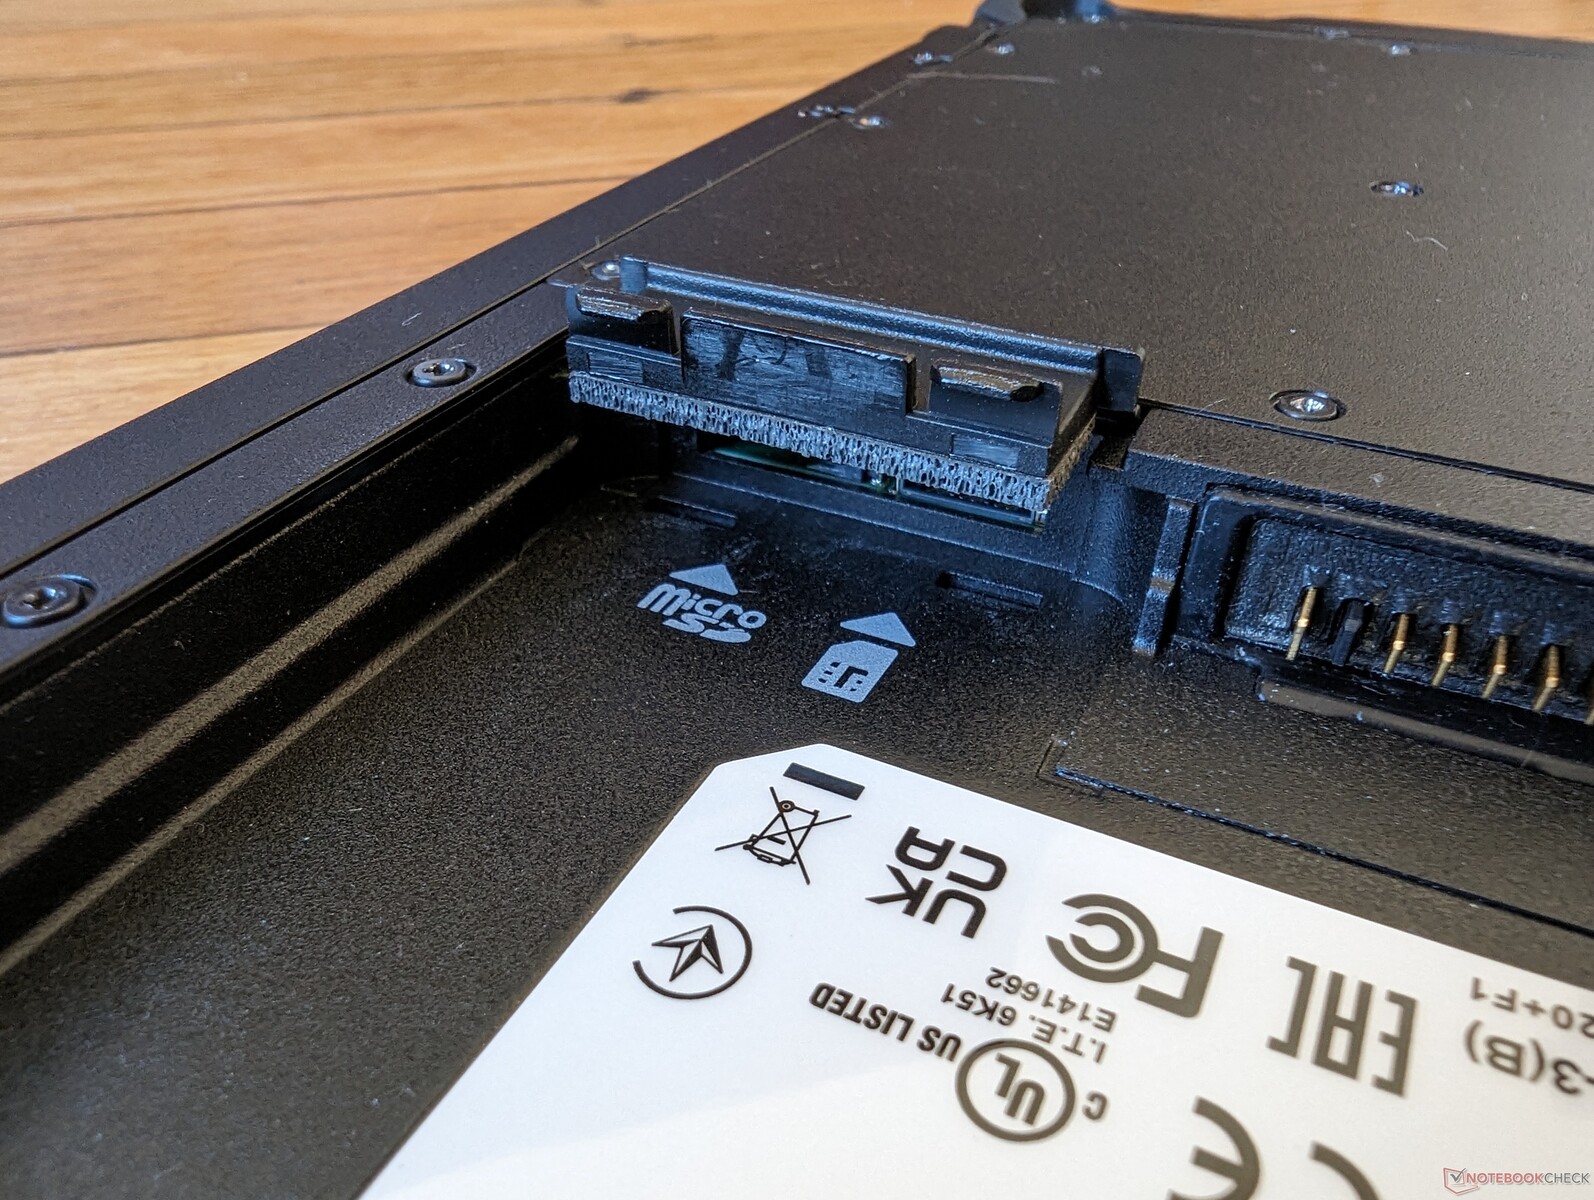
Lector de tarjetas SD - Su tarjeta MicroSD se atascará
El resorte de liberación del lector de tarjetas SD integrado es muy débil en comparación con los lectores de tarjetas de la mayoría de portátiles y tabletas. Nuestra tarjeta MicroSD de prueba se atascaba y era necesario utilizar pinzas para extraerla con cuidado.
| SD Card Reader | |
| average JPG Copy Test (av. of 3 runs) | |
| Dell Latitude 7230 Rugged Extreme (AV Pro V60) | |
| Durabook R8 Tablet (AV Pro V60) | |
| Lenovo Tab M8 (Gen 4) (Angelbird V60) | |
| maximum AS SSD Seq Read Test (1GB) | |
| Dell Latitude 7230 Rugged Extreme (AV Pro V60) | |
| Durabook R8 Tablet (AV Pro V60) | |
Comunicación
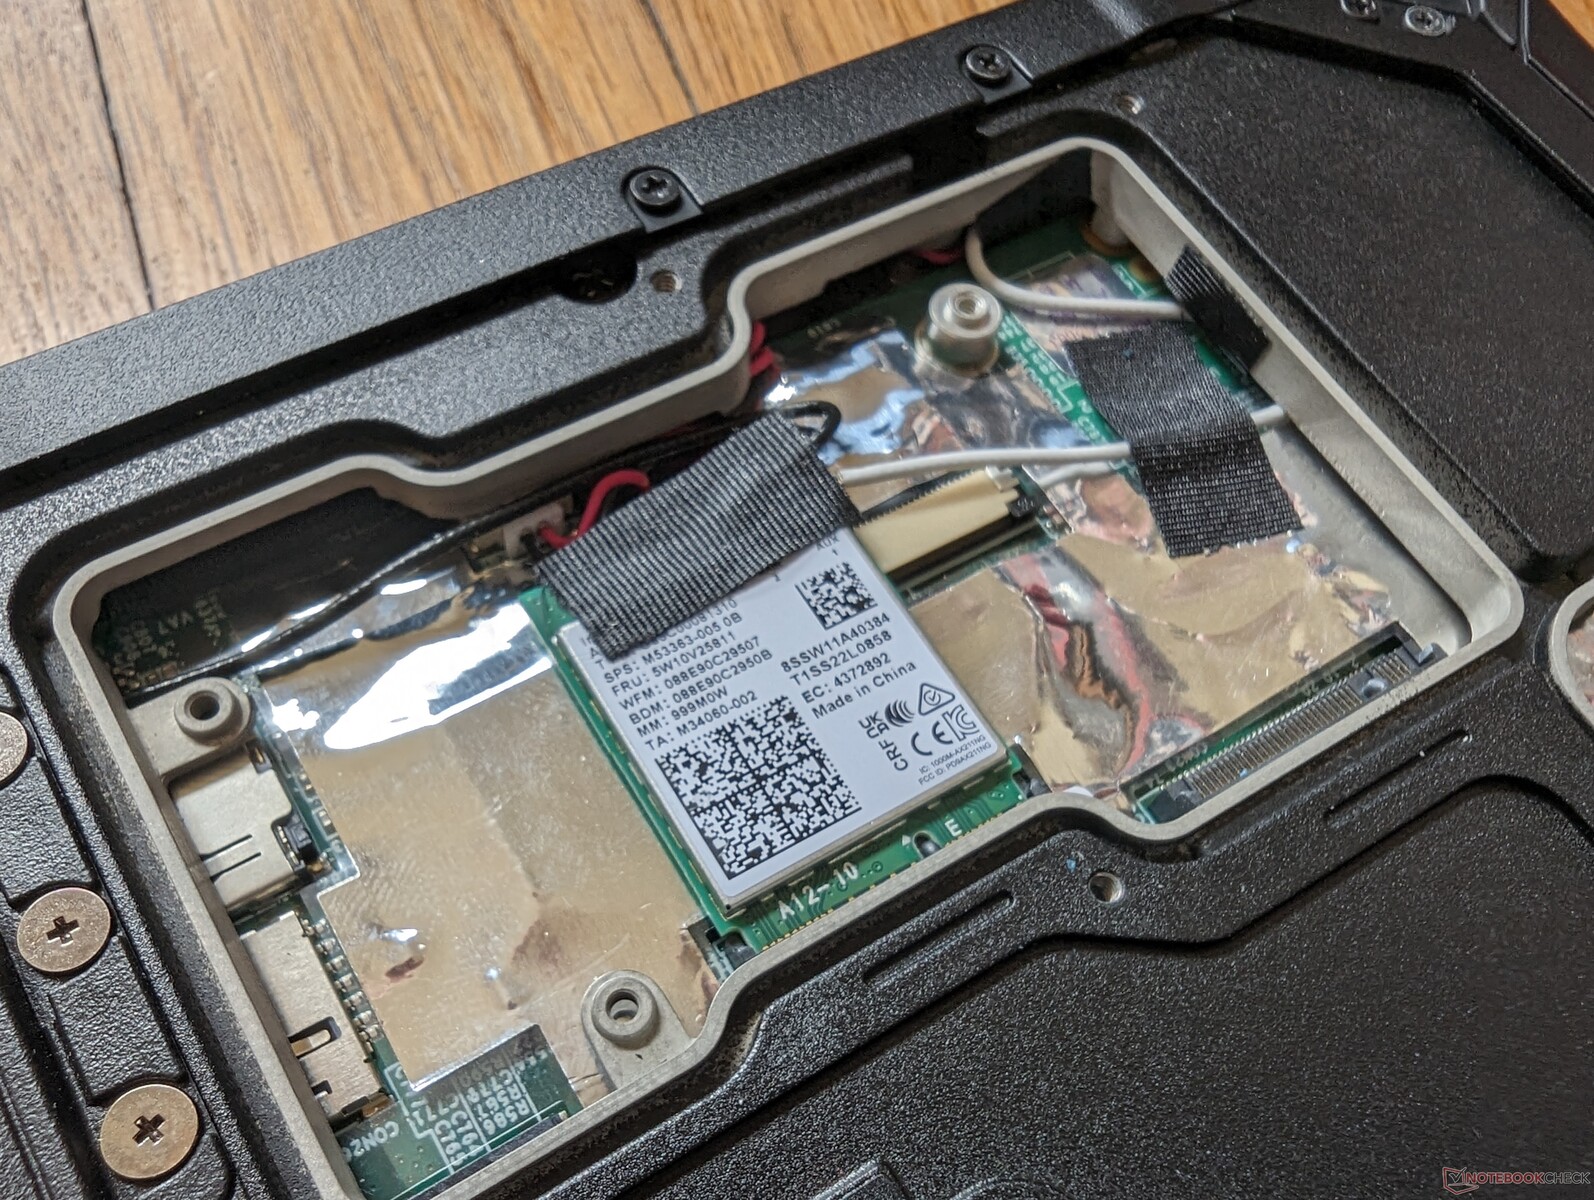
Un Intel AX211 viene de serie para la conectividad Wi-Fi 6E y Bluetooth 5.3. Las tasas de transferencia son estables sin problemas.
| Networking | |
| iperf3 transmit AX12 | |
| Panasonic Toughbook FZ-G2 | |
| Acer Enduro T1 ET108-11A A9001 | |
| iperf3 receive AX12 | |
| Panasonic Toughbook FZ-G2 | |
| Acer Enduro T1 ET108-11A A9001 | |
| iperf3 transmit AXE11000 | |
| Durabook R8 Tablet | |
| Dell Latitude 7230 Rugged Extreme | |
| Lenovo Tab M8 (Gen 4) | |
| iperf3 receive AXE11000 | |
| Durabook R8 Tablet | |
| Dell Latitude 7230 Rugged Extreme | |
| Lenovo Tab M8 (Gen 4) | |
| iperf3 transmit AXE11000 6GHz | |
| Dell Latitude 7230 Rugged Extreme | |
| Durabook R8 Tablet | |
| iperf3 receive AXE11000 6GHz | |
| Durabook R8 Tablet | |
| Dell Latitude 7230 Rugged Extreme | |
Cámara web
La cámara frontal de 2 MP viene de serie, mientras que la trasera de 8 MP con flash es una mejora opcional. La calidad de imagen es más nítida que la de las webcams de los portátiles, pero la calidad de vídeo se limita a 1080p y 30 FPS a pesar del sensor de mayor resolución.


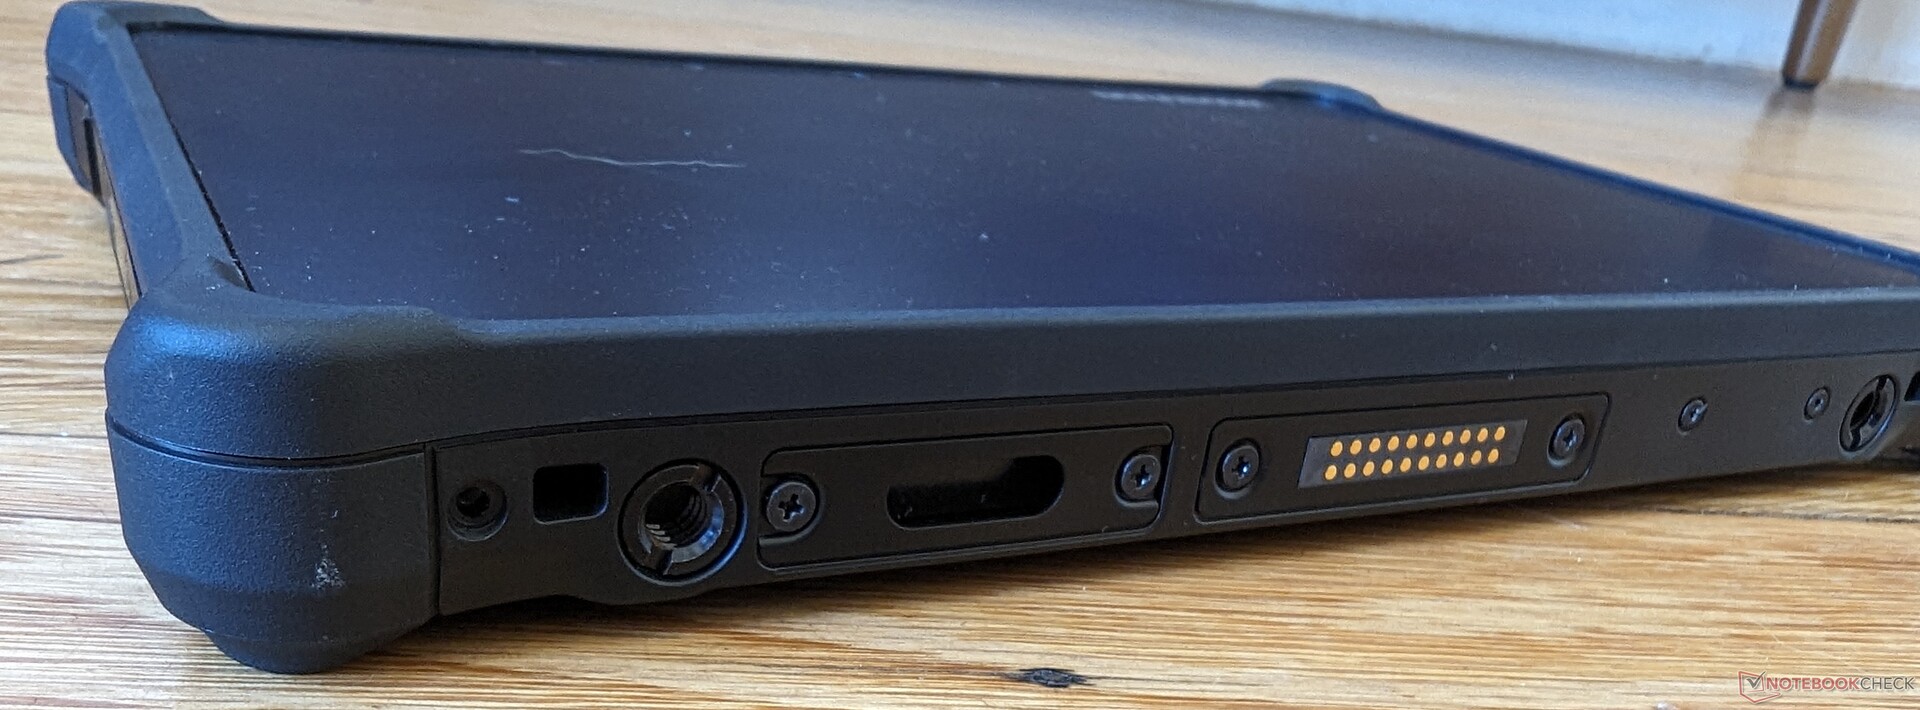
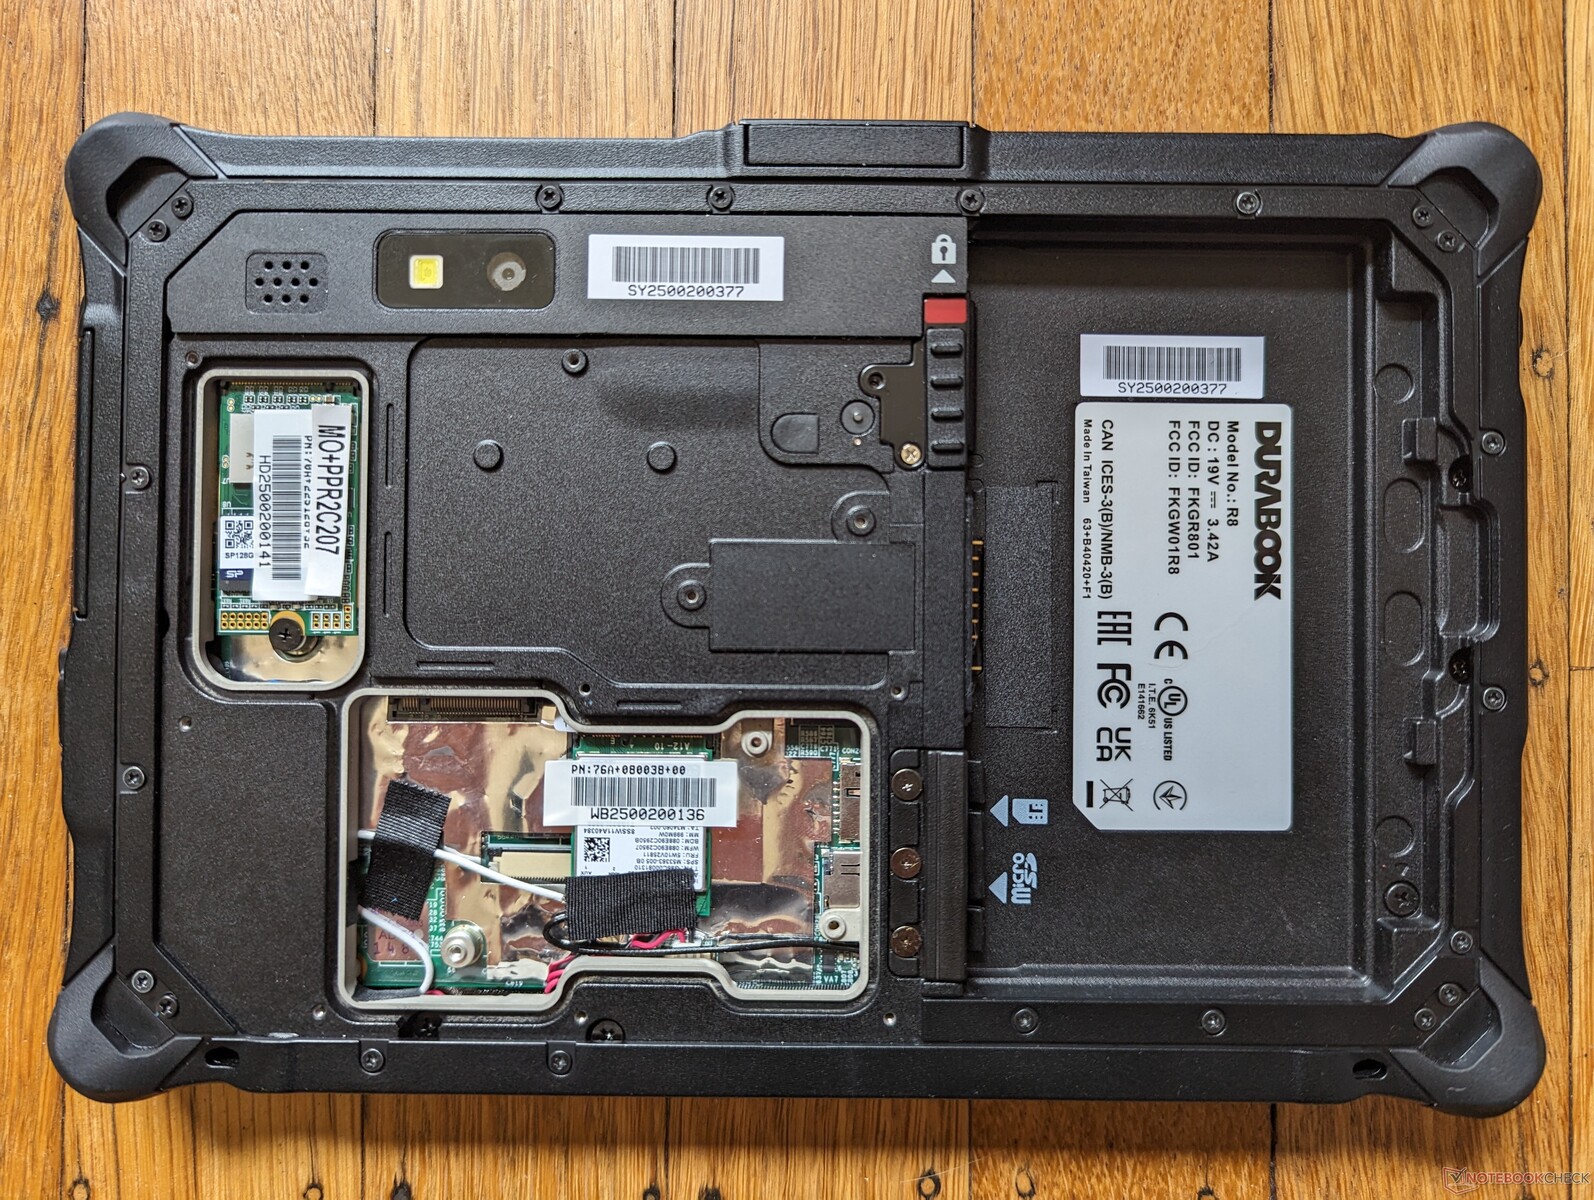
Mantenimiento
Accesorios y garantía
La caja incluye un lápiz óptico pasivo y un cordón para la muñeca. Los accesorios opcionales son muy variados, como un soporte de estación de acoplamiento especializado con puertos adicionales, batería de repuesto de mayor capacidad, bahías de carga de batería, lectores de tarjetas inteligentes, diferentes tipos de adaptadores de CA y mucho más, como se detalla en aquí.
Se incluye de serie una garantía de tres años por daños accidentales.
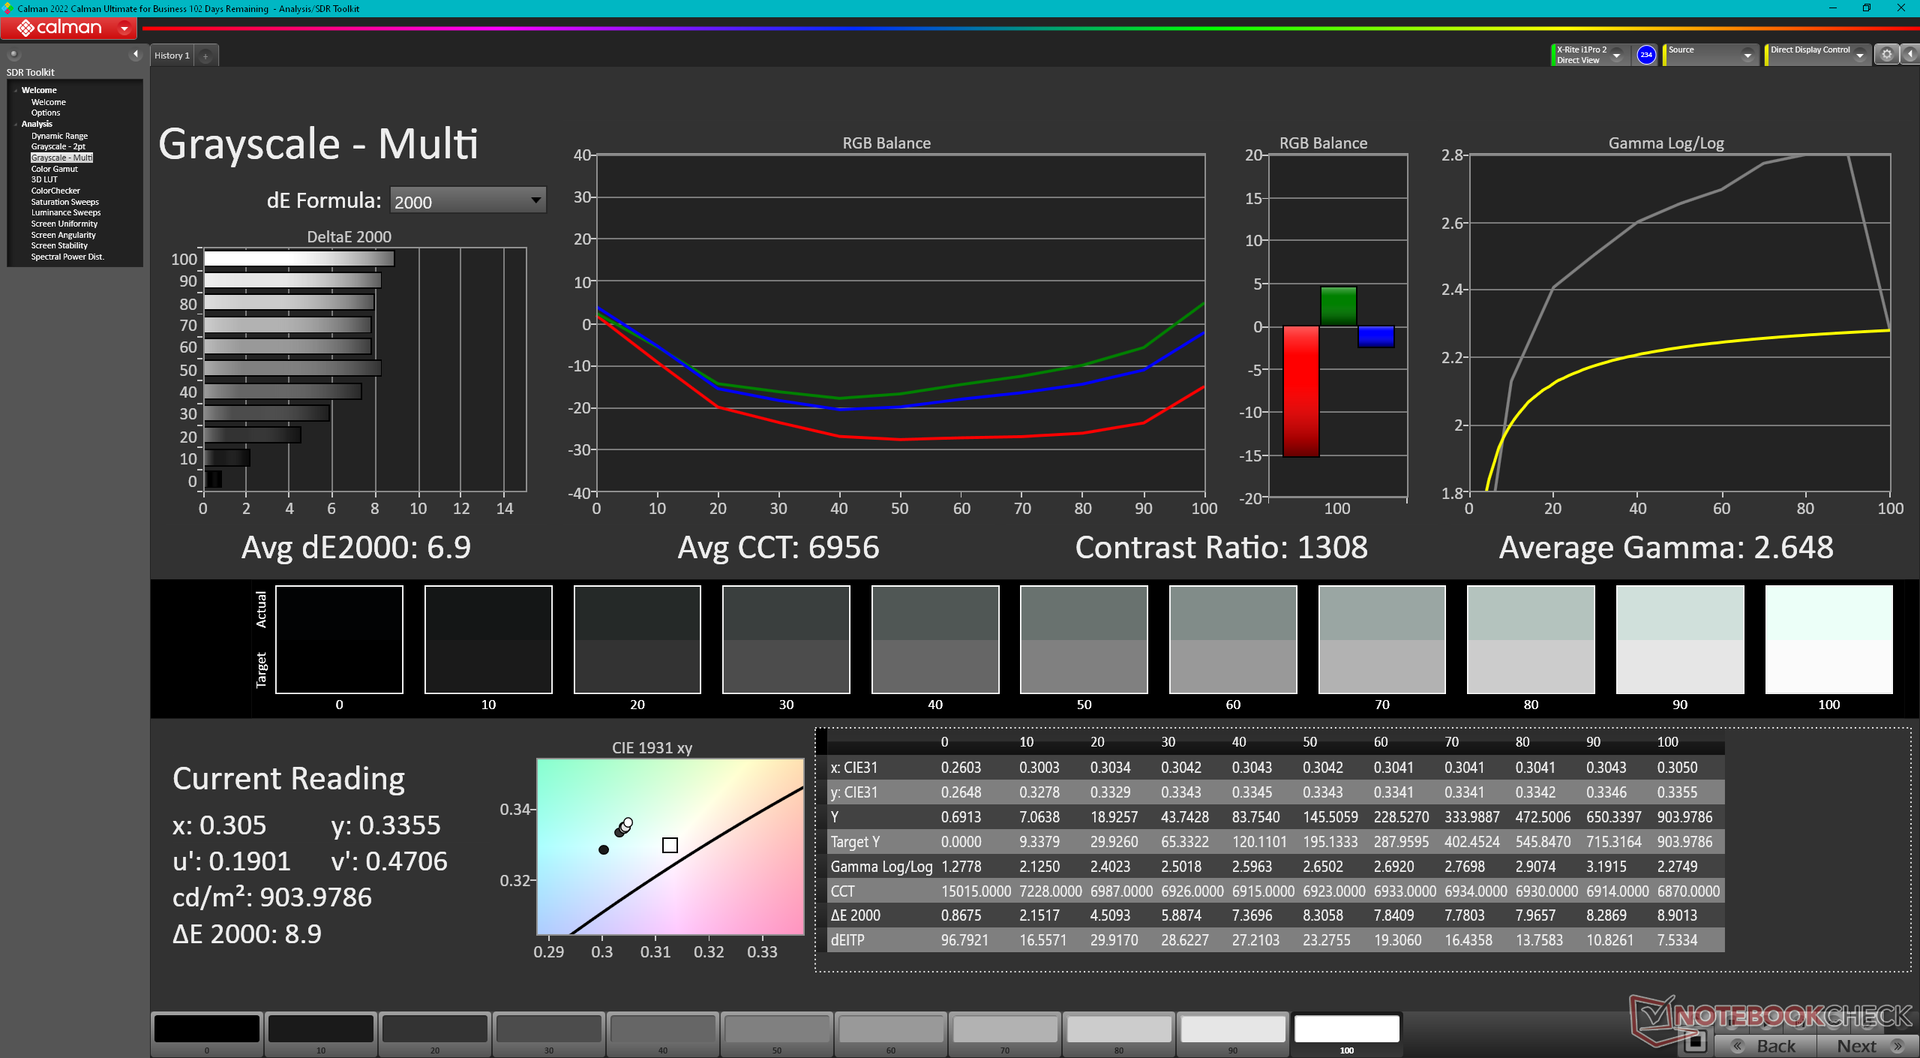
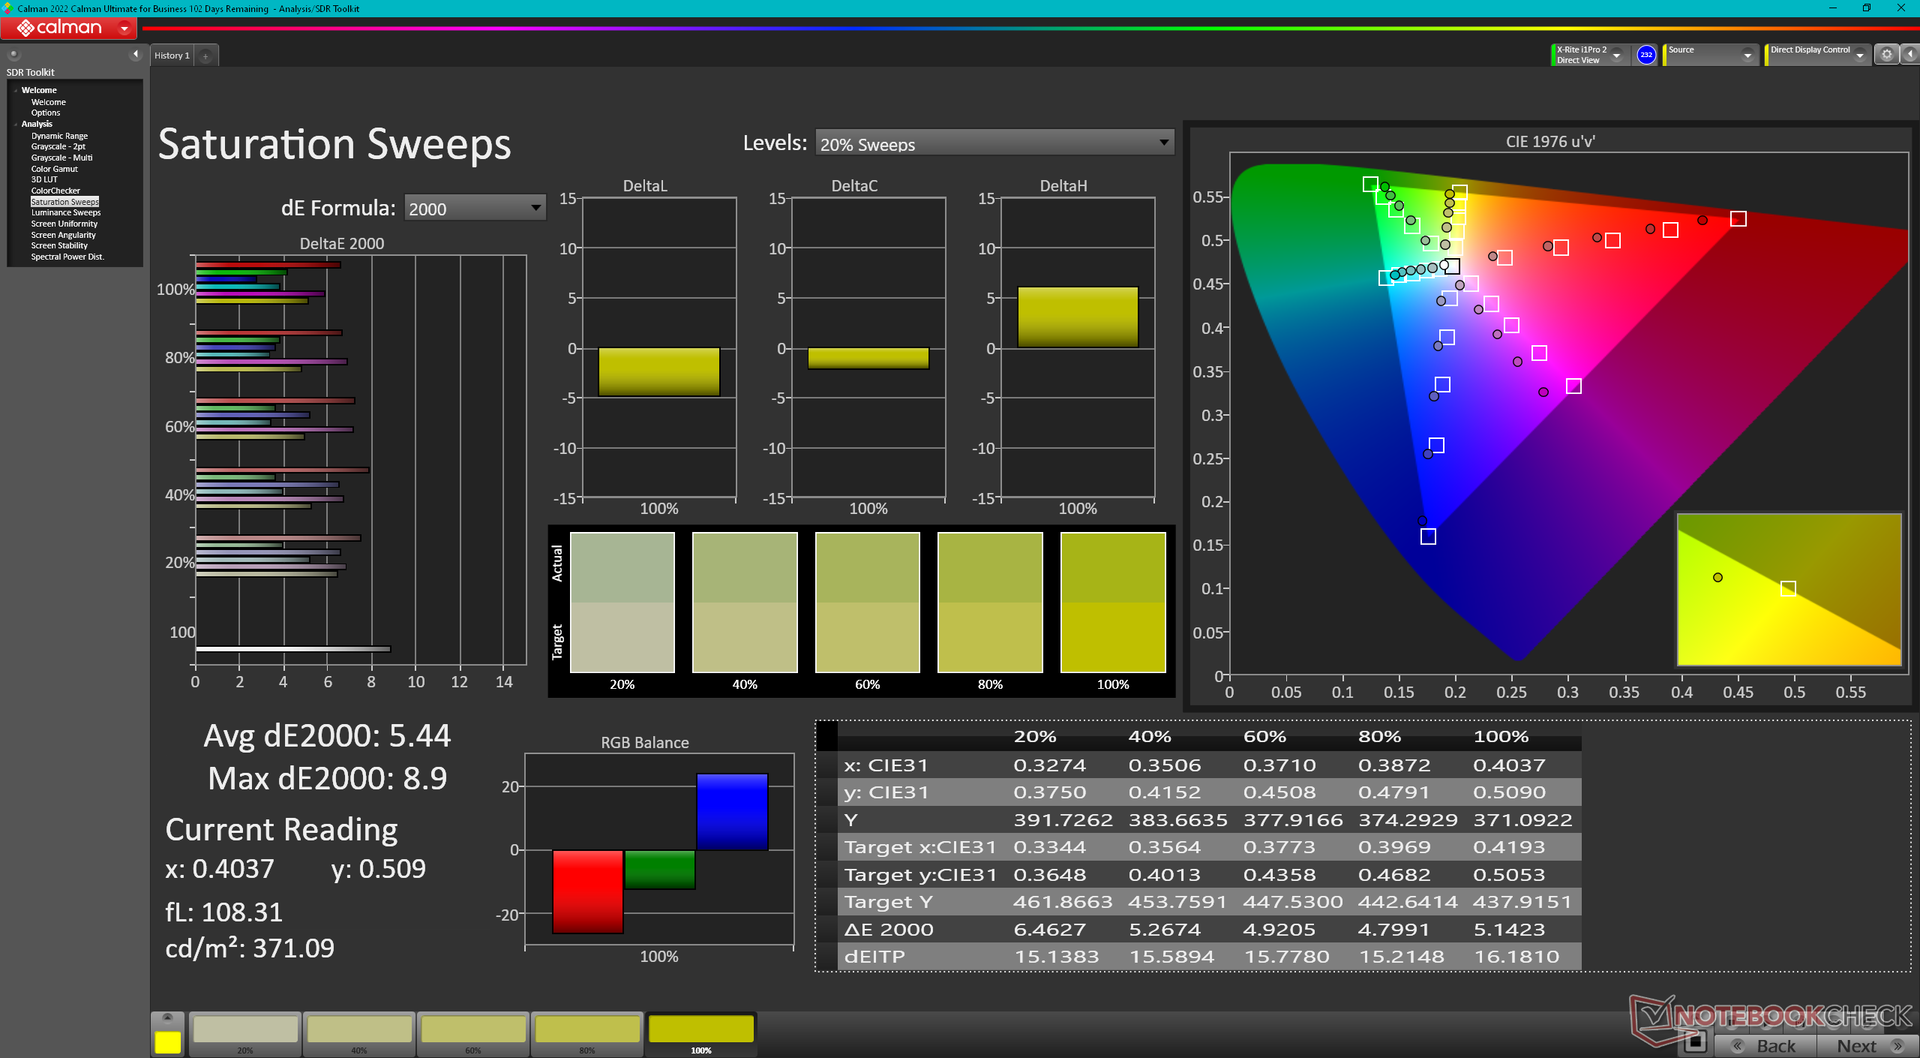
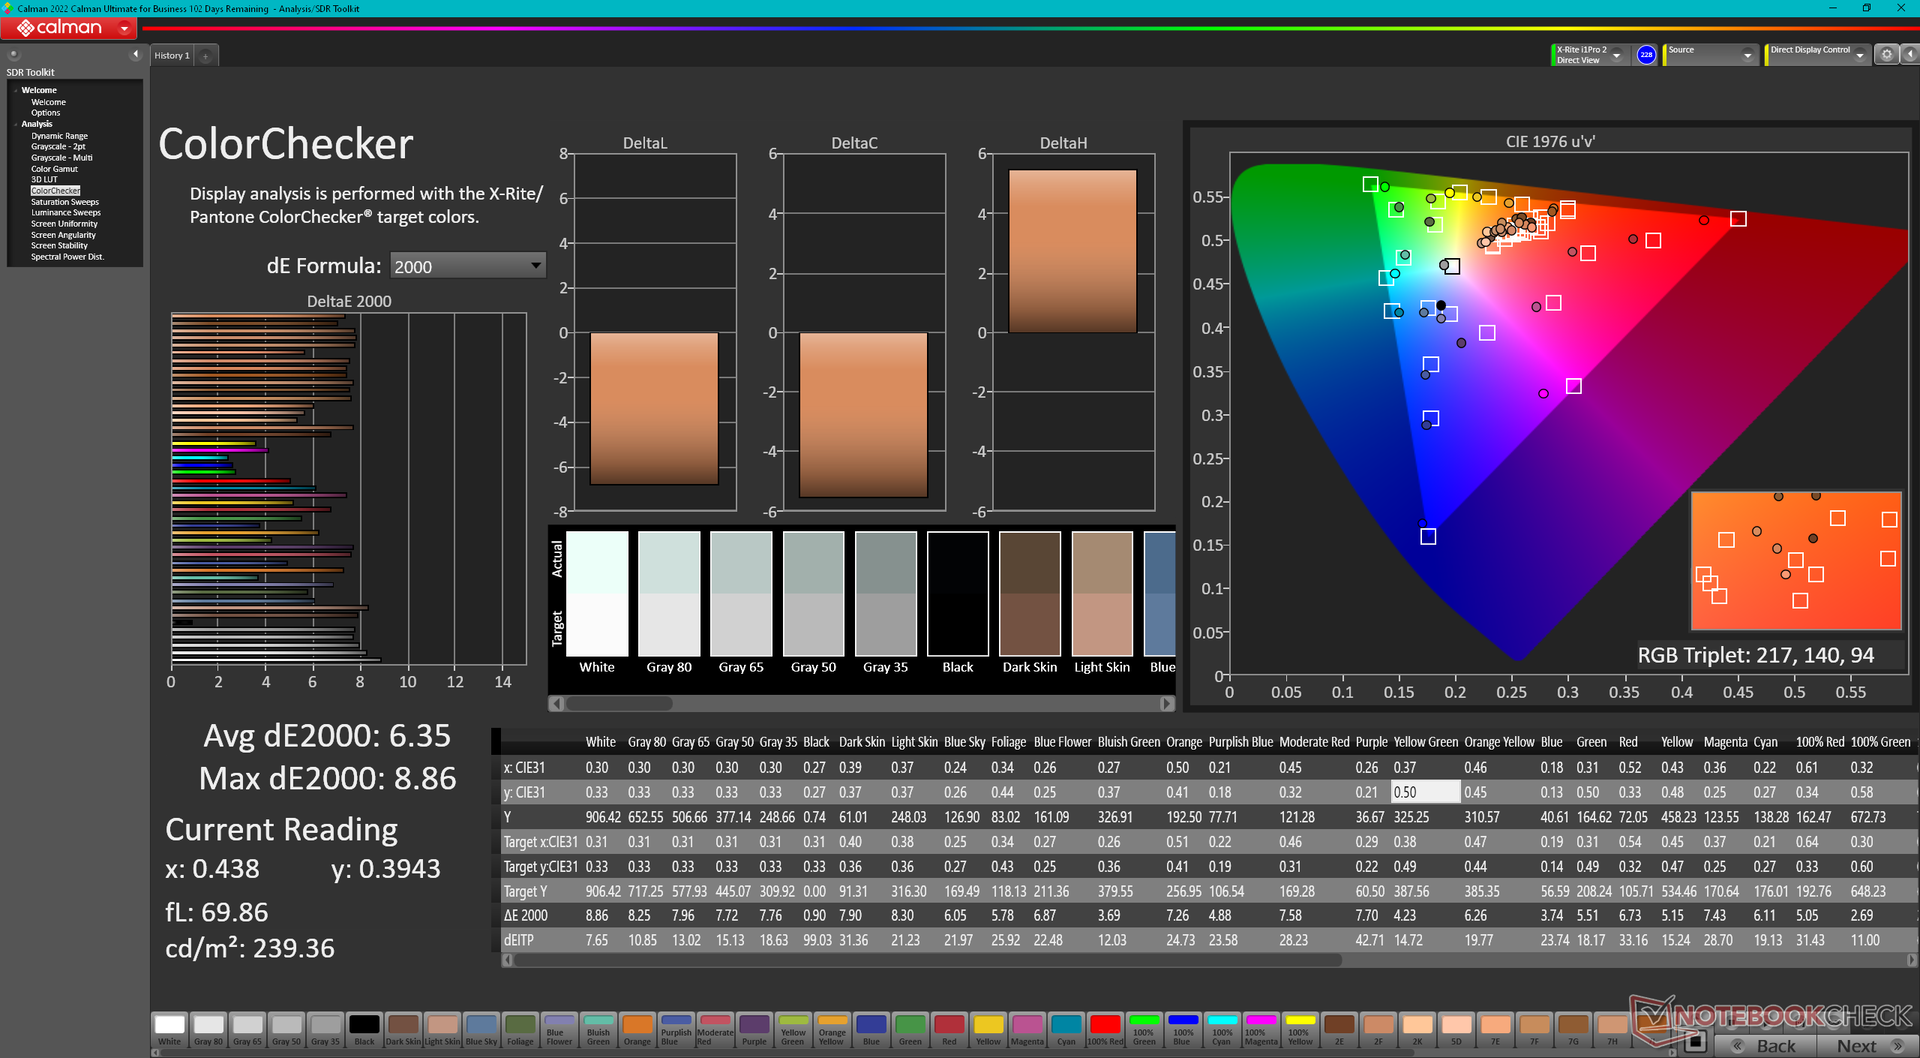
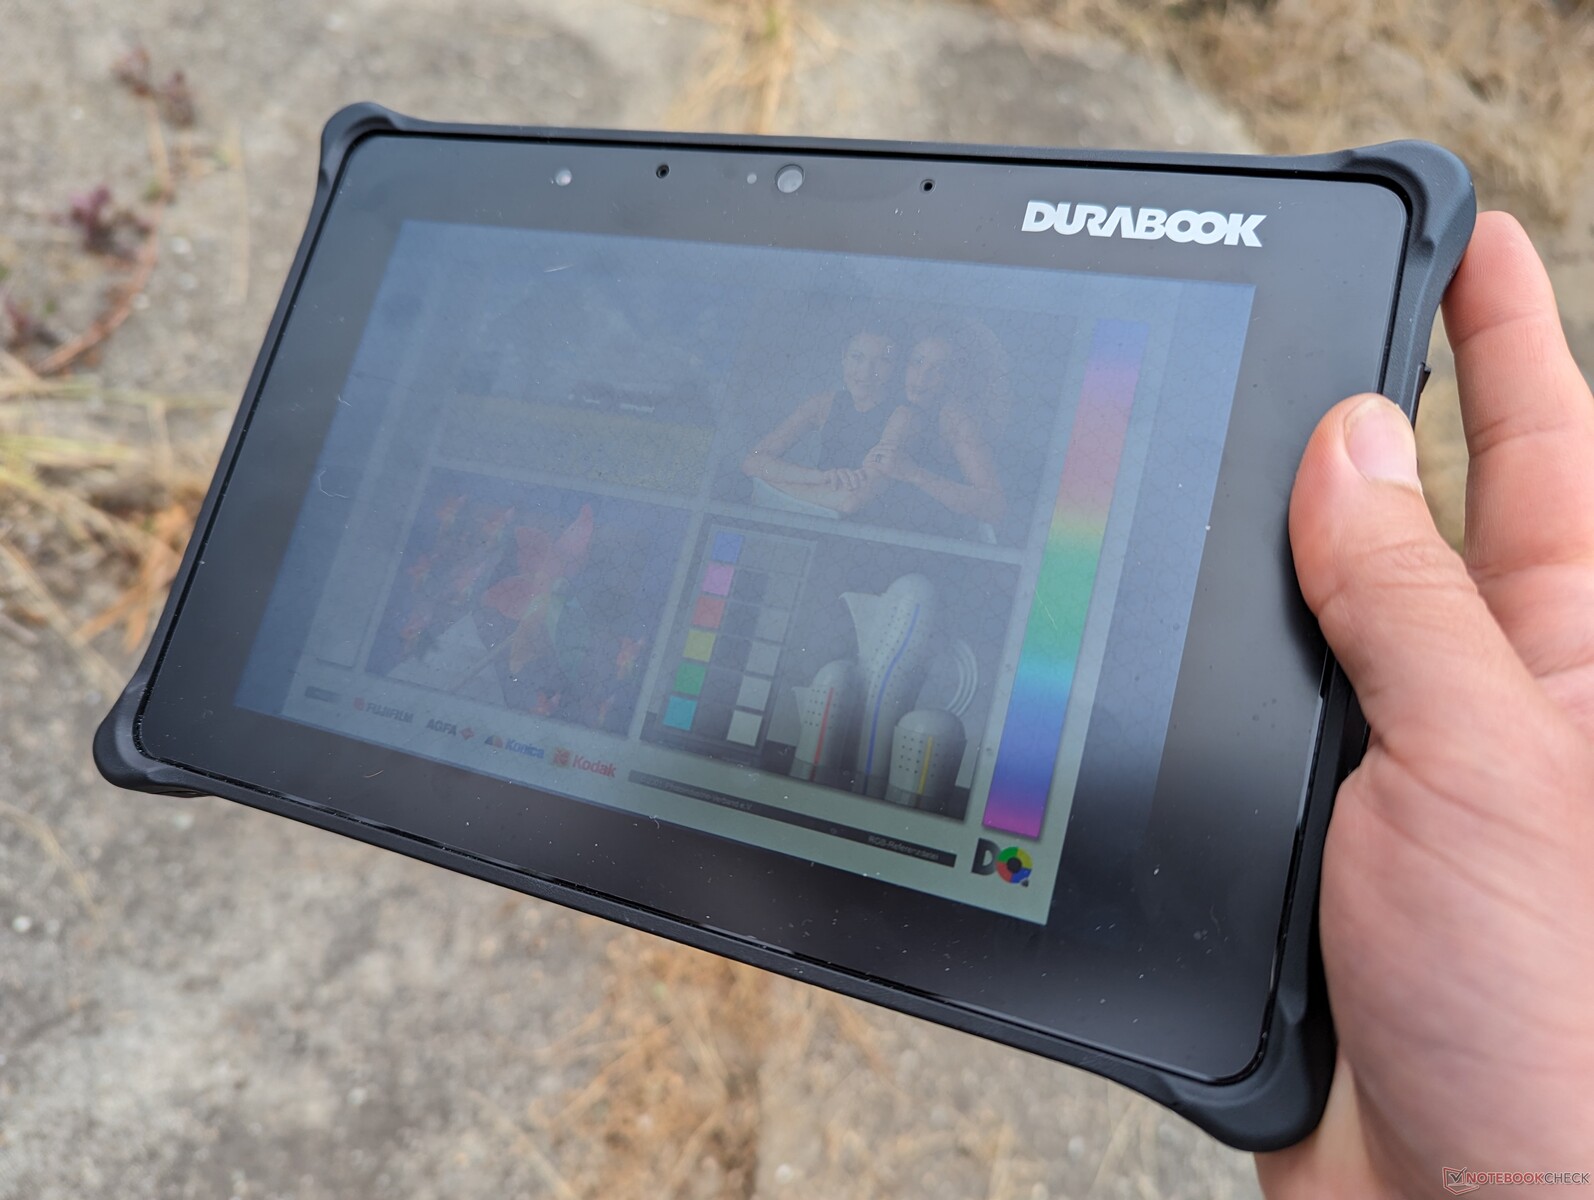
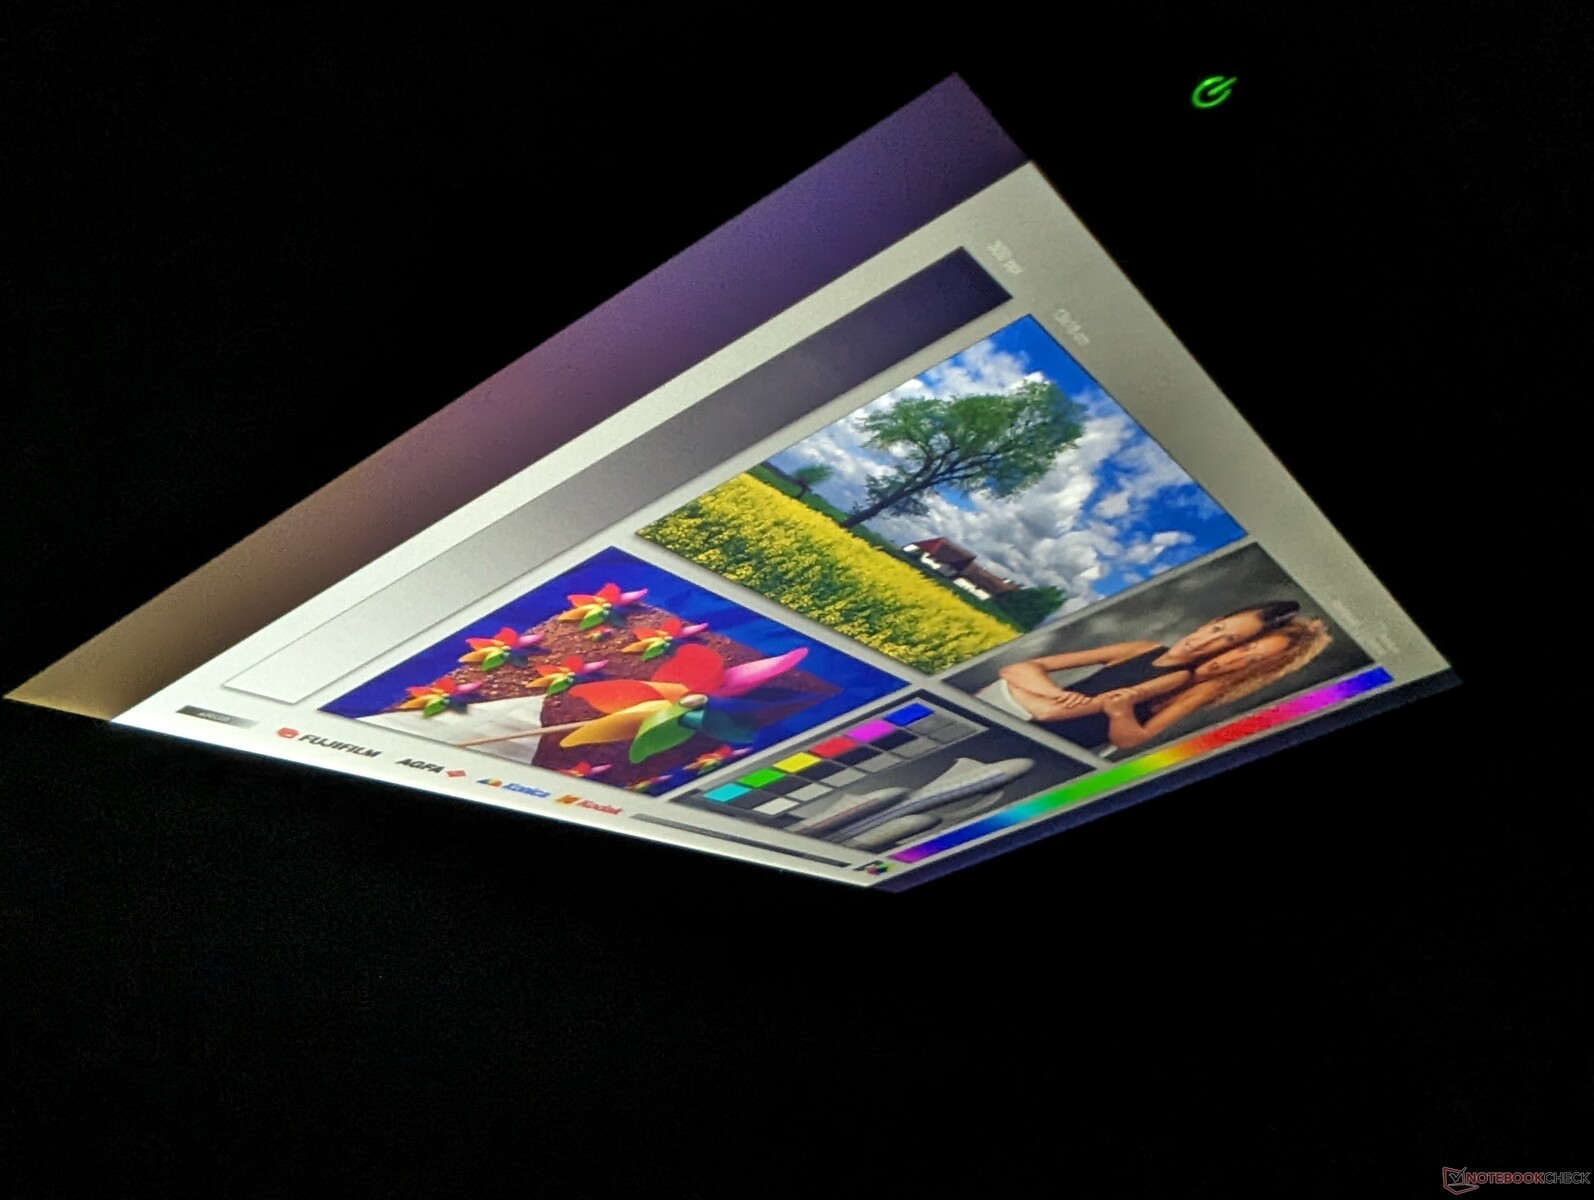
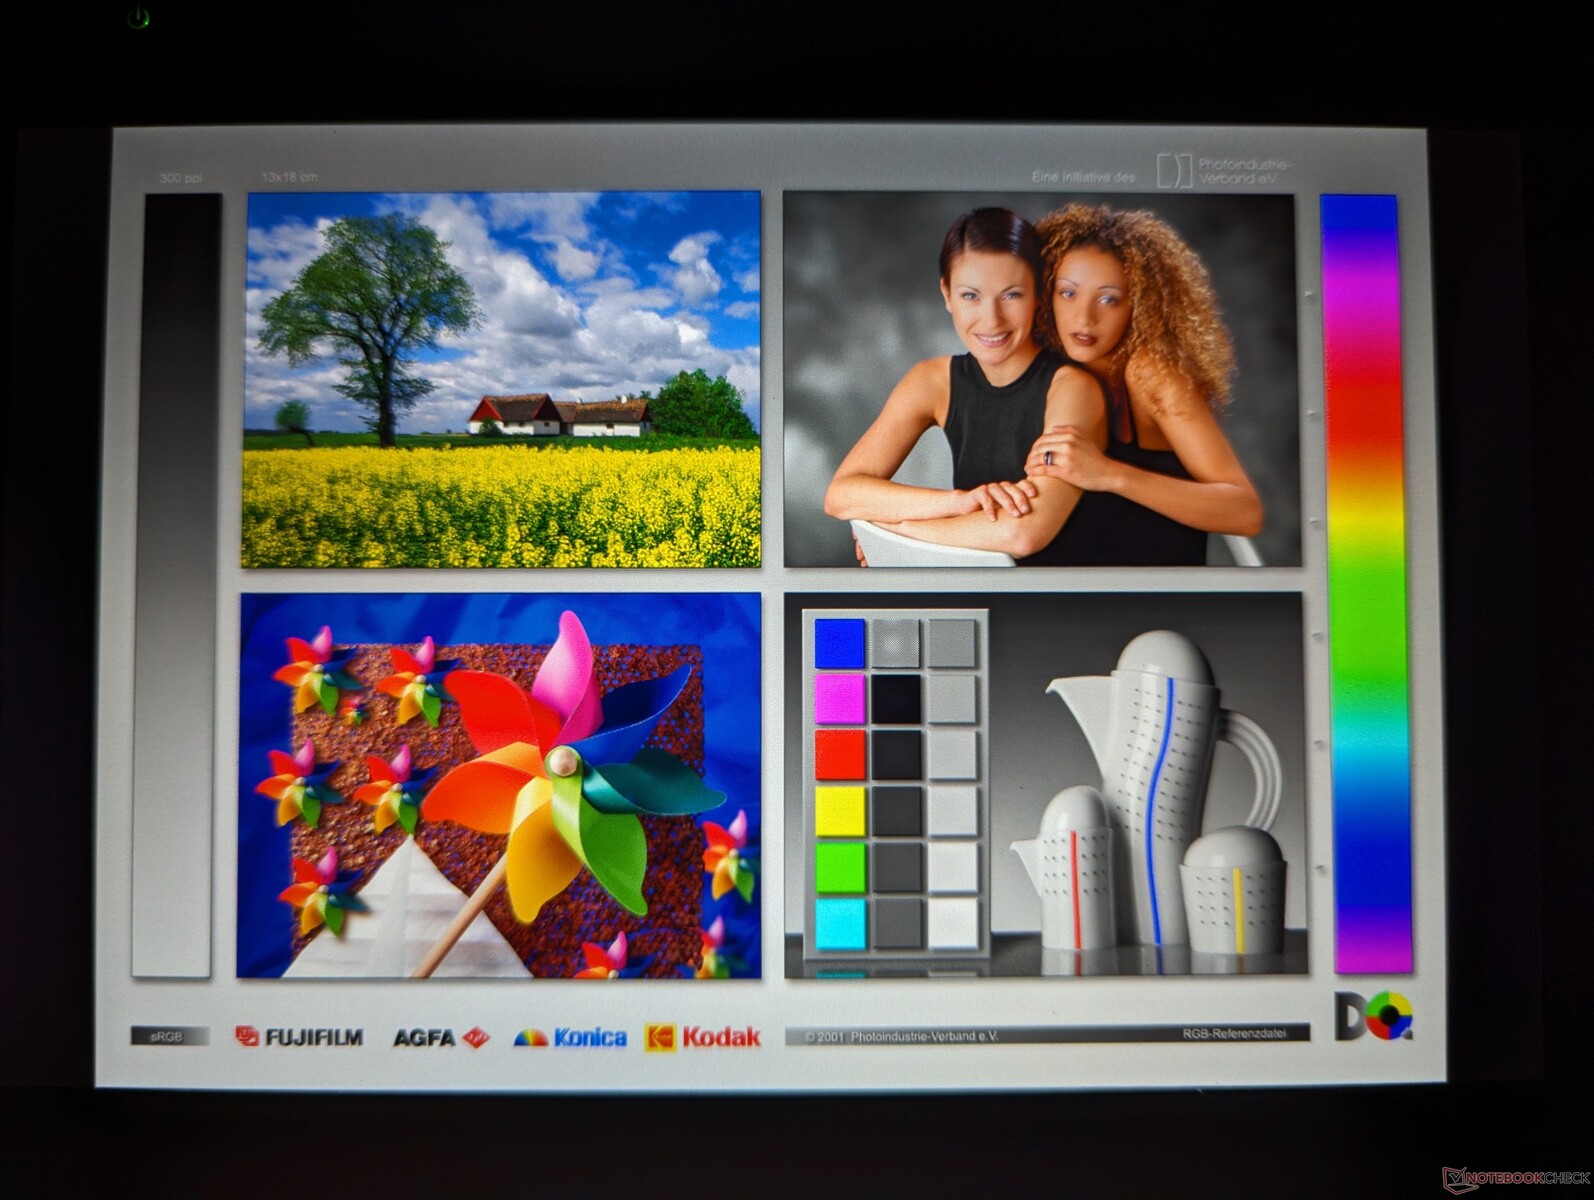
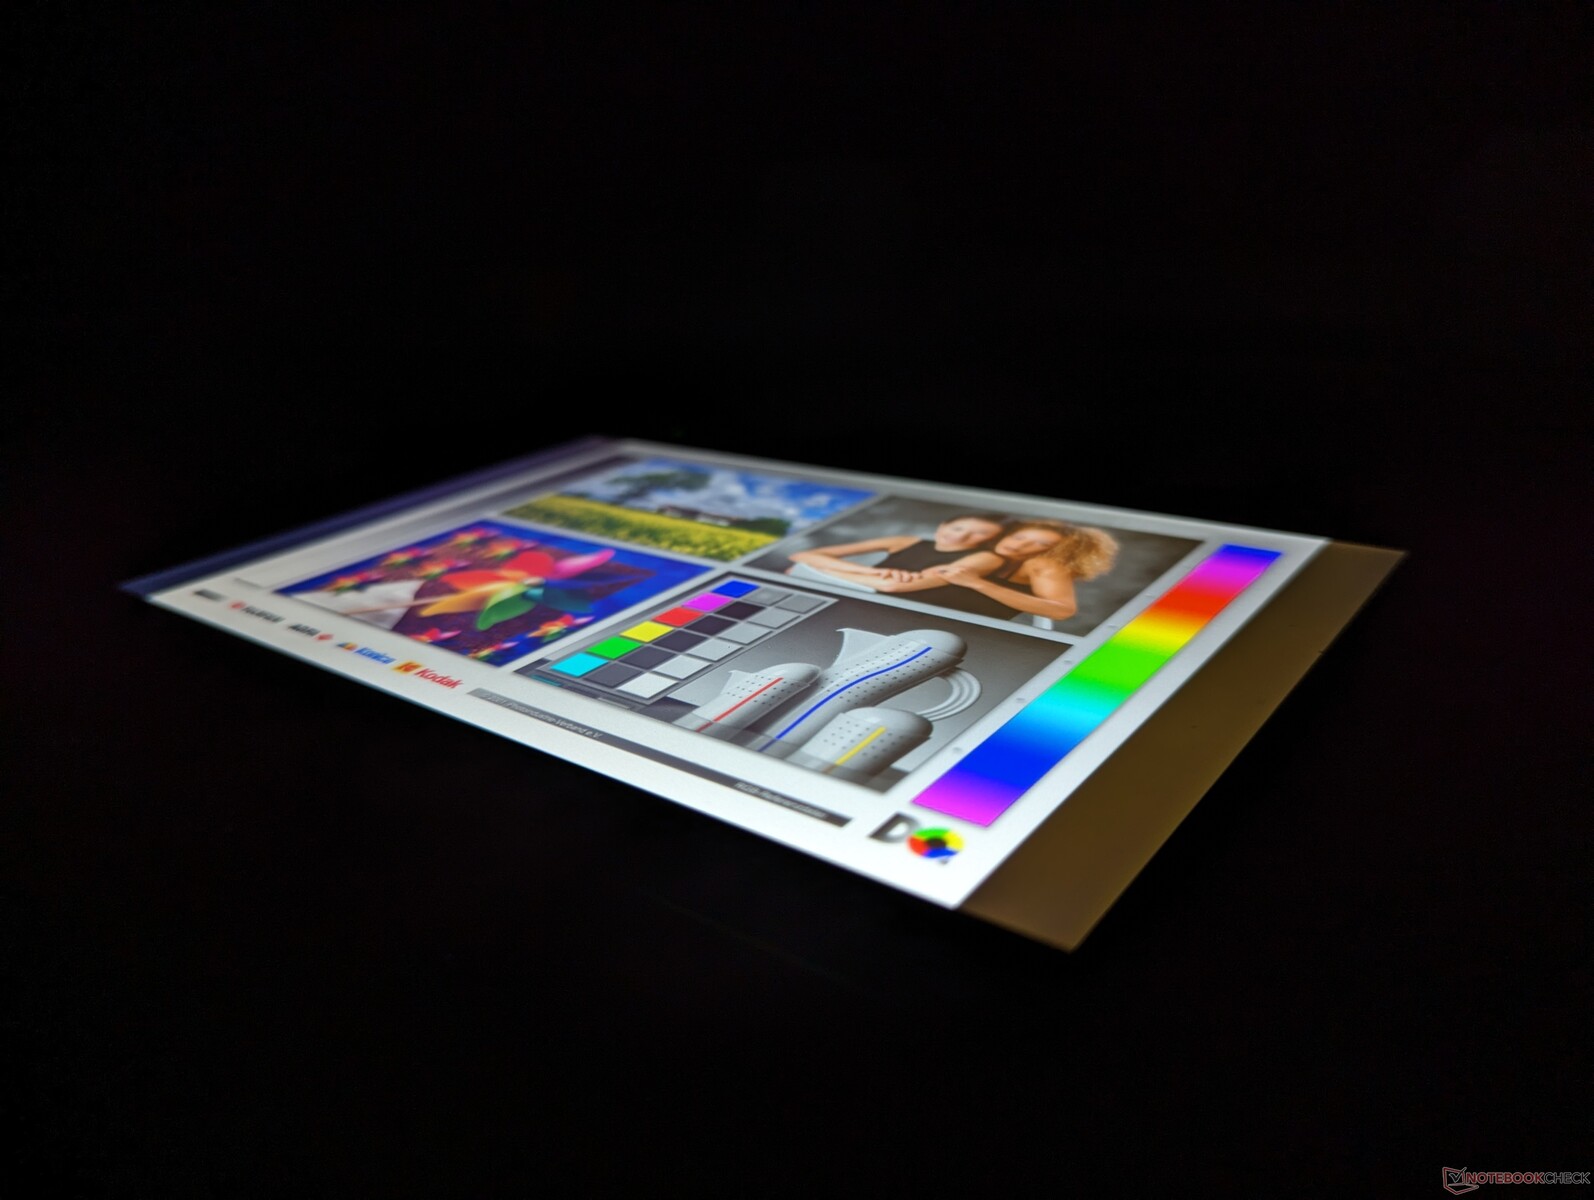
Pantalla - Pantalla táctil brillante de 800 nits
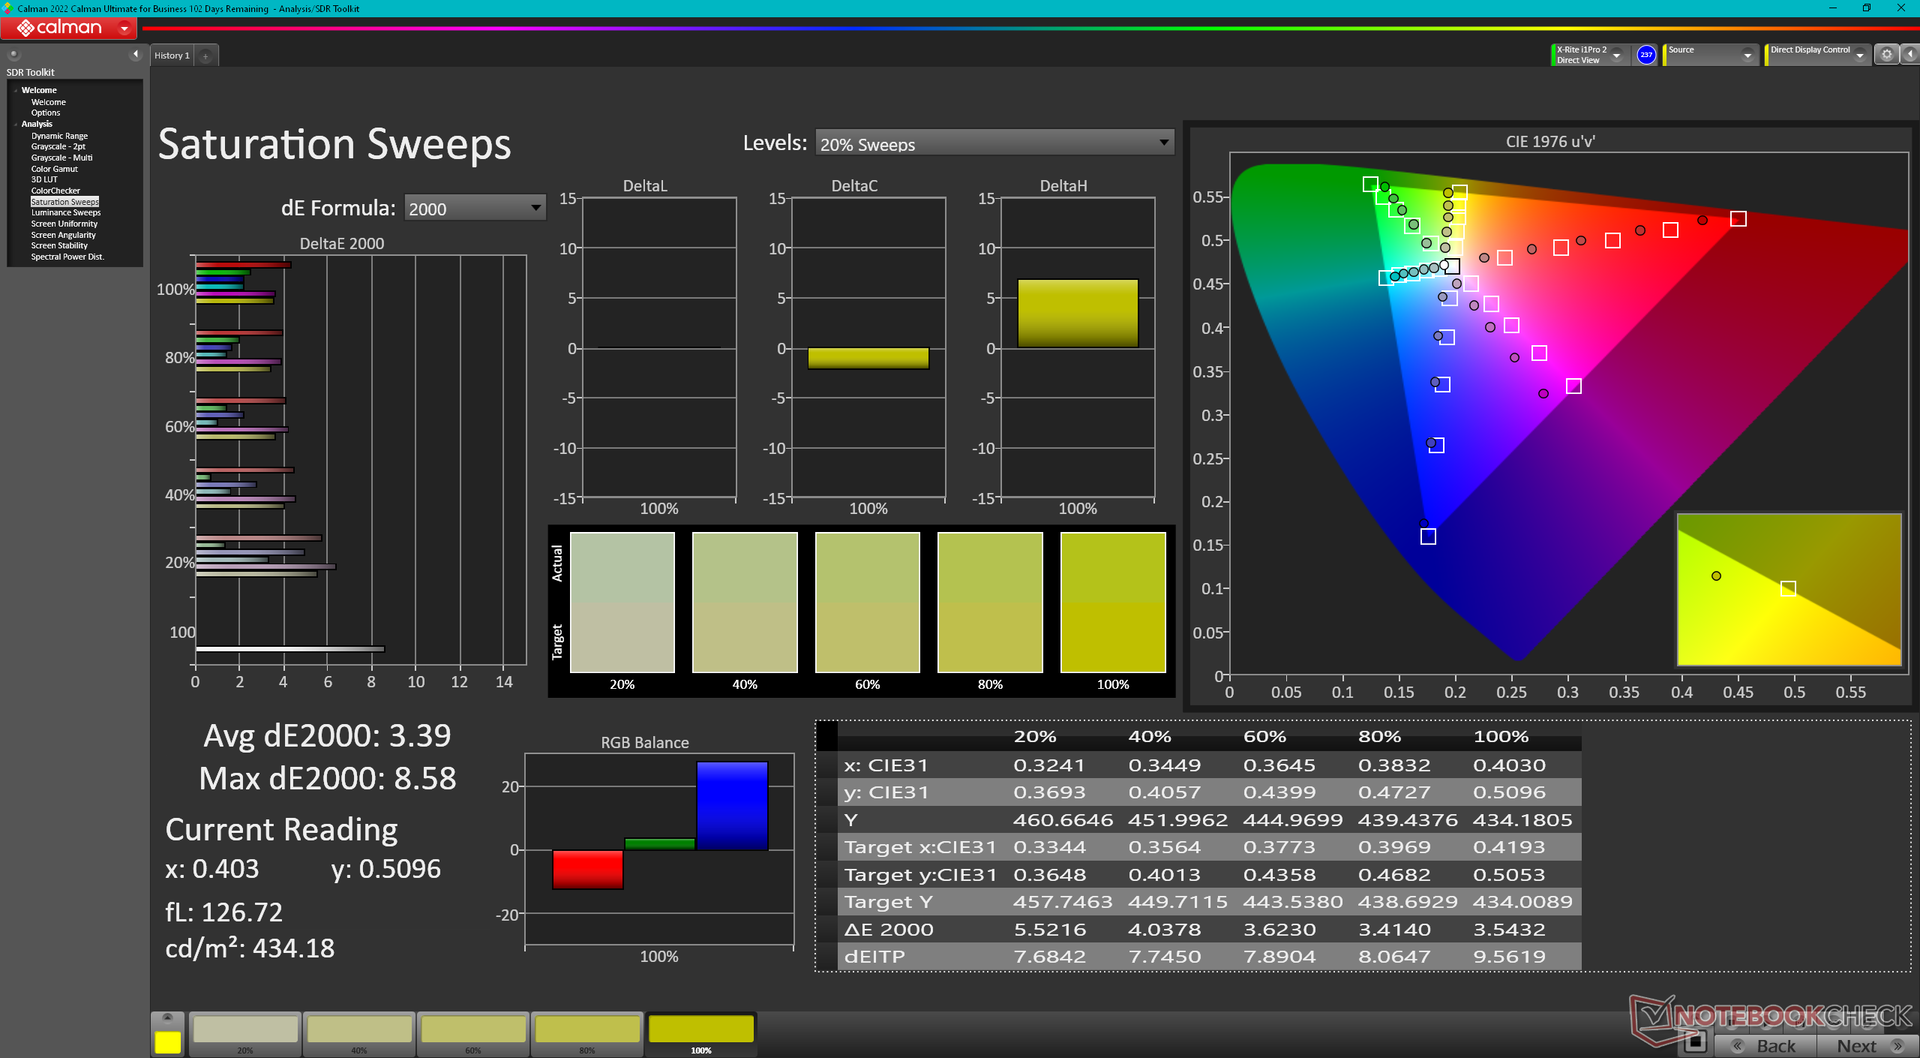
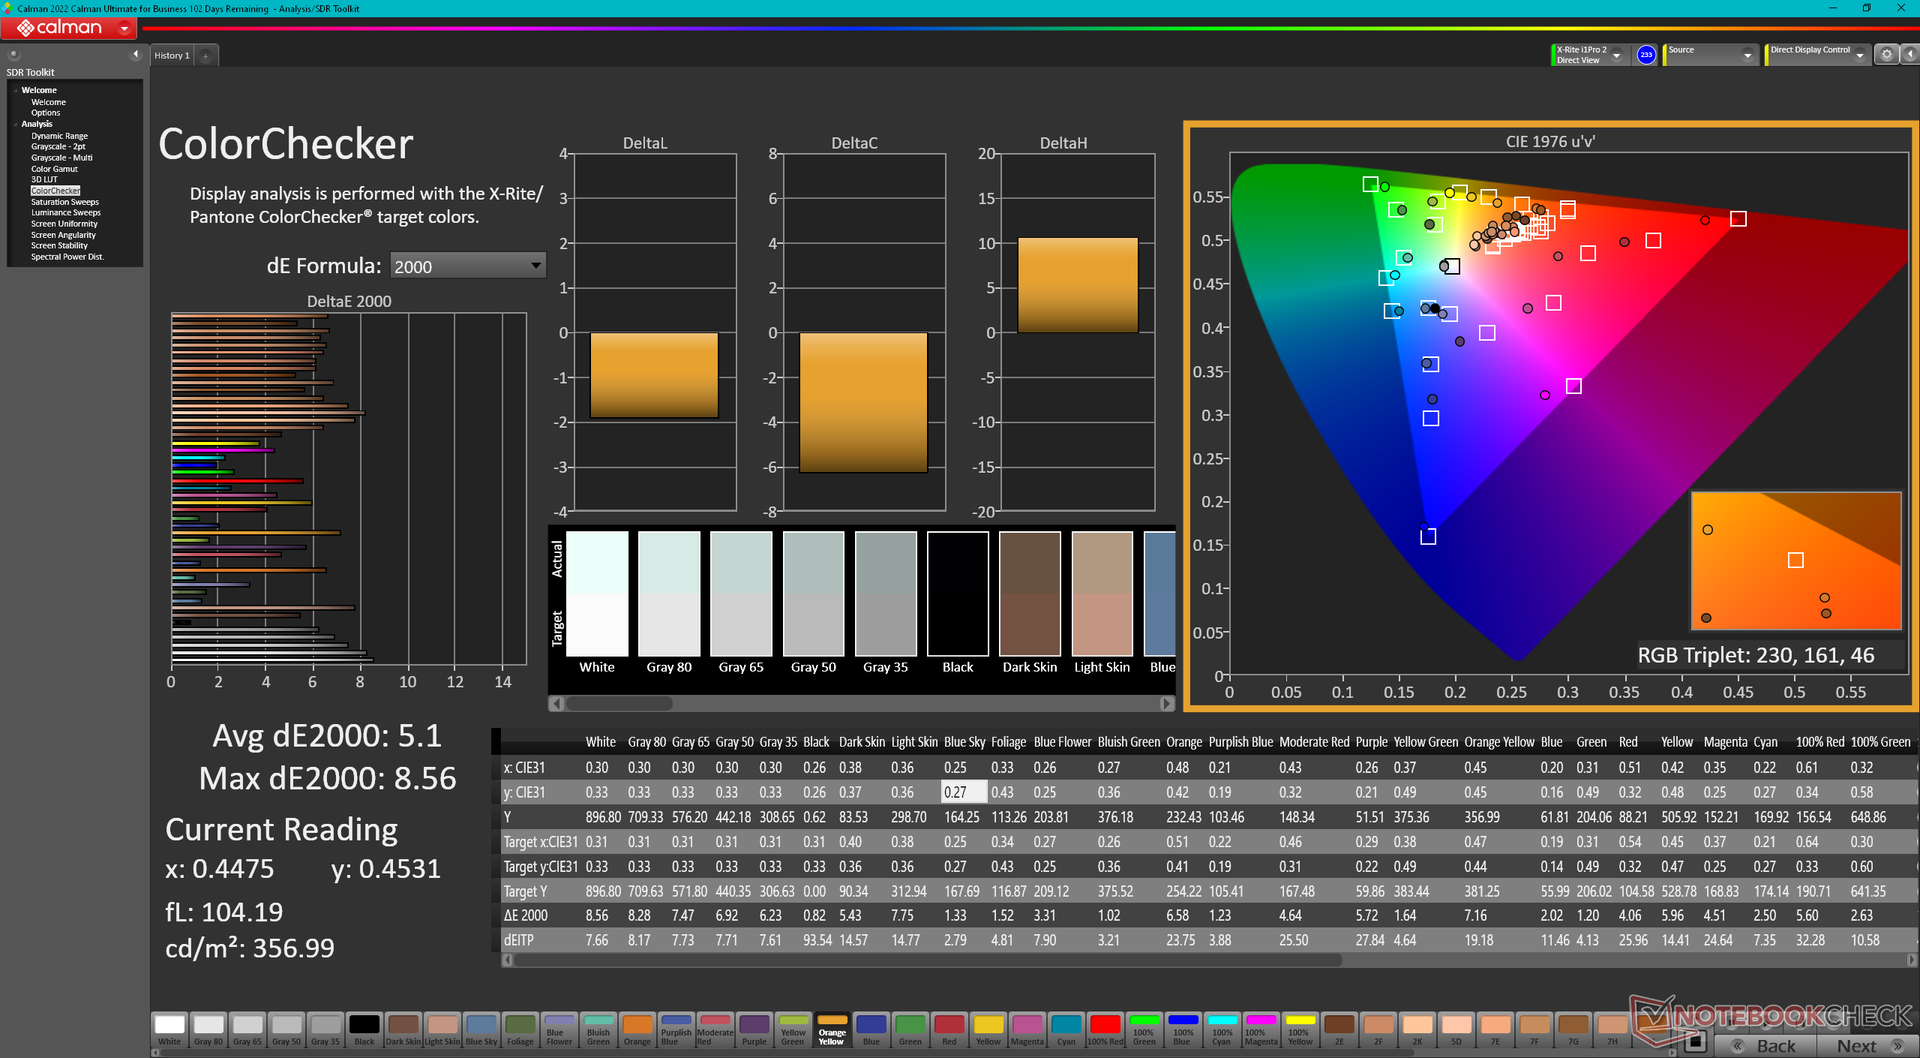
El fabricante anuncia un brillo máximo de 800 nits, lo que podemos confirmar con nuestras propias mediciones independientes. La relación de contraste también es respetable con algo más de 1000:1 para ser similar a las pantallas de la mayoría de portátiles de consumo. Por desgracia, otros aspectos del display son mediocres, como la limitada cobertura de color, los tiempos de respuesta medios y los píxeles algo granulados. Si sus cargas de trabajo requieren que las imágenes y los textos pequeños sean lo más nítidos posible, entonces el Durabook R8 puede no ser para usted.
La pantalla táctil multitáctil se puede alternar entre el modo capacitivo para entradas de dedo o el modo resistivo para entradas de guante o lápiz.

| |||||||||||||||||||||||||
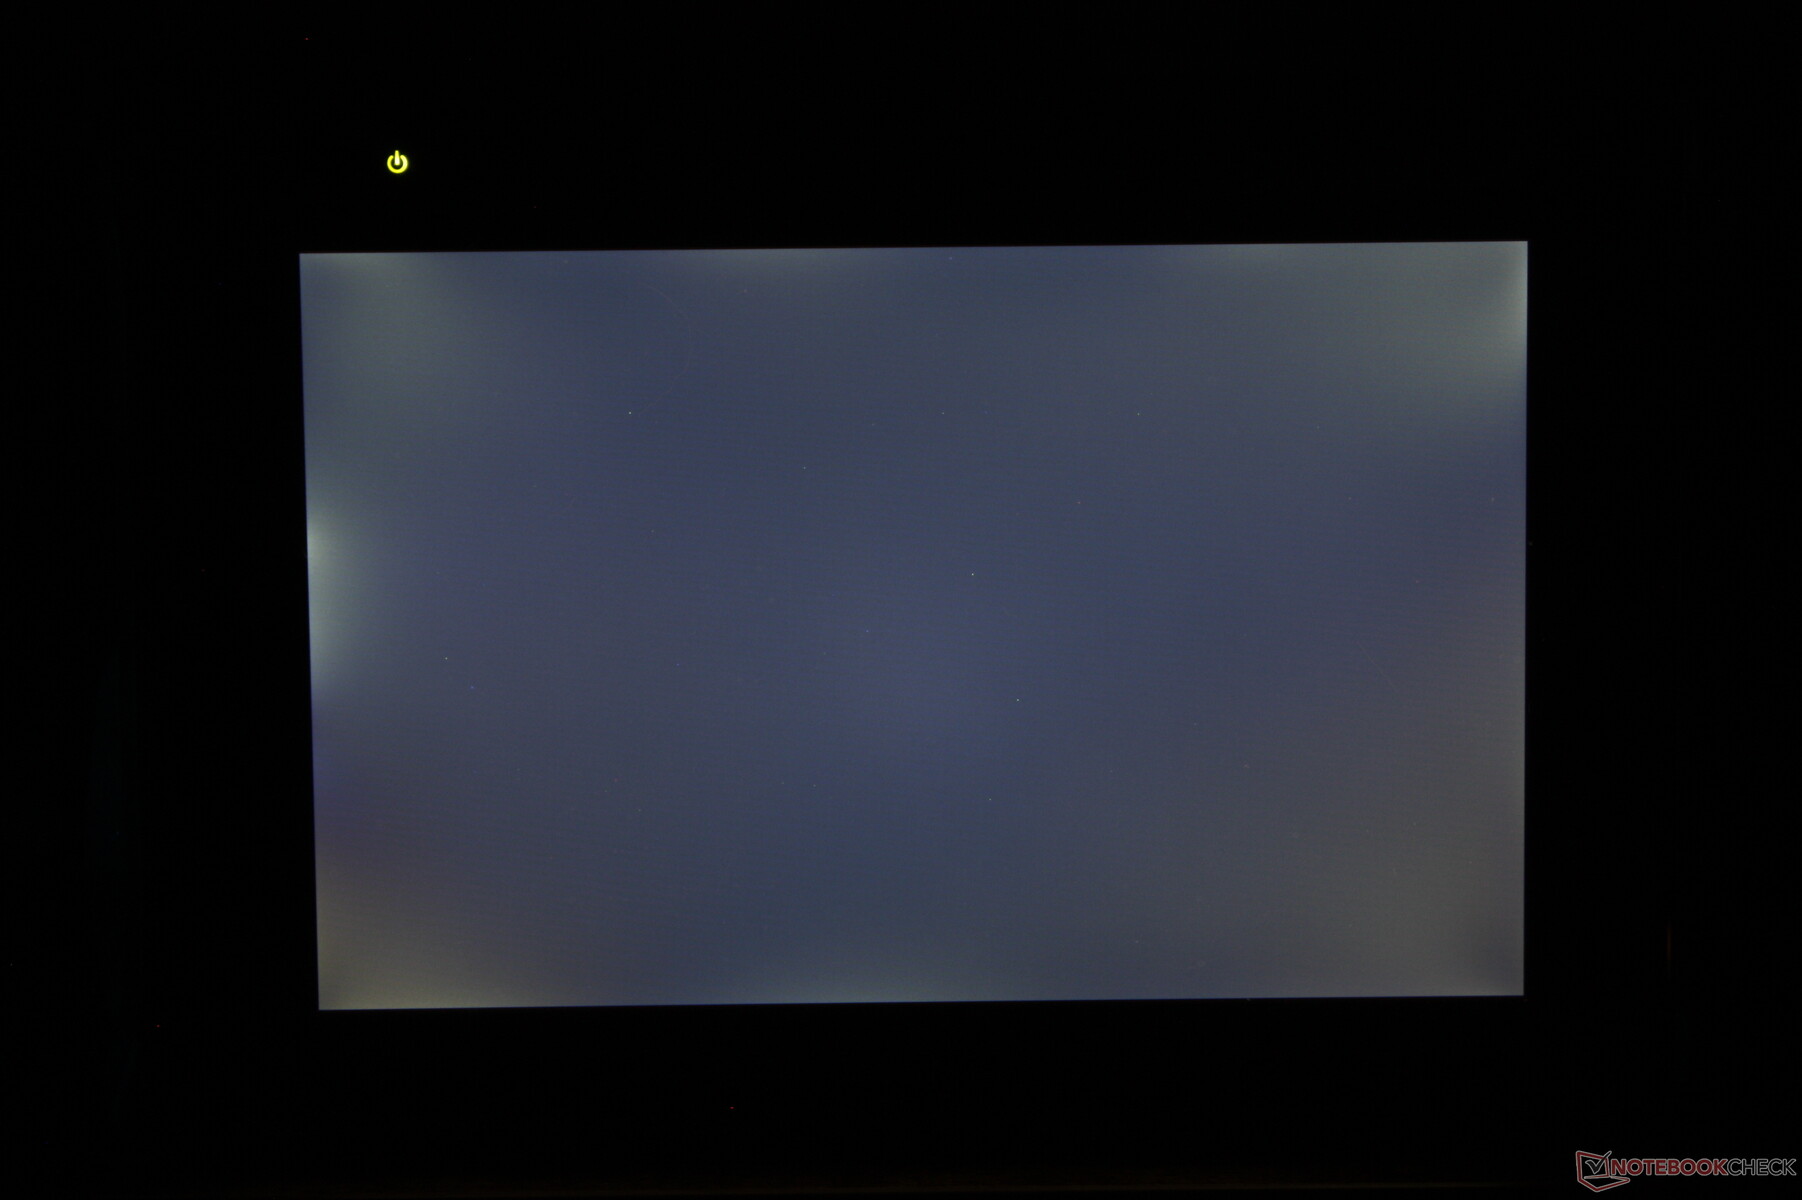
iluminación: 85 %
Brillo con batería: 943.7 cd/m²
Contraste: 1110:1 (Negro: 0.85 cd/m²)
ΔE ColorChecker Calman: 6.35 | ∀{0.5-29.43 Ø4.71}
calibrated: 5.1
ΔE Greyscale Calman: 6.9 | ∀{0.09-98 Ø4.96}
53.1% AdobeRGB 1998 (Argyll 3D)
77.4% sRGB (Argyll 3D)
51.5% Display P3 (Argyll 3D)
Gamma: 2.65
CCT: 6956 K
| Durabook R8 Tablet Digital Flat Panel, IPS, 1280x800, 8" | Acer Enduro T1 ET108-11A A9001 IPS, 1280x800, 8" | Lenovo Tab M8 (Gen 4) IPS, 1280x800, 8" | Dell Latitude 7230 Rugged Extreme Sharp LQ120N1, IPS, 1920x1200, 12" | Panasonic Toughbook FZ-G2 InfoVision M133NWFD R1, IPS, 1920x1200, 10.1" | |
|---|---|---|---|---|---|
| Display | 27% | 1% | |||
| Display P3 Coverage (%) | 51.5 | 66.2 29% | 52.1 1% | ||
| sRGB Coverage (%) | 77.4 | 96.1 24% | 78.5 1% | ||
| AdobeRGB 1998 Coverage (%) | 53.1 | 68.4 29% | 53.8 1% | ||
| Response Times | -20% | -34% | 12% | -63% | |
| Response Time Grey 50% / Grey 80% * (ms) | 32.4 ? | 33.6 ? -4% | 29.2 ? 10% | 28.4 ? 12% | 54.4 ? -68% |
| Response Time Black / White * (ms) | 21.9 ? | 29.6 ? -35% | 39 ? -78% | 19.4 ? 11% | 34.4 ? -57% |
| PWM Frequency (Hz) | 300 ? | 211.9 ? | |||
| Screen | 2% | 17% | 47% | 38% | |
| Brightness middle (cd/m²) | 943.7 | 350 -63% | 410 -57% | 1326.7 41% | 1078.6 14% |
| Brightness (cd/m²) | 870 | 353 -59% | 380 -56% | 1193 37% | 1056 21% |
| Brightness Distribution (%) | 85 | 92 8% | 86 1% | 82 -4% | 90 6% |
| Black Level * (cd/m²) | 0.85 | 0.21 75% | 0.16 81% | 0.85 -0% | 0.48 44% |
| Contrast (:1) | 1110 | 1667 50% | 2563 131% | 1561 41% | 2247 102% |
| Colorchecker dE 2000 * | 6.35 | 5.68 11% | 4.6 28% | 1.06 83% | 4.18 34% |
| Colorchecker dE 2000 max. * | 8.86 | 10.51 -19% | 9.03 -2% | 3.78 57% | 6.2 30% |
| Colorchecker dE 2000 calibrated * | 5.1 | 0.71 86% | 1.95 62% | ||
| Greyscale dE 2000 * | 6.9 | 6.3 9% | 6.3 9% | 1.5 78% | 4.8 30% |
| Gamma | 2.65 83% | 2.12 104% | 2.519 87% | 2.19 100% | 2.05 107% |
| CCT | 6956 93% | 7390 88% | 7707 84% | 6804 96% | 7565 86% |
| Media total (Programa/Opciones) | -9% /
-3% | -9% /
7% | 29% /
37% | -8% /
16% |
* ... más pequeño es mejor
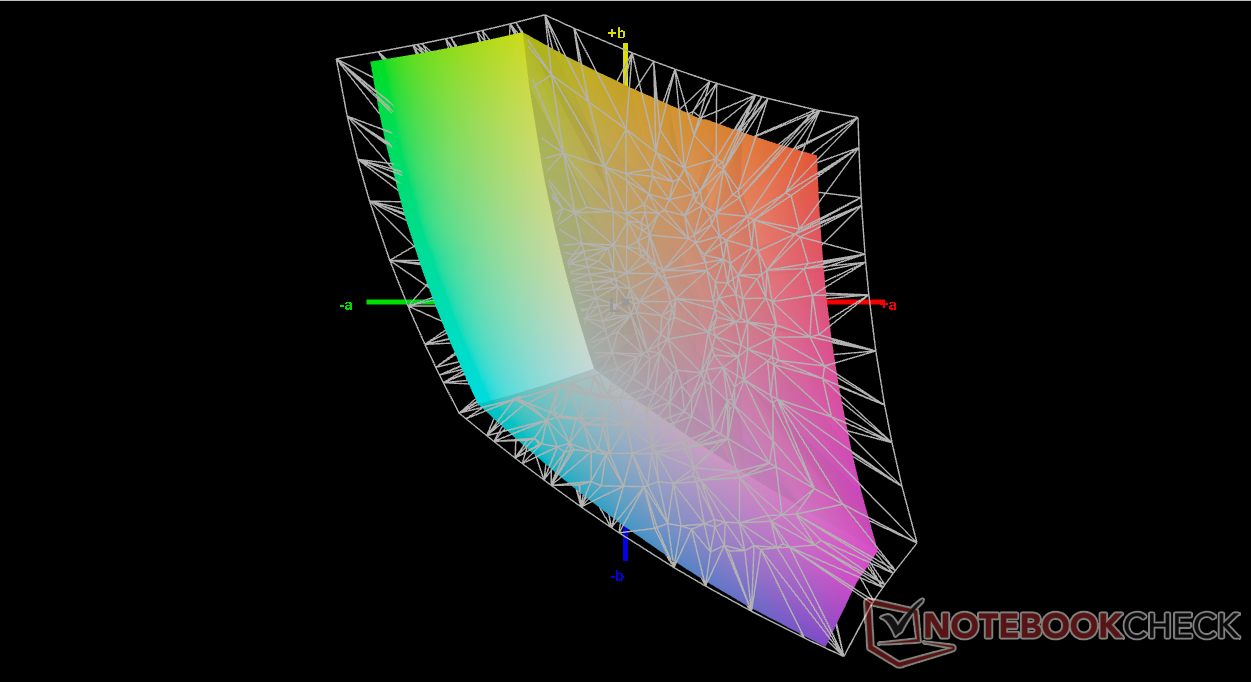
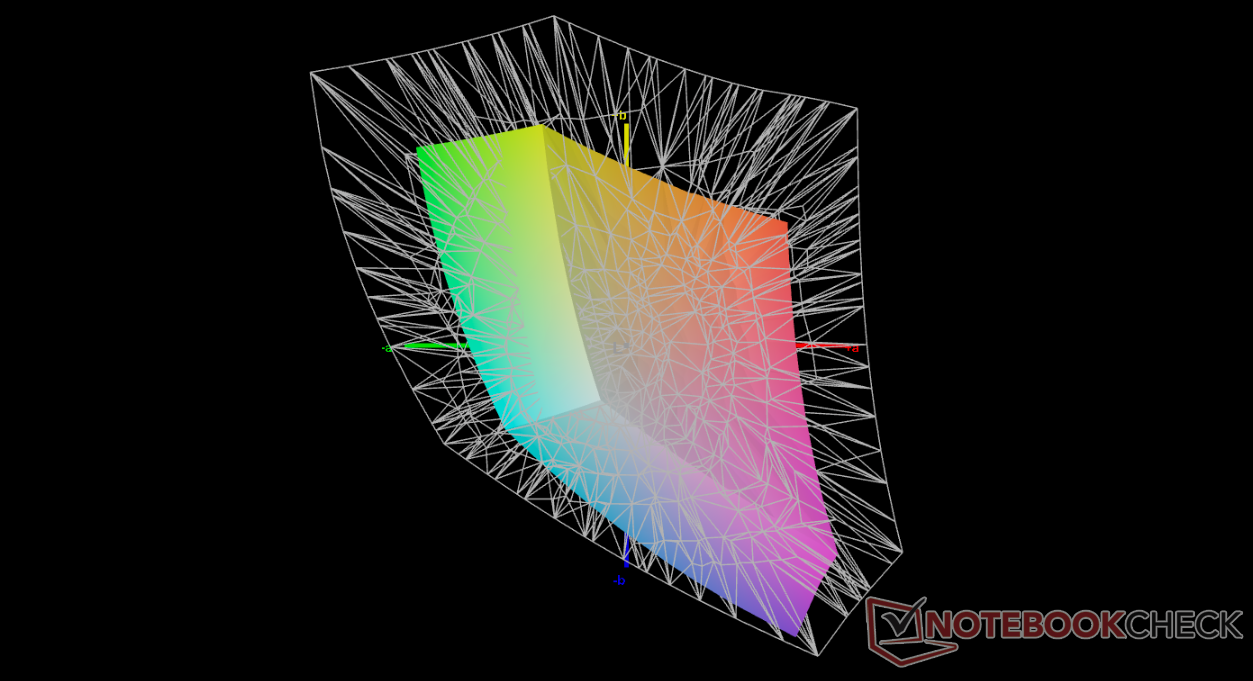
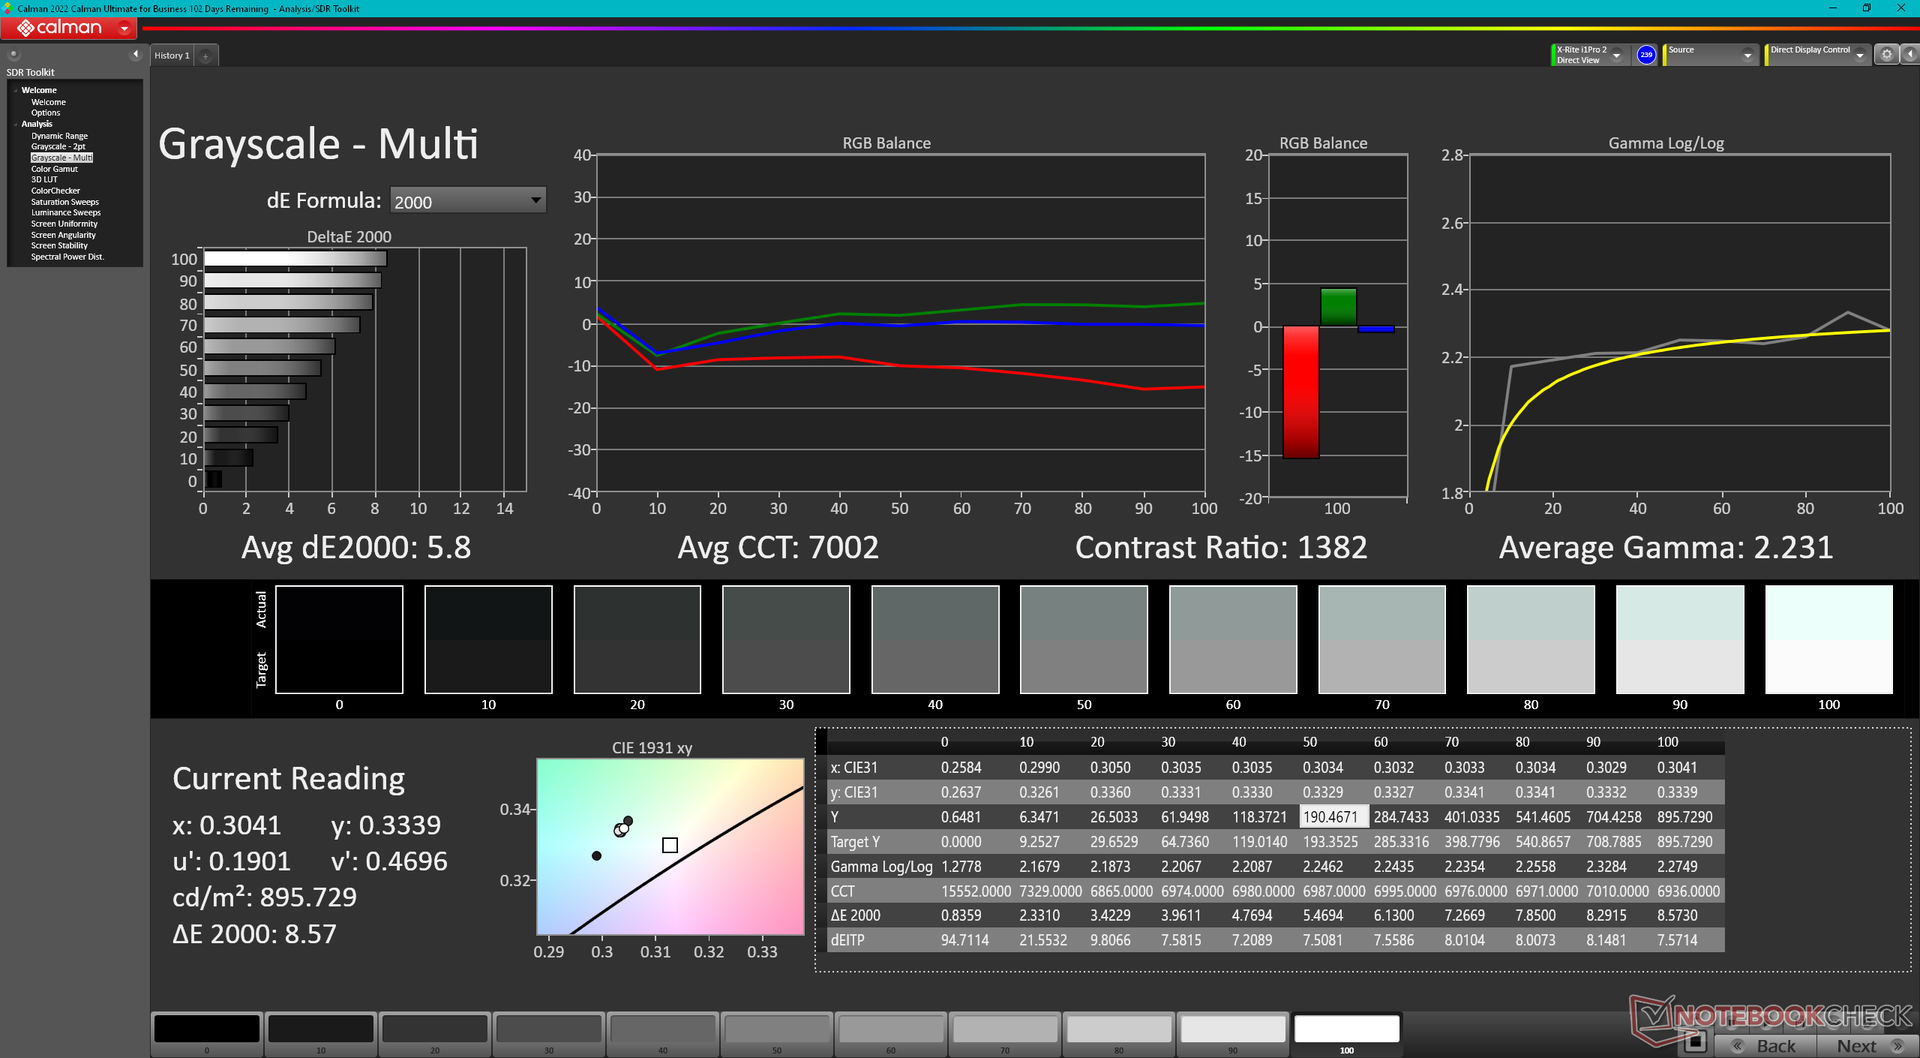
La temperatura de color está en el lado frío por defecto. Calibrar la pantalla con nuestro colorímetro X-Rite no produciría mejoras significativas debido a la limitada gama del panel antes mencionada.
Tiempos de respuesta del display
| ↔ Tiempo de respuesta de Negro a Blanco | ||
|---|---|---|
| 21.9 ms ... subida ↗ y bajada ↘ combinada | ↗ 14.2 ms subida | 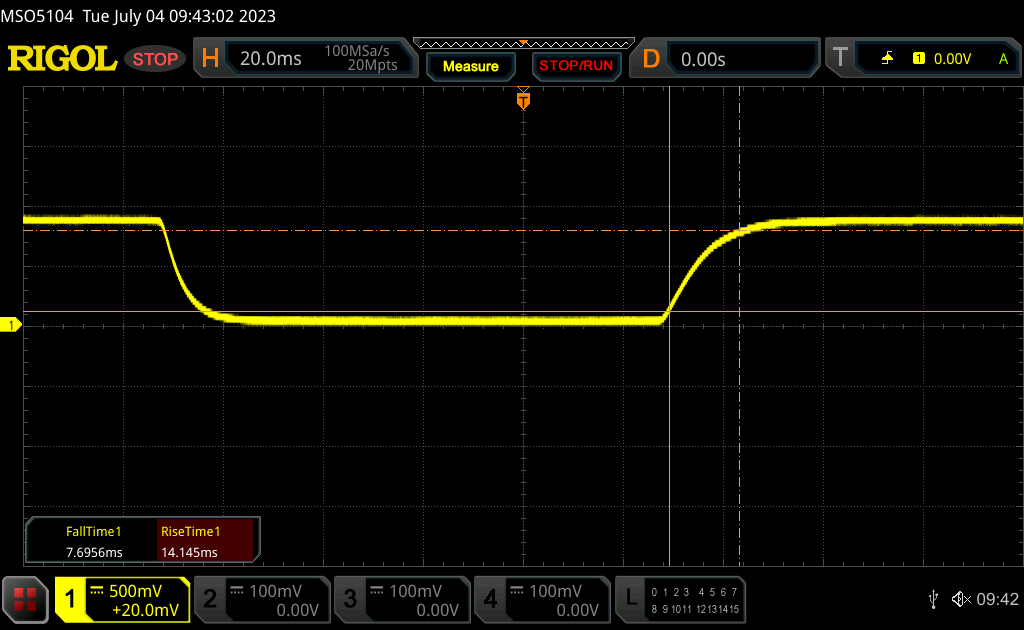 |
| ↘ 7.7 ms bajada | ||
| La pantalla mostró buenos tiempos de respuesta en nuestros tests pero podría ser demasiado lenta para los jugones competitivos. En comparación, todos los dispositivos de prueba van de ##min### (mínimo) a 240 (máximo) ms. » 49 % de todos los dispositivos son mejores. Eso quiere decir que el tiempo de respuesta es peor que la media (19.8 ms) de todos los dispositivos testados. | ||
| ↔ Tiempo de respuesta 50% Gris a 80% Gris | ||
| 32.4 ms ... subida ↗ y bajada ↘ combinada | ↗ 16.4 ms subida | 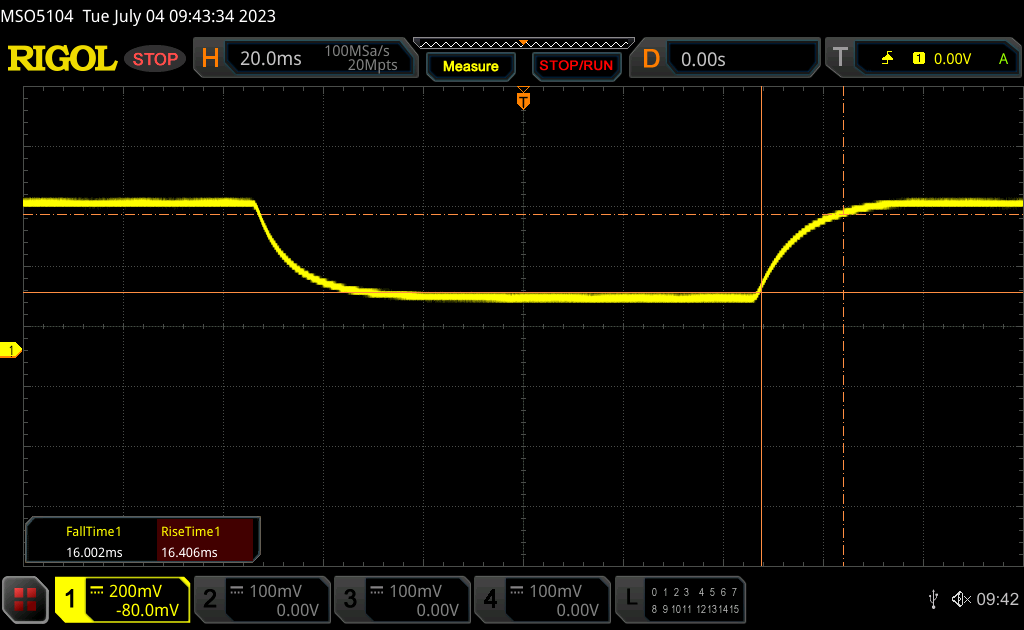 |
| ↘ 16 ms bajada | ||
| La pantalla mostró tiempos de respuesta lentos en nuestros tests y podría ser demasiado lenta para los jugones. En comparación, todos los dispositivos de prueba van de ##min### (mínimo) a 636 (máximo) ms. » 44 % de todos los dispositivos son mejores. Eso quiere decir que el tiempo de respuesta es similar al dispositivo testado medio (31 ms). | ||
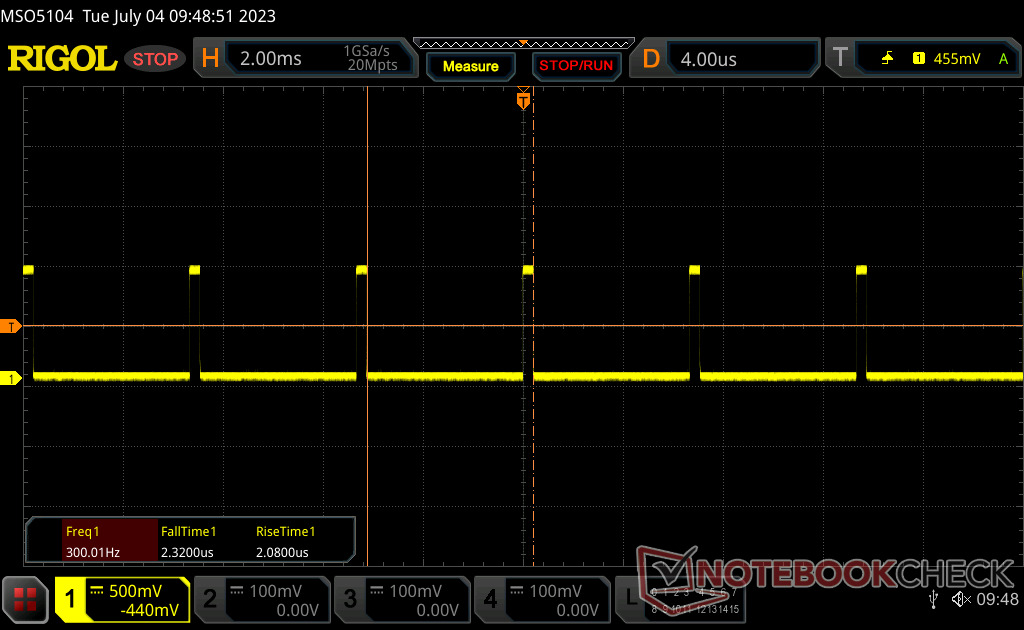
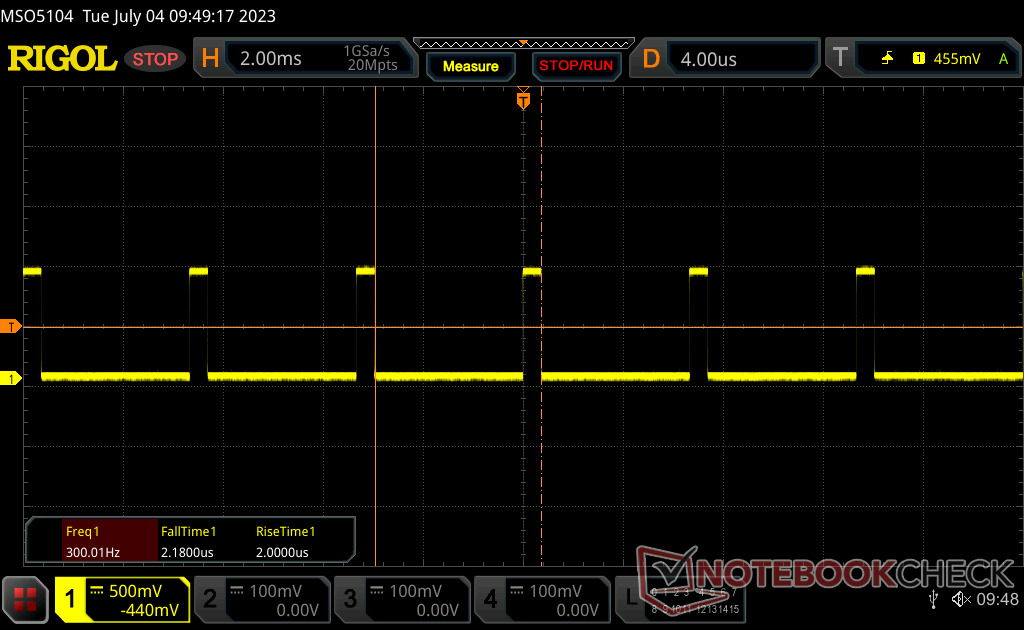
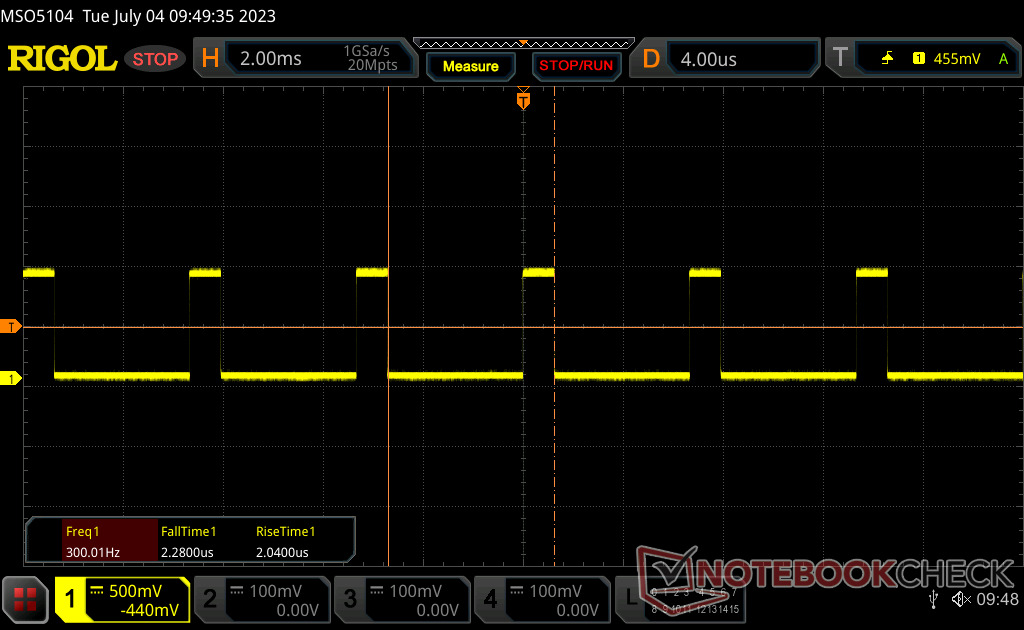
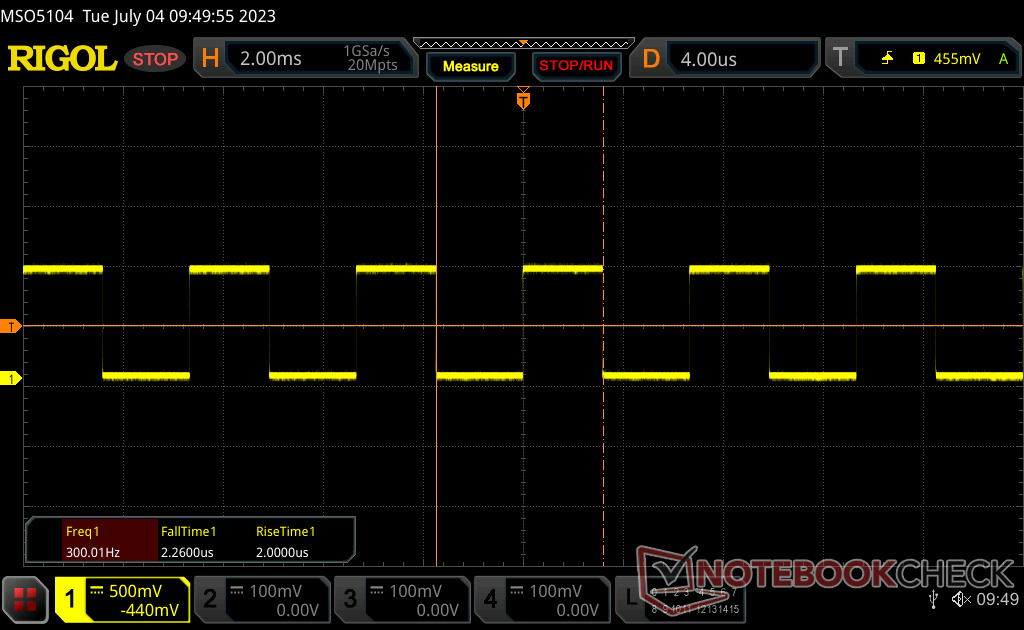
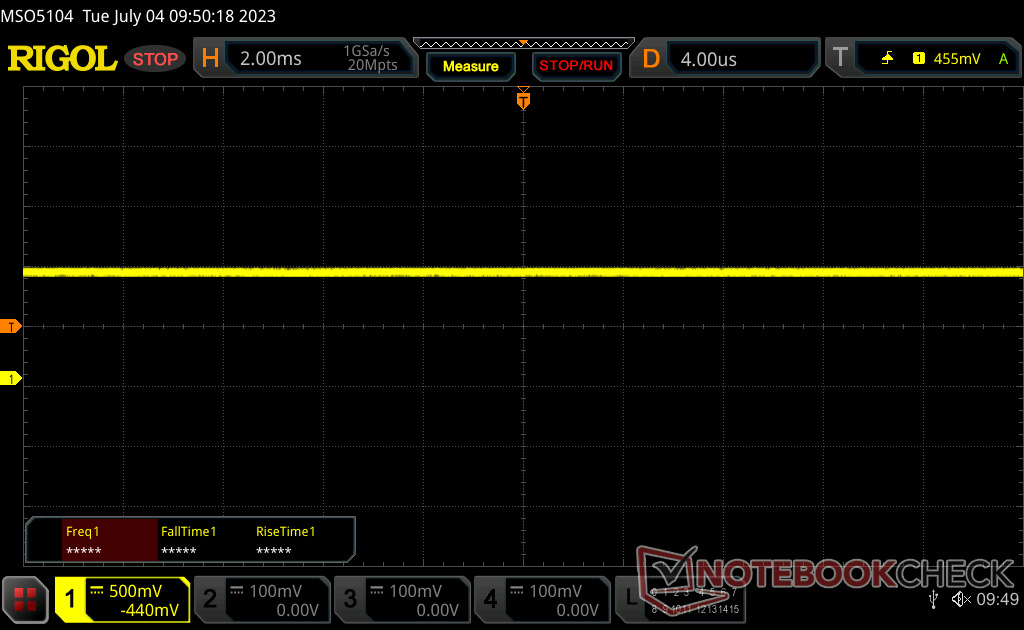
Parpadeo de Pantalla / PWM (Pulse-Width Modulation)
| Parpadeo de Pantalla / PWM detectado | 300 Hz | ≤ 99 % de brillo | 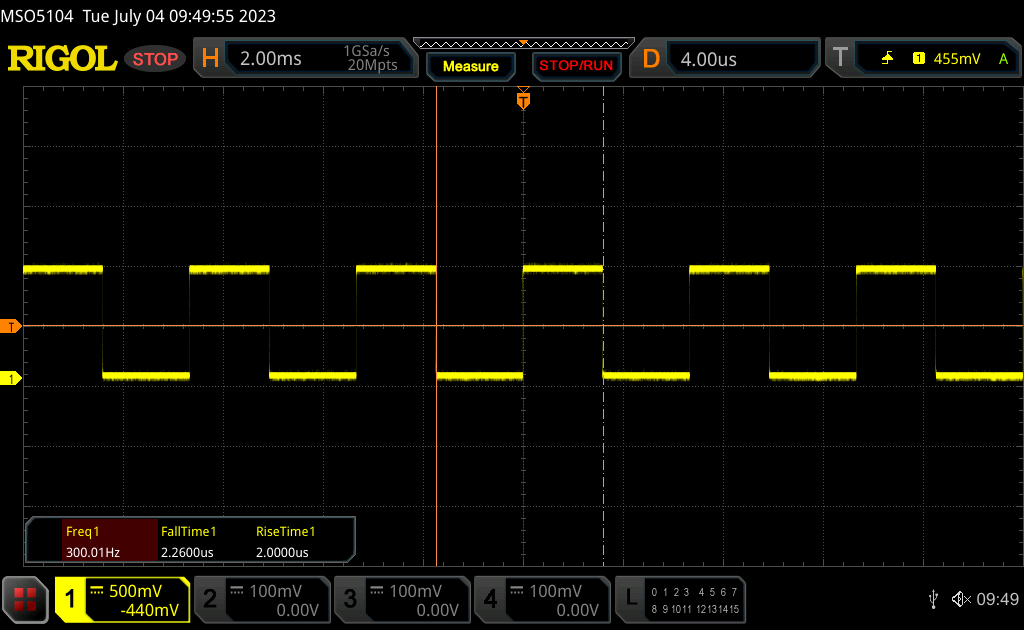 |
La retroiluminación del display parpadea a 300 Hz (seguramente usa PWM - Pulse-Width Modulation) a un brillo del 99 % e inferior. Sobre este nivel de brillo no debería darse parpadeo / PWM. La frecuencia de 300 Hz es relativamente alta, por lo que la mayoría de gente no debería ver parpadeo o tener fatiga visual. Sin embargo, hay informes de que algunas personas pueden seguir viendo parpadeos a 500 Hz y superior, por lo que cuidado. Comparación: 52 % de todos los dispositivos testados no usaron PWM para atenuar el display. Si se usó, medimos una media de 7754 (mínimo: 5 - máxmo: 343500) Hz. | |||
La modulación por ancho de pulsos o parpadeo de 300 Hz está presente en todos los niveles de brillo hasta el 99%.
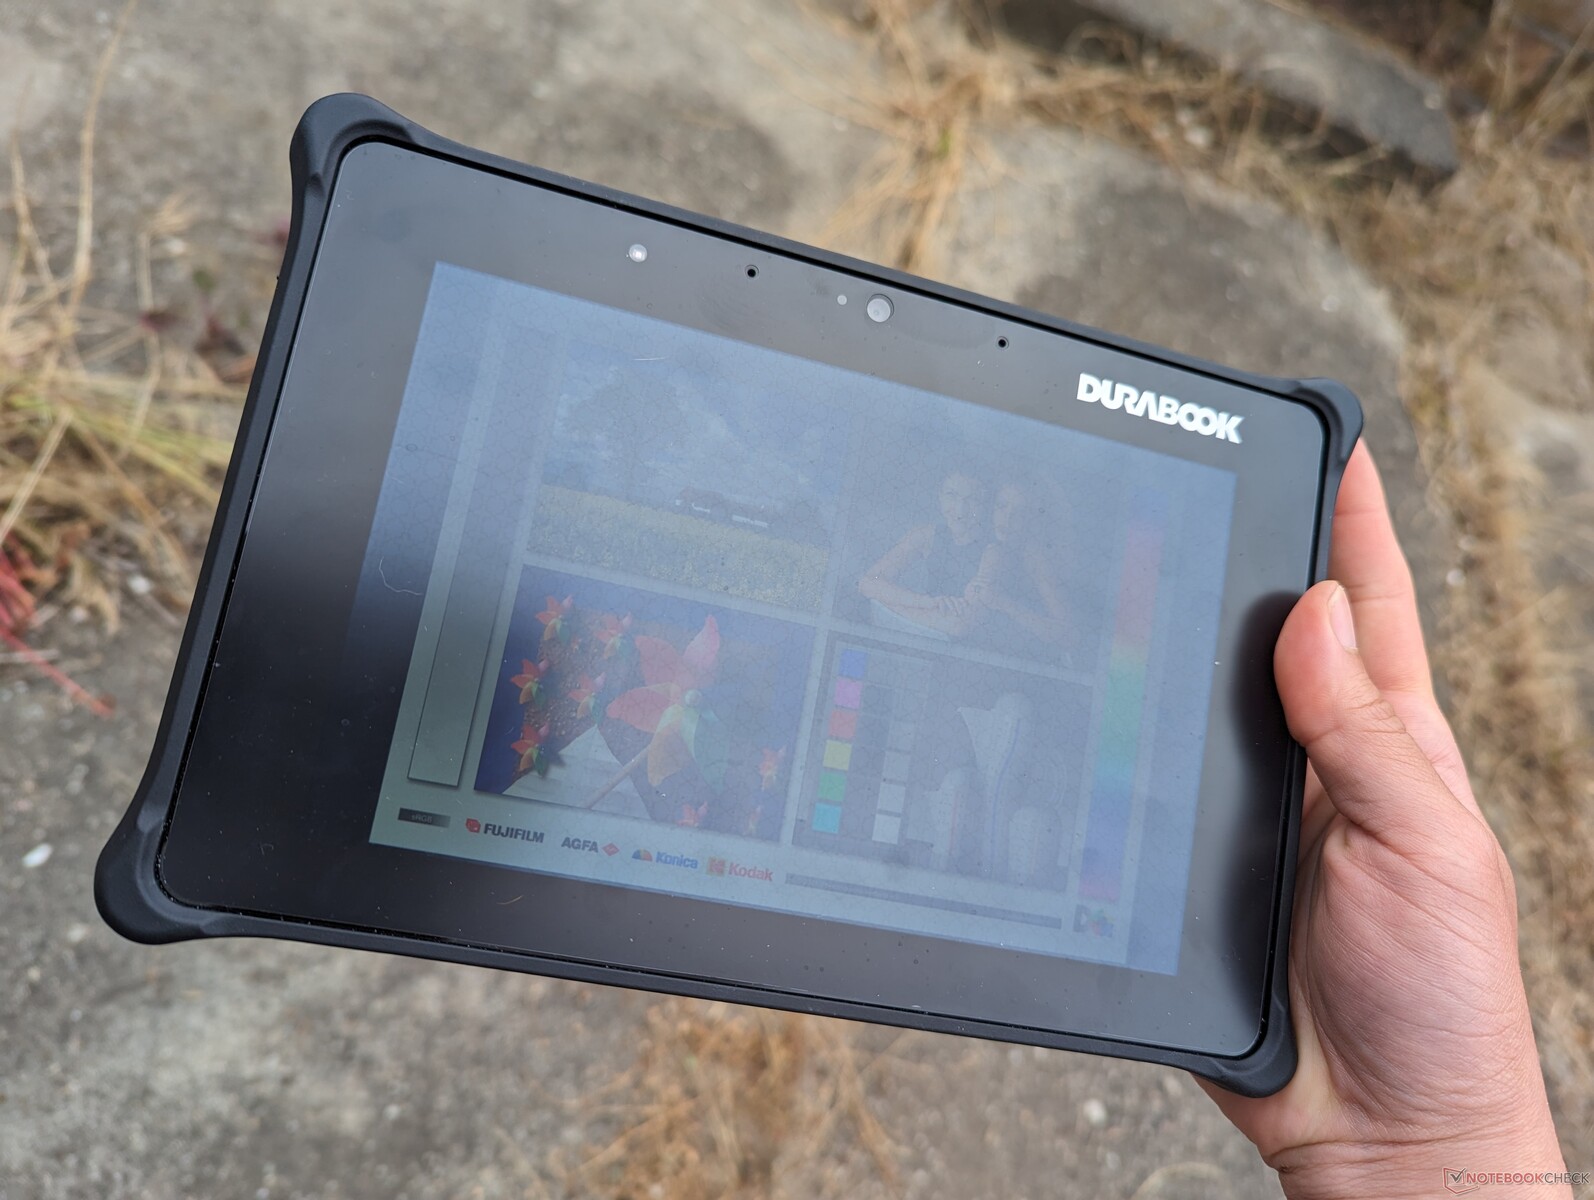
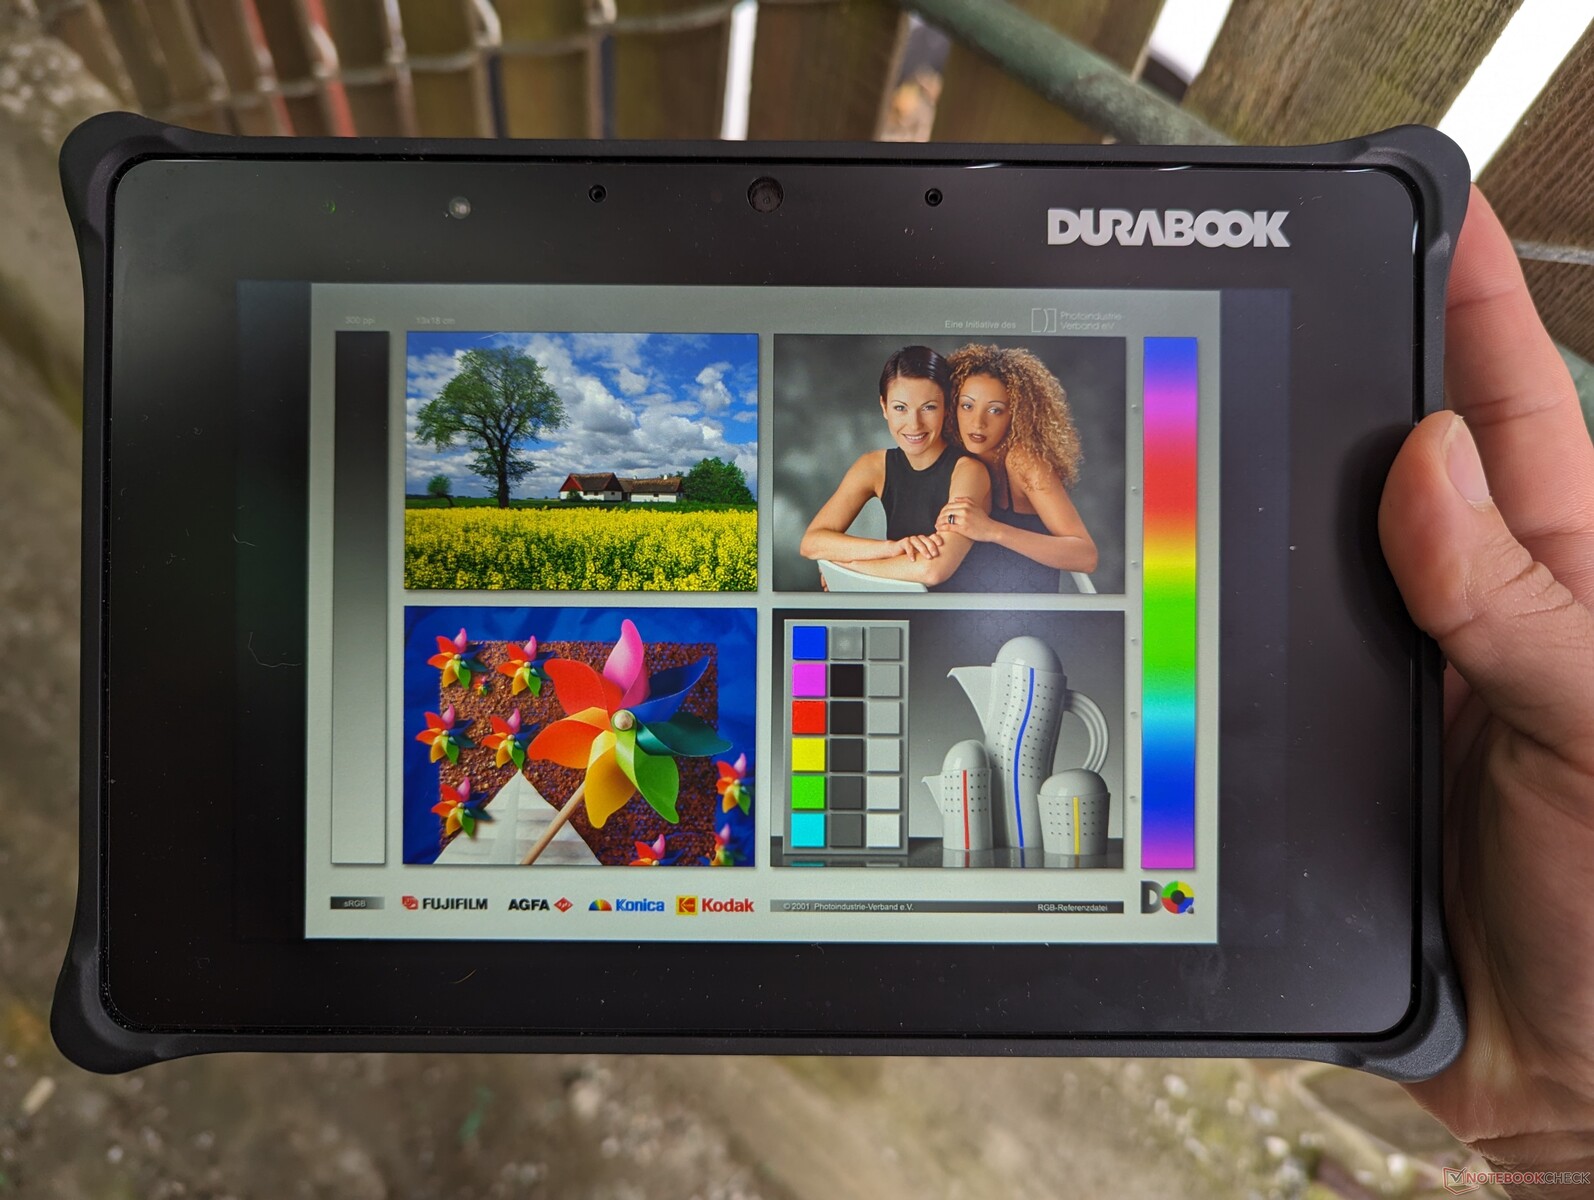
La visibilidad en exteriores es excelente a la sombra gracias a la pantalla extrabrillante. Los reflejos pueden atenuar los colores y ser un problema en condiciones de mucha luz.
Rendimiento - Intel 12ª generación con underclocking
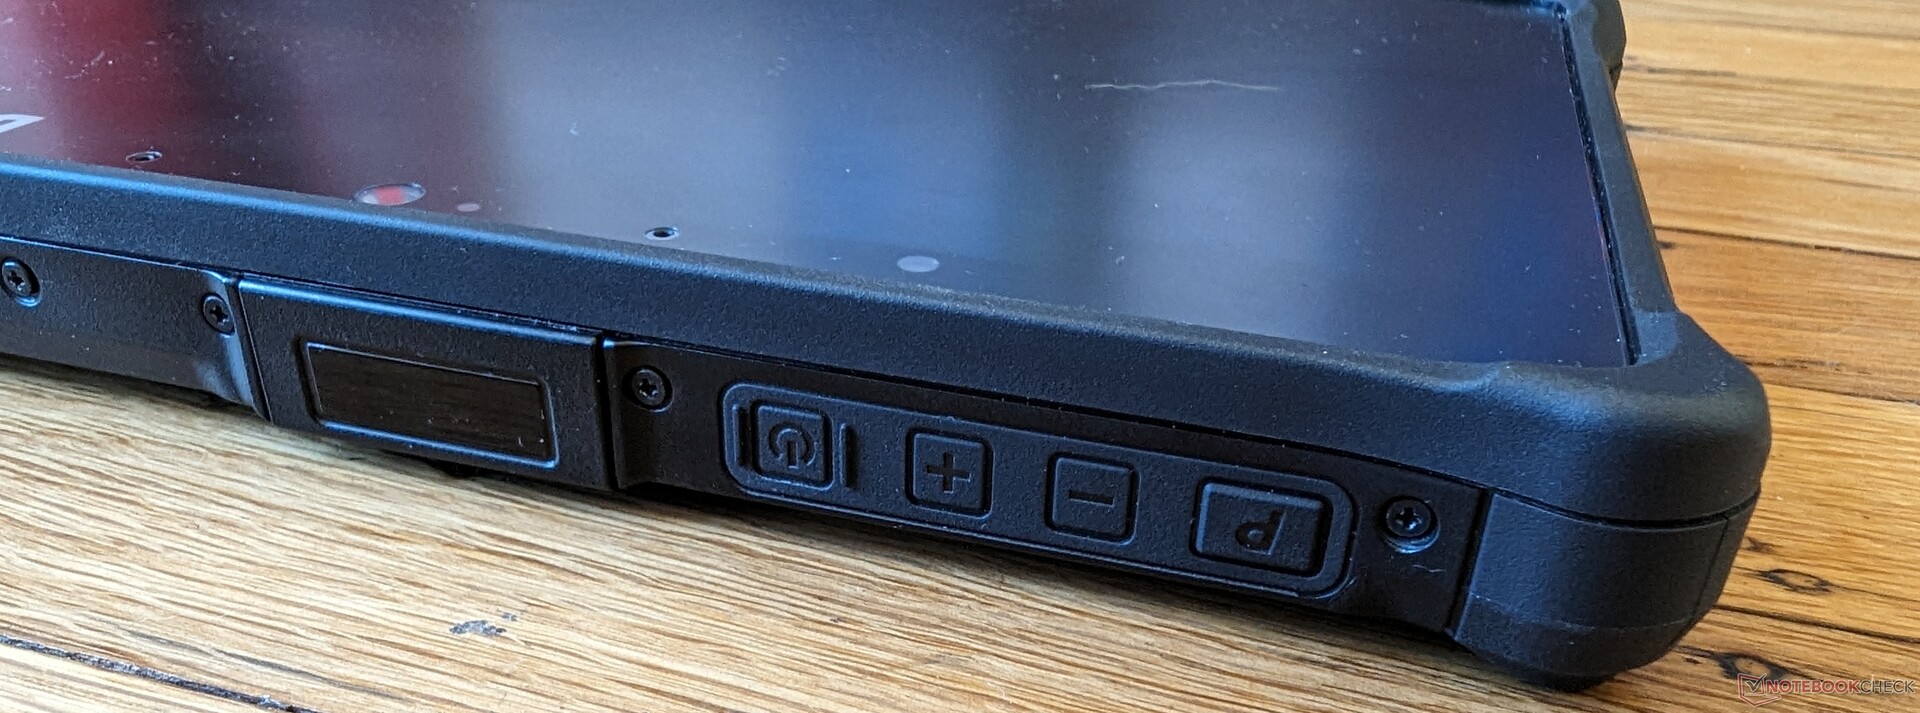
Condiciones de ensayo
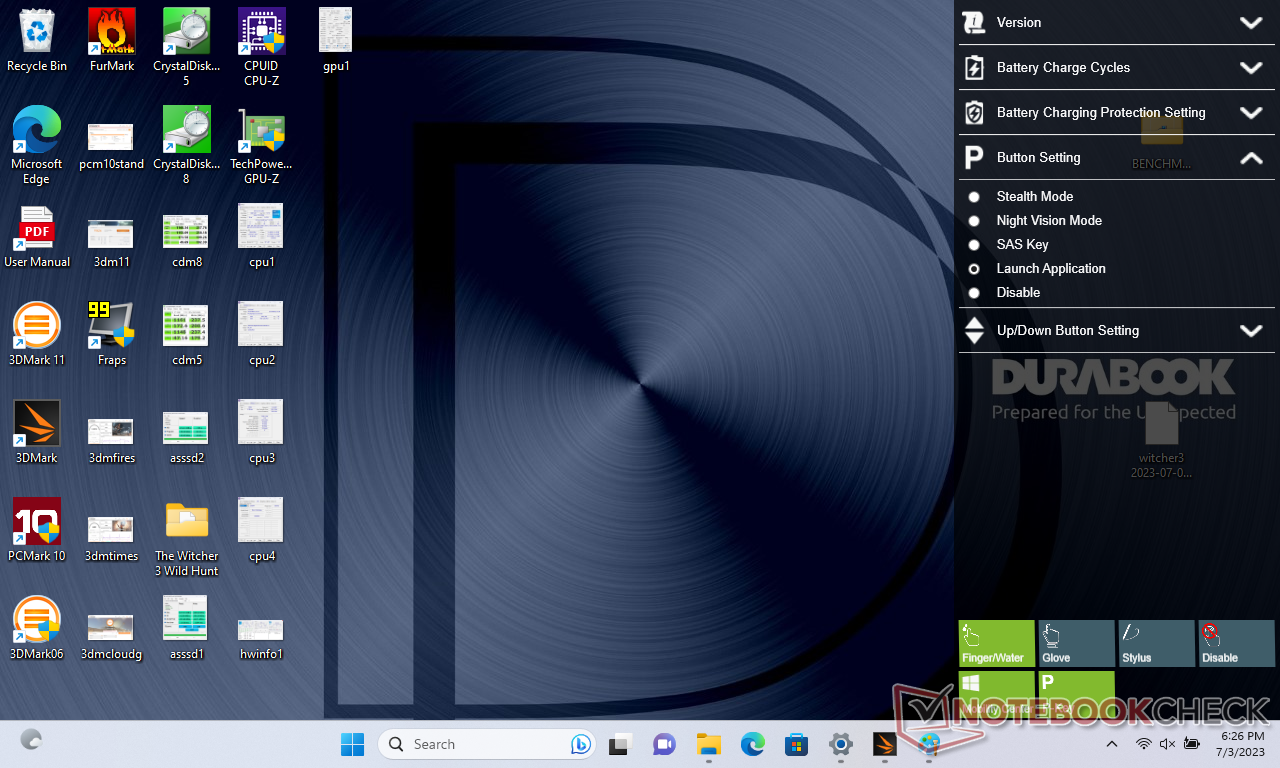
Pusimos Windows en modo Rendimiento antes de ejecutar las pruebas de rendimiento.
Al pulsar el botón "P" de la parte superior se abre el menú del centro de control para ajustar distintos aspectos de la tableta, como el comportamiento de carga de la batería, las acciones de los botones y los modos de pantalla táctil con guantes o dedos.
Procesador
Nuestra unidad de prueba utiliza el mismo Core i5-1230U que se encuentra en el Dell XPS 13 9315 y XPS 9315 2 en 1. El rendimiento, por desgracia, ha sido significativamente underclocked probablemente para maximizar la estabilidad. El rendimiento monohilo y multihilo es aproximadamente un 25% y un 60% más lento, respectivamente, que el mismo procesador en el sistema Dell antes mencionado. Por lo tanto, el rendimiento general está más cerca de los tres años de edad 10th gen Core i5-10310U.
Es difícil decir cuánto aumento de rendimiento pueden esperar los usuarios si se actualizan alCore i7-1250U ya que nuestra unidad Core i5-1230U es más lenta de lo esperado. Sin embargo, es probable que el Core i7 SKU se underclocked también.
Cinebench R15 Multi Loop
Cinebench R23: Multi Core | Single Core
Cinebench R20: CPU (Multi Core) | CPU (Single Core)
Cinebench R15: CPU Multi 64Bit | CPU Single 64Bit
Blender: v2.79 BMW27 CPU
7-Zip 18.03: 7z b 4 | 7z b 4 -mmt1
Geekbench 5.5: Multi-Core | Single-Core
HWBOT x265 Benchmark v2.2: 4k Preset
LibreOffice : 20 Documents To PDF
R Benchmark 2.5: Overall mean
| CPU Performance rating | |
| Lenovo Yoga 7-14ARB G7 | |
| Samsung Galaxy Book3 Pro 14 | |
| Lenovo ThinkPad T14s G3 21BR00CDGE | |
| HP Envy x360 13-bf0013dx | |
| Dell Latitude 7230 Rugged Extreme | |
| Dell XPS 13 9315 2-in-1 Core i5-1230U | |
| Dell Latitude 7330 Rugged Extreme | |
| Dynabook Satellite Pro C50D-B-115 | |
| Asus ZenBook 14X OLED UX5400EA-L7154W | |
| Medio Intel Core i5-1230U | |
| Durabook R8 Tablet | |
| Panasonic Toughbook FZ-G2 -2! | |
| Acer Enduro T1 ET108-11A A9001 -12! | |
| Chuwi LapBook Plus -6! | |
| Lenovo Tab M8 (Gen 4) -12! | |
| Cinebench R23 / Multi Core | |
| Lenovo Yoga 7-14ARB G7 | |
| Lenovo ThinkPad T14s G3 21BR00CDGE | |
| Samsung Galaxy Book3 Pro 14 | |
| Dell Latitude 7230 Rugged Extreme | |
| HP Envy x360 13-bf0013dx | |
| Dell XPS 13 9315 2-in-1 Core i5-1230U | |
| Dynabook Satellite Pro C50D-B-115 | |
| Asus ZenBook 14X OLED UX5400EA-L7154W | |
| Dell Latitude 7330 Rugged Extreme | |
| Medio Intel Core i5-1230U (3066 - 7264, n=3) | |
| Panasonic Toughbook FZ-G2 | |
| Durabook R8 Tablet | |
| Cinebench R23 / Single Core | |
| Lenovo ThinkPad T14s G3 21BR00CDGE | |
| Samsung Galaxy Book3 Pro 14 | |
| HP Envy x360 13-bf0013dx | |
| Dell Latitude 7230 Rugged Extreme | |
| Dell Latitude 7330 Rugged Extreme | |
| Lenovo Yoga 7-14ARB G7 | |
| Dell XPS 13 9315 2-in-1 Core i5-1230U | |
| Asus ZenBook 14X OLED UX5400EA-L7154W | |
| Dynabook Satellite Pro C50D-B-115 | |
| Medio Intel Core i5-1230U (1135 - 1512, n=3) | |
| Durabook R8 Tablet | |
| Panasonic Toughbook FZ-G2 | |
| Cinebench R20 / CPU (Multi Core) | |
| Lenovo Yoga 7-14ARB G7 | |
| Lenovo ThinkPad T14s G3 21BR00CDGE | |
| Samsung Galaxy Book3 Pro 14 | |
| Dell Latitude 7230 Rugged Extreme | |
| HP Envy x360 13-bf0013dx | |
| Dell XPS 13 9315 2-in-1 Core i5-1230U | |
| Asus ZenBook 14X OLED UX5400EA-L7154W | |
| Dynabook Satellite Pro C50D-B-115 | |
| Dell Latitude 7330 Rugged Extreme | |
| Medio Intel Core i5-1230U (1175 - 2802, n=3) | |
| Panasonic Toughbook FZ-G2 | |
| Durabook R8 Tablet | |
| Chuwi LapBook Plus | |
| Cinebench R20 / CPU (Single Core) | |
| Lenovo ThinkPad T14s G3 21BR00CDGE | |
| Samsung Galaxy Book3 Pro 14 | |
| HP Envy x360 13-bf0013dx | |
| Lenovo Yoga 7-14ARB G7 | |
| Dell Latitude 7230 Rugged Extreme | |
| Dell Latitude 7330 Rugged Extreme | |
| Dell XPS 13 9315 2-in-1 Core i5-1230U | |
| Asus ZenBook 14X OLED UX5400EA-L7154W | |
| Dynabook Satellite Pro C50D-B-115 | |
| Medio Intel Core i5-1230U (441 - 580, n=3) | |
| Durabook R8 Tablet | |
| Panasonic Toughbook FZ-G2 | |
| Chuwi LapBook Plus | |
| Cinebench R15 / CPU Multi 64Bit | |
| Lenovo Yoga 7-14ARB G7 | |
| Samsung Galaxy Book3 Pro 14 | |
| Lenovo ThinkPad T14s G3 21BR00CDGE | |
| HP Envy x360 13-bf0013dx | |
| Dynabook Satellite Pro C50D-B-115 | |
| Dell XPS 13 9315 2-in-1 Core i5-1230U | |
| Dell Latitude 7230 Rugged Extreme | |
| Asus ZenBook 14X OLED UX5400EA-L7154W | |
| Dell Latitude 7330 Rugged Extreme | |
| Medio Intel Core i5-1230U (433 - 1254, n=3) | |
| Panasonic Toughbook FZ-G2 | |
| Durabook R8 Tablet | |
| Chuwi LapBook Plus | |
| Cinebench R15 / CPU Single 64Bit | |
| Lenovo Yoga 7-14ARB G7 | |
| Lenovo ThinkPad T14s G3 21BR00CDGE | |
| Samsung Galaxy Book3 Pro 14 | |
| Dell Latitude 7330 Rugged Extreme | |
| HP Envy x360 13-bf0013dx | |
| Dell Latitude 7230 Rugged Extreme | |
| Dell XPS 13 9315 2-in-1 Core i5-1230U | |
| Dynabook Satellite Pro C50D-B-115 | |
| Asus ZenBook 14X OLED UX5400EA-L7154W | |
| Medio Intel Core i5-1230U (120.1 - 221, n=3) | |
| Panasonic Toughbook FZ-G2 | |
| Durabook R8 Tablet | |
| Chuwi LapBook Plus | |
| Blender / v2.79 BMW27 CPU | |
| Chuwi LapBook Plus | |
| Durabook R8 Tablet | |
| Panasonic Toughbook FZ-G2 | |
| Medio Intel Core i5-1230U (503 - 1005, n=2) | |
| Dell Latitude 7330 Rugged Extreme | |
| Asus ZenBook 14X OLED UX5400EA-L7154W | |
| Dell XPS 13 9315 2-in-1 Core i5-1230U | |
| Dynabook Satellite Pro C50D-B-115 | |
| HP Envy x360 13-bf0013dx | |
| Dell Latitude 7230 Rugged Extreme | |
| Lenovo ThinkPad T14s G3 21BR00CDGE | |
| Samsung Galaxy Book3 Pro 14 | |
| Lenovo Yoga 7-14ARB G7 | |
| 7-Zip 18.03 / 7z b 4 | |
| Lenovo Yoga 7-14ARB G7 | |
| Lenovo ThinkPad T14s G3 21BR00CDGE | |
| Samsung Galaxy Book3 Pro 14 | |
| Dell XPS 13 9315 2-in-1 Core i5-1230U | |
| Dynabook Satellite Pro C50D-B-115 | |
| HP Envy x360 13-bf0013dx | |
| Dell Latitude 7230 Rugged Extreme | |
| Asus ZenBook 14X OLED UX5400EA-L7154W | |
| Dell Latitude 7330 Rugged Extreme | |
| Medio Intel Core i5-1230U (12470 - 34505, n=3) | |
| Panasonic Toughbook FZ-G2 | |
| Durabook R8 Tablet | |
| Chuwi LapBook Plus | |
| 7-Zip 18.03 / 7z b 4 -mmt1 | |
| Samsung Galaxy Book3 Pro 14 | |
| Lenovo Yoga 7-14ARB G7 | |
| Dell Latitude 7330 Rugged Extreme | |
| Lenovo ThinkPad T14s G3 21BR00CDGE | |
| Dynabook Satellite Pro C50D-B-115 | |
| Asus ZenBook 14X OLED UX5400EA-L7154W | |
| Dell XPS 13 9315 2-in-1 Core i5-1230U | |
| HP Envy x360 13-bf0013dx | |
| Dell Latitude 7230 Rugged Extreme | |
| Medio Intel Core i5-1230U (3873 - 4870, n=3) | |
| Panasonic Toughbook FZ-G2 | |
| Durabook R8 Tablet | |
| Chuwi LapBook Plus | |
| HWBOT x265 Benchmark v2.2 / 4k Preset | |
| Lenovo Yoga 7-14ARB G7 | |
| Samsung Galaxy Book3 Pro 14 | |
| Lenovo ThinkPad T14s G3 21BR00CDGE | |
| Dell Latitude 7230 Rugged Extreme | |
| HP Envy x360 13-bf0013dx | |
| Dell XPS 13 9315 2-in-1 Core i5-1230U | |
| Asus ZenBook 14X OLED UX5400EA-L7154W | |
| Dynabook Satellite Pro C50D-B-115 | |
| Dell Latitude 7330 Rugged Extreme | |
| Medio Intel Core i5-1230U (3.59 - 8.33, n=2) | |
| Panasonic Toughbook FZ-G2 | |
| Durabook R8 Tablet | |
| Chuwi LapBook Plus | |
| LibreOffice / 20 Documents To PDF | |
| Asus ZenBook 14X OLED UX5400EA-L7154W | |
| Panasonic Toughbook FZ-G2 | |
| Durabook R8 Tablet | |
| Medio Intel Core i5-1230U (51.2 - 62.5, n=2) | |
| Lenovo Yoga 7-14ARB G7 | |
| Dynabook Satellite Pro C50D-B-115 | |
| HP Envy x360 13-bf0013dx | |
| Dell Latitude 7230 Rugged Extreme | |
| Dell XPS 13 9315 2-in-1 Core i5-1230U | |
| Dell Latitude 7330 Rugged Extreme | |
| Samsung Galaxy Book3 Pro 14 | |
| Lenovo ThinkPad T14s G3 21BR00CDGE | |
| R Benchmark 2.5 / Overall mean | |
| Panasonic Toughbook FZ-G2 | |
| Durabook R8 Tablet | |
| Asus ZenBook 14X OLED UX5400EA-L7154W | |
| Medio Intel Core i5-1230U (0.527 - 0.676, n=2) | |
| Dynabook Satellite Pro C50D-B-115 | |
| Dell Latitude 7330 Rugged Extreme | |
| HP Envy x360 13-bf0013dx | |
| Dell Latitude 7230 Rugged Extreme | |
| Dell XPS 13 9315 2-in-1 Core i5-1230U | |
| Lenovo Yoga 7-14ARB G7 | |
| Lenovo ThinkPad T14s G3 21BR00CDGE | |
| Samsung Galaxy Book3 Pro 14 | |
Cinebench R23: Multi Core | Single Core
Cinebench R20: CPU (Multi Core) | CPU (Single Core)
Cinebench R15: CPU Multi 64Bit | CPU Single 64Bit
Blender: v2.79 BMW27 CPU
7-Zip 18.03: 7z b 4 | 7z b 4 -mmt1
Geekbench 5.5: Multi-Core | Single-Core
HWBOT x265 Benchmark v2.2: 4k Preset
LibreOffice : 20 Documents To PDF
R Benchmark 2.5: Overall mean
* ... más pequeño es mejor
* ... más pequeño es mejor
AIDA64: FP32 Ray-Trace | FPU Julia | CPU SHA3 | CPU Queen | FPU SinJulia | FPU Mandel | CPU AES | CPU ZLib | FP64 Ray-Trace | CPU PhotoWorxx
| Performance rating | |
| Dell Latitude 7230 Rugged Extreme | |
| Medio Intel Core i5-1230U | |
| Panasonic Toughbook FZ-G2 | |
| Durabook R8 Tablet | |
| AIDA64 / FP32 Ray-Trace | |
| Dell Latitude 7230 Rugged Extreme | |
| Medio Intel Core i5-1230U (2344 - 6360, n=3) | |
| Panasonic Toughbook FZ-G2 | |
| Durabook R8 Tablet | |
| AIDA64 / FPU Julia | |
| Dell Latitude 7230 Rugged Extreme | |
| Medio Intel Core i5-1230U (11867 - 31714, n=3) | |
| Panasonic Toughbook FZ-G2 | |
| Durabook R8 Tablet | |
| AIDA64 / CPU SHA3 | |
| Dell Latitude 7230 Rugged Extreme | |
| Medio Intel Core i5-1230U (772 - 1711, n=3) | |
| Panasonic Toughbook FZ-G2 | |
| Durabook R8 Tablet | |
| AIDA64 / CPU Queen | |
| Dell Latitude 7230 Rugged Extreme | |
| Medio Intel Core i5-1230U (30824 - 52533, n=3) | |
| Panasonic Toughbook FZ-G2 | |
| Durabook R8 Tablet | |
| AIDA64 / FPU SinJulia | |
| Dell Latitude 7230 Rugged Extreme | |
| Panasonic Toughbook FZ-G2 | |
| Medio Intel Core i5-1230U (2269 - 3947, n=3) | |
| Durabook R8 Tablet | |
| AIDA64 / FPU Mandel | |
| Dell Latitude 7230 Rugged Extreme | |
| Medio Intel Core i5-1230U (6379 - 15896, n=3) | |
| Panasonic Toughbook FZ-G2 | |
| Durabook R8 Tablet | |
| AIDA64 / CPU AES | |
| Dell Latitude 7230 Rugged Extreme | |
| Durabook R8 Tablet | |
| Medio Intel Core i5-1230U (18011 - 31941, n=3) | |
| Panasonic Toughbook FZ-G2 | |
| AIDA64 / CPU ZLib | |
| Dell Latitude 7230 Rugged Extreme | |
| Medio Intel Core i5-1230U (229 - 495, n=3) | |
| Durabook R8 Tablet | |
| Panasonic Toughbook FZ-G2 | |
| AIDA64 / FP64 Ray-Trace | |
| Dell Latitude 7230 Rugged Extreme | |
| Medio Intel Core i5-1230U (1328 - 3305, n=3) | |
| Panasonic Toughbook FZ-G2 | |
| Durabook R8 Tablet | |
| AIDA64 / CPU PhotoWorxx | |
| Dell Latitude 7230 Rugged Extreme | |
| Medio Intel Core i5-1230U (17516 - 37042, n=3) | |
| Panasonic Toughbook FZ-G2 | |
| Durabook R8 Tablet | |
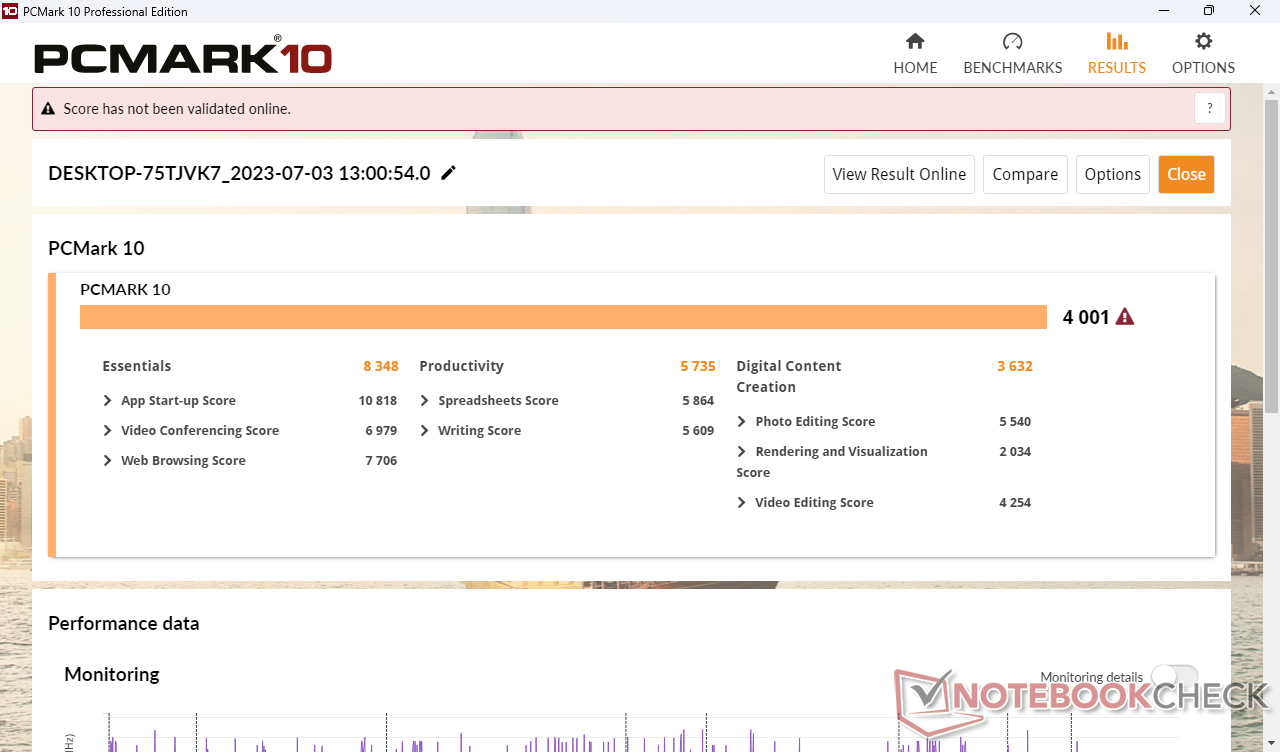
Rendimiento del sistema
Los resultados de PCMark son comparables a los del Panasonic Toughbook FZ-G2 ya que el procesador de nuestra unidad se ha reducido para funcionar de forma más similar al Toughbook.
CrossMark: Overall | Productivity | Creativity | Responsiveness
| PCMark 10 / Score | |
| Dell Latitude 7230 Rugged Extreme | |
| Medio Intel Core i5-1230U, Intel Iris Xe Graphics G7 80EUs (4001 - 4943, n=3) | |
| Durabook R8 Tablet | |
| Panasonic Toughbook FZ-G2 | |
| PCMark 10 / Essentials | |
| Dell Latitude 7230 Rugged Extreme | |
| Medio Intel Core i5-1230U, Intel Iris Xe Graphics G7 80EUs (8348 - 10139, n=3) | |
| Panasonic Toughbook FZ-G2 | |
| Durabook R8 Tablet | |
| PCMark 10 / Productivity | |
| Dell Latitude 7230 Rugged Extreme | |
| Medio Intel Core i5-1230U, Intel Iris Xe Graphics G7 80EUs (5735 - 6692, n=3) | |
| Panasonic Toughbook FZ-G2 | |
| Durabook R8 Tablet | |
| PCMark 10 / Digital Content Creation | |
| Dell Latitude 7230 Rugged Extreme | |
| Medio Intel Core i5-1230U, Intel Iris Xe Graphics G7 80EUs (3632 - 4833, n=3) | |
| Durabook R8 Tablet | |
| Panasonic Toughbook FZ-G2 | |
| CrossMark / Overall | |
| Dell Latitude 7230 Rugged Extreme | |
| Medio Intel Core i5-1230U, Intel Iris Xe Graphics G7 80EUs (1117 - 1383, n=3) | |
| Durabook R8 Tablet | |
| Lenovo Tab M8 (Gen 4) | |
| CrossMark / Productivity | |
| Dell Latitude 7230 Rugged Extreme | |
| Medio Intel Core i5-1230U, Intel Iris Xe Graphics G7 80EUs (1187 - 1356, n=3) | |
| Durabook R8 Tablet | |
| Lenovo Tab M8 (Gen 4) | |
| CrossMark / Creativity | |
| Dell Latitude 7230 Rugged Extreme | |
| Medio Intel Core i5-1230U, Intel Iris Xe Graphics G7 80EUs (1095 - 1469, n=3) | |
| Durabook R8 Tablet | |
| Lenovo Tab M8 (Gen 4) | |
| CrossMark / Responsiveness | |
| Dell Latitude 7230 Rugged Extreme | |
| Medio Intel Core i5-1230U, Intel Iris Xe Graphics G7 80EUs (990 - 1224, n=3) | |
| Durabook R8 Tablet | |
| Lenovo Tab M8 (Gen 4) | |
| PCMark 10 Score | 4001 puntos | |
ayuda | ||
| AIDA64 / Memory Copy | |
| Media de la clase Tablet (60613 - 110050, n=3, últimos 2 años) | |
| Medio Intel Core i5-1230U (32539 - 60944, n=3) | |
| Durabook R8 Tablet | |
| AIDA64 / Memory Read | |
| Media de la clase Tablet (85395 - 122306, n=3, últimos 2 años) | |
| Medio Intel Core i5-1230U (31342 - 60435, n=3) | |
| Durabook R8 Tablet | |
| AIDA64 / Memory Write | |
| Media de la clase Tablet (43045 - 117859, n=3, últimos 2 años) | |
| Medio Intel Core i5-1230U (33224 - 65665, n=3) | |
| Durabook R8 Tablet | |
| AIDA64 / Memory Latency | |
| Durabook R8 Tablet | |
| Media de la clase Tablet (94.4 - 101.7, n=2, últimos 2 años) | |
| Medio Intel Core i5-1230U (104.3 - 105.3, n=3) | |
* ... más pequeño es mejor
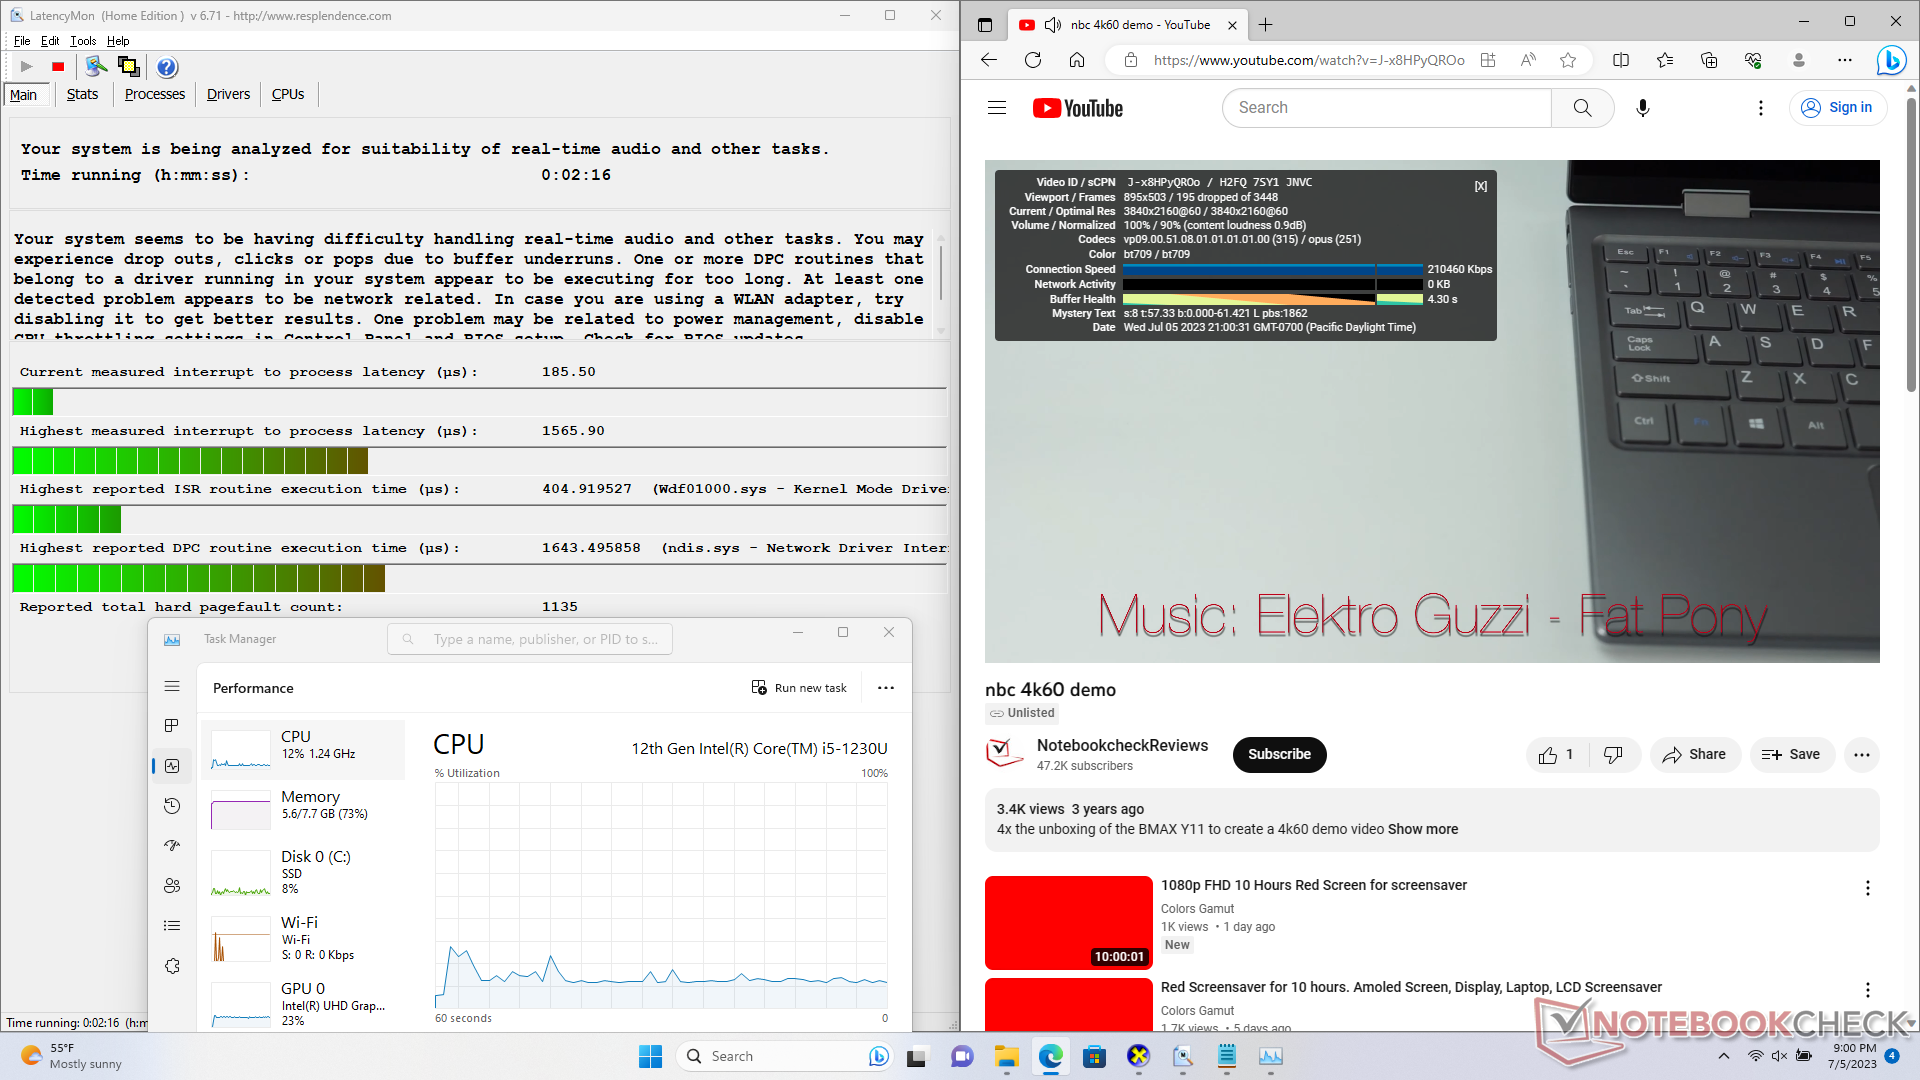
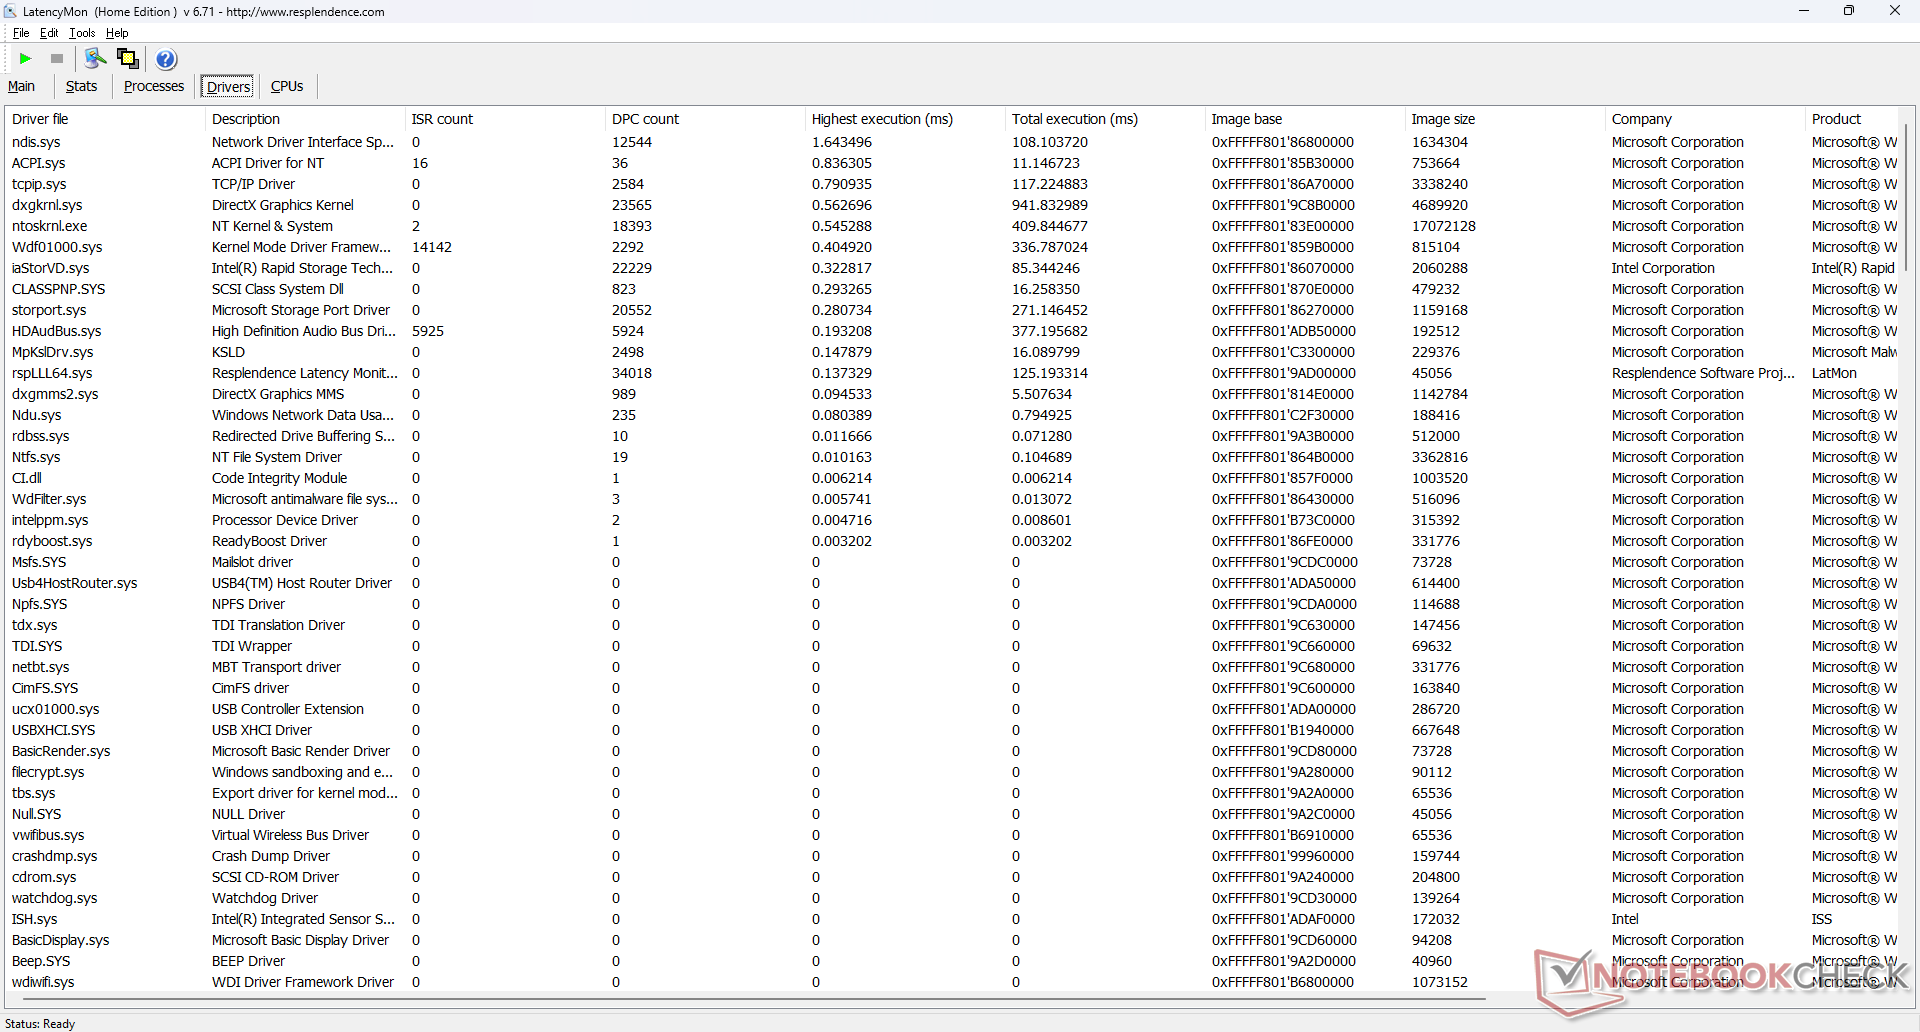
Latencia del CPD
LatencyMon revela problemas de CPD al abrir varias pestañas de nuestra página de inicio. Además, la reproducción de vídeo 4K a 60 FPS también mostró problemas, ya que registramos 195 fotogramas perdidos durante nuestro vídeo de prueba de un minuto de duración.
| DPC Latencies / LatencyMon - interrupt to process latency (max), Web, Youtube, Prime95 | |
| Dell Latitude 7230 Rugged Extreme | |
| Panasonic Toughbook FZ-G2 | |
| Durabook R8 Tablet | |
* ... más pequeño es mejor
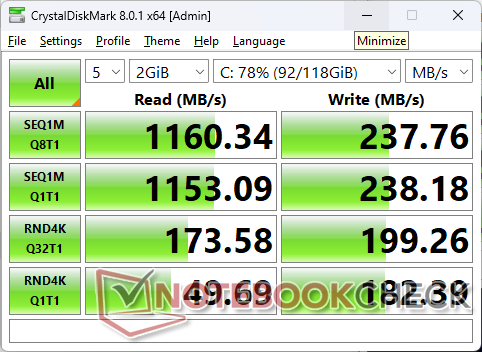
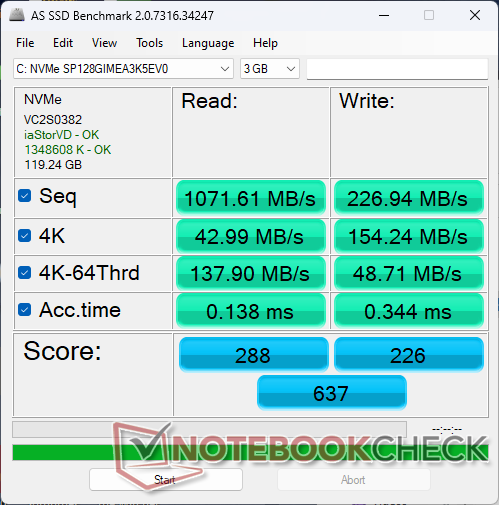
Dispositivos de almacenamiento
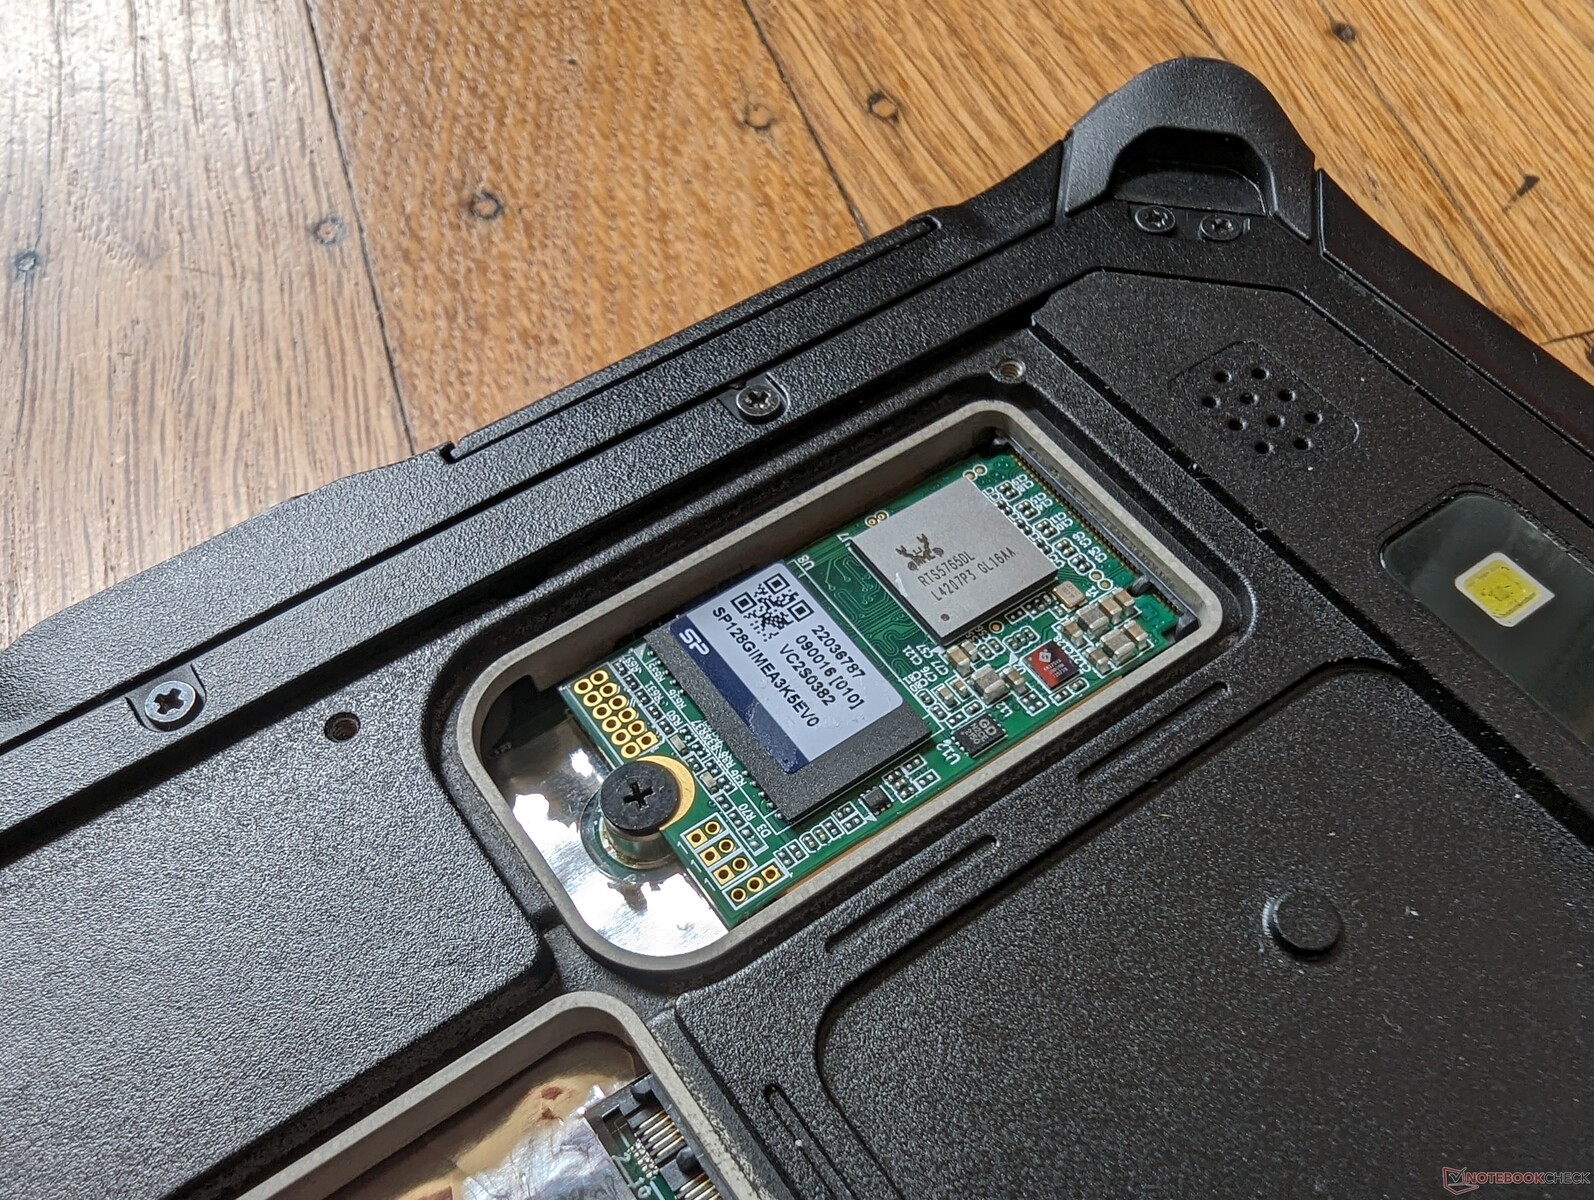
La unidad extraíble sSD NVMe de 128 GB puede mantener velocidades de lectura y escritura de hasta 1100 MB/s y 240 MB/s, respectivamente, durante periodos prolongados. Las tasas de escritura son significativamente más lentas, lo que no debería ser un problema para el público objetivo. Se espera que las opciones de mayor capacidad de 256 GB, 512 GB o 1 TB tengan un rendimiento más rápido.

| Drive Performance rating - Percent | |
| Dell Latitude 7230 Rugged Extreme | |
| Panasonic Toughbook FZ-G2 | |
| Durabook R8 Tablet | |
* ... más pequeño es mejor
Disk Throttling: DiskSpd Read Loop, Queue Depth 8
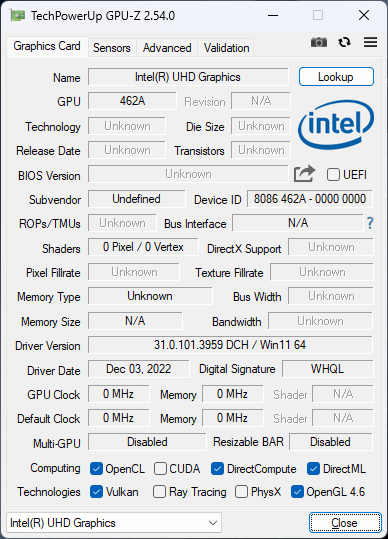
Rendimiento de la GPU
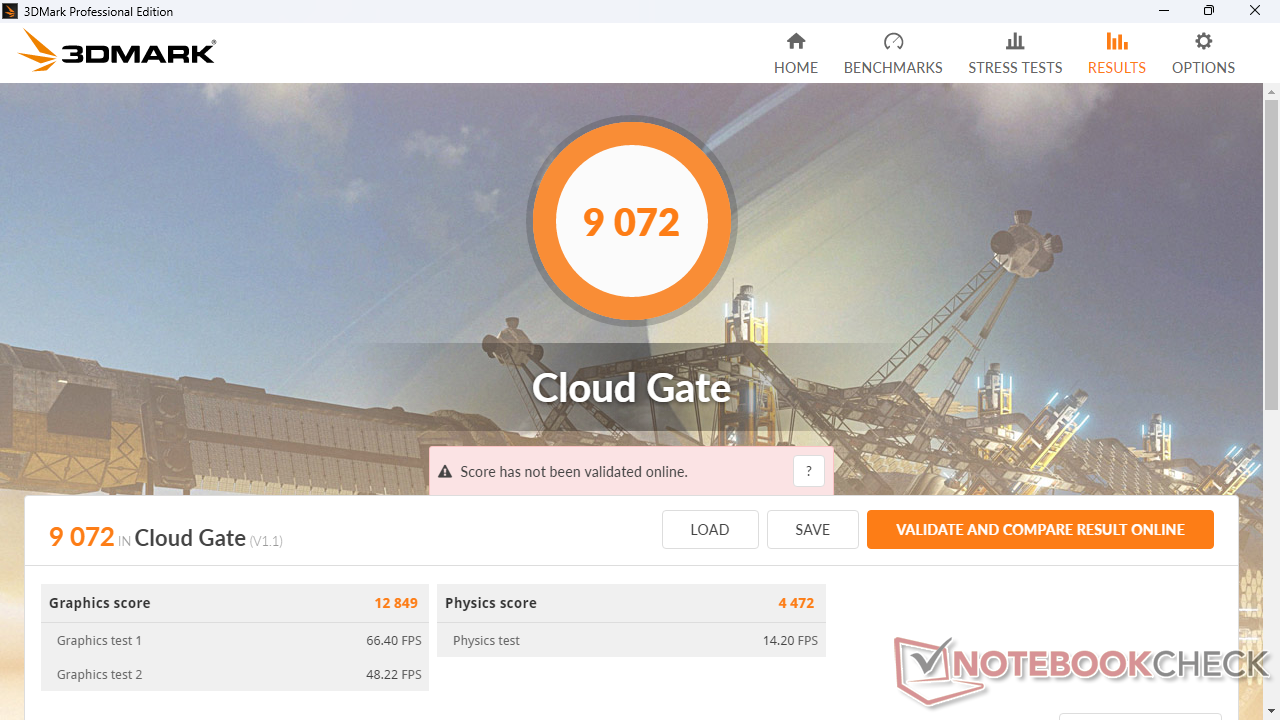
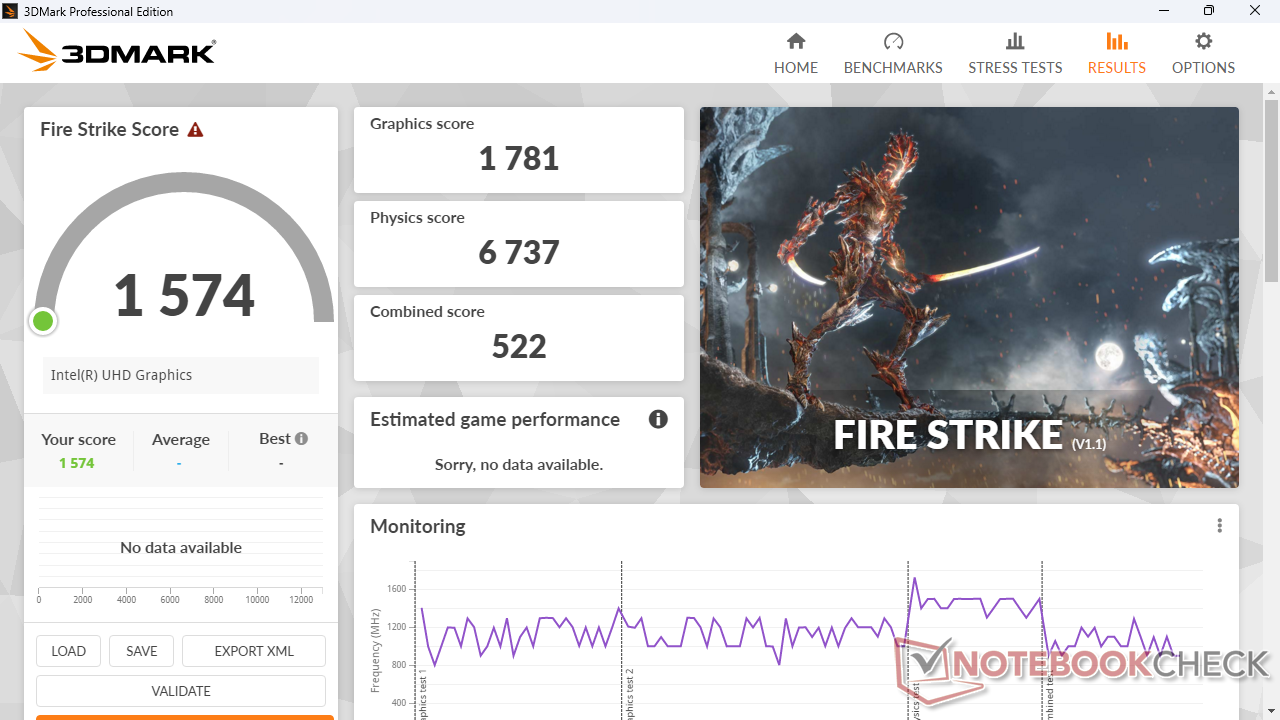
El rendimiento gráfico es entre un 30 y un 40 por ciento más lento que el mismo Iris Xe 80 EUs GPU en el XPS 13 9315 debido en parte a la CPU underclocked y más lento de un solo canal de RAM. No obstante, el rendimiento general sigue siendo más rápido que el mucho más antiguo UHD Graphics 620 entre un 40 y un 50 por ciento.
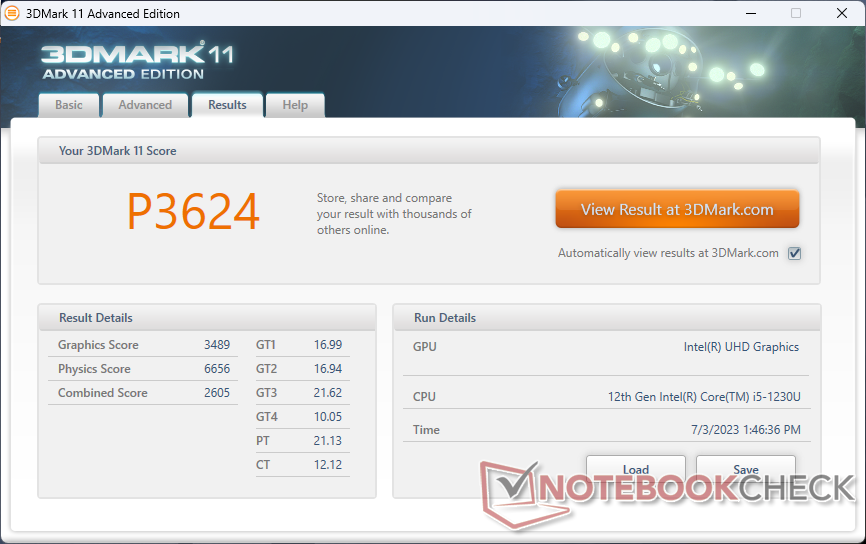
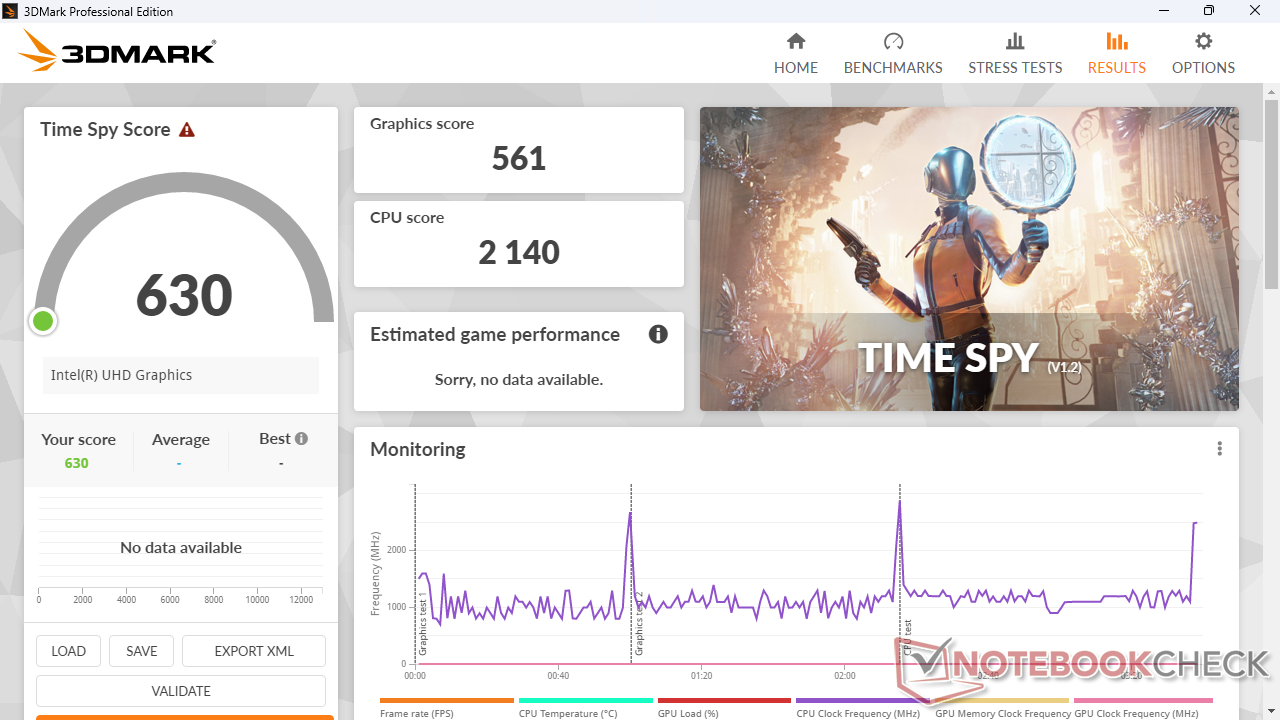
| 3DMark 11 Performance | 3624 puntos | |
| 3DMark Cloud Gate Standard Score | 9072 puntos | |
| 3DMark Fire Strike Score | 1574 puntos | |
| 3DMark Time Spy Score | 630 puntos | |
ayuda | ||
| Final Fantasy XV Benchmark - 1280x720 Lite Quality | |
| Asus ZenBook 14X OLED UX5400EA-L7154W | |
| Lenovo Yoga 7-14ARB G7 | |
| Dell Latitude 7330 Rugged Extreme | |
| Lenovo ThinkPad T14s G3 21BR00CDGE | |
| Samsung Galaxy Book3 Pro 14 | |
| Medio Intel Iris Xe Graphics G7 80EUs (8.32 - 45.6, n=107) | |
| Dell Latitude 7230 Rugged Extreme | |
| Dell XPS 13 9315 2-in-1 Core i5-1230U | |
| Dynabook Satellite Pro C50D-B-115 | |
| Panasonic Toughbook FZ-G2 | |
| Durabook R8 Tablet | |
Witcher 3 FPS Chart
| bajo | medio | alto | ultra | |
|---|---|---|---|---|
| The Witcher 3 (2015) | 30.2 | |||
| Dota 2 Reborn (2015) | 62.9 | 41.7 | 19.6 | 13.2 |
| Final Fantasy XV Benchmark (2018) | 12.1 | |||
| X-Plane 11.11 (2018) | 26.2 | 21.8 | 20.1 |
Emisiones - Diseño sin ventilador
Temperatura
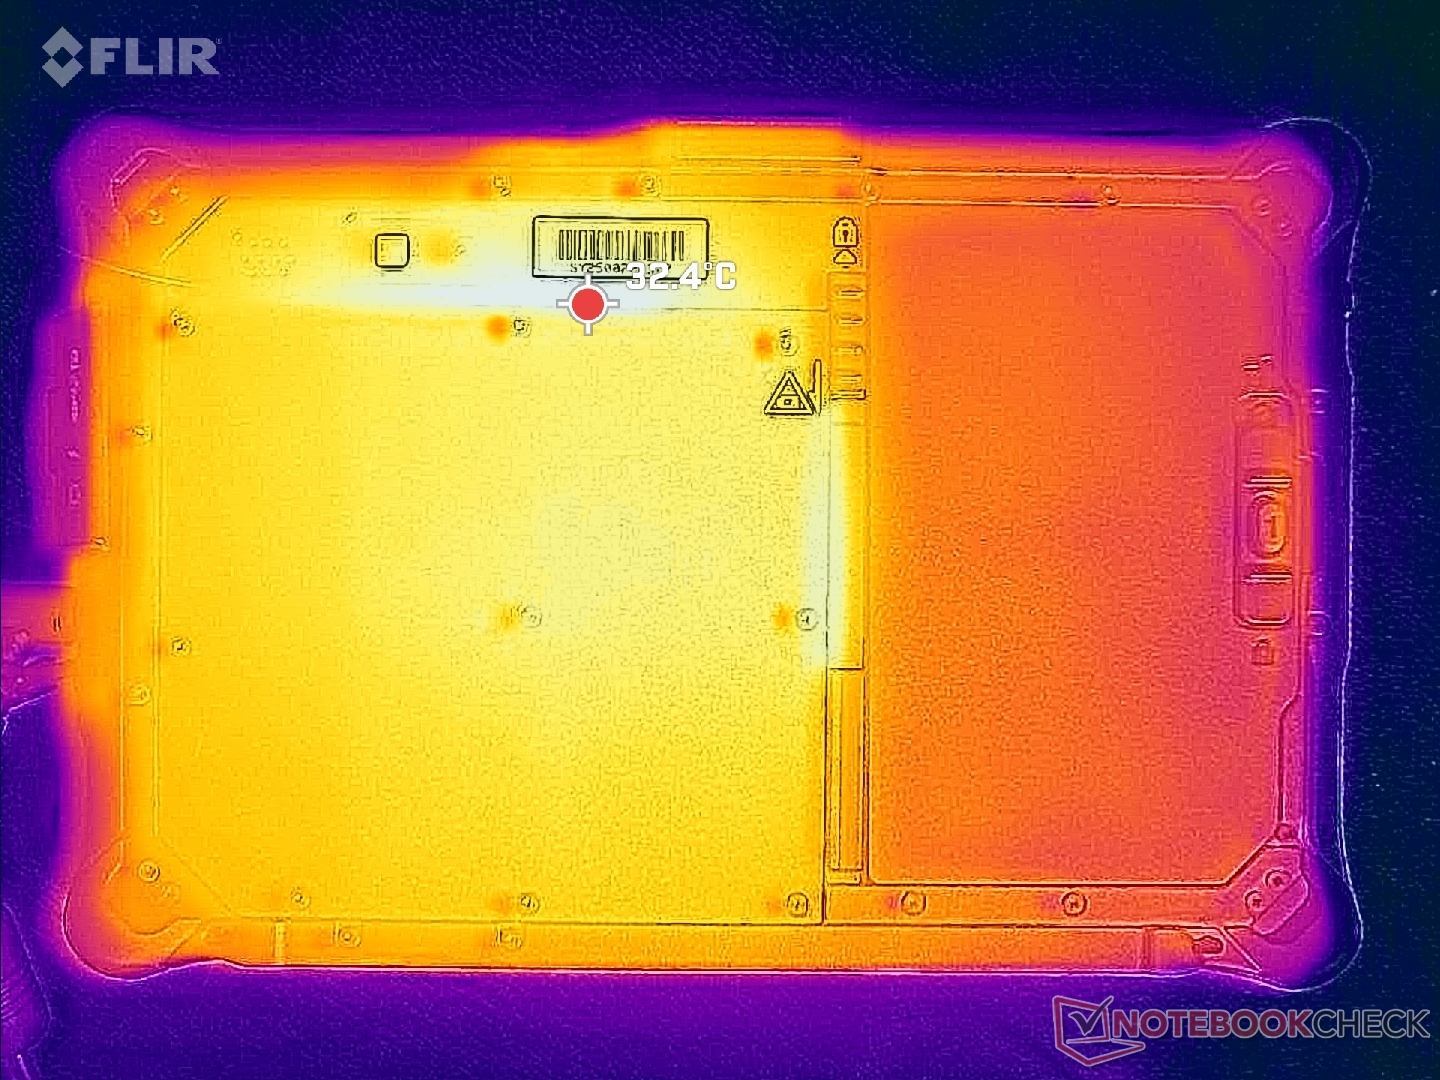
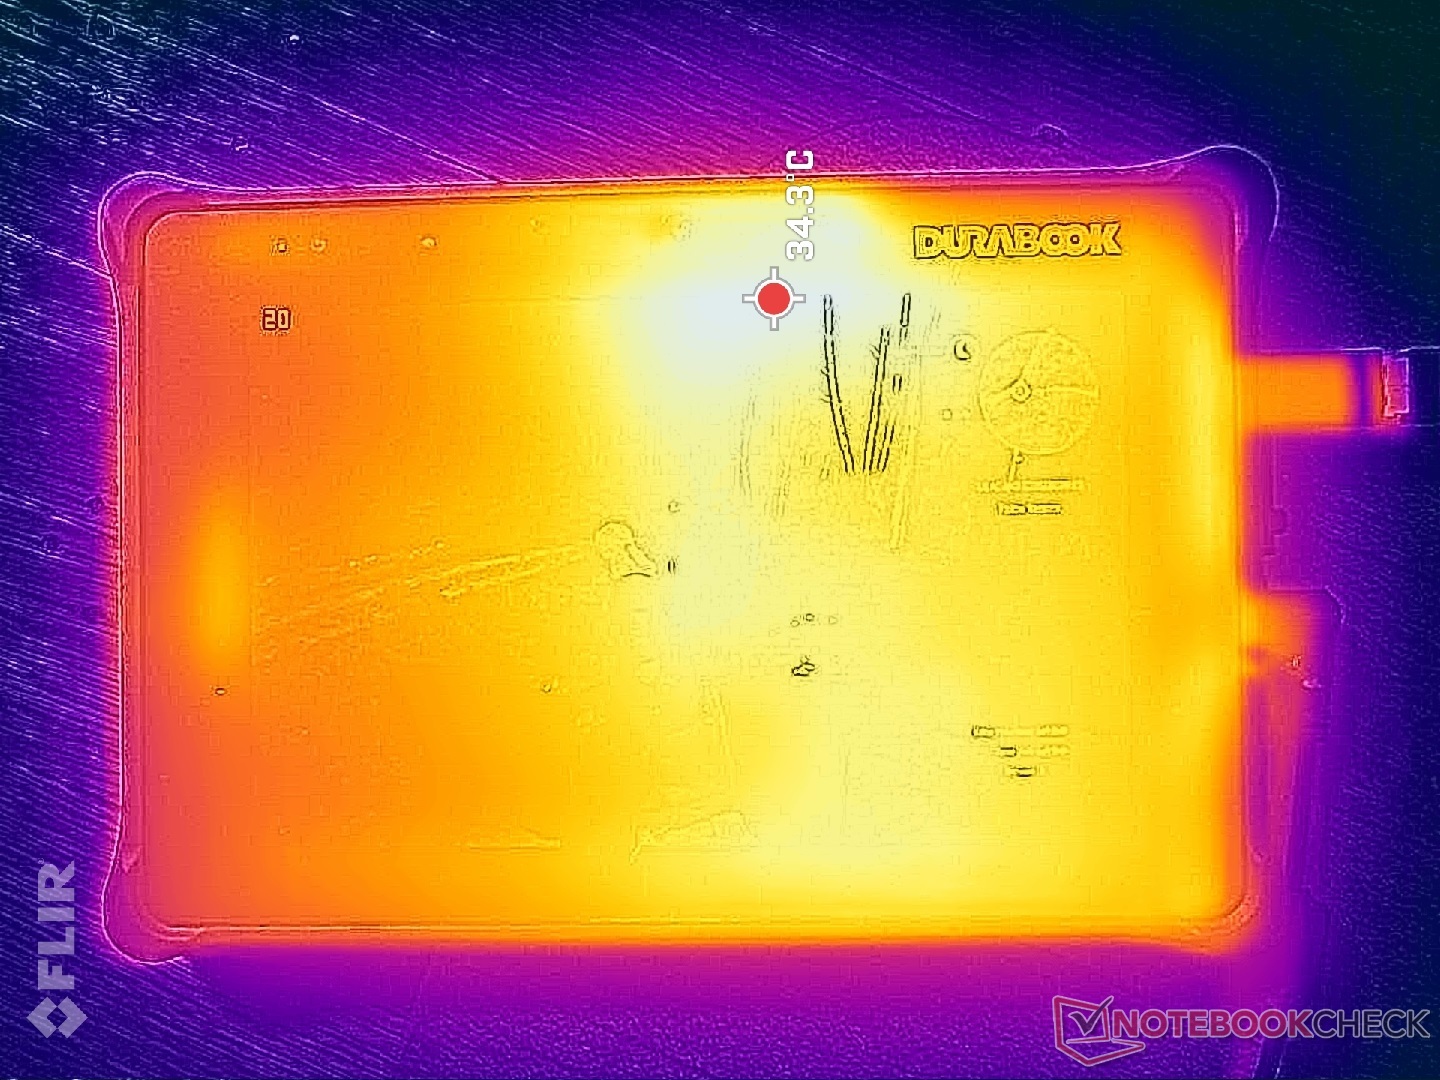
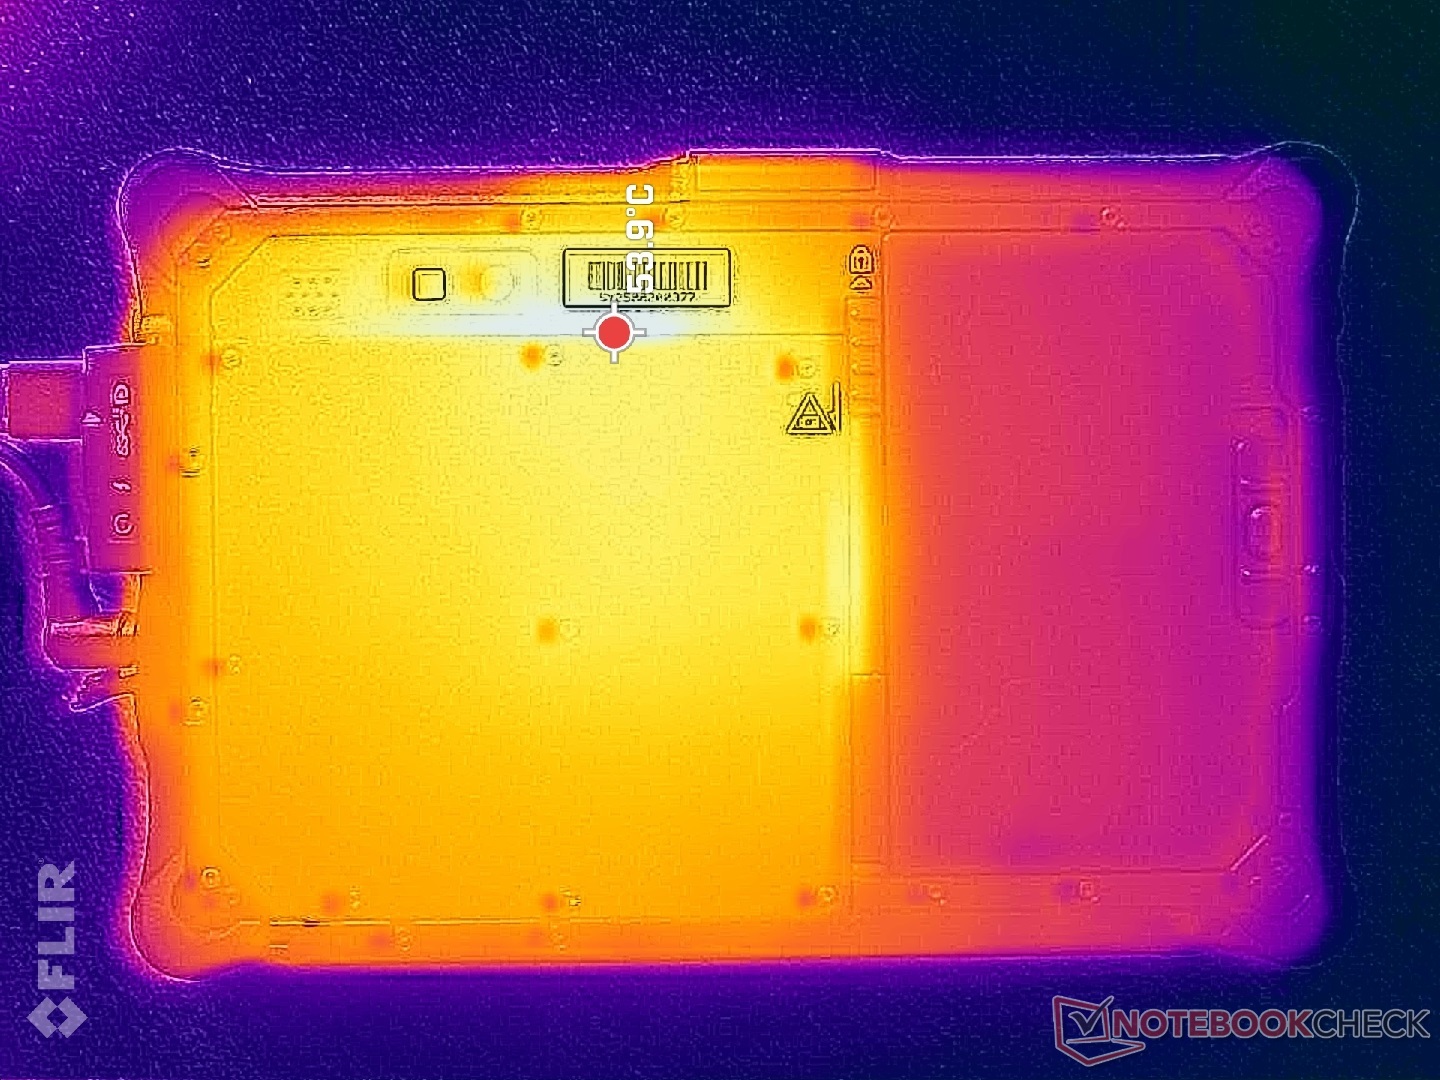
Las temperaturas de la superficie son más elevadas en la mitad derecha de la tableta que en la izquierda, debido a la posición de la placa base y la batería. La parte trasera puede calentarse mucho, hasta 54 C cuando se ejecutan cargas exigentes, en comparación con los 40 C de la AndroidAcer Enduro T1.
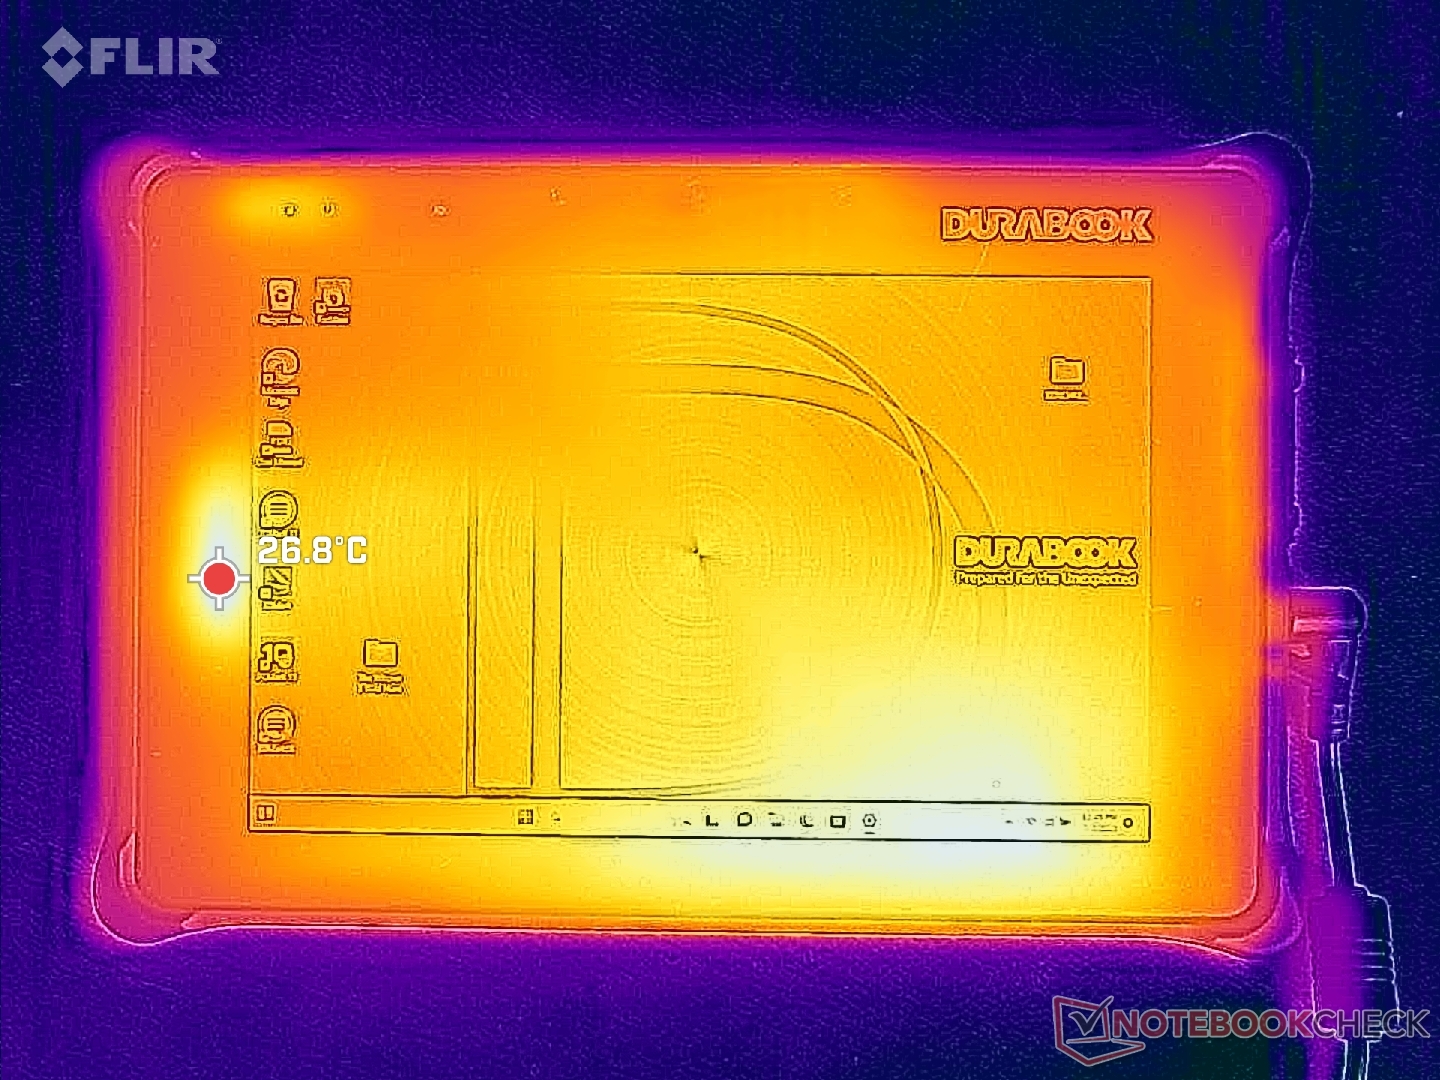
(+) La temperatura máxima en la parte superior es de 38.2 °C / 101 F, frente a la media de 33.7 °C / 93 F, que oscila entre 20.7 y 53.2 °C para la clase Tablet.
(-) El fondo se calienta hasta un máximo de 49.6 °C / 121 F, frente a la media de 33.2 °C / 92 F
(+) En reposo, la temperatura media de la parte superior es de 30.8 °C / 87# F, frente a la media del dispositivo de 30 °C / 86 F.
| Durabook R8 Tablet Intel Core i5-1230U, Intel Iris Xe Graphics G7 80EUs | Acer Enduro T1 ET108-11A A9001 | Lenovo Tab M8 (Gen 4) Mediatek Helio A22 MT6761, PowerVR GE8300 | Dell Latitude 7230 Rugged Extreme Intel Core i5-1240U, Intel Iris Xe Graphics G7 80EUs | Panasonic Toughbook FZ-G2 Intel Core i5-10310U, Intel UHD Graphics 620 | |
|---|---|---|---|---|---|
| Heat | 7% | 29% | 9% | 19% | |
| Maximum Upper Side * (°C) | 38.2 | 37.8 1% | 28.6 25% | 32.6 15% | 37.4 2% |
| Maximum Bottom * (°C) | 49.6 | 39.4 21% | 30.1 39% | 40.2 19% | 36.6 26% |
| Idle Upper Side * (°C) | 32.2 | 32.8 -2% | 23.1 28% | 30.6 5% | 25.6 20% |
| Idle Bottom * (°C) | 33.4 | 31.2 7% | 25.1 25% | 35 -5% | 24 28% |
* ... más pequeño es mejor
Prueba de resistencia
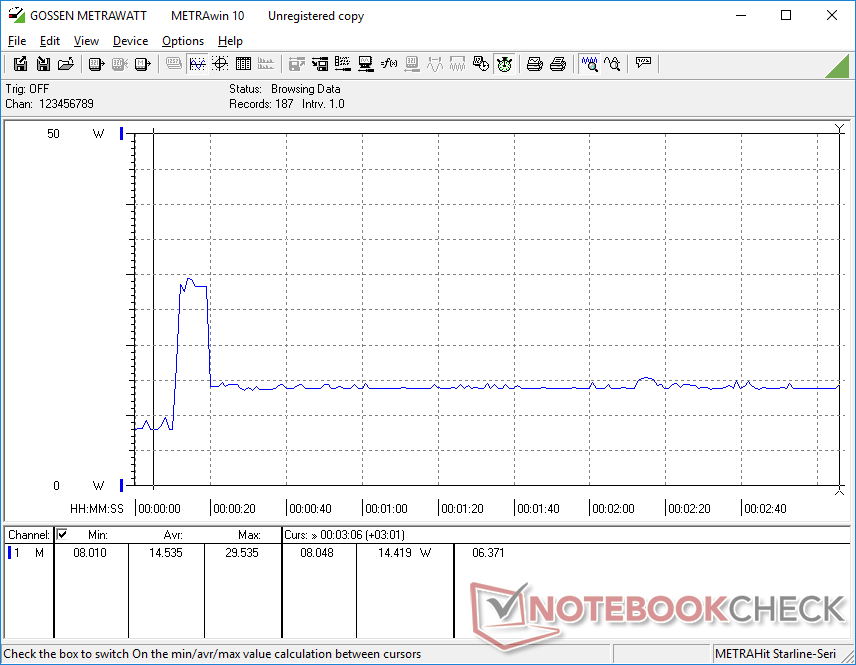
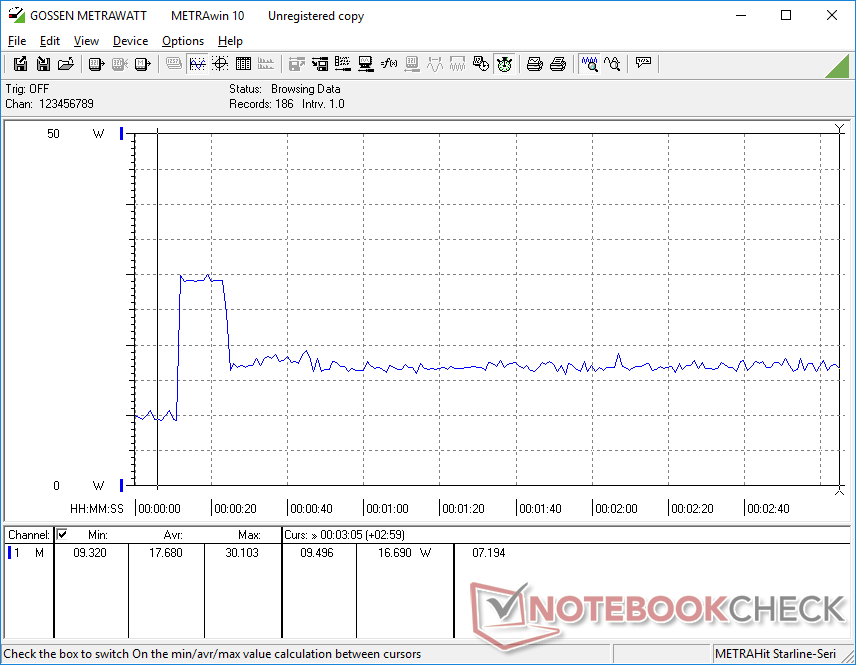
La CPU aumentaba a 1,8 GHz, 67 C y 15 W durante los primeros segundos después de iniciar el estrés Prime95 antes de caer y estabilizarse en sólo 400 MHz, 59 C y 7 W. Estos resultados son significativamente más bajos que en el Dell XPS 13 9315 que viene con exactamente la misma CPU y explica los resultados del benchmark más bajos de lo esperado en la sección de Rendimiento de CPU más arriba.
El rendimiento en batería seguiría siendo idéntico.
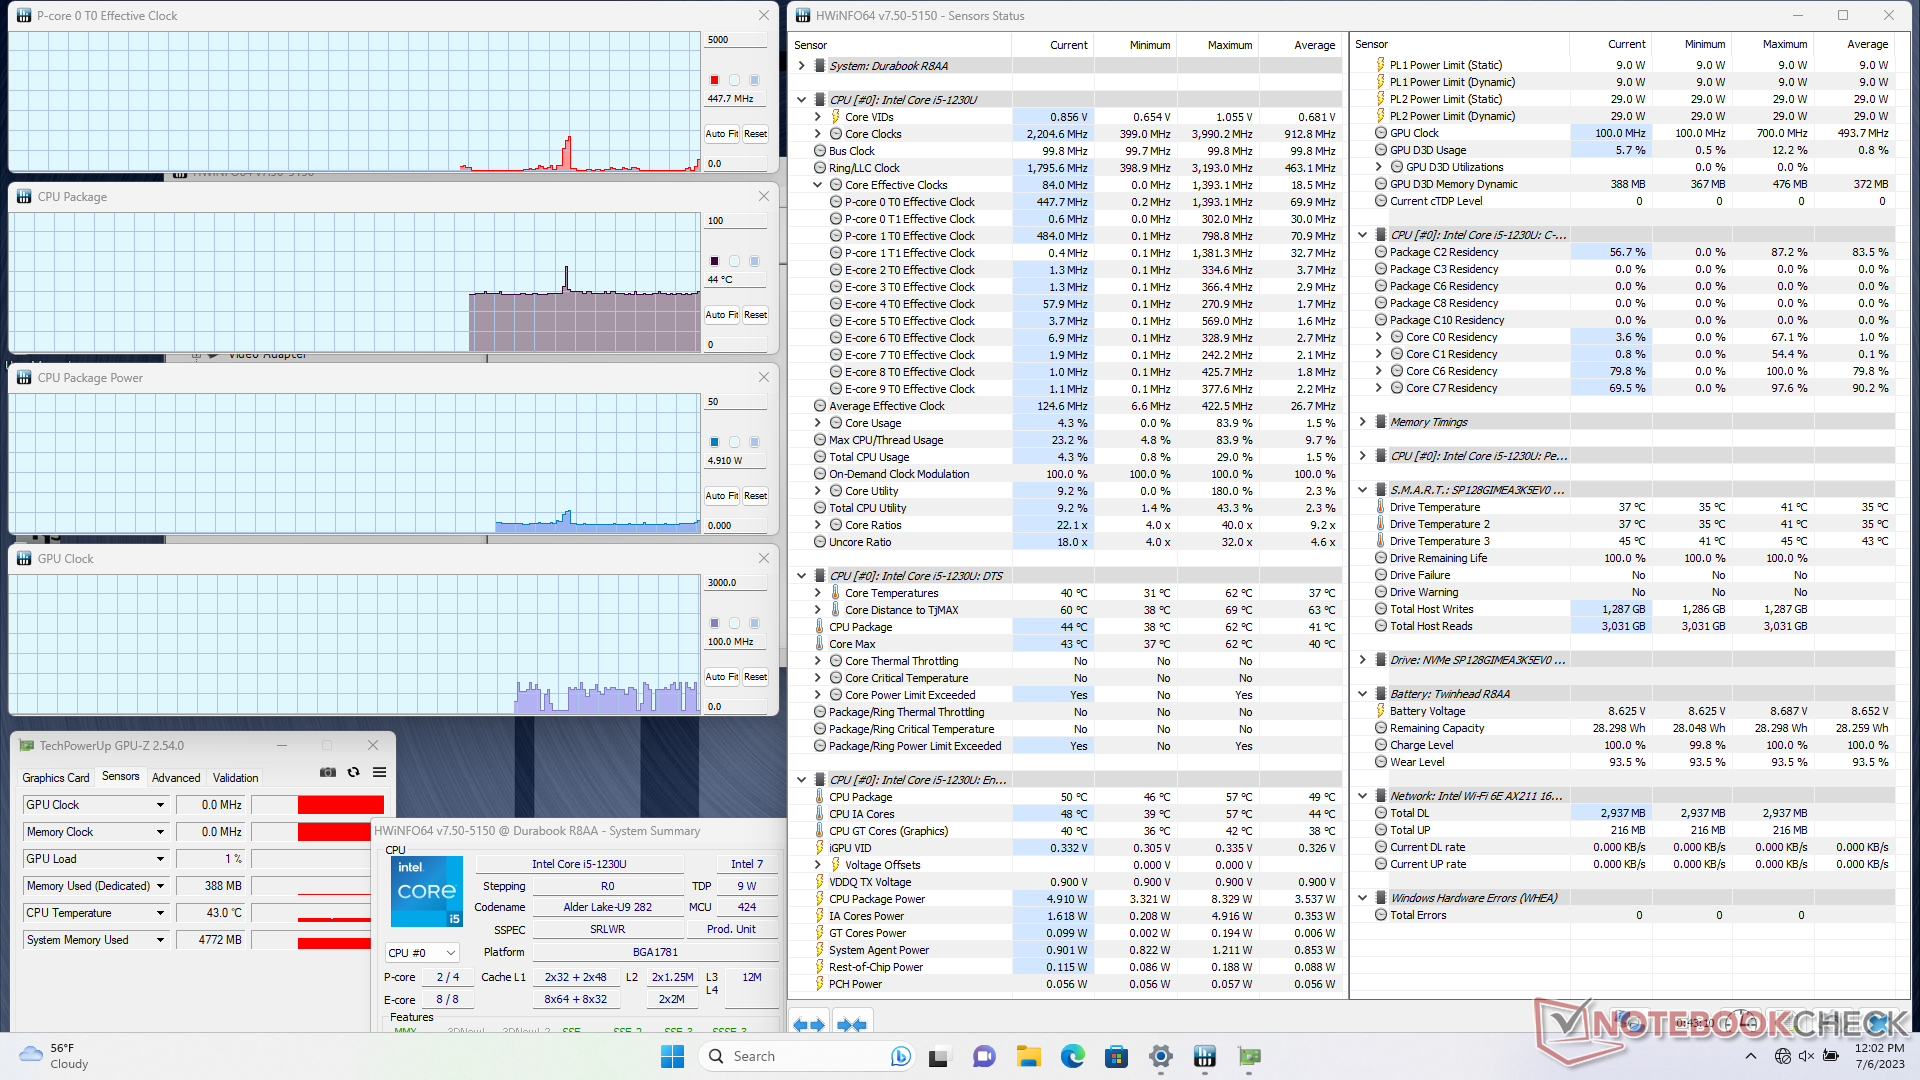
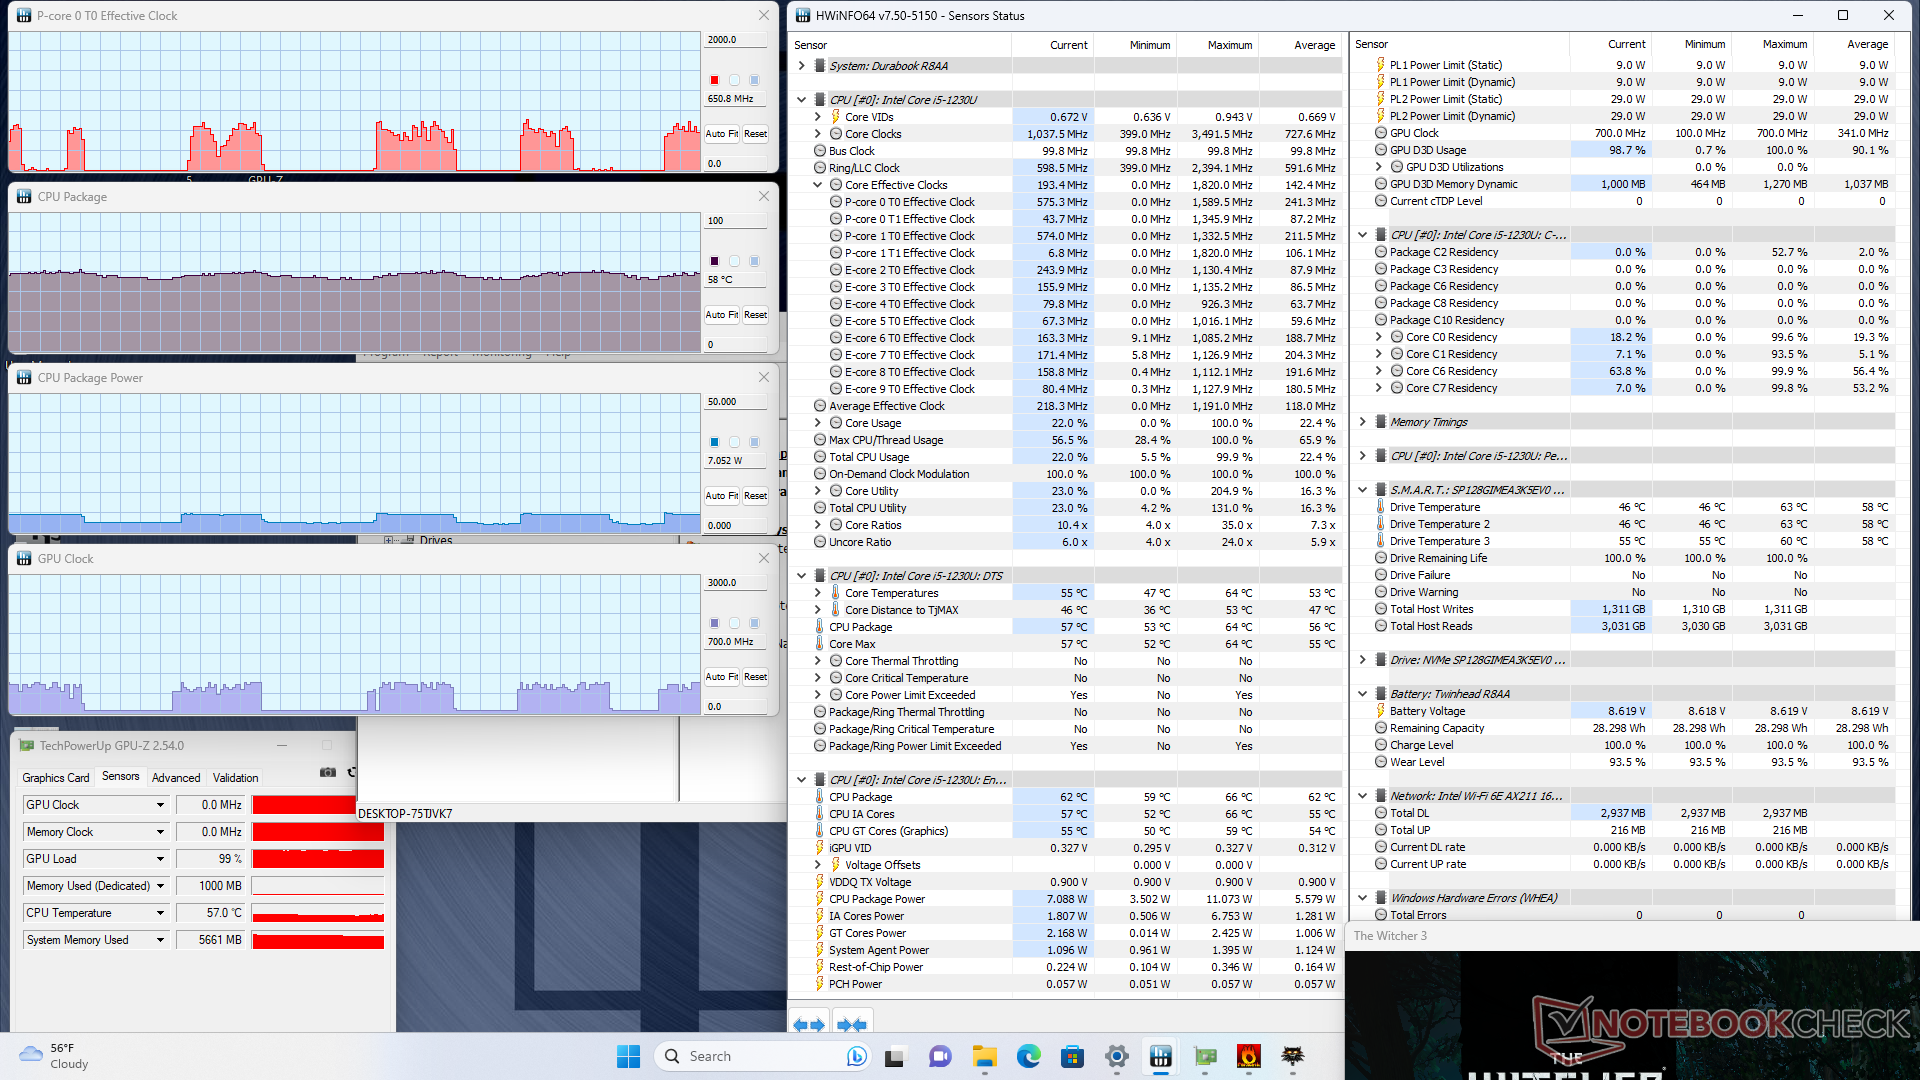
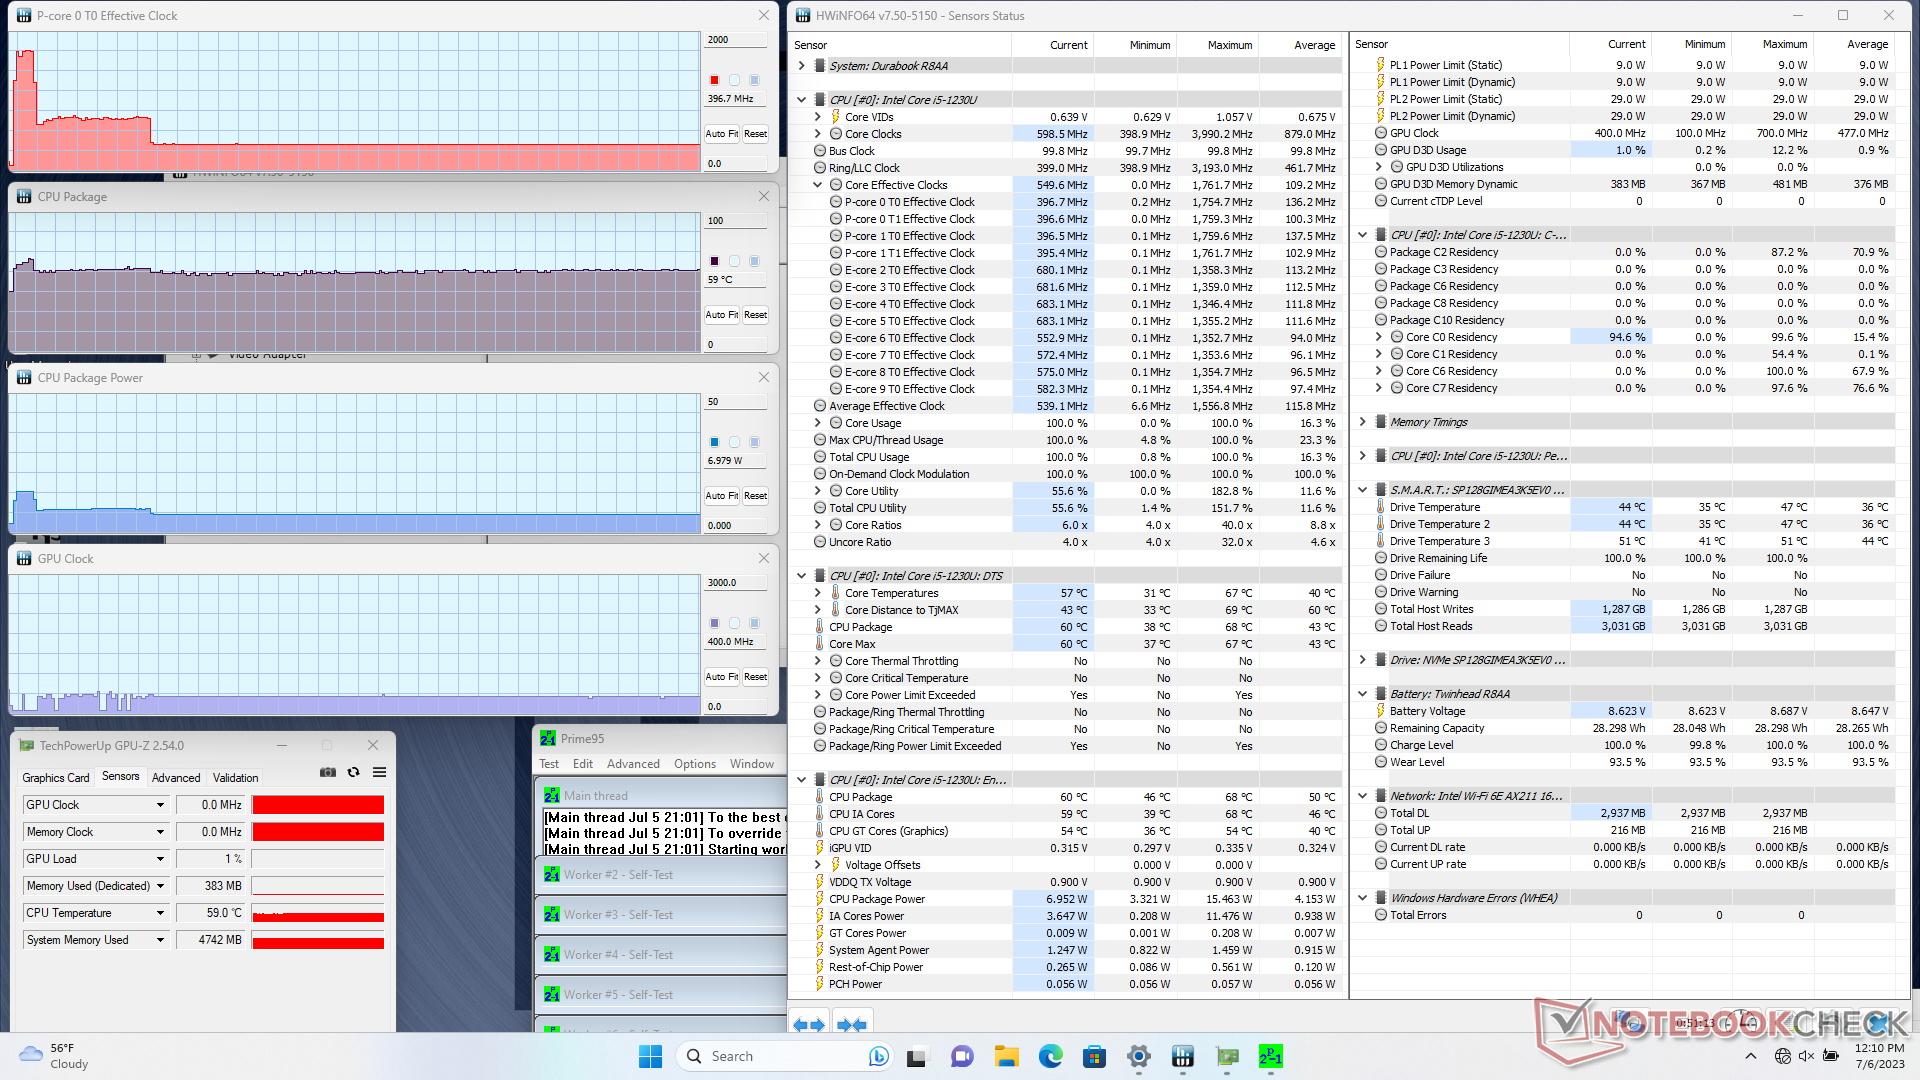
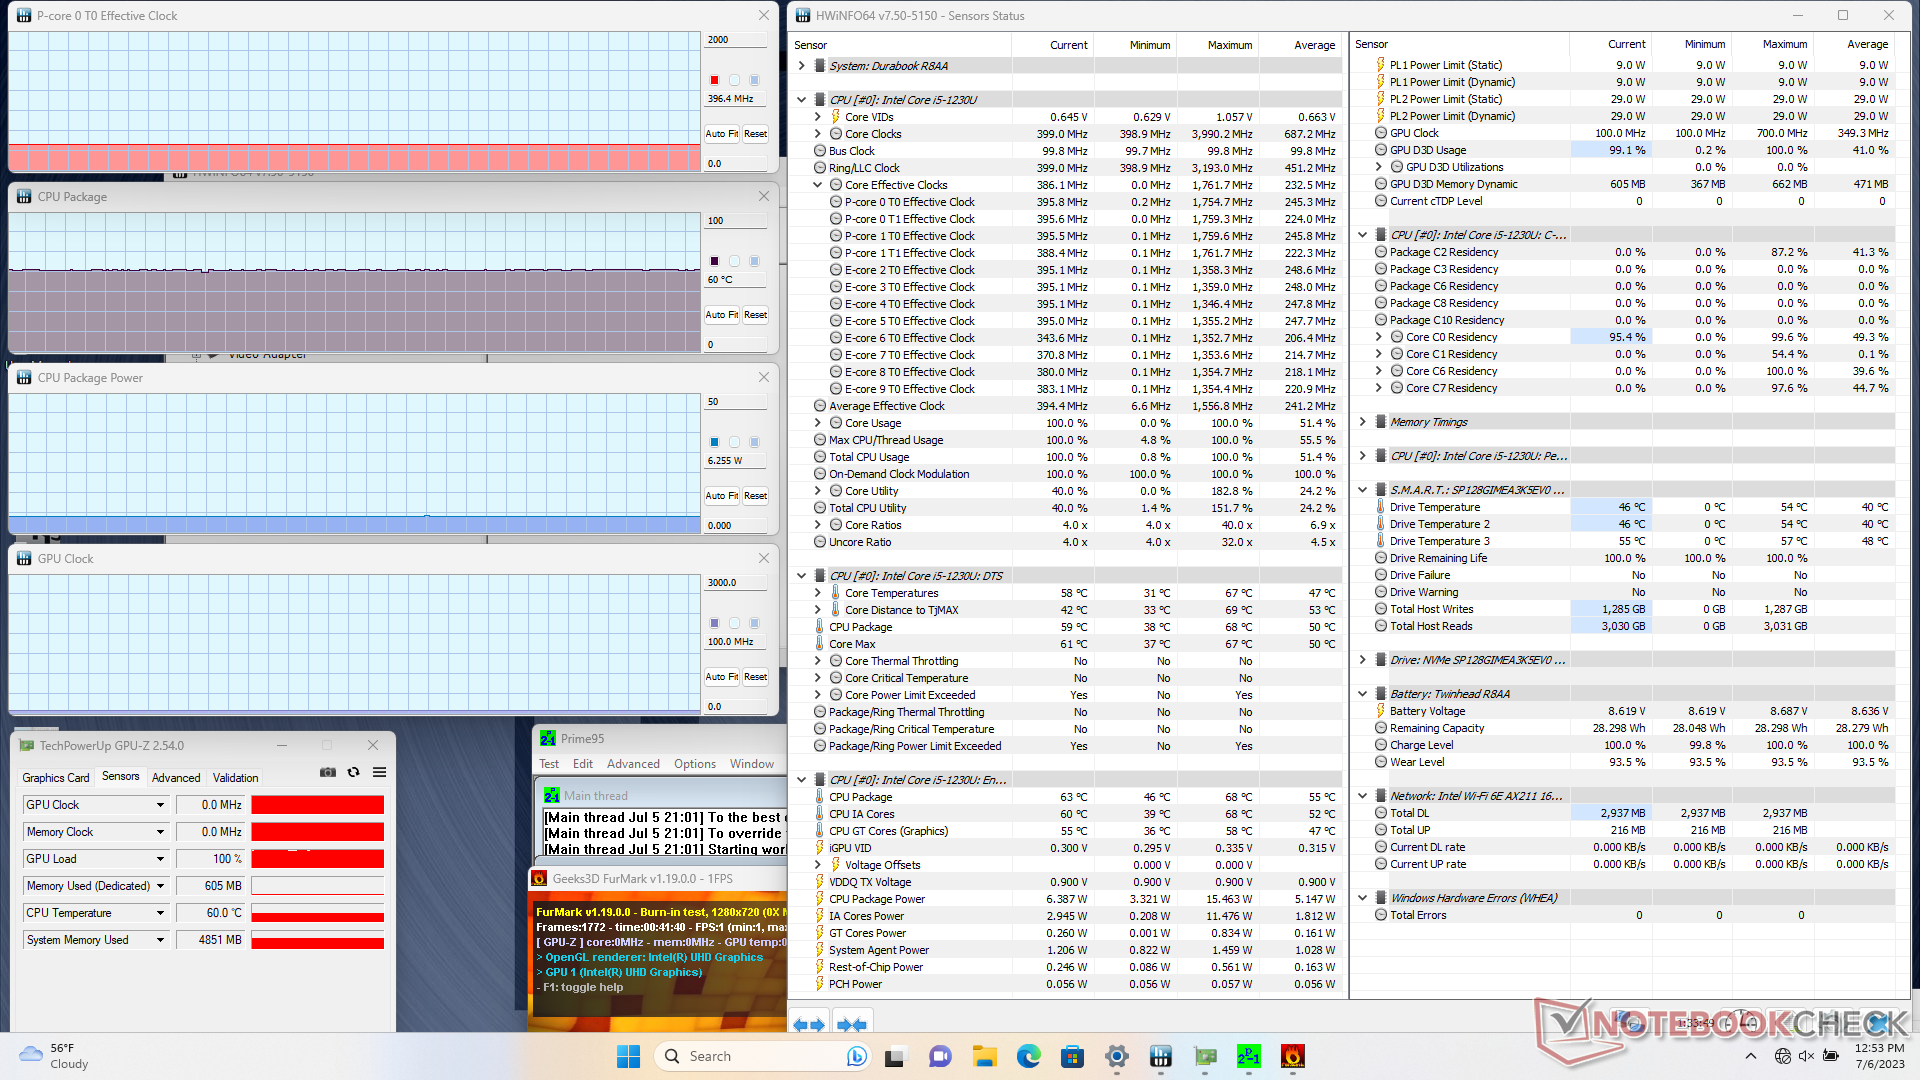
| RelojCPU (GHz) | Reloj GPU (MHz) | Temperatura media CPU (°C) | |
| Sistema en reposo | -- | -- | 44 |
| Prime95 Stress | 0.4 | -- | 59 |
| Prime95+ FurMark Stress | 0,4 | 100 | 60 |
| Witcher 3 Estrés | ~0,6 | ~700 | 58 |
Altavoces
Los graves son débiles, como era de esperar, pero el volumen máximo podría haber sido más alto con sólo 75 dB(A) frente a los 88 dB(A) del Acer Enduro T1. El altavoz del Durabook R8 está orientado hacia atrás, lo que no es óptimo para el usuario.
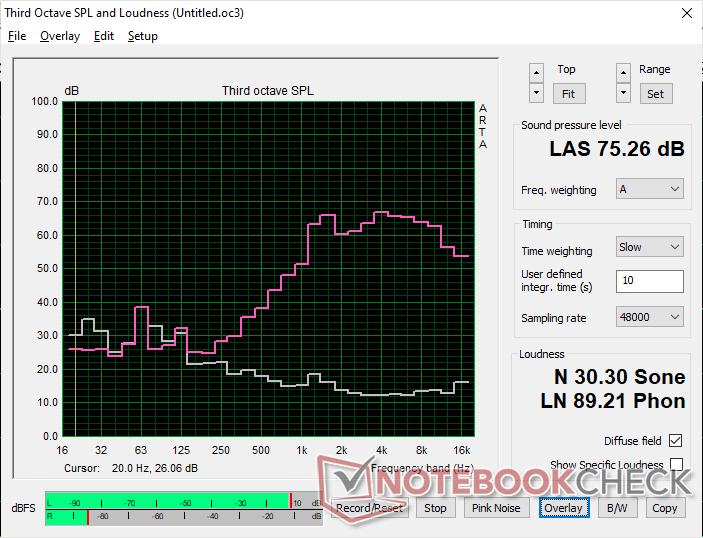
Durabook R8 Tablet análisis de audio
(±) | la sonoridad del altavoz es media pero buena (75.3 dB)
Graves 100 - 315 Hz
(-) | casi sin bajos - de media 25.7% inferior a la mediana
(±) | la linealidad de los graves es media (8.4% delta a frecuencia anterior)
Medios 400 - 2000 Hz
(±) | medios reducidos - de media 10% inferior a la mediana
(±) | la linealidad de los medios es media (13.9% delta respecto a la frecuencia anterior)
Altos 2 - 16 kHz
(±) | máximos más altos - de media 10.6% más altos que la mediana
(+) | los máximos son lineales (4.1% delta a la frecuencia anterior)
Total 100 - 16.000 Hz
(-) | el sonido global no es lineal (38% de diferencia con la mediana)
En comparación con la misma clase
» 97% de todos los dispositivos probados de esta clase eran mejores, 1% similares, 2% peores
» El mejor tuvo un delta de 7%, la media fue 20%, el peor fue ###max##%
En comparación con todos los dispositivos probados
» 95% de todos los dispositivos probados eran mejores, 1% similares, 5% peores
» El mejor tuvo un delta de 4%, la media fue 23%, el peor fue ###max##%
Apple MacBook Pro 16 2021 M1 Pro análisis de audio
(+) | los altavoces pueden reproducir a un volumen relativamente alto (#84.7 dB)
Graves 100 - 315 Hz
(+) | buen bajo - sólo 3.8% lejos de la mediana
(+) | el bajo es lineal (5.2% delta a la frecuencia anterior)
Medios 400 - 2000 Hz
(+) | medios equilibrados - a sólo 1.3% de la mediana
(+) | los medios son lineales (2.1% delta a la frecuencia anterior)
Altos 2 - 16 kHz
(+) | máximos equilibrados - a sólo 1.9% de la mediana
(+) | los máximos son lineales (2.7% delta a la frecuencia anterior)
Total 100 - 16.000 Hz
(+) | el sonido global es lineal (4.6% de diferencia con la mediana)
En comparación con la misma clase
» 0% de todos los dispositivos probados de esta clase eran mejores, 0% similares, 100% peores
» El mejor tuvo un delta de 5%, la media fue 17%, el peor fue ###max##%
En comparación con todos los dispositivos probados
» 0% de todos los dispositivos probados eran mejores, 0% similares, 100% peores
» El mejor tuvo un delta de 4%, la media fue 23%, el peor fue ###max##%
Gestión de la energía - Alto rendimiento por vatio
Consumo de energía
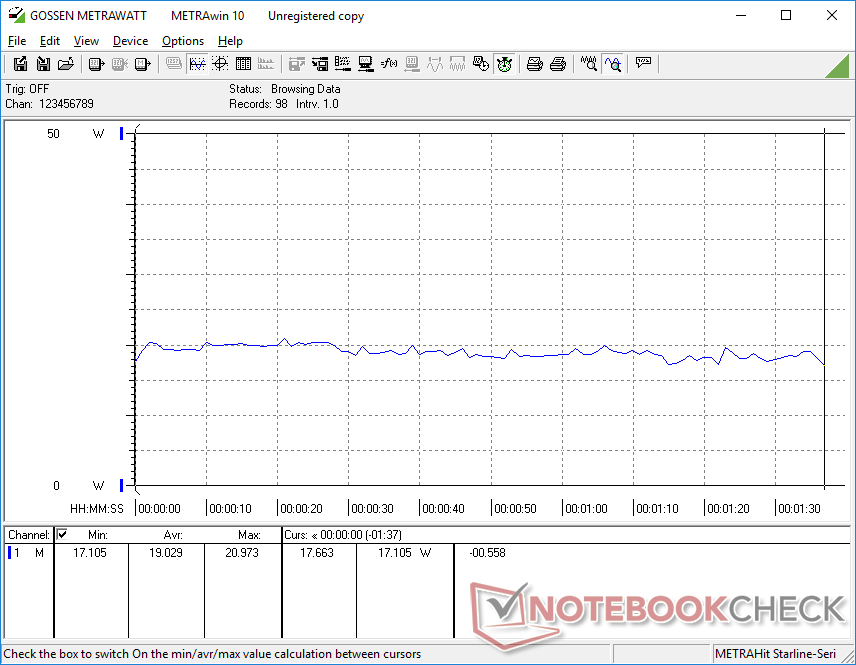
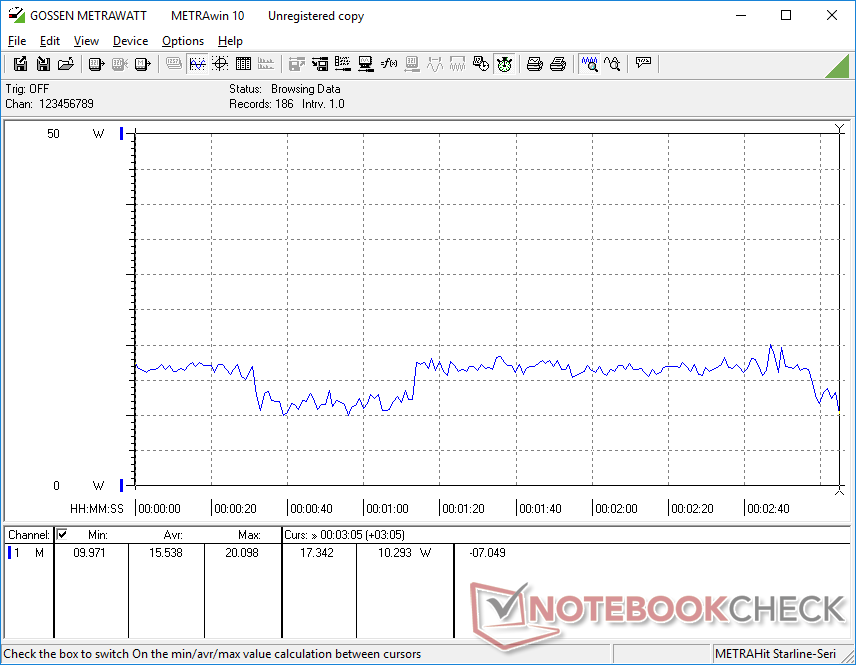
El consumo de energía puede ser tan bajo como 3 W cuando está en reposo en el escritorio en el ajuste de brillo más bajo o hasta casi 7 W si el brillo se eleva al máximo.
El consumo total bajo cargas más pesadas es aproximadamente la mitad que el del antiguo Panasonic Toughbook FZ-G2, a pesar de que el rendimiento del procesador es casi el mismo. Así, los usuarios pueden beneficiarse del mayor rendimiento por vatio del nuevo Core i5-1230U.
Hemos podido medir un consumo máximo de 30 W con el pequeño adaptador de CA de 65 W (~10,5 x 4,5 x 3 cm).
| Off / Standby | |
| Ocioso | |
| Carga |
|
Clave:
min: | |
| Durabook R8 Tablet i5-1230U, Iris Xe G7 80EUs, Silicon Power SP128GIMEA3K5EV0, IPS, 1280x800, 8" | Acer Enduro T1 ET108-11A A9001 64 GB eMMC Flash, IPS, 1280x800, 8" | Lenovo Tab M8 (Gen 4) Helio A22 MT6761, PowerVR GE8300, 32 GB eMMC Flash, IPS, 1280x800, 8" | Dell Latitude 7230 Rugged Extreme i5-1240U, Iris Xe G7 80EUs, WD PC SN740 512GB SDDPMQD-512G-1101, IPS, 1920x1200, 12" | Panasonic Toughbook FZ-G2 i5-10310U, UHD Graphics 620, Toshiba KIOXIA KBG4AZNV512G M.2 2280 OPAL, IPS, 1920x1200, 10.1" | |
|---|---|---|---|---|---|
| Power Consumption | 73% | 71% | -102% | -65% | |
| Idle Minimum * (Watt) | 2.8 | 1.1 61% | 1.7 39% | 6.5 -132% | 3.5 -25% |
| Idle Average * (Watt) | 6.3 | 2.2 65% | 1.9 70% | 8.9 -41% | 8.1 -29% |
| Idle Maximum * (Watt) | 10.3 | 2.2 79% | 2.4 77% | 14.3 -39% | 8.2 20% |
| Load Average * (Watt) | 19 | 3.6 81% | 3 84% | 44.9 -136% | 34.7 -83% |
| Witcher 3 ultra * (Watt) | 15.5 | 43.2 -179% | 31.8 -105% | ||
| Load Maximum * (Watt) | 30.1 | 6.7 78% | 3.9 87% | 54.8 -82% | 79.7 -165% |
* ... más pequeño es mejor
Power Consumption Witcher 3 / Stresstest
Power Consumption external Monitor
Duración de la batería
La autonomía WLAN real es de sólo 5,5 horas con la batería extraíble de 27 Wh. Los usuarios pueden cambiar a baterías más grandes y pesadas o llevar varias a la vez para intercambiarlas, pero la duración de la batería sigue siendo decepcionante.
La carga de la batería de 27 Wh de vacío a lleno es relativamente lento en alrededor de 2 horas.
| Durabook R8 Tablet i5-1230U, Iris Xe G7 80EUs, 27.4 Wh | Acer Enduro T1 ET108-11A A9001 Wh | Lenovo Tab M8 (Gen 4) Helio A22 MT6761, PowerVR GE8300, Wh | Dell Latitude 7230 Rugged Extreme i5-1240U, Iris Xe G7 80EUs, 72 Wh | Panasonic Toughbook FZ-G2 i5-10310U, UHD Graphics 620, 68 Wh | |
|---|---|---|---|---|---|
| Duración de Batería | 194% | 192% | 145% | 111% | |
| WiFi v1.3 (h) | 5.3 | 15.6 194% | 15.5 192% | 13 145% | 11.2 111% |
| Reader / Idle (h) | 37.1 | ||||
| H.264 (h) | 16.6 | ||||
| Load (h) | 3.8 | 3.6 |
Pro
Contra
Veredicto - Diseño sólido con algunas molestias
Los mayores puntos fuertes del Durabook R8 están en su diseño sin ventilador, sus versátiles opciones configurables y su compatibilidad con Thunderbolt 4. Es una combinación de características poco común que puede atraer a cierta categoría o profesionales. Nos gusta especialmente el fácil acceso a los módulos SSD, WLAN y WAN desde la parte trasera.
El enfoque sin ventilador viene con el habitual conjunto de advertencias, sin embargo. El rendimiento de la CPU se ha reducido bastante y las temperaturas superficiales pueden llegar a ser muy cálidas, especialmente en la parte trasera. Esto no quiere decir que la tableta sea lenta, pero no esperes que funcione tan rápido como un portátil con el mismo procesador.
Querrás el Durabook R8 principalmente por su diseño sin ventilador, facilidad de uso y amplio soporte de periféricos. Otros aspectos como la duración de la batería y los colores podrían ser mejores.
Hay varios aspectos menores que podrían mejorarse en futuras revisiones. El mecanismo de expulsión del lector MicroSD, por ejemplo, necesita ser más fuerte y fiable. El altavoz podría estar orientado hacia delante en vez de hacia atrás para ser más útil. Los estrechos puertos USB-C podrían separarse más para reducir el hacinamiento. El puerto de corriente alterna podría eliminarse en favor de la carga universal USB-C. Y por último, la duración de la batería por defecto podría ser mayor y el PWM debería reducirse o eliminarse.
Precio y disponibilidad
Los usuarios pueden solicitar un presupuesto para la tableta Durabook R8 directamente al fabricante aquí.
Durabook R8 Tablet
- 07/12/2023 v7 (old)
Allen Ngo
Transparencia
La selección de los dispositivos que se van a reseñar corre a cargo de nuestro equipo editorial. La muestra de prueba fue proporcionada al autor en calidad de préstamo por el fabricante o el minorista a los efectos de esta reseña. El prestamista no tuvo ninguna influencia en esta reseña, ni el fabricante recibió una copia de la misma antes de su publicación. No había ninguna obligación de publicar esta reseña. Como empresa de medios independiente, Notebookcheck no está sujeta a la autoridad de fabricantes, minoristas o editores.
Así es como prueba Notebookcheck
Cada año, Notebookcheck revisa de forma independiente cientos de portátiles y smartphones utilizando procedimientos estandarizados para asegurar que todos los resultados son comparables. Hemos desarrollado continuamente nuestros métodos de prueba durante unos 20 años y hemos establecido los estándares de la industria en el proceso. En nuestros laboratorios de pruebas, técnicos y editores experimentados utilizan equipos de medición de alta calidad. Estas pruebas implican un proceso de validación en varias fases. Nuestro complejo sistema de clasificación se basa en cientos de mediciones y puntos de referencia bien fundamentados, lo que mantiene la objetividad.Price comparison

