Conclusión
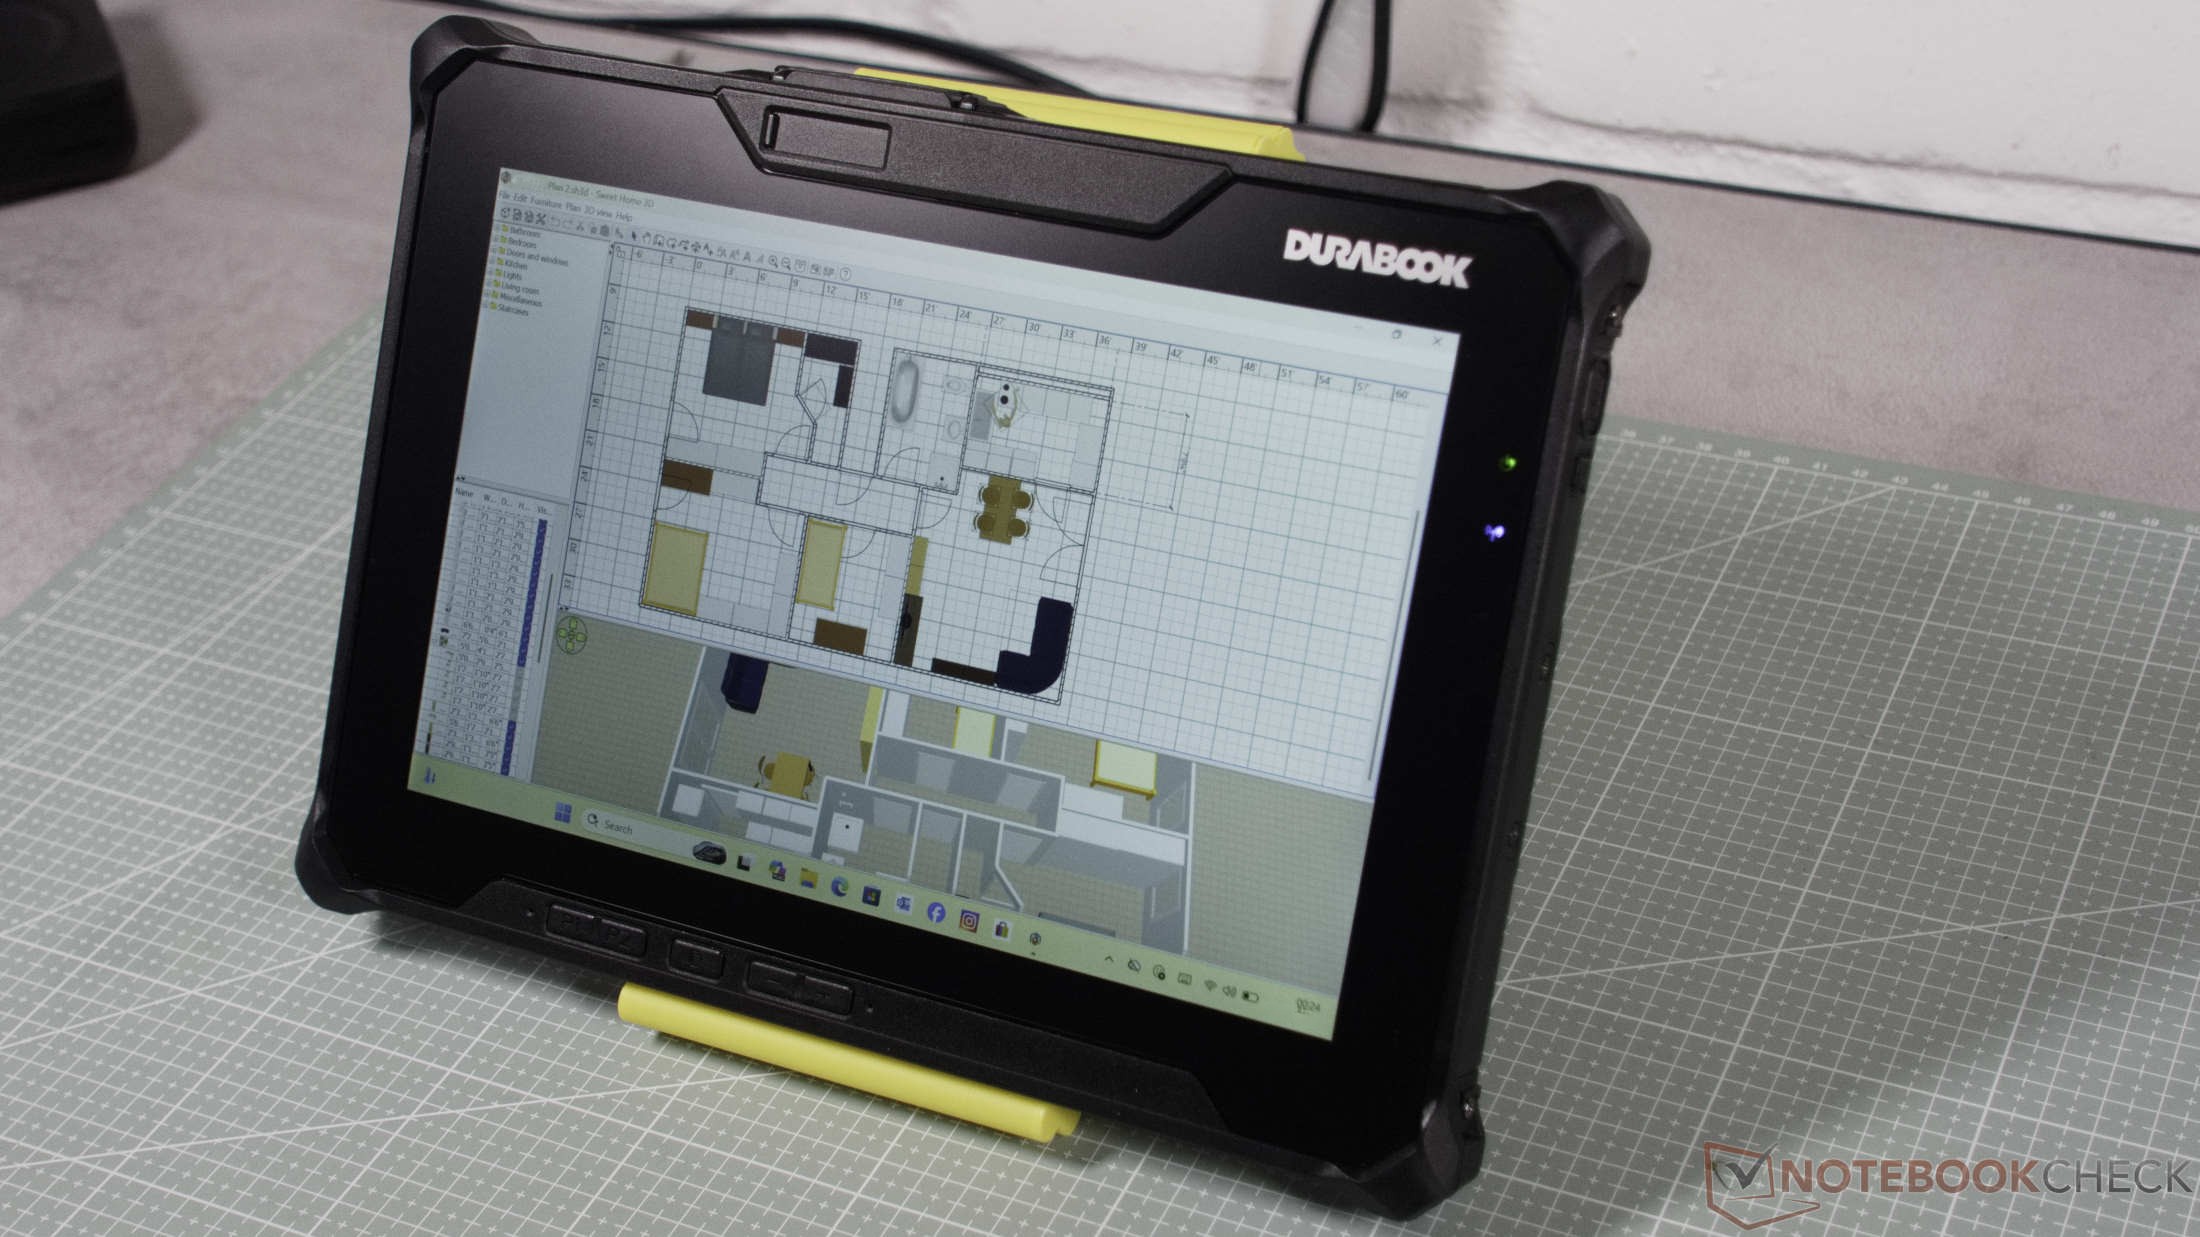
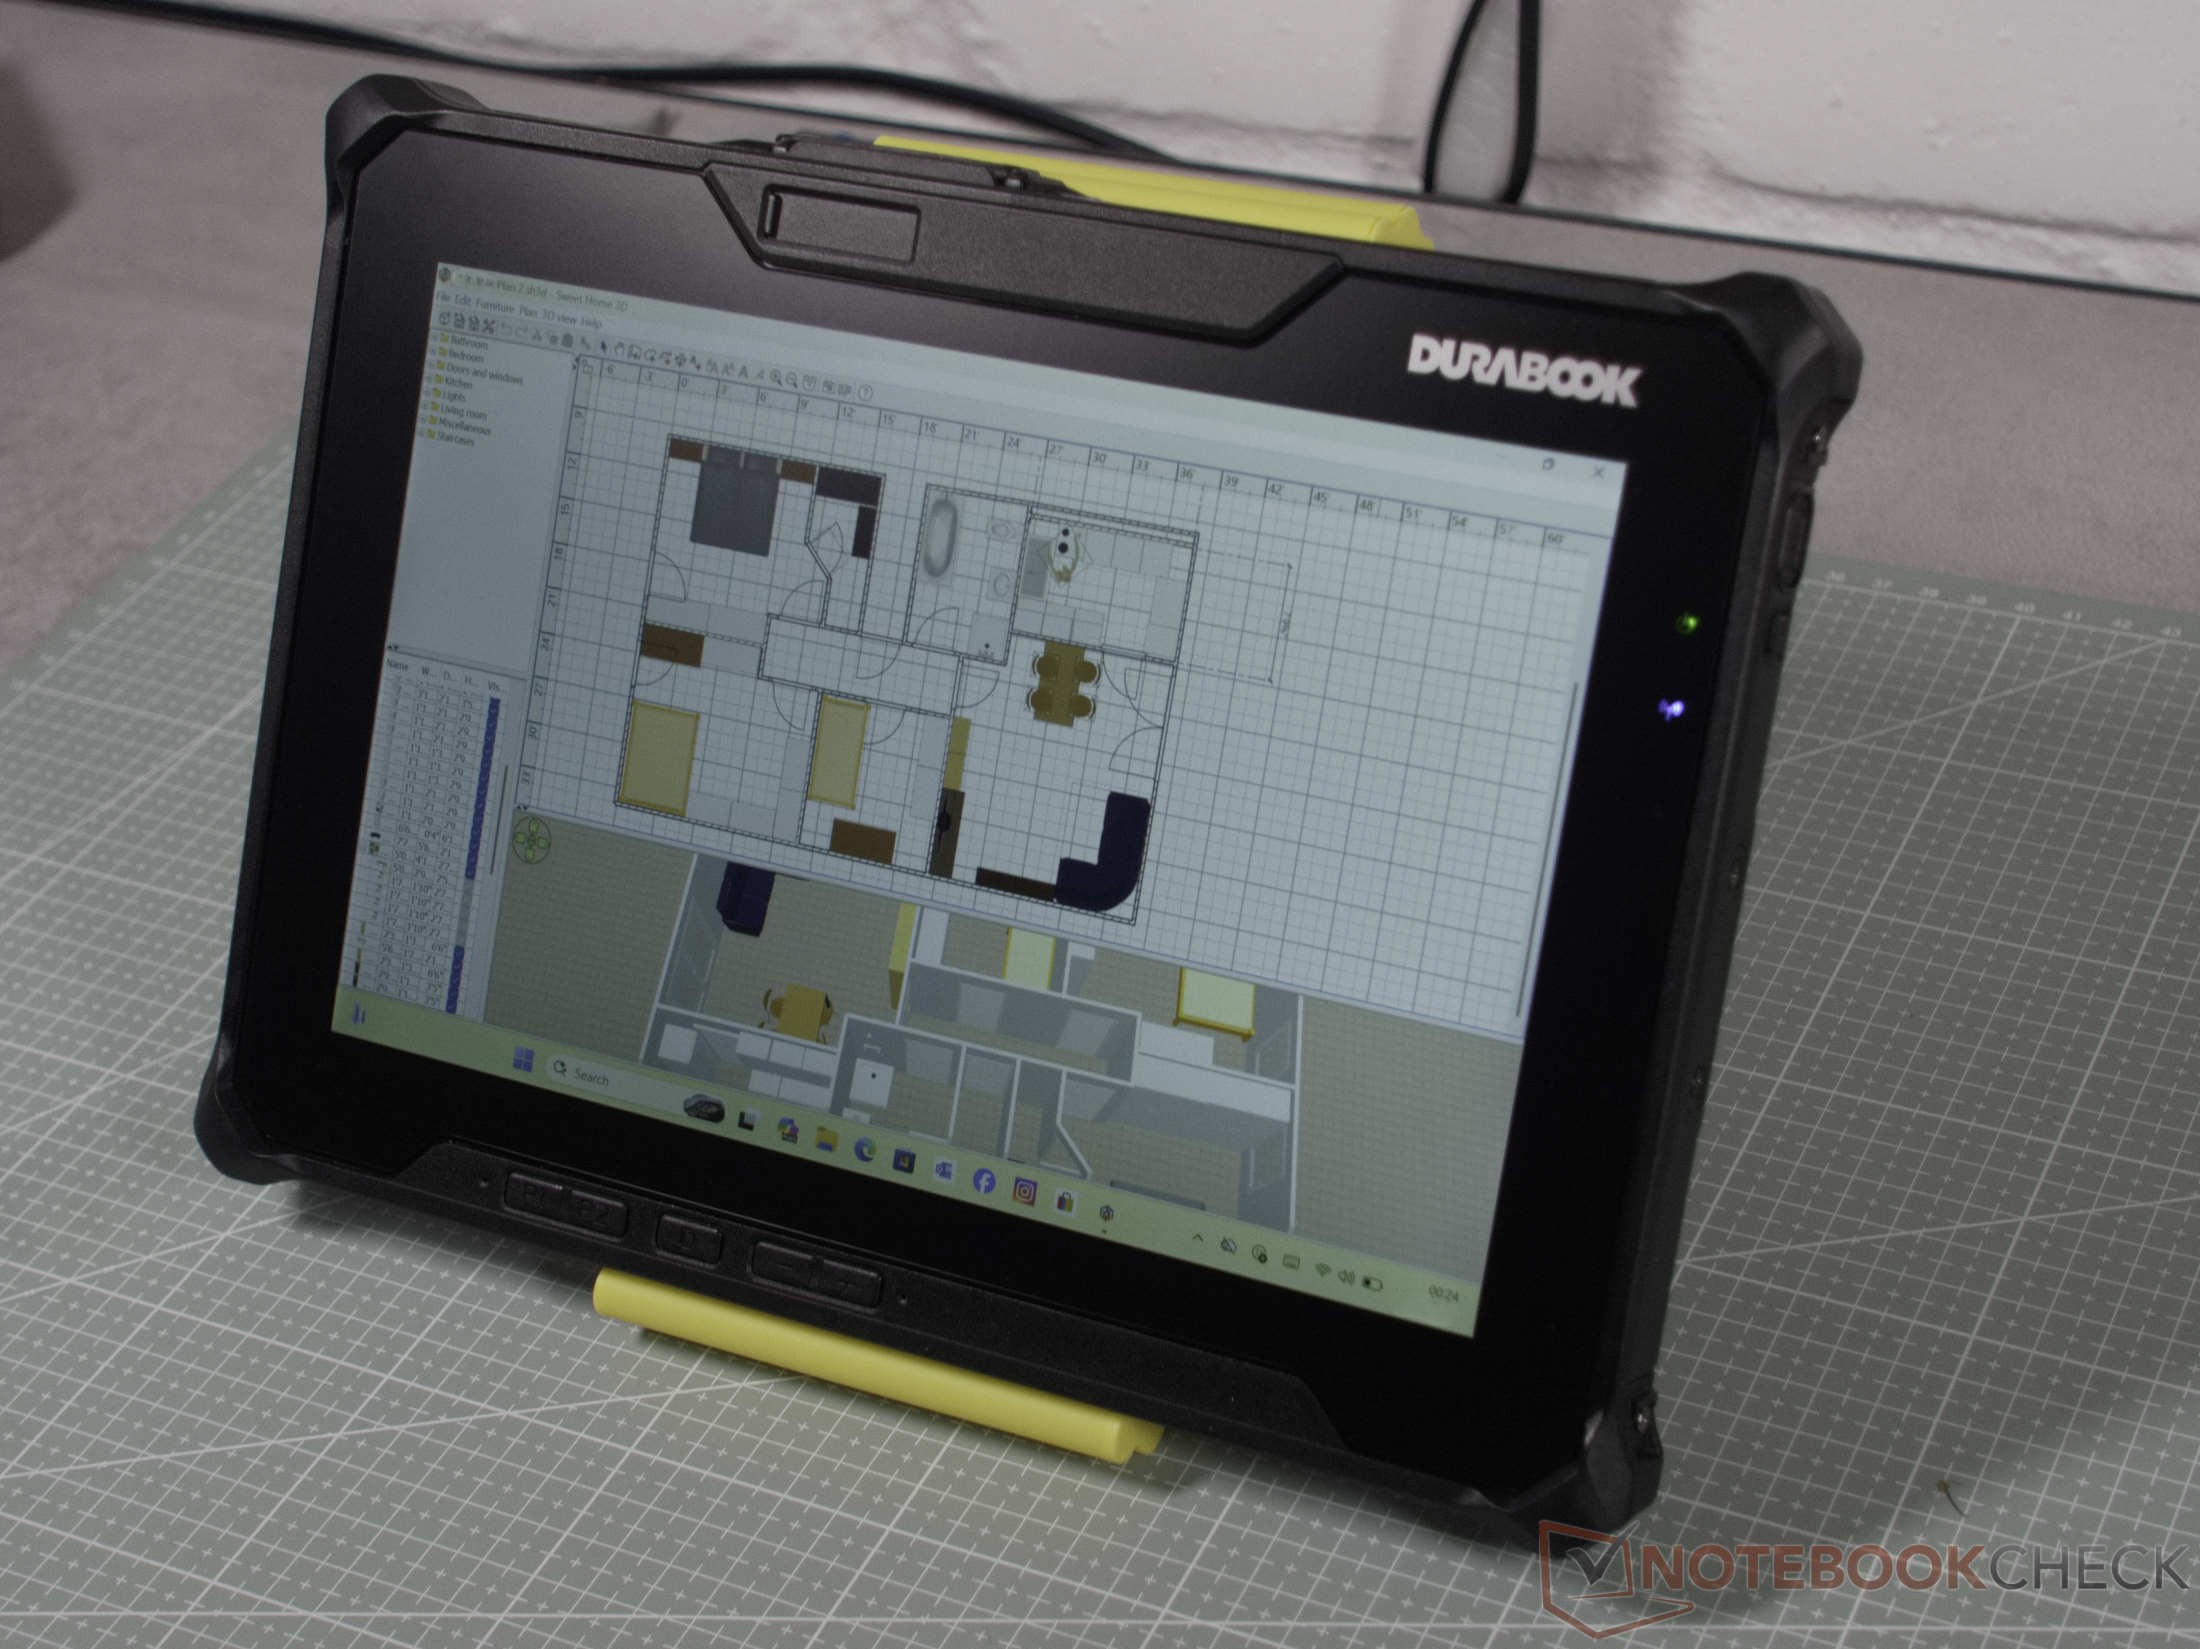
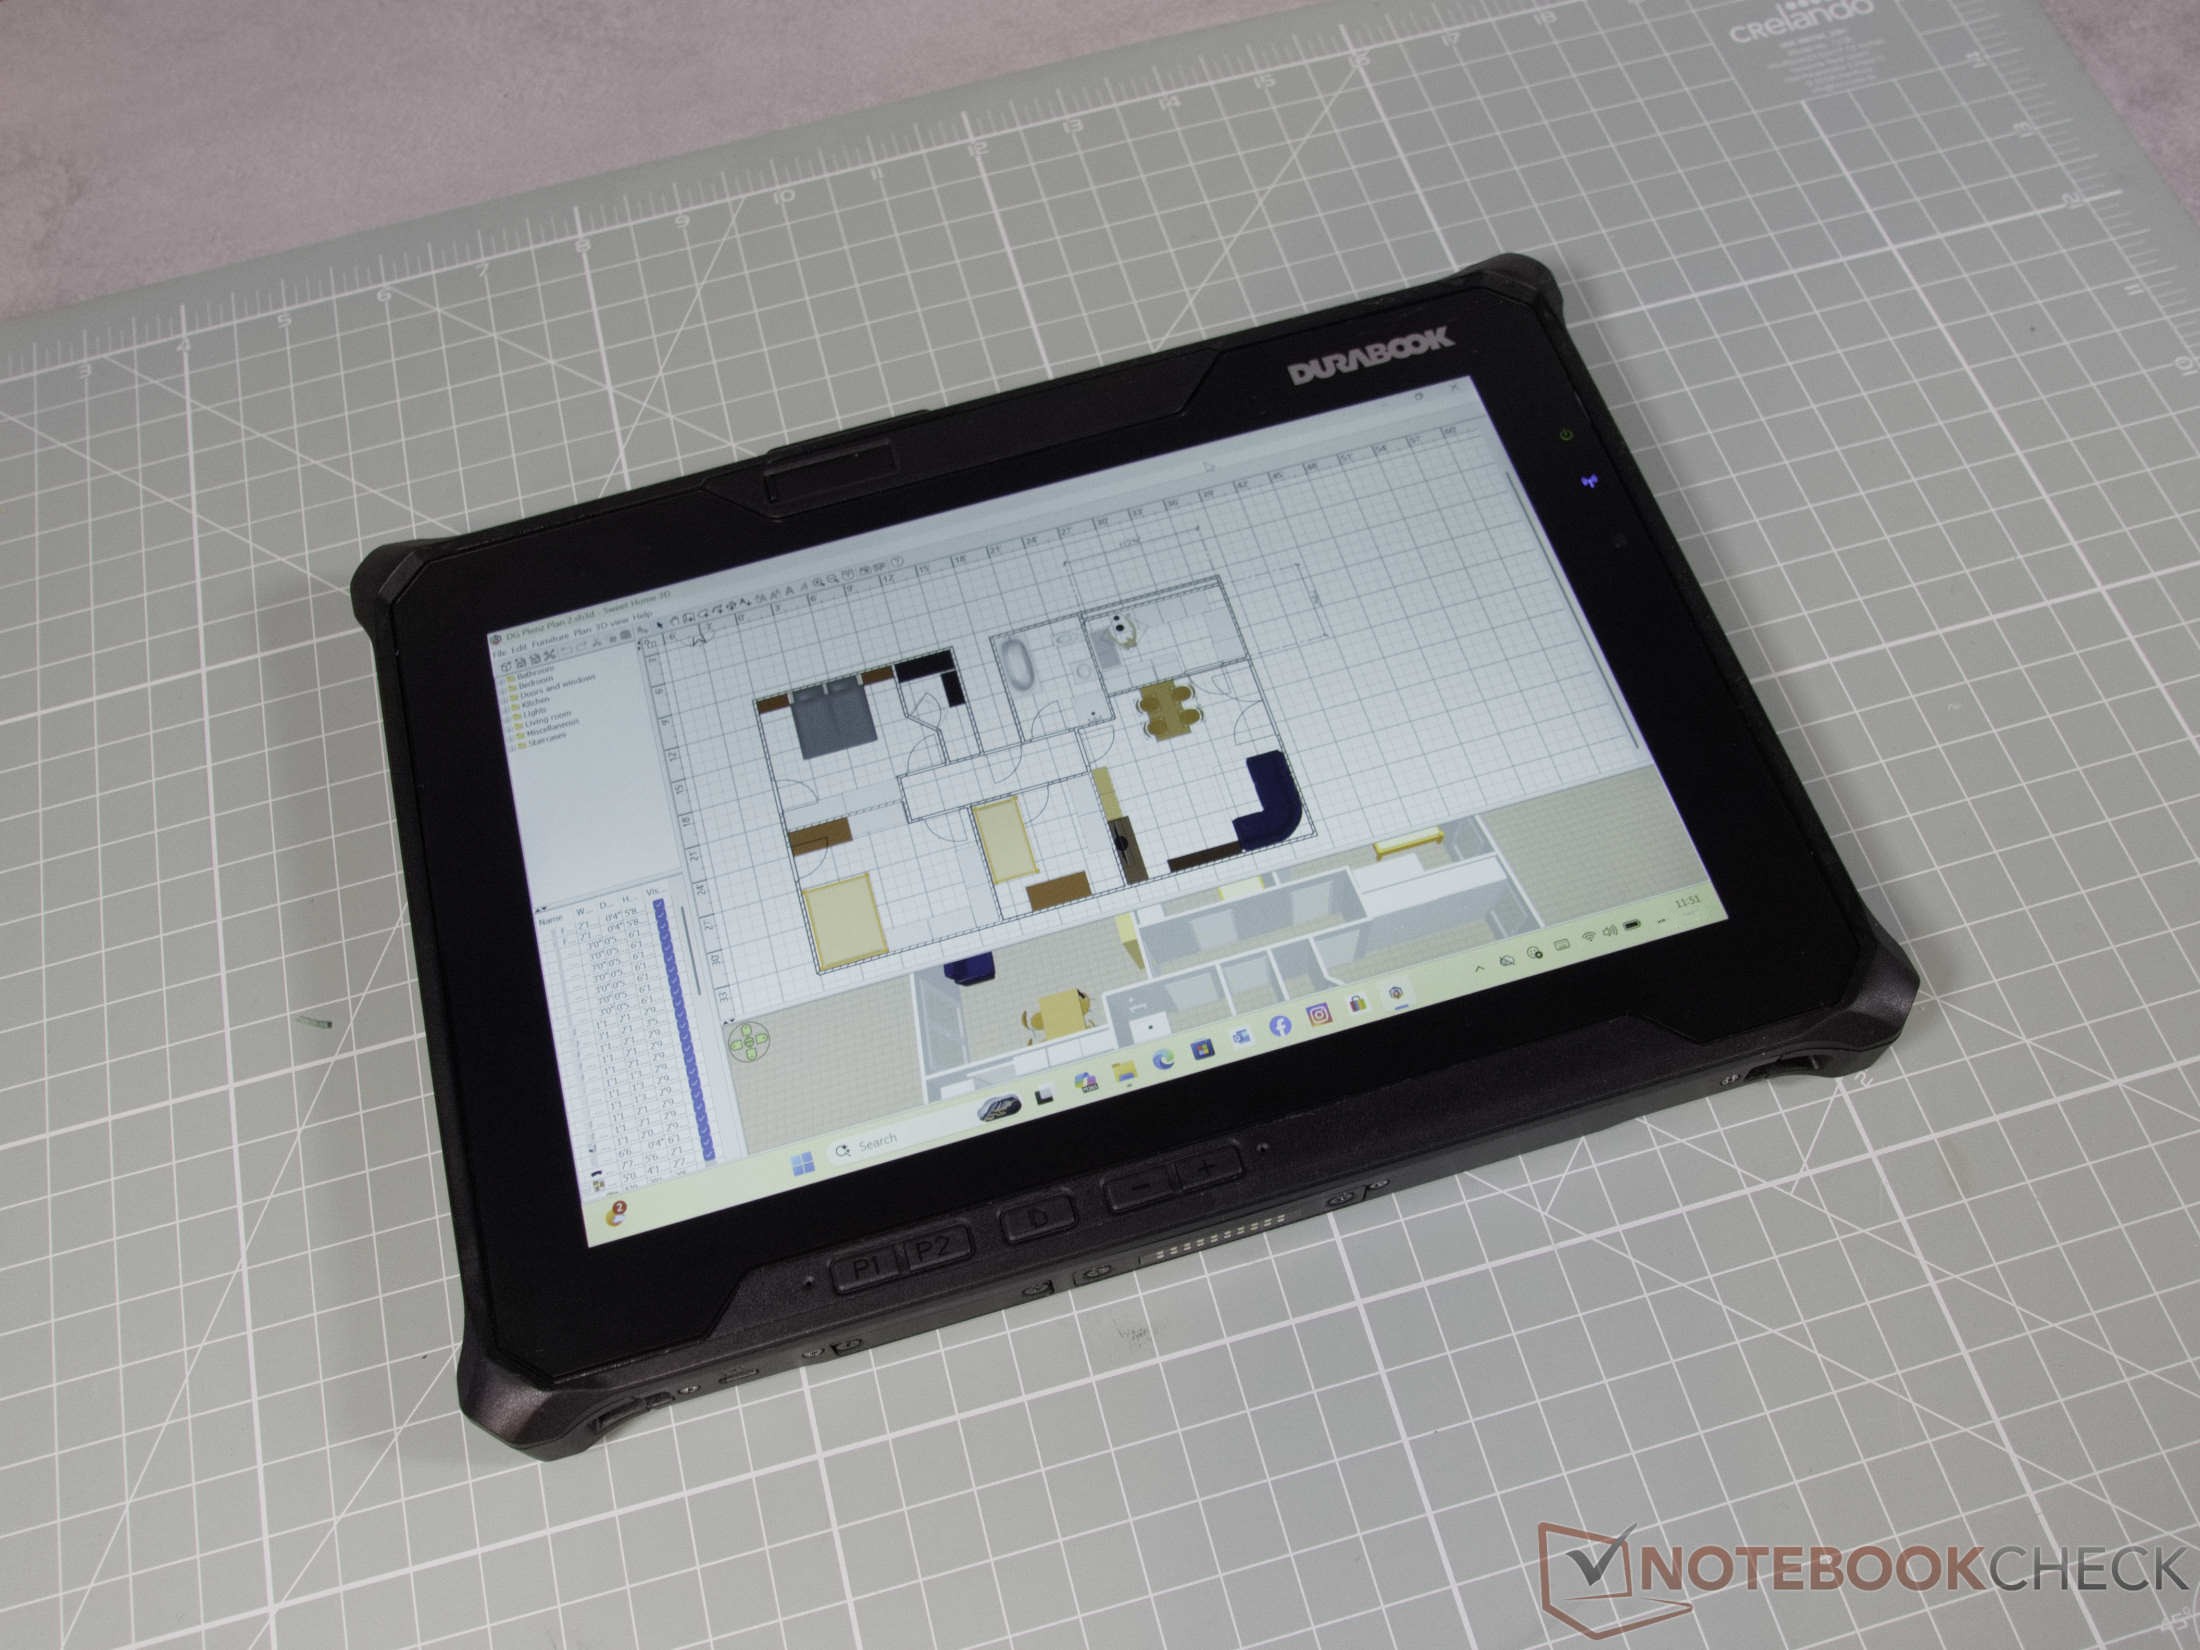
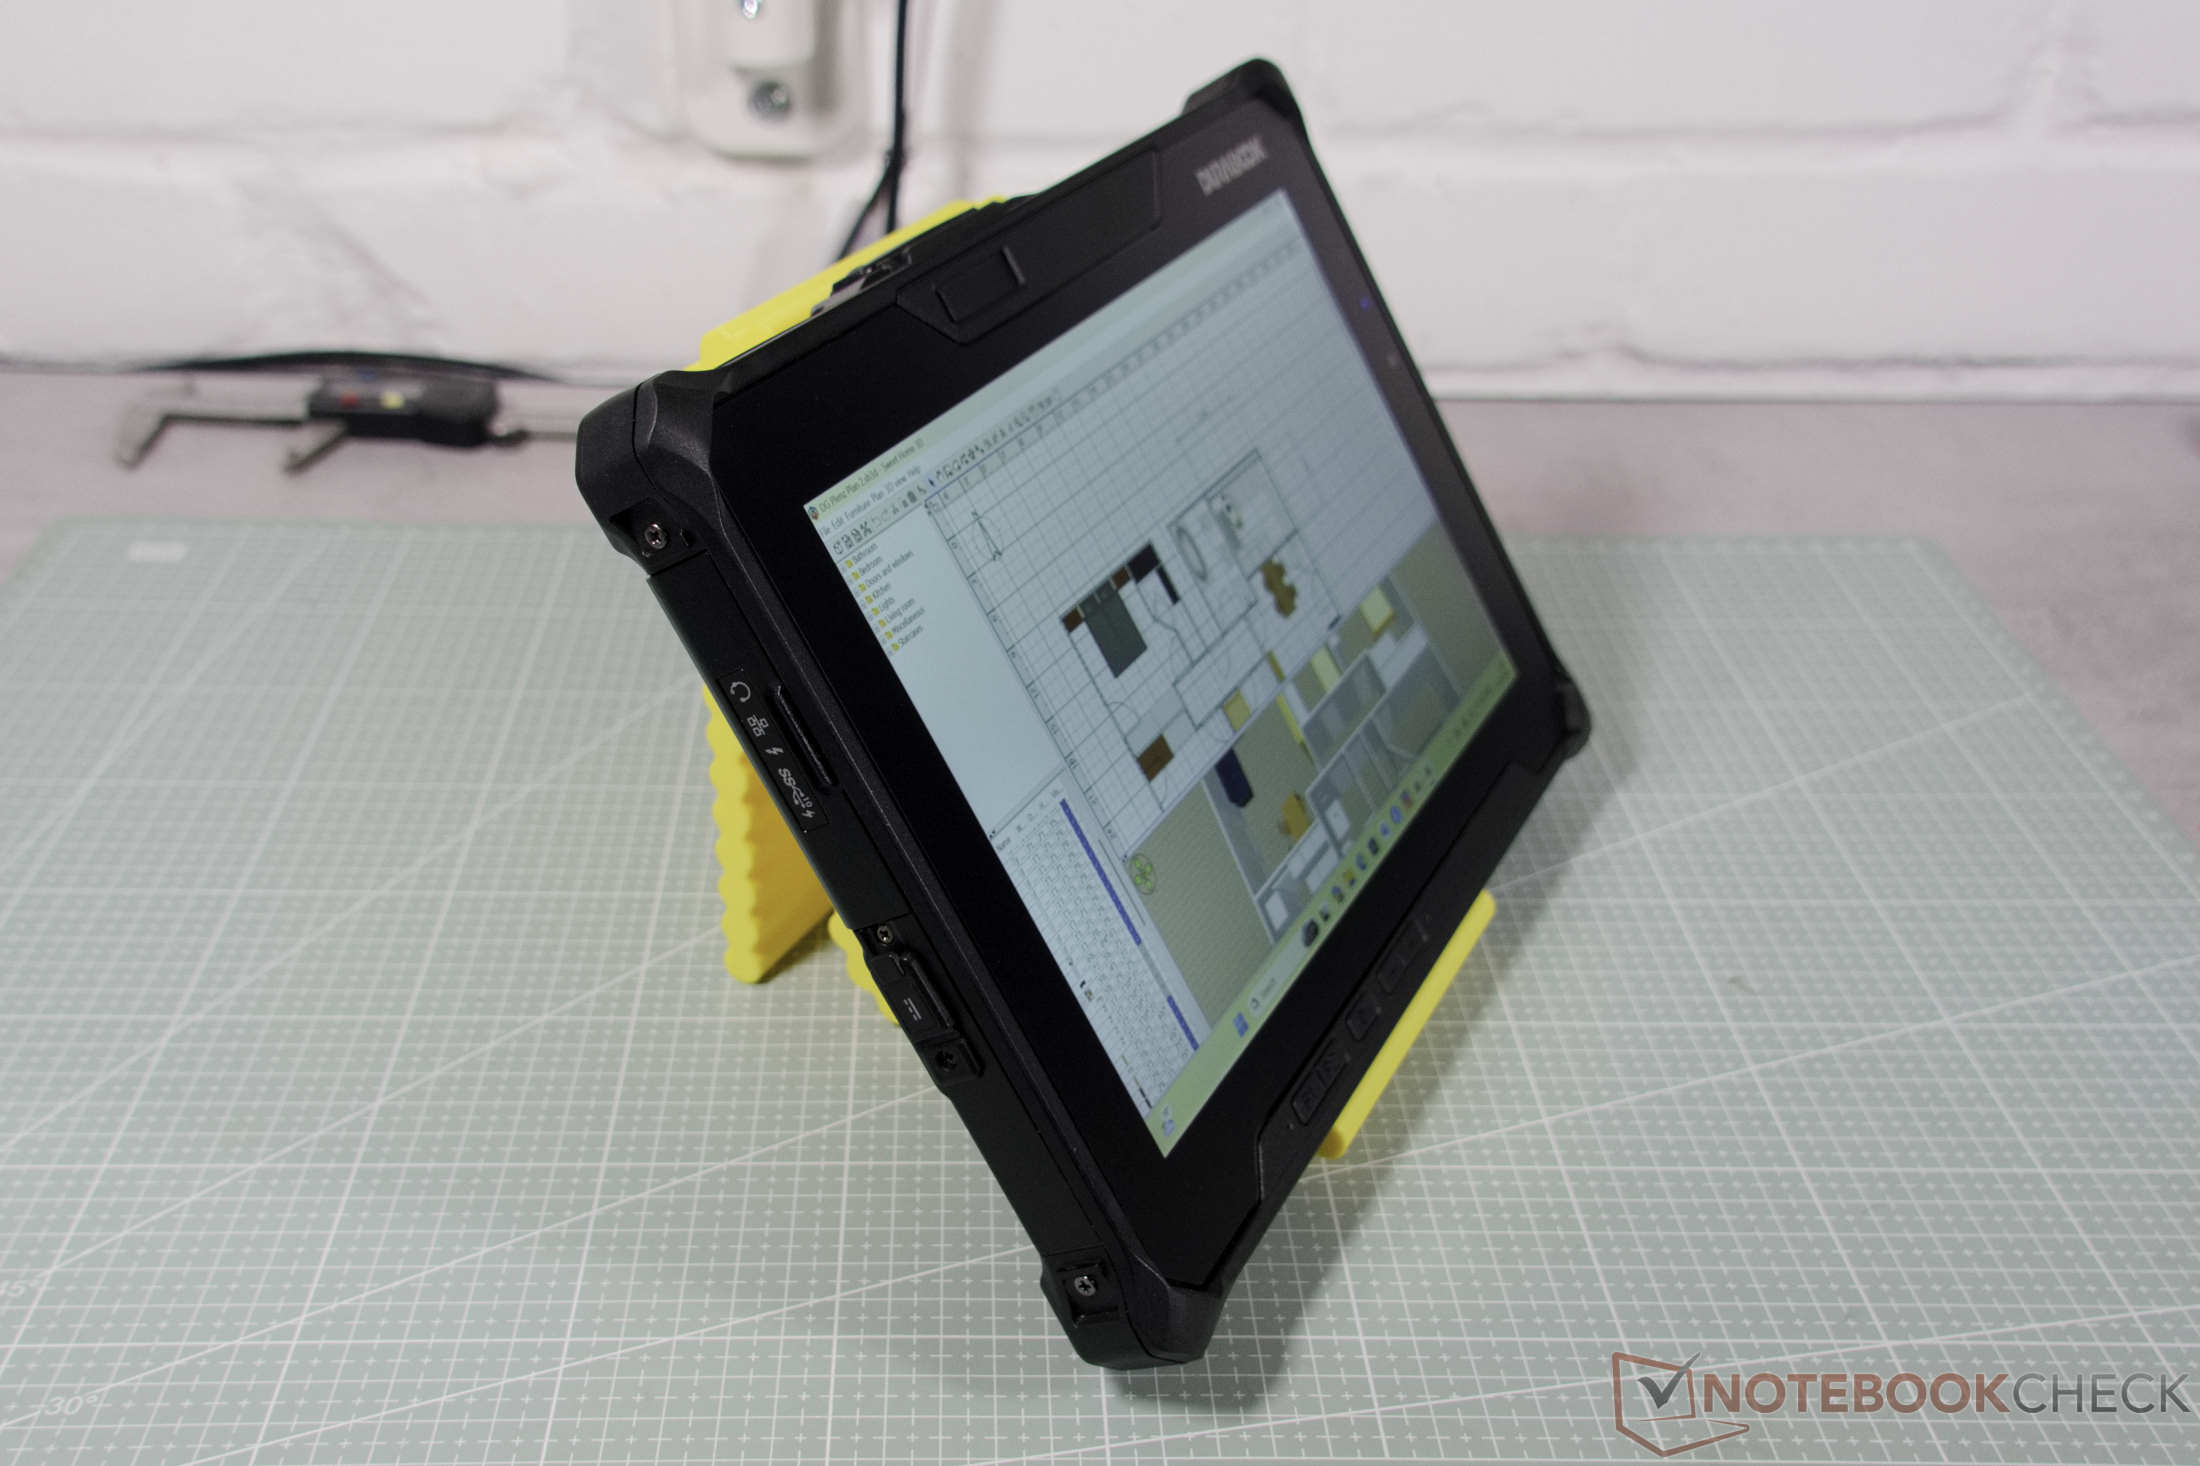
Al observar la Durabook R10, parece un ladrillo en comparación con las tabletas convencionales para el gran público. Con una altura de poco menos de tres centímetros, unos marcos de pantalla gruesos y un peso de más de 1,2 kilogramos (~2,65 libras), este dispositivo de 10,1 pulgadas resulta pesado al sostenerlo en la mano. La delgadez y la ligereza no son el objetivo en este caso. El fabricante crea herramientas sin concesiones para su uso en entornos extremadamente exigentes, ya sea en una obra polvorienta, en una instalación industrial o sobre el terreno.
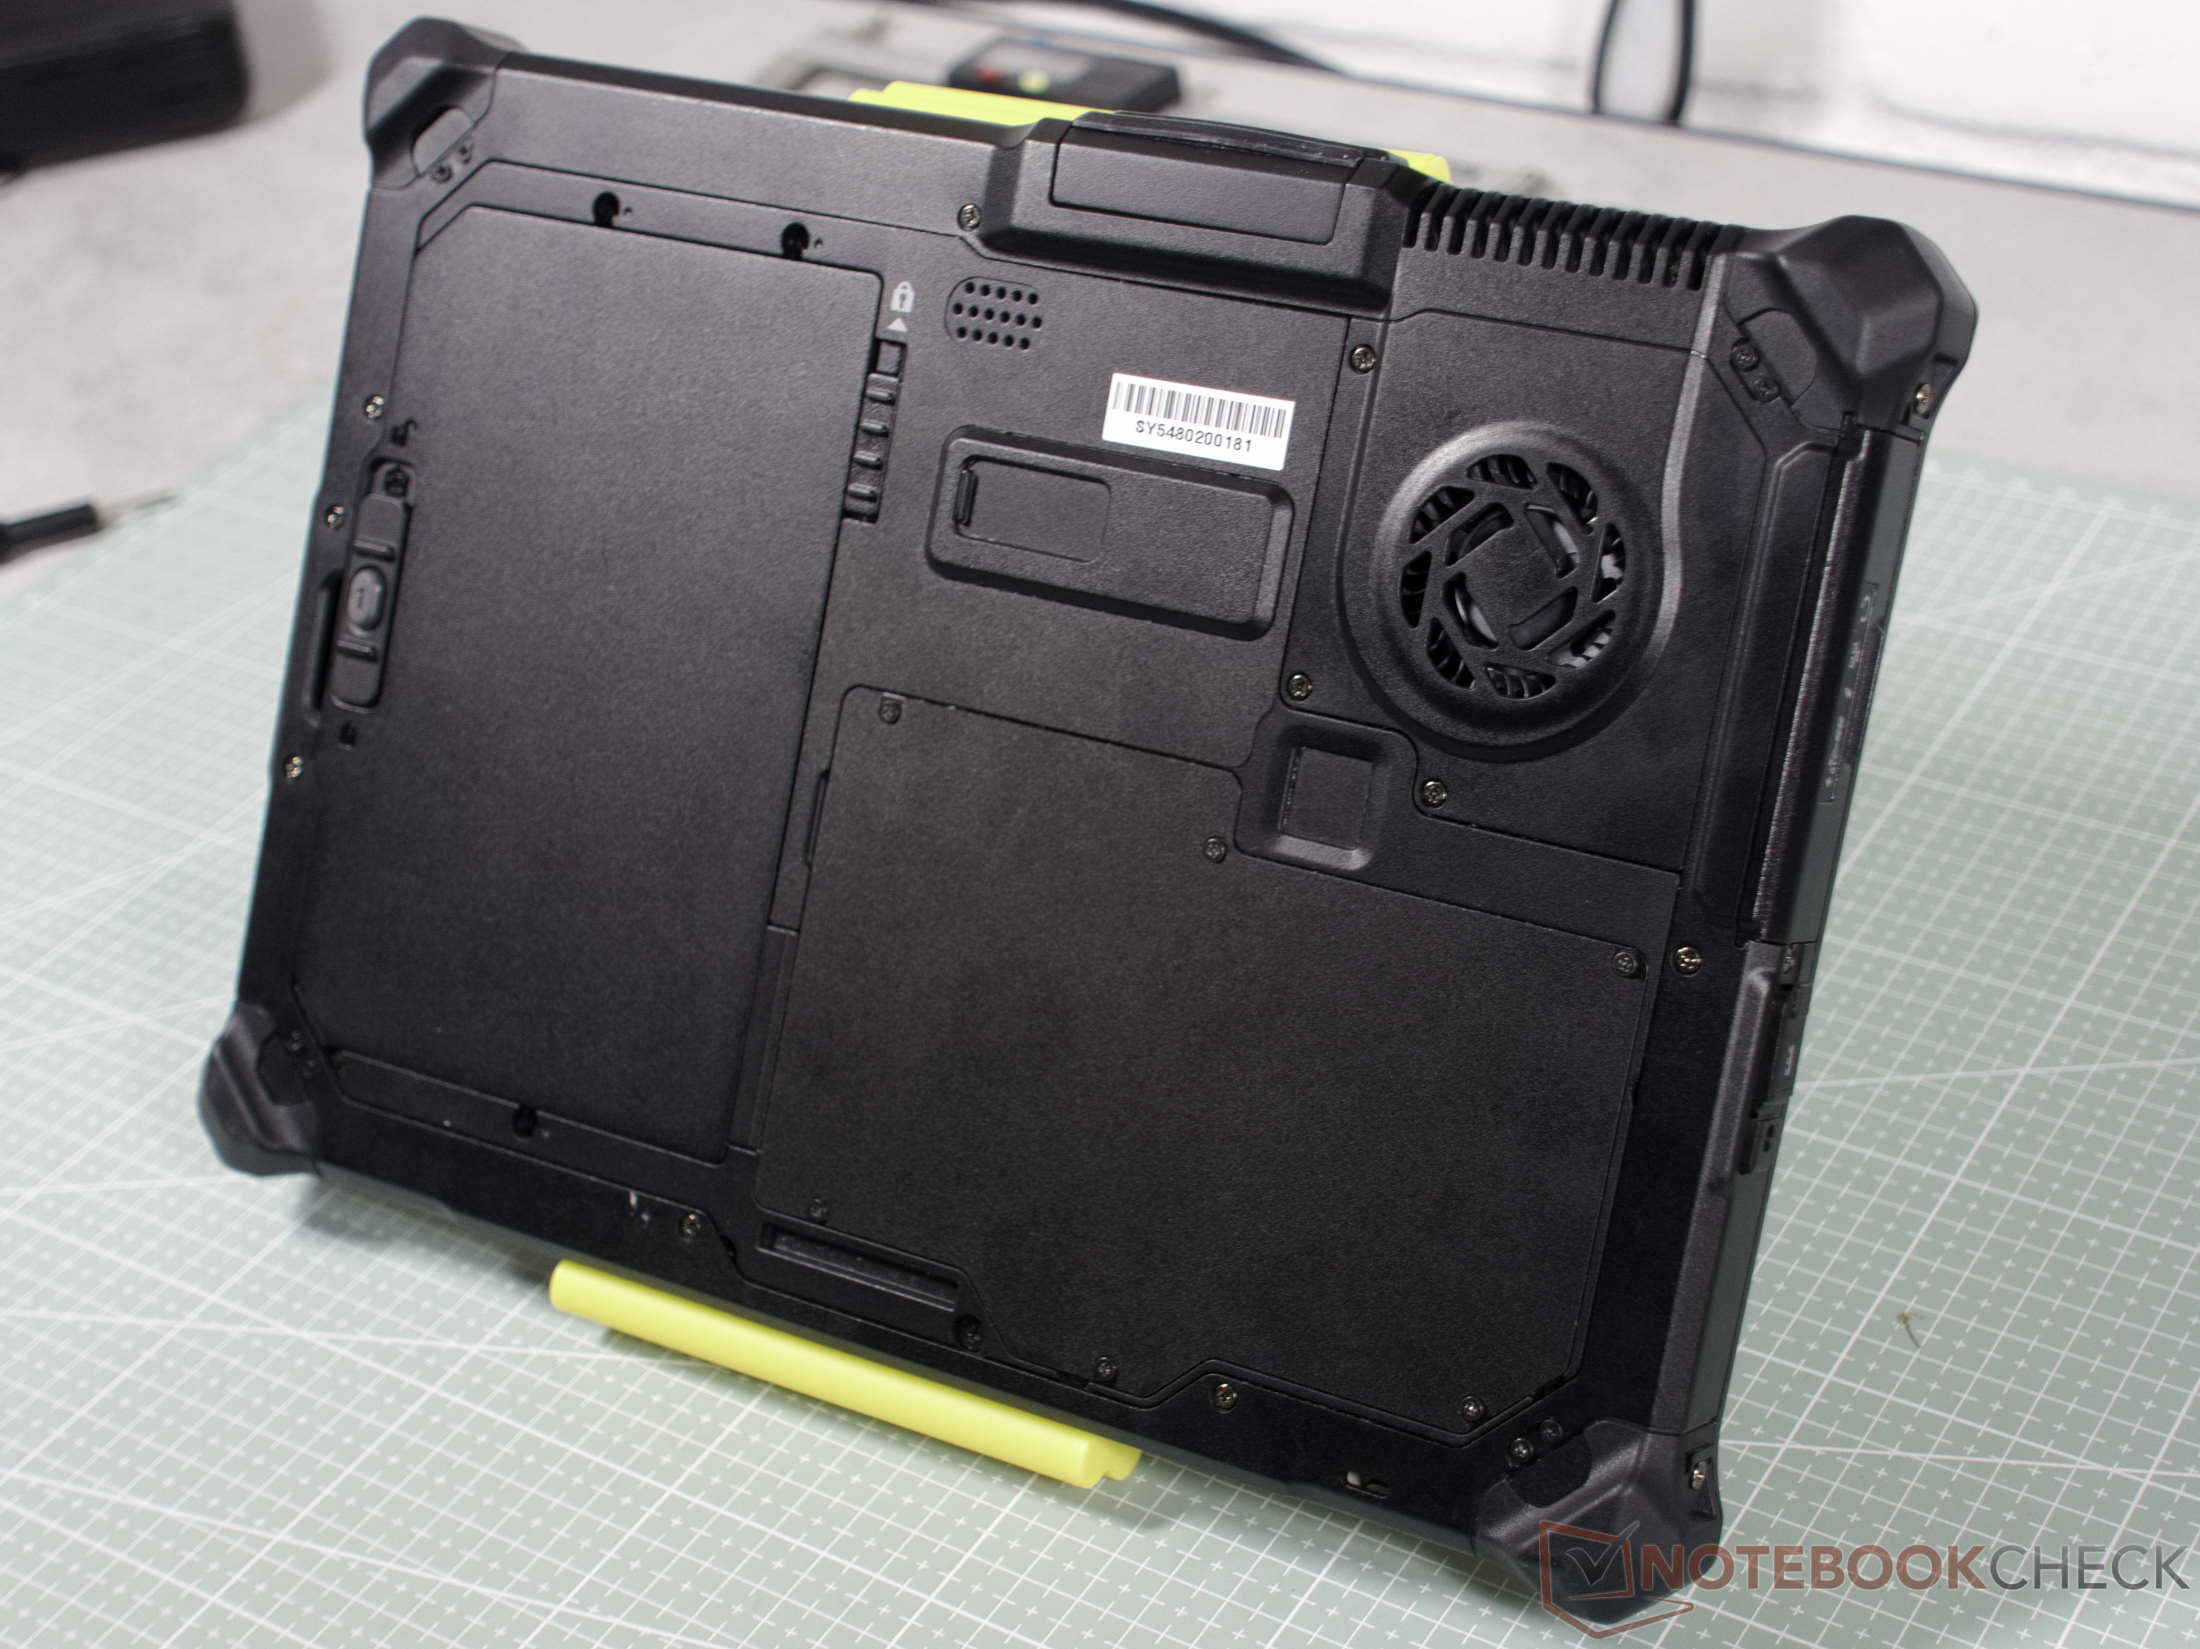
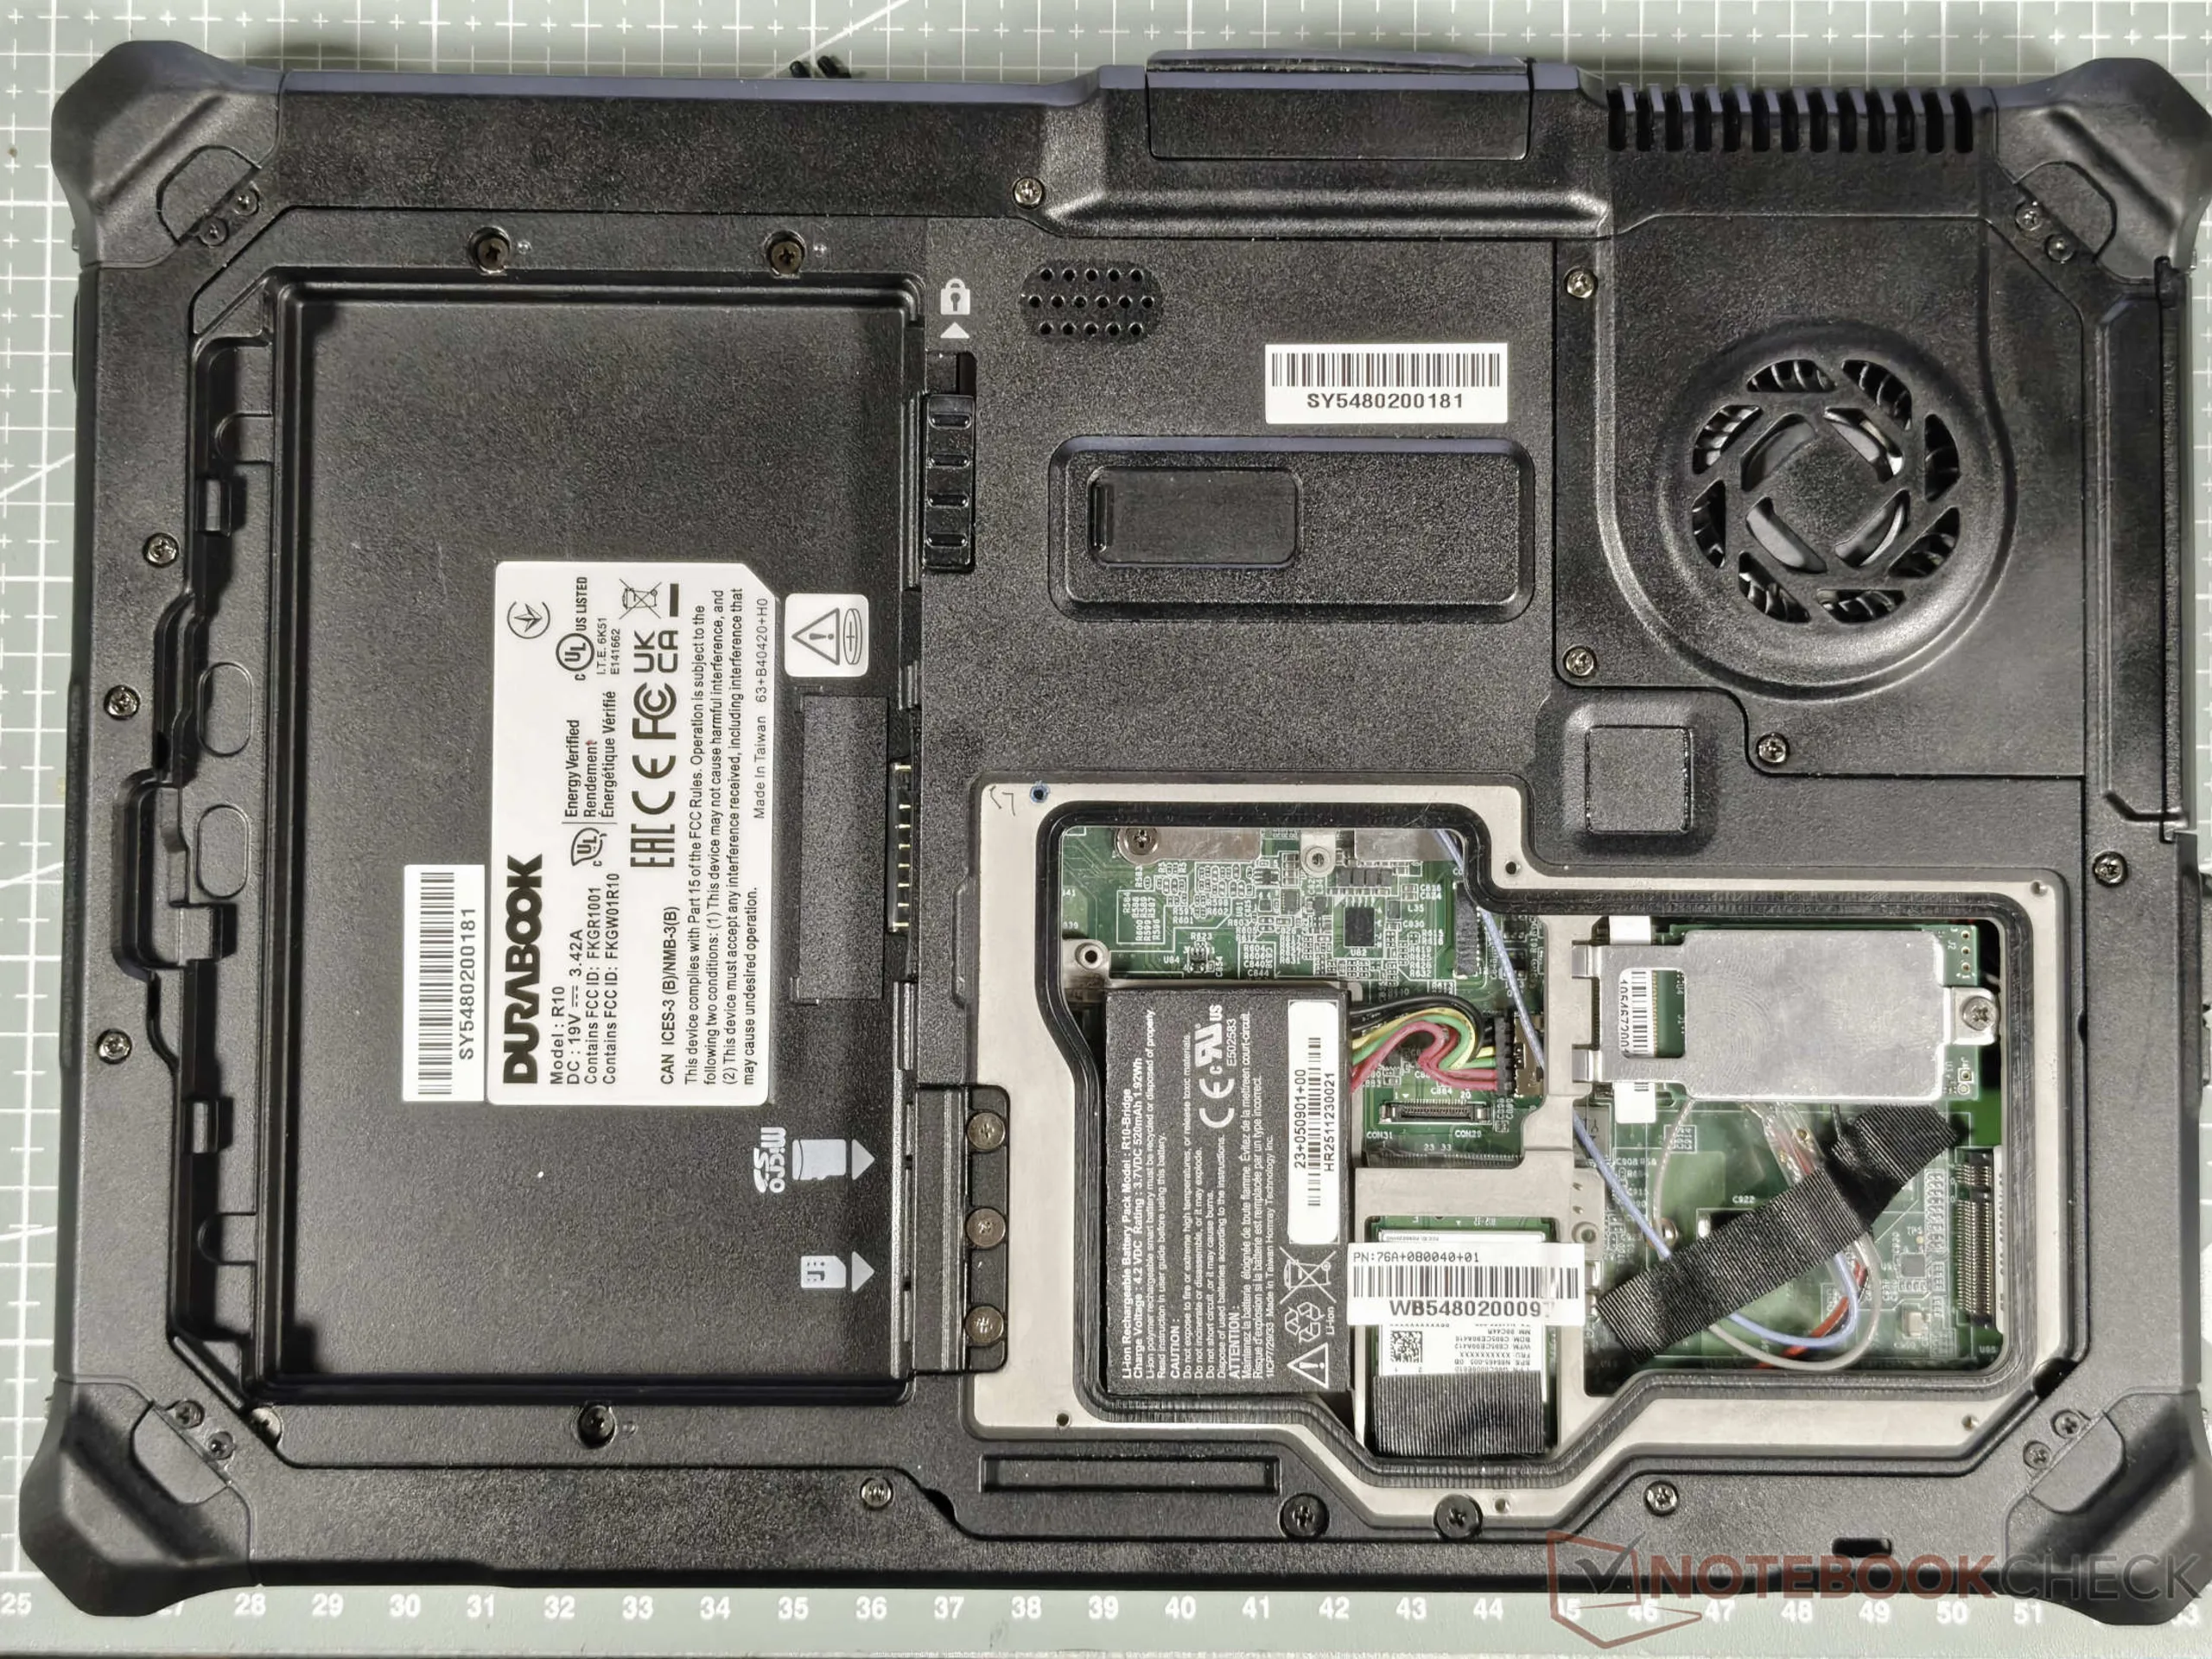
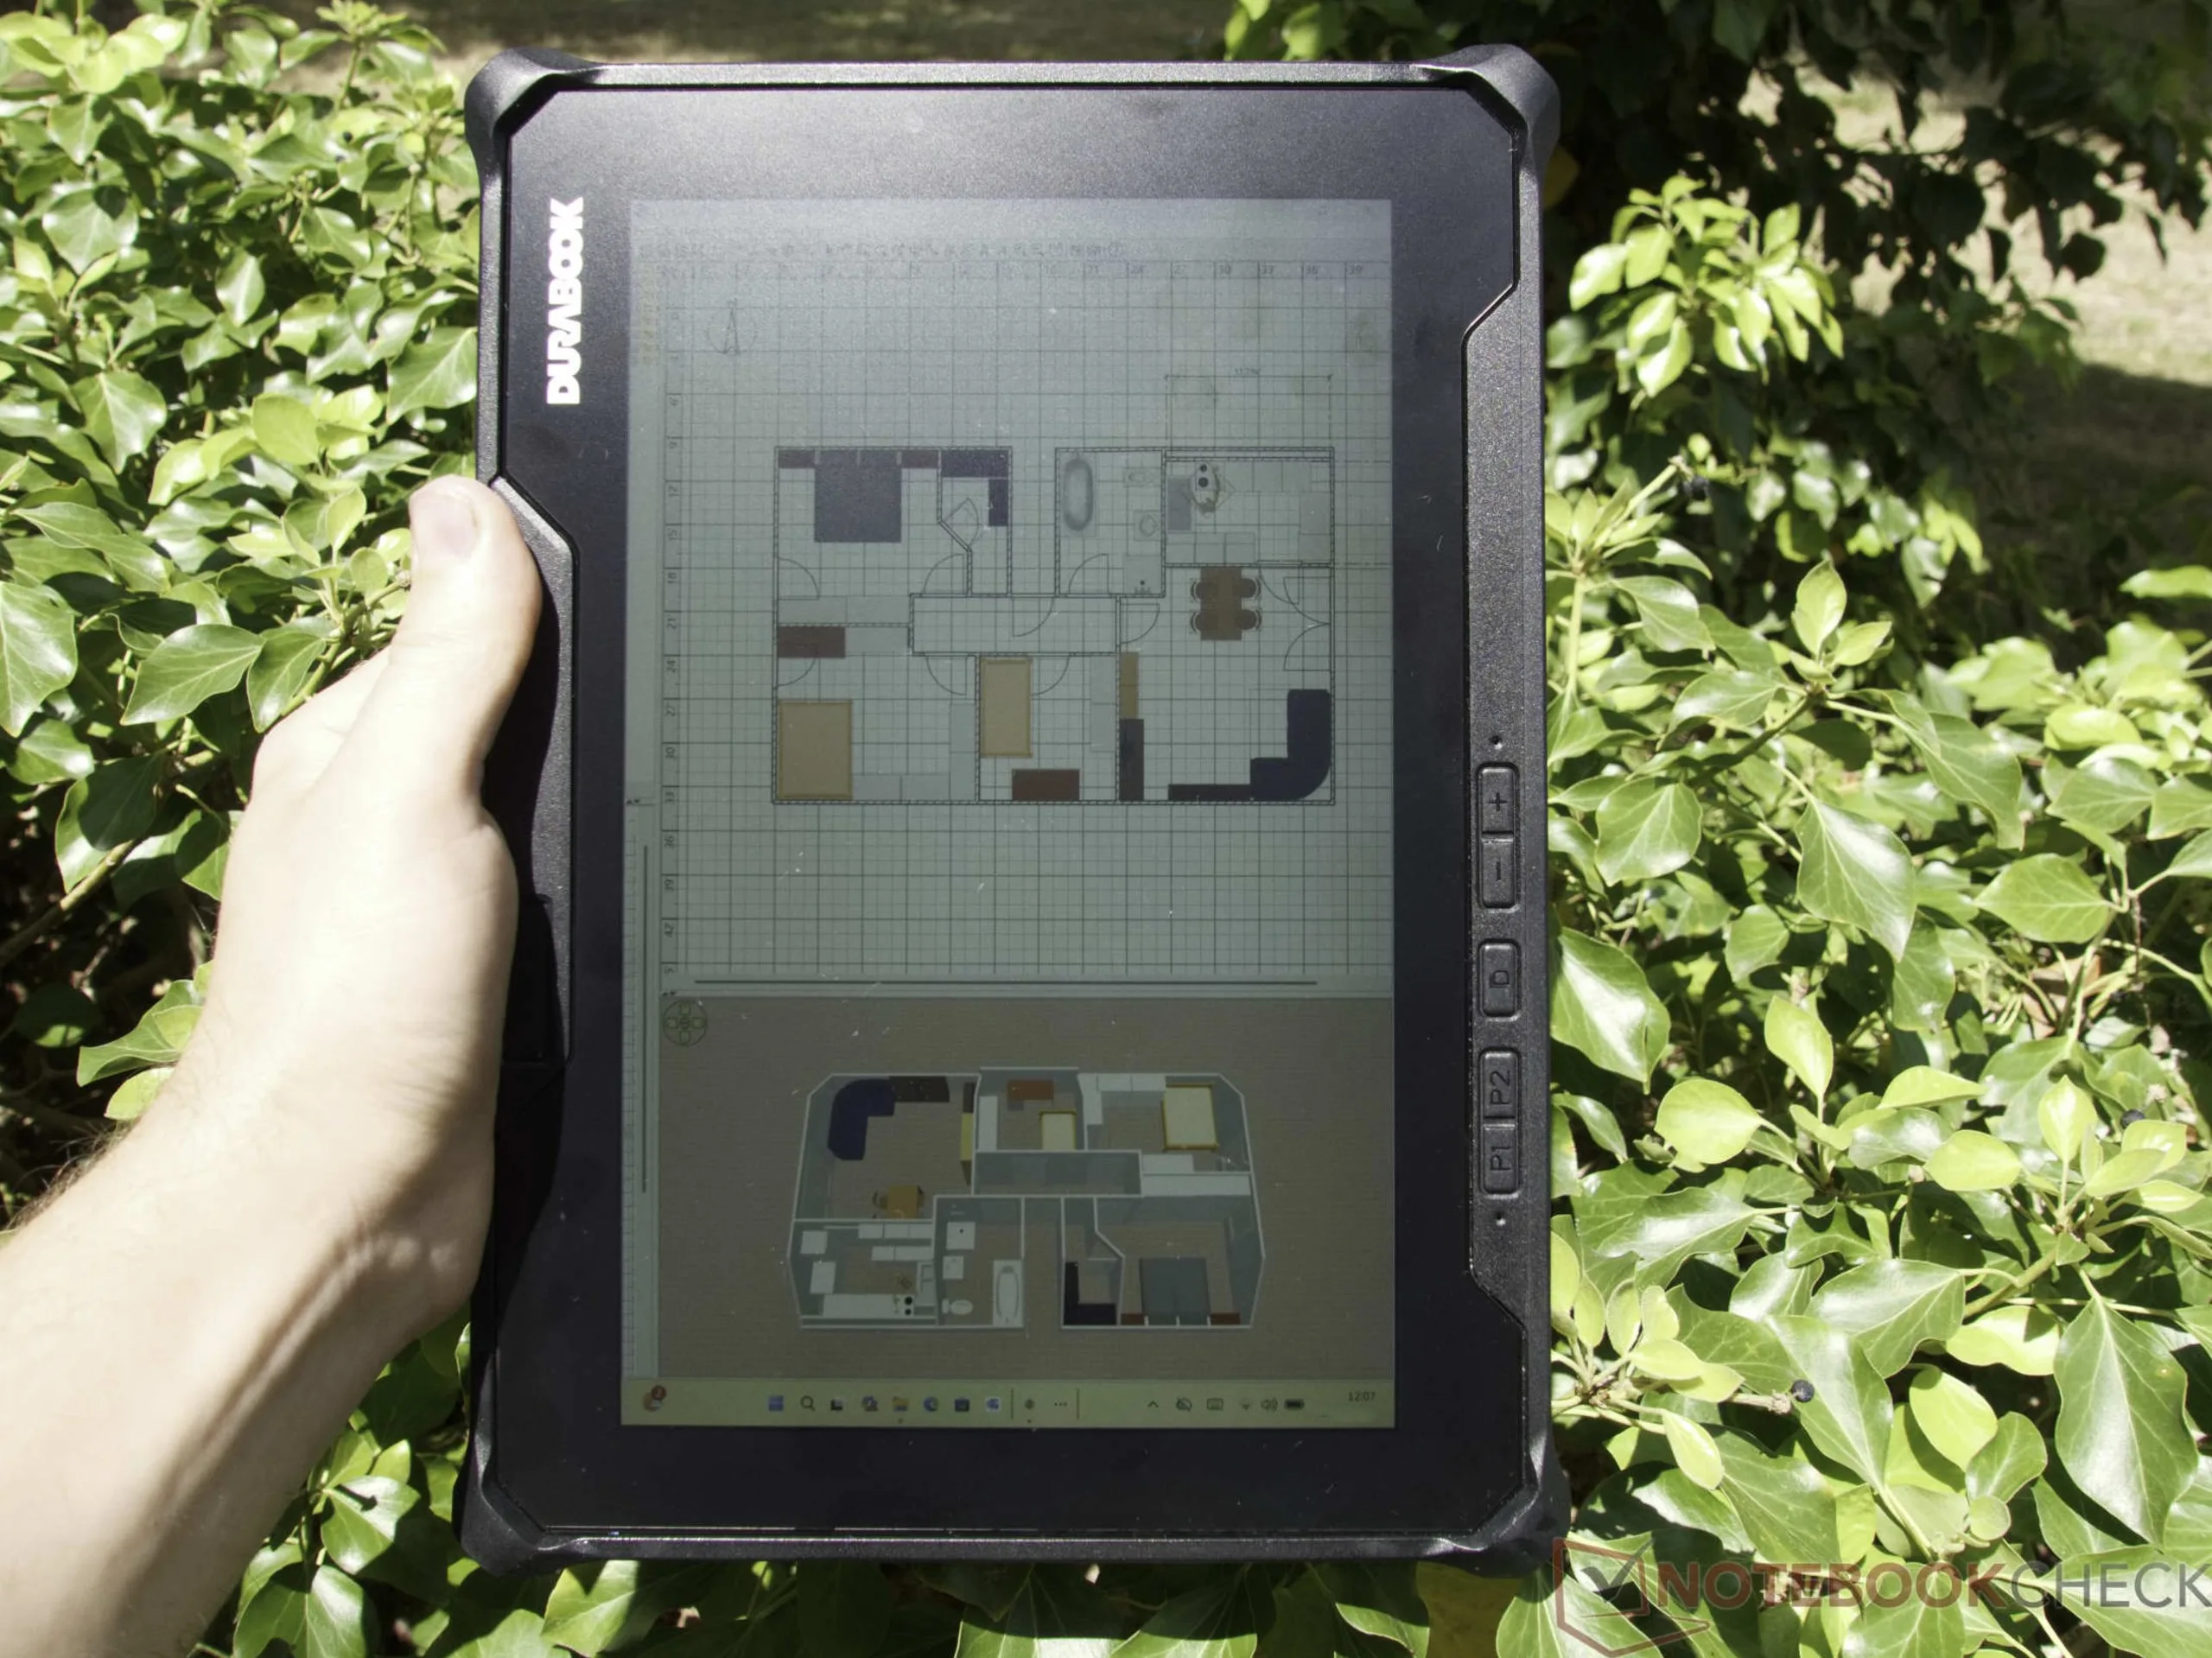
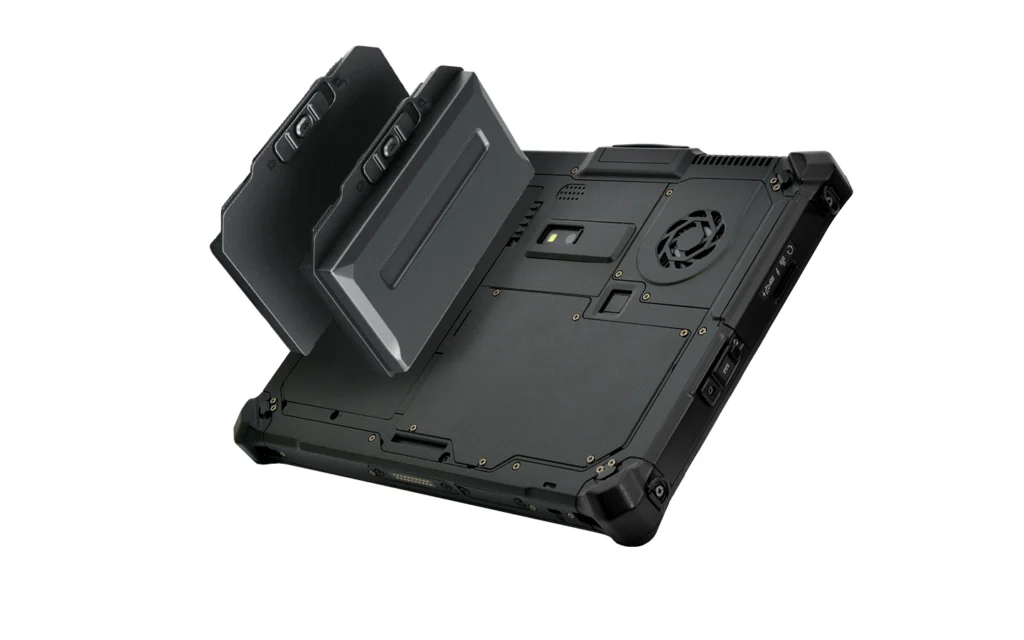
La R10 está diseñada precisamente para estas condiciones adversas. La carcasa de aleación de magnesio está construida como un tanque, resiste fácilmente caídas fuertes y está rigurosamente sellada contra el agua y la suciedad. Sin embargo, las características que más destacan para su uso al aire libre son la pantalla y el sistema de alimentación. Con un brillo que supera con creces los 1.000 cd/m² —confirmado en nuestra prueba—, esta tableta resistente soporta sin problemas incluso la luz solar directa. Además, cuenta con una batería de reserva integrada que permite una verdadera sustitución en caliente. Esto significa que la batería principal se puede extraer fácilmente del dispositivo y sustituir mientras este sigue en funcionamiento.
Por supuesto, este nivel de especialización implica algunas concesiones. Para trabajos en los que el color es fundamental, la pantalla —con su visible matiz verdoso— resulta inutilizable, y las cámaras y el altavoz mono integrado solo sirven para funciones básicas. El procesador Intel Core Ultra 7 258V integrado gestiona con facilidad las tareas cotidianas de oficina y de gestión de documentos, pero presenta dificultades con las elevadas latencias de DPC en las pruebas, lo que puede provocar problemas durante la captura de datos en tiempo real. Además, el lector de tarjetas está incómodamente oculto detrás de la batería. En el lado positivo, el voluminoso chasis no se calienta en exceso ni siquiera bajo una carga intensa, mientras que el ventilador interno emite un zumbido agradablemente silencioso en segundo plano.
Precio y disponibilidad
Los precios y la disponibilidad del Durabook R10 están orientados principalmente a clientes profesionales. El fabricante no publica los precios en su página web; en su lugar, estos se calculan exclusivamente previa solicitud individual. Esto se debe también a que muchas de las configuraciones altamente especializadas —adaptadas a las necesidades específicas de cada cliente— se venden exclusivamente a través de Durabook. En ocasiones, esta tableta resistente puede encontrarse en tiendas especializadas. Por ejemplo, el distribuidor Ruggedbooks ofrece el modelo básico con un procesador Intel Core Ultra 5 226V por unos 2.759 euros (~3.146 dólares). En Elmark-Automation , una configuración similar con el mismo procesador tiene un precio inicial de unos 2.730 euros (~3.113 dólares).
Especificaciones
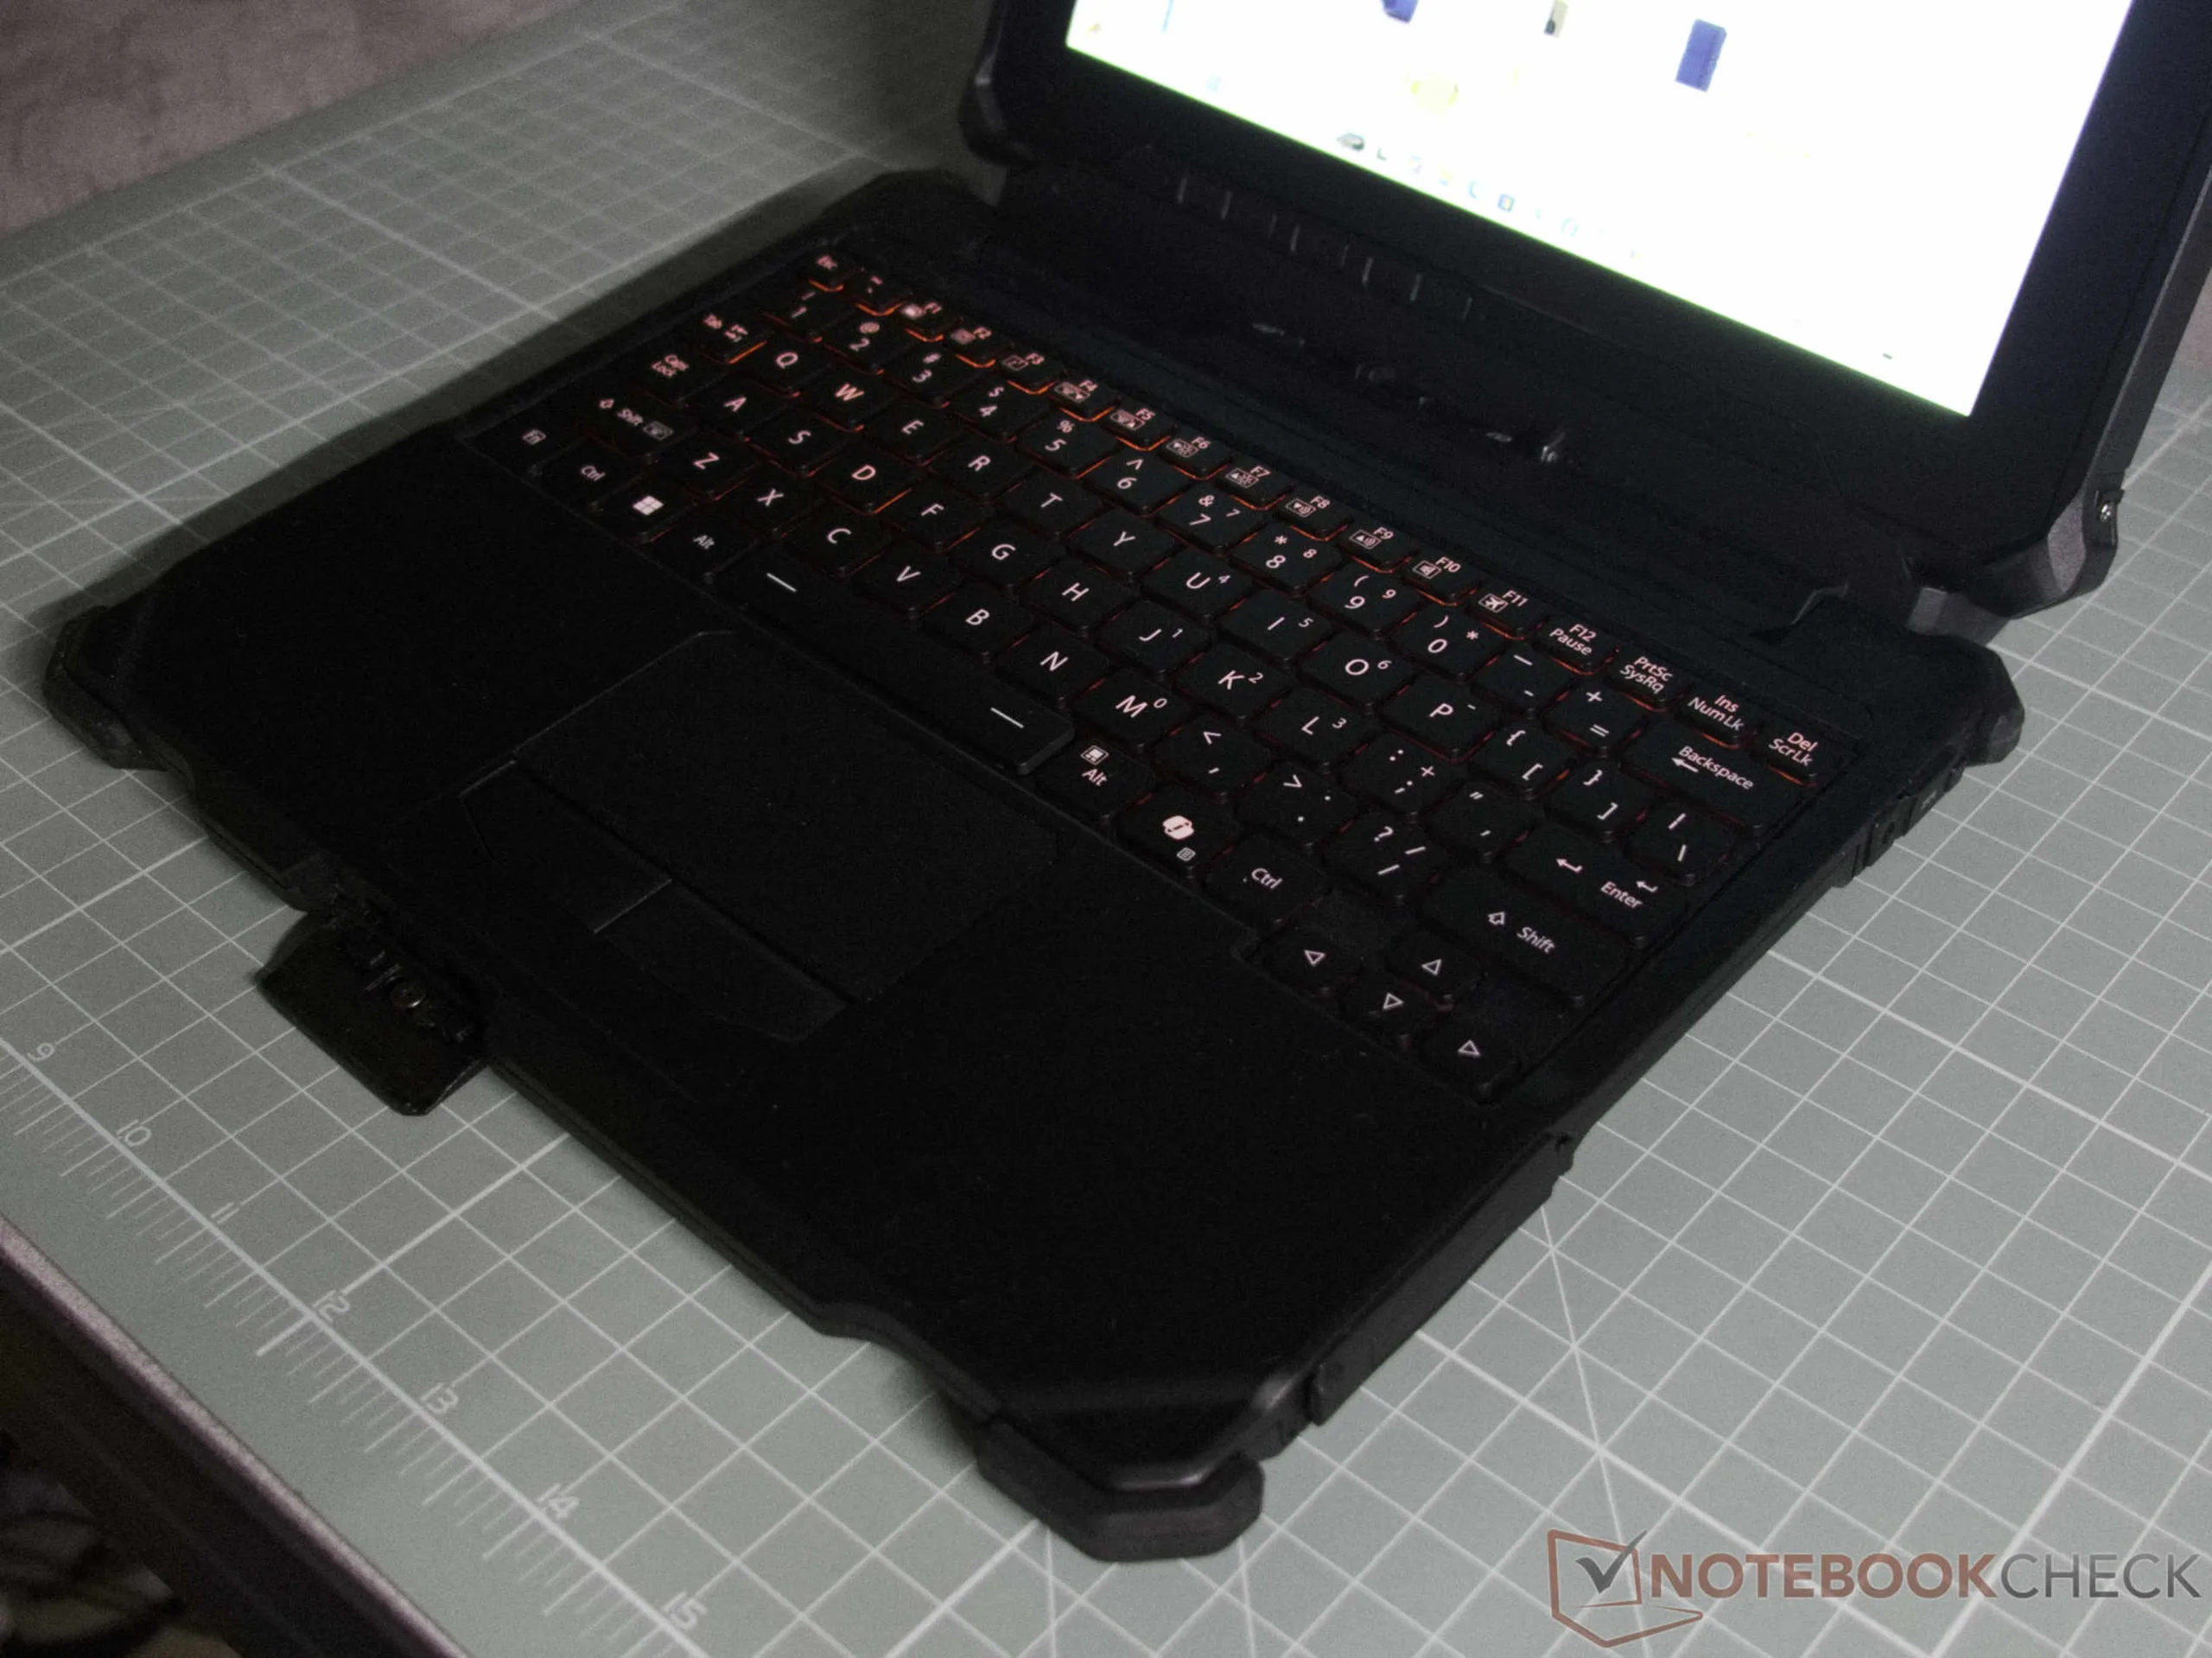
Carcasa, accesorios y dispositivos de entrada
La carcasa del Durabook R10 está fabricada con una resistente aleación de magnesio y resulta ideal para los entornos de trabajo más exigentes. Certificada según la norma militar estadounidense MIL-STD-810H, la tableta está diseñada para soportar caídas desde alturas de hasta 1,8 metros (~5,9 pies) y condiciones ambientales extremas. Además, su certificación IP66 garantiza la protección frente al polvo y a los chorros de agua a alta presión. Para aplicaciones sensibles, la certificación MIL-STD-461F garantiza asimismo una excelente compatibilidad electromagnética.
Durabook Z14I-HG: Potencia de la IA para condiciones extremas
Con el Z14I-HG, Durabook presenta una nueva generación de estaciones de trabajo portátiles: totalmente resistentes, preparadas para la IA y diseñadas para las aplicaciones más exigentes directamente en el lugar de trabajo. Este sistema de 14 pulgadas combina un rendimiento de IA en el borde de hasta 682 TOPS con potentes procesadores Intel® Core™ Ultra. Además, cuenta con una NPU AI Boost y, opcionalmente, una GPU NVIDIA® RTX™ 3500 Ada (12 GB) o RTX™ 5000 Ada (16 GB). Cualquier persona que dependa de un hardware potente y resistente —como en la automatización industrial, los servicios de campo o la investigación técnica— se beneficia de un análisis rápido mediante IA y de un rendimiento gráfico de nivel profesional para la computación móvil de alto rendimiento.
Ya se trate de renderizado 3D en tiempo real, inferencia de IA o simulaciones con gran volumen de datos, el Z14I-HG procesa localmente las cargas de trabajo más exigentes. Esto reduce la latencia. Al mismo tiempo, la independencia de los proveedores de servicios en la nube mejora la seguridad de los datos, por ejemplo, durante inspecciones, mantenimiento predictivo o aplicaciones de gemelos digitales.
El sistema cuenta con las certificaciones MIL-STD-810H, MIL-STD-461G e IP66. Resiste temperaturas extremas, humedad e interferencias electromagnéticas. Además, la pantalla DynaVue® de 1200 nits sigue siendo perfectamente legible incluso bajo la luz solar directa y admite múltiples modos de entrada, así como configuraciones multipantalla.
La estación de trabajo Z14I-HG ya está disponible y puede solicitarse directamente a Durabook.
Conectividad
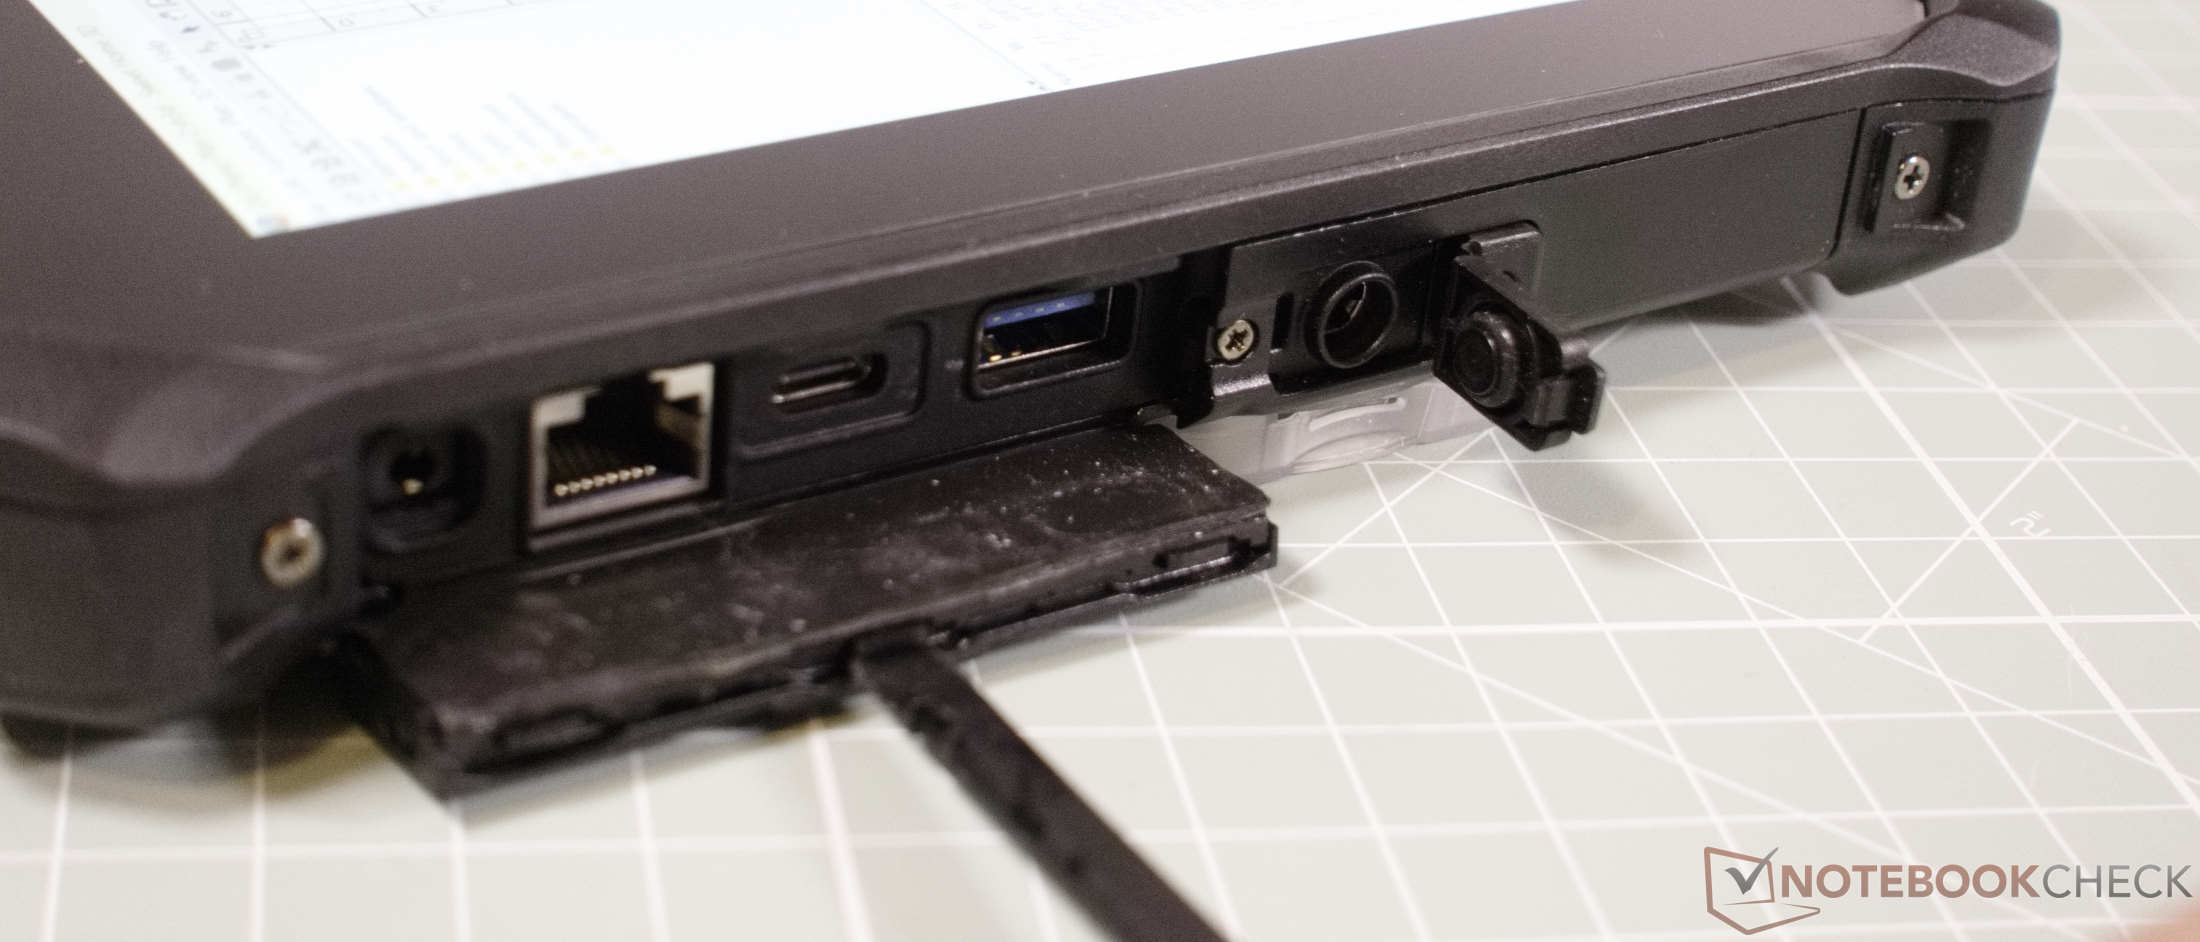
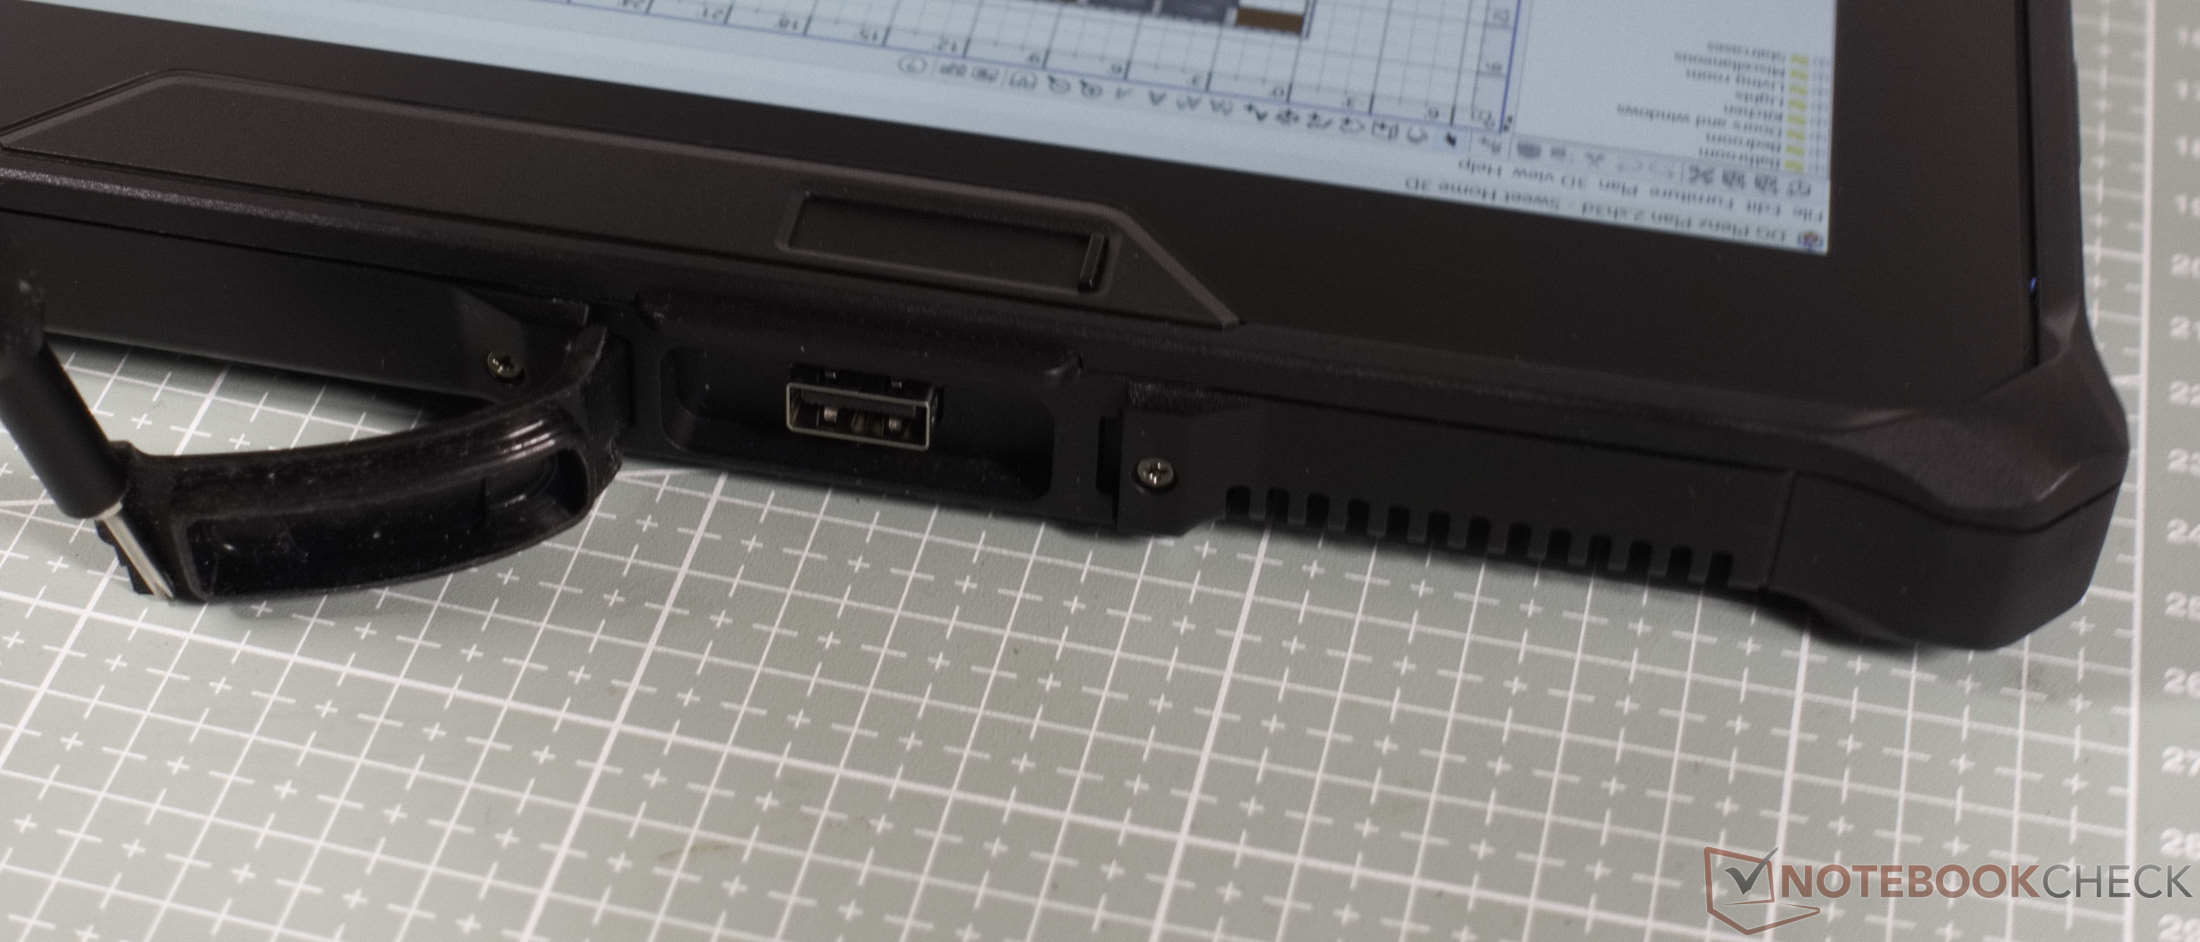
Todos los puertos están ocultos tras unas resistentes tapas protectoras. La tableta cuenta con un moderno puerto USB-C con Thunderbolt, DisplayPort y Power Delivery. También incluye un puerto RJ-45 Gigabit Ethernet, una toma para auriculares y una toma de alimentación estándar.
La parte trasera de la tableta cuenta además con un lector biométrico de huellas dactilares para un inicio de sesión seguro en el sistema. Lamentablemente, el lector de tarjetas SD integrado resulta algo difícil de acceder, ya que se encuentra en el interior, detrás de la batería. No obstante, es razonablemente rápido. En el interior de la tableta también hay ranuras vacías para tarjetas de expansión. En cuanto a la conectividad inalámbrica, la tableta resistente ofrece Wi-Fi 7 y Bluetooth 5.4.
| SD Card Reader | |
| average JPG Copy Test (av. of 3 runs) | |
| Durabook R10 | |
| Dell Latitude 7030 Rugged Extreme (AV Pro V60) | |
| Durabook R8 Tablet (AV Pro V60) | |
| Media de la clase Tablet (10.2 - 79.2, n=44, últimos 2 años) | |
| Dynabook Portege Z40L-N (AV PRO microSD 128 GB V60) | |
| maximum AS SSD Seq Read Test (1GB) | |
| Dell Latitude 7030 Rugged Extreme (AV Pro V60) | |
| Durabook R10 | |
| Dynabook Portege Z40L-N (AV PRO microSD 128 GB V60) | |
| Media de la clase Tablet (n=1últimos 2 años) | |
| Durabook R8 Tablet (AV Pro V60) | |
Cámara
La cámara frontal Full HD resulta más que suficiente para las videoconferencias. La cámara principal trasera, de 11 megapíxeles, realiza impresionantes fotos macro, pero tiene dificultades con las tomas gran angular debido a la lentitud del enfoque automático y a un rango dinámico reducido. Gracias al flash integrado, la cámara sigue siendo útil en habitaciones oscuras.


Dispositivos de entrada
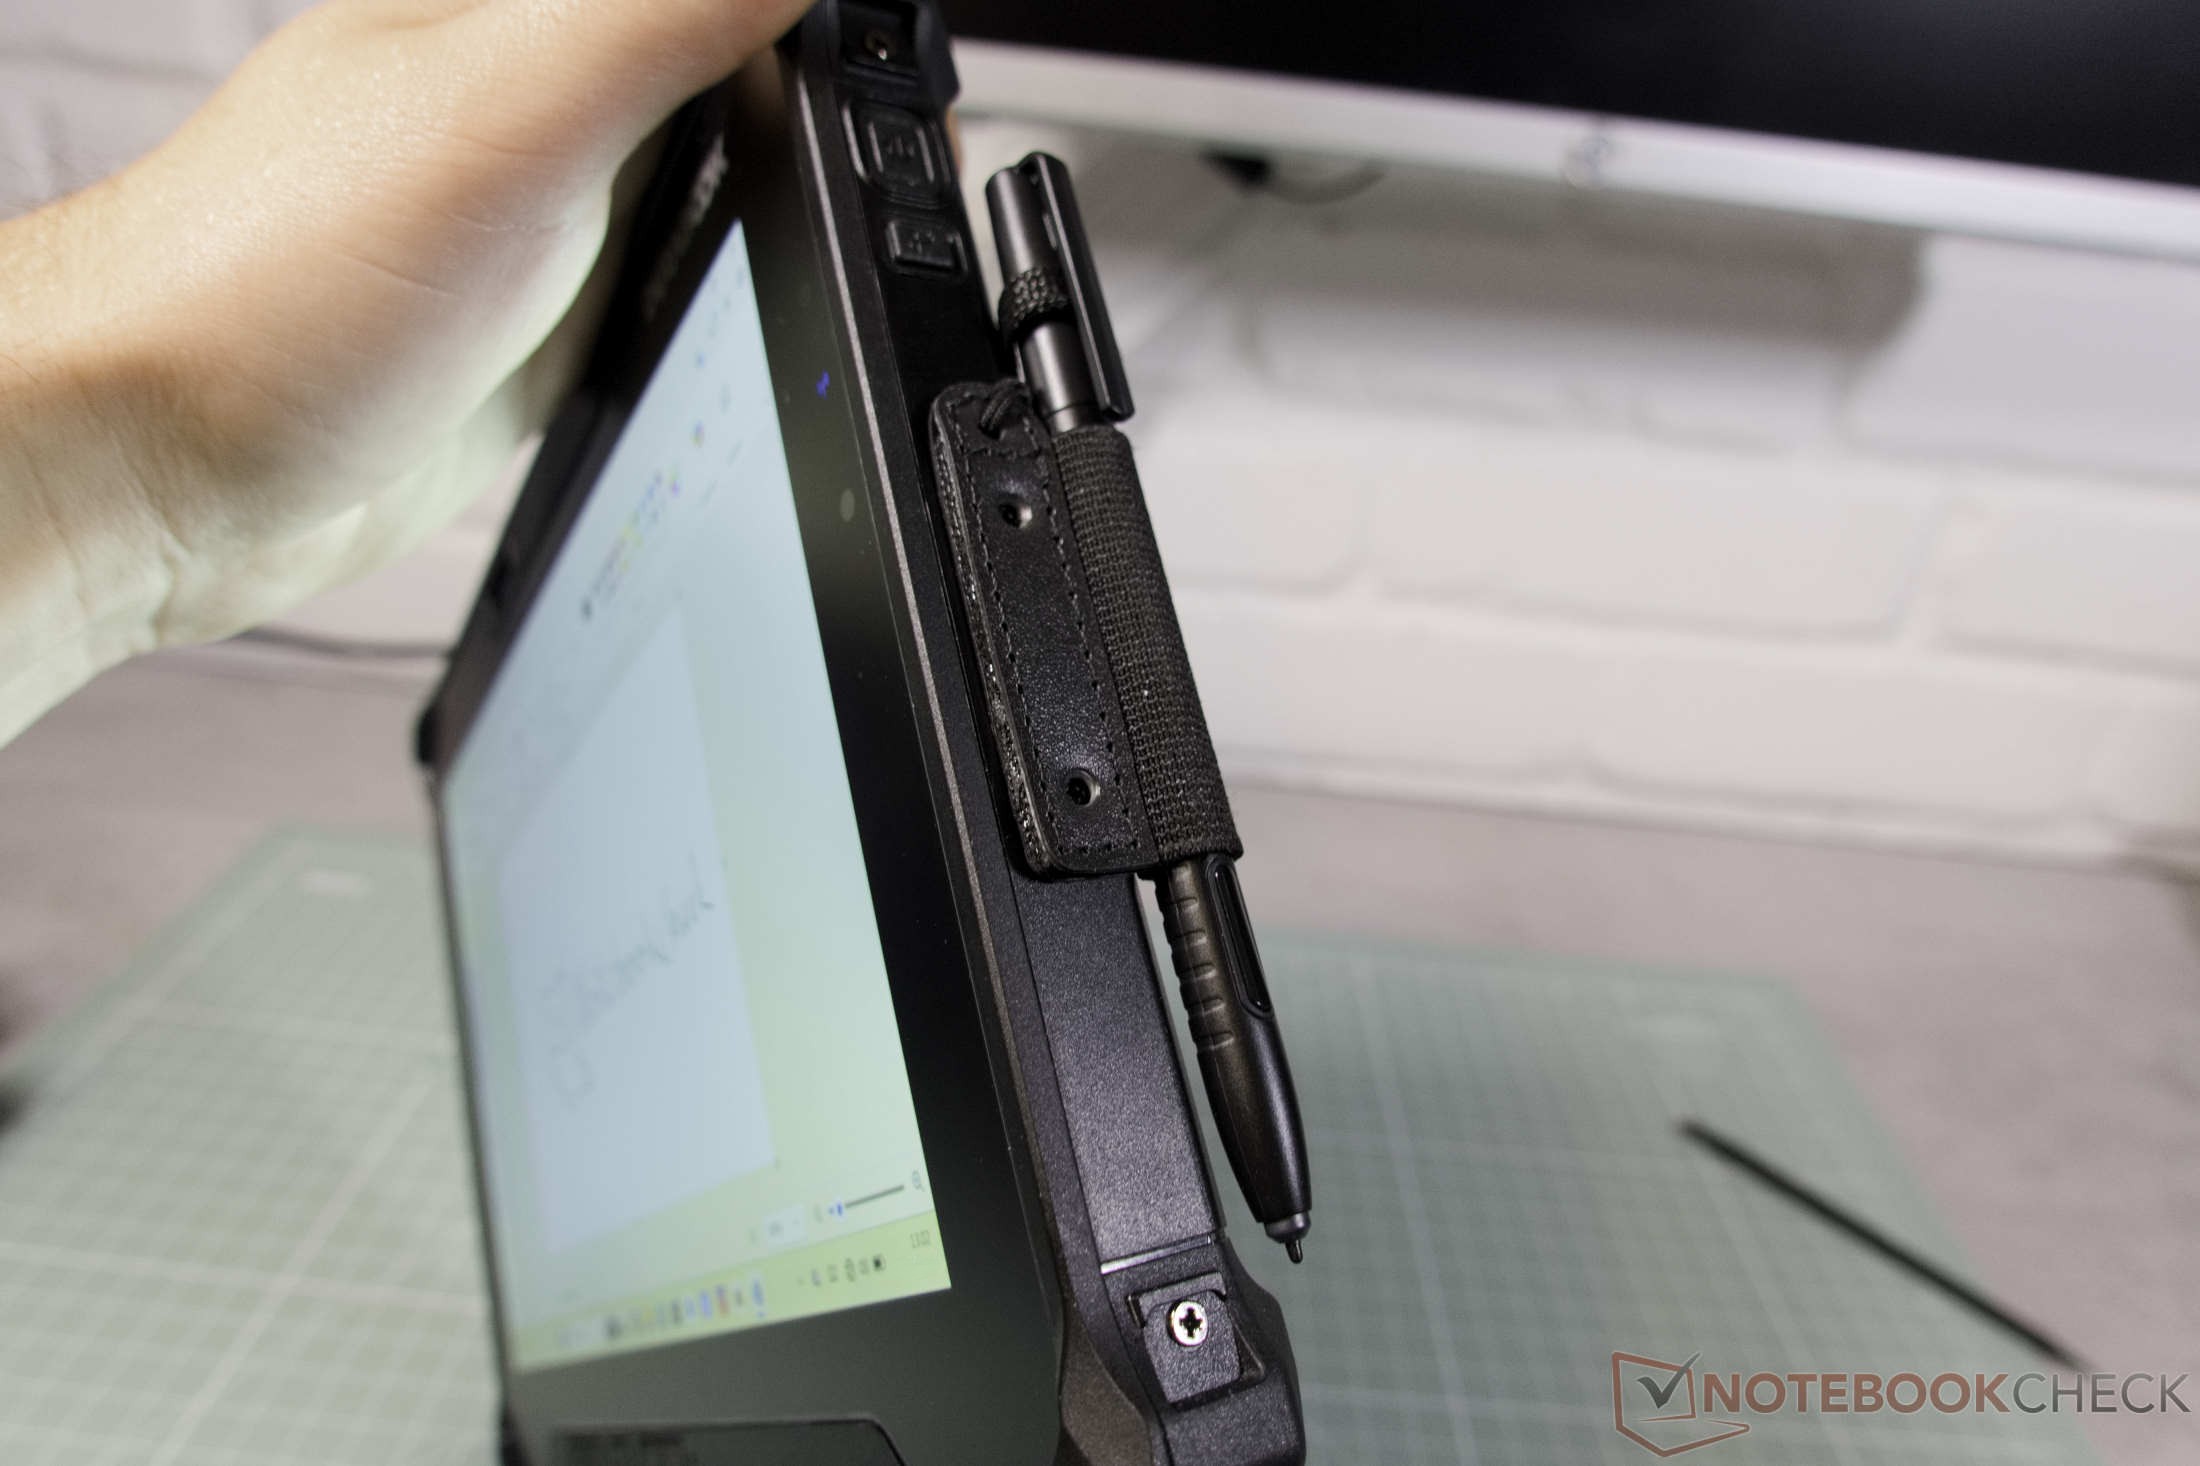
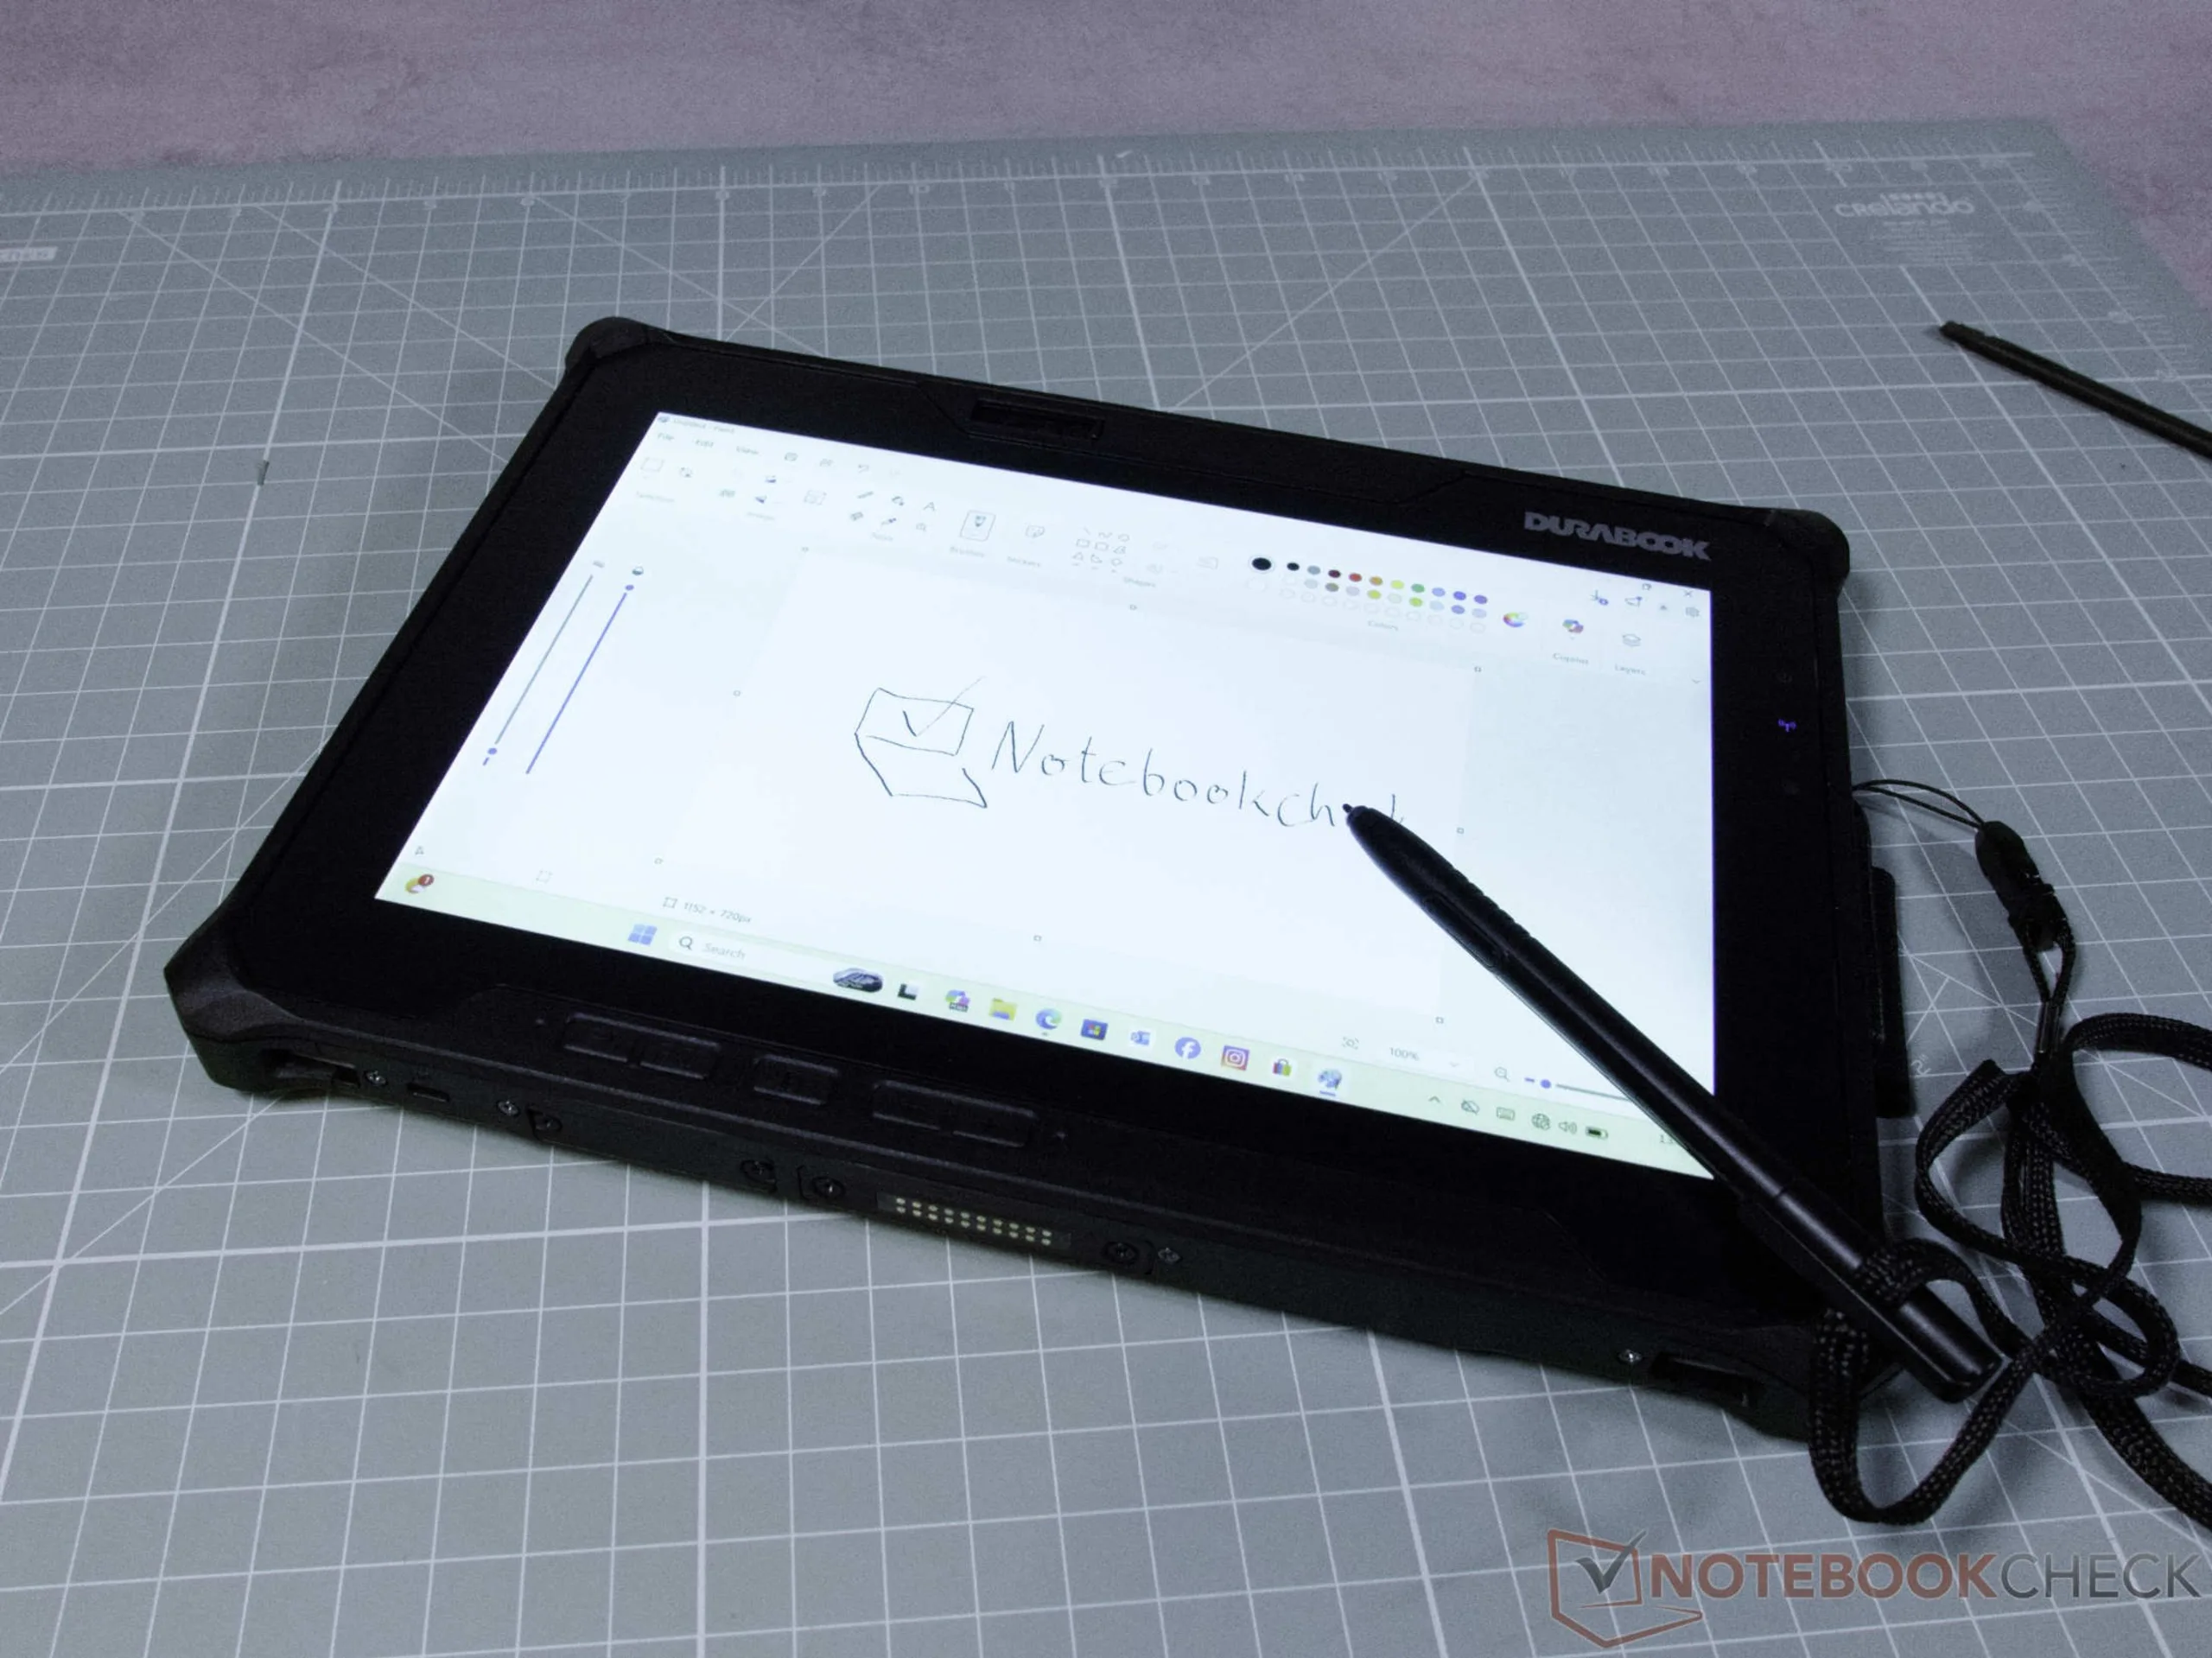
Además de la pantalla táctil, el Durabook R10 cuenta con seis botones cuyas funciones se pueden personalizar. No obstante, la pantalla táctil sigue siendo el elemento de control principal y se puede optimizar de forma flexible para entornos de trabajo exigentes. Por ejemplo, se puede cambiar el modo táctil para que la pantalla reconozca de forma fiable las entradas tanto con guantes protectores gruesos como en condiciones de humedad. Para planos detallados o bocetos, la pantalla es compatible con el Protocolo de lápiz de Microsoft 1.51.
El lápiz óptico del Durabook es sorprendentemente ligero y, al mismo tiempo, preciso. Se puede atornillar un soporte opcional para el lápiz a la tableta; además, incluye una correa de seguridad para el lápiz.
Opcionalmente, la tableta puede actualizarse a un modelo desmontable. El módulo de teclado que la acompaña ofrece una retroiluminación roja que no daña la vista, así como varios puertos adicionales. De serie, cuenta con dos puertos USB-A 3.2, y los puertos HDMI o LAN pueden configurarse según sea necesario. La unidad de teclado también dispone de un puerto de carga adicional.
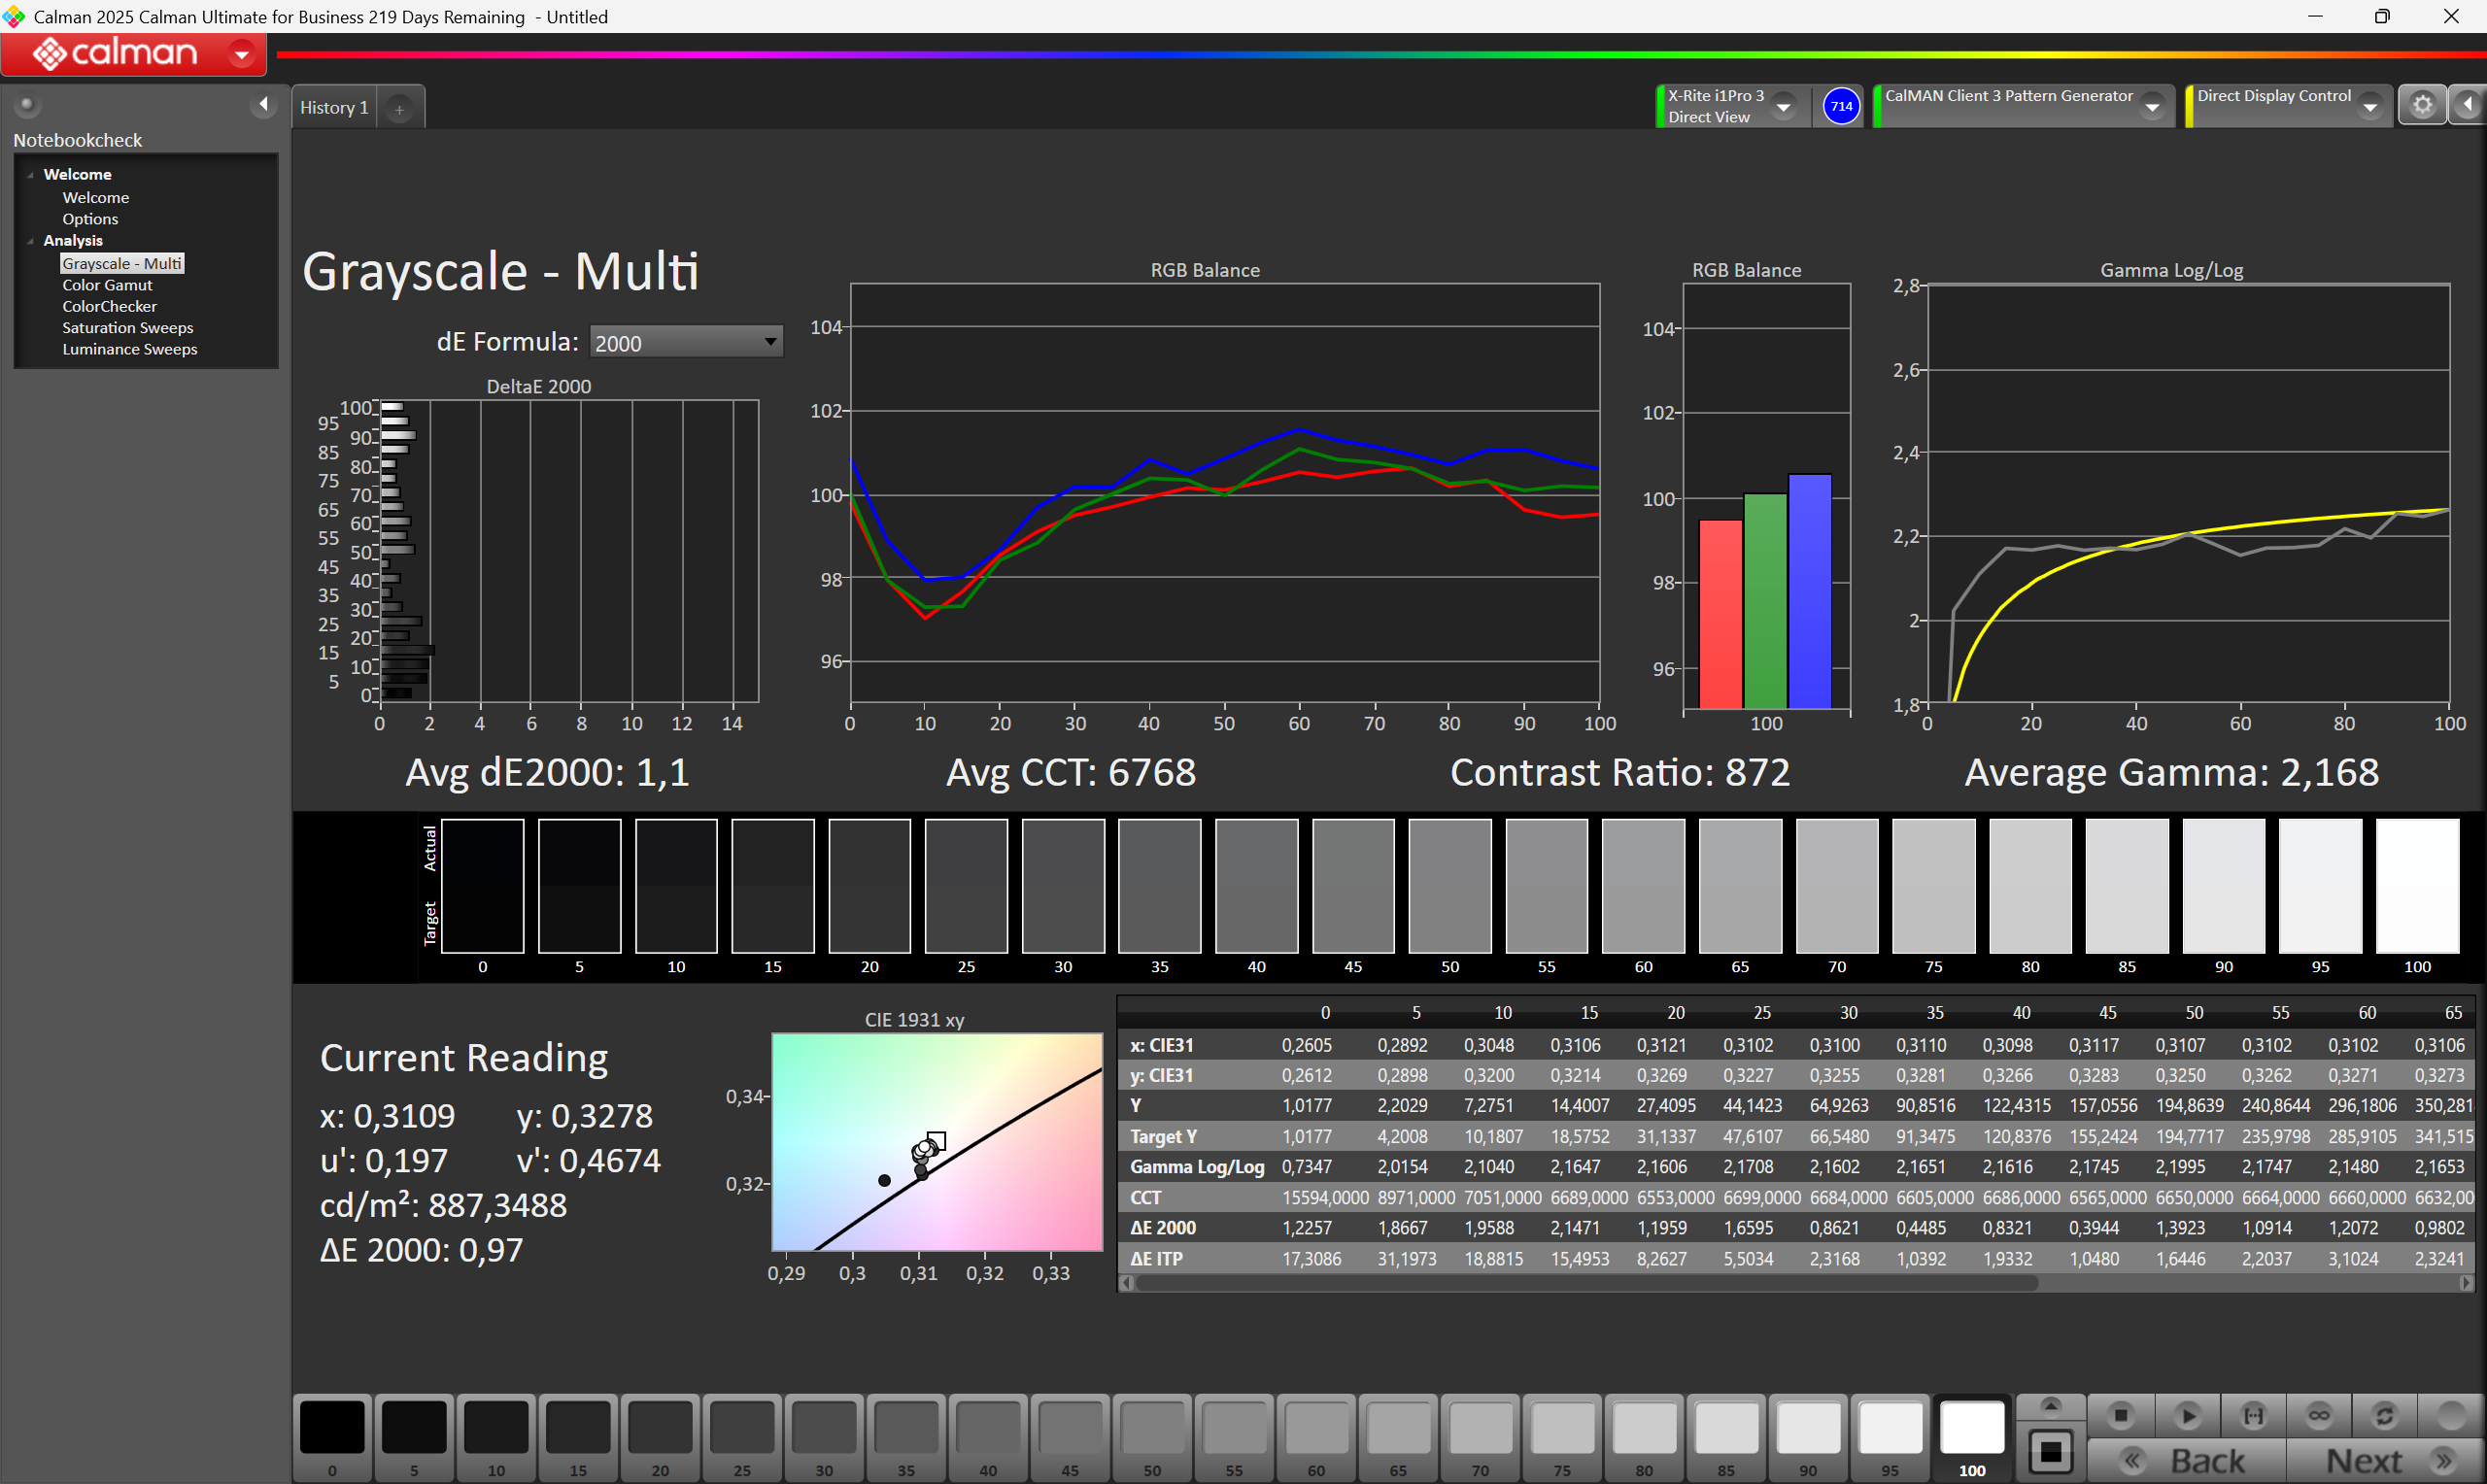
Pantalla
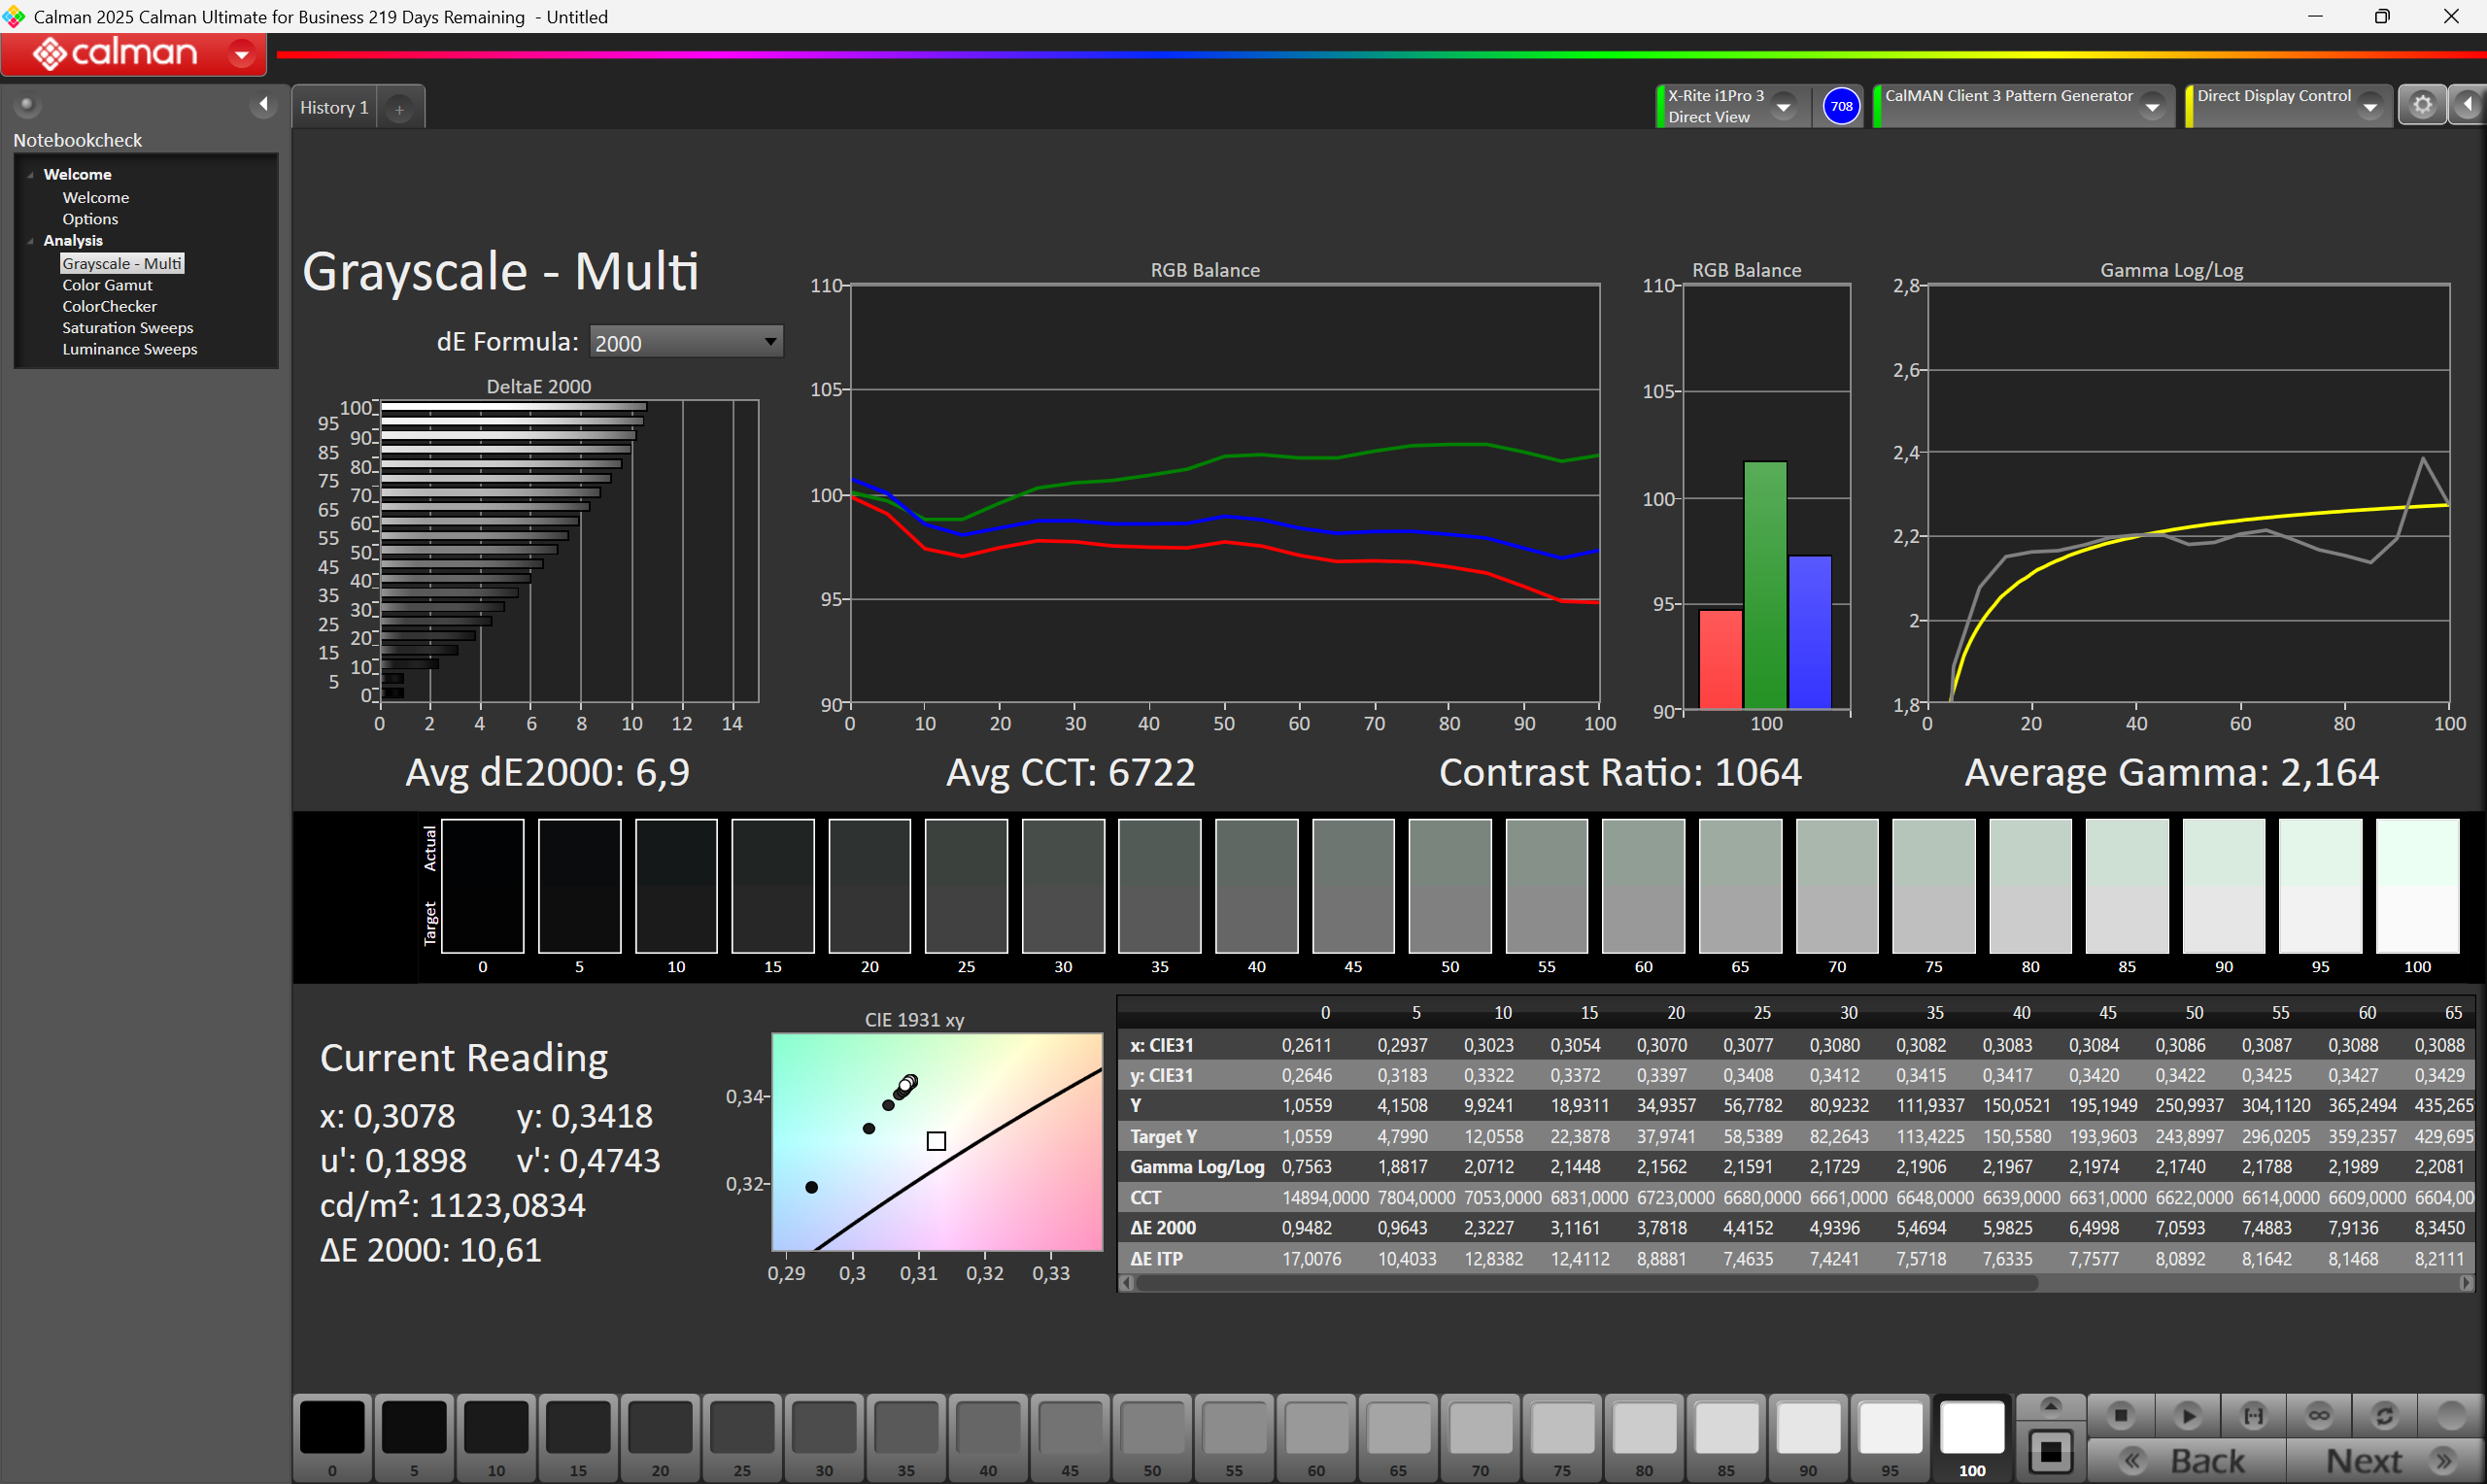
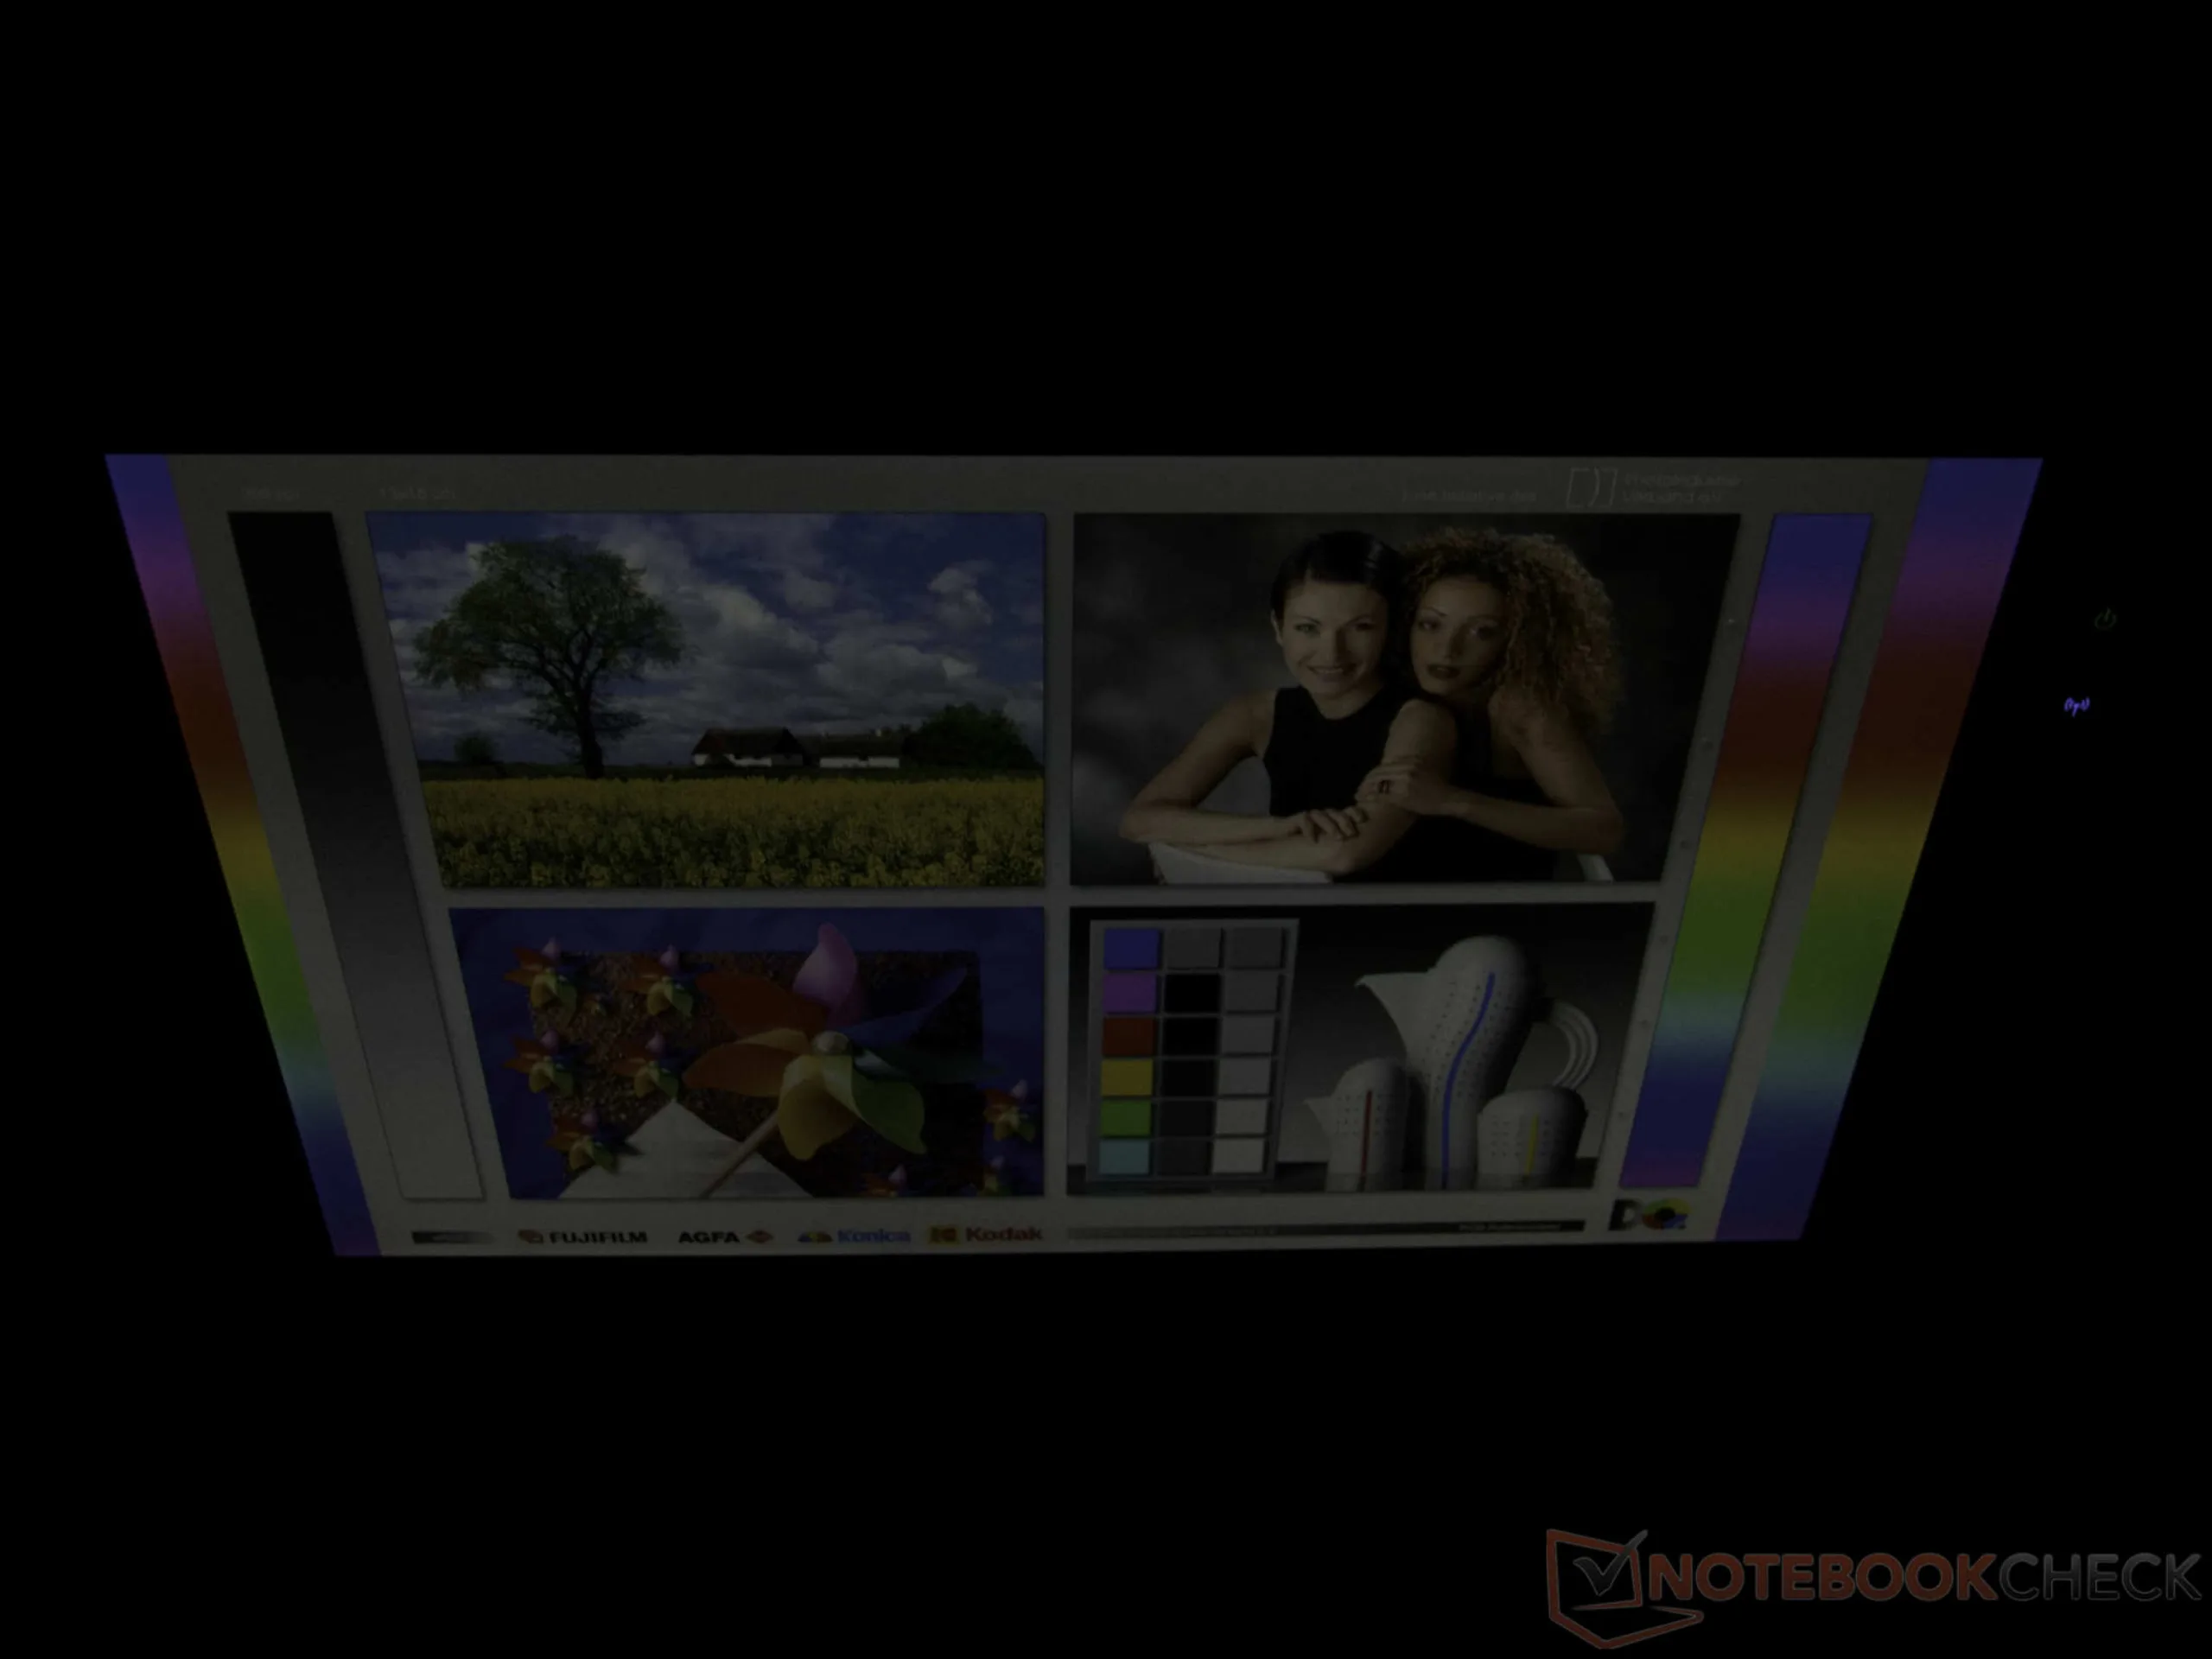
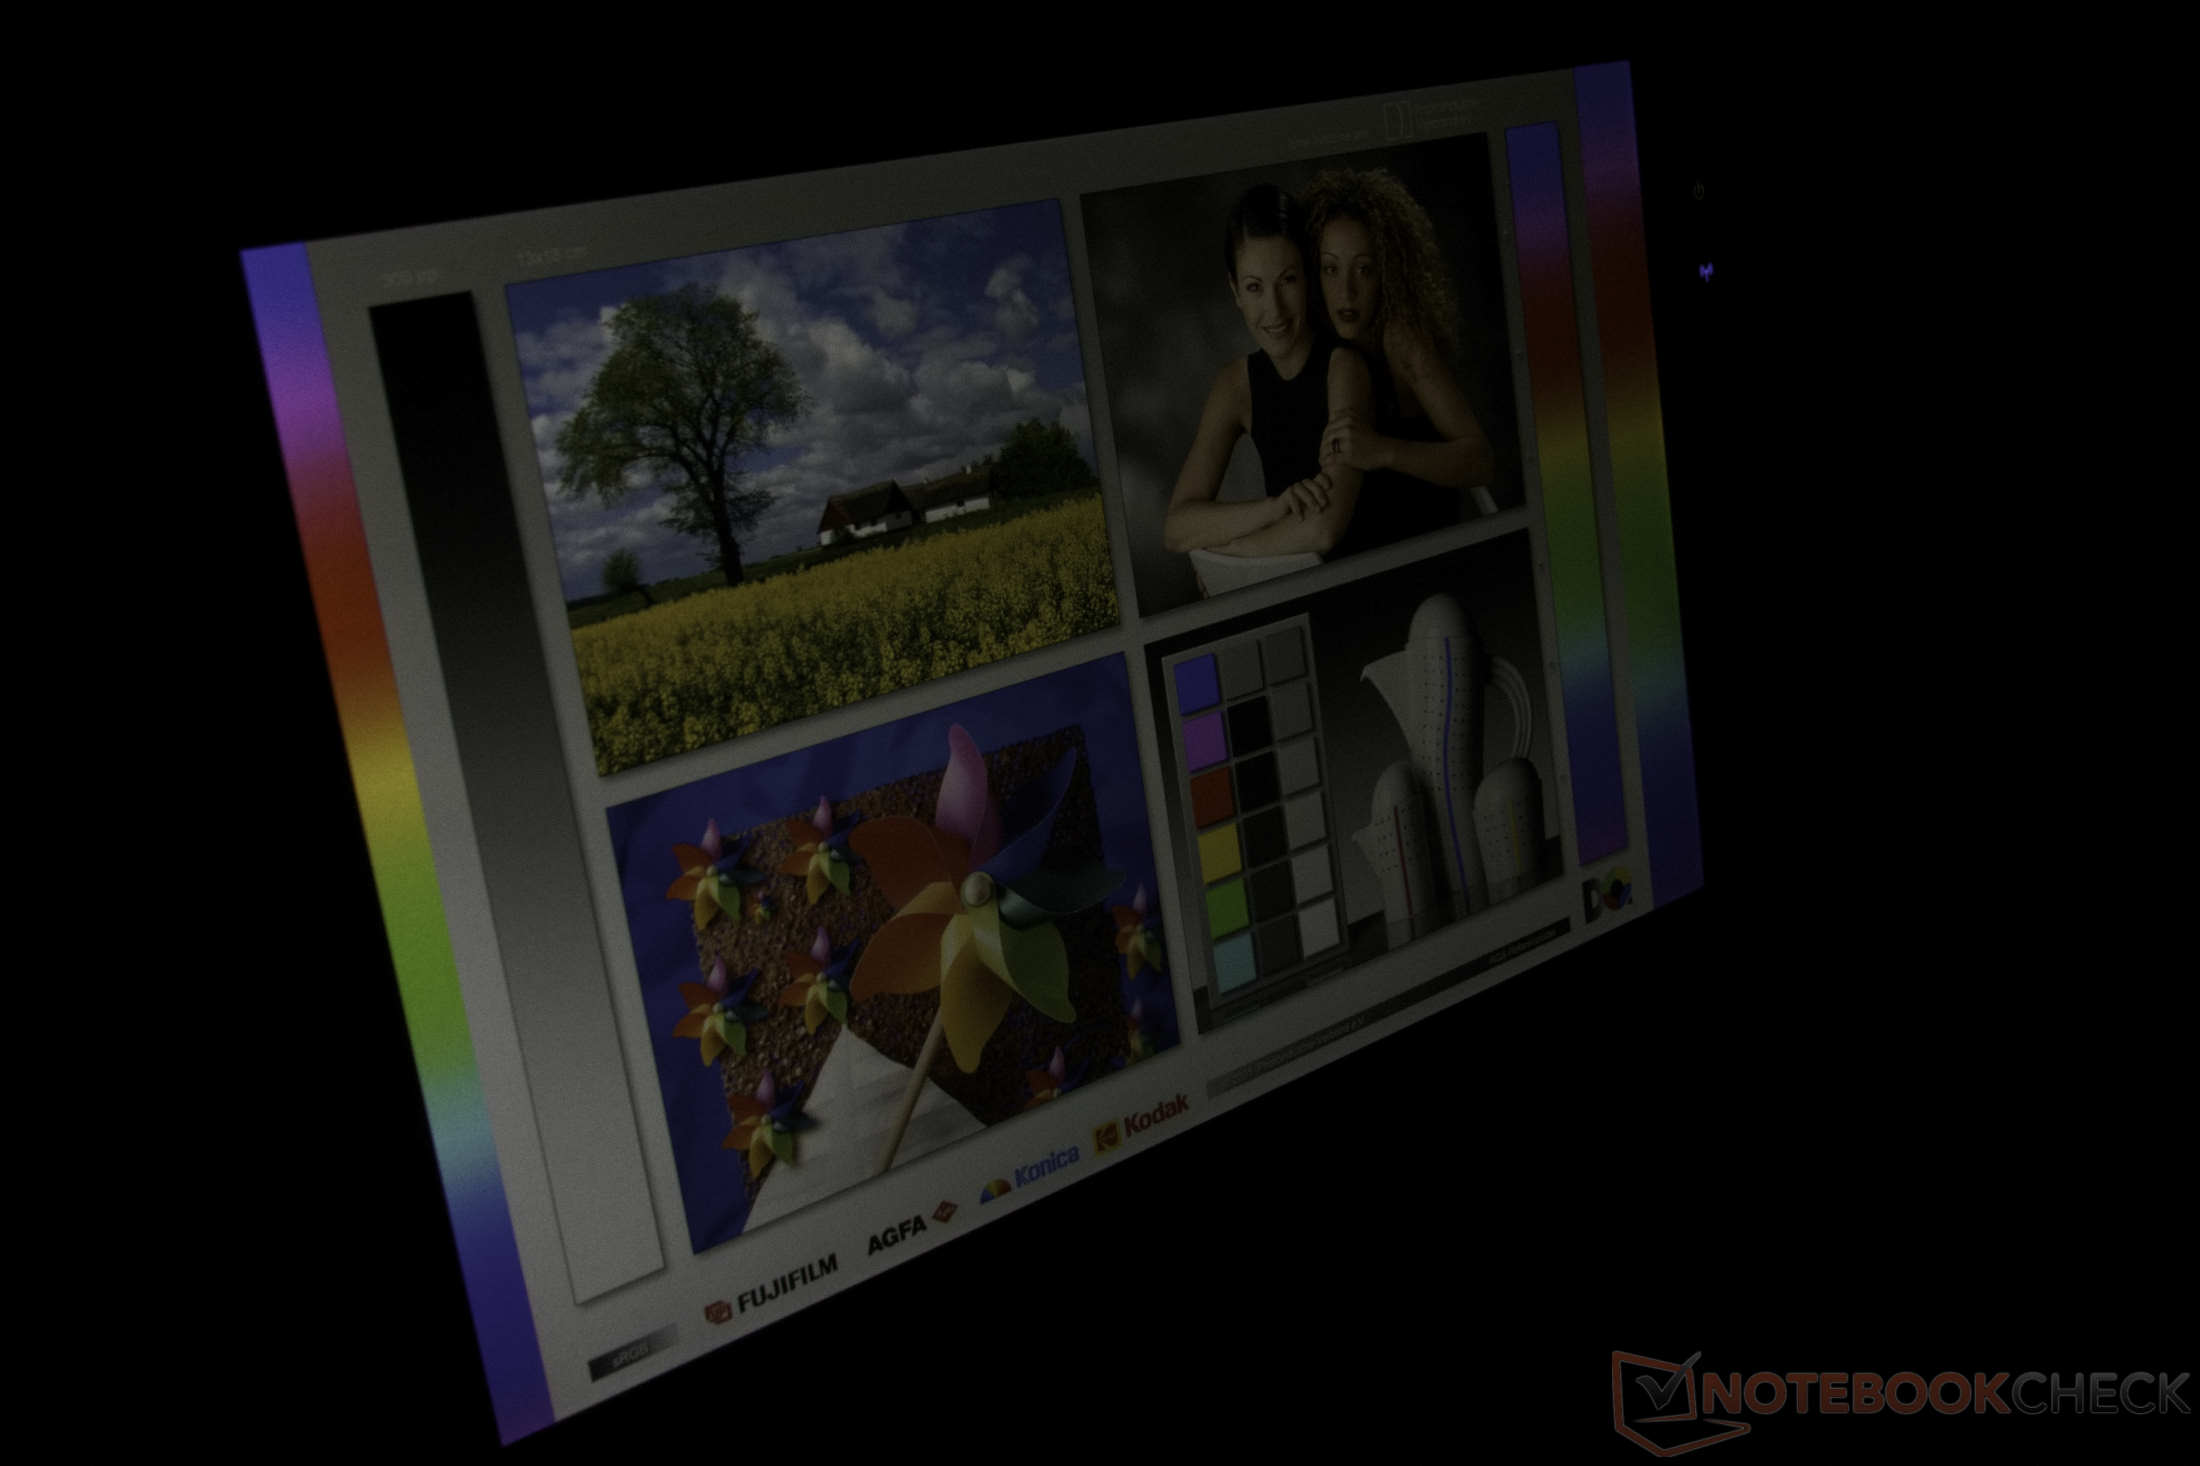
La pantalla WUXGA de 10,1 pulgadas está diseñada sin concesiones para su uso en exteriores. Con una luminancia extraordinaria de más de 1.000 cd/m², el panel es tan brillante que todo el contenido de la pantalla sigue siendo perfectamente legible incluso bajo la luz solar directa. Un protector de pantalla mate preinstalado reduce eficazmente los reflejos molestos, aunque sí que produce un ligero efecto arcoíris en las zonas más luminosas. El brillo adaptativo es una función muy práctica y cómoda.
| |||||||||||||||||||||||||
iluminación: 92 %
Brillo con batería: 1040 cd/m²
Contraste: 1024:1 (Negro: 1.05 cd/m²)
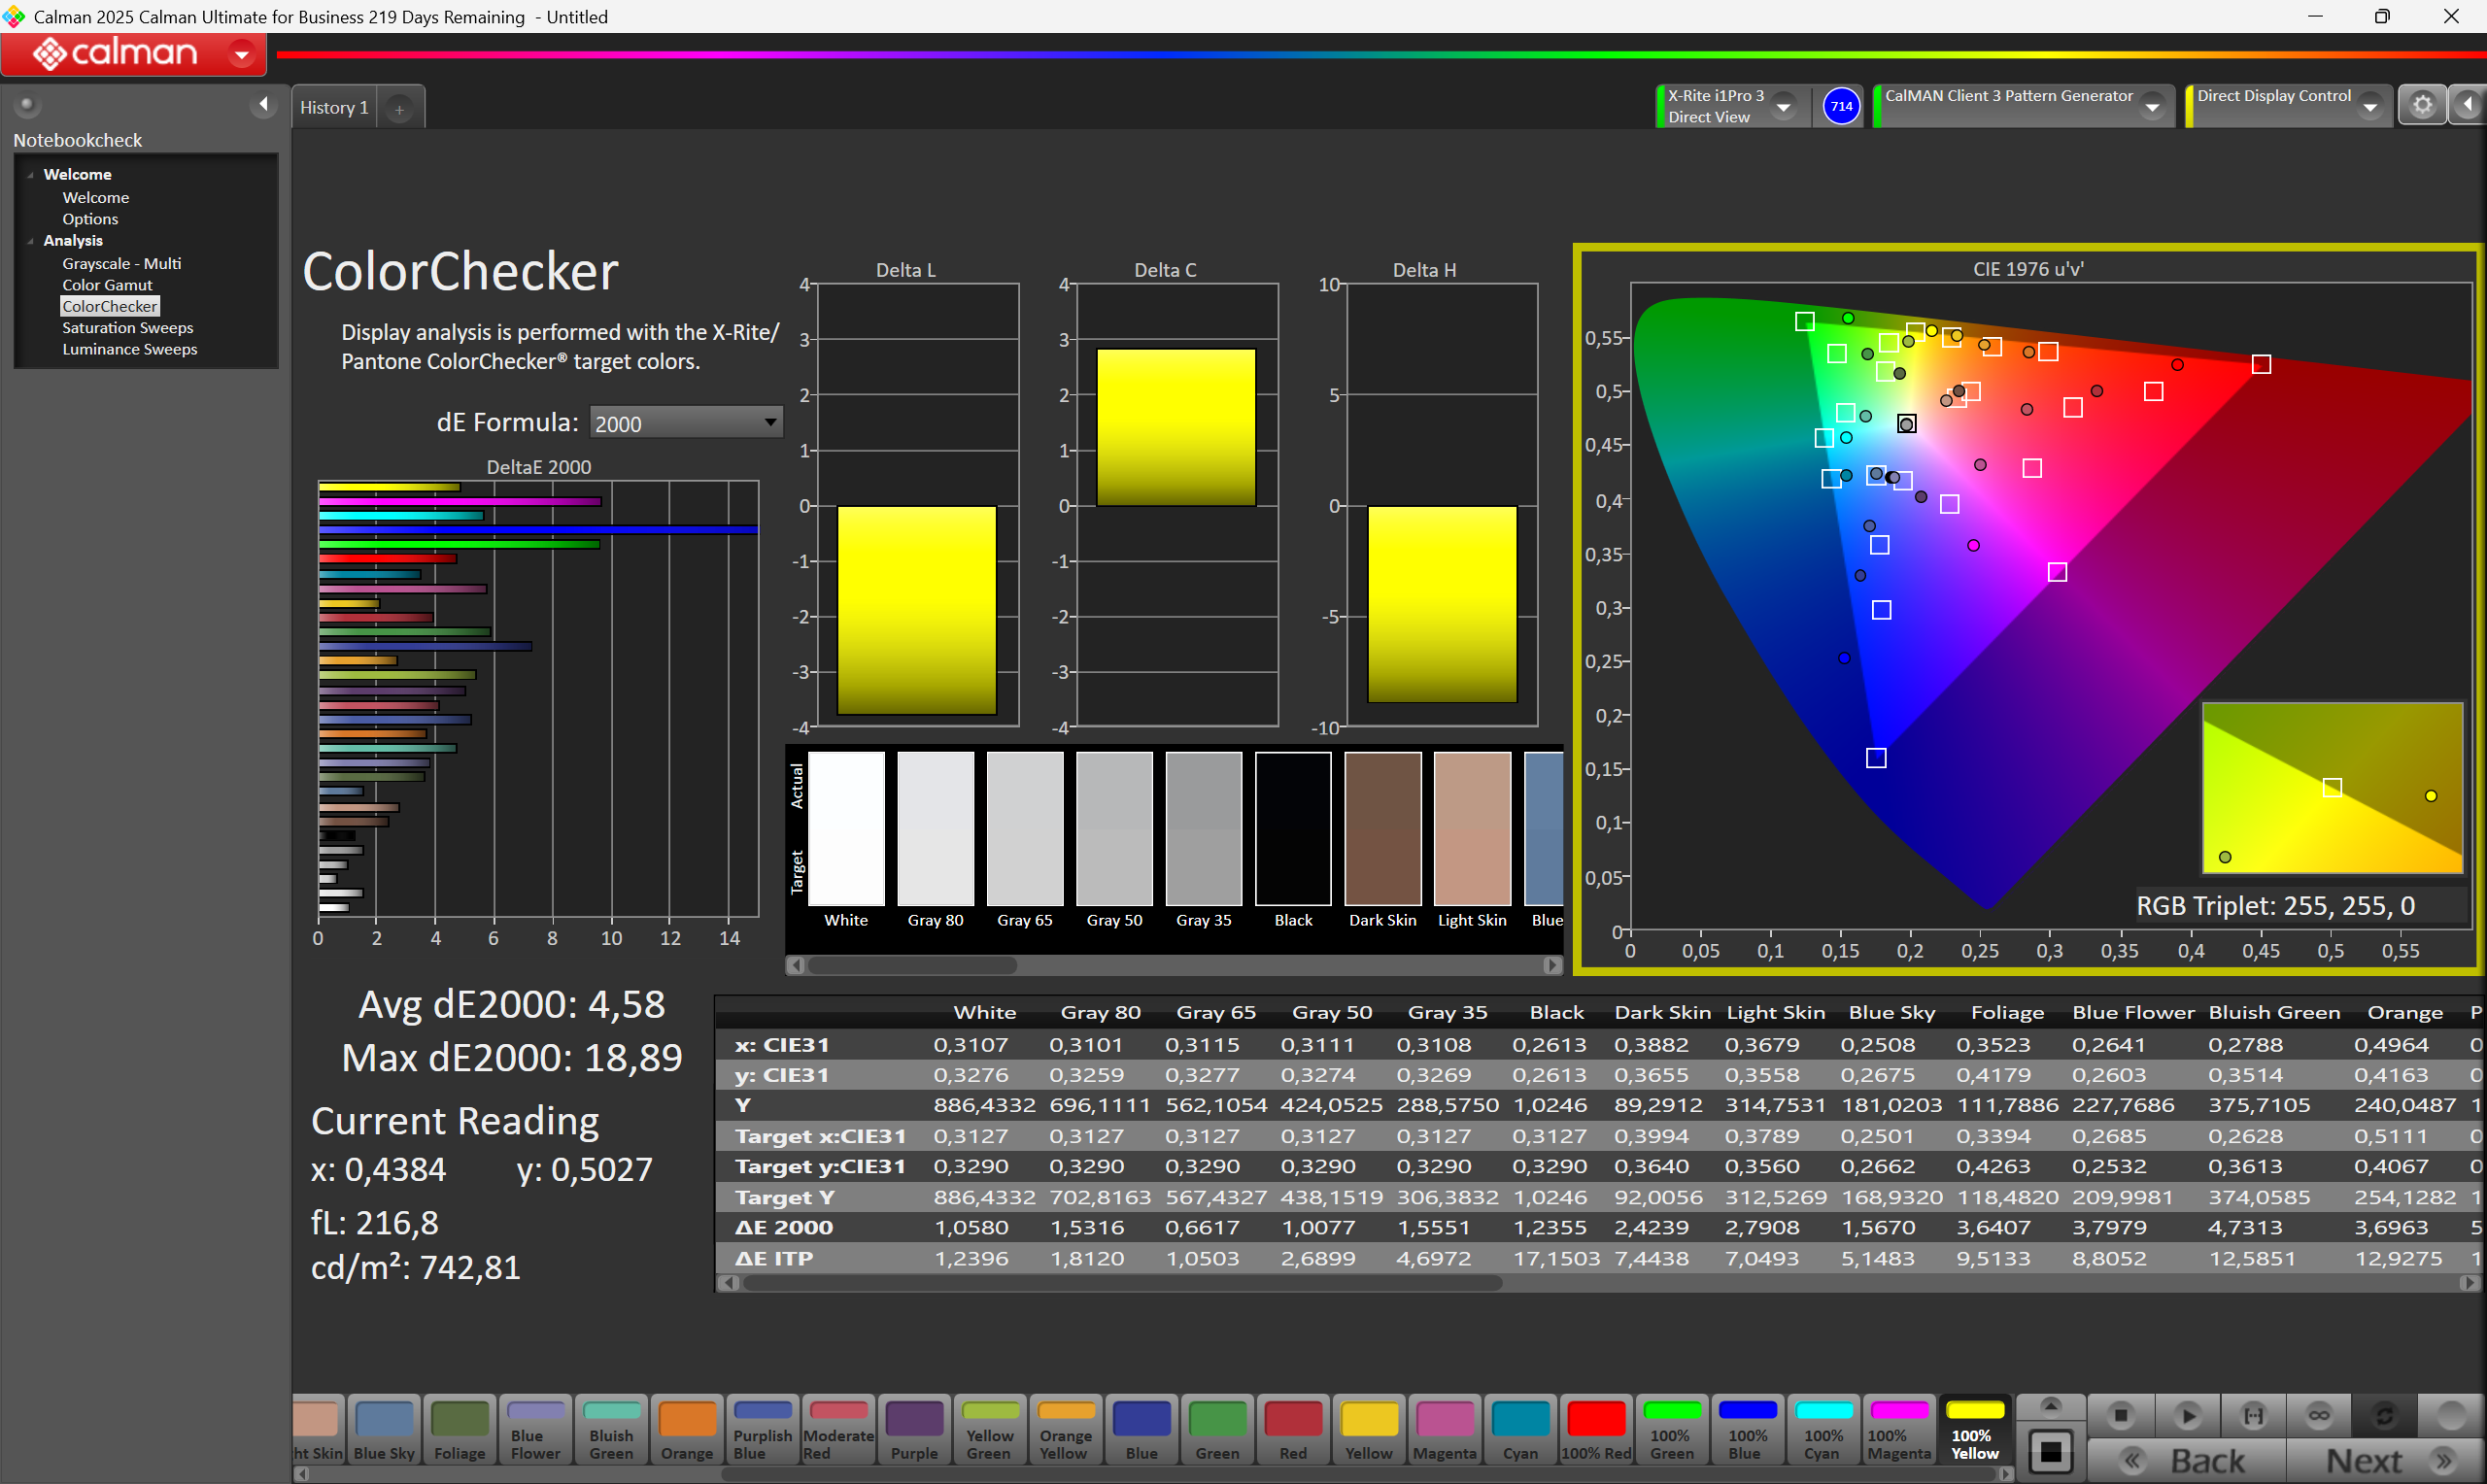
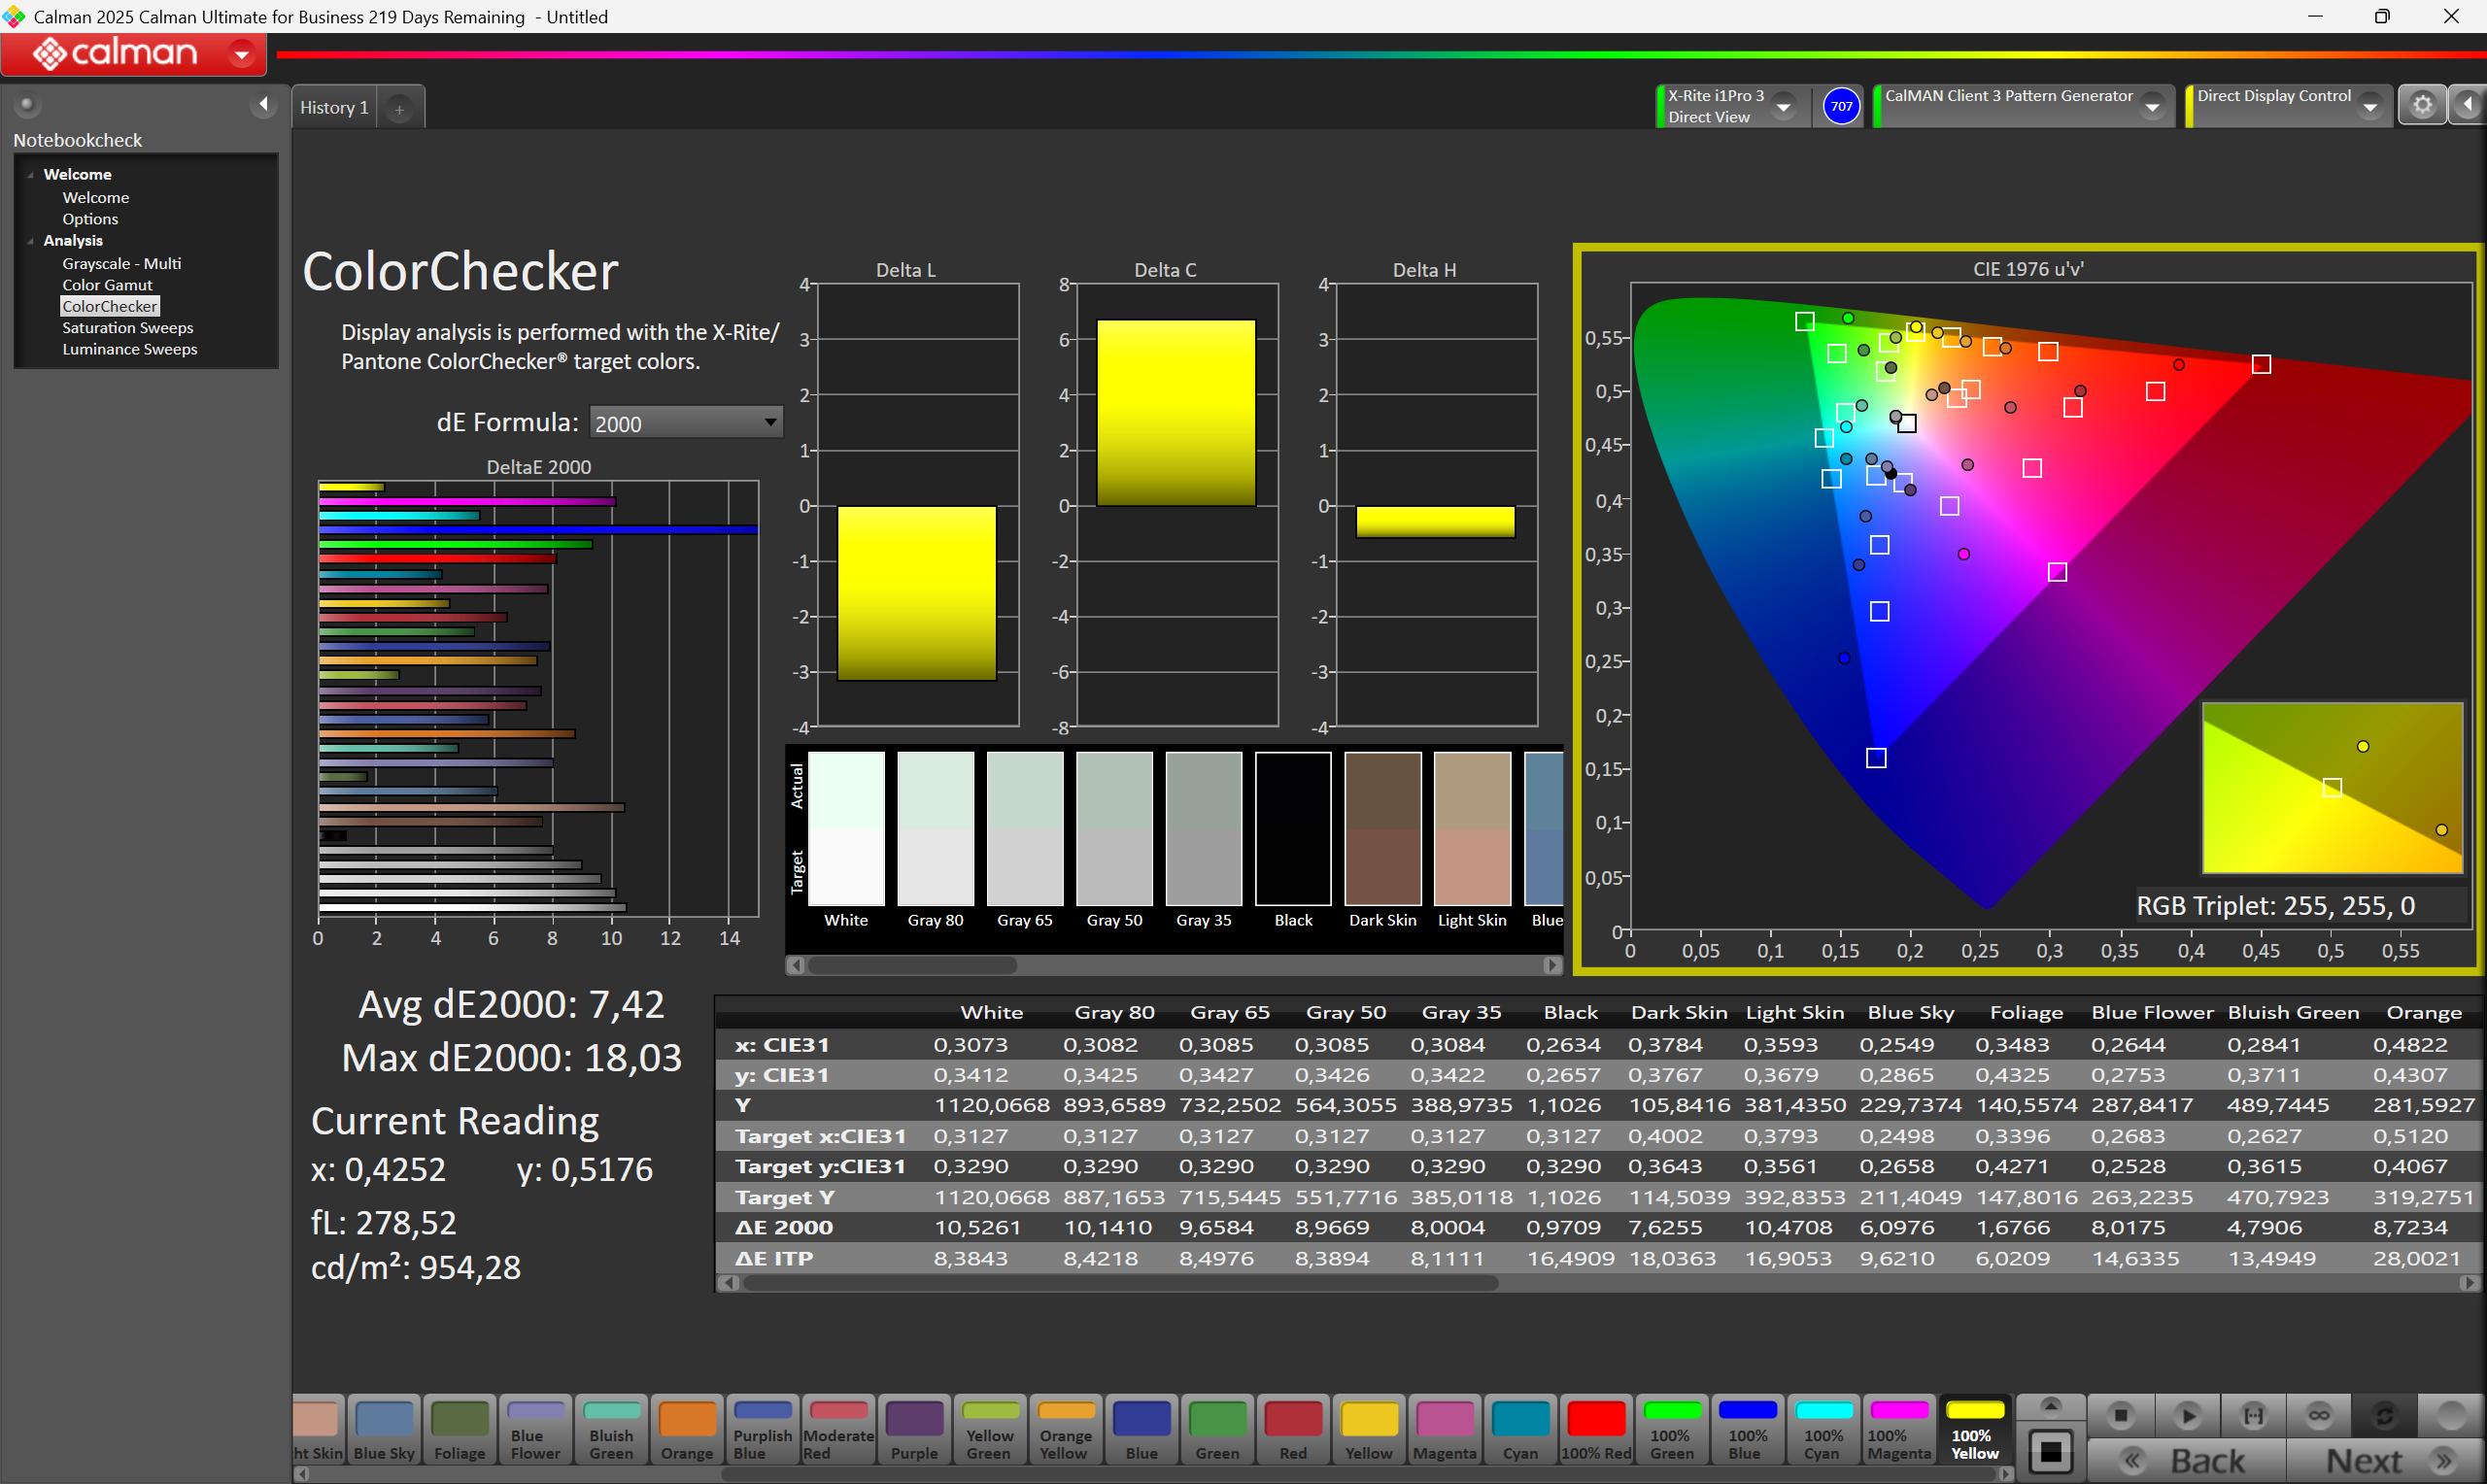
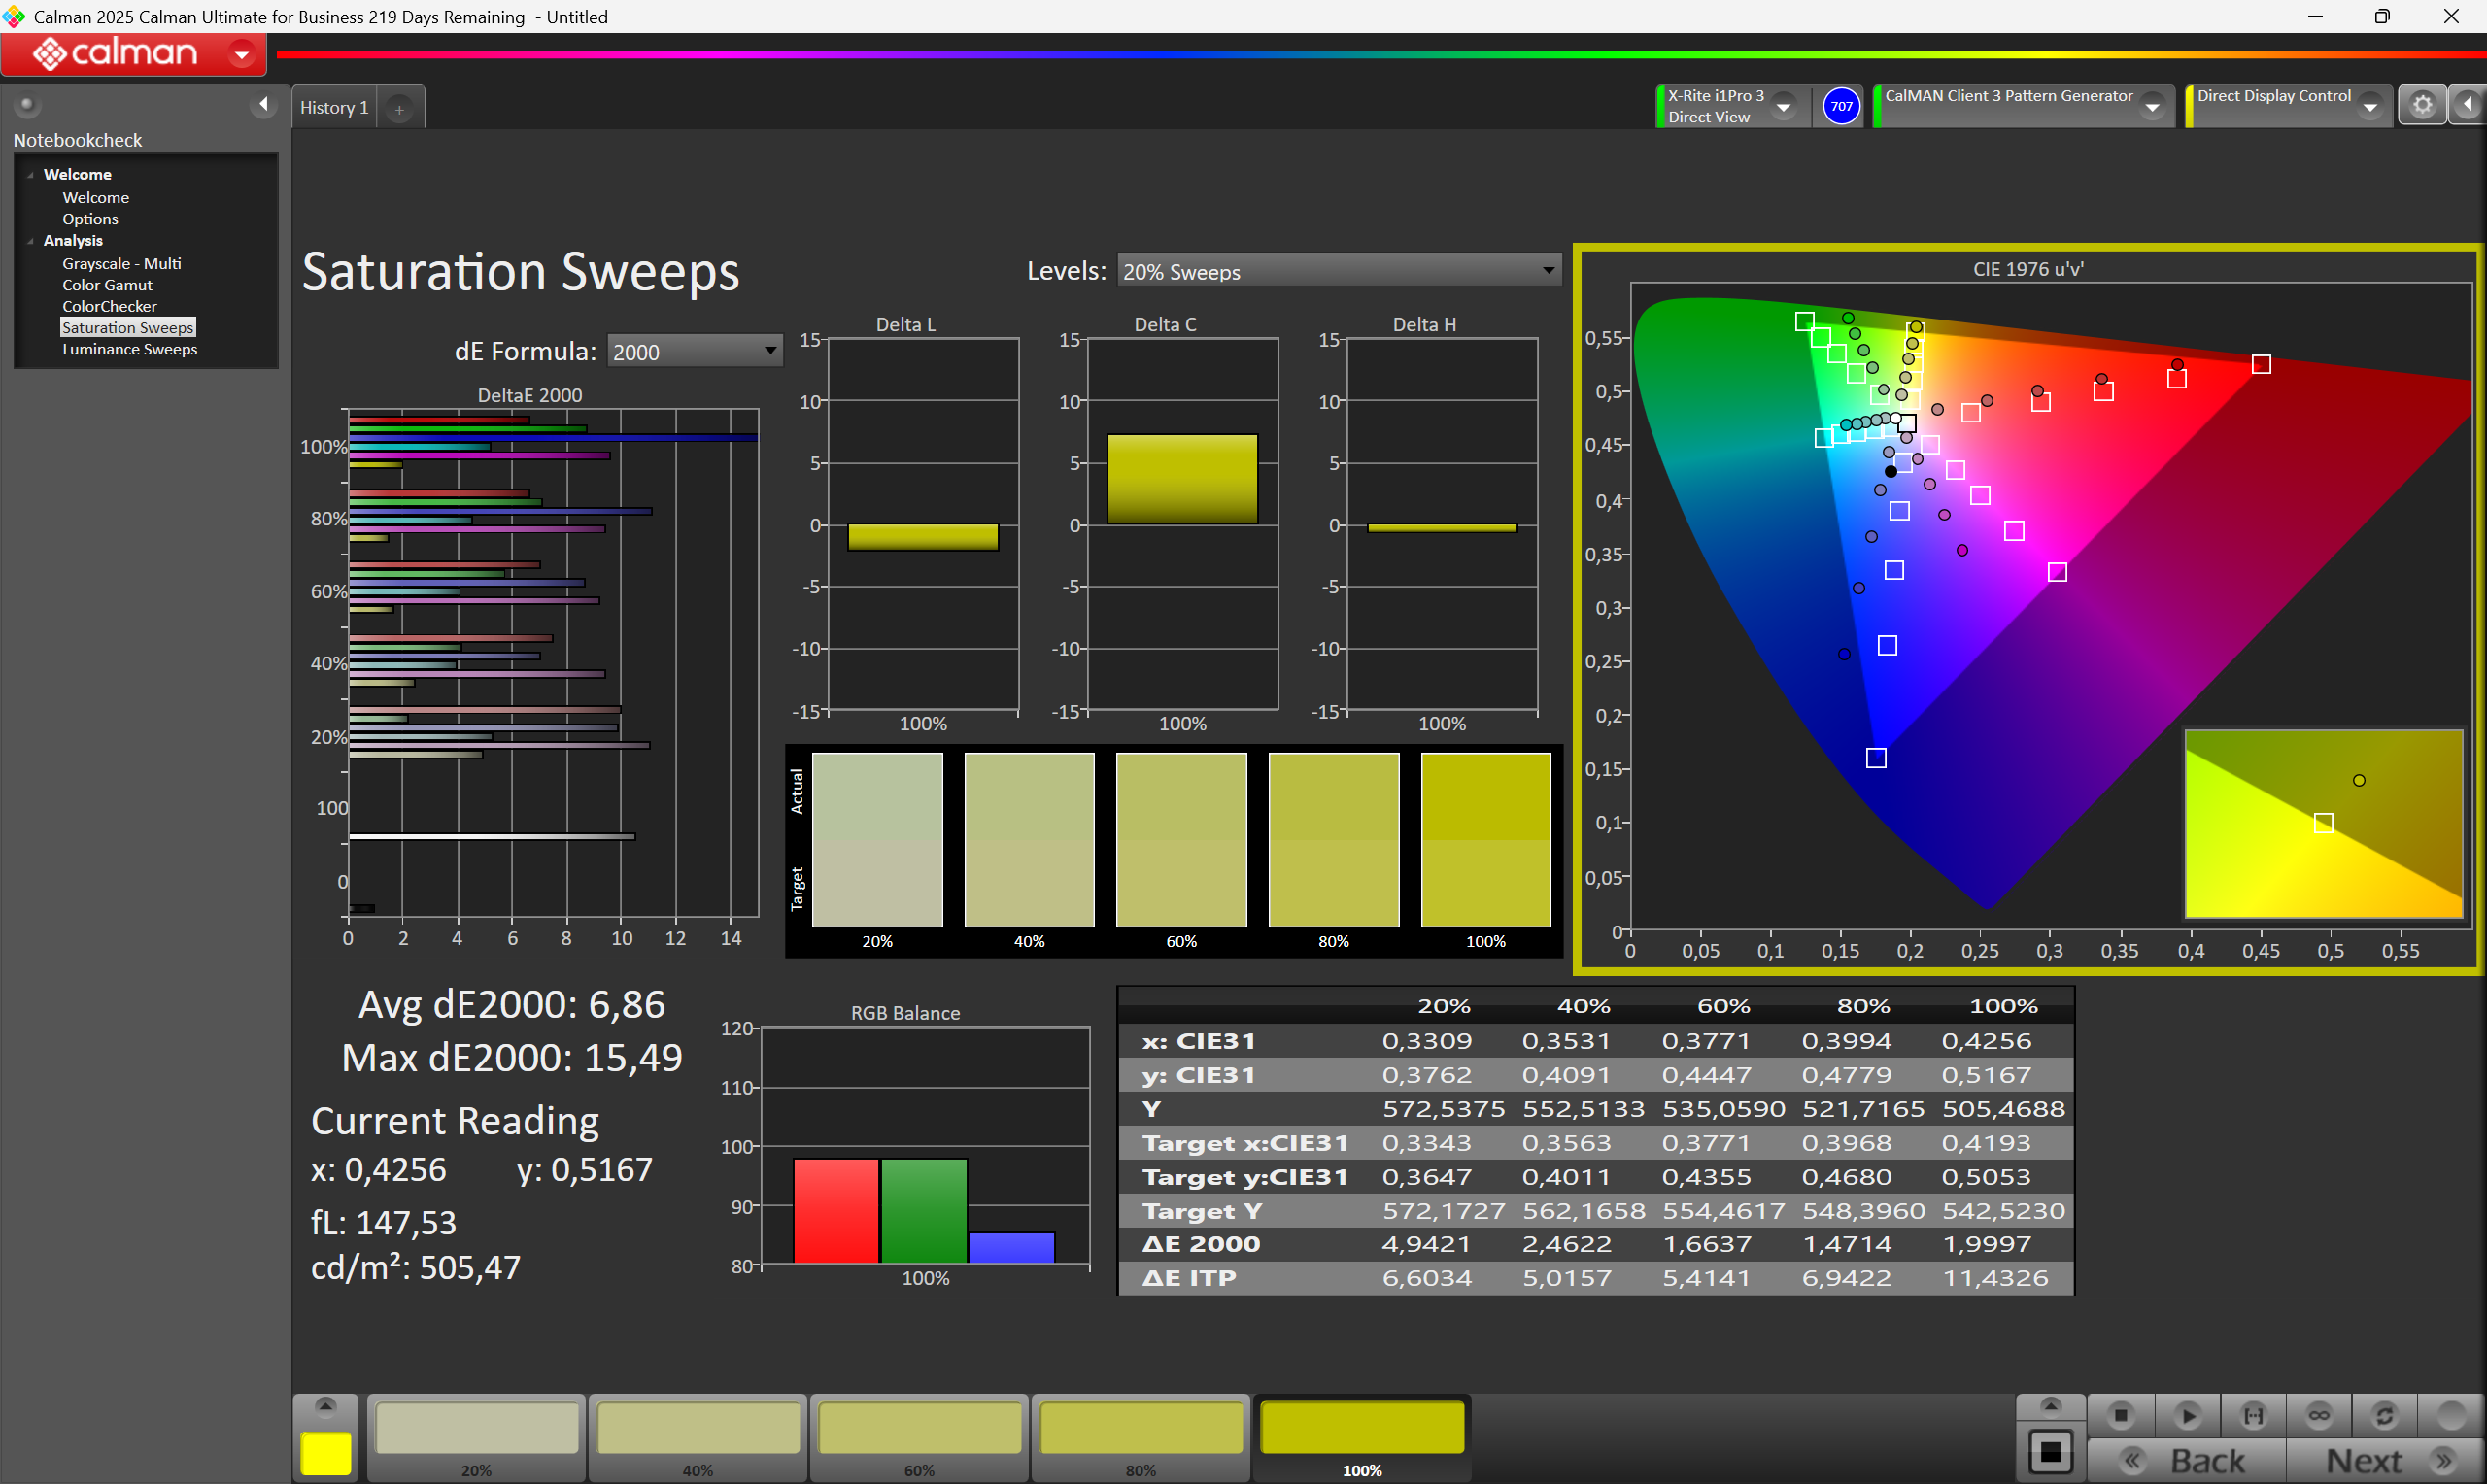
ΔE ColorChecker Calman: 7.42 | ∀{0.5-29.43 Ø4.72}
calibrated: 4.58
ΔE Greyscale Calman: 6.9 | ∀{0.09-98 Ø4.97}
44.17% AdobeRGB 1998 (Argyll 3D)
61.77% sRGB (Argyll 3D)
42.75% Display P3 (Argyll 3D)
Gamma: 2.164
CCT: 6722 K
| Durabook R10 HannStar 101GUW2, TFT, 1920x1200, 10.1", 60 Hz | Dell Latitude 7030 Rugged Extreme Sharp LQ101N1, IPS, 1920x1200, 10", 60 Hz | Lenovo ThinkPad T14 Gen 6 21QG001VGE MNE007JA1-3, IPS LED, 1920x1200, 14", 60 Hz | Dynabook Portege Z40L-N BOE NE140WUM-N6K, IPS, 1920x1200, 14", 60 Hz | Durabook R8 Tablet Digital Flat Panel, IPS, 1280x800, 8", 60 Hz | Lenovo ThinkPad T14 Gen 6 AMD NE140WUM-N6M, , 1920x1200, 14", 60 Hz | |
|---|---|---|---|---|---|---|
| Display | 65% | 58% | 62% | 22% | 57% | |
| Display P3 Coverage (%) | 42.75 | 72.2 69% | 67.7 58% | 70.1 64% | 51.5 20% | 66.9 56% |
| sRGB Coverage (%) | 61.77 | 99 60% | 98.3 59% | 99 60% | 77.4 25% | 98.5 59% |
| AdobeRGB 1998 Coverage (%) | 44.17 | 72.7 65% | 69.9 58% | 71.8 63% | 53.1 20% | 68.9 56% |
| Response Times | 26% | 10% | 8% | 30% | 28% | |
| Response Time Grey 50% / Grey 80% * (ms) | 53.2 ? | 35.9 ? 33% | 40.2 ? 24% | 42.1 ? 21% | 32.4 ? 39% | 31.1 ? 42% |
| Response Time Black / White * (ms) | 27.6 ? | 22.4 ? 19% | 29.1 ? -5% | 26.7 ? 3% | 21.9 ? 21% | 24.1 ? 13% |
| PWM Frequency (Hz) | 300 | 300 ? | ||||
| PWM Amplitude * (%) | 100 | 100 -0% | ||||
| Screen | 45% | 45% | 34% | 5% | 28% | |
| Brightness middle (cd/m²) | 1075 | 1183.9 10% | 554 -48% | 445.4 -59% | 943.7 -12% | 557 -48% |
| Brightness (cd/m²) | 1042 | 1140 9% | 516 -50% | 424 -59% | 870 -17% | 526 -50% |
| Brightness Distribution (%) | 92 | 88 -4% | 91 -1% | 91 -1% | 85 -8% | 84 -9% |
| Black Level * (cd/m²) | 1.05 | 0.74 30% | 0.24 77% | 0.23 78% | 0.85 19% | 0.4 62% |
| Contrast (:1) | 1024 | 1600 56% | 2308 125% | 1937 89% | 1110 8% | 1393 36% |
| Colorchecker dE 2000 * | 7.42 | 2.03 73% | 1.5 80% | 2.85 62% | 6.35 14% | 2.4 68% |
| Colorchecker dE 2000 max. * | 18.03 | 3.44 81% | 3.4 81% | 4.57 75% | 8.86 51% | 5.9 67% |
| Colorchecker dE 2000 calibrated * | 4.58 | 0.53 88% | 0.9 80% | 1.54 66% | 5.1 -11% | 0.7 85% |
| Greyscale dE 2000 * | 6.9 | 2.6 62% | 2.7 61% | 3.3 52% | 6.9 -0% | 4 42% |
| Gamma | 2.164 102% | 2.27 97% | 2.25 98% | 2.03 108% | 2.65 83% | 2.15 102% |
| CCT | 6722 97% | 6102 107% | 6882 94% | 6497 100% | 6956 93% | 7017 93% |
| Media total (Programa/Opciones) | 45% /
47% | 38% /
43% | 35% /
34% | 19% /
12% | 38% /
34% |
* ... más pequeño es mejor
Esta tableta no es adecuada para trabajos en los que el color sea un factor crítico. Con una cobertura de la gama de colores sRGB de apenas un 61 %, los colores se ven desvaídos. De fábrica, la pantalla presenta un notable matiz verdoso.
Tiempos de respuesta del display
| ↔ Tiempo de respuesta de Negro a Blanco | ||
|---|---|---|
| 27.6 ms ... subida ↗ y bajada ↘ combinada | ↗ 16 ms subida |   |
| ↘ 11.6 ms bajada | ||
| La pantalla mostró tiempos de respuesta relativamente lentos en nuestros tests pero podría ser demasiado lenta para los jugones. En comparación, todos los dispositivos de prueba van de ##min### (mínimo) a 240 (máximo) ms. » 70 % de todos los dispositivos son mejores. Eso quiere decir que el tiempo de respuesta es peor que la media (19.8 ms) de todos los dispositivos testados. | ||
| ↔ Tiempo de respuesta 50% Gris a 80% Gris | ||
| 53.2 ms ... subida ↗ y bajada ↘ combinada | ↗ 20 ms subida |   |
| ↘ 33.2 ms bajada | ||
| La pantalla mostró tiempos de respuesta lentos en nuestros tests y podría ser demasiado lenta para los jugones. En comparación, todos los dispositivos de prueba van de ##min### (mínimo) a 636 (máximo) ms. » 90 % de todos los dispositivos son mejores. Eso quiere decir que el tiempo de respuesta es peor que la media (31 ms) de todos los dispositivos testados. | ||
Parpadeo de Pantalla / PWM (Pulse-Width Modulation)
| Parpadeo de Pantalla / PWM detectado | 300 Hz Amplitude: 100 % |  | |
La retroiluminación del display parpadea a 300 Hz (seguramente usa PWM - Pulse-Width Modulation) . La frecuencia de 300 Hz es relativamente alta, por lo que la mayoría de gente no debería ver parpadeo o tener fatiga visual. Sin embargo, hay informes de que algunas personas pueden seguir viendo parpadeos a 500 Hz y superior, por lo que cuidado. Comparación: 52 % de todos los dispositivos testados no usaron PWM para atenuar el display. Si se usó, medimos una media de 7781 (mínimo: 5 - máxmo: 343500) Hz. | |||


Uso en exteriores
Análisis de perspectivas
Rendimiento
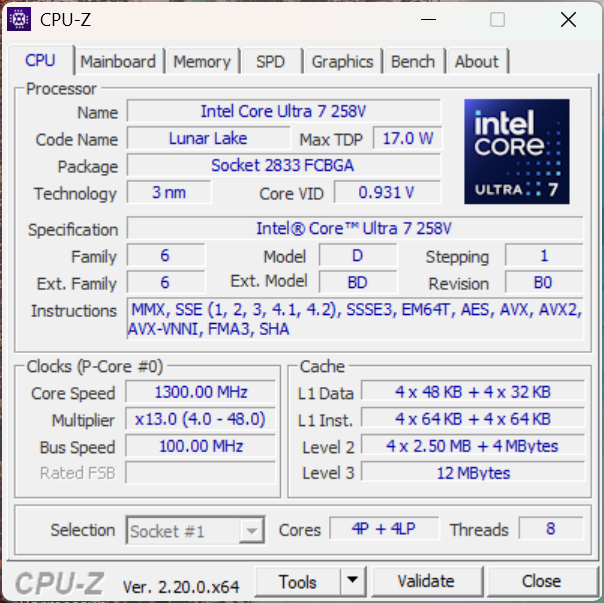
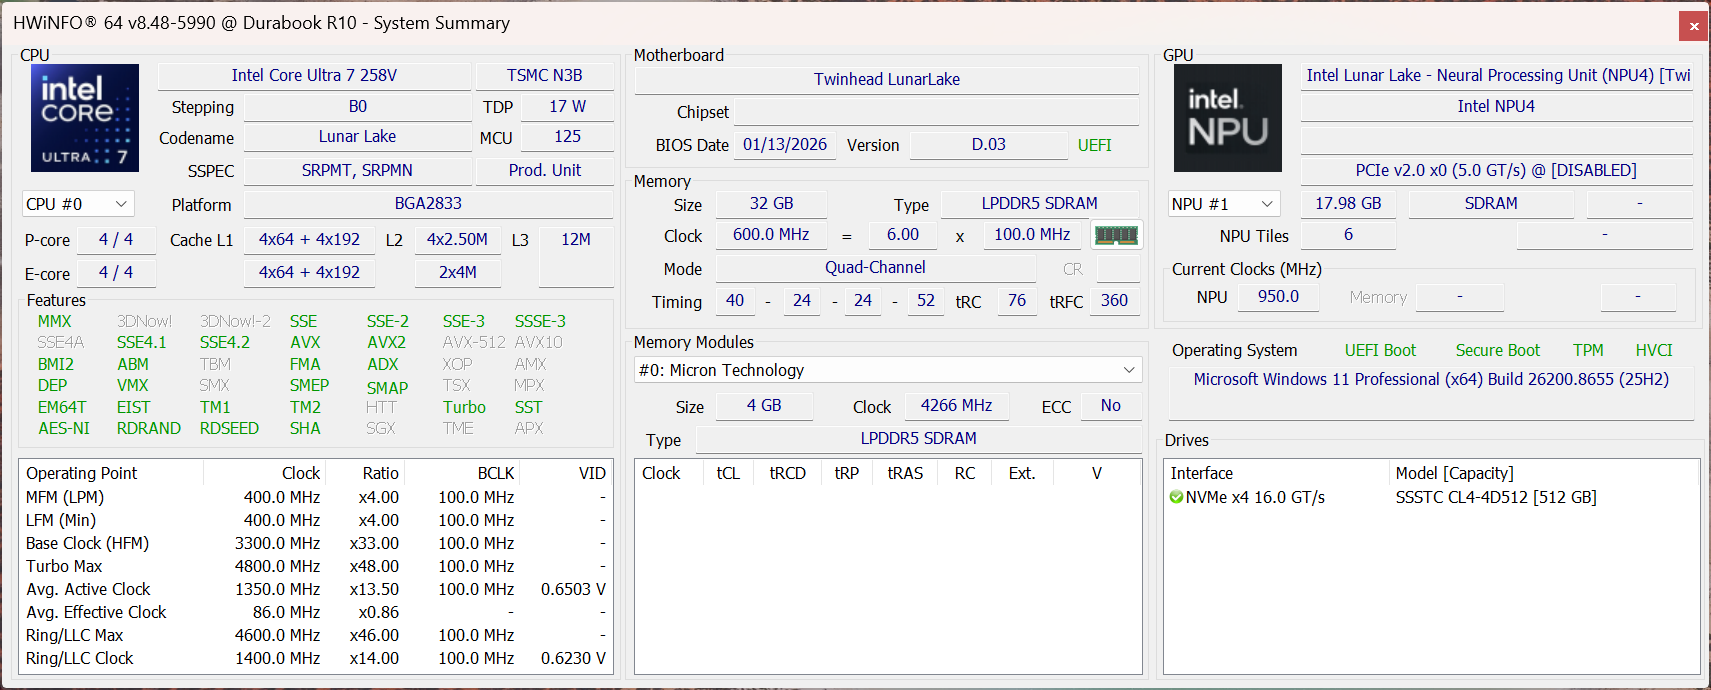
Bajo su resistente carcasa, un procesador Intel Core Ultra de última generación funciona sin descanso. En el caso del R10, se pueden configurar casi todos los procesadores Core Ultra 5 y Core Ultra 7 de la generación Lunar Lake. Dependiendo de la clase de procesador, hay disponibles versiones vPro Enterprise.
Rendimiento del procesador
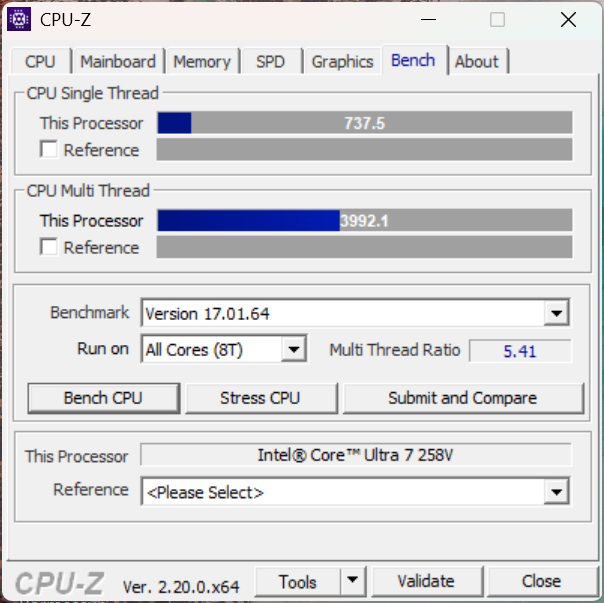
El modelo 258V de la unidad de prueba cuenta con ocho núcleos sin multithreading. Durante breves picos de carga, el sistema admite hasta 32 vatios antes de que el consumo energético se reduzca de forma permanente a unos 17 vatios. Como resultado, el rendimiento del Core Ultra 7 se mantiene por debajo de la media en nuestra comparativa. En este caso, no existe ninguna función de gestión de energía con valores de TDP ajustables.
Prueba de resistencia multinúcleo de Cinebench R15
Cinebench R23: Multi Core | Single Core
Cinebench R20: CPU (Multi Core) | CPU (Single Core)
Cinebench R15: CPU Multi 64Bit | CPU Single 64Bit
Blender: v2.79 BMW27 CPU
7-Zip 18.03: 7z b 4 | 7z b 4 -mmt1
Geekbench 6.7: Multi-Core | Single-Core
Geekbench 5.5: Multi-Core | Single-Core
HWBOT x265 Benchmark v2.2: 4k Preset
LibreOffice : 20 Documents To PDF
R Benchmark 2.5: Overall mean
| CPU Performance rating | |
| Lenovo ThinkPad T14 Gen 6 AMD | |
| Lenovo ThinkPad T14 Gen 6 21QG001VGE | |
| Medio Intel Core Ultra 7 258V | |
| Dynabook Portege Z40L-N | |
| Durabook R10 | |
| Dell Latitude 7030 Rugged Extreme | |
| Media de la clase Tablet | |
| Durabook R8 Tablet -2! | |
| Cinebench R23 / Multi Core | |
| Lenovo ThinkPad T14 Gen 6 AMD | |
| Lenovo ThinkPad T14 Gen 6 21QG001VGE | |
| Medio Intel Core Ultra 7 258V (7920 - 11097, n=25) | |
| Media de la clase Tablet (8043 - 10868, n=3, últimos 2 años) | |
| Dell Latitude 7030 Rugged Extreme | |
| Durabook R10 | |
| Durabook R10 | |
| Dynabook Portege Z40L-N | |
| Durabook R8 Tablet | |
| Cinebench R23 / Single Core | |
| Lenovo ThinkPad T14 Gen 6 AMD | |
| Lenovo ThinkPad T14 Gen 6 21QG001VGE | |
| Durabook R10 | |
| Durabook R10 | |
| Media de la clase Tablet (1822 - 1921, n=3, últimos 2 años) | |
| Medio Intel Core Ultra 7 258V (1664 - 1957, n=25) | |
| Dynabook Portege Z40L-N | |
| Dell Latitude 7030 Rugged Extreme | |
| Durabook R8 Tablet | |
| Cinebench R20 / CPU (Multi Core) | |
| Lenovo ThinkPad T14 Gen 6 AMD | |
| Lenovo ThinkPad T14 Gen 6 21QG001VGE | |
| Medio Intel Core Ultra 7 258V (3130 - 4314, n=24) | |
| Media de la clase Tablet (3137 - 4255, n=2, últimos 2 años) | |
| Dell Latitude 7030 Rugged Extreme | |
| Durabook R10 | |
| Dynabook Portege Z40L-N | |
| Durabook R8 Tablet | |
| Cinebench R20 / CPU (Single Core) | |
| Lenovo ThinkPad T14 Gen 6 AMD | |
| Lenovo ThinkPad T14 Gen 6 21QG001VGE | |
| Media de la clase Tablet (705 - 739, n=2, últimos 2 años) | |
| Dynabook Portege Z40L-N | |
| Medio Intel Core Ultra 7 258V (643 - 749, n=24) | |
| Durabook R10 | |
| Dell Latitude 7030 Rugged Extreme | |
| Durabook R8 Tablet | |
| Cinebench R15 / CPU Multi 64Bit | |
| Lenovo ThinkPad T14 Gen 6 AMD | |
| Lenovo ThinkPad T14 Gen 6 21QG001VGE | |
| Medio Intel Core Ultra 7 258V (1280 - 1656, n=24) | |
| Media de la clase Tablet (1285 - 1651, n=2, últimos 2 años) | |
| Dell Latitude 7030 Rugged Extreme | |
| Durabook R10 | |
| Dynabook Portege Z40L-N | |
| Durabook R8 Tablet | |
| Cinebench R15 / CPU Single 64Bit | |
| Media de la clase Tablet (274 - 299, n=2, últimos 2 años) | |
| Lenovo ThinkPad T14 Gen 6 21QG001VGE | |
| Medio Intel Core Ultra 7 258V (258 - 298, n=24) | |
| Dynabook Portege Z40L-N | |
| Durabook R10 | |
| Dell Latitude 7030 Rugged Extreme | |
| Lenovo ThinkPad T14 Gen 6 AMD | |
| Durabook R8 Tablet | |
| Blender / v2.79 BMW27 CPU | |
| Durabook R8 Tablet | |
| Durabook R10 | |
| Dynabook Portege Z40L-N | |
| Media de la clase Tablet (337 - 484, n=2, últimos 2 años) | |
| Dell Latitude 7030 Rugged Extreme | |
| Medio Intel Core Ultra 7 258V (315 - 484, n=24) | |
| Lenovo ThinkPad T14 Gen 6 21QG001VGE | |
| Lenovo ThinkPad T14 Gen 6 AMD | |
| 7-Zip 18.03 / 7z b 4 | |
| Lenovo ThinkPad T14 Gen 6 AMD | |
| Lenovo ThinkPad T14 Gen 6 21QG001VGE | |
| Dell Latitude 7030 Rugged Extreme | |
| Medio Intel Core Ultra 7 258V (24486 - 36724, n=24) | |
| Media de la clase Tablet (24486 - 36610, n=2, últimos 2 años) | |
| Dynabook Portege Z40L-N | |
| Durabook R10 | |
| Durabook R8 Tablet | |
| 7-Zip 18.03 / 7z b 4 -mmt1 | |
| Lenovo ThinkPad T14 Gen 6 AMD | |
| Lenovo ThinkPad T14 Gen 6 21QG001VGE | |
| Dynabook Portege Z40L-N | |
| Medio Intel Core Ultra 7 258V (4769 - 5869, n=24) | |
| Media de la clase Tablet (4769 - 5991, n=2, últimos 2 años) | |
| Dell Latitude 7030 Rugged Extreme | |
| Durabook R10 | |
| Durabook R8 Tablet | |
| Geekbench 6.7 / Multi-Core | |
| Lenovo ThinkPad T14 Gen 6 AMD | |
| Lenovo ThinkPad T14 Gen 6 21QG001VGE | |
| Medio Intel Core Ultra 7 258V (8964 - 11334, n=24) | |
| Dynabook Portege Z40L-N | |
| Durabook R10 | |
| Dell Latitude 7030 Rugged Extreme | |
| Media de la clase Tablet (1104 - 16544, n=86, últimos 2 años) | |
| Geekbench 6.7 / Single-Core | |
| Lenovo ThinkPad T14 Gen 6 AMD | |
| Lenovo ThinkPad T14 Gen 6 21QG001VGE | |
| Dynabook Portege Z40L-N | |
| Medio Intel Core Ultra 7 258V (2593 - 2795, n=24) | |
| Durabook R10 | |
| Dell Latitude 7030 Rugged Extreme | |
| Media de la clase Tablet (323 - 4128, n=86, últimos 2 años) | |
| Geekbench 5.5 / Multi-Core | |
| Lenovo ThinkPad T14 Gen 6 AMD | |
| Lenovo ThinkPad T14 Gen 6 21QG001VGE | |
| Medio Intel Core Ultra 7 258V (7574 - 9918, n=24) | |
| Dynabook Portege Z40L-N | |
| Durabook R10 | |
| Dell Latitude 7030 Rugged Extreme | |
| Media de la clase Tablet (303 - 10522, n=39, últimos 2 años) | |
| Durabook R8 Tablet | |
| Geekbench 5.5 / Single-Core | |
| Lenovo ThinkPad T14 Gen 6 AMD | |
| Lenovo ThinkPad T14 Gen 6 21QG001VGE | |
| Dynabook Portege Z40L-N | |
| Medio Intel Core Ultra 7 258V (1891 - 2046, n=24) | |
| Durabook R10 | |
| Dell Latitude 7030 Rugged Extreme | |
| Durabook R8 Tablet | |
| Media de la clase Tablet (103 - 2286, n=39, últimos 2 años) | |
| HWBOT x265 Benchmark v2.2 / 4k Preset | |
| Lenovo ThinkPad T14 Gen 6 AMD | |
| Lenovo ThinkPad T14 Gen 6 21QG001VGE | |
| Medio Intel Core Ultra 7 258V (7.11 - 14.2, n=24) | |
| Media de la clase Tablet (7.11 - 12.9, n=2, últimos 2 años) | |
| Dynabook Portege Z40L-N | |
| Dell Latitude 7030 Rugged Extreme | |
| Durabook R10 | |
| Durabook R8 Tablet | |
| LibreOffice / 20 Documents To PDF | |
| Durabook R10 | |
| Durabook R8 Tablet | |
| Media de la clase Tablet (48.3 - 62.8, n=2, últimos 2 años) | |
| Lenovo ThinkPad T14 Gen 6 AMD | |
| Medio Intel Core Ultra 7 258V (41.1 - 62.8, n=24) | |
| Lenovo ThinkPad T14 Gen 6 21QG001VGE | |
| Dell Latitude 7030 Rugged Extreme | |
| Dynabook Portege Z40L-N | |
| R Benchmark 2.5 / Overall mean | |
| Durabook R8 Tablet | |
| Durabook R10 | |
| Dell Latitude 7030 Rugged Extreme | |
| Media de la clase Tablet (0.4361 - 0.542, n=2, últimos 2 años) | |
| Dynabook Portege Z40L-N | |
| Medio Intel Core Ultra 7 258V (0.443 - 0.542, n=24) | |
| Lenovo ThinkPad T14 Gen 6 21QG001VGE | |
| Lenovo ThinkPad T14 Gen 6 AMD | |
* ... más pequeño es mejor
AIDA64: FP32 Ray-Trace | FPU Julia | CPU SHA3 | FPU SinJulia | FPU Mandel | CPU AES | CPU ZLib | FP64 Ray-Trace | CPU PhotoWorxx | CPU CheckMate
| Performance rating | |
| Lenovo ThinkPad T14 Gen 6 AMD | |
| Lenovo ThinkPad T14 Gen 6 21QG001VGE -1! | |
| Medio Intel Core Ultra 7 258V | |
| Media de la clase Tablet | |
| Durabook R10 | |
| Dynabook Portege Z40L-N -1! | |
| Dell Latitude 7030 Rugged Extreme -1! | |
| Durabook R8 Tablet -1! | |
| AIDA64 / FP32 Ray-Trace | |
| Lenovo ThinkPad T14 Gen 6 AMD (v8.20.8100) | |
| Lenovo ThinkPad T14 Gen 6 AMD (v6.92.6600) | |
| Lenovo ThinkPad T14 Gen 6 21QG001VGE (v6.92.6600) | |
| Medio Intel Core Ultra 7 258V (8454 - 12781, n=26) | |
| Media de la clase Tablet (8485 - 12759, n=2, últimos 2 años) | |
| Dynabook Portege Z40L-N (v6.92.6600) | |
| Durabook R10 (v8.20.8100) | |
| Dell Latitude 7030 Rugged Extreme (v6.92.6600) | |
| Durabook R8 Tablet (v6.85.6300) | |
| AIDA64 / FPU Julia | |
| Lenovo ThinkPad T14 Gen 6 AMD (v8.20.8100) | |
| Lenovo ThinkPad T14 Gen 6 AMD (v6.92.6600) | |
| Lenovo ThinkPad T14 Gen 6 21QG001VGE (v6.92.6600) | |
| Medio Intel Core Ultra 7 258V (40875 - 63401, n=26) | |
| Media de la clase Tablet (42586 - 62102, n=2, últimos 2 años) | |
| Dynabook Portege Z40L-N (v6.92.6600) | |
| Durabook R10 (v8.20.8100) | |
| Dell Latitude 7030 Rugged Extreme (v6.92.6600) | |
| Durabook R8 Tablet (v6.85.6300) | |
| AIDA64 / CPU SHA3 | |
| Lenovo ThinkPad T14 Gen 6 AMD (v6.92.6600) | |
| Lenovo ThinkPad T14 Gen 6 AMD (v8.20.8100) | |
| Lenovo ThinkPad T14 Gen 6 21QG001VGE (v6.92.6600) | |
| Medio Intel Core Ultra 7 258V (1930 - 2817, n=26) | |
| Media de la clase Tablet (2056 - 2784, n=2, últimos 2 años) | |
| Durabook R10 (v8.20.8100) | |
| Dynabook Portege Z40L-N (v6.92.6600) | |
| Dell Latitude 7030 Rugged Extreme (v6.92.6600) | |
| Durabook R8 Tablet (v6.85.6300) | |
| AIDA64 / FPU SinJulia | |
| Lenovo ThinkPad T14 Gen 6 AMD (v8.20.8100) | |
| Lenovo ThinkPad T14 Gen 6 AMD (v6.92.6600) | |
| Lenovo ThinkPad T14 Gen 6 21QG001VGE (v6.92.6600) | |
| Medio Intel Core Ultra 7 258V (3817 - 4440, n=26) | |
| Media de la clase Tablet (4083 - 4429, n=2, últimos 2 años) | |
| Dell Latitude 7030 Rugged Extreme (v6.92.6600) | |
| Durabook R10 (v8.20.8100) | |
| Dynabook Portege Z40L-N (v6.92.6600) | |
| Durabook R8 Tablet (v6.85.6300) | |
| AIDA64 / FPU Mandel | |
| Lenovo ThinkPad T14 Gen 6 AMD (v8.20.8100) | |
| Lenovo ThinkPad T14 Gen 6 AMD (v6.92.6600) | |
| Lenovo ThinkPad T14 Gen 6 21QG001VGE (v6.92.6600) | |
| Medio Intel Core Ultra 7 258V (21670 - 33565, n=26) | |
| Media de la clase Tablet (22775 - 31836, n=2, últimos 2 años) | |
| Dynabook Portege Z40L-N (v6.92.6600) | |
| Durabook R10 (v8.20.8100) | |
| Dell Latitude 7030 Rugged Extreme (v6.92.6600) | |
| Durabook R8 Tablet (v6.85.6300) | |
| AIDA64 / CPU AES | |
| Lenovo ThinkPad T14 Gen 6 AMD (v6.92.6600) | |
| Lenovo ThinkPad T14 Gen 6 AMD (v8.20.8100) | |
| Lenovo ThinkPad T14 Gen 6 21QG001VGE (v6.92.6600) | |
| Medio Intel Core Ultra 7 258V (30957 - 40753, n=26) | |
| Media de la clase Tablet (34551 - 38941, n=2, últimos 2 años) | |
| Dell Latitude 7030 Rugged Extreme (v6.92.6600) | |
| Durabook R10 (v8.20.8100) | |
| Dynabook Portege Z40L-N (v6.92.6600) | |
| Durabook R8 Tablet (v6.85.6300) | |
| AIDA64 / CPU ZLib | |
| Lenovo ThinkPad T14 Gen 6 AMD (v6.92.6600) | |
| Lenovo ThinkPad T14 Gen 6 AMD (v8.20.8100) | |
| Lenovo ThinkPad T14 Gen 6 21QG001VGE (v6.92.6600) | |
| Dell Latitude 7030 Rugged Extreme (v6.92.6600) | |
| Medio Intel Core Ultra 7 258V (422 - 632, n=26) | |
| Media de la clase Tablet (434 - 631, n=2, últimos 2 años) | |
| Dynabook Portege Z40L-N (v6.92.6600) | |
| Durabook R10 (v8.20.8100) | |
| Durabook R8 Tablet (v6.85.6300) | |
| AIDA64 / FP64 Ray-Trace | |
| Lenovo ThinkPad T14 Gen 6 AMD (v6.92.6600) | |
| Lenovo ThinkPad T14 Gen 6 AMD (v8.20.8100) | |
| Lenovo ThinkPad T14 Gen 6 21QG001VGE (v6.92.6600) | |
| Medio Intel Core Ultra 7 258V (4258 - 6930, n=26) | |
| Media de la clase Tablet (4660 - 6803, n=2, últimos 2 años) | |
| Dynabook Portege Z40L-N (v6.92.6600) | |
| Durabook R10 (v8.20.8100) | |
| Dell Latitude 7030 Rugged Extreme (v6.92.6600) | |
| Durabook R8 Tablet (v6.85.6300) | |
| AIDA64 / CPU PhotoWorxx | |
| Lenovo ThinkPad T14 Gen 6 21QG001VGE (v6.92.6600) | |
| Media de la clase Tablet (52755 - 54886, n=2, últimos 2 años) | |
| Medio Intel Core Ultra 7 258V (44223 - 59245, n=26) | |
| Durabook R10 (v8.20.8100) | |
| Dynabook Portege Z40L-N (v6.92.6600) | |
| Dell Latitude 7030 Rugged Extreme (v6.92.6600) | |
| Lenovo ThinkPad T14 Gen 6 AMD (v8.20.8100) | |
| Lenovo ThinkPad T14 Gen 6 AMD (v6.92.6600) | |
| Durabook R8 Tablet (v6.85.6300) | |
| AIDA64 / CPU CheckMate | |
| Lenovo ThinkPad T14 Gen 6 AMD (v8.20.8100) | |
| Medio Intel Core Ultra 7 258V (2014 - 2513, n=2) | |
| Durabook R10 (v8.20.8100) | |
| Media de la clase Tablet (n=1últimos 2 años) | |
Rendimiento del sistema y del almacenamiento
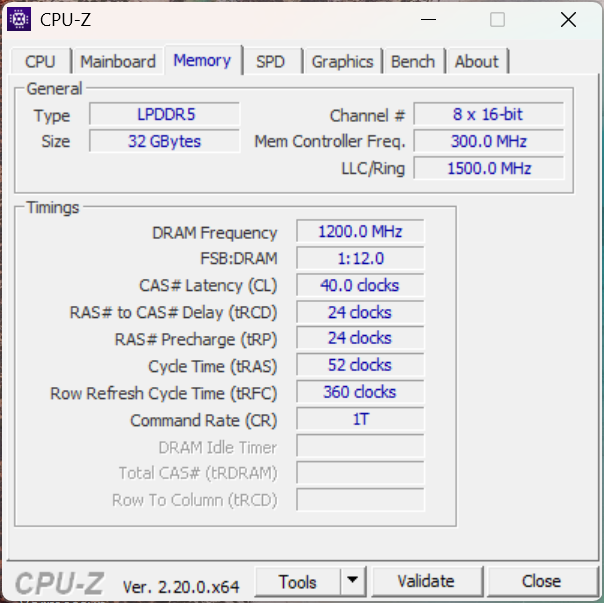
En el uso diario, la plataforma garantiza un funcionamiento fluido para las tareas de Office. Sin embargo, si se analizan los resultados de las pruebas de rendimiento, el rendimiento de la tableta se sitúa, en general, por debajo de la media de Lunar Lake. Solo en cuanto a la velocidad de almacenamiento destaca la tableta, ofreciendo el elevado rendimiento característico de Lunar Lake.
PCMark 10: Score | Essentials | Productivity | Digital Content Creation
CrossMark: Overall | Productivity | Creativity | Responsiveness
WebXPRT 3: Overall
WebXPRT 4: Overall
Mozilla Kraken 1.1: Total
| Performance rating | |
| Lenovo ThinkPad T14 Gen 6 AMD | |
| Lenovo ThinkPad T14 Gen 6 21QG001VGE | |
| Medio Intel Core Ultra 7 258V, Intel Arc Graphics 140V | |
| Dynabook Portege Z40L-N | |
| Durabook R10 | |
| Dell Latitude 7030 Rugged Extreme | |
| Media de la clase Tablet | |
| Durabook R8 Tablet | |
| PCMark 10 / Score | |
| Durabook R10 | |
| Lenovo ThinkPad T14 Gen 6 21QG001VGE | |
| Media de la clase Tablet (6924 - 7420, n=2, últimos 2 años) | |
| Lenovo ThinkPad T14 Gen 6 AMD | |
| Medio Intel Core Ultra 7 258V, Intel Arc Graphics 140V (6265 - 7420, n=23) | |
| Dynabook Portege Z40L-N | |
| Dell Latitude 7030 Rugged Extreme | |
| Durabook R8 Tablet | |
| PCMark 10 / Essentials | |
| Lenovo ThinkPad T14 Gen 6 AMD | |
| Lenovo ThinkPad T14 Gen 6 21QG001VGE | |
| Medio Intel Core Ultra 7 258V, Intel Arc Graphics 140V (9295 - 11467, n=23) | |
| Dynabook Portege Z40L-N | |
| Media de la clase Tablet (9991 - 10351, n=2, últimos 2 años) | |
| Durabook R10 | |
| Dell Latitude 7030 Rugged Extreme | |
| Durabook R8 Tablet | |
| PCMark 10 / Productivity | |
| Durabook R10 | |
| Media de la clase Tablet (8823 - 13600, n=2, últimos 2 años) | |
| Lenovo ThinkPad T14 Gen 6 AMD | |
| Dynabook Portege Z40L-N | |
| Lenovo ThinkPad T14 Gen 6 21QG001VGE | |
| Medio Intel Core Ultra 7 258V, Intel Arc Graphics 140V (7357 - 13600, n=23) | |
| Dell Latitude 7030 Rugged Extreme | |
| Durabook R8 Tablet | |
| PCMark 10 / Digital Content Creation | |
| Lenovo ThinkPad T14 Gen 6 21QG001VGE | |
| Medio Intel Core Ultra 7 258V, Intel Arc Graphics 140V (8160 - 10308, n=23) | |
| Media de la clase Tablet (8160 - 9863, n=2, últimos 2 años) | |
| Dynabook Portege Z40L-N | |
| Lenovo ThinkPad T14 Gen 6 AMD | |
| Durabook R10 | |
| Dell Latitude 7030 Rugged Extreme | |
| Durabook R8 Tablet | |
| CrossMark / Overall | |
| Lenovo ThinkPad T14 Gen 6 AMD | |
| Lenovo ThinkPad T14 Gen 6 21QG001VGE | |
| Medio Intel Core Ultra 7 258V, Intel Arc Graphics 140V (1275 - 1742, n=22) | |
| Dynabook Portege Z40L-N | |
| Dell Latitude 7030 Rugged Extreme | |
| Durabook R10 | |
| Durabook R8 Tablet | |
| Media de la clase Tablet (319 - 2375, n=46, últimos 2 años) | |
| CrossMark / Productivity | |
| Lenovo ThinkPad T14 Gen 6 AMD | |
| Lenovo ThinkPad T14 Gen 6 21QG001VGE | |
| Medio Intel Core Ultra 7 258V, Intel Arc Graphics 140V (1267 - 1684, n=22) | |
| Dynabook Portege Z40L-N | |
| Dell Latitude 7030 Rugged Extreme | |
| Durabook R10 | |
| Durabook R8 Tablet | |
| Media de la clase Tablet (346 - 2036, n=44, últimos 2 años) | |
| CrossMark / Creativity | |
| Lenovo ThinkPad T14 Gen 6 AMD | |
| Lenovo ThinkPad T14 Gen 6 21QG001VGE | |
| Medio Intel Core Ultra 7 258V, Intel Arc Graphics 140V (1393 - 1977, n=22) | |
| Dynabook Portege Z40L-N | |
| Dell Latitude 7030 Rugged Extreme | |
| Durabook R10 | |
| Durabook R8 Tablet | |
| Media de la clase Tablet (288 - 2620, n=44, últimos 2 años) | |
| CrossMark / Responsiveness | |
| Media de la clase Tablet (333 - 12671, n=44, últimos 2 años) | |
| Lenovo ThinkPad T14 Gen 6 AMD | |
| Lenovo ThinkPad T14 Gen 6 21QG001VGE | |
| Medio Intel Core Ultra 7 258V, Intel Arc Graphics 140V (999 - 1411, n=22) | |
| Dynabook Portege Z40L-N | |
| Dell Latitude 7030 Rugged Extreme | |
| Durabook R10 | |
| Durabook R8 Tablet | |
| WebXPRT 3 / Overall | |
| Lenovo ThinkPad T14 Gen 6 AMD | |
| Dynabook Portege Z40L-N | |
| Lenovo ThinkPad T14 Gen 6 21QG001VGE | |
| Medio Intel Core Ultra 7 258V, Intel Arc Graphics 140V (219 - 317, n=22) | |
| Durabook R10 | |
| Dell Latitude 7030 Rugged Extreme | |
| Media de la clase Tablet (108 - 480, n=10, últimos 2 años) | |
| Durabook R8 Tablet | |
| WebXPRT 4 / Overall | |
| Dynabook Portege Z40L-N | |
| Lenovo ThinkPad T14 Gen 6 21QG001VGE | |
| Lenovo ThinkPad T14 Gen 6 AMD | |
| Medio Intel Core Ultra 7 258V, Intel Arc Graphics 140V (199.5 - 291, n=22) | |
| Durabook R10 | |
| Dell Latitude 7030 Rugged Extreme | |
| Durabook R8 Tablet | |
| Media de la clase Tablet (39 - 376, n=56, últimos 2 años) | |
| Mozilla Kraken 1.1 / Total | |
| Media de la clase Tablet (243 - 27101, n=66, últimos 2 años) | |
| Durabook R8 Tablet | |
| Dell Latitude 7030 Rugged Extreme | |
| Durabook R10 | |
| Medio Intel Core Ultra 7 258V, Intel Arc Graphics 140V (468 - 559, n=24) | |
| Lenovo ThinkPad T14 Gen 6 21QG001VGE | |
| Dynabook Portege Z40L-N | |
| Lenovo ThinkPad T14 Gen 6 AMD | |
* ... más pequeño es mejor
| PCMark 10 Score | 7420 puntos | |
ayuda | ||
| AIDA64 / Memory Copy | |
| Durabook R10 | |
| Lenovo ThinkPad T14 Gen 6 21QG001VGE | |
| Media de la clase Tablet (108317 - 110050, n=2, últimos 2 años) | |
| Medio Intel Core Ultra 7 258V (104408 - 114336, n=24) | |
| Dynabook Portege Z40L-N | |
| Dell Latitude 7030 Rugged Extreme | |
| Lenovo ThinkPad T14 Gen 6 AMD | |
| Lenovo ThinkPad T14 Gen 6 AMD | |
| Durabook R8 Tablet | |
| AIDA64 / Memory Read | |
| Lenovo ThinkPad T14 Gen 6 21QG001VGE | |
| Medio Intel Core Ultra 7 258V (82846 - 89417, n=24) | |
| Dynabook Portege Z40L-N | |
| Media de la clase Tablet (85395 - 87747, n=2, últimos 2 años) | |
| Durabook R10 | |
| Dell Latitude 7030 Rugged Extreme | |
| Lenovo ThinkPad T14 Gen 6 AMD | |
| Lenovo ThinkPad T14 Gen 6 AMD | |
| Durabook R8 Tablet | |
| AIDA64 / Memory Write | |
| Lenovo ThinkPad T14 Gen 6 21QG001VGE | |
| Medio Intel Core Ultra 7 258V (108824 - 117989, n=24) | |
| Media de la clase Tablet (108824 - 117859, n=2, últimos 2 años) | |
| Dynabook Portege Z40L-N | |
| Durabook R10 | |
| Dell Latitude 7030 Rugged Extreme | |
| Lenovo ThinkPad T14 Gen 6 AMD | |
| Lenovo ThinkPad T14 Gen 6 AMD | |
| Durabook R8 Tablet | |
| AIDA64 / Memory Latency | |
| Dell Latitude 7030 Rugged Extreme | |
| Lenovo ThinkPad T14 Gen 6 AMD | |
| Lenovo ThinkPad T14 Gen 6 AMD | |
| Durabook R8 Tablet | |
| Durabook R10 | |
| Dynabook Portege Z40L-N | |
| Lenovo ThinkPad T14 Gen 6 21QG001VGE | |
| Media de la clase Tablet (94.4 - 101.7, n=2, últimos 2 años) | |
| Medio Intel Core Ultra 7 258V (95 - 101.7, n=24) | |
* ... más pequeño es mejor
Latencias del DPC
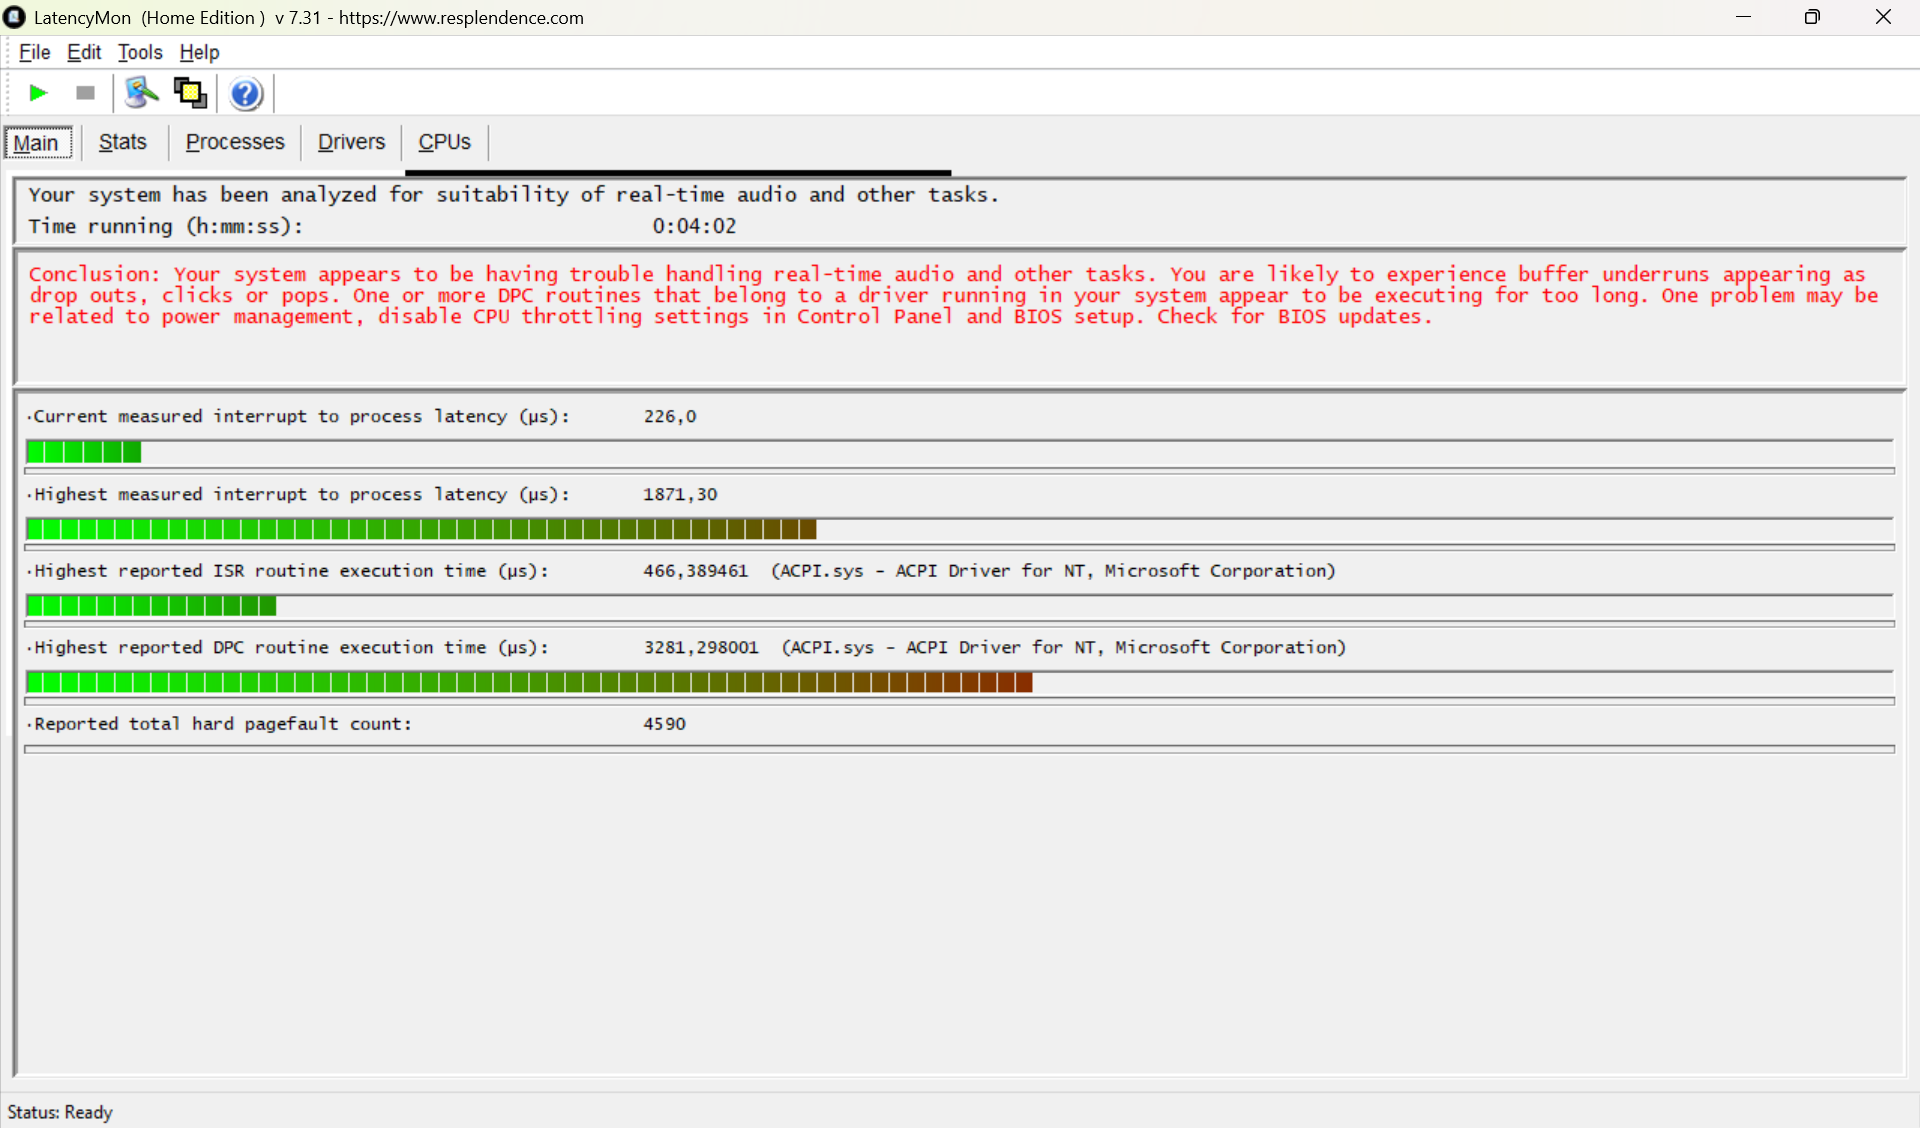
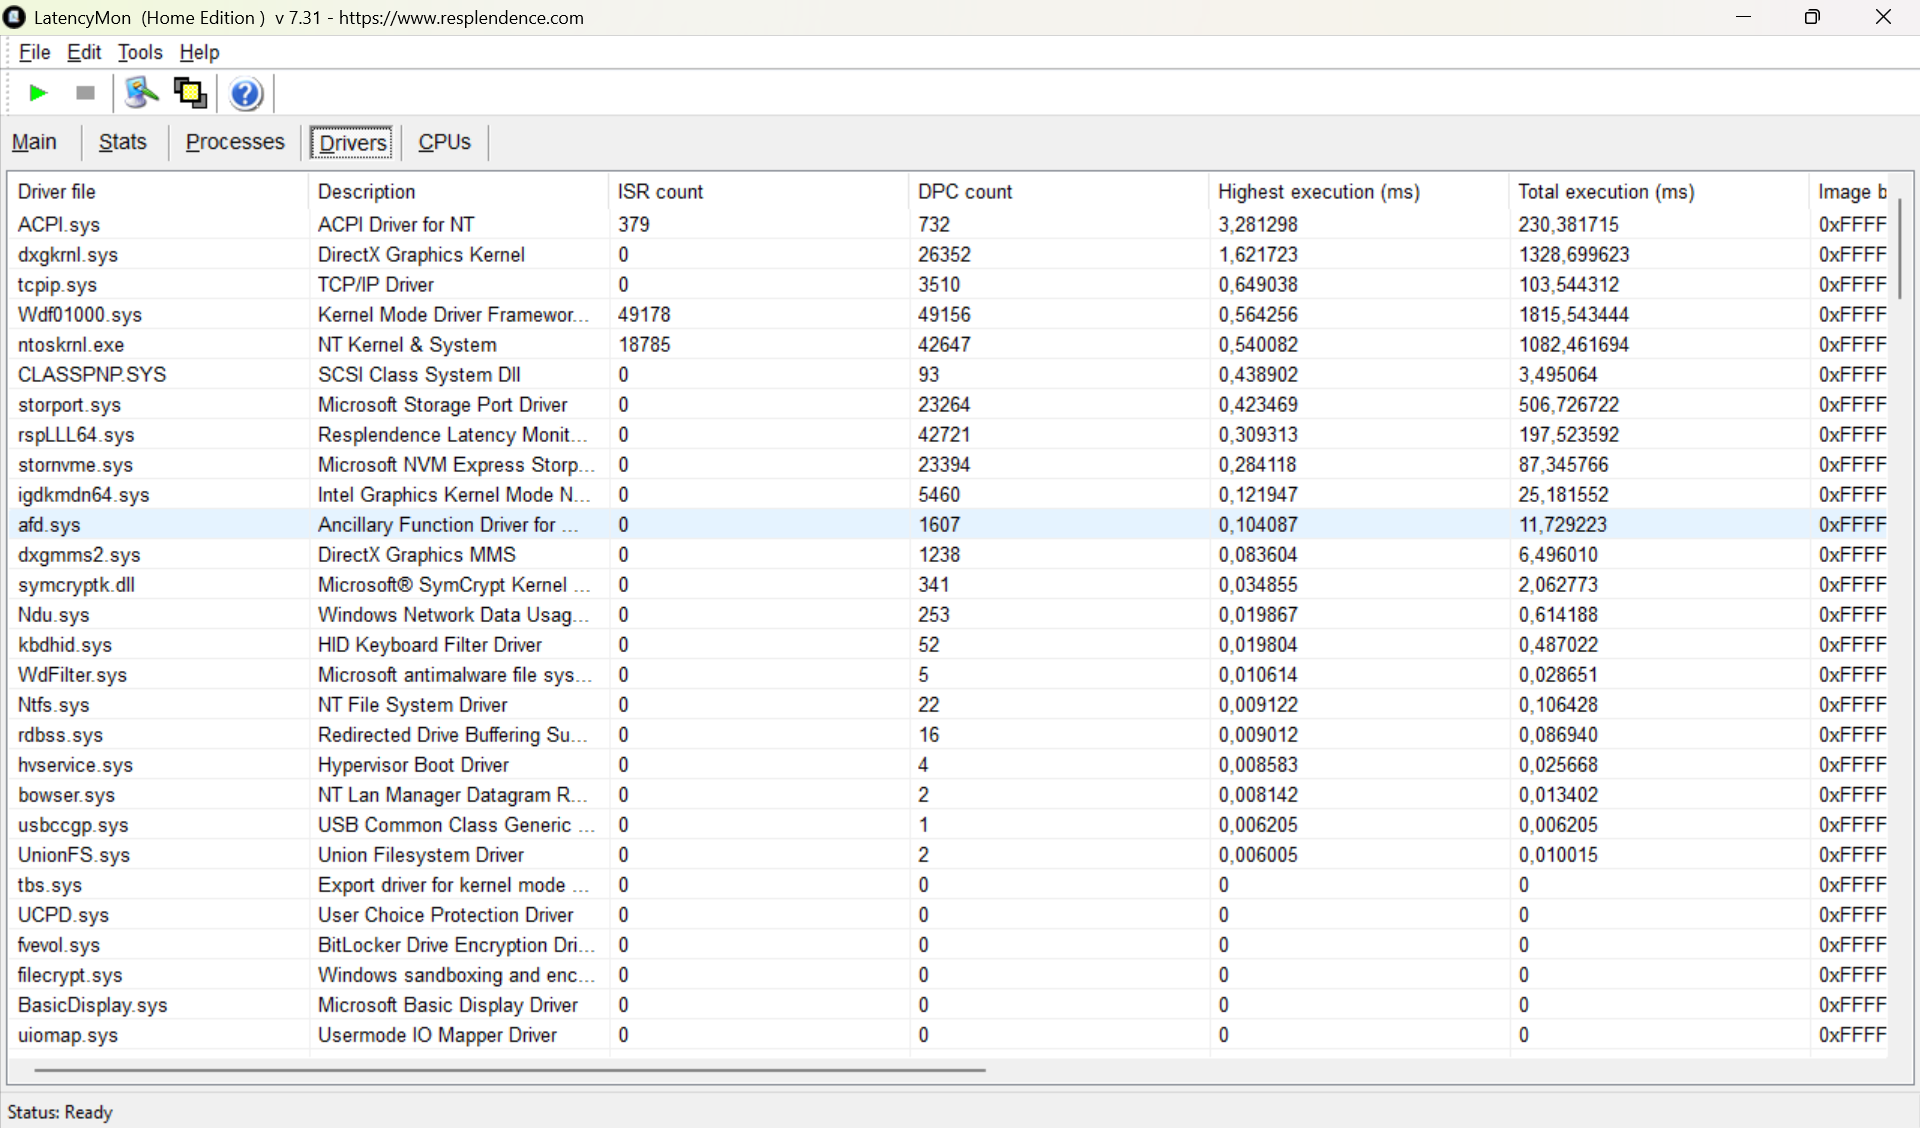
La herramienta de análisis LatencyMon muestra que el controlador ACPI provoca retrasos de hasta 3.281 microsegundos en la tableta. Esto puede dar lugar a fallos durante tareas en las que el tiempo es un factor crítico, como la edición de audio o la adquisición de datos a alta frecuencia.
| DPC Latencies / LatencyMon - interrupt to process latency (max), Web, Youtube, Prime95 | |
| Durabook R10 | |
| Dell Latitude 7030 Rugged Extreme | |
| Durabook R8 Tablet | |
| Lenovo ThinkPad T14 Gen 6 21QG001VGE | |
| Dynabook Portege Z40L-N | |
| Media de la clase Tablet (482 - 1871, n=2, últimos 2 años) | |
* ... más pequeño es mejor
Almacenamiento masivo

* ... más pequeño es mejor
Rendimiento de lectura sostenido: bucle de lectura de DiskSpd, profundidad de cola 8
Rendimiento de la GPU y en juegos
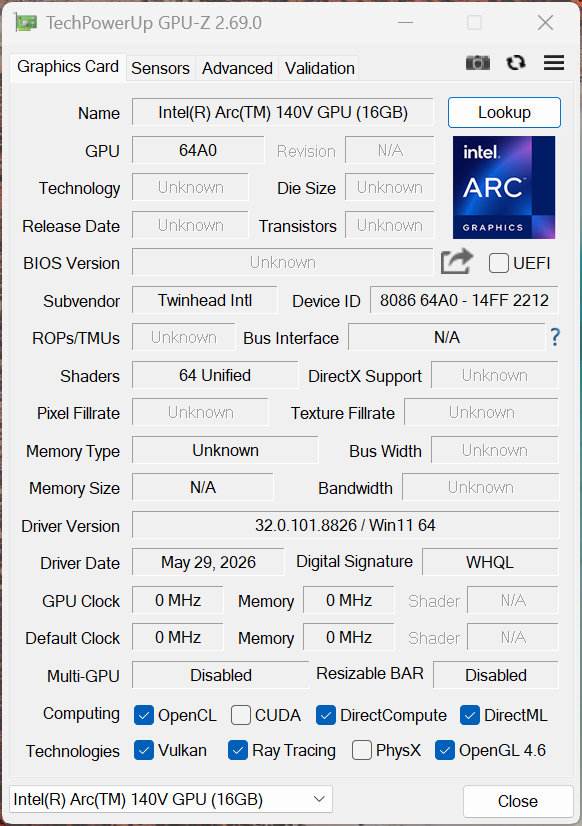
El procesamiento gráfico corre a cargo de la tarjeta Intel Arc Graphics 140V, que está integrada en el procesador. Esta tarjeta gestiona con facilidad vídeos de alta resolución, tareas 3D sencillas y configuraciones con varios monitores. Sin embargo, los archivos CAD de gran tamaño o las aplicaciones con grandes exigencias gráficas pueden suponer un reto para la tarjeta gráfica de Intel.
| 3DMark 11 Performance | 9563 puntos | |
| 3DMark Ice Storm Standard Score | 178031 puntos | |
| 3DMark Cloud Gate Standard Score | 26729 puntos | |
| 3DMark Fire Strike Score | 7287 puntos | |
| 3DMark Time Spy Score | 3373 puntos | |
| 3DMark Steel Nomad Score | 743 puntos | |
| 3DMark Steel Nomad Light Score | 2843 puntos | |
ayuda | ||
* ... más pequeño es mejor
| Performance rating - Percent | |
| Lenovo ThinkPad T14 Gen 6 21QG001VGE -1! | |
| Media de la clase Tablet | |
| Dynabook Portege Z40L-N | |
| Durabook R10 | |
| Lenovo ThinkPad T14 Gen 6 AMD -1! | |
| Dell Latitude 7030 Rugged Extreme -1! | |
| Durabook R8 Tablet -5! | |
| Cyberpunk 2077 - 1920x1080 Ultra Preset (FSR off) | |
| Lenovo ThinkPad T14 Gen 6 21QG001VGE | |
| Media de la clase Tablet (21.2 - 28.7, n=2, últimos 2 años) | |
| Durabook R10 | |
| Dynabook Portege Z40L-N | |
| Lenovo ThinkPad T14 Gen 6 AMD | |
| Dell Latitude 7030 Rugged Extreme | |
| Baldur's Gate 3 - 1920x1080 Ultra Preset AA:T | |
| Lenovo ThinkPad T14 Gen 6 21QG001VGE | |
| Media de la clase Tablet (22.8 - 28.3, n=2, últimos 2 años) | |
| Dynabook Portege Z40L-N | |
| Durabook R10 | |
| Lenovo ThinkPad T14 Gen 6 AMD | |
| GTA V - 1920x1080 Highest AA:4xMSAA + FX AF:16x | |
| Lenovo ThinkPad T14 Gen 6 21QG001VGE | |
| Media de la clase Tablet (21.1 - 27.8, n=2, últimos 2 años) | |
| Dynabook Portege Z40L-N | |
| Durabook R10 | |
| Lenovo ThinkPad T14 Gen 6 AMD | |
| Dell Latitude 7030 Rugged Extreme | |
| Final Fantasy XV Benchmark - 1920x1080 High Quality | |
| Lenovo ThinkPad T14 Gen 6 21QG001VGE | |
| Media de la clase Tablet (25.4 - 34.4, n=3, últimos 2 años) | |
| Durabook R10 | |
| Durabook R10 | |
| Dynabook Portege Z40L-N | |
| Lenovo ThinkPad T14 Gen 6 AMD | |
| Dell Latitude 7030 Rugged Extreme | |
| Strange Brigade - 1920x1080 ultra AA:ultra AF:16 | |
| Media de la clase Tablet (44.4 - 58, n=2, últimos 2 años) | |
| Dynabook Portege Z40L-N | |
| Durabook R10 | |
| Dell Latitude 7030 Rugged Extreme | |
| Dota 2 Reborn - 1920x1080 ultra (3/3) best looking | |
| Lenovo ThinkPad T14 Gen 6 21QG001VGE | |
| Media de la clase Tablet (70.9 - 84.5, n=2, últimos 2 años) | |
| Durabook R10 | |
| Dynabook Portege Z40L-N | |
| Dell Latitude 7030 Rugged Extreme | |
| Lenovo ThinkPad T14 Gen 6 AMD | |
| Durabook R8 Tablet | |
Tabla de FPS en modo Ultra de Cyberpunk 2077
| bajo | medio | alto | ultra | |
|---|---|---|---|---|
| GTA V (2015) | 128.8 | 125.6 | 50.7 | 21.1 |
| Dota 2 Reborn (2015) | 92.5 | 75 | 51.7 | 70.9 |
| Final Fantasy XV Benchmark (2018) | 63.8 | 35.9 | 25.4 | |
| X-Plane 11.11 (2018) | 34.5 | 31.4 | 30.1 | |
| Strange Brigade (2018) | 161.3 | 52.1 | 52.9 | 44.4 |
| Baldur's Gate 3 (2023) | 34.1 | 24.9 | 22.8 | |
| Cyberpunk 2077 (2023) | 37.9 | 21.2 | ||
| F1 24 (2024) | 40.4 | 14.6 | ||
| F1 25 (2025) | 55.8 | 48.6 | 34.9 |
Emisiones y energía
Emisiones sonoras
El ventilador interno funciona casi de forma continua. Aunque resulta prácticamente inaudible cuando el sistema está inactivo, tampoco llega a ser muy ruidoso ni siquiera durante una prueba de estrés, registrando un nivel de 31 dB(A). Sin embargo, este suave zumbido queda completamente ahogado cuando se utiliza el dispositivo al aire libre.
Ruido
| Ocioso |
| 27.7 / 27.7 / 27.7 dB(A) |
| Carga |
| / 31.6 dB(A) |
 | ||
30 dB silencioso 40 dB(A) audible 50 dB(A) ruidosamente alto |
||
min: | ||
| Durabook R10 Core Ultra 7 258V, Arc 140V | Dell Latitude 7030 Rugged Extreme i7-1260U, Iris Xe G7 96EUs | Lenovo ThinkPad T14 Gen 6 21QG001VGE Core Ultra 7 258V, Arc 140V | Dynabook Portege Z40L-N Core Ultra 7 258V, Arc 140V | Durabook R8 Tablet i5-1230U, Iris Xe G7 80EUs | Lenovo ThinkPad T14 Gen 6 AMD Ryzen AI 7 PRO 350, Radeon 860M | |
|---|---|---|---|---|---|---|
| Noise | -1% | 0% | 6% | 7% | ||
| apagado / medio ambiente * (dB) | 25.9 | 23 11% | 25.1 3% | 23.5 9% | 24.5 5% | |
| Idle Minimum * (dB) | 27.7 | 23.5 15% | 25.1 9% | 23.6 15% | 24.5 12% | |
| Idle Average * (dB) | 27.7 | 23.5 15% | 25.1 9% | 23.6 15% | 24.5 12% | |
| Idle Maximum * (dB) | 27.7 | 23.5 15% | 27.1 2% | 23.6 15% | 24.5 12% | |
| Load Maximum * (dB) | 31.6 | 50.6 -60% | 38.5 -22% | 39 -23% | 33.7 -7% | |
| Load Average * (dB) | 24.1 | 34.8 | 37 | 26.8 | ||
| Cyberpunk 2077 ultra * (dB) | 50.5 | 38.3 | 37.8 | 35.3 |
* ... más pequeño es mejor
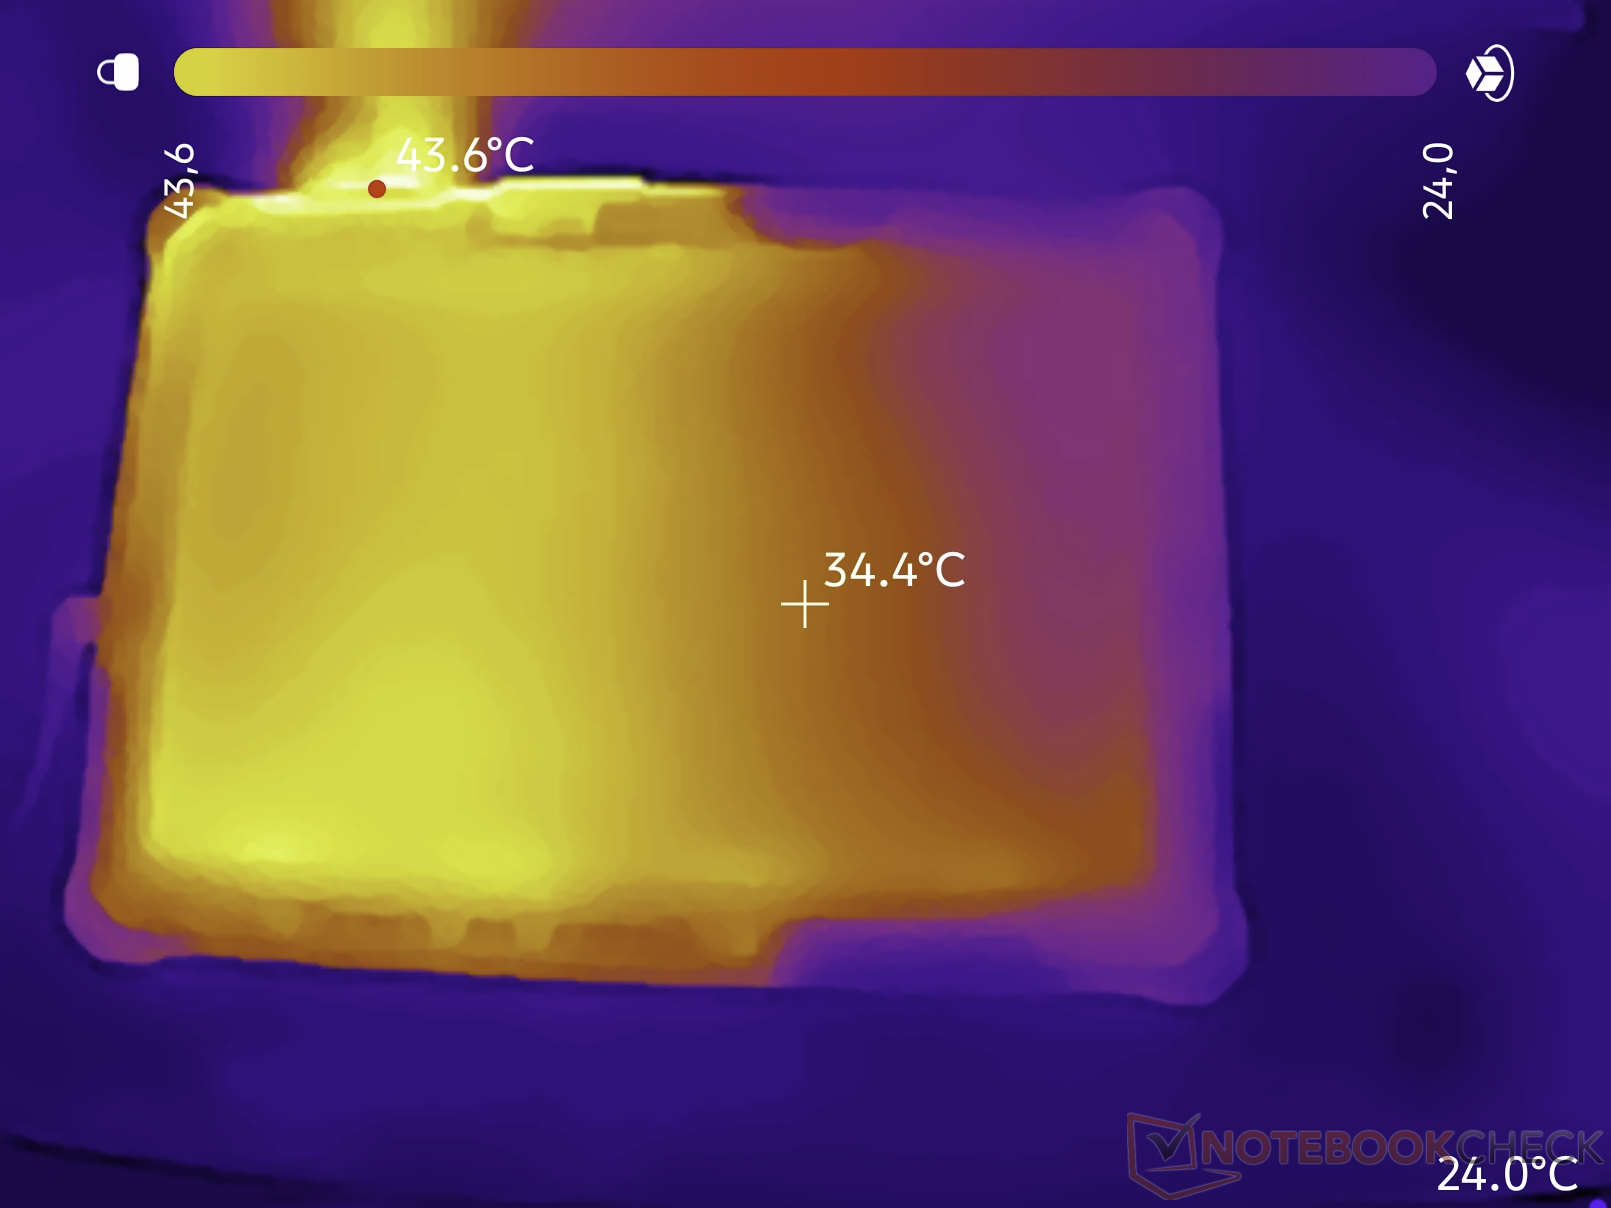
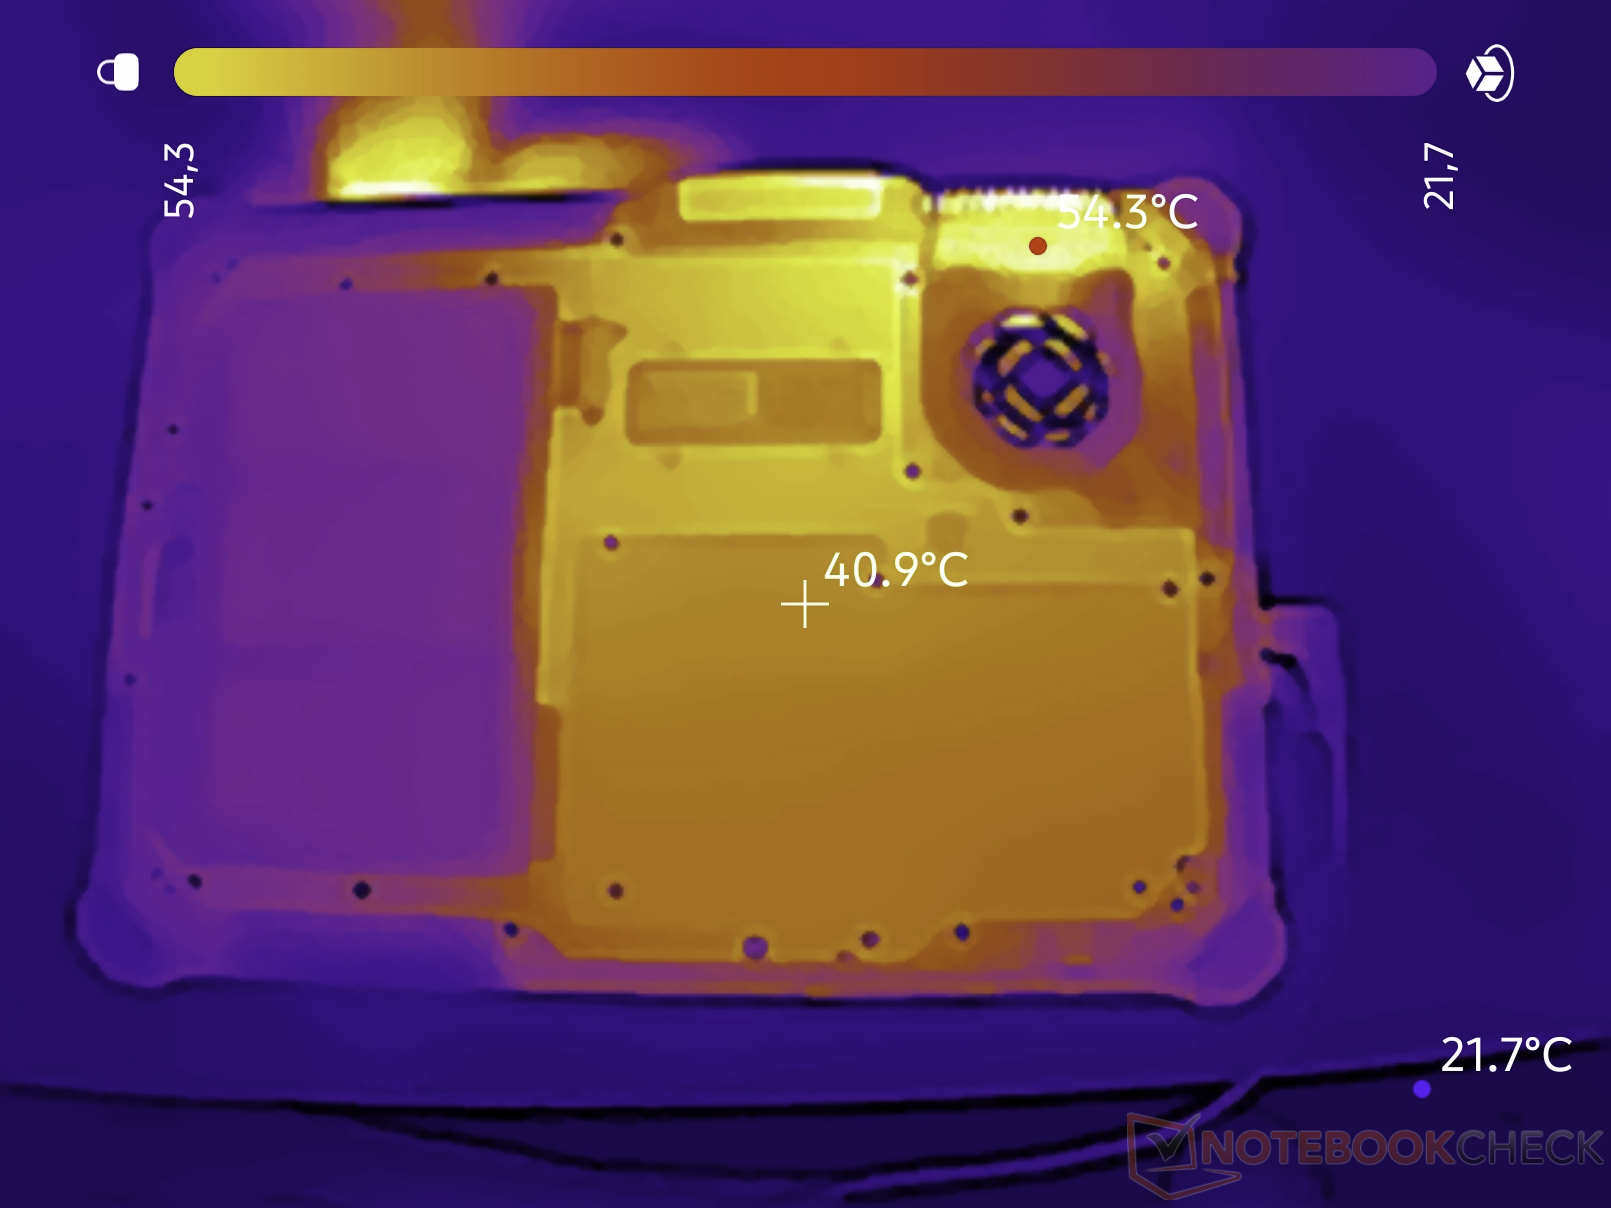
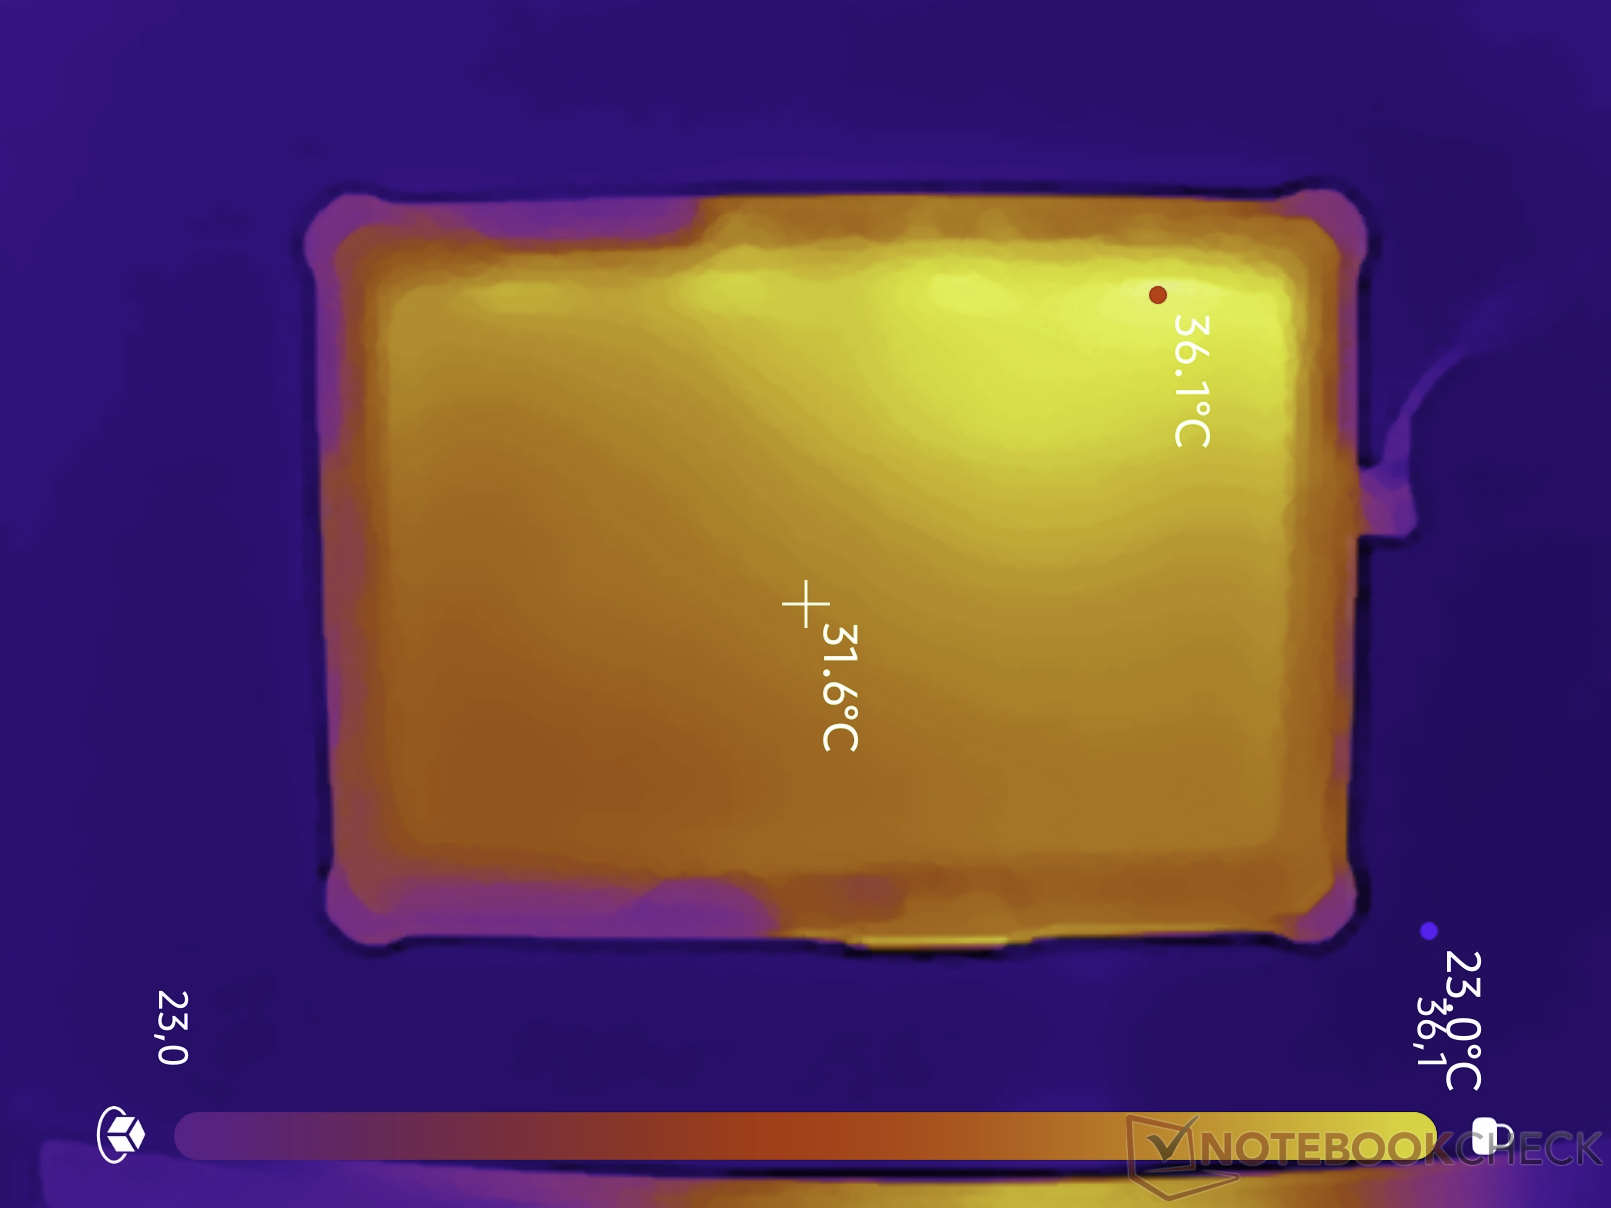
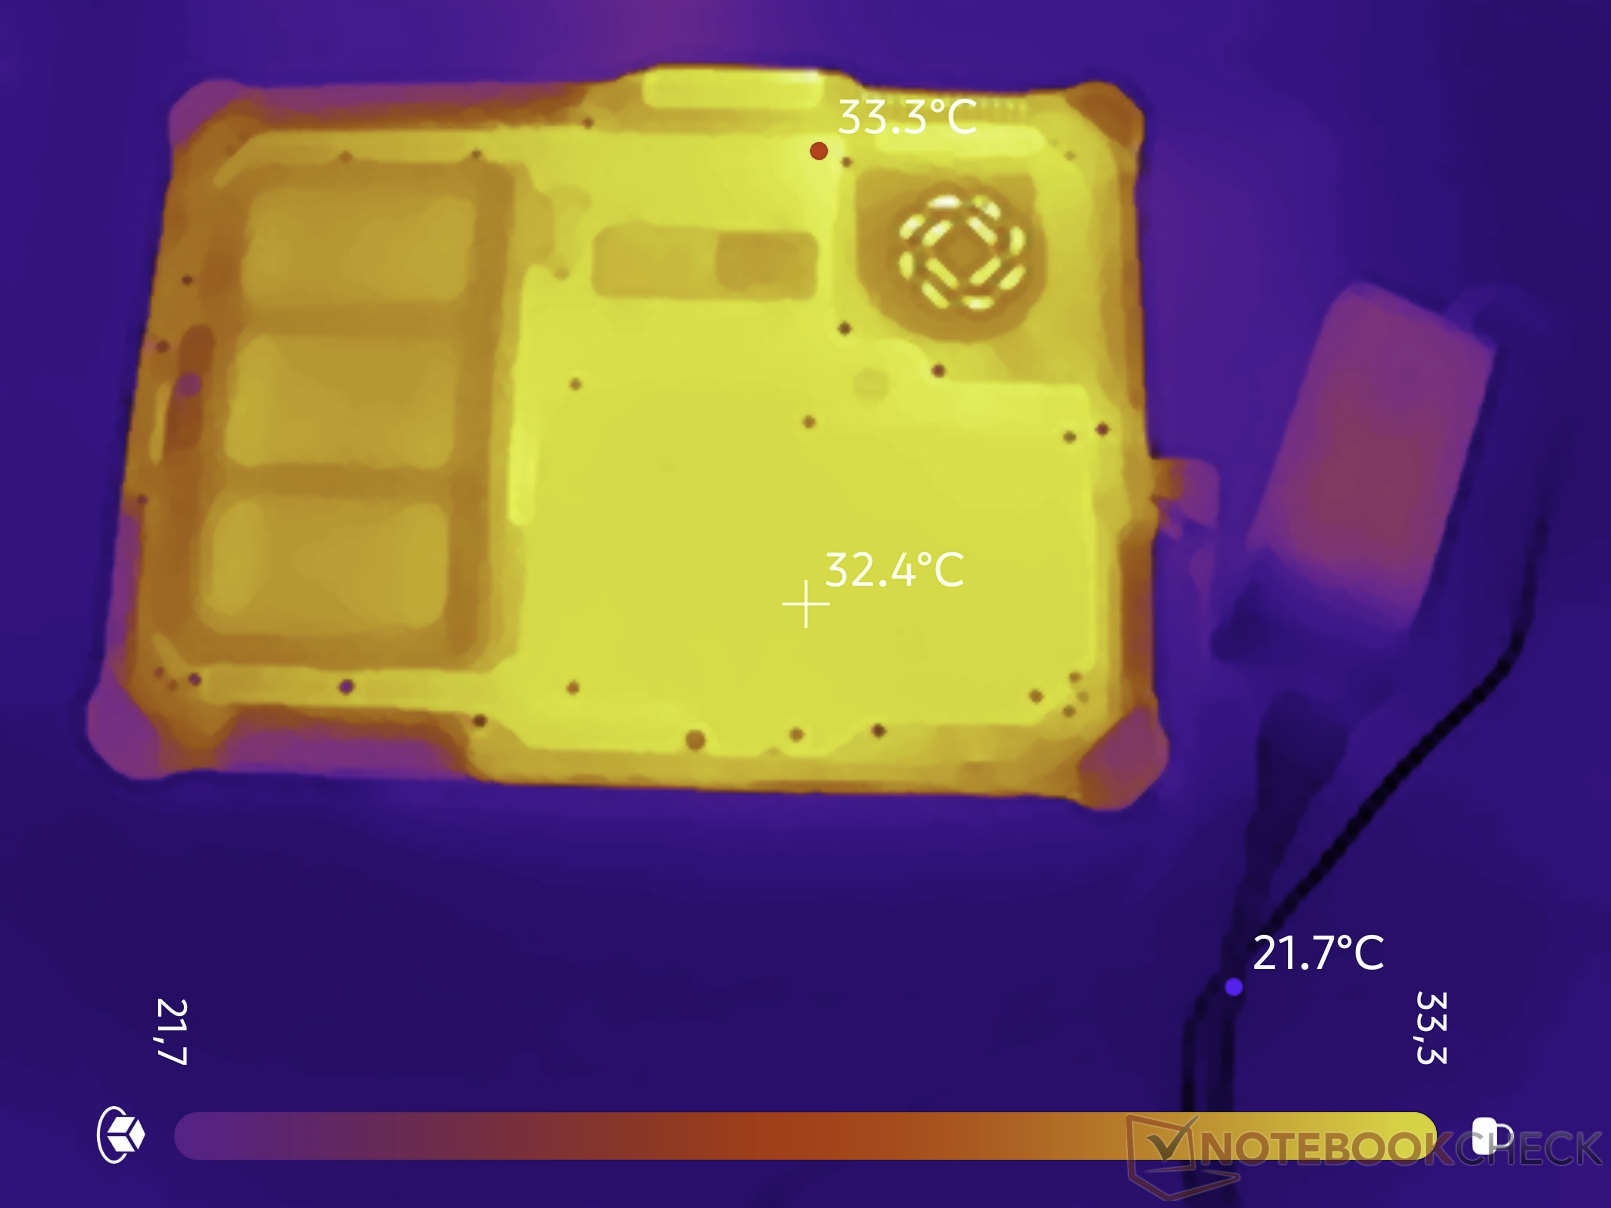
Temperatura
El sistema de refrigeración funciona de manera excepcional. Durante la prueba de estrés, la tableta solo alcanza temperaturas superiores a los 40 °C (104 °F) en algunos puntos concretos. El resto del chasis, de gran solidez, se mantiene a una temperatura agradable.
(±) La temperatura máxima en la parte superior es de 43.6 °C / 110 F, frente a la media de 33.6 °C / 92 F, que oscila entre 20.7 y 53.2 °C para la clase Tablet.
(±) El fondo se calienta hasta un máximo de 40 °C / 104 F, frente a la media de 33.2 °C / 92 F
(±) En reposo, la temperatura media de la parte superior es de 33.3 °C / 92# F, frente a la media del dispositivo de 30 °C / 86 F.
| Durabook R10 Core Ultra 7 258V, Arc 140V | Dell Latitude 7030 Rugged Extreme i7-1260U, Iris Xe G7 96EUs | Lenovo ThinkPad T14 Gen 6 21QG001VGE Core Ultra 7 258V, Arc 140V | Dynabook Portege Z40L-N Core Ultra 7 258V, Arc 140V | Durabook R8 Tablet i5-1230U, Iris Xe G7 80EUs | Lenovo ThinkPad T14 Gen 6 AMD Ryzen AI 7 PRO 350, Radeon 860M | |
|---|---|---|---|---|---|---|
| Heat | 11% | 16% | -2% | -0% | -3% | |
| Maximum Upper Side * (°C) | 43.6 | 37.2 15% | 39.7 9% | 41.2 6% | 38.2 12% | 47.7 -9% |
| Maximum Bottom * (°C) | 40 | 43.4 -9% | 38.1 5% | 38 5% | 49.6 -24% | 49.5 -24% |
| Idle Upper Side * (°C) | 36.1 | 26.4 27% | 24.3 33% | 35.4 2% | 32.2 11% | 30.7 15% |
| Idle Bottom * (°C) | 33.3 | 29.6 11% | 27.7 17% | 39.8 -20% | 33.4 -0% | 31.6 5% |
* ... más pequeño es mejor
Ponente
Las prestaciones de audio del dispositivo son modestas. El altavoz mono integrado en la parte trasera de la tableta alcanza un volumen máximo de 54 dB(A) y ofrece una calidad de sonido bastante mediocre. Esto resulta suficiente para reproducir los tonos de alerta del sistema, al menos en entornos silenciosos.
Durabook R10 análisis de audio
(-) | altavoces no muy altos (#58.3 dB)
Graves 100 - 315 Hz
(-) | casi sin bajos - de media 17.7% inferior a la mediana
(±) | la linealidad de los graves es media (7.6% delta a frecuencia anterior)
Medios 400 - 2000 Hz
(+) | medios equilibrados - a sólo 2.9% de la mediana
(±) | la linealidad de los medios es media (13.7% delta respecto a la frecuencia anterior)
Altos 2 - 16 kHz
(+) | máximos equilibrados - a sólo 4.7% de la mediana
(±) | la linealidad de los máximos es media (10.2% delta a frecuencia anterior)
Total 100 - 16.000 Hz
(-) | el sonido global no es lineal (31.3% de diferencia con la mediana)
En comparación con la misma clase
» 90% de todos los dispositivos probados de esta clase eran mejores, 3% similares, 7% peores
» El mejor tuvo un delta de 7%, la media fue 20%, el peor fue ###max##%
En comparación con todos los dispositivos probados
» 90% de todos los dispositivos probados eran mejores, 2% similares, 8% peores
» El mejor tuvo un delta de 4%, la media fue 24%, el peor fue ###max##%
Apple MacBook Pro 16 2021 M1 Pro análisis de audio
(+) | los altavoces pueden reproducir a un volumen relativamente alto (#84.7 dB)
Graves 100 - 315 Hz
(+) | buen bajo - sólo 3.8% lejos de la mediana
(+) | el bajo es lineal (5.2% delta a la frecuencia anterior)
Medios 400 - 2000 Hz
(+) | medios equilibrados - a sólo 1.3% de la mediana
(+) | los medios son lineales (2.1% delta a la frecuencia anterior)
Altos 2 - 16 kHz
(+) | máximos equilibrados - a sólo 1.9% de la mediana
(+) | los máximos son lineales (2.7% delta a la frecuencia anterior)
Total 100 - 16.000 Hz
(+) | el sonido global es lineal (4.6% de diferencia con la mediana)
En comparación con la misma clase
» 0% de todos los dispositivos probados de esta clase eran mejores, 0% similares, 100% peores
» El mejor tuvo un delta de 5%, la media fue 17%, el peor fue ###max##%
En comparación con todos los dispositivos probados
» 0% de todos los dispositivos probados eran mejores, 0% similares, 100% peores
» El mejor tuvo un delta de 4%, la media fue 24%, el peor fue ###max##%
Consumo energético y duración de la batería
En nuestra prueba de estrés, registramos un consumo máximo de energía de 55 vatios. El mayor consumo de energía, con diferencia, lo supone la pantalla extremadamente brillante, que supone una carga significativa para la batería o el adaptador de corriente. Sin estar conectado a una toma de corriente, la batería ofreció una autonomía de ocho horas durante la navegación web continua a través de Wi-Fi en nuestra prueba. Gracias a la función de sustitución en caliente, la batería se puede cambiar mientras el dispositivo está en funcionamiento. En el interior del Durabook hay una pequeña batería que proporciona algo más de un minuto de autonomía y permite sustituir la batería sin necesidad de apagar el dispositivo. Para un uso aún más prolongado sin necesidad de recargar ni sustituir la batería, el fabricante también ofrece una batería de alta capacidad, aunque sobresale considerablemente del dispositivo.
| Off / Standby | |
| Ocioso | |
| Carga |
|
Clave:
min: | |
Consumo energético: Cyberpunk / Prueba de estrés
Consumo energético con un monitor externo
| Durabook R10 Core Ultra 7 258V, Arc 140V, 48 Wh | Dell Latitude 7030 Rugged Extreme i7-1260U, Iris Xe G7 96EUs, 36 Wh | Lenovo ThinkPad T14 Gen 6 21QG001VGE Core Ultra 7 258V, Arc 140V, 57 Wh | Dynabook Portege Z40L-N Core Ultra 7 258V, Arc 140V, 56 Wh | Durabook R8 Tablet i5-1230U, Iris Xe G7 80EUs, 27.4 Wh | Lenovo ThinkPad T14 Gen 6 AMD Ryzen AI 7 PRO 350, Radeon 860M, 57 Wh | Media de la clase Tablet | |
|---|---|---|---|---|---|---|---|
| Battery Runtime | |||||||
| WiFi Websurfing (h) | 8.4 | 6.1 -27% | 19.4 131% | 19.1 127% | 5.3 -37% | 13.8 64% | 15.8 ? 88% |
| Duración de Batería | -27% | 131% | 127% | -37% | 64% | 88% | |
| WiFi v1.3 (h) | 8.4 | 6.1 -27% | 19.4 131% | 19.1 127% | 5.3 -37% | 13.8 64% | 15.8 ? 88% |
| Load (h) | 1.6 | 1.1 | 4.16 ? | ||||
| Media total (Programa/Opciones) | -27% /
-27% | 131% /
131% | 127% /
127% | -37% /
-37% | 64% /
64% | 88% /
88% |
| Durabook R10 Core Ultra 7 258V, Arc 140V, 48 Wh | Dell Latitude 7030 Rugged Extreme i7-1260U, Iris Xe G7 96EUs, 36 Wh | Lenovo ThinkPad T14 Gen 6 21QG001VGE Core Ultra 7 258V, Arc 140V, 57 Wh | Dynabook Portege Z40L-N Core Ultra 7 258V, Arc 140V, 56 Wh | Durabook R8 Tablet i5-1230U, Iris Xe G7 80EUs, 27.4 Wh | Lenovo ThinkPad T14 Gen 6 AMD Ryzen AI 7 PRO 350, Radeon 860M, 57 Wh | Media de la clase Tablet | |
|---|---|---|---|---|---|---|---|
| Duración de Batería | -27% | 131% | 127% | -37% | 64% | 88% | |
| WiFi v1.3 (h) | 8.4 | 6.1 -27% | 19.4 131% | 19.1 127% | 5.3 -37% | 13.8 64% | 15.8 ? 88% |
| Load (h) | 1.6 | 1.1 | 4.16 ? |
Valoración global de Notebookcheck
El Durabook R10 es un auténtico peso pesado diseñado para entornos de trabajo extremos. Sus normas militares certificadas, su pantalla brillante y su suministro de energía ininterrumpido resultan realmente impresionantes. Sin embargo, el rendimiento de la CPU por debajo de la media, la elevada latencia y una pantalla ligeramente verdosa obligan a aceptar algunas concesiones.
Durabook R10
- 06/18/2026 v8
Marc Herter
 Total Sustainability Score:
 Una comparación de las posibles alternativas
Imagen | Modelo | Precio | Peso | Altura | Pantalla |
|---|---|---|---|---|---|
1. 76.5%  | Durabook R10 Intel Core Ultra 7 258V ⎘ Intel Arc Graphics 140V ⎘ 32 GB Memoría | Amazon: 1. $14.99 ZBAGUG for Durabook R10 Tabl... 2. $17.99 ZBAGUG 2-Pack for Durabook R... | 1.3 kg | 29 mm | 10.10" 1920x1200 224 PPI TFT |
2. 82.3% 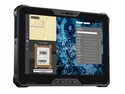 | Dell Latitude 7030 Rugged Extreme Intel Core i7-1260U ⎘ Intel Iris Xe Graphics G7 96EUs ⎘ 32 GB Memoría, 1024 GB SSD | Amazon: 1. $2,049.00 Dell Latitude Rugged Extreme... 2. $2,199.00 Dell Latitude 7330 Rugged Ex... 3. $1,850.00 Dell Latitude Rugged Extreme... Precio de catálogo: 3000 USD | 1.1 kg | 25.4 mm | 10.00" 1920x1200 226 PPI IPS |
3. 79.6% v7 (old)  | Durabook R8 Tablet Intel Core i5-1230U ⎘ Intel Iris Xe Graphics G7 80EUs ⎘ 8 GB Memoría, 128 GB SSD | Amazon: 1. $38.99 PowerHOOD DC19V AC Power Ada... 2. $39.95 BoxWave Screen Protector Com... 3. $39.95 BoxWave Screen Protector Com... | 856 g | 20.6 mm | 8.00" 1280x800 189 PPI IPS |
Transparencia
La selección de los dispositivos que se van a reseñar corre a cargo de nuestro equipo editorial. La muestra de prueba fue proporcionada al autor en calidad de préstamo por el fabricante o el minorista a los efectos de esta reseña. El prestamista no tuvo ninguna influencia en esta reseña, ni el fabricante recibió una copia de la misma antes de su publicación. No había ninguna obligación de publicar esta reseña. Como empresa de medios independiente, Notebookcheck no está sujeta a la autoridad de fabricantes, minoristas o editores.
Así es como prueba Notebookcheck
Cada año, Notebookcheck revisa de forma independiente cientos de portátiles y smartphones utilizando procedimientos estandarizados para asegurar que todos los resultados son comparables. Hemos desarrollado continuamente nuestros métodos de prueba durante unos 20 años y hemos establecido los estándares de la industria en el proceso. En nuestros laboratorios de pruebas, técnicos y editores experimentados utilizan equipos de medición de alta calidad. Estas pruebas implican un proceso de validación en varias fases. Nuestro complejo sistema de clasificación se basa en cientos de mediciones y puntos de referencia bien fundamentados, lo que mantiene la objetividad.