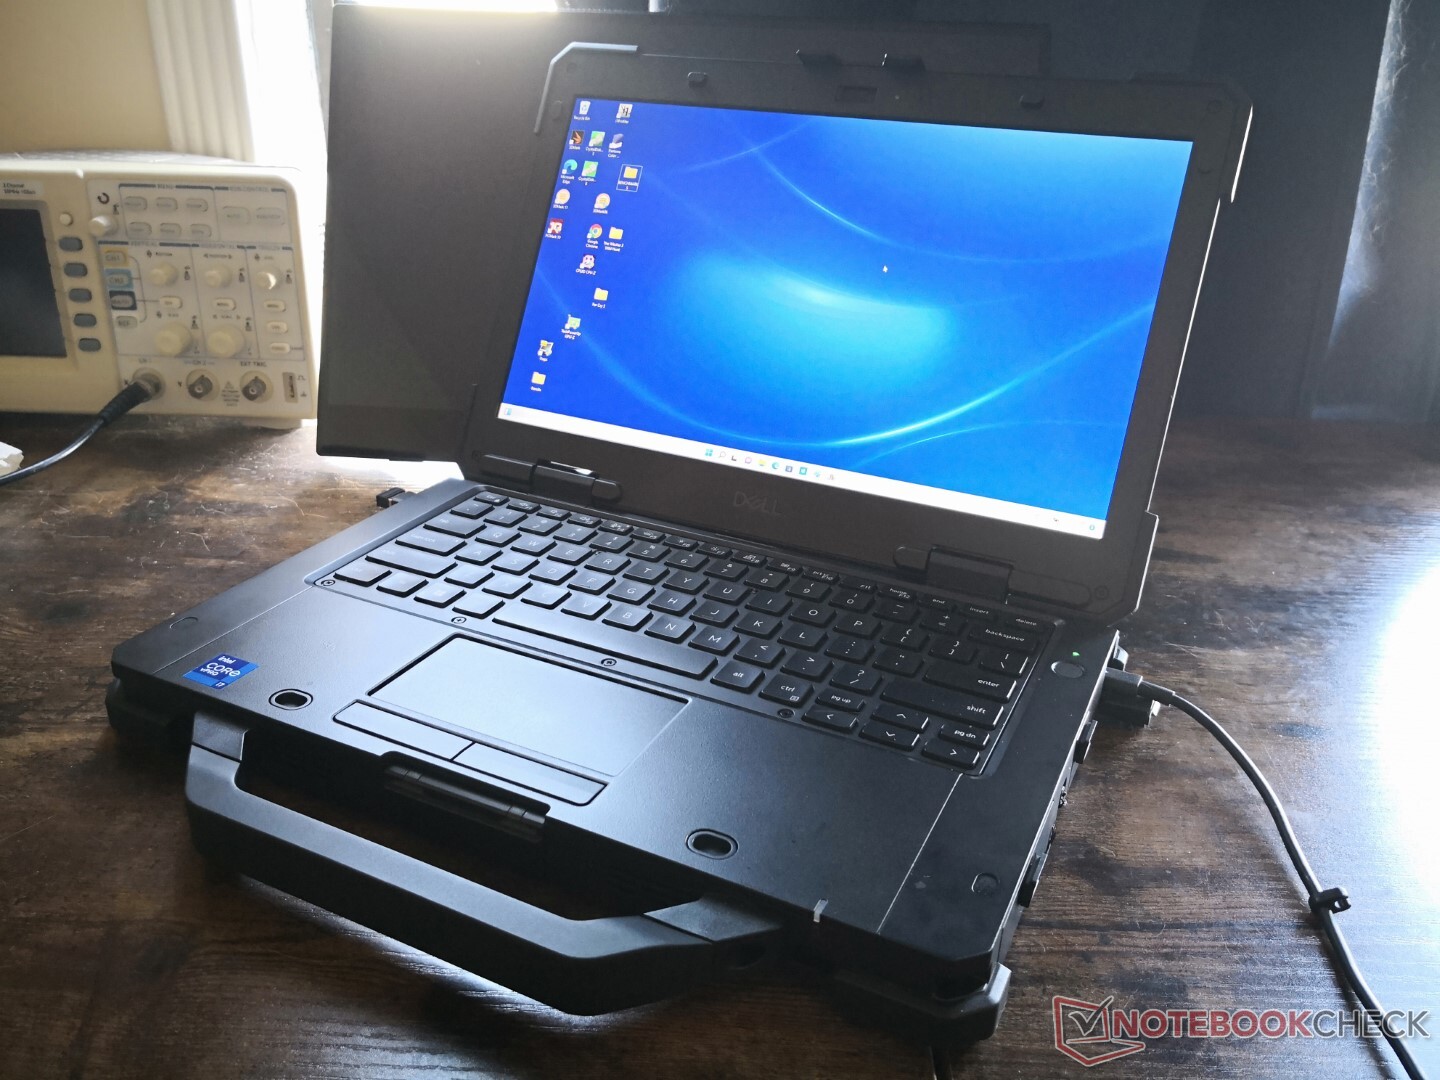
Análisis del Dell Latitude 7330 Rugged Extreme: Uno de los mejores portátiles robustos de 13 pulgadas
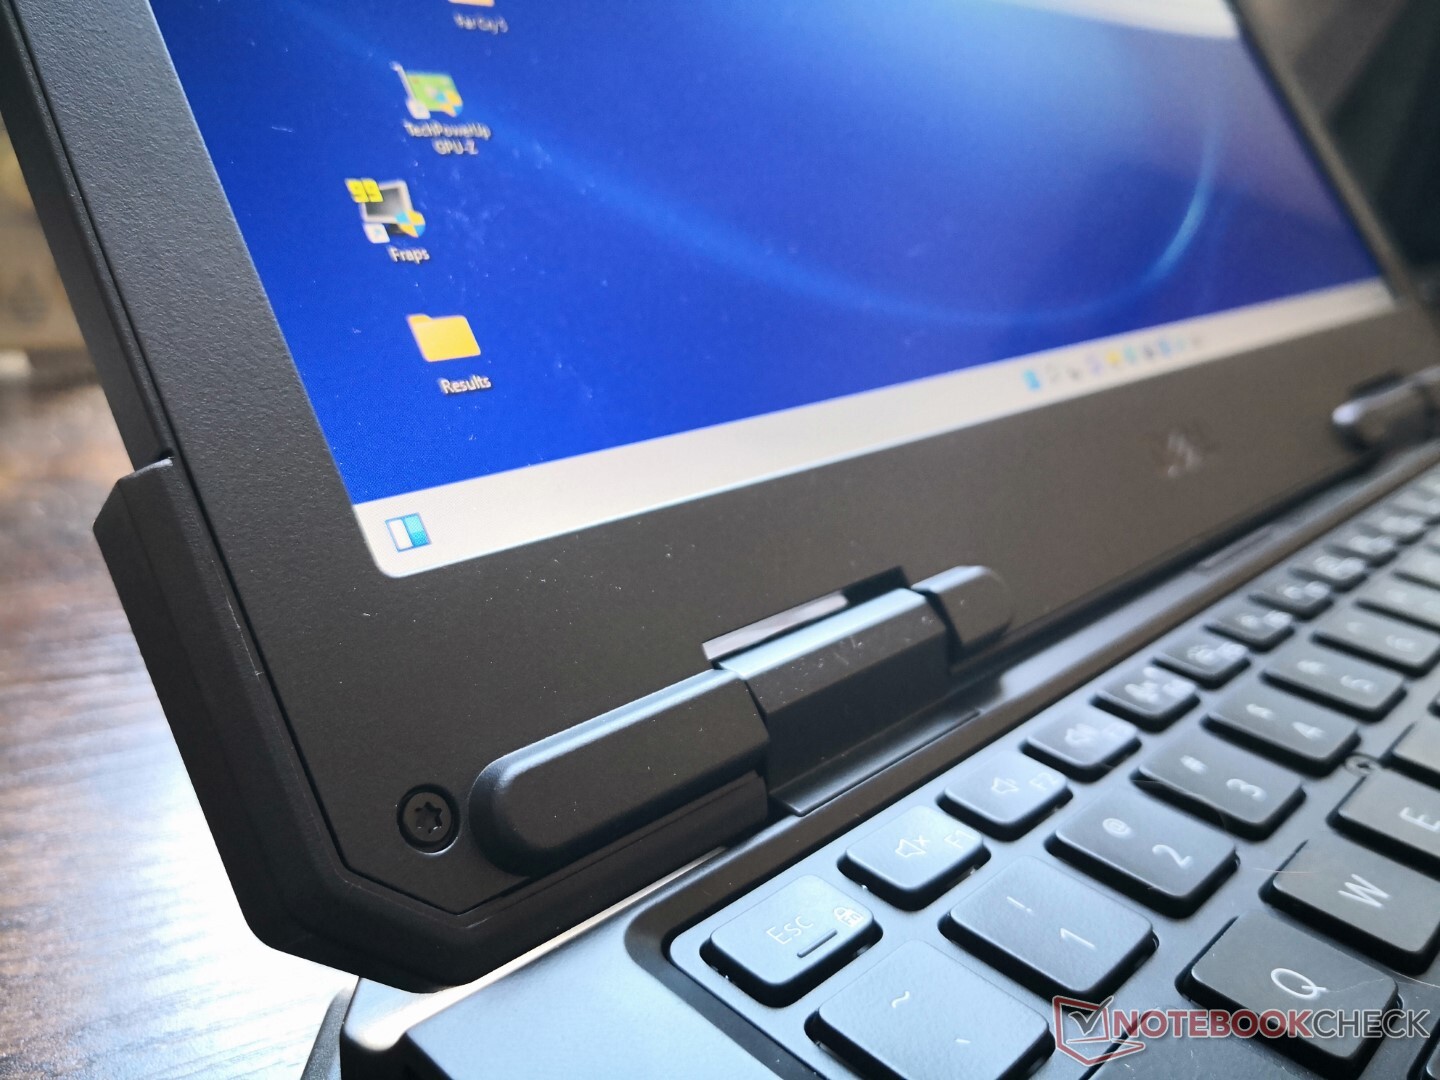
El Latitude 7330 Rugged Extreme es uno de los pocos -si no el único- portátiles robustos de 13,3 pulgadas de Dell. Se inspira en gran medida en los modelos robustos de 14 y 15 pulgadas de Latitude, pero en un formato más pequeño y compacto de 13 pulgadas.
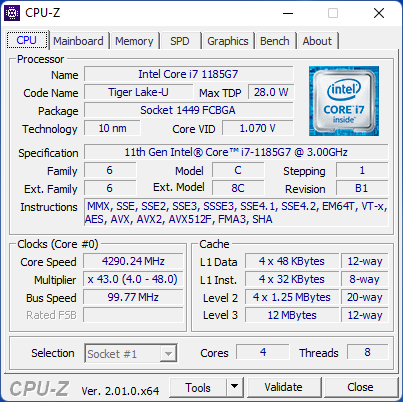
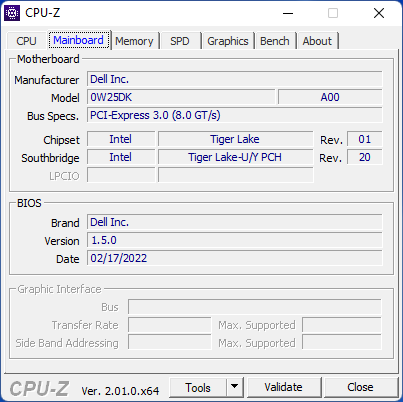
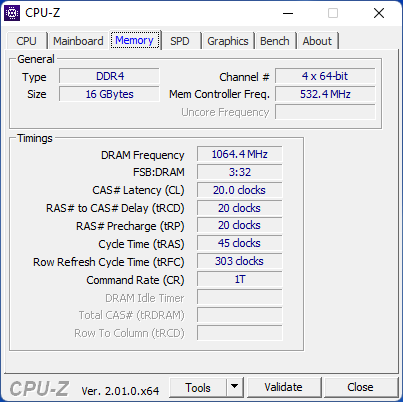
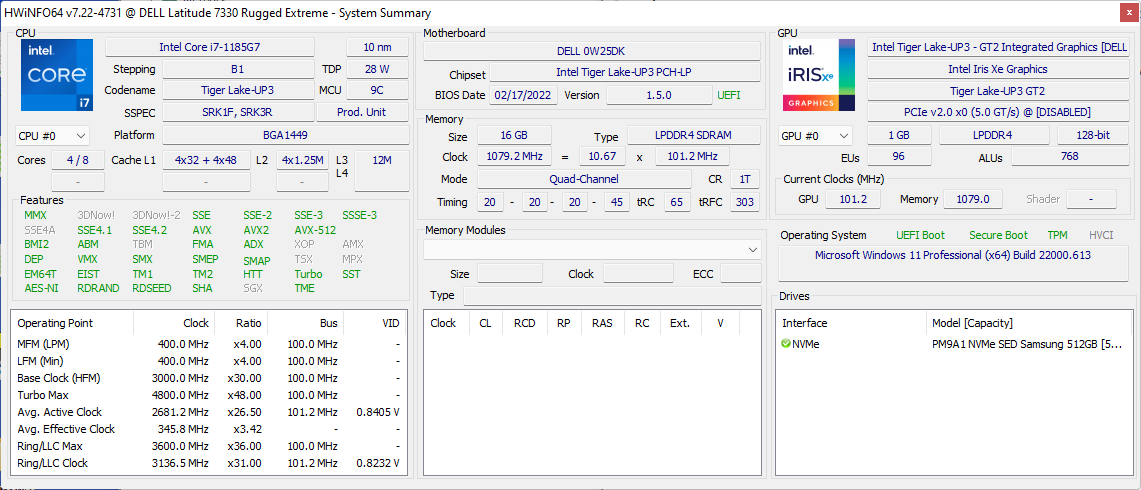
Al igual que la mayoría de los otros portátiles robustos, el Latitude 7330 Rugged Extreme está disponible en una gran variedad de configuraciones, como se detalla en la página del producto aquí. Nuestra unidad específica viene con la CPU Core i7-1185G7 vPro, 16 GB de RAM LPDDR4x-4266 y 512 GB de SSD Samsung PM9A1 NVMe, que se vende por unos 5300 dólares. Todas las unidades vienen con CPUs de la serie U de Intel de 11ª generación y el mismo panel IPS de 1400 nits.
Entre los competidores directos se encuentran otros portátiles robustos de 13,3 pulgadas como el Getac B360 o alternativas de 14 pulgadas como elDurabook S14I oPanasonic Toughbook FZ-55 MK2.
Más opiniones de Dell:
Posibles contendientes en la comparación
Valoración | Fecha | Modelo | Peso | Altura | Tamaño | Resolución | Precio |
|---|---|---|---|---|---|---|---|
v (old) | 05/2022 | Dell Latitude 7330 Rugged Extreme i7-1185G7, Iris Xe G7 96EUs | 2.7 kg | 36.5 mm | 13.30" | 1920x1080 | |
| 84.3 % v6 (old) | 04/2019 | Dell Latitude 7424 Rugged Extreme i7-8650U, Radeon RX 540 | 3.5 kg | 59.3 mm | 14.00" | 1920x1080 | |
| 89.2 % v6 (old) | 03/2019 | Dell Latitude 5420 Rugged-P85G i7-8650U, Radeon RX 540 | 2.8 kg | 32.9 mm | 14.00" | 1920x1080 | |
| 82.4 % v7 (old) | 12/2021 | Acer Enduro Urban N3 EUN314 i7-1165G7, Iris Xe G7 96EUs | 1.8 kg | 21.95 mm | 14.00" | 1920x1080 | |
| 83.9 % v7 (old) | 09/2021 | Panasonic Toughbook FZ-55 MK2 i7-1185G7, Iris Xe G7 96EUs | 2.3 kg | 33 mm | 14.00" | 1920x1080 | |
v (old) | 04/2021 | Durabook S14I i7-1165G7, Iris Xe G7 96EUs | 3 kg | 38.1 mm | 14.00" | 1920x1080 |
Caso
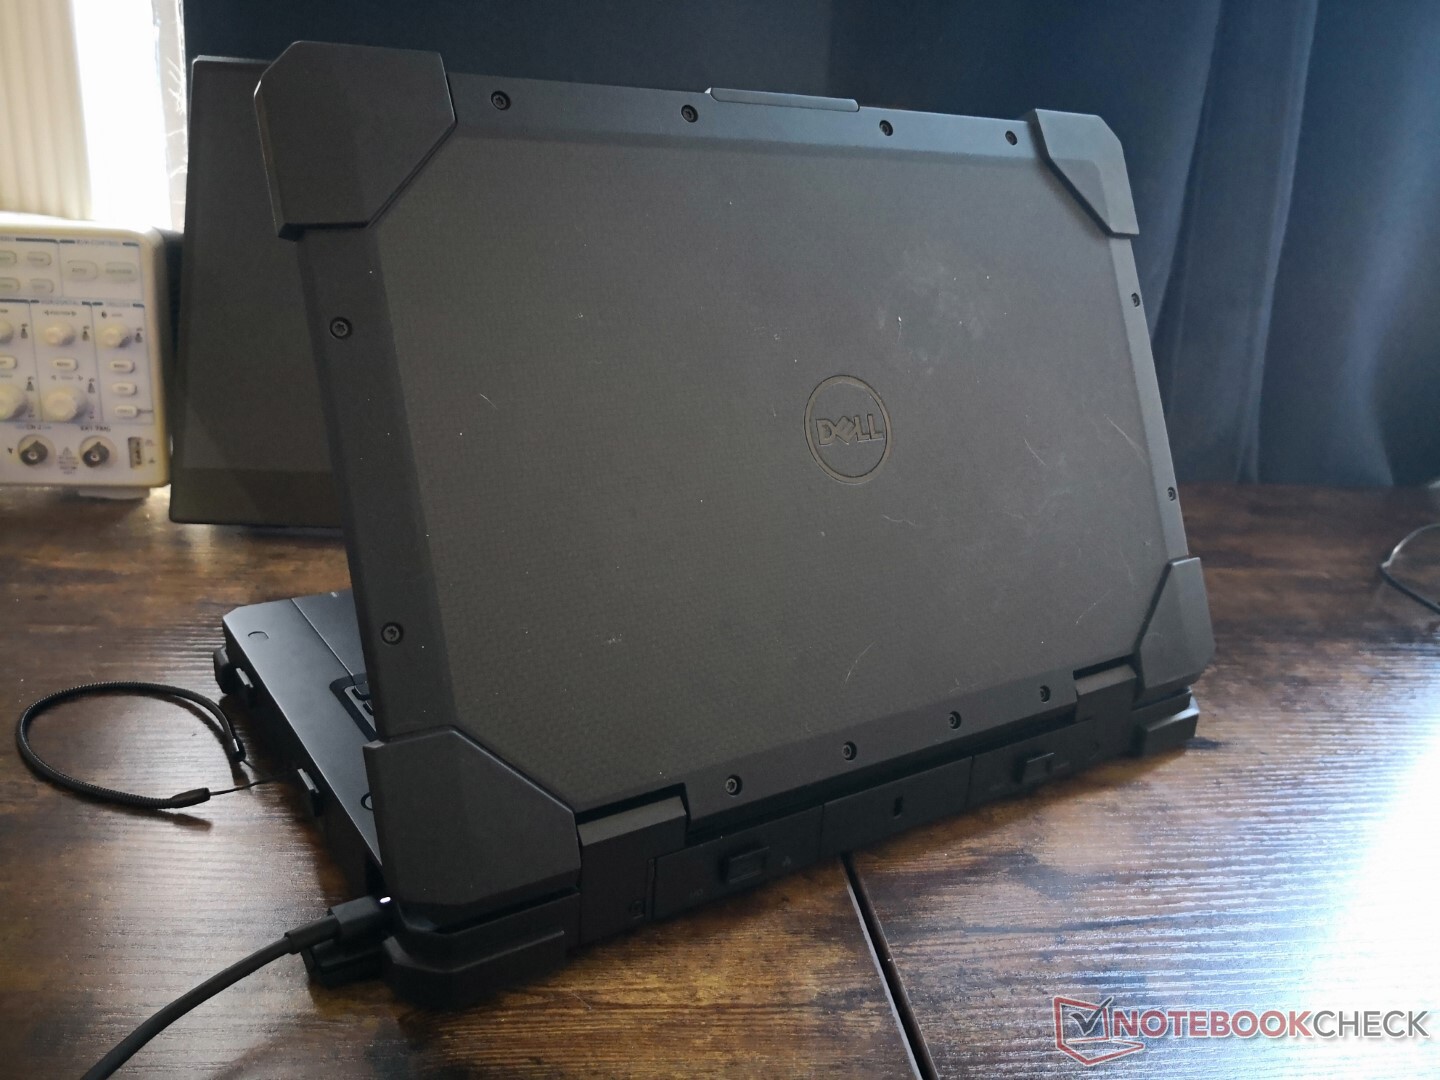
En términos de tamaño y peso, el modelo de Dell es notablemente más pequeño que el Getac B360 de 14 pulgadas o el Panasonic Toughbook FZ-55 MK2 y, sin embargo, es más pesado que ambos modelos. No hay que subestimar la densidad del Latitude 7330 Rugged Extreme.
Conectividad
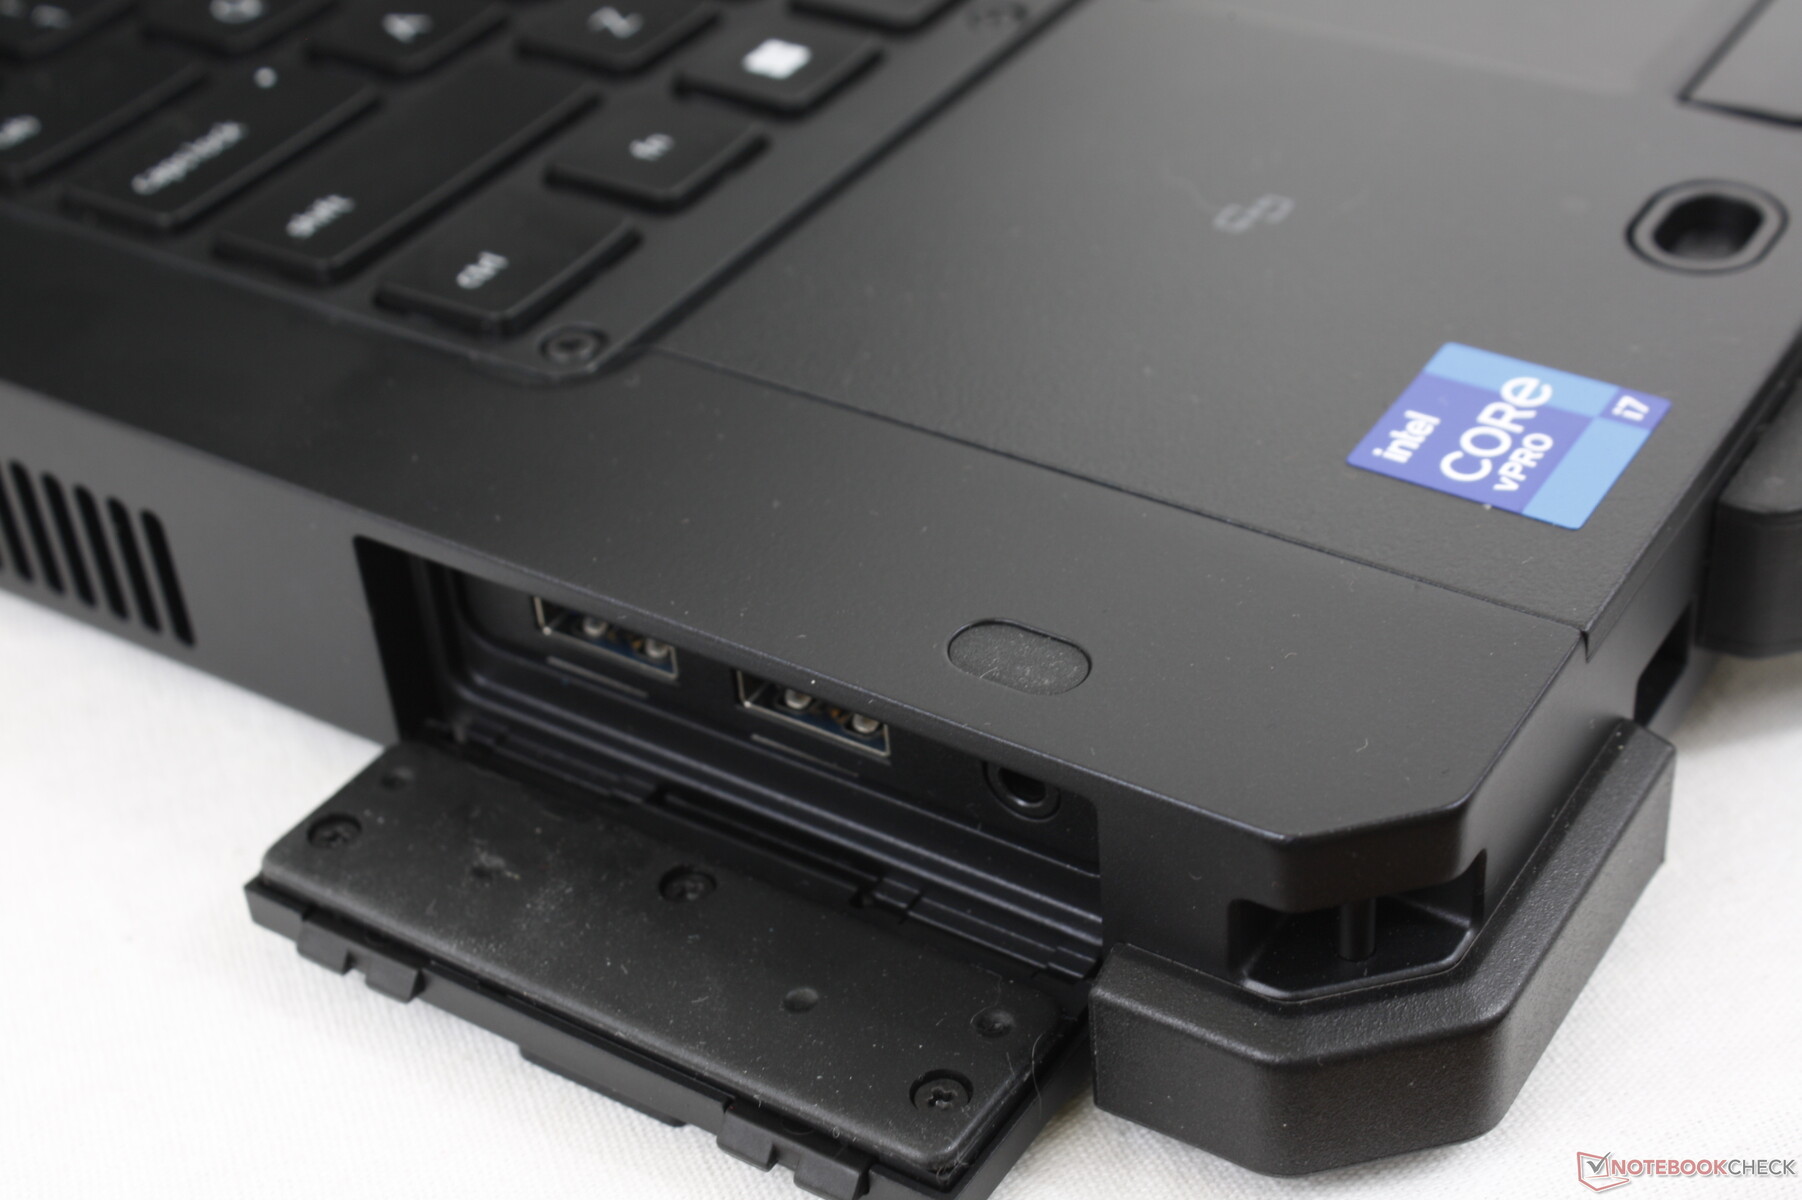
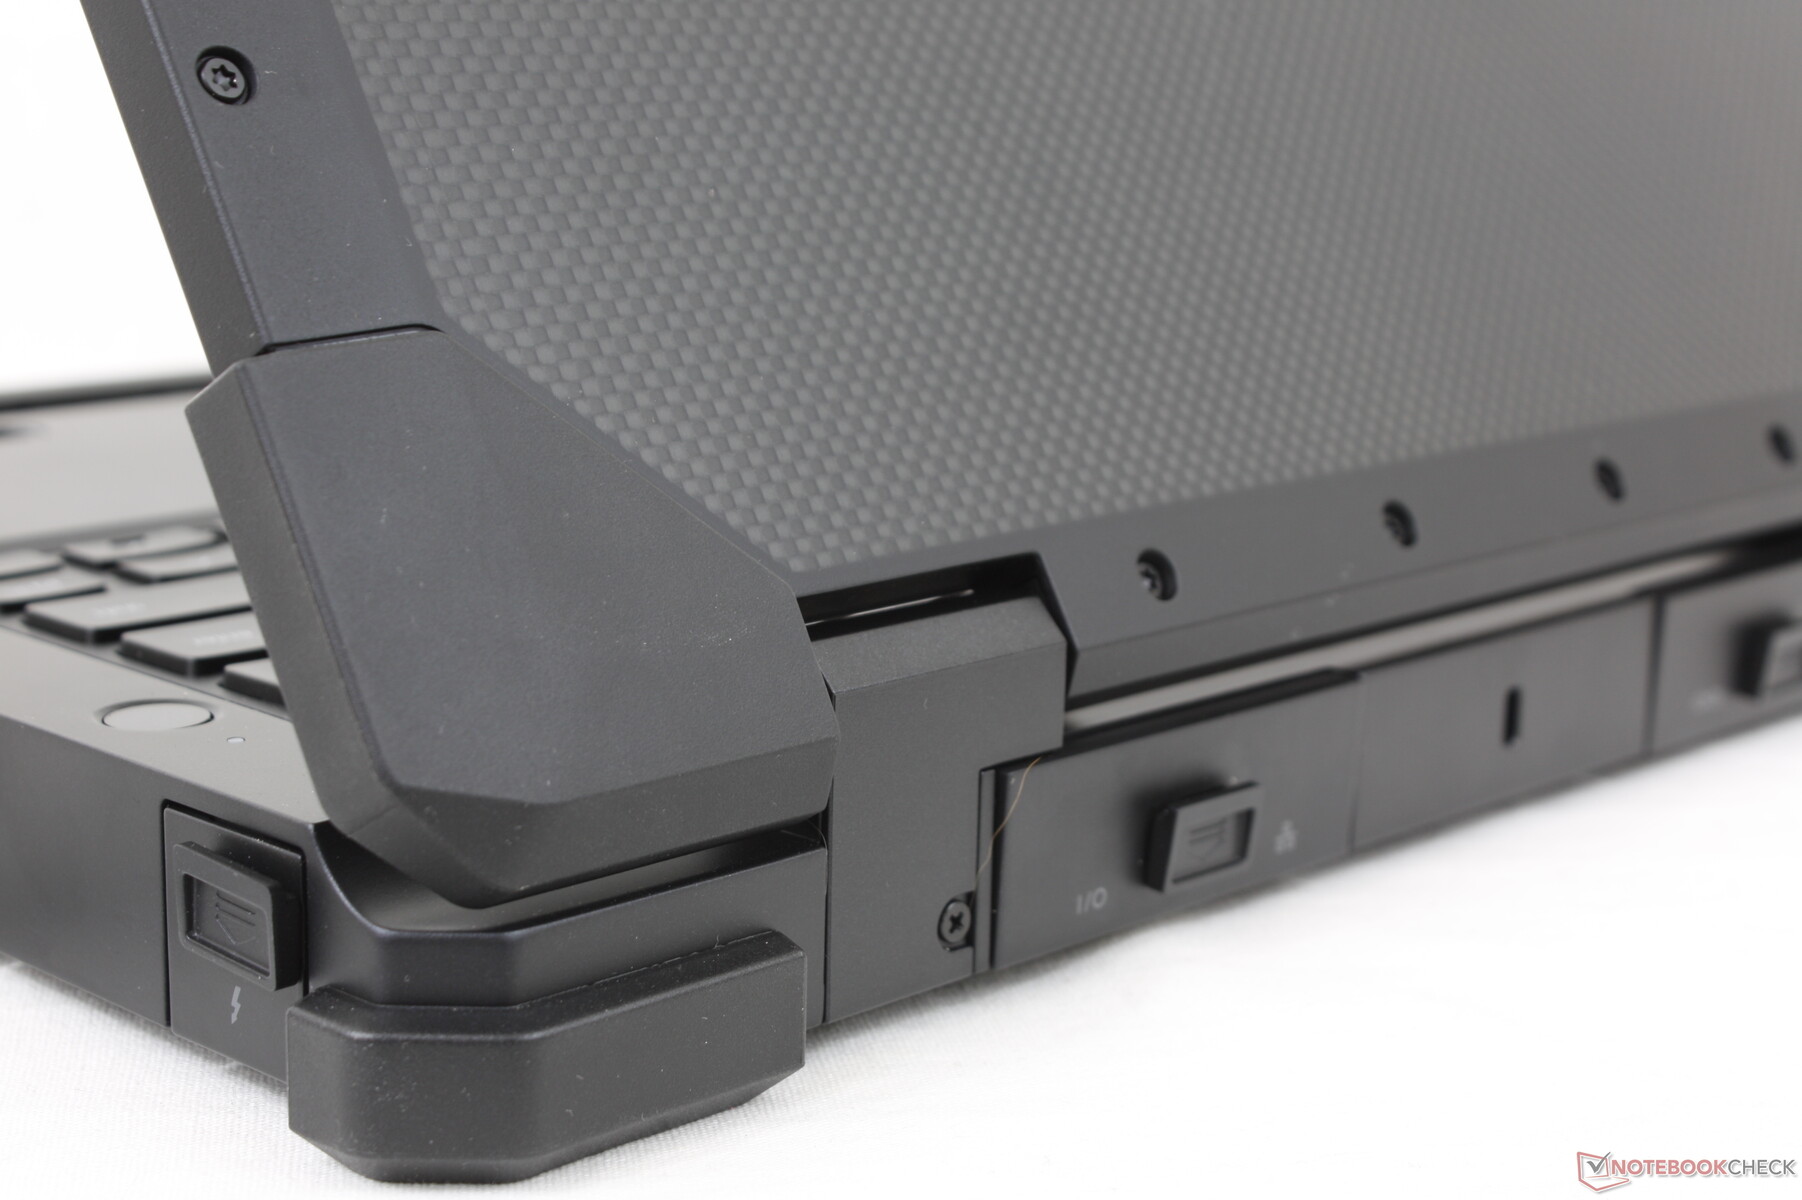
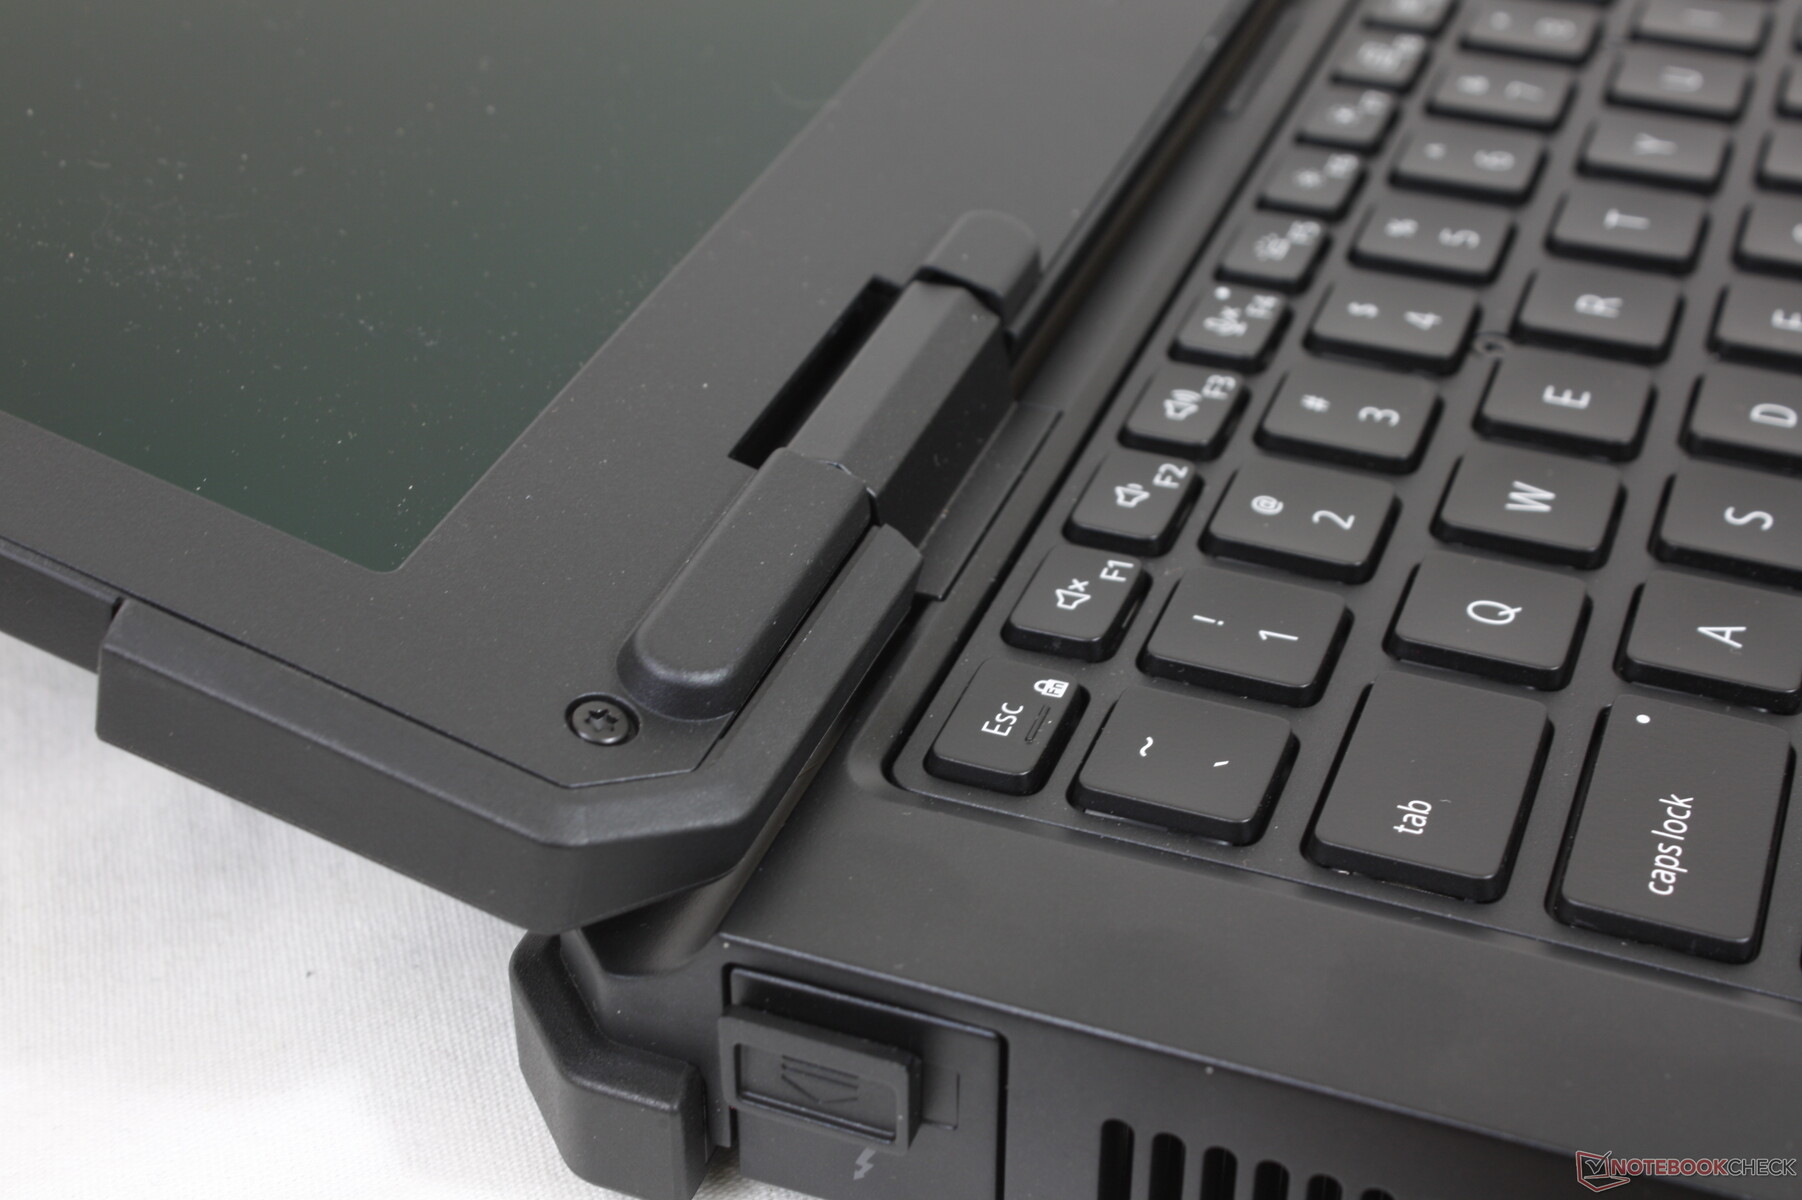
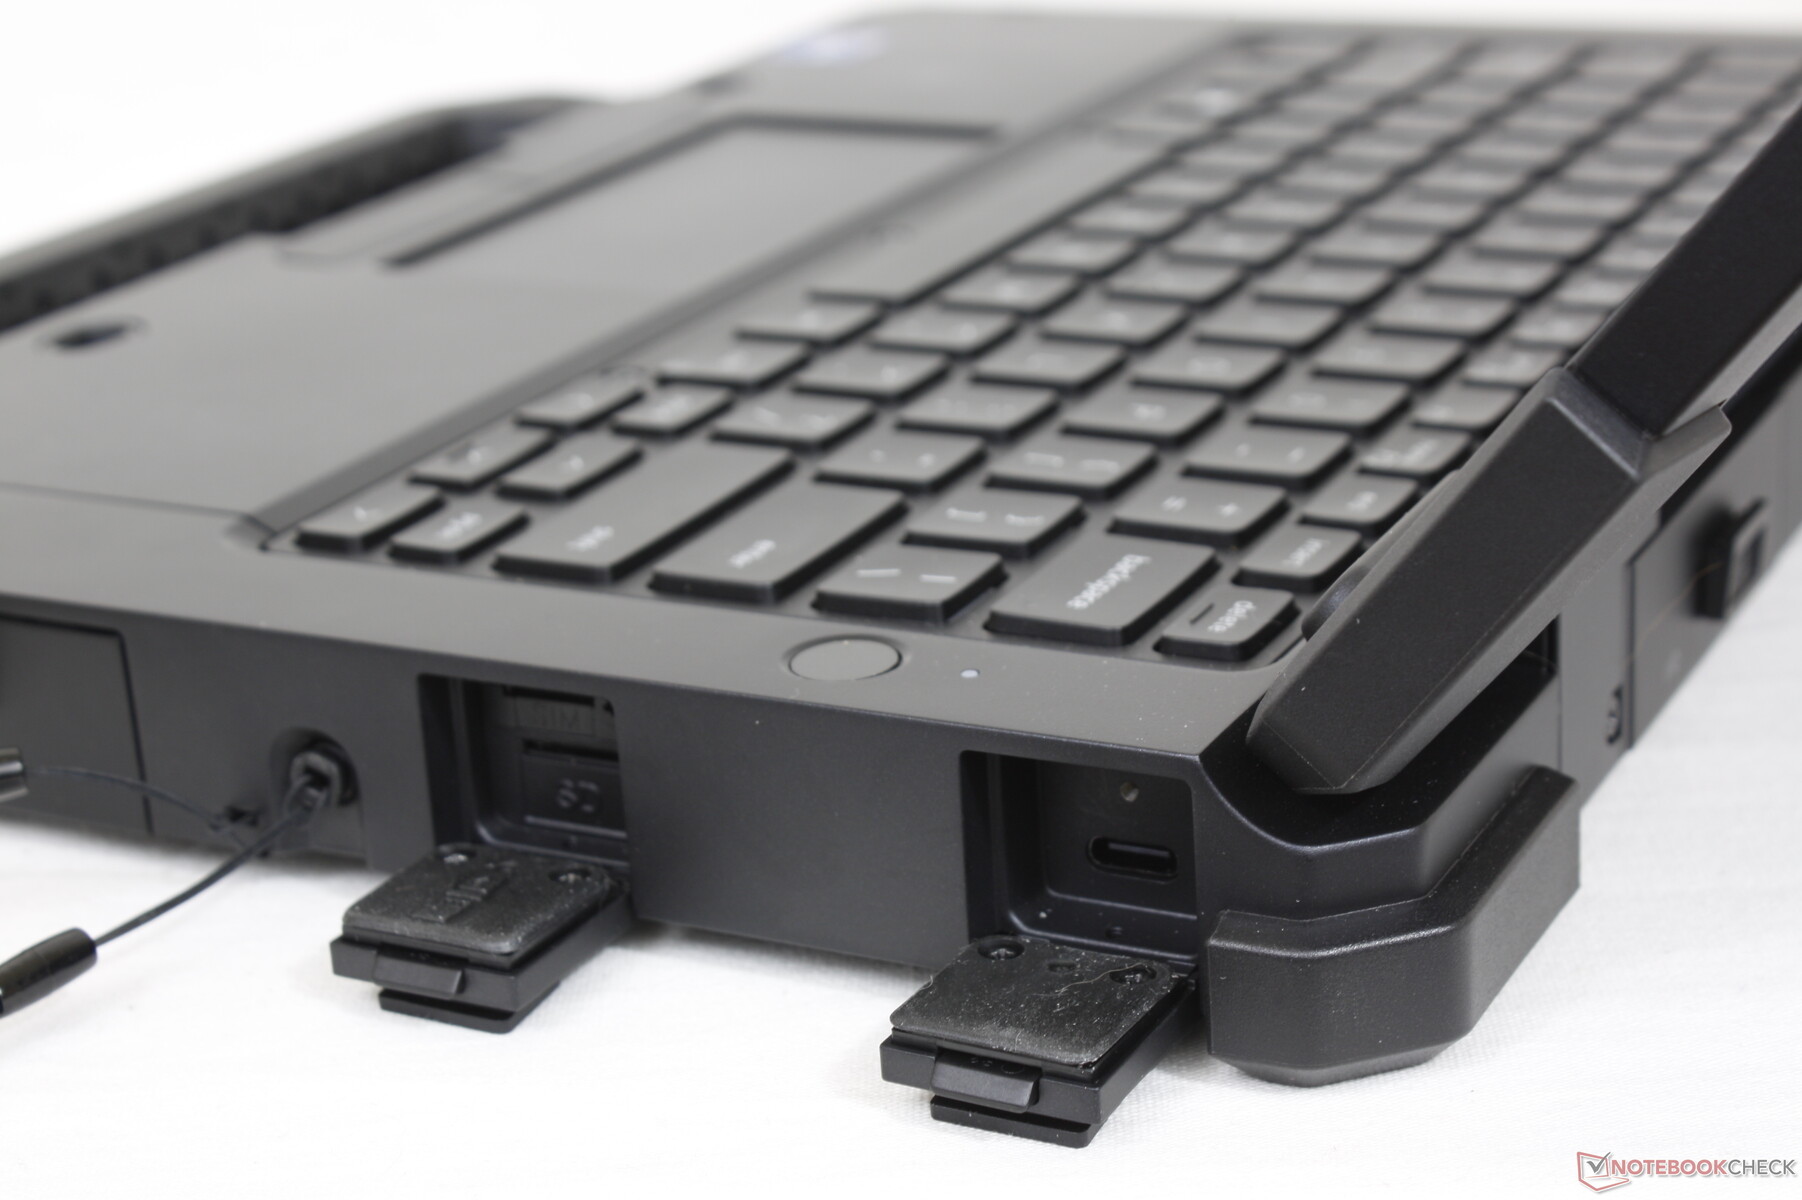
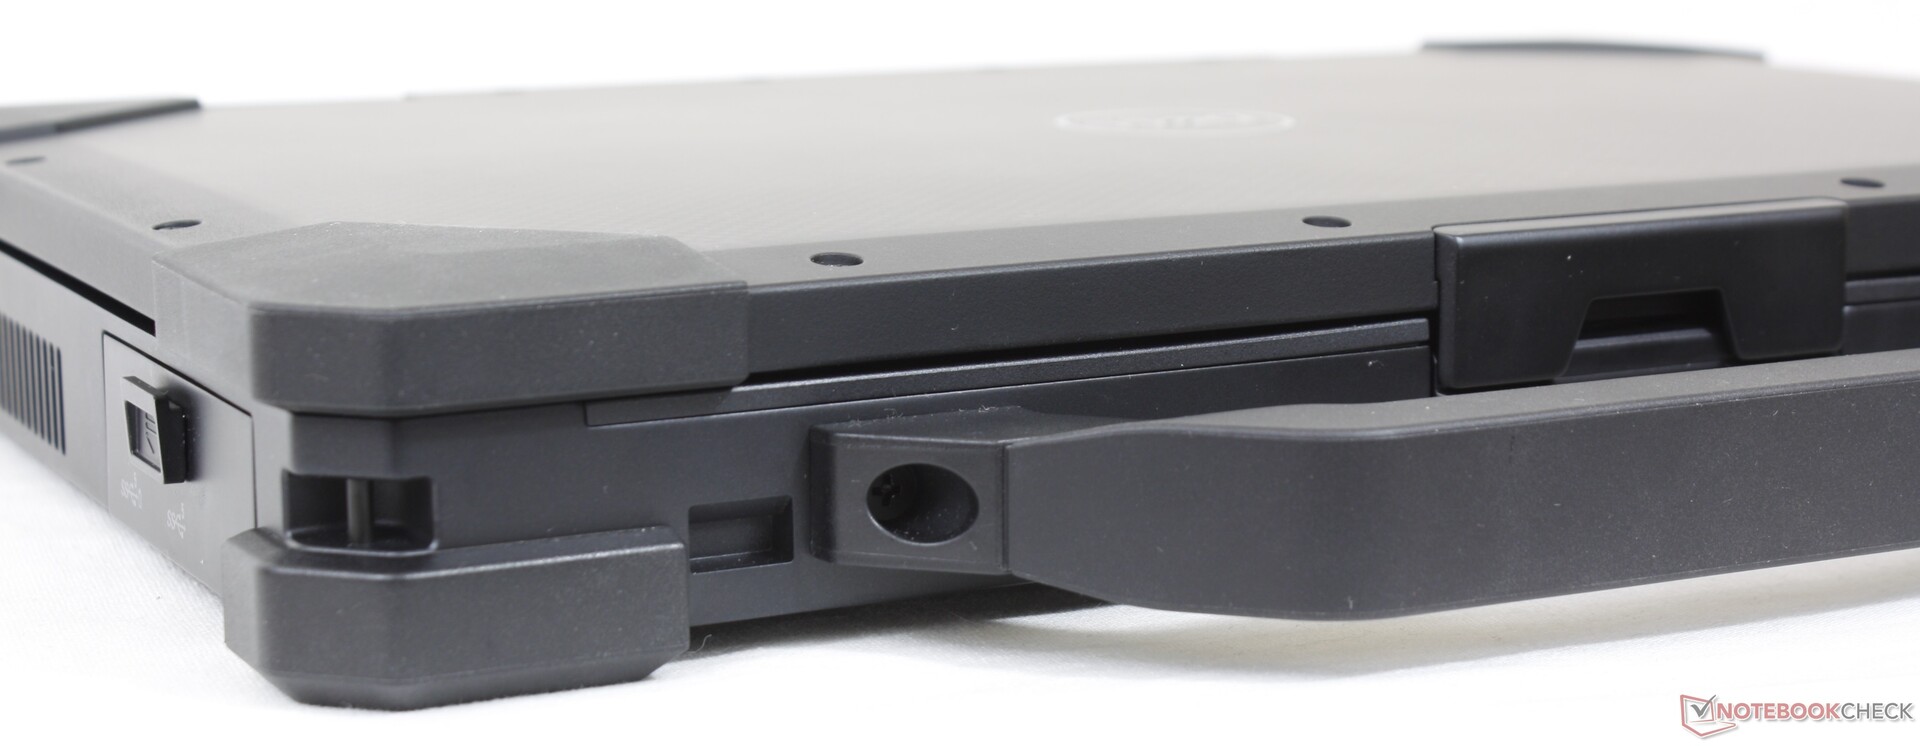
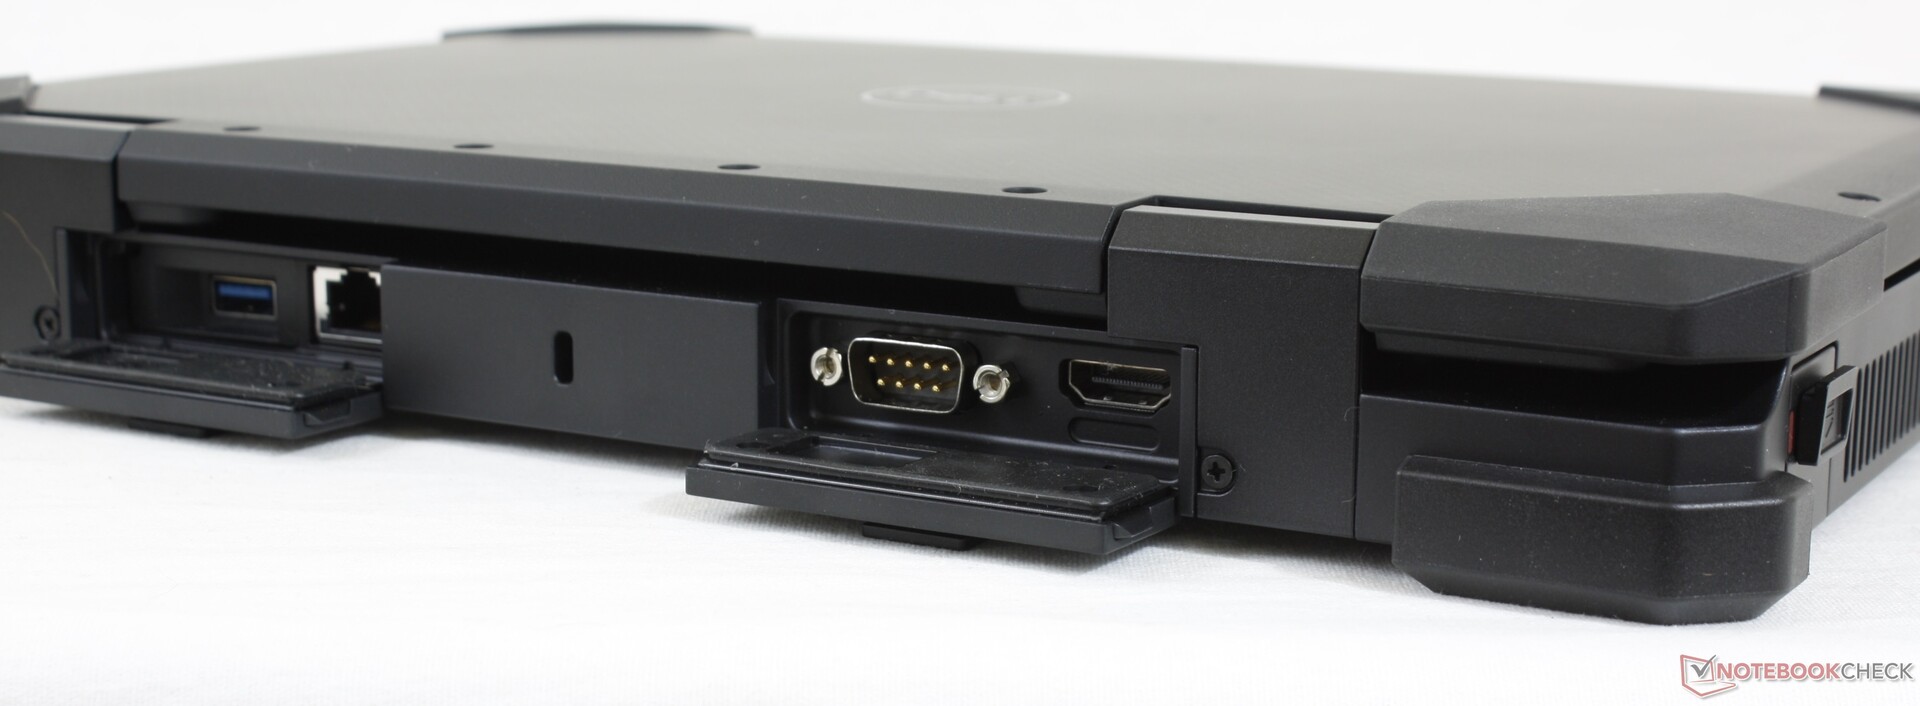
Las opciones de puerto son abundantes, con muchas que son opcionales, incluyendo los lectores de Smart Card y Express Card. Sin embargo, a diferencia del Getac B360, no hay puerto VGA, ni lector de DVD, ni soporte de almacenamiento.
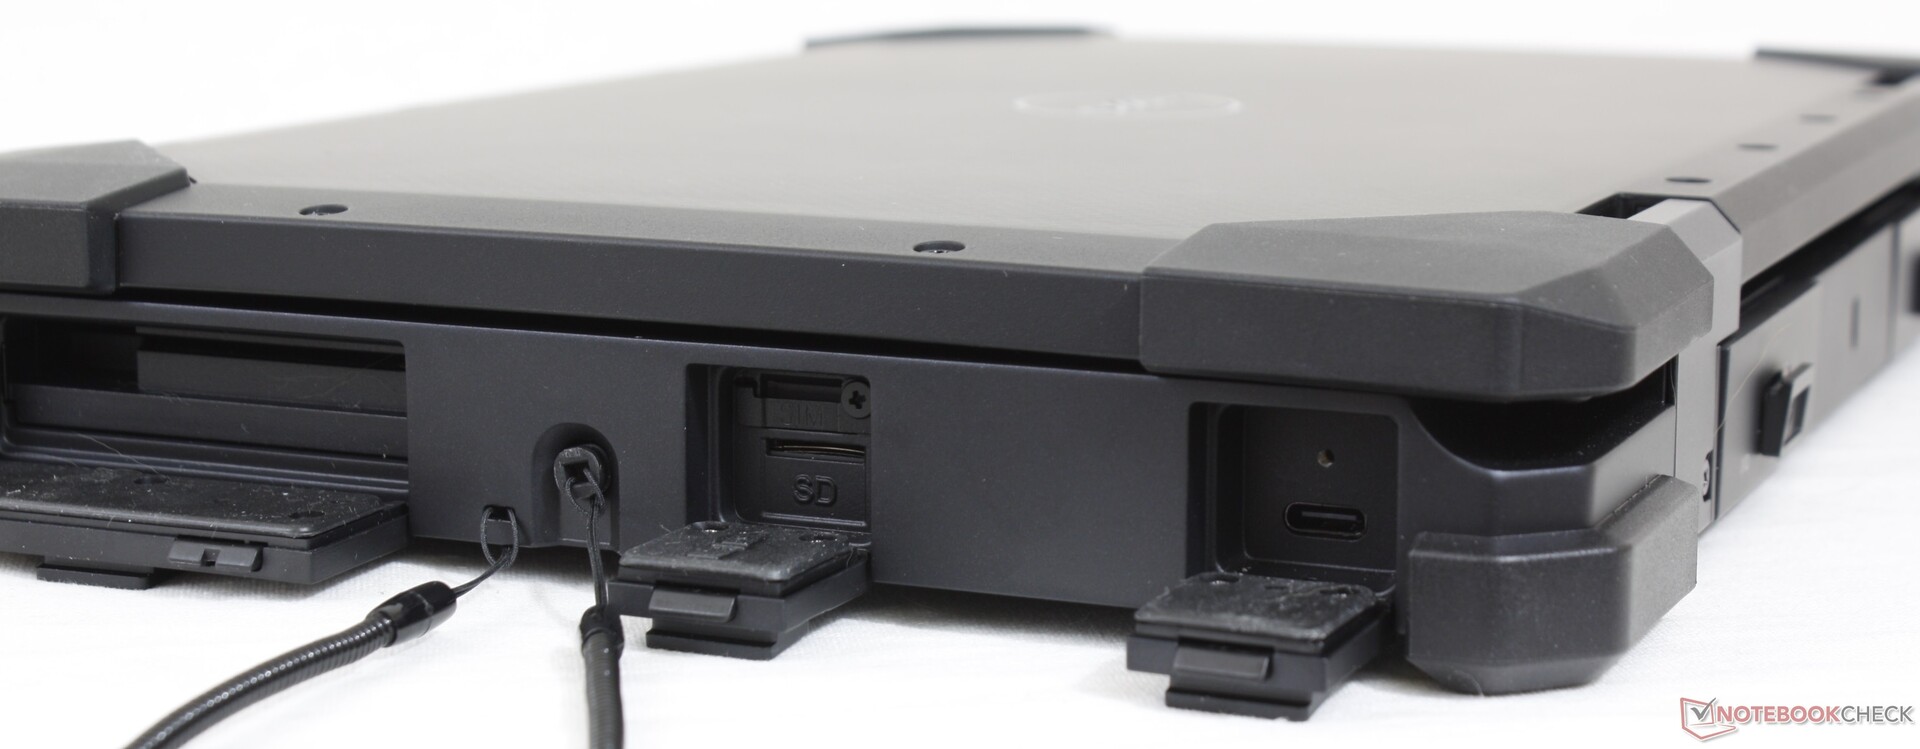
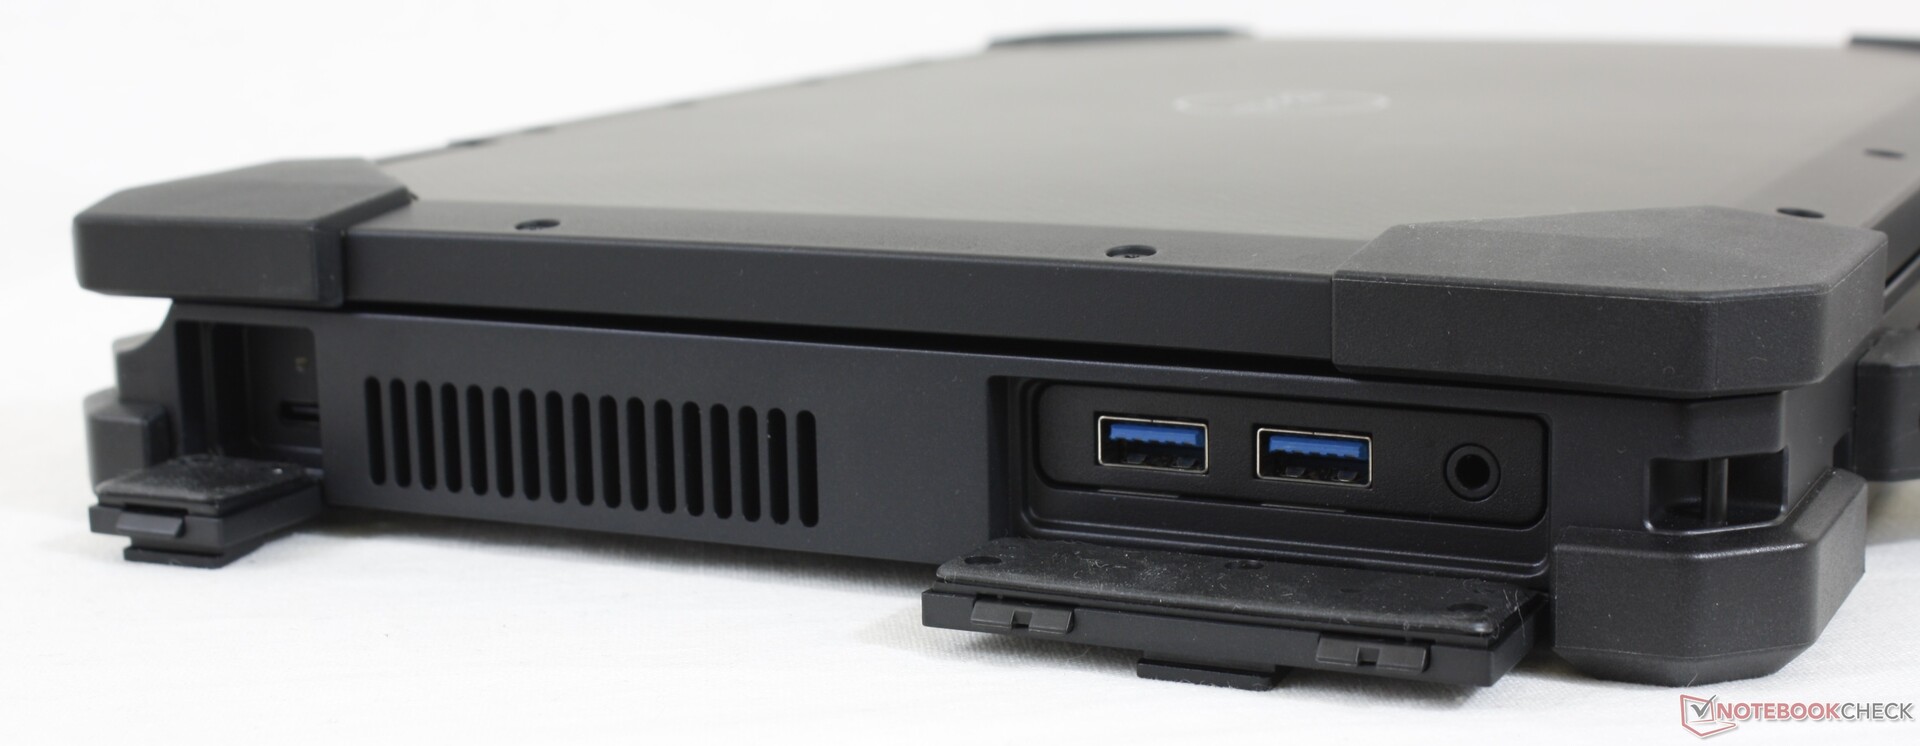
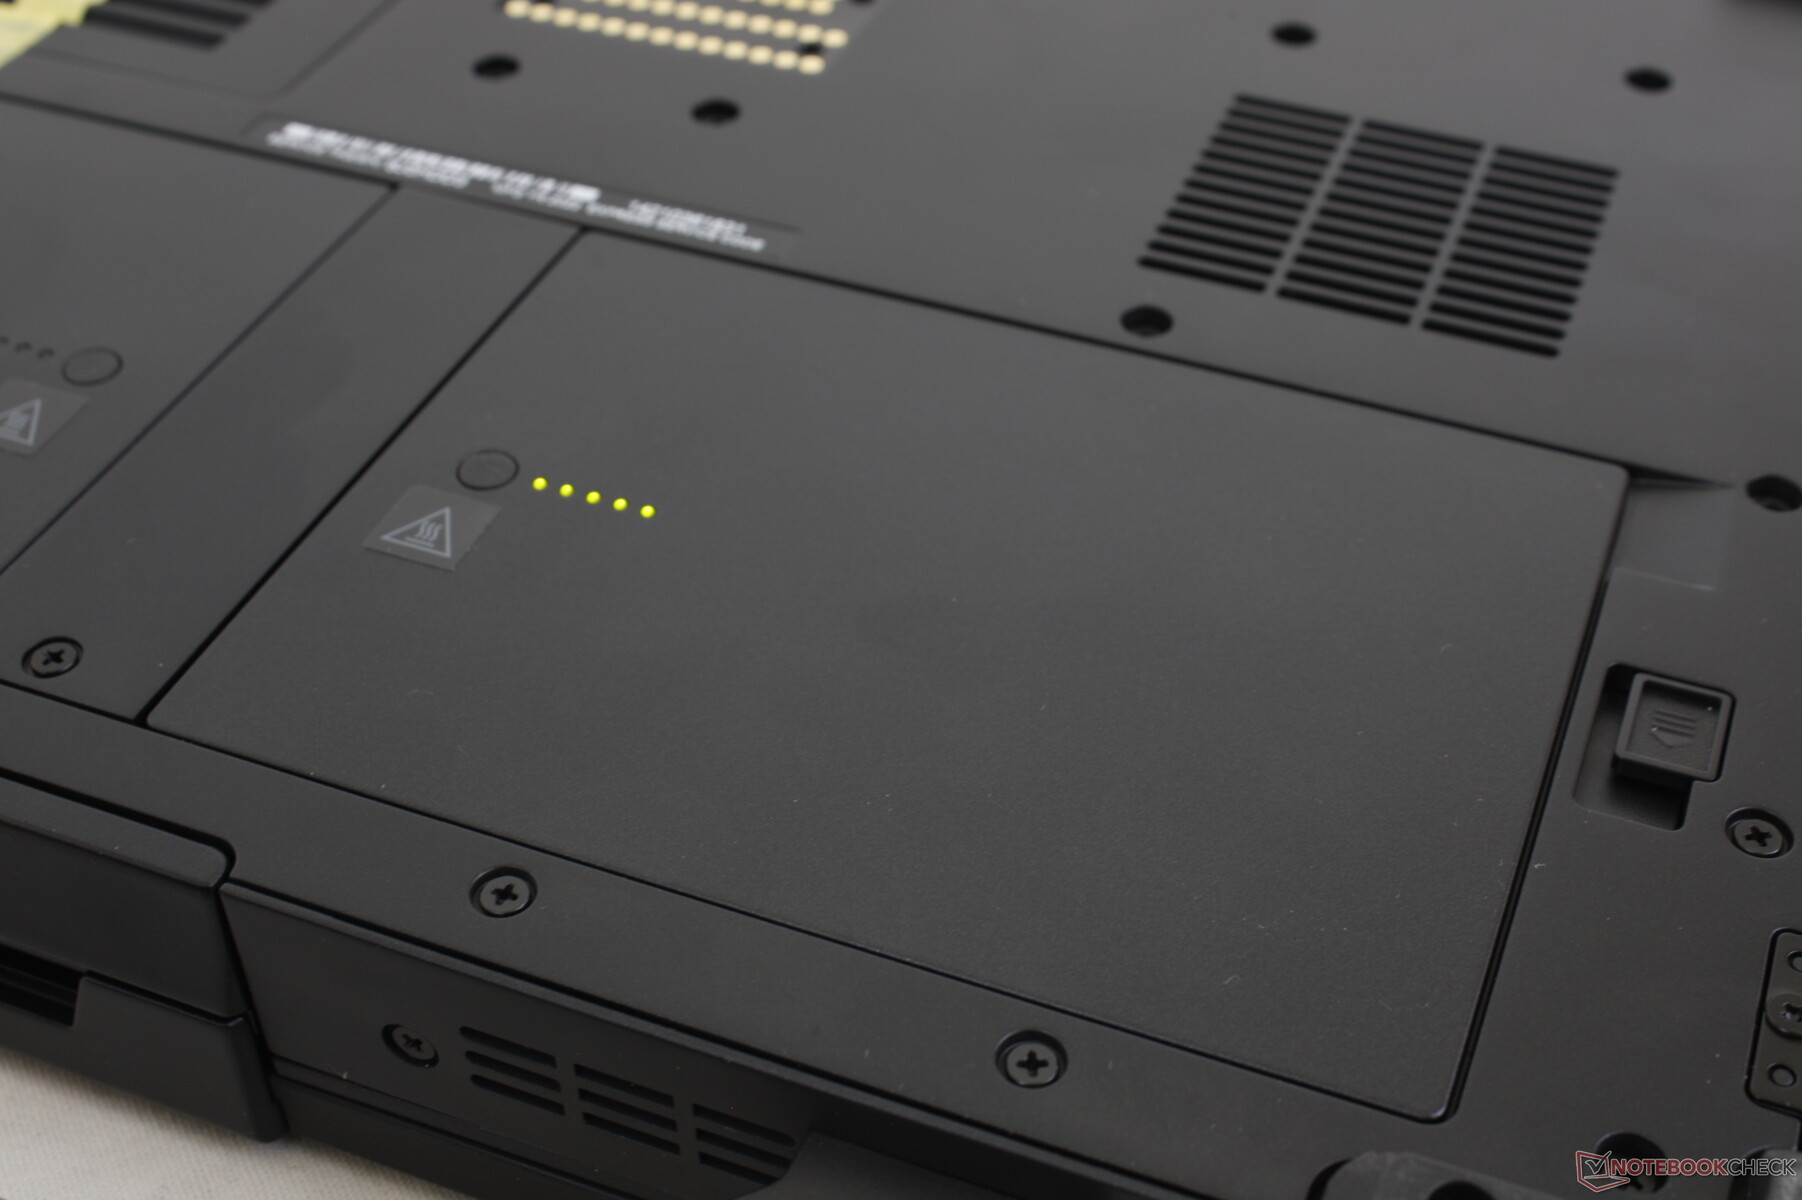
Lector de tarjetas SD
Las velocidades de transferencia del lector de MicroSD integrado con resorte son significativamente más rápidas que en la mayoría de los otros dispositivos robustos. Hay que tener en cuenta que la tarjeta MicroSD debe introducirse en la unidad al revés.
El acceso al lector puede ser especialmente difícil para los usuarios con manos grandes, ya que está empotrado detrás de una gruesa cubierta a lo largo del borde derecho.
| SD Card Reader | |
| average JPG Copy Test (av. of 3 runs) | |
| Dell Latitude 5420 Rugged-P85G (Toshiba Exceria Pro SDXC 64 GB UHS-II) | |
| Dell Latitude 7424 Rugged Extreme (Toshiba Exceria Pro SDXC 64 GB UHS-II) | |
| Dell Latitude 7330 Rugged Extreme (AV Pro V60) | |
| Fujitsu LifeBook U7310 (Toshiba Exceria Pro SDXC 64 GB UHS-II) | |
| Lenovo ThinkPad P15s Gen1-20T4000JGE (Toshiba Exceria Pro M501 64 GB UHS-II) | |
| Panasonic Toughbook FZ-55 MK2 (AV Pro V60) | |
| Acer Enduro Urban N3 EUN314 (AV Pro V60) | |
| Durabook S14I (Angelbird 128GB AV Pro UHS-II) | |
| maximum AS SSD Seq Read Test (1GB) | |
| Dell Latitude 5420 Rugged-P85G (Toshiba Exceria Pro SDXC 64 GB UHS-II) | |
| Dell Latitude 7424 Rugged Extreme (Toshiba Exceria Pro SDXC 64 GB UHS-II) | |
| Dell Latitude 7330 Rugged Extreme (AV Pro V60) | |
| Panasonic Toughbook FZ-55 MK2 (AV Pro V60) | |
| Fujitsu LifeBook U7310 (Toshiba Exceria Pro SDXC 64 GB UHS-II) | |
| Lenovo ThinkPad P15s Gen1-20T4000JGE (Toshiba Exceria Pro M501 64 GB UHS-II) | |
| Durabook S14I (Angelbird 128GB AV Pro UHS-II) | |
| Acer Enduro Urban N3 EUN314 (AV Pro V60) | |
Comunicación
El Intel AX210 es opcional para la conectividad Wi-Fi 6. Los usuarios también pueden configurar con el Qualcomm SDX55 o Snapdragon X20 para la conectividad WAN.
Cámara web
Una webcam de 2,1 MP con obturador manual de privacidad viene de serie en lugar del habitual sensor de 1 MP. También es compatible con Windows Hello.


Mantenimiento
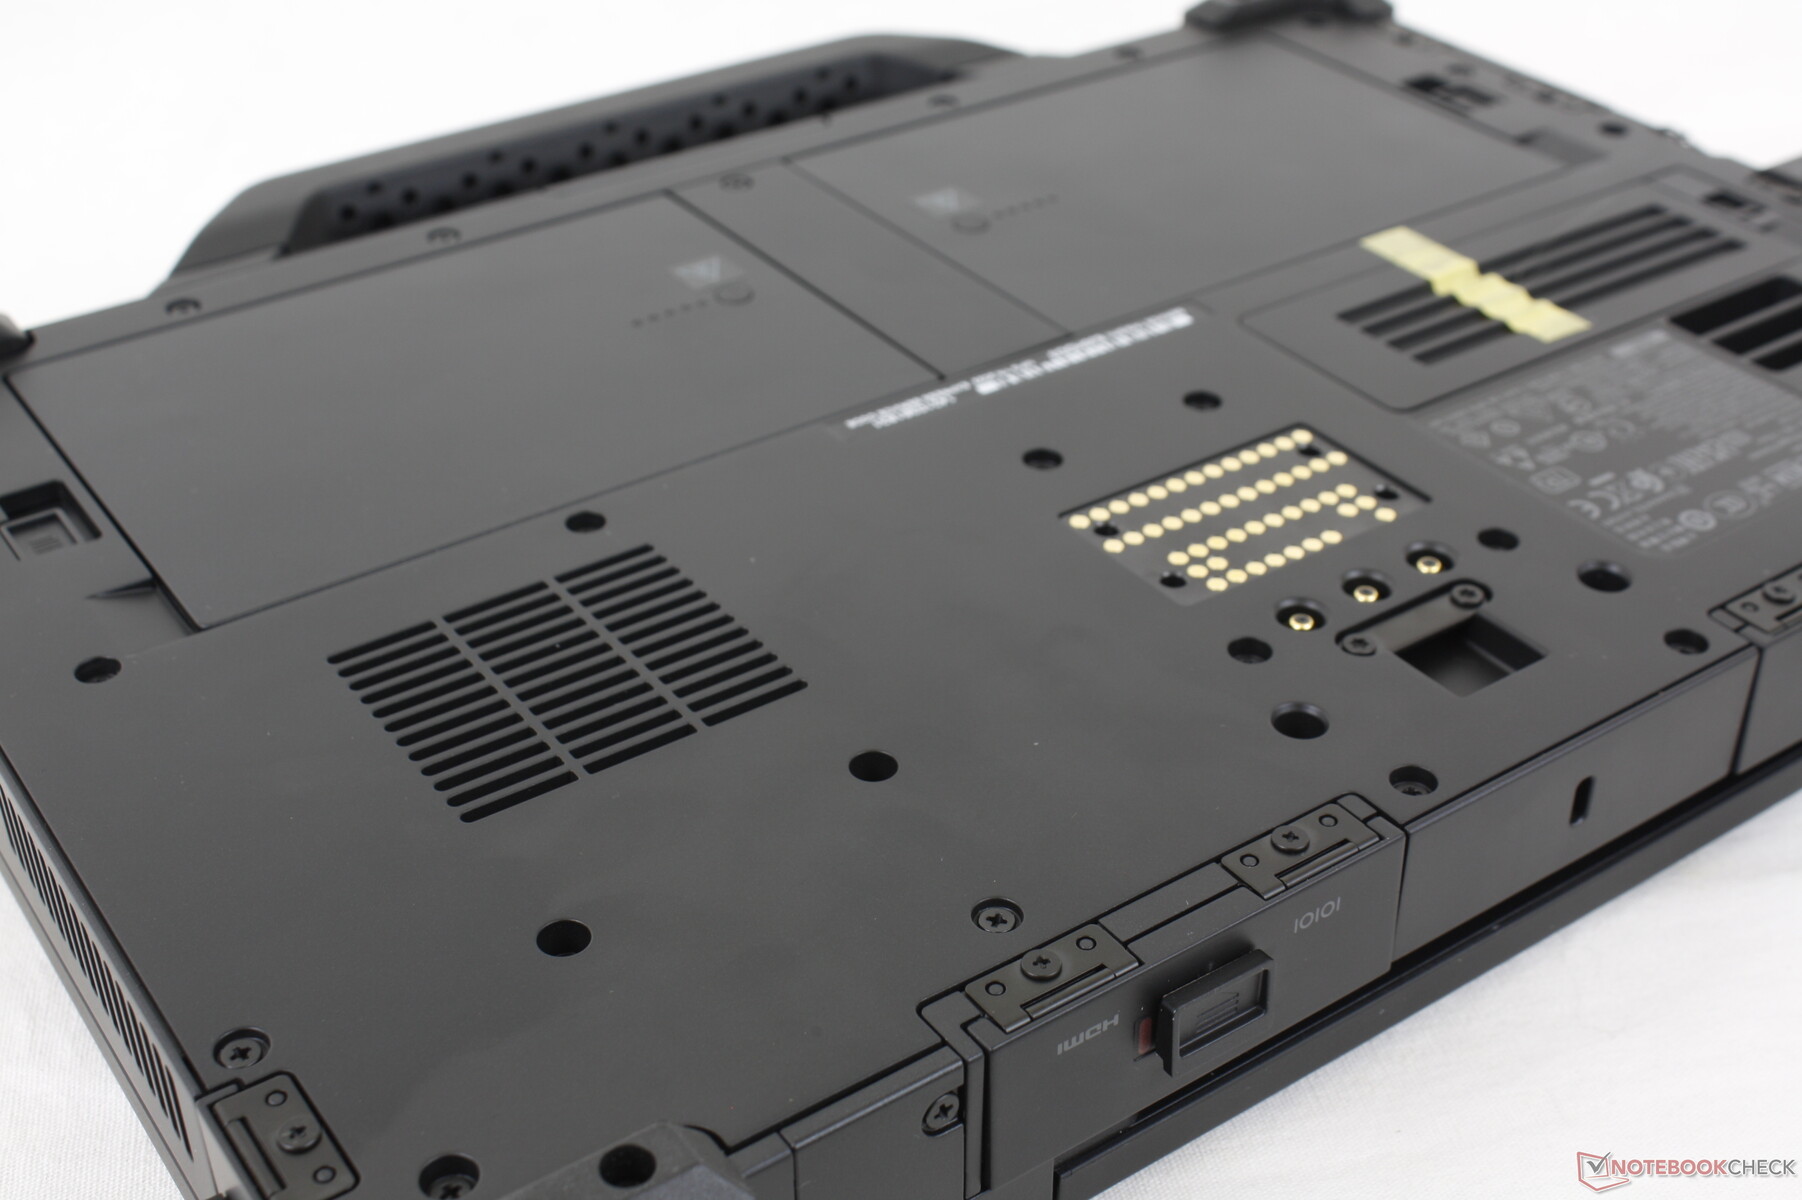
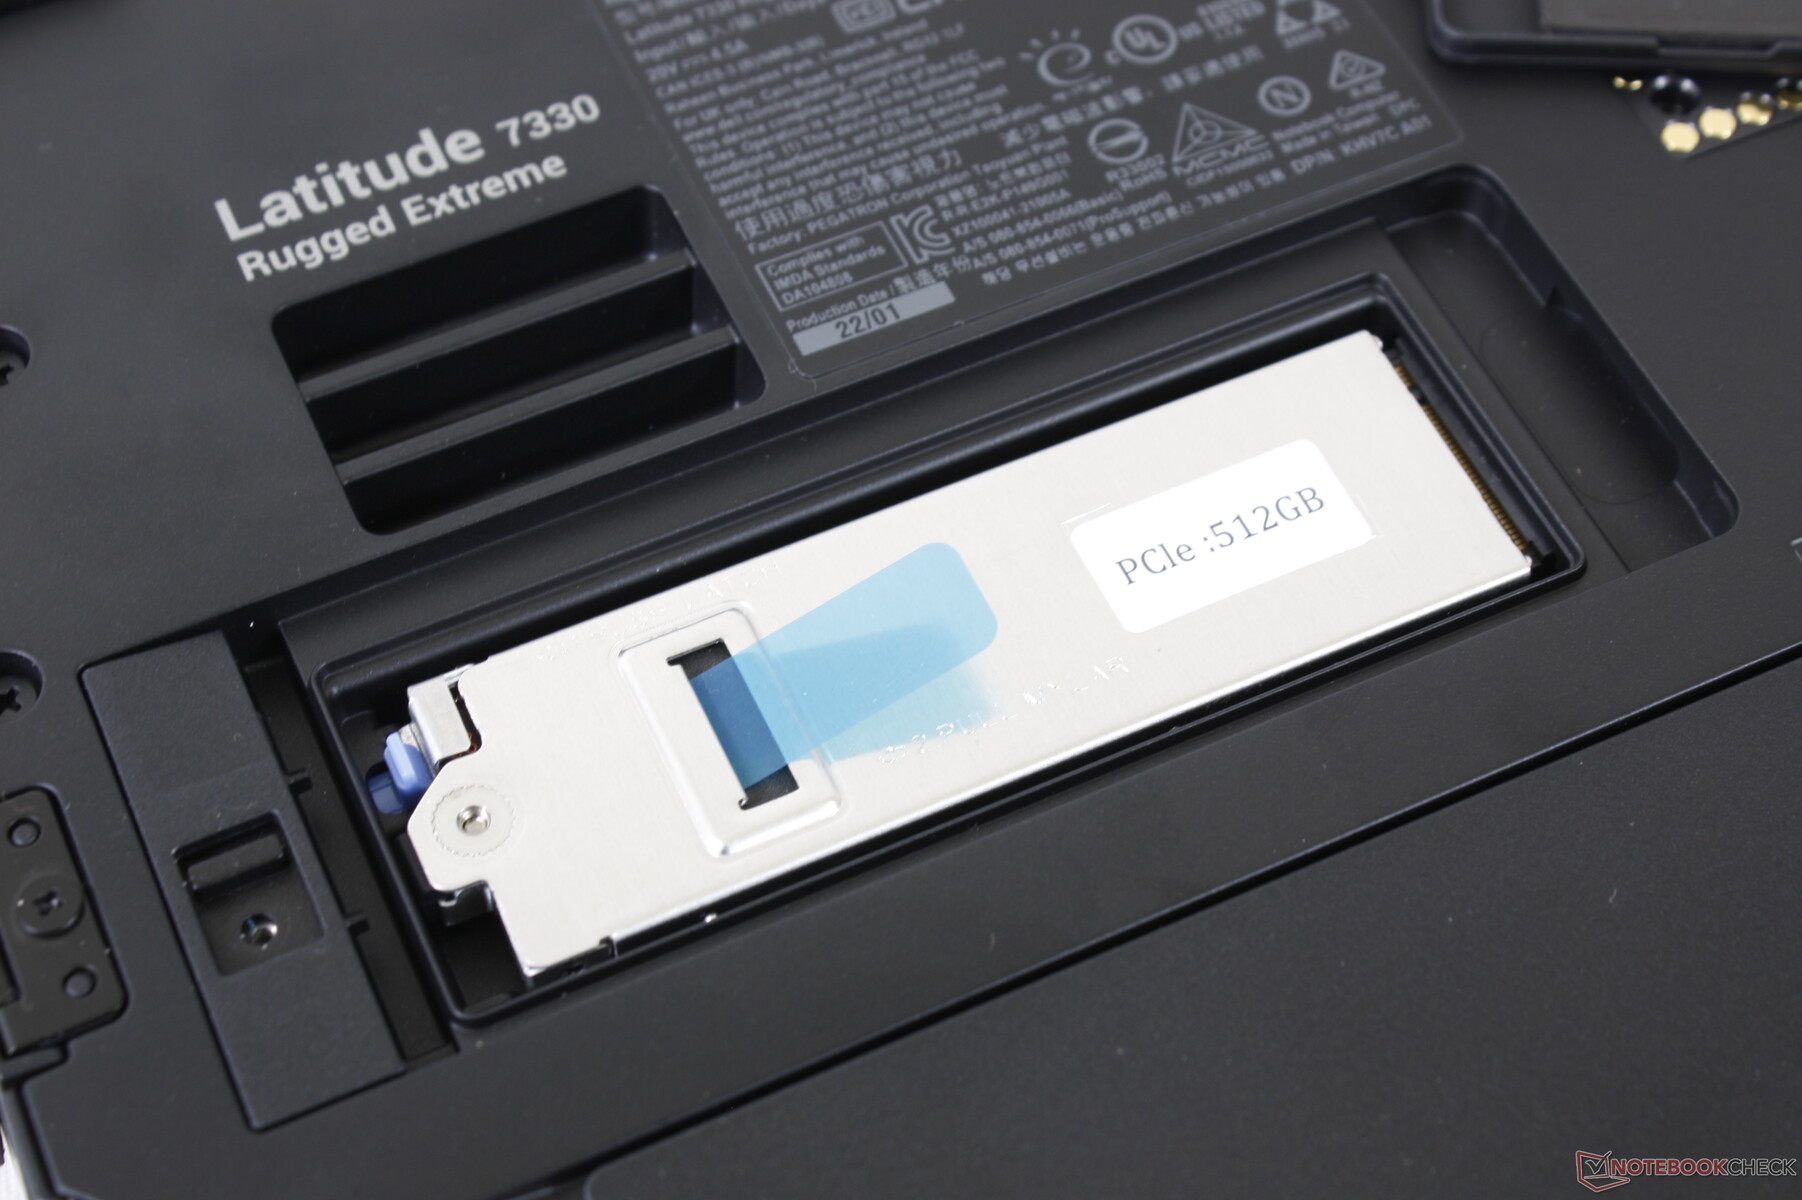
El panel inferior es relativamente fácil de quitar siempre y cuando tengas la paciencia de desatornillar sus más de dos docenas de tornillos Philips. En la mayoría de los casos no habrá razón para hacerlo, ya que la RAM está soldada y la única bahía de almacenamiento ya es accesible a través de una pequeña escotilla.
Accesorios y garantía
Existen accesorios opcionales para aprovechar las clavijas de acoplamiento patentadas en la parte inferior de la unidad. Una garantía limitada de tres años del fabricante viene de serie.
Dispositivos de entrada
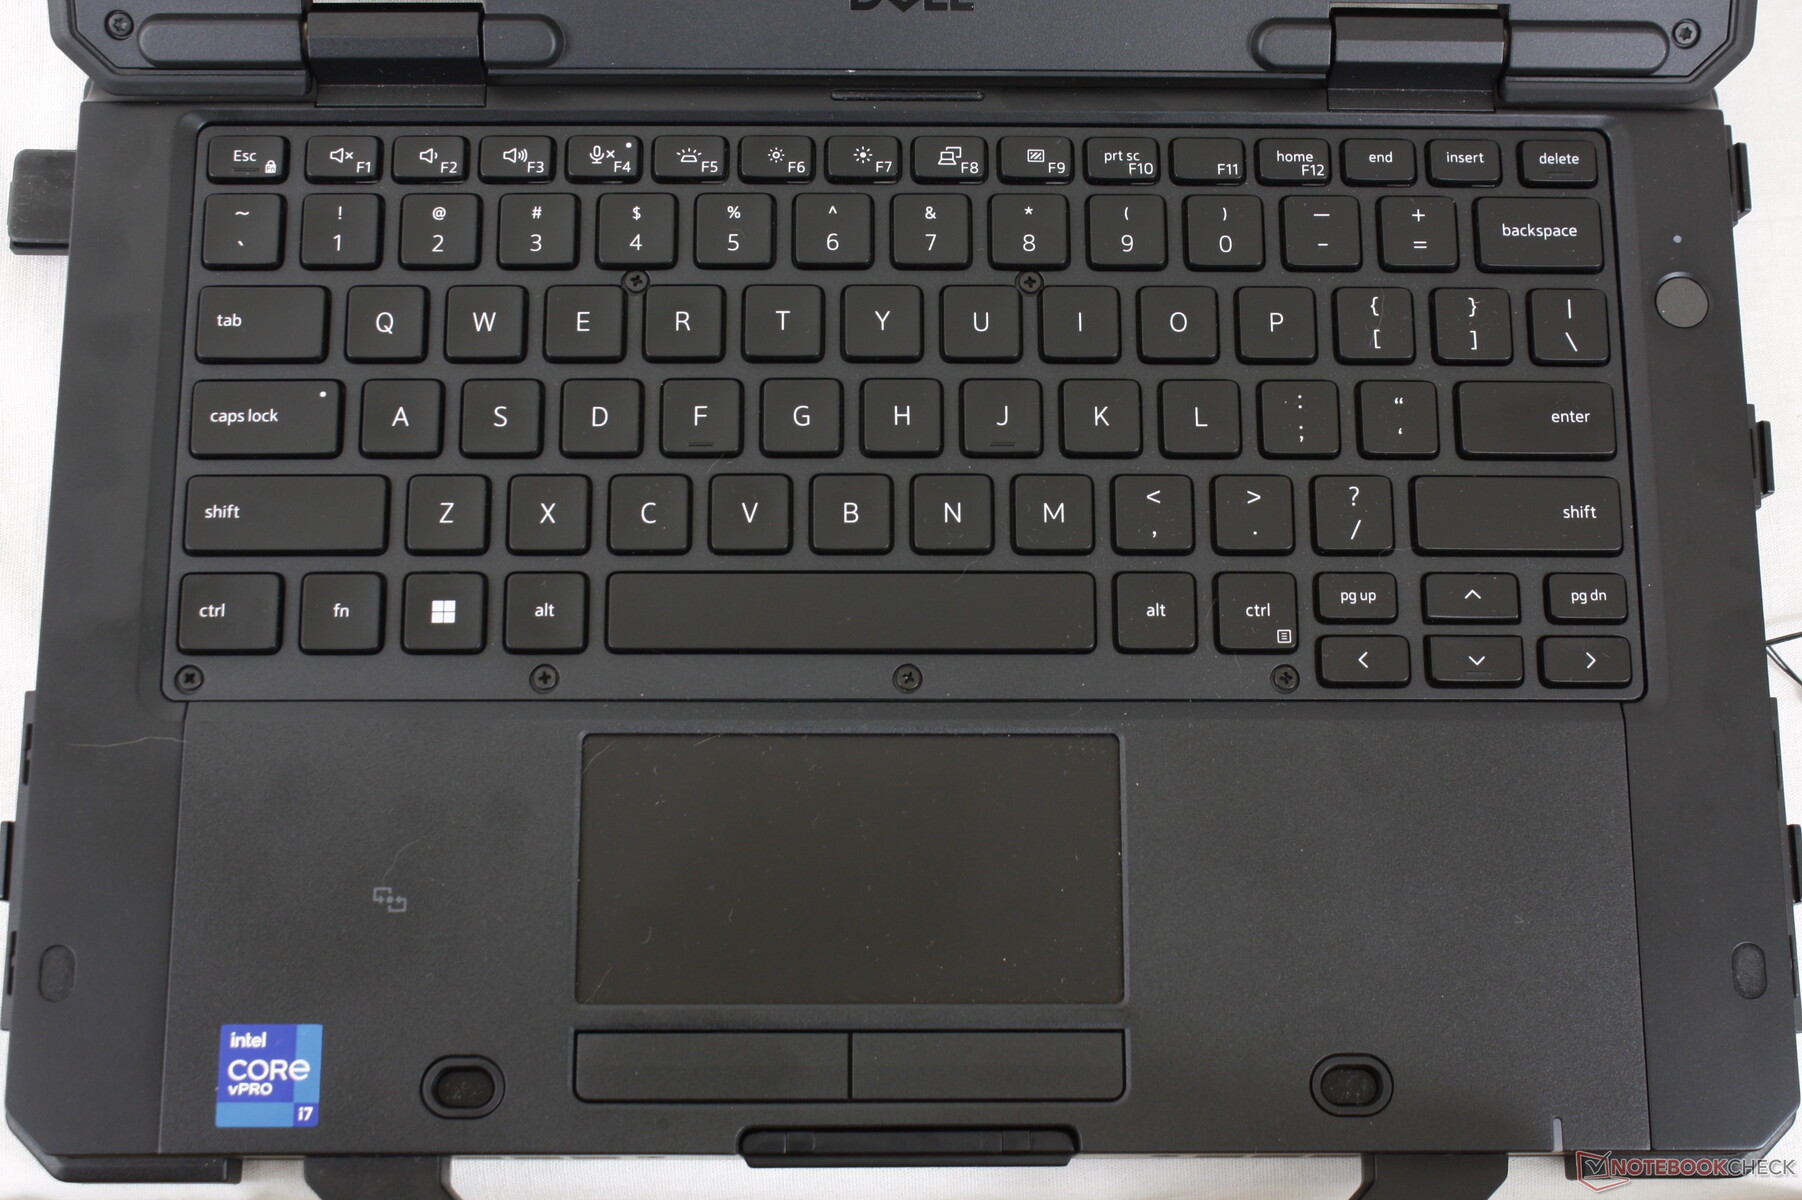
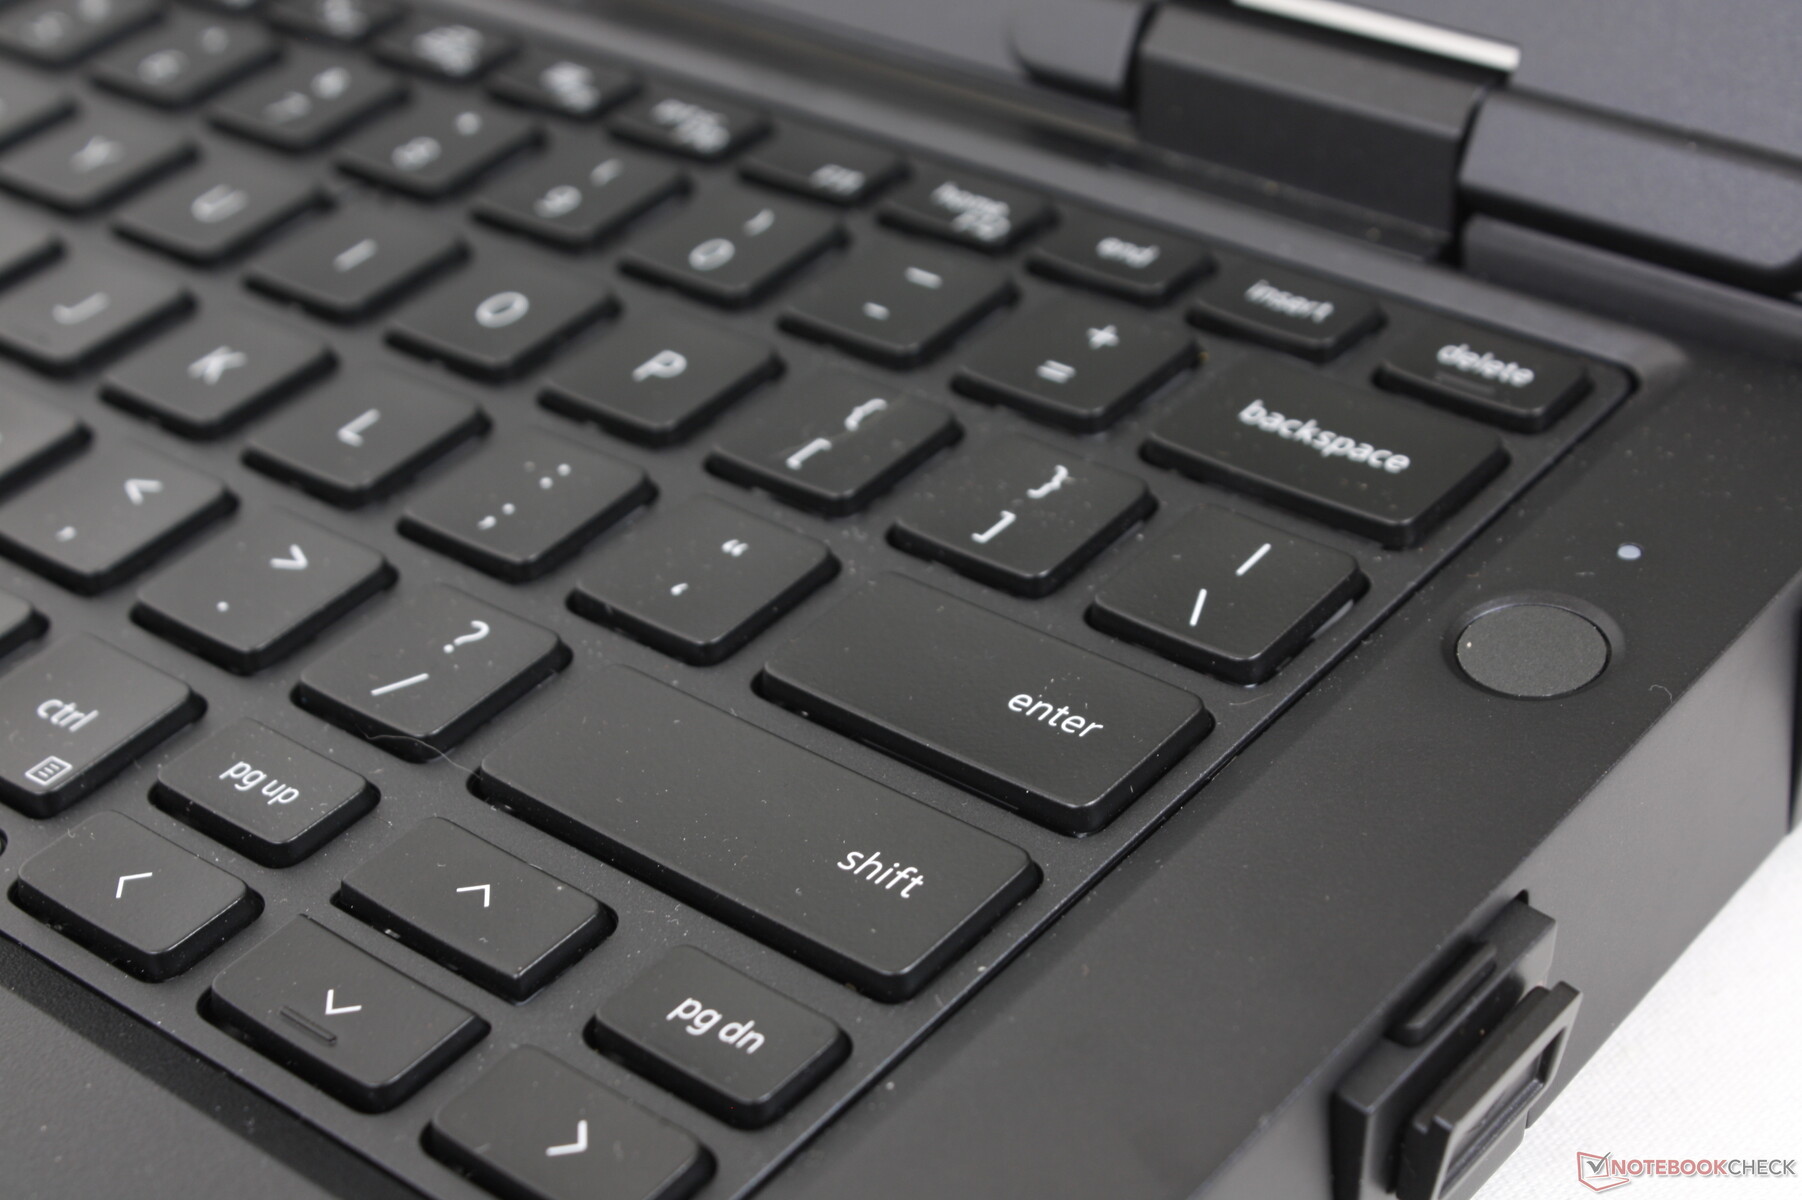
Teclado
En comparación con el teclado de la serie Getac B360, el teclado del Dell es ligeramente más suave y silencioso, pero no necesariamente menos cómodo para escribir. Los usuarios pueden preferir tener teclas más silenciosas dependiendo del escenario de uso. Sin embargo, preferimos la retroiluminación roja del B360, ya que es un poco más fácil para los ojos que la retroiluminación blanca del Dell.
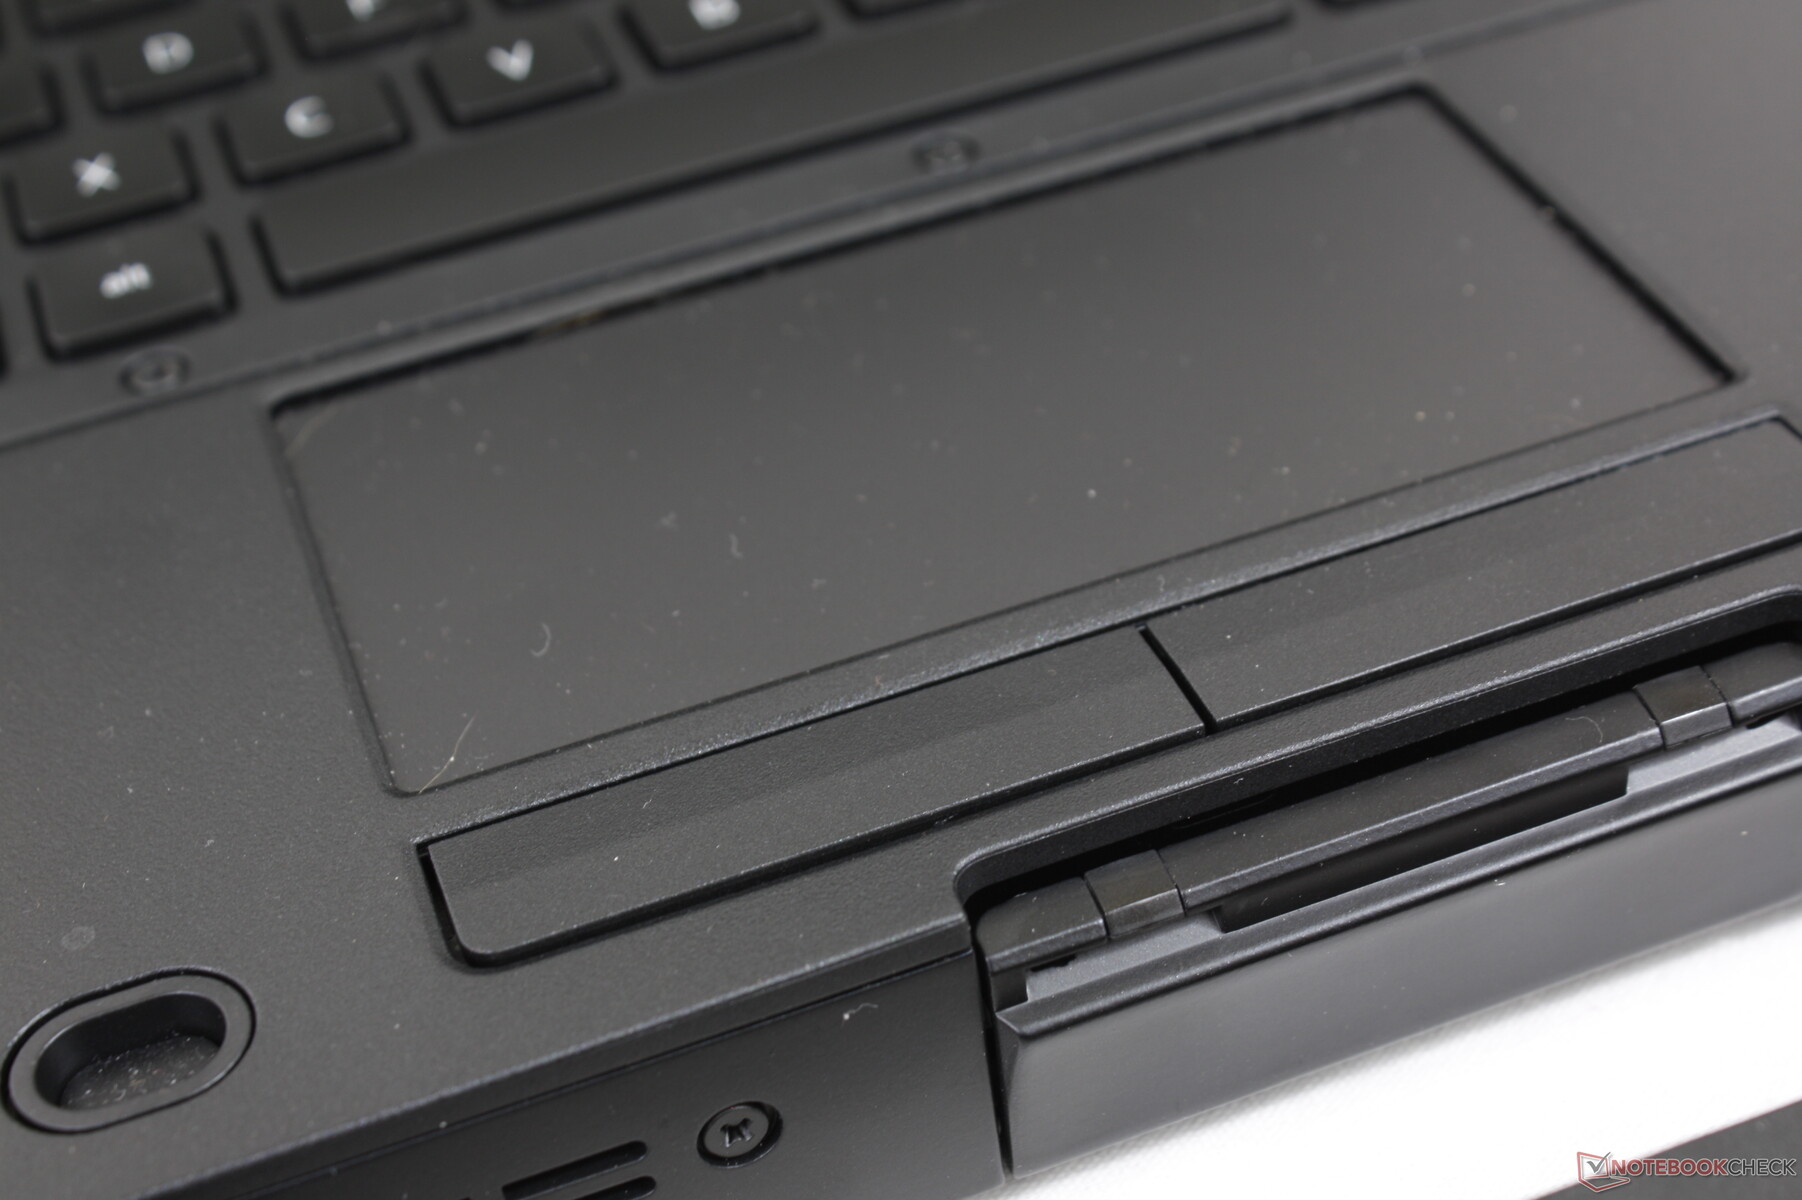
Teclado táctil
El trackpad tiene un tamaño razonable de 10 x 5 cm frente a los 9,3 x 5,3 cm del Getac B360. Aunque la tracción es suave, el control del cursor es saltarín ya que el trackpad ha sido diseñado para reconocer también las entradas de los guantes. Recomendamos presionar más firmemente la superficie del trackpad para reducir los saltos.

Mostrar
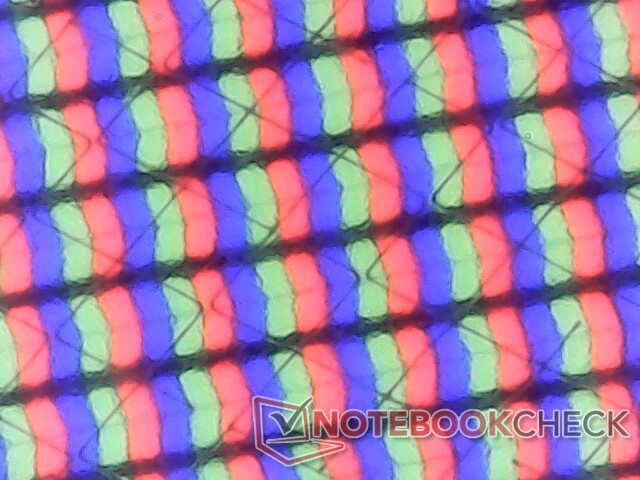
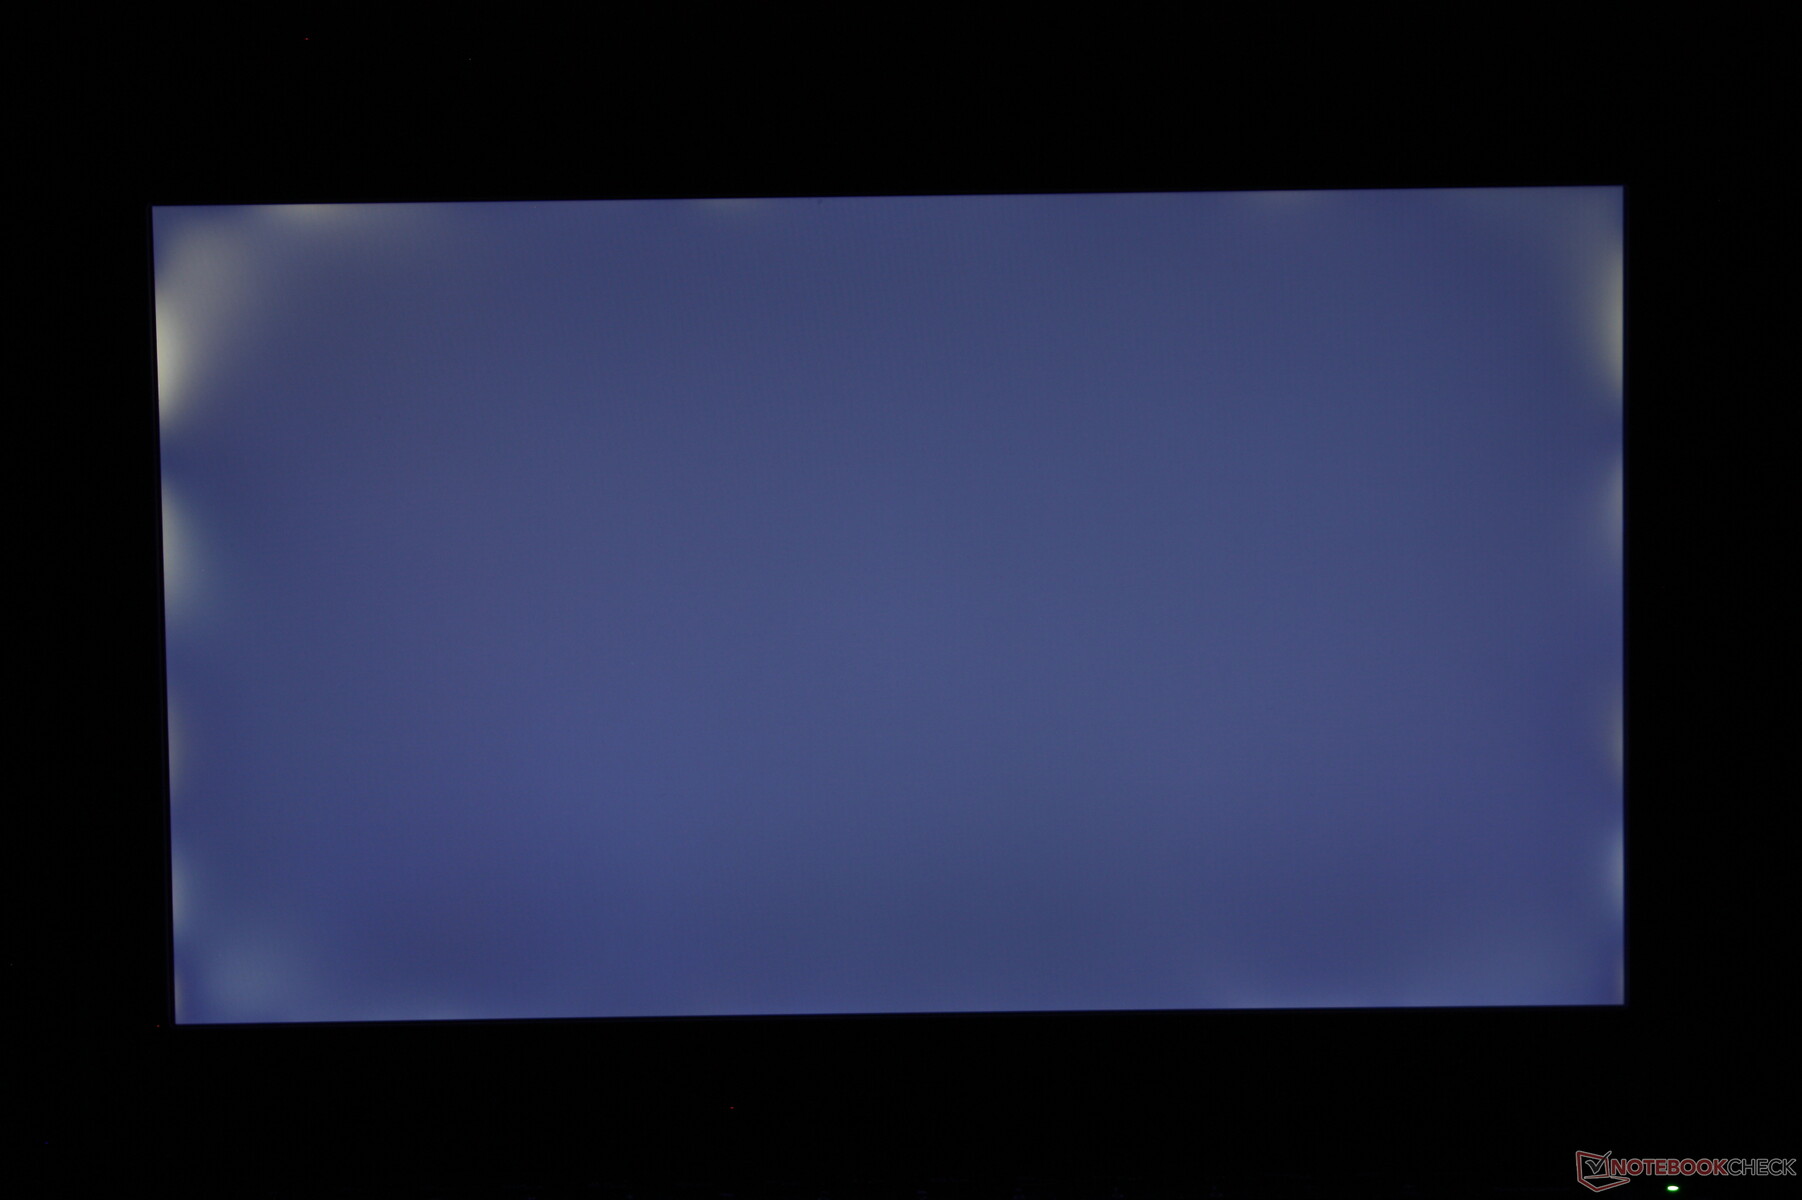
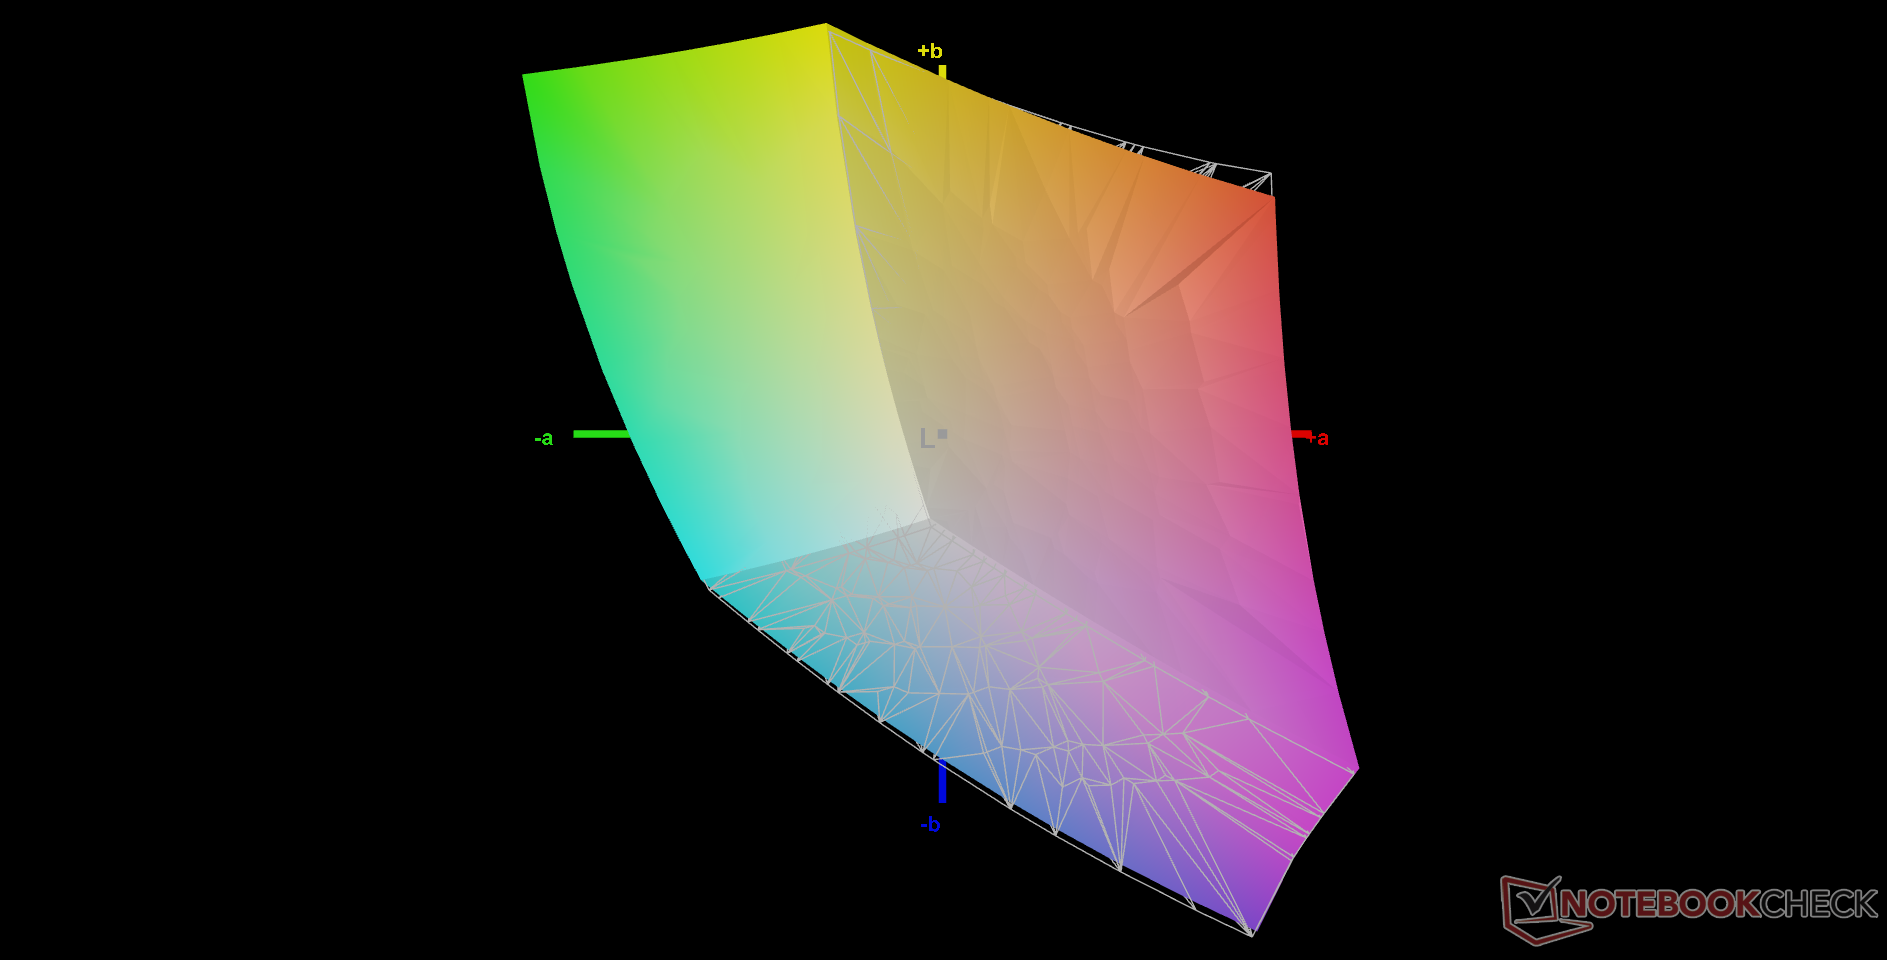
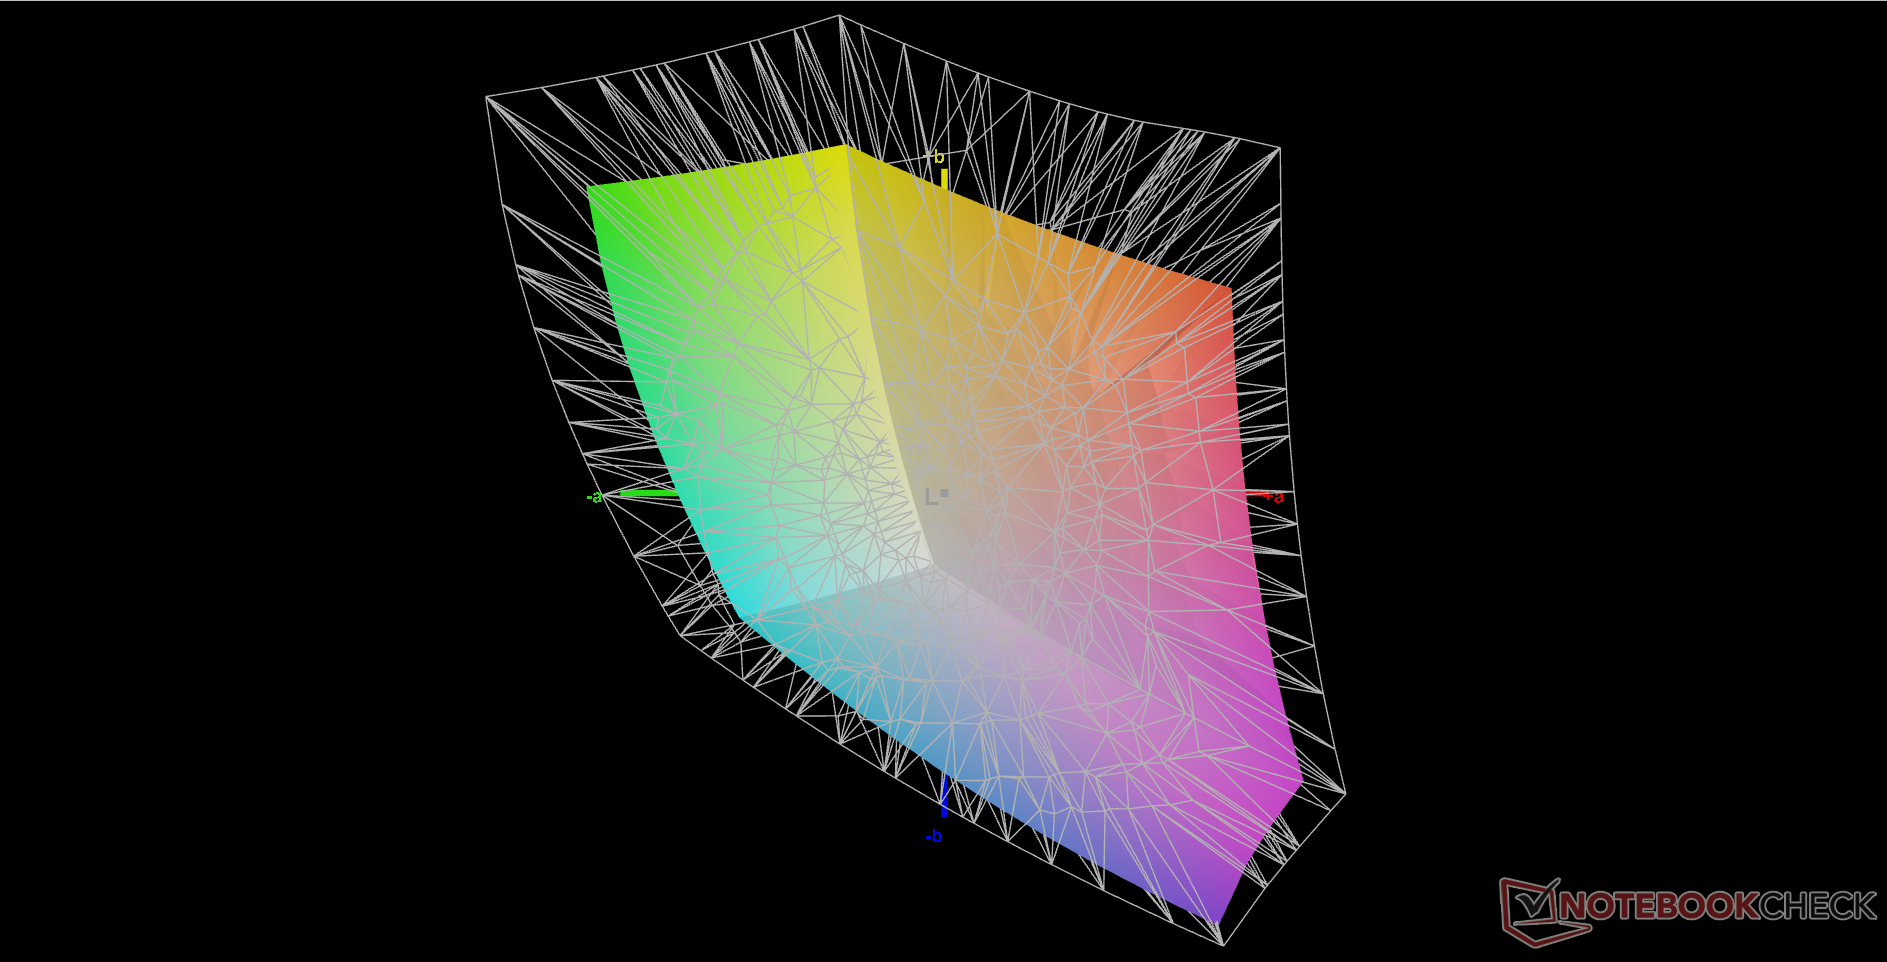
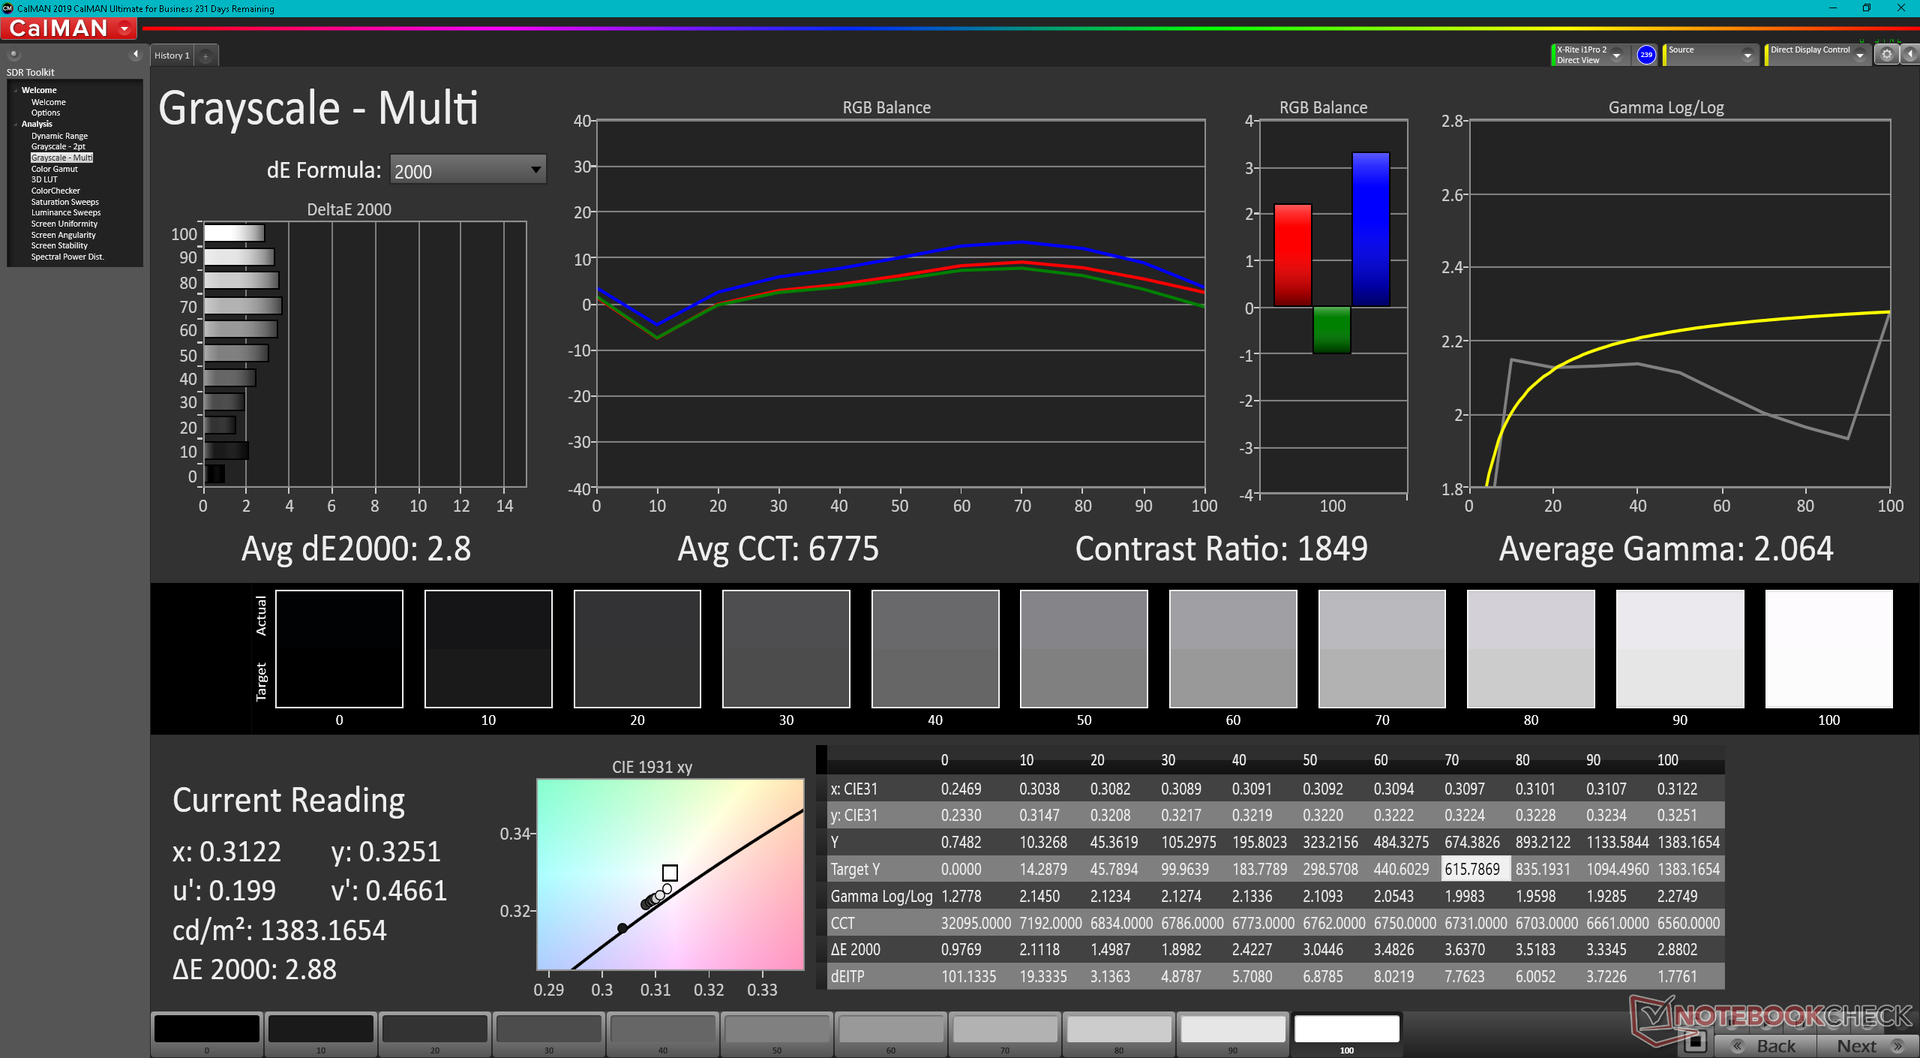
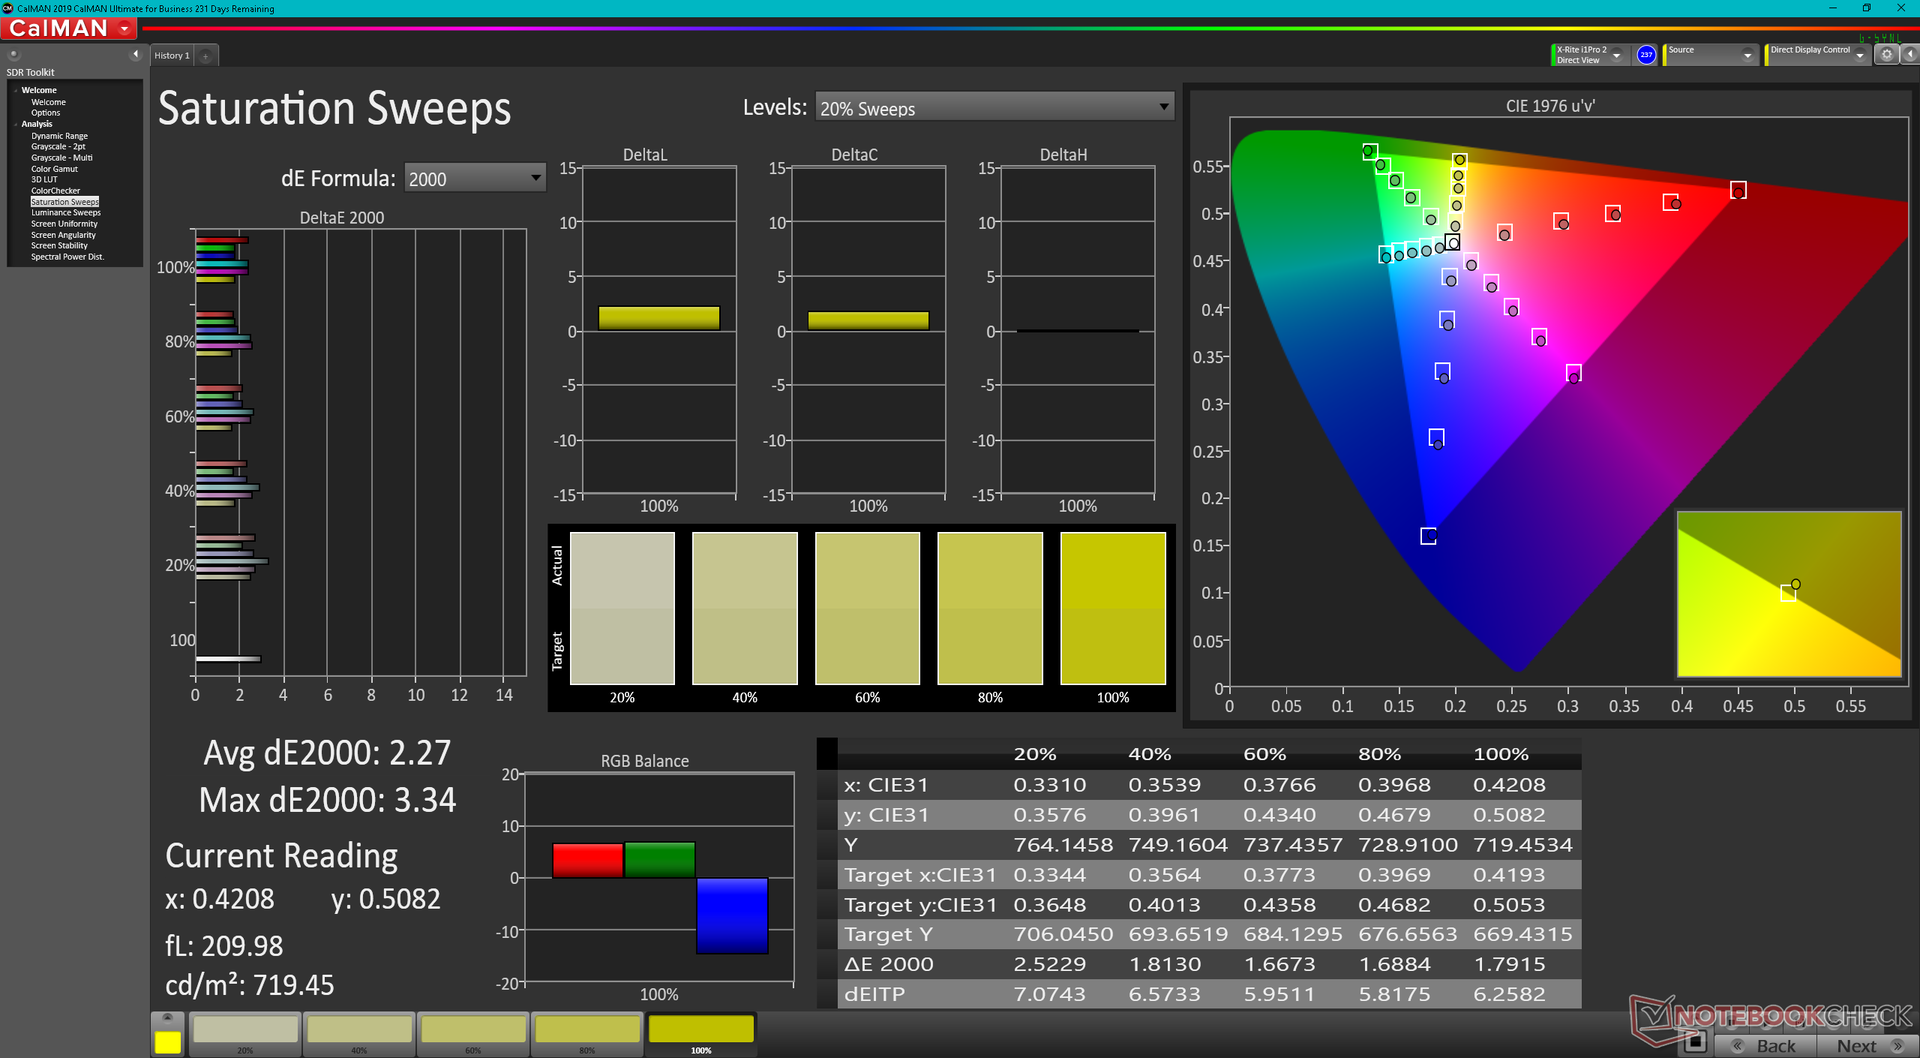
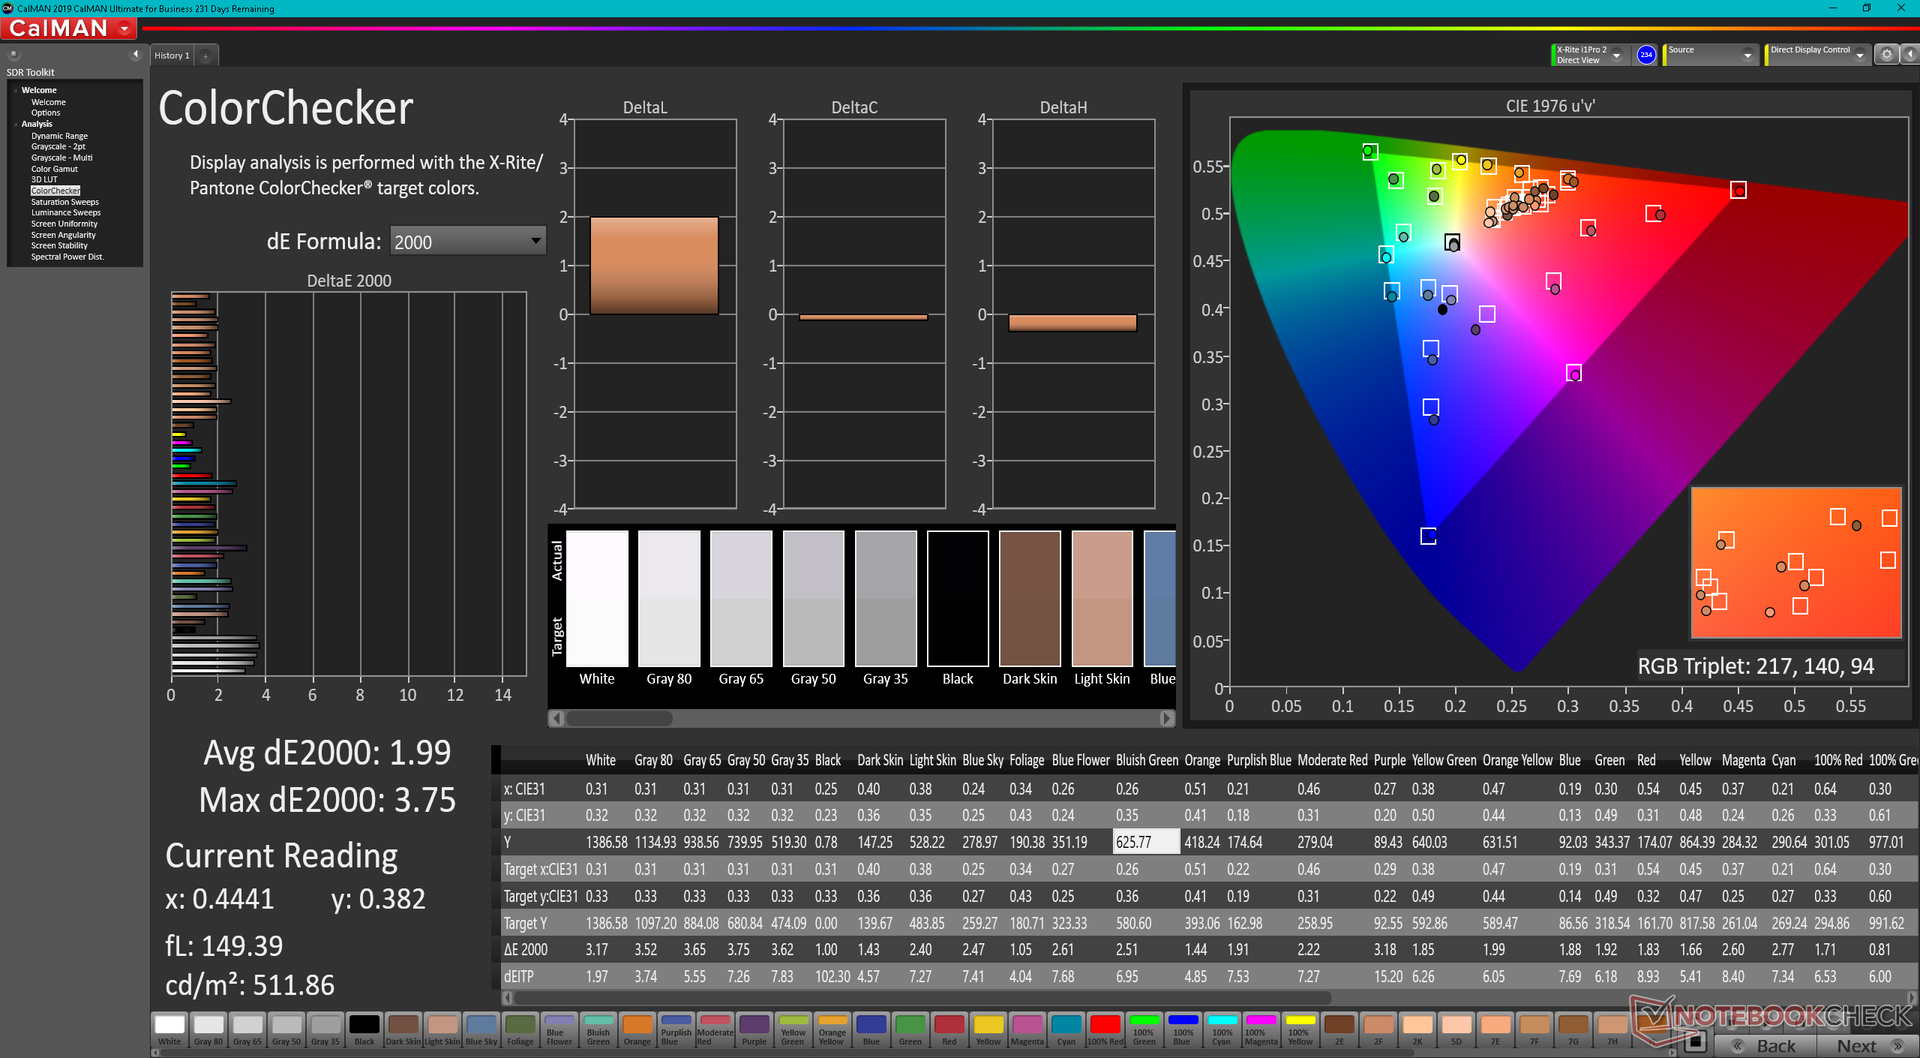
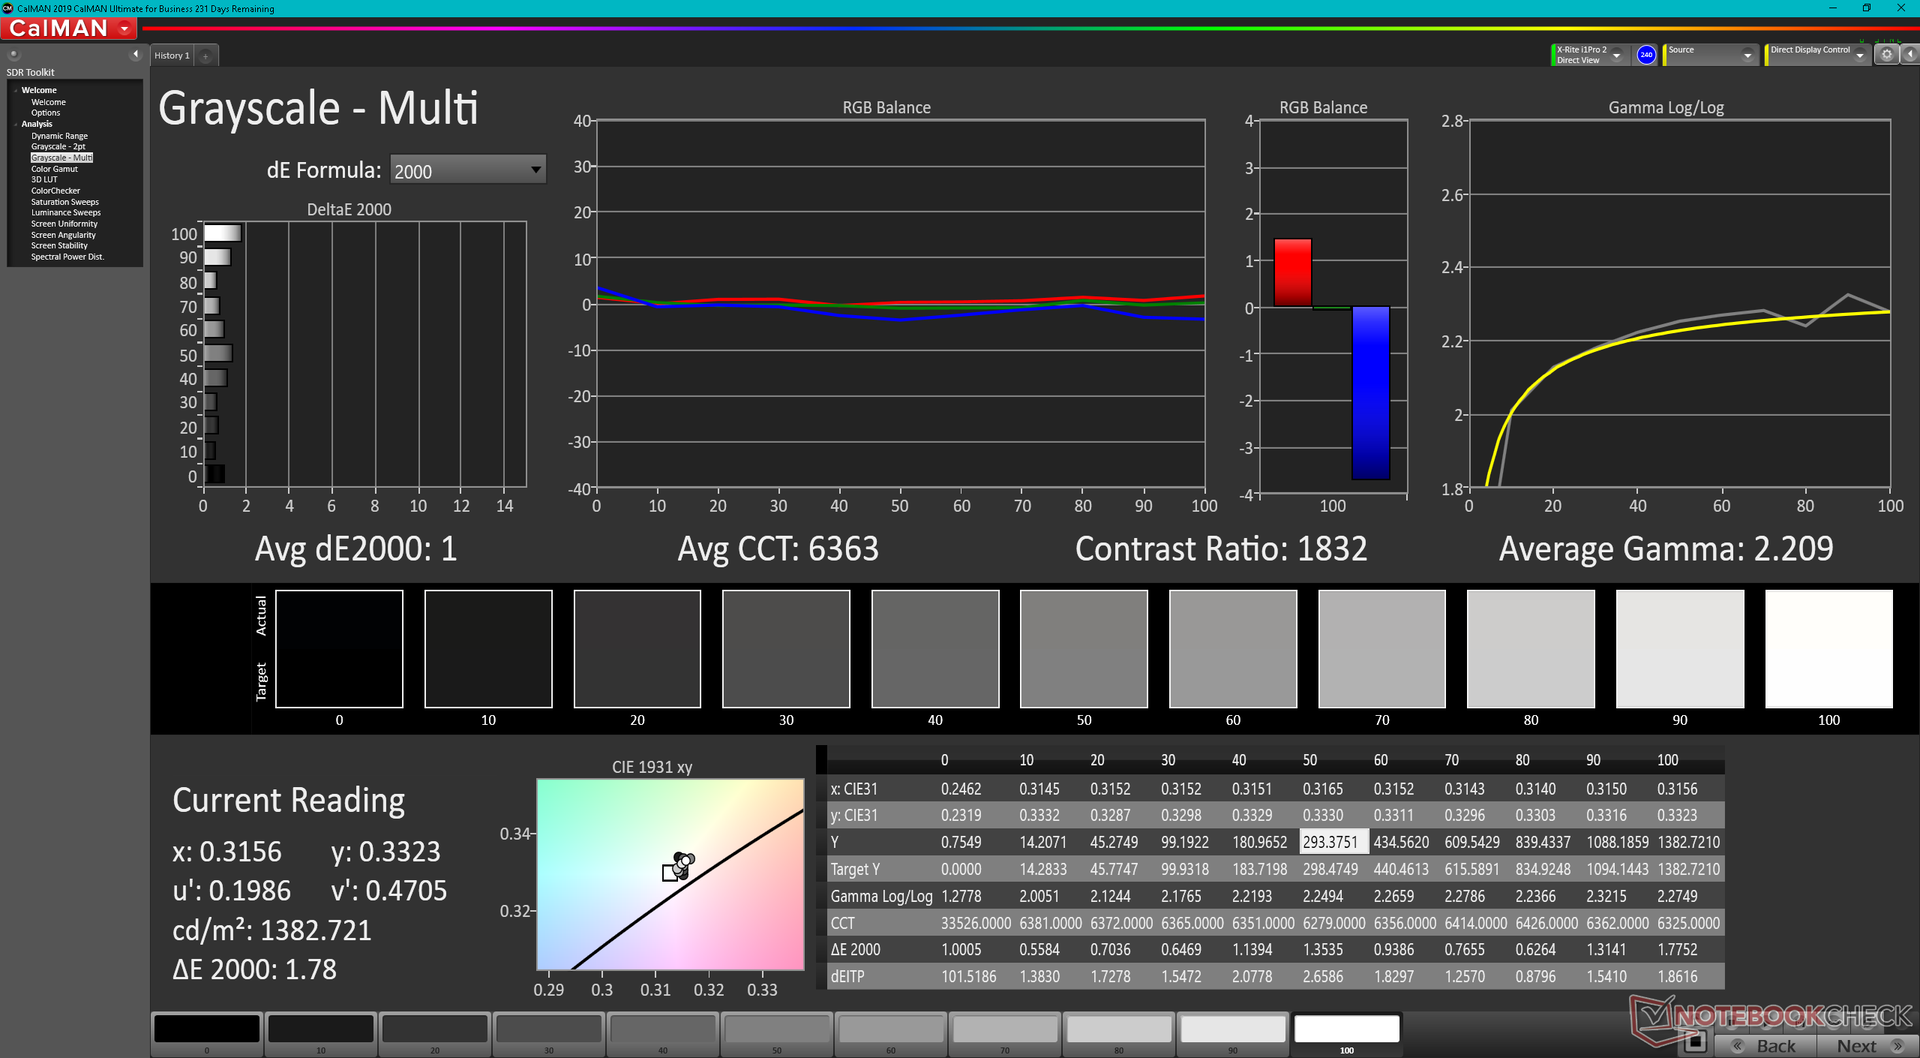
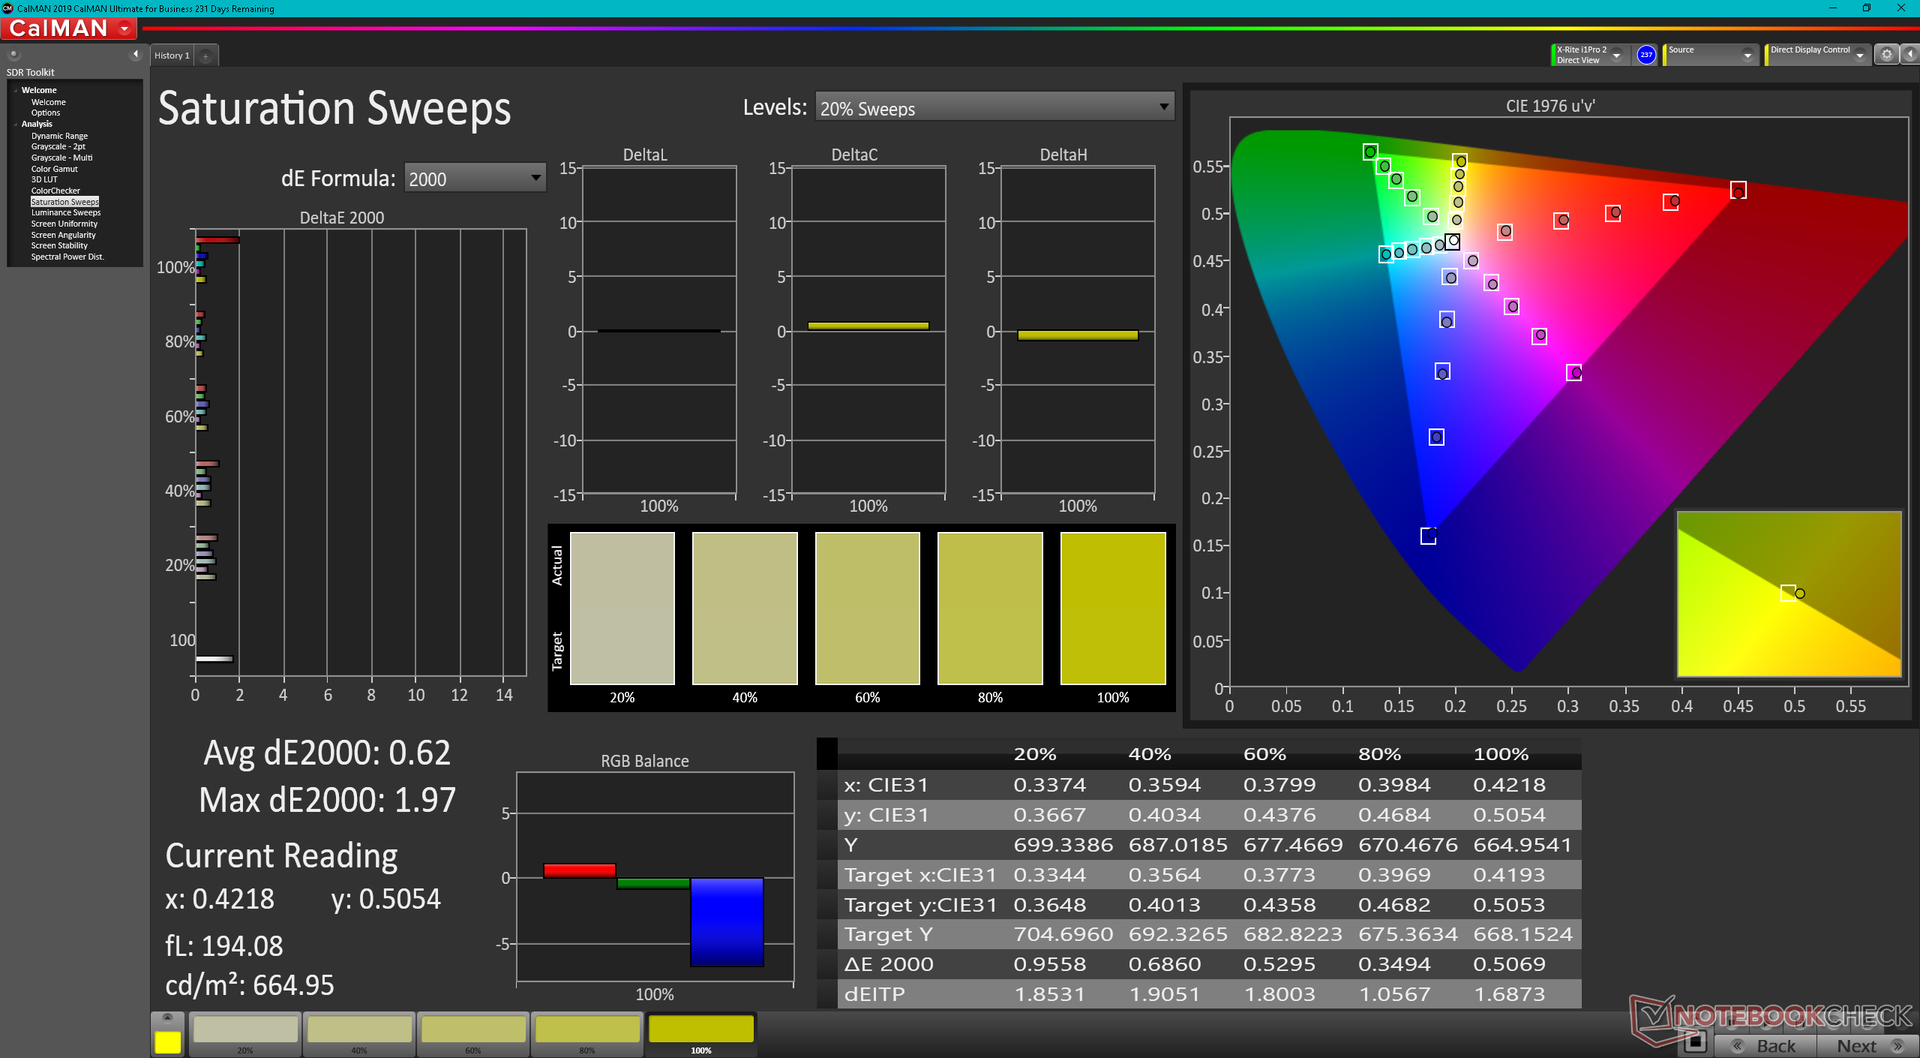
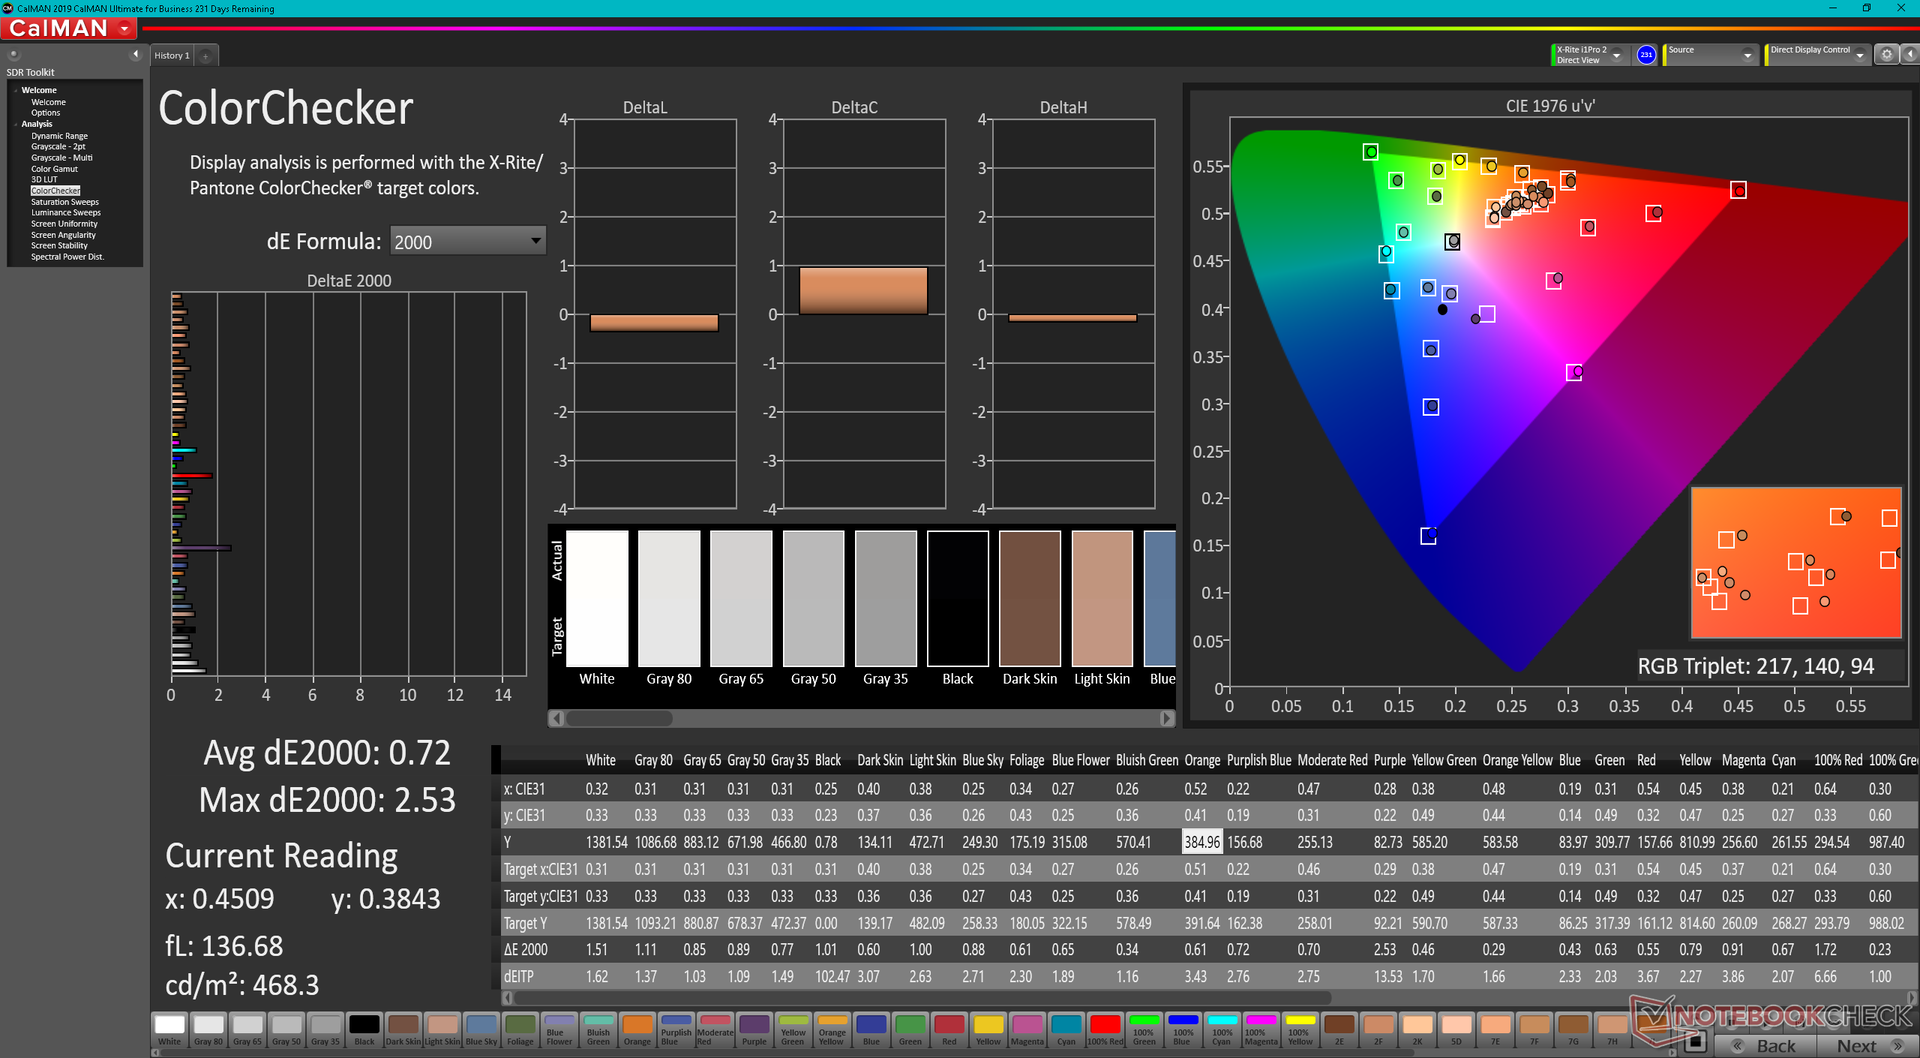
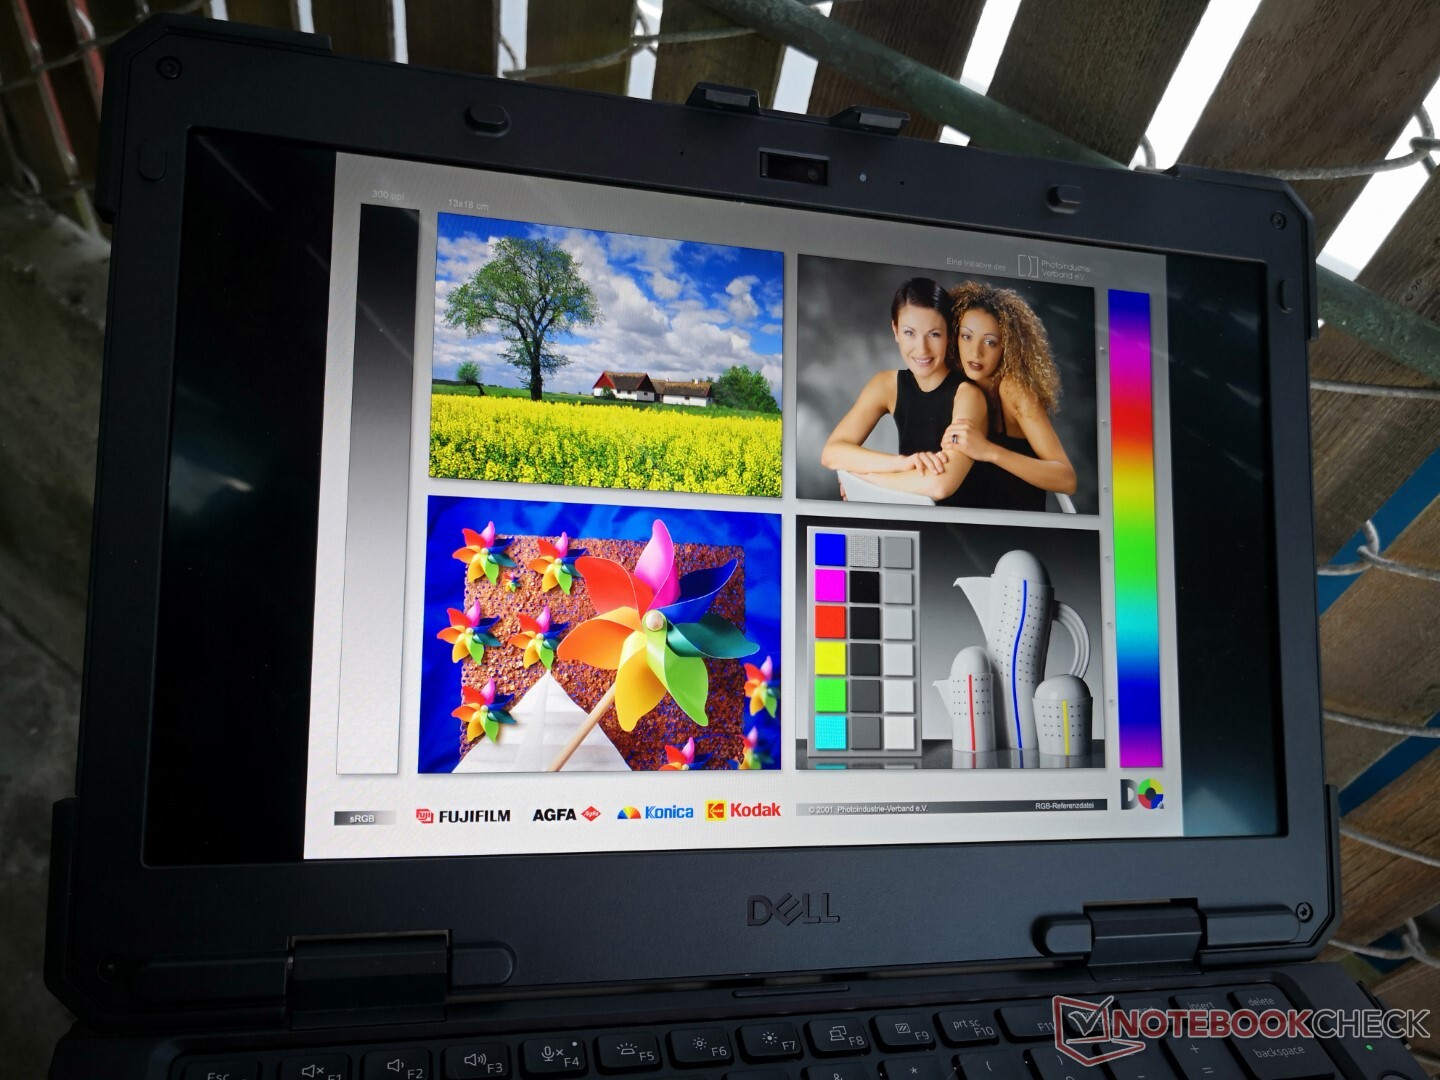
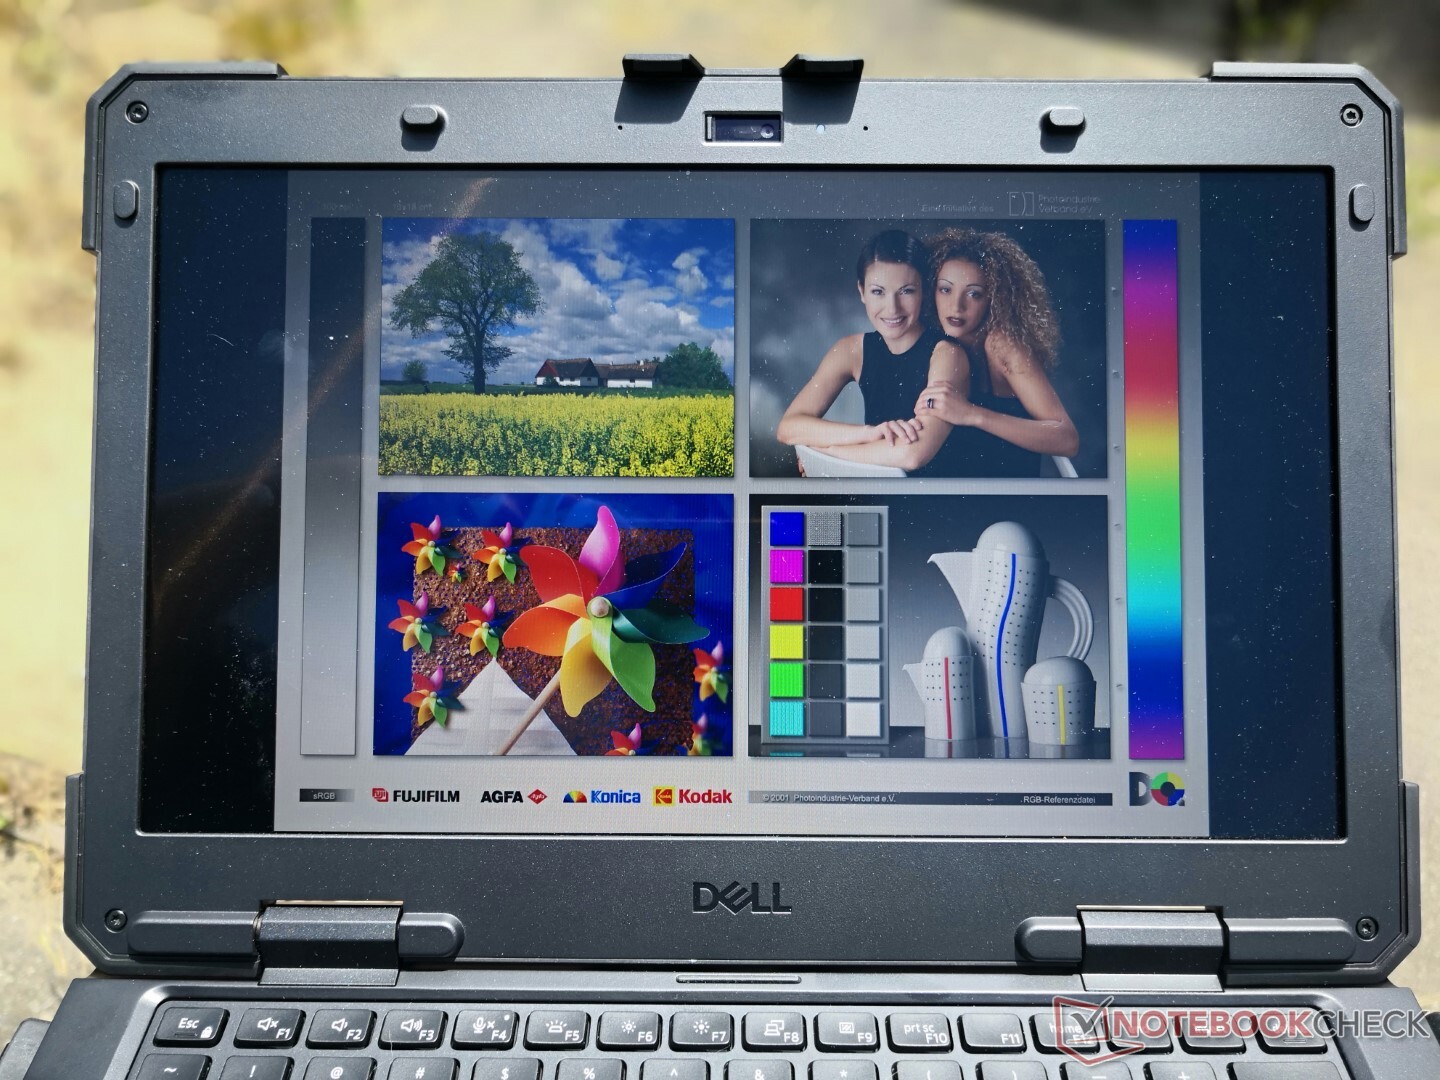
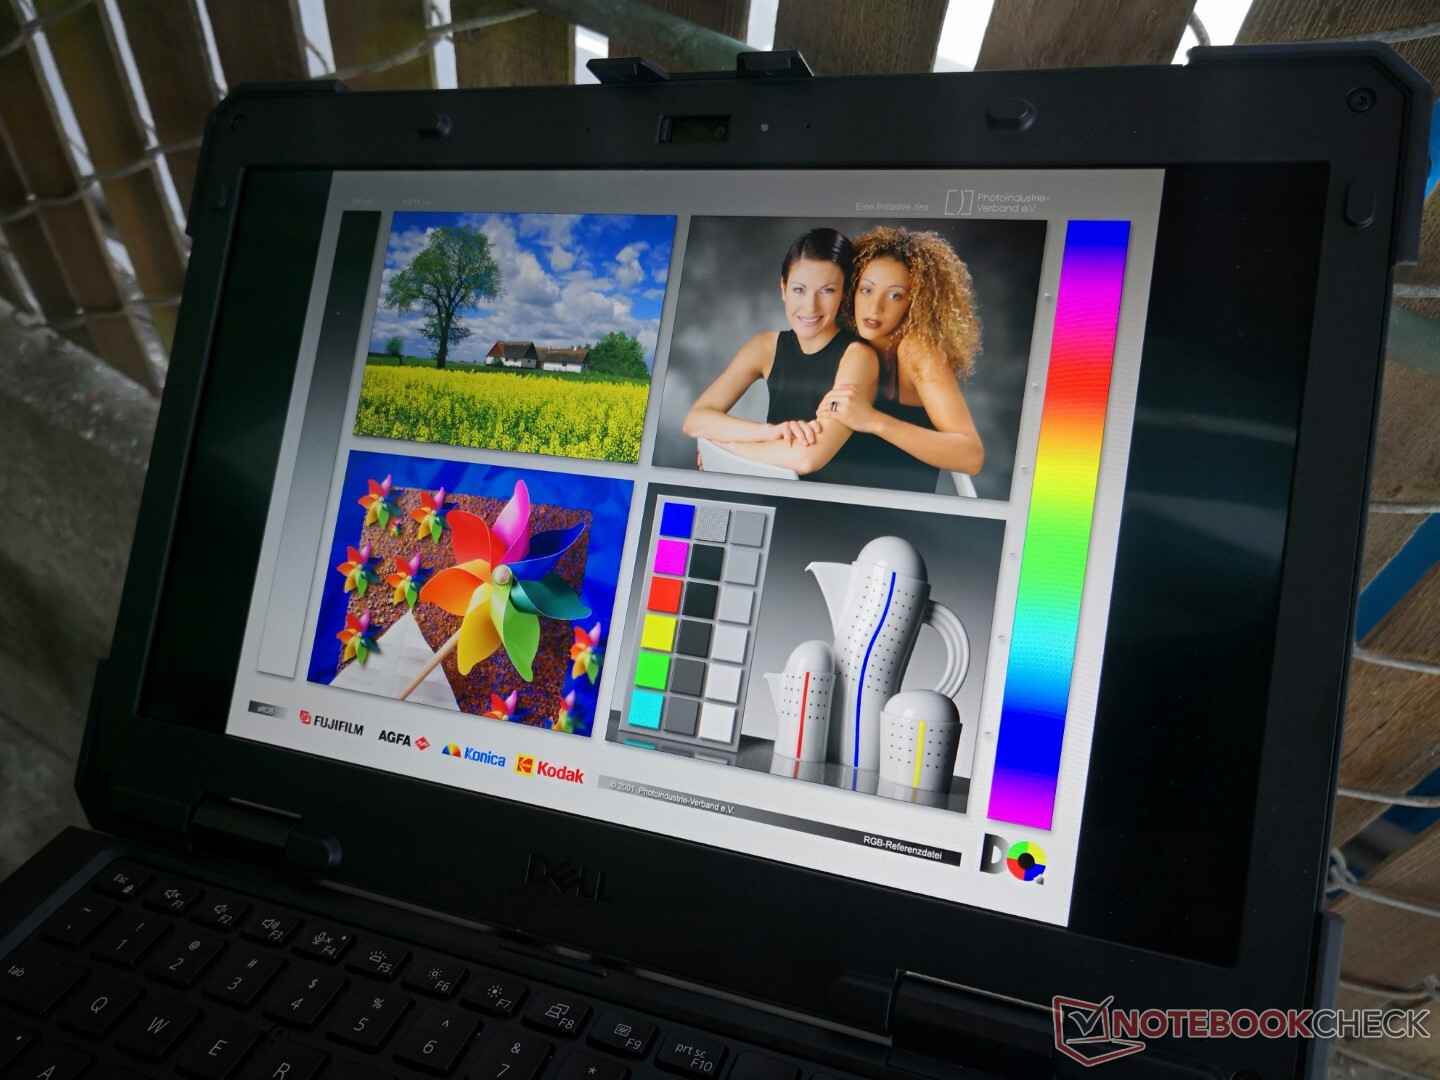
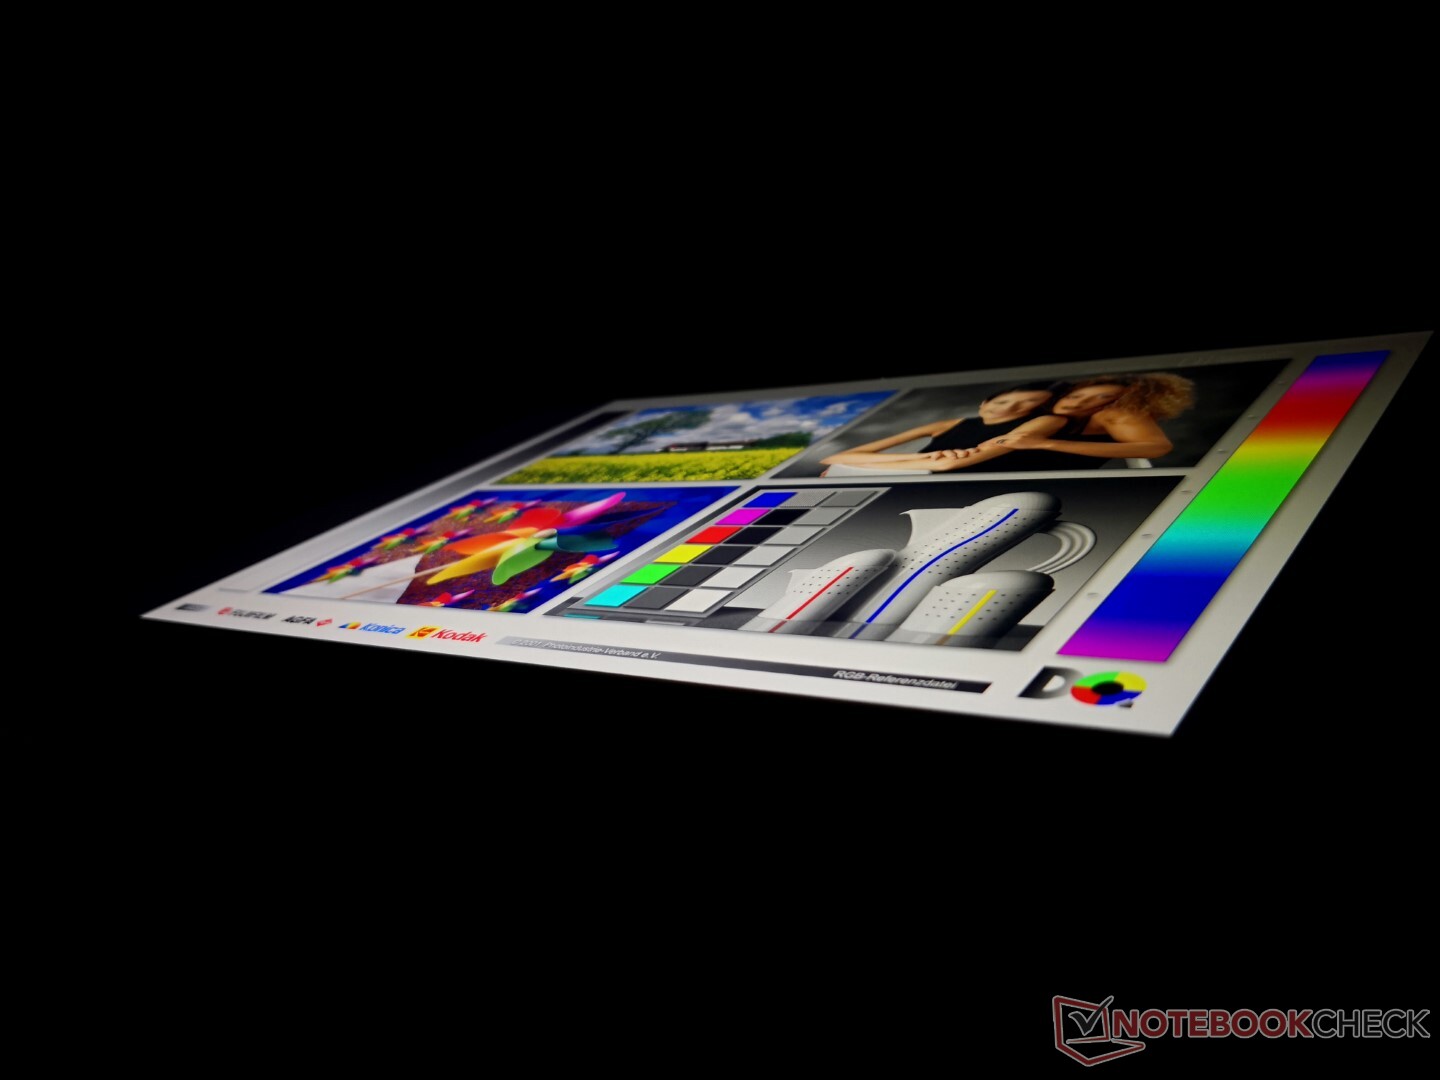
El Latitude 7330 Rugged Extreme utiliza el mismo panel IPS Sharp LQ133M1 de 1080p que se encuentra en el 2016 XPS 13 9350 oLatitude 13 7370. Aunque esto puede sonar como algo malo, este panel en particular es mejor que el panel promedio en la mayoría de los otros portátiles resistentes. El Panasonic Toughbook FZ-55 MK2, el Durabook S14I o el Getac B360, por ejemplo, utilizan paneles con una gama significativamente más estrecha y, por tanto, con colores notablemente más superficiales. Este es uno de los pocos modelos robustos que ofrece una pantalla de 1400 nits, un contraste profundo de más de 1500:1 y una cobertura sRGB completa, todo en uno. También apreciamos la ausencia de PWM, a diferencia de lo que ocurre en muchos otros dispositivos robustos.
El inconveniente más importante de este panel es su lentitud en los tiempos de respuesta blanco-negro y gris-gris, lo que significa que el ghosting es muy notable. Afortunadamente, esto no será un problema para las aplicaciones más lentas, como los navegadores o los editores de imágenes.
| |||||||||||||||||||||||||
iluminación: 84 %
Brillo con batería: 1414.1 cd/m²
Contraste: 1704:1 (Negro: 0.83 cd/m²)
ΔE ColorChecker Calman: 1.99 | ∀{0.5-29.43 Ø4.72}
calibrated: 0.72
ΔE Greyscale Calman: 2.8 | ∀{0.09-98 Ø4.97}
69% AdobeRGB 1998 (Argyll 3D)
98.2% sRGB (Argyll 3D)
67.1% Display P3 (Argyll 3D)
Gamma: 2.06
CCT: 6775 K
| Dell Latitude 7330 Rugged Extreme Sharp LQ133M1, IPS, 1920x1080, 13.3" | Dell Latitude 7424 Rugged Extreme AU Optronics AUO523D, IPS, 1920x1080, 14" | Dell Latitude 5420 Rugged-P85G AU Optronics AUO523D, IPS, 1920x1080, 14" | Acer Enduro Urban N3 EUN314 XR140EA6T, IPS, 1920x1080, 14" | Panasonic Toughbook FZ-55 MK2 InfoVision M140NWF5 R3, IPS, 1920x1080, 14" | Durabook S14I KD140N0730A01, TN, 1920x1080, 14" | |
|---|---|---|---|---|---|---|
| Display | -2% | -7% | -5% | -48% | -34% | |
| Display P3 Coverage (%) | 67.1 | 65.3 -3% | 62.5 -7% | 63.5 -5% | 34.8 -48% | 43.55 -35% |
| sRGB Coverage (%) | 98.2 | 96.9 -1% | 92.4 -6% | 91.9 -6% | 52.2 -47% | 65.4 -33% |
| AdobeRGB 1998 Coverage (%) | 69 | 67.3 -2% | 64.2 -7% | 65.5 -5% | 36 -48% | 45 -35% |
| Response Times | 11% | 15% | 21% | 46% | 66% | |
| Response Time Grey 50% / Grey 80% * (ms) | 74.4 ? | 62.8 ? 16% | 68 ? 9% | 56 ? 25% | 28.4 ? 62% | 30.4 ? 59% |
| Response Time Black / White * (ms) | 42.4 ? | 40 ? 6% | 33.6 ? 21% | 35.2 ? 17% | 30 ? 29% | 11.8 ? 72% |
| PWM Frequency (Hz) | 763 | 735 ? | 1000 ? | 685 ? | 304.9 ? | |
| Screen | -71% | -75% | -97% | -99% | -232% | |
| Brightness middle (cd/m²) | 1414.1 | 844 -40% | 1111.7 -21% | 487.8 -66% | 1061.1 -25% | 1180.7 -17% |
| Brightness (cd/m²) | 1282 | 793 -38% | 1026 -20% | 464 -64% | 997 -22% | 1102 -14% |
| Brightness Distribution (%) | 84 | 88 5% | 80 -5% | 89 6% | 76 -10% | 89 6% |
| Black Level * (cd/m²) | 0.83 | 0.54 35% | 0.81 2% | 0.48 42% | 0.7 16% | 1.91 -130% |
| Contrast (:1) | 1704 | 1563 -8% | 1372 -19% | 1016 -40% | 1516 -11% | 618 -64% |
| Colorchecker dE 2000 * | 1.99 | 4.8 -141% | 3.83 -92% | 6.51 -227% | 4.64 -133% | 13.45 -576% |
| Colorchecker dE 2000 max. * | 3.75 | 11.88 -217% | 7.85 -109% | 11.36 -203% | 20.92 -458% | 22.52 -501% |
| Colorchecker dE 2000 calibrated * | 0.72 | 1.15 -60% | 2.98 -314% | 1.77 -146% | 2.52 -250% | 3.19 -343% |
| Greyscale dE 2000 * | 2.8 | 7.6 -171% | 5.6 -100% | 7.8 -179% | 2.8 -0% | 15.4 -450% |
| Gamma | 2.06 107% | 2.334 94% | 2.306 95% | 2.28 96% | 2.08 106% | 1.97 112% |
| CCT | 6775 96% | 6546 99% | 7676 85% | 8102 80% | 6364 102% | 21134 31% |
| Color Space (Percent of AdobeRGB 1998) (%) | 62 | 59 | 41.6 | |||
| Color Space (Percent of sRGB) (%) | 97 | 93 | 65.5 | |||
| Media total (Programa/Opciones) | -21% /
-44% | -22% /
-48% | -27% /
-61% | -34% /
-68% | -67% /
-147% |
* ... más pequeño es mejor
El panel ya está bien calibrado al sacarlo de la caja, por lo que la calibración por parte del usuario final no es tan necesaria. De todos modos, calibrar el panel nosotros mismos reduciría aún más los valores medios de DeltaE en escala de grises y color, de 2,8 y 1,99 a sólo 1,0 y 0,72, respectivamente.
Tiempos de respuesta del display
| ↔ Tiempo de respuesta de Negro a Blanco | ||
|---|---|---|
| 42.4 ms ... subida ↗ y bajada ↘ combinada | ↗ 20.4 ms subida | 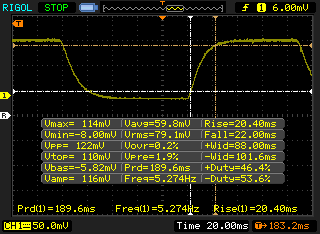 |
| ↘ 22 ms bajada | ||
| La pantalla mostró tiempos de respuesta lentos en nuestros tests y podría ser demasiado lenta para los jugones. En comparación, todos los dispositivos de prueba van de ##min### (mínimo) a 240 (máximo) ms. » 98 % de todos los dispositivos son mejores. Eso quiere decir que el tiempo de respuesta es peor que la media (19.8 ms) de todos los dispositivos testados. | ||
| ↔ Tiempo de respuesta 50% Gris a 80% Gris | ||
| 74.4 ms ... subida ↗ y bajada ↘ combinada | ↗ 37.6 ms subida | 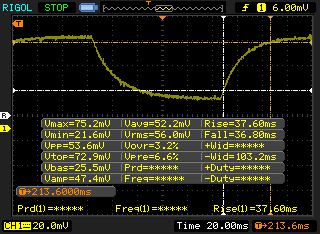 |
| ↘ 36.8 ms bajada | ||
| La pantalla mostró tiempos de respuesta lentos en nuestros tests y podría ser demasiado lenta para los jugones. En comparación, todos los dispositivos de prueba van de ##min### (mínimo) a 636 (máximo) ms. » 99 % de todos los dispositivos son mejores. Eso quiere decir que el tiempo de respuesta es peor que la media (31 ms) de todos los dispositivos testados. | ||
Parpadeo de Pantalla / PWM (Pulse-Width Modulation)
| Parpadeo de Pantalla / PWM no detectado | 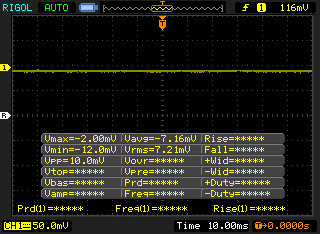 | ||
Comparación: 52 % de todos los dispositivos testados no usaron PWM para atenuar el display. Si se usó, medimos una media de 7775 (mínimo: 5 - máxmo: 343500) Hz. | |||
Rendimiento
Condiciones de la prueba
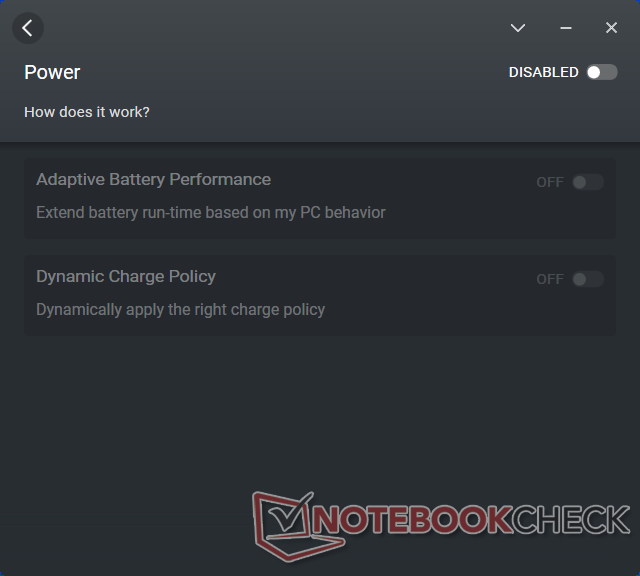
Nuestra unidad se configuró en modo Rendimiento y Ultra Rendimiento a través de Windows y el Administrador de Energía de Dell, respectivamente, antes de ejecutar cualquier punto de referencia a continuación. Recomendamos encarecidamente a los usuarios que se familiaricen con las aplicaciones preinstaladas Power Manager y Optimizer, ya que algunas características del portátil sólo pueden cambiarse a través de este software.

Procesador
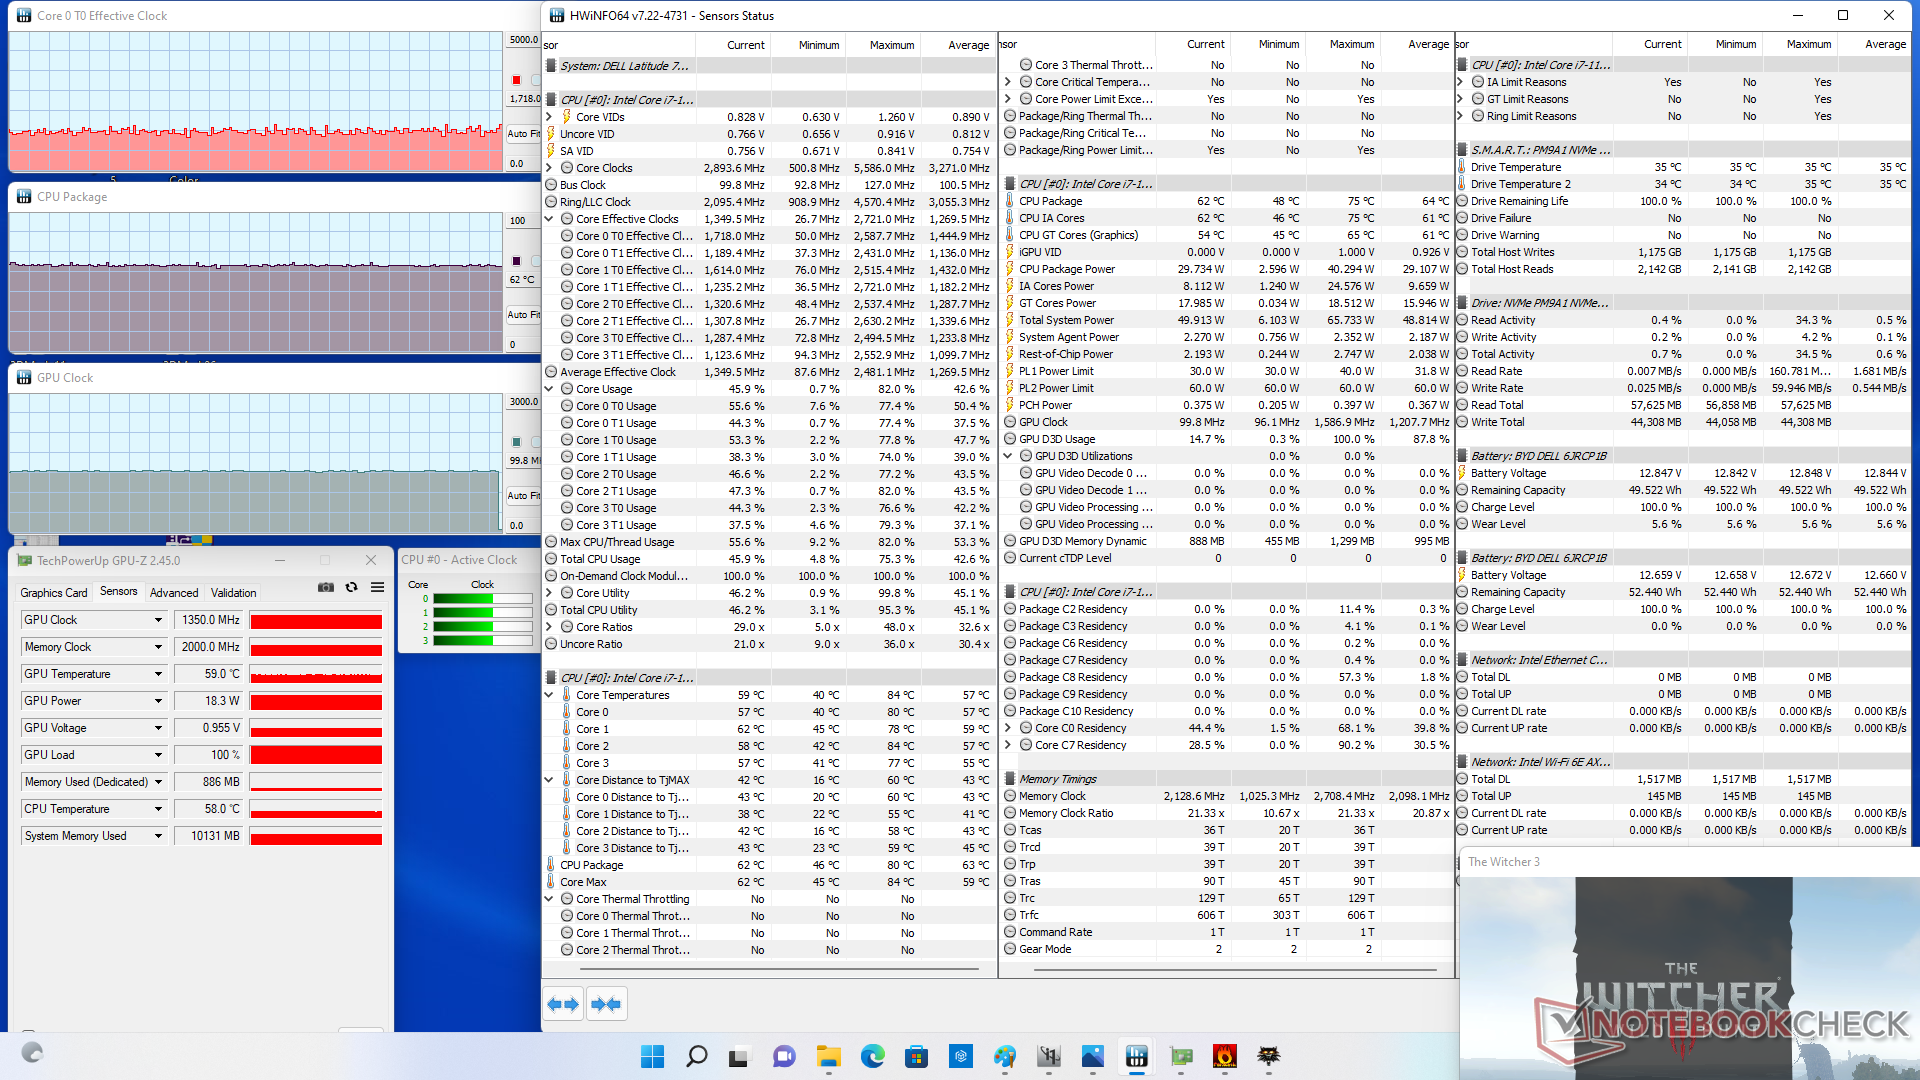
El rendimiento bruto de la CPU es excelente, con resultados que se sitúan a pocos puntos porcentuales de la media Core i7-1185G7 de nuestra base de datos. La sostenibilidad del rendimiento también es buena, ya que las puntuaciones no bajan con el tiempo cuando se ejecuta CineBench R15 xT en bucle
Hay que tener en cuenta que el Core i7-1185G7 tiene un rendimiento similar al del menos caro Core i7-1165G7. Si vPro no es importante, entonces el Core i7-1165G7 puede proporcionar esencialmente la misma experiencia.
Cinebench R15 Multi Loop
Cinebench R20: CPU (Multi Core) | CPU (Single Core)
Cinebench R23: Multi Core | Single Core
Blender: v2.79 BMW27 CPU
7-Zip 18.03: 7z b 4 | 7z b 4 -mmt1
Geekbench 5.5: Multi-Core | Single-Core
HWBOT x265 Benchmark v2.2: 4k Preset
LibreOffice : 20 Documents To PDF
R Benchmark 2.5: Overall mean
| Cinebench R15 / CPU Single 64Bit | |
| Dell Latitude 7330 Rugged Extreme | |
| Panasonic Toughbook FZ-55 MK2 | |
| Medio Intel Core i7-1185G7 (168 - 230, n=27) | |
| Acer Enduro Urban N3 EUN314 | |
| Durabook S14I | |
| Lenovo ThinkPad P15s Gen1-20T4000JGE | |
| Getac B360 | |
| Fujitsu LifeBook U7310 | |
| Dell Latitude 5420 Rugged-P85G | |
| Dell Latitude 7424 Rugged Extreme | |
| Cinebench R20 / CPU (Multi Core) | |
| Dell Latitude 7330 Rugged Extreme | |
| Panasonic Toughbook FZ-55 MK2 | |
| Medio Intel Core i7-1185G7 (1425 - 2493, n=28) | |
| Acer Enduro Urban N3 EUN314 | |
| Lenovo ThinkPad P15s Gen1-20T4000JGE | |
| Getac B360 | |
| Durabook S14I | |
| Fujitsu LifeBook U7310 | |
| Cinebench R20 / CPU (Single Core) | |
| Dell Latitude 7330 Rugged Extreme | |
| Medio Intel Core i7-1185G7 (489 - 593, n=28) | |
| Acer Enduro Urban N3 EUN314 | |
| Panasonic Toughbook FZ-55 MK2 | |
| Durabook S14I | |
| Lenovo ThinkPad P15s Gen1-20T4000JGE | |
| Getac B360 | |
| Fujitsu LifeBook U7310 | |
| Cinebench R23 / Multi Core | |
| Dell Latitude 7330 Rugged Extreme | |
| Medio Intel Core i7-1185G7 (3610 - 6383, n=24) | |
| Panasonic Toughbook FZ-55 MK2 | |
| Acer Enduro Urban N3 EUN314 | |
| Getac B360 | |
| Durabook S14I | |
| Cinebench R23 / Single Core | |
| Dell Latitude 7330 Rugged Extreme | |
| Medio Intel Core i7-1185G7 (1251 - 1532, n=24) | |
| Panasonic Toughbook FZ-55 MK2 | |
| Acer Enduro Urban N3 EUN314 | |
| Durabook S14I | |
| Getac B360 | |
| Blender / v2.79 BMW27 CPU | |
| Fujitsu LifeBook U7310 | |
| Durabook S14I | |
| Lenovo ThinkPad P15s Gen1-20T4000JGE | |
| Getac B360 | |
| Medio Intel Core i7-1185G7 (478 - 745, n=28) | |
| Panasonic Toughbook FZ-55 MK2 | |
| Acer Enduro Urban N3 EUN314 | |
| Dell Latitude 7330 Rugged Extreme | |
| 7-Zip 18.03 / 7z b 4 | |
| Acer Enduro Urban N3 EUN314 | |
| Dell Latitude 7330 Rugged Extreme | |
| Panasonic Toughbook FZ-55 MK2 | |
| Medio Intel Core i7-1185G7 (18812 - 27693, n=27) | |
| Getac B360 | |
| Lenovo ThinkPad P15s Gen1-20T4000JGE | |
| Durabook S14I | |
| Fujitsu LifeBook U7310 | |
| 7-Zip 18.03 / 7z b 4 -mmt1 | |
| Dell Latitude 7330 Rugged Extreme | |
| Acer Enduro Urban N3 EUN314 | |
| Panasonic Toughbook FZ-55 MK2 | |
| Durabook S14I | |
| Medio Intel Core i7-1185G7 (3678 - 5507, n=27) | |
| Lenovo ThinkPad P15s Gen1-20T4000JGE | |
| Getac B360 | |
| Fujitsu LifeBook U7310 | |
| Geekbench 5.5 / Multi-Core | |
| Dell Latitude 7330 Rugged Extreme | |
| Medio Intel Core i7-1185G7 (4620 - 5944, n=21) | |
| Acer Enduro Urban N3 EUN314 | |
| Getac B360 | |
| Lenovo ThinkPad P15s Gen1-20T4000JGE | |
| Durabook S14I | |
| Fujitsu LifeBook U7310 | |
| Geekbench 5.5 / Single-Core | |
| Dell Latitude 7330 Rugged Extreme | |
| Acer Enduro Urban N3 EUN314 | |
| Medio Intel Core i7-1185G7 (1398 - 1626, n=21) | |
| Durabook S14I | |
| Getac B360 | |
| Lenovo ThinkPad P15s Gen1-20T4000JGE | |
| Fujitsu LifeBook U7310 | |
| HWBOT x265 Benchmark v2.2 / 4k Preset | |
| Dell Latitude 7330 Rugged Extreme | |
| Panasonic Toughbook FZ-55 MK2 | |
| Acer Enduro Urban N3 EUN314 | |
| Medio Intel Core i7-1185G7 (5.02 - 8.13, n=27) | |
| Getac B360 | |
| Lenovo ThinkPad P15s Gen1-20T4000JGE | |
| Durabook S14I | |
| Fujitsu LifeBook U7310 | |
| LibreOffice / 20 Documents To PDF | |
| Lenovo ThinkPad P15s Gen1-20T4000JGE | |
| Acer Enduro Urban N3 EUN314 | |
| Fujitsu LifeBook U7310 | |
| Medio Intel Core i7-1185G7 (41.3 - 61.7, n=26) | |
| Dell Latitude 7330 Rugged Extreme | |
| Panasonic Toughbook FZ-55 MK2 | |
| Durabook S14I | |
| R Benchmark 2.5 / Overall mean | |
| Fujitsu LifeBook U7310 | |
| Getac B360 | |
| Lenovo ThinkPad P15s Gen1-20T4000JGE | |
| Durabook S14I | |
| Medio Intel Core i7-1185G7 (0.55 - 0.615, n=27) | |
| Acer Enduro Urban N3 EUN314 | |
| Panasonic Toughbook FZ-55 MK2 | |
| Dell Latitude 7330 Rugged Extreme | |
* ... más pequeño es mejor
AIDA64: FP32 Ray-Trace | FPU Julia | CPU SHA3 | CPU Queen | FPU SinJulia | FPU Mandel | CPU AES | CPU ZLib | FP64 Ray-Trace | CPU PhotoWorxx
| Performance rating | |
| Dell Latitude 7330 Rugged Extreme | |
| Acer Enduro Urban N3 EUN314 | |
| Medio Intel Core i7-1185G7 | |
| Panasonic Toughbook FZ-55 MK2 | |
| Durabook S14I | |
| AIDA64 / FP32 Ray-Trace | |
| Dell Latitude 7330 Rugged Extreme | |
| Acer Enduro Urban N3 EUN314 | |
| Medio Intel Core i7-1185G7 (5621 - 7453, n=20) | |
| Panasonic Toughbook FZ-55 MK2 | |
| Durabook S14I | |
| AIDA64 / FPU Julia | |
| Dell Latitude 7330 Rugged Extreme | |
| Acer Enduro Urban N3 EUN314 | |
| Panasonic Toughbook FZ-55 MK2 | |
| Medio Intel Core i7-1185G7 (23248 - 32614, n=20) | |
| Durabook S14I | |
| AIDA64 / CPU SHA3 | |
| Dell Latitude 7330 Rugged Extreme | |
| Acer Enduro Urban N3 EUN314 | |
| Medio Intel Core i7-1185G7 (1530 - 2209, n=20) | |
| Panasonic Toughbook FZ-55 MK2 | |
| Durabook S14I | |
| AIDA64 / CPU Queen | |
| Dell Latitude 7330 Rugged Extreme | |
| Acer Enduro Urban N3 EUN314 | |
| Durabook S14I | |
| Panasonic Toughbook FZ-55 MK2 | |
| Medio Intel Core i7-1185G7 (44677 - 52815, n=20) | |
| AIDA64 / FPU SinJulia | |
| Dell Latitude 7330 Rugged Extreme | |
| Acer Enduro Urban N3 EUN314 | |
| Panasonic Toughbook FZ-55 MK2 | |
| Medio Intel Core i7-1185G7 (3870 - 5027, n=20) | |
| Durabook S14I | |
| AIDA64 / FPU Mandel | |
| Dell Latitude 7330 Rugged Extreme | |
| Acer Enduro Urban N3 EUN314 | |
| Panasonic Toughbook FZ-55 MK2 | |
| Medio Intel Core i7-1185G7 (14584 - 19594, n=20) | |
| Durabook S14I | |
| AIDA64 / CPU AES | |
| Dell Latitude 7330 Rugged Extreme | |
| Acer Enduro Urban N3 EUN314 | |
| Durabook S14I | |
| Medio Intel Core i7-1185G7 (33002 - 76826, n=20) | |
| Panasonic Toughbook FZ-55 MK2 | |
| AIDA64 / CPU ZLib | |
| Dell Latitude 7330 Rugged Extreme | |
| Acer Enduro Urban N3 EUN314 | |
| Medio Intel Core i7-1185G7 (258 - 412, n=22) | |
| Panasonic Toughbook FZ-55 MK2 | |
| Durabook S14I | |
| AIDA64 / FP64 Ray-Trace | |
| Dell Latitude 7330 Rugged Extreme | |
| Acer Enduro Urban N3 EUN314 | |
| Panasonic Toughbook FZ-55 MK2 | |
| Medio Intel Core i7-1185G7 (2821 - 4094, n=20) | |
| Durabook S14I | |
| AIDA64 / CPU PhotoWorxx | |
| Dell Latitude 7330 Rugged Extreme | |
| Medio Intel Core i7-1185G7 (22349 - 43701, n=20) | |
| Acer Enduro Urban N3 EUN314 | |
| Panasonic Toughbook FZ-55 MK2 | |
| Durabook S14I | |
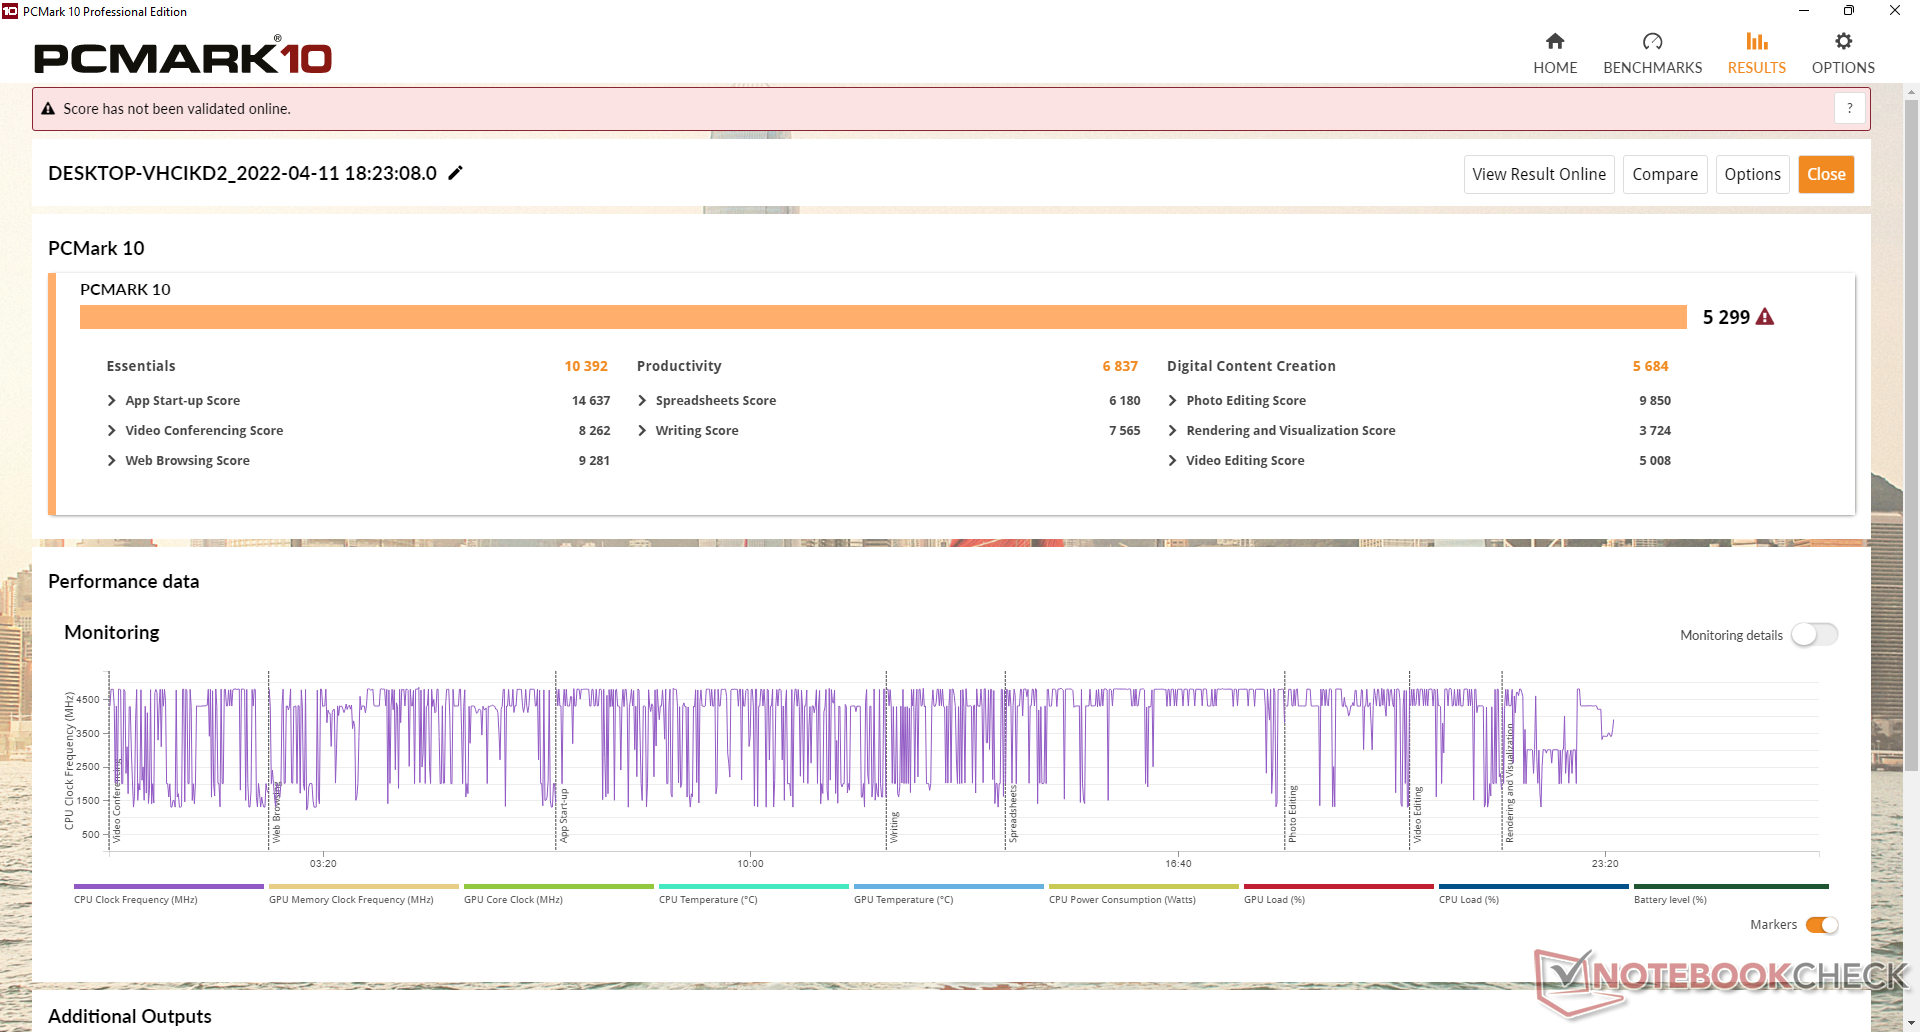
Rendimiento del sistema
Los resultados de PCMark son consistentemente más altos que en el Panasonic Toughbook FZ-55 MK2 que viene con el mismo procesador que nuestra unidad Dell. Se recomienda configurar con RAM de doble canal si es posible o el rendimiento gráfico se verá afectado.
| PCMark 10 / Score | |
| Dell Latitude 7330 Rugged Extreme | |
| Panasonic Toughbook FZ-55 MK2 | |
| Durabook S14I | |
| Acer Enduro Urban N3 EUN314 | |
| Dell Latitude 7424 Rugged Extreme | |
| Dell Latitude 5420 Rugged-P85G | |
| PCMark 10 / Essentials | |
| Dell Latitude 7330 Rugged Extreme | |
| Panasonic Toughbook FZ-55 MK2 | |
| Durabook S14I | |
| Acer Enduro Urban N3 EUN314 | |
| Dell Latitude 7424 Rugged Extreme | |
| Dell Latitude 5420 Rugged-P85G | |
| PCMark 10 / Productivity | |
| Dell Latitude 7424 Rugged Extreme | |
| Dell Latitude 5420 Rugged-P85G | |
| Durabook S14I | |
| Dell Latitude 7330 Rugged Extreme | |
| Panasonic Toughbook FZ-55 MK2 | |
| Acer Enduro Urban N3 EUN314 | |
| PCMark 10 Score | 5299 puntos | |
ayuda | ||
| AIDA64 / Memory Copy | |
| Dell Latitude 7330 Rugged Extreme | |
| Medio Intel Core i7-1185G7 (36515 - 68450, n=20) | |
| Acer Enduro Urban N3 EUN314 | |
| Panasonic Toughbook FZ-55 MK2 | |
| Durabook S14I | |
| AIDA64 / Memory Read | |
| Dell Latitude 7330 Rugged Extreme | |
| Medio Intel Core i7-1185G7 (38394 - 64291, n=20) | |
| Acer Enduro Urban N3 EUN314 | |
| Panasonic Toughbook FZ-55 MK2 | |
| Durabook S14I | |
| AIDA64 / Memory Write | |
| Dell Latitude 7330 Rugged Extreme | |
| Medio Intel Core i7-1185G7 (37684 - 66873, n=20) | |
| Acer Enduro Urban N3 EUN314 | |
| Panasonic Toughbook FZ-55 MK2 | |
| Durabook S14I | |
| AIDA64 / Memory Latency | |
| Dell Latitude 7330 Rugged Extreme | |
| Medio Intel Core i7-1185G7 (78.3 - 117, n=22) | |
| Acer Enduro Urban N3 EUN314 | |
| Panasonic Toughbook FZ-55 MK2 | |
| Durabook S14I | |
* ... más pequeño es mejor
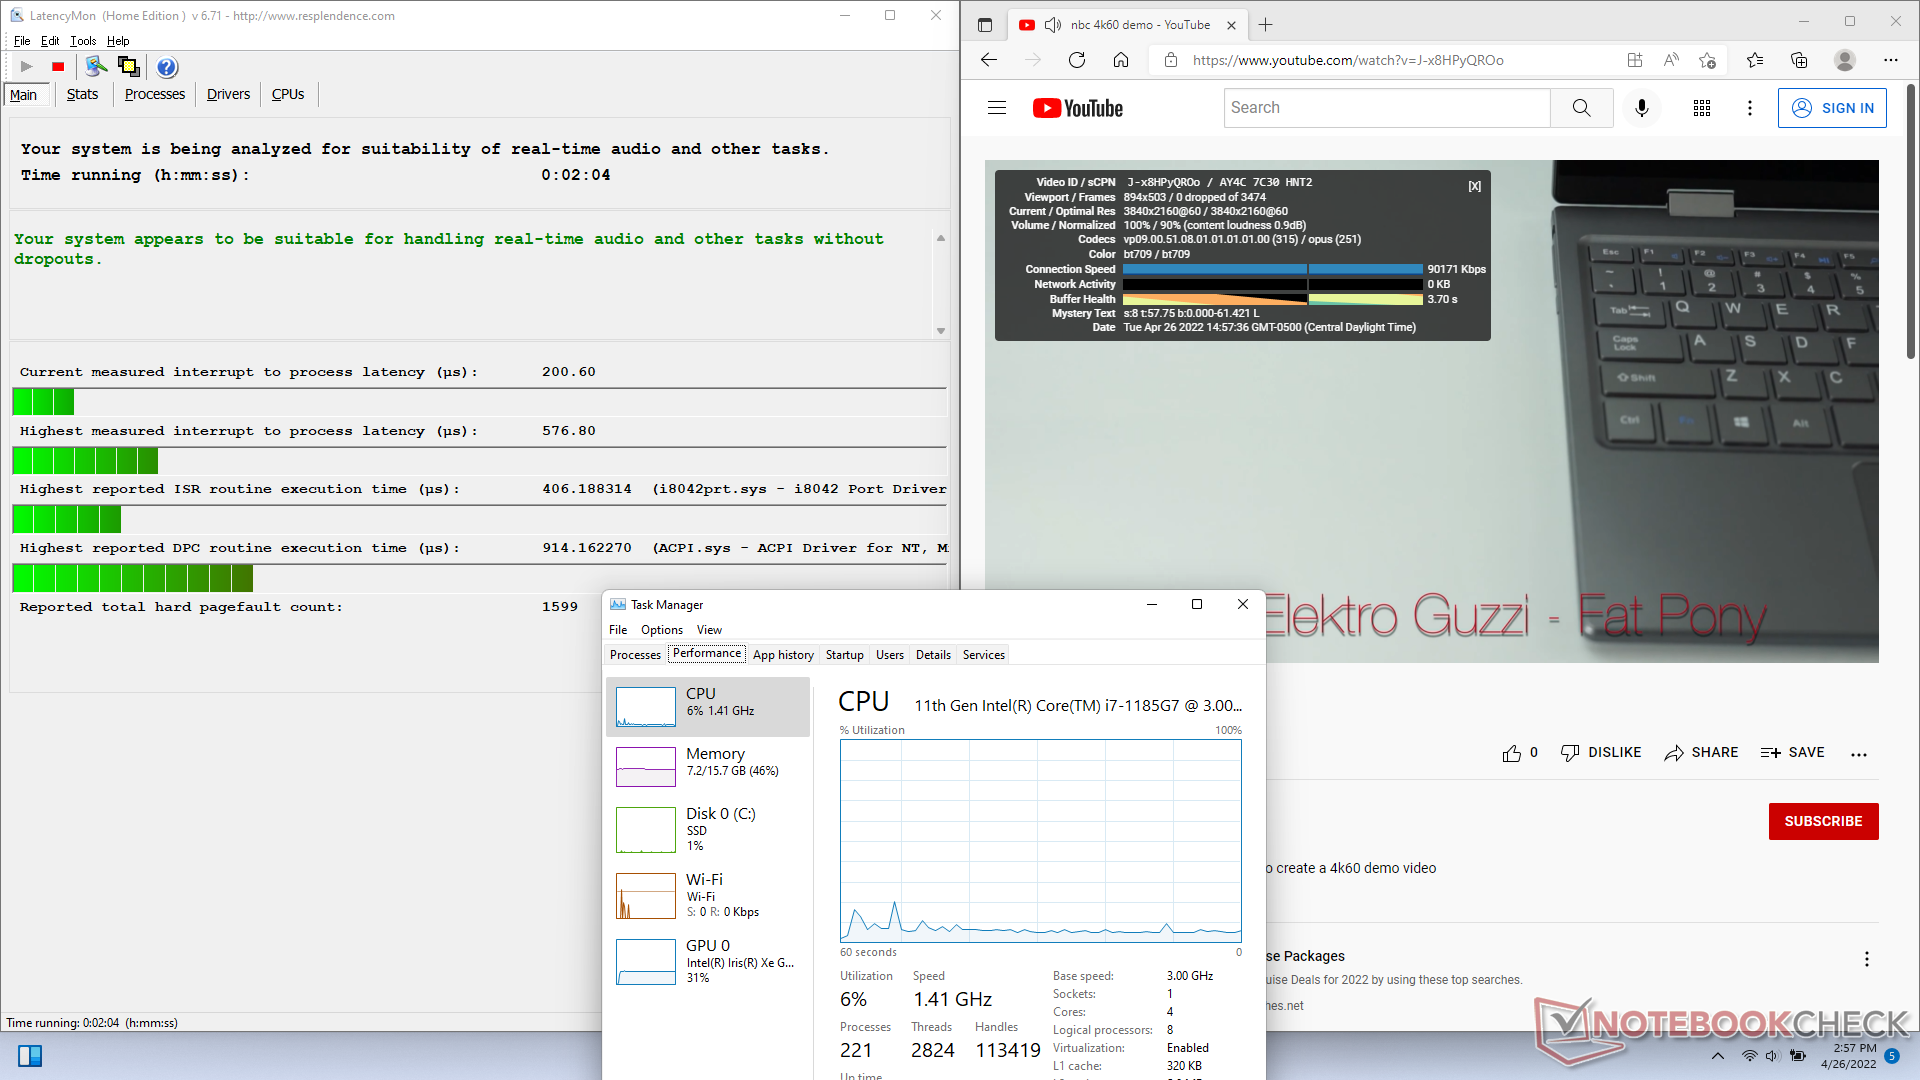
Latencia del CPD
LatencyMon no revela problemas de latencia al abrir varias pestañas de nuestra página web. la reproducción de vídeo 4K a 60 FPS también es fluida y no se registran caídas de fotogramas.
| DPC Latencies / LatencyMon - interrupt to process latency (max), Web, Youtube, Prime95 | |
| Acer Enduro Urban N3 EUN314 | |
| Panasonic Toughbook FZ-55 MK2 | |
| Durabook S14I | |
| Dell Latitude 7330 Rugged Extreme | |
* ... más pequeño es mejor
Dispositivos de almacenamiento
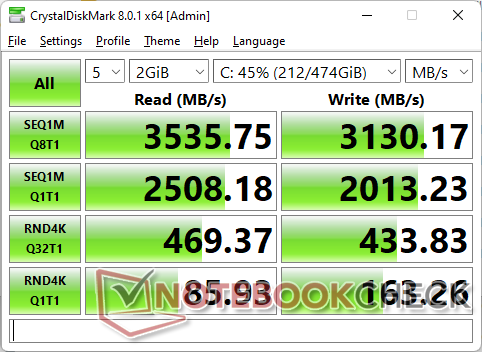
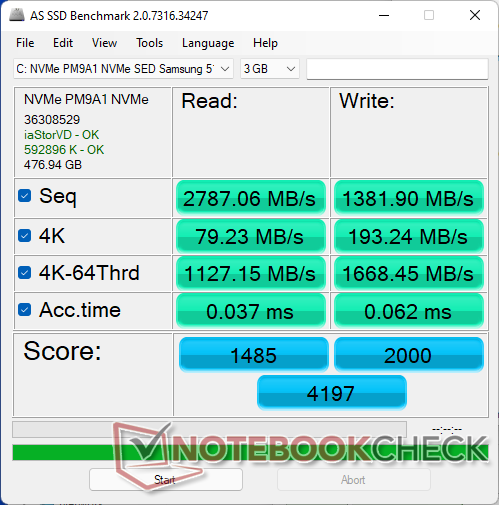
El sistema sólo admite una unidad interna M.2 2280, mientras que las múltiples unidades del Getac B360 pueden cambiarse rápidamente sin necesidad de herramientas. Nuestra unidad de prueba en particular venía con un SSD NVMe Samsung PM9A1 SEDpero también hay opciones estándar no autocifradas. El rendimiento es excelente, sin estrangulamiento, aunque las tasas de transferencia brutas no son tan rápidas como las de una unidad de consumo estándar no SED.

| Drive Performance rating - Percent | |
| Dell Latitude 7330 Rugged Extreme | |
| Acer Enduro Urban N3 EUN314 | |
| Durabook S14I | |
| Dell Latitude 5420 Rugged-P85G -8! | |
| Dell Latitude 7424 Rugged Extreme -8! | |
| Panasonic Toughbook FZ-55 MK2 | |
* ... más pequeño es mejor
Disk Throttling: DiskSpd Read Loop, Queue Depth 8
Rendimiento de la GPU
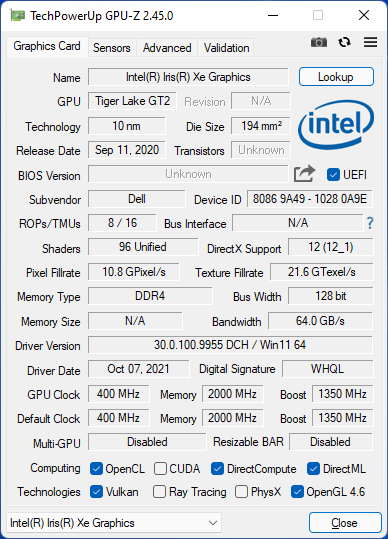
El rendimiento de los gráficos es excelente, entre un 10 y un 15 por ciento más rápido que el promedio de los portátiles de nuestra base de datos equipados con la misma tecnología integrada Iris Xe 96 EUs GPU. El rendimiento es incluso sistemáticamente más rápido que el de algunas GPU discretas más antiguas como la Radeon RX 540.
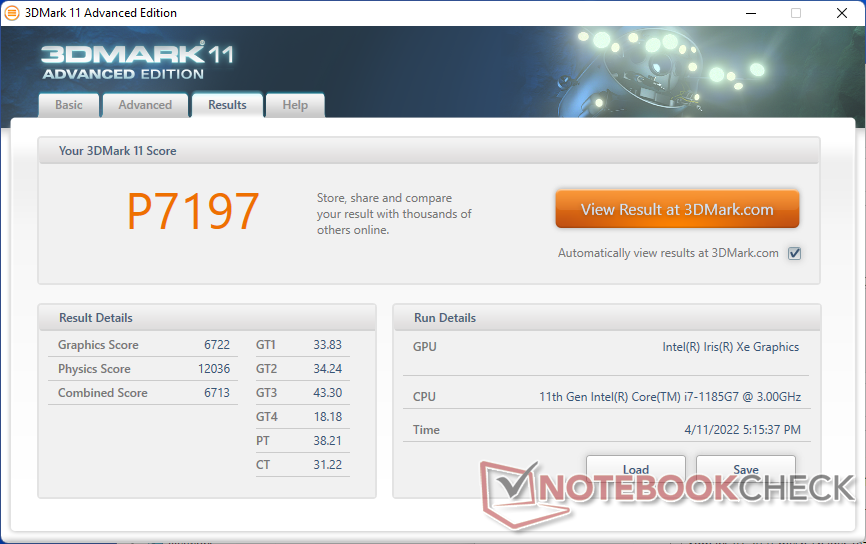
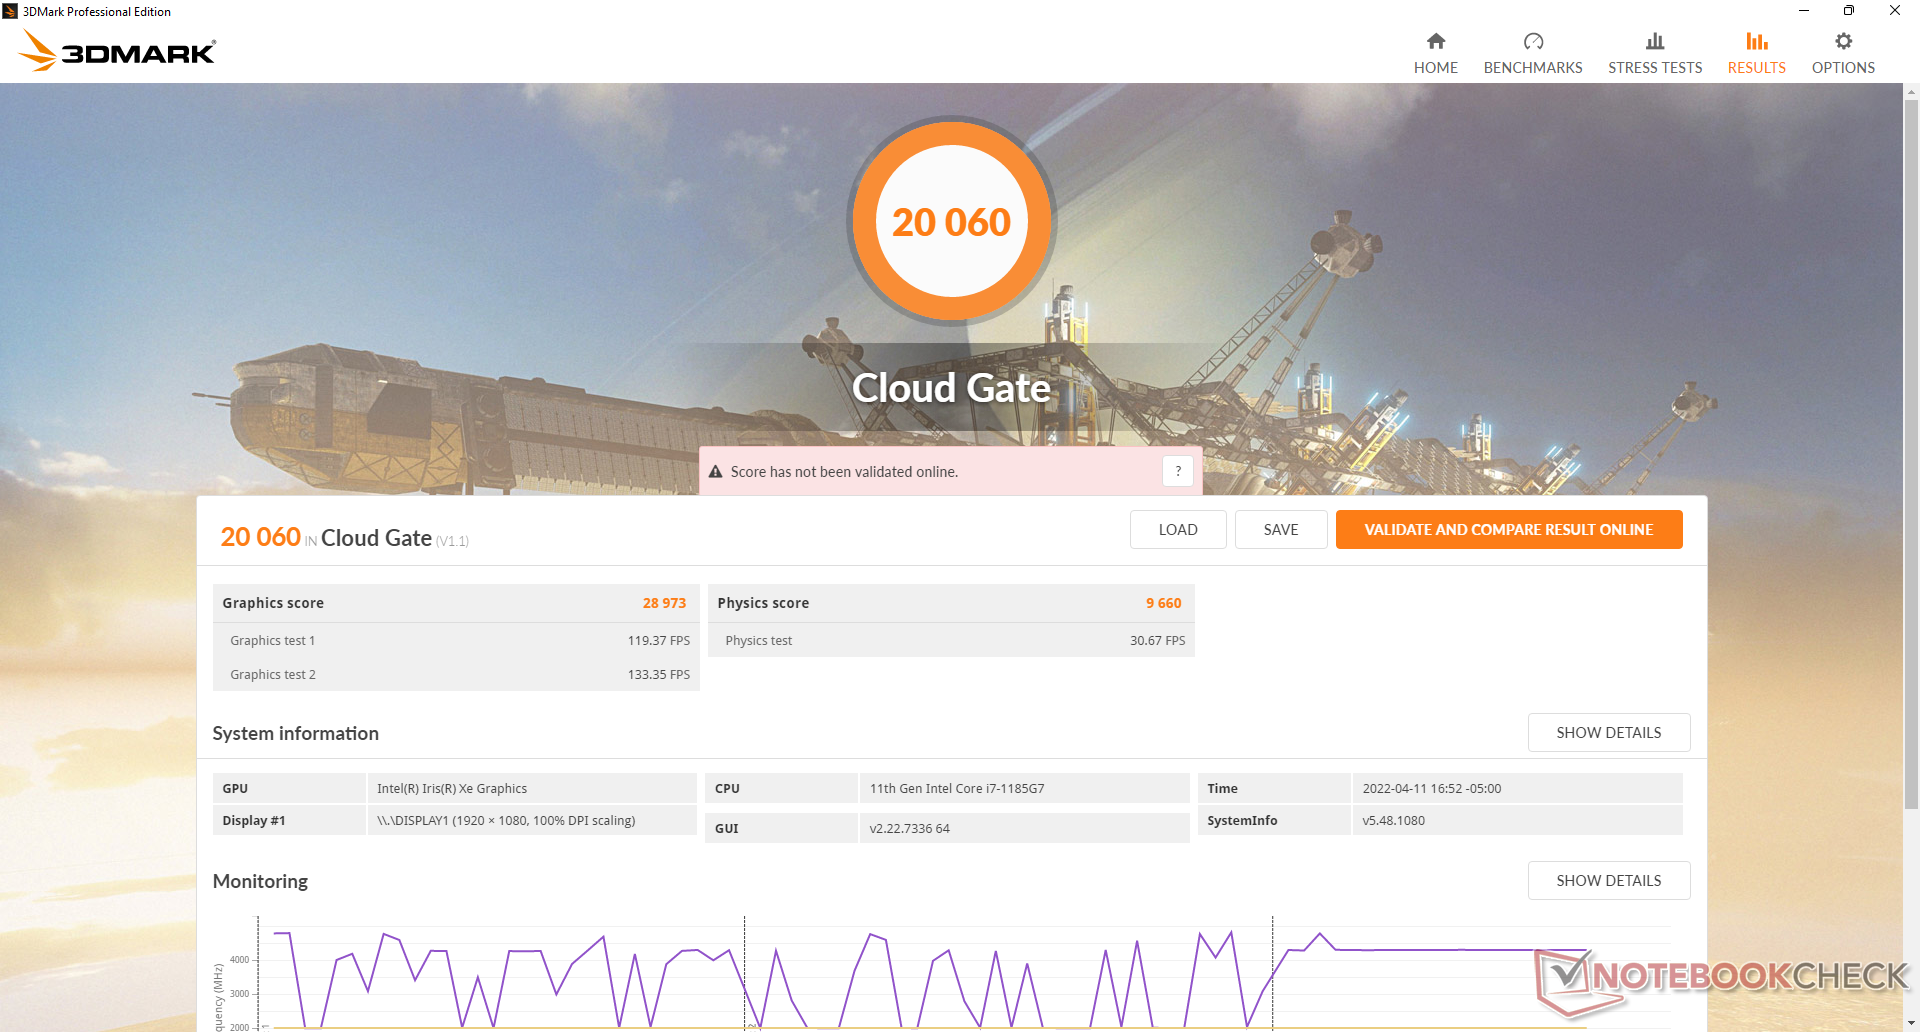
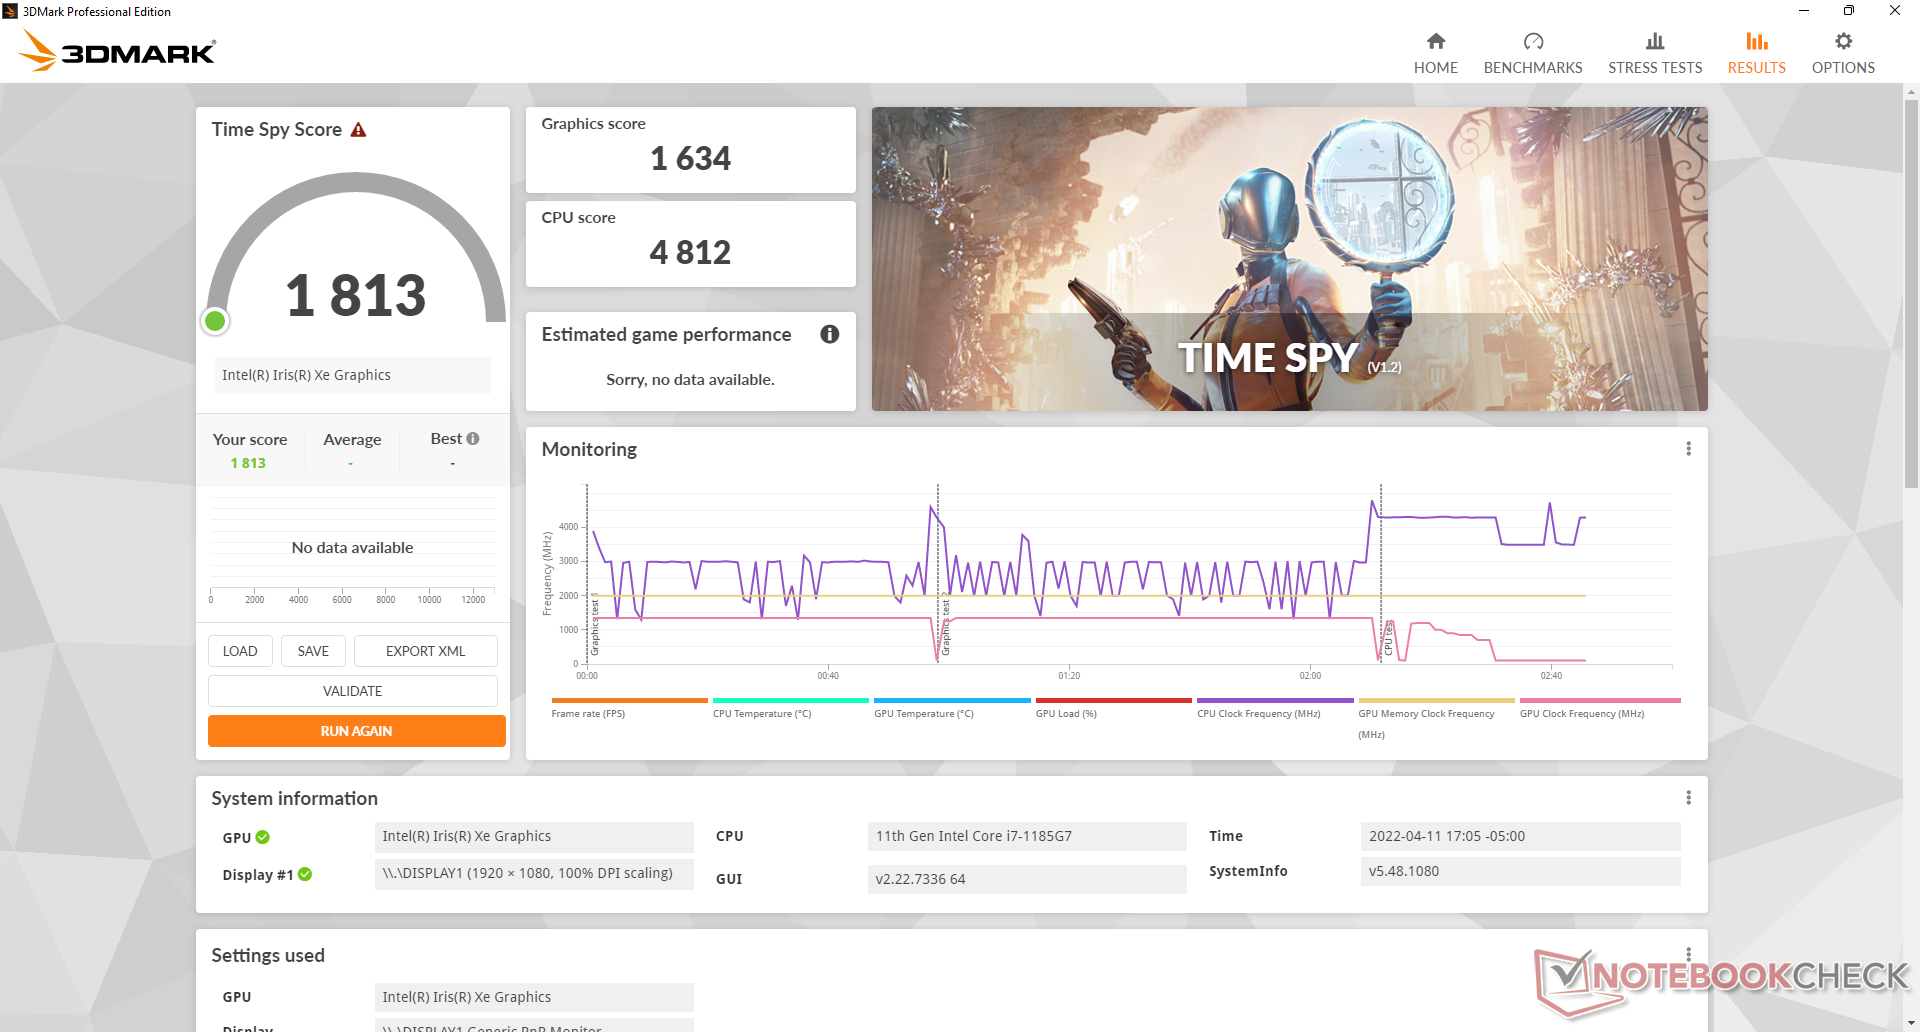
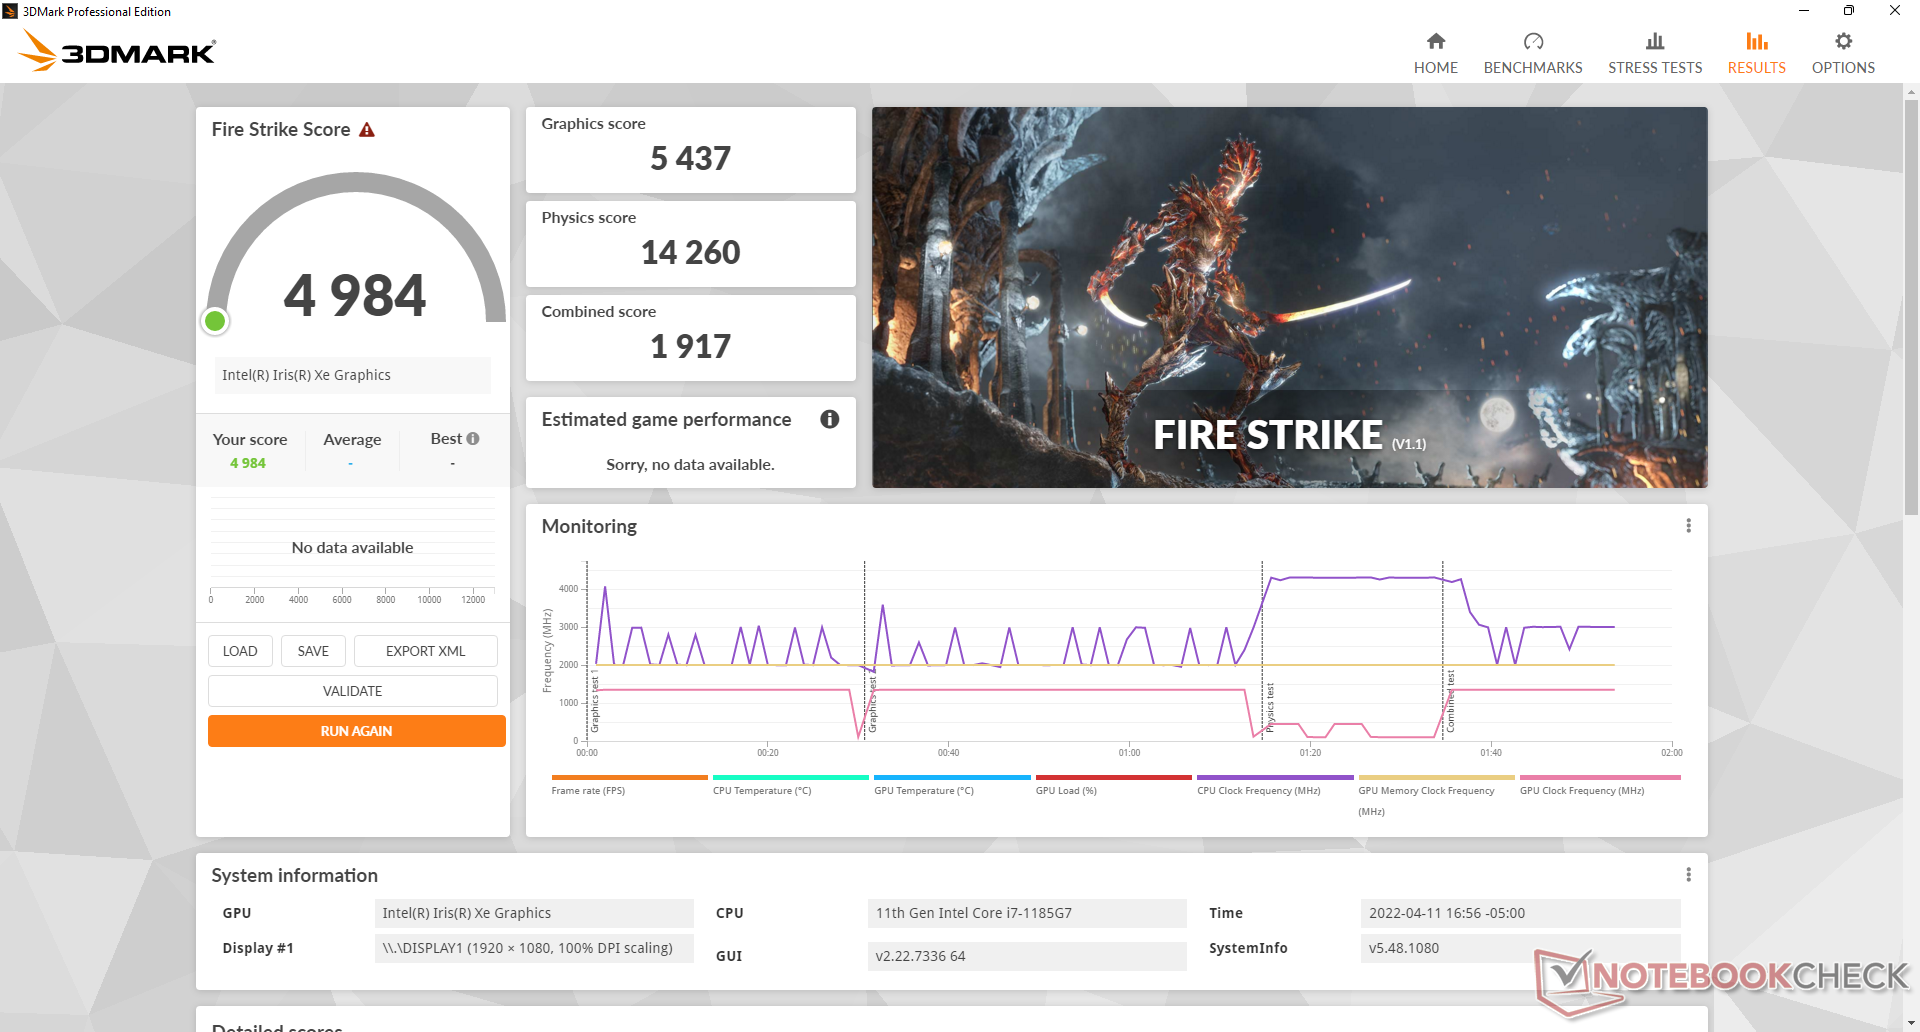
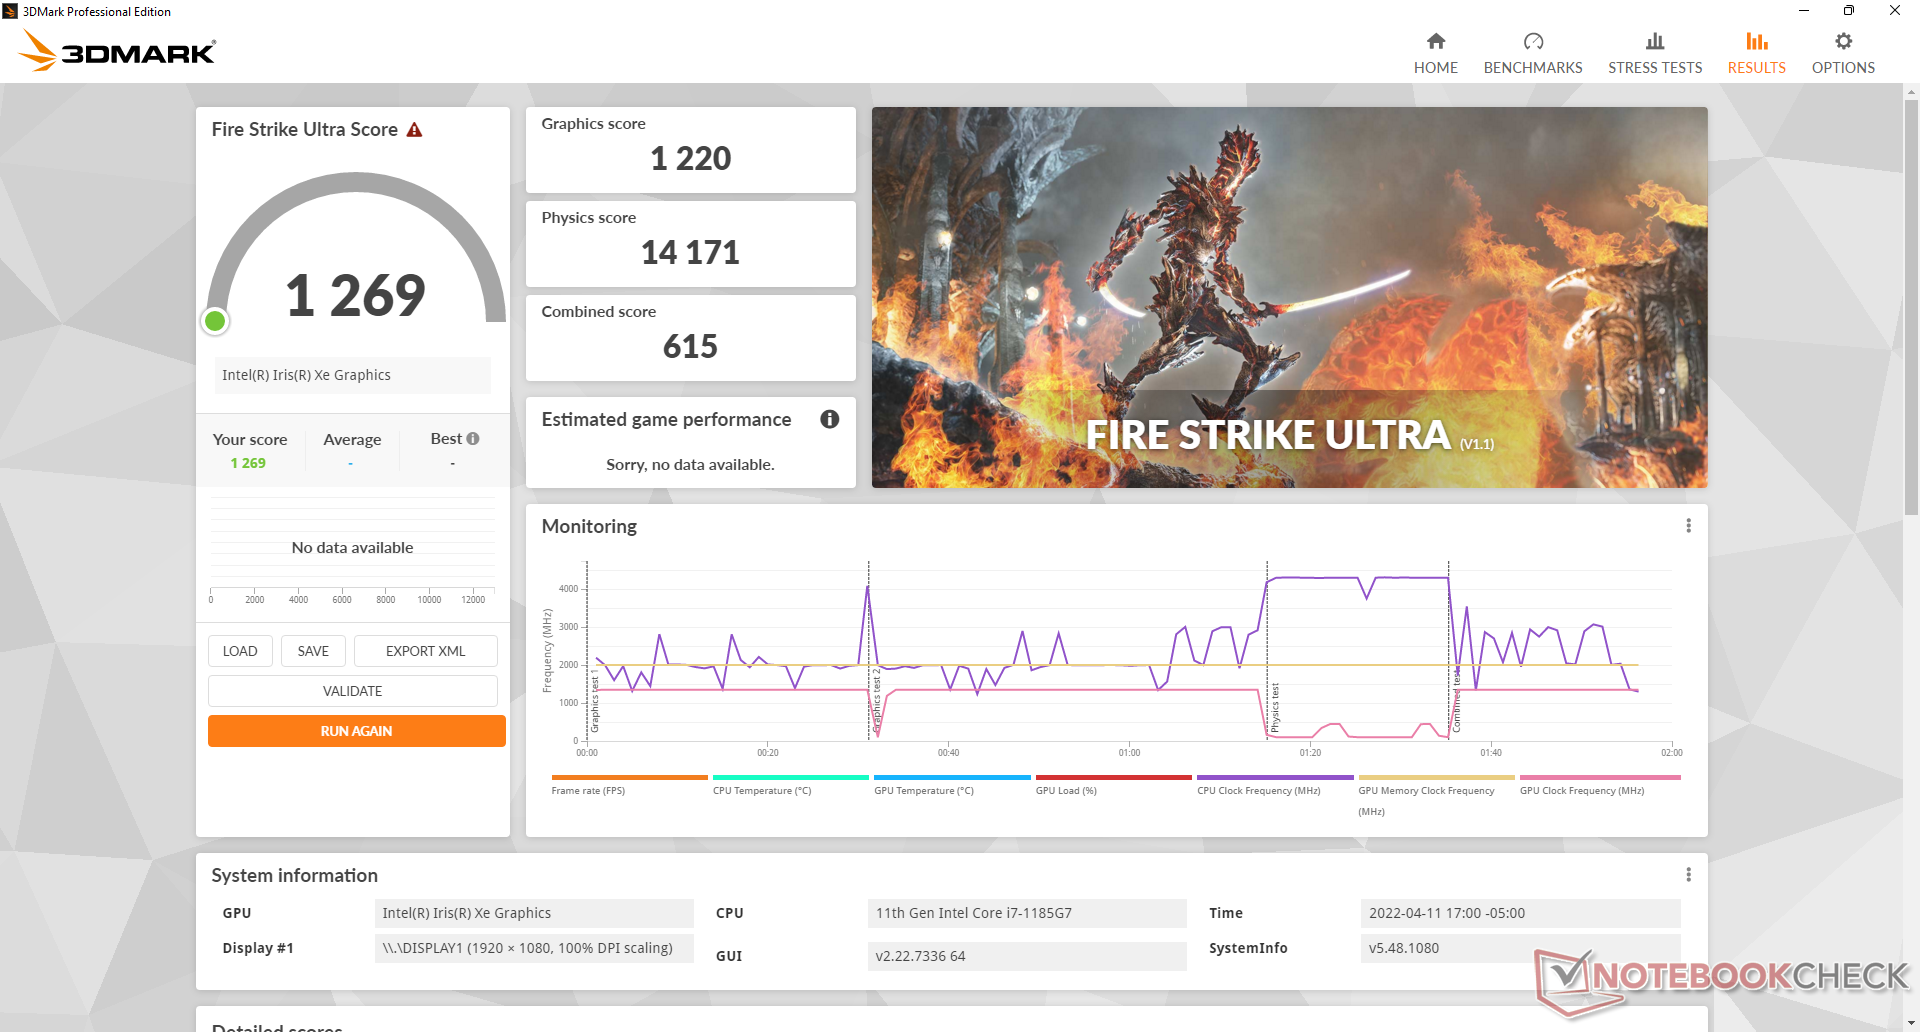
| 3DMark 11 Performance | 7197 puntos | |
| 3DMark Cloud Gate Standard Score | 20060 puntos | |
| 3DMark Fire Strike Score | 4984 puntos | |
| 3DMark Time Spy Score | 1813 puntos | |
ayuda | ||
Witcher 3 FPS Chart
| bajo | medio | alto | ultra | |
|---|---|---|---|---|
| The Witcher 3 (2015) | 99.3 | 65.3 | 34.3 | 15.8 |
| Dota 2 Reborn (2015) | 115.6 | 108.5 | 65 | 57.3 |
| Final Fantasy XV Benchmark (2018) | 46.8 | 26.2 | 26.2 | |
| X-Plane 11.11 (2018) | 27.5 | 25.3 | 22 |
Emisiones
Ruido del sistema
El ruido del ventilador es silencioso ya que el modelo utiliza la misma CPU de la serie U que se encuentra en portátiles de consumo mucho más delgados como el Dell XPS 13. Hemos podido registrar un máximo de sólo 36 dB(A) cuando se ejecuta Prime95 para ser más silencioso que muchas otras alternativas resistentes.
Ruido
| Ocioso |
| 23.1 / 23.1 / 23.1 dB(A) |
| Carga |
| 28 / 36.2 dB(A) |
 | ||
30 dB silencioso 40 dB(A) audible 50 dB(A) ruidosamente alto |
||
min: | ||
| Dell Latitude 7330 Rugged Extreme Iris Xe G7 96EUs, i7-1185G7 | Dell Latitude 7424 Rugged Extreme Radeon RX 540, i7-8650U, SK Hynix PC401 512GB M.2 (HFS512GD9TNG) | Dell Latitude 5420 Rugged-P85G Radeon RX 540, i7-8650U, SK hynix PC401 NVMe 500 GB | Acer Enduro Urban N3 EUN314 Iris Xe G7 96EUs, i7-1165G7, Samsung PM991 MZVLQ1T0HALB | Panasonic Toughbook FZ-55 MK2 Iris Xe G7 96EUs, i7-1185G7, Toshiba KIOXIA KBG4AZNV512G M.2 2280 OPAL | Durabook S14I Iris Xe G7 96EUs, i7-1165G7, UDinfo M2P M2P80DE512GBAEP | |
|---|---|---|---|---|---|---|
| Noise | -21% | -18% | -5% | -4% | -17% | |
| apagado / medio ambiente * (dB) | 22.9 | 28.6 -25% | 28.3 -24% | 23.8 -4% | 23.8 -4% | 25.2 -10% |
| Idle Minimum * (dB) | 23.1 | 28.6 -24% | 28.3 -23% | 24.1 -4% | 24 -4% | 25.2 -9% |
| Idle Average * (dB) | 23.1 | 28.6 -24% | 28.3 -23% | 24.1 -4% | 24 -4% | 25.2 -9% |
| Idle Maximum * (dB) | 23.1 | 28.6 -24% | 28.3 -23% | 24.1 -4% | 24 -4% | 34.5 -49% |
| Load Average * (dB) | 28 | 32.9 -18% | 29.9 -7% | 27.9 -0% | 26.7 5% | 34.5 -23% |
| Witcher 3 ultra * (dB) | 31.2 | 35.7 -14% | ||||
| Load Maximum * (dB) | 36.2 | 39 -8% | 38 -5% | 38.6 -7% | 41.7 -15% | 36.2 -0% |
* ... más pequeño es mejor
Temperatura
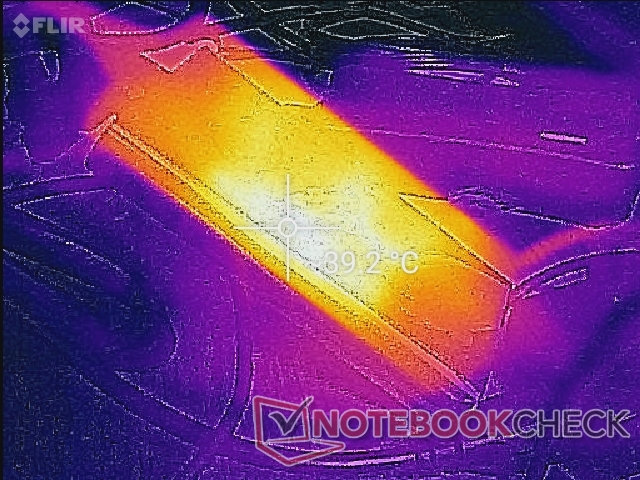
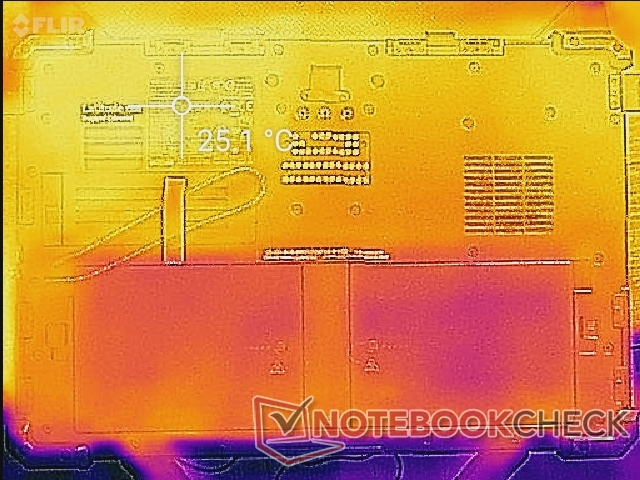
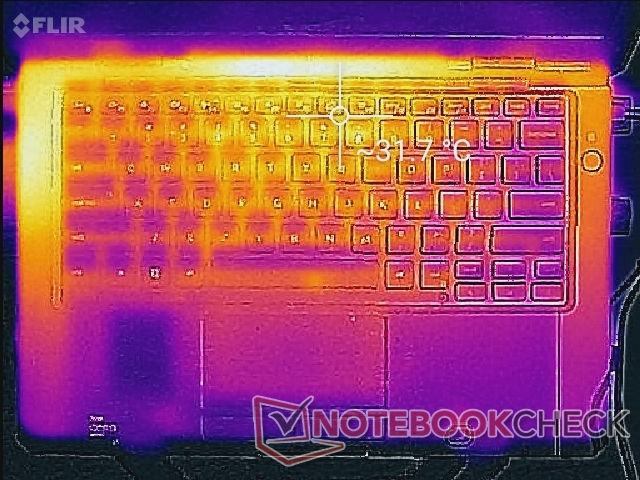
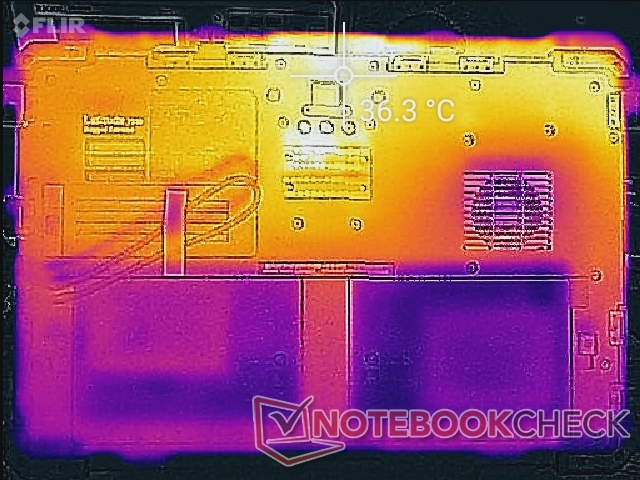
Las temperaturas de la superficie nunca son incómodamente cálidas ya que tiene un chasis más grande de lo habitual para una CPU de la serie ULV U. Pudimos registrar puntos calientes de sólo 31 C y 36 C en las superficies superior e inferior, respectivamente, en comparación con los 37 C y 46 C del Acer Enduro Urban N3.
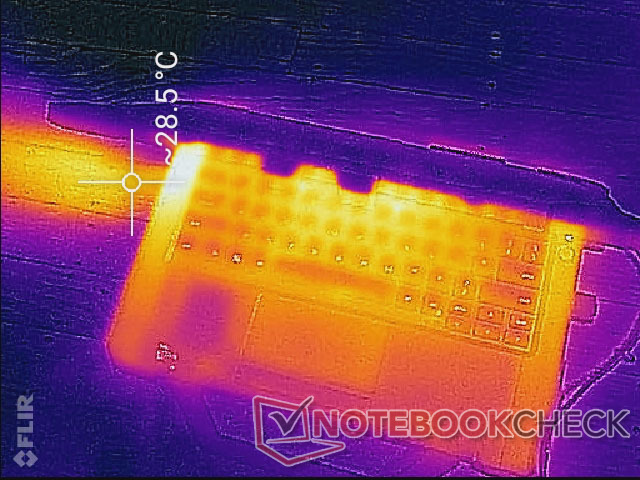
(+) La temperatura máxima en la parte superior es de 34.6 °C / 94 F, frente a la media de 36.9 °C / 98 F, que oscila entre 24.7 y 57 °C para la clase .
(+) El fondo se calienta hasta un máximo de 36.6 °C / 98 F, frente a la media de 38.5 °C / 101 F
(+) En reposo, la temperatura media de la parte superior es de 24.3 °C / 76# F, frente a la media del dispositivo de 31.9 °C / 89 F.
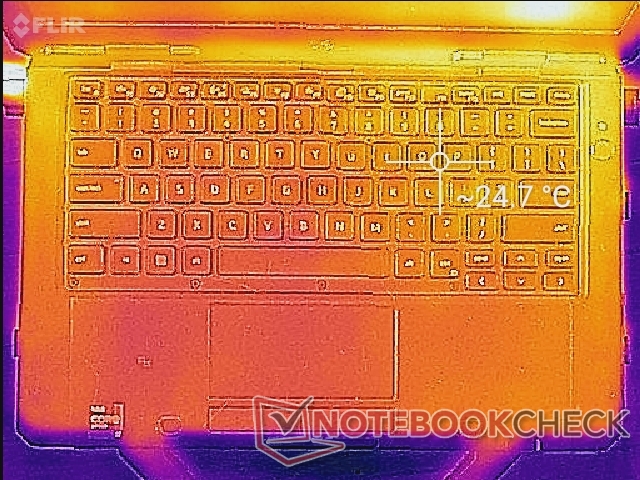
(+) El reposamanos y el panel táctil están a una temperatura inferior a la de la piel, con un máximo de 26 °C / 78.8 F y, por tanto, son fríos al tacto.
(+) La temperatura media de la zona del reposamanos de dispositivos similares fue de 29.6 °C / 85.3 F (+3.6 °C / 6.5 F).
| Dell Latitude 7330 Rugged Extreme Intel Core i7-1185G7, Intel Iris Xe Graphics G7 96EUs | Dell Latitude 7424 Rugged Extreme Intel Core i7-8650U, AMD Radeon RX 540 | Dell Latitude 5420 Rugged-P85G Intel Core i7-8650U, AMD Radeon RX 540 | Acer Enduro Urban N3 EUN314 Intel Core i7-1165G7, Intel Iris Xe Graphics G7 96EUs | Panasonic Toughbook FZ-55 MK2 Intel Core i7-1185G7, Intel Iris Xe Graphics G7 96EUs | Durabook S14I Intel Core i7-1165G7, Intel Iris Xe Graphics G7 96EUs | |
|---|---|---|---|---|---|---|
| Heat | -21% | -23% | -15% | -20% | -19% | |
| Maximum Upper Side * (°C) | 34.6 | 41.6 -20% | 42.2 -22% | 37.8 -9% | 36.2 -5% | 36.4 -5% |
| Maximum Bottom * (°C) | 36.6 | 47.6 -30% | 42 -15% | 45.8 -25% | 42.2 -15% | 38.6 -5% |
| Idle Upper Side * (°C) | 24.8 | 28.6 -15% | 31.6 -27% | 26.4 -6% | 31 -25% | 32.6 -31% |
| Idle Bottom * (°C) | 25.2 | 30.2 -20% | 31.8 -26% | 30.2 -20% | 34 -35% | 33.8 -34% |
* ... más pequeño es mejor
Prueba de esfuerzo
Bajo el estrés de Prime95, la CPU se dispara a 3,7 GHz durante unos segundos y a una temperatura del núcleo de 100 C. A continuación, la velocidad de reloj cae rápidamente y se estabiliza en 2,8 GHz para mantener una temperatura del núcleo más fría de 68 C. Si se ejecuta esta misma prueba en el Panasonic Toughbook FZ-55 MK2, la velocidad de reloj de la CPU es similar, pero la temperatura del núcleo es más cálida, de 81 C.
Funcionar con batería lamentablemente limita el rendimiento. Una prueba 3DMark 11 en baterías devolvería puntuaciones de Física y Gráficos de 8010 y 3501 puntos, respectivamente, comparado con 12036 y 6722 puntos cuando está conectado a la red.
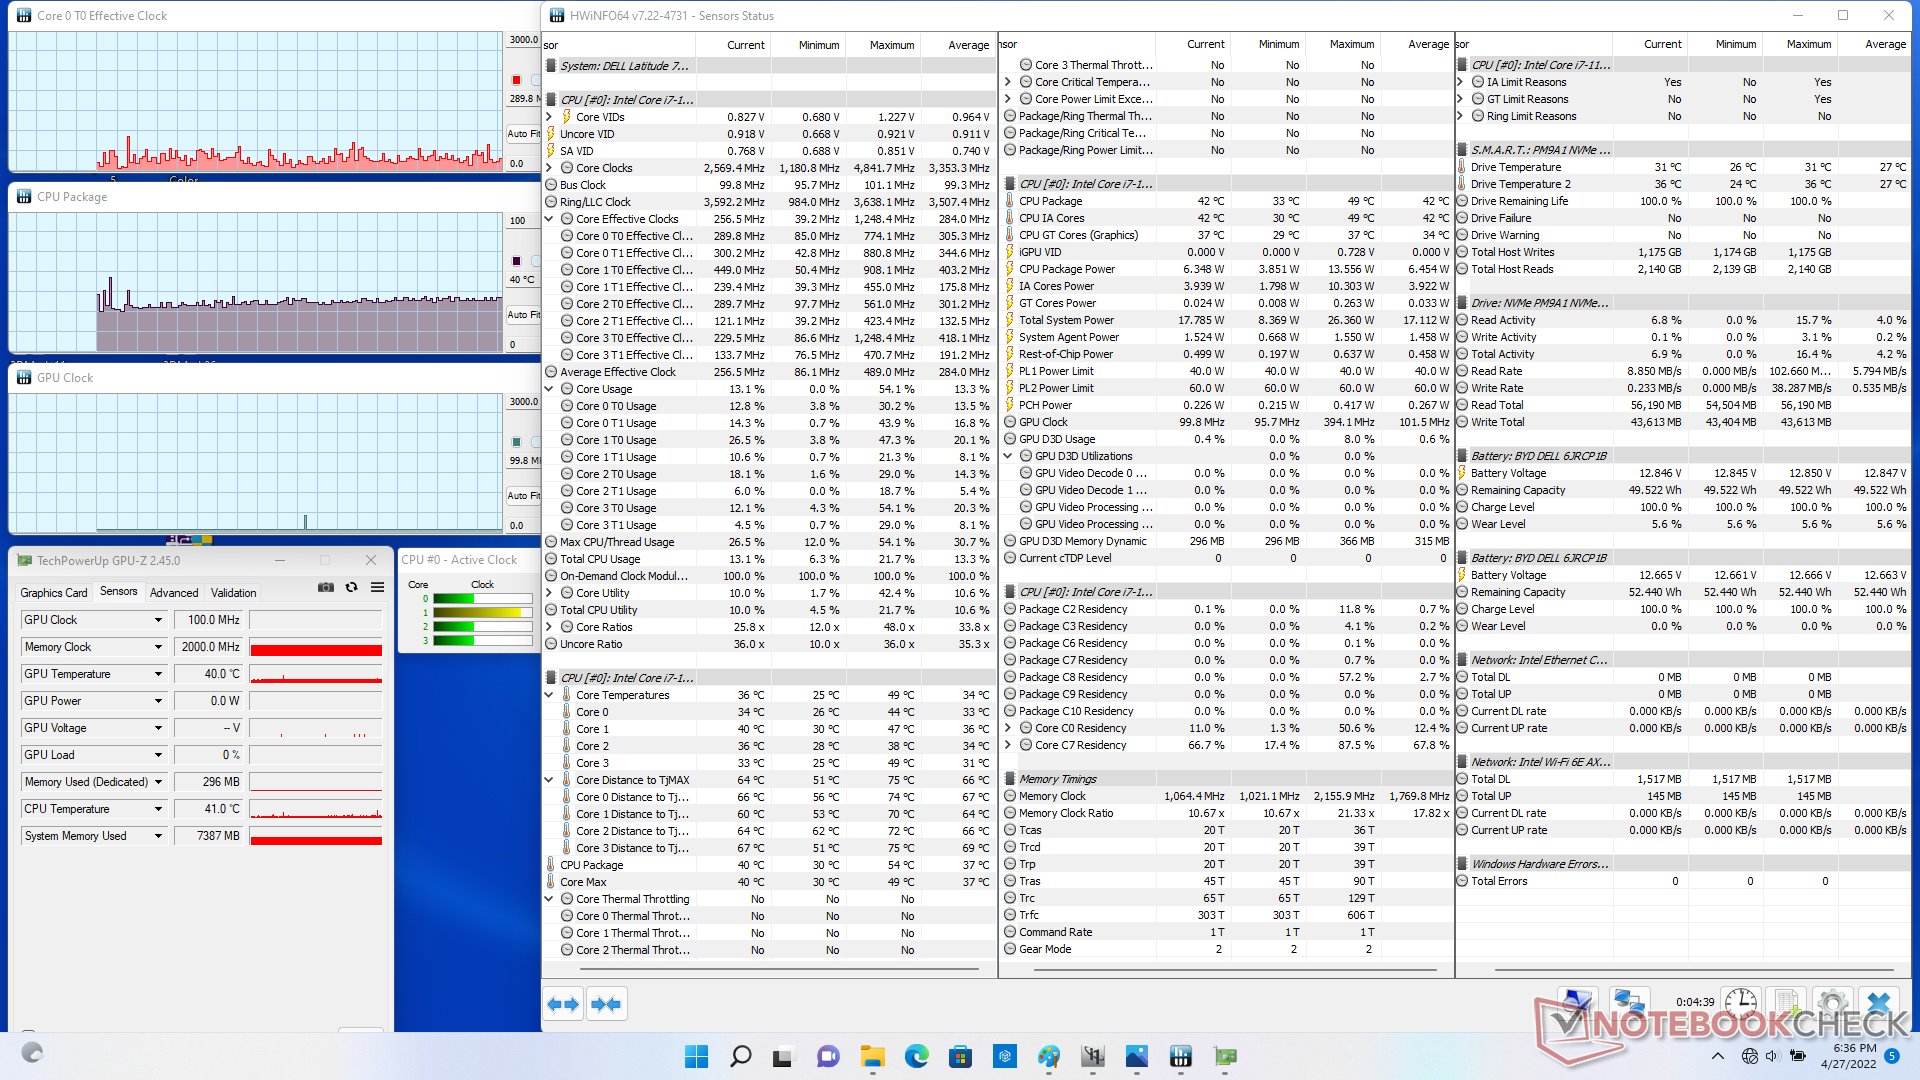
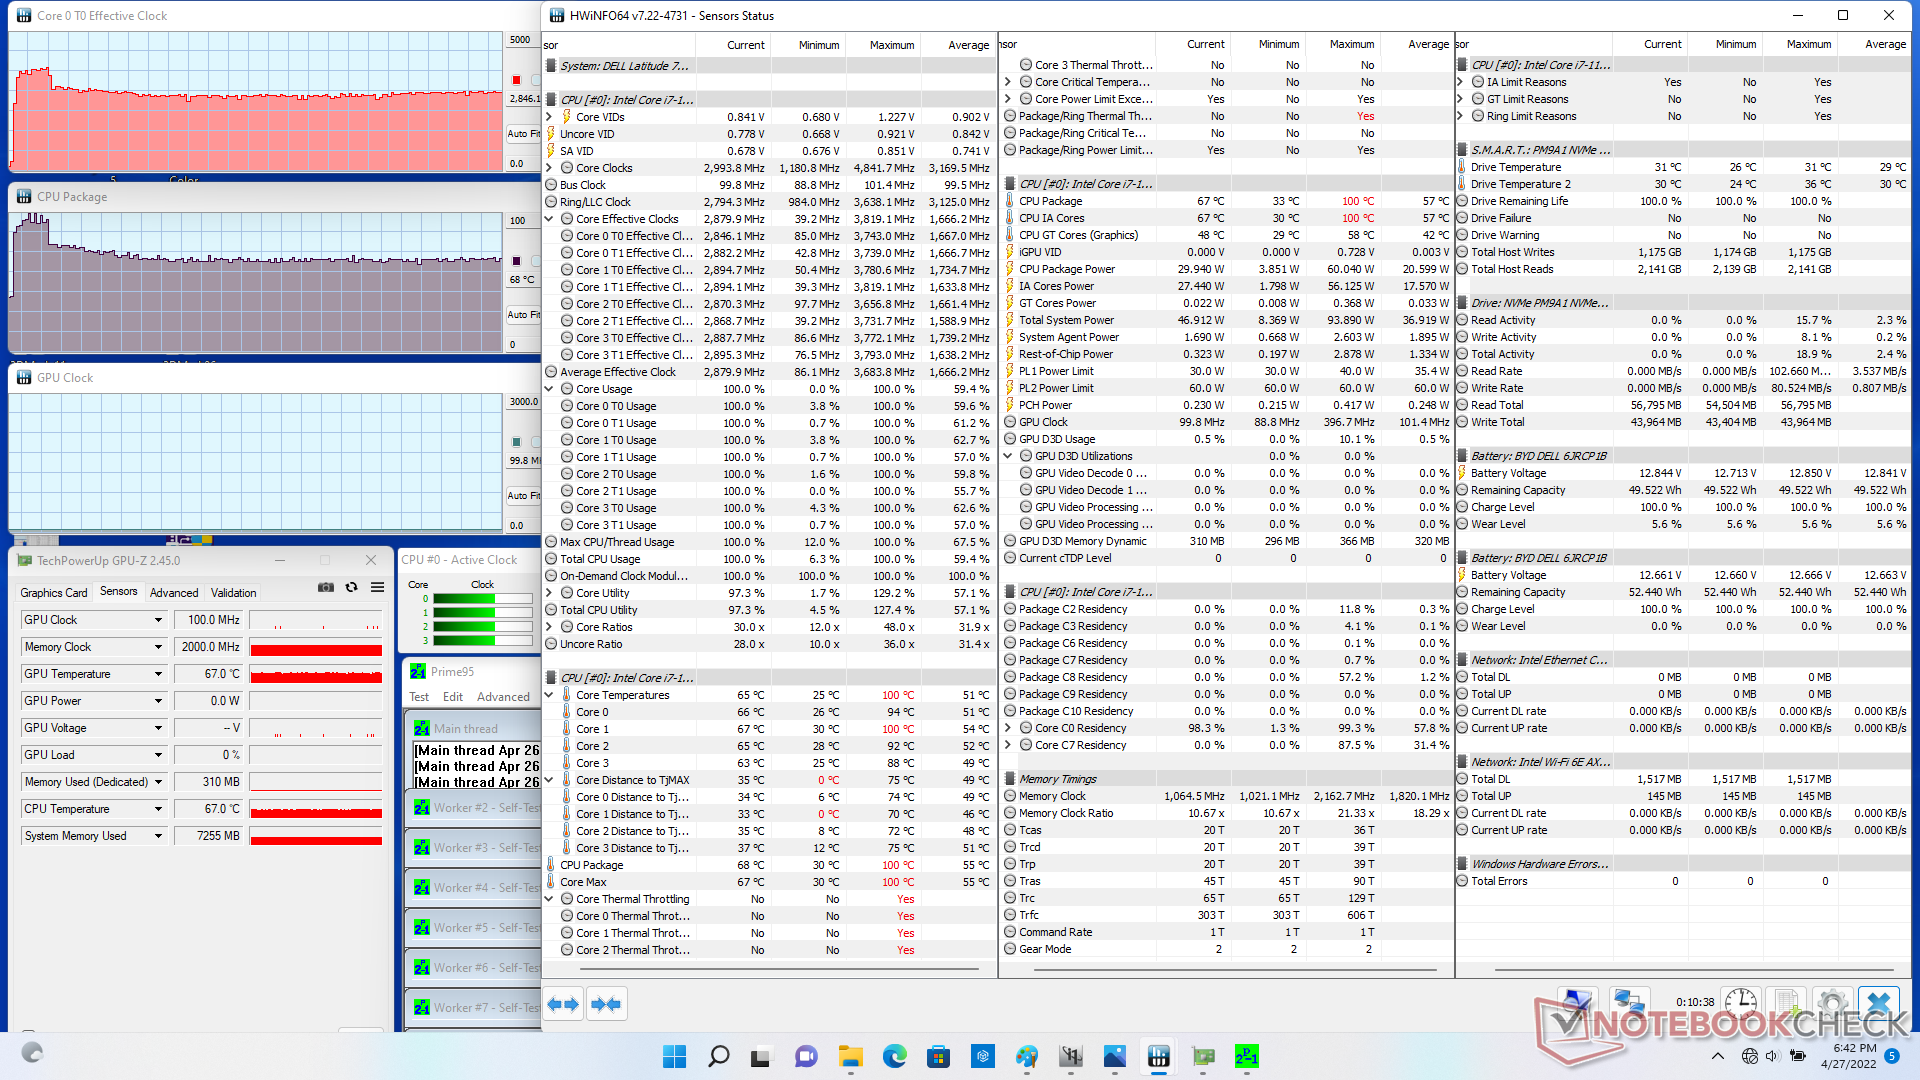
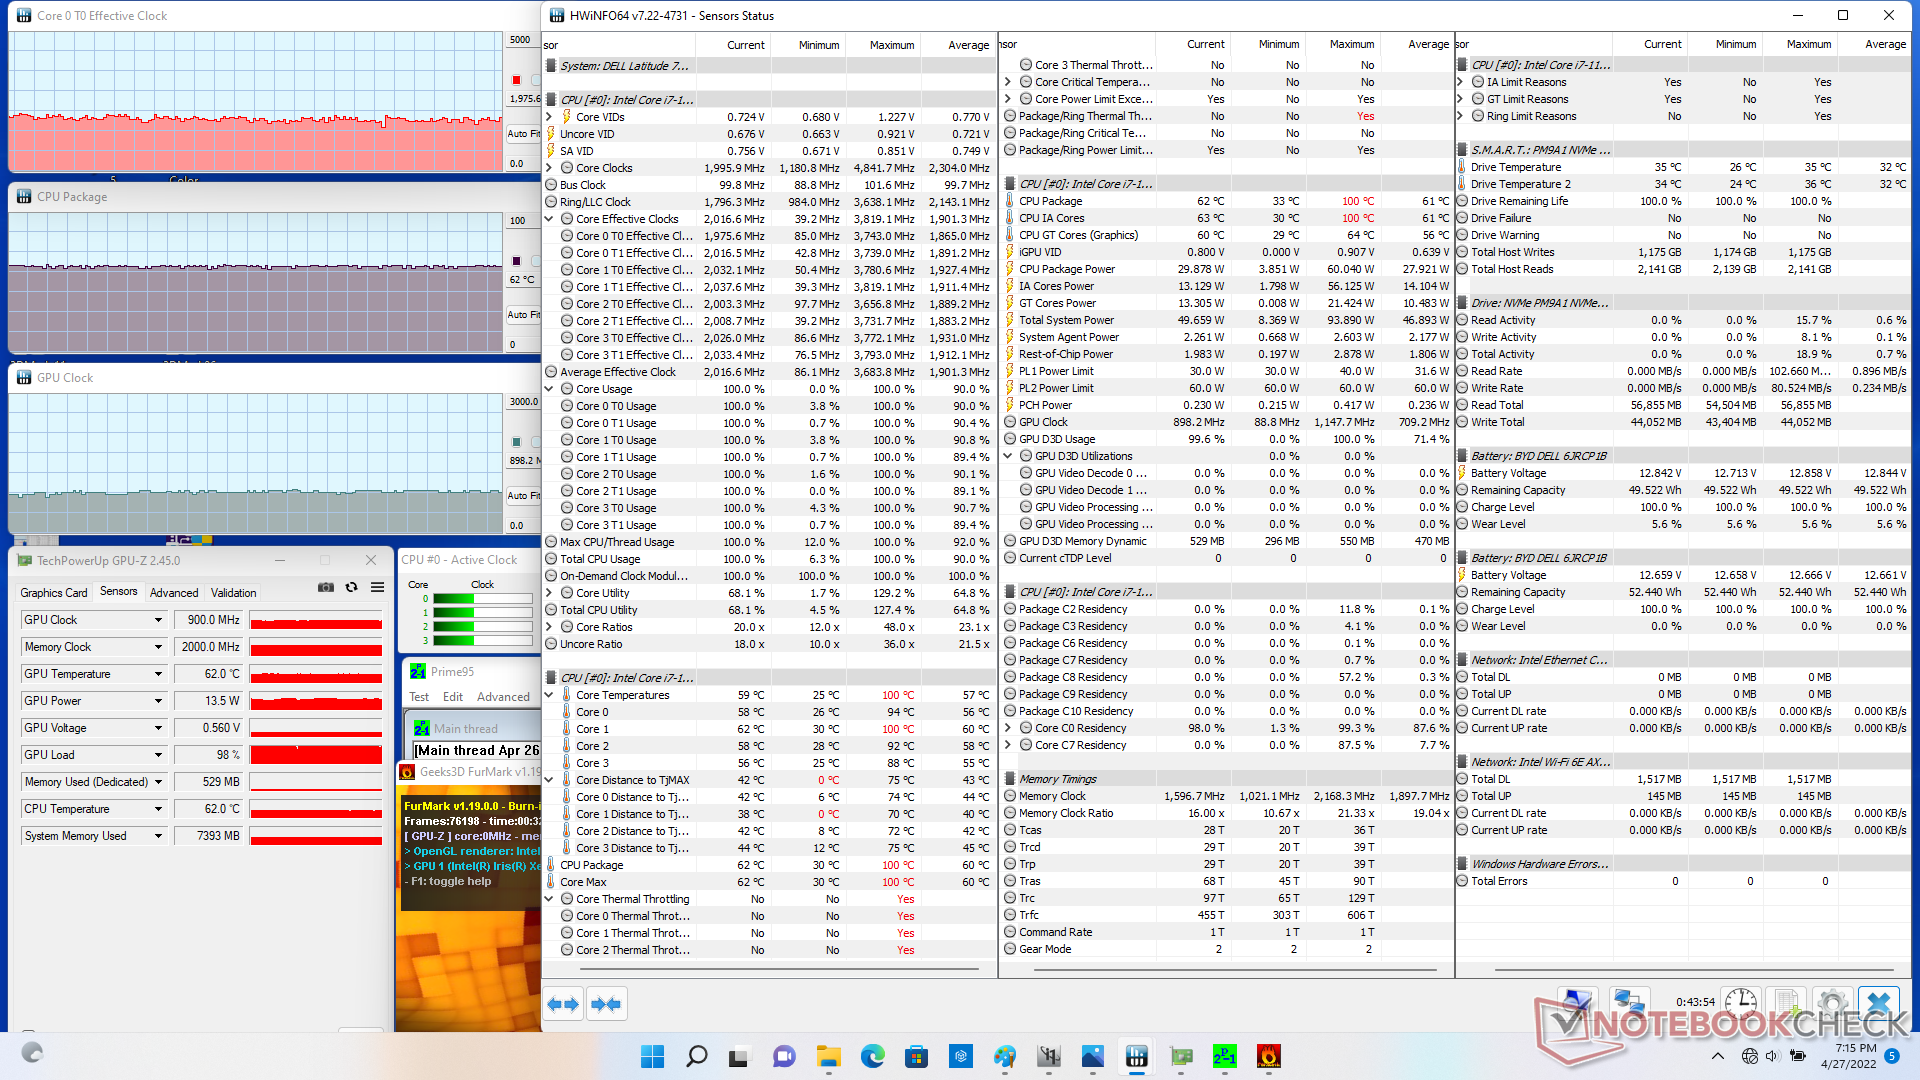
| Reloj dela CPU (GHz) | Reloj de la GPU (MHz) | Temperatura media de la CPU (°C) | |
| Sistema en reposo | -- | -- | 40 |
| Prime95Stress | 2.8 | -- | 68 |
| Prime95+ FurMarkStress | ~2,0 | 900 | 62 |
| Witcher 3 Estrés | ~1,7 | 1350 | 62 |
Altavoces
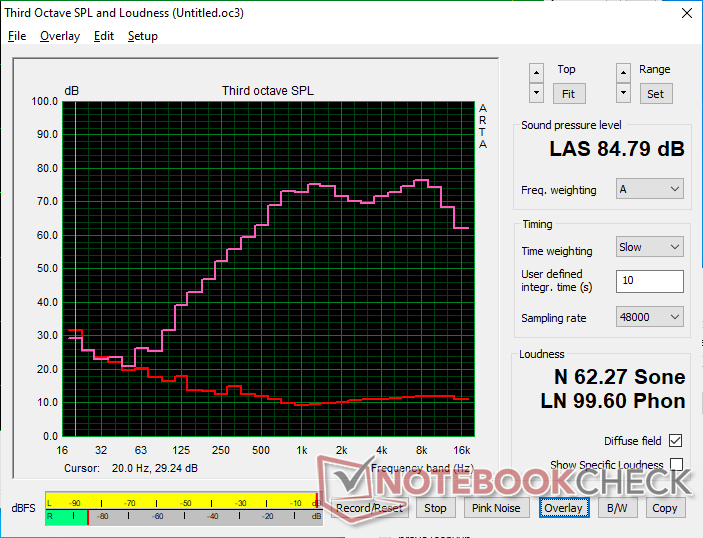
Dell Latitude 7330 Rugged Extreme análisis de audio
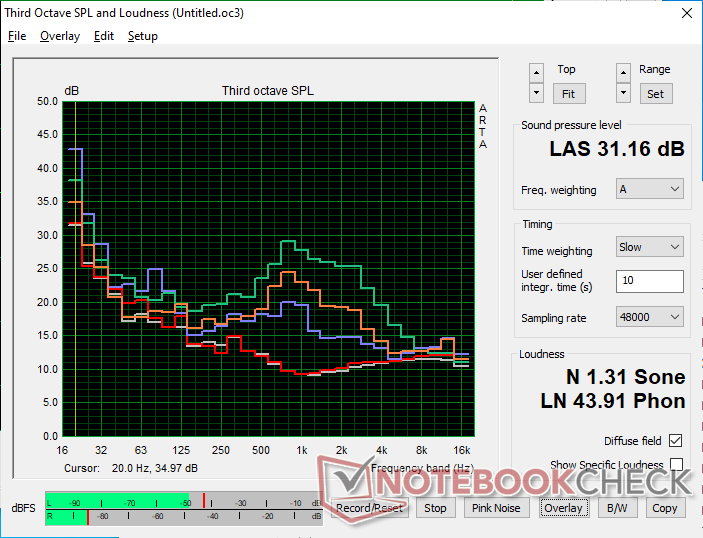
(+) | los altavoces pueden reproducir a un volumen relativamente alto (#84.8 dB)
Graves 100 - 315 Hz
(-) | casi sin bajos - de media 24.8% inferior a la mediana
(±) | la linealidad de los graves es media (8.8% delta a frecuencia anterior)
Medios 400 - 2000 Hz
(+) | medios equilibrados - a sólo 4.6% de la mediana
(+) | los medios son lineales (5.1% delta a la frecuencia anterior)
Altos 2 - 16 kHz
(+) | máximos equilibrados - a sólo 3.2% de la mediana
(+) | los máximos son lineales (2.7% delta a la frecuencia anterior)
Total 100 - 16.000 Hz
(±) | la linealidad del sonido global es media (16.5% de diferencia con la mediana)
En comparación con la misma clase
» 28% de todos los dispositivos probados de esta clase eran mejores, 6% similares, 66% peores
» El mejor tuvo un delta de 4%, la media fue 24%, el peor fue ###max##%
En comparación con todos los dispositivos probados
» 28% de todos los dispositivos probados eran mejores, 6% similares, 66% peores
» El mejor tuvo un delta de 4%, la media fue 24%, el peor fue ###max##%
Apple MacBook Pro 16 2021 M1 Pro análisis de audio
(+) | los altavoces pueden reproducir a un volumen relativamente alto (#84.7 dB)
Graves 100 - 315 Hz
(+) | buen bajo - sólo 3.8% lejos de la mediana
(+) | el bajo es lineal (5.2% delta a la frecuencia anterior)
Medios 400 - 2000 Hz
(+) | medios equilibrados - a sólo 1.3% de la mediana
(+) | los medios son lineales (2.1% delta a la frecuencia anterior)
Altos 2 - 16 kHz
(+) | máximos equilibrados - a sólo 1.9% de la mediana
(+) | los máximos son lineales (2.7% delta a la frecuencia anterior)
Total 100 - 16.000 Hz
(+) | el sonido global es lineal (4.6% de diferencia con la mediana)
En comparación con la misma clase
» 0% de todos los dispositivos probados de esta clase eran mejores, 0% similares, 100% peores
» El mejor tuvo un delta de 5%, la media fue 17%, el peor fue ###max##%
En comparación con todos los dispositivos probados
» 0% de todos los dispositivos probados eran mejores, 0% similares, 100% peores
» El mejor tuvo un delta de 4%, la media fue 24%, el peor fue ###max##%
Gestión de la energía
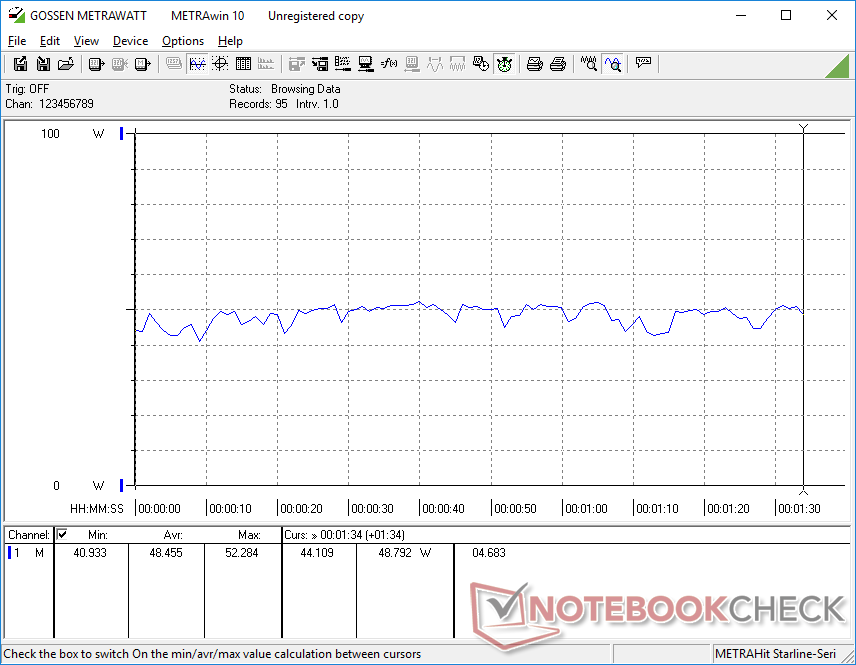
Consumo de energía
El ralentí en el escritorio exige unos 4 W si está en el ajuste de brillo más bajo o hasta 12 W si el brillo está ajustado al máximo. La ejecución de cargas más altas, equivalentes a juegos, exigirá unos 45 W, lo que supone un consumo ligeramente superior al de la mayoría de los portátiles que funcionan con la misma CPU de la serie U de Intel de 11ª generación. Hay que tener en cuenta que el consumo de energía es significativamente menor que en el antiguo Dell Latitude 7424 Rugged Extreme alimentado por la GPU Radeon RX 540, aunque nuestro Latitude 7330 Rugged Extreme es capaz de ofrecer unos gráficos hasta un 40% más rápidos
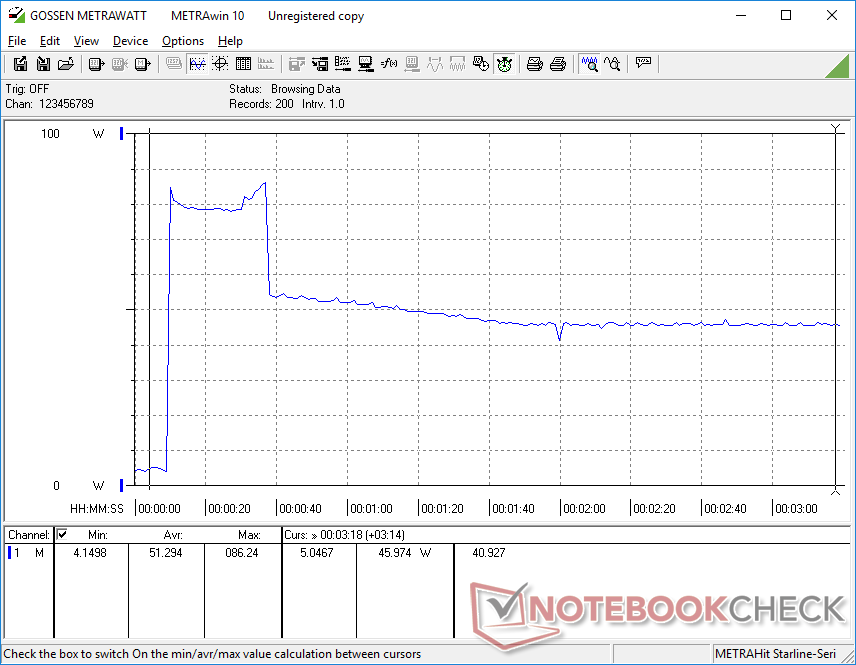
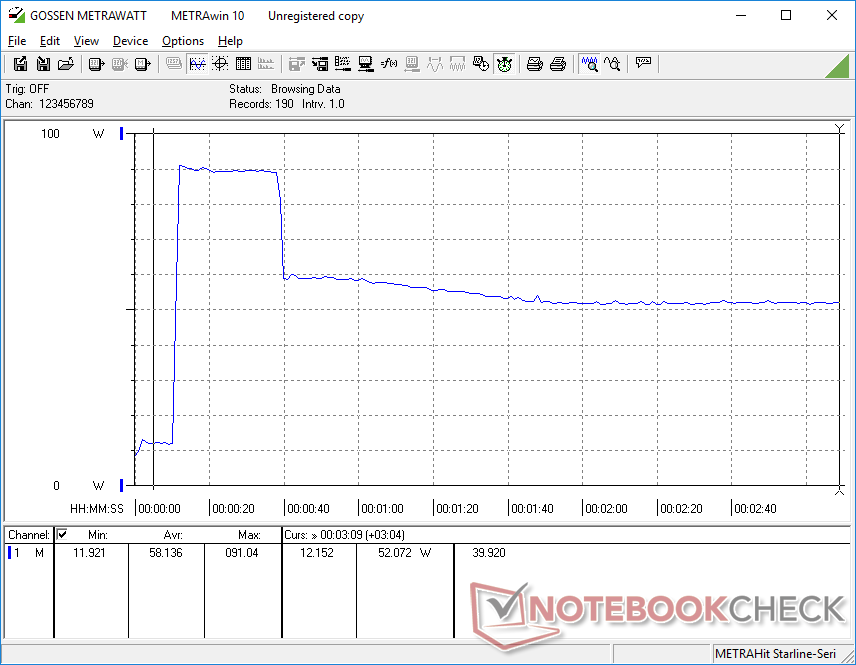
Podemos registrar un consumo máximo de 91 W del adaptador de CA USB-C pequeño-mediano (~13 x 6.5 x 2.3 cm) de 90 W al ejecutar Prime95+FurMark simultáneamente. Esta tasa es sólo temporal, como muestran nuestras capturas de pantalla a continuación, probablemente debido a las limitaciones térmicas.
| Off / Standby | |
| Ocioso | |
| Carga |
|
Clave:
min: | |
| Dell Latitude 7330 Rugged Extreme i7-1185G7, Iris Xe G7 96EUs, , IPS, 1920x1080, 13.3" | Dell Latitude 7424 Rugged Extreme i7-8650U, Radeon RX 540, SK Hynix PC401 512GB M.2 (HFS512GD9TNG), IPS, 1920x1080, 14" | Dell Latitude 5420 Rugged-P85G i7-8650U, Radeon RX 540, SK hynix PC401 NVMe 500 GB, IPS, 1920x1080, 14" | Acer Enduro Urban N3 EUN314 i7-1165G7, Iris Xe G7 96EUs, Samsung PM991 MZVLQ1T0HALB, IPS, 1920x1080, 14" | Panasonic Toughbook FZ-55 MK2 i7-1185G7, Iris Xe G7 96EUs, Toshiba KIOXIA KBG4AZNV512G M.2 2280 OPAL, IPS, 1920x1080, 14" | Durabook S14I i7-1165G7, Iris Xe G7 96EUs, UDinfo M2P M2P80DE512GBAEP, TN, 1920x1080, 14" | |
|---|---|---|---|---|---|---|
| Power Consumption | -38% | -25% | 27% | 6% | -22% | |
| Idle Minimum * (Watt) | 4.1 | 6.5 -59% | 4.8 -17% | 3.8 7% | 3.5 15% | 6.8 -66% |
| Idle Average * (Watt) | 11.7 | 15.1 -29% | 13.6 -16% | 8 32% | 10.4 11% | 16.4 -40% |
| Idle Maximum * (Watt) | 11.8 | 16.1 -36% | 13.8 -17% | 8.7 26% | 10.5 11% | 16.9 -43% |
| Load Average * (Watt) | 48.5 | 70.5 -45% | 67.8 -40% | 34.6 29% | 45.4 6% | 39.2 19% |
| Witcher 3 ultra * (Watt) | 44.3 | 68.1 -54% | 69.1 -56% | 35.4 20% | 43 3% | |
| Load Maximum * (Watt) | 91 | 95.2 -5% | 93.5 -3% | 45.4 50% | 99.3 -9% | 73.1 20% |
* ... más pequeño es mejor
Power Consumption Witcher 3 / Stresstest
Power Consumption external Monitor
Duración de la batería
Se espera una duración real de la red WLAN de casi 18 horas con un brillo de pantalla de 150 nits cuando se instalan las dos baterías de 53,5 Wh. Los usuarios pueden utilizar sólo una batería para reducir el peso si lo desean. Sin embargo, la carga desde el vacío hasta la capacidad total es relativamente lenta, con más de 3 horas, en comparación con la mitad de la mayoría de los Ultrabooks de consumo.
| Dell Latitude 7330 Rugged Extreme i7-1185G7, Iris Xe G7 96EUs, 107 Wh | Dell Latitude 7424 Rugged Extreme i7-8650U, Radeon RX 540, 102 Wh | Dell Latitude 5420 Rugged-P85G i7-8650U, Radeon RX 540, 102 Wh | Acer Enduro Urban N3 EUN314 i7-1165G7, Iris Xe G7 96EUs, 50.3 Wh | Panasonic Toughbook FZ-55 MK2 i7-1185G7, Iris Xe G7 96EUs, 71 Wh | Durabook S14I i7-1165G7, Iris Xe G7 96EUs, 50 Wh | |
|---|---|---|---|---|---|---|
| Duración de Batería | -35% | -10% | -64% | -24% | -69% | |
| WiFi v1.3 (h) | 18 | 11.7 -35% | 16.2 -10% | 6.4 -64% | 13.6 -24% | 5.5 -69% |
| Load (h) | 2.7 | 3.2 | ||||
| Reader / Idle (h) | 31.4 |
Pro
Contra
Veredicto
El Latitude 7330 Rugged Extreme sirve de estándar para lo que deberían ser otros portátiles robustos. El rendimiento de la CPU es alto y sin estrangulamientos, los tiempos de ejecución son muy largos, el adaptador USB-C AC es universal, el lector de tarjetas SD es extremadamente rápido, y el ruido del ventilador es casi siempre silencioso. La GPU integrada, en particular, ha dejado obsoletas las antiguas GPU discretas como la Radeon RX 540.
Una característica destacable del modelo es su pantalla táctil IPS de alta calidad. No es habitual encontrar un portátil robusto con cobertura sRGB completa, casi sin problemas de grano, contraste relativamente profundo, ausencia de PWM y colores bien calibrados nada más sacarlo de la caja. Incluso si la precisión del color no es una prioridad, los usuarios probablemente apreciarán lo bien que se ve la pantalla teniendo en cuenta la competencia.
Los inconvenientes son en su mayoría menores. La ranura MicroSD es de difícil acceso, las imágenes fantasma son frecuentes y la retroiluminación del teclado es sólo blanca, sin otras opciones de color. El modelo también es más pesado que muchos portátiles robustos de 14 pulgadas, por lo que los usuarios no deberían esperar que el Latitude 7330 Rugged Extreme sea más ligero sólo porque tenga un factor de forma más pequeño. Nos encantaría ver más accesorios intercambiables en caliente como el Getac B360 para una mayor versatilidad.
Precio y disponibilidad
Dell actualmente está enviando su modelo Latitude 7330 Rugged Extreme en todas las configuraciones con un precio inicial de $4350 USD.
Price comparison

