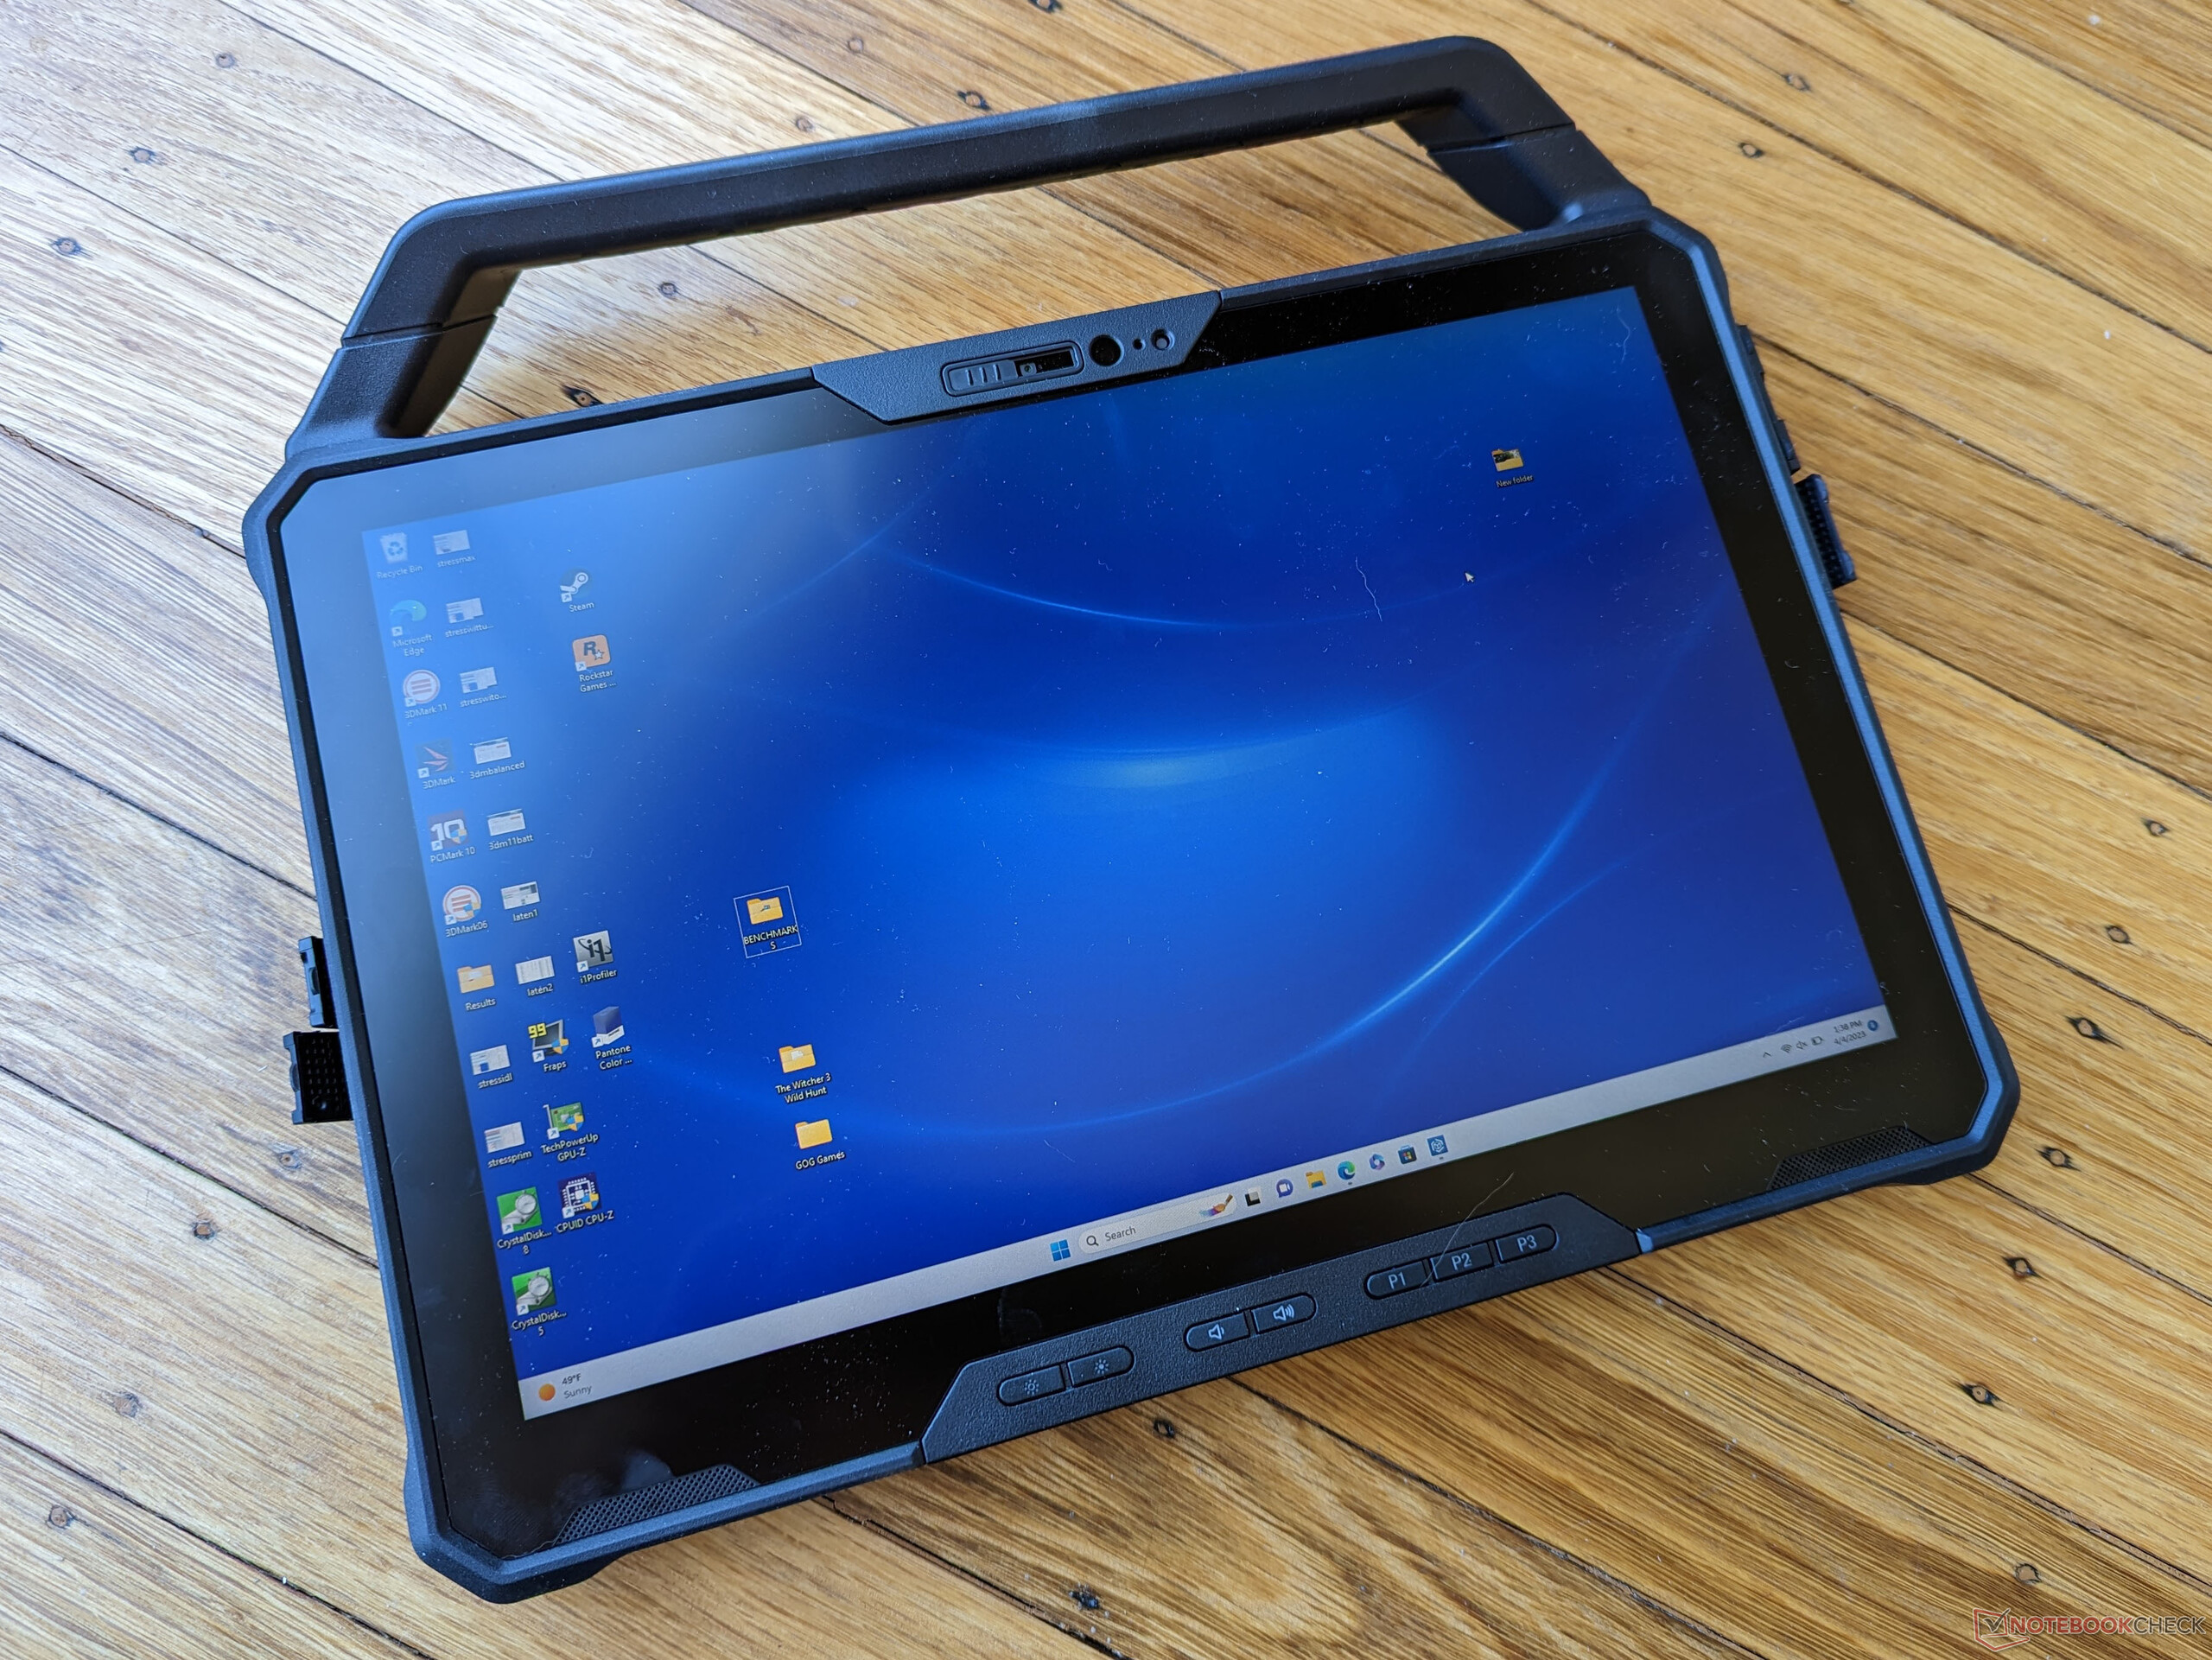
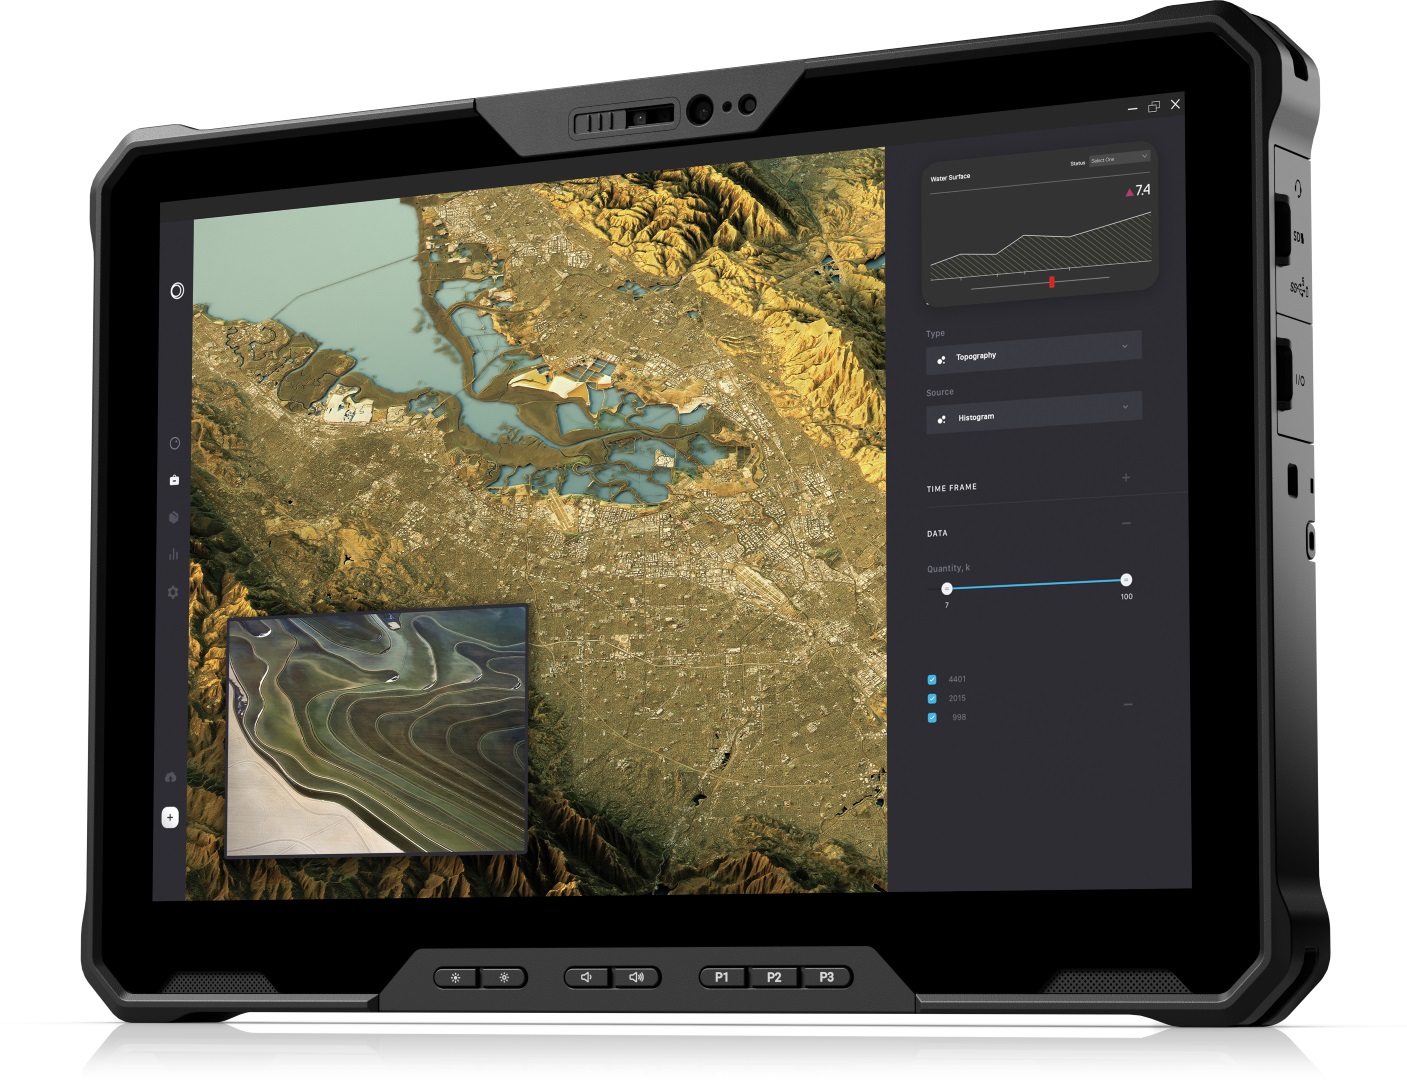
Análisis de la tableta Dell Latitude 7230 Rugged Extreme: Una de las mejores pantallas de su categoría

El Latitude 7230 Rugged Extreme se anunció en Octubre del año pasado como sucesor del Latitude 7220 Rugged Extreme. Introduce un chasis actualizado con una pantalla de mayor tamaño (de 11,6 a 12 pulgadas), opciones de CPU Intel más rápidas (de 8ª a 12ª generación) y opciones de conectividad más rápidas (Wi-Fi 6 a 6E, 5G).
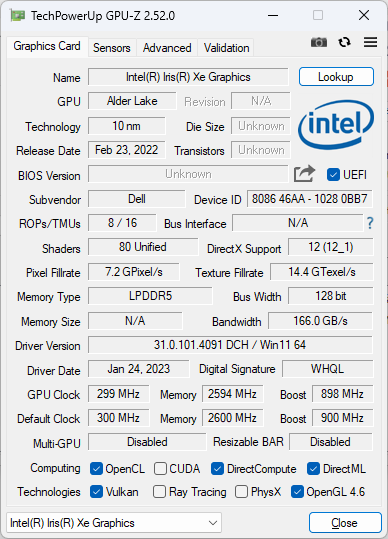
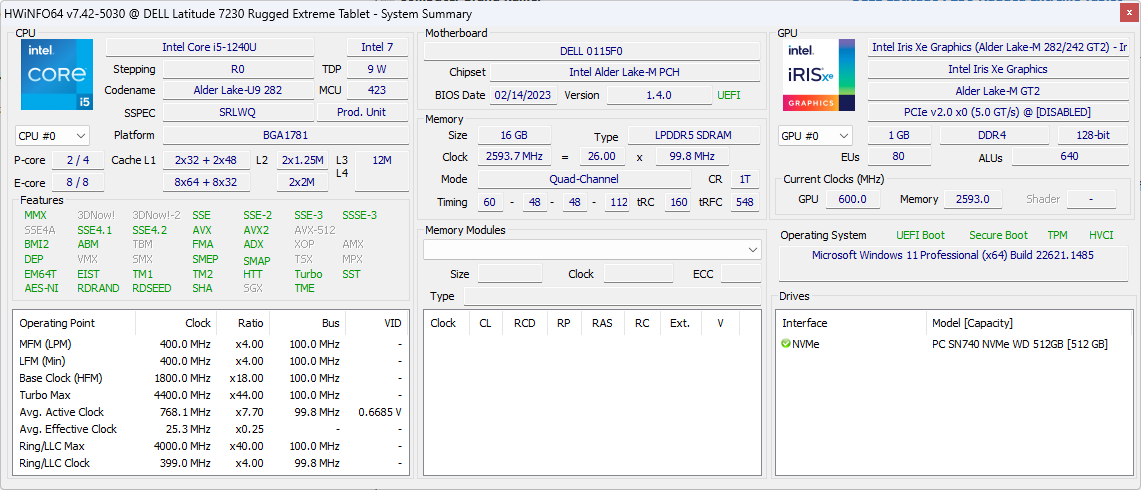
Nuestra unidad de pruebas es una versión de gama media con Core i5-1240U, 16 GB RAM y 512 GB SSD NVMe por unos 3200 $. Hay otras versiones disponibles con el Core i3-1210U más lento, el i7-1260U más rápido, más RAM o almacenamiento, y otras expansiones. Por lo demás, todas las configuraciones se entregan con la misma pantalla táctil IPS de 1920 x 1200 y 1200 nits. La hoja de especificaciones completa del Latitude 7230 Rugged Extreme está disponible públicamente a través de Dell aquí.
Otras alternativas son el Acer Enduro T1el Samsung serie Galaxy Tab Activeo la serie Panasonic Toughbook serie FZ-G2.
Más opiniones sobre Dell:
Posibles contendientes en la comparación
Valoración | Fecha | Modelo | Peso | Altura | Tamaño | Resolución | Precio |
|---|---|---|---|---|---|---|---|
| 83.9 % v7 (old) | 04/2023 | Dell Latitude 7230 Rugged Extreme i5-1240U, Iris Xe G7 80EUs | 1.6 kg | 23.9 mm | 12.00" | 1920x1200 | |
v (old) | 05/2022 | Dell Latitude 7330 Rugged Extreme i7-1185G7, Iris Xe G7 96EUs | 2.7 kg | 36.5 mm | 13.30" | 1920x1080 | |
v (old) | 07/2022 | Panasonic Toughbook 40 i7-1185G7, Iris Xe G7 96EUs | 3.9 kg | 53.4 mm | 14.00" | 1920x1080 | |
| 83.8 % v7 (old) | 01/2022 | Getac B360 i7-10710U, UHD Graphics 620 | 2.4 kg | 34.9 mm | 13.30" | 1920x1080 | |
| 82.4 % v7 (old) | 12/2021 | Acer Enduro Urban N3 EUN314 i7-1165G7, Iris Xe G7 96EUs | 1.8 kg | 21.95 mm | 14.00" | 1920x1080 | |
v (old) | 04/2021 | Durabook S14I i7-1165G7, Iris Xe G7 96EUs | 3 kg | 38.1 mm | 14.00" | 1920x1080 |
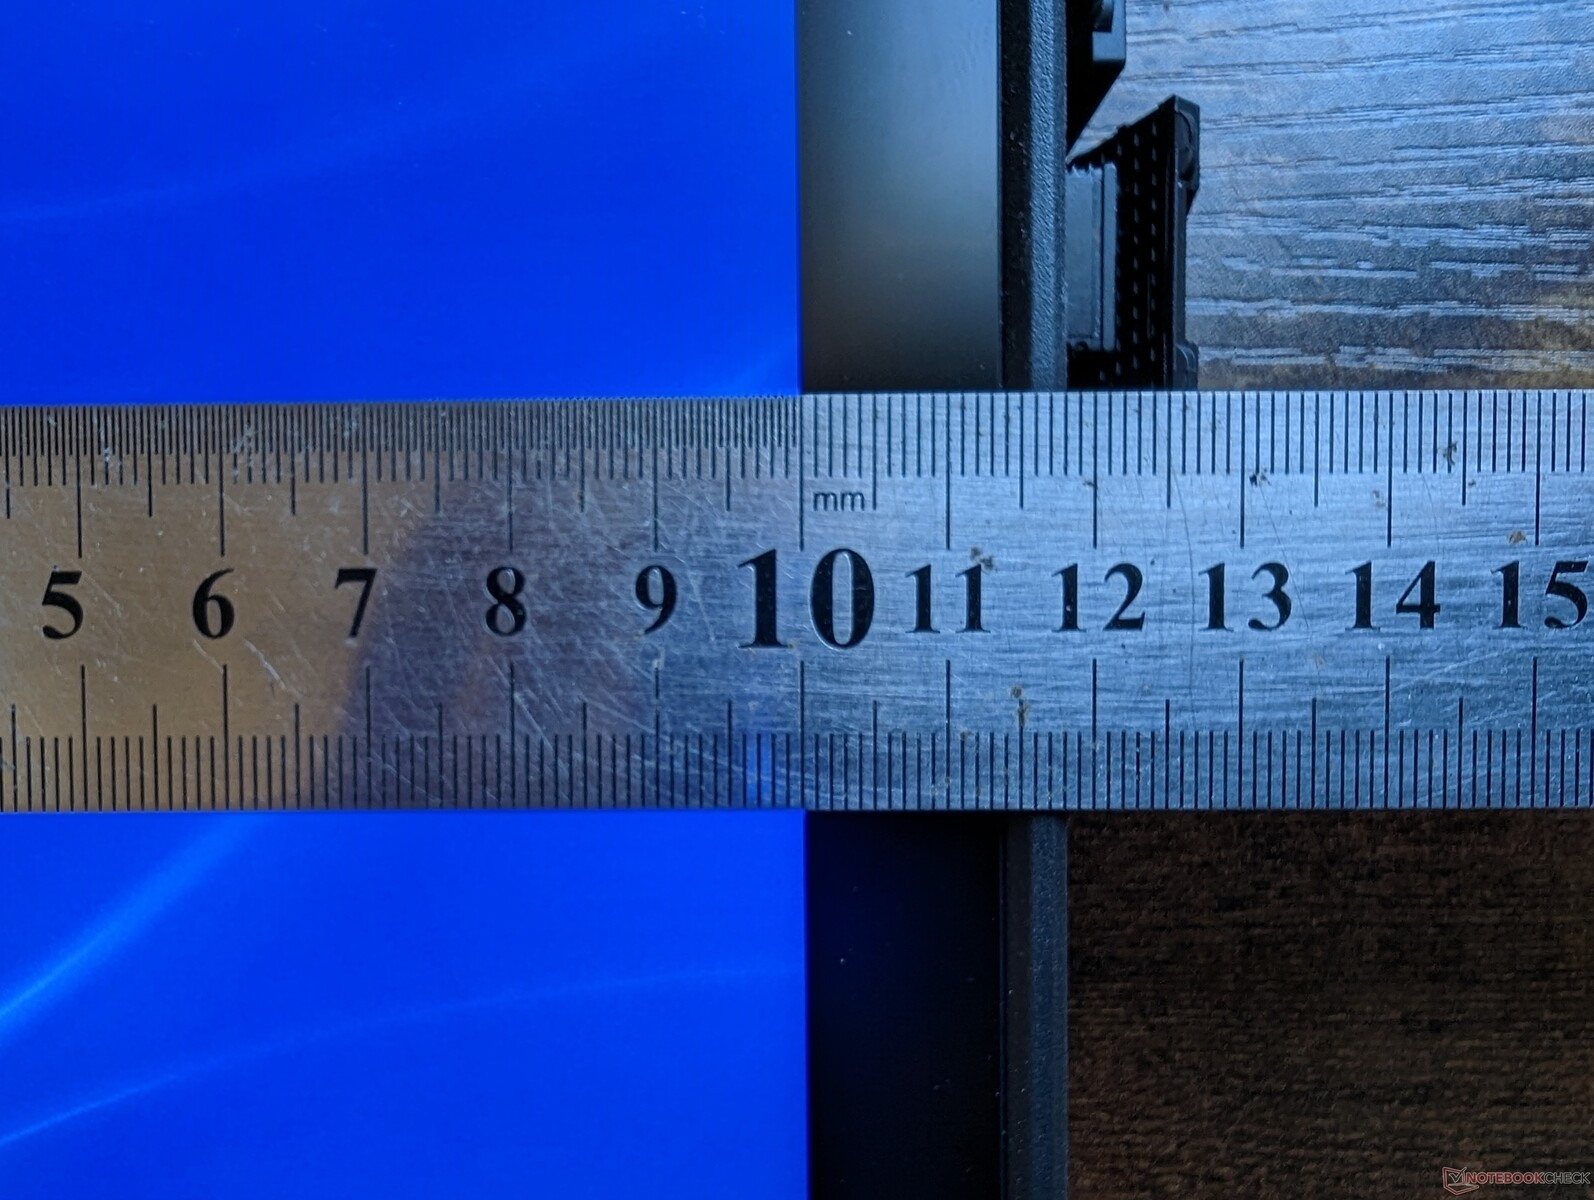
Caja - Gruesa con biseles relativamente estrechos
El chasis es robusto desde todos los ángulos, especialmente a lo largo de sus bordes y esquinas de goma. Su punto más débil es directamente en el centro de la pantalla táctil, donde la deformación es notable cuando se presiona firmemente hacia abajo con un dedo. No es una gran preocupación, pero cualquier deformación es digna de mención.
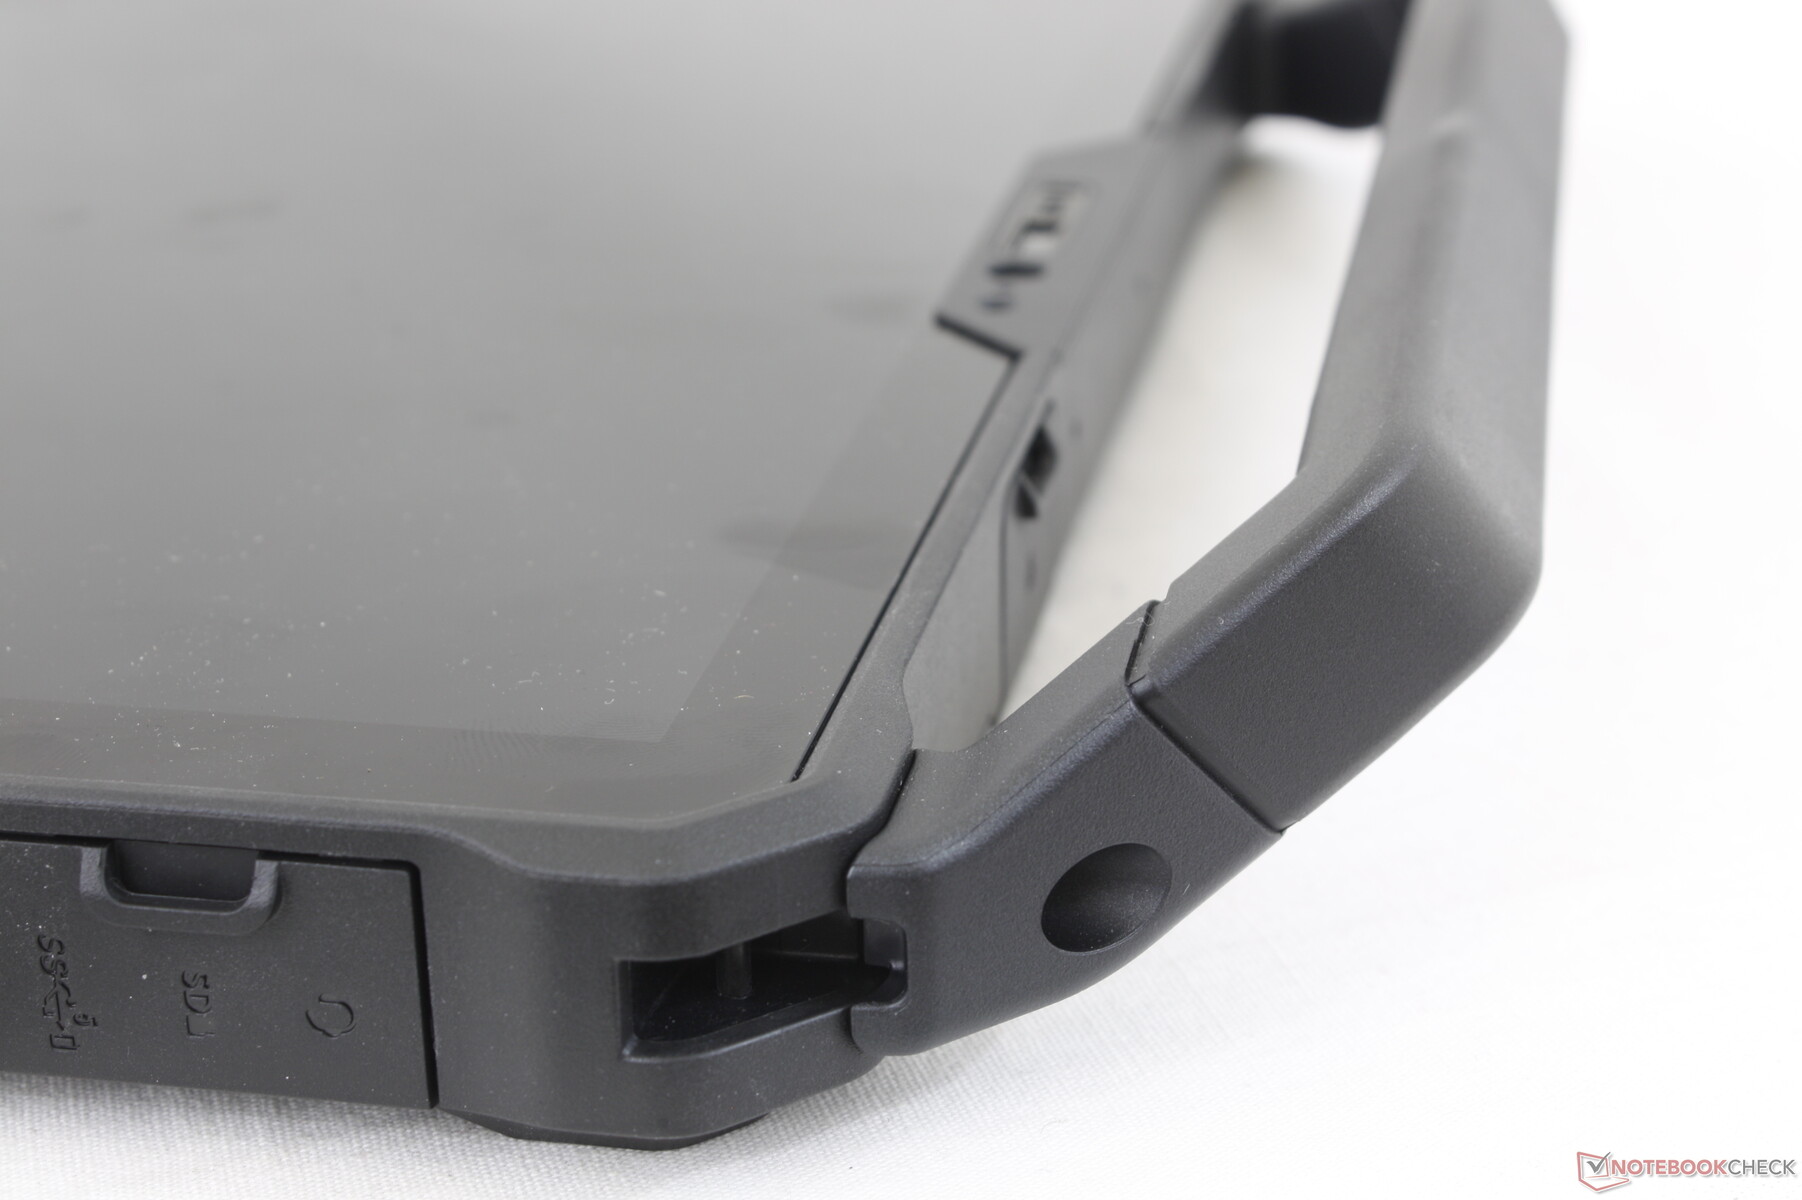
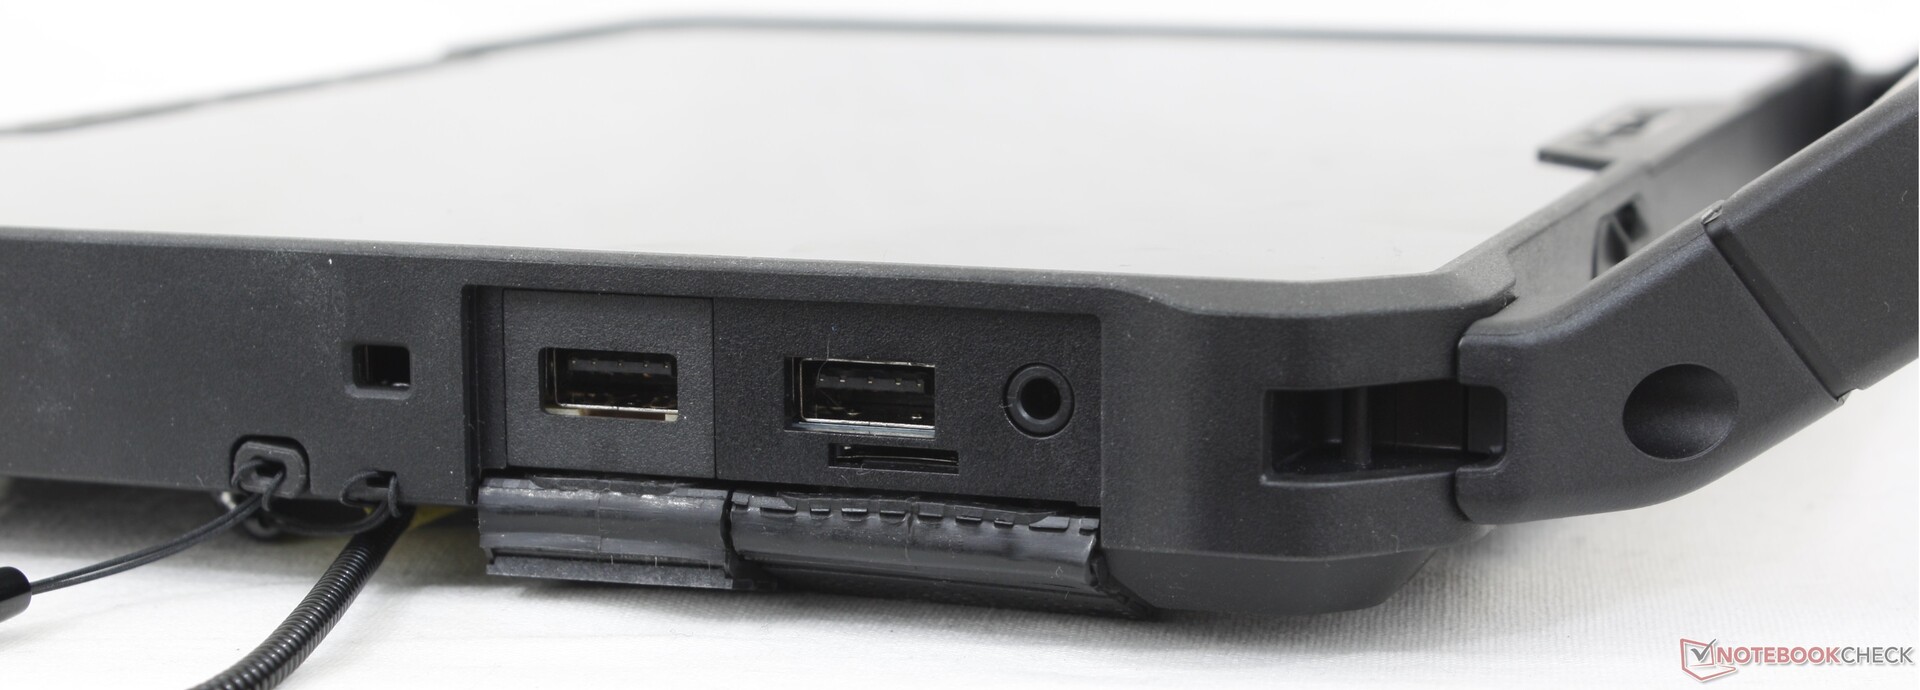
Algunos aspectos molestos de la carcasa son las inestables tapas de los puertos y los esponjosos botones frontales. Las tapas de los puertos son difíciles de agarrar, mientras que los botones de acceso directo podrían ceder un poco más al pulsarlos. El Toughbook FZ-G2 de la competencia hace las cosas un poco mejor en este sentido.
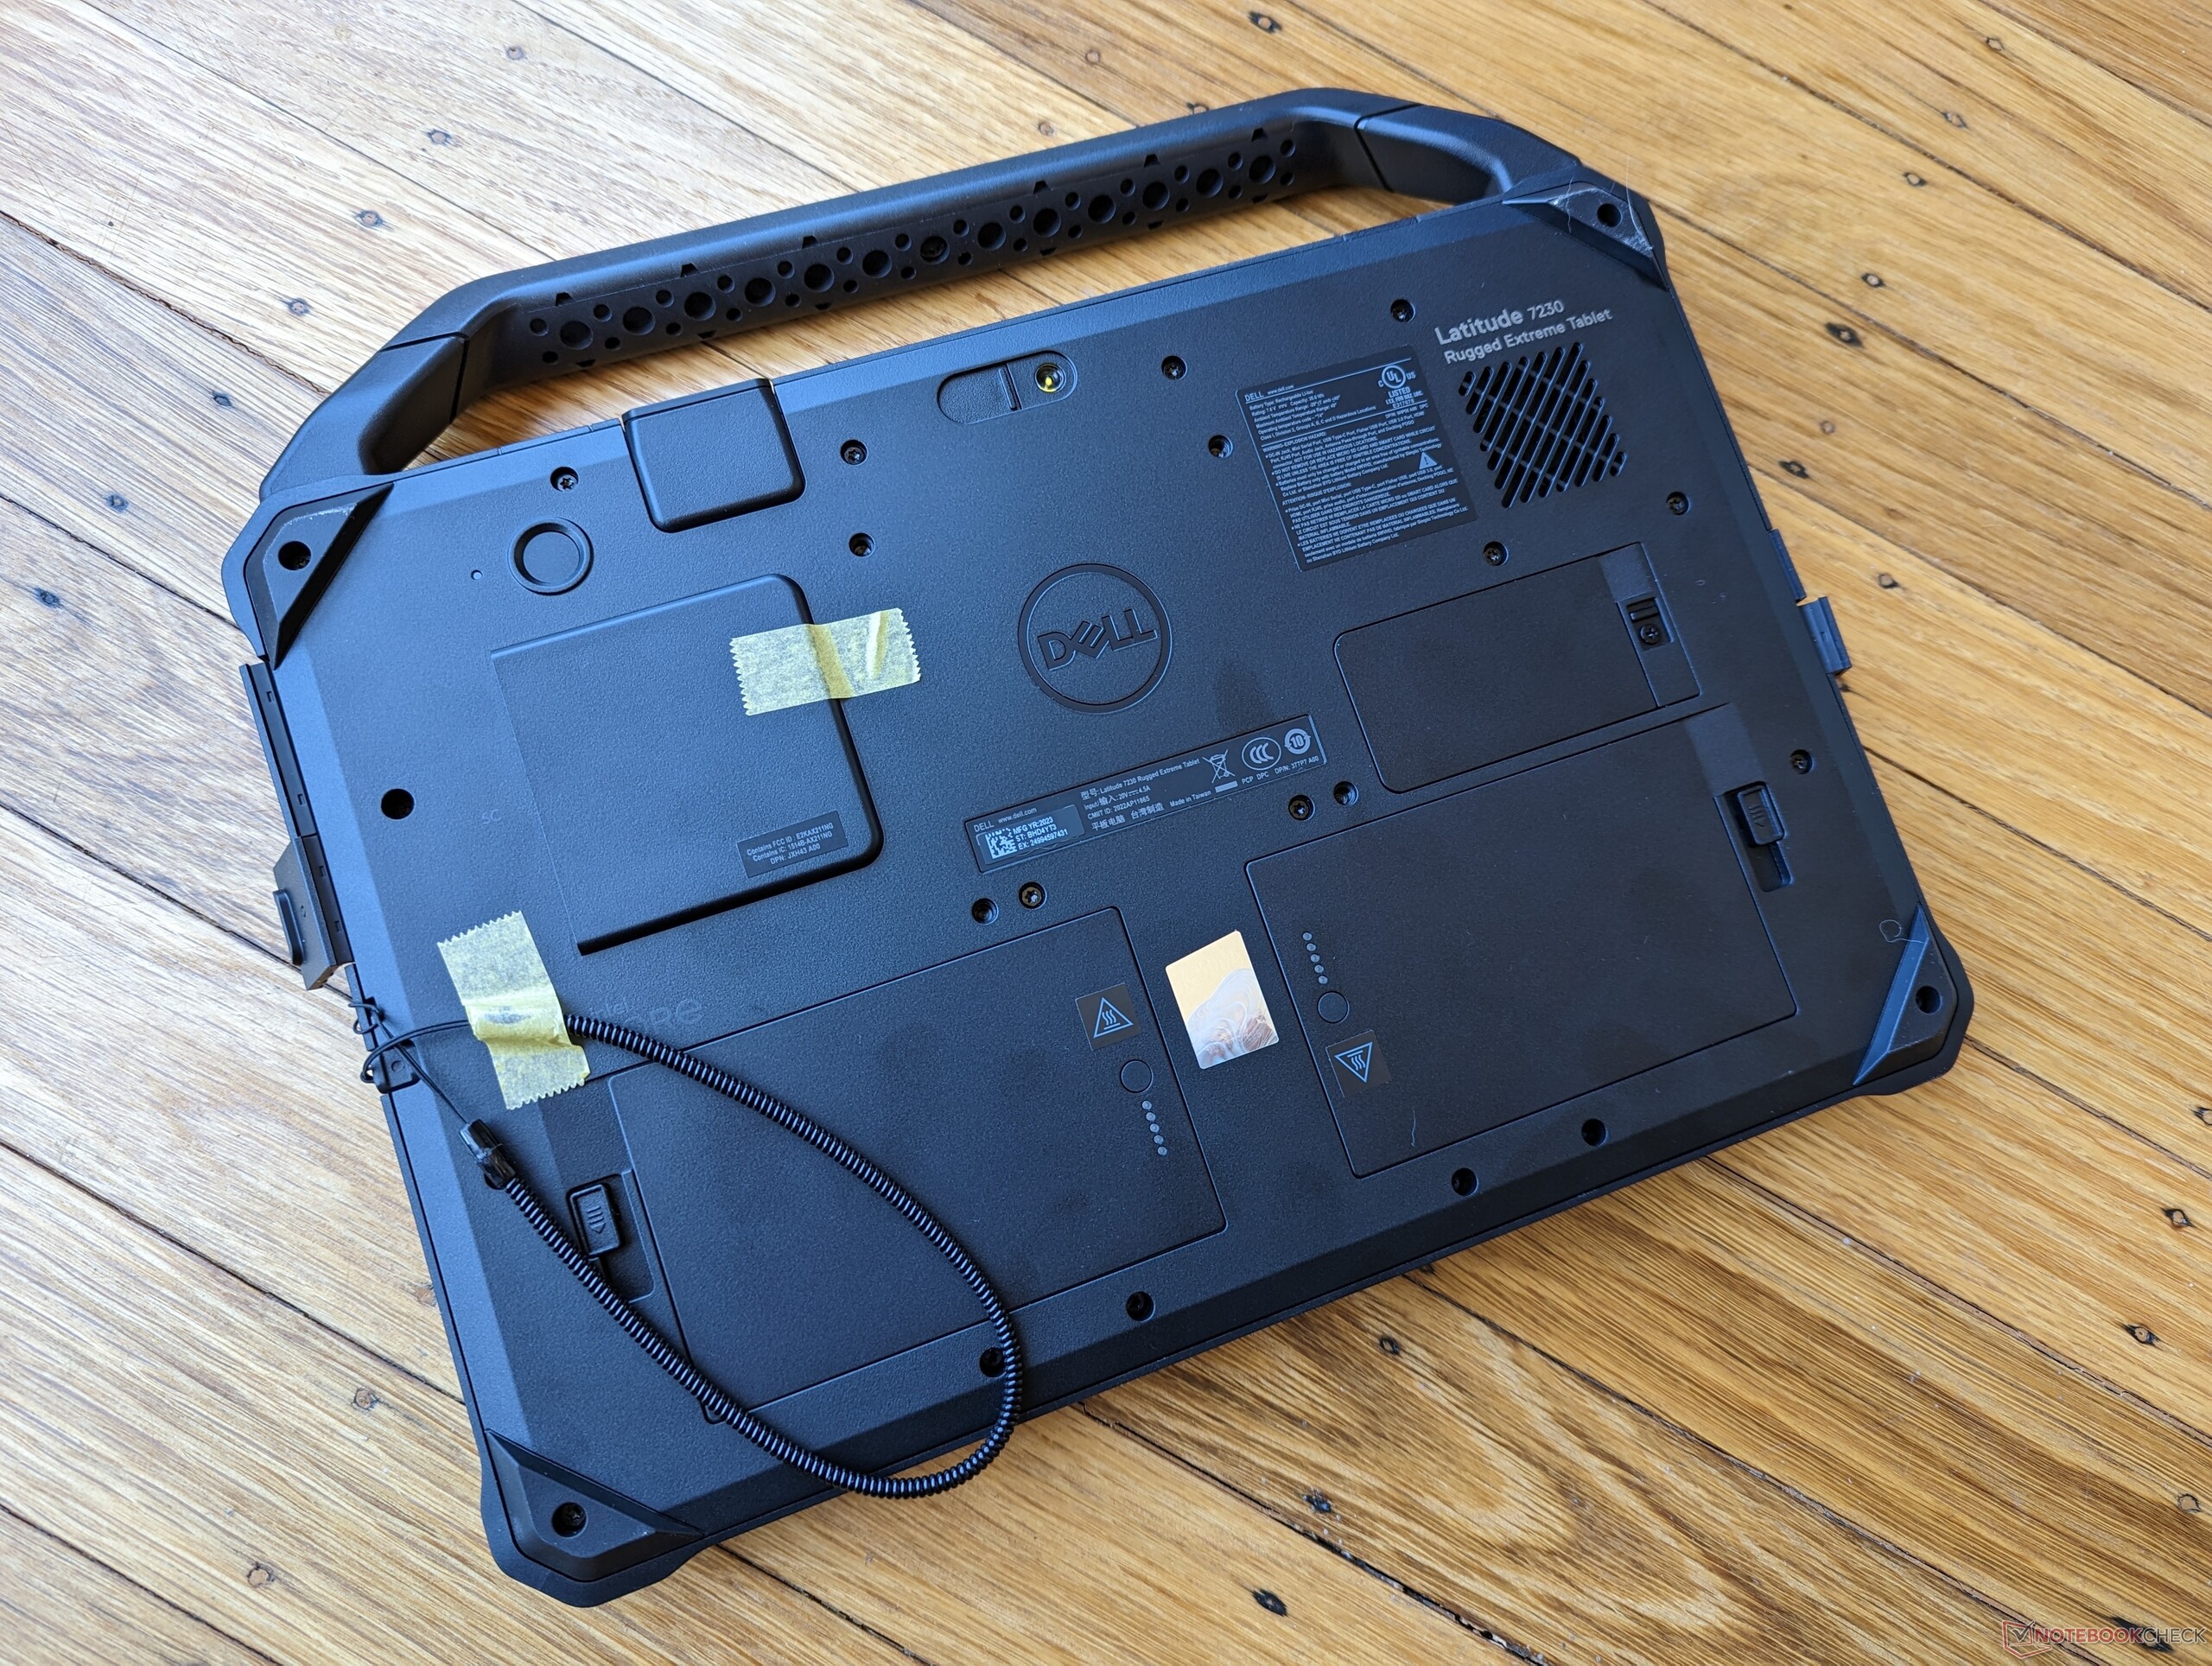
Con un peso aproximado de 1,6 kg, incluidas sus dos baterías extraíbles, es una de las tabletas robustas más ligeras de su categoría. La longitud y la anchura se acercan convenientemente a la norma DIN A4 si no se tiene en cuenta el asa de transporte extraíble.
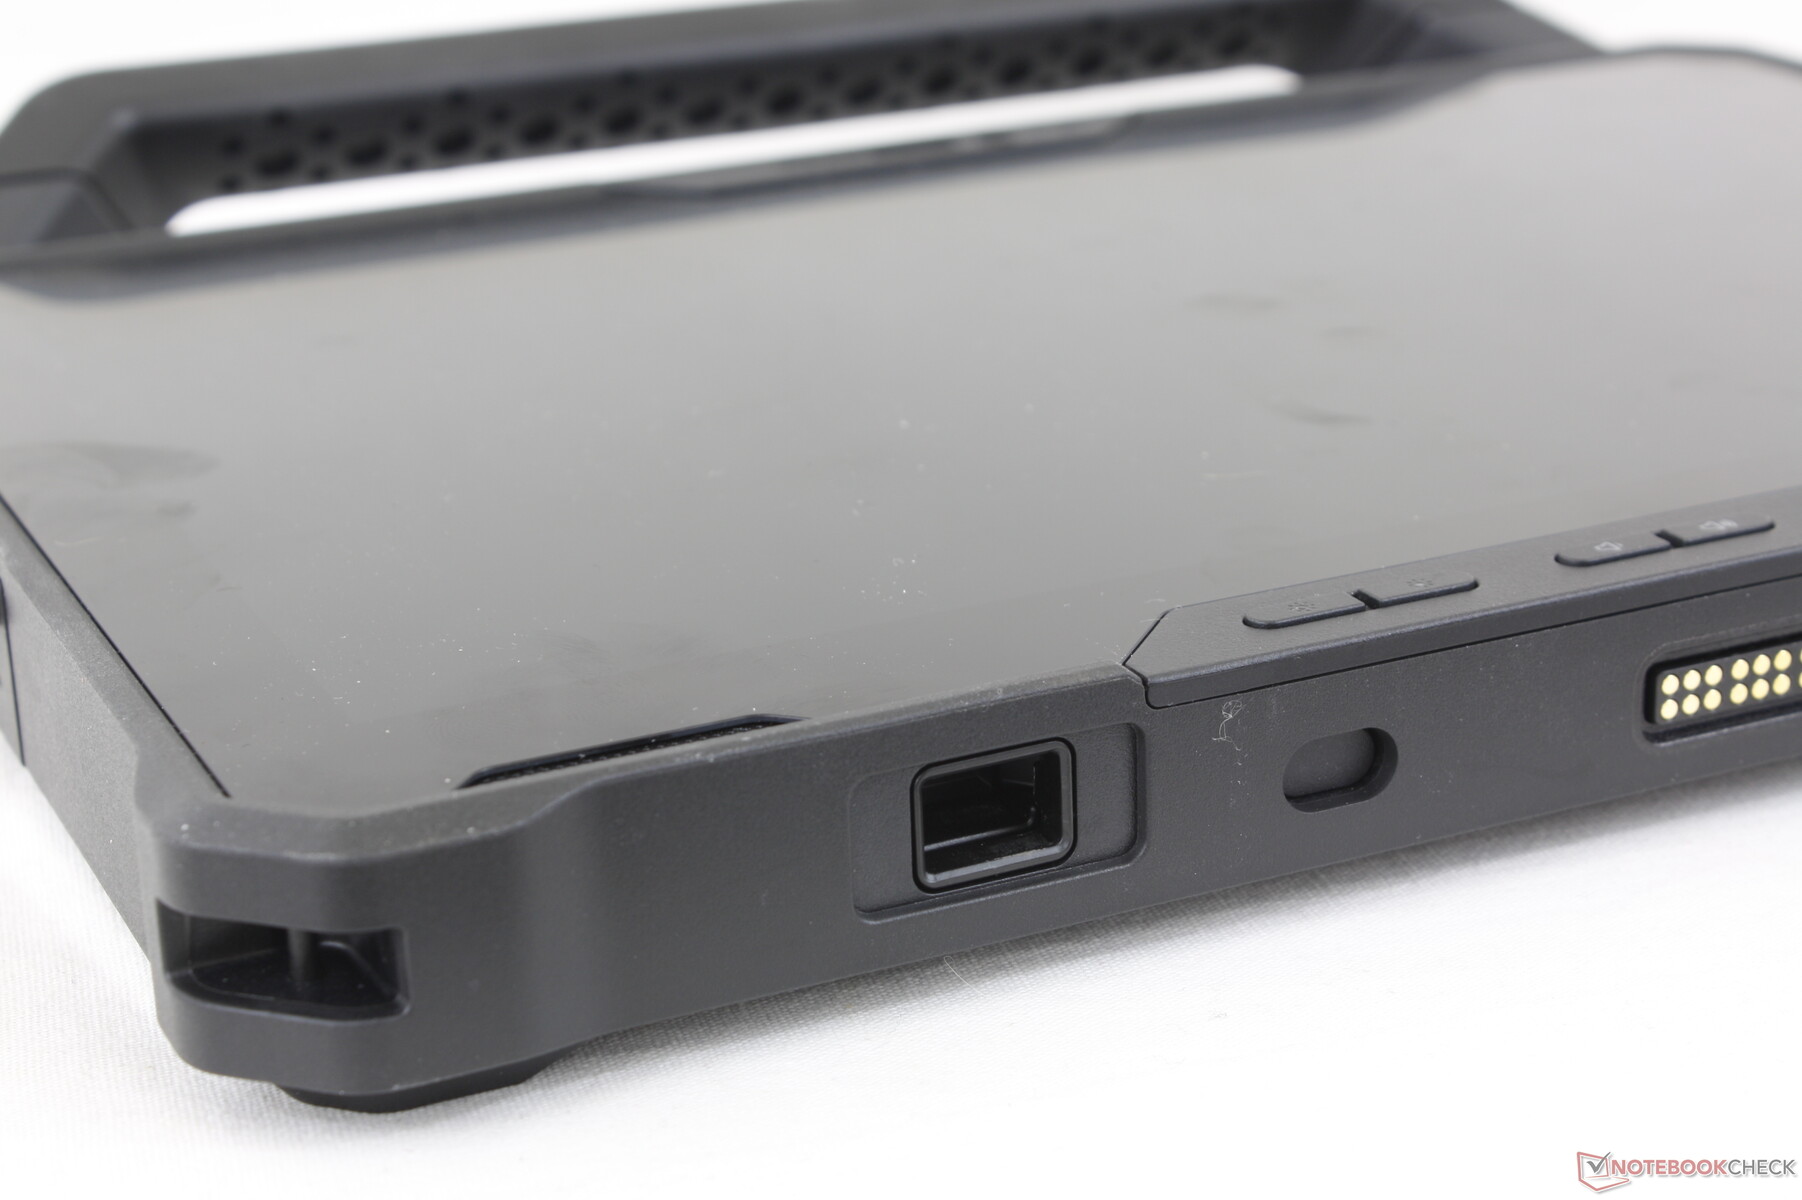
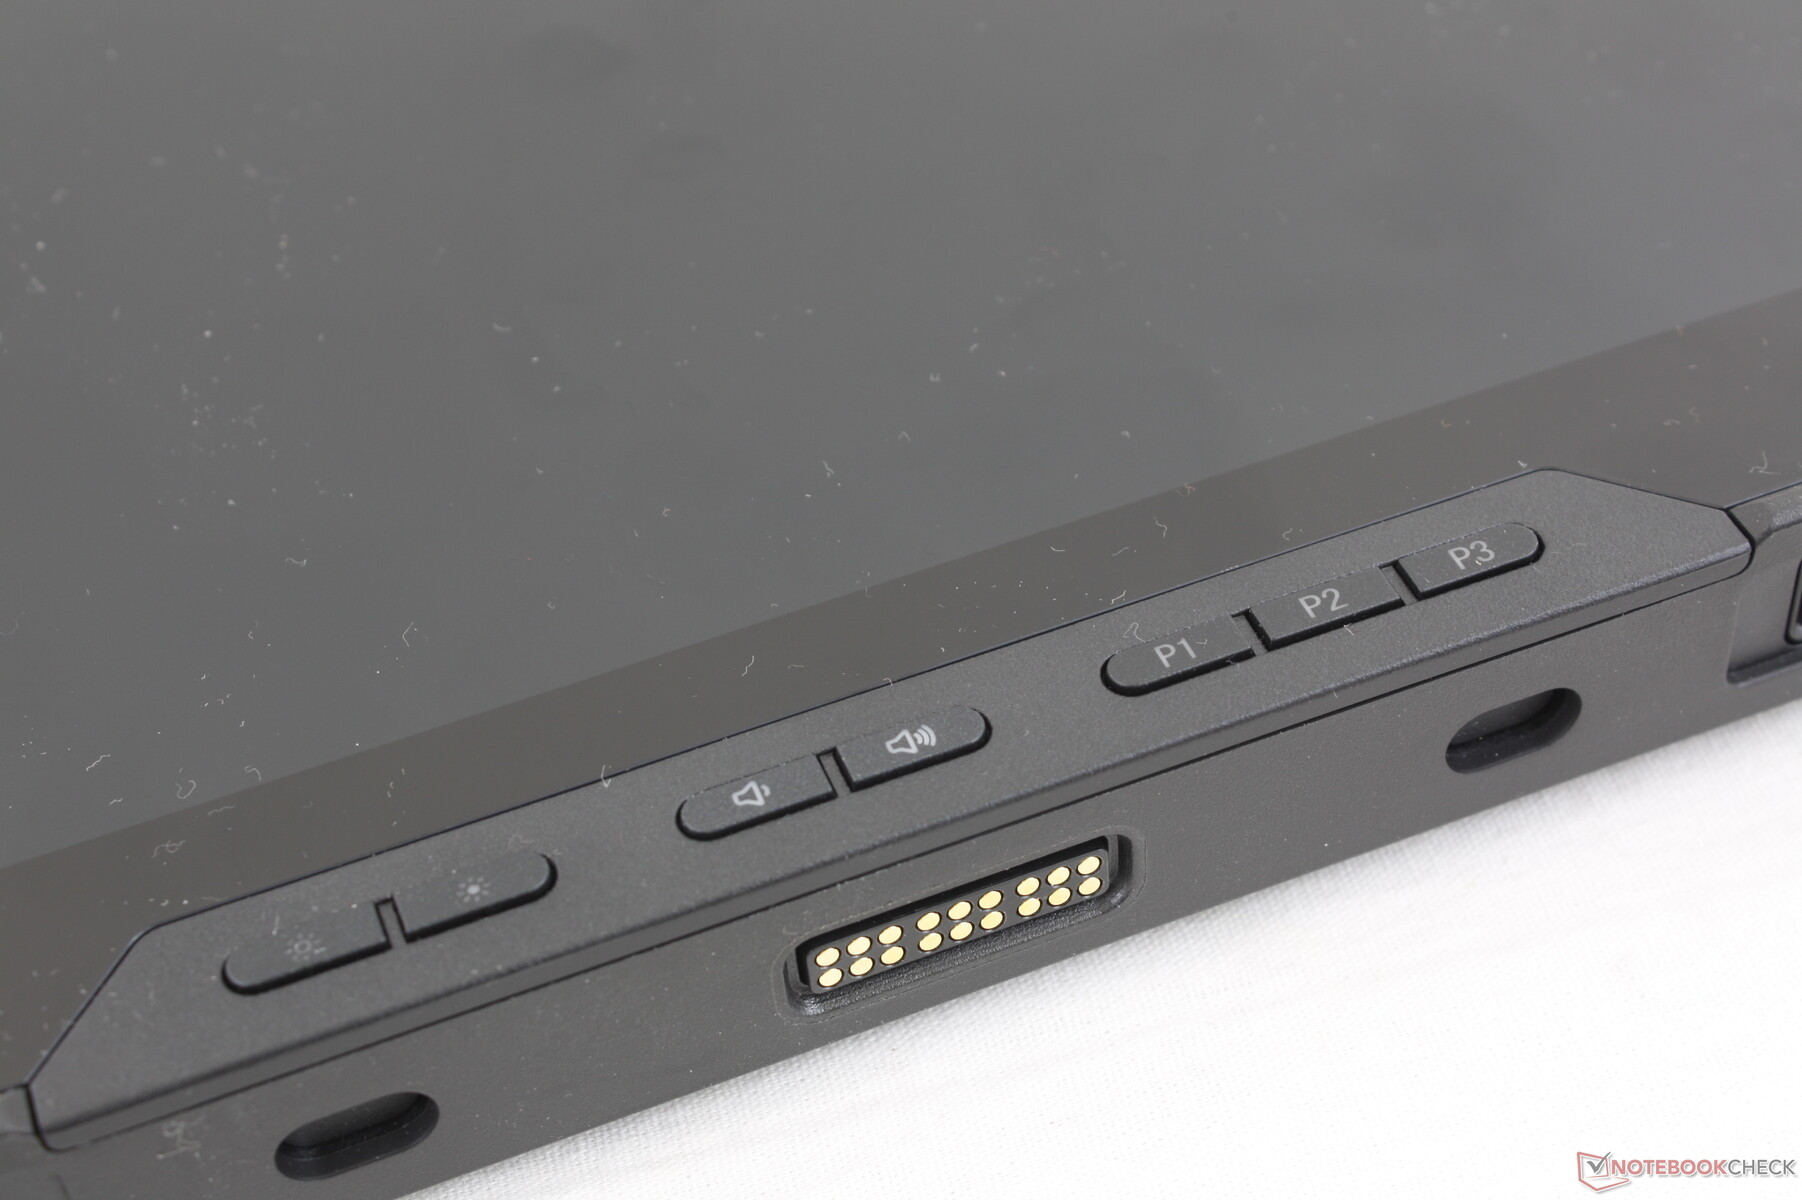
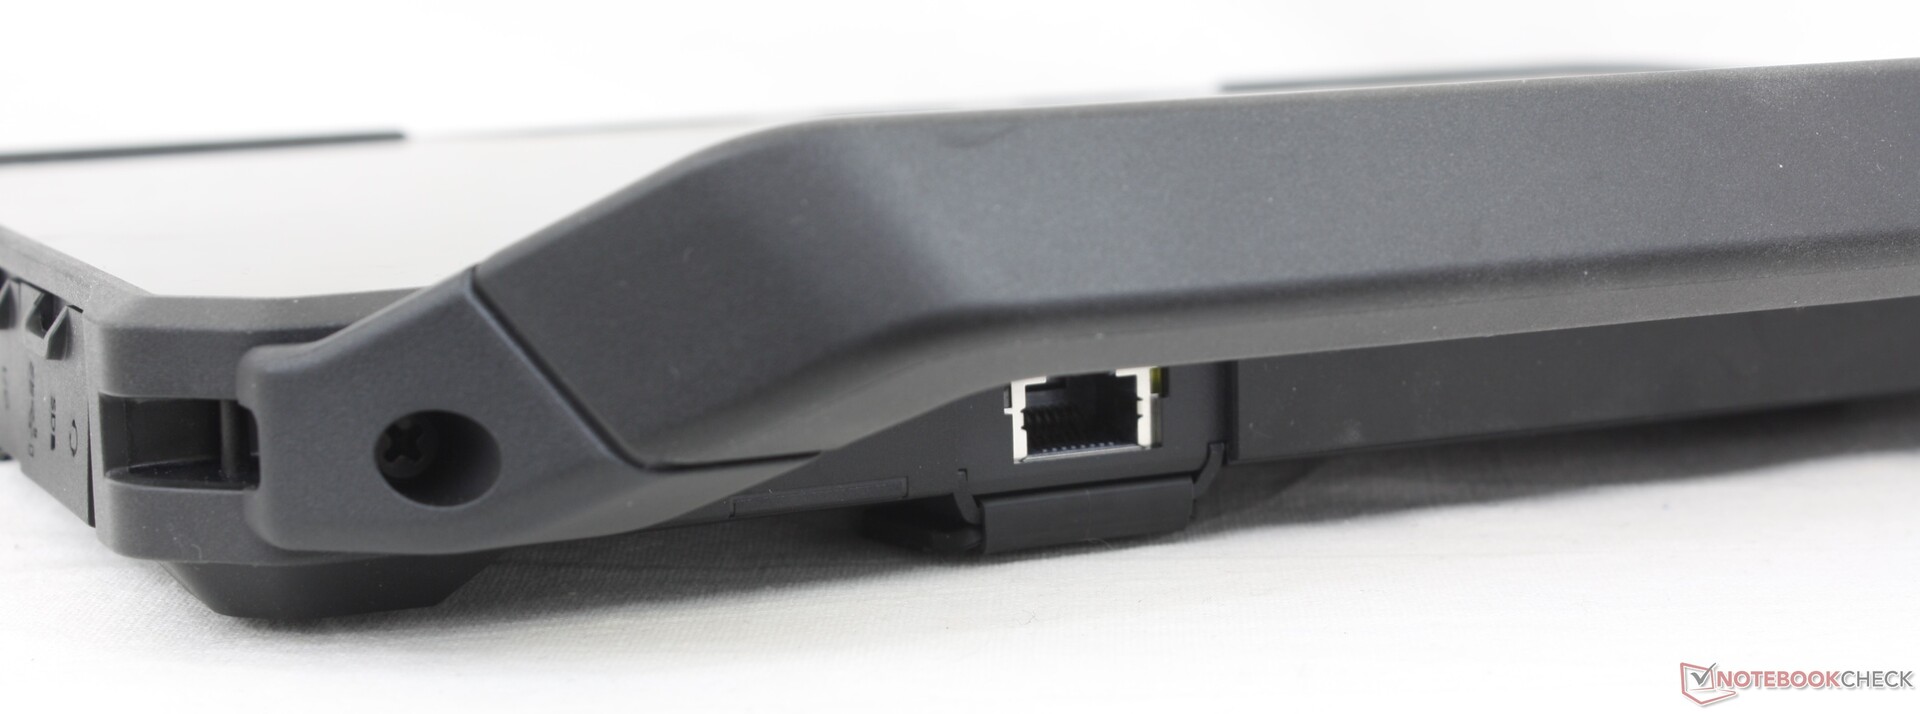
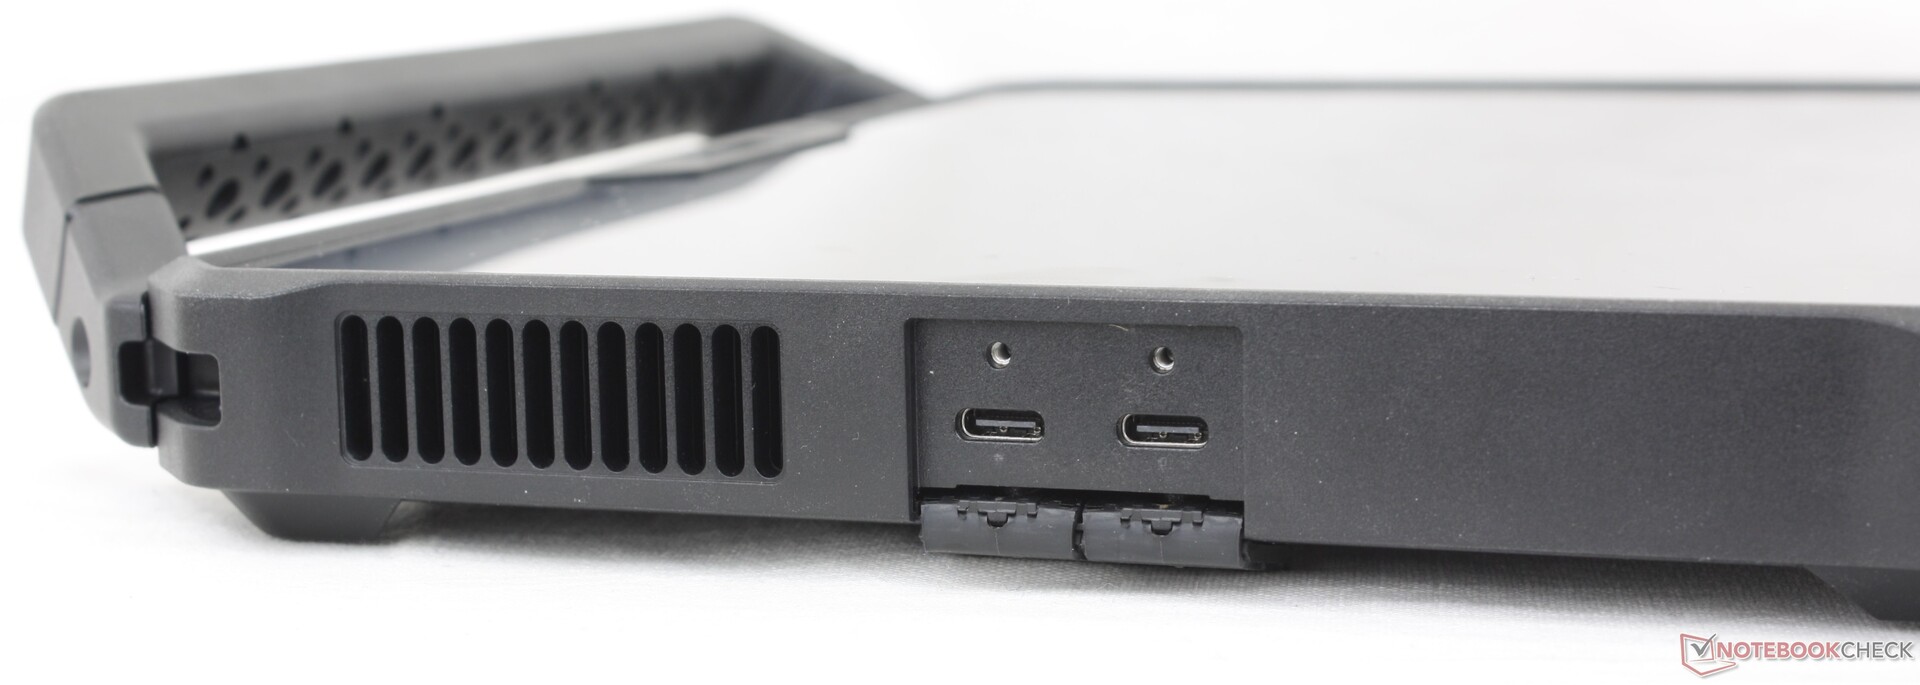
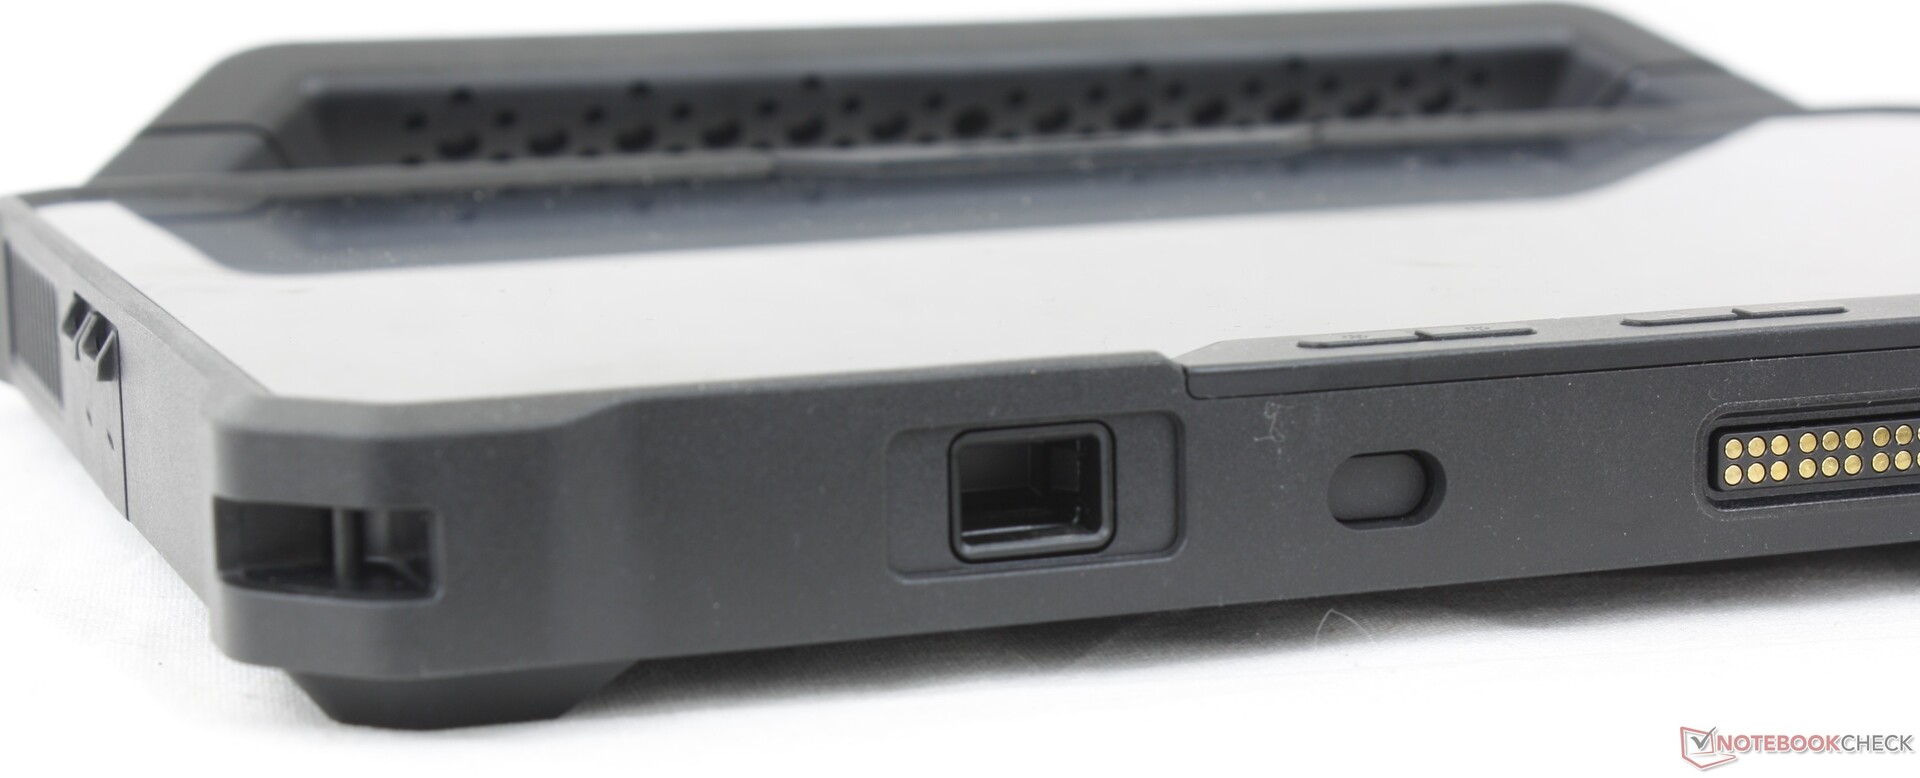
Conectividad - Compatible con 2x Thunderbolt 4
Hay una buena selección de puertos integrados entre los que elegir. Los dos puertos Thunderbolt 4 en particular son dignos de mención ya que permiten las mismas capacidades de anclaje y soporte de monitor externo que los ultrabooks de consumo modernos. Sin embargo, hay que tener en cuenta que uno siempre estará ocupado para la carga.
La mayoría de los demás puertos son opcionales y pueden configurarse en el momento de la compra, como HDMI 2.0, USB-A, RJ-45, RS-232 o un lector de códigos de barras.
Lector de tarjetas SD
| SD Card Reader | |
| average JPG Copy Test (av. of 3 runs) | |
| Dell Latitude 7330 Rugged Extreme (AV Pro V60) | |
| Dell Latitude 7230 Rugged Extreme (AV Pro V60) | |
| Panasonic Toughbook 40 (AV Pro V60) | |
| Acer Enduro Urban N3 EUN314 (AV Pro V60) | |
| Durabook S14I (Angelbird 128GB AV Pro UHS-II) | |
| maximum AS SSD Seq Read Test (1GB) | |
| Dell Latitude 7330 Rugged Extreme (AV Pro V60) | |
| Dell Latitude 7230 Rugged Extreme (AV Pro V60) | |
| Panasonic Toughbook 40 (AV Pro V60) | |
| Durabook S14I (Angelbird 128GB AV Pro UHS-II) | |
| Acer Enduro Urban N3 EUN314 (AV Pro V60) | |
Comunicación
El Intel AX211 funciona de forma fiable cuando se conecta a nuestro router de pruebas Asus AXE11000 con Wi-Fi 6E. El modelo puede configurarse sin Wi-Fi en absoluto, pero recomendamos elegir con cuidado ya que una instalación de usuario final en el Latitude 7230 Rugged Extreme es mucho más complicada que la de un ultrabook típico.
| Networking | |
| iperf3 transmit AX12 | |
| Acer Enduro Urban N3 EUN314 | |
| Durabook S14I | |
| Dell Latitude 7330 Rugged Extreme | |
| Getac B360 | |
| iperf3 receive AX12 | |
| Durabook S14I | |
| Acer Enduro Urban N3 EUN314 | |
| Getac B360 | |
| Dell Latitude 7330 Rugged Extreme | |
| iperf3 transmit AXE11000 | |
| Panasonic Toughbook 40 | |
| Dell Latitude 7230 Rugged Extreme | |
| iperf3 receive AXE11000 | |
| Panasonic Toughbook 40 | |
| Dell Latitude 7230 Rugged Extreme | |
| iperf3 transmit AXE11000 6GHz | |
| Dell Latitude 7230 Rugged Extreme | |
| iperf3 receive AXE11000 6GHz | |
| Dell Latitude 7230 Rugged Extreme | |
Cámara web
Tanto la cámara web trasera de 11 MP como la frontal de 5 MP son más nítidas que las de cualquier portátil de consumo. Cada cámara web tiene su propio control deslizante de privacidad, mientras que la cámara web trasera tiene un flash integrado.
La cámara frontal es compatible con Windows Hello.


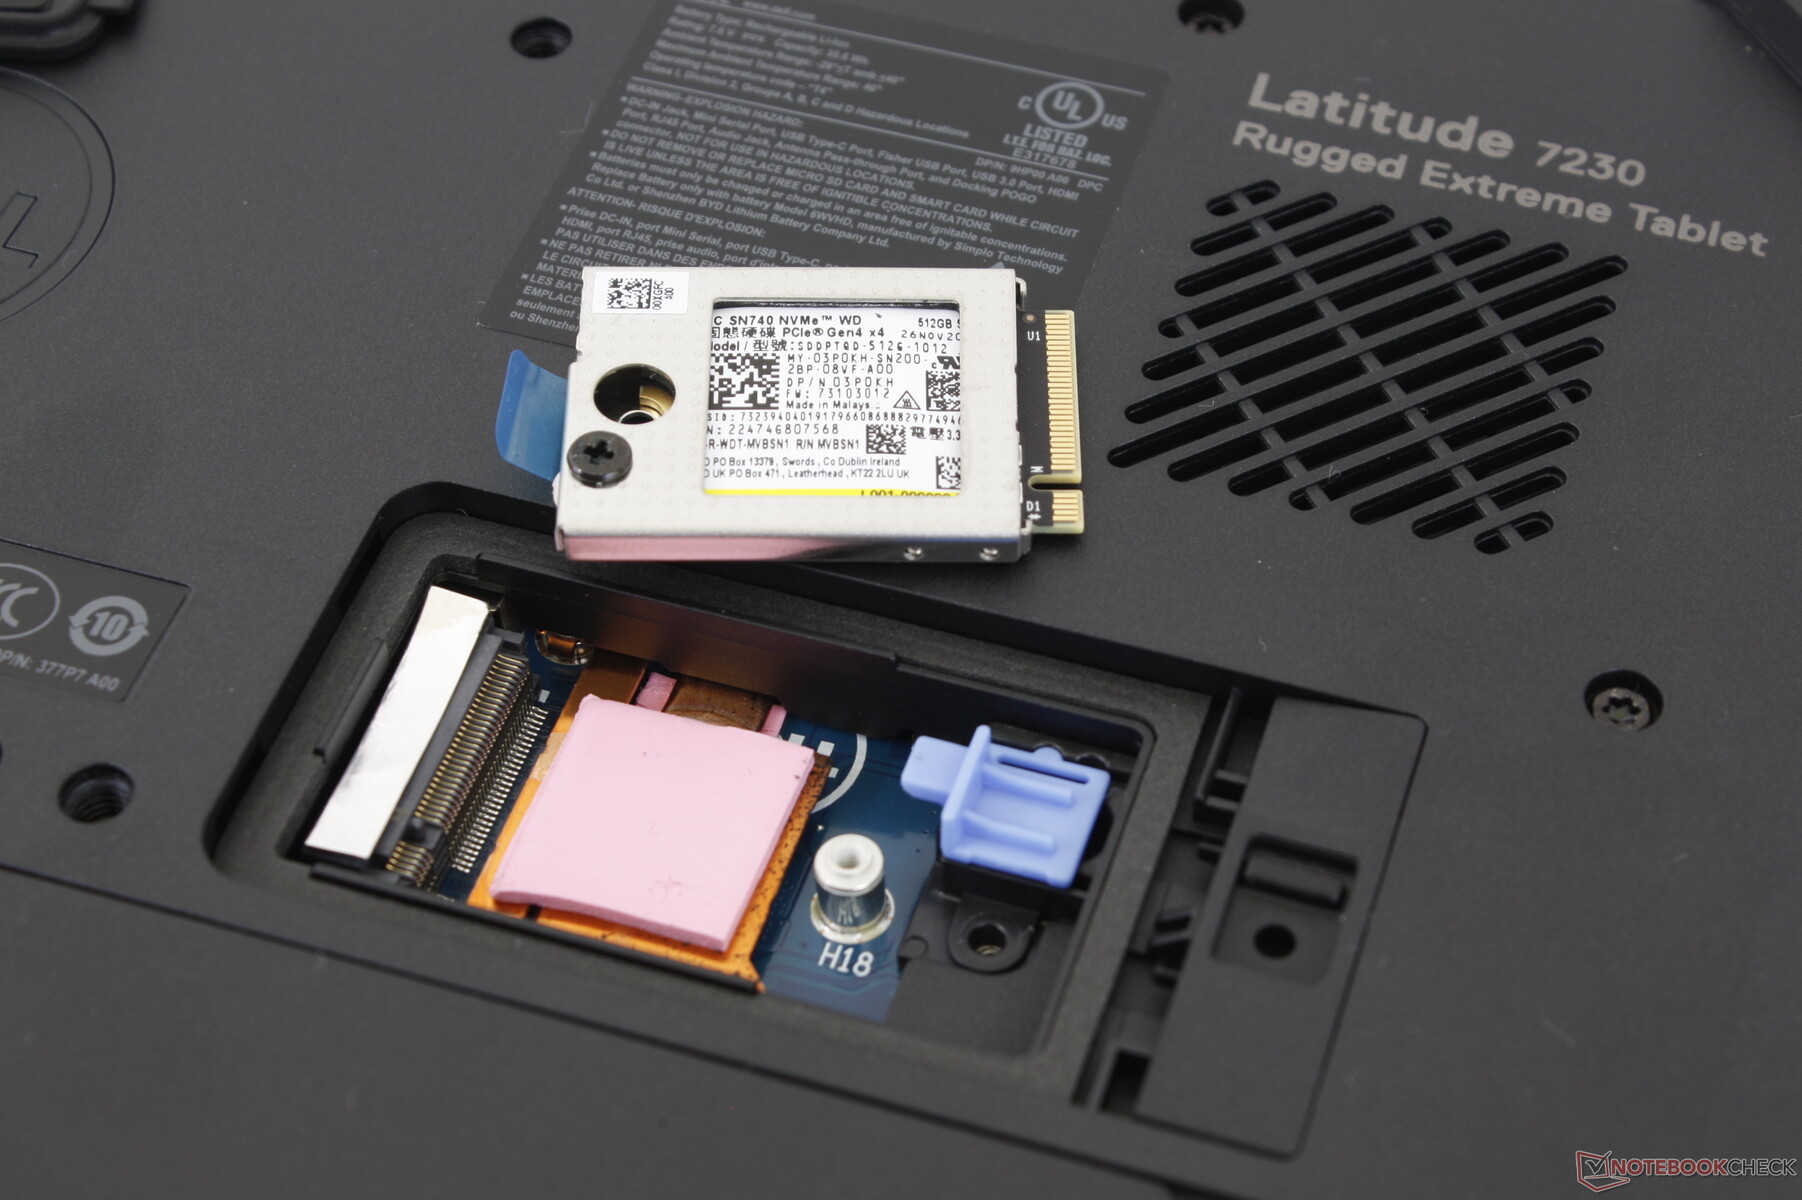
Mantenimiento
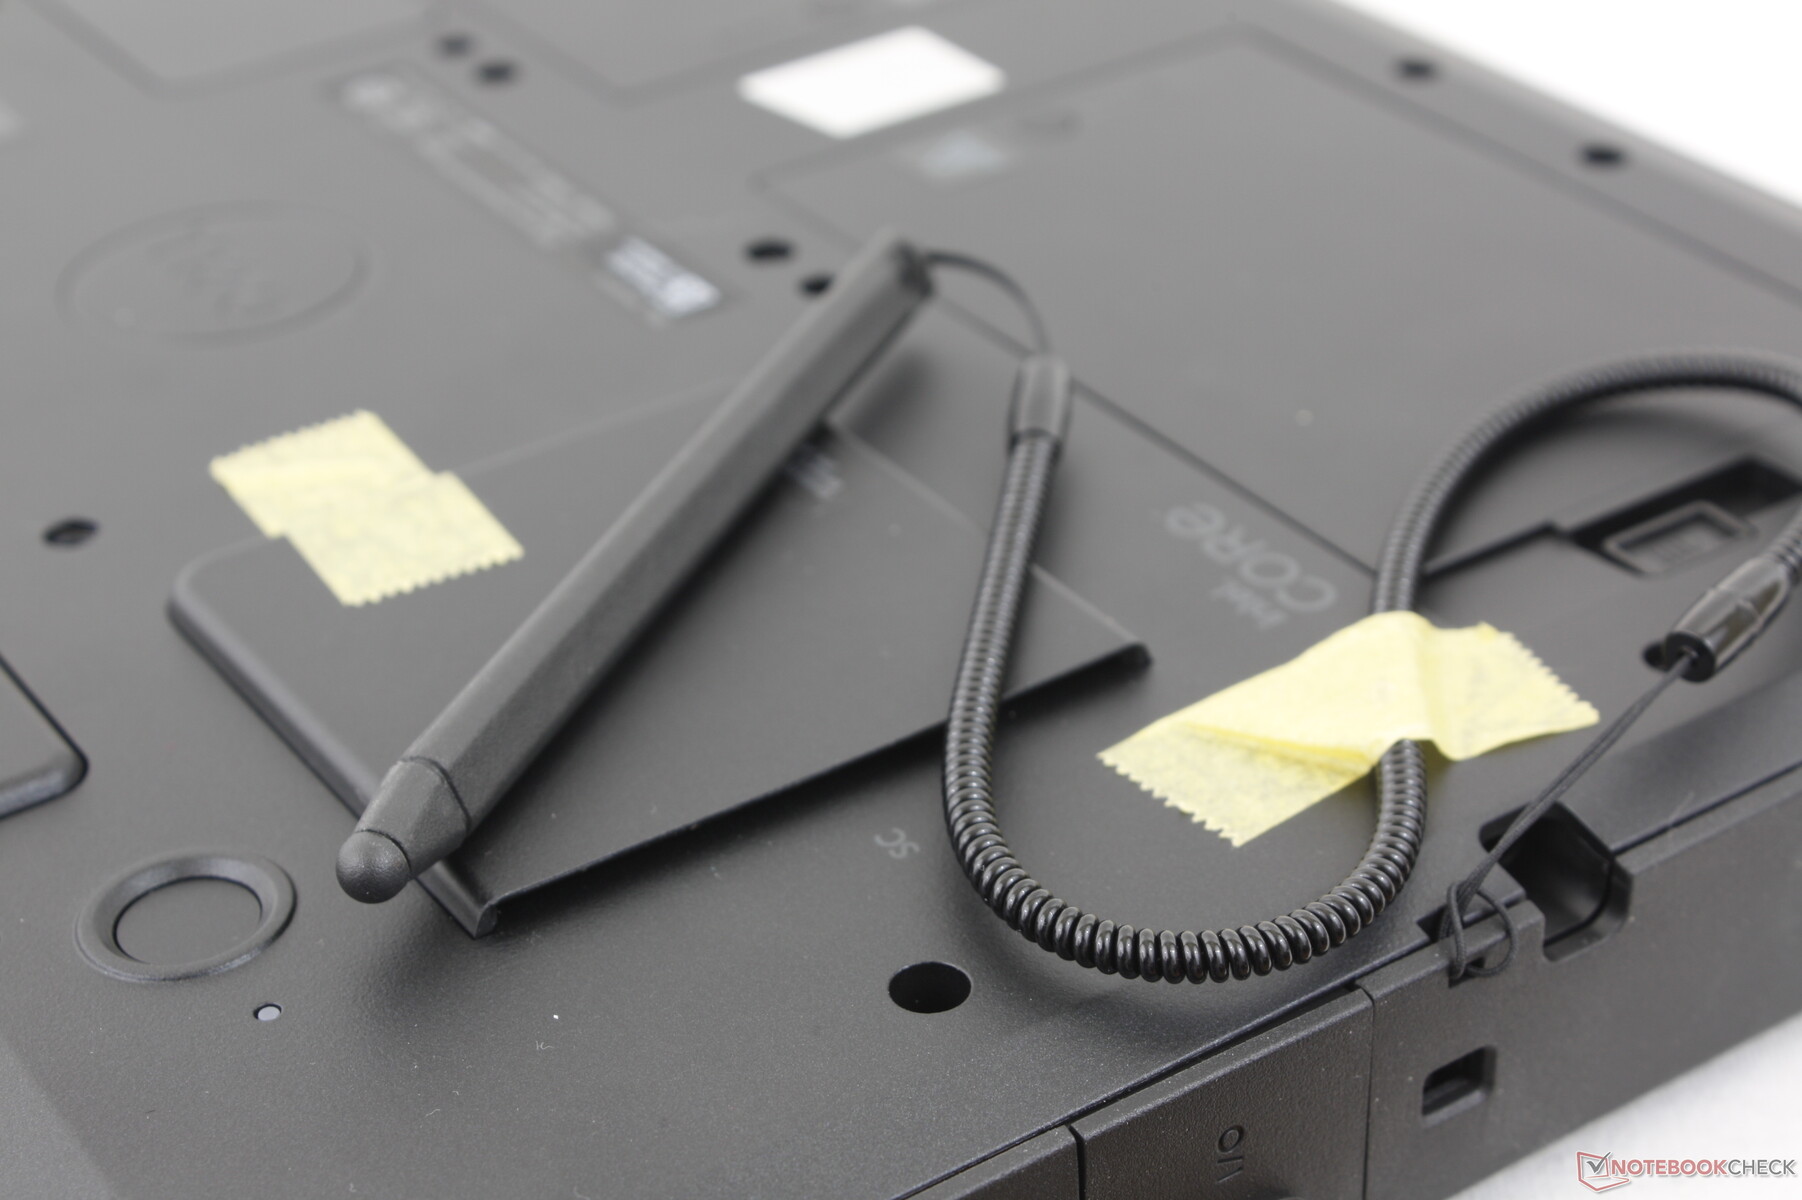
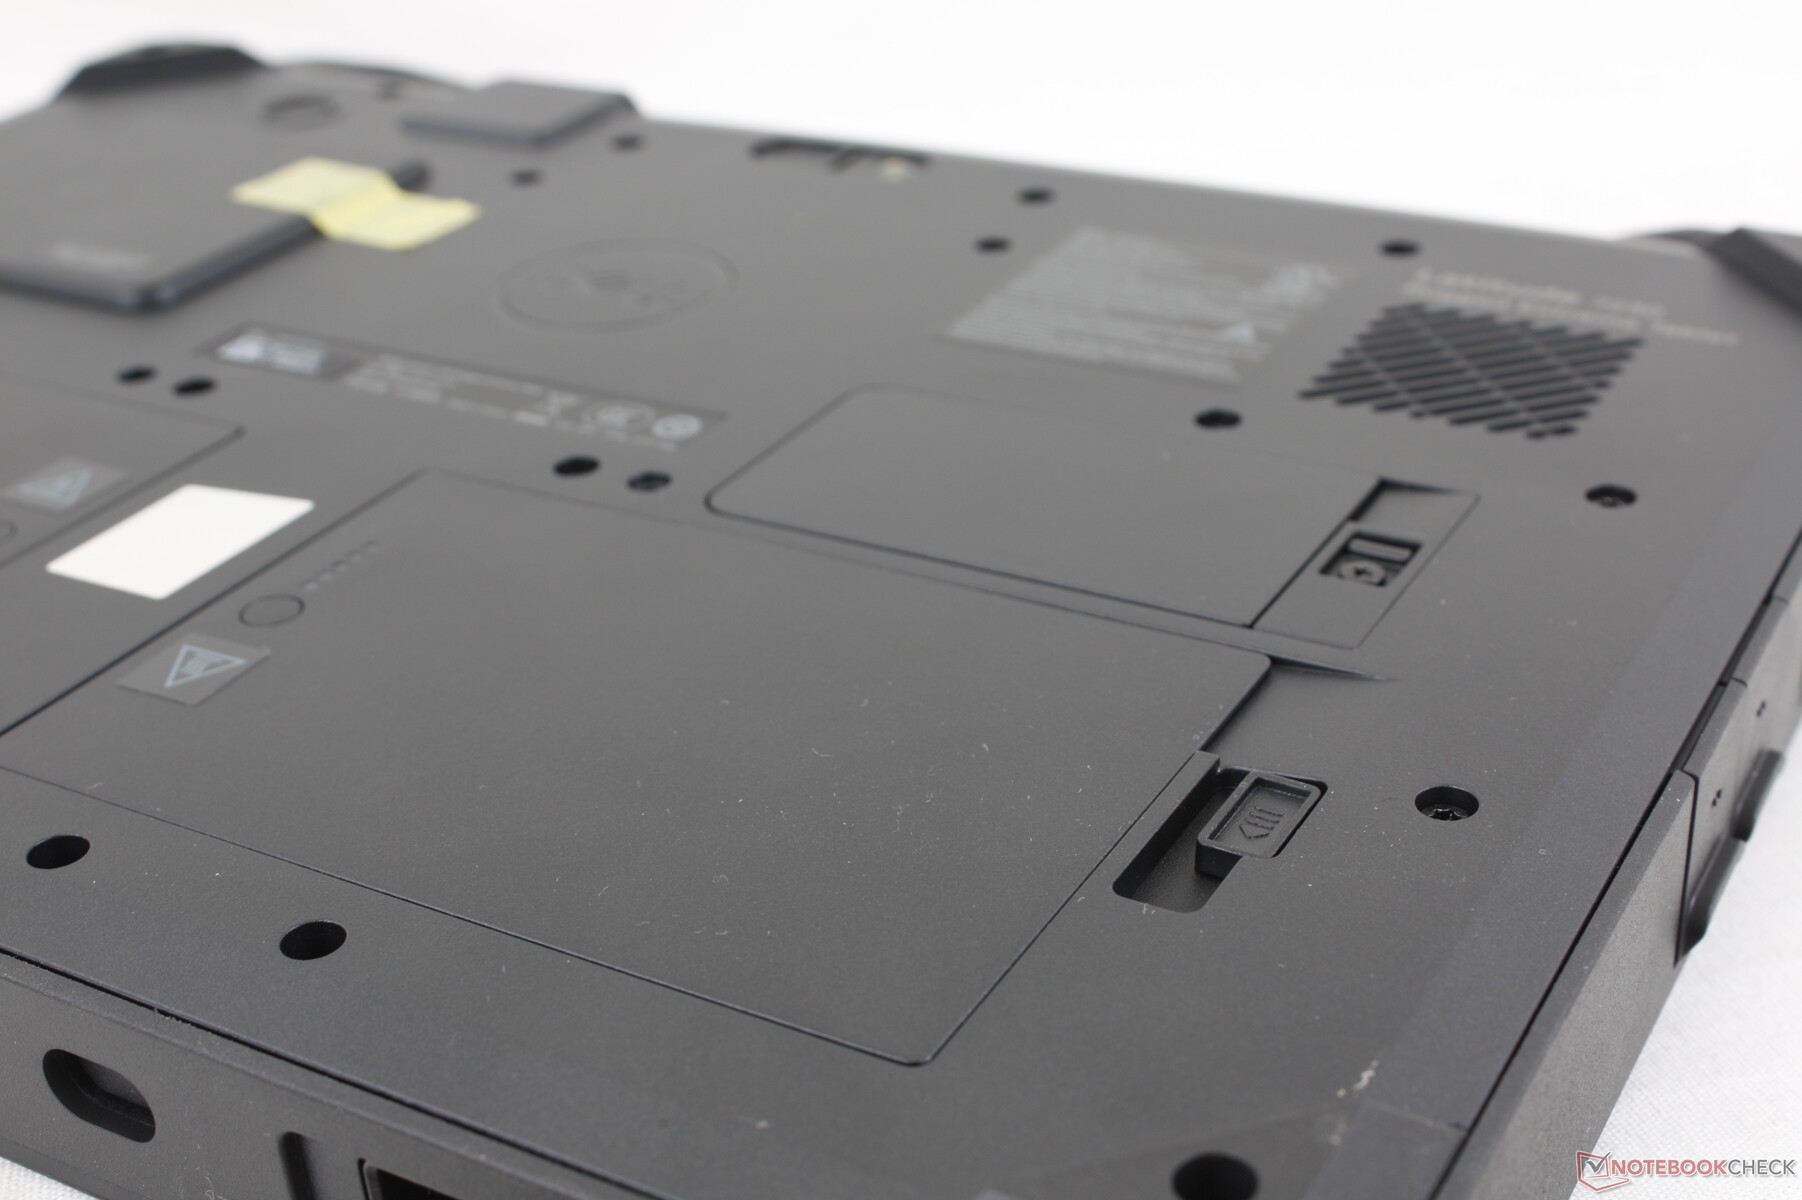
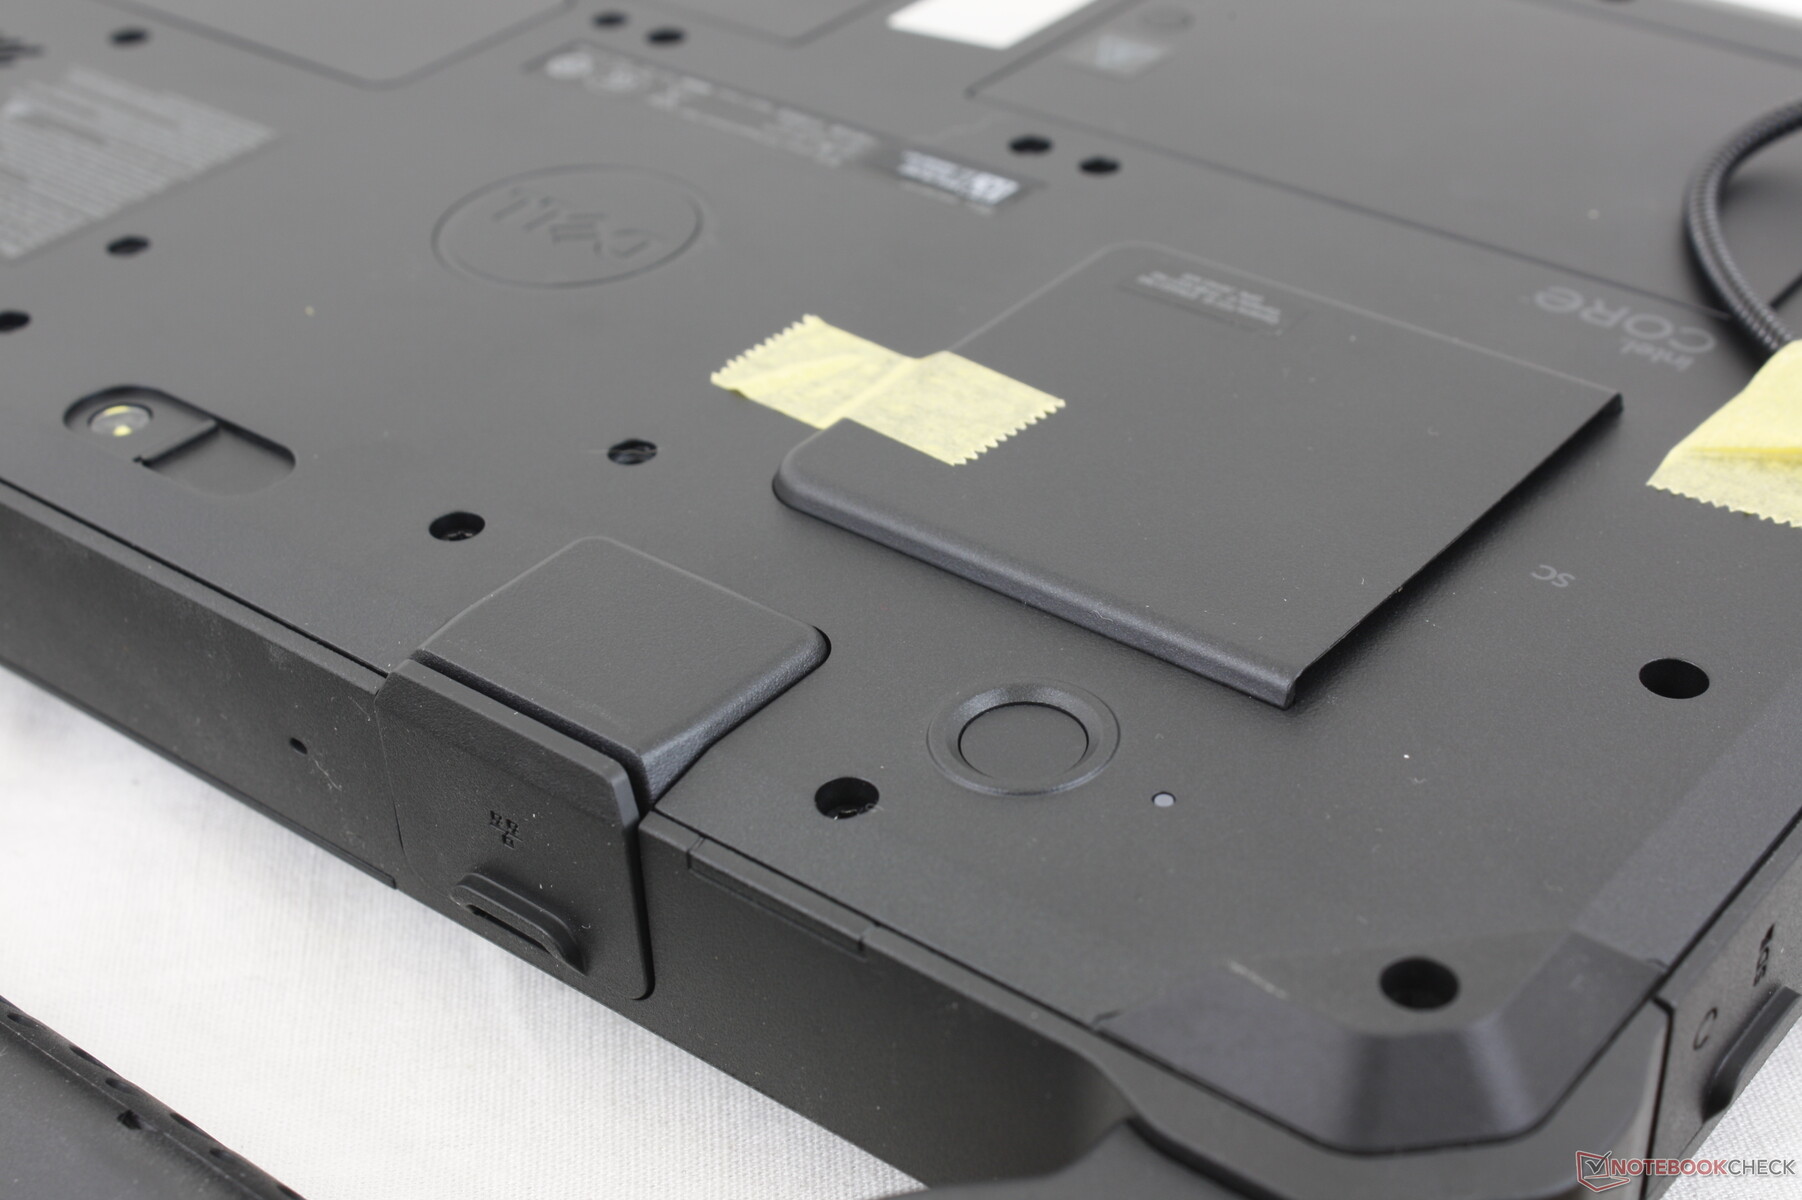
El panel trasero está asegurado por no menos de dos docenas de tornillos Torx. Por suerte, las dos baterías y la única ranura M.2 SSD son más fácilmente accesibles. La RAM está soldada y sólo se puede configurar en la caja.
Un manual de servicio oficial https://dl.dell.com/content/manual25603516-latitude-7230-rugged-extreme-tablet-service-manual.pdf?language=en-us está disponible directamente de Dell si se requiere más desmontaje.
Accesorios y garantía
Entre los accesorios opcionales se incluyen el teclado premium, la correa de mano, el bolígrafo activo y muchos otros. La caja de venta al público incluye un bolígrafo pasivo y un asa de transporte rígida ya incorporados. Se aplica una garantía limitada de tres años si se adquiere en Estados Unidos.
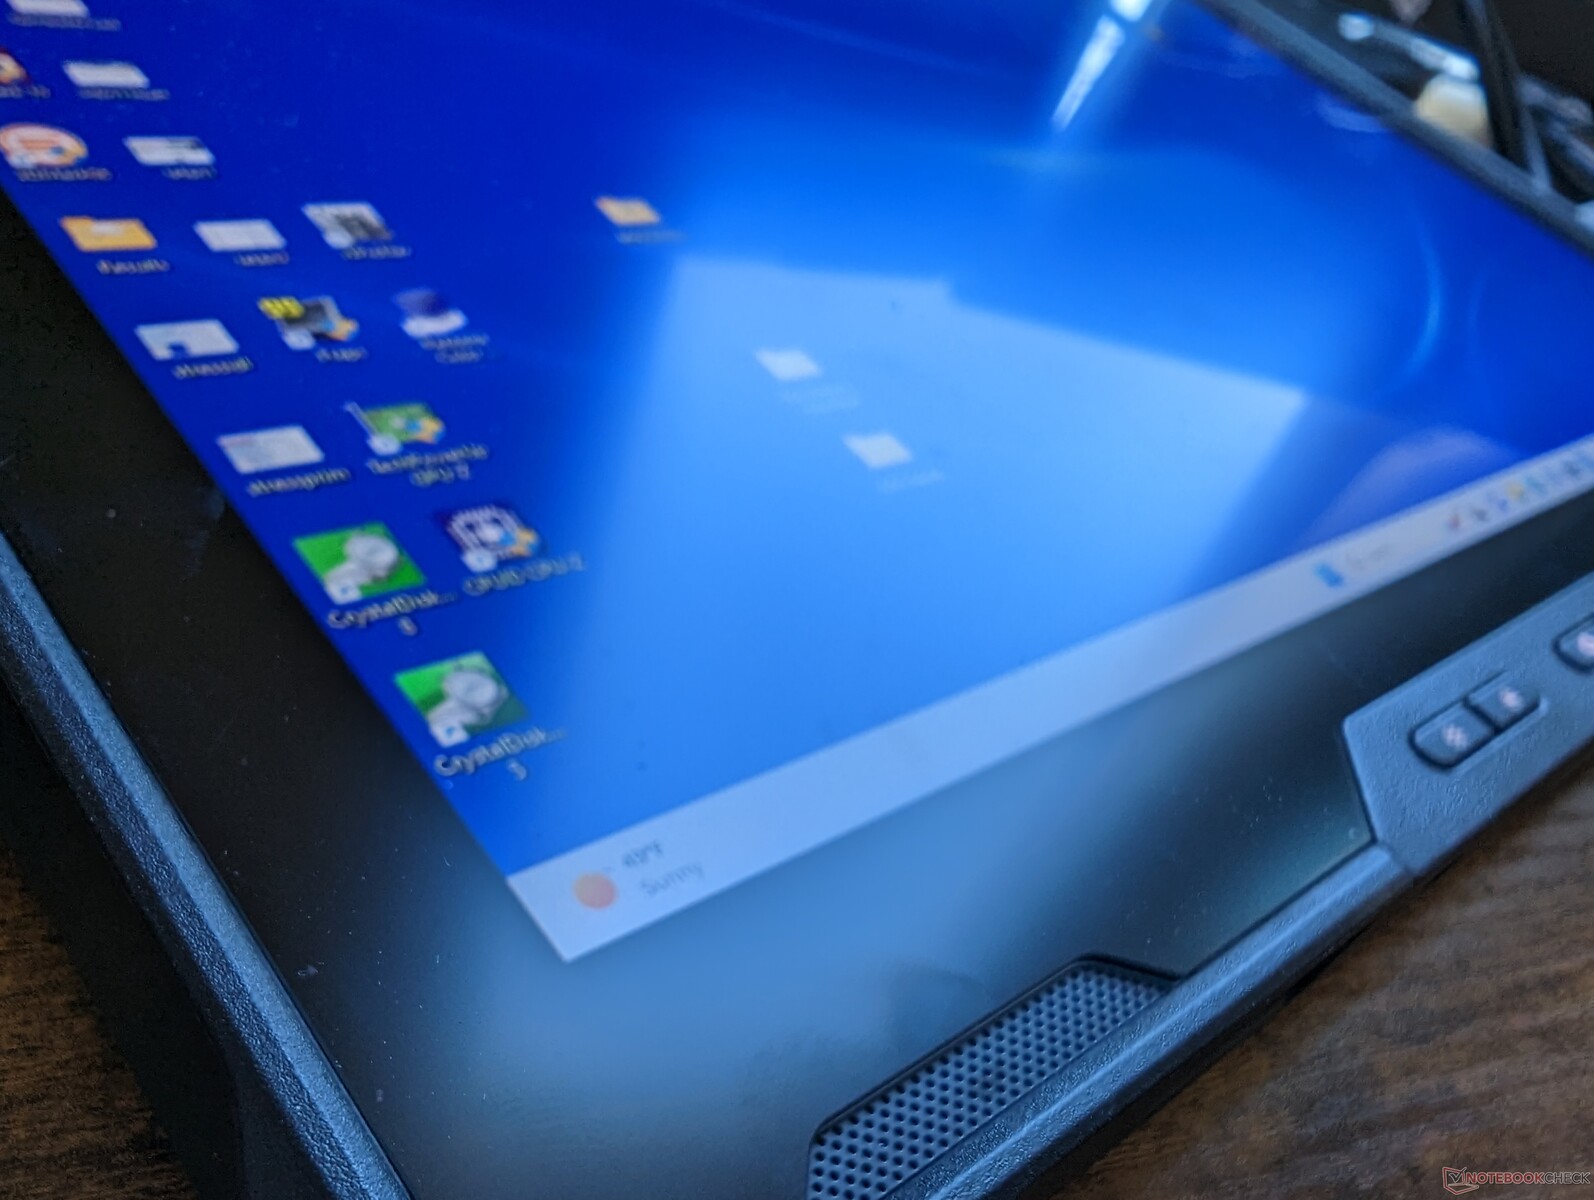
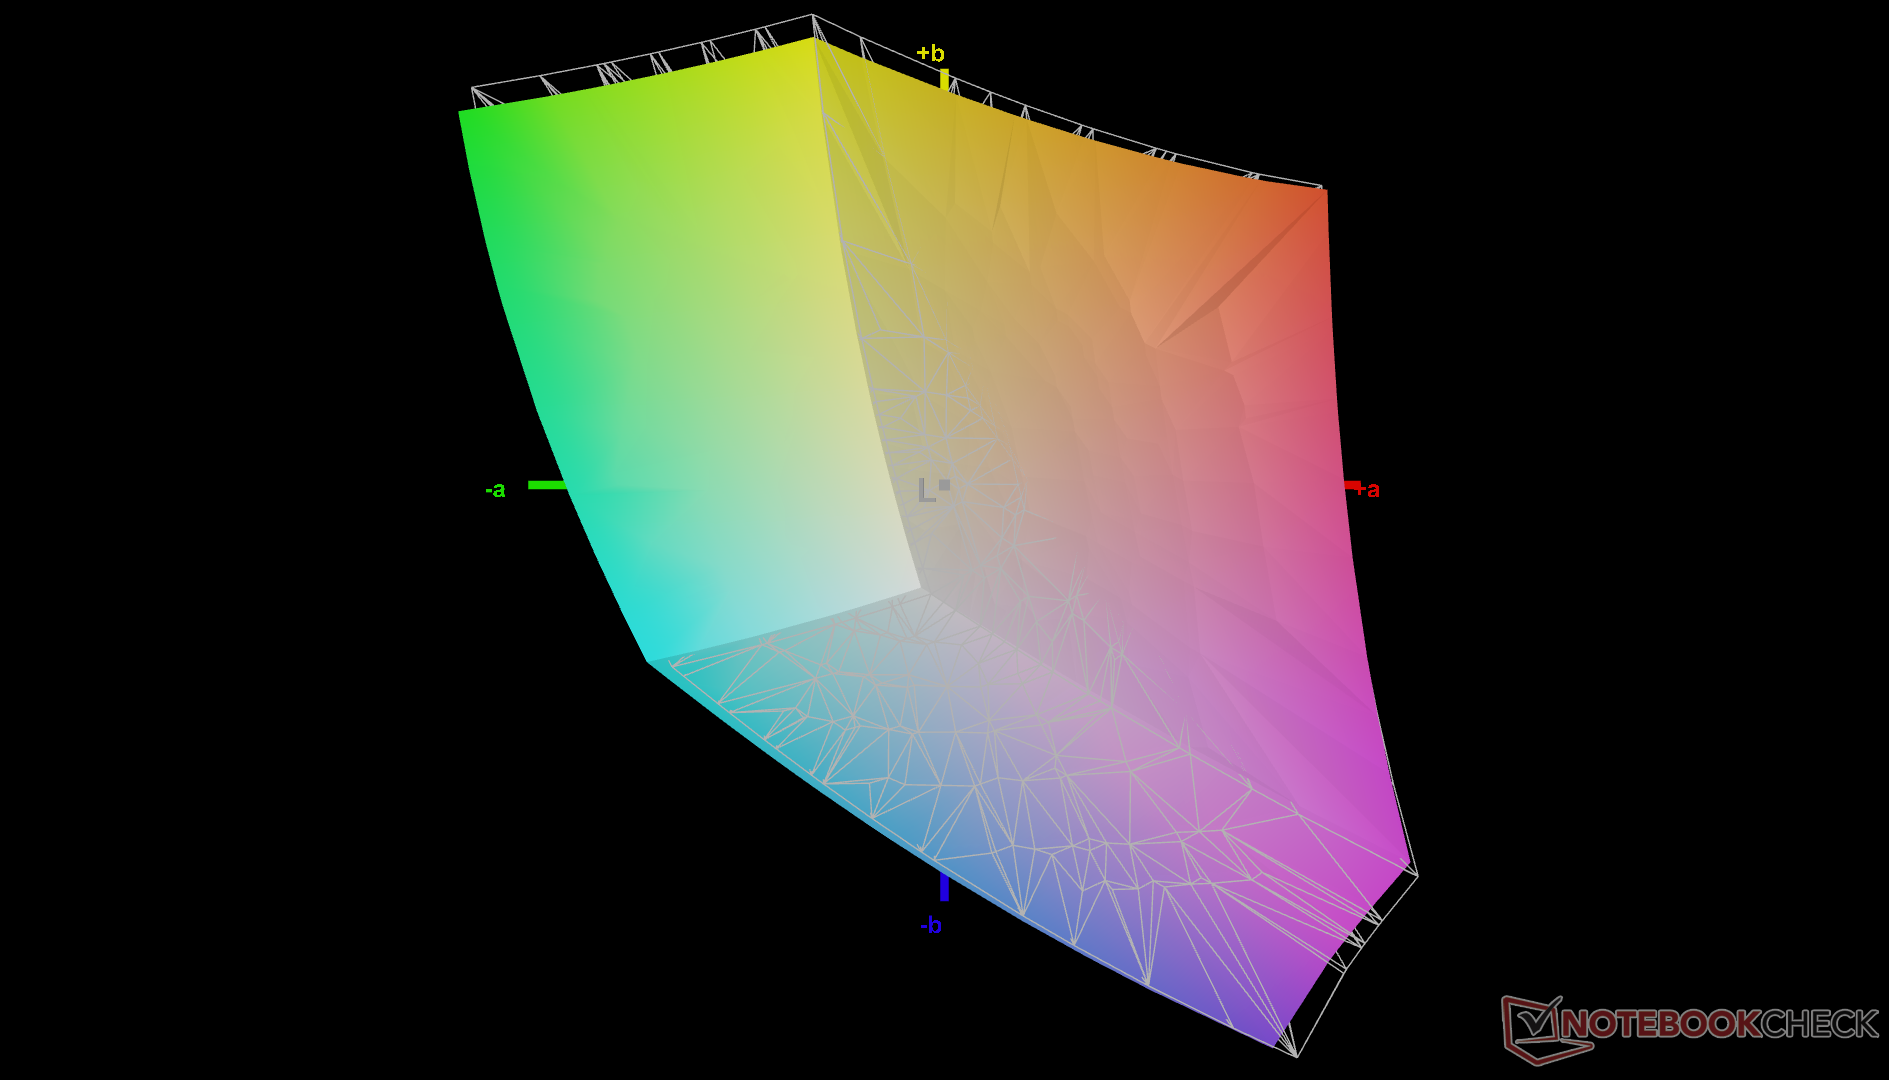
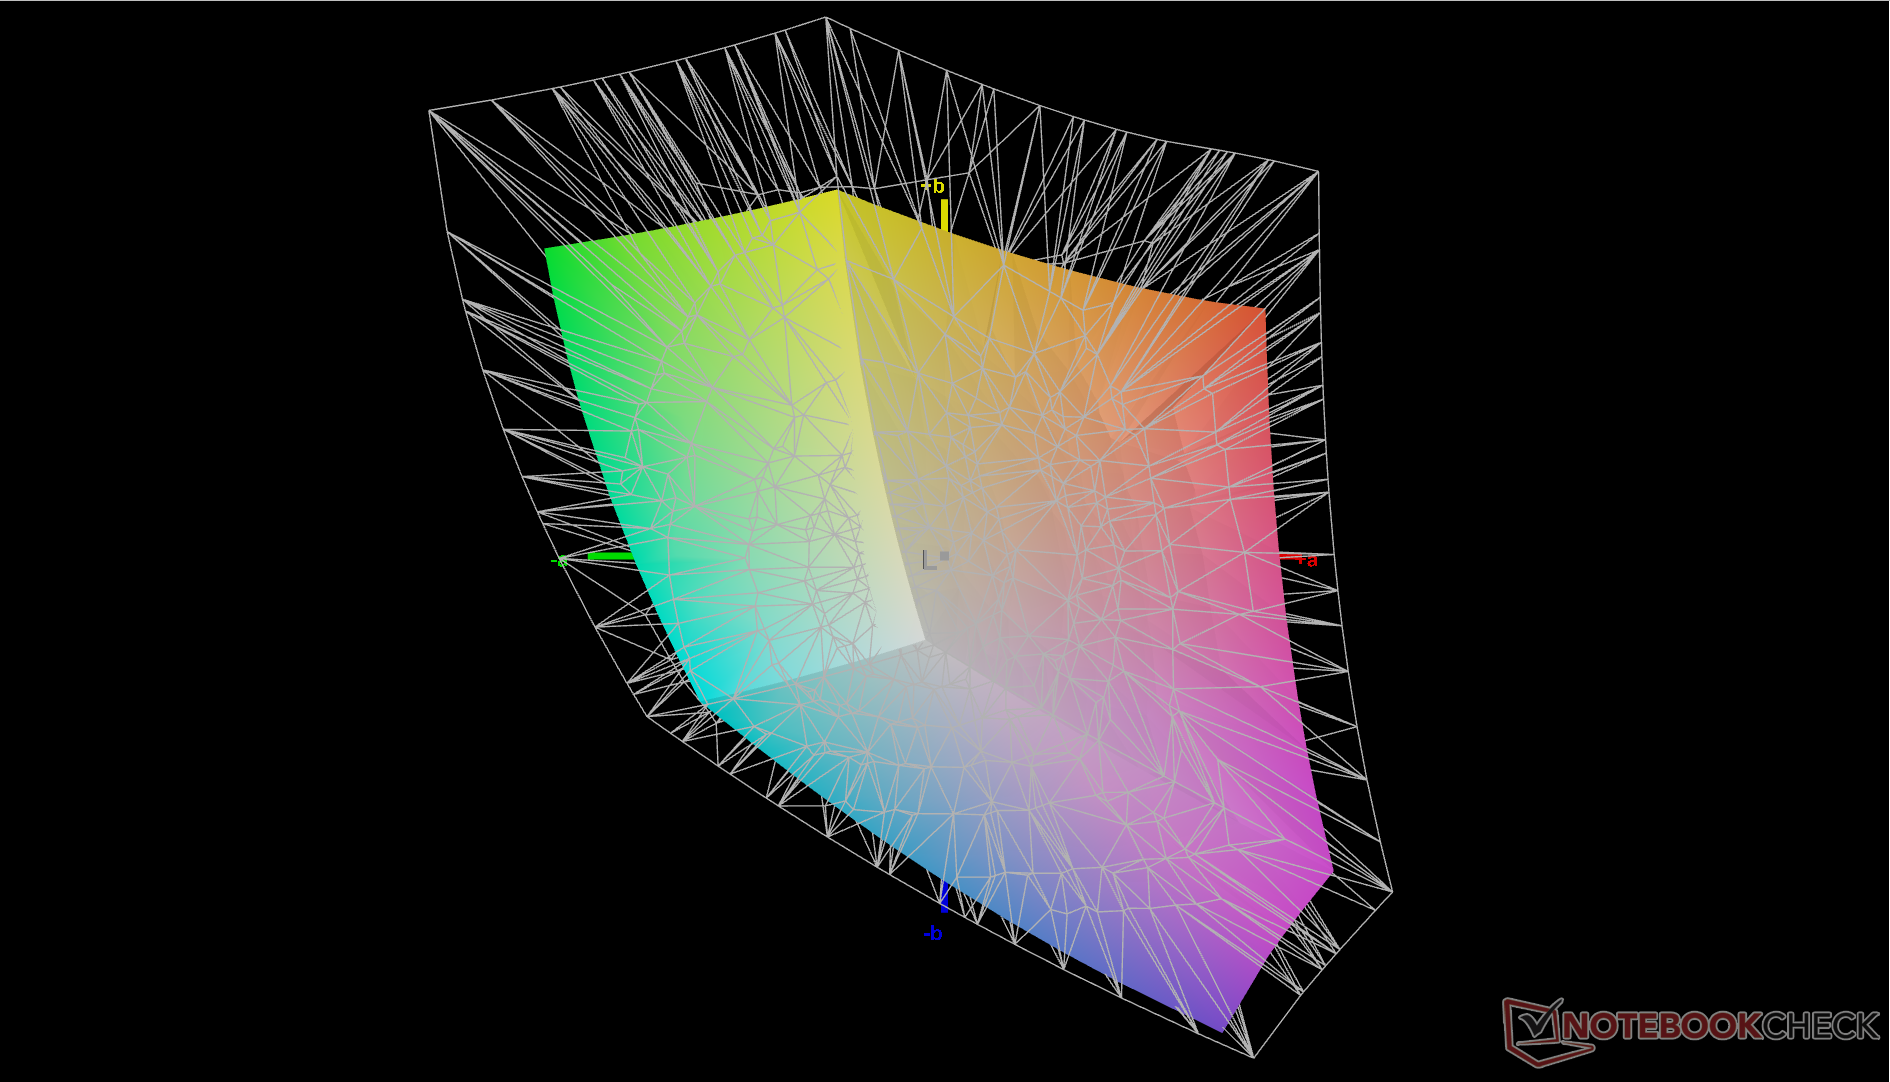
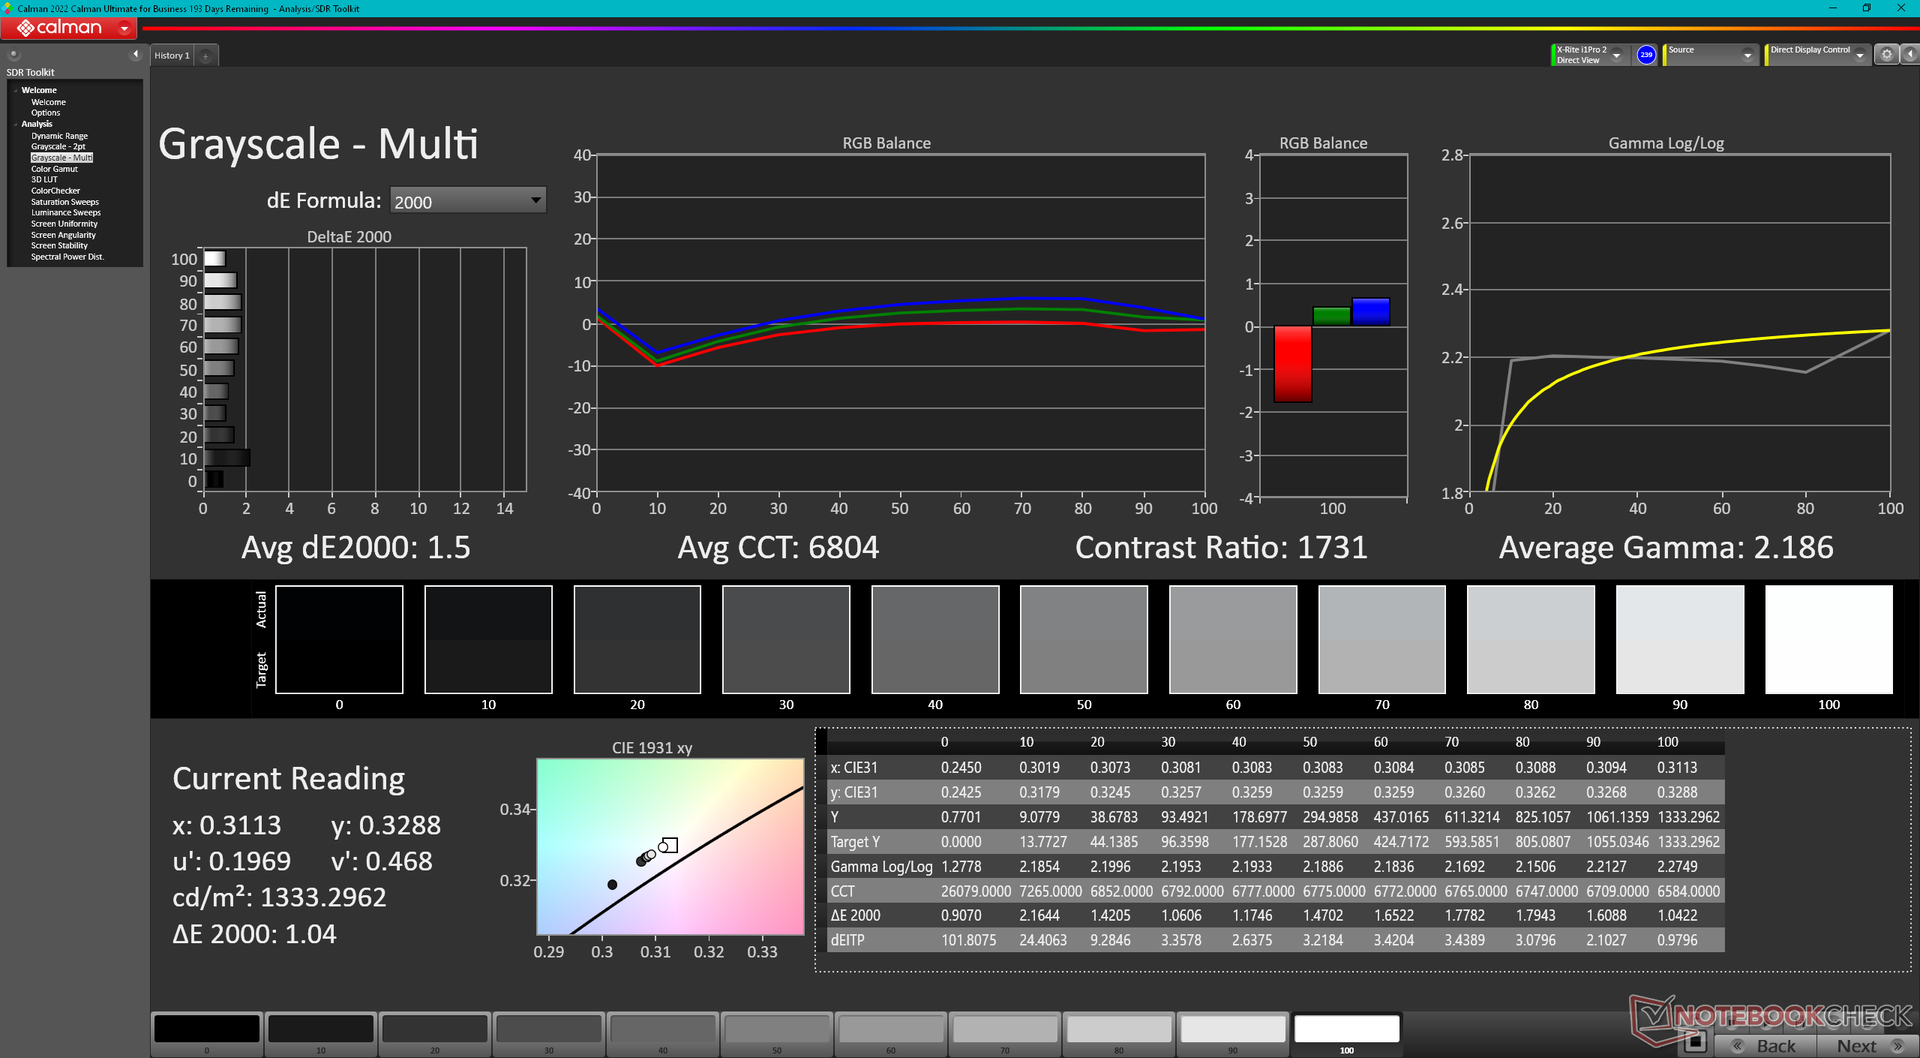
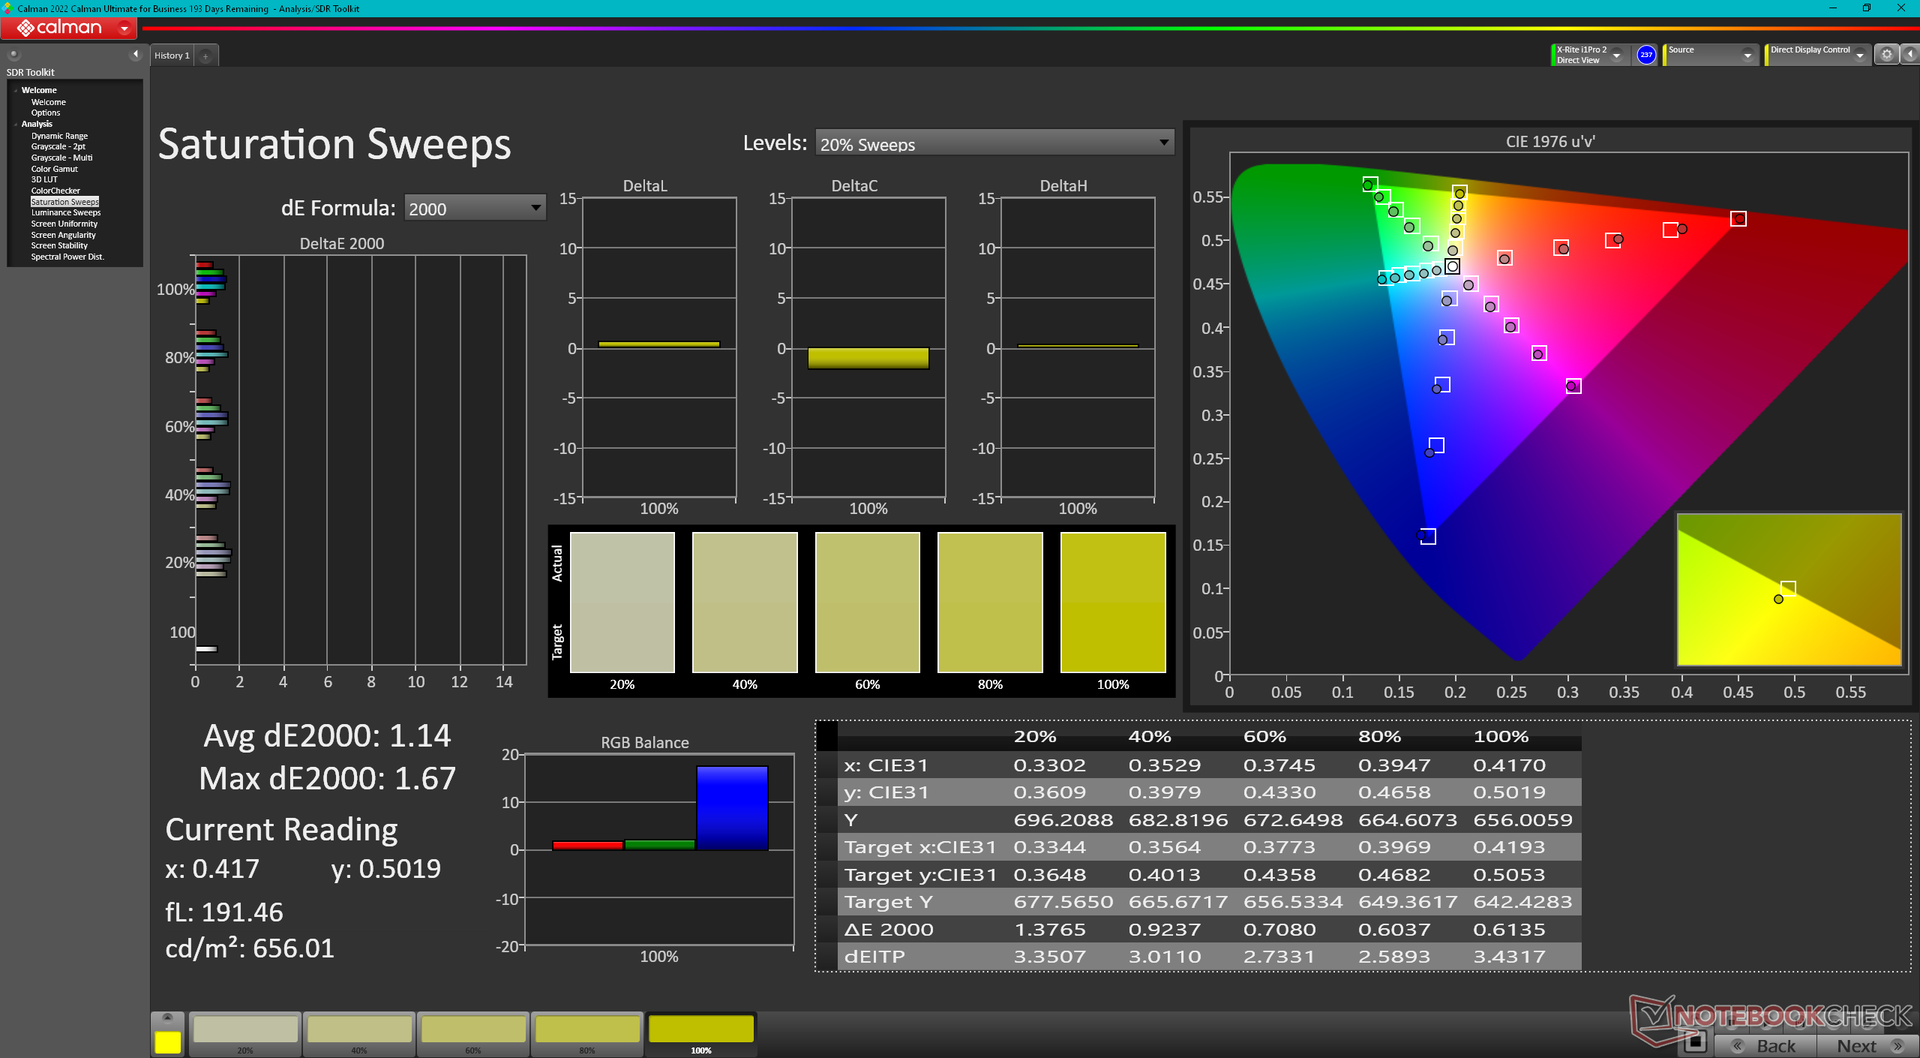
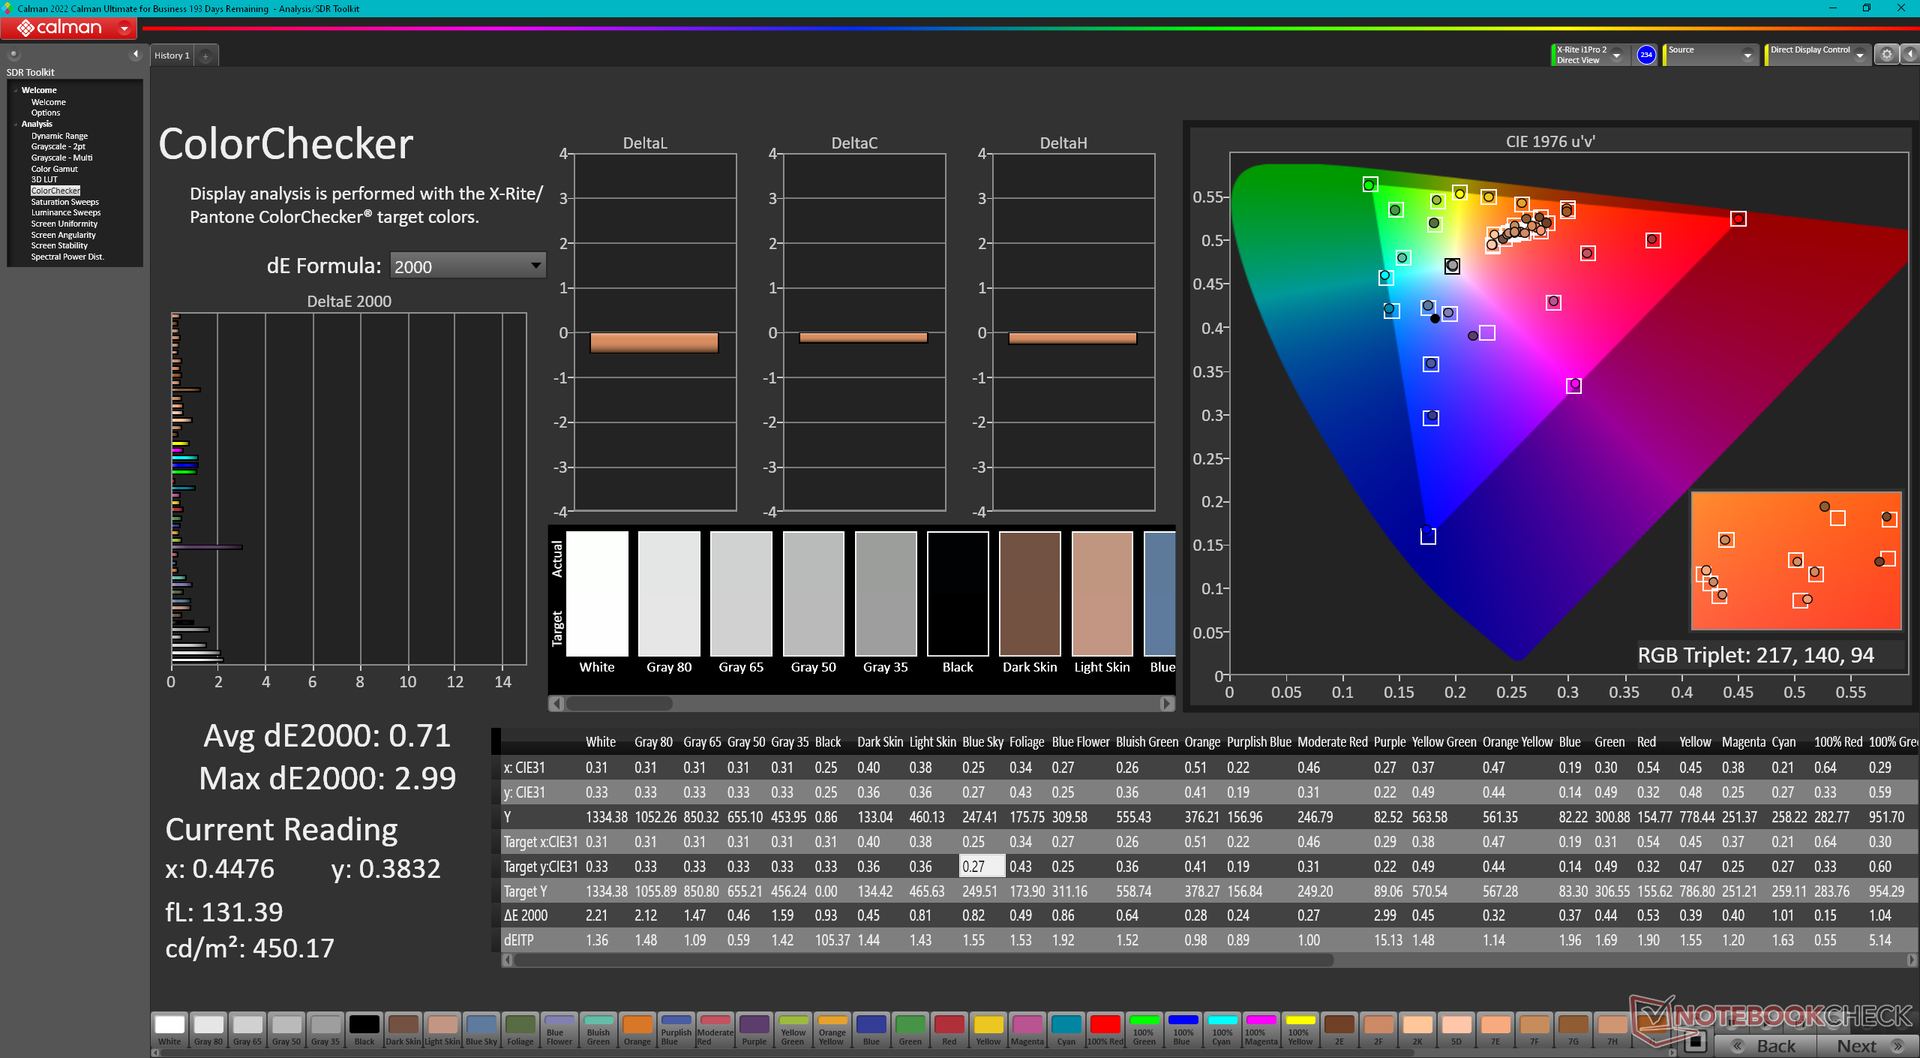
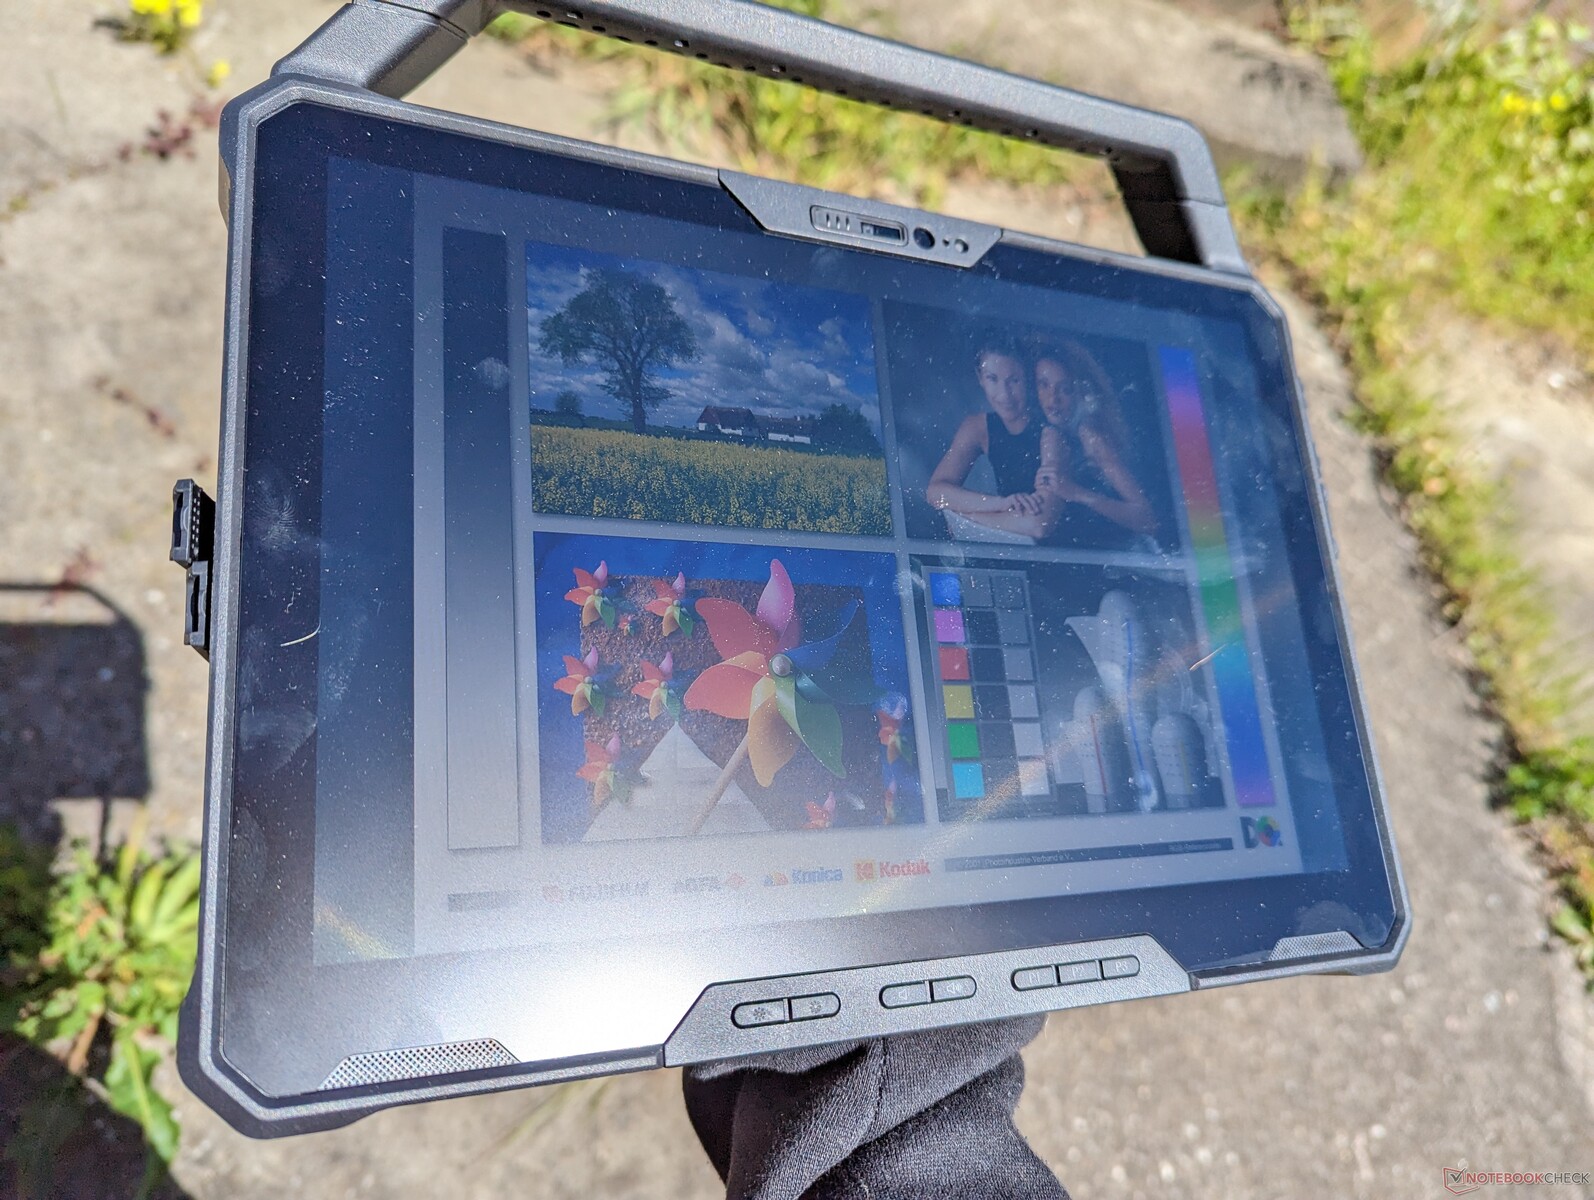
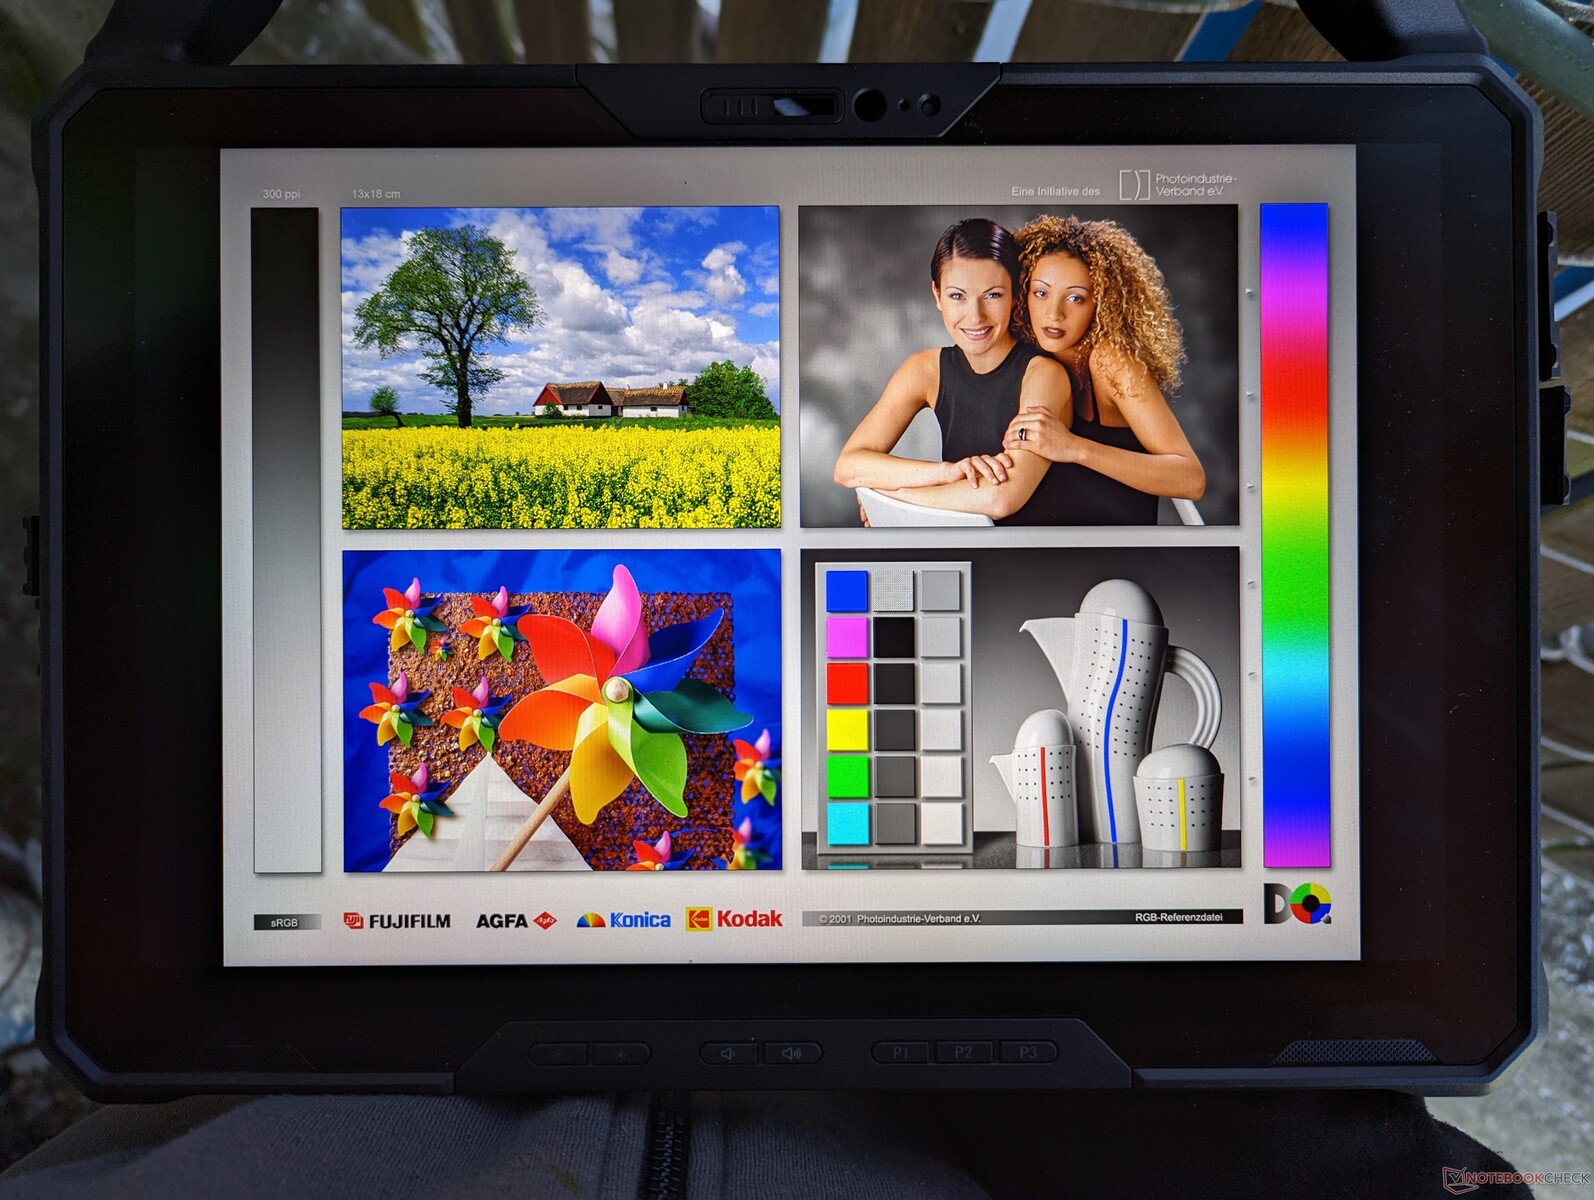
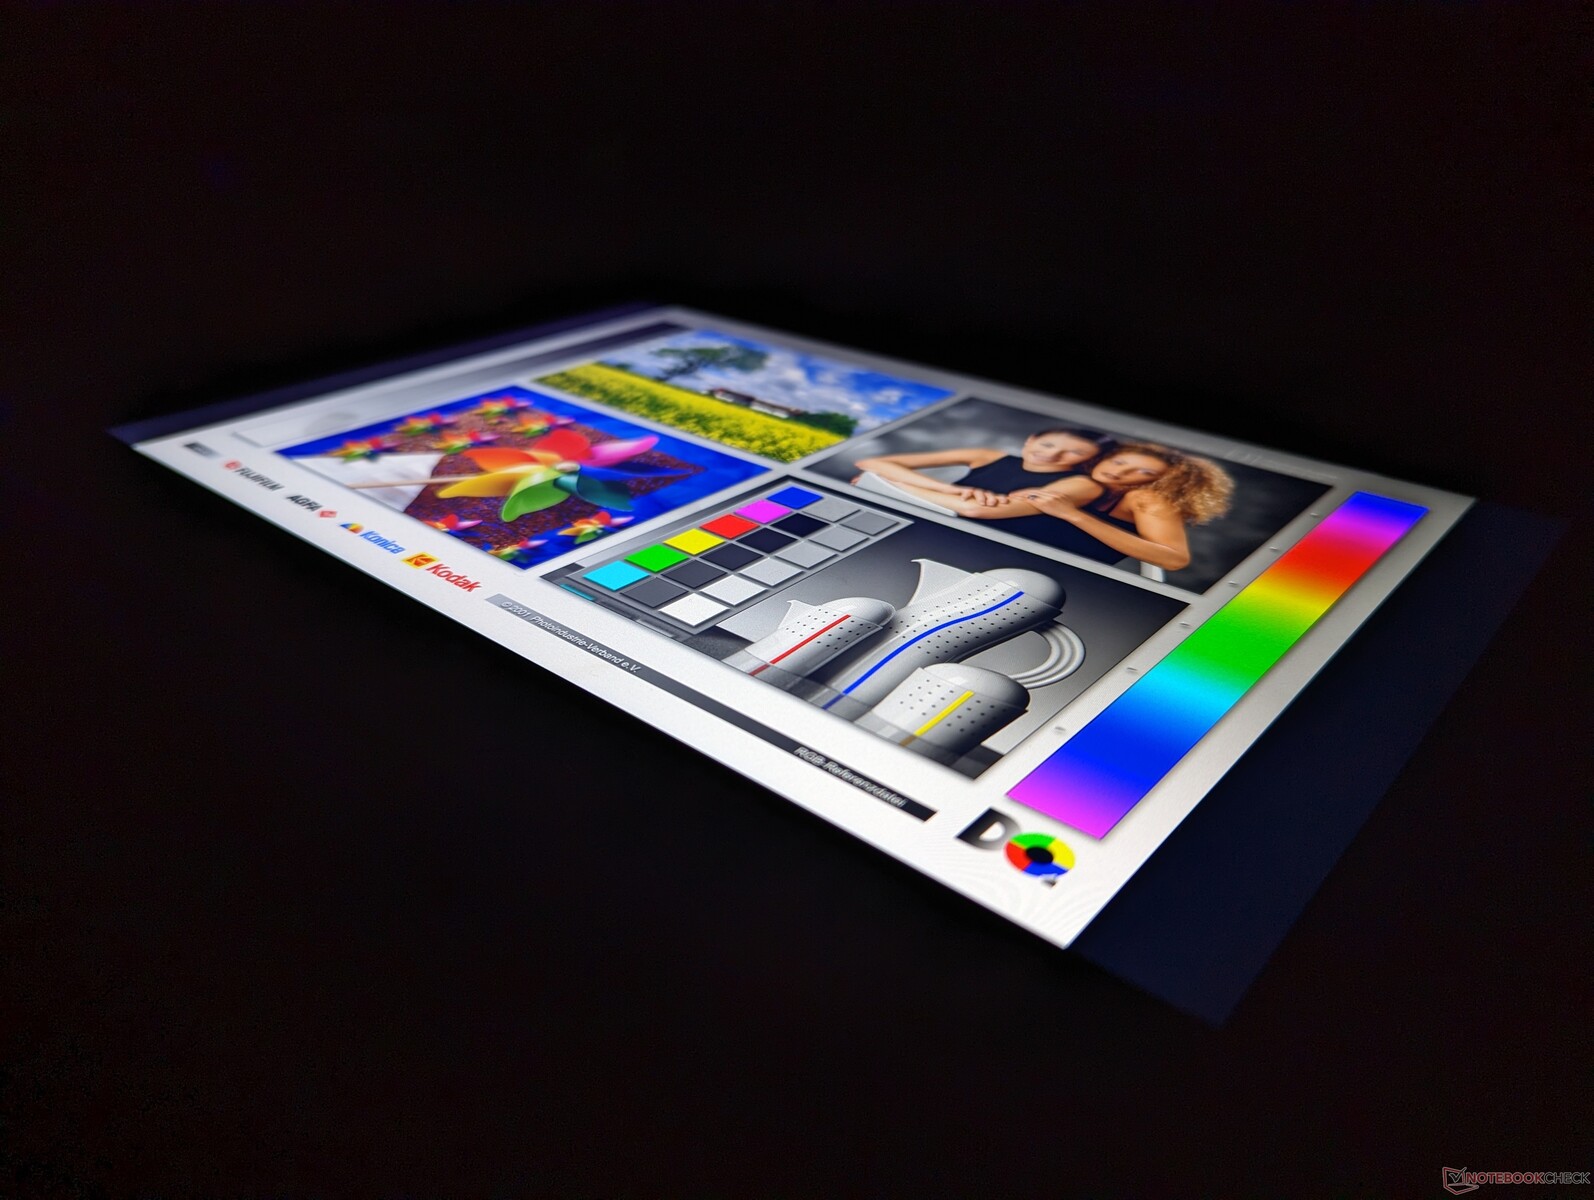
Pantalla: 1200 nits y cobertura sRGB completa
El Latitude 7230 Rugged es uno de los pocos dispositivos de su categoría y tamaño que ofrece >95 por ciento de sRGB para colores más precisos y vibrantes. Los tiempos de respuesta blanco-negro y gris-gris también son razonablemente rápidos para un efecto fantasma menos perceptible. No hay modulación de ancho de pulso para el control de brillo, lo que significa que puede utilizar la tableta a niveles muy bajos de brillo sin fatiga visual o parpadeo notable. Es una de las mejores pantallas que hemos visto en una tableta robusta.
El mayor inconveniente de la pantalla es su granularidad a pesar de los excelentes colores y la brillante retroiluminación. En comparación con las pantallas más nítidas de las tabletas de consumo o los portátiles, la pantalla táctil del Latitude 7230 Rugged se encuentra bajo capas más gruesas de cristal y protección, lo que en última instancia repercute en la calidad de la imagen. Sin embargo, para el público al que va dirigido, las imágenes supernítidas no suelen ser una prioridad.


| |||||||||||||||||||||||||
iluminación: 82 %
Brillo con batería: 1326.7 cd/m²
Contraste: 1561:1 (Negro: 0.85 cd/m²)
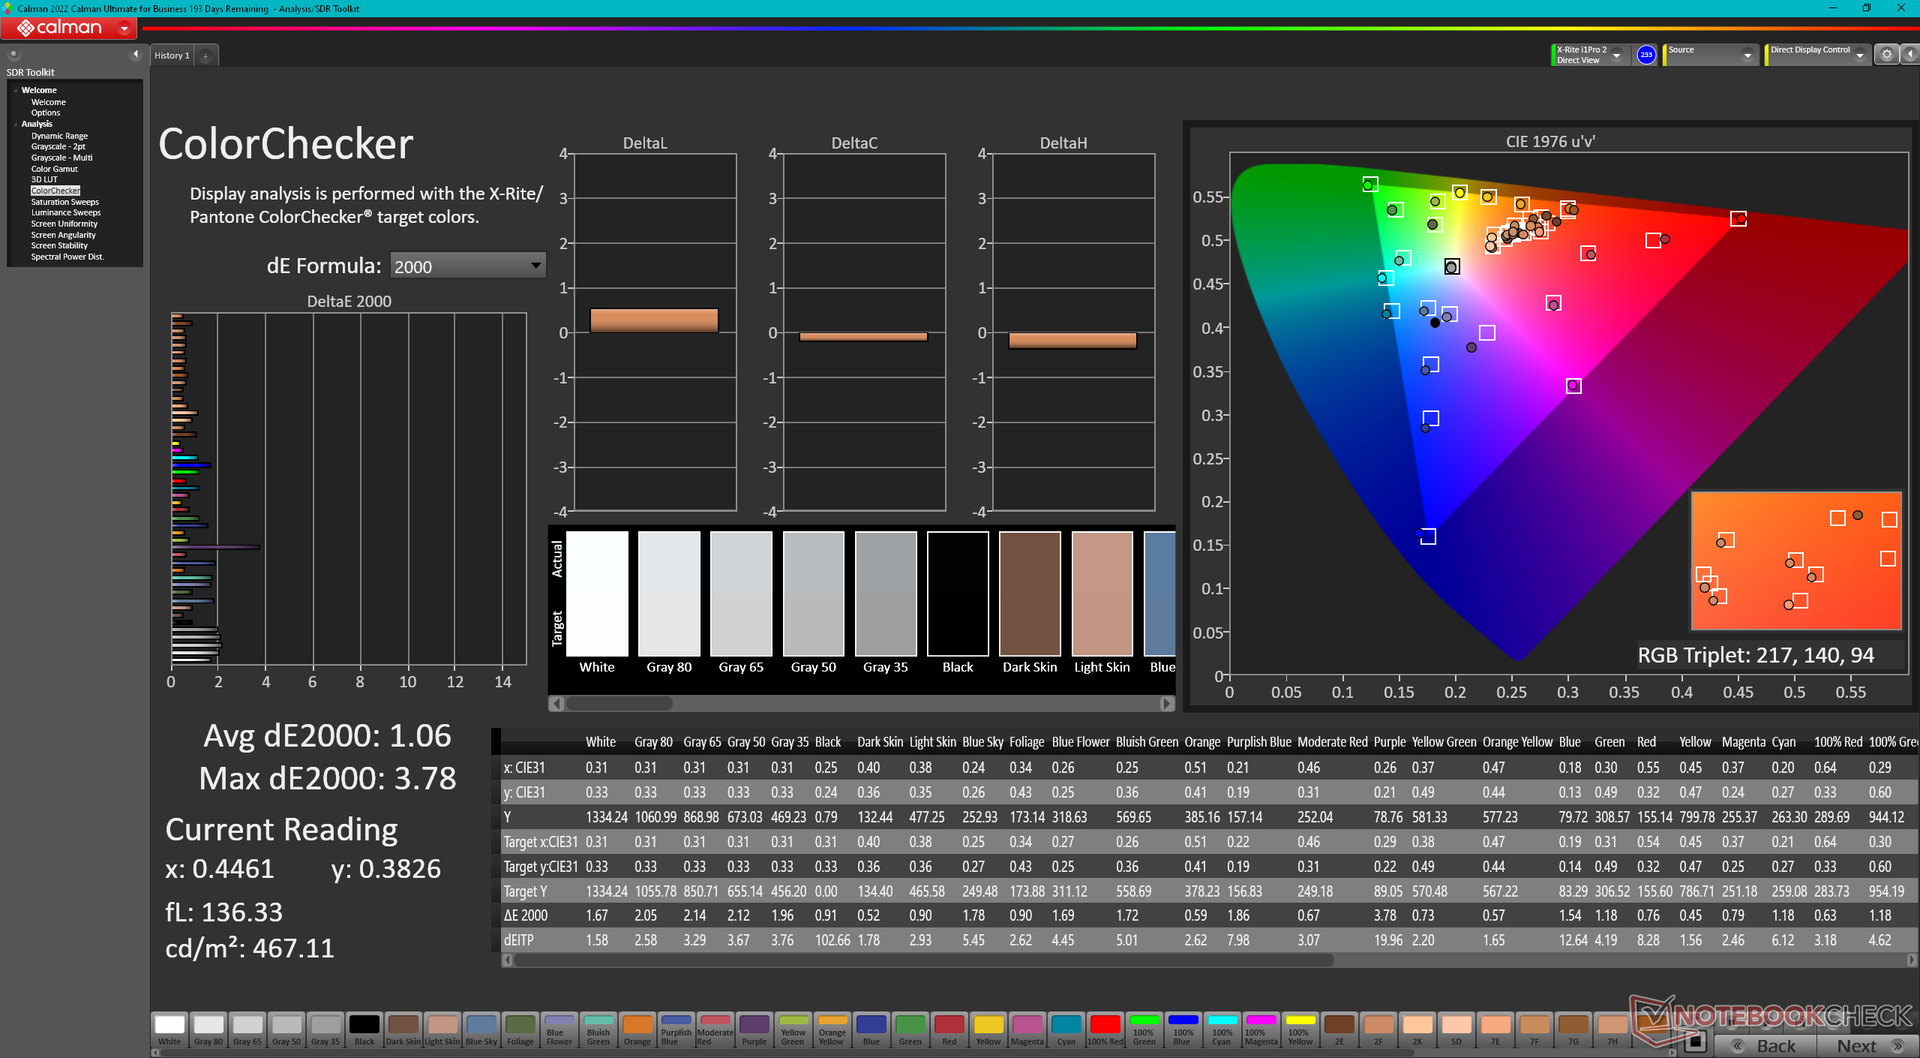
ΔE ColorChecker Calman: 1.06 | ∀{0.5-29.43 Ø4.73}
calibrated: 0.71
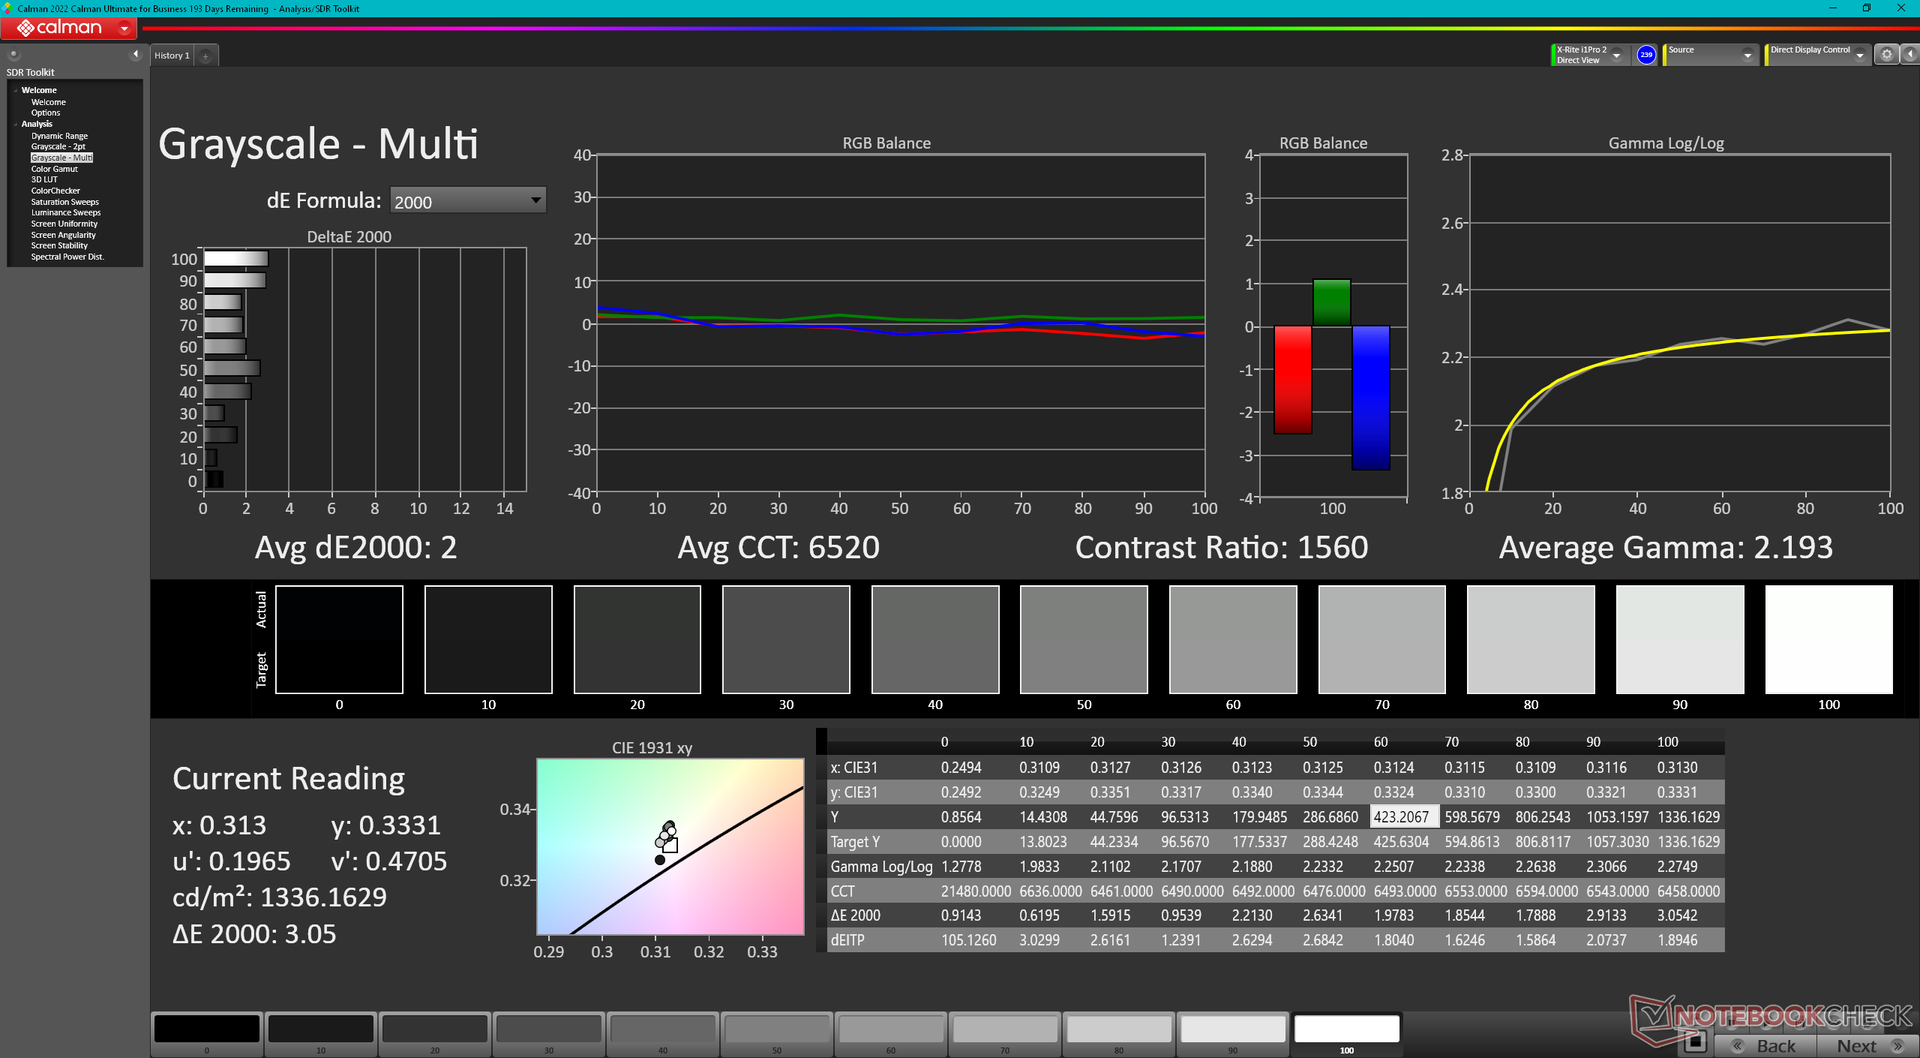
ΔE Greyscale Calman: 1.5 | ∀{0.09-98 Ø4.97}
68.4% AdobeRGB 1998 (Argyll 3D)
96.1% sRGB (Argyll 3D)
66.2% Display P3 (Argyll 3D)
Gamma: 2.19
CCT: 6804 K
| Dell Latitude 7230 Rugged Extreme Sharp LQ120N1, IPS, 1920x1200, 12" | Dell Latitude 7330 Rugged Extreme Sharp LQ133M1, IPS, 1920x1080, 13.3" | Panasonic Toughbook 40 InfoVision M140NWF5 R3, IPS, 1920x1080, 14" | Getac B360 AU Optronics AUO572D, IPS, 1920x1080, 13.3" | Acer Enduro Urban N3 EUN314 XR140EA6T, IPS, 1920x1080, 14" | Durabook S14I KD140N0730A01, TN, 1920x1080, 14" | |
|---|---|---|---|---|---|---|
| Display | 1% | -45% | -24% | -4% | -33% | |
| Display P3 Coverage (%) | 66.2 | 67.1 1% | 35.8 -46% | 51.3 -23% | 63.5 -4% | 43.55 -34% |
| sRGB Coverage (%) | 96.1 | 98.2 2% | 53.8 -44% | 72 -25% | 91.9 -4% | 65.4 -32% |
| AdobeRGB 1998 Coverage (%) | 68.4 | 69 1% | 37 -46% | 52.2 -24% | 65.5 -4% | 45 -34% |
| Response Times | -141% | -60% | -58% | -89% | 16% | |
| Response Time Grey 50% / Grey 80% * (ms) | 28.4 ? | 74.4 ? -162% | 50.4 ? -77% | 33 ? -16% | 56 ? -97% | 30.4 ? -7% |
| Response Time Black / White * (ms) | 19.4 ? | 42.4 ? -119% | 27.6 ? -42% | 38.8 ? -100% | 35.2 ? -81% | 11.8 ? 39% |
| PWM Frequency (Hz) | 694.4 ? | 870 ? | 1000 ? | 304.9 ? | ||
| Screen | -16% | -118% | -216% | -154% | -348% | |
| Brightness middle (cd/m²) | 1326.7 | 1414.1 7% | 1284.3 -3% | 1505.6 13% | 487.8 -63% | 1180.7 -11% |
| Brightness (cd/m²) | 1193 | 1282 7% | 1289 8% | 1383 16% | 464 -61% | 1102 -8% |
| Brightness Distribution (%) | 82 | 84 2% | 82 0% | 86 5% | 89 9% | 89 9% |
| Black Level * (cd/m²) | 0.85 | 0.83 2% | 0.89 -5% | 0.95 -12% | 0.48 44% | 1.91 -125% |
| Contrast (:1) | 1561 | 1704 9% | 1443 -8% | 1585 2% | 1016 -35% | 618 -60% |
| Colorchecker dE 2000 * | 1.06 | 1.99 -88% | 4.67 -341% | 9.81 -825% | 6.51 -514% | 13.45 -1169% |
| Colorchecker dE 2000 max. * | 3.78 | 3.75 1% | 19.85 -425% | 16.64 -340% | 11.36 -201% | 22.52 -496% |
| Colorchecker dE 2000 calibrated * | 0.71 | 0.72 -1% | 2.21 -211% | 1.44 -103% | 1.77 -149% | 3.19 -349% |
| Greyscale dE 2000 * | 1.5 | 2.8 -87% | 2.7 -80% | 12 -700% | 7.8 -420% | 15.4 -927% |
| Gamma | 2.19 100% | 2.06 107% | 1.97 112% | 1.98 111% | 2.28 96% | 1.97 112% |
| CCT | 6804 96% | 6775 96% | 6222 104% | 4838 134% | 8102 80% | 21134 31% |
| Color Space (Percent of AdobeRGB 1998) (%) | 41.6 | |||||
| Color Space (Percent of sRGB) (%) | 65.5 | |||||
| Media total (Programa/Opciones) | -52% /
-30% | -74% /
-94% | -99% /
-152% | -82% /
-113% | -122% /
-229% |
* ... más pequeño es mejor
La pantalla está bien calibrada de fábrica, con valores deltaE medios de escala de grises y color de sólo 1,5 y 1,06, respectivamente. Intentar calibrarla nosotros mismos con un colorímetro X-Rite no mejoraría significativamente la precisión, por lo que no es necesaria una calibración por parte del usuario final.

Tiempos de respuesta del display
| ↔ Tiempo de respuesta de Negro a Blanco | ||
|---|---|---|
| 19.4 ms ... subida ↗ y bajada ↘ combinada | ↗ 9.7 ms subida | 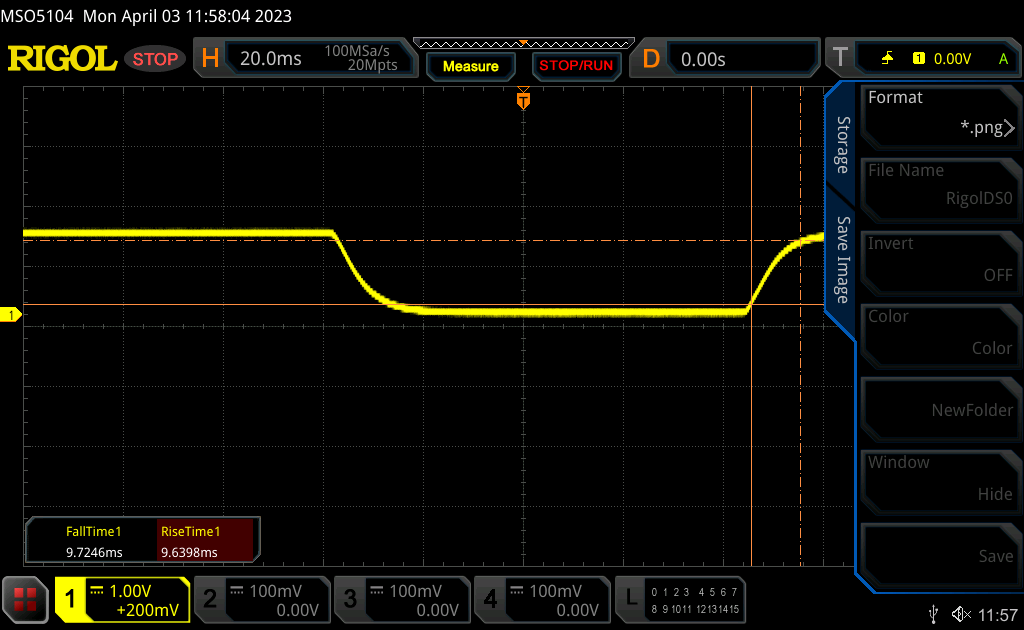 |
| ↘ 9.7 ms bajada | ||
| La pantalla mostró buenos tiempos de respuesta en nuestros tests pero podría ser demasiado lenta para los jugones competitivos. En comparación, todos los dispositivos de prueba van de ##min### (mínimo) a 240 (máximo) ms. » 43 % de todos los dispositivos son mejores. Eso quiere decir que el tiempo de respuesta es similar al dispositivo testado medio (19.9 ms). | ||
| ↔ Tiempo de respuesta 50% Gris a 80% Gris | ||
| 28.4 ms ... subida ↗ y bajada ↘ combinada | ↗ 13.8 ms subida | 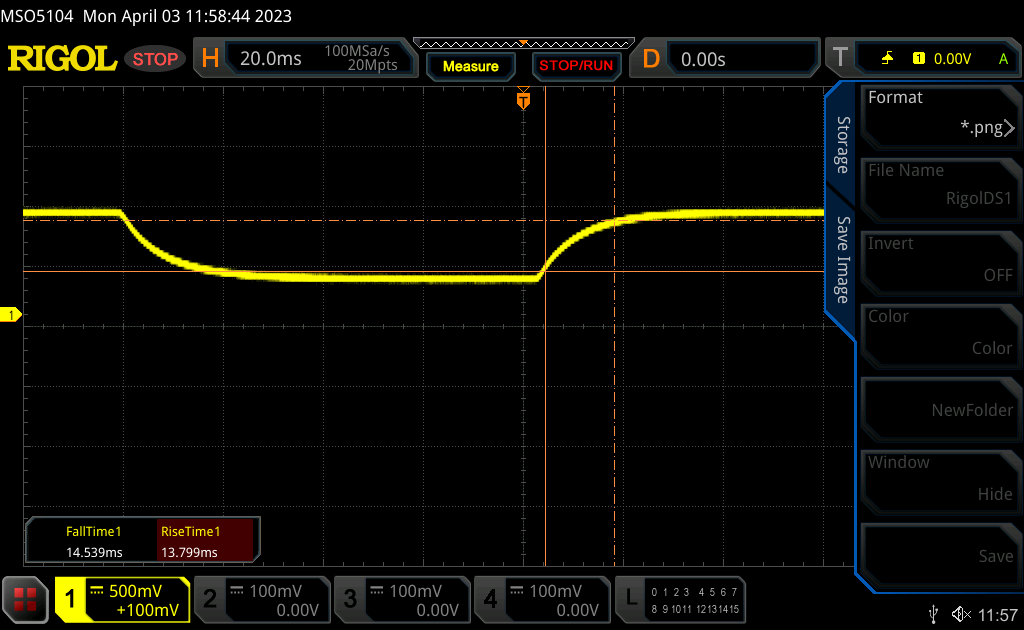 |
| ↘ 14.6 ms bajada | ||
| La pantalla mostró tiempos de respuesta relativamente lentos en nuestros tests pero podría ser demasiado lenta para los jugones. En comparación, todos los dispositivos de prueba van de ##min### (mínimo) a 636 (máximo) ms. » 38 % de todos los dispositivos son mejores. Eso quiere decir que el tiempo de respuesta es similar al dispositivo testado medio (31.1 ms). | ||
Parpadeo de Pantalla / PWM (Pulse-Width Modulation)
| Parpadeo de Pantalla / PWM no detectado | 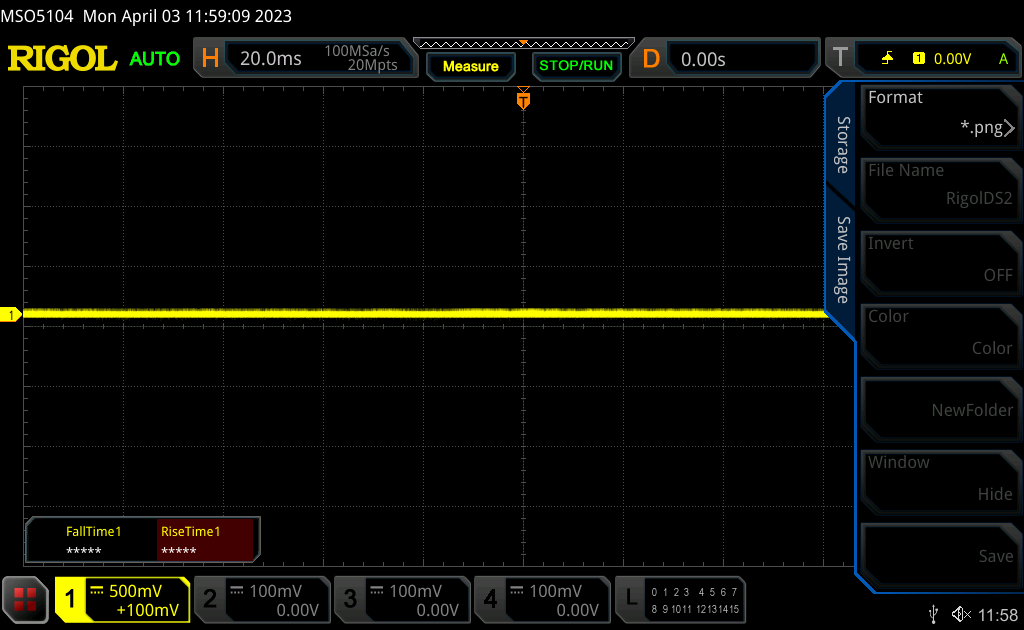 | ||
Comparación: 52 % de todos los dispositivos testados no usaron PWM para atenuar el display. Si se usó, medimos una media de 7791 (mínimo: 5 - máxmo: 343500) Hz. | |||
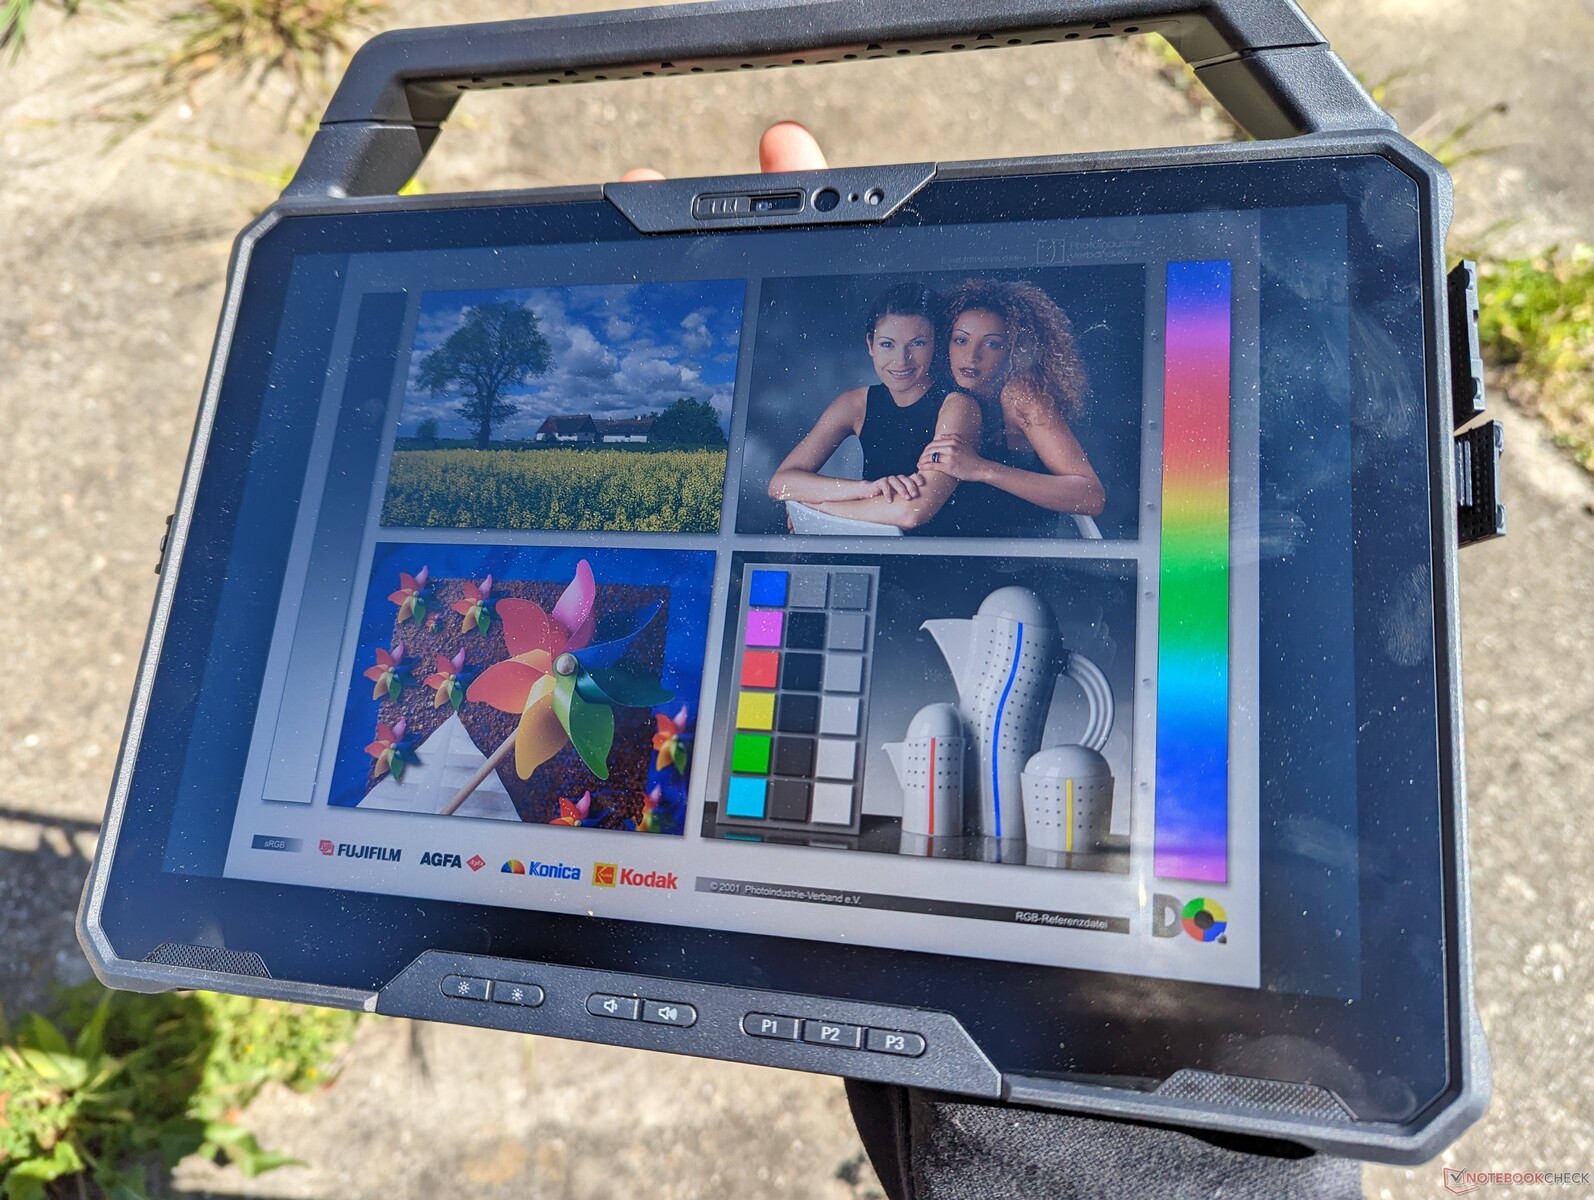
La visibilidad en exteriores es excelente, ya que la pantalla supera con creces los 1.000 nits, es decir, es dos veces más brillante que la típica tableta u ordenador portátil de consumo. Sin embargo, se producen algunos reflejos y colores desvaídos, por lo que debe evitarse la luz solar directa siempre que sea posible para maximizar la calidad de imagen.

Rendimiento
Condiciones de ensayo
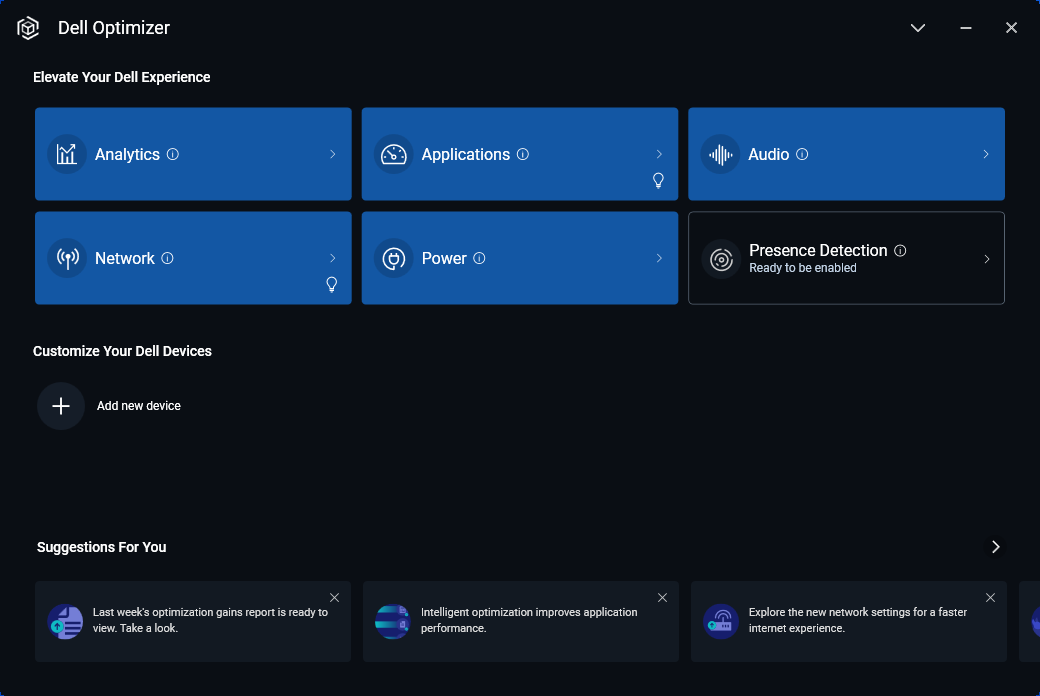
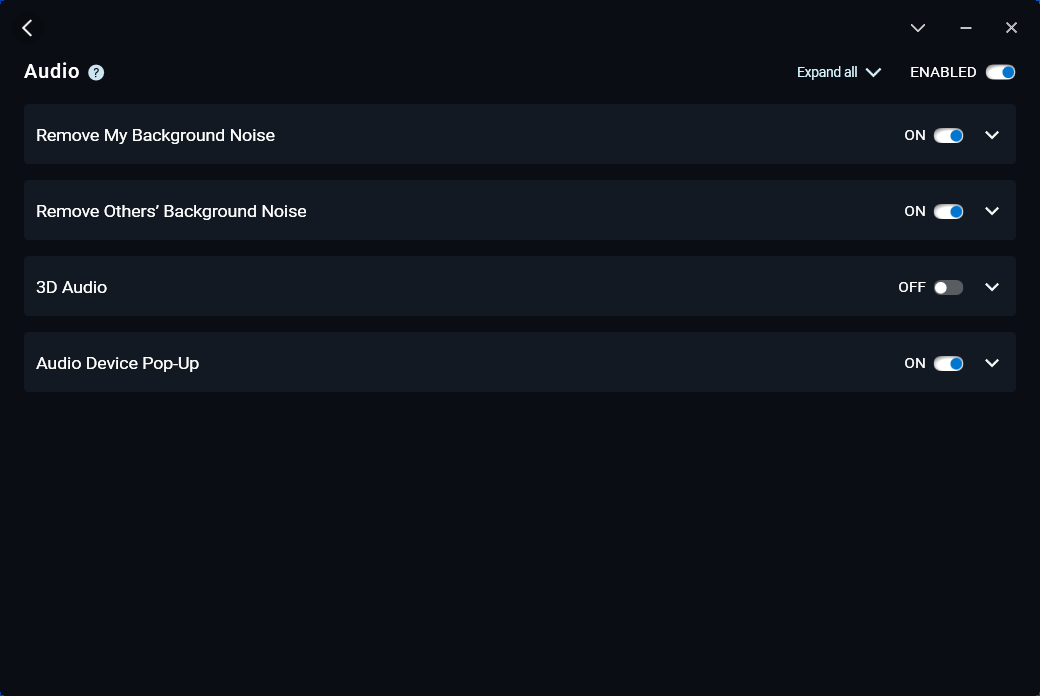
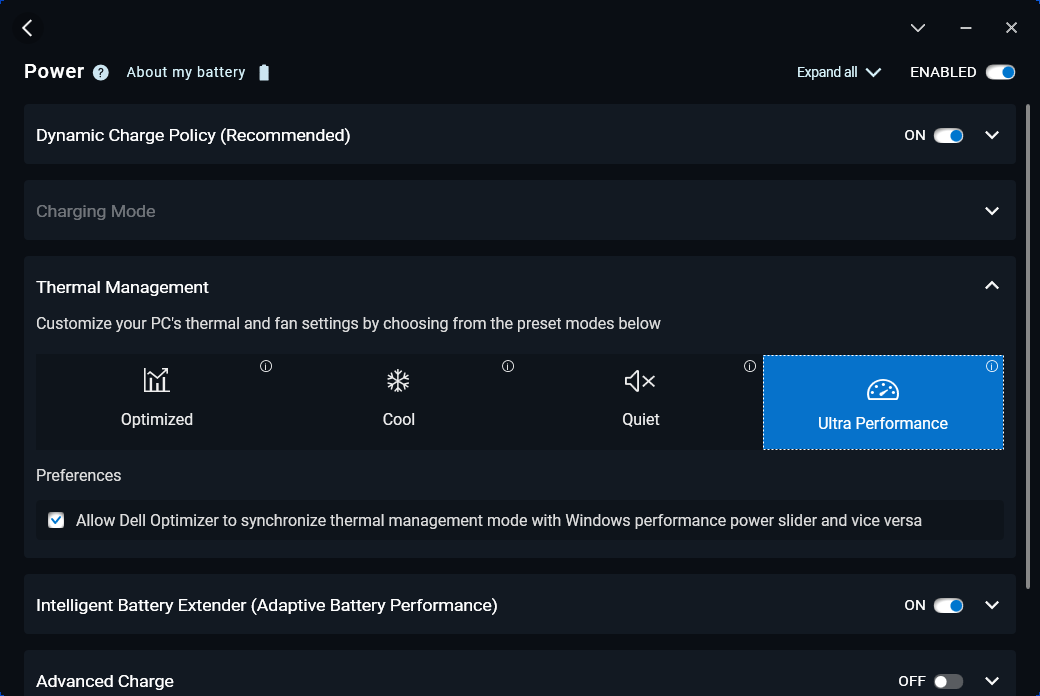
Configuramos nuestra unidad en modo Ultra Rendimiento a través del software Dell Optimizer preinstalado antes de ejecutar cualquier prueba de rendimiento a continuación. Los usuarios deberían acostumbrarse a Optimizer ya que controla aspectos clave del modelo incluyendo perfiles de energía, audio, micrófono y conectividad inalámbrica.
Dell Presence Detection no es compatible con el modelo.
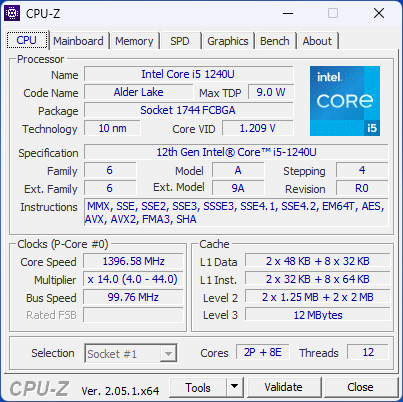
Procesador - Tan rápido como el Core i7-1260U
El rendimiento de la CPU es excelente, especialmente después del decepcionante Core i7-1260U que experimentamos en el Latitude 7330. El rendimiento multihilo es significativamente más rápido que el popular Core i7-1165G7 o i7-1185G7 que equipaban la mayoría de Ultrabooks y dispositivos robustos de antaño.
Quizás el aspecto más importante a tener en cuenta a la hora de elegir entre el Core i5-1240U o Core i7-1260U es que el rendimiento bruto del procesador es casi idéntico. En cambio, difieren sobre todo en el rendimiento de los gráficos integrados. Si necesitas la potencia adicional de la GPU, entonces la opción Core i7 sería la mejor. Por lo demás, ambos procesadores están a la altura cuando se trata de cargas de trabajo de CPU de uno o varios hilos.
Cinebench R15 Multi Loop
Cinebench R23: Multi Core | Single Core
Cinebench R20: CPU (Multi Core) | CPU (Single Core)
Cinebench R15: CPU Multi 64Bit | CPU Single 64Bit
Blender: v2.79 BMW27 CPU
7-Zip 18.03: 7z b 4 | 7z b 4 -mmt1
Geekbench 5.5: Multi-Core | Single-Core
HWBOT x265 Benchmark v2.2: 4k Preset
LibreOffice : 20 Documents To PDF
R Benchmark 2.5: Overall mean
| CPU Performance rating | |
| HP EliteBook 840 G9 | |
| Asus ExpertBook B5 Flip B5602FBN | |
| Lenovo ThinkPad P14s G3 AMD 21J6S05000 | |
| HP ZBook Firefly 14 G9-6B8A2EA | |
| Lenovo ThinkBook 13s G3 20YA0005GE | |
| HP ProBook 440 G9-5Y3Z3EA | |
| Dell Latitude 7230 Rugged Extreme | |
| Medio Intel Core i5-1240U | |
| Dell Latitude 9330 | |
| Dell Latitude 7330 Rugged Extreme | |
| Acer Enduro Urban N3 EUN314 | |
| Panasonic Toughbook 40 | |
| Durabook S14I | |
| Getac B360 -1! | |
| Cinebench R23 / Multi Core | |
| Asus ExpertBook B5 Flip B5602FBN | |
| Lenovo ThinkPad P14s G3 AMD 21J6S05000 | |
| HP EliteBook 840 G9 | |
| HP ZBook Firefly 14 G9-6B8A2EA | |
| Lenovo ThinkBook 13s G3 20YA0005GE | |
| Dell Latitude 7230 Rugged Extreme | |
| Medio Intel Core i5-1240U (n=1) | |
| HP ProBook 440 G9-5Y3Z3EA | |
| Dell Latitude 9330 | |
| Dell Latitude 7330 Rugged Extreme | |
| Acer Enduro Urban N3 EUN314 | |
| Panasonic Toughbook 40 | |
| Getac B360 | |
| Durabook S14I | |
| Cinebench R23 / Single Core | |
| Asus ExpertBook B5 Flip B5602FBN | |
| HP ZBook Firefly 14 G9-6B8A2EA | |
| HP EliteBook 840 G9 | |
| HP ProBook 440 G9-5Y3Z3EA | |
| Dell Latitude 7230 Rugged Extreme | |
| Medio Intel Core i5-1240U (n=1) | |
| Dell Latitude 9330 | |
| Dell Latitude 7330 Rugged Extreme | |
| Lenovo ThinkPad P14s G3 AMD 21J6S05000 | |
| Lenovo ThinkBook 13s G3 20YA0005GE | |
| Acer Enduro Urban N3 EUN314 | |
| Panasonic Toughbook 40 | |
| Durabook S14I | |
| Getac B360 | |
| Cinebench R20 / CPU (Multi Core) | |
| Lenovo ThinkPad P14s G3 AMD 21J6S05000 | |
| HP EliteBook 840 G9 | |
| Asus ExpertBook B5 Flip B5602FBN | |
| HP ZBook Firefly 14 G9-6B8A2EA | |
| Lenovo ThinkBook 13s G3 20YA0005GE | |
| Dell Latitude 7230 Rugged Extreme | |
| Medio Intel Core i5-1240U (n=1) | |
| HP ProBook 440 G9-5Y3Z3EA | |
| Dell Latitude 9330 | |
| Dell Latitude 7330 Rugged Extreme | |
| Acer Enduro Urban N3 EUN314 | |
| Panasonic Toughbook 40 | |
| Getac B360 | |
| Durabook S14I | |
| Cinebench R20 / CPU (Single Core) | |
| Asus ExpertBook B5 Flip B5602FBN | |
| HP ZBook Firefly 14 G9-6B8A2EA | |
| HP ProBook 440 G9-5Y3Z3EA | |
| HP EliteBook 840 G9 | |
| Lenovo ThinkPad P14s G3 AMD 21J6S05000 | |
| Dell Latitude 7230 Rugged Extreme | |
| Medio Intel Core i5-1240U (n=1) | |
| Dell Latitude 7330 Rugged Extreme | |
| Dell Latitude 9330 | |
| Lenovo ThinkBook 13s G3 20YA0005GE | |
| Acer Enduro Urban N3 EUN314 | |
| Durabook S14I | |
| Panasonic Toughbook 40 | |
| Getac B360 | |
| Cinebench R15 / CPU Multi 64Bit | |
| Asus ExpertBook B5 Flip B5602FBN | |
| HP EliteBook 840 G9 | |
| Lenovo ThinkBook 13s G3 20YA0005GE | |
| Lenovo ThinkBook 13s G3 20YA0005GE | |
| Lenovo ThinkPad P14s G3 AMD 21J6S05000 | |
| HP ZBook Firefly 14 G9-6B8A2EA | |
| HP ProBook 440 G9-5Y3Z3EA | |
| Dell Latitude 7230 Rugged Extreme | |
| Medio Intel Core i5-1240U (n=1) | |
| Dell Latitude 9330 | |
| Acer Enduro Urban N3 EUN314 | |
| Dell Latitude 7330 Rugged Extreme | |
| Panasonic Toughbook 40 | |
| Getac B360 | |
| Durabook S14I | |
| Cinebench R15 / CPU Single 64Bit | |
| HP EliteBook 840 G9 | |
| HP ZBook Firefly 14 G9-6B8A2EA | |
| Asus ExpertBook B5 Flip B5602FBN | |
| HP ProBook 440 G9-5Y3Z3EA | |
| HP ProBook 440 G9-5Y3Z3EA | |
| Lenovo ThinkPad P14s G3 AMD 21J6S05000 | |
| Lenovo ThinkBook 13s G3 20YA0005GE | |
| Dell Latitude 7330 Rugged Extreme | |
| Dell Latitude 7230 Rugged Extreme | |
| Medio Intel Core i5-1240U (n=1) | |
| Dell Latitude 9330 | |
| Acer Enduro Urban N3 EUN314 | |
| Durabook S14I | |
| Panasonic Toughbook 40 | |
| Getac B360 | |
| Blender / v2.79 BMW27 CPU | |
| Durabook S14I | |
| Getac B360 | |
| Panasonic Toughbook 40 | |
| Acer Enduro Urban N3 EUN314 | |
| Dell Latitude 7330 Rugged Extreme | |
| Dell Latitude 9330 | |
| HP ZBook Firefly 14 G9-6B8A2EA | |
| HP ProBook 440 G9-5Y3Z3EA | |
| Dell Latitude 7230 Rugged Extreme | |
| Medio Intel Core i5-1240U (n=1) | |
| Lenovo ThinkBook 13s G3 20YA0005GE | |
| Lenovo ThinkPad P14s G3 AMD 21J6S05000 | |
| Asus ExpertBook B5 Flip B5602FBN | |
| HP EliteBook 840 G9 | |
| 7-Zip 18.03 / 7z b 4 | |
| HP EliteBook 840 G9 | |
| Lenovo ThinkPad P14s G3 AMD 21J6S05000 | |
| Asus ExpertBook B5 Flip B5602FBN | |
| Lenovo ThinkBook 13s G3 20YA0005GE | |
| HP ZBook Firefly 14 G9-6B8A2EA | |
| Dell Latitude 9330 | |
| Dell Latitude 7230 Rugged Extreme | |
| Medio Intel Core i5-1240U (n=1) | |
| HP ProBook 440 G9-5Y3Z3EA | |
| Acer Enduro Urban N3 EUN314 | |
| Dell Latitude 7330 Rugged Extreme | |
| Getac B360 | |
| Panasonic Toughbook 40 | |
| Durabook S14I | |
| 7-Zip 18.03 / 7z b 4 -mmt1 | |
| HP EliteBook 840 G9 | |
| HP ZBook Firefly 14 G9-6B8A2EA | |
| Asus ExpertBook B5 Flip B5602FBN | |
| Dell Latitude 7330 Rugged Extreme | |
| Acer Enduro Urban N3 EUN314 | |
| Lenovo ThinkBook 13s G3 20YA0005GE | |
| Durabook S14I | |
| HP ProBook 440 G9-5Y3Z3EA | |
| Lenovo ThinkPad P14s G3 AMD 21J6S05000 | |
| Panasonic Toughbook 40 | |
| Dell Latitude 9330 | |
| Getac B360 | |
| Dell Latitude 7230 Rugged Extreme | |
| Medio Intel Core i5-1240U (n=1) | |
| Geekbench 5.5 / Multi-Core | |
| HP EliteBook 840 G9 | |
| Asus ExpertBook B5 Flip B5602FBN | |
| HP ZBook Firefly 14 G9-6B8A2EA | |
| Lenovo ThinkPad P14s G3 AMD 21J6S05000 | |
| Dell Latitude 9330 | |
| Dell Latitude 7230 Rugged Extreme | |
| Medio Intel Core i5-1240U (n=1) | |
| Lenovo ThinkBook 13s G3 20YA0005GE | |
| HP ProBook 440 G9-5Y3Z3EA | |
| Dell Latitude 7330 Rugged Extreme | |
| Acer Enduro Urban N3 EUN314 | |
| Panasonic Toughbook 40 | |
| Getac B360 | |
| Durabook S14I | |
| Geekbench 5.5 / Single-Core | |
| HP EliteBook 840 G9 | |
| HP ZBook Firefly 14 G9-6B8A2EA | |
| Dell Latitude 7230 Rugged Extreme | |
| Medio Intel Core i5-1240U (n=1) | |
| HP ProBook 440 G9-5Y3Z3EA | |
| Dell Latitude 9330 | |
| Dell Latitude 7330 Rugged Extreme | |
| Acer Enduro Urban N3 EUN314 | |
| Asus ExpertBook B5 Flip B5602FBN | |
| Durabook S14I | |
| Lenovo ThinkPad P14s G3 AMD 21J6S05000 | |
| Panasonic Toughbook 40 | |
| Lenovo ThinkBook 13s G3 20YA0005GE | |
| Getac B360 | |
| HWBOT x265 Benchmark v2.2 / 4k Preset | |
| Lenovo ThinkPad P14s G3 AMD 21J6S05000 | |
| HP EliteBook 840 G9 | |
| Asus ExpertBook B5 Flip B5602FBN | |
| Lenovo ThinkBook 13s G3 20YA0005GE | |
| HP ZBook Firefly 14 G9-6B8A2EA | |
| Dell Latitude 7230 Rugged Extreme | |
| Medio Intel Core i5-1240U (n=1) | |
| HP ProBook 440 G9-5Y3Z3EA | |
| Dell Latitude 9330 | |
| Dell Latitude 7330 Rugged Extreme | |
| Acer Enduro Urban N3 EUN314 | |
| Panasonic Toughbook 40 | |
| Getac B360 | |
| Durabook S14I | |
| LibreOffice / 20 Documents To PDF | |
| Acer Enduro Urban N3 EUN314 | |
| Lenovo ThinkPad P14s G3 AMD 21J6S05000 | |
| Panasonic Toughbook 40 | |
| Dell Latitude 7230 Rugged Extreme | |
| Medio Intel Core i5-1240U (n=1) | |
| HP ProBook 440 G9-5Y3Z3EA | |
| Dell Latitude 9330 | |
| Lenovo ThinkBook 13s G3 20YA0005GE | |
| Dell Latitude 7330 Rugged Extreme | |
| Asus ExpertBook B5 Flip B5602FBN | |
| Durabook S14I | |
| HP EliteBook 840 G9 | |
| HP ZBook Firefly 14 G9-6B8A2EA | |
| R Benchmark 2.5 / Overall mean | |
| Getac B360 | |
| Panasonic Toughbook 40 | |
| Durabook S14I | |
| Acer Enduro Urban N3 EUN314 | |
| Dell Latitude 7330 Rugged Extreme | |
| Lenovo ThinkBook 13s G3 20YA0005GE | |
| Lenovo ThinkPad P14s G3 AMD 21J6S05000 | |
| Dell Latitude 7230 Rugged Extreme | |
| Medio Intel Core i5-1240U (n=1) | |
| Dell Latitude 9330 | |
| HP ProBook 440 G9-5Y3Z3EA | |
| Asus ExpertBook B5 Flip B5602FBN | |
| HP ZBook Firefly 14 G9-6B8A2EA | |
| HP EliteBook 840 G9 | |
Cinebench R23: Multi Core | Single Core
Cinebench R20: CPU (Multi Core) | CPU (Single Core)
Cinebench R15: CPU Multi 64Bit | CPU Single 64Bit
Blender: v2.79 BMW27 CPU
7-Zip 18.03: 7z b 4 | 7z b 4 -mmt1
Geekbench 5.5: Multi-Core | Single-Core
HWBOT x265 Benchmark v2.2: 4k Preset
LibreOffice : 20 Documents To PDF
R Benchmark 2.5: Overall mean
* ... más pequeño es mejor
| Blender | |
| v3.3 Classroom HIP/AMD | |
| Lenovo ThinkPad P14s G3 AMD 21J6S05000 | |
| Lenovo ThinkPad P14s G3 AMD 21J6S05000 | |
| v3.3 Classroom OPTIX/RTX | |
| HP ZBook Firefly 14 G9-6B8A2EA | |
| v3.3 Classroom CUDA | |
| HP ZBook Firefly 14 G9-6B8A2EA | |
| v3.3 Classroom CPU | |
| Dell Latitude 7230 Rugged Extreme | |
| HP ProBook 440 G9-5Y3Z3EA | |
| HP ZBook Firefly 14 G9-6B8A2EA | |
| HP EliteBook 840 G9 | |
| Asus ExpertBook B5 Flip B5602FBN | |
| Lenovo ThinkPad P14s G3 AMD 21J6S05000 | |
* ... más pequeño es mejor
AIDA64: FP32 Ray-Trace | FPU Julia | CPU SHA3 | CPU Queen | FPU SinJulia | FPU Mandel | CPU AES | CPU ZLib | FP64 Ray-Trace | CPU PhotoWorxx
| Performance rating | |
| Dell Latitude 7330 Rugged Extreme | |
| Acer Enduro Urban N3 EUN314 | |
| Dell Latitude 7230 Rugged Extreme | |
| Medio Intel Core i5-1240U | |
| Panasonic Toughbook 40 | |
| Getac B360 | |
| Durabook S14I | |
| AIDA64 / FP32 Ray-Trace | |
| Dell Latitude 7330 Rugged Extreme | |
| Acer Enduro Urban N3 EUN314 | |
| Dell Latitude 7230 Rugged Extreme | |
| Medio Intel Core i5-1240U (n=1) | |
| Panasonic Toughbook 40 | |
| Durabook S14I | |
| Getac B360 | |
| AIDA64 / FPU Julia | |
| Dell Latitude 7230 Rugged Extreme | |
| Medio Intel Core i5-1240U (n=1) | |
| Dell Latitude 7330 Rugged Extreme | |
| Acer Enduro Urban N3 EUN314 | |
| Getac B360 | |
| Panasonic Toughbook 40 | |
| Durabook S14I | |
| AIDA64 / CPU SHA3 | |
| Dell Latitude 7330 Rugged Extreme | |
| Acer Enduro Urban N3 EUN314 | |
| Dell Latitude 7230 Rugged Extreme | |
| Medio Intel Core i5-1240U (n=1) | |
| Panasonic Toughbook 40 | |
| Durabook S14I | |
| Getac B360 | |
| AIDA64 / CPU Queen | |
| Getac B360 | |
| Dell Latitude 7330 Rugged Extreme | |
| Acer Enduro Urban N3 EUN314 | |
| Durabook S14I | |
| Dell Latitude 7230 Rugged Extreme | |
| Medio Intel Core i5-1240U (n=1) | |
| Panasonic Toughbook 40 | |
| AIDA64 / FPU SinJulia | |
| Dell Latitude 7330 Rugged Extreme | |
| Acer Enduro Urban N3 EUN314 | |
| Getac B360 | |
| Panasonic Toughbook 40 | |
| Dell Latitude 7230 Rugged Extreme | |
| Medio Intel Core i5-1240U (n=1) | |
| Durabook S14I | |
| AIDA64 / FPU Mandel | |
| Dell Latitude 7330 Rugged Extreme | |
| Acer Enduro Urban N3 EUN314 | |
| Dell Latitude 7230 Rugged Extreme | |
| Medio Intel Core i5-1240U (n=1) | |
| Panasonic Toughbook 40 | |
| Durabook S14I | |
| Getac B360 | |
| AIDA64 / CPU AES | |
| Dell Latitude 7330 Rugged Extreme | |
| Acer Enduro Urban N3 EUN314 | |
| Durabook S14I | |
| Dell Latitude 7230 Rugged Extreme | |
| Medio Intel Core i5-1240U (n=1) | |
| Panasonic Toughbook 40 | |
| Getac B360 | |
| AIDA64 / CPU ZLib | |
| Dell Latitude 7230 Rugged Extreme | |
| Medio Intel Core i5-1240U (n=1) | |
| Dell Latitude 7330 Rugged Extreme | |
| Acer Enduro Urban N3 EUN314 | |
| Panasonic Toughbook 40 | |
| Getac B360 | |
| Durabook S14I | |
| AIDA64 / FP64 Ray-Trace | |
| Dell Latitude 7330 Rugged Extreme | |
| Acer Enduro Urban N3 EUN314 | |
| Dell Latitude 7230 Rugged Extreme | |
| Medio Intel Core i5-1240U (n=1) | |
| Panasonic Toughbook 40 | |
| Durabook S14I | |
| Getac B360 | |
| AIDA64 / CPU PhotoWorxx | |
| Dell Latitude 7330 Rugged Extreme | |
| Dell Latitude 7230 Rugged Extreme | |
| Medio Intel Core i5-1240U (n=1) | |
| Acer Enduro Urban N3 EUN314 | |
| Panasonic Toughbook 40 | |
| Getac B360 | |
| Durabook S14I | |
Rendimiento del sistema
CrossMark: Overall | Productivity | Creativity | Responsiveness
| PCMark 10 / Score | |
| Dell Latitude 7330 Rugged Extreme | |
| Panasonic Toughbook 40 | |
| Dell Latitude 7230 Rugged Extreme | |
| Medio Intel Core i5-1240U, Intel Iris Xe Graphics G7 80EUs (n=1) | |
| Durabook S14I | |
| Acer Enduro Urban N3 EUN314 | |
| Getac B360 | |
| PCMark 10 / Essentials | |
| Dell Latitude 7330 Rugged Extreme | |
| Durabook S14I | |
| Dell Latitude 7230 Rugged Extreme | |
| Medio Intel Core i5-1240U, Intel Iris Xe Graphics G7 80EUs (n=1) | |
| Panasonic Toughbook 40 | |
| Acer Enduro Urban N3 EUN314 | |
| Getac B360 | |
| PCMark 10 / Productivity | |
| Getac B360 | |
| Durabook S14I | |
| Dell Latitude 7330 Rugged Extreme | |
| Panasonic Toughbook 40 | |
| Dell Latitude 7230 Rugged Extreme | |
| Medio Intel Core i5-1240U, Intel Iris Xe Graphics G7 80EUs (n=1) | |
| Acer Enduro Urban N3 EUN314 | |
| PCMark 10 / Digital Content Creation | |
| Dell Latitude 7330 Rugged Extreme | |
| Panasonic Toughbook 40 | |
| Acer Enduro Urban N3 EUN314 | |
| Dell Latitude 7230 Rugged Extreme | |
| Medio Intel Core i5-1240U, Intel Iris Xe Graphics G7 80EUs (n=1) | |
| Durabook S14I | |
| Getac B360 | |
| CrossMark / Overall | |
| Dell Latitude 7230 Rugged Extreme | |
| Medio Intel Core i5-1240U, Intel Iris Xe Graphics G7 80EUs (n=1) | |
| Panasonic Toughbook 40 | |
| CrossMark / Productivity | |
| Dell Latitude 7230 Rugged Extreme | |
| Medio Intel Core i5-1240U, Intel Iris Xe Graphics G7 80EUs (n=1) | |
| Panasonic Toughbook 40 | |
| CrossMark / Creativity | |
| Dell Latitude 7230 Rugged Extreme | |
| Medio Intel Core i5-1240U, Intel Iris Xe Graphics G7 80EUs (n=1) | |
| Panasonic Toughbook 40 | |
| CrossMark / Responsiveness | |
| Dell Latitude 7230 Rugged Extreme | |
| Medio Intel Core i5-1240U, Intel Iris Xe Graphics G7 80EUs (n=1) | |
| Panasonic Toughbook 40 | |
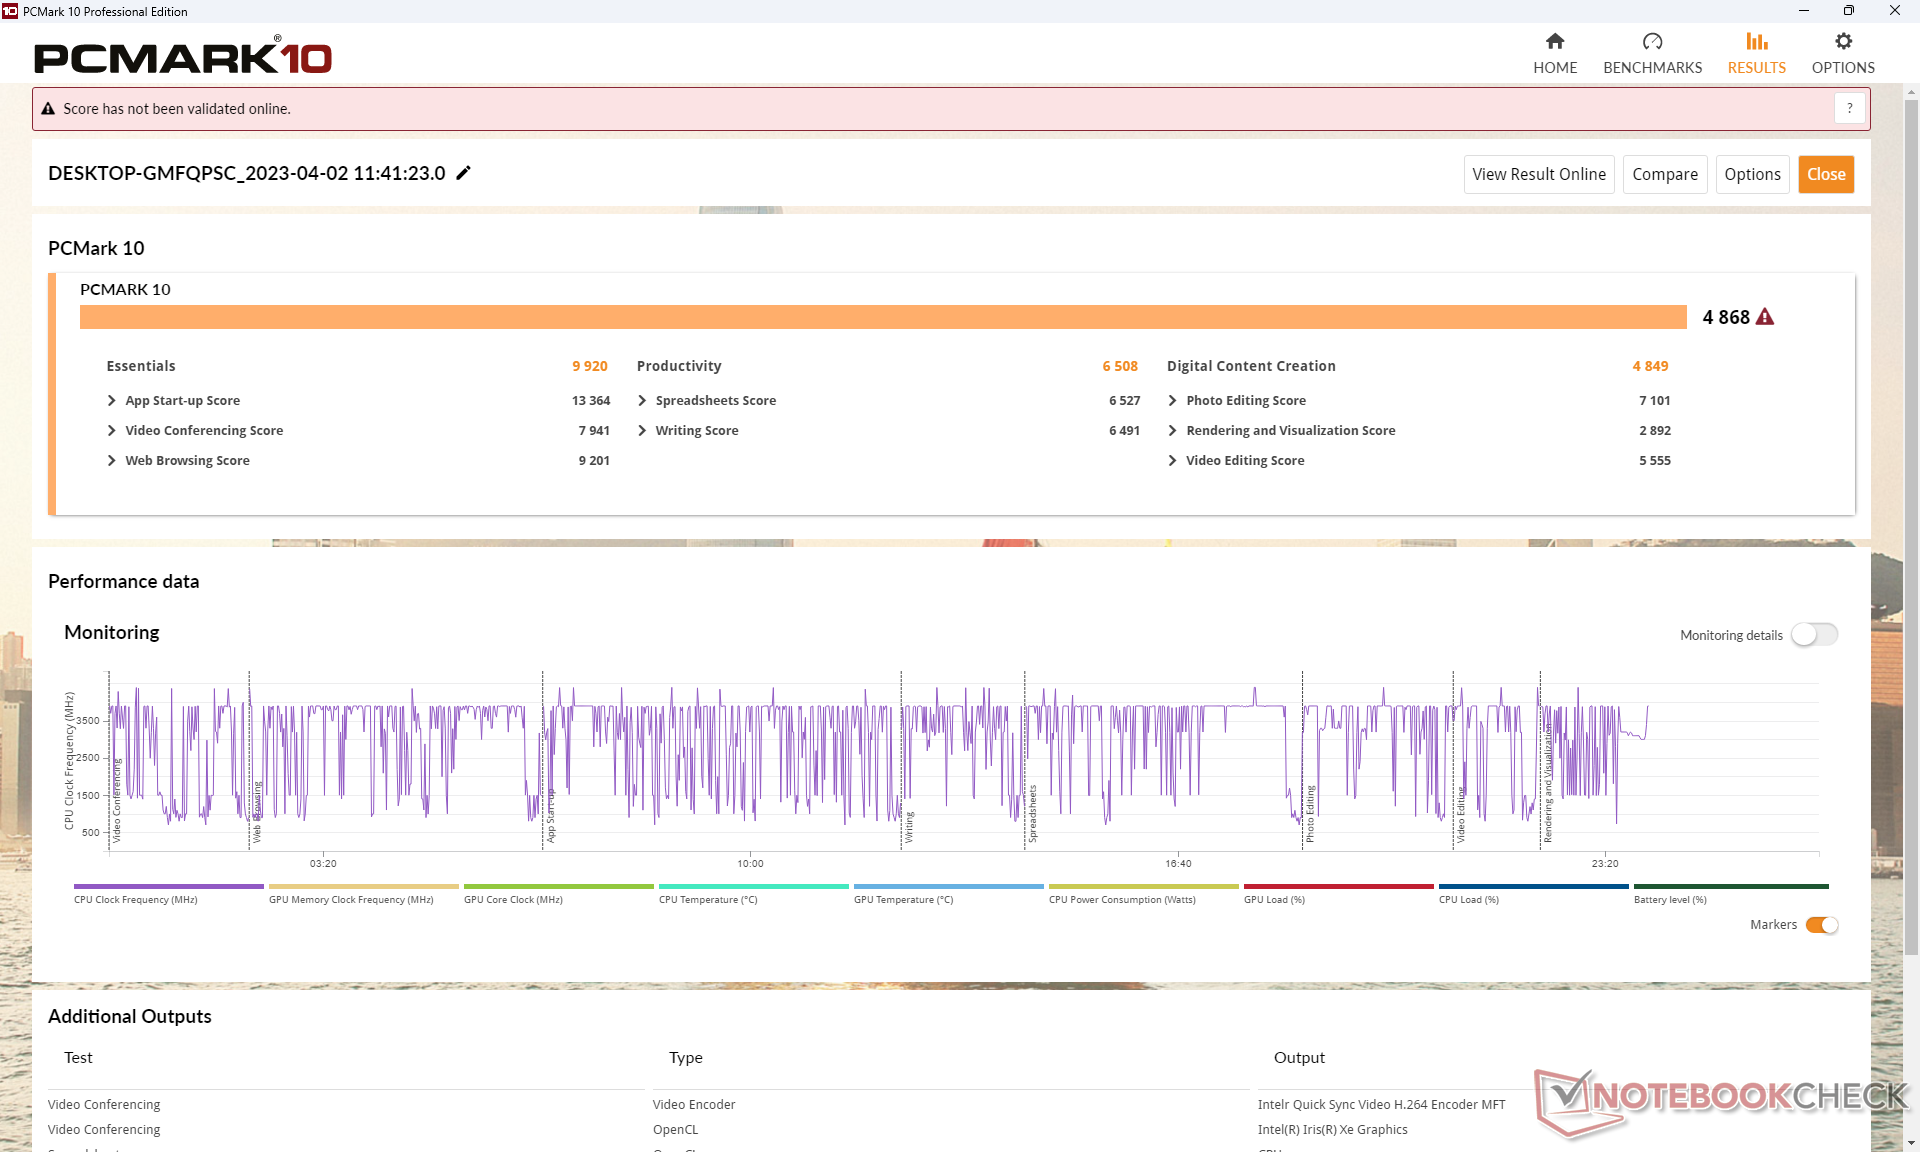
| PCMark 10 Score | 4868 puntos | |
ayuda | ||
| AIDA64 / Memory Copy | |
| Dell Latitude 7230 Rugged Extreme | |
| Medio Intel Core i5-1240U (n=1) | |
| Dell Latitude 7330 Rugged Extreme | |
| Acer Enduro Urban N3 EUN314 | |
| Panasonic Toughbook 40 | |
| Getac B360 | |
| Durabook S14I | |
| AIDA64 / Memory Read | |
| Dell Latitude 7330 Rugged Extreme | |
| Dell Latitude 7230 Rugged Extreme | |
| Medio Intel Core i5-1240U (n=1) | |
| Acer Enduro Urban N3 EUN314 | |
| Panasonic Toughbook 40 | |
| Getac B360 | |
| Durabook S14I | |
| AIDA64 / Memory Write | |
| Dell Latitude 7330 Rugged Extreme | |
| Dell Latitude 7230 Rugged Extreme | |
| Medio Intel Core i5-1240U (n=1) | |
| Acer Enduro Urban N3 EUN314 | |
| Getac B360 | |
| Panasonic Toughbook 40 | |
| Durabook S14I | |
| AIDA64 / Memory Latency | |
| Dell Latitude 7230 Rugged Extreme | |
| Medio Intel Core i5-1240U (n=1) | |
| Panasonic Toughbook 40 | |
| Dell Latitude 7330 Rugged Extreme | |
| Acer Enduro Urban N3 EUN314 | |
| Durabook S14I | |
| Getac B360 | |
* ... más pequeño es mejor
Latencia del CPD
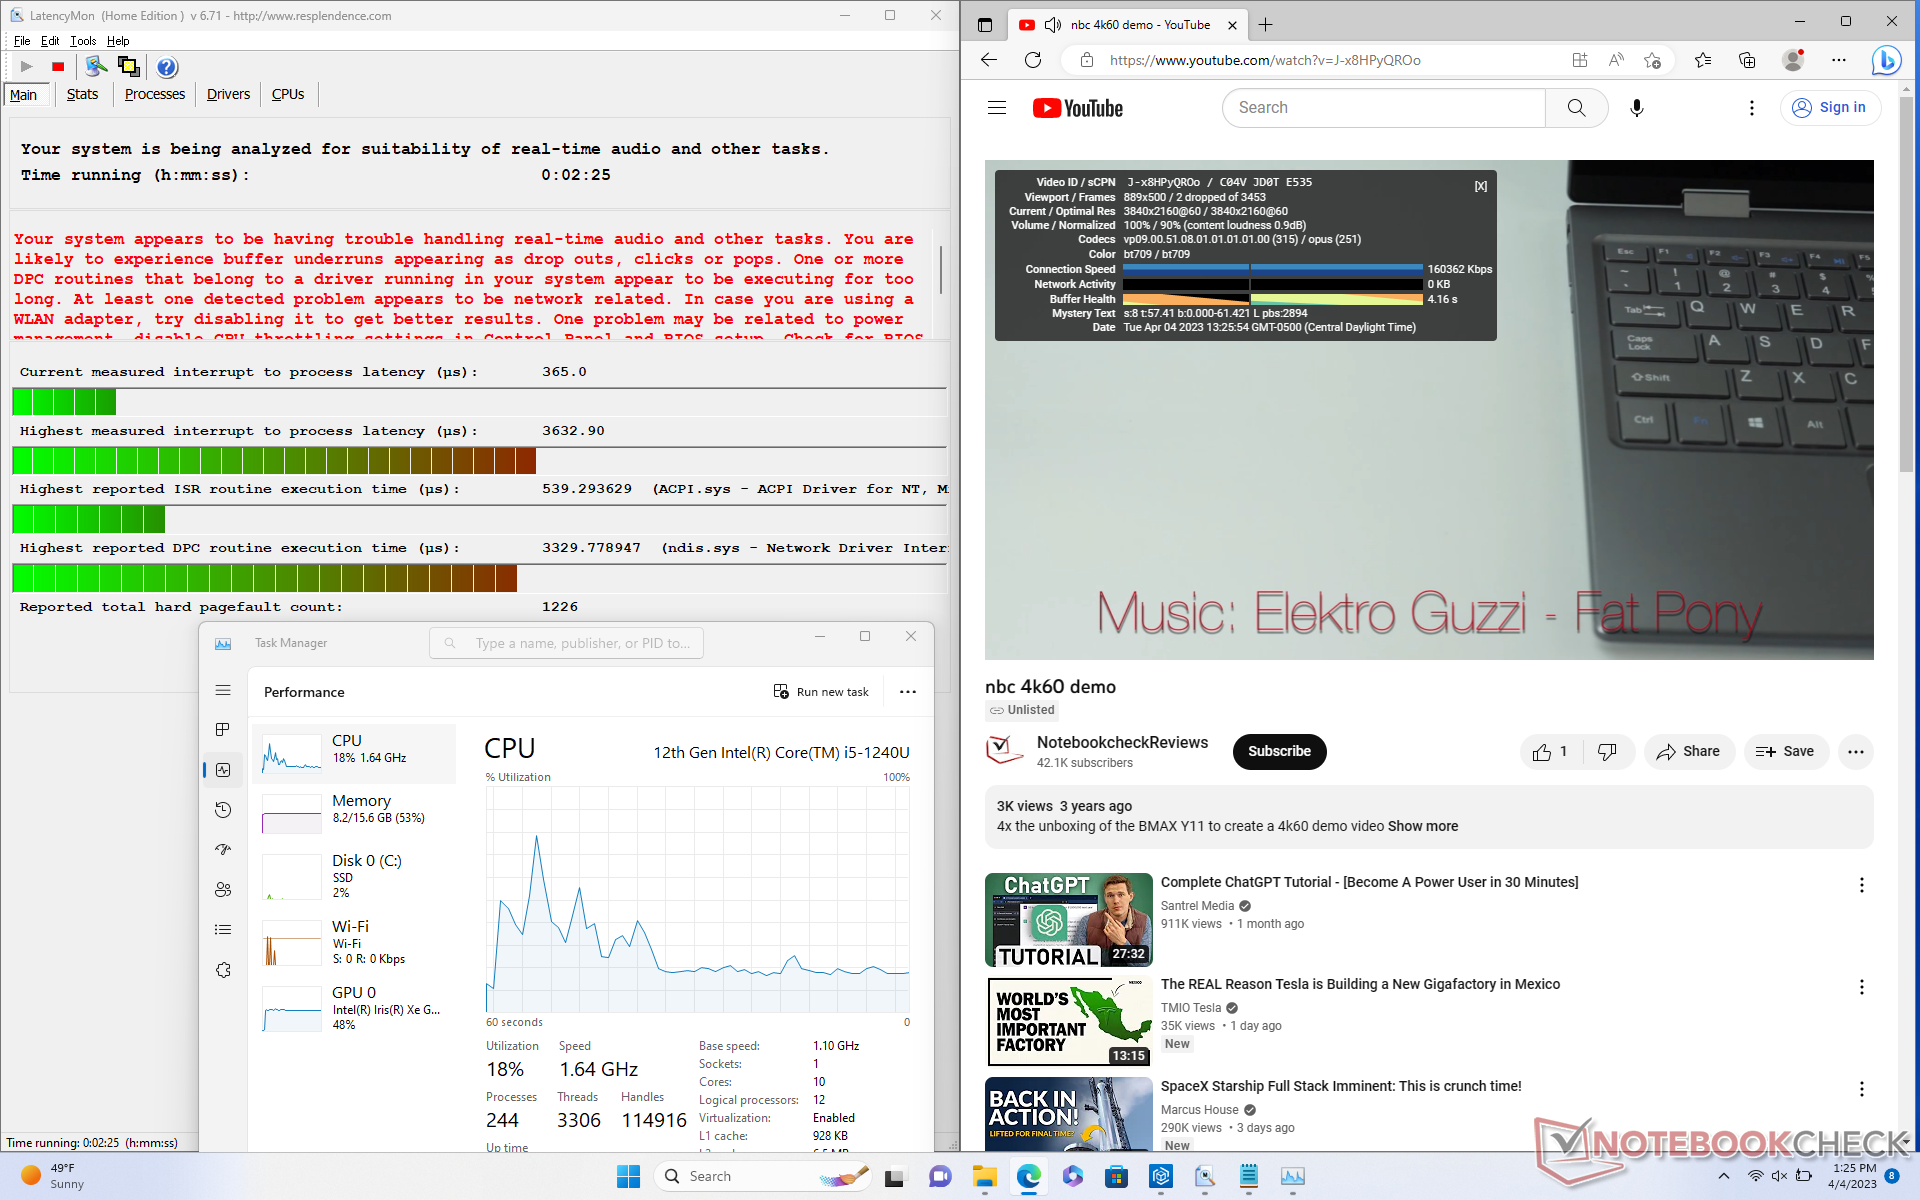
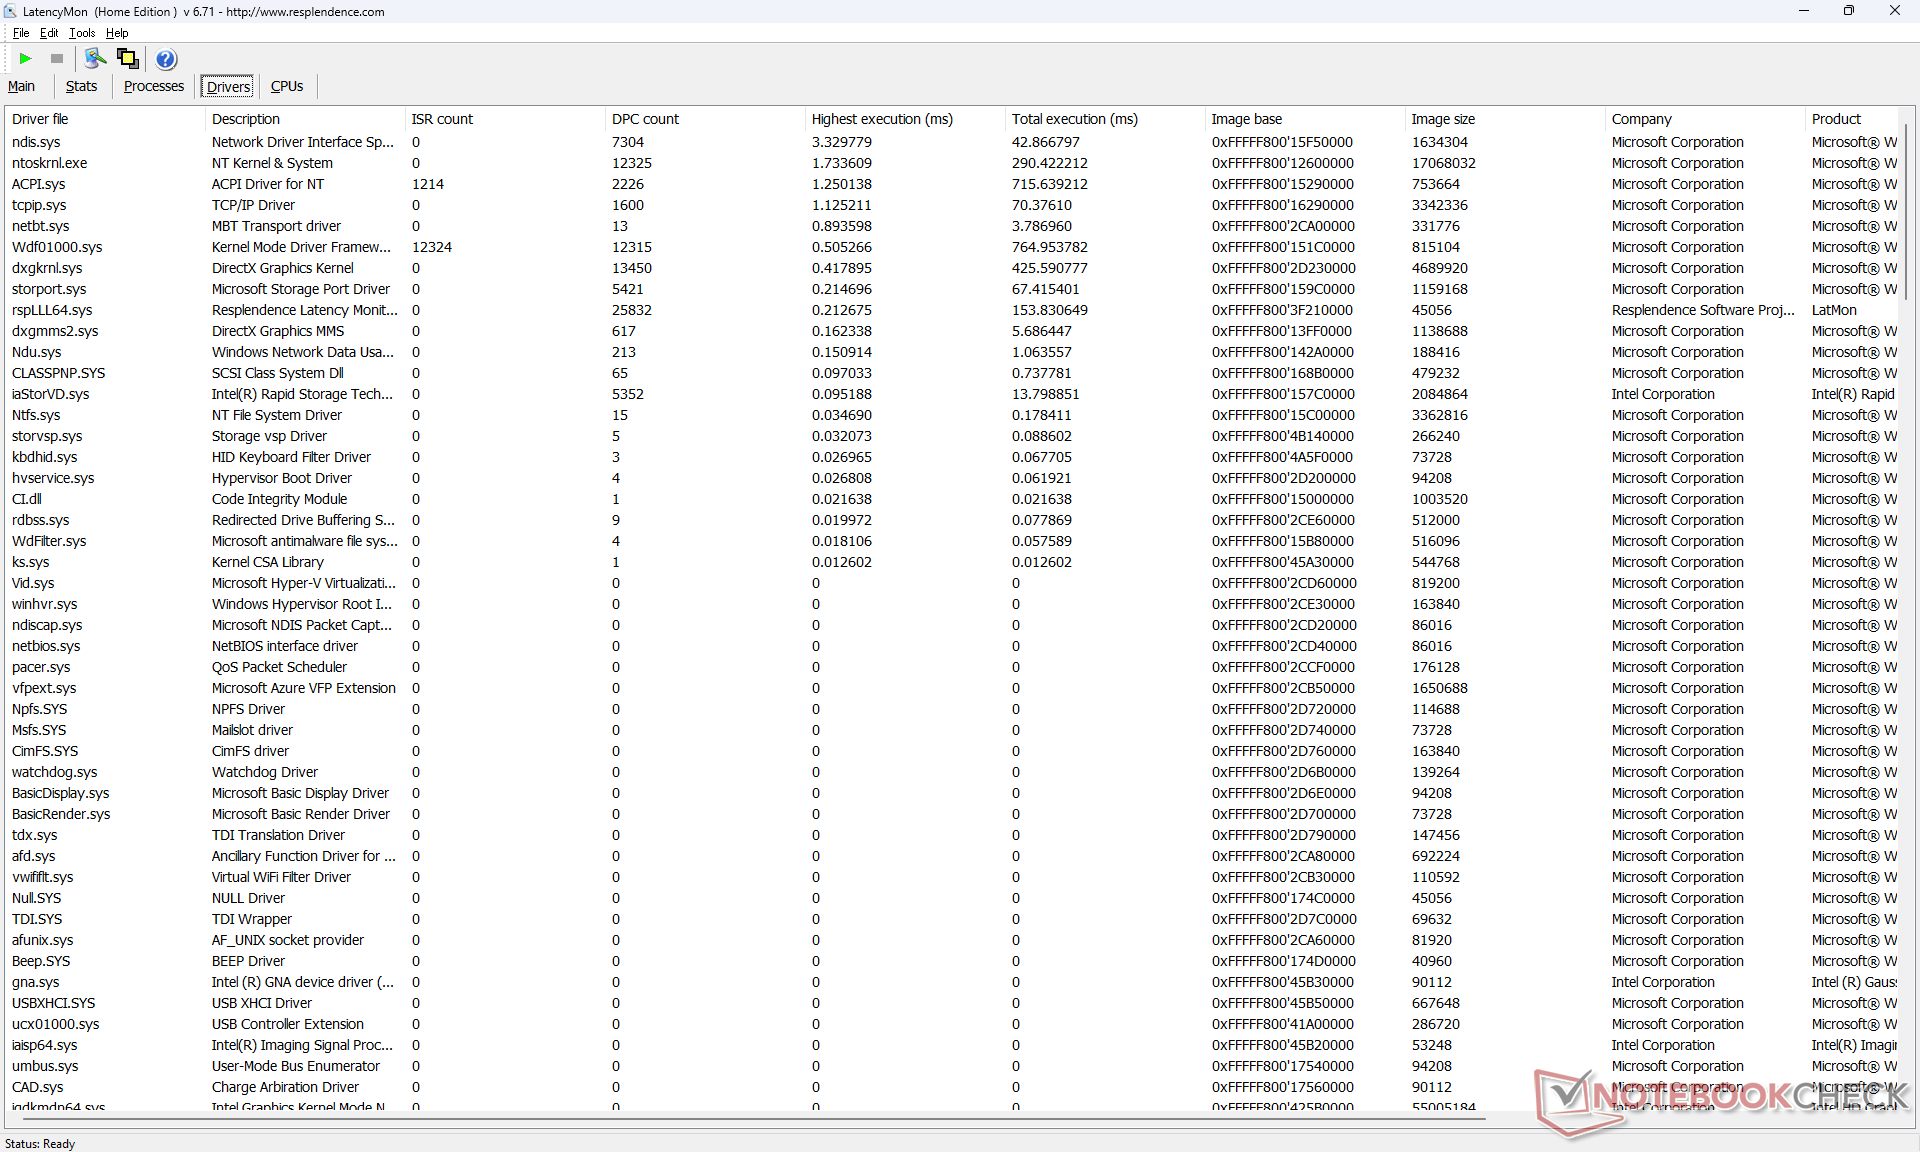
LatencyMon revela problemas de CPD al abrir varias pestañas del navegador de nuestra página de inicio, lo que es decepcionante en un dispositivo robusto en el que la estabilidad del rendimiento es primordial. la reproducción de vídeo 4K a 60 FPS también es imperfecta, con 2 fotogramas perdidos durante nuestro vídeo de prueba de un minuto.
| DPC Latencies / LatencyMon - interrupt to process latency (max), Web, Youtube, Prime95 | |
| Acer Enduro Urban N3 EUN314 | |
| Dell Latitude 7230 Rugged Extreme | |
| Durabook S14I | |
| Panasonic Toughbook 40 | |
| Getac B360 | |
| Dell Latitude 7330 Rugged Extreme | |
* ... más pequeño es mejor
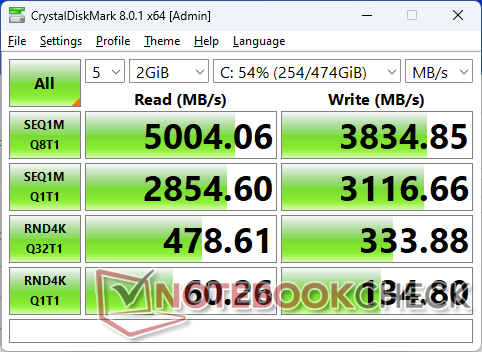
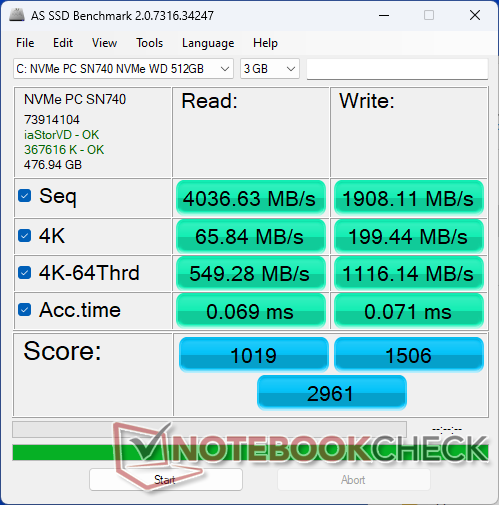
Dispositivos de almacenamiento
Nuestra unidad de prueba se suministra con un WD PC SN740 PCIe4 x4 NVMe SSD para tasas de transferencia secuencial de hasta 4800 MB/s. Sin embargo, el rendimiento máximo no es sostenible, ya que las tasas de transferencia se ralentizan hasta los 2300 MB/s tras unos pocos minutos, como muestra el siguiente gráfico.

| Drive Performance rating - Percent | |
| Dell Latitude 7330 Rugged Extreme | |
| Dell Latitude 7230 Rugged Extreme | |
| Acer Enduro Urban N3 EUN314 | |
| Getac B360 | |
| Durabook S14I | |
| Panasonic Toughbook 40 | |
* ... más pequeño es mejor
Disk Throttling: DiskSpd Read Loop, Queue Depth 8
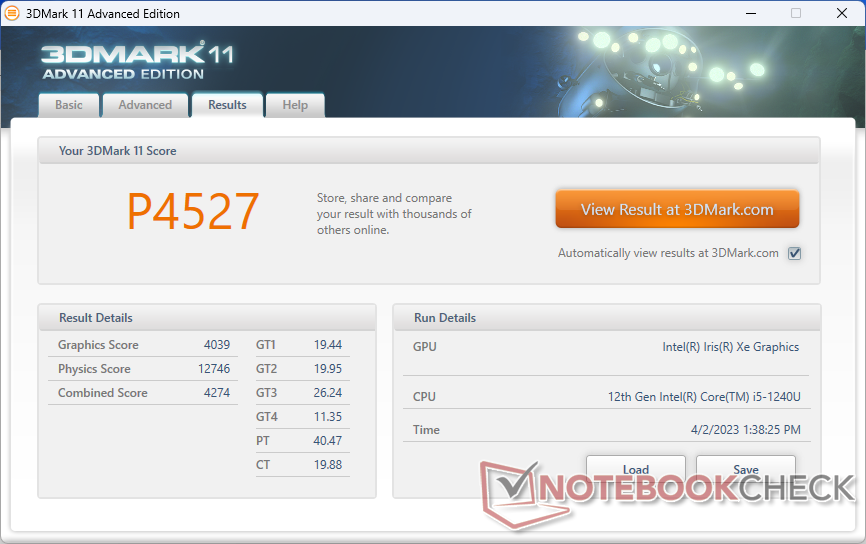
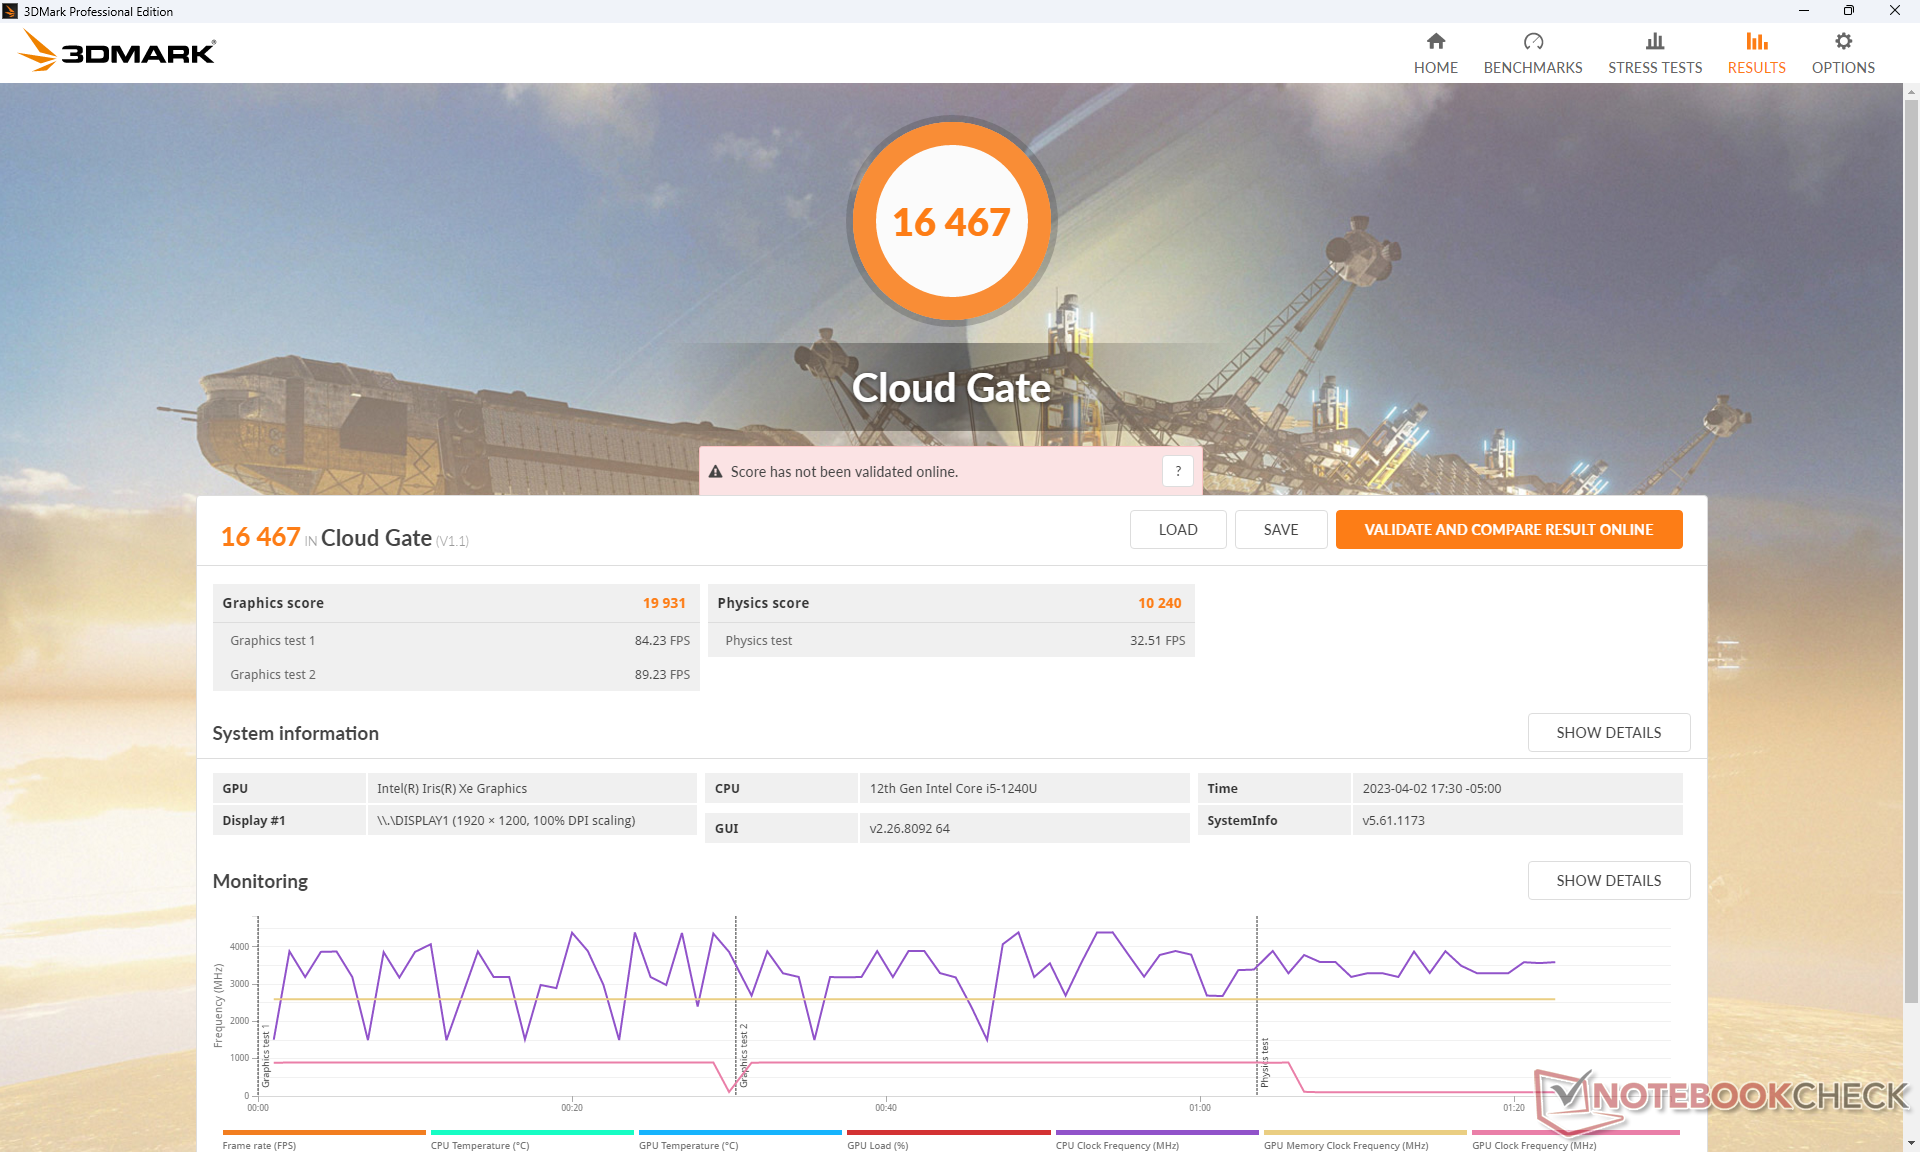
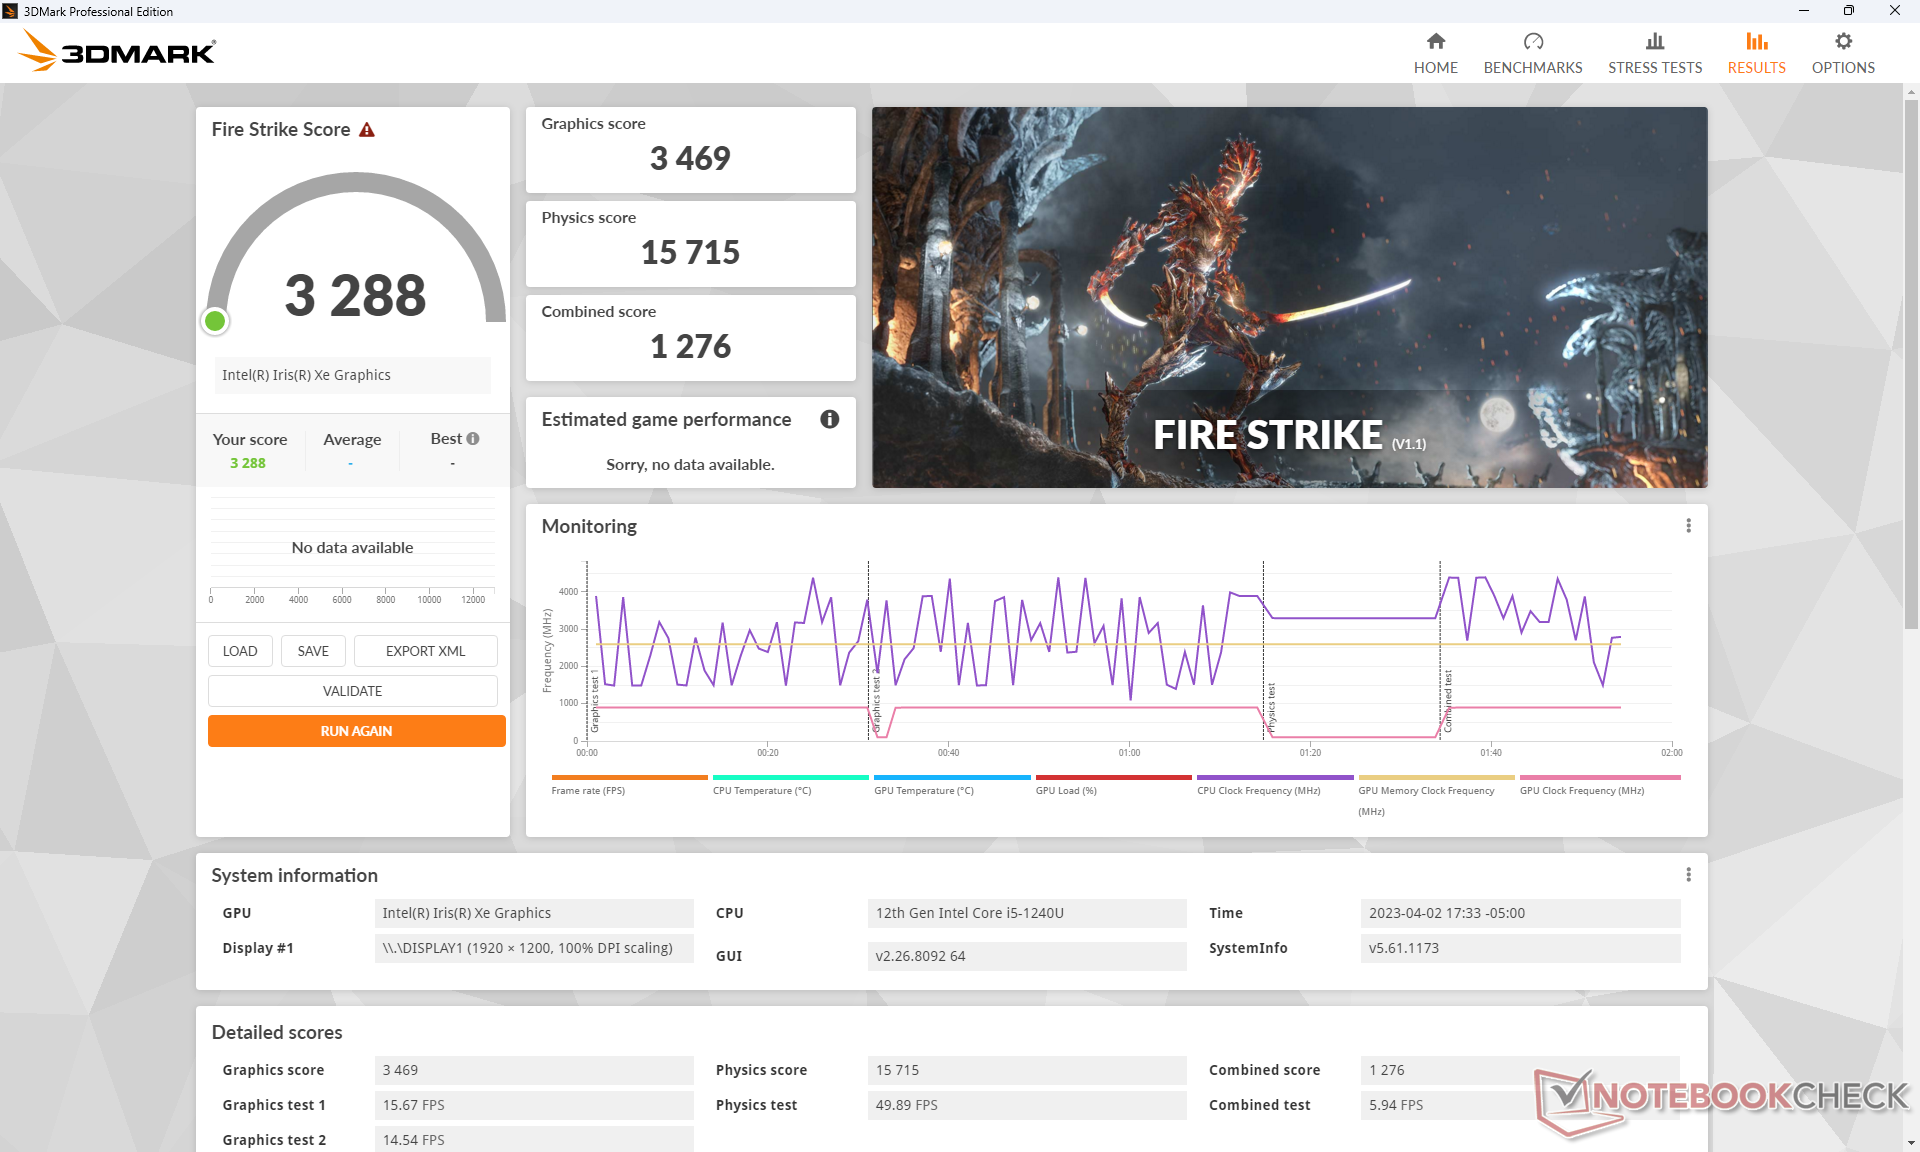
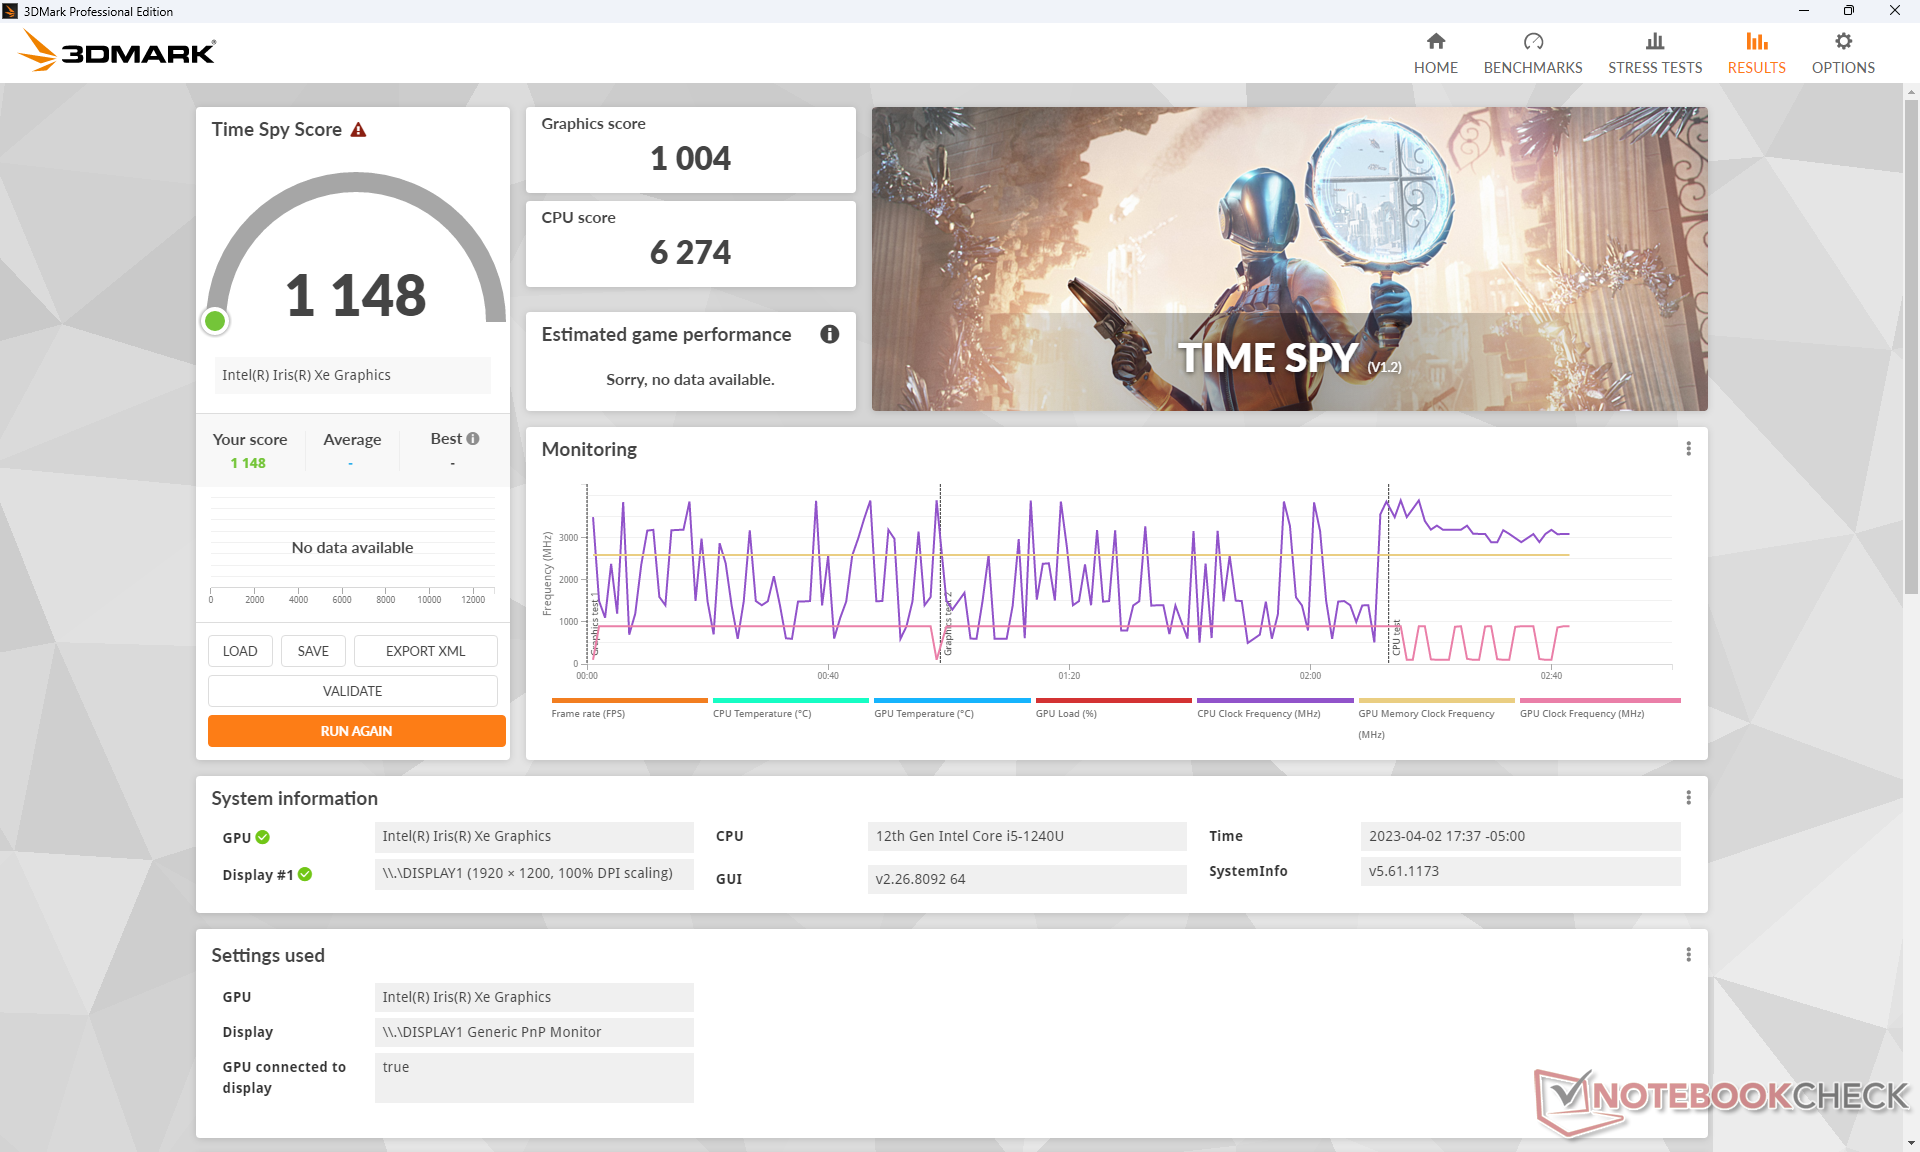
Rendimiento de la GPU - Iris Xe 80 EU de media
El rendimiento gráfico es entre un 5 y un 15 por ciento inferior al de un PC medio de nuestra base de datos equipado con la misma GPU integrada GPU Iris Xe 80 EUs integrada. Es de esperar que el rendimiento general sea entre un 30 y un 40 por ciento más lento que el de la GPU Iris Xe 96 EUs. Afortunadamente, el modelo se puede configurar con el Core i7-1260U que viene con el más rápido Iris Xe 96 UEs para aquellos que lo necesitan como se mencionó anteriormente.
El rendimiento del sistema parece ser idéntico entre los perfiles de energía Optimizado y Ultra. Una prueba 3DMark 11 en ambos modos de energía resultaría en casi los mismos puntajes finales entre ellos.
| 3DMark | |
| 1920x1080 Fire Strike Graphics | |
| Lenovo ThinkPad P14s G3 AMD 21J6S05000 | |
| Asus ExpertBook B5 Flip B5602FBN | |
| HP EliteBook 840 G9 | |
| HP ZBook Firefly 14 G9-6B8A2EA | |
| Dell Latitude 7330 Rugged Extreme | |
| Acer Enduro Urban N3 EUN314 | |
| Panasonic Toughbook 40 | |
| Medio Intel Iris Xe Graphics G7 80EUs (1560 - 5398, n=114) | |
| Dell Latitude 7230 Rugged Extreme | |
| Lenovo ThinkBook 13s G3 20YA0005GE | |
| Durabook S14I | |
| HP ProBook 440 G9-5Y3Z3EA | |
| Getac B360 | |
| 2560x1440 Time Spy Graphics | |
| Asus ExpertBook B5 Flip B5602FBN | |
| Lenovo ThinkPad P14s G3 AMD 21J6S05000 | |
| HP ZBook Firefly 14 G9-6B8A2EA | |
| HP EliteBook 840 G9 | |
| Dell Latitude 7330 Rugged Extreme | |
| Acer Enduro Urban N3 EUN314 | |
| Panasonic Toughbook 40 | |
| HP ProBook 440 G9-5Y3Z3EA | |
| Medio Intel Iris Xe Graphics G7 80EUs (561 - 1576, n=111) | |
| Lenovo ThinkBook 13s G3 20YA0005GE | |
| Durabook S14I | |
| Dell Latitude 7230 Rugged Extreme | |
| Getac B360 | |
| 3DMark 11 - 1280x720 Performance GPU | |
| Lenovo ThinkPad P14s G3 AMD 21J6S05000 | |
| Asus ExpertBook B5 Flip B5602FBN | |
| HP ZBook Firefly 14 G9-6B8A2EA | |
| HP EliteBook 840 G9 | |
| Acer Enduro Urban N3 EUN314 | |
| Dell Latitude 7330 Rugged Extreme | |
| Panasonic Toughbook 40 | |
| Lenovo ThinkBook 13s G3 20YA0005GE | |
| Medio Intel Iris Xe Graphics G7 80EUs (2246 - 6579, n=112) | |
| Durabook S14I | |
| HP ProBook 440 G9-5Y3Z3EA | |
| Dell Latitude 7230 Rugged Extreme | |
| Getac B360 | |
| 3DMark 11 Performance | 4527 puntos | |
| 3DMark Cloud Gate Standard Score | 16467 puntos | |
| 3DMark Fire Strike Score | 3288 puntos | |
| 3DMark Time Spy Score | 1148 puntos | |
ayuda | ||
| Performance rating - Percent | |
| HP ZBook Firefly 14 G9-6B8A2EA | |
| Lenovo ThinkPad P14s G3 AMD 21J6S05000 | |
| Asus ExpertBook B5 Flip B5602FBN | |
| Dell Latitude 7330 Rugged Extreme -2! | |
| HP EliteBook 840 G9 | |
| Panasonic Toughbook 40 -2! | |
| Lenovo ThinkBook 13s G3 20YA0005GE -2! | |
| Acer Enduro Urban N3 EUN314 | |
| HP ProBook 440 G9-5Y3Z3EA -2! | |
| Durabook S14I -3! | |
| Dell Latitude 7230 Rugged Extreme | |
| Getac B360 -2! | |
| The Witcher 3 - 1920x1080 Ultra Graphics & Postprocessing (HBAO+) | |
| Lenovo ThinkPad P14s G3 AMD 21J6S05000 | |
| HP ZBook Firefly 14 G9-6B8A2EA | |
| Asus ExpertBook B5 Flip B5602FBN | |
| HP EliteBook 840 G9 | |
| Dell Latitude 7330 Rugged Extreme | |
| Panasonic Toughbook 40 | |
| Lenovo ThinkBook 13s G3 20YA0005GE | |
| Acer Enduro Urban N3 EUN314 | |
| Dell Latitude 7230 Rugged Extreme | |
| HP ProBook 440 G9-5Y3Z3EA | |
| Getac B360 | |
| GTA V - 1920x1080 Highest AA:4xMSAA + FX AF:16x | |
| HP ZBook Firefly 14 G9-6B8A2EA | |
| Lenovo ThinkPad P14s G3 AMD 21J6S05000 | |
| Asus ExpertBook B5 Flip B5602FBN | |
| HP EliteBook 840 G9 | |
| Acer Enduro Urban N3 EUN314 | |
| Dell Latitude 7230 Rugged Extreme | |
| Final Fantasy XV Benchmark - 1920x1080 High Quality | |
| Dell Latitude 7330 Rugged Extreme | |
| Lenovo ThinkPad P14s G3 AMD 21J6S05000 | |
| HP ZBook Firefly 14 G9-6B8A2EA | |
| HP EliteBook 840 G9 | |
| Asus ExpertBook B5 Flip B5602FBN | |
| Acer Enduro Urban N3 EUN314 | |
| Panasonic Toughbook 40 | |
| Lenovo ThinkBook 13s G3 20YA0005GE | |
| Dell Latitude 7230 Rugged Extreme | |
| HP ProBook 440 G9-5Y3Z3EA | |
| Durabook S14I | |
| Getac B360 | |
| Strange Brigade - 1920x1080 ultra AA:ultra AF:16 | |
| Asus ExpertBook B5 Flip B5602FBN | |
| HP ZBook Firefly 14 G9-6B8A2EA | |
| Lenovo ThinkPad P14s G3 AMD 21J6S05000 | |
| HP EliteBook 840 G9 | |
| Acer Enduro Urban N3 EUN314 | |
| Dell Latitude 7230 Rugged Extreme | |
| Dota 2 Reborn - 1920x1080 ultra (3/3) best looking | |
| HP ZBook Firefly 14 G9-6B8A2EA | |
| HP EliteBook 840 G9 | |
| Lenovo ThinkPad P14s G3 AMD 21J6S05000 | |
| Dell Latitude 7330 Rugged Extreme | |
| Asus ExpertBook B5 Flip B5602FBN | |
| Panasonic Toughbook 40 | |
| Lenovo ThinkBook 13s G3 20YA0005GE | |
| Dell Latitude 7230 Rugged Extreme | |
| Acer Enduro Urban N3 EUN314 | |
| Durabook S14I | |
| HP ProBook 440 G9-5Y3Z3EA | |
| Getac B360 | |
| X-Plane 11.11 - 1920x1080 high (fps_test=3) | |
| HP ZBook Firefly 14 G9-6B8A2EA | |
| Acer Enduro Urban N3 EUN314 | |
| HP EliteBook 840 G9 | |
| Lenovo ThinkPad P14s G3 AMD 21J6S05000 | |
| HP ProBook 440 G9-5Y3Z3EA | |
| Lenovo ThinkBook 13s G3 20YA0005GE | |
| Asus ExpertBook B5 Flip B5602FBN | |
| Durabook S14I | |
| Panasonic Toughbook 40 | |
| Dell Latitude 7330 Rugged Extreme | |
| Dell Latitude 7230 Rugged Extreme | |
| Getac B360 | |
Witcher 3 FPS Chart
| bajo | medio | alto | ultra | |
|---|---|---|---|---|
| GTA V (2015) | 103.3 | 93.3 | 18.5 | 7.79 |
| The Witcher 3 (2015) | 67.3 | 40.9 | 24.1 | 10.6 |
| Dota 2 Reborn (2015) | 98.9 | 77.8 | 50.7 | 45.7 |
| Final Fantasy XV Benchmark (2018) | 31 | 17.3 | 11.8 | |
| X-Plane 11.11 (2018) | 32.6 | 22.6 | 20.6 | |
| Strange Brigade (2018) | 60.2 | 27.4 | 21.4 | 17.9 |
Emisiones - Silencio hasta que haga ruido
Ruido del sistema
El ruido del ventilador es silencioso y prácticamente inaudible con cargas bajas o medias. Ejecutar la primera escena de 3DMark 06, por ejemplo, no provocaría ningún ruido de ventilador hasta el final de la prueba.
El ventilador de pequeño diámetro es, por desgracia, más agudo que en la mayoría de portátiles. Si se ejecutan aplicaciones muy exigentes, como juegos o Prime95, el ruido del ventilador puede alcanzar los 43 dB(A), siendo una de las tabletas robustas más ruidosas que hemos probado. Sin embargo, tendrías que llevar la tableta realmente al límite para alcanzar niveles de ruido tan altos.
Ruido
| Ocioso |
| 22.9 / 22.9 / 22.9 dB(A) |
| Carga |
| 24.5 / 43.2 dB(A) |
 | ||
30 dB silencioso 40 dB(A) audible 50 dB(A) ruidosamente alto |
||
min: | ||
| Dell Latitude 7230 Rugged Extreme Iris Xe G7 80EUs, i5-1240U, WD PC SN740 512GB SDDPMQD-512G-1101 | Dell Latitude 7330 Rugged Extreme Iris Xe G7 96EUs, i7-1185G7 | Panasonic Toughbook 40 Iris Xe G7 96EUs, i7-1185G7, Samsung PM991 MZVLQ1T0HALB | Getac B360 UHD Graphics 620, i7-10710U, Lite-On CA5-8D512 | Acer Enduro Urban N3 EUN314 Iris Xe G7 96EUs, i7-1165G7, Samsung PM991 MZVLQ1T0HALB | Durabook S14I Iris Xe G7 96EUs, i7-1165G7, UDinfo M2P M2P80DE512GBAEP | |
|---|---|---|---|---|---|---|
| Noise | 2% | -13% | 0% | -3% | -18% | |
| apagado / medio ambiente * (dB) | 22.8 | 22.9 -0% | 22.8 -0% | 24.3 -7% | 23.8 -4% | 25.2 -11% |
| Idle Minimum * (dB) | 22.9 | 23.1 -1% | 26 -14% | 24.5 -7% | 24.1 -5% | 25.2 -10% |
| Idle Average * (dB) | 22.9 | 23.1 -1% | 26 -14% | 24.5 -7% | 24.1 -5% | 25.2 -10% |
| Idle Maximum * (dB) | 22.9 | 23.1 -1% | 26 -14% | 24.6 -7% | 24.1 -5% | 34.5 -51% |
| Load Average * (dB) | 24.5 | 28 -14% | 37.6 -53% | 29.8 -22% | 27.9 -14% | 34.5 -41% |
| Witcher 3 ultra * (dB) | 36 | 31.2 13% | 37.8 -5% | 27.3 24% | 35.7 1% | |
| Load Maximum * (dB) | 43.2 | 36.2 16% | 40.3 7% | 30.8 29% | 38.6 11% | 36.2 16% |
* ... más pequeño es mejor
Temperatura
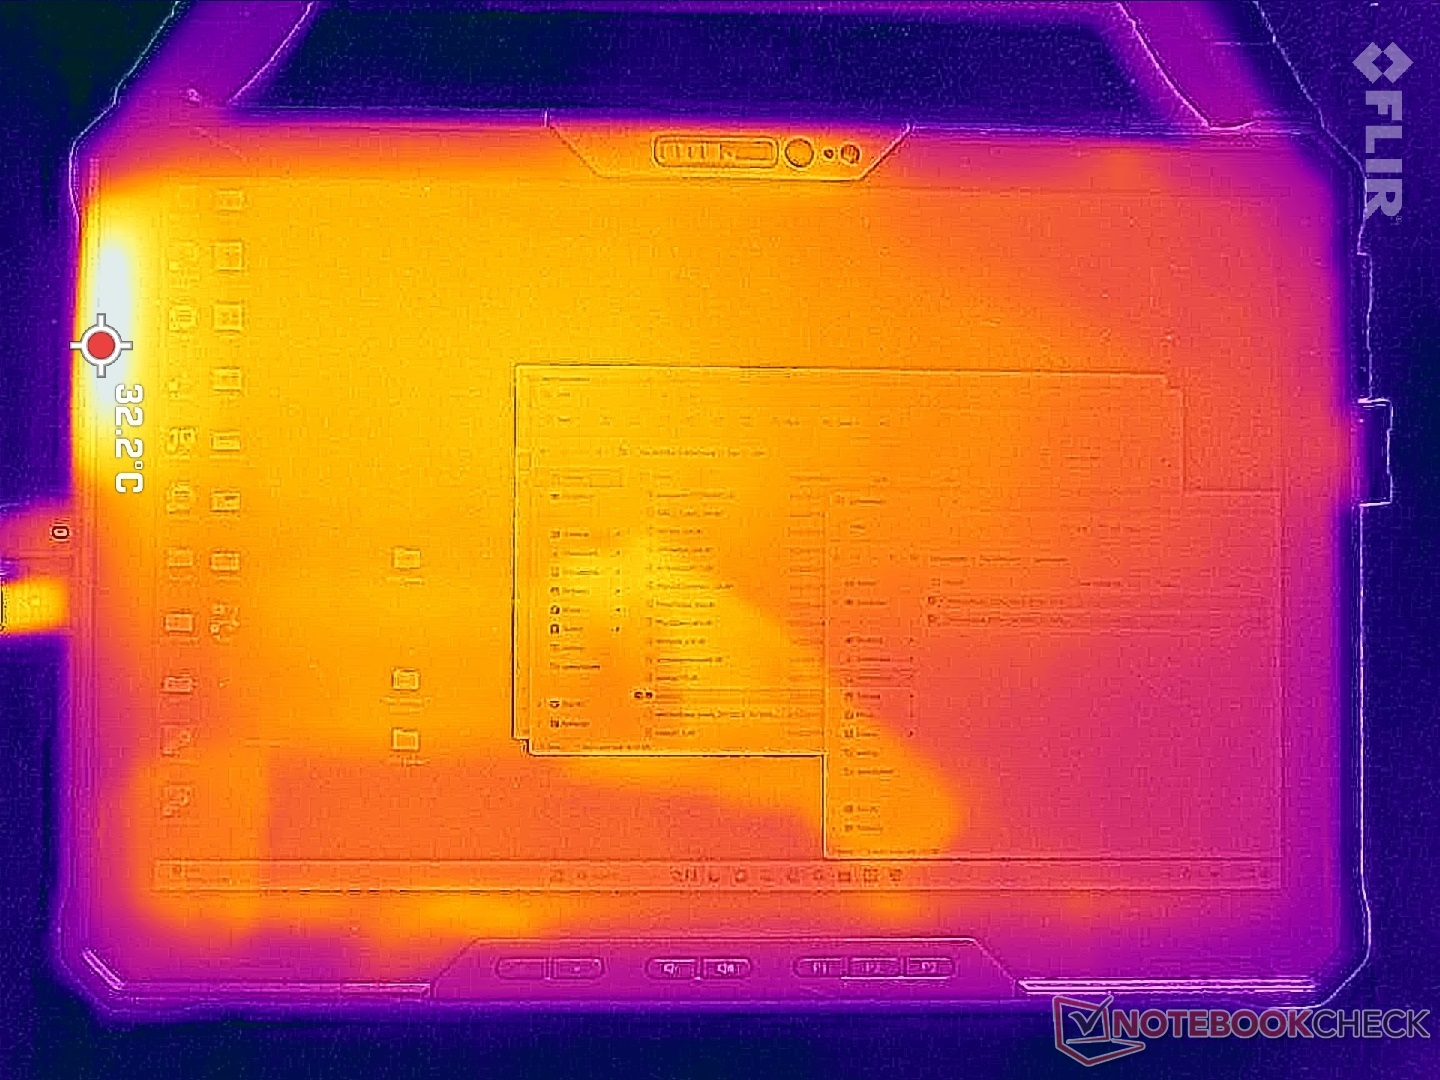
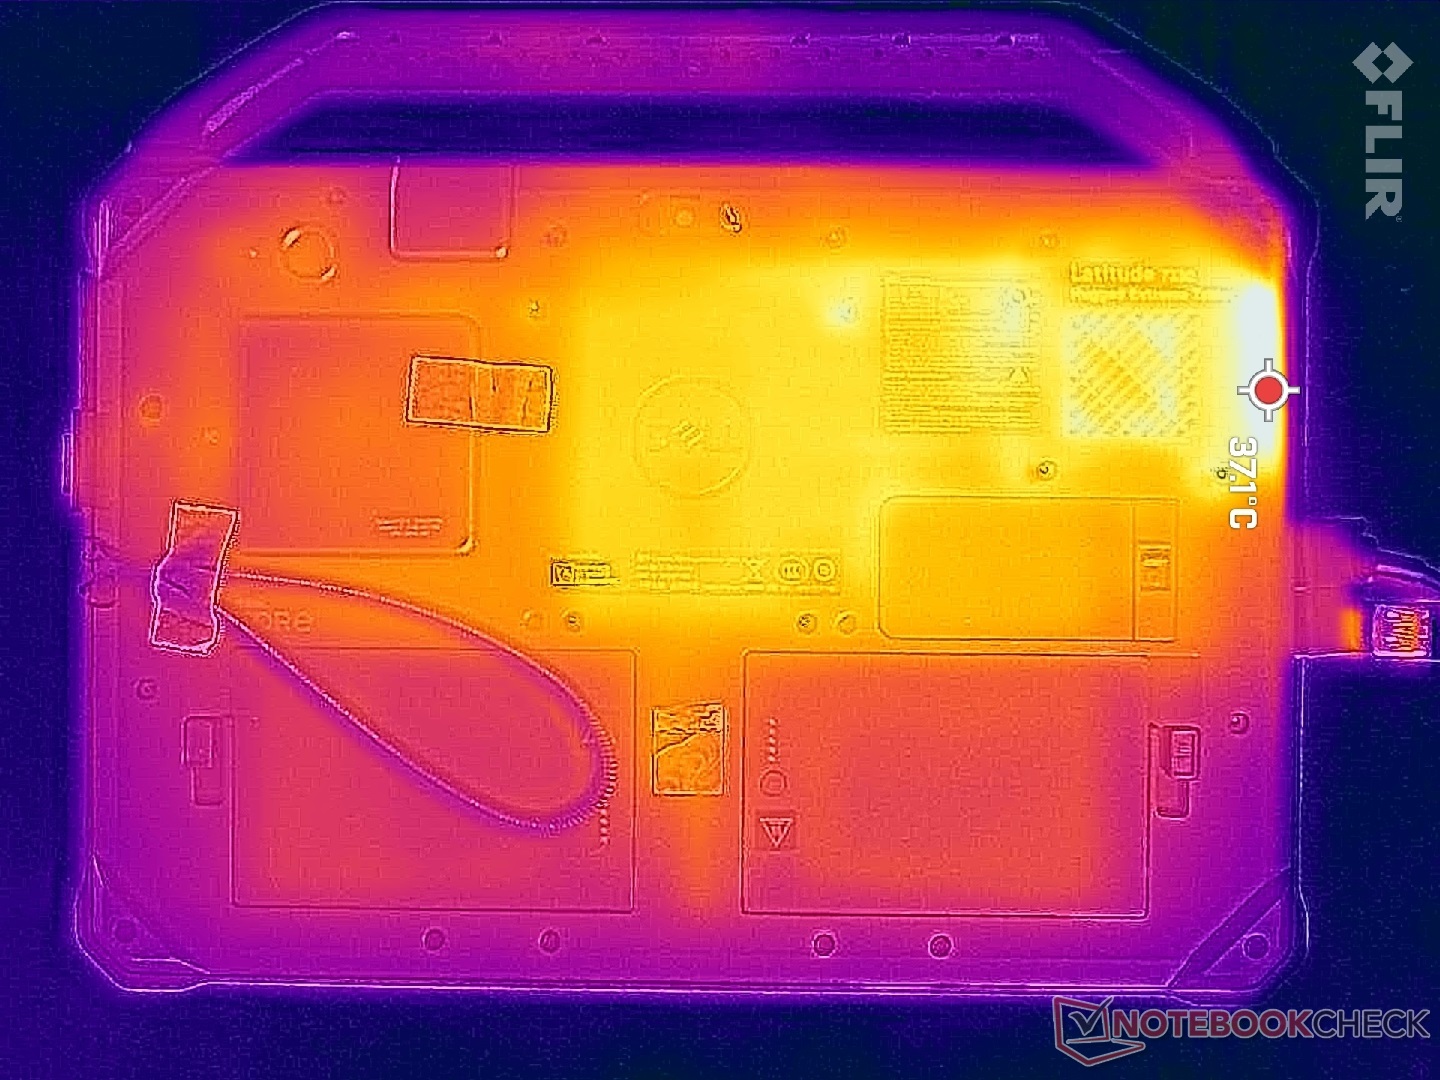
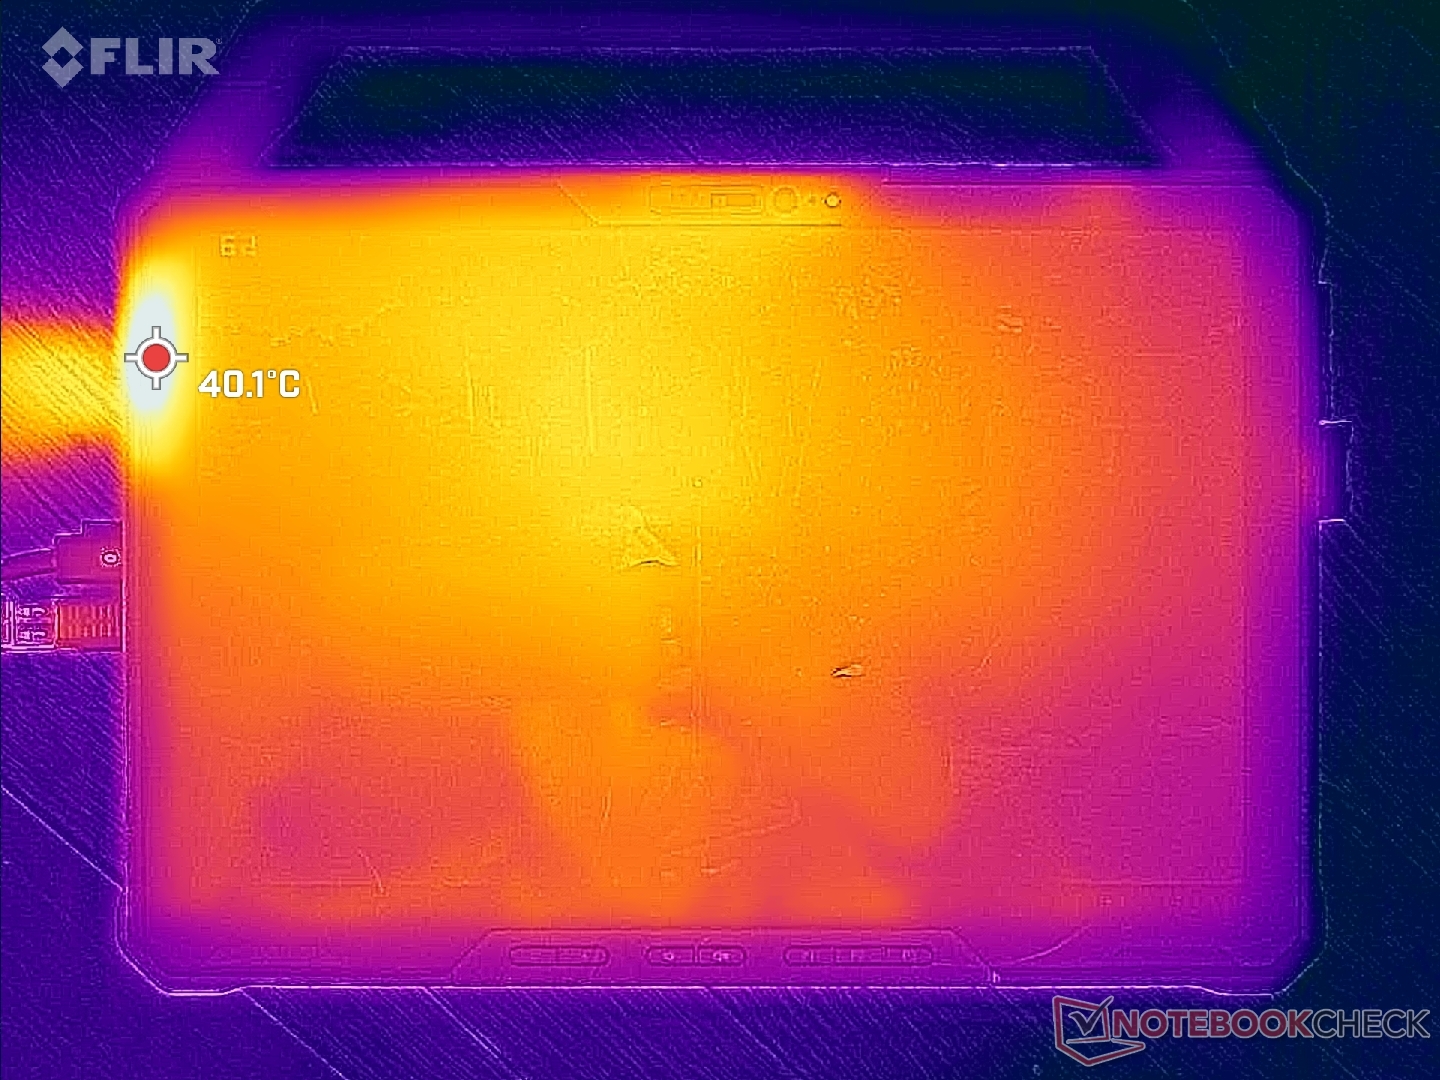
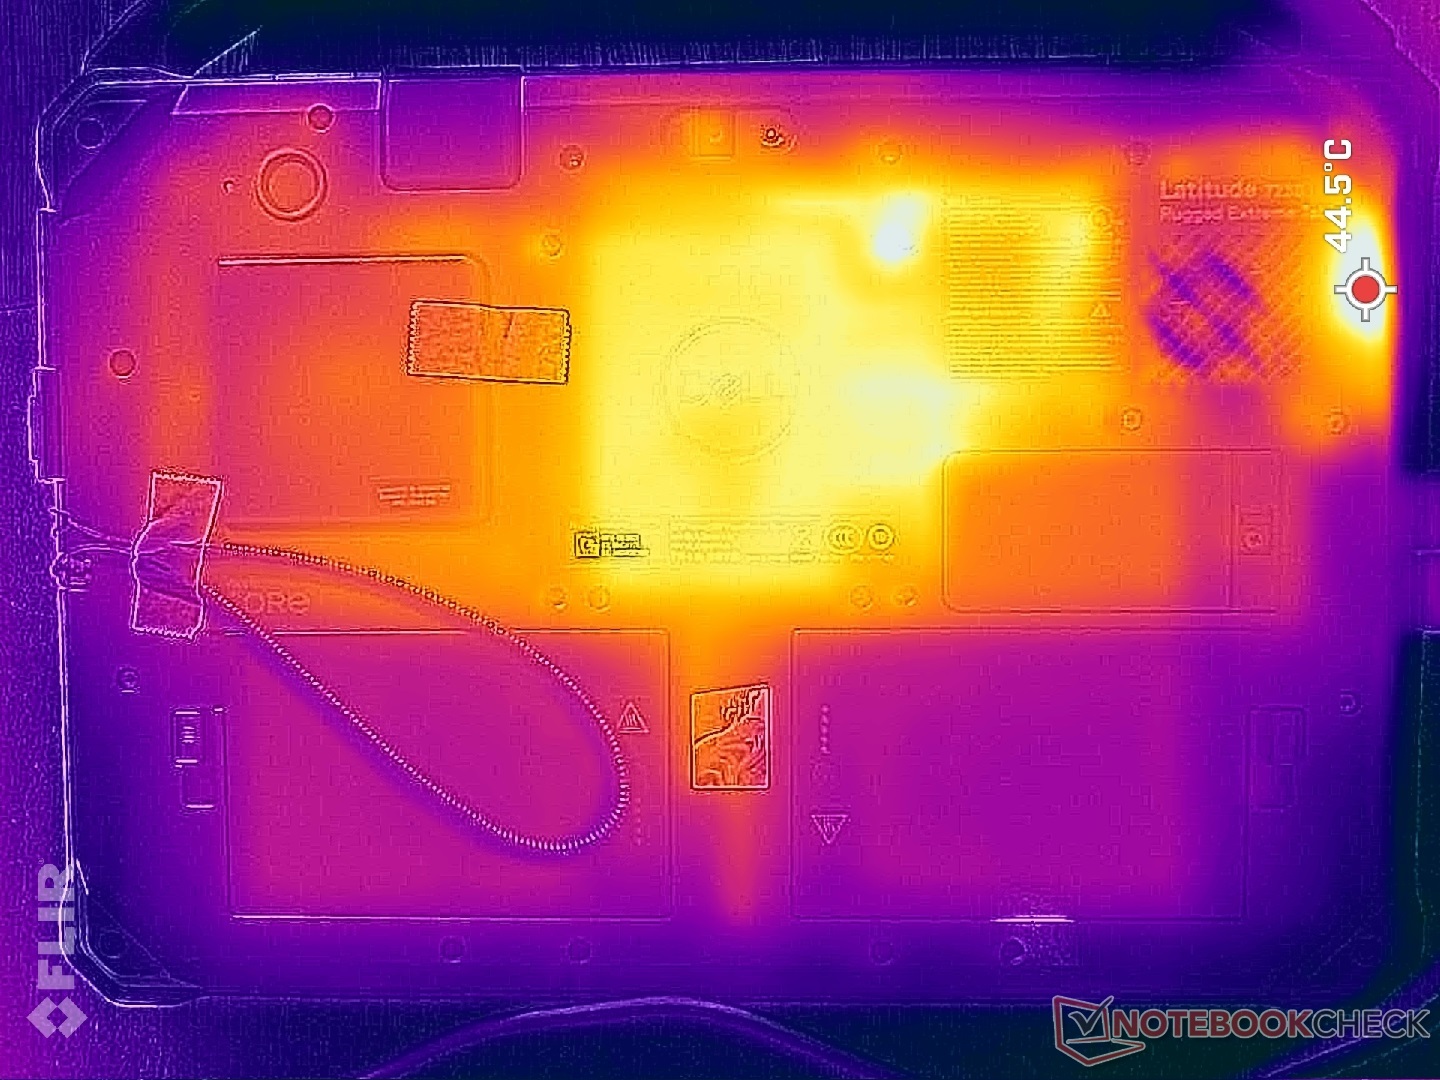
Las temperaturas superficiales no son un problema debido al grueso perfil robusto, como en la mayoría de los dispositivos robustos. En el peor de los casos, registramos un máximo de 40 C en el borde de la unidad más cercano a las rejillas de ventilación cuando la CPU está al 100% de su capacidad.
(+) La temperatura máxima en la parte superior es de 32.6 °C / 91 F, frente a la media de 33.6 °C / 92 F, que oscila entre 20.7 y 53.2 °C para la clase Tablet.
(±) El fondo se calienta hasta un máximo de 40.2 °C / 104 F, frente a la media de 33.2 °C / 92 F
(+) En reposo, la temperatura media de la parte superior es de 29 °C / 84# F, frente a la media del dispositivo de 30 °C / 86 F.
| Dell Latitude 7230 Rugged Extreme Intel Core i5-1240U, Intel Iris Xe Graphics G7 80EUs | Dell Latitude 7330 Rugged Extreme Intel Core i7-1185G7, Intel Iris Xe Graphics G7 96EUs | Panasonic Toughbook 40 Intel Core i7-1185G7, Intel Iris Xe Graphics G7 96EUs | Getac B360 Intel Core i7-10710U, Intel UHD Graphics 620 | Acer Enduro Urban N3 EUN314 Intel Core i7-1165G7, Intel Iris Xe Graphics G7 96EUs | Durabook S14I Intel Core i7-1165G7, Intel Iris Xe Graphics G7 96EUs | |
|---|---|---|---|---|---|---|
| Heat | 13% | 4% | 10% | -1% | -3% | |
| Maximum Upper Side * (°C) | 32.6 | 34.6 -6% | 35.6 -9% | 33.4 -2% | 37.8 -16% | 36.4 -12% |
| Maximum Bottom * (°C) | 40.2 | 36.6 9% | 40 -0% | 42.6 -6% | 45.8 -14% | 38.6 4% |
| Idle Upper Side * (°C) | 30.6 | 24.8 19% | 28.6 7% | 24.2 21% | 26.4 14% | 32.6 -7% |
| Idle Bottom * (°C) | 35 | 25.2 28% | 29.4 16% | 26.2 25% | 30.2 14% | 33.8 3% |
* ... más pequeño es mejor
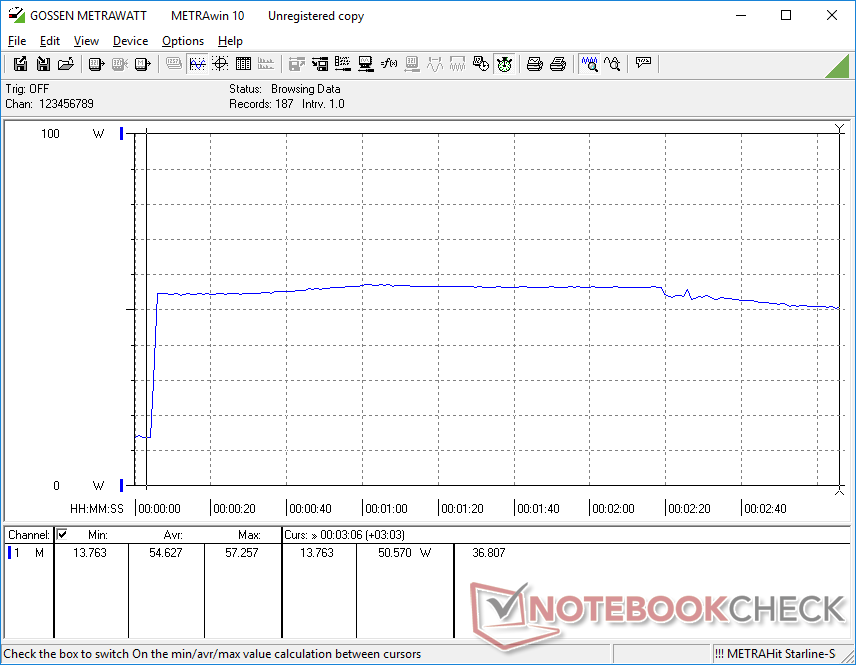
Prueba de resistencia
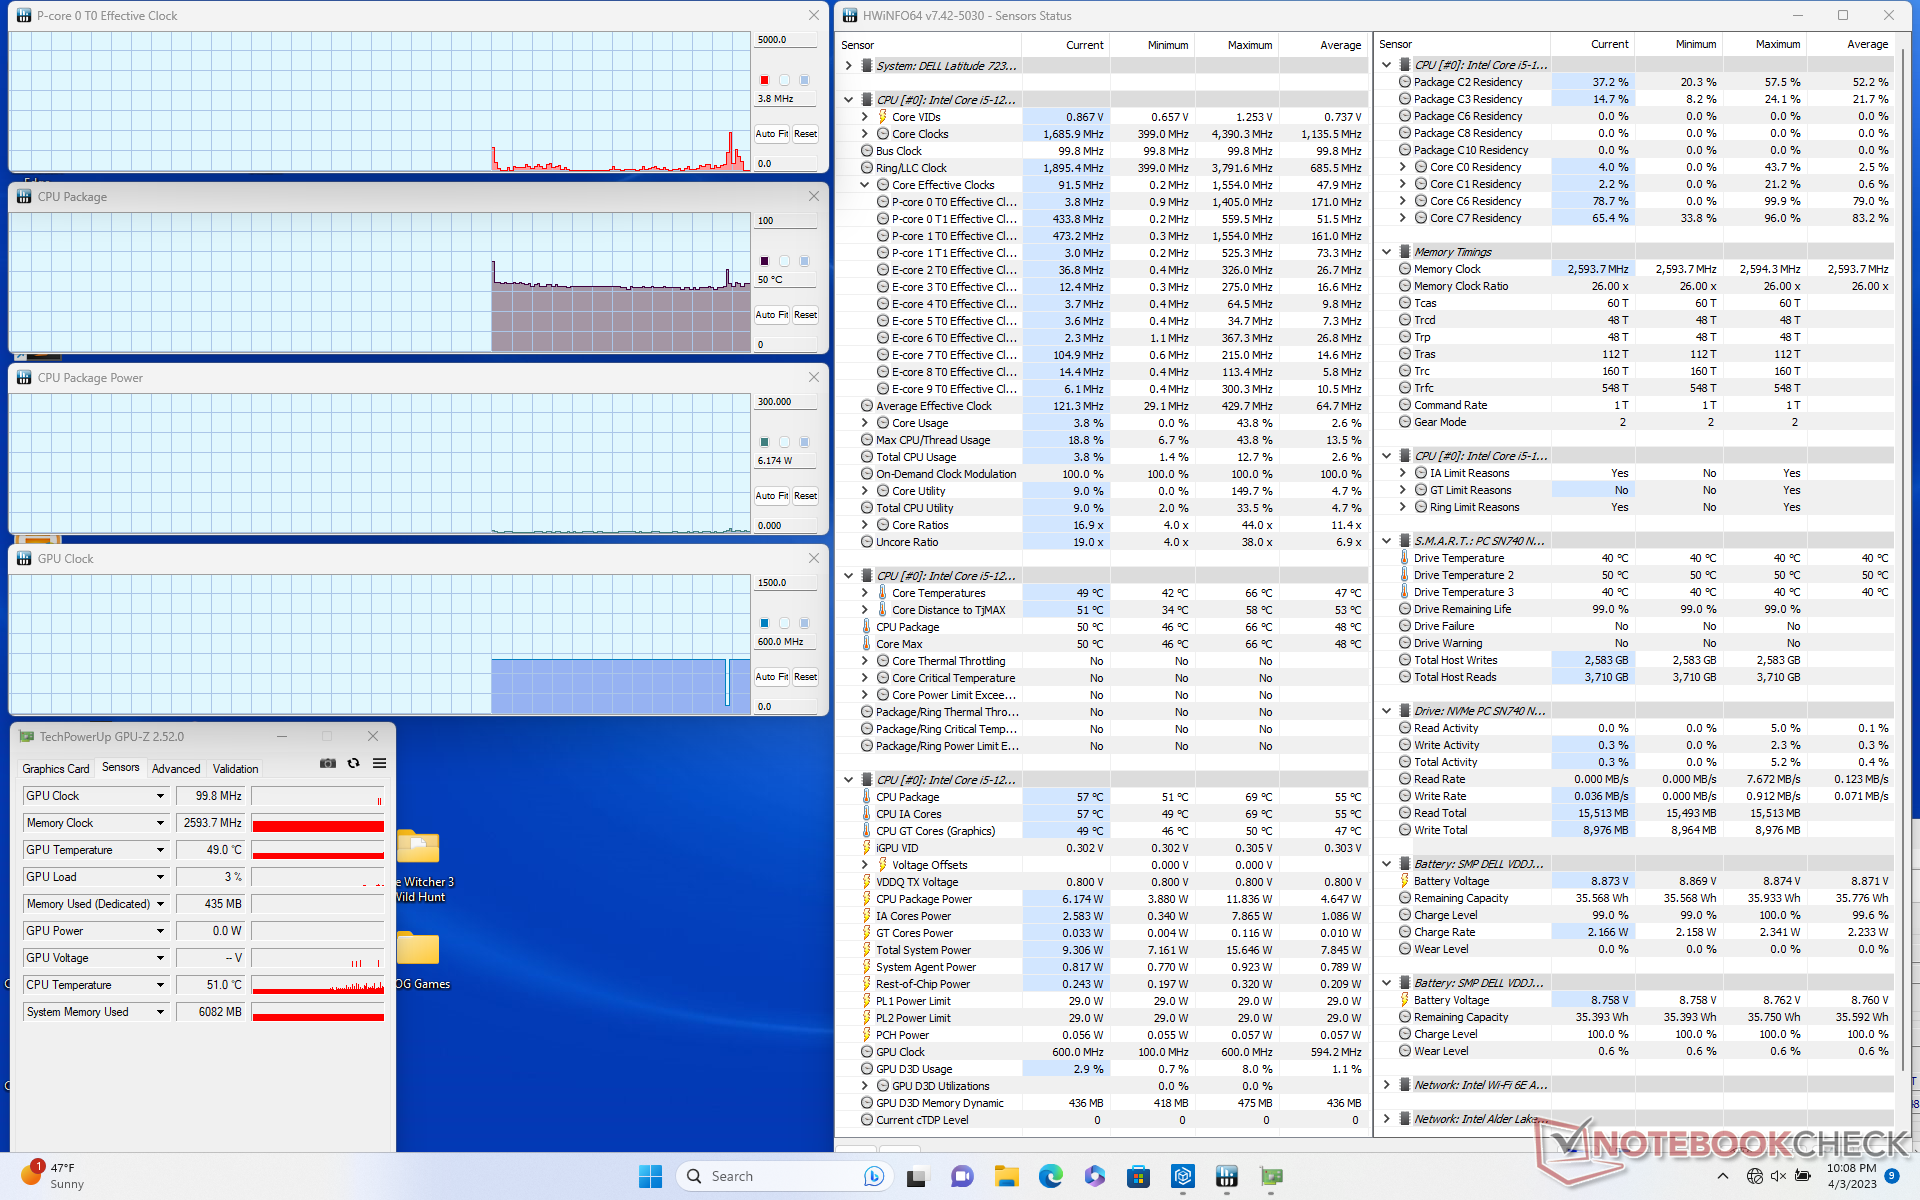
Al ejecutar Prime95 para estresar la CPU, las frecuencias de reloj y el consumo de la placa aumentaban a 2,6 GHz y 30 W, respectivamente, antes de caer ligeramente a 2,5 GHz y 26 W unos segundos después. La temperatura del núcleo se estabiliza en unos elevados 97 C, más de lo que nos gustaría. Repitiendo esta prueba en el Dell Latitude 7330 Rugged resultaría en una temperatura de núcleo mucho más fresca de sólo 68 C.
Funcionar con batería afecta ligeramente al rendimiento de la CPU. Un test 3DMark 11 a pilas devolvería puntuaciones de Física y Gráficos de 10743 y 4041 puntos, respectivamente, comparados con 12765 y 4053 puntos cuando está enchufado.
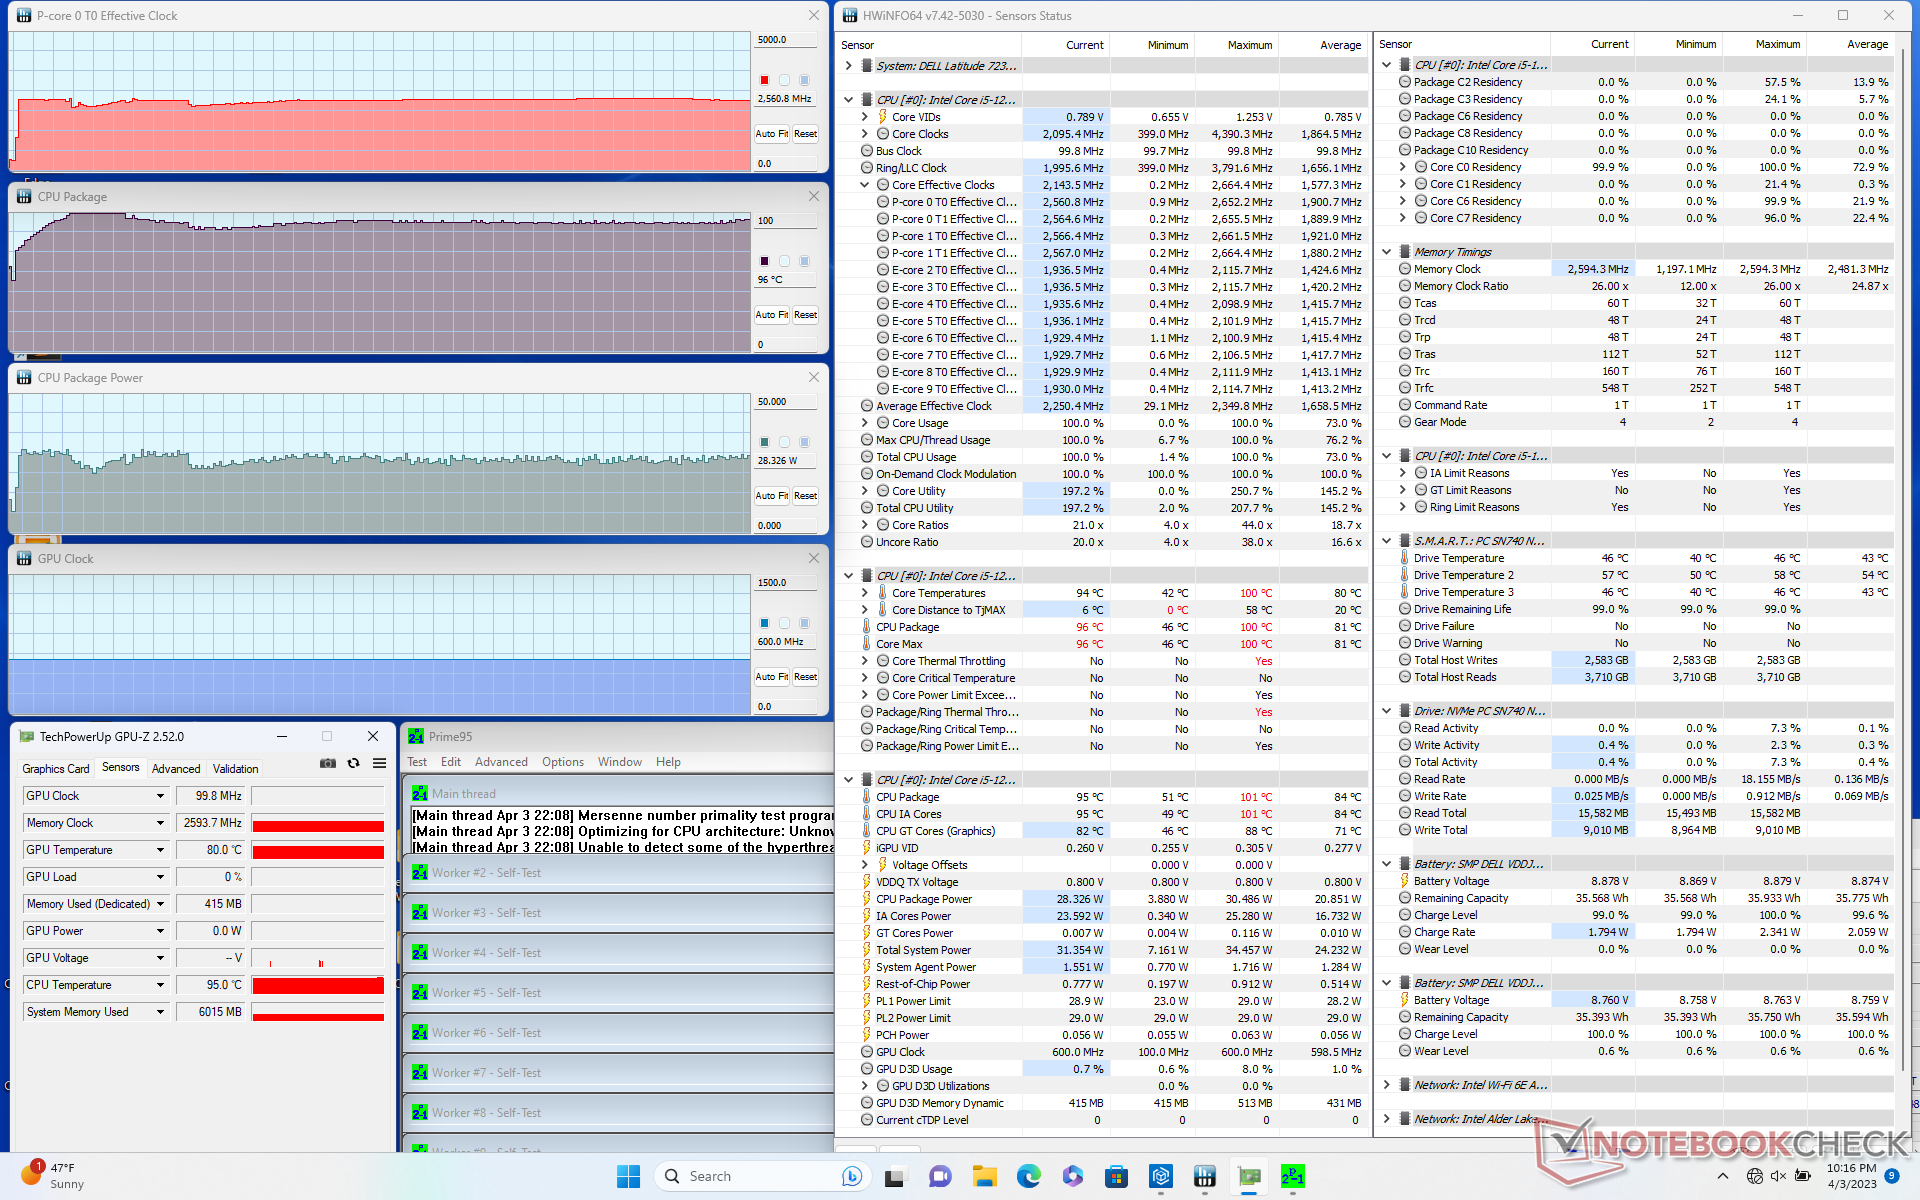
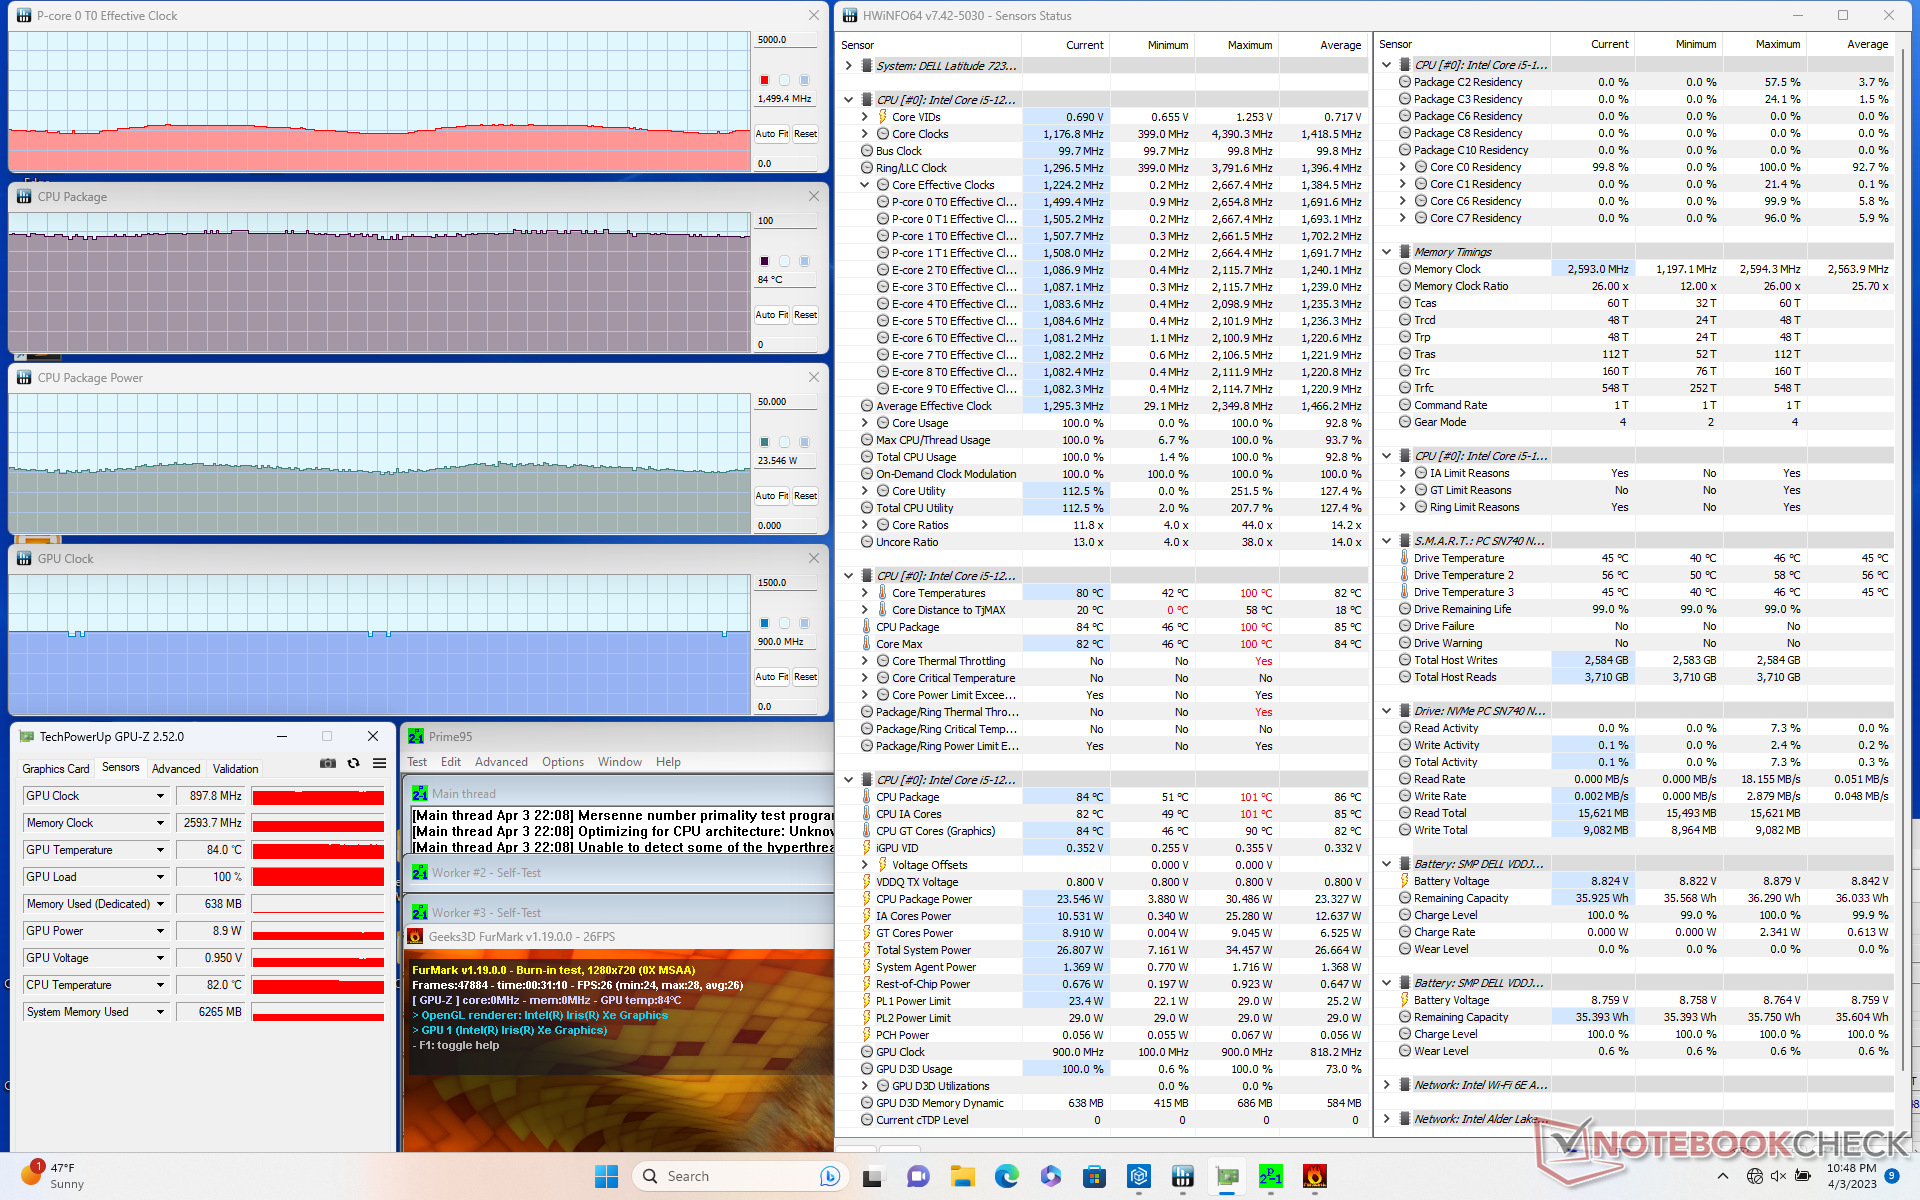
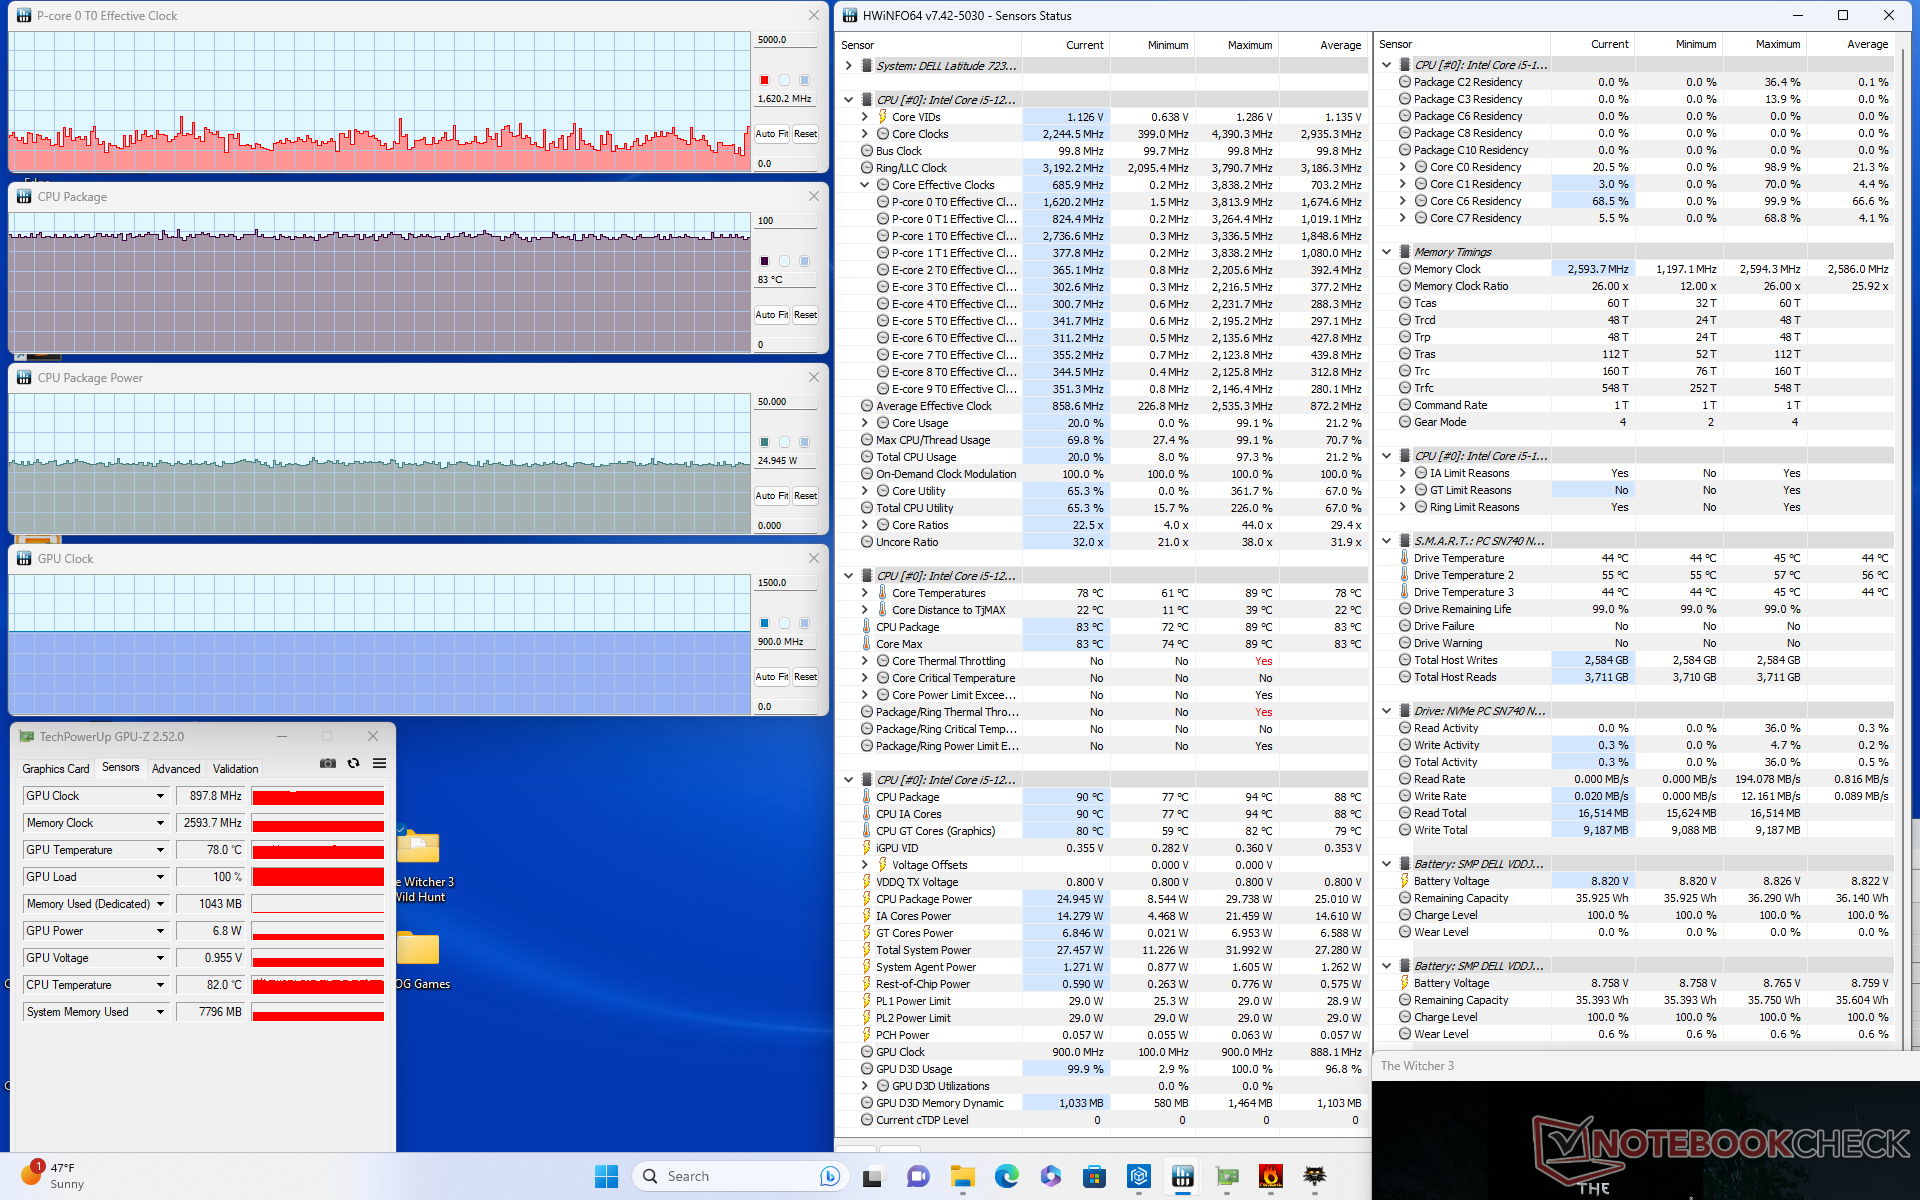

| Relojde laCPU (GHz) | Reloj de la GPU (MHz) | Temperatura media de la CPU (°C) | |
| Sistema en reposo | -- | -- | 50 |
| Prime95 Stress | 2,6 | -- | 96 |
| Prime95+ FurMark Stress | 1,4 - 1,6 | 898 | 84 |
| Witcher 3 Estrés (modoUltra) | ~3,0 | 898 | 85 |
| Witcher 3 Estrés (modooptimizado) | ~1,7 | 898 | 83 |
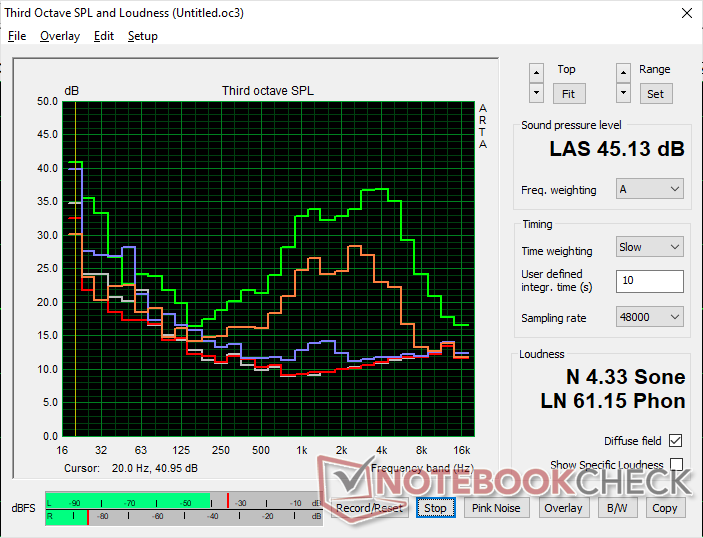
Altavoces
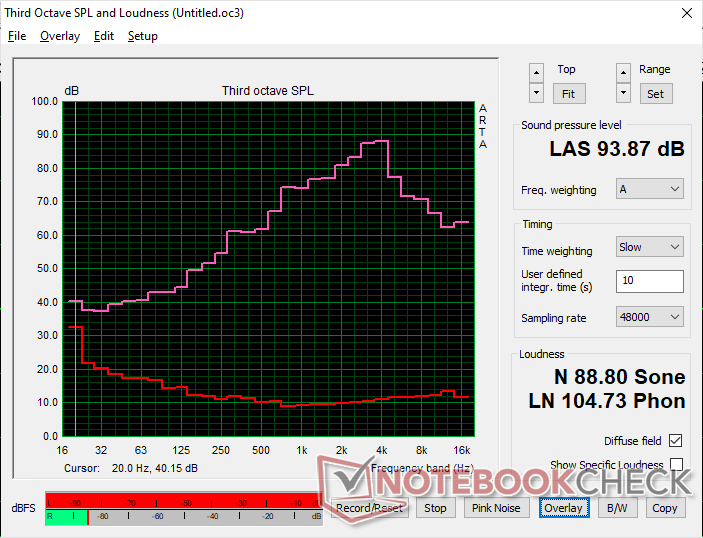
Dell Latitude 7230 Rugged Extreme análisis de audio
(+) | los altavoces pueden reproducir a un volumen relativamente alto (#93.9 dB)
Graves 100 - 315 Hz
(-) | casi sin bajos - de media 19.9% inferior a la mediana
(+) | el bajo es lineal (5.2% delta a la frecuencia anterior)
Medios 400 - 2000 Hz
(±) | medias más altas - de media 6.5% más altas que la mediana
(+) | los medios son lineales (4.5% delta a la frecuencia anterior)
Altos 2 - 16 kHz
(±) | máximos más altos - de media 8.4% más altos que la mediana
(±) | la linealidad de los máximos es media (7% delta a frecuencia anterior)
Total 100 - 16.000 Hz
(±) | la linealidad del sonido global es media (19.4% de diferencia con la mediana)
En comparación con la misma clase
» 54% de todos los dispositivos probados de esta clase eran mejores, 7% similares, 39% peores
» El mejor tuvo un delta de 7%, la media fue 20%, el peor fue ###max##%
En comparación con todos los dispositivos probados
» 48% de todos los dispositivos probados eran mejores, 7% similares, 45% peores
» El mejor tuvo un delta de 4%, la media fue 24%, el peor fue ###max##%
Apple MacBook Pro 16 2021 M1 Pro análisis de audio
(+) | los altavoces pueden reproducir a un volumen relativamente alto (#84.7 dB)
Graves 100 - 315 Hz
(+) | buen bajo - sólo 3.8% lejos de la mediana
(+) | el bajo es lineal (5.2% delta a la frecuencia anterior)
Medios 400 - 2000 Hz
(+) | medios equilibrados - a sólo 1.3% de la mediana
(+) | los medios son lineales (2.1% delta a la frecuencia anterior)
Altos 2 - 16 kHz
(+) | máximos equilibrados - a sólo 1.9% de la mediana
(+) | los máximos son lineales (2.7% delta a la frecuencia anterior)
Total 100 - 16.000 Hz
(+) | el sonido global es lineal (4.6% de diferencia con la mediana)
En comparación con la misma clase
» 0% de todos los dispositivos probados de esta clase eran mejores, 0% similares, 100% peores
» El mejor tuvo un delta de 5%, la media fue 17%, el peor fue ###max##%
En comparación con todos los dispositivos probados
» 0% de todos los dispositivos probados eran mejores, 0% similares, 100% peores
» El mejor tuvo un delta de 4%, la media fue 24%, el peor fue ###max##%
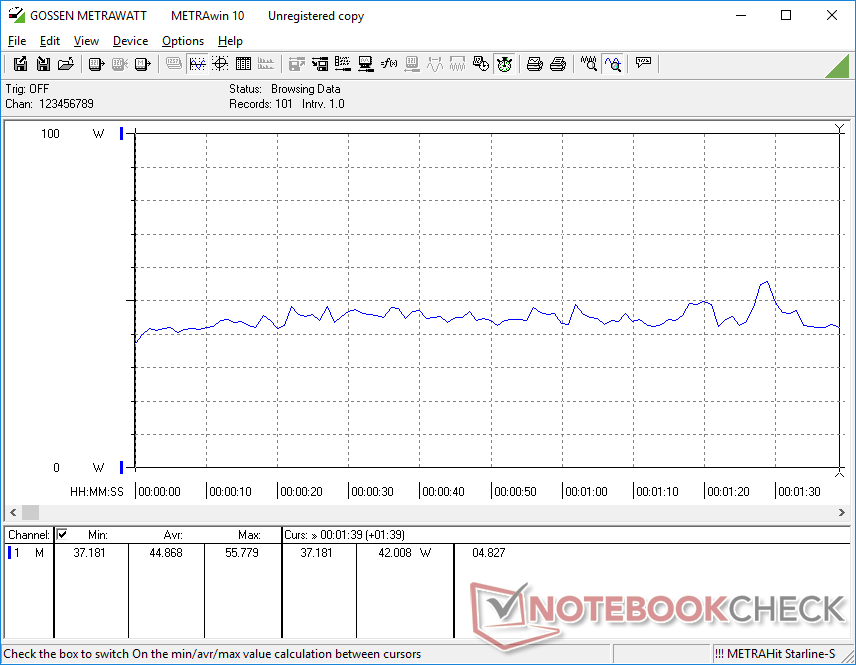
Gestión de la energía
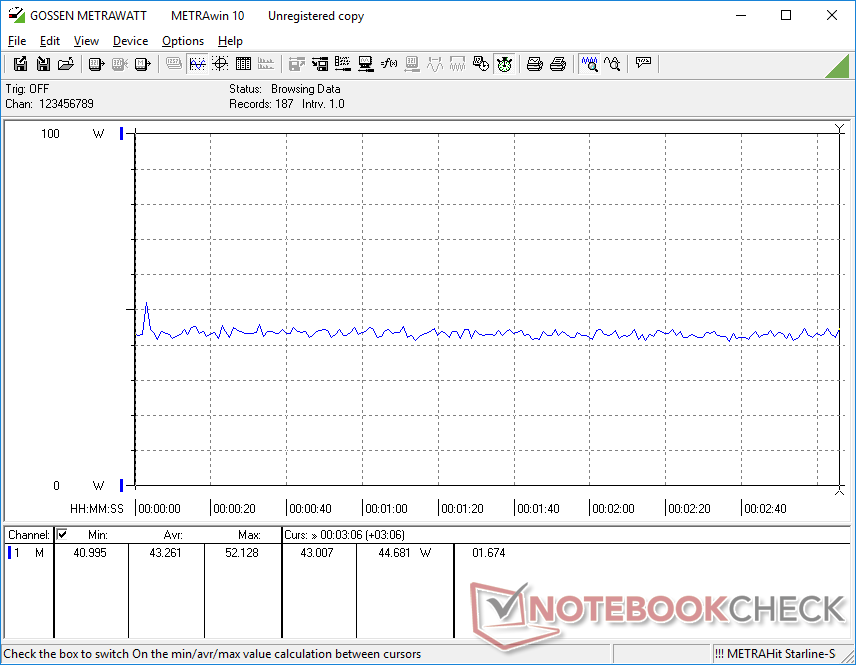
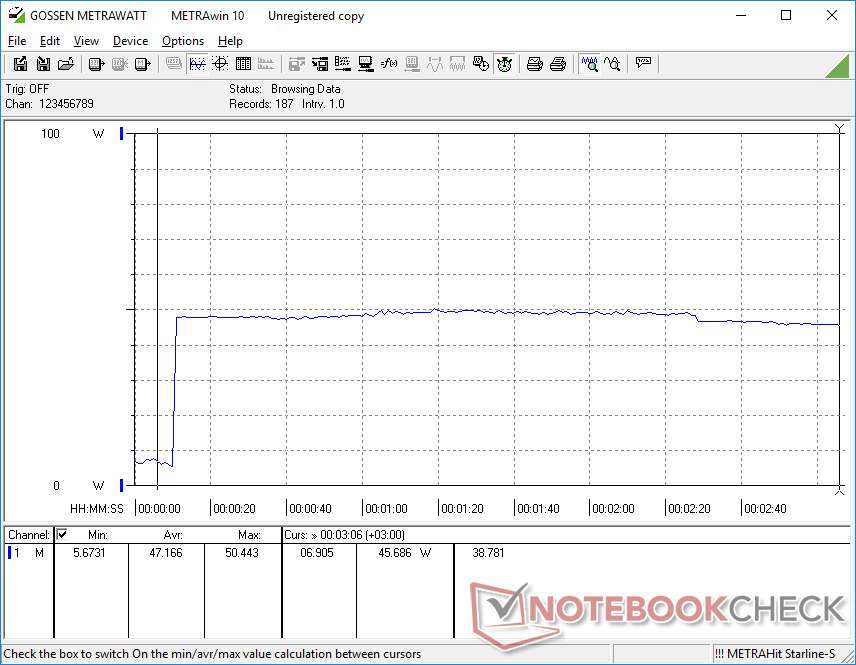
Consumo de energía
El consumo de energía es en su mayor parte similar al de otros dispositivos robustos que funcionan con CPU de 11ª generación más antiguas, como el Dell Latitude 7330 Rugged Extreme o el Panasonic Toughbook 40. Sin embargo, el rendimiento por vatio puede ser muy diferente. Más concretamente, nuestro Latitude 7230 Rugged puede ofrecer un rendimiento del procesador entre un 40 y un 50 por ciento más rápido que el Core i7-1185G7 delDell Latitude 7330 Rugged sin necesidad de consumir más energía. Por otro lado, el rendimiento de la GPU es entre un 30 y un 40 por ciento más lento.
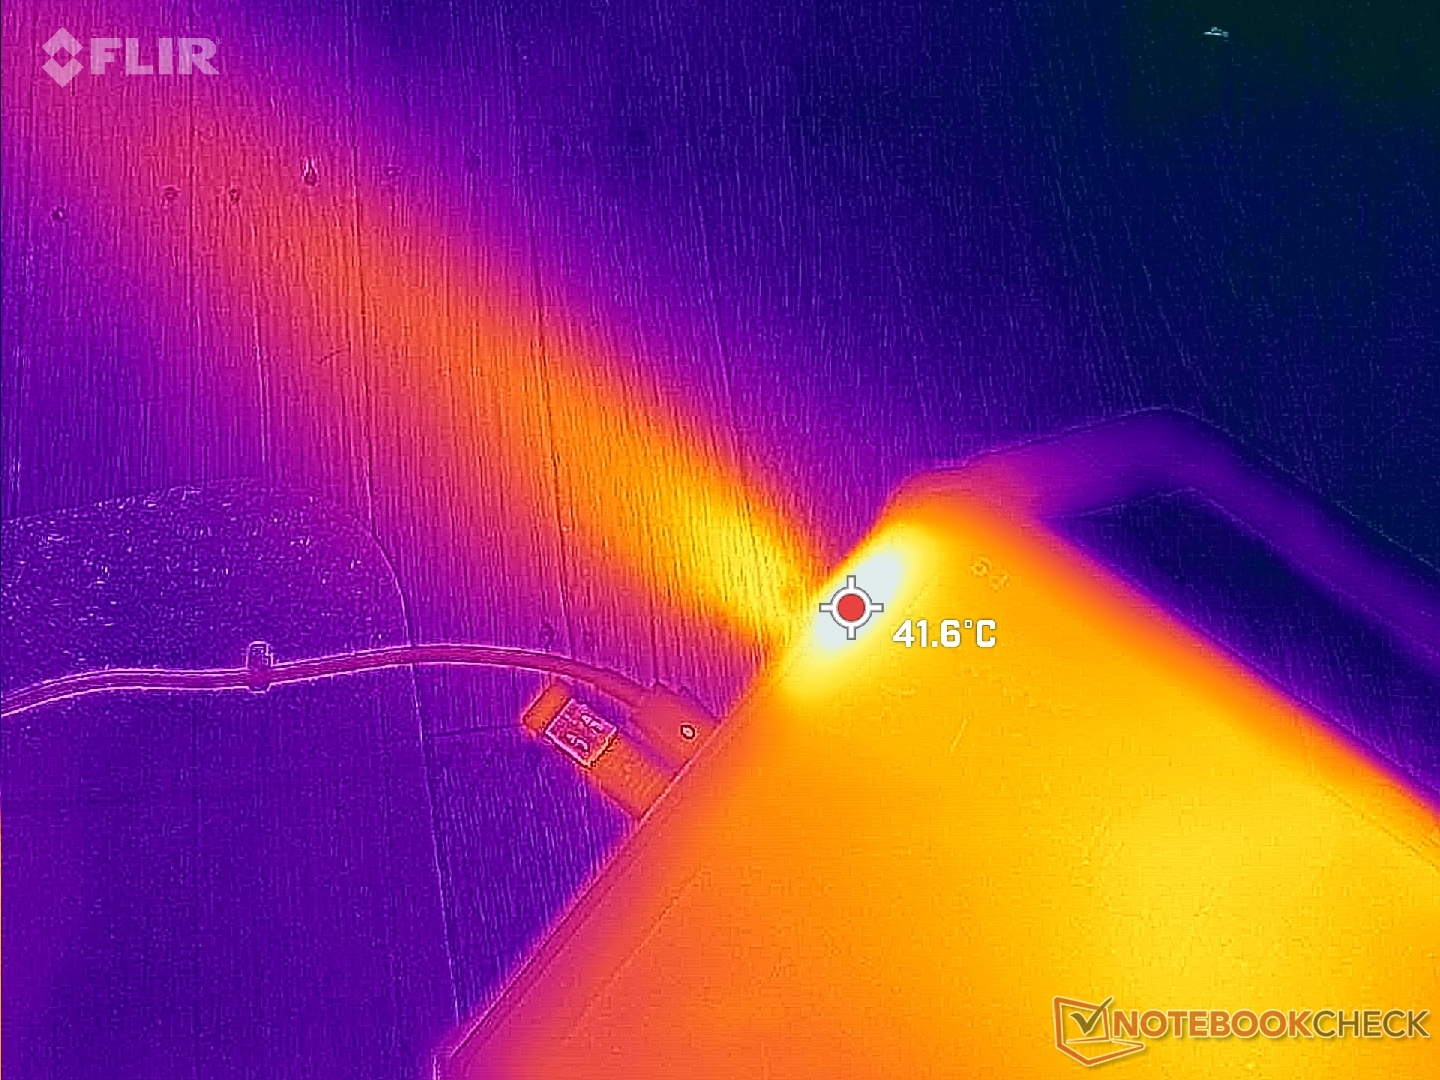
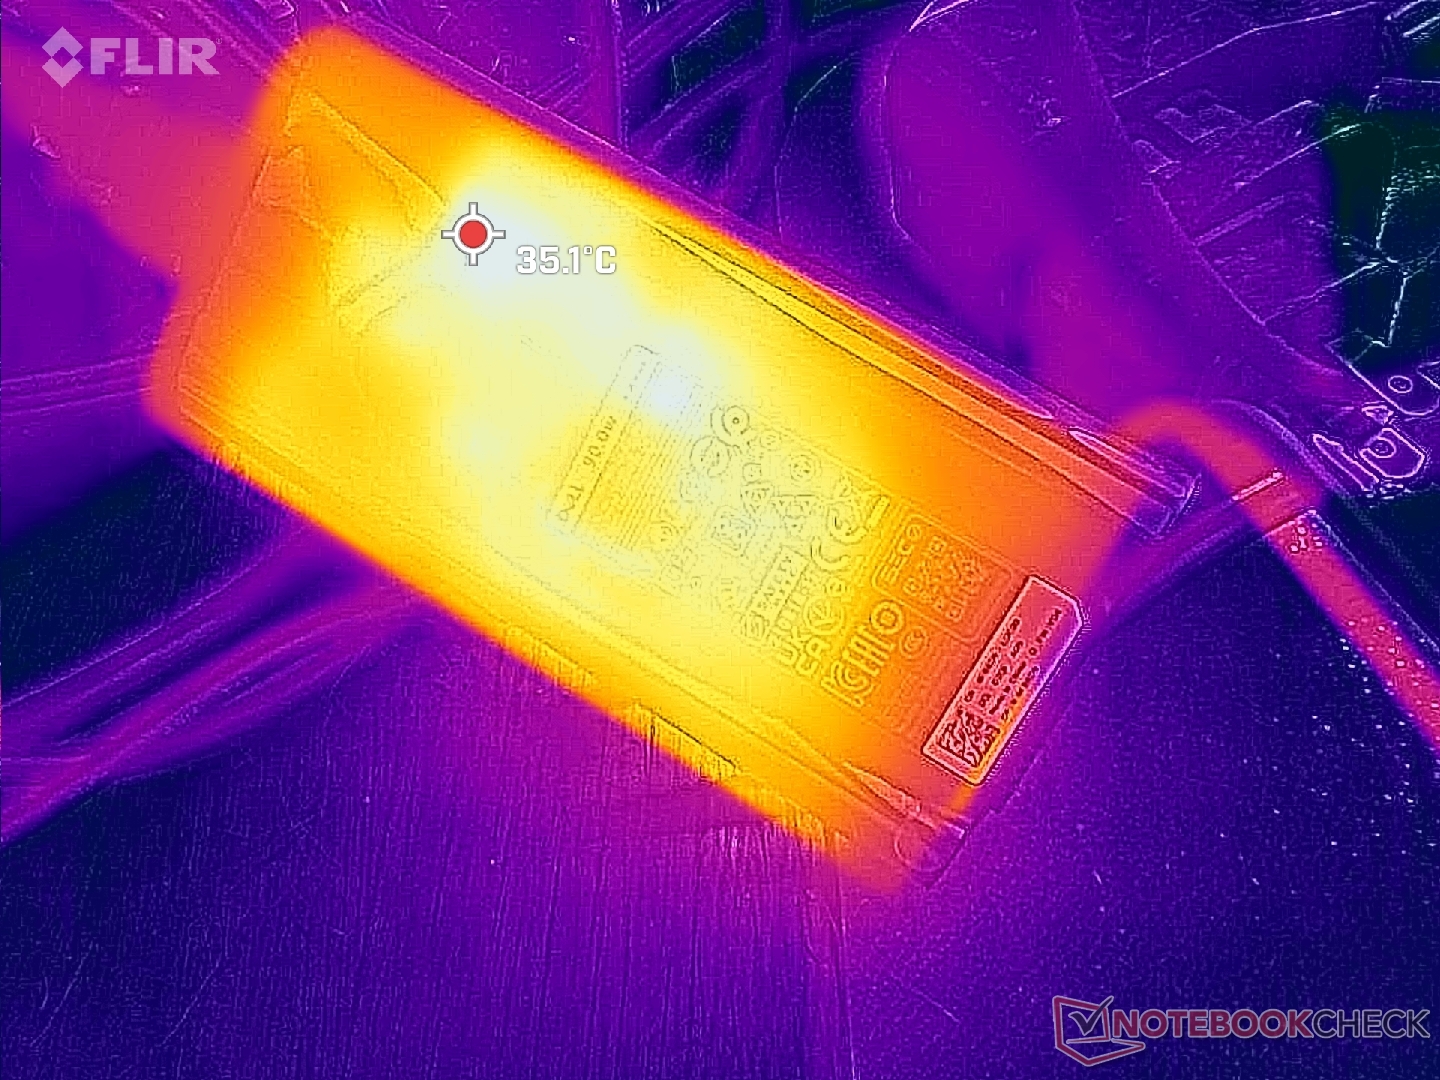
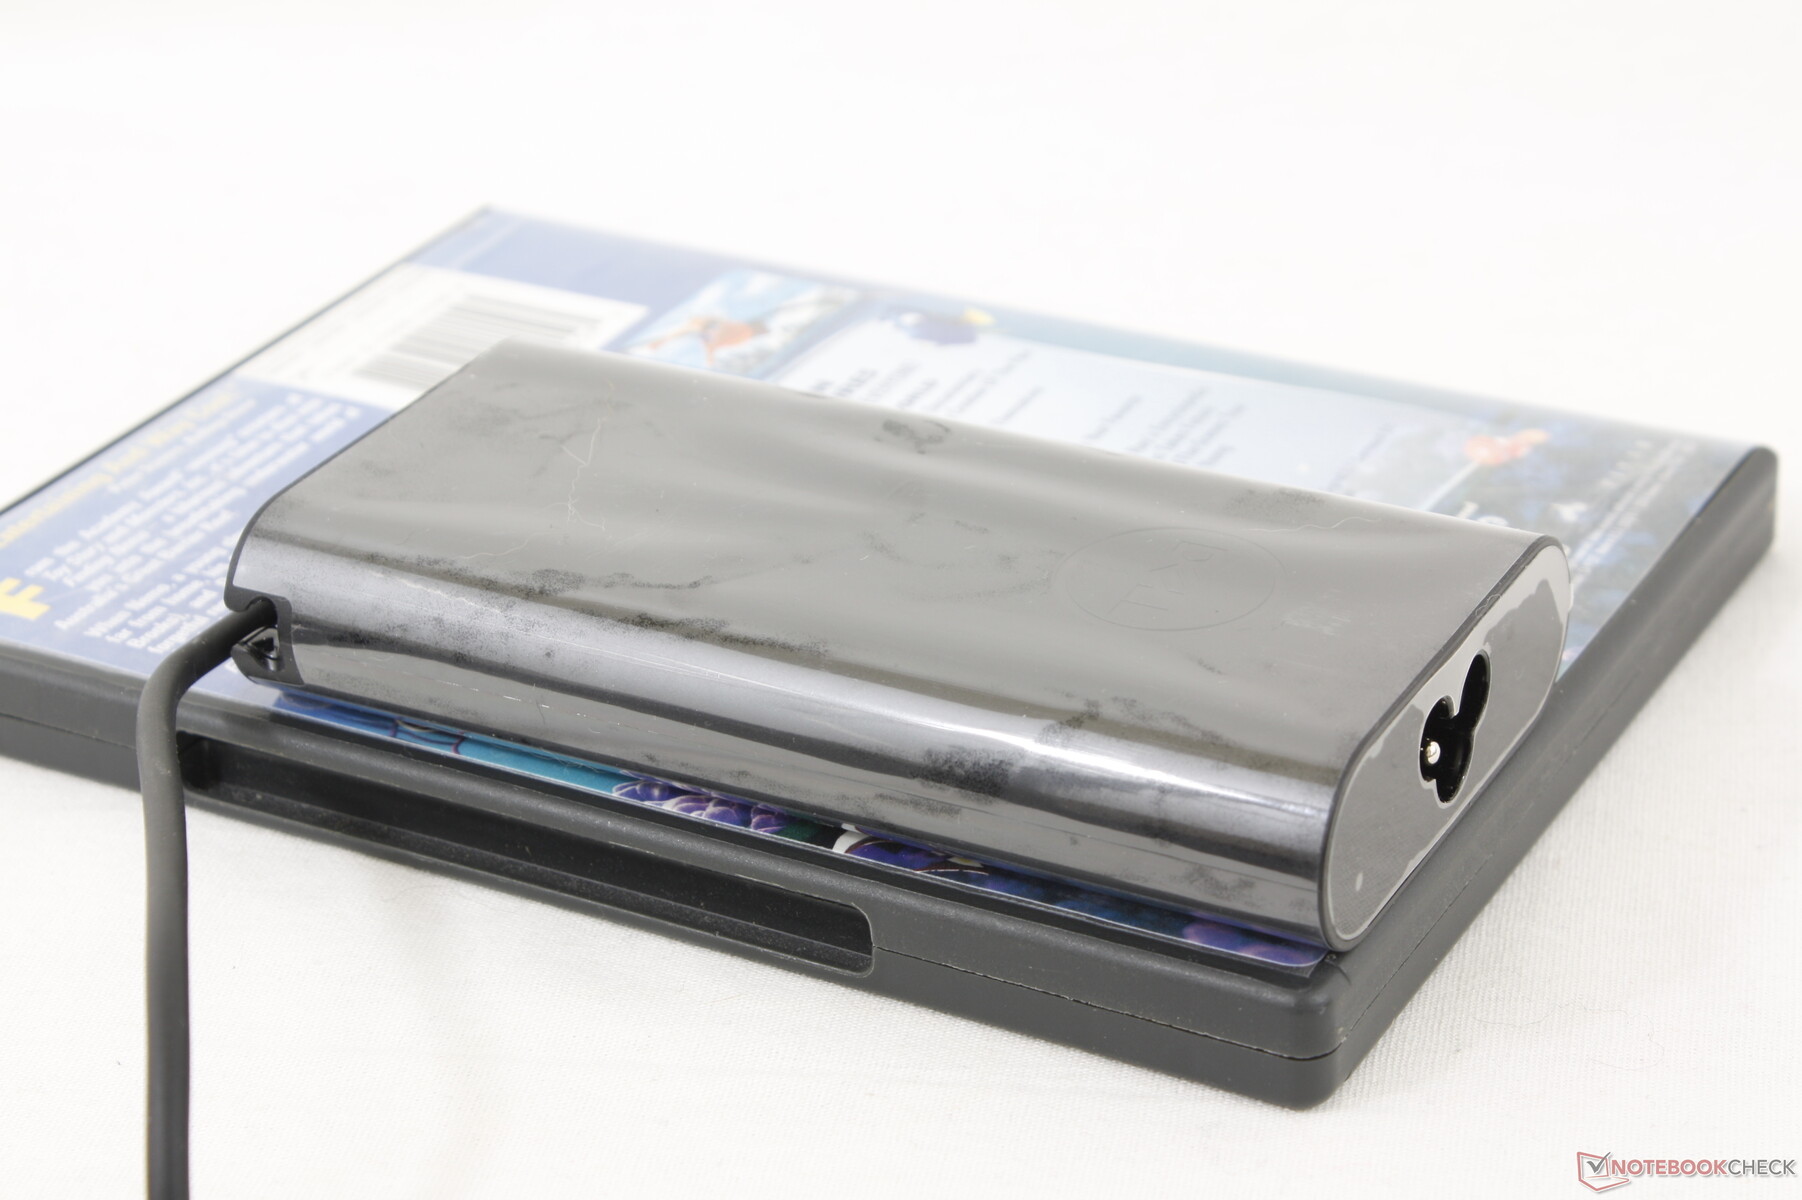
Pudimos registrar un consumo máximo de 55 W del adaptador USB-C AC de 90 W pequeño-mediano (~13 x 6.5 x 2.3 cm). Esta lectura máxima es relativamente baja comparada con muchas alternativas Core i7 ya que nuestro Core i5 tiene un límite Turbo Boost inferior. Nótese que el modelo viene con el mismo adaptador AC que se encuentra en ciertos portátiles XPS.
| Off / Standby | |
| Ocioso | |
| Carga |
|
Clave:
min: | |
| Dell Latitude 7230 Rugged Extreme i5-1240U, Iris Xe G7 80EUs, WD PC SN740 512GB SDDPMQD-512G-1101, IPS, 1920x1200, 12" | Dell Latitude 7330 Rugged Extreme i7-1185G7, Iris Xe G7 96EUs, , IPS, 1920x1080, 13.3" | Panasonic Toughbook 40 i7-1185G7, Iris Xe G7 96EUs, Samsung PM991 MZVLQ1T0HALB, IPS, 1920x1080, 14" | Getac B360 i7-10710U, UHD Graphics 620, Lite-On CA5-8D512, IPS, 1920x1080, 13.3" | Acer Enduro Urban N3 EUN314 i7-1165G7, Iris Xe G7 96EUs, Samsung PM991 MZVLQ1T0HALB, IPS, 1920x1080, 14" | Durabook S14I i7-1165G7, Iris Xe G7 96EUs, UDinfo M2P M2P80DE512GBAEP, TN, 1920x1080, 14" | |
|---|---|---|---|---|---|---|
| Power Consumption | -9% | -15% | -5% | 25% | -25% | |
| Idle Minimum * (Watt) | 6.5 | 4.1 37% | 4.9 25% | 5.4 17% | 3.8 42% | 6.8 -5% |
| Idle Average * (Watt) | 8.9 | 11.7 -31% | 12.3 -38% | 12.2 -37% | 8 10% | 16.4 -84% |
| Idle Maximum * (Watt) | 14.3 | 11.8 17% | 14 2% | 12.6 12% | 8.7 39% | 16.9 -18% |
| Load Average * (Watt) | 44.9 | 48.5 -8% | 54 -20% | 39.1 13% | 34.6 23% | 39.2 13% |
| Witcher 3 ultra * (Watt) | 43.2 | 44.3 -3% | 46.3 -7% | 36.5 16% | 35.4 18% | |
| Load Maximum * (Watt) | 54.8 | 91 -66% | 83.6 -53% | 81.8 -49% | 45.4 17% | 73.1 -33% |
* ... más pequeño es mejor
Power Consumption Witcher 3 / Stresstest
Power Consumption external Monitor
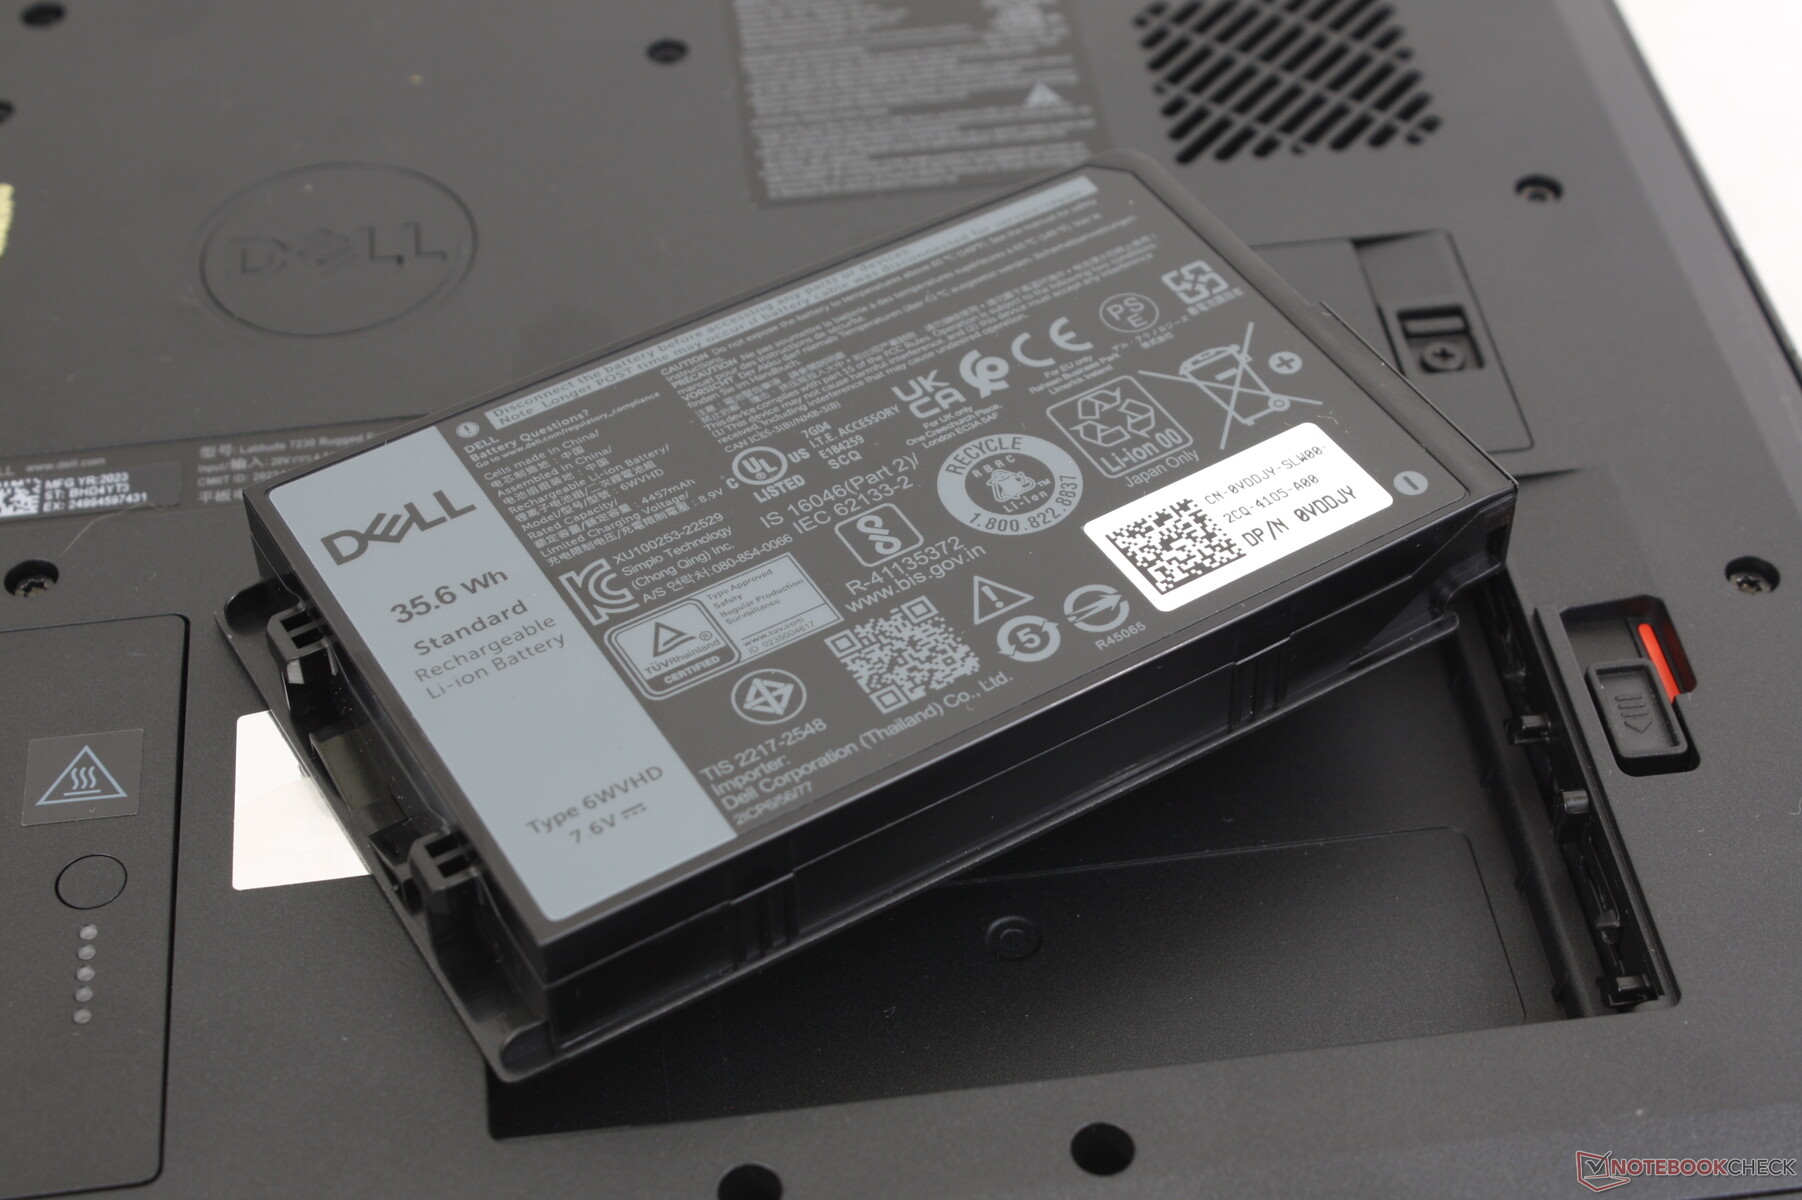
Duración de la batería: 3,5 horas en condiciones de uso extremas
Admite hasta dos baterías extraíbles. La autonomía WLAN es de casi 13 horas con las dos baterías instaladas (36 Wh x2). Por otro lado, ejecutar cargas exigentes en el nivel máximo de brillo debería durar unas 3,5 horas.
La carga de ambas baterías de vacío a lleno es, por desgracia, bastante lenta, de 4 a 5 horas frente a las 1,5 a 2 horas de la mayoría de Ultrabooks.
| Dell Latitude 7230 Rugged Extreme i5-1240U, Iris Xe G7 80EUs, 72 Wh | Dell Latitude 7330 Rugged Extreme i7-1185G7, Iris Xe G7 96EUs, 107 Wh | Panasonic Toughbook 40 i7-1185G7, Iris Xe G7 96EUs, 136 Wh | Getac B360 i7-10710U, UHD Graphics 620, 46 Wh | Acer Enduro Urban N3 EUN314 i7-1165G7, Iris Xe G7 96EUs, 50.3 Wh | Durabook S14I i7-1165G7, Iris Xe G7 96EUs, 50 Wh | |
|---|---|---|---|---|---|---|
| Duración de Batería | 38% | 46% | -38% | -51% | -58% | |
| WiFi v1.3 (h) | 13 | 18 38% | 19 46% | 8.1 -38% | 6.4 -51% | 5.5 -58% |
| Load (h) | 3.6 |
Pro
Contra
Veredicto - Mayormente un Home Run
Las características distintivas de la Latitude 7230 Rugged Extreme son su cobertura sRGB completa, el rápido rendimiento de la CPU y su bajo peso en comparación con otras tabletas robustas. La mayoría de las alternativas tienen colores más pobres y biseles más gruesos en comparación.
Nos gustaría ver mejoras en las tapas de los puertos y los botones frontales, que son demasiado resbaladizos y pequeños, respectivamente. Son aún más difíciles de manejar si se llevan guantes.
La excelente duración de la batería, la pantalla superbrillante y la cobertura sRGB completa del Latitude 7230 Rugged Extreme marcan la pauta para los futuros tablets resistentes.
Los posibles compradores deberán tener en cuenta que el Core i5-1240U, más económico, tiene un rendimiento similar al Core i7-1260U en lo que respecta a la CPU. Por tanto, los usuarios sólo deberían elegir este último si necesitan un rendimiento gráfico más rápido. Es de esperar que el ruido del ventilador sea más alto de lo habitual si planean ejecutar tareas más exigentes en el modelo.
Precio y disponibilidad
Dell ya está distribuyendo el Latitude 7230 Rugged Extreme a partir de 2700 USD para la configuración básica hasta más de 5000 USD si está totalmente configurado. Nuestra unidad de evaluación cuesta unos 3200 dólares.
Dell Latitude 7230 Rugged Extreme
- 04/07/2023 v7 (old)
Allen Ngo
Transparencia
La selección de los dispositivos que se van a reseñar corre a cargo de nuestro equipo editorial. La muestra de prueba fue proporcionada al autor en calidad de préstamo por el fabricante o el minorista a los efectos de esta reseña. El prestamista no tuvo ninguna influencia en esta reseña, ni el fabricante recibió una copia de la misma antes de su publicación. No había ninguna obligación de publicar esta reseña. Como empresa de medios independiente, Notebookcheck no está sujeta a la autoridad de fabricantes, minoristas o editores.
Así es como prueba Notebookcheck
Cada año, Notebookcheck revisa de forma independiente cientos de portátiles y smartphones utilizando procedimientos estandarizados para asegurar que todos los resultados son comparables. Hemos desarrollado continuamente nuestros métodos de prueba durante unos 20 años y hemos establecido los estándares de la industria en el proceso. En nuestros laboratorios de pruebas, técnicos y editores experimentados utilizan equipos de medición de alta calidad. Estas pruebas implican un proceso de validación en varias fases. Nuestro complejo sistema de clasificación se basa en cientos de mediciones y puntos de referencia bien fundamentados, lo que mantiene la objetividad.Price comparison

