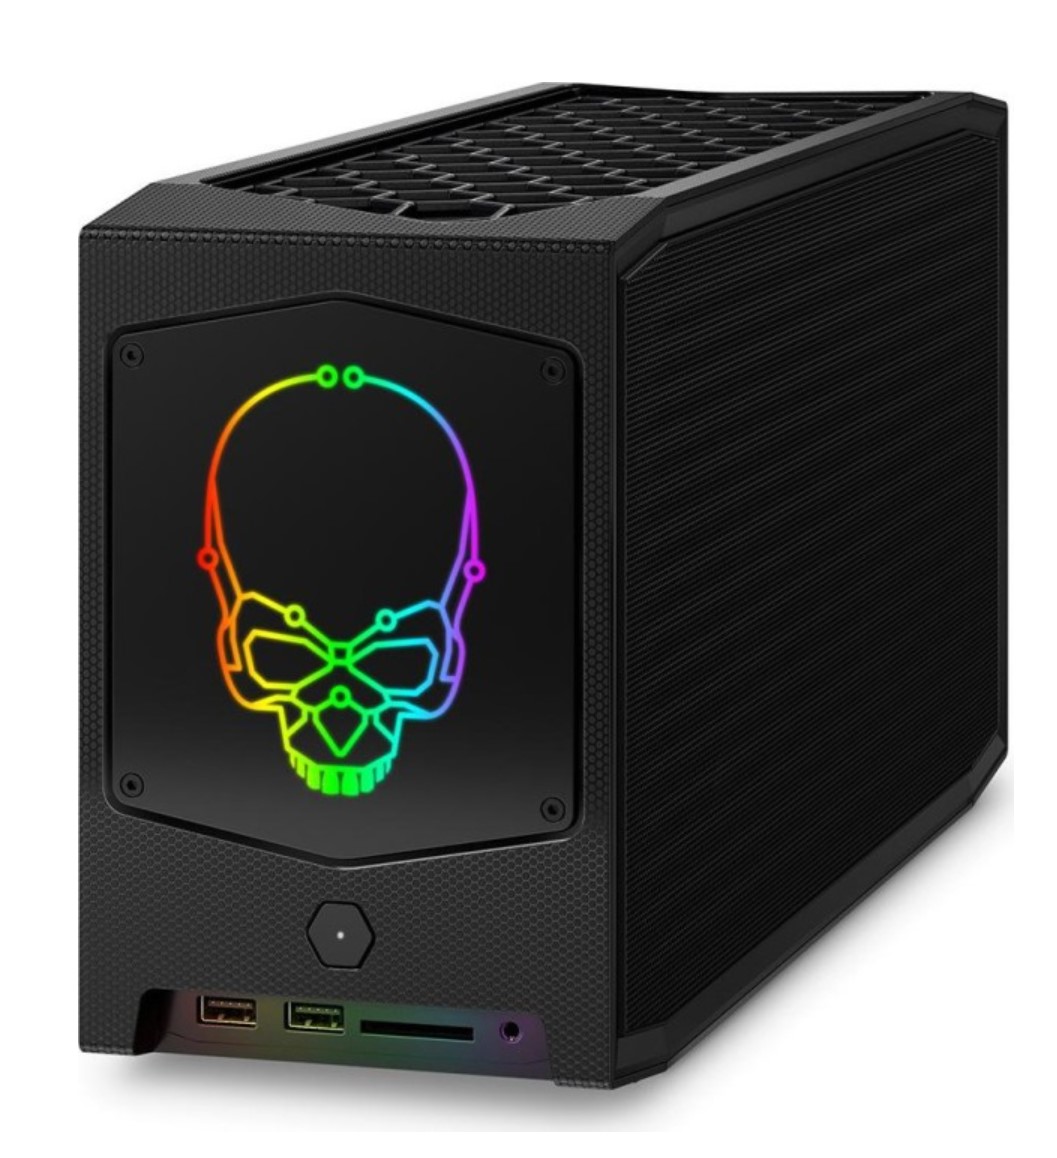
Análisis del Intel NUC 12 Dragon Canyon con Intel Core i9-12900
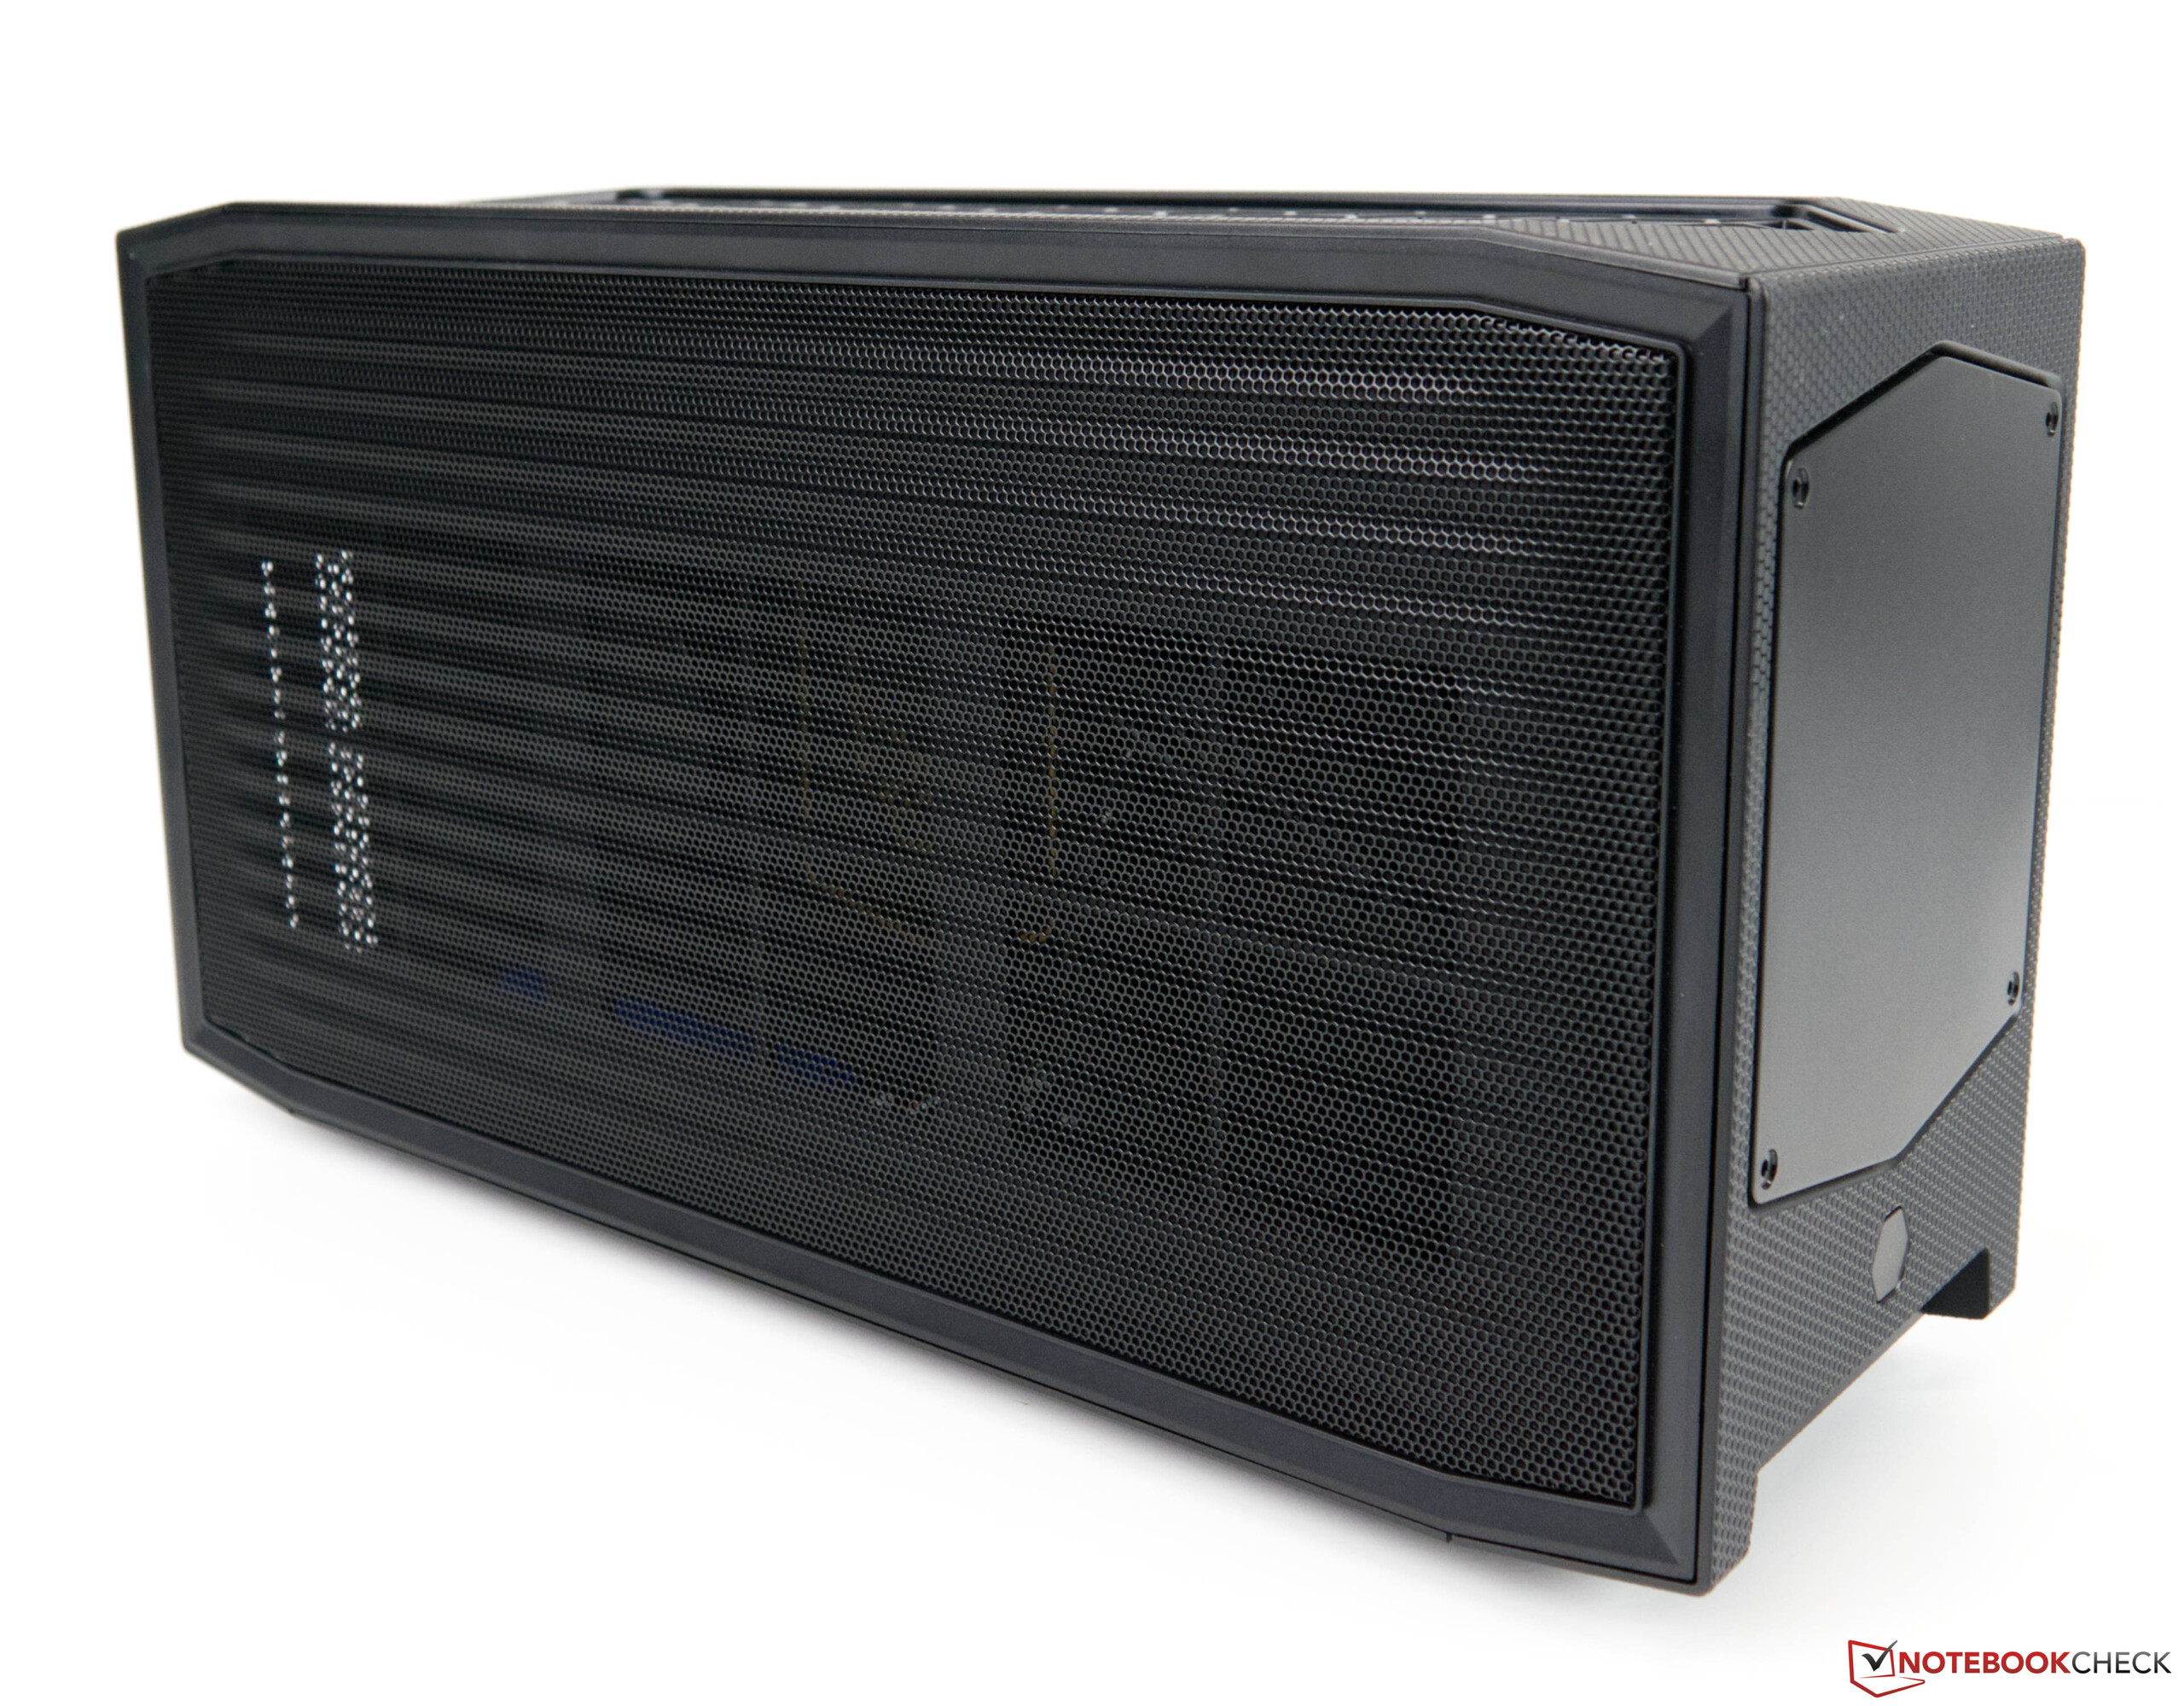
El Intel NUC Extreme Kit ya es conocido desde hace tiempo. Con su construcción compacta y su buen equipamiento, destaca entre las masas, y el diseño del ordenador de sobremesa compacto puede reconocerse fácilmente,sin duda.
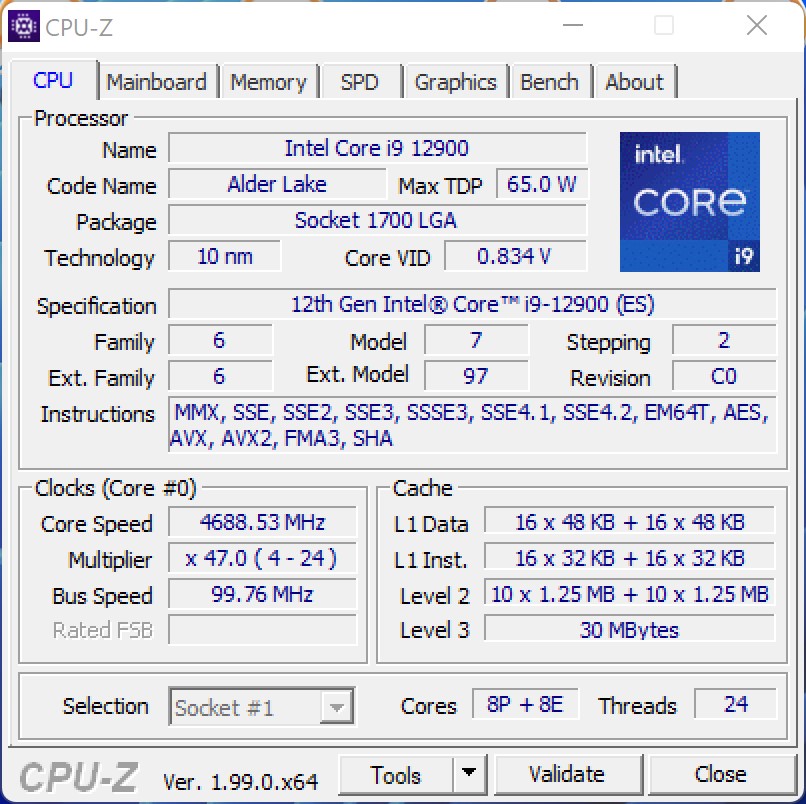
Hace poco echamos un vistazo detallado al Intel NUC 11 Extreme Kit alias Beast Canyon y ya entonces nos sorprendieron sus potentes capacidades. Con el Intel NUC 12 Extreme Kit alias Dragon Canyon, Intel presenta ahora el sucesor, mostrando que ahora hay aún más potencia con la nueva CPU. Pero esto también se podía esperar debido al progreso en el desarrollo del chip, ya que Alder Lake tiene una ventaja significativa a la antigua plataforma Tiger Lake. Sigue utilizando el Compute Element que ya conocemos, que combina todos los componentes importantes de un PC. Por primera vez, Intel toma la dirección de utilizar una CPU con zócalo tal y como la conocemos del segmento de los ordenadores de sobremesa estándar. Aquí se utiliza el Intel Core i9-12900 de la actual serie Alder Lake S. Al igual que el Intel Core i9-12900K, el procesador ofrece los núcleos P y E que ya conocemos, capaces de funcionar con hasta 24 hilos simultáneamente. Sin embargo, con un TDP ligeramente inferior, también esperamos un rendimiento ligeramente inferior. Descubre más detalles sobre esto en el segmento de rendimiento más abajo.
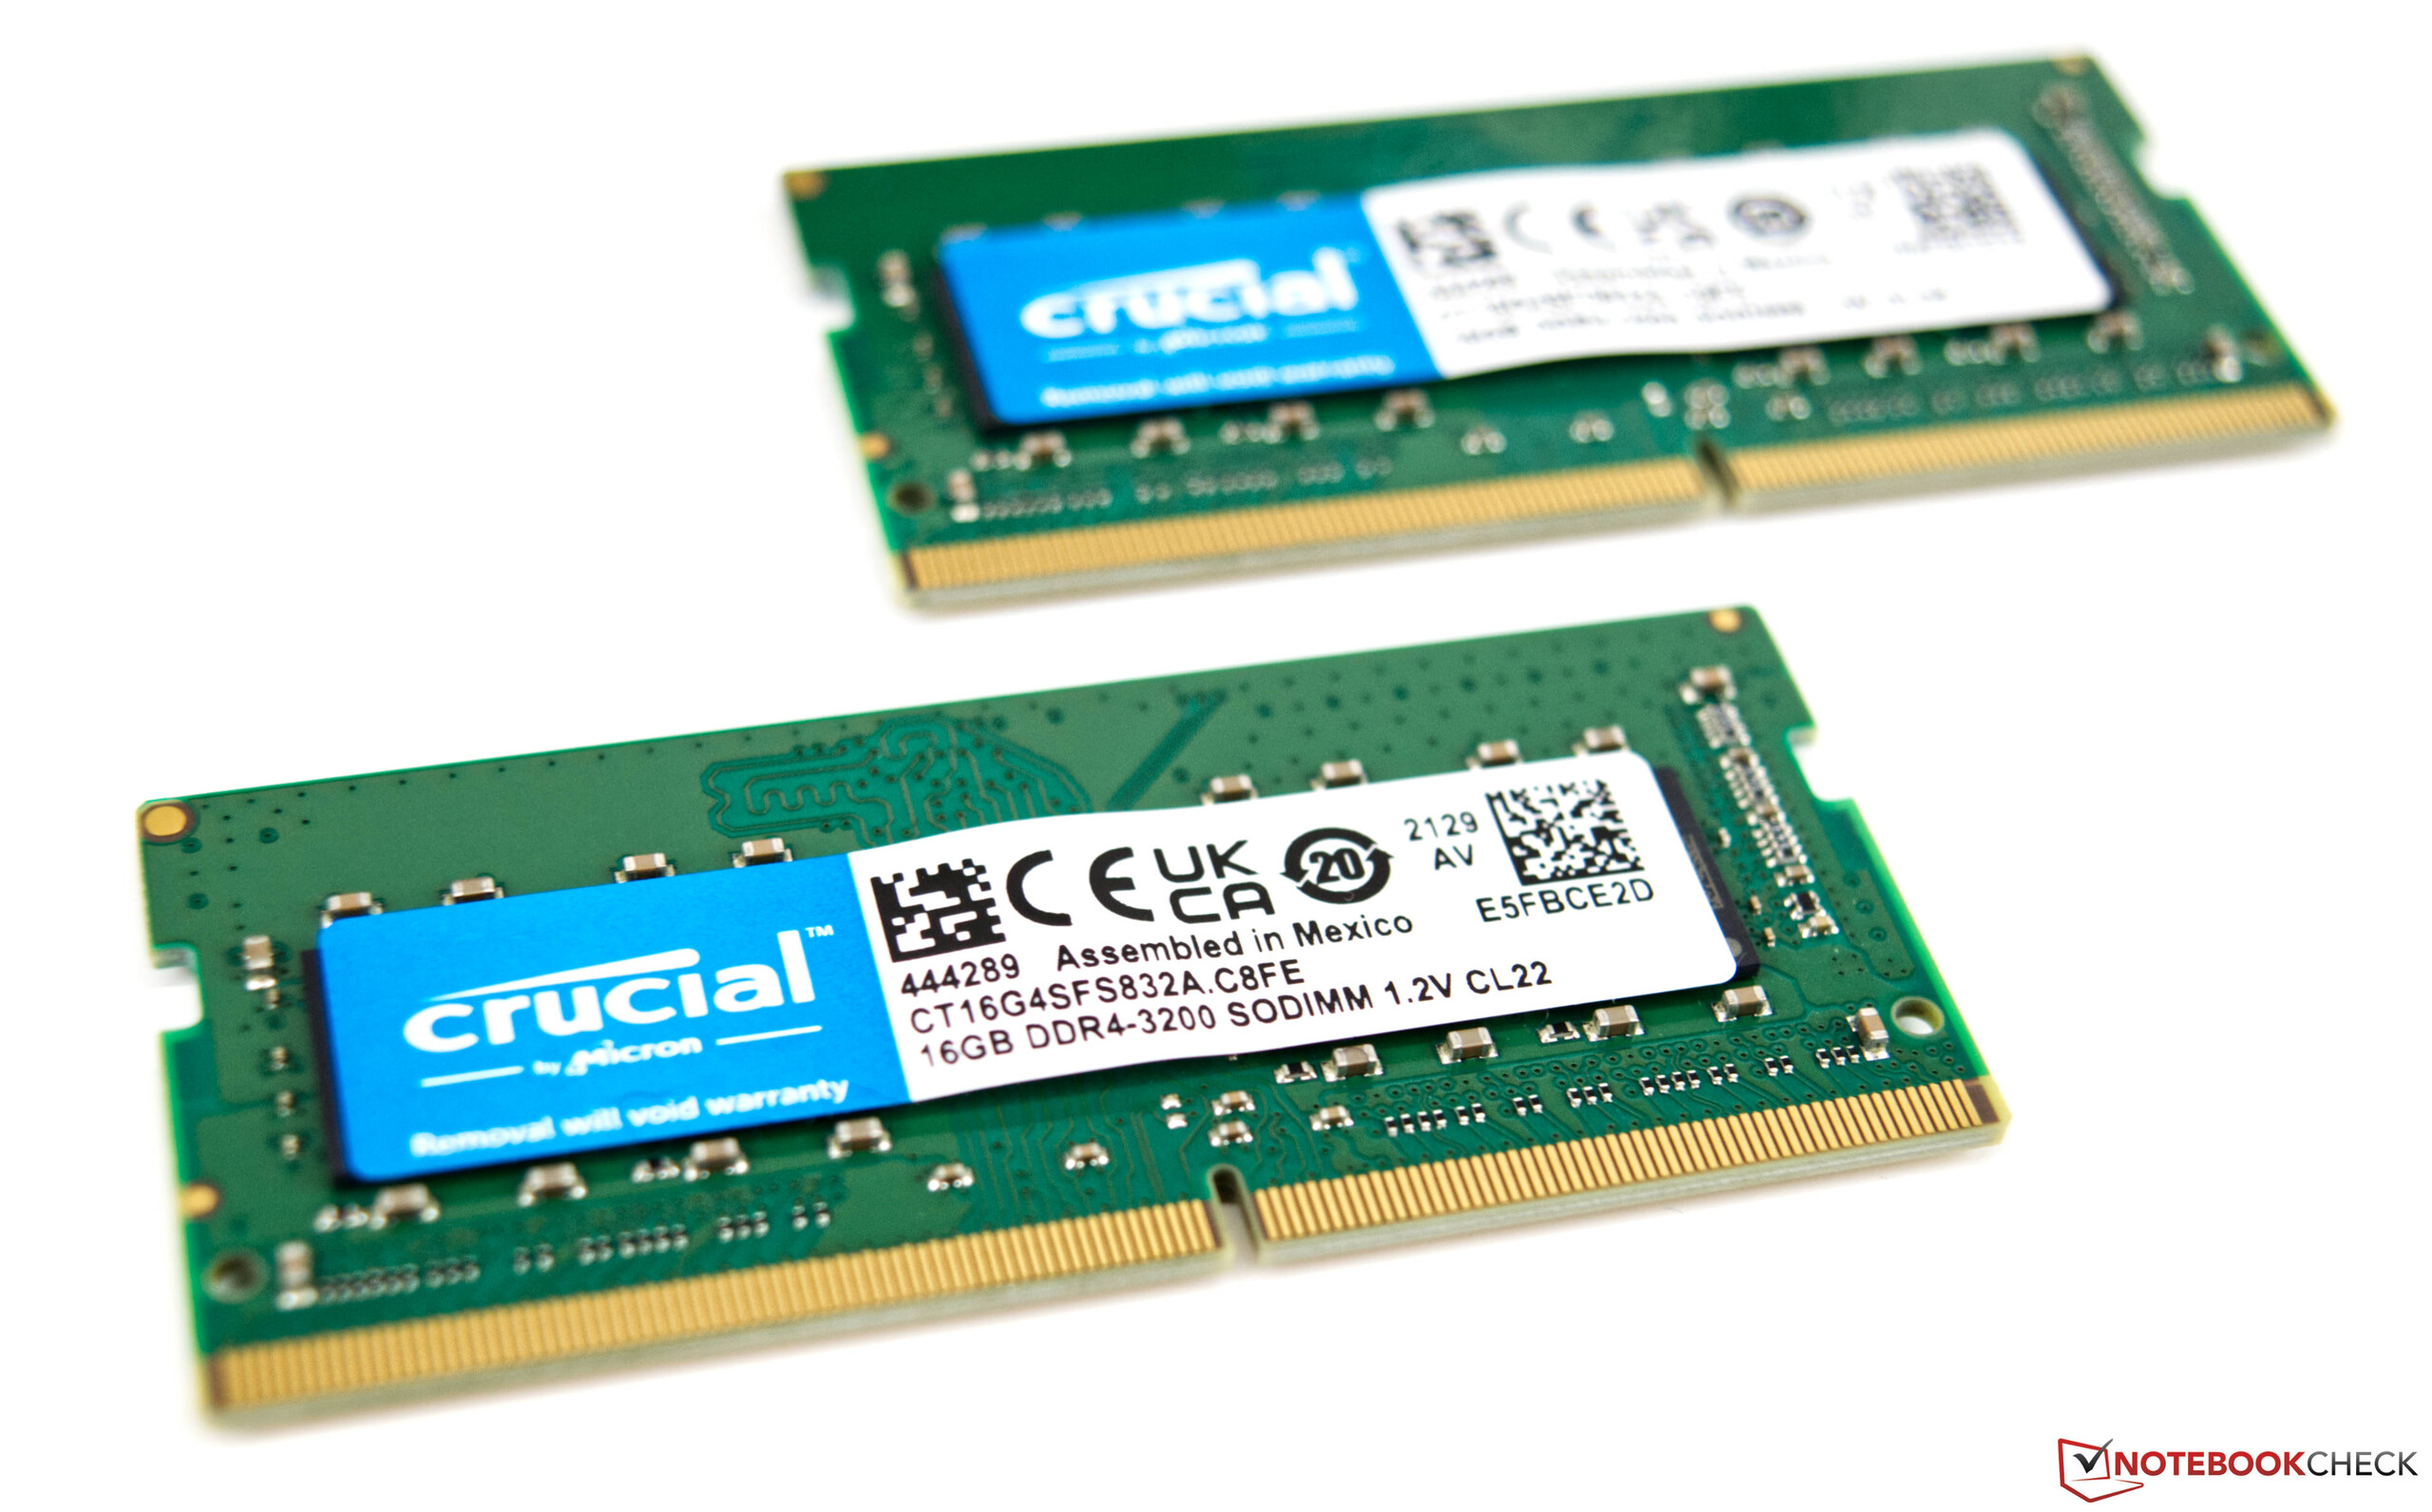
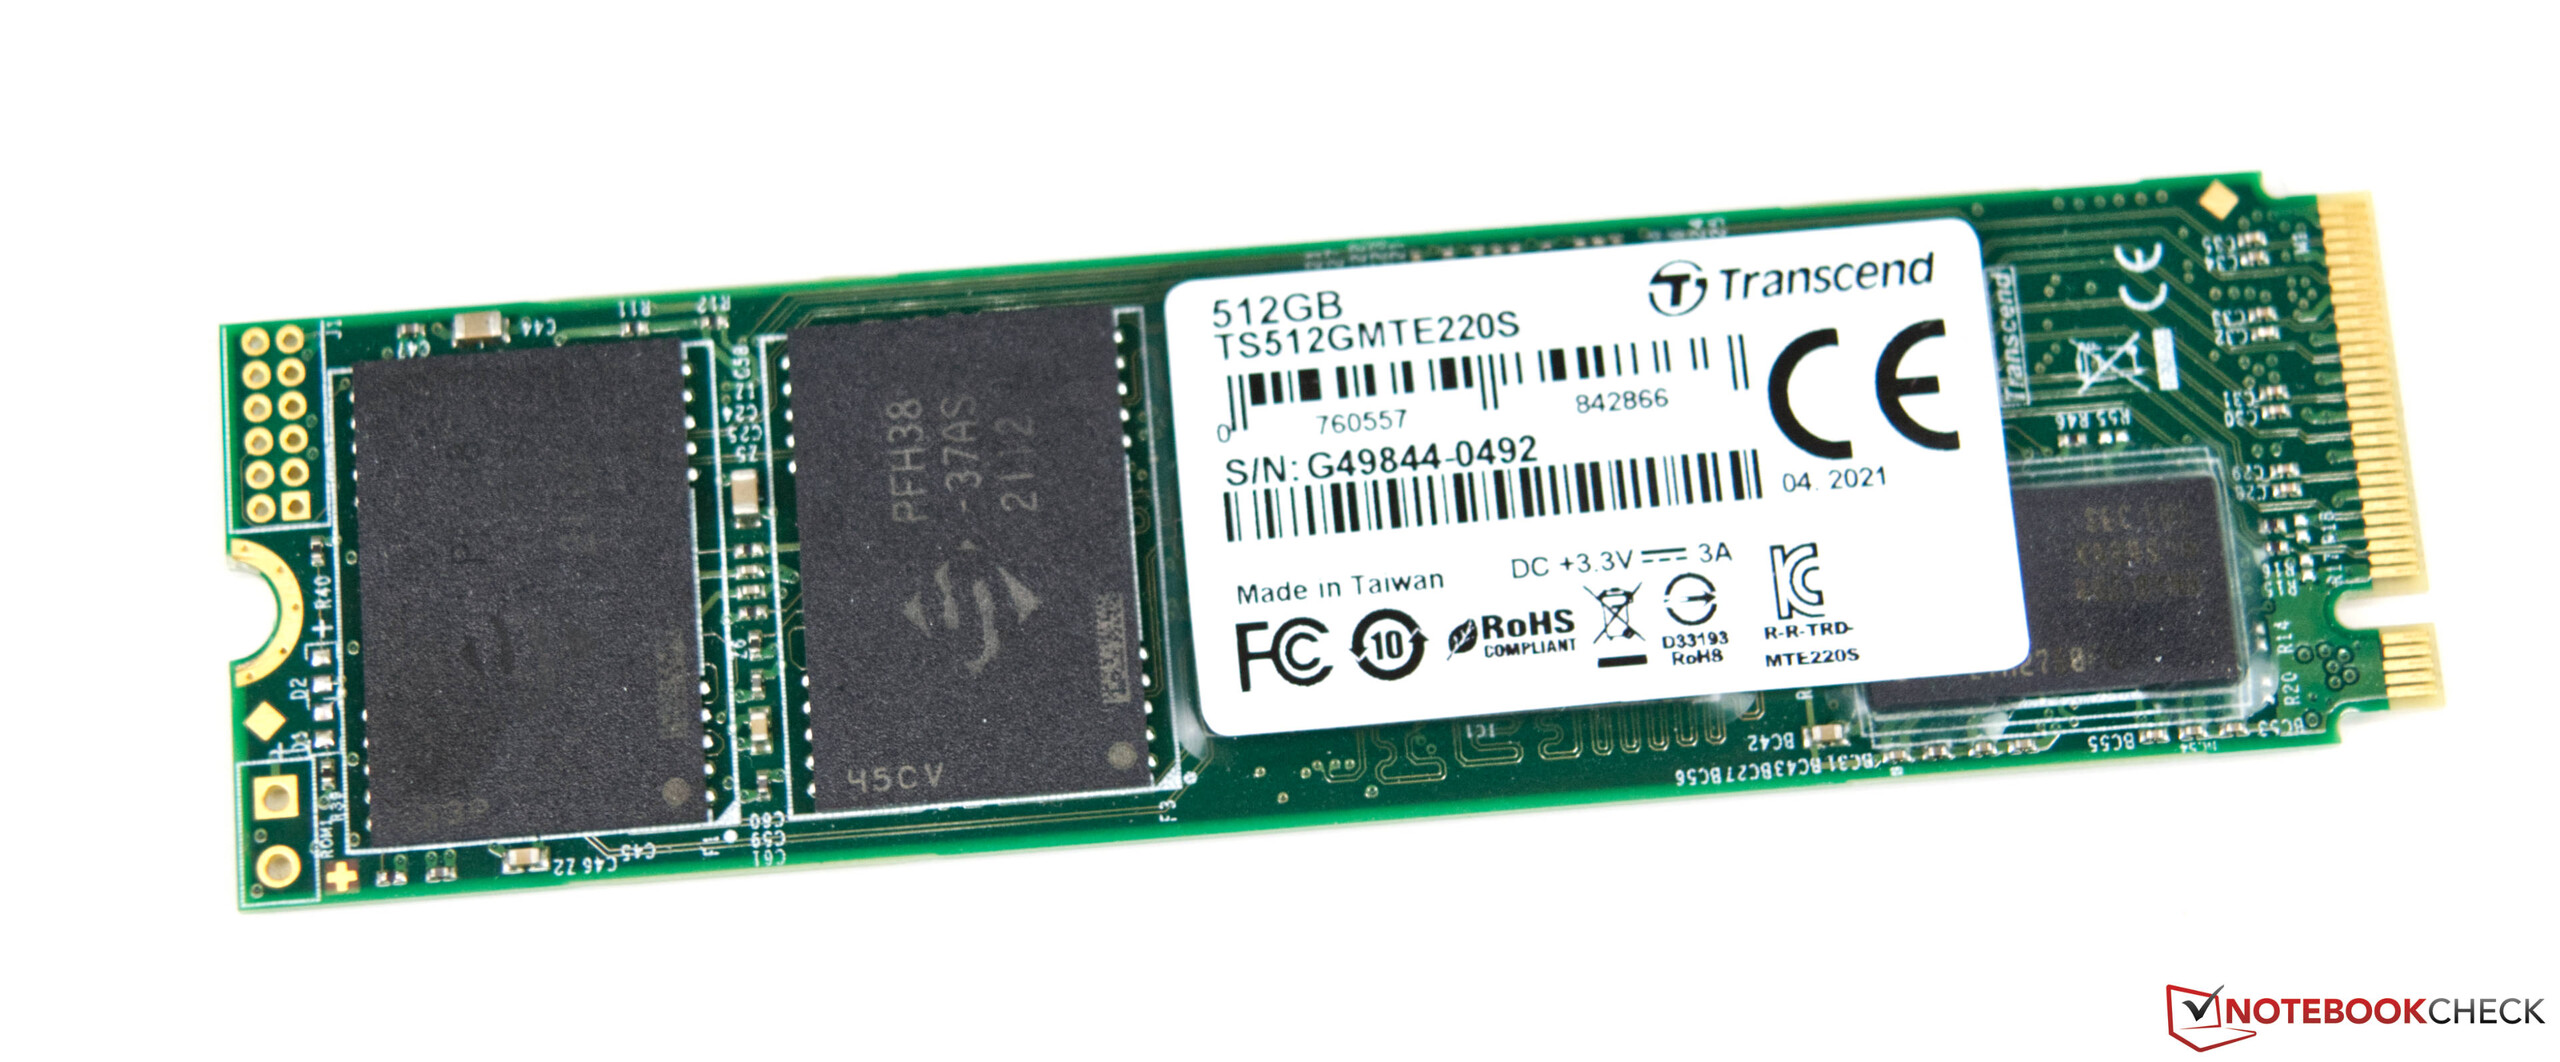
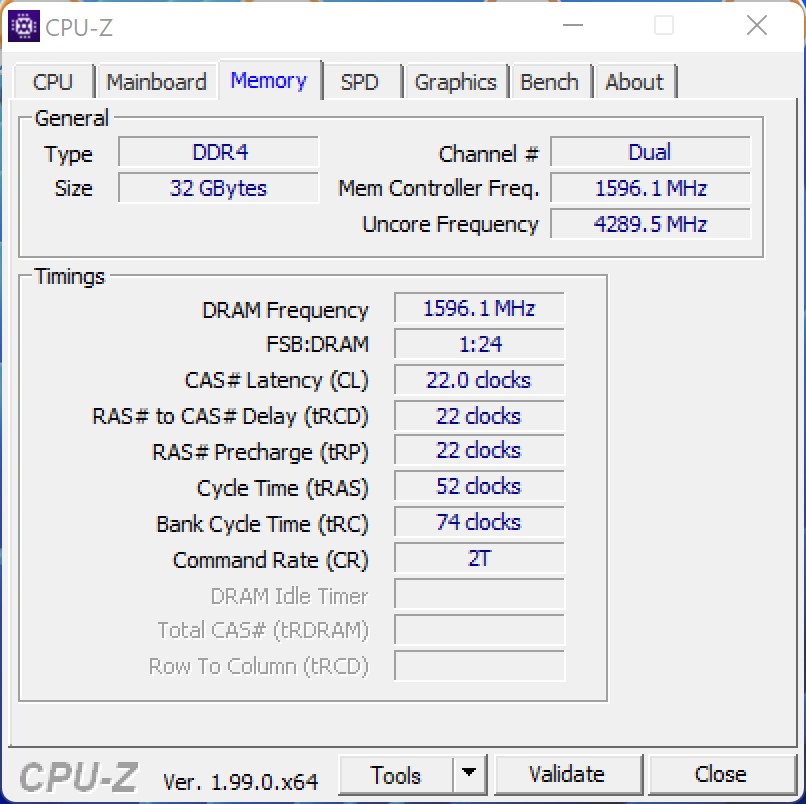
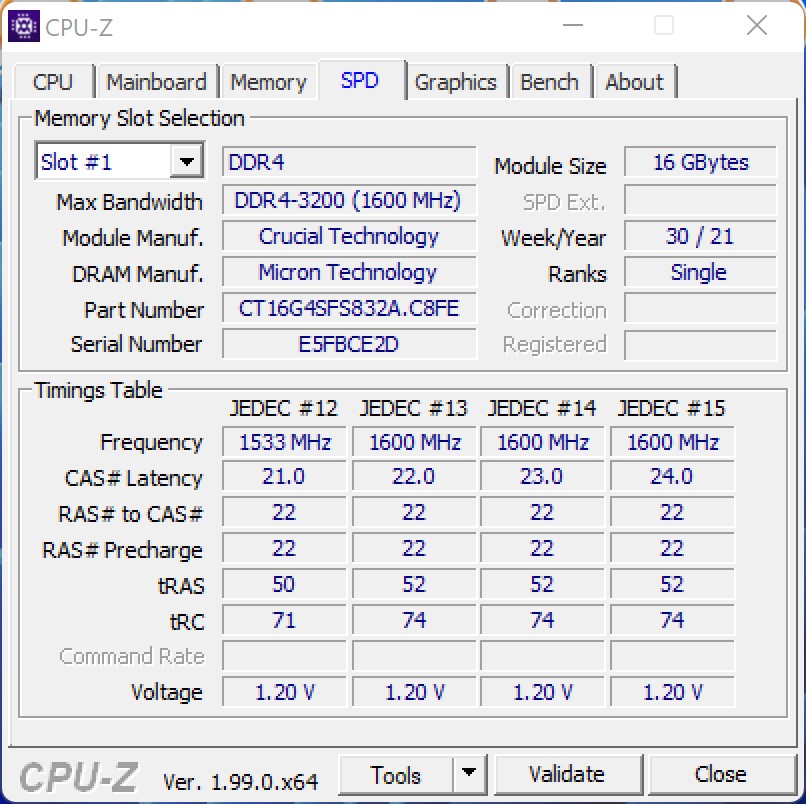
Al comprar el Intel NUC 12 Extreme Kit, hay que tener en cuenta que se trata de un sistema barebone. El SSD, la RAM y la tarjeta gráfica dedicada no están incluidos. Para estos, miramos nuestros propios suministros y equipamos el sistema con un SSD NVME de 512 GB y 32 GB de RAM DDR4. En cuanto a la tarjeta gráfica dedicada, nos decidimos a propósito por la Nvidia GeForce RTX 3060, con el fin de permitir una comparación justa con el kit Intel NUC 11 Extreme.
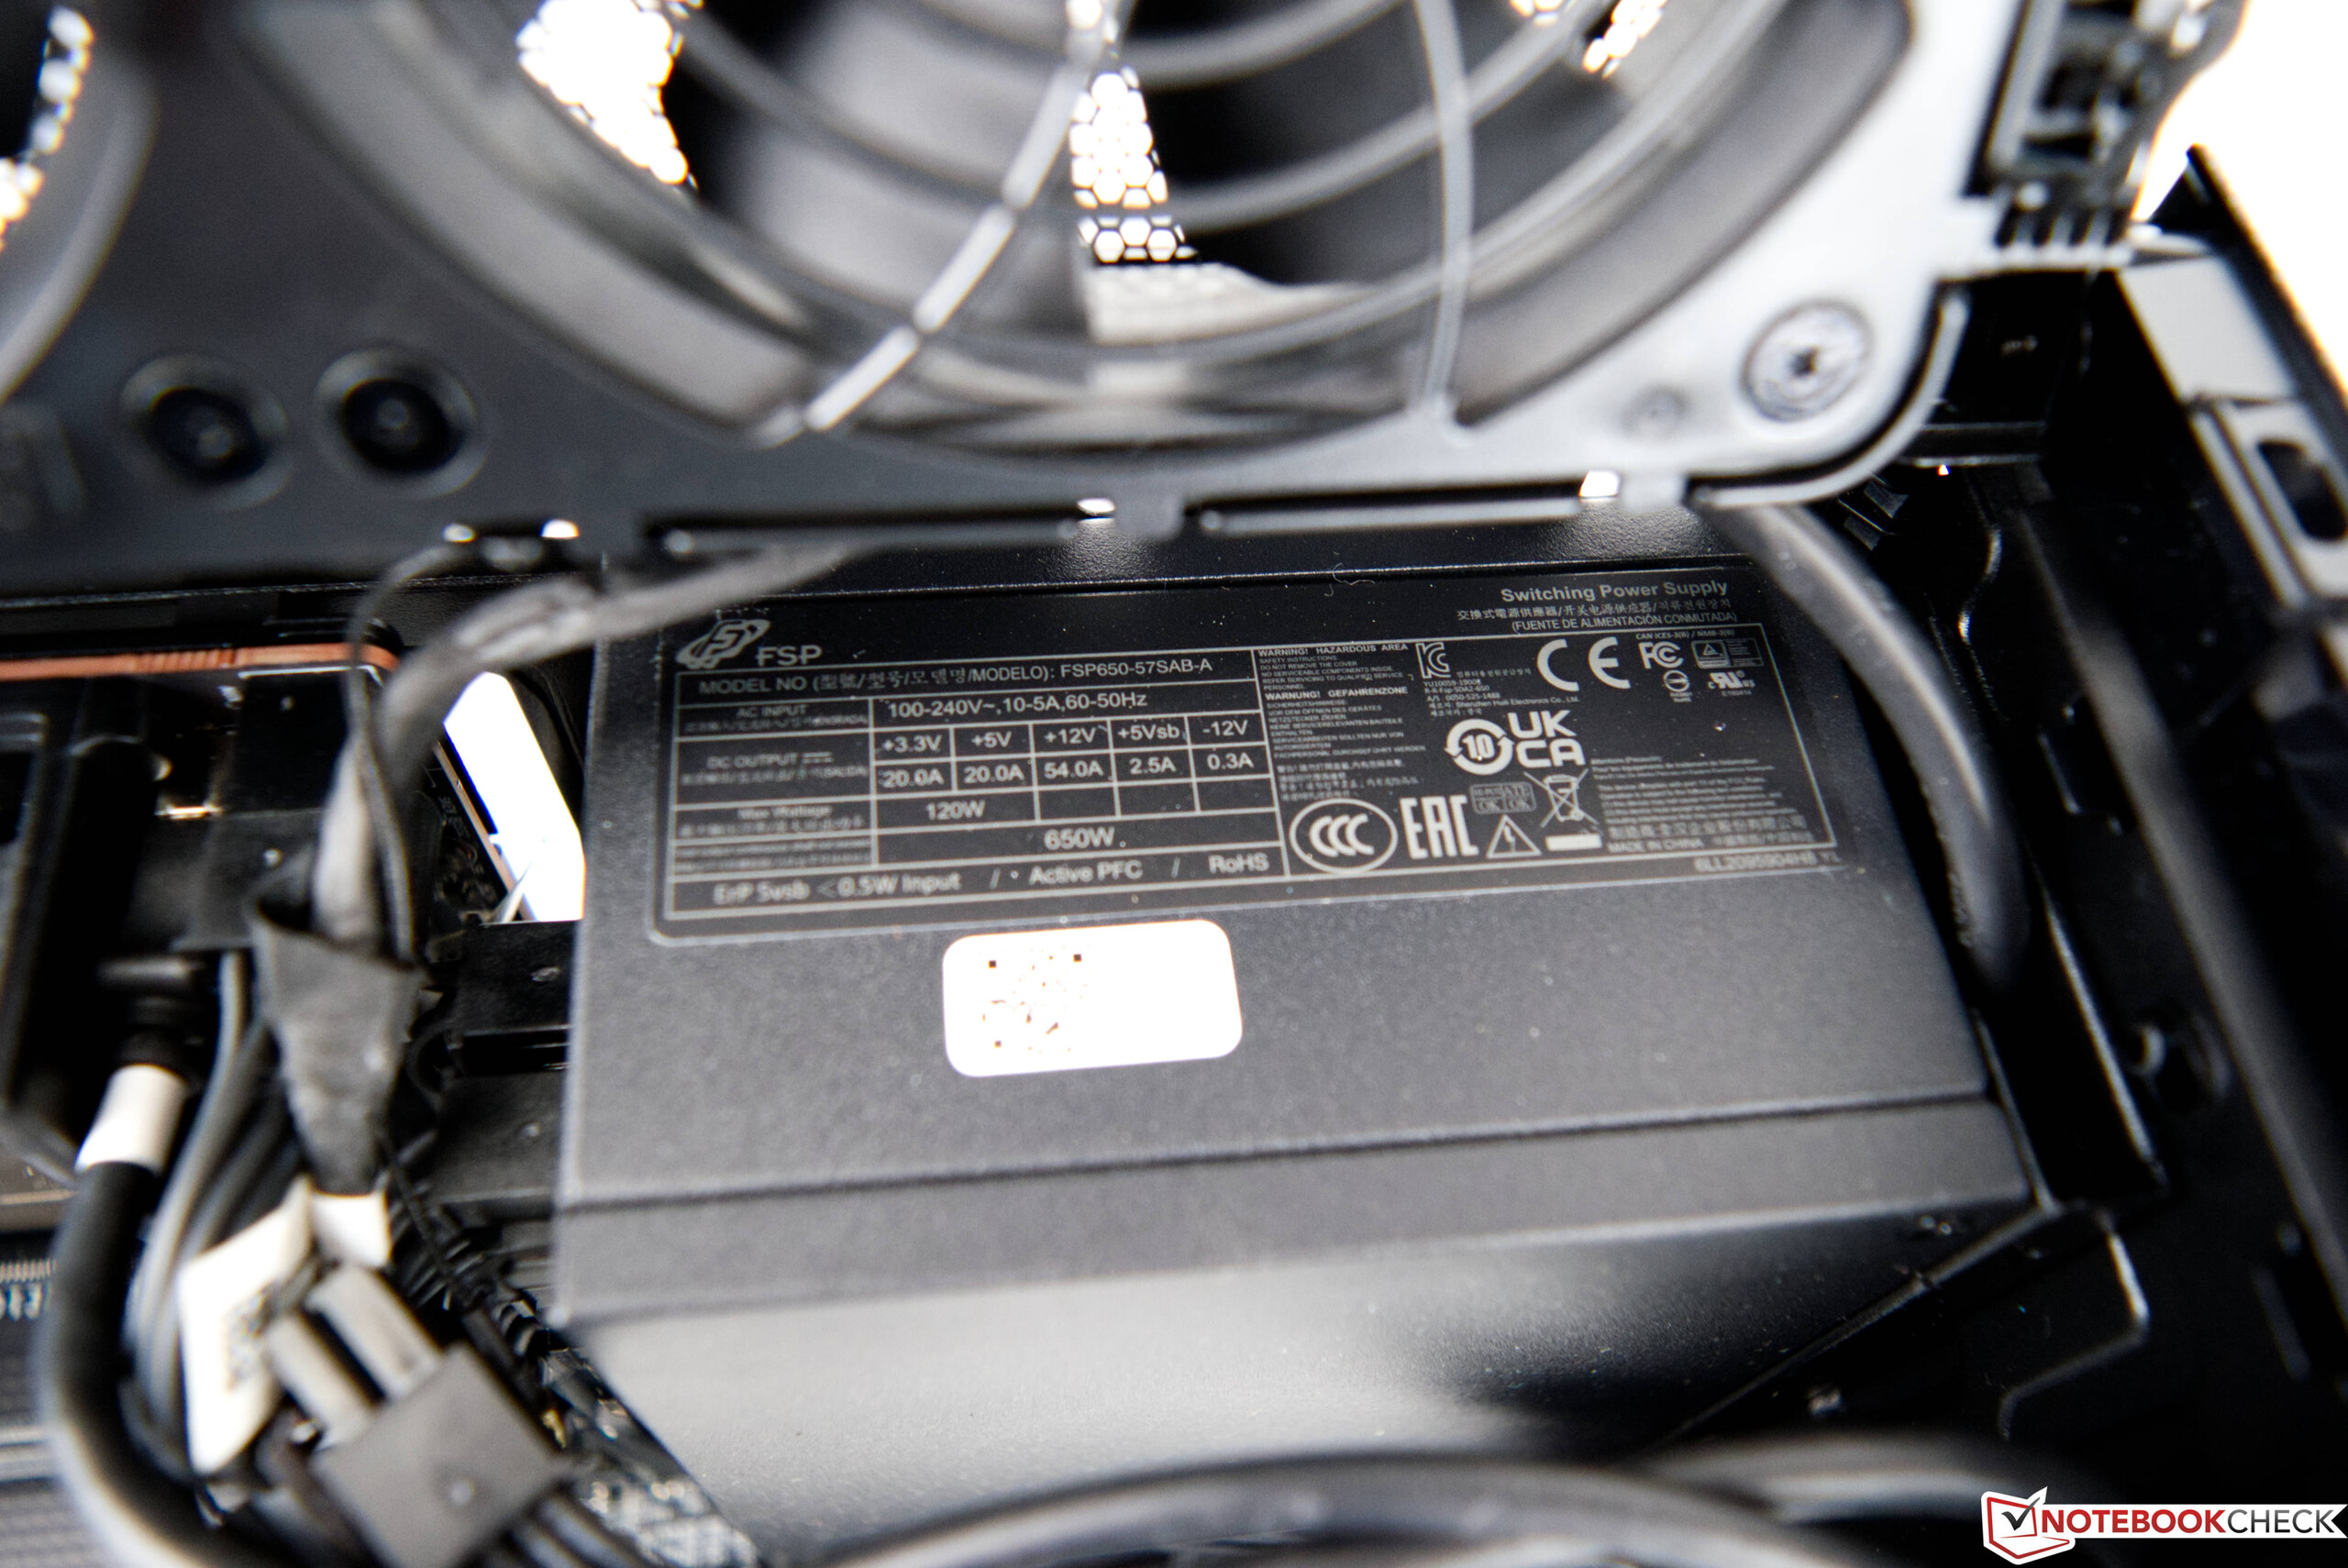
Para una tarjeta gráfica dedicada, se pueden utilizar modelos con una longitud máxima de 30,5 cm (~12 pulgadas). La fuente de alimentación SFX de 650 vatios ofrece suficiente potencia para hacer funcionar también los modelos actuales de gama alta. Sin embargo, la refrigeración de estos aceleradores de píxeles no debería ocupar más de dos ranuras. Actualmente puedes conseguir el kit Intel NUC 12 Extreme por 1450 euros (~1589 dólares).
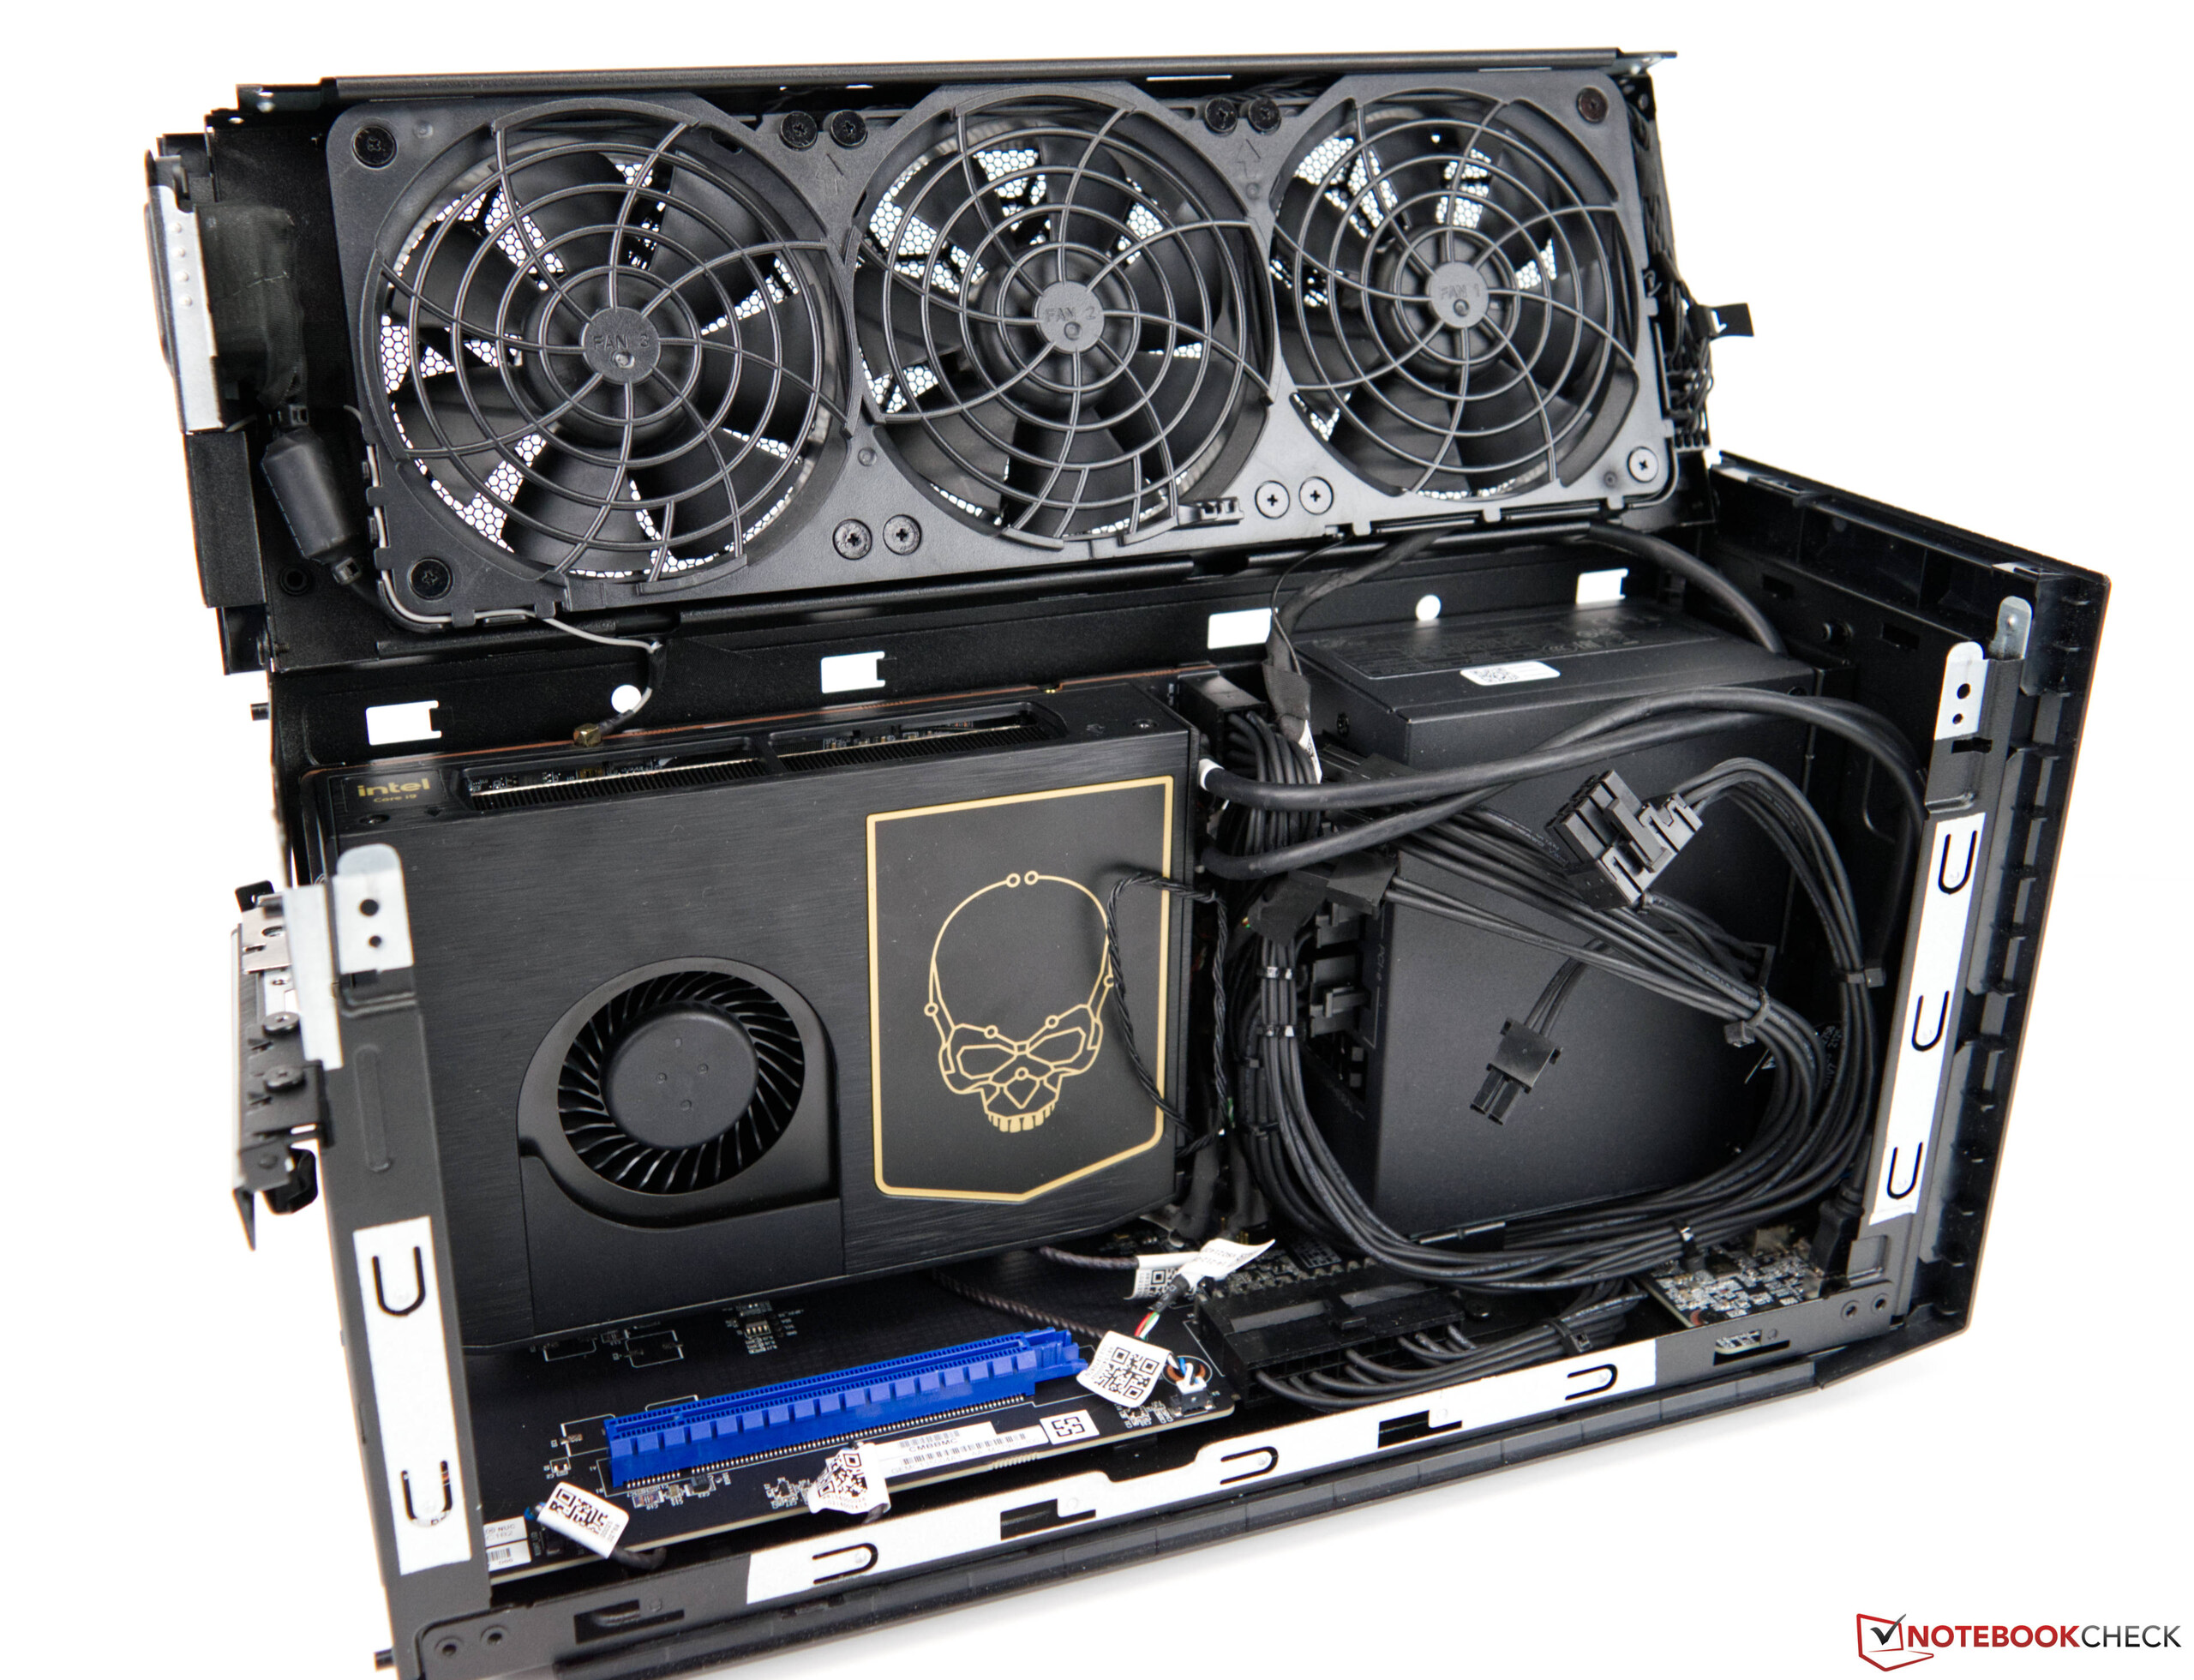
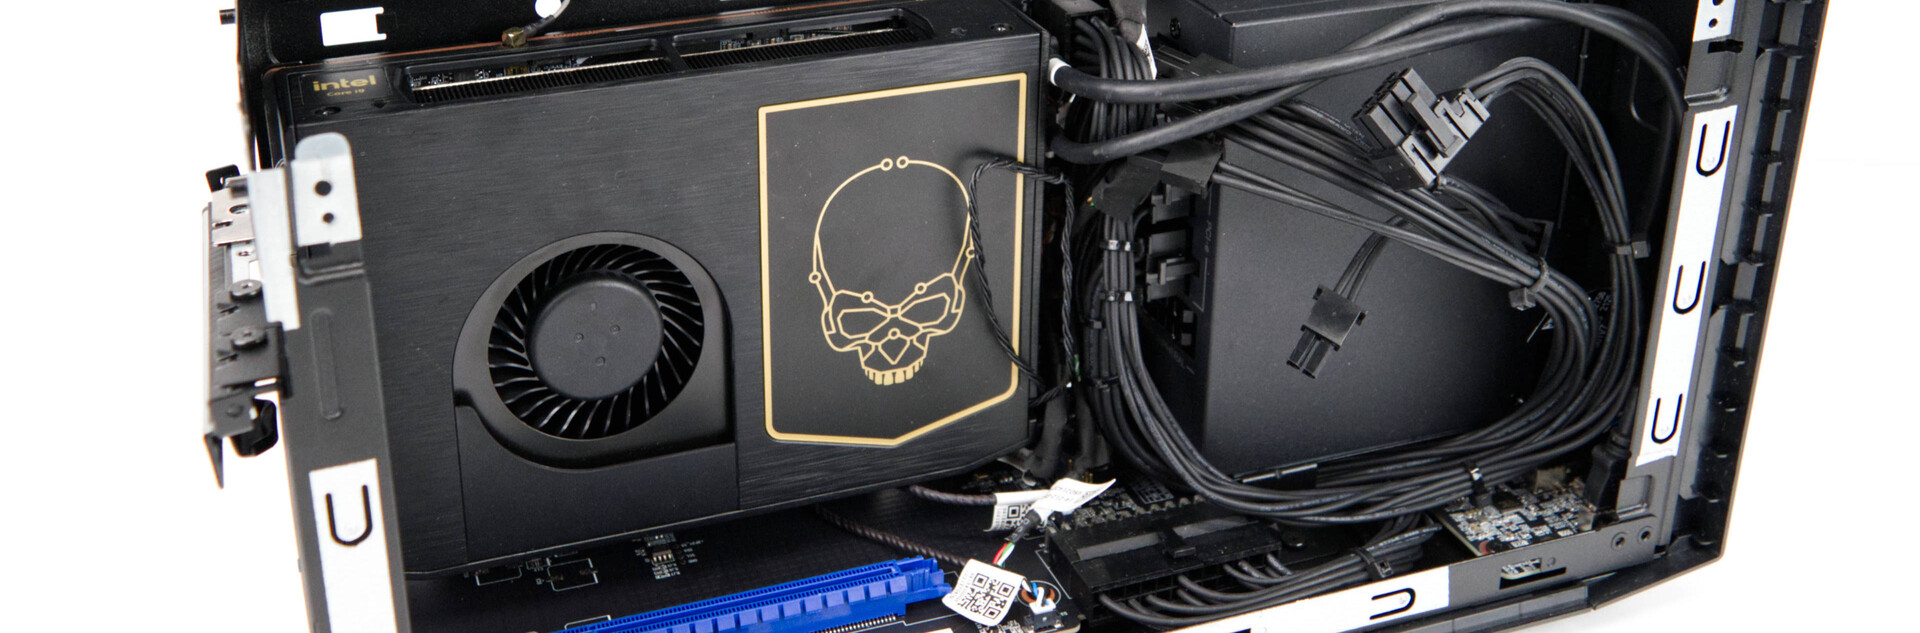
El elemento de cálculo Intel NUC 12 Extreme en detalle
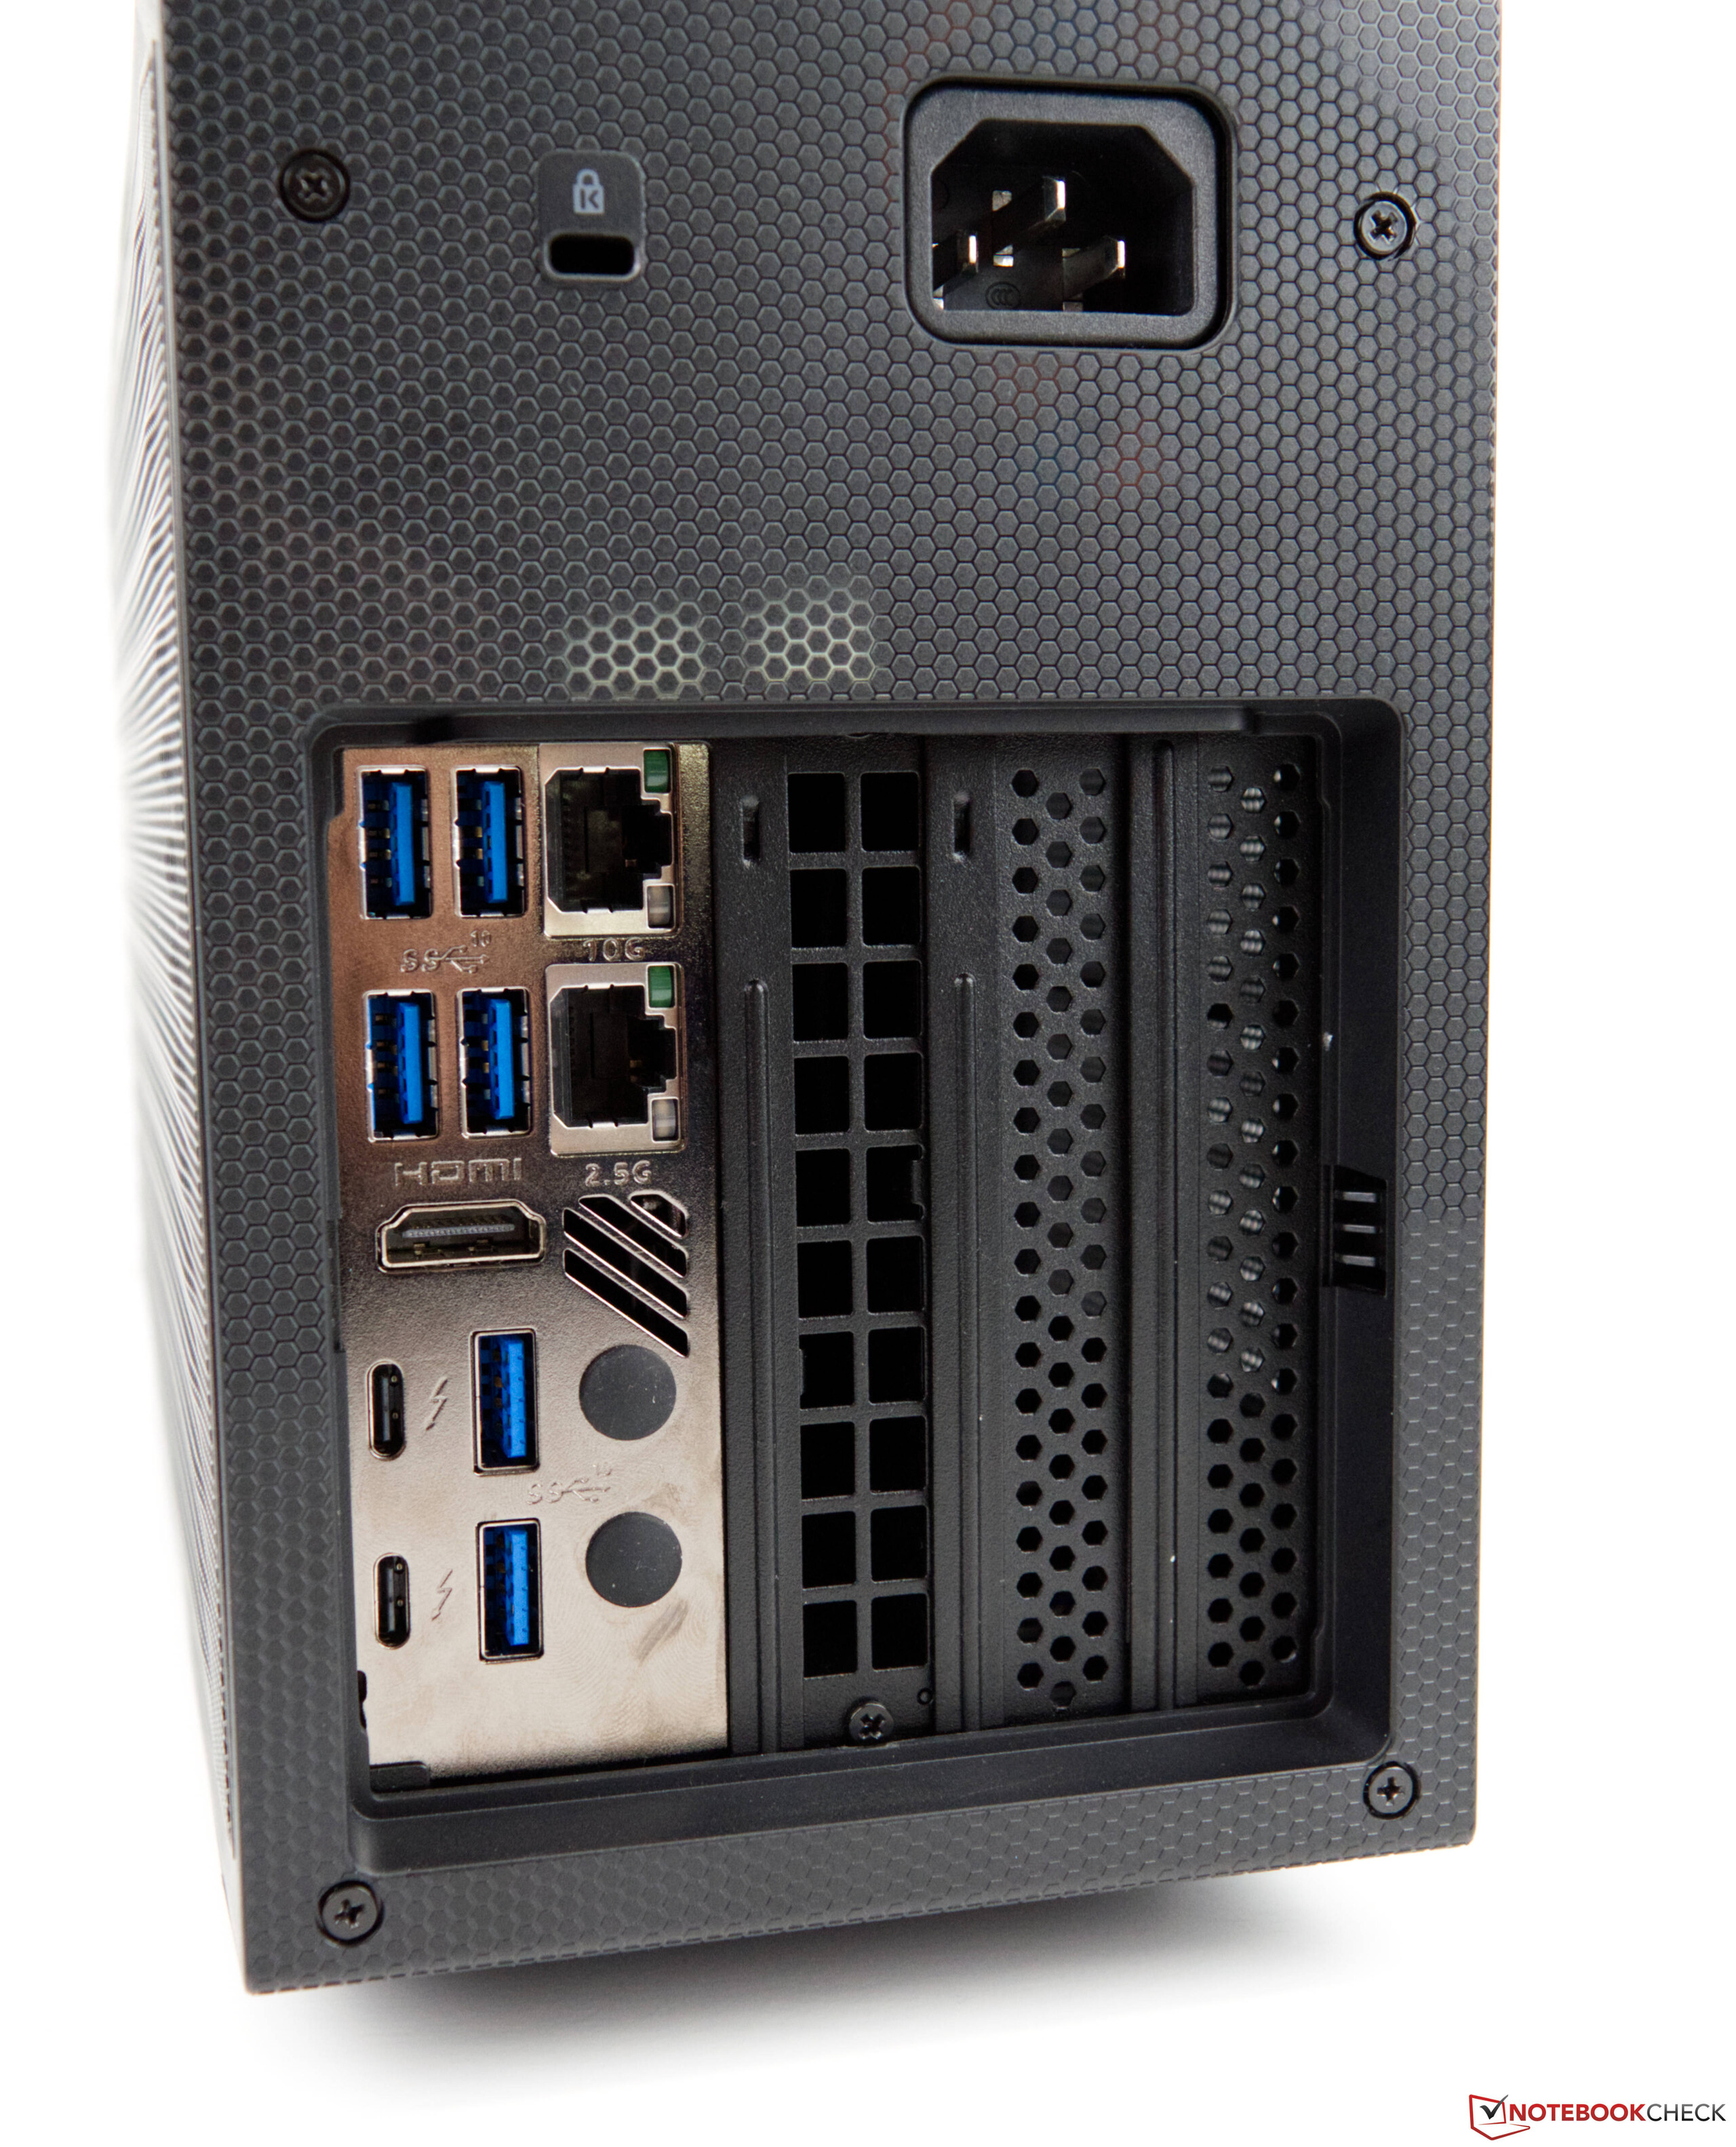
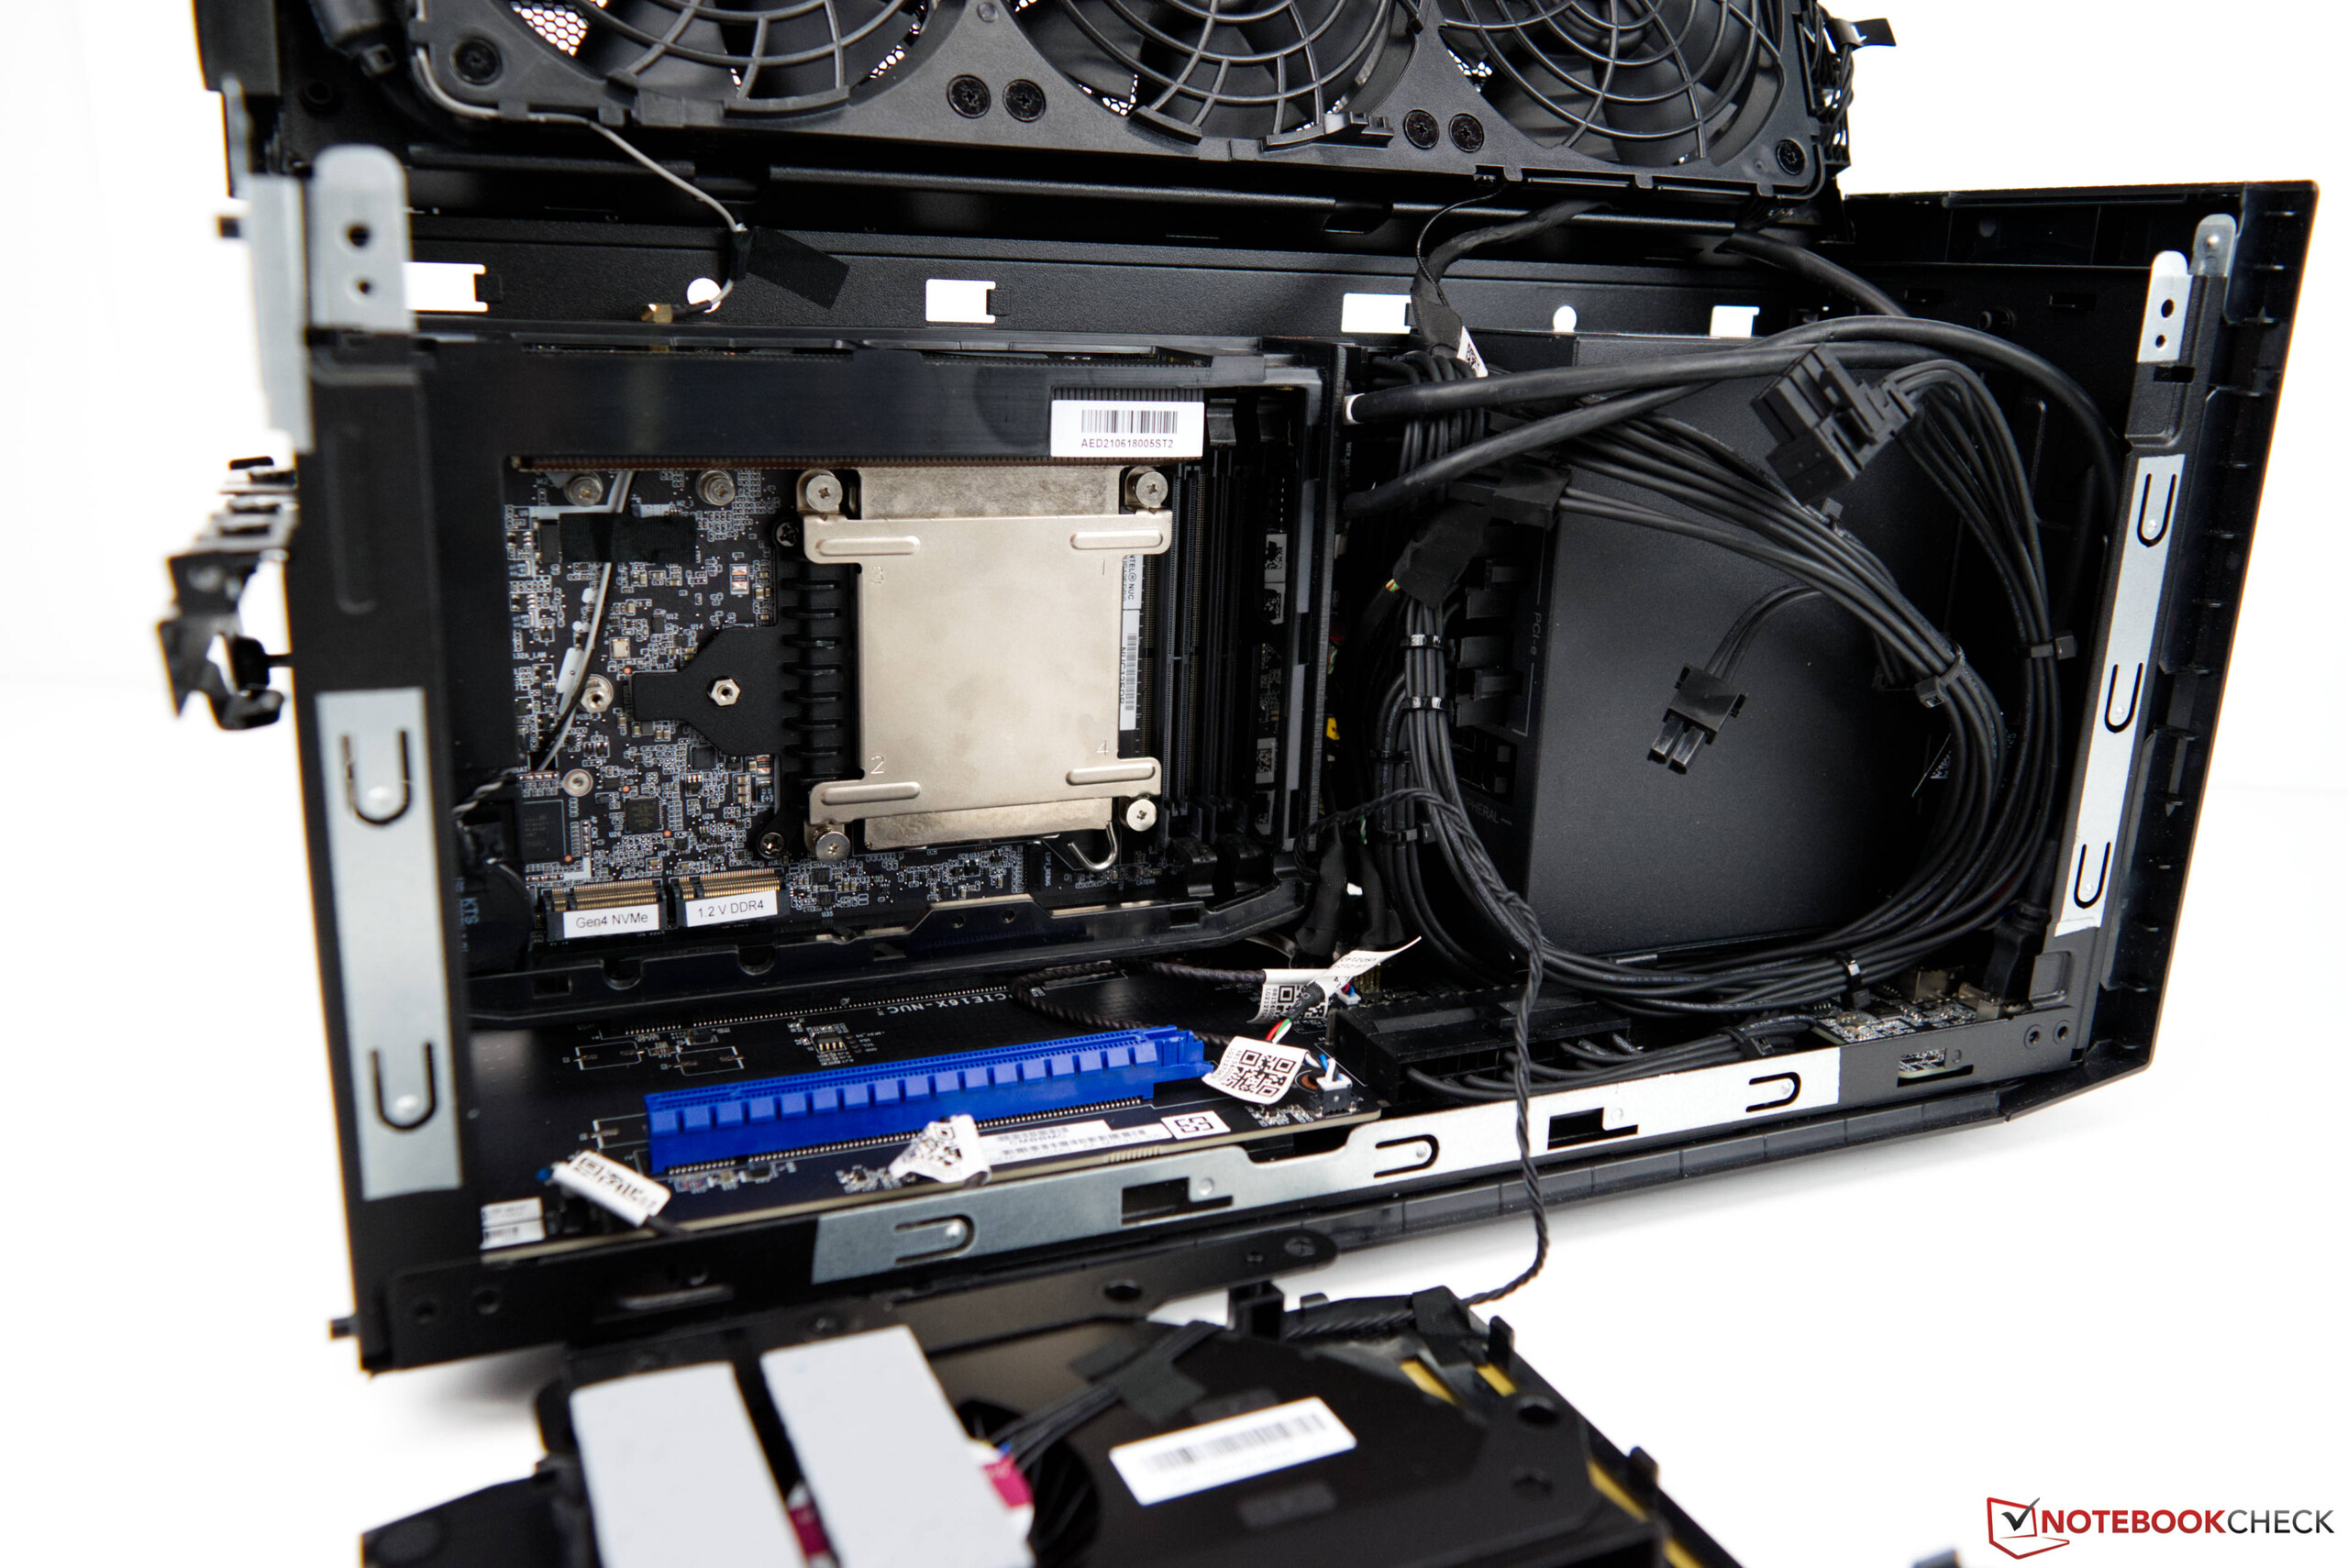
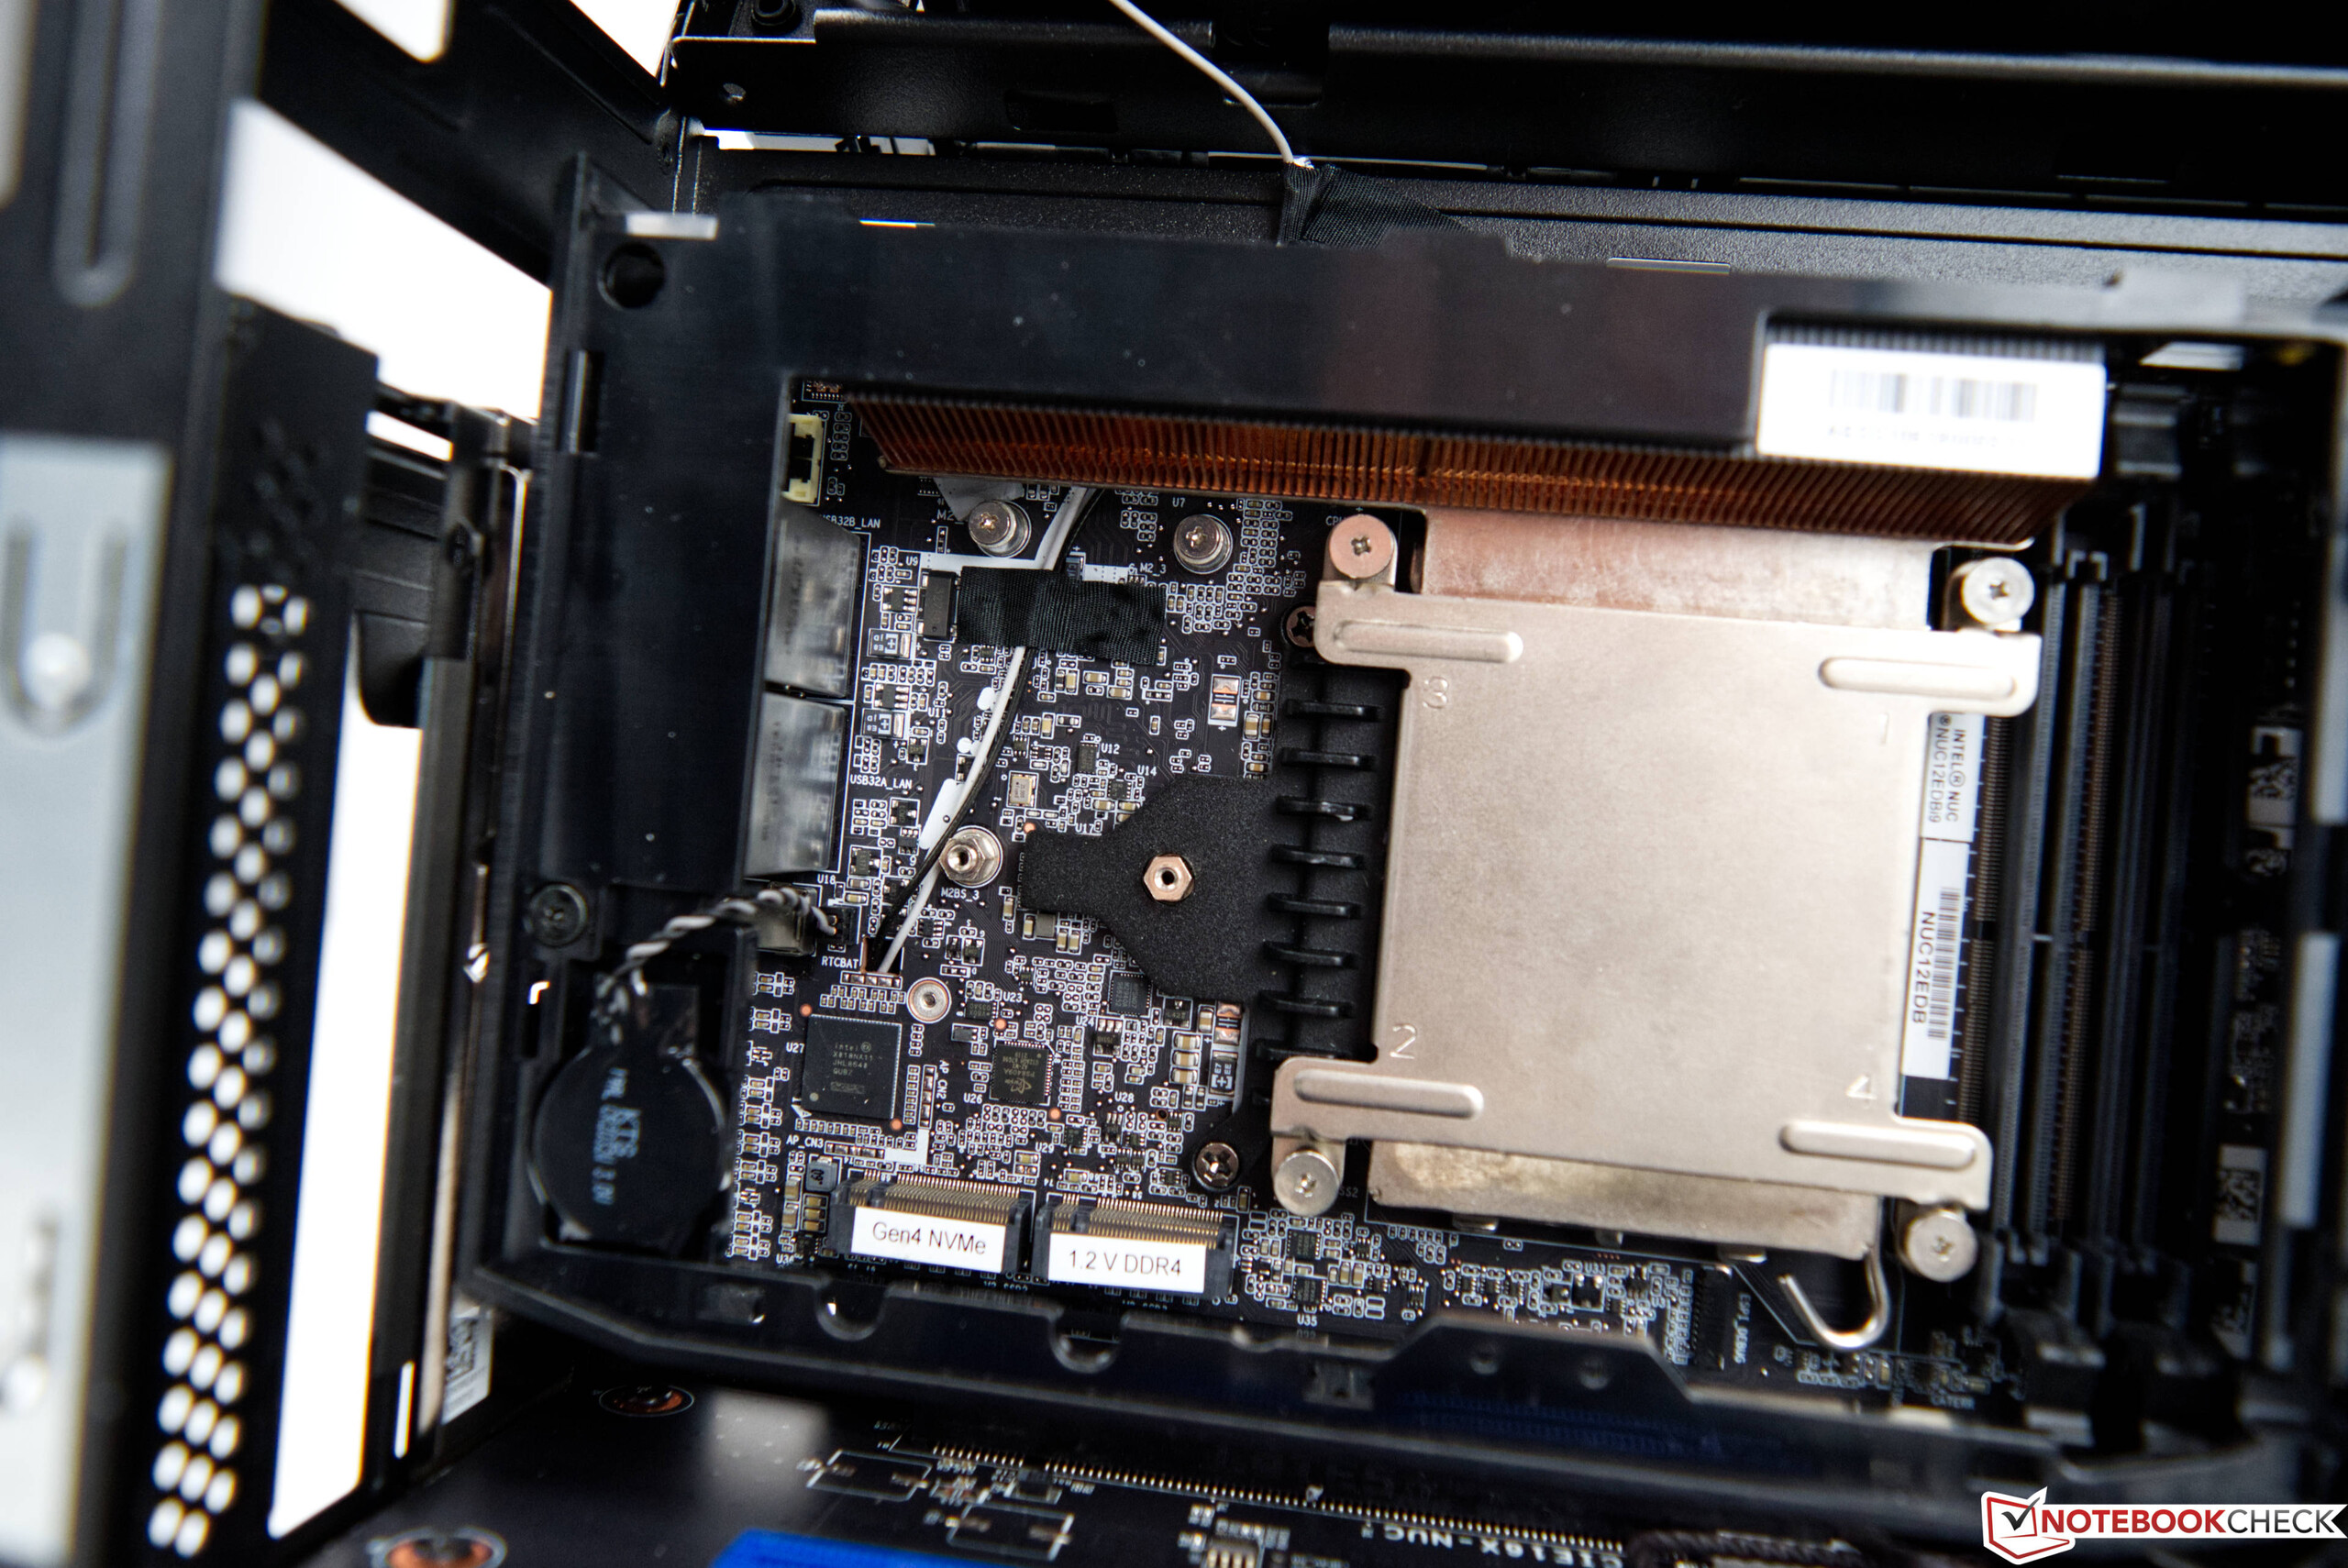
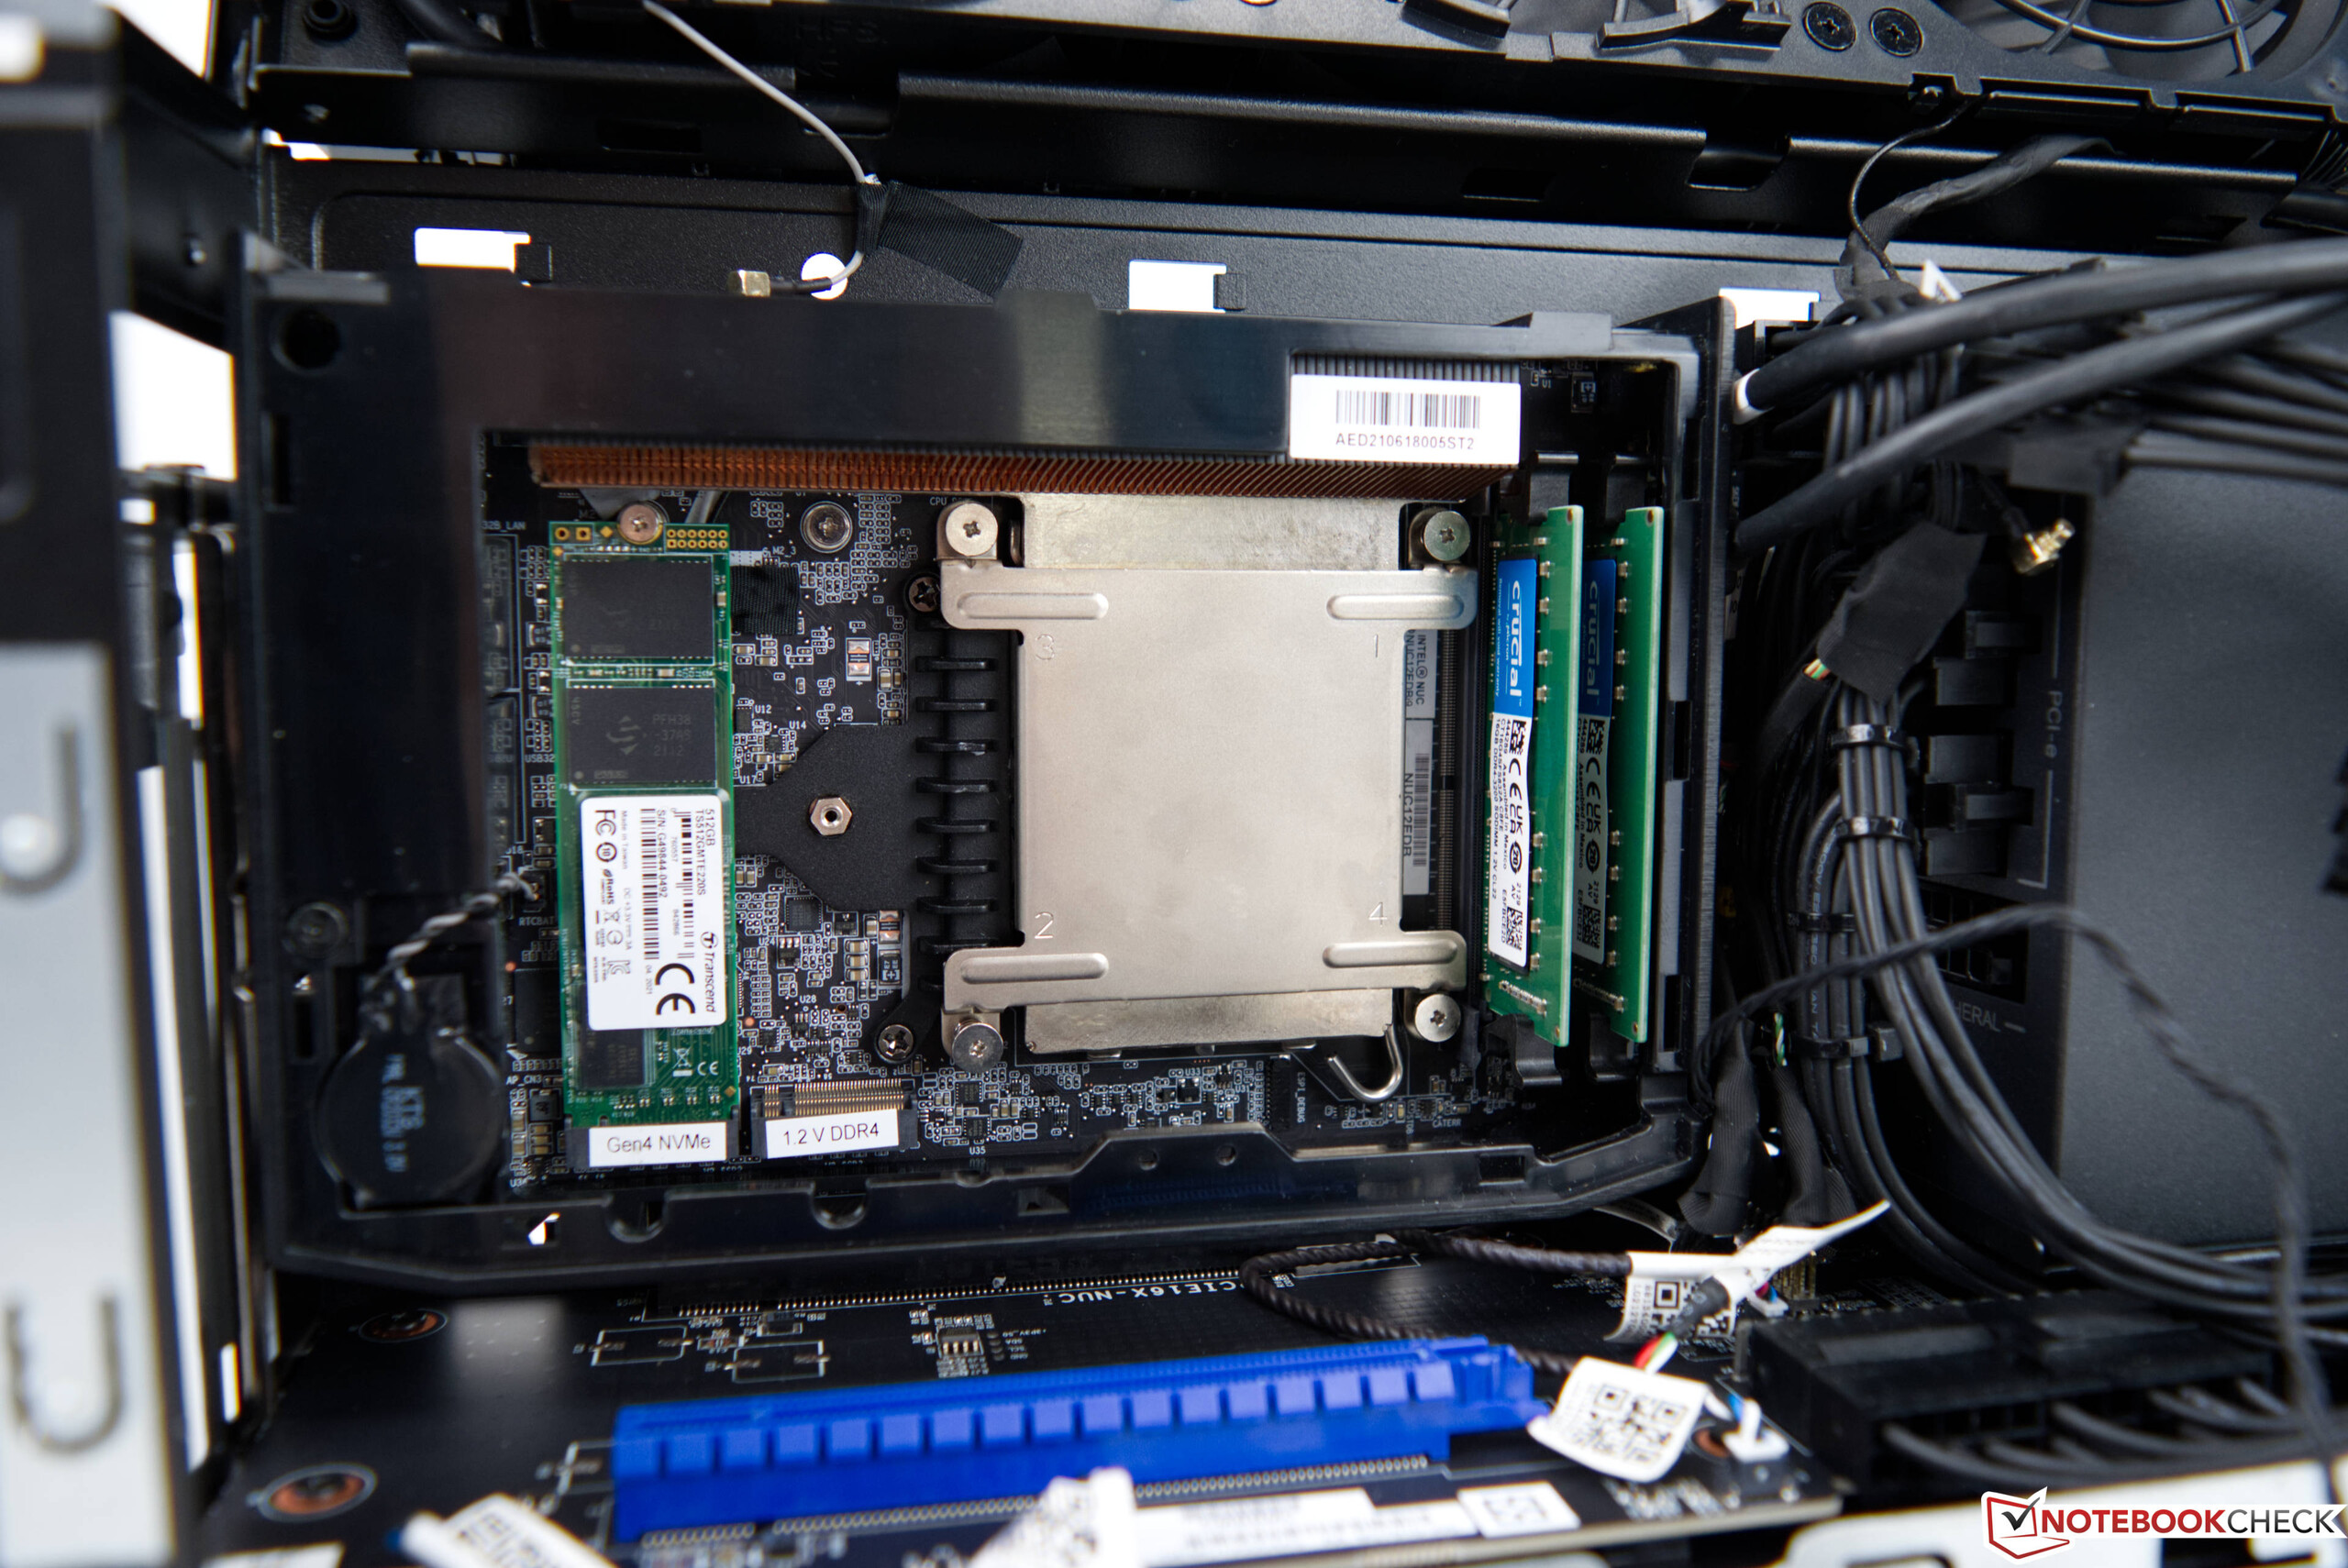
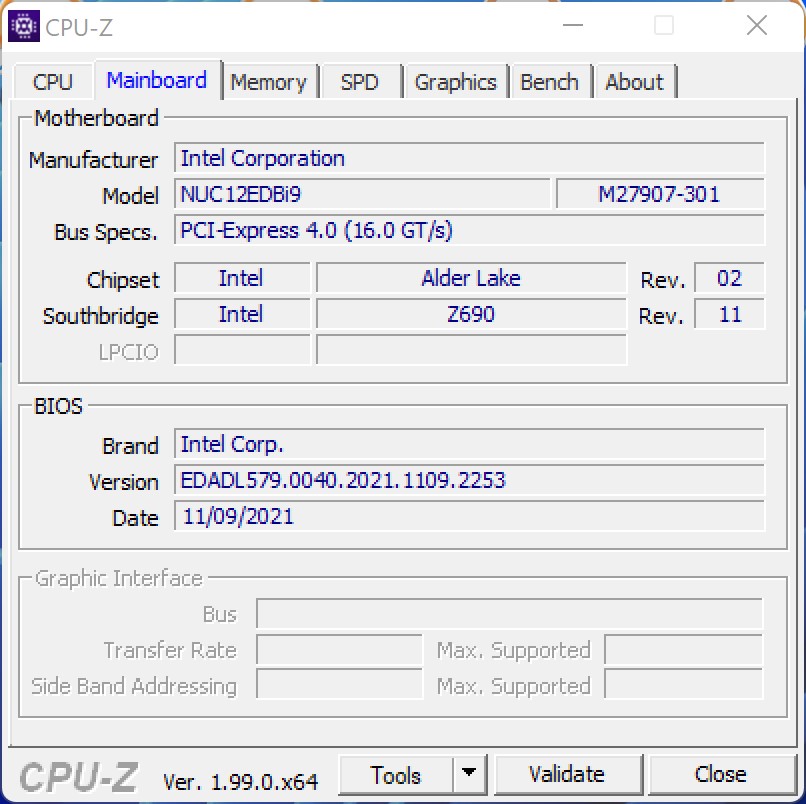
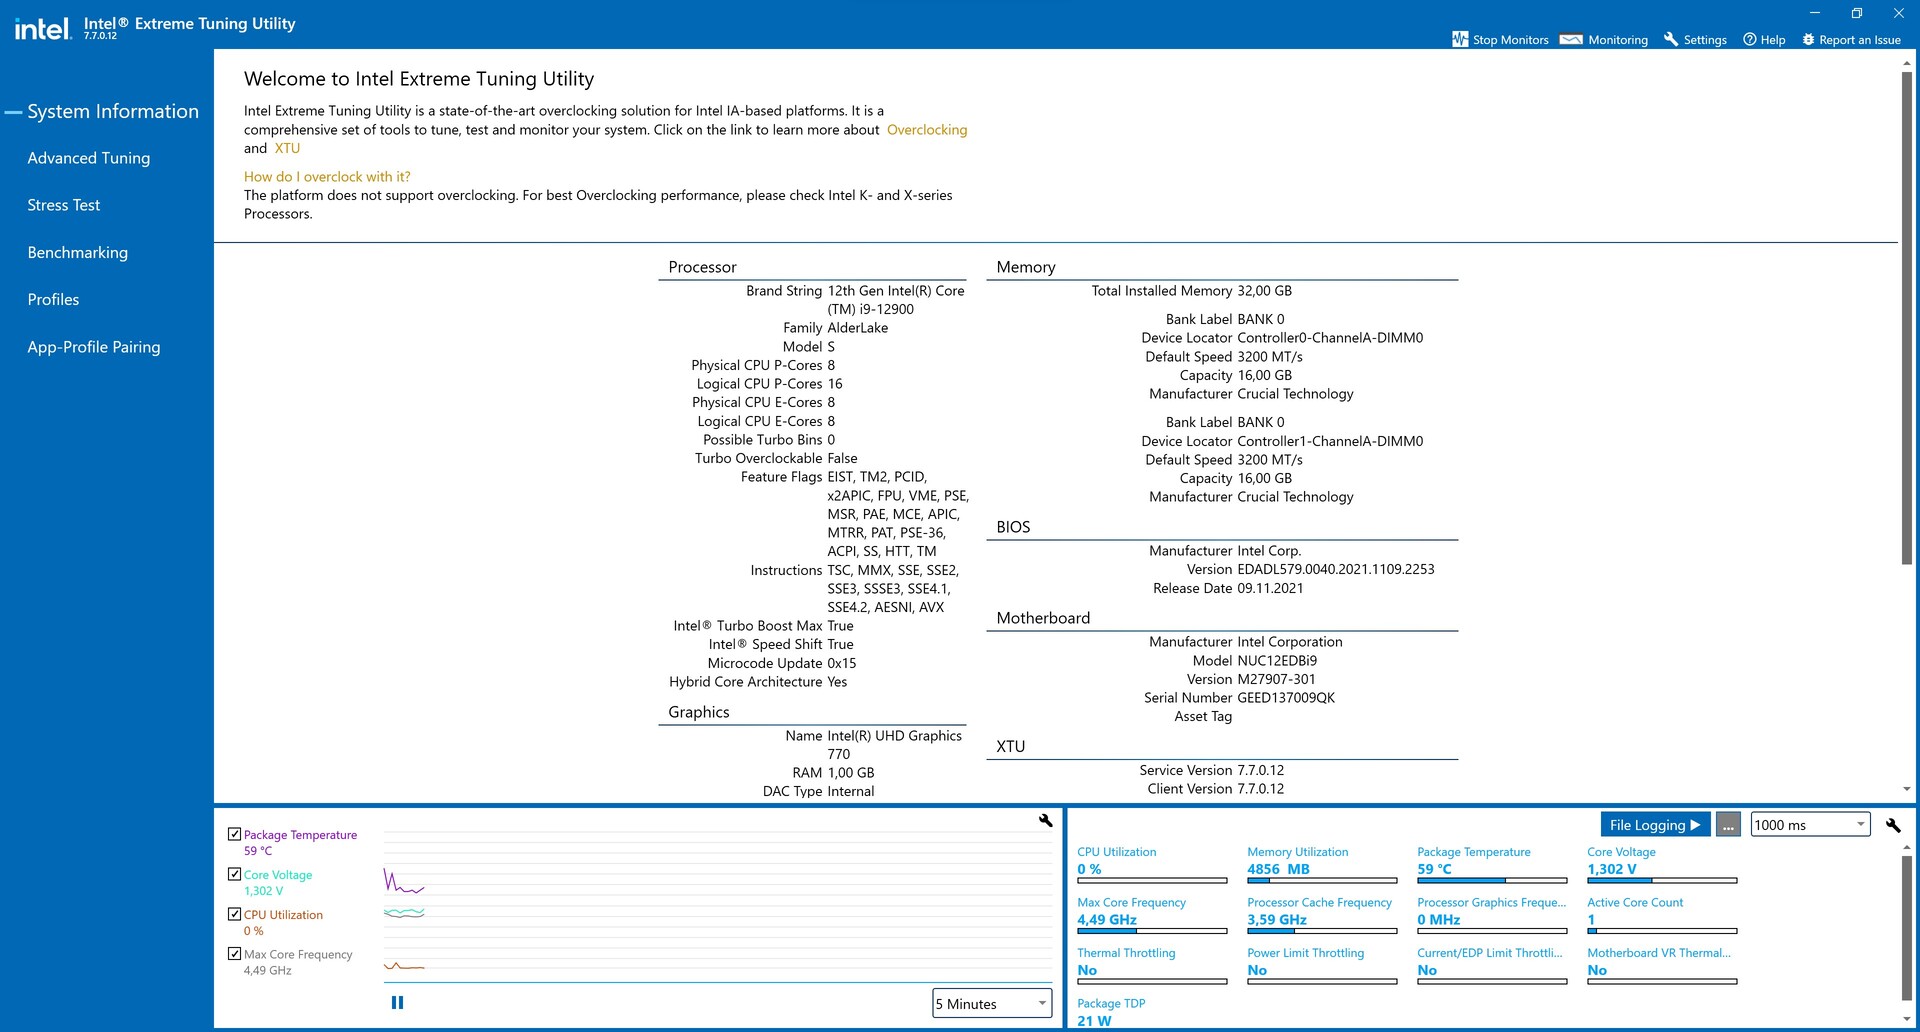
Con el Intel Core i9-12900, elIntel NUC 12Extreme ofrece un SoC de 16 núcleos con 24 hilos basado en la serie S de Alder Lake. Como ya hemos mencionado, el Core i9-12900 usa una mezcla de núcleos P y E. En contraste con el Intel NUC 11 Extreme Kit anterior, ahora se utiliza un procesador de sobremesa de tamaño completo. Todas las conexiones externas siguen estando en el Compute Element, que se aloja en el sistema en la conocida forma de tarjeta PCI Express. En la parte trasera hay seis conexiones USB 3.1 Gen2 Tipo-A y dos USB-C que soportan Thunderbolt 4. Con HDMI o Thunderbolt, se pueden ejecutar hasta tres pantallas al mismo tiempo. Hay conexiones 10G y 2,5G para la red por cable. Además, el Intel WiFi 6E AX211 se comunica utilizando el estándar más reciente. El propio Compute Element ofrece espacio para dos módulos RAM SO-DIMM de hasta 64 GB cada uno, y también hay espacio para dos SSD M.2.
Rendimiento de la WLAN
En la prueba WLAN, el Intel WiFi 6E AX211 es capaz de alcanzar muy buenas tasas de transferencia en el rango de 6 GHz en combinación con nuestro router de prueba ASUS GT-AXE11000. En nuestra prueba, medimos una buena media de 1850 Mbit/s al enviar o recibir datos.
| Networking | |
| iperf3 transmit AXE11000 6GHz | |
| Intel Dragon Canyon NUC - RTX 3060 | |
| Media de la clase (229 - 2373, n=824) | |
| Medio Intel Wi-Fi 6E AX211 (385 - 1851, n=226) | |
| Minisforum EliteMini TH50 | |
| iperf3 receive AXE11000 6GHz | |
| Intel Dragon Canyon NUC - RTX 3060 | |
| Medio Intel Wi-Fi 6E AX211 (700 - 1857, n=226) | |
| Media de la clase (291 - 2361, n=828) | |
| Minisforum EliteMini TH50 | |
| iperf3 receive AX12 | |
| MSI Vector GP66 12UGS | |
| Medio Intel Wi-Fi 6E AX211 (1178 - 1623, n=4) | |
| Alienware x14 i7 RTX 3060 | |
| Media de la clase (5 - 2374, n=2624) | |
| iperf3 transmit AX12 | |
| MSI Vector GP66 12UGS | |
| Alienware x14 i7 RTX 3060 | |
| Medio Intel Wi-Fi 6E AX211 (1003 - 1501, n=4) | |
| Media de la clase (5.59 - 2371, n=2621) | |
Puntos de referencia de los procesadores
El Intel Core i9-12900 es un modelo de sobremesa de la actual serie Alder Lake S. El consumo de energía PL1 es de 65 vatios, que puede aumentar hasta el valor PL2 de 202 vatios.
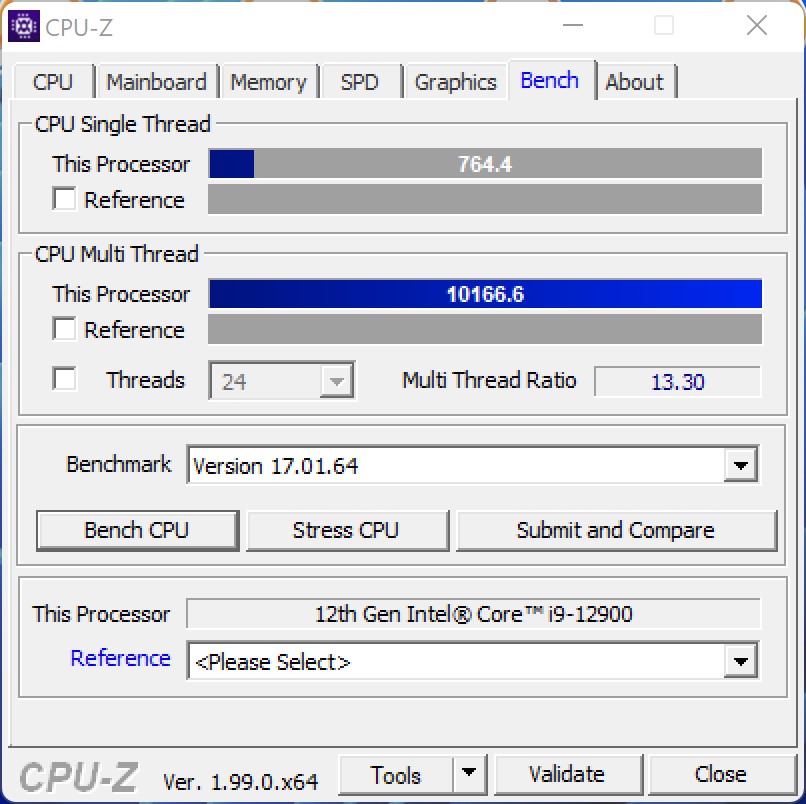
El Intel Core i9-12900 hace justicia a su clase en la prueba, superando el rendimiento del Intel Core i9-11900KB en un 15%, si nos fijamos en los resultados de todos los benchmarks (clasificación de rendimiento). Cuando se compara con los sistemas de sobremesa estándar, el Intel Core i9-12900 del Intel NUC 12 Extreme Kit también es capaz de seguir el ritmo de un AMD Ryzen 7 5800X o Intel Core i9-11900K. Por otro lado, el Intel Core i7-12700Kes capaz de vencer a nuestro NUC Dragon Canyon, y vemos un primer signo de un rendimiento ligeramente ralentizado debido al pequeñísimo sistema de refrigeración. Sin embargo, la desventaja se mantiene dentro de los límites, y el Intel Core i7-12700K fue apenas un 10% más rápido en la prueba
Puedes encontrar comparaciones y pruebas adicionales en nuestra Tabla de comparación de CPUs.
| Performance rating - Percent | |
| Intel Core i9-12900K, NVIDIA Titan RTX | |
| Intel Core i7-12700K, NVIDIA Titan RTX | |
| Intel Core i9-12900, NVIDIA GeForce RTX 3060 | |
| AMD Ryzen 7 5800X, NVIDIA Titan RTX | |
| AMD Ryzen 9 3950X, NVIDIA Titan RTX | |
| Intel Core i9-11900K, NVIDIA Titan RTX | |
| Intel Core i9-10900K, NVIDIA Titan RTX | |
| Intel Core i9-11900KB, NVIDIA GeForce RTX 3060 | |
| Intel Core i5-11600K, NVIDIA Titan RTX | |
| AMD Ryzen 7 3800XT, NVIDIA Titan RTX | |
| Intel Core i9-9980HK, NVIDIA GeForce RTX 2070 (Desktop) | |
| Intel Core i5-10600K, NVIDIA Titan RTX | |
| Blender - v2.79 BMW27 CPU | |
| Intel Core i9-9980HK, NVIDIA GeForce RTX 2070 (Desktop) | |
| Intel Core i5-10600K, NVIDIA Titan RTX | |
| Intel Core i5-11600K, NVIDIA Titan RTX | |
| Intel Core i9-11900KB, NVIDIA GeForce RTX 3060 | |
| Intel Core i9-12900, NVIDIA GeForce RTX 3060 | |
| AMD Ryzen 7 3800XT, NVIDIA Titan RTX | |
| AMD Ryzen 7 5800X, NVIDIA Titan RTX | |
| Intel Core i9-11900K, NVIDIA Titan RTX | |
| Intel Core i9-10900K, NVIDIA Titan RTX | |
| Intel Core i7-12700K, NVIDIA Titan RTX | |
| AMD Ryzen 9 3950X, NVIDIA Titan RTX | |
| Intel Core i9-12900K, NVIDIA Titan RTX | |
| wPrime 2.10 | |
| 32m | |
| Intel Core i9-12900K, NVIDIA Titan RTX | |
| Intel Core i5-11600K, NVIDIA Titan RTX | |
| Intel Core i5-10600K, NVIDIA Titan RTX | |
| AMD Ryzen 9 3950X, NVIDIA Titan RTX | |
| Intel Core i9-11900K, NVIDIA Titan RTX | |
| Intel Core i9-9980HK, NVIDIA GeForce RTX 2070 (Desktop) | |
| AMD Ryzen 7 3800XT, NVIDIA Titan RTX | |
| Intel Core i9-10900K, NVIDIA Titan RTX | |
| Intel Core i9-11900KB, NVIDIA GeForce RTX 3060 | |
| AMD Ryzen 7 5800X, NVIDIA Titan RTX | |
| Intel Core i9-12900, NVIDIA GeForce RTX 3060 | |
| Intel Core i7-12700K, NVIDIA Titan RTX | |
| 1024m | |
| Intel Core i9-12900, NVIDIA GeForce RTX 3060 | |
| Intel Core i9-12900K, NVIDIA Titan RTX | |
| Intel Core i7-12700K, NVIDIA Titan RTX | |
| Intel Core i9-9980HK, NVIDIA GeForce RTX 2070 (Desktop) | |
| Intel Core i5-10600K, NVIDIA Titan RTX | |
| Intel Core i5-11600K, NVIDIA Titan RTX | |
| Intel Core i9-11900KB, NVIDIA GeForce RTX 3060 | |
| AMD Ryzen 7 5800X, NVIDIA Titan RTX | |
| AMD Ryzen 7 3800XT, NVIDIA Titan RTX | |
| Intel Core i9-11900K, NVIDIA Titan RTX | |
| Intel Core i9-10900K, NVIDIA Titan RTX | |
| AMD Ryzen 9 3950X, NVIDIA Titan RTX | |
| X264 HD Benchmark 4.0 | |
| Pass 1 | |
| Intel Core i9-12900K, NVIDIA Titan RTX | |
| Intel Core i7-12700K, NVIDIA Titan RTX | |
| AMD Ryzen 7 5800X, NVIDIA Titan RTX | |
| Intel Core i9-12900, NVIDIA GeForce RTX 3060 | |
| Intel Core i9-11900K, NVIDIA Titan RTX | |
| Intel Core i5-11600K, NVIDIA Titan RTX | |
| Intel Core i9-10900K, NVIDIA Titan RTX | |
| Intel Core i9-11900KB, NVIDIA GeForce RTX 3060 | |
| AMD Ryzen 7 3800XT, NVIDIA Titan RTX | |
| AMD Ryzen 9 3950X, NVIDIA Titan RTX | |
| Intel Core i5-10600K, NVIDIA Titan RTX | |
| Intel Core i9-9980HK, NVIDIA GeForce RTX 2070 (Desktop) | |
| Pass 2 | |
| Intel Core i9-12900K, NVIDIA Titan RTX | |
| Intel Core i7-12700K, NVIDIA Titan RTX | |
| AMD Ryzen 9 3950X, NVIDIA Titan RTX | |
| AMD Ryzen 7 5800X, NVIDIA Titan RTX | |
| Intel Core i9-10900K, NVIDIA Titan RTX | |
| Intel Core i9-12900, NVIDIA GeForce RTX 3060 | |
| Intel Core i9-11900K, NVIDIA Titan RTX | |
| AMD Ryzen 7 3800XT, NVIDIA Titan RTX | |
| Intel Core i9-11900KB, NVIDIA GeForce RTX 3060 | |
| Intel Core i5-11600K, NVIDIA Titan RTX | |
| Intel Core i9-9980HK, NVIDIA GeForce RTX 2070 (Desktop) | |
| Intel Core i5-10600K, NVIDIA Titan RTX | |
| WinRAR - Result | |
| AMD Ryzen 7 5800X, NVIDIA Titan RTX | |
| Intel Core i9-12900K, NVIDIA Titan RTX | |
| Intel Core i9-12900, NVIDIA GeForce RTX 3060 | |
| Intel Core i7-12700K, NVIDIA Titan RTX | |
| Intel Core i9-10900K, NVIDIA Titan RTX | |
| Intel Core i9-11900KB, NVIDIA GeForce RTX 3060 | |
| Intel Core i9-11900K, NVIDIA Titan RTX | |
| Intel Core i5-11600K, NVIDIA Titan RTX | |
| AMD Ryzen 7 3800XT, NVIDIA Titan RTX | |
| AMD Ryzen 9 3950X, NVIDIA Titan RTX | |
| Intel Core i9-9980HK, NVIDIA GeForce RTX 2070 (Desktop) | |
| Intel Core i5-10600K, NVIDIA Titan RTX | |
| Geekbench 5.5 | |
| Multi-Core | |
| Intel Core i9-12900K, NVIDIA Titan RTX | |
| Intel Core i7-12700K, NVIDIA Titan RTX | |
| AMD Ryzen 9 3950X, NVIDIA Titan RTX | |
| Intel Core i9-10900K, NVIDIA Titan RTX | |
| AMD Ryzen 7 5800X, NVIDIA Titan RTX | |
| Intel Core i9-11900K, NVIDIA Titan RTX | |
| AMD Ryzen 7 3800XT, NVIDIA Titan RTX | |
| Intel Core i9-11900KB, NVIDIA GeForce RTX 3060 | |
| Intel Core i9-12900, NVIDIA GeForce RTX 3060 | |
| Intel Core i5-11600K, NVIDIA Titan RTX | |
| Intel Core i9-9980HK, NVIDIA GeForce RTX 2070 (Desktop) | |
| Intel Core i5-10600K, NVIDIA Titan RTX | |
| Single-Core | |
| Intel Core i9-12900K, NVIDIA Titan RTX | |
| Intel Core i7-12700K, NVIDIA Titan RTX | |
| Intel Core i9-11900K, NVIDIA Titan RTX | |
| Intel Core i5-11600K, NVIDIA Titan RTX | |
| AMD Ryzen 7 5800X, NVIDIA Titan RTX | |
| Intel Core i9-11900KB, NVIDIA GeForce RTX 3060 | |
| Intel Core i9-12900, NVIDIA GeForce RTX 3060 | |
| Intel Core i9-10900K, NVIDIA Titan RTX | |
| Intel Core i9-9980HK, NVIDIA GeForce RTX 2070 (Desktop) | |
| AMD Ryzen 7 3800XT, NVIDIA Titan RTX | |
| AMD Ryzen 9 3950X, NVIDIA Titan RTX | |
| Intel Core i5-10600K, NVIDIA Titan RTX | |
| 3DMark 11 - 1280x720 Performance Physics | |
| Intel Core i9-12900K, NVIDIA Titan RTX | |
| Intel Core i7-12700K, NVIDIA Titan RTX | |
| Intel Core i9-12900, NVIDIA GeForce RTX 3060 | |
| AMD Ryzen 7 5800X, NVIDIA Titan RTX | |
| Intel Core i9-10900K, NVIDIA Titan RTX | |
| Intel Core i9-11900K, NVIDIA Titan RTX | |
| AMD Ryzen 9 3950X, NVIDIA Titan RTX | |
| AMD Ryzen 7 3800XT, NVIDIA Titan RTX | |
| Intel Core i9-11900KB, NVIDIA GeForce RTX 3060 | |
| Intel Core i5-11600K, NVIDIA Titan RTX | |
| Intel Core i9-9980HK, NVIDIA GeForce RTX 2070 (Desktop) | |
| Intel Core i5-10600K, NVIDIA Titan RTX | |
| 7-Zip 18.03 | |
| 7z b 4 | |
| AMD Ryzen 9 3950X, NVIDIA Titan RTX | |
| Intel Core i9-12900K, NVIDIA Titan RTX | |
| Intel Core i7-12700K, NVIDIA Titan RTX | |
| AMD Ryzen 7 5800X, NVIDIA Titan RTX | |
| Intel Core i9-10900K, NVIDIA Titan RTX | |
| Intel Core i9-11900K, NVIDIA Titan RTX | |
| AMD Ryzen 7 3800XT, NVIDIA Titan RTX | |
| Intel Core i9-11900KB, NVIDIA GeForce RTX 3060 | |
| Intel Core i9-12900, NVIDIA GeForce RTX 3060 | |
| Intel Core i5-11600K, NVIDIA Titan RTX | |
| Intel Core i9-9980HK, NVIDIA GeForce RTX 2070 (Desktop) | |
| Intel Core i5-10600K, NVIDIA Titan RTX | |
| 7z b 4 -mmt1 | |
| AMD Ryzen 7 5800X, NVIDIA Titan RTX | |
| Intel Core i9-11900K, NVIDIA Titan RTX | |
| Intel Core i9-12900K, NVIDIA Titan RTX | |
| Intel Core i5-11600K, NVIDIA Titan RTX | |
| Intel Core i7-12700K, NVIDIA Titan RTX | |
| Intel Core i9-11900KB, NVIDIA GeForce RTX 3060 | |
| Intel Core i9-12900, NVIDIA GeForce RTX 3060 | |
| Intel Core i9-10900K, NVIDIA Titan RTX | |
| Intel Core i9-9980HK, NVIDIA GeForce RTX 2070 (Desktop) | |
| AMD Ryzen 7 3800XT, NVIDIA Titan RTX | |
| AMD Ryzen 9 3950X, NVIDIA Titan RTX | |
| Intel Core i5-10600K, NVIDIA Titan RTX | |
| HWBOT x265 Benchmark v2.2 - 4k Preset | |
| Intel Core i9-12900K, NVIDIA Titan RTX | |
| Intel Core i7-12700K, NVIDIA Titan RTX | |
| Intel Core i9-10900K, NVIDIA Titan RTX | |
| AMD Ryzen 7 5800X, NVIDIA Titan RTX | |
| Intel Core i9-11900K, NVIDIA Titan RTX | |
| AMD Ryzen 7 3800XT, NVIDIA Titan RTX | |
| AMD Ryzen 9 3950X, NVIDIA Titan RTX | |
| Intel Core i5-11600K, NVIDIA Titan RTX | |
| Intel Core i9-11900KB, NVIDIA GeForce RTX 3060 | |
| Intel Core i9-12900, NVIDIA GeForce RTX 3060 | |
| Intel Core i5-10600K, NVIDIA Titan RTX | |
| Intel Core i9-9980HK, NVIDIA GeForce RTX 2070 (Desktop) | |
| R Benchmark 2.5 - Overall mean | |
| Intel Core i5-10600K, NVIDIA Titan RTX | |
| Intel Core i9-9980HK, NVIDIA GeForce RTX 2070 (Desktop) | |
| Intel Core i9-11900KB, NVIDIA GeForce RTX 3060 | |
| Intel Core i9-12900, NVIDIA GeForce RTX 3060 | |
| Intel Core i9-10900K, NVIDIA Titan RTX | |
| AMD Ryzen 9 3950X, NVIDIA Titan RTX | |
| AMD Ryzen 7 3800XT, NVIDIA Titan RTX | |
| Intel Core i5-11600K, NVIDIA Titan RTX | |
| Intel Core i9-11900K, NVIDIA Titan RTX | |
| AMD Ryzen 7 5800X, NVIDIA Titan RTX | |
| Intel Core i7-12700K, NVIDIA Titan RTX | |
| Intel Core i9-12900K, NVIDIA Titan RTX | |
| LibreOffice - 20 Documents To PDF | |
| Intel Core i9-10900K, NVIDIA Titan RTX | |
| Intel Core i9-11900K, NVIDIA Titan RTX | |
| AMD Ryzen 9 3950X, NVIDIA Titan RTX | |
| Intel Core i5-10600K, NVIDIA Titan RTX | |
| Intel Core i9-9980HK, NVIDIA GeForce RTX 2070 (Desktop) | |
| Intel Core i9-11900KB, NVIDIA GeForce RTX 3060 | |
| Intel Core i9-12900, NVIDIA GeForce RTX 3060 | |
| AMD Ryzen 7 3800XT, NVIDIA Titan RTX | |
| AMD Ryzen 7 5800X, NVIDIA Titan RTX | |
| Intel Core i9-12900K, NVIDIA Titan RTX | |
| Intel Core i7-12700K, NVIDIA Titan RTX | |
| Intel Core i5-11600K, NVIDIA Titan RTX | |
| WebXPRT 3 - Overall | |
| Intel Core i9-12900K, NVIDIA Titan RTX | |
| Intel Core i7-12700K, NVIDIA Titan RTX | |
| AMD Ryzen 7 5800X, NVIDIA Titan RTX | |
| Intel Core i5-11600K, NVIDIA Titan RTX | |
| Intel Core i9-11900KB, NVIDIA GeForce RTX 3060 | |
| Intel Core i9-12900, NVIDIA GeForce RTX 3060 | |
| Intel Core i9-10900K, NVIDIA Titan RTX | |
| AMD Ryzen 7 3800XT, NVIDIA Titan RTX | |
| AMD Ryzen 9 3950X, NVIDIA Titan RTX | |
| Intel Core i5-10600K, NVIDIA Titan RTX | |
| Intel Core i9-9980HK, NVIDIA GeForce RTX 2070 (Desktop) | |
| Intel Core i9-11900K, NVIDIA Titan RTX | |
| Mozilla Kraken 1.1 - Total | |
| Intel Core i5-10600K, NVIDIA Titan RTX | |
| Intel Core i9-9980HK, NVIDIA GeForce RTX 2070 (Desktop) | |
| Intel Core i9-10900K, NVIDIA Titan RTX | |
| AMD Ryzen 9 3950X, NVIDIA Titan RTX | |
| AMD Ryzen 7 3800XT, NVIDIA Titan RTX | |
| Intel Core i9-11900KB, NVIDIA GeForce RTX 3060 | |
| Intel Core i9-12900, NVIDIA GeForce RTX 3060 | |
| Intel Core i5-11600K, NVIDIA Titan RTX | |
| AMD Ryzen 7 5800X, NVIDIA Titan RTX | |
| Intel Core i9-11900K, NVIDIA Titan RTX | |
| Intel Core i7-12700K, NVIDIA Titan RTX | |
| Intel Core i9-12900K, NVIDIA Titan RTX | |
* ... más pequeño es mejor
Kit Intel NUC 12 Extreme en el bucle Cinebench R15 Multi
En la prueba de carga con el bucle Cinebench R15 Mult, vemos una importante caída de rendimiento después de la ejecución inicial, antes de que siga nivelándose a 2.592 puntos. Sin embargo, en comparación con los dos predecesores sigue habiendo una clara ventaja de rendimiento incluso a plena carga.
Rendimiento de la aplicación
En los benchmarks de aplicaciones, la ventaja de rendimiento pura en comparación con el modelo predecesor resulta ser significativamente menor de lo esperado. Sin embargo, mirándolo de forma subjetiva, tanto el Beast Canyon NUC de entonces como el Dragon Canyon NUC de ahora tienen una velocidad de funcionamiento muy alta y dejan una muy buena impresión en el funcionamiento diario. Si se instala un SSD rápido, el sistema está listo para su uso ya después de unos segundos. No encontramos ningún tiempo de espera largo en nuestra configuración de prueba. Pero si lo comparamos con los sistemas actuales de gama alta, seguirán superando al Intel NUC 12 Extreme Kit. La GPU que se utiliza tiene un gran impacto aquí. Al mismo tiempo, nuestra unidad de pruebas sigue siendo un 14% más rápida que un sistema basado en un AMD Ryzen 9 5900X con la misma GPU
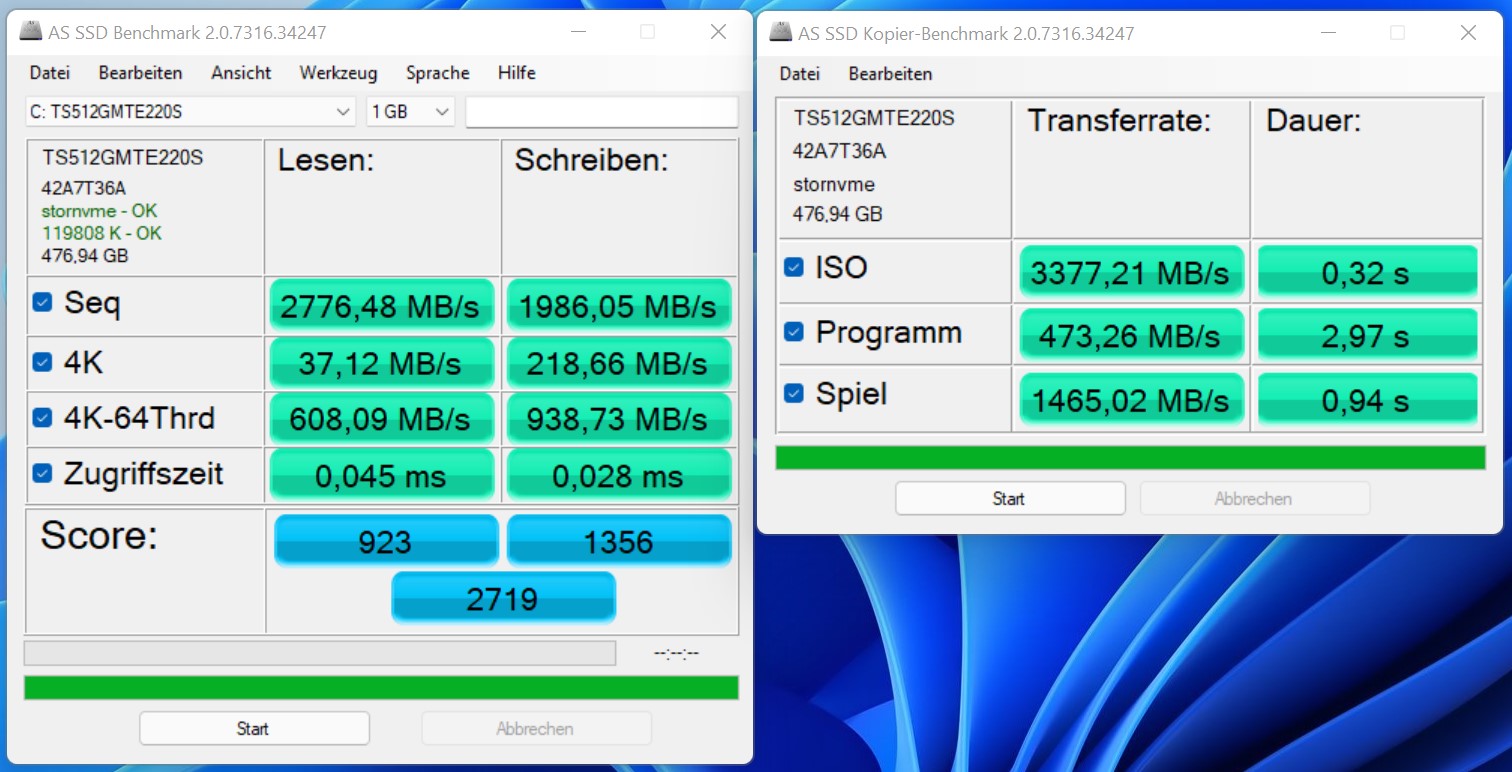
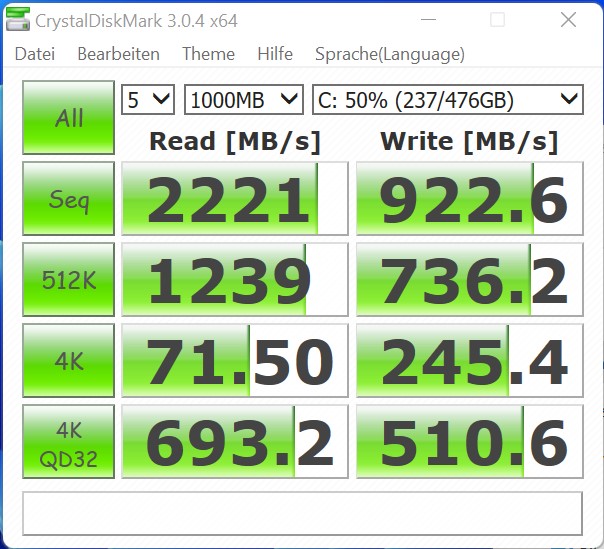
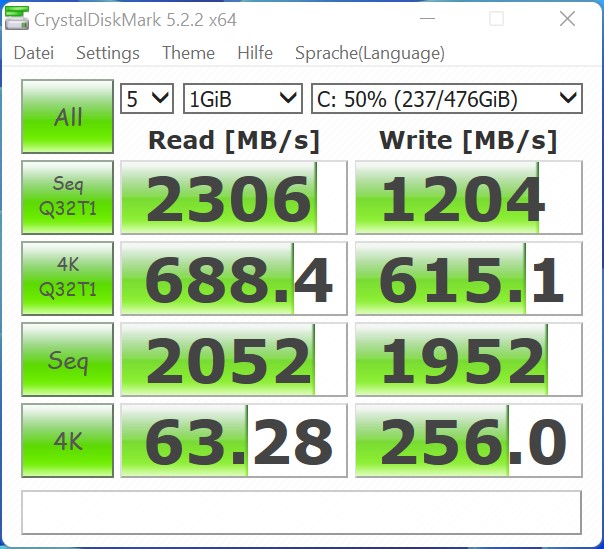
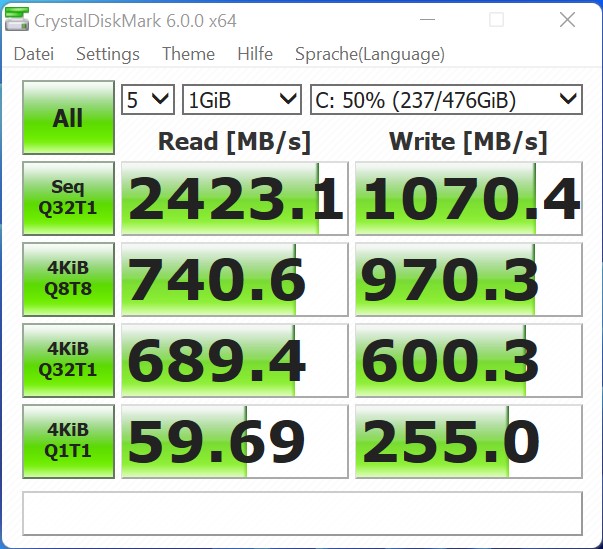
Equipamos el sistema barebone con un SSD NVMe de 512-GB. En nuestra prueba, el modelo de Transcend ofreció un sólido rendimiento. Puedes insertar un total de dos SSDs M.2-2280 en el Compute Element.
| Performance rating - Percent | |
| Intel Core i7-12700K, Intel Core i7-12700K | |
| Intel Core i9-12900K, Intel Core i9-12900K | |
| Intel Core i9-11900K, Intel Core i9-11900K | |
| Intel Core i5-11600K, Intel Core i5-11600K | |
| Intel Core i9-10900K, Intel Core i9-10900K | |
| Intel Core i5-10600K, Intel Core i5-10600K | |
| AMD Ryzen 9 3950X, AMD Ryzen 9 3950X | |
| Corsair One i160, Intel Core i9-9900K | |
| Intel Dragon Canyon NUC - RTX 3060, Intel Core i9-12900 | |
| Intel Beast Canyon NUC, Intel Core i9-11900KB | |
| Intel Ghost Canyon NUC (RTX 2070), Intel Core i9-9980HK | |
| Inno3D GeForce RTX 3060 Twin X2, AMD Ryzen 9 5900X -1! | |
| PCMark 10 - Score | |
| Intel Core i9-12900K, Intel Core i9-12900K | |
| Intel Core i7-12700K, Intel Core i7-12700K | |
| Intel Dragon Canyon NUC - RTX 3060, Intel Core i9-12900 | |
| AMD Ryzen 9 3950X, AMD Ryzen 9 3950X | |
| Intel Core i9-11900K, Intel Core i9-11900K | |
| Intel Core i5-11600K, Intel Core i5-11600K | |
| Intel Core i9-10900K, Intel Core i9-10900K | |
| Corsair One i160, Intel Core i9-9900K | |
| Intel Beast Canyon NUC, Intel Core i9-11900KB | |
| Intel Core i5-10600K, Intel Core i5-10600K | |
| Intel Ghost Canyon NUC (RTX 2070), Intel Core i9-9980HK | |
rendimiento en 3D y en juegos
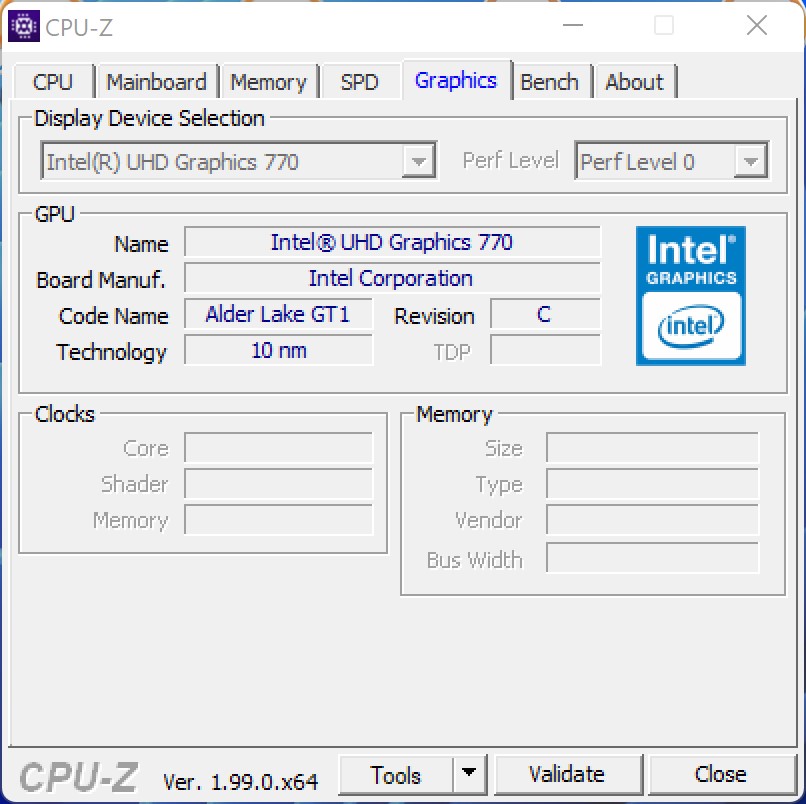
Dado que el Intel Core i9-12900 sólo ofrece una simple iGPU con la Intel UHD Graphics 770, el rendimiento 3D para los videojuegos exigentes simplemente no existe. Sin embargo, puedes instalar una tarjeta gráfica dedicada en la carcasa, lo que convertirá al NUC en un PC para juegos muy compacto. Como ya hemos probado elBeast Canyon NUCcon una Nvidia GeForce RTX 3060 en su momento, decidimos utilizar también un modelo de la RTX 3060 para el NUC Dragon Canyon. En combinación con el procesador Alder Lake, el rendimiento aumenta alrededor de un 4% en el funcionamiento de juegos. Este resultado no justifica una actualización, por lo que sólo debería ser relevante para una nueva compra
La cooperación con la Nvidia GeForce RTX 3060de INNO 3D funciona muy bien. Se puede disfrutar de todos los juegos actuales a velocidades de cuadro suficientes en resolución 1440 sin problemas. A veces, incluso se puede jugar a muchos juegos en 2160p. Sin embargo, dado que el aumento de la resolución y los niveles de detalle más altos conciernen más a los límites de la GPU, el rendimiento de la CPU es sólo secundario, lo que explica el bajo aumento de rendimiento en comparación con el NUC Beast Canyon
Puedes encontrar más comparaciones y benchmarks en nuestro GTabla de comparación de la PU.
Aquellos que quieran equipar su Dragon Canyon NUC con una tarjeta gráfica dedicada deben informarse de antemano sobre las dimensiones exactas de la GPU. La tarjeta gráfica no puede tener un diseño de refrigeración que ocupe más de dos ranuras, y también debe tener en cuenta la longitud máxima de 30,5 cm (12 pulgadas).
| Performance rating - Percent | |
| Zotac Magnus One (ECM73070C) | |
| Inno3D GeForce RTX 3060 Twin X2 | |
| Intel Dragon Canyon NUC - RTX 3060 | |
| Intel Beast Canyon NUC | |
| Intel Ghost Canyon NUC (RTX 2070) | |
| Borderlands 3 | |
| 1280x720 Very Low Overall Quality (DX11) | |
| Intel Dragon Canyon NUC - RTX 3060 | |
| Inno3D GeForce RTX 3060 Twin X2 | |
| Intel Beast Canyon NUC | |
| Intel Ghost Canyon NUC (RTX 2070) | |
| Zotac Magnus One (ECM73070C) | |
| 1920x1080 Badass Overall Quality (DX11) | |
| Intel Beast Canyon NUC | |
| Zotac Magnus One (ECM73070C) | |
| Intel Dragon Canyon NUC - RTX 3060 | |
| Inno3D GeForce RTX 3060 Twin X2 | |
| Intel Ghost Canyon NUC (RTX 2070) | |
| Dota 2 Reborn | |
| 1280x720 min (0/3) fastest | |
| Inno3D GeForce RTX 3060 Twin X2 | |
| Intel Beast Canyon NUC | |
| Intel Dragon Canyon NUC - RTX 3060 | |
| Zotac Magnus One (ECM73070C) | |
| Intel Ghost Canyon NUC (RTX 2070) | |
| 1920x1080 ultra (3/3) best looking | |
| Inno3D GeForce RTX 3060 Twin X2 | |
| Intel Beast Canyon NUC | |
| Intel Dragon Canyon NUC - RTX 3060 | |
| Intel Ghost Canyon NUC (RTX 2070) | |
| Zotac Magnus One (ECM73070C) | |
Intel NUC 12 Dragon Canyon + Nvidia GeForce RTX 3060
| bajo | medio | alto | ultra | QHD | 4K | |
|---|---|---|---|---|---|---|
| GTA V (2015) | 186 | 181 | 177 | 104 | 81.4 | 82.3 |
| The Witcher 3 (2015) | 462 | 305 | 178 | 91.3 | 62.5 | |
| Dota 2 Reborn (2015) | 178.3 | 161.7 | 155.6 | 147.1 | 116.1 | |
| Final Fantasy XV Benchmark (2018) | 196 | 123 | 88.6 | 64.8 | 38 | |
| X-Plane 11.11 (2018) | 151 | 133 | 105 | 88.5 | ||
| Far Cry 5 (2018) | 193 | 153 | 139 | 132 | 94 | 48 |
| Strange Brigade (2018) | 491 | 230 | 180 | 154 | 116 | 66.8 |
| Far Cry New Dawn (2019) | 161 | 132 | 126 | 113 | 92 | 51 |
| Metro Exodus (2019) | 207 | 113 | 83.7 | 65.3 | 51.7 | 32.2 |
| Borderlands 3 (2019) | 185 | 148 | 104 | 84.7 | 60.3 | 33.3 |
| F1 2020 (2020) | 355 | 259 | 208 | 142 | 106 | 60.2 |
| F1 2021 (2021) | 419 | 261 | 206 | 96.9 | 72 | 40.9 |
| Far Cry 6 (2021) | 167 | 129 | 110 | 96 | 70.5 | 39.3 |
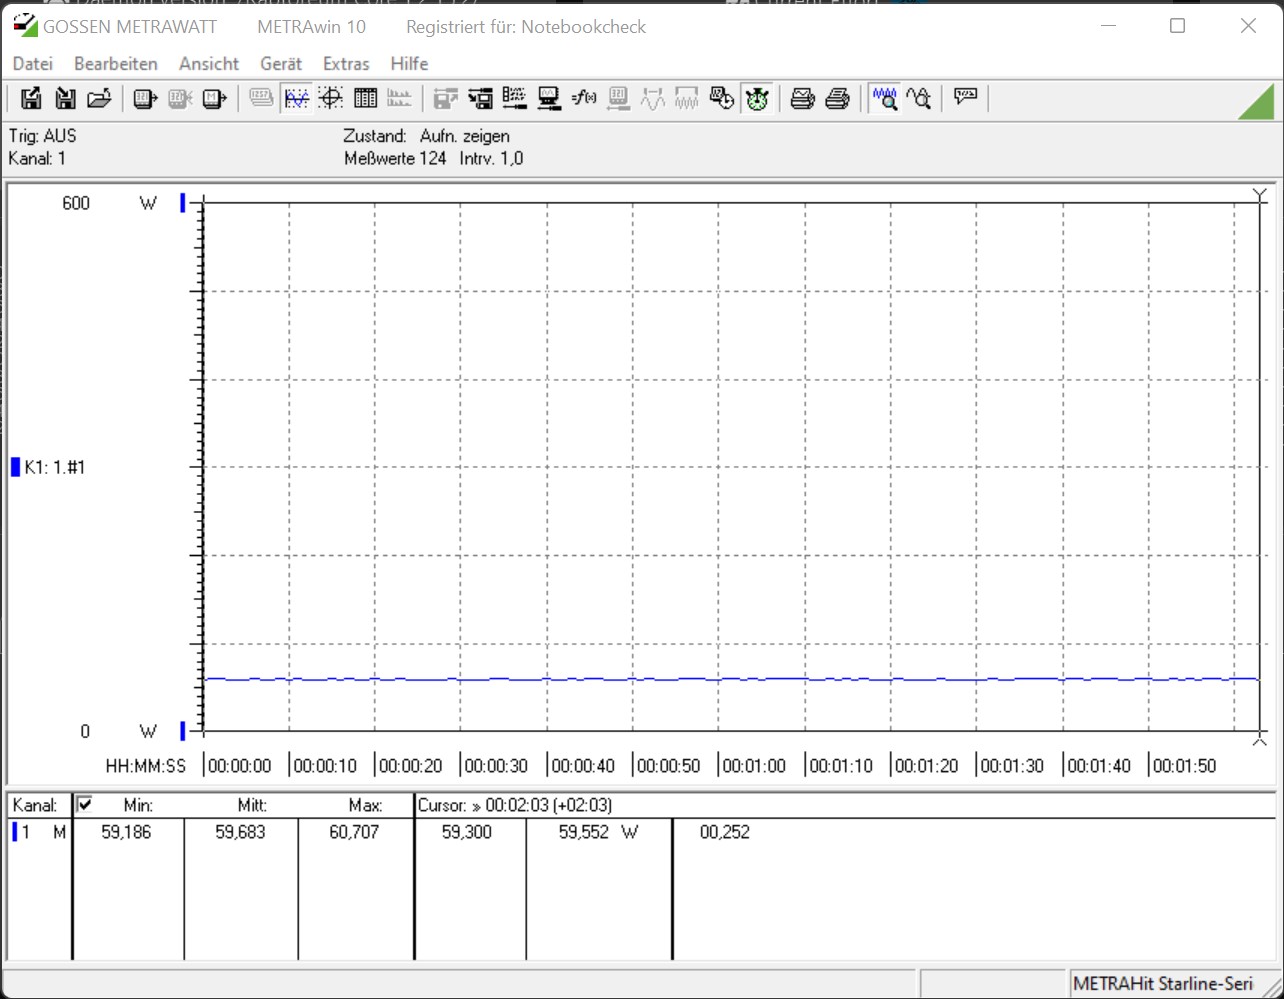
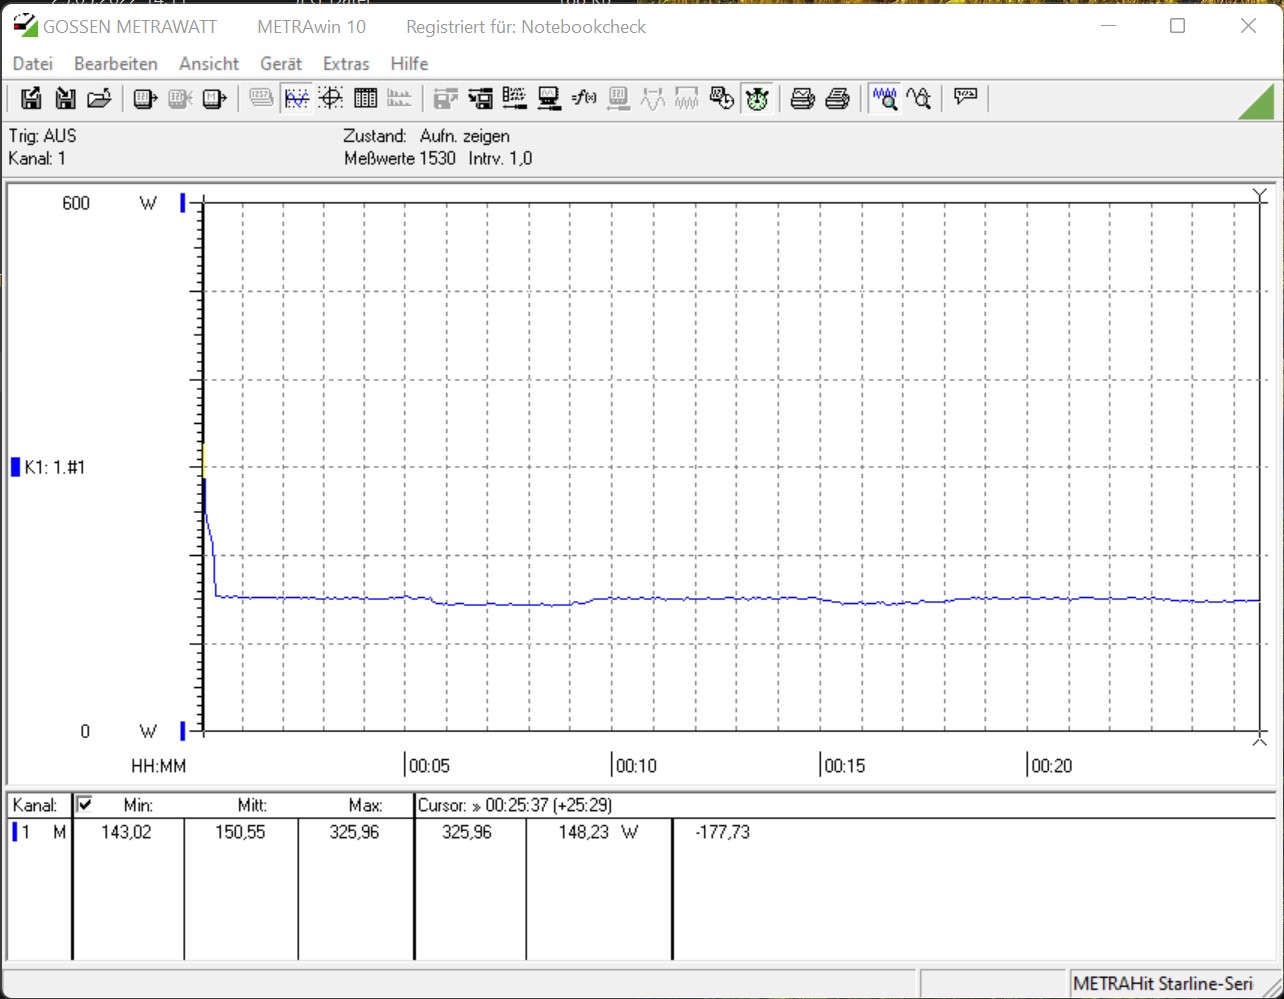
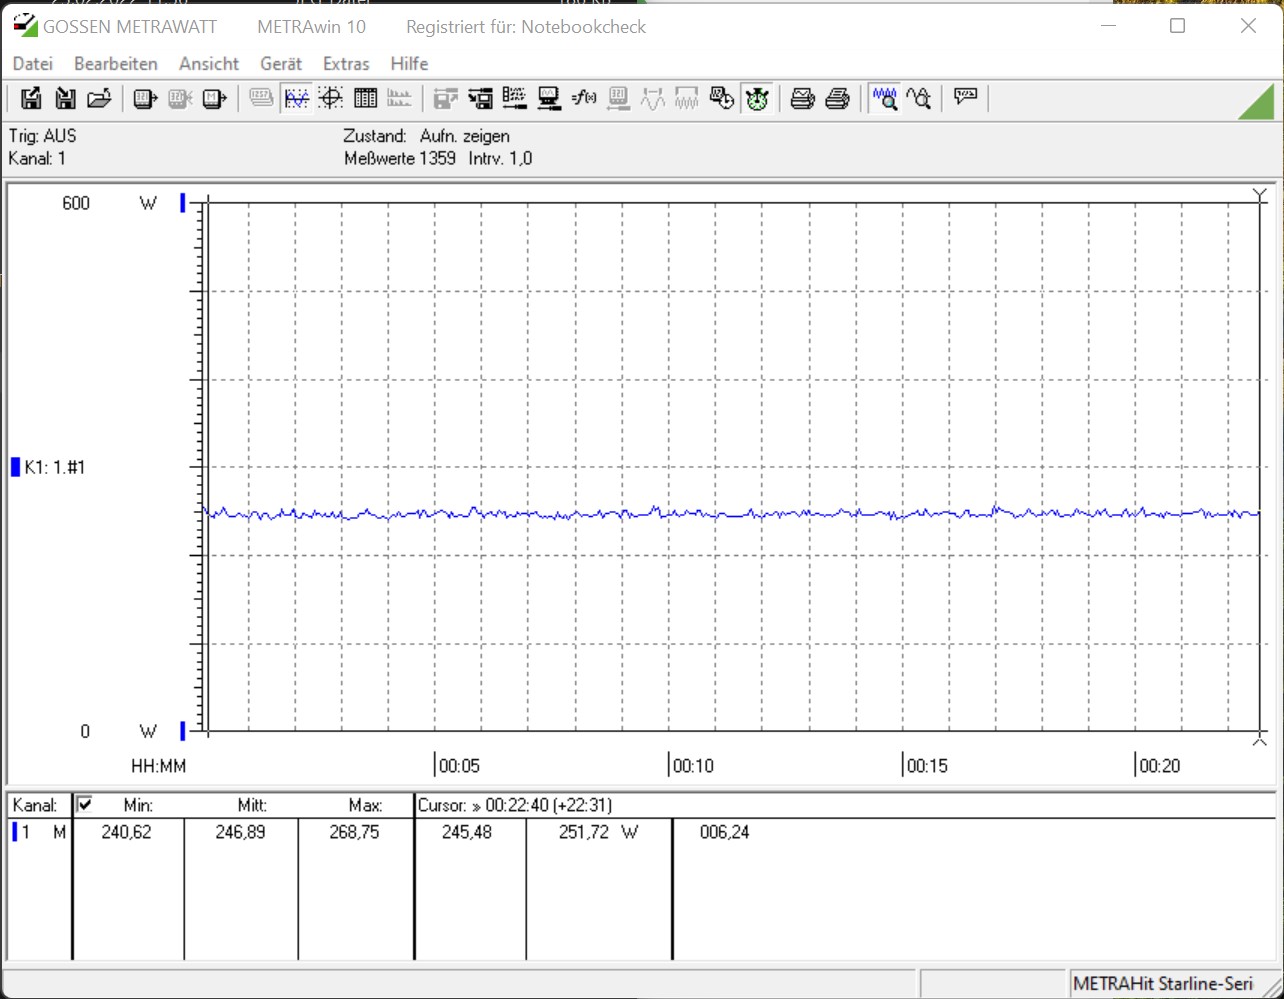
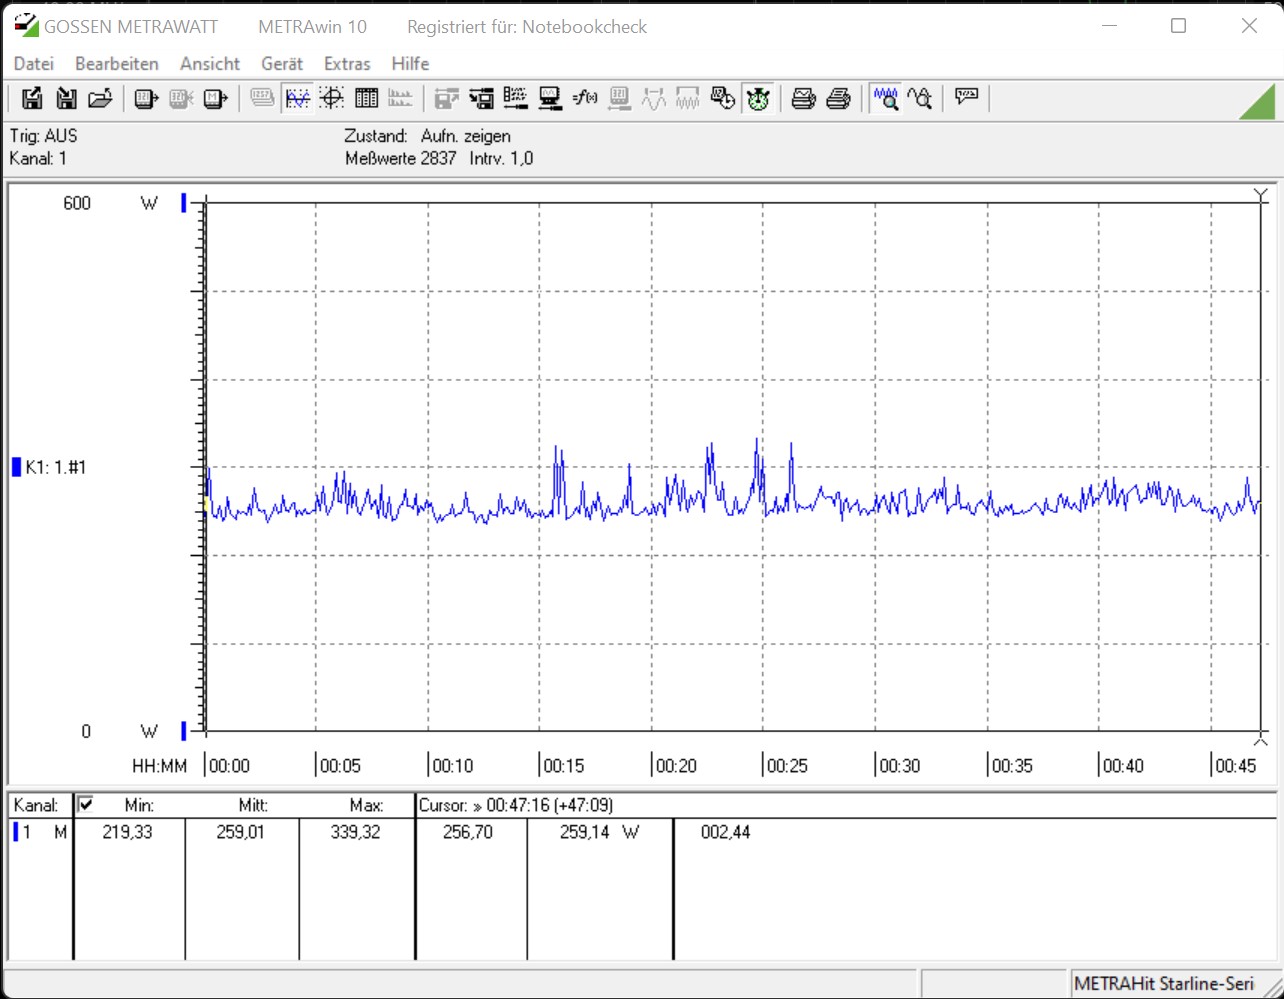
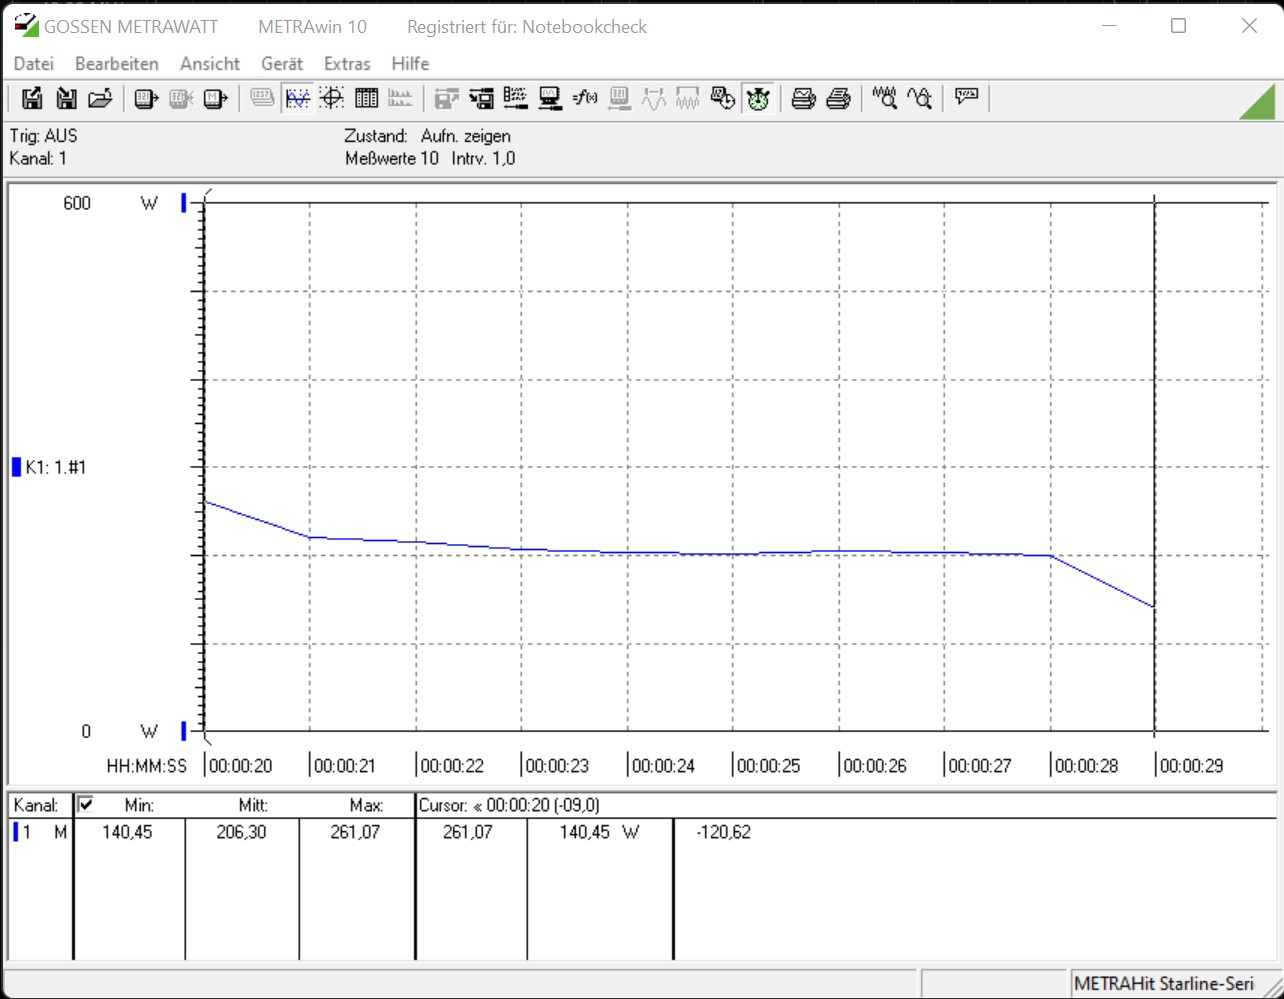
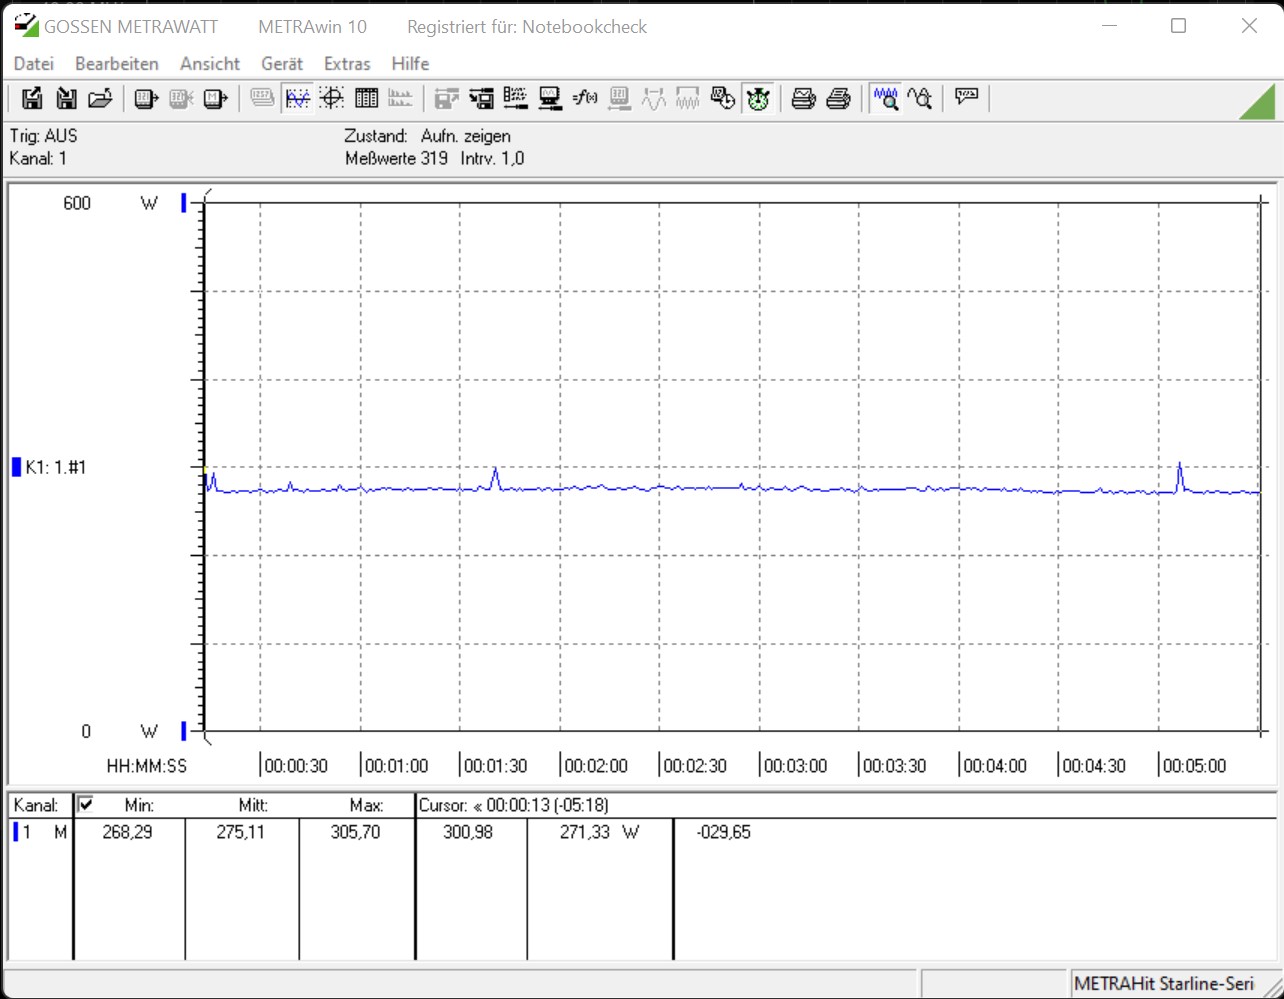
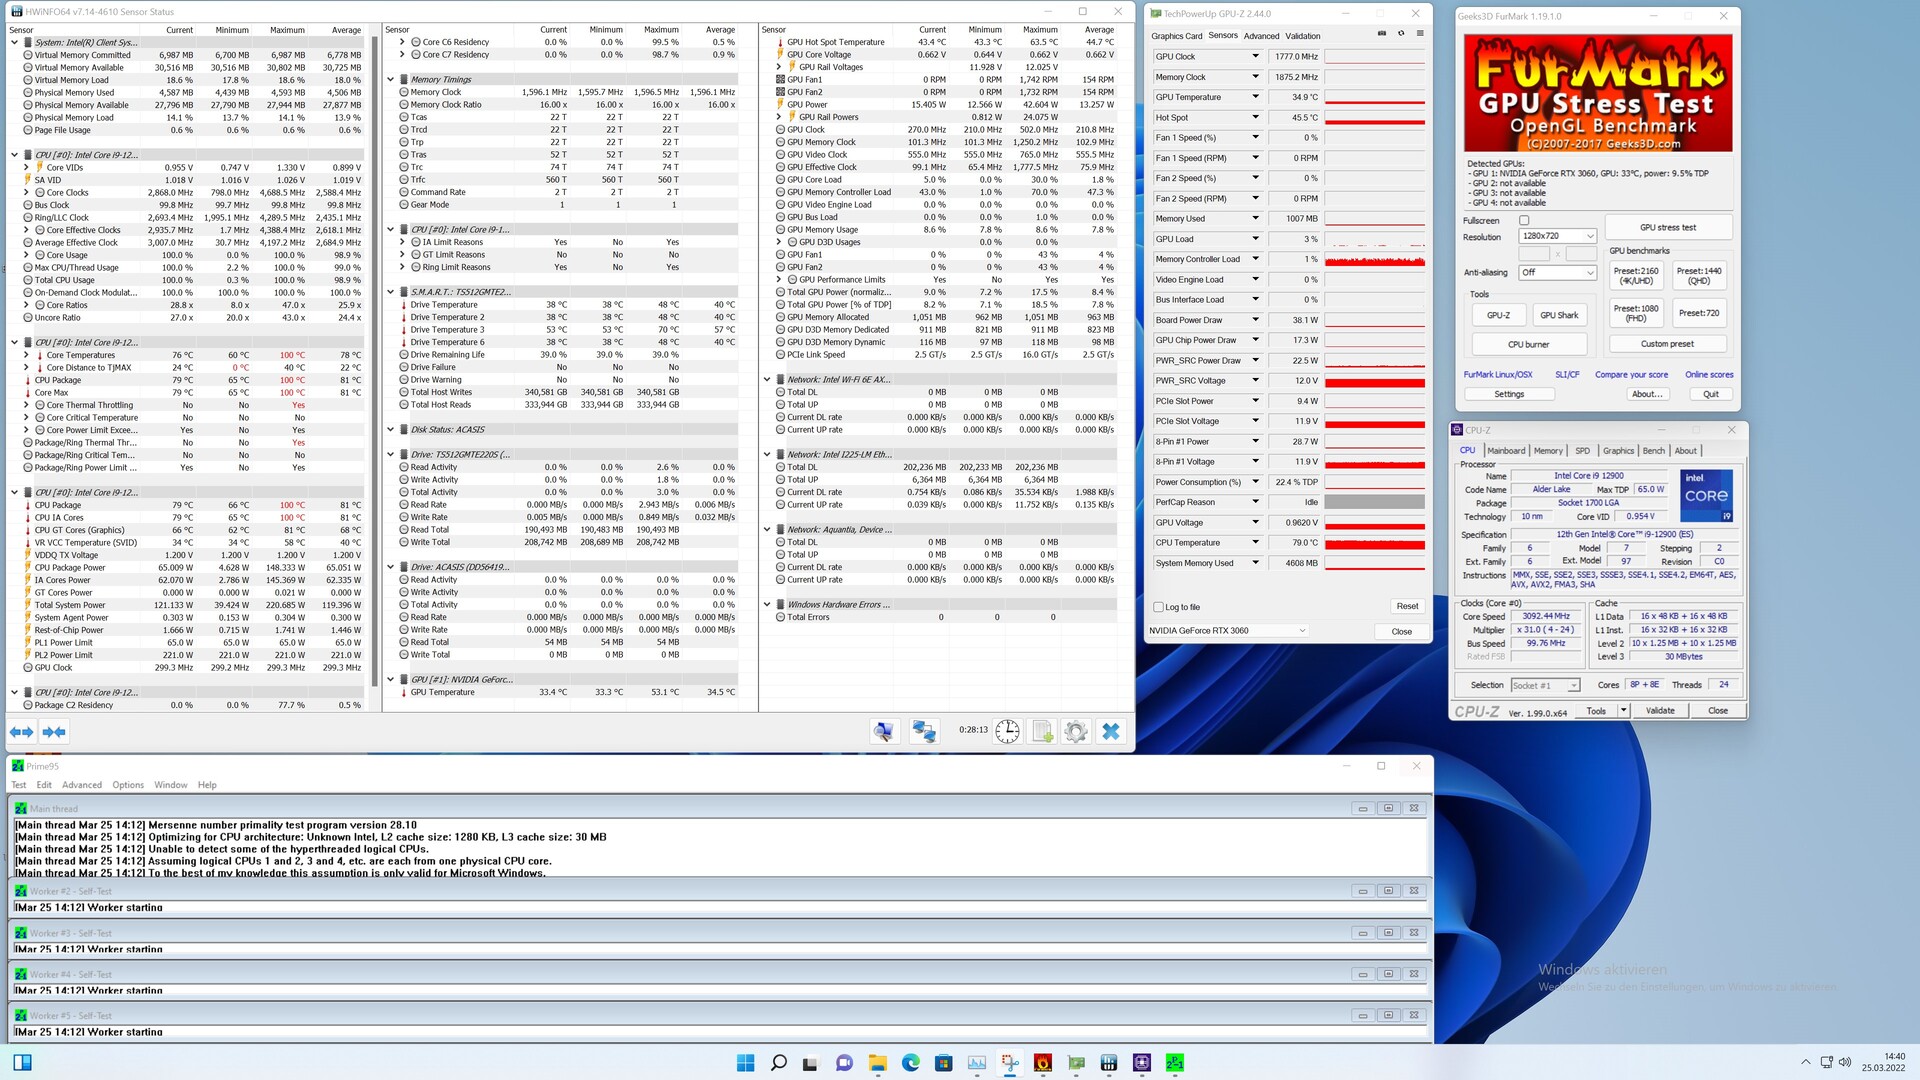
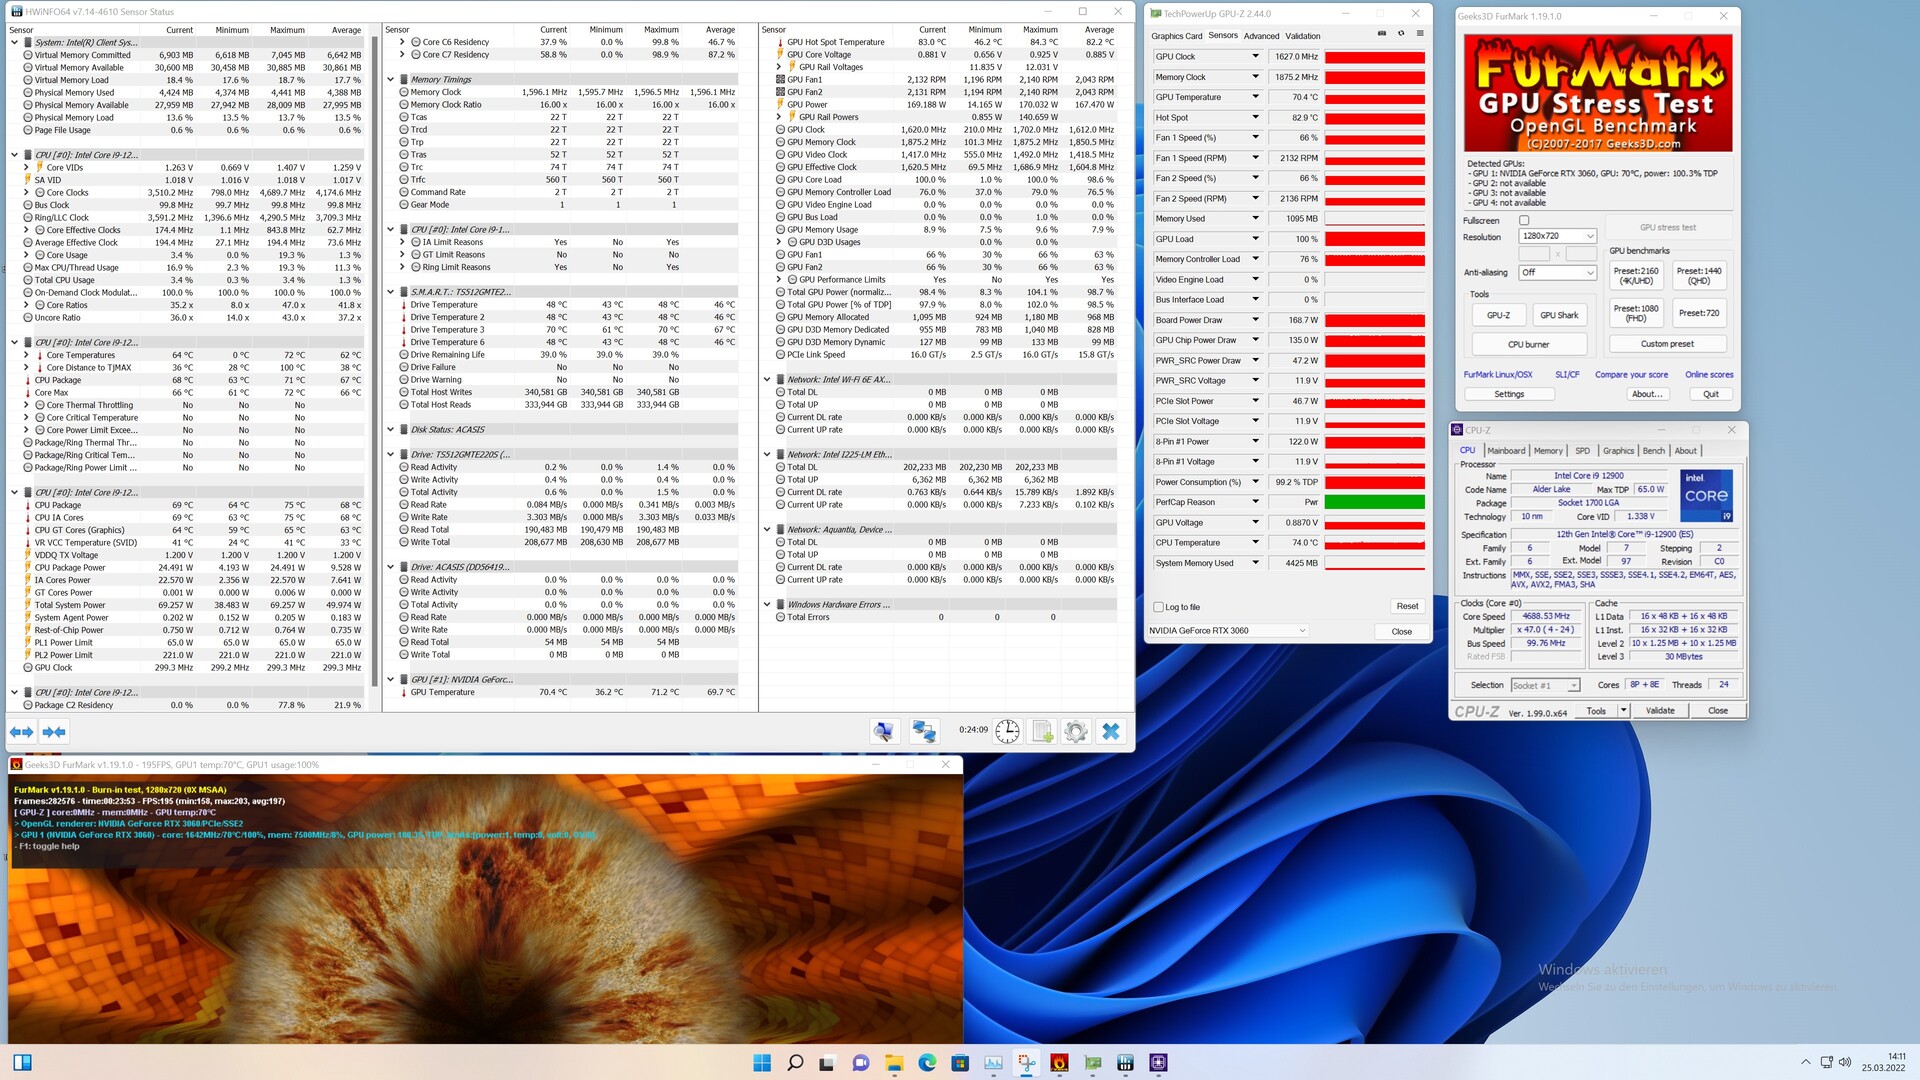
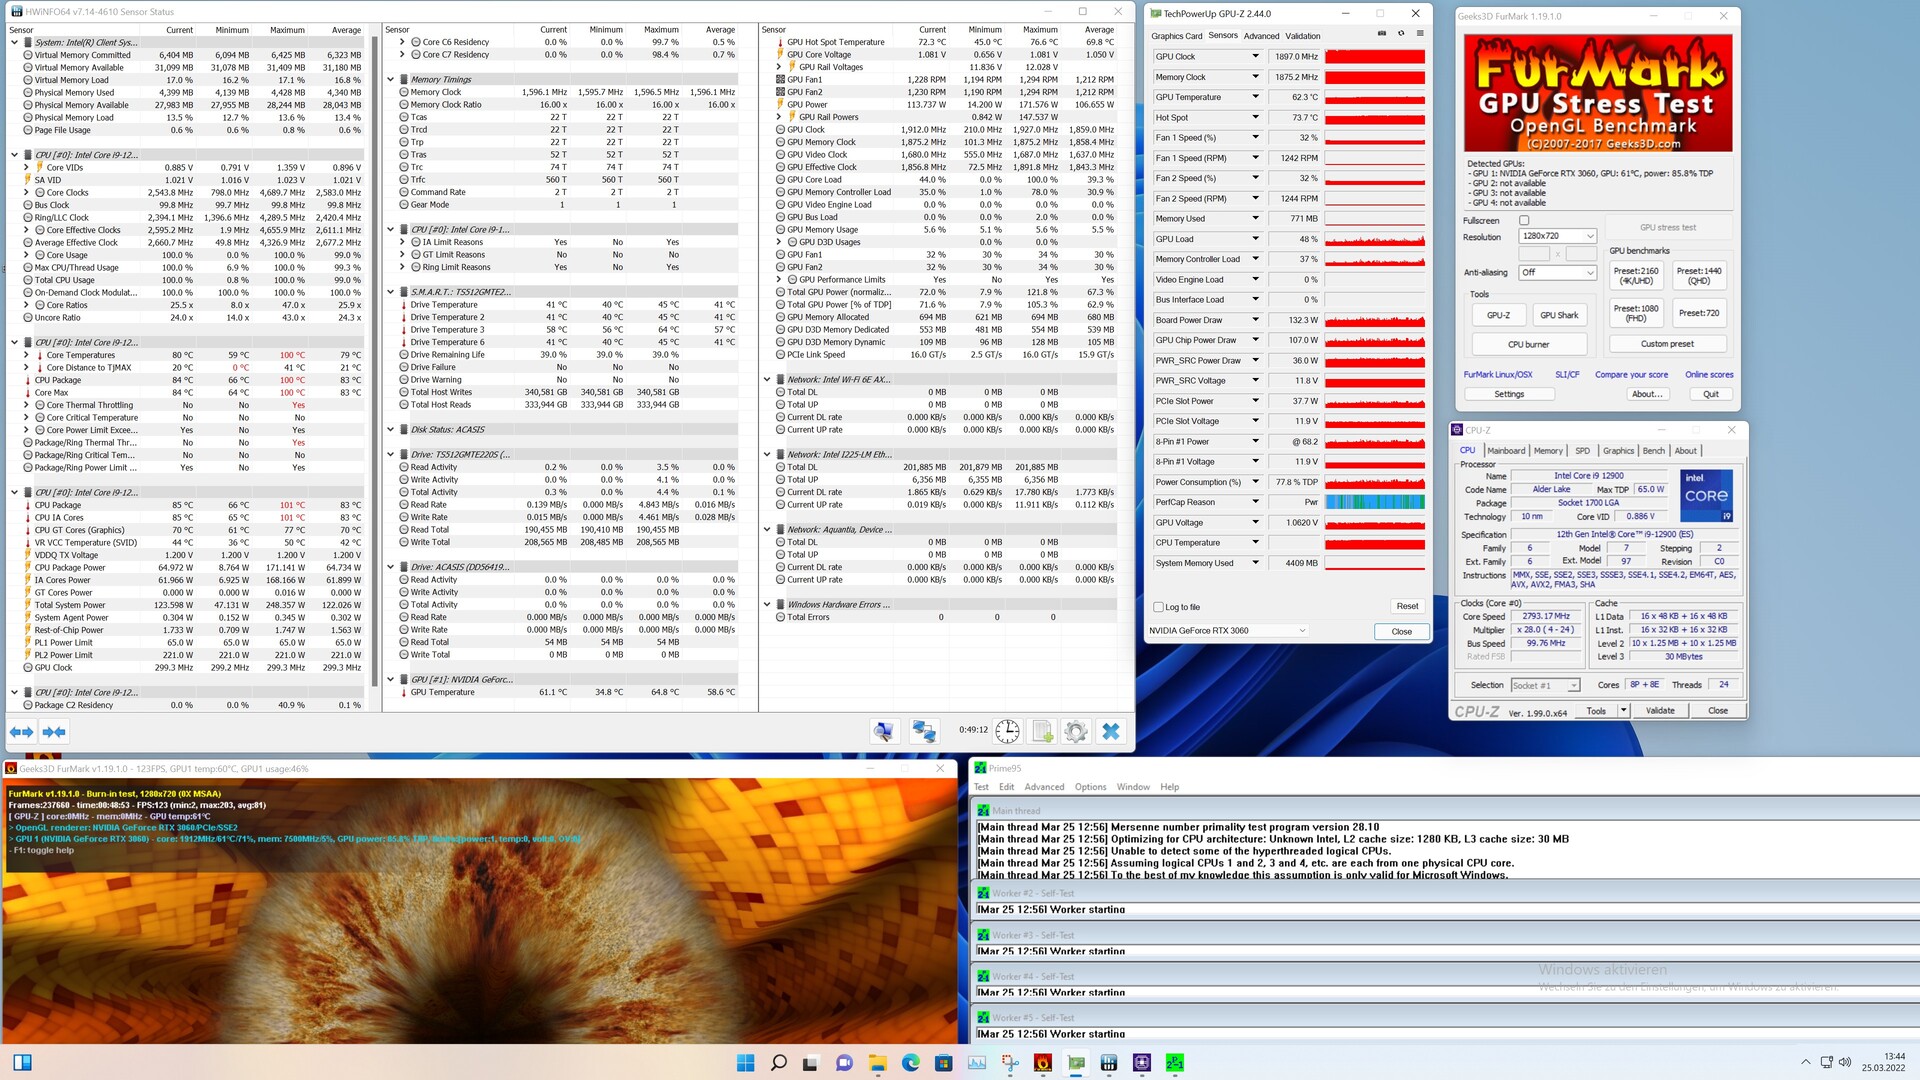
Consumo de energía, desarrollo de calor y ruido del Intel NUC 12 Dragon Canyon
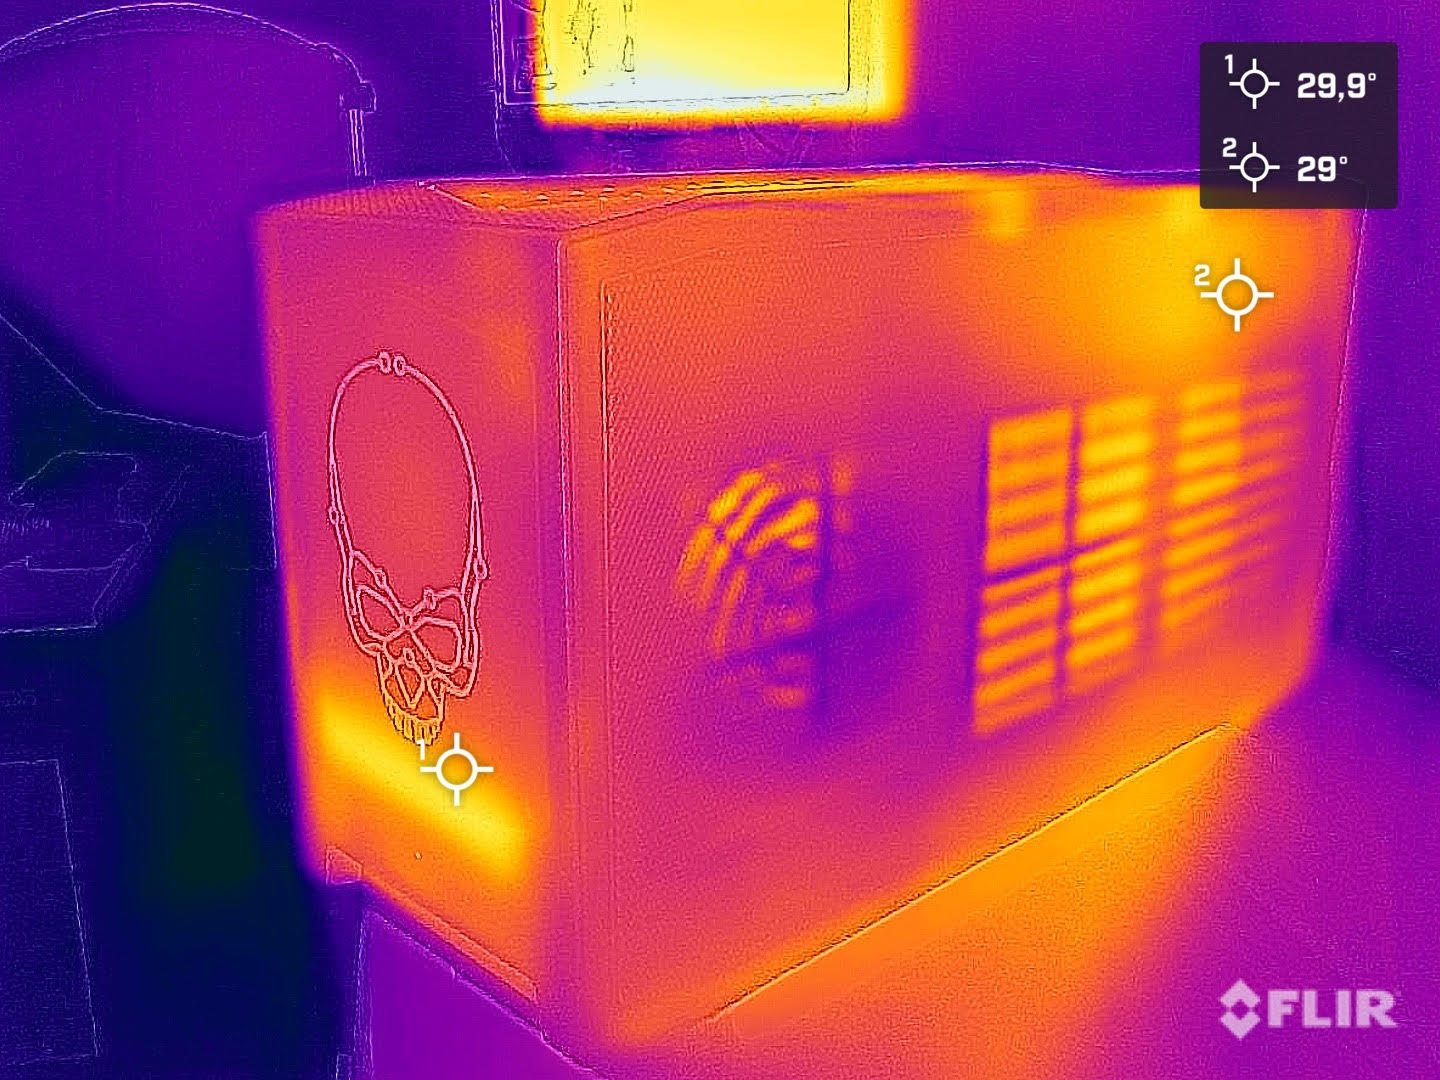
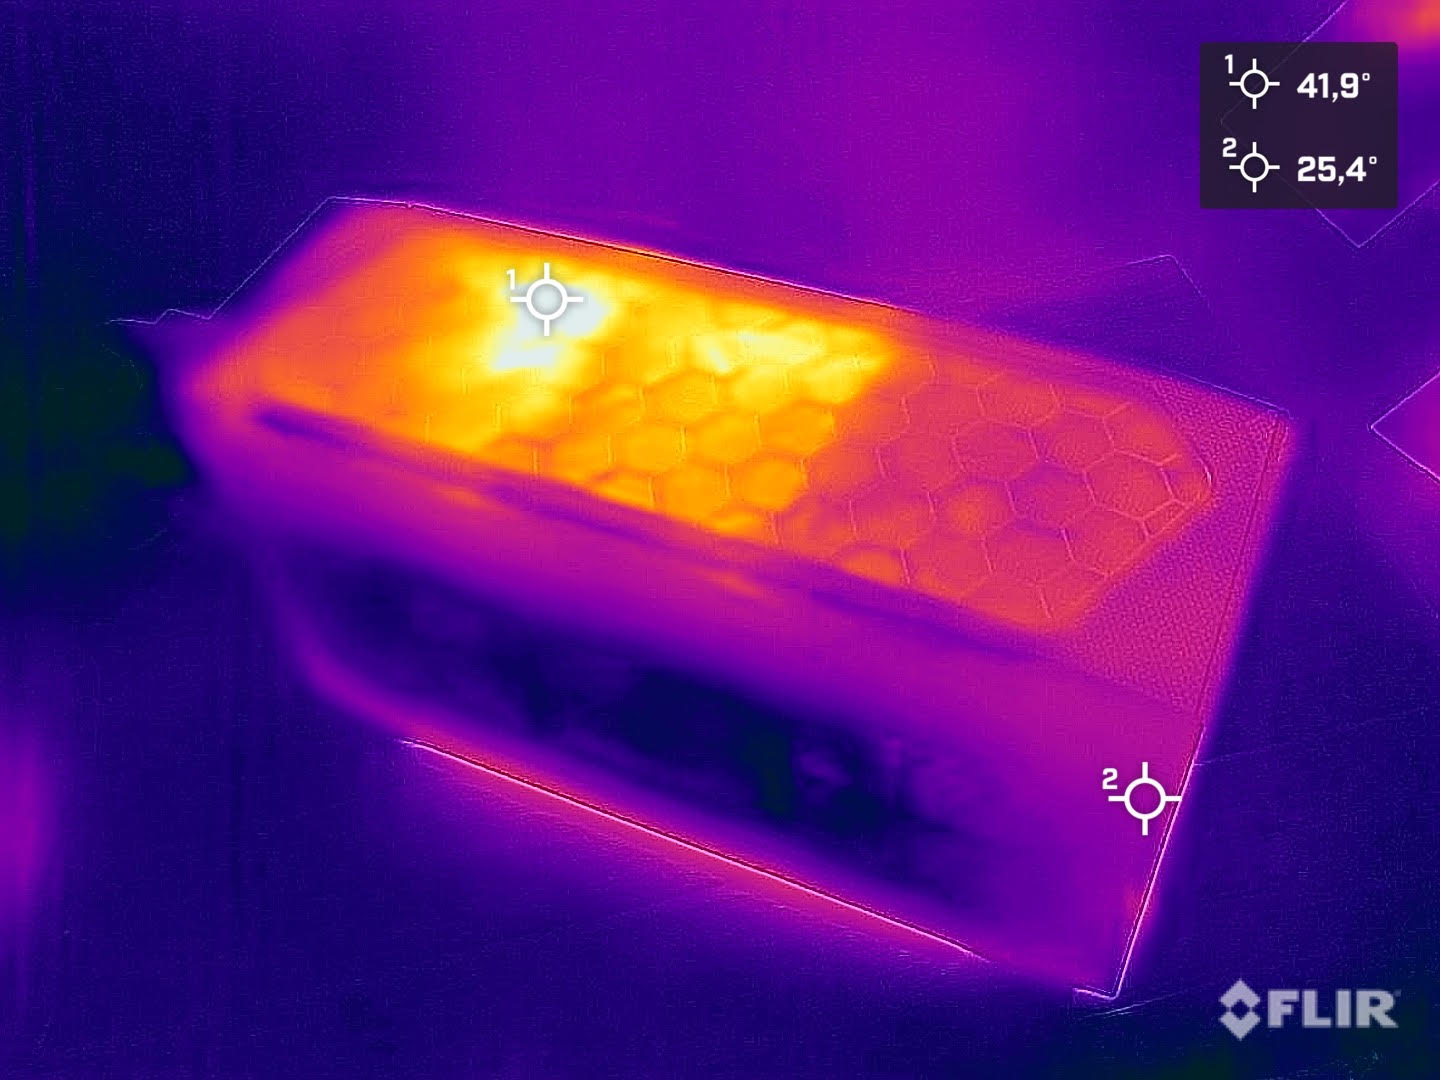
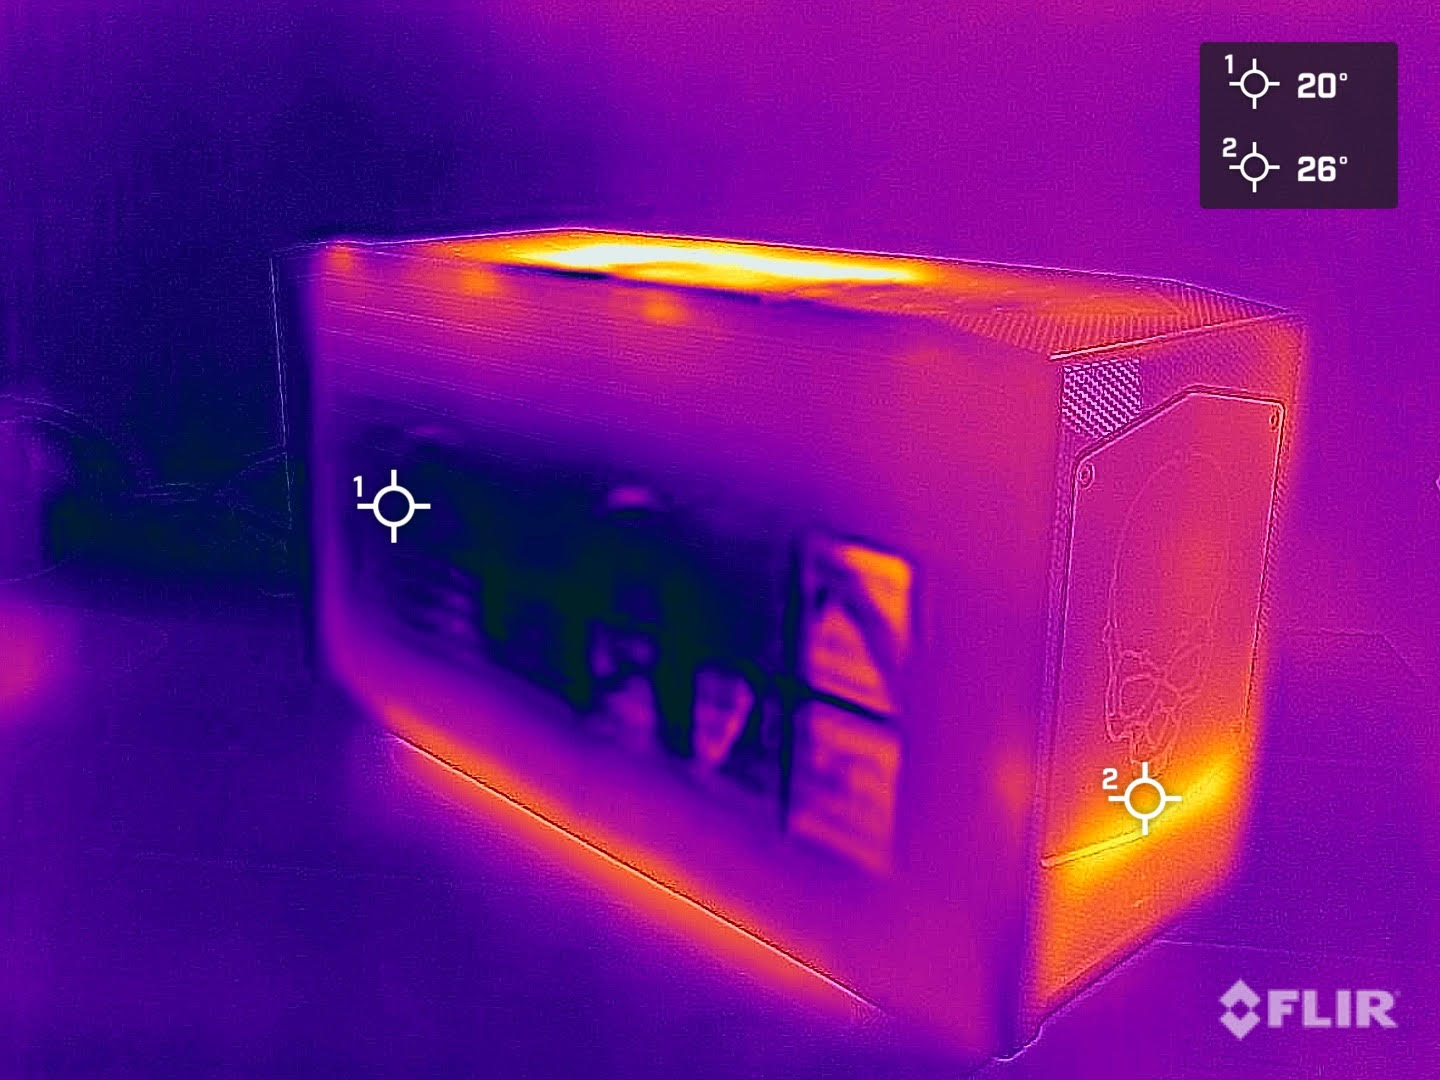
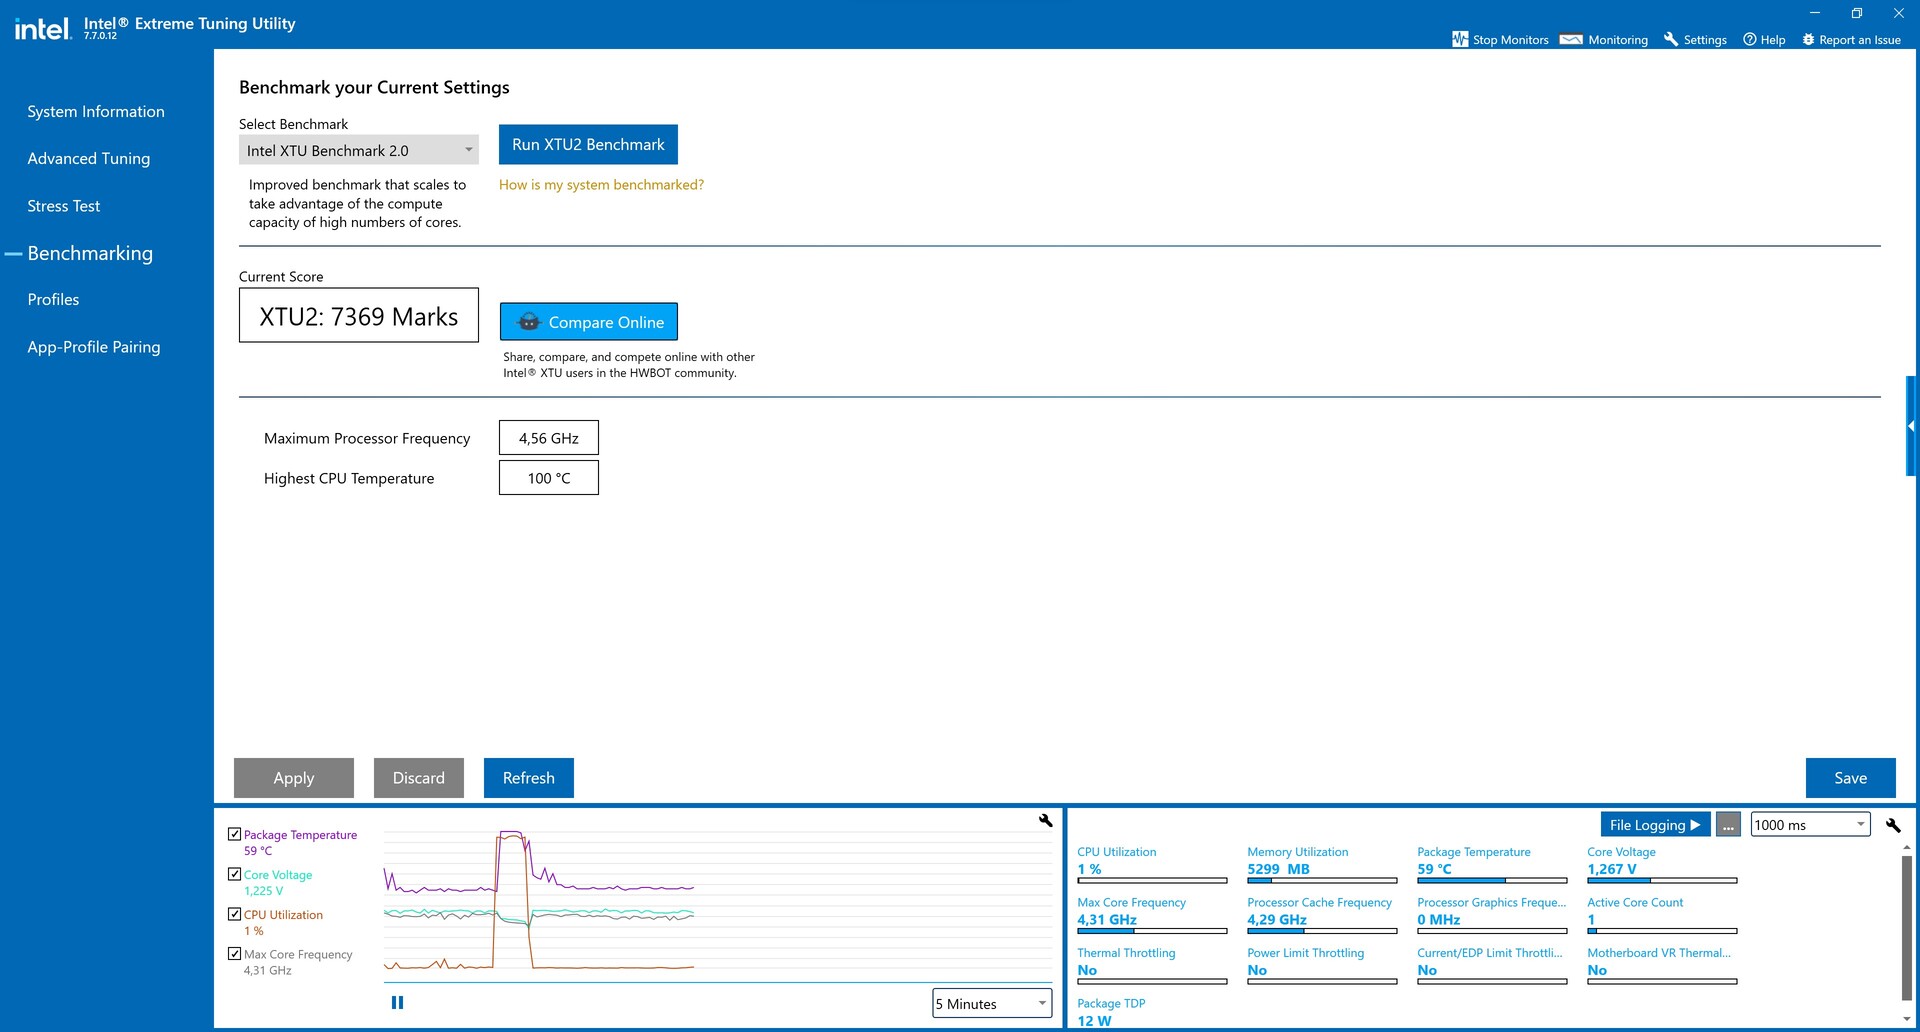
En el Intel NUC 12 Extreme Kit, el Intel Core i9-12900 aporta un consumo de energía significativamente mayor en comparación con el Intel NUC 11 Extreme Kit. Debido al mayor TDP del Intel Core i9-12900 en comparación con el Intel Core i9-11900KBesto ya era de esperar. Sin embargo, en comparación con los otros dos sistemas Alder Lake que también enumeramos aquí, el consumo de energía del Intel Dragon Canyon NUC resulta ser significativamente menor. La razón de esto se puede encontrar fácilmente, ya que la unidad de refrigeración relativamente pequeña alcanza rápidamente sus límites con el Intel Core i9-12900 bajo carga, por lo que el rendimiento del procesador tiene que ser estrangulado. Bajo carga, el límite de temperatura de 100°C casi siempre se alcanza rápidamente. En la prueba de estrés con Prime95, el límite de temperatura se alcanza después de unos segundos. Sin embargo, el Intel Core i9-12900 sigue funcionando a casi 2,6 GHz de media, lo que sigue siendo algo más que la velocidad de reloj básica (2,4 GHz). También debemos mencionar que el límite de temperatura sólo se alcanza muy brevemente.A lo largo de toda la prueba, la temperatura media se sitúa en 78°C, lo que es un valor razonable en general. También vemos una imagen similar durante la carga simultánea de la CPU y la GPU
La construcción compacta conlleva una gran desventaja. El NUC Intel Beast Canyon ya se oía claramente bajo carga. Intel hace un trabajo ligeramente mejor con el Dragon Canyon NUC, aunque sigue siendo claramente audible con 45.1 dB(A) bajo carga completa. Pero durante el funcionamiento en reposo o bajo carga baja, el sistema permanece silencioso en su mayor parte. Sólo oímos el revolucionar de los ventiladores de vez en cuando, pero debido a su baja frecuencia el ruido del ventilador es relativamente cómodo.
Ruido
| Ocioso |
| 30.2 / 30.4 / 30.8 dB(A) |
| Carga |
| / 45.1 dB(A) |
 | ||
30 dB silencioso 40 dB(A) audible 50 dB(A) ruidosamente alto |
||
min: | ||
| Power Consumption | |
| 1920x1080 The Witcher 3 ultra (external Monitor) | |
| Intel Core i9-12900K (Idle: 70.5 W) | |
| AMD Ryzen 9 3950X (Idle: 95 W) | |
| Intel Core i7-12700K (Idle: 81 W) | |
| Intel Core i9-10900K (Idle: 52.3 W) | |
| Intel Core i5-10600K (Idle: 52.2 W) | |
| Corsair One i160 (Idle: 51.5 W) | |
| Intel Dragon Canyon NUC - RTX 3060 | |
| Intel Ghost Canyon NUC (RTX 2070) (Idle: 33.1 W) | |
| Intel Beast Canyon NUC (Idle: 32 W) | |
| Prime95 V2810 Stress (external Monitor) | |
| Intel Core i7-12700K (Idle: 81 W) | |
| Intel Core i9-12900K (Idle: 70.5 W) | |
| Intel Core i9-10900K (Idle: 52.3 W) | |
| Intel Core i5-10600K (Idle: 52.2 W) | |
| AMD Ryzen 9 3950X (Idle: 95 W) | |
| Intel Dragon Canyon NUC - RTX 3060 | |
| Intel Beast Canyon NUC (Idle: 34 W) | |
| Intel Ghost Canyon NUC (RTX 2070) (Idle: 33.1 W) | |
| Cinebench R15 Multi (external Monitor) | |
| Intel Core i9-12900K (Idle: 70.5 W) | |
| Intel Core i7-12700K (Idle: 81 W) | |
| Intel Core i9-10900K (Idle: 52.3 W) | |
| AMD Ryzen 9 3950X (Idle: 95 W) | |
| Intel Dragon Canyon NUC - RTX 3060 | |
| Intel Core i5-10600K (Idle: 52.2 W) | |
| Intel Beast Canyon NUC (Idle: 32 W) | |
| Temperatures - CPU Temperature Prime95 | |
| Intel Dragon Canyon NUC - RTX 3060 | |
| Intel Core i9-10900K | |
| AMD Ryzen 9 3950X | |
| Intel Core i5-10600K | |
* ... más pequeño es mejor
Pro
Contra
Veredicto - Un caballo de batalla compacto
El Intel NUC 12 Dragon Canyon es una pequeña actualización del Intel NUC 11 Extreme Kit alias Beast Canyon. Con la nueva CPU Alder Lake, Intel realiza cierto mantenimiento del producto, retirando el antiguo procesador Tiger Lake. Además, hay una CPU con socket en el Compute Element por primera vez, lo que permite el uso de diferentes procesadores. En términos de rendimiento puro, lo que el Intel Core i9-12900 es capaz de ofrecer es ligeramente mejor que el Intel Core i9-11900KB. Al mismo tiempo, la construcción compacta sólo ofrece un espacio limitado para una refrigeración adecuada. Bajo carga, eso llega a sus límites muy rápidamente con un Intel Core i9-12900 no acelerado, haciendo que alcance repetidamente el límite de temperatura.
En este punto, el precio de compra del sistema barebone es de 1450 euros (~1585 dólares). Si se incluye el resto de componentes como la RAM, el SSD y la GPU, el Intel NUC 12 Dragon Canyon no es mucho más caro que otros sistemas completos. Esto hace que la elección recaiga en el cliente. Si te gusta el diseño del Intel NUC 12 Dragon Canyon, puedes elegirlo sin ningún tipo de reparo. La variedad de conexiones lo hacen a prueba de futuro y su número también es suficiente. Incluso hay un rápido lector de tarjetas SD que soporta el estándar UHS-II.
Con el Intel NUC 12 Extreme Kit alias Dragon Canyon, Intel vuelve a subir el listón de sus dispositivoscompactosen términos de rendimiento.
Por último, nos queda por responder a la pregunta que planteábamos al principio. A juzgar por su aspecto, consideramos que el Intel NUC 12 Dragon Canyon pertenece al segmento de los juegos. Gracias al rendimiento del procesador Alder Lake y la iGPU, el sistema también es adecuado como PC de oficina de gama alta. Al mismo tiempo, también tienes la opción de insertar una tarjeta gráfica profesional, que convierte el sistema en una estación de trabajo completa. De este modo, puedes utilizar fácilmente el pequeño Intel NUC Dragon Canyon para el procesamiento de imágenes y vídeo
La alternativa al Intel NUC 12 Extreme Kit Dragon Canyon sería construir un sistema usted mismo, que probablemente costaría más o menos lo mismo. Con el Zotac Magnus One también hay una buena alternativa si quieres un PC para juegos muy compacto.

